mechanical characterization of synthetic mesh for pelvic - D ...
367
MECHANICAL CHARACTERIZATION OF SYNTHETIC MESH FOR PELVIC ORGAN PROLAPSE REPAIR by William Robert Barone Bachelor of Science in Bioengineering, University of Pittsburgh, 2010 Submitted to the Graduate Faculty of Swanson School of Engineering in partial fulfillment of the requirements for the degree of Doctor of Philosophy University of Pittsburgh 2015
-
Upload
khangminh22 -
Category
Documents
-
view
1 -
download
0
Transcript of mechanical characterization of synthetic mesh for pelvic - D ...

\\\\\
MECHANICAL CHARACTERIZATION OF SYNTHETIC MESH FOR PELVIC ORGAN PROLAPSE REPAIR
by
William Robert Barone
Bachelor of Science in Bioengineering, University of Pittsburgh, 2010
Submitted to the Graduate Faculty of
Swanson School of Engineering in partial fulfillment
of the requirements for the degree of
Doctor of Philosophy
University of Pittsburgh
2015

UNIVERSITY OF PITTSBURGH
SWANSON SCHOOL OF ENGINEERING
This dissertation was presented
by
William Robert Barone
It was defended on
June 24th, 2015
and approved by
Tamer Ibrahim, PhD, Associate Professor, Department of Bioengineering
Spandan Maiti, PhD, Assistant Professor, Department of Bioengineering
Pamela Moalli MD, PhD, Associate Professor, Obstetrics Gynecology and Reproductive
Sciences
Anne Robertson, PhD, Professor, Department of Mechanical Engineering and Materials
Science
Dissertation Director: Steven Abramowitch, PhD, Associate Professor, Department of
Bioengineering
ii

Copyright © by William R. Barone
2015
iii

MECHANICAL CHARACTERIZATION OF SYNTHETIC MESH FOR PELVIC
ORGAN PROLAPSE REPAIR
William R. Barone, PhD
University of Pittsburgh, 2015
Pelvic organ prolapse (POP) is characterized by the abnormal descent of the pelvic organs into
the vaginal canal. POP is associated with urinary, defecatory, and sexual dysfunction, in addition
to psychological disorders including depression. Prolapse is quite common, with ~50% of
women over the age of 50 exhibiting some degree of prolapse, and over 200,000 surgical repairs
in the United States annually. During surgical repair, a graft is used to restore support to the
vagina, re-approximating the normal anatomy. Given the high failure rate of native tissue repair,
use of polypropylene mesh has become widespread. Despite the prevalence of synthetic mesh,
complication rates are ~20%, with little known about its behavior following implantation.
Therefore, this dissertation aims to rigorously characterize the mechanical behavior of synthetic
mesh, with the goal of optimizing device design for use in restoring support to the vagina.
First, micro- and macro-level deformation of mesh was assessed in response to
mechanical loads using uniaxial testing and 3D reconstruction. Upon loading, mesh pores
significantly deformed, yielding textile dimensions that are consistent with a heightened foreign
body response. In addition, point loads significantly wrinkled the mesh surface, further reducing
mesh dimensions and producing configurations consistent with those found clinically.
Next, a finite element model for synthetic mesh was developed, using a novel method to
allow for textile properties to be measured in-silico. This model was validated using a custom
testing apparatus to simultaneously load and image transvaginal mesh. Evaluation of mesh
iv

deformation found experimental and computational results to be similar, demonstrating the
predictive capabilities of this model. The validated model was then used to examine the
sensitivity of mesh behavior to variable loading conditions. Here the magnitude and orientation
of tensile forces were significantly correlated with undesired deformations.
Finally, computational mesh models were combined with MRI reconstructions of patient
specific anatomy to simulate prolapse development and mesh repair. Again, mesh pores
significantly deformed upon anatomical fixation, corresponding with clinical sites of exposure
and pain. In total, this dissertation provides a tool for the evaluation and optimization of
synthetic mesh devices prior to implantation and pre-surgical evaluation of mesh procedures.
v

TABLE OF CONTENTS
PREFACE .............................................................................................................................. XXIII
1.0 INTRODUCTION ........................................................................................................ 1
1.1 PELVIC FLOOR ANATOMY ........................................................................... 2
1.1.1 Bony Pelvis ....................................................................................................... 2
1.1.2 Musculature ..................................................................................................... 4
1.1.3 Connective Tissues ........................................................................................... 7
1.1.4 Pelvic Floor Viscera ....................................................................................... 10
1.2 PELVIC ORGAN PROLAPSE ........................................................................ 13
1.2.1 Clinical Presentation ..................................................................................... 13
1.2.2 Surgical Treatment ........................................................................................ 19
1.2.3 Graft Materials .............................................................................................. 22
1.2.4 Complications................................................................................................. 27
1.3 HOST RESPONSE TO PROLAPSE MESH .................................................. 29
1.3.1 Impact of Mesh on Vaginal Tissue ............................................................... 29
1.3.2 Factors Influencing the Host Response ....................................................... 32
1.3.2.1 Material ................................................................................................ 33
1.3.2.2 Filament Type ...................................................................................... 35
1.3.2.3 Pore Geometry ..................................................................................... 36
vi

1.3.2.4 Pore size ............................................................................................... 37
1.3.2.5 Mesh Burden ....................................................................................... 40
1.3.3 Considerations for Mesh Use in Prolapse Repair ....................................... 41
1.3.4 Gap in Knowledge ......................................................................................... 43
1.4 MOTIVATION AND SPECIFIC AIMS ......................................................... 44
2.0 EX-VIVO DEFORMATION OF PROLAPSE MESH ........................................... 49
2.1 OVERVIEW ....................................................................................................... 49
2.1.1 Textile Properties ........................................................................................... 51
2.1.2 Structural Properties ..................................................................................... 54
2.1.3 Uniaxial Tensile Properties of Synthetic Mesh ........................................... 57
2.1.4 Gap in Knowledge ......................................................................................... 58
2.2 MESH POROSITY IN RESPONSE TO UNIAXIAL LOADS ..................... 61
2.2.1 Introduction ................................................................................................... 61
2.2.2 Methods .......................................................................................................... 64
2.2.3 Results ............................................................................................................. 71
2.2.3.1 Textile Properties ................................................................................ 71
2.2.3.2 Structural Properties .......................................................................... 75
2.2.4 Discussion ....................................................................................................... 78
2.3 SURFACE CURVATURE OF SYNTHETIC MESH .................................... 83
2.3.1 Introduction ................................................................................................... 83
2.3.2 Methods .......................................................................................................... 86
2.3.2.1 Experimental Testing .......................................................................... 86
2.3.2.2 Photogrammetry ................................................................................. 88
vii

2.3.2.3 Surface Curvature............................................................................... 91
2.3.2.4 Validation ............................................................................................. 95
2.3.3 Results ............................................................................................................. 97
2.3.3.1 Mesh Surface Curvature .................................................................... 97
2.3.3.2 Validation ........................................................................................... 102
2.3.4 Discussion ..................................................................................................... 104
2.4 CONCLUSIONS .............................................................................................. 108
3.0 COMPUTATIONAL MODELING OF SYNTHETIC PROLAPSE MESH ..... 111
3.1 OVERVIEW ..................................................................................................... 111
3.1.1 Previous Modeling of Synthetic Mesh ....................................................... 113
3.1.2 Gap in Knowledge ....................................................................................... 114
3.2 DEVELOPMENT OF A COMPUTATIONAL MODEL FOR MESH ...... 115
3.2.1 Model Development ..................................................................................... 115
3.2.2 CAD Model of Prolapse Mesh .................................................................... 119
3.2.3 Discretization ............................................................................................... 121
3.2.4 Discretizing of Prolapse Mesh .................................................................... 124
3.2.5 Determination of Material Properties ....................................................... 125
3.2.6 Convergence Testing ................................................................................... 131
3.2.6.1 Mesh Burden Calculation ................................................................. 132
3.2.6.2 Minimum Pore Diameter Calculation ............................................. 134
3.2.6.3 Convergence Results ......................................................................... 135
3.2.6.4 Discussion ........................................................................................... 136
3.3 MODEL VALIDATION ................................................................................. 138
viii

3.3.1 Introduction ................................................................................................. 138
3.3.2 Methods ........................................................................................................ 141
3.3.2.1 Experimental Testing ........................................................................ 141
3.3.2.2 Computational Testing ..................................................................... 144
3.3.2.3 Mesh Burden ..................................................................................... 145
3.3.2.4 Minimum Pore Diameter.................................................................. 146
3.3.2.5 Statistics ............................................................................................. 148
3.3.3 Results ........................................................................................................... 148
3.3.4 Convergence Testing ................................................................................... 151
3.3.5 Discussion ..................................................................................................... 152
3.4 MESH BURDEN SENSITIVITY ................................................................... 158
3.4.1 Introduction ................................................................................................. 158
3.4.2 Methods ........................................................................................................ 160
3.4.2.1 Model Variables ................................................................................ 160
3.4.2.2 Statistics ............................................................................................. 164
3.4.3 Results ........................................................................................................... 165
3.4.4 Discussion ..................................................................................................... 168
3.4.5 Generalization of Methods .......................................................................... 174
3.5 CONCLUSIONS .............................................................................................. 177
4.0 COMPUTATIONAL MODEL OF PROLAPSE AND MESH REPAIR ........... 180
4.1 OVERVIEW ..................................................................................................... 180
4.1.1 Imaging of Prolapse ..................................................................................... 183
4.1.2 Imaging of Synthetic Mesh ......................................................................... 186
ix

4.1.3 Pelvic Floor Constitutive Models ............................................................... 187
4.1.4 Gap in Knowledge ....................................................................................... 190
4.2 CREATION OF PATIENT SPECIFIC GEOMETRIES ............................ 191
4.2.1 3D Reconstruction of Pelvic Floor Structures .......................................... 191
4.2.2 MRI Protocol................................................................................................ 192
4.2.3 Image Segmentation .................................................................................... 193
4.2.4 Surface Smoothing ....................................................................................... 196
4.2.5 Finite Element Discretization ..................................................................... 198
4.3 SIMULATION OF PROLAPSE AND REPAIR .......................................... 200
4.3.1 Introduction ................................................................................................. 200
4.3.2 Methods ........................................................................................................ 202
4.3.2.1 Preliminary Study: Model Development ........................................ 202
4.3.2.2 Prolapse Patient................................................................................. 209
4.3.2.3 Computational Measures ................................................................. 217
4.3.3 Results ........................................................................................................... 218
4.3.3.1 Preliminary Study: Model Development ........................................ 218
4.3.3.2 Prolapse Patient................................................................................. 221
4.3.4 Discussion ..................................................................................................... 225
4.4 CONCLUSIONS .............................................................................................. 232
5.0 CONCLUSION ......................................................................................................... 234
5.1 CLINICAL IMPLICATIONS ........................................................................ 234
5.2 ENGINEERING SIGNIFICANCE ................................................................ 239
5.3 LIMITATIONS ................................................................................................ 242
x

5.4 FUTURE DIRECTIONS................................................................................. 244
5.5 CLOSING ......................................................................................................... 247
APPENDIX A ............................................................................................................................ 248
APPENDIX B ............................................................................................................................ 281
APPENDIX C ............................................................................................................................ 288
APPENDIX D ............................................................................................................................ 309
BIBLIOGRAPHY ..................................................................................................................... 321
xi

LIST OF TABLES
Table 1. Current prolapse meshes are directly derived from abdominal hernia meshes. Often, mesh products are used for both hernia and prolapse repair, though they are cut and marketed depending on their application. While nearly all current meshes are considered type 1 polypropylene, their textile and structural properties greatly vary. ....................... 53
Table 2. Previous uniaxial tensile testing of prolapse mesh has found a wide range mechanical behavior, despite being constructed from the same material. The variation in structural properties arises from differences in pore geometry and knit pattern. Data reported is from Shepherd et al. (114). ............................................................................................... 57
Table 3. Structural properties for each mesh were obtained from load-elongation curves to 5N. Elongation values are those required for the mesh to achieve 5N of force, while low and high stiffness values are the minimum and maximum slopes of the load-elongation curve, respectively. Values are represented as Mean ± S.D. ....................................................... 77
Table 4. Mean |kmax| values of the entire mesh surface. Results for Gynemesh PS (n=5) and Restorelle (n=5) are shown for both 1 and 10N for boundary conditions (BCs) 1, 2, and 3. P-values are from a Friedman’s test, used to compare Mean |kmax| between BCs. * indicates differences between Gynemesh PS and Restorelle at the same load and BC (p < 0.05). Values are represented as Median (25th quartile - 75th quartile). ........................ 101
Table 5. Variance of kmax over the entire mesh surface. Results for Gynemesh PS (n=5) and Restorelle (n=5) are shown for both 1 and 10N for boundary conditions (BCs) 1, 2, and 3. P-values are from a Friedman’s test, used to compare Var(kmax) between BC. * indicates differences between Gynemesh PS and Restorelle at the same load and BC (p < 0.05). Values are represented as Median (25th quartile - 75th quartile). .................................. 102
Table 6. Predicted displacements of the vaginal apex and leading edge of the anterior vaginal bulge following application of anterior traction forces for a parous, nonprolapse patient geometry. The maximum effective stress in the vagina was also determined for all models. In addition, the maximum normalized mesh burden was determined for mesh repair models, following application of the anterior load. Here, mesh burden (mesh/mm3) was normalized by the maximum mesh burden of the undeformed DirectFix A geometry.......................................................................................................................................... 220
Table 7. Predicted displacements of the vaginal apex and leading edge of the anterior vaginal bulge following application of anterior traction forces for a prolapse patient geometry. The maximum effective stress in the vagina was also determined for all models. In addition, the maximum normalized mesh burden was determined for mesh repair models,
xii

following application of the anterior load. Here, mesh burden (mesh/mm3) was normalized by the maximum mesh burden of the undeformed DirectFix A geometry. . 223
Table 8. Best fit parameters for KCl and EGTA trials. KCl was found to significantly decrease a1 and β values relative to EGTA trials, indicating a decrease in stiffness. Values are represented as mean ± std., while values in parenthesis are the representative model parameters for KCl and EGTA groups. * indicates significant differences between KCl and EGTA groups (p < 0.05). ......................................................................................... 272
xiii

LIST OF FIGURES
Figure 1. The bony pelvis encloses the pelvic floor and provides attachments for a majority of the musculature and connective tissues that support the pelvic viscera. The coxal, or pelvic bone, articulates with the sacrum at the iliosacral joint, while the coccyx is fused to the inferior sacrum. Each bilateral coxal bone is a fusion of 3 bones, the ilium, ischium, and pubic bones. The two pubic bones articulate at the pubic symphysis. ......................... 3
Figure 2. The musculature of the pelvic floor closes the inferior aspect of the bony pelvis and provides support to the pelvic organs. The pelvic diaphragm, which is believed to be critical to pelvic floor support, consists of the levator ani and coccygeus muscles. ........... 6
Figure 3. Connective tissue support of the vagina is comprised of 3 distinct levels. Level I provides apical support and consists of the cardinal and uterosacral ligaments, Level II is comprised of the anterior and posterior portions of the endopelvic fascia, inserting into the arcus, and Level III support arises from the fusion of the endopelvic fascia at the pubic symphysis. ................................................................................................................. 9
Figure 4. The organs of the pelvic floor include the bladder, urethra, vagina, and rectum (from anterior to posterior). While each organ is associated with supportive fascia, it is the attachments of these organs to the vagina that are most critical for maintaining the anatomy and function of the pelvic floor. ......................................................................... 12
Figure 5. Pelvic organ prolapse is characterized by the descent of the pelvic organs into the vaginal canal, resulting in bulging of the vaginal walls. There are 4 stages of prolapse, with increasing severity as defined by the measurements taken during a POPQ exam. Shown here is an example of Stage 3 prolapse. ................................................................ 14
Figure 6. A mid-sagittal cross-section of the female pelvis (shown here via MRI), depicts alterations in vaginal positioning resulting from pregnancy and prolapse. In a nulliparous patient (left), the vagina is properly supported with a distinct change in angle at the mid-vagina, as the apex is directed towards the sacrum. Though the parous vagina (middle) does not necessarily include the characteristic change in angle, the walls of the vagina remain supported. The appearance of the vagina is markedly different in women with prolapse (right). Here the anterior vaginal wall noticeably protrudes outside of the body, and the entire vagina rests in a more distal location relative to the pubic bone (PB). ...... 16
Figure 7. During an abdominal sacrocolpopexy, a graft (purple) is fixed to the anterior and/or posterior surface of the vagina, tensioned posteriorly, and then fixed to the sacrum (a). For a transvaginal procedure, a graft is fixed to the anterior and/or posterior surface of the vagina, and subsequently tensioned to the pelvic sidewall (b). Typically, anchor locations in the pelvic sidewall include the sacrospinous ligaments and obturators........................ 20
xiv

Figure 8. Polypropylene mesh has become the dominant graft material for surgical repair of prolapse. Gynemesh PS, shown here, is currently considered the gold standard of polypropylene mesh repair. Further, Gynemesh PS highlights the recent industry trend of utilizing large pore devices. .............................................................................................. 25
Figure 9. Exposure is characterized by the degradation of vaginal tissue in contact with synthetic mesh. Here, exposure is visible on the luminal surface of the vagina following vaginal explantation from an animal model (a). Clinically, exposure is visualized and palpable during a gynecological examination (b). Often, mesh is excised in areas of exposure to relieve symptoms, including pain or vaginal discharge (c). Typically, excised mesh appears bunched and folded upon itself, as shown here. .................................................. 28
Figure 10. Immunofluorescent labeling (bottom) demonstrates the effect of synthetic mesh products (top) on vaginal tissue. Here, the red signal represents positive staining of alpha-smooth muscle actin, the green signal represents apoptotic cells, and the blue signal represents nuclei. Gynemesh PS was found to significantly reduce the thickness of the smooth muscle layer (S) and increase apoptosis in tissue surrounding the mesh (M). .... 31
Figure 11. Masson’s trichrome staining of vaginal tissue with mesh embedded, demonstrates the fibrous encapsulation associated with individual mesh filaments (a). Here, * represents mesh filaments and FBR represents the foreign body response. While each filament is encased in fibrotic tissue, large pore sizes allow for tissue to grow in between separate FBR’s (b). If filaments become too close to one another, the FBR from individual filaments fuse, resulting in bridging fibrosis (c). .............................................................. 40
Figure 12. Materials testing can be classified as either structural or mechanical. Structural properties (ultimate load, ultimate elongation, stiffness, energy absorbed) are obtained directly from load-elongation curves. Mechanical properties (ultimate strength, ultimate strain, tangent modulus, strain energy) are normalized by specimen dimensions and are used to characterize the mechanical behavior of continuous materials. While continuous materials (extruded polypropylene) can be characterized in terms of mechanical properties, porous textiles (knitted polypropylene) must be characterized using structural properties........................................................................................................................... 56
Figure 13. The mechanical role of synthetic mesh is dissimilar between hernia (a) and prolapse (b) repair. For hernia repair, mesh is loaded along all axes simultaneously, maintaining a flat configuration (c). Vaginally, mesh arms are placed in tension to provide structural support. Such loading has the potential to deform mesh pores and result in wrinkling of mesh (d). ........................................................................................................................... 63
Figure 14. Raw images (top) and corresponding binarized images after a custom thresholding protocol (bottom). Here, images of the mesh mid-substance are shown at 0N for Gynemesh PS, Alyte’s stem section, Restorelle 0° offset, and UltraPro, from left to right............................................................................................................................................ 65
Figure 15. Uniaxial tensile testing set-up to measure textile properties in response to mechanical loading. Shown here is an UltraPro sample following the application of the preload. A DSLR camera was used to image the mesh mid-substance at each load. A ruler was placed in-plane with mesh samples and used to scale images. ......................................... 67
xv

Figure 16. Following binarization, each isolated cluster of white pixels was identified as a mesh pore. The centroid of each pore was located (red circles) and the minimum diameter of each pore was determined. ................................................................................................ 69
Figure 17. Mesh mid-substance deformation at 0.1N (top), 5N (middle), and 10N (bottom) of applied force. Representative images from Gynemesh PS (a), Restorelle 0° (b), Restorelle 5° (c), Restorelle 45° (d), Alyte’s vaginal section (e), Alyte’s stem section (f), UltraPro (g), and UltraProOPP (h) are shown. Each image has dimensions of 10 x 10 mm............. 72
Figure 18. Porosity measurements at 0, 0.1, 5, and 10N of force. Error bars represent standard deviation, while * represents a significant impact of loading on mesh porosity (p < 0.05)............................................................................................................................................ 72
Figure 19. Distribution of minimum pore diameter (dmin) for Gynemesh PS (a), Restorelle 0° (b), Restorelle 5° (c), Restorelle 45° (d), Alyte’s vaginal section (e), Alyte’s stem section (f), UltraPro (g), and UltraProOPP (h) at 0, 0.1, 5 and 10N of force. The y-axis represents the fraction of total pore area contributed by pores within a given range of diameters. The application of a uniaxial load was found to significantly alter the diameter distribution for all meshes tested (p < 0.05)............................................................................................... 74
Figure 20. Representative load-elongation curves for all groups tested. Meshes display a wide range of responses from 0 to 5N, due to initial pore geometry and orientation to the loading axis (a). During imaging of samples at 5N, each mesh underwent stress relaxation prior to application of the 10N load (b). ........................................................................... 76
Figure 21. Out-of-plane deformations, such as surface wrinkling or bunching, brings mesh filaments closer together. The proximity of filaments may result in the union of foreign body responses from individual filaments, creating bridging fibrosis. ............................. 86
Figure 22. Experimental boundary conditions (BCs) utilized in this study. Each mesh sample was loaded to 1 and 10N of force at each of the 3 BCs shown above. Clamps were used to constrain an entire boundary or 2 interrupted suture ties were used to secure the mesh to custom clamps at the top and/or bottom boundaries. ........................................................ 88
Figure 23. Ten images from various angles and heights (top) were used to reconstruct 3D models of the mesh surface (bottom) in response to tensile loading. Shown here is Gynemesh PS loaded to 10N for BC 2. A registration block was included in all images for model scaling. .............................................................................................................................. 90
Figure 24. Experimental data points, representing the 3D mesh surface, were mapped to the local coordinate systems (ξ,η) of a 4-element patch of biquintic finite elements (BQFEs). 10 points on the mesh surface were manually selected to serve as nodes for finite element discretization. .................................................................................................................... 91
Figure 25. Validation of the experimental methods with various surfaces of known curvature. The top row depicts the reconstructed surface models exported from Photoscan Pro for flat, parabolic, and sinusoidal geometries. The bottom row displays the computed |kmax| for each surface. Regions of low curvature (flat) are represented by cool colors, while the warm colors signify surfaces of high curvature. kmax values are in units of cm-1. ............ 96
xvi
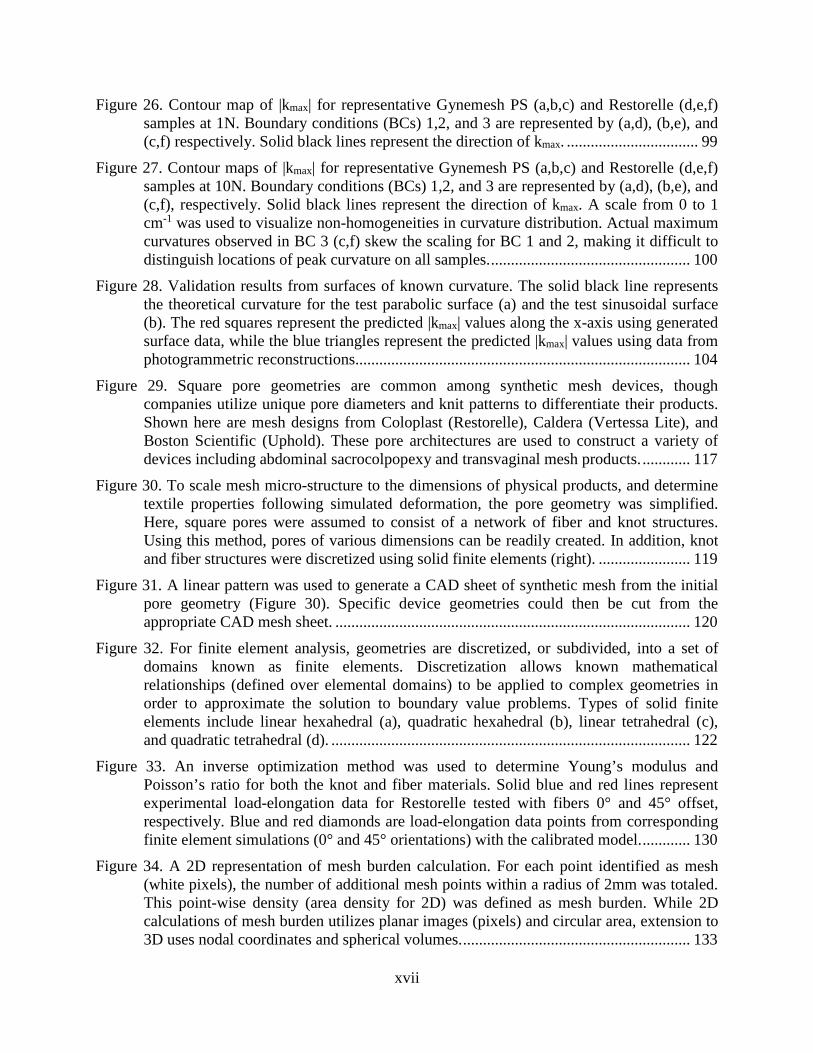
Figure 26. Contour map of |kmax| for representative Gynemesh PS (a,b,c) and Restorelle (d,e,f) samples at 1N. Boundary conditions (BCs) 1,2, and 3 are represented by (a,d), (b,e), and (c,f) respectively. Solid black lines represent the direction of kmax. ................................. 99
Figure 27. Contour maps of |kmax| for representative Gynemesh PS (a,b,c) and Restorelle (d,e,f) samples at 10N. Boundary conditions (BCs) 1,2, and 3 are represented by (a,d), (b,e), and (c,f), respectively. Solid black lines represent the direction of kmax. A scale from 0 to 1 cm-1 was used to visualize non-homogeneities in curvature distribution. Actual maximum curvatures observed in BC 3 (c,f) skew the scaling for BC 1 and 2, making it difficult to distinguish locations of peak curvature on all samples. .................................................. 100
Figure 28. Validation results from surfaces of known curvature. The solid black line represents the theoretical curvature for the test parabolic surface (a) and the test sinusoidal surface (b). The red squares represent the predicted |kmax| values along the x-axis using generated surface data, while the blue triangles represent the predicted |kmax| values using data from photogrammetric reconstructions.................................................................................... 104
Figure 29. Square pore geometries are common among synthetic mesh devices, though companies utilize unique pore diameters and knit patterns to differentiate their products. Shown here are mesh designs from Coloplast (Restorelle), Caldera (Vertessa Lite), and Boston Scientific (Uphold). These pore architectures are used to construct a variety of devices including abdominal sacrocolpopexy and transvaginal mesh products. ............ 117
Figure 30. To scale mesh micro-structure to the dimensions of physical products, and determine textile properties following simulated deformation, the pore geometry was simplified. Here, square pores were assumed to consist of a network of fiber and knot structures. Using this method, pores of various dimensions can be readily created. In addition, knot and fiber structures were discretized using solid finite elements (right). ....................... 119
Figure 31. A linear pattern was used to generate a CAD sheet of synthetic mesh from the initial pore geometry (Figure 30). Specific device geometries could then be cut from the appropriate CAD mesh sheet. ......................................................................................... 120
Figure 32. For finite element analysis, geometries are discretized, or subdivided, into a set of domains known as finite elements. Discretization allows known mathematical relationships (defined over elemental domains) to be applied to complex geometries in order to approximate the solution to boundary value problems. Types of solid finite elements include linear hexahedral (a), quadratic hexahedral (b), linear tetrahedral (c), and quadratic tetrahedral (d). .......................................................................................... 122
Figure 33. An inverse optimization method was used to determine Young’s modulus and Poisson’s ratio for both the knot and fiber materials. Solid blue and red lines represent experimental load-elongation data for Restorelle tested with fibers 0° and 45° offset, respectively. Blue and red diamonds are load-elongation data points from corresponding finite element simulations (0° and 45° orientations) with the calibrated model. ............ 130
Figure 34. A 2D representation of mesh burden calculation. For each point identified as mesh (white pixels), the number of additional mesh points within a radius of 2mm was totaled. This point-wise density (area density for 2D) was defined as mesh burden. While 2D calculations of mesh burden utilizes planar images (pixels) and circular area, extension to 3D uses nodal coordinates and spherical volumes. ......................................................... 133
xvii

Figure 35. Convergence testing for Restorelle 0° (a,b) and 45° (c,d) finite element models. The impact of increasing elements on simulated outcomes for maximum mesh burden (a,c) and dmin (b,d) was considered. Convergence of these measures was quickly attained for both orientations.............................................................................................................. 136
Figure 36. Model validation was completed through experimental loading of DirectFix A using a custom testing rig. Mesh arms were placed in custom clamps and a 250g weight was allowed to hang freely from tension posts as shown. In addition, 2 fixation rods located on a raised platform were placed through individual pores in the mesh body. .............. 142
Figure 37. For experimental validation, 2 separate loading conditions were considered. Under the first condition, upper arms were loaded at 40° and the lower arm was loaded at -20°. For condition 2, upper arms were loaded at 15°, while lower arms were loaded at -45°. All angles are relative to the horizontal axis, with the origin at the device center. A weight of 250g was applied to each mesh arm at the prescribed angle. ......................................... 143
Figure 38. A computational model of DirectFix A (right) was cut from the sheet of Restorelle pores extruded in Solidworks. Dimensions of the physical DirectFix A device (left) were used to create a 1:1 model. .............................................................................................. 145
Figure 39. Image processing was used to automatically identify mesh pores and determined their minimum diameters. First, a gradient based method was used to identify isolated clusters, representing pores. Here, each color represents a cluster of pixels identified as a pore (a). Next, the centroid of each cluster was determined (represented by red dots) and used to determine the minimum diameter for each pore (b). ...................................................... 147
Figure 40. Contour plots of normalized mesh burden for deformed DirectFix A geometries. Overall, computational and experimental results demonstrate good agreement for loading condition 1 (top) and 2 (bottom). Mesh burden values were normalized by the maximum mesh burden of the undeformed geometry. Warmer colors represent greater percent increases in mesh concentration...................................................................................... 149
Figure 41. Bland-Altman plots for average normalized mesh burden (left) and dmin (right). The y-axis represents the difference between experimental and finite element results. Condition 1 is represented by the blue circles and condition 2 is represented by the red triangles. Error bars represent standard deviation. * represents significant differences between experimental and finite element measurements (p < 0.05). ............................................ 150
Figure 42. Convergence testing results for validation geometries, examining the impact of discretization refinement on normalized mesh burden (a,c) and dmin (b,d) measurements for loading conditions 1 (a,b) and 2 (c,d). The levels of discretization considered in this study had little impact on these specific outcomes. ........................................................ 152
Figure 43. Subtle differences in mesh deformation were noted at the fixation rods (red circles). Experimentally (top), mesh was found to deform out-of-plane, resulting in bunching of the mesh about the fixation rods. However, no out-of-plane deformation was observed in FE models likely due to the flat boundaries of the computational fibers. ...................... 156
Figure 44. Anterior view of the segmented patient geometry with DirectFix A positioned anterior to the vagina. Using this geometry a series of loading angles for the upper and lower mesh arms were determined. ........................................................................................... 161
xviii

Figure 45. The validated mesh geometry was used to examine the impact of loading variables on mesh burden and pore diameter. Sensitivity of these textile properties to changes in the magnitude of tension (T), upper arm loading angle (θupper), and lower arm loading angle (θlower) were determined. Red circles represent locations of suture attachments, which were modeled using fixed boundary conditions. ............................................................ 163
Figure 46. Contour plots of raw mesh burden values, predicted by the FE model under various loading conditions. For the top row of plots, θupper and θlower were held constant at 45° and 20°, respectively. For the lower row of plots, T and θlower were held constant at 2.5N and 0°, respectively. Mesh burden was positively correlated with load, as increases in mesh concentration were observed in the inferior mesh arms and between the upper arms (top row). Though overall mesh burden was not correlated with θupper, increases in this angle led to increased mesh burden between the upper mesh arms (lower row). .................... 166
Figure 47. The magnitude of tensile load (T) was found to be a significant predictor for maximum mesh burden (R2 = 0.93, p < 0.001) and the total number of pores less then 1mm in diameter (NIP, R2 = 0.836, p < 0.001). ............................................................... 167
Figure 48. The methods outlined in this aim can be generalized to assess a wide variety of mesh devices. To demonstrate feasibility, a computational model for Uphold, a transvaginal mesh device currently in clinical use, was created and used to simulate mesh behavior under various loading conditions. ................................................................................... 175
Figure 49. Contour plot of normalized mesh burden for Uphold, following the application of tensile forces to the mesh arms. Warmer colors represent areas of increases mesh concentration. Similar to DirectFix A, tensile loading results in pore collapse in the mesh body between the superior mesh arms. ........................................................................... 176
Figure 50. Ultrasound (a) and MRI (b) are commonly used to image structures of the pelvic floor. Mid-sagittal views from each modality allow for clear identification of the bladder (B), urethra (U), vagina (V), and rectum (R). While ultrasound is relatively inexpensive and more readily allows for dynamic scans, deformation from the transducer and low resolution, limit the use of ultrasound for 3D reconstruction. ........................................ 184
Figure 51. Axial slices from a T2-weighted MRI scan were used to reconstruct patient geometries in Seg3D. First, structures of interest were identified and then manually segmented using a variety of tracing tools. Shown here are segmentations for the vagina (orange) and bony pelvis (green) (left). Segmentations were reconstructed in 3D and exported as iso-surfaces (right). ...................................................................................... 195
Figure 52. Raw iso-surfaces require smoothing to better approximate the shape of biological structures. Once geometries are smoothed, an iso-parameterization algorithm was used to discretize the surface into triangle elements. Shown here is the surface processing of a vaginal geometry following segmentation. ..................................................................... 197
Figure 53. Overall procedure for the generation of anatomical geometries from patient MRI scans. Though many software packages are available for each step, this specific protocol was found to address the challenges associated with segmentation and discretization of pelvic floor structures from current clinical diagnostic images. ..................................... 199
Figure 54. An MRI scan from a parous patient was used to assess the impact of apical support on deformation of the anterior vaginal wall. Axial slices were segmented (a) and used to
xix

create a solid vaginal geometry, discretized using linear tetrahedral elements (b) via the protocol outlined in Figure 53......................................................................................... 203
Figure 55. Mid-sagittal view of the FE vaginal geometry. To simulate “Ideal” vaginal support the entire apex of the vagina was fixed in the z-direction (black lines), in addition to z-fixation of the distal vagina. Further, a portion of the superior-posterior surface of the vaginal wall was fixed in the y-direction. A traction force was applied to the mid-distal anterior vaginal surface to simulate loading via abdominal pressure. ............................ 206
Figure 56. Mid-sagittal view of the FE vaginal geometry. To simulate the development of prolapse, an apical defect was considered by removing the superior-anterior apical support. All other boundary conditions and model parameters were unchanged from the “Ideal” support model. .................................................................................................... 207
Figure 57. Anterior view of the FE vaginal geometry with attached DirectFix A mesh. Tied contacts were used to simulate suture attachments of the mesh to the vagina (red circles). For both untensioned and tensioned models, each mesh arm was fixed in the x, y, and z-directions. All additional model parameters were unchanged from the apical defect model............................................................................................................................... 208
Figure 58. An MRI scan from a patient presenting with prolapse was used to assess the impact of anatomical mesh attachment during surgical repair. Axial slices were segmented (a) and used to create a solid vaginal geometry, using linear tetrahedral elements (b). In addition, the bony pelvis was segmented in order to identify anatomical mesh attachment sites. 210
Figure 59. Mid-sagittal view of the FE vaginal geometry reconstructed from a women with prolapse. Shown here are the boundary conditions considered for an “ideally” supported vagina. ............................................................................................................................. 212
Figure 60. Mid-sagittal view of the FE vaginal geometry reconstructed from a women with prolapse. All boundary conditions and model parameters were similar to the “ideal” support model described in Figure 59, except for the removal of the fixed boundary at the anterior apex.................................................................................................................... 213
Figure 61. For simulation of prolapse repair, two configurations of the mesh device were examined. First, an untensioned mesh repair was considered. Here, the mesh was fixed to the anterior surface of the vagina using a series of ties contacts (left, red circles), and the distal tips of all mesh arms were fixed. In addition, a tensioned mesh model was considered (right). In this scenario, mesh arms were tensioned to anatomical fixation sites and then fixed. ................................................................................................................. 215
Figure 62. To simulate implantation of synthetic mesh for prolapse repair, the bony pelvis was used to identify the 3D coordinates for mesh arm fixation (a). After identification of these attachment sites, a computational mesh model was fixed to the anterior surface of the vagina, and the mesh arms were “tensioned” to their anatomical fixation sites utilizing a displacement driven finite element simulation (b).......................................................... 216
Figure 63. Contour plots of total displacement obtained using a parous, nonprolapse vaginal geometry. Shown is a mid-sagittal view of the undeformed geometry (a) and the deformations observed following the application of anterior load for the ideally supported (b), apical defect (c), untensioned mesh repair (d), and tensioned mesh repair (e) models.
xx

The top circle (a) indicates the location of the anterior apex, while the bottom circle (a) represents the leading edge of the anterior wall prolapse. .............................................. 219
Figure 64. Contour plots of normalized mesh burden for 3D DirectFix A geometries following application of the anterior vaginal load. Shown are the untensioned (left) and tensioned (right) scenarios. Plots shown are a projection of the 3D geometry onto the xz-plane. Mesh burden values (mesh/mm3) were normalized by the maximum mesh burden for the undeformed DirectFix A geometry. ................................................................................ 221
Figure 65. Contour plots of total displacement obtained using a prolapse vaginal geometry. Shown is a mid-sagittal view of the undeformed geometry (a) and the deformations observed following the application of anterior load for the ideally supported (b), apical defect (c), untensioned mesh repair (d), and tensioned mesh repair (e) models. The top circle (a) indicates the location of the anterior apex, while the bottom circle (a) represents the leading edge of the anterior wall prolapse ................................................................ 222
Figure 66. Contour plots of normalized mesh burden for 3D DirectFix A geometries following application of the anterior vaginal load for untensioned (left) and tensioned (right) mesh repair scenarios. Plots shown are a projection of the 3D geometry onto the xz-plane. Mesh burden values (mesh/mm3) were normalized by the maximum mesh burden for the undeformed DirectFix A geometry. ................................................................................ 224
Figure 67. Contour plot of effective stress for DirectFix A, with tensile forces applied at various loading angles (a. upper arm 15°, lower arm 0°, b. upper arm 45°, lower arm 20°). Cooler colors represent lower stress values, while warmer colors represent greater stress values. ............................................................................................................................. 229
Figure 68. Custom motion carriages where designed to minimized frictional noise during testing of compliant soft tissues. Air bearings (a) and thrust bushings (c) were used to provide frictionless linear and rotational carriage movements (b), thereby eliminating erroneous force measurements during testing. ................................................................................ 255
Figure 69. Representative validation results of “frictionless” linear movement for the air bearing sleds. As the frequency approaches 0, the acceleration of the sled approaches 0 (thus, F 0). Force measurements were negligible at displacement rates below 1Hz, showing good agreement between theoretical and measured values. However, differences became pronounced at higher frequencies, suggesting the presence of friction or instability of the motion carriage at relatively high displacement rates. .................................................... 257
Figure 70. Sample preparation for biaxial testing. After explanting the reproductive track en-bloc, the vagina was isolated via proximal and distal transections at the cervix and inroitus (a, dashed-lines), respectively. The vagina was then cut along the length, just lateral to the urethra (b) and unfolded into a planar geometry (c). Finally, 5 markers were placed on the luminal surface and 4 hooks were placed along each edge of the tissue (c, d). .................................................................................................................................... 259
Figure 71. Schematic for biaxial testing of live tissue samples. A roller pump was used to deliver warmed media and distribute solutions intended to alter the contractile state of smooth muscle. ............................................................................................................................ 260
Figure 72. Entire biaxial testing apparatus. A camera was positioned above the specimen, parallel to the table, in order to record marker positions during testing. ..................................... 262
xxi

Figure 73. Upon application of preload, all vaginal samples experienced noticeable strains. Comparison of the 3 trials for each specimen revealed that preload areal strains for KCl trials were significantly greater than baseline and EGTA strains (p = 0.02). EGTA was found to return areal strains to baseline levels (p > 0.05). .............................................. 269
Figure 74. To standardize the loading history of all samples, measured strain values were normalized by the final preload strain. Therefore, all stress-strain data used to determine strain energy parameters was referenced to the preloaded state, rather than the unloaded state. ................................................................................................................................ 270
Figure 75. Representative biaxial stress-strain data for vaginal tissue. The circumferential (circ.) axis typically exhibited increased nonlinearity relative to the longitudinal (long.) axis, though both axes quickly increased in stiffness. The stress ratio noticeably impacted the stress-strain curves for both the long. and circ. axes, demonstrating axial coupling. Please note that the stress-strain data above is not referenced to the preloaded state. This was chosen to visually separate circ. and long. curves. ......................................................... 271
Figure 76. Contour plots of the strain energy (W, top) and complementary strain energy (WC, bottom) for KCl (left) and EGTA (right) groups. Plots were generated using representative model parameters. W and WC demonstrate anisotropic tissue behavior, with a stiffer longitudinal axis relative to the circumferential axis. KCl was found to decreases tissue anisotropy, significantly reducing the stiffness of the longitudinal axes, though it remains nearly twice as stiff as the circumferential axis (Table 8). ................................ 274
xxii

PREFACE
When I came to the University of Pittsburgh in 2006, never would have I imagined that I would
be completing a PhD nearly 9 years later. My time at Pitt has been more than I could have ever
asked for. The individuals I have met and my experiences during this time have been incredibly
humbling. At times, my graduate work was quite grueling, but there was never a time when I
questioned whether or not this was the right career choice for me. This belief is largely a credit to
the amazing individuals with whom I have had the pleasure of knowing over this time period.
There are a countless number of students, friends, faculty, and collaborators who have
contributed, directly or indirectly, to the work discussed below. Thus, before presenting this
dissertation, I would like express my gratitude for those who have made graduate school such an
enjoyable and rewarding experience.
I would like to first like to recognize my mentor, Dr. Steven Abramowitch. Surely it is
impossible for me to express my gratitude for all of the things you have taught me over the years.
Whether it was about research or life, your advice, and more importantly, your actions, are what
I hope to model my own career after. I cannot say enough about the training I received from you,
and I sincerely believe that it has propelled my growth as an engineer, and an individual, to
levels I had not imagined just a few years ago. Truly, I could not have had a better mentor over
the last half-decade. You constantly pushed me to improve myself, while making the lab an
extremely open and fun place to work. I thank you for having faith in me to complete this degree
and for all of your support throughout the years. So throughout all of the experiments, pranks,
xxiii

Muse talk, Apple keynotes, marathon abstract sessions, and GetGo trips – thank you. It is truly
an honor to have been one of your students and I am blessed to have you as a mentor and friend.
Thank you for making this an incredible experience
I would also like to say a very special thank you to Dr. Pamela Moalli. While it is not
stated above, Dr. Moalli has served as a co-advisor throughout my entire graduate, and even
some of my undergraduate, career. She is truly the driving force behind this research and deeply
cares about addressing these clinically issues. Dr. Moalli, thank you for all that you have taught
me throughout the years. I feel that you have provided me with such a unique graduate school
experience, especially given that I am an engineer. Not only have you kept my work grounded
and focused on improving the treatment of prolapse, but also your ability to teach and nurture my
understanding of this topic is something that has greatly enhanced my abilities as a researcher. I
am in constant awe of your passion, work ethic, motivation, and care for others. Thank you for
all that you have given me throughout the years and I once again am so grateful to have had you
as a mentor and friend.
Next, I would like to acknowledge the additional members of my committee for their
contributions to this work and my growth as a graduate student. I cannot say enough about the
enthusiasm of my committee in regards to this dissertation. Every time we met individually, or as
a group, there was a genuine sense of intrigue and excitement from each of you. This feeling
made it enjoyable to conduct research and I feel blessed to have had such a caring committee.
Dr. Robertson, thank you for all of your guidance, as both a teacher and mentor. I have learned
so much from you, from constitutive models to critical thinking and experimental design. Even
as an undergraduate in your Fluid Mechanics class, your willingness to discuss my graduate
school opportunities helped me to find my way, and is certainly a reason why this dissertation
xxiv

exists. To Dr. Ibrahim, thank you for all of feedback regarding the studies below. Certainly,
things have evolved since I proposed this dissertation and I cannot say enough about your
thoughtfulness during this process. You have challenged me to consider the rationale for all of
my decisions and it has strengthened me as a researcher. To Dr. Maiti, thank you for all your
help completing the studies found in this dissertation. I have learned so much from you in terms
of computational modeling, and the proper way to go about such research. While I understand
the limitations of our work here, I know that your teachings will greatly enhance my abilities as
an engineer.
In addition, I would like to give a special thank you to Dr. Savio L-Y Woo. My first
research experience came as a summer student in the MSRC’s summer research program.
Honestly, this experience set the foundation for my future academic pursuits and provided me
with the skills to conduct high-level research. Your teachings are something that I will always
carry with me. Thank you imparting some of your wisdom and providing me with guidance over
my time as a student researcher. It has been a privilege getting to know you and to work at the
MSRC.
I would also like to thank Dr. Harvey Borovetz for his support and encouragement
throughout my undergraduate and graduate careers. You were perhaps the most influential
person in my decision to attend graduate school. You encouraged me to explore research
opportunities and even directed me to eventual mentor. I truly appreciate your kindness and
friendship over my time at the University of Pittsburgh. So it is with great pleasure that I say, yes
Dr. Abramowitch is letting me graduate and yes, there will be plenty of publications. Thank you
for all of the opportunities you have given me.
xxv

As I’m sure any graduate student will tell you, none of this work would be possible
without the help of lab members and collaborators. I have been fortunate to attend graduate
school and perform research with an amazing group of individuals. Thank you all of my fellow
graduate students, Andrew, Zegbeh, Katrina, and Deana. It has been a pleasure working with
each of you in the Tissue Mechanics lab. You have made it a joy to come to lab everyday. I have
had so much fun these past 5 years. In addition, I would like to acknowledge Stacy, Suzan,
Alexis, and Rui. I cannot thank you enough for all that you guys have done throughout my
career. Truly, your efforts are what have kept the lab running and are the reason why I was able
to complete my testing without constantly running into problems. Lastly, I would like to thank
the staff and personnel at the Musculoskeletal Research Center, Magee-Womens Research
Institute, Magee-Womens Hopsital, and the Department of Bioengineering. Thank you for your
professionalism and your kindness during my graduate career.
I would now like to thank my family for continued love and encouragement throughout
my academic pursuits. I am blessed to have such a caring family who believes in me and
enthusiastically supports my decisions. Thank you for all of the sacrifices that you have made for
me throughout the years. Without a doubt each of you has made me who I am today. I hope that
each of you can take pride in this dissertation and I am thrilled to share this work with you. To
mom, dad, Brenda, Chris, Grandpa and Grandma Vannauker, and Grandpa and Grandma
Barone; thank you from the bottom of my heart. We earned it.
Lastly, I would like to thank my fiancée, Dr. Chelsea Marsh. I always tell people that I
have no regrets about going to graduate school. Yes, I would pick the same mentor, lab, and
topic all over again for the reasons listed above. But meeting you at orientation was truly the
highlight of my graduate career. I guess I was lucky that I knew where we needed to sign up for
xxvi

classes. Or maybe it didn’t really matter whether I knew the answer to that one or not. Thank you
for all of your love and support throughout graduate school. I know work occasionally got the
best of me, but you have always been there to pick me up. You are such an amazing, smart, and
beautiful person. I am just a lucky guy who can’t wait to see what the future holds.
xxvii

1.0 INTRODUCTION
Pelvic floor disorders are prevalent among women, affecting one-third of all premenopausal
women and one-half of all postmenopausal women (1). These disorders include pelvic organ
prolapse, urinary incontinence, fecal incontinence, voiding dysfunction, defecatory dysfunction,
and sexual dysfunction, though it is not uncommon to exhibit multiple conditions concomitantly.
In a majority of these cases, dysfunction results from the loss of structural support to the pelvic
organs, altering their positioning and the mechanisms required for proper voiding and sexual
function. As such, surgical treatment of pelvic floor disorders aims to restore the support to the
pelvic organs, often using biomaterials to reconstruct the native or non-symptomatic anatomy in
order to restore proper function (2).
Unfortunately, our current knowledge of the female pelvic floor is severely limited,
especially in regards to the mechanisms responsible for pelvic floor support. Given our poor
understanding of such a complex mechanical environment, it is unsurprising that surgical
treatment of these disorders has been met with a wide range of results since its inception. The
wide range clinical outcomes associated with synthetic mesh for prolapse repair, the main focus
of this dissertation, is perhaps the greatest indication that our grasp of the anatomy and the
supportive mechanisms is insufficient. As with many other fields of study, such as
1

cardiovascular and orthopedic disciplines, reliable treatments for pelvic floor disorders first
requires a thorough understanding of the anatomic structures and the functional mechanics of
these tissues. In this section, a brief summary of the pelvic floor anatomy will be presented as it
relates to pelvic floor support. In addition, the primary disorder studied in this dissertation, pelvic
organ prolapse, will be discussed in along with current clinical treatments for this disorder.
1.1 PELVIC FLOOR ANATOMY
The female pelvic floor is a highly complex, interdependent network of soft tissues and bony
structures that support several organs and contribute to proper voiding and sexual functions. In
turn, the vagina provides support to a number of other pelvic organs. Though the current
discussion will focus on the nulliparous anatomy and changes that result in dysfunction, it should
be noted that pelvic floor anatomy is subject to change throughout a woman’s lifetime,
particularly in response to gestation, birthing, and aging processes. In a majority of women, these
alterations do not result in dysfunction, however such changes are confounding factors in
understanding the development of disorders.
1.1.1 Bony Pelvis
In general the viscera of the pelvic floor are contained within the bony pelvis, which serves as
the base of attachment for the musculature and connective tissues that support these organs.
2

Articulations and the dimensions of the bony pelvis appear to play a critical role in pelvic floor
function, as skeletal abnormalities are highly associated with pelvic floor disorders. For instance,
nearly 100% of women with a wide transverse outlet, short anterior-posterior diameter, and
absent pubic symphysis develop pelvic organ prolapse (3). While one may expect dysfunction in
dramatically malformed geometries, even subtle changes in pelvic diameter carry an increased
risk for developing prolapse (4).
Figure 1. The bony pelvis encloses the pelvic floor and provides attachments for a majority of the
musculature and connective tissues that support the pelvic viscera. The coxal, or pelvic bone, articulates with the
sacrum at the iliosacral joint, while the coccyx is fused to the inferior sacrum. Each bilateral coxal bone is a fusion
of 3 bones, the ilium, ischium, and pubic bones. The two pubic bones articulate at the pubic symphysis.
3

The bony pelvis is comprised of the coxal bones (also known as the hip bones), sacrum,
and coccyx (Figure 1). Each coxal bone is the fusion of three bones, with the ilium superiorly,
the ischium inferiorly and posteriorly, and the pubis inferiorly and anteriorly. The two inferior
bones form the acetabulum, a concave surface that articulates with the head of the femur. In
addition, the two coxal bones articulate anteriorly at the pubic symphysis, a cartilaginous joint
located at the pelvic midline. Finally, the sacrum consists of five fused vertebral bones that
articulate bilaterally with the posterior ilium at the sacroiliac joint, and inferiorly to the coccyx.
When standing, the superior inlet plane of the normal female pelvis is tilted anteriorly,
approximately 60-65° from the horizontal plane (4).
1.1.2 Musculature
Whereas the superior outlet of the bony pelvis is open to the abdominal cavity, inferiorly it is
largely closed by the pelvic floor musculature. Located anteriorly are a group skeletal muscles,
including the obturator internus, that originate from the pubic ramus and function to stabilize and
rotate the femur. Posteriorly, the performis muscles originate on the anterior sacrum, extending
through the greater sciatic notch and act to externally rotate the thigh. Inferiorly is a group of
muscles referred to as the pelvic diaphragm. The pelvic diaphragm is believed to play a large
role in pelvic floor support and consists of the levator ani muscles and coccygeus muscles in
addition to connective fascia. Often the pelvic diaphragm is described as a “hammock-like“ or
“U-shaped” structure, stretching between the pubis and coccyx with attachments along the lateral
walls of the bony pelvis (4, 5). The area contained within this U-shaped region is referred to as
4

the urogenital hiatus, a space that contains the urethra, vagina, and rectum (Figure 2). The levator
ani fan outward with broad attachments and create the posterior and lateral pelvic floor. Given
the broad insertions of the levator ani, it is further divided into three parts according to their
points of attachment. From medial to lateral, the components of the levator ani are the
puborectalis, pubococcygeus, and iliococcygeus. Many texts portray the pelvic diaphragm as a
simple hammock structure lying in the horizontal plane, closing the inferior pelvic floor and
providing a surface for the pelvic viscera to rest upon (4). However, given the horizontal offset
of the bony pelvis and the basal tone of these muscles, their function appears more complex.
Indeed, it is often acknowledged that the resting tone of the pelvic floor muscles actively pull the
distal vagina towards the pubic symphysis, providing a unique change of angle along the long
axis of the vagina.
The appropriate orientation of the pelvic diaphragm can be observed upon MRI
segmentation of the pelvic floor muscles. Specifically, segmentation performed in our lab
exhibits a noticeable horizontal offset for these muscles, with a nearly vertical orientation. Such
positioning is better suited to actively pull the pelvic viscera anteriorly towards the pubic
symphysis. Portrayal of the pelvic floor musculature in this manner more readily illustrates the
importance of this muscle group in positioning the organs in this space.
5

Figure 2. The musculature of the pelvic floor closes the inferior aspect of the bony pelvis and provides
support to the pelvic organs. The pelvic diaphragm, which is believed to be critical to pelvic floor support, consists
of the levator ani and coccygeus muscles.
Increased vertical positioning of the pelvic diaphragm is also consistent with the
observation of a change in vaginal orientation along its length. In the nulliparous anatomy, the
vagina does not form a straight line from the introitus to the sacrum, but rather the distal vagina
is pulled anteriorly with its long axis in a predominately vertical orientation. Conversely, the
proximal vagina is directed towards the sacrum, more in-line with the horizontal axis. As such,
weakening of these muscles or defects in these structures may manifest as a more posterior
positioning of the vagina or alters the angle between the proximal and distal vagina. This change
would then effect the positioning of other pelvic viscera, potentially placing them in a less
6

optimal position, directly over the vaginal introitus. While this hypothetical scenario may or may
not be related to pelvic floor disorders, this example readily demonstrates the integral behavior
of pelvic floor structures and the impact of this musculature on viscera positioning.
1.1.3 Connective Tissues
Perhaps the least understood components of pelvic floor support are the connective tissues. The
connective tissues of the pelvic floor arise from the fascial layers of the musculature and viscera
and form a continuous web that covers and mechanically supports the vagina and the pelvic
organs. These connective tissues suspend the organs of the pelvic floor through attachments to
the pelvic sidewall. This support system is quite complex, as the composition, thickness, and
strength of the connective tissues vary significantly based on their location.
Conceptually, the connective tissue support of the pelvic floor is classified using a level-
based approach, dividing connective tissues based on their location of attachment to the vagina
(6). In total, three levels are considered, with levels I, II, and III representing support for the
proximal, middle, and distal portions of the vagina, respectively (Figure 3). Level I consists of
the cardinal and uterosacral ligaments and provides support to the uterus and upper vagina. It
should be noted that these ligaments are quite dissimilar from other ligamentous structures
throughout the body. As opposed to the dense, fibrous bundles that connect bones and consist
primarily of collagen I, the ligaments of the pelvic floor are complex connective tissue structures
that envelope neurovascular structures and attach the vagina to the bony pelvis. The composition
of the uterosacral ligament varies along its length, ranging from fat and loose connective tissue at
7

its attachment to the sacrum, to dense connective tissue in the mid-region, to predominately
smooth muscle at the cervical attachment. The primary structural protein of the uterosacral
ligament is collagen III, providing a combination of flexibility and strength (7). The paired
uterosacral ligaments direct the vagina superiorly and posteriorly, again providing support to the
cervix and upper vagina (6). In its course to the sacrum, the uterosacral ligament fans out and
attaches at sacral segments ranging from S1 to S4. Lateral stability of the vagina is maintained
by the cardinal ligaments, which also insert along the paracervical ring, combining with the
urterosacral ligaments. Similarly, the cardinal ligaments also have a fan-like appearance,
extending along to proximal third of the vagina and running laterally with broad attachments to
the pelvic sidewall. Distal to Level I support, Level II provides additional lateral stabilization of
the vagina. Level II consists of anterior and posterior portions of the endopelvic fascia, a loose
connective tissue extending from the mid-vagina to the pelvic sidewall and inserting into the
acrus tendineous fascia pelvis. Finally, Level III support arises from the fusion of the endopelvic
fascia at the pubic symphysis (anterior) and perineal body (posterior) (Figure 3).
Additional connective tissue structures in the pelvic floor include the arcus tendineus
levator ani (ATLA) and arcus tendineus fascia pelvis (ATFP), which are lateral condensations of
fascia with increased collagen content and organization relative to the neighboring endopelvic
fascia (4). The ATLA inserts at the pubic rami anteriorly and runs posteriorly to the ischial spine,
providing an anchor for the pubococcygeus and iliococcygeus muscles of the levator ani.
Running parallel to the ATLA, the ATFP inserts at the pubic rami, just anterior to the ATLA and
inserts posteriorly at the ischial spine. The ATFP is formed from the condensation of the parietal
8

fascias, overlying the obturator internus and levator ani, and serves as the lateral attachment for
the vagina anchoring the anterior vagina to the pelvic sidewall (8). Importantly, the ATFP
provides bilateral support, maintaining vaginal positioning. The ATFP is comprised of roughly
84% collagen, 13% elastin, and 3% smooth muscle. Collagen content is dominated by type III at
84%, while type I and type V are approximately 13% and 5%, respectively (8). Given this
composition, the ATFP is a fairly flexible structure, distending in response to increases in
intrabdominal pressure. The ATFP is thought to be a significant contributor to pelvic floor
support, providing necessary mechanisms by which the vagina can resist the downward pressure
applied via the bladder and urethra.
Figure 3. Connective tissue support of the vagina is comprised of 3 distinct levels. Level I provides apical
support and consists of the cardinal and uterosacral ligaments, Level II is comprised of the anterior and posterior
portions of the endopelvic fascia, inserting into the arcus, and Level III support arises from the fusion of the
endopelvic fascia at the pubic symphysis.
9

1.1.4 Pelvic Floor Viscera
The pelvic floor contains several viscera, including part of the lower urinary and alimentary
tracts (Figure 4). Urinary tract structures found within the pelvis include the ureters, bladder, and
urethra. The ureters are approximately 12-15cm within the pelvis (in addition to the 12-15cm in
the abdomen) and attach to the peritoneum of the lateral pelvic wall prior to inserting into the
superior aspect of the bladder. The bladder, a muscular organ that serves as a reservoir for the
urinary system, is quite distensible, ranging from a flat shape when empty to globular when full.
Along the base of the bladder is the bladder neck, a structure that prevents the flow of urine and
is opened via musculature (pubovesical muscle) during voiding. Extending from the bladder
neck is the urethra, a muscular tube that is central to urinary continence. In the female anatomy,
the urethra is embedded in the adventitia of the anterior vaginal wall and has an external orifice
just distal to the vaginal opening.
The vagina, a hollow fibromuscular organ that extends from the perineum to the uterine
cervix, is central to pelvic organ support. The vagina is composed of 4 distinct layers, consisting
of a nonkeratinized stratified squamous epithelium, subepithelium (lamina propia), muscularis,
and adventitia (9). The appearance of the epithelium is highly dependent on the level of cycling
hormones, becoming thinner when estrogen levels are low, and thicker when levels are restored
(10, 11). In general, the thickness of the epithelium is variable resulting in the presence of
longitudinal rugae, which run the entire length of the vagina. The subepithelium and muscularis
provide much of the mechanical integrity of the vaginal wall, as the subepithelium contains
10

dense connective tissue, while the muscularis contains predominately smooth muscle. The
muscularis itself is considered a fibromuscular layer, containing circumferentially oriented
smooth muscle at the inner region and longitudinally oriented smooth muscle at the outer region,
interspersed with fibrous tissue (collagen and elastin). Smooth muscle governs the active
mechanics of the vagina, allowing this organ to rapidly change its diameter. While the specific
function of vaginal smooth muscle is uncertain, this constituent likely plays a significant role in
events such as intercourse and childbirth (12). In addition, smooth muscle is believed to be vital
for tissue homeostasis, creating the folding rugae present in the vaginal lumen and maintaining
vaginal tone. Recent studies have found that apoptotic rates of smooth muscles cells, loss of
innervation, and disorganization of the muscularis are associated with disorders such as pelvic
organ prolapse, highlighting the importance of vaginal smooth muscle in maintaining proper
function of the pelvic floor (13-15). Conversely, the adventitia is primarily loose connective
tissue, with interspersed smooth muscle bundles, nerves, and blood vessels. The vaginal
adventitia is shared with the bladder anteriorly and the rectum posteriorly.
In general, the collagen of the vagina has been found to have a whorled appearance and
consists predominately of collagen III, though the expression of proteins varies from layer to
layer (16). Grossly, the anterior and posterior walls of the vagina are in contact with each other
except near the uterine cervix. Further, the lumen of the vagina has a distinctive cross section
along the long axis, ranging from a diamond shape near the introitus, to an “h” or butterfly shape
11

at the midsection, to an oval shape near the cervix. Anteriorly the vaginal wall is contiguous with
the bladder base, and provides support for the urethra. Posteriorly, the vagina neighbors the
rectum and perineal body.
Figure 4. The organs of the pelvic floor include the bladder, urethra, vagina, and rectum (from anterior to
posterior). While each organ is associated with supportive fascia, it is the attachments of these organs to the vagina
that are most critical for maintaining the anatomy and function of the pelvic floor.
Anatomically, the vagina is a crucial structure for pelvic floor support, providing a stable
base on which the pelvic organs passively rest. Notably, the vagina provides a sling-like base
upon which the urethra sits, providing a surface upon which the bladder neck and urethra can be
compressed against by surrounding musculature. This positioning is critical for urinary
continence. In order to maintain this anatomy, the vagina is supported bilaterally and apically by
the aforementioned connective tissues and musculature. In a non-pathological state, the lower
12

one-third of the vagina is approximately 45 degrees from the horizontal (17). However, just
above this, the vaginal angle is noticeably altered, and the proximal two-thirds of the vagina is
nearly horizontal with the vaginal apex directed towards S2 (sacral bone). The angle between
these two vaginal axes has been found to be ~145 degrees for the non-pathological anatomy (17).
1.2 PELVIC ORGAN PROLAPSE
1.2.1 Clinical Presentation
Pelvic organ prolapse (POP), or prolapse, is characterized by the abnormal descent of the pelvic
viscera into the vaginal canal. POP results from a lack of support to the vagina, allowing the
walls of the vagina, the cervix, or other viscera to bulge into the vaginal lumen and may even
lead to eversion of the vagina. Symptoms of POP include urinary incontinence, voiding difficulty
(urinary and defecatory), sensation of a bulge in the vagina, pelvic pressure or pain, and sexual
dysfunction (5). In addition, POP is associated with several psychological disorders including
depression (18). Being the central structure of pelvic floor of location and support, it is not
surprising that vaginal support defects lead to prolapse, or that prolapse often presents with
additional forms of pelvic floor dysfunction.
13

Figure 5. Pelvic organ prolapse is characterized by the descent of the pelvic organs into the vaginal canal,
resulting in bulging of the vaginal walls. There are 4 stages of prolapse, with increasing severity as defined by the
measurements taken during a POPQ exam. Shown here is an example of Stage 3 prolapse.
While prolapse is broadly defined as the descent of the pelvic organs, the specific
location at which prolapse occurs varies from patient to patient. Commonly a patient may exhibit
prolapse of the anterior vaginal wall (cystocele), the posterior vaginal wall (rectocele), or vaginal
apex (vaginal vault). Prolapse of the anterior and posterior vaginal wall are characterized by
bulging of the respective wall into the vaginal canal, while apical prolapse is characterized by
movement of the cervix, or top of the vagina after a hysterectomy, distally towards and
potentially beyond the hymen. In addition to its variable appearance, the severity of prolapse is
described using a scale of 4 stages. Classification of prolapse is determined using the pelvic
organ prolapse quantification (POPQ) system. The POPQ system scores the severity of prolapse
by measuring 9 points on vagina and perineum using an ordinal staging system. Positions of
these anatomical points are measured relative to the hymen. Stage 0 indicates ideal support,
14

while stage IV signifies severe prolapse with complete eversion of the vagina. Of those suffering
from prolapse, the majority have stage I and II, while only 3-9% have stage III or IV (4).
Evaluation of prolapse using the POPQ staging system is crucial before reconstructive surgery,
as it allows clinicians to select procedures that address each patients’ specific deficiencies in
support (19).
The primary risk factors for development of POP are childbirth and aging as these
processes are thought to degenerate or alter supportive structures (Figure 6). During pregnancy,
stretching of connective tissues and laceration of the pelvic floor muscles may impair vaginal
support. In addition, others speculate that tearing of pelvic fascia and the perineum during
vaginal delivery may destabilize vaginal support and initiate these weaknesses (5). However, it is
unclear whether pregnancy alone is permissive or if vaginal delivery is requisite for the
development of POP (20-22). Unfortunately, these mechanisms and their relation to POP are
poorly understood as prolapse often develops years or decades after injury or insult do to
childbirth. Regardless, studies report a 10% increase in POP occurrence for each birth, while
others suggest a 4-fold increase in risk with just 1 pregnancy and an 8-fold increase with a 2nd
pregnancy (23). Aging has also been shown to greatly influence the development of POP, with
an increased incidence of 30-50% for each 10 years of age, eventually plateauing at age 70 (4).
Again, the impact of aging is virtually impossible to distinguish from the independent impact of
menopause. Until recently the impact of menopause on the tissues of the pelvic floor was largely
unknown.
15

Figure 6. A mid-sagittal cross-section of the female pelvis (shown here via MRI), depicts alterations in
vaginal positioning resulting from pregnancy and prolapse. In a nulliparous patient (left), the vagina is properly
supported with a distinct change in angle at the mid-vagina, as the apex is directed towards the sacrum. Though the
parous vagina (middle) does not necessarily include the characteristic change in angle, the walls of the vagina
remain supported. The appearance of the vagina is markedly different in women with prolapse (right). Here the
anterior vaginal wall noticeably protrudes outside of the body, and the entire vagina rests in a more distal location
relative to the pubic bone (PB).
Recent studies have begun to focus on the impact of menopause on the connective
tissues, with several significant findings. Specifically, Moalli et al. examined the impact of
menopause on collagen of the arcus tendineous fascia pelvis (ATFP), as separation of the vagina
from the ATFP (a paravaginal defect) is the most common cause of anterior wall prolapse (24).
Arcus biopsies from premenopausal and postmenopausal women were examined, in addition to
postmenopausal women who were receiving hormone therapy. Postmenopausal women were
found to have decreases in both collagen I levels and the ratio of collagen I / (III+V) compared to
16

both premenopausal women and postmenopausal women receiving hormone therapy. These
findings suggest that the ATFP is a weaker structure following menopause, with increased
flexibility, as even small changes in collagen subtypes can alter the tensile strength of tissues
(25). Such remodeling of collagen subtypes may also result from mechanical stretch associated
with childbirth or increases in intra-abdominal pressure associated with a women's lifestyle,
though it remains clear that postmenopausal tissues have inferior mechanical properties relative
to premenopausal tissues.
Regardless, the absence of hormones following menopause greatly impacts the response
of soft tissues to mechanical loading. Zong et al. found that hormone treatment returned
collagenase activity to control levels, significantly lower than mechanically stimulated tissues
without hormones (26). From these data, it appears as though hormones regulate the tissues
response to biomechanical forces, preventing maladaptive remodeling or degradation.
Additional risk factors of note include hysterectomy and lifestyle, though data regarding
the impact of hysterectomy on the development of POP is unclear. Hysterectomy is generally
believed to impact apical support of the vagina by disrupting the uterosacral and cardinal
ligaments, though the incidence of prolapse between those women who have undergone
hysterectomy and the general population is similar (27-29). Of lifestyle considerations, it appears
that high-impact activities greatly increase the risk for developing prolapse. Specifically, this
includes occupations during which women repeatedly lift or carry heavy objects. For example, a
study of female nursing assistants, whose duties included regular lifting of equipment, were 60%
more likely to have prolapse relative to the general population (28). In addition, prolapse rates
17

among nulliparous paratroopers, women who regularly lift heavy equipment and experience high
impact forces while landing, are significantly higher than the general population (30). Intuitively,
these occupations lead to sustained and repetitive increases in intrabdominal pressure, which has
been linked to increased POP among obese patients (29). Given these results, it appears that
increased loading of the pelvic floor may be detrimental to pelvic floor support.
Despite the knowledge of these main risk factors, the underlying cause of prolapse
remains unclear. To better understand this pathology several studies have examined the
morphology and composition of the vagina and its supportive structures in women with and
without prolapse. Utilizing full thickness biopsies from the vaginal apex, women with prolapse
were found to have significant increases in total collagen content, with amounts 49% greater than
control levels (16). Interestingly, postmenopausal controls receiving hormone supplements were
similar to premenopausal controls, driven by a 37% rise in collagen III, the predominant collagen
subtype of the vagina. In addition, women with prolapse were found to have a 28% increase in
active MMP-9 levels. Elevated active MMP-9 suggests that the vagina is actively remodeling in
response to biomechanical stresses associated with prolapse rather than a cause of prolapse per se
(31, 32). Previously, increased MMP-9 has been associated with remodeling in soft tissues such
as the coronary artery and dermis (33, 34). One should note that these data regarding collagen
content and MMP-9 were obtained using full thickness biopsies, whereas many studies do not
consider the histology of the vagina (35-37). Unfortunately, much of the literature regarding
vaginal tissue does not indicate which layers are contained in a sample, likely contributing to the
variability of data in this area.
18

Similar to the vagina, collagen III was found to be increased in the uterosacral ligament
of women with prolapse (7). Once again, it is unclear whether these changes in collagen content
and collagenase activity are the cause of prolapse or the result of remodeling to prolapse
conditions. Regardless, such increases in collagen content have the potential to significantly
impact the mechanical behavior of the pelvic floor tissues. However, despite the increases in
stiffness likely obtained by increased collagen, support to the pelvic floor remains compromised.
1.2.2 Surgical Treatment
Pelvic organ prolapse is a common disorder among women, as it is estimated to impact 50% of
women over the age of 50 (38-41). Despite the prevalence of POP, the lifetime risk for having a
single repair procedure for pelvic organ prolapse is roughly 7%, as the severity of prolapse does
not warrant the risks of surgical intervention in most cases (27). Still, there are ~300,000
prolapse surgeries in the United States annually, resulting in a societal cost of over $1 billion (27,
42). Given the aging population, it is anticipated that these figures will substantially increase in
the near future.
In general, surgical treatment of POP utilizes a graft material, or mesh, to provide
mechanical support to the vagina, and restoring the anatomical positioning of the vagina and
other pelvic viscera. Reconstruction of pelvic floor support is accomplished by attaching mesh to
the vagina and then anchoring mesh into the pelvic sidewall or sacrum. Two of the most
common procedures for prolapse repair are transvaginal mesh repair and sacrocolpopexy (a
transabdominal approach). Procedure selection is patient specific, dependent on the site of
19

prolapse and identified support defects; however, surgeon preferences do play a significant role
in the method of repair. Historically, transvaginal procedures are widely used to repair anterior
and posterior wall prolapse, known as a cystocele and rectocele, respectively; while
sacrocolpopexy is most often used to repair apical (vaginal vault) prolapse. Aside from the
considerations of prolapse site, transvaginal mesh procedures are less invasive and technically
easier for clinicians to perform.
Figure 7. During an abdominal sacrocolpopexy, a graft (purple) is fixed to the anterior and/or posterior
surface of the vagina, tensioned posteriorly, and then fixed to the sacrum (a). For a transvaginal procedure, a graft is
fixed to the anterior and/or posterior surface of the vagina, and subsequently tensioned to the pelvic sidewall (b).
Typically, anchor locations in the pelvic sidewall include the sacrospinous ligaments and obturators.
20
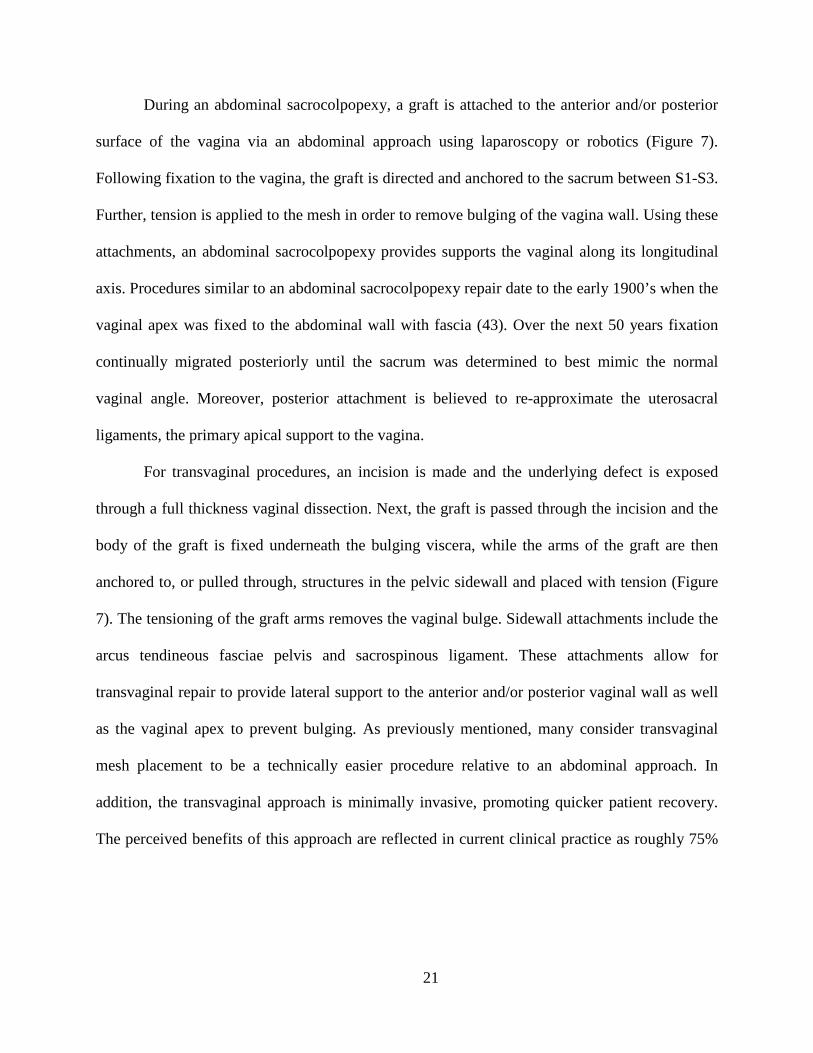
During an abdominal sacrocolpopexy, a graft is attached to the anterior and/or posterior
surface of the vagina via an abdominal approach using laparoscopy or robotics (Figure 7).
Following fixation to the vagina, the graft is directed and anchored to the sacrum between S1-S3.
Further, tension is applied to the mesh in order to remove bulging of the vagina wall. Using these
attachments, an abdominal sacrocolpopexy provides supports the vaginal along its longitudinal
axis. Procedures similar to an abdominal sacrocolpopexy repair date to the early 1900’s when the
vaginal apex was fixed to the abdominal wall with fascia (43). Over the next 50 years fixation
continually migrated posteriorly until the sacrum was determined to best mimic the normal
vaginal angle. Moreover, posterior attachment is believed to re-approximate the uterosacral
ligaments, the primary apical support to the vagina.
For transvaginal procedures, an incision is made and the underlying defect is exposed
through a full thickness vaginal dissection. Next, the graft is passed through the incision and the
body of the graft is fixed underneath the bulging viscera, while the arms of the graft are then
anchored to, or pulled through, structures in the pelvic sidewall and placed with tension (Figure
7). The tensioning of the graft arms removes the vaginal bulge. Sidewall attachments include the
arcus tendineous fasciae pelvis and sacrospinous ligament. These attachments allow for
transvaginal repair to provide lateral support to the anterior and/or posterior vaginal wall as well
as the vaginal apex to prevent bulging. As previously mentioned, many consider transvaginal
mesh placement to be a technically easier procedure relative to an abdominal approach. In
addition, the transvaginal approach is minimally invasive, promoting quicker patient recovery.
The perceived benefits of this approach are reflected in current clinical practice as roughly 75%
21

of all mesh procedures for POP repair are performed transvaginally (42). Interestingly, several
studies have shown that abdominal approaches yield twice as many “ideal” outcomes, citing
better efficacy, though risk for surgical complications remains high due to the location of graft
fixation (43). The disparity in patient outcomes between sacrocolpopexy and transvaginal
procedures highlights the need to consider the impact of surgical technique and route of mesh
implantation. For instance, the full thickness vaginal dissection performed during a transvaginal
procedure would induce an additional healing response at the incision through the vagina that
may alter the host response to mesh implantation. Alternatively, the reduced surgical difficulty of
transvaginal repairs may lead to mesh implantation by surgeons whom are relatively
inexperienced in mesh repair. As such, the surgical technique used in these procedures may not
reflect best practices used by experienced pelvic floor reconstructive surgeons.
1.2.3 Graft Materials
Historically, grafts for repair of POP have included both biologic and synthetic materials.
Originally reconstruction using autologous fascia repairs was standard, though issues such as
poor tissue quality, increased surgical time, and donor site morbidity were quickly realized as
limitations for such repairs. To address these shortcomings, autologous fascia tissues obtained
from cadavers were introduced (44). In order to reduce the risk for disease transmission and
ensure adequate graft supply, harvested allografts are “processed” and often freeze-dried (44).
Though processing manufacturers aim to eliminate infectious materials such as cells, bacteria,
myobacteria, viruses, fungi, and spores. Generally, tissue processing is not standardized and
22

varies from company to company, often with each company utilizing a unique procedure.
Further, many tissue processing protocols, in addition to freeze-drying and rehydration, are
believed to degrade the mechanical properties of allografts (45). While the complication rates for
autologous and allogeneic tissues are low, theses grafts are extremely susceptible to failure.
Recent studies have found that 40% of women undergoing prolapse repair with their own tissues
will fail within 2 years and up to 1/3 will undergo a repeat surgery within 5 years (27, 46).
Outcomes for frozen allograft fascia are even worse, with failure occurring in 83% of women
within 17 months (47). Currently, the high failure rate of biological tissue repair is thought to be
a result poor graft quality, though it is unknown whether tissue deficiencies arise from
pathogenic native tissue, tissue processing, or the fact that allograft fascia is often obtained from
elderly cadavers. Regardless, the perceived inferiority of tissue and high failure rates associated
with native tissue repair, have led to the dominance of synthetic meshes across all prolapse repair
procedures (14, 16, 48-51).
Most recently, in response to complications with synthetic mesh, and the shortcomings of
both autograft and allograft repairs, a number of studies have focused on the use of xenografts
for POP repair. Xenografts, often consist of extracellular matrix (ECM) derived from porcine
dermis, small intestinal submucosa (SIS), or urinary bladder matrix (UBM) (52). Additional
sources for xenograft devices include bovine pericardium and dermis, though these tissues are
typically not used in pelvic floor procedures (52). Xenograft tissue is decellularized, similar to
23
allografts, in order to remove genetic material while preserving the 3-D structure of the
extracellular matrix proteins. Another common treatment of xenografts is chemical crosslinking;
creating two classes of biomaterials, chemically crosslinked and non-crosslinked.
Non-crosslinked devices permit cellular infiltration allowing the implanted matrix to
readily undergo a rapid remodeling response (53-55). For POP repair, these products have
experienced low rates of erosion and infection (1.2% and 1.3% respectively), though objective
recurrence rates are often increased relative to synthetic meshes, at 14.5% (56). Given that non-
crosslinked grafts degrade over a relatively short time-frame, much of the response to these
materials, including complications, likely results from a rapid remodeling response. The rapid
remodeling of non-crosslinked grafts is believed to be disadvantageous as the mechanical
integrity of the graft is quickly compromised, allowing for recurrence of prolapse. To slow the
degradation of mechanical properties, chemical crosslinking was introduced to these products.
Unlike non-crosslinked devices, the structure of cross-linked biologics is altered by
chemically bonding collagen fibrils, typically using carbodiimide. The addition of these bonds
effectively slows the rate of degradation of the implanted matrix. Several studies have shown
that chemical cross-linking decreases the amount of cellular infiltration into the implanted matrix
and increases the stiffness of a graft (55, 57-60). The increased stiffness of the matrix is believed
to affect the differentiation of infiltrating cells; thereby, altering the subsequent remodeling of
the biologic scaffold material. Despite enhanced mechanical properties, there appears to be a
noticeable foreign body reaction to cross-linked materials as these grafts are often encapsulated
following implantation (57). Clinically, cross-linked biologics for POP repair have experienced
24

worse outcomes relative to non-crosslinked counterparts. Most strikingly, the incidence of
erosion, pain, and objective recurrence rates are noticeably increased relative to non-crosslinked
products, occurring in 6.2%, 21.6% and 24% of cases, respectively (56). Further, crosslinked
grafts repairs are associated with a nontrivial incidence of seroma formation, likely related to
residual foreign material in the product.
Figure 8. Polypropylene mesh has become the dominant graft material for surgical repair of prolapse.
Gynemesh PS, shown here, is currently considered the gold standard of polypropylene mesh repair. Further,
Gynemesh PS highlights the recent industry trend of utilizing large pore devices.
In response to the high failure rate and variability of biological materials, synthetic
materials have gained prominence for POP repair (Figure 8). The dominance of synthetic devices
was highlighted in a recent FDA release, stating that of the ~300,000 annual surgical repairs for
POP in the United States, 100,000 utilized mesh (61). Synthetic grafts for prolapse repair are
25

directly derived from synthetic mesh products introduced into the market for hernia repair. In
fact, it is common for the same device to be marketed for both hernia and prolapse repair. One
example is Ethicon’s Prolene Soft hernia mesh, which was remarketed for sacrocolpopexy as the
prototype prolapse mesh Gynemesh PS. In addition, nearly all data mesh vendors and researchers
cite as “ideal” mesh behavior, is derived from mesh studies performed in the abdominal wall. As
such, current and previous generations prolapse mesh have been “optimized” for the abdominal
wall environment and hernia repair, rather than functioning as a prolapse repair device.
Overall, synthetic mesh has demonstrated superior efficacy over biologic grafts, with
objective anatomic cure rates consistently greater than 85% (52, 56). Still, complications and
surgical concerns have resulted in significant changes in the materials and design of prolapse
meshes over the last two decades. Ultimately, the introduction of the tension free vaginal tape
(TVT) in 1996, and its subsequent success for SUI repair, led to Type 1 polypropylene mesh to
become the material of choice for prolapse meshes. Additionally, Type 1 polypropylene mesh is
often reported to have cure rates greater than 90% in sacrocolpopexy, showing greater
consistency and efficacy than other synthetic mesh materials and biologics (39, 52, 56). Still,
polypropylene devices were initially heavier in terms of mesh weight (g/m2) relative to
contemporary mesh products. The shift towards lower weight mesh was found through clinical
trial and error as surgeons noted lower rates of complication for such meshes. Despite the overall
success and improved outcomes relative to biologics, the reception of synthetic meshes for
prolapse repair has been tempered by the common occurrence of mesh related complications.
26

1.2.4 Complications
Following the introduction of the technically easier transvaginal application of prolapse mesh,
synthetic mesh use in reconstructive pelvic surgeries escalated between 2005 and 2011.
Unfortunately, as mesh use increased, the number of mesh related complications dramatically
rose, prompting the FDA to issue two public health notifications. The first, issued in 2008,
warned physicians and patients of potential complications associated with the transvaginal
application of mesh and a second, issued in 2011, warned that these complications are not rare
events (61, 62). Currently it is unclear if the act of introducing a device through the vaginal wall
alone is a risk, or if the specificity of transvaginal mesh complications is simply due to the
increased use of these procedures over the past decade, bringing to question the role of
implantation method and surgical technique.
The most widely reported complications following mesh implantation include mesh
exposure, mesh erosion, infection, dyspareunia, and pain (63-65). Mesh exposure is
characterized by the visualization of the mesh through the vaginal epithelium (Figure 9). Mesh
erosion is characterized by perforation of the mesh into adjacent structures (the bladder, rectum,
etc.). Complications such as erosion and exposure are extremely detrimental as they deteriorate
native structures and severely hinder a women’s quality of life. It is also common for these
complications to be accompanied by contraction and bunching of the mesh. Contraction, or
shrinkage of the mesh implant area, is likely caused by two potential mechanisms, either
mechanical loading or fibroblast-induced contraction as part of the foreign body response. Both
27

mechanisms are likely related to the geometry of the mesh and the loading environment in which
the mesh is placed, as well as mesh characteristics such as pore size. Women with mesh
complications may complain of vaginal discharge, pain, and dyspareunia..
Figure 9. Exposure is characterized by the degradation of vaginal tissue in contact with synthetic mesh.
Here, exposure is visible on the luminal surface of the vagina following vaginal explantation from an animal model
(a). Clinically, exposure is visualized and palpable during a gynecological examination (b). Often, mesh is excised
in areas of exposure to relieve symptoms, including pain or vaginal discharge (c). Typically, excised mesh appears
bunched and folded upon itself, as shown here.
To date, no prolapse mesh has successfully reduced complication rates to levels observed
for other elective surgical procedures, as 20% of women who undergo mesh surgery require a
repeat surgery for recurrent symptoms or complications (52, 56, 66-68). Further, mesh exposure
is quite common, occurring in up to 15% of transvaginal repairs and 10.5% of sacrocolpopexies
28
(62, 64, 69-71). In most cases, exposure requires the mesh to be removed surgically in order to
manage pain, discharge, odor, and dyspareunia; however, there are many reports that symptoms
may persist even after mesh has been removed (61, 72-74).
1.3 HOST RESPONSE TO PROLAPSE MESH
1.3.1 Impact of Mesh on Vaginal Tissue
To date, few have considered the response of the host tissue as a causative variable in prolapse
mesh outcomes, despite the host response playing a key role in patient outcomes in virtually all
other applications of biomaterials. The lack of knowledge regarding the cause of mesh related
complications (erosion, exposure, infection, dyspareunia, and pain) is concerning as it provides
little design and usage criteria for synthetic meshes. Recent studies have begun to highlight the
impact of mesh on the vagina, examine the morphology, composition, and biomechanical
behavior of the vagina. Such information is required in order to improve patient outcomes
following mesh implantation.
In a rhesus macaque model, Liang et al. compared the host response to a heavier weight,
lower porosity, higher stiffness mesh, Gynemesh PS, to two lower weight, higher porosity, lower
stiffness meshes, UltraPro (aka Prolift plus M or Artisyn) and Restorelle following implantation
by sacrocolpopexy after a hysterectomy. After 3 months, Gynemesh PS, the stiffest mesh,
dramatically altered the histological appearance and functional behavior of the vagina. While all
29

mesh implants in this study were found to disrupt the organization of vaginal tissue, Gynemesh
PS induced atrophy of the smooth muscle layer, decreasing the thickness of the muscularis by
55% relative to Sham operated controls (75) (Figure 10). Further, Gynemesh PS significantly
increased the number of apoptotic cells in the sub-epithelium and adventitia layers, rising from
0.43% and 1.56% of cells to 7.22% and 32.49% compared to Sham. The impact of mesh was
apparent, as a majority of apoptotic cells were located around the individual mesh fibers.
Interestingly, alterations in vaginal morphology and apoptosis were less pronounced for the
lower stiffness meshes UltraPro and Restorelle.
Additionally, Gynemesh PS implantation negatively impacted the composition of the
extracellular matrix, as collagen and elastin content were decreased 20% and 43%, respectively.
Though UltraPro and Restorelle did not alter collagen content, UltraPro resulted in a 49%
decrease in elastin content. Sulfated glycosaminoglycan (GAG) content, a marker of tissue
injury, was increased by 20% relative to Sham samples, while collagenase activity increased by
135% following Gynemesh PS implantation (75). These findings are consistent with acute soft
tissue injury and tissue turnover (76). Overall, it is clear that the vagina undergoes a maladaptive
remodeling response following mesh implantation, and heavier, lower porosity, higher stiffness
meshes elicit the most detrimental changes. The degenerative response observed with stiff
synthetic grafts is consistent with a phenomenon referred to as stress shielding, a
mechanosensitive phenomenon in biological tissues, which results in a degenerative remodeling
response in tissues associated with a prosthesis. Alternatively, the degradation associated with
30

mesh implantation could result from chronic inflammation, a response associated with the
foreign body response. Regardless of the mechanism, these findings demonstrate that mesh
implantation results in degradation of the vagina, predisposing this tissue to mesh exposure.
Figure 10. Immunofluorescent labeling (bottom) demonstrates the effect of synthetic mesh products (top)
on vaginal tissue. Here, the red signal represents positive staining of alpha-smooth muscle actin, the green signal
represents apoptotic cells, and the blue signal represents nuclei. Gynemesh PS was found to significantly reduce the
thickness of the smooth muscle layer (S) and increase apoptosis in tissue surrounding the mesh (M).
In terms of tissue function, mesh implantation has been shown to deteriorate both the
active and passive mechanical properties of the underlying and associated vagina (77). In
agreement with morphological findings, Feola et al. reported that Gynemesh PS eliminated
nearly all smooth muscle contractility relative to Sham (75, 77). UltraPro and Restorelle also
interfered with smooth muscle contractility, however such negative effects were much less than
that observed with Gynemesh PS. Passive properties, representing the mechanical integrity of
fibrillar extracellular matrix proteins (collagen and elastin), were evaluated via ball burst testing,
31
as typical planar mechanical tests are invalid for composite mesh-tissue structures of these
dimensions. Accounting for the combined stiffness of both mesh and tissue, Gynemesh PS
significantly reduced the passive mechanical integrity of the tissue, decreasing the estimated
stiffness of the vagina by an order of magnitude, with values approaching 0 N/mm (77). These
results suggest that Gynemesh implantation nearly abolishes the mechanical integrity of the
underlying and associated vagina, in agreement with the aforementioned decreases in total
collagen and elastin content (75). As with histological and biochemical outcomes, mesh
implantation is detrimental to the mechanical properties of the vagina, particularly with the
higher weight, lower porosity, higher stiffness devices. This is of great concern as degradation of
vaginal smooth muscle, collagen and elastin (key constituents of vaginal tissue) are already
thought to be compromised in women with prolapse (14). Ideally, graft implantation would
enhance, or at minimum, maintain the supportive capabilities of the vagina, though current
synthetic mesh products only have the potential to damage native vaginal tissue.
1.3.2 Factors Influencing the Host Response
Much of our understanding of urogynecological mesh products is from the hernia mesh
literature, which is not surprising given that the current generation of prolapse meshes were
originally developed for hernia repair (78). As such, a majority of the data regarding prolapse
mesh devices in the literature, as well as vendor marketing pamphlets, use legacy methods to
demonstrate biocompatibility by simply implanting synthetic mesh in the abdominal wall. While
there is great utility in such studies, namely verifying a lack of outright host rejection, the
32

abdominal wall and pelvic floor are quite dissimilar in regards to the biological environment and
the mechanical demands placed on a mesh implant. As evident by the large volume of
complications associated with vaginal mesh, the assumption that the abdominal and pelvic floor
environments are similar is quite flawed. Compatibility and function of mesh for abdominal
hernia repair does not guarantee similar outcomes when used in the pelvic floor. Thus,
abdominal mesh and current urogynecological mesh serve as a prototype device rather than an
optimal one. Still studying success concepts for mesh design in the abdominal wall are of great
value when examining the behavior and outcomes of prolapse mesh. Perhaps the most important
concepts learned from the hernia literature are material type, filament type, and pore size
1.3.2.1 Material
Since the introduction of the first synthetic nylon SUI sling in the 1950’s, pelvic floor grafts have
been constructed from a variety of materials, resulting in a wide range of outcomes (5). Previous
mesh materials include polyethylene terephthalate (Mersilene), polypropylene (Marlex),
polytetrafluoroethylene (Teflon), and expanded polytetrafluoroethylene (Gore-Tex) (Figure 7)
(78). Though the material chosen for mesh construction likely plays a role in dictating the host
response, additional textile features have confounded the impact of many graft materials.
For instance, prolapse meshes constructed from Teflon and Gore-tex experienced
disastrous clinical results. The response to these materials was characterized by poor tissue
integration, and while the ease of removal was initially touted as a benefit, Gore-tex was plagued
with numerous complications of alarming severity (4). Gore-tex SUI slings were reported to have
33

a removal rate of at least 35%, with a significant number of sinus tract formations (10%), in
addition to infections and reports of vaginal exposures (79). Similarly, in a large prospective
multi-center trial, Gore-tex was found to be a risk factor for mesh exposure into the vagina
following sacrocolpopexy (71, 80). Another material that has been linked to poor clinical
outcomes is polyethylene terephthalate, a polyester polymer. This polymer was used in a woven,
multifilament prolapse mesh and manufactured as Mersilene. Despite high rates of exposure and
infection relative to other meshes, surgeons continued to use Mersilene until recently.
Contemporary reports reasoned that the materials themselves, Gore-tex and polyethylene
terephthalate, were the factor responsible for poor clinical outcomes. However, our current
understanding of host response to mesh suggests that the adverse host response to these products
was likely related to the pore size and interstices inherent in the construction of these mesh
products. Rather than the chemical or surface properties of Gore-tex, it now seems likely that the
failure of Gore-tex was due to its small pore size (<10µm). Similarly, the woven construction of
Mersilene creates small interstices (<1µm). It is thought that such spaces harbor bacteria and can
lead to chronic infection, inflammation, mesh exposure, erosion, and fistula formation.
Therefore, the complications resulting from these products arise from geometric factors rather
than the use of Gore-tex or polyethylene terephthalate per se.
In recent decades, polypropylene has become the primary material for synthetic mesh
used in incontinence and prolapse surgeries. Unlike the woven construction used for
polyethylene terephthalate, polypropylene mesh is often knitted. Initial, studies found
polypropylene to elicit a strong inflammatory response, including the formation of fibrotic tissue
34

and multinucleated giant cells (i.e. foreign body response) around mesh filaments (81). However,
polypropylene mesh was found to encourage tissue ingrowth, providing a scaffold into which
tissue could penetrate. Clinically, polypropylene grafts were found to have low complication
rates relative to other material types, though it was not until the overwhelming the success of
tension-free vaginal tape (TVT) that polypropylene became the dominant material for mesh
construction (82). As with previous materials, the outcomes associated with polypropylene may
be attributed to structural features such as knit construction and large pore sizes, rather than
specific properties of polypropylene. While polypropylene grafts have significantly improved
outcomes, the publication of large case series and other clinical trials (eCARE), highlight the
relatively high rates of complication for both the transvaginal and transabdominal insertion of
polypropylene grafts (83). Given that the current generation of mesh products are almost
exclusively comprised of polypropylene, the variable success of synthetic grafts suggests that
factors other than material selection are responsible dictating the host response.
1.3.2.2 Filament Type
Often materials used to construct synthetic mesh are extremely stiff relative to biological tissue,
making them unsuitable for implantation on soft, low stiffness tissues such as the vagina. For
instance the tangent modulus of polypropylene is 1.5-2 GPa, over a 1000 times greater than that
of most soft tissues in the body. To reduce the device stiffness and provide flexibility to synthetic
grafts, materials such as polypropylene are extruded into a thin diameter thread or filament.
Filaments are classified as either mono- or multifilament, where multifilament fibers are braided
35

or interwoven. Studies have found that multifilament meshes have significantly higher bacterial
presence, believed to arise from the increased surface area of ~1.57 relative to monofilament
fibers (84). The increased amount of surface area is thought to provide more space for bacteria
adhesion and, in turn, greater bacterial proliferation (84). In addition, multifilament fibers
contain spaces between individual filaments that are typically less than 10µm in diameter. Such
diameters allow for the passage of bacteria, yet macrophages are unable to infiltrate these areas,
providing a harbor for bacterial proliferation (78).
1.3.2.3 Pore Geometry
In addition to filament type, the geometric arrangement of filaments has also been linked to the
host response to synthetic materials. Two common textile methods for constructing synthetic
grafts are knitting and weaving. Weaving is characterized by a simple interlacing technique, with
two perpendicular filament orientations. Styles of weaving include plain, twill, and satin. Woven
meshes provide superior mechanical strength and shape memory, however, these devices fray
when cut and are unable to conform to the complex geometries of the pelvic floor due to their
increased bending stiffness (85). Further, woven meshes such as Mersilene have been associated
with increased infection rates.
Unlike woven mesh, knitted mesh is constructed by looping individual filaments. Knit
techniques include warp-lock, interlock, and circular knit, though the latter is uncommon for
urogynecological meshes. Knitted grafts are flexible and can easily be manipulated to conform to
the anatomical structures. Most notably, knitted devices have a significantly lower number of
36

mesh related complications relative to woven mesh. The impact of the construction method is
illustrated by comparing Marlex, a heavyweight (~95 g/m2), woven polypropylene mesh, and
Prolene, a heavyweight (~85 g/m2), knitted polypropylene mesh. Despite similar mesh weight
and identical construction materials, Marlex exposure rates were nearly 44%, while Prolene
exposure rates were minimal (<5%) for abdominal hernia repair (85).
1.3.2.4 Pore size
Another characteristic of mesh believed to impact the host response to mesh is porosity. Porosity
is defined as a ratio of the void, or empty space, in a mesh to the area of occupied by the mesh
(void area in meters / total area in meters). A porosity of 0 signifies a solid piece of material (no
pores), while a theoretical porosity of 1 indicates that no material is present. It is generally
accepted that high porosity meshes reduce complication rates, a belief that is reflected in the
movement towards lower weight meshes. Porosity provides a simple, two-dimensional measure
of the amount of mesh material in a given area, however this value is subject to change with
mechanical loading, as will be discussed below.
Though recent products have sought to increase mesh porosity, recent studies suggest that
pore size, not porosity, is the most important factor for improving the host response to mesh. In
the hernia literature, the impact of pore size has been well characterized, specifically for
polypropylene mesh. Larger pores have been shown to improve the mechanical integrity of the
resulting mesh-tissue complex, increasing both strength and collagen deposition relative to those
resulting from grafts with smaller pore dimensions. Smaller pores restrict and reduce tissue
37

ingrowth relative to larger pore structures, yielding mesh-tissue constructs with limited vascular
growth and less mature collagen (86, 87). Further, the foreign body response is greatly reduced
with increasing pore size (88-90). Importantly, pores with dimensions less than 10µm allow for
the passage of bacteria, yet are too small for macrophages and neutrophils to pass through,
providing regions for bacterial proliferation and persistent infection (91).
While bacterial proliferation is dependent on the dimensions of individual mesh pores,
each individual mesh fiber is subject to a foreign body response regardless of size, with the
surface of each fiber becoming encased by a granuloma (92-94). Decreasing pore size reduces
the distance between these peri-fiber inflammatory reactions and once sufficiently close, fibrous
granulations can join with neighboring fibrous granulations, leading to “bridging fibrosis”.
Bridging fibrosis results in the formation of a continuous scar plate, sealing the graft from the
body and preventing tissue ingrowth (88, 95). Further, Klinge et al. have found that the foreign
body response to fibers is dependent on the hypdrophobicity of the polymer used to extrude the
filaments (96). As such, differing materials have dissimilar pore dimensions at which bridging
fibrosis will occur. Specifically, it has been shown that effective tissue in-growth for
polypropylene mesh, occurs in mesh pores with a diameter of 1000µm or greater (97), where
effective tissue in-growth is defined by the quality of the tissue which forms around mesh fibers,
with no bridging fibrosis. For polypropylene grafts, pore sizes less then 1000µm elicit greatly
enhanced inflammatory and fibrotic responses (98, 99). Once again, it should be noted that
studies regarding pore size were performed in an abdominal wall model. While these findings
have proven useful in guiding synthetic graft design for abdominal wall and vaginal meshes,
38

extrapolation of such data requires the assumption that the environmental conditions between
these sites are similar. The appropriateness of this assumption is questionable. Still, there is
likely a critical pore diameter for urogynecological meshes to minimize scar plate formation,
though it may be distinct from that found in abdominal wall studies even for the same material.
Given the importance of pore size, it is not surprising that this design feature is often
considered the primary method for mesh characterization, originally outlined by Amid et al. in
the late 1990’s (91). The Amid classification divides meshes into four classes (100);
Type I: macroporous, with pore sizes are greater than 75µm in diameter
Type II: microporous, with pore sizes less than 75µm,
Type III: predominately macroporous with microporous components (ex. Mersilene and
polytetrafluoroethylene),
Type IV: submicroscopic pore size (<1µm).
In light of the previous discussion on pore diameter, it is not surprising that type II, type III, and
type IV meshes have been met with poor clinical outcomes citing little tissue formation and no
adhesion to surrounding tissues, in addition to high infection rates (4, 79, 100). While the Amid
classification was useful for past mesh devices, nearly all contemporary products are
characterized as Type I, rendering this characterization ineffective for distinguishing products.
With nearly all contemporary meshes classified has Type I, the Amid classification must be
supplemented to guide mesh selection and graft design.
39

Figure 11. Masson’s trichrome staining of vaginal tissue with mesh embedded, demonstrates the fibrous
encapsulation associated with individual mesh filaments (a). Here, * represents mesh filaments and FBR represents
the foreign body response. While each filament is encased in fibrotic tissue, large pore sizes allow for tissue to grow
in between separate FBR’s (b). If filaments become too close to one another, the FBR from individual filaments
fuse, resulting in bridging fibrosis (c).
1.3.2.5 Mesh Burden
Finally, it should be mentioned that the area density of the mesh, referred to as mesh weight, is
not a significant factor in dictating the host response. Often, heavyweight meshes (>1g/cm2) are
constructed to have small pore sizes, thereby increasing their mesh weight, while lower-weight
meshes (< 1g/cm2) are often constructed with a large range of pore sizes. Thus, the negative
effects of heavyweight meshes are likely due to small pore dimensions rather than the specific
gravity of the device. Wehye et al. demonstrated the concept that pore size, rather than mesh
weight, is more predictive of the host response as a lightweight, microporous mesh was found to
40

provoke a more intense foreign body response with poor tissue integration compared to
heavyweight meshes with larger pore sizes (98). Given these results it appears that the relative
density or spatial distribution of material has a greater impact on the host response, than the total
amount of material implanted. The spatial distribution, or mesh per unit volume, of a device is
defined by the term mesh burden. Mesh burden is directly derived from the concept that mesh
fibers are encapsulated by fibrous granulations, which may form bridging fibrosis if mesh fibers
are sufficiently close. Increases in mesh burden imply that mesh filaments are being brought
closer together in three-dimensional space, increasing the likelihood of scar plate formation. Data
regarding this characteristic is limited, though it may prove useful in guiding future mesh
designs.
1.3.3 Considerations for Mesh Use in Prolapse Repair
Much of the advancement in prolapse mesh can be attributed to knowledge gained from hernia
mesh studies. Yet, this criterion is merely a starting point, as optimization of grafts for the vagina
requires a greater understanding of the environment in which these devices are placed and the
function they are being asked to perform. Relative to the abdominal wall, the environment of the
vagina is much more complicated from a biological and mechanical perspective, requiring
reconsideration of the role of the implant in this anatomic location. As such the requirements for
mesh repair will vary not just from the abdomen to the vagina, but from patient to patient as well.
While hernia meshes are only in contact with the abdominal fascia, urogynecological
mesh is placed in an environment with a variety of soft tissues, ranging from muscle to
41

connective tissue and specialized organs. Importantly, synthetic meshes are directly fixed to the
vagina; an organ that is heavily colonized with bacteria, creating a clean-contaminated surgical
field for transvaginal procedures. Further, the vagina and its supportive tissues are metabolically
active, as their tissue compositions dramatically change with normal aging, and during hormone
driven events such as pregnancy, menstrual cycle, and menopause (8, 16). The activity of these
tissues is an important consideration for implantable devices.
Several studies have found mesh implantation to elicit a markedly different host response
in the vagina as compared to the abdominal wall. Using a rabbit model, Pierce et al. found that
implanted polypropylene mesh elicited no mesh exposures abdominally, yet vaginal exposure
rates for the were 27% for the same mesh (101). In addition, the author’s state that the graft
length was often decreased upon explanation from the vagina, while histological analysis
revealed increased inflammation and fibroblast proliferation scores for vaginal implant samples
relative to the abdominal site.
Further emphasizing the increased metabolic activity in the vagina, Pierce et al. examined
the outcomes of cross-linked collagen grafts in these two environments. Cross-linked grafts were
noticeably degraded in 37% of abdominal implants, while 70% of grafts implanted on the vagina
were degraded. Degradation at the vaginal site was so dramatic that nearly half of all grafts were
found to be missing upon sample harvesting (101). Similarly, using a sheep model, Manodoro et
al. found no exposures in the abdominal wall, while 30% of vaginal implants resulted in
exposures (102). Interestingly Manodoro et al. reported increased folding and nearly twice the
42

amount of mesh “contraction” in vaginally placed mesh samples. It is important to note that in
each of the aforementioned studies, mesh was simply sutured to the vagina, and not tensioned as
is done for prolapse and incontinence surgeries utilizing mesh.
Overall, the vagina is a harsher biological environment for mesh implantation compared
to the abdomen. The failure to acknowledge the biologic environment in the pelvic floor has
likely resulted in high complication rates of polypropylene mesh. Still, while recent studies have
examined the impact of mesh on vaginal tissue, few have acknowledged the mechanical
environment of the pelvic floor or the mechanical role of synthetic mesh in this support system.
Failure to address the primary function of synthetic mesh devices is a significant oversight in
graft design.
1.3.4 Gap in Knowledge
Importantly, previous studies have begun to characterize the host response to synthetic mesh and
elucidate which design features of synthetic mesh products impact the host response. While this
information is invaluable, rarely have previous studies considered the implications of mechanical
loading on these design features. Clearly prolapse mesh functions in a load bearing capacity, as it
is implanted to restore vaginal position and resist prolapse upon application of in-vivo loads. As
such, studies examining the in-vivo mechanical role of prolapse mesh and the impact of such
mechanical loading on its deformation behavior are of the utmost importance.
To understand the cause of current mesh related complications and provide insight into
why some meshes succeed, others fail, and still others vary from patient to patient, a thorough
43

mechanical analysis of synthetic mesh devices is required. This characterization in conjunction
with changes in textile characteristics can vastly improve clinical outcomes and guide future
product design. Such rigorous biomechanical analysis, though currently lacking in the area of
female pelvic health, has significantly enhanced our understanding of anatomical and device
function in other fields of research, including cardiovascular and orthopedics (103-106). The
benefit of accurate computational modeling in these areas cannot be understated as it allowed for
rapid development and assessment of devices in these areas.
Though a handful of studies have modeled polypropylene meshes (107), these models are
often microsctructurally complex, as they capture details of textile construction. As such these
studies offer limited insight into the effects of mechanical forces on the design features that are
known to impact the foreign body response to synthetic meshes. Moreover, these microstructural
models do not scale to the dimensions of products currently used in clinical practice, and are
unable to capture the gross mechanical behavior of mesh devices. Ideally, computational models
of synthetic mesh would accurately represent the mechanical behavior of their physical
counterparts, while providing meaningful data regarding the impact of loading on clinically
relevant textile features.
1.4 MOTIVATION AND SPECIFIC AIMS
As previously described, pelvic organ support is a complex mechanical system in which muscles
and connective tissues combine to maintain position of the vagina, which in turn supports the
44

bladder, urethra, and rectum. Disruption of this support leads to a wide range of dysfunction,
arising from altered anatomy. Specifically, POP directly results from defects in vaginal support,
allowing the vaginal walls to descend in response to in-vivo forces. These supportive defects
destabilize the positioning of other pelvic organs, leading to the presence of a vaginal bulge, or in
the worst-case scenario, inversion the entire vagina outside the body (Stage 3 and 4 POP).
To restore vaginal support, a graft is surgically fixed to the vagina, tensioned, and
anchored to the pelvic sidewall, lifting the vagina superiorly and laterally. Due to the high failure
rates associated with biological grafts, synthetic mesh grafts have become widespread for pelvic
organ prolapse repair. Though objective cure rates are often reported to be over 90%, occurrence
of severe complications are not rare events, often with symptoms more severe than prolapse
itself. The severity of and regularity of these complications led to 2 recent public health
notifications and legislation regarding the reclassification of mesh products for prolapse repair
(61, 62, 108).
Despite the obvious mechanical role of such devices following implantation, the
mechanical behavior of synthetic mesh devices has yet to be fully characterized, let alone in
response to the specific mechanical demands urogynecologic applications. Rather, synthetic
prolapse mesh was predicated on mesh technology for abdominal hernia, which was developed
prior to the 1976 Medical Devices Amendment Act. As a result, synthetic mesh was quickly
adapted for prolapse repair, without undergoing strict pre-clinical testing. The transfer of mesh
45

technology was so direct that often surgeons would use the same abdominal hernia mesh, simply
cut into appropriate dimensions for prolapse repair. Thus, the base technology was not developed
with the pelvic floor in mind.
In this dissertation, I hope to demonstrate the importance of mechanical loading on the
design and surgical implantation of current synthetic mesh devices. First, I will experimentally
examine the microscopic and macroscopic deformation of synthetic mesh in response to
boundary conditions that mesh devices experience in-vivo. Using this data, I then develop and
validate a 3-dimensional (3D) computational model for synthetic mesh. Lastly, this dissertation
will combine computational mesh models with patient specific pelvic floor geometries to
simulate prolapse and subsequent repair in-silico. Using this approach various surgical and
patient factors will be examined in relation to procedure efficacy. Overall, this dissertation is
intended to examine the role of mechanical forces on the behavior of prolapse mesh and
demonstrate the need to consider such mechanics during mesh development. Further, I hope to
develop tools to guide and optimize future prolapse mesh products for patient specific needs
prior to implantation. Such concepts are indeed novel to the treatment of prolapse and would
provide the foundations required to dramatically improve the clinical practices in this area. To
achieve these goals, the specific aims of this dissertation are:
Specific Aim 1) Characterize the ex-vivo mechanical behavior of synthetic prolapse meshes
and examine the impact of loading on clinically relevant textile features
46
1.a. Examine the change in pore geometry of mesh products in response to uniaxial
tension. Clinically relevant textile properties including porosity, effective porosity, pore
dimensions, as well as structural properties will be determined in response to various in-vivo
loads.
1.b. Utilize 3D photogrammetry to measure the surface deformation of mesh products in
response to uniaxial tension. In addition, the impact of fixation method (boundary conditions)
and pore geometry on surface deformations will be examined.
Specific Aim 2) Utilize experimental data to develop, validate, and computationally
examine planar deformation of a computational model for synthetic mesh
2.a. Develop a protocol for CAD design and uniform discretization of pore geometry for
current synthetic mesh devices. Mechanical properties for synthetic mesh will be determined via
inverse finite element methods based on experimental data.
2.b. Utilize experimental testing to validate the deformation (quantified via pore
dimensions and mesh burden) predicted by computational models of synthetic mesh loading.
2.c. Perform a sensitivity analysis using computational mesh modeling, examining the
impact of loading angle and magnitude of force on pore deformation.
Specific Aim 3) Develop a computational model for finite element simulation of prolapse
and subsequent mesh repair
3.a. Develop a protocol for segmentation and discretization of pelvic floor structures
obtained from magnetic resonance imaging (MRI) scans. Vaginal geometries will then be
47

utilized to create a computational model of prolapse and used to simulate synthetic mesh repair.
During these simulations, the impact of surgical (tension, suture locations) and anatomic
variables (geometry, fixation points) will be examined.
48

2.0 EX-VIVO DEFORMATION OF PROLAPSE MESH
2.1 OVERVIEW
Synthetic meshes are widely used in prolapse repair surgeries in order to provide permanent
structural support to the vagina. Recent reports have found that synthetic meshes are used in
one–third of all surgical POP repairs and specifically 93% of abdominal sacrocolpopexy
procedures (62, 109). Although synthetic meshes have demonstrated superior cure rates relative
to biological grafts, the justification of their use must be weighed against complication rates (27,
46, 47, 110, 111). Mesh related complications include infection, vaginal discharge, dyspareunia,
erosion, and exposure. Perhaps the most devastating and least understood of these complications
are erosion and exposure. Erosion is characterized by the movement of implanted mesh into and
through adjacent organs, degrading tissues in contact with the mesh. Similarly, exposure is
characterized by the degradation of vaginal tissue in contact with mesh, allowing mesh to
become exposed through the vaginal epithelium. Exposure is observed clinically by visualization
and/or palpation of mesh in the vaginal lumen and is associated with pain, bleeding, odor, and
discharge. While the mechanistic causes of erosion and exposure are not currently understood, it
49
is likely that the degradation of tissues associated with the implanted mesh results from the host
response to these devices. Further, there is growing evidence that the host response to synthetic
mesh is largely influenced by the textile properties of these products (86, 112, 113).
Aside from dictating the host response, the textile properties of mesh greatly impact the
overall mechanical behavior of the device. Previous studies have found a wide range of structural
properties for synthetic mesh, varying with changes in pore geometry (2, 114, 115). Though
vendors have deliberately altered textile properties (filament diameter, knit pattern, pore size,
etc.) with the goal of tailoring the mechanical behavior of synthetic grafts, there has been little
consideration for the impact of mechanical loading on these textile properties. This is particularly
important for load bearing textiles, such as prolapse meshes, given the implications of textile
features, such as pore size, on the host response.
As previously highlighted, pelvic organ support is a complex mechanical system in which
support to the vagina is provided by the levator ani muscles and connective tissue attachments to
the pelvic sidewall. The vagina in-turn orchestrates support to the pelvic organs by maintaining
static equilibrium and resisting transient changes in abdominal pressure. Current synthetic graft
repairs mimic the mechanical role of connective tissue, as synthetic meshes are typically attached
to the vagina and then secured to the sacrum (sacrocolpopexy) or to structures in the pelvic
sidewall (transvaginal procedures). Under these conditions, mesh devices assume the role of
suspension cables, maintaining the position of the vagina while resisting the downward forces of
abdominal pressure and the weight of other pelvic viscera. When used in this capacity, synthetic
meshes are predominately subjected to uniaxial tensile loading. Given the porous construction of
50

mesh products, it is expected and widely observed, that uniaxial loads deform the mesh
substructure (pore geometry). The impact of uniaxial loads is highlighted by clinical reports of
mesh contraction (100, 102). Thus, for urogynecologic meshes to function as intended, it is
necessary to understand how mesh products deform in response to loading conditions similar to
those experienced by the vagina and its supportive structures. Understanding how prolapse mesh
deforms in response to such loading conditions, and how this relates to changes in textile
properties, is critical for the improvement of synthetic prolapse meshes.
2.1.1 Textile Properties
The textile properties of synthetic mesh refer to many of the design features found within these
products. As previously discussed, many textile properties have been linked to the host response.
Often these properties are included in promotional literature for mesh kits, as vendors highlight
how their proprietary designs are expected to reduce complications and maintain high levels of
efficacy. Typically vendors report the material, mesh weight, pore size, and porosity based on
their perceived importance to clinicians. While these properties are reported separately, it is
important to understand what each term represents and the interdependence of these
characteristics.
Mesh material refers to the substances from which a mesh is constructed, whether
synthetic, biologic, or composite (a combination of synthetic and biologic components).
Synthetic meshes are typically comprised of polymeric materials that have been extruded into
51

thin filaments. Currently, polypropylene is the dominant material for mesh construction though
many other materials have been used in previous generations of prolapse meshes (85).
Mesh weight refers to the area density of the mesh, given in units of g/cm2. Mesh weight
is similar to a measure of density or specific gravity, though given the planar geometry of
synthetic mesh, a planar measurement of density is used as opposed to a volumetric one. Thus,
mesh weight can be simply thought of as the amount of material present in a given area. Given
the porous nature of contemporary synthetic meshes, lower mesh weight is most often achieved
by utilizing greater pore diameters (though smaller filament diameters may used as well). Larger
pores increase the amount of void space per unit area, lowering the amount of mesh material
over this area.
Generally, pore size refers to the diameter of the repeating pore structure found in
synthetic mesh. However, the typical pore geometry is polygonal and thus, a range of diameters
may be reported depending on which transverse points are chosen for this measurement. There is
currently no standard by which vendors report pore size, meaning that companies may report
mean, median, or maximum diameters for their products (Table 1). Often, companies report the
maximum diameter of the largest repeating pore in light of recent publications demonstrating the
benefits of larger pores. It must be stressed that while mesh vendors report the maximum
diameter of the largest pore, smaller pores and cross-fibers found within the knit structures are
often ignored. Therefore, a single value of pore size may not accurately represent an entire mesh,
as knot structures often contain microscopic pores.
52

Lastly, vendors frequently tout the porosity of a mesh product. Though, as with mesh
weight, porosity is dependent on the pore size of a given mesh and large pore meshes tend to
have greater porosity values. Additionally, porosity may vary with filament diameter or be
dependent on whether a mesh is constructed with monofilament or multifilament fibers. It should
be noted that multifilament construction has been associated with increased rates of infection
arising from small interstices between individual filaments. These findings have led to a rapid
decline in prolapse meshes containing multifilament fibers.
Table 1. Current prolapse meshes are directly derived from abdominal hernia meshes. Often, mesh
products are used for both hernia and prolapse repair, though they are cut and marketed depending on their
application. While nearly all current meshes are considered type 1 polypropylene, their textile and structural
properties greatly vary.
53

2.1.2 Structural Properties
In addition to textile properties, vendors often report the mechanical behavior of mesh,
characterized by its structural properties. Structural properties are non-normalized measures of
mechanical behavior, and describe the load-elongation behavior of structures. Structural
properties are dependent on the amount of material present, unlike mechanical properties, which
are constant for a given material (Figure 12). For instance, a steel rod with a greater diameter
will require more force to break relative to smaller diameter steel rod of equal length. While the
structural properties of these rods are different (larger failure load and elongation for larger
diameter rod), the mechanical properties (failure stress and strain) should be statistically similar.
Mechanical properties should never be reported for synthetic mesh, as these devices are not
continuous solids since pores are of the same length scale as the mesh product. Further, prolapse
meshes are composite materials, constructed from interconnected filaments meaning that only
structural properties should be reported.
For uniaxial tensile testing, important structural properties include ultimate load at
failure, ultimate elongation, stiffness, and energy absorbed. The ultimate load is the force at
which mesh fails (breaks, tears, etc.). As a structural property, ultimate load is dependent on the
dimensions of the mesh sample tested. The ultimate load is analogous to ultimate stress or tensile
strength, (mechanical properties) where ultimate stress is defined as the ultimate load divided by
the specimen’s cross-sectional area. It should be noted that the reported ultimate load is
dependent on the type of mechanical test being performed. For example, the ultimate load for
54

uniaxial testing may vary from that obtained from biaxial or ball burst testing. These differences
arise from the unique boundary conditions used in each test. It is also interesting to note that
mesh vendors typically report the uniaxial tensile failure properties (load, elongation, linear
stiffness) in order to demonstrate the mechanical efficacy of these devices. While such
information likely suggests that mesh failure will not occur in-vivo, there is currently little
evidence that such data is related to mesh outcomes clinically.
Ultimate Elongation is the maximum elongation, or distension a mesh undergoes until the
point of failure. Similar to the ultimate load, ultimate elongation is dependent on both the
dimensions of the tested sample and the mechanical testing protocol used to analyze the mesh.
Ultimate elongation is similar to ultimate strain, where ultimate strain is defined as ultimate
elongation divided by the initial length of the samples.
The stiffness of a mesh is determined from the slope of the load-elongation curve,
reported in units of N/mm. Intuitively, stiffness is the resistance of a material to deformation or
elongation (i.e. stiffer materials require more force to elongate or deform). Stiffness can be
calculated at any point along the load-elongation curve, though often the maximum slope is
reported. It is important to note that many mesh products exhibit non-linear load-elongation
behavior, thus the slope of this line changes along the curve. As such, it is important to report the
elongation at which the slope is calculated and how this relates to anticipated in-vivo loading.
Whereas stiffness refers to the slope of the load-elongation curve, the slope of a stress-strain
curve is referred to as the tangent modulus. The tangent modulus is similar to stiffness, but
relates normalized measures, stress and strain, rather than raw load and elongation.
55

Lastly the energy absorbed is defined as the area under the load-elongation curve given in
units of Nmm. The parameter represents the total energy required to cause failure of a sample,
providing a measure of toughness for a structure. Similarly, the area under the stress-strain curve
is referred to as the strain energy density. Strain energy density provides a measurement for the
amount of energy required to fail a material, independent of the samples dimensions.
Figure 12. Materials testing can be classified as either structural or mechanical. Structural properties
(ultimate load, ultimate elongation, stiffness, energy absorbed) are obtained directly from load-elongation curves.
Mechanical properties (ultimate strength, ultimate strain, tangent modulus, strain energy) are normalized by
specimen dimensions and are used to characterize the mechanical behavior of continuous materials. While
continuous materials (extruded polypropylene) can be characterized in terms of mechanical properties, porous
textiles (knitted polypropylene) must be characterized using structural properties.
56

2.1.3 Uniaxial Tensile Properties of Synthetic Mesh
Previous studies have thoroughly examined synthetic mesh in regards to traditional structural
properties (2, 112, 114, 115). In general, the mechanical behavior of mesh is determined by the
textile properties, including construction technique (knit vs. weaving), pore geometry, and edge
treatments (tanged edges vs. free edges), though pore size has not been found to correlate with
structural properties (85, 112, 114). The impact of textile features is quite apparent when
considering the wide range of mechanical behavior exhibited by contemporary prolapse mesh
products (2, 114). Despite exclusive testing of knitted Type I polypropylene devices, the variety
of properties exhibited by synthetic mesh is remarkable with stiffness values varying as much as
3 orders of magnitude (Table 2).
Table 2. Previous uniaxial tensile testing of prolapse mesh has found a wide range mechanical behavior, despite
being constructed from the same material. The variation in structural properties arises from differences in pore
geometry and knit pattern. Data reported is from Shepherd et al. (114).
57

Whereas the specific values of structural properties greatly differ, mesh properties often
have nonlinear load-elongation curves. The non-linearity of these devices is largely expected as
their porous structure and knit construction allows for significant fiber reorganization upon
application of force. Indeed, the extent of this nonlinearity is influenced by the orientation of
pores to the axis of loading. Pores whose fibers are less aligned with the axis of loading undergo
greater rotation, thereby increasing the nonlinearity of the loading curve as complete fiber
recruitment requires a greater magnitude of stretch. This logic follows from similar mathematical
descriptions of collagen fiber recruitment developed by Lanir et al. (116). Conversely, pores
whose fibers are aligned with the axis of loading, such as a square loaded along one of its of its
orthogonal axes, or with rigid pores (i.e. little to no fiber rotation) would exhibit a largely linear
response.
2.1.4 Gap in Knowledge
While previous data regarding the structural properties of mesh is valuable, the relationship
between reported structural properties and clinical outcomes is unclear. Many studies emphasize
the failure criteria for mesh. This is especially true in vendor literature as companies look to
reassure clinicians that their products will not fail in-vivo. The perceived importance of
mechanical strength likely stems from the high failure rates for biological material, and reporting
superior ultimate load and elongation values is somewhat analogous to a factor of safety. Yet,
structural failure of synthetic mesh is extremely rare clinically, with a few anecdotal and
questionable reports of mesh deterioration following implantation (117-119). Conversely, recent
58

studies have found that mesh fibers remain intact even in patients who suffer from complications
(120). In this regard, many synthetic meshes are overdesigned for use in pelvic floor
reconstructive surgeries and may contribute to the development of complications via stress-
shielding, a mechanosensitive phenomenon in which stiff materials shield biological structures
from mechanical loads. This reduction in physiologic loading leads to degenerative tissue
remodeling. Stress shielding is believed to have resulted in the catastrophic failure of several
implants in the orthopedic area, including hip implants (121, 122).
Rather than focus on the failure criteria, structural properties should be examined within
portions of the load-elongation curve that are physiologically relevant. Unfortunately, little is
known of the loads placed on synthetic mesh during surgical tensioning or in-vivo. Regardless,
these values likely do not approach the failure criteria (>20N for a majority of meshes), and are
well within the toe-region of the load-elongation curve (115).
When considering the textile characteristics and their changes resulting from mechanical
loading, it is important to understand the environment in which mesh is used. Several studies
have compared the biological response to surgical mesh between abdominal hernia repair and
prolapse repair models, finding distinct differences between these sites. Specifically vaginal
implantation was found to have an increased inflammatory response and with greater fibrotic
tissue formation relative to abdominal implantation (101). Additionally, these studies found
exposure (incorrectly referred to as erosion in these papers) to be more common following
vaginal implantation, as no erosions were observed abdominally (102, 123). However, it should
be noted that in each of these studies, mesh was merely sutured to the vagina and not used as a
59

support to attach the vagina to the pelvic sidewall or sacrum, as is done during prolapse repair
procedures. While these studies suggest that the difference in biological location plays a key role,
it neglects one of the largest differences between hernia and prolapse repair surgeries - the forces
applied to the mesh.
When used for abdominal hernia repair, mesh predominately resists abdominal pressure,
effectively loading the mesh along the entire boundary. This pressurized system loads hernia
mesh in a multi-axial fashion, similar to the surface of a balloon undergoing inflation. These
conditions simultaneously load all axes, leaving the pore geometry relatively unchanged.
Conversely, during abdominal sacrocolpopexy and transvaginal procedures, the mesh, or mesh
arms, are anchored at 2 distinct locations (vagina and sacrum or vagina and pelvic sidewall,
receptively). Thus, in response to surgical tensioning or in-vivo loading, the mesh largely
experiences uni-directional (uniaxial) tensile loads. Such uniaxial loads likely deform mesh pores
as fibers reorganize to resist the applied force. In addition, the discrete placement of sutures
imparts strikingly different boundary conditions as it relates to hernia repair. Whereas the
perimeter of a hernia mesh is fixed in place, prolapse meshes are typically only fixed in a
minimal amount of locations (several to anchor to the vagina and one to two per attachment site).
This allows for a significant movement of mesh fibers as individual filaments orient to the axis
of loading. Given this fundamental understanding of prolapse mesh function, the changes in
textile properties must be understood in relation to two mechanical concepts - tensile loading and
boundary conditions.
60

Though previous studies clearly demonstrate significant changes in pore geometry upon
loading, these changes in pore configuration have not been quantified. Understanding how the
application of forces alter textile features such pore size, which are known to significantly alter
the host response, is critical to understanding the occurrence of complications. Further, such
information is necessary to consider when designing mesh products for urogynecologic
applications.
2.2 MESH POROSITY IN RESPONSE TO UNIAXIAL LOADS
2.2.1 Introduction
Synthetic mesh use for the surgical repair of POP is widespread, with approximately 1/3 of all
surgical repairs utilizing mesh as of 2011 (124). Ideally, synthetic mesh provides structural
support to the vagina in order to eliminate the symptoms of prolapse, including the presence of a
vaginal bulge, urinary and/or fecal incontinence, and the psycho-social issues resulting from the
disorder (18, 125). Though synthetic mesh effectively maintains the position of the pelvic organs
in long-term studies, the benefit of mesh has been questioned due to the risk of significant
surgical complications, including exposure, erosion, pain, and dyspareunia (68). Despite the
improvements in complication rates resulting from the transition to lightweight, monofilament,
61
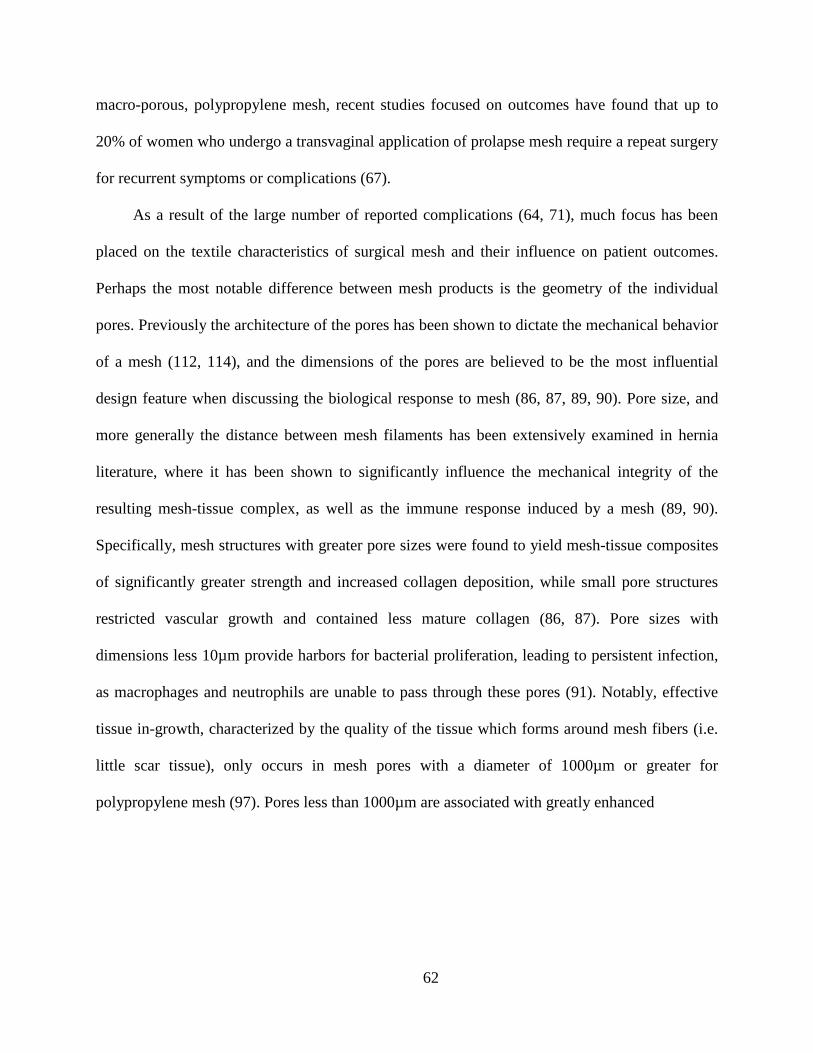
macro-porous, polypropylene mesh, recent studies focused on outcomes have found that up to
20% of women who undergo a transvaginal application of prolapse mesh require a repeat surgery
for recurrent symptoms or complications (67).
As a result of the large number of reported complications (64, 71), much focus has been
placed on the textile characteristics of surgical mesh and their influence on patient outcomes.
Perhaps the most notable difference between mesh products is the geometry of the individual
pores. Previously the architecture of the pores has been shown to dictate the mechanical behavior
of a mesh (112, 114), and the dimensions of the pores are believed to be the most influential
design feature when discussing the biological response to mesh (86, 87, 89, 90). Pore size, and
more generally the distance between mesh filaments has been extensively examined in hernia
literature, where it has been shown to significantly influence the mechanical integrity of the
resulting mesh-tissue complex, as well as the immune response induced by a mesh (89, 90).
Specifically, mesh structures with greater pore sizes were found to yield mesh-tissue composites
of significantly greater strength and increased collagen deposition, while small pore structures
restricted vascular growth and contained less mature collagen (86, 87). Pore sizes with
dimensions less 10µm provide harbors for bacterial proliferation, leading to persistent infection,
as macrophages and neutrophils are unable to pass through these pores (91). Notably, effective
tissue in-growth, characterized by the quality of the tissue which forms around mesh fibers (i.e.
little scar tissue), only occurs in mesh pores with a diameter of 1000µm or greater for
polypropylene mesh (97). Pores less than 1000µm are associated with greatly enhanced
62

inflammatory and fibrotic responses (98, 99). Given the consequences of mesh pore size on the
host response, this parameter must be considered not only prior to implantation, but more
importantly, upon surgical fixation and in response to in-vivo loading conditions (Figure 13).
Figure 13. The mechanical role of synthetic mesh is dissimilar between hernia (a) and prolapse (b) repair.
For hernia repair, mesh is loaded along all axes simultaneously, maintaining a flat configuration (c). Vaginally,
mesh arms are placed in tension to provide structural support. Such loading has the potential to deform mesh pores
and result in wrinkling of mesh (d).
As discussed earlier, many prior mechanical studies of synthetic mesh examine its failure
behavior (i.e. when it begins to tear apart) (126, 127). However, the failure properties of mesh in
many cases far exceed in-vivo loads and deformations. Thus, structural properties derived from
load-to-failure protocols (ultimate elongation and ultimate load) likely have little bearing on the
host response. Additionally, the linear stiffness is typically calculated from the linear region of
63

the load-elongation curve, a region that often exceeds anticipated physiologic loads and
displacements. As opposed to the structure properties, the characteristics of mesh deformation
within the toe region of the load-elongation curve may be more relevant for predicting mesh-host
interactions. Thus, the impact of tensile loading and boundary conditions will be considered at
forces that are within the initial toe region of the load-elongation curve.
The overall goal of the first sub-aim is to characterize the changes in mesh pore geometry
in response to tensile loading, considering the clinically relevant textile properties porosity and
pore size. Here we examine such changes within the toe-region of the load-elongation curve for
several currently available prolapse meshes. We hypothesize that regardless of initial pore
geometry, mesh pores will become unsuitable for effective tissue ingrowth (dimensions < 1mm)
with decreased porosity in response to tensile loading.
2.2.2 Methods
To account for the impact of pore geometries four synthetic mesh products with distinct
geometries were considered: Gynemesh PS (Ethicon), UltraPro (Ethicon), Restorelle (Coloplast),
and Alyte Y-mesh (Bard) (Figure 14). Each mesh was removed from sterile packaging and cut to
90 x 15mm strips along their recommended implantation direction. Additional orientations were
considered for Restorelle and UltraPro due to observations of anisotropy and anticipated loading
of these pore geometries in current sacrolcolpopoxy and transvaginal mesh kits. Specifically,
UltraPro was cut 90° offset from the recommended direction (UltraProOpp) as preliminary
uniaxial studies found significantly different mechanical behavior between these two axes. For
64
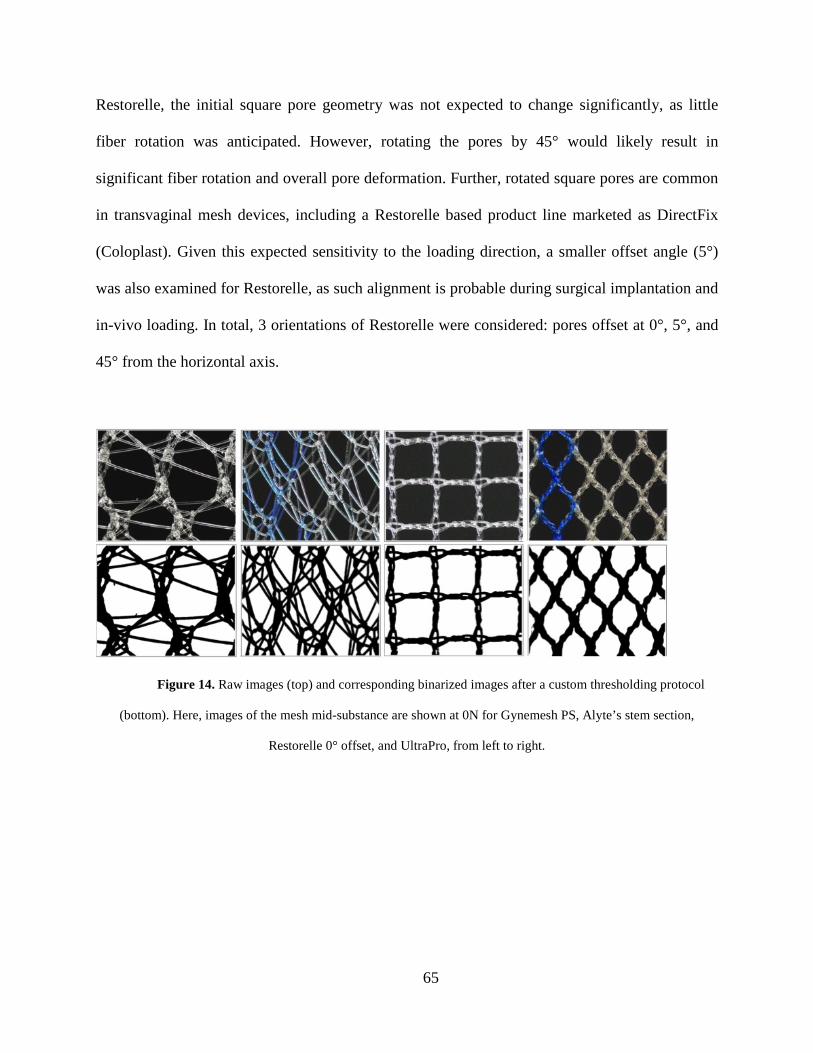
Restorelle, the initial square pore geometry was not expected to change significantly, as little
fiber rotation was anticipated. However, rotating the pores by 45° would likely result in
significant fiber rotation and overall pore deformation. Further, rotated square pores are common
in transvaginal mesh devices, including a Restorelle based product line marketed as DirectFix
(Coloplast). Given this expected sensitivity to the loading direction, a smaller offset angle (5°)
was also examined for Restorelle, as such alignment is probable during surgical implantation and
in-vivo loading. In total, 3 orientations of Restorelle were considered: pores offset at 0°, 5°, and
45° from the horizontal axis.
Figure 14. Raw images (top) and corresponding binarized images after a custom thresholding protocol
(bottom). Here, images of the mesh mid-substance are shown at 0N for Gynemesh PS, Alyte’s stem section,
Restorelle 0° offset, and UltraPro, from left to right.
65

Additionally, the amount of material was considered as the intact Alyte mesh consists of
2 distinct sections, one for vaginal attachment and one for sacral attachment. While the pattern
used to create these sections is identical, the sacral section of consists of two offset layers of this
patterning that are knitted together. This effectively doubles the amount material in the sacral
section relative to the vaginal section. Due their distinct appearance, samples from the vaginal
and sacral sections were considered independently. A total of five samples representing each of
these aforementioned groups were independently tested (n = 5).
A uniaxial tensile testing protocol was used to apply predetermined loads to each sample.
All samples were secured in custom soft tissue clamps along their length, such that the minimum
clamp-to-clamp distance (gauge length) was approximately 75mm, providing a constant aspect
ratio of 5. The bottom clamp was attached to the base of a materials testing machine (Instron
5565, Grove City, PA), while the top clamp was attached to the machine crosshead, in line with a
50lb load cell (Honeywell Sensotec, Columbus, OH) (Figure 15). A preload of 0.1N was applied
at a rate of 10 mm/min to remove slack from samples. After the preload was applied, each mesh
was loaded to 5N at 50 mm/min and subsequently to 10N at 50 mm/min. Neither force nor
elongation measurements were zeroed between loading steps. The loads chosen for this study are
estimates of in-vivo loading of mesh structures, based on reported intrabdominal pressure (IAP)
and our MRI measurements of surface area for the anterior vagina. Specifically, the loads
utilized in this protocol (5N and 10N) are within the range of forces associated with pressures
measured during valsalva and coughing (128, 129). Here we assume these forces are transmitted
to vaginal tissue via mesh attachments. While the loads associated with resting IAP
66
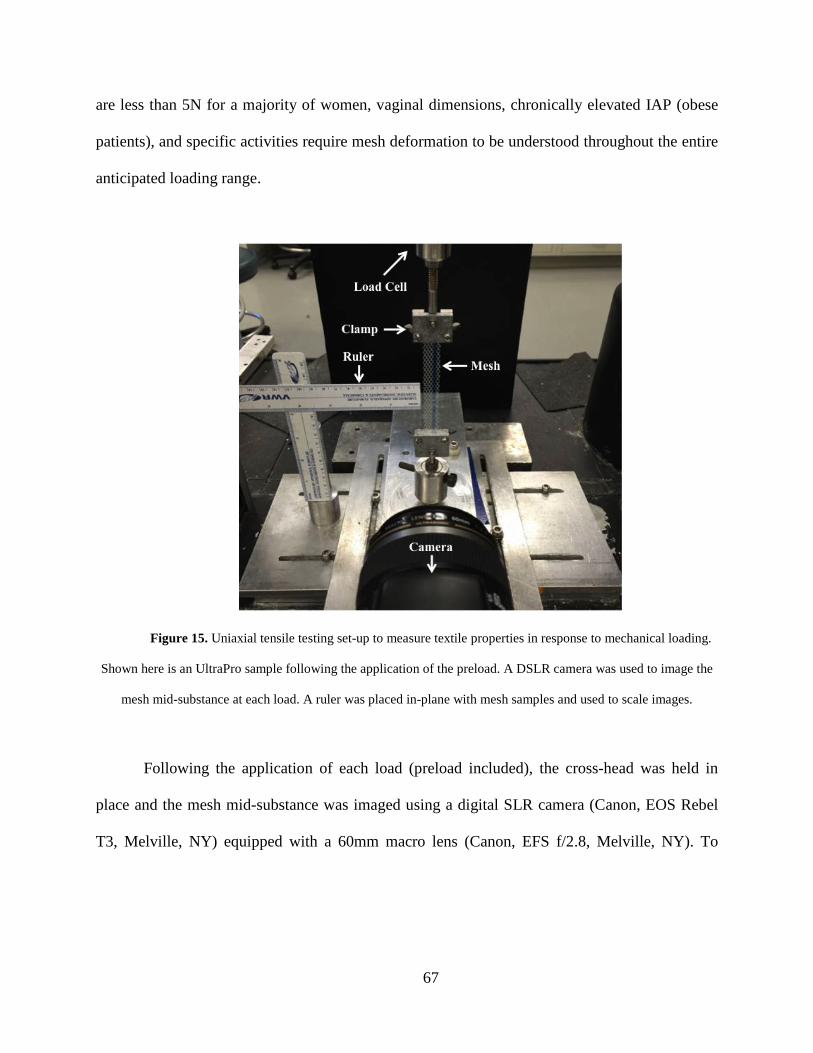
are less than 5N for a majority of women, vaginal dimensions, chronically elevated IAP (obese
patients), and specific activities require mesh deformation to be understood throughout the entire
anticipated loading range.
Figure 15. Uniaxial tensile testing set-up to measure textile properties in response to mechanical loading.
Shown here is an UltraPro sample following the application of the preload. A DSLR camera was used to image the
mesh mid-substance at each load. A ruler was placed in-plane with mesh samples and used to scale images.
Following the application of each load (preload included), the cross-head was held in
place and the mesh mid-substance was imaged using a digital SLR camera (Canon, EOS Rebel
T3, Melville, NY) equipped with a 60mm macro lens (Canon, EFS f/2.8, Melville, NY). To
67

produce repeatable image quality all images were taken using the same camera placement and
settings. Based on preliminary imaging of mesh, high aperture (F16) and low ISO (ISO 100)
settings were found to produce optimal image quality. In addition, all samples were imaged prior
to testing, providing 4 loading states for each mesh (0N, 0.1N, 5N, and 10N). Pore geometries
were analyzing using a cropped, 10 x 10 mm region from the center of each image. During
tensile loading, it was common for mesh to undergo lateral contraction, and the width was often
less than 10mm during imaging. In these instance images were cropped to the width of the mesh
while the crop length remained 10mm. The crop dimensions were chosen as they fully captured
the repeating unit structure (pore geometry) of each mesh used in this study and minimized the
boundary effects imposed by the testing clamps. Due to these constraints, larger porosity values
would be observed closer to the clamps.
Images were scaled and cropped using ImageJ (NIH, Bethesda, MD) and then imported
into a custom Mathematica script for pore analysis (V9, Champaign, IL). Images were first
binarized using a custom thresholding to ensure that all mesh fibers were included in the analysis
(Figure 14). In conjunction with a set intensity threshold, image erosion and dilation processing
was manually performed to eliminate noise and image irregularities resulting from the
translucence of mesh filaments. Following binarization, image coloring was inverted such that
mesh fibers were represented by black pixels, and white pixels represented void space. Using the
color value associated with each pixel, porosity was calculated as:
Porosity = Void Pixels / Total Pixels = White Pixels / Total Pixels
68

Porosity provides a measure of the amount of mesh material per unit area, with a value of 0
representing a solid piece of mesh (no pores) and a value of 1 representing no mesh. In addition,
pore diameters were determined by identifying the centroid of each pore in an image. Due to the
lateral contraction of the mesh samples in response to tensile loading, void space outside of the
mesh boundaries was not included for porosity measurements. Further, to avoid skewing of our
measurements, only pores which were entirely included in an image where used for analysis.
This was accomplished by subtracting the pore area along the image boundary from all
calculations.
Figure 16. Following binarization, each isolated cluster of white pixels was identified as a mesh pore. The
centroid of each pore was located (red circles) and the minimum diameter of each pore was determined.
.
69

Following binarization, a gradient-based edge algorithm was used to identify clusters of
white pixels. These clusters represent the individual pores within the mesh structure. Once
identified the center of mass for each cluster was determined and a series of diameters were
taken for each pore such that the line between the opposing pixels on the pore boundary passed
through the location of the pore centroid (Figure 16). For each pore, the minimum diameter (dmin)
was recorded, creating a distribution of dmin for all pores in an image. To more easily display
trends in pore diameter, histograms were created such that dmin values were grouped in 4 classes
from 0 to 2 mm with a bin range of 0.5 mm. The contribution of each dmin class to the total pore
area was reported as the area fraction, where area fraction was defined as the pixel area of pores
from a given diameter class divided by the total pore area in an image.
Structural properties were computed for each mesh based on the load-elongation data
obtained during testing. Due to the stress relaxation observed during imaging at 5N, structural
properties were only determined from load-elongation curves up to 5N. Elongation refers to the
mesh elongation required to reach 5N. Stiffness measurements were made considering the
nonlinearity of these curves as previously noted (2). The stiffness measurement defined as the
“low stiffness” for this study was calculated by taking the minimum slope of the curve using a
5% moving window, while a stiffness measurement defined as the “high stiffness” was taken as
the maximum slope of the curve using a 5% window.
For statistical analysis a repeated measures ANOVA with Bonferroni post-hoc was used
to examine effect of loading on mesh porosity and to make comparisons between mesh products
at a given load. The impact of loading on dmin was examined using a Kruskal-Wallis test. Finally,
70

the structural properties at each load were compared between groups using a one-way ANOVA
with Bonferroni or Dunnett’s T3 post-hoc as appropriate. Significance was set at p = 0.05.
2.2.3 Results
2.2.3.1 Textile Properties
For nearly all meshes tested, uniaxial loading dramatically altered the geometry of individual
mesh pores at 5N of force, with many pores completely collapsing by 10N of force (Figure 17).
These gross observations are well characterized by measured changes in porosity and dmin. Prior
to uniaxial loading (0N), Gynemesh PS and Alyte’s sacral portion had the lowest porosities
(60.1% and 49.7% respectively). Application of the 0.1N preload resulted in small decreases in
porosity for several groups, however none of these decreases were found to be significant. On
the other hand, the application of 5N led to a noticeable change in pore shape and a tremendous
reduction in porosity for nearly all groups, with values decreasing by as much as 87% of their
original porosity (Figure 18). Restorelle 0° offset was the only mesh whose porosity was not
significantly reduced upon application of load (p > 0.05). At 5N, Restorelle 45° offset,
UltraProOpp, and Alyte’s vaginal section saw the largest reductions in porosity, decreasing to
9.5% 11.7%, and 14.5%, respectively. At this load, Gynemesh PS and Restorelle 5° offset did
not experience as large of a reduction, but still underwent ~8% decrease in porosity, with values
falling to 51.3% and 65.8%, respectively (p < 0.05).
71

Figure 17. Mesh mid-substance deformation at 0.1N (top), 5N (middle), and 10N (bottom) of applied
force. Representative images from Gynemesh PS (a), Restorelle 0° (b), Restorelle 5° (c), Restorelle 45° (d), Alyte’s
vaginal section (e), Alyte’s stem section (f), UltraPro (g), and UltraProOPP (h) are shown. Each image has
dimensions of 10 x 10 mm.
Figure 18. Porosity measurements at 0, 0.1, 5, and 10N of force. Error bars represent standard deviation,
while * represents a significant impact of loading on mesh porosity (p < 0.05).
72

Loading to 10N led to significant pore reductions for all mesh groups other than Restorelle
0° and Restorelle 5° offsets. In fact, this deformation was so severe that the mesh structure
appeared as a solid piece of polypropylene. The deformation of these meshes is reflected in the
porosity values, which approached 0%, with values of 15.5%, 10.2%, 6.4%, 3.8%, and 8.6%, for
Gynesmesh PS, UltraProOpp, Restorelle 45° offset, Alyte vaginal, and Alyte sacral, respectively
(Figure 18).
73
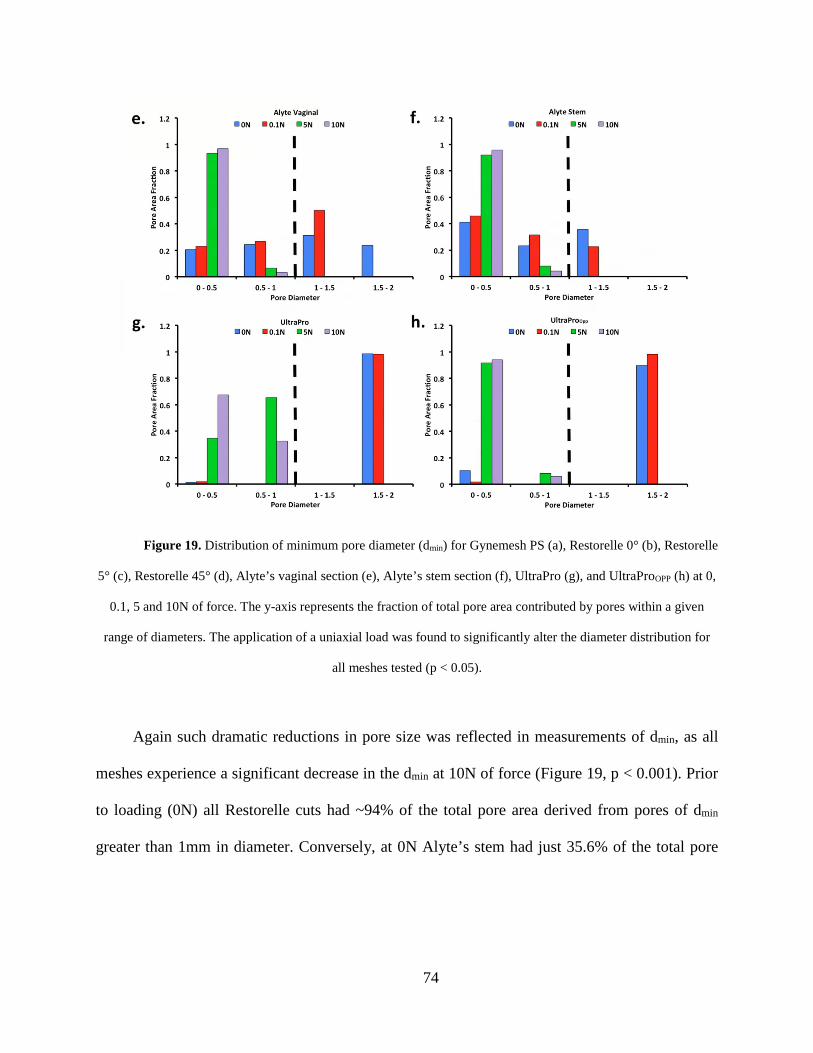
Figure 19. Distribution of minimum pore diameter (dmin) for Gynemesh PS (a), Restorelle 0° (b), Restorelle
5° (c), Restorelle 45° (d), Alyte’s vaginal section (e), Alyte’s stem section (f), UltraPro (g), and UltraProOPP (h) at 0,
0.1, 5 and 10N of force. The y-axis represents the fraction of total pore area contributed by pores within a given
range of diameters. The application of a uniaxial load was found to significantly alter the diameter distribution for
all meshes tested (p < 0.05).
Again such dramatic reductions in pore size was reflected in measurements of dmin, as all
meshes experience a significant decrease in the dmin at 10N of force (Figure 19, p < 0.001). Prior
to loading (0N) all Restorelle cuts had ~94% of the total pore area derived from pores of dmin
greater than 1mm in diameter. Conversely, at 0N Alyte’s stem had just 35.6% of the total pore
74

area from pores >1 mm. While the stem section is less likely to contact vaginal tissue, it is noted
that Alyte’s vaginal section has the next lowest area fraction from pores greater than 1 mm, at
55%. While the application of a preload did not significantly alter dmin, at 5N all meshes other
than Gynemesh PS had a significant shift in dmin distribution, with the mode decreasing in all
cases. The most striking result at 5N was the finding that Restorelle 45° offset, both UltraPro
orientations, and both Altye sections had 0 pores with a dmin above 1 mm. In fact, for Restorelle
45° offset, UltraProOpp, Altye stem, and Altye vaginal had more than 90% of the total pore area
remaining from mesh pores less than 0.5 mm in diameter. At 10N of force, pore diameter
continued to decrease for all meshes, with Gynemesh PS having the most dramatic shift in dmin
distribution in this loading range. Upon loading to 10N, Gynemesh PS did not have any pores
with a dmin greater than 1mm.
2.2.3.2 Structural Properties
Overall, the trends and observations from the load-elongation data were consistent with our
previously published data. Loading curves to 5N for Gynemesh PS, Alyte vaginal, Alyte stem,
UltraPro, UltraProOPP, and Restorelle 45° offset all exhibit a nonlinear load-elongation response
typical of fiber recruitment, while Restorelle at 0° and 5° immediately enter a linear load-
elongation response with a sudden, and brief decrease in slope, likely related to tightening of the
knot structures (Figure 20). However, as evident by the range of curves obtained, the manner by
75

which meshes are loaded appears to be dependent on the original pore shape and its orientation
relative to the loading axis. It should be noted that during imaging of the mesh mid-region at 5N,
all meshes stress-relaxed to similar values (~3N) before the next loading step.
Figure 20. Representative load-elongation curves for all groups tested. Meshes display a wide range of
responses from 0 to 5N, due to initial pore geometry and orientation to the loading axis (a). During imaging of
samples at 5N, each mesh underwent stress relaxation prior to application of the 10N load (b).
When comparing the elongation required for each mesh to reach 5N of force, Restorelle
45° required almost 27mm of elongation, twice that of nearly all other groups tested (Table 3, p
< 0.05). Most striking was the elongation of UltraProOPP which required 59 mm of elongation in
order to reach 5N, ~55% more than Restorelle 45° and nearly 4 times more elongation than all
other meshes (p < 0.0001). These compliant behaviors are reflected in the low stiffness measures
for Restorelle 45° and UltraProOPP, which were an order of magnitude lower than of nearly all
76
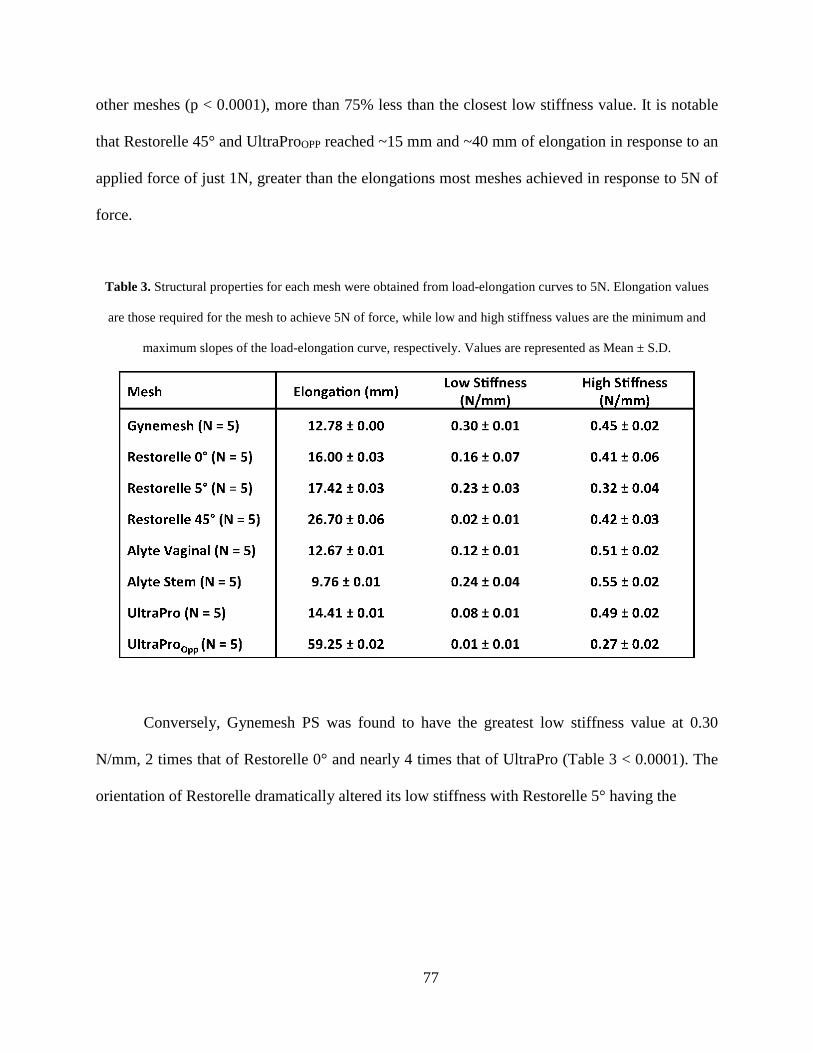
other meshes (p < 0.0001), more than 75% less than the closest low stiffness value. It is notable
that Restorelle 45° and UltraProOPP reached ~15 mm and ~40 mm of elongation in response to an
applied force of just 1N, greater than the elongations most meshes achieved in response to 5N of
force.
Table 3. Structural properties for each mesh were obtained from load-elongation curves to 5N. Elongation values
are those required for the mesh to achieve 5N of force, while low and high stiffness values are the minimum and
maximum slopes of the load-elongation curve, respectively. Values are represented as Mean ± S.D.
Conversely, Gynemesh PS was found to have the greatest low stiffness value at 0.30
N/mm, 2 times that of Restorelle 0° and nearly 4 times that of UltraPro (Table 3 < 0.0001). The
orientation of Restorelle dramatically altered its low stiffness with Restorelle 5° having the
77

greatest low stiffness value. Similarly, an increased amount of material was found to increase the
low stiffness of Alyte, as the stems stiffness was twice that of the vaginal section (p = 0.014).
High stiffness values were more similar across all mesh groups, though significant
differences were observed. Alyte stem was found to have the greatest high stiffness value at 0.55
N/mm, 18% greater than Gynemesh PS (p = 0.001) and 7% greater than the vaginal section of
Alyte (p > 0.05). Interestingly, Restorelle 5° had a lower high stiffness value compare to 0° and
45° orientations, which were nearly identical. Interestingly, the high stiffness values from 5N to
10N of loading are nearly identical for all Restorelle orientations. Conversely, the high stiffness
of UltraProOPP was ~45% lower compared to the UltraPro (p < 0.001).
2.2.4 Discussion
In this sub-aim, the changes in clinically relevant textile properties, porosity and pore diameter,
were examined in response to uniaxial tensile loading for 4 currently available mesh products.
Indeed, mechanical loading resulted in significant changes in porosity and pore diameter, the
magnitude of these deformations were primarily dictated by the knit pattern and the direction of
applied force relative to this pattern. From a mechanical perspective, these general findings were
expected and could have been predicted without experimentation. However, a major,
unanticipated finding was that the porosity of nearly all products tested approached 0% in
response to just 10N of applied force (2.22 lbs of force), which is well within the physiologic
range. A second major finding was that in response to the application of a uniaxial force, pore
diameters decreased rapidly, and by 10N nearly all meshes had 0 pores with a minimum diameter
78

greater than 1mm, regardless of the initial orientation. These findings are clinically relevant in
light of recent studies that have linked low porosity and small pore diameters (< 1mm) to
complications, presumably resulting from a higher mesh burden (mesh material in contact with
tissue within a small region). Generally, it is assumed that if a mesh has both large pore size and
high porosity prior to implantation, then the mesh will be less likely to generate complications.
However, the findings in this study suggests that this assumption is not valid, since ex-vivo
porosity values may have little bearing on the porosity of the mesh once it is surgically tensioned
and subjected to in-vivo loads. This is especially true for prolapse repair procedures, where the
mechanical demands of mesh are consistent with uniaxial tensile loading utilized in this study.
The present method for computing porosity shows good agreement with previous studies
of Gynemesh PS and Restorelle (previously Smartmesh) without loading. Previously, the
intersections of an overlaid grid were used to determine the ratio of void space to total area
(112). While the previous method provides a reasonable approximation, it appears to
overestimate porosity by several percent compared to the custom thresholding method developed
here. Defining each pixel as mesh or void area provides a more robust description and detailed
measurement of porosity and simultaneously allows for the dimensions of individual pores to be
determined. Additionally, the low stiffness values at 5N for Gynemesh PS and Restorelle 0°
offset show agreement with low stiffness values reported in previous studies during which
testing was conducted to mesh failure. Disagreements in high stiffness values suggests that
79

loading to 10N was within the toe-region of the curve, as mesh fiber requirement and
reorganization was ongoing. Preliminary testing confirmed this finding for all other meshes
tested.
The overall mesh deformation observed in this study is also consistent with previous
studies that have characterized the reduction in pore size after the application of strain (92, 93). It
should be noted that the latter studies report effective porosity, which only considers void area
from pores greater than 1mm in diameter. Rather than compute effective porosity, which was
found to have increased variability for several meshes based on the distribution of dmin around
the cutoff of 1mm, our study reports the diameters of all pores imaged. This provides a more
precise understanding of how diameters are altered throughout the loading process and
supplements porosity data. Given the dramatic decreases in porosity and pore diameters observed
in this study, one would anticipate that even at small forces, uniaxial loading of mesh would
induce an enhanced inflammatory response with increased fibrous encapsulation of the mesh.
Since fibrous encapsulation can undergo contraction by resident fibroblasts, this may provide an
explanation for pain following mesh implantation, the most common mesh related complication
(130).
Finally, this testing demonstrates the impact of mesh orientation to the direction of loading.
This is important as nearly all pore geometries have inherent anisotropy due to knit patterns. Due
to its simple square patterning, Restorelle readily illustrates this concept, providing a near
instantaneous linear response that is more apt to maintaining pore size when loaded along or
nearly along the fiber orientation (0° and 5° offsets). The same mesh with fibers oriented with a
80

45° offset immediately collapses at loads less than 1N, yielding a response with very low initial
stiffness and a rapid decrease to ~0% porosity. While only 3 differing cuts were examined here,
Restorelle likely displays a spectrum of properties between those observed at 0° and 45° offset,
depending on the specific device design and how it is implanted in-vivo. This variable behavior
is not limited to Restorelle and should be anticipated for all meshes, though the range of
properties may vary.
When interpreting these results with respect to clinical outcomes, it should be noted that
these values were obtained ex-vivo. As such, the effect of anchoring the mesh to tissue, mesh
encapsulation, tissue ingrowth, and how well the vagina is supported by other tissues may
influence actual porosity and dmin values experienced in-vivo. Nevertheless, these findings are
critical to consider when initially placing/tensioning a mesh. Lastly, it should be noted that the
dimensions of the mesh samples used in this study (90 x 15 mm) may be more similar to the
dimensions of the arms found on transvaginal mesh products, rather than the mesh at the vaginal
interface or the mesh dimensions used for abdominal sacrocolpopexy. While an increase in
overall mesh dimensions may better maintain porosity, due to the transfer of forces through the
fiber network, the load at which meshes collapse is likely not linearly scaled to the mesh
dimensions. Rather the collapse of pores is likely more dependent on the knit pattern and the
manner in which the mesh is fixed. As previously mentioned, this study focused on analysis of
the mesh mid-region, where deformation is assumed to be uniform. Conversely deformation near
the clamps is greatly influenced by the rigid fixation of the entire mesh boundary. While the
81

boundary condition here is not identical to anchoring of mesh in-vivo, it should be anticipated
that the number of attachments (sutures) used as well as their orientation to the applied load will
greatly affect the observed changes in pore geometry.
In response to tensile loading, it should be noted that mesh products are subject to out of
plane deformation. This may result in a reduction of image quality, thus introducing error into
porosity measurements. While a large depth of field was used to reduce such errors, out of plane
fiber deformation may result in image blurring, artificially increasing the porosity of the mesh.
Additionally, binarization and thresholding protocols may be subject to image quality, as they
require high contrast between the background and mesh fibers. To achieve repeatable image
quality, the same background, lighting conditions, and camera settings were used to collect all
images. Perhaps the largest source of variability in this study was due to inconsistent cutting of
mesh along a given direction. As shown in the results of this study, small changes in mesh
orientation to the applied force can drastically affect the deformation behavior of mesh products.
While little variation was observed in porosity measurements, these changes are more likely to
manifest in the loading curve, as orientation to applied loads alters the manner in which mesh
fibers are recruited and how force is distributed.
82

2.3 SURFACE CURVATURE OF SYNTHETIC MESH
2.3.1 Introduction
As of 2011, roughly one-third of all surgical repairs for POP were utilizing synthetic mesh, yet
up to 20% of those who undergo surgery with mesh require repeat operations for recurrent
symptoms or complications (61, 67). More troublesome is the severity of such complications,
with mesh exposure being not only one of the most devastating mesh related complications, but
also one of the most common (63, 64, 131). Recent federal reports have found that exposure
through the vaginal wall occurs in up to 15% of transvaginal repairs and 10.5% of
sacrolcolpopexy repairs (39). Concomitant with exposure is the deformed appearance of mesh in
the vaginal lumen. Surgeons and researchers have commonly noted mesh appears “bunched”,
“contracted”, or “folded”, in eroded areas. This evidence suggests that the deformation of mesh
may be responsible for the degenerative tissue response associated with exposure. Though the
mechanisms that lead to mesh exposure remain unclear, growing evidence suggests that small
pore size, and more generally the small inter-filament distances, greatly enhance the host foreign
body response, leading to exposure (77, 112, 114).
In the abdominal wall, it was determined that pores with diameters less than 1mm elicit
an enhanced immune response, with poor mesh incorporation into the host tissue. Building on
this concept, the previous sub-aim of this dissertation found tensile loading to drastically reduce
mesh porosity, yielding pore dimensions much less than 1mm, creating a scenario in which tissue
integration was unfavorable (92, 93). The reduction in pore size, brings mesh fibers closer
83
together in space, resulting in increases in mesh burden, where mesh burden is defined as the
amount of mesh material per unit volume of tissue. Though tensile loading clearly leads to pore
collapse at some level of force, additional deformations, such as wrinkling and folding, may
provide an alternative or concomitant mechanism to increase mesh burden. Moreover, the
boundary conditions of a standard uniaxial tensile test do not necessarily mimic the in-vivo
loading of prolapse mesh.
The boundary conditions applied to synthetic mesh have the potential to greatly impact
its mechanical behavior. For instance the deformation experienced by mesh devices during
standard uniaxial tensile testing and ball burst testing are strikingly different, though expected
due to the radical differences in constraints (112, 114). In response to uniaxial testing, mesh is
allowed to contract in the direction perpendicular to loading (similar to Poisson’s effect for
continuum solids), while fixing the mesh along the entire boundary, per a standard ball burst
protocol, prevents the collapse of pores. Although both testing methods assume a planar
geometry (i.e. no buckling or wrinkling), the method in which mesh is fixed noticeably alters
changes in mesh burden in response to mechanical loading.
While many previous studies have employed standard testing protocols to assess the
properties of mesh, the boundary conditions employed for such testing (i.e. clamping at the edge)
do not reflect those imposed during or following in-vivo fixation. As such, important features
regarding mesh deformation in-vivo may have been overlooked. Specifically, when a surgeon
places a mesh to restore vaginal support, sutures are used to attach the material to the vagina as
well as the anchoring surfaces. This method of attachment subjects the mesh to various point
84

loads, a stark contrast to the uniform application of load or displacement to an entire boundary
during traditional uniaxial tensile testing. Further, the number of point loads (sutures) and their
locations are variable, as surgeons do not necessarily use the same number of sutures or exactly
the same suture placements from patient to patient (anatomical variations, patient size, etc).
Without constraining an entire edge, point loads are more likely to create out-of-plane
deformations, resulting in a bending or wrinkling phenomenon along the lines through which
force is transmitted. Such out of plane deformations are expected due to the constraint effects of
pore deformation. Understanding the surface deformation of mesh products will provide valuable
insight into the local deformation and mesh burden throughout a mesh device, as folding of the
mesh surface is an alternative mechanism by which mesh fibers can be brought closer together in
3-dimensional space. Similar to the 2-dimensional concept of bridging fibrosis, the volumetric
proximity of fibers in or along a tissue would elicit a union of individual foreign body responses
of each fiber and reduce the likelihood of tissue ingrowth (Figure 21). In concert with the
decrease in pore geometry observed in response to uniaxial loading, surface wrinkling may
dramatically impact the host tissue response.
Describing surface deformations, such as bending, has been well characterized in several
fields of research, including neurological development (132, 133) and cardiology (134-136).
Following from these studies, out-of-plane surface deformations for a thin body can be
characterized via surface curvature, as the geometric transformation of a flat surface to a curved
one implies some local surface deformation. The same concepts used in these fields can be
directly applied to understand the out-of plane deformation of mesh in response to point loads.
85

Thus, the goal of this sub-aim was two-fold: 1) develop an experimental and theoretical approach
by which the surface curvature of polypropylene mesh could be quantified and compared and 2)
use this approach to examine the impact of variable boundary conditions on the surface curvature
of polypropylene mesh products used in the repair of pelvic organ prolapse. We hypothesize that
boundary conditions more representative of in-vivo loading will result in significantly greater
surface curvature compared to those deformations resulting from traditional tensile testing.
Figure 21. Out-of-plane deformations, such as surface wrinkling or bunching, brings mesh filaments closer
together. The proximity of filaments may result in the union of foreign body responses from individual filaments,
creating bridging fibrosis.
2.3.2 Methods
2.3.2.1 Experimental Testing
Gynemesh PS (Ethicon) and Restorelle (Coloplast) samples were removed from sterile
packaging and cut to 15 x 5 cm strips along the recommended implantation direction (n = 5
86

each). These products were chosen based on their widespread clinical use and to examine the
response of varied pore geometries following application of differing boundary conditions. All
samples were subjected to 3 uniaxial tensile tests (n=5 per test per mesh) with boundary
conditions (BCs) varied as follows: 1) the entire top and bottom edges of the mesh were fixed in
custom tissue clamps 2) the entire bottom edge was fixed and the top edge was sutured to a
custom plate using 2 interrupted suture ties 3) both the top and bottom edges were sutured to
custom plates using 2 interrupted suture ties on each edge (Figure 22). For this study, all sutures
were centered about the width of the mesh and placed 1.5 cm apart. A grid pattern was cut into
the custom design plates to allow for suture ties to be consistently tied at specific, repeatable
locations. During each trial the bottom clamp/plate was fixed to the base of a materials testing
machine (Instron 5565, Grove City, PA), while the top clamp/plate was attached to the machine
crosshead, inline with a 5kN (0.1N resolution) load cell. Each sample was preloaded to 1N at 10
mm/min and subsequently loaded to 10N at 50 mm/min. While 10N of force is estimated to be
greater than resting loads experienced by mesh (137), this load limit is estimated to be within the
range of physiologic loads (such as those for coughing, valsalva, etc). This estimate is based on
vaginal geometries and intra-abdominal pressures (128, 129). The suture distances and mesh
dimensions chosen for this study were based on those that may be applied during an abdominal
sacrocolpopexy procedure.
87

Figure 22. Experimental boundary conditions (BCs) utilized in this study. Each mesh sample was loaded to
1 and 10N of force at each of the 3 BCs shown above. Clamps were used to constrain an entire boundary or 2
interrupted suture ties were used to secure the mesh to custom clamps at the top and/or bottom boundaries.
2.3.2.2 Photogrammetry
At each load (1N and 10N) and boundary condition, ten photographs of the mesh-clamp/plate
complex were taken using a digital single-lens reflex (DSLR) camera (Canon, EOS Rebel T3,
Melville, NY) equipped with a 60mm macro lens (Canon, EFS f/2.8, Melville, NY). A
registration block was also included in each photograph (Figure 23). To ensure similar image
quality and repeatability between trials, all images were taken using the same camera settings
(F8, ISO 400, shutter speed 3s). Camera settings were optimized to produce high contrast images
88

with a large depth of field. Images were consistently taken from 5 angles at 2 differing heights,
centered about the axis of loading. All ten images were then imported into Photoscan Pro
(Agisoft, St. Petersburg, Russia) for 3D reconstruction.
In order to compute surface curvature, full scale, close-range photogrammetry was utilized
to capture the 3D (3-dimensional) mesh geometry. Photogrammetry is a reconstruction technique
which combines a set of images into a three dimensional surface model by identifying and
matching points in each image. Photogrammetry was chosen to capture surface deformation as
preliminary testing revealed that traditional experimental methods of quantifying 3D
deformations (painting the surface to create a speckle pattern, affixing surface markers, etc.)
restricted the movement of fibers at knot locations and increased the stiffness of the meshes. All
photogrammetric reconstructions were performed using Photoscan Pro software. First, the
orientation of each image was determined with respect to the object of interest using the image
metadata (focal length) and overlapping of features identified across images. This process yields
a sparse point cloud of the surface features based on the initial photo alignment. The initial point
cloud was then cropped to eliminate any obvious errors in point identification and the point
cloud was repopulated ignoring removed features.
Once the initial point cloud and spatial orientation of the images were confirmed,
Photoscan Pro continued to identify features in each image and used the 3D positioning of each
image to locate the 3D coordinates of each feature point, refining and adding detail to the point
cloud. It should be noted that such feature matching is highly dependent on the quality of images
used for reconstruction. Specifically, images with a large depth of field (significant portion of
89
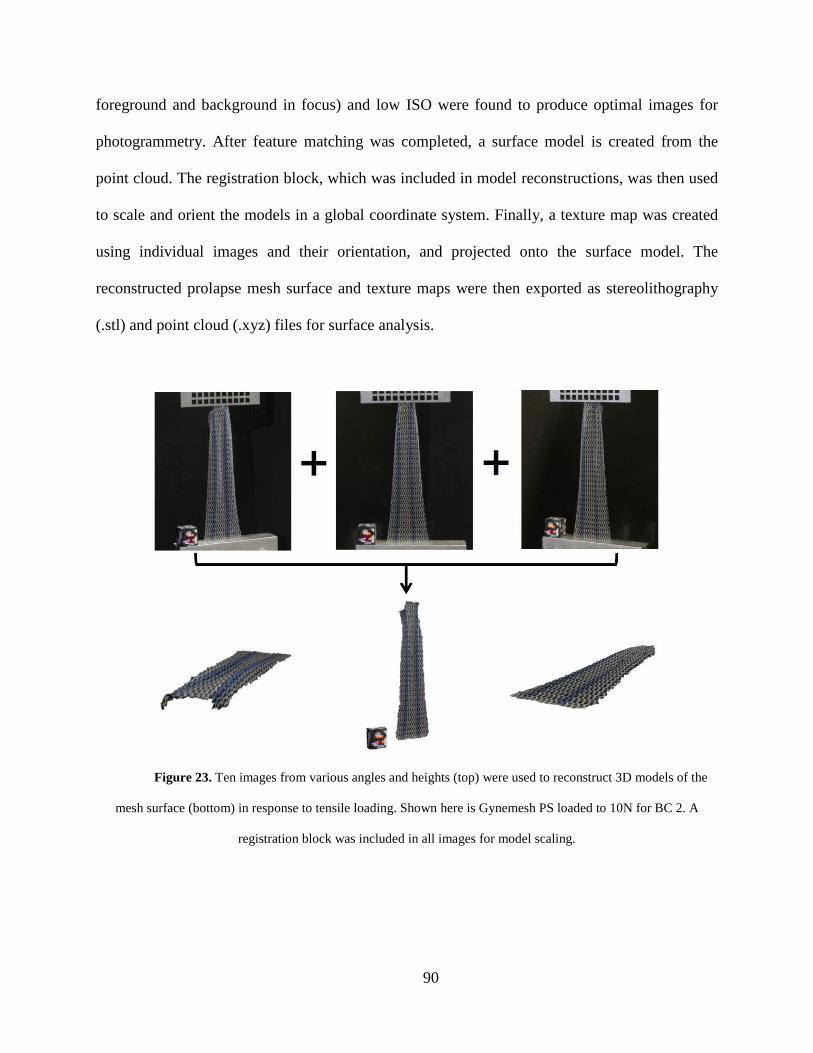
foreground and background in focus) and low ISO were found to produce optimal images for
photogrammetry. After feature matching was completed, a surface model is created from the
point cloud. The registration block, which was included in model reconstructions, was then used
to scale and orient the models in a global coordinate system. Finally, a texture map was created
using individual images and their orientation, and projected onto the surface model. The
reconstructed prolapse mesh surface and texture maps were then exported as stereolithography
(.stl) and point cloud (.xyz) files for surface analysis.
Figure 23. Ten images from various angles and heights (top) were used to reconstruct 3D models of the
mesh surface (bottom) in response to tensile loading. Shown here is Gynemesh PS loaded to 10N for BC 2. A
registration block was included in all images for model scaling.
90

2.3.2.3 Surface Curvature
Surface models from photogrammetric reconstruction were exported to Meshlab (Visual
Computing Lab, ISTI-CNR, Pisa, Italy) and 10 points along the top and bottom boundaries of the
mesh surface were manually selected to serve as nodes for finite element analysis. The 3D
coordinates representing the nodal locations were exported to a text file. These nodal
coordinates, along with the 3D coordinates representing the mesh surface (.xyz files) were then
exported into a custom Mathematica script (V9, Champaign, IL), mapped to a four element patch
of 4-node biquintic finite elements (BQFEs) and parameterized in local element coordinates
(ξ,η), where the values of ξ and η range from -1 to 1 (Figure 24).
Figure 24. Experimental data points, representing the 3D mesh surface, were mapped to the local
coordinate systems (ξ,η) of a 4-element patch of biquintic finite elements (BQFEs). 10 points on the mesh surface
were manually selected to serve as nodes for finite element discretization.
91

The 2D (2-dimensional) interpolation functions for the BQFEs are derived from the 1D
(1-dimensional) quintic hermite element and provide C2 continuity (136). In addition, each node
of the BQFE has 6 nodal values representing the z-coordinate and the first, second, and cross
derivatives with respect to the local coordinate system. Nodal values for the 4-element patch
were fit simultaneously using a least squares method, where a scalar penalty function was used to
enforce C2 continuity across the element boundaries. The z-coordinates for each element are
obtained by summing the 24 products of:
Z = Nijk(ξ, η)Zi
jk (2.1)
i = 1,4
j = 0,2
j + k ≤ 2
Where i is the node number, j and k are the order of the derivative with respect to the local
coordinates, and Z is the Cartesian z-coordinate that was fit. Summation convention is implied in
Eq. 1 (136). The large point sampling obtained via 3D reconstruction (>1000 points per element)
eliminated the need for error functions used previously for this technique.
In order to transform values from between the in-surface coordinates and Cartesian
coordinates, an appropriate covariant curvilinear basis was created such that:
g1 = �X,ξ , Y,ξ , Z,ξ � , g2 = �X, η , Y, η , Z, η � , g3 = g1×g2|g1×g2| (2.2)
Further the contravariant curvilinear basis is given by:
g1 = g1×g2�g
, g2 = g3×g1�g
, g3 = g1×g2�g
(2.3)
92
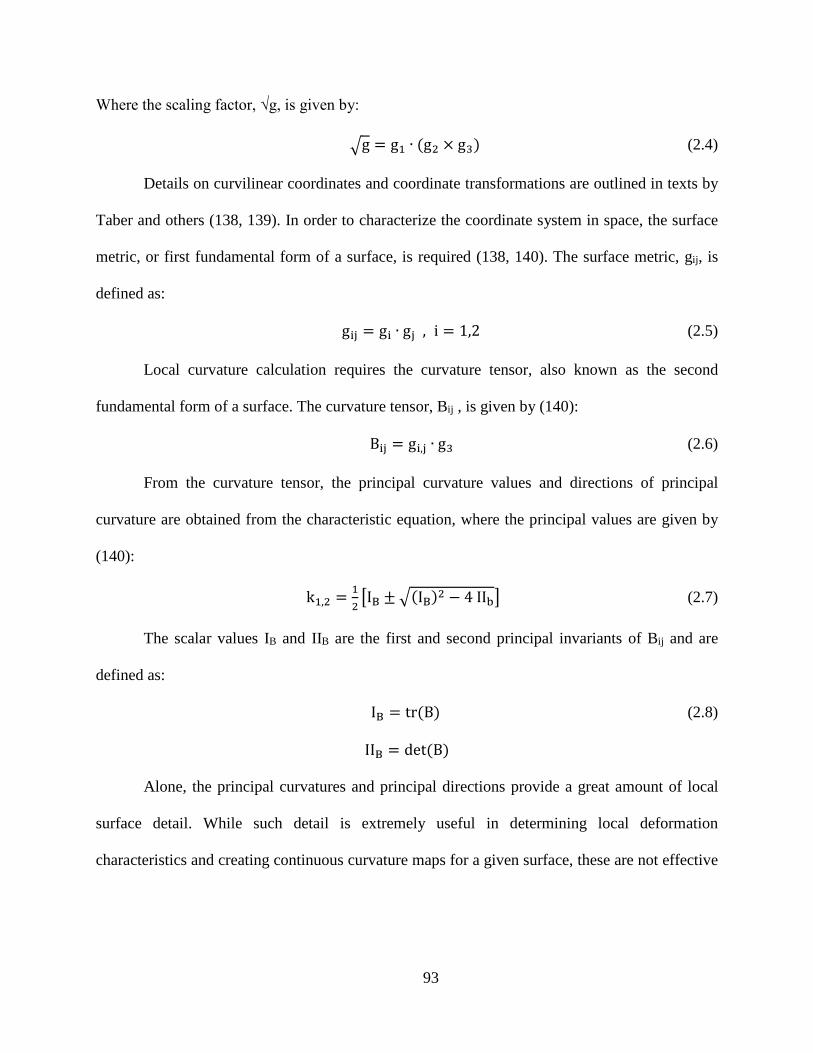
Where the scaling factor, √g, is given by:
�g = g1 ∙ (g2 × g3) (2.4)
Details on curvilinear coordinates and coordinate transformations are outlined in texts by
Taber and others (138, 139). In order to characterize the coordinate system in space, the surface
metric, or first fundamental form of a surface, is required (138, 140). The surface metric, gij, is
defined as:
gij = gi ∙ gj , i = 1,2 (2.5)
Local curvature calculation requires the curvature tensor, also known as the second
fundamental form of a surface. The curvature tensor, Bij , is given by (140):
Bij = gi,j ∙ g3 (2.6)
From the curvature tensor, the principal curvature values and directions of principal
curvature are obtained from the characteristic equation, where the principal values are given by
(140):
k1,2 = 12�IB ± �(IB)2 − 4 IIb� (2.7)
The scalar values IB and IIB are the first and second principal invariants of Bij and are
defined as:
IB = tr(B) (2.8)
IIB = det(B)
Alone, the principal curvatures and principal directions provide a great amount of local
surface detail. While such detail is extremely useful in determining local deformation
characteristics and creating continuous curvature maps for a given surface, these are not effective
93

for generalizing the gross deformation experienced by a surface. To provide an overall measure
of surface curvature and effectively demonstrate the gross changes in surface curvature during
loading, the average maximum value of principal curvature was chosen. First, the maximum
principal curvature represents the out-of-plane peaks and valleys, which arise during the
wrinkling phenomenon. Max curvature for this study is defined such that:
kmax ≔ max[|k1|, |k2|] (2.9)
All surface fitting and curvature calculations were performed using a custom
Mathematica script. Data visualization was completed in Matlab R2012a (Mathworks, Natick,
MA) where Delaunay triangulation was used to reconstruct 3D surfaces. A custom script was
used to eliminate distorted elements, rendering a smoothed geometry that was representative of
the original reconstructed model. Computed curvature values from Mathematica were then
projected onto the approximated surface.
In order to characterize the entire mesh surface and make comparisons between boundary
conditions and mesh type, the average of the absolute value of the maximum principal curvature,
Mean(|kmax|), was used. Mean(|kmax|) provides a measure of the magnitude of curvature for the
entire surface. A Mean(|kmax|) of 0 indicates a flat surface, while larger values represent surfaces
of higher curvature. In addition, the variance of kmax, (Var(kmax)), was computed to provide a
measure of the undulation or wrinkling present across a surface. Larger Var(kmax) values indicate
surfaces with greater fluctuations in curvature (i.e. higher peaks and lower valleys, though a
94

Var(kmax) of 0 may represent either a flat surface or one in which curvature does not change
rapidly (e.g. shallow parabolic shapes). As such the values of Mean(|kmax|) and Var(kmax) should
be considered together in order to make appropriate conclusions regarding a surface.
A Friedman's test was used to compare the Mean(|kmax|) and Var(kmax) values between the
applied boundary conditions at 1 and 10N of applied load. Additionally, a Kruskal-Wallis test
with Mann-Whitney post-hoc was used to compare meshes at the same load and boundary
condition. Statistical analysis was performed in SPSS (V20, IBM, Armonk, NY) with a
significance value set at p = 0.05.
2.3.2.4 Validation
In order to examine the accuracy of the custom code used for surface interpolation, validation of
the computational methods was performed using known functions with C2 continuity. Here the
parabolic (y = x2) and sinusoidal (y = 0.5sin(3x)) functions were considered. The analytical 3D
curvature was calculated for each shape using the Hessian of each function. Briefly, the Hessian
of a function is a square matrix of second-order partial derivatives that describe the local
curvature of a function. The functions used in validation were chosen as these general geometric
shapes (parabolic and sinusoidal) were observed in the deformation patterns during mesh trials.
To isolate the error associated with the surface interpolation algorithm, 3D datasets were
generated with each of these functions by extruding in the z direction. Unlike surface data
95

obtained via photogrammetry, the generated data here was equally distributed along the surface.
These ideal, generated datasets then underwent the same nodal selection protocol and surface
analysis as photogrammetry datasets.
Figure 25. Validation of the experimental methods with various surfaces of known curvature. The top row
depicts the reconstructed surface models exported from Photoscan Pro for flat, parabolic, and sinusoidal geometries.
The bottom row displays the computed |kmax| for each surface. Regions of low curvature (flat) are represented by
cool colors, while the warm colors signify surfaces of high curvature. kmax values are in units of cm-1.
Additional validation was performed to assess the total error of the overall approach or
the combined error from both the photogrammetry and surfaced interpolation techniques. To
examine this source of error, the same parabolic (y = x2) and sinusoidal (y = 0.5sin(3x))
functions were used to design and fabricate acrylic models. Each equation was sketched in
Solidworks (2012, Dassault Systèmes, Waltham, MA) and extruded to a depth of 1 inch, creating
96
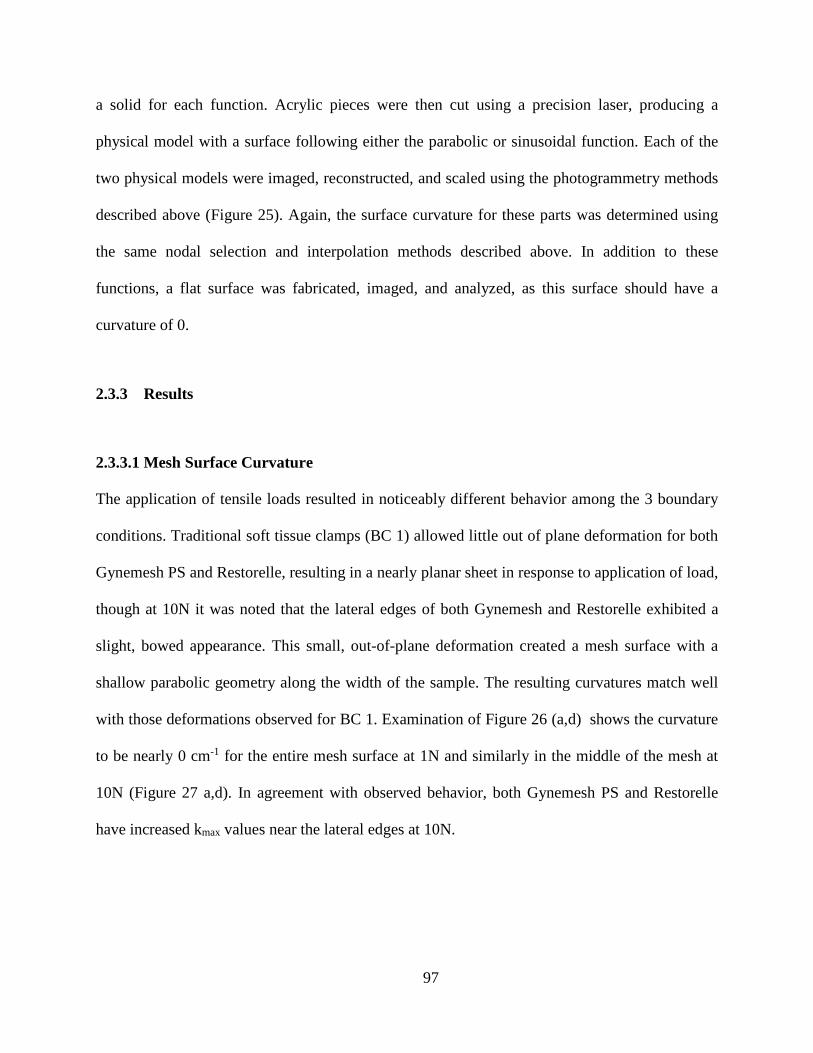
a solid for each function. Acrylic pieces were then cut using a precision laser, producing a
physical model with a surface following either the parabolic or sinusoidal function. Each of the
two physical models were imaged, reconstructed, and scaled using the photogrammetry methods
described above (Figure 25). Again, the surface curvature for these parts was determined using
the same nodal selection and interpolation methods described above. In addition to these
functions, a flat surface was fabricated, imaged, and analyzed, as this surface should have a
curvature of 0.
2.3.3 Results
2.3.3.1 Mesh Surface Curvature
The application of tensile loads resulted in noticeably different behavior among the 3 boundary
conditions. Traditional soft tissue clamps (BC 1) allowed little out of plane deformation for both
Gynemesh PS and Restorelle, resulting in a nearly planar sheet in response to application of load,
though at 10N it was noted that the lateral edges of both Gynemesh and Restorelle exhibited a
slight, bowed appearance. This small, out-of-plane deformation created a mesh surface with a
shallow parabolic geometry along the width of the sample. The resulting curvatures match well
with those deformations observed for BC 1. Examination of Figure 26 (a,d) shows the curvature
to be nearly 0 cm-1 for the entire mesh surface at 1N and similarly in the middle of the mesh at
10N (Figure 27 a,d). In agreement with observed behavior, both Gynemesh PS and Restorelle
have increased kmax values near the lateral edges at 10N.
97

Mesh deformations for BC 2 were markedly different from those seen for BC 1. BC 2
produced significant buckling in all meshes, with peaks originating from the suture locations.
Again, the contour maps for |kmax| are in agreement with the observed deformations (Fig. 26 and
27, b and e). At 1N, Gynemesh PS samples developed small kmax values at the sutures, while
Restorelle remained in a nearly flat configuration. By 10N of force, both meshes exhibited large
out-of-plane deformations, typically with 2 peaks stemming from the suture location and a valley
forming between the suture points. It should be noted that the buckling behavior produced
noticeable lateral contraction of the mesh. This lateral contraction was more pronounced at the
edge fixed with sutures, while little to no contraction was observed at the boundary with the
standard tissue clamps.
BC 3 produced the most dramatic mesh deformation, with large undulations in the mesh
surface and greater lateral contraction along the entire length of the mesh (Fig. 26 and 27, c and
f). Analysis at 1N confirmed the overall increases in kmax. In particular, distinct regions of
elevated kmax were observed along a vertical line between the top and bottom suture locations for
Gynemesh PS. Unlike Gynemesh PS, Restorelle remained relatively flat at 1N, though large
folds (nearly 90°) were commonly observed just lateral to the suture location. These folds
generated large curvatures, though the fold typically did not extend along the length of the mesh,
nor medially past the suture location. At 10N, both mesh products experienced substantial
wrinkling along the entire mesh, leading to large kmax values across the entire surface. In
addition, both meshes had a great deal of lateral contraction along the entire mesh length (Fig 27,
c and f).
98

Figure 26. Contour map of |kmax| for representative Gynemesh PS (a,b,c) and Restorelle (d,e,f) samples at
1N. Boundary conditions (BCs) 1,2, and 3 are represented by (a,d), (b,e), and (c,f) respectively. Solid black lines
represent the direction of kmax.
When characterizing the entire surface via Mean(|kmax|) and Var(kmax), the BCs considered
in this study were found to significantly impact both Gynemesh PS and Restorelle (Table 1). At
1N, Mean(|kmax|) values for Gynemesh PS increased by several orders of magnitude, with median
values of 0.0608, 0.162 and 0.406 cm-1 for BC 1, BC 2, and BC 3, respectively. Similar changes
were also seen for Restorelle, though Restorelle had a significantly lower Mean(|kmax|) for BC 3
compared to Gynemesh PS (p = 0.009). The variance of kmax was also found to increase from BC
99
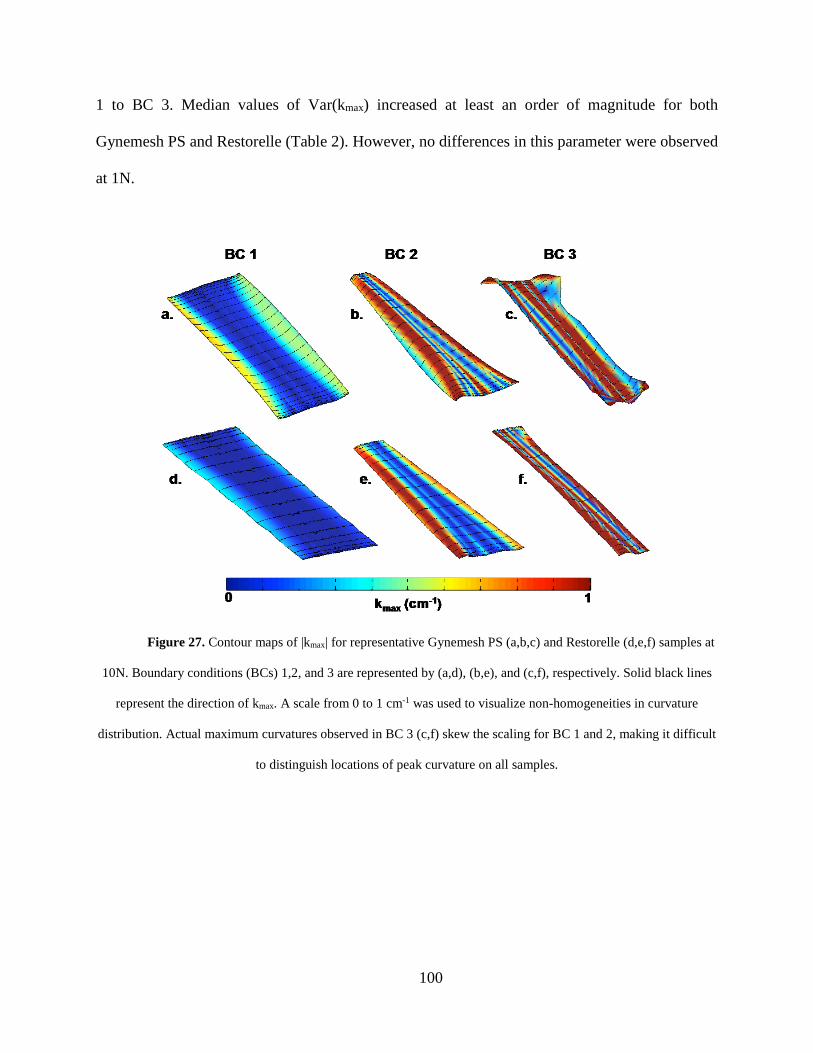
1 to BC 3. Median values of Var(kmax) increased at least an order of magnitude for both
Gynemesh PS and Restorelle (Table 2). However, no differences in this parameter were observed
at 1N.
Figure 27. Contour maps of |kmax| for representative Gynemesh PS (a,b,c) and Restorelle (d,e,f) samples at
10N. Boundary conditions (BCs) 1,2, and 3 are represented by (a,d), (b,e), and (c,f), respectively. Solid black lines
represent the direction of kmax. A scale from 0 to 1 cm-1 was used to visualize non-homogeneities in curvature
distribution. Actual maximum curvatures observed in BC 3 (c,f) skew the scaling for BC 1 and 2, making it difficult
to distinguish locations of peak curvature on all samples.
100

Table 4. Mean |kmax| values of the entire mesh surface. Results for Gynemesh PS (n=5) and Restorelle (n=5) are
shown for both 1 and 10N for boundary conditions (BCs) 1, 2, and 3. P-values are from a Friedman’s test, used to
compare Mean |kmax| between BCs. * indicates differences between Gynemesh PS and Restorelle at the same load
and BC (p < 0.05). Values are represented as Median (25th quartile - 75th quartile).
Changes in surface curvature and the surface undulation became more pronounced when
meshes were loaded to 10N, a load at which all mesh surfaces laterally contracted and became
highly curved. In addition, differences between the meshes became more apparent at 10N. For
BC 1, Mean(|kmax|) values for Gynemesh PS and Restorelle were 0.178 and 0.0698 cm-1 (p =
0.016), while Var(kmax) values were 0.05 and 0.0139 cm-1 (p = 0.016), respectively. Despite the
differences for BC 1, Gynemesh PS and Restorelle deformed similarly for BC 2 (p > 0.05). Still
values found for BC 2 were dramatically increased relative to BC 1 for each mesh. BC 3 resulted
in a highly curved, wrinkled surface for all meshes tested, with Mean(|kmax|) values of 1.834 and
1.170 cm-1 for Gynemesh PS and Restorelle, respectively. In addition, the increase Var(kmax) was
101

striking, with values of 5.714 and 1.855 cm-1 for Gynemesh PS and Restorelle. For BC 3,
Gynemesh PS was found to have significantly greater Mean(|kmax|) and Var(kmax) relative to
Restorelle (p = 0.009 and 0.016, respectively).
Table 5. Variance of kmax over the entire mesh surface. Results for Gynemesh PS (n=5) and Restorelle (n=5) are
shown for both 1 and 10N for boundary conditions (BCs) 1, 2, and 3. P-values are from a Friedman’s test, used to
compare Var(kmax) between BC. * indicates differences between Gynemesh PS and Restorelle at the same load and
BC (p < 0.05). Values are represented as Median (25th quartile - 75th quartile).
2.3.3.2 Validation
Surface interpolation with the 4-element patch of BQFEs fit the surface points of generated data
extremely well for both parabolic and sinusoidal functions, as the greatest percent error in
prediction of z-coordinates was << 0.1%. Moreover, this interpolation method was able to
102

accurately predict the curvature of the parabolic function, though errors for sinusoidal surface
curvature were as large as 8%, typically occurring in locations of peak curvature. Still, the
overall shape of the predicted curvature plot was similar to the theoretical plot (Fig. 28).
In general, the photogrammetric techniques used in this study generated excellent surface
models, with a remarkable level of textural detail (Fig. 25). Upon closer inspection, most
surfaces contained small surface fluctuations due to the point-matching algorithm used in
Photoscan Pro. The error in curvature calculation associated with the overall approach was
measured using the manufactured parabolic and sinusoidal surfaces of known curvature. Again,
surface interpolation proved accurate in predicting the z-coordinates (RMS Error < 0.003).
Analysis of the flat surface revealed first principal curvatures on the order of 0.05 cm-1, while
second principal curvatures had a peak value of 0.019 cm-1. Data from the reconstructed
parabolic surface also showed agreement with the theoretical |kmax| values, with peak errors of
~4% (Figure 28). The predicted curvatures for the reconstructed sinusoidal part were not as
accurate, with peak errors of approximately 25%. Still, the predicted curvature values capture the
overall shape of the theoretical curvature plot. Here errors were typically found at locations of
peak curvature, as peak values were consistently underestimated.
In general, this validation demonstrates that the methods used in this study accurately
measure curvature of flat and parabolic surfaces, while providing conservative measures for peak
curvature on sinusoidal geometries. Given that each of these validation geometries were
103

observed in mesh trials, we consider this method for determining surface curvatures to provide a
relatively conservative comparison between surfaces, as exact curvatures for undulated shapes
would result in larger differences than reported in the present study.
Figure 28. Validation results from surfaces of known curvature. The solid black line represents the
theoretical curvature for the test parabolic surface (a) and the test sinusoidal surface (b). The red squares represent
the predicted |kmax| values along the x-axis using generated surface data, while the blue triangles represent the
predicted |kmax| values using data from photogrammetric reconstructions.
2.3.4 Discussion
In this sub-aim, a method for quantifying and comparing the out-of-plane deformation of thin,
porous textiles was established. This method provides reasonable accuracy and effectively
describes the out-of-plane deformations experienced by synthetic meshes used for prolapse
repair in response to loading. Importantly, the findings presented here demonstrate that the
104

manner in which a prolapse mesh is fixed at its boundaries greatly impacts the magnitude of out-
of-plane deformations it experiences in response to loading. Fixation of the entire mesh boundary
using clamps, as is traditionally done when evaluating the response of meshes to uniaxial
tension, results in a flat surface. The inclusion of discrete point loads, representing suture
locations, significantly increases the amount of buckling/wrinkling deformation for these
products. Both Gynemesh and Restorelle experienced similar differences between the boundary
conditions considered here; however at 10N of force, Gynemesh was found to have greater
magnitudes of curvature and surface undulation.
While traditional materials testing protocols utilize conditions similar to BC 1, the
conditions applied during surgical implantation of mesh are typically more similar to those tested
in BCs 2 and 3 due to fixation using discrete suture attachments. The inclusion of these point
loads drastically increases the curvature of the mesh, creating regions of increased mesh density.
Based on previous findings regarding minimum pore size (92, 93), regions of increase curvature
would likely exhibit an enhanced inflammatory response with little tissue integration due to
occurrence of bridging fibrosis. Further, the non-homogenous distribution of curvature, which
may serve as a proxy for mesh burden, may explain the discrete nature of pain and exposure
which is seen clinically (65). While locations of increased curvature suggest the presence of
bridging fibrosis and increased inflammatory responses, future studies relating curvature and
histological outcomes are needed to confirm this hypothesis.
105

Despite differences in pore geometry, both Gynemesh PS and Restorelle experienced
large increases in curvature for point loading observed at 10N, though Gynemesh PS curvature
values were greater than that of Restorelle for BC 1 and BC 3. It is likely that pore geometry is
responsible for these observed differences. Indeed, the square patterning of Restorelle may more
effectively resist buckling under specific conditions (i.e. those similar to BC 1 with force applied
parallel to the fiber direction), but discrete point loads still greatly destabilizes planar
deformation for this mesh. Given the potential differences in buckling behavior, unique suturing
techniques, varying in number and position of sutures, may be required for each mesh device in
order to prevent unwanted deformations.
For clinical interpretation, it should be noted that this study provides a time-zero
perspective regarding the deformation of mesh products. Thus, the impact of tissue boundaries,
tissue integration, and additional biological factors are neglected. Still this study demonstrates
that the method of mesh fixation, in addition to the amount of tension a mesh experiences,
directly alter the configuration of mesh pores and thereby impact the host response. In a recent
study examining complications in patients undergoing transvaginal mesh procedures, Feiner et
al. illustrated contour maps of patient pain locations (65). These locations are typically
associated with palpable ridges, which are found along a horizontal line between each set of
bilateral fixation arms. It is along these lines that one would expect force to be transmitted
between fixation points, assuming tensile loading of the fixation arms. This would create
increases in curvature, similar to those as observed in the current study.
106

Moreover, these results are directly applicable to both abdominal sacrocolpopexy and
transvaginal procedures. When tensioning a mesh to restore vaginal support, surgeons must
consider both the amount of force placed on the mesh and the locations of suture attachment. For
instance, larger forces used to “tension” the mesh and “elevate” the vaginal wall may yield
significant pore collapse (similar to Poisson’s effect), while isolated suture locations, particularly
at the boundary of a mesh, may lead to mesh wrinkling upon physiological loading. Considering
these factors would help to eliminate sources of mesh bunching that have previously been
reported upon implantation (141). As previously mentioned, surgical techniques and product
designs that incorporate fixation points or geometries to reduce surface curvature and maintain of
pore size upon loading, may greatly reducing the likelihood of complications.
Finally, this is the first study in which curvature calculations were determined via
photogrammetry reconstruction. Therefore, it was necessary to report the accuracy associated
with this approach. Photogrammetry is a widely used and incredibly powerful technique to
capture the surface geometry of a wide range of objects. However, slight point-matching
inaccuracies, in concert with the limited ability of quintic functions to describe the derivative of
high oscillating surfaces, may have introduced error into curvature calculations. Based on the
validation results presented here, such errors appear to be magnified for highly oscillatory
surfaces. Future analysis may require surface smoothing techniques to minimize error arising
from the calculation of derivatives as performed here (142). Further, we will examine the use of
107

additional methods of surface interpolation to address the underestimation of curvature for highly
oscillatory surfaces. For example, subdivision surfaces may more accurately predict surface
curvature and can be directly integrated into large-scale finite element simulations.
2.4 CONCLUSIONS
In Section 2, the deformation behavior of synthetic mesh was examined, considering the in-vivo
loading of these devices for prolapse repair. The goal of this section was to relate the application
of mechanical forces to changes in mesh configuration that are known to influence the host
response. These results demonstrate that mechanical loading significantly impacts two clinically
relevant textile properties, pore size and mesh burden. Further, the deformations resulting from
the experimental tensile and point-loading protocols produced mesh deformations consistent with
the clinical presentation of mesh in regions of exposure.
More specifically, mesh deformation was characterized at two levels of scale, with
microscopic evaluation of pore geometry in response to the application of tensile forces and
macroscopic deformation quantified by changes in surface curvature for varied boundary
conditions and tensile forces. Both pore size and surface curvature are of great clinical
importance, as they are both dictate the relative density of mesh fibers. When mesh fibers come
too close in 3D space, the foreign body responses shown to encase each mesh fiber merge,
greatly enhancing the overall immune response, possibly, setting the stage for degenerative tissue
remodeling.
108

Using traditional uniaxial tensile testing, the changes in mesh pore size were examined
within the toe region of the load-elongation curve. While mesh devices are rarely subjected to
forces in the linear region of its load-elongation response, surgical implantation (tensioning) and
a majority of in-vivo forces likely fall within the initial portion of the load-elongation curve.
Despite the application of relatively small forces used in this aim, mesh pore size was
dramatically reduced for nearly all meshes and orientations of these products. While all mesh
products tested were knitted polypropylene meshes, the magnitude of pore collapse differed
between products and their relative orientation to the axis of loading. Mesh geometries whose
fibers were notably misaligned with the loading axis were subject to the most severe pore
collapse. Products such as Restorelle 45° and UltraProOpp were easily deformed with almost 0%
porosity before reaching 5N of force. Still all meshes with the exception of Restorelle 0° had 0
pores greater than 1mm in diameter at just 10N of force.
Although tensile loading alone was sufficient to increase the density of mesh material, the
boundary conditions in Sub-aim 1.a produced planar deformation of mesh. Yet, when observed
clinically, mesh in regions of exposure are often folded and bunched together, signifying some
amount of non-planar deformation. Though the foreign body response may produce mesh
contraction, this implies mesh folding is a direct result of the foreign body response, rather than a
cause. More simply, the findings of this aim suggest that the application of point loads in concert
with the tensile forces examined are sufficient to produce deformations representative of in-vivo
bunching. Such out-of-plane deformation would effectively increase the density of mesh
material, likely intensifying the immune response.
109

In general, this section identifies two mechanical factors which produce undesirable mesh
configurations; orientation of fibers to tensile forces and boundary conditions. Each of these
factors provides a mechanism by which local increases in mesh burden can, and do, occur. It is
imperative that these mechanical phenomena are understood and considered when developing
and implanting meshes for prolapse repair. As shown here, a simple understanding of how the
mechanical function of prolapse meshes alters key textile features provides valuable information
that is crucial to eliminating undesirable complications following mesh implantation.
110

3.0 COMPUTATIONAL MODELING OF SYNTHETIC PROLAPSE MESH
3.1 OVERVIEW
The primary use of synthetic mesh for prolapse repair is to provide mechanical support of the
pelvic floor organs, re-approximating a patient’s anatomy with the hope of restoring proper
function. When used in this capacity, synthetic mesh clearly functions as a load bearing
structure. The previous aim has thoroughly demonstrated that mechanical loading and the
manner in which a mesh is loaded greatly impacts the deformation of mesh devices. Further, the
deformations observed in Aim 1 are consistent with clinical presentation of complications and
textile properties that are known to induce a detrimental biological response.
Though much can be learned from experimental approaches, such as those utilized in
Aim 1, experimental testing is often expensive and resource intensive. Such experimental studies
should be statistically powered, requiring a number of physical prototypes to be constructed to
evaluate a wide range of variables. Often the scope of these studies is limited as budgetary and
time limitations force researchers to focus on a small number of variables. The tight focus on a
few variables is evident when examining the design of prolapse mesh devices. Nearly all mesh
products use the same knit construction methods with only slight variations in patterning to tune
111

the gross structural behavior of devices. Historically, significant changes to overall mesh design
have resulted not from small research studies or in-house industrial development, but from large-
scale clinical research studies in which thousands of women were implanted with a specific
device design (46, 125, 143, 144). Not only are these methods inefficient and slow to iterate, but
these studies expose women to products that could, and have, produced devastating
complications (62, 111). In order to efficiently design and evaluate mesh products for use in the
pelvic floor, computational modeling of such devices must be used.
The concept of computational modeling of medical devices in biological systems is far
from novel. In fact, such practices are commonplace in other fields of research and in industrial
settings, as researchers and companies look to reduce costs and quickly (and thoroughly)
evaluate the mechanical function of structures prior to manufacturing a physical prototype. For
example, studies have computationally evaluated the impact of stent implantation on the arterial
wall (145). Additionally, hip implants have been the subject of many computational studies,
following the disastrous results of the 1990’s, with many hip implants leading to bone fracture
(146, 147). Computational studies have greatly enhanced our knowledge of these products and
provided tremendous insight into the function of medical devices in the human body. The ability
to assess the impact of a wide range of variables, including extreme mechanical scenarios and
patient specific factors, such as variable tissue properties and anatomy, is invaluable for product
development. The application of such modeling efforts to the examination of prolapse mesh
would significantly enhance our understanding of the function of mesh in-vivo, and lead to rapid
improvement of current clinical methods.
112

3.1.1 Previous Modeling of Synthetic Mesh
To date there have been few attempts to construct computational models for synthetic mesh
devices despite the increasing prevalence of published structural properties. Of the little
computational effort directed towards synthetic meshes, the main area of focus for such studies
has been on the application of mesh for hernia repair, not pelvic organ prolapse repair. Still,
several conceptual variations of prolapse mesh have been used in finite element analysis (FEA).
One of the simplest FEA representations of synthetic mesh approximates individual filaments as
combination of 1st order beam elements. The location at which these beam structures meet are
defined as joints. In general, the overarching pore structure is recreated as a series of beam
elements, while the knots are modeled as joints (148). Using a fiber recruitment model to define
the stress-strain relationship for the beam elements, this model was found to accurately predict
the tensile behavior of several mesh products. In addition, the pore deformation of this model
grossly represented the deformation of synthetic mesh upon uniaxial loading, though the
accuracy of the geometric representation was not validated. Further, this model was not able to
accurately represent the fiber diameter of mesh; meaning that clinically relevant measurements
of mesh burden and pore size could not be attained.
In contrast to this simple representation of mesh, other groups have attempted to model
the interaction of individual filaments at the knit structures in order to predict the behavior of
prolapse meshes (107). Similar to the previous model, mesh fibers (bundles of filaments) were
approximated by “line” elements. However, these line elements were connected by knot
113

structures of increased complexity. In this representation, line elements could rotate and translate
about knot junctions, presumably approximating the “locking” or “tightening” behavior of knots
as forces are applied. Impressively, this model captured both the load-elongation response of
mesh and the deformation of individual mesh fibers and knots at a meso-level of scale (knot
level) reasonably well. However, model based predictions of load and deformation were not
accurate when dimensions were scaled to the macro-level (a large network of knots and lines),
conservatively predicting deformations. While the model deviations likely arise from the
increased degrees of freedom at larger levels of scale, such limitations prevent this detailed FE
representation from being used to predict the deformation of synthetic prolapse meshes.
3.1.2 Gap in Knowledge
While the examination of synthetic mesh via computational methods such as FEA is relatively
new, the focus of many of these models is directed solely towards predicting the load-elongation
behavior of mesh. Though this is often the main rationale for developing FE studies, such
measures have yet to be proven useful for determining the host response to synthetic mesh.
Rather than the overall deformation of these products, the deformation of its substructure (pores)
is the primary measure of interest, as distance between mesh filaments, and the change in
distance between these filaments has been shown to dictate the host response. However, neither
of the previous models discussed accurately represents the fiber diameter, and as such, it is
impossible for these previous FE representations to provide measurements of pore deformation.
114

Given the limitations of previous models, it is clear that no current computational model
of mesh has been developed for the purpose of measuring textile properties and their changes in
response to mechanical loading. The inability to determine the impact of loading on vital textile
properties is a significant shortcoming of FE studies for synthetic mesh. While previous models
may accurately predict the mechanical interaction of biological structures and mesh, the
deformations of these products may continue to produce the same complications that occur with
current prolapse meshes. In fact, simply defining the mechanical sufficiency is similar to current
attitudes towards mesh design, as the mechanical superiority of polypropylene mesh is the
primary reason for its use, with little consideration for the configuration of filaments. In light of
recent findings regarding the importance of pore size and the impact of mechanical loading on
this textile property, it is necessary for future FE models of synthetic mesh to produce accurate
predictions of this most impactful variable.
3.2 DEVELOPMENT OF A COMPUTATIONAL MODEL FOR MESH
3.2.1 Model Development
An effective clinical model for synthetic prolapse mesh must consider the geometry and size of
the pore structure. Though continuum approaches may provide accurate mechanical
characterization, the inability to determine pore dimensions or additional textile properties limits
the usefulness of such models in terms of predicting the host response (149). While modeling a
115

porous network has been performed for problems of small dimensions (150), is often
computationally expensive to create, discretize, and scale porous networks to the dimensions
found in prolapse meshes which often contain more than 2000 pores depending on the pore size
and overall mesh dimensions. Although the development and solutions to large-scale problems
are similar to those of smaller dimensions, large mesh dimensions exponentially increase
computational complexity, introducing additional degrees of freedom.
Initially, the goal of this dissertation was to develop robust mechanical models for
synthetic mesh, building upon the work of Feola et al (148). As such, a fiber-reinforced
continuum model was implemented in order to describe the mechanical interaction, specifically
the transfer of force, between synthetic mesh products and the tissues of the pelvic floor.
Embedded fiber patterns were constructed considering a unit cell centered on a knot in the mesh,
that when repeated in two directions represented the actual mesh architecture. Despite excellent
results in terms of predicting the load-elongation behavior, this continuum approach was unable
to predict pore size or gross mesh behavior. While fiber-reinforced continuum models may prove
beneficial for simulation of out-of-plane deformation or the prediction of stress and strain, at a
reduced computational cost, such methods cannot be used to examine the deformation of
individual pores.
Once again, the inability for a computational model to capture changes in mesh textile
properties led to the development of a discrete pore model, directly constructed from the pore
architecture of synthetic mesh. In order to establish a methodology for examining computational
models of mesh and to appropriately analyze appropriate variables for mesh use in the pelvic
116

floor, the remainder of this dissertation will focus on square pore geometries. Square pores were
chosen as this pore structure is one of the most widely used in prolapse meshes, found in
currently available mesh products such as Restorelle, Vertessa Lite, and Uphold prolapse meshes
(Figure 29). Though the general pore architecture of these mesh products is similar between
these products, each has a differing pore size leading to a variation in mechanical properties. In
addition to being a widely used geometry, square pores provide a simple geometry that is
relatively easy to recreate in computer-aided design (CAD) software and thus, provides a an
excellent starting point for the development and assessment of computational mesh models.
Figure 29. Square pore geometries are common among synthetic mesh devices, though companies utilize
unique pore diameters and knit patterns to differentiate their products. Shown here are mesh designs from Coloplast
(Restorelle), Caldera (Vertessa Lite), and Boston Scientific (Uphold). These pore architectures are used to construct
a variety of devices including abdominal sacrocolpopexy and transvaginal mesh products.
117

To capture the behavior of mesh textiles, the fibers (filament bundles) must be allowed to
rotate, as they undergo recruitment. After observations of uniaxial testing of synthetic mesh
samples (Sub-aim 1a), it was evident that mesh fibers rotate about the intersections of the fibers
(Figure 30). The intersections of fibers will be referred to as knots for the remainder or this
dissertation. Given the clear reorientation of fibers in response to the application of tensile
forces, it can be assumed that these sub-structures are the predominant load-bearing component
of synthetic mesh. This recruitment behavior is analogous to collagen fiber recruitment in
biological tissues. The rotation of fibers from their original position into alignment with the
direction of the applied load produces a characteristic non-linear load-elongation curve. While
fiber recruitment in biological tissues can arise from both rotations and uncrimping of collagen,
fiber recruitment in synthetic mesh largely arises from fiber rotation, as little slack is present in
the undeformed configuration. One may expect a small amount of crimp in each knot structure,
as the micro-pores present in each knot appear to vanish in response to application of load,
suggesting that the knot structure may “tighten”. This knot tightening phenomena may manifest
in slight fluctuations in stiffness in the toe region of the load-elongation curve, such as those seen
in Restorelle 0°.
In contrast to the load-bearing fibers, knots behave as a simple pivot point, allowing
fibers to rotate about their center and even compressing in response to the aforementioned
tightening (Figure 30). Simplifying mesh textiles to a system of knots and fibers greatly reduces
the geometric complexity of synthetic mesh products and utilizes sound mechanical analogues
such as pivot points and structural beams.
118

Figure 30. To scale mesh micro-structure to the dimensions of physical products, and determine textile
properties following simulated deformation, the pore geometry was simplified. Here, square pores were assumed to
consist of a network of fiber and knot structures. Using this method, pores of various dimensions can be readily
created. In addition, knot and fiber structures were discretized using solid finite elements (right).
3.2.2 CAD Model of Prolapse Mesh
Using these simplified concepts (fibers and knots) a unit cell was sketched in the x-y plane in
Solidworks (2013, Dassault Systèmes, Waltham, MA). The unit cell consisted of a single square
knot with 4 fibers, 1 placed along each edge of the knot in a cross formation. The unit cell was
then extruded in the z direction and a linear pattern was used to repeat the extruded unit cell
geometry along both x and y axes creating a “sheet” of mesh similar to those produced by
119

synthetic mesh vendors (Figure 31). With this template and unit cell structure, the dimensions of
the solid, porous-network geometry could be easily manipulated, allowing for specific product
dimensions to be examined.
Figure 31. A linear pattern was used to generate a CAD sheet of synthetic mesh from the initial pore
geometry (Figure 30). Specific device geometries could then be cut from the appropriate CAD mesh sheet.
As previously stated, this dissertation will focus on square pore geometries given their
relatively simple design and widespread clinical adoption. First, the methods outlined above
were combined with microscopic measurements from Restorelle’s mesh architecture (Pore size =
22mm, Fiber length = 1.8mm, Knot length = 0.28mm, filament thickness = 0.3 mm). The linear
pattern feature (Solidworks) was then used to create a mesh sheet that measured 440 x 440mm
(100 x100 pores). Similar to clinical practice, specific geometries of mesh products could then be
cut from the mesh sheet using Boolean addition and subtraction. For Restorelle, computational
120

models of 90 x 15mm (orientated at both 0° and 45°) were created to simulate experimental
uniaxial tensile tests. In addition, the geometry of a current transvaginal mesh product, Directfix
Anterior (Directfix A), was cut from the mesh sheet using a planar sketch and Boolean
subtraction.
3.2.3 Discretization
Though the creation of synthetic mesh structures in CAD software is relatively straightforward,
such geometries are not directly usable in FEA. This is because CAD geometries are only
defined by the surfaces that outline the boundaries of the solids. Rather, solid FEA (as opposed
to surface FEA) requires geometries to represent a volume that can be discretized, or broken
down into smaller components known as finite elements. Collectively, a set of finite elements
that represent a geometry are referred to as a “mesh”. Though the term “mesh” is widely used in
FEA literature, the term “discretization” will be used in this dissertation, as “mesh” will be
reserved for synthetic mesh textiles.
Discretization is a vital component of FEA, as this technique allows for complex
boundary value problems to be approximated by a linear system of equations. However, it must
be emphasized that FEA provides an approximate solution to a boundary value problem and the
accuracy of this solution is dependent on both the number and type of elements used to
approximate the physical system. In this sense, FEA is analogous to approximating the area
under a curve using a Riemann sum; where increasing the number of squares (elements) provides
a solution that is closer to the theoretical solution obtained via integration. In addition, the
121

solution provided by Riemann’s sum is dependent on whether a right, middle or left method is
used. These techniques (left, right, middle) are similar to differing element types (discussed
below). Regardless, as more squares, or elements, are used to approximate the solution,
Riemann’s sum converges to the theoretical value, just as the inclusion of more elements to
approximate a boundary value problem should led to convergence of a solution.
Figure 32. For finite element analysis, geometries are discretized, or subdivided, into a set of domains
known as finite elements. Discretization allows known mathematical relationships (defined over elemental domains)
to be applied to complex geometries in order to approximate the solution to boundary value problems. Types of solid
finite elements include linear hexahedral (a), quadratic hexahedral (b), linear tetrahedral (c), and quadratic
tetrahedral (d).
122

For solid FEA analysis, tetrahedral or hexahedral elements are commonly used to
discretize structures (Figure 32). Tetrahedral elements can be classified as linear or quadratic,
where the linear or quadratic describes the order of the interpolation functions (1st and 2nd order
respectively). Linear tetrahedrons are defined by a collection of 4 nodes (4-node tet), with each
node representing a vertex of a tetrahedron (tet), and 4 faces. The quadratic tetrahedron is
defined by a collection of 10 nodes (10-node tet), where 4 nodes represent the vertices of a
tetrahedron and the remaining 6 nodes represent the midpoint of the lines connecting each
vertex. Similarly, hexahedral elements (hex) can be either 1st or 2nd order. The linear hex is
defined by a collection of 8 nodes (8-node brick), whereas the quadratic hex consists of 20 nodes
(20-node brick). Each hex has 8 nodes representing the vertices of a hexahedron, though the
remaining 14 nodes of the quadratic hex are located at the midpoint of the lines connecting the
vertices. As anticipated by their mathematical definition, quadratic functions capture nonlinear
behavior and tend to provide small errors if solutions are sufficiently smooth. As such, quadratic
finite elements are often useful for nonlinear problems, such as simulations of beam bending.
While quadratic functions often lead to smaller errors, 2nd order terms (and an increased number
of nodes) introduce greater computational complexity and therefore, increase computational
expense. In addition, similar solutions can be obtained by further discretizing geometries, though
increasing the number of finite elements also dramatically increases computational expense.
Given this understanding, the magnitude of the discretization or degree of refinement must be
considered for each boundary value problem. To assess whether or not a sufficient level of
discretization has been achieved for a specific FE model, convergence testing is performed.
123

During convergence testing, geometries are further discretized by increasing the number
elements (h-refinement) and order of elements (p-refinement) until solutions to the boundary
value problem converge to a common value.
3.2.4 Discretizing of Prolapse Mesh
After being cut from the solid CAD mesh sheet, all mesh geometries were imported into
Autodesk Simulation Mechanical 2014-2015 (Autodesk, San Rafael, CA) for discretization.
Using this software various discretization techniques were applied to the mesh. First,
discretization was performed using only tetrahedral elements. This technique adequately
discretized all mesh geometries, though occasionally element quality was quite low (large aspect
ratio). The purely tetrahedral algorithm was applied using 3 levels of increasing refinement
(50%, 75%, and 100% of the “mesh/discretization” length). Next, a mixed hex/tet algorithm was
applied to all mesh geometries and the same 3 levels of refinement were used. Both pure tet and
mixed hex/tet methods provided a homogenous distribution of elements across the entire mesh
geometry. Specifically, each fiber consisted of the same number and type of elements for each
discretization protocol. Similarly, each knot was found to have the same number and type of
elements for a given discretization method. The homogeneity in element distribution implies that
all mesh fibers or knots will behave similarly (no discretization bias). This distribution was not
attainable using various other discretization software packages (TetGen, Gmsh, Trelis, etc). All
discretized geometries where then exported for further refinement and use in FEA.
124

All exported discretized geometries were further refined using Gmsh (Geuzaine and
Remacle). Specifically, the split element tool was used to divide each element into two elements,
exponentially increasing the number of overall number of elements in a model. This refinement
was applied 3 times, with each sequential refinement exported for analysis. In total, 9
discretizations (3 Simulation Mechanical refinements, each subjected to 3 Gmsh refinements)
were created for each geometry considered in this dissertation. It should be noted that all
refinements previous discussed consisted only of 1st order elements. Geometries consisting of 2nd
order elements were generated in Preview (University of Utah, MRL), where linear tets and
hexes were converted to their quadratic counterparts. However, the use of quadratic elements
was limited in this dissertation and will be noted where appropriate.
3.2.5 Determination of Material Properties
To accurately predict the mechanical behavior of synthetic mesh devices, a constitutive
relationship was considered for synthetic mesh. Here it must be understood that a constitutive
relationship assumes a material to be continuous. Clearly, synthetic meshes are discontinuous on
the level of scale of their mechanical deformation. However, the simplification of this geometry
to knots and fibers allows for meshes to be modeled as a structure of continuous materials.
Therefore knots and fibers were assigned separate constitutive formulations.
While numerous constitutive equations could be considered for the knots and fibers, the
optimal choice was to limit the number of variables used to predict the mechanical behavior of
synthetic mesh. As such, a Neo-Hookean material, one of the simplest constitutive relations, was
125

used to model the knot and fiber structures independent of one another. The strain energy of a
Neo-Hookean material is given by:
𝑊𝑊 = 𝜇𝜇2
(𝐼𝐼1 − 3) − 𝜇𝜇 ∗ ln(𝐽𝐽) + 𝜆𝜆2
(ln 𝐽𝐽)2 3.1
where μ and λ are the Lamé parameters from linear elasticity, J is the Jacobian of the
deformation gradient tensor (J = det (F)), and I1 is the first invariant of the right Cauchy-Green
tensor. Further the Lamé parameters can be determined via Young’s modulus (E) and Poisson’s
ratio (ν) by:
𝜆𝜆 = 𝜈𝜈𝜈𝜈(1+𝜈𝜈)(1−2𝜈𝜈)
3.2
𝜇𝜇 =𝐸𝐸
2(1 + 𝜈𝜈)
Thus, only two parameters, E and ν, are required to define a Neo-Hookean material. In addition,
these parameters have distinct physical meanings. Young’s modulus is a measure of stiffness of a
material, while Poisson’s ratio governs the compressibility of the material where a value of 0
represents a completely compressible material and 0.5 represents an incompressible material.
Intuitively this simple, 2 parameter model appears to possess the ability to capture large degree
of the mechanical behavior of knot and mesh structures, allowing for the stiffness and
compressibility the primary load bearing structures (fibers) and pivot points (knots) to be
determined separately. One would anticipate fibers would have a greater Young’s modulus
relative to the knots, while knots would be expected to have a lower Poisson’s ratio to provide
compressible, compliant pivot points.
126

Neo-Hookean properties were determined using an inverse optimization method, fitting
computational simulations to matching uniaxial testing data obtained experimentally. For
experimental testing, sterile sheets of Restorelle were removed from their packaging and were
cut into 90 x 15mm strips. Similar to Sub-Aim 1a, Restorelle samples were cut with the square
pores oriented either 0° or 45° offset from the horizontal. For each orientation, 5 samples were
cut and tested in uniaxial tension. Here a 0° offset was chosen as this orientation was previously
found to minimize fiber rotation (Aim 1a), thereby designating the fibers as the primary load
bearing structures. Assuming the mechanical properties of the knots to be negligible in the
absence of fiber rotation (i.e. Eknot << Efiber), the data obtained from 0° trials directly represents
the mechanical behavior of the fibers alone. The 45° offset was chosen as this orientation was
previously found to induce the maximal amount of fiber rotation. Since the amount of fiber
rotation in this model is governed by the properties of the pivot points, the 45° data can be used
to determine the material properties of the knots. All samples were secured in custom soft tissue
clamps and the bottom clamp was fixed to the base of a materials testing machine (Instron 5565,
Grove City, PA), while the top clamp was attached to a movable crosshead, inline with a 50lb
load cell (Honeywell Sensotec, Columbus, OH). Samples were then preloaded to 0.1N at a rate
of 10mm/min and subsequently loaded to failure at a rate of 50mm/min.
Following experimental testing, a computational model of the aforementioned uniaxial
testing was constructed using the FEBio software suite (Univeristy of Utah, MRL). Discretized
mesh geometries were imported into Preview (Univeristy of Utah, MRL) and the bottom edge of
the FE mesh model was fixed in all 3 directions to a rectangular plate modeled as a rigid body.
127

The rigid body was included to measure the total reaction force (N) of the mesh structure,
analogous to the measurement provided by the load cell experimentally. A displacement was
then applied to the top edge of the computational mesh where the magnitude of displacement
was set to the average elongation required for Restorelle to reach 5N of force. As previously
mentioned, the mesh failure is extremely rare clinically and thus, ultimate elongations were not
considered when fitting material properties to tensile datasets. Rather, average elongations at 5N
where obtained from the 5 experimental trials. Separate simulations were created for 0° and 45°
offset geometries with their respective experimental elongations used to drive model
displacements. Initial testing was conducted to ensure that model convergence could be attained
using a wide solution space of E and ν for both knot and fiber material. Upon varying the
modulus by several orders of magnitude and ranging ν from 0 to 0.5, it was determined that the
solution space was sufficiently large. It should be noted that geometries used in determination of
material properties were finely discretized, with the 0° offset geometry consisting of 115200 hex
elements and the 45° offset simulation containing 112320 hex elements. Models of further FE
refinement were not solvable due to the technical limitations of FEBio and its performance on
the hardware available to our laboratory.
Once the simulation files were prepared, an inverse FE method was used to optimize
material properties for the knot and fiber structures. This inverse analysis was performed in
FEBio, where a Levenberg-Marquardt optimization method was employed. First, E and ν for the
fibers were determined using the 0° offset tensile data and corresponding simulation file. Initial
guesses for E were varied by 4 orders of magnitude and ν was varied between 0 and 0.5 to ensure
128

that a global solution was attained. In addition, the Neo-Hookean properties for the knot material
were varied using the same changes in values to ensure that knot properties did not impact the
optimization of fiber properties. While rounding errors led to slight variation in fiber properties,
specifically impacting Efiber, the attained Neo-Hookean fiber parameters were determined to be:
Efiber = ~5000MPa and νfiber = ~0.49. Next, E and ν were determined for the knot material
holding Efiber and νfiber constant at their optimized values. Once again E was varied by 4 orders of
magnitude and ν was varied between 0 and 0.5 to obtain global minima. The optimal values for
the knot material were determined to be Eknot = ~100MPa and νknot = ~0.01.
After material properties were determined for both Neo-Hookean materials, simulations
were repeated for each orientation, utilizing the optimized values. The resulting FE simulations
were then post-processed and visualized in Postview (University of Utah, MRL). In order to
compare experimental load-elongation data to predicted values, the rigid body plate was selected.
Then, the total reaction force of the selected rigid body was plotted against the elongation of the
rigid body. The resulting load-elongation plot is representative of the loads and elongations
experimentally recorded by the materials testing machine.
Overall, the optimized material properties accurately predicted the load-elongation
behavior of the synthetic mesh strips up to 5N of applied tensile load (Figure 33).
Experimentally, 0° offset data exhibits a small degree of non-linearity as the slope of the load-
elongation curve is initial high and decreases between 10-13mm of elongation, before
approximately returning to its initial slope. Identical structural behavior was also present in
previous uniaxial data for Restorelle at both 0° and 5° offsets (Aim 1a). The transient decrease in
129

stiffness likely arises from tightening or slipping of individual polypropylene filaments or knot
structures. This filament displacement would produce a small amount of elongation at a reduced
resistance relative to loading when all openings in the mesh are in contact. Regardless, the Neo-
Hookean material model and the geometric simplifications used in the current model produce a
predominately linear response and were unable to capture this slight fluctuation in stiffness. Still
the model demonstrates good agreement with experimental results. Impressively, the developed
computational model was able to accurately predict the nonlinear load-elongation behavior
observed during testing of 45° offset samples (Figure 33). Notably, the simulated results exhibit
a non-linear load-elongation response capturing the recruitment of mesh fibers as they reorient
along the loading axis.
Figure 33. An inverse optimization method was used to determine Young’s modulus and Poisson’s ratio
for both the knot and fiber materials. Solid blue and red lines represent experimental load-elongation data for
Restorelle tested with fibers 0° and 45° offset, respectively. Blue and red diamonds are load-elongation data points
from corresponding finite element simulations (0° and 45° orientations) with the calibrated model.
130

3.2.6 Convergence Testing
The above work has successfully defined the geometry and material properties required to create
a computational model of synthetic mesh. This model is readily implemented in FEA and has
demonstrated the ability to accurately predict the load-elongation behavior of synthetic mesh.
While this is the first 3D solid FE model to accurately represent such behavior, it was not the
primary rationale for this work. Rather than load-elongation behavior, the purpose for
constructing this model was to measure clinically relevant textile mesh properties, including
mesh burden and pore diameter. Therefore it was necessary to determine the convergence of this
model based on the prediction of these desired outputs.
Convergence testing is a vital and necessary component of FEA. Generally, FEA sub-
divides a body into finite elements, providing a numerical approximation to a theoretical
solution. However, the most beneficial use of FEA is for boundary value problems in which a
theoretical solution is either extremely complex or unattainable. Given the difficulties in
obtaining a “true” solution, it is important to assess the trustworthiness of FEA results.
Numerical methods, such as Netwon’s method, are highly dependent on the level of
discretization used. Finer discretization utilizes additional approximation points, providing a
solution closer to the theoretical value. Convergence testing assesses the dependence of a FEA
solution on the discretization (number of elements) used. As such FEA results are considered
trustworthy (not necessarily accurate) when discretization refinement results in solutions that
converge to a common solution.
131

In order to examine model convergence, 9 discretization’s of increasing element count
were created for both 0° and 45° offset geometries as described in Section 3.2.4. Though 9
discretized geometries were created several were eliminated from convergence testing due to the
technical limitations of the version of FEBio available to our research center (>~800,000
elements). In addition, the most simplistic model, consisting of a single hex element for each
mesh fiber and a single hex element for each knot was not considered as it was clear such a
coarse discretization would restrict the deformation of mesh fibers. Therefore 6 geometries were
determined to be suitable for an initial convergence study.
Each discretized model was imported into Preview and subjected to a uniaxial tensile
loading for the boundary conditions used previously. Briefly, the bottom edge of the mesh was
attached to a rigid body and fixed the x, y, and z directions, while a displacement was applied to
the top edge of the mesh, along the y-axis. Here the magnitude of displacement was set to 39mm,
approaching, though not reaching, failure elongations determined for Restorelle 0° in response to
uniaxial testing. The mesh knots and fibers were modeled as separate Neo-Hookean materials
using the optimized Young’s Moduli and Poisson’s ratios as determined above. Solutions for all
6 discretized models were obtained and the deformed mesh geometries at 39mm of elongation
were exported for additional post-processing to determine mesh burden and pore size.
3.2.6.1 Mesh Burden Calculation
In order to determine mesh burden, solid discretized geometries of the deformed mesh at 39mm
of elongation were exported from Postview. Deformed models were then imported into Meshlab
132

(Visual Computing Lab, ISTI-CNR, Pisa, Italy) for conversion into point cloud (.xyz) files. Point
cloud files contain the 3D coordinates of all vertices in a given geometry. For discretized
geometries, these values represent the nodal locations. Since the nodal coordinates represent the
location of mesh material (polypropylene) in 3D space, the density of the nodes provides a
measure of the amount of material per unit volume, or mesh burden.
Figure 34. A 2D representation of mesh burden calculation. For each point identified as mesh (white
pixels), the number of additional mesh points within a radius of 2mm was totaled. This point-wise density (area
density for 2D) was defined as mesh burden. While 2D calculations of mesh burden utilizes planar images (pixels)
and circular area, extension to 3D uses nodal coordinates and spherical volumes.
Point clouds representing the nodal locations were then imported into a custom
Mathematica script for mesh burden calculation. Mesh burden was determined for each nodal
location by summing the total number of nodes located within a sphere with a radius of 2mm.
The radius of 2mm was chosen, as this radius is roughly the same as the pore diameter for
133

Restorelle, providing a definite, nonzero baseline mesh burden value for nodes in the
undeformed geometry. After mesh burden was calculated for each node, results can be readily
visualized as 2D point plots, where the color at each nodal location represents the value of mesh
burden. Similarly, this concept can be applied to 2D geometries or images where the number of
mesh points is summed over a circle with a radius of 2mm.
3.2.6.2 Minimum Pore Diameter Calculation
In order to calculate pore size, images of the computational mesh geometry were taken before
and after deformation was applied using a screen capture. Since the pore size of the undeformed
mesh is known (Restorelle pore size = 2.2mm) and the pixel resolution of the undeformed and
deformed geometry images were the same, all images could be scaled to the same dimensions in
ImageJ (NIH, Bethesda, MD). After scaling, each image was imported into a custom
Mathematica code for measurement of pore diameter, similar to that used in Section 2.2.2.
Briefly, images were binarized such that all pixels representing the mesh were black and all non-
mesh pixels were white (images shown here are inverted for ease of interpretation, i.e. the mesh
is white). Next, an edge detection algorithm was used to identify clusters of white pixels
enclosed around the entire border by white pixels. These clusters were identified as pores. The
center of mass for each pore was then determined and the minimum distance of a line passing
through the pore center from opposite pore edges was then identified as the minimum pore
diameter. Minimum pore diameter was recorded for all identified pores in an image.
134

3.2.6.3 Convergence Results
For 0° offset geometries, discretization convergence was obtained relatively quickly (Figure 35).
Not surprisingly, coarse discretization of synthetic mesh appears to limit the deformation of pore
geometries, as average mesh burden for models of less than 2000 elements were found to be
~17.5% lower than the converged value. Specifically, fewer elements in the knot structures
appeared to have limited the compression of the knots in response to this loading condition.
Interestingly, the average minimum pore diameter was relatively uninfluenced by increasing the
number of elements converging to a value of ~2.2mm at just 2532 elements. This may be due to
the fact that mesh loaded with the 0° offset experienced relatively little pore deformation at the
elongations considered in this study. Regardless, the measurement of mesh burden and pore
geometry converged by 14400 elements (8 elements per knot and 16 elements per fiber) for
uniaxial tensile simulation of square pores with an offset of 0°.
Similarly, output measures were found to converge with minimal refinement for 45°
offset geometries. Unlike 0° convergence trials, coarse discretization produced overestimates for
maximum mesh burden, approximately 14.5% greater than the converged value of 0.42
pixels/mm2. Once again dmin was not dramatically affected by h-refinement, with values
approaching 0.59mm with ~20,000 elements. Considering convergence outcomes from both
orientations, determination of material properties was completed with mesh geometries of 73,000
linear hexahedral elements. This discretization density was chosen as it the computational
expense for this density was not found to be limiting.
135
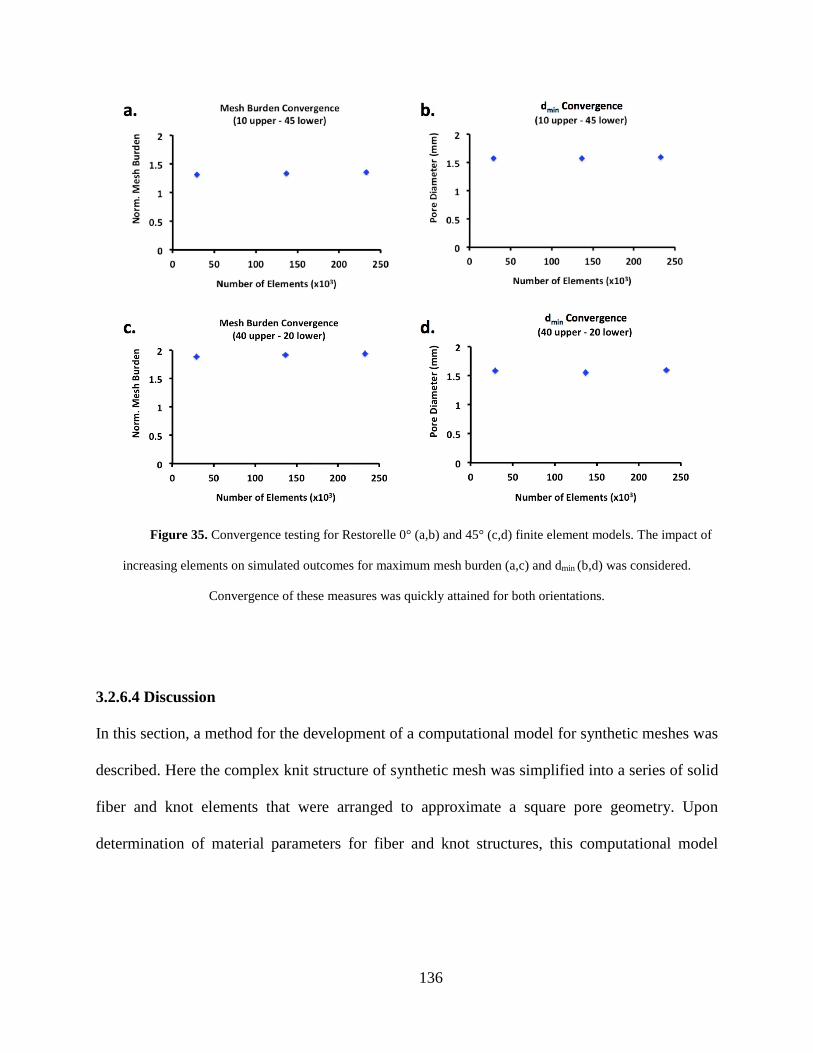
Figure 35. Convergence testing for Restorelle 0° (a,b) and 45° (c,d) finite element models. The impact of
increasing elements on simulated outcomes for maximum mesh burden (a,c) and dmin (b,d) was considered.
Convergence of these measures was quickly attained for both orientations.
3.2.6.4 Discussion
In this section, a method for the development of a computational model for synthetic meshes was
described. Here the complex knit structure of synthetic mesh was simplified into a series of solid
fiber and knot elements that were arranged to approximate a square pore geometry. Upon
determination of material parameters for fiber and knot structures, this computational model
136

accurately captured the uniaxial load-elongation behavior of synthetic mesh strips. In addition,
this is the first computational model of synthetic mesh for which the textile properties of mesh
burden and pore diameter can be measured.
Interestingly, the number of elements used to discretize synthetic mesh geometries did
not have a profound effect on the measured output variables measure in this study, for the
prescribed boundary conditions. This may result from the relatively low level of force used
relative to the failure loads reported for Restorelle. Still, elongations of the 45° offset were quite
large, resulting in significant pore collapse. Given that these outcomes were based on mesh
deformation, it is likely that such discretization convergence results will be similar for additional
loading conditions. Nonetheless, discretization of the knot and fiber structures should be
considered for all synthetic mesh simulations. Specifically, coarse meshing for knot structures
may significantly alter fiber rotation thereby impacting both the nonlinearity of the load-
elongation curve and limiting pore deformation. In addition, the number of elements used in fiber
geometries is important to consider for simulations in which fiber buckling (or non-planar
deformation) occurs, as more elements through the fiber thickness may be required to provide
accurate predictions of bending.
137

3.3 MODEL VALIDATION
3.3.1 Introduction
The pelvic floor is a mechanically complex environment with a wide range of loading
conditions. Currently, surgeons use synthetic mesh implants to provide support to the vagina, in
order to re-approximate the anatomy of the pelvic floor and relieve the symptoms associated with
POP. Though synthetic mesh is used to perform a specific mechanical function, little is known
about the response of these devices to mechanical loading. Recently, the structural properties of
mesh have become an area of interest with many publications and vendors touting the
mechanical superiority of products (85, 114, 151). However, a majority of these studies focus on
the failure properties of mesh, although mesh failure is rarely observed clinically and therefore is
not likely the cause of the complications associated with mesh. In addition, synthetic mesh is
based on a technology developed for the treatment of abdominal hernias and therefore prolapse
meshes are often designed with little consideration for the mechanical demands of the pelvic
floor. The failure to acknowledge such a vital design component is particularly interesting when
considering that exposure rates for prolapse mesh are significantly greater than those observed
for hernia mesh products (78, 101, 152, 153). Clearly there is a need to understand the impact of
mechanical loads on prolapse mesh products, specifically considering the geometries of prolapse
mesh and the boundary conditions these devices experience in the pelvic floor.
138

Experimental testing and refinement of mesh design is a resource intensive and costly
process. Rather than undergo pre-market testing, mesh manufacturers utilize the 510k approval
process and immediately enter new prolapse meshes into clinical testing. As such, vendors utilize
prolapse patients as a proving ground for new pore geometries and device architectures. Prolapse
mesh manufactures are able to avoid the premarket approval process (PMA) as prolapse mesh is
predicated on hernia mesh technology, implemented prior to the Medical Devices Amendment
Act of 1976. In order to comply with 510k regulations, and avoid PMA processes, synthetic
mesh design has seen little innovation during recent decades, stagnating the advancement of
prolapse repairs, while causing unnecessary harm to women due to a lack of testing.
Computational modeling provides a tremendous tool for optimizing mesh products to the
needs of pelvic floor support without physically creating mesh products or implanting them in
patients. The development of such a computational tool would allow for in-depth examination of
mesh designs in response to loading conditions specific to the pelvic floor. Ultimately,
computational simulations would allow for novel mesh designs and material to be evaluated
prior to implantation, optimizing the selection of devices used for clinical trials, and allowing for
rapid advancements in POP treatment standards. While previous computational models for
synthetic mesh have been published, current models have focused solely on predicting the
mechanical behavior of mesh, rather than textile factors, which are known to cause
complications. Moreover, previous models are limited in terms of their application, as they
cannot be scaled to the dimensions or gross architecture of sacrolcolpopexy and transvaginal
meshes.
139

The solid computational model of synthetic mesh previously developed in this
dissertation, aims to overcome the limitations of previous FE models. In addition, to accurately
predicting the load-elongation behavior of clinically relevant mesh structures, the proposed
model allows for direct calculation of mesh burden and pore diameter, two textile properties that
have been shown to influence the host immune response. In order is to establish the usefulness of
this model and demonstrate its ability to predict these textile properties in response to mechanical
loads, validation trials must be performed.
When using FEA, two requirements must be met in order for simulation results to be
deemed trustworthy. These requirements are verification and validation. Simply, verification
ensures that the computational tools are solving the equations correctly. In order to verify a
computational tool, the numerical solutions to the governing equations are compared with those
obtained by previously verified FE software. Verification demonstrates the ability of a
computational tool to determine the correct numerical solution. The Musculoskeletal Research
Laboratory (MRL) at the University of Utah provides verification for FEBio, with a wide array
of test cases considering implementation of nearly all features, including contact, material
selection, and element deformations. While verification is completed by the FEBio development
team, validation is required for each specific model developed in FEBio. Validation assesses a
specific model’s ability to replicate the physics of the real world (i.e. simulating the right
equations). Validation of a finite element (FE) model is completed by comparing experimental
and computational results. This ensures that the model represents real world physics and
provides solutions that correctly predict actual behavior.
140

In this study, we aim to validate the proposed FE model of synthetic prolapse mesh. Here,
an experimental testing rig will be constructed to simultaneously load and image synthetic mesh
under boundary conditions similar to those experienced by a transvaginal prolapse mesh during
surgical implantation, with tensile forces applied to the mesh arms. This experimental test will
then be recreated in FEBio. Finally, comparisons of mesh burden and pore diameter will be used
to assess the accuracy of our computational model.
3.3.2 Methods
3.3.2.1 Experimental Testing
In this study a transvaginal mesh product, DirectFix A, was used to validate our model of
synthetic mesh. Directfix A was chosen as this device is currently in clinical use and is directly
cut from a sheet of Restorelle, the same mesh for which material properties have been
established. For experimental measurement of pore deformation, a custom testing rig was
designed and constructed to mechanically load transvaginal mesh products (Figure 36). The
testing rig was comprised of a raised platform with cylindrical pegs (5mm diameter) arranged in
a circular pattern, at a radius of 5 inches. Pegs were placed in 5° increments about the
circumference, providing a total of 72 positions for mesh attachment. The raised square platform
(4 inch height) was centered and fixed within the circle. Four movable posts were also designed
and constructed for insertion onto the pegs. Posts were rounded in order to provide a pulley-like
surface for suture translation.
141

Figure 36. Model validation was completed through experimental loading of DirectFix A using a custom
testing rig. Mesh arms were placed in custom clamps and a 250g weight was allowed to hang freely from tension
posts as shown. In addition, 2 fixation rods located on a raised platform were placed through individual pores in the
mesh body.
Each DirectFix A sample was suspended above the raised platform and centered. Two
steel rods were placed through separate mesh pores on the inferior body of the device to simulate
fixation to the vagina (Figure 36). Next, soft tissue clamps were attached to each of the 4 arms of
the transvaginal mesh and a 250g weight was tied to each soft tissue clamp with a suture. Suture
lines were placed in the rounded posts and pulled taught such that the weight extended outside of
the peg circumference. To apply load to the mesh arms, weights were allowed to freely hang,
suspended from the posts.
142

Figure 37. For experimental validation, 2 separate loading conditions were considered. Under the first
condition, upper arms were loaded at 40° and the lower arm was loaded at -20°. For condition 2, upper arms were
loaded at 15°, while lower arms were loaded at -45°. All angles are relative to the horizontal axis, with the origin at
the device center. A weight of 250g was applied to each mesh arm at the prescribed angle.
A digital SLR camera (Canon, EOS Rebel T3, Melville, NY) equipped with an 18mm
lens (Canon, EFS f/2.8, Melville, NY) was placed above the testing platform and leveled such
that the camera lens was parallel to the mesh surface. Images of the entire DirectFix A sample
were taken after suture lines were pulled taught (weights not hanging) and following the
application of load (weights freely hanging). These two images represent the undeformed and
deformed configurations for measurement of mesh burden and pore diameter. For model
validation, two experimental scenarios were considered (n = 3 each, 6 total): 1) the top arms
were loaded at 45° and the bottom arms were loaded at -20° and 2) the top arms were loaded at
143
10° and the bottom arms were loaded at -45° (Figure 37). All loading angles used in this
experiment were relative to the horizontal axis, with the origin at the device/platform center. For
each trial, mesh was imaged in both its undeformed and deformed configurations.
3.3.2.2 Computational Testing
The above experiment was then recreated in Preview (University of Utah, MRL). Computational
geometries for DirectFix A were obtained using a Boolean subtraction in Solidworks to cut the
contour of the transvaginal mesh from a 100 x 100cm sheet of Restorelle (Figure 38). The
computational geometry was then discretized and imported into Preview, where the center pore
of the main body was placed at the origin of the computational space. This positioning allowed
for simple definition of the mesh arm loading vectors. Two cylindrical rods (diameter = 1.5mm)
were then created and placed in the same pores that were fixed experimentally. The experimental
images of the undeformed geometry were used to verify the rod location. Further, each rod was
defined as a rigid body and a rigid constraint was used to fix the translation and rotation of the
rods (translation = rotation = 0). While the rigid bodies represent the fixation provided by the
steel rods, contact between the cylinders and mesh pores introduced significant computational
difficulty, due to the deformation of mesh elements about the rods. To simplify this interaction,
the inner surface of the mesh pores at the rod locations were fixed in the x, y, and z directions.
The removal of this contact greatly improved model convergence and performance.
144

Figure 38. A computational model of DirectFix A (right) was cut from the sheet of Restorelle pores
extruded in Solidworks. Dimensions of the physical DirectFix A device (left) were used to create a 1:1 model.
In order to simulate the application of tensile forces to the mesh, a traction force was
applied to each of the mesh arms. Traction forces were defined as a vector with the magnitude of
2.45N (the force of the freely hanging weight), while the components of the vector were altered
in order to produce the angle at which loads were applied. A computational model was created
for each experimental condition. Lastly, a sliding contact was prescribed for all mesh surfaces to
prevent penetration of mesh fibers and knots. Similar to experimental testing, screen captures
were used to record images of the undeformed and deformed computational geometries.
3.3.2.3 Mesh Burden
Unlike previous measurements of mesh burden, which were based on 3D nodal locations
(Section 3.2.6.1), validation of mesh burden measurements required a 2D approach to be used.
145

This is because experimental measurement of mesh burden could only be obtained from
photographs, a planar imaging technique. Therefore, mesh burden calculations were modified
such that planar images could be used to determine density values (Figure 34).
Prior to determination of mesh burden, all images were binarized such that pixels
representing the mesh were black and pixels representing void space (no mesh) were white. For
each pixel representing mesh, the total number of mesh pixels within a radius of 2mm was
determined, providing a local density (pixels/mm2) value for each the number of mesh pixels. As
with 3D measurement of mesh burden, a radius of 2mm was chosen as it provides a nonzero
baseline measure of mesh burden for Restorelle. In addition, mesh burden values were
normalized by the maximum value of mesh burden in the undeformed configuration, providing a
measure of the change in mesh burden following the application of load. This normalization was
required as computational and experimental images had differing resolutions. As such, higher
resolution images resulted in greater mesh burden values relative to lower resolution images.
After calculating normalized mesh burden for each pixel, results were visualized using 2D
contour plots. Images from both computational and experimental testing were subject to the same
image processing and mesh burden measurements.
3.3.2.4 Minimum Pore Diameter
The method used to measure of minimum pore diameter, dmin, was previously detailed in Section
3.2.6.2. Briefly, images were scaled using the dimensions of the undeformed geometry and
binarized to distinguish whether pixels represented mesh or void space. Clusters of void space
146

were identified as pores and the center of mass for each pore was then determined (Figure 39).
Finally, a series of pore diameters passing through the pore center were determined and dmin was
recorded for each pore. Once again, images from both computational and experimental testing
were subject to the same image processing for pore diameter measurement.
Figure 39. Image processing was used to automatically identify mesh pores and determined their minimum
diameters. First, a gradient based method was used to identify isolated clusters, representing pores. Here, each color
represents a cluster of pixels identified as a pore (a). Next, the centroid of each cluster was determined (represented
by red dots) and used to determine the minimum diameter for each pore (b).
147

3.3.2.5 Statistics
Statistical analysis was performed for both mesh burden and dmin measurements to compare
experimental results with computational predictions. In order to compare the overall mesh
deformation, the median values of mesh burden and pore diameter were calculated for both the
undeformed and deformed geometries. A Bland-Altman analysis was used to compare
differences between experimental and finite element (FE) results for each loading condition, with
a significance of 0.05.
3.3.3 Results
Overall, computational simulations effectively captured the deformation of DirectFix A observed
experimentally (Figure 40). Examination of the deformed geometries demonstrates that the FE
boundary conditions implemented, well approximated experimental conditions, as the location of
mesh arms and the distortion of the transvaginal mesh body are strikingly similar for both
loading conditions. However, it was noted that for experimental testing the mesh device
experienced a small degree of out-of-plane deformation at the steel fixation rods, though no out-
of-plane deformation was obtained in FE simulations. Experimentally, it is likely that the contact
of the mesh fibers, along with the asymmetry of these structures, resulted in bunching and out-
of-plane movement. In addition, slight out-of-plane perturbations of the traction vector (airflow,
uneven suture height during application of load, etc.) may have initiated out of plane deformation
experimentally.
148
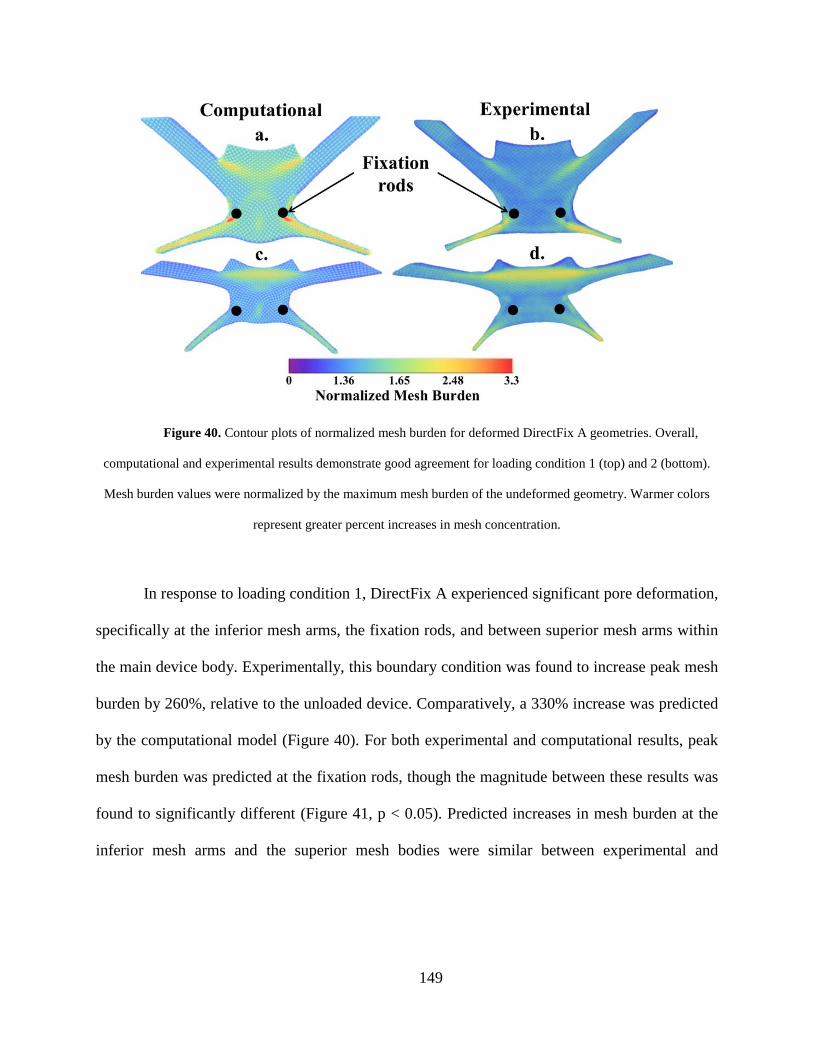
Figure 40. Contour plots of normalized mesh burden for deformed DirectFix A geometries. Overall,
computational and experimental results demonstrate good agreement for loading condition 1 (top) and 2 (bottom).
Mesh burden values were normalized by the maximum mesh burden of the undeformed geometry. Warmer colors
represent greater percent increases in mesh concentration.
In response to loading condition 1, DirectFix A experienced significant pore deformation,
specifically at the inferior mesh arms, the fixation rods, and between superior mesh arms within
the main device body. Experimentally, this boundary condition was found to increase peak mesh
burden by 260%, relative to the unloaded device. Comparatively, a 330% increase was predicted
by the computational model (Figure 40). For both experimental and computational results, peak
mesh burden was predicted at the fixation rods, though the magnitude between these results was
found to significantly different (Figure 41, p < 0.05). Predicted increases in mesh burden at the
inferior mesh arms and the superior mesh bodies were similar between experimental and
149

computational models, with approximately a 2-fold increase at these locations (p > 0.05).
Locations of decreased dmin showed good agreement with regions of increased mesh burden,
demonstrating the inverse correlation between these parameters (decrease in diameter results in
increase mesh per unit volume). Median dmin values were similar between FE predictions and
experimental findings for condition 1, with just a 0.1% and 9% difference for undeformed and
deformed geometries, respectively.
Figure 41. Bland-Altman plots for average normalized mesh burden (left) and dmin (right). The y-axis
represents the difference between experimental and finite element results. Condition 1 is represented by the blue
circles and condition 2 is represented by the red triangles. Error bars represent standard deviation. * represents
significant differences between experimental and finite element measurements (p < 0.05).
150
Similar to condition 1, condition 2 resulted in significant pore deformations for DirectFix
A. Specifically, the pores of the inferior mesh arms and the mesh body, between the superior
mesh arms, were areas of intense pore collapse. Experimentally, peak mesh burden was
increased by 236% relative to the unloaded state, while simulated results were found to increase
by ~221%. Overall the location and magnitude of mesh burden showed good agreement between
experimental and computation methods (p > 0.05). While mesh burden was accurately predicted
for condition 2, the average experimental dmin was ~0.4mm less than predicted values (p < 0.05).
3.3.4 Convergence Testing
For each boundary condition, discretization convergence (“mesh” or h-refinement) was
examined considering the output variables of normalized mesh burden and dmin. Here, three
levels of h-refinement were considered with mesh geometries consisting of 29,066, 136,349, and
232,646 linear hexahedral elements. Average normalized mesh burden and dmin values are were
found to converge quickly with standard deviations less than 2% of across all three models,
regardless of the boundary condition. Given the similarity in results between these models, all
values reported in this study were obtained using the 136,349 element geometry.
151

Figure 42. Convergence testing results for validation geometries, examining the impact of discretization
refinement on normalized mesh burden (a,c) and dmin (b,d) measurements for loading conditions 1 (a,b) and 2 (c,d).
The levels of discretization considered in this study had little impact on these specific outcomes.
3.3.5 Discussion
In this study, a computational model for a transvaginal prolapse mesh, DirectFix A, was
validated. This was accomplished by comparing experimental measures of mesh burden and pore
diameter with FE predictions. The proposed computational model effectively captured the
overall deformation of DirectFix A under 2 distinct loading conditions. Notably, the locations of
increased mesh burden and decreased dmin were similar between experimental and FE testing.
152

For loading condition 1, peak mesh burden was significantly overestimated, though this
magnitude was increased only at the location of the rod fixations. Away from this boundary
condition, mesh burden results were similar to experimental measures. Overall, the distribution
of dmin was accurate in terms of magnitude and location for condition 1. Conversely, mesh
burden predictions for loading condition 2 were accurate, while median dmin values were
overestimated by ~0.4mm. Given the sensitivity of these measures, and the accurate distribution
of mesh burden and dmin across the mesh surface, the proposed model has proven useful for
predicting areas at increased risk for mesh complications for transvaginal mesh products.
Previously, fiber reinforced continuum solids have been considered to model porous
textile structures. While such models are useful for predicting the overall load-elongation
response of synthetic meshes, the continuum assumption does not allow for the investigation of
clinically relevant parameters, such as pore diameter and mesh burden. Further, discrete
representations of synthetic mesh are not scalable to the dimensions of prolapse mesh devices
used clinically, and therefore are unusable for analysis of these products. Given that pore
diameter has been shown to greatly influence the host response to mesh, increasing inflammatory
cytokines and MMP levels in vaginal tissue (75, 93), the ability to measure this parameter served
as the main evaluation criteria for our computational model of synthetic mesh. To this end, the
novel FE model presented in this study, demonstrates the ability to examine changes in pore
diameter in response to a variety of loading conditions. More importantly, the techniques used to
create this model can be scaled to examine devices as large as prolapse mesh constructs.
153

In addition to providing the first computational measures of pore deformation, this study
was the first experimental analysis of an entire transvaginal mesh product in response to
mechanical loading. Previous ex-vivo analyses of synthetic mesh only considered small,
rectangular strips of material. Therefore, a common argument was that the data and observations
of pore collapse (Aim 1) obtained from uniaxial testing of these strips was irrelevant, as mesh
devices consisting of complex geometries, such as DirectFix A, do not experience such loading
conditions. To counter this argument, the experimental deformations observed in this study were
quite similar to those observed in Aim 1, as areas in which mesh fibers were aligned with the
axis of loading (upper mesh arms) maintained pore diameter, while areas with mesh fibers offset
from the axis of loading (lower mesh arms and mesh body), experienced significant pore
collapse. Such experimental findings confirm the need to consider the mechanical loading and
orientation of mesh filaments, throughout an entire prolapse mesh device.
When considering the results of this study, is it important to note that FE simulations only
predicted planar deformations. Though experimental loading conditions were selected to
minimize non-planar deformations, self-contact of the physical mesh fibers and the boundaries
imposed at the fixation rods are believed to have resulted in out-of-plane deflection. Such
behavior is likely the result of small bending moments of the mesh surface. Specifically,
increased loading angle of the upper arms (condition 1) resulted in greater bunching of mesh
around the fixation rods. The increased out-of-plane deformation effectively decreased our
planar measurement of mesh burden, as mesh material became hidden from view. The effect of
this bunching deformation was confirmed experimentally, as the number of pixels representing
154

mesh material decreased by 24% in the loaded state, relative to the unloaded state for loading
condition 1. Similarly, a 10% decrease was observed for loading condition 2 (Figure 43). Given
this change in the number of “mesh” pixels it is not surprising that experimental mesh burden
measurements were significantly lower (~21%) relative to computational predictions, where the
amount of mesh pixels was constant between undeformed and deformed images (no z-
displacement).
The absence of out-of-plane deformation in the FE model is largely a function of the
boundary effects of the CAD geometry and the application of traction vectors. Computational
mesh models were constructed from rectangular elements whose flat faces were in-plane with
one another. Thus, any contact forces between these faces are normal to the element surface (in-
plane). Conversely, physical mesh fibers are comprised of a bundle of circular filaments that are
not necessarily in plane. As such, contact of physical fibers may result in out-of-plane
displacement and bunching due to the normal force arising from filament contact. Additionally,
FE implementation of the traction vector assumes no z-component (2D traction vector), while
application of traction experimentally is likely to contain some nonzero z-component, due to the
tolerances of the testing rig (post pivots may not be in-plane with the raised platform). Further,
the process of hanging the 250g weights may introduce forces with z-components prior to the
attainment of static equilibrium. The presence of a constant or transient z-component has the
potential to induce bending moments in the physical mesh device.
155

Figure 43. Subtle differences in mesh deformation were noted at the fixation rods (red circles).
Experimentally (top), mesh was found to deform out-of-plane, resulting in bunching of the mesh about the fixation
rods. However, no out-of-plane deformation was observed in FE models likely due to the flat boundaries of the
computational fibers.
While the FE element implementation used here is unable to capture this out-of-plane
deformation, the current model and validation discussed in this study serve as a starting point for
clinically relevant computational modeling of synthetic mesh. At this time, there are substantial
limitations in terms of modeling out-of-plane deformation of textiles, such as surface wrinkling.
This behavior is mathematically complex and often contains multiple solutions. These factors
156

lead to convergence issues for FE models and may require significant constraints in order to
derive a solution. Further, these constraints may incorrectly approximate the real world physics,
providing inaccurate solutions. Despite these challenges, computational modeling of textiles is
an active area of research, though current methods do not consider pores such as those found in
prolapse mesh (154, 155). Although it is unclear whether a porous model can be used for
wrinkling analysis, it is likely that advancements in textile modeling will advance the FE model
used here. Nonetheless, the model developed and used in this study provides a reasonable
approximation for pore deformation and has the potential to dramatically enhance our
understanding of the mechanical behavior of synthetic mesh and optimize products for use in the
pelvic floor.
Interestingly, both experimental and computation results demonstrate severe pore
collapse at both the inferior mesh arms, as well as the mesh body between the superior arms.
Notably, the decrease in pore size is greater when predominately lateral forces (smaller loading
angles) are applied to the transvaginal mesh (condition 2). While the inferior mesh arms are
typically not in contact with the vagina, the superior mesh body is directly interacting with the
anterior vagina. Therefore, pore dimensions in this location may greatly impact the host response
and subsequent integration of mesh into the vagina. Given that many pores in this region of
DirectFix A had dmin values less than 1mm, it is likely that this location may be prone to
complications such as exposure. Indeed, this finding is in agreement with clinical observations of
pain and exposure, as this location is the most widely reported site for tenderness, pain, and mesh
exposure in the vaginal lumen (65). In addition, clinicians often note the ability to transvaginally
157

palpate a taut band between the superior mesh arms during postsurgical exams. Notably, Feiner
et al. examined post-surgical pain following transvaginal mesh implantation and specifically
highlighted this location (65). The authors even included sketches of pain locations that are
strikingly similar to the contour plots of mesh burden and dmin presented the current validation
study. The correspondence between these studies suggests that the decrease in pore size,
resulting from mechanical loading, provides a mechanism by which transvaginal mesh
complications can occur. Further, the relationship between computational results and clinical
findings highlight the need for FEA of synthetic mesh devices prior to surgical implantation and
during product development.
3.4 MESH BURDEN SENSITIVITY
3.4.1 Introduction
Through trial and error, “light-weight” (>1g/cm3), wide-pore, monofilament, polypropylene
mesh was found to reduce complications in urogynecologic applications. Recent hernia mesh
studies have highlighted the importance of mesh diameter size in determining the host response
to synthetic mesh implants. Such studies have provided a potential explanation for the improved
complication rates obtained by the latest generation of prolapse mesh, given the recent shift to
wide-pore geometries. Specifically, hernia literature has found that mesh outcomes are related to
a mesh’s pore diameter, as pores greater than 1mm are associated with decreased inflammatory
158

and fibrotic responses relative to pores less than 1mm (98, 99). Despite this design feature,
synthetic mesh use for POP repair remains plagued by relatively high rates of exposure, ranging
from 11-15% of all cases, deterring clinical use of mesh in spite of relatively good anatomic
success rates (71).
As demonstrated in Aim 1, application of mechanical forces greatly reduces mesh pore
size for a wide array of synthetic mesh products. However, industry reported pore size and
current assessment of mesh devices do not consider pore size under application of force.
Currently, mesh pore size is difficult to measure following implantation, as synthetic mesh is not
directly visible. In addition, polypropylene is considered a radiopaque material, rendering it
nearly invisible to current medical imaging modalities. Several studies have utilized synthetic
mesh impregnated with ferromagnetic particles to allow for mesh visualization via MRI, yet such
studies are unable to reconstruct individual mesh pores. Therefore, neither the pore diameters nor
the potential deformation of these pores can be assessed following implantation (156, 157).
Nonetheless, it is quite common for mesh exposure to present in areas of decreased pore size.
In order to assess the impact of mechanical loading on pore size and mesh burden, this
dissertation has proposed a novel FE model for synthetic mesh. Whereas previous computational
models of mesh have focused solely on the mechanical behavior of mesh, the current model
improves upon this computational tool by providing the ability to directly measure textile
properties. Previous work in this aim has explored the development of this computational model
and demonstrated the ability for this model to predict the uniaxial tensile behavior of Restorelle
mesh. In addition, this method for simulating mesh behavior has been validated via experimental
159

testing of a transvaginal mesh product in 2 distinct loading conditions. Following validation, this
model can now be utilized to explore the mechanical behavior of transvaginal mesh in response
to a variety of loading conditions. Therefore, the aim of this study is to conduct a sensitivity
analysis of DirectFix A, examining the impact of loading angle and the magnitude of applied
force on pore size and mesh burden.
3.4.2 Methods
In this study, a transvaginal mesh device, Restorelle DirectFix A, was used to demonstrate the
impact of arm loading angle and magnitude of force on the pore dimensions and mesh burden. A
previously validated FE model of DirectFix A was imported into Preview (University of Utah,
MRL) and the mesh geometry was partitioned into 2 parts - the knots and fibers. The fibers
represent the individual line segments of a mesh, consisting of linked filaments, while the knots
represent the intersection of fibers. Knots and fibers were considered independent Neo-Hookean
materials and material properties were determined from uniaxial tensile testing of Restorelle in 2
independent orientations (Efiber = 5000MPa, νfiber = 0.49, Eknot = 100MPa, νknot = 0.01). Details
regarding determination for material coefficients are outlined in Section 3.2.5.
3.4.2.1 Model Variables
In order to determine the location of suture fixations, a FE geometry of a prolapsed vagina and
bony pelvis were imported into Preview (a detailed method for creation of pelvic floor
geometries will be discussed in Chapter 4). Next, a surgeon specializing in pelvic floor
160

reconstructions positioned the DirectFix A mesh on the vagina and highlighted the vaginal
locations at which sutures would be placed in order to fix the device upon surgical repair. Fixed
boundary conditions (x, y, z displacements = 0) were imposed at these designated suture
locations for all simulations in this study. Following application of vaginal suture fixations, the
3D patient anatomy was rotated in order to identify sites of mesh fixation in the pelvic sidewall.
The 3D coordinates of the inferior attachment sites (left and right oburator foramen) and superior
attachment sites (left and right sacrospinous ligaments) were marked using a spherical geometry
generated in Preview. Finally, the vaginal and bony pelvis geometries were hidden from view
and a set of coronal and sagittal images were taken of the mesh and fixation spheres via screen
capture. These images were used to identify the approximate, planar loading angles for DirectFix
A (Figure 44).
Figure 44. Anterior view of the segmented patient geometry with DirectFix A positioned anterior to the
vagina. Using this geometry a series of loading angles for the upper and lower mesh arms were determined.
161
Following analysis of the sidewall attachment locations, it was determined that the
inferior mesh arms for this specific patient geometry, are loaded almost exclusively along the
global x-axis (lateral loading). Therefore, an angle of 0° was included in sensitivity analysis. In
addition, angles below the horizontal were considered, as anatomical differences in subsequent
patients may require the mesh arms to be pulled distally. Further, a clinically relevant scenario in
which surgeons are unable to dissect completely to the urethro-vaginal junction would again
require increased distal tensioning of the inferior mesh arms. Given these considerations, 3
loading angles of the inferior mesh arms were considered with respect to the horizontal axis
(θlower); 0°, -10°, -20° (Figure 45).
In addition, the loading angle of the superior mesh arms are subject to change. Based on
the location of the mid-sacrospinous ligament for this specific geometry, it was determined that
the top mesh arms are required to be tensioned predominately along the global x-axis, at an angle
of ~15° above the horizontal. Considering variable patient geometries (increased superior
location of the sacrum relative to the vagina) and distal placement of the mesh, increasing angles
relative to the horizontal were considered for DirectFix A. To provide a wide range of loading
conditions, 3 angles relative to the horizontal were chosen for tensile loading of the upper mesh
arms (θupper); 15°, 30°, 45° (Figure 45).
Finally, the amount of tension placed on each of the mesh arms was considered for this
sensitivity analysis. To date, there are no studies that have examined the amount of tension
placed on mesh arms during surgical fixation, though anecdotal evidence based on the pore
deformation and gross deformations observed in Aim 1, suggest that tensioning loads are on the
162

order of 1 to 10N. However, given that the validation of this specific mesh model was attained
using a force of ~2.5N, a maximum force value of 2.5N was used for this parametric analysis. To
examine the impact of surgical tensioning on deformation of DirectFix A, 3 levels of force were
considered in this study (T); 0.5N, 1N, and 2.5N.
Figure 45. The validated mesh geometry was used to examine the impact of loading variables on mesh
burden and pore diameter. Sensitivity of these textile properties to changes in the magnitude of tension (T), upper
arm loading angle (θupper), and lower arm loading angle (θlower) were determined. Red circles represent locations of
suture attachments, which were modeled using fixed boundary conditions.
In order to apply tension to FE models, a traction force was applied to all transvaginal
mesh arms simultaneously. The magnitude of the traction vector was constant for all arms in a
given simulation (0.5N, 1N, or 2.5N) and the components of the vector were altered in order to
163

provide the desired angle of loading. In total, 27 individual FE simulations were performed, one
for each of the possible combinations of the 3 model variables; upper arm loading angle (θupper),
lower arm loading angle (θlower), and magnitude of applied force (T). For each simulation, mesh
burden, minimum pore diameter (dmin), and the number of ineffective pores (NIP) were
determined. Details regarding the calculation of mesh burden and dmin were previously described
in Sections 3.2.6.1 and 3.2.6.2. The number of ineffective pores was derived from measurements
of dmin, where NIP is the total number of pores with a minimum pore diameter less than 1mm.
The pore diameter cutoff of 1mm is based on previous literature demonstrating that pores of
polypropylene mesh with diameters less than 1mm, increase the overall inflammatory response
to mesh and result in poor tissue integration (86, 87, 97).
3.4.2.2 Statistics
A multiple regression analysis was used to examine the relationship between the model
parameters (θupper, θlower, T) and the model outputs (mesh burden, dmin, NIP), using a forward
stepwise method. Sum of squares, R, and R2, were used to assess the ability of the model
parameters to predict the outputs and an ANOVA test was used to determine whether the
regression model significantly predicts the outcome measures. Significant was set to a value of
0.05.
164

3.4.3 Results
In response to application of tensile forces, the 4 mesh arms noticeably extended and rotated for
all loading conditions simulated in this study. At 0.5N, the deformation of the mesh pores was
minimal for all loading angles, with the inferior mesh arms undergoing the greatest pore collapse
(Figure 46). An approximately 40% increase in maximum mesh burden was observed in the
inferior mesh arms for all angles, though only a 10-14% (2-3mm) decrease in the mean dmin was
observed for meshes at 0.5N. In addition, no simulations at 0.5N were found to have mesh pores
with a dmin less than 1 (NIP = 0).
Continuing to 1N of force, mesh deformations were more pronounced, as the inferior
mesh arms continued to collapse, increasing the maximum mesh burden by 70% relative to the
unloaded mesh. At this force, mesh pores located in the superior mesh body, between the
superior mesh arms, also began to collapse. This behavior was most pronounced with superior
mesh arms loaded at 45°, as mesh burden for this region were found to be 1.6 times that of the
unloaded geometry. Still, pore collapse had little impact on the mean dmin values for the
deformed mesh. However, the number of pores with diameters less than 1mm rose dramatically
in response to 1N of force, ranging from 72-162, roughly 8-15% of all pores in the device. The
location of collapsed pores (dmin < 1mm) showed good agreement with the locations of increased
mesh burden.
165

Figure 46. Contour plots of raw mesh burden values, predicted by the FE model under various loading
conditions. For the top row of plots, θupper and θlower were held constant at 45° and 20°, respectively. For the lower
row of plots, T and θlower were held constant at 2.5N and 0°, respectively. Mesh burden was positively correlated
with load, as increases in mesh concentration were observed in the inferior mesh arms and between the upper arms
(top row). Though overall mesh burden was not correlated with θupper, increases in this angle led to increased mesh
burden between the upper mesh arms (lower row).
By 2.5N of force, the deformation of mesh pores was grossly apparent, as the pores of the
inferior mesh arms and superior mesh body continued to collapse (Figure 46). At this level of
force, average mesh burden was 2 times that of the unloaded mesh. While mesh burden of the
inferior arms was similar for all loading conditions, the loading angle altered the deformation
present in the superior mesh body. Application of load at 45° resulted in maximum mesh burden
values that were 300% of the unloaded state, with increased mesh concentration occurring in the
166

mesh body, between the contralateral superior sutures. These concentrations of mesh were
greatly reduced at loading angles of 30° and 15°, with normalized mesh burden values of ~1.7
and ~1.5 respectively. Further, NIP continued to rise dramatically at 2.5N of force, with 10-22%
of mesh pores having dmin less than 1mm. The location of these mesh pores was identical to that
observed at 1N, though the degree of pore collapse had noticeably increased.
Figure 47. The magnitude of tensile load (T) was found to be a significant predictor for maximum mesh
burden (R2 = 0.93, p < 0.001) and the total number of pores less then 1mm in diameter (NIP, R2 = 0.836, p < 0.001).
In general, regression analysis well described the impact of model variables (θupper, θlower,
and T) on the measured outputs (mesh burden, median dmin, and NIP). Regression modeling found
that T alone was the most significant variable in predicting mesh burden, accounting for 86.5%
of the variation in this outcome (Figure 47, p < 0.001). Further, the magnitude of tensioning was
significantly correlated to mesh burden outcomes, with a Pearson’s correlation coefficient of
167

0.93 (R2 = 0.93, p < 0.001). The model was slightly enhanced by the inclusion of θupper, which
explained an additional 2.4% of the variability in mesh burden. However, θupper was not
significantly correlated with mesh burden outcomes (R2 = .155, p = .219), suggesting that T
alone is the primary variable influencing overall mesh burden. As expected from visualization of
mesh burden contour plots, θlower was not found to be a significant predictor for mesh burden.
Similarly, the magnitude of tensile load (T) was the only model variable found to be a
significant predictor of NIP and median dmin, with Person’s correlation coefficients of 0.836 and -
0.687 respectively (p < 0.001 for each). The impact of T on pore collapse was dramatic, with
average NIP values of 0, 109, and 180 at 0.5N, 1N, and 2.5N, respectively. In general, model
predictions of NIP were less robust compared to mesh burden predictions, with an R2 of 0.699. It
should be noted that neither θupper nor θlower were significantly correlated to NIP (p > 0.1). Median
dmin values were also insensitive to changes in these model variables, with a maximum decrease
of 16.8% (~ 4mm) observed across all tested conditions (R2 = 0.472, p > 0.2).
3.4.4 Discussion
In this study, a validated FE model of DirectFix A was used to examine the impact of variable
loading conditions on the deformation of mesh pores. The sensitivity of textile measurements,
quantified by mesh burden and minimum pore diameter, were assessed in relation to variations in
the magnitude of tensile force, the upper arm loading angle, and the lower arm loading angle.
Understanding the impact of these variables on pore deformation provides valuable insight into
the relationship between mesh architecture, surgical technique, and mechanical loading of
168
prolapse meshes. In this study, it was observed that the magnitude of force used to tension mesh
arms significantly increases mesh burden while dramatically decreasing pore diameters. Further,
this outcome was observed for a broad range of loading angles that are likely to occur in-vivo.
Importantly, this study has identified the inferior mesh arms and superior main body of DirectFix
A to be the primary locations of pore collapse, regardless of loading condition.
Overall, this study demonstrates the potential for computational tools to be utilized for
design and virtual assessment of synthetic mesh devices. While the scope of this analysis was
limited to 3 variations of just 3 mechanical variables, the simulation used here can be further
altered to explore a wider range of angles and forces that are deemed appropriate for a given
device, or even tailored to specific patient geometries. Additionally, factors that impact pore
deformation, such as the number of suture fixations and their locations, can also be readily
manipulated in order to optimize surgical fixation of mesh devices. The impact of suture location
is readily observed by comparing the results from validation experiments (Section 3.3.3) with
those observed in the current study. Specifically, the 3 superior sutures used in this study, limited
the deformation of mesh pores between the superior mesh arms, whereas validation simulations
observed a greater magnitude of mesh burden in this same region despite, a similar gross
appearance. Further, the steel fixation rods used in the validation study were located proximal to
the placement of the inferior sutures in the current study. As such, the deformation of the inferior
pores in the current sensitivity study, extended further (medially) into the mesh body with a
greater magnitude of mesh burden.
169

The main finding from this study was the observation that the magnitude of tensioning is
the most influential variable in determining the pore deformation of DirectFix A. This is to say,
that of the three loading variables considered in this study, only the magnitude of tension was
found to alter the outcome measures. This result builds upon previous findings that tensile
loading greatly reduces the pore dimensions of synthetic mesh devices (Aim1, (93)). However,
unlike previous studies that examined rectangular strips of mesh, the current study considers the
geometry of an entire transvaginal mesh device. The present findings, in addition to experimental
observations from validation trials (Section 3.3), clearly demonstrate that significant regions of
transvaginal mesh products experience the same deformation phenomena, despite varied suture
attachments and a wide range of loading conditions. These are the first studies in which such
deformation has been measured and quantified for a transvaginal mesh device.
Interestingly, the loading angle of the lower mesh arms was not found to impact any of
the outcome measures. However, the pores of the lower mesh arms were observed to collapse
similarly regardless of the loading angle. The inherent instability of these arms directly results
from the orientation of mesh pores to the axis of loading. In the inferior mesh arms, the fibers are
offset ~45° from the direction of loading (at any angle), requiring significant fiber rotation in
order to resists applied loads. This fiber rotation is identical to observations of mesh
deformations in Section 2.2.3. As with experimental observations of pore collapse for Restorelle
at 45° offset, a significant reduction in pore diameter is observed at small levels of force for
DirectFix A (Mean NIP = 108 at just 1N). Given that pore collapse was common in the inferior
mesh arms across all loading angles (though increasing with T), it is not surprising that θlower had
170
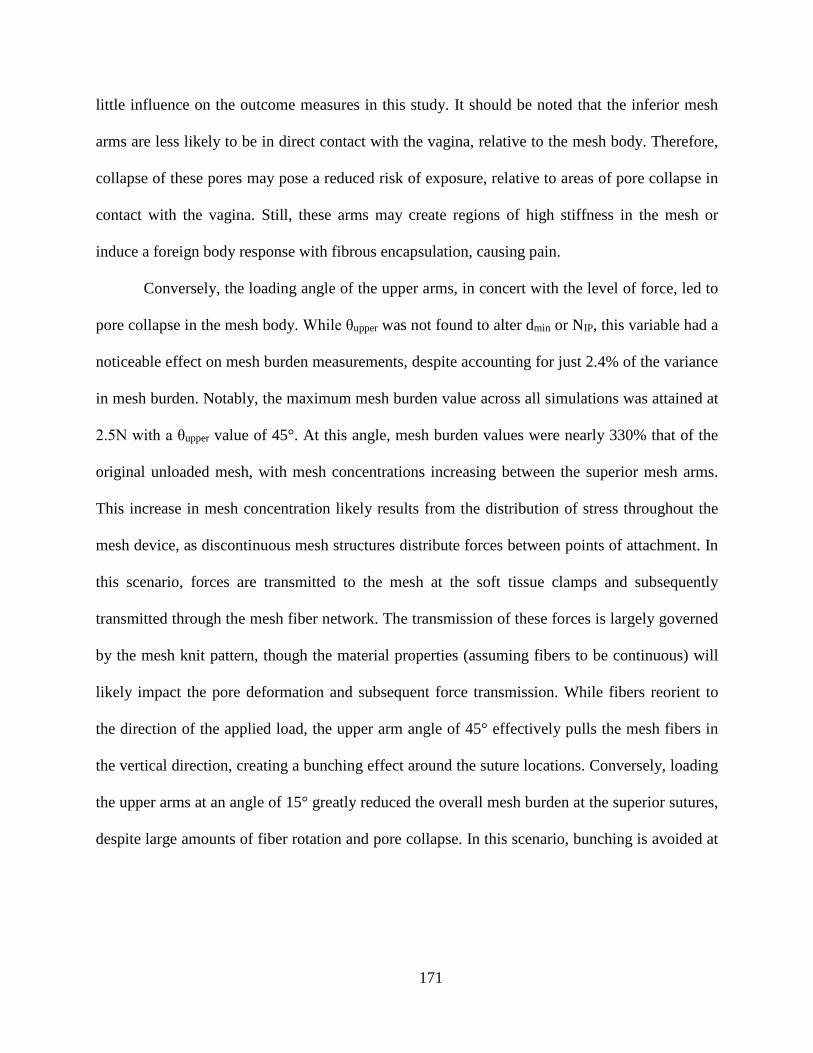
little influence on the outcome measures in this study. It should be noted that the inferior mesh
arms are less likely to be in direct contact with the vagina, relative to the mesh body. Therefore,
collapse of these pores may pose a reduced risk of exposure, relative to areas of pore collapse in
contact with the vagina. Still, these arms may create regions of high stiffness in the mesh or
induce a foreign body response with fibrous encapsulation, causing pain.
Conversely, the loading angle of the upper arms, in concert with the level of force, led to
pore collapse in the mesh body. While θupper was not found to alter dmin or NIP, this variable had a
noticeable effect on mesh burden measurements, despite accounting for just 2.4% of the variance
in mesh burden. Notably, the maximum mesh burden value across all simulations was attained at
2.5N with a θupper value of 45°. At this angle, mesh burden values were nearly 330% that of the
original unloaded mesh, with mesh concentrations increasing between the superior mesh arms.
This increase in mesh concentration likely results from the distribution of stress throughout the
mesh device, as discontinuous mesh structures distribute forces between points of attachment. In
this scenario, forces are transmitted to the mesh at the soft tissue clamps and subsequently
transmitted through the mesh fiber network. The transmission of these forces is largely governed
by the mesh knit pattern, though the material properties (assuming fibers to be continuous) will
likely impact the pore deformation and subsequent force transmission. While fibers reorient to
the direction of the applied load, the upper arm angle of 45° effectively pulls the mesh fibers in
the vertical direction, creating a bunching effect around the suture locations. Conversely, loading
the upper arms at an angle of 15° greatly reduced the overall mesh burden at the superior sutures,
despite large amounts of fiber rotation and pore collapse. In this scenario, bunching is avoided at
171

the suture locations, reducing increases in mesh burden to 200%, much less than that observed
for 45° loading. Clearly, θupper influences mesh burden between the superior mesh arms (Figure
46), yet this model parameter was not significantly correlated to the outcome measures of this
study. This is because mesh burden, dmin, and NIP are measures for the entire mesh surface. As
such, it appears as though the consistent collapse of the inferior mesh arms (for any combination
of model inputs) is the driving force behind such measurements. To address this concern, future
analyses may require individual locations of mesh devices (such as the mesh body) to be
considered independent from one another.
Overall, outcome measures used in this study vary in terms of their ability to capture the
deformation of synthetic mesh. In general, maximum mesh burden and normalized maximum
mesh burden effectively describe the pore collapse observed in many of the loading conditions
tested. However, attempts to describe the distribution of pore deformation across the entire mesh
(mean mesh burden, median dmin, mean dmin) saw small percentage changes in response to
loading, leading to difficulty interpreting the effect of model parameters. The subtle changes in
these values is likely due to the fact that only relatively small percentage of mesh pores
experience significant deformation, as 7-20% of all DirectFix A pores had diameters less than
1mm for 1N and 2.5N simulations. While only a small subset of pore diameters were less than
1mm, these deformations may have a tremendous impact on the host response to DirectFix A. In
order to capture these clinically relevant results, generalized measures such as mean and median
should be avoided. Rather, contour plots for these measures are extremely useful in determining
locations at risk for mesh related complications. Further, NIP provides a clinically relevant output
172

that can be used to assess the ability of synthetic mesh devices to maintain their pore geometries.
Combining the contour plots for mesh burden with NIP provides a useful method for assessment
of mesh devices and their response to mechanical loading.
In regards to DirectFix A, the locations of increased mesh burden in this study were
strikingly similar to those observed in the validation study, despite differing locations of suture
attachment. Specifically, pore collapse was observed in the inferior mesh arms and the mesh
body between the superior mesh arms. These locations of pore collapse are in agreement clinical
findings of mesh erosion and pain following transvaginal mesh implantation (65). As such, it
appears likely that the transmission of force through these regions leads to pore collapse,
providing a mechanism by which complications can occur. In order to alleviate this issue,
different suture techniques or mesh designs must be developed with the goal of eliminating these
areas of concern. The tools provided in this aim afford a rapid assessment of new mesh designs
and fixation techniques, allowing for products to be optimized prior to surgical implantation.
Interpretation of these results provides great insight into several mechanical factors that
govern the deformation of mesh devices. Yet, many additional factors such as the suturing
technique (number and location of sutures), or loading angles and tensions outside of those
examined here, may yield differing pore deformations. Moreover, these factors which influence
mesh burden, may vary for each individual mesh product or patient anatomy. Still, this study
provides a robust methodology for assessing a wide range of clinical scenarios and vaginal mesh
products.
173

3.4.5 Generalization of Methods
To demonstrate the feasibility of creating additional computational mesh geometries, the
protocol outlined above was utilized to create one additional transvaginal mesh geometry for
FEA (Figure 48). Briefly, a transvaginal mesh product manufactured by Boston Scientific,
Uphold, was imaged using a DLSR camera and the dimensions of the unit pore structure were
measured (pore diameter = 1.6mm, fiber thickness = 0.44mm)
Next, a sheet of pores was created in Solidworks and the device geometry was cut from
this sheet using Boolean subtraction. Mesh was then discretized using hexahedral elements such
that all knots contained the same number of elements and all fibers contained the same number
of elements. Discretized geometries were then imported into FEBio and mesh was fixed using a
series of tied contacts to mimic suture attachment to the vagina. Suture locations were identified
per a pelvic floor reconstructive surgeon (Figure 48). Finally, a tensile load of 10N was applied
to each mesh arm to examine the deformation of this particular mesh design.
Overall, Uphold deformations were strikingly similar to those observed for DirectFix A,
with increases in mesh burden occurring between the superior mesh arms (Figure 49). Unlike
DirectFix A, Uphold does not have inferior fixation arms, though additional regions of increased
mesh burden were noted at the lateral mesh body. Still, given the loading angles and suture
fixations considered in this preliminary work, maximum increases in mesh burden relative to the
deformed state were ~20%, suggesting that Uphold pores are more stable relative to DirectFix A
for the particular loading conditions considered. It must be stated that these findings regarding
174

Uphold are preliminary and additional studies characterizing the behavior of this model, in
addition to validation for this computational pore geometry, are required before further
conclusions can be made.
Figure 48. The methods outlined in this aim can be generalized to assess a wide variety of mesh devices.
To demonstrate feasibility, a computational model for Uphold, a transvaginal mesh device currently in clinical use,
was created and used to simulate mesh behavior under various loading conditions.
175

Nonetheless, the development of a computational model for Uphold demonstrates that the
methods outlined in this aim are indeed applicable to a wide variety of mesh geometries. As
such, this technique provides a valuable tool for the development and assessment of mesh
designs prior to implantation. Future studies will be required not only to validate mesh models of
differing pore geometries, but also to compare various mesh designs and their ability to maintain
pore dimensions in response to the application of mechanical forces.
Figure 49. Contour plot of normalized mesh burden for Uphold, following the application of tensile forces
to the mesh arms. Warmer colors represent areas of increases mesh concentration. Similar to DirectFix A, tensile
loading results in pore collapse in the mesh body between the superior mesh arms.
176

3.5 CONCLUSIONS
There is tremendous potential for the use of computational tools in the field of urogynecology
and reconstructive pelvic surgery. Currently, the loading environment of the pelvic floor is
largely unknown with few studies considering the role of mechanics in this field. Yet, many
pelvic floor disorders are the direct result of mechanical instability, with structural deficiencies
leading to urine leakage (urinary incontinence) or bulging of the vaginal canal (prolapse). The
need to understand this anatomy from a mechanical perspective is apparent, as many treatments
aim to restore support to pelvic floor structures through implantation of graft materials.
Specifically, synthetic mesh used to treat POP is used in a load bearing capacity, yet their
mechanical role in the pelvis is largely unknown. Just as computational models have been used
to understand and design implants for biological systems ranging from artificial hearts to stents
and joint replacements, these tools can be applied to improve clinical treatment of POP.
In Section 3, a computational model for synthetic mesh was developed, validated, and
used to examine the deformation behavior of a transvaginal mesh product. The proposed
computational model differentiates itself from previous models by accounting for the thickness
of mesh linkages and allowing for the spatial distribution of mesh to be calculated. Therefore,
this model can be used to predict the concentration of mesh material, a clinically important
parameter, in addition to general load-elongation behavior. Unlike previous attempts to model
synthetic mesh, the current FE approximation can be scaled to the dimensions of prolapse mesh
devices and accurately predict both load-elongation and pore deformation behaviors.
177

Currently, this FE implementation is only validated for planar mesh deformations, and
though the current solid model can be used to simulate 3D deformations, further validation is
required to ensure the accuracy of such measurements. Given the current technical limitations of
experimental mesh burden measurements (inability to accurately image and reconstruct mesh in
3D), validation and sensitivity analyses in this aim were limited to 2D deformations. Ultimately,
it is our hope to develop 3D imaging technologies to capture a volumetric representation of
experimental mesh deformation for the validation, or at minimum, quantitatively measure 3D
mesh deformation. Ongoing work in our lab is exploring the potential for imaging of
polypropylene mesh via MRI without the altering the behavior of these mesh devices. Currently,
MRI studies of mesh, utilize devices loaded with ferromagnetic particles in order to visualize
products following implantation. However, this technique has only been considered for PVDF
mesh (not polypropylene as it commonly used) and it is unclear whether this treatment alters the
mechanical behavior of the mesh (157, 158). Further, the resolution of these scans is not
sufficient for reconstruction of the pore structure found in most synthetic meshes.
Rather than utilize iron-loaded mesh, preliminary studies in our lab have considered
tensioned polypropylene mesh samples in a gelatin phantom. While polypropylene is radiopaque,
the phantom provides a signal using a T2 imaging protocol. Thus, the absence of signal is
interpreted as mesh material, allowing for mesh to be segmented from volumetric scans and
reconstructed. This preliminary work has demonstrated the ability to capture the porous
178

architecture of mesh samples, though much work is still required to optimize the quality of 3D
reconstructions. Though this technique may be difficult to implement for in-vivo implantation, it
may provide a useful tool for validation of 3D mesh deformation.
Finally, the studies presented in this section have focused on a single pore geometry. The
square pore geometry considered here is quite common in synthetic mesh devices, being used in
products such as Restorelle (Coloplast), Vertessa lite (Caldera), and Uphold (Boston Scientific).
In addition, a single transvaginal mesh product, DirectFix A was used to demonstrate the overall
technique developed in this dissertation. However, it is important to note that pore geometries of
increased complexity are utilized in prolapse mesh devices, and therefore, additional
assumptions may be required in order to apply the same knot and fiber simplification used in this
dissertation. Still, this methodology can be applied to numerous mesh devices currently on the
market, with vastly different designs. In order to demonstrate the potential of the method
outlined in this dissertation, an additional transvaginal mesh product, Uphold, was created and
underwent the same sensitivity analysis performed in Section 3.4. This proof of concept
demonstrates the power of computational modeling to assess the design of mesh products
without the need to manufacture a product, allowing for mesh designs to be quickly eliminated
from production. While clinical trials and testing are still required to ensure the effectiveness of
mesh products, computational modeling allows for quicker product development and greatly
reduces the risk of complication for patients during clinical trials.
179

4.0 COMPUTATIONAL MODEL OF PROLAPSE AND MESH REPAIR
4.1 OVERVIEW
Pelvic organ prolapse (POP) is a common condition amongst women, affecting more than 50%
of woman over the age of 50 (159). Though the underlying cause of POP remains unclear, this
disorder directly results from the breakdown of the mechanical support to the vagina. As
previously highlighted, synthetic mesh is widely used to restore support to the vagina with a high
degree of efficacy relative to other surgical reconstruction methods, including native tissue
repair. Unfortunately, the success of synthetic mesh products is countered by significant
complication rates (up to 20%) following mesh implantation. These complications rates are
relatively high; especially given that in many cases this procedure is often elective (62, 111).
Though a limited number of studies have sought to examine the cause of mesh related
complications, few have considered the mechanical role of synthetic mesh as used for prolapse
repair.
In order to examine synthetic mesh from a mechanical perspective the first aim of this
dissertation utilized experimental methods in order to characterize changes in clinically relevant
textile properties under mechanical loads, considering both micro- and macro- levels of
180

deformation. Following from this experimental approach, Aim 2 successfully developed and
validated a computation model for synthetic mesh, based on observations of mesh behavior from
Aim 1. This computational model was then used to simulate a variety of loading conditions for a
prolapse mesh device, allowing for virtual assessment of clinically relevant textile properties.
While the previous 2 aims highlight the importance of mechanical forces on synthetic mesh
design and implantation techniques, these studies have yet to consider whether or not such
deformations occur in women undergoing prolapse repair. While experimental evaluation of
mesh deformation is difficult to assess following implantation (often only noted following
complications), computational methods provide an excellent resource for testing mesh devices in
the pelvic floor environment.
Previous studies in this dissertation have utilized FE assessment of mesh deformation
under the application of tensile loads, allowing for a thorough analysis of mesh designs without
the need to create physical mesh prototypes. A similar concept can be applied when considering
mesh implantation to support the vagina. In addition to understanding how mesh devices deform
in response to general loading conditions, virtual implantation of a prolapse mesh allows for such
assessments to be made under boundary conditions specific to the pelvic floor. This method not
only allows for specific mesh designs to be assessed without a physical device, but prototypes or
actual products can be assessed in response to boundary conditions for a specific patient
anatomy. Development of such a methodology would provide a type of personalized medicine,
allowing for surgeons to simulate mesh implantation and choose a mesh or attachment method
that is most beneficial to a specific patient based on her anatomical defects.
181

In order to develop such a computational tool, a reliable method for the generation of
pelvic floor geometries, usable in FE studies, must be created. The concept of creating patient
specific geometries is relatively new, yet widely used across many fields of medical research.
Previously, patient specific models have been used to examine the contact mechanics of the hip,
providing insight into development of osteoarthritis (160-162). These studies have found that the
geometry of the hip joint (femur and acetabulum) greatly impacts the contact forces in the hip.
Conversely, Sigal et al. have found that alterations in material properties were more likely to
drive deformation of the optic nerve head than the geometric differences between patient specific
models (163). These studies provide significant insight into various pathologies, allowing for
numerous factors, such as geometric effects, to be virtually examined. In the literature for hip
osteoarthritis, such geometric analysis has even led to the development of clinical imaging
diagnostics.
Patient specific modeling has great potential for understanding the pelvic floor. Abnormal
pelvic bone geometries are linked to the development of POP (3), yet these known geometric
anomalies are extremely rare and do not explain the incidence of prolapse throughout the
population. Rather, understanding geometric alterations that follow gestation, a main risk factor
for POP, or the anatomical development of POP, can greatly enhance our understanding of the
mechanics of this disorder. In regards to this dissertation, a patient’s anatomy likely plays a large
role in the success of mesh repair surgery, as well as the overall deformation experienced by a
mesh device. As shown in Aim 2, the magnitude of tensile force applied to a transvaginal mesh,
is the primary factor responsible for increasing mesh burden. While a surgeon does tension
182

synthetic mesh in order to reduce vaginal bulging, the amount of tension is dependent on the
dimensions of a prolapsed anatomy. For instance, if the location of the pelvic sidewall
attachment, relative to the vagina, is sufficiently large, it may require mesh to be excessively
tensioned, increasing the likelihood of pore collapse.
Given the perceived importance of patient anatomy on prolapse development and repair,
such factors should be included in computational studies. Not only would such analysis provide
insight into the conditions that lead to prolapse, it would also allow for assessment of mesh
devices in the pelvic floor environment. Incorporation of these geometries would build upon the
second aim of this dissertation and allow for mesh products to be mechanically characterized in
regards to their specific use. To this end, the overall goal of this aim is to develop a
computational method for patient specific analysis of the pelvic floor. The computational tools
presented here will focus on the development of pelvic floor geometries, with the goal of
implementing these into FE studies of prolapse and mesh repair.
4.1.1 Imaging of Prolapse
In recent decades, medical imaging diagnostics have become common in the field of
urogynecology. Though computed tomography (CT) is occasionally used to examine the pelvis,
ultrasound and MRI are the most prevalent imaging modalities for examination of pelvic floor
disorders (Figure 50). Ultrasound is typically performed translabially or transperineally in order
to examine the position of structures such as the bladder, urethra, and vagina (164-166). While
transvaginal ultrasound can be used, insertion of the ultrasound probe into the vaginal lumen, in
183

concert with the compliance of the vagina, can distort the natural positioning and appearance of
pelvic floor structures. In general, ultrasound has proven useful for examining pelvic floor
support, quantifying the extent of prolapse in the anterior, apical, and posterior compartments
(167). In addition, ultrasound has been used to examine the effect of pregnancy on the pelvic
floor, providing evidence that gestation significantly impacts vaginal support (166). The main
advantage of ultrasound is that it provides a mobile, relatively inexpensive method for assessing
the pelvic floor. Furthermore, ultrasound fundamentally produces dynamic images, allowing for
the motility of structures to be examined in response to loads. Contemporary ultrasound devices
can also be used to create volumetric scans, allowing for 3D reconstruction of pelvic anatomy.
Figure 50. Ultrasound (a) and MRI (b) are commonly used to image structures of the pelvic floor. Mid-
sagittal views from each modality allow for clear identification of the bladder (B), urethra (U), vagina (V), and
rectum (R). While ultrasound is relatively inexpensive and more readily allows for dynamic scans, deformation from
the transducer and low resolution, limit the use of ultrasound for 3D reconstruction.
184

Unfortunately, the resolution of ultrasound is poor compared to other imaging modalities,
typically allowing only the boundaries of objects to be identified (since it is based on changes in
material density). Thus, ultrasound is most useful for gross diagnostics, such as determination of
structures or abnormal masses. Another limitation of ultrasound is its inability to penetrate dense
materials, meaning that organs or tissues cannot be imaged if they are positioned behind bone,
relative to the ultrasound transducer. This, combined with short penetration depths (less spatial
resolution with increasing depth), limits the ability for clinicians and researchers to view the
entire pelvic floor.
To address many of the limitations of ultrasound, MRI is widely used to visualize the
pelvic floor. Specifically, MRI has been used to extensively characterize the spatial orientation
of the vagina and other pelvic floor viscera as they relate to prolapse development (168). Further,
MRI can be used to characterize specific deficiencies that may lead to dysfunction, including
disruption of connective tissues or muscular defects (168). Perhaps the greatest strengths of MRI
is the level of detail that can be obtained, though the resolution of images is greatly influenced by
tissue composition, use of contrast, image field of view, and many additional factors. Still, planar
and volumetric MRI scans used for pelvic floor imaging often have resolutions well below 1mm.
This level of detail, combined with the ability of MRI to penetrate all biological structures,
provides sufficient data for rigorous anatomical characterization. Dynamic MRIs have also been
used to examine the displacement of pelvic floor structures in response to the application of load,
though dynamic sequences suffer from decreased resolution (168). However, compared to other
185

imaging modalities, MRI is expensive, limits a patient’s range of movement, and requires more
time for image acquisition (dynamic methods notwithstanding). Therefore, the choice between
MRI and ultrasound is dependent on the specific needs of a study.
4.1.2 Imaging of Synthetic Mesh
Often the efficacy of prolapse repair is evaluated via a post-surgical physical examination
(POPQ exam). While measurements obtained during this examination are used to quantify the
success or failure of surgery, they provide little insight into the behavior of synthetic mesh or its
contribution to the surgical outcome. To address this, several researchers have begun to use
imaging modalities to examine synthetic mesh following implantation. Specifically, ultrasound
has been the primary method for visualizing mesh devices, as it is currently the only imaging
modality in which standard polypropylene mesh can be observed, albeit at low resolutions (141,
169). Ultrasound studies have primarily focused on identifying the longevity of mesh
attachments and determining the gross positioning and deformation of mesh. Such studies have
been useful in identifying failure mechanisms of mesh repair, yet there are conflicting reports
regarding the amount of contraction (lateral deformation or “shrinkage”) experienced by mesh
in-vivo (141, 169).
Despite the ability to visualize synthetic mesh via ultrasound, this imaging modality fails
to provide a sufficient detail of mesh architecture for reconstruction. As with gross ultrasonic
imaging of the pelvic organs, ultrasound imaging of mesh suffers from limited resolution and
depth of penetration. Indeed, ultrasound produces images in which the location of the mesh
186

surface can be identified, yet neither planar images nor 3D scans provide the spatial resolution
required to identify the porous structure of mesh. Therefore, it is not feasible to use ultrasound to
examine changes in pore diameter or mesh burden following implantation.
As previously mentioned, standard (non-altered) polypropylene mesh is not visible via
MRI. Still, researchers have performed MRI scans following prolapse mesh repair in order to
assess the positioning of the pelvic viscera following reconstruction of support (170). Though
this method provides a quantitative assessment for clinical outcomes, once again it provides little
insight into the role or mechanical behavior of mesh. In order to visualize mesh via MRI, devices
impregnated with ferromagnetic particles have been implanted, though such studies have only
been performed in hernia literature (156). Unfortunately, even with the contrast provided by iron
particles there appears to be insufficient spatial resolution for identification of mesh pores
(though imaging protocols may not have been optimized for such resolutions).
4.1.3 Pelvic Floor Constitutive Models
The development of a reliable finite element model requires a great deal of inputs specific to the
physics of the boundary value problem of interest. Such inputs include geometries, boundary
conditions, and material properties. While the previous aims of this dissertation have focused on
developing and evaluating these model inputs for synthetic mesh materials, much work is still
required to assess these important aspects for the pelvic floor itself. Thus, Aim 3 is focused on
enhancing the inputs for pelvic floor FE models. In addition to developing a method for
identifying and preparing geometries of pelvic floor structures, experiments focused on
187

developing of a constitutive model for vaginal tissue will be discussed in Appendix A. While the
studies in Aim 3 do not consider the constitutive model in Appendix A, it should be noted that
the material properties of the vagina are important to consider for mesh repair simulations, as this
tissue is directly in contact with synthetic mesh and is often the site of complications.
Constitutive models are widely used in the field of biomechanics to simulate the behavior
of biological tissues. In mechanics, constitutive models simply refer to the relationship between
the deformation (extension, strain, etc.) of a material and the resistive forces (load, stress, etc.) of
the material. Hooke’s law is a classic example of a linear constitutive relationship, where force
and displacement are related through a single parameter, stiffness. Constitutive models can be
classified as either structural or phenomenological. Phenomenological models are developed
with the intent of mathematically describing a mechanical response curve for a given event,
leveraging the behavior of mathematical functions to describe some result. A common
phenomenological model in orthopedic biomechanics is known as the quasi-linear viscoelastic
theory (QLV). Quasi-linear viscoelasticity is used to characterize the time-dependent loading and
relaxation behavior of biological soft tissues (171, 172). Though parameters for
phenomenological models can often be related to the physical properties of a material, their
inclusion is not founded in the structure or organization of biological tissues. Unlike
phenomenological models, structural models are formulated by first taking into account the
tissue’s morphology, though often the tissue behavior and composition is simplified. For
biological tissues, structural models are often based on fiber families or contractile elements,
which serve as analogues for collagen fibers and actin-myosin chains (muscle). Importantly,
188

structural models are developed prior to mechanical testing of tissues and guide experimental
design, whereas phenomenological models are often retrofit to experimental results. Though this
is often the case, many testing methods are now associated with a prototype phenomenological
model (i.e. stress-relaxation testing and QLV) (173, 174).
Despite the prevalence of constitutive models in biomechanics, specifically in orthopedic
and cardiovascular fields (175-177), few pelvic floor tissues have undergone such rigorous
characterization. To date, constitutive relationships have only been considered for the levator ani
and vaginal tissues (178, 179). Still, the number of publications on this subject is extremely
limited, and a majority of previous studies include questionable testing methods or are severely
limited in terms of their application. For instance, currently only information on the passive
properties of the levator ani are known, despite the importance of its contractile component.
Further, strain measurements in this literature are often obtained using actuator displacements as
opposed to mid-substance deformation, likely over predicting tissue strains. Additionally,
constitutive models for vaginal tissue have been constructed from its passive uniaxial behavior,
leading to the exclusive use of isotropic material models (129, 180, 181). However, given the
prevalence of smooth muscle and the existence of orthogonal fiber families in vaginal tissue, it is
likely that an isotropic model, based on passive mechanics, is not optimal. Indeed, previous
studies have acknowledged stark differences in the mechanical behavior between the
longitudinal and circumferential axes (182). Furthermore, the data used to create previous
vaginal constitutive models is suspect, including predominately cadaveric tissue from elderly
patients and incorrectly reporting tissue strain (use crosshead elongation). While such models
189

may provide a starting point for FE analyses, it is unlikely that previous constitutive relationships
are representative of vaginal tissue, let alone vaginal tissue during gestation or at the time of
prolapse repair (177, 183). Unfortunately, the accuracy of such models is unknown, as validation
and parametric studies have yet to be performed.
4.1.4 Gap in Knowledge
As shown in the first two aims, mechanical loads dramatically influence the deformation of
synthetic mesh on both a micro- and macro- level scale. Importantly, it has been shown that such
deformations decrease the dimensions of individual mesh pores to diameters less than 1mm.
Such a reduction in pore size has been associated with poor clinical outcomes, resulting from an
enhanced host response. While such deformations have been observed in areas of exposure and
erosion in the pelvic floor, current imaging modalities are unable to provide significant
measurement of pore diameter in-vivo.
Though such measurements are difficult to obtain experimentally, computational models
provide a means by which such behavior can be studied. The combination of patient specific
models and the computational model developed in Aim 2, afford the opportunity to virtually
implant and assess the behavior of synthetic mesh. Specifically, geometries and displacements of
the pelvic floor can be readily, and accurately, obtained from imaging modalities and used to
drive computational models of POP. Combining patient anatomies with synthetic mesh models
190
allows for manipulation and assessment of variables that are difficult to measure experimentally.
Further, these computational simulations allow for measurements to be made without subjecting
women or animal models to potential mesh related complications.
The quality of FE simulations is highly dependent on the quality of the inputs used.
Unfortunately, current mechanical characterization of the pelvic floor is poor, with little invested
in identifying vital model parameters. While large parametric studies can be used to assess the
effects of inputs on a single structure (though such studies are currently uncommon in pelvic
floor FEA), physically accurate predictions concerning the interaction of multiple structures
(synthetic mesh and vagina, vagina and bladder), requires the geometries and mechanical
behavior of these structures to be well characterized. To this end, the goal of Aim 3 is to develop
a method for the creation of solid pelvic floor geometries for FEA and to utilize such geometries
to characterize the deformation of prolapse mesh following virtual implantation.
4.2 CREATION OF PATIENT SPECIFIC GEOMETRIES
4.2.1 3D Reconstruction of Pelvic Floor Structures
Three-dimensional reconstruction of biological structures from medical imaging modalities has
been performed across many disciplines, with a variety of experimental endpoints (164, 184,
185). A great number of these studies have utilized reconstruction techniques to investigate the
in-vivo stresses and strains experienced by biological tissues, as such measures are largely
191

impossible to obtain by other means. Though several imaging modalities have been used to
examine the pelvic floor, our laboratory, and others, have chosen to use MRI for the purpose of
reconstructing precise pelvic floor geometries (129, 181). The flexibility of MRI protocols
allows for a number of soft tissues to be visualized in the pelvic floor. In addition,
straightforward registration of multiple image sets allows researchers to leverage the differing
contrasts obtained by various MRI protocols. Such versatility, combined with excellent
resolution, allows for pelvic floor structures to be clearly identified relative to other imaging
methods.
4.2.2 MRI Protocol
MRI scans were obtained from an image repository, containing scans from a cohort of women
whom underwent clinical examination for gynecological issues, though not necessarily POP. All
MRI scans were performed at Oklahoma University using a Bruker Cliniscan, 3T MRI with IRB
approval (IRB #5057). For patients presenting with POP, a clinician reduced the vaginal bulge
before collection of images. Prior to imaging, a water-based gel (ultrasound gel) was injected
into the vaginal canal in order to provide contrast in the vaginal lumen. All images were taken
with the patient in a supine position. To leverage the injected contrast, a T2-weighted protocol
was used, with a slice thickness of 5mm and spatial resolution of 0.5078 x 0.5078mm (TE = 75,
TR = 2500). Both axial and sagittal slices were attained for each patient. In addition, axial
192

LAVA (liver acquisition with volume acquisition, slice thickness = 2.1mm) scans were used for
reconstruction, as these were found to provide additional detail on muscle location and confirm
the boundaries of bony structures (of 0.6836 x 0.6836mm, TE= 75, TR = 2500).
4.2.3 Image Segmentation
Image segmentation refers to the process by which structures of interest are isolated from a
sequence of images. In general, there are two primary types of segmentation - automatic and
manual. Automatic segmentation uses an image processing protocol to enhance and define image
features, such as boundaries, based on differences in intensity. Automatic methods are widely
used in fields such as orthopedics to quickly segment bones from CT scans, given that the
contrast between bone and other tissue tends to be high for CT images. Other methods for
segmenting require user input, such as seeding the initial location of the structure of interest,
before image processing is used to grow the selection based on image gradients. Methods that
require initial user input are often referred to as semi-automatic. Again, semi-automatic protocols
are extremely useful for image sets in which the structures of interest have distinct boundaries of
consistent intensity. Lastly, manual segmentation requires users to manually process each image
in order to identify the boundaries of the object of interest. Manual processes typically allow the
user to select image coordinates for material boundaries or trace a spline around the structure
with user selected seed points. Regardless of the method used, segmentations are used to create a
193

set of image masks. Here, a Boolean operation is used to set the image intensity outside the
selected region to 0 (black), while pixels inside the selected regions are set to 1 (white). Thus, a
3D stack of images is created, highlighting the spatial positioning of the object of interest.
Through trial and error, it was determined that both automatic and semi-automatic
methods were ineffective for segmenting many of the structures in the pelvic floor, though a
wide variety of segmentation software packages were utilized (Mimics, SimpleWare, Osirix,
Seg3D, etc). Even a custom, semi-automated segmentation script (Mathematica V9, Wolfram
Alpha, Champaign, IL), optimized to the contrast of pelvic floor images, struggled to reliably
identify the boundaries of many organs including muscles, the urethra, and vagina. Often,
automatic methods would produce vastly incomplete segmentations or include intensities that
were not part of the object of interest. Much of this difficulty can be attributed to the complex
architecture and irregular boundaries of the pelvic floor anatomy. In addition, it was not
uncommon for an object of interest to have a variable intensity between slices, limiting the
usefulness of seeding segmentation locations. As such, manual segmentation was required for all
geometries used in this study.
For this study all segmentations were perform using Seg3D (SCI, University of Utah).
DICOM (Digital Imaging and Communications in Medicine) files from both axial T2 and LAVA
imaging protocols were simultaneously imported. Since all scans were taken in the supine
position within a short time frame, without having patients exit the scanner, individual scans
were found to have good alignment. Nonetheless, image sets were aligned using point set
registration algorithm, where the locations of the right and left ischial spines were selected as
194

registration points. After images were aligned, the following structures were identified for
segmentation: vagina, bladder, levator ani muscles, pelvic bones (pubis, ischium, ilium), distal
rectum, and urethra.
Figure 51. Axial slices from a T2-weighted MRI scan were used to reconstruct patient geometries in
Seg3D. First, structures of interest were identified and then manually segmented using a variety of tracing tools.
Shown here are segmentations for the vagina (orange) and bony pelvis (green) (left). Segmentations were
reconstructed in 3D and exported as iso-surfaces (right).
Using Seg3D, the border of each structure was traced using the polyline tool and a fill
command was used to segment all pixels within the boundaries of the polyline (Figure 51). In
addition, the brush tool was used to aid in the selection of pixels belonging to a given structure.
For hollow organs such as the vagina and rectum, both the inner and outer lumen were traced
such that only the volume occupied by tissue were segmented. Collectively, axial segmentations
195

represent a stack of image masks, identifying the volume occupied by an object of interest. The
set of masks were then used to create an iso-surface of the segmented structure, which was
exported as a stereolithography (.stl) file for further processing. Stereolithography files represent
the raw, triangulated surface of an object, where triangle vertices are used to define the face
normal to the surface via the right hand rule. It must be noted that .stl files are not a solid
geometry definition. Rather, they provide the boundaries (surface) of solid objects. Before
proceeding to creation of solid geometries, surface renders of all hollow structures were
examined to ensure that the lumen had not been filled in during the segmentation process.
4.2.4 Surface Smoothing
A majority of segmentation software packages, such as Seg3D, utilize pixel (or voxel) based
segmentation methods. As such, individual pixels are identified as the object of interest and
selected for inclusion into segmentation masks. The inclusion of entire voxels results in jagged
boundaries for segmented geometries, as these segmentations are fundamentally constructed
from stacks of cubes (voxels, Figure 51). Conversely, spline based methods, such that
implemented in our custom segmentation script, do not require entire selection of voxels, but
rather construct surface geometries via lofting of splines obtained from each MRI image.
However, manual spline segmentation is a labor-intensive process and appeared to struggle in
capturing the variable thickness of the vagina. Therefore, pixels based methods were found to
provide geometries that were more representative of the anatomy, despite the rough appearance
of the surface.
196

Though more representative of tissue thickness, the sharp edges obtained from pixel
segmentation can dramatically alter the results of FE studies, leading to non-physiologic stress
concentrations and discontinuities in deformation. In addition, these sharp edges are not
representative of most biological structures (Figure 52). In order to remove jagged edges, all
geometries were subject to a surface smoothing. Smoothing was performed using 3D Coat (V4.1,
Pilgway), a voxel sculpting and uv-mapping software package. Stl files were imported into 3D
Coat and a sculpting tool was applied to the entire surface, until all sharp edges were removed.
Care was taken to avoid over-smoothing of geometries, as multiple applications of the sculpting
tool were found to eliminate anatomical features. Smoothed geometries were then exported as
.stl files for surface mesh refinement and solid meshing.
Figure 52. Raw iso-surfaces require smoothing to better approximate the shape of biological structures.
Once geometries are smoothed, an iso-parameterization algorithm was used to discretize the surface into triangle
elements. Shown here is the surface processing of a vaginal geometry following segmentation.
197

4.2.5 Finite Element Discretization
Smoothed geometries were then imported into Meshlab (Visual Computing Lab, ISTI-CNR,
Pisa, Italy) for surface discretization (“mesh”) refinement (Figure 52). First, a quadric edge
collapse decimation algorithm was applied to re-mesh (re-discretize) the surface and reduce the
total number of surface faces. The target face count for quadratic mesh edge detection was set to
50% of the original face count. This reduction was not found to noticeably alter the surface
geometry. The polygon surface was then examined to ensure that no surface triangulations were
overlapping. Next, an iso-parameterization filter was applied to the geometry, where the
minimum and maximum mesh sizes were set to 140 and 180, respectively. After iso-
parameterization of the surface, the iso-parameterization meshing filter was applied in order to
alter the discretization (“mesh”) density by varying the sampling rate. Here, higher sampling
rates are used to construct dense finite element “meshes” (discretization’s) and lower sampling
rates are used to create coarse finite element “meshes”. After a desired discretization density was
attained, “remeshed” geometries were exported once again as .stl files and imported into Gmsh
(Geuzaine and Remacle).
Once imported into Gmsh, surface models were used to create solid geometries via the
3D meshing tool. Both the number and quality of solid elements were dependent on the
dimensions and quality of surface mesh created in Meshlab. For all biological structures
198

considered in this dissertation, 4-node tetrahedral elements were used for solid discretization. All
discretized solid geometries were then exported as I-DEAS Universal (.unv) files for finite
element studies.
Figure 53. Overall procedure for the generation of anatomical geometries from patient MRI scans. Though
many software packages are available for each step, this specific protocol was found to address the challenges
associated with segmentation and discretization of pelvic floor structures from current clinical diagnostic images.
199
4.3 SIMULATION OF PROLAPSE AND REPAIR
4.3.1 Introduction
Pelvic organ prolapse (POP) effects up to 50% of women over the age of 50, yet relatively little
is known about the development of this condition (159). Despite the identification of several risk
factors, including pregnancy and increased intra-abdominal pressure (20, 28, 30), the
mechanisms that lead to prolapse remain unclear. However, given the clinical presentation of
prolapse, it is clear that this disorder results from deficiencies in the structural support of the
vagina. Surgical management aims to restore the positioning of the pelvic organs, using synthetic
mesh to reconstruct vaginal support. While many patients undergo successful surgery,
complication rates up to 20% suggest that a greater understanding of these repairs is needed (67),
especially in regards to the highly complex mechanics of the vagina and its supportive tissues.
To date, numerous studies have sought to identify biomarkers, such as altered protein
expression, in order to identify both the cause of prolapse and the undesired response to synthetic
mesh devices (16, 75, 186). Although such a marker would provide tremendous insight into the
evaluation and treatment of POP, this condition often develops decades after events identified as
main risk factors. Thus, the number of confounding factors is extensive, making it difficult to
identify a root biological cause. Rather than examining the many factors that may lead to
prolapse, characterizing prolapse development and treatment from a mechanical perspective can
200

help to narrow the biological phenomena of interest. Such approaches have proven extremely in
understanding the development of osteoarthritis and designing treatments specific to the causes
of this disorder (160).
Following from these orthopedic studies, finite element analysis (FEA) provides a
tremendous tool for efficiently and thoroughly assessing the mechanical variables that result in
dysfunction or negative biological responses. The use of such models to understand the pelvic
floor is truly in its infancy, with much of data and methods required to construct robust FE
models yet to be obtained or pursued. While previous pelvic floor models (both simple and
complex) have been useful for understanding general concepts in the pelvic floor (180, 181),
many of these studies fail to acknowledge the limitations of their assumptions, largely imposed
by the lack of reliable inputs. To further the development of pelvic floor FE models, while
enhancing our understanding of prolapse and mesh repair, the aim of this study was to develop a
computational model that simulates prolapse of the anterior vaginal wall and subsequent mesh
repair. This study will consider patient specific vaginal geometries, the presence of apical
support, mesh device deformation, and methods for mesh fixation. We hypothesize that loss of
apical support will result in anterior wall displacements representative of cystocele, while mesh
repair will restore anterior wall support, preventing the development of prolapse. In addition, we
hypothesize that tensioning of mesh will lead to significant increases in mesh burden, despite
effective treatment of prolapse.
201

4.3.2 Methods
4.3.2.1 Preliminary Study: Model Development
Geometry Preparation
A preliminary study was first conducted to demonstrate the feasibility of creating a patient
specific pelvic floor anatomy for analysis of prolapse and mesh repair. In addition, this study was
used to identify the impact of boundary conditions on FE predictions of prolapse. For this study,
a series of MRI scans were taken from a parous patient and used to reconstruct a vaginal
anatomy. Importantly, the selected patient was not clinically diagnosed with prolapse, nor was
prolapse identified in mid-sagittal MRI images taken during maximum valsalva. A parous, non-
prolapse patient was selected as this anatomy was identified as properly supported, yet at an
increased risk of developing prolapse (20-22). MRI scans used in this study were obtained using
the repository and imaging protocol described in Section 4.2.2, in accordance with the IRB at
Oklahoma University. Briefly, a water-based gel was injecting into the vaginal canal in order to
provide contrast in the vaginal lumen. With the patient in the supine position, a series of MRI
scans were taken. For this study, a T2-weighted protocol with a slice thickness of 5mm was used
for segmentation.
To reconstruct the 3D vaginal geometry, the interior and exterior surface of the vagina
was manually segmented from axial slices in Seg3D (SCI, University of Utah). Segmentation
methods are described in detail in Section 4.2.3 (Figure 54). Image masks were exported from
Seg3D and imported into 3D Coat for surface rendering and smoothing as previously outlined. It
202

should be noted that both the luminal and abluminal surfaces of the vagina underwent the same
smoothing process. Finally, smoothed surface geometries were imported in Gmsh for solid
discretization using linear tetrahedral elements to define the volume between the two surfaces
(14893 linear tetrahedral elements). For preliminary studies, vaginal tissue was modeled as a
Neo-Hookean material, where Young’s modulus (E) and Poisson ratio (ν) were set to 1.5MPa
and 0.3, respectively. These values were based on previous uniaxial studies of cadaveric vaginal
tissue, as well as findings from tensile testing of sheep vaginal tissue (187, 188).
Figure 54. An MRI scan from a parous patient was used to assess the impact of apical support on
deformation of the anterior vaginal wall. Axial slices were segmented (a) and used to create a solid vaginal
geometry, discretized using linear tetrahedral elements (b) via the protocol outlined in Figure 53.
203

For prolapse repair simulations, the mesh geometry was based on DirectFix A, a
transvaginal mesh device used to treat prolapse of the anterior vaginal wall (cystocele). Details
on the development and validation of the DirectFix A FE model are described in Aim 2. Briefly,
mesh pores were modeled as a series of continuum fibers, where the intersections between fibers
were assumed to be continuum knot structures. The pore dimensions of the FE mesh model were
2.2mm, equal to experimental measurements of undeformed pores in Aim 1 for Restorelle. Knots
and fibers were considered as two independent Neo-Hookean materials, where the material
properties (E and ν) were determined from uniaxial tensile testing of Restorelle (Section 3.2.5).
Fiber properties were determined using load-elongation data obtained when fibers were oriented
at 0° relative to the axis of loading, while knot properties were fit using data with fibers offset by
45°. All geometries were imported into FEBio (V2, MRL, University of Utah) for FEA.
Ideal Support Model
The solid vaginal geometry was imported into FEBio in order to examine the effect of boundary
conditions on the deformation of the anterior vaginal wall. First, boundary conditions for the
“ideal” support model were determined. Based on anatomical dissections, surgeon feedback, and
literature examining vaginal support, the entire outer surface of the proximal vagina was fixed in
the z-direction, meaning that this surface could not move distally (Figure 55). This fixation
represents level I support, which is provided by the cardinal and uterosacral ligaments.
Specifically, level I support maintains the position of the uterus and upper vagina (6). In
addition, the entire outer surface of the distal vagina was fixed in the z-direction, representing
204

attachment to the perineal body. While there is likely some descent of the distal vagina in
response to in-vivo loading (valsalva), the lack of information regarding this attachment
introduced an unknown variable. Therefore, the impact of this attachment was limited by
restricting the displacement of this boundary. Finally, the anterior aspect of the distal vagina was
fixed in all 3 axes, simulating rigid attachments of the perineal body in association with the pubic
bone. This is justified by the examination of dynamic MRIs of women presenting with cystocele.
During valsalva, the anterior distal vagina serves as a pivot point, about which the anterior wall
moves, suggesting that this point remains relatively fixed. While there is likely contact of the
vagina with other organs (bladder, rectum, etc.), such boundaries were not included in this study
in order to maintain the simplicity of this model.
To simulate increased abdominal pressure, such as that applied during valsalva, a traction
force was applied to the anterior surface of the mid to distal vagina. The traction force was
applied at an angle of -63°, with a magnitude of 1.55N. The magnitude of this vector was chosen
as it was found to produce deformations similar to that of cystocele under the prolapse boundary
conditions discussed below. As such, it must be noted that this study is based only upon
deformations and the changes in observed displacements. Additional model inputs (material
parameters, boundary conditions, etc.), as well as validation of such inputs, are required before
predicted stresses and reaction forces can be considered reliable.
205

Figure 55. Mid-sagittal view of the FE vaginal geometry. To simulate “Ideal” vaginal support the entire
apex of the vagina was fixed in the z-direction (black lines), in addition to z-fixation of the distal vagina. Further, a
portion of the superior-posterior surface of the vaginal wall was fixed in the y-direction. A traction force was applied
to the mid-distal anterior vaginal surface to simulate loading via abdominal pressure.
Prolapse Model
Anterior wall prolapse is widely associated with defects in the apical support (level I) of the
vagina, as strong correlations have been found between the support of the vaginal apex (C
measurement in POPQ exam) and the degree of prolapse of the anterior vagina (Ba measurement
in POPQ exam) (189). In addition, disruption of apical supports has been found to result
cystocele formation for planar vaginal geometries during FEA (180). Using these findings, a
prolapse model was derived from the ideal support scenario by removing the z-constraint from
206

the anterior, proximal (apical) vagina. All other boundary conditions and applied tractions were
unchanged from the ideal support model. As the properties of the vagina and in-vivo loading
conditions of the vagina are unknown, it should be noted, once again, that the magnitude of the
anterior traction vector was altered using the prolapse model in order to develop geometries
representative of prolapse. Therefore, this condition serves as a baseline for assessing the impact
of apical support and mesh repair on the deformations of the vagina. It was determined that a
traction force applied at an angle of -63°, with a magnitude of 1.55N, produced deformations
representative of prolapse.
Figure 56. Mid-sagittal view of the FE vaginal geometry. To simulate the development of prolapse, an
apical defect was considered by removing the superior-anterior apical support. All other boundary conditions and
model parameters were unchanged from the “Ideal” support model.
207

Prolapse Repair
To simulate prolapse repair, a discretized DirectFix A geometry was imported into the prolapse
model and positioned parallel to the anterior vaginal surface, such that the inferior aspect of the
device was along the urethro-vaginal junction. A traction vector was then applied to the entire
DirectFix A geometry along the y-direction, displacing the mesh posteriorly in order to conform
the mesh to the anterior surface of the vagina. A sliding contact (augmented Lagrangian) was
implemented to prevent the penetration of mesh and vaginal geometries. After conforming to the
vaginal surface, the mesh was “sutured” to the vagina using a series of 8 tied contacts placed
about the perimeter of the mesh body.
Figure 57. Anterior view of the FE vaginal geometry with attached DirectFix A mesh. Tied contacts were
used to simulate suture attachments of the mesh to the vagina (red circles). For both untensioned and tensioned
models, each mesh arm was fixed in the x, y, and z-directions. All additional model parameters were unchanged
from the apical defect model.
208

Following attachment to the vagina, 2 mesh repair scenarios were considered. In the first
case, the most distal portion of each of the 4 mesh arms were fixed in all in the x, y, and z-
directions, as they were positioned following attachment to the vagina. This was considered the
untensioned mesh case, as it simulates a scenario in which the surgeon does not apply force prior
to fixing the mesh arms. This scenario is largely hypothetical, as the positioning of the mesh
arms do not reflect the anatomical locations in which transvaginal mesh is fixed clinically. In
addition, a tensioned mesh case was considered, in which a traction vector (8.9N magnitude ≈
2lbs) was applied to each mesh arm. Mesh tensioning was completed in 2 steps. First, the
traction vector was applied along the x-axis resulting in a predominately planar mesh
deformation. Next, the traction vector was directed posteriorly at a 45° angle, relative to the x-y
plane. Finally, the most distal portion of each of the 4 mesh arms was fixed (in x, y, and z) in the
tensioned state. Again, it should be noted that the tensioned case does not necessarily reflect
anatomical mesh fixation, as the locations of the mesh arms are not necessarily at the pelvic
sidewall. All boundary conditions and anterior traction loads were identical to those used in the
prolapse model, outside of those implemented for mesh contact and attachment.
4.3.2.2 Prolapse Patient
Geometry Preparation
Next, mesh repair was assessed considering the prolapsed anatomy and the anatomical locations
for mesh fixation. For this study, MRI reconstruction utilized scans of a parous patient whom
was clinically diagnosed with prolapse. POP was confirmed upon visualization of anterior
209

vaginal wall via a mid-sagittal MRI image taken during maximum valsalva. Prior to imaging,
prolapse was reduced and remained reduced for baseline (resting) scans. Once again, MRI scans
were obtained using the repository and imaging protocol described in Section 4.2.2. For this
patient a registered set of a T2-weighted and LAVA scans were used for segmentation.
Figure 58. An MRI scan from a patient presenting with prolapse was used to assess the impact of
anatomical mesh attachment during surgical repair. Axial slices were segmented (a) and used to create a solid
vaginal geometry, using linear tetrahedral elements (b). In addition, the bony pelvis was segmented in order to
identify anatomical mesh attachment sites.
In this study, both the vagina and pelvic bones were manually segmented using axial
slices in Seg3D, as described in Section 4.2.3. Surfaces for vaginal and bone geometries were
individually reconstructed and smoothed (see 4.2.3, 4.2.4). While both surface geometries
underwent isoparameterization and refinement, only the vaginal geometry was imported into
210

Gmsh for solid “meshing” using linear tetrahedral elements. To reduce computational expense,
the pelvic bones were modeled as rigid bodies, thus only surface definitions for this structure
were required. This was justified, as stiffness of bone is much greater than that of soft tissues. In
addition, bony geometries served as anatomical landmarks and no forces were applied to this
structure during FE simulations.
The patient-specific vaginal geometry was modeled using a Neo-Hookean ground
substance with embedded fibers, distributed in a spherical orientation. This fiber orientation
allows for fiber recruitment along the direction of loading, as fibers develop force in tension.
Conversely, embedded fibers do not provide resistance to compressive force. As such, the
compressive and initial tensile behavior of the vagina is governed by the Neo-Hookean ground
substance, while tissue behavior at higher strain is governed by the embedded fibers. Here, fiber
strain energy is given by:
𝑊𝑊 = 𝜉𝜉𝛼𝛼
(𝑒𝑒𝛼𝛼(𝐼𝐼𝑛𝑛−1)𝛽𝛽 − 1) 4.1
where ξ > 0, α > 0, β ≥ 2, and In is the square of the fiber stretch ((λn)2). For the FE model in this
study, the following values were used: ξ = 10, α = 1, and β = 2. In addition, Neo-Hookean
parameters representing the ground substance remained as E = 1.5 and ν = 0.3. Upon
convergence testing, considering the displacement of the vaginal bulge, a vaginal model
consisting of 6138 linear tetrahedral elements selected for use in all FE simulations. For prolapse
repair simulations, a validated model of DirectFix A (Aim2) was considered.
211

Ideal Support Model
For all simulations, the bony pelvic and vaginal geometries were included. In this study, the bony
pelvis was considered a rigid body and a rigid constraint was used to fix the pelvis along the x, y,
and z-axes. Similar to the preliminary study, an “ideal” vaginal support model was considered.
Again, the proximal vagina was fixed in the z-direction, representing level I support, while the
entire outer surface of the distal vagina was fixed in the z-direction, representing attachment to
the perineal body (Figure 59). Finally, the anterior aspect of the distal vagina was fixed in all 3
axes, simulating rigid attachments of the perineal body in association with the pubic bone. In
order to simulate in-vivo loading, a force of 4.5N was applied to the mid to distal portion of the
anterior vaginal at a -63° angle to the x-y plane.
Figure 59. Mid-sagittal view of the FE vaginal geometry reconstructed from a women with prolapse.
Shown here are the boundary conditions considered for an “ideally” supported vagina.
212

Prolapse Model
The prolapsed vaginal geometry was used to simulate anterior wall prolapse, again assuming an
apical support defect. As such the proximal, anterior edge of was not fixed, while the proximal
posterior edge was fixed in the z-direction as implemented previously. Further, the entire outer
surface of the distal vagina was fixed in the z-direction as this represents attachment to the
perineal body and the anterior aspect of this selection was fixed in all x, y, and z. In addition, a
force of 4.5N was applied to the mid to distal portion of the anterior vaginal at a -63° angle to the
x-y plane to simulate increased intrabdominal pressure during valsalva.
Figure 60. Mid-sagittal view of the FE vaginal geometry reconstructed from a women with prolapse. All
boundary conditions and model parameters were similar to the “ideal” support model described in Figure 59, except
for the removal of the fixed boundary at the anterior apex.
213

Prolapse Repair
For simulation of prolapse repair, the validated model of DirectFix A was imported into the
prolapse simulation model and positioned parallel to the anterior vagina. A pelvic floor
reconstructive surgeon positioned the device and marked the locations for suture attachment,
specific to the vaginal geometry and based on best clinical practice. A traction vector was then
applied to the entire surface of the DirectFix A geometry in the y-direction, while the vagina was
fixed in x, y, and z. A sliding contact interface was defined between the mesh and anterior vagina
to prevent the penetration of mesh and vaginal geometries upon displacement of the mesh. After
conforming to the anterior vaginal surface, the mesh was “sutured” to the vagina at 5 locations
identified by the reconstructive surgeon using tied contacts (Figure 61).
Once again, two mesh repair scenarios were considered (Figure 61). In the first case, the
most distal portion of each of the 4 mesh arms was fixed in the x, y, and z-directions in their
configuration following attachment to the vagina. As with the previous patient, this was
considered the untensioned mesh repair case. In addition, a tensioned mesh scenario was
constructed, where the mesh arms were tensioned using prescribed displacements derived from
the anatomical fixation points. To determine the anatomical attachment sites, the bony pelvis
geometry was used. First, the 3D coordinates of the ischial spines (left and right), and the most
distal tip of the sacrum were determined (Figure 62). The line between the ischial spine and tip
of the sacrum were assumed to represent the path of the sacrospinous ligament, the attachment
214

point for the superior arms of DirectFix A. For this study, the superior mesh arms were fixed at
the midpoint of the sacrospinous ligament. In addition, the 3D coordinates of the left and right
obturator foramen were identified for inferior mesh arm fixation.
Figure 61. For simulation of prolapse repair, two configurations of the mesh device were examined. First,
an untensioned mesh repair was considered. Here, the mesh was fixed to the anterior surface of the vagina using a
series of ties contacts (left, red circles), and the distal tips of all mesh arms were fixed. In addition, a tensioned mesh
model was considered (right). In this scenario, mesh arms were tensioned to anatomical fixation sites and then fixed.
Using the coordinates of these attachments and the most distal portion of their respective
mesh arms, the displacement vector for each arm was determined. Again, mesh tensioning was
completed in 2 steps, with the first step applying the x and y components of the displacement
215

vector. After this step was completed, the z displacement was applied to complete positioning the
mesh arms. This step-wise method was found to dramatically enhance the convergence of mesh
positioning. Finally, the most distal portion of each of the 4 mesh arms was fixed (in x, y, and z).
Figure 62. To simulate implantation of synthetic mesh for prolapse repair, the bony pelvis was used to
identify the 3D coordinates for mesh arm fixation (a). After identification of these attachment sites, a computational
mesh model was fixed to the anterior surface of the vagina, and the mesh arms were “tensioned” to their anatomical
fixation sites utilizing a displacement driven finite element simulation (b)
216

4.3.2.3 Computational Measures
In order to quantify the effect of apical support and mesh repair on model deformation,
measurements of the vagina and mesh were made following the application of the anterior
surface load. To characterize vaginal deformation, the total displacement of the anterior apex and
vaginal bulge were reported. Total displacements were determined by selecting a group of
elements in the undeformed geometry and tracking their movements for each scenario. It should
be noted that total displacement is a combined measure of the individual x, y, and z
displacements for an element. For mesh repair trials, 3D mesh burden was determined as
outlined in Section 3.2.6.1. Briefly, the local density of nodes was computed by summing the
total number of nodes within a sphere with a 2mm radius. This local density value, termed mesh
burden, was determined for each node of the discretized DirectFix A geometry. In addition,
normalized mesh burden was determined by dividing each mesh burden value by the maximum
mesh burden of the undeformed DirectFix A geometry. Therefore, normalized mesh burden
provides a measure of the local increase in mesh concentration. Displacement post processing
was performed in PostView (MRL, University of Utah), while mesh burden measurements were
obtained using a custom Mathematica script (V10, Champaign, IL). Since all measures were
performed on a single patient no statistical analyses was completed.
217

4.3.3 Results
4.3.3.1 Preliminary Study: Model Development
In each case, the vagina underwent noticeable displacement in response to the anterior load, with
the anterior vaginal wall contacting the posterior wall (Figure 63). In general, maximum
displacements were observed at the distal vagina, as this portion contacted the posterior wall,
before sliding distally towards and past the hymenal ring. Interestingly, during prolapse
simulation, this contact resulted in substantial displacement (~3.8cm) of the posterior-distal
vagina, just at the attachment to the perineal body. Upon inspection, this result appears consistent
with MRI observation of prolapse during valsalva. Apical support eliminated much of the
displacement observed in the prolapse case, with apical and vaginal bulge displacements
decreased by ~104% and ~215%, relative to prolapse simulations.
Both prolapse repair methods considered for this patient were effective in reducing the
displacements of the anterior vaginal wall following removal of the anterior apical support. For
untensioned mesh, vaginal bulge displacements were nearly identical to those observed under
conditions of ideal support, though apical descent remained nearly twice that of the ideal model
(Table 6). Unsurprisingly, untensioned mesh did not result in a dramatic change in mesh burden,
as maximum normalized mesh burden increased just 13% after the application of the anterior
load. Overall, mesh pores appeared relatively unchanged, with no obvious locations of increased
mesh burden.
218

Figure 63. Contour plots of total displacement obtained using a parous, nonprolapse vaginal geometry.
Shown is a mid-sagittal view of the undeformed geometry (a) and the deformations observed following the
application of anterior load for the ideally supported (b), apical defect (c), untensioned mesh repair (d), and
tensioned mesh repair (e) models. The top circle (a) indicates the location of the anterior apex, while the bottom
circle (a) represents the leading edge of the anterior wall prolapse.
Despite reducing the overall displacement of the anterior wall, mesh tensioning was less
effective in terms of reducing the presence of a vaginal bulge. Specifically, the displacement of
the vaginal bulge remained at 5.57cm; nearly 2cm more than that observed for ideal and un-
tensioned mesh scenarios. In addition, 8.9N of tension dramatically altered the overall
appearance of both the vagina and the DirectFix A mesh. Notably, the apex experienced a greater
descent, with increased anterior movement, relative to the ideal and untensioned mesh cases,
219

with a total displacement of 5.28cm. Furthermore, tensioning of mesh to 8.9N led to a dramatic
rise in mesh burden, with increases in mesh per unit volume of 220%. Regions of pore collapse
were easily identifiable, with dramatics increases in mesh burden in the inferior mesh arms and
the superior mesh body between the superior mesh arms (Figure 64).
Table 6. Predicted displacements of the vaginal apex and leading edge of the anterior vaginal bulge following
application of anterior traction forces for a parous, nonprolapse patient geometry. The maximum effective stress in
the vagina was also determined for all models. In addition, the maximum normalized mesh burden was determined
for mesh repair models, following application of the anterior load. Here, mesh burden (mesh/mm3) was normalized
by the maximum mesh burden of the undeformed DirectFix A geometry.
220
Figure 64. Contour plots of normalized mesh burden for 3D DirectFix A geometries following application
of the anterior vaginal load. Shown are the untensioned (left) and tensioned (right) scenarios. Plots shown are a
projection of the 3D geometry onto the xz-plane. Mesh burden values (mesh/mm3) were normalized by the
maximum mesh burden for the undeformed DirectFix A geometry.
4.3.3.2 Prolapse Patient
Overall, the vaginal anatomy for the prolapse patient appeared to have an increased vertical
orientation relative to the parous, nonprolapse patient. In addition, MRI scans of this patient
allowed for a greater length of the vagina to be segmented, with the entire introitus and vaginal
apex included in all simulations. Similar to the previous patient, application of load to the
anterior vaginal surface resulted in posterior displacement of the anterior wall, before contacting
the posterior vagina and descending distally towards and past the hymen (Figure 65). However, it
was noted that much of the displacement of the anterior wall was directed in z-direction
221

(distally), with less posterior movement compared to the previous patient. As such, the total
displacement for the vaginal bulge and apex were noticeably lower, at 3.21cm and 2.38cm,
respectively. Still, this displacement produced a distinct vaginal bulge, extending outside of the
inroitus, representative of Stage 3 prolapse. Again, the deformed vaginal geometry demonstrated
good agreement between model predictions and MRI observations of POP.
Figure 65. Contour plots of total displacement obtained using a prolapse vaginal geometry. Shown is a
mid-sagittal view of the undeformed geometry (a) and the deformations observed following the application of
anterior load for the ideally supported (b), apical defect (c), untensioned mesh repair (d), and tensioned mesh repair
(e) models. The top circle (a) indicates the location of the anterior apex, while the bottom circle (a) represents the
leading edge of the anterior wall prolapse
222

Interestingly, ideal support did not appear to eliminate symptomatic prolapse, as the
displacement of the vaginal bulge was 2.53cm for this scenario. Though this displacement is a
21% decrease relative to the apical defect case, the presence of the vaginal bulge remains
substantial, resting below the level of the hymen. Unsurprisingly, addition of apical support
limited the displacement of the vaginal apex, with almost no displacement observed at this
location (Table 7).
Table 7. Predicted displacements of the vaginal apex and leading edge of the anterior vaginal bulge following
application of anterior traction forces for a prolapse patient geometry. The maximum effective stress in the vagina
was also determined for all models. In addition, the maximum normalized mesh burden was determined for mesh
repair models, following application of the anterior load. Here, mesh burden (mesh/mm3) was normalized by the
maximum mesh burden of the undeformed DirectFix A geometry.
223

Figure 66. Contour plots of normalized mesh burden for 3D DirectFix A geometries following application
of the anterior vaginal load for untensioned (left) and tensioned (right) mesh repair scenarios. Plots shown are a
projection of the 3D geometry onto the xz-plane. Mesh burden values (mesh/mm3) were normalized by the
maximum mesh burden for the undeformed DirectFix A geometry.
Unlike the ideal support case, both prolapse repair methods considered for this patient
were effective in reducing the displacements of the vaginal bulge and apex. Overall, the
deformation of the distal vaginal was similar between these two models, as the total
displacement of the vaginal bulge was reduced by 40% and 43% for untensioned and tensioned
repair models (Table 7). For each mesh repair case, it was noted that the vaginal bulge came to
rest about the level of the hymen, in contact with the posterior wall of the vagina. Again, the
displacements of the vaginal apex were decreased ~43% for both mesh repair models, though
their appearance slightly differed. Specifically, tensioned mesh repair appeared to create a
depression in the anterior vaginal surface, at the superior portion mesh body, following
application of force to this model (Figure 64e). Although such deformation was not further
224

quantified, it was noted that this location was found to have a significant amount of pore
collapse. While both untensioned and tensioned repairs resulted in apparent relief of prolapse,
tensioning of mesh greatly increased the mesh burden. Following anatomical tensioning, mesh
burden was increased 70% relative to the undeformed DirectFix A geometry. For the tensioned
model, pore collapse only occurred in the superior mesh body, between the superior mesh arms.
4.3.4 Discussion
In this study, a computational method for simulating the in-vivo mechanical loading of the
vagina was established in order to model the development of POP. In addition, patient specific
anatomies were combined with computational synthetic mesh geometries to examine the
interaction between a transvaginal mesh device, DirectFix A, and vaginal tissue following repair
of POP. Importantly, this study found that removal of apical support alone could result in the
development of prolapse for non-pathological vaginal geometries. However, restoration of this
support was not sufficient to eliminate the development of a vaginal bulge in a patient presenting
with prolapse. In addition, this study demonstrated that DirectFix A was effective in reducing the
descent of the anterior vaginal wall, though tensioning of mesh was found result in a significant
decrease in the diameters of mesh pores, with over a 70% increase in mesh burden in the superior
portion of the device. Importantly, it was demonstrated that the anatomy of a patient impacts the
manner by which prolapse develops, in addition to the deformation experienced by mesh
products following implantation.
225
The results of this study suggest that apical support is a vital component for preventing
prolapse of the anterior vaginal wall. Removal of this support from the non-prolapsed anatomy
permitted vaginal displacements representative of a cystocele. Indeed, apical support is widely
believed to play a role in the development of prolapse and has been implemented in simple FE
studies to model cystocele formation (180, 189). However, the addition of this support to the
prolapsed vaginal anatomy was not successful in eliminating symptomatic prolapse, with the
vaginal bulge remaining below the level of the hymen. Though apical defects are strongly
correlated with anterior prolapse (189), this finding suggests that factors other than apical
support may provide mechanisms by which a cystocele can develop. The result from the
prolapsed anatomy simulation, in concert with the observation that the prolapsed vaginal
anatomy was highly aligned with the vertical axis, suggests that the anatomy has remodeled
throughout the progression of prolapse. The increased vertical alignment of the vagina may result
from deficiencies of the levator ani muscles, which serve to pull the distal vagina anteriorly,
thereby angling the vaginal apex posteriorly towards the sacrum (17). Loss of this function
would allow the distal vagina to move posteriorly, placing the apex directly above the inroitus. In
this configuration, downward pressures would deform the anterior vaginal wall, predominately in
the distal direction, with minimal contact with the posterior vagina. Conversely, posterior
angling of the vagina would produce contact between the vaginal walls, providing resistance to
the downward displacement of the anterior vagina. Alternatively, remodeling of vaginal length or
level 2 support may greatly influence the extent of prolapse. For instance, increased mid- to
distal- support (level 2), such as that provided by mesh repair, was found to eliminate
226
symptomatic prolapse for both patient anatomies. Additionally, increased vaginal length may
reduce the boundary effects imposed by apical support. As such the distal vagina may be free to
distend regardless of the presence of apical support. While rigorous FE studies considering a
wide range of vaginal geometries is required to substantiate such conclusions, the current study
clearly demonstrates the importance of vaginal geometry on the observed deformation of the
vagina following application of load.
Though mesh repair was generally successful in reducing prolapse, the mesh body
between the superior mesh arms was found to experience significant deformation for both
tensioning protocols used here. This is of particular interest, as this site is a common location for
pain and mesh erosions in women whom have undergone transvaginal mesh surgery (65).
Additionally, clinicians are often able to palpate a “ridge” of mesh at this location from the
vaginal lumen. While these findings are identical to those observed in Aim 2, the results from
this study demonstrate that such deformations can occur following clinical fixation of mesh arms
in the pelvic floor. Therefore, this study provides convincing evidence that mechanical
deformations result in the collapse of mesh pores at this site, increasing the likelihood of the poor
clinical outcomes (86, 87).
Supporting this finding, posterior-lateral tensioning of the mesh arms to 8.9N
(preliminary study) led to dramatic pore collapse in the mesh body, between the superior arms,
with mesh burden increasing by 120%. Similarly, the act of displacing the superior mesh arms to
the sacrospinous ligament, resulted in a mesh burden increase of ~70% at this same location.
This deformations is nearly identical to those observed during experimental and FE sensitivity
227

studies performed in Aim 2, though the boundary conditions in this study are increasingly similar
to in-vivo loading conditions (3D tensioning and attachment to a vaginal geometry). The
consistency of this deformation across many loading conditions, specifically upon virtual
implantation in the pelvic floor, provides strong evidence that DirectFix A has an increased risk
of negative outcomes in this location.
While stress maps do not necessarily reflect accurate measures for vaginal tissue (Table 6
and 7), they are useful for understanding the transmission of force through the mesh architecture
(Figure 67). These plots demonstrate that a majority of force is transmitted from the mesh arms
to the locations of suture attachment, in agreement with results from Aim 1. As such, it is
interesting to note that the pore collapse of the inferior arms and superior mesh body occurs at
small forces, corroborating the ease with which mesh pores oriented at 45° deform in response to
mechanical loading. However, accurate and validated properties of vaginal tissue are required
before tissue stress concentrations can be evaluated, limiting the usefulness of those values
reported here. Such data would provide insight into the occurrence of stress shielding following
implantation of prolapse mesh, which may be of particular interest at mesh fixation sites or areas
of increased mesh burden (77). Still, these preliminary results demonstrate the nonhomogeneous
distribution of force throughout complex mesh geometries, creating relatively high
concentrations of force in the tissue at the suture locations, while the remaining vagina is largely
unloaded. Given the mechanosensitive behavior of vaginal tissue (26), excessive loading, or
absence of loading, may dramatically alter tissue homeostasis.
228

Figure 67. Contour plot of effective stress for DirectFix A, with tensile forces applied at various loading angles (a.
upper arm 15°, lower arm 0°, b. upper arm 45°, lower arm 20°). Cooler colors represent lower stress values, while
warmer colors represent greater stress values.
To our knowledge this was the first finite element study of the pelvic floor to utilize
patient specific anatomy to simulate prolapse and subsequent mesh repair. Though previous
studies have simulated cystocele and rectocele development, the vaginal models used were
229

greatly simplified, using 2 uniform rectangular prisms to represent the anterior and posterior
vaginal walls (180, 181). Further, these geometries were not connected and therefore did not
represent the tubular, non-uniform thickness of the vagina. While such geometric simplifications
are useful for understanding basic movements of the vagina, it greatly alters the boundary
conditions of this problem, thereby altering the deformations of the vagina. In addition to the
many model variables that were unknown in these studies, the lack of geometric accuracy adds
additional uncertainty to simulation outcomes. More concerning was the lack of consideration
for the effect of these assumptions, and the absence of quantitative model validation. Rather, the
methods developed and used in the current study, greatly advance the reliability of pelvic floor
models through the inclusion of patient specific anatomies. Still, the present model suffers from a
lack of reliable model inputs (in-vivo loads, tissue properties, etc.) and sufficient validation to
assess the accuracy of the approximations made. Nonetheless, accounting for the geometry of the
pelvic floor allows for an increasingly accurate representation of the boundary conditions in this
environment, leading to better predictive capabilities for such models.
Despite the novelty of this study, they are several limitations that must be kept in mind
when interpreting these results and expanding the scope in future studies. Again, it must be noted
that there is currently is no rigorous or validated material model for the vagina, let alone
characterization of prolapsed vaginal tissue. Previous studies have assumed the vagina to be an
isotropic material, utilizing Neo-Hookean or Mooney-Rivlin models to represent this tissue (129,
180, 181, 188). While the appropriateness of such models has not been assessed in terms of the
mechanical response, structurally, vaginal tissue is not an isotropic material, as it contains
230

distinct fiber orientations in both the longitudinal and circumferential axes. This fiber orientation
has even been shown to result in differing mechanical behaviors between these axes (182). The
current study improves upon a previous hyperelastic models by incorporating embedded fibers in
a Neo-Hookean ground substance, however this implantation only considers 1 fiber family,
rather than the 2 orthogonal fiber families present in vaginal tissue. Better characterization of the
fiber families present in vaginal tissue, as well as the interaction between these families (cross-
links, etc.), it vital to predicting the mechanical behavior of anisotropic tubular structures, such
as the vagina. Further, mechanical characterization of vaginal tissue is required in order to
develop such a robust material model.
In addition, it must be noted that while the appearance of prolapse is similar between
computational models and mid-sagittal slices, there is no quantitative validation of the model
deformation. To fully understand the limitations and application of FE prolapse models and
repair validation studies are required. Medical imaging modalities may prove useful in validation
of the computational models proposed here, as a known load or displacement can be applied to a
subject anatomy. The resulting deformation behavior can then be compared with computational
predictions for the vagina or vagina-mesh complex. Such validation would be similar to those
completed for hip FE models and can be performed with clinical patients, cadavers, or animal
models (162).
231

4.4 CONCLUSIONS
The use of computational modeling in the field of urogynecology is largely in its infancy, as
many of the required model inputs are unknown or poorly characterized. Still, there is great
potential for the use of finite element modeling in the pelvic floor to increase our understanding
of disorders and predict the impact of clinical treatments prior to surgical intervention. In order
to enhance the quality of computational simulations of the pelvic floor, it is imperative that
researchers focus on characterizing this environment and validating the behavior of
computational models.
In Section 4, a method for creating patient specific geometries of the pelvic floor was
developed. In turn, these geometries were utilized in finite element studies to simulate the
development of prolapse and subsequent mesh repair. This work represents the first attempt to
simulate the development of POP using solid, 3D finite elements that represent the anatomical
geometry of the vagina. While the simulations here are limited, given the lack of inputs
discussed above, this model is quite representative of the deformations observed in the clinical
presentation of a cystocele. As such, it has proven useful in determining the impact of supportive
structures, including mesh implantation, on the displacement of the anterior vaginal wall.
Though validation is required to assess the accuracy of such models, the methods presented here
clearly demonstrate the ability of computational models to analyze vaginal support, as well as the
232

development of prolapse and clinical treatment. Alone, this model allows for a wide range of
variables to be considered, furthering our understanding of prolapse and mesh repair. Still, if
model accuracy is desired, the inputs of this model must be improved.
To this end, the work presented in Section 4 has dramatically improved the geometries
used for computational analyses of the pelvic floor. The inclusion of actual surface geometries,
variable vaginal cross-sections, and the orientation of the vagina in the pelvis, provides a more
accurate representation of the pelvic floor and may greatly improve predictions of its overall
mechanical behavior. For instance, a non-homogenous vaginal cross-section should dictate the
manner in which the vaginal wall descends in response to application of force. Assuming
homogeneous material properties, thinner vaginal cross sections are more likely to buckle
relative to thicker cross sections. As such, these thin sections may result in regions of increased
displacement (such as the vaginal bulge). In addition, vaginal orientation may noticeably impact
the deformation of the vaginal wall. Specifically, one would expect vertically oriented vaginal
geometries to result in displacements that are predominately in the distal direction (Patient 2),
relative to geometries with increased horizontal alignment. Again, accurate material models and
measured in-vivo forces are required in order to improve these simulations, however, the
inclusions of accurate geometries is a significant advancement for this field.
233

5.0 CONCLUSION
Overall, this dissertation has thoroughly examined the mechanical behavior of synthetic mesh,
considering its use for the repair of pelvic organ prolapse (POP). Through the use of
experimental testing and computational simulations, a tool to predict the response of synthetic
mesh products has been developed and implemented to evaluate mesh in the pelvic floor. The
findings presented here are crucial to the field of urogynecology and engineers working to
improve treatments for pelvic floor disorders.
5.1 CLINICAL IMPLICATIONS
First, the deformation of synthetic mesh was examined in response to uniaxial loads. While ex-
vivo tensile testing of prolapse mesh has become quite common, this dissertation was the first to
quantify the change in textile properties in response to mechanical forces. Importantly, it was
shown that the porosity and pore diameter of mesh devices approach 0 with increasing tensile
forces. This deformation is particularly concerning given that meshes consisting of small pores
are associated with increased complication rates, relative to wide-pore devices (78, 85). Though
234
the impact of pore size has yet to be scientifically examined in the pelvic floor, overwhelming
clinical evidence has found lightweight (often wide-pore) prolapse mesh to be superior, yielding
fewer complications. Nevertheless, the impact of pore size on biological outcomes has been well
documented in the hernia mesh literature. Specifically, many studies have demonstrated that the
host response to polypropylene mesh is enhanced when pore diameters are less than 1mm.
Though nearly all prolapse meshes in use today meet this design criteria in their unloaded state,
this dissertation suggests that the mechanical forces applied during surgical tensioning or in
response to in-vivo loads, results in mesh pores which are less than 1mm in diameter. This
concept is important for clinicians to consider when placing mesh devices.
In addition, Aim 1 demonstrates that the manner in which synthetic mesh is fixed to a
substrate, significantly alters the surface deformation in response to uniaxial loading.
Specifically, discrete point loads where found to increase the amount of surface wrinkling,
relative to mesh secured along the entire boundary. Bunching or wrinkling of mesh is commonly
associated with locations of exposure, suggesting that increased mesh burden, resulting from
wrinkling deformations, likely enhances the local immune response (102). Clinically, synthetic
mesh is subjected to point loads via suture fixation, meaning that surgeons and vendors must
consider both the number and the locations of suture placement. By placing sutures at ideal
locations, surface wrinkling of mesh can be reduced, or potentially eliminated, to optimize mesh
devices and procedures.
235

In the second aim, a novel computational model for synthetic mesh was developed and
validated, comparing the experimental and simulated deformation of a transvaginal mesh
product. This computational model was then used to examine the deformation a transvaginal
mesh in response to a variety of loading conditions. For this specific mesh product, DirectFix A,
it was determined that the magnitude of tensile force was the main factor driving increases in
mesh burden, with significant pore collapse at just 1N. In addition, the location of maximum
mesh burden was impacted by alteration of the upper arm loading angle. Per a clinician specified
suturing technique, superiorly directed tensile forces greatly increased mesh burden between the
upper arms, though pore collapse (measure by the number of pores < 1mm in diameter) was
substantial for all loading angles at 1N. This computational tool is of tremendous importance for
the field of urogynecology. The ability to simulate a variety of loading conditions provides an
appreciation for the extent to which actual mesh devices (as opposed to strips of mesh for
uniaxial testing) deform. The versatility of this model allows for a wide array of pore dimensions
and product designs to be assessed, and provides a strong visual representation of the mechanical
loading of mesh products that is relatable to clinicians.
The final aim combined this computational model for synthetic mesh with patient
anatomies in order to simulate cystocele and examine the deformation of mesh following
implantation in the pelvic floor. Through the use of finite element modeling, it was shown that
apical support defects result in the development of prolapse for certain patient anatomies.
Importantly, it was demonstrated that tensioning of DirectFix A to anatomical fixation sites,
greatly increases the amount of mesh burden, with a dramatic reduction of pore diameter in the
236

region between the superior mesh arms. The methods utilized in this aim are of great clinical
importance, and have the potential to transform the treatment of POP. Specifically, these tools
allow for mesh devices to be assessed in the pelvic floor environment prior to implantation,
allowing for a new generation of devices to be optimized specifically for use in the pelvic floor.
More importantly, clinicians can utilize these techniques to identify surgical fixation sites and
select an optimal mesh design based on the needs of a specific patient. Such pre-surgical
planning will minimize undesired mesh deformations and reduce the complication rates
associated with synthetic prolapse mesh.
As a clinician interpreting the findings of this dissertation, one must note that all the
results presented provide a time zero perspective of synthetic mesh following implantation. In
other words, the experimental and computational methods used here, ignore the potential effects
of tissue ingrowth or the foreign body response on the structural mechanics of mesh. Though
some may consider this a limitation, the concepts (pore diameter, tensioning, etc.) presented in
this dissertation are most prevalent during surgical placement and in-vivo loading immediately
following mesh implantation. At these critical time points, mesh devices are subjected to
mechanical loads that dictate their configuration for the remainder of their lifespan. As such, we
argue that this initial, or time zero, deformation is most important in determining the host
response to synthetic mesh.
Overall, I believe this dissertation highlights the importance of considering, and
thoroughly understanding, the intended function of a medical device prior to clinical
implementation. While this concept may seem obvious, the shortcomings of synthetic prolapse
237

mesh are a strong remainder that we as a field do not grasp the mechanisms responsible for
vaginal support. This concept is extremely important for both the clinicians using these devices
and the engineers designing medical products. Despite the limitations of this dissertation, the
preliminary work presented above clearly exposes numerous concerns regarding the use of
prolapse mesh. Unfortunately, during the transfer of mesh technology from hernia repair to
prolapse repair, health care providers failed to acknowledge the importance of device function,
leading to unacceptable complication rates. Ultimately, I feel that new mesh devices will be
required to obtain satisfactory complication rates. Such devices should consider alternative
synthetic materials that resist plastic deformation and can be constructed to maintain pore
diameters, while yielding a minimal foreign body response. In conjunction with new synthetics,
it is likely that tissue-engineering grafts may provide effective prolapse treatments. Though
previous biologics have proven unsuccessful, the recent decade has seen tremendous
advancement in the development of specialized organs and tissues for medical use.
Regardless of the future changes in graft selection, the success of prolapse treatment is
dependent on our understanding the pelvic floor environment. Though the rigor of the
mechanical analyses performed here may be difficult to incorporate into clinical examinations, I
believe that the main concepts presented in this dissertation are important for clinicians to
consider when using synthetic mesh. Specifically, this dissertation highlights that tensioning,
mesh orientation, and the locations of suture attachment can dramatically alter mesh
deformation. While surgeons may not be able to measure these variables clinically, it is
imperative that they understand the relationship between the manipulation of a device and a
238
patient’s outcome. Understanding this relationship alone will allow surgeons to alter their mesh
selection (or at least trimming of the mesh), tensioning, and suture placement from patient to
patient. Simply, a conscious awareness of the mesh behavior and understanding the pelvic floor
function, would allow surgeons to more effectively utilize pelvic floor grafts. Clearly these
variables govern mesh deformation and embedding these principals into clinical practice is key
to altering the paradigm of prolapse treatment.
5.2 ENGINEERING SIGNIFICANCE
In addition, the results of this dissertation have a significant impact on our understanding of the
mechanics of textile meshes and the biomechanics of the female pelvic floor. The mechanical
behavior of textile products is an intense area of research, with many seeking to understand the
complex nature of knitted and woven fibers (154). Such fiber networks are challenging to model
due to the volume of interactions and fibers present, especially when considering devices on the
scale of consumer and clinical textiles (107). Often the dimensions of the knit pattern are much
less than those of a textile sheet, allowing for continuum approaches to be utilized; yet this is not
the case for prolapse meshes. Given the discrete, or highly porous, nature of prolapse mesh, the
approach used in this dissertation provides an effective method for simplifying textile
architectures, while capturing the mechanical behavior of mesh devices. Most importantly, this
approach allows for textile characteristics to be monitored in response to mechanical phenomena.
239

The research presented here provides a substantial amount of information relating
engineering principals to the field of urogynecology. To date, biomechanics in this field is
largely undeveloped, especially compared to mature engineering fields such as orthopedics and
cardiovascular systems. Yet, the pelvic floor features a wide array of mechanical functions,
ranging from voiding, peristalsis, and childbirth, to the resistance of intra-abdominal pressure.
Application of mechanical principals to such issues has great potential in terms of understanding
the normal function of this environment, progression of disorders, and the treatment of disorders.
To this end, the work presented here has shed light on many of the boundary conditions that must
be considered when designing synthetic mesh implants for use in the pelvic floor. Specifically,
the impact of tensile loading, suture placement, orientation of loads, and patient anatomies have
all been found to produce mesh deformations that are associated with a detrimental host
response. Utilizing the methods developed here, engineers can optimize synthetic mesh, or
biological products, for repair of POP. These methods allow for rapid design iteration, while
minimizing harm to patients or animals by selecting only optimal designs for implantation.
Aside from providing tools to develop synthetic meshes, this dissertation has significantly
enhanced our understanding of vaginal tissue through the use of biaxial testing (Appendix A). As
previously mentioned, urogynecological biomechanics is a relatively undeveloped field.
Therefore, much of the experimental data and relationships found in established fields have yet
to be determined. In order to address these shortcomings and improve computational models of
the pelvic floor, a biaxial device was developed to allow for rigorous mechanical characterization
240

of compliant soft tissues. Specifically, this dissertation provides the first biaxial data and
anisotropic constitutive model of vaginal tissue. Further, it was determined that smooth muscle
contraction increases the isotropic behavior of the vagina. These findings are vital for the
development of accurate computational models and greatly enhance our understanding of vaginal
tissue.
As mentioned above, this dissertation highlights the need for engineers to understand the
environment in which medical products are intended to function. While engineering concepts are
constant across a wide range of fields, it is the responsibility of an engineer to determine which
principals are important for a given situation. To appropriately identify the variables or principals
of interest, an engineer must thoroughly understand a given problem. In this sense, the
shortcomings of previous mesh devices can be largely attributed to a lack of understanding of the
pelvic floor. Likewise, the potential for future treatments is dependent better characterization of
the biology and function of this environment. Throughout this dissertation, and our additional
studies (which are not been presented here), numerous challenges have arisen from the unique
behavior of the tissues in this space. In a majority of our studies, custom testing apparatuses were
constructed to accommodate the complex boundary conditions of mesh devices, or the
unexpected behaviors of organs and tissues that were observed during preliminary testing. The
challenges presented by this complex network of tissues and their distinct behavior must be
appreciated when developing treatments for the pelvic floor. Only once we understand and
respect these characteristics can we as engineers truly create an optimal solution.
241

5.3 LIMITATIONS
Importantly, it must be stated that the all of the work presented in this dissertation represents a
first attempt to characterize the mechanical behavior of synthetic mesh in the pelvic floor. While
the findings presented above greatly enhance our knowledge of this subject area, numerous
assumptions and simplifications were made, largely stemming from the vast amount of unknown
variables in this field. Therefore, the methods and results found in this dissertation have notable
limitations. Though many limitations were discussed in their respective studies, several of these
should be considered with respect to the overall conclusions.
First, it should be noted that this dissertation did not examine all potential boundary
conditions, or present a large-scale parametric analysis. Rather, this dissertation focused on
recreating boundary conditions that were representative of that which synthetic mesh experiences
in-vivo. For this reason, tensile forces were chosen in Aim 1, and as the feasibility of
experimentally recreating such loading conditions became difficult, computational models were
used. Still, it is clear that the deformation of mesh will not be the same for all products, or from
patient to patient. While all meshes examined in this dissertation were found to yield undesirable
deformations, it is probable that boundary conditions that eliminate such deformations exist.
Given the overall efficacy of synthetic mesh repair, the effect of boundary conditions, combined
with the variability in host response, reduces the complication rate to ~20%. In short, there is no
“one size fits all” approach to mesh repair, and therefore, large-scale computational studies
242

should be pursued to access which variables are most important for yielding successful
outcomes. Such information can then be used to develop new mesh products and provide
guidelines for surgeons using synthetic mesh.
Further, it must be noted that the computational model of synthetic mesh developed in
this dissertation is limited in terms of its application. Specifically, our model was unable to
accurately capture the out-of-plane deformations observed experimentally. It is challenging to
capture the buckling of such thin textiles, and as such, modeling of this behavior may not be
feasible using the solid element definitions employed here. Moreover, the computational
frameworks for predicting this bending behavior require significant advancement prior to their
inclusion in prolapse mesh simulations. Despite the shortcomings of this model, the framework
developed here has provided a tremendous amount of information regarding the behavior of
prolapse mesh devices, specifically allowing for the examination of textile properties in response
to mechanical loads. As such, the current model provides a robust tool to guide the design of
future products and direct their clinical implementation.
In addition, the computational methods presented this dissertation only considered the response
of square pores to mechanical loads. While this pore geometry is quite common among prolapse
meshes, other configurations are currently in clinical use. Though similar methods for
discretizing other polygonal-shaped pores would be feasible, the number of knot and fiber
structures in the unit pore would likely increase. This, combined with non-orthogonal fiber
directions, may require more rigorous structural testing in order accurately determine the
243

material behavior. For instance, a modified planar biaxial protocol (synthetic mesh is not a
continuum, as such traditional planar biaxial analysis cannot be used) may be required to assess a
wide array of fiber orientations and generate sufficient material models.
Finally, additional information regarding the loading conditions and material properties
of the pelvic floor are required to validate and develop accurate finite element simulations of
prolapse and mesh repair. For instance, the boundary conditions of this environment are largely
unknown, including the location of vaginal supportive structures and their material properties.
Additionally, data regarding the forces placed on these structures and the attachments between
pelvic floor constituents must be more thoroughly characterized. While parametric analyses
allow current models to provide useful information, we must work to better characterize the
pelvic floor in total. Currently, this is a major limitation for all FE models of the pelvic floor,
though it can be readily addressed through mechanical testing and imaging diagnostics.
Nonetheless, simple computational studies, such as those found here, are incredibly useful for
determining which variables and principals are most vital for prolapse development and synthetic
mesh treatment.
5.4 FUTURE DIRECTIONS
Overall, this dissertation has provided much of the groundwork for computational modeling of
the pelvic floor and prolapse mesh repair. Though the results presented here provide significant
244

insight into mesh behavior and its use for prolapse repair, there remain several areas for
improvement. As such, the maximum benefit of this research can only be attained through
continued refinement and enhancement of the methods outlined in this dissertation.
Most importantly, future work must examine the impact of pore size on the host response
in the pelvic floor. Such studies are widely documented in the hernia literature, yet as suggested
by Pierce et al., the vagina may be more susceptible to complications (87, 123). Though fibrotic
encapsulation of mesh filaments is commonly observed in the vagina, pore size and its impact on
the host response has not been examined in previous vaginal mesh studies (75, 123). Pending the
outcomes of such studies, more strict design criteria may be required for mesh use in the pelvic
floor (i.e. requiring pore diameters greater than 1mm). While such findings will not directly
impact the results presented in this dissertation, they will enhance the context in which
simulations of mesh deformation are interpreted
In order to demonstrate the reliability of the simulations found in Aim 3, the 3D
deformation of computational mesh models must be validated. Though boundary value problems
involving surface wrinkling or bunching are computationally difficult, such behavior appears
play a significant role in clinical outcomes. Numerical methods for examining such behavior are
currently an area of intense research, though their use in FEA may not be available for some time
(190, 191). Nonetheless, quantifying the accuracy of the current FE model would be beneficial
for interpretation of these computational results. Additionally, clinical and experimental
quantification of wrinkling via ultrasound or MRI, may provide definitive evidence regarding the
impact of mesh burden on the host response (157).
245

Future studies must also work towards the advancement of computational models of the
pelvic floor. Mechanical characterization of additional pelvic floor structures, including the
development of constitutive models, is essential for representing the true behavior of this
environment. In addition, future work must explore the boundary conditions of the pelvic floor.
Specifically, better characterization of the in-vivo loads are required to enhance FE inputs. While
placement of pressure transducers in the abdomen may provide such inputs, this technique may
prove invasive and fail to accurately represent the forces placed on the vagina and its supportive
structures. Rather, processing of in-vivo imaging diagnostics using methods such as hyperelastic
warping (or other deformable image analyses), may prove to be ideal methods for determining
in-vivo stresses or strains (192, 193). Still, the determination of these values is dependent on the
accuracy of imaging modalities and the constitutive models used.
Finally, patient specific modeling has tremendous potential in the field of urogynecology.
The ability to understand variations in anatomy and its impact on synthetic mesh, provide the
opportunity to personalize treatments. However, the greatest benefit of such data may come from
the comparison of patient anatomies. Through quantification of anatomical positioning and
statistical shape analysis, researchers can examine the development of pelvic floor disorders, in
addition to the effects of synthetic mesh repair (194). Such analysis may prove useful in
predicting populations who are at risk for developing prolapse, or which mesh device is optimal
for a particular subset of women. This analysis would also provide researchers with a “standard”
patient geometry that encompasses a standard deviation of anatomic variability. The
development of standard, or average, patient geometries would provide vendors and researchers
246

with a baseline anatomy when developing mesh devices or procedures. While patient specific
analysis is well suited for individual surgeries, the development of prolapse treatments, and
products, requires larger populations to be considered.
5.5 CLOSING
In closing, I would like to thank all of those who have made this work possible. I am truly
blessed to have worked with a number of incredible individuals throughout my graduate career.
It has simply been an amazing experience working in this area of research, and having the
opportunity to approach incredibly challenging problems that few have considered. Reflecting on
this work, I believe that that we have truly made a difference and have made a tremendous
impact on the field of urogynecology and clinical treatment of prolapse. Once again, thank you
for all of your support. I know that we can all take great pride in the research presented here.
Hail to Pitt.
247

APPENDIX A
BIAXIAL TESTING OF VAGINAL TISSUE
A.1 INTRODUCTION
One of the greatest limitations of current FE simulations of the pelvic floor is the lack of data
regarding the mechanical behavior of the tissues in the pelvic floor. Previous FE models have
been created to examine tissue stretch during childbirth and to examine the deformations
associated with cystocele or rectocele (180, 181, 195). In general, these models employ
simplified vaginal and musculature geometries that are useful for understanding the general
concepts of pelvic floor injury or presentation of prolapse. However, these studies have given
little consideration to the impact of material properties on these outcomes. Often the vagina and
other organs of the pelvic floor are assumed to be Neo-Hookean materials. While the method
used to determine the material properties in many of these FE studies is unclear, a small number
248

of referenced publications imply that Neo-Hookean values were obtained from cadaveric tissues.
Unfortunately, the properties of cadaveric tissues may differ significantly from women of age to
gestate or even from tissues obtained from living women in general (183).
Though it can be assumed that these studies were merely using the data that was
available, it is concerning that this literature fails to acknowledge the impact of such important
variables. Rather than attempting to define robust material models, these previous studies merely
adjust FE boundary conditions and material properties in order to reproduce deformations that
are clinically observed, without mention of their potential impact. Perhaps the greatest weakness
of current FE modeling of the pelvic floor is the failure to perform sensitivity analyses on
boundary conditions or material selection, providing little context for the accuracy of these
models. Further, the differences between isotropic and anisotropic material behavior is likely
more pronounced when a tubular vaginal geometries are used, a geometric consideration rarely
included in previous modeling efforts. Until a thorough parametric analysis or validation study is
performed, predictions offered by such models are limited and do not utilize the full potential of
computational modeling.
Conversely, in this dissertation the vagina was modeled as a composite material with a
Neo-Hookean ground substance with spherically embedded fibers in the Section 4.3. As
previously discussed, the Young’s modulus and Possions ratio were chosen to approximate the
stress-strain behavior of vaginal tissue observed during uniaxial tensile testing. While these
values were obtained from a variety of animal species, the variation in material properties across
these tissues was minimal (49, 187, 196). Still, application of a Neo-Hookean material requires
249
one to assume that tissue behavior is isotropic, an assumption that is likely not valid for vaginal
tissue. The inclusion of embedded fiber model (Section 4.3) did was indeed isotropic in terms of
its initial configuration, though this model was able to better approximate the highly non-linear
stress-strain behavior of vaginal tissue, indicative of fiber recruitment. In addition, these fibers
only resist tensile forces and do not generate force under compressive loading, another behavior
associated with collagenous tissues (compressive loads are resisted by the ground substance).
While the inclusion of fibers is more physiologically grounded, the implementation of a single
fiber family is still not ideal for describing vaginal tissue.
In order to improve the predictive capabilities of pelvic floor FE models, it is imperative
that an appropriate material model for vaginal tissue is established. The vagina is central to
pelvic support and is directly manipulated during prolapse repair. Development of an accurate
vaginal material model will greatly advance the prolapse repair simulations, allowing for the
interface between tissue and mesh to be better understood and providing more accurate
predictions of stresses observed at this location. In mechanics it is known that the junction of two
materials leads to stress concentrations at the material interface. The greater the mismatch in
stiffness between two materials leads, the greater the stress concentrations at the interface. This
interface is a primary area of concern for numerous medical implants, and the failure to consider
this interaction has led to catastrophic device failures in other fields. For example, hip implants
were associated with a high occurrence of native bone fractures in the 1990’s. Both
computational and experimental analysis revealed that implants were mechanically stiffer (by
orders of magnitude) relative to the bones in which they were in contact with. Such a disparity in
250

mechanical properties led to atrophy and damage of the surrounding bone, resulting from stress
shielding and areas of increased stress concentrations. With advanced material models for the
vagina, it will be feasible to quantitatively assess the role of stress shielding and stress
concentrations, in relation to mesh complications, while avoiding designs that are unfavorable.
Given that such measures may be impossible to obtain experimentally, POP repair simulations
are likely the only manner in which such observations can be made.
Development of new material models for the vagina requires rigorous mechanical testing,
in which the constituents of vaginal tissue can be manipulated and characterized in response to a
wide range of loading conditions. Such experimental data can be attained through the use of
planar biaxial testing. Planar biaxial testing has been used to characterize many tissues that
exhibit anisotropic behavior (183, 197-200). Notably, this testing method has been used to
construct detailed material models for cardiac tissues, including blood vessels and heart valve,
describing their mechanical behavior while considering distinct fiber families with differing
initial orientations (201). Recent biaxial studies have also explored the impact of muscle
contraction on the biaxial properties of cardiac tissue, isolating the passive behavior of these
tissues (202, 203). Such a mechanical description is well suited for vagina given the organization
and composition of this tissue. Yet, planar biaxial testing of vagina tissue has not been performed
to date, though studies have incorrectly termed ball burst testing as a “planar biaxial” method.
Thus, the objective of this study was to rigorously characterize the planar biaxial mechanical
behavior of the rat vagina, accounting for the effect of active smooth muscle contraction on these
properties. In addition, a strain energy function will be used to describe vaginal biaxial data, in
251

order to elucidate the role of longitudinal and circumferential fibers, as well as the impact of
smooth muscle contraction. We hypothesize that smooth muscle contraction will increased the
stiffness of the vagina.
A.2 METHODS
A.2.1 Biaxial Testing Device Development
Prior to mechanical testing of vaginal tissue, a planar biaxial testing device, appropriate for
testing compliant soft tissues, was developed. The testing apparatus was designed for
incorporation into a Bose Testbench system (Bose, Eden Prairie, Minnesota), which consisted of
2 linear actuators and 2 reaction brackets. Each linear actuator had a stroke length of 12mm,
where displacements were driven by manipulation of magnetic fields, producing “frictionless”
movement. These electromagnetic based actuators are analogous to those found in speakers.
Actuators were fixed along orthogonal axes (x and y) and a reaction bracket was fixed opposite
of each motor. A 5lb (22.24N) load cell (Honeywell, Morristown, NJ) was then attached to each
reaction bracket to measure the force along a given axis. A custom designed saline bath was
placed between the actuator and load cell to ensure that tissues were kept hydrated throughout
testing. In addition, a media circulation system was interfaced with the bath to maintain constant
saline temperature and to provide even distribution of solutes added during mechanical testing.
Circulation was maintained using a simple closed loop system, with a roller pump placed in
252

series (MasterFlex Roller Pump, Cole-Parmer, Vernon Hills, IL). Finally, a camera was
suspended and leveled such that the lens was parallel to the bath, centered above the specimen.
The camera was used to track the movement of optical strain markers throughout testing.
Preliminary planar biaxial testing conducted in our lab was limited due to the extreme
compliance of vaginal tissue. During this testing, both virgin and pregnant rat vaginal tissue was
isolated in tested biaxially (204). However a majority of samples experienced large deformations
upon application of preload (6-10mm). Pregnant tissues were especially problematic; with the
entire actuator stoke length traveled before preload values were reached. Further, inspection of
the testing apparatus, found that the motion carriages, a structure used to connect the tissue to the
load cell or actuator, introduced significant mechanical friction into measurements and restricted
rotation of the tissue. Therefore, the actual loads and deformations of these specimens were
subject to significant experimental noise produced by the motion carriages.
To improve upon the previous biaxial apparatus, a new linear carriage was designed and
constructed with the goal of removing noise arising from friction (Figure 68). In order to remove
internal friction, the motion carriages were redesigned utilizing a set of air bearings (New Way
Air Bearing, Aston, PA). Air bearings utilize a porous carbon media to produce a bearing
(contact) surface that consisting of a thin layer of air. The air membrane prevents the porous
media and the moving surface (rotational or linear shaft) from contacting, with the rigid surface
“hovering” above the bearing surface. The net effect is similar to that produced by an air hockey
table. Briefly, carriage sleds were created with 2, 6-inch precision stainless steel rods (1/2 inch
diameter, Tolerance: -0.0002 to -0.0007, NB Corporation of America) placed parallel to one
253

another, and between 2 endplates. The rear endplate was designed for attachment to the load cell
or actuator, while the front end plate was attached to a thrust-bushing fixture. The parallel steel
rods were tracked through 2, standard ½” air bearings, parallel with one another. Linear shafts of
greater tolerances, or constructed from lighter materials (i.e. aluminum), did not track smoothly
through air bearings, introducing friction into movements.
A custom manufactured thrust bushing (0.625” diameter, New Way Air Bearing, Aston,
PA) was used for frictionless rotation of the suture lines used to apply forces to the biaxial
samples (discussed below). Thrust bushings are similar to air bearings, but include a flat air-
bearing surface in addition to a center bore, allowing for simultaneous suspension and rotation of
a vertically oriented shaft with attached thrust facing. Each thrust bushing was attached to the
front of a motion carriage (sled) using a custom fixture designed to overhang into the saline bath.
Finally, a steel, forked shaft was constructed for placement in the thrust bearing, allowing for
attachment of 2 separate suture lines. A pulley wheel (diameter = 9mm, groove width = 1mm)
was placed on each of these forked rods for the placement of suture lines. A total of 4 motion
carriages were created, with one attached to each actuator and load cell. It should be noted that
all air-bearings were connected to a pressurized air source (80 PSI) during testing to allow for
free movement of the rotational shafts and linear sled. All biaxial tests were performed on a
pneumatic isolation table to eliminate noise from external vibrations.
254

Figure 68. Custom motion carriages where designed to minimized frictional noise during testing of compliant soft
tissues. Air bearings (a) and thrust bushings (c) were used to provide frictionless linear and rotational carriage
movements (b), thereby eliminating erroneous force measurements during testing.
Upon completion of the air bearing sleds, a series of tests were performed to assess the
internal friction. First, a load cell was attached to the linear actuator, and the linear sled was
placed in series with the load cell. This configuration allowed for simultaneous displacement and
load measurement for each carriage. Next, a sinusoidal displacement, with an amplitude of 2mm,
was applied to each carriage. The displacement frequency was varied by orders of magnitude,
255

including 0.25, 0.5, 1, and 10Hz. These frequencies were chosen to assess the amount of internal
friction as they represent a range of displacement rates utilized in previous uniaxial and biaxial
testing protocols. Generally, slow displacement rates are used in planar biaxial testing to allow
time for fiber rotation, however the displacement rate for a specific tissue should be selected
based on its viscoelastic behavior or the specific research question (i.e. under slow strain rates,
some tissue may dissipate all force). After testing, the carriage was detached from the load cell
and actuator, and weighed on a digital scale. The sled weight and acceleration were used to
determine the theoretical force observed during testing. Ideally, as the displacement frequency
goes to 0, the measured force should go to 0, while higher frequencies should develop forces
equal to the sled mass times the acceleration (Newton’s law). This testing was performed for all
4 carriages.
Overall, sleds performed well in terms of minimizing force development from carriage
motion (Figure 69). The air bearings were particularly effective at frequencies below 1Hz, as the
forces observed during experimental testing were below the sensitivity of the load cell used.
Thus, while these measurements were variable, the effect of such forces during biaxial testing at
frequencies below 1Hz is negligible for the load cells used in this study. However, noticeable
errors were observed at 10Hz, with experimental forces ~0.5N greater than theoretical values.
Such differences may be attributed to inertia of the actuator, load cell, or sled, and may even
arise from assembly of the motion carriages. For instance, small misalignments of the linear
track may result in elevated forces, as the linear shafts pass through the bearing. In addition,
256

instabilities of the carriage may result in spurious forces (whiplash, vibration, flex of the
assembly, etc.) at the displacement peaks. Regardless, these results suggest that biaxial testing at
high displacement should be avoided for the current carriage design.
Figure 69. Representative validation results of “frictionless” linear movement for the air bearing sleds. As the
frequency approaches 0, the acceleration of the sled approaches 0 (thus, F 0). Force measurements were
negligible at displacement rates below 1Hz, showing good agreement between theoretical and measured values.
However, differences became pronounced at higher frequencies, suggesting the presence of friction or instability of
the motion carriage at relatively high displacement rates.
257

A.2.2 Experimental Testing
Vaginal tissues were obtained from virgin Long-Evans rats (n=14) in accordance with the
IACUC at the University of Pittsburgh (#12101017). Ten samples were used for preliminary
testing in order to determine the specific protocol and demonstrate feasibility and repeatability of
biaxial testing on rat vaginal tissue. The remaining 4 samples underwent the established protocol
and analysis (described below). Immediately following euthanasia, the entire reproductive tract
(vagina, cervix, uterine horns) was harvested en-bloc, using transabdominal and transperineal
incisions (Figure 70). Next, the vagina was isolated using two transecting cuts, one just distal to
the cervix and the other just proximal to the introitus. The vagina was then cut along its length,
lateral to the urethra, achieving a square-planar configuration, with the length of the vagina
representing the longitudinal axis and the width of the vagina representing the circumferential
axis. Finally, the urethra was sharply removed from the lateral edge of the planar tissue sample
and the specimen thickness was measured using a laser reflectance system. On average, tested
vaginal samples measured ~12x12x0.6mm.
For biaxial testing, suture lines were used to apply displacements to samples. In this
study, #0 braided polyester suture was chosen, as this material was found to have desirable
flexibility and minimal shape memory, relative to monofilament sutures. However, multifilament
suture was found to permanently elongate during preliminary biaxial testing. To ensure that this
plastic deformation did not influence biaxial measurements, all suture lines were pre-stressed
under uniaxial tension to 10N of force, using a materials testing machine (Instron 5565, Grove
258

City, PA). A load of 10N was chosen, as this was roughly an order of magnitude greater than
anticipated loads experienced during biaxial testing. To mount samples onto the custom designed
rotational shafts, suture lines, tipped with barbed ends were anchored along the tissue parameter.
Four evenly spaced hooks were inserted on each side of the specimen, ~1mm from each edge.
This hook placement has been shown to create a homogenous strain distribution at the tissue
mid-substance (205, 206).
Figure 70. Sample preparation for biaxial testing. After explanting the reproductive track en-bloc, the
vagina was isolated via proximal and distal transections at the cervix and inroitus (a, dashed-lines), respectively. The
vagina was then cut along the length, just lateral to the urethra (b) and unfolded into a planar geometry (c). Finally, 5
markers were placed on the luminal surface and 4 hooks were placed along each edge of the tissue (c, d).
Following suture line attachment, 5 optical markers were adhered to the tissue mid-
substance in a square grid pattern. Samples were then placed in the bath, containing an
oxygenated Krebs-bicarbonate solution, and each suture line was attached to a rotational shaft.
Throughout testing, samples were kept in the warmed (~37°C), oxygenated Krebs-bicarbonate
259
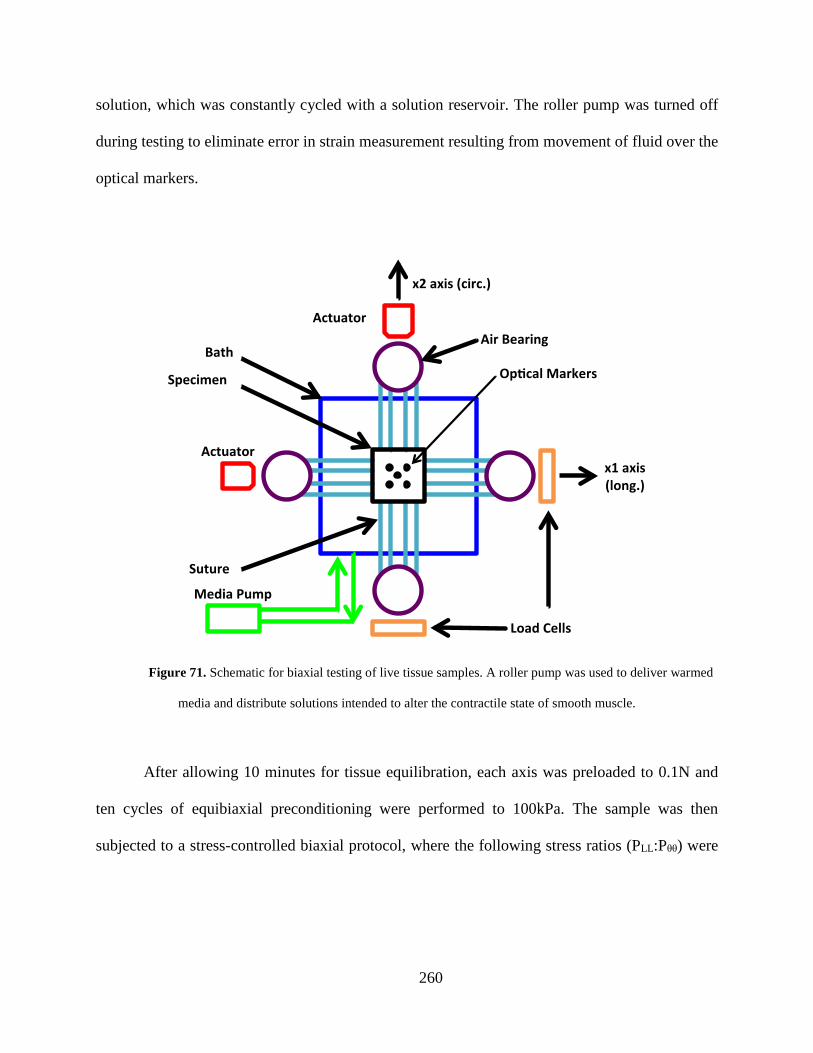
solution, which was constantly cycled with a solution reservoir. The roller pump was turned off
during testing to eliminate error in strain measurement resulting from movement of fluid over the
optical markers.
Figure 71. Schematic for biaxial testing of live tissue samples. A roller pump was used to deliver warmed
media and distribute solutions intended to alter the contractile state of smooth muscle.
After allowing 10 minutes for tissue equilibration, each axis was preloaded to 0.1N and
ten cycles of equibiaxial preconditioning were performed to 100kPa. The sample was then
subjected to a stress-controlled biaxial protocol, where the following stress ratios (PLL:Pθθ) were
260

considered: 100:100, 50:100, 75:100, 100:100, 100:50, 100:75, and 100:100 kPa. Here, the PLL
and Pθθ are the 1st Piola-Kirchoff stresses for the longitudinal and circumferential axes,
respectively. The tissue then underwent ten cycles of loading and unloading at each stress ratio.
The final loading cycle was used for all analyses described below. Preliminary testing revealed
that Pθθ ratios below 25kPa resulted in forces that were within the error of the load cells
(<0.005N), leading to difficulty controlling actuator motion. After application of all stress ratios,
the actuators were set to their home position (i.e. the position used prior to application of
preload).
Following baseline testing in Krebs solution, 120mM KCl was added to the bath to
induce smooth muscle contraction, and tissues were again given 10 minutes for equilibration.
The same preload, preconditioning, and stress ratios were then applied to the tissue in the KCl-
Krebs solution. The bath was then drained and the KCl solution was discarded. The tissue and
bath were then rinsed with the heated Krebs-bicarbonate solution and given 10 minutes to
equilibrate. This wash and equilibration procedure was repeated 3 times. Following the final
rinse, 4mM EGTA (ethylene glycol tetraacetic acid) was added to the bath solution and the tissue
was given 10 minutes for equilibration once again. Following equilibration in the EGTA-Krebs
solution, the testing protocol (preload, preconditioning, and stress ratios) was repeated once
more.
261

Figure 72. Entire biaxial testing apparatus. A camera was positioned above the specimen, parallel to the table, in
order to record marker positions during testing.
Throughout the entire testing procedure a camera was used to capture the position of the
optical strain markers (Figure 72). Marker positions were used to determine Lagrangian strain
using a digital video extensometer (DVE) and WinTest software (V4.1, Bose, Eden Prairie,
Minnesota). Additionally, homogeneity of the strain field at the tissue mid-substance was
assessed using a DSLR camera (Canon, EOS Rebel T3, Melville, NY) to record marker positions
and a custom Mathematica (V9, Wolfram Alpha, Champaign, IL) script to track marker positions
and determine experimental strains.
262
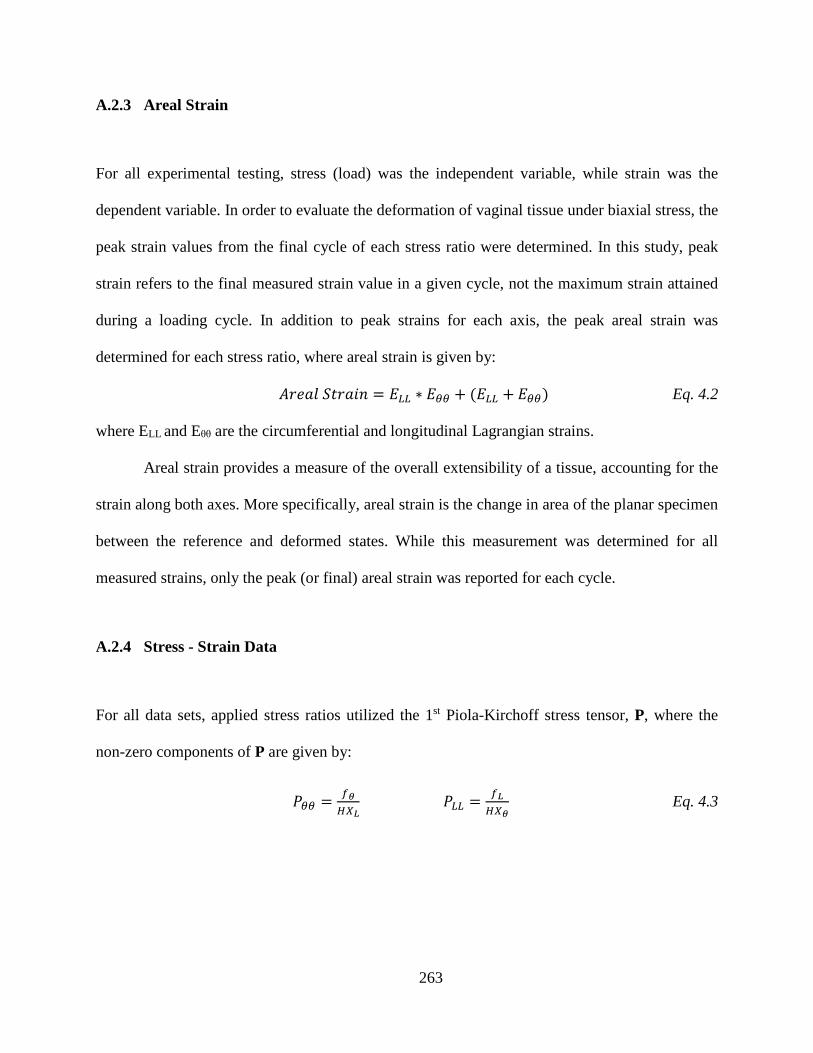
A.2.3 Areal Strain
For all experimental testing, stress (load) was the independent variable, while strain was the
dependent variable. In order to evaluate the deformation of vaginal tissue under biaxial stress, the
peak strain values from the final cycle of each stress ratio were determined. In this study, peak
strain refers to the final measured strain value in a given cycle, not the maximum strain attained
during a loading cycle. In addition to peak strains for each axis, the peak areal strain was
determined for each stress ratio, where areal strain is given by:
𝐴𝐴𝐴𝐴𝑒𝑒𝐴𝐴𝐴𝐴 𝑆𝑆𝑆𝑆𝐴𝐴𝐴𝐴𝑆𝑆𝑆𝑆 = 𝐸𝐸𝐿𝐿𝐿𝐿 ∗ 𝐸𝐸𝜃𝜃𝜃𝜃 + (𝐸𝐸𝐿𝐿𝐿𝐿 + 𝐸𝐸𝜃𝜃𝜃𝜃) Eq. 4.2
where ELL and Eθθ are the circumferential and longitudinal Lagrangian strains.
Areal strain provides a measure of the overall extensibility of a tissue, accounting for the
strain along both axes. More specifically, areal strain is the change in area of the planar specimen
between the reference and deformed states. While this measurement was determined for all
measured strains, only the peak (or final) areal strain was reported for each cycle.
A.2.4 Stress - Strain Data
For all data sets, applied stress ratios utilized the 1st Piola-Kirchoff stress tensor, P, where the
non-zero components of P are given by:
𝑃𝑃𝜃𝜃𝜃𝜃 = 𝑓𝑓𝜃𝜃𝐻𝐻𝑋𝑋𝐿𝐿
𝑃𝑃𝐿𝐿𝐿𝐿 = 𝑓𝑓𝐿𝐿𝐻𝐻𝑋𝑋𝜃𝜃
Eq. 4.3
263

Here, fθ and fL are the loads measured in the circumferential and longitudinal axis, H is the
specimen thickness, and Xθ and XL are the unloaded dimensions of the sample in the
circumferential and longitudinal of axes. In order to fit the selected constitutive model (discussed
below) to this data, the 2nd Piola-Kirchoff stress tensor, S, was determined by:
𝑺𝑺 = 𝑷𝑷 ∗ 𝑭𝑭−𝑇𝑇 Eq. 4.4
where F is the deformation gradient tensor. For each measured value of f, WinTest provides
simultaneous measures of the Lagrangian strains, ELL and Eθθ. Unfortunately, due to software
limitations, real time values of the marker positions could not be synched with the force values
from WinTest in order to directly calculate F. However, preliminary biaxial testing of vaginal
tissue revealed that the shear components of F were negligible. This was determined by
analyzing digital recordings of marker displacement during testing using a custom strain
calculation script in Mathematica (V9, Wolfram Alpha, Champaign, IL) based on a finite
element method implemented by Humphrey et al (207). While our custom analysis did provide
all components of the deformation gradient tensor, again, these values could not be synched with
force values from WinTest. Still, these preliminary results provided sufficient evidence that shear
strain was negligible for biaxial testing in this orientation (typically less than <1%). Assuming
EθL = ELθ = 0, F can be simplified to:
𝑭𝑭 = �𝝀𝝀𝑳𝑳 𝟎𝟎𝟎𝟎 𝝀𝝀𝜽𝜽
� Eq. 4.5
where λL and λθ represent the stretch along the longitudinal and circumferential axes. Using their
relation to the Green strain tensor, λL and λθ are given by:
264

𝜆𝜆𝐿𝐿 = �2 ∗ 𝐸𝐸𝐿𝐿𝐿𝐿 + 1 𝜆𝜆𝜃𝜃 = �2 ∗ 𝐸𝐸𝜃𝜃𝜃𝜃 + 1 Eq. 4.6
After determination of the axial stretch values, the deformation gradient could then be used to
determine S via Equation 4.4. Though it is implied above, it should be noted that the loading
conditions of experimental planar biaxial testing assume that SLZ = SθZ = SZZ = 0 and ELZ = EθZ =
0. Additionally, EZZ can be computed assuming isovolumetric tissue deformation, resulting from
the high water content of biological tissues (EZZ = λZ = (λL*λθ)-1).
A.2.5 Strain Energy Function
To develop a robust material model for the vagina, we sought to determine a representative
material response using all data from this study. This was accomplished by adopting a
constitutive model that characterizes the impact of smooth muscle contraction and describes the
multi-axial loading of tissues. First, it was assumed that vaginal tissue can be modeled as a
hyperelastic material, meaning that the stress state can be determined from a scalar strain energy
function, and that this behavior is independent of strain rate or loading history (no time
dependence). Following from Valdez-Jasso et al., assuming the tissue to be incompressible, S
can be related to strain energy by (203):
𝑺𝑺(𝑬𝑬) = 𝜕𝜕𝜕𝜕(𝑬𝑬)𝜕𝜕𝑬𝑬
− 𝑝𝑝𝑪𝑪−1 Eq. 4.7
where W is the strain energy (a scalar function) and C is the right Cauchy-Green tensor. Given
that SZZ = 0, SLL, and Sθθ can be expressed as a function of the tissue deformation, while the
Lagrange multiplier, p, is eliminated algebraically (201, 203).
265

Additionally, it must be noted that the stress-control protocol used in this study resulted
in the same sampling of stress-space for all tests, yet the measured strain responses were not
necessarily similar between samples. This variation in strain-space prevents direct averaging of
W(E) to determine a representative material response. Thus, the complimentary strain energy
function, Wc(E), was required to describe general tissue behavior. Here, the complimentary
strain energy function is defined as (203):
𝑊𝑊𝑐𝑐(𝑺𝑺) = 𝑺𝑺:𝑬𝑬 −𝑊𝑊(𝑬𝑬) Eq. 4.8
where : is the contraction, or inner product of the tensors S and E.
Next, a general form of the strain energy function was chosen such that (201):
𝑊𝑊 = 𝑄𝑄𝛽𝛽 = �𝐴𝐴1𝐸𝐸𝐿𝐿𝐿𝐿2 + 𝐴𝐴2𝐸𝐸𝜃𝜃𝜃𝜃2 + 𝐴𝐴3𝐸𝐸𝐿𝐿𝜃𝜃2 + 2𝐴𝐴4𝐸𝐸𝐿𝐿𝐿𝐿𝐸𝐸𝜃𝜃𝜃𝜃 + 2𝐴𝐴5𝐸𝐸𝐿𝐿𝜃𝜃𝐸𝐸𝐿𝐿𝐿𝐿 + 2𝐴𝐴6𝐸𝐸𝐿𝐿𝜃𝜃𝐸𝐸𝜃𝜃𝜃𝜃�𝛽𝛽
Eq. 4.9
Given that shear term are negligible, this simplifies to:
𝑊𝑊 = 𝑄𝑄𝛽𝛽 = �𝐴𝐴1𝐸𝐸𝐿𝐿𝐿𝐿2 + 𝐴𝐴2𝐸𝐸𝜃𝜃𝜃𝜃2 + 2𝐴𝐴4𝐸𝐸𝐿𝐿𝐿𝐿𝐸𝐸𝜃𝜃𝜃𝜃�𝛽𝛽
Eq. 4.10
where a1, a2, a4 and β are model coefficients. Physically, a1 and a2, are stiffness measures for the
longitudinal and circumferential axes respectively, while a4 is a measure of the axial coupling
stiffness. In addition, β is a stiffness parameter that governs the nonlinearity of the strain energy
function. The power form was chosen rather than a traditional Fung-type exponential, as it is
directly invertible.
Using this strain energy function, the axial stresses SLL and Sθθ are readily determined via
partial differentiation of W, with respect to the corresponding component of the Green strain
tensor, given by Equation 4.8:
266

𝑆𝑆𝐿𝐿𝐿𝐿 = 2𝛽𝛽𝑄𝑄𝛽𝛽−1(𝐴𝐴1𝐸𝐸𝐿𝐿𝐿𝐿 + 𝐴𝐴4𝐸𝐸𝜃𝜃𝜃𝜃) Eq. 4.11
𝑆𝑆𝜃𝜃𝜃𝜃 = 2𝛽𝛽𝑄𝑄𝛽𝛽−1(𝐴𝐴2𝐸𝐸𝜃𝜃𝜃𝜃 + 𝐴𝐴4𝐸𝐸𝐿𝐿𝐿𝐿)
Solving Equation 4.11 for ELL and Eθθ, the components of the strain tensor are given by:
𝐸𝐸𝐿𝐿𝐿𝐿(𝑆𝑆𝐿𝐿𝐿𝐿 ,𝑆𝑆𝜃𝜃𝜃𝜃) = 𝑄𝑄1−𝛽𝛽
2𝛽𝛽�𝑎𝑎1𝑎𝑎2−𝑎𝑎42�(𝐴𝐴2𝑆𝑆𝐿𝐿𝐿𝐿 + 𝐴𝐴4𝑆𝑆𝜃𝜃𝜃𝜃) Eq. 4.12
𝐸𝐸𝜃𝜃𝜃𝜃(𝑆𝑆𝐿𝐿𝐿𝐿 ,𝑆𝑆𝜃𝜃𝜃𝜃) =𝑄𝑄1−𝛽𝛽
2𝛽𝛽(𝐴𝐴1𝐴𝐴2 − 𝐴𝐴42) (𝐴𝐴1𝑆𝑆𝜃𝜃𝜃𝜃 + 𝐴𝐴4𝑆𝑆𝐿𝐿𝐿𝐿)
Substituting Equation 4.12 into Equation 4.10, allows for Q to be defined as:
𝑄𝑄 (𝑆𝑆𝐿𝐿𝐿𝐿 ,𝑆𝑆𝜃𝜃𝜃𝜃) = 1
(4𝛽𝛽�𝑎𝑎1𝑎𝑎2−𝑎𝑎42�12𝛽𝛽−1
�𝐴𝐴2𝑆𝑆𝐿𝐿𝐿𝐿2 + 𝐴𝐴1𝑆𝑆𝜃𝜃𝜃𝜃2 − 2𝐴𝐴4𝑆𝑆𝐿𝐿𝐿𝐿𝑆𝑆𝜃𝜃𝜃𝜃�12𝛽𝛽−1 Eq. 4.13
Given these definitions, complimentary strain energy can be written as a function of the stress
components:
𝑊𝑊𝐶𝐶(𝑆𝑆𝐿𝐿𝐿𝐿 ,𝑆𝑆𝜃𝜃𝜃𝜃) = (2𝛽𝛽 − 1) ∗ 𝑄𝑄(𝑆𝑆𝐿𝐿𝐿𝐿 ,𝑆𝑆𝜃𝜃𝜃𝜃) Eq. 4.14
For each specimen, model coefficients (a1, a2, a4, β) were determined by combining
stress-strain data from all stress ratios (5 total, as only the final 1:1 ratio was included). This data
provided a detailed description of the stress-space (SLL-Sθθ). Optimal values for model
coefficients were determined by fitting Equation 4.12 to experimental ELL and Eθθ values from
all stress ratios for a given sample, and contractile state, simultaneously, using a Marquardt-
Levenburg algorithm. Thus, 3 sets of coefficients were determined for each specimen, one for
baseline, KCl (smooth muscle contracted), and EGTA (smooth muscle relaxed) trials.
267

To determine representative values for model parameters, WC (Eq. 4.14) was calculated
for each trial over a grid of evenly spaced SLL and Sθθ coordinates, ranging from 0-100kPa, in
increments of 0.0015kPa. WC values were then averaged on a point-by-point basis for each
coordinate in the stress-space (SLL-Sθθ). Representative model coefficients were determined by
fitting averaged WC values with Equation 4.14, using a Marquardt-Levenburg algorithm. A set of
representative values was determined for baseline, KCl, and EGTA trials separately.
A.2.6 Statistics
To examine the impact of smooth muscle contraction on areal strain, a repeated-measures
ANOVA was used to compare KCl and EGTA trials. The coefficient of determination, R2, and
root mean square (RMS) error were used to assess the quality of fit to individual data sets,
including average WC data. In addition, a one-way ANOVA was used to compare fitted
parameters between contractile states (KCl vs. EGTA), with a significance value of 0.05.
A.3 RESULTS
In response to the preload, nearly all samples experienced large strains (up to ~70%) relative to
unloaded configuration, though preload strains were highly variable between samples. Preload
strains were comparable between the 3 trials for each specimen, however KCl trials reached
greater preload strains for both ELL and Eθθ for nearly all samples tested. Examination of areal
268

strain clearly demonstrated the impact of muscle contraction on tissue preload strain as KCl
increased areal strain by 6-117% (majority were ~15%), relative to baseline trials. Addition of
EGTA was found to return areal strain to baseline values (Figure 73, p > 0.05), significantly
lower than strains measured during KCl trials (p = 0.02). While strains were variable between
samples, the clear impact of KCl and EGTA suggests that tissue samples were indeed viable
throughout testing.
Figure 73. Upon application of preload, all vaginal samples experienced noticeable strains. Comparison of the 3
trials for each specimen revealed that preload areal strains for KCl trials were significantly greater than baseline and
EGTA strains (p = 0.02). EGTA was found to return areal strains to baseline levels (p > 0.05).
269

To standardize loading history across samples, all measurements were made relative to
the preloaded reference state, zeroing the strain values after application of the preload (Figure
74). Overall, samples did not appear to experience plastic deformation following preconditioning
or completion of individual trials (strains returned to ~0%). Interestingly, circumferential loading
curves exhibited increased nonlinearity, relative to the longitudinal axis, though both axes were
found to have little to no toe region (Figure 75). The absence or reduction of this toe region is a
stark contrast to previous uniaxial studies of rat vaginal tissue. In addition, application of lower
stress values on the longitudinal axis led to greater magnitudes of strain on the circumferential
axis and vice versa, demonstrating axial coupling (Figure 75). Notably, holding SLL at 100kPa,
while decreasing Sθθ to 50kPa and 75kPa, occasionally led to negative strains along the
circumferential axis. While the magnitude of negative strains varied, nearly all circumferential
loading curves exhibited decreasing strains at some point for these stress ratios.
Figure 74. To standardize the loading history of all samples, measured strain values were normalized by the final
preload strain. Therefore, all stress-strain data used to determine strain energy parameters was referenced to the
preloaded state, rather than the unloaded state.
270

Figure 75. Representative biaxial stress-strain data for vaginal tissue. The circumferential (circ.) axis typically
exhibited increased nonlinearity relative to the longitudinal (long.) axis, though both axes quickly increased in
stiffness. The stress ratio noticeably impacted the stress-strain curves for both the long. and circ. axes, demonstrating
axial coupling. Please note that the stress-strain data above is not referenced to the preloaded state. This was chosen
to visually separate circ. and long. curves.
In general, the chosen strain energy function was able to capture the complex axial
interactions observed during biaxial loading, producing good fits to experimental data with an R2
value of 0.88 and RMS error of ~0.001 for both KCl and EGTA groups. Plotting the predicted
loading curves, reveals distinct axial coupling, as both ELL and Eθθ vary depending on the stress
ratio. Impressively, all fit variables showed little variance following normalization of stress-
strain data. In addition, model coefficients were found to highlight distinct differences in tissue
behavior between contractile states. The coefficient a1 was nearly 41% greater for EGTA trials
relative to KCl trials, suggesting that smooth muscle contraction decreased the stiffness of the
271

longitudinal axis (p = 0.013). The nonlinear stiffness parameter β was also significantly
increased for EGTA trials, though this increase was roughly 5% (p = 0.048). Still, small changes
in nonlinear parameters, such as β, can dramatically impact the behavior of tissues. In general,
representative and mean values were similar for all parameters, though representative values
were appropriately determined by averaging specimen strain energy in the same SLL-Sθθ space
(WC).
Table 8. Best fit parameters for KCl and EGTA trials. KCl was found to significantly decrease a1 and β values
relative to EGTA trials, indicating a decrease in stiffness. Values are represented as mean ± std., while values in
parenthesis are the representative model parameters for KCl and EGTA groups. * indicates significant differences
between KCl and EGTA groups (p < 0.05).
Visualization of the strain energy and complimentary strain energy functions highlight
distinct differences in tissue behavior between KCl and EGTA trials. Regardless of contractile
state, the distinct asymmetry of the strain energy plots (W and WC) reveals that the rat vagina
behaves as an anisotropic material, with a stiffer longitudinal axis. This is in agreement with
model parameters, as representative a1 values are 44% and 64% greater than a2 values for KCl
272

and EGTA trials, respectively. This is indicated by the increased number of contours along the
longitudinal axis, relative to the circumferential axis in Figure 75 (top plots). Interestingly, the
vaginal mechanics were increasingly isotopic for KCl trials, relative to EGTA trials (Table 8,
Figure 76).
Contour plots of the representative-complimentary strain energy functions provide a
detailed view of the stress-space probed by the stress-controlled protocol used in this study.
Again, the distinct anisotropy of these contours well illustrates the anisotropy of vaginal tissue,
with KCl treated tissues behaving in a more isotropic manner. Complimentary strain energy plots
highlight the increased compliance of the circumferential axis, as complimentary strain energy
more rapidly increases along this axis. It is important to note that the maximum complimentary
strain energy (WC) for the experimentally tested range (up to 100kPa), is just 4kPa, less than half
of that maximum value in the strain energy (W) plots. Though experimental Eθθ values
commonly exceeded 20%, ELL values were often less than 10% suggesting that much of the
plotted longitudinal strain-space for strain energy plots consists of extrapolated data. Simply,
values closer to the y-axis were experimentally observed while, values at increasing ELL values
are based on model predictions.
273
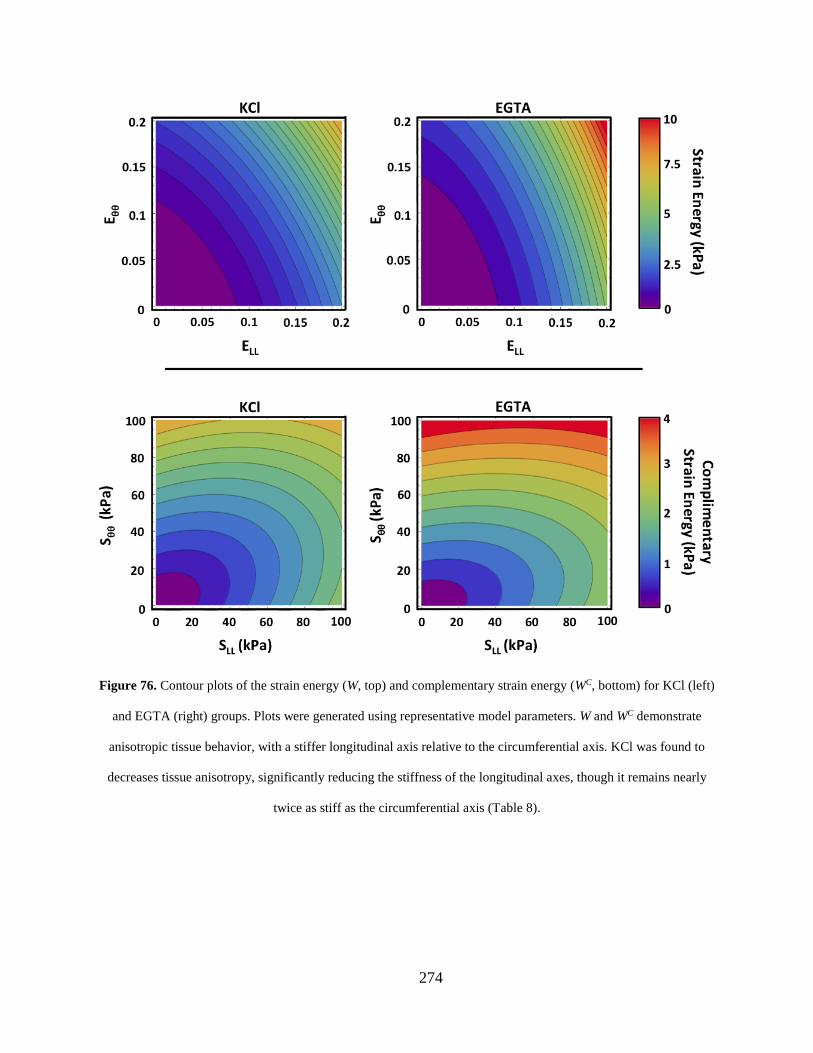
Figure 76. Contour plots of the strain energy (W, top) and complementary strain energy (WC, bottom) for KCl (left)
and EGTA (right) groups. Plots were generated using representative model parameters. W and WC demonstrate
anisotropic tissue behavior, with a stiffer longitudinal axis relative to the circumferential axis. KCl was found to
decreases tissue anisotropy, significantly reducing the stiffness of the longitudinal axes, though it remains nearly
twice as stiff as the circumferential axis (Table 8).
274

A.4 DISCUSSION
Currently, there is limited information regarding the mechanical behavior of biological tissues in
the female pelvic floor. In order improve the inputs for FE models of the pelvic floor and
enhance the predictive capabilities of such models, robust material models must be created for
these tissues. To this end, the goal of this study was two-fold; 1) design a biaxial testing
apparatus for compliant soft tissues and 2) evaluate the biaxial mechanical properties of the rat
vagina. A strain energy function was then fit to biaxial data in order to characterize the
mechanical behavior of the vagina, considering the role of smooth muscle contraction on its
biaxial properties. In this study, it was shown that the rat vagina exhibits a distinct, anisotropic
behavior, with a stiffer longitudinal axis relative to the circumferential axis, regardless of
contractile states. In general, muscle relaxation resulted in greater strain energy at comparable
strains, with values more rapidly increasing in the longitudinal direction. Interestingly, smooth
muscle contraction was found to increased tissue compliance, primarily along the longitudinal
axis. This study provides the first quantitative description of vaginal anisotropy and highlights
the impact of smooth muscle contraction on the mechanical behavior of the vagina.
Preliminary testing demonstrated the extreme compliance of virgin vaginal tissue, as
preload strains were typically on the order of 40%, though occasionally much greater strains
were observed along the circumferential axis. On average, the preload was equal to a stress
~20kPa relative to the unloaded state, which is a considerable level of stress, given the stress
ratios used in this study. The large increases in strain upon preloading for each axis suggests a
275

substantial amount of crimp within vaginal tissue. Most surprisingly, smooth muscle contraction
clearly altered the final strain values after preloading, with KCl groups averaging 15% greater
areal strain relative to EGTA trials. Though such increases were variable between samples,
comparison of KCl and EGTA trials within samples provided significant evidence to suggest that
preload strains were increased following smooth muscle contraction. This behavior likely results
from increased collagen crimp present within the extracellular matrix (ECM) of the vagina
following muscle contraction. Thus, additional crimp would require further displacement before
accruing the same preload as relaxed smooth muscle trials, manifesting as increased strain.
Given the variable nature of preload strains, all trials were normalized by this strain in
order to standardize the loading history between specimens. This was justified as all tissues and
suture lines appeared taught following application of the 0.1N preload. Still, it must be noted that
all measurements in this study were made relative to the preloaded reference state, rather than the
true unloaded configuration. As such, the predictions based on this data for vaginal tissue may
not fully capture the toe region exhibited by vaginal tissues. Applying preloads to extremely
compliant tissues, such as the vagina, is a challenging process given that low levels of force
(0.1N) can result in significant deformation. The difficulty in applying this preload demonstrates
the need to minimize noise in force measurements, highlighting the importance of the
“frictionless” motion carriages. Still, future biaxial studies of vaginal tissue may require load
cells of increased sensitivity, as the preload used in this study approached our load cell
276

resolution. Such studies may provide additional information regarding fiber requirement in
vagina tissue. Nonetheless, the present study effectively demonstrated the impact of smooth
muscle contraction, which was quite significant at the stress values used in this study.
Importantly, this study demonstrated the anisotropic behavior of the rat vagina.
Specifically, the longitudinal axis was found to be nearly twice as stiff as the circumferential axis
(parameter a1 vs. a2) regardless of smooth muscle contraction. However, smooth muscle
contraction significantly reduced the stiffness of the longitudinal axis (~41%), while
circumferential stiffness (a2) decreased by just 8%. Thus, smooth muscle contraction resulted in
stiffness values that were increasingly similar between the two axes, producing an increased
isotropic response, relative to that observed with relaxed smooth muscle. This finding contradicts
our hypothesis, as smooth muscle contraction decreased the stiffness of the longitudinal axis,
thereby altering tissue anisotropy. In agreement with observations of increased preload strain, it
is likely that smooth muscle contraction increased the initial crimp of the collagen fibers, thereby
altering the toe region for both the longitudinal and circumferential axes.
When characterizing vaginal biaxial mechanical data from a stress-controlled protocol,
traditional methods for accessing tissue behavior (maximum tangent modulus, maximum strain,
etc.) were ineffective. Such measurements suffered from extreme variability, arising from the
complex axial interactions observed during testing. Specifically, the behavior of each axis was
highly dependent on the stress ratio applied, with greater stress values limiting and occasionally
decreasing the strain (contraction) on the orthogonal axis. However, it was not uncommon for
one axis to initially experience increasing strain with increasing stress, then suddenly exhibit
277

decreasing strain (passive contraction) as stress continued to increase. Such behavior may be
attributed to Poissons effect, though the complex shape of these loading curves may suggest
significant interplay between the orthogonal axes. Regardless, the complexity of these stress-
strain curves led to difficulties in determining the tangent modulus and large variability for such
measurements.
While simplistic determination of loading curve variables did not capture the behavior of
vaginal tissue, application of a strain energy function was extremely effective in characterizing
this biaxial behavior. Not only was the chosen strain energy function able to provide good fits to
biaxial data, it was able to eliminate much of the experimental noise and provide insight into the
fundamental differences in vaginal mechanics with and without smooth muscle contraction. The
strain energy function used in this study was selected as it considers two main loading axes (a1
and a2 terms) and the interaction between these axes (a4 terms). Given the structure of the vaginal
muscularis, it was apparent that these behaviors were necessary in order to accurately represent
the tissue behavior. It should be noted that the form used here does not include shear terms, as
these were determined to be 0 for the current study. Additional testing may investigate the
impact of shear by orienting the longitudinal and circumferential axes at 45° relative to the
loading axes, and conducting a similar protocol. Such studies have previously been performed
for heart valves (201). However, the rat vagina is likely not large enough for samples to be cut
and tested in this orientation, given the dimensions considered in this study. Therefore, such
testing would not be possible on the current biaxial device or until biaxial testing boundary
conditions are developed to ensure that samples of smaller dimensions can develop homogenous
278

strain fields at the tissue mid-substance. Alternatively, other animal species may be considered,
though few species have vaginal tissues that meet the planar assumption (length >> thickness) of
biaxial testing. Given the difficulties in procuring human vaginal tissue, and the overall thickness
of this tissue, it may not be reasonable to test the human vagina biaxially. This underscores the
importance of developing animal models for pelvic floor research and characterizing the
relationship (similarities and differences) of animal tissues to human analogues (1, 49, 196).
Given the similarities in vaginal mechanics observed in uniaxial tests, it is likely that biaxial
behavior is comparable across species.
Though this biaxial study employed a stress-controlled protocol, a strain-controlled
protocol was considered. Preliminary tests were used to explore this feedback mechanism, yet
strain data obtained from the digital video extensometer (DVE) was quite noisy, and introduced
difficulty into actuator control. While strain-control may be analogous to deformation driven
events such as a fetus passing through the vaginal canal, the vagina often responds to the
application of force, including internal and external pressures. Stress-controlled do not require an
axis to reach a specified stretch, allowing fiber requirement and axial interactions to dictate the
deformation behavior of the tissue. This is dissimilar from strain-controlled protocols, which
may restrict the effects of fiber behavior. Still, strain-control may be appropriate for mimicking
certain in-vivo behaviors. Given the differing perspectives provided by these protocols, their
benefits and limitations must be considered during data analysis and upon selection (and
development) of constitutive models.
279

Overall this study provides great insight into the mechanical behavior of vaginal tissue,
stressing the need to consider its anisotropy and contractile state in FEA. Indeed, this is the first
study to quantitatively demonstrate the anisotropic behavior of vaginal tissue and the first to
demonstrate the significant impact of smooth muscle contraction it’s the behavior. Such novel
findings highlight the limitations of previous FE models of the pelvic floor, and more
importantly provide necessary data to improve the accuracy of these simulations. Further, the
biaxial device developed in this study can be used to further examine connective tissues and
other compliant tissues of the pelvic floor, in order to develop better material models for
computational studies. Though not completed in this study, the derived mechanical description of
the vagina can be implemented in constitutive relationships for FEA. In addition, fiber based
constitutive models should be examined for vaginal tissue and contrasted with the constitutive
model derived in this study.
280

APPENDIX B
POROSITY AND PORE DIAMETER CALCULATION
281

282

283

284

285

286

287

APPENDIX C
DETERMINATION OF SURFACE CURVATURE
C.1 CUVRATURE CALCULATION
288

289

290

291

292

293

294

295

296

297

298

299

300

301

302

303

304

305

C.2 CUVRATURE VISUALIZATION
% Code to read in and plot curvature results % Bill Barone % Created 6-15-12 % Last Modified 9-11-12 clear all clc % ZData = xlsread('PredictedZdata2000pts.xls'); Data = importdata('TotalSurfaceResults.txt'); X = transpose(Data(:,1)); Y = transpose(Data(:,2)); Z = transpose(Data(:,3)); %k1 = transpose(Data(:,6))/100; k2 = transpose(Data(:,7))/100; k1 = transpose(Data(:,19))/100; %k2 = transpose(Data(:,20))/100; GaussianCurvature = transpose(Data(:,10))/100; MeanCurvature = transpose(Data(:,21))/100; Uk1 = transpose(Data(:,11)); Vk1 = transpose(Data(:,12)); Wk1 = transpose(Data(:,13)); Uk2 = transpose(Data(:,14)); Vk2 = transpose(Data(:,15)); Wk2 = transpose(Data(:,16)); mean(abs(k1)) var(k1) %Create Plot for Major Curvature k1 %quiver3 creates vector plot from imported data % quiver3(X,Y,Z,Uk2,Vk2,Wk2,'black','ShowArrowHead','off') % set(gca,'DataAspectRatio',[1,1,1]) % hold on %use delaunay triangulation to create surface use interpolation of %curvature function from mathematica code for surface coloration TRI = delaunay (X,Y); trisurf(TRI,X,Y,Z) figure %%%%%%%%%%%%%%%%%%%%%%%%%%%%%%%%%%%%%%%%%%%%%%%%%%%%%%%%%%%%%%%%%%%%%%%%
%%%%%%%%%%%%%%%%%%%%%%%%%%%%%%%%%%%%%%%%%%%%%%%%%%%% %Original meshes before the cleaning the triangulation trisurf(TRI,X,Y,Z,k1) shading interp set(gca,'DataAspectRatio',[1,1,1]) colorbar title('Major Curvature k1')
306

%colorbar('location','southoutside') %figure %repeat process for Minor Curvature k2 % quiver3(X,Y,Z,Uk2,Vk2,Wk2,'black','ShowArrowHead','off') % set(gca,'DataAspectRatio',[1,1,1]) % hold on trisurf(TRI,X,Y,Z,k2) shading interp set(gca,'DataAspectRatio',[1,1,1]) title('Minor Curvature k2') caxis([-8, 8]) colorbar %figure %%%%%%%%%%%%%%%%%%%%%%%%%%%%%%%%%%%%%%%%%%%%%%%%%%%%%%%%%%%%%%%%%%%%%%%%
%%%%%%%%%%%%%%%%%%%%%%%%%%%%%%%%%%%%%%%%%%%%%%%%%%%% %Clean the mesh using Rouzbeh's code %clean_mesh.m is property of Rouzbeh Amini and is not included for print
in this dissertation factor_std = 2.5; TRI2 = clean_mesh( TRI,X,Y,Z, factor_std ); % quiver3(X,Y,Z,Uk1,Vk1,Wk1,0.25,'black','ShowArrowHead','off') % set(gca,'DataAspectRatio',[1,1,1]) % hold on trisurf(TRI2,X,Y,Z,k1) shading interp set(gca,'DataAspectRatio',[1,1,1]) caxis([-4.5, 4.5]) colorbar alpha(.9) title('Major Curvature k1') %colorbar('location','southoutside') figure %for some reason this figure does not print correctly, but if
the code is copied and pasted directly below the following plot is correct %Cleaned Major Curvature k1 quiver3(X,Y,Z,Uk1,Vk1,Wk1,1,'black','ShowArrowHead','off') set(gca,'DataAspectRatio',[1,1,1]) hold on trisurf(TRI2,X,Y,Z,abs(k1)) shading interp set(gca,'DataAspectRatio',[1,1,1]) title('Major Curvature k1') alpha(.9) caxis([0,1]) colorbar figure %repeat process for Minor Curvature k2 quiver3(X,Y,Z,Uk2,Vk2,Wk2,1,'black','ShowArrowHead','off') set(gca,'DataAspectRatio',[1,1,1]) hold on trisurf(TRI2,X,Y,Z,abs(k2))
307

shading interp set(gca,'DataAspectRatio',[1,1,1]) title('Minor Curvature k2') alpha(.9) caxis([0, 0.5]) colorbar figure %Max Curvatures (I calculated this as Major Curvature) % quiver3(X,Y,Z,Uk1,Vk1,Wk1,0.25,'black','ShowArrowHead','off') % hold on % quiver3(X,Y,Z,Uk2,Vk2,Wk2,0.25,'m','ShowArrowHead','off') % set(gca,'DataAspectRatio',[1,1,1]) % hold on trisurf(TRI2,X,Y,Z,abs(k1)) shading interp set(gca,'DataAspectRatio',[1,1,1]) title('Maximum Curvature') alpha(.9) %caxis([0,max(abs(k1))]) caxis([0,1.8]) colorbar view(0, 90) figure %GaussianCurvature % quiver3(X,Y,Z,Uk1,Vk1,Wk1,0.25,'black','ShowArrowHead','off') % hold on % quiver3(X,Y,Z,Uk2,Vk2,Wk2,0.25,'m','ShowArrowHead','off') % set(gca,'DataAspectRatio',[1,1,1]) % hold on trisurf(TRI2,X,Y,Z,GaussianCurvature) shading interp set(gca,'DataAspectRatio',[1,1,1]) title('GaussianCurvature') alpha(.9) caxis([-40, 40]) colorbar view(0, 90) figure %MeanCurvature % quiver3(X,Y,Z,Uk1,Vk1,Wk1,0.25,'black','ShowArrowHead','off') % hold on % quiver3(X,Y,Z,Uk2,Vk2,Wk2,0.25,'m','ShowArrowHead','off') % set(gca,'DataAspectRatio',[1,1,1]) % hold on trisurf(TRI2,X,Y,Z,MeanCurvature) shading interp set(gca,'DataAspectRatio',[1,1,1]) title('MeanCurvature') alpha(.9) caxis([-1,1]) colorbar view(0, 90) figure
308

APPENDIX D
BIAXIAL CONSTITUTIVE MODELING
309

310

311

312

313

314
315

316

317

318

319

320

BIBLIOGRAPHY
1. Abramowitch SD, Feola A, Jallah Z, Moalli PA. Tissue mechanics, animal models, and pelvic organ prolapse: A review. European Journal of Obstetrics & Gynecology and Reproductive Biology 2009;144S:S146–S58.
2. Jones K.A., Feola A., Meyn L., Abramowitch S.D., Moalli P.A. Tensile properties of commonly used prolapse meshes. International Urogynecology Journal and Pelvic Floor Dysfunction. 2009;20(7):847-53.
3. Muir TW, Aspera AM, Rackley RR et al. Recurrent pelvic organ prolapse in a women with bladder exstrophy: a case report of surgical management and review of the literature. Int Urogynecol J Pelvic Floor Dysfunct. 2004;15:436-8.
4. Bent AE, Cundiff GW, Swift SE. . Ostergard's Urogynecology and Pelvic Floor Dysfunction. 6th Ed. . Philadelphia, Pennsylvania: Lippincott Williams & Wilkins; 2008.
5. Walters MD, Karram MM. Clinical Urogynecology St. Louis, Missouri: Mosby- Year Book Inc.; 1993.
6. DeLancey JOL. The anatomy of the pelvic floor Current Opinion in Obstetrics and Gynecology. 1994;6(4):313-6.
7. Gabriel B, Denschlag D, Gobel H, et al. . Uterosacral ligament in postmenopausal women with or without pelvic organ prolapse. Int Urogynecol J Pelvic Floor Dysfunct. 2005;16:475-9.
8. Moalli PA, Talarico LC, Sung VW, Klingensmith WL, Shand SH, Meyn LA, Watkins, SC. Impact of menopause on collagen subtypes in the arcus tendineous fasciae pelvis. American Journal of Obstetrics and Gynecology. 2004;190(3):620-7.
9. Alperin M, Moalli PA. Current Opinion in Obstetrics and Gynecology. Current Opinion in Obstetrics and Gynecology. 2006;18 (5):544-50.
321

10. Cotreau MM, Chennathukuzhi VM, Harris HA, Han L, Dorner AJ, Apseloff G, Varadarajan U, Hatstat E, Zakaria M, Strahs AL, Crabtree JS, Winneker RC, Jelinsky SA. A study of 17β-estradiol-regulated genes in the vagina of postmenopausal women with vaginal atrophy. Maturitas. 2007;58(4):366-76. doi: 10.1016/j.maturitas.2007.09.009.
11. Vaccaro CM, Mutema GK, Fellner AN, Crisp CC, Estanol MV, Kleeman SD, Pauls RN. Histologic and cytologic effects of vaginal estrogen in women with pelvic organ prolapse: A randomized controlled trial. Female Pelvic Medicine and Reconstructive Surgery. 2013;19(1):34-9. doi: 10.1097/SPV.0b013e318278cc40.
12. Jallah Z. The Role of Vagnial Smooth Muscle in the Pathogenesis of Pelvic Organ Prolapse: University of Pittsburgh; 2014.
13. Inal HA, Kaplan PB, Usta U, Taştekin E, Aybatli A, Tokuc B. Neuromuscular morphometry of the vaginal wall in women with anterior vaginal wall prolapse. Neurourology and Urodynamics. 2010;29(3):458-63. doi: 10.1002/nau.20779.
14. Boreham MK WC, Miller RT, Schaffer JI, Word RA. Morphometric analysis of smooth muscle in the anterior vaginal wall of women with pelvic organ prolapse. Am J Obstet Gynecol. 2002;187(1):56-63. Epub 2002/07/13.
15. Boreham MK, Wai CY, Miller RT, Schaffer JI, Word RA, Weber A. Morphometric properties of the posterior vaginal wall in women with pelvic organ prolapse. American Journal of Obstetrics and Gynecology. 2002;187(6):1501-9. doi: 10.1067/mob.2002.130005.
16. Moalli PA, Shand SH, Zyczynski HM, Gordy SC, Meyn LA. Remodeling of vaginal connective tissue in patients with prolapse. Obstet Gynecol 2005;106(5 Pt 1):953-63. Epub 2005/11/02.
17. Sze EHM, Meranus J, Kohli N, Miklos JR, Karram MM. Vaginal Configuration on MRI after Abdominal Sacrocolpopexy and Sacrospinous Ligament Suspension. International Urogynecology Journal and Pelvic Floor Dysfunction. 2001;12(6):375-80.
18. Ghetti C., Lowder J. L., Ellison R., Krohn M.A., Moalli P. . Depressive symptoms in women seeking surgery for pelvic organ prolapse. International Urogynecology Journal and Pelvic Floor Dysfunction. 2010;21(7):855-60.
19. Lowder JL, Park AJ, Ellison R, Ghetti C, Moalli P, Zyczynski H, Weber AM The role of apical vaginal support in the appearance of anterior and posterior vaginal prolapse. Obstetrics and Gynecology. 2008;111(1):152-7.
322

20. MacLennan AH, Taylor AW, Wilson DH, Wilson D. The prevalence of pelvic floor disorders and their relationship to gender, age, parity and mode of delivery. British Journal of Obstetrics and Gynaecology. 2000;107(12):1460-70.
21. Sze EHM, Sherard III GB, Dolezal JM. Pregnancy, labor, delivery, and pelvic organ prolapse. Obstetrics and Gynecology. 2002;100(5):981-6.
22. Lukacz ES, Lawrence JM, Contreras R, Nager CW, Luber KM. Parity, mode of delivery, and pelvic floor disorders. Obstetrics and Gynecology. 2006;107(6):1253-60.
23. Mant J, Painter R, Vessey M. Epidemiology of genital prolapse: Observations from the oxford family planning association study. British Journal of Obstetrics and Gynaecology. 1997;104(5):579-85.
24. DeLancey JOL. Fascial and muscular abnormalities in women with urethral hypermobility and anterior vaginal wall prolapse. American Journal of Obstetrics and Gynecology. 2002;187(1):93-8.
25. Birk DE, Fitch JM, Babiarz JP, Doane KJ, Linsenmayer TF. Collagen fibrillogenesis in vitro: interaction of types I and V collagen regulates fibril diamter. J Cell Sci. 1990;95:649-57.
26. Zong W, Jallah ZC, Stein SE, Abramowitch SD, Moalli PA. Repetitive mechanical stretch increases extracellular collagenase activity in vaginal fibroblasts. Female Pelvic Med Reconstr Surg. 2010;16(5):257-62. Epub 2011/05/24.
27. Olsen AL, Smith VJ, Bergstrom JO, Colling JC, Clark AL. Epidemiology of surgically managed pelvic organ prolapse and urinary incontinence. Obstet Gynecol. 1997;89(4):501-6. Epub 1997/04/01.
28. Hendrix SI, Clark A, Nygaard I. Pelvic organ prolapse in the women's health initiative: gravity and gravidity. Am J Obstet Gynecol. 2002;186:1160-6.
29. Jones KA, Moalli PA. Pathophysiology of pelvic organ prolapse. Female Pelvic Medicine and Reconstructive Surgery. 2010;16(2):Pages 79-87.
30. Larsen WI, Yavork J. Pelvic organ prolapse and urinary incontinence in nulliparous college women in relation to paratrooper training. Int Urogynecol J. 2007;18:769-71.
31. Langberg H, Skovgaard D, Petersen LJ, Bulow J, Kjaer M. Type 1 collagen synthesis and degradation in peritendinous tissue after excercise determined by microdialysis in humans. J Physiol. 1999;521:299-306.
323

32. Kjaer M, Langberg H, Miller BF, Boushel R, Crameri R, Koskinen S, Heinemeier K, Olesen JL, Døssing S, Hansen M, Pedersen SG, Rennie MJ, Magnusson P. Metabolic activity and collagen turnover in human tendon in response to physical activity. Journal of Musculoskeletal Neuronal Interactions. 2005;5(1):41-52.
33. Gillard J, , Reed MWR, Buttle D, Cross SS, Brown NJ. Matrix metalloproteinase activity and immunohistochemical profile of matrix metalloproteinase-2 and -9 and tissue inhibitor of metalloproteinase-1 during human dermal wound healing. Wound Repair and Regeneration. 2004;12(3):295-304.
34. Orringer JS KS, Johnson TM, Karimipour DJ, Hamilton T, Hammerberg C, Voorhees JJ, Fisher GJ. Connective tissue remodeling induced by carbon dioxide laser resurfacing of photodamaged human skin. Archives of Dermatology. 2004;140(11):1326-32.
35. Chen BH, Wen Y, Li H, Polan ML. Collagen metabolism and turnover in women with stress urinary incontience and pelvic prolapse. International Urogynecology Journal and Pelvic Floor Dysfunction. 2002;13(2):80-7.
36. Goepel C, Hefler L, Methfessel H, Koelbl H. Periurethral connective tissue status of postmenopausal women with genital prolapse with and without stress incontinence. Acta Obstetricia et Gynecologica Scandinavica. 2003;82(7):659-64.
37. Söderberg MW, Falconer C, Bystrom B, Malmström A, Ekman G. Young women with genital prolapse have a low collagen concentration. Acta Obstetricia et Gynecologica Scandinavica. 2004;83(12):1193-8.
38. Ellerkmann RM, Cundiff GW, Melick CF, Nihira MA, Leffler K, Bent AE. . Correlation of symptoms with location and severity of pelvic organ prolapse. Am J Obstet Gynecol. 2001;185(6):1332-7; discussion 7-8. Epub 2001/12/18. doi: 10.1067/mob.2001.119078.
39. Nygaard I, editor. A 7-year Follow Up Study of Abdominal Sacrocolpopexy with and without BURCH Uretrhopexy: the Extended Colpopexy and Urinary Reduction Efforsts Study. 33rd Annual American Urogynecologic Society Meeting; 2012 October 3-6; Chicago, IL.
40. Subak LL, Waetjen LE, van den Eeden S, Thom DH, Vittinghoff E, Brown JS. Cost of pelvic organ prolapse surgery in the United States. Obstet Gynecol. 2001;98(4):646-51. Epub 2001/09/29.
41. Swift SE. The distribution of pelvic organ support in a population of female subjects seen for routine gynecologic health care. Am J Obstet Gynecol. 2000;183(2):277-85. Epub 2000/08/15.
324

42. FDA. Surgical Placement of Mesh to Repair Pelvic Organ Poses Risks In: FDA, editor. 2011.
43. Nygaard I, McCreery R, Brubaker L, Connolly A, Cundiff G, Weber AM, Zyczynski Halina. Abdominal Sacrocolpopexy: A Comprehensive Review. American College of Obstetricians and Gynecologists. 2004;104(4):805-23.
44. Moalli PA. Cadaveric fascia lata. International Urogynecology Journal and Pelvic Floor Dysfunction. 2006;17(SUPPL. 7):S48-S50.
45. Hinton R, Jinnah RH, Johnson C, Warden K, Clarke HJ. A biomechanical analysis of solvent-dehydrated and freeze-dried human fascia lata allografts. A preliminary report. American Journal of Sports Medicine. 1992;20(5):607-12.
46. Barber MD, Brubaker L, Burgio KL, Richter HE, Nygaard I, Weidner AC, Menefee SA, Lukacz ES, Norton P, Schaffer J, Nguyen JN, Borello-France D, Goode PS, Jakus-Waldman S, Spino C, Warren LK, Gantz MG, Meikle SF. Comparison of 2 transvaginal surgical approaches and perioperative behavioral therapy for apical vaginal prolapse: the OPTIMAL randomized trial. JAMA. 2014;311(10):1023-34.
47. FitzGerald MP MJ, Brubaker L. The antigenicity of fascia lata allografts. BJU International. 2000;86(7):826-8.
48. Budatha M RS, Zheng Q, Weislander C, Chapman SL, Davis EC, et al. . Extracellular matrix proteases contribute to progression of pelvic organ prolapse in mice and humans. J Clin Invest. 2011;121(5):2048-59. Epub 2011/04/27.
49. Feola A, Abramowitch S, Jones K, Stein S, Moalli P. Parity negatively impacts vaginal mechanical properties and collagen structure in rhesus macaques. Am J Obstet Gynecol. 2010;203(6):595 e1-8. Epub 2010/08/10.
50. Mosser DM, Edwards JP. Exploring the full spectrum of macrophage activation. Nat Rev Immunol. 2008;8(12):958-69. Epub 2008/11/26.
51. Zong W, Stein SE, Starcher B, Meyn LA, Moalli PA. Alteration of vaginal elastin metabolism in women with pelvic organ prolapse. Obstet Gynecol. 2010;115(5):953-61. Epub 2010/04/23.
52. Chen CC, Ridgeway B, Paraiso MF. Biologic grafts and synthetic meshes in pelvic reconstructive surgery Clin Obstet Gynecol. 2007;50(2):382-441. Epub 2007/05/22.
53. Hodde J. Extracellular matrix as a bioactive material for soft tissue reconstruction ANZ Journal of Surgery. 2006;76(12):1096-100.
325

54. Badylak SF, Park K, Peppas N, McCabe G, Yoder M. Marrow-derived cells populate scaffolds composed of xenogeneic extracellular matrix. Experimental Hematology. 2001;29(11):1310-8.
55. Badylak S. The extracellular matrix as a scaffold for tissue reconstruction. Seminars in Cell and Developmental Biology. 2002;13(5):377-83.
56. Dillion DJ. Docket No FDA-2011-N-0002: Cook Medical; 2011 [cited 2014 3/30/14]This is a succinct and updated review of graft-related complications and postoperative sequelae such as pain and dyspareunia after biologic, synthetic, and standard anterior compartment repairs]. Available from: http://www.fda.gov/downloads/AdvisoryCommittees/CommitteesMeetingMaterials/MedicalDevices/MedicalDevicesAdvisoryCommittee/ObstetricsandGynecologyDevices/UCM270781.pdf.
57. Gandhi S, Kubba LM, Abramov Y, Botros SM, Goldberg RP, Victor TA, Sand PK Histopathologic changes of porcine dermis xenografts for transvaginal suburethral slings American Journal of Obstetrics and Gynecology. 2005;192(S5):1643-8.
58. Jarman-Smith ML, Bodamyali T, Stevens C, Howell JA, Horrocks M, Chaudhuri JB. Porcine collagen crosslinking, degradation and its capability for fibroblast adhesion and proliferation. Journal of Materials Science: Materials in Medicine. 2004;15(8):925-32.
59. Kimuli M, Eardley I, Southgate J. In vitro assessment of decellularized porcine dermis as a matrix for urinary tract reconstruction. BJU International. 2004;94(6):859-66.
60. Buxboim A, Ivanovska IL, Discher DE. Matrix elasticity, cytoskeletal forces and physics of the nucleus: how deeply do cells “feel” outside and in? J Cell Sci. 2010;123:297-308.
61. FDA. Surgical Placement of Mesh to Repair Pelvic Organ Prolapse Poses Risks. In: FDA, editor. 2011
62. FDA. Serious Complications Associated with Transvaginal Placement of Surgical Mesh in Repair of Pelvic Organ Prolapse and Stress Urinary Incontinence. In: FDA, editor. 2008.
63. Diwadkar G.B., Barber M.D., Feiner B., Maher C., Jelovsek J.E. Complication and reoperation rates after apical vaginal prolapse surgical repair: A systematic review. Obstetrics and Gynecology. 2009;113(2 Part 1):367-73.
64. Deffieux X, de Tayrac R, Huel C, Bottero J, Gervaise A, Bonnet K, et al. Vaginal mesh erosion after transvaginal repair of cystocele using Gynemesh or Gynemesh-Soft in 138
326

women: a comparative study. Int Urogynecol J Pelvic Floor Dysfunct. 2007;18(1):73-9. Epub 2006/01/05.
65. Feiner B., Maher C. Vaginal mesh contraction: Definition, clinical presentation, and management. Obstetrics and Gynecology. 2010;115(2 Part 1):325-30.
66. Baessler K., Hewson A.D., Schuessler B., Maher C.F. Severe Mesh Complications Following Intravaginal Slingpasty. Obstet Gynecol. 2005;106(4):713-6. Epub 4/10/2005.
67. Bako A., Dhar R. Review of Synthetic Mesh-Related Complication in Pelvic Floor Reconstructive Surgery. Int Urogynecol J. 2008(20):103-11. Epub 9/9/2008.
68. Patel B.N., Lucioni A., Kobashi K.C. Anterior Pelvic Organ Prolapse Repair Using Synthetic Mesh. Current Urology Reports. 2012(13):211-5. Epub May 6, 2012.
69. Brubaker L NI, Richter HE, Visco A, Weber AM, Cundiff GW, et al. Two-year outcomes after sacrocolpopexy with and without burch to prevent stress urinary incontinence. Obstet Gynecol. 2008;112(1):49-55. Epub 2008/07/02.
70. Letouzey V, Deffieux X, Gervaise A, Mercier G, Fernandez H, de Tayrac R. Trans-vaginal cystocele repair using a tension-free polypropylene mesh: more than 5 years of follow-up. Eur J Obstet Gynecol Reprod Biol. 2010;151(1):101-5. Epub 2010/04/27.
71. Nygaard I, Barber MD, Burgio KL, Kenton K, Meikle S, Schaffer J, et al. Prevalence of symptomatic pelvic floor disorders in US women. JAMA. 2008;200(11):1311-6. Epub 2008/09/19.
72. Abed H, Rahn DD, Lowenstein L, Balk EM, Clemons JL, Rogers RG. Incidence and management of graft erosion, wound granulation, and dyspareunia following vaginal prolapse repair with graft materials: a systematic review. Int Urogynecol J. 2011;22(7):789-98. Epub 2011/03/23.
73. Collinet P, Belot F, Debodinance P, Ha Duc E, Lucot JP, Cosson M. Transvaginal mesh technique for pelvic organ prolapse repair: mesh exposure management and risk factors. Int Urogynecol J Pelvic Floor Dysfunct. 2006;17(4):315-20. Epub 2005/10/18.
74. Araco F, Gravante G, Sorge R, Overton J, De Vita D, Primicerio M, et al. The influence of BMI, smoking, and age on vaginal erosions after synthetic mesh repair of pelvic organ prolapses. A multicenter study. Acta Obstet Gynecol Scand. 2009;88(7):772-80. Epub 2009/05/20.
327

75. Liang R, Abramowitch S, Knight K, Palcsey S, Nolfi A, Feola A, et al. Vaginal degeneration following implantation of synthetic mesh with increased stiffness. BJOG. 2013;120(2):233-43. Epub 2012/12/18.
76. Plaas AHK, Wong-Palms S, Koob T, Hernandez D, Marchuk L, Frank CB. Proteoglycan metabolism during repair of the ruptured medial collateral ligament in skeletally mature rabbits. Archives of Biochemistry and Biophysics. 2000;374(1):35-41.
77. Feola A., Abramowitch S., Jallah Z., Stein S., Barone W., Palcsey S., Moalli P. Deterioration in biomechanical properties of the vagina following implantation of a high-stiffness prolapse mesh. BJOG: An International Journal of Obstetrics and Gynaecology. 2013;120(2):224-32.
78. Iglesia CB, Fenner DE, Brubaker L. The Use of Mesh in Gynecologic Surgery. Int UrogynecolJ. 1997;8:105-15.
79. Weinberger MW, Ostergard DR. Long-term clinical and urodynamic evaluation of polytetrafluoroethylene sling for treatment of genuine stress incontinence. Obstet Gynecol. 1995;86:92-6.
80. Cundiff GW, Varner E, Visco AG, Zyczynski HM, Nager CW, Norton PA, Schaffer J, Brown MB, Brubaker L. Risk Factors for Mesh/Suture Erosion Following Sacrocolpopexy. Am J Obstet Gynecol. 2008;199(6 ):688.e1–.e5.
81. Elliott MP, Juler GL. Comparison of Marlex mesh and microporous Teflon sheets when used for hernia repair in the experimental animal Am J Surg. 1979;137:342-4.
82. Ulmsten U, Henriksson I, Johnson P, Varhos G. An ambulatory surgical proocedure under local anesthesia for treatment of female urinary incontinence. Int Urogynecol J Pelvic Floor Dysfunct. 1996;7(2):81-6.
83. Nygaard I, Brubaker L, Zyczynski HM, Cundiff G, Richter H, Gantz M, Fine P, Menefee S, Ridgeway B, Visco A, Warren LK, Zhang M, Meikle S. . Long-term outcomes following abdominal sacrocolpopexy for pelvic organ prolapse. . JAMA. 2013;309(19 ):2016-24. doi: 10.1001/jama.2013.4919.
84. Klinge U, Junge K, Spellerberg B, Piroth C, Klosterhalfen B, Schumpelick V. Do multifilament alloplastic meshes increase the infection rate? Analysis of the polymeric surface, the bacteria adherence, and the in vivo consequences in a rat model. J Biomedical Material Research. 2002 63:765-71.
85. Cosson M, Debodinance P, Boukerrou M, Chauvet MP, Lobry P, Crépin G, Ego A. Mechanical properties of synthetic implants used in the repair of prolapse and urinary
328
incontinence in women: Which is the ideal material? International Urogynecology Journal and Pelvic Floor Dysfunction. 2003;14(3):169-78.
86. Greca F.H., De Paula J.B., Biondo-Simões M.L.P., Da Costa F.D., Da Silva A.P.G., Time S., Mansur A. The influence of differing pore sizes on the biocompatibility of two polypropylene meshes in the repair of abdominal defects: Experimental study in dogs. Hernia. 2001;5(2):59-64.
87. Greca F.H., Souza-Filho Z.A., Giovanini A., Rubin M.R., Kuenzer R.F., Reese F.B., Araujo L.M. The influence of porosity on the integration histology of two polypropylene meshes for the treatment of abdominal wall defects in dogs. Hernia. 2008;12(1):45-9.
88. Klinge U, Klosterhalfen B, Birkenhauer V, Junge K, Conze J, Schumpelick V. Impact of polymer pore size on the interface scar formation in a rat model. J Surgical Research. 2002;103:208-14.
89. Chvapil M., Holuša R., Kliment K., Štoll M. Some chemical and biological characteristics of a new collagen–polymer compound material. Journal of Biomedical Materials Research - Part A. 1969;3(2):315-32. Epub 9/13/2004.
90. Patel H., Ostergard D., Sternschuss G. Polypropylene mesh and the host response. International Urogynecology Journal and Pelvic Floor Dysfunction. 2012;23(6):669-79.
91. Amid P.K. Classification of biomaterials and their related complications in abdominal wall hernia surgery. Hernia. 1997(1):15-21.
92. Muhl T, Binnebosel M, Klinge U, Goedderz T. New Objective Measurement to Characterize the Porosity of Textile Implants. Journal of Biomedical Materials Research - Part B: Applied Biomaterials. 2007:176-83.
93. Otto J, Kaldenhoff E, Kirschner-Harmanns R, Muhl T, Klinge U. Elongatinon of Textile Pelvic Floor Implants Under Load is Related to Complete Loss of Effective Porosity, Thereby Favoring Incorporation in Scar Plates. Journal of Biomedical Materials Research - Part A. 2013.
94. Junge K, Binnebosel M, von Trotha KT, Rosch R, Klinge U, Neumann UP, Jansen PL. Mesh biocompatibility: effects of cellular inflammation and tissue remodeling. Langenbecks Arch Surg. 2011;397:255-70.
95. Klinge U, Junge K, Stumpf M, Öttinger AP, Klosterhalfen B. Functional and morphological evaluation of a low-weight monofilament polypropylene mesh for hernia repair. J Biomedical Material Research. 2002;63:129-36.
329

96. Klinge U, Klosterhalfen B, Öttinger AP, Junge K, Schumpelick V. PVDF as a new polymer for the construction of surgical meshes. Biomaterials. 2002;23(16):3487-93.
97. Klinge U. KB. Modified classification of surgical meshes for hernia repair based on the analysis of 1000 explanted meshes Hernia. 2011;16:251-8. Epub 5/5/2012.
98. Weyhe D., Schmitz I., Belyaev O., Garbs R., Muller K.M., Uhl W., Aumtobel V. Experimental comparision of monofile light and heavy polypropylene meshes: less weight does not mean less biological response. World Journal of Surgery. 2006;30(8):1586-91.
99. Bellon L.M., Jurado F., Garcia-Honduvilla N., Lopez R., Carrera-San Martin A. , Bujan J. The structure of a biomaterial rather than its chemical composition modulates the repair process at the peritoneal level. American Journal of Surgery. 2002;184(2):154-9.
100. Baessler K, Maher CF. Mesh augmentation during pelvic-floor reconstructive surgery: risks and benefits. Current Opinion in Obstetrics and Gynecology. 2006;18:560-6.
101. Pierce LM, Rao A, Baumann SS, Glassberg JE, Kuehl TJ, Muir TW. Long-term histologic response to synthetic and biologic graft materials implanted in the vagina and abdomen of a rabbit model. Am J Obstet Gynecol. 2009;200(5):546 e1-8. Epub 2009/03/17.
102. Manodoro S., Endo M., Uvin P., Ablersen M., Vlacil J., Engels A., Schmidt B., De Ridder D., Feola A. , Deprest J. Graft-Related Complications and Biaxial Tensiometry Following Experimental Vaginal Implantation of Flat Mesh of Variable Dimensions. BJOG. 2012;120(2):244-50.
103. Anderson AE, Peters CL, Tuttle BD, Weiss JA. Subject-specific finite element model of the pelvis: Development, validation and sensitivity studies. Journal of Biomechanical Engineering. 2005;127(3):364-73. doi: 10.1115/1.1894148.
104. Song Y, Debski RE, Musahl V, Thomas M, Woo SLY. A three-dimensional finite element model of the human anterior cruciate ligament: A computational analysis with experimental validation. Journal of Biomechanics. 2004;37(3):383-90. doi: 10.1016/S0021-9290(03)00261-6.
105. Gardiner JC, Weiss JA. Subject-specific finite element analysis of the human medial collateral ligament during valgus knee loading. Journal of Orthopaedic Research. 2003;21(6):1098-106. doi: 10.1016/S0736-0266(03)00113-X.
330

106. Sacks MS, David Merryman W, Schmidt DE. On the biomechanics of heart valve function. Journal of Biomechanics. 2009;42(12):1804-24. doi: 10.1016/j.jbiomech.2009.05.015.
107. Röhrnbauer B. Mechanical Characterization and Modeling of Prosthetic Meshes: Dipl. Ing. Technische Universität Müchen; 2013.
108. Reclassification of Surgical Mesh for Transvaginal Pelvic Organ Prolapse Repair and Surgical Instrumentation for Urogynecologic Surgical Mesh Procedures; Designation of Special Controls for Urogynecologic Surgical Mesh Instrumentation. In: Administration DoHaHSFaD, editor.: Federal Register; 2014. p. 24634 - 42.
109. Pulliam S, , et al. Use of synthetic mesh in pelvic reconstructive surgery: a survey of attitudes and practice patterns of urogynecologists. Int Urogynecol J Pelvic Floor Dysfunct. 2007;18(12):1405-8.
110. Reay Jones NHJ, Healy JC, King LJ, Saini S, Shousha S, Allen-Mersh TG. Pelvic connective tissue resilience decreases with vaginal delivery, menopause and uterine prolapse. British Journal of Surgery. 2003;90(4):466-72. doi: 10.1002/bjs.4065.
111. Margulies RU, Lewicky-Gaupp C, Fenner DE, McGuire EJ, Clemens JQ, DeLancey JOL. Complications requiring reoperation following vaginal mesh kit procedures for prolapse. American Journal of Obstetrics and Gynecology. 2008;199(6):678.e1-.e4. doi: 10.1016/j.ajog.2008.07.049.
112. Feola A., Barone W., Moalli P., Abramowitch S. . Characterizing the ex vivo textile and structural properties of synthetic prolapse mesh products. International Urogynecology Journal and Pelvic Floor Dysfunction. 2013;24(4):559-64.
113. Beets GL, Go PMTYH, Mameren HV. Foreign body reactions to monofilament and braided polypropylene mesh used as preperitoneal implants in pigs. European Journal of Surgery, Acta Chirurgica. 1996;162(10):823-5.
114. Shepherd J.P., Feola A.J., Abramowitch S.D., Moalli P.A. Uniaxial biomechanical properties of seven different vaginally implanted meshes for pelvic organ prolapse. International Urogynecology Journal and Pelvic Floor Dysfunction. 2012;23(5):613-20.
115. Moalli P.A., Papas N., Menefee S., Albo M., Meyn L., Abramowitch S.D. Tensile properties of five commonly used mid-urethral slings relative to the TVT. International Urogynecology Journal and Pelvic Floor Dysfunction. 2008;19(5):655-63.
116. Lanir Y. A structural theory for the homogeneous biaxial stress–strain relationships in flat collagenous tissues. Journal of Biomechanics 1979;12:423–36.
331

117. Sternschuss G, Ostergard DR, Patel H. Post-implantation alterations of polypropylene in the human. Journal of Urology. 2012;188(1):27-32. doi: 10.1016/j.juro.2012.02.2559.
118. Ostergard DR, Azadi A. To mesh or not to mesh with polypropylene: Does carcinogenesis in animals matter? International Urogynecology Journal and Pelvic Floor Dysfunction. 2014;25(5):569-71. doi: 10.1007/s00192-013-2239-z.
119. Moalli P, Brown B, Reitman MTF, Nager CW. Polypropylene mesh: Evidence for lack of carcinogenicity. International Urogynecology Journal and Pelvic Floor Dysfunction. 2014;25(5):573-6. doi: 10.1007/s00192-014-2343-8.
120. Moalli PA, Brown B, Reitman MTF, Nager CW. Polypropylene mesh: evidence for lack of carcinogenicity. Int Urogynecol J. 2014;25(5):573-6.
121. Jacobs JJ, Sumner DR, Galante JO. Mechanisms of bone loss associated with total hip replacement. Orthopedic Clinics of North America. 1993;24(4):583-90.
122. Rubash HE SR, Shanbhag AS, Kim S-Y. Pathogenesis of bone loss after total hip arthroplasty Orthopedic Clinics of North America. 1998;29(2):173-86.
123. Pierce L.M., Grunlan M.A., Hou Y., Baumann S.S., Kuehl T.J., Muir T.W. Biomechanical Properties of Synthetic and Biologic Graft Material Following Long-Term Implantation in the Rabbit Abdomen and Vagina. American Journal of Obstetics and Gynecology. 2009:549.e1-.e8.
124. FDA. Surgical Placement of Mesh to Repair Pelvic Organ Prolapse Poses Risks. In: FDA, editor. 2011.
125. Maher C., Baessler K., Glazener C., Adams E., Hagen S. . Surgical management of pelvic organ prolapse in women. Cochrane Database of Systematic Reviews. 2007(3).
126. Dietz H.P., Vancaillie P., Svehla M., Walsh W., Steensma A.B., Vancaillie T.G. . Mechanical properties of urogynecologic implant materials. International Urogynecology Journal and Pelvic Floor Dysfunction. 2003;14(4):239-43.
127. Krause H, Bennett M, Forwood M, Goh J. Biomechanical properties of raw meshes used in pelvic floor reconstruction. International Urogynecology Journal and Pelvic Floor Dysfunction. 2008;19(12):1677-81.
128. Cobb WS, Burns JM, Kercher KW, Matthews BD, Norton HJ, Heniford BT. Normal intraabddominal pressure in healthy adults. Journal of Surgical Research. 2005;129:231-5.
332

129. Noakes NF, Pullan AJ, Bissett IP, Cheng LK. Subject specific finite elasticity simulations of the pelvic floor. Journal of Biomechanics 2008;41:3060-5.
130. Crosby EC, Abemethy M, Berger MB, DeLancey JO, Fenner DE, Morgan DM Symptom Resolution After Operative Management of Complications From Transvaginal Mesh. Obstetrics and Gynecology. 2014;123(1):134-9.
131. Iglesia C.B., Sokol A.I., Sokol E.R., Kudish B.I., Gutman R.E., Peterson J.L., Shott S. Vaginal mesh for prolapse: A randomized controlled trial. Obstetrics and Gynecology. 2010;116(2 Part 1):293-303.
132. Filas B.A., Knutsen A.K., Bayly P.V., Taber L.A. A new method for measuring deformation of folding surfaces during morphogenesis. Journal of Biomechanical Engineering. 2008;130(6):061010-1 - -9.
133. Batchelor Ph.G., Castellano Smith A.D., Hill D.L.G., Hawkes D.J., Cox, T.C.S., Dean A.F. Measures of Folding Applied to the Development of the Human Fetal Brain. IEEE Transactions on Medical Imaging. 2002;21(8):953-65.
134. Lee K., Zhu J., Shum J. Y., Zhang, Muluk S.C., Chandra A., Eskandari M.K., Finol E.A. Surface curvature as a classifier of abdominal aortic aneurysms: A comparative analysis. Annals of Biomedical Engineering. 2013;41 (3):562-76.
135. Sacks MS, He, Z., Baijens, L., Wanant, S., Shah, P., Sugimoto, H., Yoganathan, A.P. Surface Strains in the Anterior Leaflet of the Functioning Mitral Valve. Annals of Biomedical Engineering. 2002;30(10):1281-90.
136. Smith D.B., Sacks M.S., Vorp D.A., Thorton M. Surface Geometric Analysis of Anatomic Structures Using Finite Element Interpolation. Annals of Biomedical Engineering. 2000;28:598-611. Epub 22 May 2000.
137. Ozog Y, Deprest J, Haest K, Claus F, De Ridder D, Mazza E. Calculation of membrane tension in selected sections of the pelvic floor. International Urogynecology Journal and Pelvic Floor Dysfunction. 2014;25:499-506.
138. Taber LA. Nonlinear Thoery of Elascticity: Application in Biomechanics. 5 Toh Tuck Link Singapore: World Scientific Publishing Co. Pte. Ltd.; 2004. 399 p.
139. Amini R, Voycheck CA, Debski RE. A Method for Predicting Collagen Fiber Realignment in Non-planar Tissue Surfaces as Applied to Glenohumeral Capsule during Clinically Relevant Deformation Journal of Biomechanical Engineering. 2013.
333

140. Goktepe S., Bothe W., Kvitting J.P.E., Swanson J.C., Ingels N.B., Miller D.C., Kuhl E. Anterior Mitral Leaflet Curvature in the Beating Ovine Heart: A Case Study Using Videofluoroscopic Markers and Subdivision Surfaces. Biomech Model Mechanobiol. 2009(9):281-93. Epub 13 October 2009.
141. Svabík K., Martan A., Masata J., El-Haddad R., Hubka P., Pavlikova M. Ultrasound appearances after mesh implantation - Evidence of mesh contraction or folding? . International Urogynecology Journal and Pelvic Floor Dysfunction. 2010;22(5):529-33.
142. Amini R, Eckert CE, Koomalsingh K, McGarvey J, Minakawa M, Gorman JH, et al. . On the in vivo Deformation of the Mitral Valve Anterior Leaflet: Effects of Annular Geometry and Referntial Configuration. Annals of Biomedical Engineering. 2012;40(7):1455-67.
143. Brubaker L, Norton PA, Albo ME, Chai TC, Dandreo KJ, Lloyd KL, Lowder JL, Sirls LT, Lemack GE, Arisco AM, Xu Y, Kusek JW Adverse events over two years after retropubic or transobturator midurethral sling surgery: Findings from the Trial of Midurethral Slings (TOMUS) study American Journal of Obstetrics and Gynecology 2011;205 (5):498.e1- .e6.
144. Maher C, Feiner B, Baessler K, Schmid C. Surgical management of pelvic organ prolapse in women. The Cochrane database of systematic reviews. 2013;4.
145. Mortier P, Holzapfel GA, De Beule M, Van Loo D, Taeymans Y, Segers P, Verdonck P, Verhegghe B. A novel simulation strategy for stent insertion and deployment in curved coronary bifurcations: Comparison of three drug-eluting stents. Annals of Biomedical Engineering. 2010;38(1):88-99. doi: 10.1007/s10439-009-9836-5.
146. Huiskes R, Weinans H, Van Rietbergen B. The relationship between stress shielding and bone resorption around total hip stems and the effects of flexible materials. Clinical Orthopaedics and Related Research. 1992(274):124-34.
147. Prendergast PJ. Finite element models in tissue mechanics and orthopaedic implant design. Clinical Biomechanics. 1997;12(6):343-66. doi: 10.1016/S0268-0033(97)00018-1.
148. Feola A, Pal S, Moalli P, Maiti S, Abramowitch S. Varying degrees of nonlinear mechanical behavior arising from geometric differences of urogynecological meshes. Journal of Biomechanics. 2014;47(11):2584-9. doi: 10.1016/j.jbiomech.2014.05.027.
149. Pierce DM, Unterberger MJ, Trobin W, Ricken T, Holzapfel GA. A microstructurally based continuum model of cartilage viscoelasticity and permeability incorporating
334

measured statistical fiber orientations. Biomechanics and Modeling in Mechanobiology. 2015. doi: 10.1007/s10237-015-0685-x.
150. Rao MP, Pantiuk M, Charalambides PG. Modeling the geometry of satin weave fabric composites. Journal of Composite Materials. 2009;43(1):19-56. doi: 10.1177/0021998308097437.
151. Krause H, Bennett M, Forwood M, Goh J. Biomechanical properties of raw meshes used in pelvic floor reconstruction. International Urogynecology Journal and Pelvic Floor Dysfunction. 2008;19(12):1677-81. doi: 10.1007/s00192-008-0711-y.
152. Robinson TN, Clarke JH, Schoen J, Walsh MD. Major mesh-related complications following hernia repair: Events reported to the Food and Drug Administration. Surgical Endoscopy and Other Interventional Techniques. 2005;19(12):1556-60. doi: 10.1007/s00464-005-0120-y.
153. Jones R, Simorov A, Lomelin D, Tadaki C, Oleynikov D. Long-term outcomes of radiologic recurrence after paraesophageal hernia repair with mesh. Surgical Endoscopy. 2014. doi: 10.1007/s00464-014-3690-8.
154. Yeoman MS, Reddy D, Bowles HC, Bezuidenhout D, Zilla P, Franz T. A constitutive model for the warp-weft coupled non-linear behavior of knitted biomedical textiles. Biomaterials. 2010;31(32):8484-93. doi: 10.1016/j.biomaterials.2010.07.033.
155. King MJ, Jearanaisilawong P, Socrate S. A continuum constitutive model for the mechanical behavior of woven fabrics. International Journal of Solids and Structures. 2005;42(13):3867-96. doi: 10.1016/j.ijsolstr.2004.10.030.
156. Kraemer NA, Donker HCW, Kuehnert N, Otto J, Schrading S, Krombach GA, Klinge U, Kuhl CK. In vivo visualization of polymer-based mesh implants using conventional magnetic resonance imaging and positive-contrast susceptibility imaging. Investigative Radiology. 2013;48(4):200-5. doi: 10.1097/RLI.0b013e31827efd14.
157. Kuehnert N, Kraemer NA, Otto J, Donker HCW, Slabu I, Baumann M, Kuhl CK, Klinge U. In vivo MRI visualization of mesh shrinkage using surgical implants loaded with superparamagnetic iron oxides. Surgical Endoscopy and Other Interventional Techniques. 2012;26(5):1468-75. doi: 10.1007/s00464-011-2057-7.
158. Endo M, Feola A, Sindhwani N, Manodoro S, Vlacil J, Engels AC, Claus F, Deprest JA. Mesh contraction: In vivo documentation of changes in apparent surface area utilizing meshes visible on magnetic resonance imaging in the rabbit abdominal wall model. International Urogynecology Journal and Pelvic Floor Dysfunction. 2014;25(6):737-43. doi: 10.1007/s00192-013-2293-6.
335

159. Drutz HP, Alarab M. Pelvic organ prolapse: Demographics and future growth prospects. International Urogynecology Journal and Pelvic Floor Dysfunction. 2006;17(SUPPL. 7):S6-S9. doi: 10.1007/s00192-006-0102-1.
160. Henak CR, Anderson AE, Weiss JA. Subject-specific analysis of joint contact mechanics: application to the study of osteoarthritis and surgical planning. Journal of biomechanical engineering. 2013;135(2):021003.
161. Henak CR, Carruth ED, Anderson AE, Harris MD, Ellis BJ, Peters CL, Weiss JA. Finite element predictions of cartilage contact mechanics in hips with retroverted acetabula. Osteoarthritis and Cartilage. 2013;21(10):1522-9. doi: 10.1016/j.joca.2013.06.008.
162. Henak CR, Kapron AL, Anderson AE, Ellis BJ, Maas SA, Weiss JA. Specimen-specific predictions of contact stress under physiological loading in the human hip: Validation and sensitivity studies. Biomechanics and Modeling in Mechanobiology. 2014;13(2):387-400. doi: 10.1007/s10237-013-0504-1.
163. Sigal IA, Flanagan JG, Tertinegg I, Ethier CR. Modeling individual-specific human optic nerve head biomechanics. Part II: Influence of material properties. Biomechanics and Modeling in Mechanobiology. 2009;8(2):99-109. doi: 10.1007/s10237-008-0119-0.
164. Dietz HP. Pelvic floor ultrasound: a review. American Journal of Obstetrics and Gynecology. 2010;202(4):321-34. doi: 10.1016/j.ajog.2009.08.018.
165. Dietz HP. Ultrasound imaging of the pelvic floor. Part I: Two-dimensional aspects. Ultrasound in Obstetrics and Gynecology. 2004;23(1):80-92. doi: 10.1002/uog.939.
166. Dietz HP, Bennett MJ. The effect of childbirth on pelvic organ mobility. Obstetrics and Gynecology. 2003;102(2):223-8. doi: 10.1016/S0029-7844(03)00476-9.
167. Dietz HP, Haylen BT, Broome J. Ultrasound in the quantification of female pelvic organ prolapse. Ultrasound in Obstetrics and Gynecology. 2001;18(5):511-4. doi: 10.1046/j.0960-7692.2001.00494.x.
168. Lewicky-Gaupp C, Yousuf A, Larson KA, Fenner DE, Delancey JOL. Structural position of the posterior vagina and pelvic floor in women with and without posterior vaginal prolapse. American Journal of Obstetrics and Gynecology. 2010;202(5):497.e1-.e6. doi: 10.1016/j.ajog.2010.01.001.
169. Dietz HP, Erdmann M, Shek KL. Mesh contraction: Myth or reality? American Journal of Obstetrics and Gynecology. 2011;204(2):173.e1-.e4. doi: 10.1016/j.ajog.2010.08.058.
336

170. Kasturi S, Lowman J, Kelvin FM, Akisik F, Terry C, Hale DS. Pelvic magnetic resonance imaging for assessment of the efficacy of the Prolift system for pelvic organ prolapse. American Journal of Obstetrics and Gynecology. 2010;203(5):504.e1-.e5. doi: 10.1016/j.ajog.2010.06.034.
171. Abramowitch SD, Woo SLY. An improved method to analyze the stress relaxation of ligaments following a finite ramp time based on the quasi-linear viscoelastic theory. Journal of Biomechanical Engineering. 2004;126(1):92-7. doi: 10.1115/1.1645528.
172. Fung, YC. Biomechanics: Its Foundations and Objectives. Y.C. Fung NP, and M. Anliker, editor. Englewood Cliffs: PrenticeHall; 1972.
173. Humphrey JD, Yin FC. A new constitutive formulation for characterizing the mechanical behavior of soft tissues. Biophysical Journal. 1987;52(4):563-70.
174. Hansen L, Wan W, Gleason RL. Microstructurally motivated constitutive modeling of mouse arteries cultured under altered axial stretch. Journal of Biomechanical Engineering. 2009;131(10). doi: 10.1115/1.3207013.
175. De Vita R, Slaughter WS. A structural constitutive model for the strain rate-dependent behavior of anterior cruciate ligaments. International Journal of Solids and Structures. 2006;43(6):1561-70. doi: 10.1016/j.ijsolstr.2005.04.022.
176. Billiar KL, Sacks MS. Biaxial mechanical properties of the native and glutaraldehyde-treated aortic valve cusp: Part II - A structural constitutive model. Journal of Biomechanical Engineering. 2000;122(4):327-36. doi: 10.1115/1.1287158.
177. Ferruzzi J, Vorp DA, Humphrey JD. On constitutive descriptors of the biaxial mechanical behaviour of human abdominal aorta and aneurysms. Journal of the Royal Society Interface. 2011;8(56):435-50. doi: 10.1098/rsif.2010.0299.
178. Nagle AS, Barker MA, Kleeman SD, Haridas B, Douglas Mast T. Passive biomechanical properties of human cadaveric levator ani muscle at low strains. Journal of Biomechanics. 2014;47(2):583-6. doi: 10.1016/j.jbiomech.2013.11.033.
179. Peña E, Calvo B, Martínez MA, Martins P, Mascarenhas T, Jorge RMN, Ferreira A, Doblaré M. Experimental study and constitutive modeling of the viscoelastic mechanical properties of the human prolapsed vaginal tissue. Biomechanics and Modeling in Mechanobiology. 2010;9(1):35-44. doi: 10.1007/s10237-009-0157-2.
180. Chen L, Ashton-Miller JA, DeLancey JOL. A 3D finite element model of anterior vaginal wall support to evaluate mechanisms underlying cystocele formation. Journal of Biomechanics. 2009;42(10):1371-7. doi: 10.1016/j.jbiomech.2009.04.043.
337

181. Luo J, Chen L, Fenner DE, Ashton-Miller JA, DeLancey JOL. A multi-compartment 3-D finite element model of rectocele and its interaction with cystocele. Journal of Biomechanics. 2015. doi: 10.1016/j.jbiomech.2015.02.041.
182. Martins R, Martins P, Mascarenhas T, Jorge RN, editors. Evaluation of material model parameters of vaginal tissue with different fiber orientation. Proceedings - 2015 IEEE 4th Portuguese Meeting on Bioengineering, ENBENG 2015; 2015.
183. Vande Geest JP, Sacks MS, Vorp DA. Age dependency of the biaxial biomechanical behavior of human abdominal aorta. Journal of Biomechanical Engineering. 2004;126(6):815-22. doi: 10.1115/1.1824121.
184. Vanbeckevoort D, Van Hoe L, Oyen R, Ponette E, De Ridder D, Deprest J. Pelvic floor descent in females: Comparative study of colpocystodefecography and dynamic fast MR imaging. Journal of Magnetic Resonance Imaging. 1999;9(3):373-7. doi: 10.1002/(SICI)1522-2586(199903)9:3<373::AID-JMRI2>3.0.CO;2-H.
185. Law YM, Fielding JR. MRI of pelvic floor dysfunction: Review. American Journal of Roentgenology. 2008;191(6 SUPPL.):S45-S53. doi: 10.2214/AJR.07.7096.
186. Liang R, Zong W, Palcsey S, Abramowitch S, Moalli PA. Impact of prolapse meshes on the metabolism of vaginal extracellular matrix in rhesus macaque. American Journal of Obstetrics and Gynecology. 2015;212(2):174.e1-.e7. doi: 10.1016/j.ajog.2014.08.008.
187. Knight K, Barone WR, Moalli P, Abramowitch S. , editor. Parity Negatively Impacts the Uniaxial Mechanical Properties of the Vagina in the Ewe. . 2013 American Society of Mechanical Engineers Summer Bioengineering Conference; 2013 June 26-29; Sun River, OR.
188. Rao GV, Rubod C, Brieu M, Bhatnagara N, Cosson M. Experiments and finite element modelling for the study of prolapse in the pelvic floor system. Computer Methods in Biomechanics and Biomedical Engineering. 2010;13(3):349-57. doi: 10.1080/10255840903251270.
189. Rooney K, Kenton K, Mueller ER, FitzGerald MP, Brubaker L. Advanced anterior vaginal wall prolapse is highly correlated with apical prolapse. American Journal of Obstetrics and Gynecology. 2006;195(6):1837-40. doi: 10.1016/j.ajog.2006.06.065.
190. Boisse P, Hamila N, Vidal-Sallé E, Dumont F. Simulation of wrinkling during textile composite reinforcement forming. Influence of tensile, in-plane shear and bending stiffnesses. Composites Science and Technology. 2011;71(5):683-92. doi: 10.1016/j.compscitech.2011.01.011.
338

191. Jarasjarungkiat A, Wüchner R, Bletzinger KU. A wrinkling model based on material modification for isotropic and orthotropic membranes. Computer Methods in Applied Mechanics and Engineering. 2008;197(6-8):773-88. doi: 10.1016/j.cma.2007.09.005.
192. Veress AI, Weiss JA, Huesman RH, Reutter BW, Taylor SE, Sitek A, Feng B, Yang Y, Gullberg GT. Measuring regional changes in the diastolic deformation of the left ventricle of SHR rats using microPET technology and hyperelastic warping. Annals of Biomedical Engineering. 2008;36(7):1104-17. doi: 10.1007/s10439-008-9497-9.
193. Phatak NS, Sun Q, Kim SE, Parker DL, Kent Sanders R, Veress AI, Ellis BJ, Weiss JA. Noninvasive determination of ligament strain with deformable image registration. Annals of Biomedical Engineering. 2007;35(7):1175-87. doi: 10.1007/s10439-007-9287-9.
194. Harris MD, Datar M, Whitaker RT, Jurrus ER, Peters CL, Anderson AE. Statistical shape modeling of cam femoroacetabular impingement. Journal of Orthopaedic Research. 2013;31(10):1620-6. doi: 10.1002/jor.22389.
195. Jing D, Ashton-Miller JA, DeLancey JOL. A subject-specific anisotropic visco-hyperelastic finite element model of female pelvic floor stress and strain during the second stage of labor. Journal of Biomechanics. 2012;45(3):455-60. doi: 10.1016/j.jbiomech.2011.12.002.
196. Feola A, Moalli P, Alperin M, Duerr R, Gandley RE, Abramowitch S. Impact of pregnancy and vaginal delivery on the passive and active mechanics of the rat vagina. Annals of Biomedical Engineering. 2011;39(1):549-58. doi: 10.1007/s10439-010-0153-9.
197. Grashow JS, Yoganathan AP, Sacks MS. Biaixal stress-stretch behavior of the mitral valve anterior leaflet at physiologic strain rates. Annals of Biomedical Engineering. 2006;34(2):315-25. doi: 10.1007/s10439-005-9027-y.
198. Vande Geest JP, Sacks MS, Vorp DA. The effects of aneurysm on the biaxial mechanical behavior of human abdominal aorta. Journal of Biomechanics. 2006;39(7):1324-34. doi: 10.1016/j.jbiomech.2005.03.003.
199. Gilbert TW, Wognum S, Joyce EM, Freytes DO, Sacks MS, Badylak SF. Collagen fiber alignment and biaxial mechanical behavior of porcine urinary bladder derived extracellular matrix. Biomaterials. 2008;29(36):4775-82. doi: 10.1016/j.biomaterials.2008.08.022.
200. Eilaghi A, Flanagan JG, Tertinegg I, Simmons CA, Wayne Brodland G, Ross Ethier C. Biaxial mechanical testing of human sclera. Journal of Biomechanics. 2010;43(9):1696-701. doi: 10.1016/j.jbiomech.2010.02.031.
339
201. Sun W, Sacks MS, Sellaro TL, Slaughter WS, Scott MJ. Biaxial mechanical response of bioprosthetic heart valve biomaterials to high in-plane shear. Journal of Biomechanical Engineering. 2003;125(3):372-80. doi: 10.1115/1.1572518.
202. Wognum S. A multi-phase structural constitutive model for insights into soft tissue remodeling mechanisms: University of Pittsburgh.; 2010.
203. Valdez-Jasso D, Simon MA, Champion HC, Sacks MS. A murine experimental model for the mechanical behaviour of viable right-ventricular myocardium. Journal of Physiology. 2012;590(18):4571-84. doi: 10.1113/jphysiol.2012.233015.
204. Tokar S, Feola A, Moalli PA, Abramowitch S, editors. Characterizing the biaxial mechanical properties of vaginal maternal adaptations during pregnancy. ASME 2010 Summer Bioengineering Conference, SBC 2010; 2010.
205. Sun W, Sacks MS, Scott MJ. Effects of boundary conditions on the estimation of the planar biaxial mechanical properties of soft tissues. Journal of Biomechanical Engineering. 2005;127(4):709-15. doi: 10.1115/1.1933931.
206. Eilaghi A, Flanagan JG, Brodland GW, Ethier CR. Strain uniformity in biaxial specimens is highly sensitive to attachment details. Journal of Biomechanical Engineering. 2009;131(9). doi: 10.1115/1.3148467.
207. Humphrey JD, Vawter DL, Vito RP. Quantification of strains in biaxially tested soft tissues. Journal of Biomechanics. 1987;20(1):59-65. doi: 10.1016/0021-9290(87)90267-3.
340