


Bahasa
Halaman
Hukum

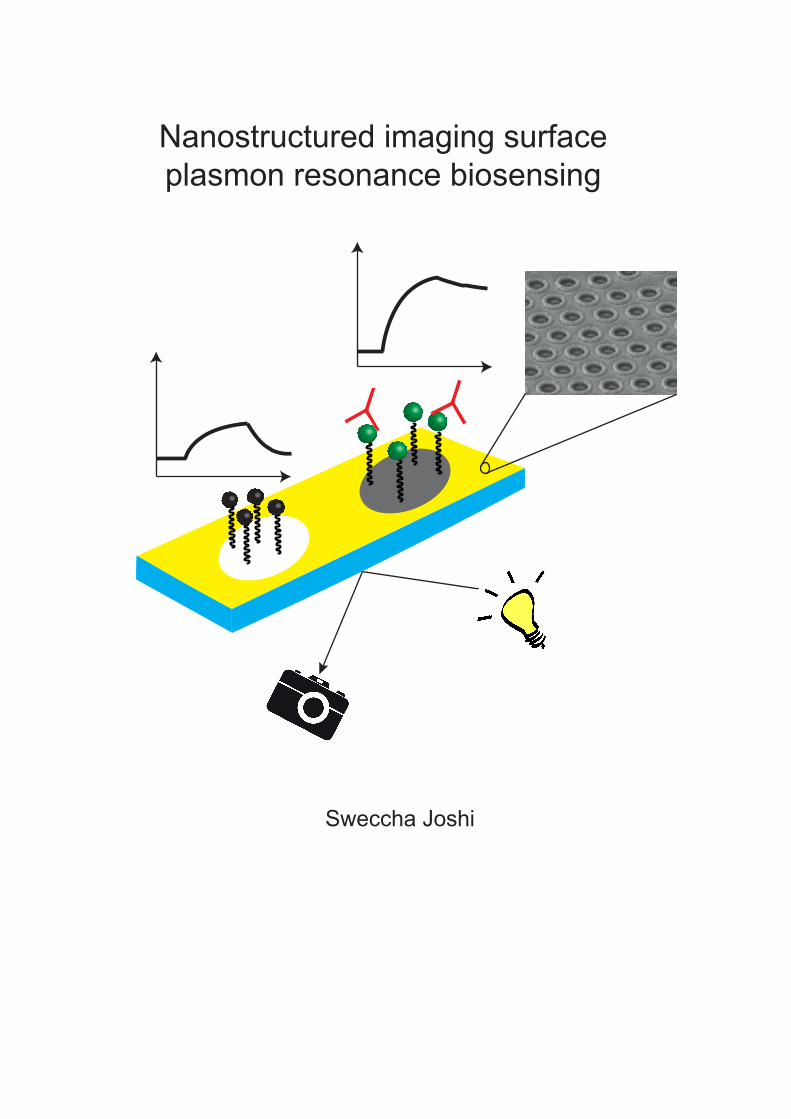
Nanostructured imaging surface plasmon resonance biosensing
Sweccha Joshi
Propositions
1. Demands of multiplex mycotoxin iSPR assays are not compatible with the wide
range of legal limits for mycotoxins.
(this thesis)
2. Despite the progress made in antifouling chemistries, the one to beat
carboxymethylated dextran in terms of SPR performance is still to be found.
(this thesis)
3. Simplicity comes at the cost of sensitivity.
4. NOED or NOESY NMR spectra can lead to wrong conclusions regarding the relative
stereochemistry of natural products.
T. C. Fleischer et al. J. Nat. Prod. 1997, 60, 1054. P. Weyerstahl et al. Flavour Fragr. J. 2000, 15, 153. A. A. Stierle et al. J. Nat. Prod. 2003, 66, 1097. K. I. Booker-Milburn et al. Org. Lett. 2003, 5, 3309. S. Amand et al. J. Nat. Prod. 2012, 75, 798.
5. Small talk in the Netherlands would not be complete without discussing the
weather.
6. Specifications of electric cars claiming zero CO2 emission per km reflect the
attempt of the industry to satisfy unrealistic expectations of consumers.
Propositions belonging to the thesis, entitled
‘Nanostructured imaging surface plasmon resonance biosensing’
Sweccha Joshi
Wageningen, 10 February 2017

Nanostructured imaging surface
plasmon resonance biosensing
Sweccha Joshi
Thesis committee
Promotors
Prof. Dr M.W.F. Nielen
Professor of Analytical Chemistry, with special emphasis for the detection of chemical
food contaminants
Wageningen University
Prof. Dr H. Zuilhof
Professor of Organic Chemistry
Wageningen University
Co-promotor
Dr T.A. van Beek
Assistant Professor, Laboratory of Organic Chemistry
Wageningen University
Other members
Prof. Dr M.H.M. Eppink, Wageningen University
Prof. Dr M.W.J. Prins, Eindhoven University of Technology
Prof. Dr G.W. Somsen, VU Amsterdam
Dr T. Kudernac, University of Twente
This research was conducted under the auspices of the Graduate School VLAG (Advanced
Studies in Food Technology, Agrobiotechnology, Nutrition and Health Sciences).

Nanostructured imaging surface
plasmon resonance biosensing
Sweccha Joshi
Thesis
submitted in fulfilment of the requirements for the degree of doctor
at Wageningen University
by the authority of the Rector Magnificus
Prof. Dr A.P.J. Mol,
in the presence of the
Thesis Committee appointed by the Academic Board
to be defended in public
on Friday 10 February 2017
at 4 p.m. in the Aula.

Sweccha Joshi
Nanostructured imaging surface plasmon resonance biosensing, 164 pages.
PhD thesis, Wageningen University, Wageningen, NL (2017)
With references, with summary in English
ISBN 978-94-6343-020-3
DOI 10.18174/398439

Table of Contents
List of abbreviations 9
Chapter 1 General introduction 11
Chapter 2 Surface characterization and antifouling properties of
nanostructured gold chips for imaging surface plasmon resonance biosensing 37
Chapter 3 Multiplex surface plasmon resonance biosensing and its
transferability towards imaging nanoplasmonics for detection of mycotoxins in
barley 67
Chapter 4 Analysis of mycotoxins in beer using a portable nanostructured
imaging surface plasmon resonance biosensor 97
Chapter 5 Biochip Spray: Simplified coupling of surface plasmon resonance
biosensing and mass spectrometry 121
Chapter 6 General discussion and future perspectives 137
Summary 153
Acknowledgements 155
Curriculum vitae 159
List of publications 161
Overview of completed training activities 163


To my mother Veena Sharma
“It does not matter how slowly you go as long as you do not stop”
Confucius

9
List of Abbreviations (3 or 15)ADON (3 or 15)acetyldeoxynivalenol
AF(B1, B2, G1, G2) Aflatoxin(B1, B2,G1, G2)
AFM Atomic force microscopy
ATRP Atom transfer radical polymerization
BCN Bicyclononyne
BiPy 2,2’-bipyridine
BSA Bovine serum albumin
CCD Charge coupled device
CDI 1,1′-carbonyldiimidazole
CMD Carboxymethylated dextran
D3G Deoxynivalenol-3-glucoside
DART Direct analysis in real time
DCC N,N’-dicyclohexylcarbodiimide
DESI Direct electrospray ionization
DMSO Dimethyl sulfoxide
DON Deoxynivalenol
EDC 1-ethyl-3-(3-dimethylaminopropyl) carbodiimide hydrochloride
EIC Extracted ion chronogram
ELISA Enzyme-linked immunosorbent assay
EU European union
EW Evanescent wave
FB(1,2,3) Fumonisin B(1,2,3)
GC Gas chromatography
HPLC High-pressure liquid chromatography
HR(MS) High resolution(mass spectrometry)
HV High voltage
iNPx Imaging nanoplasmonics
iSPR Imaging surface plasmon resonance
LC Liquid chromatography
LED Light emitting device
LFI Lateral flow immunoassay
LOD Limit of detection
LSPR Localized surface plasmon resonance
MALDI Matrix-assisted laser desorption ionization
mAb Monoclonal antibody
MHDA 16-Mercaptohexadecanoic acid
10
ML Maximum level
NHS N-hydroxysuccinimide
NP Nanoparticles
OEG Oligo(ethylene glycol)
OT (A, B) Ochratoxin (A, B)
OVA Ovalbumin
PE-CVD Plasma-enhanced chemical vapor deposition
PEG Poly(ethylene glycol)
PEG1000 and
PEG3500
Poly(ethylene glycol) 2-aminoethyl ether acetic acid (average MW 1000
and 3500)
PEGMA Poly(ethylene glycol) methacrylate
PFP Pentafluorophenol
PMMA Poly(methyl methacrylate)
PS Polystyrene
ROI Region of interest
RSD Relative standard deviation
SAM Self-assembled monolayers
SAMDI Self-assembled monolayers laser desorption/ionization
SBMA 2-(methacryloyloxy)ethyl)dimethyl-3-sulfopropyl)ammonium hydroxide
SELDI Surface-enhanced laser desorption ionization
SEM Scanning electron microscopy
SERS Surface enhanced raman spectroscopy
SI-ATRP Surface initiated atom transfer radical polymerization
SP(M)E Solid phase (micro) extraction
SPR Surface plasmon resonance
TDI Tolerable daily intake
TIC Total ion chronogram
TSL Theoretical safe limit
WCA Water contact angle
XPS X-ray photoelectron spectroscopy
ZEA or ZEN Zearalenone
α-ZEL α-zearalanol

Chapter 1
General Introduction
Chapter 1
12
Surface plasmon resonance based label free biosensors
The combination of the optical detection technique surface plasmon resonance (SPR) and
biosensing has given rise to the field of SPR-based biosensors.1-3 SPR-based biosensors
have received considerable attention in the past decades as they allow fast, reliable and
label-free detection of analytes. SPR, in addition, benefits from real-time monitoring of
the interaction kinetics and reusability of the biosensor chip. The current interest in the
field of biosensing has been on portable devices to bring the lab to the sample. However,
most SPR instruments are laboratory based and do not fulfill this requirement. Therefore,
there is a high demand for a portable SPR instrument that would allow detection of
multiple analytes directly in the field. In the next few sections, background information
about SPR, SPR instruments along with their components, development of a multiplex
SPR biosensor and coupling of SPR to mass spectrometry is described.
Surface plasmon resonance (SPR)
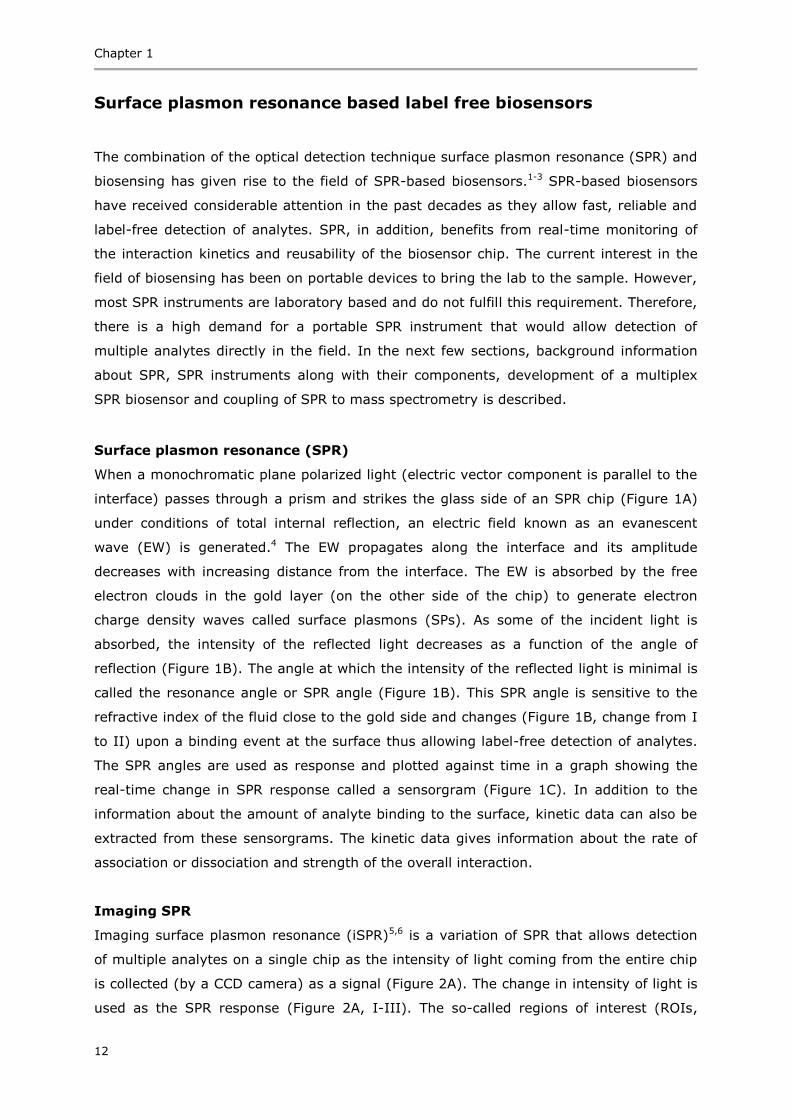
When a monochromatic plane polarized light (electric vector component is parallel to the
interface) passes through a prism and strikes the glass side of an SPR chip (Figure 1A)
under conditions of total internal reflection, an electric field known as an evanescent
wave (EW) is generated.4 The EW propagates along the interface and its amplitude
decreases with increasing distance from the interface. The EW is absorbed by the free
electron clouds in the gold layer (on the other side of the chip) to generate electron
charge density waves called surface plasmons (SPs). As some of the incident light is
absorbed, the intensity of the reflected light decreases as a function of the angle of
reflection (Figure 1B). The angle at which the intensity of the reflected light is minimal is
called the resonance angle or SPR angle (Figure 1B). This SPR angle is sensitive to the
refractive index of the fluid close to the gold side and changes (Figure 1B, change from I
to II) upon a binding event at the surface thus allowing label-free detection of analytes.
The SPR angles are used as response and plotted against time in a graph showing the
real-time change in SPR response called a sensorgram (Figure 1C). In addition to the
information about the amount of analyte binding to the surface, kinetic data can also be
extracted from these sensorgrams. The kinetic data gives information about the rate of
association or dissociation and strength of the overall interaction.
Imaging SPR
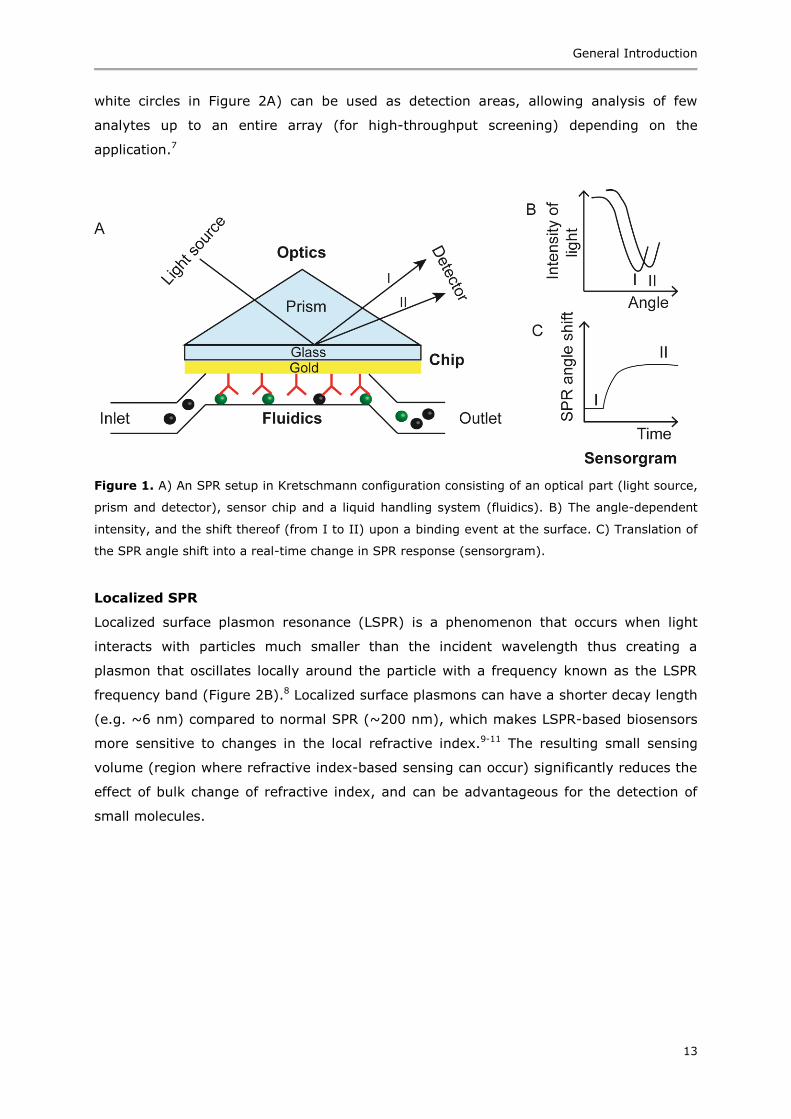
Imaging surface plasmon resonance (iSPR)5,6 is a variation of SPR that allows detection
of multiple analytes on a single chip as the intensity of light coming from the entire chip
is collected (by a CCD camera) as a signal (Figure 2A). The change in intensity of light is
used as the SPR response (Figure 2A, I-III). The so-called regions of interest (ROIs,
General Introduction
13
white circles in Figure 2A) can be used as detection areas, allowing analysis of few
analytes up to an entire array (for high-throughput screening) depending on the
application.7
Figure 1. A) An SPR setup in Kretschmann configuration consisting of an optical part (light source,
prism and detector), sensor chip and a liquid handling system (fluidics). B) The angle-dependent
intensity, and the shift thereof (from I to II) upon a binding event at the surface. C) Translation of
the SPR angle shift into a real-time change in SPR response (sensorgram).
Localized SPR
Localized surface plasmon resonance (LSPR) is a phenomenon that occurs when light
interacts with particles much smaller than the incident wavelength thus creating a
plasmon that oscillates locally around the particle with a frequency known as the LSPR
frequency band (Figure 2B).8 Localized surface plasmons can have a shorter decay length
(e.g. ~6 nm) compared to normal SPR (~200 nm), which makes LSPR-based biosensors
more sensitive to changes in the local refractive index.9-11 The resulting small sensing
volume (region where refractive index-based sensing can occur) significantly reduces the
effect of bulk change of refractive index, and can be advantageous for the detection of
small molecules.
Chapter 1
14
Figure 2. Schematic representation of A) an imaging SPR setup with antibodies immobilized on the
surface, where the change in intensity of reflected light (I-III) upon binding of an analyte is
recorded using a CCD camera. The highest intensity (I) is recorded when no analyte is present and
intensity decreases (II and III) in a specific ROI (top right with antibodies against a specific
analyte) as binding occurs while no change is seen in the other three ROIs (antibodies against
other analytes or reference). B) Schematic illustration of a localized surface plasmon where the
electric field generated around metal nanoparticles is depicted (reproduced with permission from
ref. 8).
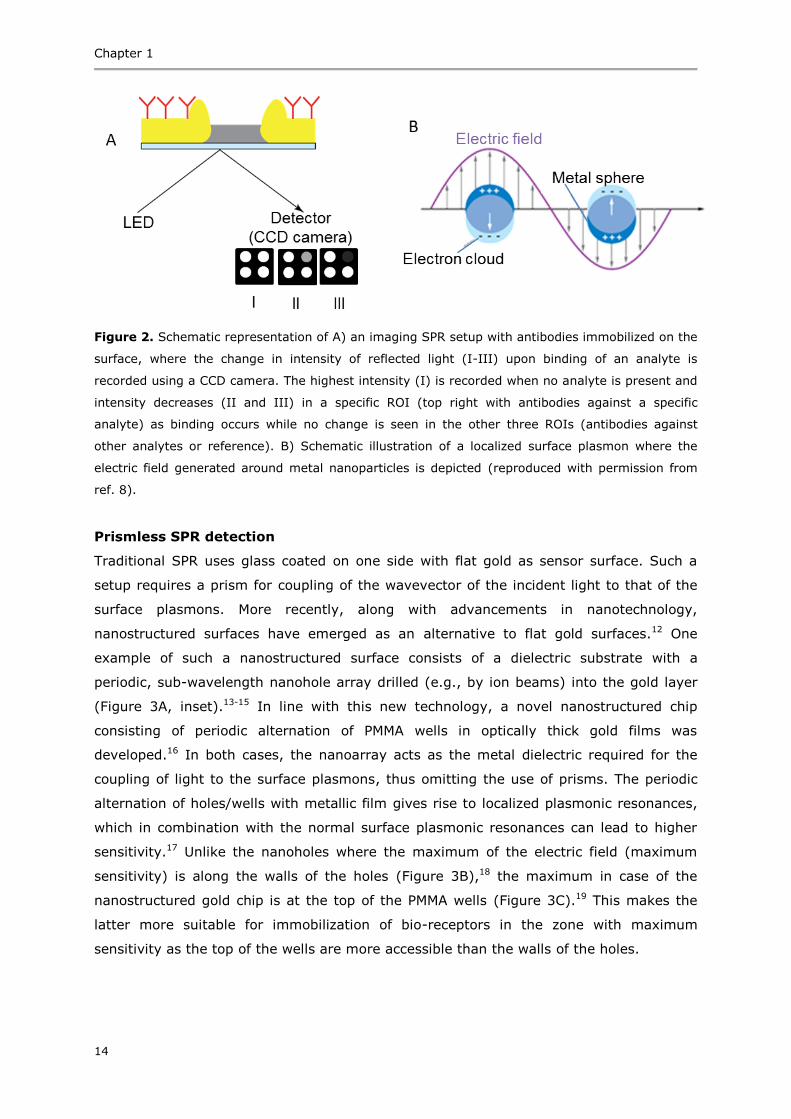
Prismless SPR detection
Traditional SPR uses glass coated on one side with flat gold as sensor surface. Such a
setup requires a prism for coupling of the wavevector of the incident light to that of the
surface plasmons. More recently, along with advancements in nanotechnology,
nanostructured surfaces have emerged as an alternative to flat gold surfaces.12 One
example of such a nanostructured surface consists of a dielectric substrate with a
periodic, sub-wavelength nanohole array drilled (e.g., by ion beams) into the gold layer
(Figure 3A, inset).13-15 In line with this new technology, a novel nanostructured chip
consisting of periodic alternation of PMMA wells in optically thick gold films was
developed.16 In both cases, the nanoarray acts as the metal dielectric required for the
coupling of light to the surface plasmons, thus omitting the use of prisms. The periodic
alternation of holes/wells with metallic film gives rise to localized plasmonic resonances,
which in combination with the normal surface plasmonic resonances can lead to higher
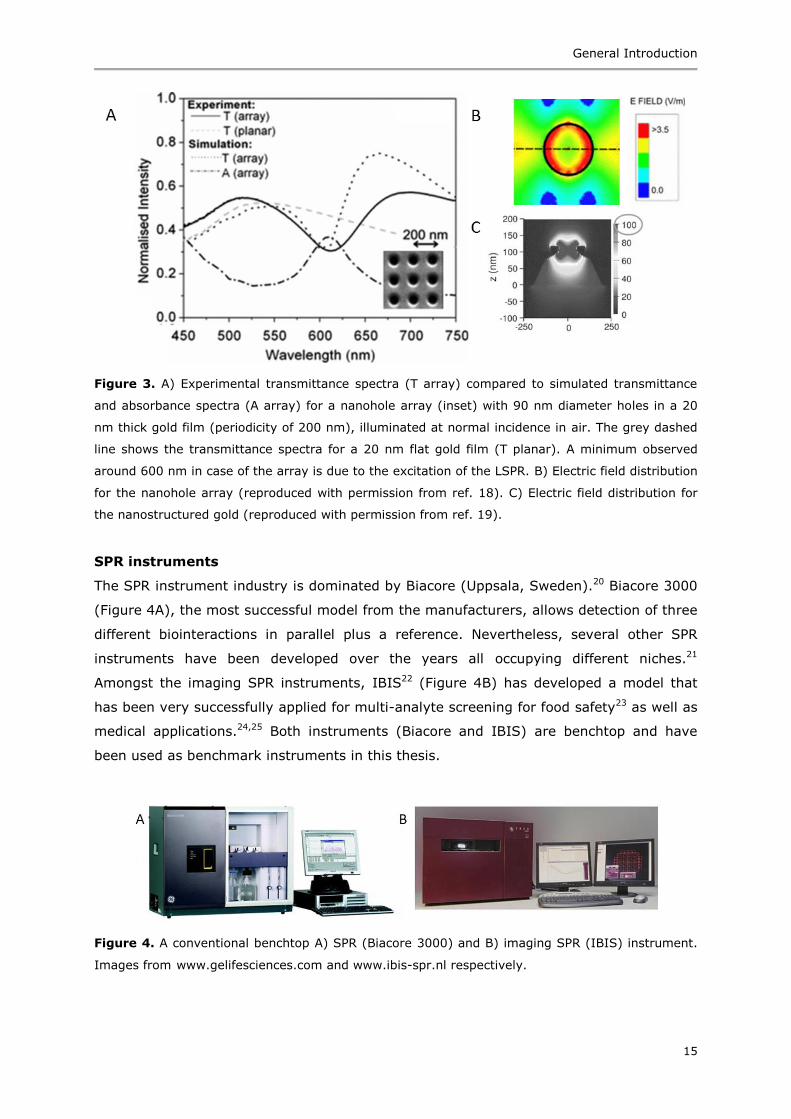
sensitivity.17 Unlike the nanoholes where the maximum of the electric field (maximum
sensitivity) is along the walls of the holes (Figure 3B),18 the maximum in case of the
nanostructured gold chip is at the top of the PMMA wells (Figure 3C).19 This makes the
latter more suitable for immobilization of bio-receptors in the zone with maximum
sensitivity as the top of the wells are more accessible than the walls of the holes.
General Introduction
15
Figure 3. A) Experimental transmittance spectra (T array) compared to simulated transmittance
and absorbance spectra (A array) for a nanohole array (inset) with 90 nm diameter holes in a 20
nm thick gold film (periodicity of 200 nm), illuminated at normal incidence in air. The grey dashed
line shows the transmittance spectra for a 20 nm flat gold film (T planar). A minimum observed
around 600 nm in case of the array is due to the excitation of the LSPR. B) Electric field distribution
for the nanohole array (reproduced with permission from ref. 18). C) Electric field distribution for
the nanostructured gold (reproduced with permission from ref. 19).
SPR instruments
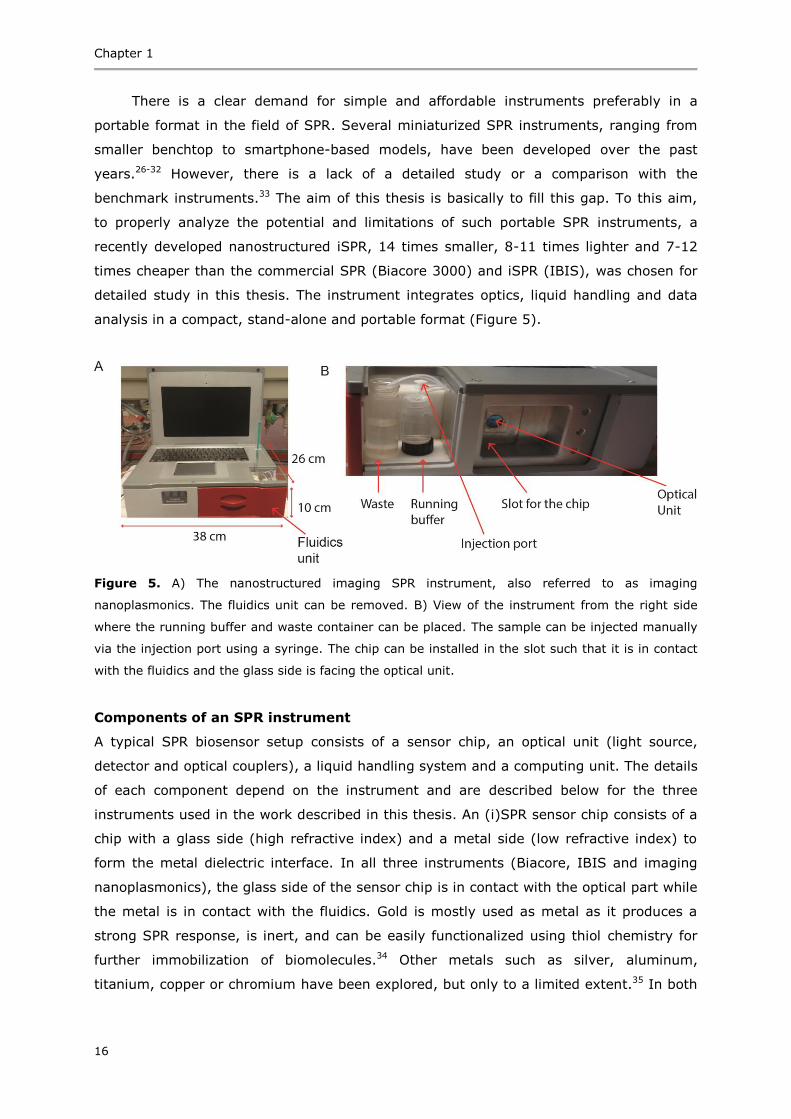
The SPR instrument industry is dominated by Biacore (Uppsala, Sweden).20 Biacore 3000
(Figure 4A), the most successful model from the manufacturers, allows detection of three
different biointeractions in parallel plus a reference. Nevertheless, several other SPR
instruments have been developed over the years all occupying different niches.21
Amongst the imaging SPR instruments, IBIS22 (Figure 4B) has developed a model that
has been very successfully applied for multi-analyte screening for food safety23 as well as
medical applications.24,25 Both instruments (Biacore and IBIS) are benchtop and have
been used as benchmark instruments in this thesis.
Figure 4. A conventional benchtop A) SPR (Biacore 3000) and B) imaging SPR (IBIS) instrument.
Images from www.gelifesciences.com and www.ibis-spr.nl respectively.
Chapter 1
16
There is a clear demand for simple and affordable instruments preferably in a
portable format in the field of SPR. Several miniaturized SPR instruments, ranging from
smaller benchtop to smartphone-based models, have been developed over the past
years.26-32 However, there is a lack of a detailed study or a comparison with the
benchmark instruments.33 The aim of this thesis is basically to fill this gap. To this aim,
to properly analyze the potential and limitations of such portable SPR instruments, a
recently developed nanostructured iSPR, 14 times smaller, 8-11 times lighter and 7-12
times cheaper than the commercial SPR (Biacore 3000) and iSPR (IBIS), was chosen for
detailed study in this thesis. The instrument integrates optics, liquid handling and data
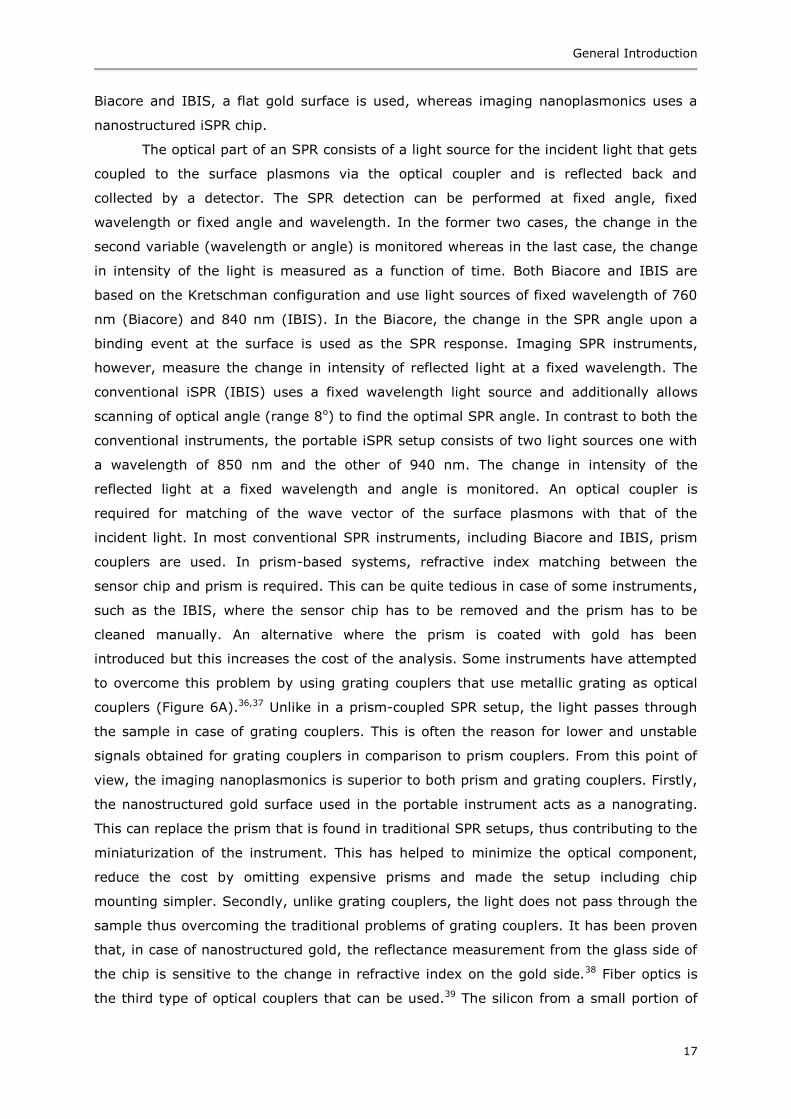
analysis in a compact, stand-alone and portable format (Figure 5).
Figure 5. A) The nanostructured imaging SPR instrument, also referred to as imaging
nanoplasmonics. The fluidics unit can be removed. B) View of the instrument from the right side
where the running buffer and waste container can be placed. The sample can be injected manually
via the injection port using a syringe. The chip can be installed in the slot such that it is in contact
with the fluidics and the glass side is facing the optical unit.
Components of an SPR instrument A typical SPR biosensor setup consists of a sensor chip, an optical unit (light source,
detector and optical couplers), a liquid handling system and a computing unit. The details
of each component depend on the instrument and are described below for the three
instruments used in the work described in this thesis. An (i)SPR sensor chip consists of a
chip with a glass side (high refractive index) and a metal side (low refractive index) to
form the metal dielectric interface. In all three instruments (Biacore, IBIS and imaging
nanoplasmonics), the glass side of the sensor chip is in contact with the optical part while
the metal is in contact with the fluidics. Gold is mostly used as metal as it produces a
strong SPR response, is inert, and can be easily functionalized using thiol chemistry for
further immobilization of biomolecules.34 Other metals such as silver, aluminum,
titanium, copper or chromium have been explored, but only to a limited extent.35 In both
General Introduction
17
Biacore and IBIS, a flat gold surface is used, whereas imaging nanoplasmonics uses a
nanostructured iSPR chip.
The optical part of an SPR consists of a light source for the incident light that gets
coupled to the surface plasmons via the optical coupler and is reflected back and
collected by a detector. The SPR detection can be performed at fixed angle, fixed
wavelength or fixed angle and wavelength. In the former two cases, the change in the
second variable (wavelength or angle) is monitored whereas in the last case, the change
in intensity of the light is measured as a function of time. Both Biacore and IBIS are
based on the Kretschman configuration and use light sources of fixed wavelength of 760
nm (Biacore) and 840 nm (IBIS). In the Biacore, the change in the SPR angle upon a
binding event at the surface is used as the SPR response. Imaging SPR instruments,
however, measure the change in intensity of reflected light at a fixed wavelength. The
conventional iSPR (IBIS) uses a fixed wavelength light source and additionally allows
scanning of optical angle (range 8o) to find the optimal SPR angle. In contrast to both the
conventional instruments, the portable iSPR setup consists of two light sources one with
a wavelength of 850 nm and the other of 940 nm. The change in intensity of the
reflected light at a fixed wavelength and angle is monitored. An optical coupler is
required for matching of the wave vector of the surface plasmons with that of the
incident light. In most conventional SPR instruments, including Biacore and IBIS, prism
couplers are used. In prism-based systems, refractive index matching between the
sensor chip and prism is required. This can be quite tedious in case of some instruments,
such as the IBIS, where the sensor chip has to be removed and the prism has to be
cleaned manually. An alternative where the prism is coated with gold has been
introduced but this increases the cost of the analysis. Some instruments have attempted
to overcome this problem by using grating couplers that use metallic grating as optical
couplers (Figure 6A).36,37 Unlike in a prism-coupled SPR setup, the light passes through
the sample in case of grating couplers. This is often the reason for lower and unstable
signals obtained for grating couplers in comparison to prism couplers. From this point of
view, the imaging nanoplasmonics is superior to both prism and grating couplers. Firstly,
the nanostructured gold surface used in the portable instrument acts as a nanograting.
This can replace the prism that is found in traditional SPR setups, thus contributing to the
miniaturization of the instrument. This has helped to minimize the optical component,
reduce the cost by omitting expensive prisms and made the setup including chip
mounting simpler. Secondly, unlike grating couplers, the light does not pass through the
sample thus overcoming the traditional problems of grating couplers. It has been proven
that, in case of nanostructured gold, the reflectance measurement from the glass side of
the chip is sensitive to the change in refractive index on the gold side.38 Fiber optics is
the third type of optical couplers that can be used.39 The silicon from a small portion of

Chapter 1
18
the fiber is removed and coated with metal followed by a dielectric layer as shown in
Figure 6B. Due to their low prices, they offer a disposable solution for medical
applications. Furthermore, they do not contain any moving parts and have an advantage
over the bulkier prism based sensors.
Figure 6. Schematic representation of a A) grating coupler and B) fiber optic coupler (reproduced
with permission from ref. 39).
The fluidics of most SPR instruments consists of a flow-cell that allows continuous
flow of the solutions. While Biacore and the portable iSPR instrument use a continuous
flow system, a back and forth flow is used in IBIS instruments. Cuvette-based systems
can also be found in some instruments. Cuvette systems are often preferred for analysis
of samples such as blood and cell cultures, as clogging is less of a problem in such
systems compared to flow-cell-based systems. However, efficient mixing of the sample is
a big challenge in cuvette-based systems, thus making flow-cells more popular.
Furthermore, there are also liquid handling systems, such as in Biacore 4000, that
consist of four independent flow-cells, each containing five detection spots that improve
the throughput of the system. Both the conventional iSPR (IBIS) and the portable iSPR
consist of a single flow-cell. However, due to the imaging technology multiple detection
spots can be incorporated. The detection spots, depending on the printing technology
and the application, can range from a few spots to an entire array for high throughput
applications.
Every SPR instrument is equipped with a computing unit that allows control of the
instrument and software that allows data analysis. In case of Biacore, the entire process
including docking of chip, sample injection and output data is automated. A similar
control is possible with IBIS, except for the docking of the chip which is done manually.
In case of imaging nanoplasmonics, the fluidics and optical unit are controlled using a
software, while chip mounting and sample injection are done manually. The data
obtained can be analyzed by dedicated software, such as Scrubber (BioLogic Software
Pty Ltd., Campbell, Australia), Sprint (IBIS technologies B.V., Enschede, the
Netherlands), ImageJ, etc., or can be exported into Excel for further analysis.
General Introduction
19
Nanostructured imaging surface plasmon resonance instrument
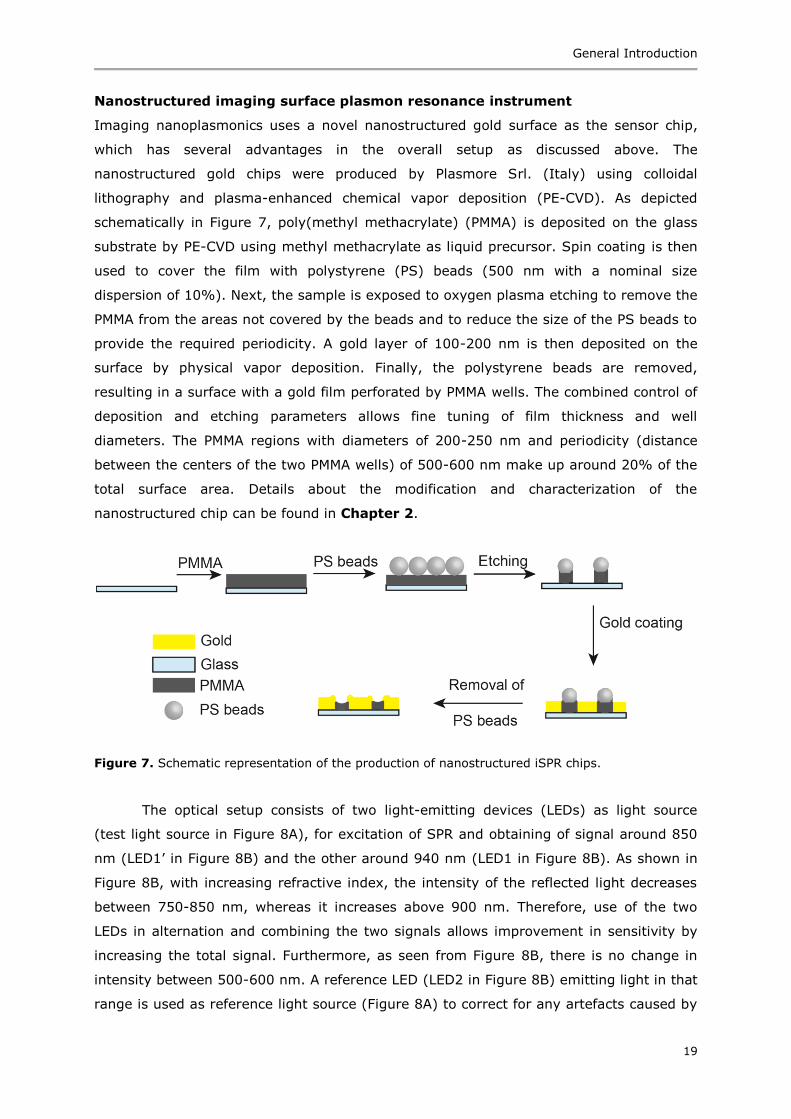
Imaging nanoplasmonics uses a novel nanostructured gold surface as the sensor chip,
which has several advantages in the overall setup as discussed above. The
nanostructured gold chips were produced by Plasmore Srl. (Italy) using colloidal
lithography and plasma-enhanced chemical vapor deposition (PE-CVD). As depicted
schematically in Figure 7, poly(methyl methacrylate) (PMMA) is deposited on the glass
substrate by PE-CVD using methyl methacrylate as liquid precursor. Spin coating is then
used to cover the film with polystyrene (PS) beads (500 nm with a nominal size
dispersion of 10%). Next, the sample is exposed to oxygen plasma etching to remove the
PMMA from the areas not covered by the beads and to reduce the size of the PS beads to
provide the required periodicity. A gold layer of 100-200 nm is then deposited on the
surface by physical vapor deposition. Finally, the polystyrene beads are removed,
resulting in a surface with a gold film perforated by PMMA wells. The combined control of
deposition and etching parameters allows fine tuning of film thickness and well
diameters. The PMMA regions with diameters of 200-250 nm and periodicity (distance
between the centers of the two PMMA wells) of 500-600 nm make up around 20% of the
total surface area. Details about the modification and characterization of the
nanostructured chip can be found in Chapter 2.
Figure 7. Schematic representation of the production of nanostructured iSPR chips.
The optical setup consists of two light-emitting devices (LEDs) as light source
(test light source in Figure 8A), for excitation of SPR and obtaining of signal around 850
nm (LED1’ in Figure 8B) and the other around 940 nm (LED1 in Figure 8B). As shown in
Figure 8B, with increasing refractive index, the intensity of the reflected light decreases
between 750-850 nm, whereas it increases above 900 nm. Therefore, use of the two
LEDs in alternation and combining the two signals allows improvement in sensitivity by
increasing the total signal. Furthermore, as seen from Figure 8B, there is no change in
intensity between 500-600 nm. A reference LED (LED2 in Figure 8B) emitting light in that
range is used as reference light source (Figure 8A) to correct for any artefacts caused by

Chapter 1
20
temperature fluctuations or light source fluctuations. The incident light beams strike the
chip at a fixed angle and the change in intensity of reflected light is recorded in
reflectance mode. Unlike most conventional nanohole setups that work in transmittance
mode,14 there is no interference due to the sample or the nanostructure feature of the
chip. A charge coupled device (CCD) is used as detector (Figure 8A) for the reflected
light, as it allows spatial mapping of the entire biosensor chip, which is the core of the
multiplexing ability of the instrument.
Figure 8. A) Schematic illustration of the preferred SPR optical setup and B) change in the spectra
of the nanostructured chip recorded in reflectance mode upon increase in refractive index
(reproduced with permission from reference 16).
The fluidics of the portable iSPR instrument (Figure 9) consists of two automatic
syringe pumps (connected to the two inlet tubings). Each pump is connected to a 3-port
valve, both connected to a T-piece, which ensures continuous flow of the buffer during
the entire experiment by simultaneous switching. The chip is mounted on a flow-cell with
a PDMS ring. The gold side of the chip is placed towards the ring (to ensure proper
sealing) and fixed using a plastic window supported by six stainless steel pins. The flow-
cell can then be installed on the side of the instrument (Figure 5B) such that it is in
contact with the fluidics and the glass side is facing the optical unit. The injection of the
sample is controlled using a 6-port Rheodyne valve that can be loaded with sample via
the injection port (in LOAD mode) and injected into the flow-cell by switching to INJECT
mode with the help of the T-piece and 3-port valve. Any excess buffer or sample from
the loop (50 µL) is collected in the waste container. The dead volume of the entire
fluidics is 70 µL, thus requiring at least 120 µL of sample to completely fill the loop. The
injection is performed manually, while the pumps and the switching of the Rheodyne
valve can be controlled using the software.

General Introduction
21
Figure 9. Schematic representation of the fluidics of the portable iSPR instrument. The chip is
mounted onto a plastic flow-cell and sealed using a PDMS ring. The chip is placed such that its
glass side faces the optical unit (LED and detector) and the gold side is in contact with the fluidics.
The imaging nanoplasmonics iSPR is operated using a computer (laptop size). The
fluidics and optical unit is controlled via the software NanoPlasmonix Imaging V1 (Figure
10, left side). Once, the chip is mounted onto the instrument, the live image can be
visualized and the camera settings (exposure and gain) can be changed in such a way
that a good contrast is obtained between the chip and the PDMS ring. The acquisition
settings allow tuning of the lateral and time resolution (number of images per second)
with three options: No decimation (highest lateral resolution; 1 image every 10 sec), ½
decimation (medium lateral resolution; 1 image every 6 sec) and ¼ decimation (lowest
lateral resolution; 1 image sec). As the instrument has two LEDs (850 nm and 940 nm),
they can be used individually or in alternation (strobe mode, the two responses can then
be summed up). The ROI setup allows defining regions of interest (of different shape and
size) including any reference ROIs. A reference outside the flow-cell is chosen to correct
for any fluctuations of the light while a reference inside the flow-cell can help correct for
any non-specific binding of the matrix. The ROIs, once saved can be loaded for later
experiments and can be visualized in the upper right window of the software. The pump
plus its speed and position of the Rheodyne valve can be controlled using the buttons on
the lower left corner of the software. Once, all the settings have been chosen, the
experiment can be started with the option to store the raw images as data. The first
Chapter 1
22
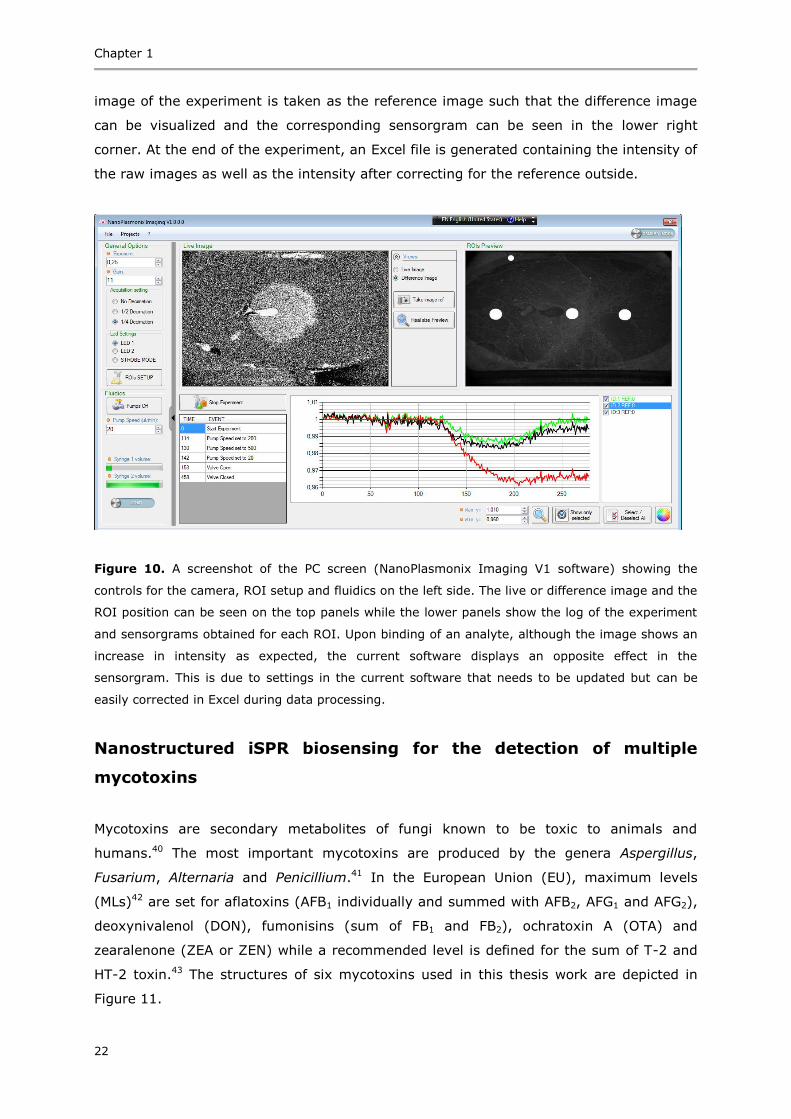
image of the experiment is taken as the reference image such that the difference image
can be visualized and the corresponding sensorgram can be seen in the lower right
corner. At the end of the experiment, an Excel file is generated containing the intensity of
the raw images as well as the intensity after correcting for the reference outside.
Figure 10. A screenshot of the PC screen (NanoPlasmonix Imaging V1 software) showing the
controls for the camera, ROI setup and fluidics on the left side. The live or difference image and the
ROI position can be seen on the top panels while the lower panels show the log of the experiment
and sensorgrams obtained for each ROI. Upon binding of an analyte, although the image shows an
increase in intensity as expected, the current software displays an opposite effect in the
sensorgram. This is due to settings in the current software that needs to be updated but can be
easily corrected in Excel during data processing.
Nanostructured iSPR biosensing for the detection of multiple
mycotoxins
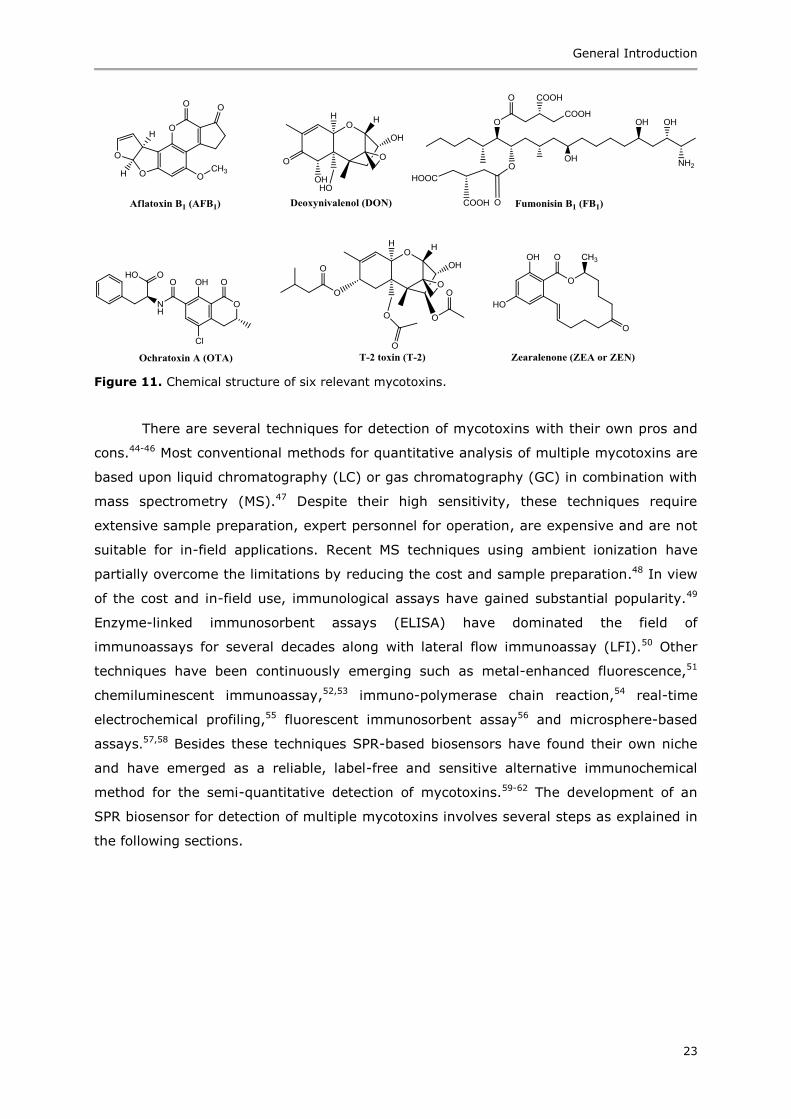
Mycotoxins are secondary metabolites of fungi known to be toxic to animals and
humans.40 The most important mycotoxins are produced by the genera Aspergillus,
Fusarium, Alternaria and Penicillium.41 In the European Union (EU), maximum levels
(MLs)42 are set for aflatoxins (AFB1 individually and summed with AFB2, AFG1 and AFG2),
deoxynivalenol (DON), fumonisins (sum of FB1 and FB2), ochratoxin A (OTA) and
zearalenone (ZEA or ZEN) while a recommended level is defined for the sum of T-2 and
HT-2 toxin.43 The structures of six mycotoxins used in this thesis work are depicted in
Figure 11.
General Introduction
23
Figure 11. Chemical structure of six relevant mycotoxins.
There are several techniques for detection of mycotoxins with their own pros and
cons.44-46 Most conventional methods for quantitative analysis of multiple mycotoxins are
based upon liquid chromatography (LC) or gas chromatography (GC) in combination with
mass spectrometry (MS).47 Despite their high sensitivity, these techniques require
extensive sample preparation, expert personnel for operation, are expensive and are not
suitable for in-field applications. Recent MS techniques using ambient ionization have
partially overcome the limitations by reducing the cost and sample preparation.48 In view
of the cost and in-field use, immunological assays have gained substantial popularity.49
Enzyme-linked immunosorbent assays (ELISA) have dominated the field of
immunoassays for several decades along with lateral flow immunoassay (LFI).50 Other
techniques have been continuously emerging such as metal-enhanced fluorescence,51
chemiluminescent immunoassay,52,53 immuno-polymerase chain reaction,54 real-time
electrochemical profiling,55 fluorescent immunosorbent assay56 and microsphere-based
assays.57,58
Besides these techniques SPR-based biosensors have found their own niche
and have emerged as a reliable, label-free and sensitive alternative immunochemical
method for the semi-quantitative detection of mycotoxins.59-62 The development of an
SPR biosensor for detection of multiple mycotoxins involves several steps as explained in
the following sections.
Chapter 1
24
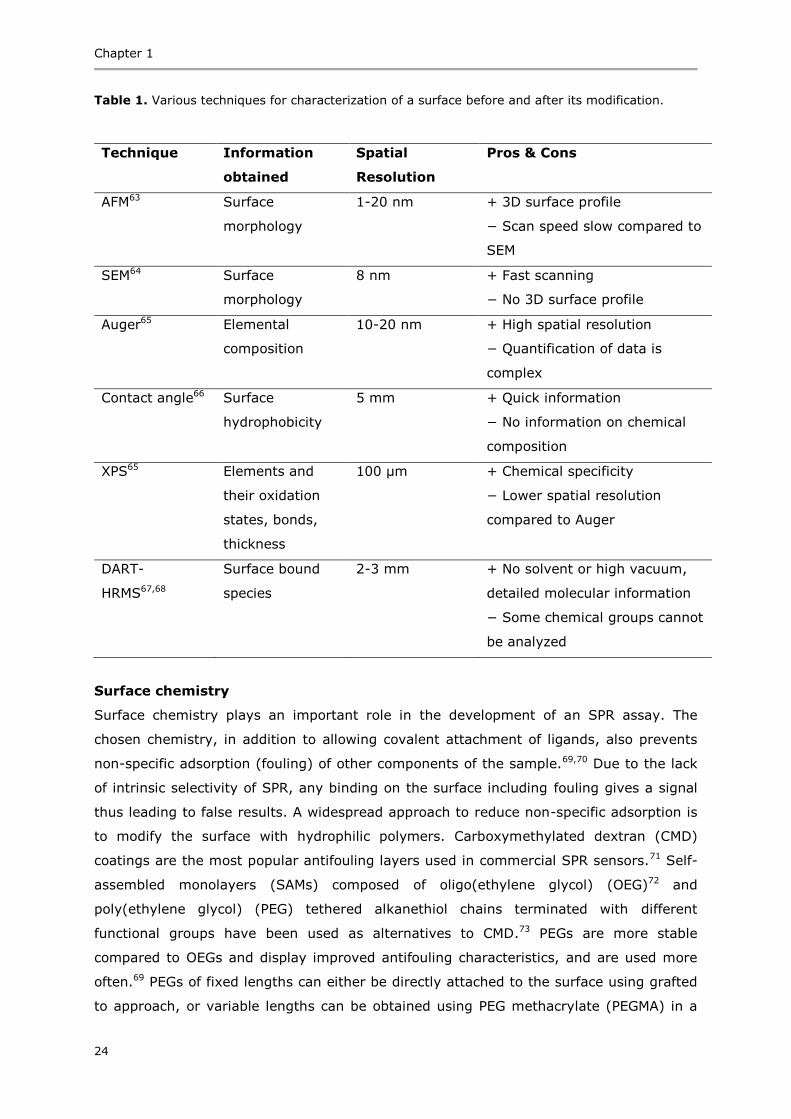
Table 1. Various techniques for characterization of a surface before and after its modification.
Technique Information
obtained
Spatial
Resolution
Pros & Cons
AFM63 Surface
morphology
1-20 nm + 3D surface profile
− Scan speed slow compared to
SEM
SEM64 Surface
morphology
8 nm + Fast scanning
− No 3D surface profile
Auger65 Elemental
composition
10-20 nm + High spatial resolution
− Quantification of data is
complex
Contact angle66 Surface
hydrophobicity
5 mm + Quick information
− No information on chemical
composition
XPS65 Elements and
their oxidation
states, bonds,
thickness
100 µm + Chemical specificity
− Lower spatial resolution
compared to Auger
DART-
HRMS67,68
Surface bound
species
2-3 mm + No solvent or high vacuum,
detailed molecular information
− Some chemical groups cannot
be analyzed
Surface chemistry
Surface chemistry plays an important role in the development of an SPR assay. The
chosen chemistry, in addition to allowing covalent attachment of ligands, also prevents
non-specific adsorption (fouling) of other components of the sample.69,70 Due to the lack
of intrinsic selectivity of SPR, any binding on the surface including fouling gives a signal
thus leading to false results. A widespread approach to reduce non-specific adsorption is
to modify the surface with hydrophilic polymers. Carboxymethylated dextran (CMD)
coatings are the most popular antifouling layers used in commercial SPR sensors.71 Self-
assembled monolayers (SAMs) composed of oligo(ethylene glycol) (OEG)72 and
poly(ethylene glycol) (PEG) tethered alkanethiol chains terminated with different
functional groups have been used as alternatives to CMD.73 PEGs are more stable
compared to OEGs and display improved antifouling characteristics, and are used more
often.69 PEGs of fixed lengths can either be directly attached to the surface using grafted
to approach, or variable lengths can be obtained using PEG methacrylate (PEGMA) in a
General Introduction
25
grafting-from approach. In recent years, zwitterionic polymers of carboxybetaine
methacrylate (CBMA) and sulfobetaine methacrylate (SBMA) have been developed as a
promising approach towards antifouling coating.74 Due to their methacrylate functional
group, surface-bound polymers of these zwitterions can be obtained using surface-
initiated atom transfer radical polymerization (SI-ATRP). A variety of PEG and zwitterionic
monomers is available, in many cases commercially, and an example of each is shown in
Figure 12. In addition to the modification of the biosensor, characterization of the
biosensor chip before and after modification is important and information about this is
often missing in biosensing literature.75 Several methods used in this thesis for the
detailed characterization of the sensor chip (Table 1) will be shown to provide highly
useful complementary information.
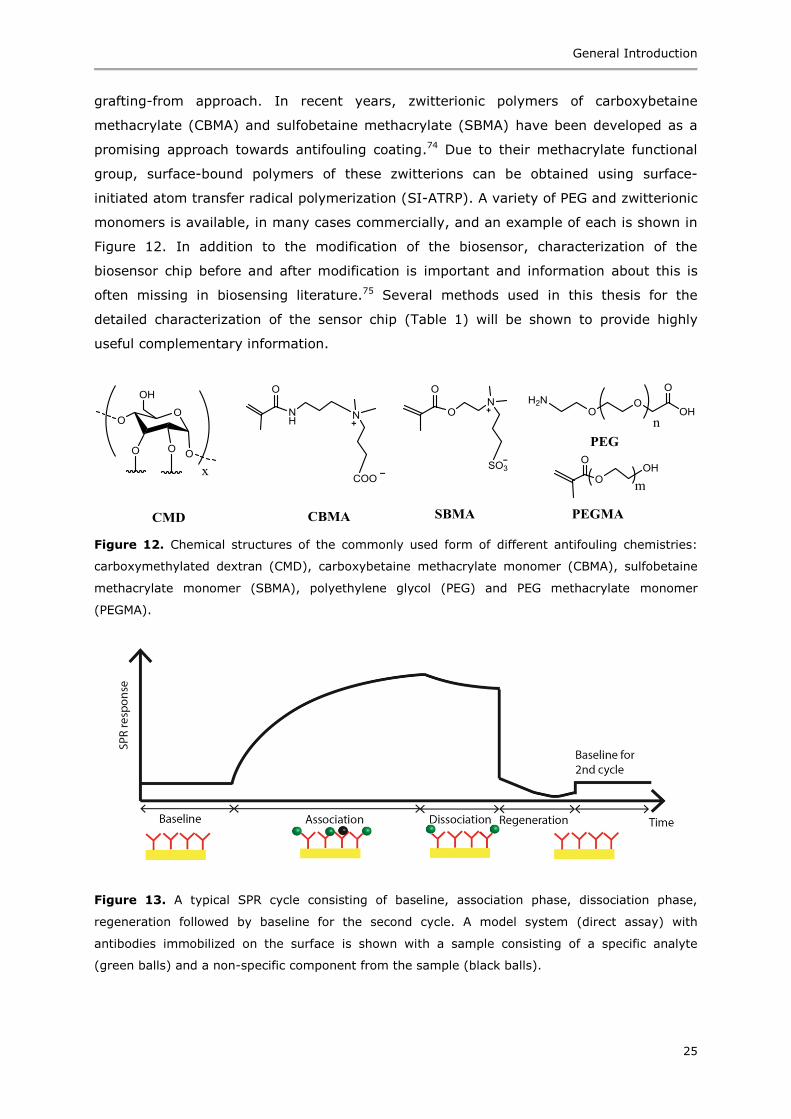
Figure 12. Chemical structures of the commonly used form of different antifouling chemistries:
carboxymethylated dextran (CMD), carboxybetaine methacrylate monomer (CBMA), sulfobetaine
methacrylate monomer (SBMA), polyethylene glycol (PEG) and PEG methacrylate monomer
(PEGMA).
Figure 13. A typical SPR cycle consisting of baseline, association phase, dissociation phase,
regeneration followed by baseline for the second cycle. A model system (direct assay) with
antibodies immobilized on the surface is shown with a sample consisting of a specific analyte
(green balls) and a non-specific component from the sample (black balls).
Chapter 1
26
SPR immunoassay development
A typical SPR immunoassay development starts with immobilization of a ligand on the
SPR chip and the choice of ligand depends on the type of SPR assay and the analyte of
interest. In a direct assay (Figure 13), antibodies against the analyte of interest are
immobilized on the surface. The SPR response upon injection of a solution containing
different concentrations of analyte is recorded. As the SPR response is directly
proportional to the mass of binding molecule, the response increases with increasing
concentration of the analyte. However, for small analytes (MW<1 kDa), the signal
generated by the analyte itself is typically not sufficient. Therefore, a signal enhancer
with a high molecular weight, such as a protein, is required. Furthermore, antibodies
directly attached to the surface are susceptible to denaturation. Thus, indirect assays are
preferred for small-molecule detection, such as for mycotoxins. In an indirect assay
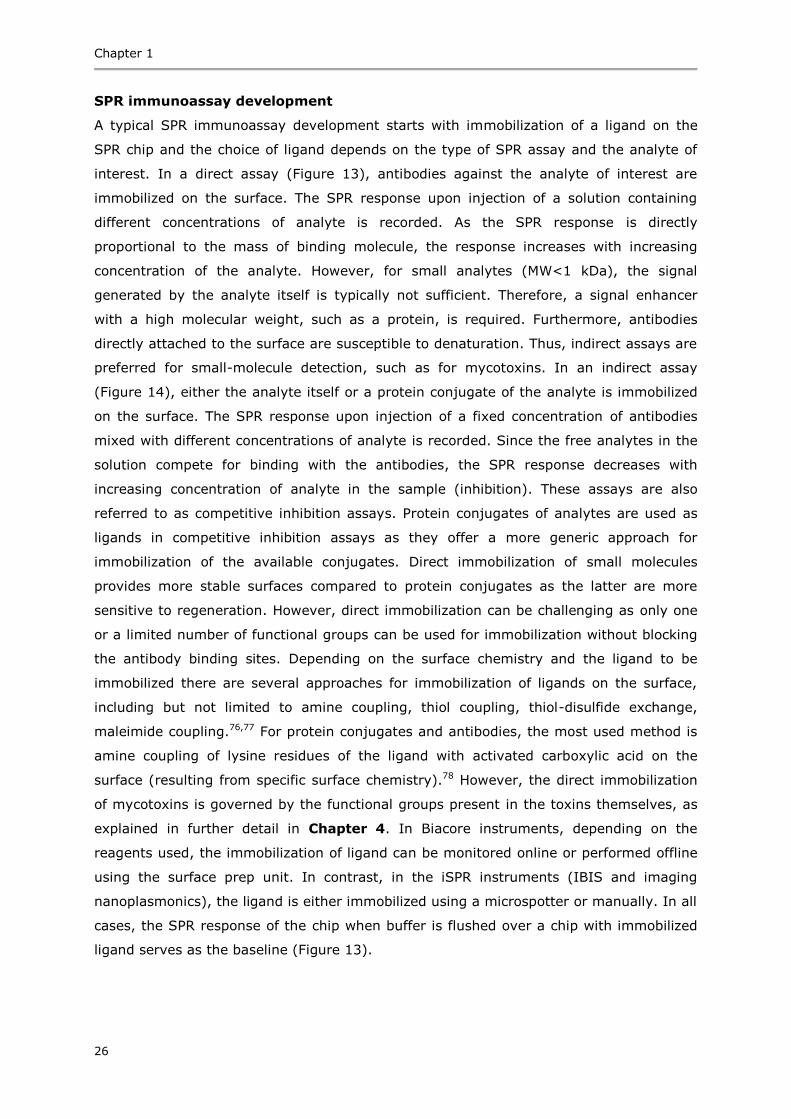
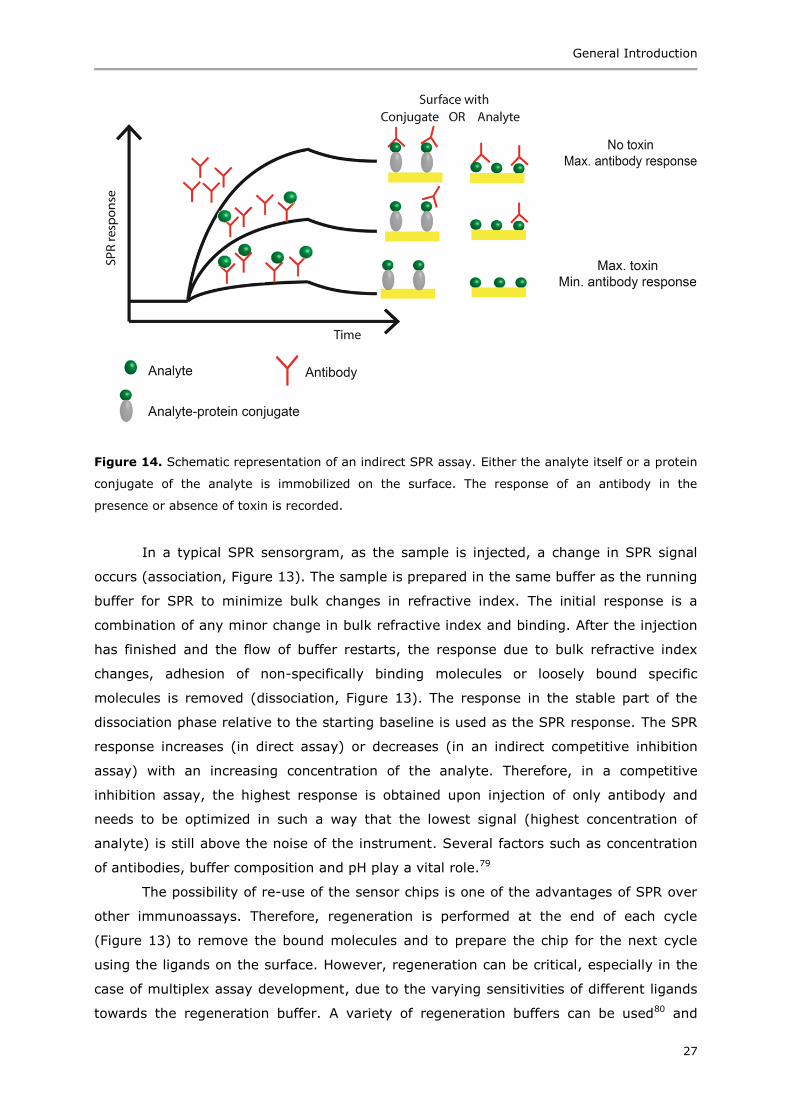
(Figure 14), either the analyte itself or a protein conjugate of the analyte is immobilized
on the surface. The SPR response upon injection of a fixed concentration of antibodies
mixed with different concentrations of analyte is recorded. Since the free analytes in the
solution compete for binding with the antibodies, the SPR response decreases with
increasing concentration of analyte in the sample (inhibition). These assays are also
referred to as competitive inhibition assays. Protein conjugates of analytes are used as
ligands in competitive inhibition assays as they offer a more generic approach for
immobilization of the available conjugates. Direct immobilization of small molecules
provides more stable surfaces compared to protein conjugates as the latter are more
sensitive to regeneration. However, direct immobilization can be challenging as only one
or a limited number of functional groups can be used for immobilization without blocking
the antibody binding sites. Depending on the surface chemistry and the ligand to be
immobilized there are several approaches for immobilization of ligands on the surface,
including but not limited to amine coupling, thiol coupling, thiol-disulfide exchange,
maleimide coupling.76,77 For protein conjugates and antibodies, the most used method is
amine coupling of lysine residues of the ligand with activated carboxylic acid on the
surface (resulting from specific surface chemistry).78 However, the direct immobilization
of mycotoxins is governed by the functional groups present in the toxins themselves, as
explained in further detail in Chapter 4. In Biacore instruments, depending on the
reagents used, the immobilization of ligand can be monitored online or performed offline
using the surface prep unit. In contrast, in the iSPR instruments (IBIS and imaging
nanoplasmonics), the ligand is either immobilized using a microspotter or manually. In all
cases, the SPR response of the chip when buffer is flushed over a chip with immobilized
ligand serves as the baseline (Figure 13).
General Introduction
27
Figure 14. Schematic representation of an indirect SPR assay. Either the analyte itself or a protein
conjugate of the analyte is immobilized on the surface. The response of an antibody in the
presence or absence of toxin is recorded.
In a typical SPR sensorgram, as the sample is injected, a change in SPR signal
occurs (association, Figure 13). The sample is prepared in the same buffer as the running
buffer for SPR to minimize bulk changes in refractive index. The initial response is a
combination of any minor change in bulk refractive index and binding. After the injection
has finished and the flow of buffer restarts, the response due to bulk refractive index
changes, adhesion of non-specifically binding molecules or loosely bound specific
molecules is removed (dissociation, Figure 13). The response in the stable part of the
dissociation phase relative to the starting baseline is used as the SPR response. The SPR
response increases (in direct assay) or decreases (in an indirect competitive inhibition
assay) with an increasing concentration of the analyte. Therefore, in a competitive
inhibition assay, the highest response is obtained upon injection of only antibody and
needs to be optimized in such a way that the lowest signal (highest concentration of
analyte) is still above the noise of the instrument. Several factors such as concentration
of antibodies, buffer composition and pH play a vital role.79
The possibility of re-use of the sensor chips is one of the advantages of SPR over
other immunoassays. Therefore, regeneration is performed at the end of each cycle
(Figure 13) to remove the bound molecules and to prepare the chip for the next cycle
using the ligands on the surface. However, regeneration can be critical, especially in the
case of multiplex assay development, due to the varying sensitivities of different ligands
towards the regeneration buffer. A variety of regeneration buffers can be used80 and

Chapter 1
28
need to be optimized based on the application. Surfaces with antibodies or protein
conjugates are more sensitive to harsh regeneration solutions. On the other hand,
surfaces with covalently bound analytes are more stable and can be re-used many more
times.
Signal enhancement
A low signal/noise ratio in the SPR signal is a serious problem in the detection of small
molecules or of large molecules in low concentrations. Use of nanostructured sensor
chips has been proposed for sensitivity enhancement due to the possibility of coupling of
normal SPR and localized SPR signals.81-84 However, accurate positioning of the ligand is
required at the region where the maximum of the evanescent wave from the LSPR lies.
This effect known as confinement enhancement85,86 of SPR signals would require very
strict control of the fabrication process and still remains a challenge.
Changes in instrumental design do not lead to sufficient signal enhancement, and
therefore experimental optimization is also required.87 Nanoparticle-enhanced SPR
studies, one of the most widely used approaches, are mostly based on the use of free or
functionalized gold nanoparticles.88,89 The enhancement is attributed to the higher
molecular weight of gold NPs conjugates compared to conjugates that are not bound to
NPs and to the electronic coupling interaction between the gold NPs and the surface
plasmon wave associated with the SPR gold film.12 Other techniques that have been used
for signal enhancement are based on enzymatic amplification or polymerization
approaches.90
Effect of cross-talk and cross-reactivity
Cross-talk, the binding of one mycotoxin to an antibody against another mycotoxin, is a
major challenge of multiplex mycotoxin analysis as it can lead to false positives. Use of
monoclonal antibodies has helped to overcome this problem to a great extent, however,
careful screening is required. During the assay development, the individual antibodies are
tested followed by the mixture to account for any cross-reactivity. From this point of
view, imaging SPR has an added advantage as all the mycotoxins or their conjugates can
be immobilized on one chip and any cross-talk can be easily visualized. In addition to the
various parent mycotoxins, conjugated forms of mycotoxins, formed by the detoxification
metabolic processes of plants, can also be present in the sample.91 Due to their structural
similarity, some conjugates can cross-react with the antibodies and this can lead to an
overestimation of the amount of target mycotoxin present in the sample. Cross-reactivity
is calculated by comparison of the calibration curve of the conjugates with that of the
parent toxin. However, cross-reactivity can also be favorable when regulations are set for
the sum of the different conjugates or toxins rather than for only the toxin itself (e.g. T-2
General Introduction
29
and HT-2, FB1 and FB2, and AFB2, AFG1 and AFG2). Furthermore, in a competitive
screening assay, cross-reactivity would result in a positive result, thus qualifying the
sample for quantitative confirmatory analysis and even helping to identify the cross-
reacting analyte.
Coupling of SPR with ambient ionization mass spectrometry for
identification of cross-reacting analytes
SPR is a powerful tool for detection of a wide range of analytes, but does not give
structural information about the binding analyte. Furthermore, cross-reactivity of the
antibodies towards other analytes or conjugates of the same analyte cannot be
distinguished by SPR, and can lead to overestimation of the main analyte. Therefore,
coupling of SPR chips using mass spectrometry allows not only identification of the main
analyte of interest, but might also help find cross-reacting analytes.92 In the past, offline
methods have been used for analysis of the analytes after SPR experiments, but this can
lead to loss of sample.93 Online coupling methods developed involve complicated and
highly specialized setups.94-96 One of the most promising approaches with matrix-assisted
laser desorption ionization (MALDI), is not suitable for analysis of small molecules (<0.6
kDa) as the matrix required for the method interferes with the analysis.97,98 Therefore,
there is a demand for a simplified coupling of SPR with mass spectrometry.
Ambient ionization methods for mass spectrometry, such as direct analysis in real
time (DART)67 and desorption electrospray ionization (DESI),99,100 have gained significant
interest. The benefits of these techniques is that analyses can be performed at room
temperature, under atmospheric conditions, often require minimal sample preparation
and are suitable for small molecules.68 Direct spray,101 one of the ambient ionization
methods, allows the analysis of a sample loaded onto a solid substrate (paper, metal,
wood etc.)102-104 where the ions of the analyte generated using an organic solvent in
combination with a high voltage (HV) are analyzed. Despite their simplicity, all these
methods rely on desorbing analytes, either already present or spiked on the substrate
and the selectivity is dependent on the mass spectrometer. Direct analysis of a SPR
biochip for complex samples containing small analytes yields several challenges,
including the interference of other components of the sample as well as ion suppressants
(buffer components). Recently, in an attempt to get rid of these possible interferences,
SPME combined with desorption electrospray ionization (DESI) source was used.105 The
method offers sample enrichment by selectively capturing the analyte from the sample
mixture. A washing step after enrichment and before the MS analysis helps to get rid of
the buffer components. An SPR chip with antibodies can provide the required enrichment
of analytes, and the buffer components can be easily washed off during the dissociation
Chapter 1
30
phase (Figure 13). Therefore, combination of SPR with direct spray would offer a simple
coupling of SPR and MS for analysis of small molecules.
Aim of the research
SPR-based biosensors have emerged as a fast, label-free and sensitive immunochemical
method for the semi-quantitative detection of a range of analytes including mycotoxins.
The real-time monitoring of the interaction kinetics and reusability of the biosensor chips
offers additional advantages. The development of imaging SPR instruments added the
possibility of multiplexing thus expanding the horizon of SPR instruments even further.
An instrument with all these features and in a portable format was only recently
developed, thanks to a nanostructured biosensor chip, in a prototype format by Plasmore
Srl. (Italy). Furthermore, very few prototype SPR instruments have been thoroughly
studied, validated, benchmarked against conventional instruments or commercialized.33
Therefore, the aim of this research was to test and further develop a prototype
nanostructured iSPR biosensor, with a focus on surface modification and detailed
characterization of the biosensor chip, and on in-field and at-line applicability in the food
industry. Furthermore, a simplified coupling of SPR and MS was developed that allows
identification of the mycotoxins of interest along with any other cross-reacting analytes.
Outline of the thesis
The aim of the research was achieved in several sub-projects as outlined below. The
surface modification, in-depth surface characterization and the antifouling performance of
the nanostructured iSPR chip is described in Chapter 2. Results were compared with
conventional flat gold chips having the same surface chemistries. Proof-of-principle
biosensing was demonstrated using biotin-streptavidin as a model system.
In Chapter 3 a 6-plex competitive inhibition assay for mycotoxins in barley was
developed using the nanostructured iSPR instrument. As a benchmark a double 3-plex
SPR assay (using Biacore) was developed. Preliminary in-house validation and
measurement of naturally contaminated barley were performed.
The iSPR assay developed in Chapter 3 was further optimized and a complete
assay for detection of two mycotoxins in beer was developed using the nanostructured
iSPR instrument and is described in Chapter 4.
A simplified coupling of surface plasmon resonance to mass spectrometry is
described in Chapter 5. The SPR chips containing antibodies against deoxynivalenol
(DON) were analyzed, after injection of sample in the SPR, by ambient mass

General Introduction
31
spectrometry that allowed confirmation of the presence of DON as well as identification of
cross-reacting conjugates.
Chapter 6 contains a general discussion about the research topic described in this
thesis and outlines possible future developments for iSPR instruments.
Chapter 1
32
References
1. Abdulhalim, I.; Zourob, M.; Lakhtakia, A. Surface plasmon resonance for biosensing: A mini-review. Electromagnetics 2008, 28, 214-242.
2. Guo, X. Surface plasmon resonance based biosensor technique: A review. J. Biophotonics 2012, 5, 483-501.
3. Singh, P. SPR biosensors: Historical perspectives and current challenges. Sens. Actuat. B: Chem. 2016, 229, 110-130.
4. Schasfoort, R.; Tudos, A., Handbook of surface plasmon resonance. The Royal Society of
Chemistry: Cambridge, 2008. 5. Yeatman, E.; Ash, E. A. Surface plasmon microscopy. Electronics Lett. 1987, 23, 1091-
1092. 6. Rothenhaüsler, B.; Knoll, W. Surface-plasmon microscopy. Nature 1988, 332, 615-617. 7. Campbell, C. T.; Kim, G. SPR microscopy and its applications to high-throughput analyses of
biomolecular binding events and their kinetics. Biomaterials 2007, 28, 2380-2392. 8. Willets, K. A.; Van Duyne, R. P. Localized surface plasmon resonance spectroscopy and
sensing. Annu. Rev. Phys. Chem. 2007, 58, 267-297. 9. Xiang, G.; Zhang, N.; Zhou, X. Localized surface plasmon resonance biosensing with large
area of gold nanoholes fabricated by nanosphere lithography. Nanoscale Res. Lett. 2010, 5,
818-822. 10. Petryayeva, E.; Krull, U. J. Localized surface plasmon resonance: Nanostructures, bioassays
and biosensing—A review. Anal. Chim. Acta 2011, 706, 8-24.
11. Joshi, G. K.; McClory, P. J.; Dolai, S.; Sardar, R. Improved localized surface plasmon resonance biosensing sensitivity based on chemically-synthesized gold nanoprisms as plasmonic transducers. J Mater. Chem. 2012, 22, 923-931.
12. Bolduc, O. R.; Masson, J.-F. Advances in surface plasmon resonance sensing with nanoparticles and thin films: Nanomaterials, surface chemistry, and hybrid plasmonic techniques. Anal. Chem. 2011, 83, 8057-8062.
13. Cheng, K.; Wang, S. J.; Cui, Z. G.; Li, Q. Q.; Dai, S. X.; Du, Z. L. Large-scale fabrication of
plasmonic gold nanohole arrays for refractive index sensing at visible region. Appl. Phys. Lett. 2012, 100, 253101-253104.
14. Im, H.; Sutherland, J. N.; Maynard, J. A.; Oh, S.-H. Nanohole-based surface plasmon resonance instruments with improved spectral resolution quantify a broad range of antibody-ligand binding kinetics. Anal. Chem. 2012, 84, 1941-1947.
15. Najiminaini, M.; Ertorer, E.; Kaminska, B.; Mittler, S.; Carson, J. J. L. Surface plasmon resonance sensing properties of a 3D nanostructure consisting of aligned nanohole and
nanocone arrays. Analyst 2014, 139, 1876-1882. 16. Valsesia, A.; Colpo, P.; Rossi, F.; Marabelli, F. A surface plasmon resonance sensing method
and sensing system. European Patent 2010, EP 2264438A1. 17. Giudicatti, S.; Marabelli, F.; Valsesia, A.; Pellacani, P.; Colpo, P.; Rossi, F. Interaction among
plasmonic resonances in a gold film embedding a two-dimensional array of polymeric nanopillars. J. Opt. Soc. Am. B 2012, 29, 1641-1647.
18. Parsons, J.; Hendry, E.; Burrows, C. P.; Auguié, B.; Sambles, J. R.; Barnes, W. L. Localized surface-plasmon resonances in periodic nondiffracting metallic nanoparticle and nanohole arrays. Phys. Rev. B 2009, 79, 0734121-0734124.
19. Valsesia, A.; Marabelli, F.; Giudicatti, S.; Marchesini, G. R.; Rossi, F.; Colpo, P. SPR sensor device with nanostructure. World Patent 2013, WO 2013/007448 A1.
20. Jönsson, U.; Fägerstam, L.; Ivarsson, B.; Johnsson, B.; Karlsson, R.; Lundh, K.; Löfas, S.; Persson, B.; Roos, H.; Rönnberg, I.; Sjölander, S.; Stenberg, E.; Stahlberg, R.; Urbaniczky,
C.; Ostlin, H.; Malmqvist, M. Real-time biospecific interaction analysis using surface plasmon resonance and a sensor chip technology. BioTechniques 1991, 11, 620-627.
21. SPR pages, SPR instruments. http://www.sprpages.nl/instruments (6 May 2016). 22. Beusink, J. B.; Lokate, A. M. C.; Besselink, G. A. J.; Pruijn, G. J. M.; Schasfoort, R. B. M.
Angle-scanning SPR imaging for detection of biomolecular interactions on microarrays. Biosens. Bioelectron. 2008, 23, 839-844.
23. Raz, S. R. On-chip food safety monitoring: Multi-analyte screening with imaging surface
plasmon resonance-based biosensor. PhD thesis, Wageningen University, Wageningen, the Netherlands, 2010.
24. van Beers, J. J. B. C.; Raijmakers, R.; Alexander, L.-E.; Stammen-Vogelzangs, J.; Lokate, A. M. C.; Heck, A. J. R.; Schasfoort, R. B. M.; Pruijn, G. J. M. Mapping of citrullinated fibrinogen B-cell epitopes in rheumatoid arthritis by imaging surface plasmon resonance. Arthrit. Res. Ther. 2010, 12, R219-R219.
General Introduction
33
25. Abdiche, Y. N.; Miles, A.; Eckman, J.; Foletti, D.; Van Blarcom, T. J.; Yeung, Y. A.; Pons, J.;
Rajpal, A. High-throughput epitope binning assays on label-free array-based biosensors can
yield exquisite epitope discrimination that facilitates the selection of monoclonal antibodies with functional activity. PLoS ONE 2014, 9, e924511-e9245116.
26. Mauriz, E.; Calle, A.; Montoya, A.; Lechuga, L. M. Determination of environmental organic pollutants with a portable optical immunosensor. Talanta 2006, 69, 359-364.
27. Chinowsky, T. M.; Soelberg, S. D.; Baker, P.; Swanson, N. R.; Kauffman, P.; Mactutis, A.; Grow, M. S.; Atmar, R.; Yee, S. S.; Furlong, C. E. Portable 24-analyte surface plasmon
resonance instruments for rapid, versatile biodetection. Biosens. Bioelectron. 2007, 22, 2268-2275.
28. Kim, S. J.; Gobi, K. V.; Iwasaka, H.; Tanaka, H.; Miura, N. Novel miniature SPR immunosensor equipped with all-in-one multi-microchannel sensor chip for detecting low-molecular-weight analytes. Biosens. Bioelectron. 2007, 23, 701-707.
29. Marchesini, G. R.; Koopal, K.; Meulenberg, E.; Haasnoot, W.; Irth, H. Spreeta-based
biosensor assays for endocrine disruptors. Biosens. Bioelectron. 2007, 22, 1908-1915. 30. Fernández, F.; Hegnerová, K.; Piliarik, M.; Sanchez-Baeza, F.; Homola, J.; Marco, M. P. A
label-free and portable multichannel surface plasmon resonance immunosensor for on site analysis of antibiotics in milk samples. Biosens. Bioelectron. 2010, 26, 1231-1238.
31. Preechaburana, P.; Gonzalez, M. C.; Suska, A.; Filippini, D. Surface plasmon resonance
chemical sensing on cell phones. Angew. Chem. Int. Ed. 2012, 51, 11585-11588. 32. Liu, Y.; Liu, Q.; Chen, S.; Cheng, F.; Wang, H.; Peng, W. Surface plasmon resonance
biosensor based on smart phone platforms. Sci. Rep. 2015, 5, 128641-128649. 33. Dahlin, A. B. Sensing applications based on plasmonic nanopores: The hole story. Analyst
2015, 140, 4748-4759. 34. Love, J. C.; Estroff, L. A.; Kriebel, J. K.; Nuzzo, R. G.; Whitesides, G. M. Self-assembled
monolayers of thiolates on metals as a form of nanotechnology. Chem. Rev. 2005, 105, 1103-1170.
35. Cheng, Z.; Wang, Z.; Gillespie, D. E.; Lausted, C.; Zheng, Z.; Yang, M.; Zhu, J. Plain silver
surface plasmon resonance for microarray application. Anal. Chem. 2015, 87, 1466-1469. 36. Ruffato, G.; Romanato, F. Grating-coupled surface plasmon resonance in conical mounting
with polarization modulation. Opt. Lett. 2012, 37, 2718-2720. 37. Petefish, J. W.; Hillier, A. C. Multipitched diffraction gratings for surface plasmon resonance-
enhanced infrared reflection absorption spectroscopy. Anal. Chem. 2015, 87, 10862-10870. 38. Giudicatti, S.; Valsesia, A.; Marabelli, F.; Colpo, P.; Rossi, F. Plasmonic resonances in
nanostructured gold/polymer surfaces by colloidal lithography. Phys. Status Solidi A 2010, 207, 935-942.
39. Sharma, A. K.; Jha, R.; Gupta, B. D. Fiber-optic sensors based on surface plasmon resonance: A comprehensive review. IEEE Sens. J. 2007, 7, 1118-1129.
40. DeVries, J. W.; Trucksess, M. W.; Jackson, L. S., Mycotoxins and food safety. Springer: New York, 2002.
41. Schatzmayr, G.; Streit, E. Global occurrence of mycotoxins in the food and feed chain: Facts
and figures. World Mycotoxin J. 2013, 6, 213-222. 42. Commission regulation (EC) No 1881/2006 of 19 December 2006 setting maximum levels for
certain contaminants in foodstuffs. Off. J. Eur. Union 2006, L364, 5-24. 43. Commission recommendation of 27 March 2013 on the presence of T-2 and HT-2 toxin in
cereals and cereal products. Off. J. Eur. Union 2013, L91, 12-15. 44. Berthiller, F.; Brera, C.; Crews, C.; Iha, M. H.; Krska, R.; Lattanzio, V. M. T.; MacDonald, S.;
Malone, R. J.; Maragos, C.; Solfrizzo, M.; Stroka, J.; Whitaker, T. B. Developments in
mycotoxin analysis: An update for 2013-2014. World Mycotoxin J. 2015, 8, 5-35. 45. Berthiller, F.; Brera, C.; Crews, C.; Iha, M. H.; Krska, R.; Lattanzio, V. M. T.; MacDonald, S.;
Malone, R. J.; Maragos, C.; Solfrizzo, M.; Stroka, J.; Whitaker, T. B. Developments in mycotoxin analysis: An update for 2014-2015. World Mycotoxin J. 2016, 9, 5-30.
46. Chauhan, R.; Singh, J.; Sachdev, T.; Basu, T.; Malhotra, B. D. Recent advances in mycotoxins detection. Biosens. Bioelectron. 2016, 81, 532-545.
47. Berthiller, F.; Sulyok, M.; Krska, R.; Schuhmacher, R. Chromatographic methods for the simultaneous determination of mycotoxins and their conjugates in cereals. Int. J. Food Microbiol. 2007, 119, 33-37.
48. Vaclavik, L.; Zachariasova, M.; Hrbek, V.; Hajslova, J. Analysis of multiple mycotoxins in cereals under ambient conditions using direct analysis in real time (DART) ionization coupled to high resolution mass spectrometry. Talanta 2010, 82, 1950-1957.
49. Goryacheva, I. Y.; De Saeger, S., Immunochemical methods for rapid mycotoxin detection in
food and feed. In: Determining mycotoxins and mycotoxigenic fungi in food and feed, De Saeger, S., Ed. Woodhead Publishing: Cambridge, 2011; pp 135-167.
Chapter 1
34
50. Li, W.; Powers, S.; Dai, S. Y. Using commercial immunoassay kits for mycotoxins: ‘Joys and
sorrows’? World Mycotoxin J. 2014, 7, 417-430.
51. Todescato, F.; Antognoli, A.; Meneghello, A.; Cretaio, E.; Signorini, R.; Bozio, R. Sensitive detection of ochratoxin A in food and drinks using metal-enhanced fluorescence. Biosens. Bioelectron. 2014, 57, 125-132.
52. Yang, L.; Zhang, Y.; Li, R.; Lin, C.; Guo, L.; Qiu, B.; Lin, Z.; Chen, G. Electrochemiluminescence biosensor for ultrasensitive determination of ochratoxin A in corn samples based on aptamer and hyperbranched rolling circle amplification. Biosens.
Bioelectron. 2015, 70, 268-274. 53. Zangheri, M.; Di Nardo, F.; Anfossi, L.; Giovannoli, C.; Baggiani, C.; Roda, A.; Mirasoli, M. A
multiplex chemiluminescent biosensor for type B-fumonisins and aflatoxin B1 quantitative detection in maize flour. Analyst 2015, 140, 358-365.
54. Liu, X.; Xu, Y.; Xiong, Y.-h.; Tu, Z.; Li, Y.-p.; He, Z.-y.; Qiu, Y.-l.; Fu, J.-h.; Gee, S. J.; Hammock, B. D. VHH phage-based competitive real-time immuno-polymerase chain reaction
for ultrasensitive detection of ochratoxin A in cereal. Anal. Chem. 2014, 86, 7471-7477. 55. Olcer, Z.; Esen, E.; Muhammad, T.; Ersoy, A.; Budak, S.; Uludag, Y. Fast and sensitive
detection of mycotoxins in wheat using microfluidics based real-time electrochemical profiling. Biosens. Bioelectron. 2014, 62, 163-169.
56. Beloglazova, N. V.; Speranskaya, E. S.; Wu, A.; Wang, Z.; Sanders, M.; Goftman, V. V.;
Zhang, D.; Goryacheva, I. Y.; De Saeger, S. Novel multiplex fluorescent immunoassays based on quantum dot nanolabels for mycotoxins determination. Biosens. Bioelectron.
2014, 62, 59-65. 57. Peters, J.; Bienenmann-Ploum, M.; de Rijk, T.; Haasnoot, W. Development of a multiplex
flow cytometric microsphere immunoassay for mycotoxins and evaluation of its application in feed. Mycotoxin Res. 2011, 27, 63-72.
58. Peters, J.; Cardall, A.; Haasnoot, W.; Nielen, M. W. F. 6-plex microsphere immunoassay with imaging planar array detection for mycotoxins in barley. Analyst 2014, 139, 3968-3976.
59. Homola, J. Surface plasmon resonance sensors for detection of chemical and biological
species. Chem. Rev. 2008, 108, 462-493. 60. Li, Y.; Liu, X.; Lin, Z. Recent developments and applications of surface plasmon resonance
biosensors for the detection of mycotoxins in foodstuffs. Food Chem. 2012, 132, 1549-1554.
61. Meneely, J. P.; Elliott, C. T. Rapid surface plasmon resonance immunoassays for the determination of mycotoxins in cereals and cereal-based food products. World Mycotoxin J.
2014, 7, 491-505. 62. Karczmarczyk, A.; Dubiak-Szepietowska, M.; Vorobii, M.; Rodriguez-Emmenegger, C.;
Dostálek, J.; Feller, K.-H. Sensitive and rapid detection of aflatoxin M1 in milk utilizing enhanced SPR and p(HEMA) brushes. Biosens. Bioelectron. 2016, 81, 159-165.
63. Gan, Y. Atomic and subnanometer resolution in ambient conditions by atomic force microscopy. Surf. Sci. Rep. 2009, 64, 99-121.
64. Kaminskyj, S. G. W.; Dahms, T. E. S. High spatial resolution surface imaging and analysis of
fungal cells using SEM and AFM. Micron 2008, 39, 349-361. 65. Watts, J. F.; Wolstenholme, J., Comparison of XPS and AES with other analytical techniques.
In: An introduction to surface analysis by XPS and AES, John Wiley & Sons, Ltd: Chichester, 2005; pp 165-182.
66. Bell, M. S.; Shahraz, A.; Fichthorn, K. A.; Borhan, A. Effects of hierarchical surface roughness on droplet contact angle. Langmuir 2015, 31, 6752-6762.
67. Cody, R. B.; Laramée, J. A.; Durst, H. D. Versatile new ion source for the analysis of
materials in open air under ambient conditions. Anal. Chem. 2005, 77, 2297-2302. 68. Manova, R. K.; Joshi, S.; Debrassi, A.; Bhairamadgi, N. S.; Roeven, E.; Gagnon, J.; Tahir,
M. N.; Claassen, F. W.; Scheres, L. M. W.; Wennekes, T.; Schroën, K.; van Beek, T. A.; Zuilhof, H.; Nielen, M. W. F. Ambient surface analysis of organic monolayers using direct analysis in real time orbitrap mass spectrometry. Anal. Chem. 2014, 86, 2403-2411.
69. Mérian, T.; Goddard, J. M. Advances in nonfouling materials: Perspectives for the food
industry. J. Agric. Food Chem. 2012, 60, 2943-2957. 70. Lowe, S.; O'Brien-Simpson, N. M.; Connal, L. A. Antibiofouling polymer interfaces:
Poly(ethylene glycol) and other promising candidates. Polym. Chem. 2015, 6, 198-212. 71. Löfås, S.; Johnsson, B. A novel hydrogel matrix on gold surfaces in surface plasmon
resonance sensors for fast and efficient covalent immobilization of ligands. J. Chem. Soc., Chem. Comm. 1990, 1526-1528.
72. Li, L.; Chen, S.; Zheng, J.; Ratner, B. D.; Jiang, S. Protein adsorption on oligo(ethylene glycol)-terminated alkanethiolate self-assembled monolayers: The molecular basis for
nonfouling behavior. J. Phys. Chem. B 2005, 109, 2934-2941.

General Introduction
35
73. Uchida, K.; Hoshino, Y.; Tamura, A.; Yoshimoto, K.; Kojima, S.; Yamashita, K.; Yamanaka,
I.; Otsuka, H.; Kataoka, K.; Nagasaki, Y. Creation of a mixed poly(ethylene glycol) tethered-
chain surface for preventing the nonspecific adsorption of proteins and peptides. Biointerphases 2007, 2, 126-130.
74. Wu, L.; Jasinski, J.; Krishnan, S. Carboxybetaine, sulfobetaine, and cationic block copolymer coatings: A comparison of the surface properties and antibiofouling behavior. J. Appl. Polym. Sci. 2012, 124, 2154-2170.
75. Duwez, A.-S. Exploiting electron spectroscopies to probe the structure and organization of
self-assembled monolayers: A review. J. Electron Spectrosc. 2004, 134, 97-138. 76. Jonkheijm, P.; Weinrich, D.; Schröder, H.; Niemeyer, C. M.; Waldmann, H. Chemical
strategies for generating protein biochips. Angew. Chem. Int. Ed. 2008, 47, 9618-9647. 77. Hermanson, G. T., Bioconjugate techniques. Academic Press: Boston, 2013. 78. O'Shannessy, D. J.; Brigham-Burke, M.; Peck, K. Immobilization chemistries suitable for use
in the Biacore surface plasmon resonance detector. Anal. Biochem. 1992, 205, 132-136.
79. Skládal, P. Effect of methanol on the interaction of monoclonal antibody with free and immobilized atrazine studied using the resonant mirror-based biosensor. Biosens. Bioelectron. 1999, 14, 257-263.
80. Geuijen, K. P. M.; Schasfoort, R. B.; Wijffels, R. H.; Eppink, M. H. M. High-throughput and multiplexed regeneration buffer scouting for affinity-based interactions. Anal. Biochem.
2014, 454, 38-40. 81. Shalabney, A.; Abdulhalim, I. Sensitivity-enhancement methods for surface plasmon
sensors. Laser Photonics Rev. 2011, 5, 571-606. 82. Breault-Turcot, J.; Masson, J.-F. Nanostructured substrates for portable and miniature SPR
biosensors. Anal. Bioanal. Chem. 2012, 403, 1477-1484. 83. Kwon, M. J.; Lee, J.; Wark, A. W.; Lee, H. J. Nanoparticle-enhanced surface plasmon
resonance detection of proteins at attomolar concentrations: Comparing different nanoparticle shapes and sizes. Anal. Chem. 2012, 84, 1702-1707.
84. Ertsgaard, C. T.; McKoskey, R. M.; Rich, I. S.; Lindquist, N. C. Dynamic placement of
plasmonic hotspots for super-resolution surface-enhanced Raman scattering. ACS Nano 2014, 8, 10941-10946.
85. Krishnamoorthy, S.; Himmelhaus, M. Confinement-induced enhancement of antigen–antibody interactions within binary nanopatterns to achieve higher efficiency of on-chip immunosensors. Adv. Mater. 2008, 20, 2782-2788.
86. Valsesia, A.; Colpo, P.; Mannelli, I.; Mornet, S.; Bretagnol, F.; Ceccone, G.; Rossi, F. Use of
nanopatterned surfaces to enhance immunoreaction efficiency. Anal. Chem. 2008, 80, 1418-1424.
87. Goggins, S.; Frost, C. G. Approaches towards molecular amplification for sensing. Analyst 2016, 141, 3157-3218.
88. Hong, X.; Hall, E. A. H. Contribution of gold nanoparticles to the signal amplification in surface plasmon resonance. Analyst 2012, 137, 4712-4719.
89. Springer, T.; Ermini, M. L.; Spackova, B.; Jablonku, J.; Homola, J. Enhancing sensitivity of
surface plasmon resonance biosensors by functionalized gold nanoparticles: Size matters. Anal. Chem. 2014, 86, 10350-10356.
90. Liu, Y.; Dong, Y.; Jauw, J.; Linman, M. J.; Cheng, Q. Highly sensitive detection of protein toxins by surface plasmon resonance with biotinylation-based inline atom transfer radical polymerization amplification. Anal. Chem. 2010, 82, 3679-3685.
91. Berthiller, F.; Crews, C.; Dall'Asta, C.; De Saeger, S.; Haesaert, G.; Karlovsky, P.; Oswald, I. P.; Seefelder, W.; Speijers, G.; Stroka, J. Masked mycotoxins: A review. Mol. Nutr. Food
Res. 2013, 57, 165-186. 92. Stigter, E. C. A.; de Jong, G. J.; van Bennekom, W. P. Coupling surface-plasmon resonance
and mass spectrometry to quantify and to identify ligands. Trends Anal. Chem. 2013, 45, 107-120.
93. Natsume, T.; Nakayama, H.; Jansson, Ö.; Isobe, T.; Takio, K.; Mikoshiba, K. Combination of biomolecular interaction analysis and mass spectrometric amino acid sequencing. Anal.
Chem. 2000, 72, 4193-4198. 94. Marchesini, G. R.; Buijs, J.; Haasnoot, W.; Hooijerink, D.; Jansson, O.; Nielen, M. W. F.
Nanoscale affinity chip interface for coupling inhibition SPR immunosensor screening with nano-LC TOF MS. Anal. Chem. 2008, 80, 1159-1168.
95. Zhang, Y.; Li, X.; Nie, H.; Yang, L.; Li, Z.; Bai, Y.; Niu, L.; Song, D.; Liu, H. Interface for online coupling of surface plasmon resonance to direct analysis in real time mass spectrometry. Anal. Chem. 2015, 87, 6505-6509.
96. Zhang, Y.; Xu, S.; Wen, L.; Bai, Y.; Niu, L.; Song, D.; Liu, H. Dielectric barrier discharge ionization based interface for online coupling surface plasmon resonance with mass spectrometry. Analyst 2016, 141, 3343-3348.
Chapter 1
36
97. Krone, J. R.; Nelson, R. W.; Dogruel, D.; Williams, P.; Granzow, R. BIA/MS: Interfacing
biomolecular interaction analysis with mass spectrometry. Anal. Biochem. 1997, 244, 124-
132. 98. Urban, P. L.; Amantonico, A.; Zenobi, R. Lab-on-a-plate: Extending the functionality of
MALDI-MS and LDI-MS targets. Mass Spectrom. Rev. 2011, 30, 435-478. 99. Takáts, Z.; Wiseman, J. M.; Gologan, B.; Cooks, R. G. Mass spectrometry sampling under
ambient conditions with desorption electrospray ionization. Science 2004, 306, 471-473. 100. Nielen, M. W. F.; Hooijerink, H.; Zomer, P.; Mol, J. G. J. Desorption electrospray ionization
mass spectrometry in the analysis of chemical food contaminants in food. Trends Anal. Chem. 2011, 30, 165-180.
101. Klampfl, C. W.; Himmelsbach, M. Direct ionization methods in mass spectrometry: An overview. Anal. Chim. Acta 2015, 890, 44-59.
102. Paine, M. R. L.; Barker, P. J.; Blanksby, S. J. Paint spray mass spectrometry for the detection of additives from polymers on conducting surfaces. Mass Spectrom. Lett. 2012, 3,
25-28. 103. Hu, B.; So, P.-K.; Yao, Z.-P. Electrospray ionization with aluminum foil: A versatile mass
spectrometric technique. Anal. Chim. Acta 2014, 817, 1-8. 104. Jiang, J.; Zhang, H.; Li, M.; Dulay, M. T.; Ingram, A. J.; Li, N.; You, H.; Zare, R. N. Droplet
spray ionization from a glass microscope slide: Real-time monitoring of ethylene
polymerization. Anal. Chem. 2015, 87, 8057-8062. 105. Gómez-Ríos, G. A.; Pawliszyn, J. Development of coated blade spray ionization mass
spectrometry for the quantitation of target analytes present in complex matrices. Angew. Chem. Int. Ed. 2014, 53, 14503-14507.
Chapter 2
Surface characterization and antifouling properties of
nanostructured gold chips for imaging surface plasmon
resonance biosensing
Sweccha Joshi1,2, Paola Pellacani3, Teris A. van Beek1, Han Zuilhof1, Michel W.F. Nielen1,4
1Laboratory of Organic Chemistry, Wageningen University, Dreijenplein 8, 6703 HB
Wageningen, The Netherlands
2TI-COAST, Science Park 904, 1098 XH, Amsterdam, The Netherlands
3Plasmore S.R.L, Via Deledda 4, 21020 Ranco (VA), Italy
4RIKILT Wageningen UR, P.O. Box 230, 6700 AE Wageningen, The Netherlands
This chapter has been published in:
Sensors and Actuators, B, 2015, 209, 505-514.

Chapter 2
38
Abstract
Surface Plasmon Resonance (SPR) optical sensing is a label-free technique for real-time
monitoring of biomolecular interactions. Recently, a portable imaging SPR (iSPR)
prototype instrument, featuring a nanostructured gold chip, has been developed. In the
present work, we investigated the crucial first steps, prior to eventual use of the
nanostructured iSPR chip, i.e., its surface modification, in-depth surface characterization
and the antifouling performance. Results were compared with conventional flat (i)SPR
gold chips having the same surface chemistries, viz. different types of polyethylene glycol
and zwitterionic polymers. Characterization of the (i)SPR chips before and after surface
modification was performed using atomic force microscopy (AFM), scanning electron
microscopy (SEM), water contact angle (WCA), X-ray photoelectron spectroscopy (XPS)
and direct analysis in real time high resolution mass spectrometry (DART-HRMS). The
antifouling properties were then studied using the nanostructured chip in the portable
iSPR instrument and the flat gold chip in conventional SPR set-up. The zwitterionic
polymer surface chemistries showed the best antifouling properties. Comparison of the
nanostructured iSPR chips with conventional flat (i)SPR gold chips showed that the latter
perform slightly better in terms of surface modification as well as antifouling properties.
The portable iSPR instrument is almost as sensitive as conventional iSPR (IBIS) and nine
times less sensitive than conventional SPR (Biacore 3000). The nanostructured iSPR chip,
along with the portable instrument, offers the advantage of about ten-fold reduction in
instrument size, weight and costs compared to conventional (i)SPR instruments using flat
gold, thus making it highly interesting for future biosensing applications.
Keywords
Nanoplasmonics, imaging SPR, surface characterization, zwitterionic polymers,
poly(ethyleneglycol), miniaturization
Surface characterization and antifouling of nanostructured chip
39
Introduction
Surface Plasmon Resonance (SPR) based biosensors have emerged as fast, sensitive, and
label-free techniques for real-time monitoring of biomolecular interactions.1,2 The desire
to measure multiple biointeractions in parallel has triggered the development of a new
platform known as imaging SPR (iSPR).2-4 In iSPR, the reflected light is collected by a
charge-coupled device (CCD) camera, which allows real-time visualization of the change
in reflectivity at multiple spots on the sensor surface.5 Conventional iSPR instruments,
although quite successful in biosensing applications,6-8 are rather heavy and costly, and
should be considered as high-end laboratory-based biosensing equipment. Considering
the demand for bringing the lab to the sample, a portable iSPR prototype has been
developed recently,9,10 which offers the potential for in-field and at-line biosensing
applications. Unlike conventional SPR (Figure 1), the miniaturized iSPR instrument uses
nanostructured gold instead of flat gold as a sensor chip surface. The nanostructured
surface is made up of a periodic alternation of poly(methyl methacrylate) and gold,11 as
shown in Figure 1A and 2. This forms a metal-dielectric pattern that acts as a metallic
nanograting,12,13 thus eliminating the use of expensive and delicate prism-based optics
and contributing to miniaturization, portability and low costs of the instrument.
Additionally, the periodicity of a nanostructured gold surface is known to influence the
SPR signal.14 Due to advantages over flat surfaces, nanostructured gold has also found
application in surface-enhanced Raman spectroscopy (SERS).15-17
A crucial step towards the use of any sensor chip for biosensor applications, is
prevention of non-specific interactions of biomolecules (biofouling) leading to false
positive signals. This requires the use of well-defined antifouling chemistries that not only
help to overcome fouling issues but also to obtain sufficient surface stability for
regeneration and repeated use of the sensor surface. SPR optical sensing has been used
extensively to study antifouling properties of chemically modified flat gold.18-22 A
widespread approach to reduce non-specific adsorption is to modify the surface using a
coating of hydrophilic polymers. Carboxymethylated (CM) dextran coatings are the oldest
and very popular antifouling layers used in commercial SPR sensors.23 As an alternative
to CM dextran, poly(ethylene glycol) (PEG)-tethered alkanethiol chains, terminated with
various functional groups, have been used.20,24 PEG is a hydrophilic, electrically neutral
polyether known to be resistant to non-specific adsorption mainly due to steric hindrance
and water barrier effects.25 Careful tuning of the length and density of the PEG-tethered
chains is, however, required to achieve the desired effect.26 These parameters are
dependent on the method of polymer growth, thus it is interesting and relevant to
compare “grafting to”27 and “grafting from”28 approaches of polymer attachment.
Although PEG has been used extensively, it is known to oxidize easily in the presence of
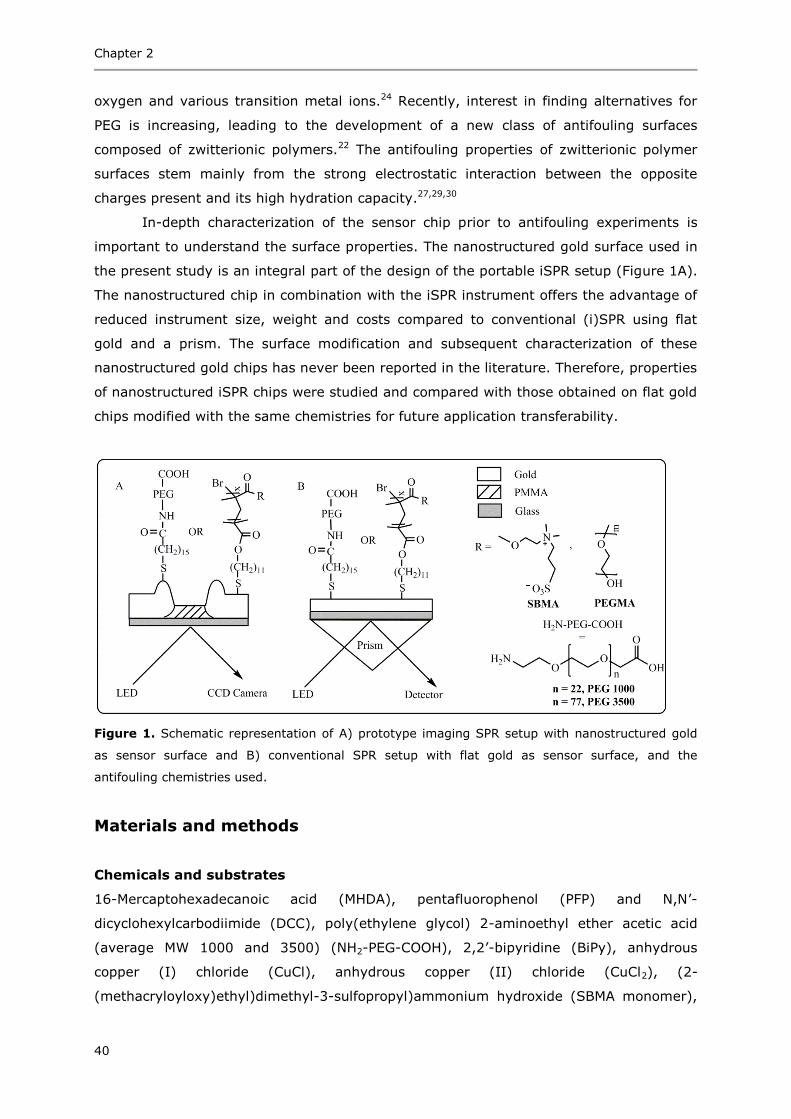
Chapter 2
40
oxygen and various transition metal ions.24 Recently, interest in finding alternatives for
PEG is increasing, leading to the development of a new class of antifouling surfaces
composed of zwitterionic polymers.22 The antifouling properties of zwitterionic polymer
surfaces stem mainly from the strong electrostatic interaction between the opposite
charges present and its high hydration capacity.27,29,30
In-depth characterization of the sensor chip prior to antifouling experiments is
important to understand the surface properties. The nanostructured gold surface used in
the present study is an integral part of the design of the portable iSPR setup (Figure 1A).
The nanostructured chip in combination with the iSPR instrument offers the advantage of
reduced instrument size, weight and costs compared to conventional (i)SPR using flat
gold and a prism. The surface modification and subsequent characterization of these
nanostructured gold chips has never been reported in the literature. Therefore, properties
of nanostructured iSPR chips were studied and compared with those obtained on flat gold
chips modified with the same chemistries for future application transferability.
Figure 1. Schematic representation of A) prototype imaging SPR setup with nanostructured gold
as sensor surface and B) conventional SPR setup with flat gold as sensor surface, and the
antifouling chemistries used.
Materials and methods
Chemicals and substrates
16-Mercaptohexadecanoic acid (MHDA), pentafluorophenol (PFP) and N,N’-
dicyclohexylcarbodiimide (DCC), poly(ethylene glycol) 2-aminoethyl ether acetic acid
(average MW 1000 and 3500) (NH2-PEG-COOH), 2,2’-bipyridine (BiPy), anhydrous
copper (I) chloride (CuCl), anhydrous copper (II) chloride (CuCl2), (2-
(methacryloyloxy)ethyl)dimethyl-3-sulfopropyl)ammonium hydroxide (SBMA monomer),
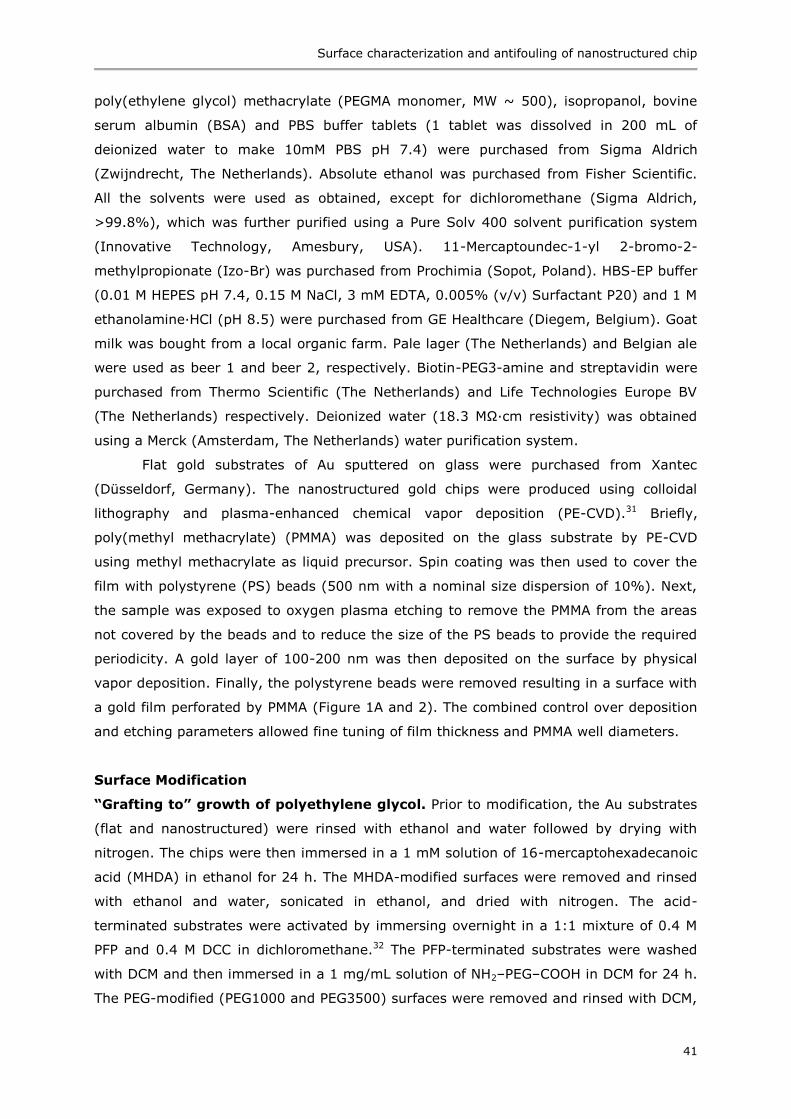
Surface characterization and antifouling of nanostructured chip
41
poly(ethylene glycol) methacrylate (PEGMA monomer, MW ~ 500), isopropanol, bovine
serum albumin (BSA) and PBS buffer tablets (1 tablet was dissolved in 200 mL of
deionized water to make 10mM PBS pH 7.4) were purchased from Sigma Aldrich
(Zwijndrecht, The Netherlands). Absolute ethanol was purchased from Fisher Scientific.
All the solvents were used as obtained, except for dichloromethane (Sigma Aldrich,
>99.8%), which was further purified using a Pure Solv 400 solvent purification system
(Innovative Technology, Amesbury, USA). 11-Mercaptoundec-1-yl 2-bromo-2-
methylpropionate (Izo-Br) was purchased from Prochimia (Sopot, Poland). HBS-EP buffer
(0.01 M HEPES pH 7.4, 0.15 M NaCl, 3 mM EDTA, 0.005% (v/v) Surfactant P20) and 1 M
ethanolamine·HCl (pH 8.5) were purchased from GE Healthcare (Diegem, Belgium). Goat
milk was bought from a local organic farm. Pale lager (The Netherlands) and Belgian ale
were used as beer 1 and beer 2, respectively. Biotin-PEG3-amine and streptavidin were
purchased from Thermo Scientific (The Netherlands) and Life Technologies Europe BV
(The Netherlands) respectively. Deionized water (18.3 MΩ∙cm resistivity) was obtained
using a Merck (Amsterdam, The Netherlands) water purification system.
Flat gold substrates of Au sputtered on glass were purchased from Xantec
(Düsseldorf, Germany). The nanostructured gold chips were produced using colloidal
lithography and plasma-enhanced chemical vapor deposition (PE-CVD).31 Briefly,
poly(methyl methacrylate) (PMMA) was deposited on the glass substrate by PE-CVD
using methyl methacrylate as liquid precursor. Spin coating was then used to cover the
film with polystyrene (PS) beads (500 nm with a nominal size dispersion of 10%). Next,
the sample was exposed to oxygen plasma etching to remove the PMMA from the areas
not covered by the beads and to reduce the size of the PS beads to provide the required
periodicity. A gold layer of 100-200 nm was then deposited on the surface by physical
vapor deposition. Finally, the polystyrene beads were removed resulting in a surface with
a gold film perforated by PMMA (Figure 1A and 2). The combined control over deposition
and etching parameters allowed fine tuning of film thickness and PMMA well diameters.
Surface Modification
“Grafting to” growth of polyethylene glycol. Prior to modification, the Au substrates
(flat and nanostructured) were rinsed with ethanol and water followed by drying with
nitrogen. The chips were then immersed in a 1 mM solution of 16-mercaptohexadecanoic
acid (MHDA) in ethanol for 24 h. The MHDA-modified surfaces were removed and rinsed
with ethanol and water, sonicated in ethanol, and dried with nitrogen. The acid-
terminated substrates were activated by immersing overnight in a 1:1 mixture of 0.4 M
PFP and 0.4 M DCC in dichloromethane.32 The PFP-terminated substrates were washed
with DCM and then immersed in a 1 mg/mL solution of NH2‒PEG‒COOH in DCM for 24 h.
The PEG-modified (PEG1000 and PEG3500) surfaces were removed and rinsed with DCM,
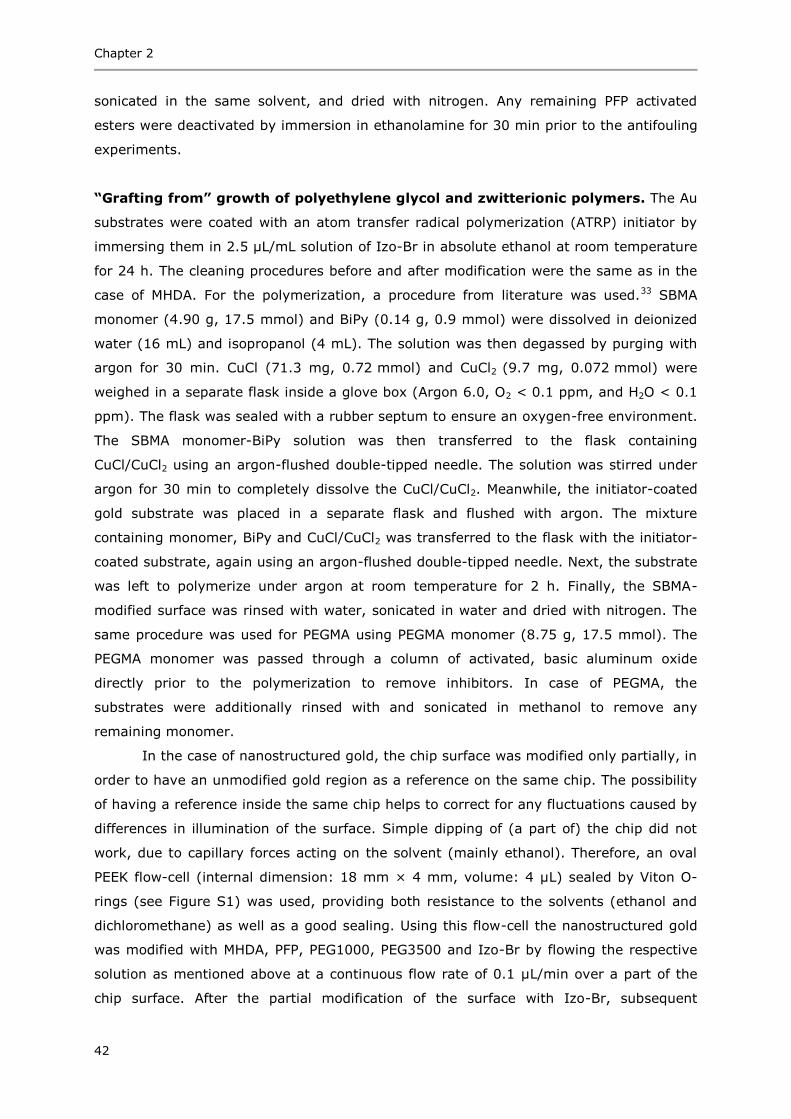
Chapter 2
42
sonicated in the same solvent, and dried with nitrogen. Any remaining PFP activated
esters were deactivated by immersion in ethanolamine for 30 min prior to the antifouling
experiments.
“Grafting from” growth of polyethylene glycol and zwitterionic polymers. The Au
substrates were coated with an atom transfer radical polymerization (ATRP) initiator by
immersing them in 2.5 µL/mL solution of Izo-Br in absolute ethanol at room temperature
for 24 h. The cleaning procedures before and after modification were the same as in the
case of MHDA. For the polymerization, a procedure from literature was used.33 SBMA
monomer (4.90 g, 17.5 mmol) and BiPy (0.14 g, 0.9 mmol) were dissolved in deionized
water (16 mL) and isopropanol (4 mL). The solution was then degassed by purging with
argon for 30 min. CuCl (71.3 mg, 0.72 mmol) and CuCl2 (9.7 mg, 0.072 mmol) were
weighed in a separate flask inside a glove box (Argon 6.0, O2 < 0.1 ppm, and H2O < 0.1
ppm). The flask was sealed with a rubber septum to ensure an oxygen-free environment.
The SBMA monomer-BiPy solution was then transferred to the flask containing
CuCl/CuCl2 using an argon-flushed double-tipped needle. The solution was stirred under
argon for 30 min to completely dissolve the CuCl/CuCl2. Meanwhile, the initiator-coated
gold substrate was placed in a separate flask and flushed with argon. The mixture
containing monomer, BiPy and CuCl/CuCl2 was transferred to the flask with the initiator-
coated substrate, again using an argon-flushed double-tipped needle. Next, the substrate
was left to polymerize under argon at room temperature for 2 h. Finally, the SBMA-
modified surface was rinsed with water, sonicated in water and dried with nitrogen. The
same procedure was used for PEGMA using PEGMA monomer (8.75 g, 17.5 mmol). The
PEGMA monomer was passed through a column of activated, basic aluminum oxide
directly prior to the polymerization to remove inhibitors. In case of PEGMA, the
substrates were additionally rinsed with and sonicated in methanol to remove any
remaining monomer.
In the case of nanostructured gold, the chip surface was modified only partially, in
order to have an unmodified gold region as a reference on the same chip. The possibility
of having a reference inside the same chip helps to correct for any fluctuations caused by
differences in illumination of the surface. Simple dipping of (a part of) the chip did not
work, due to capillary forces acting on the solvent (mainly ethanol). Therefore, an oval
PEEK flow-cell (internal dimension: 18 mm × 4 mm, volume: 4 µL) sealed by Viton O-
rings (see Figure S1) was used, providing both resistance to the solvents (ethanol and
dichloromethane) as well as a good sealing. Using this flow-cell the nanostructured gold
was modified with MHDA, PFP, PEG1000, PEG3500 and Izo-Br by flowing the respective
solution as mentioned above at a continuous flow rate of 0.1 µL/min over a part of the
chip surface. After the partial modification of the surface with Izo-Br, subsequent
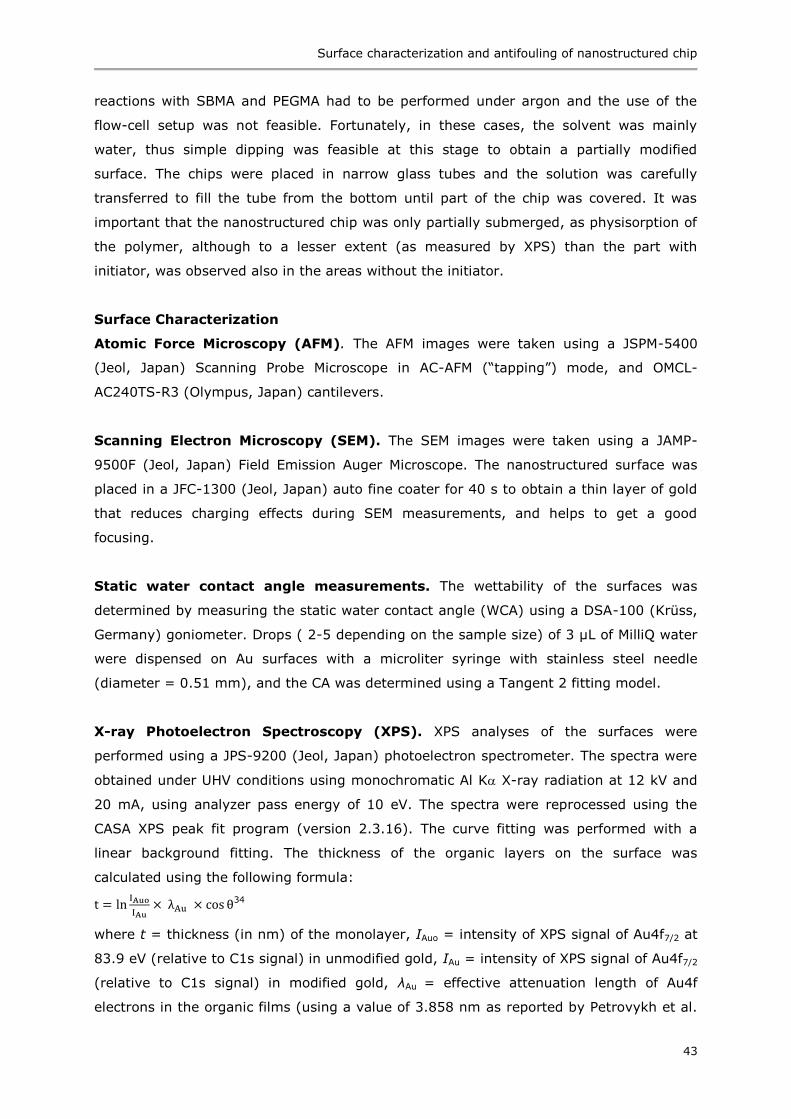
Surface characterization and antifouling of nanostructured chip
43
reactions with SBMA and PEGMA had to be performed under argon and the use of the
flow-cell setup was not feasible. Fortunately, in these cases, the solvent was mainly
water, thus simple dipping was feasible at this stage to obtain a partially modified
surface. The chips were placed in narrow glass tubes and the solution was carefully
transferred to fill the tube from the bottom until part of the chip was covered. It was
important that the nanostructured chip was only partially submerged, as physisorption of
the polymer, although to a lesser extent (as measured by XPS) than the part with
initiator, was observed also in the areas without the initiator.
Surface Characterization
Atomic Force Microscopy (AFM). The AFM images were taken using a JSPM-5400
(Jeol, Japan) Scanning Probe Microscope in AC-AFM (“tapping”) mode, and OMCL-
AC240TS-R3 (Olympus, Japan) cantilevers.
Scanning Electron Microscopy (SEM). The SEM images were taken using a JAMP-
9500F (Jeol, Japan) Field Emission Auger Microscope. The nanostructured surface was
placed in a JFC-1300 (Jeol, Japan) auto fine coater for 40 s to obtain a thin layer of gold
that reduces charging effects during SEM measurements, and helps to get a good
focusing.
Static water contact angle measurements. The wettability of the surfaces was
determined by measuring the static water contact angle (WCA) using a DSA-100 (Krüss,
Germany) goniometer. Drops ( 2-5 depending on the sample size) of 3 µL of MilliQ water
were dispensed on Au surfaces with a microliter syringe with stainless steel needle
(diameter = 0.51 mm), and the CA was determined using a Tangent 2 fitting model.
X-ray Photoelectron Spectroscopy (XPS). XPS analyses of the surfaces were
performed using a JPS-9200 (Jeol, Japan) photoelectron spectrometer. The spectra were
obtained under UHV conditions using monochromatic Al K X-ray radiation at 12 kV and
20 mA, using analyzer pass energy of 10 eV. The spectra were reprocessed using the
CASA XPS peak fit program (version 2.3.16). The curve fitting was performed with a
linear background fitting. The thickness of the organic layers on the surface was
calculated using the following formula:
t = lnIAuo
IAu× λAu × cos θ34
where t = thickness (in nm) of the monolayer, IAuo = intensity of XPS signal of Au4f7/2 at
83.9 eV (relative to C1s signal) in unmodified gold, IAu = intensity of XPS signal of Au4f7/2
(relative to C1s signal) in modified gold, λAu = effective attenuation length of Au4f
electrons in the organic films (using a value of 3.858 nm as reported by Petrovykh et al.
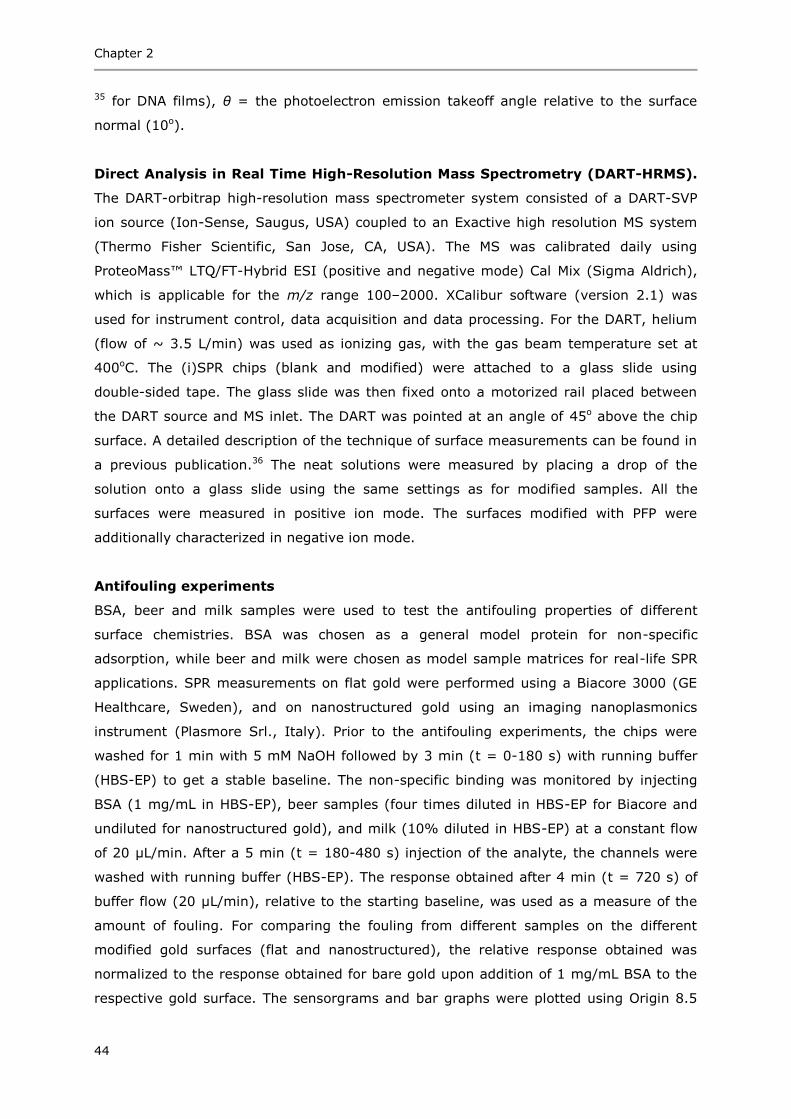
Chapter 2
44
35 for DNA films), θ = the photoelectron emission takeoff angle relative to the surface
normal (10o).
Direct Analysis in Real Time High-Resolution Mass Spectrometry (DART-HRMS).
The DART-orbitrap high-resolution mass spectrometer system consisted of a DART-SVP
ion source (Ion-Sense, Saugus, USA) coupled to an Exactive high resolution MS system
(Thermo Fisher Scientific, San Jose, CA, USA). The MS was calibrated daily using
ProteoMass™ LTQ/FT-Hybrid ESI (positive and negative mode) Cal Mix (Sigma Aldrich),
which is applicable for the m/z range 100‒2000. XCalibur software (version 2.1) was
used for instrument control, data acquisition and data processing. For the DART, helium
(flow of ~ 3.5 L/min) was used as ionizing gas, with the gas beam temperature set at
400oC. The (i)SPR chips (blank and modified) were attached to a glass slide using
double-sided tape. The glass slide was then fixed onto a motorized rail placed between
the DART source and MS inlet. The DART was pointed at an angle of 45o above the chip
surface. A detailed description of the technique of surface measurements can be found in
a previous publication.36 The neat solutions were measured by placing a drop of the
solution onto a glass slide using the same settings as for modified samples. All the
surfaces were measured in positive ion mode. The surfaces modified with PFP were
additionally characterized in negative ion mode.
Antifouling experiments
BSA, beer and milk samples were used to test the antifouling properties of different
surface chemistries. BSA was chosen as a general model protein for non-specific
adsorption, while beer and milk were chosen as model sample matrices for real-life SPR
applications. SPR measurements on flat gold were performed using a Biacore 3000 (GE
Healthcare, Sweden), and on nanostructured gold using an imaging nanoplasmonics
instrument (Plasmore Srl., Italy). Prior to the antifouling experiments, the chips were
washed for 1 min with 5 mM NaOH followed by 3 min (t = 0-180 s) with running buffer
(HBS-EP) to get a stable baseline. The non-specific binding was monitored by injecting
BSA (1 mg/mL in HBS-EP), beer samples (four times diluted in HBS-EP for Biacore and
undiluted for nanostructured gold), and milk (10% diluted in HBS-EP) at a constant flow
of 20 µL/min. After a 5 min (t = 180-480 s) injection of the analyte, the channels were
washed with running buffer (HBS-EP). The response obtained after 4 min (t = 720 s) of
buffer flow (20 µL/min), relative to the starting baseline, was used as a measure of the
amount of fouling. For comparing the fouling from different samples on the different
modified gold surfaces (flat and nanostructured), the relative response obtained was
normalized to the response obtained for bare gold upon addition of 1 mg/mL BSA to the
respective gold surface. The sensorgrams and bar graphs were plotted using Origin 8.5

Surface characterization and antifouling of nanostructured chip
45
and Excel 2010. Sensorgrams from the portable iSPR instrument were smoothened using
the Savitzky-Golay function in Origin 8.5 (10 points of window, polynomial order 2).
Sensitivity measurement: The sensitivity of the portable iSPR instrument was
compared to that of conventional SPR (Biacore 3000) and imaging SPR (IBIS
Technologies B.V., Hengelo, The Netherlands). Calibration curves were constructed with
serial dilutions of glycerol ranging from 10 to 0.01% for each instrument using the
respective bare chips. The LODs were calculated as three times the standard deviation of
the baseline (noise). To allow comparison of the different instruments, each with their
own units of response, the LODs were converted to percentage of glycerol using the
fitting equation of the calibration curve.
Biotin-streptavidin binding: PEG3500 modified chips were activated using a 1:1
mixture of 0.4 M EDC and 0.1 M NHS for 10 min. The chips were washed with water and
then covered with a 1 mg/mL solution of biotin‒PEG‒NH2 in PBS (pH 7.4) for 2 h at room
temperature. The chips were then washed with PBS and subsequently blocked with
ethanolamine for 10 min. The modifications with biotin were confirmed by XPS. The chips
were then mounted on the corresponding instruments to monitor the binding of
streptavidin (Figure 6 and S16). A 10 µg/mL solution of streptavidin (diluted in HBS-EP)
was introduced (t = 50 s) at a flow rate of 20 µL/min. After a 5 min (t = 50-350 s)
injection, the chips were washed with running buffer (HBS-EP). The response obtained
after 30s (t = 380 s) of buffer flow (20 µL/min), relative to the starting baseline, was
used as a measure of the amount of binding.
Results and discussion
Surface modification and characterization
AFM and SEM were used to investigate the surface morphology of the nanostructured
iSPR chip. Both techniques clearly display the nanograting with periodic alternation of
gold and poly(methyl methacrylate) (see Figure 2). Three regions can be seen as
indicated by the arrows in Figure 2: flat gold, poly(methyl methacrylate) (PMMA) wells,
and gold rings surrounding the PMMA. The poly(methyl methacrylate) regions with
diameters of 200‒250 nm and periodicity (distance between the centers of the two PMMA
wells) of 500‒600 nm make up around 20% of the total surface area. The height of the
gold rings is in the range of 10‒20 nm. The surface contains some defects and residual
polystyrene beads as seen in Figure 2B. However, these defects and residual PS beads
are minor, and most likely do not affect the overall modification, antifouling and sensing
properties of the chips in a significant fashion.
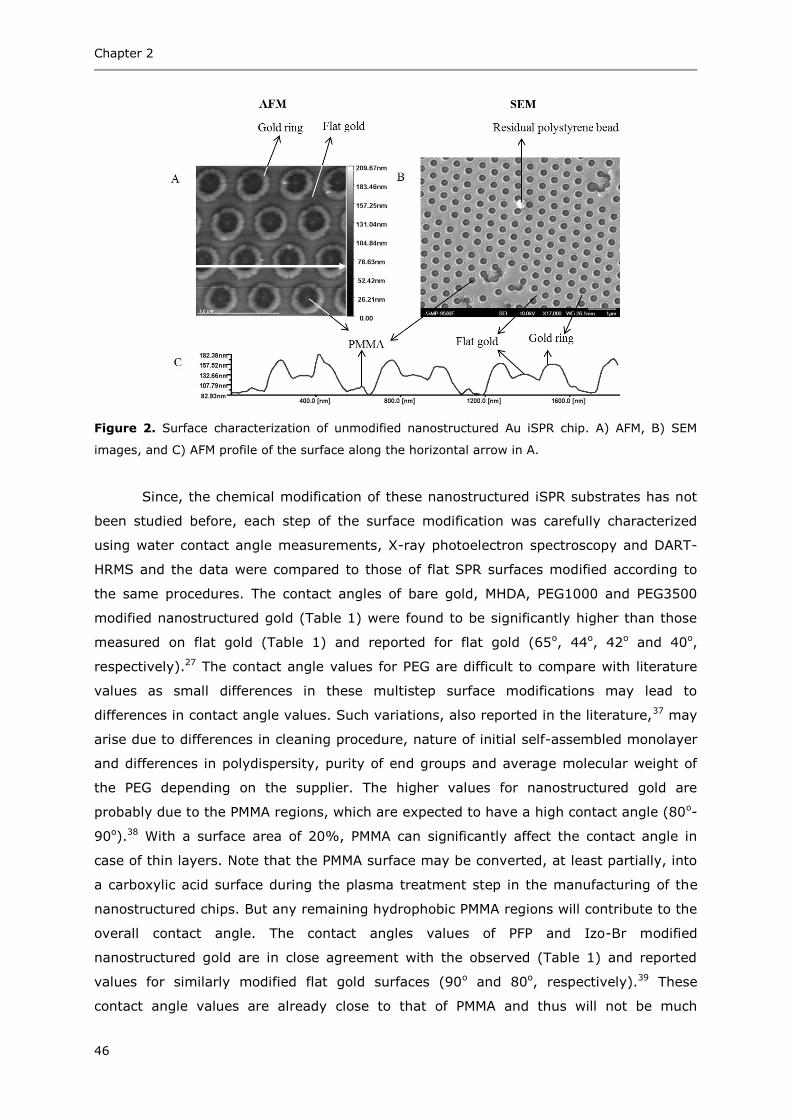
Chapter 2
46
Figure 2. Surface characterization of unmodified nanostructured Au iSPR chip. A) AFM, B) SEM
images, and C) AFM profile of the surface along the horizontal arrow in A.
Since, the chemical modification of these nanostructured iSPR substrates has not
been studied before, each step of the surface modification was carefully characterized
using water contact angle measurements, X-ray photoelectron spectroscopy and DART-
HRMS and the data were compared to those of flat SPR surfaces modified according to
the same procedures. The contact angles of bare gold, MHDA, PEG1000 and PEG3500
modified nanostructured gold (Table 1) were found to be significantly higher than those
measured on flat gold (Table 1) and reported for flat gold (65o, 44o, 42o and 40o,
respectively).27 The contact angle values for PEG are difficult to compare with literature
values as small differences in these multistep surface modifications may lead to
differences in contact angle values. Such variations, also reported in the literature,37 may
arise due to differences in cleaning procedure, nature of initial self-assembled monolayer
and differences in polydispersity, purity of end groups and average molecular weight of
the PEG depending on the supplier. The higher values for nanostructured gold are
probably due to the PMMA regions, which are expected to have a high contact angle (80o-
90o).38 With a surface area of 20%, PMMA can significantly affect the contact angle in
case of thin layers. Note that the PMMA surface may be converted, at least partially, into
a carboxylic acid surface during the plasma treatment step in the manufacturing of the
nanostructured chips. But any remaining hydrophobic PMMA regions will contribute to the
overall contact angle. The contact angles values of PFP and Izo-Br modified
nanostructured gold are in close agreement with the observed (Table 1) and reported
values for similarly modified flat gold surfaces (90o and 80o, respectively).39 These
contact angle values are already close to that of PMMA and thus will not be much

Surface characterization and antifouling of nanostructured chip
47
affected. The effect of PMMA regions becomes insignificant in the case of successful
modification with thicker polymers, such as SBMA and PEGMA, where the contact angles
of modified nanostructured gold are in good agreement with those of modified flat gold
(Table 1) and previous studies (20o and 47o, respectively).37
XPS was used to determine the elemental composition of the organic layer, and
also the dry thickness thereof, as determined from the attenuation of the Au4f7/2 signal
from the bare gold surface to the coated ones.35 The relative atomic percentages of
different elements (Figure S2‒S4) and the layer thickness (Table 1) as calculated from
an XPS survey scan for MHDA, PFP and Izo-Br for both flat and nanostructured gold, are
in agreement with the expected values of 2.1 nm, 2.3 nm, and 1.8 nm, respectively.
Typically, in the C1s narrow scan of these monolayers the peak at 286.5 eV is slightly
broader and shifted by 1 eV for the nanostructured iSPR chip relative to flat gold. This is
probably due to the underlying PMMA layer that can still be measured by XPS in case of
thin layers (<10 nm). For PEG1000 and PEG3500 modified nanostructured gold, the dry
thickness calculated from the XPS survey scan is lower than that on flat gold (roughly 2
nm versus 4 nm, respectively). According to the literature, the thickness of “grafted to”
PEG is expected to be less than 5 nm.37,40 Under the conditions of XPS, these layers are
in a collapsed state and the effect is more pronounced in the case of nanostructured
gold. This is possibly due to the underlying PMMA that obstructs the formation of a well
packed monolayer which, in turn, translates to a lower “grafting to” efficiency in case of
the nanostructured gold. Nevertheless, the increased intensity of the carbon peak at
286.7 eV in the C1s spectrum, corresponding to carbon attached to oxygen (Figure S5
and S6), does confirm the surface attachment of polyethylene glycol units, however to a
slightly lower extent compared to flat gold. The presence of PEG units on the surface was
also confirmed by the representative ion series observed in DART (see further below).
The peak at 285 eV in the C1s spectrum would be expected to be lower than observed
for both flat and nanostructured gold. This, along with a slightly higher C content from
the survey scan (C/O = 2.5 : 1) and the contact angle values, suggest an effect of PMMA
on the thin layers formed. In case of PEGMA (Figure 3A and S7), a thick layer is formed
on both nanostructured and flat gold as seen from the high C and O content in the survey
scan and a significant peak at 286.7 eV (C1s narrow scan). The dry layer thickness of
PEGMA and SBMA modified nanostructured gold, 11 and 14 nm, respectively, are slightly
lower than that of correspondingly modified flat gold, (15 and 21 nm, respectively, Table
1). In case of SBMA-modified surfaces (Figure 3B and S8), the relative percentage of the
different elements are in good agreement with expected values for the monomers, and
the ratios of the carbon peaks (C1s narrow scan) at 285 eV and 286.8 eV are as
expected almost equal. In line with reports on SBMA-modified silicon nitride surfaces,41
this indicates the formation of significant (>10 nm) polymer films.
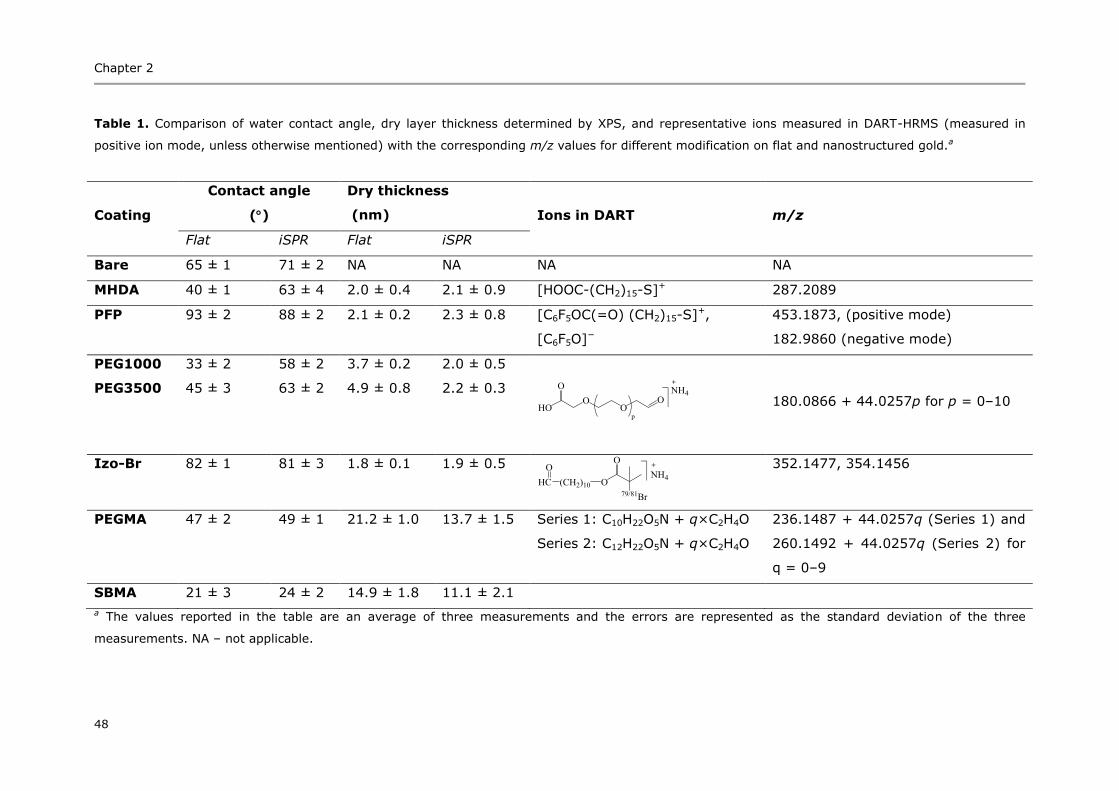
Chapter 2
48
Table 1. Comparison of water contact angle, dry layer thickness determined by XPS, and representative ions measured in DART-HRMS (measured in
positive ion mode, unless otherwise mentioned) with the corresponding m/z values for different modification on flat and nanostructured gold.a
Coating
Contact angle
()
Dry thickness
(nm) Ions in DART m/z
Flat iSPR Flat iSPR
Bare 65 ± 1 71 ± 2 NA NA NA NA
MHDA 40 ± 1 63 ± 4 2.0 ± 0.4 2.1 ± 0.9 [HOOC-(CH2)15-S]+ 287.2089
PFP 93 ± 2 88 ± 2 2.1 ± 0.2 2.3 ± 0.8 [C6F5OC(=O) (CH2)15-S]+,
[C6F5O]−
453.1873, (positive mode)
182.9860 (negative mode)
PEG1000 33 ± 2 58 ± 2 3.7 ± 0.2 2.0 ± 0.5
180.0866 + 44.0257p for p = 0‒10
PEG3500 45 ± 3 63 ± 2 4.9 ± 0.8 2.2 ± 0.3
Izo-Br 82 ± 1 81 ± 3 1.8 ± 0.1 1.9 ± 0.5
352.1477, 354.1456
PEGMA 47 ± 2 49 ± 1 21.2 ± 1.0 13.7 ± 1.5 Series 1: C10H22O5N + q×C2H4O
Series 2: C12H22O5N + q×C2H4O
236.1487 + 44.0257q (Series 1) and
260.1492 + 44.0257q (Series 2) for
q = 0‒9
SBMA 21 ± 3 24 ± 2 14.9 ± 1.8 11.1 ± 2.1
a The values reported in the table are an average of three measurements and the errors are represented as the standard deviation of the three
measurements. NA – not applicable.
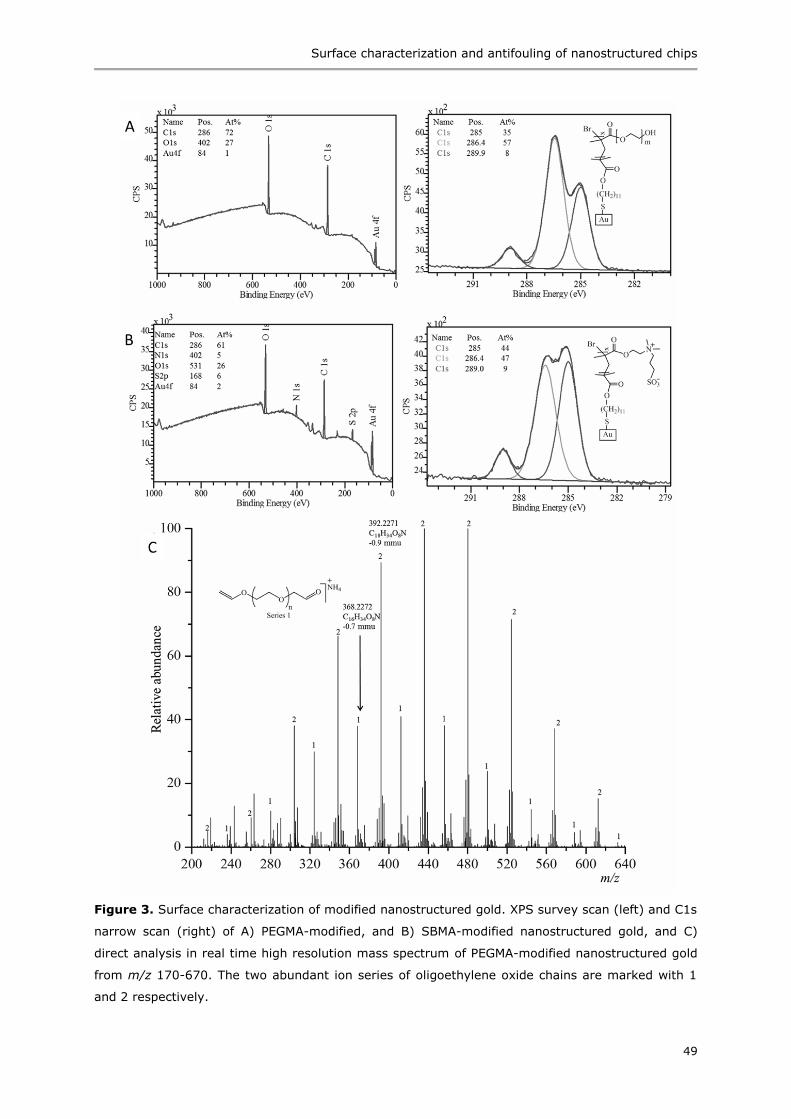
Surface characterization and antifouling of nanostructured chips
49
Figure 3. Surface characterization of modified nanostructured gold. XPS survey scan (left) and C1s
narrow scan (right) of A) PEGMA-modified, and B) SBMA-modified nanostructured gold, and C)
direct analysis in real time high resolution mass spectrum of PEGMA-modified nanostructured gold
from m/z 170-670. The two abundant ion series of oligoethylene oxide chains are marked with 1
and 2 respectively.
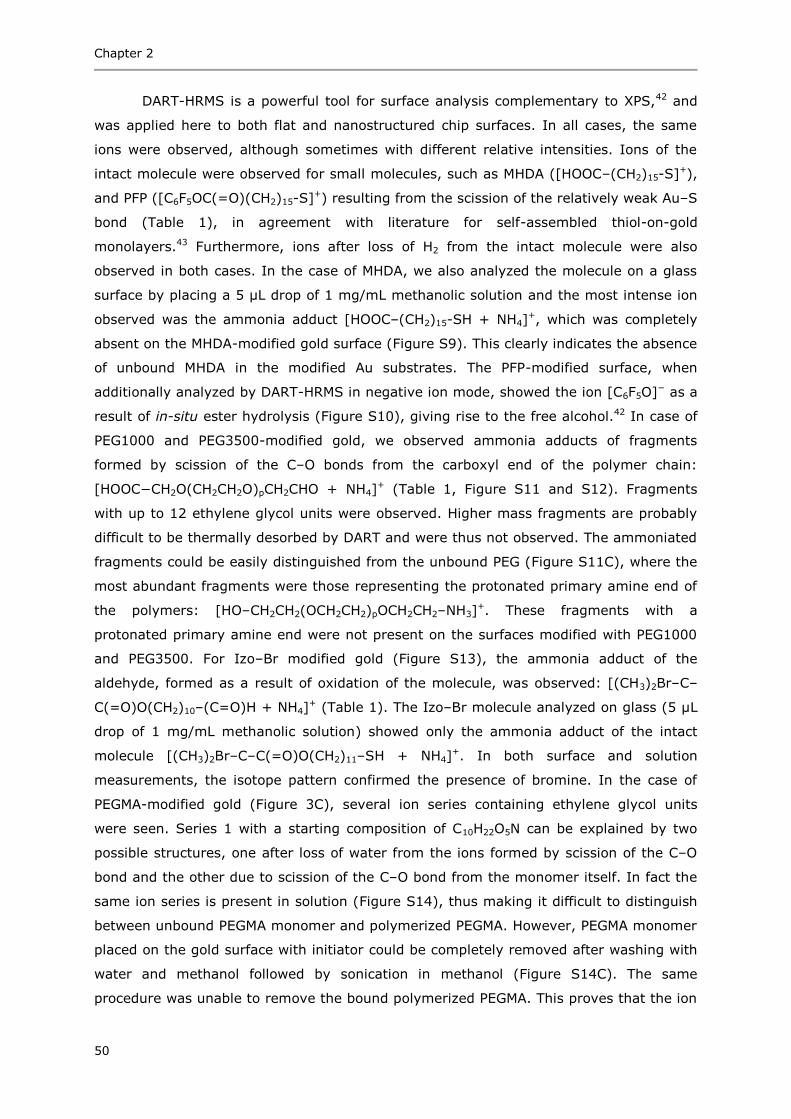
Chapter 2
50
DART-HRMS is a powerful tool for surface analysis complementary to XPS,42 and
was applied here to both flat and nanostructured chip surfaces. In all cases, the same
ions were observed, although sometimes with different relative intensities. Ions of the
intact molecule were observed for small molecules, such as MHDA ([HOOC‒(CH2)15-S]+),
and PFP ([C6F5OC(=O)(CH2)15-S]+) resulting from the scission of the relatively weak Au‒S
bond (Table 1), in agreement with literature for self-assembled thiol-on-gold
monolayers.43 Furthermore, ions after loss of H2 from the intact molecule were also
observed in both cases. In the case of MHDA, we also analyzed the molecule on a glass
surface by placing a 5 µL drop of 1 mg/mL methanolic solution and the most intense ion
observed was the ammonia adduct [HOOC‒(CH2)15-SH + NH4]+, which was completely
absent on the MHDA-modified gold surface (Figure S9). This clearly indicates the absence
of unbound MHDA in the modified Au substrates. The PFP-modified surface, when
additionally analyzed by DART-HRMS in negative ion mode, showed the ion [C6F5O]− as a
result of in-situ ester hydrolysis (Figure S10), giving rise to the free alcohol.42 In case of
PEG1000 and PEG3500-modified gold, we observed ammonia adducts of fragments
formed by scission of the C‒O bonds from the carboxyl end of the polymer chain:
[HOOC−CH2O(CH2CH2O)pCH2CHO + NH4]+ (Table 1, Figure S11 and S12). Fragments
with up to 12 ethylene glycol units were observed. Higher mass fragments are probably
difficult to be thermally desorbed by DART and were thus not observed. The ammoniated
fragments could be easily distinguished from the unbound PEG (Figure S11C), where the
most abundant fragments were those representing the protonated primary amine end of
the polymers: [HO‒CH2CH2(OCH2CH2)pOCH2CH2‒NH3]+. These fragments with a
protonated primary amine end were not present on the surfaces modified with PEG1000
and PEG3500. For Izo‒Br modified gold (Figure S13), the ammonia adduct of the
aldehyde, formed as a result of oxidation of the molecule, was observed: [(CH3)2Br‒C‒
C(=O)O(CH2)10‒(C=O)H + NH4]+ (Table 1). The Izo‒Br molecule analyzed on glass (5 µL
drop of 1 mg/mL methanolic solution) showed only the ammonia adduct of the intact
molecule [(CH3)2Br‒C‒C(=O)O(CH2)11‒SH + NH4]+. In both surface and solution
measurements, the isotope pattern confirmed the presence of bromine. In the case of
PEGMA-modified gold (Figure 3C), several ion series containing ethylene glycol units
were seen. Series 1 with a starting composition of C10H22O5N can be explained by two
possible structures, one after loss of water from the ions formed by scission of the C‒O
bond and the other due to scission of the C‒O bond from the monomer itself. In fact the
same ion series is present in solution (Figure S14), thus making it difficult to distinguish
between unbound PEGMA monomer and polymerized PEGMA. However, PEGMA monomer
placed on the gold surface with initiator could be completely removed after washing with
water and methanol followed by sonication in methanol (Figure S14C). The same
procedure was unable to remove the bound polymerized PEGMA. This proves that the ion

Surface characterization and antifouling of nanostructured chip
51
series observed for polymerized PEGMA is not due to unbound monomer. Series 2 with a
starting composition of C12H22O5N can be due to dimers of PEGMA. Series 2 was present
in both PEGMA modified flat (Figure S14A) and nanostructured gold (Figure 3C), however
the intensity was much lower in case of flat gold. Several other ion series, besides Series
1 and 2 depicted in Figure 3C, were present in case of PEG1000, PEG3500 and PEGMA,
but could not be associated yet with a particular structure. Surfaces modified with SBMA
were also studied using DART, but the results are not included in Table 1, as the ions
observed could not be related to a particular (sub)structure of SBMA. Probably, only
thermal decomposition product ions are generated from SBMA upon DART ionization.
Antifouling experiments
The antifouling behavior of the surfaces was evaluated using the (i)SPR instruments and
BSA, beer and milk as sample matrices (Figure 4). In case of BSA and beer, as expected,
the largest amount of biofouling was seen for bare gold (Figure 5).
Mercaptohexadecanoic acid is only slightly better, due to its amphiphilic nature. In the
case of MHDA-modified nanostructured gold, the underlying PMMA makes the surface
more hydrophobic compared to flat Au, thus resulting in still significant fouling upon
treatment with BSA. The PEG-modified surfaces, with internal hydrophilicity in addition to
the terminal hydrophilicity, showed better antifouling properties than MHDA. The surfaces
with PEG1000, both for flat and nanostructured gold, have showed better antifouling
properties than MHDA but were not able to completely resist fouling by beer. The
surfaces modified with PEG3500, SBMA and PEGMA showed very good antifouling
behavior, both towards BSA and beer. The responses obtained for chips having these
three surface chemistries, for both flat and nanostructured gold, were similar within the
measurement error range. This demonstrates the transferability of the chemistries to the
nanostructured gold in terms of antifouling behavior. The difference between PEG1000
and PEG3500 highlights the importance of chain length for effective antifouling surfaces.
The best antifouling performance was observed for SBMA. This zwitterionic layer is well-
known to be resistant to fouling due to the strong electrostatic interaction between the
charged groups and the water molecules, thus forming a strongly bound hydration layer
compared to the one formed via hydrogen bonding in case of PEG.18 However, in the case
of 10% milk, fouling of the nanostructured surface was high and did not improve very
much; even SBMA was unable to resist non-specific adsorption (Figure S15). Milk can be
considered a worst-case sample matrix consisting of fats (3.7%), proteins (3.4%),
lactose (4.8%) and minerals (0.7%).44 Hydrophobic regions in milk proteins (casein and
whey proteins) and long alkyl chains of fats (fatty acids and triacylglycerols) could have a
high affinity for the underlying hydrophobic PMMA in case of nanostructured gold. The
casein proteins also form micelles consisting of thousands of protein molecules that could
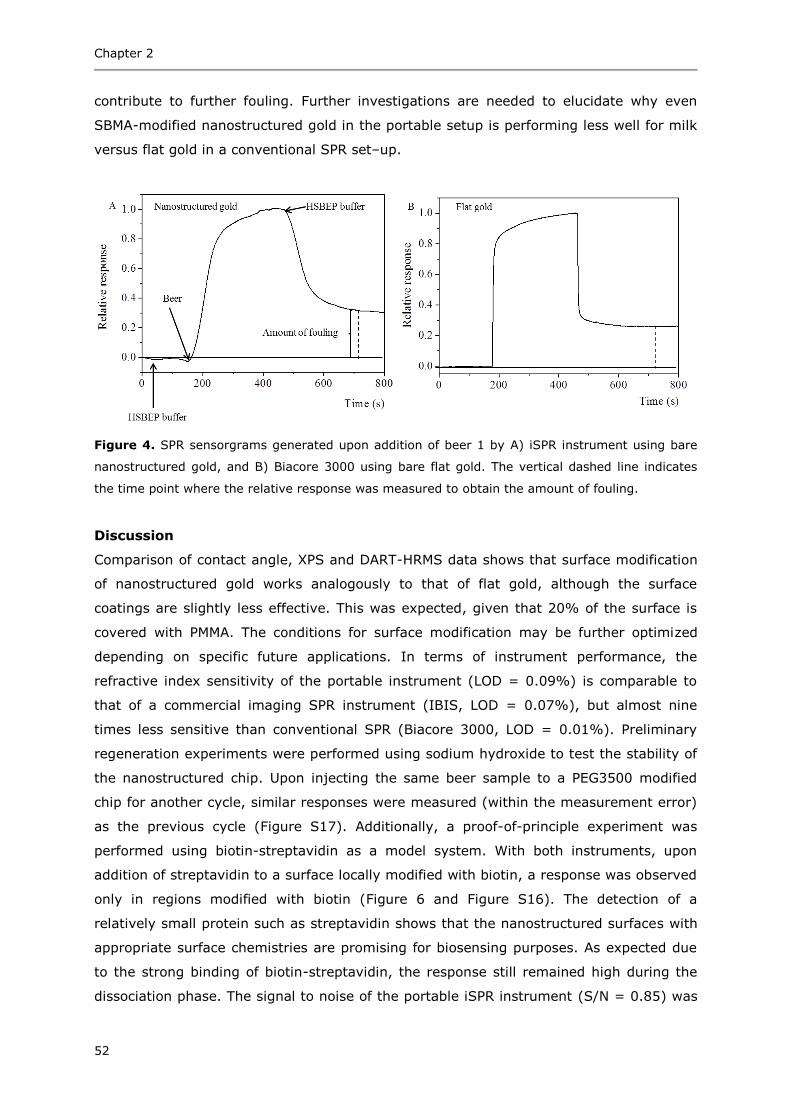
Chapter 2
52
contribute to further fouling. Further investigations are needed to elucidate why even
SBMA-modified nanostructured gold in the portable setup is performing less well for milk
versus flat gold in a conventional SPR set‒up.
Figure 4. SPR sensorgrams generated upon addition of beer 1 by A) iSPR instrument using bare
nanostructured gold, and B) Biacore 3000 using bare flat gold. The vertical dashed line indicates
the time point where the relative response was measured to obtain the amount of fouling.
Discussion
Comparison of contact angle, XPS and DART-HRMS data shows that surface modification
of nanostructured gold works analogously to that of flat gold, although the surface
coatings are slightly less effective. This was expected, given that 20% of the surface is
covered with PMMA. The conditions for surface modification may be further optimized
depending on specific future applications. In terms of instrument performance, the
refractive index sensitivity of the portable instrument (LOD = 0.09%) is comparable to
that of a commercial imaging SPR instrument (IBIS, LOD = 0.07%), but almost nine
times less sensitive than conventional SPR (Biacore 3000, LOD = 0.01%). Preliminary
regeneration experiments were performed using sodium hydroxide to test the stability of
the nanostructured chip. Upon injecting the same beer sample to a PEG3500 modified
chip for another cycle, similar responses were measured (within the measurement error)
as the previous cycle (Figure S17). Additionally, a proof-of-principle experiment was
performed using biotin-streptavidin as a model system. With both instruments, upon
addition of streptavidin to a surface locally modified with biotin, a response was observed
only in regions modified with biotin (Figure 6 and Figure S16). The detection of a
relatively small protein such as streptavidin shows that the nanostructured surfaces with
appropriate surface chemistries are promising for biosensing purposes. As expected due
to the strong binding of biotin-streptavidin, the response still remained high during the
dissociation phase. The signal to noise of the portable iSPR instrument (S/N = 0.85) was
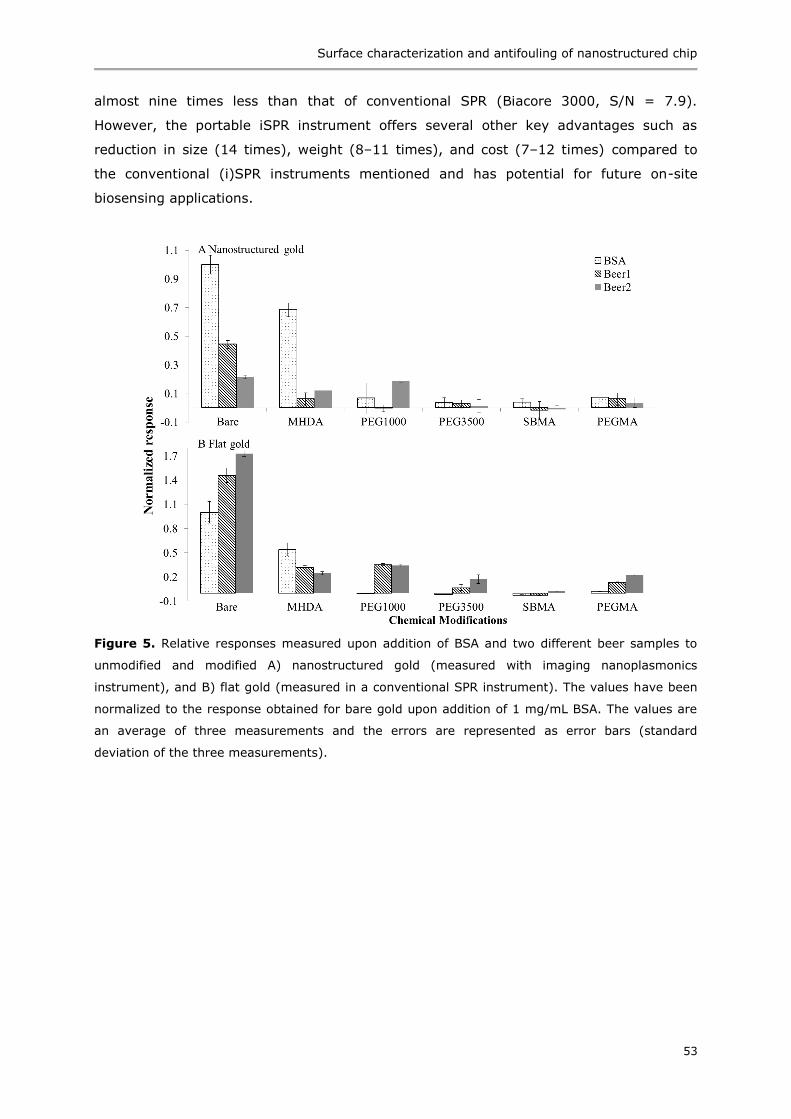
Surface characterization and antifouling of nanostructured chip
53
almost nine times less than that of conventional SPR (Biacore 3000, S/N = 7.9).
However, the portable iSPR instrument offers several other key advantages such as
reduction in size (14 times), weight (8‒11 times), and cost (7‒12 times) compared to
the conventional (i)SPR instruments mentioned and has potential for future on-site
biosensing applications.
Figure 5. Relative responses measured upon addition of BSA and two different beer samples to
unmodified and modified A) nanostructured gold (measured with imaging nanoplasmonics
instrument), and B) flat gold (measured in a conventional SPR instrument). The values have been
normalized to the response obtained for bare gold upon addition of 1 mg/mL BSA. The values are
an average of three measurements and the errors are represented as error bars (standard
deviation of the three measurements).
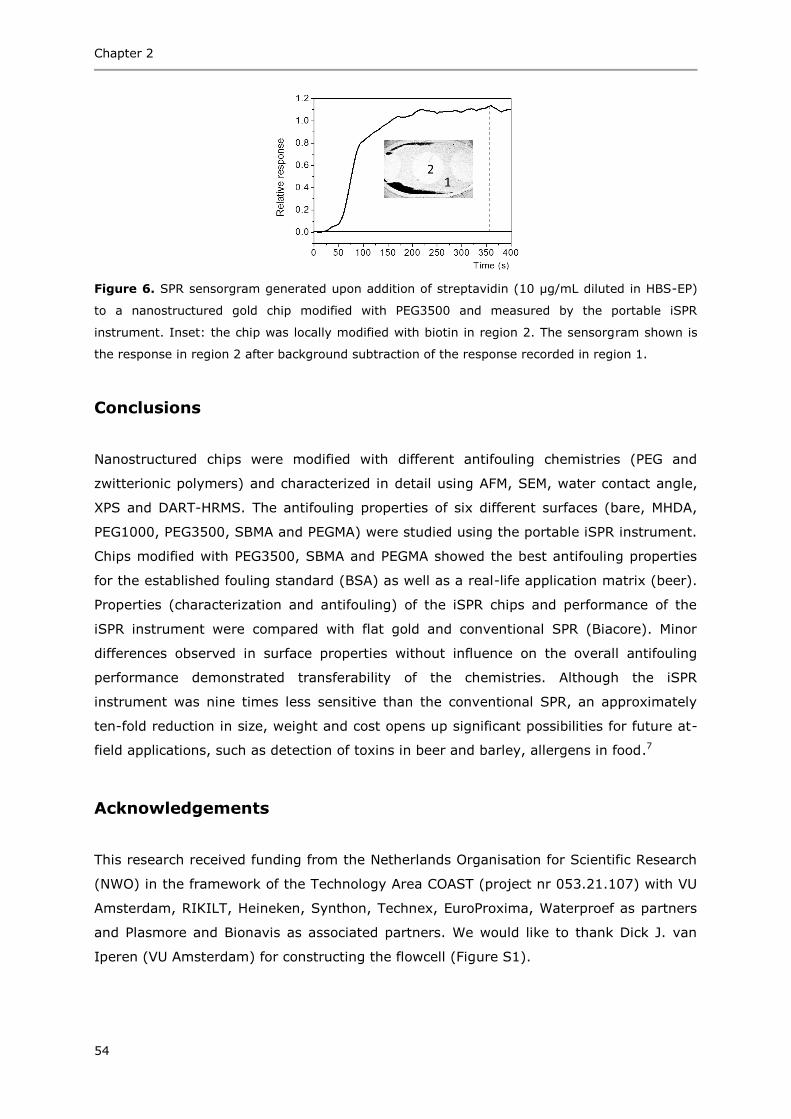
Chapter 2
54
Figure 6. SPR sensorgram generated upon addition of streptavidin (10 µg/mL diluted in HBS-EP)
to a nanostructured gold chip modified with PEG3500 and measured by the portable iSPR
instrument. Inset: the chip was locally modified with biotin in region 2. The sensorgram shown is
the response in region 2 after background subtraction of the response recorded in region 1.
Conclusions
Nanostructured chips were modified with different antifouling chemistries (PEG and
zwitterionic polymers) and characterized in detail using AFM, SEM, water contact angle,
XPS and DART-HRMS. The antifouling properties of six different surfaces (bare, MHDA,
PEG1000, PEG3500, SBMA and PEGMA) were studied using the portable iSPR instrument.
Chips modified with PEG3500, SBMA and PEGMA showed the best antifouling properties
for the established fouling standard (BSA) as well as a real-life application matrix (beer).
Properties (characterization and antifouling) of the iSPR chips and performance of the
iSPR instrument were compared with flat gold and conventional SPR (Biacore). Minor
differences observed in surface properties without influence on the overall antifouling
performance demonstrated transferability of the chemistries. Although the iSPR
instrument was nine times less sensitive than the conventional SPR, an approximately
ten-fold reduction in size, weight and cost opens up significant possibilities for future at-
field applications, such as detection of toxins in beer and barley, allergens in food.7
Acknowledgements
This research received funding from the Netherlands Organisation for Scientific Research
(NWO) in the framework of the Technology Area COAST (project nr 053.21.107) with VU
Amsterdam, RIKILT, Heineken, Synthon, Technex, EuroProxima, Waterproef as partners
and Plasmore and Bionavis as associated partners. We would like to thank Dick J. van
Iperen (VU Amsterdam) for constructing the flowcell (Figure S1).
Surface characterization and antifouling of nanostructured chip
55
References
1. Homola, J., Surface plasmon resonance sensors for detection of chemical and biological species. Chem. Rev. 2008, 108, 462-493.
2. Schasfoort, R. B. M.; Tudos, A. J., Handbook of surface plasmon resonance. The Royal Society of Chemistry: Cambridge, 2008.
3. Rothenhaüsler, B.; Knoll, W., Surface–plasmon microscopy. Nature 1988, 332, 615-617. 4. Yeatman, E.; Ash, E. A., Surface plasmon microscopy. Electron. Lett. 1987, 23, 1091-1092. 5. Scarano, S.; Mascini, M.; Turner, A. P. F.; Minunni, M., Surface plasmon resonance imaging
for affinity-based biosensors. Biosens. Bioelectron. 2010, 25, 957-966. 6. Dorokhin, D.; Haasnoot, W.; Franssen, M. C. R.; Zuilhof, H.; Nielen, M. W. F., Imaging
surface plasmon resonance for multiplex microassay sensing of mycotoxins. Anal. Bioanal. Chem. 2011, 400, 3005-3011.
7. Raz, S. R.; Liu, H.; Norde, W.; Bremer, M. G. E. G., Food allergens profiling with an imaging surface plasmon resonance-based biosensor. Anal. Chem. 2010, 82, 8485-8491.
8. Beusink, J. B.; Lokate, A. M. C.; Besselink, G. A. J.; Pruijn, G. J. M.; Schasfoort, R. B. M.,
Angle-scanning SPR imaging for detection of biomolecular interactions on microarrays. Biosens. Bioelectron. 2008, 23, 839-844.
9. Valsesia, A.; Colpo, P.; Rossi, F.; Marabelli, F., A surface plasmon resonance sensing method
and sensing system. European Patent 2010, EP 2264438A1. 10. Bottazzi, B.; Fornasari, L.; Frangolho, A.; Giudicatti, S.; Mantovani, A.; Marabelli, F.;
Marchesini, G.; Pellacani, P.; Therisod, R.; Valsesia, A., Multiplexed label-free optical
biosensor for medical diagnostics. J. Biomed. Opt. 2014, 19, 017006-017010. 11. Valsesia, A.; Marabelli, F.; Giudicatti, S.; Marchesini, G. R.; Rossi, F.; Colpo, P., SPR sensor
device with nanostructure. World Patent 2013, WO 2013/007448 A1. 12. Breault-Turcot, J.; Masson, J.-F., Nanostructured substrates for portable and miniature SPR
biosensors. Anal. Bioanal. Chem. 2012, 403, 1477-1484. 13. Najiminaini, M.; Ertorer, E.; Kaminska, B.; Mittler, S.; Carson, J. J. L., Surface plasmon
resonance sensing properties of a 3D nanostructure consisting of aligned nanohole and
nanocone arrays. Analyst 2014, 139, 1876-1882. 14. Alleyne, C. J.; Kirk, A. G.; McPhedran, R. C.; Nicorovici, N.-A. P.; Maystre, D., Enhanced SPR
sensitivity using periodic metallic structures. Opt. Express 2007, 15, 8163-8169. 15. Fan, M.; Andrade, G. F. S.; Brolo, A. G., A review on the fabrication of substrates for surface
enhanced raman spectroscopy and their applications in analytical chemistry. Anal. Chim. Acta 2011, 693, 7-25.
16. Bolduc, O. R.; Masson, J.-F., Advances in surface plasmon resonance sensing with
nanoparticles and thin films: Nanomaterials, surface chemistry, and hybrid plasmonic techniques. Anal. Chem. 2011, 83, 8057-8062.
17. Anker, J. N.; Hall, W. P.; Lyandres, O.; Shah, N. C.; Zhao, J.; Van Duyne, R. P., Biosensing with plasmonic nanosensors. Nat. Mater. 2008, 7, 442-453.
18. Ladd, J.; Zhang, Z.; Chen, S.; Hower, J. C.; Jiang, S., Zwitterionic polymers exhibiting high resistance to nonspecific protein adsorption from human serum and plasma.
Biomacromolecules 2008, 9, 1357-1361. 19. Zhang, Z.; Chen, S.; Chang, Y.; Jiang, S., Surface grafted sulfobetaine polymers via atom
transfer radical polymerization as superlow fouling coatings. J. Phys. Chem. B 2006, 110, 10799-10804.
20. Uchida, K.; Otsuka, H.; Kaneko, M.; Kataoka, K.; Nagasaki, Y., A reactive poly(ethylene glycol) layer to achieve specific surface plasmon resonance sensing with a high S/N ratio: The substantial role of a short underbrushed PEG layer in minimizing nonspecific adsorption.
Anal. Chem. 2005, 77, 1075-1080. 21. Chang, Y.; Liao, S.-C.; Higuchi, A.; Ruaan, R.-C.; Chu, C.-W.; Chen, W.-Y., A highly stable
nonbiofouling surface with well-packed grafted zwitterionic polysulfobetaine for plasma protein repulsion. Langmuir 2008, 24, 5453-5458.
22. Mi, L.; Jiang, S., Integrated antimicrobial and nonfouling zwitterionic polymers. Angew. Chem., Int. Ed. 2014, 53, 1746-1754.
23. Löfås, S.; Johnsson, B., A novel hydrogel matrix on gold surfaces in surface plasmon
resonance sensors for fast and efficient covalent immobilization of ligands. J. Chem. Soc., Chem. Commun. 1990, 1526-1528.
24. Leckband, D.; Sheth, S.; Halperin, A., Grafted poly(ethylene oxide) brushes as nonfouling surface coatings. J. Biomater. Sci., Polym. Ed. 1999, 10, 1125-1147.
25. Chen, S.; Li, L.; Zhao, C.; Zheng, J., Surface hydration: Principles and applications toward low-fouling/nonfouling biomaterials. Polymer 2010, 51, 5283-5293.

Chapter 2
56
26. Unsworth, L. D.; Sheardown, H.; Brash, J. L., Protein-resistant poly(ethylene oxide)-grafted
surfaces: Chain density-dependent multiple mechanisms of action. Langmuir 2008, 24,
1924-1929. 27. Rodriguez-Emmenegger, C.; Brynda, E.; Riedel, T.; Sedlakova, Z.; Houska, M.; Alles, A. B.,
Interaction of blood plasma with antifouling surfaces. Langmuir 2009, 25, 6328-6333. 28. Lee, B. S.; Chi, Y. S.; Lee, K.-B.; Kim, Y.-G.; Choi, I. S., Functionalization of
poly(oligo(ethylene glycol) methacrylate) films on gold and Si/SiO2 for immobilization of proteins and cells: SPR and QCM studies. Biomacromolecules 2007, 8, 3922-3929.
29. Schlenoff, J. B., Zwitteration: coating surfaces with zwitterionic functionality to reduce nonspecific adsorption. Langmuir 2014, 30, 9625-9636.
30. Estephan, Z. G.; Schlenoff, P. S.; Schlenoff, J. B., Zwitteration as an alternative to PEGylation. Langmuir 2011, 27, 6794-6800.
31. Giudicatti, S.; Valsesia, A.; Marabelli, F.; Colpo, P.; Rossi, F., Plasmonic resonances in nanostructured gold/polymer surfaces by colloidal lithography. Phys. Status Solidi A 2010,
207, 935-942. 32. Lahiri, J.; Ostuni, E.; Whitesides, G. M., Patterning ligands on reactive SAMs by microcontact
printing. Langmuir 1999, 15, 2055-2060. 33. Nguyen, A. T.; Baggerman, J.; Paulusse, J. M. J.; Zuilhof, H.; van Rijn, C. J. M.,
Bioconjugation of protein-repellent zwitterionic polymer brushes grafted from silicon nitride.
Langmuir 2012, 28, 604-610. 34. Hofmann, S., Quantitative analysis (data evaluation), in auger- and x-ray photoelectron
spectroscopy in materials science. In Springer-Verlag: Berlin Heidelberg, 2013. 35. Petrovykh, D. Y.; Kimura-Suda, H.; Tarlov, M. J.; Whitman, L. J., Quantitative
characterization of DNA Films by X-ray photoelectron spectroscopy. Langmuir 2004, 20, 429-440.
36. Manova, R. K.; Claassen, F. W.; Nielen, M. W. F.; Zuilhof, H.; van Beek, T. A., Ambient mass spectrometry of covalently bound organic monolayers. Chem. Comm. 2013, 49, 922-924.
37. lRiedel, T.; Riedelová-Reicheltová, Z.; Májek, P.; Rodriguez-Emmenegger, C.; Houska, M.;
Dyr, J. E.; Brynda, E., Complete identification of proteins responsible for human blood plasma fouling on poly(ethylene glycol)-based surfaces. Langmuir 2013, 29, 3388-3397.
38. Hosseini, S.; Ibrahim, F.; Djordjevic, I.; Koole, L. H., Recent advances in surface functionalization techniques on polymethacrylate materials for optical biosensor applications. Analyst 2014, 139, 2933-2943.
39. Jones, D. M.; Brown, A. A.; Huck, W. T. S., Surface-initiated polymerizations in aqueous
media: effect of initiator density. Langmuir 2002, 18, 1265-1269. 40. Lu, H. B.; Campbell, C. T.; Castner, D. G., Attachment of functionalized poly(ethylene glycol)
films to gold surfaces. Langmuir 2000, 16, 1711-1718. 41. Nguyen, A. T.; Baggerman, J.; Paulusse, J. M. J.; van Rijn, C. J. M.; Zuilhof, H., Stable
protein-repellent zwitterionic polymer brushes grafted from silicon nitride. Langmuir 2011, 27, 2587-2594.
42. Manova, R. K.; Joshi, S.; Debrassi, A.; Bhairamadgi, N. S.; Roeven, E.; Gagnon, J.; Tahir, M.
N.; Claassen, F. W.; Scheres, L. M. W.; Wennekes, T.; Schroën, K.; van Beek, T. A.; Zuilhof, H.; Nielen, M. W. F., Ambient surface analysis of organic monolayers using direct analysis in real time orbitrap mass spectrometry. Anal. Chem. 2014, 86, 2403-2411.
43. Kpegba, K.; Spadaro, T.; Cody, R. B.; Nesnas, N.; Olson, J. A., Analysis of self-assembled monolayers on gold surfaces using direct analysis in real time mass spectrometry. Anal. Chem. 2007, 79, 5479-5483.
44. Wong, N. P.; Jenness, R.; Keeney, M.; Marth, E. H., Fundamentals of dairy chemistry.
Springer US New York, 1988.
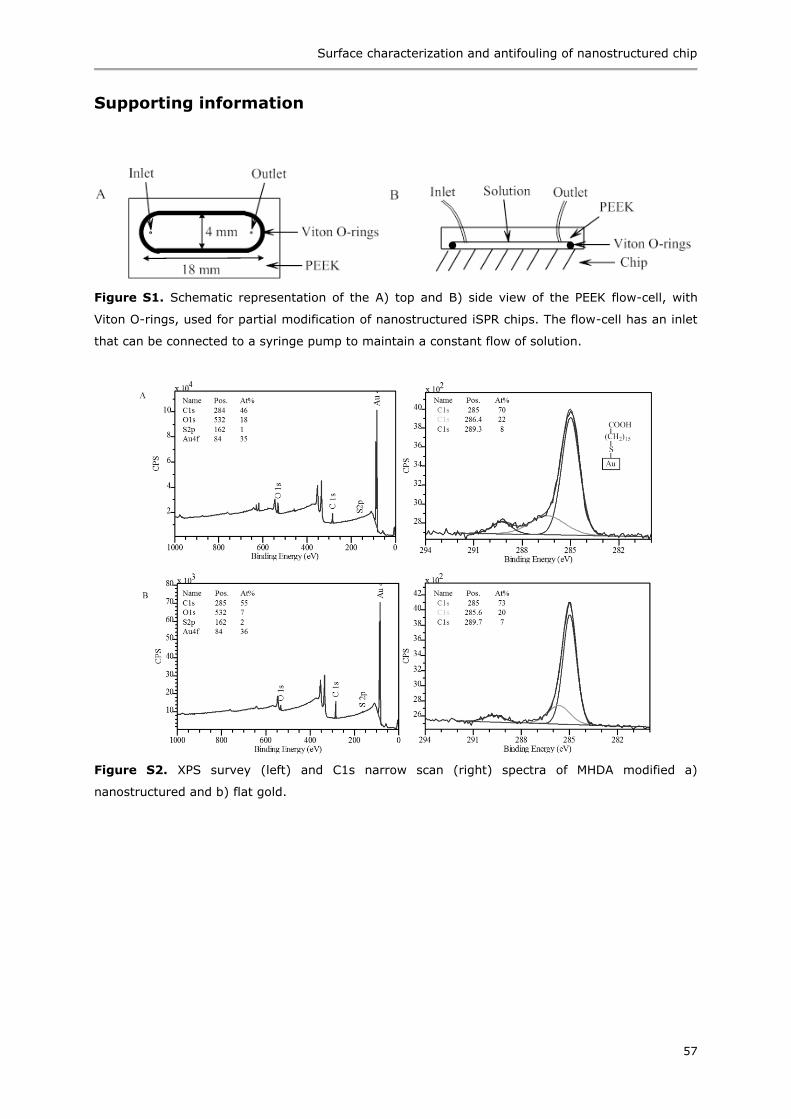
Surface characterization and antifouling of nanostructured chip
57
Supporting information
Figure S1. Schematic representation of the A) top and B) side view of the PEEK flow-cell, with
Viton O-rings, used for partial modification of nanostructured iSPR chips. The flow-cell has an inlet
that can be connected to a syringe pump to maintain a constant flow of solution.
Figure S2. XPS survey (left) and C1s narrow scan (right) spectra of MHDA modified a)
nanostructured and b) flat gold.

Chapter 2
58
Figure S3. XPS survey (left) and C1s narrow scan (right) spectra of PFP modified A)
nanostructured and B) flat gold.
Figure S4. XPS survey (left) and C1s narrow scan (right) spectra of Izo-Br modified A)
nanostructured and B) flat gold.

Surface characterization and antifouling of nanostructured chip
59
Figure S5. XPS survey (left) and C1s narrow scan (right) spectra of PEG1000 modified A)
nanostructured and B) flat gold.
Figure S6. XPS survey (left) and C1s narrow scan (right) spectra of PEG3500 modified A)
nanostructured and B) flat gold.
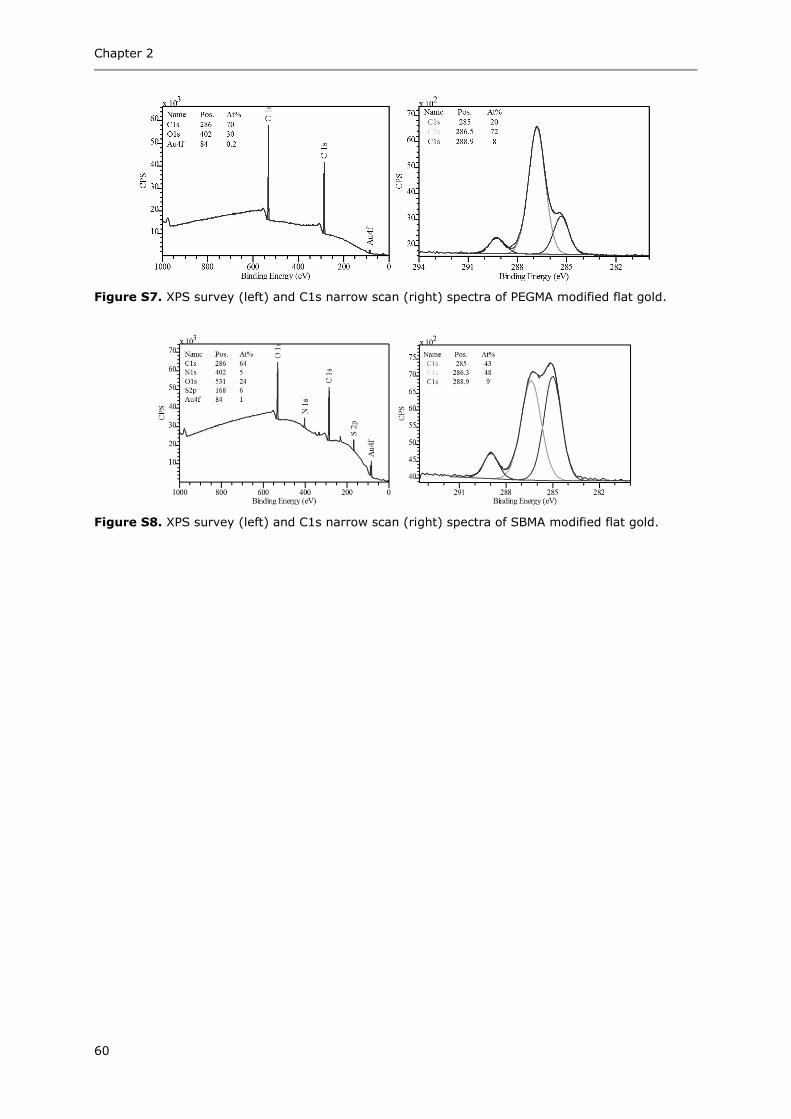
Chapter 2
60
Figure S7. XPS survey (left) and C1s narrow scan (right) spectra of PEGMA modified flat gold.
Figure S8. XPS survey (left) and C1s narrow scan (right) spectra of SBMA modified flat gold.

Surface characterization and antifouling of nanostructured chip
61
Figure S9. DART-HRMS of MHDA A) modified nanostructured gold, B) modified flat gold, and C)
solution placed on glass, measured in positive mode.
Figure S10. DART-HRMS of PFP modified A) nanostructured and B) flat gold measured in positive
(left) and negative (right) mode.
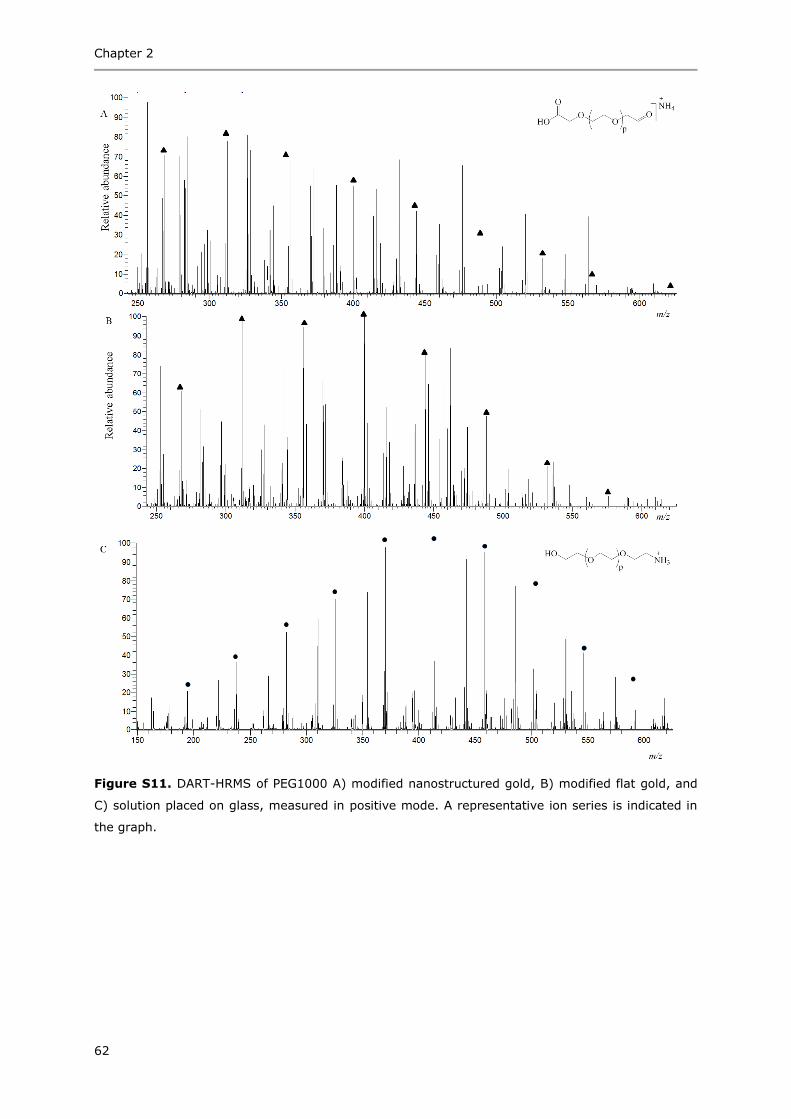
Chapter 2
62
Figure S11. DART-HRMS of PEG1000 A) modified nanostructured gold, B) modified flat gold, and
C) solution placed on glass, measured in positive mode. A representative ion series is indicated in
the graph.
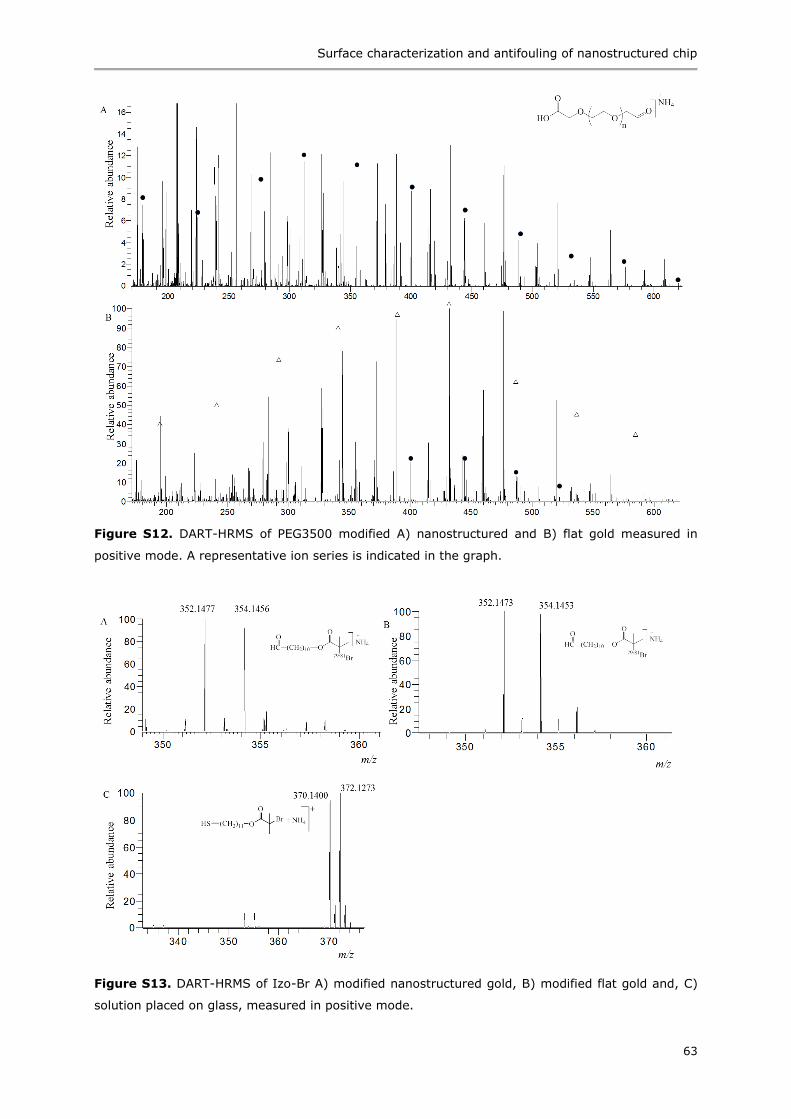
Surface characterization and antifouling of nanostructured chip
63
Figure S12. DART-HRMS of PEG3500 modified A) nanostructured and B) flat gold measured in
positive mode. A representative ion series is indicated in the graph.
Figure S13. DART-HRMS of Izo-Br A) modified nanostructured gold, B) modified flat gold and, C)
solution placed on glass, measured in positive mode.

Chapter 2
64
Figure S14. DART-HRMS of A) PEGMA modified flat gold, B) PEGMA monomer on Izo-Br modified
nanostructure gold before, and C) after washing with water and methanol and sonicating in
methanol (measured in positive mode). A representative ion series is indicated in the graph.
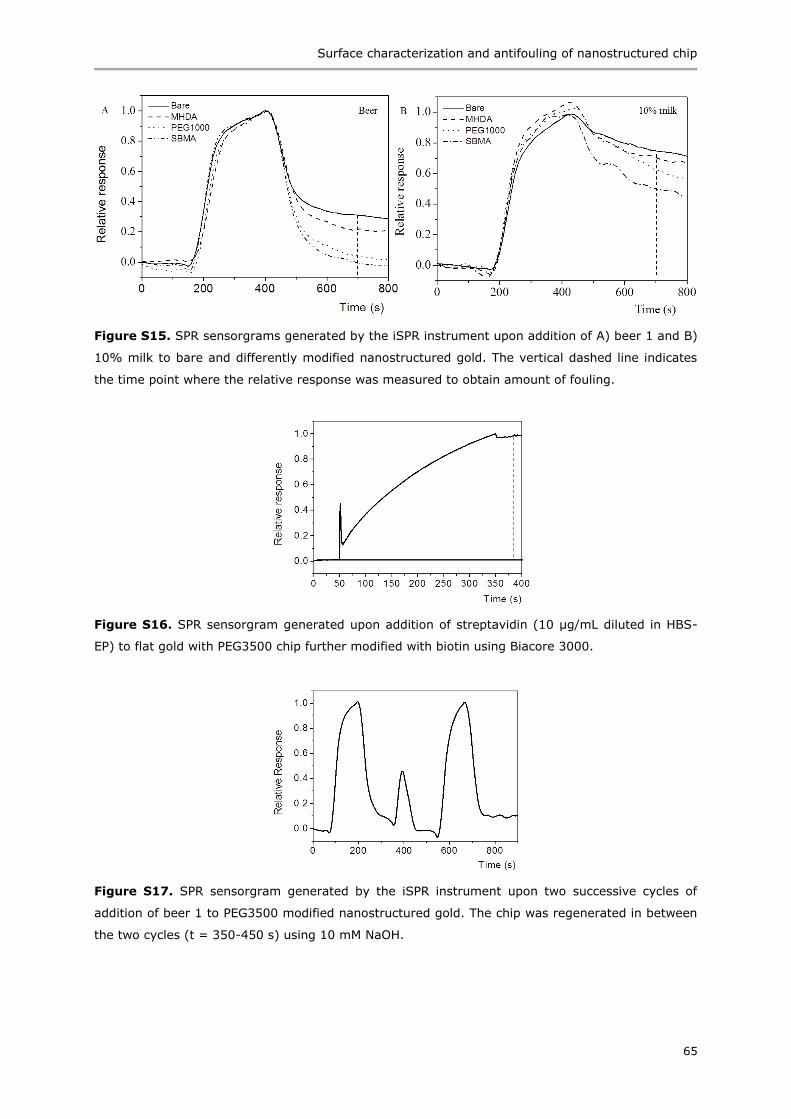
Surface characterization and antifouling of nanostructured chip
65
Figure S15. SPR sensorgrams generated by the iSPR instrument upon addition of A) beer 1 and B)
10% milk to bare and differently modified nanostructured gold. The vertical dashed line indicates
the time point where the relative response was measured to obtain amount of fouling.
Figure S16. SPR sensorgram generated upon addition of streptavidin (10 µg/mL diluted in HBS-
EP) to flat gold with PEG3500 chip further modified with biotin using Biacore 3000.
Figure S17. SPR sensorgram generated by the iSPR instrument upon two successive cycles of
addition of beer 1 to PEG3500 modified nanostructured gold. The chip was regenerated in between
the two cycles (t = 350-450 s) using 10 mM NaOH.

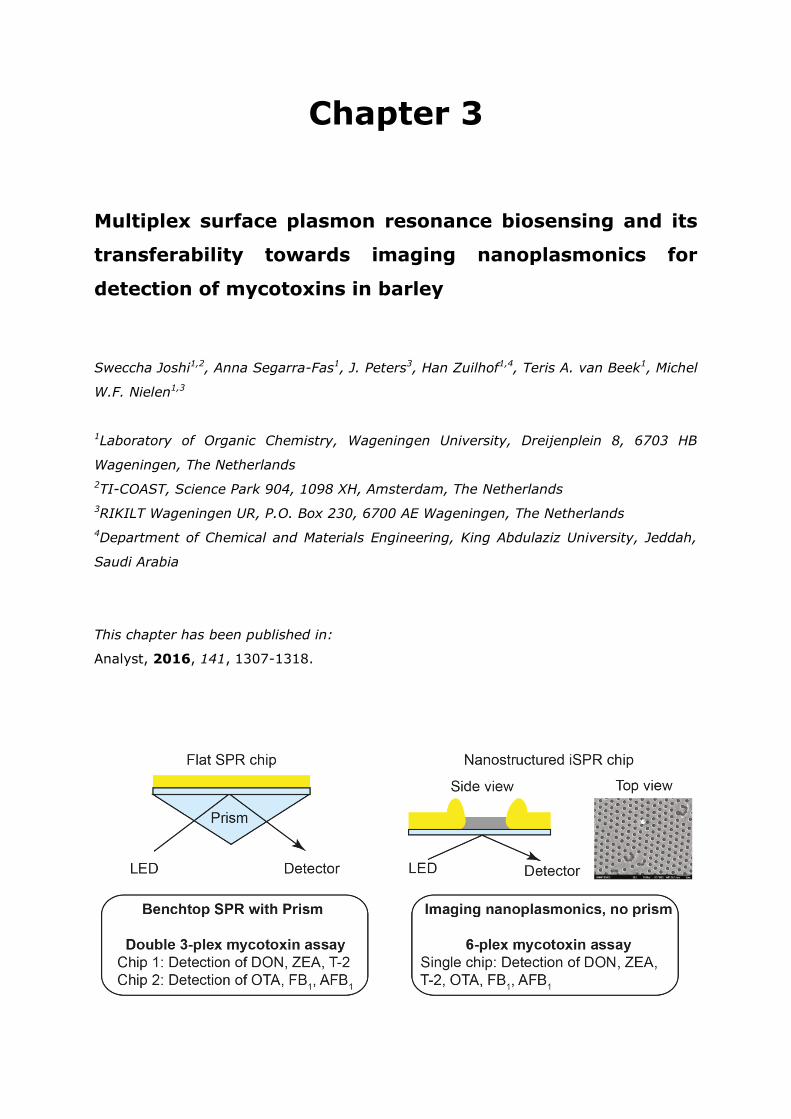
Chapter 3
Multiplex surface plasmon resonance biosensing and its
transferability towards imaging nanoplasmonics for
detection of mycotoxins in barley
Sweccha Joshi1,2, Anna Segarra-Fas1, J. Peters3, Han Zuilhof1,4, Teris A. van Beek1, Michel
W.F. Nielen1,3
1Laboratory of Organic Chemistry, Wageningen University, Dreijenplein 8, 6703 HB
Wageningen, The Netherlands
2TI-COAST, Science Park 904, 1098 XH, Amsterdam, The Netherlands
3RIKILT Wageningen UR, P.O. Box 230, 6700 AE Wageningen, The Netherlands
4Department of Chemical and Materials Engineering, King Abdulaziz University, Jeddah,
Saudi Arabia
This chapter has been published in:
Analyst, 2016, 141, 1307-1318.
Chapter 3
68
Abstract
A 6-plex competitive inhibition immunoassay for mycotoxins in barley was developed on
a prototype portable nanostructured imaging surface plasmon resonance (iSPR)
instrument, also referred to as imaging nanoplasmonics. As a benchmark for the
prototype nanoplasmonics instrument, first a double 3-plex assay was developed for the
detection of deoxynivalenol (DON), zearalenone (ZEA), T-2 toxin (T-2), ochratoxin A
(OTA), fumonisin B1 (FB1) and aflatoxin B1 (AFB1) using a well-established benchtop SPR
instrument and two biosensor chips. To this end, ovalbumin (OVA) conjugates of
mycotoxins were immobilized on the chip via amine coupling. The SPR response was then
recorded upon injection of a mixture of antibodies at a fixed concentration and the
sample (or matrix-matched standard) over a chip with immobilized mycotoxin-OVA
conjugates. The chips were regenerated after each sample using 10 mM HCl and 20 mM
NaOH and could be used for at least 60 cycles. The limits of detection in barley (in µg/kg)
were determined to be 26 for DON, 6 for ZEA, 0.6 for T-2, 3 for OTA, 2 for FB1 and 0.6
for AFB1. Preliminary in-house validation showed that DON, T-2, ZEA and FB1 can be
detected at the European Union regulatory limits, while for OTA and AFB1 sensitivities
should be improved. Furthermore, measurement of naturally contaminated barley
showed that the assay can be used as a semi-quantitative screening method for
mycotoxins prior to liquid chromatography tandem mass spectrometry (LC-MS/MS).
Finally, using the same bio-reagents the assay was transferred to a 6-plex format in the
nanoplasmonics instrument and subsequently the two assays were compared. Although
less sensitive, the 6-plex portable iSPR assay still allowed detection of DON, T-2, ZEA and
FB1 at relevant levels. Therefore, the prototype iSPR shows potential for future
applications in rapid in-field and at-line screening of multiple mycotoxins.
Multiplex SPR biosensing for detections of mycotoxins in barley
69
Introduction
Mycotoxins are secondary metabolites of fungi commonly found in several foods and
ingredients such as nuts, cereals (e.g., barley), coffee, oil seeds, fruits and, as a result,
also occur in beer, wine as well as in feed.1 Barley is used in unprocessed form as well as
processed forms in food commodities and is known to be occasionally infected with
several fungal species. The most relevant mycotoxins for barley are deoxynivalenol
(DON), zearalenone (ZEA or ZEN, referred to as ZEA throughout this article), T-2 and
HT-2 toxin, ochratoxin A (OTA), fumonisin B1 (FB1), and aflatoxin B1 (AFB1).2 Several of
these mycotoxins are known for their teratogenicity, mutagenicity and/or carcinogenicity
and could be a threat to both human and animal health. According to EU legislation, the
maximum levels (MLs) in µg/kg for unprocessed barley are 1250 for DON, 100 for ZEA,
200 for T-2 (recommendation for sum of T-2 and HT-2), 5 for OTA, 2 for AFB1 and 2000
for FB1 (sum of FB1 and FB2 in unprocessed maize).3,4
Several methods for mycotoxin detection have been developed in recent years
each with their own merits and limitations.5-8 Chromatography-based techniques for
mycotoxin detection, such as high-pressure liquid chromatography (HPLC) and gas
chromatography (GC) in combination with mass spectrometry (MS), are very sensitive
and allow quantitative analysis of multiple mycotoxins.9 However, they are rather
expensive, require skilled personnel, and sometimes involve extensive sample
preparation. One or a few mycotoxins have been measured using metal-enhanced
fluorescence,10 chemiluminescent immunoassay,11,12 immuno-polymerase chain
reaction,13 real-time electrochemical profiling,14 fluorescent immunosorbent assay,15
microsphere based assay16,17 and direct analysis in real time coupled with high-resolution
mass spectrometry (DART-HRMS).18 Amongst the immunochemical methods, enzyme-
linked immunosorbent assay (ELISA) and lateral flow immunoassays (LFI) are the most
popular approach as they allow, respectively, semi-quantitative or qualitative detection of
multiple mycotoxin samples in parallel.19,20 Surface plasmon resonance (SPR) based
biosensors have emerged as a reliable, label-free and sensitive alternative
immunochemical method for the semi-quantitative detection of mycotoxins.21-23 SPR, in
addition, benefits from real-time monitoring of the interaction kinetics and reusability of
the biosensor chip. Within the SPR field, imaging SPR (iSPR)24,25 is an interesting
development as in principle it allows the simultaneous detection of all mycotoxins of
interest using a single sensor chip. The multiplexing capability of iSPR saves both time
and cost in terms of bio-reagents as a single injection gives information about multiple
mycotoxins. But this potential has not been realized until now as only two mycotoxins
have been detected simultaneously using iSPR.26 In addition to multiplexing, there is an
increasing demand for miniaturized instruments in order to bring the lab to the sample.
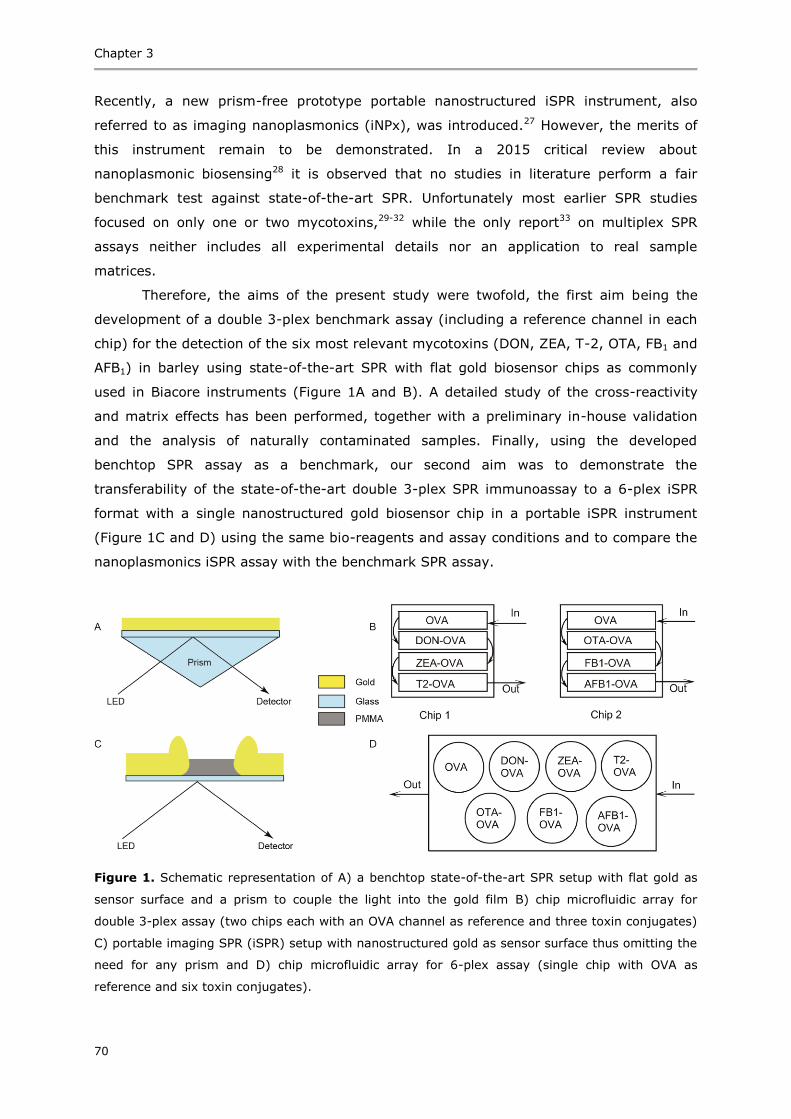
Chapter 3
70
Recently, a new prism-free prototype portable nanostructured iSPR instrument, also
referred to as imaging nanoplasmonics (iNPx), was introduced.27 However, the merits of
this instrument remain to be demonstrated. In a 2015 critical review about
nanoplasmonic biosensing28 it is observed that no studies in literature perform a fair
benchmark test against state-of-the-art SPR. Unfortunately most earlier SPR studies
focused on only one or two mycotoxins,29-32 while the only report33 on multiplex SPR
assays neither includes all experimental details nor an application to real sample
matrices.
Therefore, the aims of the present study were twofold, the first aim being the
development of a double 3-plex benchmark assay (including a reference channel in each
chip) for the detection of the six most relevant mycotoxins (DON, ZEA, T-2, OTA, FB1 and
AFB1) in barley using state-of-the-art SPR with flat gold biosensor chips as commonly
used in Biacore instruments (Figure 1A and B). A detailed study of the cross-reactivity
and matrix effects has been performed, together with a preliminary in-house validation
and the analysis of naturally contaminated samples. Finally, using the developed
benchtop SPR assay as a benchmark, our second aim was to demonstrate the
transferability of the state-of-the-art double 3-plex SPR immunoassay to a 6-plex iSPR
format with a single nanostructured gold biosensor chip in a portable iSPR instrument
(Figure 1C and D) using the same bio-reagents and assay conditions and to compare the
nanoplasmonics iSPR assay with the benchmark SPR assay.
Figure 1. Schematic representation of A) a benchtop state-of-the-art SPR setup with flat gold as
sensor surface and a prism to couple the light into the gold film B) chip microfluidic array for
double 3-plex assay (two chips each with an OVA channel as reference and three toxin conjugates)
C) portable imaging SPR (iSPR) setup with nanostructured gold as sensor surface thus omitting the
need for any prism and D) chip microfluidic array for 6-plex assay (single chip with OVA as
reference and six toxin conjugates).
Multiplex SPR biosensing for detections of mycotoxins in barley
71
Materials and methods
Chemicals, biosensor chips and barley samples
Flat gold chips (modified with carboxymethylated dextran hydrogel, CMD) were
purchased from Xantec (Düsseldorf, Germany). The nanostructured gold chips for iSPR
were produced using colloidal lithography and plasma-enhanced chemical vapor
deposition (PE-CVD).34 In short: poly(methyl methacrylate) (PMMA) was deposited on the
glass substrate by PE-CVD using methyl methacrylate as liquid precursor. Spin coating
was then used to cover the film with polystyrene (PS) beads (500 nm with a nominal size
dispersion of 10%). Next, the sample was exposed to oxygen plasma etching to remove
the PMMA from the areas not covered by the beads and to reduce the size of the PS
beads to provide the required periodicity. A gold layer of 100-200 nm was then deposited
on the surface by physical vapor deposition. Finally, the polystyrene beads were removed
resulting in a surface with a gold film perforated by PMMA (Figure 1C). The combined
control of deposition and etching parameters allowed fine tuning of film thickness and
well diameters. The PMMA regions, with diameters of 200-250 nm and periodicity
(distance between the centers of the two PMMA wells) of 500-600 nm, make up around
20% of the total surface area. Detailed characterization of the nanostructured iSPR chips
can be found in an earlier publication.35
16-Mercaptohexadecanoic acid (MHDA), pentafluorophenol (PFP), N,N’-
dicyclohexylcarbodiimide (DCC), poly(ethylene glycol) 2-aminoethyl ether acetic acid
(average MW 3500) (NH2-PEG-COOH), ovalbumin (OVA), N-hydroxysuccinimide (NHS),
ethanolamine hydrochloride, 1-ethyl-3-(3-dimethylaminopropyl) carbodiimide
hydrochloride (EDC), sodium dodecyl sulfate (SDS), Tween20, anhydrous sodium
acetate, glacial acetic acid and absolute ethanol were purchased from Sigma Aldrich
(Zwijndrecht, The Netherlands). All chemicals were used as obtained, except for
dichloromethane (Sigma-Aldrich, >99.8%), which was further purified using a Pure Solv
400 solvent purification system (Innovative Technology, Amesbury, USA). HBS-EP buffer
(0.01 M HEPES pH 7.4, 0.15 M NaCl, 3 mM EDTA, 0.005% v/v Surfactant P20) was
purchased from GE Healthcare (Uppsala, Sweden). MilliQ water (18.3 MΩ∙cm resistivity)
was obtained using a Merck Millipore (Billerica, USA) water purification system.
The OVA conjugates of mycotoxins (DON-OVA, ZEA-OVA, T-2-OVA, OTA-OVA, FB1-OVA
and AFB1-OVA) and monoclonal antibodies (mAbs) against DON (AB-02-22), ZEA (AB-01-
01) and T-2 (AB-07-02) were bought from Aokin AG (Berlin, Germany). The mAbs
against OTA (SFH-OTA-005) were from Soft Flow Biotechnology (Pecs, Hungary), while
the mAbs against FB1 were produced and kindly provided by RIKILT (Wageningen, the
Netherlands). The mAbs against AFB1 (12E6) were bought from Europroxima (Arnhem,
the Netherlands). Mycotoxin reference solutions of DON, ZEA, T-2, OTA, FB1, AFB1 and
Chapter 3
72
nivalenol (NIV) were purchased from Biopure via RomerLabs (Tulln, Austria). The other
mycotoxins deoxynivalenol-3-glucoside (D3G), 3-acetyl-DON (3ADON), α-zearalanol (α-
ZEL), HT-2, fumonisin B2 and B3 (FB2 and FB3) were kindly provided by RIKILT.
Barley reference material surpassing the maximum level for ZEA (RMM-01-363a,
729 ± 244 µg/kg) was purchased from Aokin AG. The contaminated samples for T-2/HT-
2 sample (60 µg/kg as measured by LC-MS/MS), for DON (289 µg/kg as measured by
ELISA, <50 µg/kg as measured by LC-MS/MS) and for OTA (25 µg/kg as measured by
ELISA, 210 µg/kg as measured by LC-MS/MS) were obtained from project partners.
Three different blank samples (containing no mycotoxins based on ELISA or LC-MS/MS
pre-screening) were also obtained from project partners. An extraction container and a
filtering device were obtained from Abraxis (Warmister, USA) as part of a soil extraction
kit.
Surface modification of nanostructured biosensor chips
The nanostructured iSPR chips were modified with PEG3500 as described previously.35 In
short: the chips were rinsed with ethanol and water followed by drying with nitrogen.
They were then immersed in a 1 mM solution of 16-mercaptohexadecanoic acid (MHDA)
in ethanol for 24 h. The MHDA-modified chips were removed, rinsed with ethanol and
water, and dried with nitrogen. The acid-terminated chips were activated by immersing
overnight in a 1:1 mixture of 0.4 M PFP and 0.4 M DCC in dichloromethane.36 The PFP-
terminated chips were washed with DCM and then immersed in a 1 mg/mL solution of
NH2-PEG-COOH (PEG3500) in DCM for 24 h. The PEG3500-modified chips were removed
and rinsed with DCM, sonicated in the same solvent and dried with nitrogen. All the
surface modifications were confirmed by comparison with static water contact angle
values and XPS results from a previous publication.35
Immobilization of mycotoxin-OVA conjugates
Conventional SPR chips: Ovalbumin (OVA) and mycotoxin-OVA conjugates were
immobilized on the carboxymethylated dextran chips using a Biacore 3000 SPR
instrument (GE Healthcare, Uppsala, Sweden) as follows: HBS-EP was used as running
buffer and the entire immobilization was performed at a constant flow rate of 10 µL/min.
The microfluidics of the Biacore allows all the channels to be connected in series (Figure
1B) or used separately with their own inlet and outlet. Each channel was individually
activated using a 1:1 mixture of 0.4 M EDC and 0.1 M NHS for 7 min. This was followed
by a 7 min injection of 50 µg/mL of OVA or mycotoxin-OVA conjugate (diluted in 10 mM
acetate buffer pH 4 except for ZEA-OVA in 10 mM acetate buffer pH 3.5) to achieve a
response between 3000-5000 (relative to the HBS-EP baseline). For OVA conjugates of
DON, T-2 and OTA, a second injection of 50 µg/mL had to be performed to achieve the
Multiplex SPR biosensing for detections of mycotoxins in barley
73
required response. Following the immobilization, the chips were blocked with 1 M
ethanolamine, pH 8.5 for 7 min. The chips were then stored at 4-8 oC until use.
Nanostructured iSPR chips: For the PEG3500-modified nanostructured iSPR chips
the immobilization was performed manually on the bench: the entire chip was activated
using a 1:1 mixture of 0.1 M NHS and 0.4 M EDC for 20 min followed by washing with
water and drying with nitrogen. Two µL of OVA (1 mg/mL in 10 mM acetate buffer pH
3.5) and 2 µL of each of the six mycotoxin-OVA conjugates (1 mg/mL of ZEA-OVA, 1
mg/mL of AFB1-OVA, 2.8 mg/mL of T-2-OVA, 2.8 mg/mL of FB1-OVA, 5 mg/mL of DON-
OVA and 3 mg/mL of OTA-OVA, all in 10 mM acetate buffer pH 3.5) were each spotted
(manually using a micropipette) on different areas (regions of interest, ROI) of the
activated chip. The chip was kept in an air-tight container for 2 h to avoid evaporation
and drying out of the spots. Following the spotting, the chips were washed with water
and dried with nitrogen. They were then blocked with ethanolamine for 20 min, rinsed
with MilliQ water and dried with nitrogen. The spotted chips were stored at 4-8 oC.
Measurement protocols for double 3-plex assay (SPR) and 6-plex assay (iSPR)
SPR measurements on carboxymethylated gold chips were performed using a Biacore
3000 and iSPR measurements on PEG3500-modified nanostructured gold chips using a
prototype portable imaging nanoplasmonics instrument (Plasmore Srl., Italy).27 The
channels in the Biacore were connected in series for all measurements (Figure 1B).
Typical sensorgrams generated by both instruments can be found in the supporting
information (Figure S1). In both formats (double 3-plex with SPR and 6-plex with iSPR),
chips were flushed for 1 min (t = 0-60 s) with running buffer (HBS-EP). The samples
were mixed with the antibodies and were injected at a constant flow rate of 20 µL/min
for 2 min (t = 60-180 s). The chip was then flushed with running buffer (HBS-EP) for 2
min (t = 180-240 s). The response obtained after 2 min of buffer flow, relative to the
starting baseline, was used in calculations. The chip was regenerated by injecting 10 mM
HCl (100 µL/min) for 30 s (t = 250-280 s) followed by 20 mM NaOH (100 µL/min) for 30
s (t = 350-380 s). The regeneration was followed by washing with HBS-EP buffer (2 min,
t = 400-460 s) to remove any remaining regeneration solution. The entire cycle took
approximately 15 min. In both SPR and iSPR, OVA was used as a reference, i.e., the
response of the OVA channel was subtracted from all the other responses, to correct for
any non-specific interactions. The sensorgrams were plotted using Origin 8.5 and Excel
2010. Sensorgrams (for iSPR) were smoothened using the Savitzky-Golay function in
Origin 8.5 (10 points of window, polynomial order 2).
Chapter 3
74
Calibration curves, limit of detection and cross-reactivity
For the calibration curves, a fixed concentration of single or multiple antibodies in HBS-
EP (without methanol) was mixed with an equal volume of the standard solution
containing single or multiple toxins. The toxin standards were diluted in HBS-EP
containing 20% methanol (for singleplex and multiplex assays in buffer) or in barley
extract (see below about extraction of barley) in HBS-EP containing 20% methanol (for
multiplex assays in barley). The (i)SPR response obtained for the solution containing both
toxins and antibodies (B) relative to the maximum response obtained for the solution
containing antibodies only (B0) was used to calculate the relative response as
(B/B0)×100%. The relative binding was plotted against the concentration of the toxin to
obtain the calibration curves. The calibration curves were fitted in GraphPad Prism
(Version 6.0, GraphPad Software Inc., USA) using a non-linear four-parameter model to
obtain the IC50 values (concentration at which 50% inhibition of binding occurs). The
IC10 values were used as a measure of the limit of detection (LOD) as explained in the
results section. Additionally, the IC80 and IC20 values (concentrations at which 80% and
20% inhibition of binding occurs, respectively) allowed determination of the working
range of the assay. The specificity of the antibodies was tested by determining the cross-
reactivity of the following modified mycotoxins (masked myctoxins and metabolites)
using the calibration curves for the target mycotoxin and modified mycotoxin in buffer as
(IC50 target/IC50 modified mycotoxin)×100%: D3G, 3ADON, NIV, α-ZEL, FB2, FB3, HT-2,
AFB2, AFG1, AFG2, AFM1.
Extraction of barley samples
The extraction protocol for blank and naturally contaminated barley samples was based
on a previous study.17 In short: 2.5 g of ground barley was weighed in a 50 mL
centrifuge tube. After adding 10 mL of 80% methanol, the sample was vortexed
vigorously in a Lab dancer (IKA, Staufen, Germany), and shaken for 30 min using an
Labquake (Fischer Scientific, Landsmeer, the Netherlands) tube shaker/rotator. Following
the extraction, the sample tubes were kept in the fridge for 30 min. Next, the tubes were
centrifuged for 10 min at 4000 g. The supernatant was then collected and diluted four
times using HBS-EP buffer solution to obtain an extract in HBS-EP containing 20%
methanol. Finally, the solution was centrifuged for 10 min at 12000 g to remove any
insoluble components formed as a result of the decrease in organic solvent content. This
extract in HBS-EP containing 20% methanol is referred to as “barley extract” throughout
the manuscript and was used for matrix matched calibration curves as well as blank
barley for validation experiments.
Multiplex SPR biosensing for detections of mycotoxins in barley
75
Preliminary in-house validation
In-house validation was performed using 21 blank and 21 spiked barley samples. The 42
samples (blank and spiked) were composed of three different barley batches, one
containing 0 µg/kg DON according to ELISA (B1), one with 0 µg/kg OTA according to
ELISA (B2) and one mixed barley (B3) selected as blank for all six toxins after LC-MS/MS
analysis. For fortification of the samples, the following levels of toxins were used: DON
(1/2×ML, 625 µg/kg), ZEA (1/2×ML, 50 µg/kg), T-2 (1/8×ML, 25 µg/kg), OTA (2×ML, 10
µg/kg), FB1 (1/5×ML, 400 µg/kg) and AFB1 (4×ML, 8 µg/kg). B1, B2 and B3 (blank and
spiked) were each extracted in triplicate and measured on the same day to obtain the
intra-day variation. The same experiment was then repeated on two additional days to
obtain the inter-day variation. Due to the limited quantity, sample B3 could only be
analyzed in triplicate on day 1 and could not be used for inter-day variation (see Scheme
S1). All the responses shown are relative to the response of a mixed barley (MB)
analyzed in triplicate at the beginning of each day. The mixed barley was composed of
equal volumes of all the 21 blank barley extracts. For spiked samples, the required
volumes of each toxin standard for 2.5 g of barley were mixed and the toxin mixture
(volume not exceeding a total of 50 µL) was spiked on the barley by gently pipetting the
mixed solution on the inner side of a 50 mL centrifuge tube. The solution was mixed with
the barley by vigorous vortexing followed by air-drying (left with cap open in the fume
hood) for 30 min. The barley samples were then extracted as explained in the extraction
section. The obtained barley extracts were mixed with the same volume of an antibody
solution. Assuming a 100% recovery, the mycotoxin concentration in the final solution (in
ng/mL) is 1/32 of the original concentration in the barley (in µg/kg). Data evaluation was
done based on regulations for validation of screening methods.37 Validation of a semi-
quantitative screening method requires identification of a cut-off level (Fm) and threshold
value (T). When the SPR response is at or below the cut-off level, the sample is
categorized as 'screen positive' and liable to confirmatory analysis. As described in Annex
II of the guidelines,37 the threshold value (T) was defined as T = B – 1.725 × SDb, where
B is the average response of the blank samples, and SDb is the standard deviation of
these responses. The cut-off factor (Fm) was defined as Fm = M + 1.725 × SD, where M
is the average responses of spiked samples and SD is the standard deviation of these
responses. For a successful validation, the Fm value has to be lower than the T value and
only 5% samples (one of 21) are allowed to be false negative.
Naturally contaminated samples
Naturally contaminated barley samples containing DON (289 µg/kg as measured by
ELISA, <50 µg/kg as measured by LC-MS/MS), ZEA (CS2, 729 ± 244 µg/kg), T-2/HT-2
(CS3, 60 µg/kg), and OTA (25 µg/kg as measured by ELISA, 210 µg/kg as measured by
Chapter 3
76
LC-MS/MS) were tested. Three samples were prepared for each contaminated sample
measurement: blank barley (B−), spiked barley (B+) and contaminated sample (CS).
Each sample (B−, B+ and CS) was extracted in triplicate and each extract was measured
in triplicate. The following levels of toxins were present in the spiked barley: DON
(1/2×ML, 625µg/kg), ZEA (1/2×ML, 50 µg/kg), T-2 (1/8×ML, 25 µg/kg), OTA (2×ML, 10
µg/kg), FB1 (1/5×ML, 400 µg/kg) and AFB1 (4×ML, 8 µg/kg). All the barley extracts were
prepared as described in the experimental section except for ZEA where the
contaminated barley extract had to be diluted an additional ten times in 20% methanol
(final concentration of 2.2 ng/mL assuming 100% recovery) before 1:1 dilution with
antibody mixture, to be able to measure within the detection range of the double 3-plex
assay. The responses were relative to the response of a mixed blank barley (MB, see
section on validation above) analyzed in triplicate prior to each contaminated sample.
Simplified sample preparation for field application
For possible in-field applications, a simpler extraction protocol was tested with one of the
contaminated sample (CS2). A kit (see Figure S2) consisting of a plastic container and a
stainless steel ball (d = 1.5 cm) for extraction and a filter device was used. All
components of the kit were rinsed several times with 80% methanol before use. In short:
1.25 g of ground barley was weighed in the plastic container. After adding 5 mL of 80%
methanol, the ball was added and the sample was vigorously shaken manually for 1 min.
The extract was allowed to stand on the bench for 5 min and then transferred to the
bottom container of the filtration device. A plunger containing the actual filter was
attached to the bottom container of the device. Upon applying gentle pressure to the
plunger, the extract is filtered into the plunger. The filtrate was collected and diluted four
times using HBS-EP buffer solution to obtain an extract in HBS-EP containing 20%
methanol.
Results and discussion
Double 3-plex benchtop SPR immunoassay development
Carboxymethylated dextran (CMD)38,39 is the most commonly used surface in SPR and
was used in all the Biacore experiments. OVA and OVA conjugates of mycotoxins were
immobilized on the CMD surface via amine coupling after one step NHS/EDC activation of
the carboxylic acid groups. The covalent attachment of the conjugates is important for
re-use and stability of the chips. The six mycotoxins had to be divided over two chips as
the Biacore 3000 has four channels, thus allowing the detection of a maximum of three
toxins per biosensor chip when using a reference channel. OVA conjugates of DON, ZEA
and T-2 were immobilized on one chip as the simultaneous detection of these toxins is
Multiplex SPR biosensing for detections of mycotoxins in barley
77
relevant from an application point of view. On the other chip, AFB1 and OTA were paired
together as they both have very low legal limits and might require additional sample
treatment. FB1 was the only one remaining and was thus included on the second chip.
Once the chips were stable (no significant loss of SPR signal from conjugates after
multiple injections of 20 mM NaOH), the concentration and buffer composition were
optimized for the individual antibodies. HBS-EP containing 20% methanol was chosen as
the dilution buffer for the antibodies during assay development because for most of the
antibodies at a fixed concentration, the binding with the immobilized mycotoxin-OVA
conjugates was similar (anti-T-2, anti-ZEA, anti-FB1, anti-OTA) or higher (for anti-DON
and anti-AFB1) in the methanolic buffer than in pure HBS-EP (Figure S3). Such higher
affinity of antibodies in buffer containing methanol has been reported previously in the
literature and is not uncommon.32,40 Furthermore, for matrix-matched calibration curves
in barley, 10% methanol is present after the extraction and 1:1 mixing with antibodies.
Thus, measuring the antibody binding and constructing the calibration curve in HBS-EP
containing 10% methanol is the most appropriate approach. The optimal concentration of
the antibodies (corresponding to an SPR response of 100-200 units) was 0.1 µg/mL for
anti-FB1, 1 µg/mL for anti-OTA and anti-ZEA, and 2 µg/mL for anti-T-2, anti-DON and
anti-AFB1. After optimization of the binding conditions, the regeneration step was
optimized. Regeneration is one of the advantages of SPR as it allows reuse of the
biosensor chips, unlike most other immunoassay formats. However, for multiplexing
applications this is quite challenging since both the binding and regeneration steps have
to be optimized for all the different antibodies and the toxins involved. In this study, the
most critical antibody-conjugate pairs with respect to regeneration were those for DON,
T-2 and AFB1. OVA conjugates of DON and T-2 were sensitive to regeneration and the
conjugates on the surface were partly lost according to the SPR response. On the other
hand, the antibodies against AFB1 were very strongly bound to the chip surface and could
not be removed completely upon regeneration. However, after testing a large range of
regeneration conditions as recently suggested in literature,41 we found that the
combination of 10 mM HCl (30 s at 100 µL/min) followed by 20 mM NaOH (30 s at 100
µL/min) provided the best compromise for the critical toxins (Figure S4) and the other
three toxins (data not shown). Cross-talk of these antibodies with the untargeted
mycotoxin conjugates was tested by injecting single antibodies over all the biosensor
channels. Some non-specific interaction of anti-T-2 was seen with DON-OVA and ZEA-
OVA but turned out to be mainly caused by OVA. This could thus be corrected by using
the OVA reference channel (see experimental section about measurement protocols),
underlining the importance of a suitable reference channel in SPR biosensor
immunoassays to avoid misinterpretation of results.
Chapter 3
78
After optimization of the binding and regeneration conditions, singleplex
calibration curves were prepared for all the individual toxins to determine the detection
range. These calibration curves (Figure S5) were then compared to the multiplex
calibration curves in buffer (Figure S5 and 2A). The minor differences between the
singleplex and multiplex formats show that interference upon mixing different antibodies
and toxins was insignificant. Finally, multiplex calibration curves were prepared in barley
extract (Figure S5 and 2B) and compared to the multiplex calibration curves in buffer to
test for a possible matrix effect. The IC80 values (Table S1) of all toxins (except AFB1) in
barley extract were only slightly (about two times) higher than in buffer; the most
significant difference was seen for DON where the value in barley (100 ng/mL) was four
times higher than the value in buffer (25 ng/mL). This is expected for calibration curves
in sample matrices where several other components contribute to a higher signal than in
buffer. In the case of ZEA and OTA, the IC20 and IC50 were not or hardly affected by the
sample matrix (barley). For T-2 and AFB1, both the IC20 and IC50 values were affected
by the sample matrix. For T-2, the IC20 value for multiplex in barley (0.02 ng/mL) was
five times lower than for multiplex in buffer (0.1 ng/mL) whereas the IC50 for multiplex
in barley (0.5 ng/mL) was more than two times lower than for multiplex in buffer (1.2
ng/mL). Similarly, for AFB1, the IC20 value for multiplex in barley (0.02 ng/mL) was ten
times lower than for multiplex in buffer (0.2 ng/mL) and the IC50 for multiplex in barley
(0.8 ng/mL) was two times lower than for multiplex in buffer (1.7 ng/mL). Such shifts of
the calibration curve in barley towards higher sensitivity, as seen here for T-2 and AFB1,
have also been observed in a multiplex microsphere immunoassay format.17 A significant
difference in the IC50 value was observed for DON where the value in barley (15 ng/mL)
was almost four times higher than the value in buffer (3.9 ng/mL). For FB1, the only
significant difference was in the IC10 values that was almost three times higher for
multiplex in buffer (0.2 ng/ml) compared to multiplex in barley (0.07 ng/ml). Since all
the assays were influenced by the sample matrix (barley) and the effect is not the same
for all toxins, matrix-matched calibration curves are recommended prior to measurement
of contaminated samples. As seen from the LODs (Table 1), the double 3-plex assay
allows detection of all six toxins within the legal requirements of the EU. However, in
case of OTA and AFB1, the working range does not allow analysis at ML levels. The
performance of the assay, especially for AFB1 and OTA, may be improved by the
production of more sensitive antibodies. Alternatively, less dilution of the sample may be
considered but at the risk of increased matrix effects and higher methanol
concentrations.
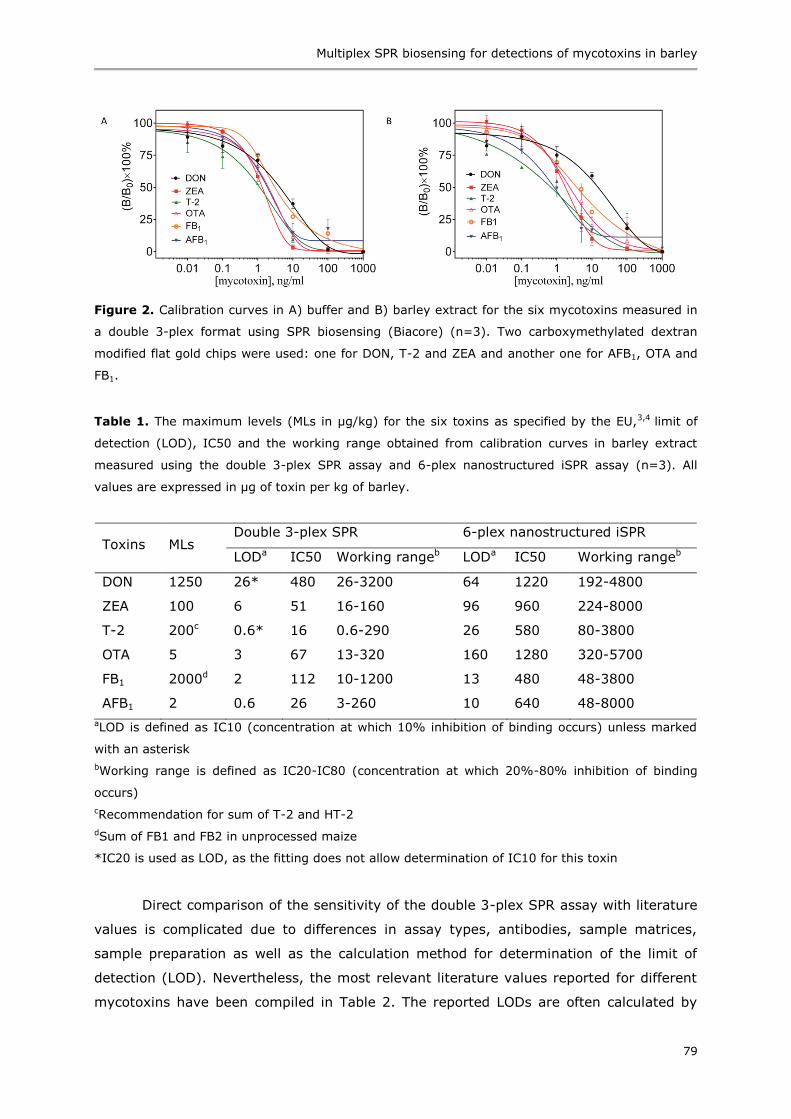
Multiplex SPR biosensing for detections of mycotoxins in barley
79
Figure 2. Calibration curves in A) buffer and B) barley extract for the six mycotoxins measured in
a double 3-plex format using SPR biosensing (Biacore) (n=3). Two carboxymethylated dextran
modified flat gold chips were used: one for DON, T-2 and ZEA and another one for AFB1, OTA and
FB1.
Table 1. The maximum levels (MLs in µg/kg) for the six toxins as specified by the EU,3,4 limit of
detection (LOD), IC50 and the working range obtained from calibration curves in barley extract
measured using the double 3-plex SPR assay and 6-plex nanostructured iSPR assay (n=3). All
values are expressed in µg of toxin per kg of barley.
Toxins MLs Double 3-plex SPR 6-plex nanostructured iSPR
LODa IC50 Working rangeb LODa IC50 Working rangeb
DON 1250 26* 480 26-3200 64 1220 192-4800
ZEA 100 6 51 16-160 96 960 224-8000
T-2 200c 0.6* 16 0.6-290 26 580 80-3800
OTA 5 3 67 13-320 160 1280 320-5700
FB1 2000d 2 112 10-1200 13 480 48-3800
AFB1 2 0.6 26 3-260 10 640 48-8000
aLOD is defined as IC10 (concentration at which 10% inhibition of binding occurs) unless marked
with an asterisk
bWorking range is defined as IC20-IC80 (concentration at which 20%-80% inhibition of binding
occurs)
cRecommendation for sum of T-2 and HT-2
dSum of FB1 and FB2 in unprocessed maize
*IC20 is used as LOD, as the fitting does not allow determination of IC10 for this toxin
Direct comparison of the sensitivity of the double 3-plex SPR assay with literature
values is complicated due to differences in assay types, antibodies, sample matrices,
sample preparation as well as the calculation method for determination of the limit of
detection (LOD). Nevertheless, the most relevant literature values reported for different
mycotoxins have been compiled in Table 2. The reported LODs are often calculated by

Chapter 3
80
subtracting three times the standard deviation from the average blank response.30,31 Due
to the very low noise of the Biacore instrument, the signal corresponding to such an LOD
is at 1-5% relative inhibition. The standard deviations of the blank sample of these
reported SPR assays are already higher than the noise of the Biacore, making such LOD
calculations less preferable.30,31 Therefore, IC10 values (10% inhibition of binding) were
used in the present work as a reasonable estimate of sensitivity (LOD). In case of DON
and T-2, IC20 values were used as LOD because the fitting of the calibration curve did
not allow determination of IC10 values. Compared to another SPR study on detection of
DON and T-2/HT-2, our assay is comparable for DON while being more sensitive for T-
2/HT-2.30,31 Compared to the reported values of a previous multiplex SPR study, our
assay may be judged less sensitive for all toxins except FB1 and AFB1.33 However, such a
comparison is unjustified as the method for calculating the LOD is not described in ref. 33
and the calibration curves are not shown in matrix (nevertheless the LODs are reported
in ng/g for “sample” without specification of the sample33). In case of AFB1, the reported
sensitivity33 is comparable to our assay. The most significant difference can be seen in
our FB1 assay, which is 25 times more sensitive than the previous SPR assay.33 For AFB1,
our assay in buffer is almost ten times more sensitive than another SPR assay reported
in literature.29 For OTA in cereals, our assay is ten times less sensitive than the assay in
a previous report.32 This can be easily explained by the gold nanoparticles used in ref. 32
for SPR signal enhancement as the authors claim a 17-fold increase in sensitivity due to
the nanoparticles. Compared to benchtop iSPR,26 our benchtop SPR assay is about 2-3
times more sensitive for DON and 6-10 times more sensitive for ZEA.
Table 2. SPR detection limits of mycotoxins in buffer (in ng/mL) and in different matrices (in
µg/kg) reported in the literature. Sensitivity of the present work can be found in Table 1 and Table
S1.
Toxins Buffer (ng/mL) Matrix (µg/kg)
Singleplex Multiplex Singleplex Multiplex
DON - - - 0.5, 1-29, 68-8426,31,33
ZEA - - - 0.01, 40-6426,33
T-2 - - 2630 31-4731
OTA - - 0.06-0.532 0.133
FB1 - - - 5033
AFB1 3.029 - - 0.233
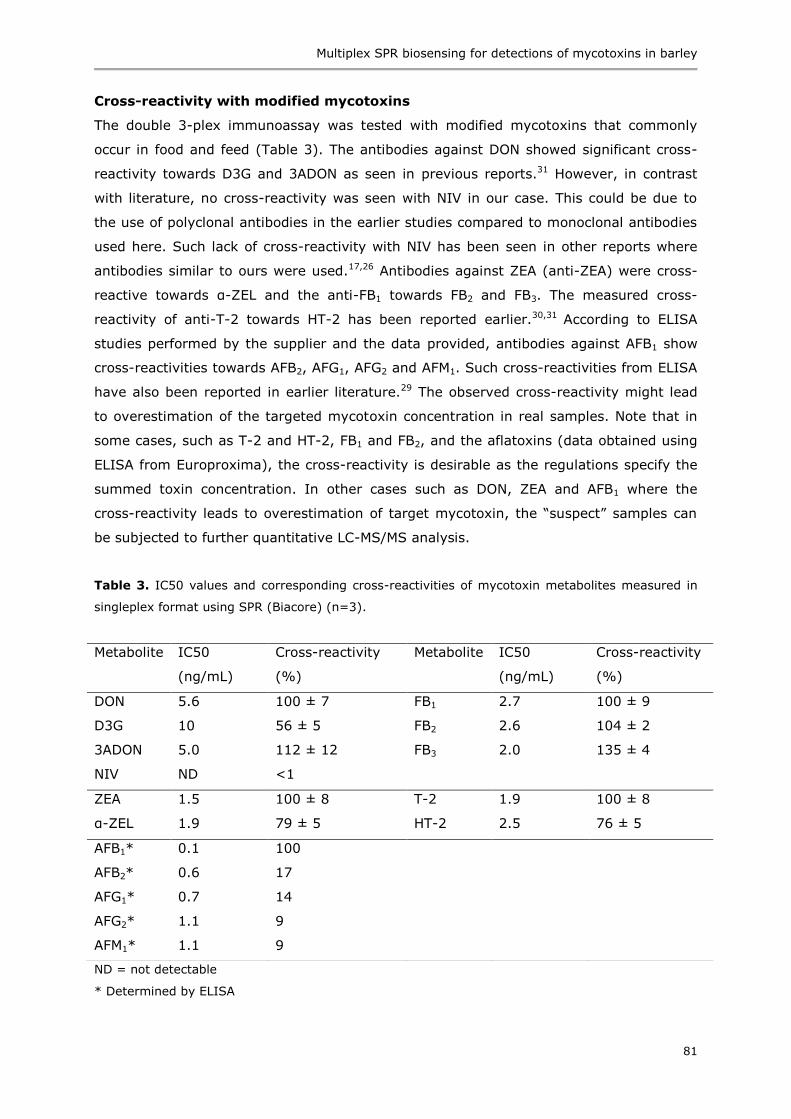
Multiplex SPR biosensing for detections of mycotoxins in barley
81
Cross-reactivity with modified mycotoxins
The double 3-plex immunoassay was tested with modified mycotoxins that commonly
occur in food and feed (Table 3). The antibodies against DON showed significant cross-
reactivity towards D3G and 3ADON as seen in previous reports.31 However, in contrast
with literature, no cross-reactivity was seen with NIV in our case. This could be due to
the use of polyclonal antibodies in the earlier studies compared to monoclonal antibodies
used here. Such lack of cross-reactivity with NIV has been seen in other reports where
antibodies similar to ours were used.17,26 Antibodies against ZEA (anti-ZEA) were cross-
reactive towards α-ZEL and the anti-FB1 towards FB2 and FB3. The measured cross-
reactivity of anti-T-2 towards HT-2 has been reported earlier.30,31 According to ELISA
studies performed by the supplier and the data provided, antibodies against AFB1 show
cross-reactivities towards AFB2, AFG1, AFG2 and AFM1. Such cross-reactivities from ELISA
have also been reported in earlier literature.29 The observed cross-reactivity might lead
to overestimation of the targeted mycotoxin concentration in real samples. Note that in
some cases, such as T-2 and HT-2, FB1 and FB2, and the aflatoxins (data obtained using
ELISA from Europroxima), the cross-reactivity is desirable as the regulations specify the
summed toxin concentration. In other cases such as DON, ZEA and AFB1 where the
cross-reactivity leads to overestimation of target mycotoxin, the “suspect” samples can
be subjected to further quantitative LC-MS/MS analysis.
Table 3. IC50 values and corresponding cross-reactivities of mycotoxin metabolites measured in
singleplex format using SPR (Biacore) (n=3).
ND = not detectable
* Determined by ELISA
Metabolite IC50
(ng/mL)
Cross-reactivity
(%)
Metabolite IC50
(ng/mL)
Cross-reactivity
(%)
DON 5.6 100 ± 7 FB1 2.7 100 ± 9
D3G 10 56 ± 5 FB2 2.6 104 ± 2
3ADON 5.0 112 ± 12 FB3 2.0 135 ± 4
NIV ND <1
ZEA 1.5 100 ± 8 T-2 1.9 100 ± 8
α-ZEL 1.9 79 ± 5 HT-2 2.5 76 ± 5
AFB1* 0.1 100
AFB2* 0.6 17
AFG1* 0.7 14
AFG2* 1.1 9
AFM1* 1.1 9
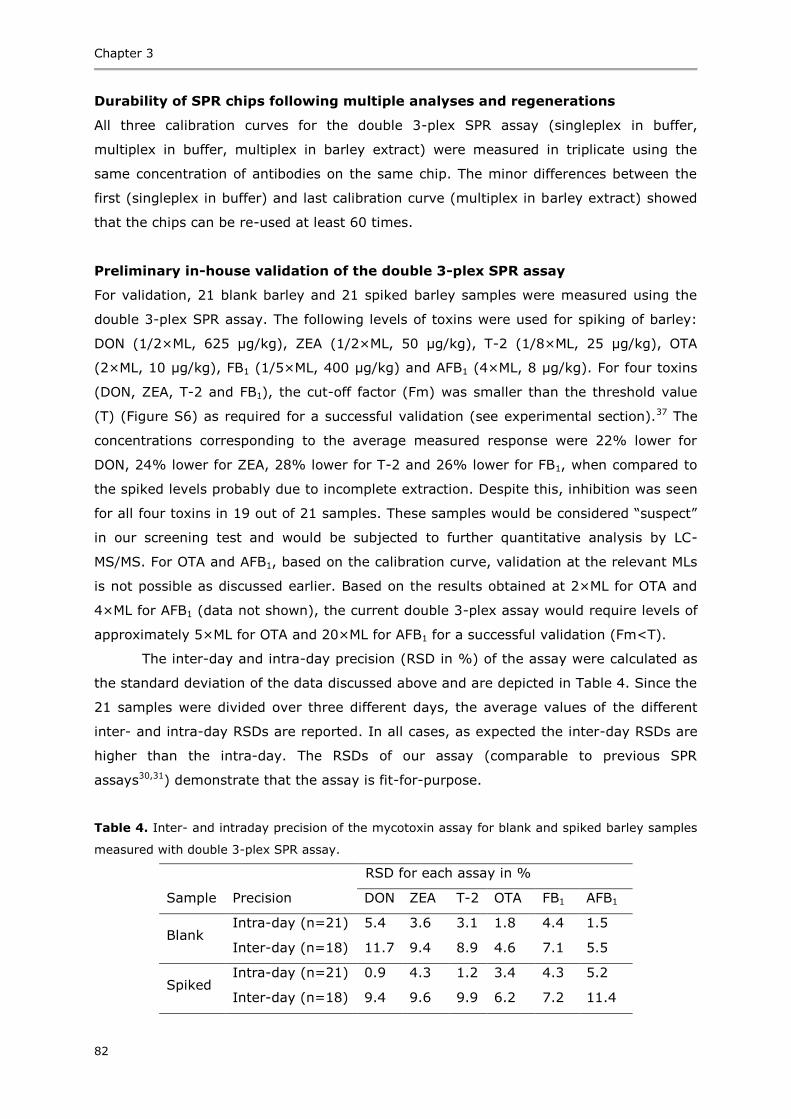
Chapter 3
82
Durability of SPR chips following multiple analyses and regenerations
All three calibration curves for the double 3-plex SPR assay (singleplex in buffer,
multiplex in buffer, multiplex in barley extract) were measured in triplicate using the
same concentration of antibodies on the same chip. The minor differences between the
first (singleplex in buffer) and last calibration curve (multiplex in barley extract) showed
that the chips can be re-used at least 60 times.
Preliminary in-house validation of the double 3-plex SPR assay
For validation, 21 blank barley and 21 spiked barley samples were measured using the
double 3-plex SPR assay. The following levels of toxins were used for spiking of barley:
DON (1/2×ML, 625 µg/kg), ZEA (1/2×ML, 50 µg/kg), T-2 (1/8×ML, 25 µg/kg), OTA
(2×ML, 10 µg/kg), FB1 (1/5×ML, 400 µg/kg) and AFB1 (4×ML, 8 µg/kg). For four toxins
(DON, ZEA, T-2 and FB1), the cut-off factor (Fm) was smaller than the threshold value
(T) (Figure S6) as required for a successful validation (see experimental section).37 The
concentrations corresponding to the average measured response were 22% lower for
DON, 24% lower for ZEA, 28% lower for T-2 and 26% lower for FB1, when compared to
the spiked levels probably due to incomplete extraction. Despite this, inhibition was seen
for all four toxins in 19 out of 21 samples. These samples would be considered “suspect”
in our screening test and would be subjected to further quantitative analysis by LC-
MS/MS. For OTA and AFB1, based on the calibration curve, validation at the relevant MLs
is not possible as discussed earlier. Based on the results obtained at 2×ML for OTA and
4×ML for AFB1 (data not shown), the current double 3-plex assay would require levels of
approximately 5×ML for OTA and 20×ML for AFB1 for a successful validation (Fm<T).
The inter-day and intra-day precision (RSD in %) of the assay were calculated as
the standard deviation of the data discussed above and are depicted in Table 4. Since the
21 samples were divided over three different days, the average values of the different
inter- and intra-day RSDs are reported. In all cases, as expected the inter-day RSDs are
higher than the intra-day. The RSDs of our assay (comparable to previous SPR
assays30,31) demonstrate that the assay is fit-for-purpose.
Table 4. Inter- and intraday precision of the mycotoxin assay for blank and spiked barley samples
measured with double 3-plex SPR assay.
RSD for each assay in %
Sample Precision DON ZEA T-2 OTA FB1 AFB1
Blank Intra-day (n=21) 5.4 3.6 3.1 1.8 4.4 1.5
Inter-day (n=18) 11.7 9.4 8.9 4.6 7.1 5.5
Spiked Intra-day (n=21) 0.9 4.3 1.2 3.4 4.3 5.2
Inter-day (n=18) 9.4 9.6 9.9 6.2 7.2 11.4
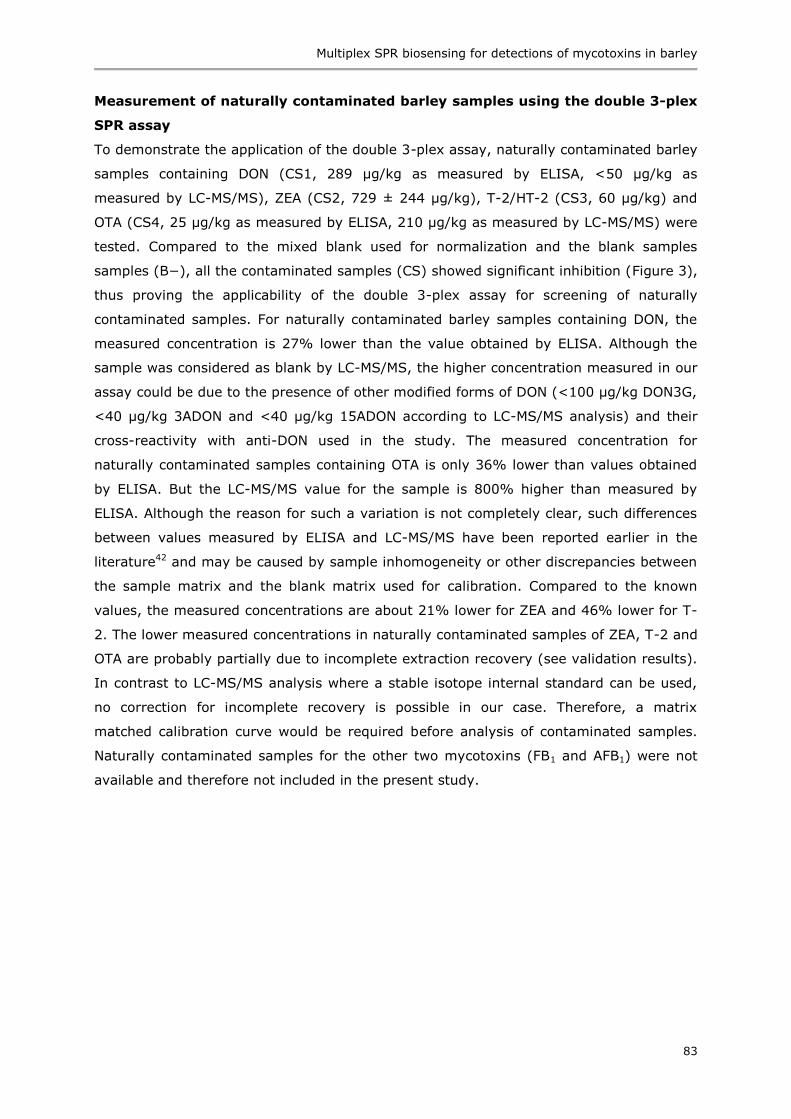
Multiplex SPR biosensing for detections of mycotoxins in barley
83
Measurement of naturally contaminated barley samples using the double 3-plex
SPR assay
To demonstrate the application of the double 3-plex assay, naturally contaminated barley
samples containing DON (CS1, 289 µg/kg as measured by ELISA, <50 µg/kg as
measured by LC-MS/MS), ZEA (CS2, 729 ± 244 µg/kg), T-2/HT-2 (CS3, 60 µg/kg) and
OTA (CS4, 25 µg/kg as measured by ELISA, 210 µg/kg as measured by LC-MS/MS) were
tested. Compared to the mixed blank used for normalization and the blank samples
samples (B−), all the contaminated samples (CS) showed significant inhibition (Figure 3),
thus proving the applicability of the double 3-plex assay for screening of naturally
contaminated samples. For naturally contaminated barley samples containing DON, the
measured concentration is 27% lower than the value obtained by ELISA. Although the
sample was considered as blank by LC-MS/MS, the higher concentration measured in our
assay could be due to the presence of other modified forms of DON (<100 µg/kg DON3G,
<40 µg/kg 3ADON and <40 µg/kg 15ADON according to LC-MS/MS analysis) and their
cross-reactivity with anti-DON used in the study. The measured concentration for
naturally contaminated samples containing OTA is only 36% lower than values obtained
by ELISA. But the LC-MS/MS value for the sample is 800% higher than measured by
ELISA. Although the reason for such a variation is not completely clear, such differences
between values measured by ELISA and LC-MS/MS have been reported earlier in the
literature42 and may be caused by sample inhomogeneity or other discrepancies between
the sample matrix and the blank matrix used for calibration. Compared to the known
values, the measured concentrations are about 21% lower for ZEA and 46% lower for T-
2. The lower measured concentrations in naturally contaminated samples of ZEA, T-2 and
OTA are probably partially due to incomplete extraction recovery (see validation results).
In contrast to LC-MS/MS analysis where a stable isotope internal standard can be used,
no correction for incomplete recovery is possible in our case. Therefore, a matrix
matched calibration curve would be required before analysis of contaminated samples.
Naturally contaminated samples for the other two mycotoxins (FB1 and AFB1) were not
available and therefore not included in the present study.
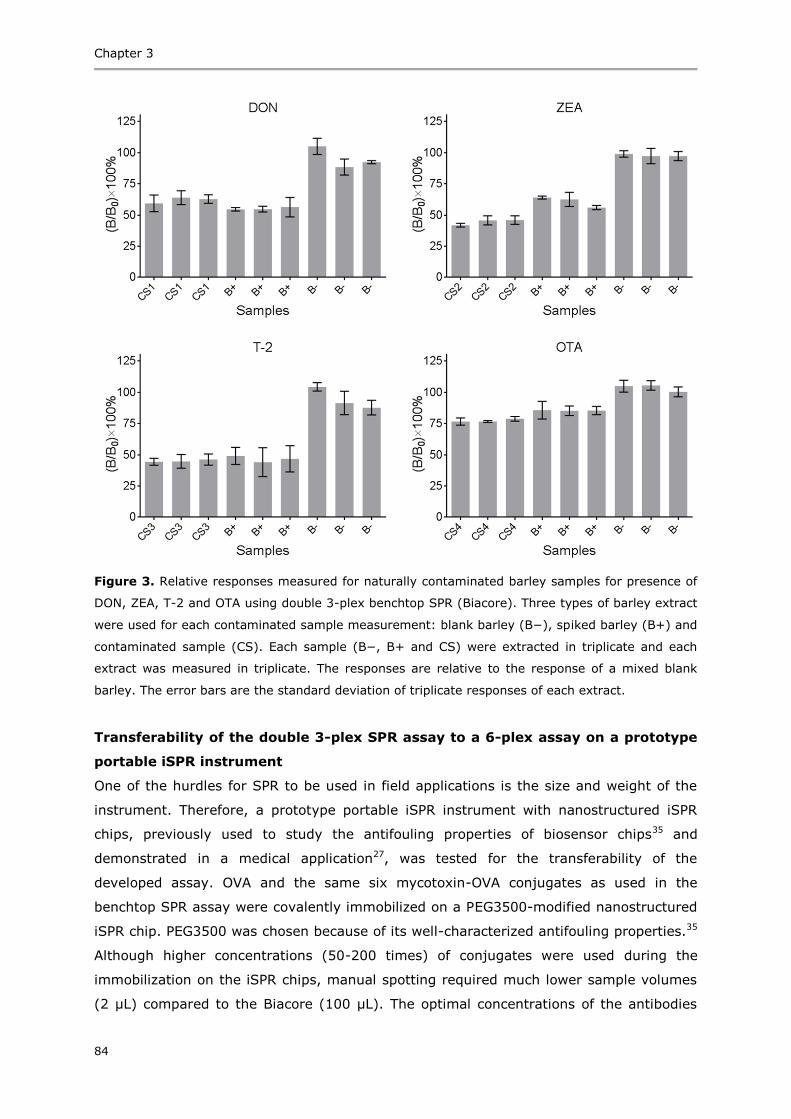
Chapter 3
84
Figure 3. Relative responses measured for naturally contaminated barley samples for presence of
DON, ZEA, T-2 and OTA using double 3-plex benchtop SPR (Biacore). Three types of barley extract
were used for each contaminated sample measurement: blank barley (B−), spiked barley (B+) and
contaminated sample (CS). Each sample (B−, B+ and CS) were extracted in triplicate and each
extract was measured in triplicate. The responses are relative to the response of a mixed blank
barley. The error bars are the standard deviation of triplicate responses of each extract.
Transferability of the double 3-plex SPR assay to a 6-plex assay on a prototype
portable iSPR instrument
One of the hurdles for SPR to be used in field applications is the size and weight of the
instrument. Therefore, a prototype portable iSPR instrument with nanostructured iSPR
chips, previously used to study the antifouling properties of biosensor chips35 and
demonstrated in a medical application27, was tested for the transferability of the
developed assay. OVA and the same six mycotoxin-OVA conjugates as used in the
benchtop SPR assay were covalently immobilized on a PEG3500-modified nanostructured
iSPR chip. PEG3500 was chosen because of its well-characterized antifouling properties.35
Although higher concentrations (50-200 times) of conjugates were used during the
immobilization on the iSPR chips, manual spotting required much lower sample volumes
(2 µL) compared to the Biacore (100 µL). The optimal concentrations of the antibodies

Multiplex SPR biosensing for detections of mycotoxins in barley
85
(corresponding to an SPR response of 0.04-0.05 units) in the 6-plex assay were 5 µg/mL
for FB1 and 50 µg/mL for OTA and ZEA, T-2, DON, and AFB1. Note that the
nanoplasmonics iSPR assay required higher concentrations of antibodies (50 times for
FB1, OTA and ZEA and 25 times for DON, T-2 and AFB1) relative to the double 3-plex SPR
(see above), which is due to two main factors: difference in surface chemistry of the two
surfaces and hardware sensitivity. The iSPR chips are coated with a 2D polymer
(PEG3500) having fewer binding groups (COOH) compared to the 3D hydrogel (CMD) in
the double 3-plex SPR set-up. This limits the amount of mycotoxin conjugates that can
be immobilized on the surface, thus requiring higher concentrations of antibodies.
Furthermore, as seen in our previous study, the sensitivity of the prototype iSPR
instrument is approximately ten times lower than that of the Biacore,35 thus more
antibodies are required to give a detectable response in the inhibition assay.
For the double 3-plex SPR assay (Biacore), the singleplex calibration curves in
buffer were rather similar to the multiplex calibration curves in buffer (Figure S5). Upon
measuring FB1 calibration curves using the prototype nanostructured iSPR instrument,
the two calibration curves were again similar. Extrapolating on this, for the other five
toxins only multiplex calibration curves in buffer and barley extract were measured in the
prototype iSPR (Figure S7 and Figure 4). As expected, the calibration curves indicate a
decrease in sensitivity compared to the double 3-plex SPR assay. For most toxins, the
sensitivity (Table 1) is about 3-20 times less than for the Biacore and similar to a
benchtop iSPR instrument (for DON and ZEA),26 except for OTA and T-2 where the iSPR
assay is almost 40 and 50 times less sensitive than the benchtop SPR assay,
respectively. The difference could be due to the amount of OVA conjugates immobilized
on the surface. Although the spots can be visualized in the imaging instrument, the
actual amount of immobilized conjugates cannot be as easily checked as in the Biacore.
Note that even in the benchtop SPR assay (Biacore), a second injection of OTA-OVA and
T-2-OVA was required to achieve a good response. For four toxins (DON, ZEA, T-2 and
FB1), the 6-plex assay is sensitive enough to detect the toxins at MLs as defined by EU
legislation.3,4 In case of OTA and AFB1, better binding antibodies will be required to
obtain the required sensitivity. One of the contaminated samples containing 729 ± 244
µg/kg of ZEA (22.7 ng/ml assuming 100% recovery) was also measured using the
prototype nanoplasmonics iSPR instrument. Although, the measured concentration was
31% lower than stated, inhibition was clearly seen relative to the mixed blank barley
sample (Figure S8). To demonstrate the applicability of the assay as a screening method
for in-field applications, the same contaminated sample was extracted using a simpler
extraction protocol (see experimental section on naturally contaminated samples. Both
extraction protocols gave similar results (Figure S8) showing the potential of such an
extraction protocol for future field applications. The simplified sample preparation is both

Chapter 3
86
time and cost effective as it required less equipment and expert personnel. The
performance of the portable iSPR assay may be further improved by using a 3D hydrogel
chip surface comparable to CMD or by functionalized zwitterionic polymer brushes.
Another approach for sensitivity improvement could be based on confinement-induced
signal enhancement.43,44 In a nanostructured chip, in addition to the bulk SPR due to the
propagation of surface plasmons, localized SPR (LSPR) occurs. The LSPR mode has been
reported to be eight times more sensitive than the bulk SPR mode.27 The maximum of
the evanescent wave from LSPR is at the top of the PMMA wells as described in ref. 44.
Therefore, controlled and precise filling of these wells in such a way that the OVA-toxin
conjugates are exactly near the top of the well after immobilization, may help to boost
sensitivity. The performance of the prototype instrument itself can be improved by
upgrading the hardware.
Figure 4. Calibration curves in A) buffer and B) barley extract for the six mycotoxins measured in
a 6-plex format using a prototype nanostructured iSPR instrument. A single PEG3500 chip was
used for detection of DON, ZEA, T-2, OTA, FB1 and AFB1.
The benchtop SPR and prototype nanostructured iSPR each have their own advantages
and disadvantages. While nanostructured iSPR is in this application less sensitive than
benchtop SPR, it allows simultaneous detection of six toxins using one chip. This would
be beneficial for rapidly detecting both targeted and other less frequently occurring
mycotoxins in real samples. Additionally, if the sensitivity could be improved,
nanostructured iSPR would save costs in terms of the chip, reagents as well as assay
time. However, it should be kept in mind that optimization of regeneration conditions can
be difficult in a one-chip format. In a double 3-plex format with benchtop SPR,
regeneration-sensitive conjugates (such as DON-OVA and T-2-OVA) can be separated
from the conjugates that are more resistant to regeneration (such as AFB1-OVA and FB1-
OVA). The toxins can also be separated based on their required detection levels set by
EU. For some toxins, such as DON and FB1, diluted sample extracts would be desirable,
whereas for others (OTA and AFB1) concentrated extracts would be desirable.

Multiplex SPR biosensing for detections of mycotoxins in barley
87
Conclusions
Mycotoxin contamination of food and feed is a major concern for producers and quality
controllers. Most published mycotoxin detection studies have focused on the detection of
one or a few mycotoxins. In addition to multiplex detection, there is also a demand for
miniaturized instruments to bring the lab to the sample. However, a benchmark to
properly evaluate such prototype miniaturized instruments is missing from the literature.
This work provides such a comprehensive study for the multiplex detection of six of the
most relevant mycotoxins. The developed benchmark method allows detection of
deoxynivalenol (DON), zearalenone (ZEA), T-2 toxin, ochratoxin A (OTA), fumonisin B1
(FB1) and aflatoxin B1 (AFB1) in a double 3-plex format using a benchtop SPR (Biacore)
with two separate SPR biosensor chips. The detection range of the assays allows the
detection of four mycotoxins (DON, ZEA, T-2 and FB1) in barley at the regulatory limits.
For OTA and AFB1, further improvement in sensitivity, either by using better antibodies or
using less diluted samples, is still required for screening at the regulatory limits. The
sensitivity of our assay is comparable to the reported literature values for singleplex SPR
assays, but offers the benefit of multiplexing. In case of FB1, our assay is 25 times more
sensitive than earlier SPR assays. The validation and measurement of contaminated
samples show that the recovery of the toxins is about 75%. Thus, the developed double
3-plex SPR assay could serve well as a semi-quantitative screening method, to be
followed up by further analysis of any “suspected” samples using LC-MS/MS. Finally, the
transfer to a prototype portable iSPR instrument showed the simultaneous detection of all
six mycotoxins in a 6-plex format using a single nanostructured iSPR chip. The prototype
iSPR sensitivity, although less than that of the benchtop instrument (Biacore), could be
improved by different strategies including change of surface chemistry, selection of
better antibodies and hardware upgrades. The demonstrated transferability provides a
step forward towards use of a miniaturized iSPR for at-line and in-field biosensing
screening of mycotoxins in barley.
Acknowledgements
This research received funding from the Netherlands Organisation for Scientific Research
(NWO) in the framework of the Technology Area COAST (SPRing, project nr 053.21.107)
with WU, VU Amsterdam, RIKILT, Heineken, Synthon, Technex, EuroProxima, Waterproef
as partners and Plasmore and Bionavis as associated partners. We would like to thank
these project partners and especially Willem Haasnoot from RIKILT and Ron Verheijen,
Nermin Sajic and Piet van Wichen from EuroProxima, for stimulating discussions, supply
of sample materials and suggestions for initial experiments.
Chapter 3
88
References
1. DeVries, J. W.; Trucksess, M. W.; Jackson, L. S., Mycotoxins and food safety. Springer: New
York, 2002. 2. Schatzmayr, G.; Streit, E., Global occurrence of mycotoxins in the food and feed chain: facts
and figures. World Mycotoxin J. 2013, 6, 213-222.
3. Commission regulation (EC) No 1881/2006 of 19 December 2006 setting maximum levels for certain contaminants in foodstuffs. Off. J. Eur. Union 2006, L364, 5-24.
4. Marmisollé, W. A.; Capdevila, D. A.; de la Llave, E.; Williams, F. J.; Murgida, D. H., Self-Assembled Monolayers of NH2-Terminated Thiolates: Order, pKa, and Specific Adsorption. Langmuir 2013, 29, 5351-5359.
5. McGrath, T. F.; Elliott, C. T.; Fodey, T. L., Biosensors for the analysis of microbiological and chemical contaminants in food. Anal. Bioanal. Chem. 2012, 403, 75-92.
6. Vidal, J. C.; Bonel, L.; Ezquerra, A.; Hernández, S.; Bertolín, J. R.; Cubel, C.; Castillo, J. R., Electrochemical affinity biosensors for detection of mycotoxins: A review. Biosens. Bioelectron. 2013, 49, 146-158.
7. Berthiller, F.; Burdaspal, P. A.; Crews, C.; Iha, M. H.; Krska, R.; Lattanzio, V. M. T.; MacDonald, S.; Malone, R. J.; Maragos, C.; Solfrizzo, M.; Stroka, J.; Whitaker, T. B.,
Developments in mycotoxin analysis: An update for 2012-2013. World Mycotoxin J. 2014, 7, 3-33.
8. Berthiller, F.; Brera, C.; Crews, C.; Iha, M. H.; Krsha, R.; Lattanzio, V. M. T.; MacDonald, S.; Malone, R. J.; Maragos, C.; Solfrizzo, M.; Stroka, J.; Whitaker, T. B., Developments in mycotoxin analysis: An update for 2013-2014. World Mycotoxin J. 2015, 8, 5-35.
9. Berthiller, F.; Sulyok, M.; Krska, R.; Schuhmacher, R., Chromatographic methods for the simultaneous determination of mycotoxins and their conjugates in cereals. Int. J. Food Microbiol. 2007, 119, 33-37.
10. Todescato, F.; Antognoli, A.; Meneghello, A.; Cretaio, E.; Signorini, R.; Bozio, R., Sensitive detection of ochratoxin A in food and drinks using metal-enhanced fluorescence. Biosens. Bioelectron. 2014, 57, 125-132.
11. Yang, L.; Zhang, Y.; Li, R.; Lin, C.; Guo, L.; Qiu, B.; Lin, Z.; Chen, G., Electrochemiluminescence biosensor for ultrasensitive determination of ochratoxin A in corn samples based on aptamer and hyperbranched rolling circle amplification. Biosens. Bioelectron. 2015, 70, 268-274.
12. Zangheri, M.; Di Nardo, F.; Anfossi, L.; Giovannoli, C.; Baggiani, C.; Roda, A.; Mirasoli, M., A multiplex chemiluminescent biosensor for type B-fumonisins and aflatoxin B1 quantitative
detection in maize flour. Analyst 2015, 140, 358-365. 13. Liu, X.; Xu, Y.; Xiong, Y.-h.; Tu, Z.; Li, Y.-p.; He, Z.-y.; Qiu, Y.-l.; Fu, J.-h.; Gee, S. J.;
Hammock, B. D., VHH phage-based competitive real-time immuno-polymerase chain reaction for ultrasensitive detection of ochratoxin A in cereal. Anal. Chem. 2014, 86, 7471-7477.
14. Olcer, Z.; Esen, E.; Muhammad, T.; Ersoy, A.; Budak, S.; Uludag, Y., Fast and sensitive
detection of mycotoxins in wheat using microfluidics based real-time electrochemical profiling. Biosens. Bioelectron. 2014, 62, 163-169.
15. Beloglazova, N. V.; Speranskaya, E. S.; Wu, A.; Wang, Z.; Sanders, M.; Goftman, V. V.; Zhang, D.; Goryacheva, I. Y.; De Saeger, S., Novel multiplex fluorescent immunoassays based on quantum dot nanolabels for mycotoxins determination. Biosens. Bioelectron. 2014, 62, 59-65.
16. Peters, J.; Bienenmann-Ploum, M.; de Rijk, T.; Haasnoot, W., Development of a multiplex flow cytometric microsphere immunoassay for mycotoxins and evaluation of its application in feed. Mycotoxin Res. 2011, 27, 63-72.
17. Peters, J.; Cardall, A.; Haasnoot, W.; Nielen, M. W. F., 6-Plex microsphere immunoassay with imaging planar array detection for mycotoxins in barley. Analyst 2014, 139, 3968-3976.
18. Vaclavik, L.; Zachariasova, M.; Hrbek, V.; Hajslova, J., Analysis of multiple mycotoxins in
cereals under ambient conditions using direct analysis in real time (DART) ionization coupled
to high resolution mass spectrometry. Talanta 2010, 82, 1950-1957. 19. Goryacheva, I. Y.; De Saeger, S., Immunochemical methods for rapid mycotoxin detection in
food and feed. In Determining mycotoxins and mycotoxigenic fungi in food and feed, De Saeger, S., Ed. Woodhead Publishing: Cambridge, 2011; pp 135-167.
20. Song, S.; Liu, N.; Zhao, Z.; Njumbe Ediage, E.; Wu, S.; Sun, C.; De Saeger, S.; Wu, A., Multiplex lateral flow immunoassay for mycotoxin determination. Anal. Chem. 2014, 86, 4995-5001.
21. Li, Y.; Liu, X.; Lin, Z., Recent developments and applications of surface plasmon resonance biosensors for the detection of mycotoxins in foodstuffs. Food Chem. 2012, 132, 1549-1554.
Multiplex SPR biosensing for detections of mycotoxins in barley
89
22. Meneely, J. P.; Elliott, C. T., Rapid surface plasmon resonance immunoassays for the
determination of mycotoxins in cereals and cereal-based food products. World Mycotoxin J.
2014, 7, 491-505. 23. Homola, J., Surface plasmon resonance sensors for detection of chemical and biological
species. Chem. Rev. 2008, 108, 462-493. 24. Yeatman, E.; Ash, E. A., Surface plasmon microscopy. Electron. Lett. 1987, 23, 1091-1092. 25. Scarano, S.; Mascini, M.; Turner, A. P. F.; Minunni, M., Surface plasmon resonance imaging
for affinity-based biosensors. Biosens. Bioelectron. 2010, 25, 957-966.
26. Dorokhin, D.; Haasnoot, W.; Franssen, M. C. R.; Zuilhof, H.; Nielen, M. W. F., Imaging surface plasmon resonance for multiplex microassay sensing of mycotoxins. Anal. Bioanal. Chem. 2011, 400, 3005-3011.
27. Bottazzi, B.; Fornasari, L.; Frangolho, A.; Giudicatti, S.; Mantovani, A.; Marabelli, F.; Marchesini, G.; Pellacani, P.; Therisod, R.; Valsesia, A., Multiplexed label-free optical biosensor for medical diagnostics. J. Biomed. Opt. 2014, 19, 017006-017010.
28. Dahlin, A. B., Sensing applications based on plasmonic nanopores: The hole story. Analyst 2015, 140, 4748-4759.
29. Daly, S. J.; Keating, G. J.; Dillon, P. P.; Manning, B. M.; O'Kennedy, R.; Lee, H. A.; Morgan, M. R. A., Development of surface plasmon resonance-based immunoassay for aflatoxin B1. J. Agric. Food Chem. 2000, 48, 5097-5104.
30. Meneely, J. P.; Sulyok, M.; Baumgartner, S.; Krska, R.; Elliott, C. T., A rapid optical immunoassay for the screening of T-2 and HT-2 toxin in cereals and maize-based baby food.
Talanta 2010, 81, 630-636. 31. Meneely, J. P.; Quinn, J. G.; Flood, E. M.; Hajšlová, J.; Elliott, C. T., Simultaneous screening
for T-2/HT-2 and deoxynivalenol in cereals using a surface plasmon resonance immunoassay. World Mycotoxin J. 2012, 5, 117-126.
32. Yuan, J.; Deng, D.; Lauren, D. R.; Aguilar, M.-I.; Wu, Y., Surface plasmon resonance biosensor for the detection of ochratoxin A in cereals and beverages. Anal. Chim. Acta 2009, 656, 63-71.
33. van der Gaag, B.; Spath, S.; Dietrich, H.; Stigter, E.; Boonzaaijer, G.; van Osenbruggen, T.; Koopal, K., Biosensors and multiple mycotoxin analysis. Food Control 2003, 14, 251-254.
34. Giudicatti, S.; Valsesia, A.; Marabelli, F.; Colpo, P.; Rossi, F., Plasmonic resonances in nanostructured gold/polymer surfaces by colloidal lithography. Phys. Status Solidi A 2010, 207, 935-942.
35. Joshi, S.; Pellacani, P.; van Beek, T. A.; Zuilhof, H.; Nielen, M. W. F., Surface
characterization and antifouling properties of nanostructured gold chips for imaging surface plasmon resonance biosensing. Sens. Actuators, B 2015, 209, 505-514.
36. Lahiri, J.; Ostuni, E.; Whitesides, G. M., Patterning ligands on reactive SAMs by microcontact printing. Langmuir 1999, 15, 2055-2060.
37. Commission Regulation (EU) No 519/2014 of 16 May 2014 amending Regulation (EC) No 401/2006 as regards methods of sampling of large lots, spices and food supplements, performance criteria for T-2, HT-2 toxin and citrinin and screening methods of analysis. Off.
J. Eur. Union 2014, L147, 29-43. 38. Johnsson, B.; Löfås, S.; Lindquist, G., Immobilization of proteins to a carboxymethyldextran-
modified gold surface for biospecific interaction analysis in surface plasmon resonance sensors. Anal. Biochem. 1991, 198, 268-277.
39. Löfås, S.; Johnsson, B., A novel hydrogel matrix on gold surfaces in surface plasmon resonance sensors for fast and efficient covalent immobilization of ligands. J. Chem. Soc., Chem. Commun. 1990, 1526-1528.
40. Skládal, P., Effect of methanol on the interaction of monoclonal antibody with free and immobilized atrazine studied using the resonant mirror-based biosensor. Biosens. Bioelectron. 1999, 14, 257-263.
41. Geuijen, K. P. M.; Schasfoort, R. B.; Wijffels, R. H.; Eppink, M. H. M., High-throughput and multiplexed regeneration buffer scouting for affinity-based interactions. Anal. Biochem. 2014, 454, 38-40.
42. Zachariasova, M.; Hajslova, J.; Kostelanska, M.; Poustka, J.; Krplova, A.; Cuhra, P.; Hochel, I., Deoxynivalenol and its conjugates in beer: A critical assessment of data obtained by enzyme-linked immunosorbent assay and liquid chromatography coupled to tandem mass spectrometry. Anal. Chim. Acta 2008, 625, 77-86.
43. Krishnamoorthy, S.; Himmelhaus, M., Confinement-induced enhancement of antigen–antibody interactions within binary nanopatterns to achieve higher efficiency of on-chip immunosensors. Adv. Mater. 2008, 20, 2782-2788.
44. Valsesia, A.; Marabelli, F.; Giudicatti, S.; Marchesini, G. R.; Rossi, F.; Colpo, P., SPR sensor device with nanostructure. World Patent 2013, WO 2013/007448 A1.

Chapter 3
90
Supporting information
Day 1 Day 2 Day 3
B1-1.1 B1-2.1 B1-3.1
B1-1.2 B1-2.2 B1-3.2
B1-1.3 B1-2.3 B1-3.3
B2-1.1 B2-2.1 B2-3.1
B2-1.2 B2-2.2 B2-3.2
B2-1.3 B2-2.3 B2-3.3
B3-1.1
B3-1.2
B3-1.3
Scheme S1. Extraction scheme for three different barley samples (B1, B2, B3) on three different
days to obtain 21 blank and 21 spiked samples for validation experiment.
Figure S1. SPR sensorgrams generated in a channel (for SPR) or ROI (for iSPR) with FB1-OVA
upon injection of A) 0.1 µg/ml anti-FB1 measured using a Biacore 3000 with flat gold and B) 5
µg/ml anti-FB1 measured using a prototype iSPR instrument with nanostructured gold. Each cycle
consists of flushing with buffer, injection of antibody and regeneration with 10 mM HCl (30 s)
followed by 20 mM NaOH (30 s). After injection of antibody and regeneration, the chip was flushed
with buffer. The blue dotted line shows the time point where the SPR response was recorded.
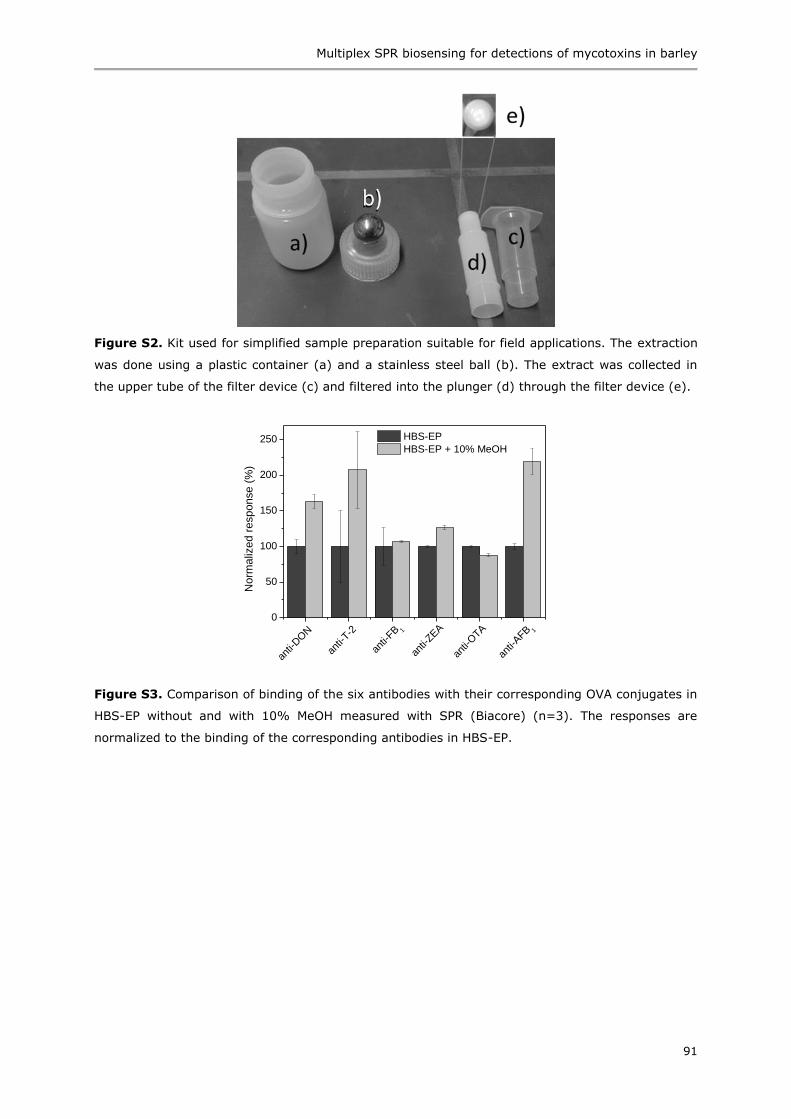
Multiplex SPR biosensing for detections of mycotoxins in barley
91
Figure S2. Kit used for simplified sample preparation suitable for field applications. The extraction
was done using a plastic container (a) and a stainless steel ball (b). The extract was collected in
the upper tube of the filter device (c) and filtered into the plunger (d) through the filter device (e).
Figure S3. Comparison of binding of the six antibodies with their corresponding OVA conjugates in
HBS-EP without and with 10% MeOH measured with SPR (Biacore) (n=3). The responses are
normalized to the binding of the corresponding antibodies in HBS-EP.
0
50
100
150
200
250
anti-
AFB 1
anti-
OTA
anti-
ZEA
anti-
FB 1
anti-
T-2
Norm
aliz
ed r
esponse (
%)
HBS-EP
HBS-EP + 10% MeOH
anti-
DON

Chapter 3
92
Figure S4. Regeneration scouting for anti-DON, anti-T-2 and anti-AFB1 performed using SPR
(Biacore). The percentage of antibody response remaining after regeneration is plotted for three
different antibodies and six different regeneration conditions (1 = 6 M guanidine HCl, 2 = 20 mM
NaOH, 3 = 5 mM NaOH + 0.5% SDS, 4 = 5 mM NaOH followed by 0.1% Tween20, 5 = 10 mM HCl
followed by 10 mM NaOH and 6 = 10 mM HCl followed by 20 mM NaOH). All regeneration solutions
were injected for 30 s at a flow rate of 100 µL/min (n=3). Please note that the other three
antibodies (anti-ZEA, anti-FB1 and anti-OTA) are not shown here but were successfully regenerated
under regeneration condition 6.
Figure S5. Calibration curves of the double 3-plex assay using SPR (Biacore) for singleplex in
buffer, multiplex in buffer and multiplex in barley extract (n=3). Two carboxymethylated chips
were used: one for DON, ZEA and T-2 and another for OTA, FB1 and AFB1.
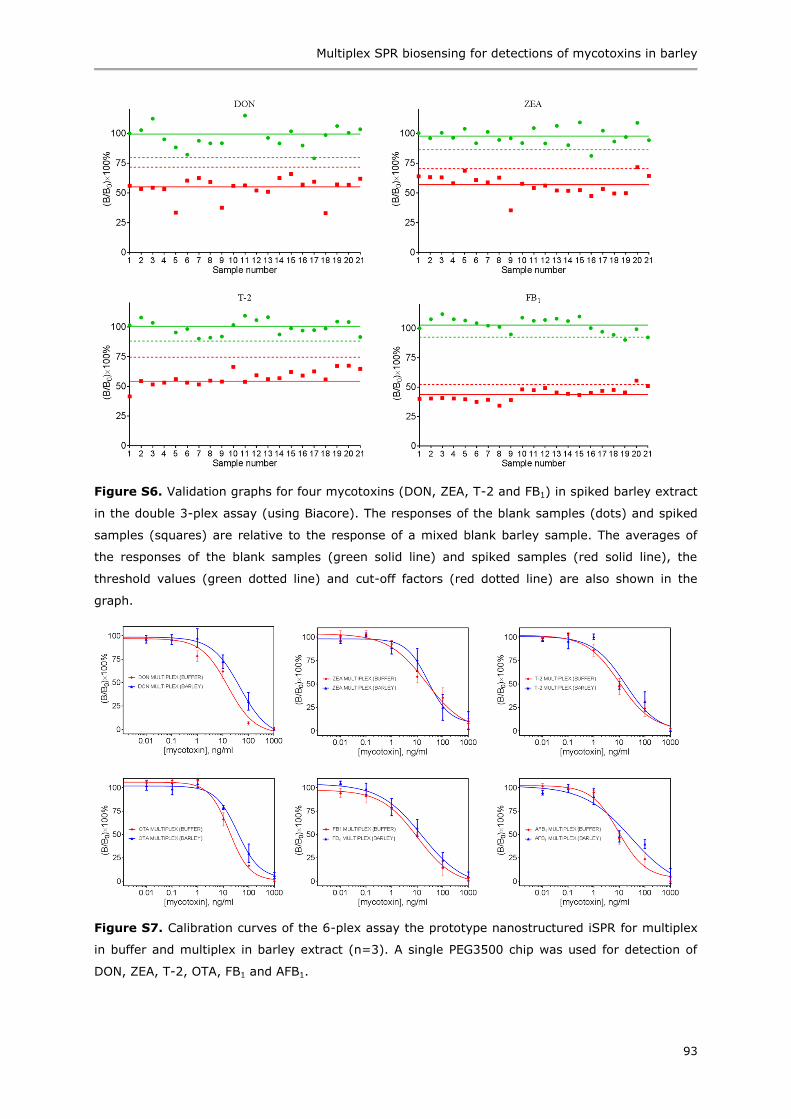
Multiplex SPR biosensing for detections of mycotoxins in barley
93
Figure S6. Validation graphs for four mycotoxins (DON, ZEA, T-2 and FB1) in spiked barley extract
in the double 3-plex assay (using Biacore). The responses of the blank samples (dots) and spiked
samples (squares) are relative to the response of a mixed blank barley sample. The averages of
the responses of the blank samples (green solid line) and spiked samples (red solid line), the
threshold values (green dotted line) and cut-off factors (red dotted line) are also shown in the
graph.
Figure S7. Calibration curves of the 6-plex assay the prototype nanostructured iSPR for multiplex
in buffer and multiplex in barley extract (n=3). A single PEG3500 chip was used for detection of
DON, ZEA, T-2, OTA, FB1 and AFB1.
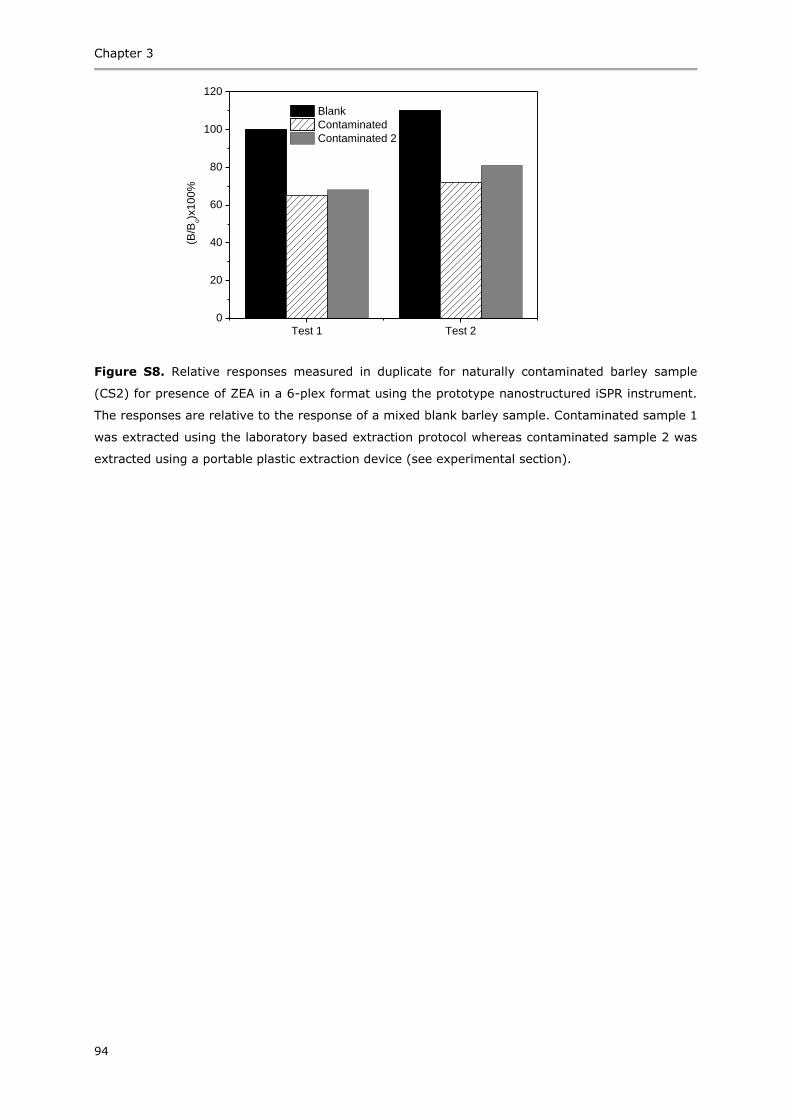
Chapter 3
94
Figure S8. Relative responses measured in duplicate for naturally contaminated barley sample
(CS2) for presence of ZEA in a 6-plex format using the prototype nanostructured iSPR instrument.
The responses are relative to the response of a mixed blank barley sample. Contaminated sample 1
was extracted using the laboratory based extraction protocol whereas contaminated sample 2 was
extracted using a portable plastic extraction device (see experimental section).
Test 1 Test 2
0
20
40
60
80
100
120
(B/B
o)x
10
0%
Blank
Contaminated
Contaminated 2
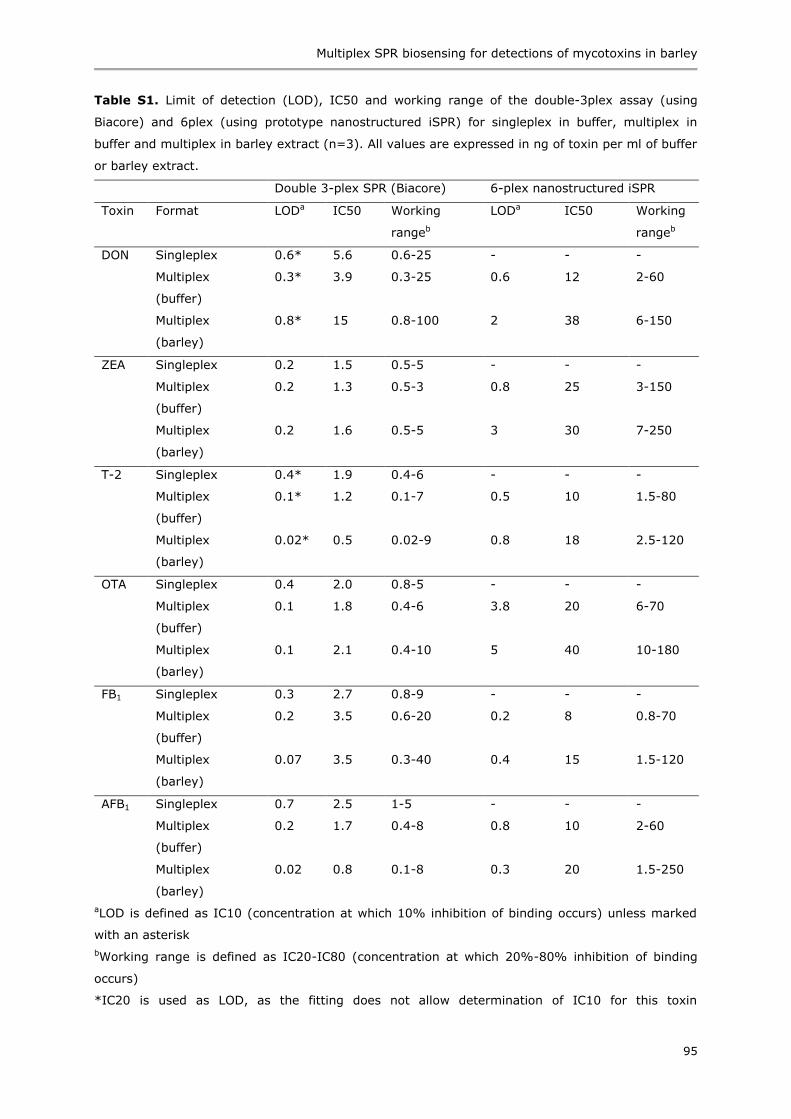
Multiplex SPR biosensing for detections of mycotoxins in barley
95
Table S1. Limit of detection (LOD), IC50 and working range of the double-3plex assay (using
Biacore) and 6plex (using prototype nanostructured iSPR) for singleplex in buffer, multiplex in
buffer and multiplex in barley extract (n=3). All values are expressed in ng of toxin per ml of buffer
or barley extract.
Double 3-plex SPR (Biacore) 6-plex nanostructured iSPR
Toxin Format LODa IC50 Working
rangeb
LODa IC50 Working
rangeb
DON Singleplex 0.6* 5.6 0.6-25 - - -
Multiplex
(buffer)
0.3* 3.9 0.3-25 0.6 12 2-60
Multiplex
(barley)
0.8* 15 0.8-100 2 38 6-150
ZEA Singleplex 0.2 1.5 0.5-5 - - -
Multiplex
(buffer)
0.2 1.3 0.5-3 0.8 25 3-150
Multiplex
(barley)
0.2 1.6 0.5-5 3 30 7-250
T-2 Singleplex 0.4* 1.9 0.4-6 - - -
Multiplex
(buffer)
0.1* 1.2 0.1-7 0.5 10 1.5-80
Multiplex
(barley)
0.02* 0.5 0.02-9 0.8 18 2.5-120
OTA Singleplex 0.4 2.0 0.8-5 - - -
Multiplex
(buffer)
0.1 1.8 0.4-6 3.8 20 6-70
Multiplex
(barley)
0.1 2.1 0.4-10 5 40 10-180
FB1 Singleplex 0.3 2.7 0.8-9 - - -
Multiplex
(buffer)
0.2 3.5 0.6-20 0.2 8 0.8-70
Multiplex
(barley)
0.07 3.5 0.3-40 0.4 15 1.5-120
AFB1 Singleplex 0.7 2.5 1-5 - - -
Multiplex
(buffer)
0.2 1.7 0.4-8 0.8 10 2-60
Multiplex
(barley)
0.02 0.8 0.1-8 0.3 20 1.5-250
aLOD is defined as IC10 (concentration at which 10% inhibition of binding occurs) unless marked
with an asterisk
bWorking range is defined as IC20-IC80 (concentration at which 20%-80% inhibition of binding
occurs)
*IC20 is used as LOD, as the fitting does not allow determination of IC10 for this toxin

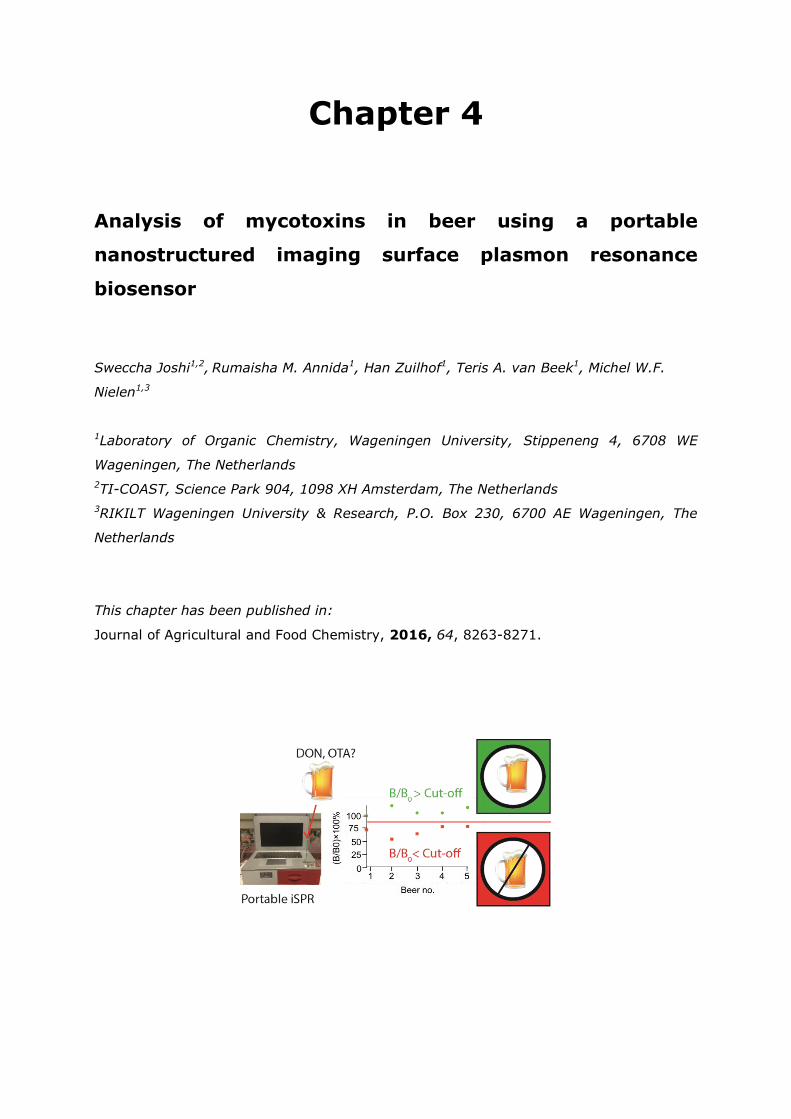
Chapter 4
Analysis of mycotoxins in beer using a portable
nanostructured imaging surface plasmon resonance
biosensor
Sweccha Joshi1,2, Rumaisha M. Annida1, Han Zuilhof1, Teris A. van Beek1, Michel W.F.
Nielen1,3
1Laboratory of Organic Chemistry, Wageningen University, Stippeneng 4, 6708 WE
Wageningen, The Netherlands
2TI-COAST, Science Park 904, 1098 XH Amsterdam, The Netherlands
3RIKILT Wageningen University & Research, P.O. Box 230, 6700 AE Wageningen, The
Netherlands
This chapter has been published in:
Journal of Agricultural and Food Chemistry, 2016, 64, 8263-8271.
Chapter 4
98
Abstract
A competitive inhibition immunoassay is described for the mycotoxins deoxynivalenol
(DON) and ochratoxin A (OTA) in beer using a portable nanostructured imaging surface
plasmon resonance (iSPR) biosensor, also referred to as imaging nanoplasmonics. The
toxins were directly and covalently immobilized on a 3-dimensional carboxymethylated
dextran (CMD) layer on a nanostructured iSPR chip. The assay is based on competition
between the immobilized mycotoxins and free mycotoxins in the solution for binding to
specific antibodies. The chip surface was regenerated after each cycle and the
combination of CMD and direct immobilization of toxins allowed the chips to be used for
more than 450 cycles. The limits of detection (LODs) in beer were 17 ng/mL for DON and
7 ng/mL for OTA (or 0.09 ng/mL after 75 times enrichment). These LODs allowed
detection of even less than 10% depletion of the tolerable daily intake of DON and OTA
by beer. Significant cross-reactivity of anti-DON was observed towards DON-3-glucoside
and 3-acetyl-DON while no cross-reactivity was seen for 15-acetyl-DON. A preliminary in-
house validation with 20 different batches of beer showed that both toxins can be
detected at the considered theoretical safe level for beer. The assay can be used for in-
field or at-line detection of DON in beer and also in barley without pre-concentration,
while OTA in beer requires an additional enrichment step thus making the latter in its
present form less suitable for field applications.
Keywords
Imaging SPR, mycotoxins, beer, nanoplasmonics, deoxynivalenol, ochratoxin A
Analysis of mycotoxins in beer using a portable nanostructured iSPR biosensor
99
Introduction
Mycotoxins are the secondary metabolites of fungi commonly found in several foods,
beverages, and animal feed and are known to be teratogenic, mutagenic, and
carcinogenic.1 They are carried-over from infected barley into malt and ultimately to beer
due to their thermal stability and relatively good water solubility.2-4 Therefore, careful
screening of beer ingredients and end products is required for safety of the consumers.
The occurrence of different mycotoxins in beer has been reported earlier with most
studies focusing on deoxynivalenol (1; DON) mainly due to its high incidence.5,6 Another
mycotoxin, ochratoxin A (5; OTA), although detected in beer at low concentrations (only
<0.2 ng/mL),7,8 is of interest due to its high toxicity. According to EU legislation, the
maximum levels (MLs) relevant for barley are set to be 1250 µg/kg for DON (in
unprocessed cereals other than durum wheat, oats and maize) and 5 µg/kg for OTA (in
unprocessed cereals).9 At present there is no specific regulation for mycotoxins in beer;
only a tolerable daily intake (TDI) of 1 µg DON10 and a tolerable weekly intake (TWI) of
120 ng OTA11 per kg body weight are defined. For a person with 70 kg body weight and a
beer consumption of 300 mL, the maximum allowable concentrations in beers based on
the TDIs are 233 ng/mL for DON and 4 ng/mL for OTA. Measuring 10% of the TDI
depletion would require sensitivities of 23 ng/mL and 0.4 ng/mL for DON and OTA
respectively. Solely for in-house validation purposes, we defined ‘theoretical safe limits’
(TSLs) and set them at 120 ng/mL for DON and 0.2 ng/mL for OTA in beer. They
correspond to 50% TDI depletion for DON and only 5% TDI depletion for the more toxic
OTA.
In recent years, several methods have been developed for the detection of
mycotoxins in different food and beverages.12-15 Literature about different methods for
detection of mycotoxins in cereals was covered in our previous publication.16 Most
methods for the detection of DON and OTA in beer are based on liquid chromatography
(LC) coupled with mass spectrometric (MS) detection.2,6,17-21 Although LC-MS based
methods are sensitive and can be used for quantitative analysis of the mycotoxins, they
are quite expensive, laboratory based, and require expert personnel. Another laboratory
based method for the detection of mycotoxins in beer is gas chromatography coupled
with mass spectrometry (GC-MS) with similar demerits as LC-MS.22 Immunological assay
kits,23 offer a simple, portable, semi-quantitative solution for mycotoxin detection with
enzyme-linked immunosorbent assay (ELISA) being the most commonly used
method.17,24-26 Amongst the immunological methods, surface plasmon resonance (SPR)
biosensing has been used for the detection of single or multiple mycotoxins in different
cereals including the malt ingredient barley.16,27 However, no SPR assay has been
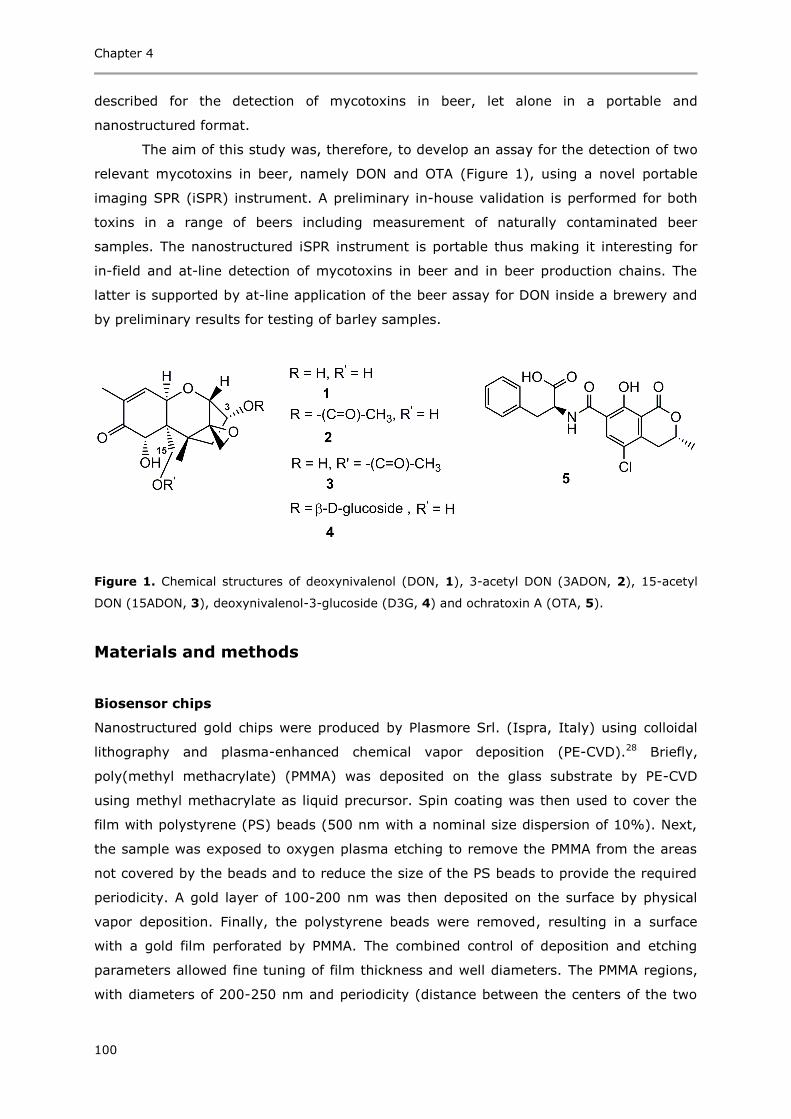
Chapter 4
100
described for the detection of mycotoxins in beer, let alone in a portable and
nanostructured format.
The aim of this study was, therefore, to develop an assay for the detection of two
relevant mycotoxins in beer, namely DON and OTA (Figure 1), using a novel portable
imaging SPR (iSPR) instrument. A preliminary in-house validation is performed for both
toxins in a range of beers including measurement of naturally contaminated beer
samples. The nanostructured iSPR instrument is portable thus making it interesting for
in-field and at-line detection of mycotoxins in beer and in beer production chains. The
latter is supported by at-line application of the beer assay for DON inside a brewery and
by preliminary results for testing of barley samples.
Figure 1. Chemical structures of deoxynivalenol (DON, 1), 3-acetyl DON (3ADON, 2), 15-acetyl
DON (15ADON, 3), deoxynivalenol-3-glucoside (D3G, 4) and ochratoxin A (OTA, 5).
Materials and methods
Biosensor chips
Nanostructured gold chips were produced by Plasmore Srl. (Ispra, Italy) using colloidal
lithography and plasma-enhanced chemical vapor deposition (PE-CVD).28 Briefly,
poly(methyl methacrylate) (PMMA) was deposited on the glass substrate by PE-CVD
using methyl methacrylate as liquid precursor. Spin coating was then used to cover the
film with polystyrene (PS) beads (500 nm with a nominal size dispersion of 10%). Next,
the sample was exposed to oxygen plasma etching to remove the PMMA from the areas
not covered by the beads and to reduce the size of the PS beads to provide the required
periodicity. A gold layer of 100-200 nm was then deposited on the surface by physical
vapor deposition. Finally, the polystyrene beads were removed, resulting in a surface
with a gold film perforated by PMMA. The combined control of deposition and etching
parameters allowed fine tuning of film thickness and well diameters. The PMMA regions,
with diameters of 200-250 nm and periodicity (distance between the centers of the two
Analysis of mycotoxins in beer using a portable nanostructured iSPR biosensor
101
PMMA wells) of 500-600 nm, make up around 20% of the total surface area (Figure 2A).
The nanostructured gold acting as a nanograting allows the omission of prisms in the
optical setup of the instrument (Figure 2B). Detailed characterization of the
nanostructured iSPR chips can be found in an earlier publication.29 The nanostructured
gold chips were further modified with carboxymethylated dextran of 200 nm thickness
with a high density of carboxymethylated groups (CMD200D) by Xantec (Düsseldorf,
Germany).
Chemicals
Ammonia, anhydrous dimethyl sulfoxide (DMSO), boric acid, 1,1′-carbonyldiimidazole
(CDI), ethanolamine hydrochloride, 1-ethyl-3-(3-dimethylaminopropyl) carbodiimide
hydrochloride (EDC), formic acid, hydrochloric acid, 2,2′(ethylenedioxy)bis(ethylamine)
(Jeffamine), N-hydroxysuccinimide (NHS), dibasic potassium phosphate, monobasic
potassium phosphate, sodium bicarbonate, sodium carbonate, sodium hydroxide and
sodium tetraborate (Sigma Aldrich, Zwijndrecht, The Netherlands), methanol and
acetonitrile (VWR, Amsterdam, The Netherlands) were used as obtained. HBS-EP (0.01 M
HEPES pH 7.4, 0.15 M NaCl, 3 mM EDTA, 0.005% v/v Surfactant P20) (GE Healthcare,
Diegem, Belgium) was used as buffer. MilliQ water (18.3 MΩ∙cm resistivity) was obtained
using a water purification system (Merck, Amsterdam, The Netherlands). Oasis MAX
mixed anion exchange SPE columns (6 cc Vac Cartridge, 150 mg sorbent per cartridge,
60 µm particle size) (Waters, Etten-Leur, The Netherlands) were used for enrichment of
OTA.
Antibodies and toxins
Monoclonal antibodies (mAbs) against DON (AB-02-02) (Aokin AG, Berlin, Germany) and
mAbs against OTA (SFH-OTA-005) (Soft Flow Biotechnology, Pecs, Hungary) were used
for all experiments. Solid mycotoxin and reference solutions of DON 1, 3-acetyl-DON
(3ADON) 2, 15-acetyl-DON (15ADON) 3, deoxynivalenol-3-glucoside (D3G) 4, and OTA 5
(Biopure via RomerLabs, Tulln, Austria) were used (Figure 1).
Samples
Nine pale lager beers (five with 5% alcohol, two pilsners with 5% alcohol, one Czech
pilsner with 4.4% alcohol, one alcohol free), one dark ale beer (abbey dubbel with 6.8%
alcohol), and one strong pale ale beer (abbey tripel with 9.5% alcohol) were bought from
Dutch supermarkets. Twenty different batches of one of the pale lager beers were
selected for the validation. Contaminated beer 1 (CB1) containing 2760 ± 95 ng/mL of
DON and 3883 ± 137 ng/mL of D3G according to previous literature (measured using
LC‒MS/MS)19 was kindly provided by Dr. Milena Zachariasova. Two other contaminated
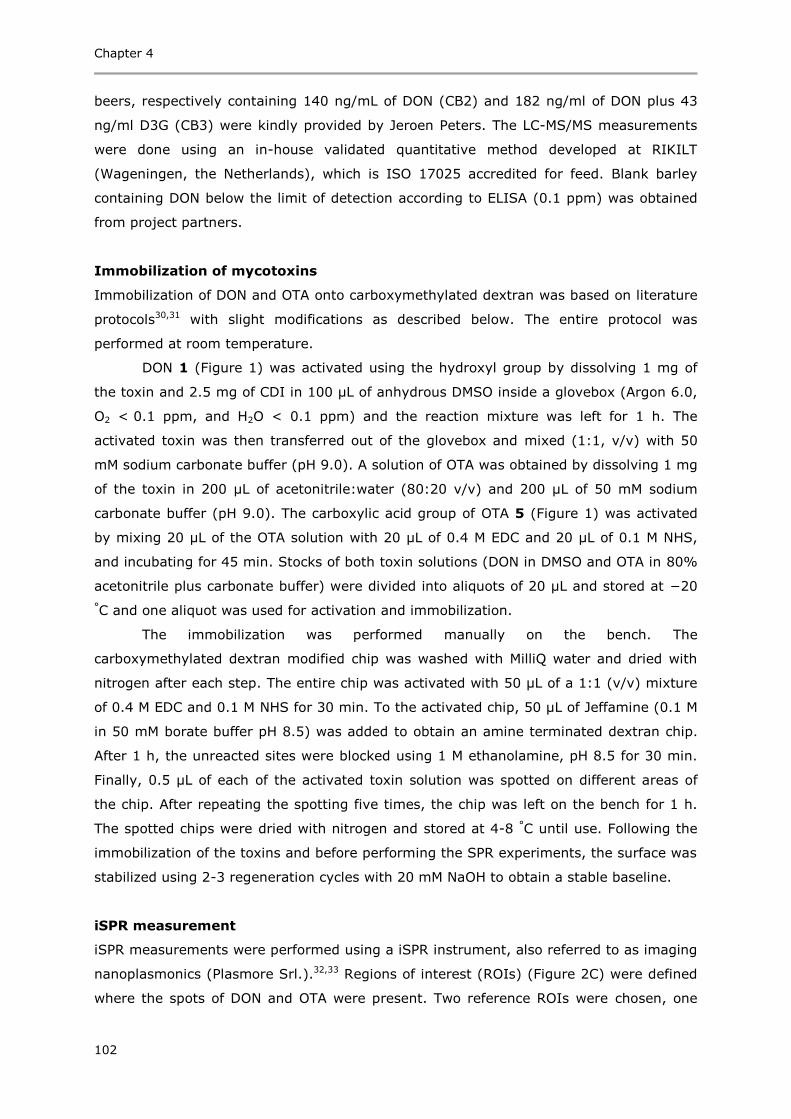
Chapter 4
102
beers, respectively containing 140 ng/mL of DON (CB2) and 182 ng/ml of DON plus 43
ng/ml D3G (CB3) were kindly provided by Jeroen Peters. The LC-MS/MS measurements
were done using an in-house validated quantitative method developed at RIKILT
(Wageningen, the Netherlands), which is ISO 17025 accredited for feed. Blank barley
containing DON below the limit of detection according to ELISA (0.1 ppm) was obtained
from project partners.
Immobilization of mycotoxins
Immobilization of DON and OTA onto carboxymethylated dextran was based on literature
protocols30,31 with slight modifications as described below. The entire protocol was
performed at room temperature.
DON 1 (Figure 1) was activated using the hydroxyl group by dissolving 1 mg of
the toxin and 2.5 mg of CDI in 100 µL of anhydrous DMSO inside a glovebox (Argon 6.0,
O2 < 0.1 ppm, and H2O < 0.1 ppm) and the reaction mixture was left for 1 h. The
activated toxin was then transferred out of the glovebox and mixed (1:1, v/v) with 50
mM sodium carbonate buffer (pH 9.0). A solution of OTA was obtained by dissolving 1 mg
of the toxin in 200 µL of acetonitrile:water (80:20 v/v) and 200 µL of 50 mM sodium
carbonate buffer (pH 9.0). The carboxylic acid group of OTA 5 (Figure 1) was activated
by mixing 20 µL of the OTA solution with 20 µL of 0.4 M EDC and 20 µL of 0.1 M NHS,
and incubating for 45 min. Stocks of both toxin solutions (DON in DMSO and OTA in 80%
acetonitrile plus carbonate buffer) were divided into aliquots of 20 µL and stored at −20
°C and one aliquot was used for activation and immobilization.
The immobilization was performed manually on the bench. The
carboxymethylated dextran modified chip was washed with MilliQ water and dried with
nitrogen after each step. The entire chip was activated with 50 µL of a 1:1 (v/v) mixture
of 0.4 M EDC and 0.1 M NHS for 30 min. To the activated chip, 50 µL of Jeffamine (0.1 M
in 50 mM borate buffer pH 8.5) was added to obtain an amine terminated dextran chip.
After 1 h, the unreacted sites were blocked using 1 M ethanolamine, pH 8.5 for 30 min.
Finally, 0.5 µL of each of the activated toxin solution was spotted on different areas of
the chip. After repeating the spotting five times, the chip was left on the bench for 1 h.
The spotted chips were dried with nitrogen and stored at 4-8 °C until use. Following the
immobilization of the toxins and before performing the SPR experiments, the surface was
stabilized using 2-3 regeneration cycles with 20 mM NaOH to obtain a stable baseline.
iSPR measurement
iSPR measurements were performed using a iSPR instrument, also referred to as imaging
nanoplasmonics (Plasmore Srl.).32,33 Regions of interest (ROIs) (Figure 2C) were defined
where the spots of DON and OTA were present. Two reference ROIs were chosen, one
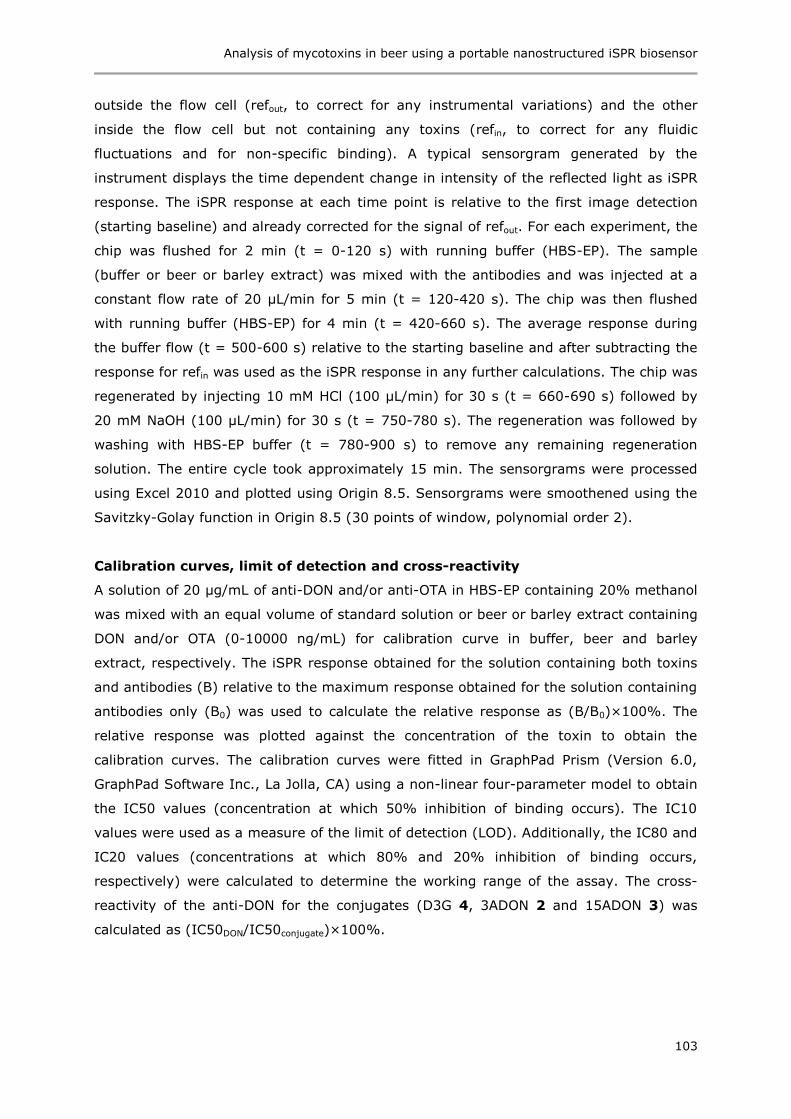
Analysis of mycotoxins in beer using a portable nanostructured iSPR biosensor
103
outside the flow cell (refout, to correct for any instrumental variations) and the other
inside the flow cell but not containing any toxins (refin, to correct for any fluidic
fluctuations and for non-specific binding). A typical sensorgram generated by the
instrument displays the time dependent change in intensity of the reflected light as iSPR
response. The iSPR response at each time point is relative to the first image detection
(starting baseline) and already corrected for the signal of refout. For each experiment, the
chip was flushed for 2 min (t = 0-120 s) with running buffer (HBS-EP). The sample
(buffer or beer or barley extract) was mixed with the antibodies and was injected at a
constant flow rate of 20 µL/min for 5 min (t = 120-420 s). The chip was then flushed
with running buffer (HBS-EP) for 4 min (t = 420-660 s). The average response during
the buffer flow (t = 500-600 s) relative to the starting baseline and after subtracting the
response for refin was used as the iSPR response in any further calculations. The chip was
regenerated by injecting 10 mM HCl (100 µL/min) for 30 s (t = 660-690 s) followed by
20 mM NaOH (100 µL/min) for 30 s (t = 750-780 s). The regeneration was followed by
washing with HBS-EP buffer (t = 780-900 s) to remove any remaining regeneration
solution. The entire cycle took approximately 15 min. The sensorgrams were processed
using Excel 2010 and plotted using Origin 8.5. Sensorgrams were smoothened using the
Savitzky-Golay function in Origin 8.5 (30 points of window, polynomial order 2).
Calibration curves, limit of detection and cross-reactivity
A solution of 20 µg/mL of anti-DON and/or anti-OTA in HBS-EP containing 20% methanol
was mixed with an equal volume of standard solution or beer or barley extract containing
DON and/or OTA (0-10000 ng/mL) for calibration curve in buffer, beer and barley
extract, respectively. The iSPR response obtained for the solution containing both toxins
and antibodies (B) relative to the maximum response obtained for the solution containing
antibodies only (B0) was used to calculate the relative response as (B/B0)×100%. The
relative response was plotted against the concentration of the toxin to obtain the
calibration curves. The calibration curves were fitted in GraphPad Prism (Version 6.0,
GraphPad Software Inc., La Jolla, CA) using a non-linear four-parameter model to obtain
the IC50 values (concentration at which 50% inhibition of binding occurs). The IC10
values were used as a measure of the limit of detection (LOD). Additionally, the IC80 and
IC20 values (concentrations at which 80% and 20% inhibition of binding occurs,
respectively) were calculated to determine the working range of the assay. The cross-
reactivity of the anti-DON for the conjugates (D3G 4, 3ADON 2 and 15ADON 3) was
calculated as (IC50DON/IC50conjugate)×100%.

Chapter 4
104
Sample preparation protocol for beer
All beer samples were degassed for 10 min in a sonication bath. Optionally, for field use
the beer can be degassed by vigorous shaking and venting in between. For DON, 180 µL
of beer (blank or spiked beer) was mixed with 2 µL of anti-DON (1000 µg/mL in HBS-EP)
and 18 µL of methanol to obtain a final concentration of 10 µg/mL anti-DON and 108
ng/mL DON (for spiked beer) in HBS-EP containing 9% methanol. For OTA, sample
enrichment was done using a mixed anion exchange SPE column. The standard protocol
from the manufacturer was optimized using LC with UV absorbance detection (Agilent
Technologies, Santa Clara, CA). Based on the UV peak at 332 nm, more than 95%
recovery was obtained using the protocol, which was eventually used in the SPR assay.
Briefly, the column was conditioned with 3 mL of methanol followed by 3 mL of water.
320 µL of 1 M phosphate buffer (pH 8) was added to 16 mL of sample (blank or spiked at
0.2 ng/mL of OTA) to obtain a final pH value around 6.8. The beer (15 mL) was then
loaded onto the column. Next, the column was rinsed with 5 mL of 5% ammonia in water
followed by 5 mL of 100% methanol. Finally, the beer was eluted with 1 mL of 2% formic
acid in methanol. The eluate was evaporated completely using a vacuum evaporator and
re-dissolved in 100 µL of HBS-EP containing 20% methanol to obtain a beer extract
containing a 150 times higher concentration of OTA (30 ng/mL in spiked beer). The
enriched beer extract was then mixed 1:1 (v/v) with 20 µg/mL of anti-OTA (in HBS-EP)
to obtain a final concentration of 10 µg/mL anti-OTA and 15 ng/mL OTA (for spiked beer)
in HBS-EP containing 10% methanol (75 times enrichment).
Extraction protocol for barley
0.5 g barley was weighed in a 10 mL centrifuge tube. For spiked barley, 31.3 µL of 20
µg/mL DON in methanol was added to the 0.5 g in order to get a spiking level at the
maximum level (ML) (1250 µg/kg). The tube was then shaken to mix the toxin with the
barley and allowed to stand on the bench for 5 min to allow the solvent to evaporate.
Extraction of blank and spiked barley was performed by adding 2 mL of HBS-EP
containing 20% methanol, followed by vigorous shaking of the mixture (manually) for 5
min. The mixture was then allowed to settle on the bench for 5 min. 700 µL of the
supernatant was collected and filtered using a 32 mm syringe filter having a 0.2 µm
Supor membrane (Pall Life Sciences, Port Washington, NY). Subsequently, 300 µL of the
filtered barley extract was mixed 1:1 with anti-DON (20 μg/mL in HBS-EP). In case of
spiked barley, considering full recovery, the final concentration of DON is 156 ng/mL
prior to iSPR analysis.
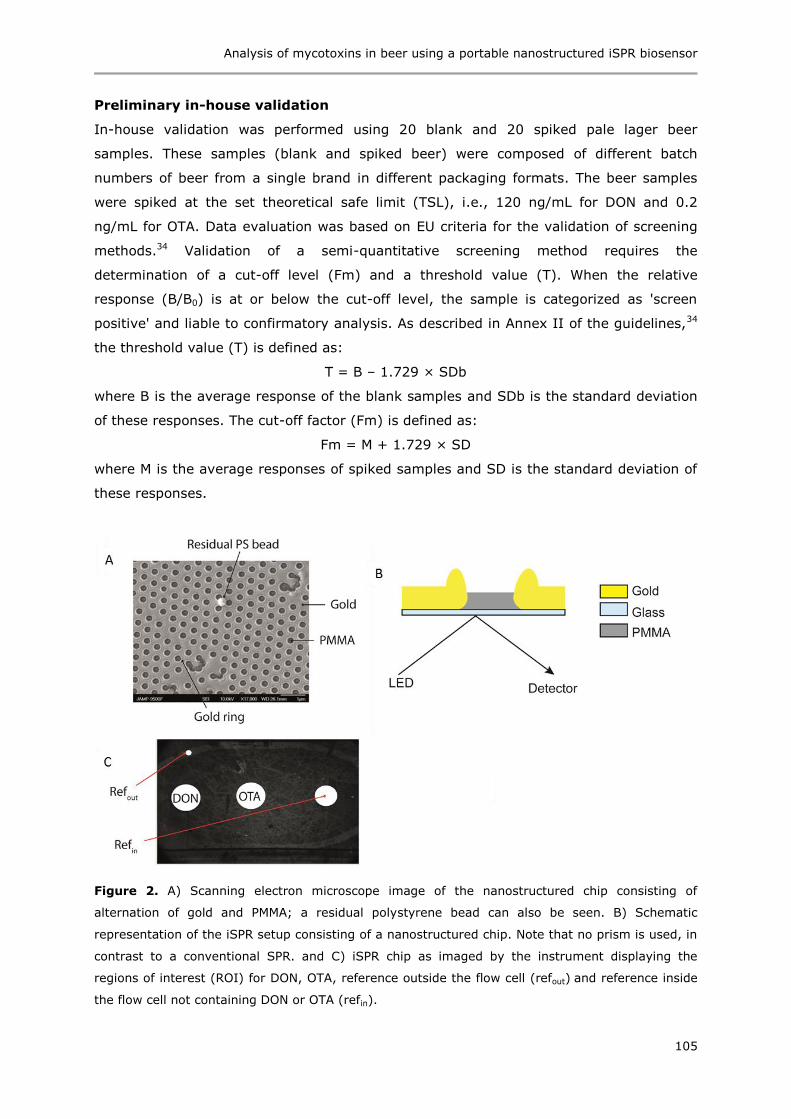
Analysis of mycotoxins in beer using a portable nanostructured iSPR biosensor
105
Preliminary in-house validation
In-house validation was performed using 20 blank and 20 spiked pale lager beer
samples. These samples (blank and spiked beer) were composed of different batch
numbers of beer from a single brand in different packaging formats. The beer samples
were spiked at the set theoretical safe limit (TSL), i.e., 120 ng/mL for DON and 0.2
ng/mL for OTA. Data evaluation was based on EU criteria for the validation of screening
methods.34 Validation of a semi-quantitative screening method requires the
determination of a cut-off level (Fm) and a threshold value (T). When the relative
response (B/B0) is at or below the cut-off level, the sample is categorized as 'screen
positive' and liable to confirmatory analysis. As described in Annex II of the guidelines,34
the threshold value (T) is defined as:
T = B – 1.729 × SDb
where B is the average response of the blank samples and SDb is the standard deviation
of these responses. The cut-off factor (Fm) is defined as:
Fm = M + 1.729 × SD
where M is the average responses of spiked samples and SD is the standard deviation of
these responses.
Figure 2. A) Scanning electron microscope image of the nanostructured chip consisting of
alternation of gold and PMMA; a residual polystyrene bead can also be seen. B) Schematic
representation of the iSPR setup consisting of a nanostructured chip. Note that no prism is used, in
contrast to a conventional SPR. and C) iSPR chip as imaged by the instrument displaying the
regions of interest (ROI) for DON, OTA, reference outside the flow cell (refout) and reference inside
the flow cell not containing DON or OTA (refin).
Chapter 4
106
Results and discussion
Biosensor development
Mycotoxins are small molecules and therefore cannot be detected using a direct SPR
assay. In the indirect approach, either the toxin itself or a protein conjugate of the toxin
is immobilized on the chip surface. The SPR response of a much larger and specific
antibody is then recorded upon injection of a mixture of antibodies and the sample
(toxins in buffer or in matrix) over a chip with covalently coupled toxins or toxin-protein
conjugates. The assay is based on competition between immobilized mycotoxin and free
mycotoxin in solution for binding to the fixed amount of antibody. In our previous
study,16 ovalbumin conjugates of mycotoxins were immobilized on a 2D polyethylene
glycol surface via the amine group of the protein. In contrast, in the current study direct
immobilization of toxins was explored as their binding to the surface is expected to be
much more robust compared to protein conjugates, which are more sensitive to the
regeneration conditions applied for disruption of antibody binding. In addition, the
absence of a big protein, such as ovalbumin, can also contribute to signal enhancement
as the SPR sensitivity decreases with increasing distance from the chip surface and is
highest close to the surface. However, the immobilization of a small molecule such as a
mycotoxin is challenging due to the limited number of functional groups (Figure 1) that
can be exploited without blocking the binding sites for antibodies. To efficiently
immobilize these small toxins, first a layer of carboxymethylated dextran (CMD)35 was
bound to the gold surface of the nanostructured iSPR chips. CMD, the most commonly
used surface in SPR, is a 3D hydrogel with excellent antifouling properties and has more
functional groups compared to the 2D polyethylene glycol layers previously used.16 The
success of the CMD modification of the nanostructured iSPR chips was confirmed by the
low contact angle (<10°) and X-ray photoelectron spectroscopy (XPS) results via
comparison with conventional flat gold SPR chips modified with the same chemistry by
the same manufacturer. The slightly lower degree of modification in case of
nanostructured iSPR chips was expected as 20% of the surface, consisting of PMMA wells
in between the gold and PMMA, cannot be modified with CMD. Although there were minor
differences in the XPS spectra we were able to successfully immobilize the mycotoxins on
the nanostructured chips. DON was chosen as it is the most relevant toxin for beer.5,6 On
the other hand, OTA, although occurring less frequently in beer, is of concern for the
beer industry due to its high toxicity.7,8 Both toxins could be successfully immobilized on
the CMD surface following our protocol. The multiplexing capability of the iSPR
instrument allows the future assay extension with other mycotoxins, depending on the
application and prioritized toxin targets.
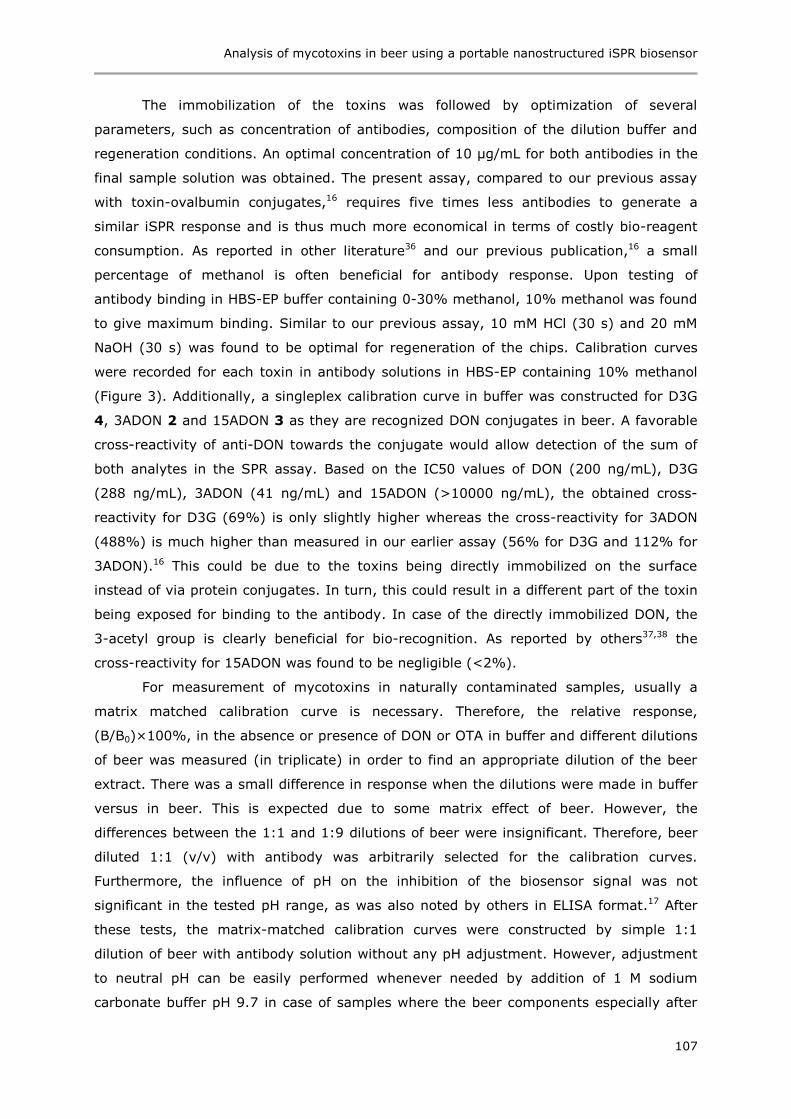
Analysis of mycotoxins in beer using a portable nanostructured iSPR biosensor
107
The immobilization of the toxins was followed by optimization of several
parameters, such as concentration of antibodies, composition of the dilution buffer and
regeneration conditions. An optimal concentration of 10 µg/mL for both antibodies in the
final sample solution was obtained. The present assay, compared to our previous assay
with toxin-ovalbumin conjugates,16 requires five times less antibodies to generate a
similar iSPR response and is thus much more economical in terms of costly bio-reagent
consumption. As reported in other literature36 and our previous publication,16 a small
percentage of methanol is often beneficial for antibody response. Upon testing of
antibody binding in HBS-EP buffer containing 0-30% methanol, 10% methanol was found
to give maximum binding. Similar to our previous assay, 10 mM HCl (30 s) and 20 mM
NaOH (30 s) was found to be optimal for regeneration of the chips. Calibration curves
were recorded for each toxin in antibody solutions in HBS-EP containing 10% methanol
(Figure 3). Additionally, a singleplex calibration curve in buffer was constructed for D3G
4, 3ADON 2 and 15ADON 3 as they are recognized DON conjugates in beer. A favorable
cross-reactivity of anti-DON towards the conjugate would allow detection of the sum of
both analytes in the SPR assay. Based on the IC50 values of DON (200 ng/mL), D3G
(288 ng/mL), 3ADON (41 ng/mL) and 15ADON (>10000 ng/mL), the obtained cross-
reactivity for D3G (69%) is only slightly higher whereas the cross-reactivity for 3ADON
(488%) is much higher than measured in our earlier assay (56% for D3G and 112% for
3ADON).16 This could be due to the toxins being directly immobilized on the surface
instead of via protein conjugates. In turn, this could result in a different part of the toxin
being exposed for binding to the antibody. In case of the directly immobilized DON, the
3-acetyl group is clearly beneficial for bio-recognition. As reported by others37,38 the
cross-reactivity for 15ADON was found to be negligible (<2%).
For measurement of mycotoxins in naturally contaminated samples, usually a
matrix matched calibration curve is necessary. Therefore, the relative response,
(B/B0)×100%, in the absence or presence of DON or OTA in buffer and different dilutions
of beer was measured (in triplicate) in order to find an appropriate dilution of the beer
extract. There was a small difference in response when the dilutions were made in buffer
versus in beer. This is expected due to some matrix effect of beer. However, the
differences between the 1:1 and 1:9 dilutions of beer were insignificant. Therefore, beer
diluted 1:1 (v/v) with antibody was arbitrarily selected for the calibration curves.
Furthermore, the influence of pH on the inhibition of the biosensor signal was not
significant in the tested pH range, as was also noted by others in ELISA format.17 After
these tests, the matrix-matched calibration curves were constructed by simple 1:1
dilution of beer with antibody solution without any pH adjustment. However, adjustment
to neutral pH can be easily performed whenever needed by addition of 1 M sodium
carbonate buffer pH 9.7 in case of samples where the beer components especially after
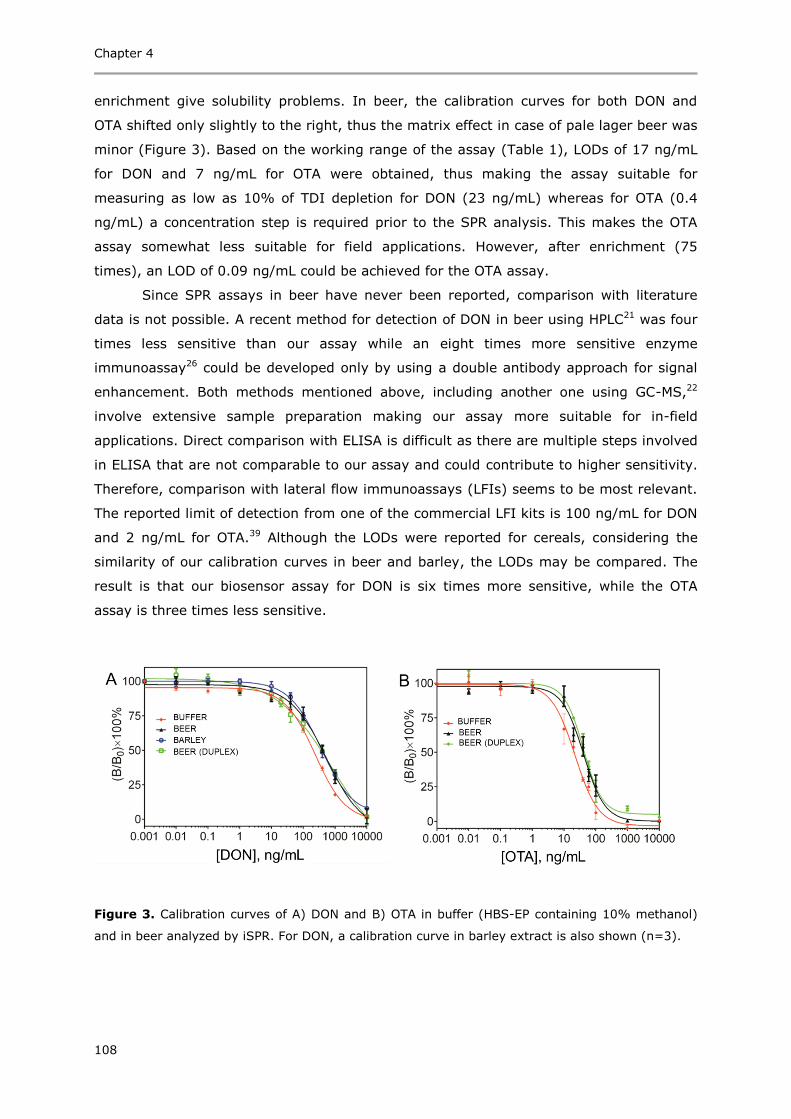
Chapter 4
108
enrichment give solubility problems. In beer, the calibration curves for both DON and
OTA shifted only slightly to the right, thus the matrix effect in case of pale lager beer was
minor (Figure 3). Based on the working range of the assay (Table 1), LODs of 17 ng/mL
for DON and 7 ng/mL for OTA were obtained, thus making the assay suitable for
measuring as low as 10% of TDI depletion for DON (23 ng/mL) whereas for OTA (0.4
ng/mL) a concentration step is required prior to the SPR analysis. This makes the OTA
assay somewhat less suitable for field applications. However, after enrichment (75
times), an LOD of 0.09 ng/mL could be achieved for the OTA assay.
Since SPR assays in beer have never been reported, comparison with literature
data is not possible. A recent method for detection of DON in beer using HPLC21 was four
times less sensitive than our assay while an eight times more sensitive enzyme
immunoassay26 could be developed only by using a double antibody approach for signal
enhancement. Both methods mentioned above, including another one using GC-MS,22
involve extensive sample preparation making our assay more suitable for in-field
applications. Direct comparison with ELISA is difficult as there are multiple steps involved
in ELISA that are not comparable to our assay and could contribute to higher sensitivity.
Therefore, comparison with lateral flow immunoassays (LFIs) seems to be most relevant.
The reported limit of detection from one of the commercial LFI kits is 100 ng/mL for DON
and 2 ng/mL for OTA.39 Although the LODs were reported for cereals, considering the
similarity of our calibration curves in beer and barley, the LODs may be compared. The
result is that our biosensor assay for DON is six times more sensitive, while the OTA
assay is three times less sensitive.
Figure 3. Calibration curves of A) DON and B) OTA in buffer (HBS-EP containing 10% methanol)
and in beer analyzed by iSPR. For DON, a calibration curve in barley extract is also shown (n=3).
Analysis of mycotoxins in beer using a portable nanostructured iSPR biosensor
109
Durability of iSPR chips following multiple analyses and regenerations
Direct immobilization of mycotoxins instead of their ovalbumin conjugates has greatly
improved the durability of the iSPR chips. A single chip was re-used for more than 450
experiments, which is unprecedented for a modified nanostructured sensor chip. After a
few initial cycles of regeneration, a perfect regeneration was obtained following each SPR
analysis, unlike protein conjugates that were much more sensitive to regenerations.16
The durability of the chip helps to reduce the overall cost per assay as the same chip can
be used to measure hundreds of samples. After more than 450 cycles, the
nanostructured gold started peeling off. The average response of a 10 µg/mL anti-DON
over the entire period was 0.027 ± 0.001 (n=32) and the final response measured was
0.028. Therefore, the damage was of a physical nature and related to the chip while the
toxins on the surface were still fully functional after 450 cycles.
Table 1. 10% of tolerable daily intake (TDI) for DON and OTA based on calibration curves in buffer
and beer using the iSPR assay (n=3).
Toxins 10% of TDI
(ng/mL)
Buffer Beer
LODa IC50 working rangeb LODa IC50 working rangeb
(ng/mL) (ng/mL)
DON 23 8 200 36-1000 17 400 60-2000
OTA 0.4 3 20 6-60 7
(0.09*)
40 10-120
aLOD is defined as IC10 (concentration at which 10% inhibition of binding occurs)
bWorking range is defined as IC20-IC80 (concentration at which 20%-80% inhibition of binding
occurs)
*LOD after 75 times enrichment
Preliminary in-house validation
To check the repeatability of inhibition at the considered theoretical safe limits (TSLs,
120 ng/mL for DON), blank beer from one bottle of pale lager was spiked and both the
blank and spiked beer were measured in five repeats on the same day. The same
experiment (including spiking) was repeated for another two days to get 15 repeats. The
average relative responses (%) of blank and spiked samples were 101.9 ± 4.6 and 77.1
± 2.8, respectively, thus highlighting the excellent repeatability of the inhibition assay.
Furthermore, based on the obtained data, the intra- and inter-day RSDs were calculated.
Since the samples were divided over three days, the intra-day RSDs are an average of
the RSDs of three days while the inter-day RSDs were the deviations of the average
responses of the three days. The obtained intra-day and inter-day variation for the
response of blank beer were 4.4% and 5.6% respectively while those of spiked beer were
Chapter 4
110
2.8 and 3.9% respectively. Preliminary in-house validation was then performed at the
considered TSLs (120 ng/mL for DON and 0.2 ng/mL for OTA) using 20 different blank
and spiked beers. In case of DON, simple dilution 90:1:9) (beer:anti-DON:methanol) was
enough to allow detection within the working range of the assay (Figure 4A). However,
for the detection of OTA at the desired TSL (0.2 ng/mL) and considering the working
range of our calibration curve in beer (10-120 ng/mL), sample pre-concentration was
required. For a successful validation, the cut-off factor (Fm) values have to be lower than
the threshold (T) values and only 5% of the spiked samples (1 out of 20) are allowed to
be false negative. Having fulfilled both these criteria, our method was successfully
validated at the considered TSLs for both DON and OTA (Figure 4). Any sample with a
relative response below the cut-off value would be considered 'screen positive' and
should be subjected to further confirmatory analysis. The obtained RSDs for different
batches of blank and beers spiked with DON were compared to the earlier experiment
where beer from one bottle of pale lager beer was used. Despite the different batch
numbers as an additional variable, the intra- and inter-day RSDs were very similar to the
earlier experiment for blank beer (4.6 and 5.5% respectively) while the values for spiked
beer were only slightly higher (4.7 and 4.3% respectively). Similar RSDs (6.5-5.1%)
were obtained for blank and beer spiked with OTA in the latter experiment. The obtained
results show that the developed assay is reproducible, robust and suitable for detection
of DON and OTA in beer.
Measurement of naturally contaminated beer samples
A few samples of beer naturally contaminated with DON and D3G were analyzed to
demonstrate the real-life application of the developed assay. Since, the anti-DON has
high cross-reactivity towards D3G, concentrations of both toxins have to be considered
during analysis. Based on the values obtained by LC-MS/MS, beer 1 (diluted 5 times in
buffer) was mixed 1:1, beer 2 was mixed 9:1 and beer 3 was mixed 1:1 with anti-DON to
obtain the iSPR response. For contaminated beer 1 (CB1) containing 664 ng/mL
DON+D3G,19 the measured inhibition for the contaminated sample corresponded to a
concentration of 529 ± 37 ng/mL, i.e., 20% lower than the LC-MS/MS value. In case of
CB2 and CB3, the measured concentrations of 169 ± 34 and 292 ± 65 ng/mL were 20
and 30% higher, respectively, than the LC-MS/MS values (140 ng/mL and 225 ng/mL).
The higher concentrations measured in the latter two cases could be due to presence of
other conjugates of DON having cross-reactivity towards anti-DON, at quantities below
the detection limit of the LC-MS/MS method. Such results have also been observed in an
earlier study where the concentrations obtained from ELISA were higher than those
obtained from LC-MS/MS.17 However, such overestimation would not affect a screening
method like the one presented here where a sample with relative responses below the
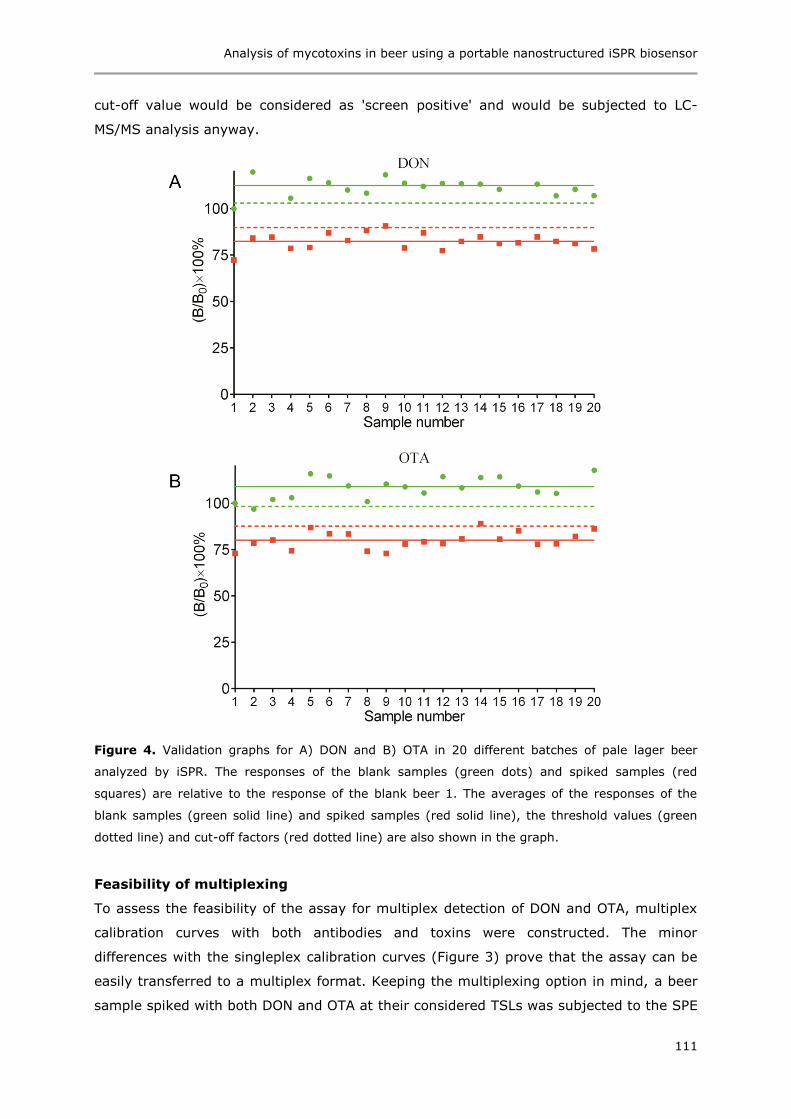
Analysis of mycotoxins in beer using a portable nanostructured iSPR biosensor
111
cut-off value would be considered as 'screen positive' and would be subjected to LC-
MS/MS analysis anyway.
Figure 4. Validation graphs for A) DON and B) OTA in 20 different batches of pale lager beer
analyzed by iSPR. The responses of the blank samples (green dots) and spiked samples (red
squares) are relative to the response of the blank beer 1. The averages of the responses of the
blank samples (green solid line) and spiked samples (red solid line), the threshold values (green
dotted line) and cut-off factors (red dotted line) are also shown in the graph.
Feasibility of multiplexing
To assess the feasibility of the assay for multiplex detection of DON and OTA, multiplex
calibration curves with both antibodies and toxins were constructed. The minor
differences with the singleplex calibration curves (Figure 3) prove that the assay can be
easily transferred to a multiplex format. Keeping the multiplexing option in mind, a beer
sample spiked with both DON and OTA at their considered TSLs was subjected to the SPE

Chapter 4
112
protocol as described for OTA. Firstly, iSPR analysis of the flow-through, collected during
loading of beer, was done to confirm that DON was not retained by the SPE column and
was present in the flow-through collected during loading. Next, the beer extract
(containing OTA), after the entire SPE procedure and evaporation, was re-dissolved in
900 µL of the flow-through (containing DON). Finally, 10 µL of anti-DON and anti-OTA
(100 µg/mL in HBS-EP of each) plus 90 µL of methanol was added to measure the
concentration of both toxins in a single experiment. The final concentrations for the iSPR
measurements were 10 µg/mL of anti-DON and 10 µg/mL of anti-OTA plus 108 ng/mL of
DON and 15 ng/mL of OTA in HBS-EP containing 9% methanol. The measured relative
responses (75 ± 4% for DON and 74 ± 8% for OTA) were identical to the expected
responses (77 ± 3% for DON and 78 ± 5% for OTA) obtained from multiplex calibration
curves, showing that simultaneous measurement of the two toxins is possible.
Measurement of other beers
To demonstrate the versatility of the assay in beer analysis, ten different beers (with
different styles and/or alcohol percentages) from the Dutch market were analyzed in
triplicate. All the beers were spiked with DON and OTA at the considered TSLs and the
average relative responses for all beer types were below the cut-off value (Figure 5).
Thus, the developed assay is applicable to beer within a range of styles (pale lager,
pilsner, Czech pilsner, abbey dubbel and abbey triple) and alcohol percentages (0-9.5%),
despite the fact that the matrix matched calibration curve was only in pale lager beer
containing 5% alcohol.
At-line testing of beers at a commercial brewery
To demonstrate the applicability for DON testing, the iSPR instrument was transported to
a brewery. Within 15 min the instrument was ready to measure and a number of
different commercial beers were measured for the presence of DON. The only sample
pretreatment required was degassing. After adding anti-DON, beers could be measured
every 15 min including regeneration. Per sample, 100 µL of beer was needed for one
measurement. All of the beers, using a calibration curve measured one week earlier in
our lab, were negative for DON (<LOD of 17 ng/mL). However after spiking with DON at
the TSL (120 ng/mL), all beers were positive. The % inhibition of the iSPR signal for the
beer spiked at the brewery deviated less than 10% from values recorded with other
beers spiked at the same level in our own laboratory. This clearly shows the
transferability of the methodology.
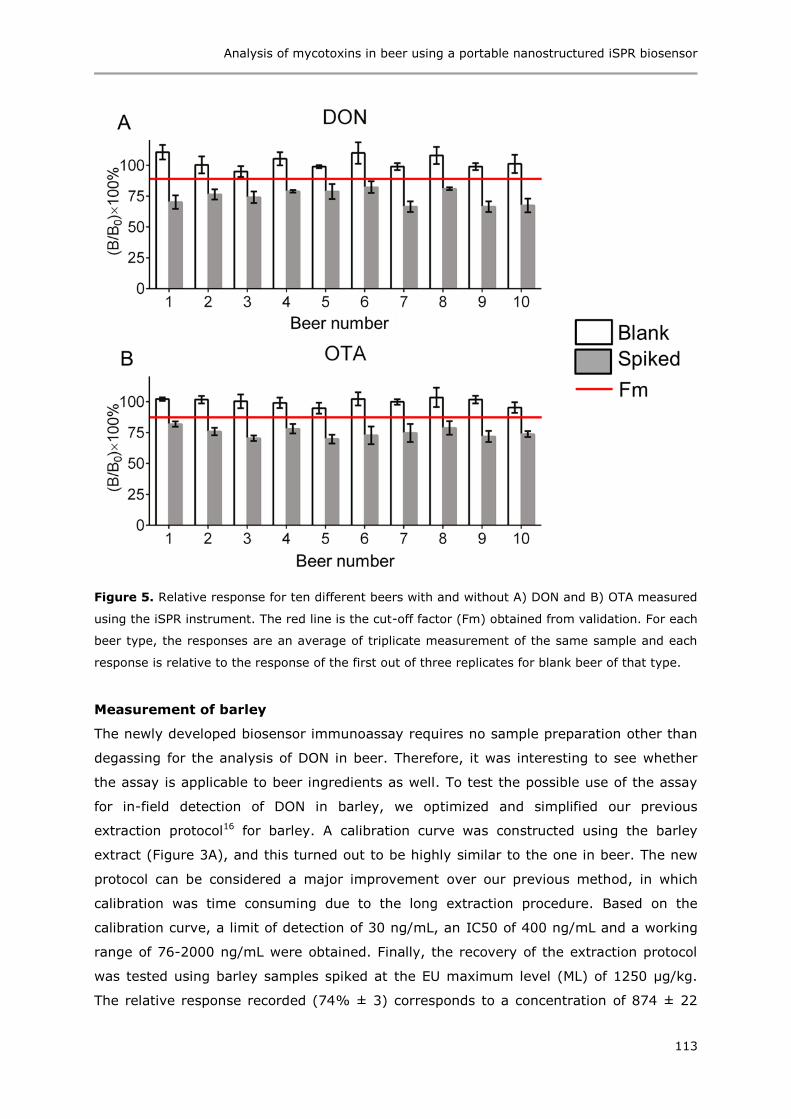
Analysis of mycotoxins in beer using a portable nanostructured iSPR biosensor
113
Figure 5. Relative response for ten different beers with and without A) DON and B) OTA measured
using the iSPR instrument. The red line is the cut-off factor (Fm) obtained from validation. For each
beer type, the responses are an average of triplicate measurement of the same sample and each
response is relative to the response of the first out of three replicates for blank beer of that type.
Measurement of barley
The newly developed biosensor immunoassay requires no sample preparation other than
degassing for the analysis of DON in beer. Therefore, it was interesting to see whether
the assay is applicable to beer ingredients as well. To test the possible use of the assay
for in-field detection of DON in barley, we optimized and simplified our previous
extraction protocol16 for barley. A calibration curve was constructed using the barley
extract (Figure 3A), and this turned out to be highly similar to the one in beer. The new
protocol can be considered a major improvement over our previous method, in which
calibration was time consuming due to the long extraction procedure. Based on the
calibration curve, a limit of detection of 30 ng/mL, an IC50 of 400 ng/mL and a working
range of 76-2000 ng/mL were obtained. Finally, the recovery of the extraction protocol
was tested using barley samples spiked at the EU maximum level (ML) of 1250 µg/kg.
The relative response recorded (74% ± 3) corresponds to a concentration of 874 ± 22
Chapter 4
114
µg/kg, i.e., 30% lower than the expected value at 100% recovery. This could be due to
incomplete recovery, as was also seen in our previous study.16 Nevertheless, a significant
inhibition was seen for barley spiked at ML, which makes this assay suitable for semi-
quantitative screening of DON in barley. The simplified extraction protocol involves a
short extraction step followed by filtration and does not require any sophisticated
laboratory equipment and can be easily performed in the field.
In summary, a competitive inhibition immunoassay using a portable iSPR
instrument was successfully developed for the detection of DON and OTA in beer. In
contrast to our previous assay using PEG3500 with OVA conjugates of mycotoxins,16 3D
carboxymethylated dextran was used for direct attachment of toxins in the present
assay. This has helped to reduce the concentration of antibodies by a factor of five and to
increase the durability of the nanostructured biosensor chip by 7.5 times. The assay LOD
allows detection of even less than 10% TDI depletion of both DON and OTA. A
preliminary in-house validation based on 20 different batches of beer, along with
measurement of ten additional beer samples of different styles and alcohol percentages,
and of naturally contaminated beer samples, demonstrates the wide applicability and
robustness of the assay for the detection of the two most relevant toxins in beer. The
observed cross-reactivity of anti-DON towards D3G and 3ADON allows determination of
the sum of the analytes. Furthermore, the DON assay requires minimal sample
preparation compared to methods reported in the literature21,22,26 and can also be easily
extended to the detection in barley and in compliance with the legal limit set by the EU.
The multiplexing capability of the iSPR would allow extension of the current assay to
other mycotoxins while the portability of the instrument and the transferability of the
method were proven by a successful at-line application at a commercial brewery.
Acknowledgements
This research received funding from the Netherlands Organisation for Scientific Research
(NWO) in the framework of the Technology Area COAST (project nr 053.21.107) with
WU, VU Amsterdam, RIKILT, Heineken, Synthon, Technex, EuroProxima, Waterproef as
partners and Plasmore and Bionavis as associated partners. Willem Haasnoot (RIKILT,
Wageningen, NL) is gratefully acknowledged for his suggestion of direct immobilization of
the toxins. We would like to thank Milena Zachariasova (UCT Prague, Czech Republic)
and Jeroen Peters (RIKILT) for the contaminated beer samples and project partners for
stimulating discussions.

Analysis of mycotoxins in beer using a portable nanostructured iSPR biosensor
115
References
1. DeVries, J. W.; Trucksess, M. W.; Jackson, L. S., Mycotoxins and food safety. Springer: New York, 2002.
2. Lancova, K.; Hajslova, J.; Poustka, J.; Krplova, A.; Zachariasova, M.; Dostalek, P.; Sachambula, L. Transfer of Fusarium mycotoxins and ‘masked’ deoxynivalenol (deoxynivalenol-3-glucoside) from field barley through malt to beer. Food Addit. Contam., Part A 2008, 25, 732-744.
3. Inoue, T.; Nagatomi, Y.; Uyama, A.; Mochizuki, N. Fate of mycotoxins during beer brewing and fermentation. Biosci., Biotechnol., Biochem. 2013, 77, 1410-1415.
4. Habler, K.; Hofer, K.; Geissinger, C.; Schuler, J.; Huckelhoven, R.; Hess, M.; Gastl, M.; Rychlik, M. Fate of Fusarium toxins during the malting process. J. Agric. Food Chem. 2016, 64, 1377-1384.
5. Curtui, V.; Brockmeyer, A.; Dietrich, R.; Kappenstein, O.; Klaffke, H.; Lepschy, J.; Märtlbauer, E.; Schneider, E.; Seidler, C.; Thielert, G.; Usleber, E.; Weber, R.; Wolff, J. Deoxynivalenol in food. Mycotoxin Res. 2005, 21, 83-88.
6. Kostelanska, M.; Hajslova, J.; Zachariasova, M.; Malachova, A.; Kalachova, K.; Poustka, J.;
Fiala, J.; Scott, P. M.; Berthiller, F.; Krska, R. Occurrence of deoxynivalenol and its major conjugate, deoxynivalenol-3-glucoside, in beer and some brewing intermediates. J. Agric. Food Chem. 2009, 57, 3187-3194.
7. Mateo, R.; Medina, Á.; Mateo, E. M.; Mateo, F.; Jiménez, M. An overview of ochratoxin A in beer and wine. Int. J. Food Microbiol. 2007, 119, 79-83.
8. Bellver Soto, J.; Fernández-Franzón, M.; Ruiz, M.-J.; Juan-García, A. Presence of ochratoxin A (OTA) mycotoxin in alcoholic drinks from southern European countries: Wine and beer. J.
Agric. Food Chem. 2014, 62, 7643-7651. 9. Commission regulation (EC) No 1881/2006 of 19 December 2006 setting maximum levels for
certain contaminants in foodstuffs. Off. J. Eur. Union 2006, L364, 5-24. 10. Scientific committee on food opnion on Fusarium toxins. Part 1: Deoxynivalenol (DON)
(expressed on 2 December 1999). http://ec.europa.eu/food/fs/sc/scf/out44_en.pdf (Accessed: 10 September 2016).
11. European Food Safety. Opinion of the scientific panel on contaminants in the food chain on a request from the commission related to ochratoxin A in food. EFSA J. 2006, 4, 1-56.
12. Berthiller, F.; Brera, C.; Crews, C.; Iha, M. H.; Krska, R.; Lattanzio, V. M. T.; MacDonald, S.; Malone, R. J.; Maragos, C.; Solfrizzo, M.; Stroka, J.; Whitaker, T. B. Developments in
mycotoxin analysis: An update for 2013-2014. World Mycotoxin J. 2015, 8, 5-35. 13. Berthiller, F.; Brera, C.; Crews, C.; Iha, M. H.; Krska, R.; Lattanzio, V. M. T.; MacDonald, S.;
Malone, R. J.; Maragos, C.; Solfrizzo, M.; Stroka, J.; Whitaker, T. B. Developments in
mycotoxin analysis: An update for 2014-2015. World Mycotoxin J. 2016, 9, 5-30. 14. Chauhan, R.; Singh, J.; Sachdev, T.; Basu, T.; Malhotra, B. D. Recent advances in
mycotoxins detection. Biosens. Bioelectron. 2016, 81, 532-545. 15. Dai, S.; Wu, S.; Duan, N.; Wang, Z. A luminescence resonance energy transfer based
aptasensor for the mycotoxin ochratoxin A using upconversion nanoparticles and gold nanorods. Microchim. Acta 2016, 183, 1909-1916.
16. Joshi, S.; Segarra-Fas, A.; Peters, J.; Zuilhof, H.; van Beek, T. A.; Nielen, M. W. F. Multiplex
surface plasmon resonance biosensing and its transferability towards imaging nanoplasmonics for detection of mycotoxins in barley. Analyst 2016, 141, 1307-1318.
17. Zachariasova, M.; Hajslova, J.; Kostelanska, M.; Poustka, J.; Krplova, A.; Cuhra, P.; Hochel, I. Deoxynivalenol and its conjugates in beer: A critical assessment of data obtained by enzyme-linked immunosorbent assay and liquid chromatography coupled to tandem mass spectrometry. Anal. Chim. Acta 2008, 625, 77-86.
18. Zachariasova, M.; Cajka, T.; Godula, M.; Malachova, A.; Veprikova, Z.; Hajslova, J. Analysis of multiple mycotoxins in beer employing (ultra)-high-resolution mass spectrometry. Rapid
Commun. Mass Spectrom. 2010, 24, 3357-3367. 19. Zachariasova, M.; Vaclavikova, M.; Lacina, O.; Vaclavik, L.; Hajslova, J. Deoxynivalenol
oligoglycosides: new “masked” Fusarium toxins occurring in malt, beer, and breadstuff. J. Agric. Food Chem. 2012, 60, 9280-9291.
20. Varga, E.; Malachova, A.; Schwartz, H.; Krska, R.; Berthiller, F. Survey of deoxynivalenol
and its conjugates deoxynivalenol-3-glucoside and 3-acetyl-deoxynivalenol in 374 beer samples. Food Addit. Contam., Part A 2013, 30, 137-146.
21. Piacentini, K. C.; Savi, G. D.; Olivo, G.; Scussel, V. M. Quality and occurrence of deoxynivalenol and fumonisins in craft beer. Food Control 2015, 50, 925-929.
Chapter 4
116
22. Rodríguez-Carrasco, Y.; Fattore, M.; Albrizio, S.; Berrada, H.; Mañes, J. Occurrence of
Fusarium mycotoxins and their dietary intake through beer consumption by the European
population. Food Chem. 2015, 178, 149-155. 23. Li, W.; Powers, S.; Dai, S. Y. Using commercial immunoassay kits for mycotoxins: ‘joys and
sorrows’? World Mycotoxin J. 2014, 7, 417-430. 24. Papadopoulou-Bouraoui, A.; Vrabcheva, T.; Valzacchi, S.; Stroka, J.; Anklam, E. Screening
survey of deoxynivalenol in beer from the European market by an enzyme-linked immunosorbent assay. Food Addit. Contam., Part A 2004, 21, 607-617.
25. Kuzdraliński, A.; Solarska, E.; Muszyńska, M. Deoxynivalenol and zearalenone occurence in beers analysed by an enzyme-linked immunosorbent assay method. Food Control 2013, 29, 22-24.
26. Bauer, J. I.; Gross, M.; Gottschalk, C.; Usleber, E. Investigations on the occurrence of mycotoxins in beer. Food Control 2016, 63, 135-139.
27. Meneely, J. P.; Elliott, C. T. Rapid surface plasmon resonance immunoassays for the
determination of mycotoxins in cereals and cereal-based food products. World Mycotoxin J. 2014, 7, 491-505.
28. Giudicatti, S.; Valsesia, A.; Marabelli, F.; Colpo, P.; Rossi, F. Plasmonic resonances in nanostructured gold/polymer surfaces by colloidal lithography. Phys. Status Solidi A 2010, 207, 935-942.
29. Joshi, S.; Pellacani, P.; van Beek, T. A.; Zuilhof, H.; Nielen, M. W. F. Surface characterization and antifouling properties of nanostructured gold chips for imaging surface plasmon
resonance biosensing. Sens. Actuators, B 2015, 209, 505-514. 30. Aqai, P.; Peters, J.; Gerssen, A.; Haasnoot, W.; Nielen, M. W. F. Immunomagnetic
microbeads for screening with flow cytometry and identification with nano-liquid chromatography mass spectrometry of ochratoxins in wheat and cereal. Anal. Bioanal. Chem. 2011, 400, 3085-3096.
31. Meneely, J. P.; Quinn, J. G.; Flood, E. M.; Hajšlová, J.; Elliott, C. T. Simultaneous screening for T-2/HT-2 and deoxynivalenol in cereals using a surface plasmon resonance immunoassay.
World Mycotoxin J. 2012, 5, 117-126. 32. Valsesia, A.; Marabelli, F.; Giudicatti, S.; Marchesini, G. R.; Rossi, F.; Colpo, P. SPR sensor
device with nanostructure. World Patent 2013, WO 2013/007448 A1. 33. Bottazzi, B.; Fornasari, L.; Frangolho, A.; Giudicatti, S.; Mantovani, A.; Marabelli, F.;
Marchesini, G.; Pellacani, P.; Therisod, R.; Valsesia, A. Multiplexed label-free optical biosensor for medical diagnostics. J. Biomed. Opt. 2014, 19, 017006-017010.
34. Commission regulation (EU) no 519/2014 of 16 May 2014 amending regulation (EC) no 401/2006 as regards methods of sampling of large lots, spices and food supplements,
performance criteria for T-2, HT-2 toxin and citrinin and screening methods of analysis. Off. J. Eur. Union 2014, L147, 29-43.
35. Löfås, S.; Johnsson, B. A novel hydrogel matrix on gold surfaces in surface plasmon resonance sensors for fast and efficient covalent immobilization of ligands. J. Chem. Soc., Chem. Commun. 1990, 1526-1528.
36. Skládal, P. Effect of methanol on the interaction of monoclonal antibody with free and immobilized atrazine studied using the resonant mirror-based biosensor. Biosens. Bioelectron. 1999, 14, 257-263.
37. Kadota, T.; Takezawa, Y.; Hirano, S.; Tajima, O.; Maragos, C. M.; Nakajima, T.; Tanaka, T.; Kamata, Y.; Sugita-Konishi, Y. Rapid detection of nivalenol and deoxynivalenol in wheat using surface plasmon resonance immunoassay. Anal. Chim. Acta 2010, 673, 173-178.
38. Peters, J.; Cardall, A.; Haasnoot, W.; Nielen, M. W. F. 6-Plex microsphere immunoassay with
imaging planar array detection for mycotoxins in barley. Analyst 2014, 139, 3968-3976. 39. Charms Science, Inc., ROSA Mycotoxin Strips
https://www.charm.com/products/mycotoxins/rosa-mycotoxin-strips (Accessed: 02 May 2016).

Analysis of mycotoxins in beer using a portable nanostructured iSPR biosensor
117
Supporting information
Figure S1. Picture of the nanostructured iSPR instrument used in this study.
Figure S2. Typical sensorgram generated upon injection of 10 µg/ml anti-OTA measured using a
prototype iSPR instrument with covalently coupled OTA to a CMD surface on a nanostructured
biosensor chip. Each cycle consists of flushing with buffer, injection of sample (antibody mixed with
buffer or beer), buffer and regeneration with 10 mM HCl (30 s) followed by 20 mM NaOH (30 s).
After injection of sample and regeneration, the chip was flushed with buffer before starting a new
cycle. The two dashed blue lines show the range where the average iSPR response was taken.
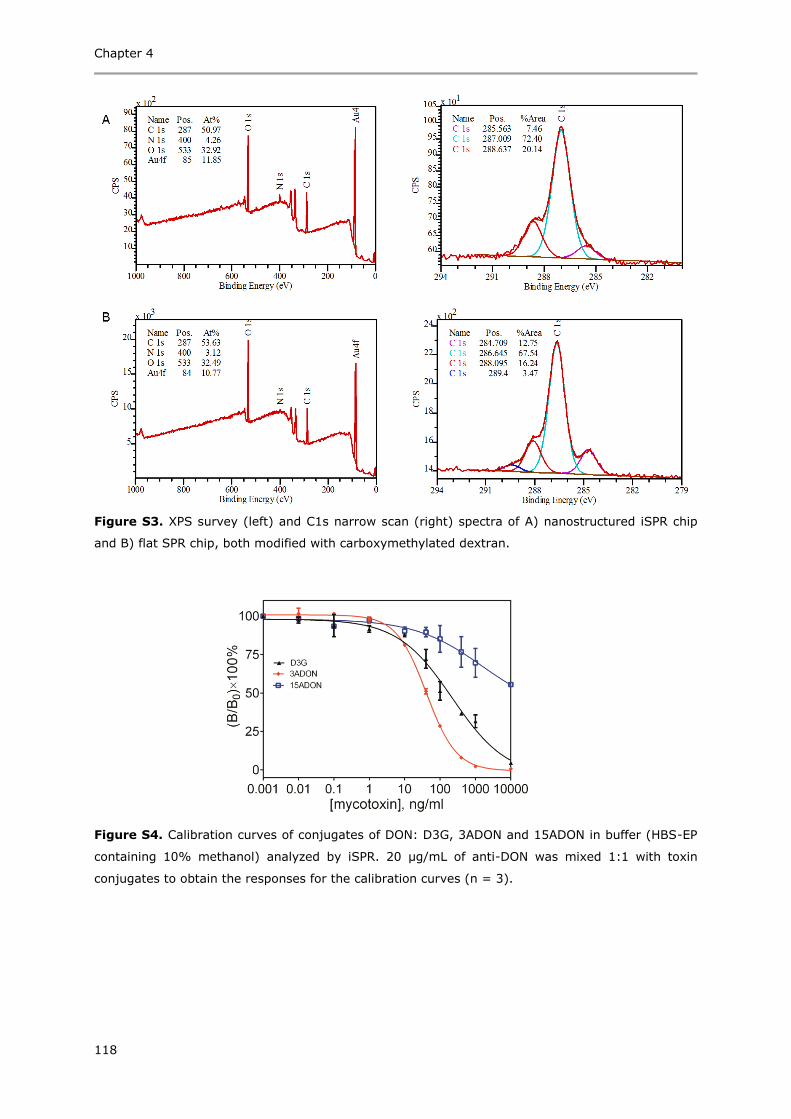
Chapter 4
118
Figure S3. XPS survey (left) and C1s narrow scan (right) spectra of A) nanostructured iSPR chip
and B) flat SPR chip, both modified with carboxymethylated dextran.
Figure S4. Calibration curves of conjugates of DON: D3G, 3ADON and 15ADON in buffer (HBS-EP
containing 10% methanol) analyzed by iSPR. 20 µg/mL of anti-DON was mixed 1:1 with toxin
conjugates to obtain the responses for the calibration curves (n = 3).
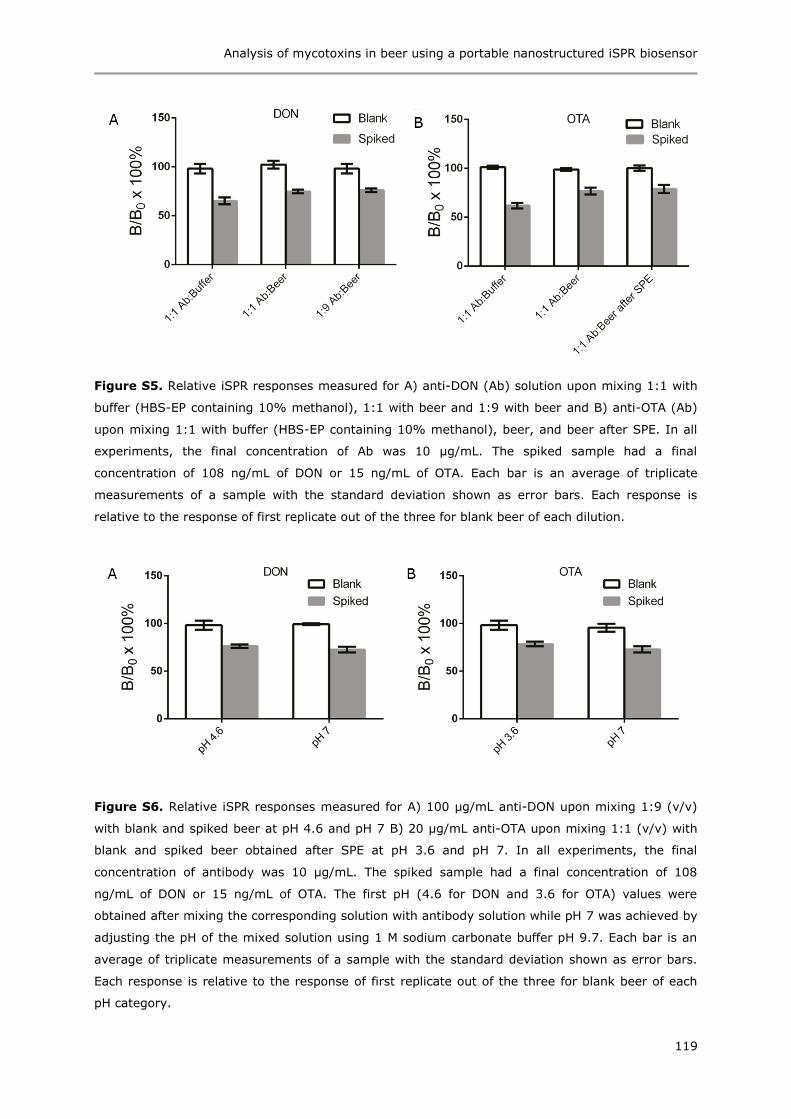
Analysis of mycotoxins in beer using a portable nanostructured iSPR biosensor
119
Figure S5. Relative iSPR responses measured for A) anti-DON (Ab) solution upon mixing 1:1 with
buffer (HBS-EP containing 10% methanol), 1:1 with beer and 1:9 with beer and B) anti-OTA (Ab)
upon mixing 1:1 with buffer (HBS-EP containing 10% methanol), beer, and beer after SPE. In all
experiments, the final concentration of Ab was 10 µg/mL. The spiked sample had a final
concentration of 108 ng/mL of DON or 15 ng/mL of OTA. Each bar is an average of triplicate
measurements of a sample with the standard deviation shown as error bars. Each response is
relative to the response of first replicate out of the three for blank beer of each dilution.
Figure S6. Relative iSPR responses measured for A) 100 µg/mL anti-DON upon mixing 1:9 (v/v)
with blank and spiked beer at pH 4.6 and pH 7 B) 20 µg/mL anti-OTA upon mixing 1:1 (v/v) with
blank and spiked beer obtained after SPE at pH 3.6 and pH 7. In all experiments, the final
concentration of antibody was 10 µg/mL. The spiked sample had a final concentration of 108
ng/mL of DON or 15 ng/mL of OTA. The first pH (4.6 for DON and 3.6 for OTA) values were
obtained after mixing the corresponding solution with antibody solution while pH 7 was achieved by
adjusting the pH of the mixed solution using 1 M sodium carbonate buffer pH 9.7. Each bar is an
average of triplicate measurements of a sample with the standard deviation shown as error bars.
Each response is relative to the response of first replicate out of the three for blank beer of each
pH category.

Chapter 4
120
Table S1. Intra- and inter-Day precision of the mycotoxin assay performed on four
different days for blank and spiked beer samples
RSD for each assay in %
sample Precision DON OTA
blank intra-day (4×n=5) 4.6 5.4
inter-day (n=4) 5.5 6.5
spiked intra-day (4×n=5) 4.7 6.2
inter-day (n=4) 4.3 5.1
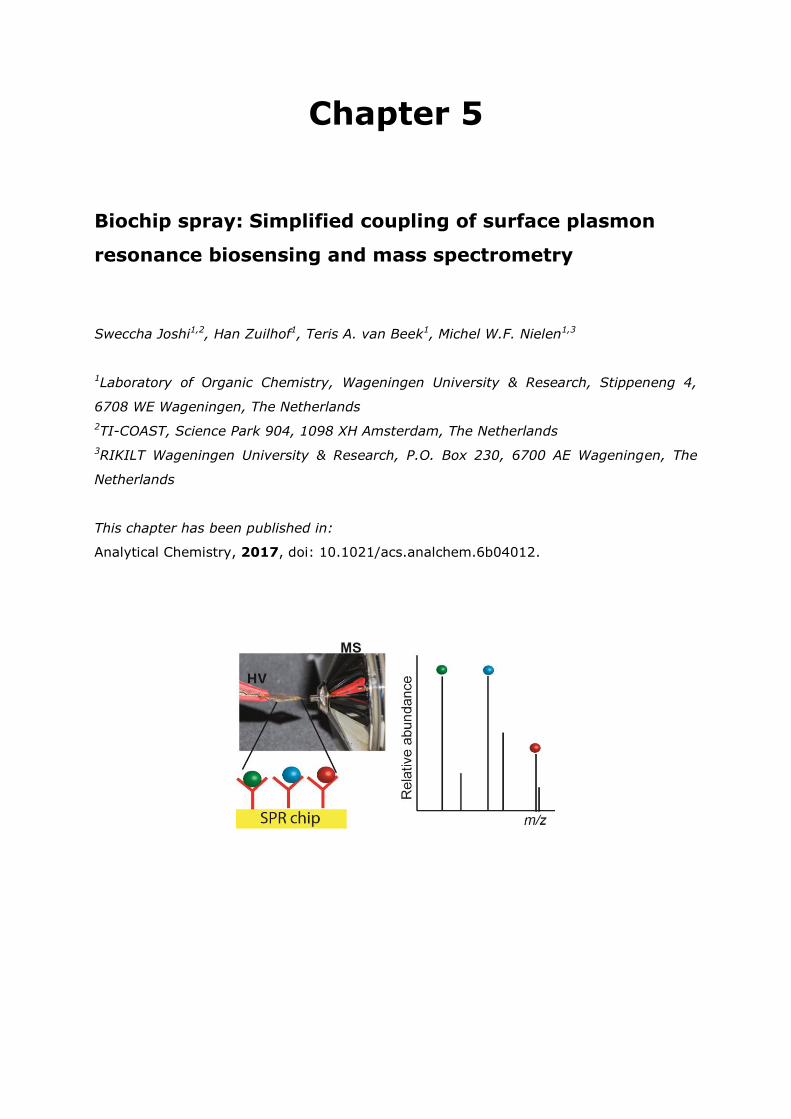
Chapter 5
Biochip spray: Simplified coupling of surface plasmon
resonance biosensing and mass spectrometry
Sweccha Joshi1,2, Han Zuilhof1, Teris A. van Beek1, Michel W.F. Nielen1,3
1Laboratory of Organic Chemistry, Wageningen University & Research, Stippeneng 4,
6708 WE Wageningen, The Netherlands
2TI-COAST, Science Park 904, 1098 XH Amsterdam, The Netherlands
3RIKILT Wageningen University & Research, P.O. Box 230, 6700 AE Wageningen, The
Netherlands
This chapter has been published in:
Analytical Chemistry, 2017, doi: 10.1021/acs.analchem.6b04012.
Chapter 5
122
Abstract
A simplified coupling of surface plasmon resonance (SPR) immuno-biosensing with
ambient ionization mass spectrometry (MS) was developed. It combines two orthogonal
analysis techniques: the biosensing capability of SPR and the chemical identification
power of high resolution MS. As a proof-of-principle, deoxynivalenol (DON), an important
mycotoxin, was captured using an SPR gold chip containing an antifouling layer and
monoclonal antibodies against the toxin and, after washing, the chip could be taken out
and analyzed by direct spray MS of the biosensor chip to confirm the identity of DON.
Furthermore, cross-reacting conjugates of DON present in a naturally contaminated beer
could be successfully identified, thus showing the potential of rapid identification of
(un)expected cross-reacting molecules.
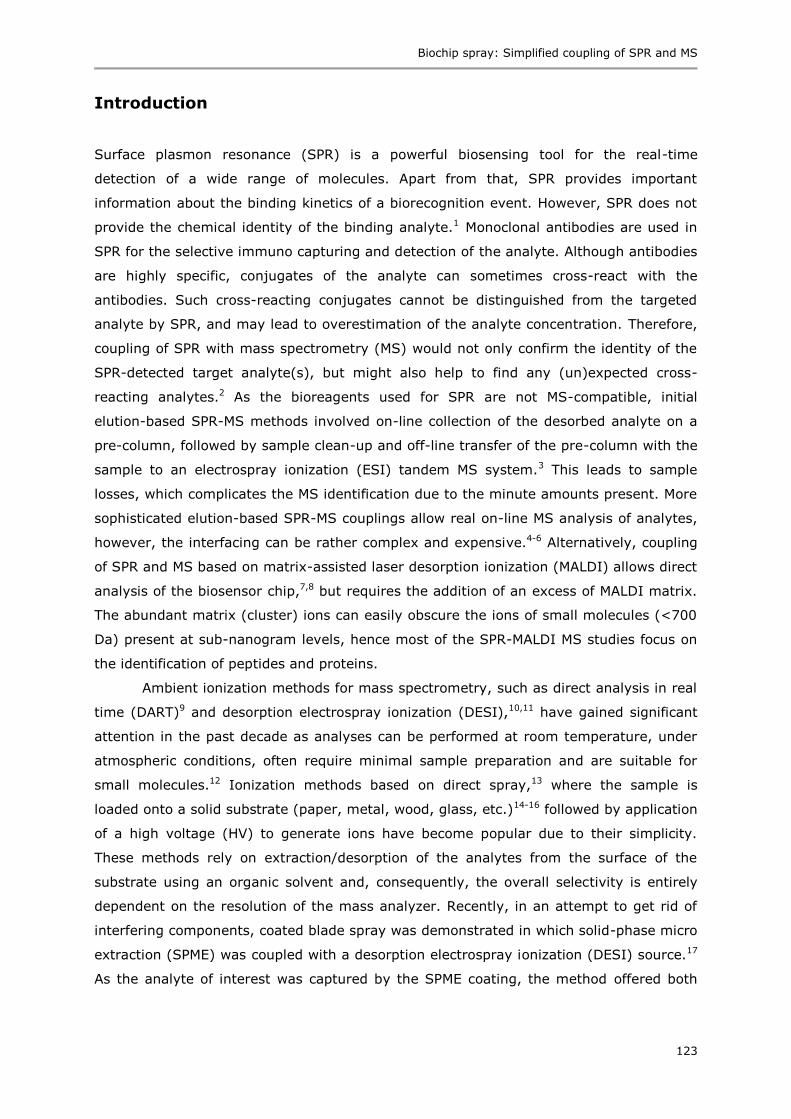
Biochip spray: Simplified coupling of SPR and MS
123
Introduction
Surface plasmon resonance (SPR) is a powerful biosensing tool for the real-time
detection of a wide range of molecules. Apart from that, SPR provides important
information about the binding kinetics of a biorecognition event. However, SPR does not
provide the chemical identity of the binding analyte.1 Monoclonal antibodies are used in
SPR for the selective immuno capturing and detection of the analyte. Although antibodies
are highly specific, conjugates of the analyte can sometimes cross-react with the
antibodies. Such cross-reacting conjugates cannot be distinguished from the targeted
analyte by SPR, and may lead to overestimation of the analyte concentration. Therefore,
coupling of SPR with mass spectrometry (MS) would not only confirm the identity of the
SPR-detected target analyte(s), but might also help to find any (un)expected cross-
reacting analytes.2 As the bioreagents used for SPR are not MS-compatible, initial
elution-based SPR-MS methods involved on-line collection of the desorbed analyte on a
pre-column, followed by sample clean-up and off-line transfer of the pre-column with the
sample to an electrospray ionization (ESI) tandem MS system.3 This leads to sample
losses, which complicates the MS identification due to the minute amounts present. More
sophisticated elution-based SPR-MS couplings allow real on-line MS analysis of analytes,
however, the interfacing can be rather complex and expensive.4-6 Alternatively, coupling
of SPR and MS based on matrix-assisted laser desorption ionization (MALDI) allows direct
analysis of the biosensor chip,7,8 but requires the addition of an excess of MALDI matrix.
The abundant matrix (cluster) ions can easily obscure the ions of small molecules (<700
Da) present at sub-nanogram levels, hence most of the SPR-MALDI MS studies focus on
the identification of peptides and proteins.
Ambient ionization methods for mass spectrometry, such as direct analysis in real
time (DART)9 and desorption electrospray ionization (DESI),10,11 have gained significant
attention in the past decade as analyses can be performed at room temperature, under
atmospheric conditions, often require minimal sample preparation and are suitable for
small molecules.12 Ionization methods based on direct spray,13 where the sample is
loaded onto a solid substrate (paper, metal, wood, glass, etc.)14-16 followed by application
of a high voltage (HV) to generate ions have become popular due to their simplicity.
These methods rely on extraction/desorption of the analytes from the surface of the
substrate using an organic solvent and, consequently, the overall selectivity is entirely
dependent on the resolution of the mass analyzer. Recently, in an attempt to get rid of
interfering components, coated blade spray was demonstrated in which solid-phase micro
extraction (SPME) was coupled with a desorption electrospray ionization (DESI) source.17
As the analyte of interest was captured by the SPME coating, the method offered both
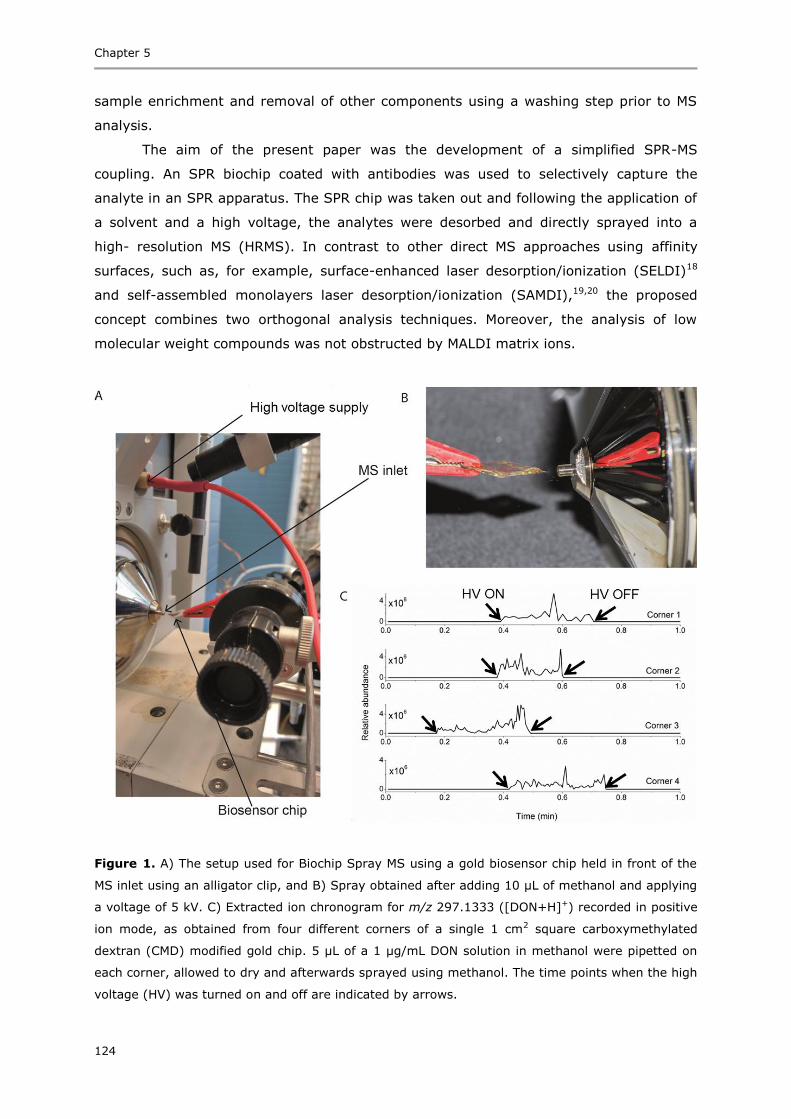
Chapter 5
124
sample enrichment and removal of other components using a washing step prior to MS
analysis.
The aim of the present paper was the development of a simplified SPR-MS
coupling. An SPR biochip coated with antibodies was used to selectively capture the
analyte in an SPR apparatus. The SPR chip was taken out and following the application of
a solvent and a high voltage, the analytes were desorbed and directly sprayed into a
high- resolution MS (HRMS). In contrast to other direct MS approaches using affinity
surfaces, such as, for example, surface-enhanced laser desorption/ionization (SELDI)18
and self-assembled monolayers laser desorption/ionization (SAMDI),19,20 the proposed
concept combines two orthogonal analysis techniques. Moreover, the analysis of low
molecular weight compounds was not obstructed by MALDI matrix ions.
Figure 1. A) The setup used for Biochip Spray MS using a gold biosensor chip held in front of the
MS inlet using an alligator clip, and B) Spray obtained after adding 10 µL of methanol and applying
a voltage of 5 kV. C) Extracted ion chronogram for m/z 297.1333 ([DON+H]+) recorded in positive
ion mode, as obtained from four different corners of a single 1 cm2 square carboxymethylated
dextran (CMD) modified gold chip. 5 µL of a 1 µg/mL DON solution in methanol were pipetted on
each corner, allowed to dry and afterwards sprayed using methanol. The time points when the high
voltage (HV) was turned on and off are indicated by arrows.
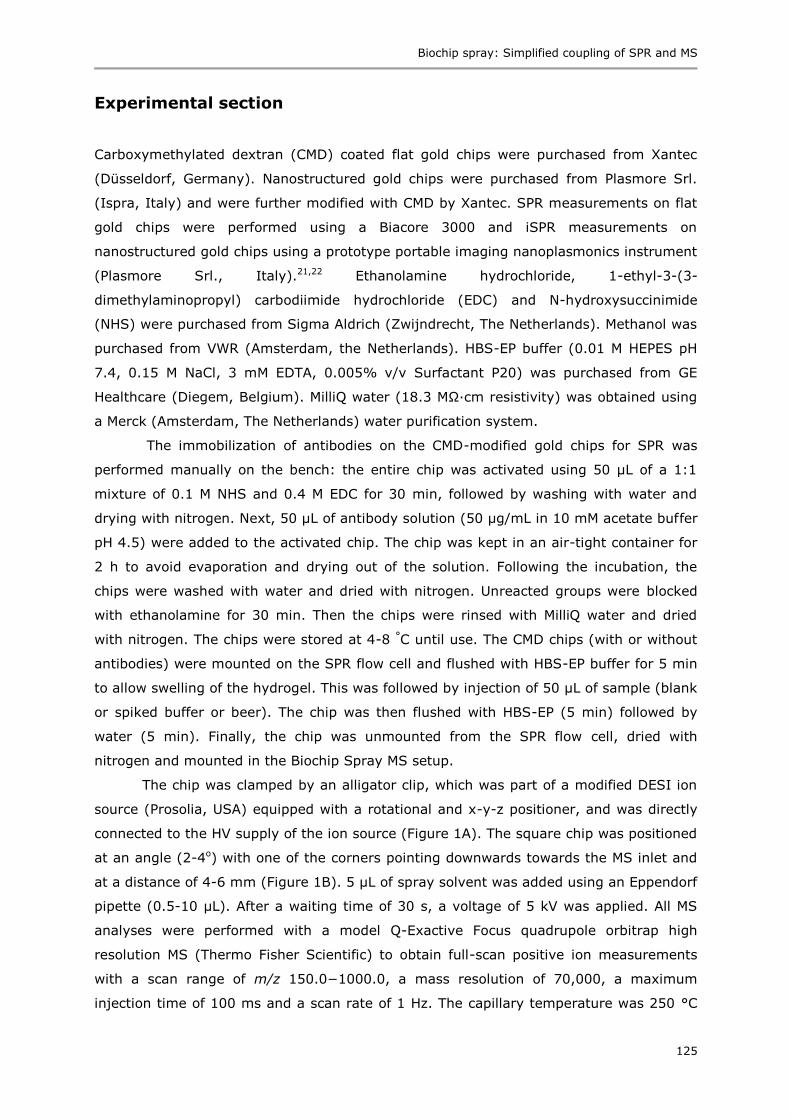
Biochip spray: Simplified coupling of SPR and MS
125
Experimental section
Carboxymethylated dextran (CMD) coated flat gold chips were purchased from Xantec
(Düsseldorf, Germany). Nanostructured gold chips were purchased from Plasmore Srl.
(Ispra, Italy) and were further modified with CMD by Xantec. SPR measurements on flat
gold chips were performed using a Biacore 3000 and iSPR measurements on
nanostructured gold chips using a prototype portable imaging nanoplasmonics instrument
(Plasmore Srl., Italy).21,22 Ethanolamine hydrochloride, 1-ethyl-3-(3-
dimethylaminopropyl) carbodiimide hydrochloride (EDC) and N-hydroxysuccinimide
(NHS) were purchased from Sigma Aldrich (Zwijndrecht, The Netherlands). Methanol was
purchased from VWR (Amsterdam, the Netherlands). HBS-EP buffer (0.01 M HEPES pH
7.4, 0.15 M NaCl, 3 mM EDTA, 0.005% v/v Surfactant P20) was purchased from GE
Healthcare (Diegem, Belgium). MilliQ water (18.3 MΩ∙cm resistivity) was obtained using
a Merck (Amsterdam, The Netherlands) water purification system.
The immobilization of antibodies on the CMD-modified gold chips for SPR was
performed manually on the bench: the entire chip was activated using 50 µL of a 1:1
mixture of 0.1 M NHS and 0.4 M EDC for 30 min, followed by washing with water and
drying with nitrogen. Next, 50 µL of antibody solution (50 µg/mL in 10 mM acetate buffer
pH 4.5) were added to the activated chip. The chip was kept in an air-tight container for
2 h to avoid evaporation and drying out of the solution. Following the incubation, the
chips were washed with water and dried with nitrogen. Unreacted groups were blocked
with ethanolamine for 30 min. Then the chips were rinsed with MilliQ water and dried
with nitrogen. The chips were stored at 4-8 °C until use. The CMD chips (with or without
antibodies) were mounted on the SPR flow cell and flushed with HBS-EP buffer for 5 min
to allow swelling of the hydrogel. This was followed by injection of 50 µL of sample (blank
or spiked buffer or beer). The chip was then flushed with HBS-EP (5 min) followed by
water (5 min). Finally, the chip was unmounted from the SPR flow cell, dried with
nitrogen and mounted in the Biochip Spray MS setup.
The chip was clamped by an alligator clip, which was part of a modified DESI ion
source (Prosolia, USA) equipped with a rotational and x-y-z positioner, and was directly
connected to the HV supply of the ion source (Figure 1A). The square chip was positioned
at an angle (2-4o) with one of the corners pointing downwards towards the MS inlet and
at a distance of 4-6 mm (Figure 1B). 5 µL of spray solvent was added using an Eppendorf
pipette (0.5-10 µL). After a waiting time of 30 s, a voltage of 5 kV was applied. All MS
analyses were performed with a model Q-Exactive Focus quadrupole orbitrap high
resolution MS (Thermo Fisher Scientific) to obtain full-scan positive ion measurements
with a scan range of m/z 150.0−1000.0, a mass resolution of 70,000, a maximum
injection time of 100 ms and a scan rate of 1 Hz. The capillary temperature was 250 °C
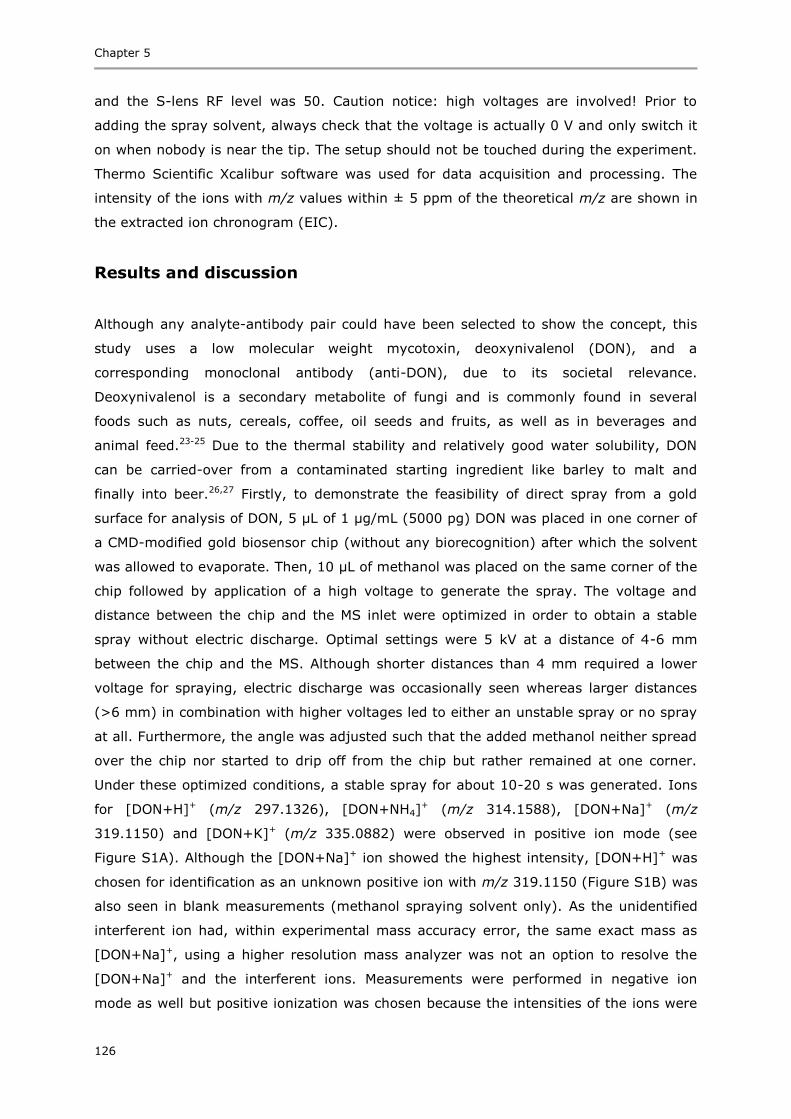
Chapter 5
126
and the S-lens RF level was 50. Caution notice: high voltages are involved! Prior to
adding the spray solvent, always check that the voltage is actually 0 V and only switch it
on when nobody is near the tip. The setup should not be touched during the experiment.
Thermo Scientific Xcalibur software was used for data acquisition and processing. The
intensity of the ions with m/z values within ± 5 ppm of the theoretical m/z are shown in
the extracted ion chronogram (EIC).
Results and discussion
Although any analyte-antibody pair could have been selected to show the concept, this
study uses a low molecular weight mycotoxin, deoxynivalenol (DON), and a
corresponding monoclonal antibody (anti-DON), due to its societal relevance.
Deoxynivalenol is a secondary metabolite of fungi and is commonly found in several
foods such as nuts, cereals, coffee, oil seeds and fruits, as well as in beverages and
animal feed.23-25 Due to the thermal stability and relatively good water solubility, DON
can be carried-over from a contaminated starting ingredient like barley to malt and
finally into beer.26,27 Firstly, to demonstrate the feasibility of direct spray from a gold
surface for analysis of DON, 5 µL of 1 µg/mL (5000 pg) DON was placed in one corner of
a CMD-modified gold biosensor chip (without any biorecognition) after which the solvent
was allowed to evaporate. Then, 10 µL of methanol was placed on the same corner of the
chip followed by application of a high voltage to generate the spray. The voltage and
distance between the chip and the MS inlet were optimized in order to obtain a stable
spray without electric discharge. Optimal settings were 5 kV at a distance of 4-6 mm
between the chip and the MS. Although shorter distances than 4 mm required a lower
voltage for spraying, electric discharge was occasionally seen whereas larger distances
(>6 mm) in combination with higher voltages led to either an unstable spray or no spray
at all. Furthermore, the angle was adjusted such that the added methanol neither spread
over the chip nor started to drip off from the chip but rather remained at one corner.
Under these optimized conditions, a stable spray for about 10-20 s was generated. Ions
for [DON+H]+ (m/z 297.1326), [DON+NH4]+ (m/z 314.1588), [DON+Na]+ (m/z
319.1150) and [DON+K]+ (m/z 335.0882) were observed in positive ion mode (see
Figure S1A). Although the [DON+Na]+ ion showed the highest intensity, [DON+H]+ was
chosen for identification as an unknown positive ion with m/z 319.1150 (Figure S1B) was
also seen in blank measurements (methanol spraying solvent only). As the unidentified
interferent ion had, within experimental mass accuracy error, the same exact mass as
[DON+Na]+, using a higher resolution mass analyzer was not an option to resolve the
[DON+Na]+ and the interferent ions. Measurements were performed in negative ion
mode as well but positive ionization was chosen because the intensities of the ions were
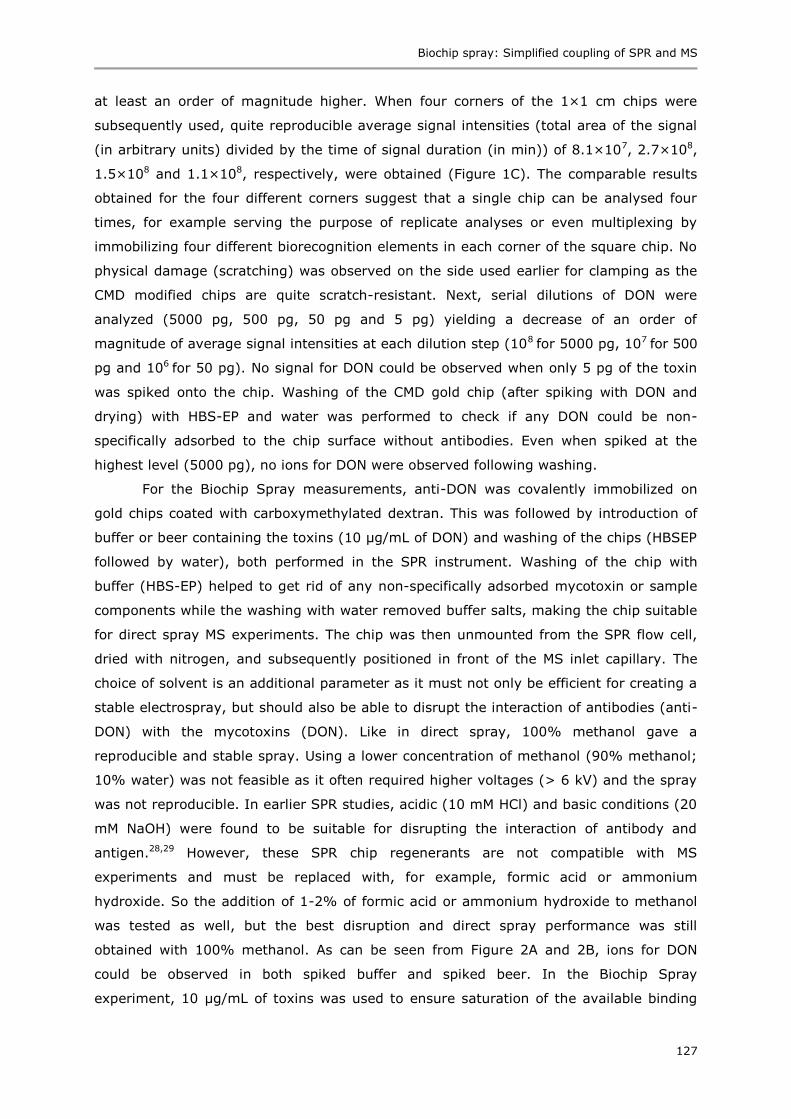
Biochip spray: Simplified coupling of SPR and MS
127
at least an order of magnitude higher. When four corners of the 1×1 cm chips were
subsequently used, quite reproducible average signal intensities (total area of the signal
(in arbitrary units) divided by the time of signal duration (in min)) of 8.1×10⁷, 2.7×10⁸,
1.5×10⁸ and 1.1×10⁸, respectively, were obtained (Figure 1C). The comparable results
obtained for the four different corners suggest that a single chip can be analysed four
times, for example serving the purpose of replicate analyses or even multiplexing by
immobilizing four different biorecognition elements in each corner of the square chip. No
physical damage (scratching) was observed on the side used earlier for clamping as the
CMD modified chips are quite scratch-resistant. Next, serial dilutions of DON were
analyzed (5000 pg, 500 pg, 50 pg and 5 pg) yielding a decrease of an order of
magnitude of average signal intensities at each dilution step (108 for 5000 pg, 107 for 500
pg and 106 for 50 pg). No signal for DON could be observed when only 5 pg of the toxin
was spiked onto the chip. Washing of the CMD gold chip (after spiking with DON and
drying) with HBS-EP and water was performed to check if any DON could be non-
specifically adsorbed to the chip surface without antibodies. Even when spiked at the
highest level (5000 pg), no ions for DON were observed following washing.
For the Biochip Spray measurements, anti-DON was covalently immobilized on
gold chips coated with carboxymethylated dextran. This was followed by introduction of
buffer or beer containing the toxins (10 µg/mL of DON) and washing of the chips (HBSEP
followed by water), both performed in the SPR instrument. Washing of the chip with
buffer (HBS-EP) helped to get rid of any non-specifically adsorbed mycotoxin or sample
components while the washing with water removed buffer salts, making the chip suitable
for direct spray MS experiments. The chip was then unmounted from the SPR flow cell,
dried with nitrogen, and subsequently positioned in front of the MS inlet capillary. The
choice of solvent is an additional parameter as it must not only be efficient for creating a
stable electrospray, but should also be able to disrupt the interaction of antibodies (anti-
DON) with the mycotoxins (DON). Like in direct spray, 100% methanol gave a
reproducible and stable spray. Using a lower concentration of methanol (90% methanol;
10% water) was not feasible as it often required higher voltages (> 6 kV) and the spray
was not reproducible. In earlier SPR studies, acidic (10 mM HCl) and basic conditions (20
mM NaOH) were found to be suitable for disrupting the interaction of antibody and
antigen.28,29 However, these SPR chip regenerants are not compatible with MS
experiments and must be replaced with, for example, formic acid or ammonium
hydroxide. So the addition of 1-2% of formic acid or ammonium hydroxide to methanol
was tested as well, but the best disruption and direct spray performance was still
obtained with 100% methanol. As can be seen from Figure 2A and 2B, ions for DON
could be observed in both spiked buffer and spiked beer. In the Biochip Spray
experiment, 10 µg/mL of toxins was used to ensure saturation of the available binding
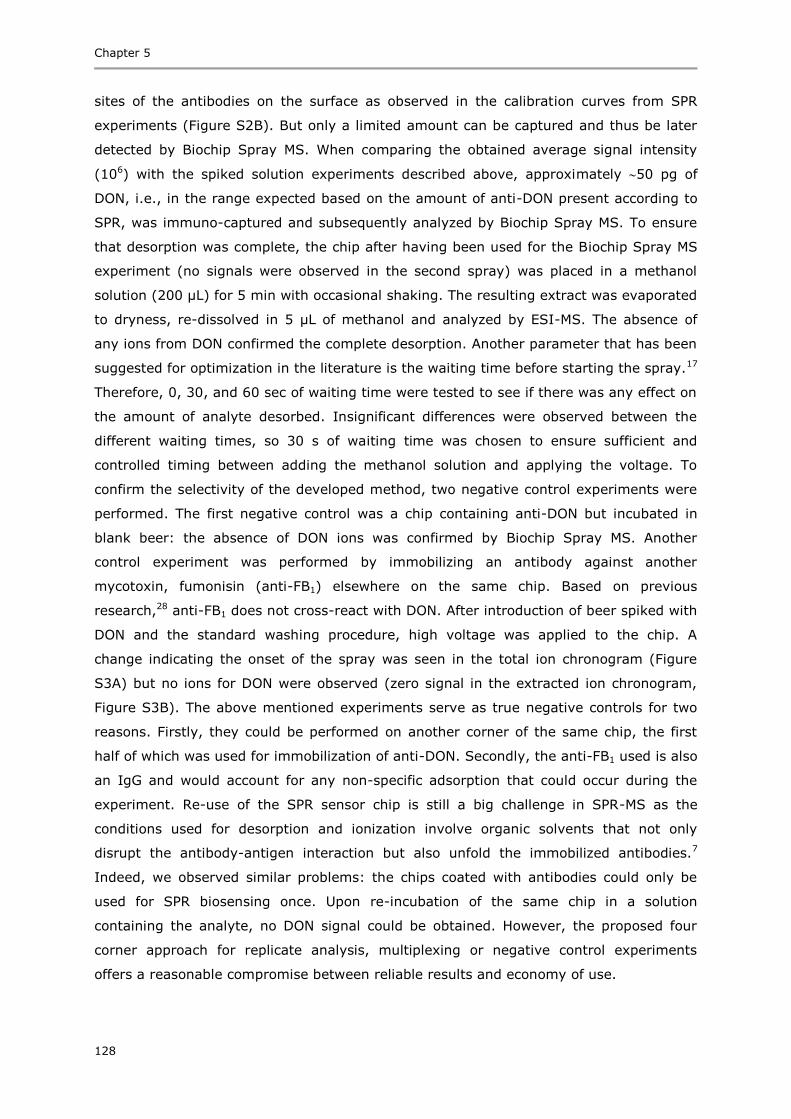
Chapter 5
128
sites of the antibodies on the surface as observed in the calibration curves from SPR
experiments (Figure S2B). But only a limited amount can be captured and thus be later
detected by Biochip Spray MS. When comparing the obtained average signal intensity
(106) with the spiked solution experiments described above, approximately 50 pg of
DON, i.e., in the range expected based on the amount of anti-DON present according to
SPR, was immuno-captured and subsequently analyzed by Biochip Spray MS. To ensure
that desorption was complete, the chip after having been used for the Biochip Spray MS
experiment (no signals were observed in the second spray) was placed in a methanol
solution (200 µL) for 5 min with occasional shaking. The resulting extract was evaporated
to dryness, re-dissolved in 5 µL of methanol and analyzed by ESI-MS. The absence of
any ions from DON confirmed the complete desorption. Another parameter that has been
suggested for optimization in the literature is the waiting time before starting the spray.17
Therefore, 0, 30, and 60 sec of waiting time were tested to see if there was any effect on
the amount of analyte desorbed. Insignificant differences were observed between the
different waiting times, so 30 s of waiting time was chosen to ensure sufficient and
controlled timing between adding the methanol solution and applying the voltage. To
confirm the selectivity of the developed method, two negative control experiments were
performed. The first negative control was a chip containing anti-DON but incubated in
blank beer: the absence of DON ions was confirmed by Biochip Spray MS. Another
control experiment was performed by immobilizing an antibody against another
mycotoxin, fumonisin (anti-FB1) elsewhere on the same chip. Based on previous
research,28 anti-FB1 does not cross-react with DON. After introduction of beer spiked with
DON and the standard washing procedure, high voltage was applied to the chip. A
change indicating the onset of the spray was seen in the total ion chronogram (Figure
S3A) but no ions for DON were observed (zero signal in the extracted ion chronogram,
Figure S3B). The above mentioned experiments serve as true negative controls for two
reasons. Firstly, they could be performed on another corner of the same chip, the first
half of which was used for immobilization of anti-DON. Secondly, the anti-FB1 used is also
an IgG and would account for any non-specific adsorption that could occur during the
experiment. Re-use of the SPR sensor chip is still a big challenge in SPR-MS as the
conditions used for desorption and ionization involve organic solvents that not only
disrupt the antibody-antigen interaction but also unfold the immobilized antibodies.7
Indeed, we observed similar problems: the chips coated with antibodies could only be
used for SPR biosensing once. Upon re-incubation of the same chip in a solution
containing the analyte, no DON signal could be obtained. However, the proposed four
corner approach for replicate analysis, multiplexing or negative control experiments
offers a reasonable compromise between reliable results and economy of use.
Biochip spray: Simplified coupling of SPR and MS
129
Figure 2. Extracted ion chronogram for m/z 297.1333 ([DON+H]+) recorded in positive mode
obtained from a CMD-modified gold chip with immobilized anti-DON, flushed in the iSPR flow cell
with A) spiked buffer containing 10 µg/mL of DON and B) spiked beer containing 10 µg/mL of DON,
followed by washing with buffer and water and transfer to the Biochip Spray MS set-up.
Finally, to demonstrate the real-life application of the newly developed method, a
naturally contaminated beer sample containing 2760 ± 95 ng/mL of DON plus 3883 ±
137 ng/mL of deoxynivalenol-3-glucoside (D3G) according to LC‒MS/MS30, or 5290 ±
370 ng/mL according to SPR (DON plus conjugates) was used.29 Large molecular weight
analytes such as proteins, yield high signals in SPR sensing with an antibody biochip and
may be analyzed in a direct SPR assay (Figure S2A + S4A) without signal enhancer.
Subsequently, the binding molecules may be identified in a direct manner by MS using
either MALDI7,8 or following elution3 using ESI MS or potentially by Biochip Spray MS
(Figure S4A). However, low molecular weight analytes, such as DON, are much more
challenging to detect in label-free biosensing approaches such as SPR: in a direct SPR
mode with an antibody biochip a low and noisy signal (Figure S2A, solid line, Biacore) or
no signal (iSPR) will be obtained, unless the assay is changed into a competition format
using a signal enhancer such as DON-OVA (Figure S2A, dashed line). Moreover, direct MS
identification of low-molecular weight binding molecules would be challenging as well due
to, e.g., matrix interference in MALDI MS and ion suppression and interference from
residual assay reagents in ESI MS. Therefore, we performed SPR biosensing of DON in
the contaminated beer sample in two different modes: (i) a competitive direct mode,
using an anti-DON biochip and the addition of DON-OVA to the beer sample as a signal
enhancer (Figure S2B + S4B), and (ii) a competitive indirect mode using an immobilized
DON biochip and the beer sample mixed with anti-DON (Figure S2D + S4C). In both SPR
modes almost full signal inhibition was observed due to the presence of DON and
conjugates in the contaminated beer (Figure S2C and S2E). Please note that as for any
Chapter 5
130
large-scale routine SPR analysis of small molecules, a competitive indirect mode using an
immobilized DON biochip (Figure S2D + S4C) would be the method of choice since such a
chip will show extreme durability and, in the present case, could be used more than 400
times.29 Obviously, an immobilized DON chip would not directly trap the low molecular
weight ligands for subsequent chemical identification by MS. As a way out, a so-called
‘recovery-chip’ approach was applied as demonstrated previously for the coupling of
inhibition SPR with nanoLC MS.4 Such a recovery chip is identical to the SPR screening
chip but the ligand binding interaction is reversed, i.e., immobilized antibodies on the
chip to trap sufficient numbers of analyte molecules for chemical identification (Figure
S4D). Thus the contaminated beer sample was re-injected into the SPR apparatus but
now onto a chip containing the anti-DON followed by washing with HBS-EP and water
(Figure S4D). The chip was then taken out of the SPR instrument, dried with nitrogen
and analyzed using the Biochip Spray MS (Figure 3). In addition to the expected ions for
DON, ions of D3G (m/z 481.1680, [D3G+Na]+) and acetyl DON (ADON, m/z 339.1438,
[ADON+H]+) were observed. Both D3G and ADON are conjugates of DON known to
cross-react with anti-DON.28 No ions from nivalenol (NIV) were visible and this is in-line
with our previous SPR research, in which no cross-reactivity was observed.28
Figure 3. A) Total ion chronogram along with the extracted ion chronogram for m/z (B) 297.1333
([DON+H]+), (C) 481.1680 ([D3G+Na]+), (D) 339.1438 ([ADON+H]+), recorded in positive ion
mode obtained from a CMD-modified gold chip with immobilized anti-DON. The chip was loaded in
an iSPR apparatus and naturally contaminated beer was injected followed by washing with buffer
and water and transfer to the Biochip Spray MS set-up.
To conclude, a simplified coupling of SPR with MS through direct Biochip Spray
was developed that allows chemical identification of low molecular weight analytes in SPR
ligand binding assays. The technique is based on selective capturing of a target analyte
on an SPR biosensor chip containing antibodies (or any other biorecognition element),
followed by identification of the analyte as well as any (un)expected cross-reacting
Biochip spray: Simplified coupling of SPR and MS
131
conjugates using ambient ionization MS directly from the gold SPR chip. The method may
be applied for those samples, which give a response in either indirect or direct SPR
biosensor screening modes (fair to say that not many low molecular weight analytes will
yield a significant response in the direct SPR mode). The aforementioned method is, in
principle, generic, and could be applied to any MS-amenable analyte provided that
antibodies are available and that they can be immobilized on an SPR chip. In this work,
the antibodies were immobilized via the amine group and thus randomly oriented on the
surface. Approaches for oriented immobilization of antibodies could be explored for better
antigen binding and thus stronger signals in the MS. A 4-plex imaging SPR (iSPR)
approach in which each corner of the biochip contains a different capturing antibody with
the corresponding analyte that can be subsequently identified by Biochip Spray MS can
be envisaged.
Acknowledgments
We would like to thank Dr Milena Zachariasova (Institute of Chemical Technology,
Prague, CZ) for the contaminated beer samples, and Dr Wilco Duvivier (RIKILT,
Wageningen, NL) and Ing. Frank Claassen (Wageningen University, NL) for technical
assistance. This research received funding from the Netherlands Organization for
Scientific Research (NWO) in the framework of the Technology Area COAST (project nr
053.21.107) with WU, VU Amsterdam, RIKILT, Heineken, Synthon, Technex,
EuroProxima, Waterproef as partners and Plasmore and Bionavis as associated partners.

Chapter 5
132
References
1. Homola, J. Surface plasmon resonance sensors for detection of chemical and biological
species. Chem. Rev. 2008, 108, 462-493. 2. Stigter, E. C. A.; de Jong, G. J.; van Bennekom, W. P. Coupling surface-plasmon resonance
and mass spectrometry to quantify and to identify ligands. Trends Anal. Chem. 2013, 45, 107-120.
3. Natsume, T.; Nakayama, H.; Jansson, Ö.; Isobe, T.; Takio, K.; Mikoshiba, K. Combination of biomolecular interaction analysis and mass spectrometric amino acid sequencing. Anal. Chem. 2000, 72, 4193-4198.
4. Marchesini, G. R.; Buijs, J.; Haasnoot, W.; Hooijerink, D.; Jansson, Ö.; Nielen, M. W. F. Nanoscale affinity chip interface for coupling inhibition SPR immunosensor screening with nano-LC TOF MS. Anal. Chem. 2008, 80, 1159-1168.
5. Zhang, Y.; Li, X.; Nie, H.; Yang, L.; Li, Z.; Bai, Y.; Niu, L.; Song, D.; Liu, H. Interface for online coupling of surface plasmon resonance to direct analysis in real time mass spectrometry. Anal. Chem. 2015, 87, 6505-6509.
6. Zhang, Y.; Xu, S.; Wen, L.; Bai, Y.; Niu, L.; Song, D.; Liu, H. A dielectric barrier discharge ionization based interface for online coupling surface plasmon resonance with mass
spectrometry. Analyst 2016, 141, 3343-3348. 7. Krone, J. R.; Nelson, R. W.; Dogruel, D.; Williams, P.; Granzow, R. BIA/MS: Interfacing
biomolecular interaction analysis with mass spectrometry. Anal. Biochem. 1997, 244, 124-132.
8. Urban, P. L.; Amantonico, A.; Zenobi, R. Lab-on-a-plate: Extending the functionality of
MALDI-MS and LDI-MS targets. Mass Spectrom. Rev. 2011, 30, 435-478. 9. Cody, R. B.; Laramée, J. A.; Durst, H. D. Versatile new ion source for the analysis of
materials in open air under ambient conditions. Anal. Chem. 2005, 77, 2297-2302. 10. Takáts, Z.; Wiseman, J. M.; Gologan, B.; Cooks, R. G. Mass spectrometry sampling under
ambient conditions with desorption electrospray ionization. Science 2004, 306, 471-473. 11. Nielen, M. W. F.; Hooijerink, H.; Zomer, P.; Mol, J. G. J. Desorption electrospray ionization
mass spectrometry in the analysis of chemical food contaminants in food. Trends Anal.
Chem. 2011, 30, 165-180. 12. Manova, R. K.; Joshi, S.; Debrassi, A.; Bhairamadgi, N. S.; Roeven, E.; Gagnon, J.; Tahir, M.
N.; Claassen, F. W.; Scheres, L. M. W.; Wennekes, T.; Schroën, K.; van Beek, T. A.; Zuilhof, H.; Nielen, M. W. F. Ambient surface analysis of organic monolayers using direct analysis in real time orbitrap mass spectrometry. Anal. Chem. 2014, 86, 2403-2411.
13. Klampfl, C. W.; Himmelsbach, M. Direct ionization methods in mass spectrometry: An
overview. Anal. Chim. Acta 2015, 890, 44-59. 14. Hu, B.; So, P.-K.; Yao, Z.-P. Electrospray ionization with aluminum foil: A versatile mass
spectrometric technique. Anal. Chim. Acta 2014, 817, 1-8. 15. Jiang, J.; Zhang, H.; Li, M.; Dulay, M. T.; Ingram, A. J.; Li, N.; You, H.; Zare, R. N. Droplet
spray ionization from a glass microscope slide: Real-time monitoring of ethylene polymerization. Anal. Chem. 2015, 87, 8057-8062.
16. Paine, M. R. L.; Barker, P. J.; Blanksby, S. J. Paint spray mass spectrometry for the detection
of additives from polymers on conducting surfaces. Mass Spectrom. Lett. 2012, 3, 25-28. 17. Gómez-Ríos, G. A.; Pawliszyn, J. Development of coated blade spray ionization mass
spectrometry for the quantitation of target analytes present in complex matrices. Angew. Chem. Int. Ed. 2014, 53, 14503-14507.
18. Seibert, V.; Wiesner, A.; Buschmann, T.; Meuer, J. Surface-enhanced laser desorption ionization time-of-flight mass spectrometry (SELDI TOF-MS) and ProteinChip® technology in proteomics research. Pathol. Res. Pract. 2004, 200, 83-94.
19. Patrie, S. M.; Mrksich, M. Self-assembled monolayers for MALDI-TOF mass spectrometry for immunoassays of human protein antigens. Anal. Chem. 2007, 79, 5878-5887.
20. Mrksich, M. Mass spectrometry of self-assembled monolayers: A new tool for molecular surface science. ACS nano 2008, 2, 7-18.
21. Valsesia, A.; Marabelli, F.; Giudicatti, S.; Marchesini, G. R.; Rossi, F.; Colpo, P. SPR sensor device with nanostructure. World Patent 2013, WO 2013/007448 A1.
22. Bottazzi, B.; Fornasari, L.; Frangolho, A.; Giudicatti, S.; Mantovani, A.; Marabelli, F.; Marchesini, G.; Pellacani, P.; Therisod, R.; Valsesia, A. Multiplexed label-free optical biosensor for medical diagnostics. J. Biomed. Opt. 2014, 19, 017006-017010.
23. Kostelanska, M.; Hajslova, J.; Zachariasova, M.; Malachova, A.; Kalachova, K.; Poustka, J.; Fiala, J.; Scott, P. M.; Berthiller, F.; Krska, R. Occurrence of deoxynivalenol and its major
Biochip spray: Simplified coupling of SPR and MS
133
conjugate, deoxynivalenol-3-glucoside, in beer and some brewing intermediates. J. Agric. Food Chem. 2009, 57, 3187-3194.
24. Papadopoulou-Bouraoui, A.; Vrabcheva, T.; Valzacchi, S.; Stroka, J.; Anklam, E. Screening survey of deoxynivalenol in beer from the European market by an enzyme-linked immunosorbent assay. Food Addit. Contam. 2004, 21, 607-617.
25. Zachariasova, M.; Hajslova, J.; Kostelanska, M.; Poustka, J.; Krplova, A.; Cuhra, P.; Hochel, I. Deoxynivalenol and its conjugates in beer: A critical assessment of data obtained by enzyme-linked immunosorbent assay and liquid chromatography coupled to tandem mass spectrometry. Anal. Chim. Acta 2008, 625, 77-86.
26. Inoue, T.; Nagatomi, Y.; Uyama, A.; Mochizuki, N. Fate of mycotoxins during beer brewing and fermentation. Biosci. Biotechnol. Biochem. 2013, 77, 1410-1415.
27. Lancova, K.; Hajslova, J.; Poustka, J.; Krplova, A.; Zachariasova, M.; Dostalek, P.;
Sachambula, L. Transfer of Fusarium mycotoxins and ‘masked’ deoxynivalenol (deoxynivalenol-3-glucoside) from field barley through malt to beer. Food Addit. Contam. 2008, 25, 732-744.
28. Joshi, S.; Segarra-Fas, A.; Peters, J.; Zuilhof, H.; van Beek, T. A.; Nielen, M. W. F. Multiplex surface plasmon resonance biosensing and its transferability towards imaging nanoplasmonics for detection of mycotoxins in barley. Analyst 2016, 141, 1307-1318.
29. Joshi, S.; Annida, R. M.; Zuilhof, H.; Van Beek, T. A.; Nielen, M. W. F. Analysis of mycotoxins
in beer using a portable nanostructured imaging surface plasmon resonance biosensor. J. Agric. Food Chem. 2016, 64, 8263-8271.
30. Zachariasova, M.; Vaclavikova, M.; Lacina, O.; Vaclavik, L.; Hajslova, J. Deoxynivalenol oligoglycosides: new “masked” Fusarium toxins occurring in malt, beer, and breadstuff. J. Agric. Food Chem. 2012, 60, 9280-9291.

Chapter 5
134
Supporting information
Figure S1. Chip Spray mass spectra recorded in positive ion mode from a CMD-modified gold chip
spiked with A) 5 µL of 1 µg/mL DON in methanol and B) 5 µL of methanol, drying, and application
of 5 µL of methanol and 5 kV. In blank methanol an unknown species with m/z 319.1150, i.e., the
same m/z as for [DON+Na]+ was observed.
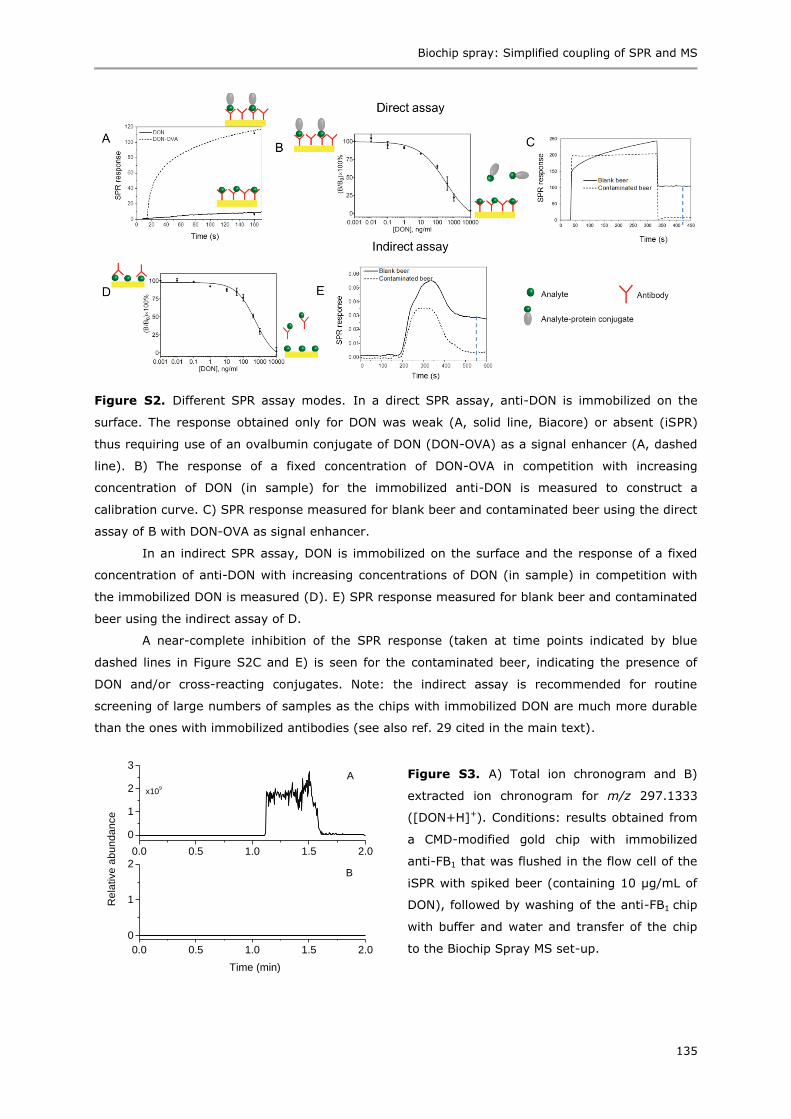
Biochip spray: Simplified coupling of SPR and MS
135
Figure S2. Different SPR assay modes. In a direct SPR assay, anti-DON is immobilized on the
surface. The response obtained only for DON was weak (A, solid line, Biacore) or absent (iSPR)
thus requiring use of an ovalbumin conjugate of DON (DON-OVA) as a signal enhancer (A, dashed
line). B) The response of a fixed concentration of DON-OVA in competition with increasing
concentration of DON (in sample) for the immobilized anti-DON is measured to construct a
calibration curve. C) SPR response measured for blank beer and contaminated beer using the direct
assay of B with DON-OVA as signal enhancer.
In an indirect SPR assay, DON is immobilized on the surface and the response of a fixed
concentration of anti-DON with increasing concentrations of DON (in sample) in competition with
the immobilized DON is measured (D). E) SPR response measured for blank beer and contaminated
beer using the indirect assay of D.
A near-complete inhibition of the SPR response (taken at time points indicated by blue
dashed lines in Figure S2C and E) is seen for the contaminated beer, indicating the presence of
DON and/or cross-reacting conjugates. Note: the indirect assay is recommended for routine
screening of large numbers of samples as the chips with immobilized DON are much more durable
than the ones with immobilized antibodies (see also ref. 29 cited in the main text).
Figure S3. A) Total ion chronogram and B)
extracted ion chronogram for m/z 297.1333
([DON+H]+). Conditions: results obtained from
a CMD-modified gold chip with immobilized
anti-FB1 that was flushed in the flow cell of the
iSPR with spiked beer (containing 10 µg/mL of
DON), followed by washing of the anti-FB1 chip
with buffer and water and transfer of the chip
to the Biochip Spray MS set-up.
0.0 0.5 1.0 1.5 2.0
0
1
2
3
B
Re
lative
ab
un
da
nce
A
x109
0.0 0.5 1.0 1.5 2.0
0
1
2
Time (min)
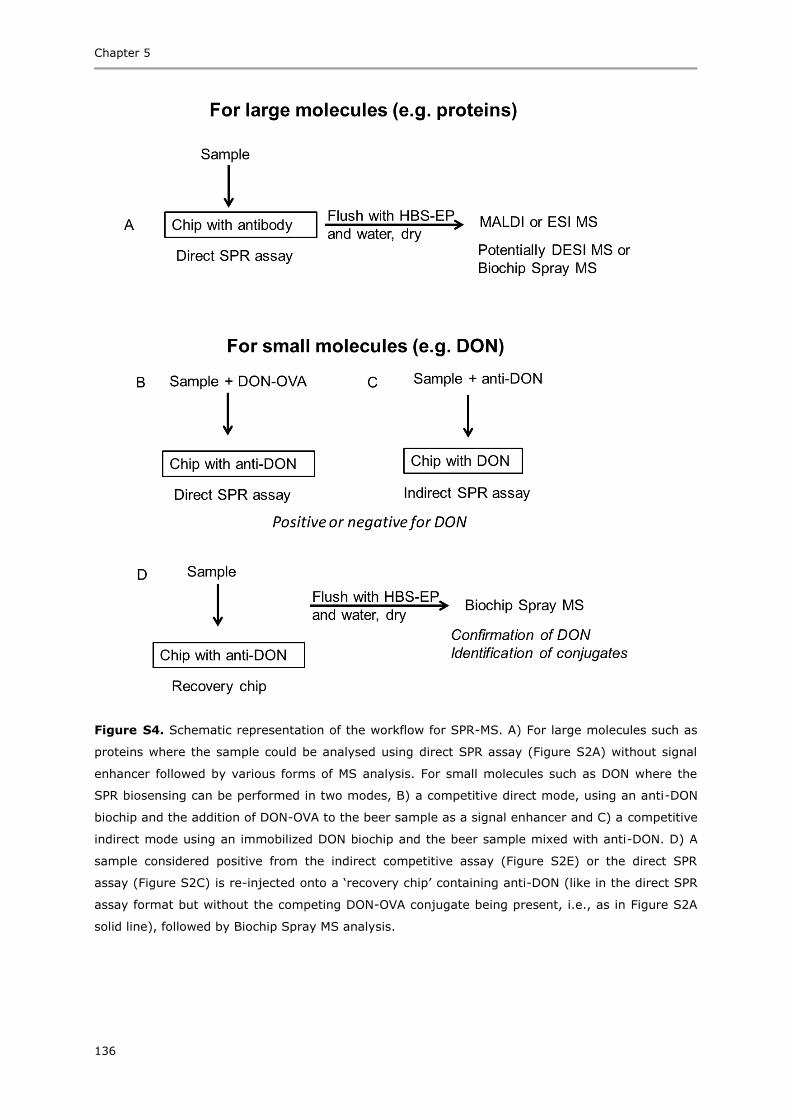
Chapter 5
136
Figure S4. Schematic representation of the workflow for SPR-MS. A) For large molecules such as
proteins where the sample could be analysed using direct SPR assay (Figure S2A) without signal
enhancer followed by various forms of MS analysis. For small molecules such as DON where the
SPR biosensing can be performed in two modes, B) a competitive direct mode, using an anti-DON
biochip and the addition of DON-OVA to the beer sample as a signal enhancer and C) a competitive
indirect mode using an immobilized DON biochip and the beer sample mixed with anti-DON. D) A
sample considered positive from the indirect competitive assay (Figure S2E) or the direct SPR
assay (Figure S2C) is re-injected onto a ‘recovery chip’ containing anti-DON (like in the direct SPR
assay format but without the competing DON-OVA conjugate being present, i.e., as in Figure S2A
solid line), followed by Biochip Spray MS analysis.

Chapter 6
General discussion and future perspectives
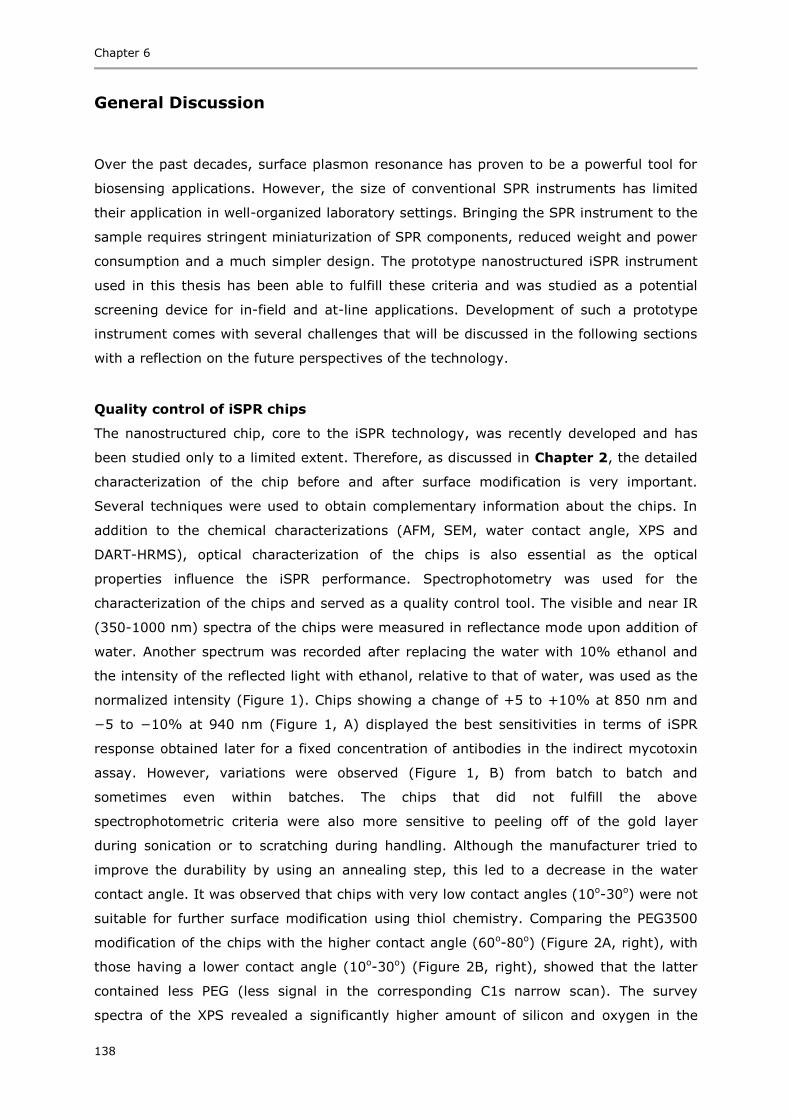
Chapter 6
138
General Discussion
Over the past decades, surface plasmon resonance has proven to be a powerful tool for
biosensing applications. However, the size of conventional SPR instruments has limited
their application in well-organized laboratory settings. Bringing the SPR instrument to the
sample requires stringent miniaturization of SPR components, reduced weight and power
consumption and a much simpler design. The prototype nanostructured iSPR instrument
used in this thesis has been able to fulfill these criteria and was studied as a potential
screening device for in-field and at-line applications. Development of such a prototype
instrument comes with several challenges that will be discussed in the following sections
with a reflection on the future perspectives of the technology.
Quality control of iSPR chips
The nanostructured chip, core to the iSPR technology, was recently developed and has
been studied only to a limited extent. Therefore, as discussed in Chapter 2, the detailed
characterization of the chip before and after surface modification is very important.
Several techniques were used to obtain complementary information about the chips. In
addition to the chemical characterizations (AFM, SEM, water contact angle, XPS and
DART-HRMS), optical characterization of the chips is also essential as the optical
properties influence the iSPR performance. Spectrophotometry was used for the
characterization of the chips and served as a quality control tool. The visible and near IR
(350-1000 nm) spectra of the chips were measured in reflectance mode upon addition of
water. Another spectrum was recorded after replacing the water with 10% ethanol and
the intensity of the reflected light with ethanol, relative to that of water, was used as the
normalized intensity (Figure 1). Chips showing a change of +5 to +10% at 850 nm and
−5 to −10% at 940 nm (Figure 1, A) displayed the best sensitivities in terms of iSPR
response obtained later for a fixed concentration of antibodies in the indirect mycotoxin
assay. However, variations were observed (Figure 1, B) from batch to batch and
sometimes even within batches. The chips that did not fulfill the above
spectrophotometric criteria were also more sensitive to peeling off of the gold layer
during sonication or to scratching during handling. Although the manufacturer tried to
improve the durability by using an annealing step, this led to a decrease in the water
contact angle. It was observed that chips with very low contact angles (10o-30o) were not
suitable for further surface modification using thiol chemistry. Comparing the PEG3500
modification of the chips with the higher contact angle (60o-80o) (Figure 2A, right), with
those having a lower contact angle (10o-30o) (Figure 2B, right), showed that the latter
contained less PEG (less signal in the corresponding C1s narrow scan). The survey
spectra of the XPS revealed a significantly higher amount of silicon and oxygen in the
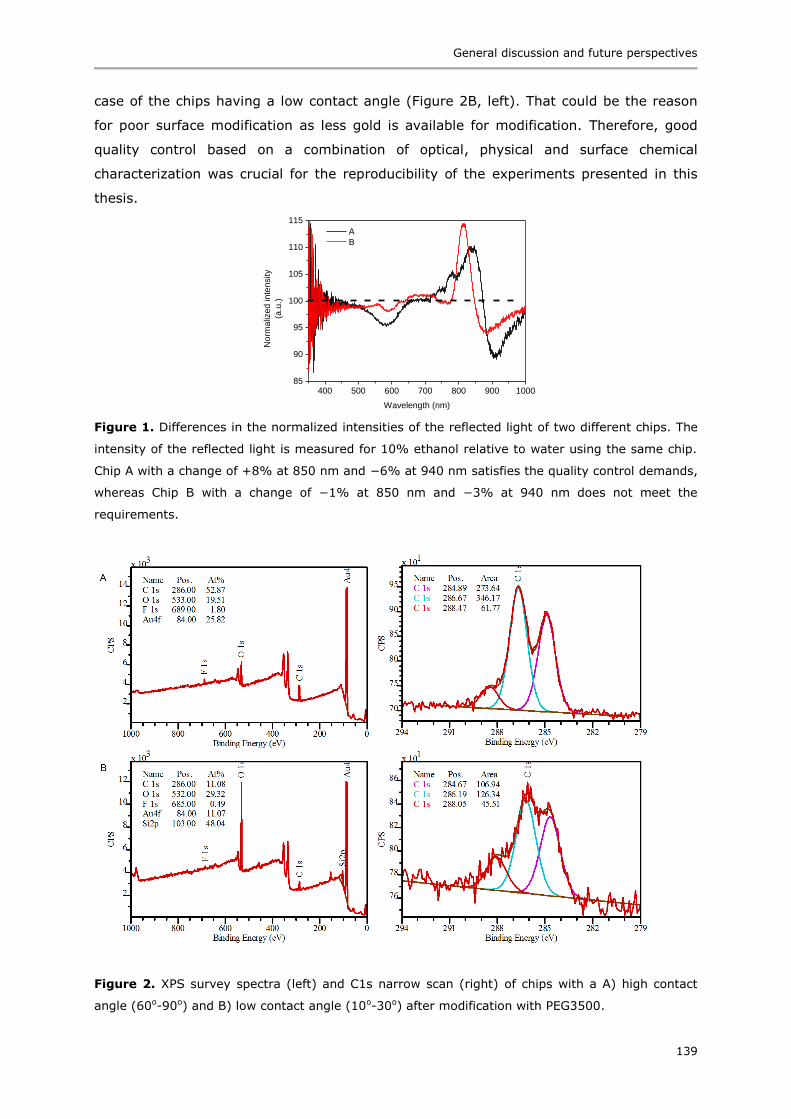
General discussion and future perspectives
139
case of the chips having a low contact angle (Figure 2B, left). That could be the reason
for poor surface modification as less gold is available for modification. Therefore, good
quality control based on a combination of optical, physical and surface chemical
characterization was crucial for the reproducibility of the experiments presented in this
thesis.
Figure 1. Differences in the normalized intensities of the reflected light of two different chips. The
intensity of the reflected light is measured for 10% ethanol relative to water using the same chip.
Chip A with a change of +8% at 850 nm and −6% at 940 nm satisfies the quality control demands,
whereas Chip B with a change of −1% at 850 nm and −3% at 940 nm does not meet the
requirements.
Figure 2. XPS survey spectra (left) and C1s narrow scan (right) of chips with a A) high contact
angle (60o-90o) and B) low contact angle (10o-30o) after modification with PEG3500.
400 500 600 700 800 900 100085
90
95
100
105
110
115
A
B
No
rma
lize
d in
ten
sity
(a.u
.)
Wavelength (nm)
Chapter 6
140
Bio-functionalization of the antifouling layer
Non-specific interactions are among the major challenges of any label-free biosensor and
were therefore addressed in Chapter 2 of the thesis. In terms of antifouling coatings,
chemistries well known from the surface modification of flat gold surfaces were used for
the nanostructured biosensor chips. Similar to flat gold, excellent antifouling behavior
following modification with both PEG and zwitterionic polymers was also observed for
nanostructured gold. Another important criterion for these antifouling chemistries is their
suitability for the immobilization of ligands. This turned out to be more challenging than
expected from antifouling literature. Zwitterionic sulfobetaine methacrylate (SBMA)
polymers, exhibiting optimal antifouling behaviour according to the literature and in our
experiments, were chosen for further bio-functionalization. The protocols reported in the
literature are based on functionalization of the bromide group.1,2 The first approach,
starting with conversion of the bromide to amine followed by attachment of bis-NHS
seemed quite straightforward (Figure 3A). However, this reaction is very difficult to
monitor using conventional surface analysis techniques such as XPS, mainly because no
unique atom is introduced in the modification steps. Furthermore, the activation with bis-
NHS is sensitive to water, making the analysis even more challenging. Therefore our
assessment of the reaction was only based on the final results of biosensing. As
demonstrated in the literature,2 the method works for detecting the binding of
streptavidin to a biotinylated surface, using fluorescence. However, even after several
modifications of the reported protocol, the indirect mycotoxin assay using OVA
conjugates could not be successfully performed. This could be either due to the
differences in sensitivities of the two techniques or due to the limited amount of OVA
conjugates immobilized on the surface. This was also observed in a recent study where
the same biotin-streptavidin interaction could not be seen using reflectometry.3 The
second approach using conversion of the bromide to an azide (Figure 3B) allows
immobilization using a click reaction with a bicyclononyne (BCN) probe.1 This approach
requires either modification of OVA conjugates with BCN or an extra step where a BCN-
NHS is used for amine coupling with the conjugates thus complicating the entire
procedure. In both approaches, the bromide group from the initiator that is required for
the growth of the polymer is used. However the fact that it is available only in a limited
amount is a constraint for further bio-functionalization. Furthermore, no success was
achieved using the hydroxyl groups of the alternative PEGMA (Figure 3C) as suggested in
the literature.4 Therefore, conventional PEG3500 with a carboxylic acid was chosen for
the proof-of-principle experiments as well as for development of 6-plex mycotoxin assay
in barley as described in Chapter 3. The activation of carboxylic acid groups using
NHS/EDC allowed immobilization of larger molecules such as ovalbumin conjugates of
mycotoxins via the amine groups (Figure 6A). In Chapter 4, carboxymethylated dextran
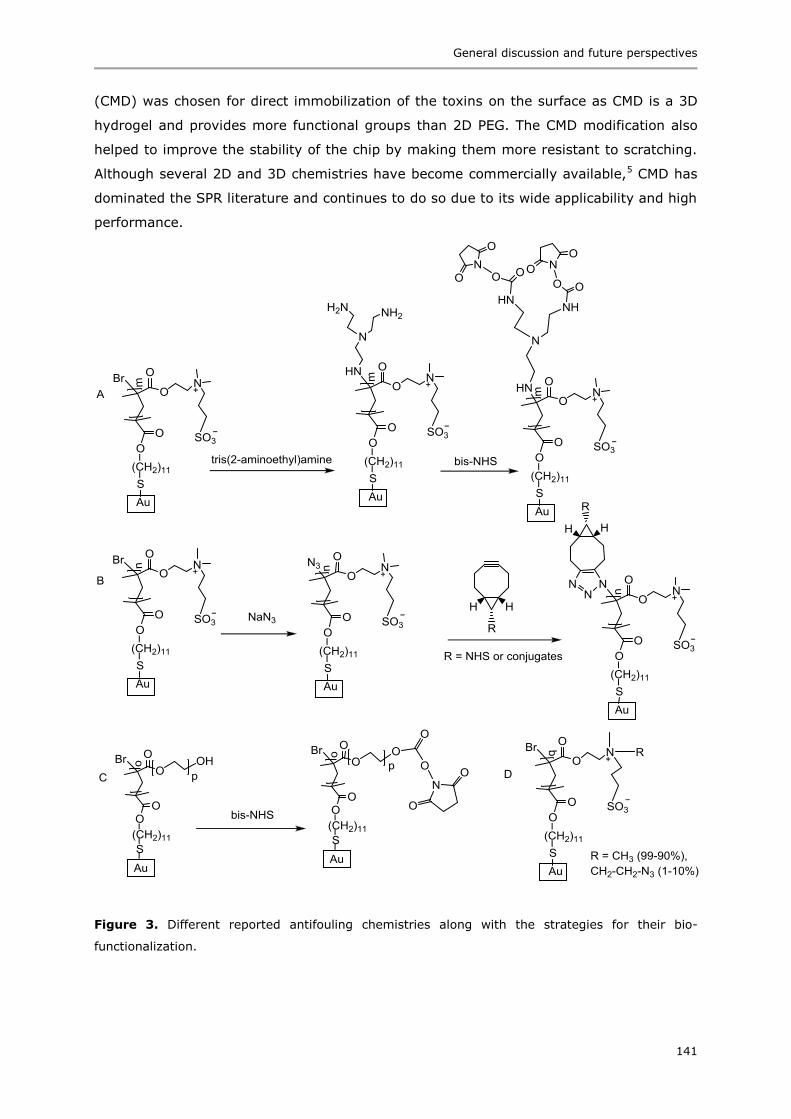
General discussion and future perspectives
141
(CMD) was chosen for direct immobilization of the toxins on the surface as CMD is a 3D
hydrogel and provides more functional groups than 2D PEG. The CMD modification also
helped to improve the stability of the chip by making them more resistant to scratching.
Although several 2D and 3D chemistries have become commercially available,5 CMD has
dominated the SPR literature and continues to do so due to its wide applicability and high
performance.
Figure 3. Different reported antifouling chemistries along with the strategies for their bio-
functionalization.
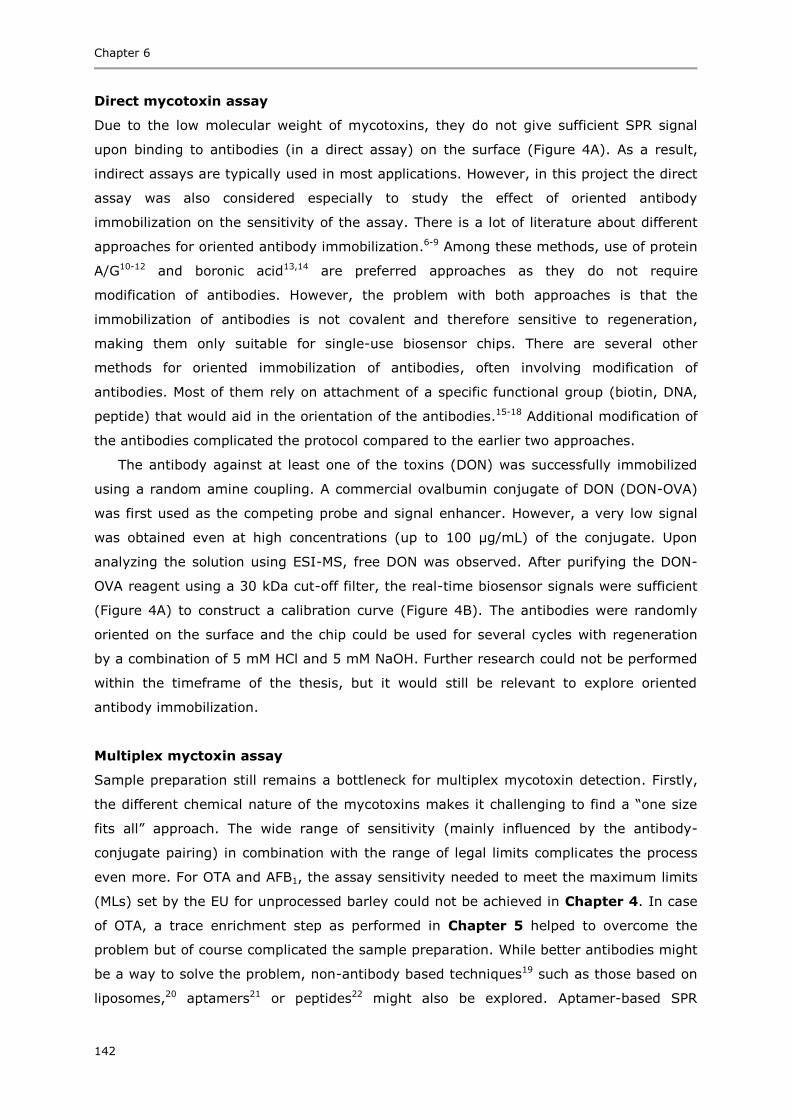
Chapter 6
142
Direct mycotoxin assay
Due to the low molecular weight of mycotoxins, they do not give sufficient SPR signal
upon binding to antibodies (in a direct assay) on the surface (Figure 4A). As a result,
indirect assays are typically used in most applications. However, in this project the direct
assay was also considered especially to study the effect of oriented antibody
immobilization on the sensitivity of the assay. There is a lot of literature about different
approaches for oriented antibody immobilization.6-9 Among these methods, use of protein
A/G10-12 and boronic acid13,14 are preferred approaches as they do not require
modification of antibodies. However, the problem with both approaches is that the
immobilization of antibodies is not covalent and therefore sensitive to regeneration,
making them only suitable for single-use biosensor chips. There are several other
methods for oriented immobilization of antibodies, often involving modification of
antibodies. Most of them rely on attachment of a specific functional group (biotin, DNA,
peptide) that would aid in the orientation of the antibodies.15-18 Additional modification of
the antibodies complicated the protocol compared to the earlier two approaches.
The antibody against at least one of the toxins (DON) was successfully immobilized
using a random amine coupling. A commercial ovalbumin conjugate of DON (DON-OVA)
was first used as the competing probe and signal enhancer. However, a very low signal
was obtained even at high concentrations (up to 100 µg/mL) of the conjugate. Upon
analyzing the solution using ESI-MS, free DON was observed. After purifying the DON-
OVA reagent using a 30 kDa cut-off filter, the real-time biosensor signals were sufficient
(Figure 4A) to construct a calibration curve (Figure 4B). The antibodies were randomly
oriented on the surface and the chip could be used for several cycles with regeneration
by a combination of 5 mM HCl and 5 mM NaOH. Further research could not be performed
within the timeframe of the thesis, but it would still be relevant to explore oriented
antibody immobilization.
Multiplex myctoxin assay
Sample preparation still remains a bottleneck for multiplex mycotoxin detection. Firstly,
the different chemical nature of the mycotoxins makes it challenging to find a “one size
fits all” approach. The wide range of sensitivity (mainly influenced by the antibody-
conjugate pairing) in combination with the range of legal limits complicates the process
even more. For OTA and AFB1, the assay sensitivity needed to meet the maximum limits
(MLs) set by the EU for unprocessed barley could not be achieved in Chapter 4. In case
of OTA, a trace enrichment step as performed in Chapter 5 helped to overcome the
problem but of course complicated the sample preparation. While better antibodies might
be a way to solve the problem, non-antibody based techniques19 such as those based on
liposomes,20 aptamers21 or peptides22 might also be explored. Aptamer-based SPR
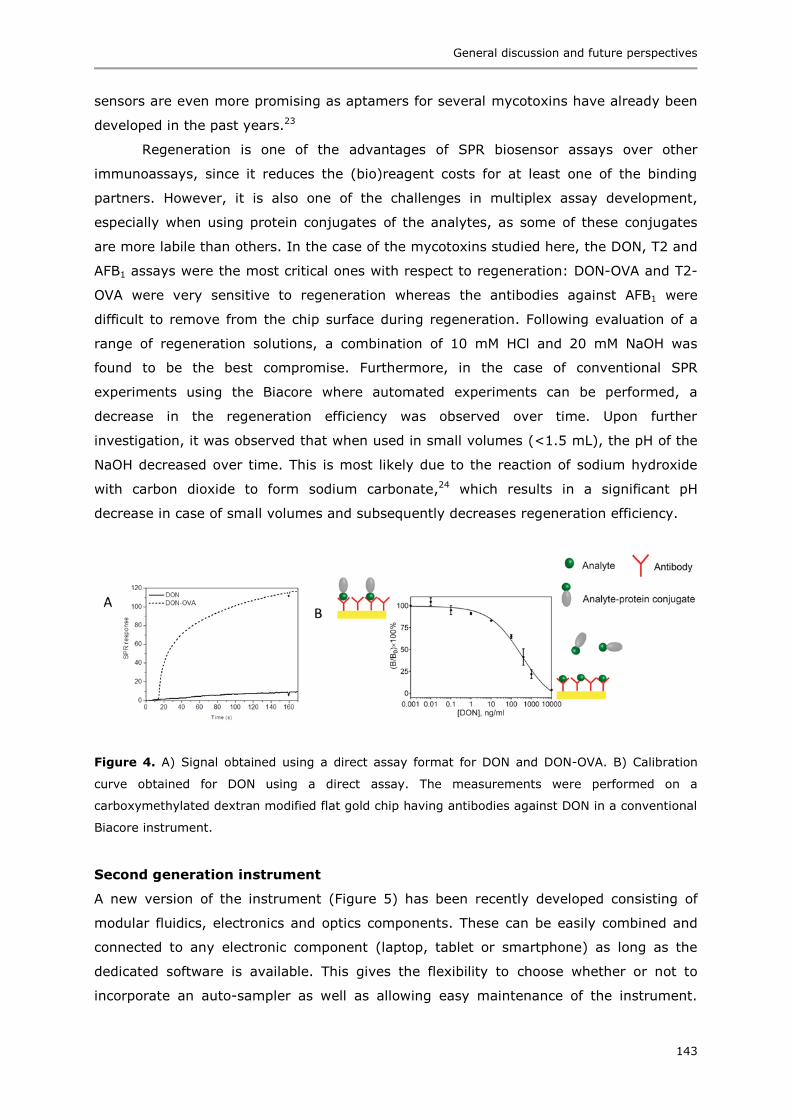
General discussion and future perspectives
143
sensors are even more promising as aptamers for several mycotoxins have already been
developed in the past years.23
Regeneration is one of the advantages of SPR biosensor assays over other
immunoassays, since it reduces the (bio)reagent costs for at least one of the binding
partners. However, it is also one of the challenges in multiplex assay development,
especially when using protein conjugates of the analytes, as some of these conjugates
are more labile than others. In the case of the mycotoxins studied here, the DON, T2 and
AFB1 assays were the most critical ones with respect to regeneration: DON-OVA and T2-
OVA were very sensitive to regeneration whereas the antibodies against AFB1 were
difficult to remove from the chip surface during regeneration. Following evaluation of a
range of regeneration solutions, a combination of 10 mM HCl and 20 mM NaOH was
found to be the best compromise. Furthermore, in the case of conventional SPR
experiments using the Biacore where automated experiments can be performed, a
decrease in the regeneration efficiency was observed over time. Upon further
investigation, it was observed that when used in small volumes (<1.5 mL), the pH of the
NaOH decreased over time. This is most likely due to the reaction of sodium hydroxide
with carbon dioxide to form sodium carbonate,24 which results in a significant pH
decrease in case of small volumes and subsequently decreases regeneration efficiency.
Figure 4. A) Signal obtained using a direct assay format for DON and DON-OVA. B) Calibration
curve obtained for DON using a direct assay. The measurements were performed on a
carboxymethylated dextran modified flat gold chip having antibodies against DON in a conventional
Biacore instrument.
Second generation instrument
A new version of the instrument (Figure 5) has been recently developed consisting of
modular fluidics, electronics and optics components. These can be easily combined and
connected to any electronic component (laptop, tablet or smartphone) as long as the
dedicated software is available. This gives the flexibility to choose whether or not to
incorporate an auto-sampler as well as allowing easy maintenance of the instrument.
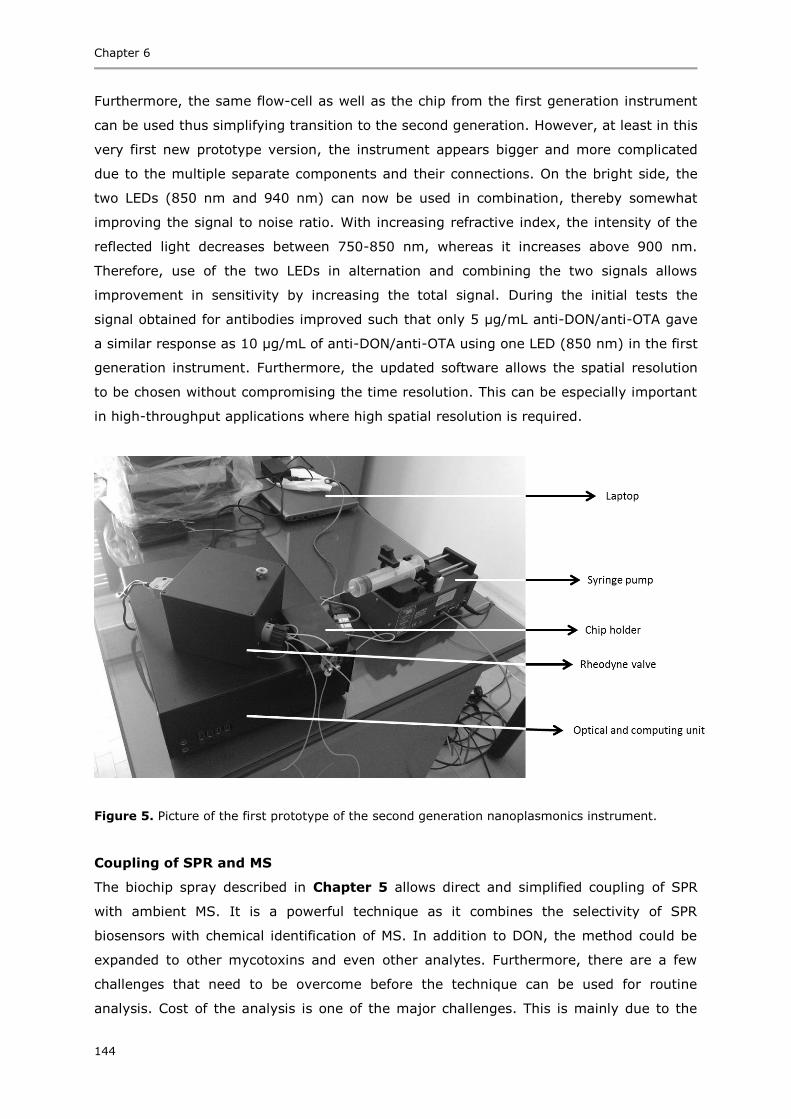
Chapter 6
144
Furthermore, the same flow-cell as well as the chip from the first generation instrument
can be used thus simplifying transition to the second generation. However, at least in this
very first new prototype version, the instrument appears bigger and more complicated
due to the multiple separate components and their connections. On the bright side, the
two LEDs (850 nm and 940 nm) can now be used in combination, thereby somewhat
improving the signal to noise ratio. With increasing refractive index, the intensity of the
reflected light decreases between 750-850 nm, whereas it increases above 900 nm.
Therefore, use of the two LEDs in alternation and combining the two signals allows
improvement in sensitivity by increasing the total signal. During the initial tests the
signal obtained for antibodies improved such that only 5 µg/mL anti-DON/anti-OTA gave
a similar response as 10 µg/mL of anti-DON/anti-OTA using one LED (850 nm) in the first
generation instrument. Furthermore, the updated software allows the spatial resolution
to be chosen without compromising the time resolution. This can be especially important
in high-throughput applications where high spatial resolution is required.
Figure 5. Picture of the first prototype of the second generation nanoplasmonics instrument.
Coupling of SPR and MS
The biochip spray described in Chapter 5 allows direct and simplified coupling of SPR
with ambient MS. It is a powerful technique as it combines the selectivity of SPR
biosensors with chemical identification of MS. In addition to DON, the method could be
expanded to other mycotoxins and even other analytes. Furthermore, there are a few
challenges that need to be overcome before the technique can be used for routine
analysis. Cost of the analysis is one of the major challenges. This is mainly due to the
General discussion and future perspectives
145
easy deactivation of the antibodies, which makes the chip only suitable for single use.
The cost issue was partially overcome by using four corners of the chip. In terms of cost
reduction, one possible solution would be to use instruments with higher spatial
resolution that would allow analysis of several interactions on a single chip. Development
of either other antibodies that are reusable or non-antibody based recognition elements
such as peptides might contribute to creating stable biosensor chips. Moreover, the
analysis was performed manually and is less suitable for screening of multiple samples.
Use of high-resolution mass spectrometry and therefore analysis of multiple analytes on
the same chip would also contribute positively to the ease of analysis aspect as each
analysis only takes a few seconds. These instruments could also allow automatic
measurements on different parts of the chip thus reducing the need for manual
operation.
Future perspectives
In addition to the research described in this thesis, there is still future research that can
be performed to further develop the nanostructured iSPR instrument as well as to
improve the mycotoxin assay. Some suggestions are given below.
Antifouling chemistry
In terms of antifouling chemistries, mixed zwitterionic polymers with small percentages
(even as little as 1-10%) of functional monomers seem to be promising.3 They combine
the excellent antifouling properties of the traditional zwitterionic polymers with high
efficiency of bio-functionalization as each branch of the functional polymer contains an
azido group (Figure 3D). As demonstrated by the authors in a proof-of-principle
experiment, a bicyclononyne (BCN) probe could be used for bio-functionalization. A
similar approach using an azido poly-(L-lysine)-graft-poly(ethylene glycol) (APP) could be
another option.25 Increasing the availability of various probes with BCN26 could help to
expand the application of this chemistry. A recently reported antifouling zwitterionic
peptide molecule22 has been shown to be especially effective for site-specific
immobilization of proteins.
Signal enhancement
Utilization of confinement induced enhancement of SPR signal27-29 would make the
technology superior to other (i)SPR technologies. To achieve this effect, as discussed
earlier (Page 138 and 139), reproducible chips with accurate control over the height of
the PMMA wells is essential.30 Furthermore, one of the most popular approaches for
molecular signal enhancement suggested in the literature is via the use of gold
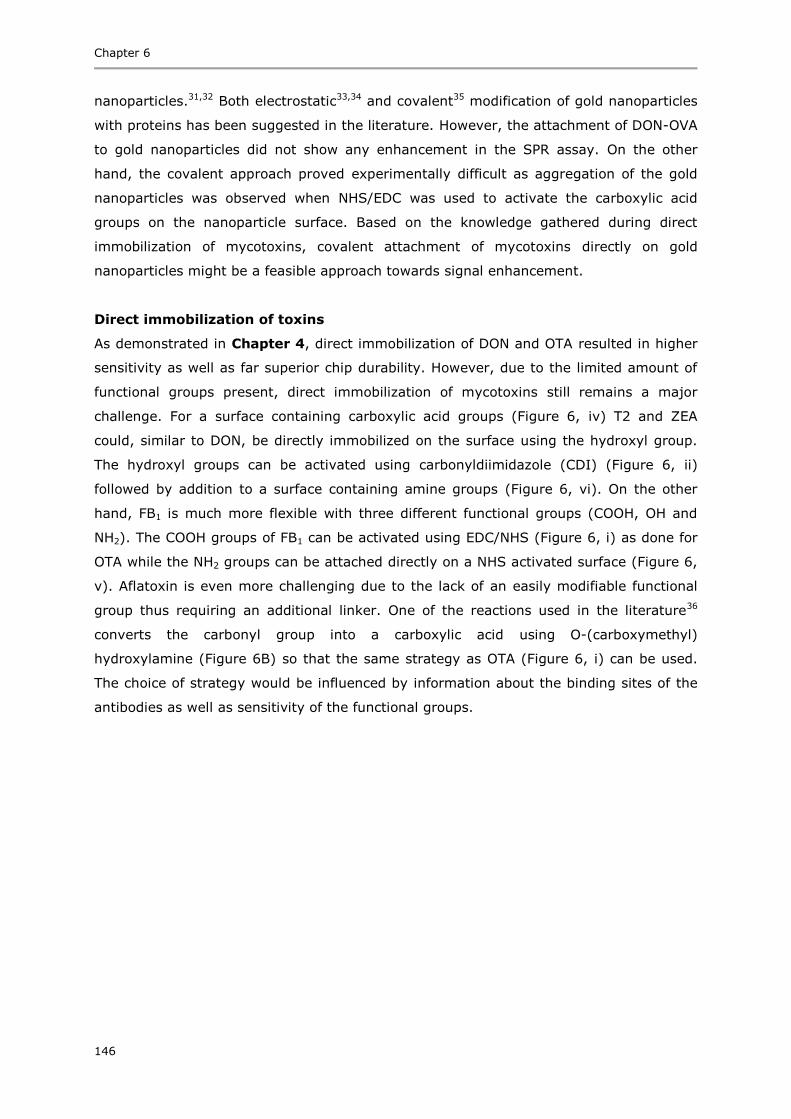
Chapter 6
146
nanoparticles.31,32 Both electrostatic33,34 and covalent35 modification of gold nanoparticles
with proteins has been suggested in the literature. However, the attachment of DON-OVA
to gold nanoparticles did not show any enhancement in the SPR assay. On the other
hand, the covalent approach proved experimentally difficult as aggregation of the gold
nanoparticles was observed when NHS/EDC was used to activate the carboxylic acid
groups on the nanoparticle surface. Based on the knowledge gathered during direct
immobilization of mycotoxins, covalent attachment of mycotoxins directly on gold
nanoparticles might be a feasible approach towards signal enhancement.
Direct immobilization of toxins
As demonstrated in Chapter 4, direct immobilization of DON and OTA resulted in higher
sensitivity as well as far superior chip durability. However, due to the limited amount of
functional groups present, direct immobilization of mycotoxins still remains a major
challenge. For a surface containing carboxylic acid groups (Figure 6, iv) T2 and ZEA
could, similar to DON, be directly immobilized on the surface using the hydroxyl group.
The hydroxyl groups can be activated using carbonyldiimidazole (CDI) (Figure 6, ii)
followed by addition to a surface containing amine groups (Figure 6, vi). On the other
hand, FB1 is much more flexible with three different functional groups (COOH, OH and
NH2). The COOH groups of FB1 can be activated using EDC/NHS (Figure 6, i) as done for
OTA while the NH2 groups can be attached directly on a NHS activated surface (Figure 6,
v). Aflatoxin is even more challenging due to the lack of an easily modifiable functional
group thus requiring an additional linker. One of the reactions used in the literature36
converts the carbonyl group into a carboxylic acid using O-(carboxymethyl)
hydroxylamine (Figure 6B) so that the same strategy as OTA (Figure 6, i) can be used.
The choice of strategy would be influenced by information about the binding sites of the
antibodies as well as sensitivity of the functional groups.
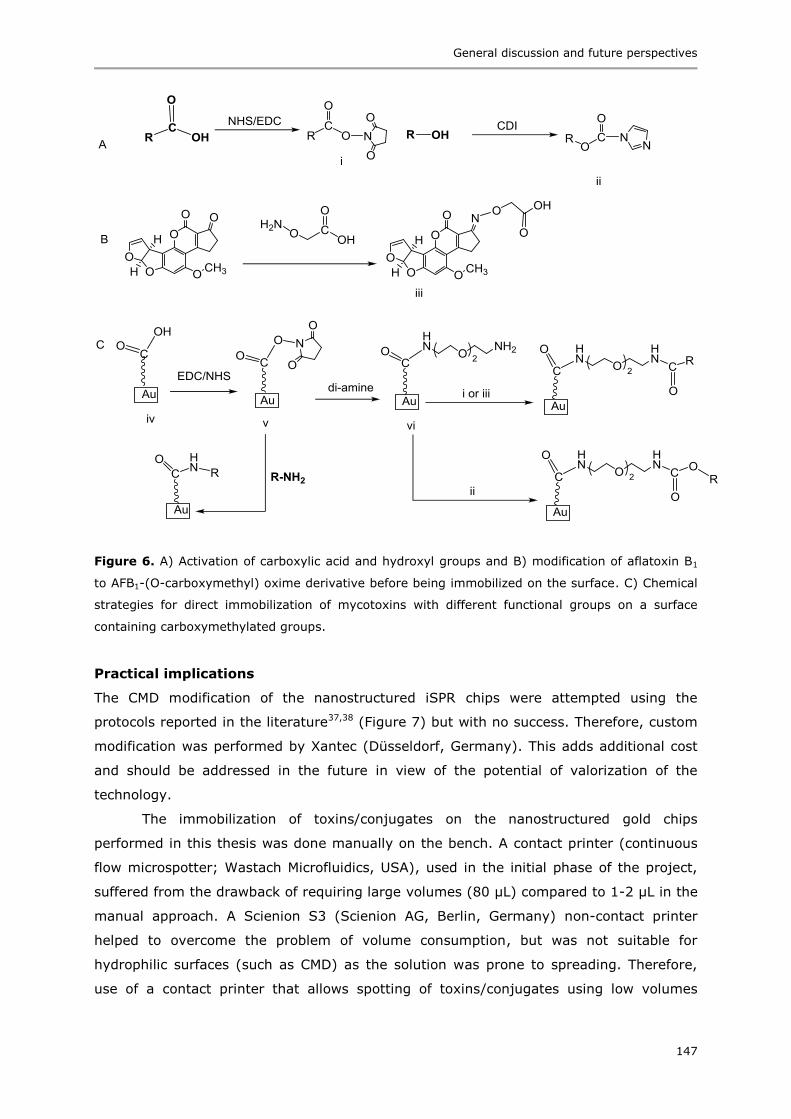
General discussion and future perspectives
147
Figure 6. A) Activation of carboxylic acid and hydroxyl groups and B) modification of aflatoxin B1
to AFB1-(O-carboxymethyl) oxime derivative before being immobilized on the surface. C) Chemical
strategies for direct immobilization of mycotoxins with different functional groups on a surface
containing carboxymethylated groups.
Practical implications
The CMD modification of the nanostructured iSPR chips were attempted using the
protocols reported in the literature37,38 (Figure 7) but with no success. Therefore, custom
modification was performed by Xantec (Düsseldorf, Germany). This adds additional cost
and should be addressed in the future in view of the potential of valorization of the
technology.
The immobilization of toxins/conjugates on the nanostructured gold chips
performed in this thesis was done manually on the bench. A contact printer (continuous
flow microspotter; Wastach Microfluidics, USA), used in the initial phase of the project,
suffered from the drawback of requiring large volumes (80 µL) compared to 1-2 µL in the
manual approach. A Scienion S3 (Scienion AG, Berlin, Germany) non-contact printer
helped to overcome the problem of volume consumption, but was not suitable for
hydrophilic surfaces (such as CMD) as the solution was prone to spreading. Therefore,
use of a contact printer that allows spotting of toxins/conjugates using low volumes
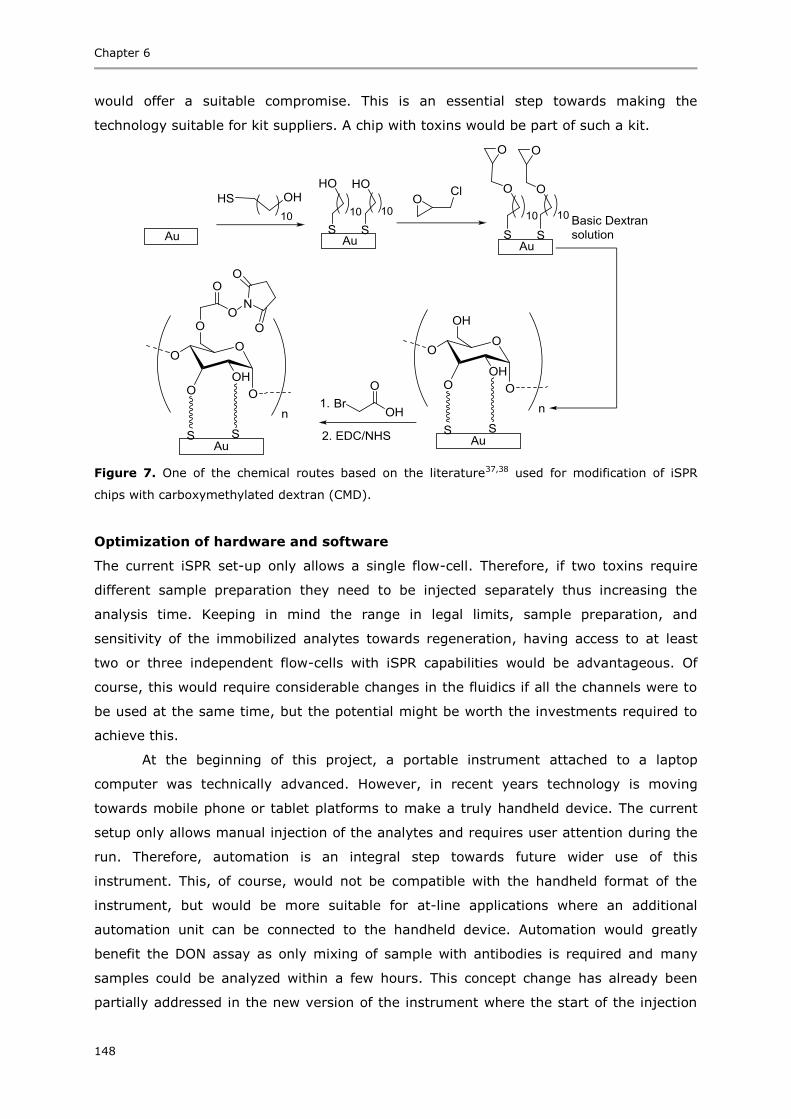
Chapter 6
148
would offer a suitable compromise. This is an essential step towards making the
technology suitable for kit suppliers. A chip with toxins would be part of such a kit.
Figure 7. One of the chemical routes based on the literature37,38 used for modification of iSPR
chips with carboxymethylated dextran (CMD).
Optimization of hardware and software
The current iSPR set-up only allows a single flow-cell. Therefore, if two toxins require
different sample preparation they need to be injected separately thus increasing the
analysis time. Keeping in mind the range in legal limits, sample preparation, and
sensitivity of the immobilized analytes towards regeneration, having access to at least
two or three independent flow-cells with iSPR capabilities would be advantageous. Of
course, this would require considerable changes in the fluidics if all the channels were to
be used at the same time, but the potential might be worth the investments required to
achieve this.
At the beginning of this project, a portable instrument attached to a laptop
computer was technically advanced. However, in recent years technology is moving
towards mobile phone or tablet platforms to make a truly handheld device. The current
setup only allows manual injection of the analytes and requires user attention during the
run. Therefore, automation is an integral step towards future wider use of this
instrument. This, of course, would not be compatible with the handheld format of the
instrument, but would be more suitable for at-line applications where an additional
automation unit can be connected to the handheld device. Automation would greatly
benefit the DON assay as only mixing of sample with antibodies is required and many
samples could be analyzed within a few hours. This concept change has already been
partially addressed in the new version of the instrument where the start of the injection

General discussion and future perspectives
149
has to be done manually but the stop of the injection is done by the software based on
the defined flow rate and injection volume. In terms of data, the current software
generates an .xls file after the experiment consisting of the data required for generating
a sensorgram (average intensity for each ROI for each time point). Automated data
analysis will help to make the technique usable even for less-trained personnel.
Furthermore, the current software does not include any tools for kinetic data analysis.
Information about real-time kinetics is crucial in evaluating performance of new
antibody-antigen pairs or in finding information about the binding sites. In the time span
of the project, several SPR instruments have already been developed and the technology
is moving towards smartphone-based SPR.39,40 This might also make the technology
more appealing for the field of biodiagnostics.41 One of such devices reported in the
literature39 (Figure 8) uses a red image displayed on the screen as a light source and the
front camera as the detector. A separate miniaturized optical coupling unit consisting of a
prism, installed on top of the screen, allows attachment of a gold chip to the optics.
Finally a microfluidic cell is added to the top to allow analysis of different samples.
Figure 8. Schematic representation of a mobile phone based SPR biosensor (reproduced with
permission from ref. 39).
Conclusions
In conclusion, this thesis provides the outcomes of the first steps towards the
development of a nanostructured iSPR instrument for real-life food applications.
Extensive optical and chemical characterization of the nanostructured iSPR chips was
performed along with modification using well-known antifouling chemistries. A multiplex
assay for in-field or at-line detection of myctoxins in beer and barley was successfully
developed. Whenever relevant, a comparison was made with conventional (i)SPR
instruments and with established reference methods such as LC-MS/MS, and these
proved the substantial potential of the portable iSPR. Finally, the coupling of SPR with
ambient mass spectrometry was developed, to add to the biosensing abilities of SPR, and
to enable rapid identification of any SPR-observed analytes.
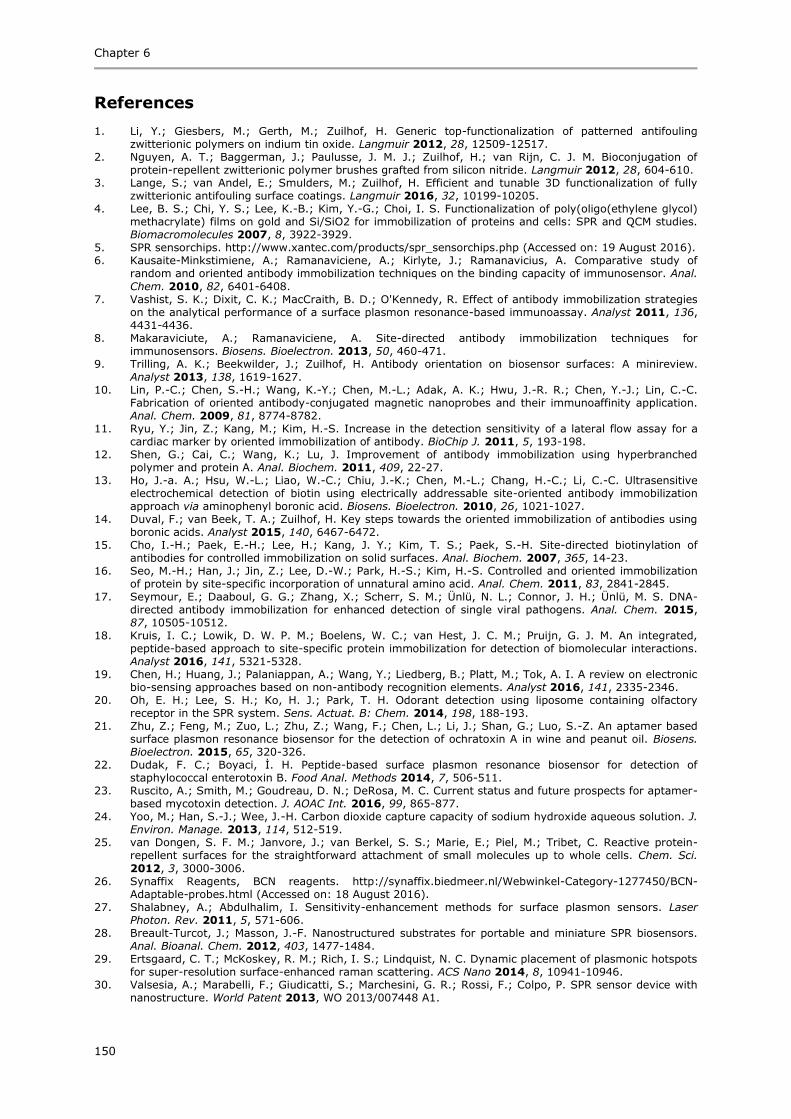
Chapter 6
150
References
1. Li, Y.; Giesbers, M.; Gerth, M.; Zuilhof, H. Generic top-functionalization of patterned antifouling zwitterionic polymers on indium tin oxide. Langmuir 2012, 28, 12509-12517.
2. Nguyen, A. T.; Baggerman, J.; Paulusse, J. M. J.; Zuilhof, H.; van Rijn, C. J. M. Bioconjugation of protein-repellent zwitterionic polymer brushes grafted from silicon nitride. Langmuir 2012, 28, 604-610.
3. Lange, S.; van Andel, E.; Smulders, M.; Zuilhof, H. Efficient and tunable 3D functionalization of fully zwitterionic antifouling surface coatings. Langmuir 2016, 32, 10199-10205.
4. Lee, B. S.; Chi, Y. S.; Lee, K.-B.; Kim, Y.-G.; Choi, I. S. Functionalization of poly(oligo(ethylene glycol) methacrylate) films on gold and Si/SiO2 for immobilization of proteins and cells: SPR and QCM studies. Biomacromolecules 2007, 8, 3922-3929.
5. SPR sensorchips. http://www.xantec.com/products/spr_sensorchips.php (Accessed on: 19 August 2016). 6. Kausaite-Minkstimiene, A.; Ramanaviciene, A.; Kirlyte, J.; Ramanavicius, A. Comparative study of
random and oriented antibody immobilization techniques on the binding capacity of immunosensor. Anal.
Chem. 2010, 82, 6401-6408. 7. Vashist, S. K.; Dixit, C. K.; MacCraith, B. D.; O'Kennedy, R. Effect of antibody immobilization strategies
on the analytical performance of a surface plasmon resonance-based immunoassay. Analyst 2011, 136, 4431-4436.
8. Makaraviciute, A.; Ramanaviciene, A. Site-directed antibody immobilization techniques for immunosensors. Biosens. Bioelectron. 2013, 50, 460-471.
9. Trilling, A. K.; Beekwilder, J.; Zuilhof, H. Antibody orientation on biosensor surfaces: A minireview. Analyst 2013, 138, 1619-1627.
10. Lin, P.-C.; Chen, S.-H.; Wang, K.-Y.; Chen, M.-L.; Adak, A. K.; Hwu, J.-R. R.; Chen, Y.-J.; Lin, C.-C. Fabrication of oriented antibody-conjugated magnetic nanoprobes and their immunoaffinity application. Anal. Chem. 2009, 81, 8774-8782.
11. Ryu, Y.; Jin, Z.; Kang, M.; Kim, H.-S. Increase in the detection sensitivity of a lateral flow assay for a cardiac marker by oriented immobilization of antibody. BioChip J. 2011, 5, 193-198.
12. Shen, G.; Cai, C.; Wang, K.; Lu, J. Improvement of antibody immobilization using hyperbranched polymer and protein A. Anal. Biochem. 2011, 409, 22-27.
13. Ho, J.-a. A.; Hsu, W.-L.; Liao, W.-C.; Chiu, J.-K.; Chen, M.-L.; Chang, H.-C.; Li, C.-C. Ultrasensitive electrochemical detection of biotin using electrically addressable site-oriented antibody immobilization approach via aminophenyl boronic acid. Biosens. Bioelectron. 2010, 26, 1021-1027.
14. Duval, F.; van Beek, T. A.; Zuilhof, H. Key steps towards the oriented immobilization of antibodies using boronic acids. Analyst 2015, 140, 6467-6472.
15. Cho, I.-H.; Paek, E.-H.; Lee, H.; Kang, J. Y.; Kim, T. S.; Paek, S.-H. Site-directed biotinylation of antibodies for controlled immobilization on solid surfaces. Anal. Biochem. 2007, 365, 14-23.
16. Seo, M.-H.; Han, J.; Jin, Z.; Lee, D.-W.; Park, H.-S.; Kim, H.-S. Controlled and oriented immobilization of protein by site-specific incorporation of unnatural amino acid. Anal. Chem. 2011, 83, 2841-2845.
17. Seymour, E.; Daaboul, G. G.; Zhang, X.; Scherr, S. M.; Ünlü, N. L.; Connor, J. H.; Ünlü, M. S. DNA-directed antibody immobilization for enhanced detection of single viral pathogens. Anal. Chem. 2015, 87, 10505-10512.
18. Kruis, I. C.; Lowik, D. W. P. M.; Boelens, W. C.; van Hest, J. C. M.; Pruijn, G. J. M. An integrated, peptide-based approach to site-specific protein immobilization for detection of biomolecular interactions. Analyst 2016, 141, 5321-5328.
19. Chen, H.; Huang, J.; Palaniappan, A.; Wang, Y.; Liedberg, B.; Platt, M.; Tok, A. I. A review on electronic bio-sensing approaches based on non-antibody recognition elements. Analyst 2016, 141, 2335-2346.
20. Oh, E. H.; Lee, S. H.; Ko, H. J.; Park, T. H. Odorant detection using liposome containing olfactory receptor in the SPR system. Sens. Actuat. B: Chem. 2014, 198, 188-193.
21. Zhu, Z.; Feng, M.; Zuo, L.; Zhu, Z.; Wang, F.; Chen, L.; Li, J.; Shan, G.; Luo, S.-Z. An aptamer based surface plasmon resonance biosensor for the detection of ochratoxin A in wine and peanut oil. Biosens. Bioelectron. 2015, 65, 320-326.
22. Dudak, F. C.; Boyaci, İ. H. Peptide-based surface plasmon resonance biosensor for detection of staphylococcal enterotoxin B. Food Anal. Methods 2014, 7, 506-511.
23. Ruscito, A.; Smith, M.; Goudreau, D. N.; DeRosa, M. C. Current status and future prospects for aptamer-based mycotoxin detection. J. AOAC Int. 2016, 99, 865-877.
24. Yoo, M.; Han, S.-J.; Wee, J.-H. Carbon dioxide capture capacity of sodium hydroxide aqueous solution. J. Environ. Manage. 2013, 114, 512-519.
25. van Dongen, S. F. M.; Janvore, J.; van Berkel, S. S.; Marie, E.; Piel, M.; Tribet, C. Reactive protein-repellent surfaces for the straightforward attachment of small molecules up to whole cells. Chem. Sci.
2012, 3, 3000-3006. 26. Synaffix Reagents, BCN reagents. http://synaffix.biedmeer.nl/Webwinkel-Category-1277450/BCN-
Adaptable-probes.html (Accessed on: 18 August 2016). 27. Shalabney, A.; Abdulhalim, I. Sensitivity-enhancement methods for surface plasmon sensors. Laser
Photon. Rev. 2011, 5, 571-606. 28. Breault-Turcot, J.; Masson, J.-F. Nanostructured substrates for portable and miniature SPR biosensors.
Anal. Bioanal. Chem. 2012, 403, 1477-1484. 29. Ertsgaard, C. T.; McKoskey, R. M.; Rich, I. S.; Lindquist, N. C. Dynamic placement of plasmonic hotspots
for super-resolution surface-enhanced raman scattering. ACS Nano 2014, 8, 10941-10946. 30. Valsesia, A.; Marabelli, F.; Giudicatti, S.; Marchesini, G. R.; Rossi, F.; Colpo, P. SPR sensor device with
nanostructure. World Patent 2013, WO 2013/007448 A1.
General discussion and future perspectives
151
31. Hong, X.; Hall, E. A. H. Contribution of gold nanoparticles to the signal amplification in surface plasmon resonance. Analyst 2012, 137, 4712-4719.
32. Springer, T.; Ermini, M. L.; Spackova, B.; Jablonku, J.; Homola, J. Enhancing sensitivity of surface plasmon resonance biosensors by functionalized gold nanoparticles: Size matters. Anal. Chem. 2014,
86, 10350-10356. 33. Moon, J.; Kim, G.; Lee, S. A gold nanoparticle and aflatoxin B1-BSA conjugates based lateral flow assay
method for the analysis of aflatoxin B1. Materials 2012, 5, 634-643. 34. Wang, X.; Niessner, R.; Knopp, D. Magnetic bead-based colorimetric immunoassay for aflatoxin B1 using
gold nanoparticles. Sensors 2014, 14, 21535-21548. 35. Li, D.; He, Q.; Cui, Y.; Duan, L.; Li, J. Immobilization of glucose oxidase onto gold nanoparticles with
enhanced thermostability. Biochem. Biophys. Res. Comm. 2007, 355, 488-493. 36. Khademi, F.; Mohammadi, M.; Kiani, A.; Haji Hosseini Baghdadabadi, R.; Parvaneh, S.; Mostafaie, A.
Efficient conjugation of aflatoxin M1 with bovine serum albumin through aflatoxin M1-(o-carboxymethyl) oxime and production of anti-aflatoxin M1 antibodies. Jundishapur J. Microbiol. 2015, 8, 168501-168507.
37. Schartner, J.; Hoeck, N.; Guldenhaupt, J.; Mavarani, L.; Nabers, A.; Gerwert, K.; Kotting, C. Chemical functionalization of germanium with dextran brushes for immobilization of proteins revealed by attenuated total reflection fourier transform infrared difference spectroscopy. Anal. Chem. 2015, 87, 7467-7475.
38. Löfås, S.; Johnsson, B. A novel hydrogel matrix on gold surfaces in surface plasmon resonance sensors for fast and efficient covalent immobilization of ligands. J. Chem. Soc., Chem. Comm. 1990, 1526-1528.
39. Preechaburana, P.; Gonzalez, M. C.; Suska, A.; Filippini, D. Surface plasmon resonance chemical sensing on cell phones. Angew. Chem. Int. Ed. 2012, 51, 11585-11588.
40. Liu, Y.; Liu, Q.; Chen, S.; Cheng, F.; Wang, H.; Peng, W. Surface plasmon resonance biosensor based on smart phone platforms. Sci. Rep. 2015, 5, 128641-128649.
41. Howes, P. D.; Rana, S.; Stevens, M. M. Plasmonic nanomaterials for biodiagnostics. Chem. Soc. Rev. 2014, 43, 3835-3853.

153
Summary
The testing and further development of a prototype nanostructured imaging surface
plasmon resonance (iSPR) biosensor, with a focus on surface modification and detailed
characterization of the biosensor chip and in-field and at-line applicability in the food
industry is described. Furthermore, a simplified coupling of SPR and MS is described that
allows identification of the mycotoxins of interest along with any other cross-reacting
analytes. Chapter 1 describes general information about SPR, SPR instruments along
with their components, development of a multiplex SPR biosensor and coupling of SPR to
mass spectrometry. In Chapter 2, the surface modification, in-depth characterization and the
antifouling performance of the nanostructured iSPR chip is described. Different types of
polyethylene glycol (PEG) and zwitterionic polymers were chosen as antifouling
chemistries. Various surface characterization techniques such as atomic force
microscopy, scanning electron microscopy, water contact angle, X-ray photoelectron
spectroscopy and direct analysis in real time high resolution mass spectrometry provided
complementary information about the chip before and after the modification. Antifouling
chemistry, an essential first step in the development of an SPR biosensor, prevents false
positive results arising from non-specific binding of sample components to the SPR chip.
Upon comparison of the surface modification and antifouling behavior with conventional
flat SPR chips, the latter were only slightly better. Zwitterionic polymers and long chain
PEG had the best antifouling performance. A proof-of-principle experiment was done to
demonstrate the selective detection of streptavidin binding to a surface partially modified
with biotin.
A 6-plex SPR assay for the detection of mycotoxins in barley was developed in
Chapter 3. A benchmark double 3-plex assay was developed for the detection of
deoxynivalenol (DON), zearalenone (ZEA), T-2 toxin (T-2), ochratoxin A (OTA),
fumonisin B1 (FB1) and aflatoxin B1 (AFB1) using benchtop SPR instrument (Biacore).
Preliminary in-house validation of the competitive inhibition assay developed using
ovalbumin conjugates of the mycotoxins showed that the method is suitable for detection
of DON, ZEA, T-2 and FB1 whereas further improvement is required for OTA and AFB1.
The method was then transferred to the nanostructured iSPR, which although less
sensitive than the benchtop SPR, was able to detect DON, T-2, ZEA and FB1 at the
relevant levels.
In Chapter 4, the assay developed in Chapter 3 was further optimized and an
entire assay along with in-house validation and measurement of naturally contaminated
was developed using the nanostructured iSPR. The antifouling chemistry used in Chapter
3, PEG, was replaced by carboxymethylated dextran (CMD) that not only allowed direct
Summary
154
immobilization of toxins but also helped to improve the stability of the chip whereby the
chip could be used for more than 450 cycles. DON could be detected at the relevant
levels in beer with minimal sample preparation whereas for OTA an enrichment step
using solid phase extraction was required.
As demonstrated in Chapter 3 and 4, the nanostructured iSPR instrument can be
used for screening of different mycotoxins in beer and related ingredients. However, SPR
is not able to provide chemical information of the binding analyte especially in cases
where the antibodies have cross-reactivity towards conjugates of the analyte. Therefore,
a simplified coupling for SPR with ambient mass spectrometry was developed in Chapter
5. The method allowed identification of DON as well as its cross-reacting conjugates such
as deoxynivalenol-3-glucoside and 3-acetyl DON.
The research presented in this thesis is an important step towards the use of the
nanostructured iSPR instrument for label free in-field and at-line detection of various
analytes. In Chapter 6, discussion of the main achievements of this thesis, challenges
and future perspectives of the technology is described.

155
Acknowledgements
I would like to start by thanking my three supervisors Michel Nielen, Teris van Beek and
Han Zuilhof for their help and support during the last four years. Michel and Teris thanks
to your fast responses, I was always able to make my deadlines, even during the busy
times of September teaching. Michel, thank you for helping me to come back on track
when I got lost trying to do everything at once. Teris, I will never forget your help with
the experiments during my last months that set the first steps for Chapter 5. Also, thank
you for showing me a little bit of the Netherlands as part of the day trips you organized
and for all the get together events we had at your house. Han, thank you for helping with
all the surface chemistry related problems and for always finding time in your busy
schedule to read my manuscripts.
I would also like to thank all my colleagues at ORC, Ton, Maurice, Tom, Cees,
Maarten, Floris, Bauke, Elly, Aleida, Anita, Barend, Anne-Marie, Cees, Carel, Erik,
Hendra, Marcel, Ronald, Remco, Elbert, Pepijn, Frank, Judith, Willem, Alexandre, Anke,
Jaime, Sidhu, Umesh, Radostina, Saurabh, Nagendra, Satesh, Yao, Steven, Wilco,
Florine, Aline, Bas, Kuldeep, Txema, Bram, Frank, Jorin, Tjerk, Rickdeb, Christie, Wang,
Fatima, Sjoerd, Medea, Esther, Digvijay, Fred, Stefanie, Jorge, Rui, Jorick, Milou and
Pepijn for creating a nice working environment. Barend, Pepijn, Ton, Maarten, Bas and
Esther, it was great fun to supervise practicals with all of you. Txema thank you for your
help in the lab and additionally for modifying some surfaces for me. Thank you Elbert for
your help with the fluidics of my instrument, I learned a lot from it. And Frank thank you
for being there when I jumped from the MS room to your office asking for help. Tjerk,
Digvijay and Medea, it was great organizing the PhD trip and of course getting to know a
little bit more about all the PhDs during these trips. Wilco thank you for being such a nice
office mate and being there throughout the PhD journey. Thank you for answering all the
questions and helping me during the entire thesis submission process. Jorin, I will miss
our dinner and board game nights but hope that we can still find time to see each other.
Aline and Fatima, it was a lot of fun to go for Zumba classes; without you guys I am sure
I would have missed quite a few of them. Esther Roeven and Esther van Andel for
accepting to be my paranymphs and I wish you all the best for your own PhD. Thank you
to Surfix and Aquamarijn team for being part of all the fun activities both inside and
outside the lab.
Thanks to my colleagues at RIKILT, Susann, Ana, Jeroen and Nathalie for helping
me get around in your lab, if I first managed to get past the reception of course. Willem
Haasnoot and Jeroen Peters thank you for all the discussions and ideas during the
project. Jeroen also thank you for the collaboration and providing naturally contaminated
beer samples.

Acknowledgements
156
I would like to thank all my project partners for the discussions and feedback.
Jeroen Kool, Dina Lakayan and Dick Iperen, thank you for your help in designing and
making the flow cell. I would like to thank the Netherlands Organization for Scientific
Research (NWO) and COAST for the financial support and the project partners of VU
Amsterdam, RIKILT, Heineken, Synthon, Technex, EuroProxima, Waterproef and
associated partners Plasmore and Bionavis for stimulating discussions during the project
meetings. I would also like to additionally thank Europroxima, Heineken, Plasmore,
RIKILT and VU for hosting me during the secondments.
I am grateful to my students Laura Schijven, Anna Segarra Fas, Marloes van
Adrichem and Rumaisha Annida for their hard work and wish them all the best for their
future. All of your support has contributed to finalizing my thesis. Anna, I really
appreciated your enthusiasm, which resulted in Chapter 3. Nida, thank you for all the
hours you worked on the mycotoxin assay for beer, which made Chapter 4 possible.
I would also like to thank my former colleagues in Germany and Spain who have
helped to pave the path until I decided to pursue a PhD degree. Patricia, I would not
have survived 3 months in Spain without speaking a word of Spanish if it wasn’t for you
and your wonderful family. Special thanks to Prof. Dr Werner Nau without whose
coaching I would not be the scientist that I am today and Dr Maik Jacob for being so
supportive and believing in me during my stay in the Nau group as well as during my
PhD application.
I would like to thank my Dutch teacher and classmates who made the learning
process so much fun.
A big thank you to all my friends and my host family for making Bremen my
second home. Amita di and Saksham dai thank you for coming to all my graduation
ceremonies, you make me feel like my family is there. I would like to thank Abhinandan
Shrestha for the friendship and academic career we shared and for going through all my
ups and downs together in the past nine years. Alexandra thank you for being such a
good friend and an awesome house mate, I miss you and our never ending
conversations.
I would like to thank all my new colleagues at AkzoNobel for creating a nice
working environment. Working extra hours during the evening did not feel so bad when
we knew there would be cake the next day. Maaike thank you for thinking along for the
design of my cover, it motivated me to get going with it.
Wouter, I am glad I chose to come to Wageningen for my PhD as there was
something even more important I found here. Thank you for being so supportive and
having dinner ready when I arrived home late, sometimes even five days a week. I would
also like to thank your family, Marjan, Theo, Charlotte and Robin who have been like a
family away from home. And of course little Noudje for bringing a smile to all our faces.

Acknowledgements
157
Of course last but not the least my parents and my brother for their love and
support. The highest credit goes to my mother, the inspiration and motivation of my life.
You made the choice to rather skip my graduation and come to support me during the
difficult last months when I was trying to manage a new house, new job and finalize my
PhD; this is just one of the many things you have done to help me fulfil my dreams.


159
Curriculum vitae
Sweccha Joshi was born on 25 August 1987 in Kathmandu,
Nepal. After finishing her high school in 2007, she moved to
Germany to pursue a bachelor studies in Chemistry at Jacobs
University Bremen. In 2010, she decided to continue at Jacobs
University and obtained a Master of Science degree in
Nanomolecular Science in 2012. During her bachelor and
masters studies she conducted research in the group of Prof. Dr
Werner Nau working on the study of interaction of metal oxide nanoparticles with short
peptides and amino acids. In 2009, she spent three months in the lab of Prof. Dr Uwe
Pischel as an intern working on the synthesis and photophysical characterization of a
novel fluorescent probe for pH modulated switching of supramolecular host-guest
complexes. In July 2012, Sweccha moved to the Netherlands to start a PhD project under
the supervision of Prof. Dr Michel Nielen, Prof. Dr Han Zuilhof and Dr Teris van Beek, the
results of which are shown in this thesis. Since July 2016, she works as a researcher in
the team of Dr Michel Rosso at the Decorative Coatings business unit of AkzoNobel in
Sassenheim.

161
List of publications
1. Joshi, S.; Ghosh, I.; Pokhrel, S.; Mädler, L.; Nau, W. M., Interactions of amino
acids and polypeptides with metal oxide nanoparticles probed by fluorescent
indicator adsorption and displacement. ACS Nano 2012, 6, 5668-5679.
2. Manova, R. K.; Joshi, S.; Debrassi, A.; Bhairamadgi, N. S.; Roeven, E.; Gagnon,
J.; Tahir, M. N.; Claassen, F. W.; Scheres, L. M. W.; Wennekes, T.; Schroën, K.;
van Beek, T. A.; Zuilhof, H.; Nielen, M. W. F., Ambient surface analysis of organic
monolayers using direct analysis in real time orbitrap mass spectrometry.
Analytical Chemistry 2014, 86, 2403-2411.
3. Joshi, S.; Pellacani, P.; van Beek, T. A.; Zuilhof, H.; Nielen, M. W. F., Surface
characterization and antifouling properties of nanostructured gold chips for
imaging surface plasmon resonance biosensing. Sensors and Actuators B:
Chemical 2015, 209, 505-514.
4. Joshi, S.; Segarra-Fas, A.; Peters, J.; Zuilhof, H.; van Beek, T. A.; Nielen, M. W.
F, Multiplex surface plasmon resonance biosensing and its transferability towards
imaging nanoplasmonics for detection of mycotoxins in barley. Analyst 2016,
141, 1307-1318.
5. Joshi, S.; Annida, R.; Zuilhof, H.; van Beek, T. A.; Nielen, M. W. F, Analysis of
mycotoxins in beer using a portable nanostructured imaging surface plasmon
resonance biosensor. Journal of Agricultural and Food Chemistry 2016, 64, 8263-
8271.
6. Joshi, S.; Zuilhof, H.; van Beek, T. A.; Nielen, M. W. F, Biochip spray: Simplified
coupling of surface plasmon resonance biosensing and mass spectrometry.
Analytical Chemistry 2017, doi:10.1021/acs.analchem.6b04012.


163
Overview of completed training activities
Discipline specific activities
Advanced Organic Chemistry (VLAG), Wageningen, the Netherlands, 2012-2014
Advanced Food Analysis (VLAG), Wageningen, the Netherlands, 2013
NWO Study Group Analytical Chemistry (NWO), Lunteren, the Netherlands, 2012-2013
TA-COAST Programme Meeting (NWO, TI-COAST), Lunteren/Amersfoort, the
Netherlands, 2012-2016
Advances in Biodetection and Biosensors (Selectbio), Berlin, Germany, 2014
CHAINS (NWO), Veldhoven, the Netherlands, 2014-2015
Micronano Conference (MinacNed), Amsterdam, the Netherlands, 2015
26th Anniversary World Congress on Biosensors (Elsevier), Gothenburg, Sweden, 2016
General courses
VLAG PhD Week (VLAG), Baarlo, the Netherlands, 2012
Techniques for Writing and Presenting (WGS), Wageningen, the Netherlands, 2013
Project and Time Management (WGS), Wageningen, the Netherlands, 2013
ACS on Campus (ACS), Utrecht, the Netherlands, 2013
Mini-symposium: How to Write a World Class Paper (WUR Library), Wageningen, the
Netherlands, 2013
Guide to Scientific Artwork (WUR Library), Wageningen, the Netherlands, 2015
Career Perspectives (WGS), Wageningen, the Netherlands, 2015
Optionals
Preparation of PhD Research Proposal, 2012
Colloquia (ORC), 2012-2016
Project Meetings, 2012-2016
Group Meetings (ORC), 2012-2016
PhD trip (ORC) to Germany and Switzerland, 2013
PhD trip (ORC) to Canada, 2015
Organizing committee PhD trip (ORC) to Canada, 2015

164
The research presented in this thesis was financially supported by The Netherlands
Organization for Scientific Research (NWO) in the framework of the Technology Area
COAST (project nr 053.21.107) with WU, VU Amsterdam, RIKILT, Heineken, Synthon,
Technex, EuroProxima, Waterproef as partners and Plasmore and Bionavis as associated
partners.
Financial support from Wageningen University for printing this thesis is gratefully
acknowledged.
Cover design: Sweccha Joshi
Printed by Digiforce, Proefschriftmaken.nl, Wageningen, the Netherlands

Top Related
Copyright © 2022 FDOKUMEN

