


Bahasa
Halaman
Hukum

Model-Based Prediction of the a-Hemolysin Structure in theHexameric State
Simone Furini,*y Carmen Domene,y Michele Rossi,z Marco Tartagni,z and Silvio Cavalcanti**Department of Electronics, Computer Science and Systems, University of Bologna, Bologna, Italy; yPhysical and Theoretical ChemistryLaboratory, Department of Chemistry, University of Oxford, Oxford, United Kingdom; and zARCES: Advanced Research Center onElectronic Systems for Information and Communication Technologies ‘‘E. De Castro’’, University of Bologna, Bologna, Italy
ABSTRACT The a-hemolysin toxin self-assembles in lipid bilayers to form water-filled pores. In recent years, a-hemolysin hasreceived great attention, mainly due to its possible usage as a sensing element. We measured the ion currents through singlea-hemolysin channels and confirmed the presence of two different subpopulations of channels with conductance levels of465 6 30 pS and 280 6 30 pS. Different oligomerization states could be responsible for these two conductances. In fact,a heptameric structure of the channel was revealed by x-ray crystallography, whereas atomic force microscopy revealeda hexameric structure. Due to the low resolution of atomic force microscopy the atomic details of the hexameric structure are stillunknown, and are here predicted by computational methods. Several possible structures of the hexameric channel weredefined, and were simulated by molecular dynamics. The conductances of these channel models were computed by anumerical method based on the Poisson-Nernst-Planck electrodiffusion theory, and the values were compared to experimentaldata. In this way, we identified a model of the a-hemolysin hexameric state with conductance characteristics consistent with theexperimental data. Since the oligomerization state of the channel may affect its behavior as a molecular sensor, knowing theatomic structure of the hexameric state will be useful for biotechnological applications of a-hemolysin.
INTRODUCTION
a-Hemolysin (aH) is a pore-forming toxin secreted by the
bacterium Staphylococcus Aureus and is a major determinant
of bacterial pathogenicity (1). Despite wide knowledge about
the functioning and structure of aH, the oligomerization state
of the protein is still under debate. A heptameric structure was
revealed by x-ray crystallography (2), whereas a hexameric
structure was suggested by atomic force microscopy (AFM)
data (3). Due to the low resolution of AFM, the atomic
structure of the hexameric state is still unknown and is here
predicted by numerical simulations.
Interest in the atomic structure of the hexameric state is
justified by the technological relevance of the aH channel
(4). Several characteristics make aH an ideal candidate for a
sensing element in biotechnological applications. Hemoly-
sins may bind directly to artificial or natural lipid membranes
(5,6), and the binding does not require any auxiliary molecule
or special experimental conditions. Once it is bound to the
lipid bilayer, aH spontaneously oligomerizes to form a trans-
membrane channel (7), and the open state of the channel is
stable and highly conductive (8). The possible use of aH as a
sensing element has already been demonstrated in various
fields, including 1), sensing of divalent metal ions (9); 2),
sensing of organic molecules (10); 3), analysis of single-
stranded RNA or DNA molecules (11); 4), detection of spe-
cific DNA or RNA sequences (12). The oligomerization state
may affect the affinity of the channel for blocking molecules,
and consequently its function as a molecular sensor. In this
context, knowledge of the atomic structure of the different
oligomerization states will prove useful.
The existence of two oligomerization states of the aH
channels is also supported by electrophysiological measure-
ments. To analyze the conduction characteristics of aH, it is
important to distinguish between two phenomena: 1), the
heterogeneous distribution of single-channel conductances in
a population of channels; and 2), the changes of conductance
within each subpopulation. The insertion of an aH channel in
a lipid bilayer is experimentally revealed by a current step in
the recording system. A heterogeneous distribution of the
channel conductance refers to the fact that under fixed ex-
perimental conditions, the amplitudes of these current steps
are distributed among different values. Histograms of single-
channel currents have shown the presence of at least two
current levels in a population of aH channels (8,13,14). Since
no transitions were observed between conductance levels
(13), it is possible to associate the different conductances
with different subpopulations of aH channels (referred to
here as high- and low-conductance states).
Experimental conditions influence the distribution of
channels among the subpopulations (13), as well as the con-
ductance characteristics within each subpopulation. Concern-
ing the latter issue, a major role is played by divalent and
trivalent cations, and by the pH of the bathing solutions. Di-
valent and trivalent cations inhibit conduction in aH channels
by a blockage mechanism (8). On the other hand, pH modu-
lates the channel conductance and the nonlinearity of the
doi: 10.1529/biophysj.107.127019
Submitted December 4, 2007, and accepted for publication May 7, 2008.
Address reprint requests to Simone Furini, Dept. of Electronics, Computer
Science and Systems, University of Bologna, Viale Risorgimento, 2.
I-40136, Bologna, Italy. Tel.: 390512093067; Fax: 390512093540; E-mail:
Editor: Peter Tieleman.
� 2008 by the Biophysical Society
0006-3495/08/09/2265/10 $2.00
Biophysical Journal Volume 95 September 2008 2265–2274 2265

current-voltage relation (15). It has been shown that the in-
fluence of pH is primarily electrostatic (16): the protonation
states of the protein molecule vary depending on the pH of the
medium and, thus, the conduction characteristics of the
channel. Together with these changes in conductance gov-
erned by the experimental conditions, an aH channel can also
switch between an open and an almost-closed state through a
mechanism that can be reversed by applying a zero membrane
potential (17). The conductance of the ‘‘closed’’ state is ;10-
fold lower than the conductance of the open state, despite the
fact that the channel radius remains almost unchanged. This
suggests that no severe structural changes of the channel take
place during gating, and that instead changes in the protonation
states of the amino acids facing the permeation pathway are
likely to occur (18).
The changes in the channel current induced by the ex-
perimental conditions and by channel gating act on single aH
channels, and should not be confused with the heterogeneous
distribution of conductances in a population of channels. A
possible explanation for the observation of different sub-
populations of channels is that aH may exist in different
structural forms that do not convert one to the other once the
channel is embedded in the lipid bilayer. In agreement with
Menestrina’s ideas (8), we hypothesized that the subpopu-
lations of aH channels are indeed channels with a different
oligomerization state.
In the crystallographic structure of aH (2), seven identical
monomers are symmetrically arranged around the channel
axis (Fig. 1). The transmembrane domain of the channel has a
b-barrel structure; each monomer contributes to the b-barrel
by two antiparallel b-sheets. The b-barrel pore is connected
to the extracellular compartment, by a wide protein domain
(extracellular cap). This heptameric structure has been as-
sociated with the high-conductance state of the channel since
the atomic structure was solved (2). Numerical simulations
using different approaches (19–21) confirmed this hypothe-
sis. Assuming that different oligomerization states are re-
sponsible for the two conductance values, and given the
association between the heptameric structure and the high-
conductance state, the low-conductance state with the hex-
americ structure remains to be identified.
To identify the atomic structure of the aH channel in the
hexameric state, we took advantage of the experimental data
on the heptameric state (2). It is assumed that the overall
structure of the heptameric state is preserved in the hexameric
state. The symmetrical structure revealed by AFM for the
hexameric state supports this hypothesis (3). By analogy with
the heptameric structure, the transmembrane pore of the
hexameric channel would include 12 b-sheets, with each
monomer contributing a couple of antiparallel sheets to the
b-barrel. It is known that the hydrogen-bond network and the
packing of the side chains restrict the admissible atomic
structures in a b-barrel channel (22,23). According to these
restrictions, we defined a set of atomic models for the
transmembrane pore of the hexameric aH channel. The
conductances of these hypothetical structures were computed
using an approach based on the Poisson-Nernst-Planck the-
ory, and were compared to experimental data to identify a
proper model of the aH channel in the hexameric state.
METHODS
Heptameric channels
Two models of the heptameric aH channel were defined: in one, all the aH
residues were included (HEPTA-CAP), and in the other, only the b-barrel
domain, from residue Thr109 to residue Val149, was considered (HEPTA-
BARREL). Atomic coordinates were taken from the crystallographic structure
of Song et al. (Protein Data Bank entry 7AHL) (2). Residues with missing
atoms were built using the software psfgen of NAMD2 (24). Default proton-
ation states were used for all the amino acids. Histidines were protonated at the
delta position. N- and C-terminals were, respectively, acetylated and amidated.
All crystallographic water molecules were included in the models.
The channel models were embedded in a preequilibrated lipid bilayer
made up of 512 dimyristoylphosphatidylcholine (DMPC) molecules. The
membrane was oriented in the xy plane, and the aH pore was oriented along
the z axis. The hydrophobic belt of the aH b-barrel (amino acids Tyr118–
Gly126 and Ile132–Ile142) was centered in the lipid bilayer. DMPC molecules
FIGURE 1 Heptameric structure and hexameric model of the aH channel.
Side and top (extracellular) views of the aH channel in the heptameric
(HEPTA-CAP model) and hexameric (HEXA-S16CAP model) states.
Channel subunits are shown in cartoon representation, using different colors
for each subunit. Vertical lines indicate the lengths of the b-barrel domain,
the hydrophobic belt, and the entire channel. Horizontal lines in the side-
view panels show the mean value of the internal diameter of the b-barrel
domain as computed by the PNP equation solver (using the atomic radii from
Nina et al. (30)). Horizontal lines in the top-view panels show the maximum
external diameter of the extracellular cap. The ratio between the inertia
momenta orthogonal to the channel axis is shown at the bottom of the figure.
All the geometrical parameters are mean values during the MD simulations.
The figure was generated with the molecular viewer software VMD (36).
2266 Furini et al.
Biophysical Journal 95(5) 2265–2274
,0.12 nm from protein atoms were removed together with crystallographic
waters ,0.2 nm from DMPC molecules. The system was solvated, and
potassium and chloride ions were added to reach a 150 mM concentration,
yielding a neutral system.
Hexameric channels
The b-sheet is one of the most common structural domains found in proteins.
In proteins with a b-barrel structure, each b-sheet is bound by hydrogen
bonds both to the previous and the next b-sheet in the sequence. The main
geometrical features of a b-barrel are based on two parameters: the number of
b-sheets (N) and the shear number (S). The shear number is defined as fol-
lows. Starting from residue k in the first b-sheet, move perpendicular to the
strand around the barrel (H-bond direction) until the first b-sheet is crossed
again. If l is the residue at the intersection, the shear number is jl� kj (Fig. 2).
Contiguous residues along a b-sheet have opposite orientation, whereas
contiguous residues along the H-bond direction have the same orientation.
As a consequence, S is an even number.
The relation between the number of b-sheets and the shear number defines
the packing of the amino acids in the b-barrel. If S . 2N or S , N, the tilt angle
of the b-sheets causes a close packing of the side chains inside the channel.
Actually, most of the b-barrel proteins satisfy the relation N # S # 2N (22),
and simple geometrical criteria identify S¼N 1 4 as the optimal relation, with
twist and coil angles of the b-sheets closest to optimal values (23).
The heptameric structure of aH was used as a template to define a set of
hexameric models. The transmembrane domain of the resulting hexameric
models has a b-barrel structure with six pairs of antiparallel b-sheets, one
pair from each subunit (N ¼ 12). Four different starting structures were
generated, with S¼ 12, 16, 20, and 24, placing the Ca atoms on a cylindrical
surface with radius R, defined by
R ¼ dH
2sinp
N
� �cosðaÞ
a ¼ tan�1 SdC
NdH
� �; (1)
where dH is the distance between consecutive b-sheets (0.44 nm); dC is the
Ca–Ca distance along the b-sheet (0.33 nm); and a is the b-sheet tilt angle
with respect to the channel axis. Cb atoms were added to each Ca atom in the
radial direction (Ca–Cb distance ¼ 0.15 nm), with Cb atoms of consecutive
residues facing alternately inward and outward. The remaining backbone
heavy atoms were added to each residue on a plane tangent to the b-barrel
surface. Residues Thr109–Gly126 and Ile132–Val149 of the heptameric crystal
structure were moved, one by one, to residues in the hexameric model
with the same side-chain orientation (inward or outward), using the Cb atom
and the backbone atoms for the fitting. Subsequently, residues Asp127–
Lys131 of the heptameric structure were moved, using residues Gly126 and
Ile132 for the fitting, to define the intracellular loops between b-sheets. Labels
HEXA-S12, HEXA-S16, HEXA-S20, and HEXA-S24 will be used for the
hexameric models with shear numbers 12, 16, 20, and 24, respectively.
Anticipating some of the results, the best agreement with the experimental
data of the low-conductance state was given by the hexameric model with
shear number 16 (see Results). Thus, the HEXA-S16 model of the trans-
membrane domain was chosen as the starting point for the entire aH channel
in the hexameric state (transmembrane domain plus extracellular cap).
It was assumed that the structure of each monomer in the extracellular cap
is preserved between the heptameric and the hexameric state, and that the
monomers are symmetrically arranged around the channel axis. The atomic
structure of each monomer was taken from the aH crystallographic structure
(amino acids Ala1–Thr109 and Val149–Asn293). Subsequently, the six mono-
mers were symmetrically arranged around a central axis. Several structures
were defined, characterized by different radial distances between monomers,
thus by different radii of the extracellular cap. Each structure was super-
imposed on the HEXA-S16 model, using amino acids Thr109 and Val149 for
the fitting procedure. The model of the extracellular cap closest to HEXA-
S16 was selected (the distance between HEXA-S16 and the extracellular cap
model was measured as the root mean-square deviation (RMSD) between
amino acids Thr109 and Val149). Residues Ala1–Asp108 and Gln150–Asn293 of
this model of the extracellular cap, together with residues Thr109–Val149 of
HEXA-S16, defined the model of the entire aH channel in the hexameric
state (HEXA-S16CAP).
The hexameric models were embedded in a DMPC lipid bilayer and solvated,
using the same procedure described previously for the heptameric models.
Molecular dynamics
The following protocol was employed for the molecular dynamics simulation
of each model. Energy was first minimized by a steepest-descent procedure
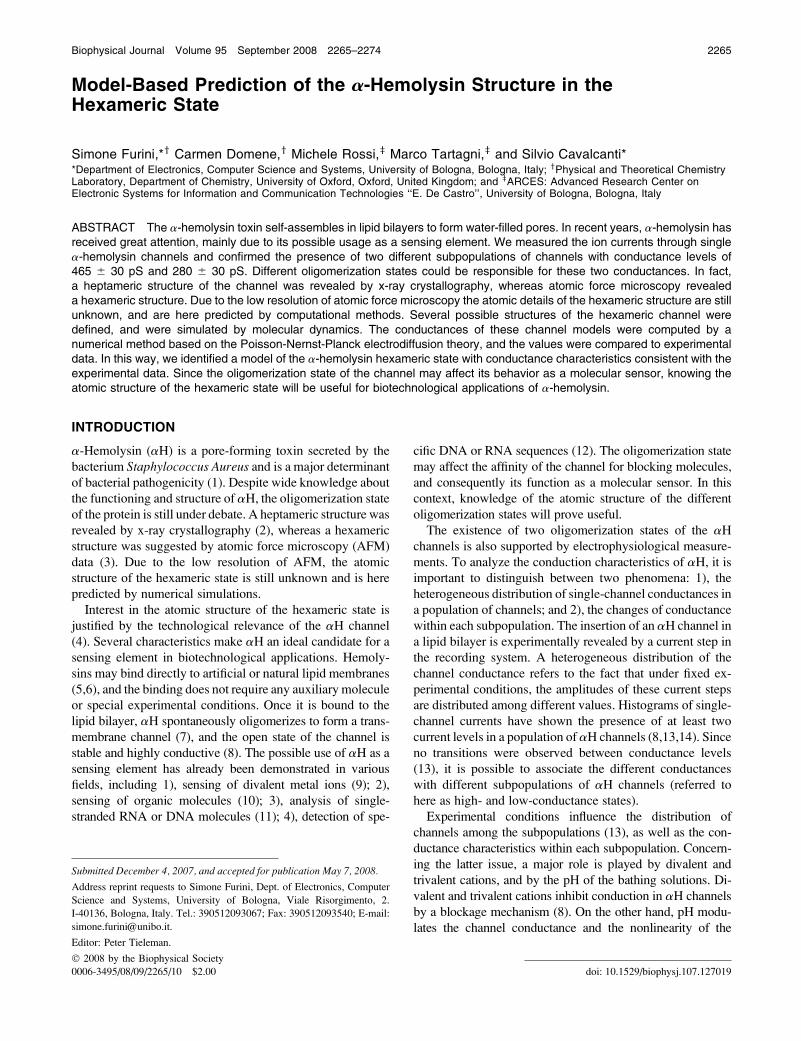
FIGURE 2 Unrolled b-barrel structures. b-sheet arrangements in b-bar-
rels are schematically shown by unrolling the b-barrel surface on a plane.
Continuous lines show the b-sheet directions, with open circles for amino
acids pointing outward, and solid circles for amino acids pointing toward the
pore lumen. Dashed lines run orthogonal to the b-sheets on the b-barrel
surface (H-bond direction) and are used to define the shear numbers (S).
Dotted lines with circles are used to highlight the relative position of
analogous amino acids (in this case, Glu111) on adjacent subunits. These
amino acids are aligned along the channel axis if S¼ N or S¼ 2N, but are no
longer aligned if S ¼ N 1 4.
Hexameric a-Hemolysin Channel 2267
Biophysical Journal 95(5) 2265–2274
(10,000 steps), followed by an equilibration period (500 ps) where harmonic
potentials were applied to the backbone atoms of the protein (force constant
set to 4 Mcal mol�1 nm�2). Harmonic restraints on protein atoms were then
removed, and unrestrained molecular dynamics (MD) simulation was run for
4 ns in the NPT ensemble.
The MD simulations were performed using the NAMD2 software (24),
the CHARMM27 force field for protein and lipids (25), and the TIP3 model
for water molecules (26). Periodic boundary conditions were adopted, and
the long-range electrostatic interactions were treated by the particle mesh
Ewald algorithm (27). A 1.2-nm smoothed cutoff was used for the van der
Waals interactions. Hydrogen-bond lengths were fixed by the SHAKE al-
gorithm (28), to use a 2-fs time step. The temperature was controlled by the
Langevin algorithm at 300 K, with a damping coefficient of 5 ps�1. Pressure
was kept at 1 atm by the Nose-Hoover Langevin piston pressure control (29),
with a piston period of 200 fs, and a damping time constant of 100 fs.
Poisson-Nernst-Planck theory
Poisson-Nernst-Planck (PNP) theory describes the steady-state fluxes of Mion species by the Poisson and Nernst-Planck equations:
= � ðe=fÞ ¼ �r � +M
i¼1
zieCi (2)
= � Ji ¼ 0 i ¼ 1; . . . ;M
Ji ¼ �Di =Ci 1 zi
e
kTCi=f
� �;
(3)
where f is the electric potential; Ci, Di, Ji, and zi are the concentration,
diffusion coefficient, flux, and valence, respectively, of the ith ion specie; r is
the density of fixed electric charge; and e is the dielectric constant (e, k, and T,
are the elementary charge, the Boltzmann constant, and the temperature,
respectively). In the Poisson equation (Eq. 2) r is the protein charge, which is
fixed in space in contrast to ionic charges. Only the protein-charge distribu-
tion was explicitly modeled, whereas the lipid bilayer was assumed to be
electrically neutral. Two monovalent ion species were included in the
mathematical model, to simulate potassium and chloride ions.
PNP equations were solved on a cylindrical grid, with the z axis along the
channel axis. The grid length was 13 nm in the axial direction, and 6 nm in the
radial direction. The number of grid points was 130 in the axial direction, 120
in the radial direction, and 72 in the angular direction. Partial atomic charges
were from the CHARMM27 force field (25). Atomic radii were defined
according to the value proposed by Nina et al. (30). The relative dielectric
constant was set to 2 for the protein and 80 for the water solution. A wa-
terproof slice was placed around the channel, orthogonal to the pore. This
slice was introduced to mimic the lipid bilayer; its relative dielectric constant
was set to 2 and its width to 2.9 nm. The center of the slice was set to the
center of the hydrophobic belt of aH (Tyr118–Gly126 and Ile132–Ile142).
Outside the channel, the diffusion coefficients were set to the experimental
values for diffusion in free solution (DK1 ¼ 1.96 3 10�9 m2/s and DCI� ¼2.03 3 10�9 m2/s (31)). Diffusion coefficients were reduced inside the
channel to take into account the confinement effects due to the pore finite
size. The analytical expression proposed by Noskov et al. (20) was used to
define the diffusion coefficients on each slice of the cylindrical grid inside the
channel:
D¼ Dbulk
6:43310�1
14:40310�4
eRion
0:069Rpore 13:56310�1
eRion
0:19Rpore
;
where Rpore is the radius of the pore; Rion is the radius of the diffusing ion; and
Dbulk is the diffusion coefficient in free solution; and numerical values were
obtained fitting the diffusion coefficients of spherical particles in cylindrical
pores (32).
PNP equations were solved by an iterative algorithm previously used to
model potassium channels (33,34), with a tolerance of 10�10 mV for the
Poisson equation, and 10�10 mM for the Nernst-Planck equations. To take
into account the movements of the protein, PNP calculations were repeated
on several snapshots of the MD trajectories. Structures were selected from
the last 3 ns of the MD trajectories every 0.5 ns.
Experimental measurements
The planar lipid bilayer workstation from Warner Instrument (Harvard Ap-
paratus, Holliston, MA) was used for single-channel recording. The bilayer
apparatus consists of two chambers (1 ml each), connected by a 150-mm
orifice through a Delrin cap. Lipid bilayers of a-phosphatidylcholine were
formed by the painting method, using a diluted phosphatidylcholine solution
in decane (15 mg/ml). Ag/AgCl electrodes connected the bathing solutions to
the recording systems. The electrode in the cis chamber—where aH was
added—was connected to the virtual ground. A positive potential indicates a
higher potential in the trans chamber, and positive currents flow from trans
(intracellular side of the channel) to cis (extracellular side of the channel).
The membrane potential was clamped at 140 mV, and the insertion of a
channel in the lipid bilayer was revealed by a current step in the recording
system. The current-voltage relation was acquired by varying the membrane
potential from�100 mV to 100 mV, with a 20-mV step. The protocol used to
measure the current-voltage relation was repeated several times (.10) for
each channel, to test the stability of the conductance. The timescale of the
entire experimental protocol was ;5 min. Bathing solutions contained 0.5 M
KCl, 10 mM EGTA, 10 mM HEPES (pH 7.5 with KOH). Signals were re-
corded with an Axopatch 200B amplifier, and data were analyzed by
pCLAMP9 (Axon Instruments, Union City, CA). Signals were sampled at 10
kHz and filtered at 5 kHz. Experiments were conducted at a room temper-
ature of 20 6 2�C. All reagents were from Sigma (Milan, Italy).
RESULTS
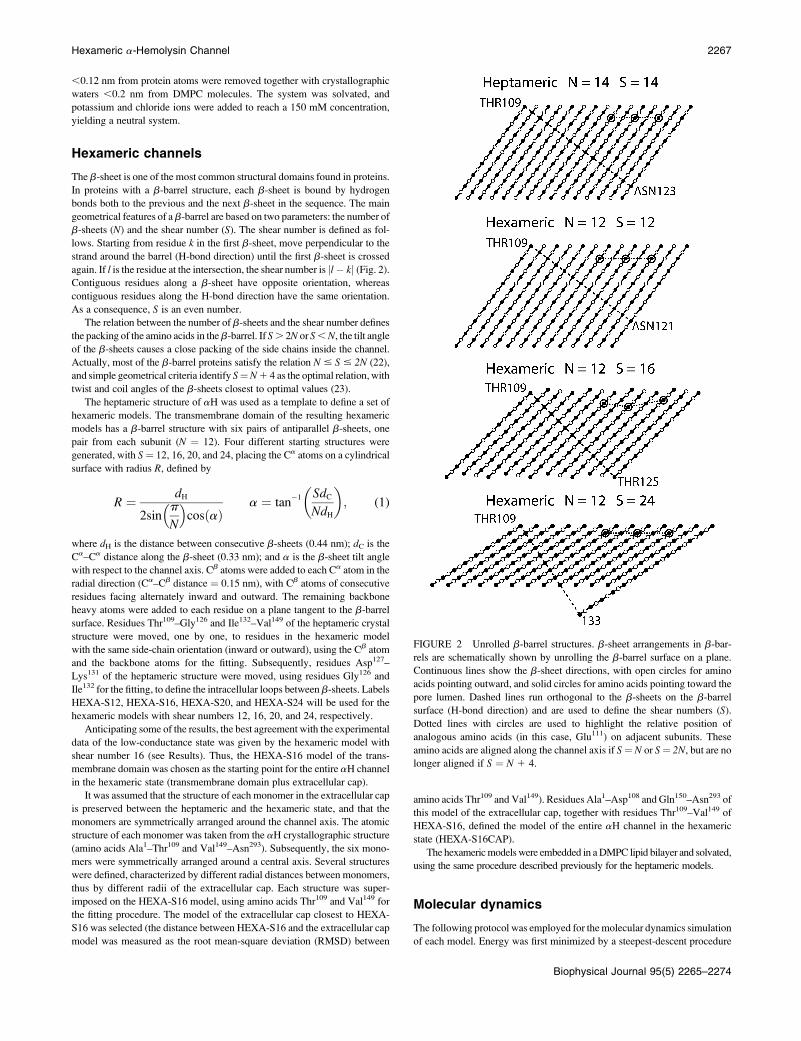
Molecular dynamics simulations
Both heptameric models (HEPTA-CAP and HEPTA-
BARREL) proved to be stable during MD trajectories (Fig.
3). Removing the extracellular cap did not affect the struc-
tural stability of the b-barrel domain. The higher RMSD of
the backbone atoms in the HEPTA-BARREL model can be
attributed to atomic displacements at the extracellular side as
a consequence of the lack of extracellular cap.
The moment of inertia tensor of the b-barrel domain was
used to evaluate the geometrical features of the pore, namely
FIGURE 3 Root mean-square deviation of b-barrel domain. Root mean-
square deviation was computed on the backbone atoms of residues Thr109–
Val149 for the various simulations.
2268 Furini et al.
Biophysical Journal 95(5) 2265–2274
the tilting of the pore with respect to the lipid membrane and
the eccentricity of the b-barrel cross section. As a conse-
quence of the cylindrical structure of the b-barrel, a principal
axis of inertia is directed along the pore axis. The angle be-
tween this principal axis and the z axis measures the tilting of
the channel in the lipid membrane. The maximum tilt was
,5� in both of the heptameric models. To estimate the cross
section eccentricity, the inertia momenta along the principal
axes orthogonal to the pore were used. The ratio between the
minor and the major of these two inertia momenta is 1 in a
b-barrel with circular cross section, whereas it decreases in a
b-barrel with elliptical cross section. The mean ratio was 0.97
in both heptameric models, which suggests an almost circular
cross section. A cross section more asymmetrical, but again
close to circular, was observed by Aksimentiev and Schulten
in a 50-ns MD simulation of aH (19) (ratio between inertia
momenta � 0.9). This deviation could be explained by dif-
ferences in the length of the simulations and in the method
employed to estimate the cross section asymmetry.
The number of hydrogen bonds in the b-barrel backbone
was compared in the two heptameric models. Donor and
acceptor atoms were counted as involved in a hydrogen bond
when their distance was ,0.4 nm and the donor-hydrogen-
acceptor angle was between 160� and 200� (35). The mean
numbers of hydrogen bonds were 180 and 172 in the HEPTA-
CAP and HEPTA-BARREL models, respectively. The
greater mobility of the extracellular side causes the decrease
of hydrogen bonds in the HEPTA-BARREL model.
The four hexameric models of the transmembrane domain
(HEXA-S12, HEXA-S16, HEXA-S20, and HEXA-S24)
were stable during the MD simulations (Fig. 3). The pore axis
was orthogonal to the lipid membrane in channel models
HEXA-S12 and HEXA-S16, with maximum deviations of
,3�. A higher deviation was observed in both the HEXA-
S20 (;14�) and HEXA-S24 models (;10�). The cross sec-
tion was almost circular in the HEXA-S12 and HEXA-S16
models (ratio between the inertia momenta ¼ 0.98 in both
models). The cross section asymmetry was more pronounced
in the HEXA-S20 and HEXA-S24 models (ratio ¼ 0.88 and
0.85, respectively). The mean number of hydrogen bonds
was 120 in HEXA-S20 and close to 140 in HEXA-S12,
HEXA-S16, and HEXA-S24. This number of hydrogen
bonds corresponds to 57% of oxygen backbone atoms in-
volved in hydrogen bonds, the same percentage as in the
HEPTA-BARREL model.
The HEXA-S16CAP model (with extracellular cap) ex-
hibited structural characteristics of the b-barrel domain
analogous to the structural characteristics revealed in the
HEXA-S16 model (no extracellular cap). In the MD simu-
lation of HEXA-S16CAP, the channel axis stayed orthogonal
to the lipid membrane (maximum deviation ,3�); the cross
section of the pore was close to circular (ratio between inertia
momenta ¼ 0.98); and the mean number of hydrogen bonds
in the b-barrel domain was ;140. The length of the HEXA-
S16CAP model along the channel axis was 10 nm, and the
external diameter of the extracellular cap was 9.1 nm. The
analogous values measured by AFM were 9.7 6 1.2 nm and
7.6 6 0.4 nm (3). The extracellular cap was stable during the
MD trajectory, with an RMSD of the backbone atoms ,0.2
nm. Changing the oligomerization state from heptameric to
hexameric influenced the packing of the monomers and,
hence, the contact area between adjacent subunits. The buried
surface area between two adjacent subunits was ;58.97 nm2
in the HEPTA-CAP model, and ;50.55 nm2 in the HEXA-
S16CAP model, with a reduction close to 20% (buried surface
area was computed by the VMD software (36), using a probe
radius of 0.14 nm). The decrease in the buried surface area
between adjacent subunits was somehow expected, due to the
transition from heptameric to hexameric symmetry. Never-
theless, most of the intersubunit interactions observed in the
crystallographic structure (2) were preserved in the simula-
tion of the HEXA-S16CAP model. The salt bridges between
Lys58 and Asp100, Lys147 and Glu111, and Lys110 and Asp152
were stable during the MD simulation (mean length ,0.35
nm); and ;75 hydrogen bonds connected adjacent subunits
of the HEXA-S16CAP model. These include the hydrogen
bonds at the N-terminal latch (residues Ala1–Val20), which
are important (37), even if not essential (38), for an efficient
oligomerization of the aH channel. As a final remark about
the structure of the extracellular cap in the HEXA-S16CAP
model, water channels appeared between adjacent subunits in
the 4-ns MD simulation. These side channels connect the
interior of the aH pore to the extracellular solution and to the
rim region (lower boundary of the extracellular cap). Similar
water channels were also observed in MD simulations of the
HEPTA-CAP model and of the heptameric aH channel by
Aksimentiv and Schulten (19).
Channel conductances
Experimental measurements in 0.5 M KCl revealed two
different current-voltage relations for the aH channels (Fig.
4). Data were associated with the high- or low-conductance
state according to the conductance at 40 mV, using a value of
400 pS as the threshold level. Once a channel was assigned to
the high- or low-conductance state, no transitions to the other
state were observed. The high and low conductances at 40
mV were 465 6 30 pS and 280 6 30 pS (Fig. 4). The ex-
perimental current-voltage relations of aH were slightly
asymmetric, with higher conductance at positive membrane
potential. The ratio between the channel conductances at
140 mV and �40 mV was 1.2 for both the high- and low-
conductance states.
The PNP theory provided a channel conductance of 680 6
25 pS for the HEPTA-CAP model at 40 mV. The mean
values and the standard deviations of the channel currents
were computed by repeating the PNP calculations on dif-
ferent snapshots from the MD simulation. The predicted
conductance overestimated the experimental high-conduc-
tance value by 1.5-fold (Fig. 4).
Hexameric a-Hemolysin Channel 2269
Biophysical Journal 95(5) 2265–2274

The asymmetry in the current-voltage relation was well
reproduced by the PNP approach. The ratio between the
computed channel conductances at 140 mV and �40 mV
was 1.2 6 0.1, in agreement with the experimental data. The
HEPTA-CAP model was slightly selective to anions, having
a ratio between cationic and anionic flux equal to 0.77 6
0.18. To better estimate the selectivity, channel currents were
computed in the presence of concentration gradients, and
the reversal potentials were then estimated. The reversal
potential is related to channel selectivity by the Gold-
man-Hodgkin-Katz equation:
Vrev¼kT
eln
PK C½ �e 1PCl C½ �iPK C½ �i 1PCl C½ �e
� �;
where PK and PCl represent the permeability to potassium
and chloride ions, respectively, and [C]e and [C]i are the ionic
concentrations in the extracellular and intracellular compart-
ments, respectively. The reversal potentials were �3.4 mV
with [C]e ¼ 1 M and [C]i ¼ 0.2 M (PK/PCl ¼ 0.8) and 15.6
mV with [C]e ¼ 2 M and [C]i ¼ 1 M (PK/PCl ¼ 0.7). Under
the same conditions, Gu et al. (39) experimentally measured
reversal potentials of �3.7 mV and 19.1 mV, respectively.
The analysis of the HEPTA-BARREL model provided
similar results (Fig. 4). The HEPTA-BARREL conductance
was 730 6 30 pS at 140 mV; the ratio between the channel
conductances at 140 mV and �40 mV was 1.3 6 0.1, and
the ratio between cationic and anionic fluxes was 0.79 6
0.10. Considering that removing the extracellular domain did
not affect the computed currents remarkably, the theoretical
conductances of the hexameric models lacking the extracel-
lular cap were compared to the experimental data of the low-
conductance state.
Ionic currents through HEXA-S20 and HEXA-S24 over-
estimated the experimental data by three- and sevenfold, re-
spectively, whereas the HEXA-S12 model underestimated
the experimental data (Fig. 5). The HEXA-S16 model showed
the best agreement with the experimental low-conductance
value. The predicted conductance at 40 mV was 370 6 25 pS,
which overestimates the low-conductance experimental value
by 1.3-fold.
The current-voltage relation of the HEXA-S16 model was
slightly asymmetric (ratio between the computed channel
conductances at 140 mV and�40 mV equal to 1.1 6 0.1), in
agreement with the experimental results. The anionic selec-
tivity was somewhat higher than in the heptameric models
(ratio between cationic and anionic fluxes equal to 0.63 6
0.14). The reversal potentials were�9.1 mV with [C]e¼ 1 M
and [C]i ¼ 0.2 M (PK/PCl ¼ 0.6) and 17.9 mV with [C]e ¼0.2 M and [C]i ¼ 1 M (PK/PCl ¼ 0.6). The tighter packing of
FIGURE 4 Current-voltage relations in the experimental data and hepta-
meric models. Experimental currents for the high-conductance state (;,
dashed line), the low-conductance state (:, dotted line), the computed
currents in the HEPTA-CAP model (d, solid line), and the computed currents
in the HEPTA-BARREL model (n, dash-dotted line). Mean values and
standard deviations of the experimental currents were defined using 10
independent measurements, whereas six different snapshots of the MD
simulations were used for the computed currents. Standard deviations are
shown as vertical lines when larger than the markers used for the mean values.
Potassium and chloride concentrations in the intracellular and extracellular
compartments were 0.5 M for both the experimental and theoretical data.
FIGURE 5 Current-voltage relations in the low-conductance state. Ex-
perimental currents for the low-conductance state (dotted green line), and
the computed currents in the HEXA-S12 model (solid blue line), HEXA-S16
model (dashed cyan line), HEXA-S20 model (dot-dashed purple line),
HEXA-S24 model (solid yellow line), and HEXA-S16CAP model (solid redline). Mean values and standard deviations of the experimental currents were
defined using 10 independent measurements, whereas six different snap-
shots of the MD simulations were used for the computed currents. Potassium
and chloride concentrations in the intracellular and extracellular compart-
ments were 0.5 M for both the experimental and theoretical data.
2270 Furini et al.
Biophysical Journal 95(5) 2265–2274
the charged residues in the HEXA-S16 model, compared to
the heptameric models, justifies the higher anionic selectivity.
Since the HEXA-S16 model showed the best agreement
with the experimental data of the low-conductance state, the
conductance calculations were repeated in the HEXA-
S16CAP model. As observed for the models of the hepta-
meric channel, the hexameric model with the extracellular
cap has a lower conductance than the model without the
extracellular cap. The conductance of the HEXA-S16CAP
model at 140 mV was 335 6 10 pS, compared to 370 6 25
pS in the HEXA-S16 model. This conductance overestimates
the experimental value of the low-conductance state by
;1.2-fold. The current-voltage relation was slightly asym-
metric (ratio of 1.1 6 0.1 between the conductances at 140
mV and �40 mV), and the channel was anion-selective. The
ratio between cationic and anionic fluxes was 0.36 6 0.13,
lower than the value computed in the HEXA-S16 model
(0.63 6 0.14). The tighter packing of positively charged
residues, such as Lys8, in the hexameric structure might cause
the increased selectivity observed in the HEXA-S16CAP
model. The internal radius of the extracellular cap is smaller
in the hexameric structure compared to the heptameric
structure (0.97 nm vs. 1.30 nm). Therefore, the effect of the
protein charges on the permeating ions is more substantial,
which explains why absence of the extracellular cap affects
the selectivity of the hexameric models and not that of the
heptameric models.
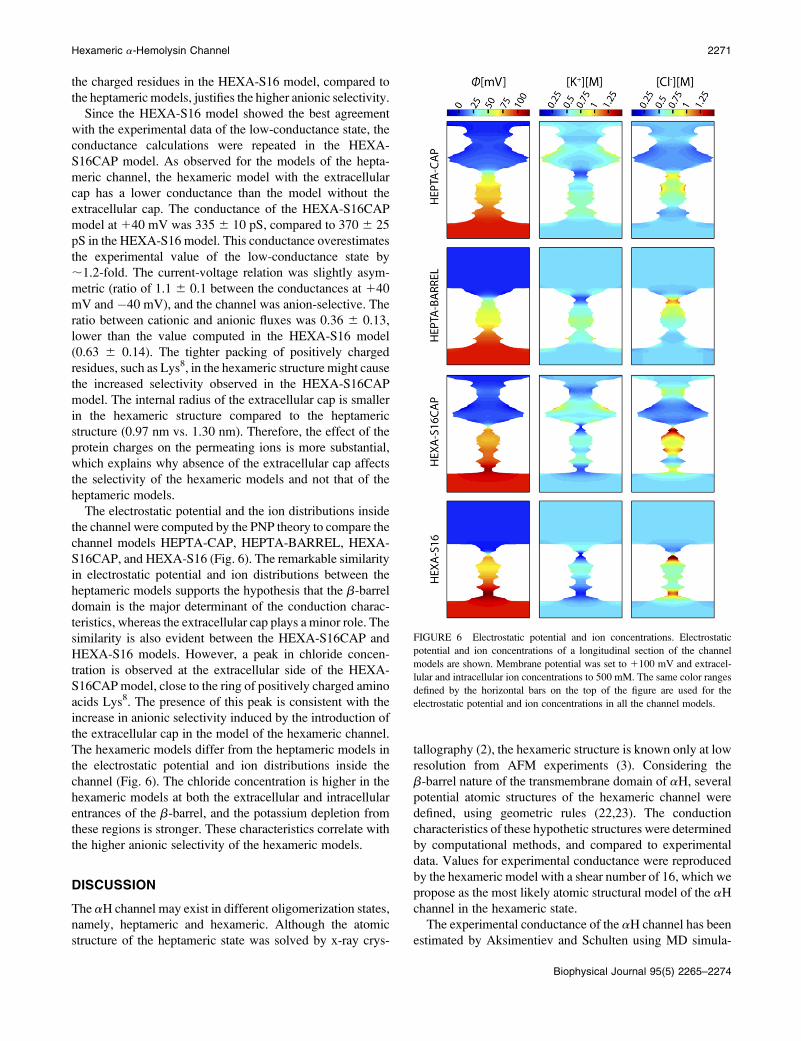
The electrostatic potential and the ion distributions inside
the channel were computed by the PNP theory to compare the
channel models HEPTA-CAP, HEPTA-BARREL, HEXA-
S16CAP, and HEXA-S16 (Fig. 6). The remarkable similarity
in electrostatic potential and ion distributions between the
heptameric models supports the hypothesis that the b-barrel
domain is the major determinant of the conduction charac-
teristics, whereas the extracellular cap plays a minor role. The
similarity is also evident between the HEXA-S16CAP and
HEXA-S16 models. However, a peak in chloride concen-
tration is observed at the extracellular side of the HEXA-
S16CAP model, close to the ring of positively charged amino
acids Lys8. The presence of this peak is consistent with the
increase in anionic selectivity induced by the introduction of
the extracellular cap in the model of the hexameric channel.
The hexameric models differ from the heptameric models in
the electrostatic potential and ion distributions inside the
channel (Fig. 6). The chloride concentration is higher in the
hexameric models at both the extracellular and intracellular
entrances of the b-barrel, and the potassium depletion from
these regions is stronger. These characteristics correlate with
the higher anionic selectivity of the hexameric models.
DISCUSSION
The aH channel may exist in different oligomerization states,
namely, heptameric and hexameric. Although the atomic
structure of the heptameric state was solved by x-ray crys-
tallography (2), the hexameric structure is known only at low
resolution from AFM experiments (3). Considering the
b-barrel nature of the transmembrane domain of aH, several
potential atomic structures of the hexameric channel were
defined, using geometric rules (22,23). The conduction
characteristics of these hypothetic structures were determined
by computational methods, and compared to experimental
data. Values for experimental conductance were reproduced
by the hexameric model with a shear number of 16, which we
propose as the most likely atomic structural model of the aH
channel in the hexameric state.
The experimental conductance of the aH channel has been
estimated by Aksimentiev and Schulten using MD simula-
FIGURE 6 Electrostatic potential and ion concentrations. Electrostatic
potential and ion concentrations of a longitudinal section of the channel
models are shown. Membrane potential was set to 1100 mV and extracel-
lular and intracellular ion concentrations to 500 mM. The same color ranges
defined by the horizontal bars on the top of the figure are used for the
electrostatic potential and ion concentrations in all the channel models.
Hexameric a-Hemolysin Channel 2271
Biophysical Journal 95(5) 2265–2274
tions, with a description of the atomistic details of the con-
duction process (19). Here, to compute the channel conduc-
tance, a simplified approach based on the PNP theory was
preferred over more complex and computationally expensive
MD simulations. Employing a computational method based
on the PNP equations significantly decreases the computa-
tional load, allowing a realistic comparison between different
channel models at different boundary conditions, like the one
presented here.
Electrodiffusion theory has been widely used to model ion
channels, and has proved to reproduce accurately a large
amount of experimental data (40,41). Nevertheless, the PNP
approach suffers from two main shortcomings: 1), ions are
described by a continuum distribution, ignoring their discrete
nature; and 2), the atomic motions of the channel protein are
neglected. To evaluate the role of atomic motion in channel
conductance, PNP calculations were performed on several
snapshots from the MD trajectories. The methodology was
first tested in the heptameric aH channel. In both heptameric
models, with and without the extracellular cap, the PNP ap-
proach overestimated the experimental high-conductance
value by ;1.5-fold. It is important to remember that: 1), no
parameter was employed to fit the experimental data; and 2),
the asymmetry of the current-voltage relation and the channel
selectivity were well reproduced.
The purpose of this study was to model a plausible atomic
structure for the aH channel in the hexameric state, not to
validate the PNP approach. The parameters of the PNP
mathematical model can always be adjusted to better repro-
duce the experimental currents, as shown in a recent work by
O’Keeffe et al. (42), where perfect agreement with the ex-
perimental data was obtained by increasing the relative di-
electric constant of the channel to ;20. In the context of the
study presented here, where we are trying to identify a model
for the hexameric structure of the aH channel, this issue is
partially irrelevant. The error introduced by the PNP theory is
influenced by the strength of the ionic solution: the overes-
timation of the channel conductance is higher at higher ionic
concentrations, and the nonlinearity of the current-voltage
relation is overestimated at low ionic concentrations (20). A
KCl concentration of 0.5 M was chosen to yield a good es-
timate of both the channel conductance and the current-
voltage relation asymmetry. Since we are comparing similar
structures (the heptameric and the hexameric aH channels) at
the same ionic concentrations, the error introduced by the
PNP theory is assumed to be systematic, i.e., once the over-
estimation in the current is known for the heptameric model, a
similar value (;1.5) is expected in the hexameric model.
The low sensitivity of the PNP results to the MD snapshot,
and the agreement with the experimental data on channel
selectivity and current-voltage relation, suggest that the PNP
approach provides a reliable description of conduction in
the aH channel, and that this approach can be used to analyze
the hexameric models. In the first phase, the analysis of the
hexameric models focused on the b-barrel domain; this is
the domain governing the conduction characteristics of the
aH channel, as proved by experimental data (39,43), previ-
ous computational works (16,20), and our results on the
HEPTA-CAP and the HEPTA-BARREL models. The
b-barrel architecture of the transmembrane domain guided
the definition of the hexameric models for this region of the
channel. In contrast, defining a model for the extracellular
cap is more ambiguous, since the structure of this domain is
not as regular as the structure of the b-barrel domain, and
only AFM images are available. Focusing the analysis on the
transmembrane domain allowed the identification of a plau-
sible structure for this relevant region of the protein and ex-
cluded any artifact due to the speculative nature of the
extracellular cap model.
All the hexameric models of the transmembrane domain
were stable during the simulation time, although the temporal
scale of the MD simulations does not allow a comparison of
the energetic stability of the different channel structures.
Instead, the calculation of the values of the channel con-
ductance allowed a selection among the hexameric models.
The hexameric model with shear number 16 was the one in
better agreement with the experimental data. Noteworthy is
the fact that the overestimation of the low-conductance value
by the HEXA-S16 model is similar to the overestimation of
the high-conductance value by the heptameric channel
models, which strengthens the identification of the HEXA-
S16 model as the plausible structure of the transmembrane
domain of the aH channel in the hexameric state.
Once a structure for the transmembrane domain of hexa-
meric aH was selected, the transmembrane model was com-
pleted with the extracellular cap. To define the extracellular
cap, it was assumed that the structure of each monomer and the
cylindrical symmetry were conserved between the heptameric
and hexameric channels. These assumptions are consistent
with the experimental data reported by AFM, but nevertheless,
different structures are possible. It is worth mentioning that the
intersubunit interactions important for oligomerization of the
heptameric channel are conserved in the hexameric model.
A different structure of the hexameric aH channel, with a
shear number of 12, was proposed by Smart et al. (44), ac-
cording to experimental data by Korchev et al. (17). In the
Korchev et al. study (17), a 1:10 ratio between the low- and
the high-conductance values was suggested. In our experi-
mental data, the ratio was 1:1.5, in agreement with previous
results by Belmonte et al. (13). The high and low values of
conductance obtained in our measurements referred to dif-
ferent channels. Once a channel entered in the lipid mem-
brane, it showed a specific conductance (high or low), and no
transitions to a different value were observed. This behavior
is consistent with the idea that the channel may enter the
membrane in different oligomerization states, characterized
by different values of conductance. In contrast, the states
described by Korchev et al. (17) correspond to open and
closed conformations of the same channel, and consequently
it is unlikely that they are related to different oligomerization
2272 Furini et al.
Biophysical Journal 95(5) 2265–2274

states of aH. A change in the oligomerization state requires
breaking and forming of a high number of hydrogen bonds,
which is unlikely to occur once the channel is inserted in the
lipid membrane.
The PNP approach made it possible to analyze the current-
voltage relation and the selectivity of the hexameric channels.
As expected, these were very similar to the analogous
properties of the heptameric channels. However, an increased
anionic selectivity was observed in the hexameric model,
which suggests that the hexameric and heptameric channels
might demonstrate different behavior. In fact, in the models
proposed, not only does the hexameric channel have an in-
ternal radius lower than that of the heptameric channel, but it
also shows different spatial alignment of the amino acids in
adjacent subunits. Analogous amino acids in adjacent subu-
nits are aligned along the channel axis in b-barrel structures
with S ¼ N (heptameric structure), but they are no longer
aligned in structures with S¼N 1 4 (hexameric structure; see
Fig. 2). These differences in the internal profile and in the
relative positions of adjacent subunits may affect the inter-
actions of the channel with permeating molecules, like mo-
lecular adapters.
Molecular adapters have been used to functionalize aH
channels for technological applications (10,45–47). For in-
stance b-cyclodextrin binds along the permeation pathway of
aH, creating a constriction with specific selectivity for vari-
ous organic molecules (10). b-Cyclodextrin has a heptameric
structure, which makes this cyclic oligosaccharide the opti-
mal choice for binding to a heptameric channel. A closely
related cyclic oligosaccharide—a-cyclodextrin—has instead
a hexameric structure, and thus a hexameric channel is ex-
pected to have a higher affinity to a-cyclodextrin than to
b-cyclodextrin. To the best of our knowledge, analysis of the
b-cyclodextrin binding in aH is restricted to channels in
high-conductance states. Our data show that the low-con-
ductance state of aH can be supported by the presence of
channels with hexameric structure. Analyses of the binding
affinity of cyclodextrins to aH channels in the low-conduc-
tance state could be used to test this hypothesis.
A problem connected to the usage of molecular adapters like
cyclodextrins in technological applications is the unstable
binding mode between the channel and the adapter. The
residence time of b-cyclodextrin inside the aH channel is
restricted to hundreds of microseconds, and although it can be
extended by three orders of magnitude through amino acid
mutations along the permeation pathway (43), unstable binding
is indeed a limitation for the development of stochastic sensors.
If the channel model proposed here actually represents the low-
conductance state of aH, the binding characteristics of a mo-
lecular adapter in the high- and low-conductance states should
be different, and these differences may help in improv-
ing the characteristics of biosensors based on aH channels.
The authors gratefully acknowledge Francesco Lodesani for helpful dis-
cussions, and CINECA (Bologna, Italy) for providing supercomputing
time. C.D. thanks The Royal Society for a University Research Fellowship
and the Engineering and Physical Sciences Research Council’s National
Service for Computational Chemistry Software.
REFERENCES
1. Bhakdi, S., and J. Tranum-Jensen. 1991. a-toxin of Staphylococcusaureus. Microbiol. Rev. 55:733–751.
2. Song, L., M. R. Hobaugh, C. Shustak, S. Cheley, H. Bayley, and J. E.Gouaux. 1996. Structure of staphylococcal a-hemolysin, a heptamerictransmembrane pore. Science. 274:1859–1866.
3. Czajkowsky, D. M., S. Sheng, and Z. Shao. 1998. Staphylococcala-hemolysin can form hexamers in phospholipid bilayers. J. Mol. Biol.276:325–330.
4. Kang, X. F., S. Cheley, A. C. Rice-Ficht, and H. Bayley. 2007. Astorable encapsulated bilayer chip containing a single protein nanopore.J. Am. Chem. Soc. 129:4701–4705.
5. Freer, J. H., J. P. Arbuthnott, and A. W. Bernheimer. 1968. Interactionof staphylococcal a-toxin with artificial and natural membranes.J. Bacteriol. 95:1153–1168.
6. Ferreras, M., F. Hoper, M. D. Serra, D. A. Colin, G. Prevost, and G.Menestrina. 1998. The interaction of Staphylococcus aureus bi-com-ponent g-hemolysins and leucocidins with cells and lipid membranes.Biochim. Biophys. Acta. 1414:108–126.
7. Valeva, A., M. Palmer, and S. Bhakdi. 1997. Staphylococcal a-toxin:formation of the heptameric pore is partially cooperative and proceedsthrough multiple intermediate stages. Biochemistry. 36:13298–13304.
8. Menestrina, G. 1986. Ionic channel formed by Staphylococcus aureusa-toxin: voltage dependent inhibition by divalent and trivalent cations.J. Membr. Biol. 90:177–190.
9. Braha, O., L.-Q. Gu, L. Zhou, X. Lu, S. Cheley, and H. Bayley. 2000.Simultaneous stochastic sensing of divalent metal ions. Nat. Biotech-nol. 18:1005–1007.
10. Gu, L.-Q., O. Braha, S. Conlan, S. Cheley, and H. Bayley. 1999.Stochastic sensing of organic analytes by a pore-forming proteincontaining a molecular adapter. Nature. 398:686–690.
11. Kasianowicz, J. J., E. Brandin, D. Branton, and D. W. Deamer. 1996.Characterization of individual polynucleotide molecules using a mem-brane channel. Proc. Natl. Acad. Sci. USA. 93:13770–13773.
12. Howorka, S., S. Cheley, and H. Bayley. 2001. Sequence-specificdetection of individual DNA strands using engineered nanopores.Nat. Biotechnol. 19:636–639.
13. Belmonte, G., L. Cescatti, B. Ferrari, T. Nicolussi, M. Ropele, and G.Menestrina. 1987. Pore formation by Staphylococcus aureus a-toxin inlipid bilayers. Dependence upon temperature and toxin concentration.Eur. Biophys. J. 14:349–358.
14. Krasilnikov, O. V., P. G. Merzlyak, L. N. Yuldasheva, C. G. Rodrigues,S. Bhakdi, and A. Valeva. 2000. Electrophysiological evidence forheptameric stoichiometry of ion channels formed by Staphylococcusaureus a-toxin in planar lipid bilayers. Mol. Microbiol. 37:1372–1378.
15. Kasianowicz, J. J., and S. M. Bezrukov. 1995. Protonation dynamics ofthe a-toxin ion channel from spectral analysis of pH-dependent currentfluctuations. Biophys. J. 69:94–105.
16. Misakian, M., and J. J. Kasianowicz. 2003. Electrostatic influence onion transport through the aHL channel. J. Membr. Biol. 195:137–146.
17. Korchev, Y. E., C. L. Bashford, G. M. Alder, J. J. Kasianowicz, andC. A. Pasternak. 1995. Low conductance states of a single ion channelare not ‘‘closed’’. J. Membr. Biol. 147:233–239.
18. Korchev, Y. E., C. L. Bashford, G. M. Alder, P. Y. Apel, D. T.Edmonds, A. A. Lev, K. Nandi, A. V. Zima, and C. A. Pasternak.1997. A novel explanation for fluctuations of ion current throughnarrow pores. FASEB J. 11:600–608.
19. Aksimentiev, A., and K. Schulten. 2005. Imaging a-hemolysin withmolecular dynamics: ionic conductance, osmotic permeability, and theelectrostatic potential map. Biophys. J. 88:3745–3761.
Hexameric a-Hemolysin Channel 2273
Biophysical Journal 95(5) 2265–2274
20. Noskov, S. Y., W. Im, and B. Roux. 2004. Ion permeation through the
a-hemolysin channel: theoretical studies based on Brownian dynamicsand Poisson-Nernst-Plank electrodiffusion theory. Biophys. J. 87:2299–
2309.
21. Cozmuta, I., J. T. O’Keeffe, B. Deepak, and V. Stolc. 2005. HybridMD-Nernst-Planck model of the a-hemolysin conductance proprieties.
Mol. Simul. 31:79–93.
22. Murzin, A. G., A. M. Lesk, and C. Chothia. 1994. Principles determin-ing the structure of b-sheet barrels in proteins. II. The observed struc-
tures. J. Mol. Biol. 236:1382–1400.
23. Murzin, A. G., A. M. Lesk, and C. Chothia. 1994. Principles deter-mining the structure of b-sheet barrels in proteins. I. A theoretical
analysis. J. Mol. Biol. 236:1369–1381.
24. Kale, L., R. Skeel, M. Bhandarkar, R. Brunner, A. Gursoy, N. Krawetz,J. Phillips, A. Shinozaki, K. Varadarajan, and K. Schulten. 1999.
NAMD2: Greater scalability for parallel molecular dynamics.J. Comput. Phys. 151:283–312.
25. MacKerell, A. D., D. Bashford, M. Bellott, R. L. Dunbrack, J. D.
Evanseck, M. J. Field, S. Fischer, J. Gao, H. Guo, S. Ha, D. Joseph-McCarthy, L. Kuchnir, K. Kuczera, F. T. K. Lau, C. Mattos, S.
Michnick, T. Ngo, D. T. Nguyen, B. Prodhom, W. E. Reiher, B. Roux,M. Schlenkrich, J. C. Smith, R. Stote, J. Straub, M. Watanabe, J.
Wiorkiewicz-Kuczera, D. Yin, and M. Karplus. 1998. All-atom em-
pirical potential for molecular modeling and dynamics studies of pro-teins. J. Phys. Chem. B. 102:3586–3616.
26. Jorgensen, W. L., J. Chandrasekhar, J. D. Madura, R. W. Impey, and
M. L. Klein. 1983. Comparison of simple potential functions for simu-lating liquid water. J. Chem. Phys. 79:926–935.
27. Essmann, U., L. Perera, M. L. Berkowitz, T. Darden, H. Lee, and L. G.
Pedersen. 1995. A smooth particle mesh Ewald method. J. Chem. Phys.103:8577–8593.
28. Ryckaert, J. P., G. Ciccotti, and H. J. C. Berendsen. 1977. Numericalintegration of the cartesian equations of motion of a system with
constraints: molecular dynamics of n-alkanes. J. Comput. Phys. 23:
327–341.
29. Feller, S. E., Y. Zhang, R. W. Pastor, and B. R. Brooks. 1995. Constant
pressure molecular dynamics simulation: the Langevin piston method.
J. Chem. Phys. 103:4613–4621.
30. Nina, M., D. Beglov, and B. Roux. 1997. Atomic radii for continuum
electrostatics calculations based on molecular dynamics free energy
simulations. J. Phys. Chem. B. 101:5239–5248.
31. Lide, D. R. 2004. CRC Handbook of Chemistry and Physics, 85th ed.
CRC Press, Boca Raton, FL.
32. Paine, P. L., and P. Scherr. 1975. Drag coefficients for the movementof rigid spheres through liquid-filled cylindrical pores. Biophys. J. 15:
1087–1091.
33. Furini, S., F. Zerbetto, and S. Cavalcanti. 2006. Application of thePoisson-Nernst-Planck theory with space-dependent diffusion coeffi-cients to KcsA. Biophys. J. 91:3162–3169.
34. Furini, S., F. Zerbetto, and S. Cavalcanti. 2007. Role of the intracellularcavity in potassium channel conductivity. J. Phys. Chem. B. 111:13993–14000.
35. Mills, J. E. J., and P. M. Dean. 1996. Three-dimensional hydrogen-bond geometry and probability information from a crystal survey.J. Comput. Aided Mol. Des. 10:607–622.
36. Humphrey, W., A. Dalke, and K. Schulten. 1996. VMD: visualmolecular dynamics. J. Mol. Graph. 14:33–38.
37. Walker, B., M. Krishnasastry, L. Zorn, and H. Bayley. 1992. Assemblyof the oligomeric membrane pore formed by staphylococcal a-hemo-lysin examined by truncation mutagenesis. J. Biol. Chem. 267:21782–21786.
38. Jayasinghe, L., G. Miles, and H. Bayley. 2006. Role of the amino latchof staphylococcal a-hemolysin in pore formation: a co-operativeinteraction between the N terminus and position 217. J. Biol. Chem.281:2195–2204.
39. Gu, L.-Q., M. Dalla Serra, J. B. Vincent, G. Vigh, S. Cheley, O. Braha,and H. Bayley. 2000. Reversal of charge selectivity in transmembraneprotein pores by using noncovalent molecular adapters. Proc. Natl.Acad. Sci. USA. 97:3959–3964.
40. Nonner, W., D. P. Chen, and B. Eisenberg. 1999. Progress andprospects in permeation. J. Gen. Physiol. 113:773–782.
41. Coalson, R. D., and M. G. Kurnikova. 2005. Poisson-Nernst-Plancktheory approach to the calculations of current through biological ionchannels. IEEE Trans. Nanobioscience. 4:81–93.
42. O’Keeffe, J. T., I. Cozmuta, D. Bose, and V. Stolc. 2007. A predictiveMD-Nernst-Planck model for transport in a-hemolysin: modelinganisotropic ion currents. Chem. Phys. 342:25–32.
43. Gu, L.-Q., S. Cheley, and H. Bayley. 2001. Prolonged residence timeof a noncovalent molecular adapter, b-cyclodextrin, within the lumenof mutant a-hemolysin pores. J. Gen. Physiol. 118:481–494.
44. Smart, O. S., G. M. P. Coates, M. S. P. Sansom, G. M. Alder, and L. C.Bashford. 1998. Structure-based prediction of the conductance prop-erties of ion channels. Faraday Discuss. 111:185–199.
45. Movileanu, L., S. Howorka, O. Braha, and H. Bayley. 2000. Detectingprotein analytes that modulate transmembrane movement of a polymerchain within a single protein pore. Nat. Biotechnol. 18:1091–1095.
46. Howorka, S., L. Movileanu, X. Lu, M. Magnon, S. Cheley, O. Braha,and H. Bayley. 2000. A protein pore with a single polymer chaintethered within the lumen. J. Am. Chem. Soc. 122:2411–2416.
47. Sanchez-Quesada, J., M. R. Ghadiri, H. Bayley, and O. Braha. 2000.Cyclic peptides as molecular adapters for a pore-forming protein.J. Am. Chem. Soc. 122:11757–11766.
2274 Furini et al.
Biophysical Journal 95(5) 2265–2274
Top Related
Copyright © 2022 FDOKUMEN

