


Bahasa
Halaman
Hukum

Article
Medial Prefrontal Cortex P
redicts Internally DrivenStrategy ShiftsHighlights
d Some participants show uninstructed and spontaneous
strategy changes
d MPFC signals allow prediction of strategy shifts ahead of time
d Otherwise suppressed signals are encoded in MPFC,
allowing flexible task updating
d Unsupervised learning can trigger changes in cognitive
control
Schuck et al., 2015, Neuron 86, 331–340April 8, 2015 ª2015 Elsevier Inc.http://dx.doi.org/10.1016/j.neuron.2015.03.015
Authors
Nicolas W. Schuck,
Robert Gaschler, ...,
John-Dylan Haynes, Carlo Reverberi
[email protected] (N.W.S.),[email protected] (C.R.)
In Brief
Schuck et al. show that before humans
spontaneously change to a novel
strategy, medial prefrontal cortex begins
encoding sensory information only
relevant for the new strategy. This
allowed predicting the spontaneous
strategy change from neuroimaging data
ahead of time.
Neuron
Article
Medial Prefrontal Cortex PredictsInternally Driven Strategy ShiftsNicolas W. Schuck,1,2,3,* Robert Gaschler,2,4 Dorit Wenke,2 Jakob Heinzle,5,6 Peter A. Frensch,2 John-Dylan Haynes,6,7,8
and Carlo Reverberi6,9,10,*1Princeton Neuroscience Institute, Princeton University, Princeton, NJ 08544, USA2Department of Psychology, Humboldt-Universitat zu Berlin, 10099 Berlin, Germany3Center for Lifespan Psychology, Max Planck Institute for Human Development, 14195 Berlin, Germany4Department of Psychology, Universitat Koblenz-Landau, 76829 Landau in der Pfalz, Germany5Translational Neuromodeling Unit (TNU), Institute for Biomedical Engineering, University of Zurich and Swiss Federal Institute of Technology
(ETH), 8032 Zurich, Switzerland6Bernstein Center for Computational Neuroscience, Charite–Universitatsmedizin Berlin, 10115 Berlin, Germany7Max Planck Institute for Human Cognitive and Brain Sciences, 04103 Leipzig, Germany8Department of Neurology, Otto-von-Guericke University, 30106 Magdeburg, Germany9Department of Psychology, University of Milano-Bicocca, 20126 Milano, Italy10Milan Center for Neuroscience, 20126 Milano, Italy
*Correspondence: [email protected] (N.W.S.), [email protected] (C.R.)
http://dx.doi.org/10.1016/j.neuron.2015.03.015
SUMMARY
Many daily behaviors require us to actively focus onthe current task and ignore all other distractions.Yet, ignoring everything else might hinder the abilityto discover new ways to achieve the same goal.Here, we studied the neural mechanisms that sup-port the spontaneous change to better strategieswhile an established strategy is executed. Multivar-iate neuroimaging analyses showed that before thespontaneous change to an alternative strategy,medial prefrontal cortex (MPFC) encoded informa-tion that was irrelevant for the current strategybut necessary for the later strategy. Importantly,this neural effect was related to future behav-ioral changes: information encoding in MPFC waschanged only in participants who eventuallyswitched their strategy and started before the actualstrategy change. This allowed us to predict sponta-neous strategy shifts ahead of time. These findingssuggest that MPFC might internally simulate alterna-tive strategies and shed new light on the organizationof PFC.
INTRODUCTION
Goal-directed behavior is a hallmark of intelligent behavior. To
pursue a goal, we usually follow a particular strategy that we
think will achieve our objective. This strategy, or behavioral
policy, can in principle be any mapping between a state of the
environment and actions that need to be taken in order to
achieve a particular goal (Sutton and Barto, 1998). Imagine, for
example, that you are leaving a New York subway station and
need to find out which direction north is. Most likely, you will
be looking for the exit signs, which indicate the direction. The
execution of such a strategy will cause you to focus on finding
the exit signs in the busy subway station and to ignore all other,
seemingly distracting, information. This ability to focus on the in-
formation that is relevant for an established strategy has the
obvious advantage to make goal-directed behavior more effi-
cient. At the same time, however, this focusmight hinder the dis-
covery of new—and potentially better—strategies. For instance,
you could notice that the direction in which the cars are driving
on the avenues also can tell you where north is. This new infor-
mation may generate a superior strategy, which can achieve
the same goal but is applicable to situations outside the subway
and depends on cues that are easier to find.
The opposition between strategy exploitation and exploration
creates a difficult dilemma for the brain. On the one hand, goal-
directed behavior requires the neural processing of sensory in-
formation to become adjusted such that it makes the execution
of a current strategy efficient (a process that is part of the more
general concept of cognitive control; e.g., Miller and Cohen,
2001). On the other hand, discovering new strategies requires
one to assess the potential usefulness of seemingly distracting
information (strategy exploration, cf. Donoso et al., 2014).
Here, we asked how the brain could solve this dilemma and
find a balance between cognitive control and strategy explora-
tion. Despite the wide interest in related issues (Cohen et al.,
2007; Hayden et al., 2011; Holroyd and Yeung, 2012; Kounios
and Beeman, 2014; March, 1991; Reverberi et al., 2005), this
question represents a major gap in our current understanding
of prefrontal cortex (PFC) functioning. Many studies have shown
that neural activity in PFC encodes components of currently
active strategies (such as ‘‘task-sets,’’ rules, or relevant stimuli)
(e.g., Reverberi et al., 2012; Sakai and Passingham, 2006; Sakai
et al., 2002), and broadcasts a brain-wide bias that favors pro-
cessing of task-relevant over task-irrelevant aspects (Dehaene
et al., 1998; Desimone and Duncan, 1995; Dreisbach andHaider,
2008; Miller and Cohen, 2001). But how these cognitive control
functions can coexist with functions that support strategy
Neuron 86, 331–340, April 8, 2015 ª2015 Elsevier Inc. 331

A
B
Figure 1. Spontaneous Strategy Switch Task
(A) An example sequence of trials in different conditions. The stimulus con-
sisted of a white frame, which was partially filled with small, randomly
distributed colored squares (all either red or green). In standard trials, the patch
of colored squares was closest to only one corner of the white frame. In
ambiguous trials, the patch was at equal distance to all corners of the frame. In
Late Go trials, the white frame appeared with a delay of 2,000 ms. Numbers
below condition names show trial proportions and durations.
(B) Participants were instructed to react to the corner of the patch within the
white frame (left, S-R = stimulus-response). Alternatively, after the first 10 min,
participants could detect the correlation between color and response and
decide to use color to generate the answer (right).
explorations, remains unclear. In particular, existing studies have
used experimental approaches that simplified the problem and
therefore missed crucial aspects of the dilemma. For example,
the alternative strategy/option is often not learned but instructed
(Jepma and Nieuwenhuis, 2011; Kolling et al., 2012), or experi-
mental interventions encourage strategy explorations (Daw
et al., 2006; Hayden et al., 2011; Meiran, 1996; Monsell, 2003;
Nassar et al., 2010; Yu and Dayan, 2005). Furthermore, promi-
nent theories of PFC function have assumed that in the presence
of a reliable strategy, alternative strategies are not explored
(Donoso et al., 2014), or they have suggested that conflicts are
the primary signal to trigger adaptations in cognitive control (Bot-
vinick et al., 2001).
This study investigated spontaneous strategy improvements,
which occur during the execution of a current strategy and there-
fore despite the presence of top-down cognitive control. We de-
signed amore naturalistic task in which strategy discovery has to
be based on learned environmental statistics and has to occur in
parallel to the execution of the old strategy. No instructions
about alternative strategies are given. We combined this novel
experimental paradigm with multivariate pattern analysis of neu-
roimaging data, allowing us to track the neural encoding of task-
332 Neuron 86, 331–340, April 8, 2015 ª2015 Elsevier Inc.
irrelevant information during a spontaneous strategy discovery
and change. We expected stimulus features, which are irrelevant
according to the current task strategy, to be mostly suppressed.
Yet, learning mechanisms may trigger a change of strategy in a
spontaneous, non-instructed manner. We predicted that such
a change in strategy would be reflected in an increase in the en-
coding of task-irrelevant sensory signals in frontal cortex imme-
diately before and after the strategy change.
RESULTS
Participants were instructed to respond manually to the location
of a patch of small, colored squares within a square reference
frame (Spontaneous Strategy Switch Task, Figure 1). While
they were instructed to select a response depending on the po-
sition of the patch within the reference frame, we induced a
deterministic relationship between the stimulus color (red or
green) and the correct response (left or right) after 336 trials
(�10 min). Learning this relationship did in principle allow partic-
ipants to switch their strategy and rely on stimulus color rather
than position (or both) to perform the task.
Behavioral AnalysesOur behavioral analysis aimed at revealing dynamics that were
related to a strategy change that involved processing stimulus
color (which was task-irrelevant according to the instructed
task set). A post-experimental questionnaire indicated that
eleven out of 36 participants (31%) had noticed and used the
color information (henceforth, color users). On a general level,
color users and corner users had comparable mean RTs
(505ms versus 562ms, p = 0.24), and amarginally significant dif-
ference in error rates (4.2% versus 5.7%, p = 0.07). The analyses
below will investigate potential differences in more detail. An
online behavioral measure, in which position information was
ambiguous (see Experimental Procedures), showed that the pro-
portion of color-consistent choices in these trials indeed
increased over time for color users (see Figure 2A, white line).
Although this average time course of color use appears gradual,
individual color users showed abrupt onsets. We thus deter-
mined large abrupt increases in color use (change-points) using
the CUSUMmethod (Durstewitz et al., 2010) and aligned all time
series to each participant’s individual change-point (Figure 2B).
Interestingly, color users changed their strategy spontaneously
with no apparent relation to the elapsed number of trials—result-
ing in a temporal distribution of the change-points not signifi-
cantly different from uniform (c2 test, p = 0.16). The remaining
25 participants (henceforth, corner users) did not report use of
the color strategy in the questionnaire. Moreover, corner users
did not show the abrupt onset of color use in ambiguous
trials, which was apparent in color users (Figures 2A and 2B;
Time 3 Group: F(10, 340) = 15.6, p < 0.001; h2 = 0.8). Further
supporting the distinction between color and corner users, an
analysis of standard trials showed that color users’ RTs tended
to transiently slow down before the change-point and speed
up after it, whereas non-users did not show this pattern (Fig-
ure 2C; Time 3 Group of RT slopes [lag 2]: F(2.1, 136.6) = 3.0,
p = 0.01, h2 = 0.34). Slight performance benefits resulting from
the updated strategy were reflected in reduced errors after color

A B C
D E F
Figure 2. Behavioral Results
During the experiment, participants spontaneously
separated into two groups of either color (white) or
corner users (gray lines; group membership deter-
mined by questionnaire).
(A) Average percent of choices consistent with color
when stimulus position was ambiguous across
blocks (84 trials). The shaded areas on the left
and right indicate blocks before color correlated
with corner and blocks with instruction to use
color, respectively. Background color indicates the
binomial probability of choices assuming random
behavior.
(B) Color users showed abrupt onsets of color use.
For each participant, all data were aligned to the
individual change-point (dashed line).
(C–F) Several independent behavioral markers
showed significant Group 3 Time interactions,
including a transient RT slowdown before the switch
([C], upper panel shows RTs; lower panel lag-2 RTs;
i.e., RT differences between blocks n and n-2),
reduced errors and congruency effects following
the switch ([D] and [E]), as well as increased antici-
patory key-presses in delayed trials (F). All error
bars/shadings represent mean ± SEM. See also
Figure S1.
users’ change-point (Figure 2D; group comparison after switch,
t(32.5) = 2.73, p = 0.01, d = 0.69; Time 3 Group ns.). For color
users, reduced reliance on spatial stimulus information during
standard trials led to a decrease in the spatial congruency effect
(Figure 2E) (RTcongruent � RTincongruent, i.e., comparing trials in
which horizontal stimulus position and response location did
match versus did not match; t-test group comparison after
switch, t(31.3) = 2.56, p = 0.02, d = 0.62; Time 3 Group, ns.).
At the same time, an increased amount of anticipatory
(correct) key-presses in NoGo ( = no response required) trials
following color users’ change-point (Figure 2F; Time 3 Group,
F(5.7,188.0) = 2.68, p = 0.02, h2 = 0.71) indicated a strengthened
association between stimulus color and motor responses. Note
that we found hints for group differences already before the
onset of the color-corner correlation. Color users tended to
have smaller congruency effects than corner user already during
the random runs at the beginning of the experiment, (t(32.86) =
1.72, p = 0.09, d = 0.48). They also showed a trend for faster
RTs (t(29.9) = �1.67, p = 0.10, d = 0.51). At the same time, there
was no difference in error rates (t(33.2) = �0.89, p = 0.41,
d = 0.24). Thus, conflict evoked in incongruent trials might not
have been a driving force behind the task set update. In sum-
mary, the above results support the distinction between color
and corner users in a number of independent behavioral
markers. The emergence of group differences was in most
cases related to the change-point and hence in accordance
with the temporal dynamics as indicated by the choices in the
ambiguous trials. In particular, color users showed reduced
errors and congruency costs in standard trials after the task
set change, and a transient increase in RTs before it. These
results indicate that the processes that preceded the switch to
the alternative strategy are associated with costs and result
in performance benefits after the new task set has been
established.
Decoding Information about Stimulus Features fromLocal Brain Activation PatternsRepresentation of stimulus color was analyzed by a multivariate
classification approach based on a support vector machine
(SVM) with a linear kernel in combination with a searchlight
approach (Haynes et al., 2007; Kriegeskorte et al., 2006). The
data were divided into small time bins, and the SVM was trained
and tested on parameter estimates (‘‘betas’’) from a general
linear model of red and green NoGo trials (see Experimental Pro-
cedures for details). To assess the representation of stimulus
position (corner), a similar analysis was conducted based on
betas of standard trials. The resulting time series of whole-brain
accuracy maps was aligned to each participant’s individual
change-point and submitted to a univariate t-test. Most results
refer to color users; see Figure S2 for corresponding analyses
in corner users.
Consistent with our expectations, the analysis of color users’
brain activity revealed several frontal brain areas in which we
could decode color information only immediately prior to or after
the change-point. Most interestingly, the stimulus became de-
codable from MPFC during the two blocks immediately before
the change-point (Peak MNI Coordinates: 5/53/22, AAL Label:
Frontal_Sup_Medial_R, duration of time window: 168 trials or
about 5 min). After the strategy switch, color information
emerged in lateral frontal brain areas, including themiddle frontal
gyrus (�36/11/33, Frontal_Mid_L) and the right Insula (42/-8/8,
Insula_R). In contrast, mean color decoding across all time
points (including early time points) was limited to visual cortex
(clusters at 18/-87/-2 Calcarine_R, �22/-93/-2 Occipital_L, and
32/-72/-25 Cerebellum_Crust1_R; Figure 3). To formally test
the different time courses of color encoding in medial and
lateral frontal areas, we performed an interaction test between
ROI (medial PFC versus lateral PFC/Insula; ROIs determined
independently, see Experimental Procedures), Time (before,
Neuron 86, 331–340, April 8, 2015 ª2015 Elsevier Inc. 333

Figure 3. Stimulus Color Decoding
Classification accuracy was analyzed separately for
either all blocks (mean) or only blocks immediately
before the switch or after the switch (see gray
shading in [B]; see also Figure S1).
(A) Color maps show areas in which stimulus color
could be decoded (pFWE < 0.05, cluster corrected).
All three time windows showed distinct brain areas.
Evidence for mean (time constant, see right) color
representation was found in visual areas only,
whereas color information emerged in MPFC
immediately before the switch (left), and was at last
found in the Insula and DLPFC (medial frontal gyrus,
MFG, BA10).
(B) Time courses of decoding accuracy from shown
clusters (smoothed with run. avg. of 2). See also
Figure S2. Peak locations of individual subjects
can be found in the Supplemental Information and
Table S1.
immediately prior to, and after the switch) andGroup (color users
versus corner users). This analysis indicated an interaction that
reflected the differential time courses of color encoding in lateral
and medial frontal areas (F(2, 68) = 4.5, p = 0.02): in MPFC the
amount of color coding did not differ between groups before or
after the switch, whereas such a difference was evident immedi-
ately prior to the switch (ps for before and after: 0.16 and 0.48,
p for immediately prior: < 0.01, all ps are one tailed). In lateral
PFC, in contrast, no difference could be found either before
(p = 0.39) or immediately prior to the switch (p = 0.94), but a sig-
nificant difference emerged after the switch (p = 0.03). Consid-
ering the same analyses only within the color user group showed
comparable effects, as reflected in a Time X ROI interaction
effect (F(2, 20) = 5.4, p = 0.01). We next analyzed the encoding
of stimulus corner information in color users. This analysis re-
vealed frontal areas in which corner could be decoded before
but not after the change-point. In particular, we found high
corner classification in superior frontal gyrus (23/9/53, Frontal_
Sup_R), extending medially into the middle cingulate cortex
(MCC, 9/17/43, Cingulum_Mid_R) and transient corner decoding
in the superior parietal lobule (SPL, 23/-42/61, Postcentral_R).
After the switch from instruction-based task processing (corner)
to incidental learning-based task processing (color), no above-
chance corner classification could be found (Figure 4).
Relation between Information Encoding in MPFC andthe Use of Color InformationOur analysis revealed that activity patterns in medial prefrontal
areas contained information about stimulus color before color-
based response selection began. Next, we scrutinized the
temporal relation between color encoding in MPFC and the
behavioral change more directly. To this end, we tested if and
when color-decoding accuracy would allow us to discriminate
between color and corner users. Specifically, we extracted
time courses from peak voxels within the PFC and applied a
simple threshold classifier (participants with classification accu-
racy > 50% are classified as color users; voxel-selection and
testing cross-validated; for details, see Experimental Proce-
dures) (Figure 5A shows the peaks of the odd and even groups).
Figure 5B shows that a significant proportion of the sample could
334 Neuron 86, 331–340, April 8, 2015 ª2015 Elsevier Inc.
be classified correctly with this simple method, with above
chance classification starting four blocks before and peaking
at about one block before the switch (73%, p = 0.01). A ROC
analysis over all possible thresholds confirms the best classifi-
ability around the same time (see Supplemental Information). In
addition, an analysis using non-time-locked data also confirmed
the discriminability of both groups (see Supplemental Informa-
tion; Figures S3 and S4). Hence, even an analysis that is
completely agnostic to the switch decision and switch time
points allowed us to predict participant’s upcoming strategy
change.
Relation between Information Encoding in MPFC andConscious Knowledge about the Alternative StrategyFinally, we explored the relation between the time point when
participants gained conscious awareness of the color-corner
relation and the onset of color encoding in MPFC. To address
this issue, we analyzed the post-experimental questionnaire in
which participants were asked to retrospectively asses the
time when they became aware of the color-corner relation.
These verbal reports correlate highly with the time of strategy
change that was determined based on behavior (r = 0.82,
p = 0.002). Importantly, however, the reported time points
where temporally very close to the behavioral switch (mean dif-
ference: 0.14 blocks; t-test that the difference between verbal
report and behavioral switch is different from 0: p = 0.82).
Thus, conscious awareness presumably came after the onset
of color encoding in MPFC (Figure 5), which started four blocks
before (�4) and peaked one block (�1) before the switch. A t-test
between the reported time of verbal knowledge and the earliest
onset of color encoding in MPFC (�4) supports the notion that
verbal knowledge came significantly later (p < 0.001). To further
support these findings, we conducted a control experiment
(n = 23) whose sole purpose was to refine the method with which
the conscious awareness was assessed (the retrospectivemem-
ory test was closer in time to the behavioral switch; see Experi-
mental Procedures). Nine participants crossed the threshold
for color use and where stopped right after their behavioral
switch (see Experimental Procedures). As before, the given ver-
bal report correlated highly with the behavioral switch (r = 0.87)

Figure 4. Stimulus Corner Decoding in Color
Users
Corner classification was analyzed in separate time
windows (indicated by the gray background areas
on the time course plots; pFWE < 0.05, cluster cor-
rected). The presented results stem from time
windows that included either all blocks before
(�5 to 0, ‘‘Early’’) or immediately before (‘‘Before,’’
same as in Figure 3). Time windows after the switch
did not show any significant results and hence are
not shown (see also Figure S2).
(A) Evidence for corner representation could be
found initially in frontal brain areas (medial frontal
gyrus, MFG, BA10) as well as in middle cingulate
gyrus (MCC) and transiently before the switch in
superior parietal lobule (SPL).
(B) Time courses from shown clusters; gray back-
ground area indicates relevant time window. See
also Figure S2.
and provided evidence that participants became aware after
we could find significant MPFC decoding in our main experi-
ment: a t-test between the reported time of verbal knowledge
in this new experiment and the earliest onset of color encoding
in MPFC (�4) again supported the idea that verbal knowledge
came significantly later (p < 0.002).
DISCUSSION
When facing a complex task, we often don’t know if the current
strategy is the best of all possible strategies. Information-rich en-
vironments often allow to use alternative strategies that can lead
to the same goal, potentially in a more effective manner. At the
same time, the efficient implementation of an existing strategy
involves top-down control mechanisms, which degrade the rep-
resentation of irrelevant information and hence make exploring
such alternatives unlikely and difficult. Here, we studied the abil-
ity to spontaneously discover and implement new strategies. Our
paradigm allowed, for the first time, the in-lab reproduction of
this striking ability and the opportunity to track its neural
underpinnings.
Participants were instructed with valid rules to perform a task
based on the spatial location of a stimulus. Unmentioned but
simple regularities in the task environment (stimulus color), how-
ever, could lead to a new strategy for reaching the same task
goal. Although this regularity was very simple and repeated
many times, most participants’ focus on the instructed sensory
signal was so strong that it prevented them from discovering
(53%) or using (16%) the alternative strategy. As a result, only
31% of participants changed to the new color-based strategy.
Once it was triggered, however, the behavioral transition to the
new strategy started abruptly and was completed within a few
minutes. Importantly, we found that the neural encoding of color
information was uniquely related to the behavioral switch in color
users. Specifically, we revealed that in areas known to be
involved in the representation of task sets, namely DLPFC and
Insula (see Dosenbach et al., 2006, but note that other cognitive
functions have been linked to these areas as well), color encod-
ing emerged only after the behavioral change. Most interestingly,
we found that the BOLD signal in MPFC started encoding color
information several minutes before the new strategy was actually
applied. Based on this effect, we could predict which of our par-
ticipants would apply the color strategy.
Our findings suggest an important role of MPFC in the sponta-
neous updating of mental programs. First, we showed that
MPFC started encoding stimulus color of the current trial when
participants were still pursuing the original (position-based)
strategy. Strikingly, MPFC behaved as if it was involved in per-
forming the task based on color, even though participants had
not yet started doing so overtly. We speculate that MPFC is
involved in planning and evaluating a future strategy shift by
internally simulating the alternative strategy (Jeannerod, 2001;
Sutton, 1990). This process takes place before a decision for
the implementation of the alternative strategy is made, a process
akin to counterfactual thinking (Barbey et al., 2009). Second, we
showed that MPFC encoded a stimulus feature that was task-
irrelevant according to the instructed task set. A large body of
studies has shown that an important function of PFC is indeed
to disadvantage processing of task-irrelevant information (e.g.,
Doll et al., 2009; Dreisbach and Haider, 2008; Duncan, 2001;
Miller and Cohen, 2001). In support of this idea, our own findings
showed that color processing was strongly impaired: the major-
ity of participants did not notice the color-response relationship,
despite its simplicity and the fact that the deterministic relation-
ship could be observed in over 700 trials. Hence, the early
encoding of color in MPFC in color users seems to reflect be-
tween-subject differences in the extent to which information pro-
cessing excluded task-irrelevant information. Accordingly, our
finding suggests that MPFC could escape the top-down bias.
At the same time, in those participants who did not discover
the color strategy, it remains an open question whether the in-
struction led to impaired learning of task-irrelevant information
or only suppressed the effect irrelevant knowledge has on
behavior (Doll et al., 2009; Gaschler et al., 2012; Zhao et al.,
2013). In addition to our findings on color representation, we
found largely absent or decreasing corner representation in color
users (Figure 4). This contrasts with widespread corner encoding
in corner users (Figure S2), although it is notable that the network
employed to represent color in color users and corner in corner
users did not overlap completely (see gray lines in Figure 2).
Neuron 86, 331–340, April 8, 2015 ª2015 Elsevier Inc. 335

Figure 5. Relations of Information Encoding to Performance
(A and B) Evidence for color representation in MPFC could be used to deter-
mine group membership, even before participants showed behavioral signs of
using the color. Time courses of color classification accuracy were extracted
from brain areas encoding color during the switch (A) and used to classify
subjects into color and corner users as a function of time ([B]; smoothing as in
Figures 3 and 4). See also Figures S3 and S4.
Our findings relate to several studies that have previously
offered accounts of MPFC function. Regarding the effects of
changing a strategy, our findings agree with research that indi-
cated that neurons in MPFC show abrupt and in some cases
transient state transitions that accompany changes in the used
rules/strategy (Durstewitz et al., 2010; Karlsson et al., 2012;
Rich and Shapiro, 2009) or proposed that MPFC is involved in
selecting a different action routine (Holroyd and Yeung, 2012).
Other research suggested that ACC, a subregion of MPFC, pro-
cesses conflict signals and evaluates the expected value of con-
trol (Botvinick et al., 2001; Shenhav et al., 2013), thus indicating a
role of MPFC in cognitive control. Finally, the same brain area
has also been linked to foraging (Hayden et al., 2011; Kolling
et al., 2012; but see Shenhav et al., 2014) and exploration (Karls-
son et al., 2012), suggesting that ACC encodes the ‘‘value of
switching to a course of action alternative to that which is taken
or is the default’’ (Kolling et al, 2012, p. 97). While our paradigm
involves all of these components—strategy switching, adaptions
in cognitive control, and deciding to explore novel courses of
action—our approach allowed us to offer a new perspective on
the functional role of MPFC in cognitive control and strategy
switching. By showing that MPFC directly engaged in process-
ing of stimulus features, our findings indicate that this brain
area deals with the specific stimulus properties whose process-
ing is affected by cognitive control (here: the color), rather than
only ‘‘global’’ variables relating to the amount of necessary
cognitive control (such as conflict, the value of control, or the
value of foraging). Our interpretation of an internal simulation
process could link our results to evidence of internally generated
sequences in the rat hippocampus (Johnson and Redish, 2007)
that reflect internal planning and influence activity in MPFC (Pez-
zulo et al., 2014).
In addition to these commonalities, our findings represent
challenging evidence for a recent theory of PFC function
(Donoso et al., 2014), which prescribes a role of anterior and
lateral frontal areas for exploring alternative strategies and
assumes that exploration is related to the unreliability of the
current strategy. Moreover, by not mentioning the alternative op-
tions, our approach contrasts with existing research (e.g., Kolling
et al., 2012). Rather, our paradigm explored participants’ ability
336 Neuron 86, 331–340, April 8, 2015 ª2015 Elsevier Inc.
to learn statistical relationships in the environment that could
lead to the new strategy. This shows that incidental learning
about features of the environment can interact with mechanisms
that adjust cognitive control and drive spontaneous exploration
of alternative strategies. Importantly, throughout the experiment
the instructed task set remained veridical (and hence reliable), all
participants made few errors, and our behavioral analyses did
not show any positive relation between measures of conflict
and the probability to discover and use the alternative rule.
Thus, the observed exploration of alternative strategies does
not seem to be driven by unreliability, conflict, or errors, as in pre-
vious studies (Botvinick et al., 2001; Collins and Koechlin, 2012;
Daw et al., 2006; Donoso et al., 2014; Nassar et al., 2010).
Rather, our findings would better relate with previous evidence
showing the involvement of MPFC in deciding which task to
perform in the future (Haynes et al., 2007; Momennejad and
Haynes, 2013; Soon et al., 2013; Wisniewski et al., 2014).
Note, however, that in the above-mentioned studies a (mostly
a priori specified) rule was decoded from brain activity, whereas
our study decoded stimulus features. Hence these existing
studies were suited to answer questions about the representa-
tions of task sets/rules during or prior to their application,
whereas the present study focused on the question how estab-
lished task sets control which information is represented in pre-
frontal brain areas and how prefrontal representations of sensory
information changes as a result learning about statistical rela-
tions in the environment. For this reason, the present experiment
investigated the switch toward a strategy that was not specified
by instructions, self-learned, and discovered despite the exis-
tence of an instructed and working rule.
MPFC was not the only region that encoded color. Following
the strategy shift, we found that color information was present
in the Insula and in the left DLPFC, while before the switch corner
information was found in the right DLPFC. These findings are
compatible with preceding proposals and evidence on the neural
basis of cognitive control and the implementation of tasks
(Koechlin et al., 2003; Reverberi et al., 2012; Sakai, 2008; Sakai
and Passingham, 2006; Woolgar et al., 2011). Furthermore, they
show how frontal cortex modifies the represented information
depending on what is relevant in the current context (Freedman
et al., 2001; Stokes et al., 2013). Recent research has also high-
lighted the importance of the adaptive representation of informa-
tion that is relevant in the context of the current task (so called
‘‘task states’’) for reinforcement learning (see Wilson et al.,
2014). The present results are witness to the ability of frontal flex-
ible coding and its potential interaction with learning.
One interesting question for future research is to assess the
role of conscious and unconscious processes in the times before
and during the changes in cognitive control and the applied strat-
egy.While our own data indicate that the conscious realization of
the color-corner relation occurs at the time of the behavioral
switch (verbal reports of when participants realized the relation
correlate to r = 0.82 with the behavioral switch time point and
do not differ from each other, p = 0.83), our control experiment
showed that 33% (3/9) of color using participants reported that
they noticed the relation only because they had involuntarily
started exploiting it (Frensch et al., 2003). Future research could
thus employ more stringent methodology to assess conscious
knowledge and which neural processes relate to the transition
from conscious to unconscious knowledge of environmental sta-
tistics (e.g., Rose et al., 2010; Schuck et al., 2013). Note that our
finding that participants’ awareness of the alternative strategy
arose mostly after we found the signal in MPFC also indicates
that our results are not related to the possibility of insights or
Aha moments. Although elucidating the role of insight for the
spontaneous discovery of alternative strategies is an interesting
question (Kounios and Beeman, 2014; Luo and Knoblich, 2007),
our task does not include a classic ‘‘problem’’ to solve and thus
our results do not directly speak to this question.
Taken together, the present study showed that MPFC is
involved in the spontaneous exploration of irrelevant information
that led to the discovery and implementation of a new strategy.
Crucially, this change of strategy was self-initiated by partici-
pants and not cued by any experimental intervention. Hence, it
is an example of self-driven and flexible goal-directed behavior.
By showing that MPFC encoded aspects of the stimulus that
eventually came to control behavior, our results highlight the
role of MPFC in carrying out computations related to freely cho-
sen exploration and adaptation of cognitive control. Finally, pre-
diction of color use across subjects is, to our knowledge, the first
demonstration that a future choice can be predicted from brain
activity even when the experiment did not ask for a choice to
be made at all. Our results shed new light on the computations
carried out in MPFC and suggest that these processes are
involved in initiating, rather than implementing, the spontaneous
updating of the mental structures, which support goal-directed
behavior.
EXPERIMENTAL PROCEDURES
Participants
Thirty-six volunteers (22 female, mean age 25.8 [21–31]) participated in the
fMRI study in return for reimbursement (20 V/hr). Prior to recruitment, all
potential participants were screened for MRI eligibility and provided informed
consent to participation. The behavioral control experiment included 23 partic-
ipants (14 female, mean age 22.9 [19–28]). The institutional review board at
Humboldt University approved the study.
Task and Procedure
Behavioral and imaging data of the main experiment were recorded while par-
ticipants performed a simple perceptual decision-making task (Spontaneous
Strategy Switch Task). Participants were instructed to respond manually to
the position of a patch of colored dots within a square reference frame (Fig-
ure 1A). They were asked to select one of two responses depending on which
corner of the reference frame the colored squares were closest to. Participants
held a button box in each hand and could press either left or right. Two oppo-
site corners (along the diagonal) were mapped to the same response (Fig-
ure 1B). The main task during scanning included twelve runs with 168 trials
each. In Runs 1 and 2 (Random Runs), the stimulus color was unrelated to
the position of the stimulus and the response. In Runs 3–10 (Correlated
Runs) the color had a fixed relation to the response (e.g., all upper-left and
lower-right stimuli were green, the remaining ones were red) (see Figure 1C).
Participants were not informed about this contingency, but could learn and
apply it spontaneously. Hence, on the one hand, the instructions provided a
functional set of rules to determine one’s responses (based on stimulus posi-
tion). On the other hand, an alternative rule based on the ‘‘irrelevant’’ feature
color could also be used once color correlated with corner (and hence signaled
the correct response). By the end of Run 10, all participants were informed
about the existence of a fixed association between color and corner (without
specifying the relation) and instructed to use the color from then on (Instructed
Runs). Each of the twelve runs of the main experiment lasted about 5 min and
was followed by a short break. The experimenter monitored performance of
participants. Written and oral feedback was given between runs if the error
rate exceeded 20%. The response stimulus interval was 400 ms. To measure
the learning and use of color information, we designed different trial condi-
tions. In the standard condition (80 out of 168 trials/run), the patch of dots
was presented for 400 ms and was closest to one of the four corners of the
reference frame. Thus, a response could be selected as instructed based on
stimulus position. Unmentioned to the participants, however, the stimulus
was centered within the reference frame in some trials (ambiguous condition,
32/168 trials, display duration 400 ms; see Figure 1A). The ambiguous trials
allowed for an online assessment of the tendency to use color because a
participant can be expected to respond left or right at chance level to a cen-
trally presented green stimulus—unless s/he has already learned that, for
example, green stimuli are usually followed by a right response. Choices,
which were more consistent with the color than expected by chance, thus
reflect emerging knowledge about this contingency. A pilot experiment
applying ambiguous trials only late in practice showed that the introduction
of ambiguous trials neither evokes nor hinders color usage. To allow efficient
measuring of BOLD responses related to color but not corner, the colored
squares were displayed for 2,000 ms without a reference frame in some trials
(48/168 trials). In two thirds of these trials, the task afterward continued with
the next trial. Participants had to hold back any key press on the current trial
(NoGo condition, 32/168). In the remaining one third of these cases, the frame
was displayed after the initial 2,000 ms, and the participants had to react in a
regular fashion (LateGo condition, 16/168, display duration of stimulus with
frame: 400 ms). To ensure that the frame was indeed needed to make the cor-
rect choice, the stimulus always appeared at the same central location in each
trial, whereas the location of the frame was changed from trial to trial. It was
thus neither possible to ignore stimuli that lacked a reference frame nor to
respond prematurely. The NoGo trials were used to study changes in the neu-
ral representation of color information. In these trials, color was displayed long
enough to estimate a neural response. It was not confoundedwith spatial stim-
ulus information and motor activation was suppressed. Finally, in eight trials of
each run the screen remained black for 3,000 ms (baseline condition). Due to
the duration of the hemodynamic response function, the fast design of the
experiment resulted in event-related BOLD signals, which also contained a
signal proportion that reflected brain activation caused by previous and
following events. BecauseNoGo trials were central to themultivariate analyses
(see below), we ensured that all trials in the 4 s preceding and following each
NoGo trial were balanced. As we aimed at decoding color (red versus green),
we ensured that for each red NoGo trial we had a green one with the exact
same composition of preceding and following trials (i.e., color, corner, and
condition). To ensure balancing of the last trials in each run, we generated
balanced sequences of 168 trials and appended these with the first 12 trials
of the sequence. Hence, from the 180 trials in each run, only the first 168
were analyzed. This procedure ensured that biases in the unwanted signal pro-
portion were minimized. Additionally, we ensured representative frequency
distributions of condition and color within windows of 42 trials. This allowed
us to do analyses with a below-run temporal resolution, which still had minimal
biases in the trial structure or signal.
Before entering the scanner, participants were instructed and trained in the
task. The instructions described all conditions (except ambiguous trials). Par-
ticipants were only told to press any key of their choosing in case they were
uncertain about the stimulus location. The color of the stimuli was mentioned
only in an unspecified manner (‘‘A stimulus can be either red or green.’’). The
response mapping was shown in all color combinations (a stimulus in each
of the four corners was shown in both red and green during the instruction).
In the training phase, participants were slowly accustomed to the short display
durations (the display duration was successively shortened until it reached
400 ms). Feedback was given for all wrong and premature responses and
time-outs (2,500 ms threshold). The color of the stimuli had no systematic rela-
tion to stimulus position during training. The training lasted at least 50 trials and
endedwhen the participant made less than 20%errors in 24 consecutive trials.
If the participant exceeded 168 trials without reaching the criterion, the training
was restarted. Participants were further instructed that upon entering the
scanner, no more feedback would be provided. After completion of the main
Neuron 86, 331–340, April 8, 2015 ª2015 Elsevier Inc. 337

experiment, participants completed a questionnaire with the following ques-
tions: (1) ‘‘In the experiment, which you have just completed, each corner
had one associated color. Did you notice this while you were performing the
task?’’ [yes/no]. (1b) ‘‘If yes, when did you notice this (after what percentage
of the experiment)’’ [participants had to mark their answer on a scale
from 0% to 100%]. (1c) ‘‘Did you use this color-corner relation to perform
the task, i.e. to choose which button to press?’’ [yes/no]. (2) ‘‘Please indicate
now which color the stimulus had for each of the four corners. If you did not
notice this relation during the experiment or you are uncertain, you can guess.’’
The task employed for the control experiment was identical to the main exper-
iment with the exception that it was automatically stopped once a participant
showed the first clear signs of color use. Because its purpose was to shed light
on the role of conscious awareness in our task and to reduce the concern that
retrospective memory of longer time periods might be unreliable, we used this
automatic stopping procedure to ask participants about their conscious
knowledge at a time that was much closer to their behavioral switch. To deter-
mine the stopping criterion, we fitted a logistic regression to predict participant
group (color users/no color user) based on the maximum overall percent of
color use in ambiguous trials in the main experiment. The resulting threshold
was 82% and correctly identified 91% (10/11) of color users while misidentify-
ing only one corner user. Therefore, as soon as participants crossed this
threshold (in the last two blocks over a running average), they were stopped
in the control experiment. After the stop, participants were asked the
same questions from the post-experimental questionnaire described above.
Furthermore, we asked participants about four potential properties of insight:
(1) whether they gained awareness suddenly, (2) whether the alternative strat-
egy did seem obvious after they learned about it, (3) whether it they could not
tell how they came to know about the alternative strategy, and (4) whether they
have been very sure that the new strategy is valid for the whole task. Finally, we
also asked them whether they initially started using the color involuntarily and
only realized later that the colors could be used.
Behavioral Analyses
Behavioral analyses were done using R (R Development Core Team, 2013).
Time-out trials were excluded from all analyses and error trials from RT ana-
lyses. For each ambiguous trial, it was determined if the given response was
the one predicted by the stimulus color or not (henceforth: ‘‘color use’’).
A participant was classified as a color user if s/he indicated a strategy switch
in the questionnaire. These responses were 100% in line with a behavioral
analysis, which determined if color use in the last run was at least 75%
(p < 0.005, binomial test over all 32 ambiguous trials in this run). Remaining par-
ticipants were classified as corner user. Six corner users reported having
noticed the color-corner relation but that they had refrained from using it.
For the behavioral and neural analyses, we divided the task into blocks of 84
trials each (half a scanner run). For each block, the median RT, mean percent
of errors, and color use was calculated.
For the present experiment, it was important that we could determine when
participants began using the color. To this end, we used the CUSUM method
to determine the block when a color user started using the color. This method
effectively detects the block where a participant started performing above her/
his own overall mean level (i.e., the point in a time series where a large upward
change occurs) (see Durstewitz et al., 2010). Because corner users per
definition do not have a change point, we used the change points that were
determined for color users and randomly assigned them to corner users.
This resulted in an equal distribution of task experience before/after the
change-points for both groups. The results can be seen in Figure 2, where
the dashed vertical lines indicate the change point.
In order to rule out that our results are dependent on the random assignment
of switch-points to corner users, we applied the CUSUM algorithm to corner
user’s data. This is an interesting test because even if a data series does not
have a clear switch point, the CUSUM algorithm will still find the point of great-
est change and thus can serve as a conservative control. Indeed, the resulting
time series of corner users shows an increase in color use around the change-
point (an artifact of the algorithm), but importantly, this increase was still
considerably smaller and more transient as compared to color users (interac-
tion Time 3 Group, F(10, 340) = 9.4, p < 0.001; see Figure S1). Hence, even in
comparison to a stringent test, color user’s showed larger change points than
338 Neuron 86, 331–340, April 8, 2015 ª2015 Elsevier Inc.
corner users. In the analysis with change-point aligned data, we only consider
time points with complete data from all subjects (if the earliest switch-point
was at block 6, the maximum number of blocks before the switch was con-
strained to be five, etc.).
Scanning Protocol and Data Preprocessing
Acquisition of magnetic resonance images was conducted at the Berlin
Center for Advanced Neuroimaging, Charite Berlin. We used a 3 T Siemens
MagnetomTrio (Siemens) research-dedicated MRI scanner to acquire all
data. T1-weighted structural images were acquired with an MP-RAGE pulse
sequence with a resolution of 1 mm3. A T2*-weighted echo-planar imaging
(EPI) pulse sequence was used for functional imaging (3 3 3 3 3 mm voxels,
slice thickness = 3mm, TR = 2,000ms, TE = 30ms, FOV = 192mm, flip angle =
78�, 33 axial slices, descending acquisition). EPI slices were aligned to the
anterior-posterior commissure axis. Field maps for distortion correction
were acquired also using an EPI sequence. To allow for T1 equilibration
effects, the experiment was started 6 s after the acquisition of the first volume
of each run. fMRI data preprocessing was done using SPM8 (www.fil.ion.ucl.
ac.uk/spm) and involved a correction for magnetic inhomogeneities using
fieldmaps and spatial realignment.
Decoding
Whole-brain maps of parameter estimates from first-level subject-wise GLM
analyses were subjected to multivariate pattern classification following a
searchlight approach (Haynes et al., 2007; Kriegeskorte et al., 2006). To obtain
these parameter (beta) maps, we conducted two separate GLM analyses. For
color classification, the GLM included two separate regressors for each block
and condition (four regressors per block), two modeling all red, and two
modeling all green NoGo trials (each regressor modeled four trials; duration
each 2,000 ms). Regressors modeled half blocks instead of blocks to get bet-
ter temporal resolution and to have more data for training/testing the classifier.
The GLM also included six motion regressors and one intercept regressor per
run, but no events from other conditions. For corner classification, the GLM
included two separate regressors for each block and corner (modeling five tri-
als per corner) plus six motion and one intercept (constant) regressor per run.
We used a SVM with a linear kernel (cost parameter = 1) to classify patterns
within spherical clusters centered on each voxel (LIBSVM; www.csie.ntu.
edu.tw/�cjlin/libsvm) and the Princeton MVPA toolbox (http://code.google.
com/p/princeton-mvpa-toolbox) for data organization. To analyze the repre-
sentation of color, the classifiers were trained on the regressors modeling
NoGo trials in the last two runs (i.e., eight red and eight green betas). In these
runs, all participants showed strong color use; hence, brain activity in this time
window reflects a task set that includes the use of color (see Figure 2A). The
classifiers were then tested on betas from Runs 1–10. This resulted in one ac-
curacy map for each block and subject, hence allowing us to analyze the time
course of color representation within a given spherical cluster. We note that
one potential confound of our findings is that color was fully correlated with re-
sponses and the classifier performance could have been based on sub-
threshold response preparation (even in NoGo trials). Yet, in light of the very
limited number of responses in NoGo trials (see Figure 2F), this interpretation
seems unlikely. In addition, the classifier can only pick up a signal if partici-
pants prepare responses based on the color and hence increased classifier
performance before a behavioral change would still hint at a mechanism for
internal simulation of the alternative strategy. The analysis of corner represen-
tation was done by training the classifiers on standard trials in Runs 1 and 2
(in which color was uncorrelated to corner and hence brain activity should
reflect the instructed task set based on corner) and testing the classifiers in
Runs 3–12. To avoid results associated with motor responses during standard
trials, this procedure was done separately for each set of two corners that were
mapped to one hand: one set of classifiers was trained to distinguish between
patterns associated with upper-left and lower-right standard trials, which were
both associatedwith the right hand, and another set, classified upper-right and
lower-left standard trials. The results of the two classifiers were averaged. For
statistical inference on the group level, normalized and smoothed (2 mm
FWHM) accuracy maps were submitted to second-level analyses in SPM. All
time points were aligned relative to the individual change-point of color use.
As mentioned above, the calculation of the change-points was derived from

behavioral data in a different condition (ambiguous trials) and hence was inde-
pendent of the current analysis. Our main hypotheses regarded changes
emerging immediately before and after the behavioral switch, and hence the
possible blocks (�5 to +6; i.e., the relative time windows where data were
available from all subjects) were divided into these categories. Maps contain-
ing the average classification within these time-windows (before, after, overall
mean) were then submitted to separate t-tests. All resulting t-maps were
thresholded at p < 0.01 with appropriate FWE cluster size correction (pFWE =
0.05). To illustrate the precise development of representations within the
above-threshold clusters, time courses of average accuracies (smoothed
with moving average of length 2 blocks) in the identified voxels were extracted
and shown separately. Time courses only serve to illustrate the temporal struc-
ture. The interaction test between ROI and time used cross-validated ROI def-
initions. Specifically, the analysis of color encoding immediately before and
after was repeated for odd- and even-numbered participants. 7 mm spheres
were centered on the resulting peak voxels (analysis constrained to prefrontal
cortex (i.e., Brodmann areas 8–12, 24, 32, 33, and 44–47), which were, as in
the main analysis, in medial (‘‘switch contrast’’ peaks at �9/34/39, Frontal_
Sup_Medial_L and 0/62/17, Frontal_Sup_Medial_L) and lateral PFC (‘‘after
contrast’’ peaks at 42/4/8, Insula_R and 45/-4/2 Insula_R). These spheres
were used as ROIs for the ANOVA. The time effects involved the three factors:
‘‘Before,’’ ‘‘Immediately Before,’’ and ‘‘After,’’ which were defined as
blocks �5, �4, �3; versus �2, �1, 0; and +1 to +5, respectively.
Classifying Subjects into Groups Based on Brain Data
To avoid peeking during the subject classification analysis, we split the color
usergroup into twosubgroups inwhichweselectedvoxels separately. Inpartic-
ular, for voxel selection,we repeated the t-testofmeancolor classification in the
switch timewindowoncewith onlyodd- andoncewith only even-numberedco-
lor users. The resulting maps were masked with an anatomical mask of PFC
(Brodmannareas8–12, 24, 32, 33, and44–47), and timecourseswere extracted
from a spherical cluster around the peak voxel (radius 8 mm, the peaks of the
odd and even groups are shown in Figure 5A; peak locations are marked in
white). For each of the two resulting clusters, we used the time courses of color
decoding accuracy of the remaining color users as well as half of the corner
users (i.e., subjects not used for voxel selection) to classify subjects as either
belonging to the color users or not (odd/even cross validation; i.e., the cluster
defined in odd participants was used to test classification in even participants
and v.v.). For classification with change-point-locked time courses, we used
a very simple threshold classifier that assigned group status based on whether
(rounded) decoding accuracy was > 50% (color user) or not (position user). The
classifier performancewasevaluatedusing theprobability of thenumberof cor-
rect guesses under a hypergeometric distribution given the baseline probability
and total number of guesses at each time point (the number of participants
labeled as color users was not constrained and differed between time points).
A control ROC analysis that shows how this effect behaves across different
thresholds canbe found in theSupplemental Information andFigureS3. Further
supporting results from an analysis, which uses natural (not time-locked) data,
can be found in in the Supplemental Information and Figure S4.
SUPPLEMENTAL INFORMATION
Supplemental Information includes four figures and one table and can
be found with this article online at http://dx.doi.org/10.1016/j.neuron.2015.
03.015.
AUTHOR CONTRIBUTIONS
All authors contributed to designing the study. N.W.S., R.G., D.W., and J.H.
conducted research. N.W.S. and C.R. analyzed the data. All authors contrib-
uted to interpretation of the findings and writing the manuscript.
ACKNOWLEDGMENTS
N.W.S. was supported by the International Max Planck Research School LIFE
and NIH grant R01MH098861 (awarded to Yael Niv). C.R. was supported by
the PRIN grant 2010RP5RNM_001 from the Italian Ministry of University.
This work was supported by the Bernstein Computational Neuroscience
Program of the German Federal Ministry of Education and Research (grant
reference 01GQ1001C) and the German Research Foundation (Exc 257
NeuroCure, DFG Grants KFO247, SFB 940, and WE 2852/3-1). We thank
Michael Kriechbaumer for help with data acquisition and Yael Niv, Robert
Wilson, and Angela Langdon for helpful comments on the manuscript.
Received: August 18, 2014
Revised: November 21, 2014
Accepted: March 2, 2015
Published: March 26, 2015
REFERENCES
Barbey, A.K., Krueger, F., and Grafman, J. (2009). Structured event complexes
in the medial prefrontal cortex support counterfactual representations for
future planning. Philos. Trans. R. Soc. Lond. B Biol. Sci. 364, 1291–1300.
Botvinick, M.M., Braver, T.S., Barch, D.M., Carter, C.S., and Cohen, J.D.
(2001). Conflict monitoring and cognitive control. Psychol. Rev. 108, 624–652.
Cohen, J.D., McClure, S.M., and Yu, A.J. (2007). Should I stay or should I go?
How the human brain manages the trade-off between exploitation and explo-
ration. Philos. Trans. R. Soc. Lond. B Biol. Sci. 362, 933–942.
Collins, A., and Koechlin, E. (2012). Reasoning, learning, and creativity: frontal
lobe function and human decision-making. PLoS Biol. 10, e1001293.
Daw, N.D., O’Doherty, J.P., Dayan, P., Seymour, B., and Dolan, R.J. (2006).
Cortical substrates for exploratory decisions in humans. Nature 441, 876–879.
Dehaene, S., Kerszberg, M., and Changeux, J.P. (1998). A neuronal model of a
global workspace in effortful cognitive tasks. Proc. Natl. Acad. Sci. USA 95,
14529–14534.
Desimone, R., and Duncan, J. (1995). Neural mechanisms of selective visual
attention. Annu. Rev. Neurosci. 18, 193–222.
Doll, B.B., Jacobs, W.J., Sanfey, A.G., and Frank, M.J. (2009). Instructional
control of reinforcement learning: a behavioral and neurocomputational inves-
tigation. Brain Res. 1299, 74–94.
Donoso, M., Collins, A.G.E., and Koechlin, E. (2014). Human cognition.
Foundations of human reasoning in the prefrontal cortex. Science 344,
1481–1486.
Dosenbach, N.U.F., Visscher, K.M., Palmer, E.D., Miezin, F.M., Wenger, K.K.,
Kang, H.C., Burgund, E.D., Grimes, A.L., Schlaggar, B.L., and Petersen, S.E.
(2006). A core system for the implementation of task sets. Neuron 50, 799–812.
Dreisbach, G., and Haider, H. (2008). That’s what task sets are for: shielding
against irrelevant information. Psychol. Res. 72, 355–361.
Duncan, J. (2001). An adaptive coding model of neural function in prefrontal
cortex. Nat. Rev. Neurosci. 2, 820–829.
Durstewitz, D., Vittoz, N.M., Floresco, S.B., and Seamans, J.K. (2010). Abrupt
transitions between prefrontal neural ensemble states accompany behavioral
transitions during rule learning. Neuron 66, 438–448.
Freedman, D.J., Riesenhuber, M., Poggio, T., and Miller, E.K. (2001).
Categorical representation of visual stimuli in the primate prefrontal cortex.
Science 291, 312–316.
Frensch, P.A., Haider, H., Ruenger, D., Neugebauer, U., Voigt, S., andWerg, J.
(2003). The route from implicit learning to verbal expression of what has been
learned: Verbal report of incidentally experienced environmental regularity. In
Attention and Implicit Learning, Volume 48Attention and Implicit Learning
(Advances in Consciousness Research), pp. 335–366.
Gaschler, R., Frensch, P.A., Cohen, A., and Wenke, D. (2012). Implicit
sequence learning based on instructed task set. J. Exp. Psychol. Learn.
Mem. Cogn. 38, 1389–1407.
Hayden, B.Y., Pearson, J.M., and Platt, M.L. (2011). Neuronal basis of sequen-
tial foraging decisions in a patchy environment. Nat. Neurosci. 14, 933–939.
Haynes, J.-D., Sakai, K., Rees, G., Gilbert, S., Frith, C., and Passingham, R.E.
(2007). Reading hidden intentions in the human brain. Curr. Biol. 17, 323–328.
Neuron 86, 331–340, April 8, 2015 ª2015 Elsevier Inc. 339

Holroyd, C.B., and Yeung, N. (2012). Motivation of extended behaviors by
anterior cingulate cortex. Trends Cogn. Sci. 16, 122–128.
Jeannerod, M. (2001). Neural simulation of action: a unifying mechanism for
motor cognition. Neuroimage 14, S103–S109.
Jepma,M., and Nieuwenhuis, S. (2011). Pupil diameter predicts changes in the
exploration-exploitation trade-off: evidence for the adaptive gain theory.
J. Cogn. Neurosci. 23, 1587–1596.
Johnson, A., and Redish, A.D. (2007). Neural ensembles in CA3 transiently
encode paths forward of the animal at a decision point. J. Neurosci. 27,
12176–12189.
Karlsson, M.P., Tervo, D.G.R., and Karpova, A.Y. (2012). Network resets in
medial prefrontal cortex mark the onset of behavioral uncertainty. Science
338, 135–139.
Koechlin, E., Ody, C., and Kouneiher, F. (2003). The architecture of cognitive
control in the human prefrontal cortex. Science 302, 1181–1185.
Kolling, N., Behrens, T.E.J., Mars, R.B., and Rushworth, M.F.S. (2012). Neural
mechanisms of foraging. Science 336, 95–98.
Kounios, J., and Beeman, M. (2014). The cognitive neuroscience of insight.
Annu. Rev. Psychol. 65, 71–93.
Kriegeskorte, N., Goebel, R., and Bandettini, P. (2006). Information-based
functional brain mapping. Proc. Natl. Acad. Sci. USA 103, 3863–3868.
Luo, J., and Knoblich, G. (2007). Studying insight problem solving with neuro-
scientific methods. Methods 42, 77–86.
March, J.G. (1991). Exploration and exploitation in organizational learning.
Organ. Sci. 2, 71–87.
Meiran, N. (1996). Reconfiguration of processing mode prior to task perfor-
mance. J. Exp. Psychol. Learn. Mem. Cogn. 22, 1423–1442.
Miller, E.K., and Cohen, J.D. (2001). An integrative theory of prefrontal cortex
function. Annu. Rev. Neurosci. 24, 167–202.
Momennejad, I., and Haynes, J.D. (2013). Encoding of prospective tasks in the
human prefrontal cortex under varying task loads. J. Neurosci. 33, 17342–
17349.
Monsell, S. (2003). Task switching. Trends Cogn. Sci. 7, 134–140.
Nassar, M.R., Wilson, R.C., Heasly, B., and Gold, J.I. (2010). An approximately
Bayesian delta-rule model explains the dynamics of belief updating in a chang-
ing environment. J. Neurosci. 30, 12366–12378.
Pezzulo, G., van der Meer, M.A.A., Lansink, C.S., and Pennartz, C.M.A. (2014).
Internally generated sequences in learning and executing goal-directed
behavior. Trends Cogn. Sci. 18, 647–657.
Reverberi, C., Toraldo, A., D’Agostini, S., and Skrap, M. (2005). Better without
(lateral) frontal cortex? Insight problems solved by frontal patients. Brain 128,
2882–2890.
Reverberi, C., Gorgen, K., and Haynes, J.-D. (2012). Distributed representa-
tions of rule identity and rule order in human frontal cortex and striatum.
J. Neurosci. 32, 17420–17430.
340 Neuron 86, 331–340, April 8, 2015 ª2015 Elsevier Inc.
Rich, E.L., and Shapiro, M. (2009). Rat prefrontal cortical neurons selectively
code strategy switches. J. Neurosci. 29, 7208–7219.
Rose,M., Haider, H., and Buchel, C. (2010). The emergence of explicit memory
during learning. Cereb. Cortex 20, 2787–2797.
Sakai, K. (2008). Task set and prefrontal cortex. Annu. Rev. Neurosci. 31,
219–245.
Sakai, K., and Passingham, R.E. (2006). Prefrontal set activity predicts rule-
specific neural processing during subsequent cognitive performance.
J. Neurosci. 26, 1211–1218.
Sakai, K., Rowe, J.B., and Passingham, R.E. (2002). Active maintenance in
prefrontal area 46 creates distractor-resistant memory. Nat. Neurosci. 5,
479–484.
Schuck, N.W., Frensch, P.A., Schjeide, B.-M.M., Schroder, J., Bertram, L., and
Li, S.-C. (2013). Effects of aging and dopamine genotypes on the emergence of
explicit memory during sequence learning. Neuropsychologia 51, 2757–2769.
Shenhav, A., Botvinick, M.M., and Cohen, J.D. (2013). The expected value of
control: an integrative theory of anterior cingulate cortex function. Neuron
79, 217–240.
Shenhav, A., Straccia, M.A., Cohen, J.D., and Botvinick, M.M. (2014). Anterior
cingulate engagement in a foraging context reflects choice difficulty, not
foraging value. Nat. Neurosci. 17, 1249–1254.
Soon, C.S., He, A.H., Bode, S., and Haynes, J.-D. (2013). Predicting free
choices for abstract intentions. Proc. Natl. Acad. Sci. USA 110, 6217–6222.
Stokes, M.G., Kusunoki, M., Sigala, N., Nili, H., Gaffan, D., and Duncan, J.
(2013). Dynamic coding for cognitive control in prefrontal cortex. Neuron 78,
364–375.
Sutton, R. (1990). Integrated architectures for learning, planning, and reacting
based on approximating dynamic programming. Proceedings of the Seventh
International Conference on Machine Learning, 216–224.
Sutton, R.S., and Barto, A.G. (1998). Reinforcement Learning: An Introduction.
(A Bradford Book).
Wilson, R.C., Takahashi, Y.K., Schoenbaum, G., and Niv, Y. (2014).
Orbitofrontal cortex as a cognitive map of task space. Neuron 81, 267–279.
Wisniewski, D., Reverberi, C., Tusche, A., and Haynes, J.-D. (2014). The Neural
Representation of Voluntary Task-Set Selection in Dynamic Environments.
Cereb. Cortex, bhu155.
Woolgar, A., Hampshire, A., Thompson, R., and Duncan, J. (2011). Adaptive
coding of task-relevant information in human frontoparietal cortex.
J. Neurosci. 31, 14592–14599.
Yu, A.J., and Dayan, P. (2005). Uncertainty, neuromodulation, and attention.
Neuron 46, 681–692.
Zhao, J., Al-Aidroos, N., and Turk-Browne, N.B. (2013). Attention is spontane-
ously biased toward regularities. Psychol. Sci. 24, 667–677.

Neuron, Volume 86
Supplemental Information
Medial Prefrontal Cortex Predicts
Internally Driven Strategy Shifts Nicolas W. Schuck, Robert Gaschler, Dorit Wenke, Jakob Heinzle, Peter A. Frensch, John-Dylan Haynes, and Carlo Reverberi

1
Supplemental Figures
Figure S1, Related to Figure 2
Figure S1. Behavioral results with alternative time locking of corner users. Instead of random assignment, corner users’ switch-points were defined based on the CUSUM algorithm. Otherwise, the figure corresponds in all respects to Figure 2 of the main article. (i) Average percent of choices consistent with color when stimulus position was ambiguous across blocks (one block = 84 trials). (ii) Time locked color use data. In comparison to Figure 2, this shows that the sheer power of the CUSUM algorithm is able to cause a dip and increase in corner users’ color use around the time of the switch. The increase in color use is transient and not as strong as in color users, however. (iii-vi) Importantly, the results of all other analysis on RTs or errors are qualitatively the same as compared to Figure 2.
2040
6080
100
.994 .975 .928 .834 .685 .5 .315 .166 .072 .025 .006 .001<.001<.001
Random Instructed
Col
or U
se [%
]
Miniblock
pi)
1 3 5 7 9 11 13 15 17 19 21 23
2040
6080
100
●●
●●
Col
or U
se [%
]Miniblock
−5 −4 −3 −2 −1 +1 +2 +3 +4 +5 +6
Rand
om
Instr
ucte
d
ii)
500
1000
●
●
●●
RT [m
s]
iii)
−100
0 ●●
●
●
dRT
[ms]
−5 −4 −3 −2 −1 +1 +2 +3 +4 +5 +6
Rand
om
Instr
ucte
d
Miniblock
05
1015
20
●
●
●●
Erro
rs [%
]
Miniblock
−5 −4 −3 −2 −1 +1 +2 +3 +4 +5 +6
Rand
om
Instr
ucte
d
iv)
−160
−100
−60
−20
●
●
●
●
Con
grue
ncy
Effe
ct [m
s]
Miniblock
−5 −4 −3 −2 −1 +1 +2 +3 +4 +5 +6
Rand
om
Instr
ucte
d
v)
02
46
810
●● ●●
Ant
icip
. Key
pres
ses
[%]
Miniblock−5 −4 −3 −2 −1 +1 +2 +3 +4 +5 +6
Rand
om
Instr
ucte
d
vi)Color UserCorner User
BlockBlock
Block Block Block
Block

2
Figure S2, Related to Figure 3
Figure S2. Classification results for corner users. The figure shows brain maps indicating significant color (upper row) and corner (lower row) classification among corner users. The analysis is complimentary to the analyses shown in Figs. 3 and 4 in the main paper (same time windows, and statistical threshold). The maps are divided into analyses considering the whole time series (mean, 1st column from left), all blocks before the switch (before, 2nd column), only the two blocks immediately before the switch (switch, 3rd column) and all blocks after the switch (after, 4th column). Corner users’ switch was defined based on the switch points of color users (see Methods). Because the definition of time windows with this method might be noisy, the image showing the mean across all time points is the most easy to interpret, whereas other results have to be interpreted with caution. Empty brain images indicate that this respective analysis did not yield any significant results. In summary, we found that among corner users corner decoding worked well in all time windows and showed significant classification in visual cortex, precuneus, MPFC, lateral PFC and pre-and postcentral gyri, but color classification was much weaker throughout and confined to visual cortex.
Mean Switch AfterColor
Corner
-50
-50Before
-12
-8
-50
-50
-8
4
4
-8
5
33
-60
5
33
-60
Color Maps indicate clusters with p’s > 0.05 (cluster FWE corrected, voxel level p < 0.01)
No significant cluster
No significant cluster
3
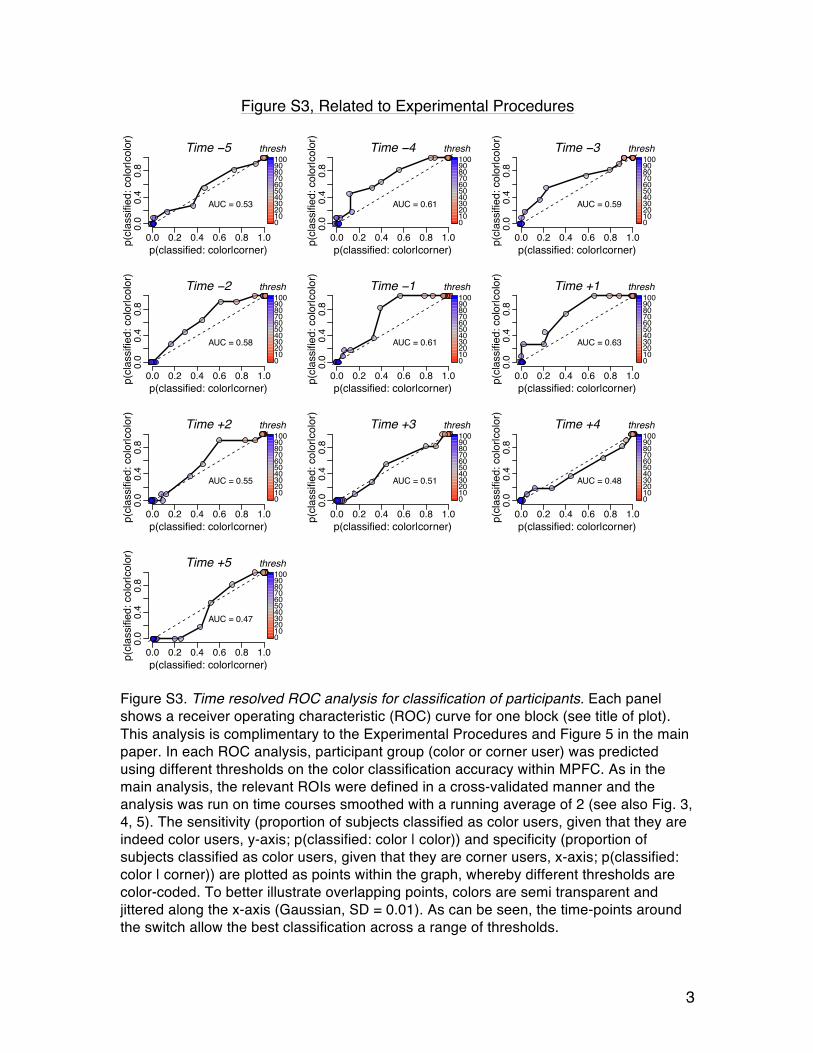
Figure S3, Related to Experimental Procedures
Figure S3. Time resolved ROC analysis for classification of participants. Each panel shows a receiver operating characteristic (ROC) curve for one block (see title of plot). This analysis is complimentary to the Experimental Procedures and Figure 5 in the main paper. In each ROC analysis, participant group (color or corner user) was predicted using different thresholds on the color classification accuracy within MPFC. As in the main analysis, the relevant ROIs were defined in a cross-validated manner and the analysis was run on time courses smoothed with a running average of 2 (see also Fig. 3, 4, 5). The sensitivity (proportion of subjects classified as color users, given that they are indeed color users, y-axis; p(classified: color | color)) and specificity (proportion of subjects classified as color users, given that they are corner users, x-axis; p(classified: color | corner)) are plotted as points within the graph, whereby different thresholds are color-coded. To better illustrate overlapping points, colors are semi transparent and jittered along the x-axis (Gaussian, SD = 0.01). As can be seen, the time-points around the switch allow the best classification across a range of thresholds.
0.0 0.2 0.4 0.6 0.8 1.0
0.0
0.4
0.8
0102030405060708090100
thresh
p(classified: color|corner)p(cl
assi
fied:
col
or|c
olor
)
Time −5
AUC = 0.53
0.0 0.2 0.4 0.6 0.8 1.0
0.0
0.4
0.8
0102030405060708090100
thresh
p(classified: color|corner)p(cl
assi
fied:
col
or|c
olor
)
Time −4
AUC = 0.61
0.0 0.2 0.4 0.6 0.8 1.0
0.0
0.4
0.8
0102030405060708090100
thresh
p(classified: color|corner)p(cl
assi
fied:
col
or|c
olor
)
Time −3
AUC = 0.59
0.0 0.2 0.4 0.6 0.8 1.0
0.0
0.4
0.8
0102030405060708090100
thresh
p(classified: color|corner)p(cl
assi
fied:
col
or|c
olor
)
Time −2
AUC = 0.58
0.0 0.2 0.4 0.6 0.8 1.0
0.0
0.4
0.8
0102030405060708090100
thresh
p(classified: color|corner)p(cl
assi
fied:
col
or|c
olor
)
Time −1
AUC = 0.61
0.0 0.2 0.4 0.6 0.8 1.0
0.0
0.4
0.8
0102030405060708090100
thresh
p(classified: color|corner)p(cl
assi
fied:
col
or|c
olor
)
Time +1
AUC = 0.63
0.0 0.2 0.4 0.6 0.8 1.0
0.0
0.4
0.8
0102030405060708090100
thresh
p(classified: color|corner)p(cl
assi
fied:
col
or|c
olor
)
Time +2
AUC = 0.55
0.0 0.2 0.4 0.6 0.8 1.0
0.0
0.4
0.8
0102030405060708090100
thresh
p(classified: color|corner)p(cl
assi
fied:
col
or|c
olor
)
Time +3
AUC = 0.51
0.0 0.2 0.4 0.6 0.8 1.00.
00.
40.
80102030405060708090100
thresh
p(classified: color|corner)p(cl
assi
fied:
col
or|c
olor
)
Time +4
AUC = 0.48
0.0 0.2 0.4 0.6 0.8 1.0
0.0
0.4
0.8
0102030405060708090100
thresh
p(classified: color|corner)p(cl
assi
fied:
col
or|c
olor
)
Time +5
AUC = 0.47

4
Figure S4, Related to Figure 5
Figure S4. Prediction of strategy switch without time-locking. To test whether we could also predict participants’ choice to switch strategy without knowledge about the switch-point, the classification was repeated without time-locking data. To this end, we applied a binomial test on the number of runs in which color classification was greater than 50%. The curve shows the sensitivity and specificity of this test if different thresholds are applied; see Fig. S3 (a ROC curve is shown for different thresholds of p). Best classification could be achieved using the conventional p = .05 or .10 thresholds (points overlap, see note in plot). ROI selection and time course smoothing as in Figs. 3, 4, 5 and S3.
0.0 0.2 0.4 0.6 0.8 1.0
0.0
0.2
0.4
0.6
0.8
1.0
00.050.10.150.20.250.30.350.40.450.50.550.60.650.70.750.80.850.90.951
p
p(classified: color|corner)
p(cl
assi
fied:
col
or|c
olor
)
0.050.10
Binomial Test

5
Supplemental Tables
Table S1, Related to Figure 3
ID Centroid MNI Coordinates
Maxpeak (%)
No. Vox
Region Dist (Vox)
X Y Z 1 3 56 22 93.3 45 Medial Frontal Gyrus (R) 2.8 2 3 56 40 91.1 5 Medial Frontal Gyrus (R) 4.3 3 12 59 16 85.2 9 Medial Frontal Gyrus (R) 4.8 4 9 44 19 89.2 45 Anterior Cingulate Cortex (R) 5.9 5 -3 41 22 87.3 60 Medial Frontal Gyrus (L) 6.9 6 -6 41 13 91.8 18 Anterior Cingulate Cortex (L) 9.1 7 -18 44 13 92.6 26 Superior Frontal Gyrus (L) 10.2 8 15 35 49 88.3 83 Superior Frontal Gyrus (R) 11.3 9 6 41 -23 83.8 8 Gyrus Rectus (R) 17.8 10 -6 2 28 94.1 18 Middle Cingulate Cortex (L) 19.4 11 -45 26 34 90.7 13 Middle Frontal Gyrus (L) 20.3 Note: Characteristics of clusters with significant classification during switch for individual color using subjects. The table is sorted by distance to the group peak and contains the locations (centroids), peak decoding accuracies, number of voxels, AAL atlas labels (Tzourio-Mazoyer et al., 2002) and peak-to-peak distances from the group result. To determine these clusters, we applied a threshold of 80.6% to the individual decoding accuracy maps (p = .01 according to empirical distribution of corner users, minimum cluster size: 5 voxels). Because the main purpose of this table is to shed some light on the individual clusters contributing to the group cluster, we list only the peak that is closest to the peak group result.
Top Related
Copyright © 2022 FDOKUMEN

