
Bahasa
Halaman
Hukum

E-00263-2005.R1
FINAL ACCEPTED VERSION
L-ARGININE INFUSION INCREASES GLUCOSE CLEARANCE DURING
PROLONGED EXERCISE IN HUMANS
G.K. McConell1,2, N. N. Huynh2, R.S. Lee-Young1, B. J. Canny2, G. D. Wadley1.
1Department of Physiology, The University of Melbourne, Parkville, Victoria, 3010,
Australia; 2Department of Physiology, Monash University, Clayton, Victoria, 3800,
Australia.
Short title: L-arginine and glucose disposal during exercise.
Correspondence: Dr. Glenn McConell,Department of Physiology,The University of Melbourne,Parkville, Victoria,3010, Australia.PH: 61-3-8344-5844FAX: 61-3-8344-5818Email: [email protected]
Articles in PresS. Am J Physiol Endocrinol Metab (August 16, 2005). doi:10.1152/ajpendo.00263.2005
Copyright © 2005 by the American Physiological Society.
E-00263-2005.R1
1
ABSTRACT
Nitric oxide synthase (NOS) inhibition has been shown in humans to attenuate
exercise-induced increases in muscle glucose uptake. We examined the effect of
infusing the NO precursor L-arginine (L-Arg) on glucose kinetics during exercise in
humans. Nine endurance-trained males cycled for 120 min at 72±1% VO2 peak
followed immediately by a 15 min “all-out” cycling performance bout. A [6,6-
2H]glucose tracer was infused throughout exercise and either saline alone (Control,
CON) or saline containing L-Arg HCl (L-Arg, 30 g at 0.5g/min) was co-infused in a
double blind, randomized order during the last 60 min of exercise. L-Arg augmented
the increases in glucose Ra, glucose Rd and glucose clearance rate (L-Arg: 16.1±1.8
ml.min-1.kg-1, CON: 11.9±0.7 ml.min-1.kg-1 at 120 min. P<0.05) during exercise with
a net effect of reducing plasma glucose concentration during exercise. L-Arg
infusion had no significant effect on plasma insulin concentration but attenuated the
increase in non-esterified fatty acid and glycerol concentrations during exercise. L-
Arg infusion had no effect on cycling exercise performance. In conclusion, L-Arg
infusion during exercise significantly increases skeletal muscle glucose clearance in
humans. Since plasma insulin concentration was unaffected by L-Arg infusion,
greater NO production may have been responsible for this effect.
Keywords: Nitric oxide, glucose kinetics, contraction.
E-00263-2005.R1
2
INTRODUCTION
Skeletal muscle glucose uptake is increased by translocation of the GLUT-4 glucose
transporter from intracellular vesicles to the plasma membrane (23). Both insulin and
muscle contraction increase skeletal muscle GLUT-4 translocation and glucose
uptake, but the mechanisms involved differ (23, 36, 37, 49). The factors regulating
glucose uptake into skeletal muscle during exercise are unclear with calcium,
calcium/calmodulin-dependent protein kinase, protein kinase C, AMP-activated
protein kinase (AMPK) and nitric oxide (NO) all implicated (23, 49).
We have evidence in humans that NO may be playing an essential role in the
regulation of skeletal muscle glucose uptake during exercise (9, 34). We found
during cycling exercise in young, healthy individuals that femoral artery infusion of a
NO synthase (NOS) inhibitor reduced leg glucose uptake during exercise by 40-50%
without influencing leg blood flow (LBF), blood pressure or arterial plasma insulin
concentration (9). In a follow up study we found that NOS inhibition reduced leg
glucose uptake during exercise to a greater extent in people with type 2 diabetes than
in matched controls (34). Although our results in humans are clear, studies in rats
examining the effect of NOS inhibition on contraction-stimulated glucose uptake
have yielded conflicting results (3, 17, 26, 51, 53, 57).
Aside from NOS inhibition, another way to examine the potential importance of NO
in skeletal muscle glucose disposal during exercise in humans is to examine the effect
of increasing the availability of L-arginine which is the substrate of NOS. In skeletal
muscle the major form of NOS expressed is the alternatively spliced neuronal form
(nNOSµ) (54)(Bradley et al. unpublished observations) which is associated with the
E-00263-2005.R1
3
sarcolemma. There is a small amount of eNOS expressed in skeletal muscle which,
in humans, appears to be confined to the endothelium of blood vessels (19, 20). We
hypothesise that L-arginine enters skeletal muscle where it is converted to NO and L-
citrulline by nNOSµ. Skeletal muscle NOS activity is increased during treadmill
exercise in rats (50) and electrical stimulation increases NO production in primary rat
skeletal muscle cell culture (55) and in isolated rat skeletal muscle (4). Exercise
appears to increase NO production in humans based on increases in urinary
nitrate/nitrite and cGMP levels in humans (7). L-arginine infusion also increases
plasma and urinary nitrate/nitrite content and cGMP concentrations in humans (5, 6,
27) suggesting increased NO production.
We postulate that any effects of L-arginine infusion on glucose kinetics during
exercise, if they exist, will most likely occur independent of changes in
haemodynamics, in particular muscle blood flow. Intravenous infusion of L-arginine
during exercise in healthy individuals (11) and patients with coronary heart disease
(45) has no affect on heart rate or blood pressure during exercise. In addition,
infusing L-arginine through a microdialysis probe into skeletal muscle has no effect
on human skeletal muscle blood flow during exercise (25) and 5 min of L-arginine
infusion into the femoral artery has no effect on leg blood flow during leg exercise in
humans (9). Further, NOS inhibition has no affect on leg blood flow during leg
exercise in humans (9, 18, 34, 46). Therefore, it appears that although NO clearly
effects blood flow at rest (46), neither increases (via L-Arg) or decreases (via NOS
inhibition) in NO production have any effect on blood flow during exercise in
humans.
E-00263-2005.R1
4
In humans, L-arginine infusion at rest results in a ~2-fold increase in plasma insulin
concentration (6, 45). It is not known if L-arginine infusion increases plasma insulin
levels during prolonged exercise in humans (i.e. under conditions when increases in
plasma catecholamines inhibit insulin secretion). It is important to determine this
since insulin is additive on skeletal muscle glucose uptake during exercise (16). Two
weeks of oral L-arginine-L-aspartate supplementation had no effect on plasma insulin
concentration during ~3 hr of running in endurance-trained athletes (15).
No study has examined the effect of L-arginine infusion on prolonged exercise
performance in humans. It is possible that if L-arginine infusion increases glucose
uptake into muscle during prolonged exercise it may also improve exercise capacity.
All previous studies examining the effects of L-arginine on exercise capacity have
only examined short intense incremental exercise (8-15 min VO2 max test). Dietary
L-arginine supplementation increases aerobic capacity (~8-9% increase in VO2 max)
in hypercholesterolemic and normal mice (38). In humans results have been
contradictory (60), but on balance it would appear that chronic oral L-arginine
supplementation improves VO2 max exercise capacity in patients with cardiovascular
diseases (12, 13, 48). Chronic oral L-arginine supplementation appears to have no
effect on VO2 max test exercise time in healthy individuals (1). In addition, acute L-
arginine infusion appears to have no effect on VO2 max test exercise time in all
human studies, including in patients with chronic heart failure (32) and patients with
hypercholesterolaemia (61).
Therefore, the first aim of this study was to determine whether L-arginine infusion
during exercise increases glucose disposal in humans. The second aim was to
determine whether L-arginine infusion influences prolonged exercise performance in
E-00263-2005.R1
5
healthy humans. We hypothesized that L-arginine infusion during exercise would
increase the rate of glucose disappearance but not significantly influence exercise
performance during exercise in healthy humans. We chose to use endurance-trained
participants in this study to minimize the possibility of adaptive changes between the
two experimental trials (CON and L-Arg). In addition, in order to detect an exercise
performance effect of a particular treatment it is known to be most appropriate to
employ exercise-trained participants who are more reproducible in their exercise
performance (29).
METHODS
PARTICIPANTS
Nine endurance-trained males provided informed written consent to participate in this
study which was approved by the Monash University Standing Committee for
Research on Humans and the Human Research Ethics Committee of The University
of Melbourne and conducted in accordance with the Declaration of Helsinki. The
participant’s age, weight and height were 28 ± 2 yr, 73.7± 2.8 kg and 180 ± 1 cm,
respectively (mean ± SEM). The participants cycled on average 283 ± 35 km.wk-1.
EXPERIMENTAL PROCEDURES
PRELIMINARY TESTING AND DIET CONTROL
Peak pulmonary oxygen consumption during cycling (VO2 peak) was determined
using a graded exercise test to volitional exhaustion on an ergometer (Lode,
Groningen, The Netherlands) and averaged 4.65 ± 0.23 l.min-1 (63.0 ± 1.9 ml.kg-
1.min-1). On a separate day, participants completed a familiarization trial where they
E-00263-2005.R1
6
cycled for 120 min at 236 ± 12 W (72±1% VO2 peak), immediately followed by
completion of as much work as possible in 15 min with the ergometer placed in the
“linear mode”. In this ‘linear mode’ participants are able increase the power output
by increasing their cadence (revolutions per minute; rpm) (power output (watts) =
‘linear factor’ x (rpm)2). On average the participants completed 249 ± 14 kJ during
the 15 min. This amount of work (249 ± 14 kJ) was then completed as quickly as
possible following the 120 min of exercise at 72 ± 1% VO2peak in the experimental
trials and comprised the performance measurement (time trial (TT)). Approximately
one week later the first of the two experimental trials was undertaken.
The day before each experimental trial, exercise and diet were standardized.
Approximately 24 hr prior to each experimental trial participants were required to
come to the laboratory to exercise for 1 hour at 70% VO2 peak (standard ride), after
which participants were asked to abstain from exercise for the remainder of the day.
Following the standard ride participants were provided with a diet (food and drinks)
for the day (i.e. breakfast, lunch, dinner and snacks). This diet was designed to
provide the participants with ~ 199 KJ/kg body weight of energy, ~ 66% of
carbohydrates, ~ 15% proteins and ~ 19% fats and was prepared according to the
participant’s body weight. Standardized exercise and diet were implemented to
replicate the pre-trial metabolic and hormonal levels that affect carbohydrate
metabolism (41). The participants were required to consume their last meal by 11pm.
Participants were also asked to maintain a similar exercise regime during the week
preceding each experimental trial.
E-00263-2005.R1
7
EXPERIMENTAL TRIALS
The participants (overnight fasted) reported to the laboratory in the morning having
abstained from exercise, alcohol and caffeine for 24 hr. One catheter was inserted
into an antecubital forearm vein for infusion of a stable isotope glucose tracer ([6,6-
2H]glucose, Cambridge Isotope Laboratories, MA) and another into the contralateral
forearm for blood sampling. A blood sample was obtained then a bolus of 44.4 ± 0.6
µmol.kg-1 of the tracer was administered prior to a 2 hr pre-exercise constant infusion
(0.63 ± 0.03 µmol.kg-1.min-1), which was continued throughout exercise (i.e. until the
end of the time trial).
Participants then cycled for 120 min at 72 ± 1% VO2peak (236 ± 12 W; 59 ± 2% of
peak power output during VO2 peak test). Blood was sampled at -120 min, -30 min, -
10 min, at 0 min then every 15 min of exercise and at the end of the performance ride.
Plasma insulin, glycerol and NEFA concentrations were not measured between the
onset and 60 min of exercise since the treatment (L-arginine infusion vs saline) did
not start until 75 min and therefore there was no reason to expect any differences
between the two trials during the first 60 min of exercise. At the commencement of
exercise 8 ml/kg body weight of water was ingested followed by 2 ml/kg every 15
min until 120 min to ensure the participant’s hydration levels were similar between
each trial. Expired air was collected into Douglas bags during the last 3 min of each
15 min of exercise (until 120 min of exercise). Heart rate was monitored throughout
exercise (Polar Favor, Oulu, Finland). Rating of perceived exertion was assessed
using the Borg scale (ranging from 6: easiest to 19: hardest) (8). In a double blind,
randomized cross-over design, participants were co-infused intravenously after 75
min of exercise with either 30g of L-arginine Hydrochloride (Opthalmic Laboratories
for Pharmalab, Brookvale, NSW, Australia) mixed with saline (L-Arg; 0.5 g/min, i.v.)
E-00263-2005.R1
8
or a placebo (CON) treatment (0.9 % Saline, Baxter Healthcare P/L, Toongabbie,
NSW, Australia). Infusion of 30g of L-arginine into humans over 30-60 min results
in plasma L-arginine concentration increasing from approximately 0.1 mM to ~ 6.2-
7.2 mM (5, 27). Immediately following the initial 120 min of exercise, the ergometer
was placed into the “linear” mode function and the participants completed 249 ± 14
kJ as quickly as possible (performance ride). To standardize motivational factors no
encouragement was given to the participants during the performance rides of the
experimental trials and the participants were only permitted to see the accumulating
kilojoules and not the clock or the instantaneous power output or RPM. The last
Douglas bag collection period was completed by 120 min of exercise just prior to
commencement of the performance ride so that participants could concentrate on their
performance. Since it has been shown that infusion of 30g of L-arginine at rest can
result in decreases in blood pressure, the participants were instructed to lie down for
30 min after each experimental trial. No participant complained of feeling light
headed during this recovery period.
ANALYTICAL TECHNIQUES
BLOOD ANALYSIS
Plasma glucose and lactate were determined using an automated glucose oxidase and
L-lactate oxidase method, respectively (YSI 2300 Stat, Yellow Springs, OH), plasma
non-esterified fatty acids (NEFA) by an enzymatic colorimetric procedure (NEFA-C
test, Wako, Osaka, Japan), plasma glycerol by an enzymatic fluorometric method (14)
and plasma insulin using a human insulin specific radioimmunoassay kit (Linco
Research, Inc, St.Charles, MO). Glucose kinetics at rest and during exercise were
estimated using a modified one-pool, non-steady-state model as proposed by Steele et
E-00263-2005.R1
9
al. (56) which has been validated by Radziuk et al. (47). We assumed 0.65 as the
rapidly mixing portion of the glucose pool and estimated the apparent glucose space
as 25% of body weight. Rates of plasma glucose appearance (Ra) and glucose
disappearance (Rd) were determined from the changes in % enrichment of [6,6-
2H]glucose and the plasma glucose concentration. The glucose clearance rate
(glucose CR) was calculated by dividing the glucose Rd by the plasma glucose
concentration (indicates the glucose disposal per unit of plasma glucose). During
cycling exercise at ~60% of VO2 max workload, over 95% of tracer-determined
glucose Rd is oxidized (30).
STATISTICAL ANALYSIS
Results were analysed using two factor repeated measures analysis of variance
(ANOVA). Because the treatment was not initiated until 75 min of exercise, the
ANOVA was partitioned and analyzed to include data up to and including 75 min and
data from 75 min onwards (including 75 min). As was expected no significant
differences were found between the two trials during the first 75 min of exercise. If
the ANOVA revealed a significant trial by time interaction, specific differences
between mean values were located using the Fisher’s least significance difference
test. Performance times were compared using Student’s paired t-test. All data are
presented as means ± SEM. The level of significance was set at P < 0.05.
RESULTS
Respiratory Measures, rating of perceived exertion, heart rate and exercise
performance
During the first 75 min of “steady-state” exercise (before commencement of saline/L-
arg infusion) there were no significant differences (p>0.05) in oxygen consumption,
E-00263-2005.R1
10
carbon dioxide production, respiratory exchange ratio (RER), heart rate (HR), or
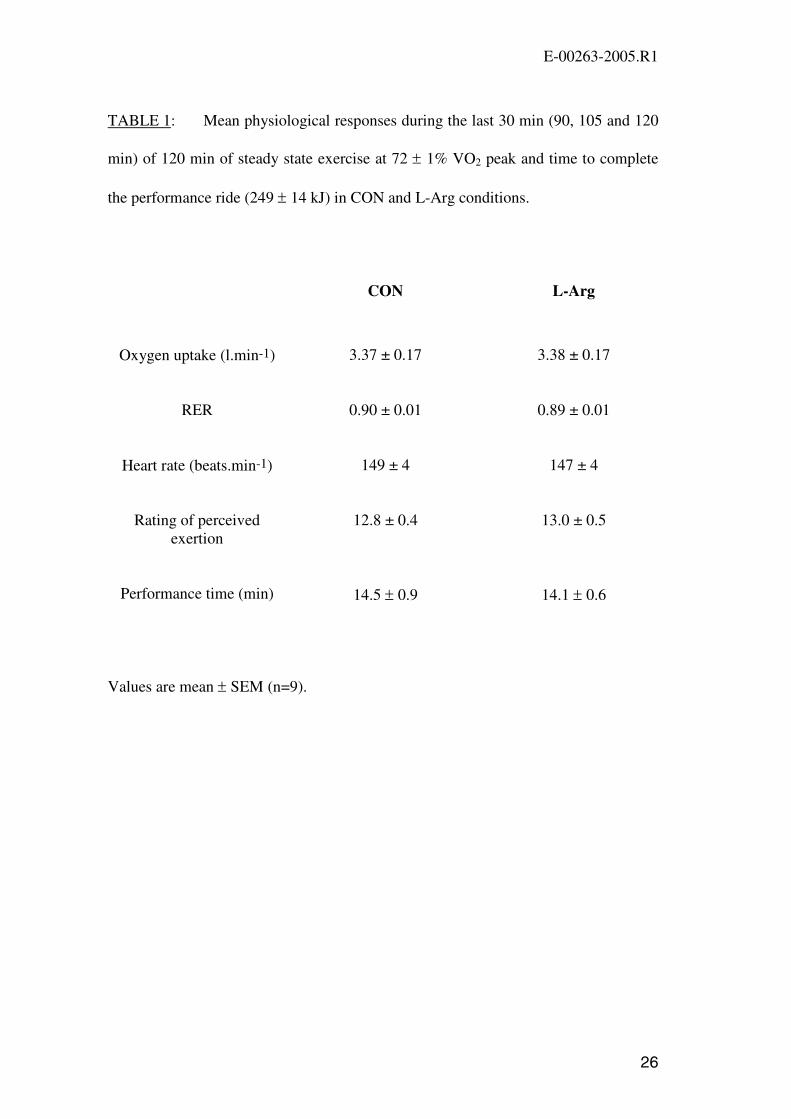
rating of perceived exertion (RPE) between the two treatments (data not shown). In
addition, there were no significant differences (p>0.05) in oxygen consumption,
carbon dioxide production (data not shown), RER, HR, or RPE between the two
treatments during the last 30 min of “steady-state” exercise after the saline/L-Arg
infusion was commenced (Table 1).
Immediately following the 120 min of “steady-state” exercise the participants
completed 249 ± 14 kJ as quickly as possible (the amount of work completed in 15
min in the familiarization ride). This “time trial” was used to determine the exercise
capacity (exercise performance). The time taken to complete the work did not differ
significantly between the two trials (P=0.62, Table 1). Accordingly, there was no
significant difference in the mean power output between the two time trials (CON:
292 ± 20 watts, L-Arg: 298 ± 19 watts, P=0.62). In addition, there were no
significant differences between trials in the HR (CON: 176 ± 4 b.min-1, L-Arg: 171 ±
4 b.min-1, P=0.19) or RPE (CON: 18.1 ± 0.4 Borg scale units, L-Arg: 18.3 ± 0.3 Borg
scale units, P=0.44) at the end of the performance ride.
Glucose Kinetics
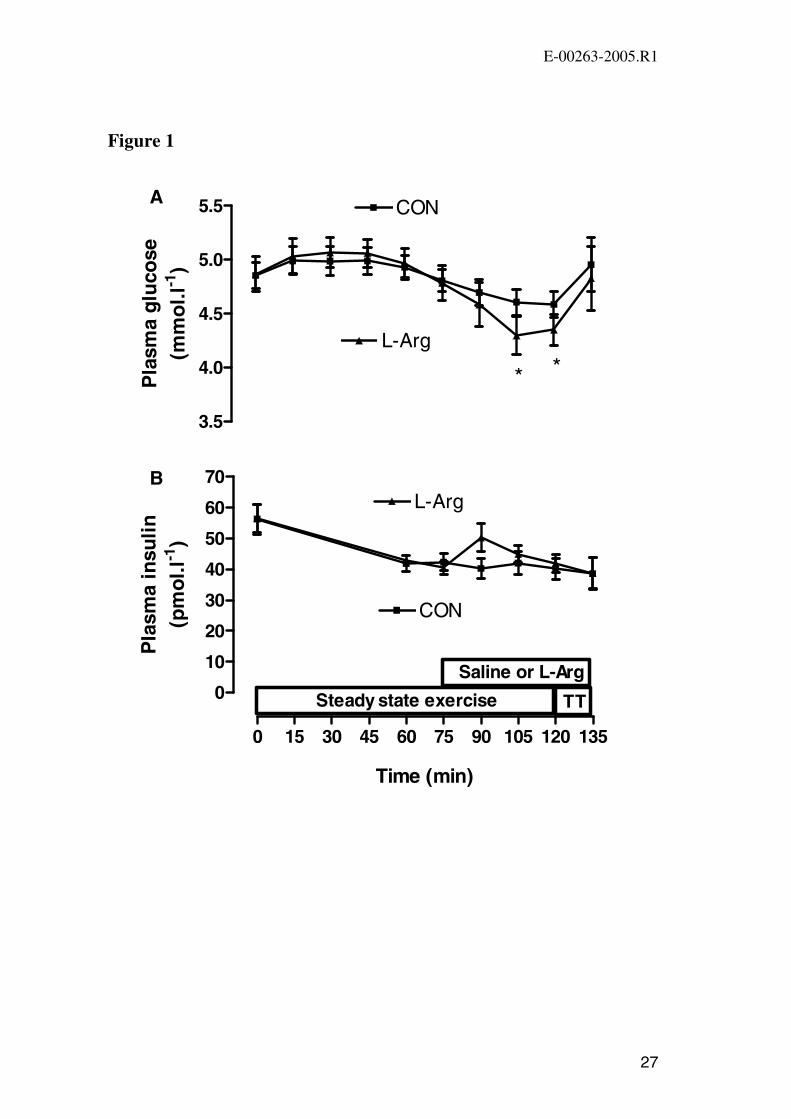
Plasma glucose concentration decreased during the second hour of the steady state
exercise in both trials and was significantly lower in the L-Arg trial at 105 min and
120 min (Figure 1A). Plasma glucose increased significantly (P<0.05) during the
performance ride in both trials and did not differ significantly (P>0.05) between trials
at the end of exercise.
E-00263-2005.R1
11
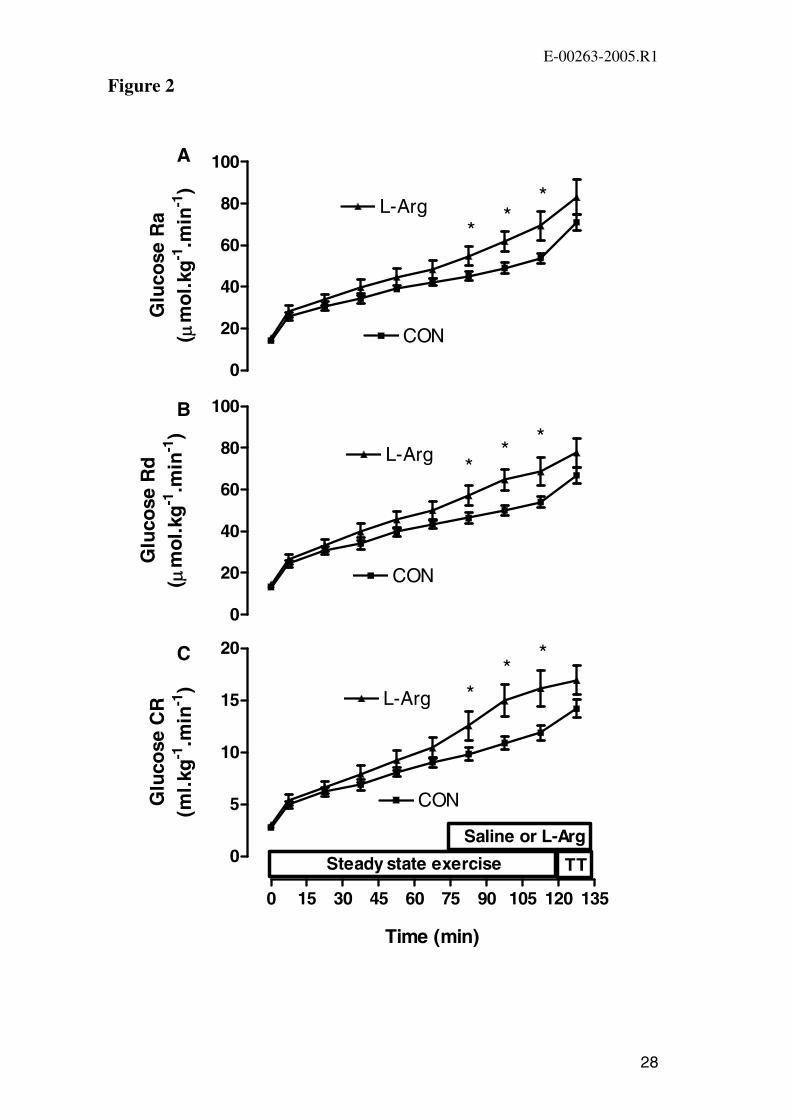
Glucose Ra, glucose Rd and glucose CR increased during exercise in both trials
(Figure 2A-C). Each of glucose Ra, glucose Rd and glucose CR were significantly
higher in L-Arg during the last 30 min of the steady state exercise. During the
performance ride glucose Ra, glucose Rd and glucose CR increased in both trials and
at the end of exercise there were no significant differences between the trials in any of
these parameters (P>0.05; Figure 2A-C).
Plasma insulin, non-esterified fatty acids (NEFA), glycerol and lactate
Plasma insulin decreased during exercise in both trials with no significant difference
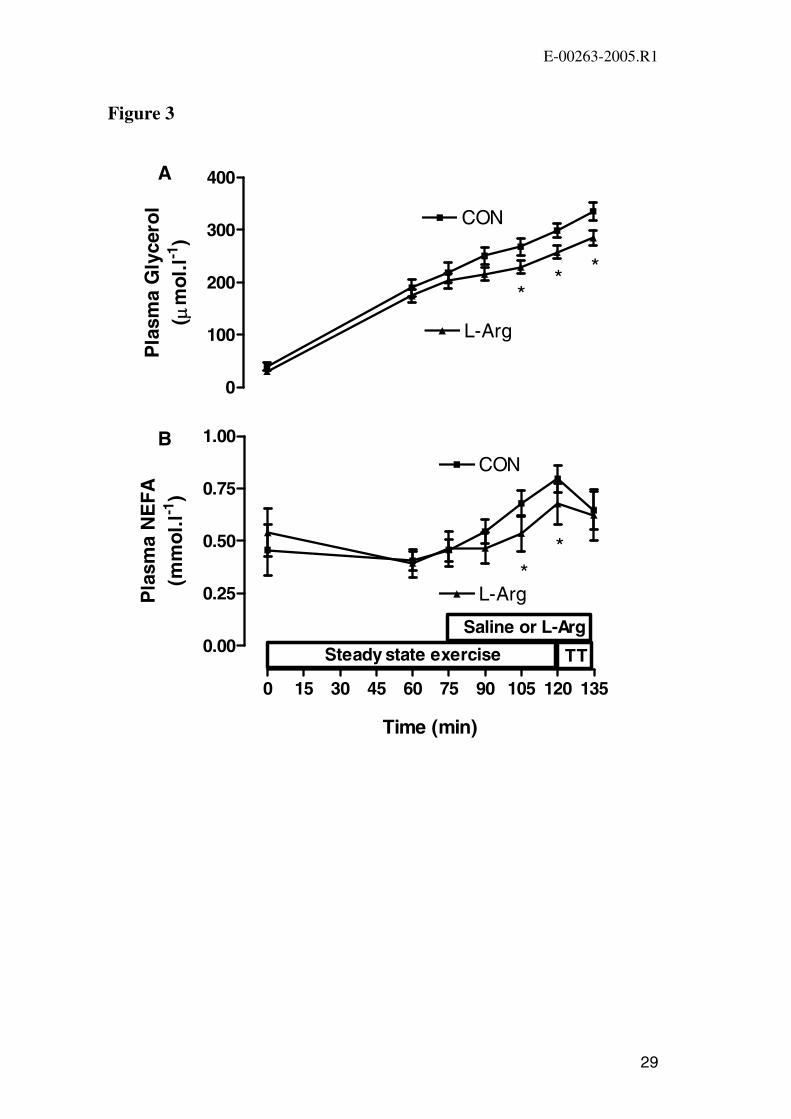
between the two trials at any time point (Figure 1B). Plasma glycerol concentration
increased during exercise in both trials but was significantly lower during the latter
stages of exercise in L-Arg (Figure 3A). Plasma NEFA increased during the second
hour of exercise in both trials (Figure 3B). Plasma NEFA was significantly lower at
105 min and 120 min of exercise in L-Arg compared with CON. There was a small
significant increase in plasma lactate concentration during the first 120 min of
exercise in both trials with no difference between trials (data not shown). Plasma
lactate then increased greatly during the performance ride in both trials with the
concentration at the end of exercise being not significantly different between the two
trials (CON: 7.8 ± 1.0 mmol.l-1, L-Arg: 6.8 ± 0.7 mmol.l-1).
DISCUSSION
The main finding of this study was that L-arginine infusion during exercise
augmented the normal exercise-induced increases in glucose disposal in humans.
One interpretation of this finding is that L-arginine infusion increased NO production,
which increased the level of glucose utilization by the contracting muscles, probably
E-00263-2005.R1
12
via increased GLUT-4 translocation. Taken with our earlier findings where NOS
inhibition reduced leg glucose uptake during cycling exercise (9, 34), our results
reinforce the hypothesis that NO is a central regulator of skeletal muscle glucose
uptake during exercise in humans.
Our studies are novel since no other groups have examined the role of NO in glucose
uptake during exercise in humans. In rats it has been universally found that NO
donors increase basal skeletal muscle glucose uptake (3, 17, 26, 63), but the effects of
NOS inhibition on contraction-stimulated glucose uptake are variable (3, 17, 26, 51,
53, 57). The rat studies are difficult to compare with our human studies because, in
general, both in vivo exercise and in vitro contraction rat studies involving NOS
inhibition assessed glucose transport/uptake 30 min or more after the series of
contractions or treadmill exercise. One exception is a study by Rottman et al. (53)
which reported that glucose uptake measured during rat treadmill exercise was not
reduced by 3 days of ingestion of a NOS inhibitor.
Since local muscle infusion of L-arginine (25), femoral artery infusion of L-arginine
(9) and femoral artery infusion of a NOS inhibitor (9, 34, 46) have no affect on blood
flow during exercise in humans, we feel that it is likely that L-arginine infusion
increased glucose Rd during exercise by increasing GLUT-4 translocation to the
plasma membrane rather than increasing skeletal muscle blood flow. Therefore it
appears that irrespective of whether NO production is increased by L-Arg infusion, or
decreased by NOS inhibition, muscle blood flow is unchanged during exercise in
humans. It should be kept in mind, however, that during exercise NO may affect the
proportion of the blood flow that enters the nutritive (capillary) vessels compared
with that entering the non-nutritive vessels (25, 59, 62). To clarify the precise
E-00263-2005.R1
13
mechanism(s) whereby NO influences skeletal muscle glucose uptake during
exercise, human studies investigating the effect of L-arginine infusion or NOS
inhibition on both GLUT-4 translocation and nutritive flow during exercise are
warranted.
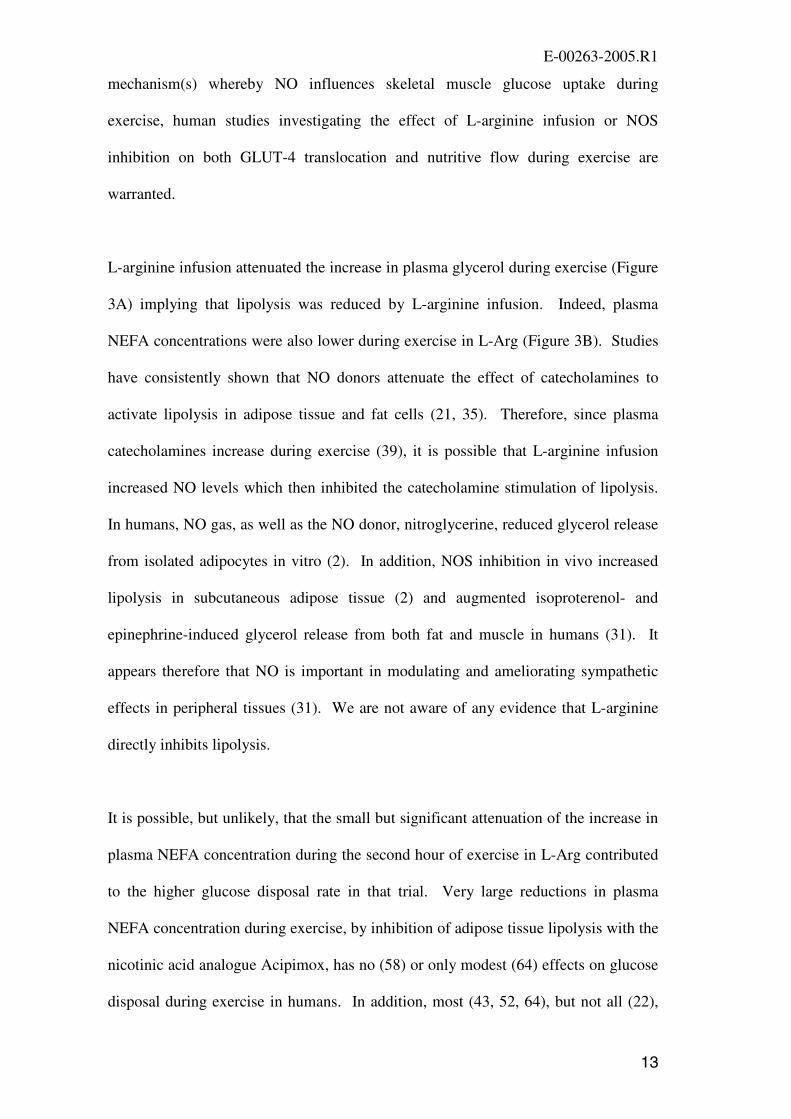
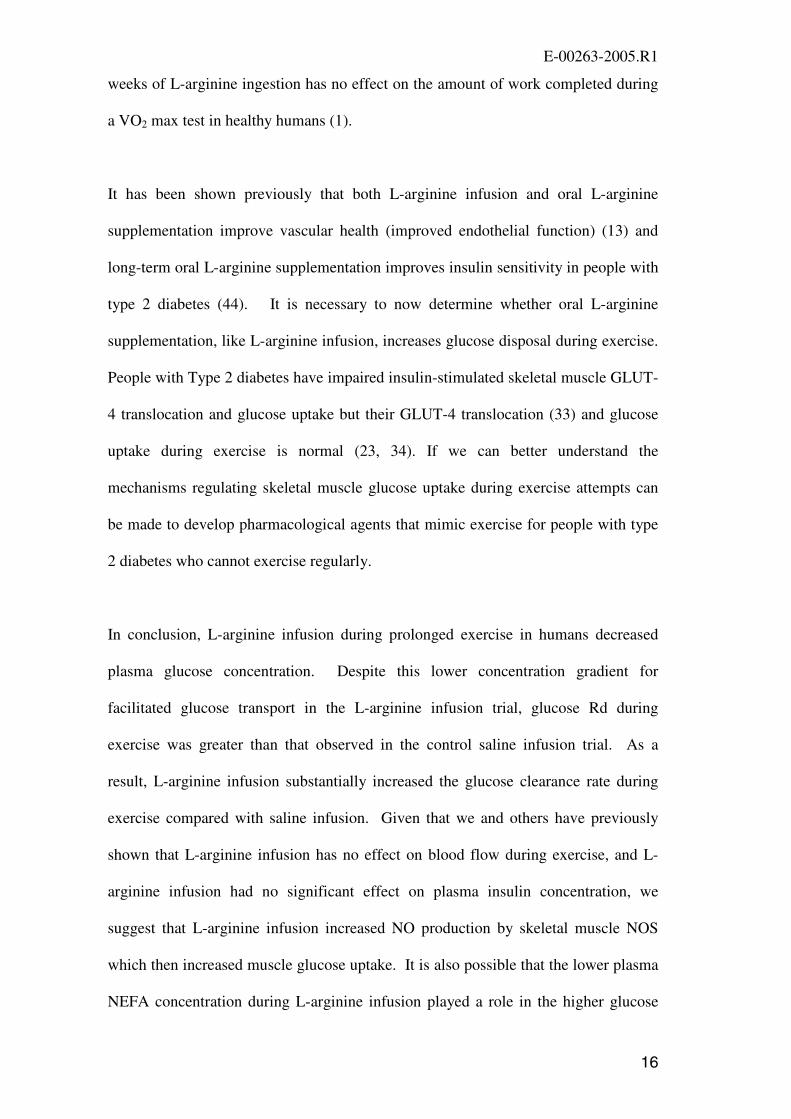
L-arginine infusion attenuated the increase in plasma glycerol during exercise (Figure
3A) implying that lipolysis was reduced by L-arginine infusion. Indeed, plasma
NEFA concentrations were also lower during exercise in L-Arg (Figure 3B). Studies
have consistently shown that NO donors attenuate the effect of catecholamines to
activate lipolysis in adipose tissue and fat cells (21, 35). Therefore, since plasma
catecholamines increase during exercise (39), it is possible that L-arginine infusion
increased NO levels which then inhibited the catecholamine stimulation of lipolysis.
In humans, NO gas, as well as the NO donor, nitroglycerine, reduced glycerol release
from isolated adipocytes in vitro (2). In addition, NOS inhibition in vivo increased
lipolysis in subcutaneous adipose tissue (2) and augmented isoproterenol- and
epinephrine-induced glycerol release from both fat and muscle in humans (31). It
appears therefore that NO is important in modulating and ameliorating sympathetic
effects in peripheral tissues (31). We are not aware of any evidence that L-arginine
directly inhibits lipolysis.
It is possible, but unlikely, that the small but significant attenuation of the increase in
plasma NEFA concentration during the second hour of exercise in L-Arg contributed
to the higher glucose disposal rate in that trial. Very large reductions in plasma
NEFA concentration during exercise, by inhibition of adipose tissue lipolysis with the
nicotinic acid analogue Acipimox, has no (58) or only modest (64) effects on glucose
disposal during exercise in humans. In addition, most (43, 52, 64), but not all (22),
E-00263-2005.R1
14
studies have shown that raising plasma NEFA levels has no affect on glucose disposal
during exercise in humans.
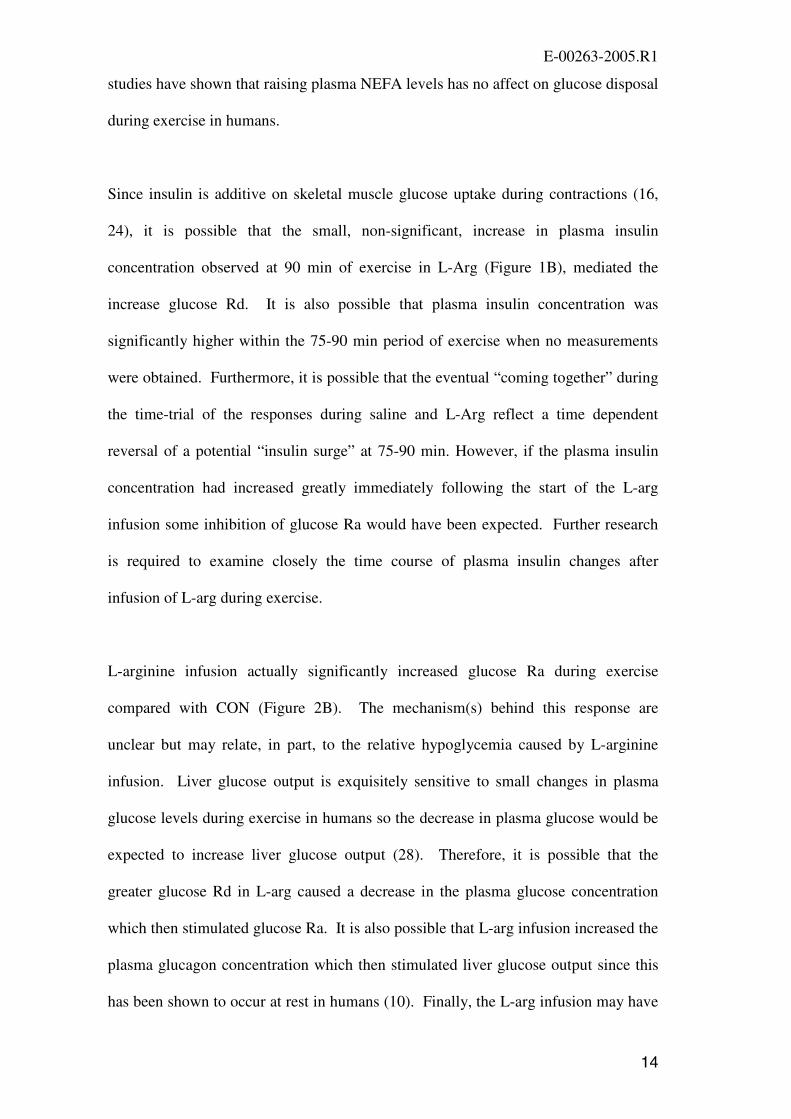
Since insulin is additive on skeletal muscle glucose uptake during contractions (16,
24), it is possible that the small, non-significant, increase in plasma insulin
concentration observed at 90 min of exercise in L-Arg (Figure 1B), mediated the
increase glucose Rd. It is also possible that plasma insulin concentration was
significantly higher within the 75-90 min period of exercise when no measurements
were obtained. Furthermore, it is possible that the eventual “coming together” during
the time-trial of the responses during saline and L-Arg reflect a time dependent
reversal of a potential “insulin surge” at 75-90 min. However, if the plasma insulin
concentration had increased greatly immediately following the start of the L-arg
infusion some inhibition of glucose Ra would have been expected. Further research
is required to examine closely the time course of plasma insulin changes after
infusion of L-arg during exercise.
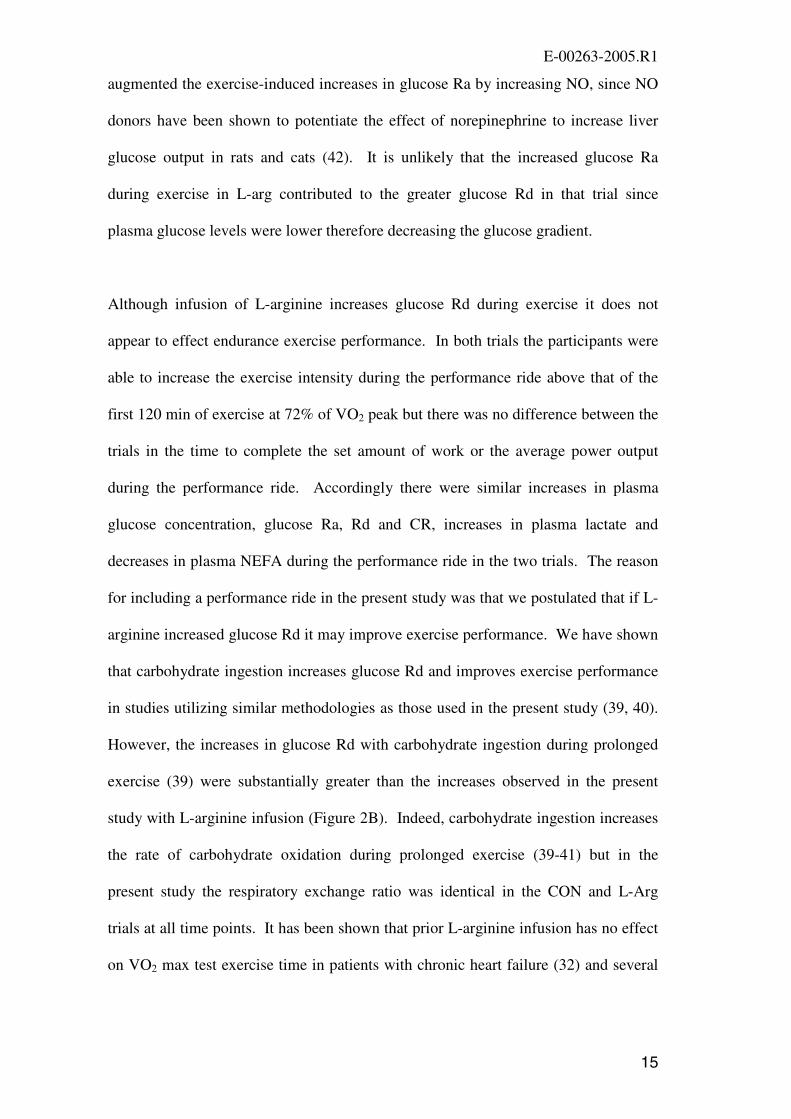
L-arginine infusion actually significantly increased glucose Ra during exercise
compared with CON (Figure 2B). The mechanism(s) behind this response are
unclear but may relate, in part, to the relative hypoglycemia caused by L-arginine
infusion. Liver glucose output is exquisitely sensitive to small changes in plasma
glucose levels during exercise in humans so the decrease in plasma glucose would be
expected to increase liver glucose output (28). Therefore, it is possible that the
greater glucose Rd in L-arg caused a decrease in the plasma glucose concentration
which then stimulated glucose Ra. It is also possible that L-arg infusion increased the
plasma glucagon concentration which then stimulated liver glucose output since this
has been shown to occur at rest in humans (10). Finally, the L-arg infusion may have
E-00263-2005.R1
15
augmented the exercise-induced increases in glucose Ra by increasing NO, since NO
donors have been shown to potentiate the effect of norepinephrine to increase liver
glucose output in rats and cats (42). It is unlikely that the increased glucose Ra
during exercise in L-arg contributed to the greater glucose Rd in that trial since
plasma glucose levels were lower therefore decreasing the glucose gradient.
Although infusion of L-arginine increases glucose Rd during exercise it does not
appear to effect endurance exercise performance. In both trials the participants were
able to increase the exercise intensity during the performance ride above that of the
first 120 min of exercise at 72% of VO2 peak but there was no difference between the
trials in the time to complete the set amount of work or the average power output
during the performance ride. Accordingly there were similar increases in plasma
glucose concentration, glucose Ra, Rd and CR, increases in plasma lactate and
decreases in plasma NEFA during the performance ride in the two trials. The reason
for including a performance ride in the present study was that we postulated that if L-
arginine increased glucose Rd it may improve exercise performance. We have shown
that carbohydrate ingestion increases glucose Rd and improves exercise performance
in studies utilizing similar methodologies as those used in the present study (39, 40).
However, the increases in glucose Rd with carbohydrate ingestion during prolonged
exercise (39) were substantially greater than the increases observed in the present
study with L-arginine infusion (Figure 2B). Indeed, carbohydrate ingestion increases
the rate of carbohydrate oxidation during prolonged exercise (39-41) but in the
present study the respiratory exchange ratio was identical in the CON and L-Arg
trials at all time points. It has been shown that prior L-arginine infusion has no effect
on VO2 max test exercise time in patients with chronic heart failure (32) and several
E-00263-2005.R1
16
weeks of L-arginine ingestion has no effect on the amount of work completed during
a VO2 max test in healthy humans (1).
It has been shown previously that both L-arginine infusion and oral L-arginine
supplementation improve vascular health (improved endothelial function) (13) and
long-term oral L-arginine supplementation improves insulin sensitivity in people with
type 2 diabetes (44). It is necessary to now determine whether oral L-arginine
supplementation, like L-arginine infusion, increases glucose disposal during exercise.
People with Type 2 diabetes have impaired insulin-stimulated skeletal muscle GLUT-
4 translocation and glucose uptake but their GLUT-4 translocation (33) and glucose
uptake during exercise is normal (23, 34). If we can better understand the
mechanisms regulating skeletal muscle glucose uptake during exercise attempts can
be made to develop pharmacological agents that mimic exercise for people with type
2 diabetes who cannot exercise regularly.
In conclusion, L-arginine infusion during prolonged exercise in humans decreased
plasma glucose concentration. Despite this lower concentration gradient for
facilitated glucose transport in the L-arginine infusion trial, glucose Rd during
exercise was greater than that observed in the control saline infusion trial. As a
result, L-arginine infusion substantially increased the glucose clearance rate during
exercise compared with saline infusion. Given that we and others have previously
shown that L-arginine infusion has no effect on blood flow during exercise, and L-
arginine infusion had no significant effect on plasma insulin concentration, we
suggest that L-arginine infusion increased NO production by skeletal muscle NOS
which then increased muscle glucose uptake. It is also possible that the lower plasma
NEFA concentration during L-arginine infusion played a role in the higher glucose
E-00263-2005.R1
17
disposal although most studies show no affect of alterations in NEFA on muscle
glucose disposal during exercise in humans.
E-00263-2005.R1
18
Acknowledgements
The authors would like to thank the participants for taking part in this study and
acknowledge the technical assistance of Dr Nigel Stepto, Dr Domenic Caredi, Terry
Stephens and Matthew Palmer. This work was supported by grants from the National
Health and Medical Research Council of Australia and Diabetes Australia.
E-00263-2005.R1
19
REFERENCES
1. Abel T, Knechtle B, Perret C, Eser P, von Arx P, and Knecht H. Influence of chronic
supplementation of arginine aspartate in endurance athletes on performance and substrate
metabolism - a randomized, double-blind, placebo-controlled study. Int J Sports Med 26: 344-349,
2005.
2. Andersson K, Gaudiot N, Ribiere C, Elizalde M, Giudicelli Y, and Arner P. A nitric oxide-
mediated mechanism regulates lipolysis in human adipose tissue in vivo. Br J Pharmacol 126:
1639-1645, 1999.
3. Balon TW and Nadler JL. Evidence that nitric oxide increases glucose transport in skeletal
muscle. J Appl Physiol 82: 359-363, 1997.
4. Balon TW and Nadler JL. Nitric oxide release is present from incubated skeletal muscle
preparations. J Appl Physiol 77: 2519-2521, 1994.
5. Bode-Boger SM, Boger RH, Galland A, Tsikas D, and Frolich JC. L-arginine-induced
vasodilation in healthy humans: pharmacokinetic-pharmacodynamic relationship. Br J Clin
Pharmacol 46: 489-497, 1998.
6. Bode-Boger SM, Boger RH, Loffler M, Tsikas D, Brabant G, and Frolich JC. L-arginine
stimulates NO-dependent vasodilation in healthy humans--effect of somatostatin pretreatment. J
Investig Med 47: 43-50, 1999.
7. Bode-Böger SM, Böger RH, Schroder EP, and Frolich JC. Exercise increases systemic nitric
oxide production in men. J Cardiovasc Risk 1: 173-178, 1994.
8. Borg GAV. Perceived exertion: a note on “history” and methods. Med Sci Sports Exerc 5: 90–93,
1973.
9. Bradley SJ, Kingwell BA, and McConell GK. Nitric oxide synthase inhibition reduces leg
glucose uptake but not blood flow during dynamic exercise in humans. Diabetes 48: 1815-1821,
1999.
10. Bratusch-Marrain P, Bjorkman O, Hagenfeldt L, Waldhausl W, and Wahren J. Influence of
arginine on splanchnic glucose metabolism in man. Diabetes 28: 126-131, 1979.
11. Brett SE, Cockcroft JR, Mant TG, Ritter JM, and Chowienczyk PJ. Haemodynamic effects of
inhibition of nitric oxide synthase and of L-arginine at rest and during exercise. J Hypertens 16:
429-435, 1998.

E-00263-2005.R1
20
12. Ceremuzynski L, Chamiec T, and Herbaczynska-Cedro K. Effect of supplemental oral L-
arginine on exercise capacity in patients with stable angina pectoris. Am J Cardiol 80: 331-333,
1997.
13. Cheng JW and Baldwin SN. L-arginine in the management of cardiovascular diseases. Ann
Pharmacother 35: 755-764, 2001.
14. Chernick S. Determination of glycerol in acyl glycerols. New York, Academic, 1969.
15. Colombani PC, Bitzi R, Frey-Rindova P, Frey W, Arnold M, Langhans W, and Wenk C.
Chronic arginine aspartate supplementation in runners reduces total plasma amino acid level at
rest and during a marathon run. Eur J Nutr 38: 263-270, 1999.
16. DeFronzo RA, Jacot E, Jequier E, Maeder E, Wahren J, and Felber JP. The effect of insulin
on the disposal of intravenous glucose. Results from indirect calorimetry and hepatic and femoral
venous catheterization. Diabetes 30: 1000-1007, 1981.
17. Etgen GJ, Jr., Fryburg DA, and Gibbs EM. Nitric oxide stimulates skeletal muscle glucose
transport through a calcium/contraction- and phosphatidylinositol-3-kinase-independent pathway.
Diabetes 46: 1915-1919, 1997.
18. Frandsen U, Bangsbo J, Sander M, Hoffner L, Betak A, Saltin B, and Hellsten Y. Exercise-
induced hyperaemia and leg oxygen uptake are not altered during effective inhibition of nitric
oxide synthase with N(G)-nitro-L-arginine methyl ester in humans. J Physiol 531: 257-264, 2001.
19. Frandsen U, Hoffner L, Betak A, Saltin B, Bangsbo J, and Hellsten Y. Endurance training
does not alter the level of neuronal nitric oxide synthase in human skeletal muscle. J Appl Physiol
89: 1033-1038, 2000.
20. Frandsen U, Lopez-Figueroa M, and Hellsten Y. Localization of nitric oxide synthase in human
skeletal muscle. Biochem Biophys Res Commun 227: 88-93, 1996.
21. Gaudiot N, Jaubert AM, Charbonnier E, Sabourault D, Lacasa D, Giudicelli Y, and Ribiere
C. Modulation of white adipose tissue lipolysis by nitric oxide. J Biol Chem 273: 13475-13481,
1998.
22. Hargreaves M, Kiens B, and Richter EA. Effect of increased plasma free fatty acid
concentrations on muscle metabolism in exercising men. J Appl Physiol 70: 194-201, 1991.
23. Hayashi T, Wojtaszewski JF, and Goodyear LJ. Exercise regulation of glucose transport in
skeletal muscle. Am J Physiol 273: E1039-1051, 1997.
24. Hespel P, Vergauwen L, Vandenberghe K, and Richter EA. Significance of insulin for glucose
metabolism in skeletal muscle during contractions. Diabetes 45 Suppl 1: S99-104, 1996.
E-00263-2005.R1
21
25. Hickner RC, Fisher JS, Ehsani AA, and Kohrt WM. Role of nitric oxide in skeletal muscle
blood flow at rest and during dynamic exercise in humans. Am J Physiol 273: H405-410, 1997.
26. Higaki Y, Hirshman MF, Fujii N, and Goodyear LJ. Nitric oxide increases glucose uptake
through a mechanism that is distinct from the insulin and contraction pathways in rat skeletal
muscle. Diabetes 50: 241-247, 2001.
27. Hishikawa K, Nakaki T, Tsuda M, Esumi H, Ohshima H, Suzuki H, Saruta T, and Kato R.
Effect of systemic L-arginine administration on hemodynamics and nitric oxide release in man.
Jpn Heart J 33: 41-48., 1992.
28. Jenkins AB, Chisholm DJ, James DE, Ho KY, and Kraegen EW. Exercise-induced hepatic
glucose output is precisely sensitive to the rate of systemic glucose supply. Metabolism 34: 431-
436, 1985.
29. Jeukendrup A, Saris WH, Brouns F, and Kester AD. A new validated endurance performance
test. Med Sci Sports Exerc 28: 266-270, 1996.
30. Jeukendrup AE, Raben A, Gijsen A, Stegen JH, Brouns F, Saris WH, and Wagenmakers AJ.
Glucose kinetics during prolonged exercise in highly trained human subjects: effect of glucose
ingestion. J Physiol 515 ( Pt 2): 579-589, 1999.
31. Jordan J, Tank J, Stoffels M, Franke G, Christensen NJ, Luft FC, and Boschmann M.
Interaction between beta-adrenergic receptor stimulation and nitric oxide release on tissue
perfusion and metabolism. J Clin Endocrinol Metab 86: 2803-2810, 2001.
32. Kanaya Y, Nakamura M, Kobayashi N, and Hiramori K. Effects of L-arginine on lower limb
vasodilator reserve and exercise capacity in patients with chronic heart failure. Heart 81: 512-517,
1999.
33. Kennedy JW, Hirshman MF, Gervino EV, Ocel JV, Forse RA, Hoenig SJ, Aronson D,
Goodyear LJ, and Horton ES. Acute exercise induces GLUT4 translocation in skeletal muscle
of normal human subjects and subjects with type 2 diabetes. Diabetes 48: 1192-1197, 1999.
34. Kingwell B, Formosa M, Muhlmann M, Bradley S, and McConell G. Nitric oxide synthase
inhibition reduces glucose uptake during exercise in individuals with type 2 diabetes more than in
control subjects. Diabetes 51(8):: 2572-2580, 2002.
35. Klatt P, Cacho J, Crespo MD, Herrera E, and Ramos P. Nitric oxide inhibits isoproterenol-
stimulated adipocyte lipolysis through oxidative inactivation of the beta-agonist. Biochem J 351 Pt
2: 485-493, 2000.
E-00263-2005.R1
22
36. Lee AD, Hansen PA, and Holloszy JO. Wortmannin inhibits insulin-stimulated but not
contraction-stimulated glucose transport activity in skeletal muscle. FEBS Lett 361: 51-54, 1995.
37. Lund S, Holman GD, Schmitz O, and Pedersen O. Contraction stimulates translocation of
glucose transporter GLUT4 in skeletal muscle through a mechanism distinct from that of insulin.
Proc Natl Acad Sci U S A 92: 5817-5821, 1995.
38. Maxwell AJ, Ho HV, Le CQ, Lin PS, Bernstein D, and Cooke JP. L-arginine enhances aerobic
exercise capacity in association with augmented nitric oxide production. J Appl Physiol 90: 933-
938., 2001.
39. McConell G, Fabris S, Proietto J, and Hargreaves M. Effect of carbohydrate ingestion on
glucose kinetics during exercise. J Appl Physiol 77: 1537-1541., 1994.
40. McConell G, Kloot K, and Hargreaves M. Effect of timing of carbohydrate ingestion on
endurance exercise performance. Med Sci Sports Exerc 28: 1300-1304., 1996.
41. McConell G, Snow RJ, Proietto J, and Hargreaves M. Muscle metabolism during prolonged
exercise in humans: influence of carbohydrate availability. J Appl Physiol 87: 1083-1086., 1999.
42. Ming Z, Han C, and Lautt WW. Nitric oxide inhibits norepinephrine-induced hepatic vascular
responses but potentiates hepatic glucose output. Can J Physiol Pharmacol 78: 36-44, 2000.
43. Odland LM, Heigenhauser GJ, Wong D, Hollidge-Horvat MG, and Spriet LL. Effects of
increased fat availability on fat-carbohydrate interaction during prolonged exercise in men. Am J
Physiol 274: R894-902, 1998.
44. Piatti PM, Monti LD, Valsecchi G, Magni F, Setola E, Marchesi F, Galli-Kienle M, Pozza G,
and Alberti KG. Long-term oral L-arginine administration improves peripheral and hepatic
insulin sensitivity in type 2 diabetic patients. Diabetes Care 24: 875-880, 2001.
45. Quyyumi AA. Does acute improvement of endothelial dysfunction in coronary artery disease
improve myocardial ischemia? A double-blind comparison of parenteral D- and L-arginine. J Am
Coll Cardiol 32: 904-911, 1998.
46. Rådegran G and Saltin B. Nitric oxide in the regulation of vasomotor tone in human skeletal
muscle. Am J Physiol 276: H1951-1960, 1999.
47. Radziuk J, Norwich KH, and Vranic M. Experimental validation of measurements of glucose
turnover in nonsteady state. Am J Physiol 234: E84-93., 1978.
48. Rector TS, Bank AJ, Mullen KA, Tschumperlin LK, Sih R, Pillai K, and Kubo SH.
Randomized, double-blind, placebo-controlled study of supplemental oral L-arginine in patients
with heart failure. Circulation 93: 2135-2141, 1996.
E-00263-2005.R1
23
49. Richter EA, Derave W, and Wojtaszewski JF. Glucose, exercise and insulin: emerging
concepts. J Physiol 535: 313-322, 2001.
50. Roberts CK, Barnard RJ, Jasman A, and Balon TW. Acute exercise increases nitric oxide
synthase activity in skeletal muscle. Am J Physiol 277: E390-394, 1999.
51. Roberts CK, Barnard RJ, Scheck SH, and Balon TW. Exercise-stimulated glucose transport in
skeletal muscle is nitric oxide dependent. Am J Physiol 273: E220-225, 1997.
52. Romijn JA, Coyle EF, Sidossis LS, Zhang XJ, and Wolfe RR. Relationship between fatty acid
delivery and fatty acid oxidation during strenuous exercise. J Appl Physiol 79: 1939-1945, 1995.
53. Rottman J, Bracy D, Malabanan C, Yue Z, Clanton J, and Wasserman D. Contrasting effects
of exercise and NOS inhibition on tissue-specific fatty acid and glucose uptake in mice. Am J
Physiol Endocrinol Metab 283: E116-123, 2002.
54. Rudnick J, Puttmann B, Tesch PA, Alkner B, Schoser BG, Salanova M, Kirsch K, Gunga
HC, Schiffl G, Luck G, and Blottner D. Differential expression of nitric oxide synthases (NOS
1-3) in human skeletal muscle following exercise countermeasure during 12 weeks of bed rest.
Faseb J 18: 1228-1230, 2004.
55. Silveira LR, Pereira-Da-Silva L, Juel C, and Hellsten Y. Formation of hydrogen peroxide and
nitric oxide in rat skeletal muscle cells during contractions. Free Radic Biol Med 35: 455-464,
2003.
56. Steele R, J. S. Wall, R. C DeBodo and N. Altszuler. Measurement of the size and turnover rate
of body glucose pool by the isotope dilution method. Am J Physiol 187: 15-24, 1956.
57. Stephens TJ, Canny BJ, Snow RJ, and McConell GK. 5'-aminoimidazole-4-carboxyamide-
ribonucleoside-activated glucose transport is not prevented by nitric oxide synthase inhibition in
rat isolated skeletal muscle. Clin Exp Pharmacol Physiol 31: 419-423, 2004.
58. van Loon LJC, Thomason-Hughes M, Constantin-Teodosiu D, Koopman R, Greenhaff PL,
Hardie DG, Keizer HA, Saris WHM, and Wagenmakers AJM. Inhibition of adipose tissue
lipolysis increases intramuscular lipid and glycogen use in vivo in humans. Am J Physiol
Endocrinol Metab: 00092.02005, 2005.
59. Vincent MA, Barrett EJ, Lindner JR, Clark MG, and Rattigan S. Inhibiting NOS blocks
microvascular recruitment and blunts muscle glucose uptake in response to insulin. Am J Physiol
Endocrinol Metab 285: E123-129, 2003.
60. Walker HA, McGing E, Fisher I, Boger RH, Bode-Boger SM, Jackson G, Ritter JM, and
Chowienczyk PJ. Endothelium-dependent vasodilation is independent of the plasma L-
E-00263-2005.R1
24
arginine/ADMA ratio in men with stable angina: lack of effect of oral L-arginine on endothelial
function, oxidative stress and exercise performance. J Am Coll Cardiol 38: 499-505, 2001.
61. Wennmalm A, Edlund A, Granstrom EF, and Wiklund O. Acute supplementation with the
nitric oxide precursor L-arginine does not improve cardiovascular performance in patients with
hypercholesterolemia. Atherosclerosis 118: 223-231, 1995.
62. Wheatley CM, Rattigan S, Richards SM, Barrett EJ, and Clark MG. Skeletal muscle
contraction stimulates capillary recruitment and glucose uptake in insulin-resistant obese Zucker
rats. Am J Physiol Endocrinol Metab 287: E804-809, 2004.
63. Young ME and Leighton B. Evidence for altered sensitivity of the nitric oxide/cGMP signalling
cascade in insulin-resistant skeletal muscle. Biochem J 329: 73-79, 1998.
64. Zderic TW, Davidson CJ, Schenk S, Byerley LO, and Coyle EF. High-fat diet elevates resting
intramuscular triglyceride concentration and whole body lipolysis during exercise. Am J Physiol
Endocrinol Metab 286: E217-225, 2004.
E-00263-2005.R1
25
FIGURE LEGENDS
Figure 1. Plasma glucose concentration (A) and plasma insulin concentration (B) at
rest, during 120 min of steady state exercise at 72 ± 1% VO2 peak and at the end of
the performance ride (249 ± 14 kJ) time-trial (TT) in CON and L-Arg conditions.
Values are mean ± SEM (n=9). * P<0.05 vs. CON.
Figure 2. Rate of glucose appearance (Glucose Ra) (A), rate of glucose
disappearance (Glucose Rd) (B), and glucose clearance rate (Glucose CR) (C) at rest,
during 120 min of steady state exercise at 72 ± 1% VO2 peak and at the end of the
performance ride (249 ± 14 kJ) time-trial (TT) in CON and L-Arg conditions.
Because glucose kinetics are calculated as the change from one time point to the next,
data are plotted midway between sequential time points (eg 7.5 min for the change
from 0 min to 15 min). Values are mean ± SEM (n=9). * P<0.05 vs. CON.
Figure 3. Plasma glycerol (A) and plasma NEFA (B) concentration at rest, during
120 min of steady state exercise at 72 ± 1% VO2 peak and at the end of the
performance ride (249 ± 14 kJ) time-trial (TT) in CON and L-Arg conditions. Values
are mean ± SEM (n=9 for NEFA, n=8 for glycerol). * P<0.05 vs. CON.
E-00263-2005.R1
26
TABLE 1: Mean physiological responses during the last 30 min (90, 105 and 120
min) of 120 min of steady state exercise at 72 ± 1% VO2 peak and time to complete
the performance ride (249 ± 14 kJ) in CON and L-Arg conditions.
CON L-Arg
Oxygen uptake (l.min-1) 3.37 ± 0.17 3.38 ± 0.17
RER 0.90 ± 0.01 0.89 ± 0.01
Heart rate (beats.min-1) 149 ± 4 147 ± 4
Rating of perceived exertion
12.8 ± 0.4 13.0 ± 0.5
Performance time (min) 14.5 ± 0.9 14.1 ± 0.6
Values are mean ± SEM (n=9).
E-00263-2005.R1
27
Figure 1
3.5
4.0
4.5
5.0
5.5 CON
L-Arg
* *
Pla
sma
glu
cose
(mm
ol.l
-1)
0 15 30 45 60 75 90 105 120 135
0
10
20
30
40
50
60
70
CON
L-Arg
Time (min)
Pla
sma
insu
lin(p
mo
l.l-1
)
Saline or L-Arg
Steady state exercise TT
A
B
E-00263-2005.R1
28
Figure 2
0 15 30 45 60 75 90 105 120 135
0
5
10
15
20
CON
L-Arg *
**
Time (min)
Glu
cose
CR
(ml.
kg-1
.min
-1)
Saline or L-Arg
Steady state exercise TT
0
20
40
60
80
100
CON
L-Arg **
*
Glu
cose
Ra
( µm
ol.
kg-1
.min
-1)
A
B
C
0
20
40
60
80
100
CON
L-Arg **
*
Glu
cose
Rd
( µm
ol.
kg-1
.min
-1)
E-00263-2005.R1
29
Figure 3
0 15 30 45 60 75 90 105 120 135
0.00
0.25
0.50
0.75
1.00
CON
L-Arg
**
Time (min)
Pla
sma
NE
FA
(mm
ol.
l-1)
Saline or L-Arg
Steady state exercise TT
0
100
200
300
400
**
CON
L-Arg
*
Pla
sma
Gly
cero
l( µ
mol
.l-1
)A
B
Top Related
Copyright © 2022 FDOKUMEN

