


Bahasa
Halaman
Hukum

Is the extracellular ATP a key in X-linked Charcot-Marie-Tooth disease and in inherited non-syndromic
deafness?
Ezequiel Mas del Molino
ADVERTIMENT. La consulta d’aquesta tesi queda condicionada a l’acceptació de les següents condicions d'ús: La difusió d’aquesta tesi per mitjà del servei TDX (www.tdx.cat) ha estat autoritzada pels titulars dels drets de propietat intel·lectual únicament per a usos privats emmarcats en activitats d’investigació i docència. No s’autoritza la seva reproducció amb finalitats de lucre ni la seva difusió i posada a disposició des d’un lloc aliè al servei TDX. No s’autoritza la presentació delseu contingut en una finestra o marc aliè a TDX (framing). Aquesta reserva de drets afecta tant al resum de presentació de la tesi com als seus continguts. En la utilització o cita de parts de la tesi és obligat indicar el nom de la persona autora.
ADVERTENCIA. La consulta de esta tesis queda condicionada a la aceptación de las siguientes condiciones de uso: La difusión de esta tesis por medio del servicio TDR (www.tdx.cat) ha sido autorizada por los titulares de los derechos de propiedad intelectual únicamente para usos privados enmarcados en actividades de investigación y docencia. No se autoriza su reproducción con finalidades de lucro ni su difusión y puesta a disposición desde un sitio ajeno al servicio TDR. No se autoriza la presentación de su contenido en una ventana o marco ajeno a TDR (framing). Esta reserva de derechos afecta tanto al resumen de presentación de la tesis como a sus contenidos. En la utilización o cita de partes de la tesis es obligado indicar el nombre de la persona autora.
WARNING. On having consulted this thesis you’re accepting the following use conditions: Spreading this thesis by the TDX (www.tdx.cat) service has been authorized by the titular of the intellectual property rights only for private uses placed in investigation and teaching activities. Reproduction with lucrative aims is not authorized neither its spreading and availability from a site foreign to the TDX service. Introducing its content in a window or frame foreign to the TDX service isnot authorized (framing). This rights affect to the presentation summary of the thesis as well as to its contents. In the usingor citation of parts of the thesis it’s obliged to indicate the name of the author.
Is the extracellular ATP a key in X-linked Charcot-Marie-Tooth disease and
in inherited non-syndromic deafness?
Programa de Doctorat en Biomedicina
Bienni 2006-2008
Doctorand: Ezequiel Mas del Molino Director de Tesi: Carles Solsona Sancho
Barcelona, January del 2011
Departament de Patologia i Terapèutica Experimental
Facultat de Medicina (Campus de Bellvitge), Universitat de Barcelona


“Your theory is crazy, but it's not crazy enough to be
true”
Niels Bohr, Danish Physicist (1885-1962), Nobel Prize in
Physics 1922

Although someone might think that this work is only mine, actually
it is not. Many people have been implicated since the beginning.
Others have been part of the project when it was already started. But
I consider them all very important. This people are not only from the
lab, I consider a part of my PhD those people that were already
friends and that I got in the way. These are from Barcelona, from Gent
and from l’Escala, and to start mentioning names would mean to
forget some. For this reason, only the most important women in my
life will be named.
Gràcies Mare i Betsabé.
This work was also possible thanks to Dr. John Demptser from the
University of Strathclyde to develop the free software Win WCP; to
Chris Patton to develop the free software MaxChelator; and to the R
Project to develop the free R statistical program.
This work has been supported by Ministerio de Ciencia e
Innovación (MICINN): BES2006-13522, SAF2005/736; by La Marató de
TV3; by l’Agència de Gestió d’Ajuts Universitaris i de Recerca (AGAUR)
de la Generalitat de Catalunya; and IDIBELL.

7
Table of Contents
ABBREVIATIONS ............................................................... 13 SUMMARY ............................................................................ 21 INTRODUCCIÓN........................................................................... 23
1. Conexina hCx32 ................................................................... 25 2. Conexinas hCx26 y hCx30 ..................................................... 26
OBJETIVOS.................................................................................. 30 METODOLOGIA ............................................................................ 31
1. Liberación de ATP en nervio ciático ........................................ 31 2. Liberación de ATP en cultivos celulares .................................. 31 3. Two electrode voltatge clamp ................................................ 32
RESULTADOS .............................................................................. 32 1. Conexina hCx32 ................................................................... 32 2. Conexina hCx26 y hCx30 ...................................................... 37
DISCUSIÓN ................................................................................. 41 1. Conexina hCx32 ................................................................... 41 2. Conexinas hCx26 y hCx30 ..................................................... 42
CONCLUSIONES ........................................................................... 44 1. Conexina hCx32 ................................................................... 44 2. Conexinas hCx26 y hCx30 ..................................................... 45
INTRODUCTION ................................................................ 47 1. PURINERGIC SIGNALING .......................................................... 50
1.1 ATP as extracellular signal ................................................... 51 1.2 Purinergic receptors ............................................................ 52 1.3 ATP release mechanisms ..................................................... 53
1.3.1 ATP release through connexins ..................................... 55 1.4 Disorders related to ATP ..................................................... 57
1.4.1 Purinergic receptors ..................................................... 57 1.4.2 Ectonucleotidases ........................................................ 59 1.4.3 ATP release ................................................................ 61
2. CONNEXINS ............................................................................. 63 2.1 Connexin genetics and structure .......................................... 64
8
2.2 Gap Junctions .................................................................... 66 2.3 Hemichannels .................................................................... 68 2.4 Connexin voltage sensitivity ................................................ 69 2.5 Connexins related to this study ............................................ 70
2.5.1 Connexin 32 ............................................................... 70 2.5.2 Connexin 26 and Connexin 30 ...................................... 71 2.5.3 Xenopus laevis connexins ............................................. 71 2.5.4 Pannexins ................................................................... 71
3. CONNEXINS AND DISEASES ...................................................... 74 4. CHARCOT-MARIE-TOOTH DISEASE ............................................ 77
4.1 The disease ....................................................................... 78 4.2 CMT1 ................................................................................ 79 4.3 CMT2 ................................................................................ 80 4.4 CMTX ................................................................................ 80 4.5 Connexin 32 ...................................................................... 81 4.6 hCx32 and CMTX ................................................................ 82 4.7 Connexin 32 knock-out mice ............................................... 85 4.8 Schwann cells .................................................................... 85 4.9 Schwann cells and connexins .............................................. 90 4.10 Schwann cells and CMTX ................................................... 92 4.11 Schwann cells and ATP ..................................................... 92
5. INHERITED NON-SYNDROMIC PRELINGUAL DEAFNESS ............... 94 5.1 The disease ....................................................................... 95 5.2 DFNB1 ............................................................................... 96 5.3 DFNA2B ............................................................................. 97 5.4 DFNA3............................................................................... 97 5.5 The human ear .................................................................. 97 5.6 K+ cycling ........................................................................ 101 5.7 Connexins in the cochlea................................................... 105 5.8 Cochlear gap junctions ...................................................... 107 5.9 Cochlear hemichannels ..................................................... 109 5.10 ATP and purinergic signaling in the inner ear .................... 110 5.11 Cx26 and Cx30 mutations ................................................ 112
MATERIALS AND METHODS ....................................... 113 1. SOLUTIONS ........................................................................... 115
1.1Sciatic nerve solutions ....................................................... 116 1.1.1 Imaging.................................................................... 116 1.1.2 Videoimaging ............................................................ 116
1.2 Xenopus oocytes .............................................................. 116 1.3 Immunofluorescence, Immunoblotting and cultures ............ 117 1.4 Luciferin-Luciferase Reaction ............................................. 117
1.4.1 Luciferase preparation ............................................... 118
9
1.4.2 D-Luciferin obtaining ................................................. 119 2. ATP RELEASE IMAGING FROM MICE SCIATIC NERVES .............. 120
2.1 Mice sciatic nerves extraction ............................................ 121 2.2 Mice sciatic nerves teasing ................................................ 121 2.3 ATP release from mice sciatic nerves pieces........................ 122
2.3.1 Previous work ........................................................... 122 2.3.2 Mechanical stimuli ..................................................... 123 2.3.3 Recording videoimages .............................................. 124 2.3.4 Hypotonic shock on sciatic nerve trunks ...................... 125 2.3.5 Effect of Low Divalents Solutions ................................ 126 2.3.6 Electrical nerve stimulation ......................................... 126
3. CELL CULTURES AND ATP ASSAYS .......................................... 128 3.1 Primary Schwann cell cultures ........................................... 129
3.1.1 Extraction and Pre-incubation ..................................... 129 3.1.2 Coating culture plates ................................................ 129 3.1.3 Digestion and plating ................................................. 130 3.1.4 Schwann cells maintenance ........................................ 131 3.1.5 Harvesting Schwann cells ........................................... 131 3.1.6 Freeze Schwann cells or sciatic nerves for Schwann cell
culture ................................................................................... 132 3.2 HeLa cells cultures............................................................ 132 3.3 Assays on Schwann cells cultures ...................................... 132 3.4 Assays on HeLa cells ......................................................... 133 3.5 Assays on HeLa cells treated with Brefeldin A ..................... 134 3.6 ATP release imaging in primary Schwann cell cultures and HeLa
cells cultures .............................................................................. 135 4. IMMUNOFLUORESCENCE ASSAYS AND WESTERN BLOT ANALYSIS ................................................................................................ 136
4.1 Sciatic nerve teasings ....................................................... 137 4.2 Sciatic nerve immunofluorescence ..................................... 138 4.3 Immunofluorescence on cells ............................................ 138 4.4 HeLa cells homogenates ................................................... 139 4.5 General Western Blot protocol ........................................... 140
5. ATP RELEASE TROUGH CONNEXINS EXPRESSED IN XENOPUS LAEVIS OOCYTES ....................................................................... 141
5.1 Obtaining and keeping Xenopus laevis oocytes ................... 142 5.2 hCx32 mutant generation by PCR ...................................... 143
5.2.1 Clone Cx32 mutants in pBSK ...................................... 144 5.2.2 MiniPREPs for hCx32 constructs .................................. 146 5.2.3 MidiPREPs to obtain hCx32 constructs in pBSK ............. 147 5.2.4 Bacterial glycerol stocks of hCx32 constructs ............... 147 5.2.5 Cloning the hCx32 mutations and wt in pMJgreen vector
............................................................................................. 147 5.2.6 Cloning the hCx32 mutations and wt in pBxG vector ..... 149
10
5.3 Obtaining cRNA from hCx26, hCx30 and hCx32, and its mutants to inject to Xenopus laevis oocytes .............................................. 150
5.3.1 Bacterian glycerol stocks ............................................ 150 5.3.2 MiniPREPs for the constructs ...................................... 152 5.3.3 Bacterial cultures to purify the plasmid ........................ 152 5.3.4 Plasmid purification ................................................... 153 5.3.5 cRNA obtaining ......................................................... 153
5.4 Injecting cRNA in Xenopus laevis oocytes ........................... 154 5.4.1 Injection of different combinations of mutated hCx26 and
hCx30 .................................................................................... 155 5.5 Collagenase treatment ...................................................... 155 5.6 Two Electrodes Voltage Clamp........................................... 156
5.6.1 Two Electrodes Voltage Clamp Technique .................... 156 5.6.2 Two Electrode Voltage Clamp Set up ........................... 156 5.6.3 Getting ready for TEVC recordings .............................. 158 5.6.4 Two electrode Voltage Clamp recordings ..................... 159 5.6.5 Simultaneous TEVC recordings and ATP release
measurements ........................................................................ 160 5.6.6 hCx32 and S26L I-V curve .......................................... 161 5.6.7 Protocol to demonstrate that P87A, Δ111-116 and R220X
were placed in the oocytes plasma membrane........................... 162 6. DATA ANALYSIS ..................................................................... 164 RESULTS ................................................................................... 167 1. HCX32 IMMUNODETECTION IN MICE SCIATIC NERVES ............. 169 2. ATP RELEASE FROM MOUSE SCIATIC NERVES .......................... 172
2.1 Whole sciatic nerve stimulation .......................................... 173 2.2 Mechanical stimulation of teased fibers from mouse sciatic
nerves ....................................................................................... 179 3. CULTURED SCHWANN CELLS .................................................. 180 4. ATP RELEASE THROUGH HCX32 ON CELL CULTURES ................ 182
4.1 ATP release from cultured Schwann cells ............................ 183 4.2 Hypotonic shock on HeLa cells ........................................... 185
4.2.1 Hypotonic shock on HeLa cells preincubated with Brefeldin A ........................................................................................... 189
5. HCX32 AND ATP RELEASE IN XENOPUS OOCYTES .................... 193 5.1. hCx32 cRNA obtention ..................................................... 194 5.2 TEVC recordings and ATP release through hCx32 and negative
controls ..................................................................................... 194 5.3 TEVC recordings and ATP release through hCx32 mutated
hemichannels............................................................................. 199 6. HCX26, HCX30 AND ATP RELEASE IN XENOPUS OOCYTES ........ 206
6.1. hCx26 cRNA obtention ..................................................... 207 6.2 Membrane currents and ATP release in oocytes expressing
hCx26, hCx30 and negative controls ............................................ 207
11
6.3 Membrane currents and ATP release in oocytes expressing hCx26 or hCx30 mutations .......................................................... 213
6.4 Membrane currents and ATP release in oocytes co- injected with different cRNAs of hCx26 and its mutations and cRNA of hCx30 ..... 219
6.5 Membrane currents and ATP release in oocytes co- injected with cRNA of hCx26 and cRNA of hCx30 T5M mutation ......................... 224 DISCUSSION ..................................................................... 229 1. HCX32 ................................................................................... 233 2. HCX26 AND HCX30 ................................................................. 243 CONCLUSIONS ................................................................. 257 1. HCX32 ................................................................................... 259 2. HCX26 AND HCX30 ................................................................. 262 BIBLIOGRAPHY ............................................................... 265

12

13
Abbreviations

14
Abbreviations
15
2-NBDG D-Glucose Fluorescent Analogue
Å Angstrom
A Amperes
A1, A2 Adenosine receptors
AP Action Potential
ADA Adenosine Deaminase
ADP Adenosine 5'-(trihydrogen diphosphate)
AFM Atomic Force Microscope
AMP Adenosine Monophosphate
ASCx38 Connexin 38 Antisense
ATP Adenosine-5'-triphosphate
AU Arbitrary Units
bp Base Pair
BFA Brefeldin A
Caspr Contactin associated protein
cDNA Complementary Deoxyribonucleic acid
CFTR Cystic fibrosis transmembrane conductance regulator
CMT Charcot-Marie-Tooth disease
CMTX X-linked Charcot-Marie-Tooth disease
CNS Central Nervous System
COPD Chronic Obstructive Pulmonary Disease
cRNA Complementary Ribonucleic acid
Cx Connexin
Abbreviations
16
Da Dalton
DAPI 4',6-diamidino-2-phenylindole
dB Decibels
DEPC Dietil pirocarbonate
DFNA Autosomal Dominant Deafness
DFNB Autosomal Recessive Deafness
DFNX X-linked Deafness
DFNMT Deafness with Mitochondrial Inheritance
DMEM Dulbecco’s Modified Eagle Medium
DMSO Dimethyl sulfoxide
DNA Deoxyribonucleic Acid
DSS Déjérine-Sottas Syndrome
EDTA Ethylenediaminetetraacetic acid
E-NPP Ecto-Nucleotide Pyrophosphatase/Phosphodiesterase
E-NTPDase Ecto-Nucleoside Triphosphate Diphosphohydrolase
EP Endocochlear Potential
ER Endoplasmatic Reticulum
FBS Foetal bovine serum
FFA Flufenamic Acid
GCPR G-Coupled Protein Receptor
Gj Transjunctional Conductance
Abbreviations
17
gja Gap Junction Alpha
gjb Gap Junction Beta
HCO3- Hydrogen Carbonate
hCx Human Connexin
HEPES (4-(2-hydroxyethyl)-1-piperazineethanesulfonic acid)
HNPP Hereditary Neuropathy with liability to Pressure Palsies
HRP Horseradish Peroxidase
I Intensity; Current
IBMX 3-Isobutyl-1-methylxanthine
IHC Inner Hair Cell
IP3 Inositol 3-Phosphate
kDa Kilo Dalton
KID Keratitis-Ichthyosis-Deafness Syndrome
Kv Potassium voltage-gated channel
LB Luria-Bertani media
LY Lucifer Yellow
mA; μA Milliamperes; Microamperes
MBP Myelin Basic Protein
MPZ Myelin Protein Zero
mV Milli Volts
mRNA Messenger Ribonucleic Acid
MΩ Mega Ohm
Abbreviations
18
μC MicroCoulombs
nA Nanoamperes
NB Neurobiotin
NGS Normal goat serum
o/n Over night
OHC Outer Hair Cell
P0 Protein Zero
P1, P2 Purinergic receptors
P2X Ionotropic Purinergic receptors
P2Y Metabotropic Purinergic receptors
PBS Phosphate buffered saline
PCO2 Partial Pressure of Carbon Dioxide
PCR Polymerase Chain Reaction
PLC Phospholipase C
PLD Phospholipase D
PMP Peripheral Myelin Protein
PMSF Phenylmethylsulphonyl Fluoride
PNS Peripheral Nervous System
PI Propidium Iodide
pS Pico Siemens
Px Pannexin
RNA Ribonucleic Acid
ROS Reactive Oxygen Species
Abbreviations
19
RT Room Temperature
s Seconds
τ Tau, Time Constant
TBS Tris Buffered Saline
TEVC Two Electrode Voltage Clamp
Tris Trishydroxymethylaminomethane
UDP Uridine Diphosphate
UTP Uridine-5'-Triphosphate
UTR Untranslated Region
V Volts; Voltage
Vj Transjunctional Voltage
Vm Membrane Potential
WT Wild Type
°C Centigrade degree

20

21
Summary

22
Summary
23
INTRODUCCIÓN El ATP es una molécula ampliamente conocida por su papel en
muchas funciones como la homeostasis celular, el mantenimiento de
gradientes iónicos, el mantenimiento del pH en gránulos secretores, el
almacenamiento energético, regulador de la interacción actina-
miosina, etc. Además, el ATP puede actuar como molécula
señalizadora a través de los receptores purinérgicos P2. De receptores
P2 hay de dos tipos, los P2X, que son ionotrópicos, y los P2Y que son
metabotrópicos. Los primeros son una familia de canales iónicos
permeables a cationes que se abren cuando se les une el ATP. Los
segundos son receptores acoplados a proteínas G, y la unión del ATP
desencadena diferentes reacciones metabólicas. Ambos tipos de
receptores se han relacionado con diferentes patologías.
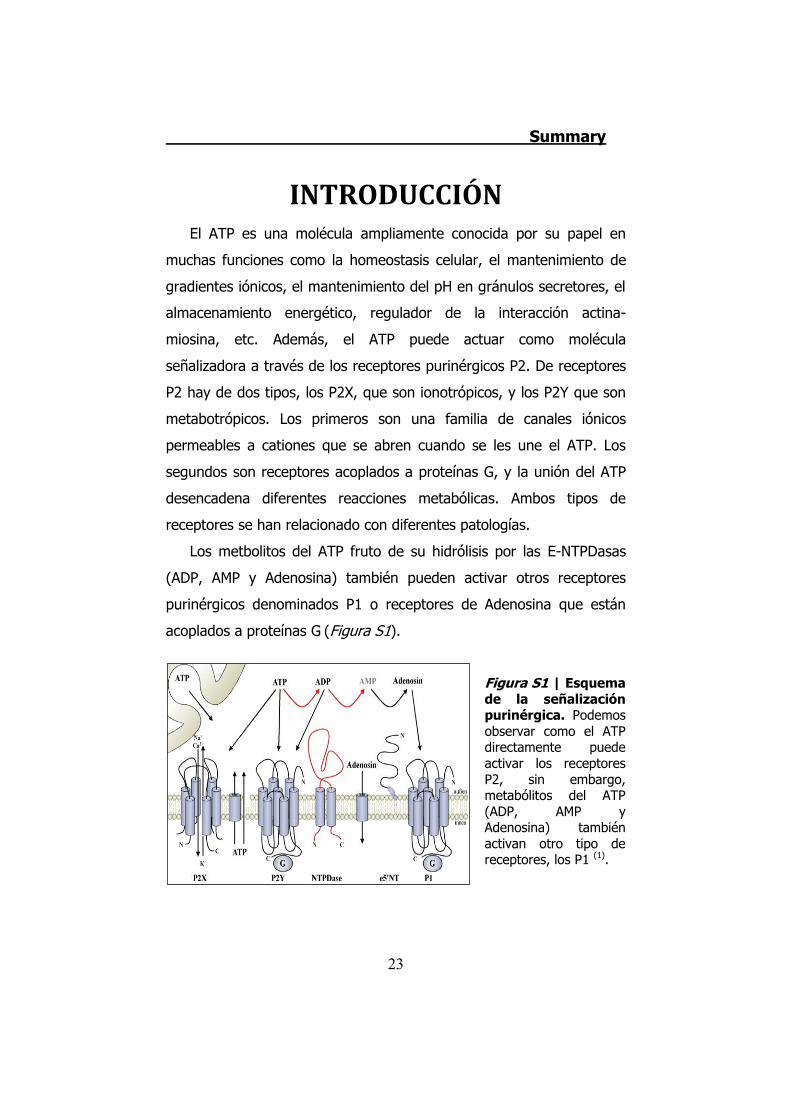
Los metbolitos del ATP fruto de su hidrólisis por las E-NTPDasas
(ADP, AMP y Adenosina) también pueden activar otros receptores
purinérgicos denominados P1 o receptores de Adenosina que están
acoplados a proteínas G (Figura S1).
Figura S1 | Esquema de la señalización purinérgica. Podemos observar como el ATP directamente puede activar los receptores P2, sin embargo, metabólitos del ATP (ADP, AMP y Adenosina) también activan otro tipo de receptores, los P1 (1).

Summary
24
Como el ATP es muy hidrofílico no puede cruzar espontáneamente
la membrana plasmática que es de naturaleza lipídica e hidrofóbica.
Por eso está ampliamente aceptado que la liberación celular de ATP es
por exocitosis o por transportadores de ATP. Investigaciones recientes
indican que algunos hemicanales formados por conexinas pueden
liberar ATP mediante estímulo.
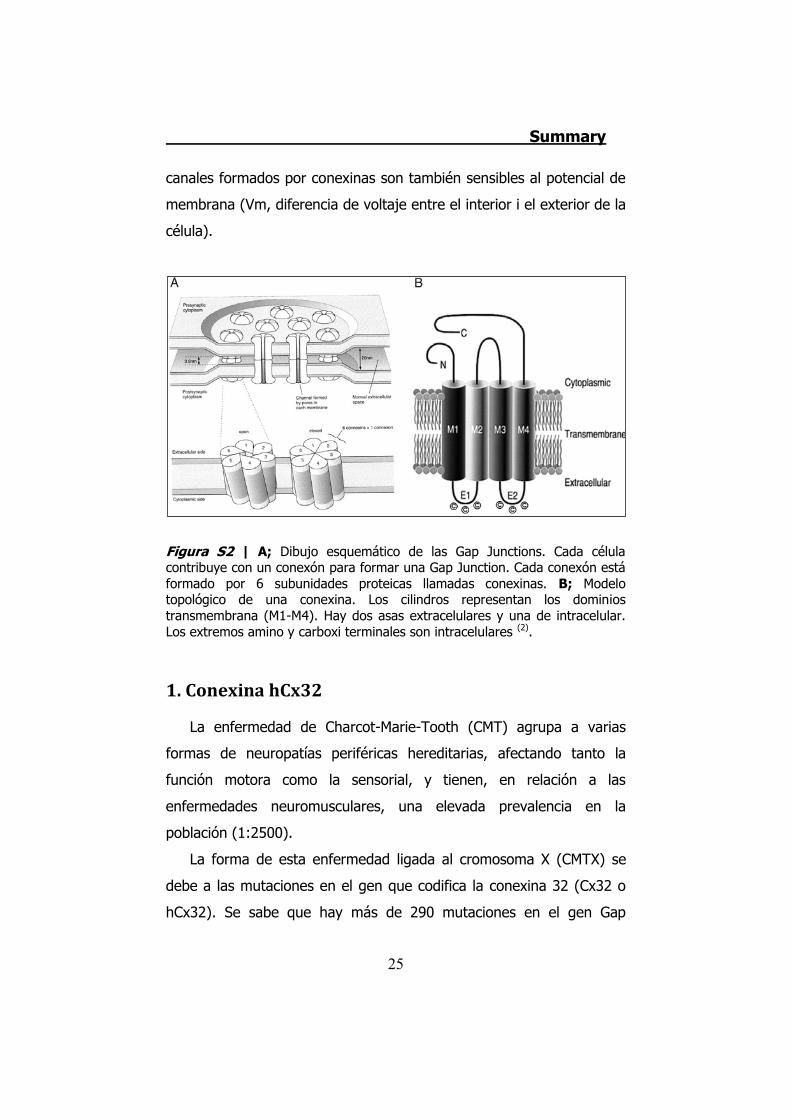
Las conexinas son proteínas de membrana formadas por cuatro
dominios transmembrana y con los extremos amino y carboxi terminal
citoplasmáticos. Las 21 conexinas descritas en el hombre difieren entre
ellas por pocos aminoácidos. Esto hace que tengan diferentes pesos
moleculares. La nomenclatura que recibe cada conexina es “Cx”
seguida del peso molecular correspondiente. Una letra antes de Cx
indicará la especie animal a la que pertenece (h=human, m=mouse,
r=rat).
Las conexinas forman hexámeros llamados conexones. Dos
conexones de dos células adyacentes forman una unión tipo
comunicante o “gap junction”. Cuando un conexón se encuentra en
una membrana que no está en contacto con otra célula forma un canal
llamado hemicanal (Figura S2).
Se sabe que los hemicanales pueden abrirse en condiciones
fisiológicas y en condiciones patológicas y también se ha podido
estudiar que estos hemicanales son permeables a iones (Na+, K+, Cl-,
Ca2+…) y a metobolitos (ATP, cAMP, IP3…). Algunos estudios sugieren
que algunos hemicanales son permeables al ATP, o sea, que en ciertas
condiciones éstas, liberan ATP al medio extracelular.
Los canales formados por conexinas tienen una sensibilidad
compleja. La mayoría de ellos tienen una conductancia sensible al
potencial eléctrico de interunión (Vj, diferencia de potencial eléctrico
entre los citoplasmas de dos células adyacentes). Además, muchos
Summary
25
canales formados por conexinas son también sensibles al potencial de
membrana (Vm, diferencia de voltaje entre el interior i el exterior de la
célula).
Figura S2 | A; Dibujo esquemático de las Gap Junctions. Cada célula contribuye con un conexón para formar una Gap Junction. Cada conexón está formado por 6 subunidades proteicas llamadas conexinas. B; Modelo topológico de una conexina. Los cilindros representan los dominios transmembrana (M1-M4). Hay dos asas extracelulares y una de intracelular. Los extremos amino y carboxi terminales son intracelulares (2).
1. Conexina hCx32
La enfermedad de Charcot-Marie-Tooth (CMT) agrupa a varias
formas de neuropatías periféricas hereditarias, afectando tanto la
función motora como la sensorial, y tienen, en relación a las
enfermedades neuromusculares, una elevada prevalencia en la
población (1:2500).
La forma de esta enfermedad ligada al cromosoma X (CMTX) se
debe a las mutaciones en el gen que codifica la conexina 32 (Cx32 o
hCx32). Se sabe que hay más de 290 mutaciones en el gen Gap
Summary
26
Junction β-1 (gjb1) relacionadas con la CMTX
(http://www.molgen.ua.ac.be/CMTMutations/Home/IPN.cfm).
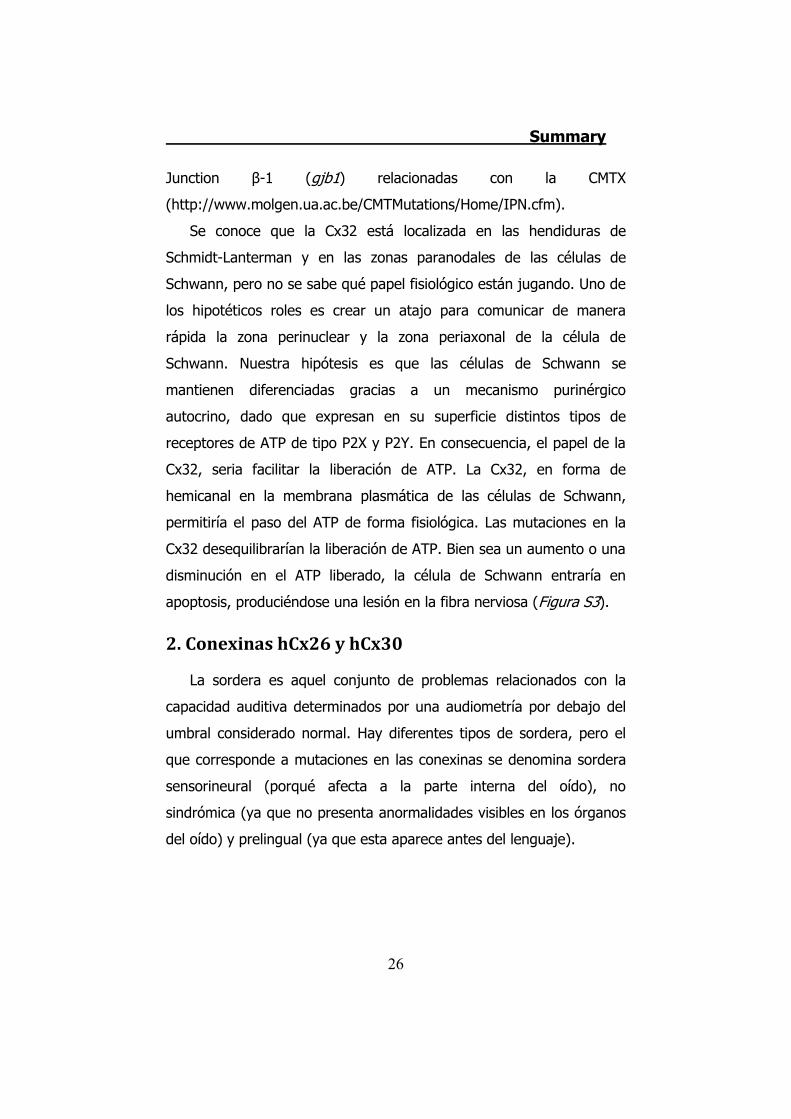
Se conoce que la Cx32 está localizada en las hendiduras de
Schmidt-Lanterman y en las zonas paranodales de las células de
Schwann, pero no se sabe qué papel fisiológico están jugando. Uno de
los hipotéticos roles es crear un atajo para comunicar de manera
rápida la zona perinuclear y la zona periaxonal de la célula de
Schwann. Nuestra hipótesis es que las células de Schwann se
mantienen diferenciadas gracias a un mecanismo purinérgico
autocrino, dado que expresan en su superficie distintos tipos de
receptores de ATP de tipo P2X y P2Y. En consecuencia, el papel de la
Cx32, seria facilitar la liberación de ATP. La Cx32, en forma de
hemicanal en la membrana plasmática de las células de Schwann,
permitiría el paso del ATP de forma fisiológica. Las mutaciones en la
Cx32 desequilibrarían la liberación de ATP. Bien sea un aumento o una
disminución en el ATP liberado, la célula de Schwann entraría en
apoptosis, produciéndose una lesión en la fibra nerviosa (Figura S3).
2. Conexinas hCx26 y hCx30
La sordera es aquel conjunto de problemas relacionados con la
capacidad auditiva determinados por una audiometría por debajo del
umbral considerado normal. Hay diferentes tipos de sordera, pero el
que corresponde a mutaciones en las conexinas se denomina sordera
sensorineural (porqué afecta a la parte interna del oído), no
sindrómica (ya que no presenta anormalidades visibles en los órganos
del oído) y prelingual (ya que esta aparece antes del lenguaje).
Summary
27
Figura S3 | Representación esquemática de una célula de Schwann en tres diferentes situaciones. A: En una célula de Schwann expresando la Cx32 WT el ATP es liberado a través de estas para una correcta función de la célula. B: Una célula de Schwann expresando una mutación de la Cx32. En este caso la mutación incrementa la cantidad de ATP liberado. Esto lleva a la célula a una hiperactivación de los receptores P2X y P2Y. C: Una célula de Schwann expresando una mutación de la Cx32. En este caso la mutación disminuye la cantidad de ATP liberado. Esto lleva a la célula a una hipoactivación de los receptores P2X y P2Y. En los casos B y C esa desregulación llevaría a la desdiferenciación de la célula de Schwann y la consecuente desmielinización.
El oído está formado por el oído externo, el medio y el interno. El
oído interno está formado por el laberinto que consta del vestíbulo, los
canales semicirculares y de la cóclea. La cóclea o caracol es el órgano
que se encarga de convertir las vibraciones mecánicas del sonido en
impulsos nerviosos. Está formado por una especie de tubo enrollado
Summary
28
de aquí el nombre de caracol. Este tubo está dividido en tres
cavidades: Scala Vestibuli, Scala Media y Scala Tympani. La Scala
Media está bañada por endolinfa mientras las otras dos están bañadas
por perilinfa. La perilinfa es una solución extracelular con una
composición iónica my parecida a cualquier otra solución extracelular,
sin embrago la endolinfa tiene una composición mucho más parecida
al interior de una célula, donde el ion más abundante es el K+. Además
también tiene un bajo contenido en Ca2+. Formando parte de la Scala
Media encontramos el órgano de Corti, que contiene, entre muchos
otros tipos celulares, las células pilosas sensoriales internas y externas.
Estas células son las que convertirán las vibraciones en estímulos
nerviosos.
En este estudio nos hemos focalizado en las conexinas 26 y 30.
Mutaciones en cualquier de estas dos proteínas puede causar sordera
de una manera recesiva o dominante dependiendo de la mutación.
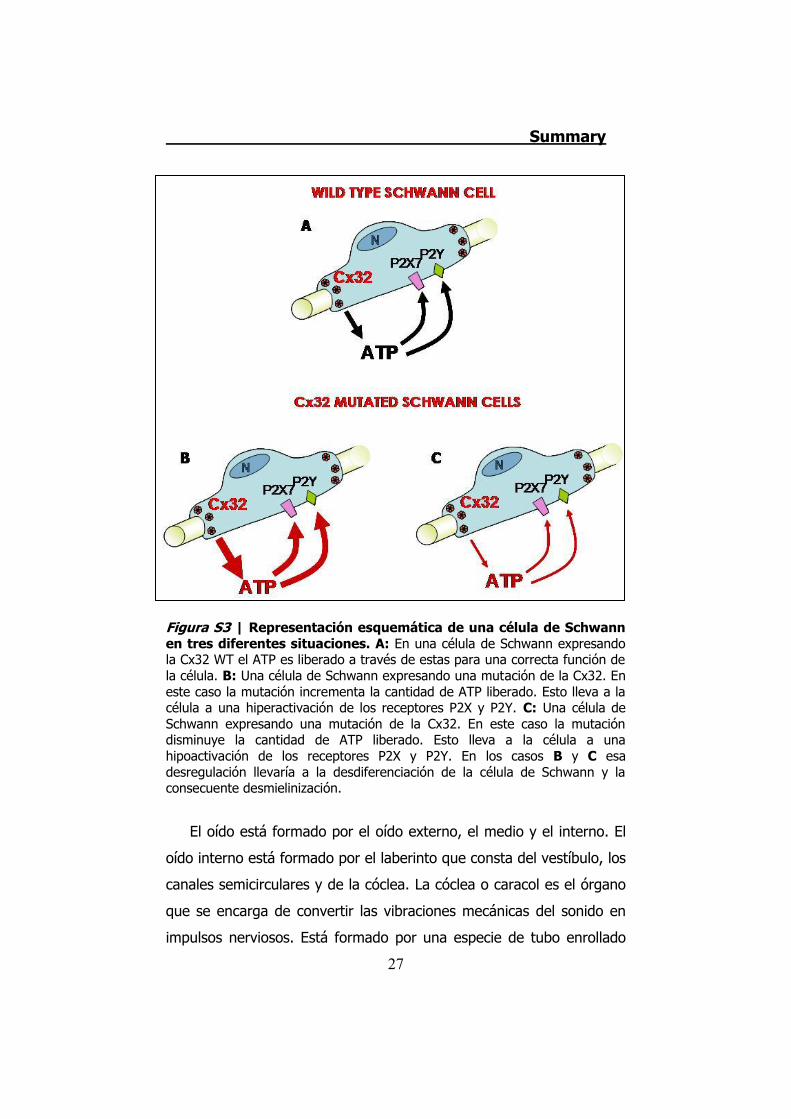
Hasta el día de hoy se sabe que estas dos conexinas están
formando redes que comunican, mediante las “gap junctions”, a
células epiteliales y conectivas de la cóclea (Figura S4). Además,
también se ha demostrado que estas conexinas forman hemicanales,
en células epiteliales, que desembocan en espacios bañados tanto por
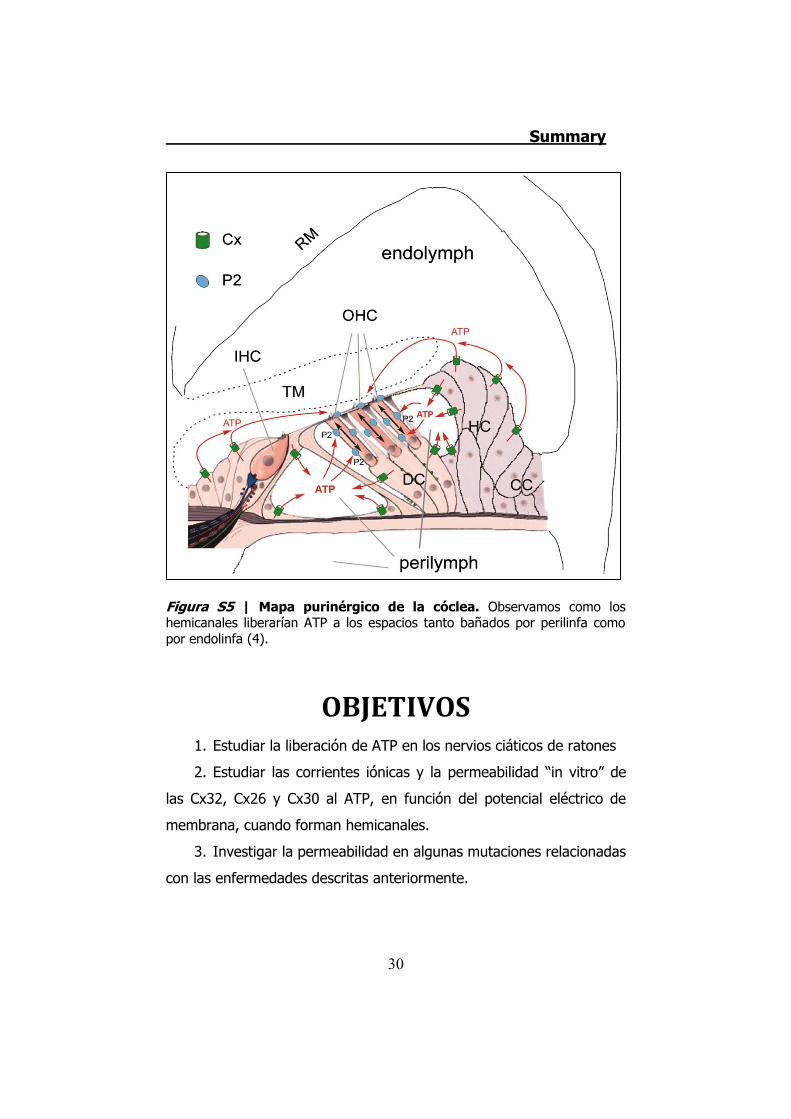
perilinfa como por endolinfa (Figura S5).
Nuestro objetivo es caracterizar las propiedades iónicas y la
permeabilidad para el ATP de los hemicanales formados por hCx26, los
formados por hCx30 y los formados por diferentes mutaciones de la
hCx26 y de la hCx30.
Summary
29
Figura S4 | Esquema del órgano de Corti y diferentes partes que lo forman y lo rodean. Observamos diferentes partes del órgano de Corti y las soluciones externas que bañan la cóclea. En verde están resaltadas esas células endoteliales que contienen conexinas y en marrón aquellas células del tejido conectivo que también las expresan (3).
Debido a los resultados que se han ido obteniendo y que se ha
descrito que la hCx26 y la hCx30 co-localizan y co-ensamblan, también
hemos querido caracterizar los hemicanales formados por ambas
conexinas y combinaciones de hCx30 con mutaciones de la hCx26 y
viceversa.
Summary
30
Figura S5 | Mapa purinérgico de la cóclea. Observamos como los hemicanales liberarían ATP a los espacios tanto bañados por perilinfa como por endolinfa (4).
OBJETIVOS 1. Estudiar la liberación de ATP en los nervios ciáticos de ratones
2. Estudiar las corrientes iónicas y la permeabilidad “in vitro” de
las Cx32, Cx26 y Cx30 al ATP, en función del potencial eléctrico de
membrana, cuando forman hemicanales.
3. Investigar la permeabilidad en algunas mutaciones relacionadas
con las enfermedades descritas anteriormente.
Summary
31
METODOLOGIA 1. Liberación de ATP en nervio ciático
Mediante una cámara de registro construida en los servicios
científico-técnicos de la Universidad de Barcelona para poner el nervio
y poder perfundir soluciones y una cámara fotográfica ultrasensible
ImageEM (Hamamatsu, Japón) pudimos registrar, mediante fotografía
y video, la salida de ATP de un nervio ciático utilizando diferentes
estímulos:
� Estímulo mecánico (contacto físico, hipotonicidad)
� Estímulo eléctrico
� Estímulo químico (baja concentración de iones divalentes)
2. Liberación de ATP en cultivos celulares
Para esto utilizamos cultivos de células de Schwann, una técnica
ya puesta a punto en el laboratorio, y el lector de placas. La técnica
consiste en hacer cultivos de estas células en placas de 12 pocillos y,
una vez en el lector de placas, realizarle el estímulo por shock
osmótico. Este aparato nos mide la luminiscencia. Haciendo curvas
patrón con soluciones de ATP de concentración conocida pudimos
cuantificar el ATP que liberan las células de un pocillo. Previamente se
hizo un recuento de las células que contiene cada pocillo. De esta
manera obtuvo la cantidad de ATP liberado por 104 células.
Las células HeLa son una línea celular que está descrito que no
tienen cantidades detectables de conexinas. Por eso, previamente a mi
llegada en el laboratorio, se utilizó esta línea para transfectarla
establemente con el gen de la hCx32. Las células HeLa y las células
HeLa establemente transfectadas con el gen de la hCx32 se utilizaron
Summary
32
para hacer el mismo tipo de experimento que en los cultivos de células
de Schwann.
3. Two electrode voltatge clamp
Esta técnica consiste en inyectar un cRNA de una proteína de
membrana en oocitos de Xenopus laevis y realizar experimentos
electrofisiológicos con ellos. Una vez tenemos los hemicanales
expresados en los oocitos se les aplicó un protocolo de despolarización
donde pasamos de -40 mV a +80 mV durante 30 s y otra vez vuelta a
-40 mV para la hCx32; para la hCx26 y la hCx30 aplicamos estímulos
de 10 s de -80 mV a +100 mV para volver a -80 mV. De esta manera
obtuvimos unas corrientes de salida seguidas de unas corrientes de
entrada llamadas corrientes de cola. Mediante la reacción de la
Luciferina-Luciferasa si había liberación de ATP lo pudimos detectar y,
gracias a la aplicación de cantidades conocidas de ATP a través de un
nanoinyector, pudimos cuantificar los fmoles de ATP liberado por
oocito. Esta técnica nos permitió registrar, simultáneamente,
corrientes iónicas y liberación de ATP. Una vez conocido el
comportamiento de estos canales pasamos a estudiar si había
diferencias en estas corrientes y en la liberación de ATP entre los
canales de hCx32, hCx26, hCx30 y las diferentes mutaciones descritas
en la enfermedad de Charcot-Marie-Tooth ligada al cromosoma X y la
pérdida de audición.
RESULTADOS 1. Conexina hCx32
Las imágenes de inmunofluorescencia realizadas previamente por
la Dra. X. Grandes en nuestro laboratorio demostraron que la
Summary
33
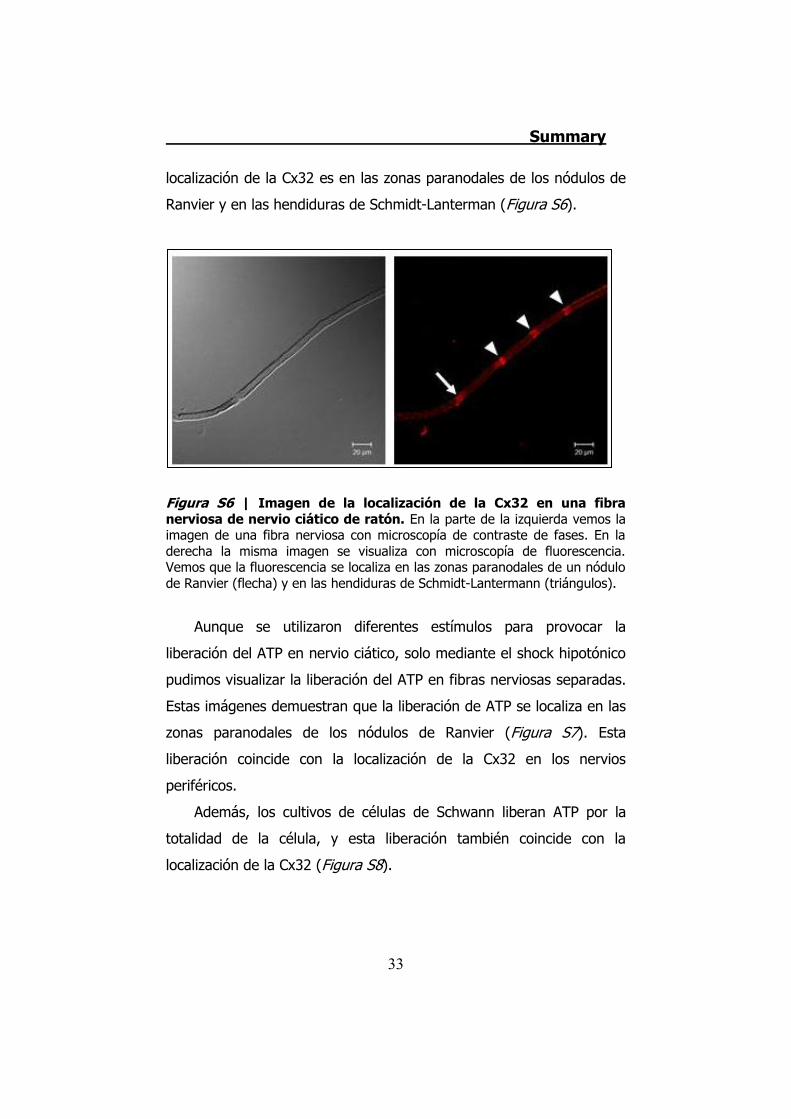
localización de la Cx32 es en las zonas paranodales de los nódulos de
Ranvier y en las hendiduras de Schmidt-Lanterman (Figura S6).
Figura S6 | Imagen de la localización de la Cx32 en una fibra nerviosa de nervio ciático de ratón. En la parte de la izquierda vemos la imagen de una fibra nerviosa con microscopía de contraste de fases. En la derecha la misma imagen se visualiza con microscopía de fluorescencia. Vemos que la fluorescencia se localiza en las zonas paranodales de un nódulo de Ranvier (flecha) y en las hendiduras de Schmidt-Lantermann (triángulos).
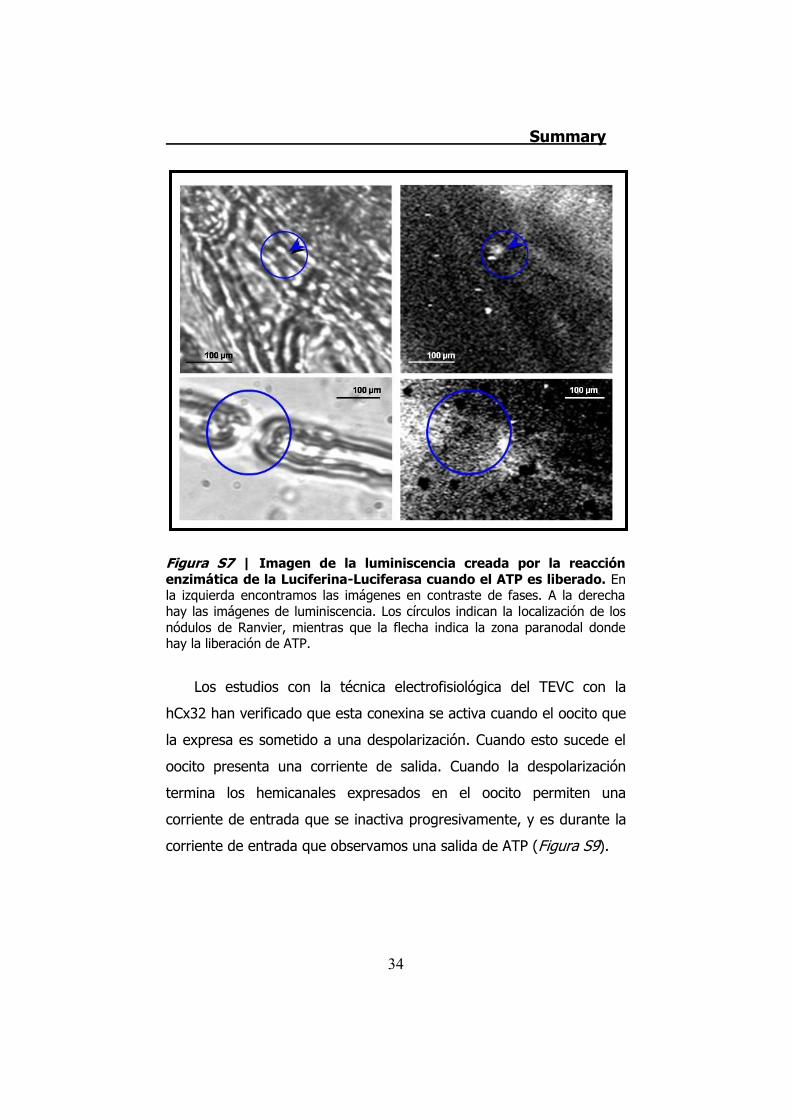
Aunque se utilizaron diferentes estímulos para provocar la
liberación del ATP en nervio ciático, solo mediante el shock hipotónico
pudimos visualizar la liberación del ATP en fibras nerviosas separadas.
Estas imágenes demuestran que la liberación de ATP se localiza en las
zonas paranodales de los nódulos de Ranvier (Figura S7). Esta
liberación coincide con la localización de la Cx32 en los nervios
periféricos.
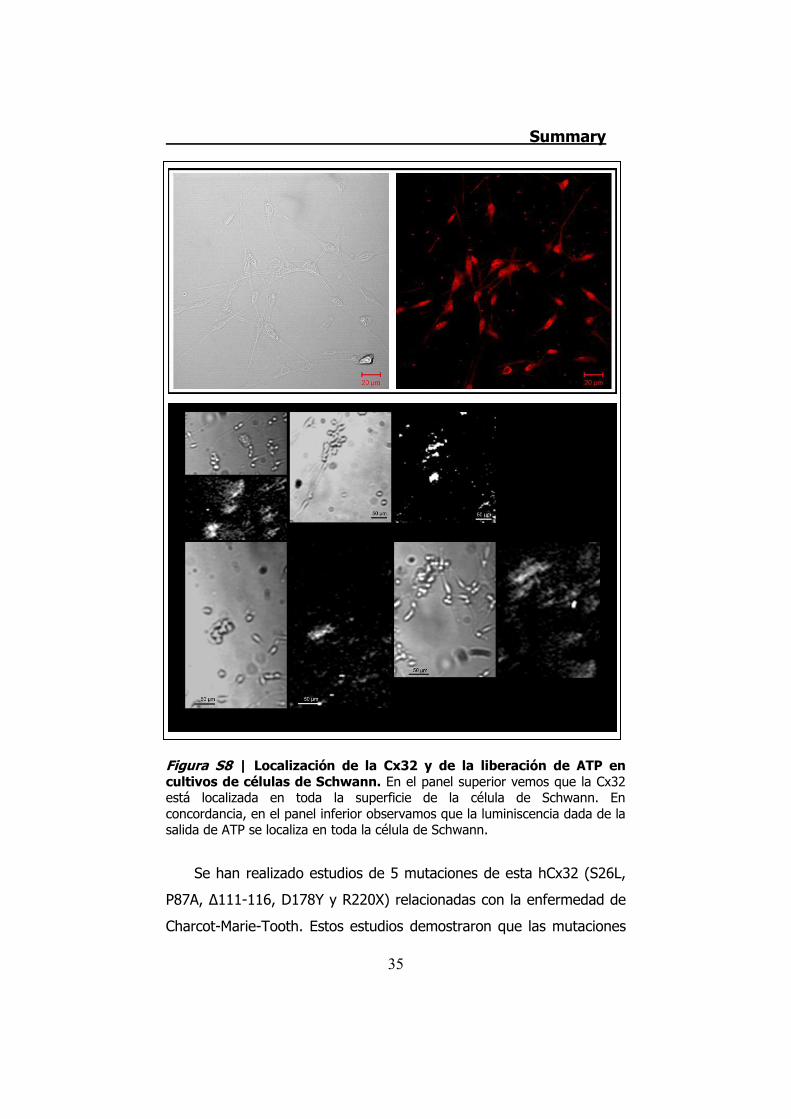
Además, los cultivos de células de Schwann liberan ATP por la
totalidad de la célula, y esta liberación también coincide con la
localización de la Cx32 (Figura S8).
Summary
34
Figura S7 | Imagen de la luminiscencia creada por la reacción enzimática de la Luciferina-Luciferasa cuando el ATP es liberado. En la izquierda encontramos las imágenes en contraste de fases. A la derecha hay las imágenes de luminiscencia. Los círculos indican la localización de los nódulos de Ranvier, mientras que la flecha indica la zona paranodal donde hay la liberación de ATP.
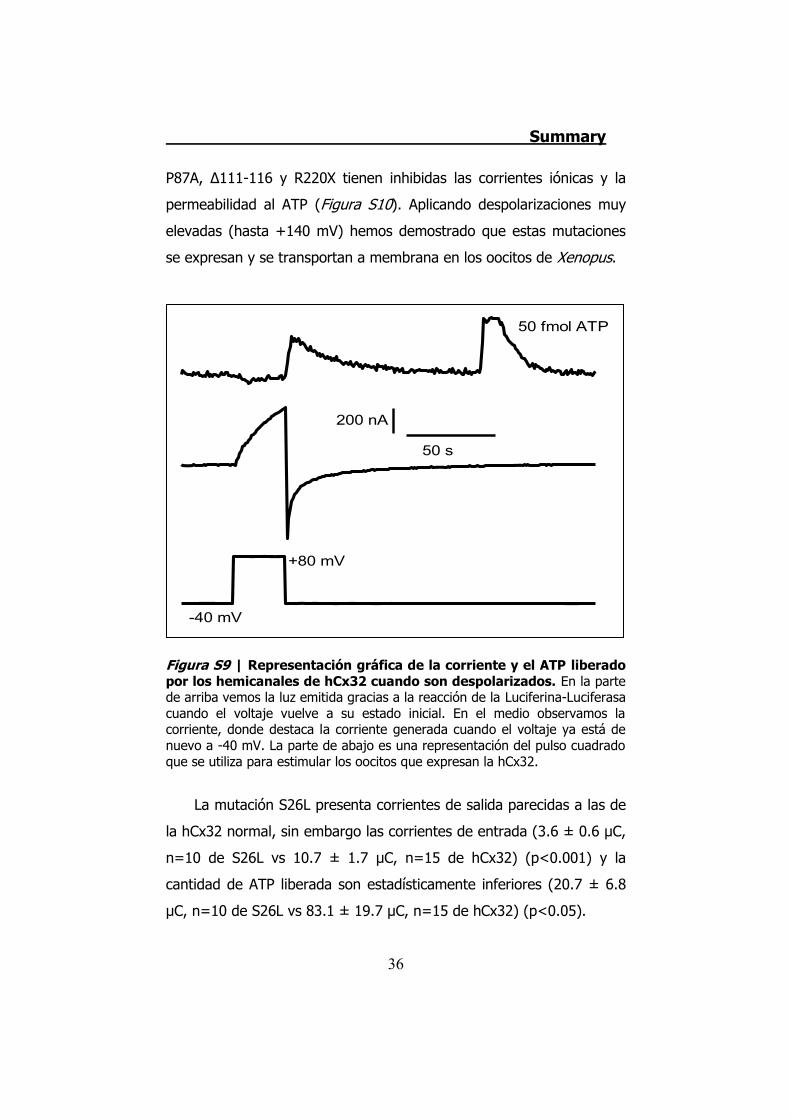
Los estudios con la técnica electrofisiológica del TEVC con la
hCx32 han verificado que esta conexina se activa cuando el oocito que
la expresa es sometido a una despolarización. Cuando esto sucede el
oocito presenta una corriente de salida. Cuando la despolarización
termina los hemicanales expresados en el oocito permiten una
corriente de entrada que se inactiva progresivamente, y es durante la
corriente de entrada que observamos una salida de ATP (Figura S9).
Summary
35
Figura S8 | Localización de la Cx32 y de la liberación de ATP en cultivos de células de Schwann. En el panel superior vemos que la Cx32 está localizada en toda la superficie de la célula de Schwann. En concordancia, en el panel inferior observamos que la luminiscencia dada de la salida de ATP se localiza en toda la célula de Schwann.
Se han realizado estudios de 5 mutaciones de esta hCx32 (S26L,
P87A, Δ111-116, D178Y y R220X) relacionadas con la enfermedad de
Charcot-Marie-Tooth. Estos estudios demostraron que las mutaciones
Summary
36
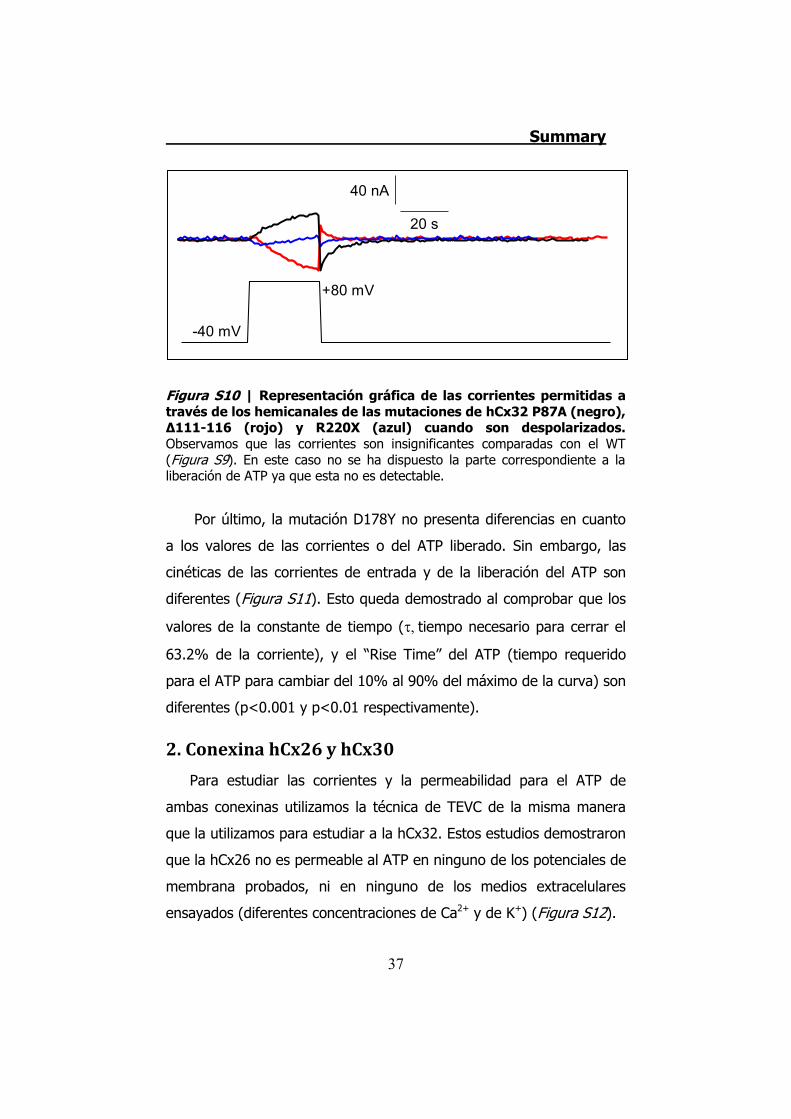
P87A, Δ111-116 y R220X tienen inhibidas las corrientes iónicas y la
permeabilidad al ATP (Figura S10). Aplicando despolarizaciones muy
elevadas (hasta +140 mV) hemos demostrado que estas mutaciones
se expresan y se transportan a membrana en los oocitos de Xenopus.
Figura S9 | Representación gráfica de la corriente y el ATP liberado por los hemicanales de hCx32 cuando son despolarizados. En la parte de arriba vemos la luz emitida gracias a la reacción de la Luciferina-Luciferasa cuando el voltaje vuelve a su estado inicial. En el medio observamos la corriente, donde destaca la corriente generada cuando el voltaje ya está de nuevo a -40 mV. La parte de abajo es una representación del pulso cuadrado que se utiliza para estimular los oocitos que expresan la hCx32.
La mutación S26L presenta corrientes de salida parecidas a las de
la hCx32 normal, sin embargo las corrientes de entrada (3.6 ± 0.6 μC,
n=10 de S26L vs 10.7 ± 1.7 μC, n=15 de hCx32) (p<0.001) y la
cantidad de ATP liberada son estadísticamente inferiores (20.7 ± 6.8
μC, n=10 de S26L vs 83.1 ± 19.7 μC, n=15 de hCx32) (p<0.05).
-40 mV
+80 mV
50 fmol ATP
200 nA
50 s
Summary
37
Figura S10 | Representación gráfica de las corrientes permitidas a través de los hemicanales de las mutaciones de hCx32 P87A (negro), Δ111-116 (rojo) y R220X (azul) cuando son despolarizados. Observamos que las corrientes son insignificantes comparadas con el WT (Figura S9). En este caso no se ha dispuesto la parte correspondiente a la liberación de ATP ya que esta no es detectable.
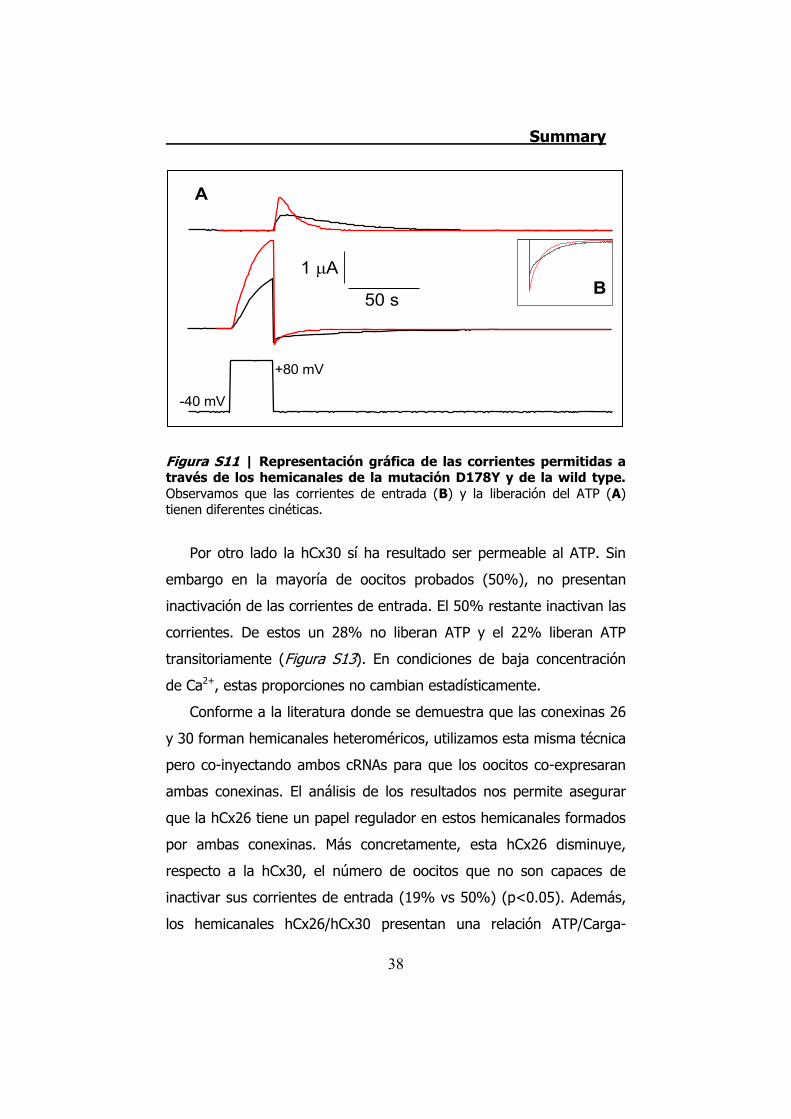
Por último, la mutación D178Y no presenta diferencias en cuanto
a los valores de las corrientes o del ATP liberado. Sin embargo, las
cinéticas de las corrientes de entrada y de la liberación del ATP son
diferentes (Figura S11). Esto queda demostrado al comprobar que los
valores de la constante de tiempo (���tiempo necesario para cerrar el
63.2% de la corriente), y el “Rise Time” del ATP (tiempo requerido
para el ATP para cambiar del 10% al 90% del máximo de la curva) son
diferentes (p<0.001 y p<0.01 respectivamente).
2. Conexina hCx26 y hCx30
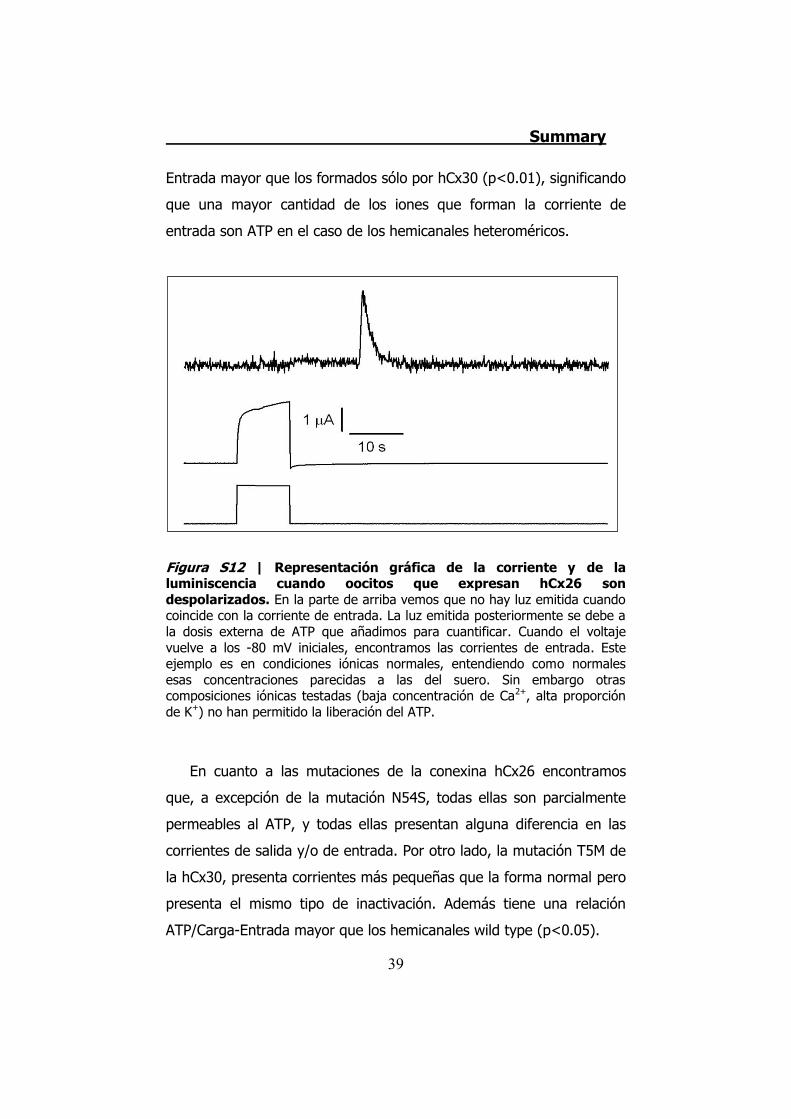
Para estudiar las corrientes y la permeabilidad para el ATP de
ambas conexinas utilizamos la técnica de TEVC de la misma manera
que la utilizamos para estudiar a la hCx32. Estos estudios demostraron
que la hCx26 no es permeable al ATP en ninguno de los potenciales de
membrana probados, ni en ninguno de los medios extracelulares
ensayados (diferentes concentraciones de Ca2+ y de K+) (Figura S12).
40 nA
20 s
-40 mV
+80 mV
Summary
38
Figura S11 | Representación gráfica de las corrientes permitidas a través de los hemicanales de la mutación D178Y y de la wild type. Observamos que las corrientes de entrada (B) y la liberación del ATP (A) tienen diferentes cinéticas.
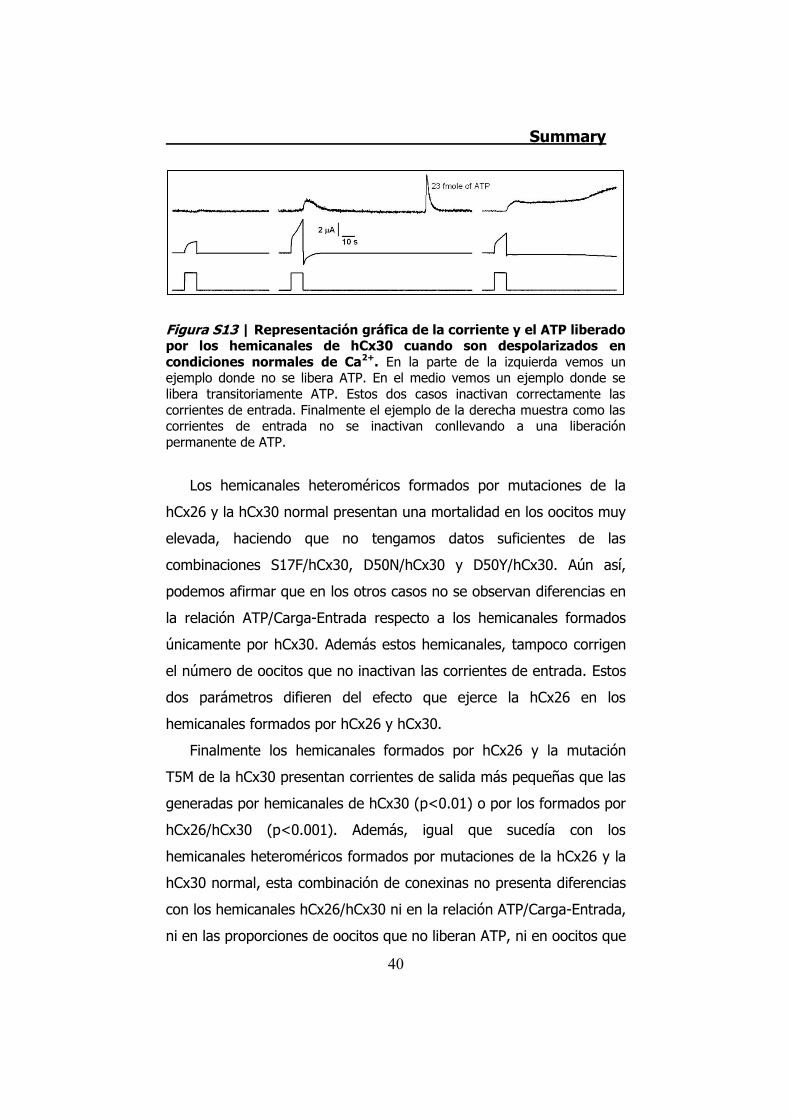
Por otro lado la hCx30 sí ha resultado ser permeable al ATP. Sin
embargo en la mayoría de oocitos probados (50%), no presentan
inactivación de las corrientes de entrada. El 50% restante inactivan las
corrientes. De estos un 28% no liberan ATP y el 22% liberan ATP
transitoriamente (Figura S13). En condiciones de baja concentración
de Ca2+, estas proporciones no cambian estadísticamente.
Conforme a la literatura donde se demuestra que las conexinas 26
y 30 forman hemicanales heteroméricos, utilizamos esta misma técnica
pero co-inyectando ambos cRNAs para que los oocitos co-expresaran
ambas conexinas. El análisis de los resultados nos permite asegurar
que la hCx26 tiene un papel regulador en estos hemicanales formados
por ambas conexinas. Más concretamente, esta hCx26 disminuye,
respecto a la hCx30, el número de oocitos que no son capaces de
inactivar sus corrientes de entrada (19% vs 50%) (p<0.05). Además,
los hemicanales hCx26/hCx30 presentan una relación ATP/Carga-
-40 mV
+80 mV
1 �A
50 s
A
B
Summary
39
Entrada mayor que los formados sólo por hCx30 (p<0.01), significando
que una mayor cantidad de los iones que forman la corriente de
entrada son ATP en el caso de los hemicanales heteroméricos.
Figura S12 | Representación gráfica de la corriente y de la luminiscencia cuando oocitos que expresan hCx26 son despolarizados. En la parte de arriba vemos que no hay luz emitida cuando coincide con la corriente de entrada. La luz emitida posteriormente se debe a la dosis externa de ATP que añadimos para cuantificar. Cuando el voltaje vuelve a los -80 mV iniciales, encontramos las corrientes de entrada. Este ejemplo es en condiciones iónicas normales, entendiendo como normales esas concentraciones parecidas a las del suero. Sin embargo otras composiciones iónicas testadas (baja concentración de Ca2+, alta proporción de K+) no han permitido la liberación del ATP.
En cuanto a las mutaciones de la conexina hCx26 encontramos
que, a excepción de la mutación N54S, todas ellas son parcialmente
permeables al ATP, y todas ellas presentan alguna diferencia en las
corrientes de salida y/o de entrada. Por otro lado, la mutación T5M de
la hCx30, presenta corrientes más pequeñas que la forma normal pero
presenta el mismo tipo de inactivación. Además tiene una relación
ATP/Carga-Entrada mayor que los hemicanales wild type (p<0.05).
Summary
40
Figura S13 | Representación gráfica de la corriente y el ATP liberado por los hemicanales de hCx30 cuando son despolarizados en condiciones normales de Ca2+. En la parte de la izquierda vemos un ejemplo donde no se libera ATP. En el medio vemos un ejemplo donde se libera transitoriamente ATP. Estos dos casos inactivan correctamente las corrientes de entrada. Finalmente el ejemplo de la derecha muestra como las corrientes de entrada no se inactivan conllevando a una liberación permanente de ATP.
Los hemicanales heteroméricos formados por mutaciones de la
hCx26 y la hCx30 normal presentan una mortalidad en los oocitos muy
elevada, haciendo que no tengamos datos suficientes de las
combinaciones S17F/hCx30, D50N/hCx30 y D50Y/hCx30. Aún así,
podemos afirmar que en los otros casos no se observan diferencias en
la relación ATP/Carga-Entrada respecto a los hemicanales formados
únicamente por hCx30. Además estos hemicanales, tampoco corrigen
el número de oocitos que no inactivan las corrientes de entrada. Estos
dos parámetros difieren del efecto que ejerce la hCx26 en los
hemicanales formados por hCx26 y hCx30.
Finalmente los hemicanales formados por hCx26 y la mutación
T5M de la hCx30 presentan corrientes de salida más pequeñas que las
generadas por hemicanales de hCx30 (p<0.01) o por los formados por
hCx26/hCx30 (p<0.001). Además, igual que sucedía con los
hemicanales heteroméricos formados por mutaciones de la hCx26 y la
hCx30 normal, esta combinación de conexinas no presenta diferencias
con los hemicanales hCx26/hCx30 ni en la relación ATP/Carga-Entrada,
ni en las proporciones de oocitos que no liberan ATP, ni en oocitos que
Summary
41
lo liberan transitoriamente ni en los oocitos que no inactivan sus
corrientes de entrada.
DISCUSIÓN 1. Conexina hCx32
Teniendo en cuenta que la enfermedad de Charcot Marie Tooh
ligada al cromosoma X está relacionada con mutaciones en la
Conexina 32, hemos investigado la relación que puede tener esta
proteína respecto a la permeabilidad para el ATP. El ATP puede
comportarse como una señal autocrina necesaria para mantener la
mielina. A lo largo de esta tesis hemos demostrado que la Cx32, ya
sea la humana como la de ratón o rata, es permeable al ATP. Esta
permeabilidad se da cuando los hemicanales son activados mediante
diferentes estímulos aplicados usando diferentes técnicas:
� Estímulo eléctrico: en nervio ciático de rata, en nervio
ciático de ratón y en oocitos de Xenopus laevis.
� Estímulo mecánico (presión o shock osmótico): en nervio
ciático de ratón, en fibras sueltas de nervio ciático de ratón
y en cultivos de células de Schwann.
� Estímulo químico (concentración baja de iones divalentes):
en nervio ciático de ratón.
Hemos utilizado la técnica del TEVC para comparar la hCx32 con
mutaciones de esta conexina que están relacionadas con la
enfermedad de Charcot-Marie-Tooth. Esta técnica nos ha permitido
determinar diferencias entre la forma normal de la hCx32 y las
mutaciones en diferentes parámetros. Las mutaciones P87A, Δ111-116
y R220X, forman hemicanales con una sensibilidad al voltaje diferente
al de la forma normal. Esto hace que estas formas mutadas no
Summary
42
permitan el paso de iones ni sean permeables al ATP en las mismas
condiciones que la forma normal. La mutación S26L forma
hemicanales que permiten el paso de iones de manera parecida a la
forma normal en cuanto a las corrientes de salida. Sin embargo,
cuando comparamos las corrientes de entrada y la permeabilidad al
ATP encontramos que en este caso están significativamente reducidas.
En último lugar los hemicanales formados por la mutación D178Y no
presentan diferencias ni en las corrientes ni en la cantidad de ATP
liberada. Sin embargo, estudiando las cinéticas de los hemicanales
formados por D178Y y los formados por la hCx32 normal,
encontramos que el valor de � de las corrientes de entrada y el “Rise
Time” del ATP son diferentes (p<0.001 y p<0.01 respectivamente).
Estas diferencias encontradas en cada una de las mutaciones
apoyan nuestra hipótesis de una liberación de ATP disminuida o
anómala en las células de Schwann y podría ser la causa de la
desmielinización de las fibras nerviosas.
2. Conexinas hCx26 y hCx30
Es posible que la permeabilidad a ATP sea una propiedad que
presentan todas las conexinas cuando forman hemicanales. En este
sentido, podría ser que otras conexinas en las que sus mutaciones
están ligadas a algunas enfermedades puedan presentar variaciones
en la forma y cantidad de ATP liberado. Las conexinas hCx26 y hCx30
están relacionadas con algunas formas de sordera congénita. Hemos
investigado mediante la misma metodología empleada para el estudio
de la hCx32, la relación entre activación dependiente de voltaje y la
liberación de ATP.
Hemos demostrado que, usando el estímulo eléctrico, los
hemicanales formados por hCx26 se abren y permiten el paso de
ciertos iones registrando corrientes de entrada y de salida. Sin
Summary
43
embargo, el ATP no se cuenta entre los iones que son liberados a
través de estos hemicanales.
La hCx30, en cambio, es permeable al ATP. Estos hemicanales, con
todo, no presentan inactivación de las corrientes de entrada en
muchos de los casos (50%). Este hecho y lo ya descrito en la
literatura, nos hizo pensar en la posibilidad de co-expresar ambas
conexinas (hCx26 y hCx30). En los registros obtenidos vemos una gran
reducción en el número de oocitos que no inactivan las corrientes de
entrada (19%) (p<0.05). Asimismo, la relación ATP/Carga-Entrada es
mayor que la de los hemicanales formados únicamente por hCx30.
De esta manera podemos afirmar que la hCx26, cuando forma
hemicanales heteroméricos con la hCx30, regula la inactivación y la
permeabilidad al ATP.
Las cinco mutaciones de hCx26 (G12R, S17F, D50N, D50Y y N54S)
también han sido estudiadas de la misma forma que la hCx26. Todas
con excepción de la N54S presentan liberación de ATP. Esta, sin
embargo, permite un paso mayor de iones que la hCx26. Esto respalda
la hipótesis de que una mala señalización purinérgica debida a una
liberación de ATP diferente a la normal, puede ser una de las razones
de la aparición de problemas auditivos cuando esta hCx26 está
mutada.
Cuando la mutación probada ha sido la de la hCx30 (T5M), esta,
aún presentando corrientes más pequeñas que la hCx30, libera el
mismo ATP, hecho que se traduce con una relación ATP/Carga-Entrada
mayor (p<0.05). Además en esta mutación las proporciones de oocitos
que no inactivan las corrientes son similares a las de la hCx30 normal.
En este caso vemos diferencias en el patrón de liberación de ATP
respecto a la forma normal de la hCx30. Esto también concuerda con
la hipótesis de la causa de la sordera.
Summary
44
Todas las mutaciones de hCx26 han sido estudiadas cuando
forman hemicanales heteroméricos con la forma normal de la hCx30,
así como la mutación T5M de la hCx30 ha sido estudiada formando
hemicanales heteroméricos con la forma normal de la hCx26.
Sorprendentemente, estas combinaciones incrementan la mortalidad
de los oocitos. Aún teniendo un número bajo de experimentos, hemos
podido demostrar que estas mutaciones no ejercen el mismo efecto en
la permeabilidad a los diferentes iones que ejerce la hCx26. Esto se
traduce en que estos hemicanales no reducen el porcentaje de oocitos
que no se inactivan. Además, estas mutaciones no reducen el valor de
la relación ATP/Carga-Entrada que sí reduce la hCx26 cuando forma
hemicanales con la hCx30. Estos datos también coinciden con la
hipótesis de la deficiente señalización purinérgica como un motivo
causante de la sordera, ya que la señal autocrina de supervivencia
estaría sensiblemente dañada.
CONCLUSIONES 1. Conexina hCx32
� Los nervios ciáticos, in vitro, liberan ATP, según los estímulos
aplicados
� La conexina 32 se localiza en las zonas paranodales de los
nódulos de Ranvier.
� La liberación de ATP se localiza en las zonas paranodales de los
nódulos de Ranvier.
� Las células de Schwann cultivadas expresan Cx32 de forma
constitutiva y liberan ATP frente a estímulos mecánicos.
Summary
45
� La Cx32 expresada in vitro en oocitos de Xenopus es
permeable al ATP al ser estimulados por pulsos cuadrados de
voltaje. Las mutaciones de hCx32 relacionadas con CMTX
(S26L, P87A, Δ111-116, D178Y y R220X) que se han estudiado
tienen inhibida su permeabilidad a ATP o alterado el curso
temporal de la liberación de ATP. La hCx26 no es permeable al
ATP frente a pulsos de voltaje.
2. Conexinas hCx26 y hCx30
�� La hCx26 no es permeable al ATP en el modelo utilizado
� La hCx30 es permeable al ATP pero en muchos casos la
corriente de entrada no se inactiva y queda permanentemente
activa.
� La hCx26 cuando forma hemicanales hereoméricos con la hCx30
reduce el número de oocitos con corrientes permanentemente
activadas y aumenta la permeabilidad al ATP
� Todas las mutaciones estudiadas de la hCx26 (G12R, S17F,
D50N, D50Y y N54S) liberan ATP exceptuando la N54S.
� Las mutaciones estudiadas de la hCx26 presentan diferencias en
las corrientes de entrada y/o salida, respecto a la hCx26 nativa.
� La mutación de la hCx30 (T5M) presenta corrientes más
pequeñas, aumenta la relación ATP/Carga-Entrada y conserva el
mismo tipo de inactivación que la hCx30 normal
� Las mutaciones de hCx26 y de hCx30 cuando forman
hemicanales heteroméricos con las formas normales de la
hCx30 y de la hCx26 respectivamente, no modifican la
inactivación de las corrientes de cola de hCx30 ni aumentan la
permeabilidad al ATP a diferencia de lo que hace la hCx26
normal.

46

47
Introduction

48

Introduction
49
The two main leading roles in this Thesis are Connexin
hemichannels and ATP release. In this introduction I will try to show
the relation within both and the implication that it could have in some
human disorders.

Introduction
50
1. Purinergic Signaling
Introduction
51
ATP is a well known molecule, which has been related to a wide
variety of different functions such as cellular homeostasis,
maintenance of ionic gradients, maintenance of pH in some organelles,
energetic storage, regulation of actin-myosin interaction, etc.
Moreover, ATP can act as a signaling molecule through P2X and P2Y
purinergic receptors.
As ATP is very hydrophilic, it is believed that it cannot cross the
plasma membrane, which has very hydrophobic moiety. That is why
one of the most accepted pathways for ATP release from cells is
through vesicular exocytosis. ATP may also cross the plasma
membrane through transporters and channels. Connexin hemichannels
could be responsible to release ATP, which could act as a signaling
molecule upon cells expressing purinergic receptors.
1.1 ATP as extracellular signal
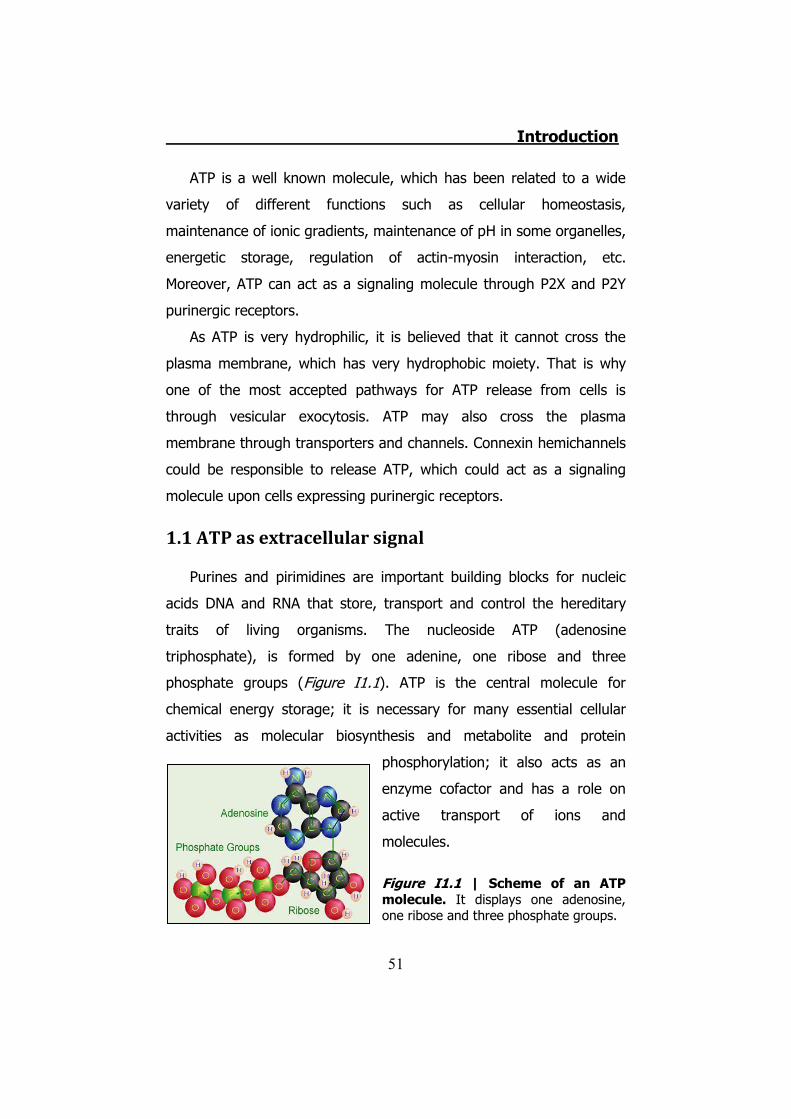
Purines and pirimidines are important building blocks for nucleic
acids DNA and RNA that store, transport and control the hereditary
traits of living organisms. The nucleoside ATP (adenosine
triphosphate), is formed by one adenine, one ribose and three
phosphate groups (Figure I1.1). ATP is the central molecule for
chemical energy storage; it is necessary for many essential cellular
activities as molecular biosynthesis and metabolite and protein
phosphorylation; it also acts as an
enzyme cofactor and has a role on
active transport of ions and
molecules.
Figure I1.1 | Scheme of an ATP molecule. It displays one adenosine, one ribose and three phosphate groups.
Introduction
52
But ATP can also act as a neurotransmitter. This hypothesis was
raised for the first time from Pamela Holton studies back in 1959 (5),
when her studies demonstrated the release of ATP when sensorial
nerves were stimulated. But it was Geoffrey Burnstock who, in 1972,
postulated ATP as the principal neurotransmitter in non-adrenergic,
non-cholinergic (NANC) neurons present in smooth muscle, giving
birth to the purinergic hypothesis (6) (7).
After these first studies, the role of ATP as a neurotransmitter has
been proven in the CNS (8) (9) (10), the PNS (11) and the autonomous
nervous system (6) (12). On the other hand, ATP has been considered a
mediator in other signaling pathways in epithelial cells (13), platelets (14)
and different cell lines (15).
1.2 Purinergic receptors
ATP and its metabolite, adenosine, are specifically recognized by
purinergic receptors. There are two main types of purinergic receptors,
P1 and P2 receptors (16). P1 receptors have a higher affinity for
adenosine than for ATP and modulate adenyl cyclase activity. P2
receptors have higher affinity for ATP and are related to phospholipase
C (PLC) activity and intracellular Ca2+ concentration.
Among the P2 purinergic receptors, with a higher affinity to ATP,
there are two main families of receptors: P2X and P2Y. P2X are
ionotropic receptors while P2Y receptors are metabotropic receptors
linked to G proteins (17).
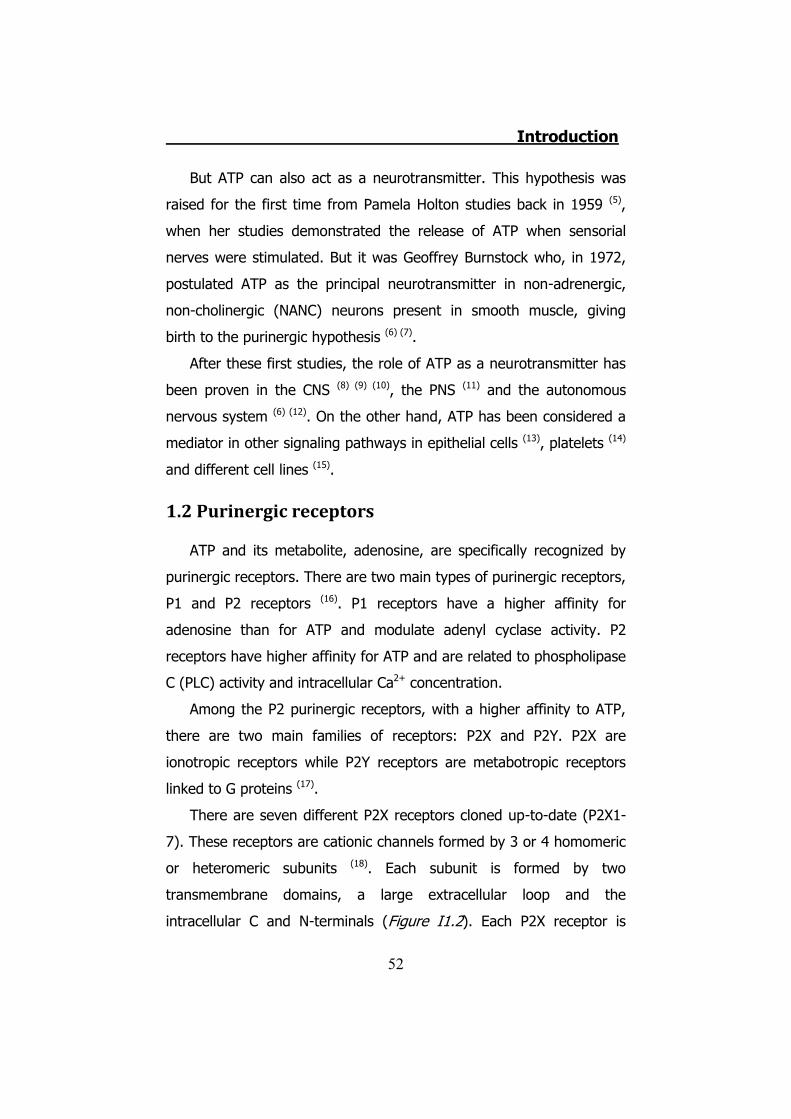
There are seven different P2X receptors cloned up-to-date (P2X1-
7). These receptors are cationic channels formed by 3 or 4 homomeric
or heteromeric subunits (18). Each subunit is formed by two
transmembrane domains, a large extracellular loop and the
intracellular C and N-terminals (Figure I1.2). Each P2X receptor is
Introduction
53
expressed in a wide variety of tissues and organs. In the PNS many
different P2X receptors are expressed with different distribution. P2X1 (19), P2X2 (20), P2X3 (21) and P2X4 (22) are expressed in spinal cord and
P2X7 is expressed in Schwann cells (23).
Figure I1.2 | Schematic view of a G-Protein coupled P2Y receptor and an ionotropic P2X receptor. It is thought that ATP binds in the extracellular domain, because it has been mapped in P2X7 (24). The physiological ligand for both receptors is ATP and its metabolites (1).
P2Y receptors, on the other
hand, have seven transmembrane domains with extracellular N-
terminus and cytoplasmatic C-terminus (Figure I1.2). All P2X receptors
specifically bind ATP but different P2Y receptors show different
affinities for ATP, ADP, UTP and UDP (25). Up to date, there are eight
different P2Y receptors cloned (P2Y1,2,4,6,11,12,13,14). While in CNS
P2Y receptors are located over the synaptic buttons, no important
roles in PNS have been described for these receptors, which have been
related to platelets aggregation, haematopoiesis and secretion
triggering in the respiratory system.
1.3 ATP release mechanisms
Although it was originally thought that, apart from the ATP
released from nerves, the main source of ATP to act on P2 receptors
was from damaged or dying cells, it is now known that ATP is released
Introduction
54
from many cell types, including glial cells, in response to mechanical
deformation, hypoxia or some agents (such as acetylcholine, ATP and
thrombin) which do not damage the cell. However, there is active
debate about the precise transport mechanism(s) involved in ATP
release (26).
ATP release mechanisms have been extensively studied during the
last decade and it is accepted that this molecule is released by
excitable cells and can act as a signaling molecule or neurotransmitter.
Subsequently, other evidences support the hypothesis that non
excitable cells can also release ATP in response to different stimuli
such as mechanical stimuli (27), stress (28), hypotonicity (29) (30) (31),
distension (32), high IP3 concentration (33) or low extracellular Ca2+
concentration (34).
The proposed mechanisms that would allow this ATP release are
diverse and require different organelles and proteins (35), including
exocytosis, CD39, connexin hemichannels, CFTR or anionic channels.
ATP is co-secreted with classic neurotransmitters in PNS and CNS
neurons. In other cells, like chromaffin cells, platelets, mastocytes and
cells from pancreatic acini (36), ATP is released together with
neurotransmitters and other messengers. In all these cases the ATP is
released via exocytosis of synaptic vesicles, chromaffin granules or
dense granules (36) (37) (38) (39).
Some studies support the idea that ABC binding cassette protein
family (CFTR and P glycoprotein are members of this family) functions
as ionic channels and allows ATP release (40) (41) (42) (43), but other
support the contrary (44) (45) (46). So the controversy is still open.
Many studies support the role of anionic channels in ATP release.
For example, anion channels blockers inhibit ATP release by
hypotonicity in a prostate cancer cell line (47), volume-regulated anion
Introduction
55
channels release ATP in a bovine aortic epithelia cell line (48) and
mammary cells from mice primary cultures or cell lines also release
ATP under hypotonic stimulus (49).
CD39 has also been described to be implicated in the release of
ATP when expressed in Xenopus oocytes and in response to
hyperpolarizing pulses (50). Moreover, CD39 expression on Xenopus
oocytes enhance the currents generated during ATP release,
suggesting that it could also be implicated in its release as well as ATP
degradation, as originally described (51).
Once the ATP has been released and has done its function, it must
be inactivated. It is usually done by enzymatic hydrolysis, which
generates adenosine and phosphate groups. There are different
enzymatic families that can extracellularly hydrolyze ATP: E-NTPDases
family, E-NPP family, alkaline phosphatase and ecto-5’-nucleotidase.
1.3.1 ATP release through connexins
ATP release regulated by connexins was suggested for the first
time by Cotrina et al (52). This work showed an ATP release
potentiation on cell lines transfected with connexins, and this
potentiation correlated with Ca2+ signaling.
ATP release is an important component of the propagation of Ca2+
waves in astrocytes (53) (54) and osteoblasts (55). It has been described in
this glial cells that this ATP release could be mediated by Cx43
hemichannels (27). ATP released by this connexin would activate P2
purinergic receptors of surrounding cells activating IP3 synthesis and
raising intracellular Ca2+ concentration, which would generate an
unknown signal that would open connexin, ATP would be released and
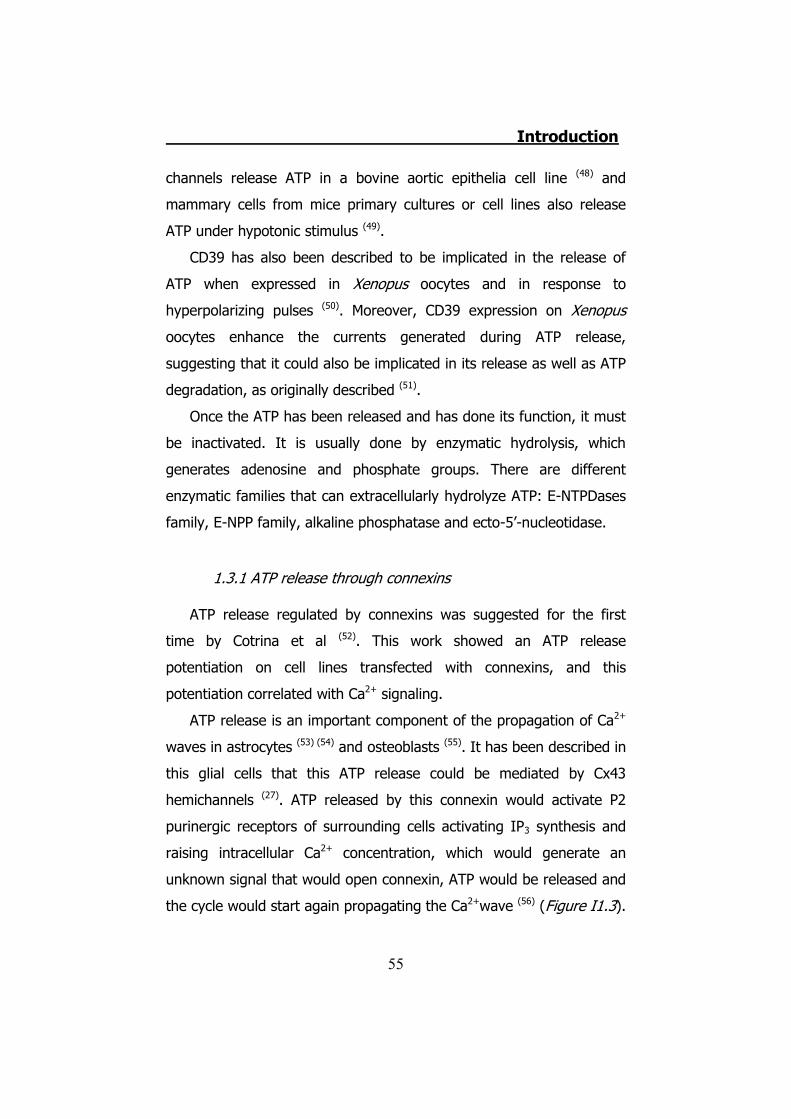
the cycle would start again propagating the Ca2+wave (56) (Figure I1.3).
Introduction
56
Figure I1.3 | ATP release through hemichannels and calcium waves propagation. A stimulus (e.g. shear stress) activates the phospholipase C, IP3 synthesis and intracellular calcium mobilization. It makes hemichannels open and ATP release. ATP binding to P2Y receptors from adjacent cells propagates the calcium wave (56).
This model of calcium wave propagation is supported by other
evidences that show that exogenous expression of connexins enhances
ATP release (54), and that ATP release induced by low extracellular
calcium is inhibited by hemichannels blockers.
Other works, however, support the idea that P2X7 and not Cx43
hemichannels, would be involved in the release of ATP amplifying Ca2+
waves in astrocytes (57) (58).
Besides these studies, evidences of possible ATP release through
hemichannels have been described in a wide range of cells like
osteoblasts under mechanical stimulation (59), bovine corneal epithelial
cells also after a mechanical stimulus (60), pigmentary epithelia of the
retina (61), mammal’s cochlea (62) and Xenopus laevis oocytes (4).
Introduction
57
1.4 Disorders related to ATP
1.4.1 Purinergic receptors
Most studies of the extracellular actions of ATP have been
concerned with the short-term events that occur in neurotransmission
and neuromodulation in the CNS, and the involvement of purinergic
signaling in these processes is now well established. However, purines
and pyrimidines can also have potent long-term (trophic) roles in cell
proliferation and growth, as well as in disease and cytotoxicity.
ATP can act as a growth and trophic factor, altering the
development of neurons and glia by regulating two important second
messengers: cytoplasmic Ca2+ and cAMP. Moreover, the release of ATP
by neural activity provides a mechanism that links functional activity in
neural circuits to growth and differentiation of cells in the nervous
system. Different effects, such as mitogenesis and apoptosis, might be
induced depending on the functional state of glial cells, the expression
of selective receptor subtypes, ectoenzymes controlling the availability
of ATP and Adenosine and the presence of multiple receptors on the
same cells (26).
Cellular damage can result in the release of large amounts of ATP
into the extracellular environment, which might be important for
triggering cellular responses to trauma. Purinergic receptors have at
this point an important role in CNS repair. In vivo, ATP released from
astrocytes is essential for mediating the injury-induced defensive
responses of microglia, establishing a potential barrier between the
healthy and injured tissue. Following neuronal injury, ATP can also act
in combination with fibroblast, epidermal and platelet derived growth
factors, as well as nerve growth factor (NGF) from both neurons and
glial cells to stimulate astrocyte proliferation, contributing to the
Introduction
58
process of reactive astrogliosis and to hypertrophic/hyperplastic
responses (63) (26) (64).
Another role of the ATP related to diseases is the function of P2X7
receptor in the killing of intracellular pathogens by macrophages, in
inflammatory responses and in bone homeostasis. Activation of P2X7
opens a cation-selective channel allowing an influx of Ca2+ and Na+
and efflux of K+. Prolonged exposure to ATP induces a second
permeability state (dilated channel or pore hypothesis), which allows
the influx of larger cations such as ethidium+ (314 Da) or YO-PRO-12+
(375 Da). Activation of this receptor initiates a cascade of downstream
signaling events such as the stimulation of PLD and the subsequent
killing of Mycobacteria and Chlamydiae. Three loos-of-function
polymorphysims have been identified in the ATP-binding site of the
extracellular loop of the P2X7 receptor (24).
Growing evidence indicates the involvement of ATP and purinergic
receptors in the pathogenesis of lung diseases. There are many in
vitro and in vivo studies that suggest a role of adenosine as a
modulator in the inflammatory airway diseases such as asthma. These
include the ability of adenosine to enhance or directly evoke mediator
release from mast cells and dendritic cells to inhibit degranulation and
superoxide anion release of eosinophils. Allergen challenge causes
acute accumulation of ATP in the airways of asthmatic subjects and
mice with experimentally induced asthma. Eosinophilic airway
inflammation, Th2 cytokine production and bronchial hyperreactivity
were abrogated when lung ATP levels were neutralized using apyrase
or when mice were treated with a P2 receptor antagonist. Inhibition of
adenosine A2B receptors can prevent the development of pulmonary
inflammation, airspace enlargement and airway fibrosis in the lung of
mice suffering from genetic deficiency of adenosine deaminase (ADA)
Introduction
59
activity. Substantial preclinical evidence suggests that targeting of
adenosine receptors may provide novel approaches for the treatment
of asthma and chronic obstructive pulmonary disease (COPD). COPD is
a multicomponent disease characterized by emphysema and/or chronic
bronchitis. There are evidences of an ATP involvement in COPD and
lung emphysema, although is not well described (65).
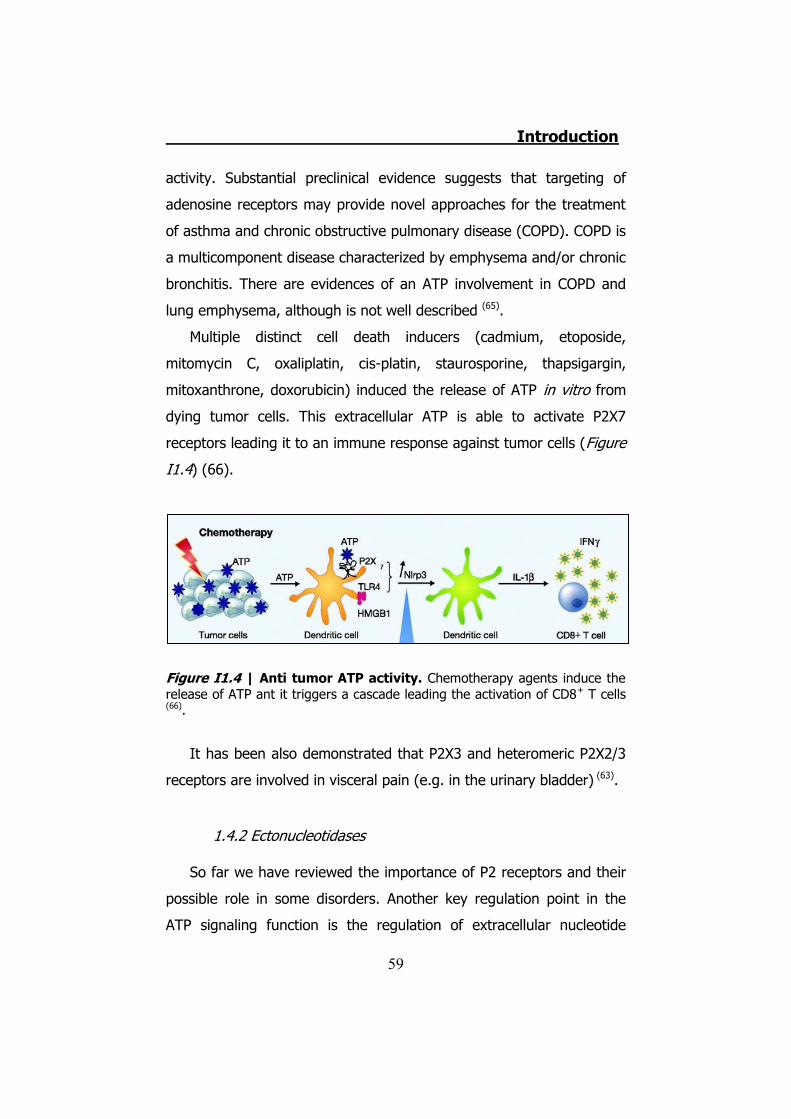
Multiple distinct cell death inducers (cadmium, etoposide,
mitomycin C, oxaliplatin, cis-platin, staurosporine, thapsigargin,
mitoxanthrone, doxorubicin) induced the release of ATP in vitro from
dying tumor cells. This extracellular ATP is able to activate P2X7
receptors leading it to an immune response against tumor cells (Figure
I1.4) (66).
Figure I1.4 | Anti tumor ATP activity. Chemotherapy agents induce the release of ATP ant it triggers a cascade leading the activation of CD8+ T cells (66).
It has been also demonstrated that P2X3 and heteromeric P2X2/3
receptors are involved in visceral pain (e.g. in the urinary bladder) (63).
1.4.2 Ectonucleotidases
So far we have reviewed the importance of P2 receptors and their
possible role in some disorders. Another key regulation point in the
ATP signaling function is the regulation of extracellular nucleotide
Introduction
60
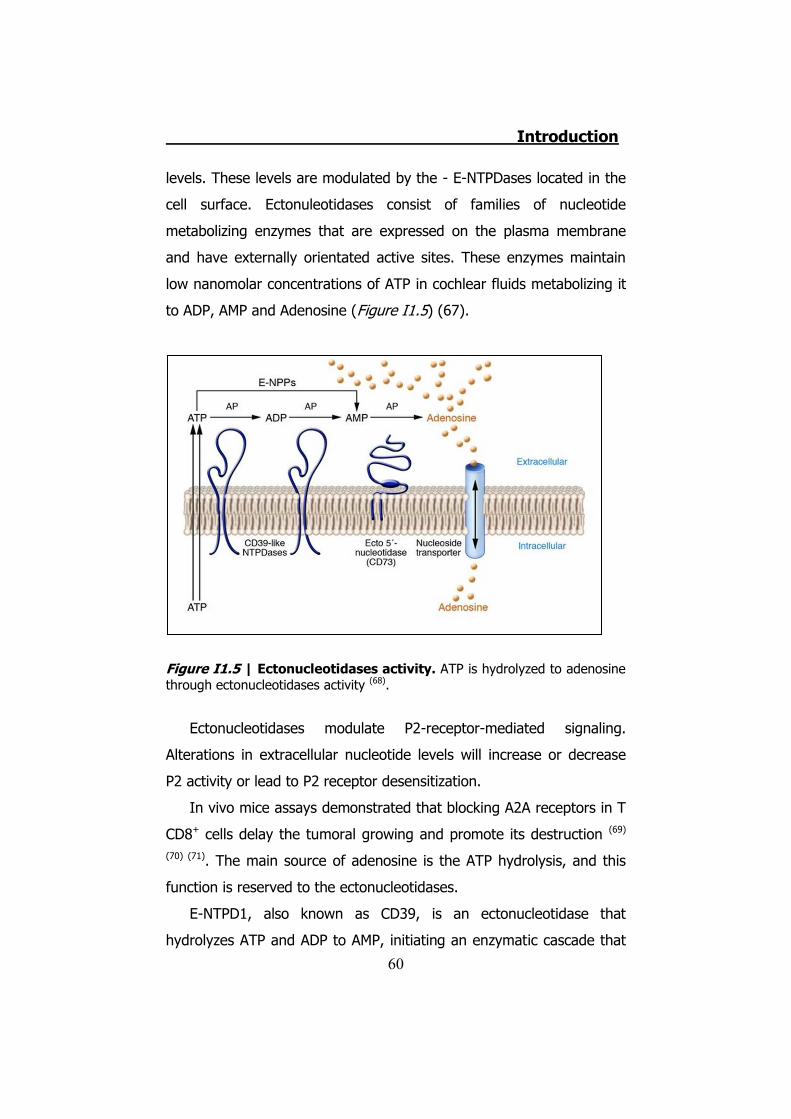
levels. These levels are modulated by the - E-NTPDases located in the
cell surface. Ectonuleotidases consist of families of nucleotide
metabolizing enzymes that are expressed on the plasma membrane
and have externally orientated active sites. These enzymes maintain
low nanomolar concentrations of ATP in cochlear fluids metabolizing it
to ADP, AMP and Adenosine (Figure I1.5) (67).
Figure I1.5 | Ectonucleotidases activity. ATP is hydrolyzed to adenosine through ectonucleotidases activity (68).
Ectonucleotidases modulate P2-receptor-mediated signaling.
Alterations in extracellular nucleotide levels will increase or decrease
P2 activity or lead to P2 receptor desensitization.
In vivo mice assays demonstrated that blocking A2A receptors in T
CD8+ cells delay the tumoral growing and promote its destruction (69)
(70) (71). The main source of adenosine is the ATP hydrolysis, and this
function is reserved to the ectonucleotidases.
E-NTPD1, also known as CD39, is an ectonucleotidase that
hydrolyzes ATP and ADP to AMP, initiating an enzymatic cascade that
Introduction
61
leads to the generation of adenosine. E-NTPD1 is present in glomeruli,
afferent arterioles, and larger vessels of the kidney and polymorphisms
in his gene have been related to diabetes and End-Stage renal disease
in African Americans (72).
Until now these E-NTPD1 polymorphisms are the only mutations
described in ectonucleotidases and have not been studied to know
where the failure is. Although this enzyme has been related to
different disorders such cancer, diabetes, renal failure, etcetera; no
ATP disorder has been associated with ectonucleotidases.
1.4.3 ATP release
Glutamate and extracellular ATP in the CNS have been related to
Ca2+ waves. Both ATP and glutamate are gliotransmitters through
which astrocytes can actively regulate synaptic transmission. ATP
differs from glutamate in that it inhibits rather than potentiates
synaptic transmission. The opposing actions of astrocytic glutamate
and ATP represent a means by which astrocytes can dynamically
modulate neuronal activity by releasing distinct transmitters, which can
either excite or inhibit synaptic transmission. Therefore dysfunctional
astrocytes in certain pathological conditions could result in an
imbalance in neuronal excitability, leading to excess neuronal
excitation, such as in epilepsy (73).
Because ATP signaling is a key step in visceral pain, therapeutic
approaches are being considered, including the development of agents
that control the expression of P2 receptors and those that enhance
ATP breakdown; but not in the ATP release mechanisms (63).
We can conclude that purinergic signaling is a clear target for
therapeutics in different medical fields. Furthermore, while it is now
clear that many different cell types release ATP physiologically in
Introduction
62
response to mechanical distortion, hypoxia, CO2, pH, Ca2+ levels and
various agents, we still await clear understanding of the mechanisms
that underlie ATP transport. Hopefully, when this will become clearer,
agents would be developed that will be able to inhibit ATP release,
another useful way forward as a therapeutic strategy.
According to that we addressed our efforts to understand the role
of different connexins in ATP release.

Introduction
63
2. Connexins
Introduction
64
2.1 Connexin genetics and structure
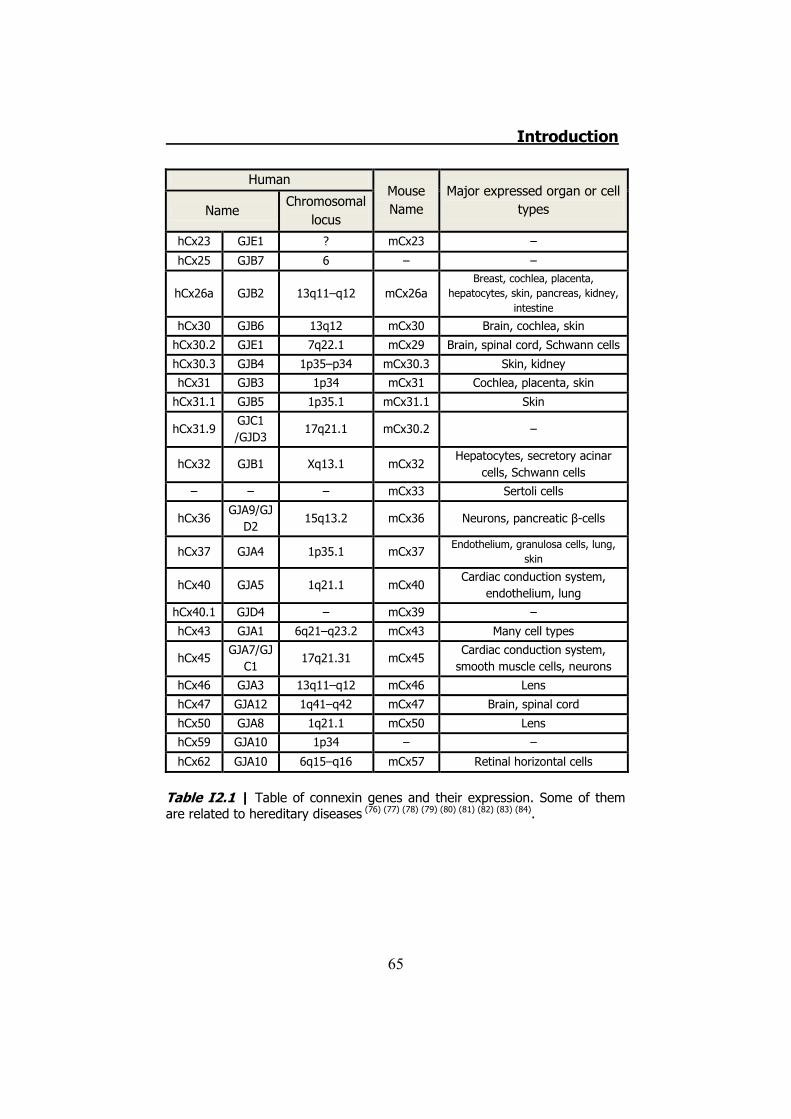
21 human genes and 20 mouse genes for connexins have been
identified till now. Each connexin is expressed in specific tissues or cell
types and many cell types express more than one connexin (Table
I2.1). Even in the same tissue, the expression pattern of each
connexin shows cell-type specificity and developmental changes,
suggesting a tight control mechanism for the regulation of connexins
expression. Connexin expression can be regulated during transcription,
RNA processing, transport and localization, translation, mRNA
degradation and protein activity control. However, transcriptional
control is the most important.
Connexin genes are translated to proteins that form hexameric
structures in the plasma membrane called hemichannels or connexons,
building a central pore that permit the passage of ions and small
molecules between cytoplasm and extracellular surroundings. Different
connexins are designated by “Cx” plus the molecular weight or the use
of Greek letters for different connexin subgroups based on similarities
in the cytoplasmic loop (74). Connexin proteins have four
transmembrane domains that allow them to be anchored in the plasma
membrane. Carboxy and amino ends are cytoplasmic and the carboxy
terminus interacts with other proteins (75). The two extracellular loops
are highly conserved and necessary for docking of two hemichannels
of adjacent cells to form gap junctions (Figure I2.1).
Introduction
65
Human Mouse Name
Major expressed organ or cell types Name
Chromosomal locus
hCx23 GJE1 ? mCx23 –
hCx25 GJB7 6 – –
hCx26a GJB2 13q11–q12 mCx26a Breast, cochlea, placenta,
hepatocytes, skin, pancreas, kidney, intestine
hCx30 GJB6 13q12 mCx30 Brain, cochlea, skin
hCx30.2 GJE1 7q22.1 mCx29 Brain, spinal cord, Schwann cells
hCx30.3 GJB4 1p35–p34 mCx30.3 Skin, kidney
hCx31 GJB3 1p34 mCx31 Cochlea, placenta, skin
hCx31.1 GJB5 1p35.1 mCx31.1 Skin
hCx31.9 GJC1 /GJD3
17q21.1 mCx30.2 –
hCx32 GJB1 Xq13.1 mCx32 Hepatocytes, secretory acinar
cells, Schwann cells – – – mCx33 Sertoli cells
hCx36 GJA9/GJ
D2 15q13.2 mCx36 Neurons, pancreatic β-cells
hCx37 GJA4 1p35.1 mCx37 Endothelium, granulosa cells, lung,
skin
hCx40 GJA5 1q21.1 mCx40 Cardiac conduction system,
endothelium, lung
hCx40.1 GJD4 – mCx39 –
hCx43 GJA1 6q21–q23.2 mCx43 Many cell types
hCx45 GJA7/GJ
C1 17q21.31 mCx45
Cardiac conduction system, smooth muscle cells, neurons
hCx46 GJA3 13q11–q12 mCx46 Lens
hCx47 GJA12 1q41–q42 mCx47 Brain, spinal cord
hCx50 GJA8 1q21.1 mCx50 Lens
hCx59 GJA10 1p34 – –
hCx62 GJA10 6q15–q16 mCx57 Retinal horizontal cells
Table I2.1 | Table of connexin genes and their expression. Some of them are related to hereditary diseases (76) (77) (78) (79) (80) (81) (82) (83) (84).
Introduction
66
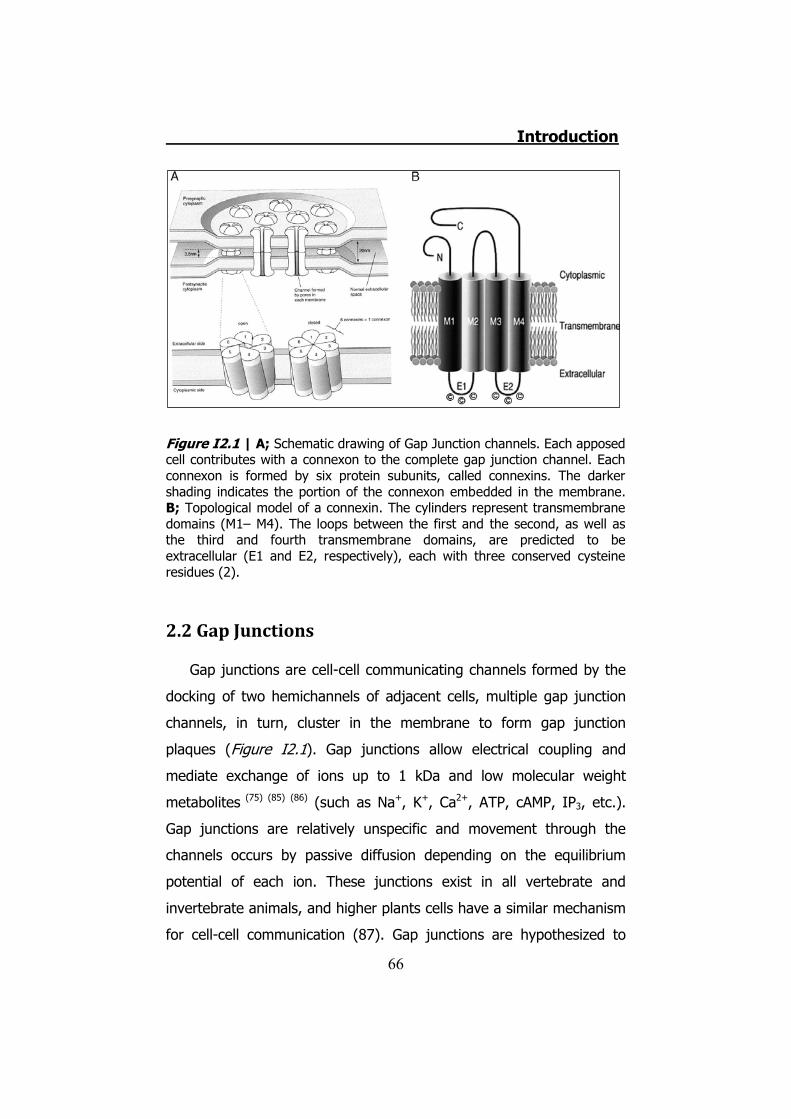
Figure I2.1 | A; Schematic drawing of Gap Junction channels. Each apposed cell contributes with a connexon to the complete gap junction channel. Each connexon is formed by six protein subunits, called connexins. The darker shading indicates the portion of the connexon embedded in the membrane. B; Topological model of a connexin. The cylinders represent transmembrane domains (M1– M4). The loops between the first and the second, as well as the third and fourth transmembrane domains, are predicted to be extracellular (E1 and E2, respectively), each with three conserved cysteine residues (2).
2.2 Gap Junctions
Gap junctions are cell-cell communicating channels formed by the
docking of two hemichannels of adjacent cells, multiple gap junction
channels, in turn, cluster in the membrane to form gap junction
plaques (Figure I2.1). Gap junctions allow electrical coupling and
mediate exchange of ions up to 1 kDa and low molecular weight
metabolites (75) (85) (86) (such as Na+, K+, Ca2+, ATP, cAMP, IP3, etc.).
Gap junctions are relatively unspecific and movement through the
channels occurs by passive diffusion depending on the equilibrium
potential of each ion. These junctions exist in all vertebrate and
invertebrate animals, and higher plants cells have a similar mechanism
for cell-cell communication (87). Gap junctions are hypothesized to
Introduction
67
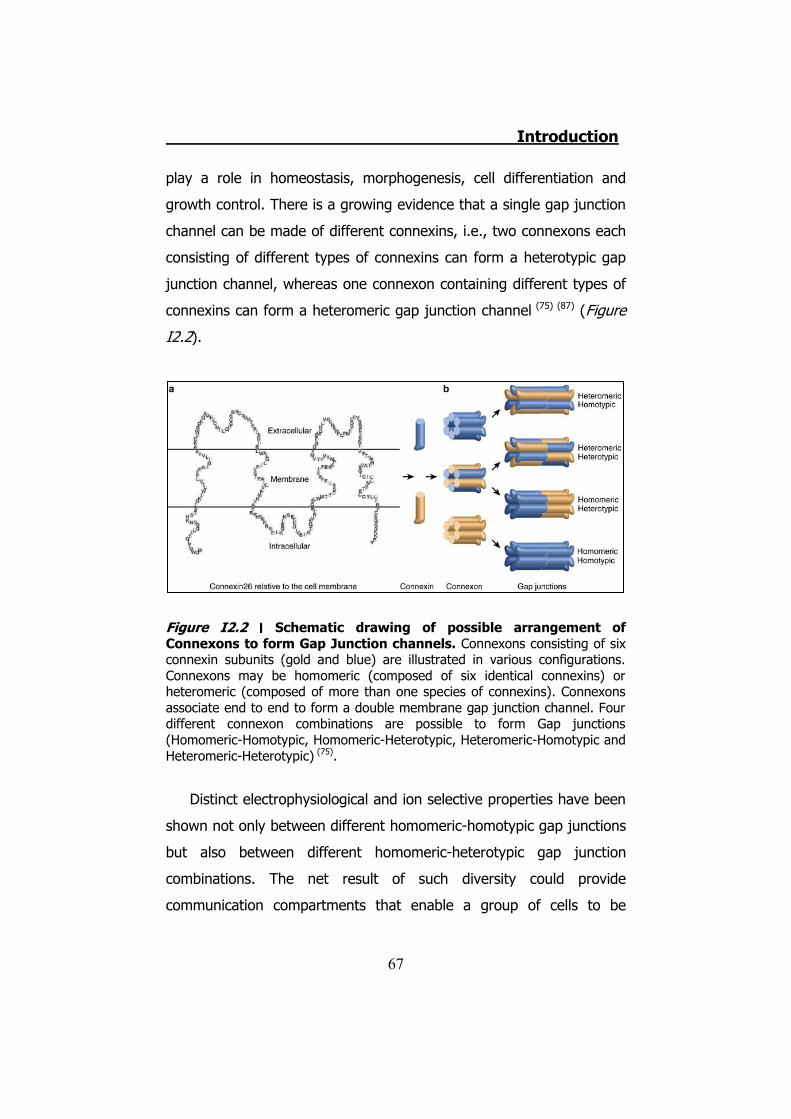
play a role in homeostasis, morphogenesis, cell differentiation and
growth control. There is a growing evidence that a single gap junction
channel can be made of different connexins, i.e., two connexons each
consisting of different types of connexins can form a heterotypic gap
junction channel, whereas one connexon containing different types of
connexins can form a heteromeric gap junction channel (75) (87) (Figure
I2.2).
Figure I2.2 ׀ Schematic drawing of possible arrangement of Connexons to form Gap Junction channels. Connexons consisting of six connexin subunits (gold and blue) are illustrated in various configurations. Connexons may be homomeric (composed of six identical connexins) or heteromeric (composed of more than one species of connexins). Connexons associate end to end to form a double membrane gap junction channel. Four different connexon combinations are possible to form Gap junctions (Homomeric-Homotypic, Homomeric-Heterotypic, Heteromeric-Homotypic and Heteromeric-Heterotypic) (75).
Distinct electrophysiological and ion selective properties have been
shown not only between different homomeric-homotypic gap junctions
but also between different homomeric-heterotypic gap junction
combinations. The net result of such diversity could provide
communication compartments that enable a group of cells to be
Introduction
68
regulated by changes in the concentration of a specific second
messenger or metabolite (83) (75) (87) (88) (89).
2.3 Hemichannels
At first it was thought that opening of hemichannels would kill cells
through loss of metabolites, collapse of ionic gradients and influx of
Ca2+, however, recent findings indicate that non-junctional
hemichannels can open under both physiological and pathological
conditions, and that opening is functional or deleterious depending on
situation (90). The first evidence of hemichannel opening was when
Paul et al. (91) found that expressing Cx46 in Xenopus oocytes resulted
in membrane depolarization and eventual cell death unless the
extracellular medium contained high Ca2+ levels. Since then, further
evidence of hemichannels activity has been described in other
connexins (92) (93). Hemichannel activity has also been related to calcium
waves and ATP release, suggesting that astrocytes release ATP
through Cx43 hemichannels and that stimulates purinergic receptors in
surrounding astrocytes, which would raise intracellular Ca2+ levels of
these cells propagating the Ca2+ wave (94) (27) (52). Other evidences for
hemichannel functions are studies in which ATP release was reported
to correlate with connexin expression (95), and it is blocked by
Flufenamic Acid (FFA) (52), which inhibits both hemichannels and gap
junctions.
Many mechanisms regulating hemichannels open and close state
have been described, and they depend on each connexin:
phosphorilation state (96), mechanical stimulus (97) (98), extracellular Ca2+
levels (99), presence of quinine (52), membrane potential (100), PCO2 (101)
(102) or pH (103).
Introduction
69
2.4 Connexin voltage sensitivity
Gap junctions exhibit a complex channel sensitivity, the
transjunctional conductance (Gj) of most of them is sensitive to
transjunctional voltage (Vj, the voltage difference between two cell
interiors coupled by gap junctions), but many are also sensitive to
membrane potential (Vm, a cell absolute inside-outside voltage). It is
hypothesized that this dual voltage regulation is due to the existence
of two different gates, each of which specifically senses one type of
voltage (104). The Gj of most homotypic connexin channels is typically
maximal at Vj=0 (Gjmax), and it decreases symmetrically for positive
and negative Vj pulses to non-zero conductance values. Transitions
between the main open state and the closed state could be either fast
or slow. Accordingly, these two gating processes have been termed
‘‘fast Vj-gating’’ and ‘‘slow Vj-gating’’ respectively. Little is known about
the mechanisms responsible for slow Vj-gating but there are proofs
that the C-terminal domain is involved in the fast Vj gating, as it is
abolished when this domain is truncated (105) or fused to a large
molecule like GFP (106), and it is recovered when truncated connexins
are co-expressed with C-terminals domains (107). It is hypothesized that
the fast Vj gating can be explained by the “ball-and-chain” model
(Figure I2.3), where the displacement of the C-terminal domain
toward the inner mouth of the channel pore would physically close the
pore, a model that had already been proposed for the closing state
triggered by pH (108), insulin and IGFs (109). Nanometric data using AFM
also support this model (110).
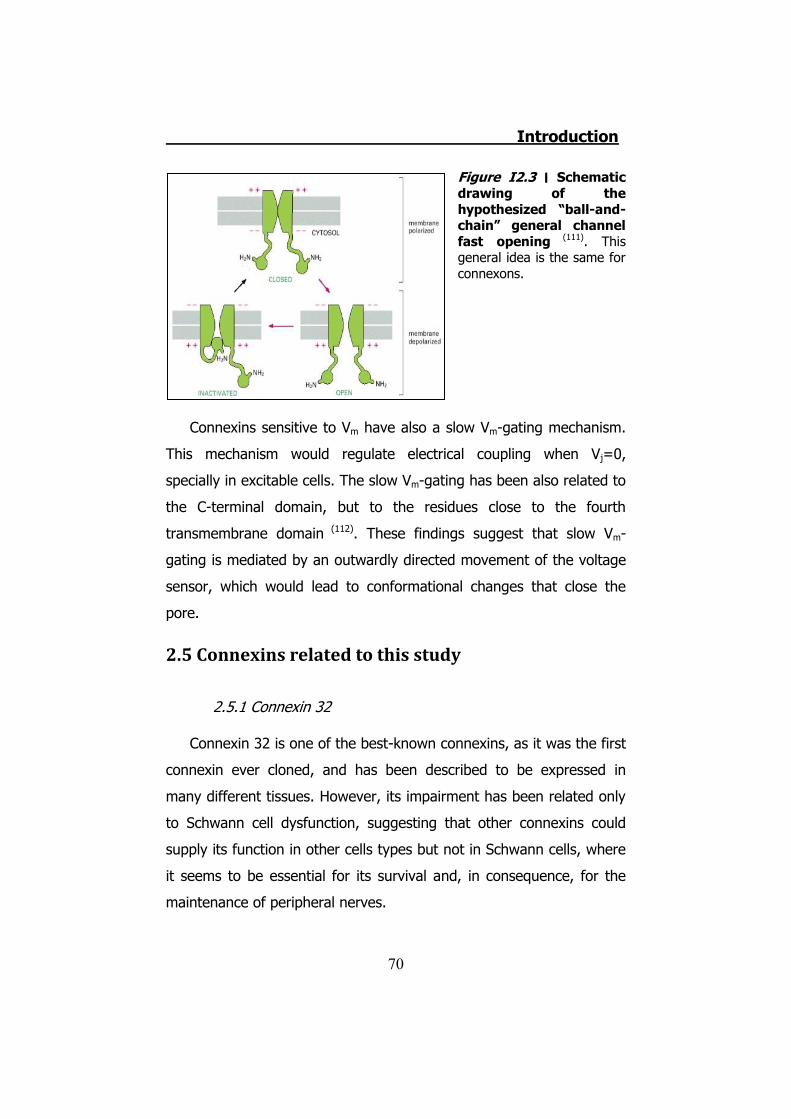
Introduction
70
Figure I2.3 ׀ Schematic drawing of the hypothesized “ball-and-chain” general channel fast opening (111). This general idea is the same for connexons.
Connexins sensitive to Vm have also a slow Vm-gating mechanism.
This mechanism would regulate electrical coupling when Vj=0,
specially in excitable cells. The slow Vm-gating has been also related to
the C-terminal domain, but to the residues close to the fourth
transmembrane domain (112). These findings suggest that slow Vm-
gating is mediated by an outwardly directed movement of the voltage
sensor, which would lead to conformational changes that close the
pore.
2.5 Connexins related to this study
2.5.1 Connexin 32
Connexin 32 is one of the best-known connexins, as it was the first
connexin ever cloned, and has been described to be expressed in
many different tissues. However, its impairment has been related only
to Schwann cell dysfunction, suggesting that other connexins could
supply its function in other cells types but not in Schwann cells, where
it seems to be essential for its survival and, in consequence, for the
maintenance of peripheral nerves.
Introduction
71
2.5.2 Connexin 26 and Connexin 30
Severe deafness or hear impairment is the most prevalent sensory
disorder affecting about 1 in 1000 children (113) (114). Hearing loss has
been related to five different connexins, Cx26, Cx30, Cx30.3, Cx31 and
Cx43, but Cx26 mutations represent about 35-45% of all congenital
sensorineural hearing loss (114) (115). However Cx26 and Cx30 are the
two main expressed connexins in the inner ear. These two connexins
are localized in the spiral limbus, the spiral ligaments, the supporting
cells of the organ of Corti and the stria vascularis (85). In addition, the
lack of Cx26 gene (gjb2) is known to be embryonic-lethal, indicating
that these connexin has an essential role during development (116).
2.5.3 Xenopus laevis connexins
Until now, four different connexins have been described in
Xenopus laevis: Cx43 (117), Cx38 (118), Cx30 (119) and Cx41 (120). But of
these four only Cx38 is expressed in oocytes (that is why is called a
maternal connexin).
2.5.4 Pannexins
Similarly to the connexin family, another molecular family has been
related with gap junction formation: The pannexin/innexin superfamily
(121). Innexins have been described as the gap junctions of
invertebrates and, while connexins have been found only in chordates,
the pannexin presence has been described both in chordates and
invertebrates genomes (121). Although connexins and pannexins have
very different primary structures (121) (122) (123), their topology is similar,
with four transmembrane domains and the C and N-terminal
cytoplasmatic domains (122) (Figure I2.4).
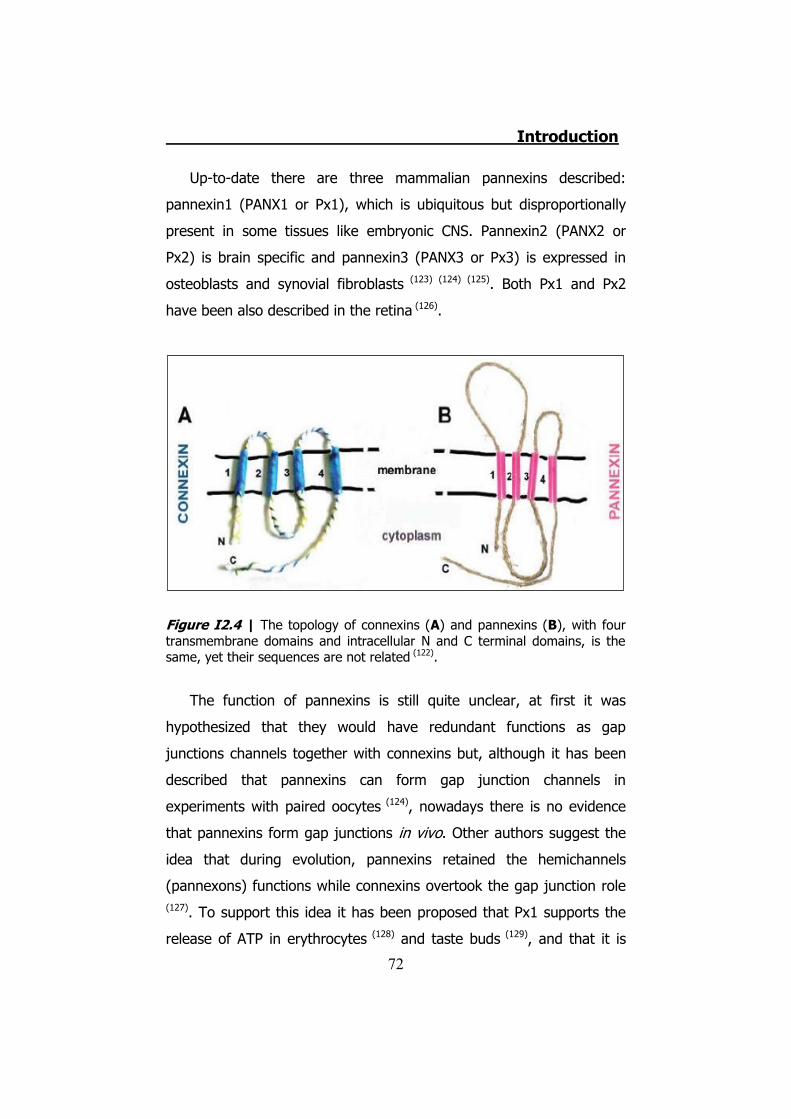
Introduction
72
Up-to-date there are three mammalian pannexins described:
pannexin1 (PANX1 or Px1), which is ubiquitous but disproportionally
present in some tissues like embryonic CNS. Pannexin2 (PANX2 or
Px2) is brain specific and pannexin3 (PANX3 or Px3) is expressed in
osteoblasts and synovial fibroblasts (123) (124) (125). Both Px1 and Px2
have been also described in the retina (126).
Figure I2.4 | The topology of connexins (A) and pannexins (B), with four transmembrane domains and intracellular N and C terminal domains, is the same, yet their sequences are not related (122).
The function of pannexins is still quite unclear, at first it was
hypothesized that they would have redundant functions as gap
junctions channels together with connexins but, although it has been
described that pannexins can form gap junction channels in
experiments with paired oocytes (124), nowadays there is no evidence
that pannexins form gap junctions in vivo. Other authors suggest the
idea that during evolution, pannexins retained the hemichannels
(pannexons) functions while connexins overtook the gap junction role
(127). To support this idea it has been proposed that Px1 supports the
release of ATP in erythrocytes (128) and taste buds (129), and that it is
Introduction
73
also responsible for the ion fluxes deregulation produced during
neuronal ischemia that lead to neuronal death (130). Recent studies
have also related Px1 with the large pore pathway described for P2X7
purinergic receptors in macrophages, which appears later than the ion
channel selective current for small cations (as Ca2+) that would be
generated by the receptor itself, after an inflammatory stimuli (131) (132).
There are also experimental evidences suggesting that pannexins
could also work in synergy with metabotropic P2Y purinergic receptors
to support the ATP induced ATP release (133) (134).
Introduction
74
3. Connexins and Diseases
Introduction
75
At least eight different Connexin genes mutations have been
implicated in hereditary human disorders. Different connexins can
cause the same disease and, in the other way, different mutations in
the same gene are able to origin different sickness.
Cx26, Cx30, Cx31, Cx32 and Cx43 have been associated to cause
in somehow different degrees of hearing impairment (135) (136) (137) (138)
(139) (140).
Different skin disorders have been linked to other connexins.
Keratopachydermia, Keratitis-ichthyosis-deafness syndrome (KID),
Erythrokeratodermia variabilis, Palmoplantar keratoderma with
deafness, Vohwinkel syndrome, Bart-Pumphrey syndrome, Hydrotic
ectodermal dysplasia (Clouston syndrome) and Hystrix-like Ichthyosis-
deafness syndrome are skin hereditary disorders associated to
mutations in Cx26, Cx30, Cx30.3 or Cx31 (136) (138) (115) (141).
Cx29 has been demonstrated to be highly expressed in Schwann
cells surrounding cochlear nerves becoming indispensable for normal
cochlear functions (142).
Charcot–Marie-Tooth as we describe below is the most prevalent
inherited neuropathy (143) (144). The X-linked form is caused to different
mutations in the gjb1 gene that encodes for the Cx32 protein (136) (138).
Mutations in human connexin genes have been shown to be
related to cataracts. Cx43, Cx46 and Cx50 are expressed in lens. Cx43
has been linked to Oculodentodigital dysplasia (136) (145), and Cx46 as
well as Cx50 have been demonstrated that mutations in their genes
cause Congenital Cataracts (136) (138) (146).
Mutations in the gene encoding Cx47 have been attributed to
Pelizaeus-Merzbacher-like disease, a defective myelination disorder
(115).

Introduction
76
Finally, mutations in the gene encoding Cx40 and Cx50 have been
proposed to be linked to Atrial fibrillation (147) and Schizophrenia
respectively (148).
Introduction
77
4. Charcot-Marie-Tooth Disease
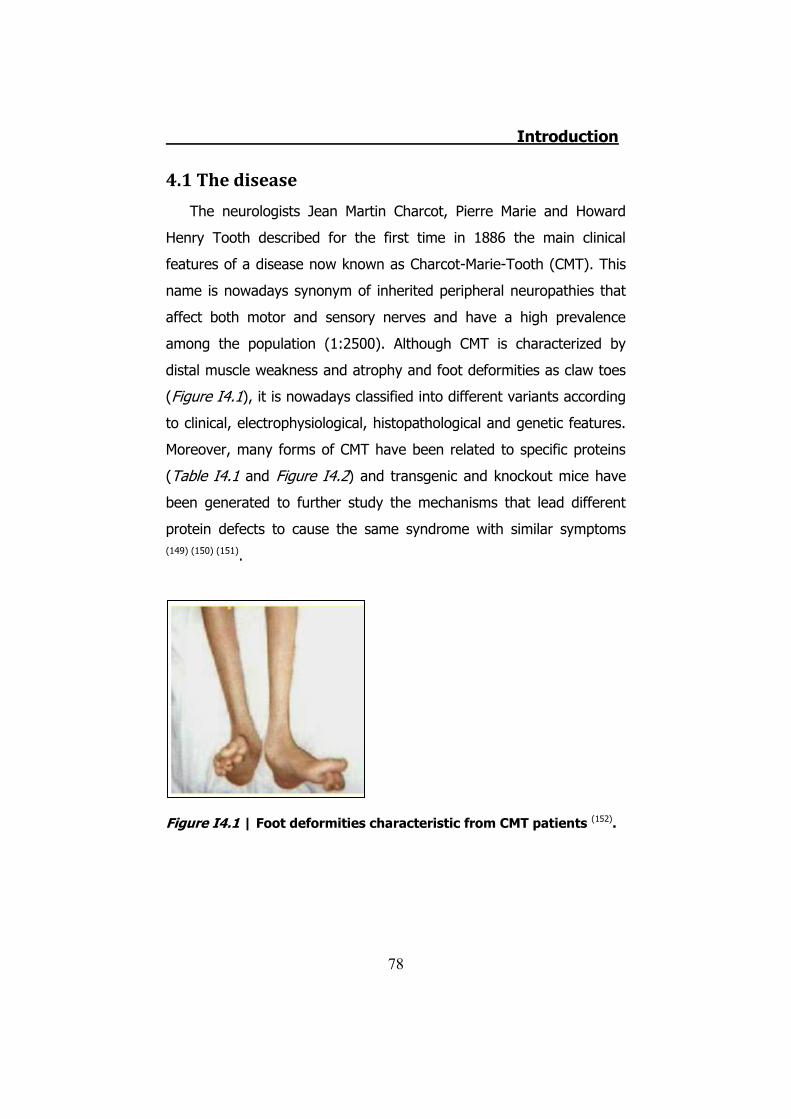
Introduction
78
4.1 The disease
The neurologists Jean Martin Charcot, Pierre Marie and Howard
Henry Tooth described for the first time in 1886 the main clinical
features of a disease now known as Charcot-Marie-Tooth (CMT). This
name is nowadays synonym of inherited peripheral neuropathies that
affect both motor and sensory nerves and have a high prevalence
among the population (1:2500). Although CMT is characterized by
distal muscle weakness and atrophy and foot deformities as claw toes
(Figure I4.1), it is nowadays classified into different variants according
to clinical, electrophysiological, histopathological and genetic features.
Moreover, many forms of CMT have been related to specific proteins
(Table I4.1 and Figure I4.2) and transgenic and knockout mice have
been generated to further study the mechanisms that lead different
protein defects to cause the same syndrome with similar symptoms
(149) (150) (151).
Figure I4.1 | Foot deformities characteristic from CMT patients (152).

Introduction
79
Gene symbol Chromosome Major mutations Mouse models
PMP22 17p13-p12
CMT1A PNPP DSS
CMT and deafness
Tr, TrJ, tg, tg(tTA)
MPZ 1q22 CMT1B
DSS CH
KO, tg
PRX 19q13.1-q13.2 CMT4F DSS KO
gjb1 Xq13.1 CMTX KO MTMR2 11q22 CMT4B
NDRG1, Proxy1 8q24.3 HMSNL KIF1B 1p36.2 CMT2A KO NFL 8p21 CMT2E KO, tg
GDAP1 8q13-q21.1 CMT4A
Neuropathy with vocal cord paralysis
LMNA 1q21.2
CMT2B1 Emery-Dreifuss
Muscular Dystrophy Dilated
Cardiomyopathy Limb Girdle Muscular
Dystrophy
KO
Table I4.1 | General table of genes (and proteins) related to major types of CMT disease (149).
In the classical classification there are two main types of CMT:
CMT1 or demyelinating CMT and CMT2 or axonal CMT.
4.2 CMT1
CMT1 typically starts on the first or second decade of life and it is
mainly characterized by demyelization, remyelinization and onion-bulb
formation on peripheral nerves that reduce nerve conduction
velocities.
There are various proteins related to CMT1 variants but
duplications of Peripheral Myelin protein (PMP22) is the most frequent
and cause CMT1A or HNPP (hereditary neuropathy with liability to
Introduction
80
pressure palsies). This neuropathy presents vulnerability to pressure
trauma leading to temporary nerve palsies and is associated with focal
hypermyelinization. It is not progressive and most patient show the
classic features of CMT1. Moreover, some point mutations of PMP22
have been related to CMT, some lead to HNPP but most of them are
associated to transmembrane domains of the protein and cause a
more severe phenotype called Déjérine-Sottas Syndrome (DSS). How
this point mutations lead to disease remains unclear.
Other proteins related to CMT1 are: Myelin Protein Zero (MPZ)
related to CMT1B, LITAF/SIMPLE related to CMT1C, and Connexin 32
related to CMT1X among others.
4.3 CMT2
CMT2 or Axonal form of CMT is characterized by normal nerve
conduction velocities and loss of myelinated axons. Some proteins
related to CMT2 are Kinesin 1(KiR 1B), which leads to defects in
axonal transport and is related to CMT2A, RAB7 related to CMT2B,
Laminin A/C (LMNA) related to CMT2B1 and neurofilament light chain
(NFL) related to CMT2E (153).
4.4 CMTX
There are more than 290 mutations on Gap Junction β-1 (gjb1)
gene described and related with X-linked form of Charcot-Marie-Tooth
disease. Gjb1 gene codifies for hCx32 and is located in the X-
chromosome, what leads CMTX to have an X-linked inheritance. Males
are uniformly affected but female carriers show variable clinical
features due to random X-chromosome inactivation.
CMTX is the second most frequent form of CMT1 (10-15%) and
clinical manifestations are the same as in CMT1A or CMT1B. Many
Introduction
81
different mutations have been linked to this neuropathy but the
severity is similar in all affected patients. These mutations can,
however, lead to disease in different manners which can include
trafficking mutants that are retained in ER or Golgi apparatus, other
that reach the plasma membrane but form defective channels or are
unable to form gap junctions and others that have been predicted to
disrupt the radial pathway that Cx32 gap junctions establish between
adjacent layers of the myelin sheath (154).
4.5 Connexin 32
It is a highly conserved protein as human Cx32 is 98% identical to
rat and mouse Cx32 (155) (156) Cx32 form not only homomeric
hemichannels but can also form heteromeric hemichannels with Cx26
and heterotypic gap junctions with Cx26 and Cx30 (157). Although Cx32
is most abundantly in liver it is also expressed in kidney, guts, lungs,
spleen, stomach, pancreas, uterus, testis, brain and peripheral nerves.
Electrophysiological studies reported that Cx32 hemichannels are
activated by membrane depolarization (158), that these hemichannels
have 90 pS conductance, and extracellular calcium modulates them (99).
It has been described that Cx32 hemichannels open with increasing
intracellular Ca2+ and that they can be closed with gap junction
blockers and with specific peptides such as 32gap27, which binds to
110-122 residues of the second extracellular loop, and 32gap24, which
binds to the intracellular loop (159).
Cx32 is the principal oligodendrocytic connexin and was the first
connexin described in oligodendrocytes, where it is expressed in the
large myelin fibres (160). Cx32 is also the principal connexin in Schwann
cells (161) where it is expressed in paranodal zones and in Schmidt-
Lanterman incisures of the myelin sheath (of peripheral nerves) (162). In
these incisures Cx32 would form reflexive gap junctions in the myelin
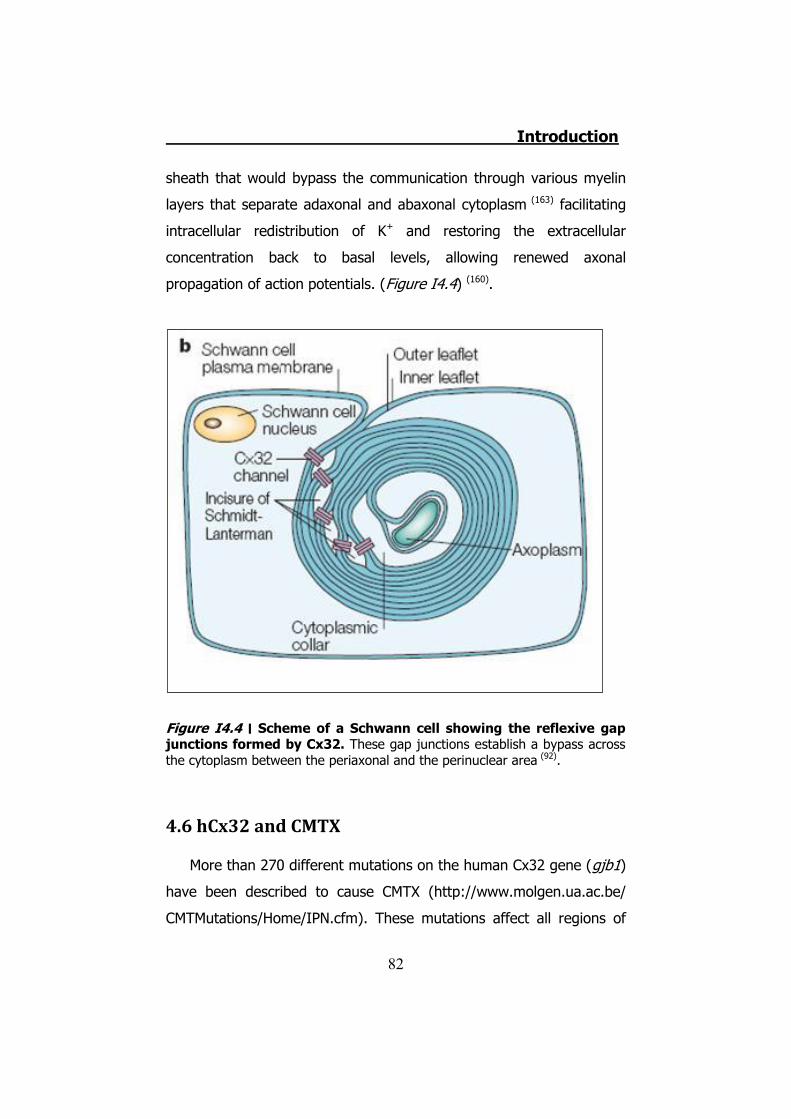
Introduction
82
sheath that would bypass the communication through various myelin
layers that separate adaxonal and abaxonal cytoplasm (163) facilitating
intracellular redistribution of K+ and restoring the extracellular
concentration back to basal levels, allowing renewed axonal
propagation of action potentials. (Figure I4.4) (160).
Figure I4.4 ׀ Scheme of a Schwann cell showing the reflexive gap junctions formed by Cx32. These gap junctions establish a bypass across the cytoplasm between the periaxonal and the perinuclear area (92).
4.6 hCx32 and CMTX
More than 270 different mutations on the human Cx32 gene (gjb1)
have been described to cause CMTX (http://www.molgen.ua.ac.be/
CMTMutations/Home/IPN.cfm). These mutations affect all regions of
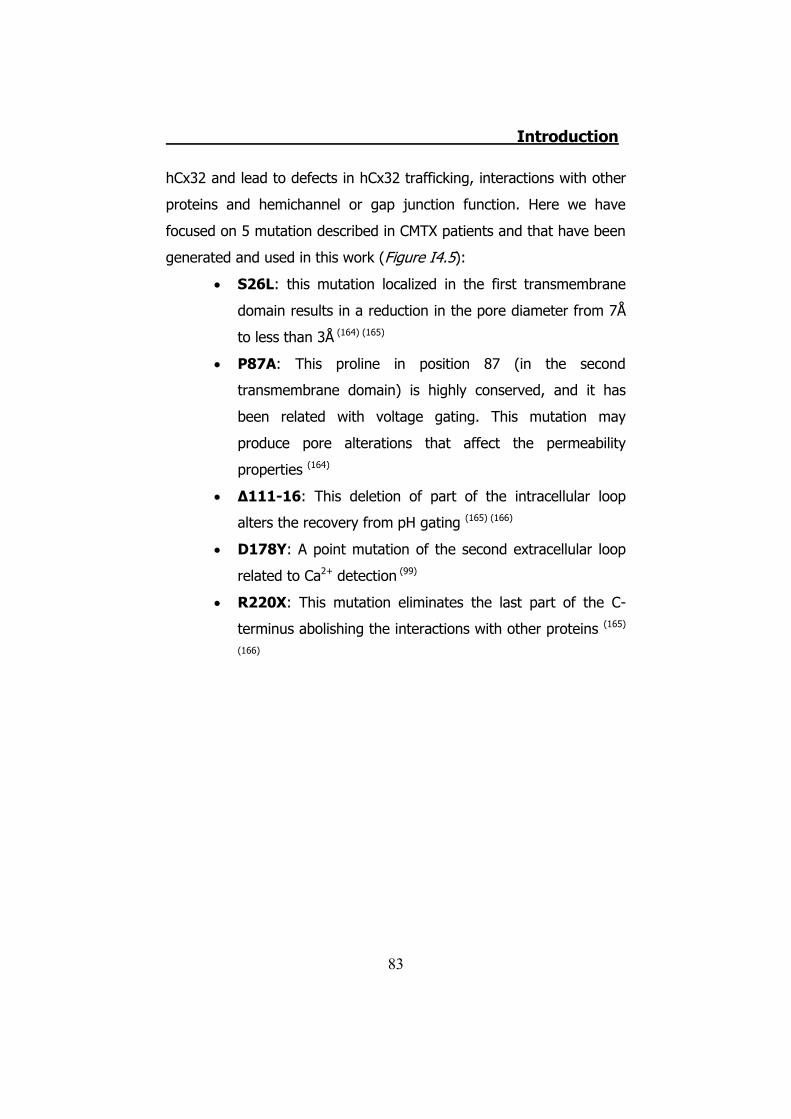
Introduction
83
hCx32 and lead to defects in hCx32 trafficking, interactions with other
proteins and hemichannel or gap junction function. Here we have
focused on 5 mutation described in CMTX patients and that have been
generated and used in this work (Figure I4.5):
� S26L: this mutation localized in the first transmembrane
domain results in a reduction in the pore diameter from 7Å
to less than 3Å (164) (165)
� P87A: This proline in position 87 (in the second
transmembrane domain) is highly conserved, and it has
been related with voltage gating. This mutation may
produce pore alterations that affect the permeability
properties (164)
� Δ111-16: This deletion of part of the intracellular loop
alters the recovery from pH gating (165) (166)
� D178Y: A point mutation of the second extracellular loop
related to Ca2+ detection (99)
� R220X: This mutation eliminates the last part of the C-
terminus abolishing the interactions with other proteins (165)
(166)
Introduction
84
Figure I4.5 | Structure of the human Cx32 protein showing some known mutations leading to CMTX disease. Mutations generated in our laboratory are marked in red (167).
Physiological consequences of dysfunctional Cx32 could be
compensated in oligodendrocytes in the CNS, as most CMTX patients
do not have clinical CNS manifestations. However, subclinical
evidences of dysfunctions are common, and few mutations have been
described to lead to clinical CNS dysfunction (168) (169). Moreover, there
Introduction
85
are few mutations related to CMTX that do not directly affect gjb1
gene but other closely related proteins like the transcription factors
Sox10 and EGR2/Knox20. These transcription factors bind to the P2
promoter of Cx32 gene activating its expression in Schwann cells.
Mutations on Sox10 and EGR2/Knox20 (170) and on P2 promoter (171)
eliminating the binding site to Sox10 have been described in some
patients with CMTX1.
4.7 Connexin 32 knock-out mice
Although the first data from Cx32 null mice suggested no
peripheral neuropathy in those mice (172) and that the only affectation
of these mice was on the liver, where Cx32 is mostly expressed (173)
(174), later studies revealed a late-onset demyelinating peripheral
neuropathy on mice older than 3 months which is comparable to
human CMTX (175). This neuropathology is characterized by unusually
thin myelin sheaths, cellular onion-bulb formations, induced Schwann
cell proliferation and enlarged periaxonal collars. In contrast
conduction velocity is only slightly decreased (176). This progressive
peripheral demyelination starts at 3 months of age and motor fibres
are more affected than sensory fibres (175). A strong evidence that this
peripheral demyelinization is due to the lack of Cx32 in Schwann cells
and not in other cell types was given by Scherer et al, by expressing
human Cx32 in Cx32 null-mice under the MPZ promoter, specific for
Schwann cells. Those mice did not develop a demyelinating
neuropathy (177).
4.8 Schwann cells
The nervous system is built from two major kinds of cells: neurons
and glial cells. Glial cells, among other functions, are responsible for
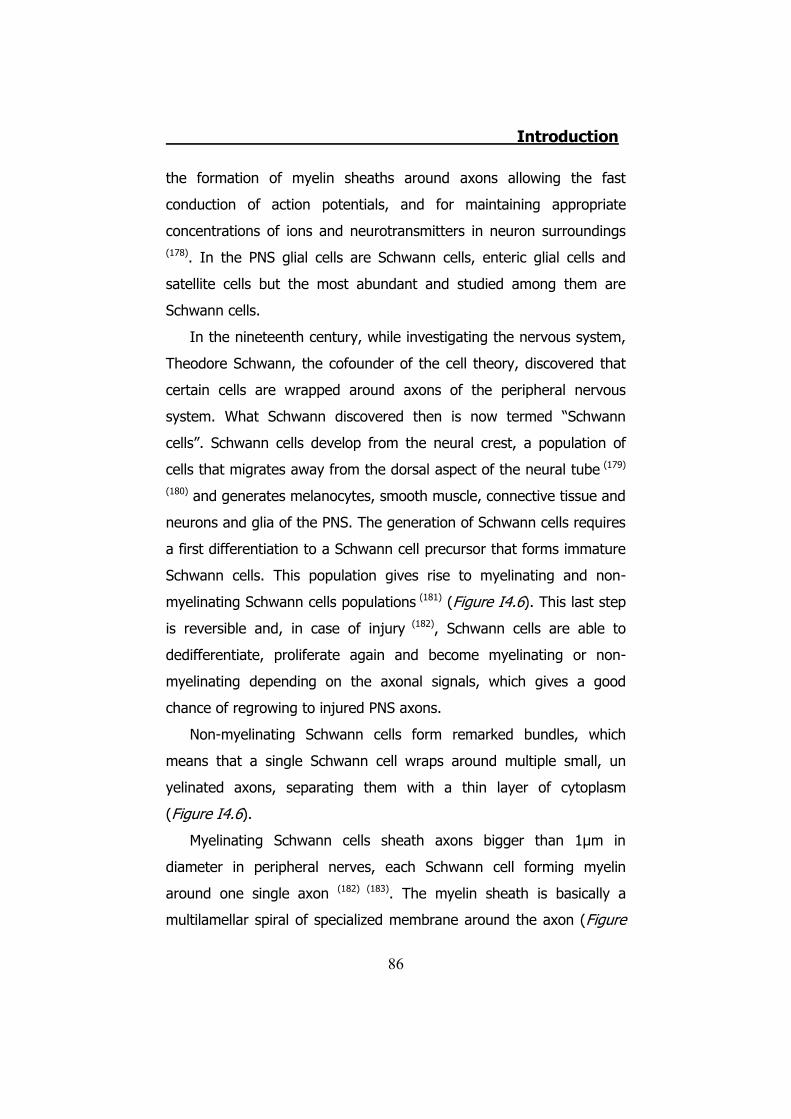
Introduction
86
the formation of myelin sheaths around axons allowing the fast
conduction of action potentials, and for maintaining appropriate
concentrations of ions and neurotransmitters in neuron surroundings
(178). In the PNS glial cells are Schwann cells, enteric glial cells and
satellite cells but the most abundant and studied among them are
Schwann cells.
In the nineteenth century, while investigating the nervous system,
Theodore Schwann, the cofounder of the cell theory, discovered that
certain cells are wrapped around axons of the peripheral nervous
system. What Schwann discovered then is now termed “Schwann
cells”. Schwann cells develop from the neural crest, a population of
cells that migrates away from the dorsal aspect of the neural tube (179)
(180) and generates melanocytes, smooth muscle, connective tissue and
neurons and glia of the PNS. The generation of Schwann cells requires
a first differentiation to a Schwann cell precursor that forms immature
Schwann cells. This population gives rise to myelinating and non-
myelinating Schwann cells populations (181) (Figure I4.6). This last step
is reversible and, in case of injury (182), Schwann cells are able to
dedifferentiate, proliferate again and become myelinating or non-
myelinating depending on the axonal signals, which gives a good
chance of regrowing to injured PNS axons.
Non-myelinating Schwann cells form remarked bundles, which
means that a single Schwann cell wraps around multiple small, un
yelinated axons, separating them with a thin layer of cytoplasm
(Figure I4.6).
Myelinating Schwann cells sheath axons bigger than 1μm in
diameter in peripheral nerves, each Schwann cell forming myelin
around one single axon (182) (183). The myelin sheath is basically a
multilamellar spiral of specialized membrane around the axon (Figure
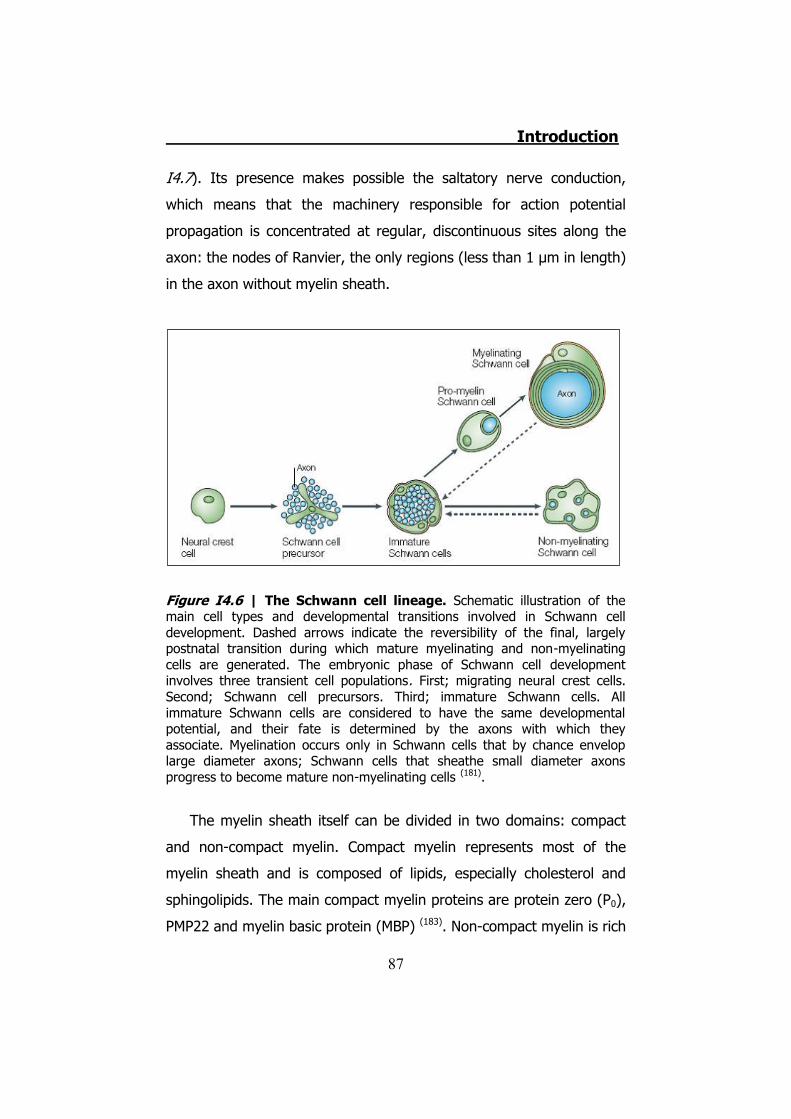
Introduction
87
I4.7). Its presence makes possible the saltatory nerve conduction,
which means that the machinery responsible for action potential
propagation is concentrated at regular, discontinuous sites along the
axon: the nodes of Ranvier, the only regions (less than 1 μm in length)
in the axon without myelin sheath.
Figure I4.6 | The Schwann cell lineage. Schematic illustration of the main cell types and developmental transitions involved in Schwann cell development. Dashed arrows indicate the reversibility of the final, largely postnatal transition during which mature myelinating and non-myelinating cells are generated. The embryonic phase of Schwann cell development involves three transient cell populations. First; migrating neural crest cells. Second; Schwann cell precursors. Third; immature Schwann cells. All immature Schwann cells are considered to have the same developmental potential, and their fate is determined by the axons with which they associate. Myelination occurs only in Schwann cells that by chance envelop large diameter axons; Schwann cells that sheathe small diameter axons progress to become mature non-myelinating cells (181).
The myelin sheath itself can be divided in two domains: compact
and non-compact myelin. Compact myelin represents most of the
myelin sheath and is composed of lipids, especially cholesterol and
sphingolipids. The main compact myelin proteins are protein zero (P0),
PMP22 and myelin basic protein (MBP) (183). Non-compact myelin is rich
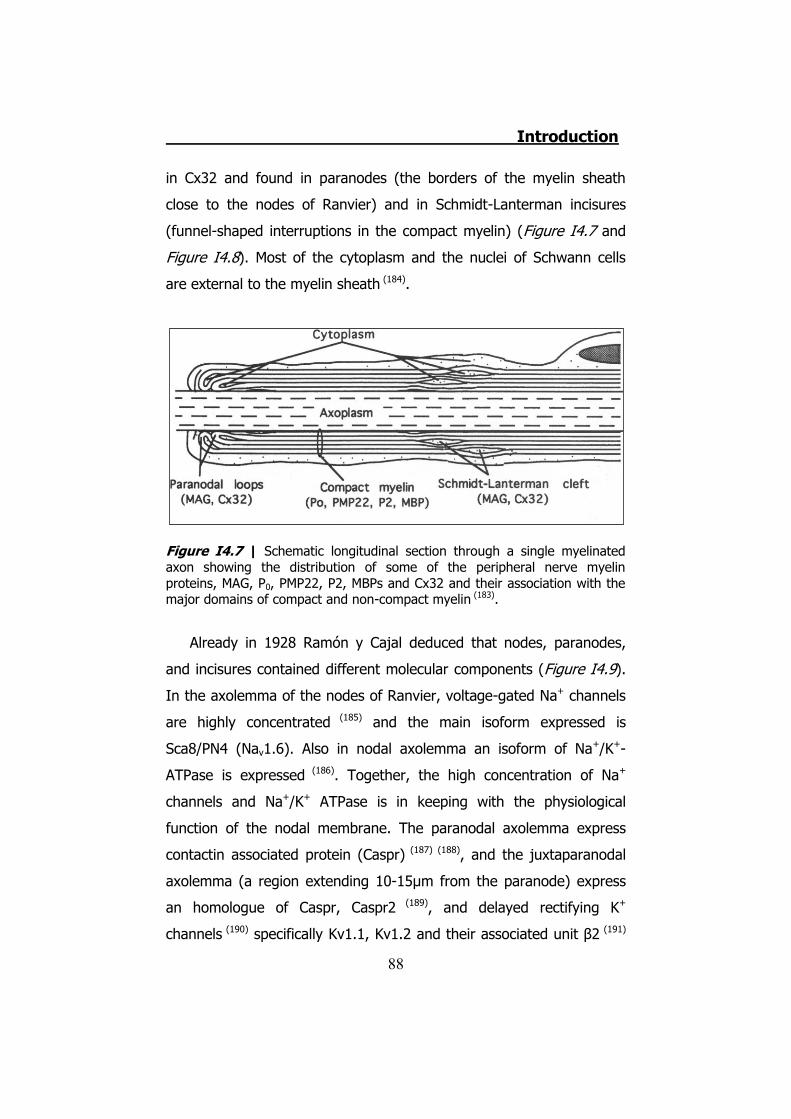
Introduction
88
in Cx32 and found in paranodes (the borders of the myelin sheath
close to the nodes of Ranvier) and in Schmidt-Lanterman incisures
(funnel-shaped interruptions in the compact myelin) (Figure I4.7 and
Figure I4.8). Most of the cytoplasm and the nuclei of Schwann cells
are external to the myelin sheath (184).
Figure I4.7 | Schematic longitudinal section through a single myelinated axon showing the distribution of some of the peripheral nerve myelin proteins, MAG, P0, PMP22, P2, MBPs and Cx32 and their association with the major domains of compact and non-compact myelin (183).
Already in 1928 Ramón y Cajal deduced that nodes, paranodes,
and incisures contained different molecular components (Figure I4.9).
In the axolemma of the nodes of Ranvier, voltage-gated Na+ channels
are highly concentrated (185) and the main isoform expressed is
Sca8/PN4 (Nav1.6). Also in nodal axolemma an isoform of Na+/K+-
ATPase is expressed (186). Together, the high concentration of Na+
channels and Na+/K+ ATPase is in keeping with the physiological
function of the nodal membrane. The paranodal axolemma express
contactin associated protein (Caspr) (187) (188), and the juxtaparanodal
axolemma (a region extending 10-15μm from the paranode) express
an homologue of Caspr, Caspr2 (189), and delayed rectifying K+
channels (190) specifically Kv1.1, Kv1.2 and their associated unit β2 (191)
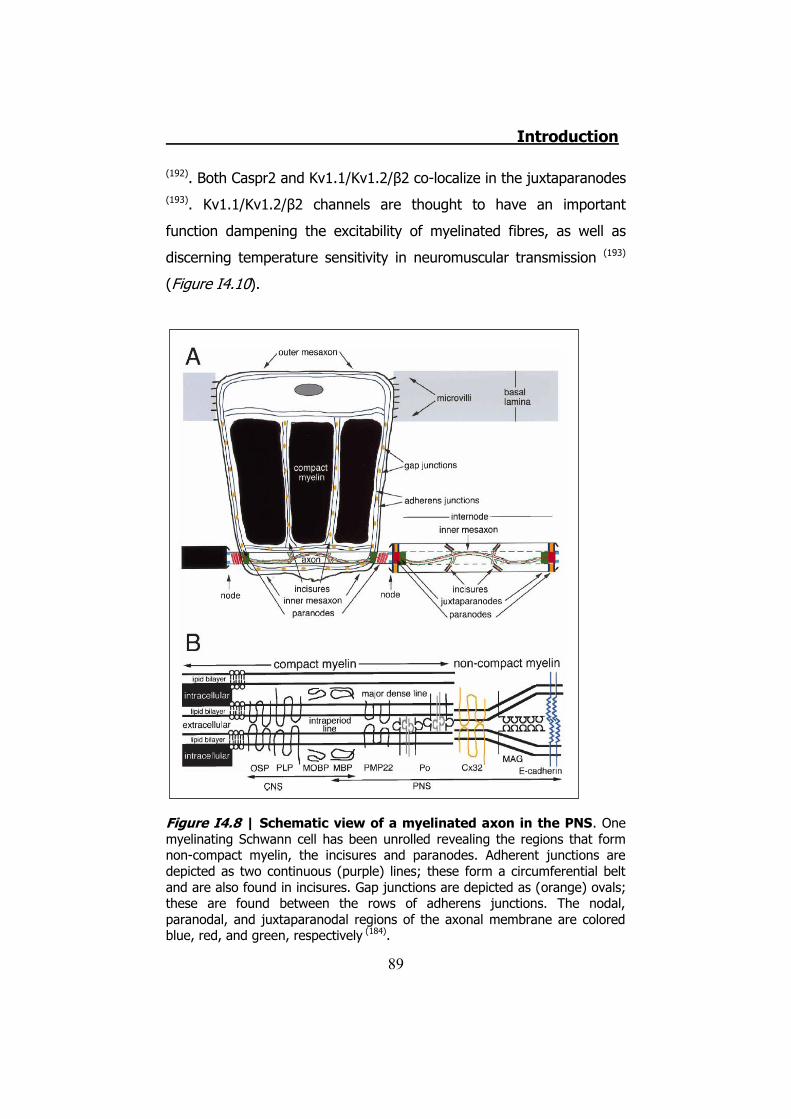
Introduction
89
(192). Both Caspr2 and Kv1.1/Kv1.2/β2 co-localize in the juxtaparanodes
(193). Kv1.1/Kv1.2/β2 channels are thought to have an important
function dampening the excitability of myelinated fibres, as well as
discerning temperature sensitivity in neuromuscular transmission (193)
(Figure I4.10).
Figure I4.8 | Schematic view of a myelinated axon in the PNS. One myelinating Schwann cell has been unrolled revealing the regions that form non-compact myelin, the incisures and paranodes. Adherent junctions are depicted as two continuous (purple) lines; these form a circumferential belt and are also found in incisures. Gap junctions are depicted as (orange) ovals; these are found between the rows of adherens junctions. The nodal, paranodal, and juxtaparanodal regions of the axonal membrane are colored blue, red, and green, respectively (184).
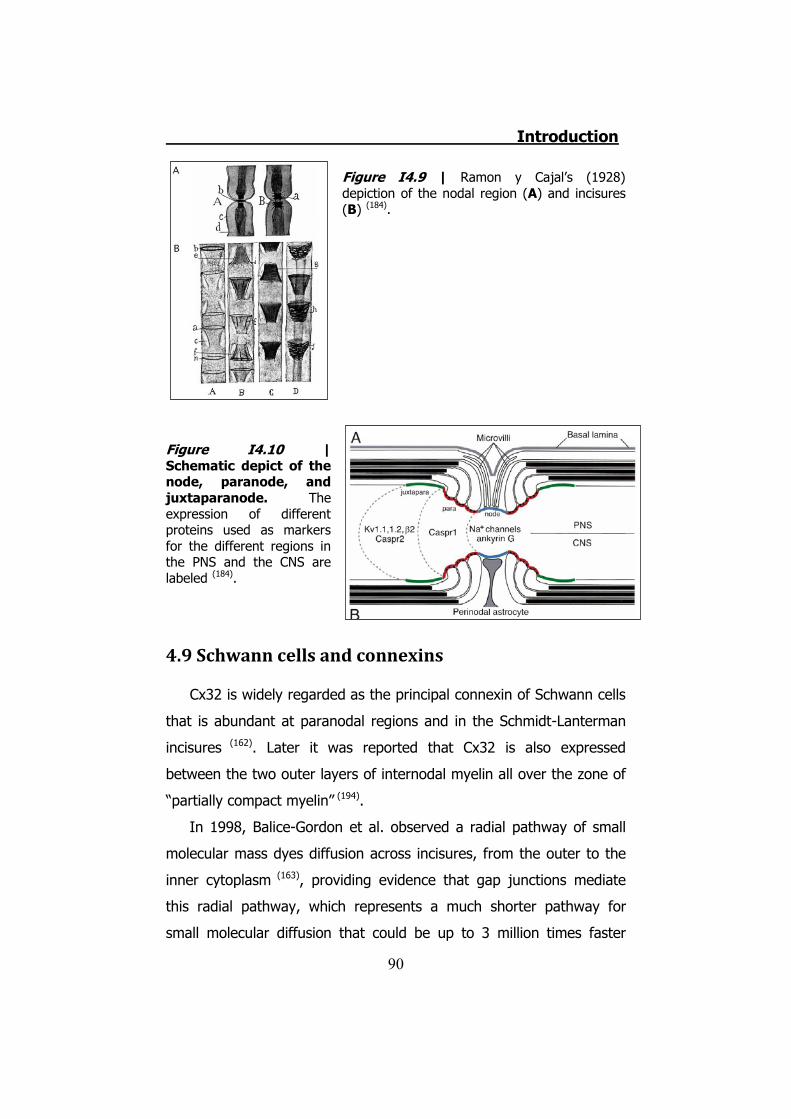
Introduction
90
Figure I4.9 | Ramon y Cajal’s (1928) depiction of the nodal region (A) and incisures (B) (184).
Figure I4.10 | Schematic depict of the node, paranode, and juxtaparanode. The expression of different proteins used as markers for the different regions in the PNS and the CNS are labeled (184).
4.9 Schwann cells and connexins
Cx32 is widely regarded as the principal connexin of Schwann cells
that is abundant at paranodal regions and in the Schmidt-Lanterman
incisures (162). Later it was reported that Cx32 is also expressed
between the two outer layers of internodal myelin all over the zone of
“partially compact myelin” (194).
In 1998, Balice-Gordon et al. observed a radial pathway of small
molecular mass dyes diffusion across incisures, from the outer to the
inner cytoplasm (163), providing evidence that gap junctions mediate
this radial pathway, which represents a much shorter pathway for
small molecular diffusion that could be up to 3 million times faster
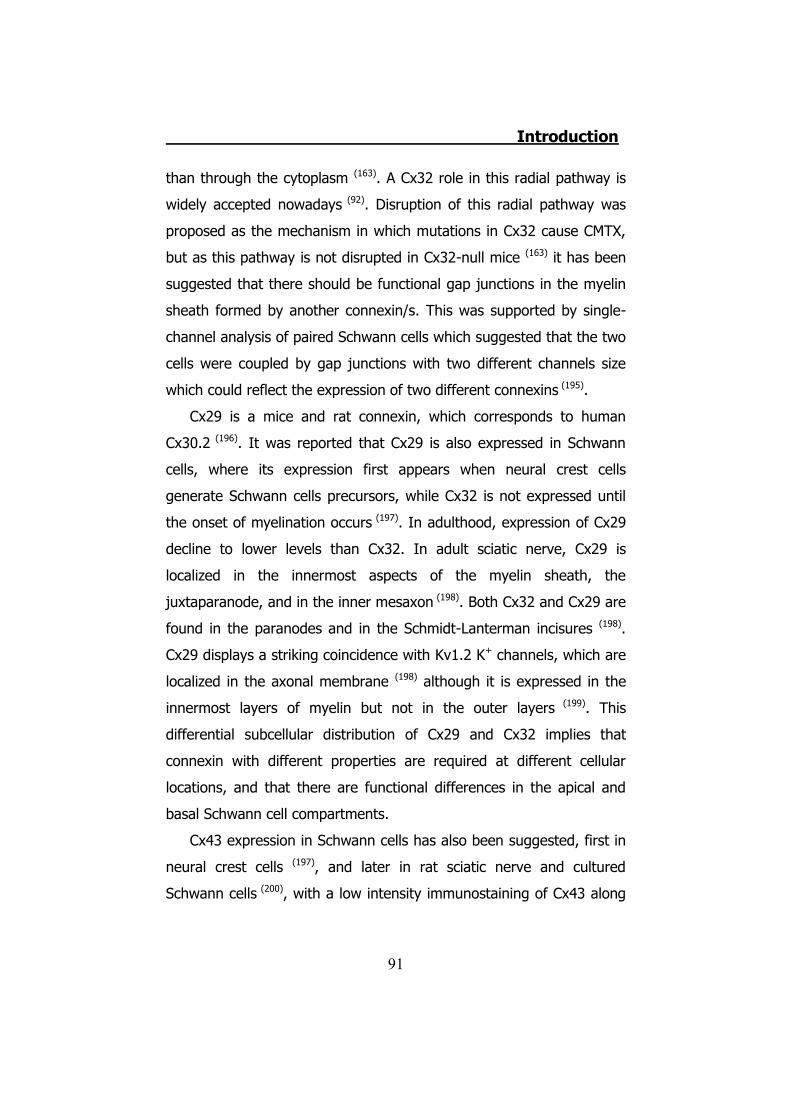
Introduction
91
than through the cytoplasm (163). A Cx32 role in this radial pathway is
widely accepted nowadays (92). Disruption of this radial pathway was
proposed as the mechanism in which mutations in Cx32 cause CMTX,
but as this pathway is not disrupted in Cx32-null mice (163) it has been
suggested that there should be functional gap junctions in the myelin
sheath formed by another connexin/s. This was supported by single-
channel analysis of paired Schwann cells which suggested that the two
cells were coupled by gap junctions with two different channels size
which could reflect the expression of two different connexins (195).
Cx29 is a mice and rat connexin, which corresponds to human
Cx30.2 (196). It was reported that Cx29 is also expressed in Schwann
cells, where its expression first appears when neural crest cells
generate Schwann cells precursors, while Cx32 is not expressed until
the onset of myelination occurs (197). In adulthood, expression of Cx29
decline to lower levels than Cx32. In adult sciatic nerve, Cx29 is
localized in the innermost aspects of the myelin sheath, the
juxtaparanode, and in the inner mesaxon (198). Both Cx32 and Cx29 are
found in the paranodes and in the Schmidt-Lanterman incisures (198).
Cx29 displays a striking coincidence with Kv1.2 K+ channels, which are
localized in the axonal membrane (198) although it is expressed in the
innermost layers of myelin but not in the outer layers (199). This
differential subcellular distribution of Cx29 and Cx32 implies that
connexin with different properties are required at different cellular
locations, and that there are functional differences in the apical and
basal Schwann cell compartments.
Cx43 expression in Schwann cells has also been suggested, first in
neural crest cells (197), and later in rat sciatic nerve and cultured
Schwann cells (200), with a low intensity immunostaining of Cx43 along
Introduction
92
the myelin sheath and Schwann cell bodies (201), thus showing a
different distribution pattern from Cx32 and Cx29.
After peripheral nerve injury Cx32 expression dramatically
decreases, retuning to basal levels at newly formed nodes of Ranvier
and Schmidt-Lanterman incisures after 30 days (202), on the other hand
Cx46 and Cx43 expression is enhanced in rat sciatic nerve, only
returning to basal levels, 12 days after injury (202), which suggest a role
of this connexins during remyelination, as it has been reported for
Cx43 in spinal cord remyelination in a guinea pig model for
experimental allergic encephalomyelitis (EAE) (203).
4.10 Schwann cells and CMTX
The pathologies associated with Schwann cells can be divided into
injury response, demyelinating disorders and tumour disorders (180).
Among demyelinating disorders there is Charcot-Marie-Tooth disease,
in which mutations of different components like PMP22 (204) P0,
periaxin, EGR2/Krox, Sox10, MTMR2 (205) etc. lead to the different
described disorders (206) (Section 4.1). Mutations on the hCx32 gene,
ranging from loss of channels formation to altered permeation
properties (165), lead to the CMTX. The successful transgenic rescue of
the Cx32 null-mice phenotype by Schwann cell specific expression of
wild type hCx32 in mice has elegantly demonstrated that the CMTX
disease has a Schwann cell origin (177).
4.11 Schwann cells and ATP
All types of glia have membrane receptors for extracellular ATP
(purinergic receptors). Schwann cells express P2X7 (25) (207) and P2Y1
(myelinated) and P2Y2 (non myelinated) receptors (208). The
concentration of ATP required to evoke a response through the P2X7
Introduction
93
receptors is in the range of millimolar for maximal activation,
concentrations that might be achieved in vivo with injury in local cell or
axonal lysis. However, it has been hypothesized that normal ATP
release from axons into the confined periaxonal space between
Schwann cell and axon may lead to local high concentrations (209).
Activation of the P2X7 receptor gives rise to a non-specific cation
current, which may lead to the activation of other membrane
conductances, through an influx of Ca2+, membrane depolarization or
Ca2+ dependent changes in gene expression, etc (210). P2Y1 and P2Y2
activation triggers changes in intracellular Ca2+ in paranodal and
interparanodal regions of Schwann cells (211).
Effects on Schwann cell gene expression, mitotic rate and
differentiation have been identified in response to activity-dependent
ATP release. ATP released from axons during action potentials
transmission arrest maturation of immature Schwann cells and
prevents myelination, this could be a mechanism by which developing
nervous system could delay terminal differentiation of Schwann cells
until exposure to appropriate axon-derived signals (210) (212) (213).
ATP is not only released by presynaptic terminals, it can also be
released by postsynaptic terminals and other cells. There is evidence
of multiple pathways for ATP release from glial cells besides vesicle
release.
Cx43, Cx32 and Cx26 connexins have been reported to increase
ATP release and intercellular calcium wave propagation (95) suggesting
that hemichannels could also release ATP. Schwann cells have been
reported to release ATP in response to glutamate, in a concentration
dependent manner (214) and UTP (215) (mediated by activation of P2Y2
receptors), and it is released from vesicles as well as through anion
transporters across the plasma membrane.
Introduction
94
5. Inherited Non-Syndromic Prelingual Deafness
Introduction
95
5.1 The disease
Hearing impairment and hearing loss are often used
interchangeably by healthcare professionals to refer to hearing
determined by audiometry to be below threshold levels for normal
hearing.
Deafness is a colloquial term that implies hearing thresholds in the
severe-to-profound range by audiometry.
Hearing impairment is the most prevalent sensory disorder in the
world with a prevalence of 2/500 in newborns increasing up to
3.5/1000 in adolescence (216) (217) (218).
Different classifications can include hereditary hearing loss and
deafness (219).
Depending if the affected part is the outer or the inner ear we talk
about conductive, sensorineural, or a combination of both.
If the affected part of the auditory organs are associated to a
syndrome we will categorize it in syndromic (associated with
malformations of the external ear or other organs or with medical
problems involving other organ systems) or non-syndromic (no
associated visible abnormalities of the external ear or any related
medical problems).
The last two groups we can divide the hereditary hearing loss or
impairment disorders are prelingual (before language develops) or
postlingual (after language develops).
Hearing is measured in decibels (dB). The threshold or 0 dB mark
for each frequency refers to the level at which normal young adults
perceive a tone burst 50% of the time. Hearing is considered normal if
an individual's thresholds are within 15 dB of normal thresholds.
In the next pages I am going to review the sensorineural, non-
syndromic, prelingual hearing impairment.
Introduction
96
More than 20 forms of non-syndromic hearing loss have been
established based on the mode of inheritance, age of onset, severity of
hearing loss, and type of audiogram. These clinical distinctions are
important for characterizing each form, but it is uncertain as to how
many different genes may be responsible for each form of non-
syndromic hearing loss (220). These hearing disorders have been
classified in four different categories related on mode of inheritance:
� DFNA: Autosomal dominant
� DFNB: Autosomal recessive. 60-75% of Non-syndromic
deafness.
� DFNX: X-linked
� DFNMT: Mitochondrial inheritance
5.2 DFNB1
DFNB1 is characterized by congenital, non-progressive, mild-to-
profound sensorineural hearing impairment.
More than 50% of prelingual deafness is hereditary, most often
autosomal recessive and non-syndromic. The recessive DFNB1 locus,
mapping to chromosome 13q11-q12, is the most prevalent.
Approximately 50% of autosomal recessive non-syndromic hearing
loss can be attributed to mutations in that locus, that contains the two
Gap junction genes gjb2 and gjb6 encoding, respectively, connexin 26
(Cx26) and connexin 30 (Cx30). Mutations in the gjb2 gene cause
DFNB1A and mutations in the gjb6 gene cause DFNB1B. The final rate
of DFNB1 is 1/33 of the total deafness. Approximately 98% of
individuals with DFNB1 have two identifiable gjb2 mutations. The other
2% have one gjb2 mutation and one of two large deletions that
include a portion of gjb6 (i.e., they are double heterozygotes) (221) (222)
(136).
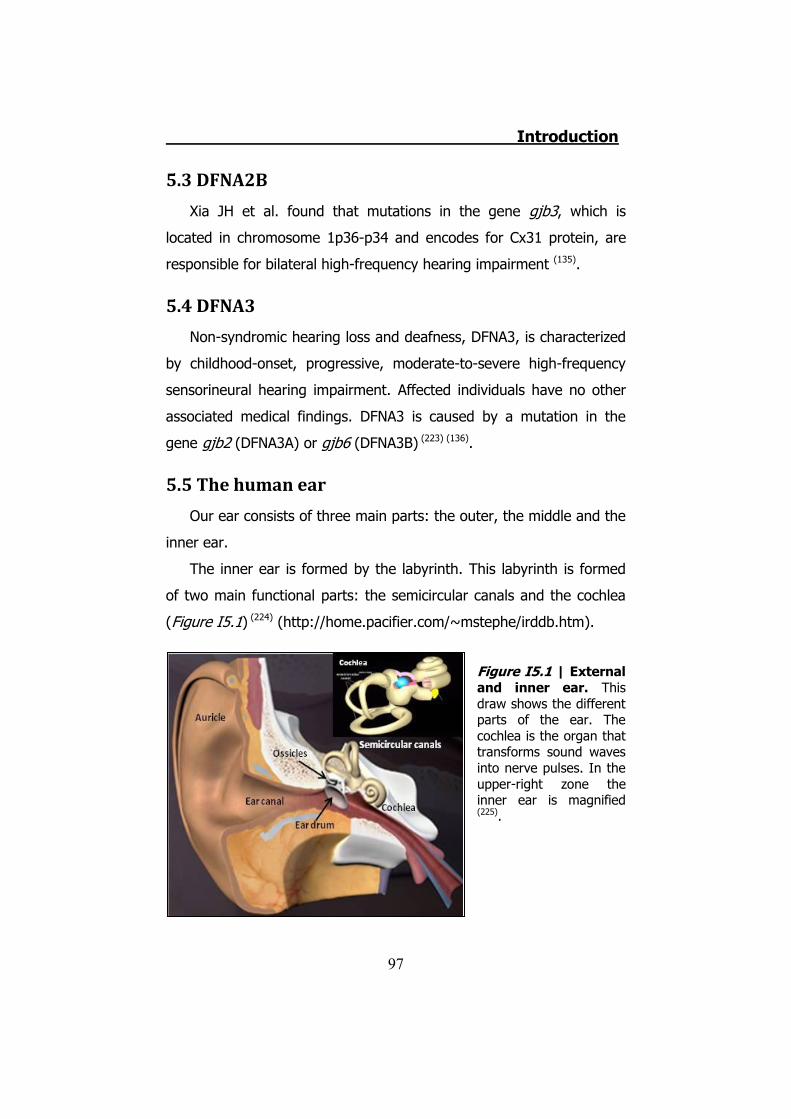
Introduction
97
5.3 DFNA2B
Xia JH et al. found that mutations in the gene gjb3, which is
located in chromosome 1p36-p34 and encodes for Cx31 protein, are
responsible for bilateral high-frequency hearing impairment (135).
5.4 DFNA3
Non-syndromic hearing loss and deafness, DFNA3, is characterized
by childhood-onset, progressive, moderate-to-severe high-frequency
sensorineural hearing impairment. Affected individuals have no other
associated medical findings. DFNA3 is caused by a mutation in the
gene gjb2 (DFNA3A) or gjb6 (DFNA3B) (223) (136).
5.5 The human ear
Our ear consists of three main parts: the outer, the middle and the
inner ear.
The inner ear is formed by the labyrinth. This labyrinth is formed
of two main functional parts: the semicircular canals and the cochlea
(Figure I5.1) (224) (http://home.pacifier.com/~mstephe/irddb.htm).
Figure I5.1 | External and inner ear. This draw shows the different parts of the ear. The cochlea is the organ that transforms sound waves into nerve pulses. In the upper-right zone the inner ear is magnified
(225).
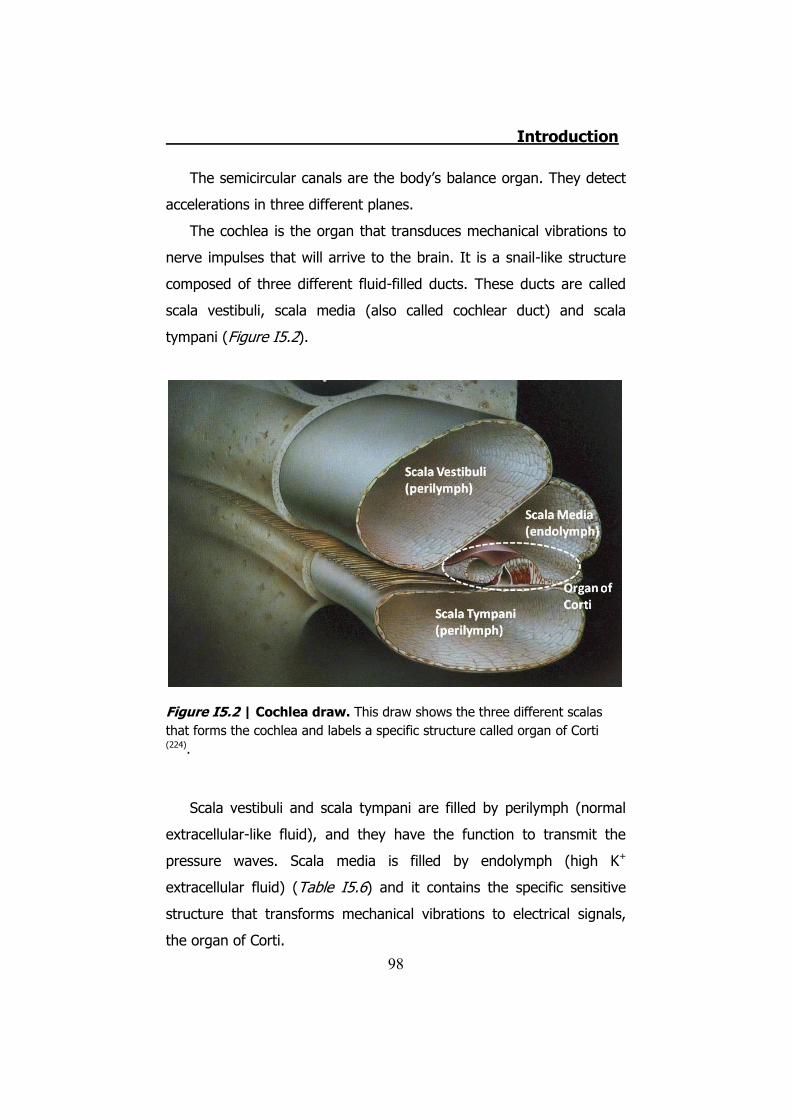
Introduction
98
The semicircular canals are the body’s balance organ. They detect
accelerations in three different planes.
The cochlea is the organ that transduces mechanical vibrations to
nerve impulses that will arrive to the brain. It is a snail-like structure
composed of three different fluid-filled ducts. These ducts are called
scala vestibuli, scala media (also called cochlear duct) and scala
tympani (Figure I5.2).
Figure I5.2 | Cochlea draw. This draw shows the three different scalas that forms the cochlea and labels a specific structure called organ of Corti (224).
Scala vestibuli and scala tympani are filled by perilymph (normal
extracellular-like fluid), and they have the function to transmit the
pressure waves. Scala media is filled by endolymph (high K+
extracellular fluid) (Table I5.6) and it contains the specific sensitive
structure that transforms mechanical vibrations to electrical signals,
the organ of Corti.
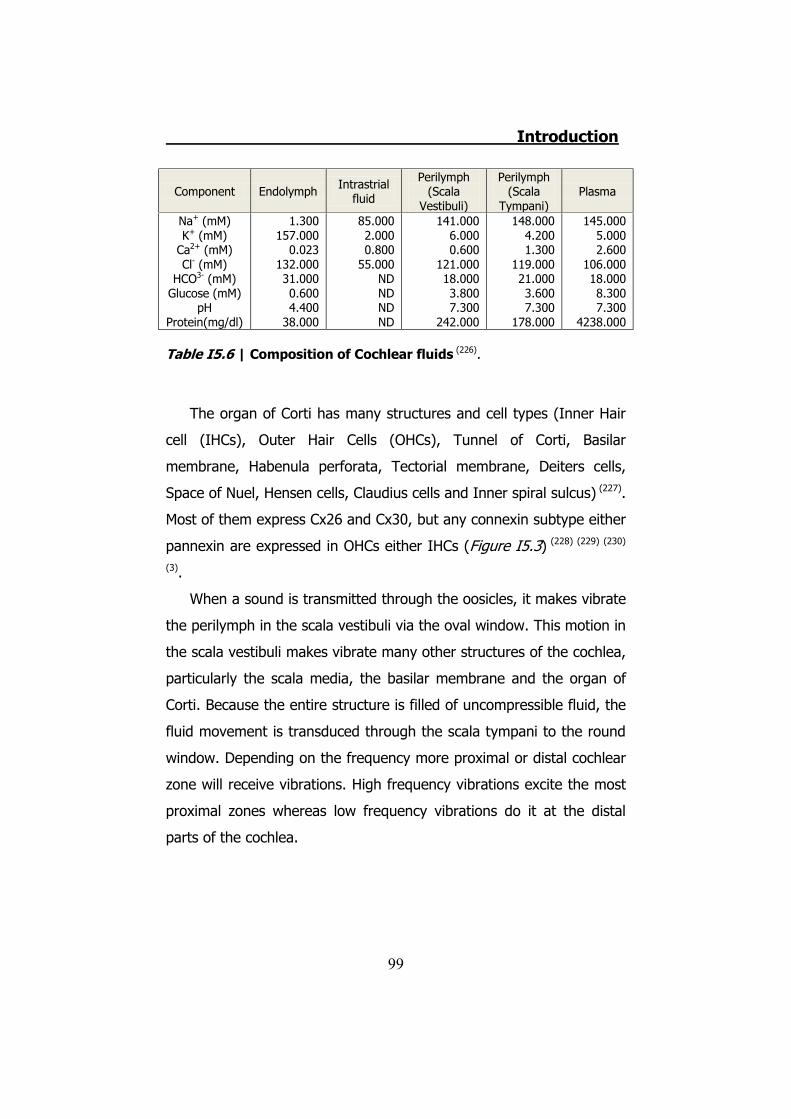
Introduction
99
Component Endolymph Intrastrial fluid
Perilymph (Scala
Vestibuli)
Perilymph (Scala
Tympani) Plasma
Na+ (mM) K+ (mM)
Ca2+ (mM) Cl- (mM)
HCO3- (mM) Glucose (mM)
pH Protein(mg/dl)
1.300 157.000
0.023 132.000 31.000 0.600 4.400
38.000
85.000 2.000 0.800
55.000 ND ND ND ND
141.000 6.000 0.600
121.000 18.000 3.800 7.300
242.000
148.000 4.200 1.300
119.000 21.000 3.600 7.300
178.000
145.000 5.000 2.600
106.000 18.000 8.300 7.300
4238.000
Table I5.6 | Composition of Cochlear fluids (226).
The organ of Corti has many structures and cell types (Inner Hair
cell (IHCs), Outer Hair Cells (OHCs), Tunnel of Corti, Basilar
membrane, Habenula perforata, Tectorial membrane, Deiters cells,
Space of Nuel, Hensen cells, Claudius cells and Inner spiral sulcus) (227).
Most of them express Cx26 and Cx30, but any connexin subtype either
pannexin are expressed in OHCs either IHCs (Figure I5.3) (228) (229) (230)
(3).
When a sound is transmitted through the oosicles, it makes vibrate
the perilymph in the scala vestibuli via the oval window. This motion in
the scala vestibuli makes vibrate many other structures of the cochlea,
particularly the scala media, the basilar membrane and the organ of
Corti. Because the entire structure is filled of uncompressible fluid, the
fluid movement is transduced through the scala tympani to the round
window. Depending on the frequency more proximal or distal cochlear
zone will receive vibrations. High frequency vibrations excite the most
proximal zones whereas low frequency vibrations do it at the distal
parts of the cochlea.

Introduction
100
Figure I5.3 | Scheme of the Cochlea. This scheme shows the three different scalas, the connective tissues bones surrounding the cochlea, the VIIIth nerve and the Organ of Corti and its different structures and cell types. Note that Cx26 and Cx30 are labeled in green in the non-sensory epithelial cells (interdental cells of the spiral limbus, inner and outer sulcus cells, sensory supporting cells, and cells within the root
process of the spiral ligament), and in brown in the connective tissue cell system (fibrocytes of the spiral ligament and spiral limbus, basal and intermediate cells of the stria vascularis) depicted in brown (3).
Each human ear contains one row of 3500 IHCs and three rows of
OHCs, totaling about 12000 hair cells. IHCs receive afferent nerve
fibers whereas OHCs receive efferent inputs from the brain that help
sharpen the frequency-resolving power of the cochlea. Each hair cell
has 50 to 200 stereocilia that are in contact with the Tectorial
membrane. The fluid motion in the cochlea makes vibrate the Basilar
membrane bending the stereocilia. It causes the opening of K+
channels in hair cells driving a K+ influx and a rapid depolarization of
the entire cell. It provokes, in the base of these hair cells, the opening
of voltage-gated Ca2+ channels and the consequent Ca2+ influx into the
cells. This increase in the intracellular Ca2+ triggers the release of
neurotransmitters from synaptic vesicles causing an Action Potential
(AP) to the postsynaptic nerve terminals placed to the base of hair
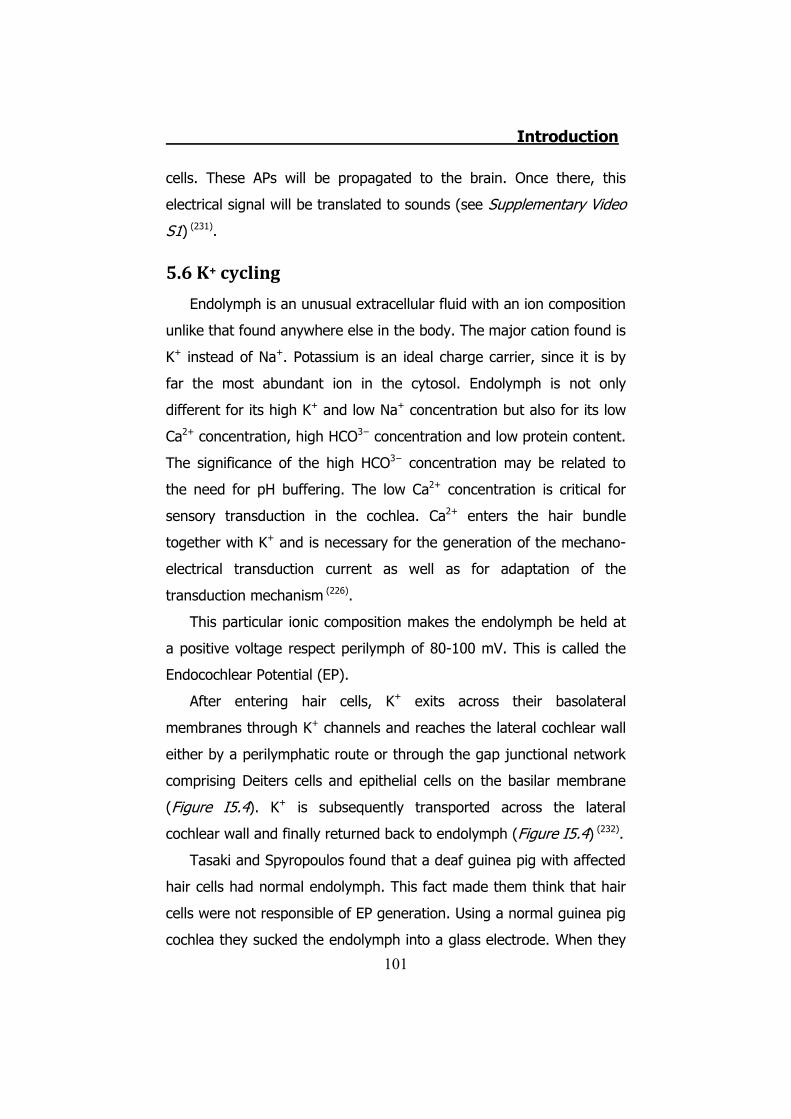
Introduction
101
cells. These APs will be propagated to the brain. Once there, this
electrical signal will be translated to sounds (see Supplementary Video
S1) (231).
5.6 K+ cycling
Endolymph is an unusual extracellular fluid with an ion composition
unlike that found anywhere else in the body. The major cation found is
K+ instead of Na+. Potassium is an ideal charge carrier, since it is by
far the most abundant ion in the cytosol. Endolymph is not only
different for its high K+ and low Na+ concentration but also for its low
Ca2+ concentration, high HCO3− concentration and low protein content.
The significance of the high HCO3− concentration may be related to
the need for pH buffering. The low Ca2+ concentration is critical for
sensory transduction in the cochlea. Ca2+ enters the hair bundle
together with K+ and is necessary for the generation of the mechano-
electrical transduction current as well as for adaptation of the
transduction mechanism (226).
This particular ionic composition makes the endolymph be held at
a positive voltage respect perilymph of 80-100 mV. This is called the
Endocochlear Potential (EP).
After entering hair cells, K+ exits across their basolateral
membranes through K+ channels and reaches the lateral cochlear wall
either by a perilymphatic route or through the gap junctional network
comprising Deiters cells and epithelial cells on the basilar membrane
(Figure I5.4). K+ is subsequently transported across the lateral
cochlear wall and finally returned back to endolymph (Figure I5.4) (232).
Tasaki and Spyropoulos found that a deaf guinea pig with affected
hair cells had normal endolymph. This fact made them think that hair
cells were not responsible of EP generation. Using a normal guinea pig
cochlea they sucked the endolymph into a glass electrode. When they
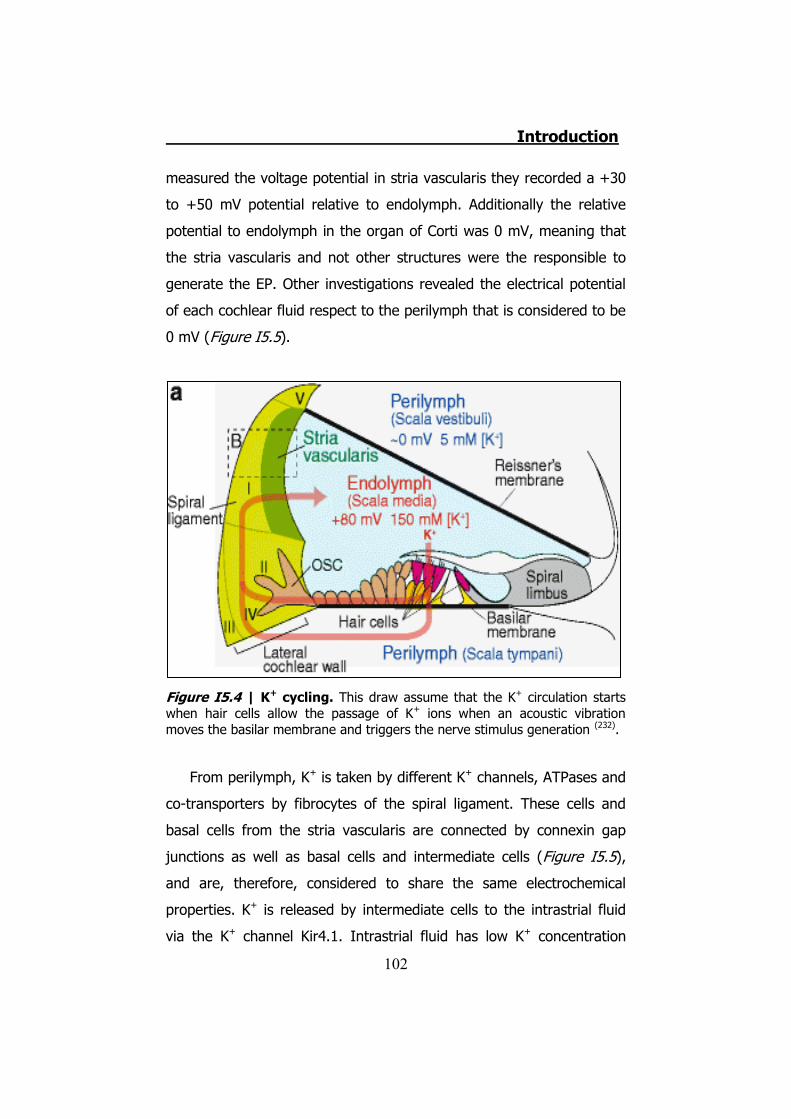
Introduction
102
measured the voltage potential in stria vascularis they recorded a +30
to +50 mV potential relative to endolymph. Additionally the relative
potential to endolymph in the organ of Corti was 0 mV, meaning that
the stria vascularis and not other structures were the responsible to
generate the EP. Other investigations revealed the electrical potential
of each cochlear fluid respect to the perilymph that is considered to be
0 mV (Figure I5.5).
Figure I5.4 | K+ cycling. This draw assume that the K+ circulation starts when hair cells allow the passage of K+ ions when an acoustic vibration moves the basilar membrane and triggers the nerve stimulus generation (232).
From perilymph, K+ is taken by different K+ channels, ATPases and
co-transporters by fibrocytes of the spiral ligament. These cells and
basal cells from the stria vascularis are connected by connexin gap
junctions as well as basal cells and intermediate cells (Figure I5.5),
and are, therefore, considered to share the same electrochemical
properties. K+ is released by intermediate cells to the intrastrial fluid
via the K+ channel Kir4.1. Intrastrial fluid has low K+ concentration
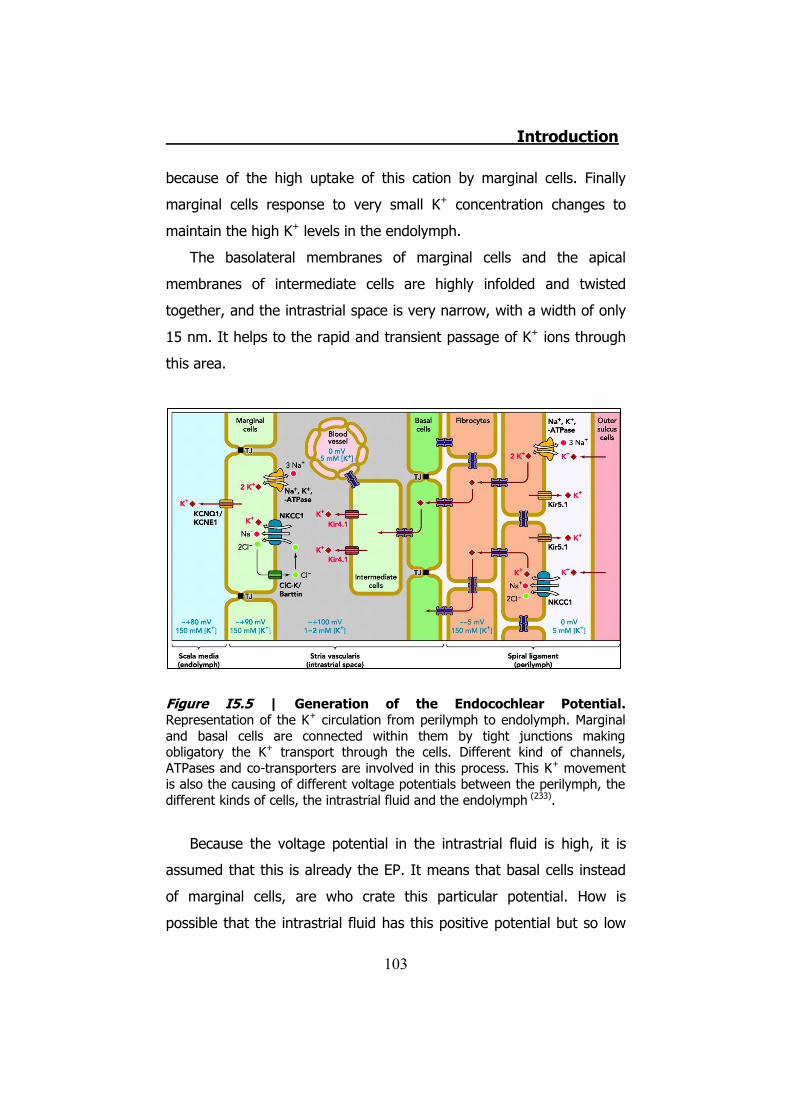
Introduction
103
because of the high uptake of this cation by marginal cells. Finally
marginal cells response to very small K+ concentration changes to
maintain the high K+ levels in the endolymph.
The basolateral membranes of marginal cells and the apical
membranes of intermediate cells are highly infolded and twisted
together, and the intrastrial space is very narrow, with a width of only
15 nm. It helps to the rapid and transient passage of K+ ions through
this area.
Figure I5.5 | Generation of the Endocochlear Potential. Representation of the K+ circulation from perilymph to endolymph. Marginal and basal cells are connected within them by tight junctions making obligatory the K+ transport through the cells. Different kind of channels, ATPases and co-transporters are involved in this process. This K+ movement is also the causing of different voltage potentials between the perilymph, the different kinds of cells, the intrastrial fluid and the endolymph (233).
Because the voltage potential in the intrastrial fluid is high, it is
assumed that this is already the EP. It means that basal cells instead
of marginal cells, are who crate this particular potential. How is
possible that the intrastrial fluid has this positive potential but so low
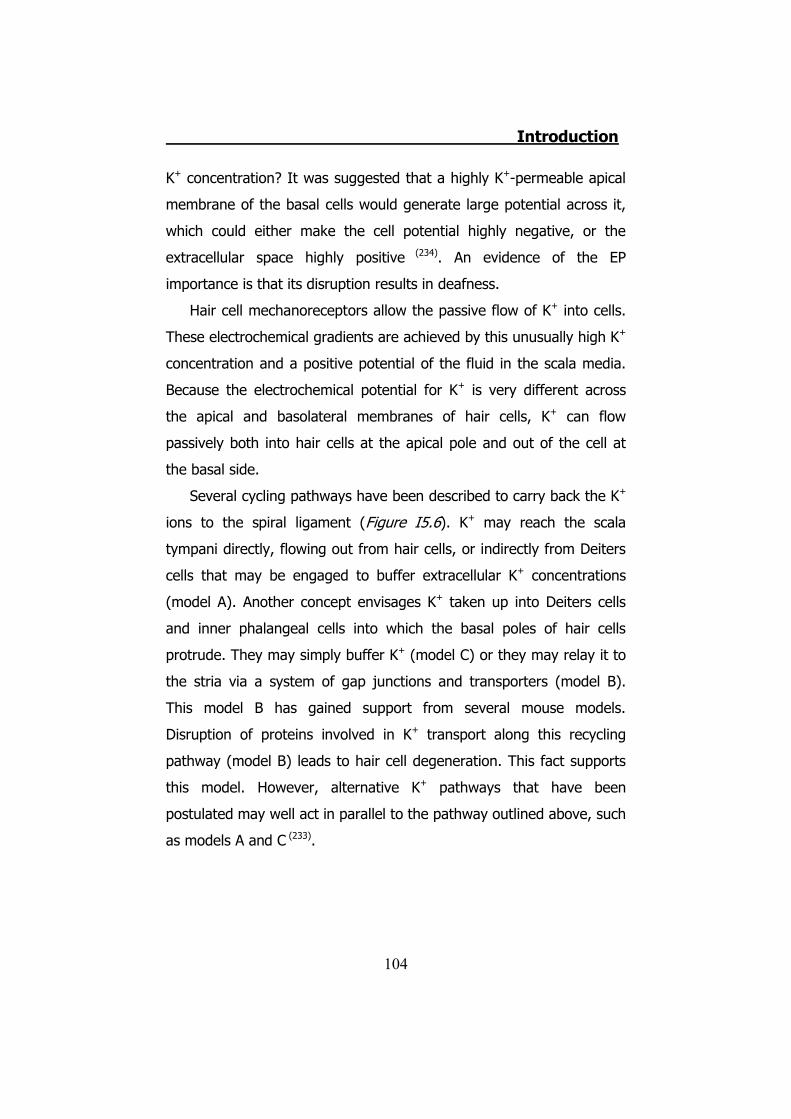
Introduction
104
K+ concentration? It was suggested that a highly K+-permeable apical
membrane of the basal cells would generate large potential across it,
which could either make the cell potential highly negative, or the
extracellular space highly positive (234). An evidence of the EP
importance is that its disruption results in deafness.
Hair cell mechanoreceptors allow the passive flow of K+ into cells.
These electrochemical gradients are achieved by this unusually high K+
concentration and a positive potential of the fluid in the scala media.
Because the electrochemical potential for K+ is very different across
the apical and basolateral membranes of hair cells, K+ can flow
passively both into hair cells at the apical pole and out of the cell at
the basal side.
Several cycling pathways have been described to carry back the K+
ions to the spiral ligament (Figure I5.6). K+ may reach the scala
tympani directly, flowing out from hair cells, or indirectly from Deiters
cells that may be engaged to buffer extracellular K+ concentrations
(model A). Another concept envisages K+ taken up into Deiters cells
and inner phalangeal cells into which the basal poles of hair cells
protrude. They may simply buffer K+ (model C) or they may relay it to
the stria via a system of gap junctions and transporters (model B).
This model B has gained support from several mouse models.
Disruption of proteins involved in K+ transport along this recycling
pathway (model B) leads to hair cell degeneration. This fact supports
this model. However, alternative K+ pathways that have been
postulated may well act in parallel to the pathway outlined above, such
as models A and C (233).
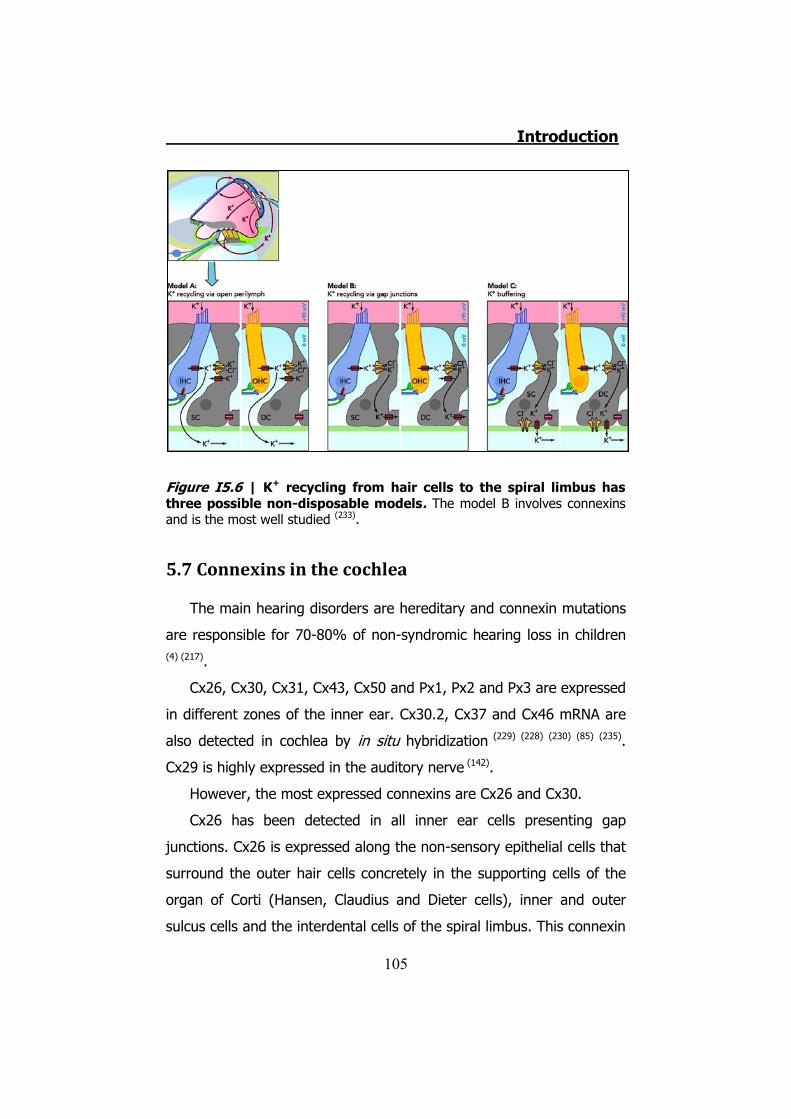
Introduction
105
Figure I5.6 | K+ recycling from hair cells to the spiral limbus has three possible non-disposable models. The model B involves connexins and is the most well studied (233).
5.7 Connexins in the cochlea
The main hearing disorders are hereditary and connexin mutations
are responsible for 70-80% of non-syndromic hearing loss in children
(4) (217).
Cx26, Cx30, Cx31, Cx43, Cx50 and Px1, Px2 and Px3 are expressed
in different zones of the inner ear. Cx30.2, Cx37 and Cx46 mRNA are
also detected in cochlea by in situ hybridization (229) (228) (230) (85) (235).
Cx29 is highly expressed in the auditory nerve (142).
However, the most expressed connexins are Cx26 and Cx30.
Cx26 has been detected in all inner ear cells presenting gap
junctions. Cx26 is expressed along the non-sensory epithelial cells that
surround the outer hair cells concretely in the supporting cells of the
organ of Corti (Hansen, Claudius and Dieter cells), inner and outer
sulcus cells and the interdental cells of the spiral limbus. This connexin
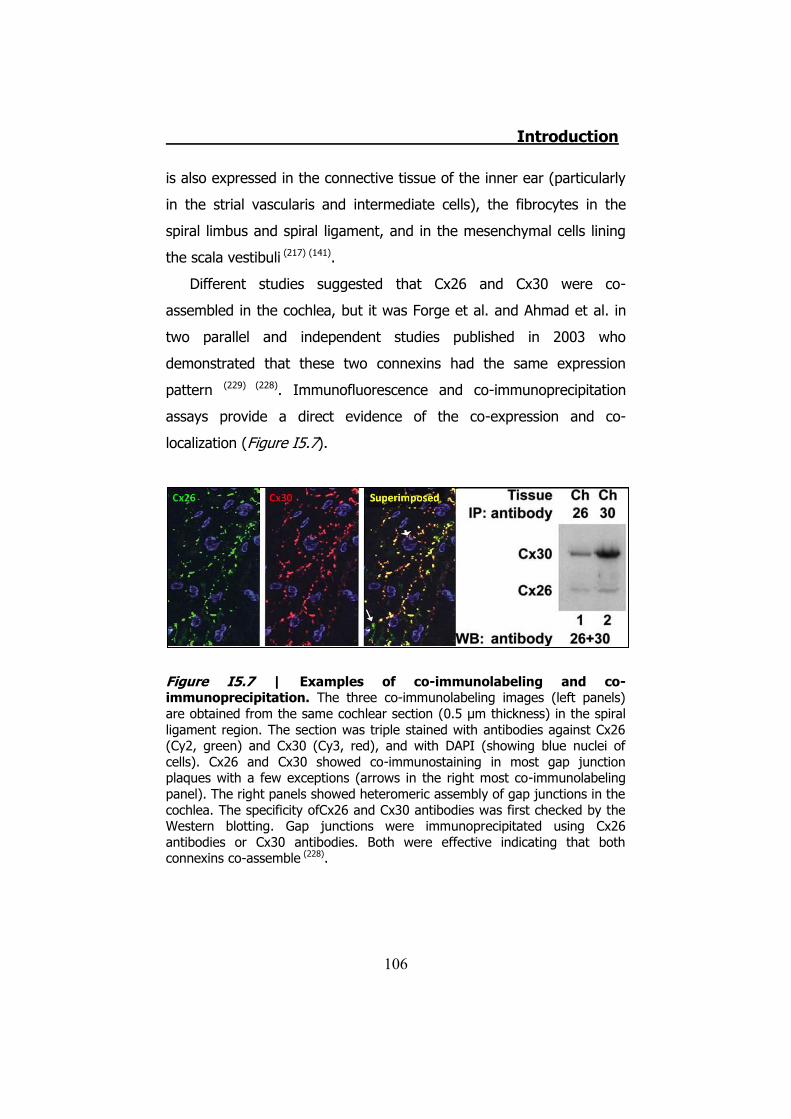
Introduction
106
is also expressed in the connective tissue of the inner ear (particularly
in the strial vascularis and intermediate cells), the fibrocytes in the
spiral limbus and spiral ligament, and in the mesenchymal cells lining
the scala vestibuli (217) (141).
Different studies suggested that Cx26 and Cx30 were co-
assembled in the cochlea, but it was Forge et al. and Ahmad et al. in
two parallel and independent studies published in 2003 who
demonstrated that these two connexins had the same expression
pattern (229) (228). Immunofluorescence and co-immunoprecipitation
assays provide a direct evidence of the co-expression and co-
localization (Figure I5.7).
Figure I5.7 | Examples of co-immunolabeling and co-immunoprecipitation. The three co-immunolabeling images (left panels) are obtained from the same cochlear section (0.5 μm thickness) in the spiral ligament region. The section was triple stained with antibodies against Cx26 (Cy2, green) and Cx30 (Cy3, red), and with DAPI (showing blue nuclei of cells). Cx26 and Cx30 showed co-immunostaining in most gap junction plaques with a few exceptions (arrows in the right most co-immunolabeling panel). The right panels showed heteromeric assembly of gap junctions in the cochlea. The specificity ofCx26 and Cx30 antibodies was first checked by the Western blotting. Gap junctions were immunoprecipitated using Cx26 antibodies or Cx30 antibodies. Both were effective indicating that both connexins co-assemble (228).
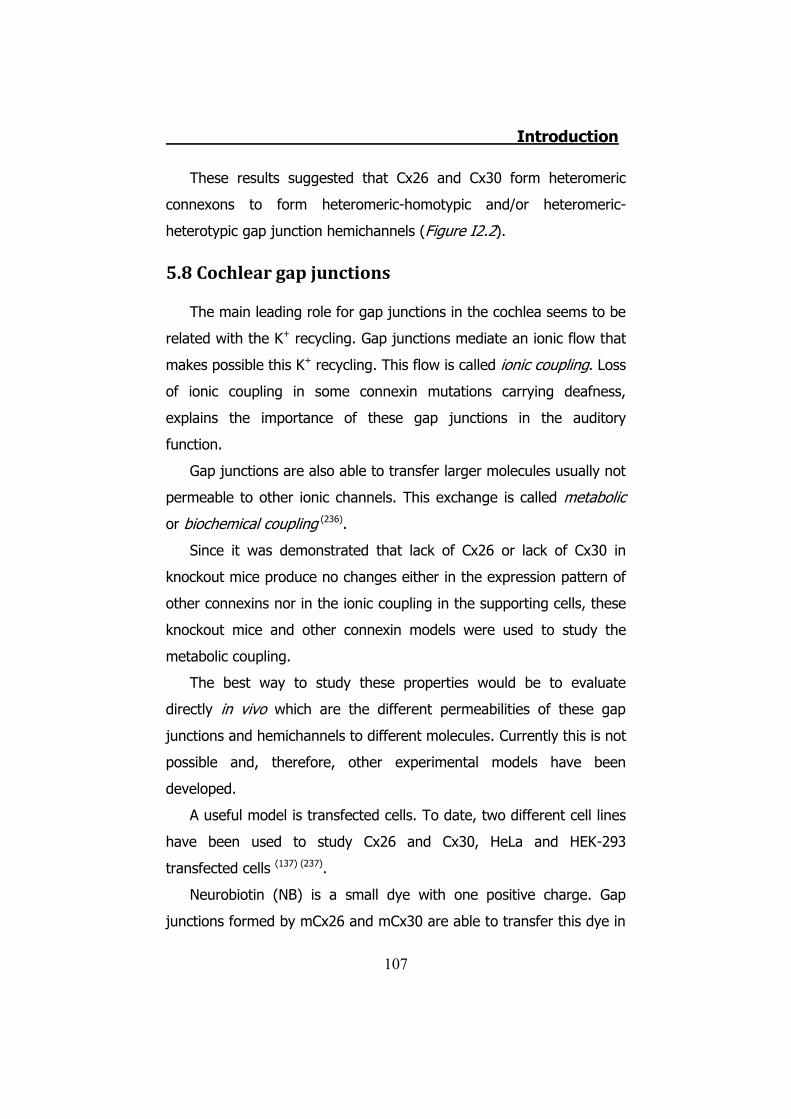
Introduction
107
These results suggested that Cx26 and Cx30 form heteromeric
connexons to form heteromeric-homotypic and/or heteromeric-
heterotypic gap junction hemichannels (Figure I2.2).
5.8 Cochlear gap junctions
The main leading role for gap junctions in the cochlea seems to be
related with the K+ recycling. Gap junctions mediate an ionic flow that
makes possible this K+ recycling. This flow is called ionic coupling. Loss
of ionic coupling in some connexin mutations carrying deafness,
explains the importance of these gap junctions in the auditory
function.
Gap junctions are also able to transfer larger molecules usually not
permeable to other ionic channels. This exchange is called metabolic
or biochemical coupling (236).
Since it was demonstrated that lack of Cx26 or lack of Cx30 in
knockout mice produce no changes either in the expression pattern of
other connexins nor in the ionic coupling in the supporting cells, these
knockout mice and other connexin models were used to study the
metabolic coupling.
The best way to study these properties would be to evaluate
directly in vivo which are the different permeabilities of these gap
junctions and hemichannels to different molecules. Currently this is not
possible and, therefore, other experimental models have been
developed.
A useful model is transfected cells. To date, two different cell lines
have been used to study Cx26 and Cx30, HeLa and HEK-293
transfected cells (137) (237).
Neurobiotin (NB) is a small dye with one positive charge. Gap
junctions formed by mCx26 and mCx30 are able to transfer this dye in
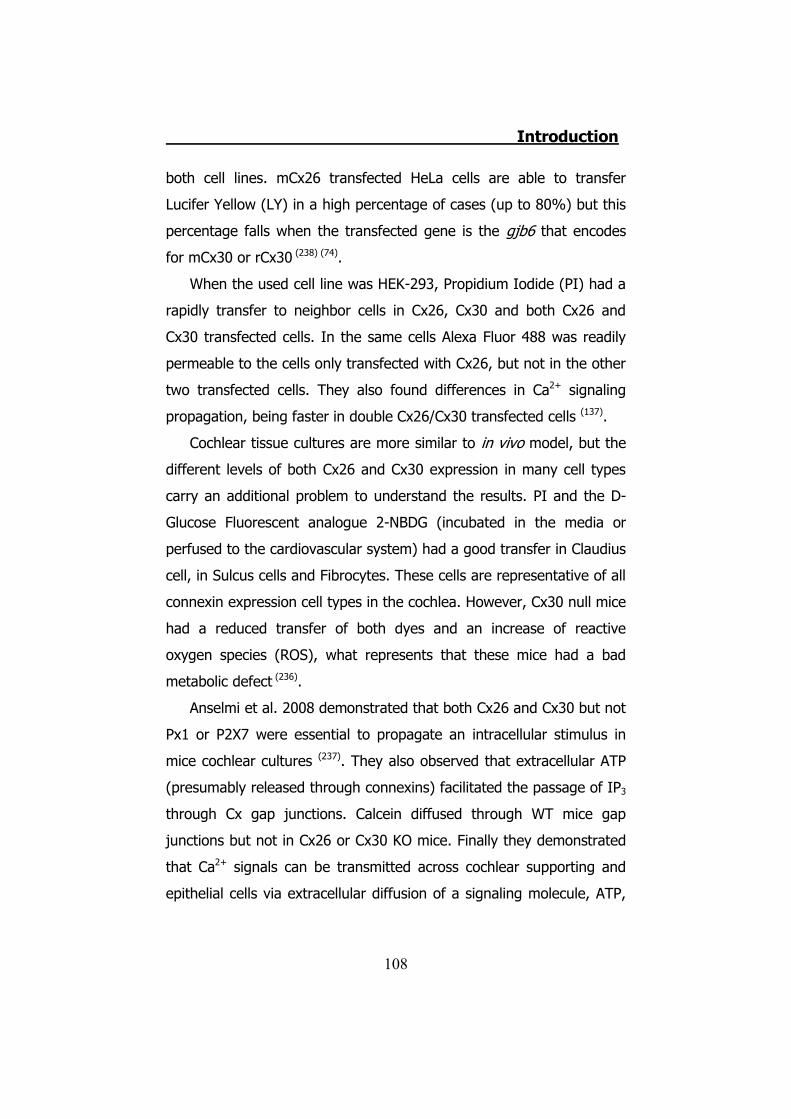
Introduction
108
both cell lines. mCx26 transfected HeLa cells are able to transfer
Lucifer Yellow (LY) in a high percentage of cases (up to 80%) but this
percentage falls when the transfected gene is the gjb6 that encodes
for mCx30 or rCx30 (238) (74).
When the used cell line was HEK-293, Propidium Iodide (PI) had a
rapidly transfer to neighbor cells in Cx26, Cx30 and both Cx26 and
Cx30 transfected cells. In the same cells Alexa Fluor 488 was readily
permeable to the cells only transfected with Cx26, but not in the other
two transfected cells. They also found differences in Ca2+ signaling
propagation, being faster in double Cx26/Cx30 transfected cells (137).
Cochlear tissue cultures are more similar to in vivo model, but the
different levels of both Cx26 and Cx30 expression in many cell types
carry an additional problem to understand the results. PI and the D-
Glucose Fluorescent analogue 2-NBDG (incubated in the media or
perfused to the cardiovascular system) had a good transfer in Claudius
cell, in Sulcus cells and Fibrocytes. These cells are representative of all
connexin expression cell types in the cochlea. However, Cx30 null mice
had a reduced transfer of both dyes and an increase of reactive
oxygen species (ROS), what represents that these mice had a bad
metabolic defect (236).
Anselmi et al. 2008 demonstrated that both Cx26 and Cx30 but not
Px1 or P2X7 were essential to propagate an intracellular stimulus in
mice cochlear cultures (237). They also observed that extracellular ATP
(presumably released through connexins) facilitated the passage of IP3
through Cx gap junctions. Calcein diffused through WT mice gap
junctions but not in Cx26 or Cx30 KO mice. Finally they demonstrated
that Ca2+ signals can be transmitted across cochlear supporting and
epithelial cells via extracellular diffusion of a signaling molecule, ATP,
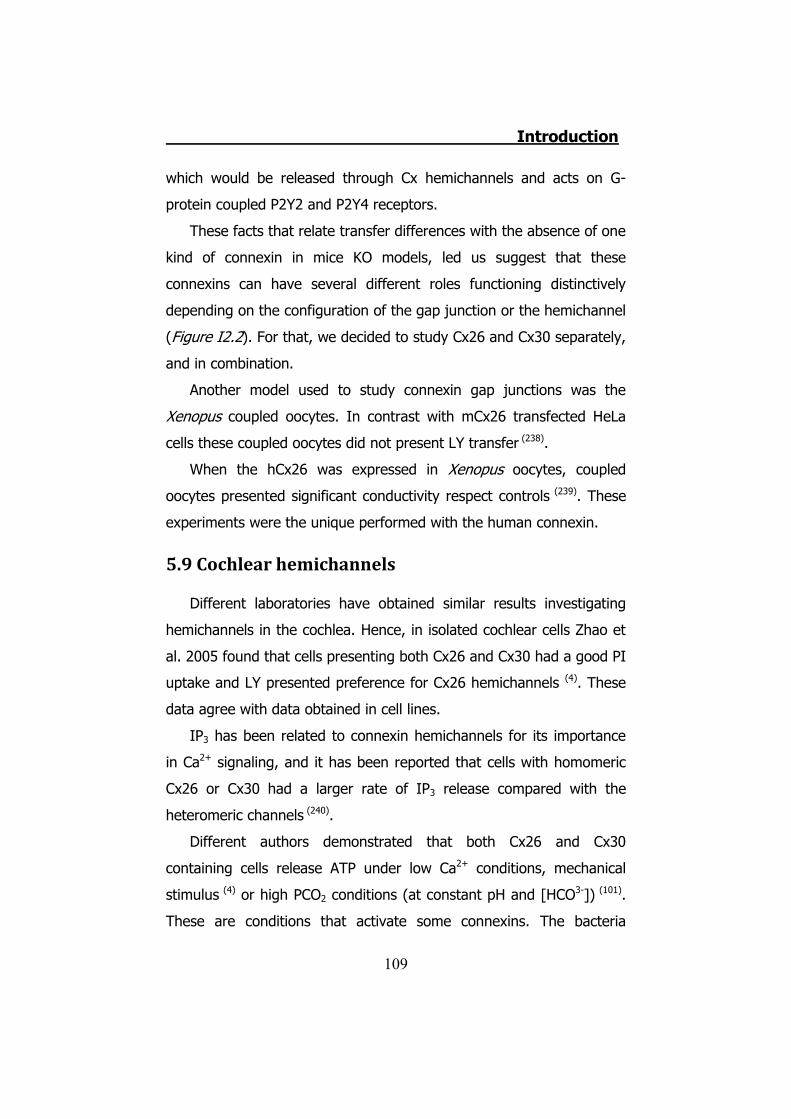
Introduction
109
which would be released through Cx hemichannels and acts on G-
protein coupled P2Y2 and P2Y4 receptors.
These facts that relate transfer differences with the absence of one
kind of connexin in mice KO models, led us suggest that these
connexins can have several different roles functioning distinctively
depending on the configuration of the gap junction or the hemichannel
(Figure I2.2). For that, we decided to study Cx26 and Cx30 separately,
and in combination.
Another model used to study connexin gap junctions was the
Xenopus coupled oocytes. In contrast with mCx26 transfected HeLa
cells these coupled oocytes did not present LY transfer (238).
When the hCx26 was expressed in Xenopus oocytes, coupled
oocytes presented significant conductivity respect controls (239). These
experiments were the unique performed with the human connexin.
5.9 Cochlear hemichannels
Different laboratories have obtained similar results investigating
hemichannels in the cochlea. Hence, in isolated cochlear cells Zhao et
al. 2005 found that cells presenting both Cx26 and Cx30 had a good PI
uptake and LY presented preference for Cx26 hemichannels (4). These
data agree with data obtained in cell lines.
IP3 has been related to connexin hemichannels for its importance
in Ca2+ signaling, and it has been reported that cells with homomeric
Cx26 or Cx30 had a larger rate of IP3 release compared with the
heteromeric channels (240).
Different authors demonstrated that both Cx26 and Cx30
containing cells release ATP under low Ca2+ conditions, mechanical
stimulus (4) or high PCO2 conditions (at constant pH and [HCO3-]) (101).
These are conditions that activate some connexins. The bacteria
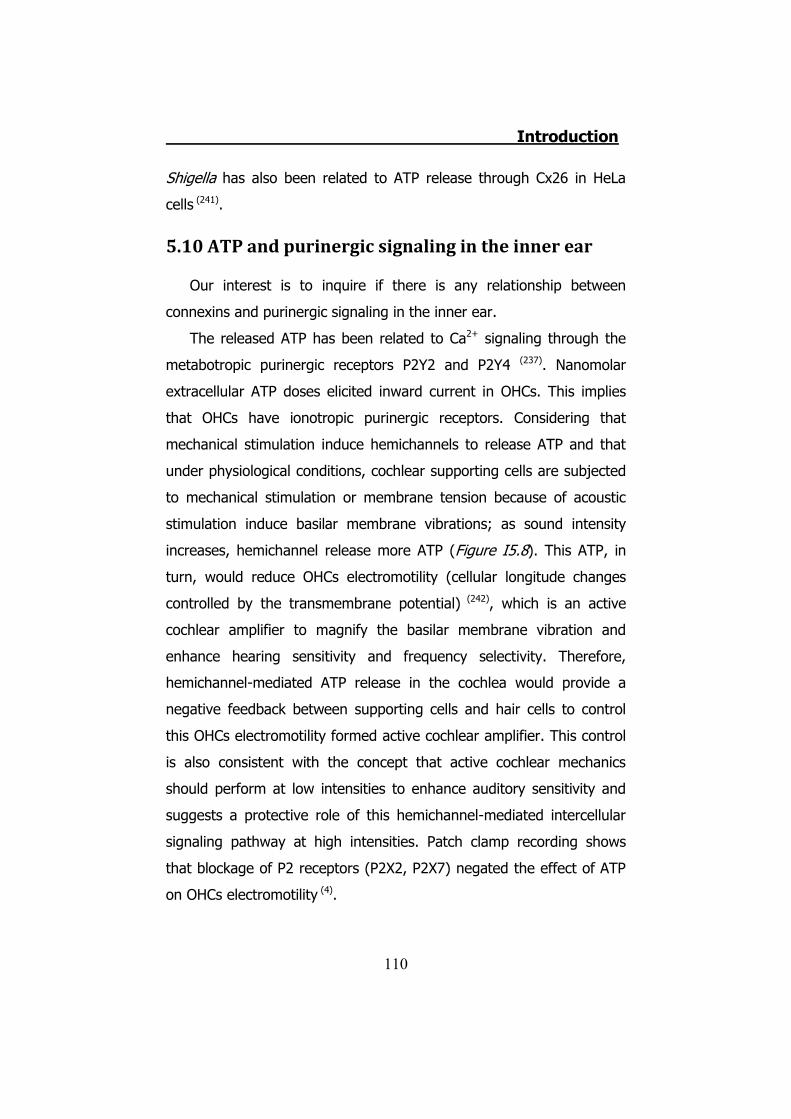
Introduction
110
Shigella has also been related to ATP release through Cx26 in HeLa
cells (241).
5.10 ATP and purinergic signaling in the inner ear
Our interest is to inquire if there is any relationship between
connexins and purinergic signaling in the inner ear.
The released ATP has been related to Ca2+ signaling through the
metabotropic purinergic receptors P2Y2 and P2Y4 (237). Nanomolar
extracellular ATP doses elicited inward current in OHCs. This implies
that OHCs have ionotropic purinergic receptors. Considering that
mechanical stimulation induce hemichannels to release ATP and that
under physiological conditions, cochlear supporting cells are subjected
to mechanical stimulation or membrane tension because of acoustic
stimulation induce basilar membrane vibrations; as sound intensity
increases, hemichannel release more ATP (Figure I5.8). This ATP, in
turn, would reduce OHCs electromotility (cellular longitude changes
controlled by the transmembrane potential) (242), which is an active
cochlear amplifier to magnify the basilar membrane vibration and
enhance hearing sensitivity and frequency selectivity. Therefore,
hemichannel-mediated ATP release in the cochlea would provide a
negative feedback between supporting cells and hair cells to control
this OHCs electromotility formed active cochlear amplifier. This control
is also consistent with the concept that active cochlear mechanics
should perform at low intensities to enhance auditory sensitivity and
suggests a protective role of this hemichannel-mediated intercellular
signaling pathway at high intensities. Patch clamp recording shows
that blockage of P2 receptors (P2X2, P2X7) negated the effect of ATP
on OHCs electromotility (4).
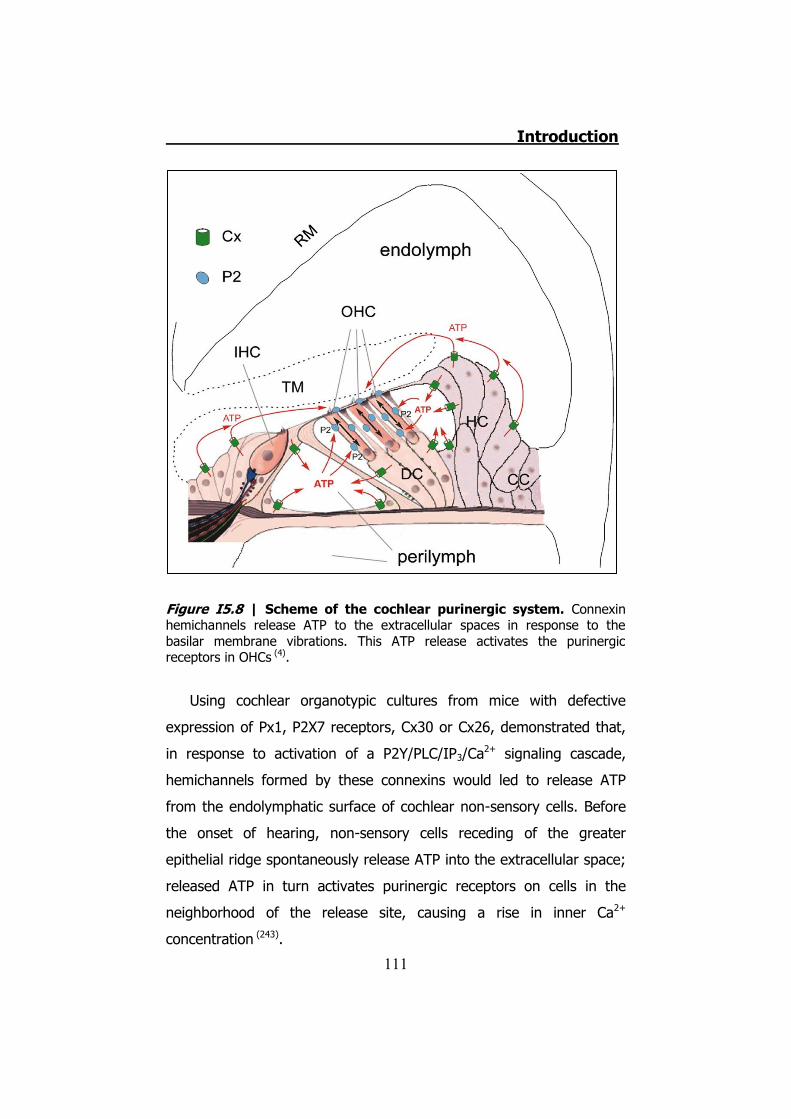
Introduction
111
Figure I5.8 | Scheme of the cochlear purinergic system. Connexin hemichannels release ATP to the extracellular spaces in response to the basilar membrane vibrations. This ATP release activates the purinergic receptors in OHCs (4).
Using cochlear organotypic cultures from mice with defective
expression of Px1, P2X7 receptors, Cx30 or Cx26, demonstrated that,
in response to activation of a P2Y/PLC/IP3/Ca2+ signaling cascade,
hemichannels formed by these connexins would led to release ATP
from the endolymphatic surface of cochlear non-sensory cells. Before
the onset of hearing, non-sensory cells receding of the greater
epithelial ridge spontaneously release ATP into the extracellular space;
released ATP in turn activates purinergic receptors on cells in the
neighborhood of the release site, causing a rise in inner Ca2+
concentration (243).
Introduction
112
5.11 Cx26 and Cx30 mutations
Guilford P et al. (1994) found that homozygotic mutations in the
locus 13q11 were the cause of recessive deafness (DFNB1) in
consanguineous Tunisian families (244). Kelsell at al. 1997 identified the
first Cx26 mutation related to dominant deafness, M34T (245). Since
then, several mutations have been described and identified. At least 13
dominant mutations, 92 recessive mutations and 10 unknown
mutations in gjb2 gene; 2 dominant and 3 recessive mutations in gjb3
gene; 2 dominant mutations in gjb6 gene; and 2 recessive mutations
in gja1 gene have been reported (246) (85) (139).
G12R, S17F, D50N, D50Y mutations in Cx26 are responsible for
dominant deafness, although in association with skin diseases. In
these cases the skin disease is the KID (246) (247) (248) (249) (250) (251).
Targeted ablation of Cx26 in cochlear supporting cells causes hair cell
and supporting cell degeneration (252).
The substitution of a C by a T in the base 14 of the gene gjb6
causes the T5M mutation in hCx30. This mutation causes Autosomal
Dominant Non-syndromic mild hearing loss (141) (243). In the paired
oocytes assay, junctional currents were detected in Xenopus laevis
oocytes expressing the wild-type Cx30 isoform. In contrast, no
transjunctional conductance was present in oocytes expressing the
Cx30T5M mutant. Co-expressing wild-type and mutant Cx30 resulted
in the inhibition of intercellular coupling, interpreted as a dominant-
negative effect of the mutant connexin on wild-type Cx30 (243). The
Cx30T5M expression in Cx30+/T5M and Cx30T5M/T5M mice reduce the
expression of Cx30WT and Cx26WT.
The following pages of the present thesis are the answers that I
and the team found relating the activation of connexins and purinergic
signaling.

113
Materials and methods

114

Materials and Methods
115
1. Solutions
Materials and Methods
116
1.1Sciatic nerve solutions
1.1.1 Imaging
� Na+ free solution (75.5 ± 26 mOsm, n=12): 5 mM KCl, 1 mM
CaCl2, 1 mM MgCl2, 10mM HEPES, pH 7.4 (NaOH)
� Isotonic solution (231 ± 13.5 mOsm, n=15): 140 mM NaCl, 5
mM KCl, 1 mM CaCl2, 1 mM MgCl2, 10mM HEPES, pH 7.4 (NaOH)
1.1.2 Videoimaging
� Hypotonic solution (140 ± 5 mOsm, n=10): 40 mM NaCl, 5 mM
KCl, 1 mM CaCl2, 1 mM MgCl2, 20mM HEPES, pH 7.4 (NaOH)
� Isotonic solution: 140 mM NaCl, 5 mM KCl, 1 mM CaCl2, 1 mM
MgCl2, 20mM HEPES, 6 mM Glucose, pH 7.4 (NaOH)
� Low Divalent Solution: 140mM NaCl; 5mM KCl; 20mM HEPES;
168.5 μM EDTA; 1mM EGTA; 6mM Glucose, pH 7.4 (NaOH)
1.2 Xenopus oocytes
� Barth’s Solution: 88 mM NaCl, 1 mM KCl, 0.33 mM Ca(NO3)2,
0.41 mM CaCl2, 2.40 mM NaHCO3, 0.82 mM MgSO4, 20 mM HEPES,
(100 U/ml) Penicillin G, (100 μg/ml) Streptomycin, pH 7.5 (autoclave)
� Low Ca2+ Ringer solution: 115 mM NaCl, 2 mM KCl, 0.5 mM
CaCl2, 10 μM MgCl2, 10 mM HEPES, pH 7.4 (NaOH)
� Ringer 0mM Ca2+: 115 mM NaCl, 2 mM KCl, 2 mM EDTA, 10 μM
Mg2+ (final concentration 4.4 μM), 10 mM HEPES, pH 7.4 (HCl)
� Ringer Mg2+: 115 mM NaCl, 2 mM KCl, 1.8 mM CaCl2, 1.8 mM
MgCl2, 10 mM HEPES, pH 7.4
� Ringer solution (NR): 115 mM NaCl, 2 mM KCl, 1.8 mM CaCl2,
10 mM HEPES, pH 7.4 (NaOH)
Materials and Methods
117
1.3 Immunofluorescence, Immunoblotting and cultures
� Electrophoresis Buffer: 192 mM Glycine, 25 mM Tris, 1% SDS
� LB agar: LB medium, 15 g/ L Bacto agar (autoclave)
� Loading Buffer: 100 mM Tris-HCl (pH 6.8), 200 MN
Dithiothreitol, 4% SDS, 0.2% Bromophenol blue, 0.2% Glycerol
� Lysis Buffer: PBS 1x, 1% Triton X-100, 10 μg/ml Leupeptin, 10
μg/ml Aprotinin, 1 mM EDTA, 1 mM PMSF
� Medium Luria-Bertani (LB): 10% Bacto Tryptone, 5% Yeast
extract, 10% NaCl, pH 7.0 (autoclave)
� Milk buffer: TBS 1x, 5% fat free powder milk
� Phosphate Buffered Saline (PBS): 137 mM NaCl, 2,7 mM KCl, 2
mM NaH2PO4, pH 7.4 (HCl) (autoclave)
� Sandwich Buffer: 48 mM Tris, 39 mM Glycine, 0.04% SDS, 20%
Methanol
� Tris Buffer Solution (TBS) (10X) : 100mM Tris, 1.4M NaCl, 1%
Tween-20, pH 7.4 (HCl) (autoclave)
Osmolarity was mesured using the Vapor Osmometer VAPRO5520
(Wescor Inc).
1.4 Luciferin-Luciferase Reaction
One of the most widely used and accepted assays to detect ATP is
the Luciferin-Luciferase luminescent reaction (253). This method can
detect direct and continuously ATP levels on a solution or sample. It is
based on the luciferin capacity to, in presence of luciferase (an enzyme
obtained from the American firefly, Photinus pyralis) and ATP, to
oxidate to form oxiluciferin and emit light (Figure M1.1). Luminescence
can be easily detected and quantified using photomultipliers or plate
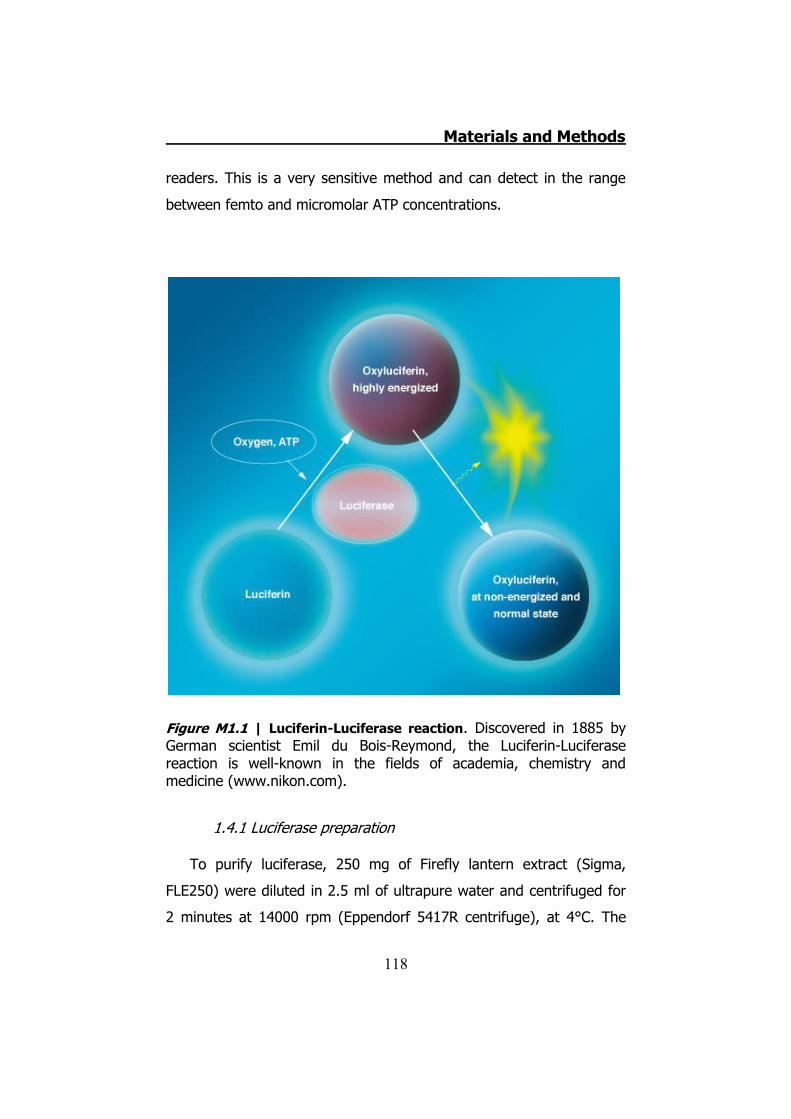
Materials and Methods
118
readers. This is a very sensitive method and can detect in the range
between femto and micromolar ATP concentrations.
Figure M1.1 | Luciferin-Luciferase reaction. Discovered in 1885 by German scientist Emil du Bois-Reymond, the Luciferin-Luciferase reaction is well-known in the fields of academia, chemistry and medicine (www.nikon.com).
1.4.1 Luciferase preparation
To purify luciferase, 250 mg of Firefly lantern extract (Sigma,
FLE250) were diluted in 2.5 ml of ultrapure water and centrifuged for
2 minutes at 14000 rpm (Eppendorf 5417R centrifuge), at 4°C. The
Materials and Methods
119
supernatant was desalted on a disposable chromatography column (10
ml, Econo-pac 10DG BioRad, UK) previously equilibrated with working
solution. Eluted luciferase was collected and aliquoted on eppendorfs
(100 μl/eppendorf). Aliquots were stored at -20°C until use.
1.4.2 D-Luciferin obtaining
10 mg of luciferin (Sigma, L-9504) was diluted in 7.5 ml ultrapure
water and pH was adjusted to pH 7.4 with NaOH 1M. Aliquots of 500
μl were stored at -20°C until used.
Before use, 30 μl of D-Luciferin solution were added to a 100 μl
luciferase aliquot, and this Luciferin-Luciferase mix was added to
detect ATP in the extracellular milieu. The Luciferin-Luciferase reaction
is pH sensitive (needs neutral pH values) and needs the presence of
Mg2+ ions as a cofactor.
Materials and Methods
120
2. ATP release imaging from mice sciatic nerves
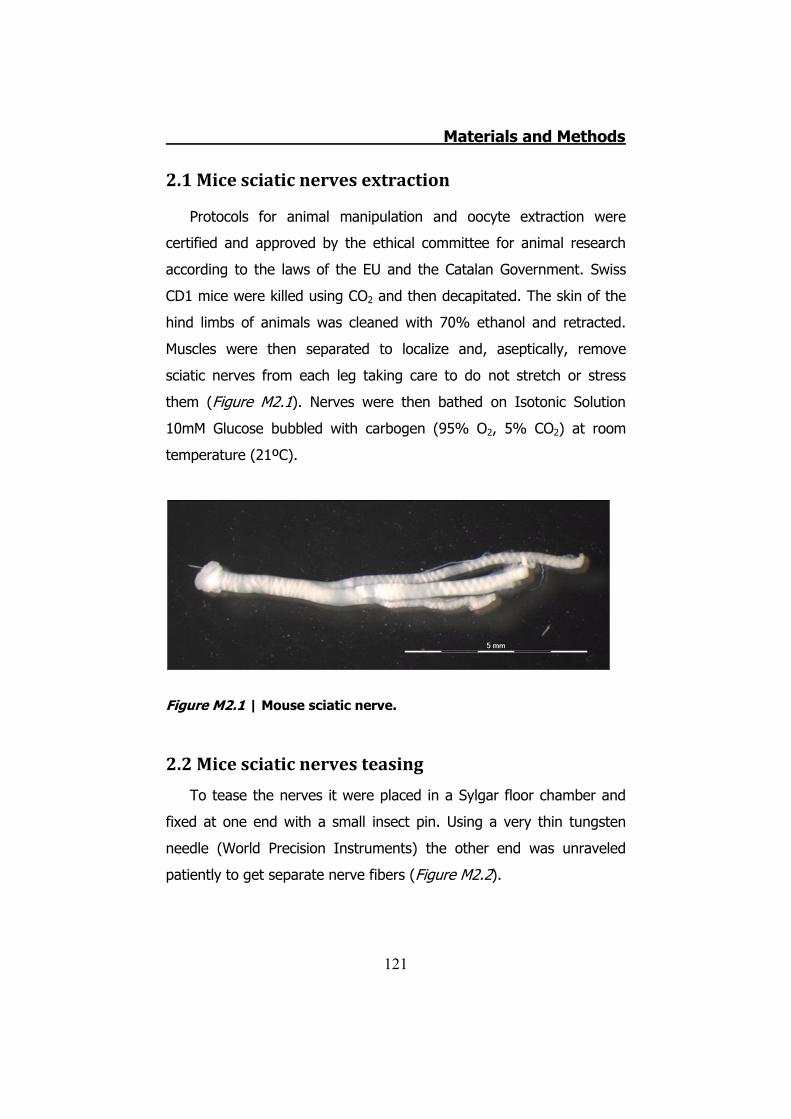
Materials and Methods
121
2.1 Mice sciatic nerves extraction
Protocols for animal manipulation and oocyte extraction were
certified and approved by the ethical committee for animal research
according to the laws of the EU and the Catalan Government. Swiss
CD1 mice were killed using CO2 and then decapitated. The skin of the
hind limbs of animals was cleaned with 70% ethanol and retracted.
Muscles were then separated to localize and, aseptically, remove
sciatic nerves from each leg taking care to do not stretch or stress
them (Figure M2.1). Nerves were then bathed on Isotonic Solution
10mM Glucose bubbled with carbogen (95% O2, 5% CO2) at room
temperature (21ºC).
Figure M2.1 | Mouse sciatic nerve.
2.2 Mice sciatic nerves teasing
To tease the nerves it were placed in a Sylgar floor chamber and
fixed at one end with a small insect pin. Using a very thin tungsten
needle (World Precision Instruments) the other end was unraveled
patiently to get separate nerve fibers (Figure M2.2).
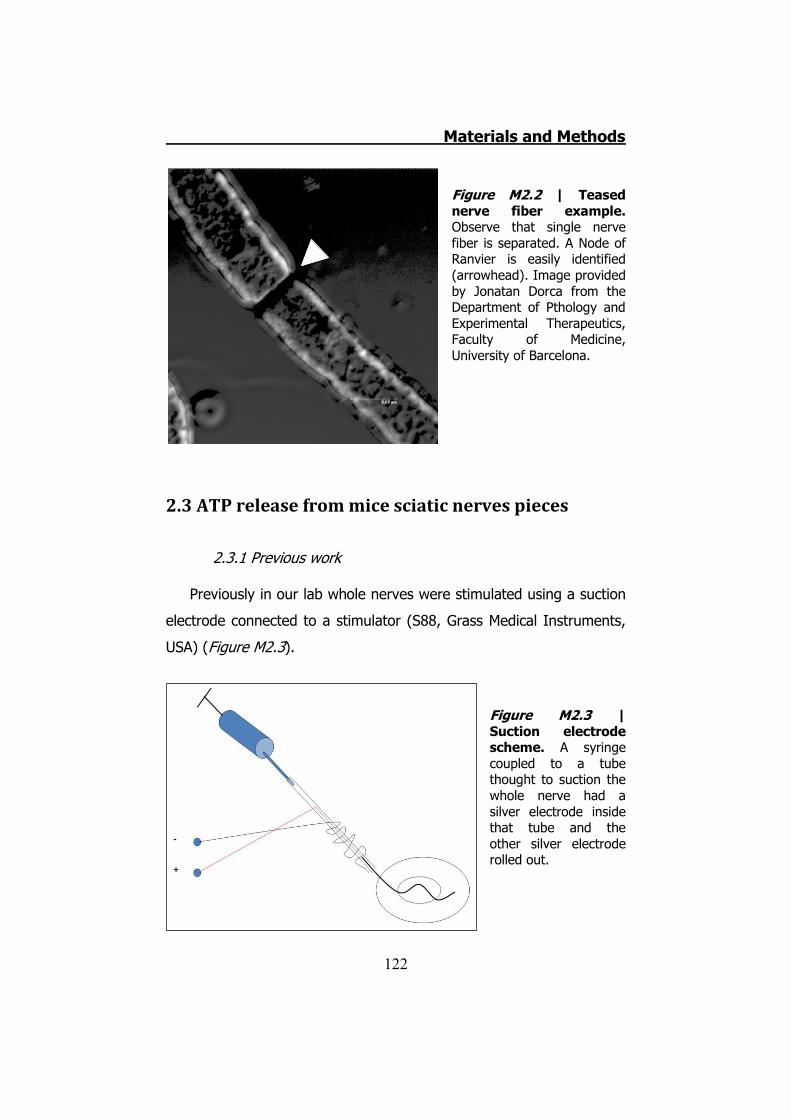
Materials and Methods
122
Figure M2.2 | Teased nerve fiber example. Observe that single nerve fiber is separated. A Node of Ranvier is easily identified (arrowhead). Image provided by Jonatan Dorca from the Department of Pthology and Experimental Therapeutics, Faculty of Medicine, University of Barcelona.
2.3 ATP release from mice sciatic nerves pieces
2.3.1 Previous work
Previously in our lab whole nerves were stimulated using a suction
electrode connected to a stimulator (S88, Grass Medical Instruments,
USA) (Figure M2.3).
Figure M2.3 | Suction electrode scheme. A syringe coupled to a tube thought to suction the whole nerve had a silver electrode inside that tube and the other silver electrode rolled out.

Materials and Methods
123
2.3.2 Mechanical stimuli
Nerve pieces (teased or not) of 5 mm long were placed on a
homemade chamber containing 100 μl of Isotonic Solution and then
fixed at the bottom by gravity using small pieces of silver wire (Figure
M2.4 arrows). Then 100 μl of Luciferin-Luciferase mixture was added.
Figure M2.4 | Piece of a mouse sciatic nerve fixed at the bottom by gravity using small pieces of silver wire (arrows).
Fire polished glass pipette was
used to stimulate mechanically
non-teased nerve pieces through a
micromanipulator coupled to a
piezo-electric controller (Figure M2.5 green arrowhead). Travel
distance of the pipette was 150 μm and the frequency 0.5 Hz. During
and after the stimulus pictures of 20 min acquisition time were taken
using Aquacosmos software (Hamamatsu, Japan) by ORCA II cooled
camera (Hamamatsu, Japan) connected to a Microscope (IX-50,
Olympus) placed on a vibration isolation table (Technical
Manufacturing Corporation, USA).
Figure M2.5 | Piece of a mouse sciatic nerve with a fire polished glass pipette above it (green arrowhead).
Hypotonic shock was
another mechanical stimulus
used to release ATP from
teased and non-teased nerve pieces. In this case, isotonic solution was
removed and 100 μl of Na+ free solution was added to the chamber

Materials and Methods
124
containing the piece of nerve. Different magnifications and times of
opening position of the camera were used to take the pictures.
2.3.3 Recording videoimages
A plastic nerve chamber was built in the facilities of the University
of Barcelona. The chamber was connected on one side to a perfusion
system filled with working solutions that flowed into the chamber by
gravity from a height of 80 cm (Figure M2.6). The solution flow had a
speed between 6-10 ml/min and was controlled by a perfusion system
BPS-8 Valve Control System (ALA Scientific Instruments, EUA). The
valve system was connected through an interface card BNC adapter
(BNC-2090, National Instruments, USA) to a computer with a specific
protocol designed with WinWCP v3.3.3 setup (John Dempster,
University of Strathclyde, Scotland, UK). The solution that went into
the chamber bathed the nerve and was removed through a tubing
system connected to the building general vacuum. Sciatic nerve was
placed in a hole on the middle of the chamber which had a depth of 2
mm and a length of 30 mm. Two silver wires were placed on the
extremes of the nerve to prevent it from moving or going away during
the solution perfusion. Teased sciatic nerve was washed out with
isotonic solution for a time up to 10 min. After this time, the chamber
was depleted from solution and the nerve bathed with 30 μl of the
Luciferin-Luciferase mixture. The setup was protected from light by a
dark curtain. Light emitted by the bioluminescent reaction was
detected by an EM-CCD cooled camera (Hamamatsu, Japan) with an
acquisition time frame of 0.122 s. It was connected to a Magnifying
glass (SZ-CVT, Olympus) with a duplicator, placed on a vibration
isolation table (Technical Manufacturing Corporation, USA). The
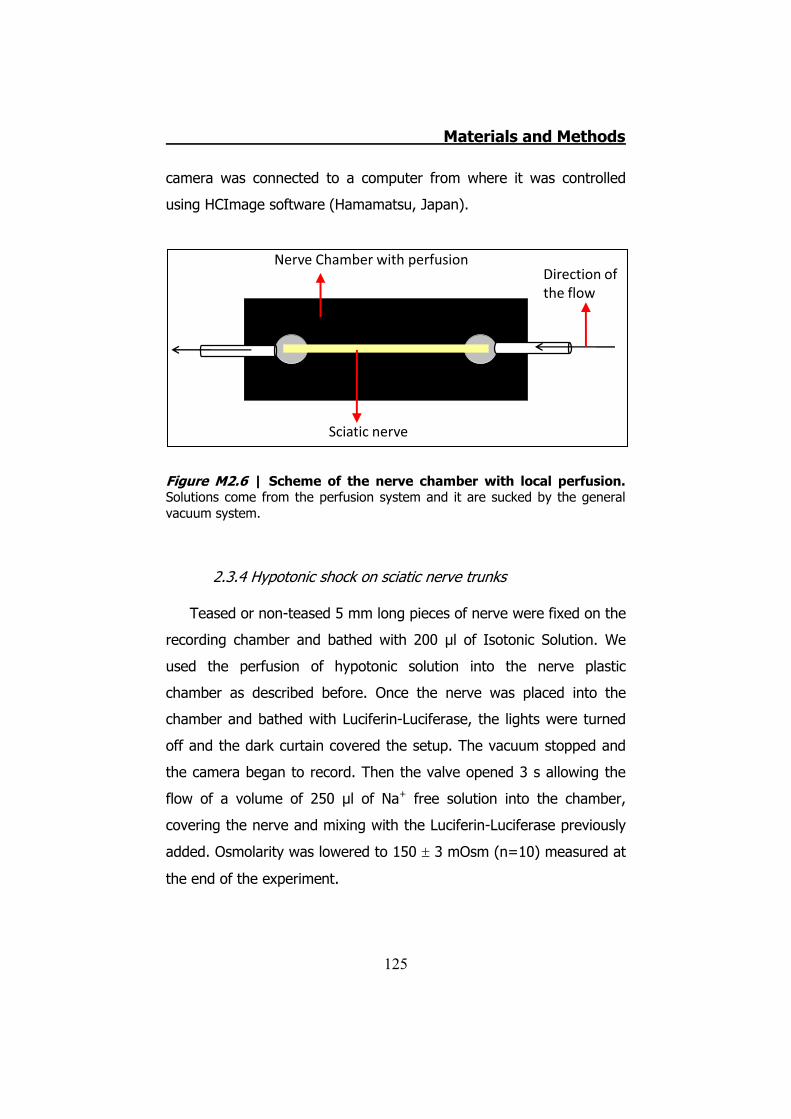
Materials and Methods
125
camera was connected to a computer from where it was controlled
using HCImage software (Hamamatsu, Japan).
Figure M2.6 | Scheme of the nerve chamber with local perfusion. Solutions come from the perfusion system and it are sucked by the general vacuum system.
2.3.4 Hypotonic shock on sciatic nerve trunks
Teased or non-teased 5 mm long pieces of nerve were fixed on the
recording chamber and bathed with 200 μl of Isotonic Solution. We
used the perfusion of hypotonic solution into the nerve plastic
chamber as described before. Once the nerve was placed into the
chamber and bathed with Luciferin-Luciferase, the lights were turned
off and the dark curtain covered the setup. The vacuum stopped and
the camera began to record. Then the valve opened 3 s allowing the
flow of a volume of 250 μl of Na+ free solution into the chamber,
covering the nerve and mixing with the Luciferin-Luciferase previously
added. Osmolarity was lowered to 150 � 3 mOsm (n=10) measured at
the end of the experiment.
Nerve Chamber with perfusionDirection of the flow
Sciatic nerve
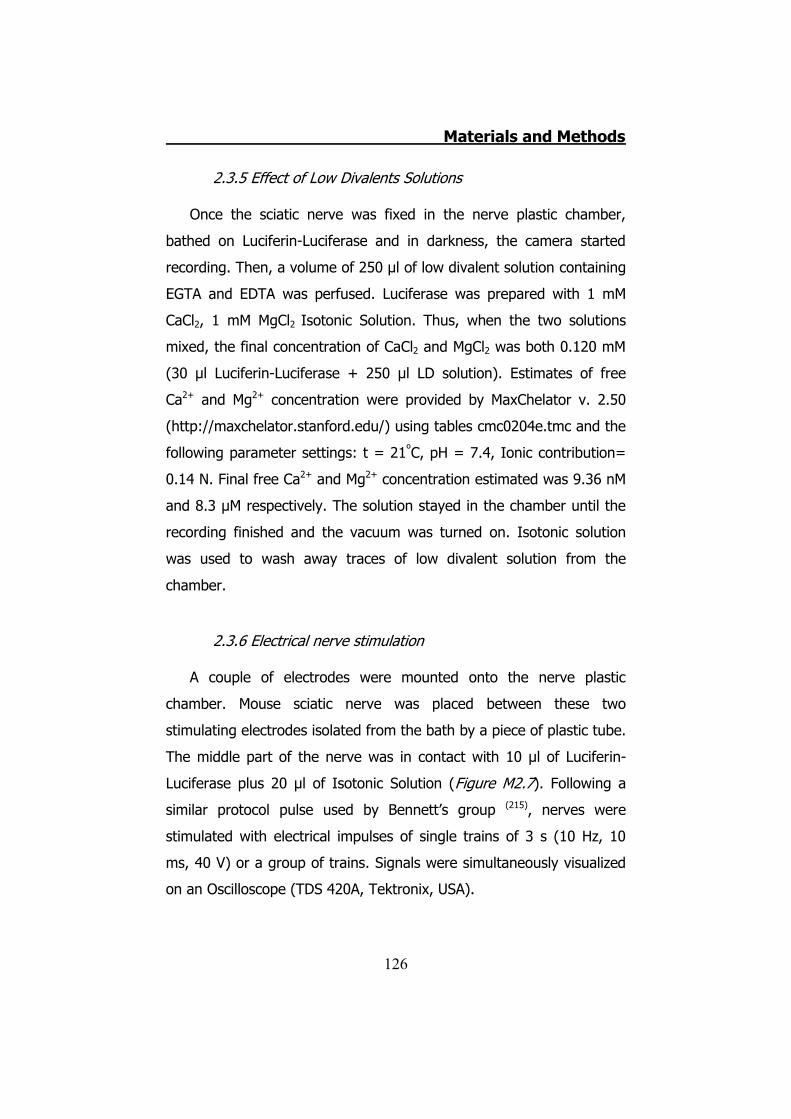
Materials and Methods
126
2.3.5 Effect of Low Divalents Solutions
Once the sciatic nerve was fixed in the nerve plastic chamber,
bathed on Luciferin-Luciferase and in darkness, the camera started
recording. Then, a volume of 250 μl of low divalent solution containing
EGTA and EDTA was perfused. Luciferase was prepared with 1 mM
CaCl2, 1 mM MgCl2 Isotonic Solution. Thus, when the two solutions
mixed, the final concentration of CaCl2 and MgCl2 was both 0.120 mM
(30 μl Luciferin-Luciferase + 250 μl LD solution). Estimates of free
Ca2+ and Mg2+ concentration were provided by MaxChelator v. 2.50
(http://maxchelator.stanford.edu/) using tables cmc0204e.tmc and the
following parameter settings: t = 21ºC, pH = 7.4, Ionic contribution=
0.14 N. Final free Ca2+ and Mg2+ concentration estimated was 9.36 nM
and 8.3 μM respectively. The solution stayed in the chamber until the
recording finished and the vacuum was turned on. Isotonic solution
was used to wash away traces of low divalent solution from the
chamber.
2.3.6 Electrical nerve stimulation
A couple of electrodes were mounted onto the nerve plastic
chamber. Mouse sciatic nerve was placed between these two
stimulating electrodes isolated from the bath by a piece of plastic tube.
The middle part of the nerve was in contact with 10 μl of Luciferin-
Luciferase plus 20 μl of Isotonic Solution (Figure M2.7). Following a
similar protocol pulse used by Bennett’s group (215), nerves were
stimulated with electrical impulses of single trains of 3 s (10 Hz, 10
ms, 40 V) or a group of trains. Signals were simultaneously visualized
on an Oscilloscope (TDS 420A, Tektronix, USA).
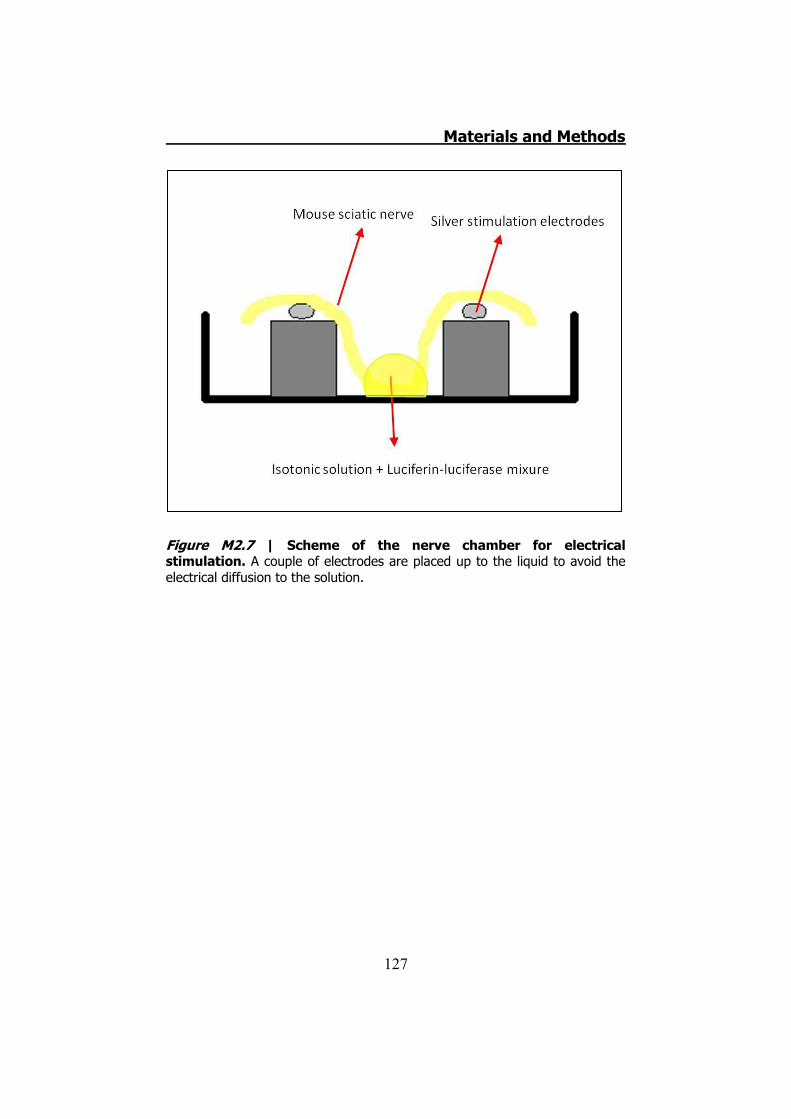
Materials and Methods
127
Figure M2.7 | Scheme of the nerve chamber for electrical stimulation. A couple of electrodes are placed up to the liquid to avoid the electrical diffusion to the solution.

Materials and Methods
128
3. Cell cultures and ATP assays
Materials and Methods
129
3.1 Primary Schwann cell cultures
Primary Schwann cell cultures were grown using a modification of
Brokes method (254), which is based on culturing Schwann cells from
adult peripheral nerve. We did our cultures according to Dr. Conxi
Lázaro group, from the department of Genetics, Hospital Duran i
Reynals - IDIBELL, Barcelona, Spain (255) (256). The method is based on
Schwann cells cultures from human schwannomas, adapted to mice
sciatic nerve Schwann cells from Swiss CD1, male mice (20 g body
weight).
3.1.1 Extraction and Pre-incubation
Mice Schwann cells for primary cultures were obtained from sciatic
nerves. Sciatic nerves from each limb of 12 mice were extracted as
described before in Materials and Methods (Section 2.1). The
connective sheath was removed and nerve fibers were placed on Petri
dishes with basal growth media for Schwann cells (DMEM
supplemented with 10% FBS, 100 U/ml of Penicillin and 100 μg/ml of
Streptomycin, DMEM was commercially enriched with
glucose/glutamine/pyruvate, (GIBCO, 41966-029), and pre-incubated
on a incubator at 37°C, 10% CO2 for 3 to 5 days to induce the
dedifferentiation of myelinated Schwann Cells. During this period of
time, the plates were not removed from the incubator. The best
results were obtained when the preparations were not submitted to
any vibration or gentle movement.
3.1.2 Coating culture plates
Before plating, cell culture plates were coated with poly-L-lysine
and laminin. With this aim, 0.1 mg/ml poly-L-lysine (Sigma, P-1524)
Materials and Methods
130
solution was prepared from a stock solution (10 mg/ml) in PBS and
filtered with 0.45 μm pore filter (Millex HA SLHA033SS, Millipore).
Poly-L-lysine concentration was raised to 1 mg/ml if cells had to be
seeded on cleaned glass circular coverslips. The poly-L-lysine solution
was placed on 12 wells from a 24 wells plates, covering the entire
bottom, and was left for 1 hour at RT. Poly-L-lysine was recovered and
wells were washed twice with PBS before adding a 4 μg/ml of laminin
solution. Laminin stock solution was diluted in PBS to 4 μg/ml and also
filtered with a 0.45 μm pore filter before placing it on the culture wells.
Laminin was left on culture wells for 4 hours, at RT (21ºC) or o/n, at
4°C. After that, Laminin was recovered and wells were washed twice
with PBS and left with PBS at 4°C until the time to plate cells. Coating
only lasts for a few days.
3.1.3 Digestion and plating
Media from Petri dishes containing pre-incubating sciatic nerves
was removed and nerves were disaggregated with sterile scalpel
blades. Once properly disaggregated 1 ml basal growth media
containing enzymes 0.8-1U Dispase I (Roche 210-455 or Sigma, D-
4818) and 160 U Collagenase 1A (Sigma, C-0130) was added and left
for 1 hour in the incubator (37°C, 10% CO2). Tissue was further
disrupted with suction through a sterilized glass Pasteur pipette and
placed it in a centrifuge tube. After 5 min, 1500 rpm centrifugation
(Hermle Z383) the supernatant was discarded and the Pellet was
resuspended with complete GFM media (Basal Growth media
supplemented with 0.5 μM Forskolin (Sigma, F-6886), 0.5 mM IBMX
(Sigma, I-7018), 2.5 μg/ml Insulin (Sigma, I-5500) and 10 nM
Herregulin β (R&D systems, 396-HB)), and placed in coated culture
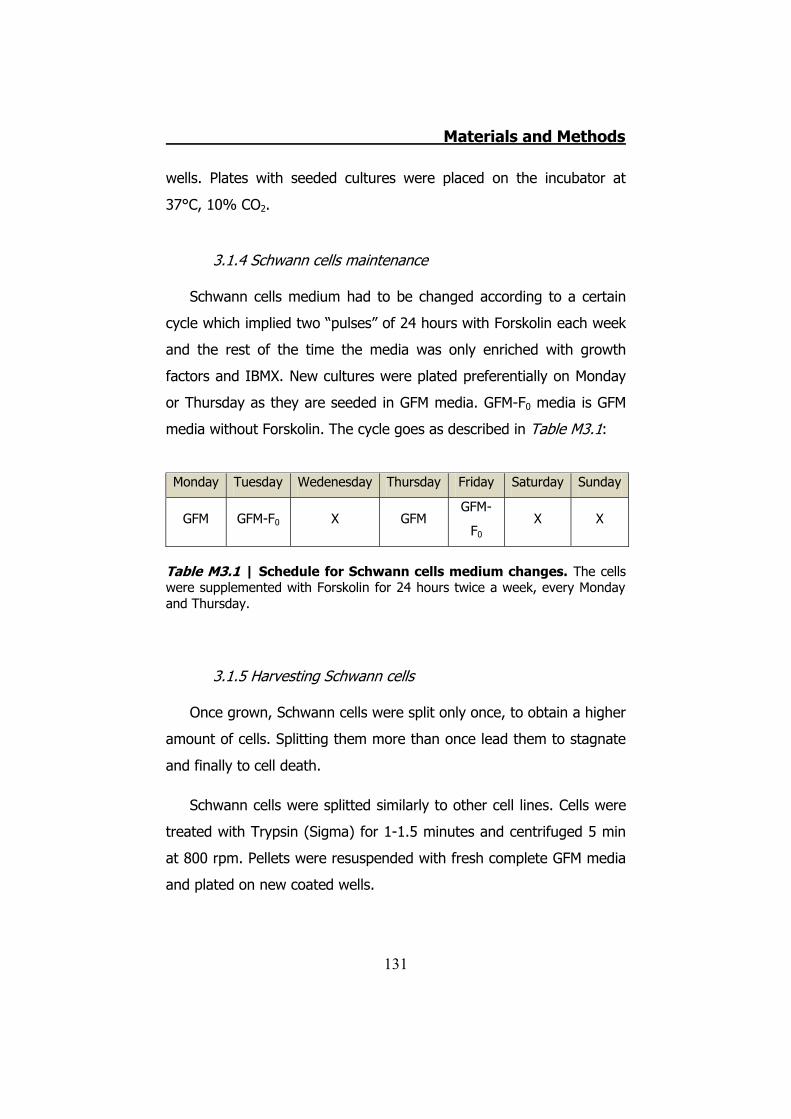
Materials and Methods
131
wells. Plates with seeded cultures were placed on the incubator at
37°C, 10% CO2.
3.1.4 Schwann cells maintenance
Schwann cells medium had to be changed according to a certain
cycle which implied two “pulses” of 24 hours with Forskolin each week
and the rest of the time the media was only enriched with growth
factors and IBMX. New cultures were plated preferentially on Monday
or Thursday as they are seeded in GFM media. GFM-F0 media is GFM
media without Forskolin. The cycle goes as described in Table M3.1:
Monday Tuesday Wedenesday Thursday Friday Saturday Sunday
GFM GFM-F0 X GFM GFM-
F0 X X
Table M3.1 | Schedule for Schwann cells medium changes. The cells were supplemented with Forskolin for 24 hours twice a week, every Monday and Thursday.
3.1.5 Harvesting Schwann cells
Once grown, Schwann cells were split only once, to obtain a higher
amount of cells. Splitting them more than once lead them to stagnate
and finally to cell death.
Schwann cells were splitted similarly to other cell lines. Cells were
treated with Trypsin (Sigma) for 1-1.5 minutes and centrifuged 5 min
at 800 rpm. Pellets were resuspended with fresh complete GFM media
and plated on new coated wells.
Materials and Methods
132
3.1.6 Freeze Schwann cells or sciatic nerves for Schwann cell culture
To freeze Schwann cells they were first trypsinized and
centrifuged. (To freeze whole sciatic nerves preincubated with basal
growth media, they were only centrifuged). Pellets were resuspended
with 1 ml basal growth medium supplemented with 40% FBS and 10%
DMSO. All was quickly mixed and placed on an Isopropanol
surrounded freezing plate. Samples were left at -80°C for 24 hours,
and then transferred to liquid nitrogen for long term storage.
3.2 HeLa cells cultures
HeLa cell line was kindly provided by Dr. Klaus Willecke, from
Rheinische Friedrich-Wilhelms-Universität Bonn, Institut für Genetik,
Bonn, Germany. Transfections were done in our laboratory previously.
HeLa cell line cultures are easy to maintain and grow. Cells were
splitted every 3 or 4 days and maintained using DMEM media (Sigma,
D-6046) supplemented with 10% FBS (Biological Industries, 04007-
1A), 100 U/ml of Penicillin and 100 μg/ml of Streptomycin (Sigma, P-
0781).
hCx32 transfected HeLa cells were done previously in our
laboratory by Dr. Xènia Grandes.
3.3 Assays on Schwann cells cultures
For ATP release in response to hypotonicity assay, confluent
Schwann cells were grown on 24 well plates. The Medium of these
cells was changed to isotonic buffer 4 hours prior to experiments. Just
before experiments, this solution was removed and 250 μl of fresh
isotonic solution were added. Luciferin and Luciferase were mixed (100
μl Luciferase + 30 μl Luciferin) and 40 μl of the mixture was added to
Materials and Methods
133
each well containing cells. Plates were then inserted into the
microplate reader (Fluostar Optima, BMG) and the following program
was run: Luminescence was read every 4 seconds, with a total number
of 75 readings per well (5 minutes/well). At second 40, 250 μl of either
isotonic, 280-290 mOsm (controls) or Na+ free solution, 27 mOsm
(hypotonic shock) were injected. The final osmolarity was 140-150
mOsm. To quantify the amount of ATP released the same protocol was
performed, and known amounts of ATP were injected to wells
containing the concentration of Luciferin-Luciferase used in cell
containing wells. The resulting regression straight line was used to
interpolate the results obtained in cells containing wells.
To obtain the ATP fmole/104 cells, the number of cells per well was
calculated as follows: five different microscope fields were
photographed and cells were counted using Image J (NIH, USA). The
mean value obtained on each well was used to calculate the total
number of cells per well, using known areas from microscope field (at
200x) and surface of wells (from 12 and 24 wells plates).
3.4 Assays on HeLa cells
Cells were grown on 12 or 24 well plates until 70-90% confluence.
At that point, the media was removed and cells were washed with PBS
and left in the incubator at 37°C, 5% CO2 for 2-4 h with isotonic
solution). Just before experiments this solution was removed and 250
μl of fresh isotonic solution was added. Luciferin and Luciferase were
mixed (100 μl Luciferase + 30 μl Luciferin) and 40 μl of mixture was
added to each well containing cells. Plates were inserted to the plate
reader machine and the same program used for Schwann cells was
run. ATP controls were also obtained in the same way.
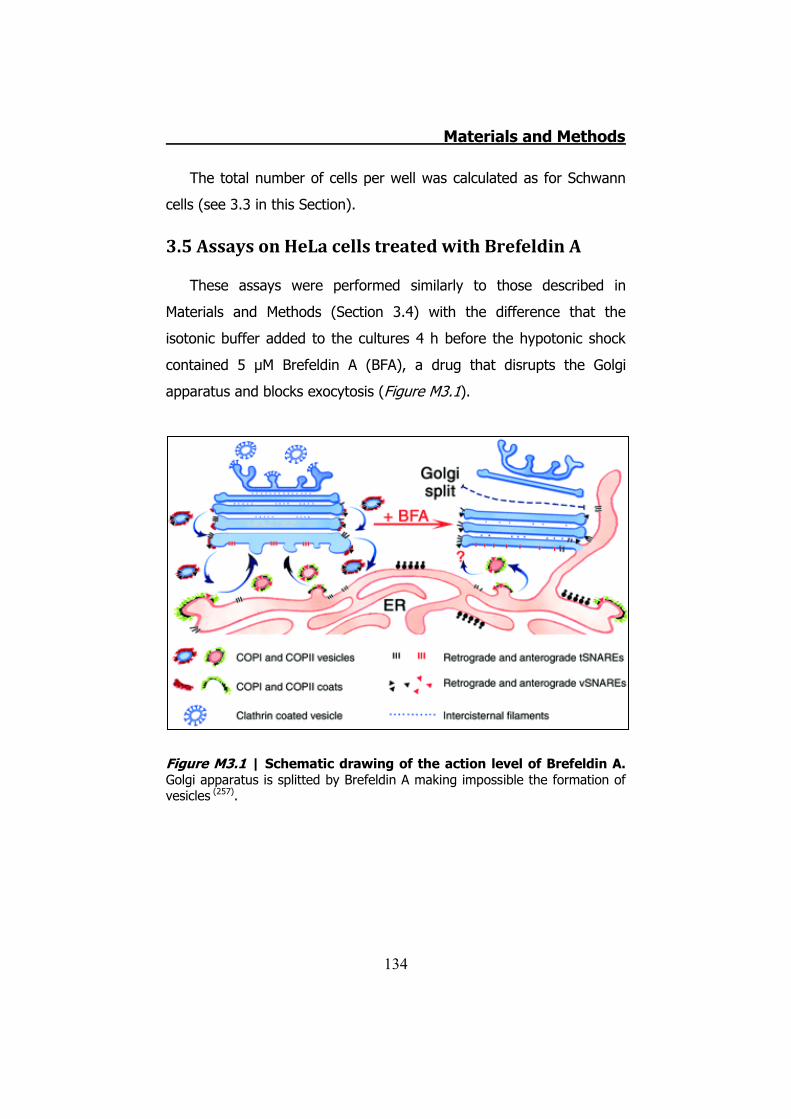
Materials and Methods
134
The total number of cells per well was calculated as for Schwann
cells (see 3.3 in this Section).
3.5 Assays on HeLa cells treated with Brefeldin A
These assays were performed similarly to those described in
Materials and Methods (Section 3.4) with the difference that the
isotonic buffer added to the cultures 4 h before the hypotonic shock
contained 5 μM Brefeldin A (BFA), a drug that disrupts the Golgi
apparatus and blocks exocytosis (Figure M3.1).
Figure M3.1 | Schematic drawing of the action level of Brefeldin A. Golgi apparatus is splitted by Brefeldin A making impossible the formation of vesicles (257).

Materials and Methods
135
3.6 ATP release imaging in primary Schwann cell cultures and HeLa cells cultures
The same cultures used in the MicroPlate Reader were used to
capture images as done before with mice nerves. In this case, cell
cultures were plated on glass coverslips, and placed in a recording
chamber to be placed at the same time in the Microscope (IX-50,
Olympus) located on a vibration isolation table (Technical
Manufacturing Corporation, USA). Once a cell or a group of cells were
localized and focused, we added 30 μl of Luciferin-Luciferase mixture
to the isotonic solution. During five minutes an image was taken using
the Aquacosmos software (Hamamatsu, Japan) by ORCA II cooled
camera (Hamamatsu, Japan) to see if under these conditions cells
released ATP. After those minutes we added free Na+ solution to cause
the hypotonic shock and we captured another picture of five minutes
exposition.
Materials and Methods
136
4. Immunofluorescence assays and Western Blot analysis
Materials and Methods
137
4.1 Sciatic nerve teasings
For these preparations we used Swiss CD1, C57BL6 mice and
Knock out C57BL6 mice for Cx32 and Cx29. CD1 mice were taken from
the animal device installation from the Campus Bellvitge, Universitat
de Barcelona, Spain. All kinds of C57BL6 mice were gently provided by
Dr. Klaus Willecke, Institut für Genetik, Bonn University, Germany.
There were two ways to prepare sciatic nerve teasings for
immunofluorescences: The first method was fixing the tissue: Ketolar
and Rompun were mixed (4:1) and injected intraperitoneally to mice
(500μl/mouse) to anaesthetize them before perfusion. When mice
were correctly anaesthetized, they were secured on a surface and
dissected to expose the heart. A needle connected to the perfusion
system was inserted to the left ventricle, and the right auricle was cut
open to let blood flow. First we washed injecting PBS through the
perfusion system and then we switched to 4 or 2% paraformaldehyde.
When the animal was fixed we extracted both sciatic nerves (Section
2.1). Sciatic nerves were placed on a Petri dish with PBS to wash them
and then postfixed with 4 or 2% paraformaldehyde until used.
The second method (not fixing) was to sacrifice mice by cervical
dislocation and immediately extract sciatic nerves. From that point all
samples (fixed or unfixed) were placed on a microscope slide and
covered with a drop of PBS. Under a magnifier and using a pair of fine
tweezers the connective layers were removed and nerve fibres were
gently separated and placed on superfrost microscope slides (Esco,
Erie scientific company. USA), trying to get single fibres separated
from the others. PBS was aspirated and microscope slides were let dry.
Dried samples were stored at -20°C until used.
Materials and Methods
138
4.2 Sciatic nerve immunofluorescence
Coverslips were thawed and post-fixed 10 minutes with ice-cold
acetone. Coverslips were washed with PBS before being blocked with
IF blocking solution for 1 hour, at RT.
Primary antibodies were diluted in IF incubation solution
(concentration depending on antibody) and placed on the coverslips
for 1h 30 min, at RT or ON at 4°C. Samples were then washed three
times with PBS. Secondary, Fluorochrome conjugated (Alexa Fluor®
488 or Alexa Fluor® 546, Molecular probes, A-11034 and A-11035),
antibodies diluted in IF incubation solution were then transferred to
the coverslips and left for 1h, at RT. Afterwards nuclei were stained
with TO-PRO-3 (Molecular Probes, Invitrogen) 1/6000 in PBS for 10
min, at RT. Coverslips were washed three times with PBS and
mounted with anti-fading immunofluore mounting medium (ICN
Biomedicals, USA). Samples were stored at 4°C for 12-24 hours in
darkness conditions until the mounting media was dry. Coverslips were
observed using a Leica Confocal microscope, or a Karl Zeiss LSM
microscope. Photographs were taken using Leica or Karl Zeiss specific
camera and software.
Primary antibodies were used at the following dilutions:
-Antibody against Cx32 106-124 (Sigma, C3595): 1/500
-
-Antibody against Cx32 monoclonal (Zymed 13-8200 and 35-
8900): 1/300
-Antibody against Cx32 polyclonal (Zymed 71-0600)
4.3 Immunofluorescence on cells
Cultured Schwann cells grown on coverslips were rinsed twice with
PBS and fixed with ice cold ethanol for 10 min. Afterwards, coverslips
Materials and Methods
139
were washed again twice with ethanol and blocked with a PBS solution
containing 5% NGS, 5% BSA and 0.1% Triton X-100, 1h at RT. After
that the blocking solution was removed and fresh blocking solution
with primary antibodies was added for 1h 30 min at RT or o/n at 4°C.
Coverslips were then washed three times with PBS for 10 min and
incubated with secondary antibody diluted in blocking solution.
Coverslips were washed again in PBS three times for 10 min, rinsed
with ultrapure water and dried before mounted with permafluor
mounting media (Immunotech, Beckman coulter company) and stored
at 4°C in darkness conditions, at least for 24 h, before observed on
LSM or fluorescence microscope.
Primary monoclonal antibody against Cx32 (Zymed 13-8200 and
35-8900) was used at the 1/300 dilution
4.4 HeLa cells homogenates
To obtain protein homogenates from HeLa cells grown on 12 wells
plates, cells were trypsinized (Tryspin from Gibco, 25300-061) and
centrifuged for 5 min at 800 rpm (Hermle 2383 centrifuge). Sediments
were resuspended with 1 ml of lysis buffer and were centrifuged twice
for 2 min at 900 rpm. Pellets were rinsed with PBS plus protease
inhibitors. After the second centrifugation, pellets were resuspended in
1 ml PBS plus protease inhibitors and were homogenated with
repeated aspirations through the pipette. The homogenates were left
for 5 min on ice, and finally were centrifuged again for 10 min at
1000xG. Pellets were kept and supernatants were transferred to new
eppendorf tubes and centrifuged again 30 min at 100000xG. Pellets
obtained both before and after these centrifugations were
resuspended in 100 μl PBS plus protease inhibitors. Protein
concentration was quantified using the BCA method (Pierce protein
Materials and Methods
140
assay kit) or the Bradford method, and samples were stored at -20°C
until used. Pellets obtained before the last centrifugation contained the
cell nuclei and pellets obtained after the last centrifugation contained
all intracellular and plasma membrane proteins.
4.5 General Western Blot protocol
Acrilamide/Bisacrilamide gels for electrophoresis were made using
a concentration of 12 % for the resolving part and at 4% for stacking
portion. Loading buffer was added and samples were boiled for 5
minutes before loading them on a gel and ran for 1 hour and 10
minutes at 200 V and 18 mA (per gel). Proteins were then transferred
from Acrilamide gels to nitrocellulose membranes using the wet
transference protocol. For the protocol all parts were soaked in
sandwich buffer and transference was held at 100 mA, for 1 hour.
Transferred nitrocellulose membranes were then blocked for 45
minutes with milk buffer. Milk buffer was removed and the membrane
was incubated o/n at 4ºC with new milk buffer with the primary
antibody anti Cx32 (Sigma 106-124) at 1/1000 dilution. The day after
membranes were washed three times with TBS buffer before the
secondary HRP conjugated antibody (anti Rabbit (DAKO P0217))
diluted 1/2000 in milk buffer was added for 1 hour, at RT. Membranes
were then washed three times with TBS buffer. Membranes were
developed using the ECL reaction (GE Healthcare) system. This system
use HRP conjugated to the secondary antibody to, in conjunction with
H2O2 and Luminol (a chemiluminescent substrate) generate a light
signal that is captured by a film (Kodak). In some experiments the
light was not recorded on a film but in a new integrated system for
chemiluminiscence detection (Syngene Bio imaging, Gene-Gnome).
All this Section 4 was performed before by Dr. Xènia Grandes.
Materials and Methods
141
5. ATP release trough connexins expressed in Xenopus laevis
oocytes
Materials and Methods
142
5.1 Obtaining and keeping Xenopus laevis oocytes
Xenopus laevis female individuals were kept at the animal facilities
of the University of Barcelona, Campus of Bellvitge, Barcelona, Spain.
Each specimen was maintained separately in 2% NaCl water and feed
three times per week with grinded beef heart meat.
To extract oocytes, Xenopus laevis females were anaesthetized by
immersion in a 0.3% 3-aminobenzoic acid ethyl ester (Sigma) solution
in water. Then the frog was maintained anaesthetized placing it on an
ice bed. A small incision was performed on the abdominal muscles,
first through the skin and afterwards through the muscles, in order to
reach the ovary. A few ovarian bags were extracted and placed on a
55 mm Petri dish filled with sterile Barth’s solution. The incision was
then sewed with 0.2 mm sterile silk yarn, first the muscle and
afterwards the skin; avoiding any oocyte or air bag between the
muscle and the skin. The animal recovered in a tank containing clean
water was left to rest for at least three months before new surgery.
Each individual was operated no more than four times. Protocol for
animal manipulation and oocyte extraction was certified and approved
by the Catalan Government according to the laws of the EU.
Once in the Petri dish, the phase V and VI oocytes were manually
separated under a magnifier lenses (Sz-40, Olympus), using a pair of
watch tweezers (World precision instruments, num.55) and the rest of
ovarian tissue was removed. These developmental phases of the
oocytes were optically distinguishable, as cells are very big. Selected
oocytes were maintained in Petri dishes with Barth’s medium at 16°C.
Medium was changed daily and dead oocytes were removed. With this
protocol we had a 90-95% oocyte survival.
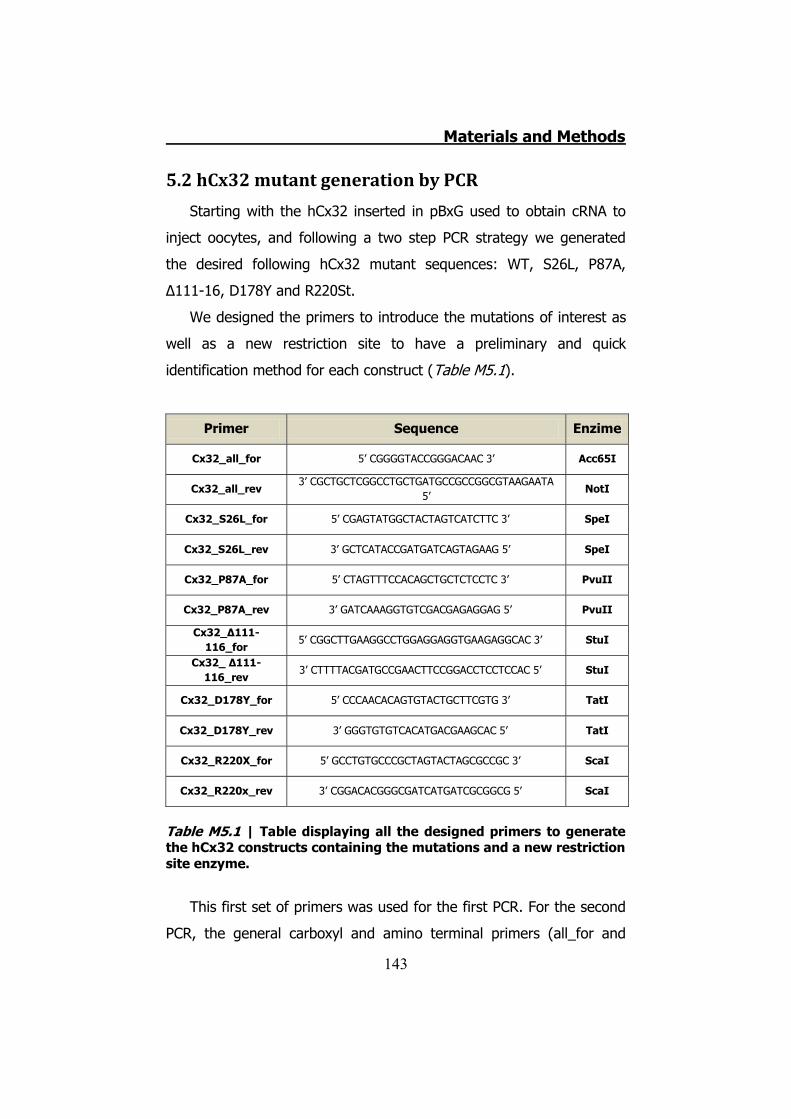
Materials and Methods
143
5.2 hCx32 mutant generation by PCR
Starting with the hCx32 inserted in pBxG used to obtain cRNA to
inject oocytes, and following a two step PCR strategy we generated
the desired following hCx32 mutant sequences: WT, S26L, P87A,
Δ111-16, D178Y and R220St.
We designed the primers to introduce the mutations of interest as
well as a new restriction site to have a preliminary and quick
identification method for each construct (Table M5.1).
Primer Sequence Enzime
Cx32_all_for 5’ CGGGGTACCGGGACAAC 3’ Acc65I
Cx32_all_rev 3’ CGCTGCTCGGCCTGCTGATGCCGCCGGCGTAAGAATA
5’ NotI
Cx32_S26L_for 5’ CGAGTATGGCTACTAGTCATCTTC 3’ SpeI
Cx32_S26L_rev 3’ GCTCATACCGATGATCAGTAGAAG 5’ SpeI
Cx32_P87A_for 5’ CTAGTTTCCACAGCTGCTCTCCTC 3’ PvuII
Cx32_P87A_rev 3’ GATCAAAGGTGTCGACGAGAGGAG 5’ PvuII
Cx32_Δ111-116_for
5’ CGGCTTGAAGGCCTGGAGGAGGTGAAGAGGCAC 3’ StuI
Cx32_ Δ111-116_rev
3’ CTTTTACGATGCCGAACTTCCGGACCTCCTCCAC 5’ StuI
Cx32_D178Y_for 5’ CCCAACACAGTGTACTGCTTCGTG 3’ TatI
Cx32_D178Y_rev 3’ GGGTGTGTCACATGACGAAGCAC 5’ TatI
Cx32_R220X_for 5’ GCCTGTGCCCGCTAGTACTAGCGCCGC 3’ ScaI
Cx32_R220x_rev 3’ CGGACACGGGCGATCATGATCGCGGCG 5’ ScaI
Table M5.1 | Table displaying all the designed primers to generate the hCx32 constructs containing the mutations and a new restriction site enzyme.
This first set of primers was used for the first PCR. For the second
PCR, the general carboxyl and amino terminal primers (all_for and
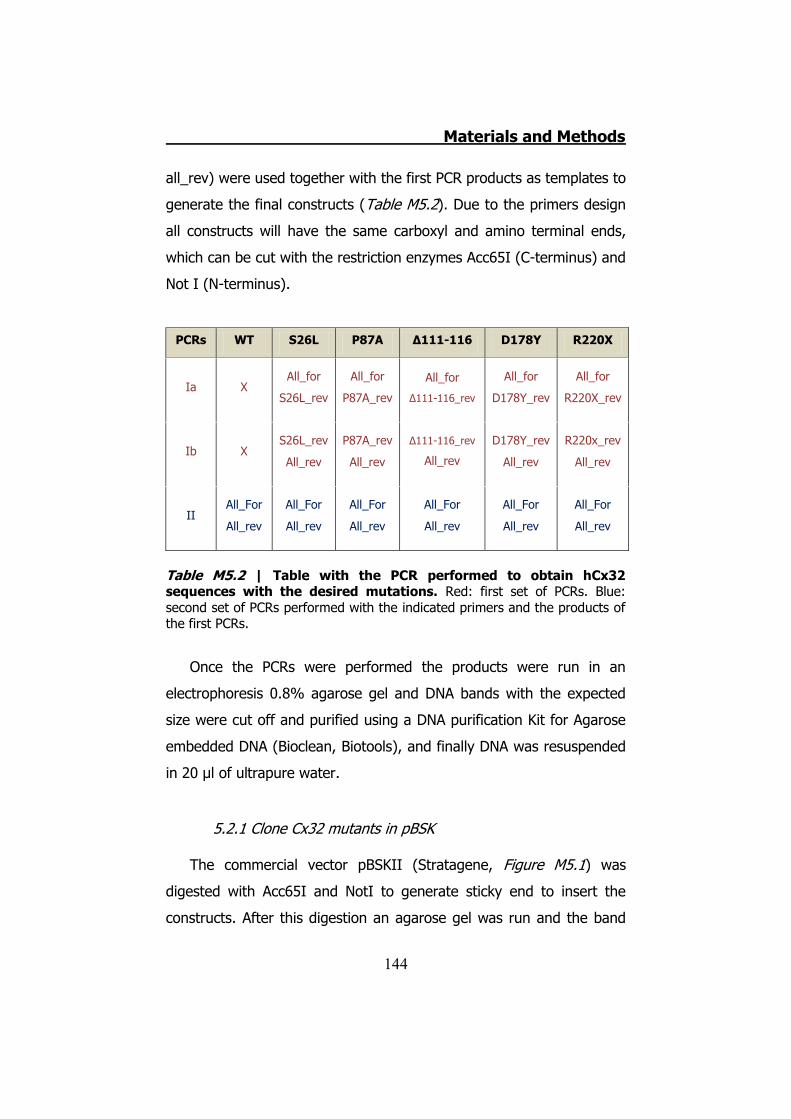
Materials and Methods
144
all_rev) were used together with the first PCR products as templates to
generate the final constructs (Table M5.2). Due to the primers design
all constructs will have the same carboxyl and amino terminal ends,
which can be cut with the restriction enzymes Acc65I (C-terminus) and
Not I (N-terminus).
PCRs WT S26L P87A Δ111-116 D178Y R220X
Ia X All_for
S26L_rev
All_for
P87A_rev
All_for
Δ111-116_rev
All_for
D178Y_rev
All_for
R220X_rev
Ib X S26L_rev
All_rev
P87A_rev
All_rev
Δ111-116_rev
All_rev
D178Y_rev
All_rev
R220x_rev
All_rev
II All_For
All_rev
All_For
All_rev
All_For
All_rev
All_For
All_rev
All_For
All_rev
All_For
All_rev
Table M5.2 | Table with the PCR performed to obtain hCx32 sequences with the desired mutations. Red: first set of PCRs. Blue: second set of PCRs performed with the indicated primers and the products of the first PCRs.
Once the PCRs were performed the products were run in an
electrophoresis 0.8% agarose gel and DNA bands with the expected
size were cut off and purified using a DNA purification Kit for Agarose
embedded DNA (Bioclean, Biotools), and finally DNA was resuspended
in 20 μl of ultrapure water.
5.2.1 Clone Cx32 mutants in pBSK
The commercial vector pBSKII (Stratagene, Figure M5.1) was
digested with Acc65I and NotI to generate sticky end to insert the
constructs. After this digestion an agarose gel was run and the band
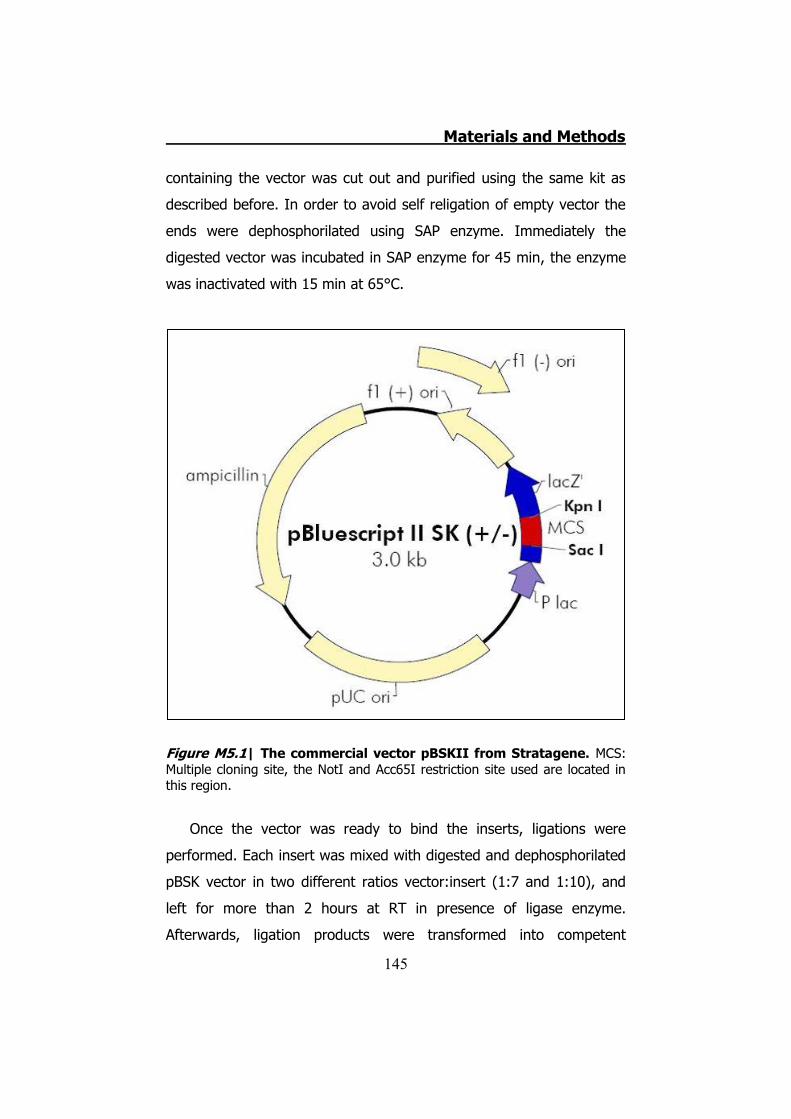
Materials and Methods
145
containing the vector was cut out and purified using the same kit as
described before. In order to avoid self religation of empty vector the
ends were dephosphorilated using SAP enzyme. Immediately the
digested vector was incubated in SAP enzyme for 45 min, the enzyme
was inactivated with 15 min at 65°C.
Figure M5.1| The commercial vector pBSKII from Stratagene. MCS: Multiple cloning site, the NotI and Acc65I restriction site used are located in this region.
Once the vector was ready to bind the inserts, ligations were
performed. Each insert was mixed with digested and dephosphorilated
pBSK vector in two different ratios vector:insert (1:7 and 1:10), and
left for more than 2 hours at RT in presence of ligase enzyme.
Afterwards, ligation products were transformed into competent
Materials and Methods
146
Escherichia coli. Each ligation was added into one competent
bacterium aliquot on ice for 30 min and heat shocked for 45 s at 65°C.
After that, aliquots were placed on ice again for 2 min before fresh LB
medium was added. Bacteria were then incubated at 37°C with
continuous shacking for 30 min-1h and seeded on LB 50 μg/ml
Ampicillin supplemented Agar plates. Plates were left o/n at 37°C.
5.2.2 MiniPREPs for hCx32 constructs
From each hCx32 mutation a variable number of transformed
colonies grown on LB ampicillin plates were picked and further grown
in 3 ml LB ampicillin o/n at 37°C. 1.5 ml of grown cultures were
centrifuged and pellets were resuspended with 100 μl of Alkaline
Solution 1 supplemented with 1 μl/ml RNAse 2000 (New England
Biolabs, UK). After 2 min at RT, 200 μl of Alkaline Solution 2 were
added, all was mixed and left for 2 min more at RT. Finally, 150 μl of
Alkaline Solution 3 were added and mixed. The tubes were centrifuged
for 10 min at 12000 rpm (Eppendorf 5417R centrifuge). Supernatants
were transferred to new eppendorf tubes containing 500 μl of absolute
ethanol. After mixing, samples were centrifuged again for 6 min at
12500 rpm. Pellets were washed with 70% ethanol air dried. Dried
pellets were resuspended with 50-100 μl of ultrapure water. MiniPREPs
were stored at -20°C until used.
To check if vectors had an insert, MiniPREPs were digested with
Pst I restriction enzyme and ran in a 0.8% agarose gel. Those positive
clones were further tested by digestion with the specific restriction
enzymes for the newly generated restriction sites of each mutant. The
best clone for each mutation and for hCx32WT insert was selected to
perform the MidiPREPS.
Materials and Methods
147
5.2.3 MidiPREPs to obtain hCx32 constructs in pBSK
The best MiniPREP clone for each construct was selected and
grown further in 50 ml LB ampicillin o/n at 37°C. Grown cultures were
transferred to falcons and centrifuged 5 min at 8500rpm (Beckman J2-
HS centrifuge). From that point, the instructions for the Jet Star Kit,
the plasmid purification system (Genomed, USA) were followed. The
final pellet was resuspended with 100 μl of ultrapure water. Each
MidiPrep was digested with the corresponding restriction enzymes,
checked by electrophoresis on 0.8% agarose gels and sequenced
(Agowa, Germany). MidiPREPs were stored at -20°C when not in use.
5.2.4 Bacterial glycerol stocks of hCx32 constructs
The selected colonies were stored in glycerol after checking the
correct sequence of respective plasmids. To do that, new LB ampicillin
cultures of bacteria containing the appropriated plasmids were grown
o/n at 37°C. 850 μl of each culture and 150 μl of glycerol were mixed
in an eppendorf tube and immediately frozen in liquid Nitrogen.
Eppendorfs containing glycerol stocks were then stored at -80°C.
5.2.5 Cloning the hCx32 mutations and wt in pMJgreen vector
To clone all the hCx32 constructs (wt, S26L, P87A, Δ111-16,
D178Y and R200St) in a new pMJgreen plasmid (Figure M5.2) for
eukaryotic expression, all MidiPREPs of pBSK constructs with the
different hCx32 inserts and a MidiPREP of the empty pMJgreen vector
were digested with Acc65I and NotI restriction enzymes.
After this digestion, inserts were liberated from the pBSK vector
and pMJgreen was liniarized with the right sticky ends for an easy
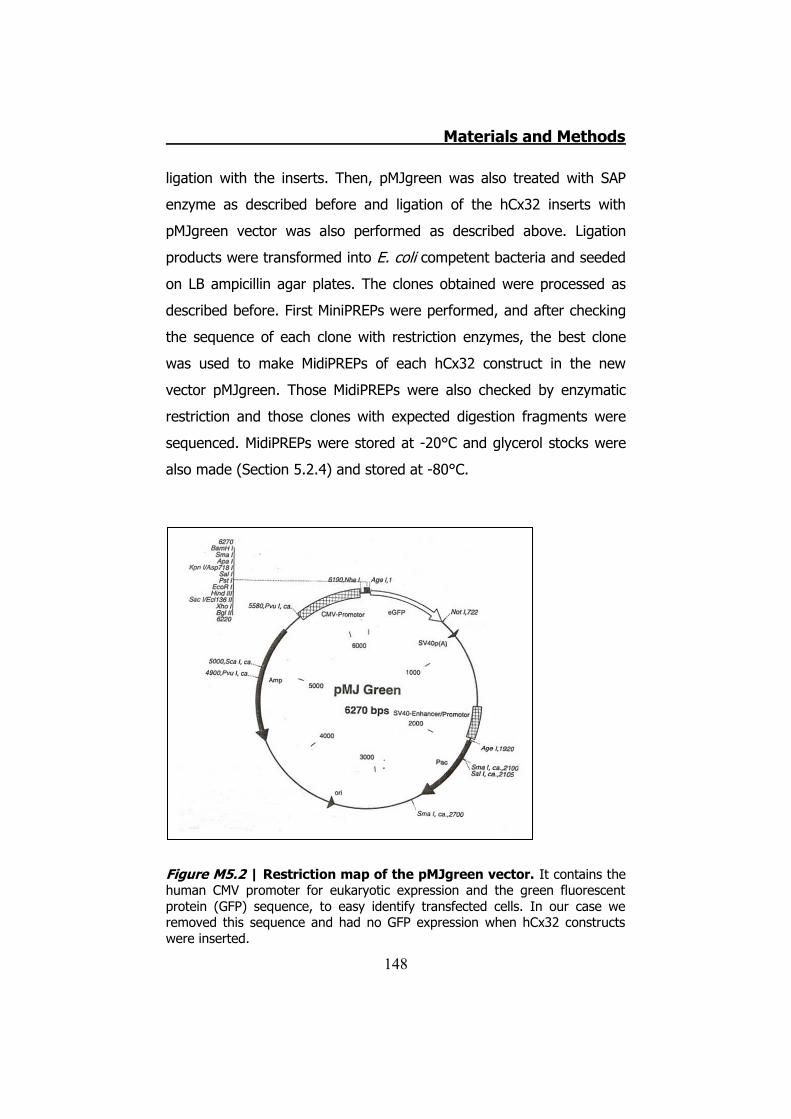
Materials and Methods
148
ligation with the inserts. Then, pMJgreen was also treated with SAP
enzyme as described before and ligation of the hCx32 inserts with
pMJgreen vector was also performed as described above. Ligation
products were transformed into E. coli competent bacteria and seeded
on LB ampicillin agar plates. The clones obtained were processed as
described before. First MiniPREPs were performed, and after checking
the sequence of each clone with restriction enzymes, the best clone
was used to make MidiPREPs of each hCx32 construct in the new
vector pMJgreen. Those MidiPREPs were also checked by enzymatic
restriction and those clones with expected digestion fragments were
sequenced. MidiPREPs were stored at -20°C and glycerol stocks were
also made (Section 5.2.4) and stored at -80°C.
Figure M5.2 | Restriction map of the pMJgreen vector. It contains the human CMV promoter for eukaryotic expression and the green fluorescent protein (GFP) sequence, to easy identify transfected cells. In our case we removed this sequence and had no GFP expression when hCx32 constructs were inserted.
Materials and Methods
149
5.2.6 Cloning the hCx32 mutations and wt in pBxG vector
To clone all the hCx32 constructs (wt, S26L, P87A, Δ111-16,
D178Y and R200St) in the pBxG plasmid (Figure M5.3) to express
them in Xenopus oocytes, a similar procedure to clone them in
pMJgreen was used with some variations. First, empty pBxG vector
was liniarized using StuI restriction enzyme and treated with SAP
enzyme.
At the same time, all constructs inserted in pBSK were digested
with Acc65I and NotI. As StuI is a blunt cutter, once inserts were
digested the sticky ends were blunted with Klenow enzyme, which
adds nucleotides to single strand DNA ends. Ligations were performed
as described above and the inserts ligated to the new vector were
transformed into E.coli competent bacteria. MiniPREPs from the
resulting clones were performed also as described above and were
digested first with PstI to check the insert presence and also the
direction of insertion. Insert and vector ends were blunt constructs and
had two possible insertion directions. We were only interested on one
direction, the one that allowed us to use the T7 polymerase to
transcribe them into cRNA (to inject them into Xenopus oocytes), so
only clones with the correct direction were digested further to test the
different mutations. As shown before, the best clones were chosen to
perform MidiPREPs and glycerol stocks.
All these hCx32 cloning steps were previously performed by Dr.
Xènia Grandes in our laboratory.
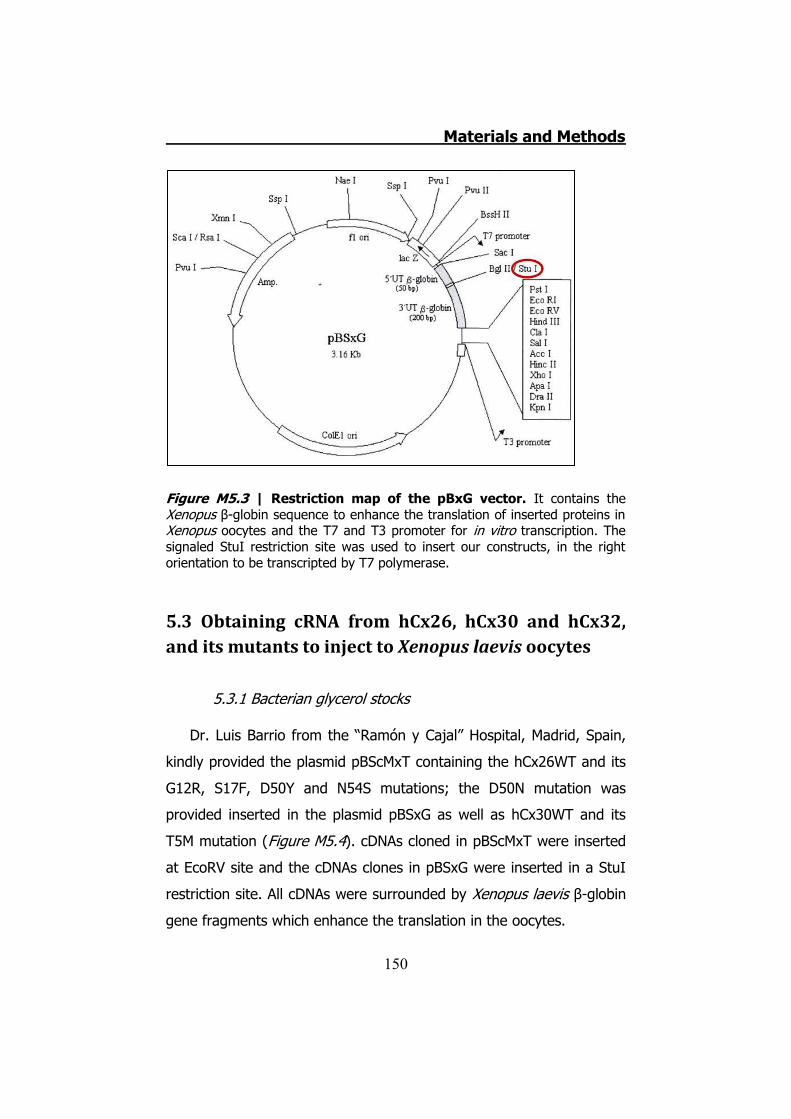
Materials and Methods
150
Figure M5.3 | Restriction map of the pBxG vector. It contains the Xenopus β-globin sequence to enhance the translation of inserted proteins in Xenopus oocytes and the T7 and T3 promoter for in vitro transcription. The signaled StuI restriction site was used to insert our constructs, in the right orientation to be transcripted by T7 polymerase.
5.3 Obtaining cRNA from hCx26, hCx30 and hCx32, and its mutants to inject to Xenopus laevis oocytes
5.3.1 Bacterian glycerol stocks
Dr. Luis Barrio from the “Ramón y Cajal” Hospital, Madrid, Spain,
kindly provided the plasmid pBScMxT containing the hCx26WT and its
G12R, S17F, D50Y and N54S mutations; the D50N mutation was
provided inserted in the plasmid pBSxG as well as hCx30WT and its
T5M mutation (Figure M5.4). cDNAs cloned in pBScMxT were inserted
at EcoRV site and the cDNAs clones in pBSxG were inserted in a StuI
restriction site. All cDNAs were surrounded by Xenopus laevis β-globin
gene fragments which enhance the translation in the oocytes.
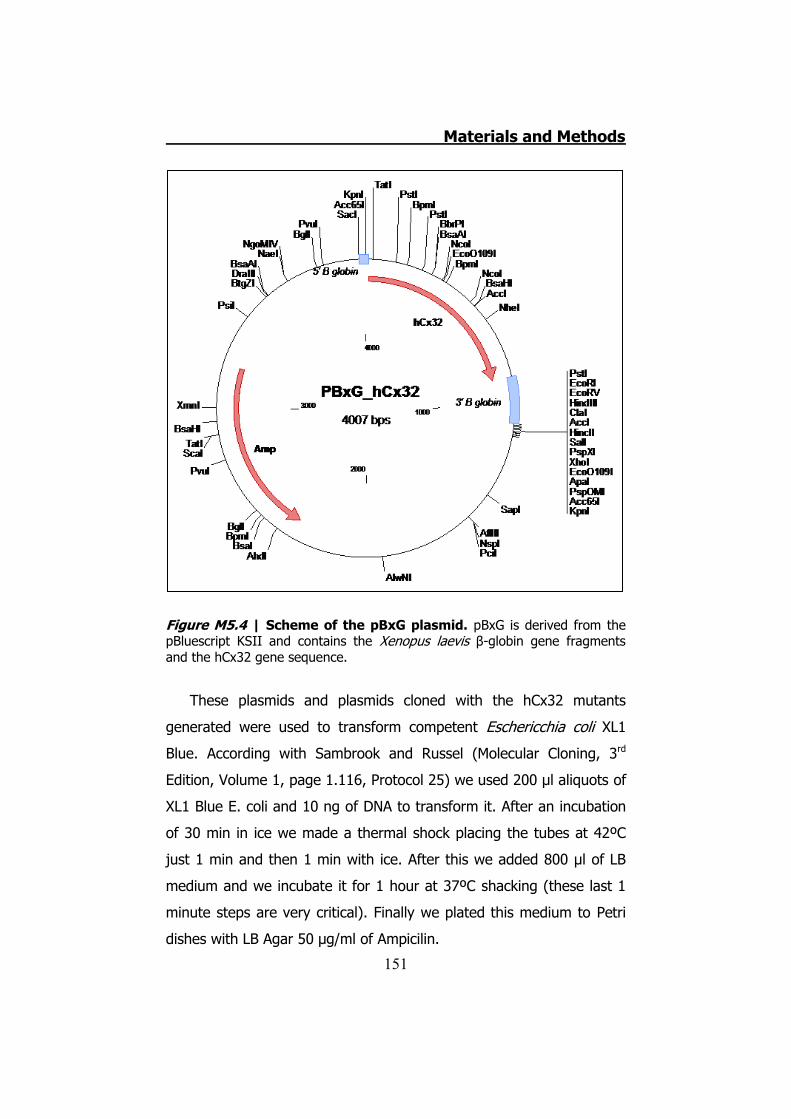
Materials and Methods
151
Figure M5.4 | Scheme of the pBxG plasmid. pBxG is derived from the pBluescript KSII and contains the Xenopus laevis β-globin gene fragments and the hCx32 gene sequence.
These plasmids and plasmids cloned with the hCx32 mutants
generated were used to transform competent Eschericchia coli XL1
Blue. According with Sambrook and Russel (Molecular Cloning, 3rd
Edition, Volume 1, page 1.116, Protocol 25) we used 200 μl aliquots of
XL1 Blue E. coli and 10 ng of DNA to transform it. After an incubation
of 30 min in ice we made a thermal shock placing the tubes at 42ºC
just 1 min and then 1 min with ice. After this we added 800 μl of LB
medium and we incubate it for 1 hour at 37ºC shacking (these last 1
minute steps are very critical). Finally we plated this medium to Petri
dishes with LB Agar 50 μg/ml of Ampicilin.

Materials and Methods
152
5.3.2 MiniPREPs for the constructs
From each hCx26, hCx30, hCx32 or its mutants cDNAs, a variable
number of transformed colonies grown on LB Ampicillin plates were
picked up and further grown in 3 ml LB Ampicillin o/n at 37°C. A
volume of 1.5 ml of grown cultures were centrifuged and pellets were
resuspended with 100 μl of Alkaline Solution 1 supplemented with 1
μl/ml RNAse 2000 (New England Biolabs, UK). After 2 min at RT, 100
μl of Alkaline Solution 2 was added and all was mixed. Finally 100 μl of
Alkaline Solution 3 was added, mixed and incubated for 5 min on ice.
The resulting mix was centrifuged for 10 min at 14000 rpm (Eppendorf
5417R centrifuge). Supernatants were transferred to new eppendorf
tubes and 10 μl of Silica matrix were added pippeting constantly. Dried
pellets were resuspended with 50-100 μl of ultrapure water. MiniPREPs
were stored at 20°C until used.
To check if vectors had the insert, MiniPREPs were digested with
the corresponding restriction enzymes and ran in a 0.8% agarose gel.
Those positive clones were further tested by digestion with the specific
restriction enzymes for the newly generated restriction sites of each
mutant. The best clone for each mutation and for hCx26WT, hCx30WT
and hCx32WT insert was selected to perform the MidiPREPs.
5.3.3 Bacterial cultures to purify the plasmid
First time we did a MidiPREP to purify these different cDNAs we
used the already grown bacteria used for MiniPREPs. A volume of 100
μl of these bacteria was added in a 3 ml 50 μg/ml of Ampicilin LB tube
and were incubated during the day (approximately 8 h) at 37ºC
shacking, and then it was poured in an erlenmeyer containing 100 ml
Materials and Methods
153
50 μg/ml Ampicilin LB to grow it o/n at the same conditions. The day
after, we used 0.7 ml of those grown bacteria to make glycerol stocks.
Once we made the bacterial glycerol stocks they were used for
growing. A sterile tip was used to take a small amount of bacterial
glycerol and it was placed in a 3 ml 50 μg/ml of Ampicilin LB tub for 6-
8 h. After these hours we poured the culture in an erlenmeyer
containing 100 ml 50 μg/ml Ampicilin LB to grow it o/n at the same
conditions.
5.3.4 Plasmid purification
Grown cultures were transferred to centrifuge tubes and
centrifuged 15 min at 8000 rpm (Sorval RC5C centrifuge). From that
point we followed the instructions for the Plasmid Midi Kit (Qiagen,
12143). The final pellet was resuspended with 60 μl of ultrapure
water. Each MidiPREP were digested with the corresponding restriction
enzymes, checked by electrophoresis on 0.8% agarose gels and were
quantified by GeneQuant II (Pharmacia Biotech). MidiPREPs were
stored at -20°C when not in use.
5.3.5 cRNA obtaining
To obtain the cRNA from the cDNA we followed the instructions of
the mCAP RNA Capping kit (Stratagene, protocol #200350). This
protocol starts with 10 μg of cDNA containing plasmid, which was
linearized using SalI for hCx26, hCx30 and its mutants and XhoI for
hCx32 and the corresponding mutants. Transcription was performed
using T3 polymerase for pBScMxT plasmid and T7 for pBSxG plasmid.
All the protocol was performed according the Stratagene manual and
the cRNA obtained was resuspended in 10 μl DEPC treated water. The
Materials and Methods
154
volume of 1 μl was used to quantify the resulting cRNA (using a
Genequant II, Pharmacia Biotech) and 1 μl were tested on a 0.8%
Agarose gel to check the size and possible degradation. The cRNA
obtained was stored at -80°C until used.
5.4 Injecting cRNA in Xenopus laevis oocytes
Injection micropipettes were pulled from glass capillaries (4878
World precision instruments, Inc; EUA) using a two step pull protocol
performed by a puller (P-97, Sutter Instruments Co; EUA). Once
pulled, micropipettes tips were broken under a magnifier to reach a 5-
15 μm diameter, the desired size for microinjection. Micropipettes
were sterilized 4h at 200°C.
For the cRNA injection, all material and injection place had to be
sterile. Micropipettes were half filled with sterile mineral oil (Sigma, M-
5904) to avoid the direct contact of the sample with the nanoinjector
plunger. Micropipettes were placed on the nanoinjector (WPI,
A203XVZ), which was fixed with a micromanipulator (Narshigue, MMN-
3R, Japan). A drop of sample was placed on a cap of a sterilized
eppendorf tube and then the micropipette tip contacted the drop with
the help of a micromanipulator and was filled with the sample solution
using the nanoinjector commands. Mature oocytes were placed on 1
mm holes made on a parafilm surface and kept humid during injection
protocol. Each oocyte was injected on the vegetal pole, near the
equator and far from the nucleus, with 50 nl of sample containing 7 ng
of each cRNA.
An antisense nucleotide for the Xenopus endogenous Cx38 mRNA
(ASCx38) 5’-GCTTTAGTAATTCCCATCCTGCCATGTTTC-3’ (239) was
sintetized by Invitrogen-Life Technologies S.A. (Barcelona). This
oligonucleotide was resuspended with pure water and 14 ng injected
together with the studied protein/s cRNA/s.
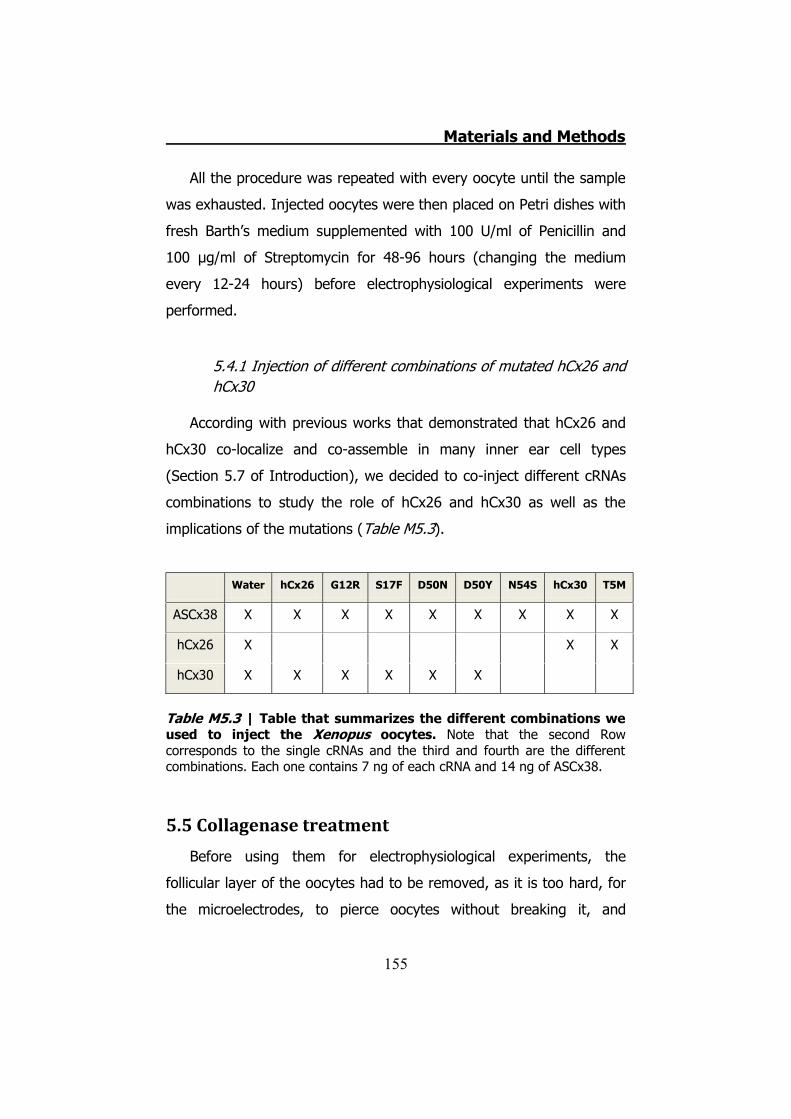
Materials and Methods
155
All the procedure was repeated with every oocyte until the sample
was exhausted. Injected oocytes were then placed on Petri dishes with
fresh Barth’s medium supplemented with 100 U/ml of Penicillin and
100 μg/ml of Streptomycin for 48-96 hours (changing the medium
every 12-24 hours) before electrophysiological experiments were
performed.
5.4.1 Injection of different combinations of mutated hCx26 and hCx30
According with previous works that demonstrated that hCx26 and
hCx30 co-localize and co-assemble in many inner ear cell types
(Section 5.7 of Introduction), we decided to co-inject different cRNAs
combinations to study the role of hCx26 and hCx30 as well as the
implications of the mutations (Table M5.3).
Water hCx26 G12R S17F D50N D50Y N54S hCx30 T5M
ASCx38 X X X X X X X X X
hCx26 X X X
hCx30 X X X X X X
Table M5.3 | Table that summarizes the different combinations we used to inject the Xenopus oocytes. Note that the second Row corresponds to the single cRNAs and the third and fourth are the different combinations. Each one contains 7 ng of each cRNA and 14 ng of ASCx38.
5.5 Collagenase treatment
Before using them for electrophysiological experiments, the
follicular layer of the oocytes had to be removed, as it is too hard, for
the microelectrodes, to pierce oocytes without breaking it, and
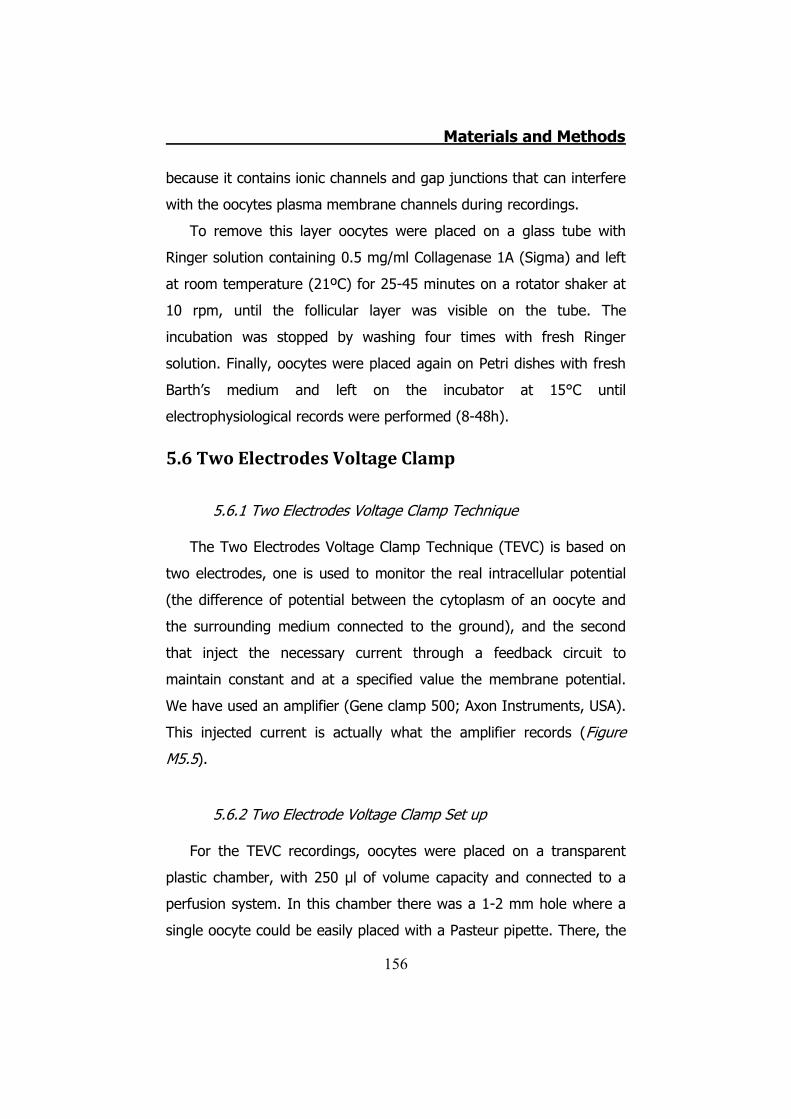
Materials and Methods
156
because it contains ionic channels and gap junctions that can interfere
with the oocytes plasma membrane channels during recordings.
To remove this layer oocytes were placed on a glass tube with
Ringer solution containing 0.5 mg/ml Collagenase 1A (Sigma) and left
at room temperature (21ºC) for 25-45 minutes on a rotator shaker at
10 rpm, until the follicular layer was visible on the tube. The
incubation was stopped by washing four times with fresh Ringer
solution. Finally, oocytes were placed again on Petri dishes with fresh
Barth’s medium and left on the incubator at 15°C until
electrophysiological records were performed (8-48h).
5.6 Two Electrodes Voltage Clamp
5.6.1 Two Electrodes Voltage Clamp Technique
The Two Electrodes Voltage Clamp Technique (TEVC) is based on
two electrodes, one is used to monitor the real intracellular potential
(the difference of potential between the cytoplasm of an oocyte and
the surrounding medium connected to the ground), and the second
that inject the necessary current through a feedback circuit to
maintain constant and at a specified value the membrane potential.
We have used an amplifier (Gene clamp 500; Axon Instruments, USA).
This injected current is actually what the amplifier records (Figure
M5.5).
5.6.2 Two Electrode Voltage Clamp Set up
For the TEVC recordings, oocytes were placed on a transparent
plastic chamber, with 250 μl of volume capacity and connected to a
perfusion system. In this chamber there was a 1-2 mm hole where a
single oocyte could be easily placed with a Pasteur pipette. There, the
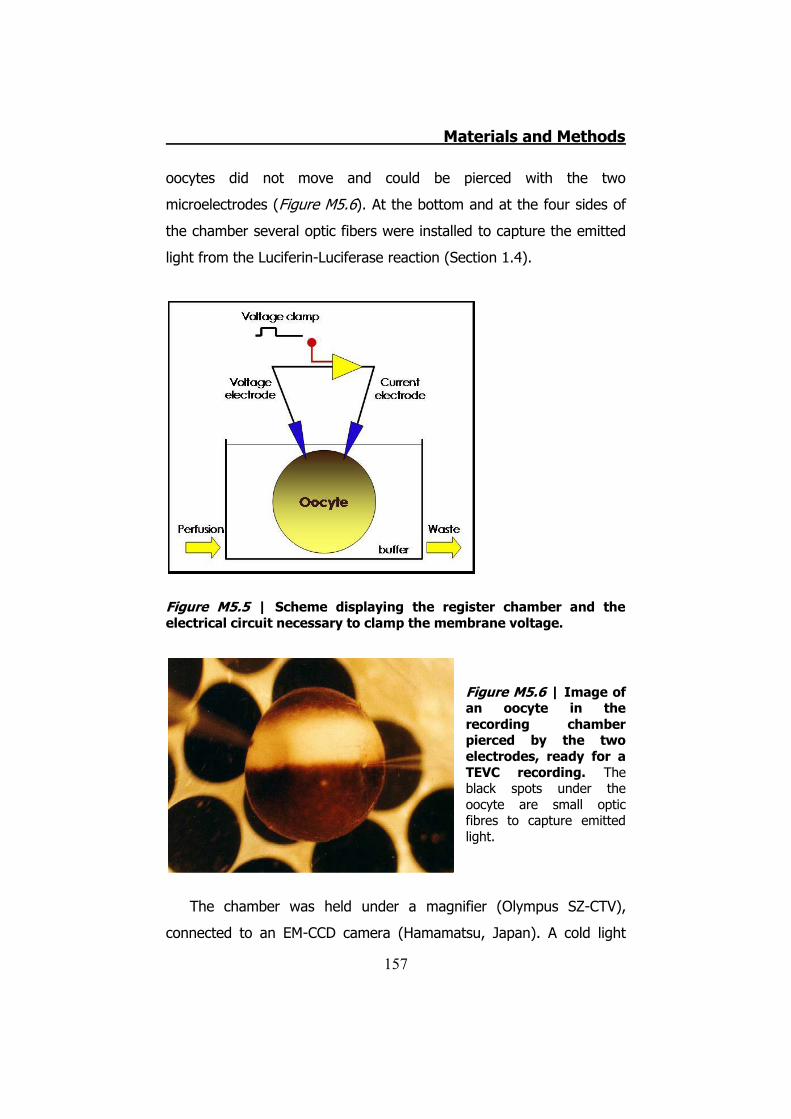
Materials and Methods
157
oocytes did not move and could be pierced with the two
microelectrodes (Figure M5.6). At the bottom and at the four sides of
the chamber several optic fibers were installed to capture the emitted
light from the Luciferin-Luciferase reaction (Section 1.4).
Figure M5.5 | Scheme displaying the register chamber and the electrical circuit necessary to clamp the membrane voltage.
Figure M5.6 | Image of an oocyte in the recording chamber pierced by the two electrodes, ready for a TEVC recording. The black spots under the oocyte are small optic fibres to capture emitted light.
The chamber was held under a magnifier (Olympus SZ-CTV),
connected to an EM-CCD camera (Hamamatsu, Japan). A cold light
Materials and Methods
158
source (Olympus Highlight 3000) was placed in the chamber. All this
was on a vibration isolation table (Technical Manufacturing
Corporation, USA), to avoid any vibration that could affect the stability
of recordings. The table was surrounded by an opaque Faraday cage.
The perfusion system had eight 70 ml syringes placed at 80 cm
high to store solutions, each one with an exit by gravity flow at the
end. The flow from the syringes reached between 6 and 10 ml/min
and was controlled using a BPS-8 valve control system (ALA Scientific
Instruments, USA). Solution flowed to the chamber to bath the oocyte
and then drained on the other side of the chamber. All waste solutions
were collected in double kitasato system, which was connected to the
central vacuum system.
Oocytes were pierced with two intracellular microelectrodes, each
one placed on a preamplifier holder, connected to an amplifier (Gene
clamp 500; Axon Instruments, USA), which was connected to a
computer through an interface card (BNC-2090, National Instruments,
USA). Information was processes using Whole cell Analysis software
WinWCP by Professor John Dempster (Strathclyde University, Scotland,
UK). On the other hand, signals were simultaneously visualized on an
Oscilloscope (TDS 420A, Tektronix, USA) (Figure M5.7).
5.6.3 Getting ready for TEVC recordings
First, microelectrodes used for the recordings were made using
GC120TF-7.5 glass capillaries (Harvard Apparatus, UK) and pulled
using a two step program in a P-97 puller (Stutter Instruments Co;
USA). Microelectrodes had to have a resistance between 0.5 and 1
MΩ. Afterwards microelectrodes were filled with a 3M KCl solution and
placed on a holder (Axon instruments, USA) with a 0.25 mm chloride
silver wire connected to the holder itself and contacting the KCl
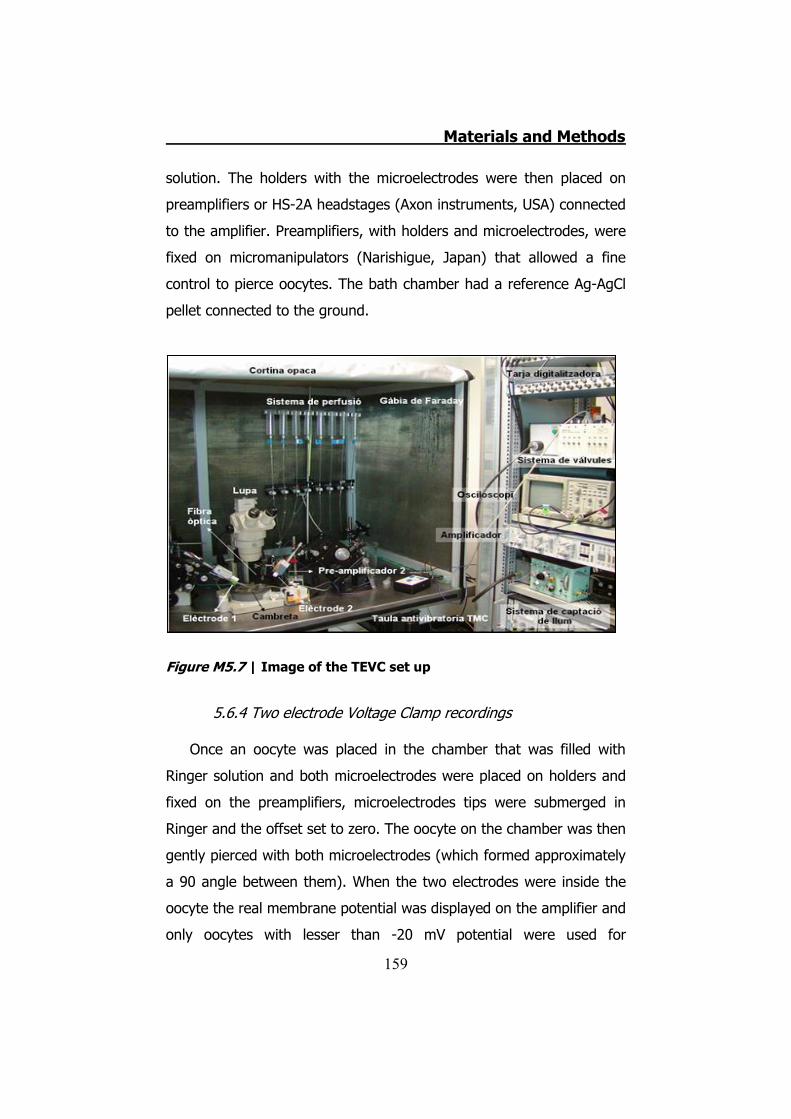
Materials and Methods
159
solution. The holders with the microelectrodes were then placed on
preamplifiers or HS-2A headstages (Axon instruments, USA) connected
to the amplifier. Preamplifiers, with holders and microelectrodes, were
fixed on micromanipulators (Narishigue, Japan) that allowed a fine
control to pierce oocytes. The bath chamber had a reference Ag-AgCl
pellet connected to the ground.
Figure M5.7 | Image of the TEVC set up
5.6.4 Two electrode Voltage Clamp recordings
Once an oocyte was placed in the chamber that was filled with
Ringer solution and both microelectrodes were placed on holders and
fixed on the preamplifiers, microelectrodes tips were submerged in
Ringer and the offset set to zero. The oocyte on the chamber was then
gently pierced with both microelectrodes (which formed approximately
a 90 angle between them). When the two electrodes were inside the
oocyte the real membrane potential was displayed on the amplifier and
only oocytes with lesser than -20 mV potential were used for
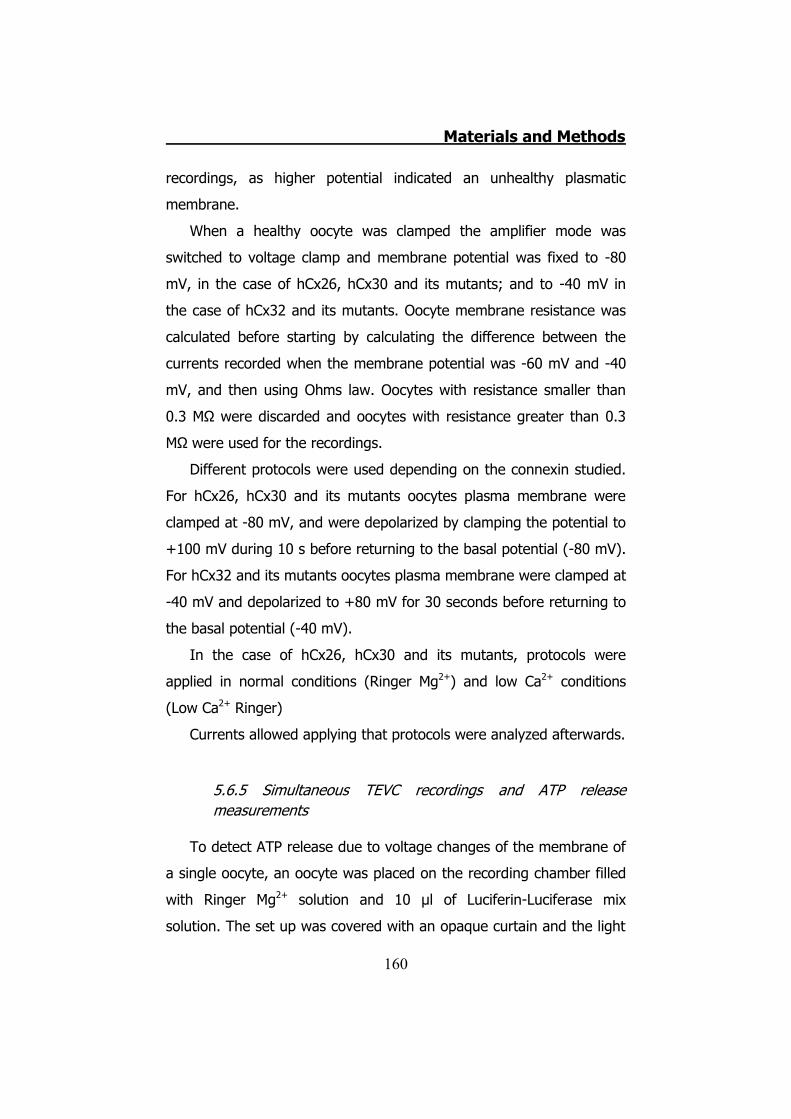
Materials and Methods
160
recordings, as higher potential indicated an unhealthy plasmatic
membrane.
When a healthy oocyte was clamped the amplifier mode was
switched to voltage clamp and membrane potential was fixed to -80
mV, in the case of hCx26, hCx30 and its mutants; and to -40 mV in
the case of hCx32 and its mutants. Oocyte membrane resistance was
calculated before starting by calculating the difference between the
currents recorded when the membrane potential was -60 mV and -40
mV, and then using Ohms law. Oocytes with resistance smaller than
0.3 MΩ were discarded and oocytes with resistance greater than 0.3
MΩ were used for the recordings.
Different protocols were used depending on the connexin studied.
For hCx26, hCx30 and its mutants oocytes plasma membrane were
clamped at -80 mV, and were depolarized by clamping the potential to
+100 mV during 10 s before returning to the basal potential (-80 mV).
For hCx32 and its mutants oocytes plasma membrane were clamped at
-40 mV and depolarized to +80 mV for 30 seconds before returning to
the basal potential (-40 mV).
In the case of hCx26, hCx30 and its mutants, protocols were
applied in normal conditions (Ringer Mg2+) and low Ca2+ conditions
(Low Ca2+ Ringer)
Currents allowed applying that protocols were analyzed afterwards.
5.6.5 Simultaneous TEVC recordings and ATP release measurements
To detect ATP release due to voltage changes of the membrane of
a single oocyte, an oocyte was placed on the recording chamber filled
with Ringer Mg2+ solution and 10 μl of Luciferin-Luciferase mix
solution. The set up was covered with an opaque curtain and the light
Materials and Methods
161
was switched off. The TEVC recordings were then performed as
previously described while, at the same time, any signal of light
produced by ATP presence was detected by optic fibers, which were
connected to a photomultiplier (P16, Grass Medical Instruments, USA)
and the resulting current was filtered in a Bessel (Frequency devices,
USA). A known amount of ATP (fmole range) was injected to the
recording chamber, near the oocyte, after the voltage pulse, to
validate and calibrate the luminescent reaction. The signal was sent to
a PC using the same interface and Whole Cell Analysis software
WinWCP used to register currents and voltage (51). The ATP released
was analyzed by deconvolution by Dr. Rafel Puchal, Dept. of Nuclear
Medicine, Hospital Universitari de Bellvitge, Hospitalet de Llobregat,
Spain; using Sigmaplot 10 software (Systat Software Inc, Richmond,
CA, USA) as described before (253).
Sometimes, the light emitted was also captured by the EM-CCD
camera and recorded by the HCImage software (Hamamatsu, Japan)
at the following conditions: 4x4 Bining; Acquision time 0.1 s; 10
pictures/s
5.6.6 hCx32 and S26L I-V curve
An example of voltage protocols and analysis of signals is
provided. A specific protocol was performed to make and compare the
I-V curves of expressed connexins. Oocytes were clamped at -40 mV
and several 10 s depolarizations up to +80 mV were done. Each
depolarization had a different returning potential (from -80 mV to +40
mV in +10 mV steps) (Figure M5.8). At each returning potential
oocytes generated inward currents with different amplitudes (Figure
M5.9). These current amplitudes were calculated using the WinWCP.
Materials and Methods
162
Figure M5.8 | Scheme of the voltage protocol to get an I-V curve. The oocytes were depolarized 10 s from -40 mV up to +80 mV. The key are the different returning voltages.
Each current corresponding to each voltage was used to make a I-
V curve that gave us an snap of the behavior of this mutation (Section
5.3 of Results).
5.6.7 Protocol to demonstrate that P87A, Δ111-116 and R220X were placed in the oocytes plasma membrane
To demonstrate that the mutated proteins were in the plasma
membrane we tried to open these mutated hemichannels applying a
higher depolarization voltages. We clamped the oocytes at -40 mV and
switched the voltage to +140 mV during 10 s. Data were analyzed and
compared.
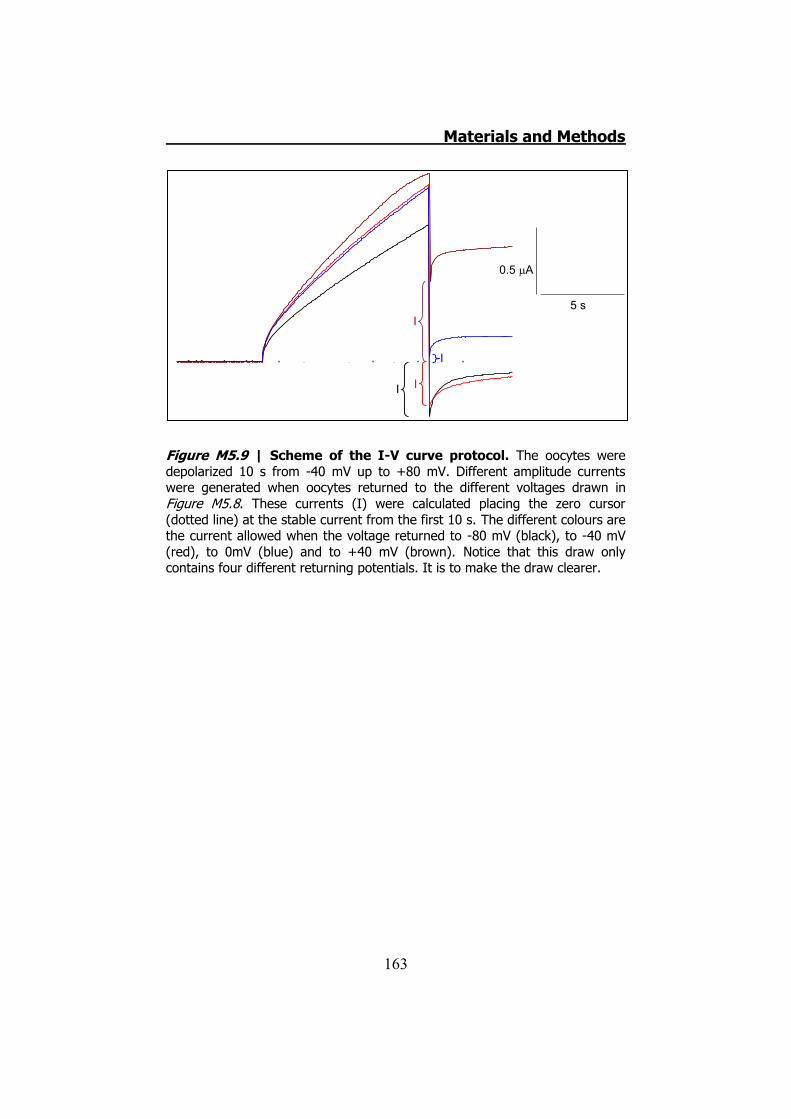
Materials and Methods
163
Figure M5.9 | Scheme of the I-V curve protocol. The oocytes were depolarized 10 s from -40 mV up to +80 mV. Different amplitude currents were generated when oocytes returned to the different voltages drawn in Figure M5.8. These currents (I) were calculated placing the zero cursor (dotted line) at the stable current from the first 10 s. The different colours are the current allowed when the voltage returned to -80 mV (black), to -40 mV (red), to 0mV (blue) and to +40 mV (brown). Notice that this draw only contains four different returning potentials. It is to make the draw clearer.
0.5 �A
5 s
II
I
I
Materials and Methods
164
6. Data analysis
Materials and Methods
165
Images and videos recorded by EM-CCD camera (Hamamatsu,
Japan) were processed with HCImage (Hamamatsu, Japan) and
ImageJ (NIH Image, US) softwares
All the electrophysiology data were analyzed using Whole cell
Analysis software (WinWCP).
All graphs were done using Sigmaplot 10 software (Systat
Software Inc, Richmond, CA, USA) and Excel (Microsoft).
The statistical significances were tested using SigmaStat software
(Systat Software Inc, Richmond, CA, USA) and the free program R
v2.12.0 (The R Foundation for Statistical Computing).

166

167
Results

168
Results
169
1. hCx32 immunodetection in mice sciatic nerves
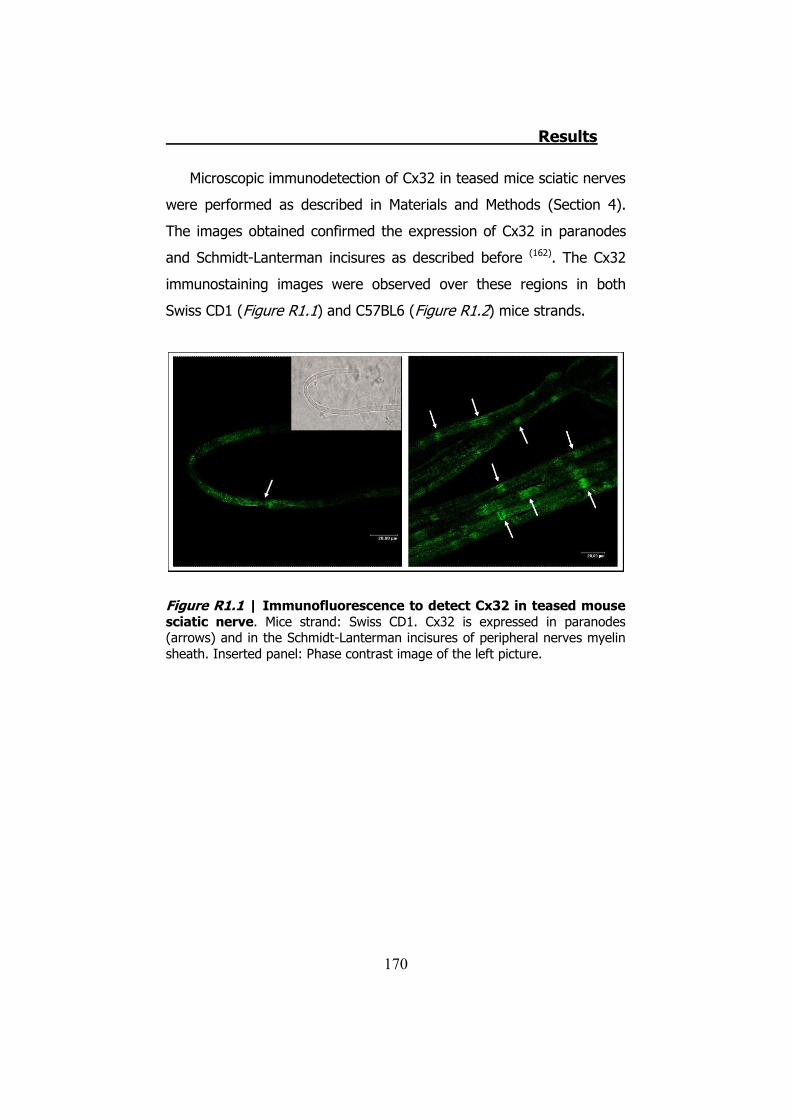
Results
170
Microscopic immunodetection of Cx32 in teased mice sciatic nerves
were performed as described in Materials and Methods (Section 4).
The images obtained confirmed the expression of Cx32 in paranodes
and Schmidt-Lanterman incisures as described before (162). The Cx32
immunostaining images were observed over these regions in both
Swiss CD1 (Figure R1.1) and C57BL6 (Figure R1.2) mice strands.
Figure R1.1 | Immunofluorescence to detect Cx32 in teased mouse sciatic nerve. Mice strand: Swiss CD1. Cx32 is expressed in paranodes (arrows) and in the Schmidt-Lanterman incisures of peripheral nerves myelin sheath. Inserted panel: Phase contrast image of the left picture.

Results
171
Figure R1.2 | Immunofluorescence to detect Cx32 in teased mouse sciatic nerve. Mice strand: C57BL6. Left: Phase contrast images corresponding to the image on their right. Right: Immunofluorescence against Cx32. Cx32 is expressed on paranodes and Schmidt-Lanterman incisures of peripheral nerves myelin sheath. Arrows: Nodes of Ranvier, Arrowheads: Schmidt-Lanterman incisures.
Results
172
2. ATP release from mouse sciatic nerves
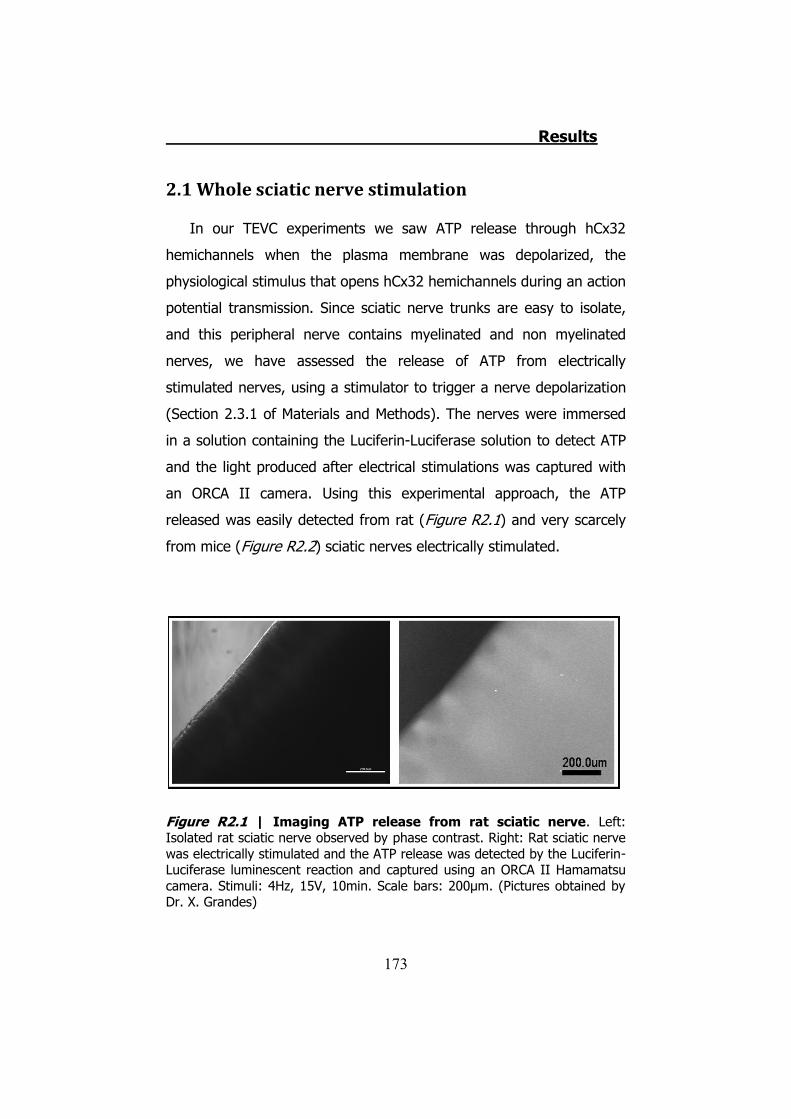
Results
173
2.1 Whole sciatic nerve stimulation
In our TEVC experiments we saw ATP release through hCx32
hemichannels when the plasma membrane was depolarized, the
physiological stimulus that opens hCx32 hemichannels during an action
potential transmission. Since sciatic nerve trunks are easy to isolate,
and this peripheral nerve contains myelinated and non myelinated
nerves, we have assessed the release of ATP from electrically
stimulated nerves, using a stimulator to trigger a nerve depolarization
(Section 2.3.1 of Materials and Methods). The nerves were immersed
in a solution containing the Luciferin-Luciferase solution to detect ATP
and the light produced after electrical stimulations was captured with
an ORCA II camera. Using this experimental approach, the ATP
released was easily detected from rat (Figure R2.1) and very scarcely
from mice (Figure R2.2) sciatic nerves electrically stimulated.
Figure R2.1 | Imaging ATP release from rat sciatic nerve. Left: Isolated rat sciatic nerve observed by phase contrast. Right: Rat sciatic nerve was electrically stimulated and the ATP release was detected by the Luciferin-Luciferase luminescent reaction and captured using an ORCA II Hamamatsu camera. Stimuli: 4Hz, 15V, 10min. Scale bars: 200μm. (Pictures obtained by Dr. X. Grandes)
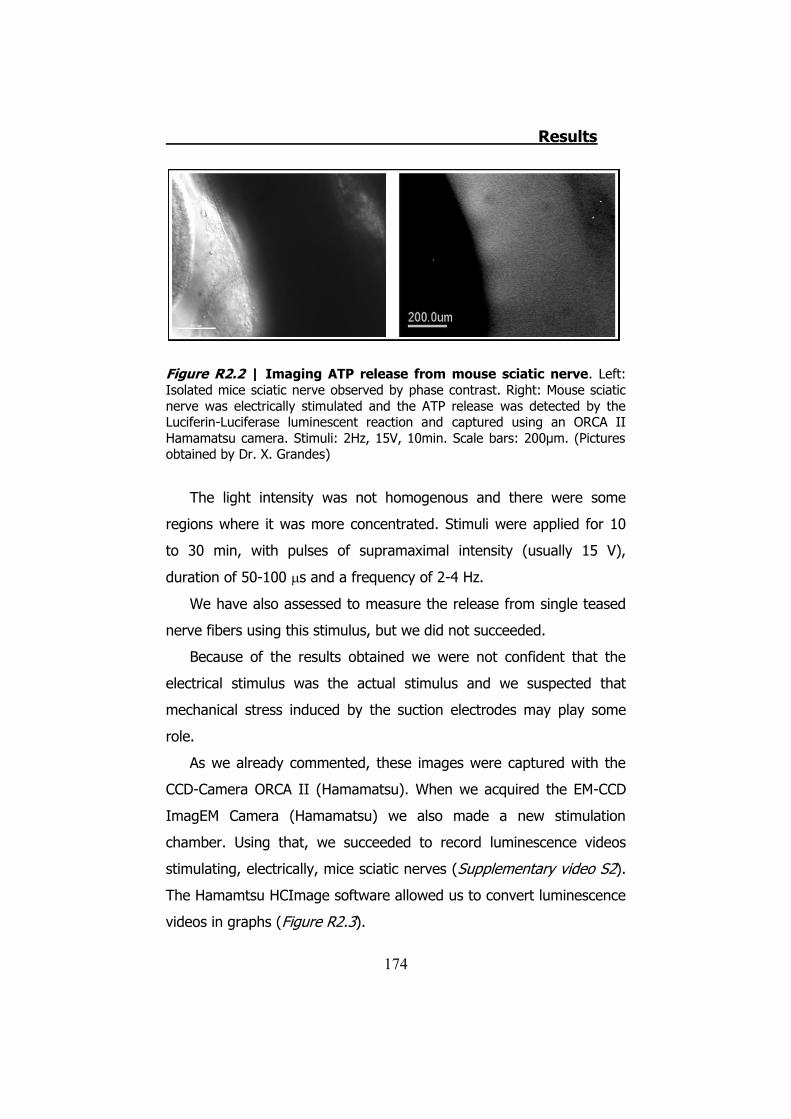
Results
174
Figure R2.2 | Imaging ATP release from mouse sciatic nerve. Left: Isolated mice sciatic nerve observed by phase contrast. Right: Mouse sciatic nerve was electrically stimulated and the ATP release was detected by the Luciferin-Luciferase luminescent reaction and captured using an ORCA II Hamamatsu camera. Stimuli: 2Hz, 15V, 10min. Scale bars: 200μm. (Pictures obtained by Dr. X. Grandes)
The light intensity was not homogenous and there were some
regions where it was more concentrated. Stimuli were applied for 10
to 30 min, with pulses of supramaximal intensity (usually 15 V),
duration of 50-100 �s and a frequency of 2-4 Hz.
We have also assessed to measure the release from single teased
nerve fibers using this stimulus, but we did not succeeded.
Because of the results obtained we were not confident that the
electrical stimulus was the actual stimulus and we suspected that
mechanical stress induced by the suction electrodes may play some
role.
As we already commented, these images were captured with the
CCD-Camera ORCA II (Hamamatsu). When we acquired the EM-CCD
ImagEM Camera (Hamamatsu) we also made a new stimulation
chamber. Using that, we succeeded to record luminescence videos
stimulating, electrically, mice sciatic nerves (Supplementary video S2).
The Hamamtsu HCImage software allowed us to convert luminescence
videos in graphs (Figure R2.3).
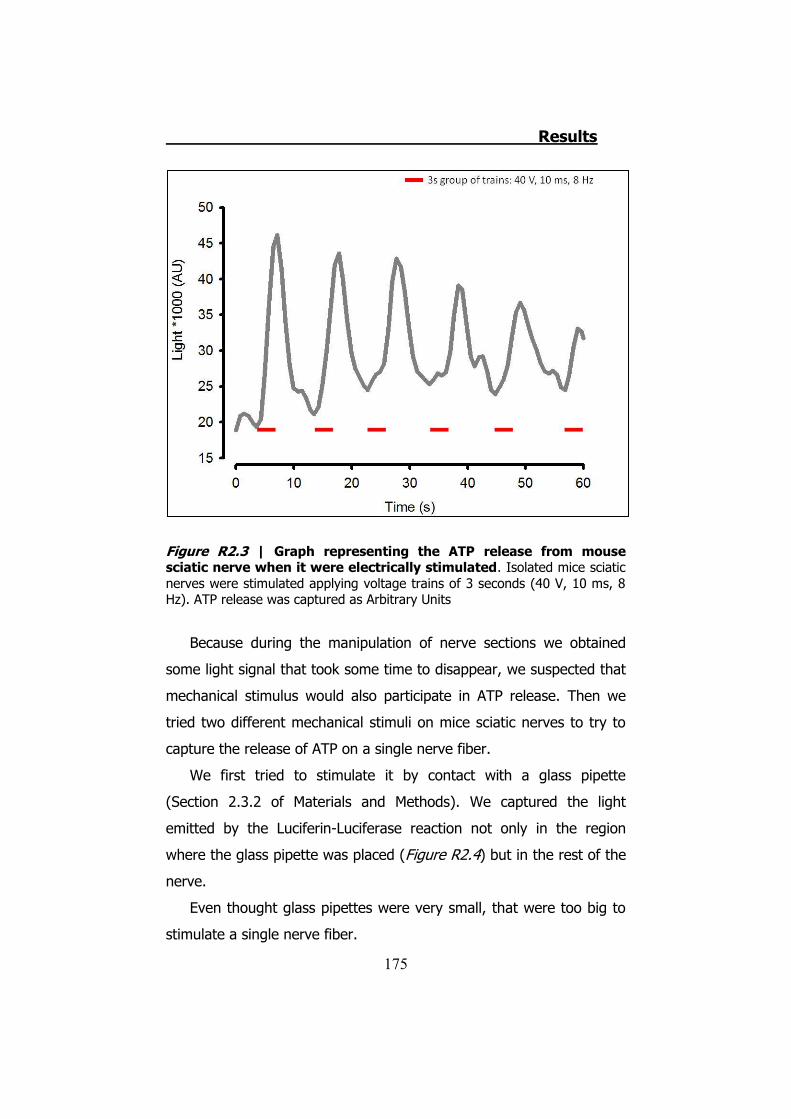
Results
175
Figure R2.3 | Graph representing the ATP release from mouse sciatic nerve when it were electrically stimulated. Isolated mice sciatic nerves were stimulated applying voltage trains of 3 seconds (40 V, 10 ms, 8 Hz). ATP release was captured as Arbitrary Units
Because during the manipulation of nerve sections we obtained
some light signal that took some time to disappear, we suspected that
mechanical stimulus would also participate in ATP release. Then we
tried two different mechanical stimuli on mice sciatic nerves to try to
capture the release of ATP on a single nerve fiber.
We first tried to stimulate it by contact with a glass pipette
(Section 2.3.2 of Materials and Methods). We captured the light
emitted by the Luciferin-Luciferase reaction not only in the region
where the glass pipette was placed (Figure R2.4) but in the rest of the
nerve.
Even thought glass pipettes were very small, that were too big to
stimulate a single nerve fiber.
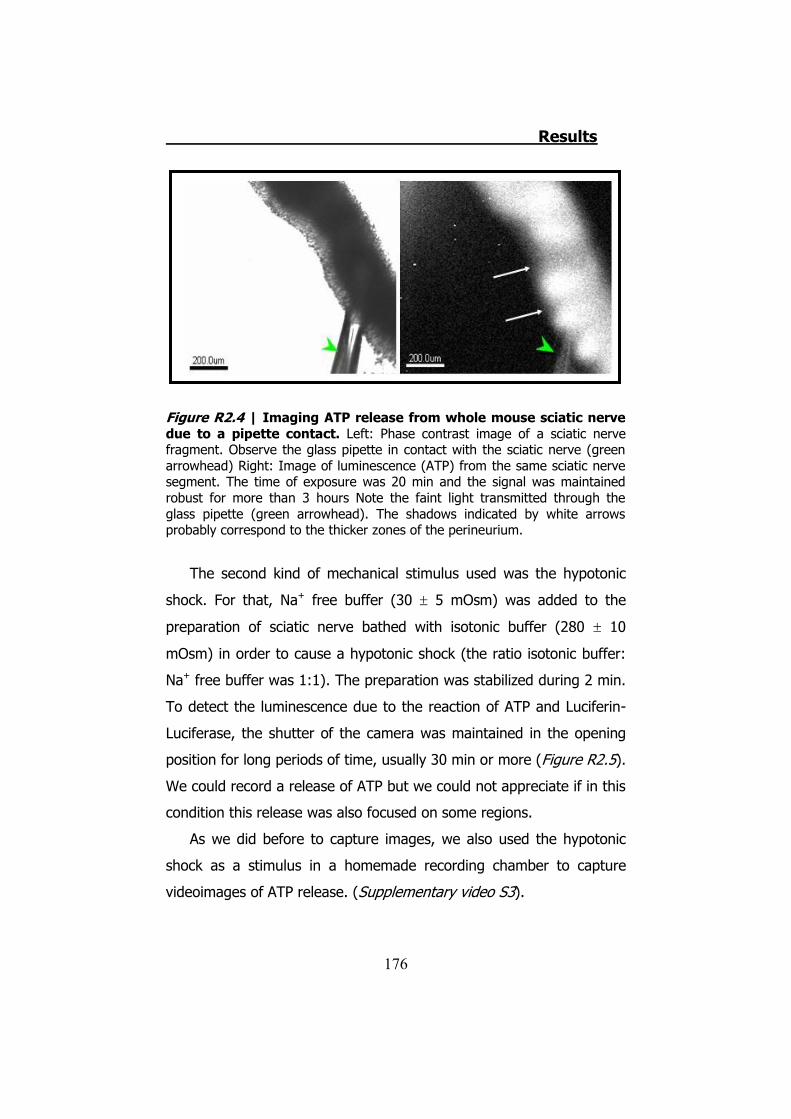
Results
176
Figure R2.4 | Imaging ATP release from whole mouse sciatic nerve due to a pipette contact. Left: Phase contrast image of a sciatic nerve fragment. Observe the glass pipette in contact with the sciatic nerve (green arrowhead) Right: Image of luminescence (ATP) from the same sciatic nerve segment. The time of exposure was 20 min and the signal was maintained robust for more than 3 hours Note the faint light transmitted through the glass pipette (green arrowhead). The shadows indicated by white arrows probably correspond to the thicker zones of the perineurium.
The second kind of mechanical stimulus used was the hypotonic
shock. For that, Na+ free buffer (30 � 5 mOsm) was added to the
preparation of sciatic nerve bathed with isotonic buffer (280 � 10
mOsm) in order to cause a hypotonic shock (the ratio isotonic buffer:
Na+ free buffer was 1:1). The preparation was stabilized during 2 min.
To detect the luminescence due to the reaction of ATP and Luciferin-
Luciferase, the shutter of the camera was maintained in the opening
position for long periods of time, usually 30 min or more (Figure R2.5).
We could record a release of ATP but we could not appreciate if in this
condition this release was also focused on some regions.
As we did before to capture images, we also used the hypotonic
shock as a stimulus in a homemade recording chamber to capture
videoimages of ATP release. (Supplementary video S3).
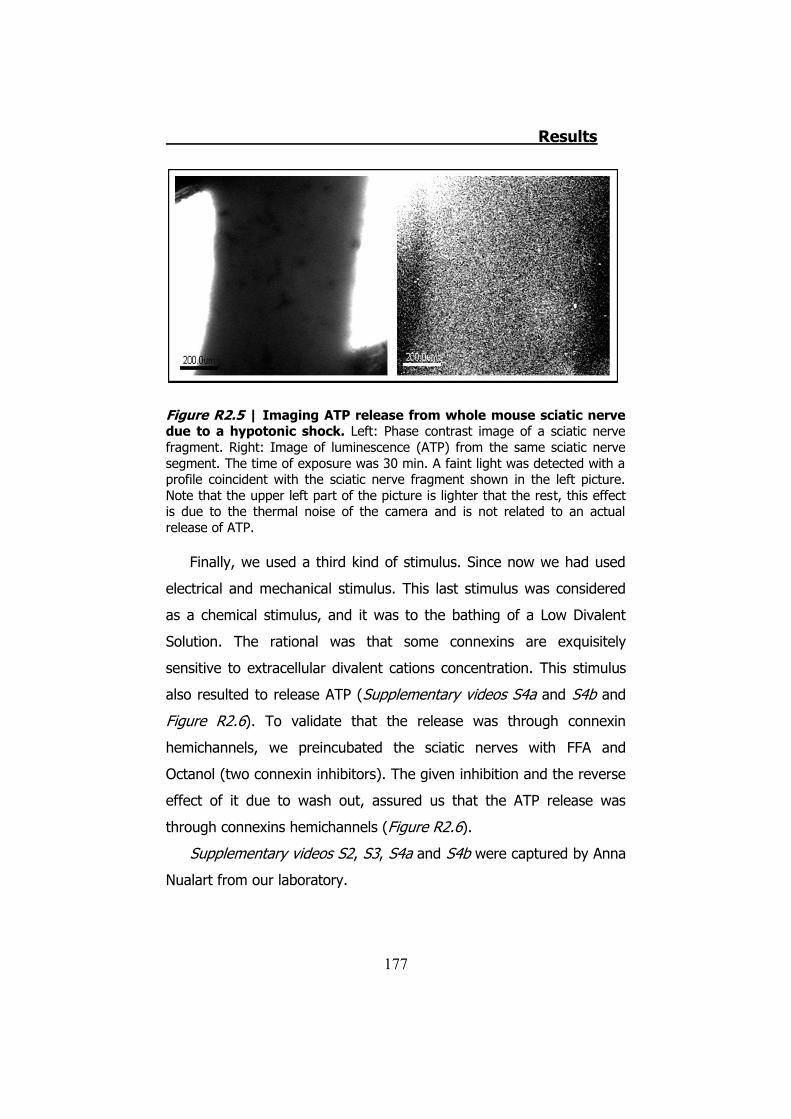
Results
177
Figure R2.5 | Imaging ATP release from whole mouse sciatic nerve due to a hypotonic shock. Left: Phase contrast image of a sciatic nerve fragment. Right: Image of luminescence (ATP) from the same sciatic nerve segment. The time of exposure was 30 min. A faint light was detected with a profile coincident with the sciatic nerve fragment shown in the left picture. Note that the upper left part of the picture is lighter that the rest, this effect is due to the thermal noise of the camera and is not related to an actual release of ATP.
Finally, we used a third kind of stimulus. Since now we had used
electrical and mechanical stimulus. This last stimulus was considered
as a chemical stimulus, and it was to the bathing of a Low Divalent
Solution. The rational was that some connexins are exquisitely
sensitive to extracellular divalent cations concentration. This stimulus
also resulted to release ATP (Supplementary videos S4a and S4b and
Figure R2.6). To validate that the release was through connexin
hemichannels, we preincubated the sciatic nerves with FFA and
Octanol (two connexin inhibitors). The given inhibition and the reverse
effect of it due to wash out, assured us that the ATP release was
through connexins hemichannels (Figure R2.6).
Supplementary videos S2, S3, S4a and S4b were captured by Anna
Nualart from our laboratory.
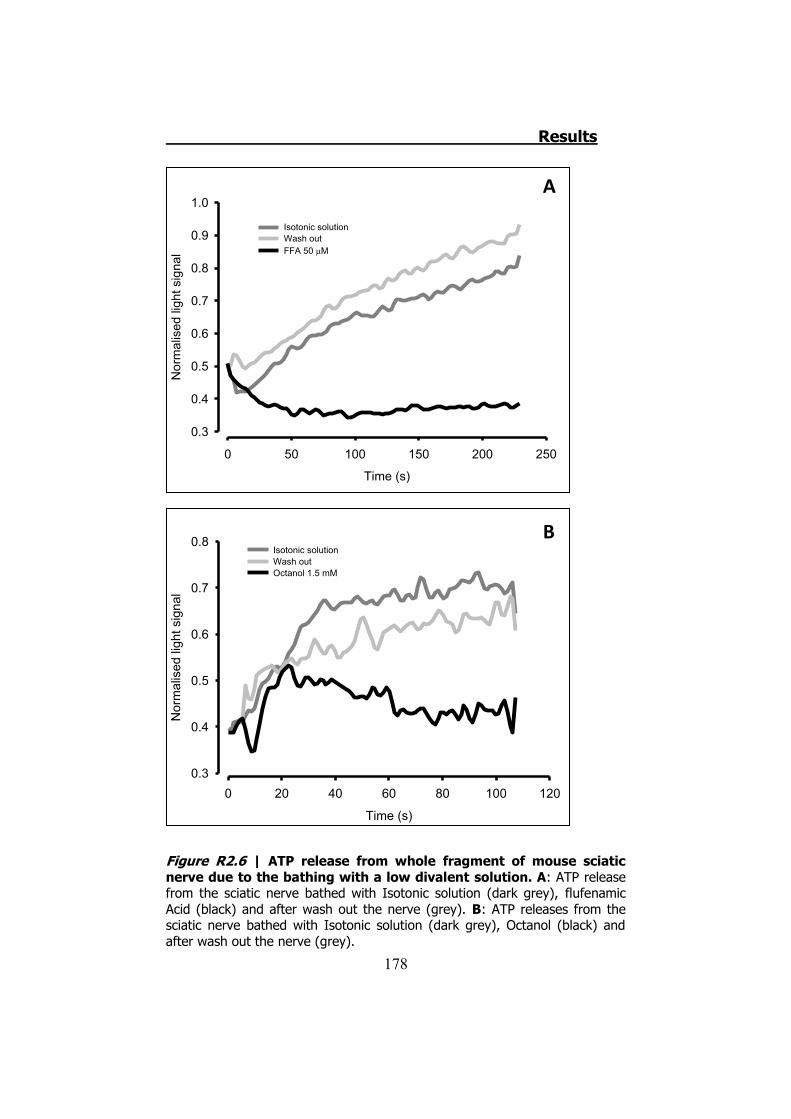
Results
178
Figure R2.6 | ATP release from whole fragment of mouse sciatic nerve due to the bathing with a low divalent solution. A: ATP release from the sciatic nerve bathed with Isotonic solution (dark grey), flufenamic Acid (black) and after wash out the nerve (grey). B: ATP releases from the sciatic nerve bathed with Isotonic solution (dark grey), Octanol (black) and after wash out the nerve (grey).
Time (s)
0 50 100 150 200 250
Nor
mal
ised
ligh
t sig
nal
0.3
0.4
0.5
0.6
0.7
0.8
0.9
1.0
Isotonic solutionWash outFFA 50 �M
A
Time (s)
0 20 40 60 80 100 120
Nor
mal
ised
ligh
t sig
nal
0.3
0.4
0.5
0.6
0.7
0.8Isotonic solutionWash outOctanol 1.5 mM
B
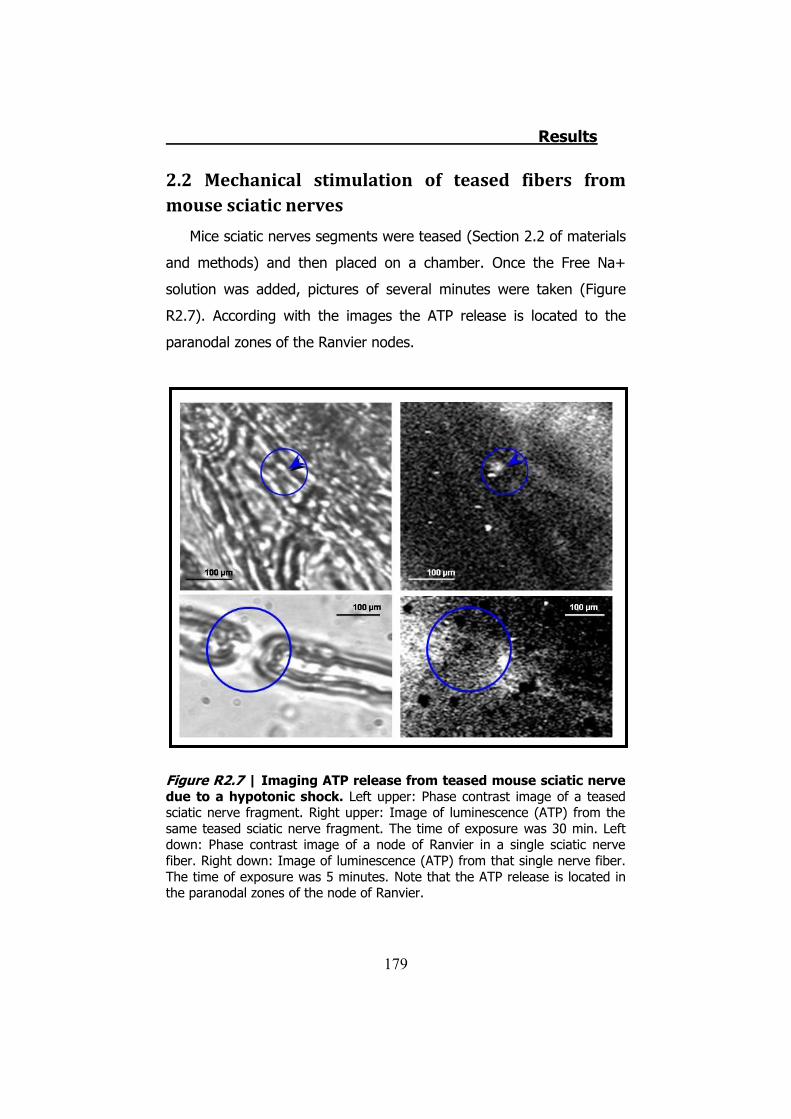
Results
179
2.2 Mechanical stimulation of teased fibers from mouse sciatic nerves
Mice sciatic nerves segments were teased (Section 2.2 of materials
and methods) and then placed on a chamber. Once the Free Na+
solution was added, pictures of several minutes were taken (Figure
R2.7). According with the images the ATP release is located to the
paranodal zones of the Ranvier nodes.
Figure R2.7 | Imaging ATP release from teased mouse sciatic nerve due to a hypotonic shock. Left upper: Phase contrast image of a teased sciatic nerve fragment. Right upper: Image of luminescence (ATP) from the same teased sciatic nerve fragment. The time of exposure was 30 min. Left down: Phase contrast image of a node of Ranvier in a single sciatic nerve fiber. Right down: Image of luminescence (ATP) from that single nerve fiber. The time of exposure was 5 minutes. Note that the ATP release is located in the paranodal zones of the node of Ranvier.
Results
180
3. Cultured Schwann cells
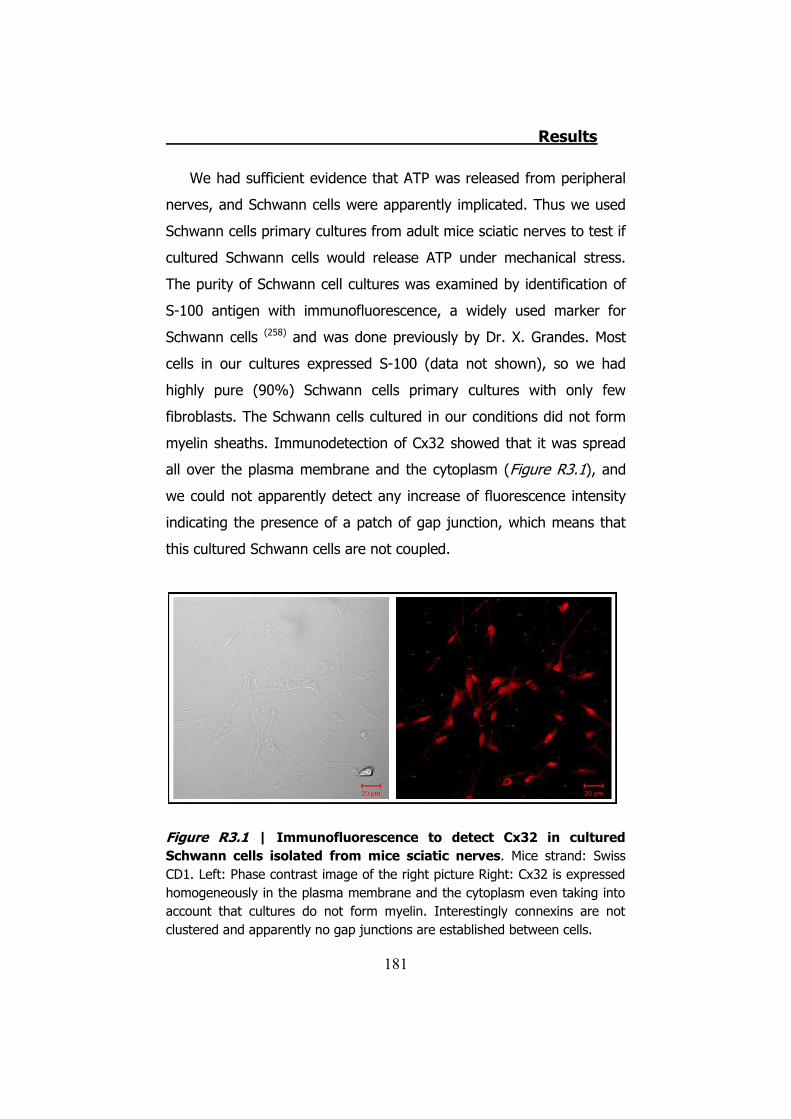
Results
181
We had sufficient evidence that ATP was released from peripheral
nerves, and Schwann cells were apparently implicated. Thus we used
Schwann cells primary cultures from adult mice sciatic nerves to test if
cultured Schwann cells would release ATP under mechanical stress.
The purity of Schwann cell cultures was examined by identification of
S-100 antigen with immunofluorescence, a widely used marker for
Schwann cells (258) and was done previously by Dr. X. Grandes. Most
cells in our cultures expressed S-100 (data not shown), so we had
highly pure (90%) Schwann cells primary cultures with only few
fibroblasts. The Schwann cells cultured in our conditions did not form
myelin sheaths. Immunodetection of Cx32 showed that it was spread
all over the plasma membrane and the cytoplasm (Figure R3.1), and
we could not apparently detect any increase of fluorescence intensity
indicating the presence of a patch of gap junction, which means that
this cultured Schwann cells are not coupled.
Figure R3.1 | Immunofluorescence to detect Cx32 in cultured Schwann cells isolated from mice sciatic nerves. Mice strand: Swiss CD1. Left: Phase contrast image of the right picture Right: Cx32 is expressed homogeneously in the plasma membrane and the cytoplasm even taking into account that cultures do not form myelin. Interestingly connexins are not clustered and apparently no gap junctions are established between cells.
Results
182
4. ATP release through hCx32 on cell cultures
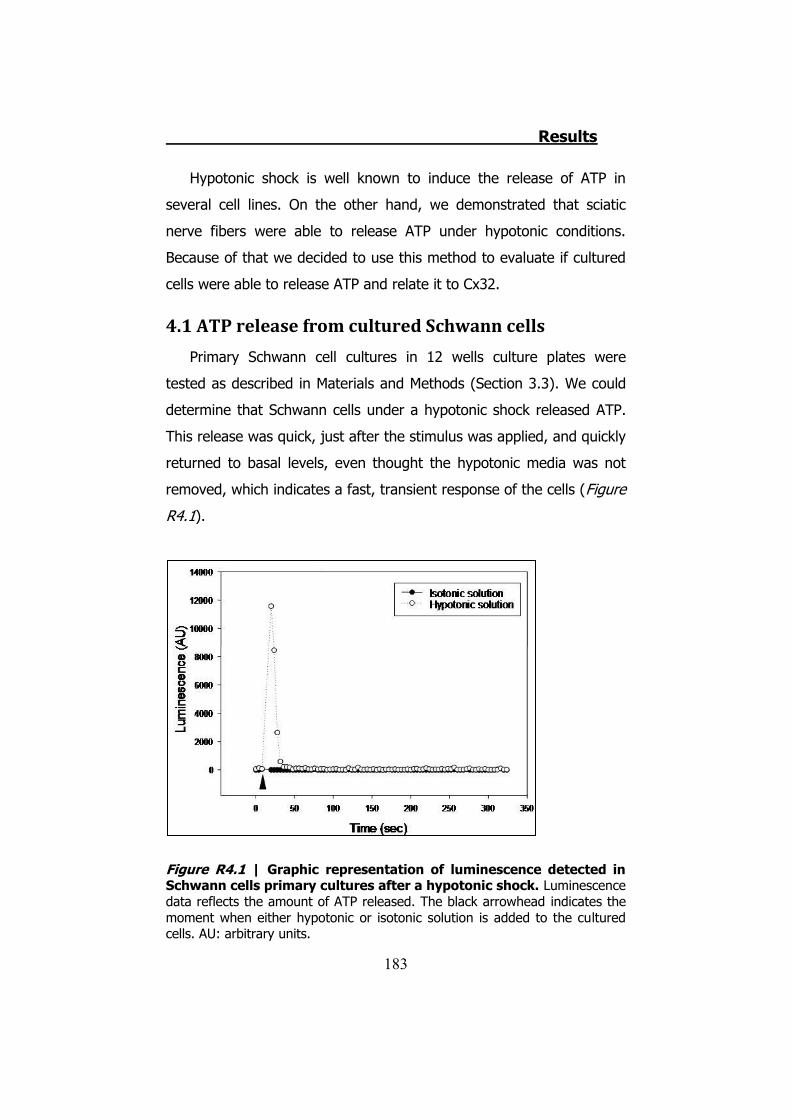
Results
183
Hypotonic shock is well known to induce the release of ATP in
several cell lines. On the other hand, we demonstrated that sciatic
nerve fibers were able to release ATP under hypotonic conditions.
Because of that we decided to use this method to evaluate if cultured
cells were able to release ATP and relate it to Cx32.
4.1 ATP release from cultured Schwann cells
Primary Schwann cell cultures in 12 wells culture plates were
tested as described in Materials and Methods (Section 3.3). We could
determine that Schwann cells under a hypotonic shock released ATP.
This release was quick, just after the stimulus was applied, and quickly
returned to basal levels, even thought the hypotonic media was not
removed, which indicates a fast, transient response of the cells (Figure
R4.1).
Figure R4.1 | Graphic representation of luminescence detected in Schwann cells primary cultures after a hypotonic shock. Luminescence data reflects the amount of ATP released. The black arrowhead indicates the moment when either hypotonic or isotonic solution is added to the cultured cells. AU: arbitrary units.
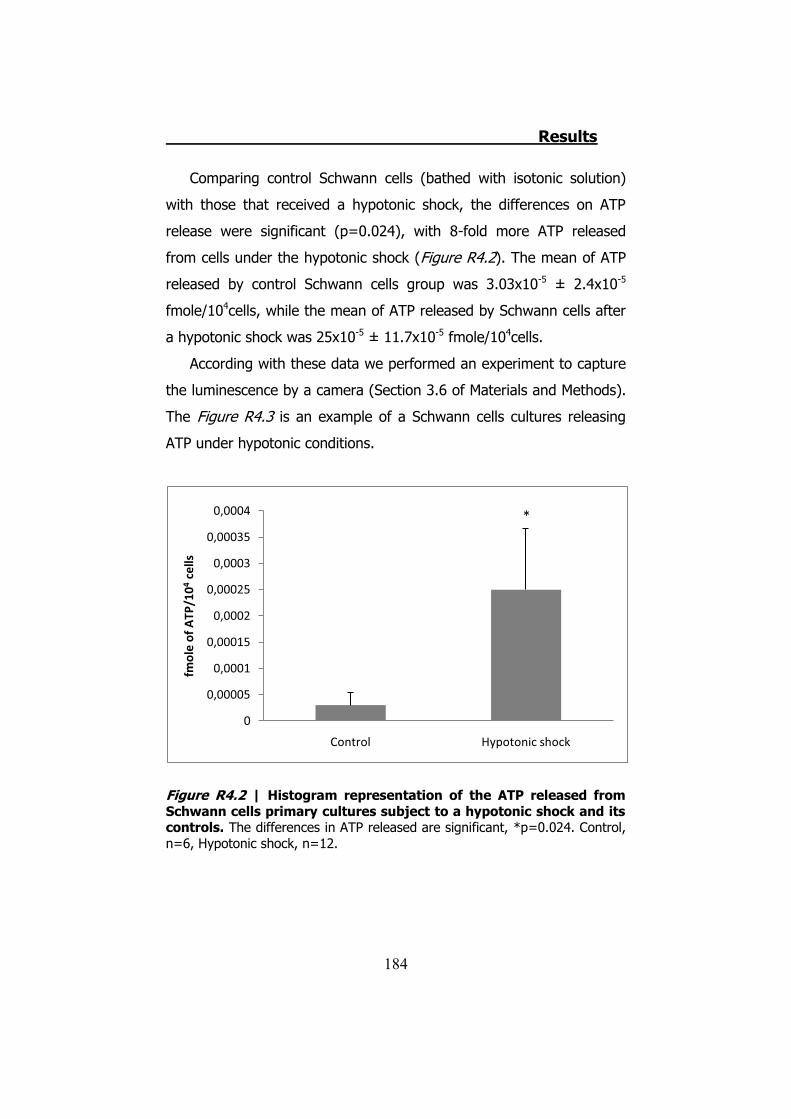
Results
184
Comparing control Schwann cells (bathed with isotonic solution)
with those that received a hypotonic shock, the differences on ATP
release were significant (p=0.024), with 8-fold more ATP released
from cells under the hypotonic shock (Figure R4.2). The mean of ATP
released by control Schwann cells group was 3.03x10⁻⁵ ± 2.4x10⁻⁵
fmole/104cells, while the mean of ATP released by Schwann cells after
a hypotonic shock was 25x10-5 ± 11.7x10⁻⁵ fmole/104cells.
According with these data we performed an experiment to capture
the luminescence by a camera (Section 3.6 of Materials and Methods).
The Figure R4.3 is an example of a Schwann cells cultures releasing
ATP under hypotonic conditions.
Figure R4.2 | Histogram representation of the ATP released from Schwann cells primary cultures subject to a hypotonic shock and its controls. The differences in ATP released are significant, *p=0.024. Control, n=6, Hypotonic shock, n=12.
0
0,00005
0,0001
0,00015
0,0002
0,00025
0,0003
0,00035
0,0004
Control Hypotonic shock
fmol
e of
ATP
/104
cells
*
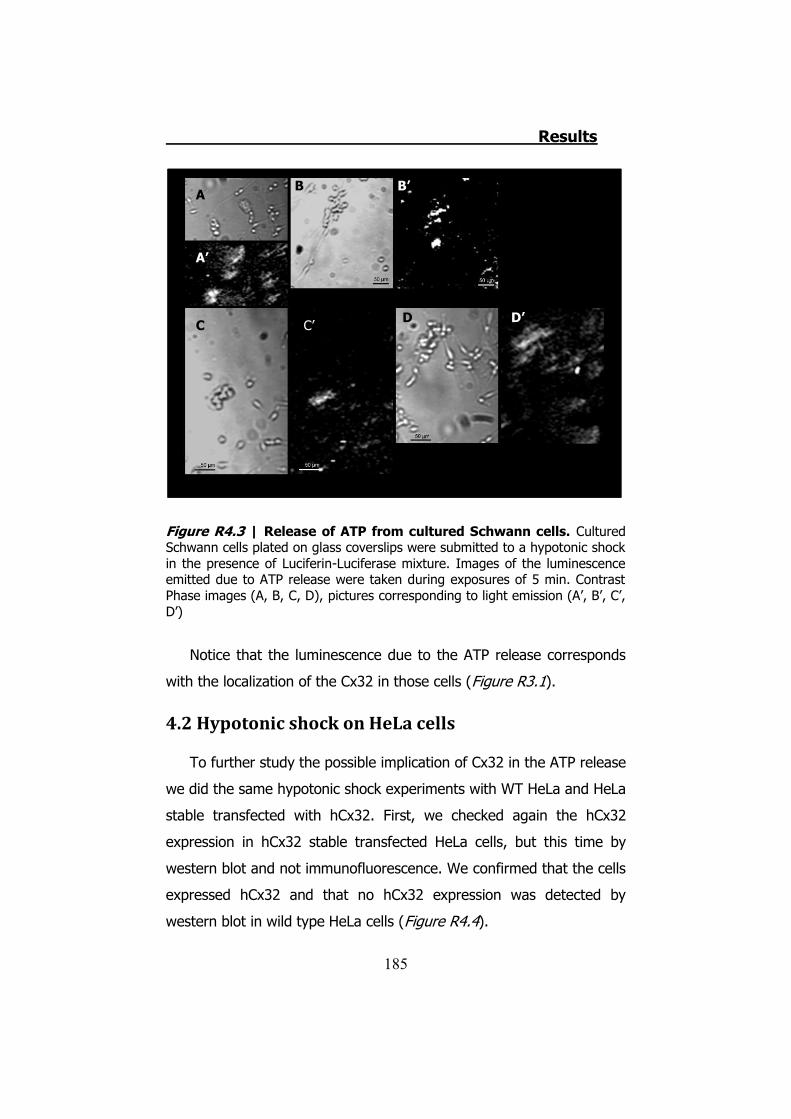
Results
185
Figure R4.3 | Release of ATP from cultured Schwann cells. Cultured Schwann cells plated on glass coverslips were submitted to a hypotonic shock in the presence of Luciferin-Luciferase mixture. Images of the luminescence emitted due to ATP release were taken during exposures of 5 min. Contrast Phase images (A, B, C, D), pictures corresponding to light emission (A’, B’, C’, D’)
Notice that the luminescence due to the ATP release corresponds
with the localization of the Cx32 in those cells (Figure R3.1).
4.2 Hypotonic shock on HeLa cells
To further study the possible implication of Cx32 in the ATP release
we did the same hypotonic shock experiments with WT HeLa and HeLa
stable transfected with hCx32. First, we checked again the hCx32
expression in hCx32 stable transfected HeLa cells, but this time by
western blot and not immunofluorescence. We confirmed that the cells
expressed hCx32 and that no hCx32 expression was detected by
western blot in wild type HeLa cells (Figure R4.4).
A B
A’
B’
C C’ D D’
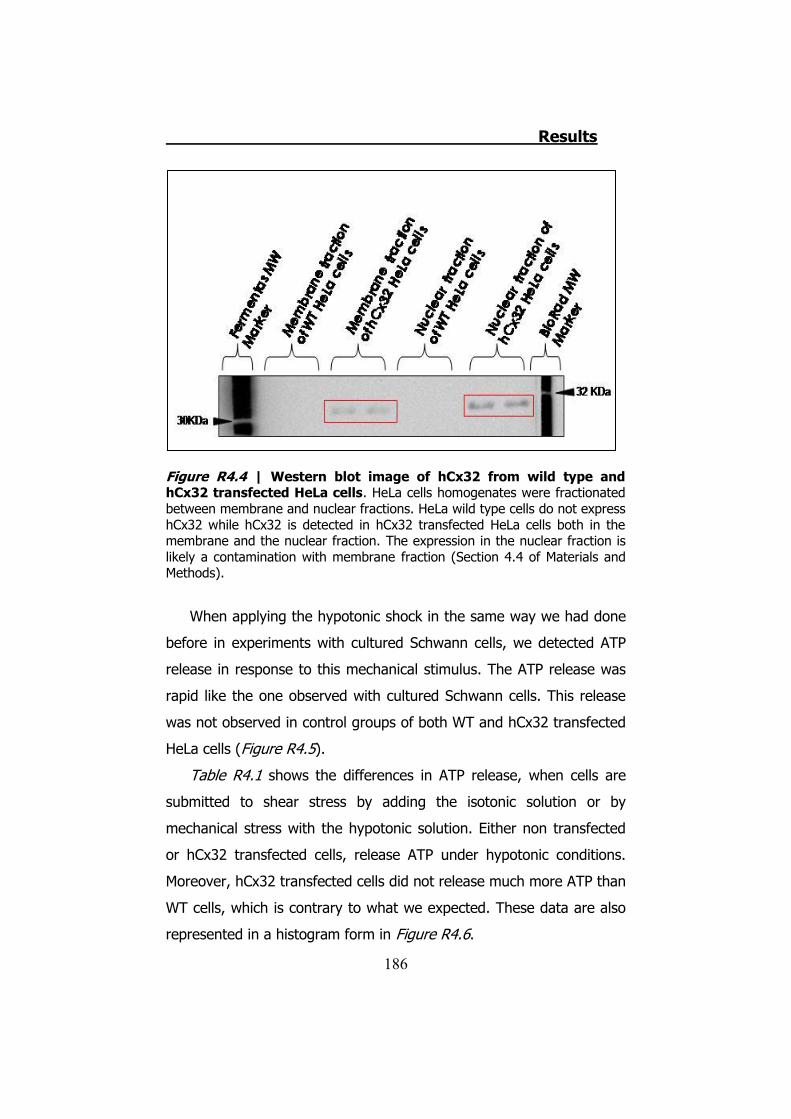
Results
186
Figure R4.4 | Western blot image of hCx32 from wild type and hCx32 transfected HeLa cells. HeLa cells homogenates were fractionated between membrane and nuclear fractions. HeLa wild type cells do not express hCx32 while hCx32 is detected in hCx32 transfected HeLa cells both in the membrane and the nuclear fraction. The expression in the nuclear fraction is likely a contamination with membrane fraction (Section 4.4 of Materials and Methods).
When applying the hypotonic shock in the same way we had done
before in experiments with cultured Schwann cells, we detected ATP
release in response to this mechanical stimulus. The ATP release was
rapid like the one observed with cultured Schwann cells. This release
was not observed in control groups of both WT and hCx32 transfected
HeLa cells (Figure R4.5).
Table R4.1 shows the differences in ATP release, when cells are
submitted to shear stress by adding the isotonic solution or by
mechanical stress with the hypotonic solution. Either non transfected
or hCx32 transfected cells, release ATP under hypotonic conditions.
Moreover, hCx32 transfected cells did not release much more ATP than
WT cells, which is contrary to what we expected. These data are also
represented in a histogram form in Figure R4.6.
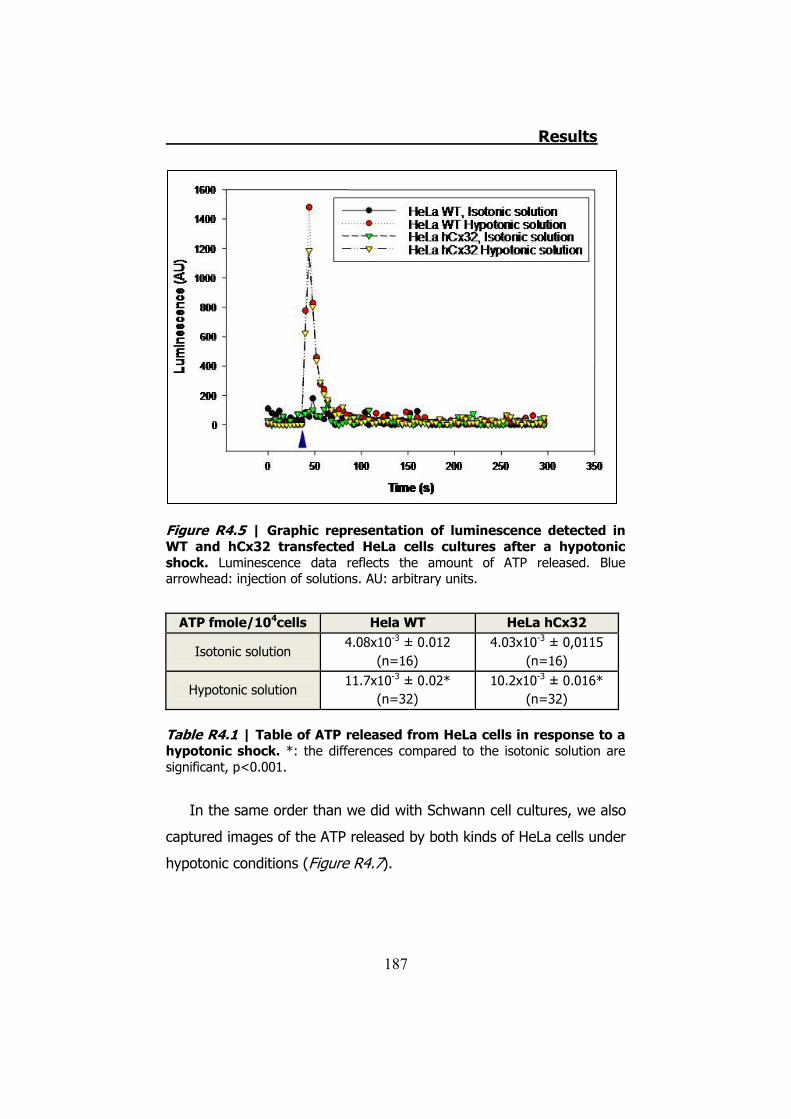
Results
187
Figure R4.5 | Graphic representation of luminescence detected in WT and hCx32 transfected HeLa cells cultures after a hypotonic shock. Luminescence data reflects the amount of ATP released. Blue arrowhead: injection of solutions. AU: arbitrary units.
ATP fmole/104cells Hela WT HeLa hCx32
Isotonic solution 4.08x10⁻³ ± 0.012
(n=16) 4.03x10⁻³ ± 0,0115
(n=16)
Hypotonic solution 11.7x10⁻³ ± 0.02*
(n=32) 10.2x10⁻³ ± 0.016*
(n=32)
Table R4.1 | Table of ATP released from HeLa cells in response to a hypotonic shock. *: the differences compared to the isotonic solution are significant, p<0.001.
In the same order than we did with Schwann cell cultures, we also
captured images of the ATP released by both kinds of HeLa cells under
hypotonic conditions (Figure R4.7).
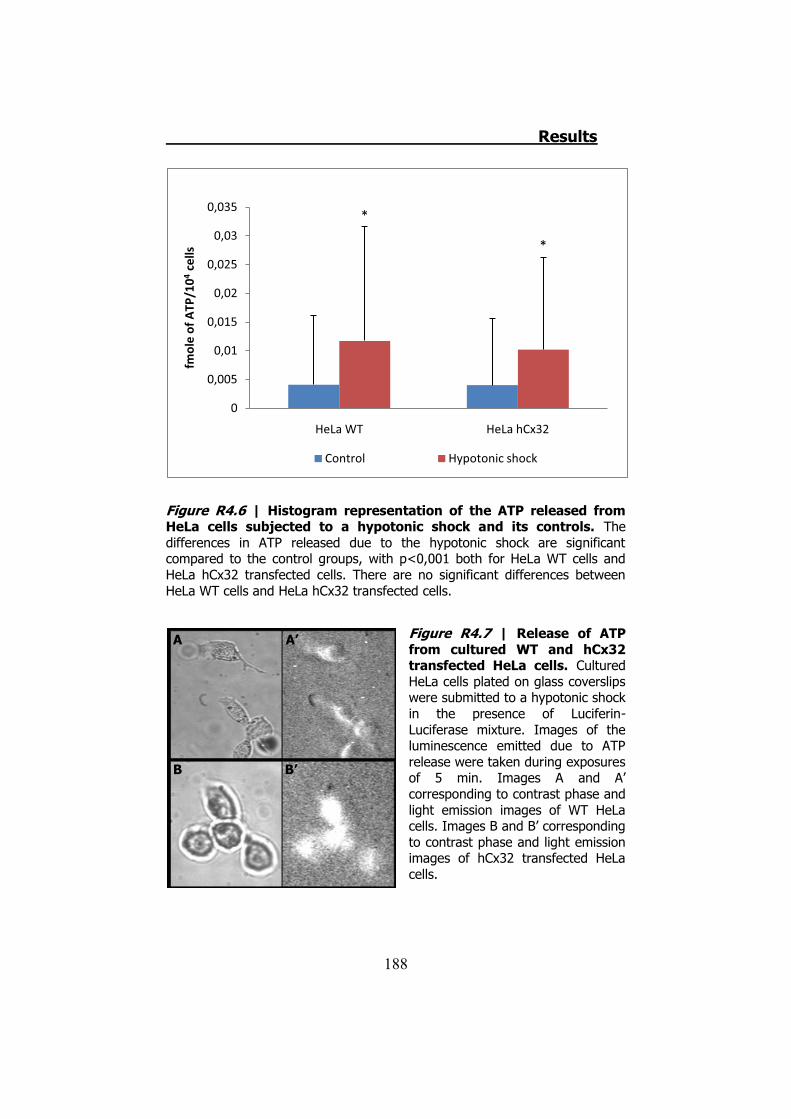
Results
188
Figure R4.6 | Histogram representation of the ATP released from HeLa cells subjected to a hypotonic shock and its controls. The differences in ATP released due to the hypotonic shock are significant compared to the control groups, with p<0,001 both for HeLa WT cells and HeLa hCx32 transfected cells. There are no significant differences between HeLa WT cells and HeLa hCx32 transfected cells.
Figure R4.7 | Release of ATP from cultured WT and hCx32 transfected HeLa cells. Cultured HeLa cells plated on glass coverslips were submitted to a hypotonic shock in the presence of Luciferin-Luciferase mixture. Images of the luminescence emitted due to ATP release were taken during exposures of 5 min. Images A and A’ corresponding to contrast phase and light emission images of WT HeLa cells. Images B and B’ corresponding to contrast phase and light emission images of hCx32 transfected HeLa cells.
0
0,005
0,01
0,015
0,02
0,025
0,03
0,035
HeLa WT HeLa hCx32
fmol
e of
ATP
/104
cells
Control Hypotonic shock
*
*
A
B
A’
B’
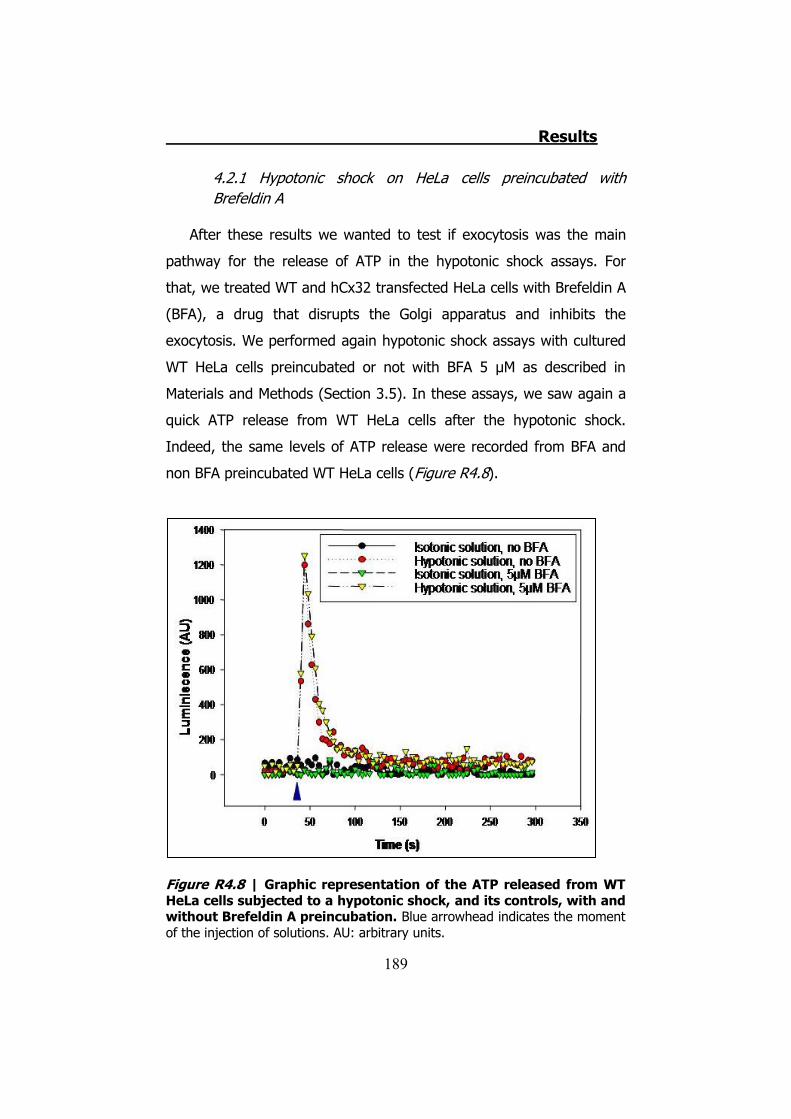
Results
189
4.2.1 Hypotonic shock on HeLa cells preincubated with Brefeldin A
After these results we wanted to test if exocytosis was the main
pathway for the release of ATP in the hypotonic shock assays. For
that, we treated WT and hCx32 transfected HeLa cells with Brefeldin A
(BFA), a drug that disrupts the Golgi apparatus and inhibits the
exocytosis. We performed again hypotonic shock assays with cultured
WT HeLa cells preincubated or not with BFA 5 μM as described in
Materials and Methods (Section 3.5). In these assays, we saw again a
quick ATP release from WT HeLa cells after the hypotonic shock.
Indeed, the same levels of ATP release were recorded from BFA and
non BFA preincubated WT HeLa cells (Figure R4.8).
Figure R4.8 | Graphic representation of the ATP released from WT HeLa cells subjected to a hypotonic shock, and its controls, with and without Brefeldin A preincubation. Blue arrowhead indicates the moment of the injection of solutions. AU: arbitrary units.
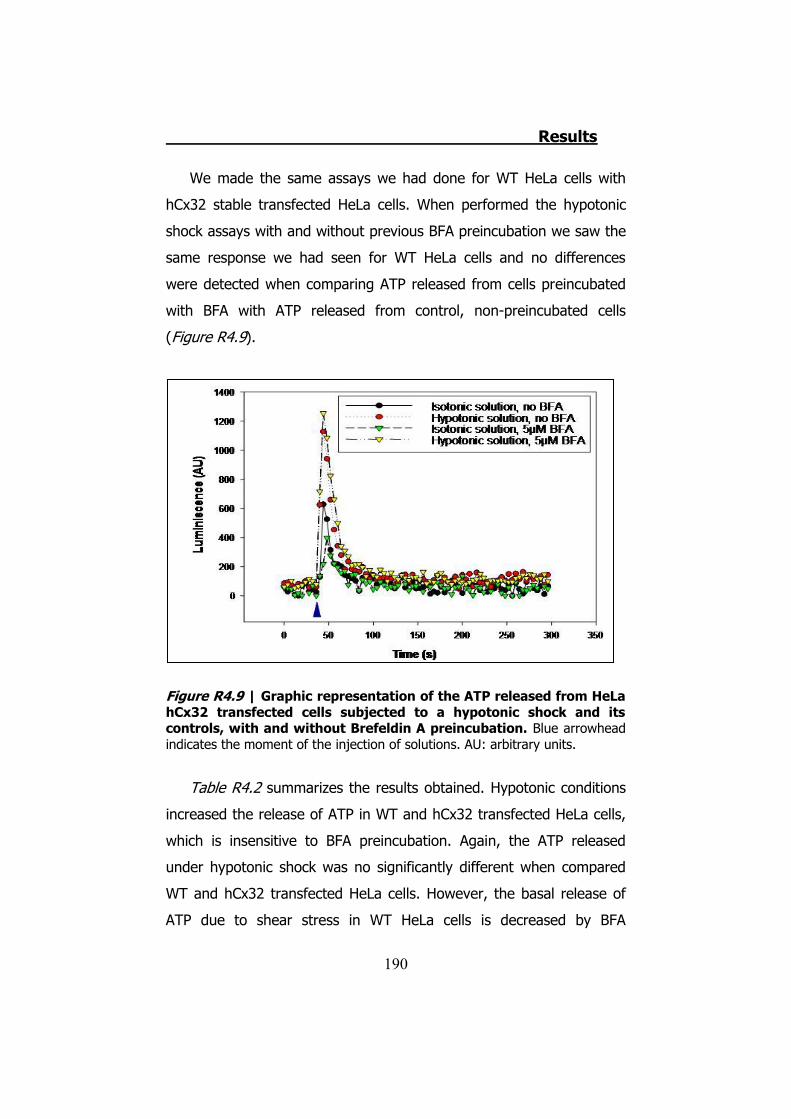
Results
190
We made the same assays we had done for WT HeLa cells with
hCx32 stable transfected HeLa cells. When performed the hypotonic
shock assays with and without previous BFA preincubation we saw the
same response we had seen for WT HeLa cells and no differences
were detected when comparing ATP released from cells preincubated
with BFA with ATP released from control, non-preincubated cells
(Figure R4.9).
Figure R4.9 | Graphic representation of the ATP released from HeLa hCx32 transfected cells subjected to a hypotonic shock and its controls, with and without Brefeldin A preincubation. Blue arrowhead indicates the moment of the injection of solutions. AU: arbitrary units.
Table R4.2 summarizes the results obtained. Hypotonic conditions
increased the release of ATP in WT and hCx32 transfected HeLa cells,
which is insensitive to BFA preincubation. Again, the ATP released
under hypotonic shock was no significantly different when compared
WT and hCx32 transfected HeLa cells. However, the basal release of
ATP due to shear stress in WT HeLa cells is decreased by BFA
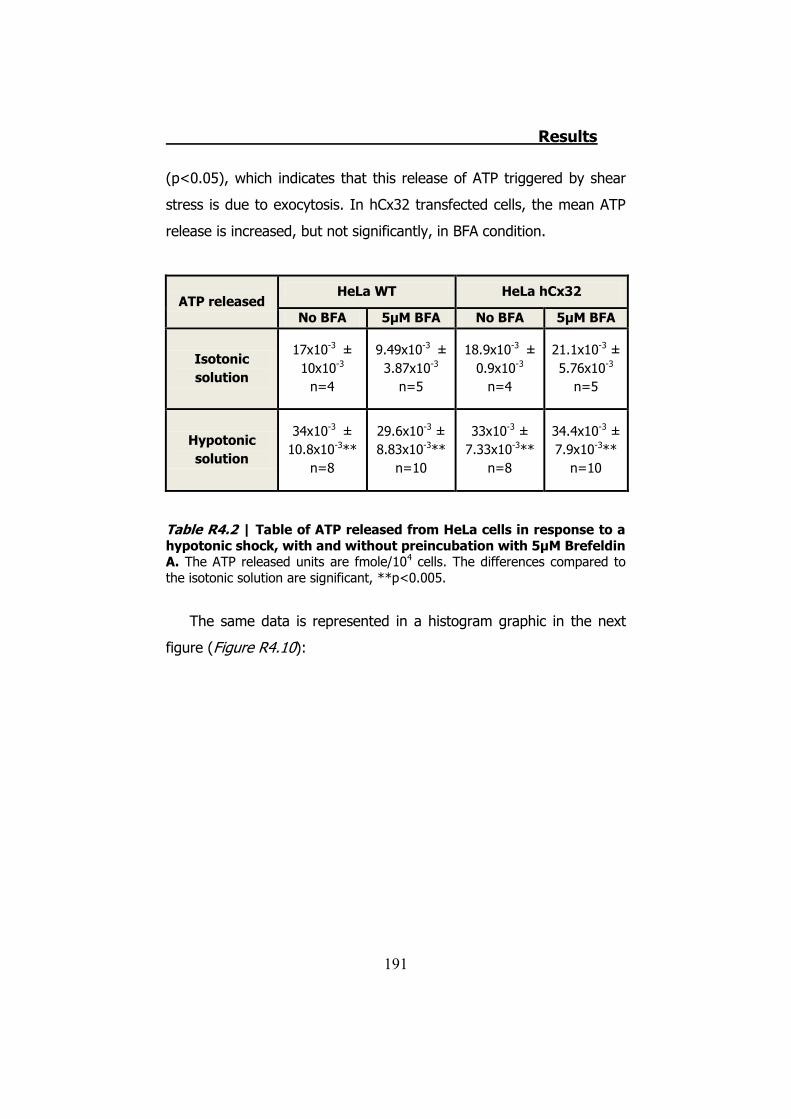
Results
191
(p<0.05), which indicates that this release of ATP triggered by shear
stress is due to exocytosis. In hCx32 transfected cells, the mean ATP
release is increased, but not significantly, in BFA condition.
ATP released HeLa WT HeLa hCx32
No BFA 5μM BFA No BFA 5μM BFA
Isotonic solution
17x10-3 ± 10x10-3
n=4
9.49x10⁻³ ± 3.87x10⁻³
n=5
18.9x10⁻³ ± 0.9x10⁻³
n=4
21.1x10⁻³ ± 5.76x10⁻³
n=5
Hypotonic solution
34x10-3 ± 10.8x10⁻³**
n=8
29.6x10⁻³ ± 8.83x10⁻³**
n=10
33x10-3 ± 7.33x10⁻³**
n=8
34.4x10⁻³ ± 7.9x10⁻³**
n=10
Table R4.2 | Table of ATP released from HeLa cells in response to a hypotonic shock, with and without preincubation with 5μM Brefeldin A. The ATP released units are fmole/104 cells. The differences compared to the isotonic solution are significant, **p<0.005.
The same data is represented in a histogram graphic in the next
figure (Figure R4.10):
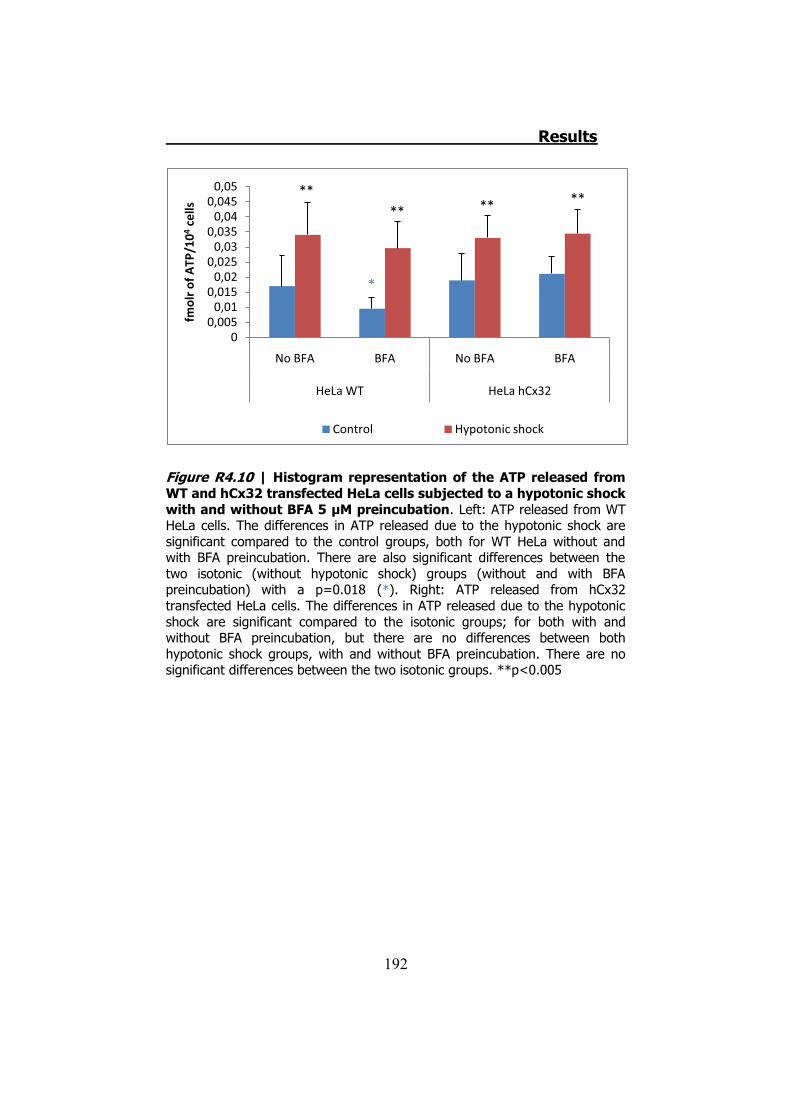
Results
192
Figure R4.10 | Histogram representation of the ATP released from WT and hCx32 transfected HeLa cells subjected to a hypotonic shock with and without BFA 5 μM preincubation. Left: ATP released from WT HeLa cells. The differences in ATP released due to the hypotonic shock are significant compared to the control groups, both for WT HeLa without and with BFA preincubation. There are also significant differences between the two isotonic (without hypotonic shock) groups (without and with BFA preincubation) with a p=0.018 (*). Right: ATP released from hCx32 transfected HeLa cells. The differences in ATP released due to the hypotonic shock are significant compared to the isotonic groups; for both with and without BFA preincubation, but there are no differences between both hypotonic shock groups, with and without BFA preincubation. There are no significant differences between the two isotonic groups. **p<0.005
00,005
0,010,015
0,020,025
0,030,035
0,040,045
0,05
No BFA BFA No BFA BFA
HeLa WT HeLa hCx32
fmol
r of A
TP/1
04ce
lls
Control Hypotonic shock
**** ** **
*
Results
193
5. hCx32 and ATP release in Xenopus oocytes
Results
194
5.1. hCx32 cRNA obtention
In order to express foreign proteins in Xenopus laevis oocytes we
have first obtained the cRNA. The hCx32 cDNA sequence cloned in the
Xenopus pBxG plasmid for Xenopus oocytes improved expression was
obtained from Dr. Luis C. Barrio, Hospital Ramón y Cajal, Madrid,
Spain. Using the molecular biology techniques described in Materials
and Methods (Section 5.3) cRNAs for these proteins were transcribed
from the cDNAs. The cRNA of hCx32 was about 1000 bp long.
cRNAs were injected into Xenopus oocytes 48-72h prior to
electrophysiological recordings together with the antisense
oligonucleotide for Cx38 (ASCx38) to abolish the activity of this
endogenous Xenopus connexin present in oocytes.
5.2 TEVC recordings and ATP release through hCx32 and negative controls
To study the activity of hCx32 hemichannels expressed in Xenopus
oocytes after a depolarizing stimulus, we have used the Two Electrode
Voltage Clamp technique as described in Materials and Methods
(Section 5.6). Simultaneously we also recorded the release of ATP
during the activation of hCx32. We applied a voltage protocol designed
to depolarize the plasma membrane for 30 s (99). The resting
membrane potential of oocytes was fixed at -40 mV. We switched up
to +80 mV for 30 s and then went back to -40 mV. In oocytes injected
with hCx32, while the plasma membrane was depolarized there was an
outward current with an increasing amplitude respect time, at 30 s the
mean charge was of 41.3 � 5.6 μC, n=15. When voltage went back to
resting potential we recorded a transient inward current, with a charge
of 10.7 � 1.7 μC, n=15.
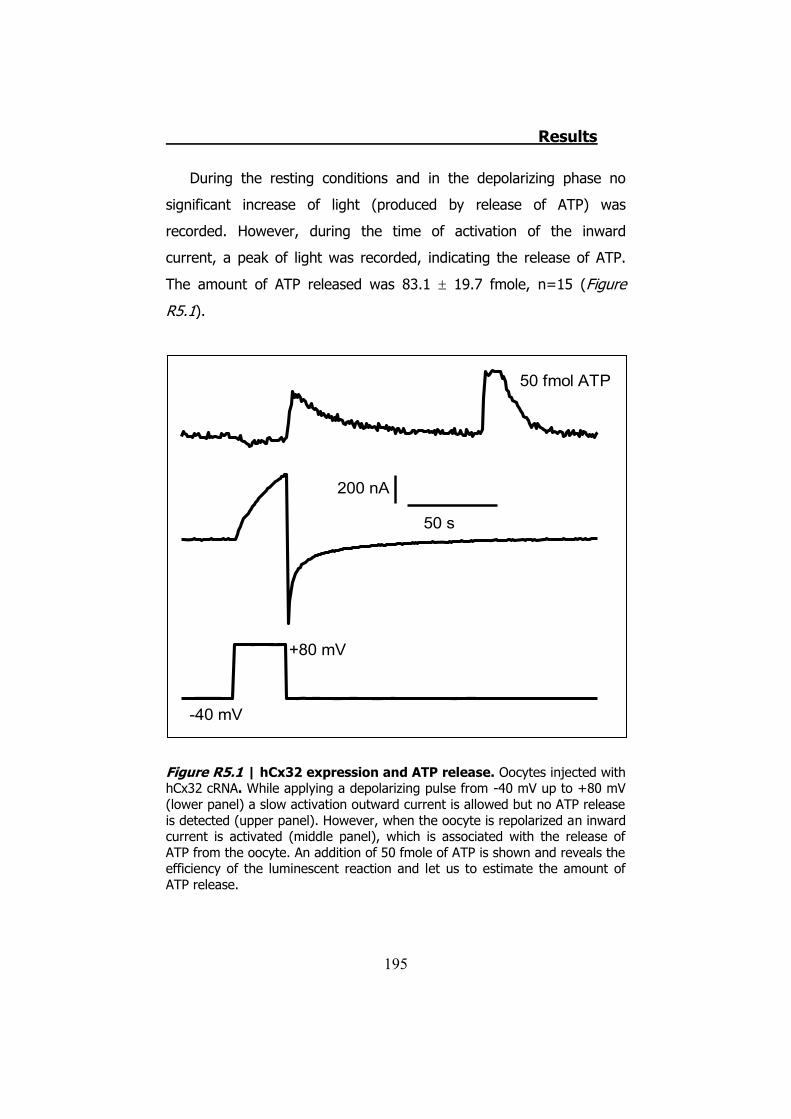
Results
195
During the resting conditions and in the depolarizing phase no
significant increase of light (produced by release of ATP) was
recorded. However, during the time of activation of the inward
current, a peak of light was recorded, indicating the release of ATP.
The amount of ATP released was 83.1 � 19.7 fmole, n=15 (Figure
R5.1).
Figure R5.1 | hCx32 expression and ATP release. Oocytes injected with hCx32 cRNA. While applying a depolarizing pulse from -40 mV up to +80 mV (lower panel) a slow activation outward current is allowed but no ATP release is detected (upper panel). However, when the oocyte is repolarized an inward current is activated (middle panel), which is associated with the release of ATP from the oocyte. An addition of 50 fmole of ATP is shown and reveals the efficiency of the luminescent reaction and let us to estimate the amount of ATP release.
-40 mV
+80 mV
50 fmol ATP
200 nA
50 s
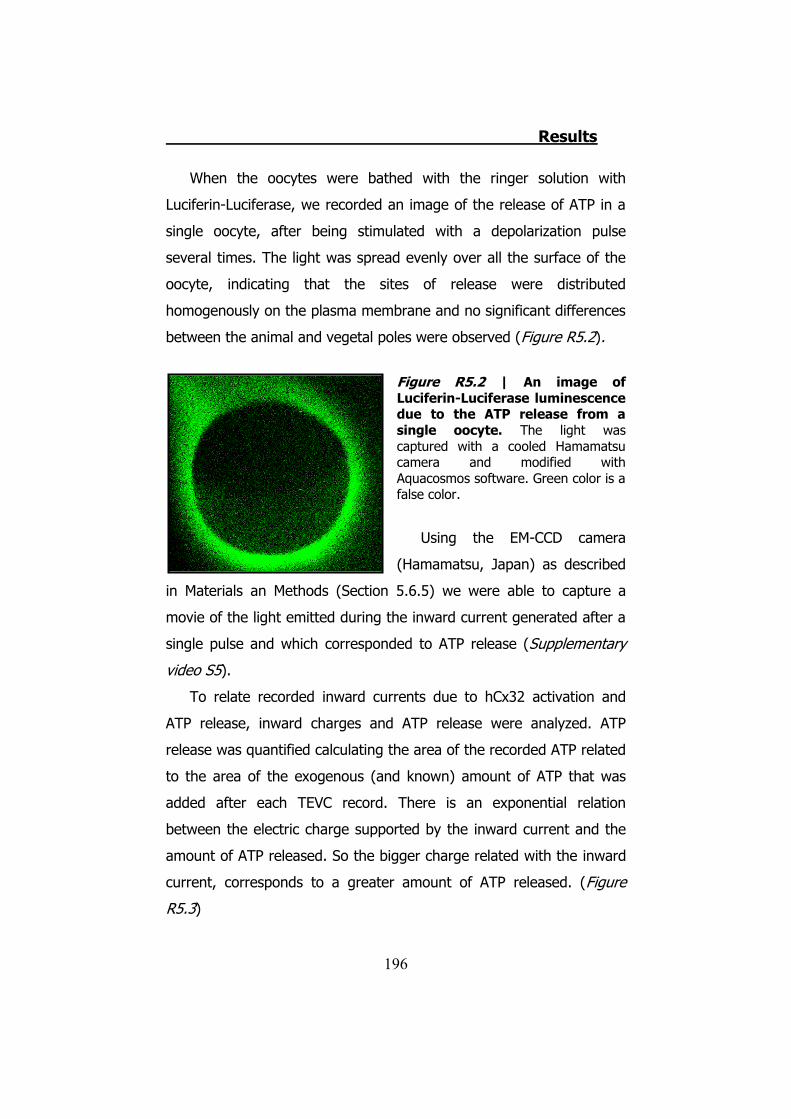
Results
196
When the oocytes were bathed with the ringer solution with
Luciferin-Luciferase, we recorded an image of the release of ATP in a
single oocyte, after being stimulated with a depolarization pulse
several times. The light was spread evenly over all the surface of the
oocyte, indicating that the sites of release were distributed
homogenously on the plasma membrane and no significant differences
between the animal and vegetal poles were observed (Figure R5.2).
Figure R5.2 | An image of Luciferin-Luciferase luminescence due to the ATP release from a single oocyte. The light was captured with a cooled Hamamatsu camera and modified with Aquacosmos software. Green color is a false color.
Using the EM-CCD camera
(Hamamatsu, Japan) as described
in Materials an Methods (Section 5.6.5) we were able to capture a
movie of the light emitted during the inward current generated after a
single pulse and which corresponded to ATP release (Supplementary
video S5).
To relate recorded inward currents due to hCx32 activation and
ATP release, inward charges and ATP release were analyzed. ATP
release was quantified calculating the area of the recorded ATP related
to the area of the exogenous (and known) amount of ATP that was
added after each TEVC record. There is an exponential relation
between the electric charge supported by the inward current and the
amount of ATP released. So the bigger charge related with the inward
current, corresponds to a greater amount of ATP released. (Figure
R5.3)
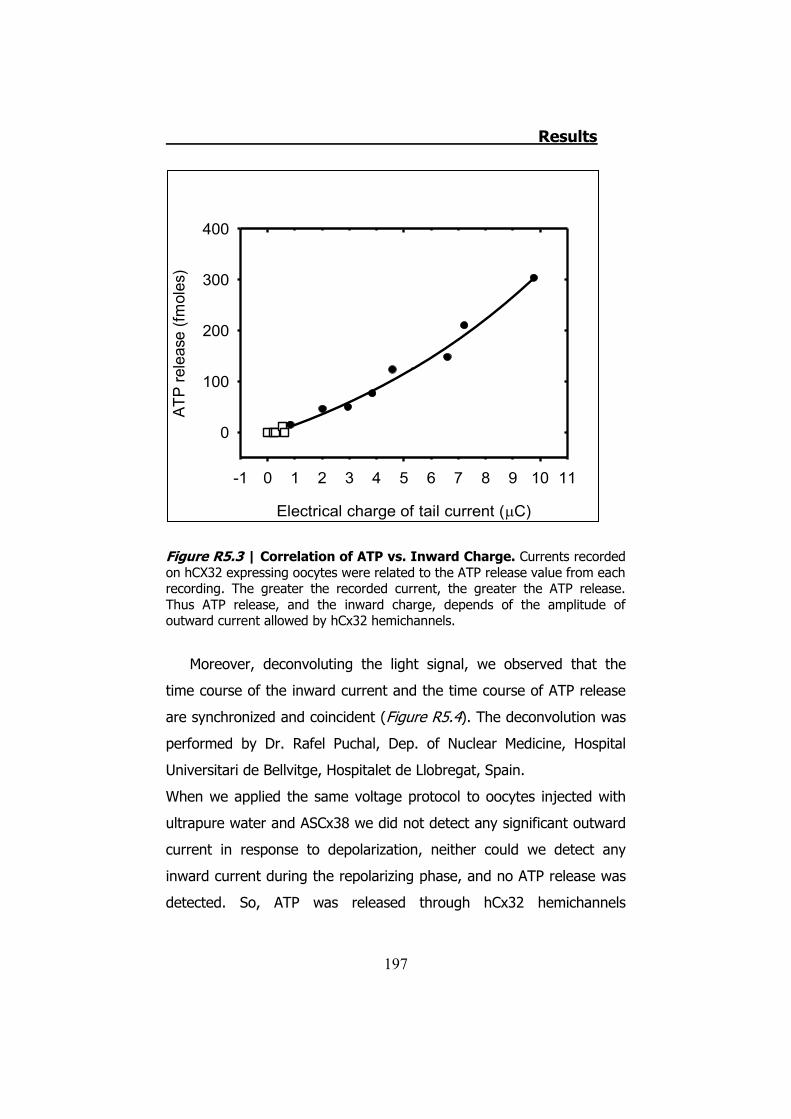
Results
197
Figure R5.3 | Correlation of ATP vs. Inward Charge. Currents recorded on hCX32 expressing oocytes were related to the ATP release value from each recording. The greater the recorded current, the greater the ATP release. Thus ATP release, and the inward charge, depends of the amplitude of outward current allowed by hCx32 hemichannels.
Moreover, deconvoluting the light signal, we observed that the
time course of the inward current and the time course of ATP release
are synchronized and coincident (Figure R5.4). The deconvolution was
performed by Dr. Rafel Puchal, Dep. of Nuclear Medicine, Hospital
Universitari de Bellvitge, Hospitalet de Llobregat, Spain.
When we applied the same voltage protocol to oocytes injected with
ultrapure water and ASCx38 we did not detect any significant outward
current in response to depolarization, neither could we detect any
inward current during the repolarizing phase, and no ATP release was
detected. So, ATP was released through hCx32 hemichannels
Electrical charge of tail current (�C)
-1 1 2 3 4 6 7 8 9 110 5 10
ATP
rele
ase
(fmol
es)
0
100
200
300
400
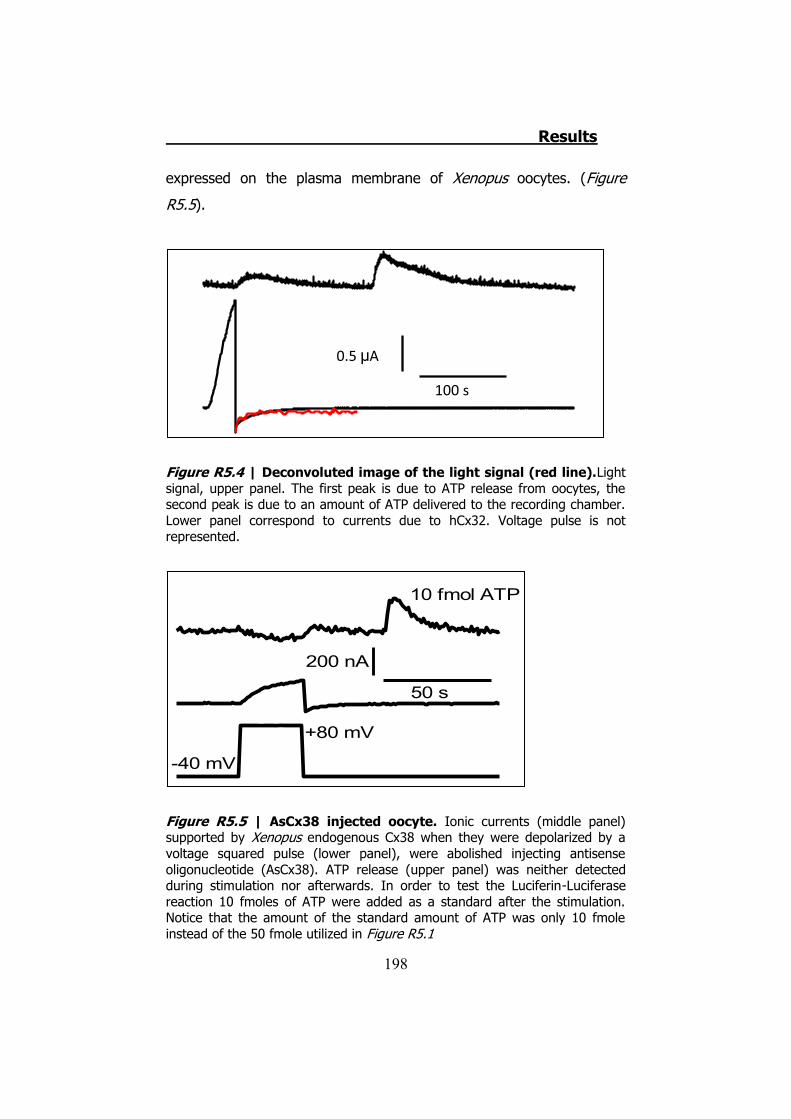
Results
198
expressed on the plasma membrane of Xenopus oocytes. (Figure
R5.5).
Figure R5.4 | Deconvoluted image of the light signal (red line).Light signal, upper panel. The first peak is due to ATP release from oocytes, the second peak is due to an amount of ATP delivered to the recording chamber. Lower panel correspond to currents due to hCx32. Voltage pulse is not represented.
Figure R5.5 | AsCx38 injected oocyte. Ionic currents (middle panel) supported by Xenopus endogenous Cx38 when they were depolarized by a voltage squared pulse (lower panel), were abolished injecting antisense oligonucleotide (AsCx38). ATP release (upper panel) was neither detected during stimulation nor afterwards. In order to test the Luciferin-Luciferase reaction 10 fmoles of ATP were added as a standard after the stimulation. Notice that the amount of the standard amount of ATP was only 10 fmole instead of the 50 fmole utilized in Figure R5.1
100s
���A
10 fmol ATP
-40 mV
+80 mV
200 nA
50 s
0.5 μA
100 s
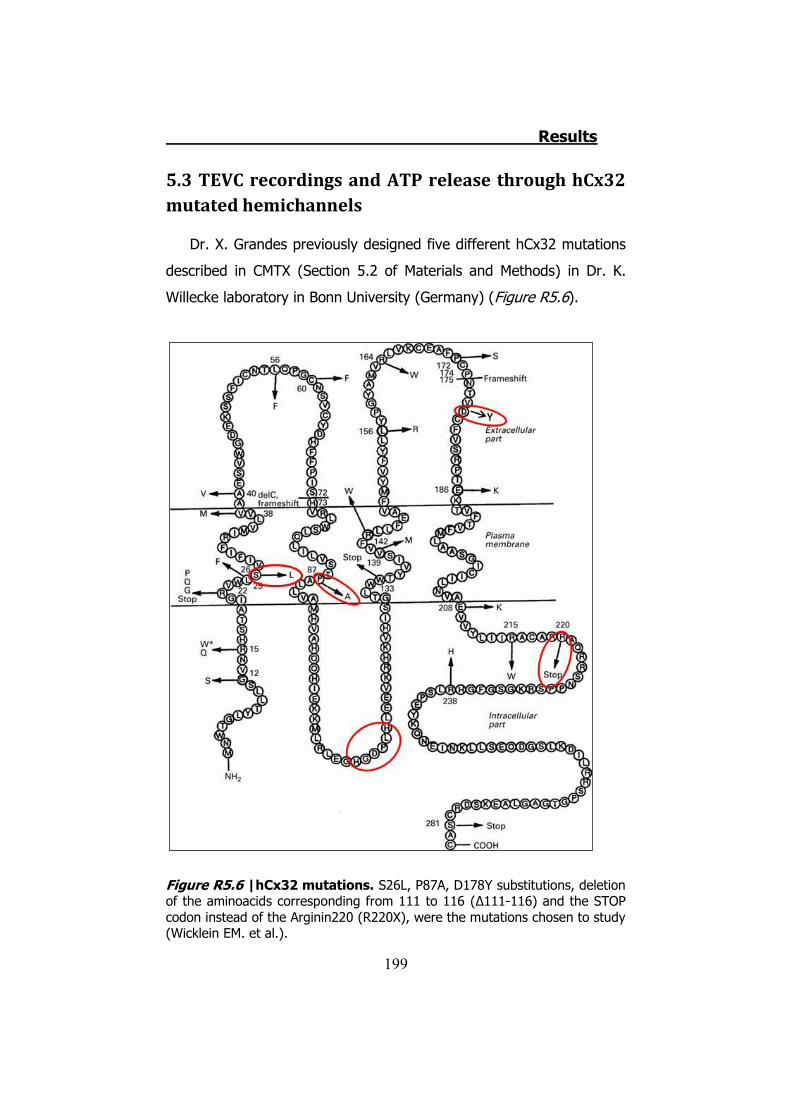
Results
199
5.3 TEVC recordings and ATP release through hCx32 mutated hemichannels
Dr. X. Grandes previously designed five different hCx32 mutations
described in CMTX (Section 5.2 of Materials and Methods) in Dr. K.
Willecke laboratory in Bonn University (Germany) (Figure R5.6).
Figure R5.6 |hCx32 mutations. S26L, P87A, D178Y substitutions, deletion of the aminoacids corresponding from 111 to 116 (Δ111-116) and the STOP codon instead of the Arginin220 (R220X), were the mutations chosen to study (Wicklein EM. et al.).
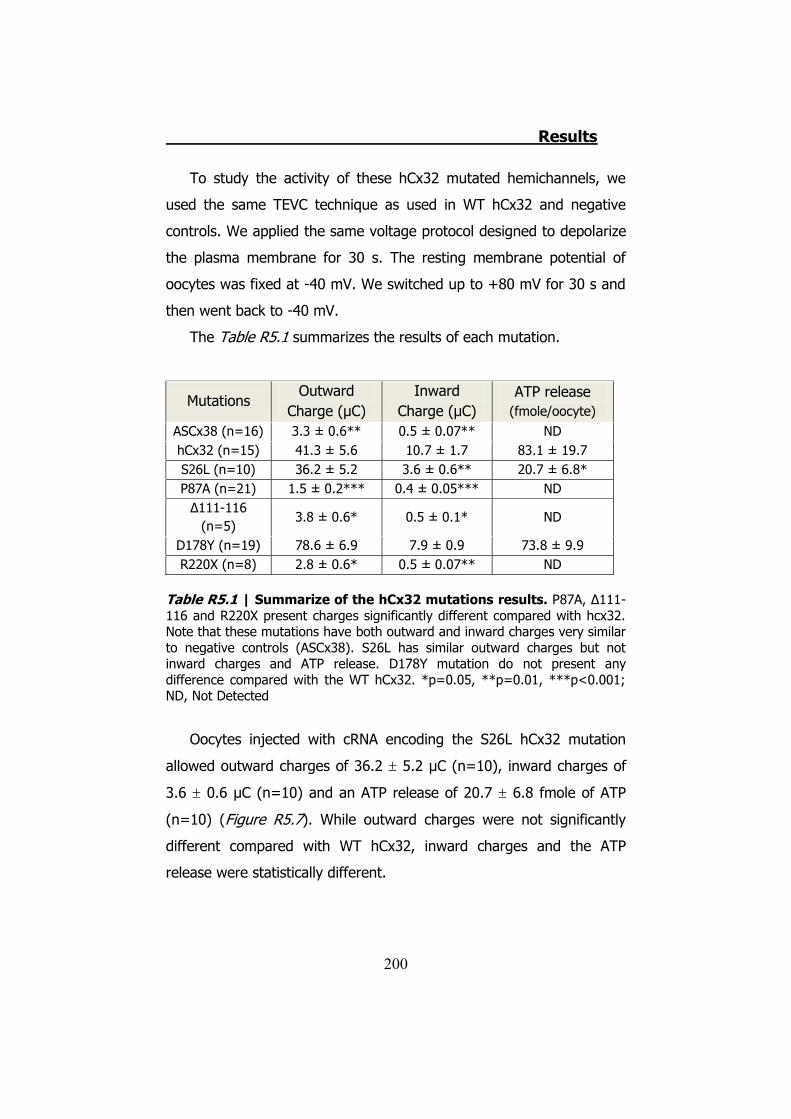
Results
200
To study the activity of these hCx32 mutated hemichannels, we
used the same TEVC technique as used in WT hCx32 and negative
controls. We applied the same voltage protocol designed to depolarize
the plasma membrane for 30 s. The resting membrane potential of
oocytes was fixed at -40 mV. We switched up to +80 mV for 30 s and
then went back to -40 mV.
The Table R5.1 summarizes the results of each mutation.
Mutations Outward
Charge (μC) Inward
Charge (μC) ATP release
(fmole/oocyte) ASCx38 (n=16) 3.3 ± 0.6** 0.5 ± 0.07** ND hCx32 (n=15) 41.3 ± 5.6 10.7 ± 1.7 83.1 ± 19.7 S26L (n=10) 36.2 ± 5.2 3.6 ± 0.6** 20.7 ± 6.8* P87A (n=21) 1.5 ± 0.2*** 0.4 ± 0.05*** ND
Δ111-116 (n=5)
3.8 ± 0.6* 0.5 ± 0.1* ND
D178Y (n=19) 78.6 ± 6.9 7.9 ± 0.9 73.8 ± 9.9 R220X (n=8) 2.8 ± 0.6* 0.5 ± 0.07** ND
Table R5.1 | Summarize of the hCx32 mutations results. P87A, Δ111-116 and R220X present charges significantly different compared with hcx32. Note that these mutations have both outward and inward charges very similar to negative controls (ASCx38). S26L has similar outward charges but not inward charges and ATP release. D178Y mutation do not present any difference compared with the WT hCx32. *p=0.05, **p=0.01, ***p<0.001; ND, Not Detected
Oocytes injected with cRNA encoding the S26L hCx32 mutation
allowed outward charges of 36.2 � 5.2 μC (n=10), inward charges of
3.6 � 0.6 μC (n=10) and an ATP release of 20.7 � 6.8 fmole of ATP
(n=10) (Figure R5.7). While outward charges were not significantly
different compared with WT hCx32, inward charges and the ATP
release were statistically different.
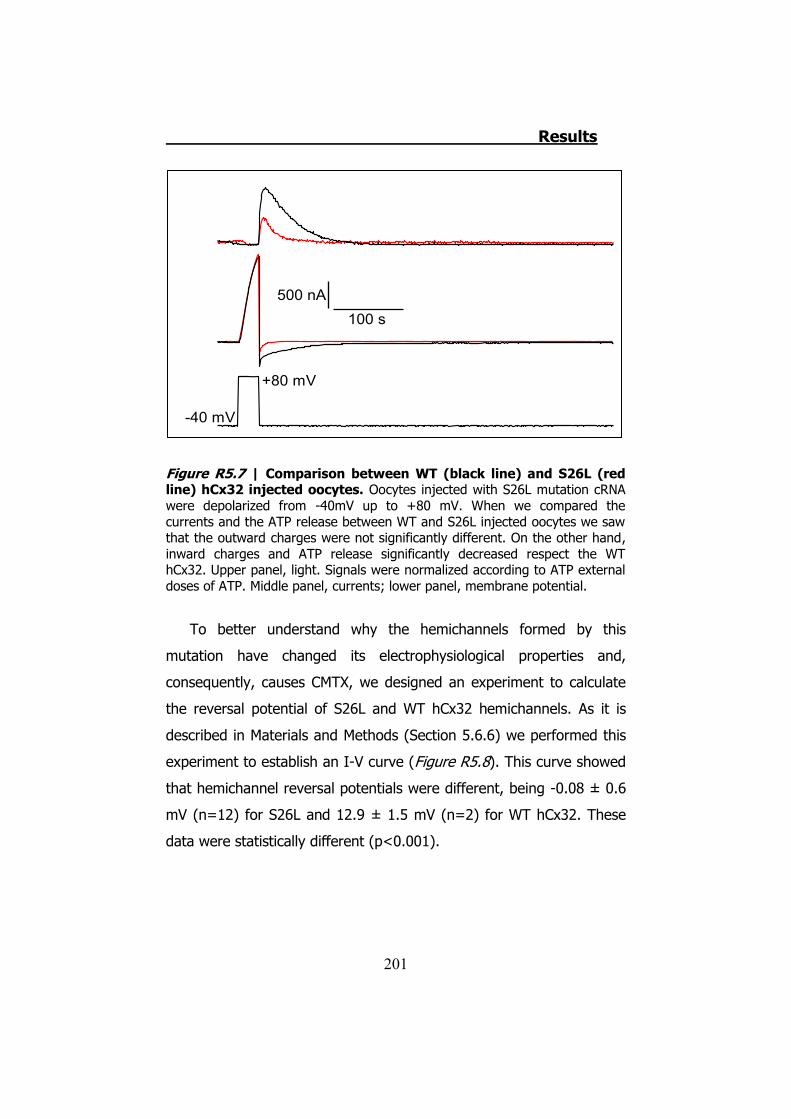
Results
201
Figure R5.7 | Comparison between WT (black line) and S26L (red line) hCx32 injected oocytes. Oocytes injected with S26L mutation cRNA were depolarized from -40mV up to +80 mV. When we compared the currents and the ATP release between WT and S26L injected oocytes we saw that the outward charges were not significantly different. On the other hand, inward charges and ATP release significantly decreased respect the WT hCx32. Upper panel, light. Signals were normalized according to ATP external doses of ATP. Middle panel, currents; lower panel, membrane potential.
To better understand why the hemichannels formed by this
mutation have changed its electrophysiological properties and,
consequently, causes CMTX, we designed an experiment to calculate
the reversal potential of S26L and WT hCx32 hemichannels. As it is
described in Materials and Methods (Section 5.6.6) we performed this
experiment to establish an I-V curve (Figure R5.8). This curve showed
that hemichannel reversal potentials were different, being -0.08 ± 0.6
mV (n=12) for S26L and 12.9 ± 1.5 mV (n=2) for WT hCx32. These
data were statistically different (p<0.001).
-40 mV
+80 mV
500 nA100 s
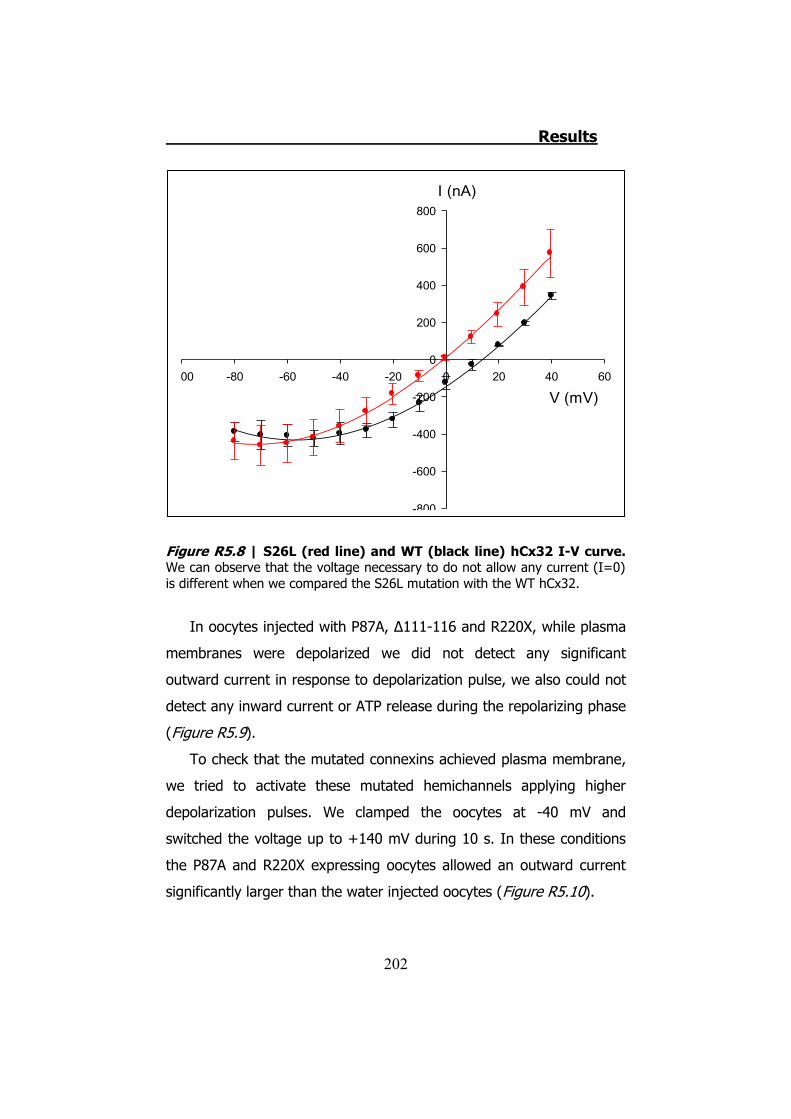
Results
202
Figure R5.8 | S26L (red line) and WT (black line) hCx32 I-V curve. We can observe that the voltage necessary to do not allow any current (I=0) is different when we compared the S26L mutation with the WT hCx32.
In oocytes injected with P87A, Δ111-116 and R220X, while plasma
membranes were depolarized we did not detect any significant
outward current in response to depolarization pulse, we also could not
detect any inward current or ATP release during the repolarizing phase
(Figure R5.9).
To check that the mutated connexins achieved plasma membrane,
we tried to activate these mutated hemichannels applying higher
depolarization pulses. We clamped the oocytes at -40 mV and
switched the voltage up to +140 mV during 10 s. In these conditions
the P87A and R220X expressing oocytes allowed an outward current
significantly larger than the water injected oocytes (Figure R5.10).
V (mV)00 -80 -60 -40 -20 0 20 40 60
-800
-600
-400
-200
0
200
400
600
800I (nA)
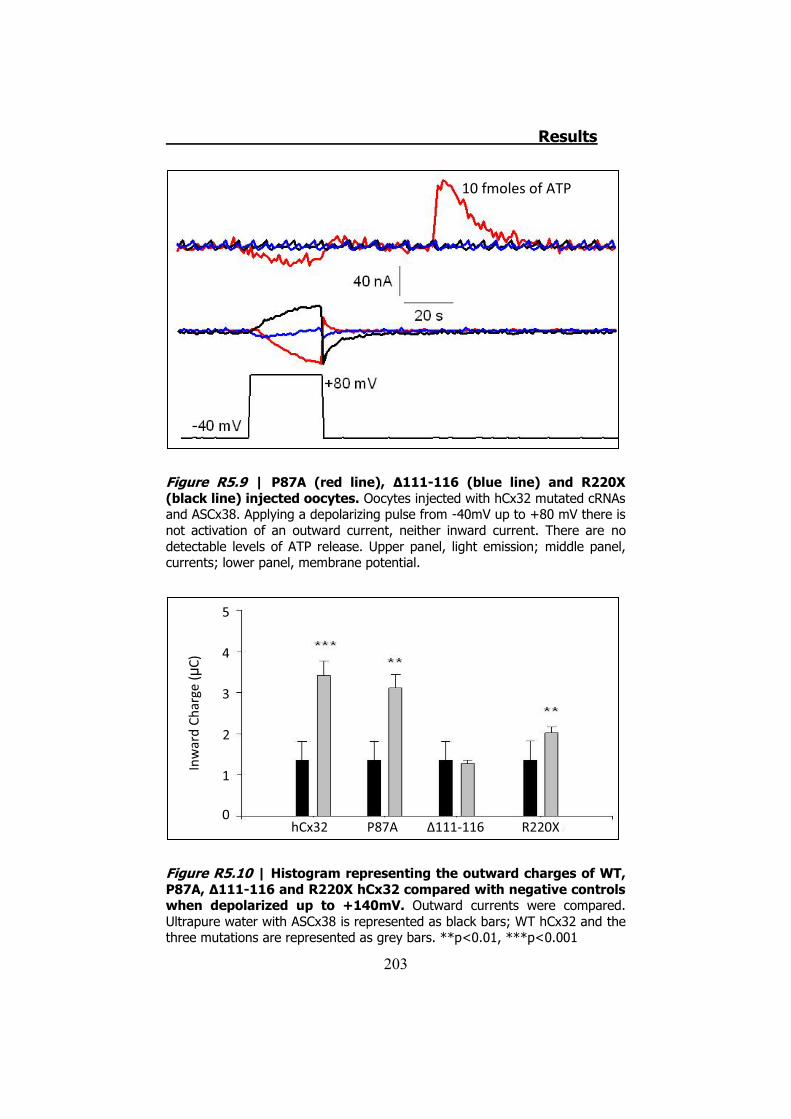
Results
203
Figure R5.9 | P87A (red line), Δ111-116 (blue line) and R220X (black line) injected oocytes. Oocytes injected with hCx32 mutated cRNAs and ASCx38. Applying a depolarizing pulse from -40mV up to +80 mV there is not activation of an outward current, neither inward current. There are no detectable levels of ATP release. Upper panel, light emission; middle panel, currents; lower panel, membrane potential.
Figure R5.10 | Histogram representing the outward charges of WT, P87A, Δ111-116 and R220X hCx32 compared with negative controls when depolarized up to +140mV. Outward currents were compared. Ultrapure water with ASCx38 is represented as black bars; WT hCx32 and the three mutations are represented as grey bars. **p<0.01, ***p<0.001
hCx32 P87A Δ111-116 R220X
5
4
3
2
1
0
Inw
ard
Char
ge (μ
C) 10 fmoles of ATP
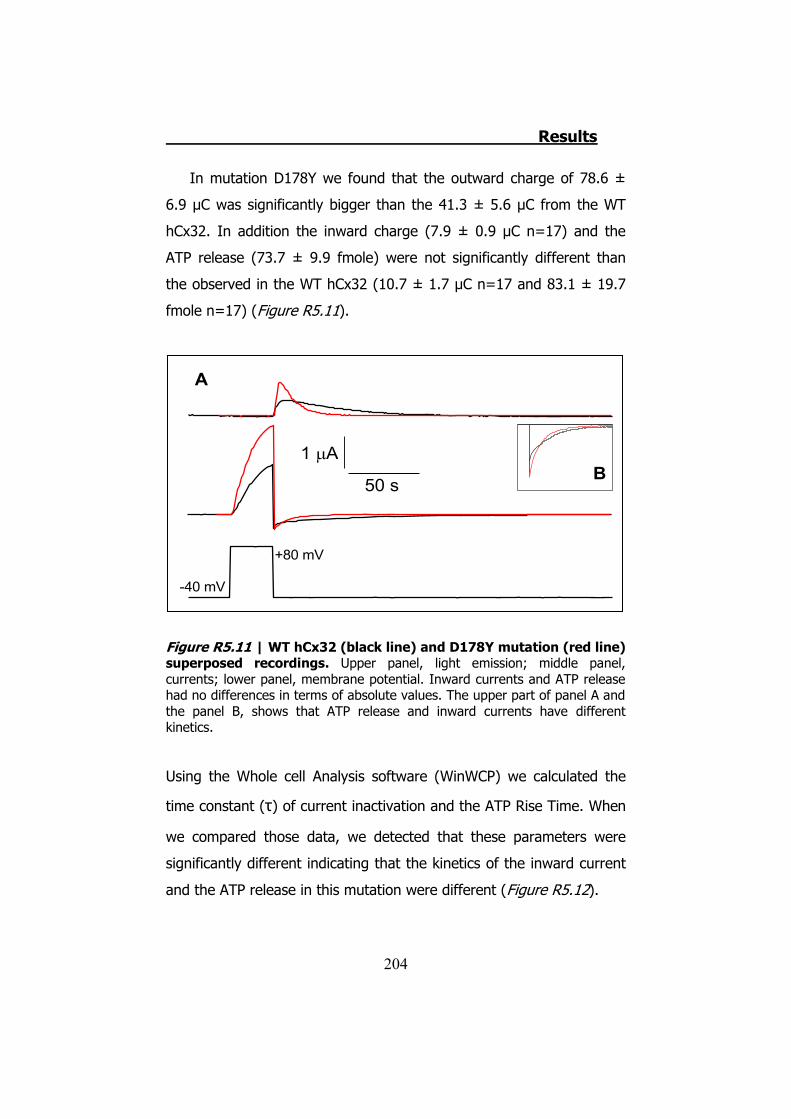
Results
204
In mutation D178Y we found that the outward charge of 78.6 ±
6.9 μC was significantly bigger than the 41.3 ± 5.6 μC from the WT
hCx32. In addition the inward charge (7.9 ± 0.9 μC n=17) and the
ATP release (73.7 ± 9.9 fmole) were not significantly different than
the observed in the WT hCx32 (10.7 ± 1.7 μC n=17 and 83.1 ± 19.7
fmole n=17) (Figure R5.11).
Figure R5.11 | WT hCx32 (black line) and D178Y mutation (red line) superposed recordings. Upper panel, light emission; middle panel, currents; lower panel, membrane potential. Inward currents and ATP release had no differences in terms of absolute values. The upper part of panel A and the panel B, shows that ATP release and inward currents have different kinetics.
Using the Whole cell Analysis software (WinWCP) we calculated the
time constant (τ) of current inactivation and the ATP Rise Time. When
we compared those data, we detected that these parameters were
significantly different indicating that the kinetics of the inward current
and the ATP release in this mutation were different (Figure R5.12).
-40 mV
+80 mV
1 �A
50 s
A
B
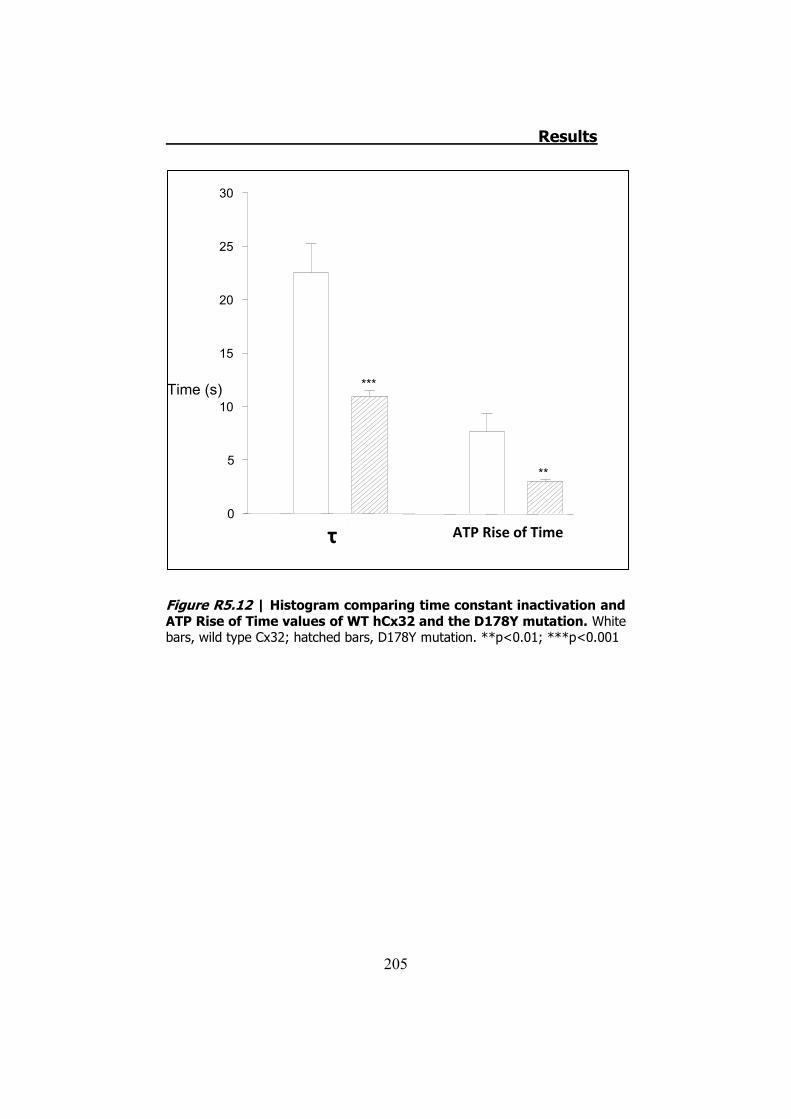
Results
205
Figure R5.12 | Histogram comparing time constant inactivation and ATP Rise of Time values of WT hCx32 and the D178Y mutation. White bars, wild type Cx32; hatched bars, D178Y mutation. **p<0.01; ***p<0.001
Tau ATP Rise Time
***
**
Time (s)
0
5
10
15
20
25
30
τ ATP Rise of Time
Results
206
6. hCx26, hCx30 and ATP release in Xenopus oocytes
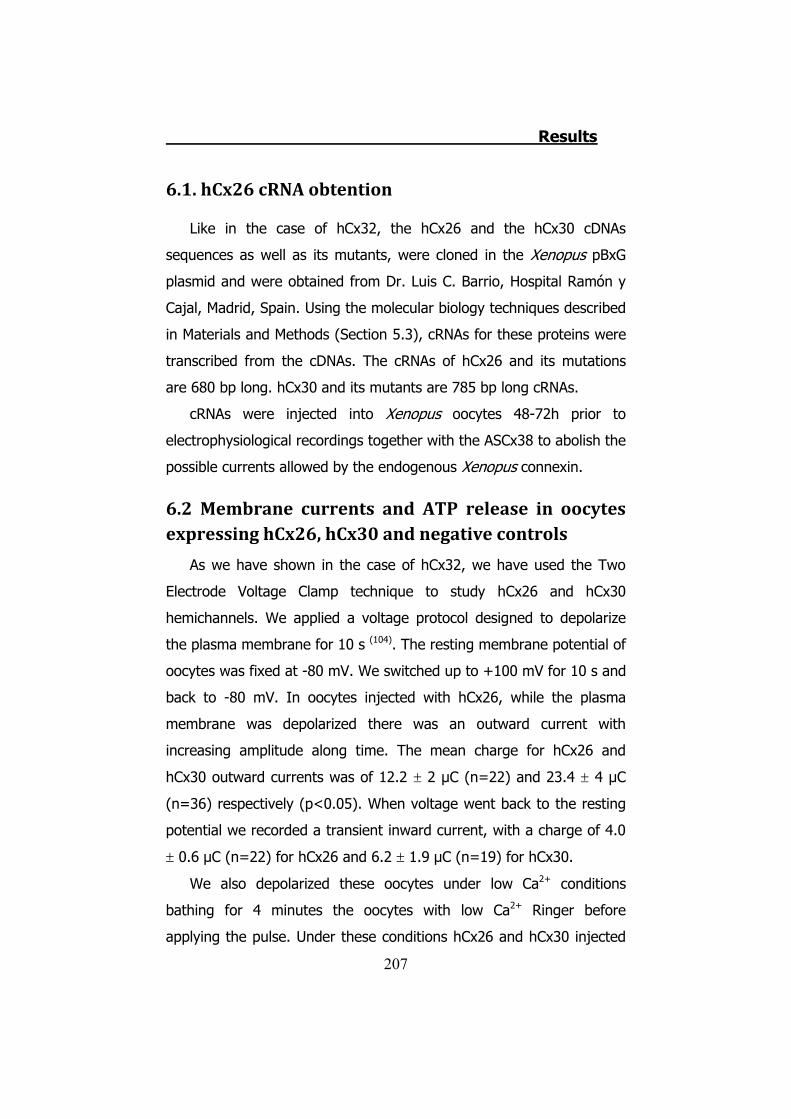
Results
207
6.1. hCx26 cRNA obtention
Like in the case of hCx32, the hCx26 and the hCx30 cDNAs
sequences as well as its mutants, were cloned in the Xenopus pBxG
plasmid and were obtained from Dr. Luis C. Barrio, Hospital Ramón y
Cajal, Madrid, Spain. Using the molecular biology techniques described
in Materials and Methods (Section 5.3), cRNAs for these proteins were
transcribed from the cDNAs. The cRNAs of hCx26 and its mutations
are 680 bp long. hCx30 and its mutants are 785 bp long cRNAs.
cRNAs were injected into Xenopus oocytes 48-72h prior to
electrophysiological recordings together with the ASCx38 to abolish the
possible currents allowed by the endogenous Xenopus connexin.
6.2 Membrane currents and ATP release in oocytes expressing hCx26, hCx30 and negative controls
As we have shown in the case of hCx32, we have used the Two
Electrode Voltage Clamp technique to study hCx26 and hCx30
hemichannels. We applied a voltage protocol designed to depolarize
the plasma membrane for 10 s (104). The resting membrane potential of
oocytes was fixed at -80 mV. We switched up to +100 mV for 10 s and
back to -80 mV. In oocytes injected with hCx26, while the plasma
membrane was depolarized there was an outward current with
increasing amplitude along time. The mean charge for hCx26 and
hCx30 outward currents was of 12.2 � 2 μC (n=22) and 23.4 � 4 μC
(n=36) respectively (p<0.05). When voltage went back to the resting
potential we recorded a transient inward current, with a charge of 4.0
� 0.6 μC (n=22) for hCx26 and 6.2 � 1.9 μC (n=19) for hCx30.
We also depolarized these oocytes under low Ca2+ conditions
bathing for 4 minutes the oocytes with low Ca2+ Ringer before
applying the pulse. Under these conditions hCx26 and hCx30 injected

Results
208
oocytes allowed outward currents of 12.7 � 1.9 (n=21) μC and 25.7 �
9.6 μC (n=10) respectively, whereas inward currents were 6.6 � 0.9
μC (n=19) and 16.5 � 9.2 μC (n=4).
Notice that under any conditions no significant increase of light
(produced by release of ATP) was recorded in hCx26 injected oocytes
(Figure R6.1, Figure R6.2 and Supplementary video S6).
Figure R6.1 | hCx26 expression and ATP measurements under normal Ca2+ conditions. Oocytes injected with hCx26 cRNA. While applying a depolarizing pulse from -40 mV up to +100 mV activation outward currents are allowed followed by inward currents. No release of ATP was detected during any kind of allowed current. An addition of 23 fmole of ATP is shown and reveals the efficiency of the luminescent reaction.
Figure R6.2 | hCx26 expression and ATP measurements under low Ca2+ conditions. Oocytes injected with hCx26 cRNA. While applying a depolarizing pulse from -40 mV up to +100 mV activation outward currents are allowed followed by inward currents. No release of ATP was detected during any kind of current allowed. An addition of 23 fmole of ATP is shown and reveals the efficiency of the luminescent reaction.
23 fmoles of ATP
1 μA 10 s
23 fmoles of ATP
1 μA 10 s
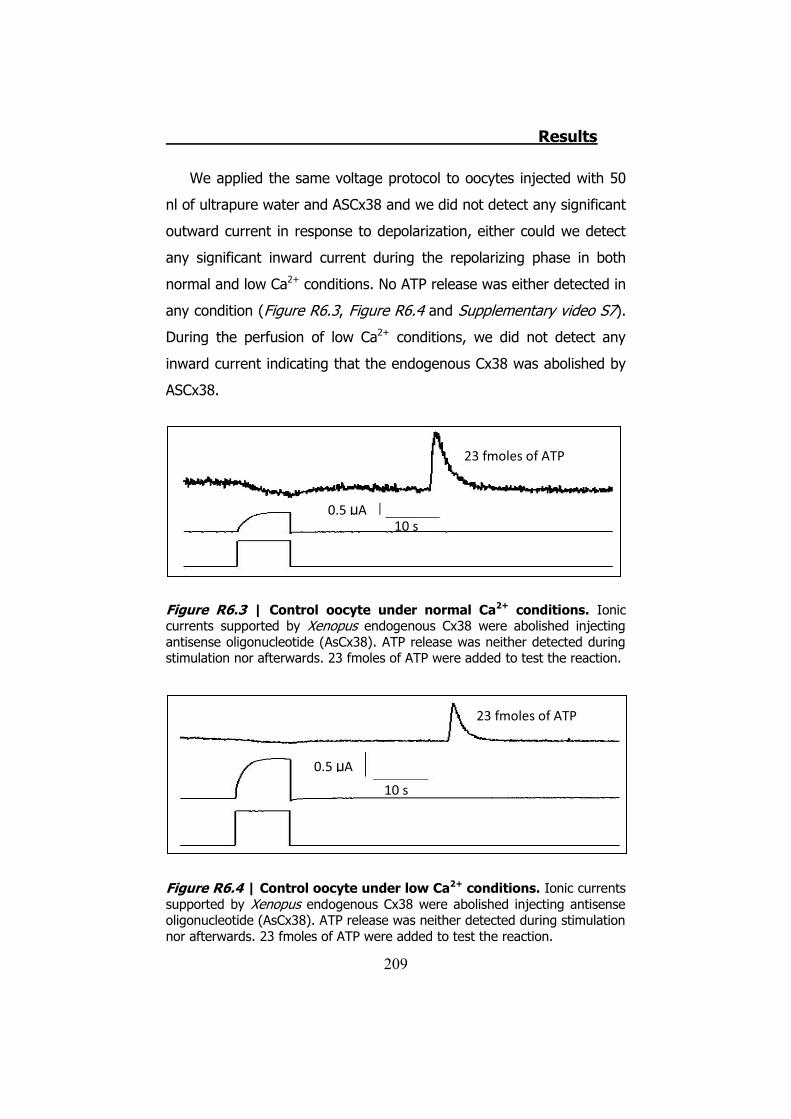
Results
209
We applied the same voltage protocol to oocytes injected with 50
nl of ultrapure water and ASCx38 and we did not detect any significant
outward current in response to depolarization, either could we detect
any significant inward current during the repolarizing phase in both
normal and low Ca2+ conditions. No ATP release was either detected in
any condition (Figure R6.3, Figure R6.4 and Supplementary video S7).
During the perfusion of low Ca2+ conditions, we did not detect any
inward current indicating that the endogenous Cx38 was abolished by
ASCx38.
Figure R6.3 | Control oocyte under normal Ca2+ conditions. Ionic currents supported by Xenopus endogenous Cx38 were abolished injecting antisense oligonucleotide (AsCx38). ATP release was neither detected during stimulation nor afterwards. 23 fmoles of ATP were added to test the reaction.
Figure R6.4 | Control oocyte under low Ca2+ conditions. Ionic currents supported by Xenopus endogenous Cx38 were abolished injecting antisense oligonucleotide (AsCx38). ATP release was neither detected during stimulation nor afterwards. 23 fmoles of ATP were added to test the reaction.
23 fmoles of ATP
0.5 μA 10 s
23 fmoles of ATP
0.5 μA
10 s
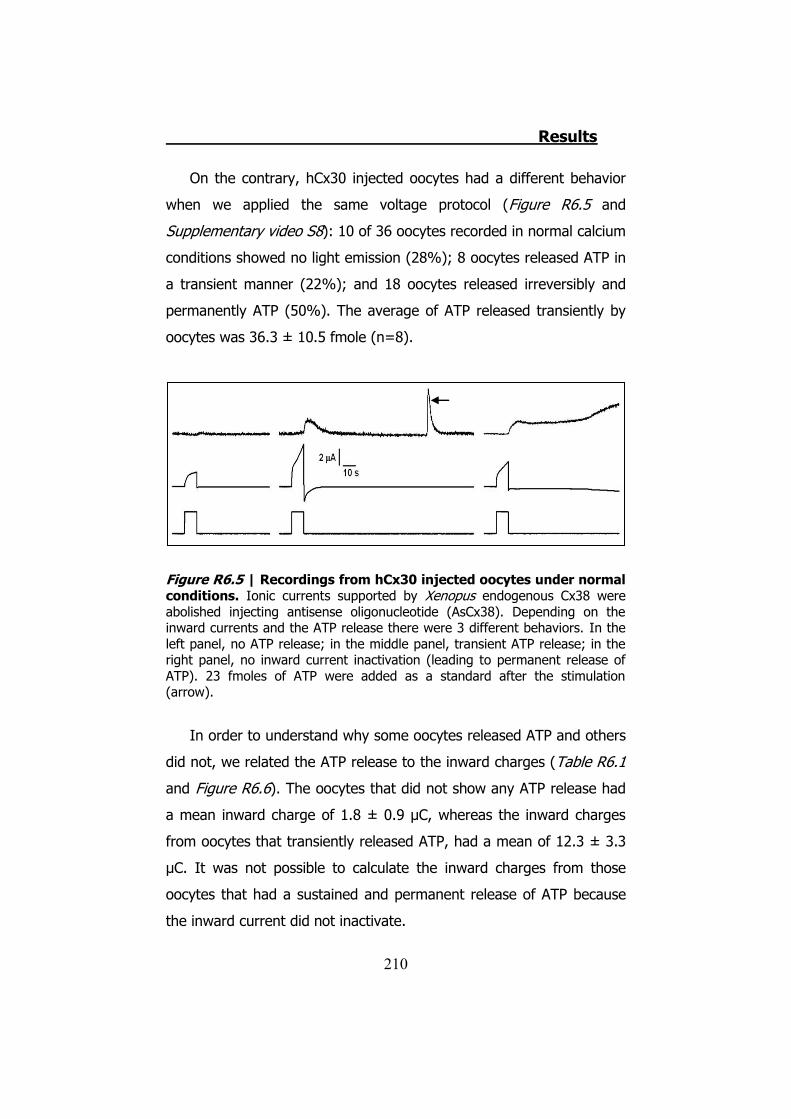
Results
210
On the contrary, hCx30 injected oocytes had a different behavior
when we applied the same voltage protocol (Figure R6.5 and
Supplementary video S8): 10 of 36 oocytes recorded in normal calcium
conditions showed no light emission (28%); 8 oocytes released ATP in
a transient manner (22%); and 18 oocytes released irreversibly and
permanently ATP (50%). The average of ATP released transiently by
oocytes was 36.3 ± 10.5 fmole (n=8).
Figure R6.5 | Recordings from hCx30 injected oocytes under normal conditions. Ionic currents supported by Xenopus endogenous Cx38 were abolished injecting antisense oligonucleotide (AsCx38). Depending on the inward currents and the ATP release there were 3 different behaviors. In the left panel, no ATP release; in the middle panel, transient ATP release; in the right panel, no inward current inactivation (leading to permanent release of ATP). 23 fmoles of ATP were added as a standard after the stimulation (arrow).
In order to understand why some oocytes released ATP and others
did not, we related the ATP release to the inward charges (Table R6.1
and Figure R6.6). The oocytes that did not show any ATP release had
a mean inward charge of 1.8 ± 0.9 μC, whereas the inward charges
from oocytes that transiently released ATP, had a mean of 12.3 ± 3.3
μC. It was not possible to calculate the inward charges from those
oocytes that had a sustained and permanent release of ATP because
the inward current did not inactivate.
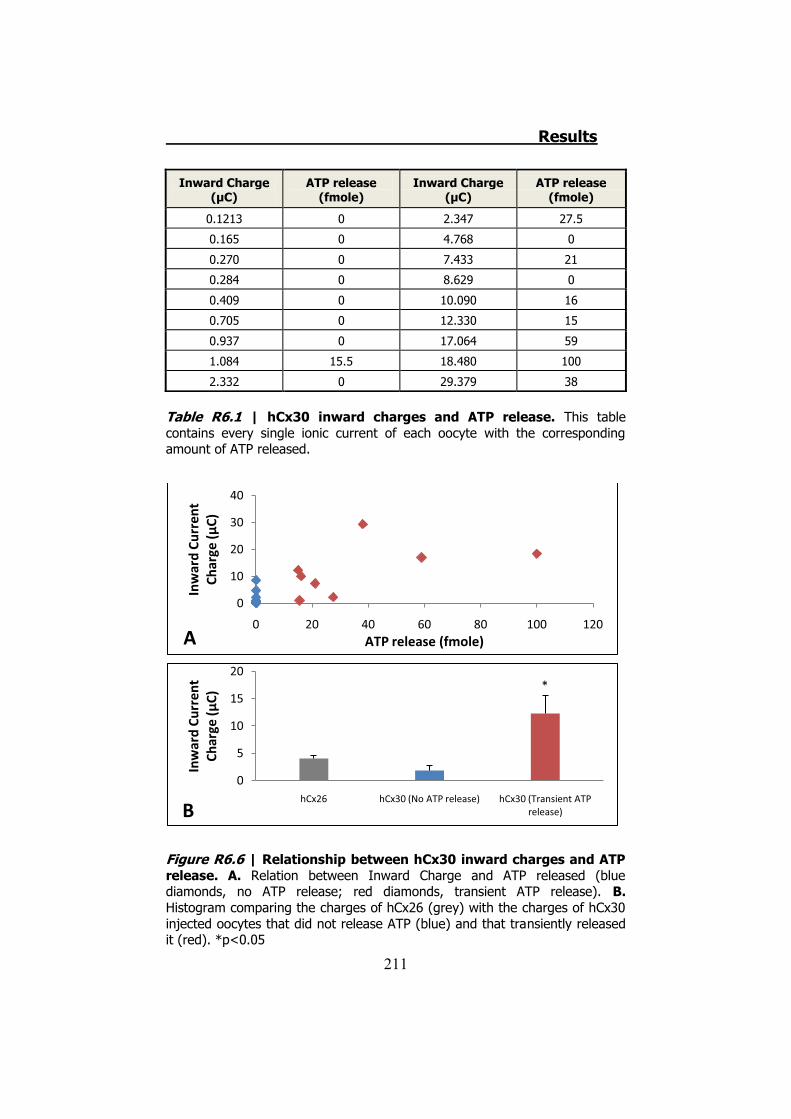
Results
211
Table R6.1 | hCx30 inward charges and ATP release. This table contains every single ionic current of each oocyte with the corresponding amount of ATP released.
Figure R6.6 | Relationship between hCx30 inward charges and ATP release. A. Relation between Inward Charge and ATP released (blue diamonds, no ATP release; red diamonds, transient ATP release). B. Histogram comparing the charges of hCx26 (grey) with the charges of hCx30 injected oocytes that did not release ATP (blue) and that transiently released it (red). *p<0.05
0
10
20
30
40
0 20 40 60 80 100 120
Inw
ard
Curr
ent
Char
ge (μ
C)
ATP release (fmole)A
0
5
10
15
20
hCx26 hCx30 (No ATP release) hCx30 (Transient ATP release)
Inw
ard
Curr
ent
Char
ge (μ
C)
B
*
Inward Charge (μC)
ATP release (fmole)
Inward Charge (μC)
ATP release (fmole)
0.1213 0 2.347 27.5
0.165 0 4.768 0
0.270 0 7.433 21
0.284 0 8.629 0
0.409 0 10.090 16
0.705 0 12.330 15
0.937 0 17.064 59
1.084 15.5 18.480 100
2.332 0 29.379 38
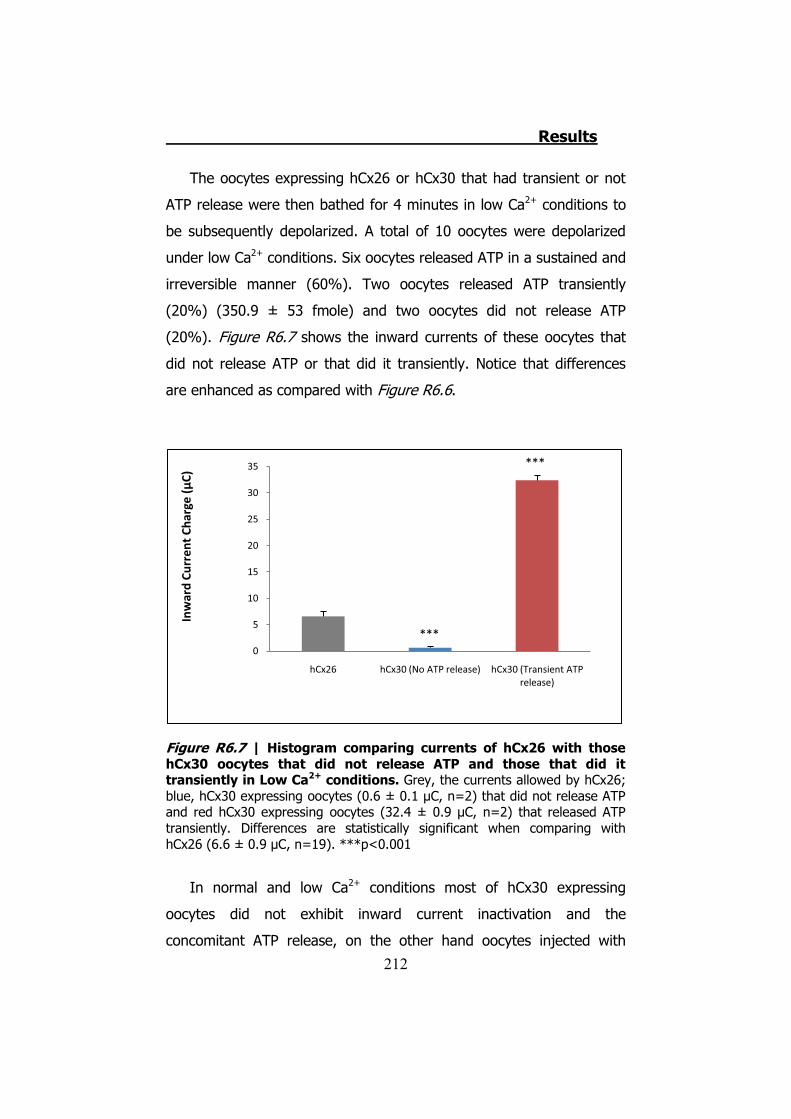
Results
212
The oocytes expressing hCx26 or hCx30 that had transient or not
ATP release were then bathed for 4 minutes in low Ca2+ conditions to
be subsequently depolarized. A total of 10 oocytes were depolarized
under low Ca2+ conditions. Six oocytes released ATP in a sustained and
irreversible manner (60%). Two oocytes released ATP transiently
(20%) (350.9 ± 53 fmole) and two oocytes did not release ATP
(20%). Figure R6.7 shows the inward currents of these oocytes that
did not release ATP or that did it transiently. Notice that differences
are enhanced as compared with Figure R6.6.
Figure R6.7 | Histogram comparing currents of hCx26 with those hCx30 oocytes that did not release ATP and those that did it transiently in Low Ca2+ conditions. Grey, the currents allowed by hCx26; blue, hCx30 expressing oocytes (0.6 ± 0.1 μC, n=2) that did not release ATP and red hCx30 expressing oocytes (32.4 ± 0.9 μC, n=2) that released ATP transiently. Differences are statistically significant when comparing with hCx26 (6.6 ± 0.9 μC, n=19). ***p<0.001
In normal and low Ca2+ conditions most of hCx30 expressing
oocytes did not exhibit inward current inactivation and the
concomitant ATP release, on the other hand oocytes injected with
0
5
10
15
20
25
30
35
hCx26 hCx30 (No ATP release) hCx30 (Transient ATP release)
Inw
ard
Curr
ent C
harg
e (μ
C)
***
***

Results
213
hCx26 never released ATP. It is well known that both connexins are
highly expressed in the inner ear, and they co-localize (228) (229). All
these facts let us to hypothesize that hCx26 may change the
permeability of hCx30 in heteromeric hemichannels. To try to prove
this hypothesis we co-injected hCx26 and hCx30 cRNAs. Results from
these experiments are shown below (Section 6.4), but before doing
that, we investigated the activity of different mutations of Cx26 and
Cx30.
6.3 Membrane currents and ATP release in oocytes expressing hCx26 or hCx30 mutations
Five different hCx26 mutations (G12R, S17F, D50N, D50Y and
N54S) and one from hCx30 (T5M) were studied using the TEVC
technique and analyzed as well as in chapter 6.2.
cRNA injected to
oocytes
Outward Charge (μC)
Inward Charge (μC) (No ATP
release
Inward Charge (μC) (Transient ATP release, fmole)
hCx26 12.2 ± 2 (n=22) 4.0 ± 0.6 (n=22) ---
G12R 26.4 ± 3.2 (n=14) 6.8 ± 1.8 (n=12) 3.6 ± 0 (n=1)
30,2 ± 14,3 (n=2)
S17F 15.1 ± 3 (n=13 1.4 ± 0.2 (n=7) 7.7 ± 2.9
134,1 ± 107,5 (n=5)
D50N 24.4 ± 4.5 (n=9) 1.4 ± 0.3 (n=7) 4.2 ± 0.6
21,2 ± 3,8 (n=2)
D50Y 38.2 ± 9.3 (n=13) 4.3 ± 1.6 (n=4) 10.2 ± 2
101,4 ± 37,1 (n=9)
N54S 25.4 ± 1.9 (n=8) 8.8 ± 1.7 (n=8) ---
Table R6.2 | Data obtained from oocytes injected with hCx26 and the indicated mutations under normal Ca2+ conditions. These data are presented as histograms in Figure R6.8. Notice that the total number of oocytes corresponds to the number of outward charges.
Mutations in hCx26 have been described to be the major cause of
sensorineural, non-syndromic, prelingual deafness (4) (217). Dr. Barrio
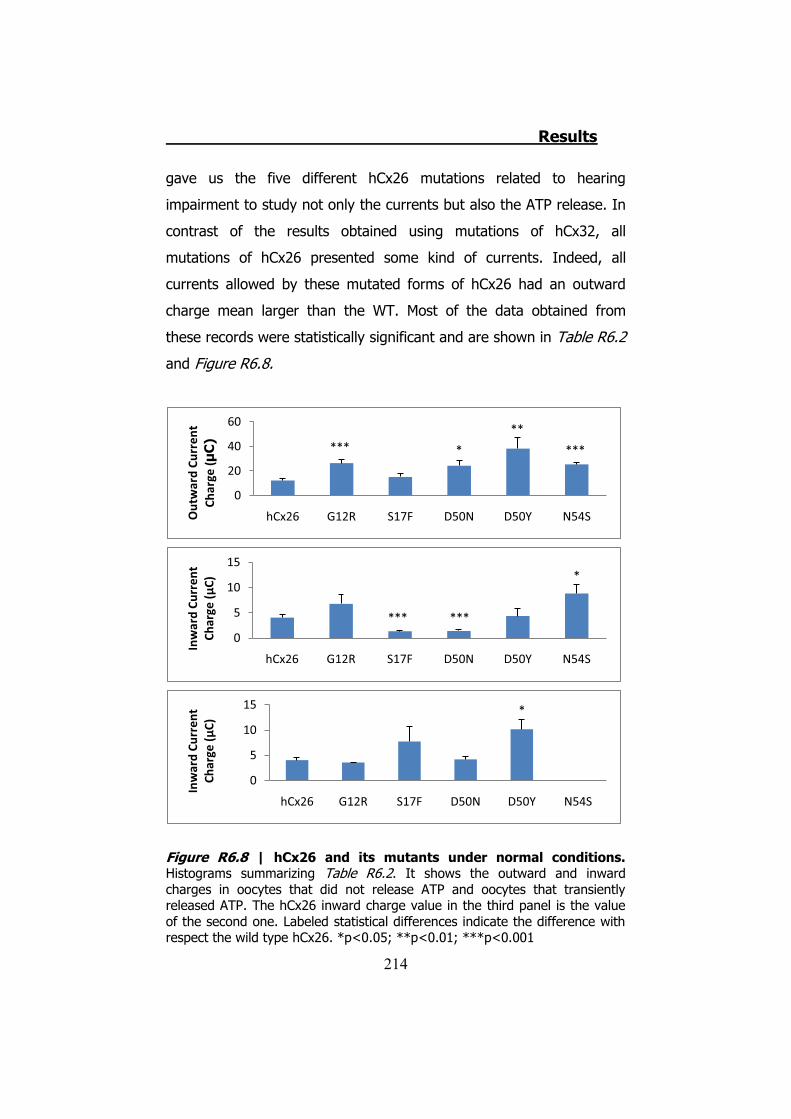
Results
214
gave us the five different hCx26 mutations related to hearing
impairment to study not only the currents but also the ATP release. In
contrast of the results obtained using mutations of hCx32, all
mutations of hCx26 presented some kind of currents. Indeed, all
currents allowed by these mutated forms of hCx26 had an outward
charge mean larger than the WT. Most of the data obtained from
these records were statistically significant and are shown in Table R6.2
and Figure R6.8.
Figure R6.8 | hCx26 and its mutants under normal conditions. Histograms summarizing Table R6.2. It shows the outward and inward charges in oocytes that did not release ATP and oocytes that transiently released ATP. The hCx26 inward charge value in the third panel is the value of the second one. Labeled statistical differences indicate the difference with respect the wild type hCx26. *p<0.05; **p<0.01; ***p<0.001
0
20
40
60
hCx26 G12R S17F D50N D50Y N54SOut
war
d Cu
rren
t Ch
arge
(μC
) *** *
**
***
0
5
10
15
hCx26 G12R S17F D50N D50Y N54S
Inw
ard
Curr
ent
Char
ge (μ
C)
*** ***
*
0
5
10
15
hCx26 G12R S17F D50N D50Y N54S
Inw
ard
Curr
ent
Char
ge (μ
C)
*
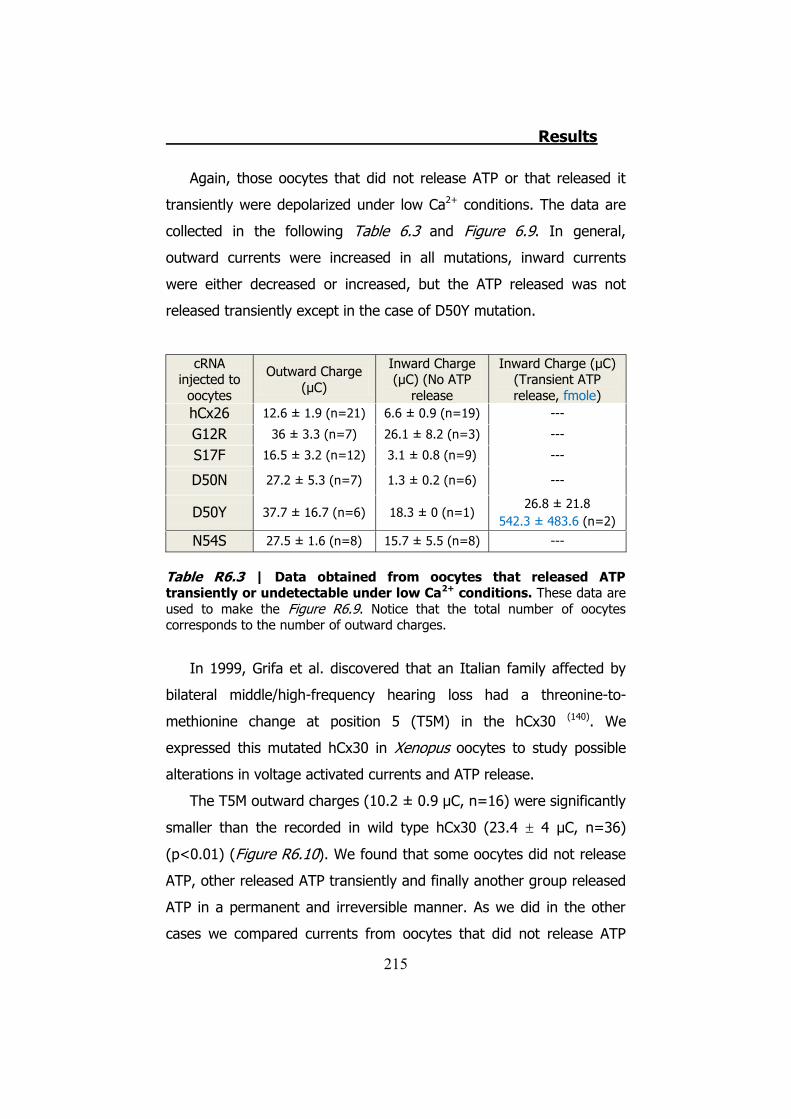
Results
215
Again, those oocytes that did not release ATP or that released it
transiently were depolarized under low Ca2+ conditions. The data are
collected in the following Table 6.3 and Figure 6.9. In general,
outward currents were increased in all mutations, inward currents
were either decreased or increased, but the ATP released was not
released transiently except in the case of D50Y mutation.
cRNA injected to
oocytes
Outward Charge (μC)
Inward Charge (μC) (No ATP
release
Inward Charge (μC) (Transient ATP release, fmole)
hCx26 12.6 ± 1.9 (n=21) 6.6 ± 0.9 (n=19) ---
G12R 36 ± 3.3 (n=7) 26.1 ± 8.2 (n=3) ---
S17F 16.5 ± 3.2 (n=12) 3.1 ± 0.8 (n=9) ---
D50N 27.2 ± 5.3 (n=7) 1.3 ± 0.2 (n=6) ---
D50Y 37.7 ± 16.7 (n=6) 18.3 ± 0 (n=1) 26.8 ± 21.8
542.3 ± 483.6 (n=2)
N54S 27.5 ± 1.6 (n=8) 15.7 ± 5.5 (n=8) ---
Table R6.3 | Data obtained from oocytes that released ATP transiently or undetectable under low Ca2+ conditions. These data are used to make the Figure R6.9. Notice that the total number of oocytes corresponds to the number of outward charges.
In 1999, Grifa et al. discovered that an Italian family affected by
bilateral middle/high-frequency hearing loss had a threonine-to-
methionine change at position 5 (T5M) in the hCx30 (140). We
expressed this mutated hCx30 in Xenopus oocytes to study possible
alterations in voltage activated currents and ATP release.
The T5M outward charges (10.2 ± 0.9 μC, n=16) were significantly
smaller than the recorded in wild type hCx30 (23.4 � 4 μC, n=36)
(p<0.01) (Figure R6.10). We found that some oocytes did not release
ATP, other released ATP transiently and finally another group released
ATP in a permanent and irreversible manner. As we did in the other
cases we compared currents from oocytes that did not release ATP
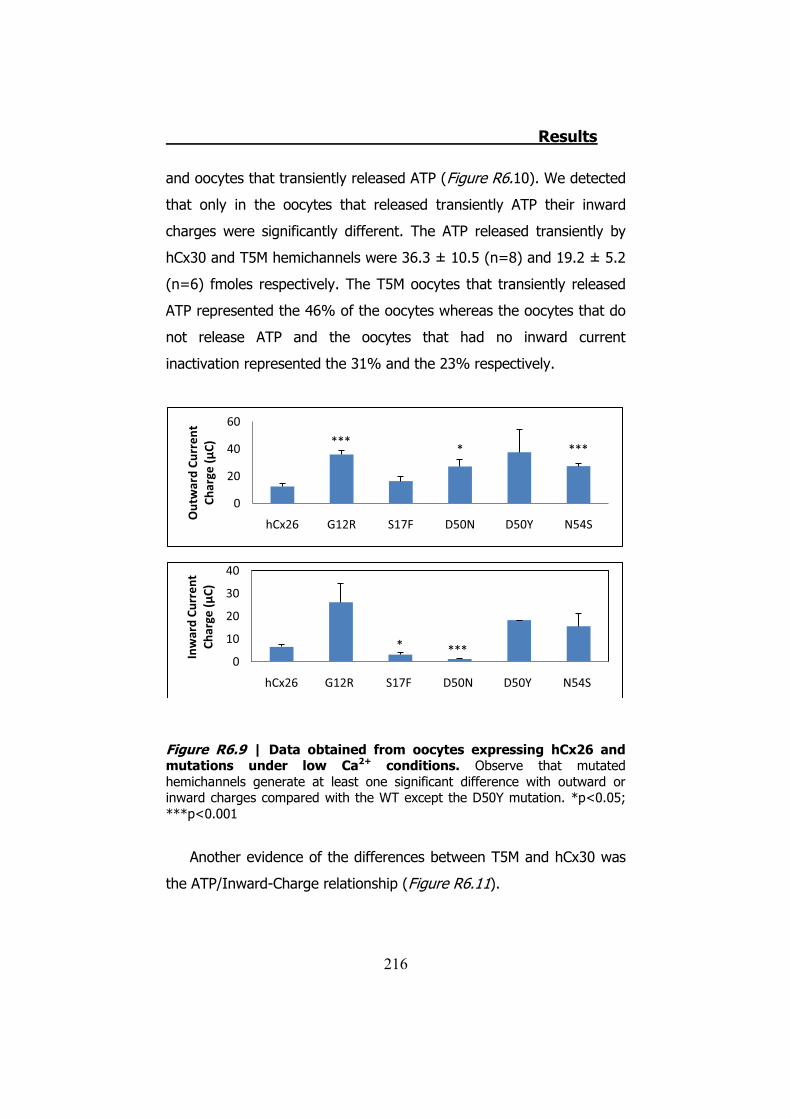
Results
216
and oocytes that transiently released ATP (Figure R6.10). We detected
that only in the oocytes that released transiently ATP their inward
charges were significantly different. The ATP released transiently by
hCx30 and T5M hemichannels were 36.3 ± 10.5 (n=8) and 19.2 ± 5.2
(n=6) fmoles respectively. The T5M oocytes that transiently released
ATP represented the 46% of the oocytes whereas the oocytes that do
not release ATP and the oocytes that had no inward current
inactivation represented the 31% and the 23% respectively.
Figure R6.9 | Data obtained from oocytes expressing hCx26 and mutations under low Ca2+ conditions. Observe that mutated hemichannels generate at least one significant difference with outward or inward charges compared with the WT except the D50Y mutation. *p<0.05; ***p<0.001
Another evidence of the differences between T5M and hCx30 was
the ATP/Inward-Charge relationship (Figure R6.11).
0
20
40
60
hCx26 G12R S17F D50N D50Y N54S
Out
war
d Cu
rren
t Ch
arge
(μC) ***
* ***
0
10
20
30
40
hCx26 G12R S17F D50N D50Y N54S
Inw
ard
Curr
ent
Char
ge (μ
C)
* ***
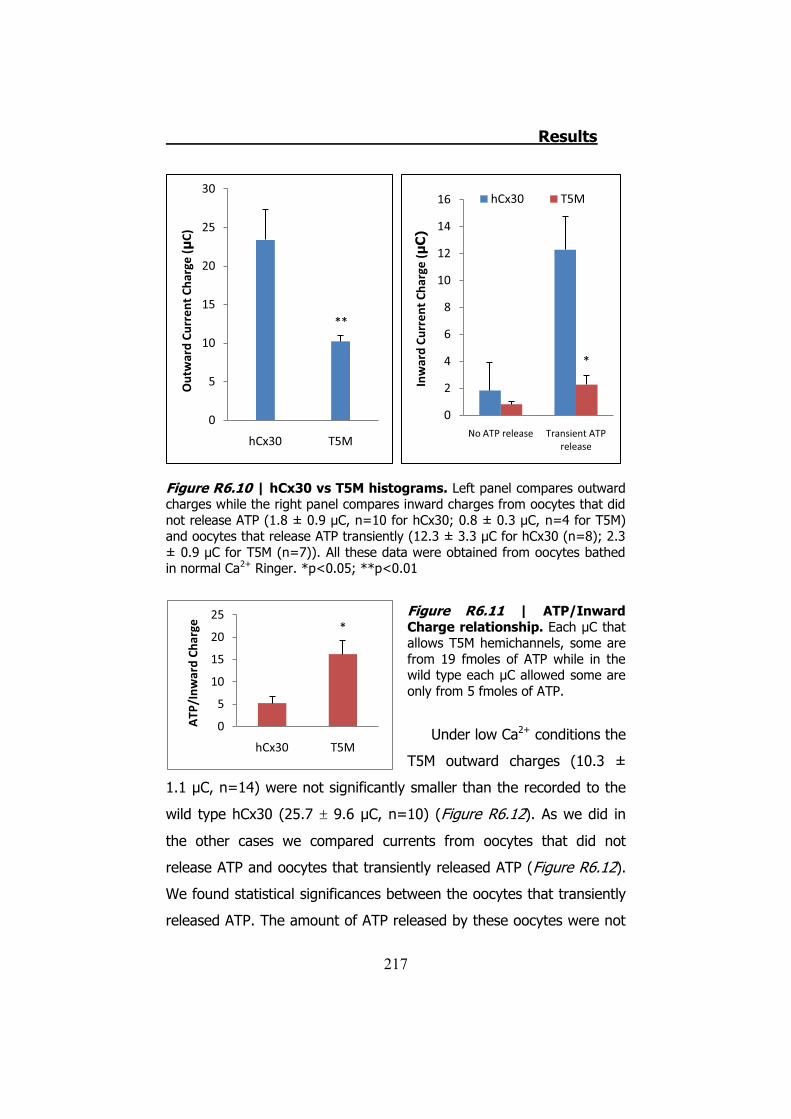
Results
217
0
5
10
15
20
25
hCx30 T5M
ATP
/Inw
ard
Char
ge *
Figure R6.10 | hCx30 vs T5M histograms. Left panel compares outward charges while the right panel compares inward charges from oocytes that did not release ATP (1.8 ± 0.9 μC, n=10 for hCx30; 0.8 ± 0.3 μC, n=4 for T5M) and oocytes that release ATP transiently (12.3 ± 3.3 μC for hCx30 (n=8); 2.3 ± 0.9 μC for T5M (n=7)). All these data were obtained from oocytes bathed in normal Ca2+ Ringer. *p<0.05; **p<0.01
Figure R6.11 | ATP/Inward Charge relationship. Each μC that allows T5M hemichannels, some are from 19 fmoles of ATP while in the wild type each μC allowed some are only from 5 fmoles of ATP.
Under low Ca2+ conditions the
T5M outward charges (10.3 ±
1.1 μC, n=14) were not significantly smaller than the recorded to the
wild type hCx30 (25.7 � 9.6 μC, n=10) (Figure R6.12). As we did in
the other cases we compared currents from oocytes that did not
release ATP and oocytes that transiently released ATP (Figure R6.12).
We found statistical significances between the oocytes that transiently
released ATP. The amount of ATP released by these oocytes were not
0
5
10
15
20
25
30
hCx30 T5M
Out
war
d Cu
rren
t Cha
rge
(μC)
**
0
2
4
6
8
10
12
14
16
No ATP release Transient ATP release
Inw
ard
Curr
ent C
harg
e (μ
C)
hCx30 T5M
*
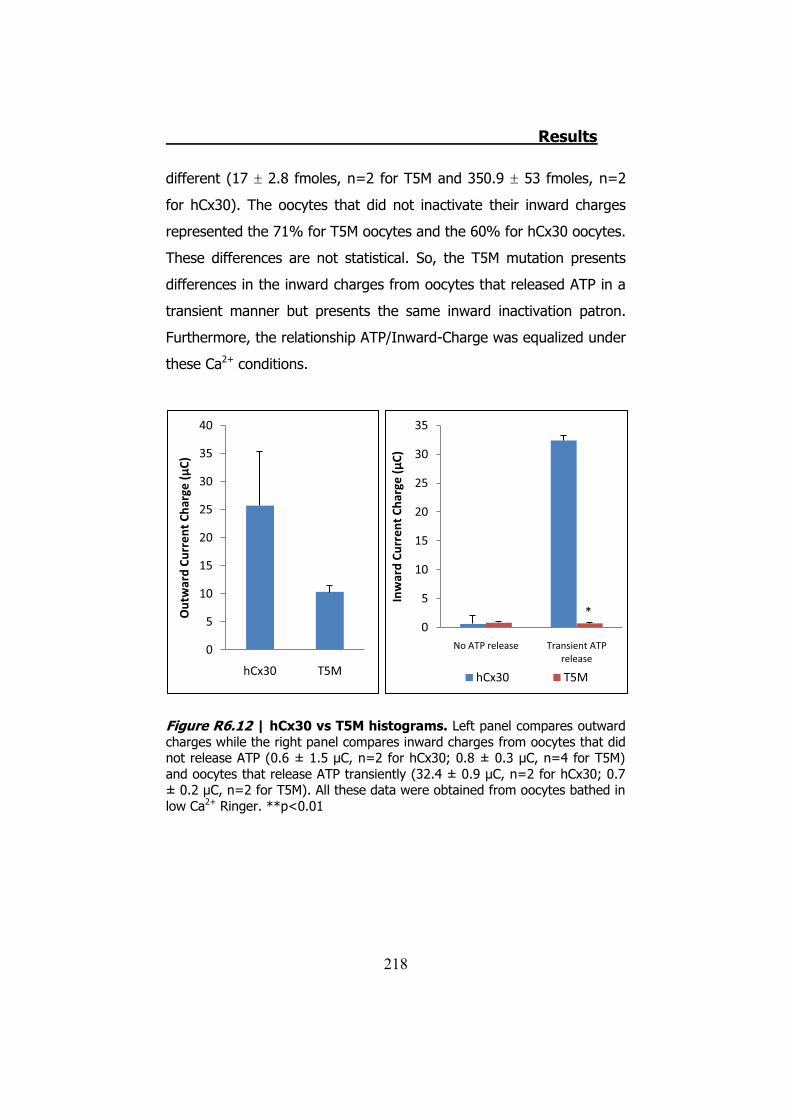
Results
218
different (17 � 2.8 fmoles, n=2 for T5M and 350.9 � 53 fmoles, n=2
for hCx30). The oocytes that did not inactivate their inward charges
represented the 71% for T5M oocytes and the 60% for hCx30 oocytes.
These differences are not statistical. So, the T5M mutation presents
differences in the inward charges from oocytes that released ATP in a
transient manner but presents the same inward inactivation patron.
Furthermore, the relationship ATP/Inward-Charge was equalized under
these Ca2+ conditions.
Figure R6.12 | hCx30 vs T5M histograms. Left panel compares outward charges while the right panel compares inward charges from oocytes that did not release ATP (0.6 ± 1.5 μC, n=2 for hCx30; 0.8 ± 0.3 μC, n=4 for T5M) and oocytes that release ATP transiently (32.4 ± 0.9 μC, n=2 for hCx30; 0.7 ± 0.2 μC, n=2 for T5M). All these data were obtained from oocytes bathed in low Ca2+ Ringer. **p<0.01
0
5
10
15
20
25
30
35
40
hCx30 T5M
Out
war
d Cu
rren
t Cha
rge
(μC)
0
5
10
15
20
25
30
35
No ATP release Transient ATP release
Inw
ard
Curr
ent C
harg
e (μ
C)
hCx30 T5M
*
Results
219
6.4 Membrane currents and ATP release in oocytes co- injected with different cRNAs of hCx26 and its mutations and cRNA of hCx30
We realized that a significant part of hCx30 injected oocytes
exhibited non inactivating inward currents. Because Cx26 and Cx30 co-
express and form heteromeric connexons in the cochlea (228) (229) we
decided to co-inject hCx26 and hCx30 cRNAs to check if the presence
of hCx26 would alter hCx30 inactivation. The different combinations of
injected cRNAs are detailed in Materials and Methods (Section 5.4.1).
Only 7 of the 37 hCx26/hCx30 co-injected oocytes did not
inactivate the large inward current and had a permanent release of
ATP, after the application of the depolarization pulse when immersed
in normal Ca2+ conditions, representing the 19% of cases. The 22%
presented a transient ATP release and the rest, a 59%, did not release
ATP at all. In contrast, 50% of the oocytes expressing hCx30
homomeric hemichannels had a sustained and not inactivating inward
current, the 22% of the oocytes transiently released ATP and the 28%
did not release ATP. When we compared these rates, we observed
that the number of oocytes that did not release ATP and the number
of oocytes that did not inactivate the inward currents were statistically
different (p=0.013 and p=0.011 respectively). Table R6.4 collects the
percentages of oocytes with different combinations of hCx30 and
hCx26 mutations. No more statistical differences were found between
hCx30 and the different combinations, neither between hCx26/hCx30
and the combinations. Interestingly, all connexin combinations
increased the rate of non-viable oocytes, showing patches and dots
(Supplementary Images); the mortality rate is also shown in Table
R6.4.
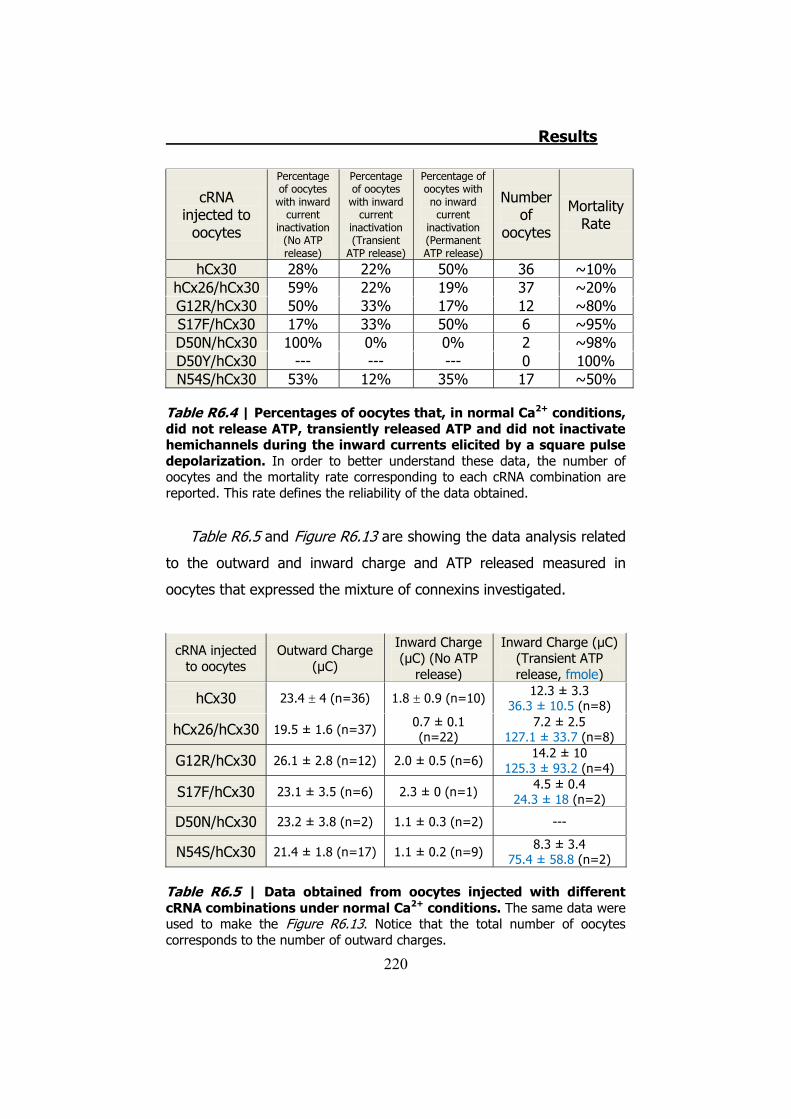
Results
220
cRNA injected to
oocytes
Percentage of oocytes
with inward current
inactivation (No ATP release)
Percentage of oocytes
with inward current
inactivation (Transient
ATP release)
Percentage of oocytes with no inward current
inactivation (Permanent ATP release)
Number of
oocytes
Mortality Rate
hCx30 28% 22% 50% 36 ~10% hCx26/hCx30 59% 22% 19% 37 ~20% G12R/hCx30 50% 33% 17% 12 ~80% S17F/hCx30 17% 33% 50% 6 ~95% D50N/hCx30 100% 0% 0% 2 ~98% D50Y/hCx30 --- --- --- 0 100% N54S/hCx30 53% 12% 35% 17 ~50%
Table R6.4 | Percentages of oocytes that, in normal Ca2+ conditions, did not release ATP, transiently released ATP and did not inactivate hemichannels during the inward currents elicited by a square pulse depolarization. In order to better understand these data, the number of oocytes and the mortality rate corresponding to each cRNA combination are reported. This rate defines the reliability of the data obtained.
Table R6.5 and Figure R6.13 are showing the data analysis related
to the outward and inward charge and ATP released measured in
oocytes that expressed the mixture of connexins investigated.
cRNA injected to oocytes
Outward Charge (μC)
Inward Charge (μC) (No ATP
release)
Inward Charge (μC) (Transient ATP release, fmole)
hCx30 23.4 � 4 (n=36) 1.8 � 0.9 (n=10) 12.3 ± 3.3 36.3 ± 10.5 (n=8)
hCx26/hCx30 19.5 ± 1.6 (n=37) 0.7 ± 0.1 (n=22)
7.2 ± 2.5 127.1 ± 33.7 (n=8)
G12R/hCx30 26.1 ± 2.8 (n=12) 2.0 ± 0.5 (n=6) 14.2 ± 10 125.3 ± 93.2 (n=4)
S17F/hCx30 23.1 ± 3.5 (n=6) 2.3 ± 0 (n=1) 4.5 ± 0.4 24.3 ± 18 (n=2)
D50N/hCx30 23.2 ± 3.8 (n=2) 1.1 ± 0.3 (n=2) ---
N54S/hCx30 21.4 ± 1.8 (n=17) 1.1 ± 0.2 (n=9) 8.3 ± 3.4 75.4 ± 58.8 (n=2)
Table R6.5 | Data obtained from oocytes injected with different cRNA combinations under normal Ca2+ conditions. The same data were used to make the Figure R6.13. Notice that the total number of oocytes corresponds to the number of outward charges.

Results
221
Figure R6.13 | Histogram representation of hCx30, hCx26/hCx30 and the different combination with mutants forms under normal Ca2+ conditions. We observe only differences in the inward charge of the G12R/hCx30 oocytes that did not release ATP compared with the double wild type hCx26/hCx30. *p<0.05
We also tested the effect of low Ca2+ conditions on the oocytes
that did not release or transiently permeated for ATP. Table R6.6
summarizes the results. The Supplementary video S9 is an example of
an oocyte injected with hCx26 and hCx30 that released transiently ATP
under normal Ca2+ conditions and did not inactivate inward currents
under low Ca2+ conditions.
010203040
Out
war
d Cu
rren
t Ch
arge
(μC)
0
1
2
3
Inw
ard
Curr
ent
Char
ge (μ
C)
No ATP release
0102030
Inw
ard
Curr
ent
Char
ge (μ
C)
Transient ATP release
*
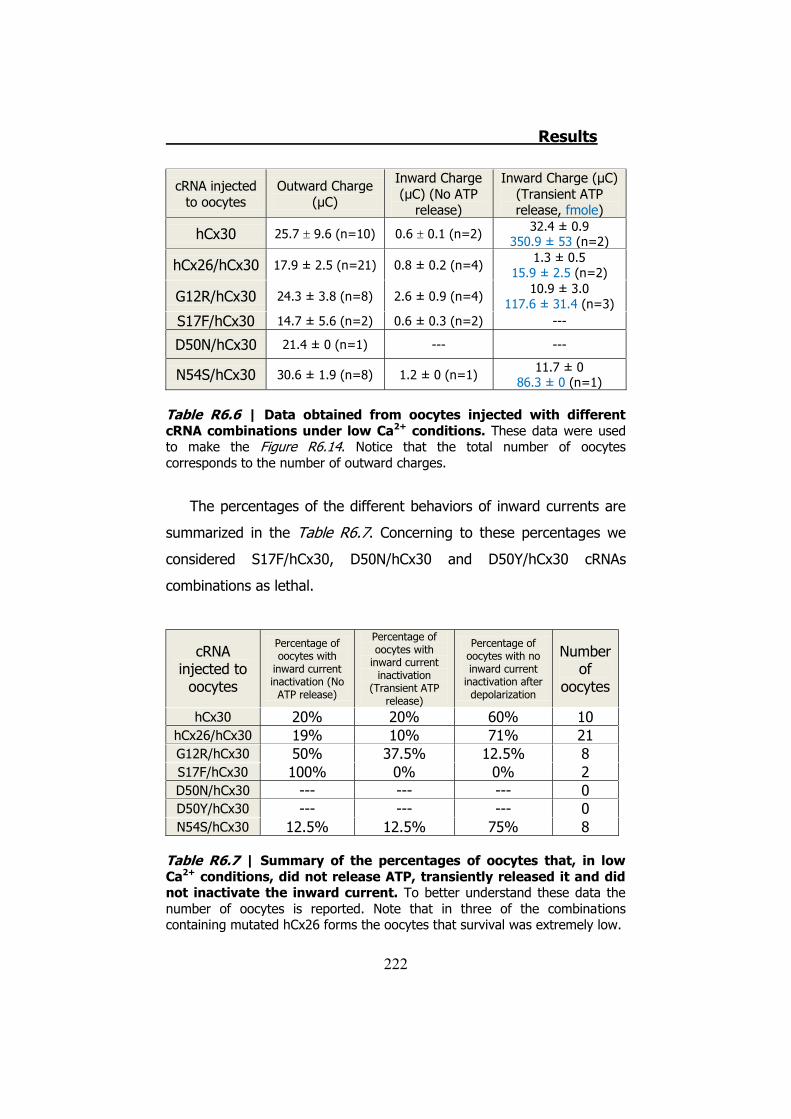
Results
222
cRNA injected to oocytes
Outward Charge (μC)
Inward Charge (μC) (No ATP
release)
Inward Charge (μC) (Transient ATP release, fmole)
hCx30 25.7 � 9.6 (n=10) 0.6 � 0.1 (n=2) 32.4 ± 0.9 350.9 ± 53 (n=2)
hCx26/hCx30 17.9 ± 2.5 (n=21) 0.8 ± 0.2 (n=4) 1.3 ± 0.5 15.9 ± 2.5 (n=2)
G12R/hCx30 24.3 ± 3.8 (n=8) 2.6 ± 0.9 (n=4) 10.9 ± 3.0 117.6 ± 31.4 (n=3)
S17F/hCx30 14.7 ± 5.6 (n=2) 0.6 ± 0.3 (n=2) ---
D50N/hCx30 21.4 ± 0 (n=1) --- ---
N54S/hCx30 30.6 ± 1.9 (n=8) 1.2 ± 0 (n=1) 11.7 ± 0 86.3 ± 0 (n=1)
Table R6.6 | Data obtained from oocytes injected with different cRNA combinations under low Ca2+ conditions. These data were used to make the Figure R6.14. Notice that the total number of oocytes corresponds to the number of outward charges.
The percentages of the different behaviors of inward currents are
summarized in the Table R6.7. Concerning to these percentages we
considered S17F/hCx30, D50N/hCx30 and D50Y/hCx30 cRNAs
combinations as lethal.
cRNA injected to
oocytes
Percentage of oocytes with
inward current inactivation (No
ATP release)
Percentage of oocytes with
inward current inactivation
(Transient ATP release)
Percentage of oocytes with no inward current
inactivation after depolarization
Number of
oocytes
hCx30 20% 20% 60% 10 hCx26/hCx30 19% 10% 71% 21 G12R/hCx30 50% 37.5% 12.5% 8 S17F/hCx30 100% 0% 0% 2 D50N/hCx30 --- --- --- 0 D50Y/hCx30 --- --- --- 0 N54S/hCx30 12.5% 12.5% 75% 8
Table R6.7 | Summary of the percentages of oocytes that, in low Ca2+ conditions, did not release ATP, transiently released it and did not inactivate the inward current. To better understand these data the number of oocytes is reported. Note that in three of the combinations containing mutated hCx26 forms the oocytes that survival was extremely low.
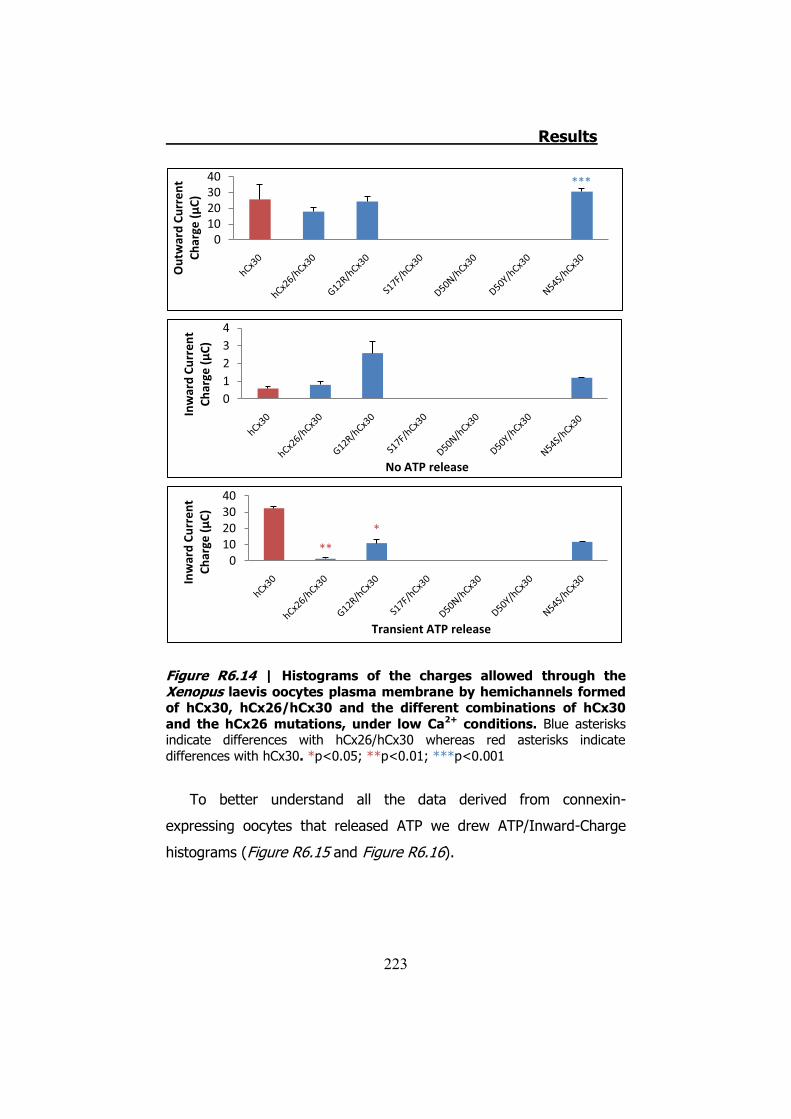
Results
223
Figure R6.14 | Histograms of the charges allowed through the Xenopus laevis oocytes plasma membrane by hemichannels formed of hCx30, hCx26/hCx30 and the different combinations of hCx30 and the hCx26 mutations, under low Ca2+ conditions. Blue asterisks indicate differences with hCx26/hCx30 whereas red asterisks indicate differences with hCx30. *p<0.05; **p<0.01; ***p<0.001
To better understand all the data derived from connexin-
expressing oocytes that released ATP we drew ATP/Inward-Charge
histograms (Figure R6.15 and Figure R6.16).
010203040
Out
war
d Cu
rren
t Ch
arge
(μC)
***
01234
Inw
ard
Curr
ent
Char
ge (μ
C)
No ATP release
010203040
Inw
ard
Curr
ent
Char
ge (μ
C)
Transient ATP release
**
*
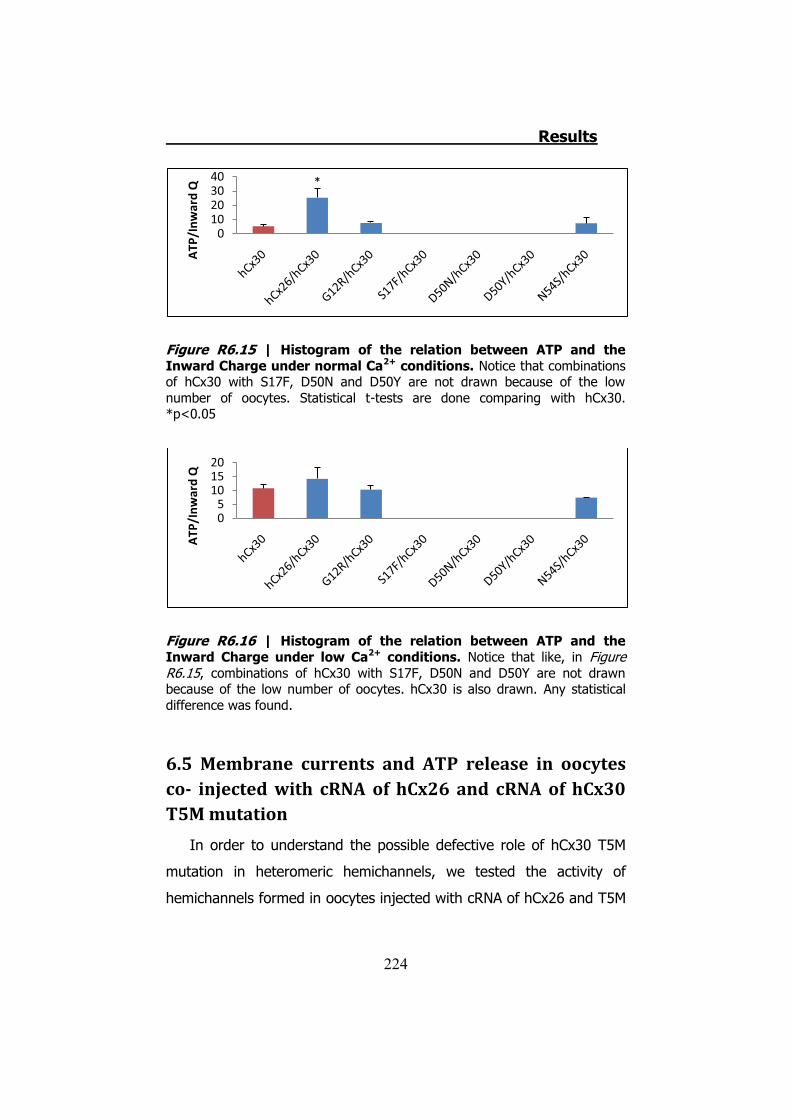
Results
224
Figure R6.15 | Histogram of the relation between ATP and the Inward Charge under normal Ca2+ conditions. Notice that combinations of hCx30 with S17F, D50N and D50Y are not drawn because of the low number of oocytes. Statistical t-tests are done comparing with hCx30. *p<0.05
Figure R6.16 | Histogram of the relation between ATP and the Inward Charge under low Ca2+ conditions. Notice that like, in Figure R6.15, combinations of hCx30 with S17F, D50N and D50Y are not drawn because of the low number of oocytes. hCx30 is also drawn. Any statistical difference was found.
6.5 Membrane currents and ATP release in oocytes co- injected with cRNA of hCx26 and cRNA of hCx30 T5M mutation
In order to understand the possible defective role of hCx30 T5M
mutation in heteromeric hemichannels, we tested the activity of
hemichannels formed in oocytes injected with cRNA of hCx26 and T5M
010203040
ATP
/Inw
ard
Q *
05
101520
ATP
/Inw
ard
Q
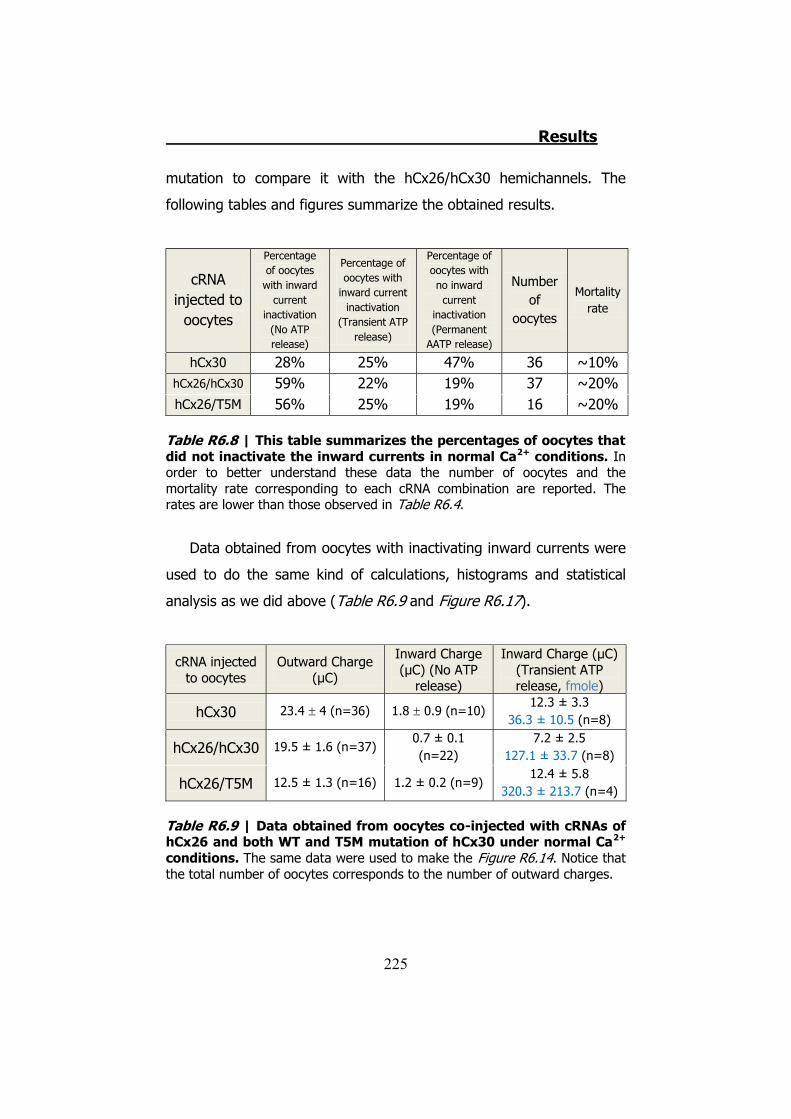
Results
225
mutation to compare it with the hCx26/hCx30 hemichannels. The
following tables and figures summarize the obtained results.
cRNA injected to
oocytes
Percentage of oocytes
with inward current
inactivation (No ATP release)
Percentage of oocytes with
inward current inactivation
(Transient ATP release)
Percentage of oocytes with no inward current
inactivation (Permanent
AATP release)
Number of
oocytes
Mortality rate
hCx30 28% 25% 47% 36 ~10% hCx26/hCx30 59% 22% 19% 37 ~20% hCx26/T5M 56% 25% 19% 16 ~20%
Table R6.8 | This table summarizes the percentages of oocytes that did not inactivate the inward currents in normal Ca2+ conditions. In order to better understand these data the number of oocytes and the mortality rate corresponding to each cRNA combination are reported. The rates are lower than those observed in Table R6.4.
Data obtained from oocytes with inactivating inward currents were
used to do the same kind of calculations, histograms and statistical
analysis as we did above (Table R6.9 and Figure R6.17).
cRNA injected to oocytes
Outward Charge (μC)
Inward Charge (μC) (No ATP
release)
Inward Charge (μC) (Transient ATP release, fmole)
hCx30 23.4 � 4 (n=36) 1.8 � 0.9 (n=10) 12.3 ± 3.3
36.3 ± 10.5 (n=8)
hCx26/hCx30 19.5 ± 1.6 (n=37) 0.7 ± 0.1 (n=22)
7.2 ± 2.5 127.1 ± 33.7 (n=8)
hCx26/T5M 12.5 ± 1.3 (n=16) 1.2 ± 0.2 (n=9) 12.4 ± 5.8
320.3 ± 213.7 (n=4)
Table R6.9 | Data obtained from oocytes co-injected with cRNAs of hCx26 and both WT and T5M mutation of hCx30 under normal Ca2+ conditions. The same data were used to make the Figure R6.14. Notice that the total number of oocytes corresponds to the number of outward charges.
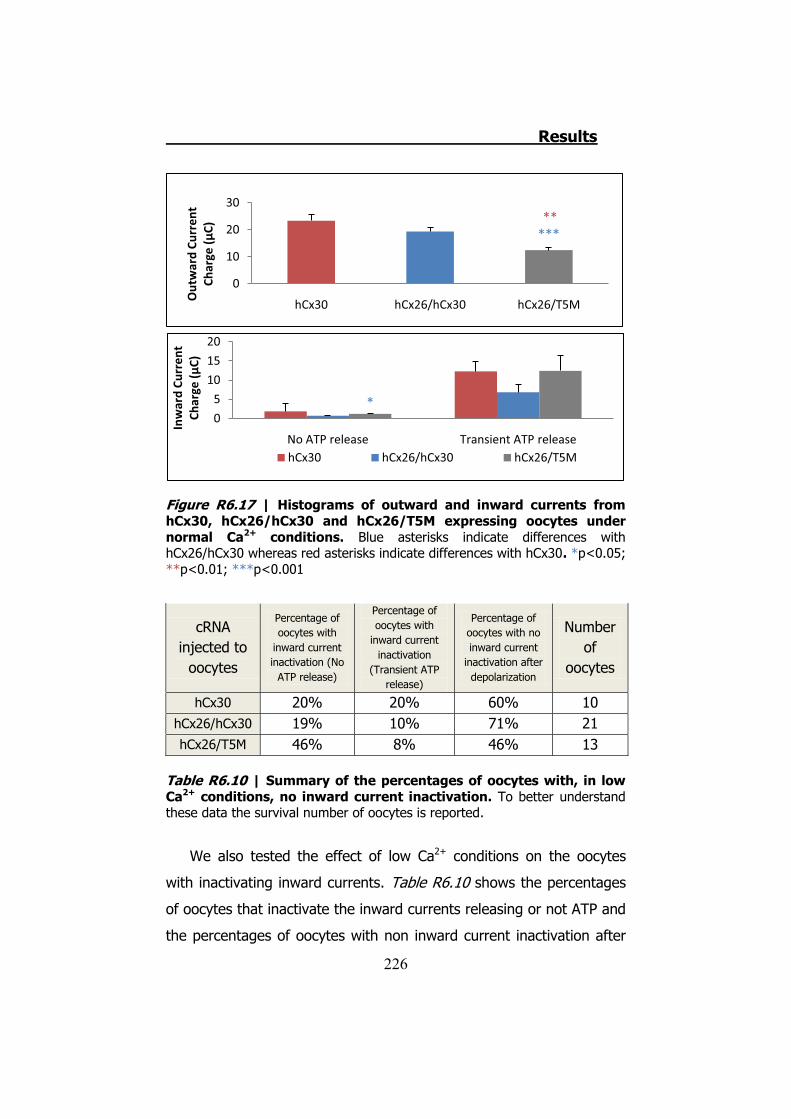
Results
226
Figure R6.17 | Histograms of outward and inward currents from hCx30, hCx26/hCx30 and hCx26/T5M expressing oocytes under normal Ca2+ conditions. Blue asterisks indicate differences with hCx26/hCx30 whereas red asterisks indicate differences with hCx30. *p<0.05; **p<0.01; ***p<0.001
cRNA injected to
oocytes
Percentage of oocytes with
inward current inactivation (No
ATP release)
Percentage of oocytes with
inward current inactivation
(Transient ATP release)
Percentage of oocytes with no inward current
inactivation after depolarization
Number of
oocytes
hCx30 20% 20% 60% 10 hCx26/hCx30 19% 10% 71% 21 hCx26/T5M 46% 8% 46% 13
Table R6.10 | Summary of the percentages of oocytes with, in low Ca2+ conditions, no inward current inactivation. To better understand these data the survival number of oocytes is reported.
We also tested the effect of low Ca2+ conditions on the oocytes
with inactivating inward currents. Table R6.10 shows the percentages
of oocytes that inactivate the inward currents releasing or not ATP and
the percentages of oocytes with non inward current inactivation after
0
5
10
15
20
No ATP release Transient ATP release
Inw
ard
Curr
ent
Char
ge (μ
C)
hCx30 hCx26/hCx30 hCx26/T5M
*
0
10
20
30
hCx30 hCx26/hCx30 hCx26/T5M
Out
war
d Cu
rren
t Ch
arge
(μC) ***
**
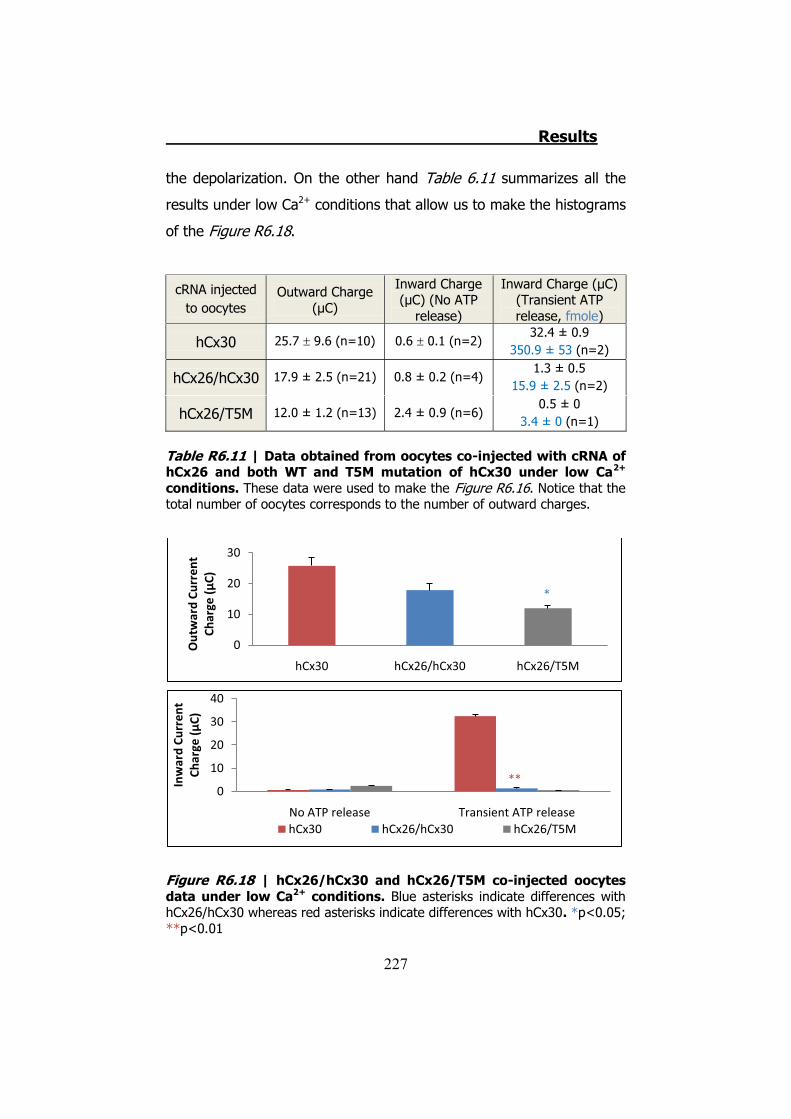
Results
227
the depolarization. On the other hand Table 6.11 summarizes all the
results under low Ca2+ conditions that allow us to make the histograms
of the Figure R6.18.
cRNA injected to oocytes
Outward Charge (μC)
Inward Charge (μC) (No ATP
release)
Inward Charge (μC) (Transient ATP release, fmole)
hCx30 25.7 � 9.6 (n=10) 0.6 � 0.1 (n=2) 32.4 ± 0.9
350.9 ± 53 (n=2)
hCx26/hCx30 17.9 ± 2.5 (n=21) 0.8 ± 0.2 (n=4) 1.3 ± 0.5
15.9 ± 2.5 (n=2)
hCx26/T5M 12.0 ± 1.2 (n=13) 2.4 ± 0.9 (n=6) 0.5 ± 0
3.4 ± 0 (n=1)
Table R6.11 | Data obtained from oocytes co-injected with cRNA of hCx26 and both WT and T5M mutation of hCx30 under low Ca2+ conditions. These data were used to make the Figure R6.16. Notice that the total number of oocytes corresponds to the number of outward charges.
Figure R6.18 | hCx26/hCx30 and hCx26/T5M co-injected oocytes data under low Ca2+ conditions. Blue asterisks indicate differences with hCx26/hCx30 whereas red asterisks indicate differences with hCx30. *p<0.05; **p<0.01
0
10
20
30
hCx30 hCx26/hCx30 hCx26/T5M
Out
war
d Cu
rren
t Ch
arge
(μC)
*
0
10
20
30
40
No ATP release Transient ATP release
Inw
ard
Curr
ent
Char
ge (μ
C)
hCx30 hCx26/hCx30 hCx26/T5M
**
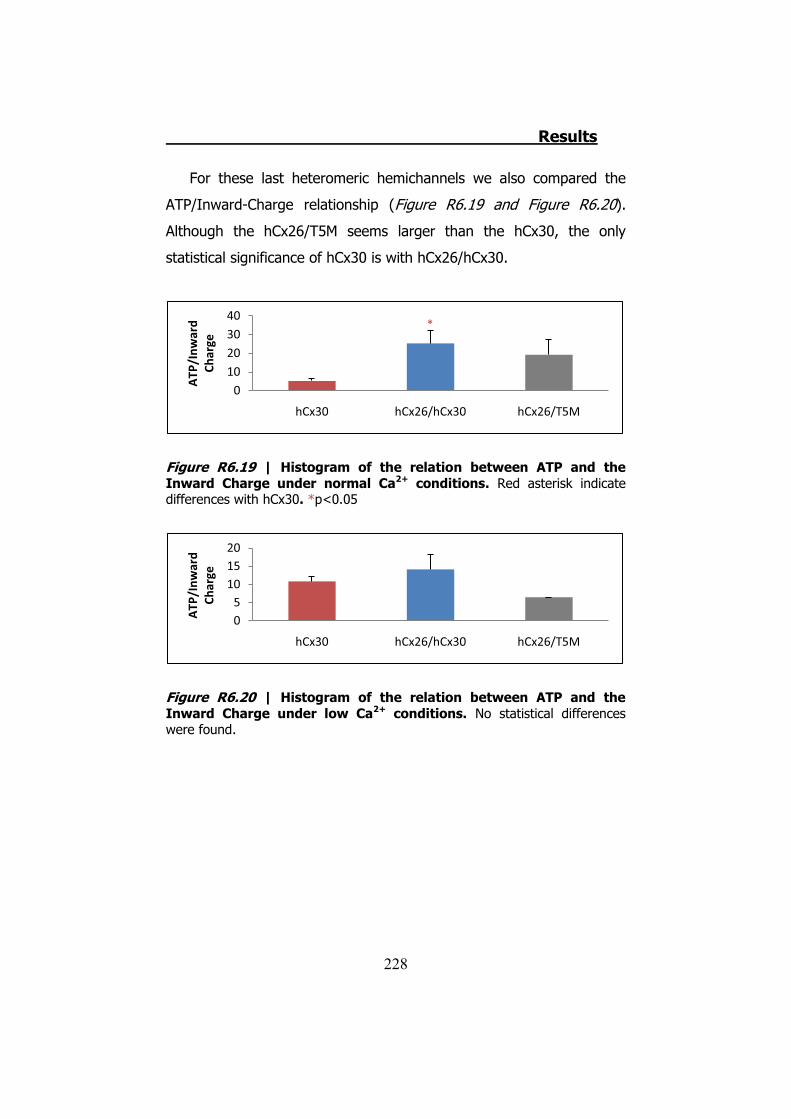
Results
228
For these last heteromeric hemichannels we also compared the
ATP/Inward-Charge relationship (Figure R6.19 and Figure R6.20).
Although the hCx26/T5M seems larger than the hCx30, the only
statistical significance of hCx30 is with hCx26/hCx30.
Figure R6.19 | Histogram of the relation between ATP and the Inward Charge under normal Ca2+ conditions. Red asterisk indicate differences with hCx30. *p<0.05
Figure R6.20 | Histogram of the relation between ATP and the Inward Charge under low Ca2+ conditions. No statistical differences were found.
010203040
hCx30 hCx26/hCx30 hCx26/T5M
ATP
/Inw
ard
Char
ge
*
05
101520
hCx30 hCx26/hCx30 hCx26/T5M
ATP
/Inw
ard
Char
ge

229
Discussion

230
Discussion
231
Gap junctions allow electrical and metabolical communication
between adjacent cells. A gap junction is composed of two connexons,
each one expressed in the plasma membrane of both adjacent cells.
One hemichannel is composed of six connexins. As it has been
reported, connexons can form gap junctions together with other
connexons (87) (88) or can have other functions as independent ionic
channels in the cell plasma membrane (27) (90) (259). In this case we call it
hemichannels Several groups have suggested that ATP can be
released via connexin hemichannels in cells like astrocytes, osteoblasts
or corneal endothelial cells among others (52) (55) (60) (61) (92) (95), where
ATP release has been related to propagation of calcium waves. This
role of connexin hemichannels in ATP release had to be demonstrated
against a historical background of other ATP-release mechanisms like
exocytosis (36) (58) (260), ABC (ATP-binding cassette) transporters (261),
diffusion via P2X7 (59) (261) receptor channels, etc.
In previous studies in our laboratory, ATP release through the
Xenopus laevis oocyte endogenous connexin (Cx38) was already
documented (5) in response to low Ca2+ concentration, together with
an inward current. This current was reversibly inactivated by calcium
presence and was inhibited by gap junctions unspecific inhibitors like
octanol and flufenamic acid, and by Cx38 antisense oligonucleotide
injection. Parallel to this calcium-sensitive currents ATP release from
the oocytes was also recorded, and, like the currents, was inhibited by
octanol, flufenamic acid and Cx38 antisense oligonucleotide injection.
With these results in hand we wanted to know if other connexin
hemichannels could also be permeable to cytoplasmatic ATP. We kept
on using the Xenopus laevis experimental model because is easy to
express other connexins only injecting the cRNA, and we could record
ionic currents and ATP release simultaneously in one single cell.
Discussion
232
ATP release has already been documented for Cx43 (52) and Cx38,
and purinergic signaling disorders have been studied as the cause of
several human diseases (24) (26) (65) (67), we decided to investigate if
human Cx26, Cx30 and Cx32 were permeable to ATP, and if there was
any relation between ATP release through these hemichannels and the
linked diseases we described above. For that these human
hemichannels were studied using different in vitro models.
Discussion
233
1. hCx32
Discussion
234
hCx32 was expressed in Xenopus laevis oocytes and it was
activated using a depolarizing protocol. In response we recorded an
outward current characteristic for hCx32 (99) (158). The possible
interferences of endogenous oocyte Cx38 were abolished injecting
Cx38 antisense oligonucleotide together with hCx32 cRNA 48 hours
before the recordings were performed. The outward currents recorded
became inward currents abruptly once the depolarization stimuli ended
and membrane potential went back to holding potential. It was during
this inward current that ATP release was detected (Figure R5.1). This
ATP release during the inward current makes sense, because in our
experimental conditions the equilibrium potential for ATP is highly
positive and extracellular ATP concentration should be nearly zero.
During the depolarization stimulus the potential is positive and ATP
does not cross through hemichannels even when they are in their
open state, because membrane potential is close to ATP equilibrium
potential (Figure D1). But the inward current is generated when the
membrane potential returns to negative values while hCx32
hemichannels are still in an open state, allowing cytoplasmatic ATP to
cross the membrane and be released.
There is a direct relationship between the inward current electric
charge (inward charge) and the amount of ATP released (Figure R5.3).
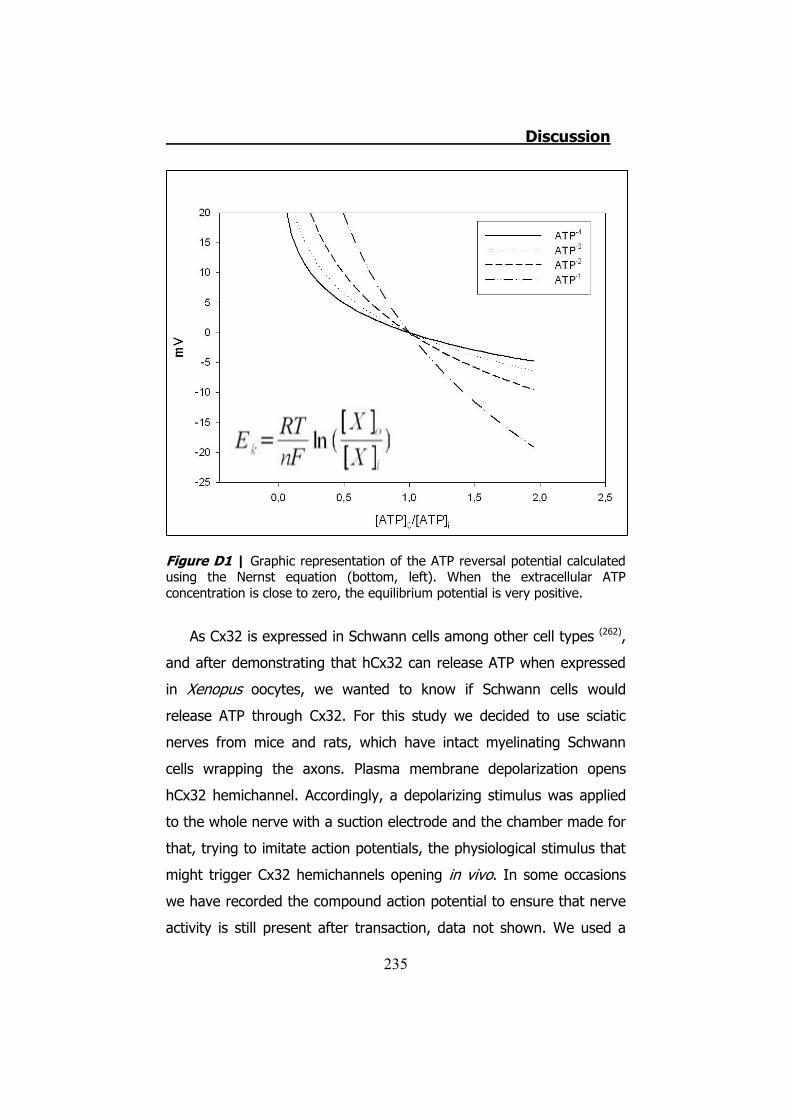
Discussion
235
Figure D1 | Graphic representation of the ATP reversal potential calculated using the Nernst equation (bottom, left). When the extracellular ATP concentration is close to zero, the equilibrium potential is very positive.
As Cx32 is expressed in Schwann cells among other cell types (262),
and after demonstrating that hCx32 can release ATP when expressed
in Xenopus oocytes, we wanted to know if Schwann cells would
release ATP through Cx32. For this study we decided to use sciatic
nerves from mice and rats, which have intact myelinating Schwann
cells wrapping the axons. Plasma membrane depolarization opens
hCx32 hemichannel. Accordingly, a depolarizing stimulus was applied
to the whole nerve with a suction electrode and the chamber made for
that, trying to imitate action potentials, the physiological stimulus that
might trigger Cx32 hemichannels opening in vivo. In some occasions
we have recorded the compound action potential to ensure that nerve
activity is still present after transaction, data not shown. We used a
Discussion
236
cooled high sensitive camera and the Luciferin-Luciferase reaction to
capture the ATP release from the sciatic nerve. With this approach, we
observed ATP release in response to electrical and mechanical stimuli.
We performed other experiments to evoke ATP release from single
nerve fibers. Hypotonic shock was the best way to achieve it as we
can see in Results (Section 2.2). We have obtained evidence doing
immunofluorescence assays, (Section 1 of Results) that Cx32 is highly
present at the paranodes of Schwann cells (Figure R1.1 and Figure
R1.2), precisely the part of the cell that releases the higher amounts of
ATP (Figure R2.7).
To make sure that the ATP release that we saw was from Schwann
cells itself and not from other nerve components we started to culture
Schwann cells from adult mice sciatic nerve. We also checked the
connexin expression in cultured Schwann cells doing immunostainings
for Cx32. Staining was localized all along the cell bodies and
prolongations (Figure R3.1).
Once demonstrated that cultured Schwann cells express Cx32 we
activated these hemichannels with mechanical stimuli. Hypotonic shock
has been described to trigger hemichannel opening (97) (98), and the
release of ATP through hemichannels has been described in
osteoblasts (60) and corneal epithelial cells (61) under mechanical
stimulation, we decided to stimulate Schwann cell primary cultures
with an hypotonic shock. Moreover, hypotonic conditions induce cell
swelling and, in this condition, ATP is a necessary signal for the cells to
recover their volume through a process known as regulated volume
decreased (RVD). This process implies an autocrine and paracrine ATP
effect through purinergic receptors (both P2Y and P2X), that would
activate G-coupled proteins and an eventual intracellular Ca2+ increase,
which would activate K+ and Cl- extrusion, necessary for the cell
Discussion
237
volume recovery (263). The mechanism by which ATP is released after
the hypotonic stimulus is yet unclear. Exocytosis, ionic channels and
transporters have been proposed, and it is thought nowadays that
multiple release mechanism may be involved (264).
ATP release was detected using Luciferin-Luciferase reaction and
we could see a fast ATP release response from Schwann cell to a
hypotonic shock. The amount of ATP released was of 2.5x 10⁻⁴
fmole/104cells, which is significantly greater (p=0.024) than the ATP
released from control Schwann cells, that did not received the
hypotonic shock, which released 3.03x 10⁻⁵ fmole/104cells.
To further study the possible implication on Cx32 in ATP release
we repeated the hypotonic shock assays with hCx32 stable transfected
HeLa cells, using as a control group WT HeLa cells. We worked with
HeLa cells since they are widely used for connexin-transfection studies (265) (266) (267), because wild type HeLa cells do not form gap junctions (268) (269) and have a very low expression of endogenous connexins. So,
we performed the hypotonic assays both with WT and hCx32
transfected HeLa cells. We could record a significant ATP release from
cells that had undergone the hypotonic shock, compared to those that
had not, but we could not see significant differences between wild
type and hCx32 transfected HeLa cells. Cells suffering the hypotonic
shock showed a mean ATP release of 0.0117 fmole/104 cells for HeLa
WT cells, while there was a mean ATP release of 0.0102 fmole/104
cells for hCx32 transfected HeLa cells. So our results did not support
the view that ATP released in response to hypotonic shock is related to
Cx32 hemichannels in HeLa cells. To check if it could be released by
the exocytic pathway, the assays were repeated but with a previous
incubation of both WT and hCx32 transfected HeLa cells with Brefeldin
A, a drug that disrupts the Golgi apparatus, and, in consequence,

Discussion
238
exocytosis (270) (271). But we could not find significant differences
between the ATP released in response to the hypotonic shock, either
for WT or for hCx32 transfected HeLa cells when we compared the
assays without BFA preincubation with the ones that were
preincubated for 5-7 hours with an isotonic solution containing 5 μM
BFA. We concluded that the ATP release from these cells in response a
hypotonic shock was not apparently released through exocytosis, but
by another pathway probably involving different channels.
Interestingly, in these assays we could detect a change in the ATP
release from the control cells that did not received the hypotonic shock
but had the shear stress stimuli triggered by the injection of solution in
the cultured wells. In the case of HeLa cells preincubated with BFA,
they showed a reduction in the ATP release compared with the
controls not preincubated with BFA (although it was only significant for
WT HeLa cells, hCx32 transfected HeLa cells preincubated with BFA
also had a smaller mean of ATP released), indicating that exocytosis
could be the main mechanism by which ATP is released in response to
shear stress in these cells. To answer the question of how HeLa cells
release ATP, a possible approximation would be to combine at the
same time, whole cell voltage clamp and luminescence.
In our laboratory we have been working with the hypothesis that
ATP release could be involved with CMTX disease. But how could this
happen?
In Schwann cells ATP release has already been described in
response to glutamate (215) and UTP (214), and this release has been
related to exocytosis and anionic channels. In other glial cells, such as
astrocytes, different mechanisms for ATP release have been described:
exocytosis (272), anionic channels (260) and hemichannels (52). We
consider that Schwann cells can also release ATP by different
Discussion
239
mechanism, among them, Cx32 hemichannels.
As it has been described before (Section 4.9 of Introduction) and
we also demonstrated (Figure R1.1 and Figure R1.2), Cx32 in Schwann
cells is expressed in paranodal regions, close to the axon. In this
location Cx32 could sense the depolarization triggered by action
potentials and become active, open hemichannel pores and release
ATP to the extracellular medium. This ATP would, in turn, activate
P2X7 and P2Y2 purinergic receptors, also expressed in Schwann cells (25) (207) (208).
However, P2X7 receptor activates at high or low ATP
concentrations; at low concentrations P2X7 has a conductance very
similar to other P2X receptors, however in the presence of mM levels
of ATP they exhibited a very high conductance that has been related
to cell necrosis or apoptosis (273) (274). Usually P2X7 would normally be
in a low conductance state (275) (276). On the other hand, P2Y2 can be
activated at lower ATP concentrations, and trigger an increase of
intracellular calcium concentration, which would activate other
intracellular signals, some of them presumably involved in Schwann
cell survival.
Considering all these data and according to our hypothesis, when
Cx32 is mutated, as it has been described in CMTX disease (154) (164)
(170), two different alterations could occur to this signaling pathway
(Figure D2): (B) an increase or (C) a decrease of ATP release through
Cx32 hemichannels.
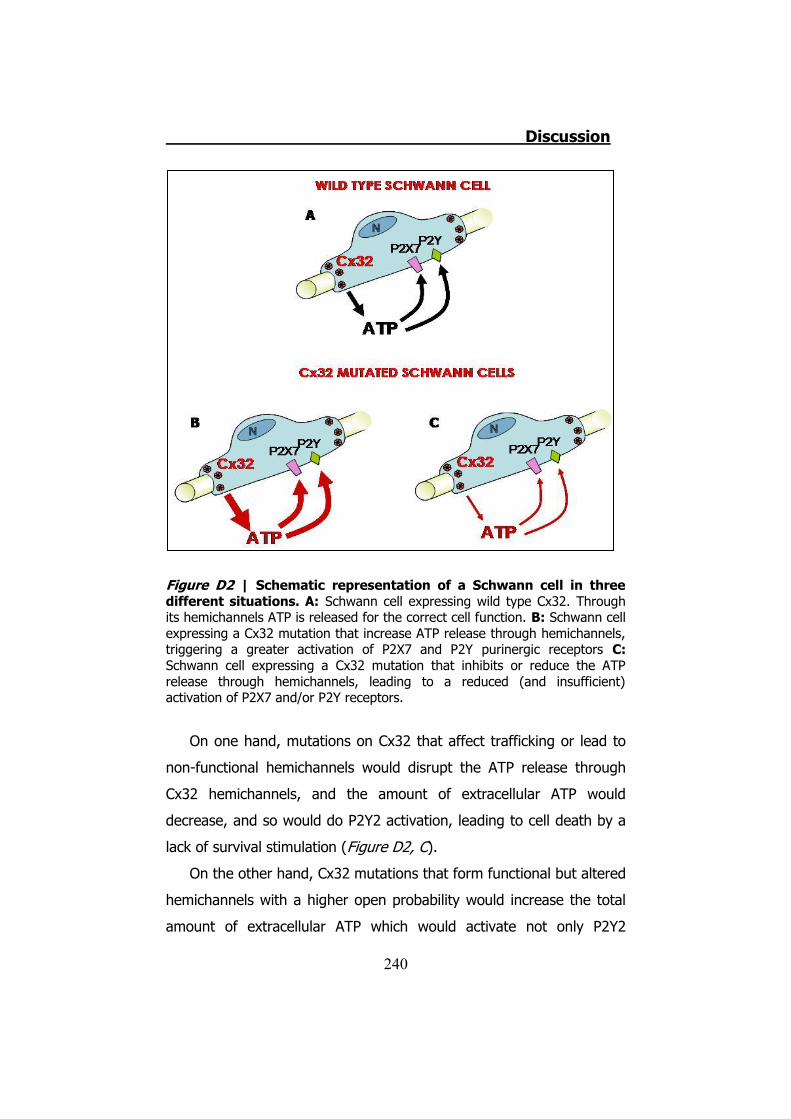
Discussion
240
Figure D2 | Schematic representation of a Schwann cell in three different situations. A: Schwann cell expressing wild type Cx32. Through its hemichannels ATP is released for the correct cell function. B: Schwann cell expressing a Cx32 mutation that increase ATP release through hemichannels, triggering a greater activation of P2X7 and P2Y purinergic receptors C: Schwann cell expressing a Cx32 mutation that inhibits or reduce the ATP release through hemichannels, leading to a reduced (and insufficient) activation of P2X7 and/or P2Y receptors.
On one hand, mutations on Cx32 that affect trafficking or lead to
non-functional hemichannels would disrupt the ATP release through
Cx32 hemichannels, and the amount of extracellular ATP would
decrease, and so would do P2Y2 activation, leading to cell death by a
lack of survival stimulation (Figure D2, C).
On the other hand, Cx32 mutations that form functional but altered
hemichannels with a higher open probability would increase the total
amount of extracellular ATP which would activate not only P2Y2
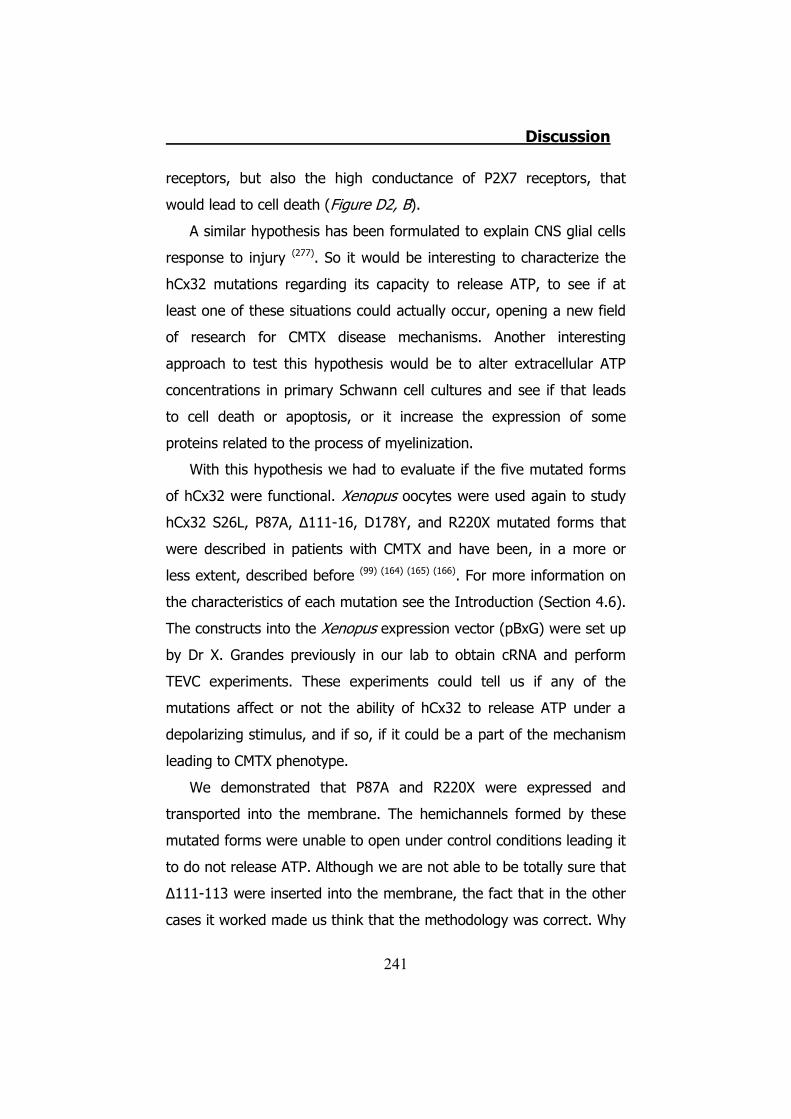
Discussion
241
receptors, but also the high conductance of P2X7 receptors, that
would lead to cell death (Figure D2, B).
A similar hypothesis has been formulated to explain CNS glial cells
response to injury (277). So it would be interesting to characterize the
hCx32 mutations regarding its capacity to release ATP, to see if at
least one of these situations could actually occur, opening a new field
of research for CMTX disease mechanisms. Another interesting
approach to test this hypothesis would be to alter extracellular ATP
concentrations in primary Schwann cell cultures and see if that leads
to cell death or apoptosis, or it increase the expression of some
proteins related to the process of myelinization.
With this hypothesis we had to evaluate if the five mutated forms
of hCx32 were functional. Xenopus oocytes were used again to study
hCx32 S26L, P87A, Δ111-16, D178Y, and R220X mutated forms that
were described in patients with CMTX and have been, in a more or
less extent, described before (99) (164) (165) (166). For more information on
the characteristics of each mutation see the Introduction (Section 4.6).
The constructs into the Xenopus expression vector (pBxG) were set up
by Dr X. Grandes previously in our lab to obtain cRNA and perform
TEVC experiments. These experiments could tell us if any of the
mutations affect or not the ability of hCx32 to release ATP under a
depolarizing stimulus, and if so, if it could be a part of the mechanism
leading to CMTX phenotype.
We demonstrated that P87A and R220X were expressed and
transported into the membrane. The hemichannels formed by these
mutated forms were unable to open under control conditions leading it
to do not release ATP. Although we are not able to be totally sure that
Δ111-113 were inserted into the membrane, the fact that in the other
cases it worked made us think that the methodology was correct. Why
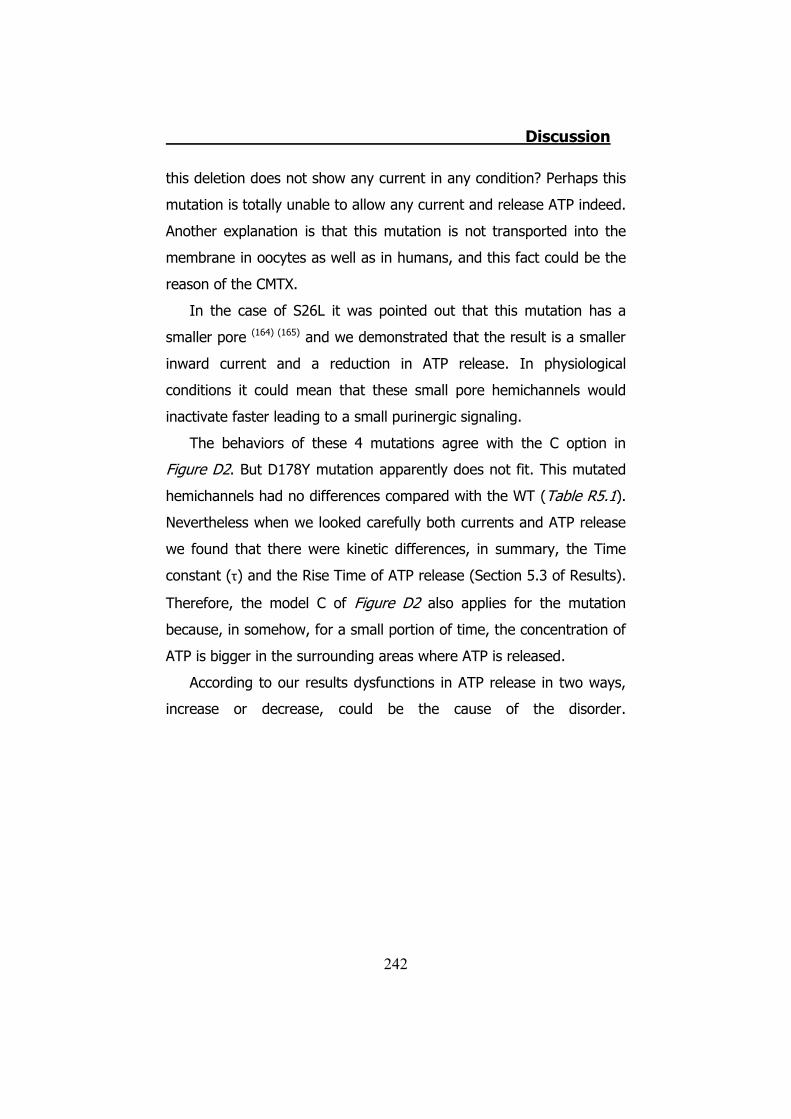
Discussion
242
this deletion does not show any current in any condition? Perhaps this
mutation is totally unable to allow any current and release ATP indeed.
Another explanation is that this mutation is not transported into the
membrane in oocytes as well as in humans, and this fact could be the
reason of the CMTX.
In the case of S26L it was pointed out that this mutation has a
smaller pore (164) (165) and we demonstrated that the result is a smaller
inward current and a reduction in ATP release. In physiological
conditions it could mean that these small pore hemichannels would
inactivate faster leading to a small purinergic signaling.
The behaviors of these 4 mutations agree with the C option in
Figure D2. But D178Y mutation apparently does not fit. This mutated
hemichannels had no differences compared with the WT (Table R5.1).
Nevertheless when we looked carefully both currents and ATP release
we found that there were kinetic differences, in summary, the Time
constant (τ) and the Rise Time of ATP release (Section 5.3 of Results).
Therefore, the model C of Figure D2 also applies for the mutation
because, in somehow, for a small portion of time, the concentration of
ATP is bigger in the surrounding areas where ATP is released.
According to our results dysfunctions in ATP release in two ways,
increase or decrease, could be the cause of the disorder.
Discussion
243
2. hCx26 and hCx30
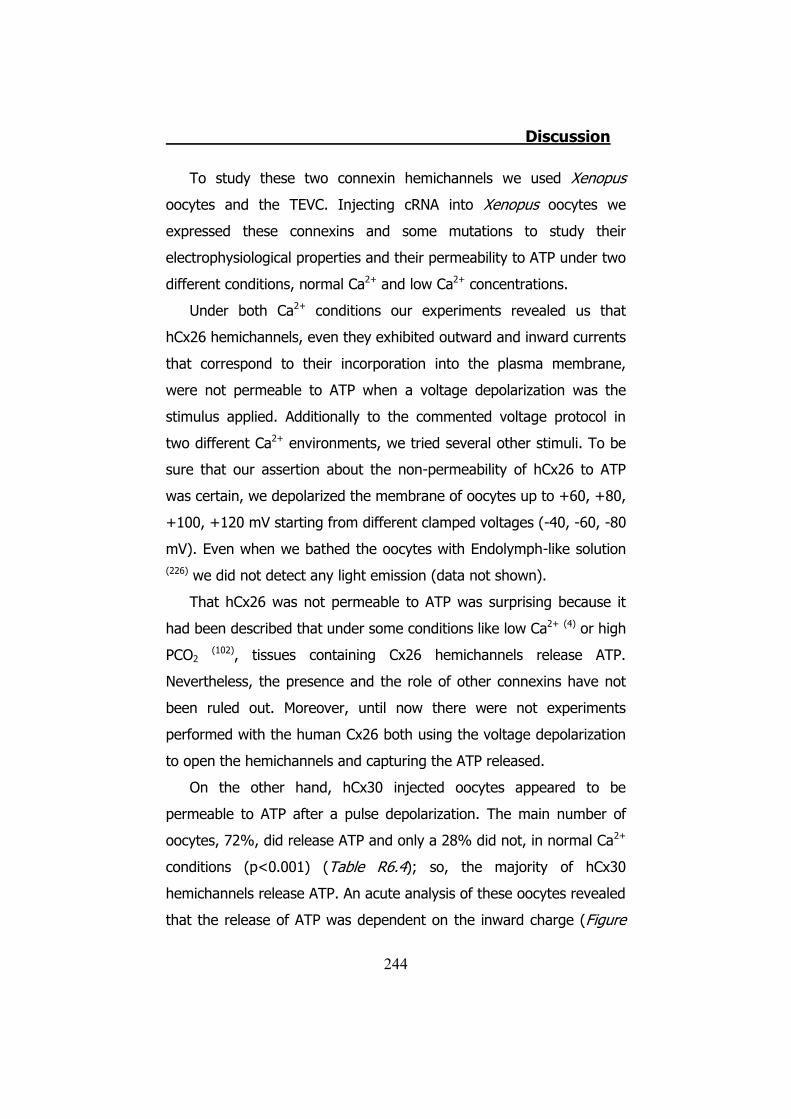
Discussion
244
To study these two connexin hemichannels we used Xenopus
oocytes and the TEVC. Injecting cRNA into Xenopus oocytes we
expressed these connexins and some mutations to study their
electrophysiological properties and their permeability to ATP under two
different conditions, normal Ca2+ and low Ca2+ concentrations.
Under both Ca2+ conditions our experiments revealed us that
hCx26 hemichannels, even they exhibited outward and inward currents
that correspond to their incorporation into the plasma membrane,
were not permeable to ATP when a voltage depolarization was the
stimulus applied. Additionally to the commented voltage protocol in
two different Ca2+ environments, we tried several other stimuli. To be
sure that our assertion about the non-permeability of hCx26 to ATP
was certain, we depolarized the membrane of oocytes up to +60, +80,
+100, +120 mV starting from different clamped voltages (-40, -60, -80
mV). Even when we bathed the oocytes with Endolymph-like solution (226) we did not detect any light emission (data not shown).
That hCx26 was not permeable to ATP was surprising because it
had been described that under some conditions like low Ca2+ (4) or high
PCO2 (102), tissues containing Cx26 hemichannels release ATP.
Nevertheless, the presence and the role of other connexins have not
been ruled out. Moreover, until now there were not experiments
performed with the human Cx26 both using the voltage depolarization
to open the hemichannels and capturing the ATP released.
On the other hand, hCx30 injected oocytes appeared to be
permeable to ATP after a pulse depolarization. The main number of
oocytes, 72%, did release ATP and only a 28% did not, in normal Ca2+
conditions (p<0.001) (Table R6.4); so, the majority of hCx30
hemichannels release ATP. An acute analysis of these oocytes revealed
that the release of ATP was dependent on the inward charge (Figure
Discussion
245
R6.6). At low Ca2+ conditions the majority of hCx30 expressing oocytes
released ATP (80%) (p<0.05) (Table R6.7). These data did not
present statistical differences when compared with the 72% in normal
Ca2+ conditions. Comparing the currents and the ATP released in both
Ca2+ conditions we did not found significant differences. These results
and the published evidences of the co-expression and co-assembly of
hCx26 and hCx30, led us to consider the possibility that the role of
hCx26 in the cochlear hemichannels was to control the gating and/or
the inactivation and/or the permeability of hCx30 and their subsequent
release of ATP, and we figured out the formation of heteromeric
hemichannels. To test this hypothesis, we co-expressed hCx26 and
hCx30 cRNAs to carry out the necessary experiments. Using the same
voltage protocol performed for the homomeric hemichannels we saw
conclusive differences. The 19% of hCx26/hCx30 oocytes did not
inactivate their inward currents and the current was permanently
activated. This percentage is smaller compared with the ratio of hCx30
expressing oocytes that had the same behavior (50%) (p=0.01). The
ratio of oocytes that did not release ATP expressing hCx30 (28%) and
hCx26/hCx30 (59%) also differ (p=0.013). In contrast, although more
oocytes expressing hCx30 released ATP than the oocytes expressing
hCx26/hCx30, the amount of ATP transiently released was larger in the
oocytes co-injected with hCx26 and hCx30 cRNAs (p<0.05). These
differences are also reflected in the relationship ATP/Inward-Charge,
where the hCx26/hCx30 hemichannels have a larger relationship than
the hCx30 (p<0.05) (Figure R6.15). It means that these two kinds of
hemichannels allow similar outward and inward currents but the
heteromeric form releases more ATP and does it under a finer control
than in hCx26 and hCx30 alone.
In low Ca2+ concentration, 80% of hCx30 expressing oocytes
Discussion
246
released ATP (20% transiently and 60% permanently) (Table R6.7). In
these Ca2+ conditions the 71% of hCx26/hCx30 expressing oocytes
had no inward current inactivation and the consequent permanent ATP
release. Furthermore, the 10% released ATP transiently and the total
oocytes releasing ATP were the 81%. So, in these Ca2+ conditions, no
statistical differences between hCx30 and hCx26/hcx30 oocytes were
found when we compared the different ratios related only to the total
oocytes that released ATP or the oocytes that released it transiently or
permanently. When we compared the different currents allowed in
oocytes injected with hCx30 cRNA or both hCx26 and hCx30 cRNAs,
we did not find any difference. Although hCx30 hemichannels seemed
to release more ATP than hCx26/hCx30 hemichannels, differences are
not significant. Finally we did not find any difference between those
oocytes when we compared the relation ATP/Inward-Charge (Figure
R6.16).
In addition, oocytes expressing hCx26/hCx30 hemichannels did not
present any statistical change in their currents or ATP release when
the extracellular solution was changed from normal to low Ca2+. In the
same way, hCx30 did not change statistically the ATP transiently
released. The ratios related to the behavior did not change in the case
of hCx30 being very similar in both Ca2+ conditions. On the other
hand, the number of hCx26/hCx30 oocytes that did not release ATP in
low Ca2+ conditions decreased (p<0.01), the number that released
ATP transiently did not change and the number of oocytes that did not
inactivate the inward currents increased (p<0.001). Therefore, low
Ca2+ conditions affects hCx26/hCx30 increasing the number of oocytes
with no inactivation hemichannel currents. It means that hCx26 exerts
a control action to hCx30, which is Ca2+ dependent.
Mutations in the gjb2 gene are reported to cause sensorineural,
Discussion
247
non-syndromic, prelingual hearing impairment. Five different hCx26
mutations associated with this disease were tested. Contrary to the
WT form of hCx26, all mutations except N54S were permeable to ATP
in a transient manner (Table R6.2) in normal Ca2+ conditions. In other
words, at least some of the oocytes released ATP. Comparing currents
we found differences in many parameters (Figure R6.8). Each
mutation had statistically differences at least in two parameters
indicating that hemichannels formed by these mutations had different
permeabilities to ions compared with the WT. These ions include ATP
in the inward currents except for the N54S mutation. In low Ca2+
conditions results were similar (Table R6.3), but the oocytes that were
transiently permeable to ATP they became permanently permeable to
ATP so, they did not present inward current inactivation. Every single
mutation presented statistical differences in outward charge, inward
charge or both charges compared with the wild type form (Figure
R6.9) except D50Y mutation, who presents a huge variability.
However, these mutations did not present significant differences
between normal and low Ca2+ conditions (Figure D3) indicating that,
like in the wild type connexin, extracellular Ca2+ do not affect the
currents allowed through the oocytes plasma membrane.
Nevertheless, extracellular Ca2+ might be implicated in the inactivation
process that leads the hemichannels to the closing state. The
appearance of oocytes expressing mutations of hCx26 that do not
inactivate the inward currents under low Ca2+ conditions support this
idea.
Although the majority of mutations in connexins that cause
deafness are in the gene gjb2, at least two single substitutions and
two deletions have been described in the gene gjb6 (79) (140) (278) (279)
(280). T5M mutation was the first described mutation in hCx30 to cause
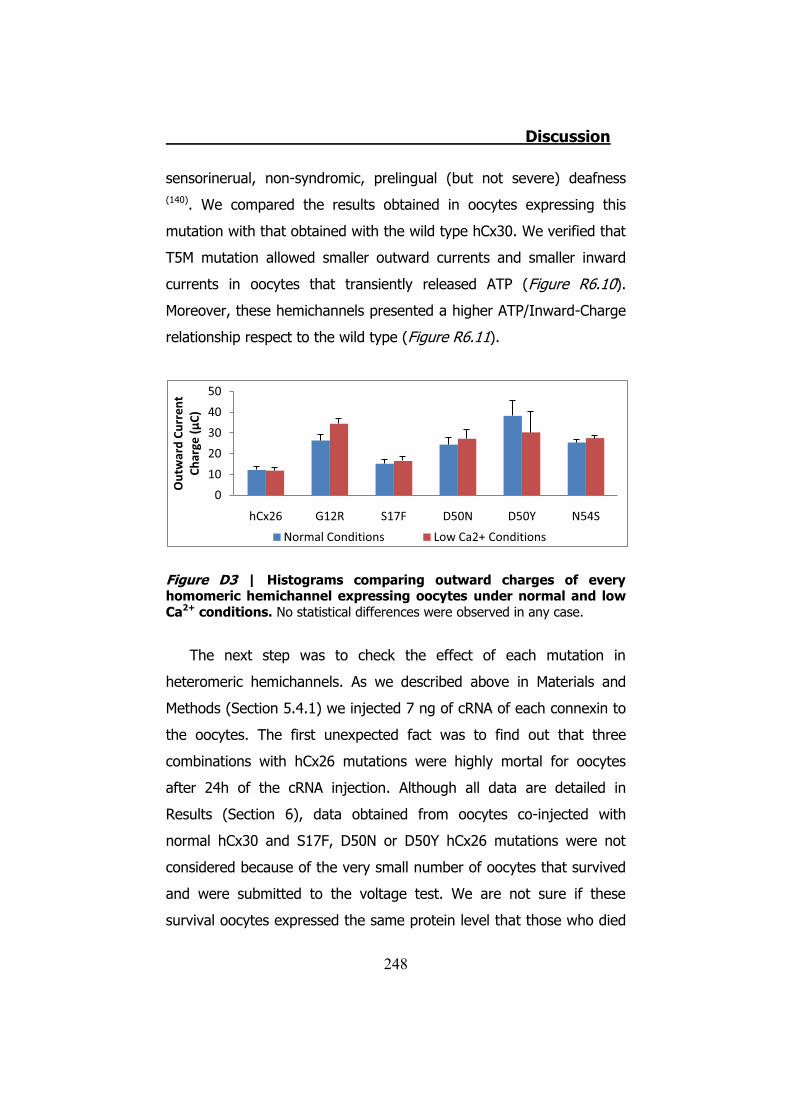
Discussion
248
sensorinerual, non-syndromic, prelingual (but not severe) deafness (140). We compared the results obtained in oocytes expressing this
mutation with that obtained with the wild type hCx30. We verified that
T5M mutation allowed smaller outward currents and smaller inward
currents in oocytes that transiently released ATP (Figure R6.10).
Moreover, these hemichannels presented a higher ATP/Inward-Charge
relationship respect to the wild type (Figure R6.11).
Figure D3 | Histograms comparing outward charges of every homomeric hemichannel expressing oocytes under normal and low Ca2+ conditions. No statistical differences were observed in any case.
The next step was to check the effect of each mutation in
heteromeric hemichannels. As we described above in Materials and
Methods (Section 5.4.1) we injected 7 ng of cRNA of each connexin to
the oocytes. The first unexpected fact was to find out that three
combinations with hCx26 mutations were highly mortal for oocytes
after 24h of the cRNA injection. Although all data are detailed in
Results (Section 6), data obtained from oocytes co-injected with
normal hCx30 and S17F, D50N or D50Y hCx26 mutations were not
considered because of the very small number of oocytes that survived
and were submitted to the voltage test. We are not sure if these
survival oocytes expressed the same protein level that those who died
0
10
20
30
40
50
hCx26 G12R S17F D50N D50Y N54S
Out
war
d Cu
rren
t Ch
arge
(μC)
Normal Conditions Low Ca2+ Conditions
Discussion
249
during the incubation time.
In normal Ca2+ conditions G12R/hCx30 injected oocytes presented
also a high mortality, but even so, we used those data as well as the
obtained from oocytes injected with cRNAs of hCx30 and the N54S
mutation. G12R/hCx30 heteromeric hemichannels allowed, in normal
Ca2+ conditions, larger inward currents compared with hCx26/hCx30,
only when the oocytes did not release ATP (50% of cases) (Figure
R6.13). When these oocytes released transiently ATP (33%), we did
not observe statistical differences in the inward charges (7.2 ± 2.5 μC,
n=8 from hCx26/hCx30 vs 14.2 ± 10 μC, n=4 from G12R/hCx30)
(Figure R6.13). The transient release of ATP was similar for both
varieties of oocytes (127.1 ± 33.7 fmole, n=8 from WT and 125.3 ±
93.2 fmole, n=4 from G12R/hCx30) (Table R6.5). Conversely, when
we compared the different values of currents and ATP release of
hCx30 and G12R/hCx30 hemichannels, we did not find any difference,
even in the ATP/Inward-Charge relationship. The percentages of
oocytes presenting the three different behaviors of Table R6.4, did not
present any statistical difference respect to the hCx30. So we can
assert that the mutation G12R does not have the same effect on
hCx30 as the wild type when forming heteromeric hemichannels.
Under low Ca2+ conditions the G12R/hCx30 presented only
differences respect to the hCx30 in inward charges of oocytes that
released ATP transiently. They were smaller (p<0.05) (Figure R6.14).
However, differences neither in ATP release nor in the ATP/Inward-
Charge were not found when we compared G12R/hCx30 with either
the hCx30 or the hCx26/hCx30. The percentage of oocytes that
released ATP also was not different.
N54S/hCx30 heteromeric hemichannels under normal Ca2+
conditions presented no differences in both currents and ATP release
Discussion
250
and neither with the hCx30 hemichannels nor with the hCx26/hCx30
hemichannels. The 47% of N54S/hCx30 oocytes released ATP (12%
transiently) and the 53% did not. These ratios are not different than
those of hCx30 alone. Under low Ca2+ conditions, the rate of oocytes
that released ATP increased in the three kinds of injected oocytes,
87.5% of N54S/hCx30 oocytes, 81% of hCx26/hCx30 oocytes and
80% of hCx30 oocytes, but did not differ between them. Under these
low Ca2+ conditions, larger outward currents were recorded (p<0.001).
In addition, these N54S/hCx30 oocytes did not present any difference
in the ATP/Inward-Charge respect the hCx30 in any Ca2+ condition
indicating that this mutation has not the same effect on hCx30 than
hCx26 has.
hCx30 only presented differences with the oocytes that were co-
injected with hCx26. Notice that when we compared the same kind of
percentages of the G12R/hCx30 and the N54S/hCx30 co-injections,
any difference was detected. The ATP/Inward-Charge histograms from
the Figure R6.15 also supported the view that hCx30 is only modulated
by hCx26 but not by their mutations.
Finally the hCx30 mutation T5M was co-injected with hCx26 to
check the effect on heteromeric hemichannels. When oocytes were
bathed with normal Ca2+ Ringer, this combination presented smaller
outward charges compared with both hCx30 and hCx26/hCx30.
Comparing the inward charges we saw only differences in the oocytes
that did not release ATP with the hCx26/hCx30. There were not
differences in the amount of ATP released. We also did not find any
difference in the ATP/Inward-Charge relationship with hCx30. Even
comparing the percentages of oocytes that did not release ATP, that
released ATP transiently and that did not inactivate inward currents,
we could not find the differences that appeared with the hCx26/hCx30.
Discussion
251
So, the effect of hCx30 mutation is different respect to the co-
expression of hCx26 and hCx30 wild types.
Under low Ca2+ conditions only the outward current values and the
percentages can be taken seriously due to the low number
experiments. What we observed is that, whereas hCx26/hCx30
increased the number of oocytes releasing ATP when the extracellular
calcium was low, the number of hCx26/T5M oocytes releasing ATP
remained constant.
Taking into account the results obtained in oocytes injected with a
single type of cRNA, we guess that hCx26 mutations present a
different behavior in cochlear cells when they are expressed as
homomeric hemichannels. According with our results, we can assert
that, if cochlear cells present hCx26 hemichannels, in the case of
mutations these hemichannels will present several variations. As we
have shown before, these variations are related with the ion flow
between both sides of the membrane through the hemichannels. But
even that, we also have demonstrated that these mutated
hemichannels, except N54S, present ATP release contrary to the wild
type hCx26. With these results and our knowledge in the area, we can
venture to say that a different K+ and Ca2+ concentration in the
endolymph and an over purinergic stimulation can be, independently,
a cause of the hearing impairment. We cannot ignore that G12R
mutation has been demonstrated to form non-functional gap junctions,
and this would be another key point for this mutation.
Our experiments reveal that oocytes expressing the hCx30
mutation T5M allow smaller currents than the wild type under both,
normal and low, Ca2+conditions. Our data lead us to speculate that
these T5M hemichannels allow smaller outward currents in
physiological conditions. We know that this behavior does not affect
Discussion
252
the formation of the EP and the electrical coupling within cochlear
supporting cells. However, calcein transfer was reduced in Cx30T5M
mice as well as intercellular Ca2+ signaling due to spontaneous ATP
release from connexin hemichannels (243). It agrees with our results
about the miss regulation of hCx26/T5M hemichannels in terms of the
ATP/Inward-Charge ratio. It would bring a kind of understimulation,
particularly with low purinergic signaling. These T5M hemichannels do
not present differences with the WT when we compare the percentage
of oocytes that do not inactivate inward currents in both normal and
low Ca2+ conditions. So, this mutation presents the same inactivation
characteristics as hCx30.
The differences found in the hCx26/hCx30 oocytes in both Ca2+
conditions led us to think about the localization of these hemichannels
in the cochlea. As it is shown in the Figure I5.8, hemichannels are
equally localized in cells bathed by endolymph or perilymph. It is worth
to underline that endolymph has a lower concentration of Ca2+ than
the perilymph, and we can consider our working solutions as
perilymph-like and endolymph-like solutions. In the perilymph areas
the hCx26 subunits would offer a control to the hCx30 subunits. This is
extracted from the data discussed above where we compared that the
number of oocytes co-expressing hCx26 and hCx30 that did not
inactivate the inward currents was reduced. Even that, the relation
ATP/Inward-Charge was also changed, being more permeable to ATP
the hCx26/hCx30 heteromeric hemichannels. So, we can guess that, in
these perilymph zones, hCx26 is required for hCx30 to release large
amounts of ATP without falling into a path of no return of inward
currents.
Under endolymph-like Ca2+ conditions hCx26 seems to have not
the control to hCx30 that was present under normal Ca2+ conditions.
Discussion
253
This statement is a reflection of the results where we do not find any
difference. Moreover, under low Ca2+ conditions, the number of
oocytes that, expressing hCx26/hCx30 hemichannels, do not inactivate
the inward currents, increase to be like the hCx30. The relation
ATP/Inward-Charge is also similar in both kinds of hemichannels.
When these heteromeric hemichannels are formed by hCx30 and a
mutation of hCx26, there are three combinations that we considered
lethal for the oocytes. We can postulate that, in the oocytes, the three
“lethal” combinations are permanently in the open state and it leads to
the death of oocytes. Physiologically, it could be interpreted in the
same way, and that lack of hemichannel inactivation would lead the
cochlear cells to a miss-function.
The G12R/hCx30 heteromeric hemichannels also present a huge
mortality (~80%). Moreover, they present larger currents in normal
Ca2+ conditions. Under the same Ca2+ conditions, G12R mutation has
not the same effect than the wild type hCx26 diminishing the number
of oocytes that do not inactivate their inward currents and increasing
the ATP/Inward-Charge relationship. In addition, under low Ca2+
conditions, these oocytes presented larger inward currents in the
oocytes that release transiently ATP, but not statistical differences in
the ratio of oocytes that released ATP and the fmole of ATP transiently
released. The low number of surviving oocytes hardly difficult to
extract conclusions, but the high mortality itself is a proof of an unlike
regulation of hCx30 by G12R.
Finally, the N54S/hCx30 hemichannels do not present significant
changes with hCx26/hCx30 hemichannels, but, in the same way than
G12R/hCx30, N54S mutation has not the properties of hCx26 to
change the ATP/Inward-Charge relationship of hCx30. In contrast, this
heteromeric hemichannels present significant differences with
Discussion
254
hCx26/hCx30 hemichannels in the outward charges under low Ca2+
conditions. The rest of values compared with hCx30 or hCx26/hCx30
do not present differences. The possible physiological significance for
that is that under low extracellular Ca2+ conditions (Scala Media
conditions) these hemichannels have larger K+ outflows increasing the
endolymph K+ concentration. It would lead the cochlea to a similar
situation than what we draw for the homomeric hemichannels formed
by hCx26 mutations. In the same way than the other hCx26
mutations, N54S/hCx30 also presents a high mortality ratio leading us
to consider that N54S also presents an abnormal regulation of hCx30.
The last heteromeric hemichannels that we tested were the formed
by hCx26 and T5M mutation of hCx30. Outward charges are
significantly lower (p=0.01). Inward charges are larger, but only the
oocytes that do not release ATP present statistical significances
(p<0.05). The ratios about the oocytes that release or not ATP (Table
R6.8) are not different compared with the hCx30 hemichannels, and
also the relation ATP/Inward-Charge do not change under low
extracellular calcium conditions. These hemichannels allow smaller
outward charges (p<0.05) and larger inward charges when the
oocytes do not release ATP (p<0.001). Only one oocyte released
transiently ATP being not enough to take solid conclusions. The
number of hCx26/hCx30 oocytes that released ATP (41%) under
normal Ca2+ conditions increased when these oocytes were bathed in
low Ca2+ Ringer solution (81%) (p<0.01). The mutated heteromeric
hemichannel T5M/hCx30 remained the same (44% vs 54%). The lack-
of-calcium effect on hCx26/hCx30 heteromeric hemichannels
disappeared.
All data exposed and discussed since here, supports our hypothesis
that hCx26 controls the ATP permeability of hCx30 but not the charges
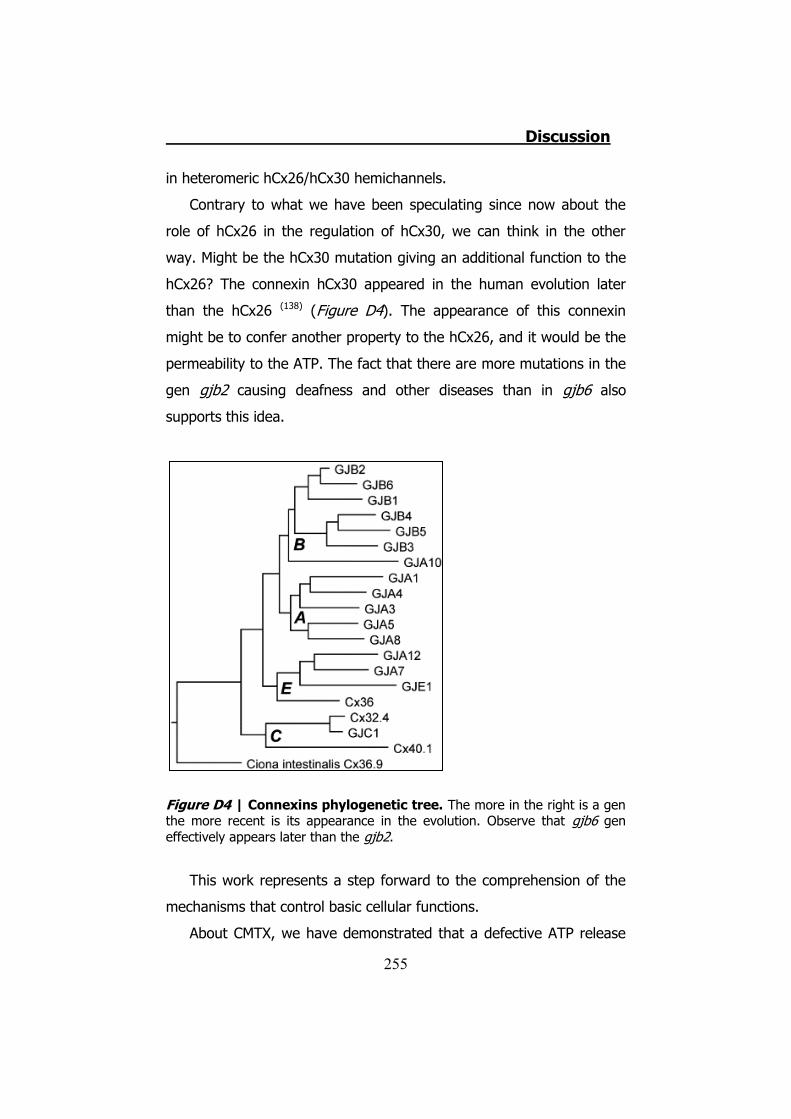
Discussion
255
in heteromeric hCx26/hCx30 hemichannels.
Contrary to what we have been speculating since now about the
role of hCx26 in the regulation of hCx30, we can think in the other
way. Might be the hCx30 mutation giving an additional function to the
hCx26? The connexin hCx30 appeared in the human evolution later
than the hCx26 (138) (Figure D4). The appearance of this connexin
might be to confer another property to the hCx26, and it would be the
permeability to the ATP. The fact that there are more mutations in the
gen gjb2 causing deafness and other diseases than in gjb6 also
supports this idea.
Figure D4 | Connexins phylogenetic tree. The more in the right is a gen the more recent is its appearance in the evolution. Observe that gjb6 gen effectively appears later than the gjb2.
This work represents a step forward to the comprehension of the
mechanisms that control basic cellular functions.
About CMTX, we have demonstrated that a defective ATP release
Discussion
256
(among other ions) may be involved in the physiopathology. To
complete our work, the use of animal models for CMTX would be a
necessary tool. The creation of knock in mice with these studied
mutations to evaluate possible therapies would be a positive step. Until
now, there is not known any connexin enhancer compound that could
act to activate the P87A, Δ111-116 and R220X hemichannels, or
increase inward currents and ATP release of S26L hemichannels. In
contrast, some connexin blockers have been described. At very low
doses, these could act rectifying the kinetics of D178Y hemichannels.
The last advances in mimetic peptides also would provide a strong tool
to work on gain-of-function mutations.
About the connexins implicated in deafness, the deregulation
seems to be on the gain-of-function direction. Even that we present
here a wide range of results, a lot of work has to be done to
understand the role of purinergic signaling between supporting and
sensorial cells. In the experiments done with heteromeric
hemichannels we lack the control of expression level of each connexin
cRNA, impeding the interpretation of the results. The ignorance of the
localization of these mutations in the human cochlea also represents
an impediment to the understanding. Transfection of cell lines,
immunodetection of these mutations in human cochleae, and knock in
mice would provide us an additional knowledge very necessary. About
the abnormal operation of the hCx26 mutations studied, connexin
inhibitors and, more specifically, mimetic peptides, would be the
molecules used to control the target.
Finally, as general conclusion of this thesis, we have obtained
evidence that not all, but at least some, connexins are permeable to
ATP and control its release, opening the field of purinergic signaling
related to connexonopathies.

257
Conclusions

258
Conclusions
259
1. hCx32
Conclusions
260
1. Connexin 32 is localized in the paranodal regions of Ranvier’s
nodes and Schmidt-Lanterman incisures in mice sciatic nerve.
2. Cultured Schwann cells express Cx32.
3. Mice and Rat sciatic nerves release ATP in response to
electrical stimulation with a suction electrode. This release is
concentrated to specific areas of the nerve.
4. Mice sciatic nerves release ATP in response to mechanical
stimulation. This release is concentrated to specific areas of the
nerve.
5. Mice sciatic nerve fibers release ATP in response to hypotonic
shock stimulation. This release is concentrated to the paranodal
zones of Ranvier’s nodes.
6. Primary cultures of Schwann cells release ATP under hypotonic
conditions.
7. HeLa cells respond to hypotonic shock releasing ATP. There are
no differences between wild type and stable hCx32 transfected
HeLa cells after a hypotonic shock.
8. Both wild type and hCx32 HeLa cells preincubated with 5 μM
BFA do not show significant differences in ATP released in
response to hypotonic shock compared to not BFA
preincubated cells.
9. Wild type HeLa cells preincubated with BFA present a reduction
in ATP release compared with cells that are not preincubated.
10. Human Cx32 expressed in Xenopus oocytes forms
hemichannels that are activated by depolarizing potentials.
Outward currents are allowed during those depolarizing
potentials.
11. When the membrane potential return to resting values after a
depolarizing pulse, inward currents are allowed. ATP is released
Conclusions
261
during the inward currents.
12. P87A, Δ111-116 and R220X mutations do not allow any
significant outward nor inward current. Any release of ATP is
related with those hemichannels.
13. S26L mutation allows similar outward currents to those allowed
by the wild type. The inward currents and the ATP release are
significantly decreased.
14. S26L mutation has a different I-V curve.
15. D178Y mutation has no differences in either the outward or the
inward or the ATP release compared with the wild type. This
mutation has statistical differences in the Tau and the ATP Rise
Time values.
Conclusions
262
2. hCx26 and hCx30
Conclusions
263
1. hCx26, hCx30 homomeric hemichannels and hCx26/hCx30
heteromeric hemichannels allow outward and inward currents
during and after voltage depolarization. These currents are not
sensible to extracellular Ca2+ concentration.
2. hCx26 hemichannels do not release ATP in any tested
condition.
3. hCx30 hemichannels release ATP. This release depends on the
inward charge and is not affected by the extracellular Ca2+
concentration.
4. The 50% of inward currents allowed by hCx30 hemichannels
do not inactivate.
5. The presence of hCx26 in heteromeric hCx26/hCx30
hemichannels reduces the ratio of cases that do not inactivate
inward currents 50% vs 19%.
6. hCx26/hCx30 current charges are not significantly different
than the allowed by hCx30 in both Ca2+ conditions.
7. The ATP transiently released through hCx26/hCx30 heteromeric
hemichannels is not sensible to the extracellular Ca2+
conditions.
8. hCx26 controls the ATP release but not the currents of hCx30
in heteromeric hCx26/hCx30 hemichannels.
9. All the mutations of hCx26 present differences with the wild
type as for the currents it refers in both normal and low Ca2+
conditions.
10. All hCx26 mutations are partially permeable to ATP with the
exception of the N54S mutation.
11. S17F/hCx30, D50N/hCx30 and D50Y/hCx30 heteromeric
hemichannels are lethal to Xenopus oocytes.
12. G12R/hCx30 and N54S/hCx30 heteromeric hemichannels are
Conclusions
264
highly mortal to Xenopus oocytes.
13. G12R/hCx30 heteromeric hemichannels allow bigger currents
but they do not present any alteration in the ATP release
compared with hCx26/hCx30 when bathed in normal and low
extracellular Ca2+ conditions.

265
Bibliography

266
267
1. Sträter N. Universität Leipzig. Center for Biotechnology and Biomedicin; http://www.uni-leipzig.de/~straeter/research/ntpdase.html. 2. Gap junctions and the connexin protein family. Sohl G, Willecke K. 2004, Cardiovascular Research. 3. Advances in molecular and cellular therapies for hearing loss. Hildebrand MS, Newton SS, Gubbels SP, Sheffield AM, Kochhar A, de Silva MG, Dahl HH, Rose SD, Behlke MA, Smith RJ,. 2008, Molecular Therapy, Vol. 2:224-36. 4. Gap junctional hemichannel-mediated ATP release and hearing controls in the inner ear. Zhao HB, Ning Yu and Carrie R. Fleming. 2005, PNAS. 5. Endogenous hemichannels play a role in the release of ATP from Xenopus oocytes. Bahima L, Aleu J, Elias M, Martín-Satué M, Muhaisen A, Blasi J, Marsal J, Solsona C. 2006, Journal of Cell Physiology, p. 206(1): p. 95-102. 6. The liberation of adenosine triphosphate on antidromic stimulation of sensory nerves. Holton P. 1959, Journal of Physiology, p. 145(3): p. 494-504. 7. Evidence that adenosine triphosphate or a related nucleotide is the transmitter substance released by non-adrenergic inhibitory nerves in the gut. Burnstock G, Campbell G, Satchell D, Smythe A,. 1970, British Journal of Pharmacology , p. 40(4): p. 668-88. 8. Purinergic nerves. Burnstock G. 1972, Pharmacology Reviews, p. 24(3): p. 509-81. 9. ATP P2X receptors mediate fast synaptic transmission in the dorsal horn of the rat spinal cord. Bardoni R, Goldstein PA, Lee CJ, Gu JG, MacDermott AB,. 1997, Journal of Neuroscience, p. 17(14): p. 5297-304. 10. Role of ATP in fast excitatory synaptic potentials in locus coeruleus neurones of the rat. Nieber K, Poelchen W, Illes P,. 1997, Brain Journal of Pharmacology, p. 122(3): p. 423-30. 11. A purinergic component of the excitatory postsynaptic current
268
mediated by P2X receptors in the CA1 neurons of the rat hippocampus. Pankratov Y, Castro E, Miras-Portugal MT, Krishtal O. 1998, European Journal of Neuroscience, p. 10(12): p. 3898-902. 12. Autonomic neuromuscular junctions: current developments and future directions. Burnstock G. 1986, Journal of Anatomy, Vol. 146: p. 1-30. 13. ATP mediates excitatory synaptic transmission in mammalian neurones. Silinsky EM, Gerzanich V, and Vanner SM. 1992, Brain Journal of Pharmacology, Vol. 106(4): p. 762-3. 14. Extracellular ATP as a signaling molecule for epithelial cells. Schwiebert EM, and Zsembery A. 2003, Biochimica and Biophysica Acta, Vol. 1615(1-2): p. 7-32. 15. Regulation of platelet functions by P2 receptors. Gachet G. 2006, Annual Reviews in Pharmacological Toxicology, Vol. 46: p. 277-300. 16. The P2X7 receptor sustains the growth of human neuroblastoma cells through a substance P-dependent mechanism. Raffaghello L, Chiozzi P, Falzoni S, Di Virgilio F, Pistoia V. 2006, Cancer Research, Vol. 66(2): p. 907-14. 17. Towards a revised nomenclature for P1 and P2 receptors. Fredholm BB, Abbracchio MP, Burnstock G, Dubyak GR, Harden TK, Jacobson KA, Schwabe U, Williams M. 1997, Trends on Pharmacology Science, Vol. 18(3): p. 79-82. 18. Purinoceptors: are there families of P2X and P2Y purinoceptors? Abbracchio MP, and Burnstock G. 1994, Pharmacology & Therapeutics, Vol. 64(3): p. 445-75. 19. Receptors for purines and pyrimidines. Ralevic V, and Burnstock G. 1998, Pharmacological Reviews, Vol. 50(3): p. 413-92. 20. Localization of P2X purinoceptor transcripts in the rat nervous system. Kidd EJ, Grahames CB, Simon J, Michel AD, Barnard EA, Humphrey PP. 1995, Molecular Pharmacology, Vol. 48(4): p. 569-73. 21. Distribution of the P2X2 receptor subunit of the ATP-gated ion channels in the rat central nervous system. Kanjhan R, Housley GD,
269
Burton LD, Christie DL, Kippenberger A, Thorne PR, Luo L, Ryan AF. 1999, Journal of Comparative Neurology, Vol. 407(1): p. 11-32. 22. Molecular characterization and pharmacological properties of the human P2X3 purinoceptor. Garcia-Guzman M, Stuhmer W, and Soto F. 1997, Molecular Brain Research, Vol. 47(1-2): p. 59-66. 23. Characterization of recombinant human P2X4 receptor reveals pharmacological differences to the rat homologue. Garcia-Guzman M, Soto F, Gomez-Hernandez JM, Lund PE, Stühmer W. 1997, Molecular Pharmacology, Vol. 51(1): p. 109-18. 24. A Thr357 to Ser polymorphism in homozygous and compound heterozygous subjects causes absent or reduced P2X7 function and impairs ATP-induced mycobacterial killing by macrophages. Shemon AN, Sluyter R, Fernando SL, Clarke AL, Dao-Ung LP, Skarratt KK, Saunders BM, Tan KS, Gu BJ, Fuller SJ, Britton WJ, Petrou S, Wiley JS,. 2006, Journal of Biology Chemistry, Vol. 281(4):2079-86. 25. Confocal calcium imaging reveals an ionotropic P2 nucleotide receptor in the paranodal membrane of rat Schwann cells. Grafe P, Mayer C, Takigawa T, Kamleiter M, Sanchez-Brandelik R. 1999, Journal of Physiology, Vol. 515 ( Pt 2): p. 377-83. 26. Purinergic signalling and disorders of the central nervous system. Burnstock G. 2008, Nature Reviews Drug Discovery, Vol. 7, 575-590. 27. New roles for connexons. Ebihara L. 2003, News in Physiological Sciences. 28. Pannexins and gap junction protein diversity. Shestopalov VI, and Panchin Y. 2008, Cellular and Molecular Life Sciencies, Vol. 65(3): p. 376-94. 29. Mechanical Strain Opens Connexin 43 Hemichannels in Osteocytes: A Novel Mechanism for the Release oF Prostaglandin. Cherian PP, Siller-Jackson AJ, Gu S, Wang X, Bonewald LF, Sprague E, and Jiang JX. 2005, Molecular Biology of the Cell, Vol.

270
16: 3100–3106. 30. Hypotonicity-induced ATP release is potentiated by intracellular Ca2+ and cyclic AMP in cultured human bronchial cells. Takemura H, Takamura Y, Isono K, Tamaoki J, Nagai A, Kawahara K. 2003, Japanese Journal of Physiology, Vol. 53(5):319-26. 31. A release mechanism for stored ATP in ocular ciliary epithelial cells. Mitchell CH, Carré DA, McGlinn AM, Stone RA, Civan MM. 1998, PNAS, Vol. 9;95(12):7174-8. 32. Cell swelling-induced ATP release is tightly dependent on intracellular calcium elevations. Boudreault, F. and Grygorczyk R. 2004, Journal of Physiology, Vol. 561(Pt 2): p. 499-513. 33. ATP is released from guinea pig ureter epithelium on distension. Knight GE, Bodin P, De Groat WC, and Burnstock G. 2002, American Journal of Physiology - Renal Physiology, Vol. 282: F281–F288. 34. Pharmacological sensitivity of ATP release triggered by photoliberation of inositol-1,4,5-trisphosphate and zero extracellular calcium in brain endothelial cells. Braet K, Aspeslagh S, Vandamme W, Willecke K, Martin PE, Evans WH, Leybaert L. 2003, Journal of Cell Physiology, Vol. 197(2):205-13. 35. Intercellular calcium signaling mediated by point-source burst release of ATP. Arcuino G, Lin JH, Takano T, Liu C, Jiang L, Gao Q, Kang J, Nedergaard M. 2002, PNAS, Vol. 23;99(15):9840-5. 36. Mechanisms of release of nucleotides and integration of their action as P2X- and P2Y-receptor activating molecules. Lazarowski ER, Boucher RC, and Harden TK. 2003, Molecular Pharmacology, Vol. 64(4): p. 785-95. 37. Visualization of ATP release in pancreatic acini in response to cholinergic stimulus. Use of fluorescent probes and confocal microscopy. Sorensen CE, and Novak I. 2001, Journal of Biology Chemistry, Vol. 276(35): p. 32925-32. 38. The past, present and future of purine nucleotides as signalling
271
molecules. Burnstock G. 1997, Neuropharmacology, Vol. 1997. 36(9): p. 1127-39. 39. Vesicular release of ATP at central synapses. Pankratov Y, Lalo U, Verkhratsky A, North R A,. 2006, Pflugers Arch., Vol. 452: 589–597. 40. ATP mediates fast synaptic transmission in mammalian neurons. Evans RJ, Derkach V, and Surprenant A. 1992, Nature , Vol. 357(6378): p. 503-5. 41. Glial cells express multiple ATP binding cassette proteins which are involved in ATP release. Ballerini P, Di Iorio P, Ciccarelli R, Nargi E, D'Alimonte I, Traversa U, Rathbone MP, Caciagli F. 2002, Neuroreport, Vol. 7;13(14):1789-92. 42. Release of ATP from retinal pigment epithelial cells involves both CFTR and vesicular transport. Reigada D, and Mitchell CH. 2005, American Journal of Physiology - Cell Physiology, Vol. 288(1): p. C132-40. 43. Deformation-induced ATP release from red blood cells requires CFTR activity. Sprague RS, Ellsworth ML, Stephenson AH, Kleinhenz ME, Lonigro AJ. 1998, American Journal of Physiology, Vol. 275(5 Pt 2): p. H1726-32. 44. Cystic fibrosis transmembrane conductance regulator and adenosine triphosphate. Abraham EH, Okunieff P, Scala S, Vos P, Oosterveld MJ, Chen AY, Shrivastav B. 1997, Science, Vol. 275(5304):1324-6. 45. Swelling-induced, CFTR-independent ATP release from a human epithelial cell line: lack of correlation with volume-sensitive cl(-) channels. Hazama A, Shimizu T, Ando-Akatsuka Y, Hayashi S, Tanaka S, Maeno E, Okada Y. 1999, v, Vol. 114(4):525-33. 46. Cystic fibrosis transmembrane regulator-independent release of ATP. Its implications for the regulation of P2Y2 receptors in airway epithelia. Watt WC, Lazarowski ER, and Boucher RC. 1998, Journal of Biology Chemistry, Vol. 273(22): p. 14053-8.
272
47. Basal nucleotide levels, release, and metabolism in normal and cystic fibrosis airways. Donaldson SH, Lazarowski ER, Picher M, Knowles MR, Stutts MJ, Boucher RC. 2000, Molecular Medicine, Vol. 6(11):969-8. 48. Mechanical strain-induced Ca(2+) waves are propagated via ATP release and purinergic receptor activation. Sauer H, Hescheler J, and Wartenberg M. 2000, American Journal of Physiology - Cell Physiology, Vol. 279(2): p. C295-307. 49. Volume-regulated anion channels serve as an auto/paracrine nucleotide release pathway in aortic endothelial cells. Hisadome K, Koyama T, Kimura C, Droogmans G, Ito Y, Oike M. 2002, Journal of General Physiology, Vol. 119(6): p. 511-20. 50. Volume-dependent ATP-conductive large-conductance anion channel as a pathway for swelling-induced ATP release. Sabirov RZ, Dutta AK, and Okada Y. 2001, Journal of General Physiology, Vol. 118(3): p. 251-66. 51. ATP crossing the cell plasma membrane generates an ionic current in xenopus oocytes. Bodas E, Aleu J, Pujol G, Martin-Satué M, Marsal J, Solsona C. 2000, Journal of Biology Chemistry, Vol. 275(27):20268-73. 52. Intercellular calcium signaling in astrocytes via ATP release through connexin hemichannels. Stout CE, Costantin JL, Naus CC, and Charles AC. 2002, Journal of Biology Chemistry. 53. Erythrocyte membrane ATP binding cassette (ABC) proteins: MRP1 and CFTR as well as CD39 (ecto-apyrase) involved in RBC ATP transport and elevated blood plasma ATP of cystic fibrosis. Abraham EH, Sterling KM, Kim RJ, Salikhova AY, Huffman HB, Crockett MA, Johnston N, Parker HW, Boyle WE Jr, Hartov A, Demidenko E, Efird J, Kahn J, Grubman SA, Jefferson DM, Robson SC, Thakar JH, Lorico A, Rappa G, Sartorelli AC, Okunieff P. 2001, Blood Cells Molecular Disorders, Vol. 27(1): p. 165-80. 54. ATP released from astrocytes mediates glial calcium waves.
273
Guthrie PB, Knappenberger J, Segal M, Bennett MV, Charles AC, Kater SB. 1999, Journal of Neuroscience, Vol. 19(2): p. 520-8. 55. ATP-mediated glia signaling. Cotrina ML, Lin JH, López-García JC, Naus CC, Nedergaard M. 2000, Journal of Neuroscience, Vol. 20(8): p. 2835-44. 56. Intercellular calcium signaling occurs between human osteoblasts and osteoclasts and requires activation of osteoclast P2X7 receptors. Jørgensen NR, Henriksen Z, Sørensen OH, Eriksen EF, Civitelli R, Steinberg TH. 2002, Journal of Biology Chemistry, Vol. 277(9): p. 7574-80. 57. Connexins: functions without junctions. Stout C, Goodenough DA, and Paul DL. 2004, Current Opinion on Cell Biology, Vol. 16(5): p. 507-12. 58. Storage and release of ATP from astrocytes in culture. . Coco S, Calegari F, Pravettoni E, Pozzi D, Taverna E, Rosa P, Matteoli M, Verderio C. 2003, Journal of Biology Chemistry, Vol. 278(2):1354-62. 59. P2X7 receptors mediate ATP release and amplification of astrocytic intercellular Ca2+ signaling. Suadicani SO, Brosnan CF, and Scemes E. 2006, Neuroscience, Vol. 26(5): p. 1378-85. 60. Mechanosensitivity and intercellular communication in HOBIT osteoblastic cells: a possible role for gap junction hemichannels. Romanello M, Veronesi V, and D'Andrea P. 2003, Biorheology, Vol. 40(1-3): p. 119-21. 61. ATP release through connexin hemichannels in corneal endothelial cells. Gomes P, Srinivas SP, Van Driessche W, Vereecke J, Himpens B. 2005, Investigative Ophtalmology and Visual Science, Vol. 46(4): p. 1208-18. 62. ATP released via gap junction hemichannels from the pigment epithelium regulates neural retinal progenitor proliferation. Pearson RA, Dale N, Llaudet E, Mobbs P. 2005, Neuron, Vol. 46(5): p. 731-44. 63. Purinergic mechanosensory transduction and visceral pain.
274
Burnstock G. 2009, Molecular Pain, Vol. 5:69. 64. P2 purinergic receptors signal to STAT3 in astrocytes: Difference in STAT3 responses to P2Y and P2X receptor activation. Washburn KB, Neary JT. 2006, Neuroscience, p. 142(2):411-23. 65. ATP and the pathogenesis of COPD. Mortaz E, Folkerts G, Nijkamp FP, Henricks PA,. 2010, European Journal of Pharmacology, Vol. 638(1-3):1-4. 66. Tumor cell death and ATP release prime dendritic cells and efficient anticancer immunity. Aymeric L, Apetoh L, Ghiringhelli F, Tesniere A, Martins I, Kroemer G, Smyth MJ, Zitvogel L,. 2010, Cancer Research, Vol. 70(3):855-8. 67. Distribution of NTPDase5 and NTPDase6 and the regulation of P2Y receptor signalling in the rat cochlea. O'Keeffe MG, Thorne PR, Housley GD, Robson SC, Vlajkovic SM,. 2010, Purinergic signaling, Vol. 6(2):249-61. 68. A1 antagonism in asthma: better than coffee? Tilley SL, Boucher RC. 2005, Journal of Clinical Investigation, p. 115(1):13 doi:10. 69. A2A adenosine receptor protects tumors from antitumor T cells. Ohta A, Gorelik E, Prasad SJ, Ronchese F, Lukashev D, Wong MK, Huang X, Caldwell S, Liu K, Smith P, Chen JF, Jackson EK, Apasov S, Abrams S, Sitkovsky M,. 2006, PNAS, Vol. 103(35):13132-7. 70. From "Hellstrom Paradox" to anti-adenosinergic cancer immunotherapy. Lukashev D, Sitkovsky M, Ohta A,. 2007, Purinergic signaling, Vol. 3(1-2):129-34. 71. Hypoxia-adenosinergic immunosuppression: tumor protection by T regulatory cells and cancerous tissue hypoxia. Sitkovsky MV, Kjaergaard J, Lukashev D, Ohta A. 2008, Clinical Cancer Research, Vol. 14(19):5947-52. 72. Functional ENTPD1 polymorphisms in African Americans with diabetes and end-stage renal disease. Friedman DJ, Talbert ME, Bowden DW, Freedman BI, Mukanya Y, Enjyoji K, Robson SC,.
275
2009, Diabetes, Vol. 58(4):999-1006. 73. Synchronization of Ca2+ oscillations: involvement of ATP release in astrocytes. Koizumi S. 2010, The FEBS Journal, Vol. 277(2):286-92. 74. Intracellular Domains of Mouse Connexin26 and -30 Affect Diffusional and Electrical Properties of Gap Junction Channels. Manthey D, Banach K, Desplantez T, Lee CG, Kozak CA, Traub O, Weingart R, Willecke K. 2001, The Journal of Membrane Biology. 75. Gap Junctions: Basic Structure and Function. Mese G, White TW. 2007, Journal of Investigative Dermatology. 76. Expression of connexin 43 and connexin 32 gap-junction proteins in epilepsy-associated brain tumors and in the perilesional epileptic cortex. Aronica E, Gorter JA, Jansen GH, Leenstra S, Yankaya B, Troost D,. 2001, Acta Neuropathologica, p. 101(5):449-59. 77. Connexins: A Guide . Beyer EC, Berthound VM. 2009, Springer-Verlag Gmbh. 78. Electrical synapses in the mammalian brain. Connors BW, Long MA. 2004, Annual Review of Neuroscience. 79. A deletion involving the connexin 30 gene in nonsyndromic hearing impairment. del Castillo I, Villamar M, Moreno-Pelayo MA, del Castillo FJ, Alvarez A, Tellería D, Menéndez I, Moreno F. 2002, The New England Journal of Medicine, Vol. 346(4):243-9. 80. Characterization of connexin 30.3 and 43 in thymocytes. Fonseca PC, Nihei OK, Urban-Maldonado M, Abreu S, de Carvalho AC, Spray DC, Savino W, Alves LA. 2004, Immunology Letters. 81. Somatic Mutations in the Connexin 40 Gene (GJA5) in Atrial Fibrillation. Gollob MH, Jones DL, Krahn AD, Danis L, Gong XQ, Shao Q, Liu X, Veinot JP, Tang AS, Stewart AF, Tesson F, Klein GJ, Yee R, Skanes AC, Guiraudon GM, Ebihara L, Bai D,. 2006, The New England Journal of Medicine , Vol. 354(25):2677-88. 82. Connexins: A Guide. Massey S. 2009, Springer-Verlag Gmbh. 83. Regulation of connexin expression. . Oyamada M., Oyamada Y.
276
and Takamatsu T,. 2005, Biochimica Biophysica Acta . 84. Characterization of Gap Junctional Intercellular Communication in Immortalized Human Pancreatic Ductal Epithelial Cells With Stem Cell Characteristics. Tai MH, Olson LK, Madhukar BV, Linning KD, Van Camp L, Tsao MS, Trosko JE. 2003, Pancreas. 85. Diverse deafness mechanisms of connexin mutations revealed by studies using in vitro approaches and mouse models. Dinh EH, Shoe Ahmad, Qing Chang, Wenxue Tang, Benjamin Stong, Xi Lin. 2009, Brain Research. 86. Gap Junction Mediated Intercellular Metabolite Transfer in the Cochlea Is Compromised in Connexin30 Null Mice. Qing Chang, Wenxue Tang, Shoeb Ahmad, Binfei Zhou, Xi Lin. 2008, PLOS ONE. 87. The gap junction communication channel. Kumar NM, Gilula NB. 1996, Cell. 88. Gap junctions: structure and function. Evans WH, Martin PE. 2002, Molecular Membrane Biology . 89. Structural organization of gap junction channels. Sosinsky GE, Nicholson BJ. 2005, Biochimica and Biophysica Acta . 90. New roles for astrocytes: gap junction hemichannels have something to communicate. Bennett MV, Contreras JE, Bukauskas FF, Saez JC. 2003, Trends in Neuroscience. 91. Connexin46, a novel lens gap junction protein, induces voltage-gated currents in nonjunctional plasma membrane of Xenopus oocytes. Paul DL, Ebihara L, Takemoto LJ, Swenson KI, Goodenough DA. 1991, Journal of Cell Biology. 92. Beyond the gap: functions of unpaired connexon channels. Goodenough DA, Paul DL. 2003, Nature Reviews Molecular Cell Biology. 93. Connexin-based gap junction hemichannels: gating mechanisms. Saez JC, Retamal MA, Basilio D, Bukauskas FF, Bennett MV. 2005, Biochimica and Biophysica Acta.
277
94. Ca(2+) regulation of connexin 43 hemichannels in C6 glioma and glial. De Vuyst E, Wang N, Decrock E, De Bock M, Vinken M, Van Moorhem M, Lai C, Culot M, Rogiers V, Cecchelli R, Naus CC, Evans WH, Leybaert L. 2009, Cell Calcium. 95. Connexins regulate calcium signaling by controlling ATP release. Cotrina ML. 1998, PNAS. 96. Properties and regulation of gap junctional hemichannels in the plasma membranes of cultured cells. Li H, Liu TF, Lazrak A, Peracchia C, Goldberg GS, Lampe PD, Johnson RG,. 1996, Journal of Cell Biology, Vol. 134(4):1019-30. 97. Connexins are mechanosensitive. Bao L, Sachs F, Dahl G,. 2004, American Journal of Physiology - Cell Physiology. 98. Isolated rat hepatocytes can signal to other hepatocytes and bile duct cells by release of nucleotides. Schlosser SF, Burgstahler AD, Nathanson MH,. 1996, PNAS. 99. Molecular basis of calcium regulation in connexin-32 hemichannels. Gomez-Hernandez JM, de Miguel M, Larrosa B, Gonzalez D, Barrio LC. 2003, PNAS. 100. Pharmacological enhancement of hemi-gap-junctional currents in Xenopus oocytes. Ripps H, Qian H, Zakevicius J. 2002, Journal of Neuroscience Methods . 101. CO2-dependent opening of connexin 26 and related β connexins. Huckstepp RT, Eason R, Sachdev A, Dale N,. 2010, Journal of Physiology, Vol. 588(Pt 20):3921-31. 102. Connexin hemichannel-mediated CO2-dependent release of ATP in the medulla oblongata contributes to central respiratory chemosensitivity. Huckstepp RT, id Bihi R, Eason R, Spyer KM, Dicke N, Willecke K, Marina N, Gourine AV, Dale N,. 2010, Journal of Physiology, Vol. 588(Pt 20):3901-20. 103. Rapid and direct effects of pH on connexins revealed by the connexin46 hemichannel preparation. Trexler EB, Bukauskas FF, Bennett MV, Bargiello TA, Verselis VK. 1999, Journal of General
278
Physiology. 104. Molecular basis of voltage dependence of connexin channels: an integrative appraisal. Gonzalez D, Gomez-Hernandez JM, Barrio LC. 2007, Progress in Biophysics and Molecular Biology. 105. Molecular dissection of transjunctional voltage dependence in the connexin-32 and connexin-43 junctions. Revilla A, Castro C, Barrio LC. 1999, Biophysical Journal. 106. Clustering of connexin 43-enhanced green fluorescent protein gap junction channels and functional coupling in living cells. Bukauskas FF, Jordan K, Bukauskiene A, Bennett MV, Lampe PD, Laird DW, Verselis VK. 2000, PNAS, Vol. 97(6):2556-61. 107. Hetero-domain interactions as a mechanism for the regulation of connexin channels. Stergiopoulos K, Alvarado JL, Mastroianni M, Ek-Vitorin JF, Taffet SM, Delmar M,. 1999, Circulation Research, Vol. 84(10):1144-55. 108. A structural basis for the unequal sensitivity of the major cardiac and liver gap junctions to intracellular acidification: the carboxyl tail length. Liu S, Taffet S, Stoner L, Delmar M, Vallano ML, Jalife J,. 1993, Biophysical Journal, Vol. 64(5):1422-33. 109. A particle-receptor model for the insulin-induced closure of connexin43 channels. Homma N, Alvarado JL, Coombs W, Stergiopoulos K, Taffet SM, Lau AF, Delmar M,. 1998, Circulation Research, Vol. 83(1):27-32. 110. Nanomechanics of hemichannel conformations: connexin flexibility underlying channel opening and closing. Liu F, Arce FT, Ramachandran S, Lal R,. 2006, Journal of Biology Chemistry. 111. Chapter 11: Ion Channels and the Electrical Properties of Membranes. Alberts B, Johnson A, Lewis J, Raff M, Roberts K, Walter P,. 2002, Molecular Biology of the Cell, 4th edition. 112. Molecular determinants of membrane potential dependence in vertebrate gap junction channels. Revilla A, Bennett MV, Barrio LC,. 2000, PNAS.
279
113. Genetic epidemiology of hearing impairment. Morton NE. 1991, Annals of the New York Academy of Sciences, Vol. 630:16-31. 114. Molecular genetics of hearing loss. Petit C, Levilliers J, Hardelin JP,. 2001, Annual Reviews Genetics. 115. Closing the Gap on Autosomal Dominant Connexin-26 and Connexin-43 Mutants Linked to Human Disease. Laird DW. 2008, The Journal of Biological Chemistry. 116. Connexin 26: required for normal auditory function. Kelley PM, Cohn E, Kimberling WJ,. 2000, Brain Research Reviews, Vol. 32:184–188. 117. Sequence and developmental expression of mRNA coding for a gap junction protein in Xenopus. Gimlich RL, Kumar NM, Gilula NB,. 1988, Journal of Cell Biology, Vol. 107(3):1065-73. 118. Differential regulation of the levels of three gap junction mRNAs in Xenopus embryos. Gimlich RL, Kumar NM, Gilula NB,. 1990, Journal of Cell Biology, Vol. 110(3): p. 597-605. 119. Molecular cloning, tissue distribution, and hormonal control in the ovary of Cx41 mRNA, a novel Xenopus connexin gene transcript. Yoshizaki G, Patiño R,. 1995, Molecular Reproduction and Development, Vol. 42(1):7-18. 120. Cloning and expression of a Xenopus embryonic gap junction protein. Ebihara L, Beyer EC, Swenson KI, Paul DL, Goodenough DA,. 1989, Science, Vol. 3;243(4895):1194-5. 121. Gap junctional proteins of animals: The innexin/pannexinsuperfamily. Yen MR, Saier Jr MH,. 2007, Progress in Biophysics and Molecular Biology, Vol. 94: 5–14. 122. Evolution of gap junction proteins – the pannexin alternative. Panchin YV. 2005, The Journal of Experimental Biology, Vol. 208, 1415-1419. 123. The mammalian pannexin family is homologous to the invertebrateinnexin gap junction proteins. Baranova A, Ivanov D, Petrash N, Pestova A, Skoblov M, Kelmanson I, Shagin D,

280
Nazarenko S, Geraymovych E, Litvin O, Tiunova A, Born TL, Usman N, Staroverov D, Lukyanov S, Panchin Y. 2004, Genomics , Vol. 83: 706–716. 124. Pannexins, a family of gap junction proteins expressed in brain. Bruzzone R, Hormuzdi SG, Barbe MT, Herb A, Monyer H,. 2003, PNAS, Vol. 100-23:13644–13649. 125. Innexins get into the gap. Phelan P, Starich TA,. 2001, BioEssays, Vol. 23:388-396. 126. Expression of pannexin family of proteins in the retina. Dvoriantchikova G, Ivanova D, Panchinc Y, Shestopalov VI,. 2006, FEBS Letters, Vol. 580: 2178–2182. 127. Pannexin: To Gap or not to Gap, is that a Question? Dahl G, Locovei S,. 2006, IUBMB Life, Vol. 58(7): 409 – 419. 128. Pannexin 1 in erythrocytes: Function without a gap. Locovei S, Bao L, Dahl G,. 2006, PNAS, Vol. 103-23: 7655–7659. 129. The role of pannexin 1 hemichannels in ATP release and cell– cell communication in mouse taste buds. Huang JY, Maruyama Y, Dvoryanchikov G, Pereira E, Chaudhari N, Roper SD,. 2006, PNAS, Vol. 104-15: 6436–6441. 130. Ischemia Opens Neuronal Gap Junction Hemichannels. Thompson RJ, Zhou N, MacVicar BA,. 2006, Science, Vol. 312. 131. Pannexin-1 mediates large pore formation and interleukin-1beta release by the ATP-gated P2X7 receptor. Pelegrin P, Surprenant A,. 2006, EMBO Journal, Vol. 25(21): p. 5071-82. 132. Pannexin-1 couples to maitotoxin- and nigericin-induced interleukin-1beta release through a dye uptake-independent pathway. Pelegrin P, Surprenant A,. 2007, Journal of Biology Chemistry, Vol. 282(4): p. 2386-94. 133. Activation of pannexin 1 channels by ATP through P2Y receptors and by cytoplasmic calcium. Locovei S, Wang J, Dahl G,. 2006, FEBS Letters, Vol. 580(1): p. 239-44. 134. Pannexins and gap junction protein diversity. Shestopalov VI,
281
Panchin Y,. 2008, Cellular and Molecular Life Sciencies, Vol. 65(3): p. 376-94. 135. Mutations in the gene encoding gap junction protein beta-3 associated with autosomal dominant hearing impairment. Xia JH, Liu CY, Tang BS, Pan Q, Huang L, Dai HP, Zhang BR, Xie W, Hu DX, Zheng D, Shi XL, Wang DA, Xia K, Yu KP, Liao XD, Feng Y, Yang YF, Xiao JY, Xie DH, Huang JZ,. 1998, Nature Genetics, Vol. 4:370-3. 136. Connexin gene mutations in human genetic diseases. Krutovskikh V, Yamasaki H,. 2000, Mutation research, Vol. 462(2-3):197-207. 137. Mutations in connexin31 underlie recessive as well as dominant non-syndromic hearing loss. Liu XZ, Xia XJ, Xu LR, Pandya A, Liang CY, Blanton SH, Brown SD, Steel KP, Nance WE,. 2000, Human Molecular Genetics, Vol. 9(1):63-7. 138. Connexin disorders of the ear, skin, and lens. Gerido DA, White TW,. 2004, Biochimica and Biophysica Acta, Vol. 1662: 159-170. 139. Estivill X, Gasparini P,. The Connexin-deafness homepage. 140. Mutations in GJB6 cause nonsyndromic autosomal dominant deafness at DFNA3 locus. Grifa A, Wagner CA, D'Ambrosio L, Melchionda S, Bernardi F, Lopez-Bigas N, Rabionet R, Arbones M, Monica MD, Estivill X, Zelante L, Lang F, Gasparini P,. 1999, Nature Genetics, Vol. 23(1):16-8. 141. Connexin mutations in hearing loss, dermatological and neurological disorders. Rabionet R, Lopez-Bigas N, Arbonès ML, Estivill X,. 2002, TRENDS in Molecular Medicine, Vol. 8; 5:205-212. 142. Connexin29 is highly expressed in cochlear Schwann cells, and it is required for the normal development and function of the auditory nerve of mice. Tang W, Zhang Y, Chang Q, Ahmad S, Dahlke I, Yi H, Chen P, Paul DL, Lin X,. 2006, Journal of Neuroscience, Vol. 26(7):1991-9. 143. Inherited neuropathies. Chance PF, Reilly M,. 1994, Current
282
Opinion on Neurology, Vol. 5:372-80. 144. National Institutes of Health. Charcot-Marie-Tooth Disease Information Page. Hereditary Neuropathies Information Page. NINDS: National Institute of Neurological Disorders and Stroke, 2010. 145. Connexin 43 (GJA1) mutations cause the pleiotropic phenotype of oculodentodigital dysplasia. Paznekas WA, Boyadjiev SA, Shapiro RE, Daniels O, Wollnik B, Keegan CE, Innis JW, Dinulos MB, Christian C, Hannibal MC, Jabs EW,. 2003, The American Journal of Human Genetics, Vol. 72-2:408-418. 146. Mutations in connexin genes and disease. Pfenniger A, Wohlwend A, Kwak BR,. 2010, European Journal of Clinical Investigation, Vol. 10.1111/j.1365-2362. 147. Somatic Mutations in the Connexin 40 Gene (GJA5) in Atrial Fibrillation. Gollob MH, Jones DL, Krahn AD, Danis L, Gong XQ, Shao Q, Liu X, Veinot JP, Tang AS, Stewart AF, Tesson F, Klein GJ, Yee R, Skanes AC, Guiraudon GM, Ebihara L, Bai D,. 2006, The New England Journal of Medicine , Vol. 354(25):2677-88. 148. Connexin 50 gene on human chromosome 1q21 is associated with schizophrenia in matched case control and family-based studies. Ni X, Valente J, Azevedo MH, Pato MT, Pato CN, Kennedy JL,. 2007, Journal of Medical Genetics, Vol. 44(8):532-6. 149. Mouse models of Charcot-Marie-Tooth disease. Tanaka Y, Hirokawa N,. 2002, Trends in Genetics, Vol. 18(12): p. S39-44. 150. Advances in Charcot-Marie-Tooth disease research: cellular function of CMT-related proteins, transgenic animal models, and pathomechanisms. The European CMT Consortium. Müller HW, Suter U, Van Broeckhoven C, Hanemann CO, Nelis E, Timmerman V, Sancho S, Barrio L, Bolhuis P, Dermietzel R, Frank M, Gabreëls-Festen A, Gillen C, Haites N, Levi G, Mariman E, Martini R, Nave K, Rautenstrauss B, Schachner M, Schenone A, Schneide. 1997, Neurobiology of Disease, Vol. 4(3-4):215-20. 151. Disease mechanisms in inherited neuropathies. Suter U, Scherer
283
S,. 2003, Nature Reviews in Neuroscience, Vol. 4(9): p. 714-26. 152. Kedlaya D, http://emedicine.medscape.com/article/1232386-overview. 153. The causes of Charcot-Marie-Tooth disease. . Young P, Suter U,. 2003, Cellular and Molecular Life Sciencies, Vol. 60(12): p. 2547-60. 154. Connexin32 and X-linked Charcot-Marie-Tooth disease. Bone LJ, Deschênes SM, Balice-Gordon RJ, Fischbeck KH, Scherer SS,. 1996, Neurobiology of Disease, Vol. 4(3-4): p. 221-30. 155. Cloning and characterization of human and rat liver cDNAs coding for a gap junction protein. Kumar NM, Gilula NB,. 1986, Journal of Cell Biology, Vol. 103(3): p. 767-76. 156. Molecular cloning of cDNA for rat liver gap junction protein. Paul DL. 1986, Journal of Cell Biology, Vol. 103(1): p. 123-34. 157. Emerging issues of connexin channels: biophysics fills the gap. Harris AL. 2001, Quarterly Review of Biophysics, Vol. 34(3): p. 325-472. 158. Altered formation of hemichannels and gap junction channels caused by C-terminal connexin-32 mutations. Castro C, Gómez-Hernandez JM, Silander K, Barrio LC,. 1999, Journal of Neuroscience, Vol. 19(10):3752-60. 159. Intracellular calcium changes trigger connexin 32 hemichannel opening. De Vuyst E, Decrock E, Cabooter L, Dubyak GR, Naus CC, Evans WH, Leybaert L,. 2006, EMBO Journal, Vol. 25(1): p. 34-44. 160. Emerging complexities in identity and function of glial connexins. Theis M, Sohl G, Eiberger J, Willecke K. 2005, Trends in Neuroscience. 161. Connexin mutations in X-linked Charcot-Marie-Tooth disease. Bergoffen J, Scherer SS, Wang S, Scott MO, Bone LJ, Paul DL, Chen K, Lensch MW, Chance PF, Fischbeck KH,. 1993, Science, Vol. 262(5142): p. 2039-42. 162. Connexin32 is a myelin-related protein in the PNS and CNS.
284
Scherer SS, Deschênes SM, Xu YT, Grinspan JB, Fischbeck KH, Paul DL,. 1995, Journal of Neuroscience, Vol. 15(12): p. 8281-94. 163. Functional gap junctions in the schwann cell myelin sheath. Balice-Gordon RJ, Bone LJ, Scherer SS,. 1998, Journal of Cell Biology, Vol. 142(4): p. 1095-104. 164. Mutations in connexin 32: the molecular and biophysical bases for the X-linked form of Charcot-Marie-Tooth disease. Abrams CK, Oh S, Ri Y, Bargiello TA,. 2000, Brain Research Reviews, Vol. 32(1): p. 203-14. 165. Selective defects in channel permeability associated with Cx32 mutations causing X-linked Charcot-Marie-Tooth disease. Bicego M, Morassutto S, Hernandez VH, Morgutti M, Mammano F, D'Andrea P, Bruzzone R,. 2006, Neurobiology of Disease, Vol. 21(3): p. 607-17. 166. Connexin channels in Schwann cells and the development of the X-linked form of Charcot-Marie-Tooth disease. Brain . Ressot C, Bruzzone R,. 2000, Brain Research Reviews, Vol. 32(1): p. 192-202. 167. Missense mutation (R15W) of the connexin32 gene in a family with X chromosomal Charcot-Marie-Tooth neuropathy with only female family members affected. Wicklein EM, Orth U, Gal A, Kunze K,. 1997, Journal of Neurology, Neurosurgery, and Psychiatry, Vol. 63:379–381. 168. Cellular mechanisms of connexin32 mutations associated with CNS manifestations. Kleopa KA, Yum SW, Scherer SS,. 2002, Journal of Neuroscience Research, Vol. 68(5): p. 522-34. 169. A novel Cx32 mutation causes X-linked Charcot-Marie-Tooth disease with brainstem involvement and brain magnetic resonance spectroscopy abnormalities. Murru MR, Vannelli A, Marrosu G, Cocco E, Corongiu D, Tranquilli S, Cherchi MV, Mura M, Barberini L, Mallarini G, Marrosu MG,. 2006, Neurology Sciences, Vol. 27(1): p. 18-23. 170. Human Connexin 32, a gap junction protein altered in the X-
285
linked form of Charcot-Marie-Tooth disease, is directly regulated by the transcription factor SOX10. Bondurand N, Girard M, Pingault V, Lemort N, Dubourg O, Goossens M,. 2001, Human Molecular Genetics, Vol. 10(24): p. 2783-95. 171. Connexin 32 promoter P2 mutations: a mechanism of peripheral nerve dysfunction. Houlden H, Girard M, Cockerell C, Ingram D, Wood NW, Goossens M, Walker RW, Reilly MM,. 2004, Annals of Neuroscience, Vol. 56(5): p. 730-4. 172. Defective propagation of signals generated by sympathetic nerve stimulation in the liver of connexin32-deficient mice. Nelles E, Bützler C, Jung D, Temme A, Gabriel HD, Dahl U, Traub O, Stümpel F, Jungermann K, Zielasek J, Toyka KV, Dermietzel R, Willecke K,. 1996, PNAS, Vol. 93(18): p. 9565-70. 173. Connexin 32 gap junctions enhance stimulation of glucose output by glucagon and noradrenaline in mouse liver. Stümpel F, Ott T, Willecke K, Jungermann K. 1998, Hepathology, Vol. 28(6): p. 1616-20. 174. High incidence of spontaneous and chemically induced liver tumors in mice deficient for connexin32. Temme A, Buchmann A, Gabriel HD, Nelles E, Schwarz M, Willecke K,. 1997, Current Biology, Vol. 7(9): p. 713-6. 175. Connexin32-null mice develop demyelinating peripheral neuropathy. Scherer SS, Xu YT, Nelles E, Fischbeck K, Willecke K, Bone LJ,. 1998, Glia, Vol. 24(1): p. 8-20. 176. Structural abnormalities and deficient maintenance of peripheral nerve myelin in mice lacking the gap junction protein connexin 32. Anzini P, Neuberg DH, Schachner M, Nelles E, Willecke K, Zielasek J, Toyka KV, Suter U, Martini R,. 1997, Journal of Neuroscience, Vol. 17(12): p. 4545-51. 177. Transgenic expression of human connexin32 in myelinating Schwann cells prevents demyelination in connexin32-null mice. Scherer SS, Xu YT, Messing A, Willecke K, Fischbeck KH, Jeng
286
LJ,. 2005, Journal of Neuroscience, Vol. 25(6): p. 1550-9. 178. Journal of Biochemistry Cell Biology. KR, Jessen. 2004, Glial cells, Vol. 36(10): p. 1861-7. 179. Signals that determine Schwann cell identity. Jessen KR, Mirsky R,. 2002, Journal of Anatomy, Vol. 200(4): p. 367-76. 180. Schwann cells: origins and role in axonal maintenance and regeneration. Bhatheja K, Field J,. 2006, Journal of Biochemistry Cell Biology, Vol. 38(12): p. 1995-9. 181. The origin and development of glial cells in peripheral nerves. Jessen KR, Mirsky R,. 2005, Nature Reviews in Neuroscience, Vol. 6(9): p. 671-82. 182. Target size regulates calibre and myelination of sympathetic axons. Voyvodic JT. 1989, Nature, Vol. 342(6248): p. 430-3. 183. Molecular anatomy and genetics of myelin proteins in the peripheral nervous system. Snipes GJ, Suter U,. 1995, Journal of Anatomy, Vol. 186 ( Pt 3): p. 483-94. 184. On the molecular architecture of myelinated fibers. Arroyo EJ, Scherer SS,. 2000, Histochemistry Cell Biology, Vol. 113(1): p. 1-18. 185. Density of sodium channels in mammalian myelinated nerve fibers and nature of the axonal membrane under the myelin sheath. Ritchie JM, Rogart RB,. 1977, PNAS, Vol. 74(1): p. 211-5. 186. Localization of sodium/potassium adenosine triphosphatase in multiple cell types of the murine nervous system with antibodies raised against the enzyme from kidney. Ariyasu RG, Nichol JA, Ellisman MH,. 1985, Journal of Neuroscience, Vol. 5(10): p. 2581-96. 187. The axonal membrane protein Caspr, a homologue of neurexin IV, is a component of the septate-like paranodal junctions that assemble during myelination. Einheber S, Zanazzi G, Ching W, Scherer S, Milner TA, Peles E, Salzer JL,. 1997, Journal of Cell Biology, Vol. 139(6): p. 1495-506. 188. Paranodin, a glycoprotein of neuronal paranodal membranes. Menegoz M, Gaspar P, Le Bert M, Galvez T, Burgaya F, Palfrey C,
287
Ezan P, Arnos F, Girault JA,. 1997, Neuron, Vol. 19(2): p. 319-31. 189. Caspr2, a new member of the neurexin superfamily, is localized at the juxtaparanodes of myelinated axons and associates with K+ channels. Poliak S, Gollan L, Martinez R, Custer A, Einheber S, Salzer JL, Trimmer JS, Shrager P, Peles E,. 1999, Neuron, Vol. 24(4):1037-47. 190. Potassium channels in nodal and internodal axonal membrane of mammalian myelinated fibres. Chiu SY, Ritchie JM,. 1980, Nature, Vol. 284(5752): p. 170-1. 191. Ion channel redistribution and function during development of the myelinated axon. Vabnick I, Shrager P,. 1998, Journal of Neurobiology, Vol. 37(1): p. 80-96. 192. Deletion of the K(V)1.1 potassium channel causes epilepsy in mice. Smart SL, Lopantsev V, Zhang CL, Robbins CA, Wang H, Chiu SY, Schwartzkroin PA, Messing A, Tempel BL,. 1998, Neuron, Vol. 20(4): p. 809-19. 193. Temperature-sensitive neuromuscular transmission in Kv1.1 null mice: role of potassium channels under the myelin sheath in young nerves. Zhou L, Zhang CL, Messing A, Chiu SY,. 1998, Journal of Neuroscience, Vol. 18(18): p. 7200-15. 194. Connexin32-containing gap junctions in Schwann cells at the internodal zone of partial myelin compaction and in Schmidt-Lanterman incisures. Meier C, Dermietzel R, Davidson KG, Yasumura T, Rash JE,. 2004, Journal of Neuroscience, Vol. 24(13): p. 3186-98. 195. Gating characteristics of a steeply voltage-dependent gap junction channel in rat Schwann cells. Chanson M, Chandross KJ, Rook MB, Kessler JA, Spray DC,. 1993, Journal of General Physiology, Vol. 102(5): p. 925-46. 196. The mouse gap junction gene connexin29 is highly expressed in sciatic nerve and regulated during brain development. Söhl G, Eiberger J, Jung YT, Kozak CA, Willecke K,. 2001, Biology
288
Cemistry, Vol. 382(6): p. 973-8. 197. Analysis of connexin expression during mouse Schwann cell development identifies connexin29 as a novel marker for the transition of neural crest to precursor cells. Li J, Habbes HW, Eiberger J, Willecke K, Dermietzel R, Meier C,. 2007, Glia, Vol. 55(1): p. 93-103. 198. Connexin29 is uniquely distributed within myelinating glial cells of the central and peripheral nervous systems. Altevogt BM, Kleopa KA, Postma FR, Scherer SS, Paul DL,. 2002, Neuroscience, Vol. 22(15): p. 6458-70. 199. Connexin29 expression, immunocytochemistry and freeze-fracture replica immunogold labelling (FRIL) in sciatic nerve. Li X, Lynn BD, Olson C, Meier C, Davidson KG, Yasumura T, Rash JE, Nagy JI,. 2002, European Journal of Neuroscience, Vol. 16(5): p. 795-806. 200. Connexin43 is another gap junction protein in the peripheral nervous system. Yoshimura T, Satake M, Kobayashi T,. 1996, Journal of Neurochemistry, Vol. 67(3): p. 1252-8. 201. Multiple connexin expression in peripheral nerve, Schwann cells, and Schwannoma cells. Mambetisaeva ET, Gire V, Evans WH,. 1999, Journal of Neuroscience Research, Vol. 57(2): p. 166-75. 202. Altered connexin expression after peripheral nerve injury. Chandross KJ, Kessler JA, Cohen RI, Simburger E, Spray DC, Bieri P, Dermietzel R,. 1996, Molecular Cell Neuroscience, Vol. 7(6): p. 501-18. 203. Connexin 43 gap junction proteins are up-regulated in remyelinating spinal cord. Roscoe WA, Messersmith E, Meyer-Franke A, Wipke B, Karlik SJ,. 2007, Journal of Neuroscience Research, Vol. 85(5): p. 945-53. 204. Understanding Schwann cell-neurone interactions: the key to Charcot-Marie-Tooth disease? . Maier M, Berger P, Suter U,. 2002, Journal of Anatomy, Vol. 200(4): p. 357-66. 205. Silencing of the Charcot-Marie-Tooth associated MTMR2 gene
289
decreases proliferation and enhances cell death in primary cultures of Schwann cells. . Chojnowski A, Ravisé N, Bachelin C, Depienne C, Ruberg M, Brugg B, Laporte J, Baron-Van Evercooren A, LeGuern E,. 2007, Neurobiology of Disease, Vol. 26(2): p. 323-31. 206. Schwann cells and the pathogenesis of inherited motor and sensory neuropathies (Charcot-Marie-Tooth disease). Berger P, Niemann A, Suter U,. 2006, Glia, Vol. 54(4): p. 243-57. 207. ATP stimulation of P2X(7) receptors activates three different ionic conductances on cultured mouse Schwann cells. Colomar A, Amedee T,. 2001, European Journal of Neuroscience, Vol. 14(6): p. 927-36. 208. Schwann cells exhibit P2Y purinergic receptors that regulate intracellular calcium and are up-regulated by cyclic AMP analogues. Lyons SA, Morell P, McCarthy KD,. 1994, Journal of Neurochemistry, Vol. 63(2): p. 552-60. 209. Electrophysiology of mammalian Schwann cells. Baker MD. 2002, Progress in Biophysics and Molecular Biology, Vol. 78(2-3): p. 83-103. 210. Response of Schwann cells to action potentials in development. Stevens B, Fields RD,. 2000, Science, Vol. 287(5461): p. 2267-71. 211. Differences in the sensitivity to purinergic stimulation of myelinating and non-myelinating Schwann cells in peripheral human and rat nerve. Mayer C, Quasthoff S, Grafe P,. 1998, Glia, Vol. 23(4): p. 374-82. 212. ATP: an extracellular signaling molecule between neurons and glia. Fields RD, Stevens B,. 2000, Trends in Neuroscience, Vol. 23(12): p. 625-33. 213. Purinergic signalling in neuron-glia interactions. Fields RD, Burnstock G,. 2006, Nature Reviews in Neuroscience, Vol. 7(6): p. 423-36. 214. Secretion of ATP from Schwann cells in response to uridine triphosphate. Liu GJ, Werry EL, Bennett MR,. 2005, The European Journal of Neuroscience, Vol. 21(1): p. 151-60.
290
215. ATP secretion from nerve trunks and Schwann cells mediated by glutamate. Liu GJ, Bennett MR,. 2003, Neuroreport, Vol. 14(16): p. 2079-83. 216. Newborn hearing screening--a silent revolution. Morton CC, Nance WE. 2006, The new england journal o f medicine, Vol. 354(20):2151-64. 217. Connexin 26 mutations in autosomal recessive deafness disorders: A review. Apps SA, Rankin WA, Kurmis AP,. 2007, International Journal of Audiology. 218. Forty-six genes causing nonsyndromic hearing impairment: which ones should be analyzed in DNA diagnostics? Hilgert N, Smith RJ, Van Camp G,. 2009, Mutation research, Vol. 681(2-3):189-96. 219. Smith RJH, Hildebrand MS, Van Camp G,. Deafness and Hereditary Hearing Loss Overview. Gene Reviews, 1999. http://www.ncbi.nlm.nih.gov/bookshelf/br.fcgi?book=gene&part=deafness-overview. 220. A gene for a dominant form of non-syndromic sensrineural deafness (DFNA11) maps within the region containing the DFNB2 recessive deafness gene. Tamagawa Y, Kitamura K, Ishida T, Ishikawa K, Tanaka H, Tsuji S, Nishizawa M,. 1996, Human Molecular Genetics, Vol. 6:849-5. 221. Smith RJH, Van Camp G,. Nonsyndromic Hearing Loss and Deafness, DFNB1. Gene Reviews, 1999. http://www.ncbi.nlm.nih.gov/ bookshelf/br.fcgi?book=gene&part=dfnb1. 222. Molecular epidemiology of DFNB1 deafness in France. Roux AF, Pallares-Ruiz N, Vielle A, Faugère V, Templin C, Leprevost D, Artières F, Lina G, Molinari N, Blanchet P, Mondain M, Claustres M,. 2004, BMC Medical Genetics, Vol. Mar 6;5:5. 223. Smith RJH, Sheffield AM, Van Camp G,. Nonsyndromic Hearing Loss and Deafness, DFNA3. Gene Reviews, 1998. http://www.ncbi.nlm.nih.gov/bookshelf/br.fcgi?book=gene&part=dfna3 224. Harris J, Stephens M,. Deafblindness; otology and auditory
291
impairment; ophthalmology and visual impairment. 1997. http://www.pacifier.com/~mstephe/irddb.htm. 225. Zygote Media Group, Inc. 3DScience. 2010. http://www.3dscience.com/3D_Models/Human_Anatomy/Sensory/Inner_Ear.php. 226. Supporting sensory trnsduction: cochlear fluid homeostasis and the cochlear potential. Wangemann P. 2006, Journal of Physiology, Vol. 576.1:11-21. 227. Recherches sur l'organe de Corti de l'ouïe des mammifères. Corti A. 1851, Zeitschrift fur Wissenschaftliche Zoologie, Vol. 3: 1-106. 228. Connexins 26 and 30 are co-assembled to form gap junctions in the cochlea of mice. Ahmad S, Shanping Chen, Jianjun Sun, Xi Lin,. 2003, Biochemical and Biophysical Research Communications. 229. Gap Junctions in the Inner Ear: Comparison of Distribution Patterns in Different Vertebrates and Assessement of Connexin Composition in Mammals. Forge A, Becker D, Casalotti, Edwards J, Marziano N, Nevill G,. 2003, The Journal of Comparative Neurology, Vol. 467:207–231. 230. Cochlear gap junctions coassembled from Cx26 and 30 show faster intercellular Ca2+ signaling than homomeric counterparts. Sun J, Ahmad S, Chen S, Tang W, Zhang Y, Chen P, Lin X,. 2005, American Journal of Physiology - Cell Physiology, Vol. 288(3):C613-23. 231. Breedlove et al. The Human Ear. Biological Psychology, 2007. http://www.sumanasinc.com/webcontent/animations/content/soundtransduction.html. 232. How is the highly positive endocochlear potential formed? The specific architecture of the stria vascularis and the roles of the ion-transport apparatus. Hibino H, Fumiaki Nin, Chizuru Tsuzuki, Yoshihisa Kurachi,. 2010, European Journal of Physiology. 233. Potassium Ion Movement in the Inner Ear: Insights from Genetic Disease and Mouse Models. Zdebik AA, Wangemann P, Jentsch TJ,.
292
2009, Physiology, Vol. 24: 307-316. 234. Mechanisms of endocochlear potential generation by stria vascularis. Salt AN, Melichar I, Thalmann R,. 1987, Laryngoscope, Vol. 97(8 Pt 1):984-91. 235. Identification and Characterization of Pannexin Expression in the Mammalian Cochlea. Wang XH, Streeter M, Liu YP, Zhao HB,. 2009, The Journal of Comparative Neurology. 236. Gap Junction Mediated Intercellular Metabolite Transfer in the Cochlea Is Compromised in Connexin30 Null Mice. Chang Q, Wenxue Tang, Shoeb Ahmad, Binfei Zhou, Xi Lin,. 2008, PLOS ONE. 237. ATP release through connexin hemichannels and gap junction transfer of second messengers propagate Ca2+ signals across the inner ear. Anselmi F, Hernandez VH, Crispino G, Seydel A, Ortolano S, Roper SD, Kessaris N, Richardson W, Rickheit G, Filippov MA, Monyer H, Mammano F,. 2008, PNAS. 238. A quantitative analysis of connexin-specific permeability differences of gap junctions expressed in HeLa transfectants and Xenopus oocytes. Cao F, Eckert R, Elfgang C, Nitsche JM, Snyder SA, Hülser DF, Willecke K, Nicholson BJ,. 1998, Journal of Cell Science, Vol. 111: 31-43. 239. Gap junctions formed by connexins 26 and 32 alone and in combination are differently affected by applied voltage. Barrio LC, Suchyna T, Bargiello T, Xui LX, Roginski RS, Bennet MVL, Nicholson BJ,. 1991, PNAS. 240. Heteromeric, but not homomeric, connexin channels are selectively permeable to inositol phosphates. Ayad WA, Locke D, Koreen IV, Harris AL,. 2006, The Journal of Biological Chemistry, Vol. 281(24):16727-39. 241. Connexin-dependent inter-cellular communication increases invasion and dissemination of Shigella in epithelial cells. Van Nhieu GT, Clair C, Bruzzone R, Mesnil M, Sansonetti P, Combettes L,.
293
2003, Nature Cell Biology. 242. Sistema eferente auditivo. Délano P, Robles I, Robles L,. 2005, Revista de Otorrinolaringología y Cirugía de Cabeza y Cuello, Vol. 65: 55-62. 243. The human deafness-associated connexin 30 T5M mutation causes mild hearing loss and reduces biochemical coupling among cochlear non-sensory cells in knock-in mice. Schütz M, Scimemi P, Majumder P, De Siati RD, Crispino G, Rodriguez L, Bortolozzi M, Santarelli R, Seydel A, Sonntag S, Ingham N, Steel KP, Willecke K, Mammano F,. 2010, Human Molecular Genetics. 244. A non-syndrome form of neurosensory, recessive deafness maps to the pericentromeric region of chromosome 13q. Guilford P, Ben Arab S, Blanchard S, Levilliers J, Weissenbach J, Belkahia A, Petit C,. 1994, Nature Genetics, p. 1:24-8. 245. Connexin 26 mutations in hereditary non-syndromic sensorineural deafness. Kelsell DP, Dunlop J, Stevens HP, Lench NJ, Liang JN, Parry G, Mueller RF, Leigh IM,. 1997, Nature, p. 387(6628):80-3. 246. Missense Mutations in GJB2 Encoding Connexin-26 Cause the Ectodermal Dysplasia Keratitis-Ichthyosis-Deafness Syndrome. Richard G, Rouan F, Willoughby CE, Brown N, Chung P, Ryynänen M, Jabs EW, Bale SJ, DiGiovanna JJ, Uitto J, Russell L,. 2002, American Journal of Human Genetics, Vol. 70(5):1341-8. 247. A novel dominant missense mutation--D179N--in the GJB2 gene (Connexin 26) associated with non-syndromic hearing loss. Primignani P, Castorina P, Sironi F, Curcio C, Ambrosetti U, Coviello DA,. 2003, Clinical Genetics, Vol. 63(6):516-21. 248. Connexin gene pathology. Richard G. 2003, Clinical and Experimental Dermatology, Vol. 28(4):397-409. 249. Novel mutations in GJB2 encoding connexin-26 in Japanese patients with keratitis-ichthyosis-deafness syndrome. Yotsumoto S, Hashiguchi T, Chen X, Ohtake N, Tomitaka A, Akamatsu H, Matsunaga K, Shiraishi S, Miura H, Adachi J, Kanzaki T,. 2003,

294
The British Journal of Dermatology, Vol. 148(4):649-53. 250. Connexin interaction patterns in keratinocytes revealed morphologically and by FRET analysis . Di WL, Gu Y, Common JE, Aasen T, O'Toole EA, Kelsell DP, Zicha D,. 2005, Journal of Cell Science, Vol. 118(Pt 7):1505-14. 251. A novel missense mutation in GJB2 disturbs gap junction protein transport and causes focal palmoplantar keratoderma with deafness . Zwart-Storm EA, Hamm H, Stoevesandt J,. 2007, Journal of Medical Genetics, Vol. 45:161–166. 252. Targeted Ablation of Connexin26 in the Inner Ear Epithelial Gap Junction Network Causes Hearing Impairment and Cell Death. Cohen-Salmon M, Ott T, Michel V, Hardelin JP, Perfettini I, Eybalin M, Wu T, Marcus DC, Wangemann P, Willecke K, Petit C. 2002, Current Biology. 253. Ionic dependence of the velocity of release of ATP from permeabilized cholinergic synaptic vesicles. González-Sistal A, Reigada D, Puchal R, Gómez de Aranda I, Elias M, Marsal J, Solsona C. 2007, Neuroscience, p. 149(2):251-5. 254. Studies on cultured rat Schwann cells I. Establishment of purified populations from cultures of peripheral nerve. Brockes JP, Fields KL, Raff MC. 1979, Brain Research, p. 165, 105-18 . 255. Schwann cells harbor the somatic NF1 mutation in neurofibromas: evidence of two different Schwann cell subpopulations. Serra E, Rosenbaum T, Winner U, Aledo R, Ars E, Estivill X, Lenard HG, Lázaro C. 2000, .Human Molecular Genetics, p. 9(20):3055-64. 256. Long-term culture and characterization of human neurofibroma-derived Schwann cells. Rosenbaum T, Rosenbaum C, Winner U, Müller HW, Lenard HG, Hanemann CO. 2000, Journal of Neuroscience Research, p. 61(5):524-32. 257. Brefeldin A: Deciphering an Enigmatic Inhibitor of Secretion. Nebenführ A, Ritzenthaler C, Robinson DG. 2002, Plant Physiology,
295
p. 130: 1102-1108. 258. Immunocytochemical localization of S-100b protein in degenerating and regenerating rat sciatic nerves. Spreca A, Rambotti MG, Rende M, Saccardi C, Aisa MC, Giambanco I, Donato R. 1989, Journal of Histochemistry and Cytochemistry, p. 37(4):441-6. 259. The gap junction cellular internet: connexin hemichannels enter the signalling limelight. Evans WH, De Vuyst E, Leybaert L. 2006, The Biochemical Journal, p. 397(1):1-14. 260. Mechanisms of secretion of ATP from cortical astrocytes triggered by uridine triphosphate. Abdipranoto A, Liu GJ, Werry EL, Bennett MR. 2003, Neuroreport, p. 14(17):2177-81. 261. Are second messengers crucial for opening the pore associated with P2X7 receptor? Faria RX, Defarias FP, Alves LA. 2005, American Journal of physiology. Cell Physiology, p. 288(2):C260-71. 262. Update on connexins and gap junctions in neurons and glia in the mammalian nervous system. Nagy JI, Dudek FE, Rash JE. 2004, Brain Research Reviews, p. 47, 191-215. 263. Receptor-mediated control of regulatory volume decrease (RVD) and apoptotic volume decrease (AVD). Okada Y, Maeno E, Shimizu T, Dezaki K, Wang J, Morishima S. 2001, The Journal of Physiology, p. 532, 3-16. 264. Autocrine signaling involved in cell volume regulation: the role of released transmitters and plasma membrane receptors. Franco R, Panayiotidis MI, Ochoa de la Paz LD. 2008, Journal of Cell Physiology, p. 216(1):14-28. 265. Specific permeability and selective formation of gap junction channels in connexin-transfected HeLa cells. Elfgang C, Eckert R, Lichtenberg-Fraté H, Butterweck A, Traub O, Klein RA, Hülser DF, Willecke K. 1995, Journal of Cell Biology, p. 129, 805-17. 266. Subconductance states of Cx30 gap junction channels: data from transfected HeLa cells versus data from a mathematical model. Vogel R, Valiunas V, Weingart R. 2006, Biophysical Journal, p. 91, 2337-
296
48. 267. Regulation of connexin43 oligomerization is saturable. Das Sarma J, Das S, Koval M. 2005, Cell Communication and Adhesion, p. 12, 237-47. 268. Biophysical characterization of gap-junction channels in HeLa cells. Eckert R, Dunina-Barkovskaya A, Hulser DF. 1993, Pflugers Arch., p. 424, 335-42. 269. Relation between ionic coupling and morphology of established cells in culture. Hulser DF, Webb DJ. 1973, Experimental Cell Research, p. 80, 210-22. 270. Brefeldin A block of integrin-dependent mechanosensitive ATP release from Xenopus oocytes reveals a novel mechanism of mechanotransduction. Maroto R, Hamill OP,. 2001, The Journal of Biological Chemistry, p. 276(26):23867-72. 271. Golgi-disturbing agents. Dinter A, Berger EG. 1998, Histochemistry Cell Biology, p. 109, 571-90. 272. Nitric oxide induces rapid, calcium-dependent release of vesicular glutamate and ATP from cultured rat astrocytes. Bal-Price A, Moneer Z, Brown GC. 2002, Glia, p. 40, 312-23. 273. Extracellular ATP mediates necrotic cell swelling in SN4741 dopaminergic neurons through P2X7 receptors. Jun DJ, Kim J, Jung SY, Song R, Noh JH, Park YS, Ryu SH, Kim JH, Kong YY, Chung JM, Kim KT. 2007, The Journal of Biological Chemistry, p. 282(52):37350-8. 274. Purines and their roles in apoptosis. Chow SC, Kass GE, Orrenius S. 1997, Neuropharmacology, p. 36, 1149-56. 275. Molecular physiology of P2X receptors. North RA. 2002, Physiology Reviews, p. 82, 1013-67. 276. Purinergic transmission in the central nervous system. North RA, Verkhratsky A. 2006, Pflugers Arch, p. 452, 479-85. 277. P2Y and P2X purinoceptor mediated Ca2+ signalling in glial cell pathology in the central nervous system. James G, Butt AM. 2002,
297
European Journal of Pharmacology, p. 447, 247-60. 278. A deletion mutation in GJB6 cooperating with a GJB2 mutation in trans in non-syndromic deafness: A novel founder mutation in Ashkenazi Jews. Lerer I, Sagi M, Ben-Neriah Z, Wang T, Levi H, Abeliovich D. 2001, Human Mutation, p. 18(5):460. 279. A large deletion including most of GJB6 in recessive non syndromic deafness: a digenic effect? Pallares-Ruiz N, Blanchet P, Mondain M, Claustres M, Roux AF. 2002, European Journal of Human Genetics, p. 1:72-6. 280. Novel mutation p.Gly59Arg in GJB6 encoding connexin 30 underlies palmoplantar keratoderma with pseudoainhum, knuckle pads and hearing loss. Nemoto-Hasebe I, Akiyama M, Kudo S, Ishiko A, Tanaka A, Arita K, Shimizu H. 2009, The British Journal of Dermatology, p. 161(2):452-5. 281. Multiple connexins contribute to intercellular communication in the Xenopus embryo. Landesman Y, Postma FR, Goodenough DA, Paul DL,. 2003, Journal of Cell Science, Vol. 1;116(Pt 1):29-38. 282. Altered molecular architecture of peripheral nerves in mice lacking the peripheral myelin protein 22 or connexin32. Neuberg DH, Sancho S, Suter U,. 1999, Journal of Neuroscience Research, Vol. 58(5): p. 612-23. 283. Altered gene expression in Schwann cells of connexin32 knockout animals. Nicholson SM, Gomès D, de Néchaud B, Bruzzone R,. 2001, Journal of Neuroscience Research, Vol. 66(1): p. 23-36. 284. Oligodendrocyte progenitor enrichment in the connexin32 null-mutant mouse. Melanson-Drapeau L, Beyko S, Davé S, Hebb AL, Franks DJ, Sellitto C, Paul DL, Bennett SA,. 2003, Journal of Neuroscience, Vol. 23(5): p. 1759-68. 285. Myelination defects and neuronal hyperexcitability in the neocortex of connexin 32-deficient mice. Sutor B, Schmolke C, Teubner B, Schirmer C, Willecke K,. 2000, Cerebral Cortex, Vol. 10(7): p. 684-97.
Top Related
Copyright © 2022 FDOKUMEN

