


Bahasa
Halaman
Hukum


CALIFORNIA
ENERGY COMMISSION
INVESTMENT PLAN FOR THE ALTERNATIVE AND RENEWABLE FUEL
AND VEHICLE TECHNOLOGY PROGRAM
C
OM
MIS
SIO
N R
EPO
RT
April 2009
CEC-600-2009-008-CMF
Arnold Schwarzenegger, Governor
DATE RECD.
DOCKET08-ALT-1
APR 30 2009

CALIFORNIA ENERGY COMMISSION Karen Douglas Chairman James D. Boyd Vice Chair Commissioners: Arthur H. Rosenfeld Jeffrey Byron Julia Levin Melissa Jones Executive Director Peter Ward Tim Olson Principal Author Charles Mizutani Manager EMERGING FUELS AND TECHNOLOGIES OFFICE Michael A. Smith Deputy Director FUELS AND TRANSPORTATION DIVISION

This report is dedicated in the memory of:
TOM ALEXANDER August 23, 1948 – April 17, 2009
With gratitude and appreciation for Tom’s talent, dedication, and cheerful nature as a pioneer for 20 years in alternative fuels and clean air transportation. As we now embark on the opportunities for a new California transportation future, Tom’s reliable and tireless efforts serve as a continuing inspiration to all those who knew him.

Acknowledgments
The authors wish to acknowledge the contributors who were key participants in preparing this report.
California Air Resources Board California Energy Commission
Gerhard Achtelik Mike Smith Analisa Bevan Jennifer Allen Tom Cackette Jared Babula Joe Calavita Panama Bartholomy Elise Keddie Kelly Birkinshaw Jack Kitowski Susan Brown Johanna Levine Darcie Chapman Meri Miles Don Coe Lucena Negrette Rhetta deMesa Andrew Panson Susan Fleming Arlene Ichien Debbie Jones Alma Karr Aleecia Macias Pilar Magaña TIAX LLC Jonah Margolis Mike Jackson Mike McCormack Matt Kromer Jim McKinney Steve Lasher Charles Mizutani Jeff Rosenfeld Tobias Muench Philip Sheehy Patty Rinaldi Larry Waterland Linda Schrupp Diana Schwyzer Dongyoung Shin Mike Trujillo Ysbrand van der Werf Joanne Vinton Carolyn Walker Malachi Weng‐Gutierrez Gary Yowell McKinley Addy Gerry Bemis
Advisory Committee Members The California Energy Commission thanks the Advisory Committee Members for guidance in helping identify the opportunities and priorities for consideration in the Investment Plan.
Bonnie Holmes‐Gen, American Lung Association
Stephen Clarke, Applied Intellectual Capital
Carla Din, Apollo Alliance
Tom Frantz, Association of Irritated Residents
Jay McKeeman, California Independent Oil Marketers Association
Gerald Secundy, California Council for Environmental and Economic Balance
Tom Cackette, California Environmental Protection Agency
Karnig Kazarian, California Business Transportation and Housing Agency
Doug Hoffner, California Labor and Workforce Development Agency
Mike Chrisman and Anthony Brunello, California Resources Agency
Rick Shedd, California Department of General Services
John Shears, Center for Energy Efficiency and Renewable Technologies
Tim Carmichael, Coalition for Clean Air
Elisa Odabashian, Consumers Union
Daniel Emmett, Energy Independence Now
Michael Walsh, International Council on Clean Transportation
Peter Cooper, Labor Federation
Will Coleman, Mohr Davidow Ventures
Roland Hwang, Natural Resources Defense Council
Jim Sweeney, Precourt Institute for Energy Efficiency
Dan Kammen, UC Berkeley Renewable and Appropriate Energy Laboratory (RAEL) Energy and Resources Group
Jananne Sharpless
David Geoffrey, Southern California Marine Association
Patricia Monahan, Union of Concerned Scientists
Participating Organizations The following organizations reviewed and commented on drafts of the Investment Plan or provided information for inclusion. Their participation enriched the development of the Investment Plan and their submitted comments improved the report. Participation does not imply endorsement of the Investment Plan.
A123 Systems
A Better Place
AC Transit District
AC Propulsion
AeroVironment, Inc.
AHL‐Tech
Air Products and Chemicals
Alameda‐Contra Costa Transit District
Alliance of Automobile Manufacturers
Alternative Fuels Consulting
Alternative Learning Corporation
Alternative Power Train/Brilliance Automotive Group
Altra Biofuels
America West Bioenergy
American Honda Motor Company
American Jewish Committee
American Palm Oil Council
Amyris Biotechnologies
ASA Inc.
Aspire Corporation
Assemblon
Association of Irritated Residents
ATTE Miramar College
ATTE West Valley
Aura Systems, Inc.
Automobile Association of America
Autumn Wind Associates
Aventine Renewables
A‐Z Bus Company
Barefoot Motors, LLC
Batley Enterprises
Bay Area Air Quality Management District
Bay Area Community College Consortium
Baytech
Biodiesel Industries, Inc
Bio Energy Producers Association
BioFuelBox
Biofuels Logistics & Terminals, LLC
Bluefire Ethanol
Blue Sun Biodiesel
Breathe LA
Bright Automotive
Bustamante and Associates
C3 Bioenergy
CP Biofuels
CR&R
California Biodiesel Alliance
California Cars Initiative
California Clean Cities Coordinators
California Community Colleges Chancellor’s Office
California Department of Consumer Affairs – Bureau of Automotive Repair
California Department of Food and Agriculture
California Department of Transportation
California Electric Transportation Coalition
California Employment Development Department
California Ethanol Vehicle Coalition
California Ethanol and Power
California Farm Bureau Federation
California Fuel Cell Partnership
California Independent Oil Marketers Association
California Labor Federation – Workforce and Economic Development Program
California Natural Gas Vehicle Coalition
California Renewable Energies LLC
California State Treasurer’s Office
California Strategies
California Workforce Investment Board
Calgren
CALSTART
Capstone Turbine Co
Cascade Sierra Solutions.
Catepillar
Center for Sustainable Energy
Charisma Consulting
Cilion Ethanol, Inc.
City of Los Angeles
Clean Energy
Clean Fuel Connection
Clean Fuel USA
Clean Power Cooperative of Nevada County
CompAir USA
Coulomb Technologies
Corn Products
County of Los Angeles
Crimson Renewable Energy
Cummins, Inc.
Cummins – Westport, Inc.
Cybertran International, Inc.
Daimler
Darling International
David Verdiner & Friends
Delta Liquid Energy
Dueco
Dunlop Group
Eaton
EDV Commercialization
EEC Energy
Energy Independence Now
Energy Recovery Group
Environmental Business Cluster – San Jose
Environmental Coalition
Environmental Defense Fund
EVT America
FedEx
Ford Motor Company
Freightliner
Friends of the Earth
Fulcrum Bioenergy
General Atomics
General Electric Marine
General Motor Corporation
Gladstein, Neandross and Associates
Global Cooling Solutions/Clean Energy Technologies
Global Electric Motorcars, LLC
Great Valley Ethanol
Haldex Hydraulics Corporation
Hydronol
Hythane Company LLC
Imperial Bioresources LLC
Imperial County
Imperial Irrigation District
Imperial Valley Biorefining, Inc.
IMPCO Technologies
International Council on Clean Transportation
International Truck and Engine Corporation
Interstate Oil Company
ISE Corporation
Senator Christine Kehoe
Kenworth Trucks
Kings Canyon USD/City of Reedley
KWJ Engineering, Inc.
Lehr, Inc.
Lightning Rod Foundation
The Linde Group
Long Beach City College
Los Angeles Valley College
Los Angeles Metropolitan Transit Authority
LS9, Inc.
Marin Climate and Energy Partnership
Monterey Bay Unified Air Pollution Control District
Monterey County
National Biodiesel Board
National Hydrogen Association
Nature’s Energy Group
Navistar, inc
New Fuels Alliance
New Leaf Biofuel
Nextfuels
Nissan North America
North State Rendering/Terra Fuels
One Cycle Control
Pacific Ethanol
Pacific Gas & Electric Company
The Partnership
Pearson Fuels
Perfect Motors Corporation
Plug‐In America
Plug Power, Inc.
Ports of Los Angeles and Long Beach
Poulsen Hybrid
Price Consulting
Progressive Auto Insurance
Propane Education and Research Council
Propel Biofuels
Rapid Force Exhaust Technology
Recreational Boaters Association
Renewable Energy Institute International
Rexroth Bosch Group
Robert Reynolds
John Reed, MD
Roush Performance
Sacramento City College
Sacramento Metropolitan Air Quality Management District
Sacramento Municipal Utility District
SANDAG
San Diego County Regional Airport Authority
San Diego Environmental Foundation
San Diego Gas & Electric
San Diego Metropolitan Transit System
San Diego UDS Committee
San Francisco International Airport
San Joaquin Air Pollution Control District
San Luis Obispo County
SEMPRA Energy
Smith Electric Vehicles
Solazyme, Inc.
Sonoma County
South Bay Cities Council of Governments
South Bay Workforce Investment Board/California Green Workforce Coalition
South Coast Air Quality Management District
Southern California Edison
Southern California Regional Transit Training Consortium
Sturman Industries
Sustainable Biodiesel Alliance
Sustainable Conservation
Sun Bioenergy LLC
Swan Biomass
Target Growth, Inc.
Teaching Green
Third Point Ventures
Thomas & Associates
Toyota Motor Corporation
Trillium USA
TS&L Seed Company
UC Berkeley Energy and Resources Group
UC Berkeley Goldman School of Public Policy
UC Davis Biomass Collaborative
UC Davis Institute for Transportation Studies
UC Irvine Advanced Power and Energy Program
UC Riverside Center for Nanoscale Science and Engineering
UC San Diego
UNICA
Unified Port of San Diego
Unimodal Skytran Systems
US Hybrids
U.S. Navy
Vectrix Corporation
Vision Motor Corporation
Waste Management Inc.
Western Propane Gas Association
Western States Petroleum Association
Westport Innovations, Inc.
Whole Energy Fuels Co.
Sean Yan
Yibon/Hugo
ZED Power Corporation
Zero Truck
i
Preface
The increased use of alternative fuels supports the state’s commitment to curb greenhouse gas emissions, reduce petroleum use, improve air quality, and stimulate the sustainable production and use of biofuels within California. Alternative transportation fuels include electricity, natural gas, biomethane, propane, hydrogen, ethanol, renewable diesel, and biodiesel fuels. State investment is needed to fill the gap and fund the differential cost of emerging fuels and vehicle technologies.
Assembly Bill (AB) 118 (Núñez, Chapter 750, Statutes of 2007) created the Alternative and Renewable Fuel and Vehicle Technology Program (program). This legislation authorizes the California Energy Commission (Energy Commission) to spend up to approximately $120 million per year over seven years to “develop and deploy innovative technologies that transform California’s fuel and vehicle types to help attain the state’s climate change policies.” The American Recovery and Reinvestments Act of 2009 presents an additional opportunity for California to build upon this program by leveraging the federal funding now available for clean technology and “green” jobs creation.
The statute, amended by Assembly Bill 109 (Núñez, Chapter 313, Statutes of 2008), directs the Energy Commission to create an advisory committee to help develop and adopt an Investment Plan to determine priorities and opportunities for the program, and describe how funding will complement existing public and private investments, including existing state and federal programs. The Energy Commission will use the Investment Plan as a guide for awarding funds. The statute calls for the Investment Plan to be updated annually.
Please use the following citation for this report:
Ward, Peter, Tim Olson, Michael A. Smith, Charles Mizutani. Investment Plan for the Alternative and Renewable Fuel and Vehicle Technology Program Commission Report. California Energy Commission CEC‐600‐2009‐008‐CMF.

ii
iii
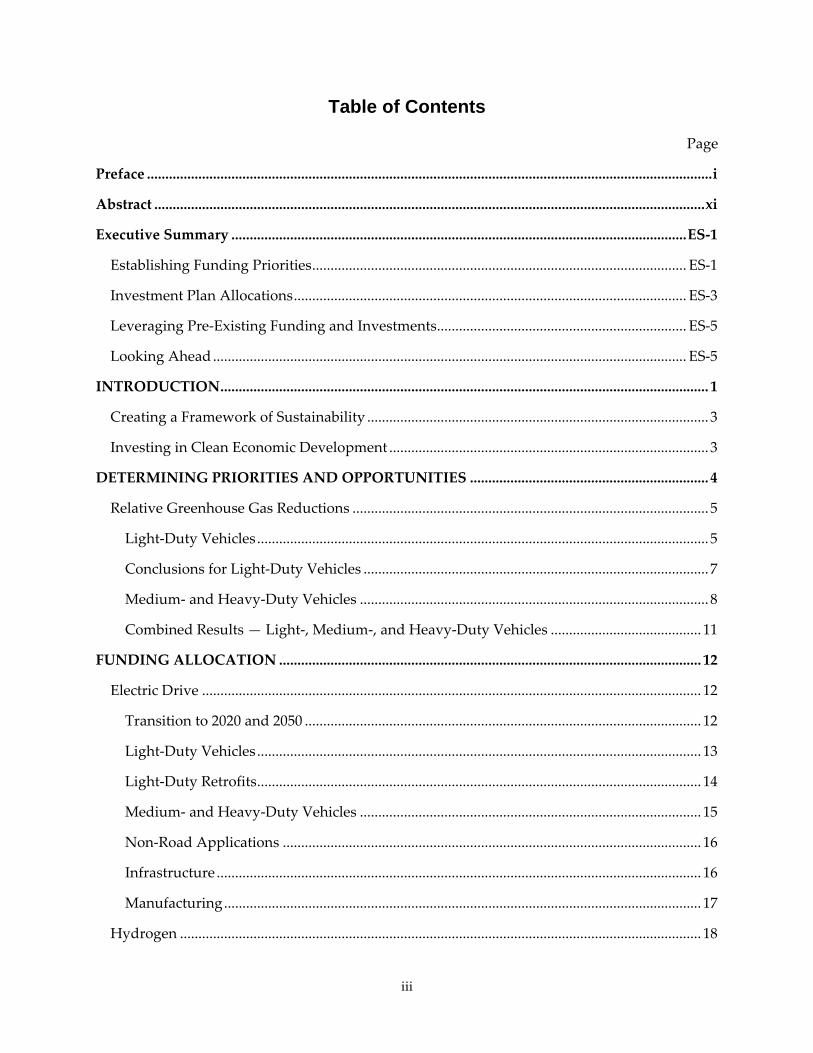
Table of Contents
Page
Preface .......................................................................................................................................................... i
Abstract ...................................................................................................................................................... xi
Executive Summary ............................................................................................................................ ES‐1
Establishing Funding Priorities ...................................................................................................... ES‐1
Investment Plan Allocations ........................................................................................................... ES‐3
Leveraging Pre‐Existing Funding and Investments .................................................................... ES‐5
Looking Ahead ................................................................................................................................. ES‐5
INTRODUCTION ..................................................................................................................................... 1
Creating a Framework of Sustainability ............................................................................................. 3
Investing in Clean Economic Development ....................................................................................... 3
DETERMINING PRIORITIES AND OPPORTUNITIES ................................................................. 4
Relative Greenhouse Gas Reductions ................................................................................................. 5
Light‐Duty Vehicles ........................................................................................................................... 5
Conclusions for Light‐Duty Vehicles .............................................................................................. 7
Medium‐ and Heavy‐Duty Vehicles ............................................................................................... 8
Combined Results — Light‐, Medium‐, and Heavy‐Duty Vehicles ......................................... 11
FUNDING ALLOCATION ................................................................................................................... 12
Electric Drive ........................................................................................................................................ 12
Transition to 2020 and 2050 ............................................................................................................ 12
Light‐Duty Vehicles ......................................................................................................................... 13
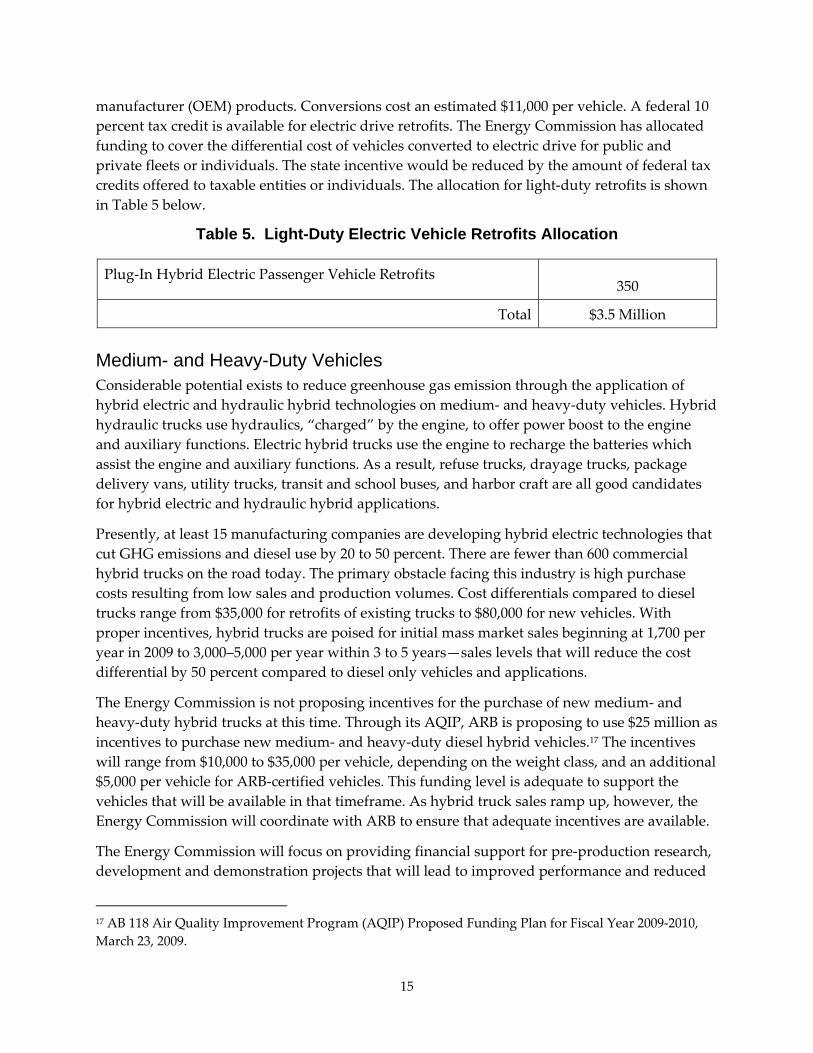
Light‐Duty Retrofits ......................................................................................................................... 14
Medium‐ and Heavy‐Duty Vehicles ............................................................................................. 15
Non‐Road Applications .................................................................................................................. 16
Infrastructure .................................................................................................................................... 16
Manufacturing .................................................................................................................................. 17
Hydrogen .............................................................................................................................................. 18
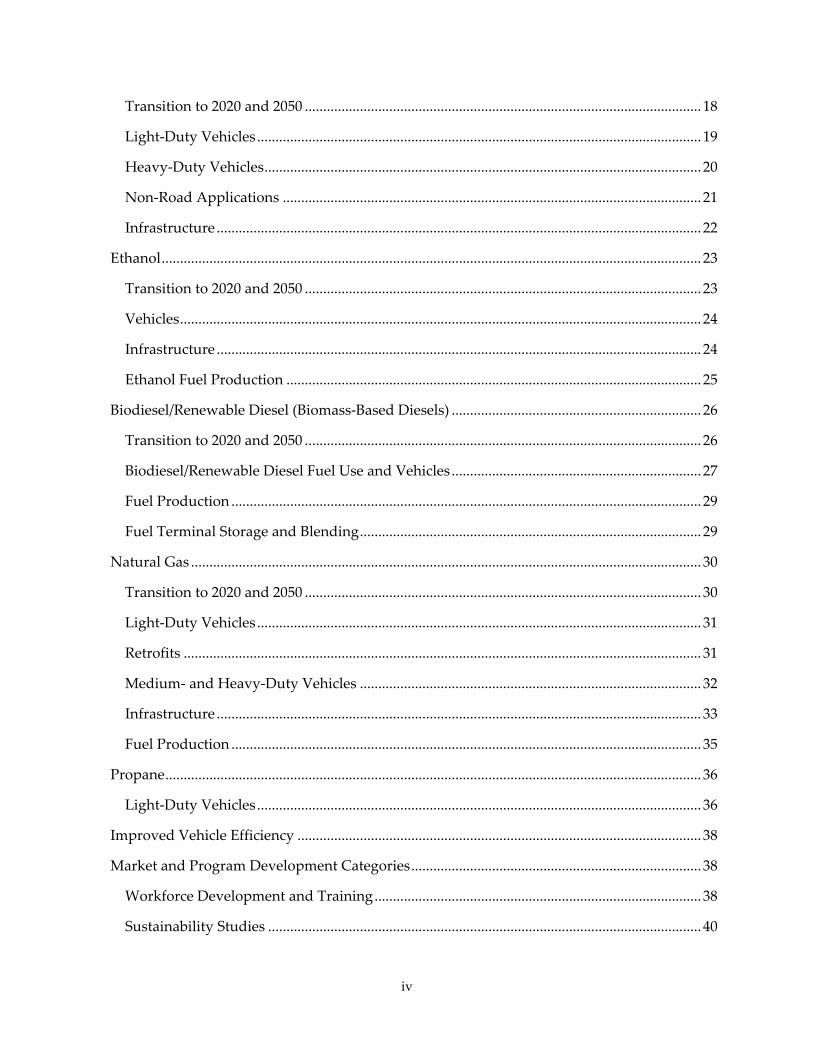
iv
Transition to 2020 and 2050 ............................................................................................................ 18
Light‐Duty Vehicles ......................................................................................................................... 19
Heavy‐Duty Vehicles ....................................................................................................................... 20
Non‐Road Applications .................................................................................................................. 21
Infrastructure .................................................................................................................................... 22
Ethanol ................................................................................................................................................... 23
Transition to 2020 and 2050 ............................................................................................................ 23
Vehicles .............................................................................................................................................. 24
Infrastructure .................................................................................................................................... 24
Ethanol Fuel Production ................................................................................................................. 25
Biodiesel/Renewable Diesel (Biomass‐Based Diesels) .................................................................... 26
Transition to 2020 and 2050 ............................................................................................................ 26
Biodiesel/Renewable Diesel Fuel Use and Vehicles .................................................................... 27
Fuel Production ................................................................................................................................ 29
Fuel Terminal Storage and Blending ............................................................................................. 29
Natural Gas ........................................................................................................................................... 30
Transition to 2020 and 2050 ............................................................................................................ 30
Light‐Duty Vehicles ......................................................................................................................... 31
Retrofits ............................................................................................................................................. 31
Medium‐ and Heavy‐Duty Vehicles ............................................................................................. 32
Infrastructure .................................................................................................................................... 33
Fuel Production ................................................................................................................................ 35
Propane .................................................................................................................................................. 36
Light‐Duty Vehicles ......................................................................................................................... 36
Improved Vehicle Efficiency .............................................................................................................. 38
Market and Program Development Categories ............................................................................... 38
Workforce Development and Training ......................................................................................... 38
Sustainability Studies ...................................................................................................................... 40

v
Standards and Certification ............................................................................................................ 44
Public Education and Outreach ..................................................................................................... 45
Technical Assistance and Environmental/Market/Technology Analyses ................................ 47
Funding Allocation Table ................................................................................................................... 48
APPENDIX A: Analytical Method for Determining Funding Priorities and Opportunities . A‐1
APPENDIX B: Analytical Method for Establishing Funding Priorities and Opportunities .. B‐1
Analysis for Medium‐ and Heavy‐Duty Vehicles ..................................................................... B‐1
Carbon Content Calculation ......................................................................................................... B‐1
Initial Transportation Fuel Demand Forecast ............................................................................ B‐3
Emission Reduction Strategies ..................................................................................................... B‐4
Vehicle Miles Traveled Reduction Strategies ............................................................................. B‐5
Low‐Carbon Fuel Standard .......................................................................................................... B‐6
Fuel Economy Gain ........................................................................................................................ B‐7
Introduction of Emerging Fuels ................................................................................................... B‐9
Medium‐ and Heavy‐Duty Vehicle Analysis Conclusions .................................................... B‐10
APPENDIX C: Gap Analysis For The AB 118 Program ................................................................. C‐1
APPENDIX D: Important References for Program Development .............................................. D‐1

vi
vii
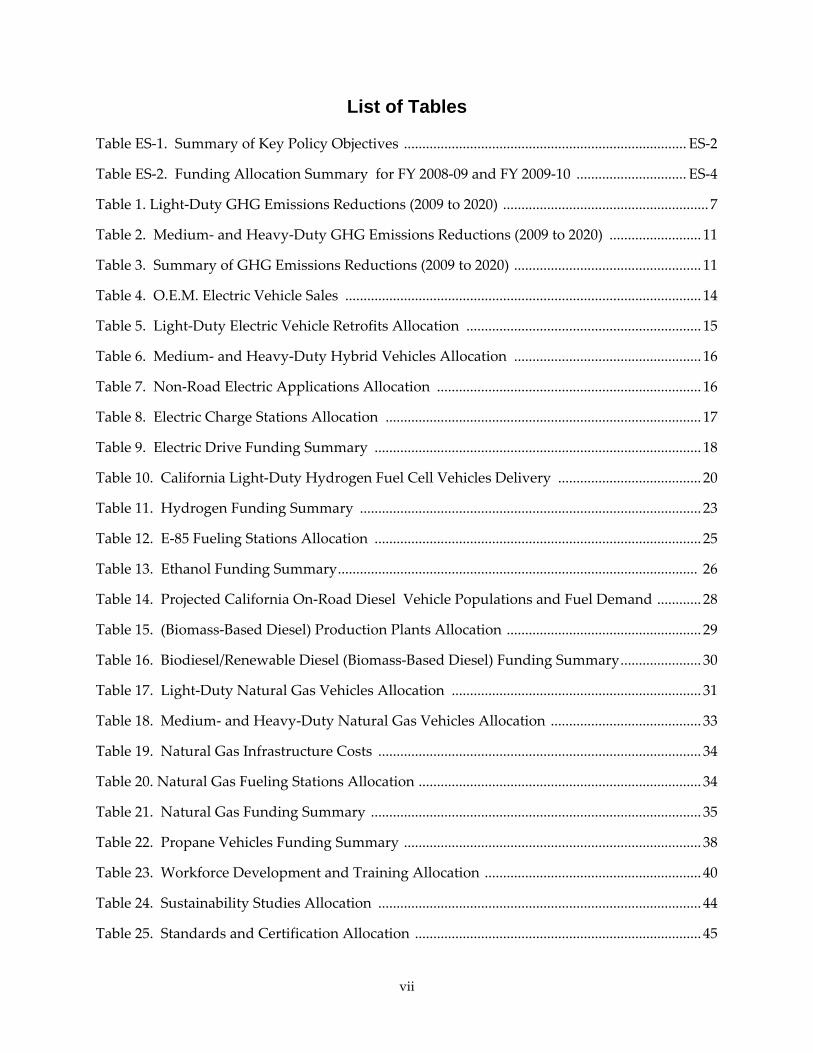
List of Tables
Table ES‐1. Summary of Key Policy Objectives ............................................................................. ES‐2
Table ES‐2. Funding Allocation Summary for FY 2008‐09 and FY 2009‐10 .............................. ES‐4
Table 1. Light‐Duty GHG Emissions Reductions (2009 to 2020) ........................................................ 7
Table 2. Medium‐ and Heavy‐Duty GHG Emissions Reductions (2009 to 2020) ......................... 11
Table 3. Summary of GHG Emissions Reductions (2009 to 2020) ................................................... 11
Table 4. O.E.M. Electric Vehicle Sales ................................................................................................. 14
Table 5. Light‐Duty Electric Vehicle Retrofits Allocation ................................................................ 15
Table 6. Medium‐ and Heavy‐Duty Hybrid Vehicles Allocation ................................................... 16
Table 7. Non‐Road Electric Applications Allocation ........................................................................ 16
Table 8. Electric Charge Stations Allocation ...................................................................................... 17
Table 9. Electric Drive Funding Summary ......................................................................................... 18
Table 10. California Light‐Duty Hydrogen Fuel Cell Vehicles Delivery ....................................... 20
Table 11. Hydrogen Funding Summary ............................................................................................. 23
Table 12. E‐85 Fueling Stations Allocation ......................................................................................... 25
Table 13. Ethanol Funding Summary .................................................................................................. 26
Table 14. Projected California On‐Road Diesel Vehicle Populations and Fuel Demand ............ 28
Table 15. (Biomass‐Based Diesel) Production Plants Allocation ..................................................... 29
Table 16. Biodiesel/Renewable Diesel (Biomass‐Based Diesel) Funding Summary ...................... 30
Table 17. Light‐Duty Natural Gas Vehicles Allocation .................................................................... 31
Table 18. Medium‐ and Heavy‐Duty Natural Gas Vehicles Allocation ......................................... 33
Table 19. Natural Gas Infrastructure Costs ........................................................................................ 34
Table 20. Natural Gas Fueling Stations Allocation ............................................................................. 34
Table 21. Natural Gas Funding Summary .......................................................................................... 35
Table 22. Propane Vehicles Funding Summary ................................................................................. 38
Table 23. Workforce Development and Training Allocation ........................................................... 40
Table 24. Sustainability Studies Allocation ........................................................................................ 44
Table 25. Standards and Certification Allocation .............................................................................. 45
viii
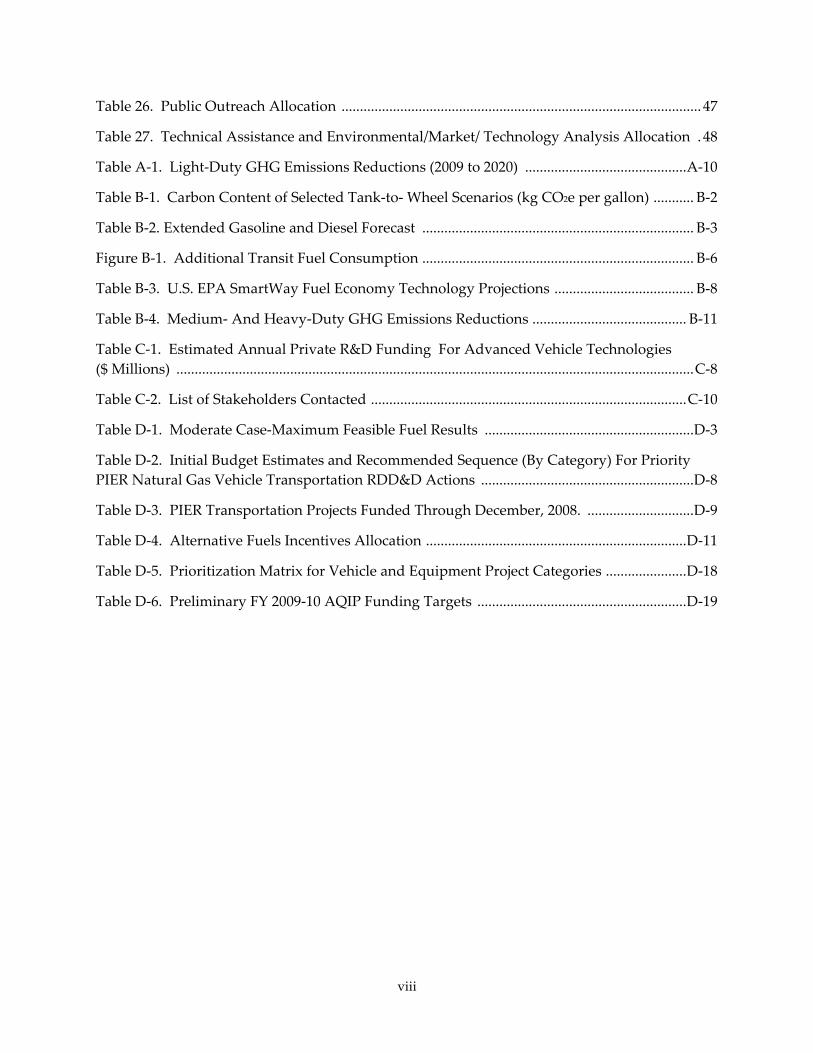
Table 26. Public Outreach Allocation .................................................................................................. 47
Table 27. Technical Assistance and Environmental/Market/ Technology Analysis Allocation . 48
Table A‐1. Light‐Duty GHG Emissions Reductions (2009 to 2020) ............................................ A‐10
Table B‐1. Carbon Content of Selected Tank‐to‐ Wheel Scenarios (kg CO2e per gallon) ........... B‐2
Table B‐2. Extended Gasoline and Diesel Forecast .......................................................................... B‐3
Figure B‐1. Additional Transit Fuel Consumption .......................................................................... B‐6
Table B‐3. U.S. EPA SmartWay Fuel Economy Technology Projections ...................................... B‐8
Table B‐4. Medium‐ And Heavy‐Duty GHG Emissions Reductions .......................................... B‐11
Table C‐1. Estimated Annual Private R&D Funding For Advanced Vehicle Technologies ($ Millions) ............................................................................................................................................. C‐8
Table C‐2. List of Stakeholders Contacted ...................................................................................... C‐10
Table D‐1. Moderate Case‐Maximum Feasible Fuel Results ......................................................... D‐3
Table D‐2. Initial Budget Estimates and Recommended Sequence (By Category) For Priority PIER Natural Gas Vehicle Transportation RDD&D Actions .......................................................... D‐8
Table D‐3. PIER Transportation Projects Funded Through December, 2008. ............................. D‐9
Table D‐4. Alternative Fuels Incentives Allocation ....................................................................... D‐11
Table D‐5. Prioritization Matrix for Vehicle and Equipment Project Categories ...................... D‐18
Table D‐6. Preliminary FY 2009‐10 AQIP Funding Targets ......................................................... D‐19
ix
List of Figures
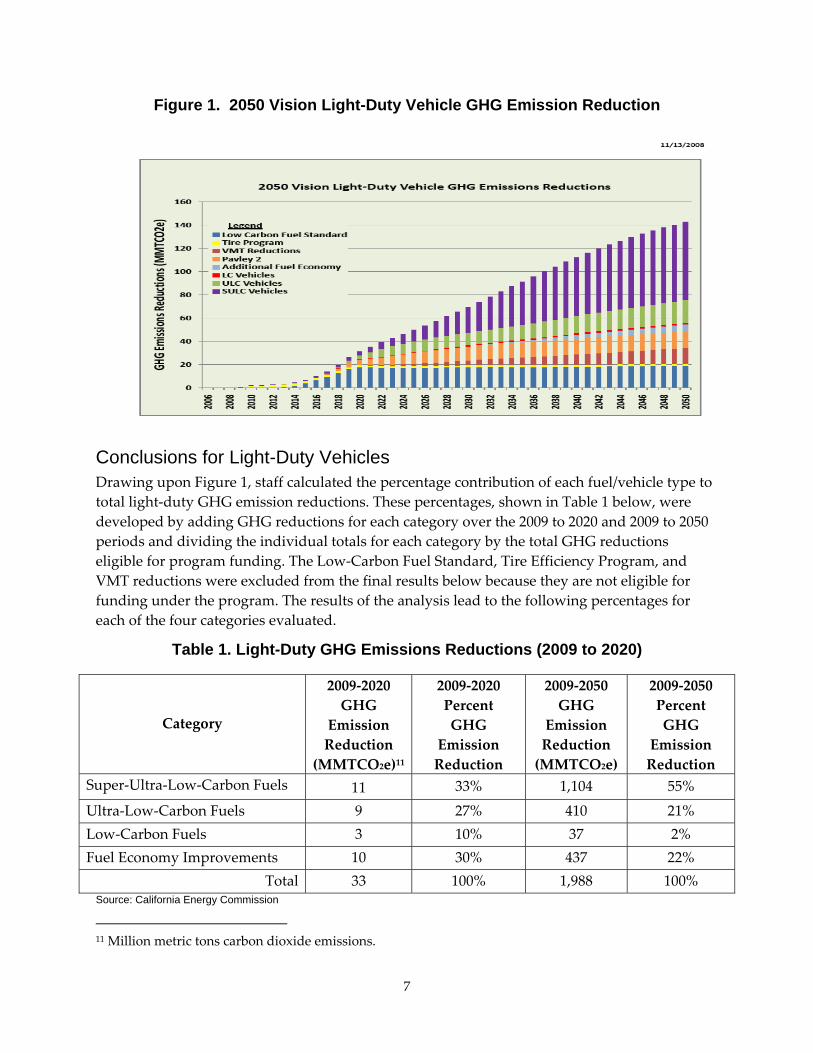
Figure 1. 2050 Vision Light‐Duty Vehicle GHG Emission Reduction .............................................. 7
Figure 2. California Light Duty Vehicle GHG Emissions ................................................................... 8
Figure 3. Estimated GHG Reductions from Each of the Four Categories ..................................... 10
Figure A‐1: California LDV GHG Emissions ................................................................................... A‐8
Figure A‐2. 2050 Vision Light‐Duty Vehicle GHG Emissions Reductions ................................... A‐9
Figure B‐2. GHG Reductions From Emerging Fuels ..................................................................... B‐10
Figure C‐1. Total Estimate Annual Investment In Advanced Vehicle Technologies ................. C‐1
Figure C‐2. Federal Agencies Projected FY 2009 Funding and Credits ........................................ C‐5
Figure C‐3. Estimated Annual Federal Investment in Advanced Vehicle Technologies .......... C‐6
Figure C‐4. Estimated Annual State Investment In Advanced Vehicle Technologies .............. C‐7
Figure C‐5. Estimated Annual Private Investment In Advanced Vehicle Technologies .......... C‐9

x
xi
Abstract
The Investment Plan for the Assembly Bill (AB)118 (Núñez, Chapter 750, Statutes of 2007) Alternative and Renewable Fuel and Vehicle Technology Program serves as the guidance document for the allocation of program funding and is prepared annually based on input and advice of the AB 118 Advisory Committee. This first Investment Plan covers the first two years of the program, and details how the California Energy Commission (Energy Commission) and the Advisory Committee determined the priorities and opportunities for funding, consistent with the program’s purpose “to develop and deploy innovative technologies that transform California’s fuel and vehicle types to help attain the state’s climate change policies”. The Investment Plan also reflects laws, executive orders and policies to reduce petroleum use and increase alternative fuel use and spur the development of bioenergy sources in California (Governor’s Executive Order S‐06‐06).
The Investment Plan describes the analytical method used to assure greenhouse gas (GHG) reductions for the Assembly Bill 32 target of 2020, and beyond to 2050; the Market and Program Development funding allocations for the program; and the gap analysis showing where funding is most useful and productive. It provides proposed funding recommendations, based on the analyses and identified opportunities, for the first two years of the program. Appendices A through D include all the supporting analyses and important references for the development of this seven‐year incentive program to help transform California’s transportation sector to a low‐carbon, cleaner, non‐petroleum, and more efficient future.
Keywords: California Energy Commission, Alternative and Renewable Fuel and Vehicle Technology Program, Alternative Transportation Fuels, Investment Plan, Electric Drive, Hydrogen, Biodiesel/Renewable Diesel/Ethanol, Natural Gas, Propane, Workforce Training, Vehicle Efficiency, Sustainability Vehicles, Fueling Stations, Fuel Production, Fuel Storage and Blending, Biofuels, Biomethane

xii
ES‐1
Executive Summary It begins with energy. We know the country that harnesses the power of clean, renewable energy will lead the 21st century…
President Barack Obama’s Address to Congress, February 24, 2009
Assuring the health and life of planet Earth will require the marshalling of resources, governments, and innovation to reverse the catastrophic trends that many human technologies and lifestyles have brought to bear. As part of a massive effort to reverse this environmental damage, California is embarking on a fundamental transformation of its transportation system that will substantially decrease greenhouse gas (GHG) emissions and petroleum use.
The California Energy Commission (Energy Commission), in response to recent legislation,1 is implementing the Alternative and Renewable Fuel and Vehicle Technology Program (program) to develop and deploy alternative and renewable fuel and advanced transportation technologies to achieve the state’s climate change policies, reduce petroleum use, increase the use of alternative fuels and spur the development of in‐state bioenergy sources. The program also will provide a foundation for the sustainable development and use of transportation energy and an economic stimulus to create California jobs and businesses by encouraging the invention and production of the technologies and services necessary for the future transportation system. This seven‐year program is funded at up to $120 million per year. Although significant, the funding needed to transform California’s transportation system is far greater than what the program provides and requires the Energy Commission to effectively leverage its funding with other agencies and private industry. This Investment Plan provides the guidance and rationale for the allocation of program funding.
Establishing Funding Priorities In this landmark program, the Energy Commission will provide funding to accelerate the development and deployment of clean, efficient low‐carbon technologies that will achieve several key policy objectives summarized in Table ES‐1 below. Achieving these multiple objectives will require a portfolio of fuels and vehicle technologies including the development of electric drive and fuel cell vehicles, the production of low‐carbon biofuels, increased vehicle efficiency, and the continued deployment of natural gas and propane vehicles.
1 Assembly Bill 118 (Núñez, Chapter 750, Statutes of 2007) and Assembly Bill 109 (Núñez, Chapter 351, Statutes of 2008).
ES‐2
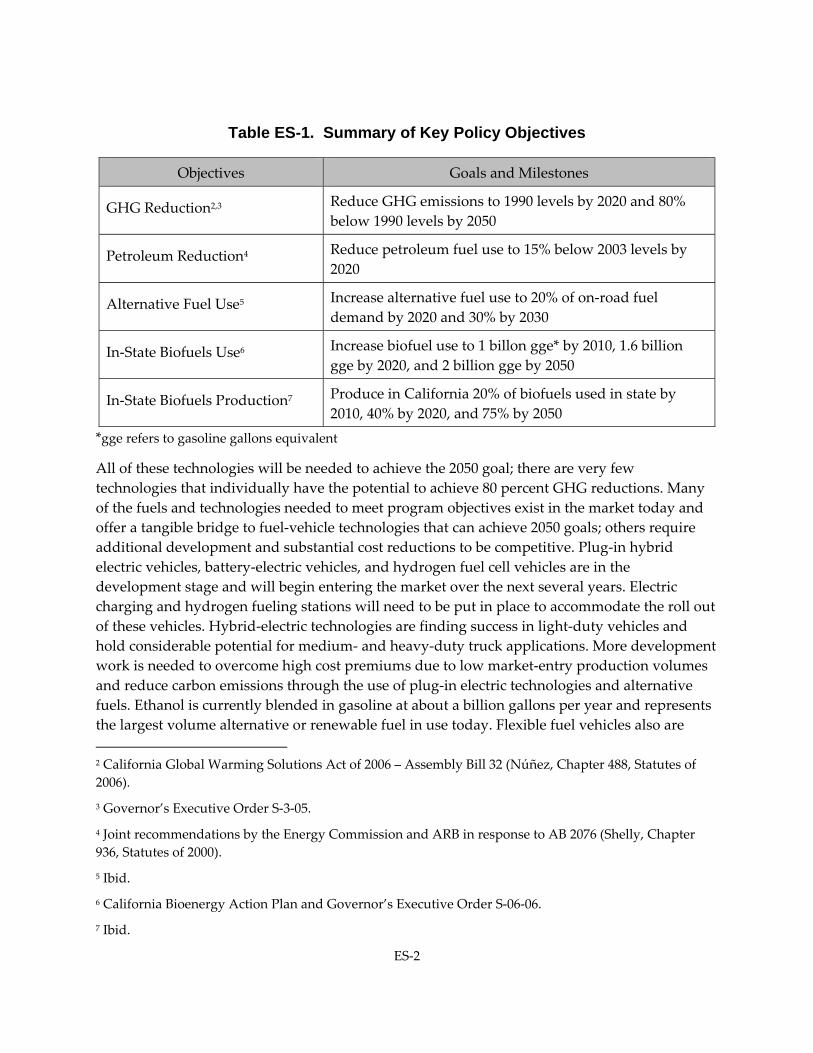
Table ES-1. Summary of Key Policy Objectives
Objectives Goals and Milestones
GHG Reduction2,3 Reduce GHG emissions to 1990 levels by 2020 and 80% below 1990 levels by 2050
Petroleum Reduction4 Reduce petroleum fuel use to 15% below 2003 levels by 2020
Alternative Fuel Use5 Increase alternative fuel use to 20% of on‐road fuel demand by 2020 and 30% by 2030
In‐State Biofuels Use6 Increase biofuel use to 1 billon gge* by 2010, 1.6 billion gge by 2020, and 2 billion gge by 2050
In‐State Biofuels Production7 Produce in California 20% of biofuels used in state by 2010, 40% by 2020, and 75% by 2050
*gge refers to gasoline gallons equivalent
All of these technologies will be needed to achieve the 2050 goal; there are very few technologies that individually have the potential to achieve 80 percent GHG reductions. Many of the fuels and technologies needed to meet program objectives exist in the market today and offer a tangible bridge to fuel‐vehicle technologies that can achieve 2050 goals; others require additional development and substantial cost reductions to be competitive. Plug‐in hybrid electric vehicles, battery‐electric vehicles, and hydrogen fuel cell vehicles are in the development stage and will begin entering the market over the next several years. Electric charging and hydrogen fueling stations will need to be put in place to accommodate the roll out of these vehicles. Hybrid‐electric technologies are finding success in light‐duty vehicles and hold considerable potential for medium‐ and heavy‐duty truck applications. More development work is needed to overcome high cost premiums due to low market‐entry production volumes and reduce carbon emissions through the use of plug‐in electric technologies and alternative fuels. Ethanol is currently blended in gasoline at about a billion gallons per year and represents the largest volume alternative or renewable fuel in use today. Flexible fuel vehicles also are 2 California Global Warming Solutions Act of 2006 – Assembly Bill 32 (Núñez, Chapter 488, Statutes of 2006).
3 Governor’s Executive Order S‐3‐05.
4 Joint recommendations by the Energy Commission and ARB in response to AB 2076 (Shelly, Chapter 936, Statutes of 2000).
5 Ibid.
6 California Bioenergy Action Plan and Governor’s Executive Order S‐06‐06.
7 Ibid.
ES‐3
produced today and are capable of using gasoline or E‐85 (85 percent ethanol and 15 percent gasoline) or any blend level in between. Biodiesel and renewable diesel also are being used in various applications. Researchers are developing other biofuels with a lower carbon footprint that can be more easily blended with gasoline and diesel fuels. Investments are needed to construct facilities to produce so‐called “second generation” biofuels using energy crops and current waste streams such as landfills, agricultural wastes, and forest residues. Propane and natural gas have found important applications in the medium‐ and heavy‐duty truck and transit sectors and may see expanded use for light‐duty cars and trucks. Other combinations of technology are in various stages of the research, development, demonstration and deployment cycle (for example, hydraulic hybrid applications in medium and heavy duty vehicles and hybrid electric in heavy duty vehicles and transit buses). Any or all of these options could find their way into the market place of the future. Furthermore, these vehicles will provide a pathway for deeper GHG reductions with the development of biomethane and renewable propane.
Developing and deploying advanced fuels and vehicles will not be enough. Investments will be needed to establish certification and standards for fuels and vehicles, construct advanced fuel and vehicle production facilities, meet work force training needs, and educate and inform the public.
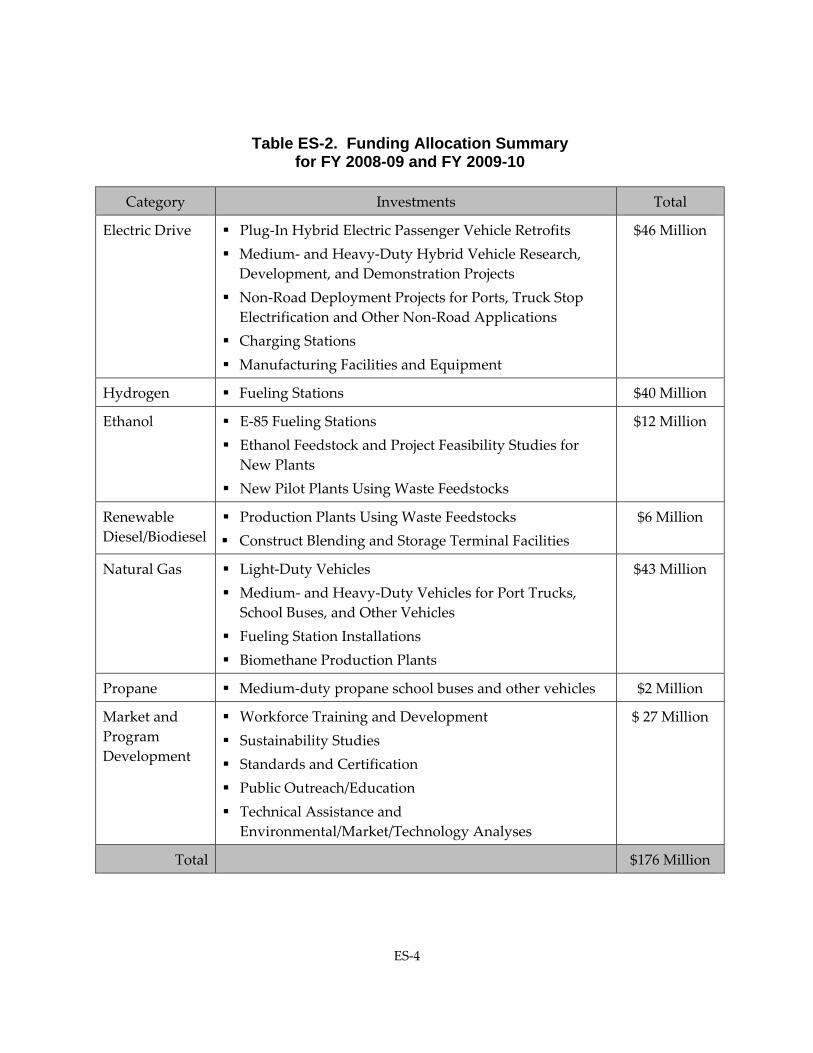
Investment Plan Allocations The allocations in the Investment Plan are based on a scenario of alternative and renewable fuels and advanced vehicle technology deployment, potential GHG reductions, the level of current public and private funding, and feedback from stakeholders. The funding allocation will be re‐evaluated and the Investment Plan revised annually. The funding allocations for the first two years are shown in Table ES‐2.
ES‐4
Table ES-2. Funding Allocation Summary for FY 2008-09 and FY 2009-10
Category Investments Total
Electric Drive Plug‐In Hybrid Electric Passenger Vehicle Retrofits Medium‐ and Heavy‐Duty Hybrid Vehicle Research, Development, and Demonstration Projects
Non‐Road Deployment Projects for Ports, Truck Stop Electrification and Other Non‐Road Applications
Charging Stations Manufacturing Facilities and Equipment
$46 Million
Hydrogen Fueling Stations $40 Million
Ethanol E‐85 Fueling Stations Ethanol Feedstock and Project Feasibility Studies for New Plants
New Pilot Plants Using Waste Feedstocks
$12 Million
Renewable Diesel/Biodiesel
Production Plants Using Waste Feedstocks Construct Blending and Storage Terminal Facilities
$6 Million
Natural Gas Light‐Duty Vehicles Medium‐ and Heavy‐Duty Vehicles for Port Trucks, School Buses, and Other Vehicles
Fueling Station Installations Biomethane Production Plants
$43 Million
Propane Medium‐duty propane school buses and other vehicles $2 Million
Market and Program Development
Workforce Training and Development Sustainability Studies Standards and Certification Public Outreach/Education Technical Assistance and Environmental/Market/Technology Analyses
$ 27 Million
Total $176 Million
ES‐5
Leveraging Pre-Existing Funding and Investments This Investment Plan recognizes the need for the program to leverage existing federal, state, and local funding as well as stakeholder investments. Auto manufacturers, utilities, other stakeholders, and federal and local governments are investing in alternative fuel and advanced vehicle technologies, and the Energy Commission intends to leverage these investments to accelerate the introduction and use of these fuels and technologies.
Looking Ahead In this and subsequent investment plans, the Energy Commission will focus on and leverage those technologies that show the most promise and market potential, and will balance that focus with the need to have a robust portfolio approach to technology development. This approach will help address and mitigate investment risks. This approach also will emphasize investments that provide immediate lower carbon and GHG and petroleum reduction benefits while developing the technologies and infrastructure to compete in the future. As fuels and technologies evolve, the Energy Commission must continually evaluate a clear pathway, with landmarks, to the 2020 and 2050 GHG reduction goals.
The Energy Commission will use its best judgment in setting specific allocations and its flexibility to redirect funding within a fiscal year as emerging conditions (environmental, energy, or economic) require, as noted under section 3108(f) of proposed regulations for the Alternative and Renewable Fuel and Vehicle Technology Program.


1
INTRODUCTION The increased use of alternative fuels supports the state’s commitment to curb greenhouse gas emissions, reduce petroleum use, improve air quality, and stimulate the sustainable production and use of biofuels within California. Alternative transportation fuels include electricity, natural gas, biomethane, propane, hydrogen, ethanol, renewable diesel, and biodiesel fuels. State investment is needed to fill the gap and fund the differential cost of emerging fuels and vehicle technologies.
Assembly Bill (AB) 118 (Núñez, Chapter 750, Statutes of 2007) created the Alternative and Renewable Fuel and Vehicle Technology Program (program). This legislation authorizes the California Energy Commission (Energy Commission) to spend up to approximately $120 million per year over seven years to “develop and deploy innovative technologies that transform California’s fuel and vehicle types to help attain the state’s climate change policies.” The American Recovery and Reinvestments Act of 2009 presents an additional opportunity for California to build upon this program by leveraging the federal funding now available for clean technology and “green” jobs creation.
The statute, amended by Assembly Bill 109 (Núñez, Chapter 313, Statutes of 2008), directs the Energy Commission to create an advisory committee to help develop and adopt an Investment Plan to determine priorities and opportunities for the program, and describe how funding will complement existing public and private investments, including existing state and federal programs. The Energy Commission will use the Investment Plan as a guide for awarding funds. The statute calls for the Investment Plan to be updated annually. This initial Investment Plan, however, will guide funding decisions during the first two years of the program (fiscal years 2008‐09 and 2009‐10).
The statute provides a broad array of activities and projects that are eligible to receive funding under the program. The Energy Commission may select projects to:
• Develop and improve alternative and renewable low‐carbon fuels.
• Optimize alternative and renewable fuels for existing and developing engine technologies.
• Produce alternative and renewable low‐carbon fuels in California.
• Decrease the overall impact of an alternative and renewable fuel’s life‐cycle carbon footprint and increase sustainability.
• Install alternative and renewable fuel infrastructure, fueling stations, and equipment.
• Improve light‐, medium‐, and heavy‐duty vehicle technologies to provide for better fuel efficiency and lower greenhouse gas (GHG) emissions, alternative fuel use and storage, or emission reductions.
• Accelerate the commercialization of vehicles and alternative and renewable fuels including buy‐down programs through pre‐commercial demonstrations and market‐
2
path deployments, advanced technology warranty or replacement insurance, development of market niches, and supply‐chain development.
• Retrofit medium‐ and heavy‐duty on‐road and non‐road vehicle fleets with technologies that create higher fuel efficiencies, including alternative and renewable fuel vehicles and technologies, idle management technology, and aerodynamic retrofits that decrease fuel consumption.
• Promote alternative and renewable fuel infrastructure development connected with existing fleets, public transit, and existing transportation corridors.
• Provide workforce development and training related to alternative and renewable fuel feedstock production and extraction, renewable fuel production, distribution, transport, and storage, high‐performance and low‐emission vehicle technology and high tower electronics, automotive computer systems, mass transit fleet conversion, servicing, and maintenance, and other sectors or occupations.
• Initiate education and program promotion within California and develop alternative and renewable fuel and vehicle technology centers.
• Conduct analyses, evaluations and assessments needed to assist in preparing the Investment Plan and implementing the program.
The statute allows the Energy Commission to use grants, loans, loan guarantees, revolving loans, and other appropriate financial measures and provide funding to a broad suite of entities, including public agencies, private businesses, public‐private partnerships, vehicle and technology consortia, workforce training partnerships and collaboratives, fleet owners, consumers, recreational boaters, and academic institutions.
The level of state funding that is envisioned for this program over the next seven years and the breadth of eligible activities will send a strong and consistent market development signal and will stimulate private investment in new fuels and vehicle technologies. This program creates the opportunity to make existing alternative and renewable fuels and vehicle technologies available in the marketplace to provide immediate GHG reduction benefits and to help create the impetus for the long‐term transition and evolution of the transportation sector in California.
However, the vision for this program must extend far beyond California’s borders, to other states and nations, and must extend far beyond the projected seven‐year authorization for the program, to 2020 and 2050. The priority to attain the state’s climate change goals must be approached in a careful and informed manner. The growing importance of improving and maintaining sustainability principles and practices in the production and use of energy is paramount in the design, preparation and implementation of the program. The many public benefits that can accrue from this landmark program necessitate setting the highest possible standard and vision from the outset.
3
Creating a Framework of Sustainability The statute directs the Energy Commission to “establish sustainability goals to ensure that alternative and renewable fuel and vehicle deployment projects, on a full fuel‐cycle assessment basis, will not adversely impact natural resources, especially state and federal lands.”
The Energy Commission, in its 2007 Integrated Energy Policy Report, adopted a goal of increasing the use of alternative and renewable fuels to 26 percent of on‐road demand by 2022, which is more than 4 billion gallons of alternative and renewable fuel. Meeting this goal will require the addition of more than 1 million gallons of new supplies of alternative and renewable fuel per day into the California market for the next 14 years.
The Energy Commission recognizes that the volume of alternative and renewable fuel needed to help meet the state’s GHG reduction goals from the transportation sector carries the risk of encouraging or promoting environmentally and socially destructive production practices in California, North America, and globally. These concerns compel California to expand its notions of sustainability beyond the express language in statute. As discussed in the many public workshops and meetings convened to design and implement the program, sustainability concerns permeate all aspects of fuels and transportation technologies and encompass environmental, social, and economic issues.
Investing in Clean Economic Development California and the rest of the nation are in the grips of a recession. Investments in alternative and renewable fuels could become an important economic stimulus. The state is the third largest consumer of gasoline and diesel fuels in the world, second only to the United States as a whole and China. Transforming this complex petroleum‐based fuels market to one based on a diversity of low‐carbon alternative and renewable fuels represents a substantial investment opportunity and the potential to create new “green collar” employment. A reasoned and well‐planned transition to a diversified, low‐carbon transportation future will require substantial investment in fuel production and vehicle manufacturing facilities, fuel storage, distribution and retail infrastructure, and commercial development of advanced vehicle components and “next generation” alternative and renewable fuels.
This transition will require private capital investment and public financial incentives to foster technology advancement and innovation. To stimulate a moderate growth rate of alternative and renewable fuels, it is estimated that $2 billion in government incentives invested between 2008 and 2022 will stimulate more than $40 billion in private investment leading to a mature market rollout of alternative and renewable fuel options in 2050. Between 2008 and 2050 about $100 billion in total market (public and private) investment will be required. These estimates are based on capital cost assumptions, technology research and development needs, infrastructure requirements, manufacturing investments, and consumer education program cost estimates.
This transition can begin by offering consumers choices. California consumers have little or no choice in the fuels they use in their vehicles. In some respects, the expanded use of alternative
4
and renewable fuels in the near term will be invisible to most consumers as it will likely be limited to blended fuels (such as ethanol and biodiesel) dispensed through existing petroleum retail stations. Alternative and renewable fuel and vehicle choices do exist to consumers, but are currently limited. Bringing to market a broader suite of alternative and renewable fuel sources and vehicles and allowing consumers more options will increase price competition and provide additional means to achieve early climate change and air quality benefits.
To provide consumers and businesses a choice in the fuels or vehicles they use, new markets must be created and existing markets significantly grown. Growing an alternative and renewable fuels industry, coupled with a “state‐of‐the‐science” vehicle technology development industry will attract and retain clean technology businesses, stimulate high‐quality employment, and help reduce the state’s vulnerability to fuel price volatility.
“Centers of Excellence” have been successfully established in the state’s college and university system and the non‐profit sector to push advancements in alternative and renewable fuels, vehicle technologies, emissions reduction and workforce training and development. These centers are an essential element in the transition to a diverse, low‐carbon market.
This transition also will require new sources of energy and fuel feedstocks. California’s waste streams represent a large and growing feedstock opportunity, and environmental challenge for the state. Traditional solutions are overtaxed and ineffectual. The waste from agriculture, food processing, landfills, forests, and municipal or water treatment plants holds substantial resource potential for conversion to alternative and renewable fuels, and this program seeks to encourage this development in a responsible and sustainable manner. Also, purpose‐grown, energy crops offer new commercial opportunities for the agricultural community in California. But, this endeavor must be carefully considered and pursued according to the best sustainability practices, principles, and goals for California natural resources. Lastly, the state has established aggressive goals for the development of renewable electricity. An alternative and renewable fuels and vehicle market can be developed with attention paid to the use renewable process energy, providing added stimulus for the expansion of businesses in California that manufacture clean, renewable energy systems.
DETERMINING PRIORITIES AND OPPORTUNITIES The goal of AB 32 (Núñez, Chapter 488, Statutes of 2006) is to return the State of California’s entire GHG emissions back to their 1990 emissions level by 2020. The Governor’s Executive Order S‐03‐05 calls for an 80 percent GHG emissions reduction from 1990 levels by 2050. The Energy Commission has developed a goal‐driven analytical method for establishing funding priorities and opportunities for the program to achieve the AB 32 statutory requirement by 2020 and examine the necessary “trajectory” of continual climate change emission improvements to achieve the 2050 target. The method is based, in part, on the 2050 Vision included in the State Alternative Fuels Plan that was jointly adopted by the Energy Commission and the Air Resources Board (ARB) in December 2007. The 2050 Vision represents a plausible scenario for which specific categories of fuels and light‐duty vehicles would be introduced and used over the next 42 years enabling the state to achieve the 2050 target. A similar analytical approach has been
5
developed for medium‐ and heavy‐duty vehicles and used in a two‐step process that produces a percentage allocation of available funds.
Step 1. Relative Greenhouse Gas Reductions The first step establishes the relative contributions of each fuel and vehicle category to meeting the 2020 and 2050 GHG targets. The method uses as a base the Energy Commission’s most recent fuel demand forecast incorporating the effects of the “Pavley” regulations, the Low‐Carbon Fuel Standard (LCFS), and assumptions for reduction in vehicle miles traveled (VMT).
Step 2. Gap Analysis and Funding Allocation The second step determines where existing public and private funding is already in place to develop and deploy alternative and renewable fuels and vehicle technology, and where “gaps” exist and need funding. As part of this analysis, the Energy Commission sought input from fuel, vehicle, and public interest stakeholders to help determine which identified funding gaps are anticipated and assumable by the industry or stakeholders would not need to be funded through the program. This second step also addresses funding for other important categories that are not directly driven or apportioned by their respective ability to reduce GHG emissions. These areas include funding workforce training, sustainability studies, standards and certification, public education and outreach, and analytical support. Each is discussed later in this Investment Plan.
Relative Greenhouse Gas Reductions
Light-Duty Vehicles This analysis evaluates one potential scenario where the light‐duty vehicle segment8 can reduce GHG emissions in a partially successful attempt to meet “fair share” reduction targets for 2020, and on to 2050. The transportation sector’s “fair share” emission reduction target is not established by statute, but is the calculated emission reduction target for the transportation sector (or in this case for light‐duty vehicles) based on the sector’s contribution to the state’s total GHG emissions. In other words, since the transportation sector is responsible for 38 percent of statewide GHG emissions, its “fair share” emission reduction is 38 percent of the total reduction needed to meet 2020 and 2050 policy goals.
The objective was to work backward from the 2050 Vision to depict the alternative and renewable fuel and vehicle pathways that may be needed to meet the GHG emissions reduction statutory requirement of AB 32 and to be consistent with the trajectory needed to meet the 2050 target as well. Chapter 6 of the State Alternative Fuels Plan describes this vision.9 The major attributes of this 2050 Vision are that:
• Most vehicles in 2050 would achieve a fleet‐average of 60 miles per gallon; electric‐drive vehicles would achieve a fleet‐average of 80 miles per gallon.
8 The full Light‐Duty Vehicle Analysis is in Appendix A. 9 State Alternative Fuels Plan, Final Adopted Report CEC‐600‐2007‐011‐CMF, December 2007.
6
• The 2050 fuel mix would consist of electricity and hydrogen (40 percent), biofuels (30 percent) and petroleum fuels (30 percent).
• The carbon intensity of fuels used in these three populations of vehicles in 2050 would be reduced 90 percent relative to today’s gasoline vehicles for electric and hydrogen vehicles, 80 percent for biofuels vehicles and at least 10 percent for other vehicles (those that meet the ARB’s Low Carbon Fuel Standard.
• Vehicle miles traveled (VMT) in 2050 would be reduced from 10,300 under a business‐as‐usual scenario to 8,200, a reduction of about 20 percent.
To establish funding priorities and opportunities for the program, specific fuel and vehicle categories were designated according to their ability to reduce GHG emissions. The categories are:
• The Low‐Carbon (LC) category includes vehicles using propane and natural gas and show at least a 40 percent reduction in GHG emissions.
• The Ultra‐Low‐Carbon (ULC) category includes fuel‐flexible vehicles using ethanol (E85) and average at least a 60 percent reduction in GHG emissions.
• The Super‐Ultra‐Low‐Carbon (SULC) category includes fuel cell, plug‐in hybrid electric and battery electric vehicles and show at least an 82 percent reduction in GHG emission.
• The Additional Fuel Economy Improvements category includes efforts to improve vehicle fuel use efficiency beyond Pavley 1 and 210 and would apply to later years with a goal of 60 miles per gallon (mpg) on‐road by 2050.
Figure 1 shows the contribution of each of these fuel and vehicle categories toward meeting the total light‐duty GHG emissions reduction target through 2050.
10 In response to AB 1493 (Pavley, Chapter 200, Statutes of 2002), ARB adopted vehicular GHG regulations that also affect fuel economy for model year (MY) 2009 (applicability uncertain pending legal issues) through MY 2016. ARB has stated its commitment to adopt further Pavley GHG reductions in the AB 32 Scoping Plan and has indicated it will implement Pavley 2 requirements that would apply to MY 2017 through MY 2020 (and possibly to 2025). Under Pavley 2, on‐road fuel economy would improve from about 21 miles per gallon (mpg) today to about 35.5 mpg in 2025.
7
Figure 1. 2050 Vision Light-Duty Vehicle GHG Emission Reduction
Conclusions for Light-Duty Vehicles Drawing upon Figure 1, staff calculated the percentage contribution of each fuel/vehicle type to total light‐duty GHG emission reductions. These percentages, shown in Table 1 below, were developed by adding GHG reductions for each category over the 2009 to 2020 and 2009 to 2050 periods and dividing the individual totals for each category by the total GHG reductions eligible for program funding. The Low‐Carbon Fuel Standard, Tire Efficiency Program, and VMT reductions were excluded from the final results below because they are not eligible for funding under the program. The results of the analysis lead to the following percentages for each of the four categories evaluated.
Table 1. Light-Duty GHG Emissions Reductions (2009 to 2020)
Category
2009‐2020 GHG
Emission Reduction
(MMTCO2e)11
2009‐2020 Percent GHG
Emission Reduction
2009‐2050 GHG
Emission Reduction (MMTCO2e)
2009‐2050 Percent GHG
Emission Reduction
Super‐Ultra‐Low‐Carbon Fuels 11 33% 1,104 55%
Ultra‐Low‐Carbon Fuels 9 27% 410 21% Low‐Carbon Fuels 3 10% 37 2% Fuel Economy Improvements 10 30% 437 22%
Total 33 100% 1,988 100% Source: California Energy Commission
11 Million metric tons carbon dioxide emissions.
8
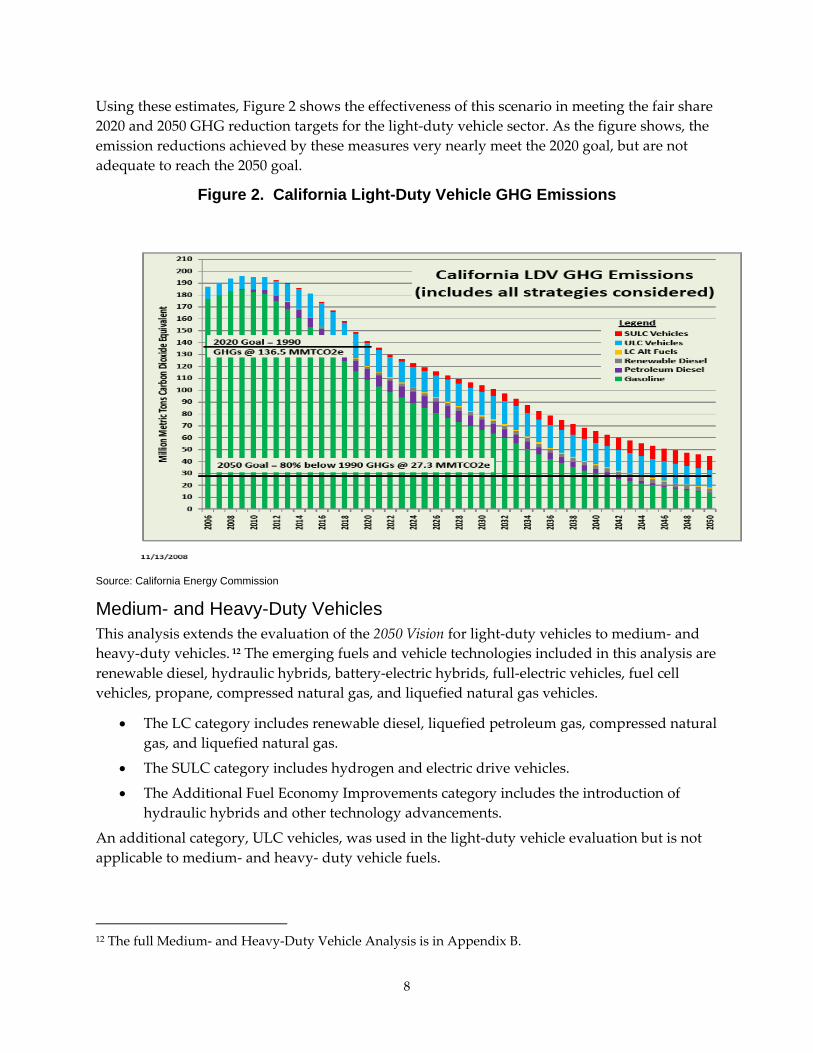
Using these estimates, Figure 2 shows the effectiveness of this scenario in meeting the fair share 2020 and 2050 GHG reduction targets for the light‐duty vehicle sector. As the figure shows, the emission reductions achieved by these measures very nearly meet the 2020 goal, but are not adequate to reach the 2050 goal.
Figure 2. California Light-Duty Vehicle GHG Emissions
Source: California Energy Commission
Medium- and Heavy-Duty Vehicles This analysis extends the evaluation of the 2050 Vision for light‐duty vehicles to medium‐ and heavy‐duty vehicles. 12 The emerging fuels and vehicle technologies included in this analysis are renewable diesel, hydraulic hybrids, battery‐electric hybrids, full‐electric vehicles, fuel cell vehicles, propane, compressed natural gas, and liquefied natural gas vehicles.
• The LC category includes renewable diesel, liquefied petroleum gas, compressed natural gas, and liquefied natural gas.
• The SULC category includes hydrogen and electric drive vehicles.
• The Additional Fuel Economy Improvements category includes the introduction of hydraulic hybrids and other technology advancements.
An additional category, ULC vehicles, was used in the light‐duty vehicle evaluation but is not applicable to medium‐ and heavy‐ duty vehicle fuels.
12 The full Medium‐ and Heavy‐Duty Vehicle Analysis is in Appendix B.
9
The total GHG reduction from medium‐ and heavy‐duty vehicles is developed by adding GHG reductions for all categories over the 2009 to 2020 and 2009 to 2050 periods, and then specific percentages of the total are derived for each category eligible for program funding.
As in the light‐duty assessment, the GHG emission reduction scenario presented here was “unconstrained” in that projections had no limitations for cost, fuel supply, or biomass feedstock availability placed upon them, even though the updated fuel and technology market information is influenced by costs and considers barriers to market penetration. Still, these fuels and vehicle technologies were evaluated independently and do not reflect interactions in a competitive marketplace. The Energy Commission used a simple accounting method to calculate the estimated emission reductions over a 42‐year period for the medium‐ and heavy‐duty vehicles and fuels based on market information developed in the preparation of the AB 1007 State Alternative Fuels Plan. The final GHG emission reduction scenario used in this evaluation assumed the moderate market development penetration estimates of the emerging fuels and vehicle technologies in the four categories.
Figure 3 shows how each fuel/vehicle category contributes to achieving the total medium/heavy‐duty GHG emission reductions through 2050.
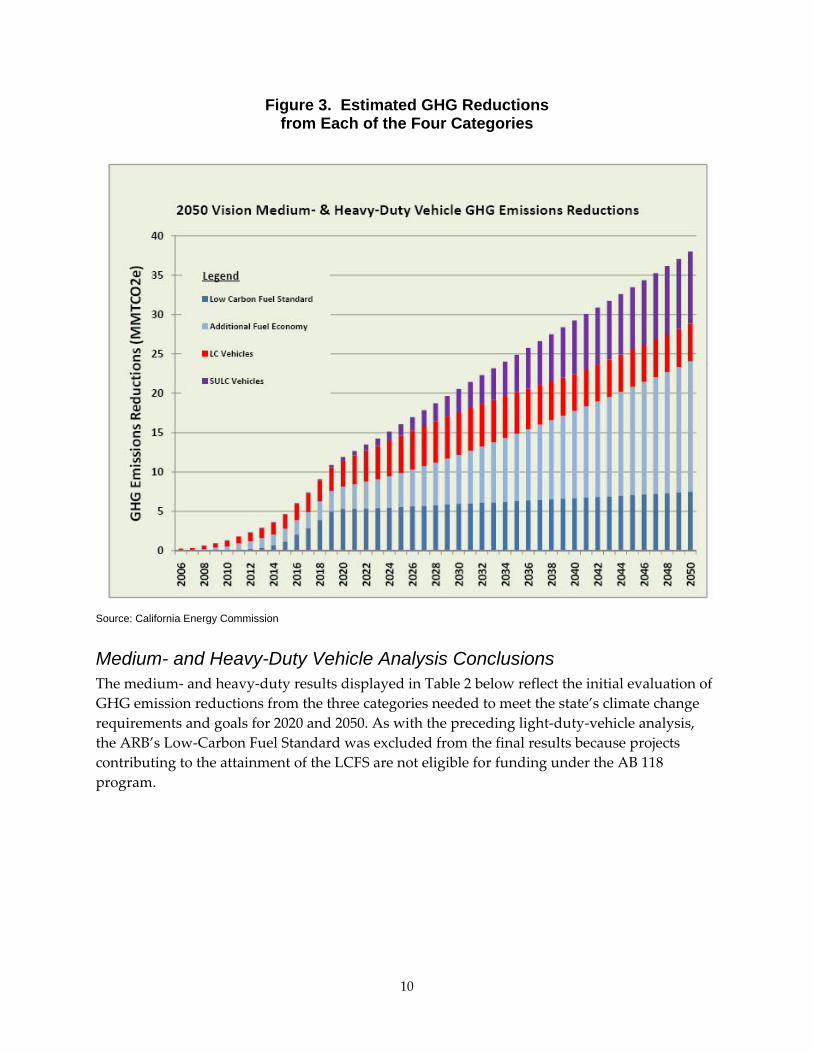
10
Figure 3. Estimated GHG Reductions from Each of the Four Categories
Source: California Energy Commission
Medium- and Heavy-Duty Vehicle Analysis Conclusions The medium‐ and heavy‐duty results displayed in Table 2 below reflect the initial evaluation of GHG emission reductions from the three categories needed to meet the state’s climate change requirements and goals for 2020 and 2050. As with the preceding light‐duty‐vehicle analysis, the ARB’s Low‐Carbon Fuel Standard was excluded from the final results because projects contributing to the attainment of the LCFS are not eligible for funding under the AB 118 program.
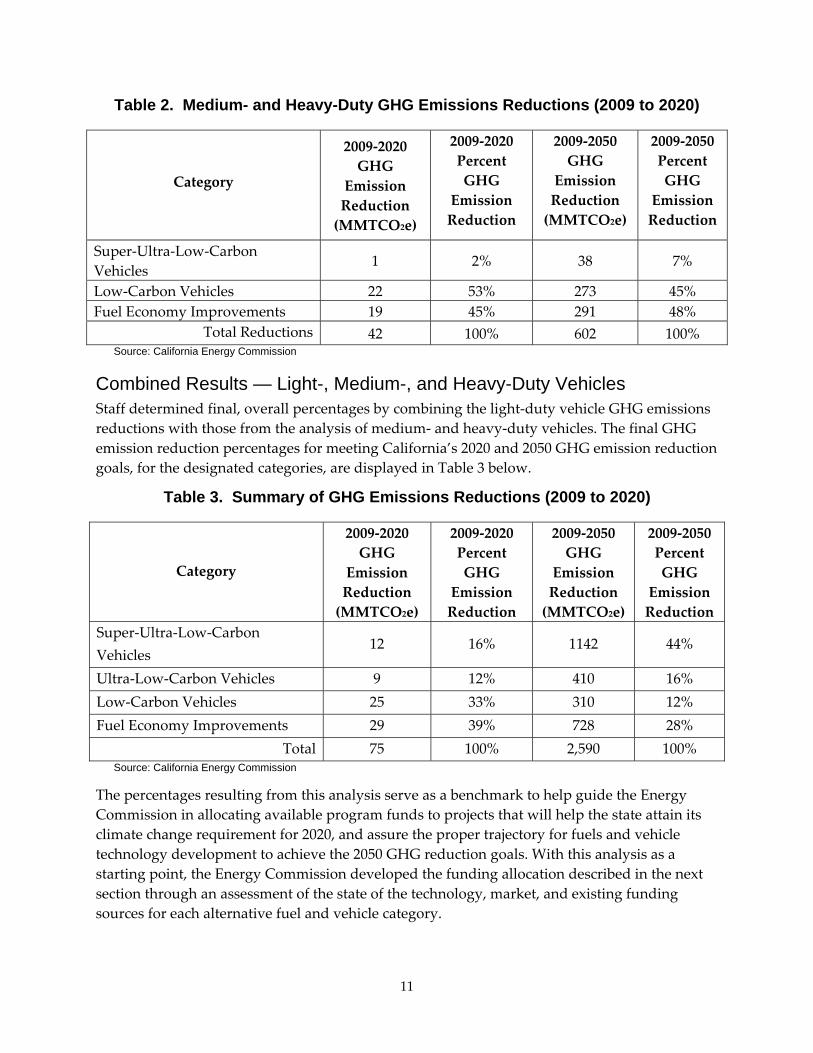
11
Table 2. Medium- and Heavy-Duty GHG Emissions Reductions (2009 to 2020)
Category
2009‐2020 GHG
Emission Reduction (MMTCO2e)
2009‐2020 Percent GHG
Emission Reduction
2009‐2050 GHG
Emission Reduction (MMTCO2e)
2009‐2050 Percent GHG
Emission Reduction
Super‐Ultra‐Low‐Carbon Vehicles
1 2% 38 7%
Low‐Carbon Vehicles 22 53% 273 45% Fuel Economy Improvements 19 45% 291 48%
Total Reductions 42 100% 602 100% Source: California Energy Commission
Combined Results — Light-, Medium-, and Heavy-Duty Vehicles Staff determined final, overall percentages by combining the light‐duty vehicle GHG emissions reductions with those from the analysis of medium‐ and heavy‐duty vehicles. The final GHG emission reduction percentages for meeting California’s 2020 and 2050 GHG emission reduction goals, for the designated categories, are displayed in Table 3 below.
Table 3. Summary of GHG Emissions Reductions (2009 to 2020)
Category
2009‐2020 GHG
Emission Reduction (MMTCO2e)
2009‐2020 Percent GHG
Emission Reduction
2009‐2050 GHG
Emission Reduction (MMTCO2e)
2009‐2050 Percent GHG
Emission Reduction
Super‐Ultra‐Low‐Carbon Vehicles
12 16% 1142 44%
Ultra‐Low‐Carbon Vehicles 9 12% 410 16% Low‐Carbon Vehicles 25 33% 310 12% Fuel Economy Improvements 29 39% 728 28%
Total 75 100% 2,590 100% Source: California Energy Commission
The percentages resulting from this analysis serve as a benchmark to help guide the Energy Commission in allocating available program funds to projects that will help the state attain its climate change requirement for 2020, and assure the proper trajectory for fuels and vehicle technology development to achieve the 2050 GHG reduction goals. With this analysis as a starting point, the Energy Commission developed the funding allocation described in the next section through an assessment of the state of the technology, market, and existing funding sources for each alternative fuel and vehicle category.
12
FUNDING ALLOCATION The sections below describe the state of the technologies and markets for each category of alternative fuels and vehicles: electric drive, hydrogen, ethanol, biodiesel/renewable diesel, natural gas, and propane. They also incorporate the results of the Energy Commission’s “gap analysis”,13 which identified existing public and private investments in alternative fuels and vehicles, to identify funding gaps and prevent duplication of effort.
The gap analysis shows that overall funding from all sources — federal, state, and private — for alternative fuels and drive trains totals about $35 billion14 per year. The most well‐funded fuel category by far from all sources, individually and collectively, is biofuels, with most of the funding going to incentives and commercialization. Federal government and private research and development (R&D) expenditures total about $11 billion per year. Much of this R&D funding is focused on biofuels, though fuel cell and battery R&D is also well‐funded.
Overall, federal funding for alternative and renewable fuels has been focused on three primary areas: next generation biofuels processes and pilot‐plant construction; energy storage; and plug‐in hybrid electric vehicles. Outside of the Federal Transit Administration’s fuel cell bus program, federal investment in hydrogen has effectively stopped. However, the American Recovery and Reinvestment Act of 2009 allocates $3 billion for transportation programs and an additional $2 billion to transportation‐related tax incentives. The Energy Commission will work with the Department of Energy to leverage limited AB 118 funds and support projects that create jobs and provide long‐term economic benefits.
In addition, several California programs complement the Energy Commission’s AB 118 program in supporting alternative fuels and vehicles: ARB’s recent Alternative Fuel Incentive Program (AFIP), Energy Commission’s Public Interest Energy Research (PIER) Transportation Program, and ARB’s Air Quality Improvement Program (AQIP), which was also authorized by AB 118. These programs are described further in Appendix D and mentioned as relevant in the discussion below.
Based on the current funding landscape and the status of the alternative and renewable fuels and advanced vehicle technologies and markets, the Energy Commission presents the following observations and funding allocations.
Electric Drive
Transition to 2020 and 2050 Plug‐in hybrid and battery electric vehicles are essential to California’s low‐carbon transportation future. Full fuel‐cycle emissions of electric vehicles using today’s electricity grid
13 The Full Gap Analysis appears in Appendix C.
14 This does not include funding from the American Recovery and Reinvesment Act of 2009.
13
are as much as 70 percent lower than the emissions of conventional gasoline vehicles,15 and as California shifts to a renewable electricity generation system, electric vehicles will become even cleaner on a full fuel‐cycle basis. However, electric vehicles are currently more expensive than conventional petroleum‐fueled vehicles, and existing electric charging infrastructure is inadequate to support electric vehicles on a commercial scale.
Mass market availability of light‐duty electric drive passenger vehicles at affordable prices will require several automakers to manufacture vehicles in high volume assembly lines approaching 50,000 to 100,000 vehicles per year. Cost effective battery technology (lighter weight and smaller in size) that provides longer range driving is a key challenge. In addition, integration of electric drive components into vehicle designs and platforms will take several years to perfect. It is likely that small commuter size battery electric vehicles, once produced in large volume, will be attractive in the market place and volume may grow to significant market share in this segment.
Medium‐ and heavy‐duty trucks, buses and non‐road vehicles can saturate market niches earlier than passenger vehicles at a much lower level of manufacturing (3,000 to 5,000 per year) to achieve cost competitiveness with diesel vehicles. Hybrid electric designs are being offered for sale in limited volumes. Technology improvements and demonstrations will reduce costs and broaden market availability. Also, greenhouse gas emissions can be further reduced by introducing alternative and renewable fuels in electric truck hybrid applications, demonstrating advanced hydraulic technology, electrifying on‐board vehicle accessories and demonstrating plug‐in electric and battery electric trucks.
Installation of electric charge infrastructure will need to keep up with the roll‐out of electric drive vehicles. As more consumers desire home vehicle recharging, electric utilities may consider expanding their role in electric drive infrastructure by developing special rates for home recharging installations and for cap and trade credits that expand off‐peak charging and create utility benefits system wide.
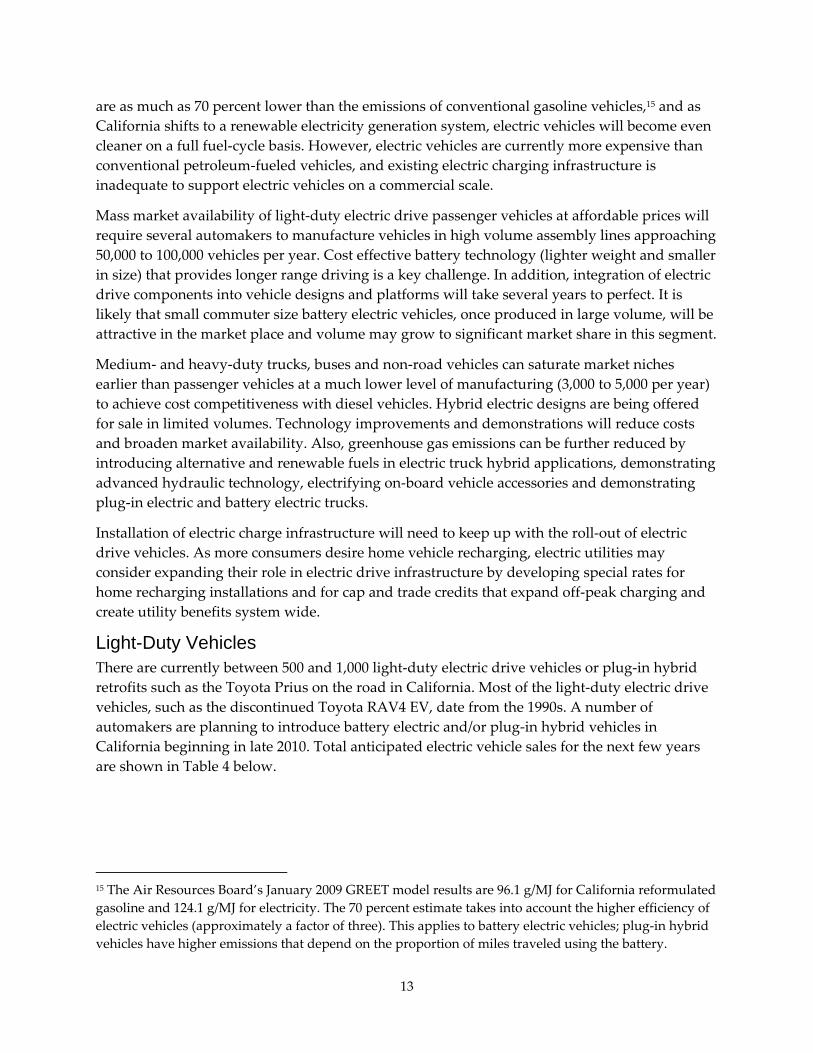
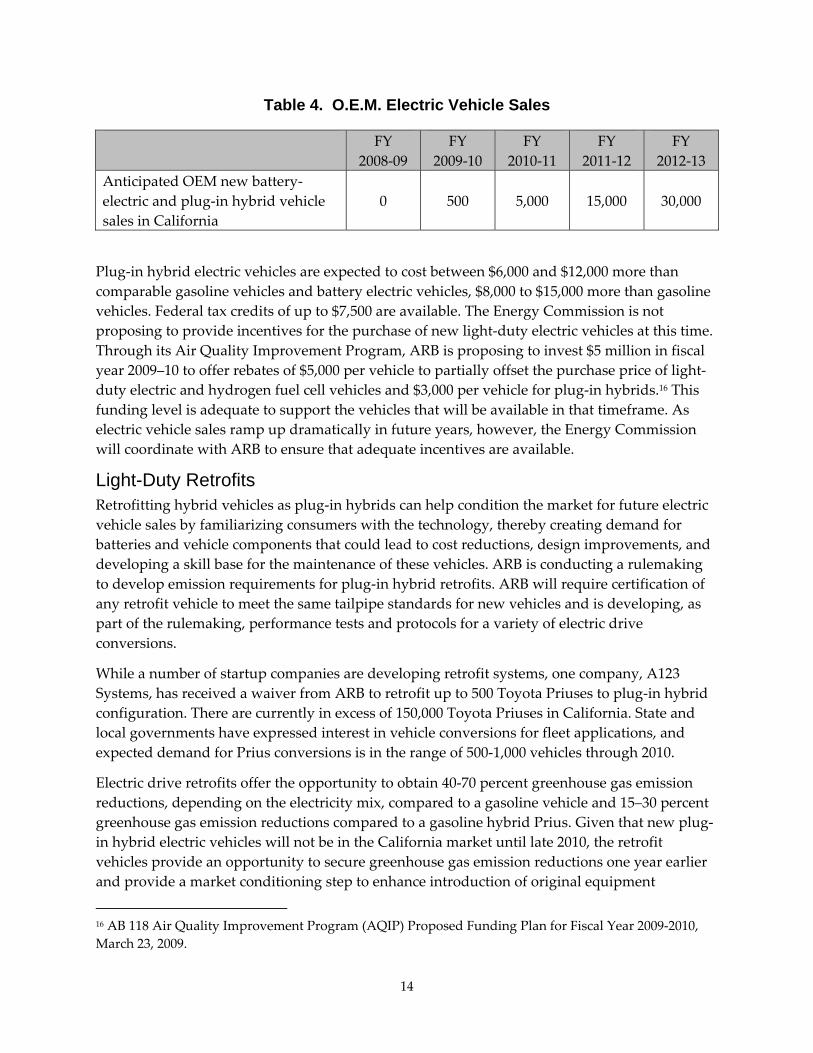
Light-Duty Vehicles There are currently between 500 and 1,000 light‐duty electric drive vehicles or plug‐in hybrid retrofits such as the Toyota Prius on the road in California. Most of the light‐duty electric drive vehicles, such as the discontinued Toyota RAV4 EV, date from the 1990s. A number of automakers are planning to introduce battery electric and/or plug‐in hybrid vehicles in California beginning in late 2010. Total anticipated electric vehicle sales for the next few years are shown in Table 4 below.
15 The Air Resources Board’s January 2009 GREET model results are 96.1 g/MJ for California reformulated gasoline and 124.1 g/MJ for electricity. The 70 percent estimate takes into account the higher efficiency of electric vehicles (approximately a factor of three). This applies to battery electric vehicles; plug‐in hybrid vehicles have higher emissions that depend on the proportion of miles traveled using the battery.
14
Table 4. O.E.M. Electric Vehicle Sales
FY 2008‐09
FY 2009‐10
FY 2010‐11
FY 2011‐12
FY 2012‐13
Anticipated OEM new battery‐electric and plug‐in hybrid vehicle sales in California
0 500 5,000 15,000 30,000
Plug‐in hybrid electric vehicles are expected to cost between $6,000 and $12,000 more than comparable gasoline vehicles and battery electric vehicles, $8,000 to $15,000 more than gasoline vehicles. Federal tax credits of up to $7,500 are available. The Energy Commission is not proposing to provide incentives for the purchase of new light‐duty electric vehicles at this time. Through its Air Quality Improvement Program, ARB is proposing to invest $5 million in fiscal year 2009–10 to offer rebates of $5,000 per vehicle to partially offset the purchase price of light‐duty electric and hydrogen fuel cell vehicles and $3,000 per vehicle for plug‐in hybrids.16 This funding level is adequate to support the vehicles that will be available in that timeframe. As electric vehicle sales ramp up dramatically in future years, however, the Energy Commission will coordinate with ARB to ensure that adequate incentives are available.
Light-Duty Retrofits Retrofitting hybrid vehicles as plug‐in hybrids can help condition the market for future electric vehicle sales by familiarizing consumers with the technology, thereby creating demand for batteries and vehicle components that could lead to cost reductions, design improvements, and developing a skill base for the maintenance of these vehicles. ARB is conducting a rulemaking to develop emission requirements for plug‐in hybrid retrofits. ARB will require certification of any retrofit vehicle to meet the same tailpipe standards for new vehicles and is developing, as part of the rulemaking, performance tests and protocols for a variety of electric drive conversions.
While a number of startup companies are developing retrofit systems, one company, A123 Systems, has received a waiver from ARB to retrofit up to 500 Toyota Priuses to plug‐in hybrid configuration. There are currently in excess of 150,000 Toyota Priuses in California. State and local governments have expressed interest in vehicle conversions for fleet applications, and expected demand for Prius conversions is in the range of 500‐1,000 vehicles through 2010.
Electric drive retrofits offer the opportunity to obtain 40‐70 percent greenhouse gas emission reductions, depending on the electricity mix, compared to a gasoline vehicle and 15–30 percent greenhouse gas emission reductions compared to a gasoline hybrid Prius. Given that new plug‐in hybrid electric vehicles will not be in the California market until late 2010, the retrofit vehicles provide an opportunity to secure greenhouse gas emission reductions one year earlier and provide a market conditioning step to enhance introduction of original equipment
16 AB 118 Air Quality Improvement Program (AQIP) Proposed Funding Plan for Fiscal Year 2009‐2010, March 23, 2009.
15
manufacturer (OEM) products. Conversions cost an estimated $11,000 per vehicle. A federal 10 percent tax credit is available for electric drive retrofits. The Energy Commission has allocated funding to cover the differential cost of vehicles converted to electric drive for public and private fleets or individuals. The state incentive would be reduced by the amount of federal tax credits offered to taxable entities or individuals. The allocation for light‐duty retrofits is shown in Table 5 below.
Table 5. Light-Duty Electric Vehicle Retrofits Allocation
Plug‐In Hybrid Electric Passenger Vehicle Retrofits 350
Total $3.5 Million
Medium- and Heavy-Duty Vehicles Considerable potential exists to reduce greenhouse gas emission through the application of hybrid electric and hydraulic hybrid technologies on medium‐ and heavy‐duty vehicles. Hybrid hydraulic trucks use hydraulics, “charged” by the engine, to offer power boost to the engine and auxiliary functions. Electric hybrid trucks use the engine to recharge the batteries which assist the engine and auxiliary functions. As a result, refuse trucks, drayage trucks, package delivery vans, utility trucks, transit and school buses, and harbor craft are all good candidates for hybrid electric and hydraulic hybrid applications.
Presently, at least 15 manufacturing companies are developing hybrid electric technologies that cut GHG emissions and diesel use by 20 to 50 percent. There are fewer than 600 commercial hybrid trucks on the road today. The primary obstacle facing this industry is high purchase costs resulting from low sales and production volumes. Cost differentials compared to diesel trucks range from $35,000 for retrofits of existing trucks to $80,000 for new vehicles. With proper incentives, hybrid trucks are poised for initial mass market sales beginning at 1,700 per year in 2009 to 3,000–5,000 per year within 3 to 5 years—sales levels that will reduce the cost differential by 50 percent compared to diesel only vehicles and applications.
The Energy Commission is not proposing incentives for the purchase of new medium‐ and heavy‐duty hybrid trucks at this time. Through its AQIP, ARB is proposing to use $25 million as incentives to purchase new medium‐ and heavy‐duty diesel hybrid vehicles.17 The incentives will range from $10,000 to $35,000 per vehicle, depending on the weight class, and an additional $5,000 per vehicle for ARB‐certified vehicles. This funding level is adequate to support the vehicles that will be available in that timeframe. As hybrid truck sales ramp up, however, the Energy Commission will coordinate with ARB to ensure that adequate incentives are available.
The Energy Commission will focus on providing financial support for pre‐production research, development and demonstration projects that will lead to improved performance and reduced
17 AB 118 Air Quality Improvement Program (AQIP) Proposed Funding Plan for Fiscal Year 2009‐2010, March 23, 2009.
16
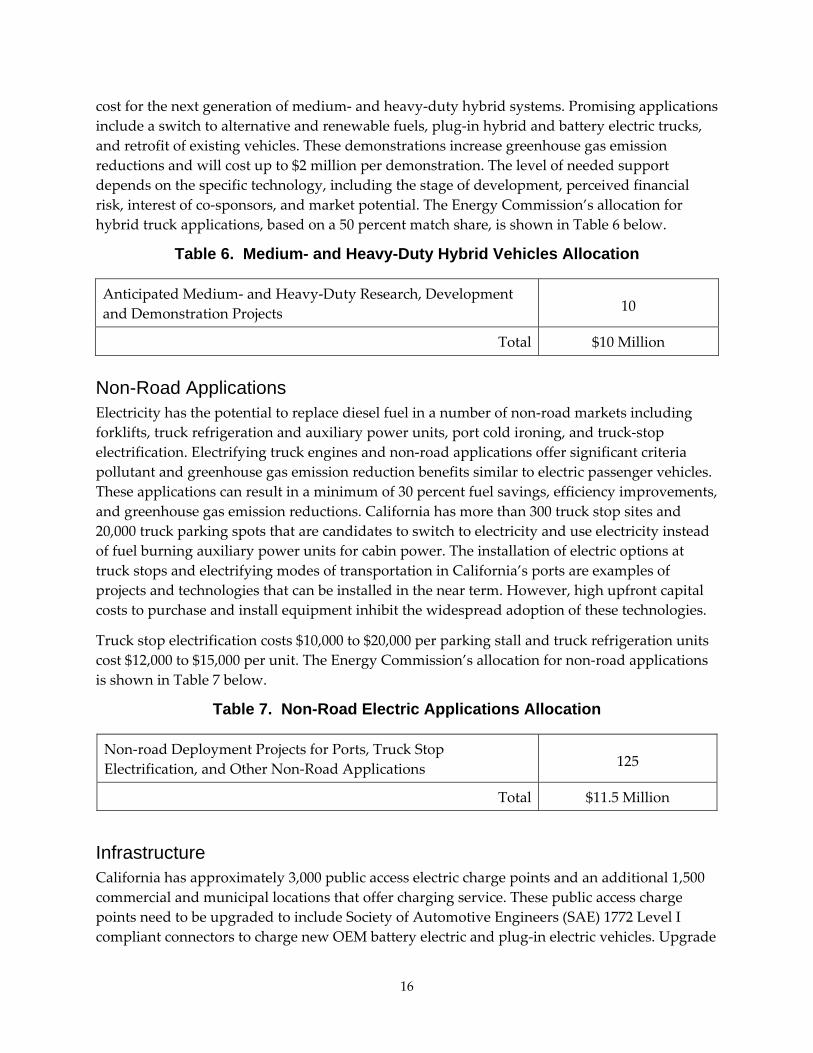
cost for the next generation of medium‐ and heavy‐duty hybrid systems. Promising applications include a switch to alternative and renewable fuels, plug‐in hybrid and battery electric trucks, and retrofit of existing vehicles. These demonstrations increase greenhouse gas emission reductions and will cost up to $2 million per demonstration. The level of needed support depends on the specific technology, including the stage of development, perceived financial risk, interest of co‐sponsors, and market potential. The Energy Commission’s allocation for hybrid truck applications, based on a 50 percent match share, is shown in Table 6 below.
Table 6. Medium- and Heavy-Duty Hybrid Vehicles Allocation
Anticipated Medium‐ and Heavy‐Duty Research, Development and Demonstration Projects 10
Total $10 Million
Non-Road Applications Electricity has the potential to replace diesel fuel in a number of non‐road markets including forklifts, truck refrigeration and auxiliary power units, port cold ironing, and truck‐stop electrification. Electrifying truck engines and non‐road applications offer significant criteria pollutant and greenhouse gas emission reduction benefits similar to electric passenger vehicles. These applications can result in a minimum of 30 percent fuel savings, efficiency improvements, and greenhouse gas emission reductions. California has more than 300 truck stop sites and 20,000 truck parking spots that are candidates to switch to electricity and use electricity instead of fuel burning auxiliary power units for cabin power. The installation of electric options at truck stops and electrifying modes of transportation in California’s ports are examples of projects and technologies that can be installed in the near term. However, high upfront capital costs to purchase and install equipment inhibit the widespread adoption of these technologies.
Truck stop electrification costs $10,000 to $20,000 per parking stall and truck refrigeration units cost $12,000 to $15,000 per unit. The Energy Commission’s allocation for non‐road applications is shown in Table 7 below.
Table 7. Non-Road Electric Applications Allocation
Non‐road Deployment Projects for Ports, Truck Stop Electrification, and Other Non‐Road Applications 125
Total $11.5 Million
Infrastructure California has approximately 3,000 public access electric charge points and an additional 1,500 commercial and municipal locations that offer charging service. These public access charge points need to be upgraded to include Society of Automotive Engineers (SAE) 1772 Level I compliant connectors to charge new OEM battery electric and plug‐in electric vehicles. Upgrade
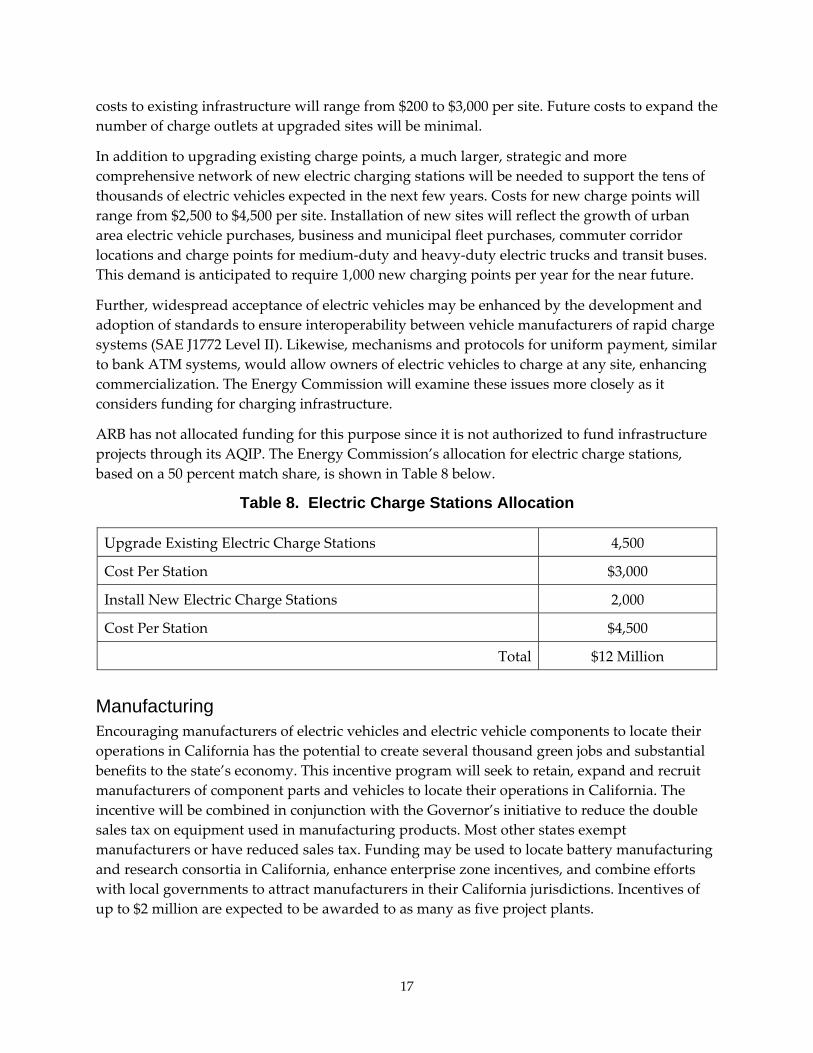
17
costs to existing infrastructure will range from $200 to $3,000 per site. Future costs to expand the number of charge outlets at upgraded sites will be minimal.
In addition to upgrading existing charge points, a much larger, strategic and more comprehensive network of new electric charging stations will be needed to support the tens of thousands of electric vehicles expected in the next few years. Costs for new charge points will range from $2,500 to $4,500 per site. Installation of new sites will reflect the growth of urban area electric vehicle purchases, business and municipal fleet purchases, commuter corridor locations and charge points for medium‐duty and heavy‐duty electric trucks and transit buses. This demand is anticipated to require 1,000 new charging points per year for the near future.
Further, widespread acceptance of electric vehicles may be enhanced by the development and adoption of standards to ensure interoperability between vehicle manufacturers of rapid charge systems (SAE J1772 Level II). Likewise, mechanisms and protocols for uniform payment, similar to bank ATM systems, would allow owners of electric vehicles to charge at any site, enhancing commercialization. The Energy Commission will examine these issues more closely as it considers funding for charging infrastructure.
ARB has not allocated funding for this purpose since it is not authorized to fund infrastructure projects through its AQIP. The Energy Commission’s allocation for electric charge stations, based on a 50 percent match share, is shown in Table 8 below.
Table 8. Electric Charge Stations Allocation
Upgrade Existing Electric Charge Stations 4,500
Cost Per Station $3,000
Install New Electric Charge Stations 2,000
Cost Per Station $4,500
Total $12 Million
Manufacturing Encouraging manufacturers of electric vehicles and electric vehicle components to locate their operations in California has the potential to create several thousand green jobs and substantial benefits to the state’s economy. This incentive program will seek to retain, expand and recruit manufacturers of component parts and vehicles to locate their operations in California. The incentive will be combined in conjunction with the Governor’s initiative to reduce the double sales tax on equipment used in manufacturing products. Most other states exempt manufacturers or have reduced sales tax. Funding may be used to locate battery manufacturing and research consortia in California, enhance enterprise zone incentives, and combine efforts with local governments to attract manufacturers in their California jurisdictions. Incentives of up to $2 million are expected to be awarded to as many as five project plants.
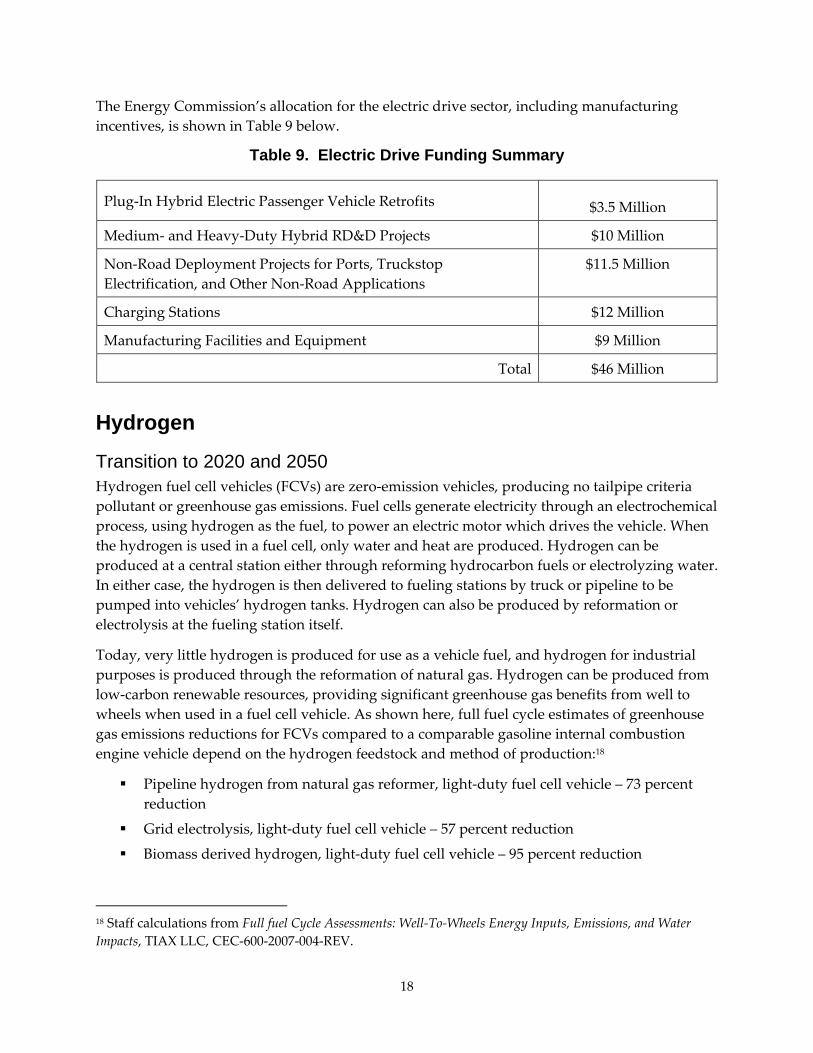
18
The Energy Commission’s allocation for the electric drive sector, including manufacturing incentives, is shown in Table 9 below.
Table 9. Electric Drive Funding Summary
Plug‐In Hybrid Electric Passenger Vehicle Retrofits $3.5 Million
Medium‐ and Heavy‐Duty Hybrid RD&D Projects $10 Million
Non‐Road Deployment Projects for Ports, Truckstop Electrification, and Other Non‐Road Applications
$11.5 Million
Charging Stations $12 Million
Manufacturing Facilities and Equipment $9 Million
Total $46 Million
Hydrogen
Transition to 2020 and 2050 Hydrogen fuel cell vehicles (FCVs) are zero‐emission vehicles, producing no tailpipe criteria pollutant or greenhouse gas emissions. Fuel cells generate electricity through an electrochemical process, using hydrogen as the fuel, to power an electric motor which drives the vehicle. When the hydrogen is used in a fuel cell, only water and heat are produced. Hydrogen can be produced at a central station either through reforming hydrocarbon fuels or electrolyzing water. In either case, the hydrogen is then delivered to fueling stations by truck or pipeline to be pumped into vehicles’ hydrogen tanks. Hydrogen can also be produced by reformation or electrolysis at the fueling station itself.
Today, very little hydrogen is produced for use as a vehicle fuel, and hydrogen for industrial purposes is produced through the reformation of natural gas. Hydrogen can be produced from low‐carbon renewable resources, providing significant greenhouse gas benefits from well to wheels when used in a fuel cell vehicle. As shown here, full fuel cycle estimates of greenhouse gas emissions reductions for FCVs compared to a comparable gasoline internal combustion engine vehicle depend on the hydrogen feedstock and method of production:18
Pipeline hydrogen from natural gas reformer, light‐duty fuel cell vehicle – 73 percent reduction
Grid electrolysis, light‐duty fuel cell vehicle – 57 percent reduction
Biomass derived hydrogen, light‐duty fuel cell vehicle – 95 percent reduction
18 Staff calculations from Full fuel Cycle Assessments: Well‐To‐Wheels Energy Inputs, Emissions, and Water Impacts, TIAX LLC, CEC‐600‐2007‐004‐REV.
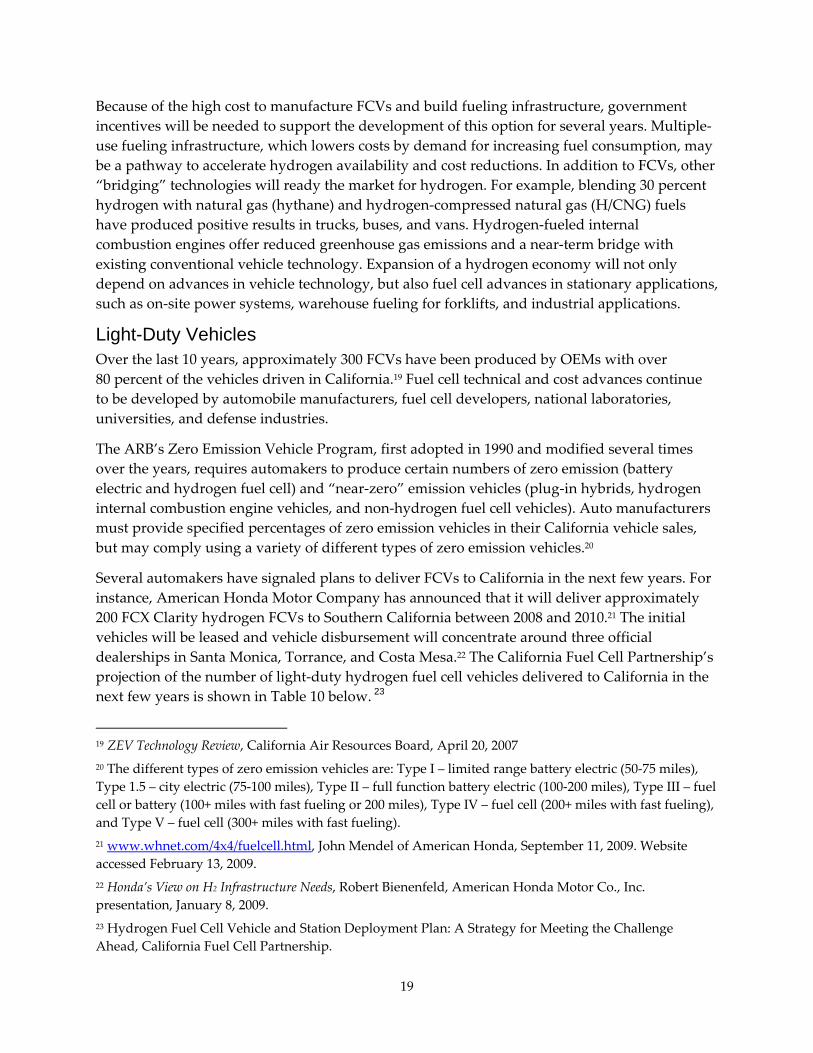
19
Because of the high cost to manufacture FCVs and build fueling infrastructure, government incentives will be needed to support the development of this option for several years. Multiple‐use fueling infrastructure, which lowers costs by demand for increasing fuel consumption, may be a pathway to accelerate hydrogen availability and cost reductions. In addition to FCVs, other “bridging” technologies will ready the market for hydrogen. For example, blending 30 percent hydrogen with natural gas (hythane) and hydrogen‐compressed natural gas (H/CNG) fuels have produced positive results in trucks, buses, and vans. Hydrogen‐fueled internal combustion engines offer reduced greenhouse gas emissions and a near‐term bridge with existing conventional vehicle technology. Expansion of a hydrogen economy will not only depend on advances in vehicle technology, but also fuel cell advances in stationary applications, such as on‐site power systems, warehouse fueling for forklifts, and industrial applications.
Light-Duty Vehicles Over the last 10 years, approximately 300 FCVs have been produced by OEMs with over 80 percent of the vehicles driven in California.19 Fuel cell technical and cost advances continue to be developed by automobile manufacturers, fuel cell developers, national laboratories, universities, and defense industries.
The ARB’s Zero Emission Vehicle Program, first adopted in 1990 and modified several times over the years, requires automakers to produce certain numbers of zero emission (battery electric and hydrogen fuel cell) and “near‐zero” emission vehicles (plug‐in hybrids, hydrogen internal combustion engine vehicles, and non‐hydrogen fuel cell vehicles). Auto manufacturers must provide specified percentages of zero emission vehicles in their California vehicle sales, but may comply using a variety of different types of zero emission vehicles.20
Several automakers have signaled plans to deliver FCVs to California in the next few years. For instance, American Honda Motor Company has announced that it will deliver approximately 200 FCX Clarity hydrogen FCVs to Southern California between 2008 and 2010.21 The initial vehicles will be leased and vehicle disbursement will concentrate around three official dealerships in Santa Monica, Torrance, and Costa Mesa.22 The California Fuel Cell Partnership’s projection of the number of light‐duty hydrogen fuel cell vehicles delivered to California in the next few years is shown in Table 10 below. 23
19 ZEV Technology Review, California Air Resources Board, April 20, 2007 20 The different types of zero emission vehicles are: Type I – limited range battery electric (50‐75 miles), Type 1.5 – city electric (75‐100 miles), Type II – full function battery electric (100‐200 miles), Type III – fuel cell or battery (100+ miles with fast fueling or 200 miles), Type IV – fuel cell (200+ miles with fast fueling), and Type V – fuel cell (300+ miles with fast fueling). 21 www.whnet.com/4x4/fuelcell.html, John Mendel of American Honda, September 11, 2009. Website accessed February 13, 2009. 22 Honda’s View on H2 Infrastructure Needs, Robert Bienenfeld, American Honda Motor Co., Inc. presentation, January 8, 2009. 23 Hydrogen Fuel Cell Vehicle and Station Deployment Plan: A Strategy for Meeting the Challenge Ahead, California Fuel Cell Partnership.
20
Table 10. California Light-Duty Hydrogen Fuel Cell Vehicles Delivery
FY 2008‐09
FY 2009‐10
FY 2010‐11
FY 2011‐12
FYs 2012‐2014
Number of Light‐Duty Hydrogen FCVs Deployed Per Year
50 328 541 1,074 3,588
The Emergency Economic Stabilization Act of 2008 included an extension of the Investment Tax Credit for fuel cell technology through 2016. For FCVs that weigh less than or equal to 8,500 pounds, the base credit amount is $8,000 if the vehicle is placed in service on or before December 31, 2009, and $4,000 if the vehicle is placed in service after that date.
The Energy Commission is not proposing to provide incentives for the purchase of new FCVs at this time. It is expected that light‐duty FCVs available in California through June 2014 will be OEM subsidized leases. Further, ARB is proposing to invest $5 million to partially offset the purchase price of light‐duty electric, plug‐in hybrid, and hydrogen vehicles. The Energy Commission may allocate funds for this purpose in future years, if hydrogen vehicles are available on the market in significant numbers and the Energy Commission determines that purchase incentives beyond those offered by the federal government and the ARB are necessary to foster consumer demand.
Heavy-Duty Vehicles California has pursued the vigorous development and deployment of alternative‐fueled transit buses and hydrogen fuel cell transit buses through regulations and incentives for more than 10 years. Over this time, many developments and successes have occurred in Californiaʹs market and have advanced the evolution of transit bus technologies for the benefit of the state and the nation.
Under the ARB’s Zero‐Emission Bus (Z‐Bus) requirements, transit agencies with more than 200 urban buses in active service on January 1 of 2007 or 2009 (depending on regulation requirements) must have 15 percent of their new bus purchases be zero‐emission. According to the 2007 Transit Vehicle Database from the American Public Transportation Association, 12 transit agencies in California would fall under the Z‐Bus mandate.
The Federal Investment Tax Credit for fuel cell technology provides tax credits of between $10,000 and $40,000 for heavy‐duty vehicles, based on the weight of the vehicle. The credit may be claimed for vehicles placed in service after December 31, 2005, and purchased on or before December 31, 2014.
Because ARB is planning to fund fuel cell bus demonstrations, the Energy Commission is not proposing an allocation of funding to support the continued development and demonstration of hydrogen fuel cell buses in northern and southern California.
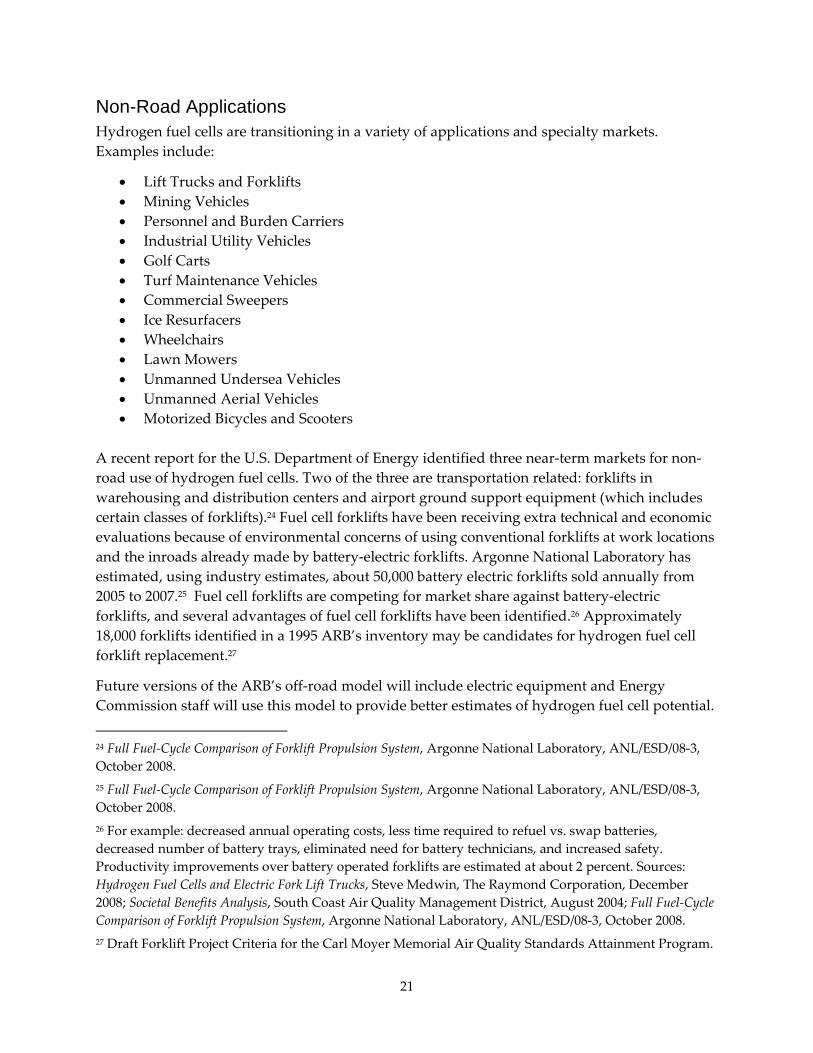
21
Non-Road Applications Hydrogen fuel cells are transitioning in a variety of applications and specialty markets. Examples include:
• Lift Trucks and Forklifts • Mining Vehicles • Personnel and Burden Carriers • Industrial Utility Vehicles • Golf Carts • Turf Maintenance Vehicles • Commercial Sweepers • Ice Resurfacers • Wheelchairs • Lawn Mowers • Unmanned Undersea Vehicles • Unmanned Aerial Vehicles • Motorized Bicycles and Scooters
A recent report for the U.S. Department of Energy identified three near‐term markets for non‐road use of hydrogen fuel cells. Two of the three are transportation related: forklifts in warehousing and distribution centers and airport ground support equipment (which includes certain classes of forklifts).24 Fuel cell forklifts have been receiving extra technical and economic evaluations because of environmental concerns of using conventional forklifts at work locations and the inroads already made by battery‐electric forklifts. Argonne National Laboratory has estimated, using industry estimates, about 50,000 battery electric forklifts sold annually from 2005 to 2007.25 Fuel cell forklifts are competing for market share against battery‐electric forklifts, and several advantages of fuel cell forklifts have been identified.26 Approximately 18,000 forklifts identified in a 1995 ARB’s inventory may be candidates for hydrogen fuel cell forklift replacement.27
Future versions of the ARB’s off‐road model will include electric equipment and Energy Commission staff will use this model to provide better estimates of hydrogen fuel cell potential. 24 Full Fuel‐Cycle Comparison of Forklift Propulsion System, Argonne National Laboratory, ANL/ESD/08‐3, October 2008. 25 Full Fuel‐Cycle Comparison of Forklift Propulsion System, Argonne National Laboratory, ANL/ESD/08‐3, October 2008. 26 For example: decreased annual operating costs, less time required to refuel vs. swap batteries, decreased number of battery trays, eliminated need for battery technicians, and increased safety. Productivity improvements over battery operated forklifts are estimated at about 2 percent. Sources: Hydrogen Fuel Cells and Electric Fork Lift Trucks, Steve Medwin, The Raymond Corporation, December 2008; Societal Benefits Analysis, South Coast Air Quality Management District, August 2004; Full Fuel‐Cycle Comparison of Forklift Propulsion System, Argonne National Laboratory, ANL/ESD/08‐3, October 2008. 27 Draft Forklift Project Criteria for the Carl Moyer Memorial Air Quality Standards Attainment Program.

22
Ground transport equipment will be included at a later date from information being collected by the Air Transport Association. The ARB is still developing incentives, emission credits, and grant funding available for hydrogen fuel cell off‐road vehicle applications.
The Energy Commission is not allocating any funding for off‐road hydrogen applications at this time, but will continue to monitor the state of the technologies and markets.
Infrastructure There are nearly 30 hydrogen fueling stations in California.28 Of these, between 4 and 15 are reported to be “public” stations (the range is a result of differing definitions of that term). The California Fuel Cell Partnership identified the need to support high‐volume; retail‐oriented hydrogen fueling stations as being the most important action AB 118 funding can take to promote the success of FCVs.29
Based on expected rollout of hydrogen vehicles, the California Fuel Cell Partnership estimates that at least 50 new hydrogen fueling stations will be needed by 2017, of which at least 7 should be started in 2009 (assuming two years from planning to commissioning). In particular, American Honda Motor Company estimates that four new publicly accessible 100 kg/day hydrogen fueling stations are needed in the Los Angeles Basin by mid‐2010 to support rollout of the Honda Clarity.30 Studies completed by the UC Davis Institute for Transportation Study note that eight public access hydrogen fueling stations strategically located in Southern California are needed each year for the next few years to support automaker rollout of hydrogen passenger vehicles.
In preparation for the upcoming FCV rollouts, in 2008 ARB awarded $7.6 million for three new publicly accessible hydrogen stations scheduled for full operation by the end of 2009, to be located in Emeryville, Los Angeles, and Orange County. Additional stations will still be required to meet the projected demand by hydrogen fuel cell demonstrations.31 In January 2009, ARB announced a new grant solicitation to co‐fund three to four additional hydrogen refueling stations. A maximum of $2.3 million will be made available per renewable station (with a requirement of $1.7 million co‐funding.) Four additional stations have been awarded funding as
28 California Air Resources Board: 29 research, public, and private stations with 8 additional in planning or development stage. www.driveclean.ca.gov/charging_fueling_H2.php (accessed 2/10/09).
U.S. Department of Energy Alternative Fuels and Advanced Vehicles Data Center: 28 public and private stations. www.afdc.energy.gov/afdc/progs/ind_state.php/CA/HY/print (accessed 2/17/09).
California Fuel Cell Partnership, 26 hydrogen stations in January 2009. 29 CEC Draft Alternative Fuels Plan, Docket #06‐AFP‐1, Comments of Catherine Dunwoody, Executive Director, California Fuel Cell Partnership, October 12, 2007. 30 Honda’s View on H2 Infrastructure Needs, Robert Bienenfeld, American Honda Motor Co., Inc. presentation, January 8, 2009. 31 Honda’s View on H2 Infrastructure Needs, Robert Bienenfeld, American Honda Motor Co., Inc. presentation, January 8, 2009.
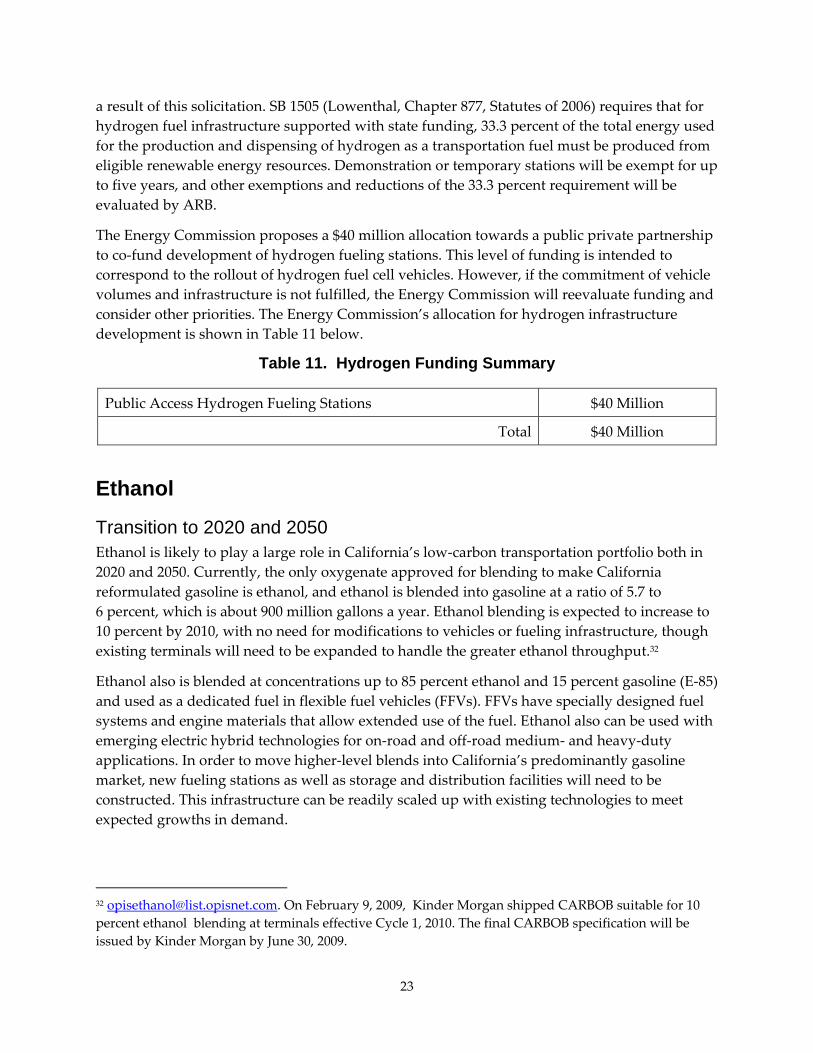
23
a result of this solicitation. SB 1505 (Lowenthal, Chapter 877, Statutes of 2006) requires that for hydrogen fuel infrastructure supported with state funding, 33.3 percent of the total energy used for the production and dispensing of hydrogen as a transportation fuel must be produced from eligible renewable energy resources. Demonstration or temporary stations will be exempt for up to five years, and other exemptions and reductions of the 33.3 percent requirement will be evaluated by ARB.
The Energy Commission proposes a $40 million allocation towards a public private partnership to co‐fund development of hydrogen fueling stations. This level of funding is intended to correspond to the rollout of hydrogen fuel cell vehicles. However, if the commitment of vehicle volumes and infrastructure is not fulfilled, the Energy Commission will reevaluate funding and consider other priorities. The Energy Commission’s allocation for hydrogen infrastructure development is shown in Table 11 below.
Table 11. Hydrogen Funding Summary
Public Access Hydrogen Fueling Stations $40 Million
Total $40 Million
Ethanol
Transition to 2020 and 2050 Ethanol is likely to play a large role in California’s low‐carbon transportation portfolio both in 2020 and 2050. Currently, the only oxygenate approved for blending to make California reformulated gasoline is ethanol, and ethanol is blended into gasoline at a ratio of 5.7 to 6 percent, which is about 900 million gallons a year. Ethanol blending is expected to increase to 10 percent by 2010, with no need for modifications to vehicles or fueling infrastructure, though existing terminals will need to be expanded to handle the greater ethanol throughput.32
Ethanol also is blended at concentrations up to 85 percent ethanol and 15 percent gasoline (E‐85) and used as a dedicated fuel in flexible fuel vehicles (FFVs). FFVs have specially designed fuel systems and engine materials that allow extended use of the fuel. Ethanol also can be used with emerging electric hybrid technologies for on‐road and off‐road medium‐ and heavy‐duty applications. In order to move higher‐level blends into California’s predominantly gasoline market, new fueling stations as well as storage and distribution facilities will need to be constructed. This infrastructure can be readily scaled up with existing technologies to meet expected growths in demand.
32 [email protected]. On February 9, 2009, Kinder Morgan shipped CARBOB suitable for 10 percent ethanol blending at terminals effective Cycle 1, 2010. The final CARBOB specification will be issued by Kinder Morgan by June 30, 2009.
24
The primary feedstock for the production of ethanol is Midwest corn. Several processes are used in the production of ethanol. According to the most recent ARB calculations, on average, the greenhouse gas emissions of corn‐based ethanol produced in the Midwest and delivered to California slightly exceed those of gasoline when emissions associated with indirect land use change are included. However, modern California‐based ethanol production facilities produce ethanol with a carbon intensity that, on average, is better than gasoline when indirect land uses are considered.33
The multitude of feedstocks available in California from biomass waste streams to bioenergy crops such as sweet sorghum and sugarcane, make expanded in‐state production of very low‐carbon ethanol a realistic goal. Conversion of cellulosic waste streams to ethanol has the potential to create ultra‐low‐carbon transportation fuels with carbon intensity values 78 percent below the gasoline baseline.34 Using sugarcane grown in the Imperial Valley, a near carbon neutral ethanol could be produced using existing technologies that, coupled with electricity co‐generation, would have carbon intensity values 95 percent below the petroleum baseline.35
Vehicles There are currently around 400,000 light‐duty FFVs registered in California. It is likely that most of these vehicles have never used E‐85 due to the lack of available fueling stations. Where E‐85 is available, it is generally priced lower than gasoline per gallon, but not low enough to make up for the lower energy content of ethanol.36
The differential cost of manufacturing a new FFV as opposed to a gasoline vehicle is less than $150 per vehicle. Auto manufacturers including General Motors, Ford, and Chrysler have committed to producing 50 percent of their new vehicles as FFVs by 2012, which will significantly increase the number of FFVs in the United States and in California. Because FFVs are already in the California vehicle market at no additional cost to consumers or fleet users, government funding is not needed to support these vehicles. In future years, emerging technologies such as flexible‐fuel electric hybrid vehicles may require incentives to offset higher costs of production.
Infrastructure There are only 13 publicly available E‐85 stations in California today. The cost of installing E‐85 fueling capacity at existing or new fueling stations ranges from $100,000 to $250,000 per
33 Low Carbon Fuel Standard, March 5, 2009 Initial Statement of Reasons.
34 LCFS ISOR.
35 Life Cycle Associates, Technical Briefing LCA.8016.9B.2009 .
36 Ethanol has roughly two‐thirds the energy content of gasoline per gallon, so vehicles running on E‐85 achieve fewer miles per gallon than vehicles running on gasoline. Nationwide E‐85 prices are reported at http://e85prices.com.

25
station.37 The 2005 Energy Policy Act (EPAct) provides a 30 percent tax credit up to $30,000 for ethanol infrastructure. The Energy Commission has allocated funding for up to 50 E‐85 fueling stations to continue the development of infrastructure. Emphasis will be placed on using California‐based ethanol feedstocks with high potential to reduce greenhouse gas emission.
Table 12. E-85 Fueling Stations Allocation
E‐85 Fueling Stations 50
Total $5 Million
Ethanol Fuel Production There are currently seven existing ethanol production facilities in California with a combined installed capacity of 251 million gallons per year (MGPY). However, five of these facilities are currently idle due to low market prices for ethanol. These facilities range in size from 5 to 60 MGPY, with five of the seven using corn railed in from the Midwest. These five dry mill plants, all of which became operational between 2005 and 2008, are significantly more efficient than many Midwest plants.
For advanced ethanol to enter the California transportation fuels market, pilot‐scale and larger proof‐of‐concept commercial plant demonstrations are needed. Both biological and thermal process technologies are developing rapidly, with several existing pilot plants in California and other states. California’s vast biomass resources of 83 million bone dry tons per year of agricultural, forest, and municipal solid waste residues is available for the production of advanced biofuels, with appropriate safeguards to ensure the protection of California’s natural resources. In addition, potential California feedstocks for energy crops include sugar cane, sugar beets, sweet sorghum, grain sorghum, and cull fruits.
BlueFire Ethanol has received financial support from the Department of Energy for a 3.1 MGPY landfill waste‐to‐ethanol proof of concept plant, scheduled to start up in 2011. A 19 MGPY commercial‐scale plant is expected to follow in 2013. Four sugar cane‐to‐ethanol plant projects are in the planning stages for the Imperial Valley with ground breakings planned in 2009 and 2010. Assuming full funding of these projects, about 200 MGPY of ethanol production capacity could be on‐line by 2013 or 2014.
The Energy Commission has allocated $3 million over the next two fiscal years to support up to 20 feasibility studies for low‐carbon ethanol feedstock and project feasibility studies, which will include feasibility studies of modifications to existing plants. The emphasis will be on cellulosic technologies, but the Energy Commission will also consider near‐term alternate sugar and
37 There will be site‐specific situations where retrofit costs could be considerably lower based on existing available compatible equipment. Some examples of low cost systems can be found for proposed E‐85 stations under ARB’s funding for E‐85 infrastructure in 2007 (Alternative Fuels Infrastructure Program). www.arb.ca.gov/fuels/altfuels/incentives/incentives.htm.
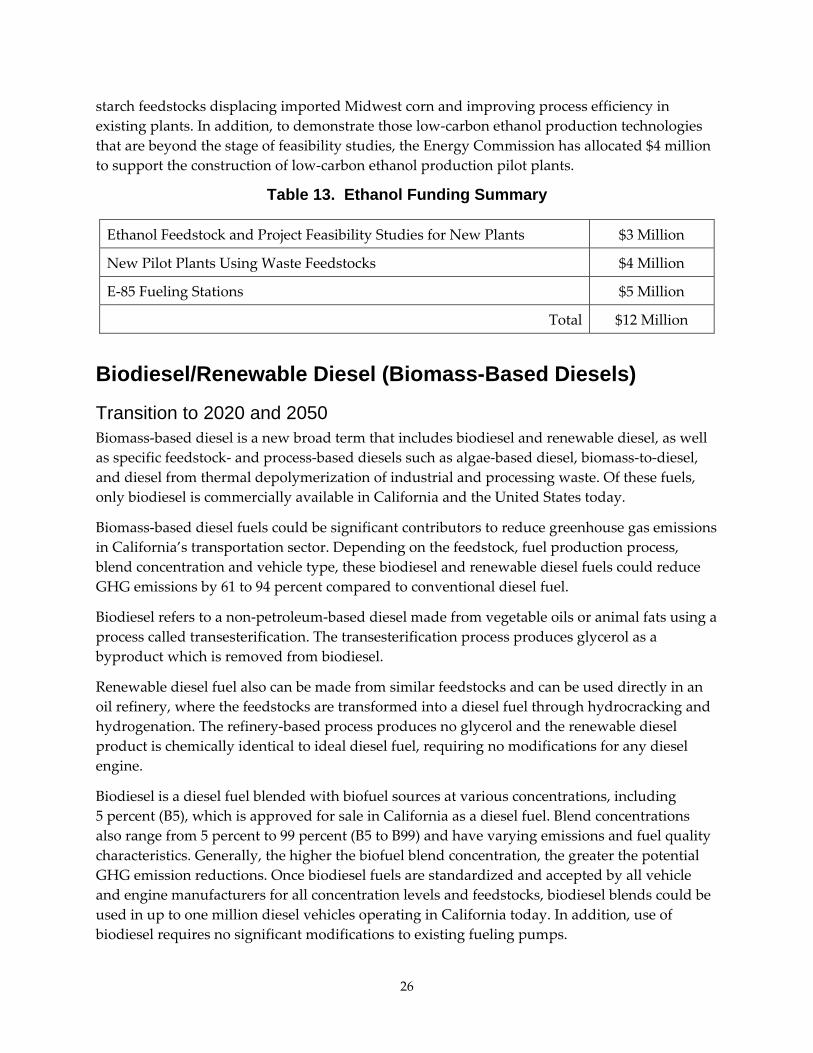
26
starch feedstocks displacing imported Midwest corn and improving process efficiency in existing plants. In addition, to demonstrate those low‐carbon ethanol production technologies that are beyond the stage of feasibility studies, the Energy Commission has allocated $4 million to support the construction of low‐carbon ethanol production pilot plants.
Table 13. Ethanol Funding Summary
Ethanol Feedstock and Project Feasibility Studies for New Plants $3 Million
New Pilot Plants Using Waste Feedstocks $4 Million
E‐85 Fueling Stations $5 Million
Total $12 Million
Biodiesel/Renewable Diesel (Biomass-Based Diesels)
Transition to 2020 and 2050 Biomass‐based diesel is a new broad term that includes biodiesel and renewable diesel, as well as specific feedstock‐ and process‐based diesels such as algae‐based diesel, biomass‐to‐diesel, and diesel from thermal depolymerization of industrial and processing waste. Of these fuels, only biodiesel is commercially available in California and the United States today.
Biomass‐based diesel fuels could be significant contributors to reduce greenhouse gas emissions in California’s transportation sector. Depending on the feedstock, fuel production process, blend concentration and vehicle type, these biodiesel and renewable diesel fuels could reduce GHG emissions by 61 to 94 percent compared to conventional diesel fuel.
Biodiesel refers to a non‐petroleum‐based diesel made from vegetable oils or animal fats using a process called transesterification. The transesterification process produces glycerol as a byproduct which is removed from biodiesel.
Renewable diesel fuel also can be made from similar feedstocks and can be used directly in an oil refinery, where the feedstocks are transformed into a diesel fuel through hydrocracking and hydrogenation. The refinery‐based process produces no glycerol and the renewable diesel product is chemically identical to ideal diesel fuel, requiring no modifications for any diesel engine.
Biodiesel is a diesel fuel blended with biofuel sources at various concentrations, including 5 percent (B5), which is approved for sale in California as a diesel fuel. Blend concentrations also range from 5 percent to 99 percent (B5 to B99) and have varying emissions and fuel quality characteristics. Generally, the higher the biofuel blend concentration, the greater the potential GHG emission reductions. Once biodiesel fuels are standardized and accepted by all vehicle and engine manufacturers for all concentration levels and feedstocks, biodiesel blends could be used in up to one million diesel vehicles operating in California today. In addition, use of biodiesel requires no significant modifications to existing fueling pumps.

27
To maximize greenhouse gas emission reductions and produce biodiesel/renewable fuels in California, several milestone achievements will be required. Additional progress will be needed to produce fuels from renewable, low greenhouse gas feedstocks, including waste sources and algae, and to demonstrate the viability of these sources. Automakers and engine manufacturers will need to show widespread acceptance of all biodiesel/renewable diesel blend concentrations for use in all diesel vehicles. California will need strategic deployment of blending and storage terminals to increase the availability of biodiesel/renewable diesel to customers. A tracking method will be needed to verify environmental sustainability impacts of all feedstock sources and will be the subject of work under an AB 118 sustainability program.
Biodiesel/Renewable Diesel Fuel Use and Vehicles California started using biodiesel in 1990, and its use has grown to 50 million gallons per year, or 1.7 percent of on‐road diesel demand. In 2007, 1.1 million on‐road diesel vehicles were registered in California, consuming 2.8 billion gallons of diesel. Off‐road diesel demand is estimated at an additional one billion gallons. Table 14 below shows projected California on‐road diesel vehicle populations and fuel demand, and the volumes of biodiesel/renewable diesel that would be needed at 5 and 20 percent blends.38
In 2006, roughly 50 percent of all biodiesel was used by on‐road vehicles, 25 percent in marine applications and 25 percent in other off‐road applications. Approximately one‐third of all on‐road biodiesel fuel use was in light‐duty cars and pickup trucks.
Between 2003 and 2009, diesel cars were not sold in California due to diesel exhaust emission standards. New clean diesel cars were re‐introduced into California’s market in 2009, and have received substantial consumer interest. Volkswagen diesel models have such a demand that there is a waiting list of customers today.39
38 The B5 and B20/R20 rows show the hypothetical volumes of biodiesel/renewable diesel needed at the projected diesel demand. They are not forecasts of available biodiesel/renewable diesel volumes.
39 Diesel Technology Forum, Mr. Tom Fulks, conversation with Energy Commission staff February 14, 2009.
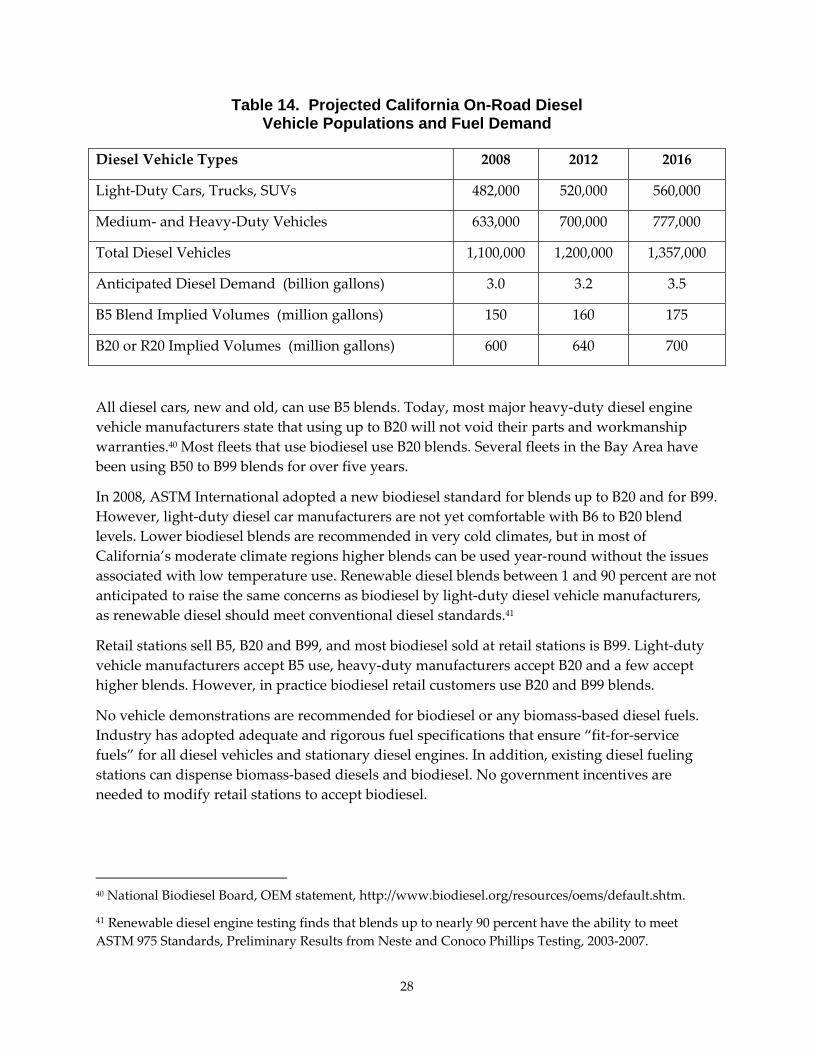
28
Table 14. Projected California On-Road Diesel Vehicle Populations and Fuel Demand
Diesel Vehicle Types 2008 2012 2016
Light‐Duty Cars, Trucks, SUVs 482,000 520,000 560,000
Medium‐ and Heavy‐Duty Vehicles 633,000 700,000 777,000
Total Diesel Vehicles 1,100,000 1,200,000 1,357,000
Anticipated Diesel Demand (billion gallons) 3.0 3.2 3.5
B5 Blend Implied Volumes (million gallons) 150 160 175
B20 or R20 Implied Volumes (million gallons) 600 640 700
All diesel cars, new and old, can use B5 blends. Today, most major heavy‐duty diesel engine vehicle manufacturers state that using up to B20 will not void their parts and workmanship warranties.40 Most fleets that use biodiesel use B20 blends. Several fleets in the Bay Area have been using B50 to B99 blends for over five years.
In 2008, ASTM International adopted a new biodiesel standard for blends up to B20 and for B99. However, light‐duty diesel car manufacturers are not yet comfortable with B6 to B20 blend levels. Lower biodiesel blends are recommended in very cold climates, but in most of California’s moderate climate regions higher blends can be used year‐round without the issues associated with low temperature use. Renewable diesel blends between 1 and 90 percent are not anticipated to raise the same concerns as biodiesel by light‐duty diesel vehicle manufacturers, as renewable diesel should meet conventional diesel standards.41
Retail stations sell B5, B20 and B99, and most biodiesel sold at retail stations is B99. Light‐duty vehicle manufacturers accept B5 use, heavy‐duty manufacturers accept B20 and a few accept higher blends. However, in practice biodiesel retail customers use B20 and B99 blends.
No vehicle demonstrations are recommended for biodiesel or any biomass‐based diesel fuels. Industry has adopted adequate and rigorous fuel specifications that ensure “fit‐for‐service fuels” for all diesel vehicles and stationary diesel engines. In addition, existing diesel fueling stations can dispense biomass‐based diesels and biodiesel. No government incentives are needed to modify retail stations to accept biodiesel.
40 National Biodiesel Board, OEM statement, http://www.biodiesel.org/resources/oems/default.shtm.
41 Renewable diesel engine testing finds that blends up to nearly 90 percent have the ability to meet ASTM 975 Standards, Preliminary Results from Neste and Conoco Phillips Testing, 2003‐2007.
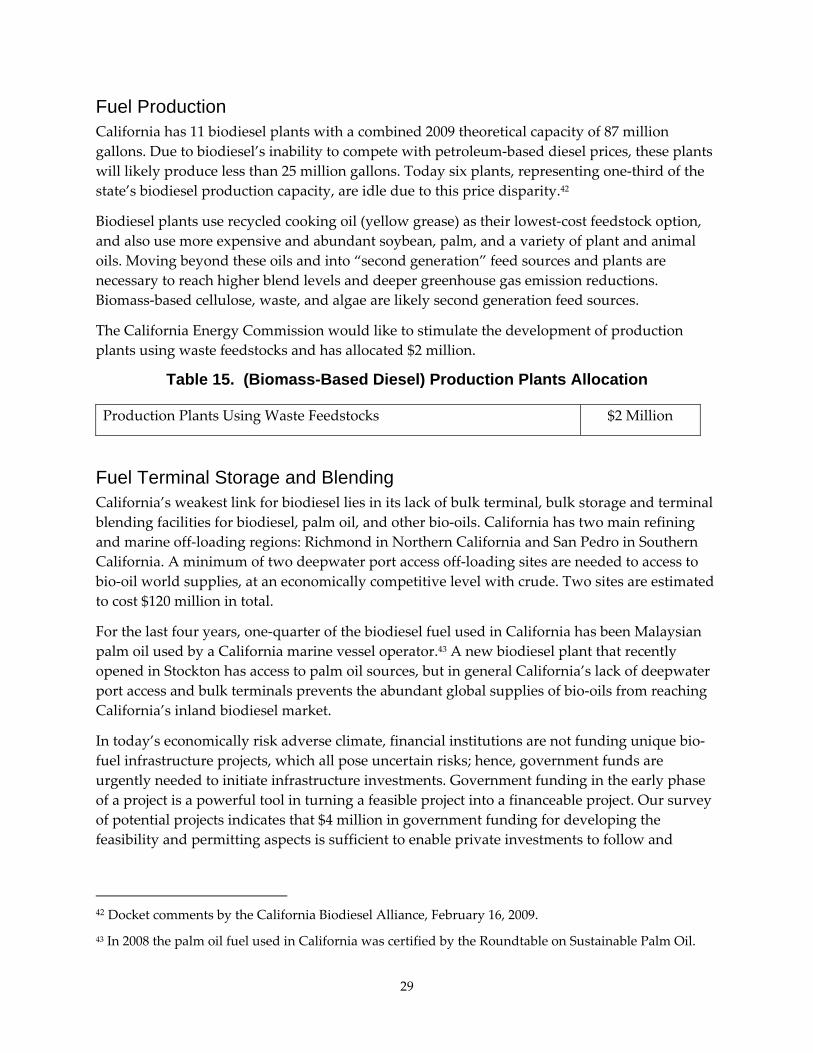
29
Fuel Production California has 11 biodiesel plants with a combined 2009 theoretical capacity of 87 million gallons. Due to biodiesel’s inability to compete with petroleum‐based diesel prices, these plants will likely produce less than 25 million gallons. Today six plants, representing one‐third of the state’s biodiesel production capacity, are idle due to this price disparity.42
Biodiesel plants use recycled cooking oil (yellow grease) as their lowest‐cost feedstock option, and also use more expensive and abundant soybean, palm, and a variety of plant and animal oils. Moving beyond these oils and into “second generation” feed sources and plants are necessary to reach higher blend levels and deeper greenhouse gas emission reductions. Biomass‐based cellulose, waste, and algae are likely second generation feed sources.
The California Energy Commission would like to stimulate the development of production plants using waste feedstocks and has allocated $2 million.
Table 15. (Biomass-Based Diesel) Production Plants Allocation
Production Plants Using Waste Feedstocks $2 Million
Fuel Terminal Storage and Blending California’s weakest link for biodiesel lies in its lack of bulk terminal, bulk storage and terminal blending facilities for biodiesel, palm oil, and other bio‐oils. California has two main refining and marine off‐loading regions: Richmond in Northern California and San Pedro in Southern California. A minimum of two deepwater port access off‐loading sites are needed to access to bio‐oil world supplies, at an economically competitive level with crude. Two sites are estimated to cost $120 million in total.
For the last four years, one‐quarter of the biodiesel fuel used in California has been Malaysian palm oil used by a California marine vessel operator.43 A new biodiesel plant that recently opened in Stockton has access to palm oil sources, but in general California’s lack of deepwater port access and bulk terminals prevents the abundant global supplies of bio‐oils from reaching California’s inland biodiesel market.
In today’s economically risk adverse climate, financial institutions are not funding unique bio‐fuel infrastructure projects, which all pose uncertain risks; hence, government funds are urgently needed to initiate infrastructure investments. Government funding in the early phase of a project is a powerful tool in turning a feasible project into a financeable project. Our survey of potential projects indicates that $4 million in government funding for developing the feasibility and permitting aspects is sufficient to enable private investments to follow and
42 Docket comments by the California Biodiesel Alliance, February 16, 2009.
43 In 2008 the palm oil fuel used in California was certified by the Roundtable on Sustainable Palm Oil.
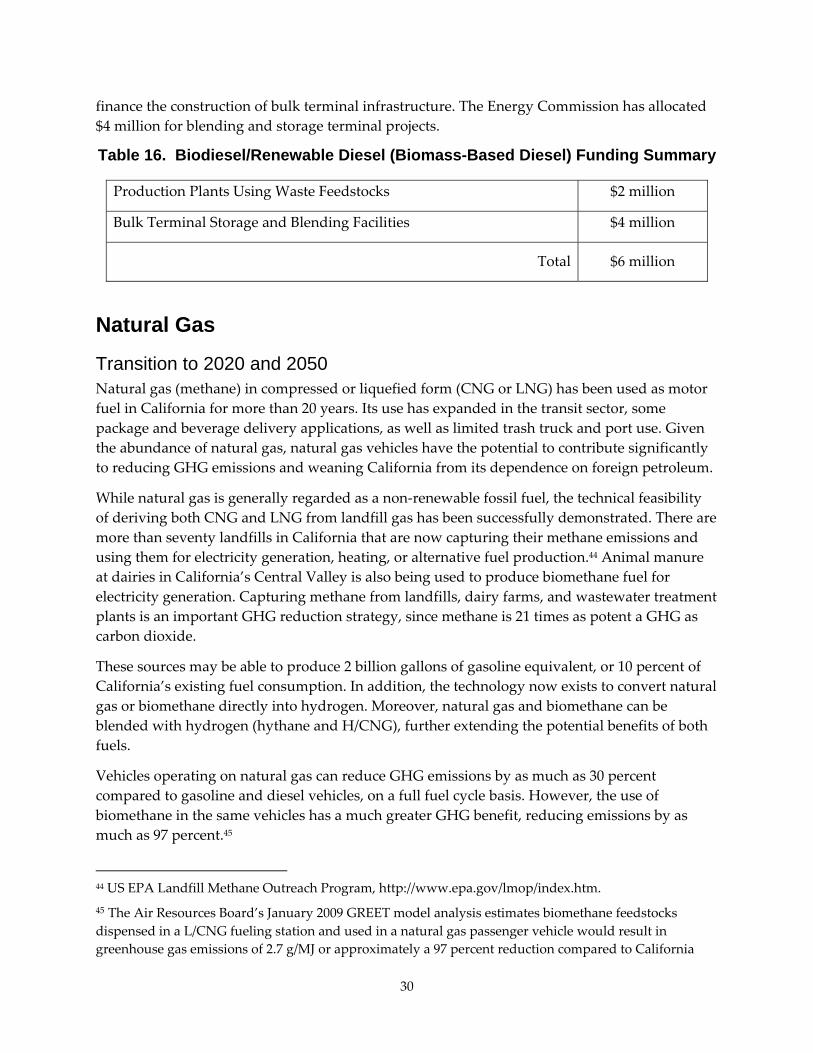
30
finance the construction of bulk terminal infrastructure. The Energy Commission has allocated $4 million for blending and storage terminal projects.
Table 16. Biodiesel/Renewable Diesel (Biomass-Based Diesel) Funding Summary
Production Plants Using Waste Feedstocks $2 million
Bulk Terminal Storage and Blending Facilities $4 million
Total $6 million
Natural Gas
Transition to 2020 and 2050 Natural gas (methane) in compressed or liquefied form (CNG or LNG) has been used as motor fuel in California for more than 20 years. Its use has expanded in the transit sector, some package and beverage delivery applications, as well as limited trash truck and port use. Given the abundance of natural gas, natural gas vehicles have the potential to contribute significantly to reducing GHG emissions and weaning California from its dependence on foreign petroleum.
While natural gas is generally regarded as a non‐renewable fossil fuel, the technical feasibility of deriving both CNG and LNG from landfill gas has been successfully demonstrated. There are more than seventy landfills in California that are now capturing their methane emissions and using them for electricity generation, heating, or alternative fuel production.44 Animal manure at dairies in California’s Central Valley is also being used to produce biomethane fuel for electricity generation. Capturing methane from landfills, dairy farms, and wastewater treatment plants is an important GHG reduction strategy, since methane is 21 times as potent a GHG as carbon dioxide.
These sources may be able to produce 2 billion gallons of gasoline equivalent, or 10 percent of California’s existing fuel consumption. In addition, the technology now exists to convert natural gas or biomethane directly into hydrogen. Moreover, natural gas and biomethane can be blended with hydrogen (hythane and H/CNG), further extending the potential benefits of both fuels.
Vehicles operating on natural gas can reduce GHG emissions by as much as 30 percent compared to gasoline and diesel vehicles, on a full fuel cycle basis. However, the use of biomethane in the same vehicles has a much greater GHG benefit, reducing emissions by as much as 97 percent.45
44 US EPA Landfill Methane Outreach Program, http://www.epa.gov/lmop/index.htm. 45 The Air Resources Board’s January 2009 GREET model analysis estimates biomethane feedstocks dispensed in a L/CNG fueling station and used in a natural gas passenger vehicle would result in greenhouse gas emissions of 2.7 g/MJ or approximately a 97 percent reduction compared to California
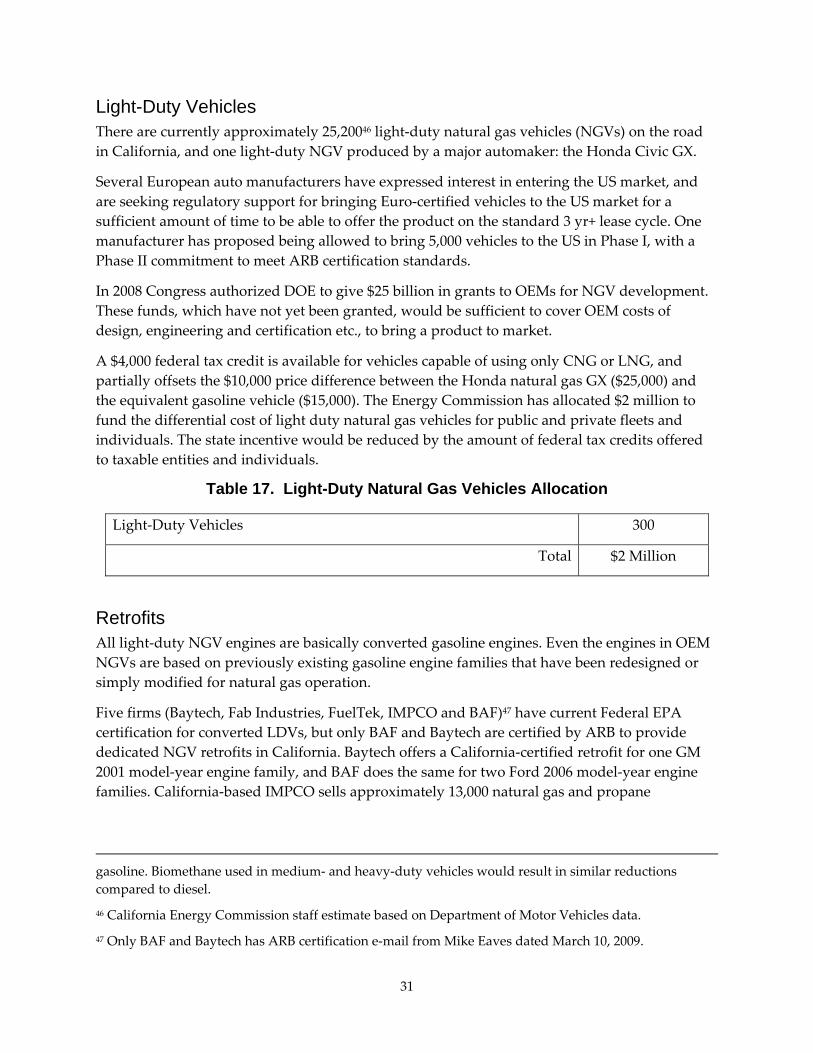
31
Light-Duty Vehicles There are currently approximately 25,20046 light‐duty natural gas vehicles (NGVs) on the road in California, and one light‐duty NGV produced by a major automaker: the Honda Civic GX.
Several European auto manufacturers have expressed interest in entering the US market, and are seeking regulatory support for bringing Euro‐certified vehicles to the US market for a sufficient amount of time to be able to offer the product on the standard 3 yr+ lease cycle. One manufacturer has proposed being allowed to bring 5,000 vehicles to the US in Phase I, with a Phase II commitment to meet ARB certification standards.
In 2008 Congress authorized DOE to give $25 billion in grants to OEMs for NGV development. These funds, which have not yet been granted, would be sufficient to cover OEM costs of design, engineering and certification etc., to bring a product to market.
A $4,000 federal tax credit is available for vehicles capable of using only CNG or LNG, and partially offsets the $10,000 price difference between the Honda natural gas GX ($25,000) and the equivalent gasoline vehicle ($15,000). The Energy Commission has allocated $2 million to fund the differential cost of light duty natural gas vehicles for public and private fleets and individuals. The state incentive would be reduced by the amount of federal tax credits offered to taxable entities and individuals.
Table 17. Light-Duty Natural Gas Vehicles Allocation
Light‐Duty Vehicles 300
Total $2 Million
Retrofits All light‐duty NGV engines are basically converted gasoline engines. Even the engines in OEM NGVs are based on previously existing gasoline engine families that have been redesigned or simply modified for natural gas operation.
Five firms (Baytech, Fab Industries, FuelTek, IMPCO and BAF)47 have current Federal EPA certification for converted LDVs, but only BAF and Baytech are certified by ARB to provide dedicated NGV retrofits in California. Baytech offers a California‐certified retrofit for one GM 2001 model‐year engine family, and BAF does the same for two Ford 2006 model‐year engine families. California‐based IMPCO sells approximately 13,000 natural gas and propane
gasoline. Biomethane used in medium‐ and heavy‐duty vehicles would result in similar reductions compared to diesel.
46 California Energy Commission staff estimate based on Department of Motor Vehicles data.
47 Only BAF and Baytech has ARB certification e‐mail from Mike Eaves dated March 10, 2009.
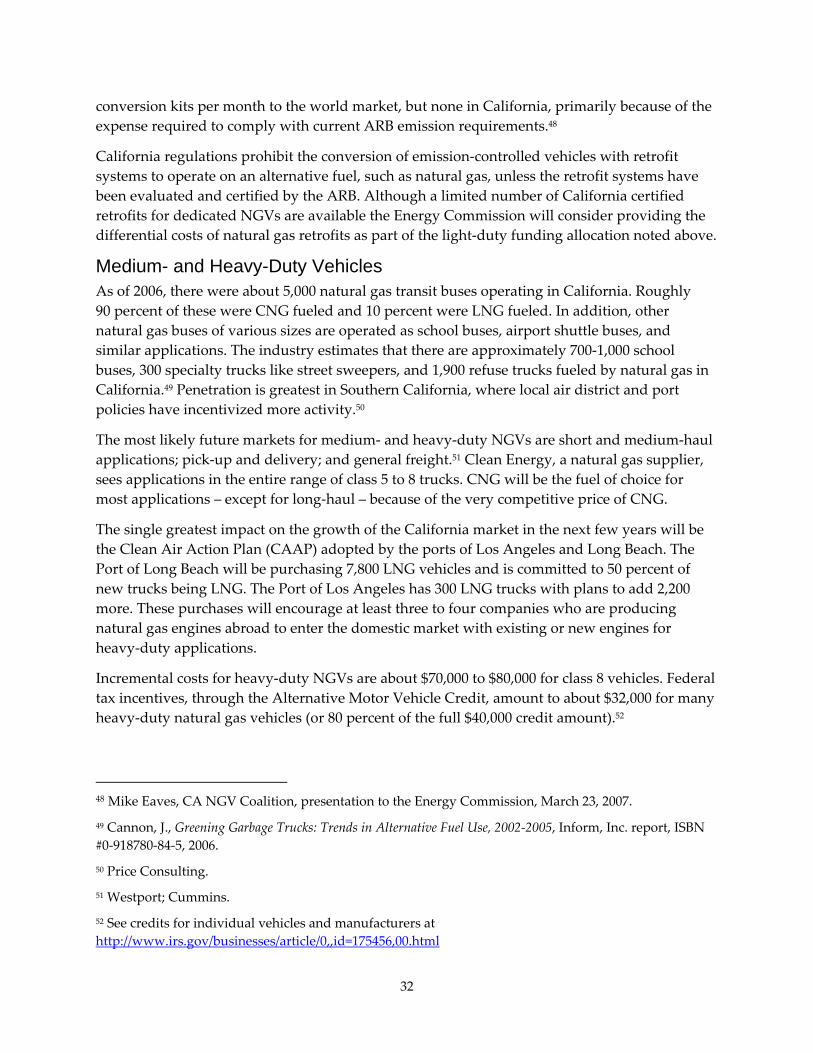
32
conversion kits per month to the world market, but none in California, primarily because of the expense required to comply with current ARB emission requirements.48
California regulations prohibit the conversion of emission‐controlled vehicles with retrofit systems to operate on an alternative fuel, such as natural gas, unless the retrofit systems have been evaluated and certified by the ARB. Although a limited number of California certified retrofits for dedicated NGVs are available the Energy Commission will consider providing the differential costs of natural gas retrofits as part of the light‐duty funding allocation noted above.
Medium- and Heavy-Duty Vehicles As of 2006, there were about 5,000 natural gas transit buses operating in California. Roughly 90 percent of these were CNG fueled and 10 percent were LNG fueled. In addition, other natural gas buses of various sizes are operated as school buses, airport shuttle buses, and similar applications. The industry estimates that there are approximately 700‐1,000 school buses, 300 specialty trucks like street sweepers, and 1,900 refuse trucks fueled by natural gas in California.49 Penetration is greatest in Southern California, where local air district and port policies have incentivized more activity.50
The most likely future markets for medium‐ and heavy‐duty NGVs are short and medium‐haul applications; pick‐up and delivery; and general freight.51 Clean Energy, a natural gas supplier, sees applications in the entire range of class 5 to 8 trucks. CNG will be the fuel of choice for most applications – except for long‐haul – because of the very competitive price of CNG.
The single greatest impact on the growth of the California market in the next few years will be the Clean Air Action Plan (CAAP) adopted by the ports of Los Angeles and Long Beach. The Port of Long Beach will be purchasing 7,800 LNG vehicles and is committed to 50 percent of new trucks being LNG. The Port of Los Angeles has 300 LNG trucks with plans to add 2,200 more. These purchases will encourage at least three to four companies who are producing natural gas engines abroad to enter the domestic market with existing or new engines for heavy‐duty applications.
Incremental costs for heavy‐duty NGVs are about $70,000 to $80,000 for class 8 vehicles. Federal tax incentives, through the Alternative Motor Vehicle Credit, amount to about $32,000 for many heavy‐duty natural gas vehicles (or 80 percent of the full $40,000 credit amount).52
48 Mike Eaves, CA NGV Coalition, presentation to the Energy Commission, March 23, 2007.
49 Cannon, J., Greening Garbage Trucks: Trends in Alternative Fuel Use, 2002‐2005, Inform, Inc. report, ISBN #0‐918780‐84‐5, 2006.
50 Price Consulting.
51 Westport; Cummins.
52 See credits for individual vehicles and manufacturers at http://www.irs.gov/businesses/article/0,,id=175456,00.html
33
The Energy Commission is proposing to allocate $23 million over the next two fiscal years for medium‐ and heavy‐duty NGV rebates, which will cover a portion of the incremental cost for hundreds of vehicles and make these vehicles much more attractive for fleet applications.
The table below shows estimated heavy‐duty CNG and LNG vehicle sales in California, available tax credits, and the Energy Commission’s funding allocation. ARB is not proposing to allocate funds for heavy‐duty natural gas vehicle incentives.
Table 18. Medium- and Heavy-Duty Natural Gas Vehicles Allocation
Heavy‐Duty CNG Vehicle Sales 3,000
Heavy‐Duty LNG Vehicle Sales 3,000
Federal Tax Credits $2,500 to $32,000
Total Funding for Medium‐ and Heavy‐Duty Port Trucks, School Buses and Other Vehicles
$23 Million
Infrastructure The natural gas fueling infrastructure consists of seven types of fueling facilities:
• CNG home refueling appliances (HRAs)
• Small‐capacity CNG stations
• Medium‐capacity CNG stations
• Large‐capacity CNG stations
• Large‐capacity LNG stations
• CNG dispensers added to existing gasoline stations
• Combined CNG and LNG station (LCNG)
There are several hundred public and private CNG stations and approximately 30 LNG‐dispensing facilities in California. Small, medium, and large CNG stations (compressors and dispensers) can be added to existing gasoline stations or built as “stand alone” CNG stations. It is also possible for a single station to dispense both CNG and LNG, and in fact LNG can be gasified to CNG with conventional pumps with less energy than it takes to compress pipeline gas to CNG, though CNG from LNG is more expensive than CNG from pipeline gas.
A network of 8‐12 stations would be capable of handling the thousands of trucks involved in southern California’s goods movement. On the heavy duty side, large stations will play by far the largest role. Smaller stations can be viable, but only if there is adequate vehicle throughput.
The natural gas fuel infrastructure is gradually expanding as a result of fleet rules in several California air basins, market‐leader fleets, and the persistence of infrastructure developers. However, because natural gas infrastructure is relatively small in comparison to petroleum infrastructure, large amounts of capital are required to expand infrastructure. For the customer,
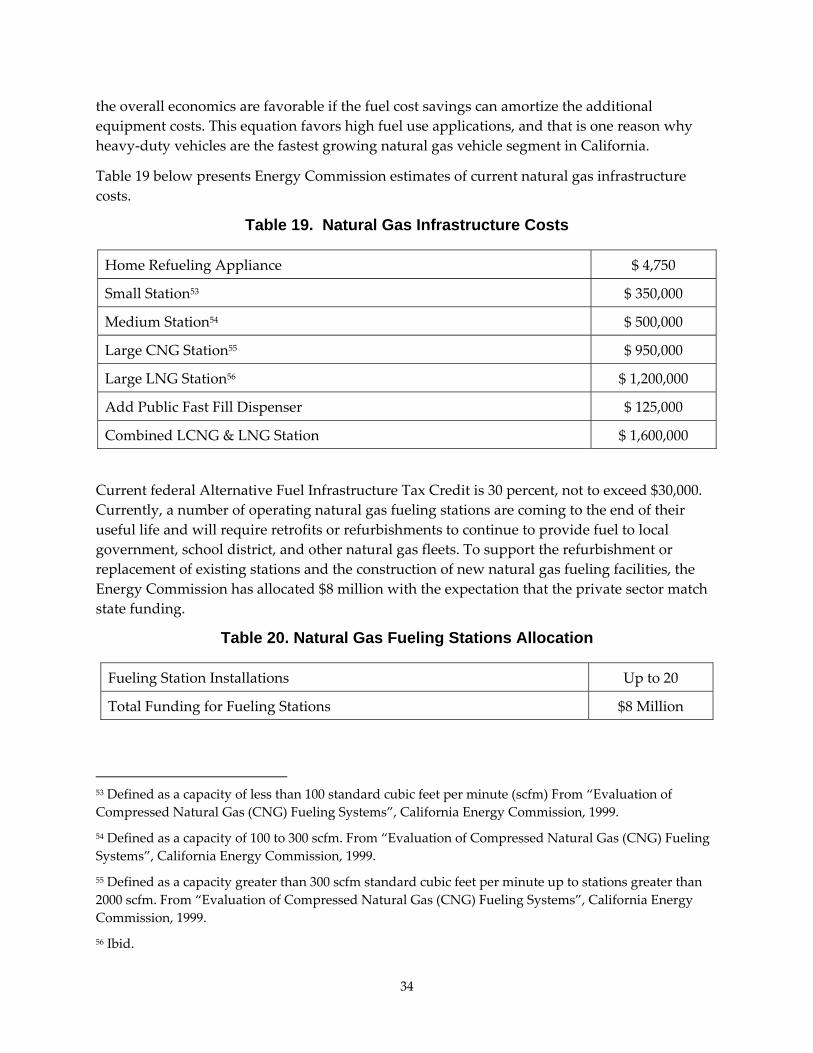
34
the overall economics are favorable if the fuel cost savings can amortize the additional equipment costs. This equation favors high fuel use applications, and that is one reason why heavy‐duty vehicles are the fastest growing natural gas vehicle segment in California.
Table 19 below presents Energy Commission estimates of current natural gas infrastructure costs.
Table 19. Natural Gas Infrastructure Costs
Home Refueling Appliance $ 4,750
Small Station53 $ 350,000
Medium Station54 $ 500,000
Large CNG Station55 $ 950,000
Large LNG Station56 $ 1,200,000
Add Public Fast Fill Dispenser $ 125,000
Combined LCNG & LNG Station $ 1,600,000
Current federal Alternative Fuel Infrastructure Tax Credit is 30 percent, not to exceed $30,000. Currently, a number of operating natural gas fueling stations are coming to the end of their useful life and will require retrofits or refurbishments to continue to provide fuel to local government, school district, and other natural gas fleets. To support the refurbishment or replacement of existing stations and the construction of new natural gas fueling facilities, the Energy Commission has allocated $8 million with the expectation that the private sector match state funding.
Table 20. Natural Gas Fueling Stations Allocation
Fueling Station Installations Up to 20
Total Funding for Fueling Stations $8 Million
53 Defined as a capacity of less than 100 standard cubic feet per minute (scfm) From “Evaluation of Compressed Natural Gas (CNG) Fueling Systems”, California Energy Commission, 1999.
54 Defined as a capacity of 100 to 300 scfm. From “Evaluation of Compressed Natural Gas (CNG) Fueling Systems”, California Energy Commission, 1999.
55 Defined as a capacity greater than 300 scfm standard cubic feet per minute up to stations greater than 2000 scfm. From “Evaluation of Compressed Natural Gas (CNG) Fueling Systems”, California Energy Commission, 1999.
56 Ibid.
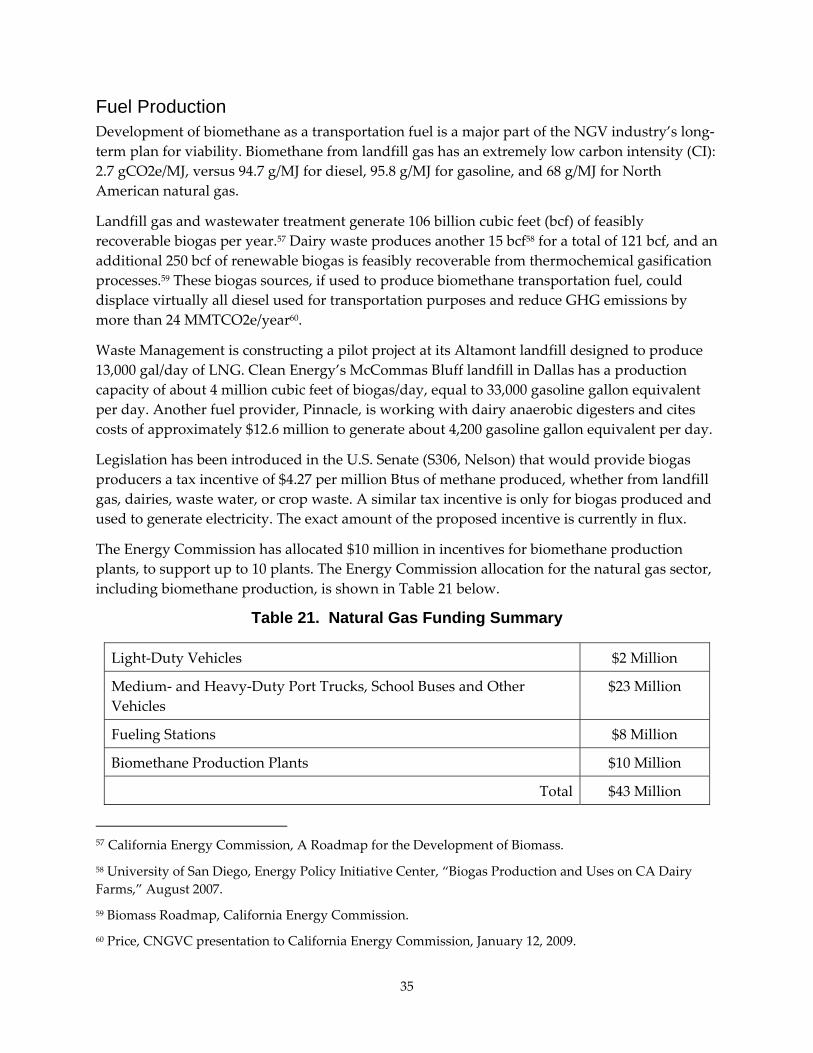
35
Fuel Production Development of biomethane as a transportation fuel is a major part of the NGV industry’s long‐term plan for viability. Biomethane from landfill gas has an extremely low carbon intensity (CI): 2.7 gCO2e/MJ, versus 94.7 g/MJ for diesel, 95.8 g/MJ for gasoline, and 68 g/MJ for North American natural gas.
Landfill gas and wastewater treatment generate 106 billion cubic feet (bcf) of feasibly recoverable biogas per year.57 Dairy waste produces another 15 bcf58 for a total of 121 bcf, and an additional 250 bcf of renewable biogas is feasibly recoverable from thermochemical gasification processes.59 These biogas sources, if used to produce biomethane transportation fuel, could displace virtually all diesel used for transportation purposes and reduce GHG emissions by more than 24 MMTCO2e/year60.
Waste Management is constructing a pilot project at its Altamont landfill designed to produce 13,000 gal/day of LNG. Clean Energy’s McCommas Bluff landfill in Dallas has a production capacity of about 4 million cubic feet of biogas/day, equal to 33,000 gasoline gallon equivalent per day. Another fuel provider, Pinnacle, is working with dairy anaerobic digesters and cites costs of approximately $12.6 million to generate about 4,200 gasoline gallon equivalent per day.
Legislation has been introduced in the U.S. Senate (S306, Nelson) that would provide biogas producers a tax incentive of $4.27 per million Btus of methane produced, whether from landfill gas, dairies, waste water, or crop waste. A similar tax incentive is only for biogas produced and used to generate electricity. The exact amount of the proposed incentive is currently in flux.
The Energy Commission has allocated $10 million in incentives for biomethane production plants, to support up to 10 plants. The Energy Commission allocation for the natural gas sector, including biomethane production, is shown in Table 21 below.
Table 21. Natural Gas Funding Summary
Light‐Duty Vehicles $2 Million
Medium‐ and Heavy‐Duty Port Trucks, School Buses and Other Vehicles
$23 Million
Fueling Stations $8 Million
Biomethane Production Plants $10 Million
Total $43 Million
57 California Energy Commission, A Roadmap for the Development of Biomass.
58 University of San Diego, Energy Policy Initiative Center, “Biogas Production and Uses on CA Dairy Farms,” August 2007.
59 Biomass Roadmap, California Energy Commission.
60 Price, CNGVC presentation to California Energy Commission, January 12, 2009.
36
Propane In the early 1980s, liquefied petroleum gas (LPG, or propane) was the leading alternative fuel in California; more than 200,000 propane vehicles were operating in the state. Propane fuel use and vehicle availability have since declined to negligible levels, though some fleet owners continue to express interest in using propane as an alternative to gasoline because of its low fuel cost and widespread availability.
Propane can offer moderate GHG reductions over the next few years until lower‐carbon alternative fuels are more widely available. Propane produced along with natural gas reduces GHG emissions by 9 to19 percent compared to gasoline, slightly better than petroleum‐derived propane.
Fueling infrastructure for propane can be installed at low cost at either publicly accessible stations or for private businesses, and upgrading existing propane infrastructure for vehicle fueling is cost effective as well. Additionally, new supplies of propane may become available with advancements in processes that derive propane from renewable sources. Bio‐propane can give the industry an additional advantage as a transitional fuel that will be beneficial economically and environmentally in the coming years.
Light-Duty Vehicles Currently, there are no light‐duty propane vehicles made by OEMs available in California. The Roush F‐150 is certified for retrofit applications by the United States Environmental Protection Agency and the California Air Resources Board.
Medium-Duty Vehicles Most propane vehicles are retrofits. While light‐duty passenger vehicles could be retrofitted to use propane, retrofits are more common for medium‐duty vehicles used in fleets. Propane is viewed as an economical retrofit option for delivery trucks and school buses like the Bluebird school bus. Only three companies offer propane conversions for gasoline engines today, Baytech, Bi‐Phase Technologies, and Clean Fuel USA. All are retrofits to medium‐duty GM engines (6.0 and 8.1 L models). Cummins offers a propane‐fueled version of its 5.9 L engine (B LPG Plus). Retrofits generally cost between $7,000 and $12,000 for medium‐ and heavy‐duty applications. The Energy Commission proposes to allocate $1 million for medium‐duty propane retrofits of school buses over the next two years.
Heavy-Duty and Non-Road Vehicle There are currently no heavy‐duty vehicles or engines that run on propane. However, propane has been successfully used in off‐road applications such as forklifts. Several thousand forklifts in California run on propane. The cost of a propane forklift is usually between $16,000 and $24,000, which is comparable to a gasoline‐powered forklift and nearly $10,000 cheaper than a diesel forklift. Propane forklifts also require less maintenance and have lower emissions than gasoline and diesel. Very little additional infrastructure is needed to support propane forklifts;
37
propane suppliers can maintain on‐site storage tanks for fleets or have cylinder exchange programs. Since propane forklifts are cost‐competitive with conventional forklifts, the Energy Commission is not proposing to use AB 118 funds for this purpose.
Fuel Production While not yet available commercially, renewable propane is showing potential as an alternative fuel option in the coming years. Currently, studies are being conducted on the generation of renewable propane at institutes like Mississippi State University and Massachusetts Institute of Technology. Renewable propane can be derived from several different feedstocks that can include algae, row crops, and wood. Both high‐pressure and catalytic cracking have been used as processes for extracting renewable propane from various feedstocks. The derivation of renewable propane requires little additional energy use and results in a product that contains the same energy content as propane derived from petroleum.
The Propane and Education Research Council is supporting work specifically for the continued development and expansion of renewable propane. While there is potential for renewable propane to compete in future years in the alternative fuel market for transportation, it is not available in large quantities or commercially and would be unable to support a large vehicle population or fleet. Funding for renewable propane will not be made immediately available through the Program; however, Energy Commission staff will continue to monitor the progress of renewable propane and currently considers it a promising alternative fuel option in future years.
Infrastructure Propane is already widely available and can easily be expanded as demand for propane as a transportation fuel increases. There are approximately 202 alternative fuel vehicle stations in California that supply propane, according to the Department of Energy’s alternative fuel and vehicle data center. There is potential to quickly expand the infrastructure for propane vehicle fueling, as existing propane stations can be used for vehicle fueling through the addition of fuel capacity, a tank pump, and metering equipment.
Due to its low cost and ease of installation, a minimal amount of funding is needed to support propane infrastructure. Average fueling station costs were estimated using data from the DOE’s Clean Cities grant program. Based on information described in grant applications, coupled with propane working group information, staff estimated that the cost of a fueling station is $65,000. Given the existing federal incentives, the Energy Commission does not propose funding propane fueling stations in this budget cycle.
The Energy Commission has allocated $2 million for propane vehicles as shown in Table 22 below.
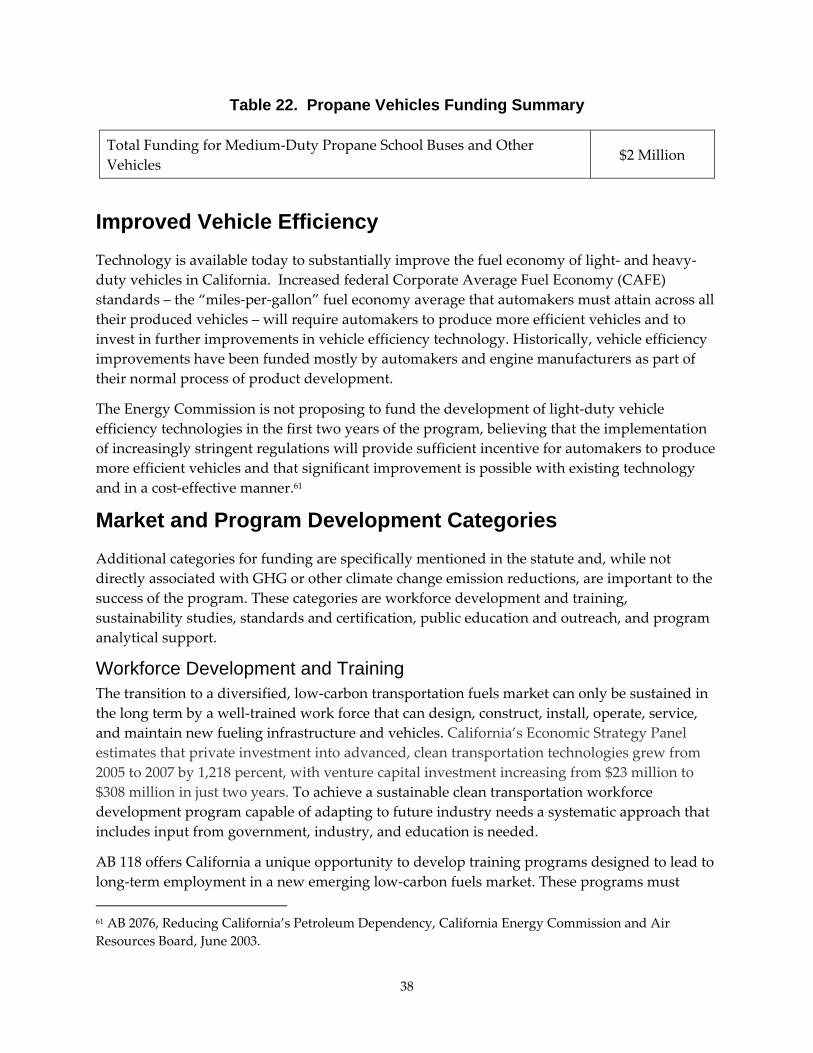
38
Table 22. Propane Vehicles Funding Summary
Total Funding for Medium‐Duty Propane School Buses and Other Vehicles
$2 Million
Improved Vehicle Efficiency Technology is available today to substantially improve the fuel economy of light‐ and heavy‐duty vehicles in California. Increased federal Corporate Average Fuel Economy (CAFE) standards – the “miles‐per‐gallon” fuel economy average that automakers must attain across all their produced vehicles – will require automakers to produce more efficient vehicles and to invest in further improvements in vehicle efficiency technology. Historically, vehicle efficiency improvements have been funded mostly by automakers and engine manufacturers as part of their normal process of product development.
The Energy Commission is not proposing to fund the development of light‐duty vehicle efficiency technologies in the first two years of the program, believing that the implementation of increasingly stringent regulations will provide sufficient incentive for automakers to produce more efficient vehicles and that significant improvement is possible with existing technology and in a cost‐effective manner.61
Market and Program Development Categories Additional categories for funding are specifically mentioned in the statute and, while not directly associated with GHG or other climate change emission reductions, are important to the success of the program. These categories are workforce development and training, sustainability studies, standards and certification, public education and outreach, and program analytical support.
Workforce Development and Training The transition to a diversified, low‐carbon transportation fuels market can only be sustained in the long term by a well‐trained work force that can design, construct, install, operate, service, and maintain new fueling infrastructure and vehicles. California’s Economic Strategy Panel estimates that private investment into advanced, clean transportation technologies grew from 2005 to 2007 by 1,218 percent, with venture capital investment increasing from $23 million to $308 million in just two years. To achieve a sustainable clean transportation workforce development program capable of adapting to future industry needs a systematic approach that includes input from government, industry, and education is needed.
AB 118 offers California a unique opportunity to develop training programs designed to lead to long‐term employment in a new emerging low‐carbon fuels market. These programs must 61 AB 2076, Reducing California’s Petroleum Dependency, California Energy Commission and Air Resources Board, June 2003.
39
provide education and training for people who are preparing to leave school to join the workforce, want to enter or re‐enter the workforce, or just advance in their current career paths. These programs must be cognizant of and responsive to the needs of an industry undergoing significant change and strive to form commitments and partnerships between the environmental community, labor unions, private sector industries, workforce development programs, primary and secondary education systems, and government.
On September 26, 2008, Governor Schwarzenegger signed AB 3018 (Núñez, Chapter 312, Statutes of 2008), establishing the California Green Collar Jobs Council, a collaborative effort among environmental, workforce development and educational state agencies, California’s local workforce development community, private employers, and financial institutions to develop a comprehensive approach to addressing Californiaʹs emerging workforce needs specifically with its budding ʺgreenʺ economy. The Green Collar Jobs Council is an opportunity for state agencies and other stakeholders in the workforce development community to collaborate across traditional organizational silos to address multiple barriers associated with workforce development as well as program expansion to meet industry needs. The Green Collar Jobs Council will play an important role in determining where funding is needed and how program funds can be leveraged to create jobs that are needed in the clean transportation sector.
For the first two years of program funding, the Energy Commission will look to several agencies to provide expert guidance in workforce development. These agencies specialize in the tasks that are necessary to develop a sustainable workforce development component of the program. The efforts of these agencies will assist the Energy Commission in three areas: 1) Labor Market Information, 2) Regional Industry Sector Plan Development, and 3) Training and Education Program Development and Delivery.
The workforce development efforts will support and generate high‐quality, high‐growth employment opportunities in the transportation industry. The Energy Commission will rely on labor market information and regional sector analyses to develop training programs that are responsive to industry needs. Furthermore, the Energy Commission plans to support workforce development efforts that complement the projects funded by the program. The Energy Commission’s goal is that the program will result in high‐quality jobs that offer family‐sustaining wages, adequate benefits, career advancements with upward mobility, and contribute directly to preserving or enhancing environmental quality.
Labor Market Information There is significant need to learn more about the existing and future needs of the clean transportation workforce. There is a lack of understanding of the programs and resources currently in place in the workforce and the skills that will be needed in an alternative transportation economy. Partnering with state agencies such as Employment Development Department (EDD) and the Community College Centers of Excellence, the Energy Commission will develop industry and occupation‐specific labor market information to inform future allocation of program funds. Partnering with the EDD the Energy Commission will take advantage of the extensive labor market data and measurement and verification infrastructure at that department to develop a clear picture of the clean transportation workforce needs.
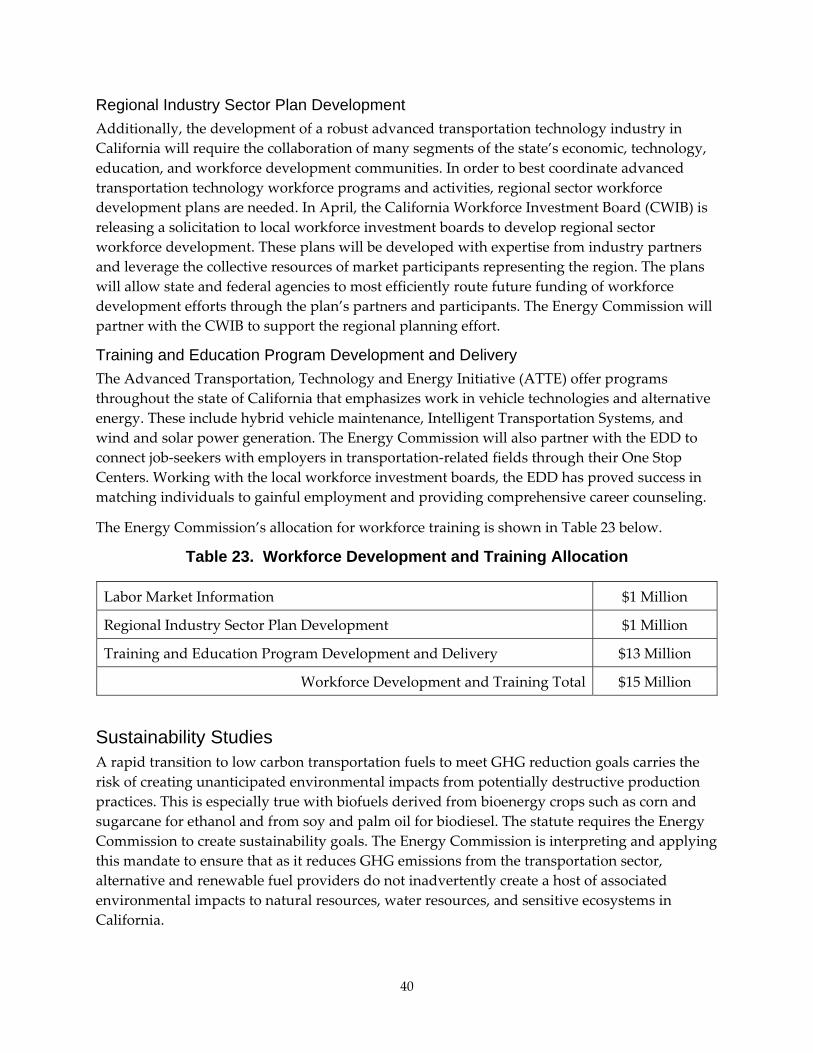
40
Regional Industry Sector Plan Development Additionally, the development of a robust advanced transportation technology industry in California will require the collaboration of many segments of the state’s economic, technology, education, and workforce development communities. In order to best coordinate advanced transportation technology workforce programs and activities, regional sector workforce development plans are needed. In April, the California Workforce Investment Board (CWIB) is releasing a solicitation to local workforce investment boards to develop regional sector workforce development. These plans will be developed with expertise from industry partners and leverage the collective resources of market participants representing the region. The plans will allow state and federal agencies to most efficiently route future funding of workforce development efforts through the plan’s partners and participants. The Energy Commission will partner with the CWIB to support the regional planning effort.
Training and Education Program Development and Delivery The Advanced Transportation, Technology and Energy Initiative (ATTE) offer programs throughout the state of California that emphasizes work in vehicle technologies and alternative energy. These include hybrid vehicle maintenance, Intelligent Transportation Systems, and wind and solar power generation. The Energy Commission will also partner with the EDD to connect job‐seekers with employers in transportation‐related fields through their One Stop Centers. Working with the local workforce investment boards, the EDD has proved success in matching individuals to gainful employment and providing comprehensive career counseling.
The Energy Commission’s allocation for workforce training is shown in Table 23 below.
Table 23. Workforce Development and Training Allocation
Labor Market Information $1 Million
Regional Industry Sector Plan Development $1 Million
Training and Education Program Development and Delivery $13 Million
Workforce Development and Training Total $15 Million
Sustainability Studies A rapid transition to low carbon transportation fuels to meet GHG reduction goals carries the risk of creating unanticipated environmental impacts from potentially destructive production practices. This is especially true with biofuels derived from bioenergy crops such as corn and sugarcane for ethanol and from soy and palm oil for biodiesel. The statute requires the Energy Commission to create sustainability goals. The Energy Commission is interpreting and applying this mandate to ensure that as it reduces GHG emissions from the transportation sector, alternative and renewable fuel providers do not inadvertently create a host of associated environmental impacts to natural resources, water resources, and sensitive ecosystems in California.
41
The Energy Commission is developing a comprehensive approach to ensure that sustainability will be considered and evaluated in every funding decision it makes. One objective of this program is to identify and promote transportation‐related GHG reduction projects that can serve as national and international examples for sustainable production and superior environmental performance. Another important objective is to support the development of an in‐state bioenergy industry and to ensure its environmental sustainability from the start. The Energy Commission is working cooperatively with California producers, growers, sister agencies, and expert institutions such as the University of California to create new standards and processes for in‐state bioenergy production.
Sustainability will also be crucial in the consideration of out‐of‐state biofuel production such as Midwest corn, palm oil from Southeast Asia, and sugarcane from Brazil. The Energy Commission is working to create incentives that can improve grower, harvest, and production practices; minimize use of natural resources; minimize environmental damage; and maximize production of low‐carbon fuels. The incentives provided through the program are intended to create model practices that may be of interest to other parts of North America and the world.
For internationally produced biofuel feedstocks, staff is assessing the major international initiatives and sustainable certification programs that are in development. The Energy Commission is working with the ARB and other stakeholders to determine how to evaluate international certification programs to determine if they might meet California’s goals and standards for sustainable production.
Looking beyond the sustainability of biomass‐related fuels, sustainability can be applied to nearly every aspect of alternative and renewable fuel production and low‐carbon vehicle technology. Again, sustainability compels California to look beyond the current regulatory standards and status quo manufacturing processes to identify production methods and consumption patterns that reduce the total environmental footprint of the transportation sector. Sustainability should also be considered and applied to other alternative fuels and vehicle technologies, such as use of electricity, batteries (as storage), and natural gas as vehicle fuels, improved environmental performance of vehicle manufacturing, construction and deconstruction processes.
Through Energy Commission‐sponsored public forums such as the Sustainability Working Group, staff proposed a series of sustainability concepts that culminated in the Energy Commission’s adoption of three sustainability goals and 11 sustainability evaluation criteria in the AB 118 program’s implementing regulations. The goals are:
• The first sustainability goal shall be the substantial reduction of greenhouse gas emissions associated with California’s transportation system to help meet California’s 2020 and 2050 targets as defined in Health and Safety Code Section 38550 and the Governor’s Executive Order S‐03‐05.
• The second sustainability goal shall be to protect the environment, including all natural resources, from the effects of alternative and renewable fuel development and promote

42
the superior environmental performance of alternative and renewable fuels, infrastructure and vehicle technologies.
• The third sustainability goal shall be to enhance market and public acceptance of sustainably produced alternative and renewable fuels by developing, promoting, and creating incentives for the production of such fuels in accordance with certified sustainable production practices and standards as established by government agencies, academic institutions, and nongovernmental organizations.
The sustainability evaluation criteria will be used to assess how well each proposal for AB 118 funding meets the sustainability goals. The criteria encompass the following:
Criteria 1: Strong preference for projects with substantial reductions in greenhouse gas emissions
Criteria 2: Strong preference to projects demonstrating environmental protection, natural resource preservation and superior environmental performance
Criteria 2A: Projects that maximize use of waste streams as feedstocks
Criteria 2B: Use of existing Best Management Practices (BMPs) from natural resource and pollution control agencies
Criteria 2C: For purpose‐grown energy crops
Criteria 2C(i): Sustainability best management practices plan for specific bio‐energy crops
Criteria 2C(ii): Use of lands historically used for agricultural purposes
Criteria 2C(iii): Use of marginal crop lands not used for food and that do not displace food crops
Criteria 2C(iv): Use of crops uniquely suited to climate, water and natural resource constraints in California
Criteria 2D: Projects that 1) use water efficiency and water use reduction measures, 2) use recycled or reclaimed water, and 3) reduce eliminate point and nonpoint source wastewater discharge
Criteria 2E: Projects that use 1) renewable energy or 2) cogeneration in production, processing or distribution
Criteria 2F: Projects that use forest biomass resources collected or harvested in a manner that does not diminish ecological values and that are consistent with restoration, fire risk management and ecosystem management goals
Criteria 2G: Projects that create benefits to state natural resources or ameliorate degraded resources
Criteria 2H: Alternative fuel infrastructure projects that use 1) low carbon intensity fuels, 2) fuels produced in accordance with natural resource and superior
43
environmental performance goals, or 3) fuels produced in accordance with a certified sustainability protocol
Criteria 3: Preference to projects that 1) produce certified sustainable feedstocks, or 2) produce or distribute alternative fuels, in accordance with sustainability certification standards. Staff is producing additional guidance that will inform project applicants on how sustainability goals and criteria will be applied to each part of the AB 118 funding program. The guidance will include technical information requirements and weighting factors.
In addition to development of the sustainability goals and evaluation criteria, much more research and technical development is needed to advance the science and assessment of sustainability principles, criteria, indicators, and evaluation methods. Staff has identified a number of technical areas where additional research on sustainability issues is needed to develop and implement the AB 118 sustainability program. Some of these sustainability technical support areas are appropriate for early funding through an Interagency Agreement with the University of California (UC). The preliminary funding estimate for this early sustainability technical support for the AB 118 2009‐2010 funding cycle is $2.3 million. UC research teams at Davis and Berkeley are well‐suited for this work because they have actively participated in the AB 118 workshops on sustainability, and because they are working as part of the Low Carbon Fuel Standard technical support team. As a result of initial discussions with the UC teams on sustainability research, an additional series of innovate sustainability research proposals are being developed that may be suitable for AB 118 funding.
The following is a list of sustainability research topics identified by staff:
1. Assessment of sustainability certification programs such as the United Kingdom’s Renewable Fuels Transport Obligation, the Roundtable on Sustainable Biofuels, and the Roundtable on Sustainable Palm Oil to identify potential applicability to California. This is a critical research item that is needed to enhance market acceptance of sustainably produced fuels through use of third‐party certification programs.
2. Identification or development methods for supply chain management techniques to allow for batches of alternative fuels with sustainability certification to be tracked and credited for use in California markets. This is a critical element for establishing sustainability reporting for AB 118 and the Low Carbon Fuel Standard.
3. Development of field‐based sustainability indicators for California. The Energy Commission’s approach to sustainability focuses on BMPs and technical protocols for biorefinery production and feedstock growth. Field‐based indicators are needed to assess whether the BMPs and protocols create measurable environmental benefits and reduce actual environmental damage in ecosystems affected by alternative fuel production.
4. Development of protocols for potential sustainable production of forest‐biomass material for alternative fuels. Fund model projects or demonstration projects in cooperation with forestry agencies. Research is needed to develop such protocols in
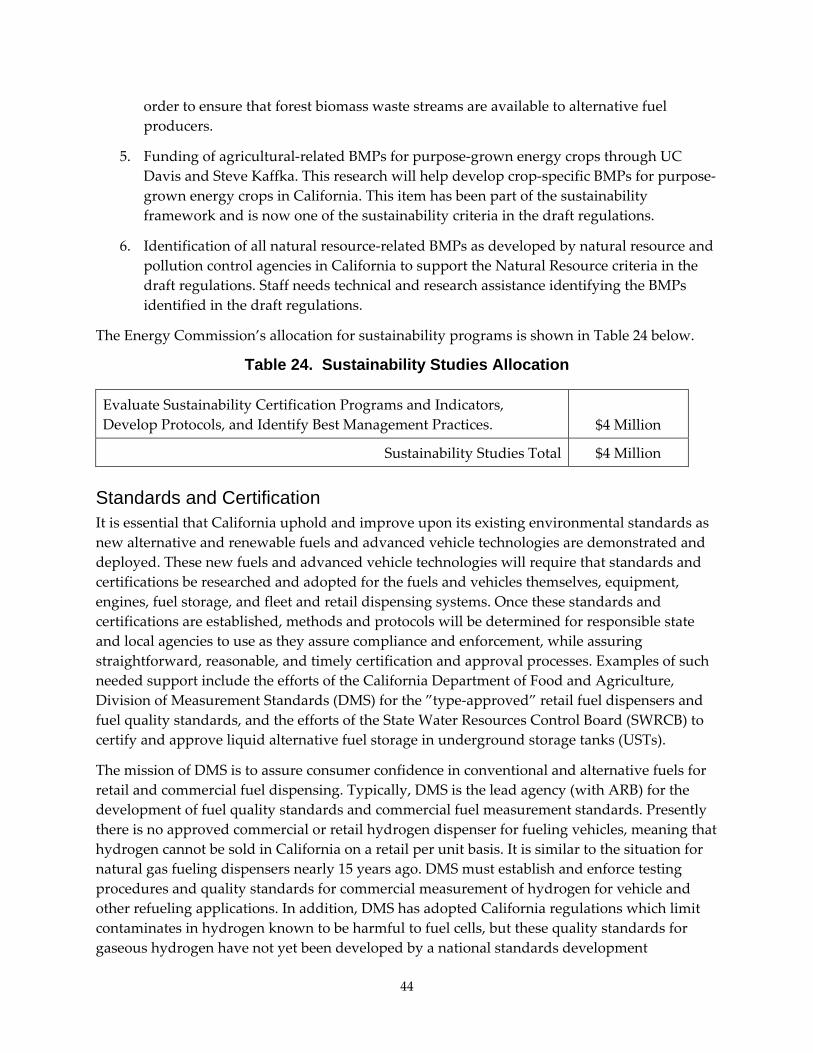
44
order to ensure that forest biomass waste streams are available to alternative fuel producers.
5. Funding of agricultural‐related BMPs for purpose‐grown energy crops through UC Davis and Steve Kaffka. This research will help develop crop‐specific BMPs for purpose‐grown energy crops in California. This item has been part of the sustainability framework and is now one of the sustainability criteria in the draft regulations.
6. Identification of all natural resource‐related BMPs as developed by natural resource and pollution control agencies in California to support the Natural Resource criteria in the draft regulations. Staff needs technical and research assistance identifying the BMPs identified in the draft regulations.
The Energy Commission’s allocation for sustainability programs is shown in Table 24 below.
Table 24. Sustainability Studies Allocation
Evaluate Sustainability Certification Programs and Indicators, Develop Protocols, and Identify Best Management Practices. $4 Million
Sustainability Studies Total $4 Million Standards and Certification It is essential that California uphold and improve upon its existing environmental standards as new alternative and renewable fuels and advanced vehicle technologies are demonstrated and deployed. These new fuels and advanced vehicle technologies will require that standards and certifications be researched and adopted for the fuels and vehicles themselves, equipment, engines, fuel storage, and fleet and retail dispensing systems. Once these standards and certifications are established, methods and protocols will be determined for responsible state and local agencies to use as they assure compliance and enforcement, while assuring straightforward, reasonable, and timely certification and approval processes. Examples of such needed support include the efforts of the California Department of Food and Agriculture, Division of Measurement Standards (DMS) for the ”type‐approved” retail fuel dispensers and fuel quality standards, and the efforts of the State Water Resources Control Board (SWRCB) to certify and approve liquid alternative fuel storage in underground storage tanks (USTs).
The mission of DMS is to assure consumer confidence in conventional and alternative fuels for retail and commercial fuel dispensing. Typically, DMS is the lead agency (with ARB) for the development of fuel quality standards and commercial fuel measurement standards. Presently there is no approved commercial or retail hydrogen dispenser for fueling vehicles, meaning that hydrogen cannot be sold in California on a retail per unit basis. It is similar to the situation for natural gas fueling dispensers nearly 15 years ago. DMS must establish and enforce testing procedures and quality standards for commercial measurement of hydrogen for vehicle and other refueling applications. In addition, DMS has adopted California regulations which limit contaminates in hydrogen known to be harmful to fuel cells, but these quality standards for gaseous hydrogen have not yet been developed by a national standards development
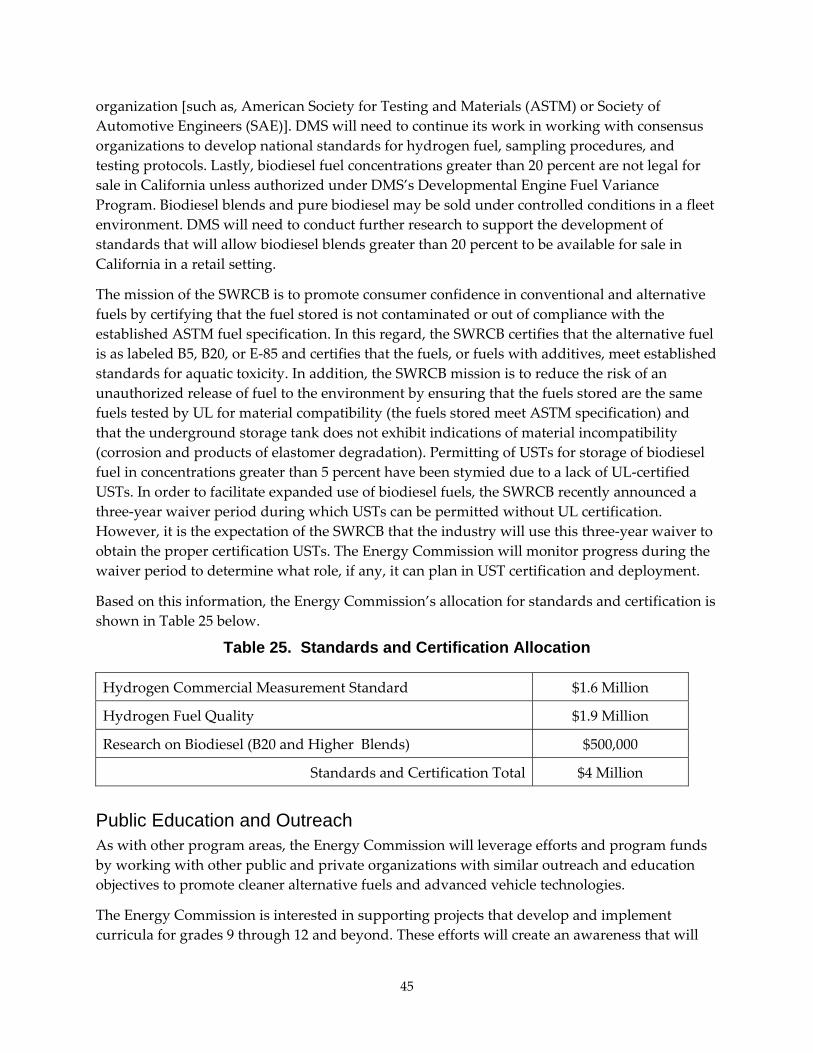
45
organization [such as, American Society for Testing and Materials (ASTM) or Society of Automotive Engineers (SAE)]. DMS will need to continue its work in working with consensus organizations to develop national standards for hydrogen fuel, sampling procedures, and testing protocols. Lastly, biodiesel fuel concentrations greater than 20 percent are not legal for sale in California unless authorized under DMS’s Developmental Engine Fuel Variance Program. Biodiesel blends and pure biodiesel may be sold under controlled conditions in a fleet environment. DMS will need to conduct further research to support the development of standards that will allow biodiesel blends greater than 20 percent to be available for sale in California in a retail setting.
The mission of the SWRCB is to promote consumer confidence in conventional and alternative fuels by certifying that the fuel stored is not contaminated or out of compliance with the established ASTM fuel specification. In this regard, the SWRCB certifies that the alternative fuel is as labeled B5, B20, or E‐85 and certifies that the fuels, or fuels with additives, meet established standards for aquatic toxicity. In addition, the SWRCB mission is to reduce the risk of an unauthorized release of fuel to the environment by ensuring that the fuels stored are the same fuels tested by UL for material compatibility (the fuels stored meet ASTM specification) and that the underground storage tank does not exhibit indications of material incompatibility (corrosion and products of elastomer degradation). Permitting of USTs for storage of biodiesel fuel in concentrations greater than 5 percent have been stymied due to a lack of UL‐certified USTs. In order to facilitate expanded use of biodiesel fuels, the SWRCB recently announced a three‐year waiver period during which USTs can be permitted without UL certification. However, it is the expectation of the SWRCB that the industry will use this three‐year waiver to obtain the proper certification USTs. The Energy Commission will monitor progress during the waiver period to determine what role, if any, it can plan in UST certification and deployment.
Based on this information, the Energy Commission’s allocation for standards and certification is shown in Table 25 below.
Table 25. Standards and Certification Allocation
Hydrogen Commercial Measurement Standard $1.6 Million
Hydrogen Fuel Quality $1.9 Million
Research on Biodiesel (B20 and Higher Blends) $500,000
Standards and Certification Total $4 Million
Public Education and Outreach As with other program areas, the Energy Commission will leverage efforts and program funds by working with other public and private organizations with similar outreach and education objectives to promote cleaner alternative fuels and advanced vehicle technologies.
The Energy Commission is interested in supporting projects that develop and implement curricula for grades 9 through 12 and beyond. These efforts will create an awareness that will
46
inspire and guide students toward advanced education and career choices necessary to sustain emerging technologies.
First and second year funding opportunities exist with several state agencies that administer existing education and outreach programs related to transportation or that could easily be adapted to include a transportation component.
Some of the more notable efforts are described below.
• The ARB has developed the “Drive Clean” campaign which is a resource for car buyers searching for green technology vehicles. An interactive on‐line website [www.driveclean.ca.gov] allows consumers to research and find alternative vehicles, related incentives, and appropriate fueling stations in their neighborhoods. Car buyers can now check for the Environmental Performance Label displayed on new vehicles allowing for comparison of smog and global warming scores. Collaborating with the ARB by providing financial support for this project will provide the Energy Commission an outlet to effectively showcase the potential for reducing GHG emissions by educating consumers and encouraging the purchase and use of alternative fuel vehicles.
• The California Department of Education’s Partnership Academy program connects school districts, community colleges, and businesses to develop integrated academic and career technical instruction that focuses on clean technology and energy. The goal is to reach students interested in exploring and preparing for careers in these emerging fields. The Energy Commission’s participation will enable the development of transportation‐related curricula and program delivery. The Partnership Academies are funded for fiscal year 2008‐09 and solicitations were released for 61 new academies throughout the state. The Energy Commission proposes to supplement the Partnership Academies with the Alternative and Renewable Fuel and Vehicle Technology Program funding during fiscal year 2009‐10.
• The goal of the Bureau of Automotive Repairs is to maintain existing vehicles for maximum fuel efficiency. Its website [www.drivehealthy.com] helps consumers find smog testing stations and repair facilities. Consumers can also download applications for cash incentives in exchange for retiring aging cars that are heavy polluters. Additionally, compelling reasons for changing behaviors are outlined in the detailed descriptions of tailpipe emissions such as carbon monoxide, hydrocarbons, and nitrogen oxides.
• Private industry can play a huge role in getting the public’s attention. The Progressive Automotive X PRIZE, in collaboration with the U.S. Department of Energy, has developed a national education program with the goal of engaging students and the public in learning about advanced vehicle technologies, energy efficiency, climate change, alternative fuels, and the science and math behind efficient vehicle development. Combined with their education efforts, the Progressive Automotive X PRIZE will offer a multi‐million dollar prize for teams that can best engineer a clean, production‐ready vehicle. A project of the X PRIZE Foundation, the competition expects
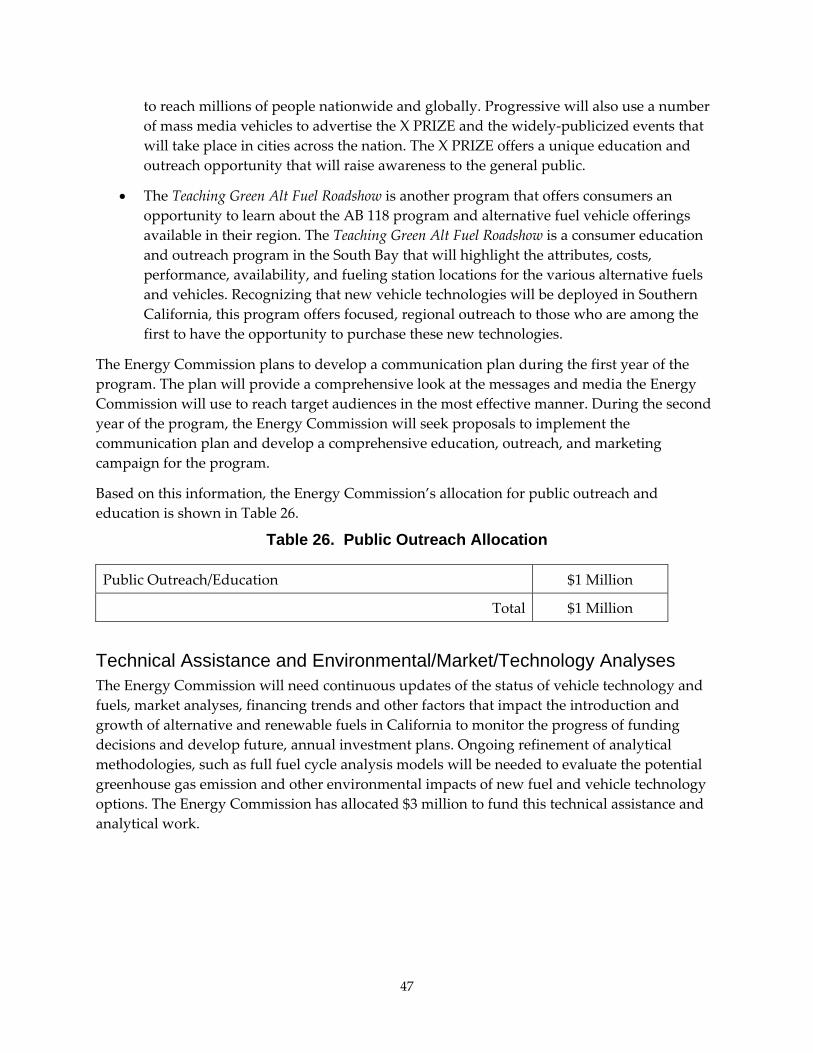
47
to reach millions of people nationwide and globally. Progressive will also use a number of mass media vehicles to advertise the X PRIZE and the widely‐publicized events that will take place in cities across the nation. The X PRIZE offers a unique education and outreach opportunity that will raise awareness to the general public.
• The Teaching Green Alt Fuel Roadshow is another program that offers consumers an opportunity to learn about the AB 118 program and alternative fuel vehicle offerings available in their region. The Teaching Green Alt Fuel Roadshow is a consumer education and outreach program in the South Bay that will highlight the attributes, costs, performance, availability, and fueling station locations for the various alternative fuels and vehicles. Recognizing that new vehicle technologies will be deployed in Southern California, this program offers focused, regional outreach to those who are among the first to have the opportunity to purchase these new technologies.
The Energy Commission plans to develop a communication plan during the first year of the program. The plan will provide a comprehensive look at the messages and media the Energy Commission will use to reach target audiences in the most effective manner. During the second year of the program, the Energy Commission will seek proposals to implement the communication plan and develop a comprehensive education, outreach, and marketing campaign for the program.
Based on this information, the Energy Commission’s allocation for public outreach and education is shown in Table 26.
Table 26. Public Outreach Allocation
Public Outreach/Education $1 Million
Total $1 Million
Technical Assistance and Environmental/Market/Technology Analyses The Energy Commission will need continuous updates of the status of vehicle technology and fuels, market analyses, financing trends and other factors that impact the introduction and growth of alternative and renewable fuels in California to monitor the progress of funding decisions and develop future, annual investment plans. Ongoing refinement of analytical methodologies, such as full fuel cycle analysis models will be needed to evaluate the potential greenhouse gas emission and other environmental impacts of new fuel and vehicle technology options. The Energy Commission has allocated $3 million to fund this technical assistance and analytical work.
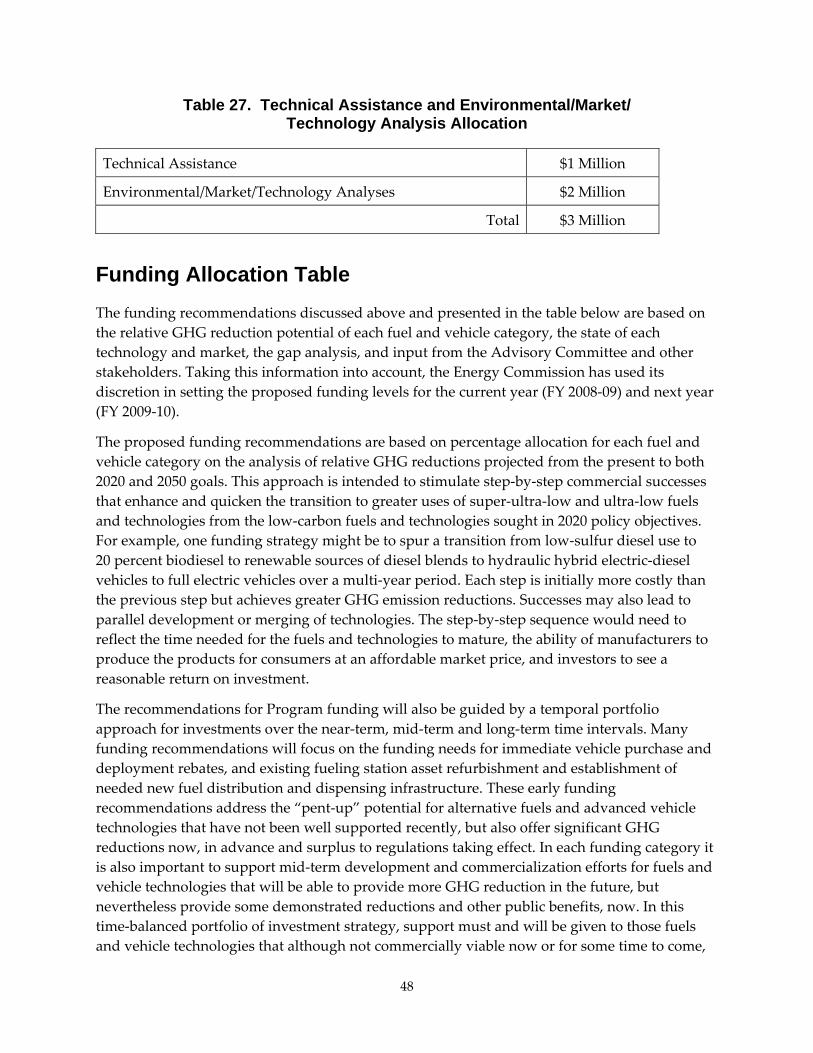
48
Table 27. Technical Assistance and Environmental/Market/ Technology Analysis Allocation
Technical Assistance $1 Million
Environmental/Market/Technology Analyses $2 Million
Total $3 Million
Funding Allocation Table The funding recommendations discussed above and presented in the table below are based on the relative GHG reduction potential of each fuel and vehicle category, the state of each technology and market, the gap analysis, and input from the Advisory Committee and other stakeholders. Taking this information into account, the Energy Commission has used its discretion in setting the proposed funding levels for the current year (FY 2008‐09) and next year (FY 2009‐10).
The proposed funding recommendations are based on percentage allocation for each fuel and vehicle category on the analysis of relative GHG reductions projected from the present to both 2020 and 2050 goals. This approach is intended to stimulate step‐by‐step commercial successes that enhance and quicken the transition to greater uses of super‐ultra‐low and ultra‐low fuels and technologies from the low‐carbon fuels and technologies sought in 2020 policy objectives. For example, one funding strategy might be to spur a transition from low‐sulfur diesel use to 20 percent biodiesel to renewable sources of diesel blends to hydraulic hybrid electric‐diesel vehicles to full electric vehicles over a multi‐year period. Each step is initially more costly than the previous step but achieves greater GHG emission reductions. Successes may also lead to parallel development or merging of technologies. The step‐by‐step sequence would need to reflect the time needed for the fuels and technologies to mature, the ability of manufacturers to produce the products for consumers at an affordable market price, and investors to see a reasonable return on investment.
The recommendations for Program funding will also be guided by a temporal portfolio approach for investments over the near‐term, mid‐term and long‐term time intervals. Many funding recommendations will focus on the funding needs for immediate vehicle purchase and deployment rebates, and existing fueling station asset refurbishment and establishment of needed new fuel distribution and dispensing infrastructure. These early funding recommendations address the “pent‐up” potential for alternative fuels and advanced vehicle technologies that have not been well supported recently, but also offer significant GHG reductions now, in advance and surplus to regulations taking effect. In each funding category it is also important to support mid‐term development and commercialization efforts for fuels and vehicle technologies that will be able to provide more GHG reduction in the future, but nevertheless provide some demonstrated reductions and other public benefits, now. In this time‐balanced portfolio of investment strategy, support must and will be given to those fuels and vehicle technologies that although not commercially viable now or for some time to come,
49
still hold the promise to provide significant GHG reductions and other public benefits over the long term, if strategically and wisely invested in now. To recommend the wisest and most strategic funding portfolio over time, it will be essential that this Program be consistently engaged and informed for the key trends, developments, and fuel and technology breakthroughs that will occur over the next decade and beyond.
Some of the funding recommendations can be accomplished cooperatively with federal, state and other public agencies and partners by using memorandums of understanding, interagency agreements, and other collaborative mechanisms that can meet each entity’s objectives and shared goals. These partnerships, many of which will be cost‐shared and jointly directed, provide a cost‐efficient means to achieve the program’s desired goals and opportunities.
The Energy Commission will use its best judgment in setting specific allocations and its flexibility to redirect funding within a fiscal year as emerging conditions (environmental, energy, or economic) require as noted under section 3108(f) of proposed regulations for the Alternative and Renewable Fuel and Vehicle Technology Program.

50
PROPOSED FUNDING ALLOCATION
Fuel/Technology
Project/Activity
Number of
Vehicles/Projects
Two-Year Allocation (FY 2008-09 and FY 2009-10)
Electric Drive
Plug-In Hybrid Electric Passenger Vehicle Retrofits 350 $3.5 Million
Medium- and Heavy-Duty Hybrid Vehicle Research, Development, and Demonstration Projects
10 $10 Million
Non-Road Deployment Projects for Ports, Truck Stop Electrification, and Other Non-Road Applications 125 $11.5 Million
Charging Stations 6500 $12 Million
Manufacturing Facilities and Equipment 5 $9 Million
Subtotal $46 Million
Hydrogen Fueling Stations 11 $40 Million
Subtotal $40 Million
Ethanol
E-85 Fueling Stations 50 $5 Million
Ethanol Feedstock and Project Feasibility Studies for New Plants 20 $3 Million
New Pilot Plants Using Waste FeedStocks 2 $4 Million
Subtotal $12 Million
Renewable Diesel/Biodiesel
Production Plants Using Waste FeedStocks 5 $2 Million
Construct Blending and Storage Terminal Facilities 2 $4 Million
Subtotal $6 Million
Natural Gas
Light-Duty Vehicles 300 $2 Million
Medium- and Heavy-Duty Vehicles for Port Trucks, School Buses, and Other Vehicles
700 $23 Million
Fueling Station Installations 20 $8 Million
Biomethane Production Plants Up to 10 $10 Million
Subtotal $43 Million
Propane Medium-Duty Propane School Buses and Other Vehicles Up to 150 $2 Million
Subtotal $2 Million
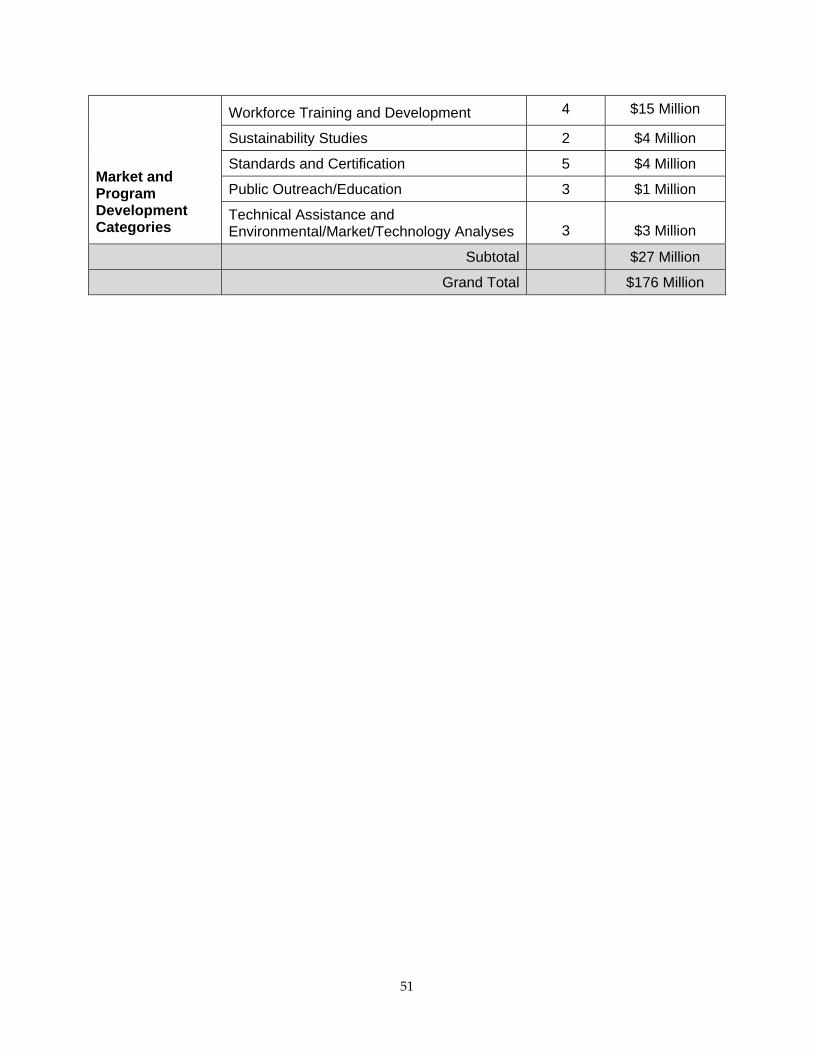
51
Market and Program Development Categories
Workforce Training and Development 4 $15 Million
Sustainability Studies 2 $4 Million
Standards and Certification 5 $4 Million
Public Outreach/Education 3 $1 Million
Technical Assistance and Environmental/Market/Technology Analyses 3 $3 Million
Subtotal $27 Million
Grand Total $176 Million

A‐1
APPENDIX A: Analytical Method for Determining Funding Priorities and Opportunities Analysis for Light-Duty Vehicles
The first step in the effort was to use the Energy Commission’s adopted forecast62 for gasoline and diesel demand for the 2005 to 2030 period. Staff developed this forecast using the California Light‐Duty Vehicle Conventional and Alternative Fuel Response Simulator (CALCARS), a California consumer choice model. The second step was to project business as usual (BAU) development out to 2050. Staff used the estimate of 10,300 vehicle miles traveled (VMT) under the business as usual case (BAU), extending a straight line backward to the VMT from CALCARS. A straight line was representative of the data, extending to well before 2030. The third step was to construct a scenario that implemented the 2050 Vision to the fullest extent possible. The fourth step was to modify that scenario to incorporate “Story Lines,” a description of each alternative fuel’s development and growth potential and barriers taken from the State Alternative Fuels Plan and updated into the scenario. For the most part, this last step constituted “populating” the three vehicle classes identified with market penetrations of alternative‐fueled vehicles from those story lines that were deemed most likely to meet the attributes identified for the 2050 vision.
For this analysis, the population of vehicles that achieve a pooled average of 80 miles/gallon and a 90 percent carbon intensity reduction were labeled “super‐ultra‐low carbon” (SULC) vehicles. The population of vehicles that achieve a pooled average of 60 miles/gallon and an 80 percent carbon intensity reduction were designated “ultra‐low‐carbon” (ULC) vehicles. The remaining petroleum fueled vehicles and non‐renewable alternative fueled vehicles could rightfully be considered “low‐carbon” (LC) vehicles, since they also achieve a pooled average of 60 miles /gallon and at least a 10 percent carbon intensity reduction. Finally, the reduction of vehicle miles traveled per capita is called VMT and not strictly allocated to “land use changes”, since these could be achieved (at least to the degree required in earlier years) by drivers shifting from light‐duty passenger cars to transit, increased telecommuting, and similar measures. However, achieving the endpoint of a 20 percent reduction in VMT would certainly require land use changes such as “smart growth” and other density increasing measures.
Business-As-Usual (BAU) The first step was to develop a spreadsheet to incorporate results from CALCARS for the 2005 to 2030 period. This incorporation essentially “froze” consumer choices in terms of vehicle class and usage at the values set for the estimated “high fuel price” range. Since this estimate has been exceeded by actual fuel prices, the CALCARS model is being updated to better represent current market conditions for the 2009 Integrated Energy Policy Report (IEPR), but this update is not yet available. 62 Transportation Energy Forecasts for the 2007 Integrated Energy Policy Report – Staff Final Report, CEC-600-2007-009-SF. September 2007.

A‐2
The next step was to project light‐duty vehicle fuel consumption to 2050 under BAU. The 2007 IEPR forecast was limited to the 2005 to 2030 period, but the forecast was extended to 2050 using the State Alternative Fuels Plan’s 2050 Vision estimate of 10,300 annual VMT under BAU (Table 8, State Alternative Fuels Plan). To reflect the most timely and accurate estimate, population data63 were taken from the Department of Finance, with a 2050 value of 59.6 million in 2050 (rather than the 55 million from Table 8 of the 2050 Vision). VMT for the 2005 to 2030 period was approximately linear from 2016 to 2030 and, when projected to 2050, matched the value of 10,300 from Table 8. Future VMT is estimated simply by multiplying VMT by population.64
Fuel economy for the 2030 to 2050 period under BAU was held constant at 2030 fuel consumption rates for all 15 vehicle classes used in CALCARS and three fuel/drive configurations (gasoline internal combustion engines, gasoline hybrid vehicles, and diesel internal combustion engines) for a total of 45 combinations in all. VMT per the 45 “vehicle classes” was projected based upon the ratio of VMT in 2030 and the projected VMT in each year from 2031 to 2050. Staff projected the number of new vehicles sold in 2050 for BAU as a straight line from the CALCARS trend line for 2017 to 2030.
The BAU shows a population and VMT growth‐driven trend of increased fuel consumption from 2005 to about 2011, where it begins to decrease as Assembly Bill (AB) 1493 (Pavley, Chapter 200, Statutes of 2002) requirements take effect. It continues to decline to about 2024, when population and VMT growth lead to renewed increases in overall fuel consumption extending out to 2050. It was not necessary to update BAU for the recently adopted federal CAFE requirements of 35 miles/gallon because ARB staff analysis indicated that the AB 1493 /Pavley requirements, which were already in the BAU forecast, exceed the miles/gallon requirement of the new federal CAFE requirements.
Emissions Reduction Strategies Staff evaluated strategies to reach the greenhouse gas (GHG) emission reduction targets in a step‐wise fashion. This process proceeded from those strategies most likely to occur (or to occur earlier), proceeding to those strategies that would require more work to develop or more time to implement. Staff used this approach in a partially successful attempt to develop at least one GHG reduction strategy that meets both the 2020 and 2050 GHG emissions reduction targets. The results approached the 2020 target but exceeded the 2050 target.
Due to the time constraint, this analysis did not evaluate the technological readiness, the necessary development costs or probability for this scenario for meeting these GHG reduction goals. It also did not evaluate the funding amounts that would be needed to provide the necessary market‐changing incentives.
63 Data from Department of Finance: http://www.dof.ca.gov/html/DEMOGRAP/ReportsPapers/Projections/P1/P1.php. 64 A draft chart shown to the TAC on September 2, 2008, inadvertently used VMT/capita rather than total VMT.
A‐3
Estimating Future GHG Emissions The analysis used portions of the 2050 vision, updating data where appropriate and as explained below. It proceeded in the following order (the order matters in terms of relative GHG emissions reductions for at least some of these strategies):
• Low‐Carbon Fuel Standard (LCFS): The analysis assumes that the Low‐Carbon Fuel Standard (being implemented by ARB) begins in 2010. The standard reduces the carbon intensity of the pool of gasoline and diesel used by all vehicles on the road by 1 percent every year until 2020. Since the Energy Commission analysis, ARB released its LCFS proposal, which has a back‐loaded phase‐in schedule for the carbon content reduction in the fuel, with most of the reductions coming in 2015 and beyond. Fuel contains 90 percent of the pre‐LCFS carbon content by 2020 and remains at this level from 2020 through 2050. This LCFS applies to both gasoline and diesel on‐road light‐duty vehicles (as well as other vehicles beyond the scope of this discussion). Staff does not have any information on the manner in which bio‐derived fuels and other non‐petroleum fuels will be used to meet LCFS requirements. The use of fuels in this analysis is in addition to the degree to which they are used to meet LCFS requirements.
• Tire Efficiency Program: The Energy Commission’s Tire Efficiency program is assumed to begin in 2010, reducing annual light‐duty vehicle fuel consumption by 1 percent from 2010 to 2050. The AB 1493/Pavley requirements already include use of low‐rolling‐resistance tires. Therefore, the benefits of the Energy Commission’s Tire Efficiency Program, which this analysis may include, are limited to efforts to get consumers to maintain tire pressure and any state standards that may require lower rolling resistance tires than what vehicle manufacturers provide as original tires on their vehicles.
• ARB’s Pavley 2 Program: The Air Resources Board is committed to extending its AB 1493/Pavley requirements, called “Pavley 2.” While not yet adopted, and therefore eligible for AB 118 Program funds at the time of this writing, ARB staff expects its board to adopt additional GHG reduction requirements that would likely be implemented with fuel economy improvements beyond the scope of their existing “Pavley 1” program requirements. The original Pavley requirements apply to model year 2009 (which may be delayed due to legal issues) to 2016. Pavley 2 is expected to lead to increasing fuel economy requirements annually until 2024. Staff assumed the 2024 levels through 2050. Additional fuel economy improvements are considered in a separate component of this analysis, and these are described below. Pavley requirements are often converted into their fuel economy effects. These effects are expressed in terms of laboratory testing conditions (often expressed by CAFE or Federal Test Procedure, FTP, requirements). These must be converted into equivalent “on‐road” fuel economy values which are used in this analysis. Staff divided CAFE‐equivalent fuel economy values by 0.85 to estimate the on‐road fuel economy equivalent.
• Low‐Carbon (LC) Alternative Fuel Vehicles: The analysis included natural gas‐and propane‐fueled vehicles as potential substitutes for gasoline and diesel vehicles. These were considered in a separate category because their GHG emissions reduction potential
A‐4
was much less than for the ultra‐low carbon or super‐ultra‐low‐carbon vehicles (which have at least a 72 percent GHG emissions reduction relative to gasoline). Staff considered CNG an option for all vehicle classes except sub‐compact vehicles because of their small size (no room for CNG cylinders) and sports cars (too much weight and not enough power boost to overcome the increased weight). The analysis considered propane to be an option only for gasoline internal combustion standard pickup vehicles, and more recently, school buses. Market penetration rates for these vehicles are described in corresponding story lines for these vehicle types.
• Ultra‐Low Carbon (ULC) Vehicles: As stated above, the 2050 Vision included “ultra‐low carbon‐vehicles” (or ULC vehicles), which achieve up to an 80 percent GHG emissions reduction relative to petroleum‐fueled vehicles and have a fleet‐average of 60 miles per gallon in 2050. ULC vehicles were described in the 2050 Vision as being flexible‐fueled vehicles. Therefore, this group of vehicles includes gasoline internal combustion engines (ICEs) and gasoline hybrids only, fueled with bio‐derived fuels. It does not include diesel ICEs. The 2050 Vision included a ULC vehicle market penetration rate of 0.3 million vehicles in 2005, 5 million vehicles in 2022, 11 million vehicles in 2030, and 28 million vehicles in 2050. Correspondingly, biofuels used in these ULC vehicles were “envisioned” to be 4 percent of the on‐road light‐duty vehicle fuel mix in 2005, 16 percent in 2022, 38 percent in 2030, and 30 percent in 2050 (from Table 9).
Staff developed annual estimates for the number of ULC vehicles on the road that correspond to the 2050 Vision fuel mix estimates extending out to 2050 (see Table 9 of 2050 Vision). The percent of vehicle sales in each of the 45 vehicle classes in 2030 was held constant from 2030 to 2050. Text under “VMT Reductions under 2050 Plan” explains the total number of new vehicles sold yearly from 2031 to 2050 under the 2050 Vision. The fuel economy of the fleet of ULC light‐duty vehicles was a harmonically averaged65 60 miles/gallon in 2050, taken from page 67 of the 2050 Vision of the State Alternative Fuels Plan. This overall fleet average fuel economy, the number of new vehicles in 2050 in each vehicle class, and the BAU miles/gallon in 2050 (held constant for all 45 vehicle classes at 2030 values) were all used to calculate the harmonic average fuel economy for 2050. Once staff derived the 2050 fuel economy values for the 45 vehicle classes, these interpolated values for 2031 through 2049 using the 2030 values from CALCARS and 2050 values derived from the 60 miles/gallon harmonic averaging. Staff was not able to estimate the number of vehicles by class that would transition from gasoline ICEs to hybrids and diesels over this period, nor their impact on fuel economy improvement. This complication results from freezing consumer preference with the transfer of values from CALCARS to the analysis spreadsheet.
65 Harmonic Averaging: This approach is used to compute the overall average fuel economy for a fleet of vehicles. For example, harmonic averaging is used to compute the Corporate Average Fuel Economy (CAFE) value for a specific automobile manufacturer. Harmonic averaging is done using the following four steps: (1) divide specific fuel economy (in miles/gallon) into the number of vehicles sold with that particular fuel economy, (2) repeat for each fuel economy value reported, (3) sum these values, (4) divide the total number of vehicles sold by the sum derived in Step 3.
A‐5
It is likely that achieving a fleet‐average on‐road economy of 60 miles/gallon would involve considerable use of hybrid‐electric vehicle technology. However, because staff froze the market shares of internal combustible engine (ICE) vehicles and hybrid‐electric vehicles at their 2030 percentages, this transfer of technology was not assessed. As a practical matter, since both groups of vehicles converge on 60 miles/gallon by 2050, the only other difference that matters is vehicle miles traveled per year. Since for a given vehicle class (sub‐compact, compact, and so forth) the annual mileage of a conventional gasoline ICE is very similar to its hybrid‐electric counterpart, results would not change had the analysis somehow included the class‐by‐class transfer from ICE to hybrid.
The 2050 Vision in the State Alternative Fuels Plan includes an assumption that ULC vehicles have an 80 percent reduction in GHG emissions relative to gasoline. An example of a ULC vehicle is a flex‐fueled E‐85 (85 percent ethanol/15 percent gasoline) vehicle fueled with an advanced form of ethanol that does not compete with food production and does not incur indirect GHG emissions from land conversions. The 2050 Vision describes the method of achieving this 80 percent carbon intensity reduction for this class of vehicles as including biofuels, electricity and hydrogen produced from renewable or very‐low‐carbon emitting technologies (page 68).
Therefore, staff assumed that ULC vehicles were all flexible‐fueled vehicles using E‐85 (85 percent ethanol and 15 percent gasoline), with the ethanol produced from purpose‐grown poplar trees. The carbon intensity of poplar tree ethanol was obtained from Figure A‐6 of the Energy Commission’s Full Fuel Cycle Assessment.66 These data indicate that the carbon intensity of the ULC vehicles would constitute a 72 percent decrease rather than the 80 percent decrease stated in the 2050 Vision. Thus, the carbon intensity of ULC vehicles in the staff analysis, as applied to intermediate years, was somewhat higher than the 2050 Vision. The Full Fuel Cycle Assessment included values for 2012, 2022, and 2030. Staff assumed the 80 percent carbon intensity reduction was reached by 2050 and developed values for intervening years using linear interpolation.
Staff compared the number of gallons of ethanol demand for these flex‐fueled vehicles to the non‐electric portion of travel by plug‐in hybrid vehicles (see below). Staff estimates that the total demand for ethanol for all these vehicles would be about 12 percent of nationwide supply, consistent with the percentage of the nationwide population, which is currently about 12 percent and rising. Since California oftentimes leads the nation in breaking new ground, this portion of the nationwide ethanol supply should be manageable.
Super‐Ultra‐Low Carbon (SULC) Vehicles: Above, staff describes the total number of new vehicles entering the California light‐duty vehicle market in 2050 under both BAU and 2050 Vision scenarios. SULC vehicles include fuel cell vehicles, battery electric, and plug‐in electric vehicles. Collectively, staff refers to these as “electric‐drive vehicles.” All 45 vehicle classes were considered to be eligible for treatment as SULC vehicles.
66 Fuel-Fuel Cycle Assessment: Well to Wheels Energy Inputs, Emissions and Water Impacts: State Plan to Increase the Use of Non-Petroleum Transportation Fuels – Assembly Bill 1007 (AB 1007, Pavley) Alternative Transportation Fuels Plan Proceeding – REVI CEC-600-2007-004-REV, revised August 1, 2007.
A‐6
Market penetration begins in 2012 for each of the three types of SULVs, reaching about 55 percent of new vehicle sales by 2050. The market penetration rate steadily increases throughout the time period for fuel cell and battery electric vehicles. However, plug‐in electric vehicles peak at 35 percent of new vehicle sales in 2035. After that, they lose market share67 to battery electric vehicles as these vehicles become more capable of providing the service life and function of plug‐in electric vehicles. By 2050, fuel cell vehicles comprise 22 percent of new vehicles sales and battery electric vehicles comprise 26 percent, while the plug‐in vehicle sales have fallen to 7 percent of new vehicle sales. See corresponding story lines for more details on market penetration rates.
Staff developed fuel economy values for electric drive vehicles (in units of equivalent gallons of gasoline per mile of travel), adjusted to be consistent with the 2050 Vision of a fleet average of 80 miles per gallon for these vehicles.
Separate GHG emissions rates were developed for fuel cell, battery electric and plug‐in hybrid electric vehicles. Staff used data from the Full Fuel Cycle Assessment (footnote 5) to estimate full fuel cycle emissions relative to gasoline and the same approach of interpolation between years where data were available. Staff also held 2030 values constant for the 2031 to 2050 period. Carbon intensity for hydrogen used as a fuel for fuel cell vehicles was estimated based upon use of steam‐reformed methane for the 2012 to 2022 period. For 2030 to 2050, staff assumed 70 percent of the hydrogen could be supplied by biomass‐derived hydrogen and the remainder by steam‐reformed methane. Values were interpolated between 2022 and 2030.
Staff developed an emissions factor for GHG emissions related to recharging batteries for battery electric and plug‐in electric vehicles using Case 4A from the report, Scenario Analysis of California’s Electricity System, third addendum, prepared for the Energy Commission’s 2007 Integrated Energy Policy Report.68 Since values were available only for 2009 through 2020, staff assumed that the emissions factor continued to decline somewhat below the 2020 value of 595 pounds carbon dioxide per megawatt hours (MWh), leveling off at 500 pounds carbon dioxide per MWh in 2030 and later years. Since this emissions factor was applicable only for carbon dioxide, there was a need to adjust this value to account for other GHG emissions associated with electricity production and transmission, notably methane, nitrous oxide, and sulfur‐hexaflouride. Using Air Resources Board GHG emissions inventory date, staff developed percentage trends for each of these additional gases. The percentages of methane and nitrous oxide were fairly constant over the 1990 to 2004 period, while the percentage of sulfur hexaflouride declined over time. Since the sulfur hexafluoride decline is due to a concerted effort by electric utilities to reduce these emissions, and since the other two relevant gas
67 Staff used data from Table 1 (gasoline) and Table 2 (diesel) of ARBʹs October 2008 staff draft report for their analysis. ARB updated values slightly in their December 2008 staff draft rule, but only for 2018 and 2019. All other values are identical in both sources. These slight changes are not expected to have a noticeable impact on the staff results.
68 Scenario Analysis of California’s Electricity System: Preliminary Results for the 2007 Integrated Energy Policy Report – Addendum. CEC‐200‐2007‐010‐AD3.
A‐7
emissions were relatively constant over the study period, the percentages computed for 2004 were assumed to represent a reasonable ratio to be used for future emissions, at 1.25 percent.
Since greenhouse gas emissions for other fuels included upstream emissions (usually called a “well‐to‐wheels” analysis), staff also needed to estimate upstream GHG emissions associated with electricity production for use in transportation. This estimate was derived in a similar manner to that described above for the non‐carbon dioxide portion of GHG emissions for electricity. Staff used nationwide GHG emissions data from the U.S. GHG emissions inventory69 for this analysis. National values were available only for 1997 through 2006. Staff used values for 1997 to 2004 to compute the percentage of the nation’s natural gas and coal used to make electricity. Staff used California electricity production compared to national values to pro‐rate results to California. In the case of coal, out‐of‐state coal plants that were known to supply coal‐derived electricity to California were included. Since the computed “adder” for these upstream emissions declined from 2000 to 2004, staff used the 2004 value for future estimates. These upstream emissions add another 4.57 percent.
A less carbon‐intense case (Case 5A) could also be used which includes more aggressive energy efficiency improvements, although it leads to only slightly lower emissions factor values. Finally, staff assumed that the non‐electric portion of the plug‐in vehicle trip was fueled with E‐85, using the same frequency of fueling with E‐85 as described above for flex‐fuel vehicles.
Vehicle Miles of Travel (VMT) Reductions from 2050 Vision The 2050 Vision (Chapter 6 of the State Alternative Fuels Plan) called for reduced vehicle‐miles of travel (VMT) per capita from a BAU‐projected amount of 10,300 in 2050 to 8,200, about a 20 percent reduction by 2050. Staff assumed these changes to begin in 2016, increasing linearly until reaching the required reduction in 2050. A ratio of “2050 Vision VMT” to “BAU VMT” was developed for each year from 2016 to 2050.
The analysis modified the number of new vehicles purchased yearly between 2031 and 2050 under BAU to a smaller number set to match the 20 percent reduction in VMT. As a direct result, the annual number of miles of travel per vehicle remains the same under BAU and the 2050 Vision. This improves the economics of using vehicles, compared to an alternative approach of absorbing the VMT reduction by using a larger number of vehicles but operating them fewer miles per year. This correspondingly reduces fuel demand.
69 Inventory of U.S. GHG Emissions and Sinks: 1990 to 2006, April 15, 2006; Table 3‐34 (methane) and 3‐36 (non‐combustion carbon dioxide) from natural gas supply system and methane emissions from Tables 3‐26 (coal mines) and 3‐30 (abandoned coal mines).

A‐8
Figure A-1: California LDV GHG Emissions
Source: California Energy Commission
Computed Carbon Intensities By using the results of staff’s analysis of the computed effective carbon intensities relative to gasoline, diesel, propane, and natural gas, vehicles all show at least a 40 percent reduction in GHG emissions. ULC vehicles achieve a 70 percent or better reduction in GHG emissions and SULC vehicles achieve over 90 percent reduction. These reductions, while impressive, do not meet the 2050 target.
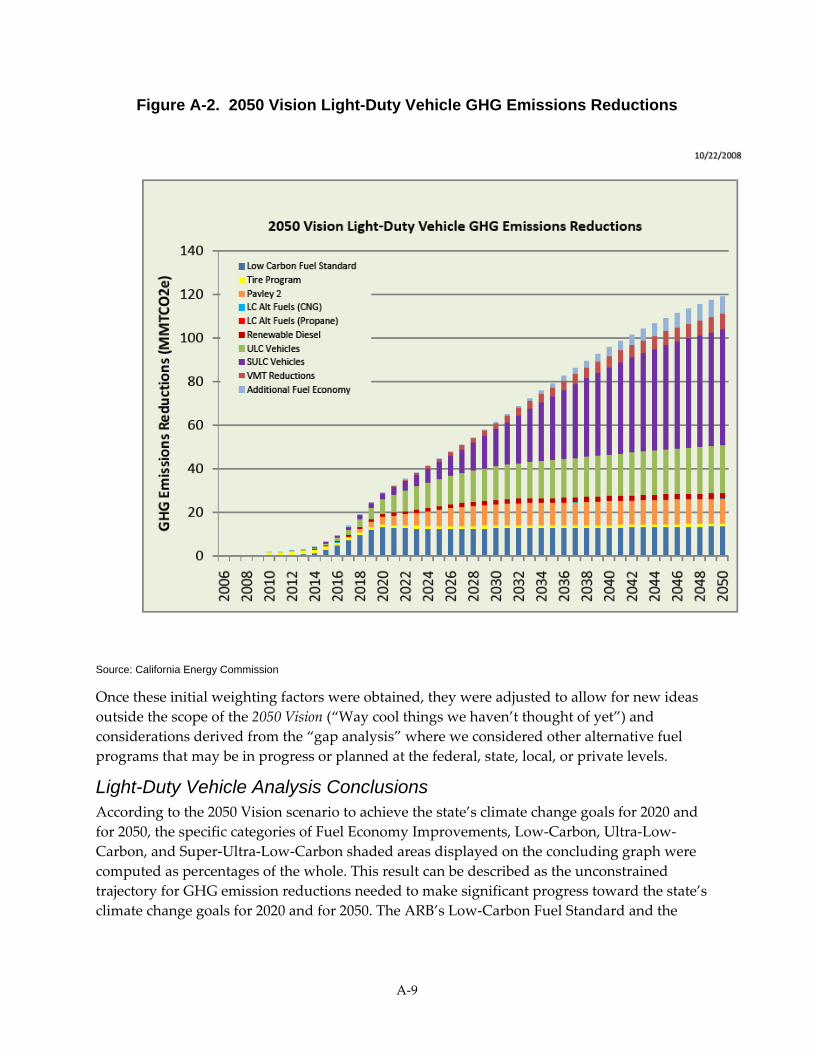
A‐9
Figure A-2. 2050 Vision Light-Duty Vehicle GHG Emissions Reductions
Source: California Energy Commission
Once these initial weighting factors were obtained, they were adjusted to allow for new ideas outside the scope of the 2050 Vision (“Way cool things we haven’t thought of yet”) and considerations derived from the “gap analysis” where we considered other alternative fuel programs that may be in progress or planned at the federal, state, local, or private levels.
Light-Duty Vehicle Analysis Conclusions According to the 2050 Vision scenario to achieve the state’s climate change goals for 2020 and for 2050, the specific categories of Fuel Economy Improvements, Low‐Carbon, Ultra‐Low‐Carbon, and Super‐Ultra‐Low‐Carbon shaded areas displayed on the concluding graph were computed as percentages of the whole. This result can be described as the unconstrained trajectory for GHG emission reductions needed to make significant progress toward the state’s climate change goals for 2020 and for 2050. The ARB’s Low‐Carbon Fuel Standard and the

A‐10
Energy Commission’s Tire Efficiency Program were both excluded from the final results because they are not eligible for funding under the AB 118 program.
The results of the analysis are summed below over several periods to show the effect of the period in terms of affecting the final results. The analysis uses values summed over the 2009 to 2020 period for final determination of funding percentages. Other periods are shown for information only.
Table A-1. Light-Duty GHG Emissions Reductions (2009 to 2020)
Category GHG Emission Reduction
(MMTCO2e)70
Percent GHG Emission Reduction
Super‐Ultra‐Low‐Carbon Fuels 11 33%
Ultra‐Low‐Carbon Fuels 9 27% Fuel Economy Improvements 10 30% Low‐Carbon Fuels 3 10%
Total 33 100% Source: California Energy Commission
Using these estimates, the following graph shows the effectiveness of this scenario in meeting the “fair share” 2020 and 2050 GHG reduction targets.
70 Million metric tons carbon dioxide emissions.
B‐1
APPENDIX B: Analytical Method for Establishing Funding Priorities and Opportunities Analysis for Medium- and Heavy-Duty Vehicles This analysis extends the evaluation of the 2050 Vision for light‐duty vehicles (LDVs) to medium‐ and heavy‐duty vehicles in a manner similar to that for the LDVs. This analysis uses a different list of fuel and vehicle emission reduction strategies but also determines a percentage for specific fuel categories in the 2050 Vision. The calculated percentage will help establish funding priorities and opportunities for the evaluated fuel or technology. The fuels and technologies included in this analysis are biomass‐derived diesel, hydraulic hybrids, battery electric hybrids, full electric vehicles, fuel cell vehicles, propane, compressed natural gas, and liquefied natural gas. The projected market penetrations, fuel economies, fuel consumption, and diesel displacement for evaluated fuels and technologies were obtained from the AB 1007 State Alternative Fuels Plan and updated. The initial projections have no constraints placed upon them and were evaluated without consideration of market competition or biomass constraints. However, the updated fuel and technology market information should be influenced by costs and potentially do consider barriers to market penetration, which may include some of the constraints mentioned above. Still, the fuels and technologies themselves were evaluated independently and do not reflect a truly competitive marketplace or instances of direct synergistic effects. Additionally, staff is currently evaluating California biomass constraints and is working with other California Energy Commission divisions to ensure a consistent set of assumptions related to the availability and use of biomass in California.
Generally, the Energy Commission used a simple accounting method to calculate the estimated emissions for the medium‐ and heavy‐duty greenhouse gas (GHG) emissions for the AB 118 Investment Plan. All calculations and assumptions are documented in a simple spreadsheet model. As can be observed in the spreadsheets, the fuel consumption is used to directly calculate the associated full fuel cycle GHG emissions using emission factors derived from the CA‐GREET71 model results.
Carbon Content Calculation This section describes the method and references used to calculate the carbon content for all fuels and technologies.
Gasoline and diesel GHG emission carbon contents were held constant over the forecast period at values of 8,130 grams (gms) carbon dioxide equivalent (CO2e) per gallon and 10,300 gms CO2e per gallon, respectively. All other fuels used values from the CA‐GREET correlated to the gasoline and diesel constant values. The selection of the CA‐GREET specific carbon contents were obtained from specific past evaluated scenarios. The list of scenarios used from the well to
71 The CA-GREET model is being updated again as part of the AB 118 work. Additionally, the CA-GREET model was developed in cooperation with the California Air Resources Board during the AB 1007 California State Alternative Fuels Plan work in 2007.
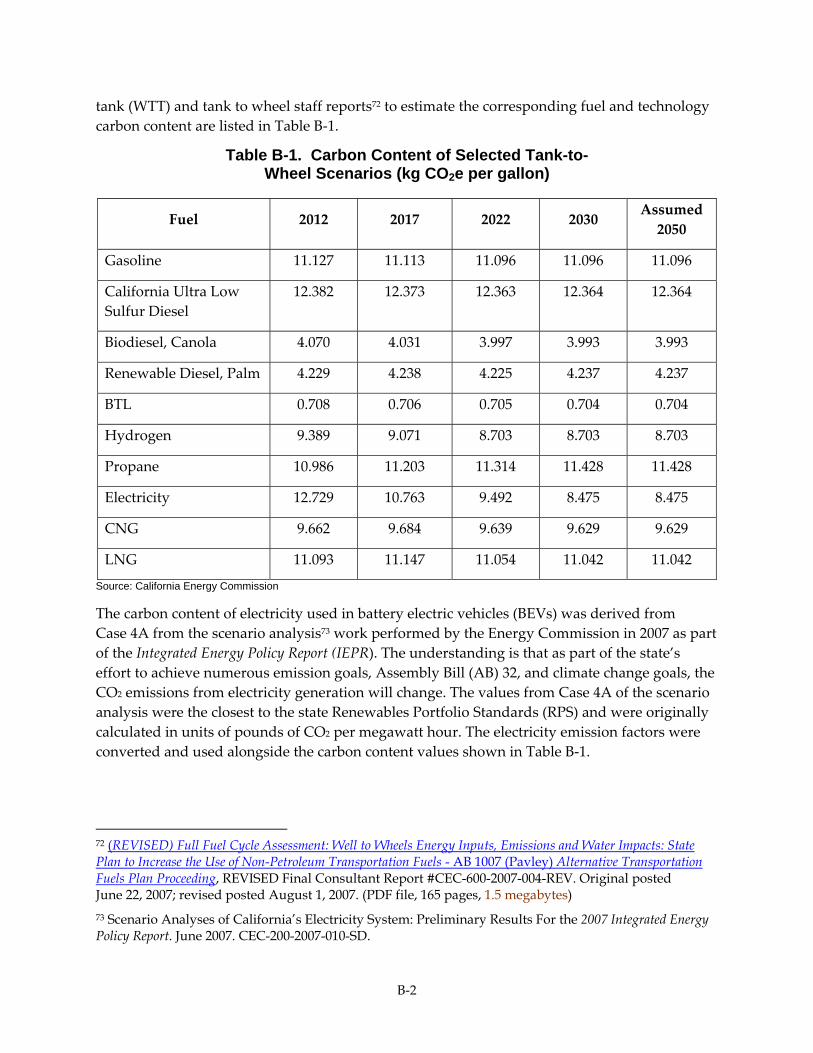
B‐2
tank (WTT) and tank to wheel staff reports72 to estimate the corresponding fuel and technology carbon content are listed in Table B‐1.
Table B-1. Carbon Content of Selected Tank-to- Wheel Scenarios (kg CO2e per gallon)
Fuel 2012 2017 2022 2030 Assumed 2050
Gasoline 11.127 11.113 11.096 11.096 11.096
California Ultra Low Sulfur Diesel
12.382 12.373 12.363 12.364 12.364
Biodiesel, Canola 4.070 4.031 3.997 3.993 3.993
Renewable Diesel, Palm 4.229 4.238 4.225 4.237 4.237
BTL 0.708 0.706 0.705 0.704 0.704
Hydrogen 9.389 9.071 8.703 8.703 8.703
Propane 10.986 11.203 11.314 11.428 11.428
Electricity 12.729 10.763 9.492 8.475 8.475
CNG 9.662 9.684 9.639 9.629 9.629
LNG 11.093 11.147 11.054 11.042 11.042
Source: California Energy Commission
The carbon content of electricity used in battery electric vehicles (BEVs) was derived from Case 4A from the scenario analysis73 work performed by the Energy Commission in 2007 as part of the Integrated Energy Policy Report (IEPR). The understanding is that as part of the state’s effort to achieve numerous emission goals, Assembly Bill (AB) 32, and climate change goals, the CO2 emissions from electricity generation will change. The values from Case 4A of the scenario analysis were the closest to the state Renewables Portfolio Standards (RPS) and were originally calculated in units of pounds of CO2 per megawatt hour. The electricity emission factors were converted and used alongside the carbon content values shown in Table B‐1.
72 (REVISED) Full Fuel Cycle Assessment: Well to Wheels Energy Inputs, Emissions and Water Impacts: State Plan to Increase the Use of Non-Petroleum Transportation Fuels - AB 1007 (Pavley) Alternative Transportation Fuels Plan Proceeding, REVISED Final Consultant Report #CEC-600-2007-004-REV. Original posted June 22, 2007; revised posted August 1, 2007. (PDF file, 165 pages, 1.5 megabytes) 73 Scenario Analyses of California’s Electricity System: Preliminary Results For the 2007 Integrated Energy Policy Report. June 2007. CEC-200-2007-010-SD.
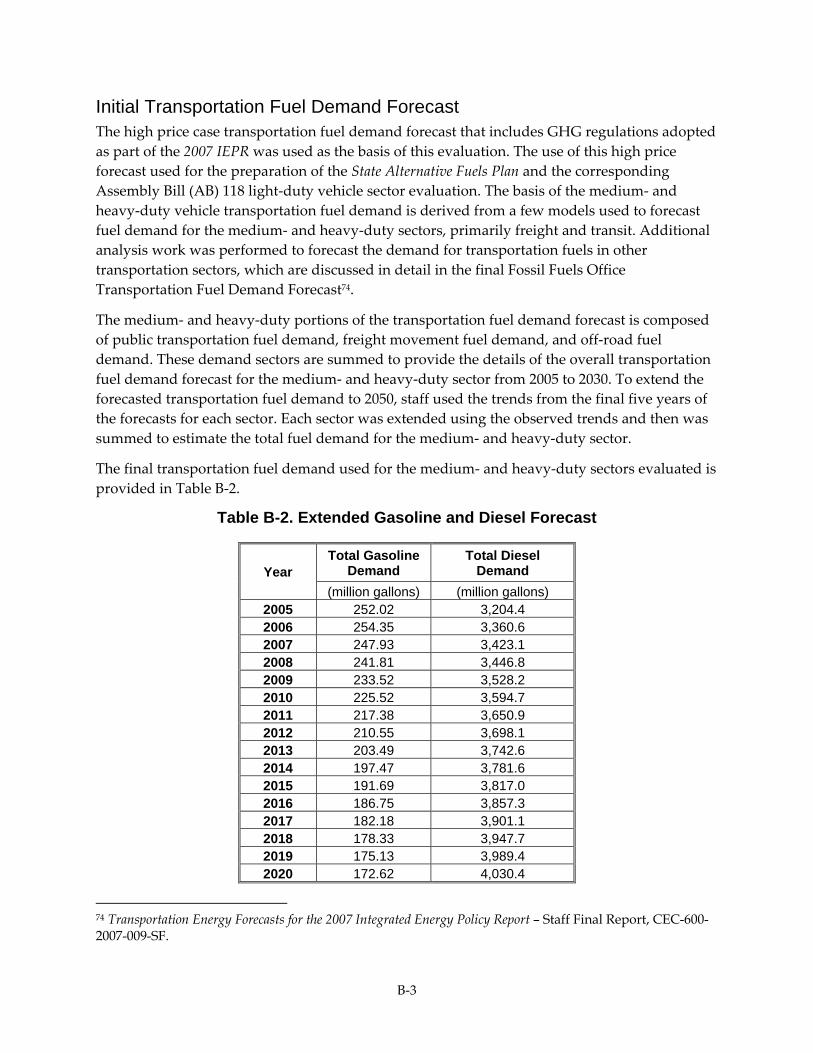
B‐3
Initial Transportation Fuel Demand Forecast The high price case transportation fuel demand forecast that includes GHG regulations adopted as part of the 2007 IEPR was used as the basis of this evaluation. The use of this high price forecast used for the preparation of the State Alternative Fuels Plan and the corresponding Assembly Bill (AB) 118 light‐duty vehicle sector evaluation. The basis of the medium‐ and heavy‐duty vehicle transportation fuel demand is derived from a few models used to forecast fuel demand for the medium‐ and heavy‐duty sectors, primarily freight and transit. Additional analysis work was performed to forecast the demand for transportation fuels in other transportation sectors, which are discussed in detail in the final Fossil Fuels Office Transportation Fuel Demand Forecast74.
The medium‐ and heavy‐duty portions of the transportation fuel demand forecast is composed of public transportation fuel demand, freight movement fuel demand, and off‐road fuel demand. These demand sectors are summed to provide the details of the overall transportation fuel demand forecast for the medium‐ and heavy‐duty sector from 2005 to 2030. To extend the forecasted transportation fuel demand to 2050, staff used the trends from the final five years of the forecasts for each sector. Each sector was extended using the observed trends and then was summed to estimate the total fuel demand for the medium‐ and heavy‐duty sector.
The final transportation fuel demand used for the medium‐ and heavy‐duty sectors evaluated is provided in Table B‐2.
Table B-2. Extended Gasoline and Diesel Forecast
Year Total Gasoline
Demand Total Diesel
Demand (million gallons) (million gallons)
2005 252.02 3,204.4 2006 254.35 3,360.6 2007 247.93 3,423.1 2008 241.81 3,446.8 2009 233.52 3,528.2 2010 225.52 3,594.7 2011 217.38 3,650.9 2012 210.55 3,698.1 2013 203.49 3,742.6 2014 197.47 3,781.6 2015 191.69 3,817.0 2016 186.75 3,857.3 2017 182.18 3,901.1 2018 178.33 3,947.7 2019 175.13 3,989.4 2020 172.62 4,030.4
74 Transportation Energy Forecasts for the 2007 Integrated Energy Policy Report – Staff Final Report, CEC-600-2007-009-SF.
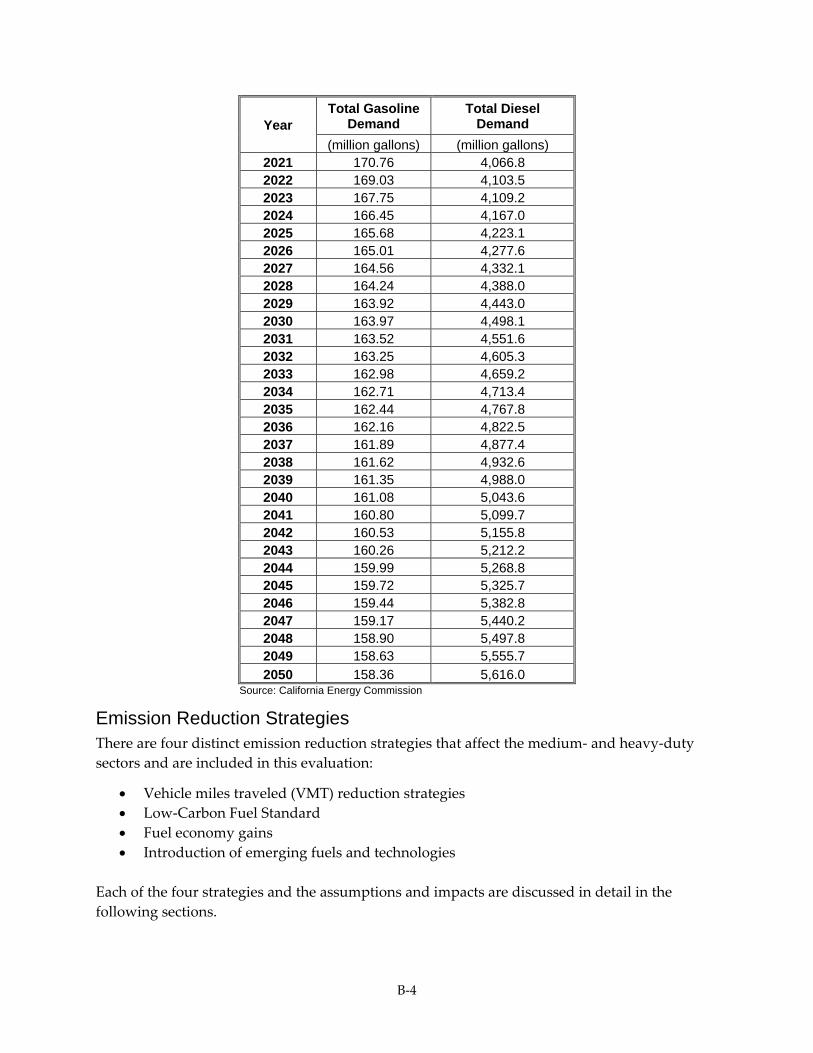
B‐4
Year Total Gasoline
Demand Total Diesel
Demand (million gallons) (million gallons)
2021 170.76 4,066.8 2022 169.03 4,103.5 2023 167.75 4,109.2 2024 166.45 4,167.0 2025 165.68 4,223.1 2026 165.01 4,277.6 2027 164.56 4,332.1 2028 164.24 4,388.0 2029 163.92 4,443.0 2030 163.97 4,498.1 2031 163.52 4,551.6 2032 163.25 4,605.3 2033 162.98 4,659.2 2034 162.71 4,713.4 2035 162.44 4,767.8 2036 162.16 4,822.5 2037 161.89 4,877.4 2038 161.62 4,932.6 2039 161.35 4,988.0 2040 161.08 5,043.6 2041 160.80 5,099.7 2042 160.53 5,155.8 2043 160.26 5,212.2 2044 159.99 5,268.8 2045 159.72 5,325.7 2046 159.44 5,382.8 2047 159.17 5,440.2 2048 158.90 5,497.8 2049 158.63 5,555.7 2050 158.36 5,616.0
Source: California Energy Commission
Emission Reduction Strategies There are four distinct emission reduction strategies that affect the medium‐ and heavy‐duty sectors and are included in this evaluation:
• Vehicle miles traveled (VMT) reduction strategies • Low‐Carbon Fuel Standard • Fuel economy gains • Introduction of emerging fuels and technologies
Each of the four strategies and the assumptions and impacts are discussed in detail in the following sections.
B‐5
Vehicle Miles Traveled Reduction Strategies A large part of the 2050 Vision involves strategies focused on reducing VMT by Californians. Among the detailed strategies is the shifting from personal vehicles toward public transportation. Therefore, as a result of successful VMT reduction strategies, increasing ridership of public transportation is anticipated. This increased public transportation ridership will result in an increase in the fuel consumed by transit agencies and increase the GHG emissions of this sector.
Staff estimated the increased ridership of public transportation as a result of the VMT reduction strategies outlined in the 2050 Vision document and included in the light‐duty vehicle evaluation. The calculation of displaced VMT is discussed as part of the light‐duty vehicle emission reduction evaluations.
The displaced VMT is primarily the difference between two per capita VMT estimates, the California Light‐Duty Vehicle Conventional and Alternative Fuel Response Simulator (CALCARS) model and the AB 1007 2050 Visionʹs. The difference between per capita VMT is multiplied by the population to arrive at total displaced VMT due to the reductions strategies outlined in the 2050 Vision document.
The increase in public transportation use assumes that two‐thirds (66 percent) of the displaced VMT will be replaced with public transportation trips. The load factors, or the number of passengers per vehicle, of an average personal vehicle and an average transit bus were then used to estimate the number of addition transit bus miles traveled. The assumed fuel economy of 6 miles per diesel gallon equivalent (mpdge) was used to then calculate the fuel consumption created by the additional VMT.
The fuel consumption was divided among the four fuel types for transit buses, CNG, Diesel, LNG, and LPG. The fuel distribution of the base year was used for estimating the additional forecasted fuel consumption. The additional fuel consumption was then included in the emission estimates.
The results of the additional VMT were significant, resulting in an increase in fuel consumption of 726,657,286 diesel gallon equivalents in 2050. Figure B‐1 shows the increasing fuel consumption over the forecast period.
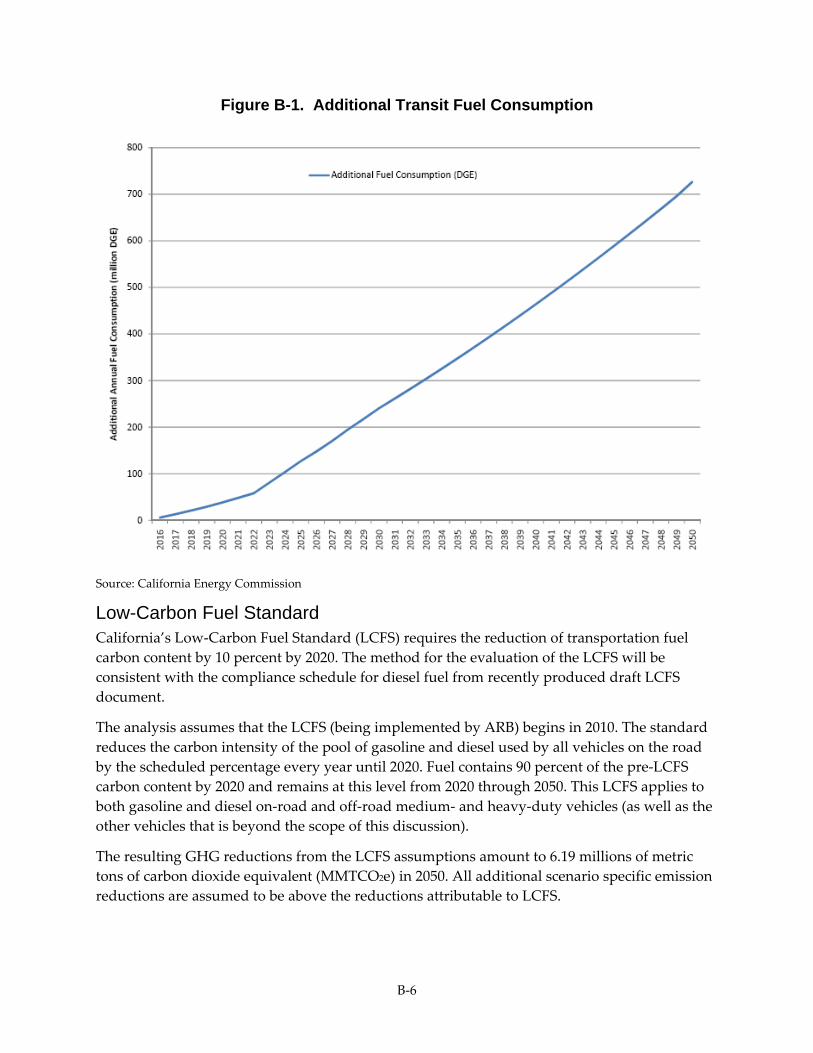
B‐6
Figure B-1. Additional Transit Fuel Consumption
Source: California Energy Commission
Low-Carbon Fuel Standard California’s Low‐Carbon Fuel Standard (LCFS) requires the reduction of transportation fuel carbon content by 10 percent by 2020. The method for the evaluation of the LCFS will be consistent with the compliance schedule for diesel fuel from recently produced draft LCFS document.
The analysis assumes that the LCFS (being implemented by ARB) begins in 2010. The standard reduces the carbon intensity of the pool of gasoline and diesel used by all vehicles on the road by the scheduled percentage every year until 2020. Fuel contains 90 percent of the pre‐LCFS carbon content by 2020 and remains at this level from 2020 through 2050. This LCFS applies to both gasoline and diesel on‐road and off‐road medium‐ and heavy‐duty vehicles (as well as the other vehicles that is beyond the scope of this discussion).
The resulting GHG reductions from the LCFS assumptions amount to 6.19 millions of metric tons of carbon dioxide equivalent (MMTCO2e) in 2050. All additional scenario specific emission reductions are assumed to be above the reductions attributable to LCFS.

B‐7
Fuel Economy Gain The fuel economy of medium‐ and heavy‐duty vehicles will improve over current levels through 2050. The transportation fuel demand forecasts have basic assumptions involving the fuel economies of medium‐ and heavy‐duty vehicles but do not include recent technologies. Consequently, the evaluation of technologies increasing the fuel economy of medium‐ and heavy‐duty vehicles was performed separately.
Information for fuel economy technologies was obtained from U.S. Environmental Protection Agency (EPA) SmartWay75 program and a literature search of medium‐ and heavy‐duty vehicle technologies. The default evaluated values for the estimation of fuel economy were modified to better reflect California.
Specifically, the 32.2 percent idle vehicle heating time was calculated using the National Oceanic and Atmospheric Administration’s (NOAAʹs) heating degree‐day76 records reflecting Californiaʹs year‐round moderate temperatures, when compared to the national average.77 Table B‐3 shows the data associated with the introduction of fuel‐efficient technologies.
75 Calculations used reflect methodology described at U.S. EPA website on SmartWay technology benefits and costs. http://www.epa.gov/smartway/transport/calculators/index.htm. 76 Heating degree-days are a quantitative index used to reflect the amount of heating required over a one year period. 77 U.S. Department of Commerce, NOAA, National Environment Sat, Data, and Information Service. Historical Climatology Series 5-1, Monthly, State, Regional, and National, Heating Degree Days Weighted by Populations. September 2008.
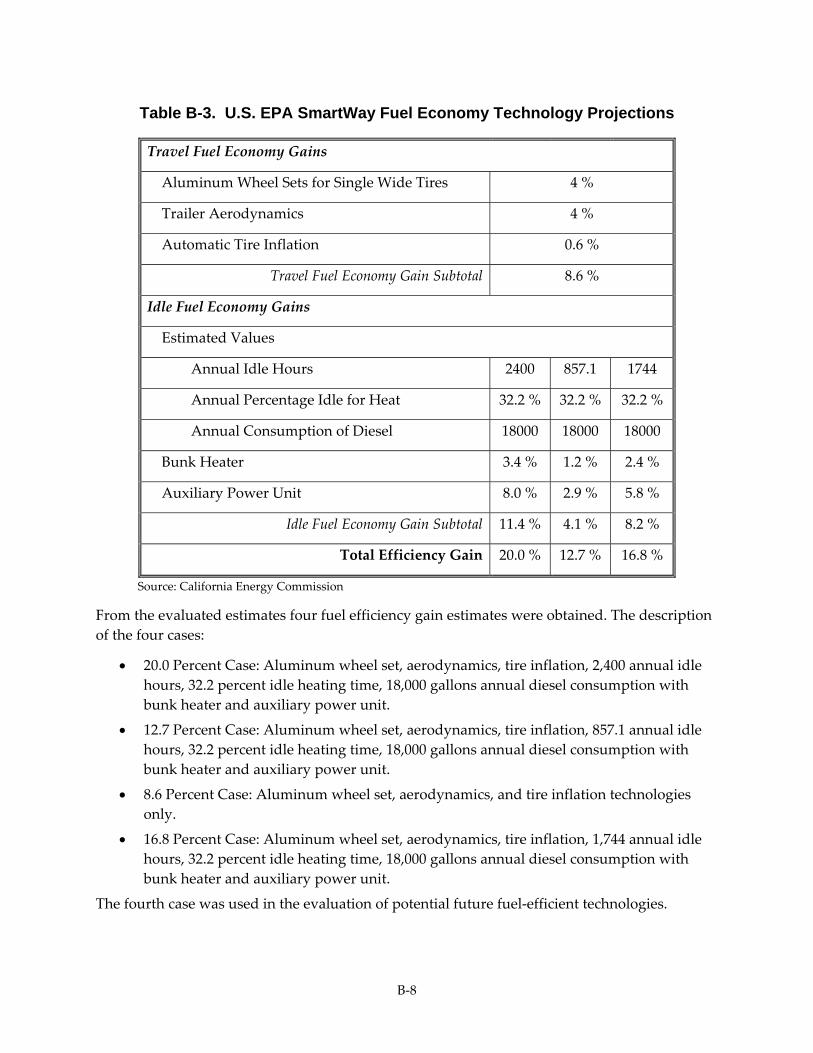
B‐8
Table B-3. U.S. EPA SmartWay Fuel Economy Technology Projections
Travel Fuel Economy Gains
Aluminum Wheel Sets for Single Wide Tires 4 %
Trailer Aerodynamics 4 %
Automatic Tire Inflation 0.6 %
Travel Fuel Economy Gain Subtotal 8.6 %
Idle Fuel Economy Gains
Estimated Values
Annual Idle Hours 2400 857.1 1744
Annual Percentage Idle for Heat 32.2 % 32.2 % 32.2 %
Annual Consumption of Diesel 18000 18000 18000
Bunk Heater 3.4 % 1.2 % 2.4 %
Auxiliary Power Unit 8.0 % 2.9 % 5.8 %
Idle Fuel Economy Gain Subtotal 11.4 % 4.1 % 8.2 %
Total Efficiency Gain 20.0 % 12.7 % 16.8 %
Source: California Energy Commission
From the evaluated estimates four fuel efficiency gain estimates were obtained. The description of the four cases:
• 20.0 Percent Case: Aluminum wheel set, aerodynamics, tire inflation, 2,400 annual idle hours, 32.2 percent idle heating time, 18,000 gallons annual diesel consumption with bunk heater and auxiliary power unit.
• 12.7 Percent Case: Aluminum wheel set, aerodynamics, tire inflation, 857.1 annual idle hours, 32.2 percent idle heating time, 18,000 gallons annual diesel consumption with bunk heater and auxiliary power unit.
• 8.6 Percent Case: Aluminum wheel set, aerodynamics, and tire inflation technologies only.
• 16.8 Percent Case: Aluminum wheel set, aerodynamics, tire inflation, 1,744 annual idle hours, 32.2 percent idle heating time, 18,000 gallons annual diesel consumption with bunk heater and auxiliary power unit.
The fourth case was used in the evaluation of potential future fuel‐efficient technologies.
B‐9
For comparison staff looked at other reports evaluating projected fuel economy gains, one document being the ARB AB 32 Scoping Document78. Three items were identified in the document relating to efficiency:
• Heavy‐duty vehicle GHG emission reduction measure aerodynamic efficiency (discrete early action) (1.4 MMTCO2E by 2020)
• Medium‐ and heavy‐duty vehicle hybridization (0.5 MMTCO2E by 2020)
• Heavy‐duty engine efficiency (0.6 MMTCO2E by 2020)
The evaluated combined efficiency for the medium‐ and heavy‐duty sector amounted to a reduction of 3.291 MMTCO2E by 2020 and includes benefits from hybridization that were calculated separately. Efficiency gains for the system wide optimization of goods movement was not evaluated as part of this work because it involved technologies and strategies not evaluated in this report, such as empty cargo container logistic improvement and increased use of barges to transfer containers to smaller distribution ports.
Introduction of Emerging Fuels The final reduction strategy included in the evaluation involved the increased market penetration of various emerging fuels and technologies. The vehicles included in this evaluation are divided into two categories, those considered low‐carbon‐fueled vehicles and super‐ultra‐low‐carbon fueled vehicles. A third category was used in the light‐duty vehicle evaluation but is not applicable to the evaluated medium‐ and heavy‐duty vehicle fuels, ultra–low‐carbon vehicles.
Low‐carbon fuels included in this evaluation included renewable diesel, liquefied petroleum gas, compressed natural gas, and liquid natural gas.
Super‐ultra‐low‐carbon included hydrogen and electric drive vehicles.
Figure B‐2 presents the estimated GHG reductions from the Low‐Carbon Fuel Standard, low‐carbon, super‐ultra‐low‐carbon, and new technology fuel economy gains primarily due to the introduction of hydraulic hybrids.
78 [http://www.arb.ca.gov/cc/scopingplan/document/draftscopingplan.pdf] p. 30.
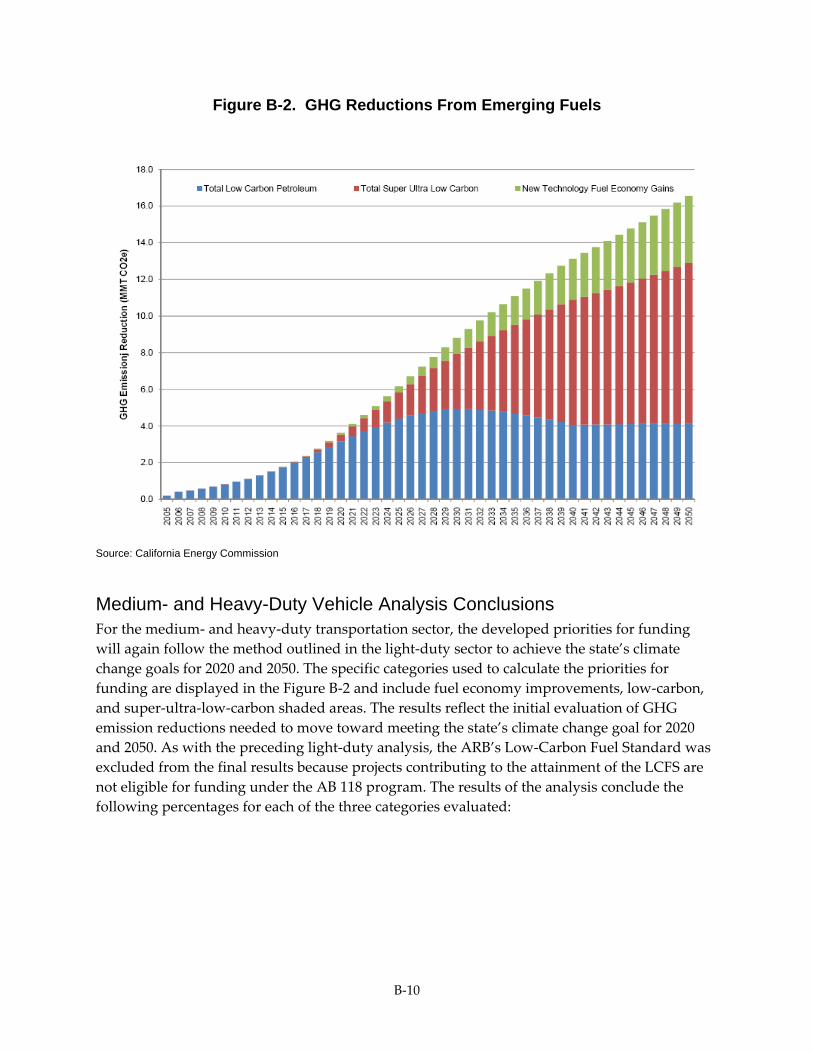
B‐10
Figure B-2. GHG Reductions From Emerging Fuels
Source: California Energy Commission
Medium- and Heavy-Duty Vehicle Analysis Conclusions For the medium‐ and heavy‐duty transportation sector, the developed priorities for funding will again follow the method outlined in the light‐duty sector to achieve the state’s climate change goals for 2020 and 2050. The specific categories used to calculate the priorities for funding are displayed in the Figure B‐2 and include fuel economy improvements, low‐carbon, and super‐ultra‐low‐carbon shaded areas. The results reflect the initial evaluation of GHG emission reductions needed to move toward meeting the state’s climate change goal for 2020 and 2050. As with the preceding light‐duty analysis, the ARB’s Low‐Carbon Fuel Standard was excluded from the final results because projects contributing to the attainment of the LCFS are not eligible for funding under the AB 118 program. The results of the analysis conclude the following percentages for each of the three categories evaluated:
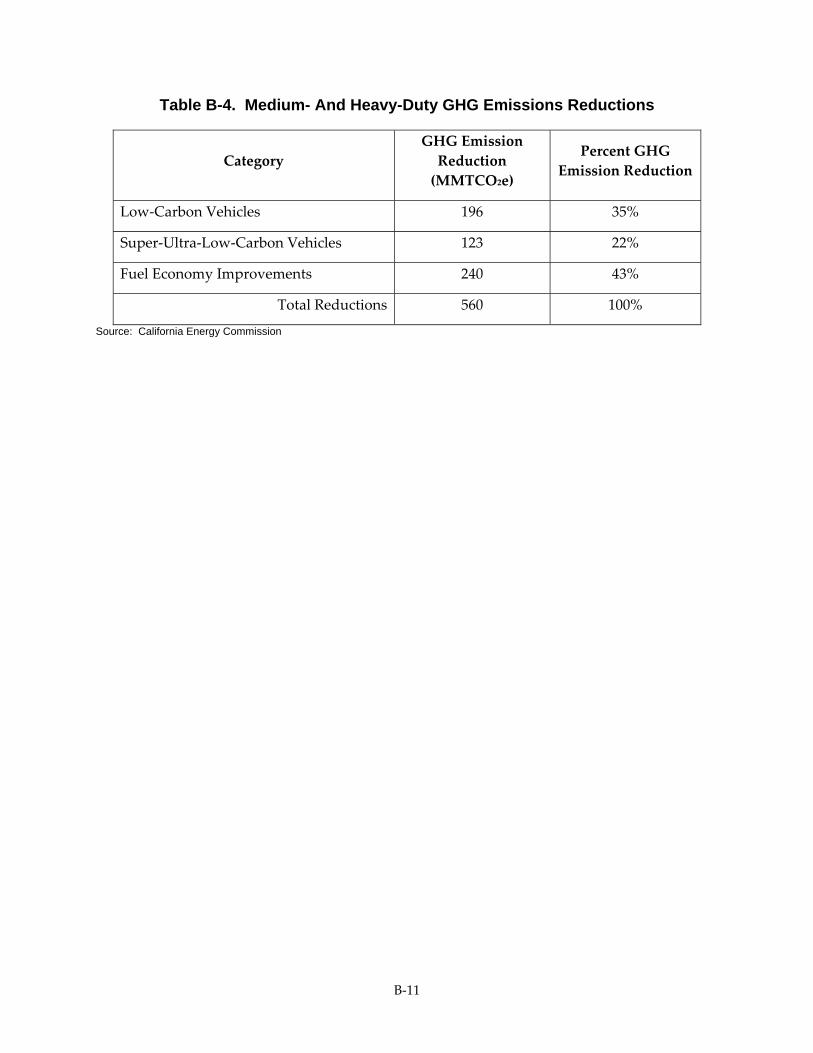
B‐11
Table B-4. Medium- And Heavy-Duty GHG Emissions Reductions
Category GHG Emission Reduction (MMTCO2e)
Percent GHG Emission Reduction
Low‐Carbon Vehicles 196 35%
Super‐Ultra‐Low‐Carbon Vehicles 123 22%
Fuel Economy Improvements 240 43%
Total Reductions 560 100%
Source: California Energy Commission

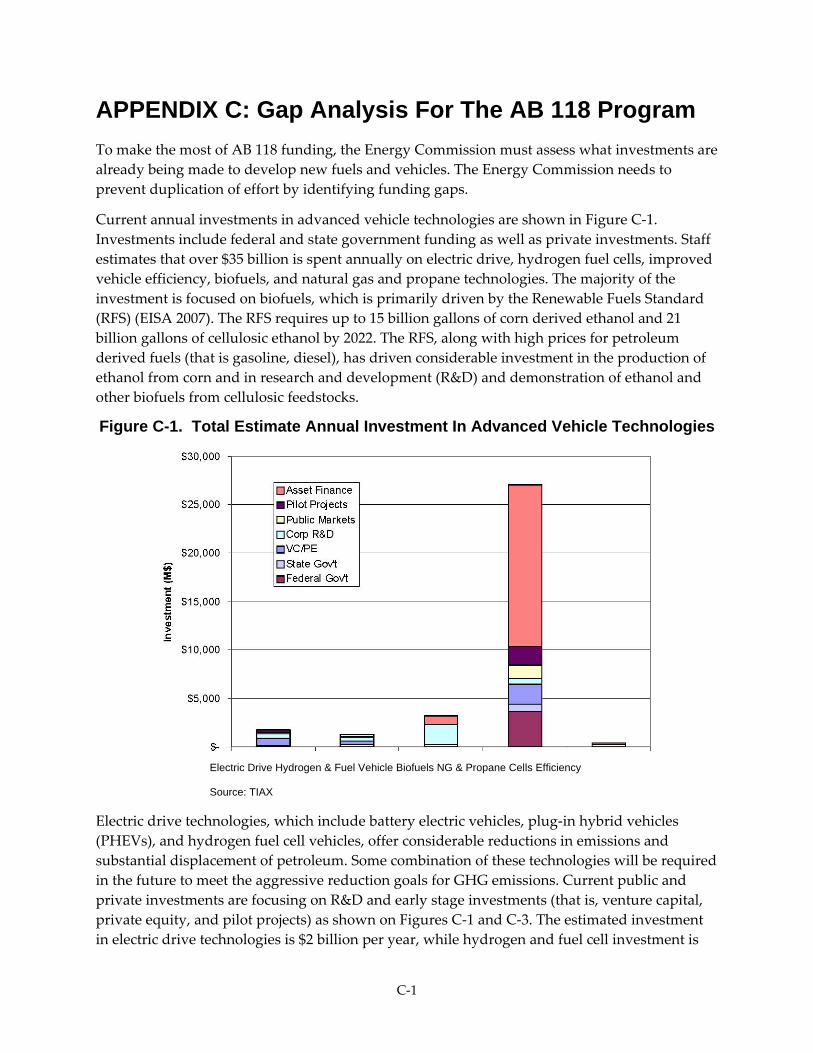
C‐1
APPENDIX C: Gap Analysis For The AB 118 Program To make the most of AB 118 funding, the Energy Commission must assess what investments are already being made to develop new fuels and vehicles. The Energy Commission needs to prevent duplication of effort by identifying funding gaps.
Current annual investments in advanced vehicle technologies are shown in Figure C‐1. Investments include federal and state government funding as well as private investments. Staff estimates that over $35 billion is spent annually on electric drive, hydrogen fuel cells, improved vehicle efficiency, biofuels, and natural gas and propane technologies. The majority of the investment is focused on biofuels, which is primarily driven by the Renewable Fuels Standard (RFS) (EISA 2007). The RFS requires up to 15 billion gallons of corn derived ethanol and 21 billion gallons of cellulosic ethanol by 2022. The RFS, along with high prices for petroleum derived fuels (that is gasoline, diesel), has driven considerable investment in the production of ethanol from corn and in research and development (R&D) and demonstration of ethanol and other biofuels from cellulosic feedstocks.
Figure C-1. Total Estimate Annual Investment In Advanced Vehicle Technologies
Electric Drive Hydrogen & Fuel Vehicle Biofuels NG & Propane Cells Efficiency Source: TIAX
Electric drive technologies, which include battery electric vehicles, plug‐in hybrid vehicles (PHEVs), and hydrogen fuel cell vehicles, offer considerable reductions in emissions and substantial displacement of petroleum. Some combination of these technologies will be required in the future to meet the aggressive reduction goals for GHG emissions. Current public and private investments are focusing on R&D and early stage investments (that is, venture capital, private equity, and pilot projects) as shown on Figures C‐1 and C‐3. The estimated investment in electric drive technologies is $2 billion per year, while hydrogen and fuel cell investment is
C‐2
about $1.2 billion per year. Currently, federal funding is higher for hydrogen and fuel cells than for electric drive technologies. Hydrogen fuel cell vehicles are being demonstrated in small numbers with automakers ready to increase the number of vehicles, but this will require additional investment in hydrogen fueling infrastructure to support these limited production vehicles.
PHEVs or range‐extended electric vehicles are just being developed by the major automakers.79 No large‐scale, coordinated demonstration of these technologies has yet occurred. Current investments focus on the batteries for these vehicles as well as for “pure” battery electric vehicles. Several automakers are developing PHEVs and are committed to demonstrating and selling these vehicles in the near future. Automakers are developing different vehicle designs, and it is yet to be determined how these differing designs will be accepted in the marketplace.
Based on an analysis of the current funding landscape and staff’s understanding of the status of the advanced vehicle technologies, staff offers the following observations:
Biofuels: Considerable money is already being invested by the private sector for fuel production, and by the federal government’s fuel tax credits of Generation I biofuels, and the combined federal government/private sector support for the R&D of Generation II (cellulosic) biofuels. It t is not clear that additional funding will accelerate commercialization, especially Generation I biofuels (that is, starch‐based ethanol). Nevertheless, a key California objective is to produce biofuels in‐state. So it is recommended that some portion of the AB 118 funding be invested in California‐based biofuels production. Funding could also be used to support the distribution and use of high‐blend biofuel.
Natural Gas and Propane: Natural gas and propane receive the lowest investments. This is a result of very limited end‐use product being offered to the marketplace. There is one automaker producing a CNG light‐duty vehicle (Honda) and one heavy‐duty engine manufacture providing natural gas or propane engines (Cummins Westport). No automakers are providing propane or LPG for the light‐duty sector. Both fuels have incentives for vehicle purchases and a $0.50‐per‐gasoline‐gallon‐equivalent fuel credit. These incentives encourage the use of these fuels but are not used at the same level as biofuels.
A major funding issue facing these technologies is product development for the light‐duty and heavy‐duty vehicle markets. AB 118 funding could be used to help bring more products to the marketplace, including continued incentives to help support infrastructure and the purchase of vehicles for individuals and fleets. Funds could also be used to develop and demonstrate advanced gas‐to‐liquids technologies if the resulting GHG emissions are low enough.
Improved Vehicle Efficiency: Improving vehicle efficiency is funded mostly by the automakers and engine manufacturers themselves as part of their normal product improvement, although both receive public funding as well. Proposed CAFE standards will require the automakers to invest heavily in advanced conventional technologies to improve fuel economy. These
79However, a number of PHEV retrofits, including bolt-on modifications to the Toyota Prius, have been conducted by individual vehicle owners and some state/local funding agencies.
C‐3
investments will also help to reduce GHG and criteria pollutant emissions, but further reductions will be necessary beyond what is possible through improvements in conventional technologies alone.
Most of the investments in these technologies are being made by the auto industries. Public funding is also helping the industries, but more work could be performed on concepts to reduce vehicle weight, improve aerodynamics, and find other approaches to improve vehicle fuel economy, especially for heavy‐duty vehicles (that is, bottoming cycles, auxiliary power units).
Hydrogen and Fuel Cells: Federal and state governments have made substantial investments in this technology with the hope that the vehicles will be accepted in the market place. These zero‐tailpipe emissions vehicles will provide significant GHG and petroleum reductions. Automakers are on the verge of introducing a limited number of vehicles, but fuel infrastructure will be needed to support these vehicles. At these limited vehicle volumes the infrastructure investments will not be economical, and therefore public funding is necessary. AB 118 funding could be used to provide this infrastructure in limited areas where vehicles are likely to be demonstrated and sold.
Plug‐In Hybrids and Battery Electric Vehicles: Considerable investments are being made in battery technologies for these vehicles, but substantial work is necessary to “prove” these vehicles in the marketplace. Will smart meters be necessary to encourage night charging? What is the impact on the electric grid? Will the vehicle designs incorporate large enough batteries to gain the GHG benefits of California’s clean grid? Large‐scale demonstrations of varying vehicle types and architectures will be needed to better understand their impacts and value proposition in a carbon‐constrained world.
Introduction
During the process of developing California’s Alternative Fuels Plan (Energy Commission 2007), industry working group meetings were held with representatives from the fuel and vehicle industries. These meetings determined the barriers to commercialization of alternative fuels and advanced vehicle technologies and what is needed to overcome these barriers. Stakeholders were also asked what funding would be needed to bring these technologies to the marketplace. Much of this work was summarized for each affected industry in AB 1007 State Alternative Fuels Plan. Also, some work was completed to account for other government funding available for developing these advanced transportation systems. For example, TIAX previously estimated the amount of funding the federal government was providing to the hydrogen and fuel cell program.
The outcome of the analysis performed as part of the Alternative Fuels Plan was a first look at the investments made in research and development (R&D), demonstrations, fuel production, infrastructure and incentives. The implementation of AB 118 requires an update and extension of the previous analysis. This information will help the Energy Commission continue to develop this Investment Plan. This plan needs to consider on‐going investment in fuels and vehicle technologies so that the plan does not duplicate existing efforts. Just as important, the plan
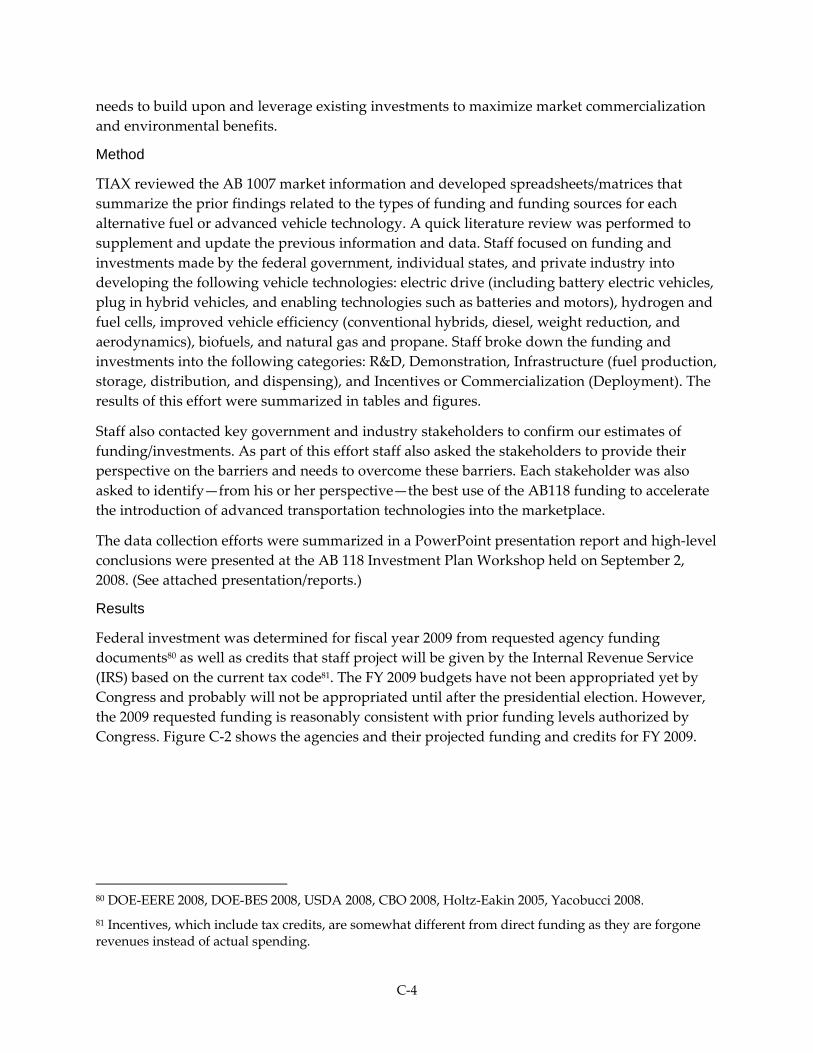
C‐4
needs to build upon and leverage existing investments to maximize market commercialization and environmental benefits.
Method
TIAX reviewed the AB 1007 market information and developed spreadsheets/matrices that summarize the prior findings related to the types of funding and funding sources for each alternative fuel or advanced vehicle technology. A quick literature review was performed to supplement and update the previous information and data. Staff focused on funding and investments made by the federal government, individual states, and private industry into developing the following vehicle technologies: electric drive (including battery electric vehicles, plug in hybrid vehicles, and enabling technologies such as batteries and motors), hydrogen and fuel cells, improved vehicle efficiency (conventional hybrids, diesel, weight reduction, and aerodynamics), biofuels, and natural gas and propane. Staff broke down the funding and investments into the following categories: R&D, Demonstration, Infrastructure (fuel production, storage, distribution, and dispensing), and Incentives or Commercialization (Deployment). The results of this effort were summarized in tables and figures.
Staff also contacted key government and industry stakeholders to confirm our estimates of funding/investments. As part of this effort staff also asked the stakeholders to provide their perspective on the barriers and needs to overcome these barriers. Each stakeholder was also asked to identify—from his or her perspective—the best use of the AB118 funding to accelerate the introduction of advanced transportation technologies into the marketplace.
The data collection efforts were summarized in a PowerPoint presentation report and high‐level conclusions were presented at the AB 118 Investment Plan Workshop held on September 2, 2008. (See attached presentation/reports.)
Results
Federal investment was determined for fiscal year 2009 from requested agency funding documents80 as well as credits that staff project will be given by the Internal Revenue Service (IRS) based on the current tax code81. The FY 2009 budgets have not been appropriated yet by Congress and probably will not be appropriated until after the presidential election. However, the 2009 requested funding is reasonably consistent with prior funding levels authorized by Congress. Figure C‐2 shows the agencies and their projected funding and credits for FY 2009.
80 DOE-EERE 2008, DOE-BES 2008, USDA 2008, CBO 2008, Holtz-Eakin 2005, Yacobucci 2008. 81 Incentives, which include tax credits, are somewhat different from direct funding as they are forgone revenues instead of actual spending.
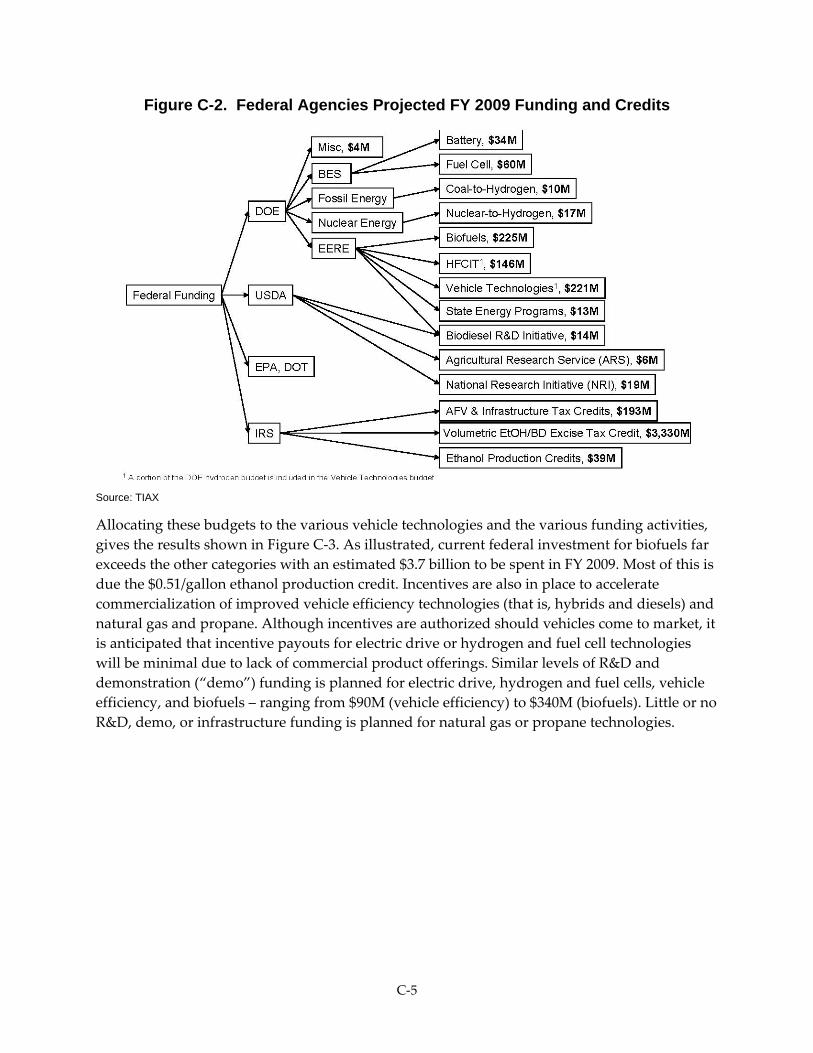
C‐5
Figure C-2. Federal Agencies Projected FY 2009 Funding and Credits
Source: TIAX
Allocating these budgets to the various vehicle technologies and the various funding activities, gives the results shown in Figure C‐3. As illustrated, current federal investment for biofuels far exceeds the other categories with an estimated $3.7 billion to be spent in FY 2009. Most of this is due the $0.51/gallon ethanol production credit. Incentives are also in place to accelerate commercialization of improved vehicle efficiency technologies (that is, hybrids and diesels) and natural gas and propane. Although incentives are authorized should vehicles come to market, it is anticipated that incentive payouts for electric drive or hydrogen and fuel cell technologies will be minimal due to lack of commercial product offerings. Similar levels of R&D and demonstration (“demo”) funding is planned for electric drive, hydrogen and fuel cells, vehicle efficiency, and biofuels – ranging from $90M (vehicle efficiency) to $340M (biofuels). Little or no R&D, demo, or infrastructure funding is planned for natural gas or propane technologies.
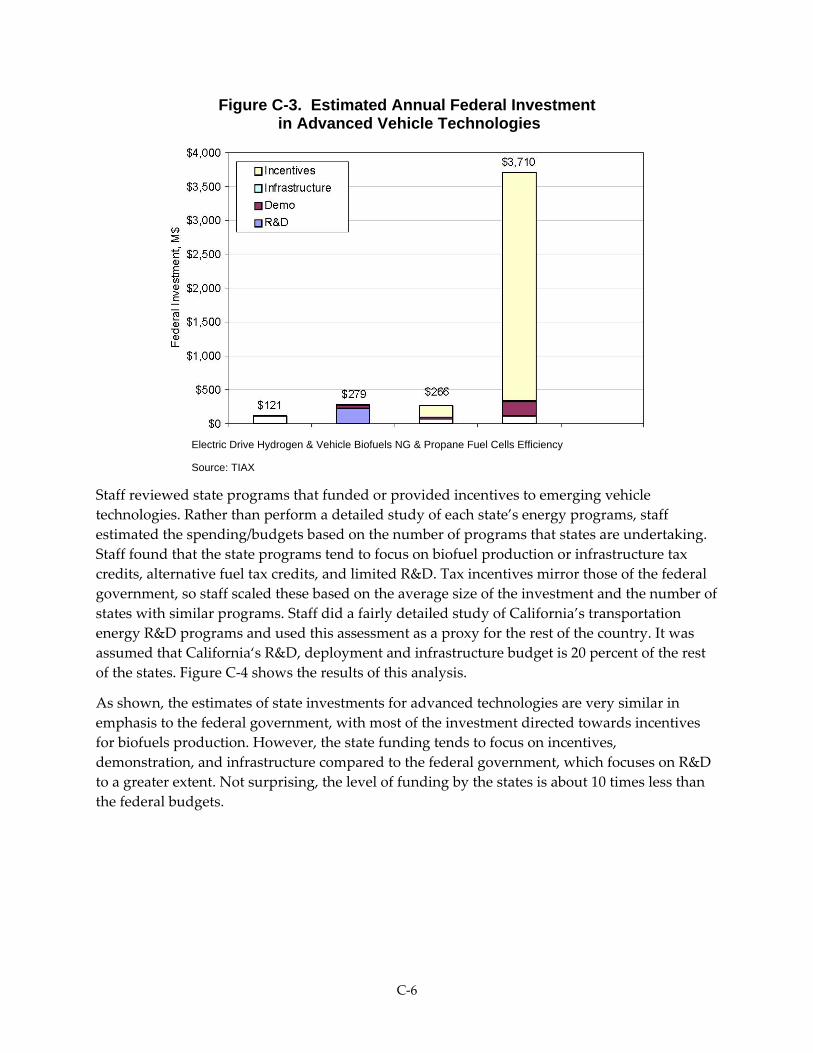
C‐6
Figure C-3. Estimated Annual Federal Investment in Advanced Vehicle Technologies
Electric Drive Hydrogen & Vehicle Biofuels NG & Propane Fuel Cells Efficiency
Source: TIAX
Staff reviewed state programs that funded or provided incentives to emerging vehicle technologies. Rather than perform a detailed study of each state’s energy programs, staff estimated the spending/budgets based on the number of programs that states are undertaking. Staff found that the state programs tend to focus on biofuel production or infrastructure tax credits, alternative fuel tax credits, and limited R&D. Tax incentives mirror those of the federal government, so staff scaled these based on the average size of the investment and the number of states with similar programs. Staff did a fairly detailed study of California’s transportation energy R&D programs and used this assessment as a proxy for the rest of the country. It was assumed that California‘s R&D, deployment and infrastructure budget is 20 percent of the rest of the states. Figure C‐4 shows the results of this analysis.
As shown, the estimates of state investments for advanced technologies are very similar in emphasis to the federal government, with most of the investment directed towards incentives for biofuels production. However, the state funding tends to focus on incentives, demonstration, and infrastructure compared to the federal government, which focuses on R&D to a greater extent. Not surprising, the level of funding by the states is about 10 times less than the federal budgets.
C‐7
Figure C-4. Estimated Annual State Investment In Advanced Vehicle Technologies
Electric Drive Hydrogen & Vehicle Biofuels NG & Propane Fuel Cells Efficiency
Source: TIAX
The private sector investment was estimated from Global Trends in Sustainable Energy Investment 2008 (Boyle 2008). This report was prepared by the Sustainable Energy Finance Initiative (SEFI) and is the result of collaboration between the United Nations Environment Program and New Energy Finance (an energy investment research firm). This report offers detailed estimates of investments at different stages of the commercial pipeline from emerging technologies to those sold into the market place. Several technologies are identified in this report: biofuels, fuel cells, and energy storage. The report also provides detailed estimates of global investment in venture capital and private equity, public markets, asset finance, and merger and acquisitions. Merger and acquisitions estimates were not used in this study as they do not represent “new” investment in clean energy, but rather transfer of ownership.
The SEFI report provides estimates of global private sector R&D investments in clean energy, but does not segment this estimate into investment by individual technology. Also, ongoing R&D—like automakers’ investment in higher efficiency vehicles—is likely not captured in the report.
To supplement the SEFI data, we used several other reports. Both the National Science Foundation (NSF) (NSF 2008) and the National Institute of Standards and Technology (NIST) (Auerswald 2005) track statistics on R&D. Based on these three reports and limited research on the size of the fuel cell, battery, and biofuels industries.82 Staff made estimates of the VC investment. The author made several key assumptions to estimate private investments for each technology category. For corporate R&D, the author used the NIST and NSF reports to estimate 82 PWC 2008, Makower 2008, RFA 2008.
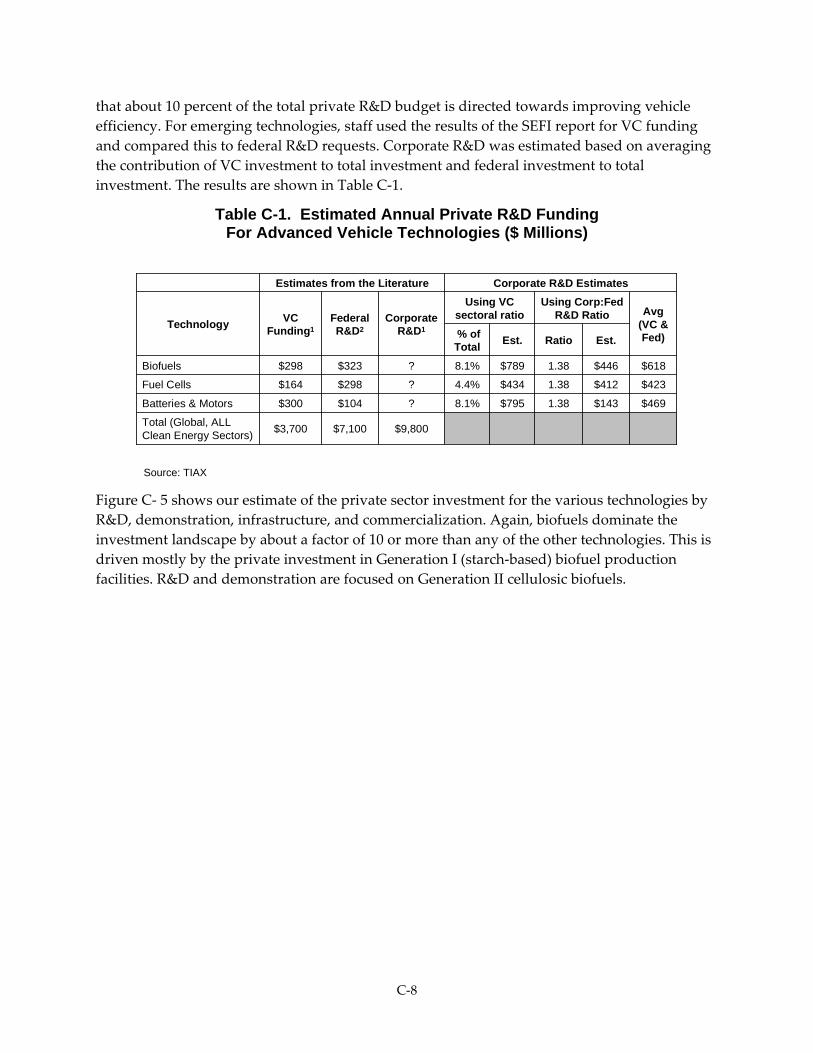
C‐8
that about 10 percent of the total private R&D budget is directed towards improving vehicle efficiency. For emerging technologies, staff used the results of the SEFI report for VC funding and compared this to federal R&D requests. Corporate R&D was estimated based on averaging the contribution of VC investment to total investment and federal investment to total investment. The results are shown in Table C‐1.
Table C-1. Estimated Annual Private R&D Funding For Advanced Vehicle Technologies ($ Millions)
Corporate R&D EstimatesEstimates from the Literature
Est.RatioEst.% of Total
$9,800 $7,100$3,700Total (Global, ALL Clean Energy Sectors)
$469$1431.38$7958.1%?$104$300Batteries & Motors
$423$4121.38$4344.4%?$298$164Fuel Cells
$618$4461.38$7898.1%?$323$298Biofuels
Avg(VC & Fed)
Using Corp:Fed R&D Ratio
Using VC sectoral ratioCorporate
R&D1Federal R&D2
VC Funding1Technology
Source: TIAX
Figure C‐ 5 shows our estimate of the private sector investment for the various technologies by R&D, demonstration, infrastructure, and commercialization. Again, biofuels dominate the investment landscape by about a factor of 10 or more than any of the other technologies. This is driven mostly by the private investment in Generation I (starch‐based) biofuel production facilities. R&D and demonstration are focused on Generation II cellulosic biofuels.
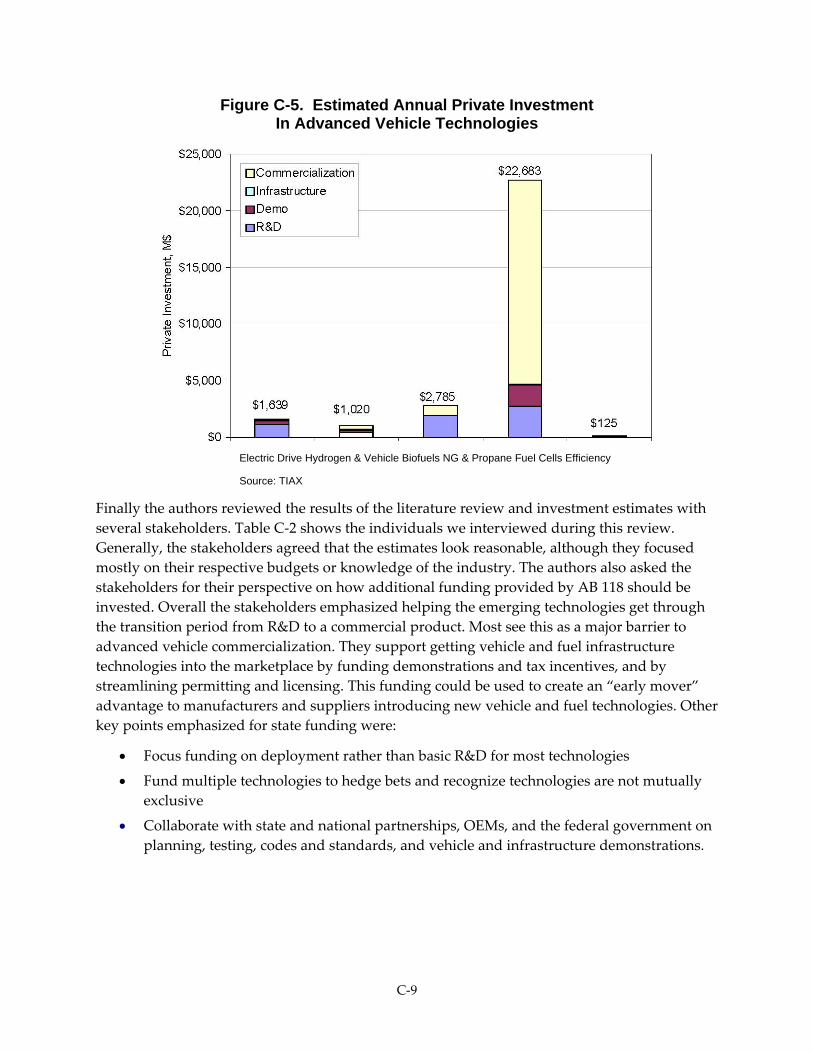
C‐9
Figure C-5. Estimated Annual Private Investment In Advanced Vehicle Technologies
Electric Drive Hydrogen & Vehicle Biofuels NG & Propane Fuel Cells Efficiency
Source: TIAX
Finally the authors reviewed the results of the literature review and investment estimates with several stakeholders. Table C‐2 shows the individuals we interviewed during this review. Generally, the stakeholders agreed that the estimates look reasonable, although they focused mostly on their respective budgets or knowledge of the industry. The authors also asked the stakeholders for their perspective on how additional funding provided by AB 118 should be invested. Overall the stakeholders emphasized helping the emerging technologies get through the transition period from R&D to a commercial product. Most see this as a major barrier to advanced vehicle commercialization. They support getting vehicle and fuel infrastructure technologies into the marketplace by funding demonstrations and tax incentives, and by streamlining permitting and licensing. This funding could be used to create an “early mover” advantage to manufacturers and suppliers introducing new vehicle and fuel technologies. Other key points emphasized for state funding were:
• Focus funding on deployment rather than basic R&D for most technologies
• Fund multiple technologies to hedge bets and recognize technologies are not mutually exclusive
• Collaborate with state and national partnerships, OEMs, and the federal government on planning, testing, codes and standards, and vehicle and infrastructure demonstrations.
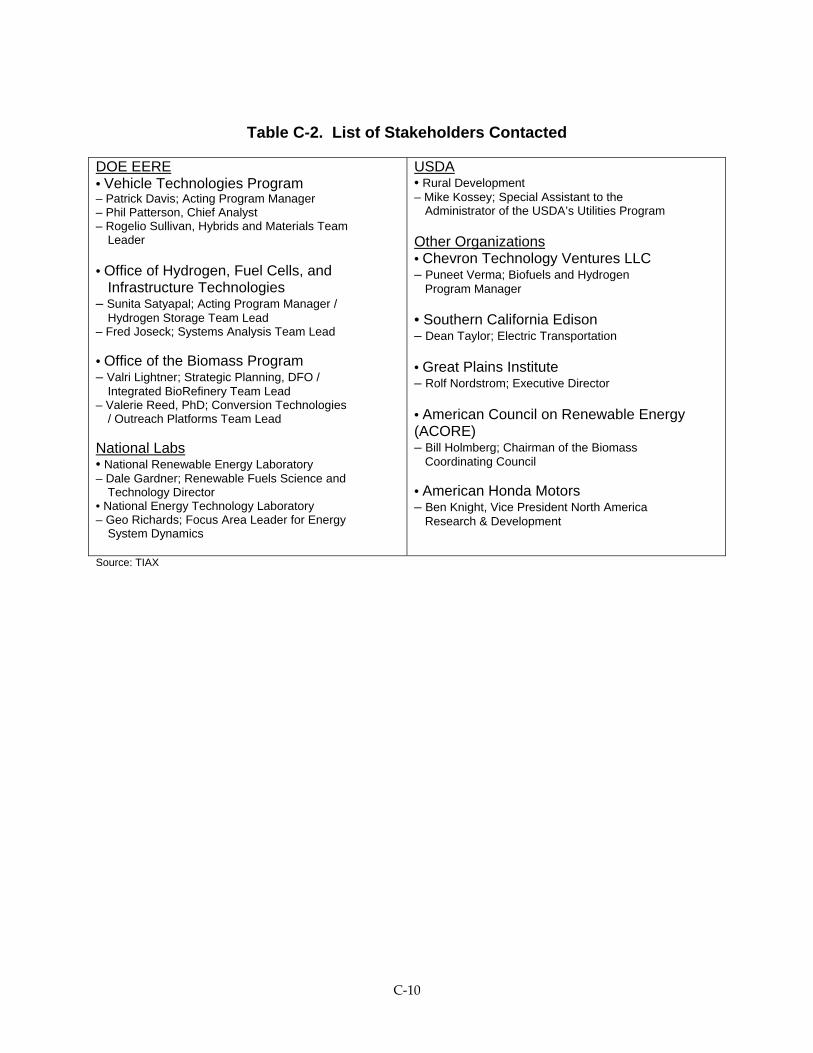
C‐10
Table C-2. List of Stakeholders Contacted
DOE EERE • Vehicle Technologies Program – Patrick Davis; Acting Program Manager – Phil Patterson, Chief Analyst – Rogelio Sullivan, Hybrids and Materials Team
Leader
• Office of Hydrogen, Fuel Cells, and Infrastructure Technologies
– Sunita Satyapal; Acting Program Manager / Hydrogen Storage Team Lead
– Fred Joseck; Systems Analysis Team Lead • Office of the Biomass Program – Valri Lightner; Strategic Planning, DFO /
Integrated BioRefinery Team Lead – Valerie Reed, PhD; Conversion Technologies
/ Outreach Platforms Team Lead
National Labs • National Renewable Energy Laboratory – Dale Gardner; Renewable Fuels Science and
Technology Director • National Energy Technology Laboratory – Geo Richards; Focus Area Leader for Energy
System Dynamics
USDA • Rural Development – Mike Kossey; Special Assistant to the
Administrator of the USDA’s Utilities Program
Other Organizations • Chevron Technology Ventures LLC – Puneet Verma; Biofuels and Hydrogen
Program Manager
• Southern California Edison – Dean Taylor; Electric Transportation • Great Plains Institute – Rolf Nordstrom; Executive Director • American Council on Renewable Energy (ACORE) – Bill Holmberg; Chairman of the Biomass
Coordinating Council
• American Honda Motors – Ben Knight, Vice President North America
Research & Development
Source: TIAX
C‐11
Appendix C References Auerswald, P, Branscomb, L, Demos N, Min, B. Understanding Private‐Sector Decision Making
for Early‐Stage Technology Development, NIST Advanced Technology Program. NIST GCR 02‐841A. September 2005.
Boyle et al. Global Trends in Sustainable Energy Investment 2008. Sustainable Energy Finance Initiative (SEFI) of the United Nations Environment Program and New Energy Finance. 2008.
California Energy Commission and California Air Resources Board (ARB). State Alternative Fuels Plan. CEC‐600‐2007‐011‐CMF. December 2007.
Congressional Budget Office (CBO). Congressional Budget Office Cost Estimate: Energy Independence and Security Act of 2007. Feb 12, 2008.
Energy Policy Act (EPACT) of 2005.
Energy Independence and Security Act (EISA) of 2007.
Holtz‐Eakin, D. Congressional Budget Office Cost Estimate: Energy Policy Act of 2005. July 27, 2005.
Greencar Congress. Biofuel Provisions in the US Farm Bill. May 27, 2008. On‐line at http://www.greencarcongress.com/2008/05/biofuels‐provis.html, accessed 8/20/2008.
Jackson, M. Draft AB 1007 Storylines. Prepared for California Energy Commission AB 1007 Workshop. May 2007.
Koplow, D. Biofuels: At What Cost? Government Support for Ethanol and Biodiesel in United States: 2007 Update. International Institute for Sustainable Development. October 2007.
Makower, J, Pernick, R, and Wilder, C. Clean Energy Trends 2008. Clean Edge. March 2008.
National Science Foundation (NSF). Division of Science Resource Statistics ‐ National Science Foundation. On‐line at http://www.nsf.gov/statistics/, accessed 8/24/2008.
Neff, S. Review of the Energy Policy Act of 2005. Center for Energy, Marine Transportation and Public Policy at Columbia University. Aug. 2, 2005.
PriceWaterhouseCoopers (PWC). The Promise of Clean Power? 2007 Survey of Public Fuel Cell Companies. 2007.
Renewable Fuels Association (RFA). Changing the Climate: Ethanol Industry Outlook 2008. February 2008.
Sissine, F. Energy Independence and Security Act of 2007: A Summary of Major Provisions. Congressional Research Service RL34294. Dec .21, 2007.
C‐12
US Department of Agriculture (USDA). FY 2009 Budget Summary and Annual Performance Plan. 2008.
US Department of Energy, Basic Energy Sciences Program (DOE‐BES). FY 2009 Congressional Budget. 2008.
US Department of Energy, Office of Energy Efficiency and Renewable Energy. Alternative Fuels and Advanced Vehicles Data Center ‐ ‐ Energy Independence and Security Act of 2007. On‐line at http://www.eere.energy.gov/afdc/incentives_laws_security.html, accessed 8/22/2008.
US Department of Energy, Office of Energy Efficiency and Renewable Energy. Alternative Fuels and Advanced Vehicles Data Center ‐ Energy Policy Act of 2005. On‐line at http://www.eere.energy.gov/afdc/incentives_laws_epact.html, accessed 8/22/2008.
US Department of Energy, Office of Energy Efficiency and Renewable Energy. Alternative Fuels and Advanced Vehicles Data Center ‐ ‐ Summary of State Incentives and Laws. On‐line at http://www.eere.energy.gov/afdc/progs/in_matrx.php, accessed 8/22/2008.
US Department of Energy, Office of Energy Efficiency and Renewable Energy (DOE‐EERE). Fiscal Year 2009 Budget‐In‐Brief. 2008.
Weather.com. Toyota Building Battery Plant in Japan to Rev Up Production. 5/23/2008. Online at http://climate.weather.com/articles/toyota052308.html, accessed 8/25/2008.
Yacobucci, B. Biofuels Incentives: A Summary of Federal Programs. Congressional Research Service, RL33572. July 29, 2008.
D‐1
APPENDIX D: Important References for Program Development Several important references and complementary programs have been considered for the development of the Alternative and Renewable Fuel and Vehicle Technology Program. The State Alternative Fuels Plan, the Public Interest Energy Research (PIER) Transportation Program, the Alternative Fuels Incentive Program and the Air Resources Board’s (ARB)’s AB 118 Air Quality Improvement Program (AQIP) are all important and useful references for this program because they have recently addressed or will address aspects for the increased use of alternative fuels and vehicle technologies and have provided or will provide incentives for those purposes. In addition, the staff‐prepared summary Identifying Complementary Funding Sources describes the evaluation of strategic alliances, funding partnerships, and stakeholder funding and needs as an important, ongoing part of the gap analysis and the funding plan development for the program.
The Energy Commission and the ARB prepared and adopted the plan in December 2007. It presents a five‐part strategy83 to:
• Promote alternative fuel blends with gasoline and diesel in the near‐ and mid‐term and stimulate innovation through the development of the Low‐Carbon Fuel Standard;
• Maximize alternative fuels in early adopter market niches, such as heavy‐duty vehicles, fleets, off‐road vehicles, and ports in the near‐ and mid‐term;
• Transportation technologies, such as electric drive and hydrogen fuel cells, in the mid‐ to long‐term;
• Maximize the use of mass transit and encourage smart growth and land use planning to help reduce vehicle miles traveled and vehicle hours traveled, and encourage improvements in vehicle efficiency to improve fuel economy; and
• Achieve the maximum feasible vehicle improvements to reduce the total energy needed to power California’s transportation sector.
The full fuel cycle analysis concludes that alternative fuels can provide substantial greenhouse gas (GHG) emission reduction benefits. Depending on the fuel pathway chosen, fuels such as ethanol, natural gas, liquefied petroleum gas, electricity, and hydrogen have certain advantages over conventionally produced gasoline and diesel fuels. In addition, the use of blends, such as renewable diesel, biomass‐to‐liquids, and gas‐to‐liquid, can have significant short‐term advantages. The full fuel cycle analysis however, must be refined and updated to address sustainability issues and land use conversion impacts of biofuels. The Commission has committed funding to update the data and re‐evaluate the Full Fuel‐Cycle Analysis for biofuels and for other alternative and renewable fuels and has already begun this process.
83 Near-term: 2008 – 2012, mid-term: 2012 – 2017, long-term: 2017 – 2022.
D‐2
The plan also sets alternative fuel use goals of 9 percent by 2012, 11 percent by 2017, and 26 percent by 2022, excluding aviation and rail. These goals were developed using a scenario approach as each alternative fuel was evaluated assuming a business‐as‐usual, moderate, and aggressive case. The cases differ by the assumptions made about technology maturity, vehicle and infrastructure availability, fuel supply, and fuel type. These cases were based on assessments about the potential market expansion of each alternative fuel and substantial research and discussions with the alternative fuel industries and other stakeholders.
Generally, the conservative or business‐as‐usual case assumes market conditions with limited technological advancements or innovation, limited product availability, cost constraints, and slow infrastructure expansion, resulting in modest market growth.
The moderate case assumes increased technology innovation to remove barriers unique to the vehicle and fuel combination, and expanded product availability and significant reduction in vehicle and infrastructure costs, leading to anticipated market growth.
The aggressive case assumes a market where all barriers to competitiveness and use are removed; substantial cost reductions occur ensuring the alternatives are fully competitive with, or, in some cases, enjoy price advantages compared to the conventional fuels; a full range of vehicle product offerings are widely available; and infrastructure expansion keeps pace with the growing alternative fuel vehicle population.
The moderate growth case represents a plausible description of the market circumstances, technology advances, investment requirements, and government incentives necessary for alternative fuels to fulfill the petroleum reduction and proportionate GHG emission reduction goals. The maximum feasible alternative fuel use results for each fuel in the moderate case are shown in Table D‐1.
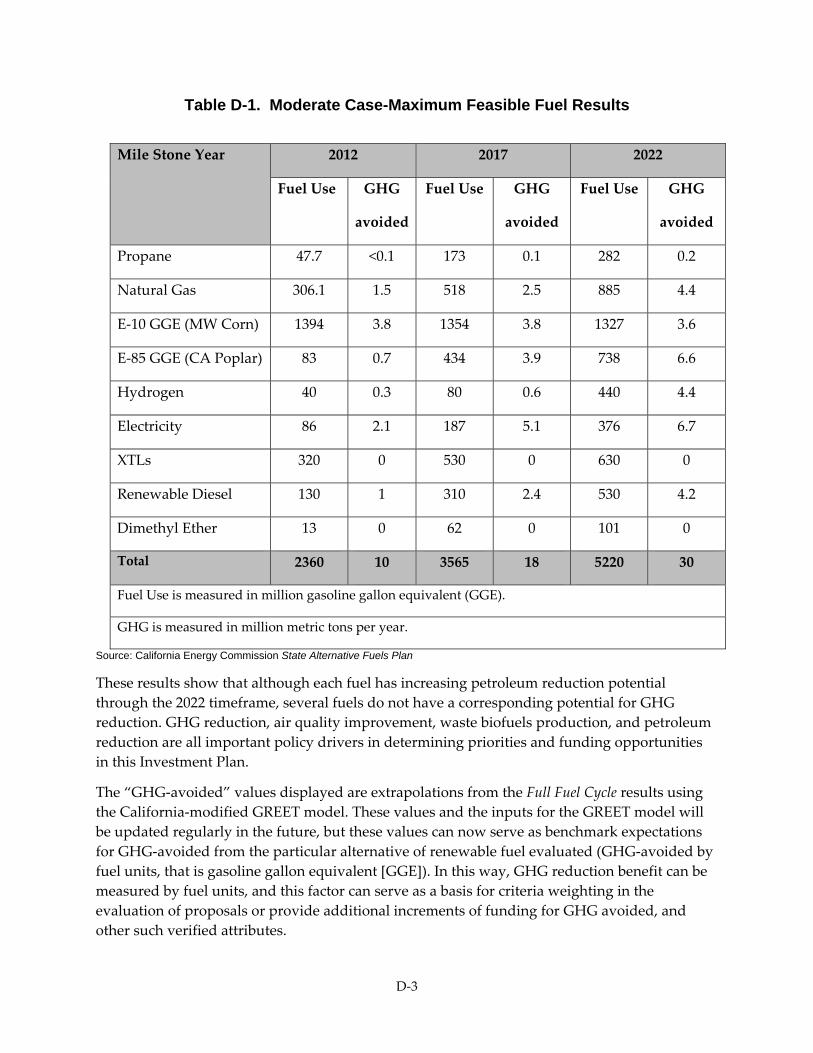
D‐3
Table D-1. Moderate Case-Maximum Feasible Fuel Results
Source: California Energy Commission State Alternative Fuels Plan
These results show that although each fuel has increasing petroleum reduction potential through the 2022 timeframe, several fuels do not have a corresponding potential for GHG reduction. GHG reduction, air quality improvement, waste biofuels production, and petroleum reduction are all important policy drivers in determining priorities and funding opportunities in this Investment Plan.
The “GHG‐avoided” values displayed are extrapolations from the Full Fuel Cycle results using the California‐modified GREET model. These values and the inputs for the GREET model will be updated regularly in the future, but these values can now serve as benchmark expectations for GHG‐avoided from the particular alternative of renewable fuel evaluated (GHG‐avoided by fuel units, that is gasoline gallon equivalent [GGE]). In this way, GHG reduction benefit can be measured by fuel units, and this factor can serve as a basis for criteria weighting in the evaluation of proposals or provide additional increments of funding for GHG avoided, and other such verified attributes.
Mile Stone Year 2012 2017 2022
Fuel Use GHG
avoided
Fuel Use GHG
avoided
Fuel Use GHG
avoided
Propane 47.7 <0.1 173 0.1 282 0.2
Natural Gas 306.1 1.5 518 2.5 885 4.4
E‐10 GGE (MW Corn) 1394 3.8 1354 3.8 1327 3.6
E‐85 GGE (CA Poplar) 83 0.7 434 3.9 738 6.6
Hydrogen 40 0.3 80 0.6 440 4.4
Electricity 86 2.1 187 5.1 376 6.7
XTLs 320 0 530 0 630 0
Renewable Diesel 130 1 310 2.4 530 4.2
Dimethyl Ether 13 0 62 0 101 0
Total 2360 10 3565 18 5220 30
Fuel Use is measured in million gasoline gallon equivalent (GGE).
GHG is measured in million metric tons per year.
D‐4
The Public Interest Energy Research (PIER) Transportation Program The California Legislature intended to have AB 118 (Núñez) Alternative and Renewable Fuel and Vehicle Technology Program (AB 118 Program) closely coordinate with the existing PIER Transportation Program as much as possible. It is both logical and extremely valuable for this coordination to take place so that the state’s transportation planning, research, activities, and resources can focus on advancing the fuels and vehicle technologies along the research, development and commercialization continuum, in the most informed and cost‐efficient manner.
The Legislature created the PIER Program in 1996 when it enacted Assembly Bill (AB) 1890 (Brulte, Chapter 854, Statutes of 1996) Californiaʹs utility restructuring legislation. This law required that $62.5 million be collected annually from the three investor‐owned electric utilities and deposited in the Public Interest Energy Research and Development Account, to be invested by the Energy Commission for energy‐related research, development, and demonstration (RD&D) efforts not adequately provided by competitive and regulated markets. In doing so, administration of public interest RD&D was shifted from Californiaʹs investor‐owned utilities to state government, a major change intended to ensure an appropriate role for public interest energy research in a newly competitive energy marketplace.
The Legislature explicitly defined the meaning of public interest energy RD&D. These three principles, contained in Public Resources Code Section 25620 et seq, have guided the Energy Commissionʹs investments since the PIER Programʹs inception:
• Provide environmentally sound, safe, reliable, and affordable energy services and products.
• Support RD&D not adequately provided by competitive or regulated energy markets.
• Advance energy science and technology to the benefit of Californiaʹs ratepayers.
While much of the initial RD&D carried out focused primarily on electricity‐related applications, in 2004 the Energy Commission was given authority to expand the scope of its public interest RD&D efforts. Assembly Bill (AB) 1002 (Wright, Chapter 932, Statutes of 2000) granted the CPUC the authority and discretion to determine the appropriate funding levels for natural gas, energy efficiency, and public interest RD&D activities. On August 19, 2004, the CPUC adopted Decision 04‐08‐010 that established the funding level for natural gas public interest RD&D, identified the Energy Commission as the administrator of the natural gas funds, and established the administratorʹs responsibilities.
On July 21, 2005, Governor Arnold Schwarzenegger signed Senate Bill (SB) 76 (Committee on Budget and Fiscal Review, Chapter 91, Statutes of 2005) which stated that “funds deposited in the Public Interest Research, Development, and Demonstration Fund may be expended for projects that serve the energy needs of both stationary and transportation purposes if the research provides a natural gas (NG) ratepayer benefit.”
D‐5
In 2006, Senate Bill (SB) 1250 (Perata, Chapter 512, Statutes of 2006) reauthorized funding for the PIER Program from 2007 to 2011 and sharpened the Energy Commissionʹs research priorities and included a transportation element to the existing program.
Specifically, SB 1250 indicated that the general goal of the program is to develop, and help bring to market, energy technologies that provide increased environmental benefits, greater system reliability, and lower system costs, and that provide tangible benefits to electric utility customers through the following investments:
• Advanced transportation technologies that reduce air pollution and greenhouse gas emissions beyond applicable standards, and that benefit electricity and natural gas ratepayers.
• Increased energy efficiency in buildings, appliances, lighting, and other applications beyond applicable standards, and that benefit electric utility customers.
• Advanced electricity generation technologies that exceed applicable standards to increase reductions in GHG emissions from electricity generation, and that benefit electric utility customers.
• Advanced electricity technologies that reduce or eliminate consumption of water or other finite resources, increase use of renewable energy resources, or improve transmission or distribution of electricity generated from renewable energy resources.
Transportation research was implemented beginning in 2007 by inviting a group of volunteers to provide expert input and guidance within the context of applicable legislation, policies, trends, and drivers to Energy Commission staff. This Transportation Research Planning Group (TRPG) had the following members:
JanAnne Sharpless Former Energy Commission Commissioner
Patricia Monahan Union of Concerned Scientists
Jim Woolsey Booz Allen Hamilton
George Mozurkewich Former Ford Scientist
Bill Reinert Toyota Motor Sales
Ron Stoltz Sandia National Laboratory
Roland Hwang National Resources Defense Council
Theo Fleisch British Petroleum
Paul MacCready AeroVironment
The TRPG concluded its work in September, 2007 by recommending the following general areas of public interest transportation research:
• Land Use, Sustainability, and Infrastructure • Life‐Cycle Analysis • Alternative Fuels • Battery Technology • Alternative Powertrains
D‐6
• Vehicle Chassis • Vehicle Subsystem Efficiency
Based on this and other input, the PIER Transportation Subject Area was organized into three areas of research focus:
Vehicle Technologies
The Vehicle Technologies focus area identifies opportunities to promote improved fuel efficiency and energy savings through innovations in vehicle components, systems and platforms. Additionally, research in this area must reduce vehicle grams of CO2 per kilometer beyond proposed standards. Research topics in this area include:
• Energy Efficiency o Active Components o Passive Components
• Vehicle Lightweighting (Weight Reduction) • Natural Gas Vehicles • Plug‐in Hybrid Electric Vehicles
Alternative Fuels
The Alternative Fuels research area seeks to reduce consumption of petroleum‐based fuels in transportation through advancement of a variety of renewable and non‐renewable alternative fuels and production opportunities. This research area also includes low carbon fuels and beneficial in‐state resource development. Research topics in this area include:
• Resource and Upstream (Biomass Production and Feedstock Transporting) • Fuel Processing and Conversion • Distribution and Fuel Infrastructure
Transportation Systems
The Transportation Systems focus area will conduct research to identify and quantify complex interrelationships that characterize our modern transportation systems. Examples of these interrelationships include those among our built environment, roads and fueling. Others include infrastructure and goods movement. Still more will emerge as we contemplate shifting more of our transportation energy needs from petroleum to the electricity system. Transportation systems research will provide tools, methods and information needed to avoid shifting transportation energy problems from one sector to another, thereby defining pathways to permanent and verifiable carbon reductions within these systems. Research topics in this area include:
• Land Use and Sustainability • Goods Movement • Electric Fuel
D‐7
The PIER Transportation Subject Area is producing research roadmaps within the focus areas, including natural gas vehicles, alternative fuels, vehicle technologies and plug‐in hybrid electric vehicles.
The roadmaps are essential for defining the opportunities, direction, and priorities for the PIER Transportation Subject Area. The roadmap objectives are:
• To identify gaps in ongoing research. • To facilitate collaborations with other research institutions, state agencies and utilities. • To define short‐, mid‐, and long‐term goals, timeframes, budgets, and activities. • To balance timeframes and risk and provide the greatest public benefit. • To define success metrics.
The first roadmap for natural gas vehicles has been completed, and the roadmap for alternative fuels is expected to be completed in the first quarter of 2009. Roadmaps for plug‐in hybrid electric vehicles and vehicle sub‐system efficiency will also be completed early next year.
The natural gas vehicle research roadmap was developed with input from industry, state government, national laboratory and environmental stakeholders. The natural gas vehicle roadmap has identified the following areas for funding in Table D‐2.
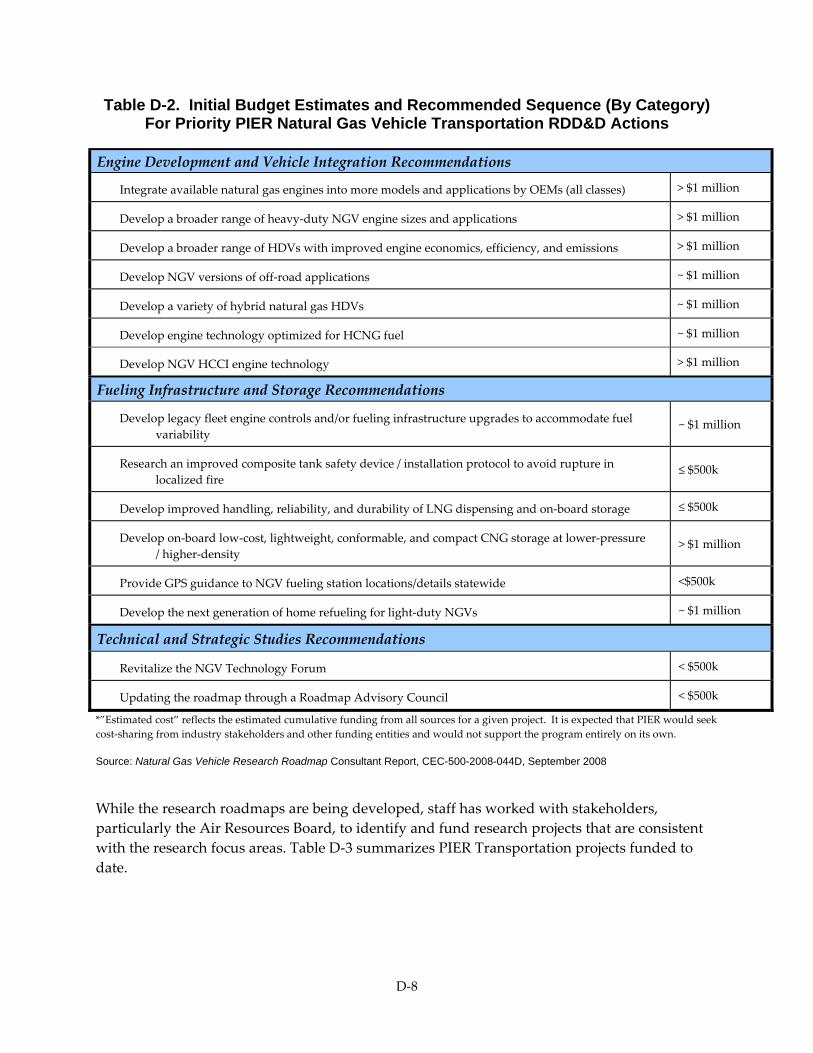
D‐8
Table D-2. Initial Budget Estimates and Recommended Sequence (By Category) For Priority PIER Natural Gas Vehicle Transportation RDD&D Actions
Engine Development and Vehicle Integration Recommendations
Integrate available natural gas engines into more models and applications by OEMs (all classes) > $1 million
Develop a broader range of heavy‐duty NGV engine sizes and applications > $1 million
Develop a broader range of HDVs with improved engine economics, efficiency, and emissions > $1 million
Develop NGV versions of off‐road applications ~ $1 million
Develop a variety of hybrid natural gas HDVs ~ $1 million
Develop engine technology optimized for HCNG fuel ~ $1 million
Develop NGV HCCI engine technology > $1 million
Fueling Infrastructure and Storage Recommendations
Develop legacy fleet engine controls and/or fueling infrastructure upgrades to accommodate fuel variability
~ $1 million
Research an improved composite tank safety device / installation protocol to avoid rupture in localized fire
≤ $500k
Develop improved handling, reliability, and durability of LNG dispensing and on‐board storage ≤ $500k
Develop on‐board low‐cost, lightweight, conformable, and compact CNG storage at lower‐pressure / higher‐density
> $1 million
Provide GPS guidance to NGV fueling station locations/details statewide <$500k
Develop the next generation of home refueling for light‐duty NGVs ~ $1 million
Technical and Strategic Studies Recommendations
Revitalize the NGV Technology Forum < $500k
Updating the roadmap through a Roadmap Advisory Council < $500k
*”Estimated cost” reflects the estimated cumulative funding from all sources for a given project. It is expected that PIER would seek cost‐sharing from industry stakeholders and other funding entities and would not support the program entirely on its own. Source: Natural Gas Vehicle Research Roadmap Consultant Report, CEC-500-2008-044D, September 2008
While the research roadmaps are being developed, staff has worked with stakeholders, particularly the Air Resources Board, to identify and fund research projects that are consistent with the research focus areas. Table D‐3 summarizes PIER Transportation projects funded to date.
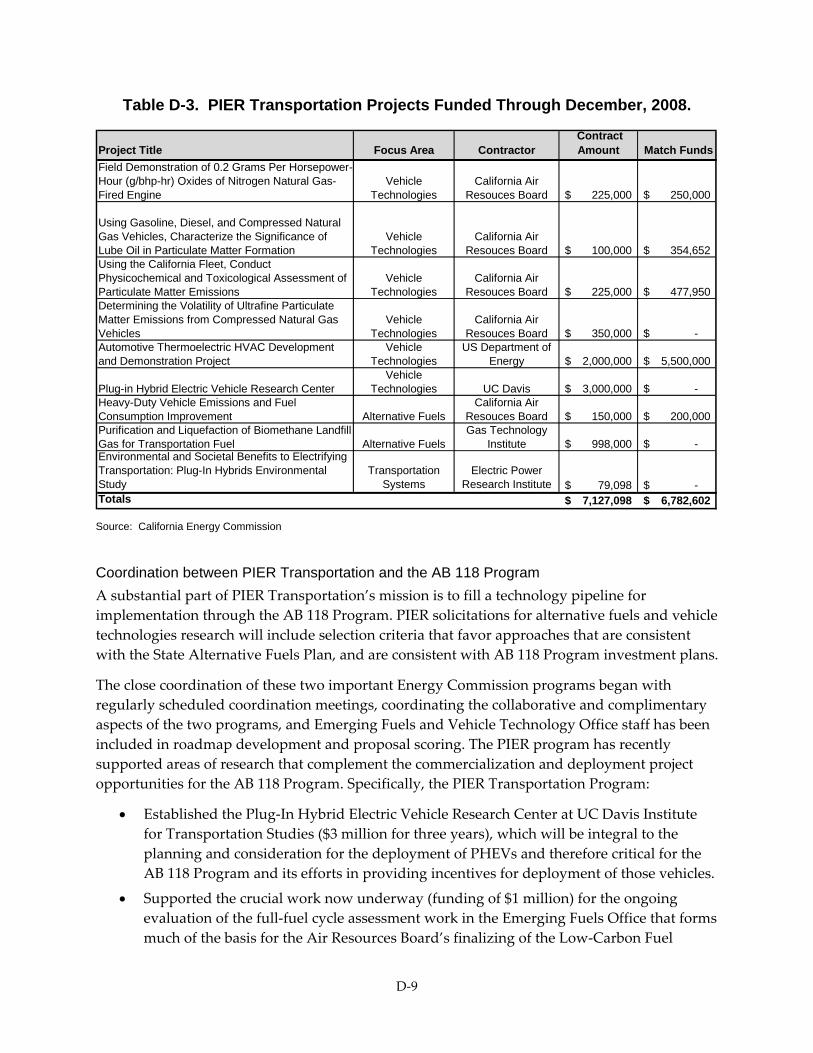
D‐9
Table D-3. PIER Transportation Projects Funded Through December, 2008.
Project Title Focus Area Contractor Contract Amount Match Funds
Field Demonstration of 0.2 Grams Per Horsepower-Hour (g/bhp-hr) Oxides of Nitrogen Natural Gas-Fired Engine
Vehicle Technologies
California Air Resouces Board 225,000$ 250,000$
Using Gasoline, Diesel, and Compressed Natural Gas Vehicles, Characterize the Significance of Lube Oil in Particulate Matter Formation
Vehicle Technologies
California Air Resouces Board 100,000$ 354,652$
Using the California Fleet, Conduct Physicochemical and Toxicological Assessment of Particulate Matter Emissions
Vehicle Technologies
California Air Resouces Board 225,000$ 477,950$
Determining the Volatility of Ultrafine Particulate Matter Emissions from Compressed Natural Gas Vehicles
Vehicle Technologies
California Air Resouces Board 350,000$ -$
Automotive Thermoelectric HVAC Development and Demonstration Project
Vehicle Technologies
US Department of Energy 2,000,000$ 5,500,000$
Plug-in Hybrid Electric Vehicle Research CenterVehicle
Technologies UC Davis 3,000,000$ -$ Heavy-Duty Vehicle Emissions and Fuel Consumption Improvement Alternative Fuels
California Air Resouces Board 150,000$ 200,000$
Purification and Liquefaction of Biomethane Landfill Gas for Transportation Fuel Alternative Fuels
Gas Technology Institute 998,000$ -$
Environmental and Societal Benefits to Electrifying Transportation: Plug-In Hybrids Environmental Study
Transportation Systems
Electric Power Research Institute 79,098$ -$
Totals 7,127,098$ 6,782,602$ Source: California Energy Commission
Coordination between PIER Transportation and the AB 118 Program A substantial part of PIER Transportation’s mission is to fill a technology pipeline for implementation through the AB 118 Program. PIER solicitations for alternative fuels and vehicle technologies research will include selection criteria that favor approaches that are consistent with the State Alternative Fuels Plan, and are consistent with AB 118 Program investment plans.
The close coordination of these two important Energy Commission programs began with regularly scheduled coordination meetings, coordinating the collaborative and complimentary aspects of the two programs, and Emerging Fuels and Vehicle Technology Office staff has been included in roadmap development and proposal scoring. The PIER program has recently supported areas of research that complement the commercialization and deployment project opportunities for the AB 118 Program. Specifically, the PIER Transportation Program:
• Established the Plug‐In Hybrid Electric Vehicle Research Center at UC Davis Institute for Transportation Studies ($3 million for three years), which will be integral to the planning and consideration for the deployment of PHEVs and therefore critical for the AB 118 Program and its efforts in providing incentives for deployment of those vehicles.
• Supported the crucial work now underway (funding of $1 million) for the ongoing evaluation of the full‐fuel cycle assessment work in the Emerging Fuels Office that forms much of the basis for the Air Resources Board’s finalizing of the Low‐Carbon Fuel
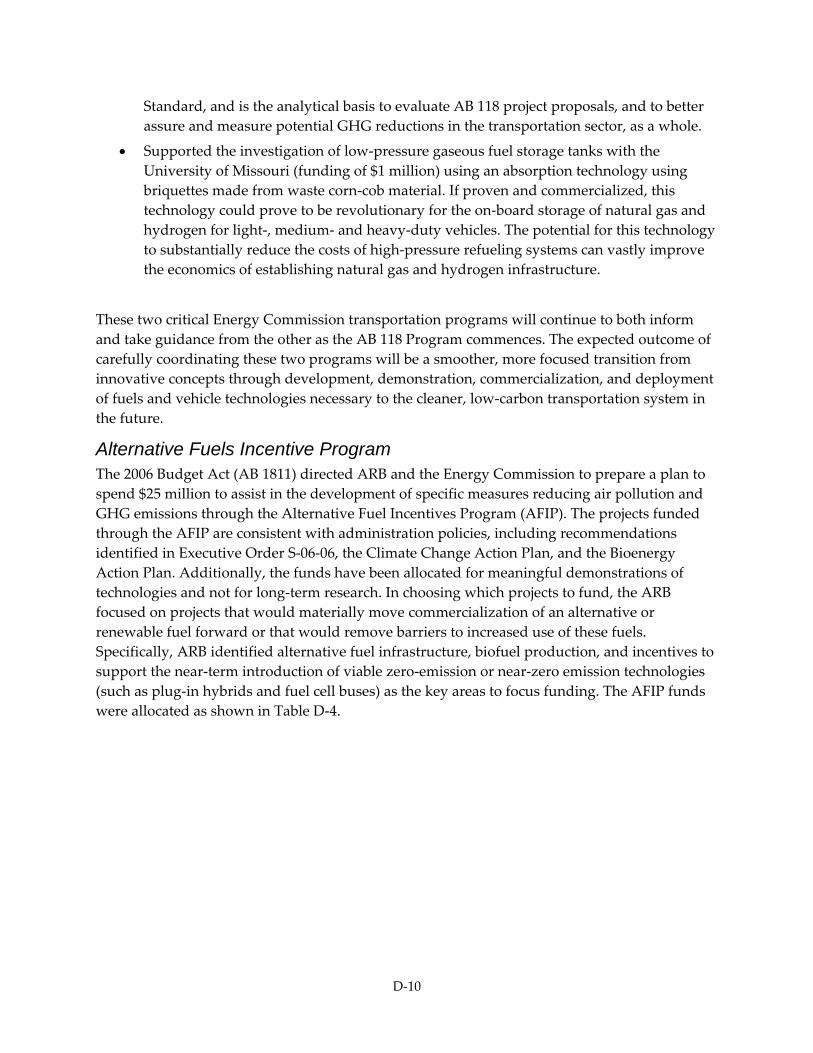
D‐10
Standard, and is the analytical basis to evaluate AB 118 project proposals, and to better assure and measure potential GHG reductions in the transportation sector, as a whole.
• Supported the investigation of low‐pressure gaseous fuel storage tanks with the University of Missouri (funding of $1 million) using an absorption technology using briquettes made from waste corn‐cob material. If proven and commercialized, this technology could prove to be revolutionary for the on‐board storage of natural gas and hydrogen for light‐, medium‐ and heavy‐duty vehicles. The potential for this technology to substantially reduce the costs of high‐pressure refueling systems can vastly improve the economics of establishing natural gas and hydrogen infrastructure.
These two critical Energy Commission transportation programs will continue to both inform and take guidance from the other as the AB 118 Program commences. The expected outcome of carefully coordinating these two programs will be a smoother, more focused transition from innovative concepts through development, demonstration, commercialization, and deployment of fuels and vehicle technologies necessary to the cleaner, low‐carbon transportation system in the future.
Alternative Fuels Incentive Program The 2006 Budget Act (AB 1811) directed ARB and the Energy Commission to prepare a plan to spend $25 million to assist in the development of specific measures reducing air pollution and GHG emissions through the Alternative Fuel Incentives Program (AFIP). The projects funded through the AFIP are consistent with administration policies, including recommendations identified in Executive Order S‐06‐06, the Climate Change Action Plan, and the Bioenergy Action Plan. Additionally, the funds have been allocated for meaningful demonstrations of technologies and not for long‐term research. In choosing which projects to fund, the ARB focused on projects that would materially move commercialization of an alternative or renewable fuel forward or that would remove barriers to increased use of these fuels. Specifically, ARB identified alternative fuel infrastructure, biofuel production, and incentives to support the near‐term introduction of viable zero‐emission or near‐zero emission technologies (such as plug‐in hybrids and fuel cell buses) as the key areas to focus funding. The AFIP funds were allocated as shown in Table D‐4.
D‐11
Table D-4. Alternative Fuels Incentives Allocation
Alternative Fuel Incentives Program Summary of Allocations
Alternative Fuel Infrastructure $5.4 million
Biofuels Production $6.0 million
Plug‐in Hybrids $5.0 million
Fuel Cell Transit Buses $2.0 million
Alternative Fuel Vehicle Incentives $1.5 million
Consumer Education/Outreach $1.6 million
Research and Testing $3.2 million
Total Funding: $24.7 million
Source: Program Summary, ARB Approval May 2007.
By June 2007, ARB encumbered all the funds. Recipients must spend these funds by June 30, 2009. A detailed characterization of the specific projects funded in the AFIP will be useful to the AB 118 Program. Some of those project details are:
E-85 Infrastructure
Statewide there are 34 retail E‐85 stations, 12 fleet E‐85 stations, 6 electric vehicle fleet station upgrades, and 1 biodiesel 99 percent (B99) retail station now under development.
Recommendation: Currently retail E‐85 station development is adequate. However, funding for both retail and fleet alternative fuel stations of other types will be requested and necessary. Considering the fleet needs and the larger volume throughput, fleet‐fueling facilities offer excellent funding opportunities for all alternative fuels. Retail facilities tied to specific concentrations of alternative fuel vehicles should be considered wherever possible.
Biofuels Production
Biodiesel production dominated this funding category with six projects using cooking oil and vegetable oils (canola, palm, or soy). Four projects funded will generate biogas, either as a gas (from manure) or for liquefied natural gas (LNG) production (from landfills) for the transportation market. Ethanol projects proposed from corn were not recommended for funding since they were considered not to be competitive.
Recommendation: It is likely that biofuels production facilities would be proposed for funding, and so the featuring of biofuels, especially those from waste residues and feedstocks, seems a sound policy as the full fuel cycle and land‐use impacts are further evaluated.
D‐12
Plug-In Hybrids
The seven projects recommended for funding all directly relate to “preparing the market” for light‐duty PHEVs, EVs, and medium‐duty PHEVs, and all fill identified gaps to smooth the transition to PHEVs and EVs.
Recommendation: Additional support of commercialization will be needed in the areas of vehicle technology and charging infrastructure.
Fuel Cell Transit
Two funded projects will demonstrate fuel cell buses in transit districts. The $1,379,000 project for the City of Burbank will feature a battery‐dominant fuel cell system, which may prove to be an evolutionary advancement for the technology. The other project provides $630,000 to the Bay Area Zero‐Emission Bus Advanced Demonstration supporting placement of up to 12 new fuel cell buses for service.
Recommendation: Transit will continue to be an important area to demonstrate and deploy alternative and renewable fuels and advanced vehicle technologies. The Investment Plan should emphasize the need for a broad array of advanced technologies in addition to fuel cell systems.
Alternative Fuel Vehicle Incentives
This category is expected to be completely subscribed by the end of 2008.
Recommendation: Additional support is needed to encourage the purchase of alternative and renewable fuel vehicles that are currently available to consumers and expected to be available in the near term.
Consumer Education and Outreach
Four projects were recommended for funding in this important “preparing the market” category. Most notable is a $1 million project for a public relations campaign for alternative fuels and vehicles and a grant of $400,000 to San Diego’s Ecocenter, a facility for educating more than 10,000 school children per year that is co‐located with an alternative fuel station that dispenses natural gas, propane, E‐85, and biodiesel, and provides for electric charging, all at the same location.
Recommendation: Additional support is needed for a more aggressive media campaign and for the development of a broader educational curriculum.
Research and Testing
Six projects were funded; four of these involve the emissions and multimedia assessment84 of biodiesel. This activity is quite important given the current needs for biodiesel standardization and evaluation of its fate of storage and emissions profile. The other two projects are for the
84 Assessment of the fuels impact on air, water, soil, and its characteristics of age in storage on fuel quality.
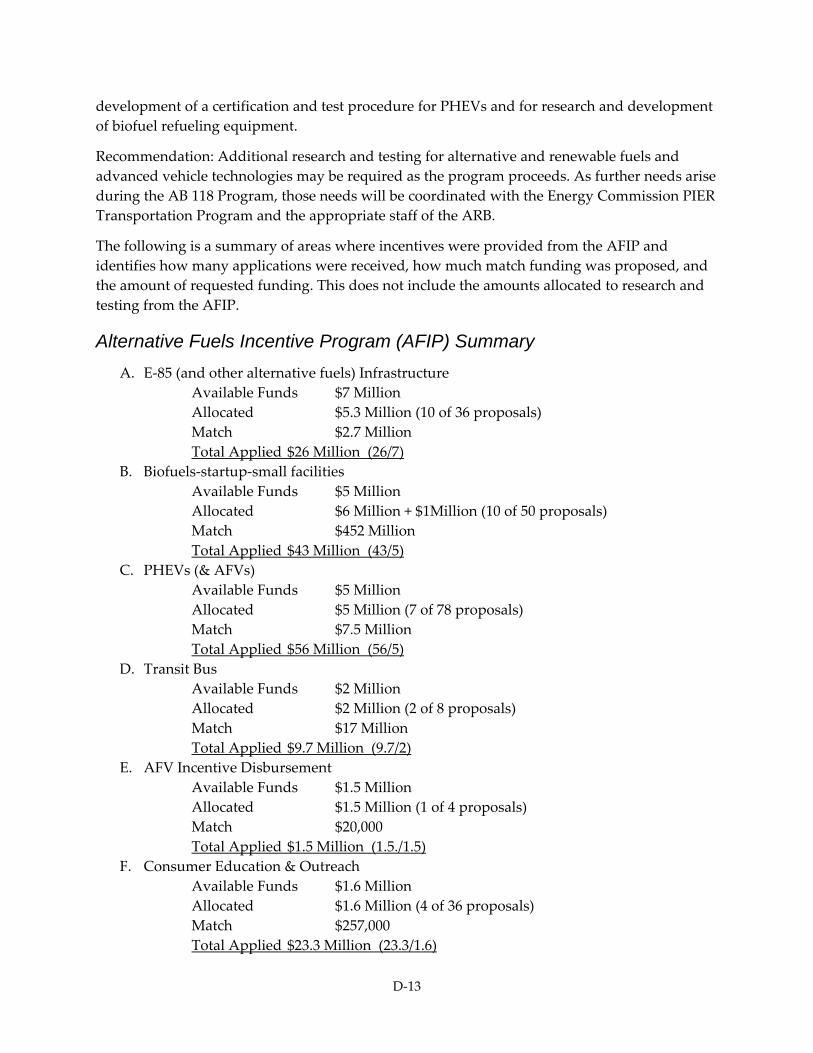
D‐13
development of a certification and test procedure for PHEVs and for research and development of biofuel refueling equipment.
Recommendation: Additional research and testing for alternative and renewable fuels and advanced vehicle technologies may be required as the program proceeds. As further needs arise during the AB 118 Program, those needs will be coordinated with the Energy Commission PIER Transportation Program and the appropriate staff of the ARB.
The following is a summary of areas where incentives were provided from the AFIP and identifies how many applications were received, how much match funding was proposed, and the amount of requested funding. This does not include the amounts allocated to research and testing from the AFIP.
Alternative Fuels Incentive Program (AFIP) Summary A. E‐85 (and other alternative fuels) Infrastructure
Available Funds $7 Million Allocated $5.3 Million (10 of 36 proposals) Match $2.7 Million Total Applied $26 Million (26/7)
B. Biofuels‐startup‐small facilities Available Funds $5 Million Allocated $6 Million + $1Million (10 of 50 proposals) Match $452 Million Total Applied $43 Million (43/5)
C. PHEVs (& AFVs) Available Funds $5 Million Allocated $5 Million (7 of 78 proposals) Match $7.5 Million Total Applied $56 Million (56/5)
D. Transit Bus Available Funds $2 Million Allocated $2 Million (2 of 8 proposals) Match $17 Million Total Applied $9.7 Million (9.7/2)
E. AFV Incentive Disbursement Available Funds $1.5 Million Allocated $1.5 Million (1 of 4 proposals) Match $20,000 Total Applied $1.5 Million (1.5./1.5)
F. Consumer Education & Outreach Available Funds $1.6 Million Allocated $1.6 Million (4 of 36 proposals) Match $257,000 Total Applied $23.3 Million (23.3/1.6)
D‐14
Applied=$159.5 Million on $22.1 Million Available
Identifying Complementary Funding Sources
As identified in the AB 118 statute, the Energy Commission has begun to carefully identify and evaluate complementary funding sources and revenue streams for programs created under the statute as it determines priorities and opportunities for program funding. The State Alternative Fuels Plan (AB 1007, Pavley, Chapter 371, Statutes of 2005) adopted by the Energy Commission and Air Resources Board, identified the need for a fund to provide state incentives in the range of $100 million to $200 million per year to increase alternative fuel development and use to help fulfill multiple policy goals to reduce petroleum dependency, curb greenhouse gas emissions, cut criteria pollutants, and develop in‐state sources of biofuels. The alternative fuels plan noted state incentives would be needed in addition to the Low‐Carbon Fuel Standard regulations and extension of federal tax incentives to stimulate a $40 billion market investment by 2022 and $100 billion thru 2050 to meet the policy goals.
The Energy Commission could be managing up to $120 million per year under AB 118 programs for more than seven years or an approximate total of $900 million. The challenge is to use this amount to stimulate a $100 billion market investment, compelling Energy Commission staff to explore revenue streams, identify potential co‐funders, and develop strategic partnerships.
The Energy Commission staff identified two primary revenue streams (government incentives/programs and private investment), gathered information on investment objectives and interviewed 30 organizations to understand funding and financing priorities. This initial analysis requires additional work to clarify amounts of investment and other revenue stream characteristics.
Government revenue streams include federal tax credits, fuel subsidies, and other incentives that were created or extended by the Energy Independence and Patriot Act of 2007 and the 2008 Farm Bill. The total amount of incentives allocated for alternative and renewable fuels and vehicle technology is estimated at $5 billion through 2012 for the entire United States. Federal tax incentives are spent on a first‐come, first‐served basis, so aggressive efforts may channel investments to California that exceed the state’s proportional share of the U.S. population (California represents 12 percent of the U.S. population). In addition, programs managed by the U.S. Department of Energy (USDOE), U.S. Environmental Protection Agency, and U.S. Department of Agriculture contribute an average of $200 million in annual funding, primarily for research projects and biofuel development. USDOE provided dedicated alternative fuels funding under the “Clean Cities” program, which California excelled at securing, but this program has subsided in funding and has rarely exceeded $2 million per year for the entire country the last few years.
California state government incentives are managed primarily by the ARB and the Energy Commission. ARB provides incentives under the following programs:
D‐15
• The Carl Moyer Program funds heavy‐duty engine retrofits, replacements, and new vehicle/equipment purchase to reduce criteria pollutants and toxics. Annually, up to $140 million is available through 2015 to fund clean vehicles and equipment.
• Proposition 1B Goods Movement Emission Reduction Program will provide up to $1 billion to reduce emissions from freight movement along California’s trade corridors.
• California Transportation Commission funding from fuel and sales tax to fund highway, road, and bridge improvements. Some funding has been allocated to alternative fuel projects proposed by local government recipients. Lest than 1 percent of the $2 billion allocated in FY 2008‐09 will be spent on alternative fuel projects.
• Proposition 1B bond will provide $200 million to the Lower Emission School Bus Program to replace and retrofit older school buses to reduce criteria pollutants and toxics as well as improve safety. About 40 percent of the past Lower Emission School Bus Program funding has been used for alternative fueled buses. Historically, less than 5 percent of all school bus replacement funding has been used for alternative fuels.
• Zero‐Emission Vehicle (ZEV) program combines regulations requiring automakers to fulfill production levels of plug‐in hybrid (58,000) and fuel cell (7,500) vehicles by 2015 with consumer purchase rebates. Rebates average $2 million per year.
• Hydrogen Highway infrastructure program proposes a $7 million allocation in FY 2008‐09 for hydrogen fueling stations.
• Alternative Fuels Incentive Program – Funding provided on a one time basis ($25 million in FY 2006‐07) to provide incentives for a variety of starting projects, including E‐85 stations, certification programs, plug‐in hybrid purchases, and other alternative fuel vehicles and infrastructure.
• AB 118 Air Quality Improvement Fund to provide an estimated $50 million per year for over seven years beginning in FY 2008‐09 to reduce criteria pollutants. An unspecified amount of the funds could be used for alternative fuel and vehicle projects that address air quality improvements. ARB staff’s preliminary AQIP funding ideas for FY 2009‐10, shared at its November 2008 public workshop, are shown on the next several pages. ARB staff plans to present its AQIP funding plan for FY 2009‐10 to its Board for approval in April 2009.
Some local and regional governments have developed funding sources through local taxes and assessments. The South Coast Air Quality Management District ($70 million ‐ $100 million per year )and the San Pedro Bay ports of Los Angeles and Long Beach ($2.2 billion over five years) allocate funding for a variety of air quality improvement programs. Approximately $ 270 million has been allocated for alternative fuels projects.
A bilateral source of government investment is the North American Development Bank, which can provide up to half of the project financing for any single environmental improvement and clean energy project located within 60 miles of the U.S.‐Mexico border. Total financing available in any single year has not exceeded $50 million.
D‐16
AB 118 Air Quality Improvement Program (AQIP)85
Preliminary Funding Ideas for Fiscal Year (FY) 2009-2010
Discussion Document for November 5 and 6, 2008 Public Workshops
ARB staff is developing a proposed Air Quality Improvement Program (AQIP) Funding Plan for Fiscal Year (FY) 2009‐10. The Funding Plan is each year’s plan for expending AQIP funds, and includes funding allocations, the administering agency (or potential administering agency) and general criteria for each project category. Staff plans to bring the FY 2009‐10 Funding Plan to the Board for its consideration in Spring 2009.
This discussion document provides staff’s preliminary funding ideas for FY 2009‐10, a step in the development of the Funding Plan. These preliminary ideas are intended to elicit public comment and input.
Background AB 118 (Núñez, Chapter 750, Statutes of 2007) provides ARB with approximately $50 million annually for the AQIP upon appropriation by the Legislature. The purpose of the program is specified in Health and Safety Code, Section 44274(a):
The primary purpose of the program shall be to fund projects to reduce criteria air pollutants, improve air quality, and provide funding for research to determine and improve the air quality impacts of alternative transportation fuels and vehicles, vessels, and equipment technologies.
AQIP may fund a wide variety of air quality projects, including low‐emission vehicles and equipment, research, and workforce training. Statute lists eight broad project types which are eligible for funding:
1. On‐ and off‐road equipment projects. 2. Projects to reduce off‐road gasoline exhaust and evaporative emissions. 3. Research projects to determine the air quality impacts of alternative fuels. 4. Projects that augment the University of California’s agricultural experiment station and
cooperative extension programs for research to increase sustainable biofuels production and improve the collection of biomass feedstock.
5. Incentives for consumers to replace lawn and garden equipment. 6. Incentives for medium‐ and heavy‐duty vehicles and equipment mitigation including:
a. Lower emission school bus programs. b. Electric, hybrid, and plug‐in hybrid on‐ and off‐road medium‐ and heavy‐duty
equipment. c. Regional air quality improvement and attainment programs implemented by the
state or districts in the most impacted regions of the state. 7. Workforce training initiatives related to advanced energy technology designed to reduce
air pollution. 8. Incentives to reduce emissions from high emitting light‐duty vehicles.
85 AQIP Preliminary FY 09-10 Funding Ideas for Discussion at November 2008 Workshops.
D‐17
Implementation Priorities The following implementation considerations are shaping staff’s FY 2009‐10 funding proposals:
• Funding is unlikely to be directed to all eight project categories in any single funding cycle. If a category does not receive funding in one year, it could still be considered for funding in future years.
• ARB staff is considering directing a significant portion of AQIP funding towards on‐the‐ground vehicle and equipment project categories that provide an immediate emission reduction benefit. We anticipate the following broad distribution of funds:
- 65‐85 percent of funds for clean vehicle/equipment deployment projects.
- 10‐30 percent of funds for advanced technology demonstration projects.
- 0‐10 percent of funds for research and workforce training projects.
• ARB staff is considering directing significant funding toward a few key project categories instead of spreading a small amount of funding across many categories.
Guiding Principles for Vehicle and Equipment Deployment Projects At a public workshop on August 19, 2008, ARB staff presented the following guiding principles for selecting eligible vehicle and equipment project categories for FY 2009‐10:
• Attain Ambient Air Quality Standards: Projects should help California meet federal ambient air quality standards by spurring deployment of technologies to meet our State Implementation Plan (SIP) “black box” commitments. Early deployment is critical to ensure significant technology penetration by 2024. Projects should also help achieve the state air quality standards, reduce toxic air contaminant emissions, and complement California’s efforts to meet its climate change goals.
• Ready for Deployment: Projects should be cost‐effective and be ready for immediate on‐the‐ground deployment. Technologies that could help meet SIP “black box” commitments but which are not ready for deployment may be considered for funding as demonstration projects.
• Modify Consumer Choice: Incentives should be focused on inducing vehicle and equipment purchases that would not otherwise have occurred.
• Consider Funding Need: Project types that do not have access to other incentive program funds, such as Carl Moyer Program and Goods Movement Emission Reduction Bond Program funds, would be prioritized. Eligible project categories should also not overlap with those AB 118 projects being funded by the California Energy Commission.
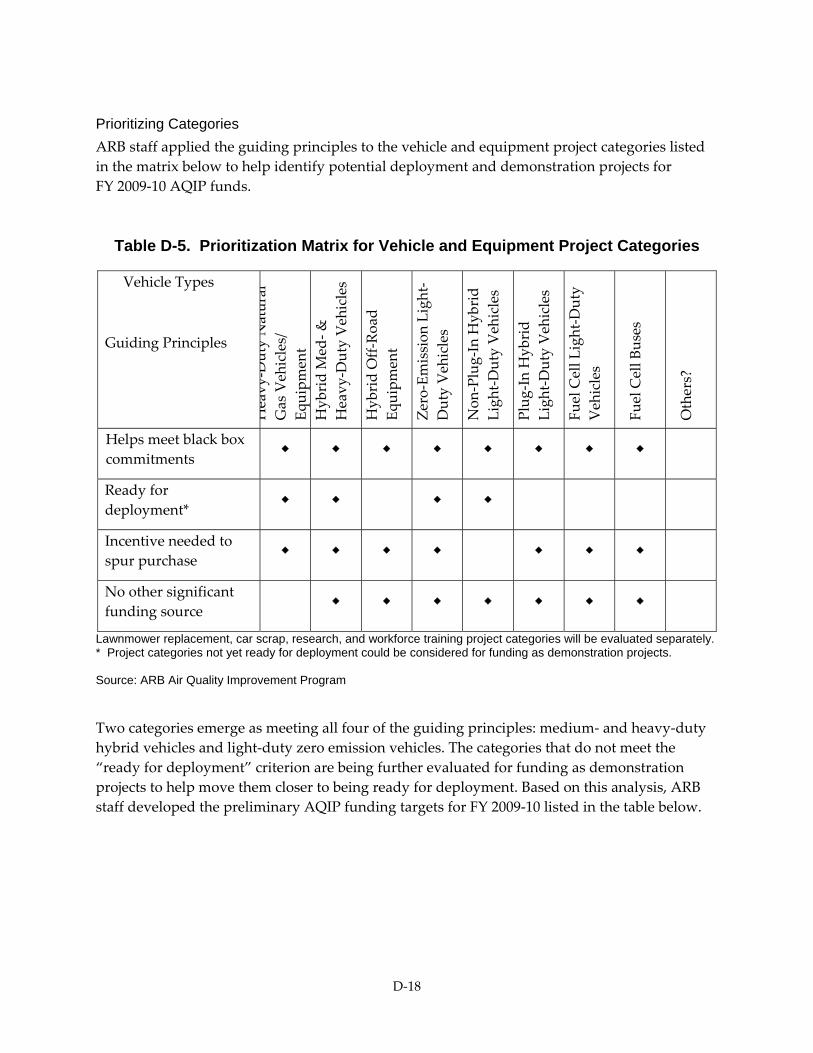
D‐18
Prioritizing Categories ARB staff applied the guiding principles to the vehicle and equipment project categories listed in the matrix below to help identify potential deployment and demonstration projects for FY 2009‐10 AQIP funds.
Table D-5. Prioritization Matrix for Vehicle and Equipment Project Categories
Vehicle Types �
Guiding Principles
�
Heavy‐D
uty Natural
Gas Vehicles/
Equipm
ent
Hyb
rid Med‐ &
Heavy‐D
uty Vehicles
Hyb
rid Off‐Ro
ad
Equipm
ent
Zero‐Emission Light‐
Duty Vehicles
Non‐Plug‐In H
ybrid
Ligh
t‐Duty Vehicles
Plug‐In Hyb
rid
Ligh
t‐Duty Vehicles
Fuel Cell L
ight‐D
uty
Vehicles
Fuel Cell B
uses
Others?
Helps meet black box commitments ◆ ◆ ◆ ◆ ◆ ◆ ◆ ◆
Ready for deployment* ◆ ◆ ◆ ◆
Incentive needed to spur purchase ◆ ◆ ◆ ◆ ◆ ◆ ◆
No other significant funding source
◆ ◆ ◆ ◆ ◆ ◆ ◆
Lawnmower replacement, car scrap, research, and workforce training project categories will be evaluated separately. * Project categories not yet ready for deployment could be considered for funding as demonstration projects. Source: ARB Air Quality Improvement Program
Two categories emerge as meeting all four of the guiding principles: medium‐ and heavy‐duty hybrid vehicles and light‐duty zero emission vehicles. The categories that do not meet the “ready for deployment” criterion are being further evaluated for funding as demonstration projects to help move them closer to being ready for deployment. Based on this analysis, ARB staff developed the preliminary AQIP funding targets for FY 2009‐10 listed in the table below.
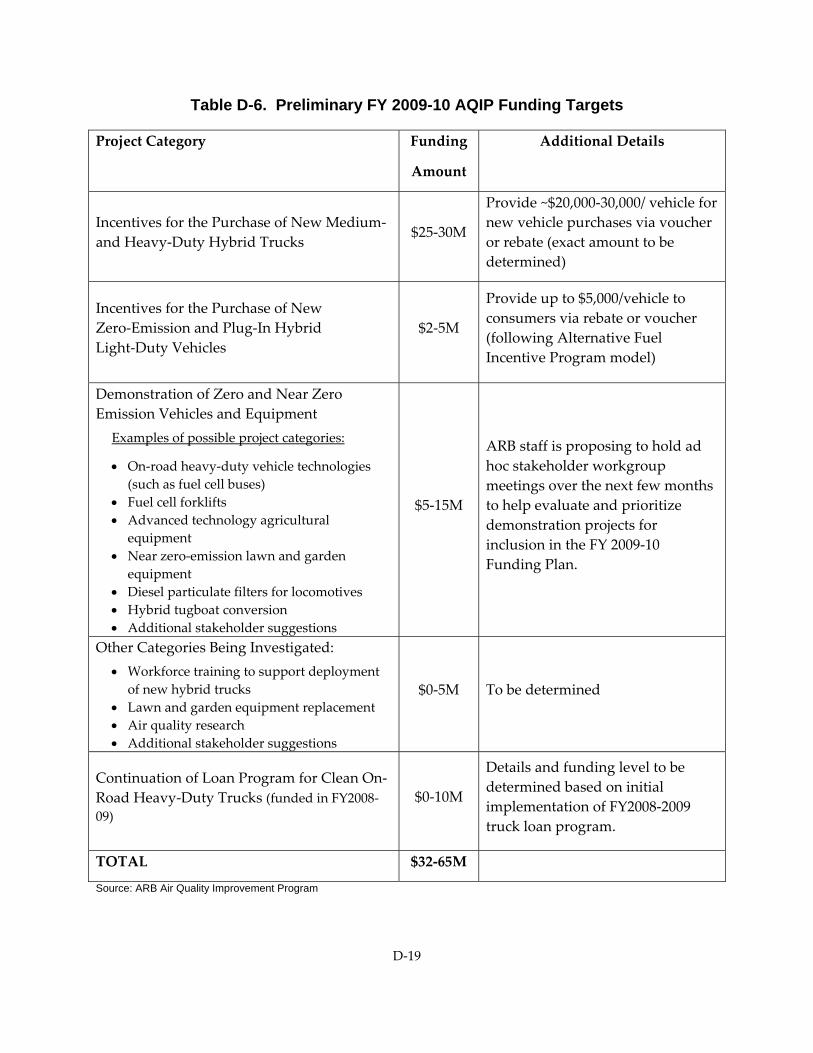
D‐19
Table D-6. Preliminary FY 2009-10 AQIP Funding Targets
Project Category
Funding
Amount
Additional Details
Incentives for the Purchase of New Medium‐ and Heavy‐Duty Hybrid Trucks
$25‐30M
Provide ~$20,000‐30,000/ vehicle for new vehicle purchases via voucher or rebate (exact amount to be determined)
Incentives for the Purchase of New Zero‐Emission and Plug‐In Hybrid Light‐Duty Vehicles
$2‐5M
Provide up to $5,000/vehicle to consumers via rebate or voucher (following Alternative Fuel Incentive Program model)
Demonstration of Zero and Near Zero Emission Vehicles and Equipment
Examples of possible project categories:
• On‐road heavy‐duty vehicle technologies (such as fuel cell buses)
• Fuel cell forklifts • Advanced technology agricultural
equipment • Near zero‐emission lawn and garden
equipment • Diesel particulate filters for locomotives • Hybrid tugboat conversion • Additional stakeholder suggestions
$5‐15M
ARB staff is proposing to hold ad hoc stakeholder workgroup meetings over the next few months to help evaluate and prioritize demonstration projects for inclusion in the FY 2009‐10 Funding Plan.
Other Categories Being Investigated: • Workforce training to support deployment
of new hybrid trucks • Lawn and garden equipment replacement • Air quality research • Additional stakeholder suggestions
$0‐5M To be determined
Continuation of Loan Program for Clean On‐Road Heavy‐Duty Trucks (funded in FY2008‐09)
$0‐10M
Details and funding level to be determined based on initial implementation of FY2008‐2009 truck loan program.
TOTAL $32‐65M
Source: ARB Air Quality Improvement Program
D‐20
Appendix D References State Alternative Fuels Plan, Final Commission Report, publication # CEC‐600‐2007‐011‐CMF.
Posted December 24, 2007. Adopted December 5, 2007, at Energy Commission Business Meeting. (PDF file, 88 pages, 2.8 megabytes).
California Alternative Fuels Market Assessment 2006 ‐ Draft Consultant Report, publication # CEC‐600‐2006‐015‐D, posted October 6, 2006. (PDF file, 149 pages, 1.2 megabytes).
Full Fuel Cycle Assessment: Well to Wheels Energy Inputs, Emissions and Water Impacts: State Plan to Increase the Use of Non‐Petroleum Transportation Fuels ‐ AB 1007 (Pavley) Alternative Transportation Fuels Plan Proceeding, REVISED Final Consultant Report #CEC‐600‐2007‐004‐REV. Original posted June 22, 2007; revised posted August 1, 2007. (PDF file, 165 pages, 1.5 megabytes).
Bioenergy Action Plan for California, Consultant Report, CEC‐60‐206‐010, July 2006.
Alternative Fuel Use Among California Fleets: Current Use, Barriers, and Opportunities, Consultant Report #CEC‐600‐2007‐006, posted June 4, 2007 (PDF file, 91 pages, 440 kilobytes).
2050 ʺVisionʺ Portion of the AB1007 Report, posted May 30, 2007. (PDF file, 9 pages, 284 kilobytes).
Analytical Method for Authorizing Program Funds: 2050 Vision Analysis for Light‐Duty Vehicles. Gerry Bemis and Malachi Weng‐Gutierrez, Energy Commission, September 2008.
Top Related
Copyright © 2022 FDOKUMEN

