


Bahasa
Halaman
Hukum


JAG l Volume 2 - Issue 2 - 2000
COMMUNICATION
Inventory of major landscape changes in the Czech Republic, Hungary, Romania and Slovak Republic 1970s - 1990s
J2n Feranecl, Marcel %ril, J2n Ot’ahel’l, Tom25 Cebecauerl, Jan Kol32, Tom% Soukupz, Dagmar Zdetikovd2, Jifi Waszmuthz, Vasile Vdjdea3, Anca-Marina Vijdea3 and Constantin Nitica3
1 institute of Geography, Slovak Academy of Sciences, Stefanikova 49, 814 73 Bratislava, Slovak Republic (e-mail: [email protected])
* GISAT, Charkovska 7, 101 00 Praha 10, Czech Republic
3 Geological Institute of Romania, 1 Caransebes Street, 783 44 Bucharest, Romania
KEYWORDS: Afforestation, change detection, computer-
aided visual interpretation, CORINE land cover database,
deforestation, extensification of agriculture, intensifica-
tion of agriculture, land cover changes, urbanisation
ABSTRACT
One of the most important achievements in 1998-1999 of Phare
Topic Link on Land Cover has been the development and practical
application of a methodological approach to landscape change iden-
tification and analysis in the territories of four Phare countries (the
Czech Republic, Hungary, Romania, and the Slovak Republic). The
changes were identified on a national level from Landsat TM and
MSS satellite images by application of the CORINE Land Cover data-
bases for two time horizons (the late 1970s and early 1990s) at the
second hierarchic level. Based on identified causality, the landscape
changes were grouped into 7 types: intensification of agriculture,
extensification of agriculture, urbanisation-industrialisation, enlarge-
ment (exhaustion) of natural resources, afforestation, deforestation
and other anthropogenic causes. The results of the groupings are
presented in the form of contingency tables and maps showing the
spatial distribution of the changes. From the point of view of total
extent, forest landscape changed the most in the Czech Republic.
This change represents a reduction of forest by 167,702 ha and an
enlargement of transitional woodland-scrub by about 26,339 ha. In
Hungary the most pronounced changes were decrease of forests by
66,622 ha and decrease of arable land, orchards and vineyards by
21,529 ha. The most remarkable changes identified in Romania were
decrease of arable land, forests and wetlands by 366,817 ha,
285,887 ha, and 59,967 ha, respectively, as well as enlargement of
areas of complex cultivation pattern by almost 347,220 ha. The most
pronounced changes in Slovakia were represented by diminution of
forest by 94,935 ha and that of heterogeneous agricultural areas by
18,451 ha; enlargement of transitional woodland-scrub areas and
urbanised area were about 13,107 ha and 14,990 ha, respectively.
INTRODUCTION
Changes of landscape objects represent in the most gen-
eral sense a sequence of linked states of these objects,
characterised by the particular time horizon and by a set
physiognomic, physical, chemical and biological proper-
ties, as well as functions and relations to its environs
(Figure 1). Changes of landscape objects can be identified
by analysis of the selected states the objects pass
through during a period of study [Feranec et al, 19991.
Analysis of landscape changes is equally important from
the point of view of assessing natural and socio-economic
processes, their dynamics and causes, as well as possible
trends of future development. Direct observation of land
cover changes by multispectral remote sensing data
allows identification of major processes of change and,
by inference, the characterisation of landscape dynamics
[Martens & Lambin, 19991. Therefore, land cover is
important in terms of gaining better understanding of the
landscape at any level.
CORINE Land Cover (CLC) is one of the most important
databases managed by the European Environmental
Agency, and it aims at collecting comparable and consis-
tent land cover data across Europe by application of
satellite images. This information base combined with
other relevant data (eg, thematic maps, aerial pho-
tographs, statistical data) offers an essential tool for
inventory analysis and assessment of landscape changes,
in addition to providing useful long-term monitoring
tools.
m-7 /
0 4. /
/ / *’ FIGURE 1 Changes of the IL) I landscaoi obiect in the
/ 4
/ course ‘of three temporal horizons. Tl, T2, T3 -
129

inventory of major landscape changes JAG l Volume 2 - Issue 2 - 2000
The importance of studying landscape changes at a local and regional level has also been highlighted in other EC
projects. The LACOAST Project was one of the first,
applying CLC data from the period 1975-1999 of a
10 km coastal strip of 9 EU Member States with the aim
of measuring land cover changes in coastal areas.
Another EC project based on the application of CLC -
MURBANDY - aims to study land cover/land use changes
and to develop a set of indicators to monitor the urban
dynamics associated with the change.
CLC70) was created from CLC90 by computer aided visu-
al interpretation of the Landsat MSS images [Perdigao &
Annoni, 19971. The land cover changes database for the
period 197Os-1990s (hereafter CLC70-90) is the result of
GIS overlaying and postprocessing the CLC70 and CLC90
databases (see Figure 2).
Within the framework of EEA, Phare Topic Link on Land
Cover (PTULC) is a consortium co-ordinated by the GISAT
company (Czech Republic) and its members include the
Institute of Geography SAS (Slovak Republic), the
Geological Institute (Romania) and HNIT-Baltic (Lithuania).
Its seven main tasks were identified under the Phare pro-
ject No. ZZ-9512. The contract among the respective par-
ties was signed in July 1997 for a duration of 24 months.
The aim of the task “Development of the application
using the CLC database” was landscape changes identifi-
cation and analysis. This introduces the practical case of
the large-scale application of the CLC database and the
methodology of landscape changes inventory (the territo- ry of the Czech Republic, Hungary, Romania and the
Slovak Republic was mapped, a total area of almost half
million square kilometres). Extension of this approach to other European countries will it possible to compare land-
scape changes, which has taken place on the continent in
different geographical regions and under different social
and economic conditions.
The aim of this paper is to describe the basic characteris-
tics of the methodology of a newly created land cover
changes database and to evaluate the results of a land-
scape changes inventory in the four Phare countries men-
tioned for the period 197Os-1990s.
FIGURE 2: Creation of the land cover change database CLC70- 90 (example of Starina valley, East Slovakia)
The applied methodological procedure is summarised in the following steps:
METHODOLOGY OF LANDSCAPE CHANGE ANALYSIS
The methodology was based on the basic assumption
that changes in land cover can be used to infer changes
in landscape. It consists of two parts - creation of a land
cover changes database and landscape change analysis.
CREATION OF A LAND COVER CHANGES DATABASE
The basic input data for identification of land cover
changes was a vector database 1 :I 00 000 representing
the beginning of the 1990s (1989-1992, hereafter CLC90) that was mapped under the framework of a CLC project realised in 6 Phare countries in the period 1994-
1996. From a methodological point of view, the CLC90 database was created by the visual interpretation of Landsat TM images and subsequent digitising of the results obtained. A land cover database for the period of the second half of the 1970s (1976-1980, hereafter
preparation of Landsat TM and Landsat MSS satellite
imagery for mapping the land cover classes of the
1970s (CLC70); aggregation of the 3rd level classes to the 2nd hierar-
chic level of the CLC nomenclature (Table 1; Heymann
et a/, 1994) and segmentation of the CLC90 vector
database; identification of CLC70 classes by re-interpretation of
the aggregated CLC90 database; mosaicking of the single CLC70 database segments, checking the physical and logical integrity; creation of the CLC70-90 changes database by over-
laying CLC70 and CLC90; elimination of sliver poly- gons by application of cleaning procedures and sepa- ration of revised CLC70 database.
The individual steps of the methodology were realised using the GIS software Easi/Pace, ERDAS Imagine (prepa-
130

Inventory of major landscape changes JAG l Volume 2 - Issue 2 - 2000
TABLE 1: CLC nomenclature
1. Artificial surfaces
1.1. Urban fabric 1 .I .I. Continuous urban fabric 1 .1.2. Discontinuous urban fabric
1.2. industrial, commercial and transport units 1.2.1. Industrial or commercial units 1.2.2. Road and rail networks and associated land 1.2.3. Port areas 1.2.4. Airports
1.3. Mine, dump and constructions sites 1.3.1. Mineral extraction sites 1.3.2. Dump sites 1.3.3. Construction sites
1.4. Artificial, non-agricultural vegetated areas 1.4.1. Green urban areas 1.4.2. Sport and leisure facilities
2. Agricultural areas
2.1. Arable land 2.1 .I. Non-irrigated arable land 2.1.2. Permanently irrigated land 2.1.3. Rice fields
2.2. Permanent crops 2.2.1. Vineyards 2.2.2. Fruit trees and berry plantations 2.2.3. Olive groves
2.3. Pastures 2.3.1. Pastures
2.4. Heterogeneous agricultural areas 2.4.1. Annual crops associated with permanent crops 2.4.2. Complex cultivation patterns 2.4.3. Land principally occupied by agriculture,with
significant areas of natural vegetation 2.4.4. Agro-forestry areas
3. Forest and semi-natural areas
3.1. Forests 3.1 .l. Broad-leaved forests 3.1.2. Coniferous forests 3.1.3. Mixed forests
3.2. Scrub and/or herbaceous vegetation associations 3.2.1. Natural grasslands 3.2.2. Moors and heathland 3.2.3. Sclerophyllous vegetation 3.2.4. Transitional woodland-scrub
3.3. Open spaces with little or no vegetation 3.3.1. Beaches, dunes, sands 3.3.2. Bare rocks 3.3.3. Sparsely vegetated areas 3.3.4. Burnt areas 3.3.5. Glaciers and perpetual snow
4. Wetlands
4.1. Inland wetlands 4.1.1. Inland marshes 4.1.2. Peat bogs
4.2. Maritime wetlands 4.2.1. Salt marshes 4.2.2. Salines 4.2.3. Intertidal flats
5. Water bodies
5.1. Inland waters 5.1 .l. Water courses 5.1.2. Water bodies
5.2. Marine waters 5.2.1. Coastal lagoons 5.2.2. Estuaries 5.2.3. Sea and ocean
ration of the satellite data for interpretation), ArcView
GIS, Arc/INFO, COPILOT and GenaMap GIS (computer
aided visual interpretation, database processing and final
checking).
In the preparatory stage the source data were segmented
according to the sheets of 1 :I 00 000 topographic maps
as resulting from the system of S-42 Gauss-Kruger map
projection in the Czech Republic, Romania and Slovakia
and EOV Reduced Conformal Cylindrical projection in
Hungary. Coloured, contrasted compositions (spectral
bands TM 542 and MSS 421) were created from satellite
data and prepared for the visual interpretation. The RMS
(root mean square) error of transformed (geocoded)
Landsat TM data is about 1 pixel (30 m). It was not possi-
ble to maintain this 30-m accuracy for MSS data as well,
due to its pixel size of 80 m. Nevertheless, the relative
accuracy of the transformation was kept to less than 2
pixels. A mean value of RMS error on GCPs of trans-
formed MSS scenes was 0.712 pixels (49.8 m).
Because of the coarse resolution of the MSS data (spatial
resolution 80 m, radiometric resolution 6 bits, 4 spectral
bands) it was reasonable to work only with the second
hierarchic level of the CLC nomenclature. Hence the pri-
mary CLC data set, as the source for identification of the
land cover from the 197Os, was derived from the original
CLC90 segments aggregated at the 2nd level (which
reduced the number of land cover classes from 36 at the
third level to 15 at the second level).
Creation of the CLC70 database was based on the retro-
spective analysis (downdating), of comparison of original
CLC90 polygons with the Landsat MSS images from the
1970s and their modification. The computer-aided visual
interpretation was carried out using two parallel win-
dows. The CLC90 data overlaid on the Landsat TM image
in the left window represented the auxiliary etalon. The
aggregated CLC90 data with the Landsat MSS were visu-
alised in the right window. In the right window, the
CLC70 database was created gradually, polygon by poly-
gon, based on the identified shape and size changes of
the corresponding land cover classes. Identified change in
CLC70 database was accepted only if the area of the
changed polygon was larger than 4 ha. Identification also
respected the requirement of the spatial characteristics of
the generated database in terms of the CLC project
methodology, ie, the resulting polygon had to comply
with the criteria of a minimum area of 25 ha and a mini-
mum width of 100 m.
131

Inventory of major landscape changes
More difficulties arose during change detection. From a
spectral point of view, discernability of changes in CLC
classes (on the 2nd level) using MSS data was feasible,
although correct identification and delineation of certain
changes (eg, classes 23121, 22121 - see Table 1) was
problematic without support of additional information
(eg, topographic maps at various scales, aerial photos).
The most sensitive types of change for support of ancil-
lary data were those that took place within the main land
cover classes on the 1st level. Above all, this was the case
for changes in agricultural areas. Detection and delin-
eation of changes connected to urban fabric and forested
areas were generally much more feasible with the help of
additional image processing. There was no problem with
detecting and delineating changes connected with mining
activities or water bodies. From a geometrical point of
view, on the other hand, delineation of detected changes
was problematic, especially in heterogeneous classes 24
and 32 (see Table I), and the help of original TM data or
a topographic map was necessary. On particular locations
the lower geometrical resolution and the positional accu-
racy of the geocoded MSS data interfered with the criteri-
on of a minimum width of 100 m for delineating the
change.
Mosaicking of the individual CLC70 map segments result-
ed in a single data layer at a national level. While aggre-
gating the segments, control procedures and correction
of the physical and logical integrity of the data were car-
ried out. This included the topology-related quality
checks, elimination of polygons not complying with the
area requirement, correction of aggregation inconsisten-
cies, identification of thematic errors, and edge-matching
on national boundaries.
In the next stage, the CLC70-90 land cover changes data-
base was created using overlay (intersect) GIS procedures
for the two CLC70 and CLC90 data sets. The resulting
database was tested on presence of polygons not com-
plying with criterion of at least 4 ha area. Polygons small-
TABLE 2: Conversion table
JAG l Volume 2 - Issue 2 - 2000
er than 4 ha were excluded using a set of border tests
under the condition to preserve the original structure of
CLC90. The only polygons that did not have to meet the
criterion were those artificially limited by the state border.
The final CLC70 database was generated from the
cleaned CLC70-90 changes database.
METHODOLOGY OF THE LANDSCAPE CHANGE ANALYSIS
This approach consists of the three steps [Feranec et al,
19991:
1.
2.
3.
The classes of the CLC70-90 land cover changes
databases were reclassified into 7 types of land-
scape changes according to the conversion table
(Table 2).
Statistics - contingency tables (Tables 3, 4, 5 & 6) -
were calculated using standard GIS cross-tabulation
procedures; they express thematic re-distribution of
individual classes within the study period.
Comparisons of the area of changes are presented
in Figure 3 and Table 7.
Spatial intensity of landscape changes was
expressed by a set of 8 maps (7 maps show individ-
ual type of changes, and the 8th map depicts the
sum of all 7 types of changes), at original scale
1:3,000,000. The maps show the spatial extent of
changes recalculated to a grid with resolution 1.5
km x 1.5 km. The selected examples are presented
in Figures 4-7. The four intervals of the landscape
changes spatial intensity were considered:
76-100 % of the grid cell area
was changed - full change,
25-75 % of the grid cell area
was changed - substantial change,
l-24 % of the grid cell area
was changed - minor change,
0 % of the grid cell area
was changed - no change.
132

Inventory of major landscape changes JAG • Vo lume 2 - Issue 2 - 2000
©
c ,m
© t ~
u~
i
i ill
133

Inventory of major landscape changes JAG l Volume 2 - Issue 2 - 2000

inventory of major landscape changes
3 f. c a
AREA OF CHANGES 400000
350000
3ooooo
250000
200000
150000
100000
5oooo
0
X OF TOTAL AREA
% OF CHANGED AREA
UC2 q HU q BRO q SK
FIGURE 3 Comparison of area of identified landscape changes in the Czech Republic, Hungary, Romania and the Slovak Republic
JAG l Volume 2 - Issue 2 - 2000
Definitions of types of landscape change are based on
land cover information, which is the attribute of the CLC
database [Feranec et al, 19991:
Intensification of agriculture
Change of meadow-pasture or forest to arable land, as
well as the change of arable land to vineyards, orchards,
berry plantations, greenhouse management, etc. This
definition accepts general principles of agricultural pro-
duction within the context of the analysed land cover
classes.
Extensification of agriculture
Change of vineyards, orchards and berry plantations to
arable land or grassland, and change of arable land to
grassland. For this type of landscape change it is impor-
tant also to take into account abandoned agricultural
land - land not used for three or more years: it can
change later into the class 231 Pastures and thereafter to
324 Transitional woodland shrub.
Urbanisa tion (industrialisa tion)
Change of mainly agricultural and forest land to
urbanised land (construction of buildings destined for liv-
ing, education, health care, recreation and sport) and
industrialised land (construction of facilities for produc-
tion, all forms of transports, electric power generation,
construction connected with the enlargement of water
reservoirs and ponds).
Enlargement or exhaustion of natural resources
Change of agricultural, forest and other types of land to
areas for mineral mining, and their enlargement or
exhaustion in corresponding localities.
Afforestation
Natural or man-induced changes of areas after tree
felling, changes of meadow-pasture or arable land to
forests in various stages of growth.
TABLE 7: Comparison of area for individual types of changes - a) area in hectares, b) proportion (%) of total area, c) propor- tion (%) of changed area
%oftomlanxi 0 1 2 3 4 5 6 7 Tatwluw TocJdNnfm
-Rapublic 96.59 0.27 0.22 0.14 0.10 0.33 2.12 0.22 ml.09 3.41
itiz 9aO5 94.24 0.22 1.24 0.23 1.51 0.06 0.12 0.04 0.03 0.52 1.14 0.72 1.18 0.54 0.17 lUb.00 100.00 1.95 5.76 SlovdRumblk 93.56 226 1.52 0.31 0.02 0.27 1.94 0.19 l~.OO 6.44
%dchimaedarea 0 1 2 9 4 5 6 7 To#mm rotddmnm
czecilRqnlblk 7.93 634 4.18 294 9.76 6z26 6s 100.00 HMpry 11.20 11.67 3.19 1.94 26.56 36b74 a50 1OlMO
21.60 26.20 2.07 0.45 19.% 20.42 9.41 100.00 SbmkRwublk 3426 23.55 4.75 0.33 4.15 30.67 2% 100.00
135

Inventory of major landscape changes JAG l Volume 2 - Issue 2 - 2000
Deforestation
Clear-cut, devastation of forest by anthropogenic activity,
natural disasters, etc.
Other anthropogenic causes
Re-cultivation of former mining areas, dump sites, etc.
ANALYSIS OF LANDSCAPE CHANGES
Land cover changes generally reflect socio-economic and
political development of the state. The largest changes in
period 1970s1990s were determined by continuing
industrialisation, accompanied by urbanisation, as well as
anthropogenic pressure on arable land, forests and wet-
lands (see Tables 3, 4, 5 & 6).
The greatest volume of landscape changes by country
was caused by extensification processes in Romanian agri-
culture (Figure 4): 366,817 ha, or 26 percent of the total
area of change in the country, were affected. This large
change was a consequence of Land Use Act No. 18,
enacted in 1991. Agricultural land returned to former
owners was subsequently divided into parcels for complex
cultivation with a lower proportion of arable land.
Similarly large changes - the result of extensification of
agriculture - on 74,331 ha (24 percent of the total area
of change) were identified in Slovakia. The effect here is
related to a lower production efficiency of arable land on
steeper hilly slopes and its transition to meadow and pas-
ture, in addition to the process of privatisation of agricul-
tural land. This type of change was not so distinct in the
Czech republic; and Hungary (17,090 ha, or 6 percent,
and 2 1,529 ha, or 12 percent, respectively).
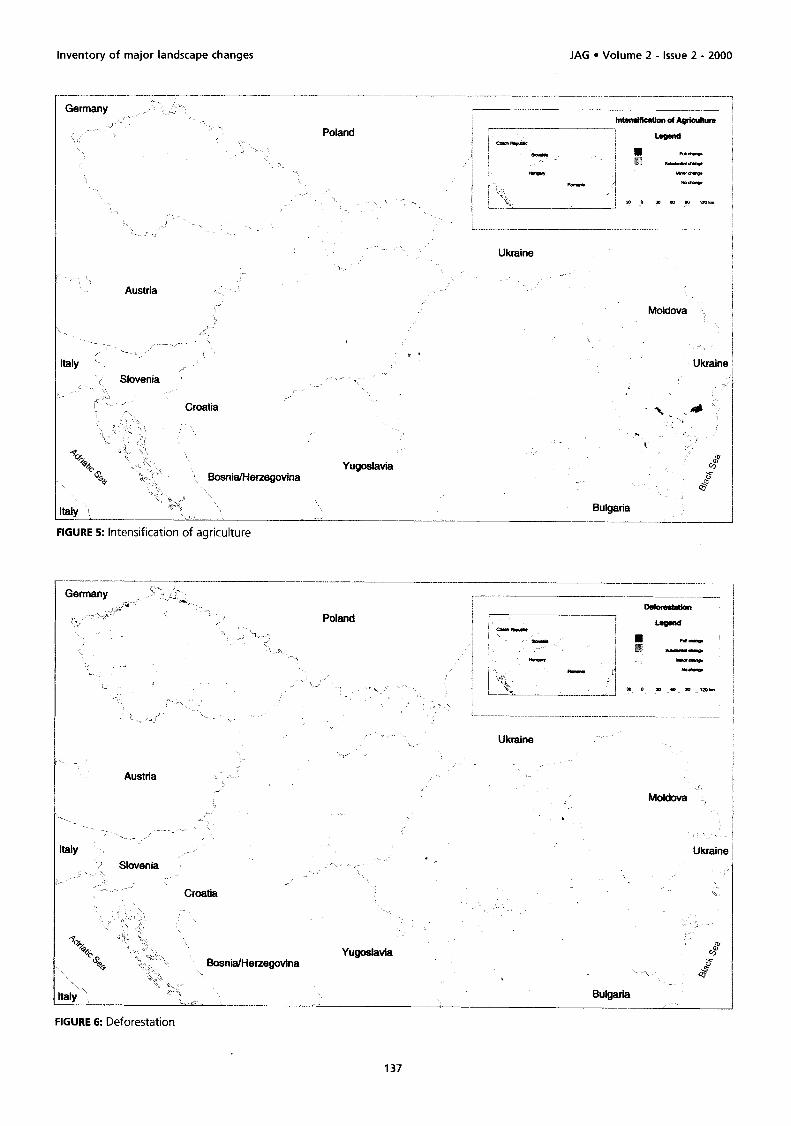
The second greatest change identified was intensification
of agriculture (Figure 5). This type of change was most apparent in Slovakia (IO&l 53 ha, which accounts for 34
percent of the total changed area), where it was connect-
ed with amelioration and other water-management mea-
sures undertaken on agricultural land, especially on
meadows and pastures in water-logged areas of alluvial
plains. In Romania it covers 302,448 ha, which accounts
for 22 percent of the total changed area. The scope of intensification of agriculture in the Czech Republic and
Hungary was balanced by the extensification process
(21,359 ha, which accounts for 8 percent of the total
changed area in the Czech Republic and 20,315 ha,
which accounts for 11 percent of the total changed area
in Hungary).
The amount of afforestation and deforestation also varied
to large extent among the countries. Deforestation (Figure 6) reached 285,887 ha (20 percent of the total
changed area) in Romania and 167,702 ha (62 percent of
the total changed area) in the Czech Republic. Thus,
deforestation was the most noticeable change in the
Germany Extenstticatton of Agriculture
Poland
Ukraine
Austria
Moldova
Italy
Slovenia
Croatia
Bosnia/Herzegovina Yugoslavia
taly Bulgaria
FIGURE 4 Extensification of agriculture
136
Inventory of major landscape changes JAG l Volume 2 - Issue 2 - 2000
Germany 1 ,I ~. ) -
_,’ / .’ Poland
j :, j, ~ ., .”
./
.’ .-
: ,, ‘\
: ‘_,“’
Ukraine
, Austria : :
,I Moldova
._ .;
-. .._ -.. I _ I
Italy i / _’ Siovenia
;\ r ,.. Croatia
FIGURE 5: Intensification of agriculture
Ukraine
Bulgaria
Ukraine
Austria
Ukrain
FIGURE 6: Deforestation

Inventory of major landscape changes JAG l Volume 2 - Issue 2 - 2000
.
Poland
Ukraine
Austria :’
W
FIGURE 7: Total changes
Bulgaria -~~ --..---.-. ----~ .--..-..-- ----~~~-~ -..-...--.-....... ..~.-~._...- ..--..-. ~~~~~~..._...__.._._~_~_~_ .._.._.. _
Czech Republic. These changes stemmed from both forest
management (regulated logging and planting) and air pol-
lution, as well as the devastating impact of snow, wind
and insects on the forests. Such extensive areas of defor-
estation were not observed in Slovakia or Hungary
(94,935 ha, which accounts for 30 percent of the total
changed area, and 66,622 ha, or 37 percent of the total
changed area, respectively). The most extensive process of
afforestation (natural and man-induced) was observed in
Romania (278,119 ha or 20 percent of the total changed
area), while in Slovakia it was the least 13,107 ha
(accounting for 4 percent of the total changed area).
The remaining types of change (urbanisation, enlarge-
ment of natural resources and other anthropogenic caus-
es) represented only several percent of changed areas.
Figure 7 presents the total share of changes within the
four countries.
CONCLUSIONS
The applications of CLC70-90, remote sensing data and
methodological tools of GIS for identification and analysis
of landscape changes in the Czech Republic, Hungary,
Romania and the Slovak Republic revealed the following
principal findings concerning the methodology and
results:
- Coarse spatial and spectral resolution of Landsat MSS
data represents a limitation in observation of land cover
changes in the CORINE land cover database. Further, it
causes problems with distinguishing CLC classes on the
2nd level (for instance 21 and 24, 31 and 32).
- Computer-aided visual interpretation is a more effec-
tive and precise approach for identification of land cover
changes than traditional techniques.
- Causes of detected changes cannot be determined
from satellite images. They can be only determined by
means of ancillary data (particularly for identification of
natural causes - floods, blizzards, landslides, etc.). The
use of topographic and thematic maps, aerial pho-
tographs and statistical yearbooks for analysis was
inevitable.
- Analyses confirmed that land cover data from various
time horizons are an indispensable condition for suc-
cessful detection of landscape changes. It is one of the
rationales for regular CLC database updating.
- GIS technology makes it possible to produce informa-
tion on landscape changes, determining trends in nat-
ural and social development, and documenting the
rate and scope of the changes.
- Ongoing changes in landscape are permanent and
depend on natural, social, economic and political con-
ditions The structure and character of landscape
changes are variable in a wide scope and depend on
particular driving forces. It is the human factor that is
predominant, at least in the countries studied. For
instance, application of Land Use Act 18/l 991 brought
138

Inventory of major landscape changes JAG l Volume 2 - issue 2 - 2000
about the most extensive changes in Romanian agri-
culture.
- The output maps (Figures 4-7) demonstrate the unique
feature of spatial data. The geographical distribution
of those areas in the Czech Republic, Hungary,
Romania and Slovakia where the greatest landscape
changes occurred are easily discernable. For instance,
areas of the Northwest of the Czech Republic in which
more than 75 percent land surface has changed over
the last dozen years, and a construction site for the
Gabcikovo hydroelectric power plant in Slovakia - are
clearly identifiable.
under different social and economic conditions.
Results obtained demonstrate the significance of peri-
odical up-dating of the CLC database. The up-dated
CLC database will become an irreplaceable informa-
- The PTULC project is one of the first practical large-
scale applications of land cover change identification
(a territory of four European countries with total area
of almost one half million square kilometres was
analysed). Extension of this approach to other
European countries will make it possible to compare
landscape changes that take place in different regions
sage dans les territoires de quatre pays Phare (la Republique Tcheque, la Hongrie, la Roumanie et la Republique Slovaque).
Les changements les plus marques en Slovaquie ont ete la dimi-
Les changements ont ete identifies au niveau national a partir d’images satellite Landsat TM et MSS en appliquant les bases de
nution des for&s de 94.935 ha et des zones d’agriculture hete-
donnees de couverture des terres CORINE pour deux epoques (fin 1970 et debut 1990) au deuxieme niveau hierarchique.
rogene de 18.451 ha ; I’augmentation des zones de transition
Bases sur une causalite identifiee, les changements de paysage ont ete group& en 7 types : agriculture intensive, agriculture
for&- buisson et de zones urbanisees a ete respectivement de
extensive, urbanisation-industrialisation, accroissement (Ppuise-
13.107 ha environ et de 14.990 ha.
ment) des ressources naturelles, boisement, deboisement et autres causes anthropogeniques. Les resultats des groupements sont present& sous la forme de tables de contingence et de cartes montrant la distribution spatiale des changements. Du point de vue de I’etendue totale, le paysage forestier changeait le plus en Republique Tcheque. Ce changement represente une reduction de la for& de 167.702 ha et une augmentation des zones de transition for&-buisson d’environ 26.339 ha. En Hongrie les changements les plus marques ont Pte la diminution des forets de 66.622 ha et la diminution de terres cultivables, de vergers et de vignes de 21.529 ha. Les changements les plus frappants identifies en Roumanie ont ete la diminution des terres cultivables, des for&s, et des marais respectivement de 366.817 ha, 285.887 ha et 59.967 ha ainsi qu’une augmenta- tion des zones de forme de culture comolexe de 347.220 ha.
tion source for landscape change observation in the
whole Europe.
ACKNOWLEDGEMENTS
This paper presents part of the results of the project EEA Phare Topic Link on Land Cover, which is supported by
the Phare Programme. The authors wish to express their
thanks to H. Contrerasova for the revision of English text.
REFERENCES
Feranec, J., M. Suri, J. Otahel, T. Cebecauer, J. Kolar, T. Soukup, D. Zdenkova & V. Vajdea, 1999. inventory and analysis of major land cover changes in Central and Eastern Europe over the past 20 years. PTULC Topic Report, Gisat Praha, 37 pp.
Heymann, Y., Ch. Steenmans, G. Croisille & M. Bossard, 1994. CORINE Land Cover. Technical Guide. Office for Official Publications of the European Communities, Luxembourg, 136 PP.
Martens, B. & E. Lambin, 1999. Modelling land cover dynamics: inte- gration of fine scale land cover data with landscape attributes, JAG 1: 48-52.
Perdigao, V. & A. Annoni, 1997. Technical and Methodological Guide for Updating CORINE Land Cover Data Base. Joint Research Centre, European Environmental Agency, Luxembourg, 124 pp.
RESUME
Une des realisations les plus importantes en 1998-1999 de ’ Phare Topic Link’ sur la couverture des terres a ete le develop- pement et I’application pratique d’une approche methodolo- gique pour I’identification et I’analyse de changements de pay-
RESUMEN
Una de las realizaciones mds importantes del Phare Topic Link sobre Cobertura Vegetal en 1998-l 999 ha sido el desarrollo y la aplicacion practica de un enfoque metodologico para la identifi- caci6n y el analisis de cambios de paisaje en 10s territorios de cuatro paises pertenecientes a Phare (la Republica Checa, Hungria, Rumania, y la Republica Eslovaca). Se identificaron 10s cambios a nivel national a partir de imagenes satelitdrias de Landsat TM y MSS mediante aplicaci6n de las bases de datos de Cobertura Vegetal de CORINE al Segundo nivel jerarquico para dos horizontes temporales (finales de 10s atios 1970 y principios de 10s arias 1990). Los cambios,de paisaje fueron agrupados en siete tipos en base a causas identificadas: intensificaci6n de la agricultura, extensificaci6n de la agricultura, urbanizacion-indus- trializacion, ampliacidn (agotamiento) de 10s recursos naturales, plantaci6n de bosques, deforestaci6n y otras causas antropoge- nicas. Los resultados del agrupamiento se presentan en la forma de tablas de contingencia y de mapas que muestran la distribu- cidn espacial de 10s cambios. Desde el punto de vista de la extensi6n total, el paisaje de bosque es el que mds cambi6 en la Republica Checa. Este cambio representa una reduction de 10s bosques por 167.702 ha y una ampliaci6n de la formaci6n tran- sicional de monte-chaparral por 26.339 ha. En Hungria, 10s cam- bios mas pronunciados fueron una disminucidn de 10s bosques por 66.622 ha y una disminucion de las tierras arables, 10s huer- tos y 10s viriedos por 21.529 ha. Los cambios mas notables iden- tificados en Rumania fueron una disminuci6n de las tierras ara- bles, 10s bosques y 10s humedales por 366.817 ha, 285.887 ha y 59.967 ha, respectivamente, y una ampliacion de las areas con un complejo patr6n de agricultura por aproximadamente 347.220 ha. Los cambios mas marcados en Eslovaquia corres- ponden a una disminuci6n de 10s bosques por 94.935 ha y de las areas agricolas heterogeneas por 18.451 ha; la expansion de las areas transicionales de monte-chaparral y de las areas urbani- zadas fueron de 13.107 ha y 14.990 ha, respectivamente.
139
Top Related
Copyright © 2022 FDOKUMEN

