


Bahasa
Halaman
Hukum


Interaction of 6 Mercaptopurine with Calf Thymus DNA –Deciphering the Binding Mode and Photoinduced DNADamageSayeed Ur Rehman1, Zahid Yaseen2, Mohammed Amir Husain1, Tarique Sarwar1, Hassan Mubarak Ishqi1,
Mohammad Tabish1*
1Department of Biochemistry, Faculty of Life Sciences, A.M. University, Aligarh, Uttar Pradesh, India, 2Department of Chemistry, Faculty of Sciences, A.M. University,
Aligarh, Uttar Pradesh, India
Abstract
DNA is one of the major intracellular targets for a wide range of anticancer and antibiotic drugs. Elucidating the bindingbetween small molecules and DNA provides great help in understanding drug-DNA interactions and in designing of newand promising drugs for clinical use. The ability of small molecules to bind and interfere with DNA replication andtranscription provides further insight into how the drugs control the expression of genes. Interaction of an antimetaboliteanticancer drug 6mercaptopurine (6MP) with calf thymus DNA was studied using various approaches like UV-visiblespectroscopy, fluorescence spectroscopy, CD, viscosity and molecular docking. UV-visible spectroscopy confirmed 6MP-DNAinteraction. Steady state fluorescence experiments revealed a moderate binding constant of 7.486103 M21 which wasconsistent with an external binding mode. Competitive displacement assays further confirmed a non-intercalative bindingmode of 6MP which was further confirmed by CD and viscosity experiments. Molecular docking further revealed theminimum energy conformation (2119.67 kJ/mole) of the complex formed between DNA and 6MP. Hence, the biophysicaltechniques and in-silico molecular docking approaches confirmed the groove binding/electrostatic mode of interactionbetween 6MP and DNA. Further, photo induced generation of ROS by 6MP was studied spectrophotometrically and DNAdamage was assessed by plasmid nicking and comet assay. There was a significant increase in ROS generation andconsequent DNA damage in the presence of light.
Citation: Rehman SU, Yaseen Z, Husain MA, Sarwar T, Ishqi HM, et al. (2014) Interaction of 6 Mercaptopurine with Calf Thymus DNA – Deciphering the BindingMode and Photoinduced DNA Damage. PLoS ONE 9(4): e93913. doi:10.1371/journal.pone.0093913
Editor: Heidar-Ali Tajmir-Riahi, University of Quebect at Trois-Rivieres, Canada
Received January 4, 2014; Accepted March 10, 2014; Published April 9, 2014
Copyright: � 2014 Rehman et al. This is an open-access article distributed under the terms of the Creative Commons Attribution License, which permitsunrestricted use, distribution, and reproduction in any medium, provided the original author and source are credited.
Funding: The authors are thankful to the Council of Scientific and Industrial Research, New Delhi, for the award of CSIR-SRF fellowship to SUR and A.M.U., Aligarhfor providing the necessary facilities. They also thank University Grants Commission, New Delhi for providing financial assistance to their department under theDRS-III program and Advance Instrumentation Research Facility, Jawaharlal Nehru University, New Delhi, where CD experiments were performed. The funders hadno role in study design, data collection and analysis, decision to publish, or preparation of the manuscript.
Competing Interests: The authors have declared that no competing interests exist.
* E-mail: [email protected]
Introduction
Interaction between drug molecules and DNA has become an
active area of research in recent years [1–2]. DNA is one of the
most important bio-macromolecule since it controls the structure
and function of the cell. It is also a major intracellular target for a
wide range of anticancer and antibiotic drugs [3–4]. Several
studies have been conducted to elucidate the binding of these small
molecules and DNA that provide great help in understanding
drug-DNA interaction and in designing of new and promising
drugs for clinical use. The ability of small molecules to bind and
interfere with DNA replication and RNA transcription provides
further insight into how the drugs control the expression of genes
[5–7]. Interaction of small molecules and DNA are mainly of two
types, covalent interactions and non-covalent interactions. Three
major modes of non-covalent interactions are electrostatic
interactions, groove binding and intercalative binding. Small
molecule can interact with DNA involving a single mode of
binding or mixed binding modes. It is worth noting that the
property of mixed binding mode can be linked to their mechanism
of action and therapeutic efficiency [8,9]. Studying DNA as a drug
target is attractive due to the availability of the well-studied three-
dimensional DNA structures and the predictability of their
accessible chemical functional groups. However, the number of
known DNA-based drug targets is still very limited in comparison
to the protein-based drug targets [10].
6 Mercaptopurine (6MP) is an anticancer drug commonly used
to treat childhood acute lymphoblastic leukemia. It is also used as
an immunosuppressive as well as anti inflammatory drug. 6MP
comes under the antimetabolite class of anticancer drug that leads
to inhibition of purine de novo synthesis. 6MP metabolism in cell
leads to the formation of 6 thioguanine (6-TG) that further gets
incorporated in DNA. After being methylated, 6meTG mispairs
with thymine (T) in subsequent replications that invokes mismatch
repair system which is lethal [11]. 6MP is also found to control the
expression of various genes in cell where it up-regulate certain
genes (abcc4, xdh, krt2-7) or down-regulate some genes (abcc8,
Hoxa13) [12,13]. Although their metabolism has been studied in
detail, the precise molecular events that underlie their therapeutic
activity have remained unclear. Due to direct or indirect
interaction of 6MP with different genes/products, study of 6MP-
PLOS ONE | www.plosone.org 1 April 2014 | Volume 9 | Issue 4 | e93913

DNA interaction under physiological conditions was of high
significance.
In the present study we have evaluated the interaction of 6MP
and DNA in vitro by using various biophysical techniques and in-
silico by exploiting molecular docking. UV-visible spectroscopy was
used to determine the binding mode as well as the stability of
DNA-drug complex [14–16]. Steady state fluorescence, circular
dichroism (CD) spectroscopy and viscosity experiments were
employed to get into the insight of drug-DNA interaction.
Molecular docking further revealed the minimum energy isomer
of the complex formed between DNA and 6MP. Several studies
were also conducted to assess the DNA damage caused by 6MP
induced ROS generation in presence of light.
Materials and Methods
Materials6 Mercaptopurine (6MP), calf thymus DNA (CT-DNA),
acridine orange (AO) and Hoechst 33258 were purchased from
Sigma Aldrich, USA. Ethidium bromide (EB) was purchased from
Himedia, India. Plasmid pBR322 was purified according to
method described earlier [17]. All the other chemicals and solvents
were of reagent grade and used without purification.
Sample PreparationStock solution of 6MP was prepared in DMSO. CT-DNA was
suspended in 10 mM Tris-HCl buffer (pH 7.2) at 4uC for 24 h
with occasional mixing by vortex to ensure the formation of a
homogeneous solution. To check the purity of DNA solution,
absorbance ratio A260/A280 was recorded. No further purification
was required since the attenuance ratio was between 1.8 and 1.9.
Various concentration of DNA solutions were used in different
experiments after determining its concentration spectrophotomet-
rically using average molar extinction coefficient value of
6600 M21 cm21 of a single nucleotide at 260 nm. All reactions
were done in presence of 10 mM Tris-HCl buffer (pH 7.2) at
room temperature.
UV-visible SpectroscopyUV-visible spectra were recorded on Beckman DU 40
spectrophotometer (USA) using a cuvette of 161cm path length.
Spectra of 6MP and 6MP-DNA complex were measured in the
wavelength range of 300–400 nm. Increasing concentration of
CT-DNA was titrated against 25 mM of 6MP.
Fluorescence StudiesFluorescence emission spectra of 6MP were recorded on a
Shimadzu spectroflurometer-5000 (Japan) equipped with xenon
flash lamp using 1.0 cm quartz cells. Excitation was fixed at
280 nm [18] and emission spectra were recorded from 300 nm to
500 nm after setting the widths of both the excitation and the
emission slits at 10 nm. Appropriate blanks corresponding to the
buffer were subtracted to correct the background fluorescence.
The fluorescence titration was carried out by keeping the
concentration of 6MP constant (50 mM) and varying DNA
concentration (0–45 mM). In case of EB displacement assay, a
solution containing 2 mM of EB and 20 mM of DNA was titrated
with increasing concentration of 6MP. EB-DNA complex was
excited at 471 nm and emission spectra were recorded from 500–
700 nm. In another experiments, AO-DNA complex was excited
at 490 nm while DNA-Hoechst 33258 complex was excited at
343 nm and emission spectra were recorded from 500–600 nm
and 360–600 nm respectively. Iodide quenching experiments were
performed in presence and absence of DNA. Emission spectra
were recorded either in presence or absence of 50 mM DNA in
3ml reaction mixture which included 50 mM 6MP, 10 mM Tris-
HCl (pH 7.2) and varying concentration of KI between 0–8 mM.
Excitation was done at 280 nm and emission spectra were
recorded from 300–500 nm. Effect of ionic strength was studied
by varying the concentration of NaCl between 0–70 mM in total
volume of 3 ml containing 50 mM 6MP, 50 mM CT-DNA and
10 mM Tris-HCl (pH 7.2). Excitation was done at 280 nm and
emission spectra were recorded between 300–500 nm.
Figure 1. Interaction of 6MP with CT-DNA. UV-visible absorption spectra of 6MP (25 mM) in presence of increasing concentrations of CT-DNA inTris-HCl buffer (pH 7.2). Hyperchromism was observed with increasing concentration of CT-DNA confirming the interaction of 6MP and DNA.Structure of 6 Mercaptopurine is shown in the inset.doi:10.1371/journal.pone.0093913.g001
6MP-DNA Interaction and Phototoxicity
PLOS ONE | www.plosone.org 2 April 2014 | Volume 9 | Issue 4 | e93913
Circular Dichroism (CD) StudiesCD spectra of DNA alone and 6MP-DNA complex were
recorded using Applied Photophysics CD spectrophotometer
(model CIRASCAN, U.K.) equipped with a Peltier temperature
controller to keep the temperature of the sample constant at 25uC.
All the CD spectra were recorded in a range from 200 nm to
320 nm with a scan speed of 200 nm/min with a spectral band
width of 10 nm. Average of three scans was taken in all
experiments. Background spectrum of buffer solution (10 mM
Tris-HCl, pH 7.2) was subtracted from the spectra of DNA and
6MP-DNA complex.
Viscosity MeasurementTo further elucidate the binding mode of 6MP, viscosity
measurements were carried out by keeping DNA concentration
constant (100 mM) and varying the concentration of 6MP.
Viscosity measurements were carried out with an Ubbelohde
viscometer (Cannon, Model-9721-K56, Cole-Parmer, USA) sus-
pended vertically in a thermostat at 25uC (accuracy +0.1uC). The
flow time was measured with a digital stopwatch, and each sample
was tested three times to get an average calculated time. The data
were presented as (g/g0) versus ratio of DNA/6MP concentra-
tions, where g and g0 are the viscosity of DNA in the presence
and absence of 6MP.
Molecular DockingHEX 6.3, a molecular graphics program, was used to study the
6MP-DNA interaction. Structure of the B–DNA dodecamer
d(CGCGAATTCGCG)2 (PDB ID: 1BNA) was downloaded from
the protein data bank (http://www.rcsb.org./pdb). Mol file of
6MP was obtained from http://www.drugbank.ca/drugs/
DB01033 and further converted into PDB format using Avoga-
dro’s 1.01. The Hex 6.3 performs docking using Spherical Polar
Fourier Correlations. It necessitates the ligand and the receptor as
input in PDB format. The parameters that were used for docking
include: correlation type – shape only, FFT mode –3D, grid
dimension –0.6, receptor range –180, ligand range –180, twist
range –360, distance range –40. PyMol software was used for
visualization of the docked pose.
ROS Generation and DNA Damage AssessmentSuperoxide generation assay. Superoxide generation by
6MP was studied by nitroblue tetrazolium (NBT) reduction assay
[19]. Assay mixture contained 10 mM sodium phosphate buffer
(pH 7.8), 0.5 mM NBT, 0.1 mM EDTA and 0.06% Triton X-
100 in a total reaction mixture of 3 ml. After mixing, samples were
placed in front of white fluorescent lamp at a distance of 10 cm
and absorbance was recorded at 560 nm using a suitable blank.
Concentration dependent generation of superoxide in presence of
white light was studied. There was no observable change in the
temperature of the solution at the end of experiment.
Plasmid Nicking AssayTo examine the generation of nicks in double stranded DNA by
ROS generated by 6MP, plasmid nicking assay was performed.
Reaction mixture contained 0.5 mg pBR322 plasmid DNA,
desired concentration of 6MP and 10 mM Tris-HCl (pH 7.2)
was added to a final volume of 25 ml in all the tubes. Irradiation
was performed with white light for 4 h at 37uC. After incubation,
5 ml of 6X tracking dye solution containing (40 mM EDTA,
0.05% bromophenol blue and 50% glycerol) was added and the
reaction mixture was subjected to electrophoresis using 1% (w/v)
agarose gel. Gel was stained with EB and photographed on a UV-
transilluminator.
Comet AssayDNA damage caused by 6MP in dark, and in presence of light
was analysed using comet assay. Fresh blood samples (3ml) were
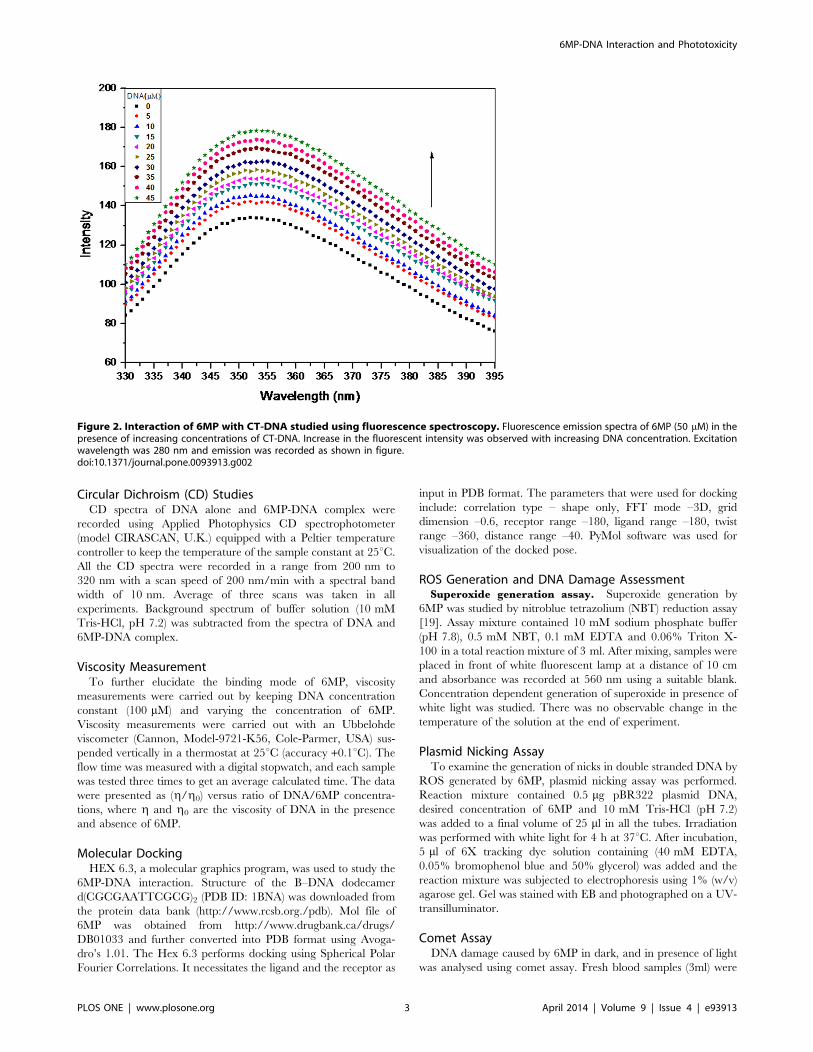
Figure 2. Interaction of 6MP with CT-DNA studied using fluorescence spectroscopy. Fluorescence emission spectra of 6MP (50 mM) in thepresence of increasing concentrations of CT-DNA. Increase in the fluorescent intensity was observed with increasing DNA concentration. Excitationwavelength was 280 nm and emission was recorded as shown in figure.doi:10.1371/journal.pone.0093913.g002
6MP-DNA Interaction and Phototoxicity
PLOS ONE | www.plosone.org 3 April 2014 | Volume 9 | Issue 4 | e93913
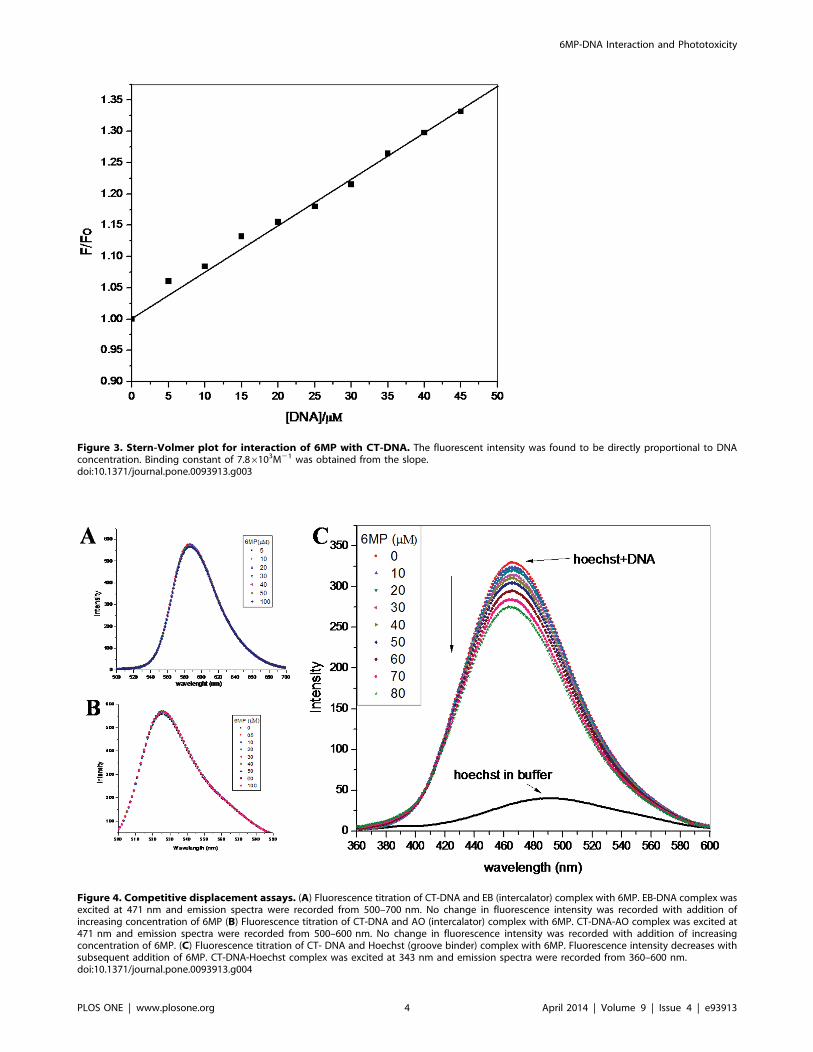
Figure 3. Stern-Volmer plot for interaction of 6MP with CT-DNA. The fluorescent intensity was found to be directly proportional to DNAconcentration. Binding constant of 7.86103M21 was obtained from the slope.doi:10.1371/journal.pone.0093913.g003
Figure 4. Competitive displacement assays. (A) Fluorescence titration of CT-DNA and EB (intercalator) complex with 6MP. EB-DNA complex wasexcited at 471 nm and emission spectra were recorded from 500–700 nm. No change in fluorescence intensity was recorded with addition ofincreasing concentration of 6MP (B) Fluorescence titration of CT-DNA and AO (intercalator) complex with 6MP. CT-DNA-AO complex was excited at471 nm and emission spectra were recorded from 500–600 nm. No change in fluorescence intensity was recorded with addition of increasingconcentration of 6MP. (C) Fluorescence titration of CT- DNA and Hoechst (groove binder) complex with 6MP. Fluorescence intensity decreases withsubsequent addition of 6MP. CT-DNA-Hoechst complex was excited at 343 nm and emission spectra were recorded from 360–600 nm.doi:10.1371/journal.pone.0093913.g004
6MP-DNA Interaction and Phototoxicity
PLOS ONE | www.plosone.org 4 April 2014 | Volume 9 | Issue 4 | e93913

obtained from healthy volunteers by vein puncture and stored in
presence of heparin to avoid clotting. Lymphocytes were isolated
from the diluted blood using Histopaque 1077 (HiMedia) and
suspended in RPMI 1640. Trypan Blue Exclusion test [20] was
performed before the start and at the end of experiment to check
the viability of lymphocytes. Lymphocytes (16105 cells) were
exposed to different concentrations of 6MP in dark and in
presence of light in a total reaction volume of 500 ml that also
Figure 5. KI quenching experiment. Stern-Volmer plot for fluorescence quenching of 6MP (50 mM) by KI in absence and presence of CT-DNA(100 mM). Quenching of 6MP fluorescent intensity was done using KI in absence and presence of CT-DNA and quenching constant was calculated inboth the case. Difference in Ksv value was further used to investigate the binding mode of 6MP and DNA.doi:10.1371/journal.pone.0093913.g005
Figure 6. Role of ionic strength. To study the role of electrostatic effect on 6MP-DNA binding, NaCl was used. Maximum emission intensity plot of6MP-DNA was plotted with increasing concentration of NaCl (0–70mM). Excitation wavelength was 280 nm. Increase in fluorescence intensitysuggests for a possible electrostatic interaction between 6MP and CT-DNA.doi:10.1371/journal.pone.0093913.g006
6MP-DNA Interaction and Phototoxicity
PLOS ONE | www.plosone.org 5 April 2014 | Volume 9 | Issue 4 | e93913

included Ca2+ and Mg2+ free PBS and RPMI 1640. Incubation
was performed for 2 h at 37uC and the mixture was centrifuged at
5000 rpm to collect the lymphocyte. The cell pellet was further
suspended in 100 ml Ca2+ and Mg2+ free PBS and further
processed for comet assay. Single cell alkaline gel electrophoresis
was performed as described earlier [21,22]. Analysis of the slides
was done same day and cells were scored using image analysis
system (Komet 5.5; Kinetic Imaging, Liverpool, UK) attached to
an Olympus (CX41) fluorescent microscope (Olympus Optical Co,
Tokyo, Japan) and a COHU 4910 integrated CC camera
equipped with 510–560 nm excitation and 590 nm barrier filters
(COHU, San Diego, CA, USA). Images from 50 cells (25 from
each replicate slide) were analysed. Migration of DNA from the
nucleus i.e. tail length was measured as the main parameter to
assess lymphocyte DNA damage.
Figure 7. Effect of 6MP on CD spectra of CT-DNA. CD spectra of CT-DNA (30 mM) in 10mM Tris-HCl (pH 7.2) with the addition of varyingconcentration of 6MP. Each spectrum was obtained at 25uC with a 10 mm path length cell.doi:10.1371/journal.pone.0093913.g007
Figure 8. Effect of increasing the concentration of 6MP on the viscosity of CT-DNA. The concentration of CT-DNA was kept constant(100 mM) with increasing amount of 6MP. Values reported are mean of three independent experiments.doi:10.1371/journal.pone.0093913.g008
6MP-DNA Interaction and Phototoxicity
PLOS ONE | www.plosone.org 6 April 2014 | Volume 9 | Issue 4 | e93913

Figure 9. Molecular docked structure of 6MP complex with DNA. Dodecamer duplex sequence (CGCGAATTCGCG)2 (PDB ID: 1BNA) was usedin the docking studies. The binding energy of the complex system was found to be 2116.97 kJ/mole.doi:10.1371/journal.pone.0093913.g009
Figure 10. 6MP induced generation of superoxide anion. Concentration dependent photo generation of superoxide anion by 6MP. Indicatedconcentration of 6MP was exposed to white light for 1h at RT and absorbance was measured at 560 nm. Values reported are 6SEM of threeindependent experiments. *p value ,0.01 when compared to control.doi:10.1371/journal.pone.0093913.g010
6MP-DNA Interaction and Phototoxicity
PLOS ONE | www.plosone.org 7 April 2014 | Volume 9 | Issue 4 | e93913

Figure 11. 6MP induced damage to plasmid DNA in presence of light. Agarose gel electrophoresis pattern of ethidium bromide stainedpBR322 DNA after the treatment with 6MP in presence of white light. Lane ‘A’ depicts the ‘Control’ which contain only plasmid DNA. Theconcentrations of 6MP in lanes ‘B–F’ was 100, 200, 300, 400 and 500 mM respectively. Arrows indicating OC and SC on the right represent the opencircular and supercoiled forms of plasmid DNA.doi:10.1371/journal.pone.0093913.g011
Figure 12. 6MP induced human lymphocyte DNA breakage. Comet tail length obtained after treatment with 6MP in dark and light. Valuesreported are 6SEM of three independent experiments. *p value ,0.01 when compared to control.doi:10.1371/journal.pone.0093913.g012
6MP-DNA Interaction and Phototoxicity
PLOS ONE | www.plosone.org 8 April 2014 | Volume 9 | Issue 4 | e93913

Result and Discussion
UV–Visible SpectroscopyInteraction of small molecules with DNA is easily studied and
interpreted using UV-visible spectroscopy. We exploited this
technique to investigate 6MP-DNA interaction. 6MP alone shows
maximum absorption near 320 nm. On subsequent addition of
CT-DNA, hyperchromism was observed with no apparent shift in
the position of maximum absorption peak (Figure 1). It is well
known that intercalation of small molecules into the DNA helix
results in bathochromic shift as well as hypochromism [23]. Since
bathochromic shift or hypochromism was not observed on 6MP
and CT-DNA interaction, intercalation mode of binding can be
excluded in case of 6MP. However, the absence of any clear
isobestic point in the 6MP-DNA spectra indicates that more than
one type of binding may be present or 1:1/drug: DNA
stoichiometry is not maintained during the process [24]. The
exact mode of interaction cannot be established merely by this
technique, hence further experiments were required to explore the
binding mode.
Steady State FluorescenceTo further elucidate the interaction of 6MP with CT-DNA,
steady state fluorescence was employed in our study. Since the
endogenous fluorescence property of DNA is poor, we studied the
fluorescence spectra of 6MP in all subsequent studies. Emission
spectra of 6MP in 10mM Tris-HCl, pH 7.2, showed a broad
unstructured peak with maxima around 350 nm (Figure 2). On
addition of CT-DNA, enhancement in the fluorescence yield
occurred with no detectable shift in the absorption peak position.
This hyperchromism establishes the binding interaction of 6MP
with CT-DNA. To further understand the interaction, ratio of
peak fluorescence intensity in presence and in absence of CT-
DNA (F/F0) was plotted as a function of DNA concentration
(Figure 3). The plot indicated that the fluorescent intensity is
directly proportional to the CT-DNA concentration. Further, Ksv
(Stern–Volmer quenching constant) was calculated since it is
considered as a measure for efficiency of fluorescence quenching
by DNA. Ksv was obtained from the slope of Figure 3 and was
calculated to be 7.486103 M21, which was much lower than the
other classical intercalators [25–26] and hence indicating less
possibility of intercalation of 6MP with CT-DNA. Thus, 6MP is
suggested to interact with DNA via non-intercalative binding
mode.
Competitive Displacement AssayDNA binding dyes are extensively used to study the mode of
drug-DNA interaction. Binding of such dyes to DNA are well
studied and their binding mode is well established. Any small
molecule that competitively replaces a bound dye from DNA helix
is expected to bind the DNA in similar fashion as the bound dye
[27–30]. Thus any change in fluorescence intensity of dye-DNA
complex on addition of small molecule is easily interpreted. EB is a
well known probe that binds to the DNA in intercalative fashion
[27]. Since EB works as an excellent spectral probe to investigate
the binding mode of drug with DNA, it was used to confirm the
mode of binding of 6MP to CT-DNA. With continuous addition
of 6MP to the system, there was no significant change in the
fluorescence intensity (Figure 4A). This suggested that 6MP does
not replace EB from CT-DNA helix as 6MP binds to CT-DNA in
non-intercalative mode. To further confirm the binding mode, we
used AO in a similar competitive replacement assay. AO is a
classical intercalating dye [28] and it was not replaced by 6MP as
expected (Figure 4B). In another experiment, Hoechst 33258,
which binds to the minor groove of double stranded B-DNA [29],
was used to study competitive replacement by groove binders.
Hoechst 33258 on binding with DNA showed enhancement in the
fluorescence intensity [30]. Groove binding molecules are able to
displace Hoechst 33258 from the minor groove of DNA helix,
resulting in decreased fluorescence intensity of DNA-Hoechst
system. On addition of 6MP, the fluorescent intensity of Hoechst-
DNA system was found to decrease as 6MP could replace the
groove bounded dye from the CT-DNA (Figure 4C). This further
suggested the binding mode of 6MP to be groove binding rather
than intercalation.
Iodide Quenching StudiesIodide ion quenching experiments provide great help in
deducing the binding interaction of drug with DNA [31–33].
Iodide ions, being negatively charged, can effectively quench the
fluorescence of small molecules in an aqueous medium. However,
in presence of DNA, iodide ions are repelled by negatively charged
phosphates present in DNA backbone. Any small molecule
intercalated into the DNA helix is well protected as the approach
of anionic quenchers towards such molecule is restricted.
However, this is not the case with electrostatic binding and
groove binding molecules which are exposed to the external
environment and are easily approachable for quenchers even in
presence of DNA [31]. The relative accessibility of small molecules
to anionic quencher in free medium and in presence of DNA is
studied by calculating Ksv using Stern-Volmer equation
F0=F ~ 1zKsv½Q�
where F0 and F are the highest fluorescence intensity in the
absence and presence of the anionic quencher [Q]. Ksv is Stern-
Volmer quenching constant calculated from the slope of [F0/F] vs
[Q] plot. Ksv obtained in absence and presence of DNA
environment signifies the binding mode of drug. Relative decrease
in Ksv in presence of DNA occurs in case of intercalation, however
it remains unchanged when interaction is electrostatic or groove
binding. As seen in Figure 5, KI could effectively quench the
fluorescence of 6MP in a buffer solution and a Ksv value of
26.51 M21 was obtained. However, in presence of CT-DNA,
there was an increase in the Ksv value to 32.61 M21. Since, earlier
experiments suggested for a groove binding mode of interaction
between 6MP and DNA, relatively similar Ksv value was expected
in KI quenching studies. However, this unexpected increase in
Ksv value, decrease in fluorescence yield, can be explained by
involving the role of ionic strength. Firstly, on addition of KI there
is increase in the ionic strength in the medium resulting in the
release of DNA bound 6MP. Since the fluorescence intensity of
free 6MP is less than 6MP-DNA complex, there is a decrease in
fluorescence yield. Also, KI effectively quenches the fluorescence
of free 6MP in solution. Hence two factors operate together
resulting in enhanced quenching of fluorescence intensity by KI in
presence of DNA causing an increased Ksv value. Thus, it can be
confirmed that groove binding mode of interaction occurs between
6MP and DNA.
Effect of Ionic StrengthStudying the effect of ionic strength is also a resourceful method
to differentiate the binding mode between small molecules and
DNA. Generally, strong electrolyte such as NaCl is used where the
addition of NaCl does not affect the fluorescence yield of drug
alone. In presence of DNA, Na+ partly neutralizes the negative
charges of DNA phosphate backbone resulting in reduced
6MP-DNA Interaction and Phototoxicity
PLOS ONE | www.plosone.org 9 April 2014 | Volume 9 | Issue 4 | e93913

electrostatic repulsion between them. The electrostatic attraction
between small molecule and DNA surface is weakened by the
addition of Na+. In case of surface binding molecules, the
electrostatic binding takes place out of the groove, addition of
NaCl will weaken the interaction resulting in the weakening of
quenched fluorescent intensity [34]. In our study, addition of NaCl
to 6MP-DNA complex (Figure 6) increased the fluorescence
intensity. This observation could be explained on the basis that the
negative charge of DNA phosphate backbone is neutralised with
the addition of NaCl causing negatively charged 6MP to further
interact with DNA resulting in enhanced fluorescence intensity.
This enhancement may have masked the probable decrease in the
electrostatic interaction on increasing the ionic strength. Thus,
electrostatic interaction between 6MP and DNA cannot be ruled
out.
Circular Dichroism StudiesCD spectroscopy is a sensitive technique to detect any alteration
in the DNA backbone. Non covalent DNA-drug interactions affect
the structure of the DNA, and hence alter their intrinsic CD
spectral behaviour [35]. As seen in figure 7, the CD spectrum of
free CT-DNA in Tris-HCl at pH 7.2 showed a positive peak at
277 nm and a negative peak at 245nm which represents the right-
handed B-form with 10.4 base pairs per turn. In CD spectrum of
CT-DNA alone, there are four major bands i.e. at 277 nm
(positive), 243 nm (negative), 223 nm (positive) and 213 nm
(negative). The positive band at ,277 nm is due to base stacking
and helicity is responsible for a negative band at ,243 nm which
is a characteristic of right-handed B form DNA [36–38]. These
bands are considered to be highly sensitive toward interaction of
small molecules with DNA [39,40]. It is known that binding of a
molecule with DNA may stabilize or destabilize the DNA
structure. Secondary structure of DNA is altered by intercalation
with small molecules [41,42]. However, minor groove binders do
not perturb the CD spectrum of DNA significantly. In order to
obtain further information about the binding of 6MP to DNA, we
recorded the CD spectra of CT-DNA with increasing concentra-
tion (0–150 mM) of 6MP (Figure 7). There was no noticeable
change in the CD spectra confirming the absence of intercalation
of 6MP within DNA strands.
Viscosity MeasurementViscosity measurement of drug-DNA complex provides reliable
evidence to study the mode of interaction. In case of intercalative
mode of binding, length of DNA helix is increased due to
separation of base pairs resulting in increased viscosity of DNA
[43,44]. On the other hand, if the drug interacts with DNA via
electrostatic/groove binding mode, viscosity of DNA solution does
not change significantly [45–47]. A plot of (g/g0)1/3 versus
[6MP]/[DNA] was obtained to study any change in viscosity of
CT-DNA solution in presence of 6MP. As seen in Figure 8, with
continuing addition of 6MP to CT-DNA solution, viscosity of CT-
DNA solution remains the same. This confirms that 6MP binds to
DNA via external binding mode and hence does not intercalate
into DNA helix.
Molecular DockingMolecular docking techniques are an attractive scaffold to
understand the drug–DNA interactions in rational drug design, as
well as in the mechanistic study by placing a small molecule into
the binding site of the target specific region of the DNA mainly in
a non-covalent fashion. Structure of drug is made flexible to attain
different conformations in order to predict the best fit orientation,
and the best energy docked structure is analyzed. Figure 9 shows
the minimized orientation of minor groove interaction of 6MP
with DNA. The minimized conformation of 6MP sitting in the
groove of the sequence d(CGCGAATTCGCG)2 does not show
hydrogen bonding with the base pairs of dodecamer. The binding
energy of the complex system was 2116.97 kJ/mole. Even in the
presence of similar charge on 6MP and DNA backbone, the
negative value of binding energy indicated binding potential of
6MP with DNA. The docking result further supported the groove
binding mode between 6MP and DNA that was earlier obtained
with the help of spectral techniques.
Photo-induced ROS generation and DNA damage by
6MP. 6MP induced DNA damage in presence of light was
studied using various techniques. In NBT assay, upon induction
with white light 6MP produces superoxide anion, these superoxide
anion reduce NBT via a one-electron transfer reaction, producing
partially reduced (2e2) monoformazan (NBT+) as a stable
intermediate, whose formation can be recorded spectrophotomet-
rically at 560 nm. With increasing concentration of 6MP, there
was a consistent increase in the generation of superoxide anions in
presence of white light (Figure 10).
To further study DNA damaging ability of 6MP induced ROS
in presence of light, plasmid nicking assay was performed. Plasmid
nicking assay is a sensitive method to detect DNA damage directly
caused by any interacting small molecule/drug. Various concen-
trations of 6MP used in the present study in absence of light did
not cause any nick in double stranded plasmid DNA. However, in
the presence of white light, there was an increase in formation of
open circular form of plasmid DNA due to nicking caused by 6MP
induced ROS. As seen in Figure 11, increase in the intensity of the
open circular form and decrease in the intensity of a DNA band
corresponding to super coiled DNA depicts the plasmid DNA
strand breaks activity. It is well documented that ROS such as
singlet oxygen and superoxide act as major toxic mediators in the
upstream of drug-induced phototoxic cascades [48]. To further
study the 6MP induced DNA damage in the cell, single cell gel
electrophoresis (comet assay) was performed using human
lymphocyte. Comet assay is a simple, rapid and sensitive method
for detecting DNA damage [21]. It is also very often used to detect
DNA cross links, presence of alkali labile sites and incomplete
excision repair sites apart from finding great application in
genotoxicological studies [22]. Cells treated with test compounds
are subjected to unwinding and electrophoresis at neutral pH (to
detect double strand breaks) or alkaline pH (to detect single strand
breaks) after cell lysis in high salt concentration. In presence of
electric field, DNA migrates towards the positive electrode and a
comet like pattern is observed after final processing. Comet
consists of a head and a tail that includes undamaged and
damaged DNA respectively. In absence of light, 6MP caused little
damage to lymphocyte DNA. This observation can be attributed
to the presence of various metals ions associated with DNA. In a
study (result not shown) we have shown the redox cycling of
copper, one of the metal ions associated with DNA, by 6MP and
subsequent generation of ROS that damage DNA. However, in
presence of light, degree of damage was high as increase in tail
length was observed (Figure 12). This is possible due to enhanced
ROS generation by 6MP in presence of light.
In conclusion, we have studied the mode of interactions
between 6MP and DNA using various approaches and confirmed
that there could be mixed type of binding interactions. Groove
binding of 6MP to DNA was confirmed while role of electrostatic
interactions cannot be ruled out. However, 6MP does not
intercalate into the strands of DNA. In absence of light, under
observed concentration, 6MP did not cause nick in plasmid DNA.
However, DNA damage was observed when 6MP-DNA was
6MP-DNA Interaction and Phototoxicity
PLOS ONE | www.plosone.org 10 April 2014 | Volume 9 | Issue 4 | e93913

exposed to light in plasmid nicking assay. In case of comet assay,
there was a noticeable damage to DNA even in absence of light.
However, the damage was enhanced to a greater extent in
presence of light. Our present study clearly demonstrated the
photogenotoxic action of 6MP probably mediated by ROS. This
study could also be useful to classify drug as phototoxic or non-
phototoxic and also provide a deep insight in determining the
mechanism of action of various drugs.
Author Contributions
Conceived and designed the experiments: SUR ZY MAH TS HMI MT.
Performed the experiments: SUR ZY MAH TS HMI. Analyzed the data:
SUR ZY MAH TS MT. Contributed reagents/materials/analysis tools:
ZY MAH TS HMI. Wrote the paper: SUR ZY MT.
References
1. Rauf S, Gooding JJ, Akhtar K, Ghauri MA, Rahman M et al. (2005)
Electrochemical approach of anticancer drugs–DNA interaction. J Pharm
Biomed Anal 37: 205–17.
2. Li J, Shuang S, Dong C (2009) Study on the phosphorescence characterizations
of palmatine chloride on the solid substrate and its interaction with ctDNA.
Talanta 77: 1043–9.
3. Hurley LH (2002) DNA and its associated processes as targets for cancer
therapy. Nat Rev Cancer 2: 188–200.
4. Liu YJ, Wei XY, Wu FH, Mei WJ, He LX (2008) Interaction studies of DNA
binding of ruthenium(II) mixed-ligand complexes: [Ru(phen)2(dtmi)]2+ and
[Ru(phen)2(dtni)]2+. Spectrochim Acta A 70: 171–176.
5. Shi Y, Guo C, Sun Y, Liu Z, Xu F et al. (2011) Interaction between DNA and
microcystin-LR studied by spectra analysis and atomic force microscopy.
Biomacromolecules 12: 7972803.
6. Ding YH, Zhang L, Xie J, Guo R (2010) Binding characteristics and molecular
mechanism of interaction between ionic liquid and DNA. J Phys Chem B 114:
203322043.
7. Elder RM, Emrick T, Jayaraman A (2011) Understanding the effect of polylysine
architecture on DNA binding using molecular dynamics simulations. Bioma-
cromolecules 12: 387023879.
8. Chen AY, Liu LF (1994) DNA Topoisomerases: Essential Enzymes and Lethal
Targets. Annu Rev Pharmacol Toxicol 34: 191–218.
9. Pilch DS, Kirolos MA, Liu X, Plum GE, Breslauer KJ (1995) Berenil [1,3-bis(49-
amidinophenyl)triazene] Binding to DNA Duplexes and to a RNA Duplex:
Evidence for Both Intercalative and Minor Groove Binding Properties.
Biochemistry 34: 9962–9976.
10. Berman HM, Westbrook J, Feng Z, Gilliland G, Bhat TN et al. (2000) The
Protein Data Bank. Nucleic Acids Res 28: 235–242.
11. Swann PF, Waters TR, Moulton DC, Xu YZ, Zheng Q et al. (1996) Role of
postreplicative DNA mismatch repair in the cytotoxic action of thioguanine.
Science 273: 1109–1111.
12. Taki K, Fukushima T, Ise R, Horii I, Yoshida T (2013) Microarray analysis of 6-
mercaptopurine-induced-toxicity-related genes and microRNAs in the rat
placenta. J Toxicol Sci 38: 159–167.
13. Kim HL, Kim HN, Lee EJ (2006) Gene Expression Profiling of 6-MP (6
mercaptopurine) in Liver. Genomics & Informatics 4: 16–22.
14. Kypr J, Kejnovska I, Renciuk D, Vorlıckova M (2009) Circular dichroism and
conformational polymorphism of DNA. Nucleic Acids Res 37: 1713–1725.
15. Sprecher CA, Baase WA, Johnson WC (1979) Conformation and circular
dichroism of DNA. Biopolymers 18: 1009–1019.
16. Hillen W, Wells RD (1980) Circular dichroism studies of the B goes to A
conformational transition in seven small DNA restriction fragments containing
the Escherichia coli lactose control region. Nucleic Acids Res 8: 5427–5444.
17. Maniatis T, Fritsch EF, Sambrook J (1982) Molecular Cloning: A Laboratory
Manual. NY: Cold Spring Harbor Laboratory.
18. Chuan D, Li-hua D, Yu-xia W, Jun-fen L, Yan-li W (2003) Spectroscopy
behavior of 6-Mercaptopurine, Azathiopurine, and 8-Azaguanine. Spectrochim
Acta A Mol Biomol Spectrosc 59: 3131–7.
19. Nakayama T, Kimura T, Kodama M, Nagata C (1983) Generation of hydrogen
peroxide and superoxide anion from active metabolites of naphthylamine and
amino azo dyes: its possible role in carcinogenesis. Carcinogenesis 4: 765–769.
20. Pool-Zobel BL, Guigas C, Klein RG, Neudecker CH, Renner HW et al. (1993)
Assessment of genotoxic effects by lindane. Food and Chemical Toxicology 31:
271–283.
21. Singh NP, McCoy MT, Tice RR, Schneider EL (1998) A simple technique for
quantitation of low levels of DNA damage in individual cells. Experiment Cell
Research 175: 184–191.
22. Tice RR, Agurell E, Anderson D, Burlinson B, Hartmann A et al. (2000) Single
cell gel/comet assay; guidelines for in vitro and in vivo genetic toxicology
testing. Environmental and Molecular Mutagenesis 35: 206–221.
23. Pyle AM, Rehmann JP, Meshoyrer R, Kumar CV, Turro NJ et al. (1989)
Mixed-ligand complexes of ruthenium(II): factors governing binding to DNA.
J Am Chem Soc 111: 3051–8.
24. Rahban M, Divsalar A, Saboury AA, Golestani A (2010) Nanotoxicity and
spectroscopy studies of silver nanoparticle: Calf thymus DNA and K562 as
targets. J Phys Chem C 114: 579825803.
25. Chen QY, Li DH, Zhao Y, Yang HH, Zhu QZ et al. (1999) Interaction of a
novel red-region fluorescent probe, Nile blue, with DNA and its application tonucleic acids assay. Analyst: 124, 901–6.
26. Kashanian S, Dolatabadi JEN (2010) In vitro studies on calf thymus DNA
interaction and 2-tert-butyl-4-methylphenol food additive. Eur Food ResTechnol 230: 821–825.
27. Song YM, Kang JW, Zhou J, Wang ZH, Lu XQ et al. (2000) Study on thefluorescence spectra and electrochemical behavior of ZnL2 and Morin with
DNA. Spectrochim Acta A 56: 2491–7.28. Liu HK, Sadler PJ (2011) Metal complexes as DNA intercalators. Acc Chem Res
44: 3492359.
29. Kakkar R, Garg R, Suruchi (2002) Theoretical study of tautomeric structuresand fluorescence spectra of Hoechst 33258. J Mol Struct THEOCHEM 579:
109–113.30. Guan Y, Zhou W, Yao XH, Zhao MP, Li YZ (2006) Determination of nucleic
acids based on the fluorescence quenching of Hoechst 33258 at pH 4.5. Anal
Chim Acta 570: 21–28.31. Lerman LS (1961) Structural considerations in the interaction of DNA and
acridines. J Mol Biol 3: 18–30.32. Kumar CV, Asuncion EH (1992) Sequence dependent energy transfer from
DNA to a simple aromatic chromophore. J Chem Soc Chem Commun 6: 470–472.
33. Kumar CV, Turner RS, Asuncion EH (1993) Groove binding of a styrylcyanine
dye to the DNA double helix: the salt effect. J Photochem Photobiol A: Chem74: 231–238.
34. Lepecq JB, Paoletti C (1967) A fluorescent complex between ethidium bromideand nucleic acids. Physical-chemical characterization. Mol Biol 27: 87–105.
35. Bonincontro A, Falivene M, LaMesa C, Risuleo G, RuizPena M (2008)
Dynamics of DNA adsorption on and release from SDS-DDAB cat-anionicvesicles: a multitechnique study. Langmuir 24: 1973–1978.
36. Nejedly K, Chladkova J, Vorlickova M, Hrabcova I, Kypr J (2005) Mapping theB–A conformational transition along plasmid DNA. Nucl Acids Res 33: 1–8.
37. M Vorlıckova (1995) Conformational transitions of alternating purine–
pyrimidine DNAs in perchlorate ethanol solutions. Biophys J 69: 2033–2043.38. Kypr J, Vorlickova M (2002) Circular dichroism spectroscopy reveals invariant
conformation of guanine runs in DNA. Biopolymers (Biospectroscopy) 67: 275–277.
39. Uma MP, Palaniandavar MJ (2004) DNA binding and cleavage properties ofcertain tetrammine ruthenium(II) complexes of modified 1,10-phenanthrolines–
effect of hydrogen-bonding on DNA-binding affinity. Inorg Biochem 98: 2192
230.40. Ivanov VI, Minchenkova LE, Schyolkina AK, Poletayev AI (1973) Different
conformations of double-stranded nucleic acid in solution as revealed by circulardichroism. Biopolymers 12: 892110.
41. Jain SS, Matjaz A, Hud NV (2003) Controlling nucleic acid secondary structure
by intercalation: effects of DNA strand length on coralyne-driven duplexdisproportionation. Nucleic Acids Res 31: 4608–4614.
42. Mergny JL, Duval-Valentin G, Nguyen CH, Perrouault L, Faucon B et al.(1992) Triple helix-specific ligands. Science 256: 1681–1684.
43. Satyanarayana S, Dabrowiak JC, Chaires JB (1993) Tris(phenanthroline)ruthe-nium(II) enantiomer interactions with DNA: mode and specificity of binding.
Biochemistry 32: 2573–2584.
44. Satyanarayana S, Dabrowiak JC, Chaires JB (1992) Neither delta-nor lambda-tris(phenanthroline)ruthenium(II) binds to DNA by classical intercalation.
Biochemistry 31: 9319–9324.45. Tsilikia P, Perdihb F, Turelb I, Psomasa G (2013) Structure, DNA and albumin-
binding of the manganese(II) complex with the non-steroidal antiinflammatory
drug niflumic acid. Polyhedron 53: 215–222.46. Rafique B, Khalid AM, Akhtar K, Jabbar A (2013) Interaction of anticancer
drug methotrexate with DNA analyzed by electrochemical and spectroscopicmethods. Biosens Bioelectron 44: 21–26.
47. Wang Y, Lin GW, Hong J, Li L, Lu T et al. (2009) Synthesis, structures andDNA binding of ternary transition metal complexes M (II)L with the 2,29-
bipyridylamine (L = p-aminobenzenecarboxylic acid, M = Ni, Cu and Zn). Inorg
Chim Acta 362: 377–384.48. Onoue S, Seto Y, Gandy G, Yamada S (2009) Drug-induced phototoxicity; an
early in vitro identification of phototoxic potential of new drug entities in drugdiscovery and development. Curr Drug Saf 4: 123–136.
6MP-DNA Interaction and Phototoxicity
PLOS ONE | www.plosone.org 11 April 2014 | Volume 9 | Issue 4 | e93913
Top Related
Copyright © 2022 FDOKUMEN

