


Bahasa
Halaman
Hukum

Influence of periglacial cover beds on in situ-produced
cosmogenic 10Be in soil sections
M. Schaller a,*,1, F. von Blanckenburg a,2, H. Veit b, P.W. Kubik c
aInstitut fur Geologie, Universitat Bern, Erlachstrasse 9a, CH-3012 Bern, SwitzerlandbGeographisches Institut, Universitat Bern, Hallerstrasse 12, CH-3012 Bern, Switzerland
cPaul Scherrer Institut, c/o Institute of Particle Physics, ETH Honggerberg, CH-8093 Zurich, Switzerland
Received 21 September 2001; received in revised form 18 June 2002; accepted 21 June 2002
Abstract
Cover beds, widespread on hillslopes of temperate climate zones, represent layers of allochthonous material laterally
transported by periglacial processes during the Late Pleistocene. Two soil sections comprised of cover beds from the Bavarian
Forest, SE Germany, have been analysed for in situ-produced cosmogenic 10Be. Major changes in the nuclide concentration
agree well with soil section boundaries defined by field observations and grain size analyses. Numeric modeling of these
cosmogenic nuclide sections demonstrates that simple continuous erosion and regolith mixing models fail to explain the
measured nuclide concentrations. Instead, the measured data can be best described by modeling an admixture of material such
as loess or reworked allochthonous material, which have different nuclide concentrations.
A comparison of cosmogenic nuclide concentrations from the two cover bed sections with concentrations from river bed-
load sediments of the Regen catchment reveals that cover bed formation might affect the result of basin-wide erosion rate
determinations based on cosmogenic nuclides. Nuclide concentration of river bedload is potentially a binary mixture produced
by (1) spatial erosion of the soil surfaces; and (2) spatially nonuniform incision into deep cover bed layers that contributes
sediment low in nuclide concentration.
D 2002 Elsevier Science B.V. All rights reserved.
Keywords: Soil; Cover bed; Cosmogenic nuclide; Erosion; Europe
1. Introduction
European soils frequently consist of several
allochthonous layers and are not an in situ weath-
ering product of a homogeneous bedrock substratum
materials (Semmel, 1993). These layers are called
‘‘cover beds’’ and differ in the lithology of their rock
fragments, texture, grain size distribution, mineral-
ogy, and heavy mineral association. Cover beds in
Central Europe are predominantly Late Pleistocene
in age and consist of material transported laterally
down-slope during climate cold stages, mostly by
periglacial processes such as solifluction or cryotur-
bation. Additionally, loess may have been incorpo-
0169-555X/02/$ - see front matter D 2002 Elsevier Science B.V. All rights reserved.
PII: S0169 -555X(02 )00189 -7
* Corresponding author.
E-mail address: [email protected] (M. Schaller).1 Present address: Department of Earth Sciences, University of
Cambridge, Downing Street, Cambridge CB2 3EQ, UK.2 Present address: Institut fur Mineralogie, Universitat Hann-
over, Callinstrasse 9, D-30167 Hannover, Germany.
www.elsevier.com/locate/geomorph
Geomorphology 49 (2002) 255–267
rated into some of the layers due to periglacial
processes (Semmel, 1993). Mixing by floral and
bioturbation processes during the Holocene some-
times locally overprints these periglacial features.
The spatial and chronological correlation between
these layered deposits have been systematically
investigated in Germany (overviews in e.g. AK
Bodensystematik, 1998; Kleber, 1992; Mailander
and Veit, 2001; Semmel, 1993; Volkel, 1995). The
existence of cover beds as soil parent materials has
been proven in many mid-latitude regions (Kleber,
1997; Mailander and Veit, 2001). The presence of
layered deposits has important ecological consequen-
ces. Slope hydrology and the distribution of soil
types are governed by the physical and mineralogical
characteristics of cover beds. The identification of
cover beds is crucial for any type of geochemical
balance in soil profiles, whether of nutrients or
pollutants.
Cover beds in Germany may be classified into
three main layers (e.g. AK Bodensystematik, 1998;
Semmel, 1968): the Basal layer, the Intermediate
layer, and the Upper layer (Table 1). The age of
formation of the Upper layer is believed to be
Younger Dryas (e.g. Semmel, 1968; AG Boden der
Geologischen Landesamter, 1994) or Oldest Dryas
(Mahr, 1998; Volkel et al., 2001). The lower two
layers lack chronostratigraphic definition, but are
believed to be products of an evolutionary succession
of processes independent of the age of any particular
event. Formation ages of the Basal and Intermediate
layers vary from Early Wurmian to Late Glacial time
(Kleber, 1992). It has recently been shown that floral
and bioturbation processes occurred in the Upper
layer during the Holocene period (Mahr, 1998; Rus-
sow and Heinrich, 2001).
To date, the different layers have been identified by
field observations, grain size, bulk density and heavy
mineral analysis. In this study, in situ-produced cos-
mogenic nuclides are used to examine cover beds.
Cosmogenic nuclides represent a novel means of
quantifying the history of complex soil sections (e.g.
Braucher et al., 1998, 2000; Brown et al., 1994;
Phillips et al., 1998). These rare nuclides are produced
by nuclear reactions in minerals bombarded with
cosmic rays. The abundance of cosmogenic nuclides
in minerals is a function of depth and time and the
activity decreases exponentially with depth (Lal,
1991). The time a mineral resides at a certain depth
is given by the soil’s erosion or deposition history.
The highest activity of cosmogenic nuclides occurs at
a stable surface.
Two cover bed sections from the Bavarian Forest
(SE Germany) have been analysed for in situ-pro-
duced cosmogenic 10Be in quartz. The cosmogenic
nuclide data are compared with a classification of
layers based on field observations and grain size
analyses. Model calculations are performed to fit the
complex cosmogenic nuclide pattern. Finally, the
observed cosmogenic nuclide concentrations with
depth are compared with the nuclide concentrations
derived from the river sediment load of the Regen
catchment (Schaller et al., 2001).
2. Theory
The depth and time dependence of cosmogenic
nuclides in soil sections may be used to detect a
variety of processes operating in complex hillslope
settings. Some of the potential complex cosmogenic
nuclide patterns are discussed in the following
section.
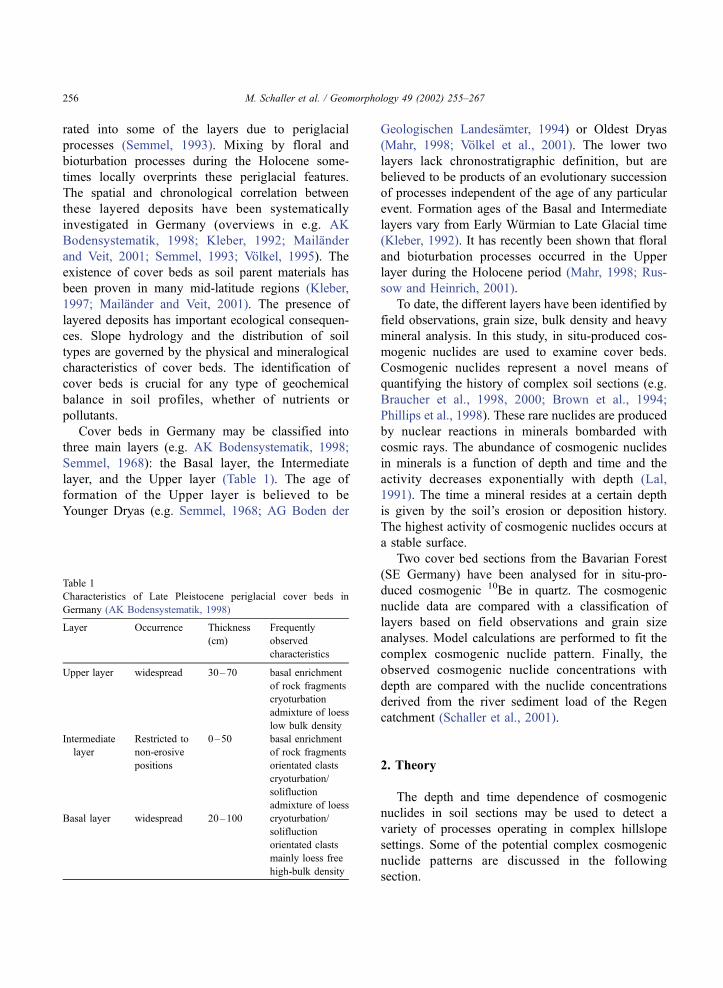
Table 1
Characteristics of Late Pleistocene periglacial cover beds in
Germany (AK Bodensystematik, 1998)
Layer Occurrence Thickness
(cm)
Frequently
observed
characteristics
Upper layer widespread 30–70 basal enrichment
of rock fragments
cryoturbation
admixture of loess
low bulk density
Intermediate
layer
Restricted to
non-erosive
positions
0–50 basal enrichment
of rock fragments
orientated clasts
cryoturbation/
solifluction
admixture of loess
Basal layer widespread 20–100 cryoturbation/
solifluction
orientated clasts
mainly loess free
high-bulk density
M. Schaller et al. / Geomorphology 49 (2002) 255–267256
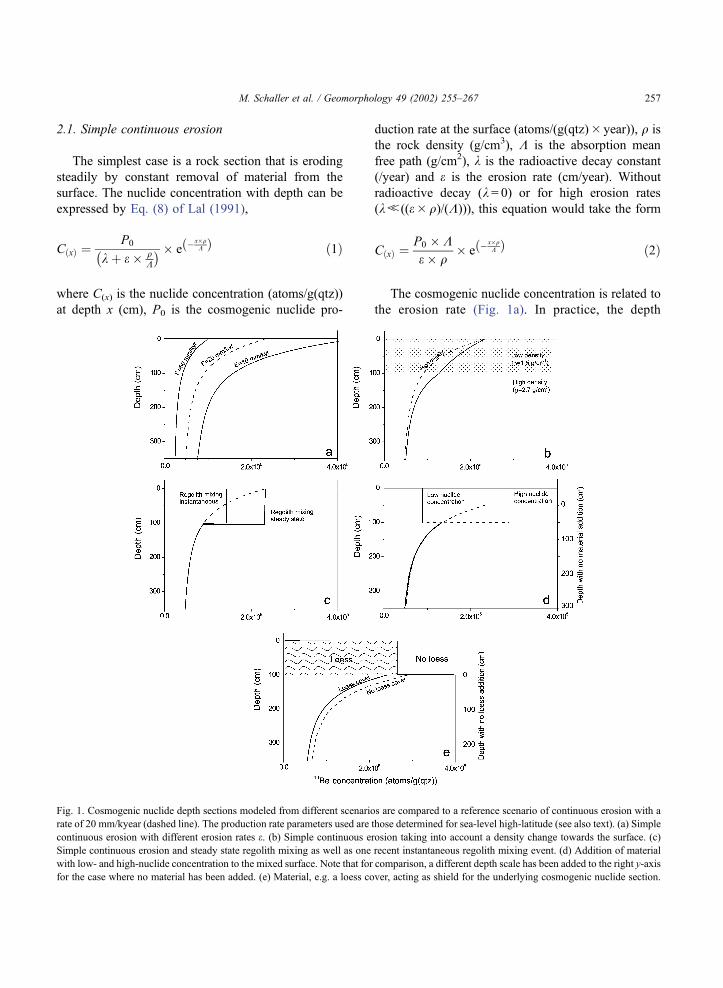
2.1. Simple continuous erosion
The simplest case is a rock section that is eroding
steadily by constant removal of material from the
surface. The nuclide concentration with depth can be
expressed by Eq. (8) of Lal (1991),
CðxÞ ¼P0
k þ e � qK
� � � e �x�qKð Þ ð1Þ
where C(x) is the nuclide concentration (atoms/g(qtz))
at depth x (cm), P0 is the cosmogenic nuclide pro-
duction rate at the surface (atoms/(g(qtz)� year)), q is
the rock density (g/cm3), K is the absorption mean
free path (g/cm2), k is the radioactive decay constant
(/year) and e is the erosion rate (cm/year). Without
radioactive decay (k= 0) or for high erosion rates
(kb((e� q)/(K))), this equation would take the form
CðxÞ ¼P0 � Ke � q
� e �x�qKð Þ ð2Þ
The cosmogenic nuclide concentration is related to
the erosion rate (Fig. 1a). In practice, the depth
Fig. 1. Cosmogenic nuclide depth sections modeled from different scenarios are compared to a reference scenario of continuous erosion with a
rate of 20 mm/kyear (dashed line). The production rate parameters used are those determined for sea-level high-latitude (see also text). (a) Simple
continuous erosion with different erosion rates e. (b) Simple continuous erosion taking into account a density change towards the surface. (c)
Simple continuous erosion and steady state regolith mixing as well as one recent instantaneous regolith mixing event. (d) Addition of material
with low- and high-nuclide concentration to the mixed surface. Note that for comparison, a different depth scale has been added to the right y-axis
for the case where no material has been added. (e) Material, e.g. a loess cover, acting as shield for the underlying cosmogenic nuclide section.
M. Schaller et al. / Geomorphology 49 (2002) 255–267 257
dependence of the nuclide concentration is the sum of
all nucleonic and muonic production mechanisms
(Schaller et al., 2001). Eqs. (1) and (2) have to be
expanded accordingly. High erosion rates lead to a
low-nuclide concentration at the surface with a mod-
erate decrease in nuclide concentration with depth.
Low erosion rates result in high-nuclide concentration
at the surface and a strong decrease in nuclide con-
centration with depth (Fig. 1a).
2.2. Simple continuous erosion and density change
In eroding sections with regolith (Fig. 1b), a
density change occurs at a given depth as hard rock
(q = 2.7 g/cm3) is converted into regolith (q = 1.5 g/
cm3). The effect of such a decrease in density on
cosmogenic nuclide activity is that the mean
absorption depth, given by q/K, increases. The
nuclide concentration is higher at a given depth
of regolith than at the equivalent depth of rock. If
the mass loss rate for regolith is the same as for
rock, the surface nuclide concentrations are the
same for sections with regolith or sections consist-
ing of pure bedrock.
2.3. Simple continuous erosion and regolith mixing
One of the most likely complexities in a regolith
section is that the surface layer has been mixed by
processes such as bioturbation, wind-throw, or con-
tinuous soil creep. Complete mixing would result in
uniform 10Be concentrations (Phillips et al., 1998;
Braucher et al., 2000). In this case, the concentration
of all samples over the mixed depth interval is equal to
the concentration of the surface samples (Granger et
al., 1996). Surface regolith mixing for both an instan-
taneous mixing scenario and a continuous steady state
scenario is shown in Fig. 1c.
2.4. Addition of material
During mixing processes such as solifluction,
external material that has a different nuclide concen-
tration can be incorporated into the regolith. Depend-
ing on the nuclide concentration of the added material,
the resulting 10Be concentrations will be either lower
or higher than in the case of simple continuous
erosion and regolith mixing (Fig. 1d). Assuming
complete mixing, the nuclide concentrations are uni-
form within the mixed layer. Incorporation of non-
quartz material has the long-term effect of decreasing
the production of cosmogenic nuclides in quartz by
providing shielding from cosmic rays. The same effect
results from incorporation of fine-grained material,
which will not be used for cosmogenic nuclide anal-
ysis. For example, the nuclide concentration measured
in a coarse-grained sample at a depth of a cover bed
admixed with loess is lower than in an undisturbed
cover bed (Fig. 1e).
2.5. Variable erosion rates
Eq. (1) assumes constant long-term erosion rates
and is therefore not valid if erosion rates change
through time. In the case of variable erosion rates,
Eq. (1) must be replaced by forward modeling. For
variable erosion rates, the nuclide concentration in
quartz at a given depth is the sum of all nuclides
produced as a certain regolith increment is trans-
ported towards the surface. To calculate the nuclide
concentration at a given depth, Eq. (3) of Lal
(1991) is used:
dCðxÞdt
¼ �CiðxÞ � k þ PðxÞ ð3Þ
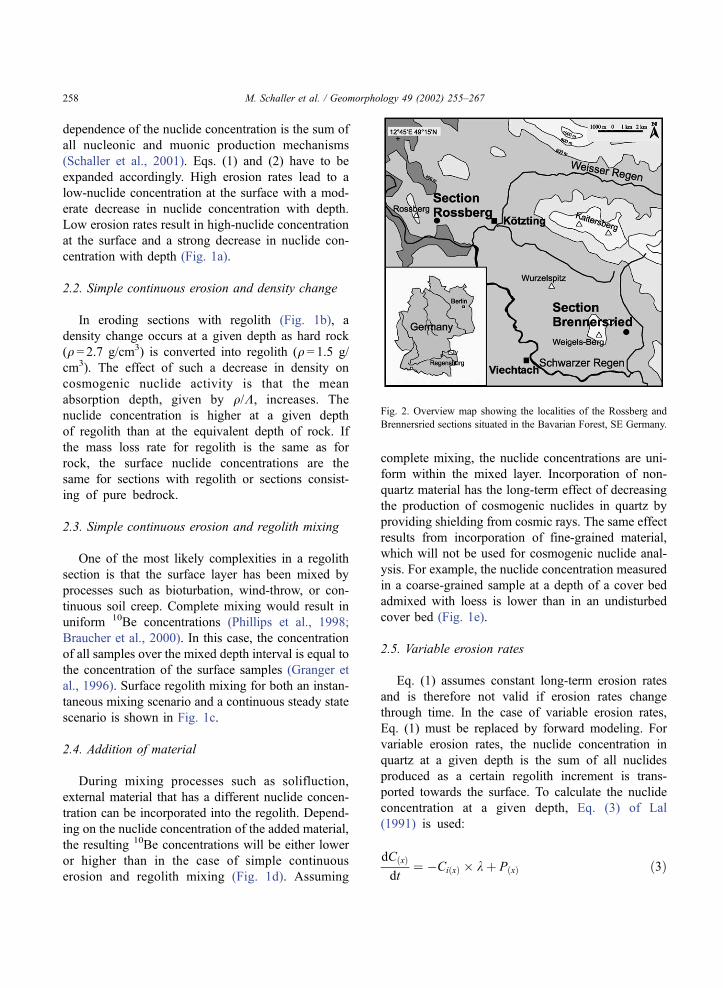
Fig. 2. Overview map showing the localities of the Rossberg and
Brennersried sections situated in the Bavarian Forest, SE Germany.
M. Schaller et al. / Geomorphology 49 (2002) 255–267258
where
PðxÞ ¼ Pð0Þ � e�x�q
Kð Þ ð4Þ
and
CiðxÞ ¼Xx�1
x¼max depth
PðxÞ � Dti ð5Þ
Here, each discrete time step is assigned an index i.
Dti is the period a particle is irradiated at a certain
depth x. Dti is given by the time it takes to erode
one soil depth increment Dx by the erosion rate ei(Dti =Dx/ei).
2.6. Cover beds
Cover beds consisting of different layers may be a
product of all of the above mentioned processes. Non-
steadily eroding surfaces may be mixed several times
and external material may be incorporated. A density
change occurs in the surface layer. Furthermore, as
regolith moves towards the surface by continuous
erosion, quartz may be enriched relative to feldspar
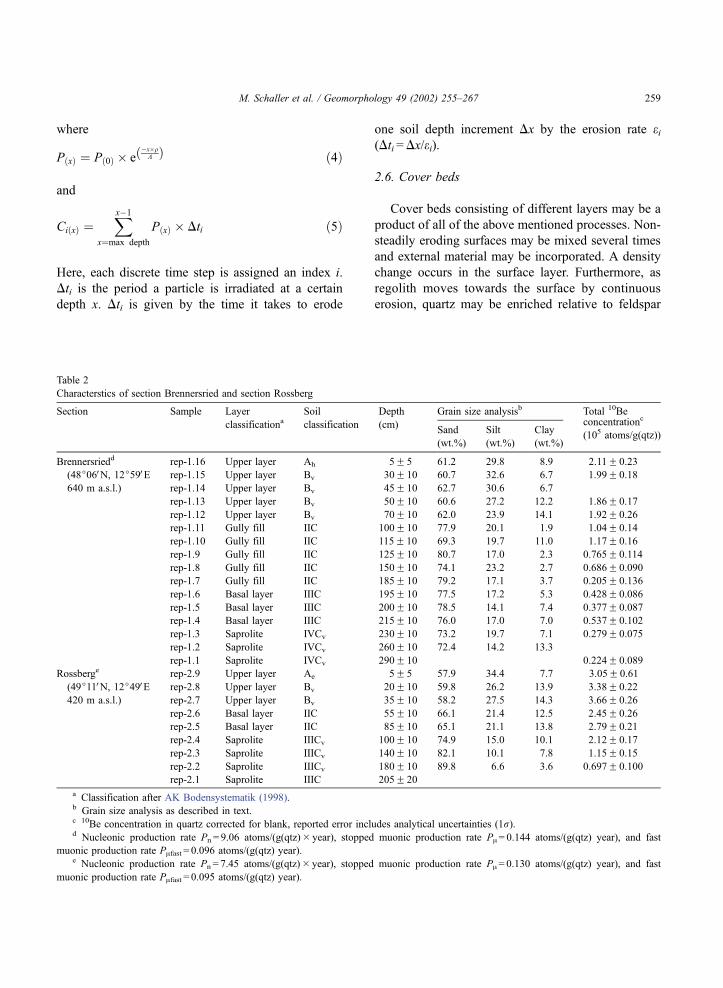
Table 2
Characterstics of section Brennersried and section Rossberg
Section Sample Layer Soil Depth Grain size analysisb Total 10Be
classificationa classification (cm)Sand
(wt.%)
Silt
(wt.%)
Clay
(wt.%)
concentrationc
(105 atoms/g(qtz))
Brennersriedd rep-1.16 Upper layer Ah 5F 5 61.2 29.8 8.9 2.11F 0.23
(48j06VN, 12j59VE rep-1.15 Upper layer Bv 30F 10 60.7 32.6 6.7 1.99F 0.18
640 m a.s.l.) rep-1.14 Upper layer Bv 45F 10 62.7 30.6 6.7
rep-1.13 Upper layer Bv 50F 10 60.6 27.2 12.2 1.86F 0.17
rep-1.12 Upper layer Bv 70F 10 62.0 23.9 14.1 1.92F 0.26
rep-1.11 Gully fill IIC 100F 10 77.9 20.1 1.9 1.04F 0.14
rep-1.10 Gully fill IIC 115F 10 69.3 19.7 11.0 1.17F 0.16
rep-1.9 Gully fill IIC 125F 10 80.7 17.0 2.3 0.765F 0.114
rep-1.8 Gully fill IIC 150F 10 74.1 23.2 2.7 0.686F 0.090
rep-1.7 Gully fill IIC 185F 10 79.2 17.1 3.7 0.205F 0.136
rep-1.6 Basal layer IIIC 195F 10 77.5 17.2 5.3 0.428F 0.086
rep-1.5 Basal layer IIIC 200F 10 78.5 14.1 7.4 0.377F 0.087
rep-1.4 Basal layer IIIC 215F 10 76.0 17.0 7.0 0.537F 0.102
rep-1.3 Saprolite IVCv 230F 10 73.2 19.7 7.1 0.279F 0.075
rep-1.2 Saprolite IVCv 260F 10 72.4 14.2 13.3
rep-1.1 Saprolite IVCv 290F 10 0.224F 0.089
Rossberge rep-2.9 Upper layer Ae 5F 5 57.9 34.4 7.7 3.05F 0.61
(49j11VN, 12j49VE rep-2.8 Upper layer Bv 20F 10 59.8 26.2 13.9 3.38F 0.22
420 m a.s.l.) rep-2.7 Upper layer Bv 35F 10 58.2 27.5 14.3 3.66F 0.26
rep-2.6 Basal layer IIC 55F 10 66.1 21.4 12.5 2.45F 0.26
rep-2.5 Basal layer IIC 85F 10 65.1 21.1 13.8 2.79F 0.21
rep-2.4 Saprolite IIICv 100F 10 74.9 15.0 10.1 2.12F 0.17
rep-2.3 Saprolite IIICv 140F 10 82.1 10.1 7.8 1.15F 0.15
rep-2.2 Saprolite IIICv 180F 10 89.8 6.6 3.6 0.697F 0.100
rep-2.1 Saprolite IIIC 205F 20
a Classification after AK Bodensystematik (1998).b Grain size analysis as described in text.c 10Be concentration in quartz corrected for blank, reported error includes analytical uncertainties (1r).d Nucleonic production rate Pn = 9.06 atoms/(g(qtz)� year), stopped muonic production rate PA= 0.144 atoms/(g(qtz) year), and fast
muonic production rate PAfast = 0.096 atoms/(g(qtz) year).e Nucleonic production rate Pn = 7.45 atoms/(g(qtz)� year), stopped muonic production rate PA= 0.130 atoms/(g(qtz) year), and fast
muonic production rate PAfast = 0.095 atoms/(g(qtz) year).
M. Schaller et al. / Geomorphology 49 (2002) 255–267 259
by continued weathering. The general result of non-
quartz mineral dissolution is that quartz material irra-
diated at a certain depth is located, after dissolution, at a
higher level in the section relative to the surface
(Braucher et al., 1998; Small et al., 1999). The process
of non-quartz mineral dissolution adds a level of
complexity that has not been modeled in cover beds.
3. Study area and characteristics of soil sections
3.1. Study area
The cover beds studied are located in the Bavarian
Forest, which forms part of the middle European
uplands of the Bohemian Massif (Fig. 2). Precambrian
metamorphic rocks and Variscan granites exposed in
the Bavarian Forest were eroded and severely weath-
ered during the Tertiary (Mahr, 1998). The Bavarian
Forest is located within the boundary between a
maritime dominated climate and an increasingly con-
tinental climate. This combination leads to heavy
winter snowfall (173 days/year with >1 cm snowfall
and complete snow cover). Despite today’s climatic
conditions, only the highlands of the Bavarian Forest
were glaciated during the Late Pleistocene (Raab,
1999). The lower parts of the Bavarian Forest have,
however, been influenced by periglacial processes that
formed cover beds during the Pleistocene cold phases.
The two soil sections occur outside of the glacial
margins of the Last Glacial Maximum. The periglacial
cover beds of the Bavarian Forest show typical char-
acteristics of the cover beds defined in the classifica-
tion known from Germany (Table 1). The formation of
the Upper layer in the Bavarian Forest occurred during
the Late Glacial probably during Oldest Dryas (Volkel
and Mahr, 1997). Pollen analyses indicate that the area
was not forested during the Oldest Dryas (Stalling,
1987). During the Bølling and Allerød periods
(12,600–12,000 and 11,800–10,750 14C year BP,
respectively) the vegetation changed from shrubs to
forest. The vegetation during the Older Dryas period
(12,000–11,800 14C year BP) is not well defined due
to its short duration. During the Younger Dryas time, a
change in non-tree pollen content, as well as a retreat
of birches and forest clearance, have been determined.
At the end of the Younger Dryas, a sharp decrease in
non-tree pollen and the first appearance of thermo-
phile tree pollen are reported and reflect the transition
to the warmer Holocene epoch (Stalling, 1987).
3.2. Characteristics of soil sections
Two soil sections from the Bavarian Forest have
been analysed for grain size distribution and classified
according to the nomenclature known from Germany
(AK Bodensystematik, 1998). The sand-sized fractions
of sediment samples were separated by wet sieving
(dispersion with Na2CO3). The silt and clay grain size
fractions were analysed using a Micromeritics Sedi-
Graph 5100 (dispersion with (NaPO3)12–13�Na2O and
NaHCO3).
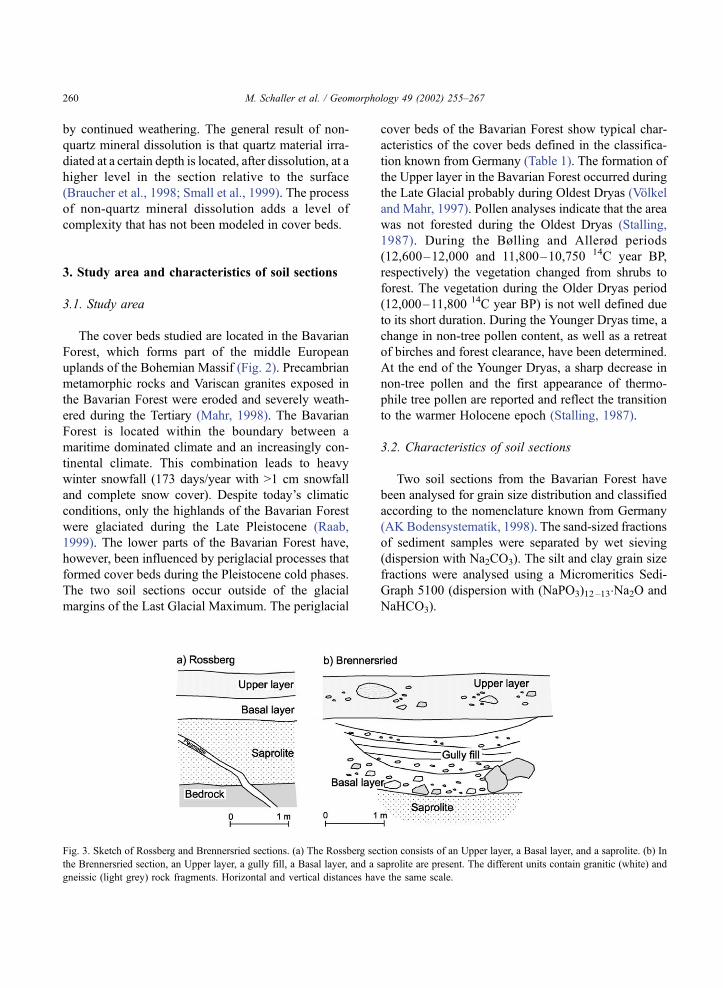
Fig. 3. Sketch of Rossberg and Brennersried sections. (a) The Rossberg section consists of an Upper layer, a Basal layer, and a saprolite. (b) In
the Brennersried section, an Upper layer, a gully fill, a Basal layer, and a saprolite are present. The different units contain granitic (white) and
gneissic (light grey) rock fragments. Horizontal and vertical distances have the same scale.
M. Schaller et al. / Geomorphology 49 (2002) 255–267260

The cover bed of the Rossberg section (Table 2;
Figs. 3a and 4a) shows the commonly observed
succession of Upper and Basal layers and is situated
on granitic saprolite. The high silt content (26–34%)
in the Upper layer is attributed to the admixture of
loess. The Basal layer is characterised by a higher
sand content and a lower silt content than the Upper
layer. A continuous increase in the amount of sand
and a decrease in the amount of silt and clay are
observed in the saprolite with increasing depth. The
layers of the Rossberg section do not contain any rock
fragments. The soil type of section Rossberg is a
Cambisol. The lower boundary of the Bv horizon
coincides with that of the Upper layer.
In the Brennersried section (Table 2; Figs. 3b
and 5a), the Upper layer contains granitic and
Fig. 4. (a) Layers of cover beds (bold lines) from the Rossberg section defined by grain size analyses and field observations. Samples (triangles)
have been separated into sand- (dark grey), silt- (white) and clay-fractions (light grey). The reported values are weight percentages. (b)
Significant changes in the 10Be concentration of samples from the Rossberg section coincide with layers defined by grain size analyses and field
observations. Uncertainties in nuclide concentration are analytical errors (1r). Error bars with depth indicate the depth range in which the
samples have been collected.
Fig. 5. (a) Grain size analyses from samples of the Brennersried section. See Fig. 4 for further explanations. (b) 10Be concentrations of quartz
material from different depths. Some major changes coincide with layer boundaries defined by field observations and grain size analyses.
M. Schaller et al. / Geomorphology 49 (2002) 255–267 261
gneissic rock fragments and is deposited uncon-
formably over all discontinuities observed in the
lower part of the soil section. The lower part
consists of a Basal layer and a gully incised into
the Basal layer. The gully fill, containing few small
granitic and gneissic rock fragments, consists of
several small sublayers. The Basal layer overlies a
granitic saprolite and shows no internal sedimento-
logical layering. The soil type of the Brennersried
section is a slightly podzolic Cambisol. Again, the
lower boundary of the Bv horizon coincides with
that of the Upper layer.
4. Cosmogenic nuclide analysis
Samples were taken in at least 40 cm depth
intervals within a depth range of at least 10 cm in
order to obtain a suitable weight for cosmogenic
nuclide analysis The sample depth indicated in Table
2 is the mean sample depth. Quartz grains (0.5–1.0
mm) were separated from the bulk samples. This grain
size range was selected to avoid changes in the
cosmogenic nuclide concentration due to different
grain size distributions. Furthermore, it ensures that
no wind-blown material is incorporated into the cos-
mogenic nuclide measurement. To eliminate possible
contamination by 10Be produced in the atmosphere,
the quartz was leached with hydrofluoric acid. After
dissolution of the quartz (approximately 50 g per
sample) and addition of the 9Be spike, Be was
separated by extraction and precipitation using the
modified method of von Blanckenburg et al. (1996).
Accelerator mass spectrometry to measure the 10Be/
Be ratios was carried out at the PSI/ETH facility in
Zurich. The measured 10Be/Be ratios were corrected
as described in Kubik et al. (1998). The blank-
corrected 10Be concentrations and the analytical errors
(reported throughout as 1r errors), including blank
error, are listed in Table 2.
For model calculations, use was made of sea-level
high-latitude production rates of 5.33F .34 atoms/
(g(qtz) � year) for nucleonic, 0.106 atoms/
(g(qtz)� year) for stopped muonic, and 0.093
atoms/(g(qtz)� year) for fast muonic production
mechanisms. The sea-level high-latitude values were
scaled to the sample altitude and latitude using com-
bined scaling factors of Dunai (2000) and Heisinger et
al. (2002a,b). Total production rates are 7.73 and 9.30
atoms/(g(qtz)� year) for profile Rossberg and Bren-
nersried, respectively (see also Table 2). In order to
take into account the exponential decrease of produc-
tion rate with depth, we made use of the revised
absorption laws published in Heisinger et al.
(2002a,b) that were converted into multiexponential
fits similar to Schaller et al. (2001). Absorption of
nucleons was calculated by a double-exponential fit
with coefficients a1 = 1.0747, b1 = 157 g/cm2 and
a2 =� 0.0747, b2 = 5.887 g/cm2. Stopped muonic
absorption was approximated with a three-exponential
fit: a1 =� 0.050, b1 = 160 g/cm2; a2 = 0.845, b2 = 1030
g/cm2; a3 = 0.205, b3 = 3000 g/cm2. Fast muonic
absorption was approximated with a three-exponential
fit: a1 = 0.010, b1 = 100 g/cm2; a2 = 0.615, b2 = 1520 g/
cm2; a3 = 0.375, b3 = 7600 g/cm2.
5. Results
The Rossberg section reveals 10Be concentrations
in quartz ranging from 0.7� 105 to 3.7� 105 atoms/
g(qtz) (Fig. 4b). The highest 10Be concentrations are
measured in the Upper layer. Using Eq. (1), an
apparent mean erosion rate of about 20 mm/kyear is
determined from the nuclide concentration of the
uppermost sample. The samples of the Upper layer
are identical within error and no trend with depth can
be determined. A 1.4-fold decrease in the average10Be concentration of the samples from the Upper
layer to the uppermost sample of the Basal layer is
observed. A sample taken from the saprolite has a10Be activity 25% less than the lower sample of the
Basal layer. A 3-fold decrease of the 10Be concen-
tration is observed in the samples collected from
within the saprolite (depth difference 80 cm).
The 10Be concentrations of quartz from the Bren-
nersried section range from 0.2� 105 to 2.1�105
atoms/g(qtz) (Fig. 5b). Four samples from the Upper
layer have identical nuclide concentrations within
error. An apparent mean erosion rate of about 35
mm/kyear is calculated from the nuclide concentration
of the uppermost sample. A 2-fold decrease in the
nuclide concentrations from the Upper layer to the
gully fill defines a clear boundary between the Upper
layer and the gully fill. The 10Be concentration
measured in quartz decreases steadily from the top
M. Schaller et al. / Geomorphology 49 (2002) 255–267262
of the gully fill to the bottom. Samples analysed from
the Basal layer have a 10Be activity that is identical
within error. The two samples collected from the
saprolite contain lower nuclide concentrations than
the overlying Basal layer.
In comparison, the two sections show similar
relative changes in 10Be concentration. However,
the 10Be concentration at the surface of the Ross-
berg section is higher than that at the surface of the
Brennersried section. Layer boundaries determined
by field observations and grain size analyses coin-
cide well with changes in the 10Be concentrations.
6. Discussion
6.1. Cover beds
The physics of cover bed formation are complex.
In central Europe, long-term monitoring of modern
solifluction and process studies have been under-
taken in the alpine/sunivale ecotone of the Alps
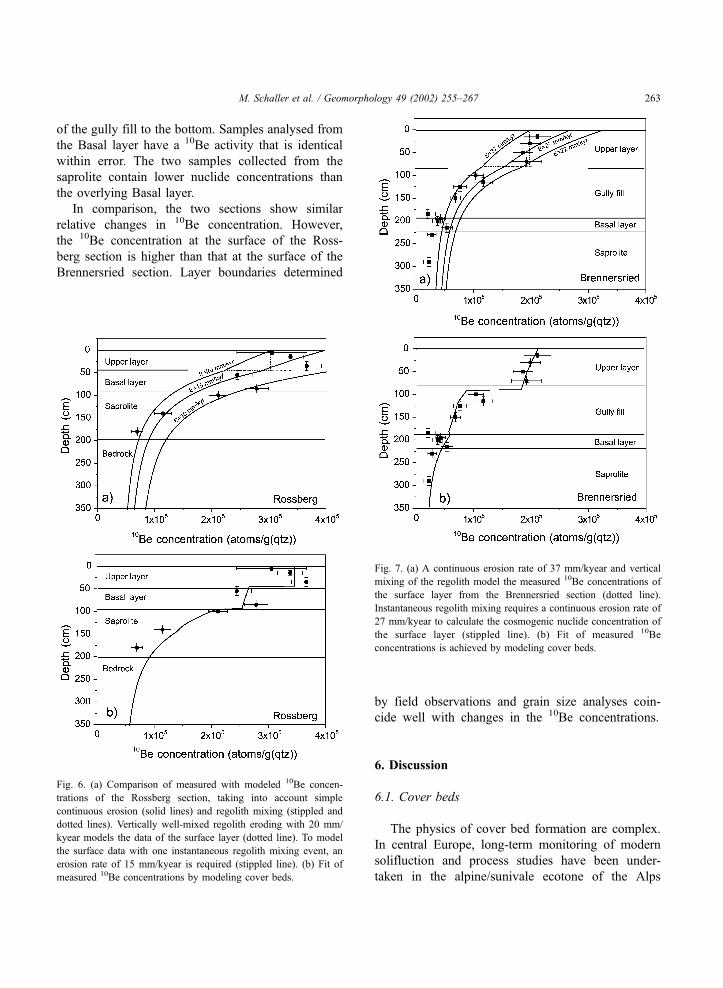
Fig. 6. (a) Comparison of measured with modeled 10Be concen-
trations of the Rossberg section, taking into account simple
continuous erosion (solid lines) and regolith mixing (stippled and
dotted lines). Vertically well-mixed regolith eroding with 20 mm/
kyear models the data of the surface layer (dotted line). To model
the surface data with one instantaneous regolith mixing event, an
erosion rate of 15 mm/kyear is required (stippled line). (b) Fit of
measured 10Be concentrations by modeling cover beds.
Fig. 7. (a) A continuous erosion rate of 37 mm/kyear and vertical
mixing of the regolith model the measured 10Be concentrations of
the surface layer from the Brennersried section (dotted line).
Instantaneous regolith mixing requires a continuous erosion rate of
27 mm/kyear to calculate the cosmogenic nuclide concentration of
the surface layer (stippled line). (b) Fit of measured 10Be
concentrations is achieved by modeling cover beds.
M. Schaller et al. / Geomorphology 49 (2002) 255–267 263
(Gamper, 1986; Jaesche, 1999; Veit et al., 1995). It
is difficult to determine the exact timing of the Late
Pleistocene cover bed formation as datable material
is scarce. The characteristic patterns of cosmogenic
nuclides may reveal some information about cover
bed genesis.
The 10Be of both the Rossberg and Brennersried
sections have been modeled by simple continuous
erosion taking into account a density change from
rock (q = 2.7 g/cm3) to soil (q = 1.5 g/cm3) (Figs. 6a
and 7a and Section 2). Simple continuous erosion
with a density change cannot explain the complex
cosmogenic nuclide pattern. Also, simple continuous
erosion combined with regolith mixing of the surface
layer by floral and bioturbation or solifluction pro-
cesses fails to explain the measured nuclide concen-
trations (Figs. 6a and 7a and Section 2). The
complex features in the measured nuclide concen-
trations can best be explained by several mixing
processes and the addition of allochthonous material
as described for cover bed formation (Figs. 6b and
7b; Table 3 and Section 2). The modeled formation
processes described below are not unique but possi-
ble solutions, most of which agree with the published
concepts of cover bed genesis.
We modeled the Basal layers of the two sections
by adding external material at 15 and 39 kyear BP,
respectively. No loess has been added to the mod-
eled Basal layer, which is in agreement with the
low silt content of the Basal layer. Basal layer
formation ages are within the range of literature
ages, which differ significantly from each other due
to the lack of datable material. Formation ages of
the Basal and Intermediate layers postulated in the
literature vary from Early Wurmian to Late Glacial.
The incorporation of a large quantity of material
with low-nuclide concentration into the gully fill at
section Brennersried can be attributed to the fact
that the stratified gully fill is not the product of
periglacial solifluction but is produced by other
mechanisms such as erosion by water and transport
by water during or since periglacial conditions. The
modeled admixture of fine-grained material (e.g.
loess) into the Upper layer is in agreement with
the characteristics of cover beds in Germany (AK
Bodensystematik, 1998). The modeled loess depo-
sition took place at the Pleistocene to Holocene
transition. This age agrees well with the reported
Younger or Oldest Dryas age of the Upper layer.
Furthermore, the modeling of the cover beds indi-
cates continuous mixing of the surface layers. This
observation supports postulated mixing by floral
and bioturbation processes during the Holocene
period. (Mahr, 1998; Russow and Heinrich, 2001).
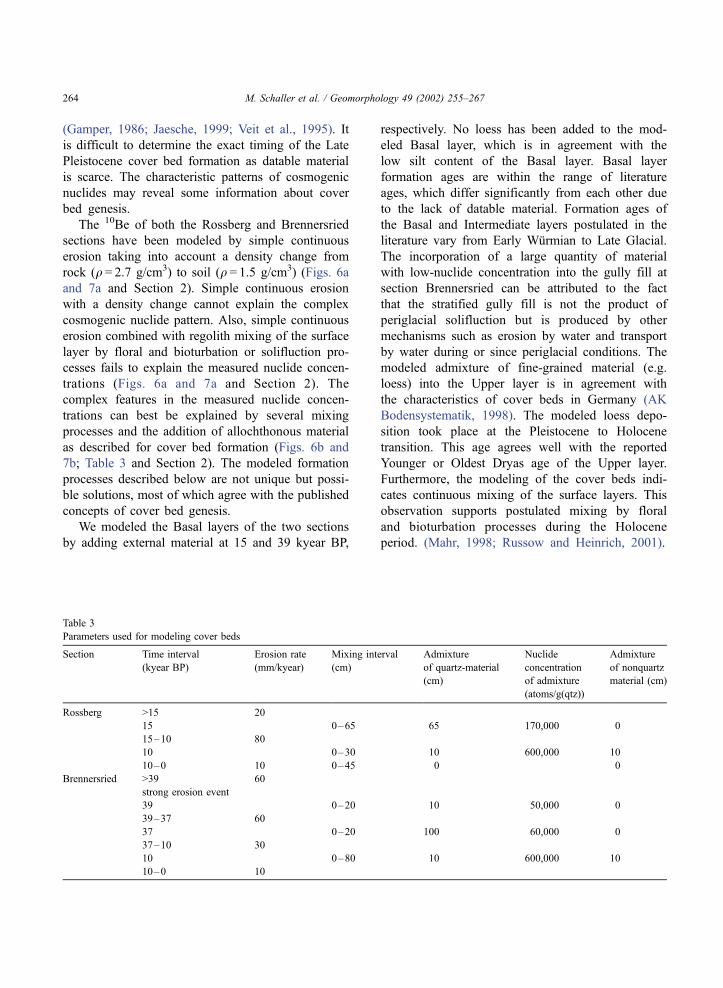
Table 3
Parameters used for modeling cover beds
Section Time interval
(kyear BP)
Erosion rate
(mm/kyear)
Mixing interval
(cm)
Admixture
of quartz-material
(cm)
Nuclide
concentration
of admixture
(atoms/g(qtz))
Admixture
of nonquartz
material (cm)
Rossberg >15 20
15 0–65 65 170,000 0
15–10 80
10 0–30 10 600,000 10
10–0 10 0–45 0 0
Brennersried >39 60
strong erosion event
39 0–20 10 50,000 0
39–37 60
37 0–20 100 60,000 0
37–10 30
10 0–80 10 600,000 10
10–0 10
M. Schaller et al. / Geomorphology 49 (2002) 255–267264

6.2. Catchment-wide erosion rates
In situ-produced cosmogenic nuclides offer an
approach to quantify catchment-wide erosion esti-
mates from alluvial sediments. The concept addresses
the mixing of a multitude of individual bedrock and
soil surface samples by hillslope and fluvial processes
(Brown et al., 1995; Bierman and Steig, 1996;
Granger et al., 1996). This approach has been applied
to large catchments (1�103–4� 104 km2) in Middle
Europe, among them the Regen catchment from
where the samples of the present study have been
taken (Schaller et al., 2001). Schaller et al. (2001)
made the observation that cosmogenic nuclide-
derived erosion rates are 1.5–4 times higher than
river load gauging-derived erosion rates. A similar
trend has been observed in the temperate USA by
Kirchner et al. (2001). Schaller et al. (2001) offer
three potential explanations: (1) systematic underesti-
mation of modern river loads, for example by failing
to include high-magnitude, low-frequency transport
events in the gauging period; (2) spatially nonuniform
erosion (e.g. linear dissection) and selective tapping of
deeper segments of the irradiation section; and (3)
inheritance of a Late Pleistocene erosion signal.
The two soil sections from the Bavarian Forest
give a first insight into the depth dependency of cos-
mogenic nuclide concentrations and address explan-
ation (2). The range encompassed by nuclide con-
centrations of surface samples from Rossberg and
Brennersried sections are at the lower and upper
end, respectively, of the nuclide concentrations mea-
sured in bedload of the Regen catchment (Fig. 8).
The spread of nuclide concentrations in river bed-
load can be explained (1) by eroding only the sur-
face of the soil sections. However, river concen-
trations are also compatible with (2) delivery of
deep sediment by linear incision. For example,
material from the Basal layer of section Rossberg
(100 cm) would deliver sediment with the cosmo-
genic nuclide concentration observed in river bed-
load. Therefore, remobilisation of cover bed sedi-
ments from depth cannot be excluded as one of two
sources of sediment to the river Regen, or to any
river in areas affected by these periglacial hillslope
processes.
7. Conclusion
Major changes in cosmogenic nuclide concentra-
tions in two soil profiles agree well with slope deposit
boundaries defined by grain size analyses and field
observations. Measured nuclide concentrations are
incompatible with cover bed genesis involving simple
continuous erosion and regolith mixing only. Nuclide
concentrations of cover beds can only be fitted with
complex modeling, taking into account several stages
of soil mixing and material addition.
A comparison of cosmogenic nuclides measured in
the bedload of rivers with those in slope deposits
indicate that the nuclide concentrations in river sedi-
ments used for the determination of catchment-wide
erosion rates can be produced by surface material of
cover beds. However, the dissection of cover beds by
modern streams might potentially contribute bedload
low in nuclide concentrations.
Acknowledgements
We gratefully acknowledge laboratory assistance by
I. Hebeisen and A. Brockman. Comments by P.
Bierman and W. Blake helped to improve an earlier
version of the manuscript. This study was supported by
Fig. 8. Comparison of 10Be concentrations measured in the
Rossberg section (open circles) and the Brennersried section (open
squares), as well as of sediments from rivers (triangles), draining
parts of the Bavarian Forest. 10Be concentrations of the surface
samples from the two sections are at the lower and upper ends of the
range observed in river sediments.
M. Schaller et al. / Geomorphology 49 (2002) 255–267 265
the Schweizerische Nationalfonds (Grant 2100-053971
to FVB).
References
AG Boden der Geologischen Landesamter, 1994. Bodenkundliche
Kartieranleitung Schweizerbart’sche Verlagbuchhandlung (Na-
gele und Obermiller), Stuttgart.
AK Bodensystematik, 1998. Systematik der Boden und bodenbil-
denden Substrate Deutschlands. Mitteilungen der Deutschen
Bodenkundlichen Gesellschaft 86, 1–180.
Bierman, P., Steig, E.J., 1996. Estimating rates of denudation using
cosmogenic isotope abundances in sediment. Earth Surface Pro-
cesses and Landforms 21, 125–139.
Braucher, R., Colin, F., Brown, E.T., Bourles, D.L., Bamba, O.,
Raisbeck, G.M., Yiou, F., Koud, J.M., 1998. African laterite
dynamics using in situ-produced 10Be. Geochimica Cosmochi-
mica Acta 62, 1501–1507.
Braucher, R., Bourles, D.L., Brown, E.T., Colin, F., Muller, J.-P.,
Braun, J.-J., Delaune, M., Edou Minko, A., Lescouet, C., Rais-
beck, G.M., Yiou, F., 2000. Application of in situ-produced
cosmogenic 10Be and 26Al to the study of lateritic soil develop-
ment in tropical forest: theory and examples from Cameroon
and Gabon. Chemical Geology 170, 95–111.
Brown, E.T., Bourles, D.L., Colin, F., Sanfo, Z., Raisbeck, G.M.,
Yiou, F., 1994. The development of iron crust lateritic systems
in Burkina Faso. Earth and Planetary Science Letters 124,
19–33.
Brown, E.T., Stallard, R.F., Larsen, M.C., Raisbeck, G.M., Yiou, F.,
1995. Denudation rates determined from the accumulation of in
situ-produced 10Be in the Luquillo experimental forest, Puerto
Rico. Earth and Planetary Science Letters 129, 193–202.
Dunai, T.J., 2000. Scaling factors for production rates of in situ-
produced cosmogenic nuclides: a critical reevaluation. Earth and
Planetary Science Letters 176, 157–169.
Gamper, M., 1986. Mikroklima und Solifluktion: Resultate von
Messungen im Schweizerischen Nationalpark in den Jahren
1975 – 1985. Gottinger Geographische Abhandlungen 94,
31–44.
Granger, D.E., Kirchner, J.W., Finkel, R., 1996. Spatially averaged
long-term erosion rates measured from in situ-produced cosmo-
genic nuclides in alluvial sediment. Journal of Geology 104,
249–257.
Heisinger, B., Lal, D., Jull, A.J.T., Kubik, P.W., Ivy-Ochs, S., Neu-
maier, S., Knie, K., Lazarev, V., Nolte, E., 2002a. Production of
selected cosmogenic radionuclides by muons: 1. Fast muons.
Earth and Planetary Science Letters 200, 345–355.
Heisinger, B., Lal, D., Jull, A.J.T., Kubik, P.W., Ivy-Ochs, S., Knie,
K., Nolte, E., 2002b. Production of selected cosmogenic radio-
nuclides by muons: 2. Capture of negative muons. Earth and
Planetary Science Letters 200, 357–369.
Jaesche, P., 1999. Bodenfrost und Solifluktionsdynamik in einem
alpinen Periglazialgebiet (Hohe Tauern, Osttirol). Bayreuther
Geowissenschaftliche Arbeiten 20, 1–136.
Kirchner, J.W., Finkel, R.C., Riebe, C.S., Granger, D.E., Clayton,
J.L., King, J.G., Megahan, W.F., 2001. Mountain erosion over
10 y, 10 k.y., and 10 m.y. time scales. Geology 29, 591–594.
Kleber, A., 1992. Periglacial slope deposits and their pedogenic
implications in Germany. Palaeogeography, Palaeoclimatology,
Palaeoecology 99, 361–371.
Kleber, A., 1997. Cover-beds as soil parent materials in mid-latitude
regions. Catena 30, 197–213.
Kubik, P.W., Ivy-Ochs, S., Masarik, J., Frank, M., Schluchter, C.,
1998. 10Be and 26Al production rates deduced from an instanta-
neous event within the dendro-calibration curve, the landslide of
Kofels, Oetz Valley, Austria. Earth and Planetary Science Let-
ters 161, 231–241.
Lal, D., 1991. Cosmic ray labeling of erosion surfaces: in situ
nuclide production rates and erosion models. Earth and Plane-
tary Science Letters 104, 424–439.
Mahr, A., 1998. Lockerbraunerden und periglaziale Hangsedimente
im Bayerischen Wald. Regensburger Geographische Schriften
30, 1–326.
Mailander, R., Veit, H., 2001. Periglacial cover-beds on the Swiss
Plateau: indicators of soil, climate and landscape evolution dur-
ing the Late Quaternary. Catena 45, 251–272.
Phillips, W.M., McDonald, E.V., Reneau, S.L., Poths, J., 1998.
Dating soils and alluvium with cosmogenic 21Ne depth profiles:
case studies from the Pajarito Plateau, New Mexico, USA. Earth
and Planetary Science Letters 160, 209–223.
Raab, T., 1999. Wurmzeitliche Vergletscherung des Bayerischen
Waldes im Arbergebiet. Regensburger Geographische Schriften
32, 1–327.
Russow, F., Heinrich, J., 2001. Jungholozane Ueberpragung von
quartaren Deckschichten und Boden des Mittelgebirgsraumes
durch biomechanische Prozesse in Mitteleuropa. Geo-oko 22,
37–58.
Schaller, M., von Blanckenburg, F., Hovius, N., Kubik, P.W., 2001.
Large-scale erosion rates from in situ-produced cosmogenic nu-
clides in European river sediments. Earth and Planetary Science
Letters 188, 441–458.
Semmel, A., 1968. Studien uber den Verlauf jungpleistozaner For-
mung in Hessen. Frankfurter Geographische Hefte 45.
Semmel, A., 1993. Grundzuge der Bodengeographie. Teubner,
Stuttgart, 133 pp.
Small, E.E., Anderson, R.S., Hancock, G.S., 1999. Estimates of the
rate of regolith production using 10Be and 26Al from an alpine
hillslope. Geomorphology 27, 131–150.
Stalling, H., 1987. Untersuchungen zur spat- und postglazialen veg-
etationsgeschichte im Bayerischen Wald. Dissertationes Botani-
cae 105, 1–201.
Veit, H., Stingl, H., Emmerich, K.-H., John, B., 1995. Zeitliche und
raumliche Variabilitat solifluidaler Prozesse und ihre Ursachen.
Ein Zwischenbericht nach acht Jahren Soli-fluktionsmessungen
(1985–1993) an der Meßstation ‘‘Glorer Hutte’’, Hohe Tauern,
Osterreich. Zeitschrift fur Geomorphologie N.F., Supplement-
band 99, 107–122.
Volkel, J., 1995. Periglaziale Deckschichten und Boden im Bayeri-
schen Wald und seinen Randgebieten als geogene Grundlagen
landschaftsokologischer Forschung im Bereich naturnaher Wald-
standorte. Zeitschrift fur Geomorphologie N.F., Supplementband
96, 1–301.
M. Schaller et al. / Geomorphology 49 (2002) 255–267266
Volkel, J., Mahr, A., 1997. Neue Befunde zum Alter der periglazia-
len Deckschichten im Vorderen Bayerischen Wald. Zeitschrift
fur Geomorphologie N.F. 41, 131–137.
Volkel, J., Leopold, M., Roberts, M., 2001. The radar signatures and
age of periglacial slope deposits in the German Highlands. Per-
mafrost and Periglacial Processes 12, 379–387.
von Blanckenburg, F., Belshaw, N.S., O’Nions, R.K., 1996. Sepa-
ration of 9Be and cosmogenic 10Be from environmental materi-
als and SIMS isotope dilution analysis. Chemical Geology 129,
93–99.
M. Schaller et al. / Geomorphology 49 (2002) 255–267 267
Top Related
Copyright © 2022 FDOKUMEN

