


Bahasa
Halaman
Hukum

Available online at www.sciencedirect.com
Journal of Hazardous Materials 158 (2008) 196–201
Improved derivatisation methods for the determination of freecyanide and cyanate in mine effluent
Caliphs M. Zvinowanda a,∗, Jonathan O. Okonkwo a, Rogers C. Gurira b
a Department of Environmental, Water & Earth Sciences, Faculty of Science, Tshwane University of Technology,Private Bag X680, Arcadia, Pretoria 0001, South Africa
b Department of Chemistry, Faculty of Science, University of Zimbabwe, Private Bag MP167, Mount Pleasant, Harare, Zimbabwe
Received 13 November 2007; received in revised form 18 January 2008; accepted 18 January 2008Available online 26 January 2008
Abstract
Generally, the level of cyanide in waste effluents is too high to be discharged into the environment. Consequently, treatment regimes are necessaryin order to protect the environment. However, the cost of most of the treatment methods is expensive and not sensitive enough and, therefore, cannotalways be justified. In this research, cyanide speciation products, free cyanide (CN−) and cyanate (CNO−) were determined by highly sensitivederivatisation methods followed by spectrometric analysis. Spectral scans were carried out for pure and environmental samples derivatives in orderto evaluate the possibility of interfering species. For CN− a linear range from 0.01 to 80.0 mg/L was determined. In the case of CNO−, the linearrange was between 0.02 and 80.0 mg/L. The detection limits were 0.05 and 0.20 mg/L for CN− and CNO−, respectively. These values are in goodagreement with those reported in literature. The concentration ranges of the speciation products in environmental samples were 0.70–52.0 mg/Land 0.50–76.0 mg/L for CN− and CNO−, respectively. These values were well above their acute toxicity levels. Increase in cyanate levels in the
effluent with time was clearly observed while the concentration of cyanide decreased. This was attributed to the oxidation of CN− to CNO−.© 2008 Elsevier B.V. All rights reserved.K ent
1
thpda
iissc
sm
(tcnTc
giocwiF
0d
eywords: Derivatisation method; Spectrometry; Cyanide; Cyanate; Mine efflu
. Introduction
Cyanide is a strong ligand capable of complexing with vir-ually any heavy metal [1]. The complexation of cyanide witheavy metals in organs can totally inhibit all the biochemicalrocesses which may result in human organ failure and eveneath. The lethal dose of cyanide to human adult is between 50nd 200 mg [2].
Cyanide waste management at most gold mining dump sitesnvolves the monitoring of levels of cyanide and its remediations by addition of oxidants and complexing agents such as ferrousulphate which acts as cyanide sinks. The overall toxicity thoughynergistic, can also depend on the predominant species withoncentration above acute toxicity range [3–9].
Different methods for the determination of cyanide and itspecies have been reported [8–10]. Ion pair/ion interaction chro-atography (IIC) has also been used to determine free cyanide
∗ Corresponding author. Tel.: +27 12 382 6281; fax: +27 12 382 6354.E-mail address: [email protected] (C.M. Zvinowanda).
whrr
ps
304-3894/$ – see front matter © 2008 Elsevier B.V. All rights reserved.oi:10.1016/j.jhazmat.2008.01.059
CN−) from leached liquor [11–14]. However the method isime consuming in sample pretreatment. For the analysis of freeyanides, Guibauilt and Kramer described the reaction of p-itrobenzaldehyde (I) with cyanide in alkaline solution [10].he method is widely used as a qualitative test since a highlyoloured purple compound is formed in the presence of cyanide.
Cyanate is commonly determined using the Kjeldahl nitro-en method. This method requires over 1 h per analysis andnvolves boiling of concentrated acids. Prior to the developmentf ion chromatographic method for the analysis of cyanate, aolorimetric method was used [15,16]. This colorimetric methodas shown to be unreliable for samples containing low CNO−
n the presence of high concentrations of metals or ammonia.agan and Haddad [17] reported an ion chromatographic methodhich was suitable for samples with Cl− levels up to 100-foldigher than the CNO−. However, rapid column deterioration waseported, thus this technique was considered very expensive for
outine CNO− analysis [18,19].Cyanate is one such anion which is produced during proteinoisoning in the body. This anion has been studied exten-ively in the field of biochemistry because of its toxicity.
C.M. Zvinowanda et al. / Journal of Hazar
Fl
Cwttff
2
2
A
FLP
aoeipgc
2
tpwpitsS
2
odFc3
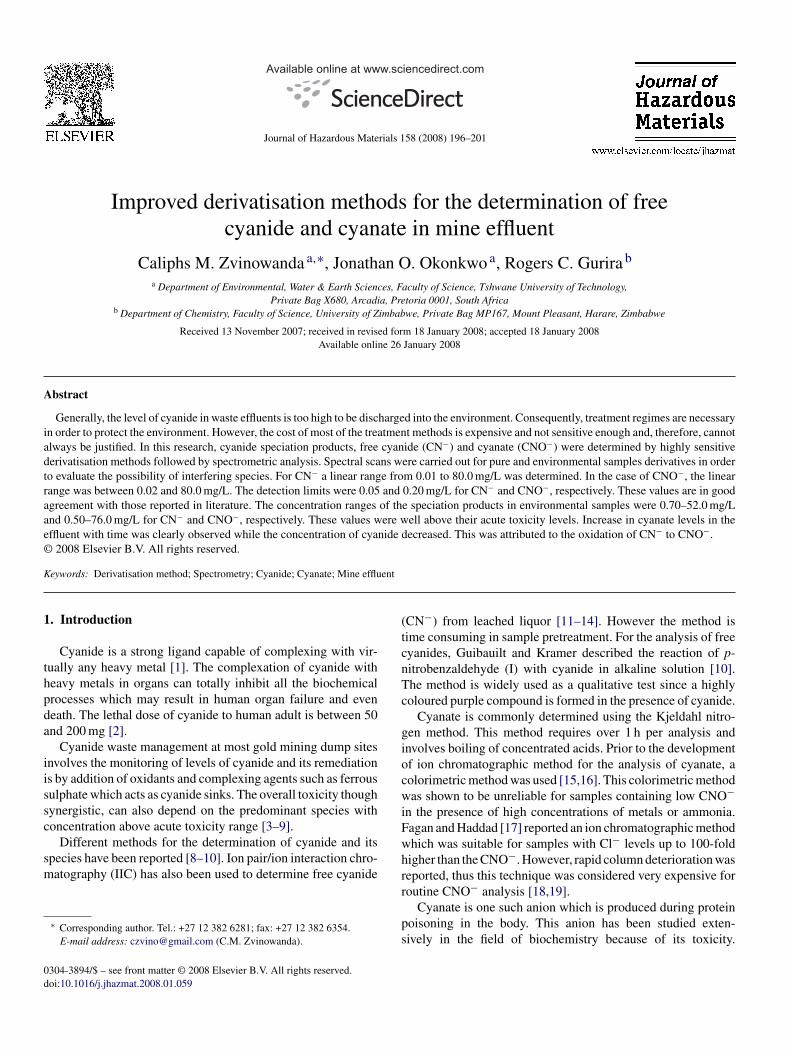
ig. 1. Map of Zimbabwe (bottom right) and the position of Arcturus Mine (topeft).
yanate in blood plasma has been determined by the methodhich involves the derivatisation of cyanate with 2-nitro-5-
hiocarbamylbenzoic acid (TNB) [20]. In this paper we reporthe use of the derivatisation of CNO− and 2-amino benzoic acid,ollowed by spectrophotometric method of analysis to determineree cyanate (CNO−) in environmental samples [23].
. Experimental
.1. Location of study area
The location of the study area is shown in Fig. 1, marked asrcturus Mine.
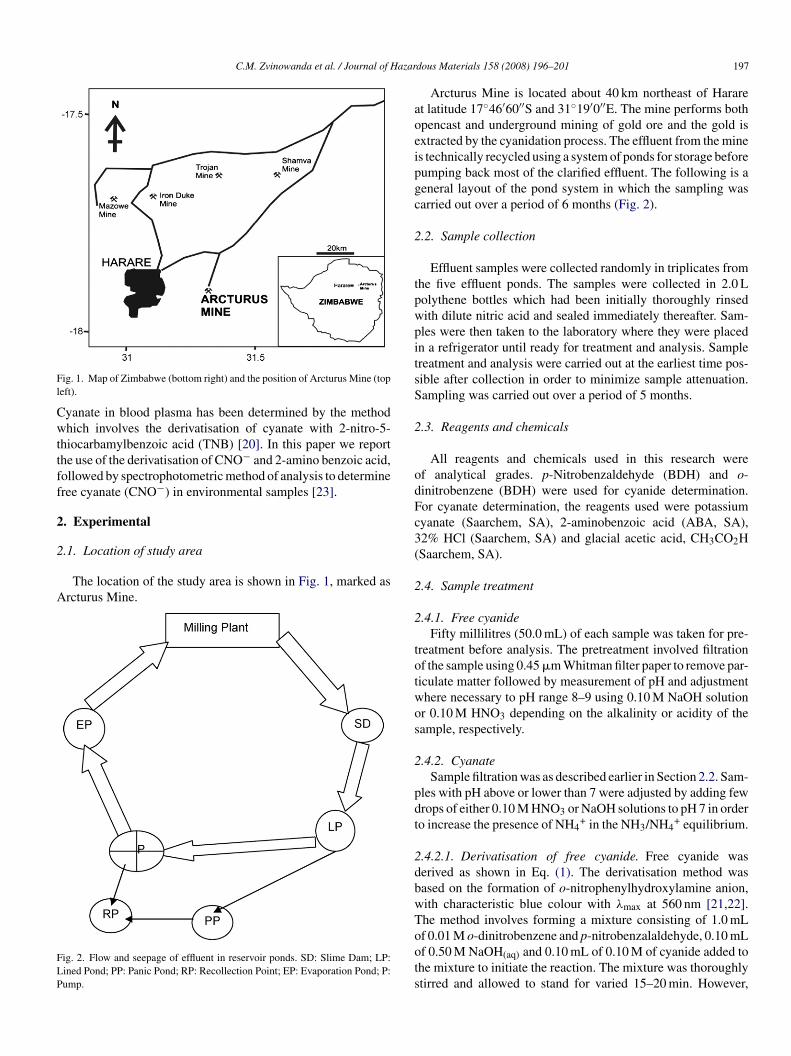
ig. 2. Flow and seepage of effluent in reservoir ponds. SD: Slime Dam; LP:ined Pond; PP: Panic Pond; RP: Recollection Point; EP: Evaporation Pond; P:ump.
(
2
2
totwos
2
pdt
2dbwToots
dous Materials 158 (2008) 196–201 197
Arcturus Mine is located about 40 km northeast of Hararet latitude 17◦46′60′′S and 31◦19′0′′E. The mine performs bothpencast and underground mining of gold ore and the gold isxtracted by the cyanidation process. The effluent from the mines technically recycled using a system of ponds for storage beforeumping back most of the clarified effluent. The following is aeneral layout of the pond system in which the sampling wasarried out over a period of 6 months (Fig. 2).
.2. Sample collection
Effluent samples were collected randomly in triplicates fromhe five effluent ponds. The samples were collected in 2.0 Lolythene bottles which had been initially thoroughly rinsedith dilute nitric acid and sealed immediately thereafter. Sam-les were then taken to the laboratory where they were placedn a refrigerator until ready for treatment and analysis. Samplereatment and analysis were carried out at the earliest time pos-ible after collection in order to minimize sample attenuation.ampling was carried out over a period of 5 months.
.3. Reagents and chemicals
All reagents and chemicals used in this research weref analytical grades. p-Nitrobenzaldehyde (BDH) and o-initrobenzene (BDH) were used for cyanide determination.or cyanate determination, the reagents used were potassiumyanate (Saarchem, SA), 2-aminobenzoic acid (ABA, SA),2% HCl (Saarchem, SA) and glacial acetic acid, CH3CO2HSaarchem, SA).
.4. Sample treatment
.4.1. Free cyanideFifty millilitres (50.0 mL) of each sample was taken for pre-
reatment before analysis. The pretreatment involved filtrationf the sample using 0.45 �m Whitman filter paper to remove par-iculate matter followed by measurement of pH and adjustmenthere necessary to pH range 8–9 using 0.10 M NaOH solutionr 0.10 M HNO3 depending on the alkalinity or acidity of theample, respectively.
.4.2. CyanateSample filtration was as described earlier in Section 2.2. Sam-
les with pH above or lower than 7 were adjusted by adding fewrops of either 0.10 M HNO3 or NaOH solutions to pH 7 in ordero increase the presence of NH4
+ in the NH3/NH4+ equilibrium.
.4.2.1. Derivatisation of free cyanide. Free cyanide waserived as shown in Eq. (1). The derivatisation method wasased on the formation of o-nitrophenylhydroxylamine anion,ith characteristic blue colour with λmax at 560 nm [21,22].he method involves forming a mixture consisting of 1.0 mL
f 0.01 M o-dinitrobenzene and p-nitrobenzalaldehyde, 0.10 mLf 0.50 M NaOH(aq) and 0.10 mL of 0.10 M of cyanide added tohe mixture to initiate the reaction. The mixture was thoroughlytirred and allowed to stand for varied 15–20 min. However,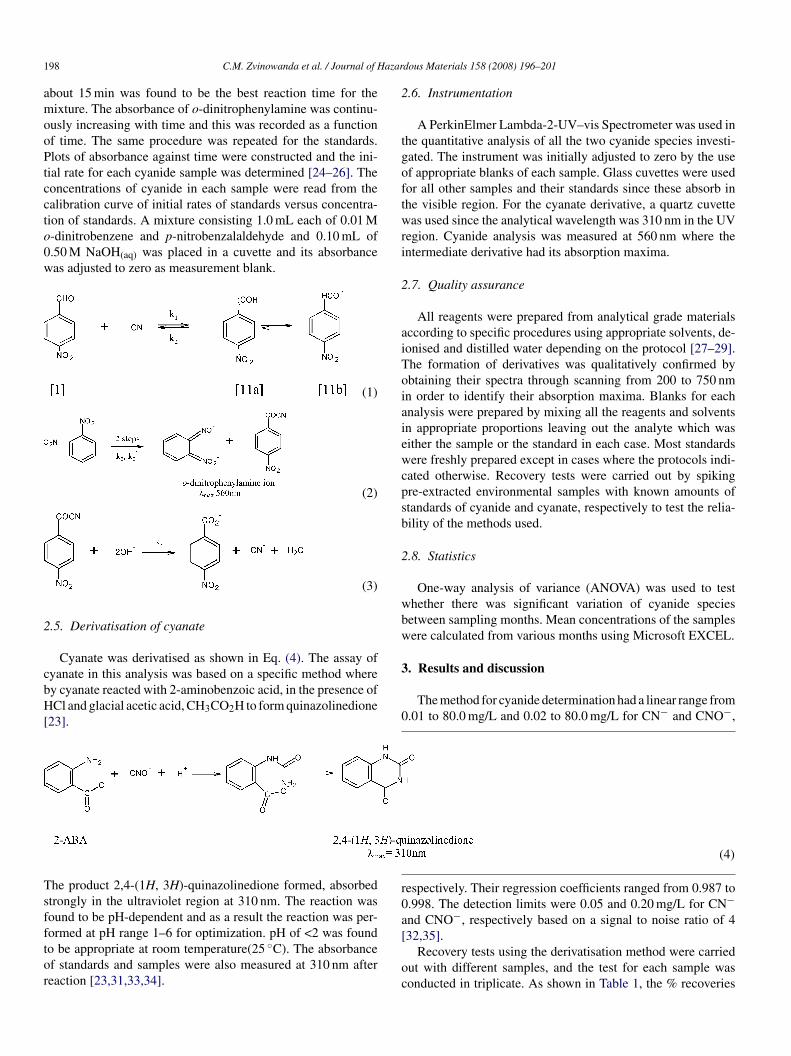
1 azar
amooPtccto0w
2
cbH[
Tsfftor
2
tgoftwri
2
aiToiaiewcpsb
2
wbw
3
0
r0a
98 C.M. Zvinowanda et al. / Journal of H
bout 15 min was found to be the best reaction time for theixture. The absorbance of o-dinitrophenylamine was continu-
usly increasing with time and this was recorded as a functionf time. The same procedure was repeated for the standards.lots of absorbance against time were constructed and the ini-
ial rate for each cyanide sample was determined [24–26]. Theoncentrations of cyanide in each sample were read from thealibration curve of initial rates of standards versus concentra-ion of standards. A mixture consisting 1.0 mL each of 0.01 M-dinitrobenzene and p-nitrobenzalaldehyde and 0.10 mL of.50 M NaOH(aq) was placed in a cuvette and its absorbanceas adjusted to zero as measurement blank.
(1)
(2)
(3)
.5. Derivatisation of cyanate
Cyanate was derivatised as shown in Eq. (4). The assay ofyanate in this analysis was based on a specific method wherey cyanate reacted with 2-aminobenzoic acid, in the presence ofCl and glacial acetic acid, CH3CO2H to form quinazolinedione
23].
he product 2,4-(1H, 3H)-quinazolinedione formed, absorbedtrongly in the ultraviolet region at 310 nm. The reaction wasound to be pH-dependent and as a result the reaction was per-
ormed at pH range 1–6 for optimization. pH of <2 was foundo be appropriate at room temperature(25 ◦C). The absorbancef standards and samples were also measured at 310 nm aftereaction [23,31,33,34].[
oc
dous Materials 158 (2008) 196–201
(4)
.6. Instrumentation
A PerkinElmer Lambda-2-UV–vis Spectrometer was used inhe quantitative analysis of all the two cyanide species investi-ated. The instrument was initially adjusted to zero by the usef appropriate blanks of each sample. Glass cuvettes were usedor all other samples and their standards since these absorb inhe visible region. For the cyanate derivative, a quartz cuvetteas used since the analytical wavelength was 310 nm in the UV
egion. Cyanide analysis was measured at 560 nm where thentermediate derivative had its absorption maxima.
.7. Quality assurance
All reagents were prepared from analytical grade materialsccording to specific procedures using appropriate solvents, de-onised and distilled water depending on the protocol [27–29].he formation of derivatives was qualitatively confirmed bybtaining their spectra through scanning from 200 to 750 nmn order to identify their absorption maxima. Blanks for eachnalysis were prepared by mixing all the reagents and solventsn appropriate proportions leaving out the analyte which wasither the sample or the standard in each case. Most standardsere freshly prepared except in cases where the protocols indi-
ated otherwise. Recovery tests were carried out by spikingre-extracted environmental samples with known amounts oftandards of cyanide and cyanate, respectively to test the relia-ility of the methods used.
.8. Statistics
One-way analysis of variance (ANOVA) was used to testhether there was significant variation of cyanide speciesetween sampling months. Mean concentrations of the samplesere calculated from various months using Microsoft EXCEL.
. Results and discussion
The method for cyanide determination had a linear range from.01 to 80.0 mg/L and 0.02 to 80.0 mg/L for CN− and CNO−,
espectively. Their regression coefficients ranged from 0.987 to.998. The detection limits were 0.05 and 0.20 mg/L for CN−nd CNO−, respectively based on a signal to noise ratio of 4
32,35].Recovery tests using the derivatisation method were carriedut with different samples, and the test for each sample wasonducted in triplicate. As shown in Table 1, the % recoveries
C.M. Zvinowanda et al. / Journal of Hazardous Materials 158 (2008) 196–201 199
Table 1Results of recovery test of spiked pre-extracted real samples
Sample Amount added (mg/L ± R.S.D.) Amount recovered (mg/L ± R.S.D.) Recovery (% ± R.S.D.)
CN− CNO− CN− CNO− CN− CNO−
SD 4.00 ± 0.12 5.00 ± 2.10 3.60 ± 1.80 4.25 ± 1.77 90.0 ± 1.2 85.2 ± 0.7LP 1.50 ± 0.10 2.50 ± 0.86 1.44 ± 1.60 2.33 ± 1.42 96.4 ± 0.8 93.1 ± 1.3PP 0.20 ± 0.20 2.00 ± 0.52 0.18 ± 0.65 1.88 ± 0.84 92.3 ± 0.5 94.0 ± 0.4R 0.40E 0.35
S EP = E
rhu
cDuIDht[trC
C
TiK
wAt
TCi
S
12345
DR
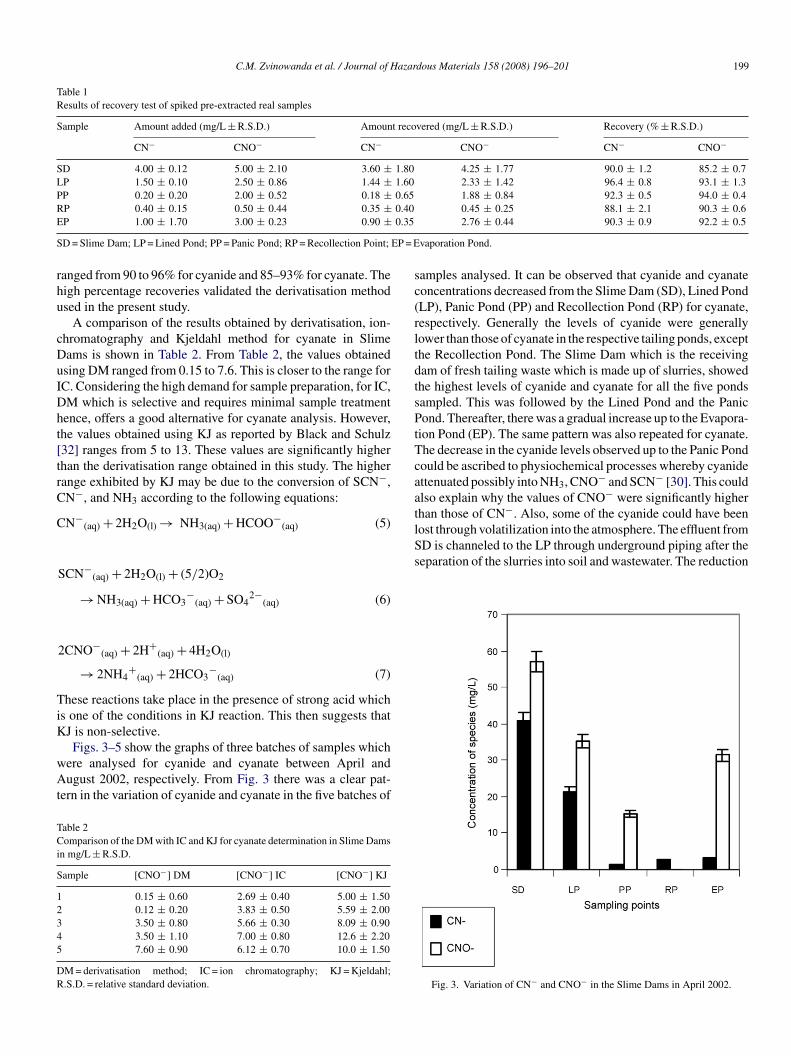
sc(rltdtsPtTcaathan those of CN−. Also, some of the cyanide could have beenlost through volatilization into the atmosphere. The effluent fromSD is channeled to the LP through underground piping after theseparation of the slurries into soil and wastewater. The reduction
P 0.40 ± 0.15 0.50 ± 0.44 0.35 ±P 1.00 ± 1.70 3.00 ± 0.23 0.90 ±D = Slime Dam; LP = Lined Pond; PP = Panic Pond; RP = Recollection Point;
anged from 90 to 96% for cyanide and 85–93% for cyanate. Theigh percentage recoveries validated the derivatisation methodsed in the present study.
A comparison of the results obtained by derivatisation, ion-hromatography and Kjeldahl method for cyanate in Slimeams is shown in Table 2. From Table 2, the values obtainedsing DM ranged from 0.15 to 7.6. This is closer to the range forC. Considering the high demand for sample preparation, for IC,M which is selective and requires minimal sample treatmentence, offers a good alternative for cyanate analysis. However,he values obtained using KJ as reported by Black and Schulz32] ranges from 5 to 13. These values are significantly higherhan the derivatisation range obtained in this study. The higherange exhibited by KJ may be due to the conversion of SCN−,N−, and NH3 according to the following equations:
N−(aq) + 2H2O(l) → NH3(aq) + HCOO−
(aq) (5)
SCN−(aq) + 2H2O(l) + (5/2)O2
→ NH3(aq) + HCO3−
(aq) + SO42−
(aq) (6)
2CNO−(aq) + 2H+
(aq) + 4H2O(l)
→ 2NH4+
(aq) + 2HCO3−
(aq) (7)
hese reactions take place in the presence of strong acid whichs one of the conditions in KJ reaction. This then suggests thatJ is non-selective.
Figs. 3–5 show the graphs of three batches of samples whichere analysed for cyanide and cyanate between April andugust 2002, respectively. From Fig. 3 there was a clear pat-
ern in the variation of cyanide and cyanate in the five batches of
able 2omparison of the DM with IC and KJ for cyanate determination in Slime Dams
n mg/L ± R.S.D.
ample [CNO−] DM [CNO−] IC [CNO−] KJ
0.15 ± 0.60 2.69 ± 0.40 5.00 ± 1.500.12 ± 0.20 3.83 ± 0.50 5.59 ± 2.003.50 ± 0.80 5.66 ± 0.30 8.09 ± 0.903.50 ± 1.10 7.00 ± 0.80 12.6 ± 2.207.60 ± 0.90 6.12 ± 0.70 10.0 ± 1.50
M = derivatisation method; IC = ion chromatography; KJ = Kjeldahl;.S.D. = relative standard deviation.
0.45 ± 0.25 88.1 ± 2.1 90.3 ± 0.62.76 ± 0.44 90.3 ± 0.9 92.2 ± 0.5
vaporation Pond.
amples analysed. It can be observed that cyanide and cyanateoncentrations decreased from the Slime Dam (SD), Lined PondLP), Panic Pond (PP) and Recollection Pond (RP) for cyanate,espectively. Generally the levels of cyanide were generallyower than those of cyanate in the respective tailing ponds, excepthe Recollection Pond. The Slime Dam which is the receivingam of fresh tailing waste which is made up of slurries, showedhe highest levels of cyanide and cyanate for all the five pondsampled. This was followed by the Lined Pond and the Panicond. Thereafter, there was a gradual increase up to the Evapora-
ion Pond (EP). The same pattern was also repeated for cyanate.he decrease in the cyanide levels observed up to the Panic Pondould be ascribed to physiochemical processes whereby cyanidettenuated possibly into NH3, CNO− and SCN− [30]. This couldlso explain why the values of CNO− were significantly higher
Fig. 3. Variation of CN− and CNO− in the Slime Dams in April 2002.
200 C.M. Zvinowanda et al. / Journal of Hazar
oi
CRt
Smcvw
FooivRwlmRaptff
4
c0a
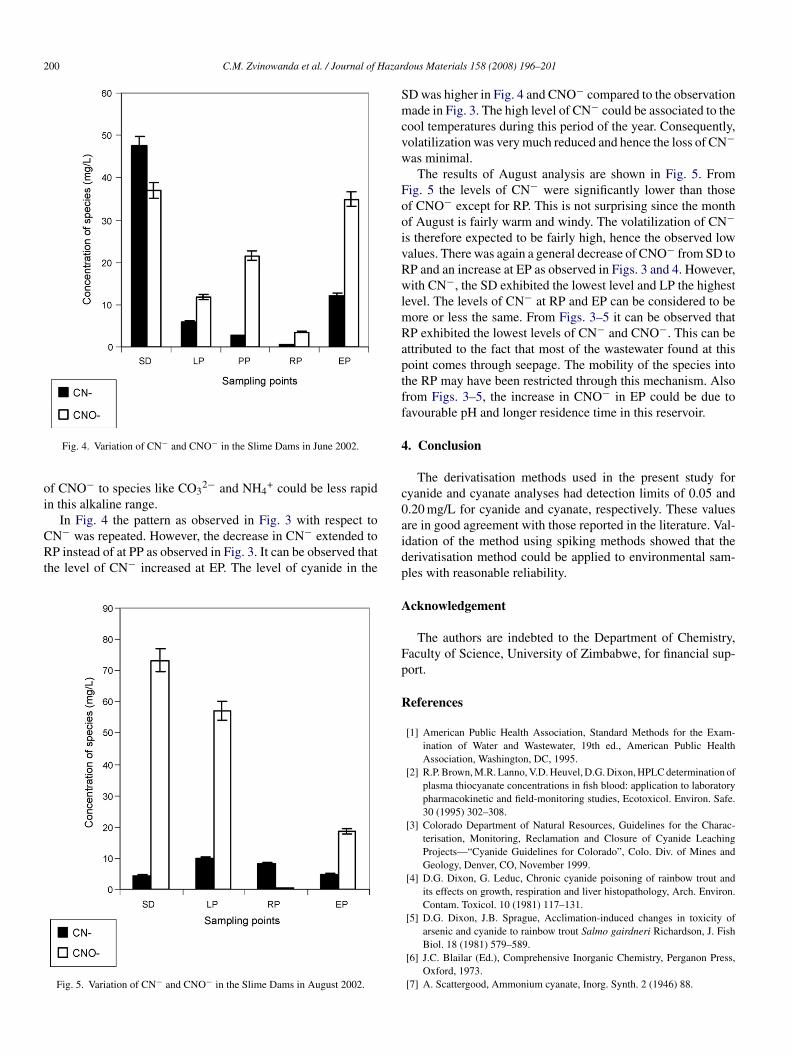
Fig. 4. Variation of CN− and CNO− in the Slime Dams in June 2002.
f CNO− to species like CO32− and NH4
+ could be less rapidn this alkaline range.
In Fig. 4 the pattern as observed in Fig. 3 with respect to
N− was repeated. However, the decrease in CN− extended toP instead of at PP as observed in Fig. 3. It can be observed thathe level of CN− increased at EP. The level of cyanide in the
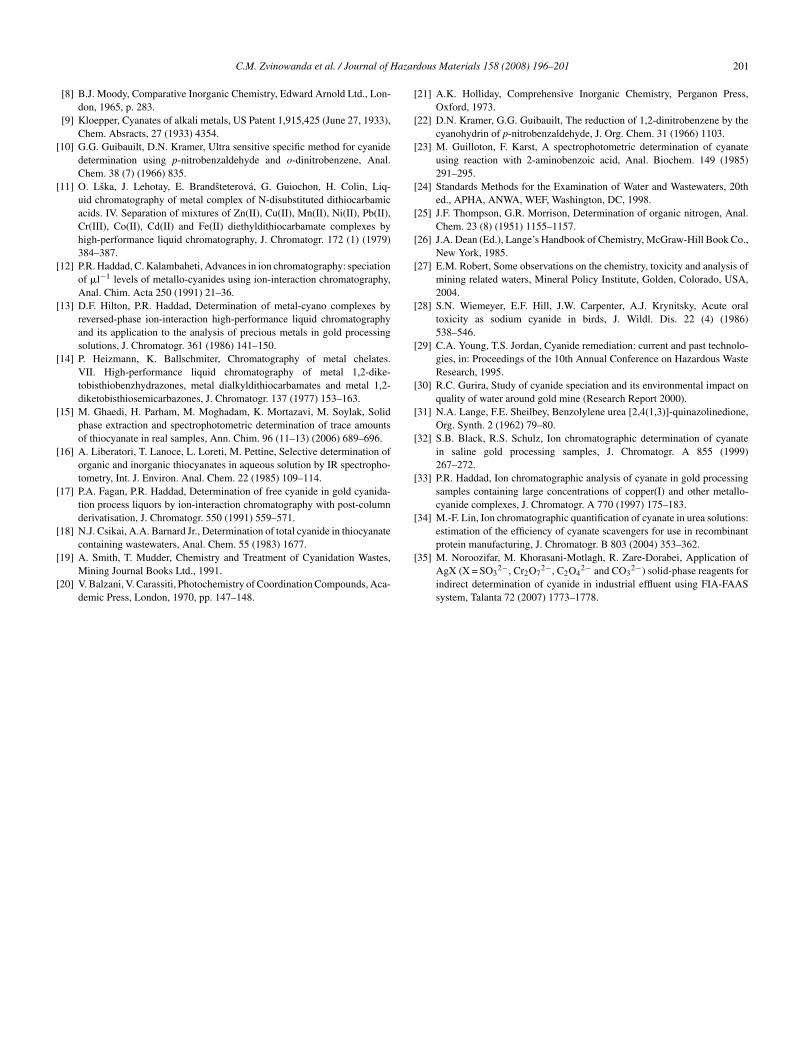
Fig. 5. Variation of CN− and CNO− in the Slime Dams in August 2002.
idp
A
Fp
R
dous Materials 158 (2008) 196–201
D was higher in Fig. 4 and CNO− compared to the observationade in Fig. 3. The high level of CN− could be associated to the
ool temperatures during this period of the year. Consequently,olatilization was very much reduced and hence the loss of CN−as minimal.The results of August analysis are shown in Fig. 5. From
ig. 5 the levels of CN− were significantly lower than thosef CNO− except for RP. This is not surprising since the monthf August is fairly warm and windy. The volatilization of CN−s therefore expected to be fairly high, hence the observed lowalues. There was again a general decrease of CNO− from SD toP and an increase at EP as observed in Figs. 3 and 4. However,ith CN−, the SD exhibited the lowest level and LP the highest
evel. The levels of CN− at RP and EP can be considered to beore or less the same. From Figs. 3–5 it can be observed thatP exhibited the lowest levels of CN− and CNO−. This can bettributed to the fact that most of the wastewater found at thisoint comes through seepage. The mobility of the species intohe RP may have been restricted through this mechanism. Alsorom Figs. 3–5, the increase in CNO− in EP could be due toavourable pH and longer residence time in this reservoir.
. Conclusion
The derivatisation methods used in the present study foryanide and cyanate analyses had detection limits of 0.05 and.20 mg/L for cyanide and cyanate, respectively. These valuesre in good agreement with those reported in the literature. Val-dation of the method using spiking methods showed that theerivatisation method could be applied to environmental sam-les with reasonable reliability.
cknowledgement
The authors are indebted to the Department of Chemistry,aculty of Science, University of Zimbabwe, for financial sup-ort.
eferences
[1] American Public Health Association, Standard Methods for the Exam-ination of Water and Wastewater, 19th ed., American Public HealthAssociation, Washington, DC, 1995.
[2] R.P. Brown, M.R. Lanno, V.D. Heuvel, D.G. Dixon, HPLC determination ofplasma thiocyanate concentrations in fish blood: application to laboratorypharmacokinetic and field-monitoring studies, Ecotoxicol. Environ. Safe.30 (1995) 302–308.
[3] Colorado Department of Natural Resources, Guidelines for the Charac-terisation, Monitoring, Reclamation and Closure of Cyanide LeachingProjects—“Cyanide Guidelines for Colorado”, Colo. Div. of Mines andGeology, Denver, CO, November 1999.
[4] D.G. Dixon, G. Leduc, Chronic cyanide poisoning of rainbow trout andits effects on growth, respiration and liver histopathology, Arch. Environ.Contam. Toxicol. 10 (1981) 117–131.
[5] D.G. Dixon, J.B. Sprague, Acclimation-induced changes in toxicity of
arsenic and cyanide to rainbow trout Salmo gairdneri Richardson, J. FishBiol. 18 (1981) 579–589.[6] J.C. Blailar (Ed.), Comprehensive Inorganic Chemistry, Perganon Press,Oxford, 1973.
[7] A. Scattergood, Ammonium cyanate, Inorg. Synth. 2 (1946) 88.
azar
[
[
[
[
[
[
[
[
[
[
[
[
[
[
[
[
[
[
[
[
[
[
[
[
[
C.M. Zvinowanda et al. / Journal of H
[8] B.J. Moody, Comparative Inorganic Chemistry, Edward Arnold Ltd., Lon-don, 1965, p. 283.
[9] Kloepper, Cyanates of alkali metals, US Patent 1,915,425 (June 27, 1933),Chem. Absracts, 27 (1933) 4354.
10] G.G. Guibauilt, D.N. Kramer, Ultra sensitive specific method for cyanidedetermination using p-nitrobenzaldehyde and o-dinitrobenzene, Anal.Chem. 38 (7) (1966) 835.
11] O. Lska, J. Lehotay, E. Brandsteterova, G. Guiochon, H. Colin, Liq-uid chromatography of metal complex of N-disubstituted dithiocarbamicacids. IV. Separation of mixtures of Zn(II), Cu(II), Mn(II), Ni(II), Pb(II),Cr(III), Co(II), Cd(II) and Fe(II) diethyldithiocarbamate complexes byhigh-performance liquid chromatography, J. Chromatogr. 172 (1) (1979)384–387.
12] P.R. Haddad, C. Kalambaheti, Advances in ion chromatography: speciationof �l−1 levels of metallo-cyanides using ion-interaction chromatography,Anal. Chim. Acta 250 (1991) 21–36.
13] D.F. Hilton, P.R. Haddad, Determination of metal-cyano complexes byreversed-phase ion-interaction high-performance liquid chromatographyand its application to the analysis of precious metals in gold processingsolutions, J. Chromatogr. 361 (1986) 141–150.
14] P. Heizmann, K. Ballschmiter, Chromatography of metal chelates.VII. High-performance liquid chromatography of metal 1,2-dike-tobisthiobenzhydrazones, metal dialkyldithiocarbamates and metal 1,2-diketobisthiosemicarbazones, J. Chromatogr. 137 (1977) 153–163.
15] M. Ghaedi, H. Parham, M. Moghadam, K. Mortazavi, M. Soylak, Solidphase extraction and spectrophotometric determination of trace amountsof thiocyanate in real samples, Ann. Chim. 96 (11–13) (2006) 689–696.
16] A. Liberatori, T. Lanoce, L. Loreti, M. Pettine, Selective determination oforganic and inorganic thiocyanates in aqueous solution by IR spectropho-tometry, Int. J. Environ. Anal. Chem. 22 (1985) 109–114.
17] P.A. Fagan, P.R. Haddad, Determination of free cyanide in gold cyanida-tion process liquors by ion-interaction chromatography with post-columnderivatisation, J. Chromatogr. 550 (1991) 559–571.
18] N.J. Csikai, A.A. Barnard Jr., Determination of total cyanide in thiocyanate
containing wastewaters, Anal. Chem. 55 (1983) 1677.19] A. Smith, T. Mudder, Chemistry and Treatment of Cyanidation Wastes,Mining Journal Books Ltd., 1991.
20] V. Balzani, V. Carassiti, Photochemistry of Coordination Compounds, Aca-demic Press, London, 1970, pp. 147–148.
[
dous Materials 158 (2008) 196–201 201
21] A.K. Holliday, Comprehensive Inorganic Chemistry, Perganon Press,Oxford, 1973.
22] D.N. Kramer, G.G. Guibauilt, The reduction of 1,2-dinitrobenzene by thecyanohydrin of p-nitrobenzaldehyde, J. Org. Chem. 31 (1966) 1103.
23] M. Guilloton, F. Karst, A spectrophotometric determination of cyanateusing reaction with 2-aminobenzoic acid, Anal. Biochem. 149 (1985)291–295.
24] Standards Methods for the Examination of Water and Wastewaters, 20thed., APHA, ANWA, WEF, Washington, DC, 1998.
25] J.F. Thompson, G.R. Morrison, Determination of organic nitrogen, Anal.Chem. 23 (8) (1951) 1155–1157.
26] J.A. Dean (Ed.), Lange’s Handbook of Chemistry, McGraw-Hill Book Co.,New York, 1985.
27] E.M. Robert, Some observations on the chemistry, toxicity and analysis ofmining related waters, Mineral Policy Institute, Golden, Colorado, USA,2004.
28] S.N. Wiemeyer, E.F. Hill, J.W. Carpenter, A.J. Krynitsky, Acute oraltoxicity as sodium cyanide in birds, J. Wildl. Dis. 22 (4) (1986)538–546.
29] C.A. Young, T.S. Jordan, Cyanide remediation: current and past technolo-gies, in: Proceedings of the 10th Annual Conference on Hazardous WasteResearch, 1995.
30] R.C. Gurira, Study of cyanide speciation and its environmental impact onquality of water around gold mine (Research Report 2000).
31] N.A. Lange, F.E. Sheilbey, Benzolylene urea [2,4(1,3)]-quinazolinedione,Org. Synth. 2 (1962) 79–80.
32] S.B. Black, R.S. Schulz, Ion chromatographic determination of cyanatein saline gold processing samples, J. Chromatogr. A 855 (1999)267–272.
33] P.R. Haddad, Ion chromatographic analysis of cyanate in gold processingsamples containing large concentrations of copper(I) and other metallo-cyanide complexes, J. Chromatogr. A 770 (1997) 175–183.
34] M.-F. Lin, Ion chromatographic quantification of cyanate in urea solutions:estimation of the efficiency of cyanate scavengers for use in recombinant
protein manufacturing, J. Chromatogr. B 803 (2004) 353–362.35] M. Noroozifar, M. Khorasani-Motlagh, R. Zare-Dorabei, Application ofAgX (X = SO3
2−, Cr2O72−, C2O4
2− and CO32−) solid-phase reagents for
indirect determination of cyanide in industrial effluent using FIA-FAASsystem, Talanta 72 (2007) 1773–1778.
Top Related
Copyright © 2022 FDOKUMEN

