


Bahasa
Halaman
Hukum


SEPTEMBER 2021 Working Paper 208
Impact of Technical Barriers to Trade on the Trade in Goods in the Information and Communications Technology Sector:
Differentiating by Aim of the Regulatory Measure
Mahdi Ghodsi
The Vienna Institute for International Economic Studies Wiener Institut für Internationale Wirtschaftsvergleiche

Impact of Technical Barriers to Trade on the Trade in Goods in the Information and Communications Technology Sector:
Differentiating by Aim of the Regulatory Measure MAHDI GHODSI
Mahdi Ghodsi is Economist at The Vienna Institute for International Economic Studies (wiiw). Research for this paper was financed by the Anniversary Fund of the Oesterreichische Nationalbank (Project No. 18128). Support provided by Oesterreichische Nationalbank for this research is gratefully acknowledged.

Abstract
In this modern digital world, goods from the information and communications technology (ICT) sector are the engine of the global economy. While tariffs levied on ICT goods have been eliminated or significantly reduced since the conclusion in December 1996 of the Information Technology Agreement of the World Trade Organization (WTO), non-tariff measure (NTMs) have come to be used more frequently with regard to imports of these goods. Technical barriers to trade (TBTs), as the most important trade policy measure imposed on imports of ICT goods, form the focus of this study. This paper analyses how different types of TBTs imposed on imports of ICT goods globally affected the values and volumes of imported goods at the six-digit level of the Harmonised System (HS) during the period 1996-2018. Keywords cited in the TBTs notified to the WTO give an indication of the aims behind the imposition of TBTs. Therefore, this study digs deeper into the impact of 30 types of TBT, using the keywords cited. The methodology used in this paper controls for zero trade flows using the Pseudo Poisson Maximum Likelihood (PPML) technique; and it controls for endogeneity bias using the exogenous instrumental variable approach. Furthermore, the paper provides more detailed analysis of the impact of TBTs across five ICT product categories that are defined by the United Nations Conference on Trade and Development (UNCTAD). The results indicate that TBTs have a generally strong positive impact on the value of imports of ICT goods. While many keywords cited in TBTs notified to the WTO affect the values and volumes of imports in a positive way, certain other TBTs function as trade barriers that reduce their values and volumes.
Keywords: Information and communications technology, non-tariff measures, technical barrier to trade, World Trade Organization, Pseudo Poisson Maximum Likelihood
JEL classification: F13, F14, L15

CONTENTS
1. Introduction .................................................................................................................................................... 11
2. Methodology and data ............................................................................................................................... 15
2.1. Data ...............................................................................................................................................17
3. Estimation results ....................................................................................................................................... 18
3.1. Estimation results by product category ..........................................................................................19 3.2. Impact of TBTs on imports by the keyword cited ...........................................................................20 3.3. Impact of TBTs on import values by the cited keyword across product categories .......................21
4. Concluding remarks ................................................................................................................................... 23
References ................................................................................................................................................................... 24
Appendix ...................................................................................................................................................................... 26
TABLES AND FIGURES
Table 1 / Second-stage instrumental variable estimation results using PPML on imports of ICT goods during 1996-2018 ..................................................................................................................... 18
Figure 1 / Development of trade, tariffs and TBTs on ICT goods – 1996-2018 ....................................... 11 Figure 2 / TBT notifications (based on keywords) in force in 2018 on ICT goods .................................... 13
Appendix
Table A1 / List of ICT products and their related categories in the HS 1996 version ............................... 26 Table A2 / PPML estimation results on imports of ICT goods during 1996-2018 .................................... 28 Table A3 / PPML estimation results on imports of ICT goods during 1996-2018 .................................... 28
Figure A1 / Point estimates and confidence intervals of the PPML second-stage instrumental variable on import values of ICT goods by category during the period 1996-2018, using TBTs in levels ................................................................................................................. 29
Figure A2 / Point estimates and confidence intervals of the PPML second-stage instrumental variable on import values of ICT goods by category during the period 1996-2018, using TBTs in arcsine transformation ...................................................................................... 29
Figure A3 / Point estimates and confidence intervals of the PPML second-stage instrumental variable on import volumes of ICT goods by category during the period 1996-2018, using TBTs in levels ................................................................................................................. 30
Figure A4 / Point estimates and confidence intervals of the PPML second-stage instrumental variable on import volumes of ICT goods by category during the period 1996-2018, using TBTs in arcsine transformation ...................................................................................... 30
Figure A5 / Point estimates and confidence intervals of the PPML second-stage instrumental variable on import values of ICT goods during the period 1996-2018 by keywords of TBTs, using hyperbolic TBTs ................................................................................................... 31
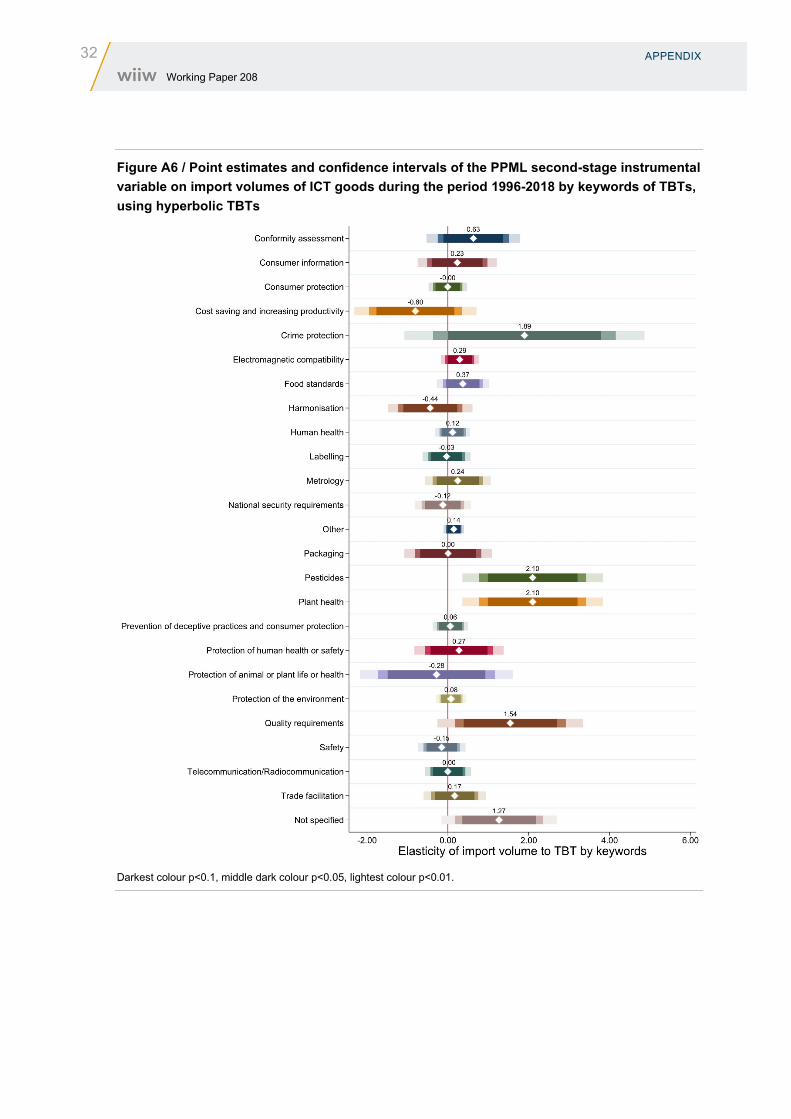
Figure A6 / Point estimates and confidence intervals of the PPML second-stage instrumental variable on import volumes of ICT goods during the period 1996-2018 by keywords of TBTs, using hyperbolic TBTs ............................................................................................... 32
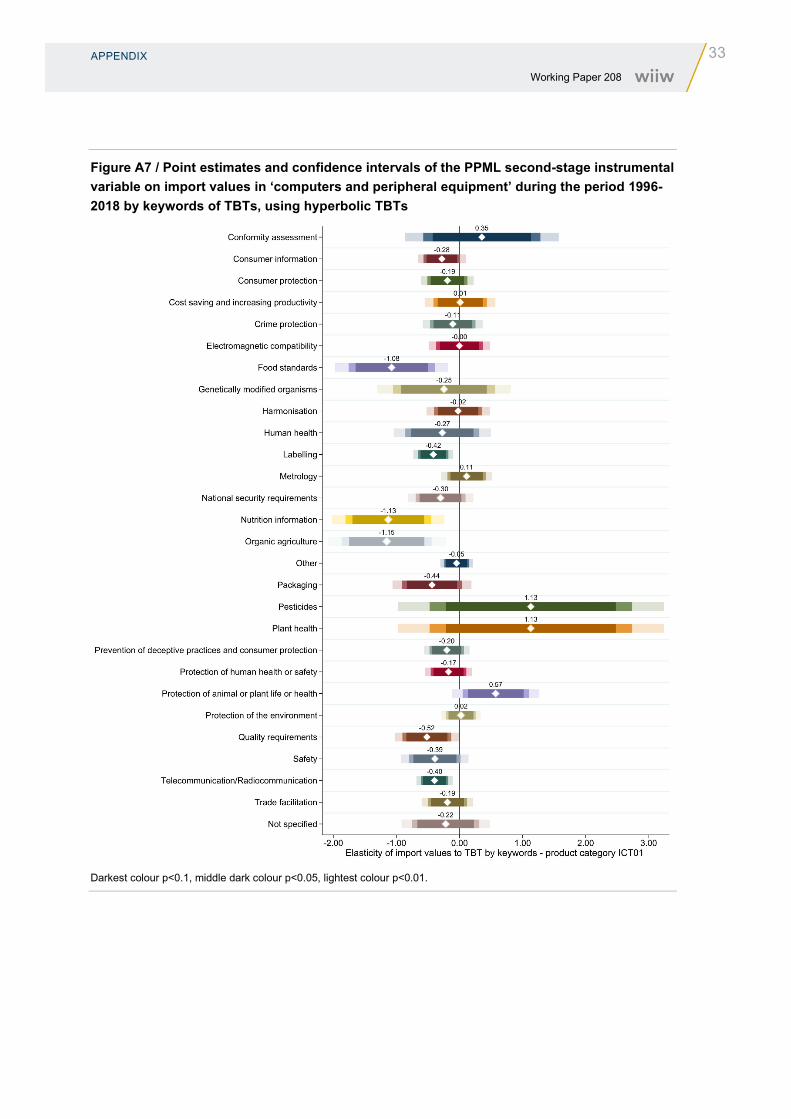
Figure A7 / Point estimates and confidence intervals of the PPML second-stage instrumental variable on import values in ‘computers and peripheral equipment’ during the period 1996-2018 by keywords of TBTs, using hyperbolic TBTs ........................................................ 33
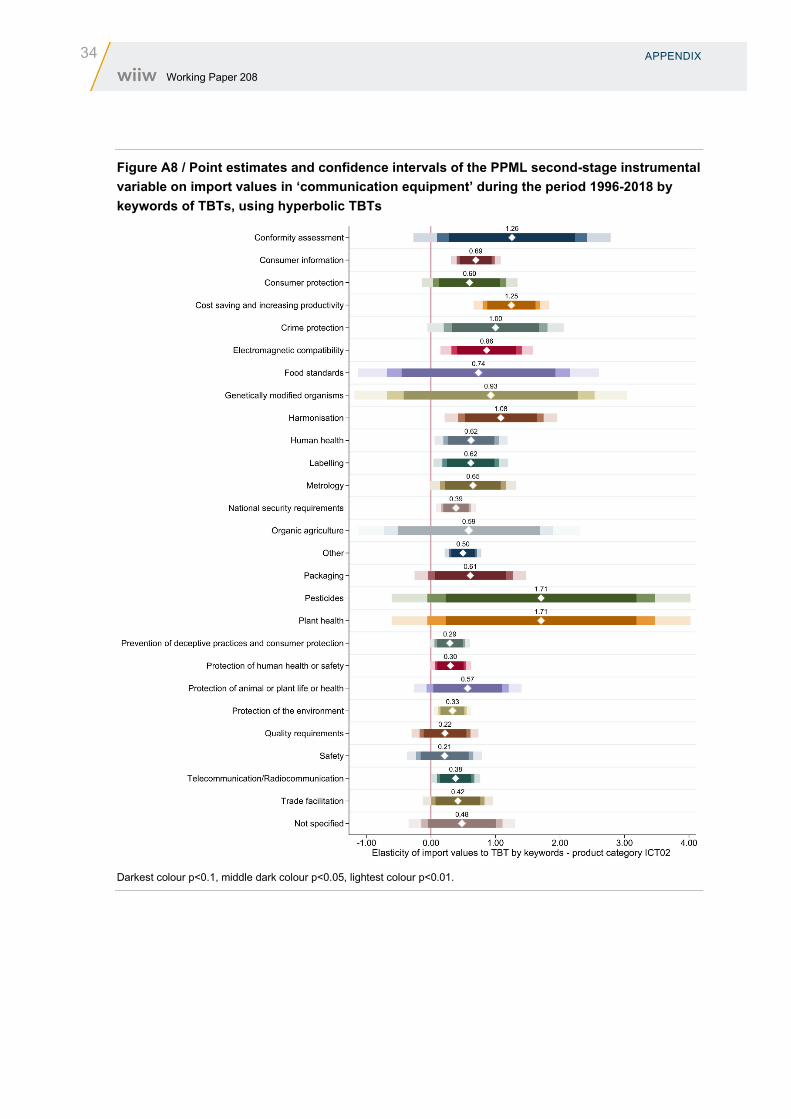
Figure A8 / Point estimates and confidence intervals of the PPML second-stage instrumental variable on import values in ‘communication equipment’ during the period 1996-2018 by keywords of TBTs, using hyperbolic TBTs ............................................................................... 34
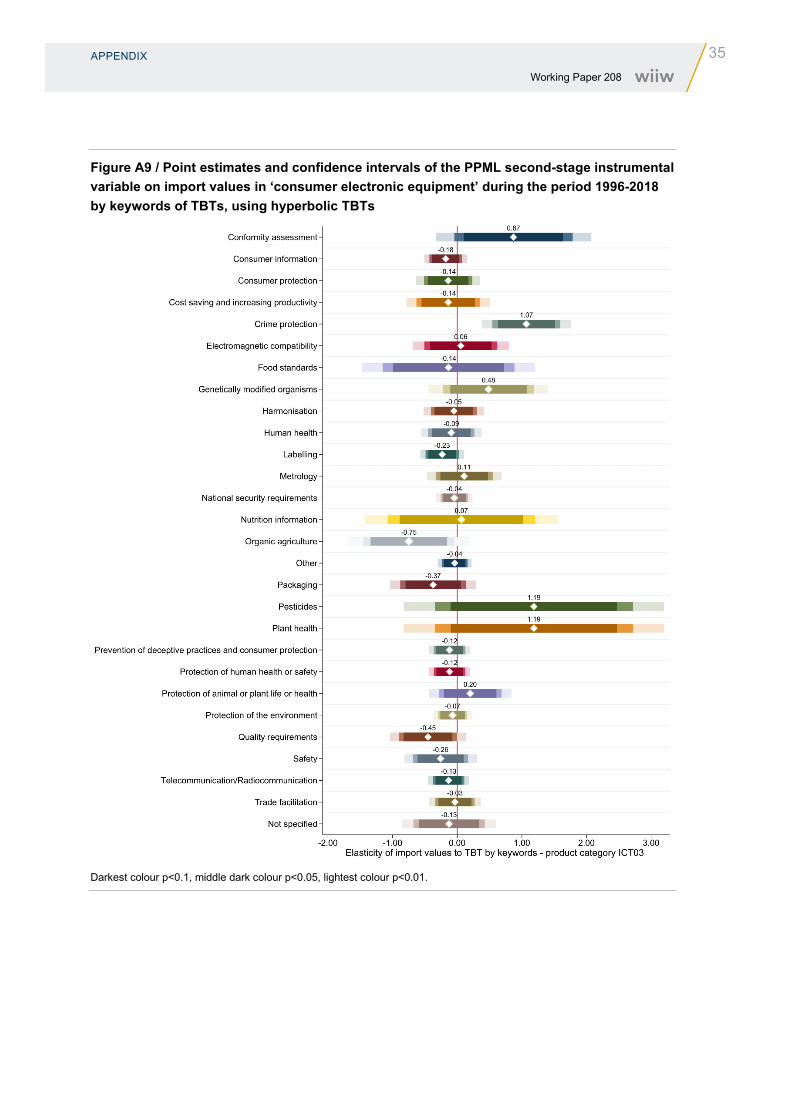
Figure A9 / Point estimates and confidence intervals of the PPML second-stage instrumental variable on import values in ‘consumer electronic equipment’ during the period 1996-2018 by keywords of TBTs, using hyperbolic TBTs .......................................................................... 35
Figure A10 / Point estimates and confidence intervals of the PPML second-stage instrumental variable on import values in ‘electronic components’ during the period 1996-2018 by keywords of TBTs, using hyperbolic TBTs ...............................................................................36
Figure A11 / Point estimates and confidence intervals of the PPML second-stage instrumental variable on import values in ‘miscellaneous’ during the period 1996-2018 by keywords of TBTs, using hyperbolic TBTs ...............................................................................................37
Figure A12 / Point estimates and confidence intervals of the PPML second-stage instrumental variable on import volumes in ‘computers and peripheral equipment’ during the period 1996-2018 by keywords of TBTs, using hyperbolic TBTs .................................................................38
Figure A13 / Point estimates and confidence intervals of the PPML second-stage instrumental variable on import volumes in ‘communication equipment’ during the period 1996-2018 by keywords of TBTs, using hyperbolic TBTs ..........................................................................39
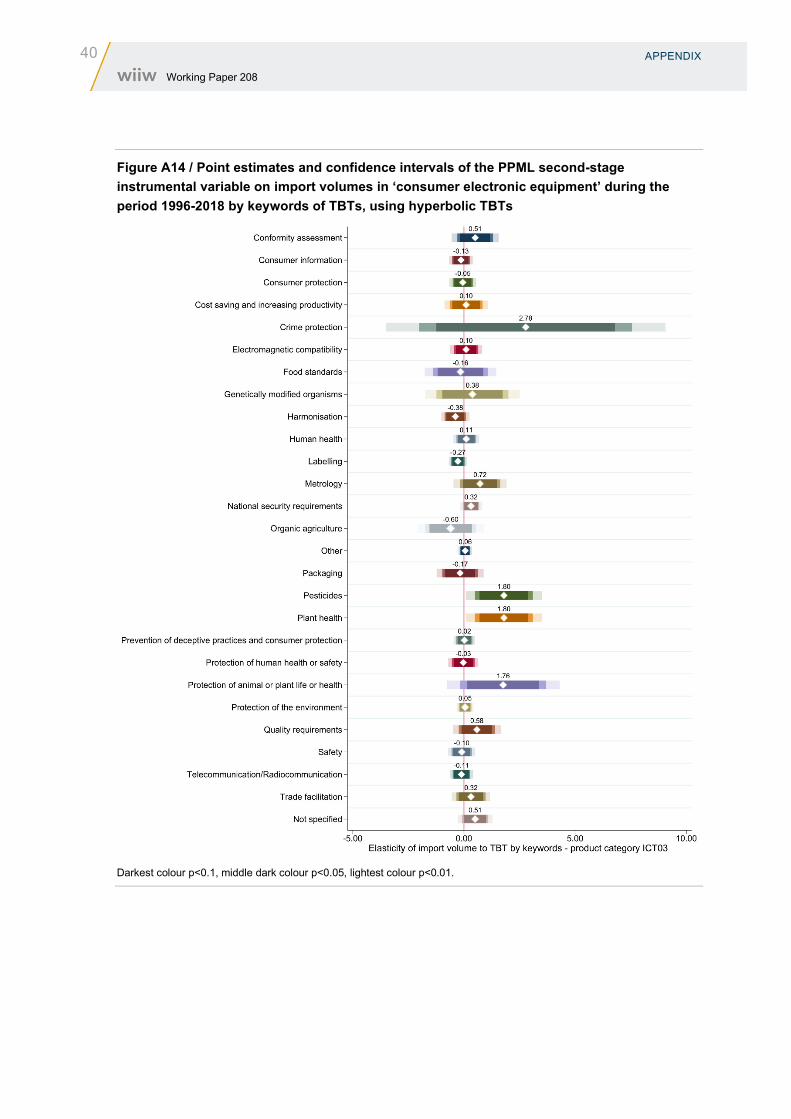
Figure A14 / Point estimates and confidence intervals of the PPML second-stage instrumental variable on import volumes in ‘consumer electronic equipment’ during the period 1996-2018 by keywords of TBTs, using hyperbolic TBTs ........................................................40
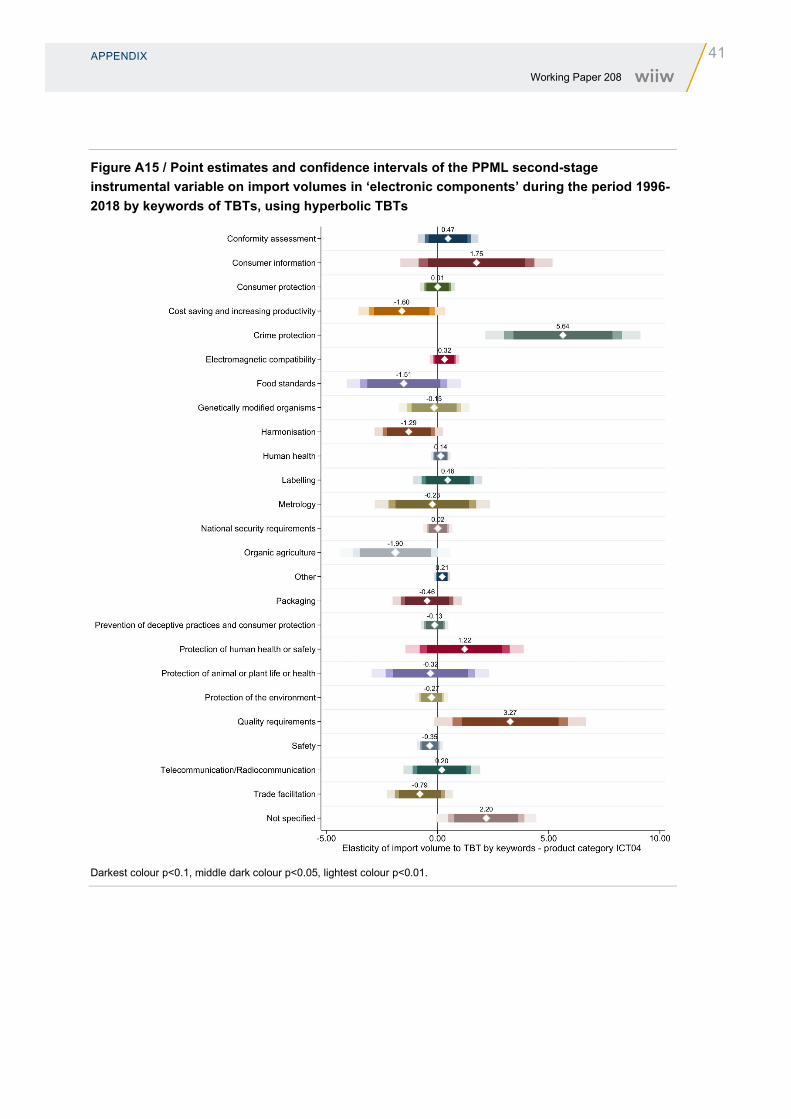
Figure A15 / Point estimates and confidence intervals of the PPML second-stage instrumental variable on import volumes in ‘electronic components’ during the period 1996-2018 by keywords of TBTs, using hyperbolic TBTs ...............................................................................41
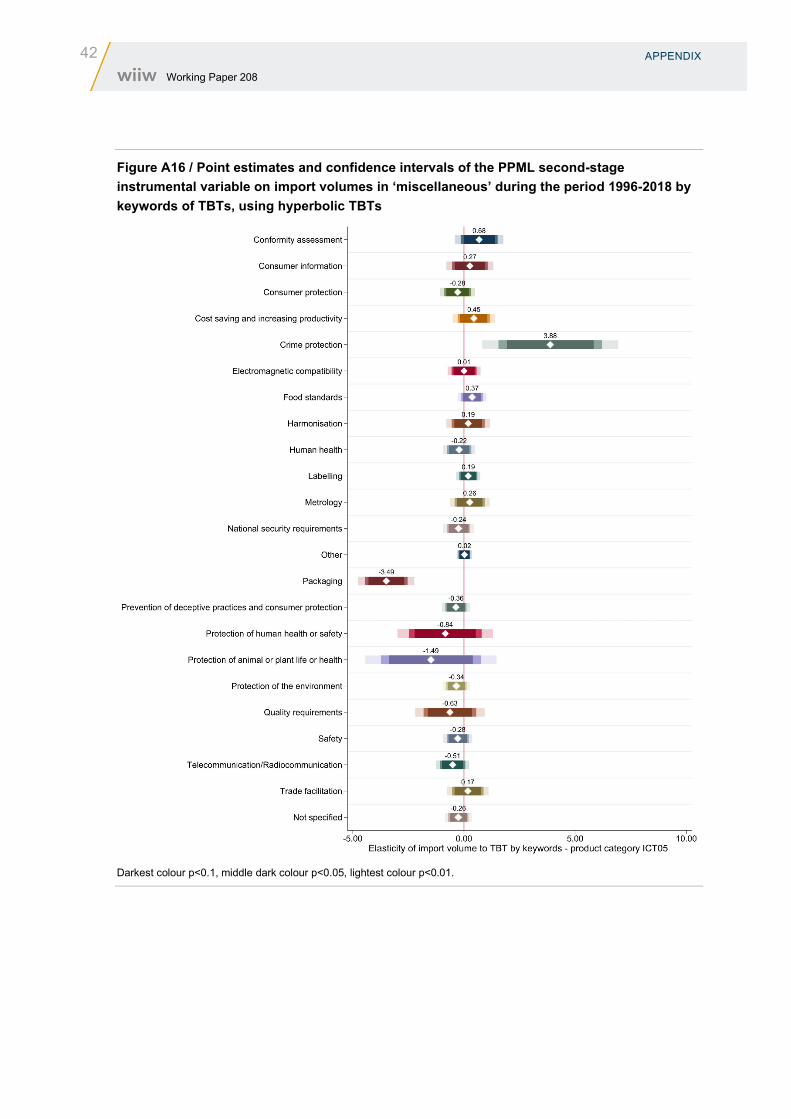
Figure A16 / Point estimates and confidence intervals of the PPML second-stage instrumental variable on import volumes in ‘miscellaneous’ during the period 1996-2018 by keywords of TBTs, using hyperbolic TBTs ...............................................................................................42

INTRODUCTION 11 Working Paper 208
1. Introduction
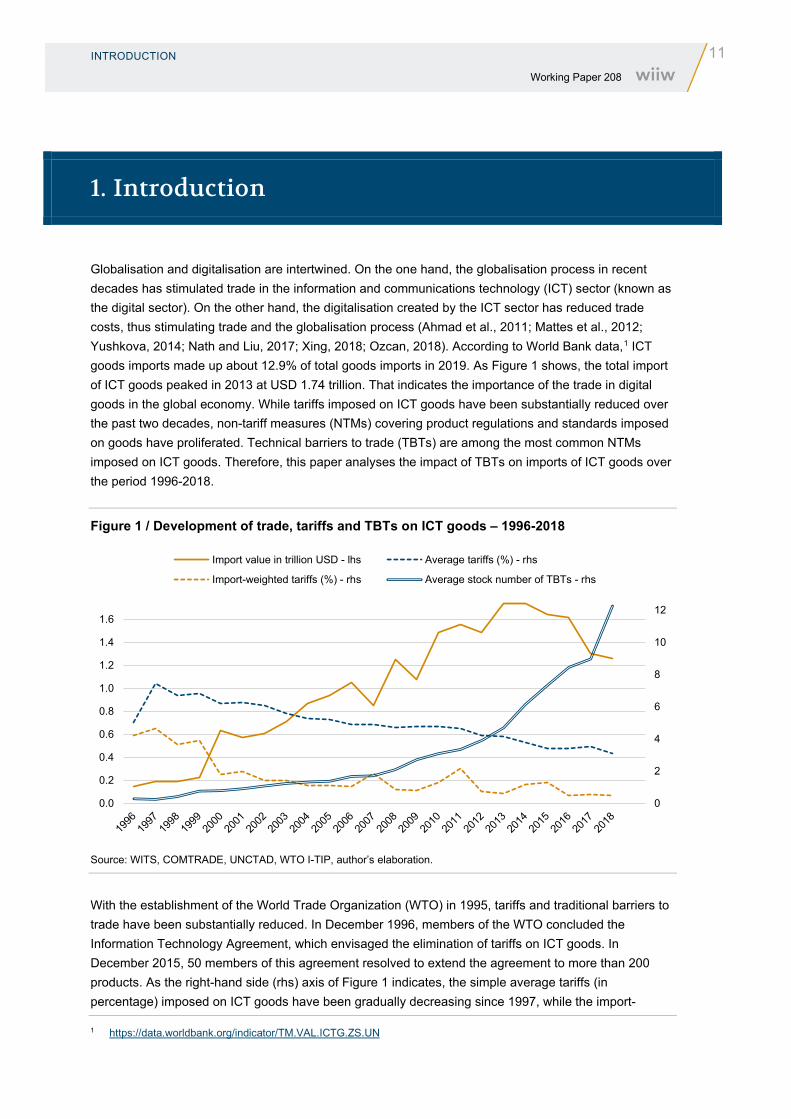
Globalisation and digitalisation are intertwined. On the one hand, the globalisation process in recent decades has stimulated trade in the information and communications technology (ICT) sector (known as the digital sector). On the other hand, the digitalisation created by the ICT sector has reduced trade costs, thus stimulating trade and the globalisation process (Ahmad et al., 2011; Mattes et al., 2012; Yushkova, 2014; Nath and Liu, 2017; Xing, 2018; Ozcan, 2018). According to World Bank data,1 ICT goods imports made up about 12.9% of total goods imports in 2019. As Figure 1 shows, the total import of ICT goods peaked in 2013 at USD 1.74 trillion. That indicates the importance of the trade in digital goods in the global economy. While tariffs imposed on ICT goods have been substantially reduced over the past two decades, non-tariff measures (NTMs) covering product regulations and standards imposed on goods have proliferated. Technical barriers to trade (TBTs) are among the most common NTMs imposed on ICT goods. Therefore, this paper analyses the impact of TBTs on imports of ICT goods over the period 1996-2018.
Figure 1 / Development of trade, tariffs and TBTs on ICT goods – 1996-2018
Source: WITS, COMTRADE, UNCTAD, WTO I-TIP, author’s elaboration.
With the establishment of the World Trade Organization (WTO) in 1995, tariffs and traditional barriers to trade have been substantially reduced. In December 1996, members of the WTO concluded the Information Technology Agreement, which envisaged the elimination of tariffs on ICT goods. In December 2015, 50 members of this agreement resolved to extend the agreement to more than 200 products. As the right-hand side (rhs) axis of Figure 1 indicates, the simple average tariffs (in percentage) imposed on ICT goods have been gradually decreasing since 1997, while the import-
1 https://data.worldbank.org/indicator/TM.VAL.ICTG.ZS.UN
0
2
4
6
8
10
12
0.0
0.2
0.4
0.6
0.8
1.0
1.2
1.4
1.6
Import value in trillion USD - lhs Average tariffs (%) - rhs
Import-weighted tariffs (%) - rhs Average stock number of TBTs - rhs
12 INTRODUCTION
Working Paper 208
weighted tariffs have been much lower than the simple average tariffs. This indicates that import flows are directed at tariff lines with lower tariffs in this sector. However, the use of NTMs has been on the rise. In fact, the average number of technical barriers to trade imposed on the import of ICT goods increased by 43 times, from about 0.3 at the start of the period to 12.3 in 2018.
This highlights the importance of the regulatory NTMs on the trade pattern of ICT goods, which is the focus of this study. Many studies in the literature have shown the heterogeneity of regulatory NTMs and their diverse implications for the trade in goods (Kee et al., 2009; Beghin et al., 2015; Ghodsi et al., 2016; Bratt, 2017; and Niu et al., 2018). TBTs imposed by a large, growing economy, such as China, may stimulate imports to facilitate the organisation of supply chains and imports of intermediate materials that are used in other stages of production domestically (Ghodsi, 2020). By contrast, certain other regulatory NTMs, such as sanitary and phytosanitary (SPS) measures imposed on the import of consumer goods may significantly hamper trade (Disdier et al., 2008). ICT goods are used as capital, intermediate inputs and consumer goods. Therefore, the implications of NTMs for trade in ICT goods may be very far-reaching. In other words, the impact of regulations and standards embedded within TBTs on the use of goods, demand and price may be very heterogeneous.
The statistics department of the United Nations Conference on Trade and Development (UNCTAD) considers 93 goods at the six-digit level of the Harmonised System (HS) 2012 version, placing them in five broad categories.2 Each of these goods may have a different functionality and use that can be clearly distinguished from other goods. Therefore, UNCTAD classifies these goods into five categories:
› ICT01 - Computers and peripheral equipment
› ICT02 - Communication equipment
› ICT03 - Consumer electronic equipment
› ICT04 - Electronic components
› ICT05 - Miscellaneous
These goods correspond to 77 product codes in the HS 1996 version, for which data exist for a longer time span (since 1996). These goods and the related categories defined by UNCTAD are presented in Table A1 in the Appendix.
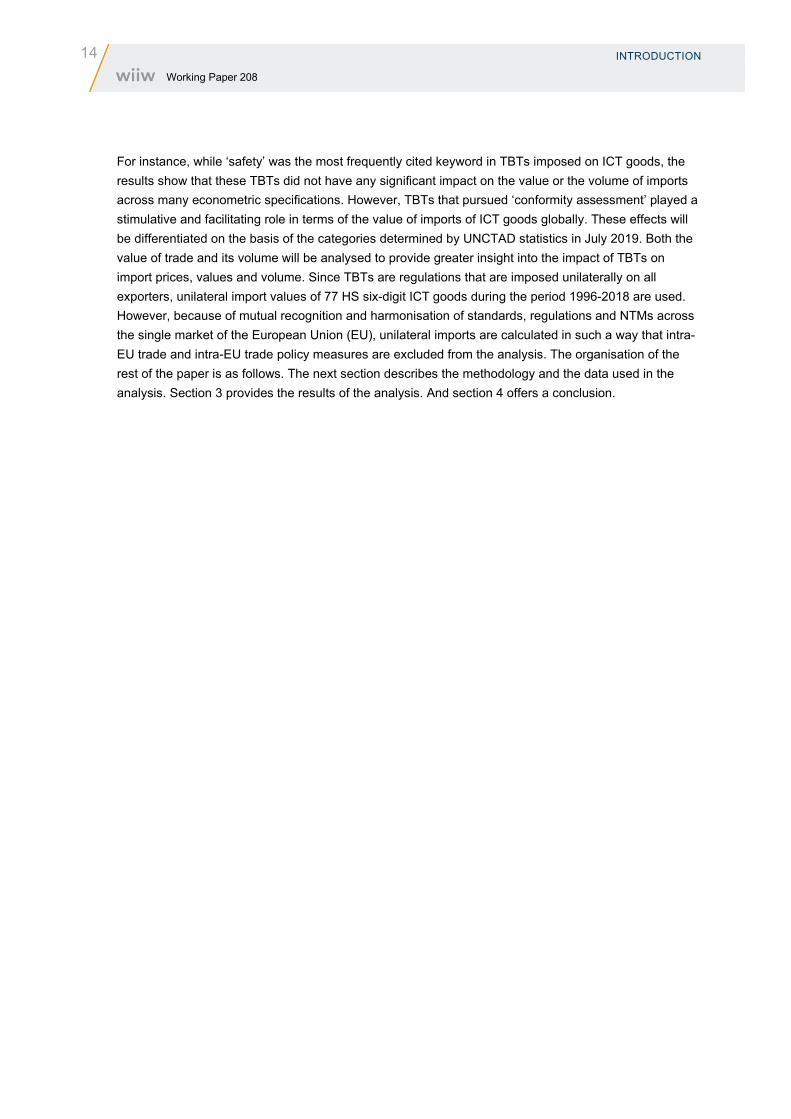
TBTs are imposed to regulate the market for legitimate reasons that are in line with all WTO agreements, and specifically with the TBT agreement of the WTO. According to the WTO’s Integrated Trade Intelligence Portal (I-TIP) data, 1,351 TBT notifications were imposed on these 77 goods between 1996 and 2018. According to the descriptions of these notifications, the NTMs were imposed in pursuit of 30 different regulatory objectives (suggested by their keywords). Figure 2 presents the number of TBT notifications in force in 2018 for each of the 30 objectives, on the basis of the keywords cited. Some 95% of the notifications provided at least one keyword; for the remaining 5% of the TBTs imposed on ICT goods, no keyword was specified (‘not specified’ ranks tenth among all the keywords cited in TBT notifications to the WTO – see Figure 2). About 46% of the TBTs imposed on ICT goods had only one keyword (including those with ‘not specified’); thus 54% of TBTs provided at least two keywords (and up to eight).
2 The classification of ICT goods by UNCTADstat can be found here: https://unctadstat.unctad.org/en/Classifications/DimHS2012Products_Ict_Hierarchy.pdf
INTRODUCTION 13 Working Paper 208
The most common keyword used in the description of a TBT imposed on ICT goods and notified to the WTO was ‘safety’, with 422 notifications. The second most important category, with 383 TBTs imposed on ICT goods, had the keyword ‘telecommunication/radiocommunication’ (which is uncommon for other types of goods). ‘Protection of human health or safety’ was the third most common keyword, mentioned in 379 TBT notifications. ‘Prevention of deceptive practices & consumer protection’, ‘protection of the environment’, ‘human health’ and ‘quality requirements’ are the next most commonly cited keywords, in 174, 173, 137 and 95 TBT notifications, respectively.
Each of these TBTs may target more than one product for regulation across a border. For instance, many TBTs are imposed on all products classified under chapter 85 of HS, which covers all ‘electrical machinery and equipment and parts thereof; sound recorders and reproducers, television image and sound recorders and reproducers, and parts and accessories of such articles’, which also includes non-ICT goods. Therefore, these TBTs may be very effective in controlling imports across the whole sector, if complying with them becomes too costly. Compliance costs may increase simply because of the bureaucracy or ‘red tape’: extra staff may be required to handle it. However, the costs may decline thanks to digitalisation and the automation of many customs offices. To reduce costs, some countries may regulate the market using ‘harmonisation’, ‘trade facilitation’ and ‘conformity assessment’ TBTs, with the relevant keywords cited in, respectively, 43, 35 and 18 TBT notifications that target ICT goods. When the cost of compliance across the border increases due to the burden of the numerous regulations, these become an example of red tape hindering trade.
Figure 2 / TBT notifications (based on keywords) in force in 2018 on ICT goods
Source: WTO I-TIP, author’s elaboration.
Therefore, this paper analyses the impact of regulatory TBTs on the import of ICT goods during the period 1996-2018. More precisely, the keywords mentioned in the regulations notified to the WTO will be used to provide greater insight into what types of TBT have what kind of impact on imports of ICT goods.
0 100 200 300 400 500
SafetyTelecommunication/Radiocommunication
Protection of human health or safetyOther
Prevention of deceptive practices & consumer protectionProtection of the environment
Human healthQuality requirements
LabellingNot specified
Consumer informationHarmonisation
Trade facilitationElectromagnetic compatibility
Consumer protectionMetrology
Other 10 keywords aggregated hereConformity assessment
Cost saving and increasing productivityNational security requirements
Protection of animal or plant life or health
14 INTRODUCTION Working Paper 208
For instance, while ‘safety’ was the most frequently cited keyword in TBTs imposed on ICT goods, the results show that these TBTs did not have any significant impact on the value or the volume of imports across many econometric specifications. However, TBTs that pursued ‘conformity assessment’ played a stimulative and facilitating role in terms of the value of imports of ICT goods globally. These effects will be differentiated on the basis of the categories determined by UNCTAD statistics in July 2019. Both the value of trade and its volume will be analysed to provide greater insight into the impact of TBTs on import prices, values and volume. Since TBTs are regulations that are imposed unilaterally on all exporters, unilateral import values of 77 HS six-digit ICT goods during the period 1996-2018 are used. However, because of mutual recognition and harmonisation of standards, regulations and NTMs across the single market of the European Union (EU), unilateral imports are calculated in such a way that intra-EU trade and intra-EU trade policy measures are excluded from the analysis. The organisation of the rest of the paper is as follows. The next section describes the methodology and the data used in the analysis. Section 3 provides the results of the analysis. And section 4 offers a conclusion.
METHODOLOGY AND DATA 15 Working Paper 208
2. Methodology and data
As mentioned above, TBTs are imposed unilaterally on imports of goods from all exporting countries. Therefore, to measure the impact of TBTs on imported goods, one can choose a unilateral setting, which is also used in earlier studies, such as Kee et al. (2009). However, there are zero trade flows for some imported products to certain countries, which may cause sample selection bias in the estimation of the impact of NTMs, especially if the NTM imposed on a product prohibits trade completely. To control for zero trade flows in the import data, the Pseudo Poisson Maximum Likelihood (PPML) is used that is implemented in Stata by Santos Silva and Tenreyro (2006) (see also Head and Ries, 2008; Head and Mayer, 2014; Yotov et al., 2016; Larch et al., 2019), further developed by Correia et al. (2019a,b) to run multidimensional fixed effects. The equation for the estimation of unilateral trade is as follows:
𝑚𝑚𝑖𝑖ℎ𝑡𝑡 = 𝑒𝑒𝑒𝑒𝑒𝑒[𝛼𝛼0+𝛼𝛼1 arc𝑇𝑇𝑖𝑖ℎ𝑡𝑡+𝛼𝛼2𝑇𝑇𝑇𝑇𝑇𝑇𝑖𝑖ℎ𝑡𝑡+𝜔𝜔𝑖𝑖𝑡𝑡+𝜔𝜔𝑖𝑖ℎ] + 𝜀𝜀𝑖𝑖ℎ𝑡𝑡 (1)
where 𝑚𝑚𝑖𝑖ℎ𝑡𝑡 is total import values 𝑚𝑚𝑖𝑖ℎ𝑡𝑡𝑣𝑣 (or import volumes 𝑚𝑚𝑖𝑖ℎ𝑡𝑡
𝑞𝑞 ) of product ℎ to country 𝑖𝑖 in year 𝑡𝑡; arc𝑇𝑇𝑖𝑖ℎ𝑡𝑡 is the hyperbolic sine transformation (Bellemare and Wichman, 2020) of simple average tariffs (in per cent) levied by country 𝑖𝑖 on imports of product ℎ in year 𝑡𝑡; 𝑇𝑇𝑇𝑇𝑇𝑇𝑖𝑖ℎ𝑡𝑡 is the stock number of TBTs imposed by country 𝑖𝑖 on the imports of products ℎ and in force in year 𝑡𝑡, which also includes TBTs imposed in earlier years that are not withdrawn;3 𝜔𝜔𝑖𝑖𝑡𝑡 is the country-time dummy that controls for any time-variant country characteristics, such as the size of the economy or the level of development, factors of production, membership of the WTO or the EU or any other preferential trade agreements, etc.; 𝜔𝜔𝑖𝑖ℎ is the country-product fixed effect that controls for any time-invariant characteristics of a country-product dyad, such as those persistent on the supply side or the demand side of a product in a country; and 𝜀𝜀𝑖𝑖ℎ𝑡𝑡 is the error term. As noted above, intra-EU values are excluded from the analysis. Therefore, when country 𝑖𝑖 is a member of the EU, its imports from other EU members are not included in the dependent variable, and its tariffs and TBTs that are usually set to zero are also excluded from the calculation of explanatory variables.
It is widely discussed in the literature that, due to reverse causality of TBTs and the dependent variable, there is a potential endogeneity bias in the estimation of TBTs, as TBTs may be correlated with the error term 𝐸𝐸(𝑇𝑇𝑇𝑇𝑇𝑇𝑖𝑖ℎ𝑡𝑡 𝜀𝜀𝑖𝑖ℎ𝑡𝑡) ≠ 0. Such an endogeneity bias is controlled for using the instrumental variable approach in the literature (Kee et al., 2009; Beghin et al., 2015; Bratt, 2017; Niu et al., 2018; Ghodsi, 2020). Moreover, other sources of endogeneity bias could be measurement error and the omitted variable bias. While the latter is controlled for using the appropriate fixed effects in equation (1), the former could also be controlled for using the instrumental approach. Following the seminal work of Kee et al. (2009), past growth in imports ∆𝑚𝑚𝑖𝑖ℎ𝑡𝑡−1 = arc𝑚𝑚𝑖𝑖ℎ𝑡𝑡−1 − arc𝑚𝑚𝑖𝑖ℎ𝑡𝑡−2, and total exports arc𝑒𝑒𝑖𝑖ℎ𝑡𝑡 of product ℎ from country 𝑖𝑖 in year 𝑡𝑡 are two exogenous variables that may affect the imposition of TBTs, but do not correlate with the dependent variable in year 𝑡𝑡. Moreover, Kee et al. (2009) also use the GDP-weighted average TBT of the five geographically closest countries to importing country 𝑖𝑖 as the third exogenous instrument for TBT, to control for the measurement error in the calculation of TBT. However, the five closest countries may be quite arbitrary: in a globalised world, distant countries may
3 It is important to note that no TBT in the WTO I-TIP data is reported as having been withdrawn.
16 METHODOLOGY AND DATA
Working Paper 208
impose new TBTs, following other distant trading partners, to harmonise their standards and regulation settings. For instance, China is very distant from the EU and the US, but their global value chains have been intensively intertwined in the past two decades. This means that regulations and standards in Chinese manufacturing sectors may have converged with those in other countries, so that foreign intermediate inputs can be imported and used in Chinese value chains (Ghodsi, 2020). Therefore, as the third exogenous instrument, the average stock number of TBTs imposed by countries other than the importing country 𝑖𝑖 under estimation 𝑇𝑇𝑇𝑇𝑇𝑇𝑖𝑖′ℎ𝑡𝑡
𝑤𝑤 is used, which is weighted by the per capita GDP of countries. The reason for choosing per capita GDP, rather than GDP, is that the level of development may be a better indicator of a qualitative and regulatory framework for the implementation of TBTs than simply the size of the economy.4 Therefore, the first stage of the instrumental variable approach is as follows:
𝑇𝑇𝑇𝑇𝑇𝑇𝑖𝑖ℎ𝑡𝑡 = 𝑒𝑒𝑒𝑒𝑒𝑒�𝛽𝛽0+𝛽𝛽1 arc 𝑇𝑇𝑖𝑖ℎ𝑡𝑡+𝛽𝛽2∆𝑚𝑚𝑖𝑖ℎ𝑡𝑡−1+𝛽𝛽3 arc 𝑥𝑥𝑖𝑖ℎ𝑡𝑡+𝛽𝛽4𝑇𝑇𝑇𝑇𝑇𝑇𝑖𝑖′ℎ𝑡𝑡𝑤𝑤 +𝜔𝜔𝑖𝑖𝑡𝑡+𝜔𝜔𝑖𝑖ℎ� + 𝜇𝜇𝑖𝑖ℎ𝑡𝑡 (2)
After estimating equation (2) and after retrieving the fitted value of 𝑇𝑇𝑇𝑇𝑇𝑇�𝑖𝑖ℎ𝑡𝑡, this variable is included in the second-stage estimation, as follows:
𝑚𝑚𝑖𝑖ℎ𝑡𝑡 = 𝑒𝑒𝑒𝑒𝑒𝑒[𝛾𝛾0+𝛾𝛾1 arc𝑇𝑇𝑖𝑖ℎ𝑡𝑡+𝛾𝛾2𝑇𝑇𝑇𝑇𝑇𝑇�𝑖𝑖ℎ𝑡𝑡+𝜔𝜔𝑖𝑖𝑡𝑡+𝜔𝜔𝑖𝑖ℎ] + 𝜗𝜗𝑖𝑖ℎ𝑡𝑡 (3)
where the fitted value of TBT is not correlated with the error term 𝐸𝐸�𝑇𝑇𝑇𝑇𝑇𝑇�𝑖𝑖ℎ𝑡𝑡 𝜗𝜗𝑖𝑖ℎ𝑡𝑡� = 0. It is important to note that because multiple fixed effects are used in the second stage, it is not possible to use a bootstrapping estimation. However, the error term is clustered by importer-product 𝑖𝑖ℎ to control for the heteroskedasticity and autocorrelation in the error term.
The benchmark estimation of equation (3) is done on the sample of all 77 ICT goods in the HS 1996 version, which gives the average global impact of TBTs on the values and volumes of imports across all these ICT goods. However, as noted above and discussed in the literature, different products may be differently affected by TBTs. Therefore, to observe the impact of TBTs across the five product categories defined by UNCTAD, the fitted TBT in equation (3) is interacted with five product category dummies to obtain five point estimates and confidence intervals for a TBT’s impact on the imports of the five product categories. A list of these categories and the ICT goods classified is provided in Table A1 in the Appendix. One can estimate the impact of TBTs on different product categories using separate samples of estimations. However, estimating all the products in the same sample would yield results that are more robust. The main reason for that is that all the available information on all products is used in one single estimation; that not only provides a greater degree of freedom for the calculation of statistics, but also uses more information for the estimation of parameters. Moreover, this methodology gives standard deviation and point estimates of each coefficient of TBT for each product category conditional on the coefficients of TBT for other product categories in the same estimation.
Furthermore, the TBT variable used in the benchmark specification includes all types of TBT notified to the WTO that target ICT goods. Thirty separate variables are generated to take account of the 30 different keywords cited in the TBTs imposed on these goods. These 30 variables are estimated in separate regressions to infer their impact on trade flows in ICT goods and their product categories.
4 The GDP weights instead of per capita GDP weights are also used in separate specifications, the results of which are available on request.
METHODOLOGY AND DATA 17 Working Paper 208
2.1. DATA
The data on bilateral import values and import volumes are downloaded from UN COMTRADE and are provided by the World Integrated Trade Solution (WITS) at the six-digit level of the HS 1996 version. These bilateral trade data are then aggregated to the unilateral level. As noted, intra-EU trade data are excluded from this aggregation.
Data on bilateral tariffs are also downloaded from WITS. These data come from two sources: UNCTAD – with its Global Database on Non-Tariff Measures (TRAINS) (for tariffs and NTMs); and the WTO – withits Integrated Database (WTO-IDB) and the WTO Consolidated Tariff Schedules Database (WTO-CTS).Preferential tariffs take priority in the construction of tariff data for countries that have preferential tradeagreements. If preferential tariffs are not available, effectively applied rates are used. When neither isavailable, most-favoured nation (MFN) tariffs are included in the tariff data. The ad valorem equivalenttariffs are collected in the data when tariff quota rates are actually used. Then, using simple averagesand including zero bilateral trade flows at the six-digit HS level, bilateral tariffs are aggregated to aunilateral tariff for each product by importing country. Intra-EU trade is again excluded from thisaggregation.
The data on TBTs are downloaded from the WTO’s I-TIP data, which include official notifications to the WTO committees concerning NTMs imposed by WTO members. As is documented in Ghodsi et al. (2017), many notifications lack the HS codes of the products targeted by the NTMs. These HS codes are imputed using other information available in the notification. Since only WTO members notify their NTMs, and since the data include only the TBTs imposed by WTO members, the estimation sample is restricted to countries that were members of the WTO during the period in question. China joined the WTO in 2001, and so its imports of ICT goods are included in the analysis for the whole period 1996-2018. However, Iran has never been a member of the WTO, and thus it is excluded from the sample of analysis as an importing country.
18 ESTIMATION RESULTS
Working Paper 208
3. Estimation results
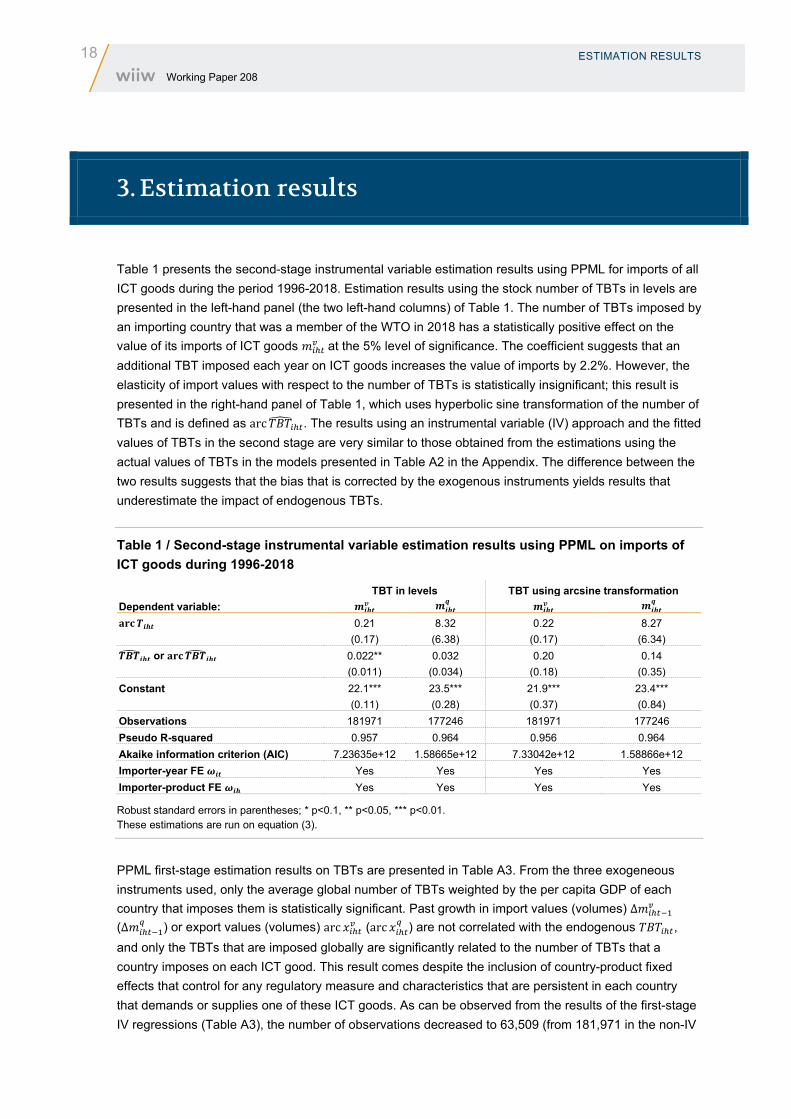
Table 1 presents the second-stage instrumental variable estimation results using PPML for imports of all ICT goods during the period 1996-2018. Estimation results using the stock number of TBTs in levels are presented in the left-hand panel (the two left-hand columns) of Table 1. The number of TBTs imposed by an importing country that was a member of the WTO in 2018 has a statistically positive effect on the value of its imports of ICT goods 𝑚𝑚𝑖𝑖ℎ𝑡𝑡
𝑣𝑣 at the 5% level of significance. The coefficient suggests that an additional TBT imposed each year on ICT goods increases the value of imports by 2.2%. However, the elasticity of import values with respect to the number of TBTs is statistically insignificant; this result is presented in the right-hand panel of Table 1, which uses hyperbolic sine transformation of the number of TBTs and is defined as arc𝑇𝑇𝑇𝑇𝑇𝑇�𝑖𝑖ℎ𝑡𝑡. The results using an instrumental variable (IV) approach and the fitted values of TBTs in the second stage are very similar to those obtained from the estimations using the actual values of TBTs in the models presented in Table A2 in the Appendix. The difference between the two results suggests that the bias that is corrected by the exogenous instruments yields results that underestimate the impact of endogenous TBTs.
Table 1 / Second-stage instrumental variable estimation results using PPML on imports of ICT goods during 1996-2018
TBT in levels TBT using arcsine transformation Dependent variable: 𝒎𝒎𝒊𝒊𝒊𝒊𝒊𝒊
𝒗𝒗 𝒎𝒎𝒊𝒊𝒊𝒊𝒊𝒊𝒒𝒒 𝒎𝒎𝒊𝒊𝒊𝒊𝒊𝒊
𝒗𝒗 𝒎𝒎𝒊𝒊𝒊𝒊𝒊𝒊𝒒𝒒
𝐚𝐚𝐚𝐚𝐚𝐚𝑻𝑻𝒊𝒊𝒊𝒊𝒊𝒊 0.21 8.32 0.22 8.27 (0.17) (6.38) (0.17) (6.34)
𝑻𝑻𝑻𝑻𝑻𝑻�𝒊𝒊𝒊𝒊𝒊𝒊 or 𝐚𝐚𝐚𝐚𝐚𝐚𝑻𝑻𝑻𝑻𝑻𝑻�𝒊𝒊𝒊𝒊𝒊𝒊 0.022** 0.032 0.20 0.14 (0.011) (0.034) (0.18) (0.35)
Constant 22.1*** 23.5*** 21.9*** 23.4*** (0.11) (0.28) (0.37) (0.84)
Observations 181971 177246 181971 177246 Pseudo R-squared 0.957 0.964 0.956 0.964 Akaike information criterion (AIC) 7.23635e+12 1.58665e+12 7.33042e+12 1.58866e+12 Importer-year FE 𝝎𝝎𝒊𝒊𝒊𝒊 Yes Yes Yes Yes Importer-product FE 𝝎𝝎𝒊𝒊𝒊𝒊 Yes Yes Yes Yes
Robust standard errors in parentheses; * p<0.1, ** p<0.05, *** p<0.01. These estimations are run on equation (3).
PPML first-stage estimation results on TBTs are presented in Table A3. From the three exogeneous instruments used, only the average global number of TBTs weighted by the per capita GDP of each country that imposes them is statistically significant. Past growth in import values (volumes) ∆𝑚𝑚𝑖𝑖ℎ𝑡𝑡−1
𝑣𝑣 (∆𝑚𝑚𝑖𝑖ℎ𝑡𝑡−1
𝑞𝑞 ) or export values (volumes) arc 𝑒𝑒𝑖𝑖ℎ𝑡𝑡𝑣𝑣 (arc 𝑒𝑒𝑖𝑖ℎ𝑡𝑡𝑞𝑞 ) are not correlated with the endogenous 𝑇𝑇𝑇𝑇𝑇𝑇𝑖𝑖ℎ𝑡𝑡,
and only the TBTs that are imposed globally are significantly related to the number of TBTs that a country imposes on each ICT good. This result comes despite the inclusion of country-product fixed effects that control for any regulatory measure and characteristics that are persistent in each country that demands or supplies one of these ICT goods. As can be observed from the results of the first-stage IV regressions (Table A3), the number of observations decreased to 63,509 (from 181,971 in the non-IV
ESTIMATION RESULTS 19 Working Paper 208
regression presented in Table A2). The reason is that dropped observations are either singletons or are separated by a fixed effect, as Correia (2015) also explains. This means that those dropped observations for TBTs will be controlled for by the fixed effects if they are included in the estimations as explanatory variables. However, the inclusion of these fixed effects gave statistically insignificant coefficients for other exogenous instruments in the first stage. Therefore, when the fitted value of a TBT is used in the second stage, the actual values of TBTs could replace the missing observations from the fitted values of the first-stage estimation, simply because those actual values of TBTs are controlled for by the fixed effects in the second-stage estimation.
Another interesting result appears to be the insignificant impact of tariffs on the value or volume of imports in any specification. As explained above, tariffs were reduced to a low level (or zero) by many WTO members after the Information Technology Agreement was concluded in December 1996. The simple average global tariffs levied on these products declined from 7.4% in 1997 to 2.1% in 2018. In December 2015, 50 members of the WTO that were committed to the Information Technology Agreement implemented a reduction in tariffs to zero on the import of further ICT goods.
Even more interestingly, the results of the first-stage estimation (Table A2) illustrate that a 1% reduction in tariffs is correlated in a statistically significant way with a 0.032% increase in the number of TBTs imposed, which serves to indicate the substitutability of TBTs for tariffs. The reason is that, while tariffs fell by 58% from 1997 to 2018, the number of TBTs grew by 48 times over the same period. Meanwhile, the impact is estimated to be 0.032%, controlling for fixed effects and other variables in the estimation. The substitutability of NTMs for other types of trade policy measures – such as traditional tariffs or other NTMs – has been widely studied in the literature (Rosendorff, 1996; Yu, 2000; Moore and Zanardi, 2011; Aisbett and Pearson, 2012; Orefice, 2017).
3.1. ESTIMATION RESULTS BY PRODUCT CATEGORY
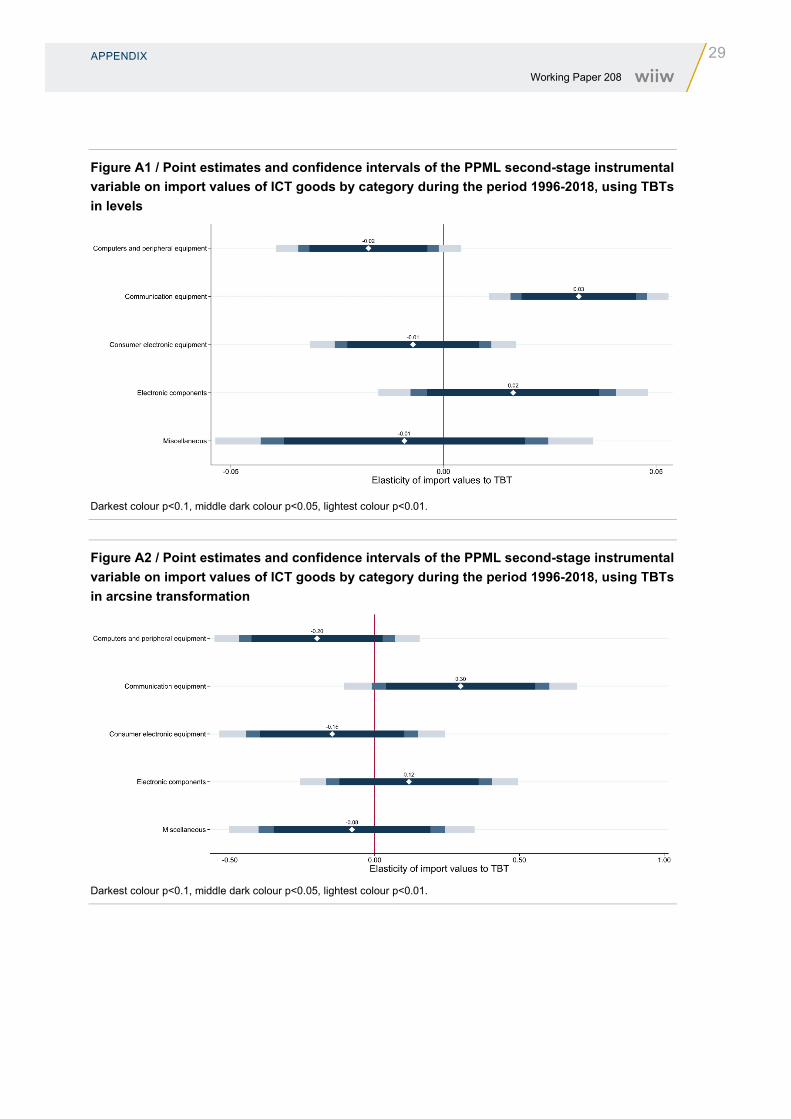
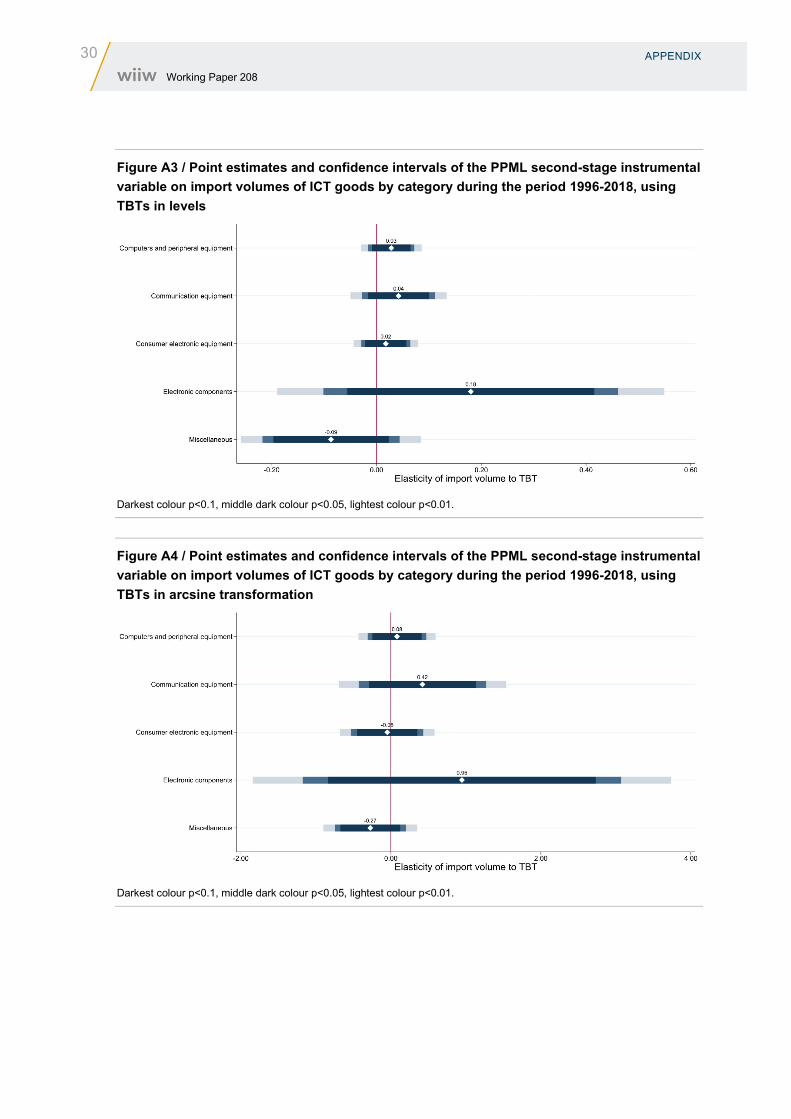
Figures A1 to A4 in the Appendix illustrate the point estimates and confidence intervals of TBT coefficients that are interacted with the five product categories, using the models presented in Table 1. Full estimation tables of these results are available on request. As may be observed, in none of the product categories is the volume of imports affected by TBTs in a statistically significant way. With a few exceptions, a similar picture may be observed for the impact of TBTs on the value of imports. The value of the import of products in the second category (‘communication equipment’) is increased in a statistically significant way by the TBT imposed. In fact, from Figure A1 it is possible to see that an additional TBT imposed on the products in that category can stimulate the value of imports by a point estimate of 0.03 which is statistically significant at the 1% level. From Figure A2, one can observe that a 1% increase in the number of TBTs imposed on the import of goods in this product category can increase import values by 0.3%, which is statistically significant at the 10% level. Since the point estimate for the import volume of products in this category is also positive in Figure A4 (0.42), despite its statistical insignificance at the 10% level, one can conclude that TBTs imposed on the imports of this product category increase the volume of imports more than their value. This means that prices decline because of TBTs, resulting in a greater volume and value of imports.
20 ESTIMATION RESULTS
Working Paper 208
3.2. IMPACT OF TBTS ON IMPORTS BY THE KEYWORD CITED
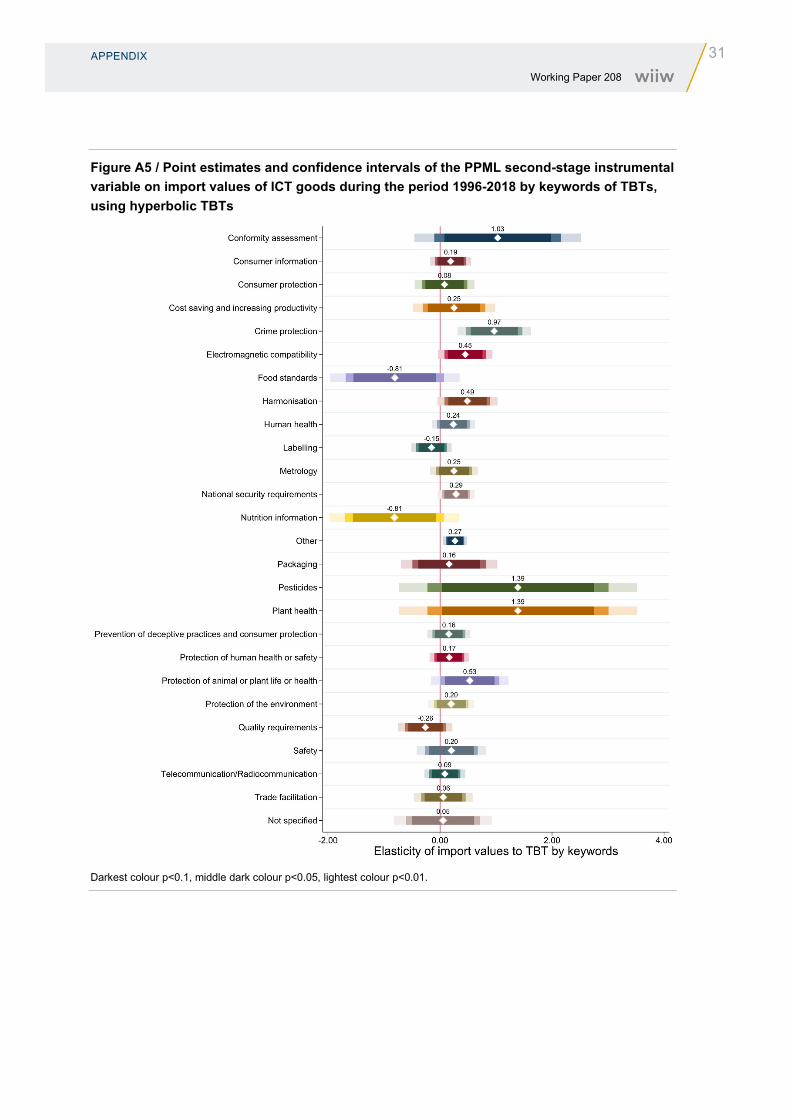
Figure A5 in the Appendix illustrates the point estimates and confidence intervals of the PPML second-stage instrumental variable on import values of ICT goods during the period 1996-2018 by the keywords cited in TBTs, using the hyperbolic transformation of the number of TBTs. The hyperbolic sine transformation is used because it is asymptotically a log-log estimation that gives comparable elasticity results across different models (Bellemare and Wichman, 2020). As may be observed from the keywords, only a very few types of TBT stimulate import values to a statistically significant degree. A 1% increase in TBTs that cite the keywords ‘conformity assessment’, for instance, stimulates the value of imports by 1.03%, which is statistically significant at the 10% level. However, by taking a look at Figure A6 in the Appendix, which illustrates the point estimates and confidence intervals of the PPML second-stage instrumental variable on import volumes of ICT goods during the period 1996-2018 by keywords cited in the TBTs using the hyperbolic transformation of TBTs, one can observe that TBTs with the keyword ‘conformity assessment’ have a positive coefficient that is slightly smaller in magnitude than the coefficient in Figure A5 and that is also statistically less significant. This result suggests that those TBTs that pursue ‘conformity assessment’ may have a significant impact on the price of imports, which results in a larger value of the imports of these goods. TBTs that cite the keywords ‘electromagnetic compatibility’ and ‘other’ have a similar characteristic to those that cite ‘conformity assessment’. While these TBTs increase the value of imports in a statistically significant way, they increase the volume of imports to a statistically insignificant degree. TBTs that pursue ‘electromagnetic compatibility’ may lead to an additional cost for the imported goods, in the drive to make them more compatible with the domestic standards settings implemented for all electronic devices. This additional cost may bring about higher quality, making the product more compatible, but it also results in a higher value of imports (and export revenue for the exporting firm).
TBTs with the keyword ‘crime protection’ also have a statistically significant impact on import values: though the impact is smaller than the impact on the volume of imports, it is statistically more significant. This means that TBTs that pursue ‘crime protection’ and that are imposed on ICT goods may reduce the price of imported goods, resulting in greater demand for imports and also higher import values.
TBTs with the keyword ‘food standards’ (mentioned in just five TBTs) reduce the value of ICT goods imports, though this is statistically significant only at the 10% level. However, the impact of these TBTs on the volume of imports of ICT goods is negative but statistically insignificant. Therefore, it could be argued that while the volume of imports is not affected in a statistically significant way by these ‘food standards’, the prices of the imported goods may have been reduced by them. TBTs with the keyword ‘protection of animal or plant life or health’ have similar results and are susceptible to a similar interpretation as ‘food standards’: they increase the value of imports in a statistically significant way and reduce the volume of imports to a statistically insignificant degree. TBTs with the keyword ‘nutrition information’ have a negative effect on the import values of ICT goods that is statistically significant at the 10% level. However, these TBTs do not have any impact on the volume of imports, and their results do not appear in Figure A6. The reason is that these TBTs target products that become collinear with fixed effects in the estimation of import volumes.
A 1% increase in the number of TBTs citing the keyword ‘harmonisation’ stimulates the value of imports of ICT goods by 0.49%, which is statistically significant at 5%. However, these TBTs do not affect the volume of imports to any statistically significant degree. This suggests that when a government tries to
ESTIMATION RESULTS 21 Working Paper 208
harmonise the regulations and standards governing these products with those of other countries, the adjustment may be costly, resulting in higher import prices and consequently higher import values. TBTs citing the keyword ‘national security requirements’ have similar results and a similar interpretation.
The only types of TBT that increase the volume of imports of ICT goods to a statistically significant extent are the 95 that cite the keyword ‘quality requirements’ and the 67 with no keywords specified in their notifications (‘not specified’). It is interesting that those TBTs that cite ‘quality requirements’ do not affect the value of imports in a statistically significant way, but they do increase the volume of imports at a 5% level of significance. In fact, a 1% increase in the number of TBTs imposed that target quality requirements may increase the volume of imports of ICT goods by 1.54%. The main reason behind such a shift in demand is the greater demand for better quality, which is also analysed in earlier studies (Khandelwal, 2010; Hallak and Schott, 2011; Feenstra and Romalis, 2014; Ghodsi and Stehrer, 2021; Ghodsi, 2021).
3.3. IMPACT OF TBTS ON IMPORT VALUES BY THE CITED KEYWORD ACROSS PRODUCT CATEGORIES
Figures A7 to A11 in the Appendix present the point estimates and confidence intervals of the PPML second-stage instrumental variable estimations on import values in the five product categories, using the hyperbolic sine transformation of TBTs. Figure A7 shows the results for the product category ‘computers and peripheral equipment’. Only one keyword cited in the TBTs stimulates the value of imports of products in this category: ‘protection of animal or plant life or health’. In fact, a 1% increase in the number of TBTs citing this keyword stimulates import values by 0.57%, which is statistically significant at the 5% level. Many other keywords that have statistically significant coefficients reduce the value of imports of these goods. ‘Consumer information’, ‘food standards’, ‘labelling’, ‘nutrition information’, ‘organic agriculture’, ‘packaging’, ‘quality requirements’, ‘safety’ and ‘telecommunication/radiocommunication’ are the keywords mentioned in TBTs that reduce the value of imports of goods in this category.
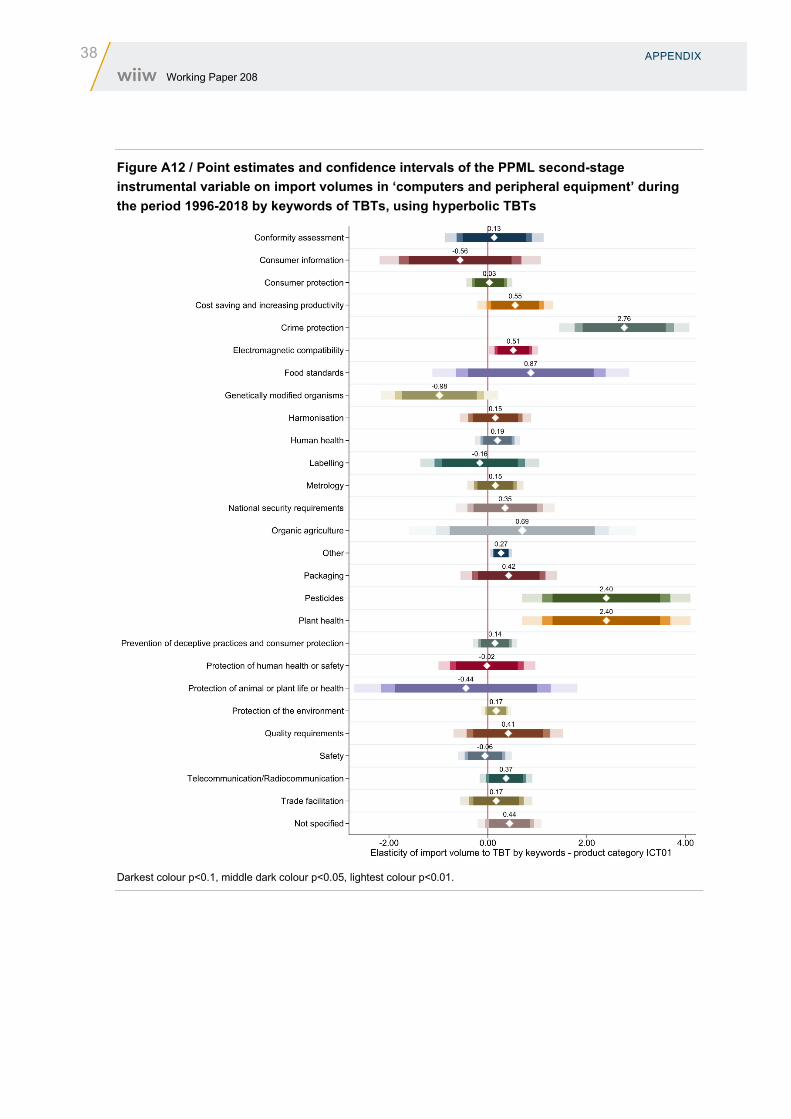
Figures A12 to A16 in the Appendix illustrate the point estimates and confidence intervals of the PPML second-stage instrumental variable estimations on import volumes of ICT goods in the five product categories, using the hyperbolic sine transformation of TBTs. Looking at the results obtained for the first product category of ‘computers and peripheral equipment’, one can observe that many TBT keywords stimulate the volume of imports of these goods in a statistically significant way. These are TBTs with keywords ‘cost saving and increasing productivity’, ‘crime protection’, ‘electromagnetic compatibility’, ‘other’, ‘pesticides’, ‘plant health’, ‘telecommunication/radiocommunication’ and other TBTs whose keywords were ‘not specified’. However, there is only one keyword cited that has a statistically significant and negative impact on the volume of imports of these goods: ‘genetically modified organisms’. These results indicate the heterogeneous impact of different types of TBT: many of them have a negative impact on the value of imports, while some of them have a positive impact on the import volumes of these goods. This could be due to a lower price of the imports caused by TBTs: that would result in higher import volumes, but lower import values.
The results for the impact of TBTs by keyword on the value of the import of goods in the category of ‘communication equipment’ are presented in Figure A8, and the corresponding results for import volume are presented in Figure A13. In all, 21 keywords cited in TBTs have a statistically significant stimulation
22 ESTIMATION RESULTS
Working Paper 208
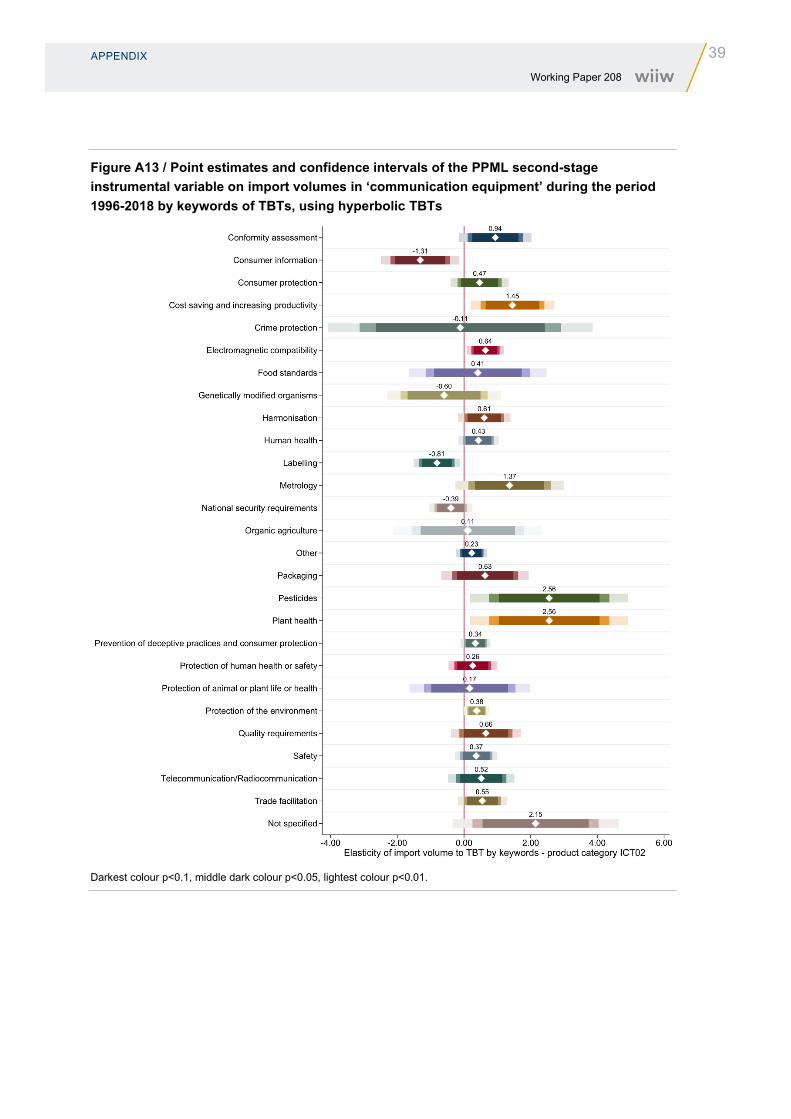
effect on the value of imports in this category. None of the keywords has any statistically significant and negative effect on import values. This is not surprising, and is in line with the positive and statistically significant effect of all types of TBT presented in Figures A1 and A2. Figure A13 indicates that 12 keywords cited in TBTs have a statistically significant and positive effect on the volume of imports of these goods. However, there are only two keywords with a statistically significant and negative effect in this graph: ‘labelling’ and ‘consumer information’. These two keywords have a statistically significant and positive impact on the value of imports of these goods, which suggests that these two types of TBT have resulted in a higher cost and price of the imported goods. The higher cost and price of goods after compliance with these two types of TBT is much greater than the reduction in the volume of imports, leading to a lower volume of imports, but a higher value.
The point estimates and confidence intervals on the impact of TBTs by keyword on the import value of goods in the category ‘consumer electronic equipment’ are presented in Figure A9, while the corresponding results for import volumes are illustrated in Figure A14. The import values of these goods are statistically increased by only two keywords cited in TBTs: ‘conformity assessment’ and ‘crime protection’. ‘Labelling’, ‘organic agriculture’ and ‘quality requirements’ are the keywords cited in TBTs that lead to a statistically significant decrease in the value of imports of these goods. TBTs citing ‘labelling’ as a keyword also reduce the volume of imports at the 10% level of significance. ‘National security requirements’, ‘pesticides’, ‘plant health’, ‘protection of animal or plant life or health’ and other TBTs that did not specify keywords (‘not specified’) lead to a statistically significant improvement in import volumes. Since these goods are consumer goods, it is not surprising that these objectives of the TBTs should have increased consumer demand.
‘Electronic components’ is the next import product category, and the estimation results for point estimates and confidence intervals of the keywords of TBTs affecting import values are presented in Figure A10, while the corresponding results for import volumes are presented in Figure A15. Semiconductors and technologically advanced electronic chipsets form part of this category. More recently, the COVID-19 pandemic and the border closures have disrupted the global value chains of these high-tech products and have led to semiconductor shortages; these have affected many sectors, such as the automobile industry, which uses these goods as intermediate inputs. Nine keywords cited in the TBTs imposed on these goods lead to a statistically significant increase in the import values of these goods. There is no keyword cited in the TBTs that has a statistically significant negative effect on the value of imports of these vital goods. However, ‘cost saving and increasing productivity’, ‘harmonisation’ and ‘organic agriculture’ are keywords cited in TBTs that lead to a statistically significant reduction in the volume of imports of these goods. ‘Crime protection’ and keywords that are not specified (‘not specified’) in other TBTs have a positive and statistically significant effect on the volume of imports of these goods.
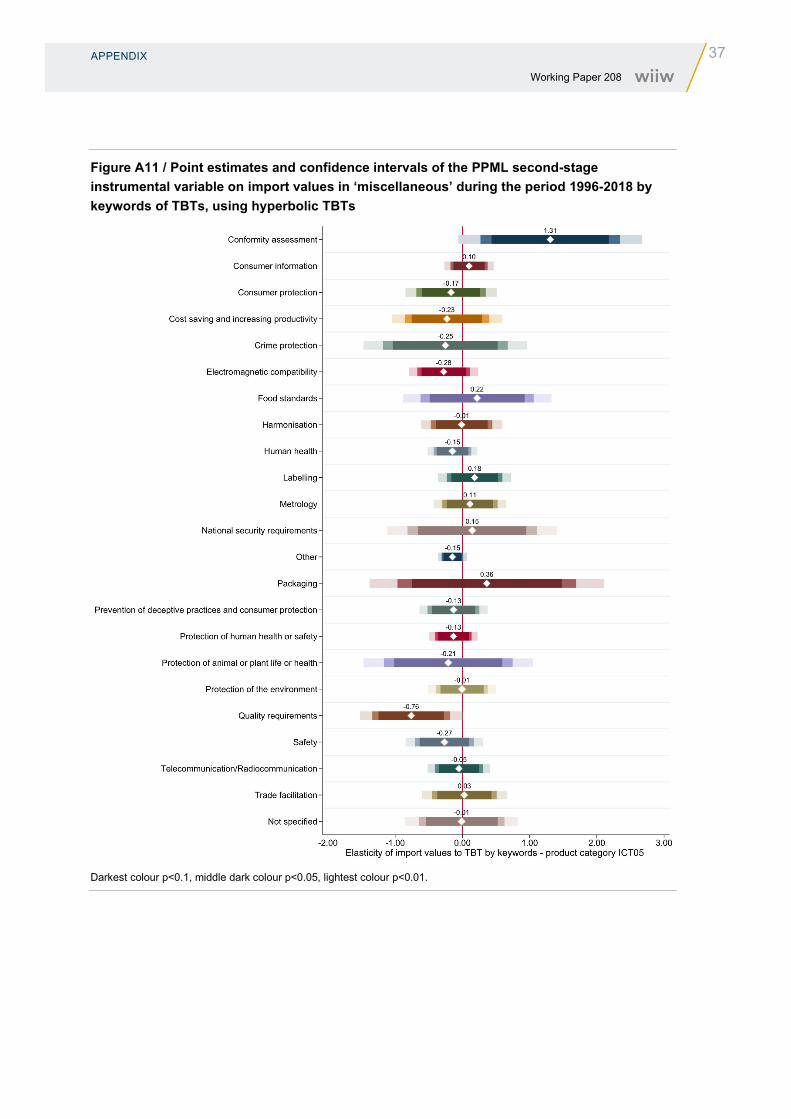
‘Miscellaneous’ is the fifth category of ICT goods, and its estimation results, with point estimates and confidence intervals of TBTs by keyword, are presented in Figure A11 for the value of imports, and in Figure A16 for the volume of imports. ‘Conformity assessment’ is the only keyword cited in TBTs that results in a statistically significant increase in the value of imports of these goods. In fact, TBTs citing the keyword ‘conformity assessment’ stimulate the value of imports of all ICT goods across all product categories. ‘Quality requirements’ and ‘other’ are the keywords cited in TBTs that lead to a statistically significant reduction in the value of imports. TBTs citing ‘crime protection’ increase the volume of imports in this category in a statistically significant way, while those citing ‘packaging’ and ‘telecommunication/radiocommunication’ reduce the volume of imports of these goods.
CONCLUDING REMARKS 23 Working Paper 208
4. Concluding remarks
In the modern digitalised world, ICT goods are the engine of the global economy. According to the data provided by UNCTAD to the World Bank, trade in ICT goods was about 12.9% of total imports of goods in 2019, which indicates their importance in the global economy. While tariffs levied on ICT goods have been eliminated or significantly reduced since the conclusion of the WTO’s Information Technology Agreement in December 1996, NTMs have become more relevant and important for trade in these goods. As the most important trade policy measure imposed on imports of ICT goods, TBTs form the focus of this study. This paper analyses how the different types of TBT imposed on imports of ICT goods globally affected the value and volume of imports of these goods at the six-digit level of the Harmonised System during the period 1996-2018. Keywords cited in the TBTs that are notified to the WTO indicate the aims behind the imposition of the TBTs. Therefore, as a major contribution to the literature, this study delves deeper into the impact of 30 types of TBT, using the keywords cited in them. The methodology used in the paper controls for zero trade flows by using the PPML technique and for endogeneity bias by using the exogenous instrumental variable approach. Moreover, the paper provides more detailed analysis of the impact of TBTs across five ICT product categories that were defined by UNCTAD in July 2019.
The results indicate that TBTs have a generally strong positive impact on the value of imports of ICT goods. Moreover, this positive impact is stronger and statistically more significant for the ‘communication equipment’ category of ICT goods. Furthermore, TBTs that cite the keywords ‘conformity assessment’, ‘crime protection’, ‘electromagnetic compatibility’, ‘harmonisation’, ‘national security requirements’, ‘other’, ‘protection of animal or plant life or health’ lead to a statistically significant stimulation of the value of imports of ICT goods. While TBTs that cite ‘nutrition information’ significantly reduce the value of imports, other TBTs do not have any statistically significant impact on the import values of ICT goods. Most importantly, TBTs that cite ‘quality requirements’ stimulate the volume of imports of ICT goods in a statistically significant way. The imposition of this important TBT – one that improves the quality of traded goods – could be an important way of stimulating trade volume, while the imposition of other TBTs mentioned above can increase export revenues.
Overall, the results presented here could give policy makers a better insight into how to adjust trade in ICT goods by implementing smart policies to regulate the market, when the market cannot automatically adjust and reduce the negative externalities. For instance, TBTs that cite ‘conformity assessment’ stimulate the value of imports of all ICT goods in all five product categories. TBTs in pursuit of ‘harmonisation’ or ‘plant health’ may also improve trade values across many categories. However, some other TBTs – such as those that pursue ‘labelling’ or ‘packaging’ – may result in a statistically significant reduction in the volume of imports, as the costs associated with compliance increase at the plant level where the ICT good is produced or packed, but do not necessarily induce positive externalities to stimulate demand or export revenues.
24 REFERENCES Working Paper 208
References
Ahmad, N. A., Ismail, N. W., & Hook, L. S. (2011). The role of ICT infrastructure on Malaysian trade. Journal of Economics and Management, 5(1), 140-148.
Aisbett, E., & Pearson, L. (2012). Environmental and health protections, or new protectionism? Determinants of SPS notifications by WTO members. Determinants of SPS Notifications by WTO Members (December 21, 2012). Crawford School Research Paper, 12-13.
Beghin, J. C., Disdier, A. C., & Marette, S. (2015). Trade restrictiveness indices in the presence of externalities: An application to non-tariff measures. Canadian Journal of Economics/Revue canadienne d'économique, 48(4), 1513-1536.
Bellemare, M. F., and Wichman, C. J. (2020). Elasticities and the inverse hyperbolic sine transformation. Oxford Bulletin of Economics and Statistics, 82(1), 50-61.
Bratt, M. (2017). Estimating the bilateral impact of nontariff measures on trade. Review of International Economics, 25(5), 1105-1129.
Correia, S. (2015). Singletons, cluster-robust standard errors and fixed effects: A bad mix. Technical Note, Duke University, 7.
Correia, S., Guimarães, P., & Zylkin, T. (2019a). ppmlhdfe: Fast Poisson estimation with high-dimensional fixed effects, arXiv.org.
Correia, S., Guimarães, P., & Zylkin, T. (2019b). Verifying the existence of maximum likelihood estimates for generalized linear models. arXiv preprint arXiv:1903.01633.
Disdier, A. C., Fontagné, L., & Mimouni, M. (2008). The impact of regulations on agricultural trade: Evidence from the SPS and TBT agreements. American Journal of Agricultural Economics, 90(2), 336-350.
Feenstra, R. C., & Romalis, J. (2014). International prices and endogenous quality. The Quarterly Journal of Economics, 129(2). https://doi.org/10.1093/qje/qju001
Ghodsi, M. (2020). The impact of Chinese technical barriers to trade on its manufacturing imports when exporters are heterogeneous. Empirical Economics, 59(4), 1667-1698.
Ghodsi, M. (2021). Exploring ‘non-tariff measures black box’: Whose regulative NTMs on which products improve the imported quality? The Vienna Institute for International Economic Studies (wiiw), Working Paper 195.
Ghodsi, M., & Stehrer, R. (2021). Non-tariff measures and the quality of imported products. World Trade Review, forthcoming
Ghodsi, M., Gruebler, J., & Stehrer, R. (2016). Estimating importer-specific ad valorem equivalents of non-tariff measures. The Vienna Institute for International Economic Studies (wiiw), Working Paper 129.
Ghodsi, M., Grübler, J., Reiter, O., & Stehrer, R. (2017). The evolution of non-tariff measures and their diverse effects on trade. The Vienna Institute for International Economic Studies (wiiw), Research Report 419.
Hallak, J. C., & Schott, P. K. (2011). Estimating cross-country differences in product quality. The Quarterly Journal of Economics, 126(1), 417-474.
Head, K., & Mayer, T. (2014). Gravity equations: Workhorse, toolkit, and cookbook. In Handbook of international economics (Vol. 4, pp. 131-195). Elsevier. https://doi.org/10.1016/B978-0-444-54314-1.00003-3
REFERENCES 25 Working Paper 208
Head, K., & Ries, J. (2008). FDI as an outcome of the market for corporate control: Theory and evidence. Journal of International Economics, 74(1), 2-20.
Kee, H. L., Nicita, A., and Olarreaga, M. (2009). Estimating trade restrictiveness indices. The Economic Journal, 119(534), 172-199.
Khandelwal, A. (2010). The long and short (of) quality ladders. The Review of Economic Studies, 77(4), 1450-1476.
Larch, M., Wanner, J., Yotov, Y. V., & Zylkin, T. (2019). Currency unions and trade: A PPML re‐assessment with high‐dimensional fixed effects. Oxford Bulletin of Economics and Statistics, 81(3), 487-510.
Mattes, A., Meinen, P., & Pavel, F. (2012). Goods follow bytes: The impact of ICT on EU trade. DIW Berlin Discussion Paper No. 1182, Available at SSRN: https://ssrn.com/abstract=2006481 or http://dx.doi.org/10.2139/ssrn.2006481
Moore, M. O., & Zanardi, M. (2011). Trade liberalization and antidumping: Is there a substitution effect? Review of Development Economics, 15(4), 601-619.
Nath, H. K., & Liu, L. (2017). Information and communications technology (ICT) and services trade. Information Economics and Policy, 41, 81-87.
Niu, Z., Liu, C., Gunessee, S., & Milner, C. (2018). Non-tariff and overall protection: Evidence across countries and over time. Review of World Economics, 154(4), 675-703.
Orefice, G. (2017). Non‐tariff measures, specific trade concerns and tariff reduction. The World Economy, 40(9), 1807-1835.
Ozcan, B. (2018). Information and communications technology (ICT) and international trade: Evidence from Turkey. Eurasian Economic Review, 8(1), 93-113.
Rosendorff, B. P. (1996). Voluntary export restraints, antidumping procedure, and domestic politics. The American Economic Review, 544-561.
Santos Silva, J., & Tenreyro, S. (2006). The log of gravity. The Review of Economics and Statistics, 88(4), 641-658.
Xing, Z. (2018). The impacts of information and communications technology (ICT) and e-commerce on bilateral trade flows. International Economics and Economic Policy, 15(3), 565-586.
Yotov, Y. V., Piermartini, R., Monteiro, J. A., & Larch, M. (2016). An advanced guide to trade policy analysis: The structural gravity model. Geneva: World Trade Organization. https://vi.unctad.org/tpa/web/vol2/vol2home.html
Yu, Z. (2000). A model of substitution of non‐tariff barriers for tariffs. Canadian Journal of Economics/Revue canadienne d'économique, 33(4), 1069-1090.
Yushkova, E. (2014). Impact of ICT on trade in different technology groups: Analysis and implications. International Economics and Economic Policy, 11(1), 165-177.
26 APPENDIX Working Paper 208
Appendix
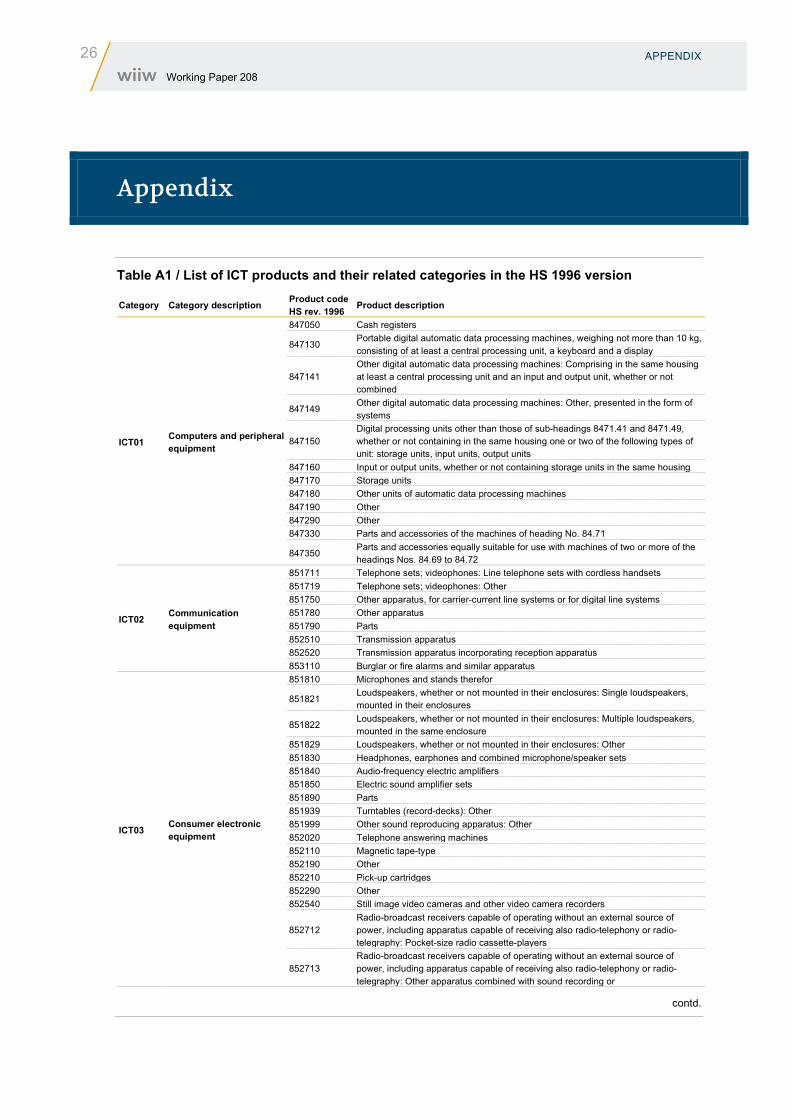
Table A1 / List of ICT products and their related categories in the HS 1996 version
Category Category description Product code HS rev. 1996 Product description
ICT01 Computers and peripheral equipment
847050 Cash registers
847130 Portable digital automatic data processing machines, weighing not more than 10 kg, consisting of at least a central processing unit, a keyboard and a display
847141 Other digital automatic data processing machines: Comprising in the same housing at least a central processing unit and an input and output unit, whether or not combined
847149 Other digital automatic data processing machines: Other, presented in the form of systems
847150 Digital processing units other than those of sub-headings 8471.41 and 8471.49, whether or not containing in the same housing one or two of the following types of unit: storage units, input units, output units
847160 Input or output units, whether or not containing storage units in the same housing 847170 Storage units 847180 Other units of automatic data processing machines 847190 Other 847290 Other 847330 Parts and accessories of the machines of heading No. 84.71
847350 Parts and accessories equally suitable for use with machines of two or more of the headings Nos. 84.69 to 84.72
ICT02 Communication equipment
851711 Telephone sets; videophones: Line telephone sets with cordless handsets 851719 Telephone sets; videophones: Other 851750 Other apparatus, for carrier-current line systems or for digital line systems 851780 Other apparatus 851790 Parts 852510 Transmission apparatus 852520 Transmission apparatus incorporating reception apparatus 853110 Burglar or fire alarms and similar apparatus
ICT03 Consumer electronic equipment
851810 Microphones and stands therefor
851821 Loudspeakers, whether or not mounted in their enclosures: Single loudspeakers, mounted in their enclosures
851822 Loudspeakers, whether or not mounted in their enclosures: Multiple loudspeakers, mounted in the same enclosure
851829 Loudspeakers, whether or not mounted in their enclosures: Other 851830 Headphones, earphones and combined microphone/speaker sets 851840 Audio-frequency electric amplifiers 851850 Electric sound amplifier sets 851890 Parts 851939 Turntables (record-decks): Other 851999 Other sound reproducing apparatus: Other 852020 Telephone answering machines 852110 Magnetic tape-type 852190 Other 852210 Pick-up cartridges 852290 Other 852540 Still image video cameras and other video camera recorders
852712 Radio-broadcast receivers capable of operating without an external source of power, including apparatus capable of receiving also radio-telephony or radio-telegraphy: Pocket-size radio cassette-players
852713 Radio-broadcast receivers capable of operating without an external source of power, including apparatus capable of receiving also radio-telephony or radio-telegraphy: Other apparatus combined with sound recording or
contd.
APPENDIX 27 Working Paper 208
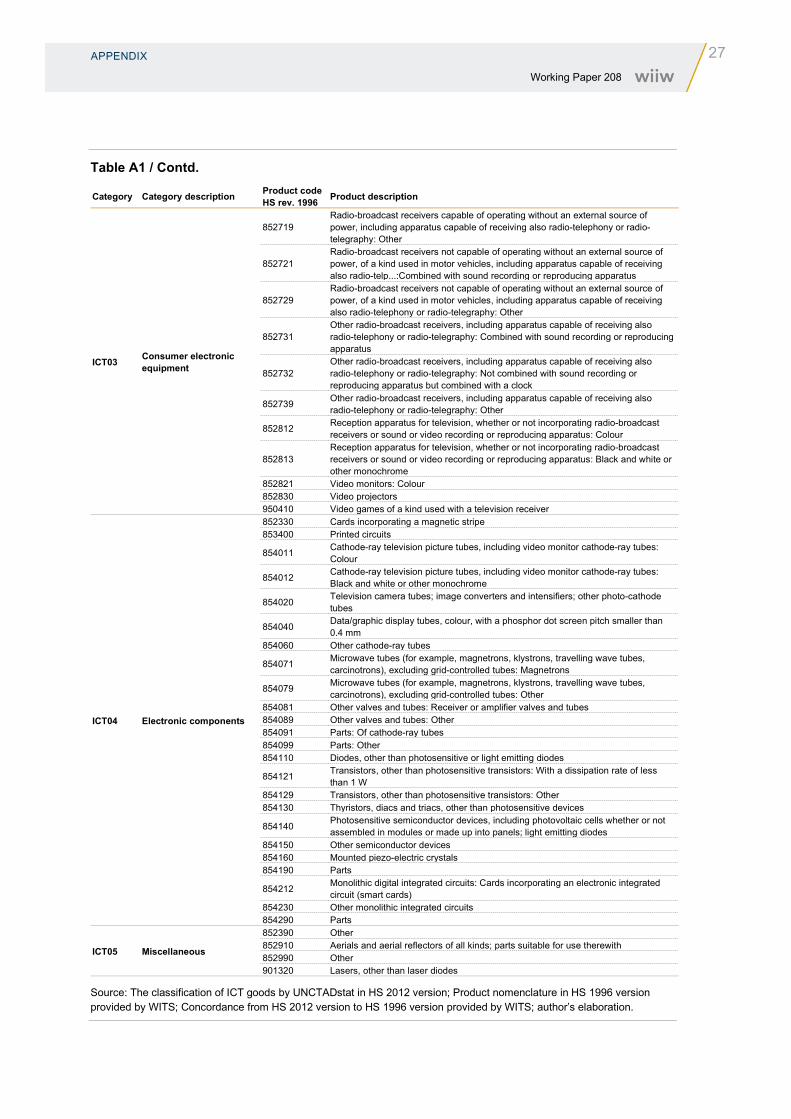
Table A1 / Contd.
Category Category description Product code HS rev. 1996 Product description
ICT03 Consumer electronic equipment
852719 Radio-broadcast receivers capable of operating without an external source of power, including apparatus capable of receiving also radio-telephony or radio-telegraphy: Other
852721 Radio-broadcast receivers not capable of operating without an external source of power, of a kind used in motor vehicles, including apparatus capable of receiving also radio-telp...:Combined with sound recording or reproducing apparatus
852729 Radio-broadcast receivers not capable of operating without an external source of power, of a kind used in motor vehicles, including apparatus capable of receiving also radio-telephony or radio-telegraphy: Other
852731 Other radio-broadcast receivers, including apparatus capable of receiving also radio-telephony or radio-telegraphy: Combined with sound recording or reproducing apparatus
852732 Other radio-broadcast receivers, including apparatus capable of receiving also radio-telephony or radio-telegraphy: Not combined with sound recording or reproducing apparatus but combined with a clock
852739 Other radio-broadcast receivers, including apparatus capable of receiving also radio-telephony or radio-telegraphy: Other
852812 Reception apparatus for television, whether or not incorporating radio-broadcast receivers or sound or video recording or reproducing apparatus: Colour
852813 Reception apparatus for television, whether or not incorporating radio-broadcast receivers or sound or video recording or reproducing apparatus: Black and white or other monochrome
852821 Video monitors: Colour 852830 Video projectors 950410 Video games of a kind used with a television receiver
ICT04 Electronic components
852330 Cards incorporating a magnetic stripe 853400 Printed circuits
854011 Cathode-ray television picture tubes, including video monitor cathode-ray tubes: Colour
854012 Cathode-ray television picture tubes, including video monitor cathode-ray tubes: Black and white or other monochrome
854020 Television camera tubes; image converters and intensifiers; other photo-cathode tubes
854040 Data/graphic display tubes, colour, with a phosphor dot screen pitch smaller than 0.4 mm
854060 Other cathode-ray tubes
854071 Microwave tubes (for example, magnetrons, klystrons, travelling wave tubes, carcinotrons), excluding grid-controlled tubes: Magnetrons
854079 Microwave tubes (for example, magnetrons, klystrons, travelling wave tubes, carcinotrons), excluding grid-controlled tubes: Other
854081 Other valves and tubes: Receiver or amplifier valves and tubes 854089 Other valves and tubes: Other 854091 Parts: Of cathode-ray tubes 854099 Parts: Other 854110 Diodes, other than photosensitive or light emitting diodes
854121 Transistors, other than photosensitive transistors: With a dissipation rate of less than 1 W
854129 Transistors, other than photosensitive transistors: Other 854130 Thyristors, diacs and triacs, other than photosensitive devices
854140 Photosensitive semiconductor devices, including photovoltaic cells whether or not assembled in modules or made up into panels; light emitting diodes
854150 Other semiconductor devices 854160 Mounted piezo-electric crystals 854190 Parts
854212 Monolithic digital integrated circuits: Cards incorporating an electronic integrated circuit (smart cards)
854230 Other monolithic integrated circuits 854290 Parts
ICT05 Miscellaneous
852390 Other 852910 Aerials and aerial reflectors of all kinds; parts suitable for use therewith 852990 Other 901320 Lasers, other than laser diodes
Source: The classification of ICT goods by UNCTADstat in HS 2012 version; Product nomenclature in HS 1996 version provided by WITS; Concordance from HS 2012 version to HS 1996 version provided by WITS; author’s elaboration.
28 APPENDIX Working Paper 208
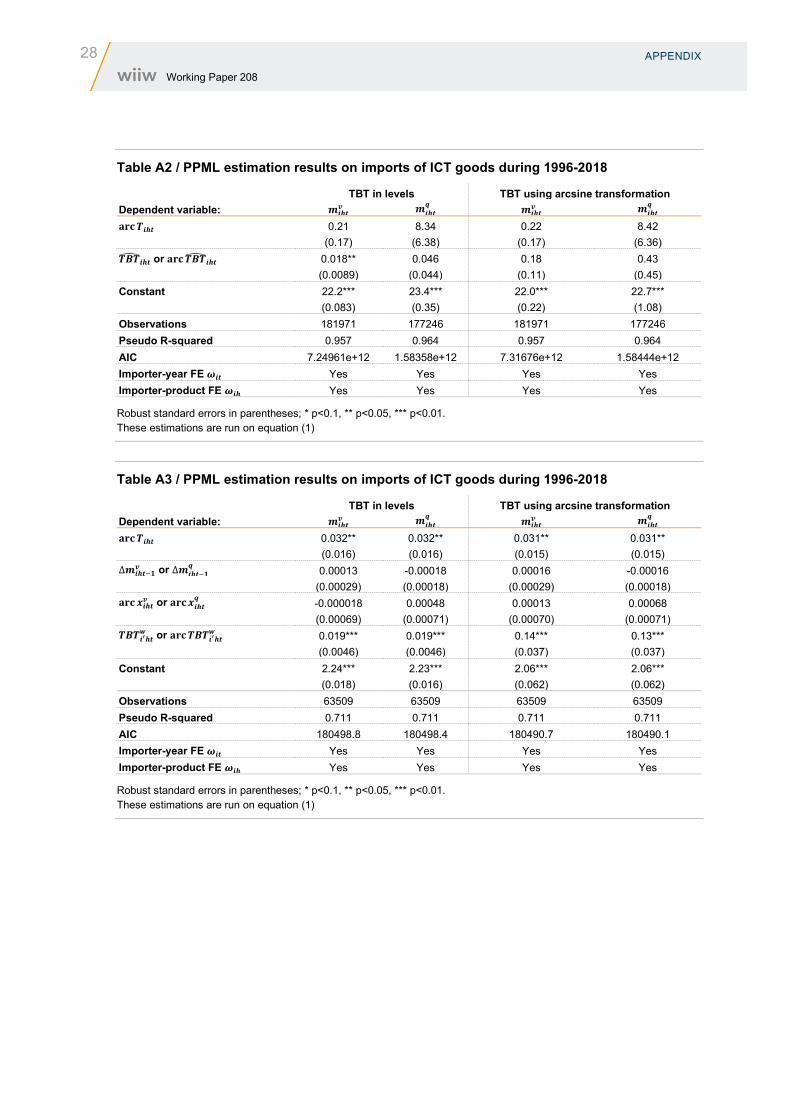
Table A2 / PPML estimation results on imports of ICT goods during 1996-2018
TBT in levels TBT using arcsine transformation Dependent variable: 𝒎𝒎𝒊𝒊𝒊𝒊𝒊𝒊
𝒗𝒗 𝒎𝒎𝒊𝒊𝒊𝒊𝒊𝒊𝒒𝒒 𝒎𝒎𝒊𝒊𝒊𝒊𝒊𝒊
𝒗𝒗 𝒎𝒎𝒊𝒊𝒊𝒊𝒊𝒊𝒒𝒒
𝐚𝐚𝐚𝐚𝐚𝐚𝑻𝑻𝒊𝒊𝒊𝒊𝒊𝒊 0.21 8.34 0.22 8.42 (0.17) (6.38) (0.17) (6.36) 𝑻𝑻𝑻𝑻𝑻𝑻�𝒊𝒊𝒊𝒊𝒊𝒊 or 𝐚𝐚𝐚𝐚𝐚𝐚𝑻𝑻𝑻𝑻𝑻𝑻�𝒊𝒊𝒊𝒊𝒊𝒊 0.018** 0.046 0.18 0.43 (0.0089) (0.044) (0.11) (0.45) Constant 22.2*** 23.4*** 22.0*** 22.7*** (0.083) (0.35) (0.22) (1.08) Observations 181971 177246 181971 177246 Pseudo R-squared 0.957 0.964 0.957 0.964 AIC 7.24961e+12 1.58358e+12 7.31676e+12 1.58444e+12 Importer-year FE 𝝎𝝎𝒊𝒊𝒊𝒊 Yes Yes Yes Yes Importer-product FE 𝝎𝝎𝒊𝒊𝒊𝒊 Yes Yes Yes Yes
Robust standard errors in parentheses; * p<0.1, ** p<0.05, *** p<0.01. These estimations are run on equation (1)
Table A3 / PPML estimation results on imports of ICT goods during 1996-2018
TBT in levels TBT using arcsine transformation Dependent variable: 𝒎𝒎𝒊𝒊𝒊𝒊𝒊𝒊
𝒗𝒗 𝒎𝒎𝒊𝒊𝒊𝒊𝒊𝒊𝒒𝒒 𝒎𝒎𝒊𝒊𝒊𝒊𝒊𝒊
𝒗𝒗 𝒎𝒎𝒊𝒊𝒊𝒊𝒊𝒊𝒒𝒒
𝐚𝐚𝐚𝐚𝐚𝐚𝑻𝑻𝒊𝒊𝒊𝒊𝒊𝒊 0.032** 0.032** 0.031** 0.031** (0.016) (0.016) (0.015) (0.015) ∆𝒎𝒎𝒊𝒊𝒊𝒊𝒊𝒊−𝟏𝟏
𝒗𝒗 or ∆𝒎𝒎𝒊𝒊𝒊𝒊𝒊𝒊−𝟏𝟏𝒒𝒒 0.00013 -0.00018 0.00016 -0.00016
(0.00029) (0.00018) (0.00029) (0.00018) 𝐚𝐚𝐚𝐚𝐚𝐚𝒙𝒙𝒊𝒊𝒊𝒊𝒊𝒊𝒗𝒗 or 𝐚𝐚𝐚𝐚𝐚𝐚𝒙𝒙𝒊𝒊𝒊𝒊𝒊𝒊
𝒒𝒒 -0.000018 0.00048 0.00013 0.00068 (0.00069) (0.00071) (0.00070) (0.00071) 𝑻𝑻𝑻𝑻𝑻𝑻𝒊𝒊′𝒊𝒊𝒊𝒊
𝒘𝒘 or 𝐚𝐚𝐚𝐚𝐚𝐚𝑻𝑻𝑻𝑻𝑻𝑻𝒊𝒊′𝒊𝒊𝒊𝒊𝒘𝒘 0.019*** 0.019*** 0.14*** 0.13***
(0.0046) (0.0046) (0.037) (0.037) Constant 2.24*** 2.23*** 2.06*** 2.06*** (0.018) (0.016) (0.062) (0.062) Observations 63509 63509 63509 63509 Pseudo R-squared 0.711 0.711 0.711 0.711 AIC 180498.8 180498.4 180490.7 180490.1 Importer-year FE 𝝎𝝎𝒊𝒊𝒊𝒊 Yes Yes Yes Yes Importer-product FE 𝝎𝝎𝒊𝒊𝒊𝒊 Yes Yes Yes Yes
Robust standard errors in parentheses; * p<0.1, ** p<0.05, *** p<0.01. These estimations are run on equation (1)
APPENDIX 29 Working Paper 208
Figure A1 / Point estimates and confidence intervals of the PPML second-stage instrumental variable on import values of ICT goods by category during the period 1996-2018, using TBTs in levels
Darkest colour p<0.1, middle dark colour p<0.05, lightest colour p<0.01.
Figure A2 / Point estimates and confidence intervals of the PPML second-stage instrumental variable on import values of ICT goods by category during the period 1996-2018, using TBTs in arcsine transformation
Darkest colour p<0.1, middle dark colour p<0.05, lightest colour p<0.01.
30 APPENDIX Working Paper 208
Figure A3 / Point estimates and confidence intervals of the PPML second-stage instrumental variable on import volumes of ICT goods by category during the period 1996-2018, using TBTs in levels
Darkest colour p<0.1, middle dark colour p<0.05, lightest colour p<0.01.
Figure A4 / Point estimates and confidence intervals of the PPML second-stage instrumental variable on import volumes of ICT goods by category during the period 1996-2018, using TBTs in arcsine transformation
Darkest colour p<0.1, middle dark colour p<0.05, lightest colour p<0.01.
APPENDIX 31 Working Paper 208
Figure A5 / Point estimates and confidence intervals of the PPML second-stage instrumental variable on import values of ICT goods during the period 1996-2018 by keywords of TBTs, using hyperbolic TBTs
Darkest colour p<0.1, middle dark colour p<0.05, lightest colour p<0.01.
32 APPENDIX Working Paper 208
Figure A6 / Point estimates and confidence intervals of the PPML second-stage instrumental variable on import volumes of ICT goods during the period 1996-2018 by keywords of TBTs, using hyperbolic TBTs
Darkest colour p<0.1, middle dark colour p<0.05, lightest colour p<0.01.
APPENDIX 33 Working Paper 208
Figure A7 / Point estimates and confidence intervals of the PPML second-stage instrumental variable on import values in ‘computers and peripheral equipment’ during the period 1996-2018 by keywords of TBTs, using hyperbolic TBTs
Darkest colour p<0.1, middle dark colour p<0.05, lightest colour p<0.01.
34 APPENDIX Working Paper 208
Figure A8 / Point estimates and confidence intervals of the PPML second-stage instrumental variable on import values in ‘communication equipment’ during the period 1996-2018 by keywords of TBTs, using hyperbolic TBTs
Darkest colour p<0.1, middle dark colour p<0.05, lightest colour p<0.01.
APPENDIX 35 Working Paper 208
Figure A9 / Point estimates and confidence intervals of the PPML second-stage instrumental variable on import values in ‘consumer electronic equipment’ during the period 1996-2018 by keywords of TBTs, using hyperbolic TBTs
Darkest colour p<0.1, middle dark colour p<0.05, lightest colour p<0.01.
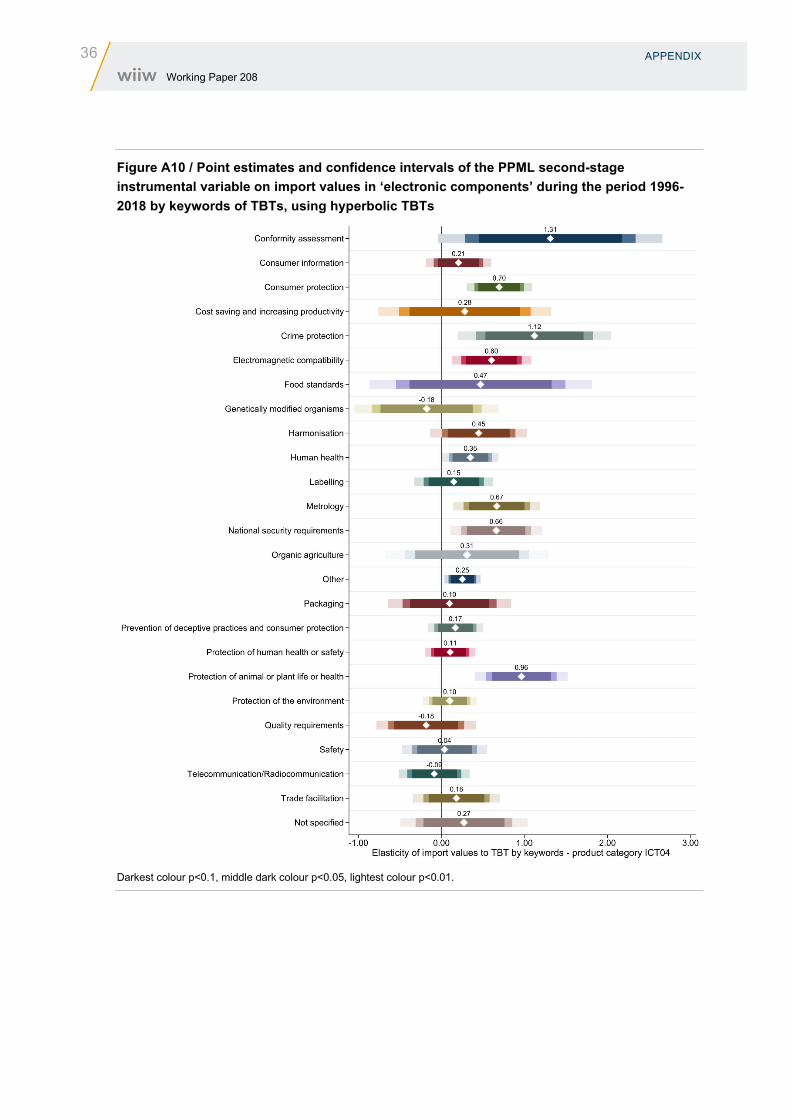
36 APPENDIX Working Paper 208
Figure A10 / Point estimates and confidence intervals of the PPML second-stage instrumental variable on import values in ‘electronic components’ during the period 1996-2018 by keywords of TBTs, using hyperbolic TBTs
Darkest colour p<0.1, middle dark colour p<0.05, lightest colour p<0.01.
APPENDIX 37 Working Paper 208
Figure A11 / Point estimates and confidence intervals of the PPML second-stage instrumental variable on import values in ‘miscellaneous’ during the period 1996-2018 by keywords of TBTs, using hyperbolic TBTs
Darkest colour p<0.1, middle dark colour p<0.05, lightest colour p<0.01.
38 APPENDIX Working Paper 208
Figure A12 / Point estimates and confidence intervals of the PPML second-stage instrumental variable on import volumes in ‘computers and peripheral equipment’ during the period 1996-2018 by keywords of TBTs, using hyperbolic TBTs
Darkest colour p<0.1, middle dark colour p<0.05, lightest colour p<0.01.
APPENDIX 39 Working Paper 208
Figure A13 / Point estimates and confidence intervals of the PPML second-stage instrumental variable on import volumes in ‘communication equipment’ during the period 1996-2018 by keywords of TBTs, using hyperbolic TBTs
Darkest colour p<0.1, middle dark colour p<0.05, lightest colour p<0.01.
40 APPENDIX Working Paper 208
Figure A14 / Point estimates and confidence intervals of the PPML second-stage instrumental variable on import volumes in ‘consumer electronic equipment’ during the period 1996-2018 by keywords of TBTs, using hyperbolic TBTs
Darkest colour p<0.1, middle dark colour p<0.05, lightest colour p<0.01.
APPENDIX 41 Working Paper 208
Figure A15 / Point estimates and confidence intervals of the PPML second-stage instrumental variable on import volumes in ‘electronic components’ during the period 1996-2018 by keywords of TBTs, using hyperbolic TBTs
Darkest colour p<0.1, middle dark colour p<0.05, lightest colour p<0.01.
42 APPENDIX Working Paper 208
Figure A16 / Point estimates and confidence intervals of the PPML second-stage instrumental variable on import volumes in ‘miscellaneous’ during the period 1996-2018 by keywords of TBTs, using hyperbolic TBTs
Darkest colour p<0.1, middle dark colour p<0.05, lightest colour p<0.01.
IMPRESSUM
Herausgeber, Verleger, Eigentümer und Hersteller: Verein „Wiener Institut für Internationale Wirtschaftsvergleiche“ (wiiw), Wien 6, Rahlgasse 3 ZVR-Zahl: 329995655 Postanschrift: A 1060 Wien, Rahlgasse 3, Tel: [+431] 533 66 10, Telefax: [+431] 533 66 10 50 Internet Homepage: www.wiiw.ac.at Nachdruck nur auszugsweise und mit genauer Quellenangabe gestattet. Offenlegung nach § 25 Mediengesetz: Medieninhaber (Verleger): Verein "Wiener Institut für Internationale Wirtschaftsvergleiche", A 1060 Wien, Rahlgasse 3. Vereinszweck: Analyse der wirtschaftlichen Entwicklung der zentral- und osteuropäischen Länder sowie anderer Transformationswirtschaften sowohl mittels empirischer als auch theoretischer Studien und ihre Veröffentlichung; Erbringung von Beratungsleistungen für Regierungs- und Verwaltungsstellen, Firmen und Institutionen.
Top Related
Copyright © 2022 FDOKUMEN

