Barriers to trade and labour mobility in conflict-affected regions
325
Barriers to trade and labour mobility in conflict-affected regions: an economy-wide analysis with applications to the Palestinian economy D I S S E R T A T I O N for the Completion of the Academic Degree “Doctor of Philosophy“ (Ph.D.) submitted to the Faculty of Life Sciences at Humboldt-Universität zu Berlin by M.Sc., Johanes Uriel Ibidjola Agbahey President of the Humboldt-Universität zu Berlin Prof. Dr.-Ing. Dr. Sabine Kunst Dean of the Faculty of Life Sciences Prof. Dr. Bernhard Grimm Reviewers 1. Prof. Dr. Harald Grethe 2. Prof. Dr. Martin Banse 3. PD. Dr. Matthias Ritter Date of Oral Exam: 11 October 2018
-
Upload
khangminh22 -
Category
Documents
-
view
1 -
download
0
Transcript of Barriers to trade and labour mobility in conflict-affected regions
Barriers to trade and labour mobility in conflict-affected regions: an economy-wide analysis with applications to
the Palestinian economy
D I S S E R T A T I O N for the Completion of the Academic Degree
“Doctor of Philosophy“ (Ph.D.)
submitted to the
Faculty of Life Sciences at Humboldt-Universität zu Berlin
by M.Sc., Johanes Uriel Ibidjola Agbahey
President of the
Humboldt-Universität zu Berlin Prof. Dr.-Ing. Dr. Sabine Kunst
Dean of the
Faculty of Life Sciences Prof. Dr. Bernhard Grimm
Reviewers 1. Prof. Dr. Harald Grethe 2. Prof. Dr. Martin Banse 3. PD. Dr. Matthias Ritter
Date of Oral Exam: 11 October 2018

Table of contents
Table of contents
Pages Acknowledgments ............................................................................................................................ i
List of tables .................................................................................................................................... v
List of figures .................................................................................................................................. vi
List of appendices......................................................................................................................... viii
List of abbreviations ...................................................................................................................... ix
Summary ...................................................................................................................................... xiii
Zusammenfassung ....................................................................................................................... xix
Chapter 1 General introduction .................................................................................................... 3
1.1. Background .......................................................................................................................... 3
1.2. Problem statement ............................................................................................................... 4
1.3. Research objectives ............................................................................................................. 6
1.4. Contributions to science....................................................................................................... 6
1.5. Theoretical framework ......................................................................................................... 7
1.6. Outputs of the thesis .......................................................................................................... 10
1.7. Outline of the thesis ........................................................................................................... 12
Chapter 2 Social accounting matrix: origins, theory and applications .................................... 15
2.1. Introduction ........................................................................................................................ 15
2.2. Origins and structure of the social accounting matrix (SAM) ........................................... 15
2.3. Decomposing household and factor accounts .................................................................... 22
2.4. SAM as a theoretical framework ....................................................................................... 26
2.5. Application of the social accounting matrix: SAM multiplier analysis ............................. 28
2.6. Conclusion ......................................................................................................................... 29
Chapter 3 Computable general equilibrium models: theory and applications ....................... 33
3.1. Introduction ........................................................................................................................ 33
3.2. Theory of CGE models ...................................................................................................... 33
3.3. Modelling labour markets in CGE models ........................................................................ 36
3.4. Application of CGE modelling .......................................................................................... 40
3.5. Typology of CGE models .................................................................................................. 43
3.6. Basic structure of the STAGE-2 single-country model ..................................................... 44
3.7. Conclusion ......................................................................................................................... 55
Chapter 4 Economic consequences of conflicts: the case of the Palestinian economy ............ 59
4.1. Introduction ........................................................................................................................ 59
Table of contents
4.2. The Palestinian economy from 1967 to 1987: asymmetric integration with Israel ........... 60
4.3. The Palestinian first uprising and the Oslo agreements ..................................................... 61
4.4. The Israeli security measures: closure policy and work permit system ............................. 63
4.5. Consequences of the restrictions and the economic environment in the post-Oslo era ..... 65
4.6. Pathway towards a two-state solution ................................................................................ 69
4.7. Conclusion ......................................................................................................................... 70
Chapter 5 A social accounting matrix for the West Bank ......................................................... 75
5.1. Introduction ........................................................................................................................ 75
5.2. Main features of the SAM for the West Bank ................................................................... 75
5.3. Constructing the macro-SAM ............................................................................................ 78
5.4. Constructing the detailed SAM .......................................................................................... 83
5.5. Structure of the West Bank economy: observations from the SAM .................................. 93
5.6. Conclusion and potential for data improvement .............................................................. 101
Chapter 6 Empirical analysis of the implications of different labour market conditions
in CGE models: the case of the West Bank .............................................................................. 109
6.1. Introduction ...................................................................................................................... 109
6.2. Stylized specifications of the labour market conditions .................................................. 110
6.3. Methods ........................................................................................................................... 112
6.4. Simulations ...................................................................................................................... 117
6.5. Results and analyses ........................................................................................................ 117
6.6. Conclusions and policy implications ............................................................................... 127
Chapter 7 Short-term effects of Palestinian employment in Israel on the West Bank
economy ....................................................................................................................................... 133
7.1. Introduction ...................................................................................................................... 133
7.2. Methods ........................................................................................................................... 134
7.3. Simulations ...................................................................................................................... 138
7.4. Results and analyses ........................................................................................................ 140
7.5. Conclusions and policy implications ............................................................................... 150
Chapter 8 Long-term effects of Palestinian employment in Israel on the West Bank
economy ....................................................................................................................................... 157
8.1. Introduction ...................................................................................................................... 157
8.2. Methods ........................................................................................................................... 158
8.3. Simulation ........................................................................................................................ 163
8.4. Results and analyses ........................................................................................................ 164
8.5. Conclusions and policy implications ............................................................................... 175
Table of contents
Chapter 9 Palestinian trade policy in a final settlement .......................................................... 181
9.1. Introduction ...................................................................................................................... 181
9.2. Overview of the trade conditions in the West Bank ........................................................ 182
9.3. Methods ........................................................................................................................... 184
9.4. Simulations ...................................................................................................................... 191
9.5. Results and analyses ........................................................................................................ 192
9.6. Conclusions and policy implications ............................................................................... 206
Chapter 10 Concluding remarks ............................................................................................... 213
10.1. Key findings and answers to the research questions ........................................................ 213
10.2. Contributions to the state of knowledge .......................................................................... 218
10.3. Policy implications .......................................................................................................... 220
10.4. Limitations of the thesis and suggestions for future research .......................................... 221
References .................................................................................................................................... 225
Appendices ................................................................................................................................... 235
Statement of authorship ............................................................................................................. 294


Acknowledgments
i
Acknowledgments
In writing this thesis, I have depended on countless acts of support and guidance. I begin with my
supervisor, Prof. Dr. Harald Grethe. It has been a long journey, which would not have started if you
had not offered me the opportunity to become a member of your team and conduct this research. I
would like to express my sincere gratitude to you for supervising this thesis and tirelessly providing
scientific guidance. Beyond the academic sphere, I have always appreciated your support and
guidance regarding the career prospective and my personal life.
I am sincerely thankful to PD. Dr. Khalid Siddig. You took my hands from the beginning, provided
a much-needed support to kick-start the work. Throughout these five years, I have relied on you for
discussion and guidance. I will always remember me knocking at your door, asking for five minutes
of your time and finally spending twenty minutes together, so interesting were our discussions.
I gratefully acknowledge the support from Prof. Dr. Scott McDonald. You have been a source of
inspiration for me and I learned much from our discussions. I will always remember your special
way to address issues, very direct, sometimes harsh, but always to the point.
For the last five years, I have been privileged to have great colleagues. Dr. Jonas Luckmann, my
long-time office mate, I have always appreciated your friendship and dedication to help no matter
the issue. Thank you for your contributions on chapters of this thesis. I am deeply thankful to my
colleague and friend Khawla Konyna for proofreading this thesis and for the memorable moments
at our lunch club together with another colleague and friend Dr. Marco Artavi. To my fellow PhD
candidates Arndt Feuerbacher, Judith Puttkammer, Abdulaziz Mosa, Samir Elagara, Zuhal
Mohammed, Davit Stepanyan, Nicholas Ashiabi, and Wiebke Nowack I am grateful for sharing the
joy and stresses of the PhD. My sincere gratefulness also goes to Peggy Beßler, Ulrike Marschinke
and Melanie Chadeayne. Thank you for your support to solve all complex administrative paperwork
that I encountered. I am indebted to Dr. Dorothee Flaig, Dr. Julia Schmid and the entire staff of the
International Agricultural Trade and Development Group for comments and helpful suggestions.
I owe a special gratitude to my family, wife Fifamin, daughter Charice and son Chaniel for their
love, patience and unconditional support. This has been a family effort. Fifamin has been my
inspiration through the years. Your questions to understand what I was doing often helped me to
clarify the concepts for myself and find ways to convey the message. My kids are real wonders, and
their excitement to play with Dad, has always helped me to keep the balance between work and
family life. In all this family effort, the full support of my parents, Hyacinthe Agbahey and Lydie
Acakpo, sisters Mireille and Aubierge, and brother Jeannot has played a tremendous role in keeping
me focused. I am deeply grateful to my parents-in-law, Alphonse Quenum and Catherine Montcho,
and sisters-in-law Dagbeli, Dagbesse and Dagbegnon for their affection.
This work has necessitated the collection of a large amount of data, gracefully provided by the
Palestinian Central Bureau of Statistics (PCBS). I owe special thanks to Faed Rayyan from the
PCBS, who has always been available to answer my questions about the economic and social
conditions in the West Bank. My special appreciation also goes to Dr. Amineh Khasseb and the
department of user services of the PCBS for their continued support.

Acknowledgments
ii
The research conducted in this thesis was funded by the German Research Foundation (DFG). I am
thankful to my previous supervisors at the International Institute of Tropical Agriculture (IITA),
Dr. Ousmane Coulibaly, Dr. Brice Gbaguidi, Dr. Razack Adeoti and Dr. Raymond Allomasso. I
am indebted to friends Dr. Capo-chichi Virgile, Dr. Nicodeme Fassinou, Dr. Belarmain Fandohan,
Dr. Alice Bonou, Mohamed Akadiri, Fidel Sessou, Landry Fanou, and Raymond Mehou for their
continuous encouragement. I am also grateful to Prof. Gauthier Biaou, Prof. Rigobert Tossou, Prof.
Pierre Vissoh, Prof. Anselme Adegbidi, Prof. Esaie Gandonou, Prof. Houinsou Dedehouannou, Dr.
Pascaline Babadankpodji, Dr. Emile Houngbo and Dr. Sylvain Kpenavoun for their support.

iii
To
Fifamin,
Charice,
and Chaniel.

iv
List of tables
v
List of tables
Pages
Table 2.1. SAM structure ............................................................................................................... 21
Table 3.1. Behavioural relationships in STAGE-2 ........................................................................ 47
Table 5.1. Data sources for compiling the unbalanced macro-SAM ............................................. 79
Table 5.2. Unbalanced prior macro-SAM for 2011 (in Million US$) ........................................... 80
Table 5.3. Estimated and balanced final macro-SAM (in Million US$) ....................................... 82
Table 5.4. Distribution of West Bank households by consumption quintiles and skill ................. 88
Table 5.5. Household classes according to number of eligible members ...................................... 90
Table 5.6. Distribution of value added by activity ......................................................................... 94
Table 5.7. Shares of household income by income source and household quintile ....................... 96
Table 5.8. Distribution of labour income to households by labour and household group ............. 96
Table 5.9. Distribution of capital income among household quintiles .......................................... 97
Table 5.10. Household expenditure shares ...................................................................................... 98
Table 5.11. Data reliability matrix for the macro-SAM ................................................................ 104
Table 5.12. Data reliability matrix for the detailed SAM .............................................................. 105
Table 6.1. Employment data in the base year (unit = physical person) ....................................... 113
Table 6.2. Number of Palestinian workers in Israel in the base year (physical units) and
in the scenario (% change compared to the base year) ............................................... 117
Table 6.3. Origin of Palestinian workers starting employment within the production
boundary of the Israeli market ................................................................................... 118
Table 6.4. Changes in macroeconomic aggregates in real terms ................................................. 126
Table 7.1. Base values of and shocks to the number of Palestinians working in Israel,
factor income from Israel and size of the labour force ............................................... 139
Table 7.2. Changes in employment status among labour categories ........................................... 143
Table 8.1. Employment data in the base year (unit = 8 hours) .................................................... 159
Table 8.2. Number of Palestinian workers in Israel in the base (physical units) and in
the scenario (% change as compared to the base) ...................................................... 164
Table 8.3. Labour movement results (number of workers) .......................................................... 166
Table 8.4. Values of parameters in the initial model and in the robustness checks,
and key results of the sensitivity analysis .................................................................. 173
Table 9.1. Shares of West Bank imports and exports by trade partner in the base (in %) ........... 185
Table 9.2. Tariff rates (in %) by commodity group and trade partner in the base period ............ 186
Table 9.3. Weighted tariff rates (in %) aggregated over all commodities in the base and
the two scenarios ........................................................................................................ 192
Table 9.4. Unemployment rates (in %) ........................................................................................ 198
Table 9.5. Impacts on import demand under three monetary policies ......................................... 205
Table A1. Decomposition of value added .................................................................................... 276
List of figures
vi
List of figures
Pages
Figure 2-1. Circular flow diagram ................................................................................................. 20
Figure 3-1. Steps in an applied CGE model .................................................................................. 40
Figure 3-2. Price system in the STAGE-2 model .......................................................................... 49
Figure 3-3. Quantity system in the STAGE-2 model .................................................................... 51
Figure 4-1. Evolution of real GNI per capita (in US$ with 2015 as base year) and the
number of closure days, 1996 - 2016 .......................................................................... 66
Figure 4-2. Evolution of the number of Palestinians employed in Israel and the
unemployment rate in Palestine, 1996-2016 ............................................................... 67
Figure 4-3. Evolution of Palestinian total trade value in real terms (in million US$ with
2004 as base year) and the number of closure days, 1996 - 2016 ............................... 67
Figure 5-1. Distribution of West Bank working population by labour market .............................. 85
Figure 5-2. Disaggregation of factor accounts ............................................................................... 87
Figure 5-3. Distribution of households by the labour market of their active members ................. 89
Figure 5-4. Disaggregation of household accounts ........................................................................ 91
Figure 5-5. Domestic production by aggregated activity ............................................................... 93
Figure 5-6. Intermediate input demand shares by aggregated activity sector ................................ 93
Figure 5-7. Value added shares by aggregated activity sector ....................................................... 94
Figure 5-8. Share of compensation of employees received from Israel by labour group .............. 95
Figure 5-9. Share of compensation of employees received from the rest of the world ................. 95
Figure 5-10. Share of income received by household group and income source ............................ 97
Figure 5-11. Household consumption expenditure by aggregated commodity group ..................... 98
Figure 5-12. Household food expenditure share in consumption expenditure ................................ 99
Figure 5-13. Shares of West Bank exports by destination ............................................................... 99
Figure 5-14. Shares of West Bank exports by commodity group .................................................. 100
Figure 5-15. Shares of West Bank imports by commodity group ................................................. 100
Figure 5-16. Shares of West Bank imports by commodity group ................................................. 101
Figure 6-1. Movements into and out of employment in domestic market activities .................... 119
Figure 6-2. Labour movements into and out of non-market activities ......................................... 120
Figure 6-3. Change in factor prices .............................................................................................. 121
Figure 6-4. Changes in production cost and domestic market output .......................................... 122
Figure 6-5. Changes in household consumption and in intermediate input demand ................... 123
Figure 6-6. Welfare effects measured in equivalent variation as share of initial household
expenditure ................................................................................................................ 124
Figure 7-1. Production module nesting ........................................................................................ 135
Figure 7-2. Characteristics of workers starting to work in Israel (in 1,000) and shares
with respect to selected characteristics (in %) .......................................................... 140
List of figures
vii
Figure 7-3. Number of domestically employed in the Base & Scenario 1 (in 1,000)
as well as change (in 1,000 & %) .............................................................................. 141
Figure 7-4. Number of unemployed in the Base & Scenario 1 (in 1,000) as well as change
(in 1,000 & %) .......................................................................................................... 144
Figure 7-5. Change in household consumption and in domestic output (in %) ........................... 145
Figure 7-6. Welfare effects (equivalent variation as share of initial household expenditure) ..... 146
Figure 7-7. Comparison of the results on employment in scenario 2 to scenario 1 (in 1,000
workers) .................................................................................................................... 148
Figure 7-8. Changes in employment in scenario 3 as compared to scenario 1 (1,000 workers
& %) .......................................................................................................................... 149
Figure 8-1. Nesting structure of the utility function .................................................................... 161
Figure 8-2. Levels of employment in domestic market activities (in 1,000 workers) and
change in scenario compared to the base (in 1,000 workers and in %) .................... 166
Figure 8-3. Change in domestic output by sector (in %) ............................................................. 167
Figure 8-4. Change in household and intermediate demand for goods and services (in %) ........ 168
Figure 8-5. Change in household consumption of goods, services and leisure compared to
base (in %) ................................................................................................................ 169
Figure 8-6. Welfare results (equivalent variation as share of initial household expenditure) ..... 170
Figure 8-7. Change in number of workers (physical units) and in real GDP (%) in the
models with initial and new nesting structures ......................................................... 174
Figure 9-1. Commodity price system ........................................................................................... 187
Figure 9-2. Production module .................................................................................................... 189
Figure 9-3. Change in domestic prices of imports by region in the ND-Lib scenario ................. 193
Figure 9-4. Volume of imports by region of origin in the ND-Lib scenario as compared to
the Base (in million US$ and % change) .................................................................. 194
Figure 9-5. Change in domestic prices of imports by region in the MFN scenario ..................... 195
Figure 9-6. Volume of imports by region of origin in the MFN scenario as compared to
the base (in million US$ and % change) ................................................................... 195
Figure 9-7. Change in domestic prices and volumes of composite imports by commodity
in the ND-Lib scenario .............................................................................................. 196
Figure 9-8. Change in domestic prices and volumes of composite imports by commodity
in the MFN scenario .................................................................................................. 197
Figure 9-9. Domestic output by sector ......................................................................................... 199
Figure 9-10. Change in consumer prices by commodity group ..................................................... 200
Figure 9-11. Household consumption by commodity group ......................................................... 201
Figure 9-12. Change in household welfare by household quintile ................................................ 203
Figure A1. Nesting structure in the production module ............................................................... 244
Figure A2. Single stage LES utility function ............................................................................... 246
Figure A3. Three-stages LES-CES utility functions .................................................................... 247
Figure A4. Representation of the nesting structure with multiple trade partners ........................ 252
Figure A5. Nesting structure with multiple trade partners and small/large trade shares
specification ............................................................................................................... 254
List of appendices
viii
List of appendices
Pages
Appendix 1. Model modifications ............................................................................................... 237
Appendix 2. List of accounts in the SAM .................................................................................... 261
Appendix 3. Description of West Bank SAM construction ......................................................... 270
Appendix 4. Elasticities used in the price systems (Armington and CET elasticities) ................ 287
Appendix 5. Elasticities used in the production module .............................................................. 288
Appendix 6. Income demand elasticities ..................................................................................... 288
Appendix 7. Shares of imports in total supply and exports in domestic output ........................... 289
Appendix 8. Nested utility function for sensitivity analysis ........................................................ 289
Appendix 9. In-quota and out-of-quota tariffs in Palestine by commodity group and trade
partner (in %)........................................................................................................... 290
Appendix 10. Estimated import quotas in the West Bank (in thousands US$) ............................. 292
Appendix 11. Composition of household income (in %)............................................................... 293
List of abbreviations
ix
List of abbreviations
CES : Constant Elasticity of Substitution
CET : Constant Elasticity of Transformation
CGE : Computable General Equilibrium
COGAT : Coordination of Government Activities in the Territories
CPI : Consumer Price Index
EFTA : European Free Trade Area
EU : European Union
EV : Equivalent Variation
FTA : Free Trade Agreement
GAFTA : Great Arab Free Trade Area
GAMS : General Algebraic Modelling System
GATS : General Agreement on Trade in Services
GATT : General Agreement on Tariffs and Trade
GDP : Gross National Product
GNI : Gross National Income
ICSE : International Classification of Status in Employment
ILO : International Labour Organisation
IMF : International Monetary Fund
IOT : Input-Output Tables
ISCO : International Standard Classification of Occupations
ISIC : International Standard Industrial Classification
LES : Linear Expenditure System
LFS : Labour Force Survey
MAS : Palestinian Economic Policy Research Institute
MFN : Most-favoured-nation
MoF : Ministry of Finance (Palestine)
NA : National Accounts
NPISH : Non-Profit Institutions Serving Households
PECS : Palestinian Expenditure and Consumption Survey
PCBS : Palestinian Central Bureau of Statistics
PIPA : Palestinian Investment Promotion Agency
PLO : Palestinian Liberation Organisation
PMA : Palestinian Monetary Authority
PNA : Palestinian National Authority
PPI : Producer Price Index

List of abbreviations
x
PTA : Preferential Trade Agreement
OECD : Organisation for Economic Cooperation and Development
SAM : Social Accounting Matrix
SNA : Systems of National Accounts
STAGE : Static Applied General Equilibriun
SUT : Supply and Use Table
UNCTAD : United Nations Conference on Trade and Development
UNComtrade : United Nations Commodity Trade Statistics
USA : United States of America
WTO : World Trade Organisation
xi
SUMMARY AND ZUSAMMENFASSUNG

Summary
xii
Summary
xiii
Summary
Barriers to the movement of goods, services and labour are used by states to signal their
resolve in political conflicts. Although the outcome of such barriers negatively affects both
the sanctioning and sanctioned economies, the burden can be particularly high for small
economies with few trading partners and a small number of traded commodities.
In the case of the Palestinian-Israeli conflict, the asymmetry of power between the two
parties leaves the Palestinian economy vulnerable to policies implemented by Israel. Of
particular interest are the closure policy and work permit scheme which render the labour
markets in Palestine subject to substantial fluctuations when the access of Palestinian labour
to the Israeli market is changed by a legislative fiat.
With respect to trade, the 1994 agreement on economic relations between the two parties –
assumed to enable a trade-led growth of the Palestinian economy – provides the Palestinian
National Authority (PNA) only with limited policy space. Consequently, the one-sided
customs union with Israel and the relative isolation of Palestine from international markets
led the Palestinian economy to evolve into a captive market for the Israeli products.
Palestinian production for the domestic market is undercut by the economies of scale
realised by the technologically advanced Israeli manufacturers. Moreover, the development
of a productive capacity in Palestine is held back by restrictions and regulations of different
sorts imposed on the Palestinian entrepreneurs by the Israeli administration.
While the Palestinian-Israeli conflict attracts considerable media attention for its violence
and political developments, the assessment of the economy-wide implications of policy
options in the areas of trade and labour markets on the Palestinian economy is understudied.
Most of the previous studies either used a descriptive analysis or highly aggregated
databases which are unable to provide a detailed analysis of the multiple implications of the
simulated policies. Therefore, this thesis aims at the following five research objectives:
1. Develop a detailed database to use in simulation models for assessing the economy-
wide effects of policies in Palestine and more specifically in the West Bank;
2. Identify the model specifications that capture the labour markets conditions in the
West Bank and quantify their implications for the simulation results;
3. Analyse the short-term effects of changes in the employment of Palestinians in Israel
on the West Bank economy;
4. Assess the long-term implications of increased employment of Palestinians in Israel
on the West Bank economy;
5. Investigate the effects of changes in the trade regime on the West Bank economy.
Summary
xiv
Each of these research objectives is addressed in a separate chapter of the thesis. As the
West Bank is the only Palestinian territory having official trade with Israel and workers
employed in the Israeli labour market since the Gaza blockade in 2007, the database
developed and the simulations implemented focus only on the West Bank.
The method used in this thesis to capture the economy-wide effects of policy changes is the
computable general equilibrium (CGE) class of simulation models. Starting from a standard
CGE model (STAGE-2), this thesis contributes to model development by adopting a nested
utility function combining the benefits of linear expenditure systems and constant elasticity
of substitution functions to depict household preferences. Moreover, the trade and
production modules of the model have been extended in order to depict the particularities
of the West Bank economy and enhance the relevance of the simulation results to inform
policies. The other contributions of this thesis to science are the following:
West Bank Social Accounting Matrix (SAM)
This thesis contributes to data development by building the first social accounting matrix
(SAM) for the West Bank. This SAM is highly disaggregated to allow its future users to
adopt alternative classifications depending on the research question. Among its distinctive
features, this SAM takes proper account of the remuneration of labour for the self-employed
and unlike most of the existing SAMs, it recognises that households derive income from
unincorporated capital. This SAM is based on the most reliable and recent data for the West
Bank. Its base year, 2011, can be considered a year of relative stability which can serve as
a benchmark for simulation models.
Assessing the implications of different labour market conditions
This thesis makes a contribution to the current state of knowledge by assessing empirically
the implications of different labour market conditions in CGE models. The four stylized
model specifications investigated are: the fixed labour supply (full employment), the
surplus labour, the upward-sloping labour supply curve and the labour-leisure trade-off.
Among the four specifications, the upward-sloping labour supply curve is not neutral to
welfare generated outside the System of National Accounts (SNA) production boundary
because labour enters the SNA boundary at a positive price but has a zero opportunity cost
outside this boundary.
The fixed supply specification, while neutral to welfare generated outside the production
boundary, assumes a strict separability between uses of labour within and outside the
boundary. Hence, the supply of labour to market activities – i.e. the activities within the
boundary – is perfectly inelastic. This specification does not fit the analysis of the effects
Summary
xv
of the Palestinian employment in Israel which involves a transfer of labour across the
boundary as shown in several empirical studies.
Between the two remaining specifications, the surplus labour specification is suitable to
represent the labour market conditions in the West Bank in the short-term. While this
specification is likely to overstate the policy effects on employment, absorption and welfare,
it captures well the empirical evidence of involuntary unemployment in the West Bank since
the outbreak of the second Palestinian uprising. This involuntary unemployment is caused
by the volatility of Palestinian employment in Israel and the inability of the domestic market
to absorb in the short-term large numbers of workers, due to its small size.
For assessing the long-term effects of Palestinian employment in Israel, a labour-leisure
trade-off specification is suitable because it explicitly accounts for welfare changes within
and outside the production boundary. Moreover, in the long-term, labour markets are
assumed flexible and labour can be employed either in the market or non-market activities.
Therefore, on the long-term, no involuntary unemployment is assumed. Nevertheless, the
labour-leisure trade-off specification allows the transfer of labour between the market and
non-market activities which is expected to occur when the level of Palestinian employment
in Israel changes.
After reaching these conclusions, the effects of changes in the Palestinian employment level
in Israel are assessed from both short and long-term perspectives.
Short and long-term effects of changes in the employment of Palestinians in Israel
The findings show that a revert of the Palestinian employment in Israel to its pre-intifada
level – i.e. reduced barriers to labour movement between the two regions – has positive
effects on the West Bank economy in the short-term. The shock absorbs a substantial share
of the unemployed labour, and stimulates both consumption and production in the West
Bank economy. Labour moves out of unemployment to start working not only in the Israeli
market, but also in the domestic market. Subsequently, the unemployment rate falls from
17.3% to 10.9%, and the West Bank economy grows as reflected in the real GDP increase
by 3.6%. In addition, household welfare improves by 5.5% on average.
By contrast, in the long-term, the “Dutch disease” effects of increased Palestinian
employment in Israel dominate the scene. The additional inflow of labour income from
Israel reduces incentives to work inside the production boundary by increasing the demand
for non-market commodities, i.e. the services produced by activities outside the production
boundary. Labour is relocated away from the market activities and a real appreciation of the
domestic currency reduces the competitiveness of the West Bank export industry in the
international markets. Domestic output in the West Bank declines by 2.1% on average. The
Summary
xvi
manufacturing sector is the most affected by the real appreciation of the domestic currency
as it is the leading export sector in the West Bank. This finding highlights the trade-off
between exporting more labour to Israel and exporting more goods and services to the rest
of the world. Ultimately, the West Bank economy shrinks, as real GDP declines by 1.1%.
However, the increased labour income from Israel allows households to consume more
goods and services, and to experience a welfare gain of 1.8% on average.
This thesis shows that an increased Palestinian employment in Israel improves household
welfare in both the short- and long-term. While in the short-term, it stimulates both
consumption and production in the West Bank, in the long-term it reduces the economic
growth by bidding up wages and reducing the competitiveness of the West Bank export
industry in the international markets. Subsequently, policymakers would be recommended
to aim at keeping the welfare gains of increased Palestinian employment in Israel, while
reducing its “Dutch disease” negative effects on domestic production.
Palestinian future trade regime
The results show that eliminating tariffs on imports from all trade partners outperforms the
other trade regimes considered regarding the positive welfare effects. Liberalising the West
Bank trade improves all macroeconomic indicators as compared to the status quo of a
continued customs union with Israel. The results also show that Israel will remain the
dominant trade partner of the West Bank. Subsequently, introducing new tariffs on imports
from Israel hurts the West Bank economy and generates an outcome that is worse than a
continued customs union with Israel. Therefore, a preferential trade agreement with Israel,
though worse than the current status quo, is more desirable than trading with Israel under
the most-favoured-nation trade regime that would introduce high taxes on imports/exports
from/to Israel.
Although a greater integration of the West Bank with other Arab countries is important, it
cannot be a substitute to the economic link with Israel since Israel will remain, for both
economic and geographic reasons, the main outlet for Palestinian trade.
The results also show that eliminating the in-quota tariffs in the West Bank hardly affects
the import of agricultural and food products, as the import quotas become binding.
Subsequently, the domestic agricultural and food sectors are shielded against import
competition. However, doubling the import quotas improves consumer welfare, though it
reduces the producer welfare. Thus, the net effect is a welfare gain in the West Bank. This
finding highlights the trade-off between food sovereignty and net welfare improvement
through trade. Finally, the results show that monetary policies have a substantial impact on
the magnitude of trade policy effects.
Summary
xvii
Policy implications
This thesis identifies administrative and political options for the PNA to regulate labour
markets and design an optimal trade regime.
With respect to the labour markets, considering the limited development options in the West
Bank, it may be interesting for the PNA to seek increased Palestinian employment in Israel
in order to improve the welfare of Palestinian households. However, the “Dutch disease”
effects of labour income inflow from Israel on the domestic economy need to be mitigated.
To do so, the PNA could collect a tax on Palestinian workers employed in Israel and use
the tax revenue to incentivise domestic employers to invest in order to restore their
competitiveness in the international markets. The tax would also reduce the attractiveness
of employment in Israel, keep workers in domestic market activities and limit the structural
dependence on the Israeli labour market. By fostering employment opportunities in the
domestic market through the incentives given to the private sector, the eventual loss in
Palestinian employment in Israel – subsequent to the implementation of the tax – could be
compensated by the employment opportunities created in the domestic market.
With respect to the optimal trade regime, this thesis shows that the West Bank would be
better off with a liberal and non-discriminatory trade policy. The results also show that
Israel is likely to remain the dominant trade partner for the West Bank. Therefore, the PNA
may want to pursue the freest possible movement of goods and services between the West
Bank and Israel. The results show that changes in the exchange rate regime have strong
implications for the magnitude of the effects of any trade policy. Subsequently, the PNA
may seek the fullest control over its national currency and exchange rate in the future.
Finally, the tariff-rate-quota system on agricultural and food products effectively shields
those domestic sectors against import competition, but at the cost of consumer welfare.
Hence, maintaining the system or changing the tariff-rate-quotas is a political choice
between achieving a certain level of food sovereignty or taking advantage of trade benefits.

xviii
Zusammenfassung
xix
Zusammenfassung
Zu Beginn eines Konfliktes werden der Handel von Gütern und Dienstleistungen sowie die
Mobilität von Arbeitskräften gestört. Oft werden Handels- und Mobilitätshemmnisse von
Staaten als Druckmittel genutzt, um ihre Entschlossenheit in einem politischen Konflikt zu
signalisieren. Die Folgen dieser Hemmnisse beeinflussen sowohl die sanktionierenden als
auch die sanktionierten Volkswirtschaften negativ, stellen dabei aber insbesondere für
kleine Volkswirtschaften eine sehr große Belastung dar. Das Hauptziel der vorliegenden
Arbeit besteht darin, die Auswirkungen von Veränderungen auf Güter-, Dienstleistungs-
und Arbeitsmärkten auf die Ökonomie in von Konflikten betroffenen Regionen zu
untersuchen. Der Fokus liegt hierbei auf kleinen und engreifbaren Volkswirtschaften.
Als Fallstudie für diese Arbeit dient der palästinensisch-israelische Konflikt. In diesem
Konflikt macht die Machtasymmetrie zwischen den beiden Parteien die palästinensische
Wirtschaft anfällig für Handelsbarrieren und Sicherheitsmaßnahmen durch die israelische
Regierung. Von besonderem Interesse sind die Mitte der neunziger Jahre von Israel
eingeführten politischen Maßnahmen zur temporären Grenzschließung und der Vergabe
von Arbeitserlaubnissen, die den natürlichen Fluss von Arbeitskraft, Gütern und
Dienstleistungen zwischen den beiden Regionen wirkungsvoll verändert haben. Darüber
hinaus hat die 1994 von den beiden Konfliktparteien unterzeichnete Vereinbarung über
Wirtschaftsbeziehungen, die darauf abzielte, der palästinensischen Wirtschaft Wachstum
zu ermöglichen, der palästinensischen Autonomiebehörde (PA) nur begrenzten politischen
Spielraum gelassen. Infolgedessen sind die Arbeitsmärkte in den palästinensischen
Autonomiegebieten verzerrt und unterliegen erheblichen Schwankungen, welche eng mit
den Veränderungen des Zugangs von palästinensischen Arbeitnehmern zum israelischen
Arbeitsmarkt zusammenhängen.
In Bezug auf Handel hat die einseitige Zollunion mit Israel und die relative Isolation der
palästinensischen Autonomiegebiete von den Weltmärkten durch die israelischen Politik
dazu geführt, dass die palästinensische Wirtschaft zu einem monopolistischen Markt für
israelische Produkte geworden ist. Die palästinensische Produktion für den lokalen Markt
wird durch Skaleneffekte der fortschrittlicheren Produktion in Israel unterhöhlt. Darüber
hinaus wird die Entwicklung der Produktionskapazität in der palästinensischen Wirtschaft
durch Restriktionen und Regelungen verschiedener Art behindert, die die israelische
Regierung palästinensischen Unternehmern auferlegt. Daher macht das Handelsdefizit mit
Israel allein zwei Drittel des gesamten palästinensischen Handelsdefizits aus, auf das fast
die Hälfte des nationalen BIP entfällt.
Während der israelisch-palästinensische Konflikt wegen seiner Gewalt, seines historischen
Hintergrunds und seiner diplomatischen Entwicklungen in den Medien viel
Aufmerksamkeit erhält, ist die Bewertung der makroökonomischen Auswirkungen
Zusammenfassung
xx
politischer Optionen in den Bereichen Handel und Arbeitsmärkte auf die palästinensische
Ökonomie wenig untersucht. Die meisten der früheren Studien, die sich mit diesen Fragen
befassten, verwendeten entweder deskriptive Analysen oder Methoden, die die
gesamtwirtschaftliche Wirkung der jeweils untersuchten Politik nicht darstellten. Die
wenigen Studien, die versucht haben, die gesamtwirtschaftlichen Auswirkungen der
politischen Maßnahmen in Palästina zu bewerten, basieren auf hochaggregierten
Datenbanken, die keine detaillierte Analyse der multiplen Implikationen simulierter
Politiken liefern können.
Diese Arbeit hat fünf Forschungsziele: 1) Entwicklung einer detaillierten Datenbank für die
Simulationsmodellierung und zur gesamtwirtschaftliche Analyse der Politik in Palästina,
insbesondere im Westjordanland ; 2) Ermittlung der Modellspezifikationen, die die
Besonderheiten des Arbeitsmarktes im Westjordanland erfassen und die Implikationen für
die Simulationsergebnisse quantifizieren können; 3) Analyse der kurzfristigen
Auswirkungen von Veränderungen der palästinensischen Beschäftigung in Israel; 4)
Analyse der langfristigen Auswirkungen der steigenden palästinensischen Beschäftigung in
Israel; und 5) Untersuchung der Auswirkungen von Änderungen des Handelsregimes auf
die palästinensische Wirtschaft.
Da, das Westjordanland seit der Gaza-Blockade im Jahr 2007 das einzige palästinensische
Gebiet ist, welches eine offizielle Handelsbeziehung zu Israel unterhält und auch nur
Arbeitnehmer aus diesem Gebiet im israelischen Arbeitsmarkt beschäftigt sind, fokussieren
sich die entwickelte Datenbank, sowie die Simulationen ausschließlich auf die Ökonomie
des Westjordanlands. Aufgrund ihrer Fähigkeit die gesamtwirtschaftlichen Auswirkungen
von Politikänderungen zu erfassen, werden für die Simulationen in dieser Arbeit allgemeine
Gleichgewichtsmodelle verwendet. Ausgehend von einem standard Gleichgewichtsmodell
wurden spezifische Erweiterungen entwickelt, um die Besonderheiten der Arbeitsmärkte
und Handelsbeziehungen im Westjordanland sowie Haushaltspräferenzen zu modellieren.
Jedes der fünf Forschungsziele wird in einem separaten Kapitel der Arbeit behandelt. Die
Hauptergebnisse in Bezug auf die Forschungsziele sind:
Die Datenbank: eine Social Accounting Matrix für das Westjordanland
Die Die Datenbank, die in der vorliegenden Arbeit entwickelt wird ist die erste detaillierte
Social Accounting Matrix (SAM), die für das Westjordanland erstellt wurde. Sie hat
mehrere besondere Eigenschaften. Sie ist ausreichend disaggregiert, um es zukünftigen
Nutzern zu ermöglichen, je nach Fragestellung alternative Aggregationen zu wählen. Sie
bietet eine detaillierte Darstellung von Gütern, Wirtschaftsaktivitäten, Arbeitsmärkten,
Handelspartnern und Haushaltsgruppen, um die Auswirkungen von politischen
Veränderungen der Mobilität von Arbeit, Gütern und Dienstleistungen auf die Wirtschaft
Zusammenfassung
xxi
des Westjordanlands sowie damit einhergehende Verteilungseffekte auf Haushaltsebene zu
quantifizieren. Die entwickelte SAM berücksichtigt außerdem die Entlohnung der Arbeit
von Selbständigen angemessen. Im Gegensatz zu den meisten schon existierenden SAMs
berücksichtigt diese Datenbank darüber hinhaus, dass Haushalte Einkommen aus Kapital
ohne eigene Rechtsperson erzielen. Die SAM basiert auf den zuverlässigsten und
aktuellsten Daten zur Ökonomie des Westjordanlands. Das Basisjahr ist aus Gründen der
Datenverfügbarkeit 2011. Das Jahr 2011 kann zudem als ein Jahr der relativen Stabilität
betrachtet werden und ist somit als Basisjahr für Simulationsmodelle geeignet.
Identifikation und Auswirkungen verschiedener Faktorenmarktbedingungen
Vier stilisierte Modellspezifikationen werden häufig verwendet, um die
Arbeitsmarktbedingungen in allgemeinen Gleichgewichtsmodellen darzustellen. Diese
sind: gleichbleibendes Arbeitsangebot (Vollbeschäftigung), Arbeitskräfteüberschuss,
ansteigende Arbeitsangebotskurve und Arbeit-Freizeit-Zielkonflikt. Von den vier
Spezifikationen ist die ansteigende Arbeitsangebotskurve nicht wohlfahrtsneutral, da sie
außerhalb der Produktionsgrenze des Systems der Volkswirtschaftlichen Gesamtrechnung
(SVG) erzeugt wird, da Arbeitskräfte zu einem positiven Preis die SVG-Grenze
überschreiten, jedoch keine Opportunitätskosten außerhalb der SVG berücksichtigt werden.
Die Spezifikation des gleichbleibenden Arbeitsangebots, die neutral bezüglich außerhalb
der SVG-Grenze erzeugter Wohlfahrt ist, setzt eine strikte Trennung zwischen Arbeit
innerhalb und außerhalb der Grenze voraus. Aus diesem Grund werden Haushalte bei ihren
Entscheidungen bezüglich der Allokation ihrer Arbeitskraft als gleichgültig gegenüber
Änderungen der Lohnsätze betrachtet. Das Arbeitsangebot innerhalb der SVG-Grenze ist
vollkommen unelastisch. Diese Spezifikation passt nicht zur Analyse der Auswirkungen
der palästinensischen Beschäftigung in Israel, die eine Übertragung von Arbeitskraft über
die SVG-Grenze hinweg beinhaltet, wie in mehreren empirischen Studien gezeigt wurde.
Unter den Bedingungen der beiden verbleibenden Spezifikationen stellt sich heraus, dass
die Annahme eines Arbeitskräfteüberschusses ein geeigneter Rahmen ist, um die
Arbeitsmarktbedingungen im Westjordanland kurzfristig abzubilden. Während diese
Spezifikation die Effekte auf Beschäftigung, gesamte Endnachfrage und Wohlfahrt
wahrscheinlich überzeichnet, erfasst sie gut die empirisch bewiesene unfreiwillige
Arbeitslosigkeit im Westjordanland seit dem Ausbruch des Konflikts. Diese unfreiwillige
Arbeitslosigkeit wird durch die Volatilität der palästinensischen Beschäftigung in Israel und
die Unfähigkeit der relativ kleinen Ökonomie des Westjordanlands verursacht, kurzfristig
eine große Anzahl von Arbeitern aufzunehmen.
Für eine langfristige Analyse ist der Arbeit-Freizeit-Zielkonflikt die bevorzugte
Spezifikation, da sie explizit die Wohlfahrtsänderungen innerhalb und außerhalb der SVG-
Zusammenfassung
xxii
Grenze berücksichtigt. Darüber hinaus wird langfristig davon ausgegangen, dass
Arbeitsmärkte flexibel sind und dass Arbeitskräfte innerhalb oder außerhalb der SVG-
Grenze beschäftigt werden könen. Daher wird auf lange Sicht keine unfreiwillige
Arbeitslosigkeit angenommen. Dennoch erlaubt die Arbeit-Freizeit-Zielkonflikt die
Übertragung von Arbeitskraft zwischen den Markt- und Nicht-Markt-Produktionssektors,
was bei Änderungen der palästinensischen Beschäftigung in Israel erwartet wird.
Nach diesen Schlussfolgerungen wurde eine gründliche Bewertung der Auswirkungen der
Veränderungen des palästinensischen Beschäftigungsniveaus in Israel sowohl auf kurze als
auch auf lange Sicht durchgeführt.
Kurz- und langfristige Analysen der Auswirkungen von Veränderungen der palästinensischen
Beschäftigung in Israel
Die Ergebnisse dieser Studie zeigen, dass eine Rückkehr der palästinensischen
Beschäftigung in Israel auf das Niveau vor der Intifada unter der Annahme reduzierter
Hemmnisse für die Mobilität von Arbeitnehmern zwischen dem Westjordanland und Israel
kurzfristig positive Auswirkungen auf die Ökonomie des Westjordanlands hat. Eine
steigende israelische Nachfrage nach palästinensischen Arbeitskräften absorbiert einen
erheblichen Teil der Arbeitslosen und stimuliert sowohl Konsum als auch Produktion im
Westjordanland. Arbeitslose treten in den Arbeitsmarkt ein, um nicht nur auf dem
israelischen Markt, sondern auch auf dem heimischen Markt zu arbeiten. Dadurch sinkt die
Arbeitslosenquote von 17,3% auf 10,9%. Letztendlich bewirkt dies Wachstum der
Wirtschaft des Westjordanlands. Das reale BIP steigt um 3,6%. Die ökonomische
Haushaltswohlfahrt verbessert sich im Durchschnitt um 5,5%.
Im Gegensatz dazu dominieren in der langfristigen Analyse die Effekte der "holländischen
Krankheit" der zunehmenden palästinensischen Beschäftigung in Israel das Bild. Der
zusätzliche Zustrom von Arbeitseinkommen aus Israel verringert die Anreize innerhalb der
Produktionsgrenze zu arbeiten, da sich die Nachfrage Nicht-Markt Güter erhöht, was alle
Dienstleistungen, die durch Aktivitäten außerhalb der Produktionsgrenze erbracht werden
einschließt. Arbeitskraft wird von der Markt-Produktionsektors weg verlagert, und die reale
Aufwertung des Wechselkurses verringert die Wettbewerbsfähigkeit der Exportwirtschaft
des Westjordanland auf den Weltmärkten. Die Produktion im Westjordanland sinkt im
Durchschnitt um 2,1%. Im verarbeitenden Gewerbe, dem führenden Exportsektor im
Westjordanland, sinkt die Produktion dabei am stärksten. Dieses Ergebnis unterstreicht den
Kompromiss zwischen dem Export von mehr Arbeitskräften nach Israel und dem
langfristigen Export von mehr Waren und Dienstleistungen in den Rest der Welt.
Letztendlich schrumpft die Ökonomie des Westjordanlands, da das reale BIP um 1,1%
sinkt. Trotz des negativen Wirtschaftswachstums verzeichnen die privaten Haushalte einen
Zusammenfassung
xxiii
Wohlfahrtsgewinn von durchschnittlich 1,8%, da die gestiegenen Arbeitseinkommen aus
Israel es ihnen ermöglichen, mehr Güter und Dienstleistungen zu konsumieren.
Im Vergleich der kurz- und langfristigen Analyse zeigt diese Arbeit, dass eine Steigerung
der palästinensischen Beschäftigung in Israel die Wohlfahrt der Haushalte in beiden Fällen
verbessert. Während sie auf kurze Sicht sowohl den Konsum als auch die Produktion im
Westjordanland stimuliert, verringert sie auf lange Sicht das Wirtschaftswachstum, da sie
die inländischen Löhne erhöht und die Wettbewerbsfähigkeit der Exportwirtschaft des
Westjordanlands auf den Weltmärkten verringert. Die politischen Entscheidungsträger im
Westjordanland sollten daher versuchen, die Wohlfahrtsgewinne der palästinensischen
Beschäftigung in Israel zu erhalten und gleichzeitig die negativen Auswirkungen auf die
inländischen Produktionskapazitäten zu reduzieren.
Zukünftiges palästinensisches Handelsregime
Diese Studie zeigt, dass die komplette Abschaffung der Zölle auf Importe aller
Handelspartner alle anderen untersuchten Handelsregime übertrifft. Die Liberalisierung des
Handels des Westjordanlands verbessert alle makroökonomischen Indikatoren im
Vergleich zum status quo, der fortgesetzten Zollunion mit Israel. Die Ergebnisse zeigen
auch, dass Israel der dominierende Handelspartner für das Westjordanland bleiben wird.
Die Einführung neuer Zölle auf Importe aus Israel schadet der Wirtschaft des
Westjordanlands und führt zu einem Ergebnis, dass aus ökonomischer Sicht nachteilig
gegenüber einer fortgesetzte Zollunion mit Israel ist. Ein präferentielles Handelsabkommen
mit Israel unter der Annahme moderater Zölle auf Importe und Exporte von und nach Israel,
ist zwar schlechter als der gegenwärtige status quo, allerdings wünschenswerter als Handel
mit Israel nach dem Meistbegünsstigungsprinzip. Obwohl eine stärkere Integration
Palästinas mit den anderen arabischen Ländern wichtig ist, kann sie die wirtschaftlichen
Beziehungen zu Israel nicht ersetzen, da Israel sowohl aus wirtschaftlichen als auch aus
geographischen Gründen der natürliche Absatzmarkt für palästinensischen Handel bleiben
wird.
Die Studienergebnisse zeigen auch, dass die Abschaffung der Kontingentzölle kaum
Auswirkungen auf die Einfuhr von Agrarprodukten- und Lebensmitteln hat, da die
Einfuhrquoten verbindlich werden und der heimische Agrar- und Ernährungssektor gegen
Importkonkurrenz abgeschirmt ist. Eine Verdoppelung der Einfuhrquoten verbessert die
Wohlfahrt der Konsumenten, verringert jedoch die Wohlfahrt der Produzenten im
Westjordanland. Der Nettoeffekt ist ein Wohlfahrtsgewinn. Dieses Ergebnis hebt den
Zielkonflikt zwischen Ernährungssouveränität und Verbesserung der Nettowohlfahrt
hervor. Schließlich zeigt die Studie, dass die Geldpolitik einen wesentlichen Einfluss auf
das Ausmaß der handelspolitischen Effekte hat.
Zusammenfassung
xxiv
Politische Implikationen
Diese Arbeit ermittelt die administrativen und politischen Optionen der PA zur Regulierung
der Arbeitsmärkte und zur Gestaltung eines optimalen Handelsregimes.
Aufgrund der begrenzten Entwicklungsmöglichkeiten im Westjordanland, ist es für die PA
in Bezug auf die Arbeitsmärkte interessant eine verstärkte palästinensische Beschäftigung
in Israel anzustreben, um die Wohlfahrt der palästinensischen Haushalte zu verbessern. Die
negativen Auswirkungen auf die Binnenkonjunktur sollten jedoch langfristig abgemildert
werden. Um dies zu tun, könnte die PA die palästinensische Beschäftigung in Israel
besteuern. Die sich ergebenden Steuereinnahmen würden dringend benötigte zusätzliche
Einnahmen für die PA generieren. Mit diesen Einnahmen könnten Anreize für inländische
Arbeitgeber geschaffen werden, in die Modernisierung von Produktionstechnologien zu
investieren, um ihre Wettbewerbsfähigkeit auf den Weltmärkten zu verbessern. Die Steuer
würde auch die Attraktivität der Beschäftigung in Israel verringern, einige Arbeitnehmer
auf dem Binnenmarkt belassen und die strukturelle Abhängigkeit vom israelischen
Arbeitsmarkt vermindern. Die etwaige Reduktion an palästinensischer Beschäftigung in
Israel nach der Einführung der Steuer könnte jedoch durch den Aufbau von
Beschäftigungsmöglichkeiten im Westjordanland durch die Anreize für den privaten Sektor
ausgeglichen werden.
In Bezug auf das optimale Handelsregime zeigt diese Studie, dass das Westjordanland eine
liberale, nicht diskriminierende Handelspolitik verfolgen sollte. Die Ergebnisse zeigen
auch, dass Israel wohl der dominierende Handelspartner für das Westjordanland bleiben
wird. Daher sollte die PA der freiest mögliche Mobilität von Gütern und Dienstleistung
zwischen dem Westjordanland und Israel anstreben. Die Studie zeigt außerdem, dass die
gewählte Geldpolitik starke Implikationen hat. Daher sollte die PA in der Zukunft die volle
Kontrolle über ihre nationale Währung und deren Wechselkurs anstreben. Schließlich
schützt das System der Zollkontingente für Agrarerzeugnisse und Lebensmittel wirksam
die inländischen Produzenten vor dem Importwettbewerb, jedoch auf Kosten der
Verbraucherwohlfahrt. Daher ist die Beibehaltung des Systems oder die Änderung der
Importquoten eine politische Entscheidung bei der die Erreichung eines gewissen Maßes an
Ernährungssouveränität gegen die Vorteile des Handels abgewogen werden muss.

1
1
GENERAL INTRODUCTION

Chapter 1
2
General introduction
3
Chapter 1 General introduction
1.1. Background
International trade, except smuggling, presumes a certain degree of inter-state cooperation
(Heilmann, 2016). Trade relations in general, whether in goods or in services, and whether
involving the movement of persons or not, require inter-state agreements. Both the General
Agreement on Tariffs and Trade (GATT) and its successor the World Trade Organisation
(WTO) have been a successful multilateral platform to foster inter-state cooperation and
non-discriminatory trade (Mansfield and Reinhardt, 2003). Besides the trade liberalisation
mechanisms enshrined in the WTO rules, the proliferation of preferential trade agreements
(PTAs) since 1990 has contributed to the considerable reduction in the level of tariff
protection around the world (Orefice, 2017). The PTAs aim at promoting trade with specific
partners by providing a set of incentives. The signing of PTAs and the decision to join the
WTO are all political decisions in the first place. Hence, trade flows do not only reflect a
comparative advantage in production, but also political interests. Trade in strategic
commodities particularly is initiated by countries to create dependency and influence the
decisions of other countries (Goenner, 2010).
Despite the substantial reduction in tariff rates, the overall protection of domestic markets
remains high on global average. The nature of barriers to trade has shifted from tariffs to
non-tariff measures (Crivelli and Gröschl, 2016). Non-tariff measures include sanitary and
phytosanitary measures and technical barriers to trade. These initially aim at protecting
domestic resources and consumers from unhealthy or low-quality products. However, they
effectively restrict trade. Especially for trade in services, barriers are not of the kind of
explicit taxes, but rather regulatory obstacles (Dee et al., 2014). Unlike goods, services are
often intangible. Production and consumption decisions taking place simultaneously require
the consumer or the producer to move before making an international transaction possible.
Among the different modes of supply defined in the General Agreement on Trade in
Services (GATS), the temporary movement of persons to supply services abroad is the most
antagonistic (Stephenson and Hufbauer, 2010). Restrictions that impede trade in services
often target the mobility of low or semi-skilled foreign workers. These restrictions often
include quantitative regulations (quotas of workers), rules for obtaining work permits or
business visas, and inefficiencies in the processing of such permits and visas (Cattaneo et
al., 2010).
When political conflicts arise, trade and labour mobility are affected in two ways. First,
importers and exporters as well as workers and employers depend on continuity and stability
to maintain long-term commercial and employment links. The expectation or outbreak of
conflicts destroys those links and reduces the volume of trade and cross-border labour
Chapter 1
4
mobility (Long, 2008). Second, trade gives states a set of coercive instruments to signal
their resolve in a political conflict. Through trade disruption measures, sanctions, and
regulatory restrictions on the movement of persons, states aim at influencing the behaviour
of the partner and making it change course. The outcome of the sanctions is a reduced trade
volume between the partners (Heilmann, 2016) as well as a reduced flow of workers
(Mansour, 2010). While both the sanctioning and sanctioned economies are negatively
affected, the magnitude of the shock and the capacity of the economy to absorb it depend
on the relative importance of trade for each partner. Small countries with few trading
partners and a small number of traded commodities are particularly vulnerable to trade
disruptions (Goenner, 2010).
Understanding the nexus of political decisions, trade, conflict and labour movement is the
focus of this thesis. This issue has attracted scholarly attention mostly in the political
economy arena. This thesis makes an empirical contribution to the field of international
trade and labour economics by assessing the economy-wide effects of barriers to cross-
border movement of goods, services and labour in conflict-affected regions with
applications to the Palestinian-Israeli case. The thesis focuses on the economic impacts on
the West Bank economy, using a computable general equilibrium (CGE) model. In the next
Section, 1.2, the problem statement is clarified and the derived research objectives are
presented in Section 1.3. Section 1.5 discusses the theoretical framework of the thesis. Then,
the key outputs of the thesis are highlighted in Section 1.6; and finally, the outline of the
thesis is presented in Section 1.7.
1.2. Problem statement
The Palestinian and Israeli economies have been partially integrated since 1967 (Missaglia
and Valensisi, 2014). While an economic integration usually moves the different parties
involved towards a convergence in terms of economic performance and living standards,
the integration between Israel and Palestine is far from perfect. Until 1994, the integration
was unilaterally decided by Israel and imposed on the Palestinian territories. Meanwhile,
the Palestinian economy was held back by restrictions and regulations of different sorts
(Botta, 2010). Moreover, the Palestinian production for the domestic market was undercut
by the economies of scale realised by the technologically advanced Israeli manufacturers
(Naqib, 2003). As a result, the Palestinian economy developed structural trade deficits and
a high dependency on Israeli goods and labour markets (UNCTAD, 2016).
After the outbreak of the first Palestinian uprising in 1987, a protocol was signed between
the Israeli government and the Palestinian Liberation Organisation in 1994 to regulate the
economic relations between the two economies. Due to the asymmetry of power between
General introduction
5
the negotiating partners, on the one hand ,and to its transitional nature, on the other hand,
the protocol failed to address the structural issues such as the creation of a Palestinian state
with full ownership of economic policies and with unambiguous borders (Arnon, 2007).
Instead, the protocol formalised the existing one-sided customs union, with the two
economies co-existing within the Israeli-controlled borders (Arnon and Weinblatt, 2001).
Trade policies in Palestine had to be aligned to the Israeli policies (Vaggi and Baroud,
2005). Consequently, the structural dependency on Israel for both trade and employment
opportunities developed further. Israel accounted in 2016 for 58% of Palestinian imports
and 83% of their exports (PCBS, 2017a). Moreover, 12% of Palestinian workers were
employed in Israel in 2016 and the income they earned there represented about 12% of the
Palestinian gross national income (PCBS, 2017b; PCBS & PMA, 2017).
In addition to this structural dependency, the Palestinian economy is vulnerable to the
security-related measures implemented by Israel. The political conflict led Israel to impose
tight restrictions on the free movement of goods, services and people between the two
regions. Since the mid 1990s, Israel has conducted a closure policy consisting of roadblocks,
curfews, and checkpoints that effectively restrict movements between the two regions (Ihle
and Rubin, 2013). Moreover, for Palestinians willing to work in Israel, a work permit system
based on personal criteria and sectoral quotas was implemented (Etkes et al., 2012). As a
result of these policies, the number of Palestinians employed in Israel substantially declined,
raising unemployment and poverty rates in the Palestinian territories (Flaig et al., 2013a).
The conflict between Israel and Palestine attracts substantial attention in the media for its
violence, historical background and political developments. However, the assessment of the
economy-wide implications of policy options in the areas of trade and labour markets on
the Palestinian economy is understudied. Most of the previous studies that address the
question of Palestinian trade options are either descriptive (Arnon and Bamya, 2007, Vaggi
and Baroud, 2005, Fischer et al., 2001) or use methods that miss the economy-wide effects
of these policies (Schiff, 2002). Other studies (Astrup and Dessus, 2001 & 2005; Missaglia
and Valensisi, 2014) are based on highly aggregated databases unable to provide a detailed
analysis of the multiple implications of the simulated trade options. Similarly, most of
previous studies that tackled policy change in the movement of labour between Palestine
and Israel either miss the economy-wide implications (Etkes, 2012; Bulmer, 2003) or
address the question from the perspective of the Israeli economy (Flaig et al., 2013a), thus
missing important implications for the Palestinian economy.
Chapter 1
6
1.3. Research objectives
The main goal of this thesis is to explore the economy-wide implications of changes in
barriers to the movement of goods, services and labour in conflict-affected regions. The
thesis uses the case of the Palestinian-Israeli conflict and assesses the effects on the West
Bank economy upon changes in barriers to the movement of goods, services, and labour
between the West Bank and Israel. This main goal entails five research objectives:
1. Develop a detailed database to use in simulation models for assessing the economy-
wide effects of policies in the West Bank
2. Identify the model specifications that capture the labour market conditions in the
West Bank and quantify their implications for the simulation results
3. Analyse the short-term effects of changes in the employment of Palestinians in Israel
on the West Bank economy
4. Assess the long-term effects of increased employment of Palestinians in Israel on
the West Bank economy
5. Investigate the effects of changes in the trade regime on the West Bank economy
To achieve these research objectives a CGE model is used because this class of models is
well suited to assess the effects of policy changes on the performance and structure of the
whole economy (Arndt et al., 2012).
1.4. Contributions to science
This thesis makes four contributions to science.
The first original contribution is the development of the first social accounting matrix for
the West Bank which is currently the only Palestinian territory with trade and labour market
relations with Israel.
Second, this thesis contributes to the current state of knowledge by assessing empirically
the implications of different labour market conditions in CGE models.
Third, this thesis contributes to model development by adopting a nested utility function
combining the benefits of linear expenditure systems and constant elasticity of substitution
functions to depict household preferences. Moreover, this thesis extends the trade and
production modules of the model to replicate the conditions in the West Bank economy.
General introduction
7
Finally, this thesis contributes to policymaking by formulating political and administrative
options for the Palestinian National Authority to achieve economic growth under
suboptimal conditions due to conflict.
1.5. Theoretical framework
The theoretical framework of this thesis is based on the theory of economic interdependence
and conflict and the computable general equilibrium modelling.
1.5.1. Theory of economic interdependence and conflict
The relationship between economic interdependence and conflict has been subject to a
heated debate in the field of political economy. There are two distinct schools of thought in
the debate. The first group, considered as the liberals, maintains that economic
interdependence brings peace. The second group, considered as the realists, argues that
trade increases conflict between the trading partners.
The liberal proposition is associated with Kant’s philosophy of a perpetual peace that is the
result of economic interdependence, expansion of democratic institutions, and joint
commitment to the international law and institutions (Oneal and Russett, 2015). The liberals
advance the theoretical argument that mutual dependence established between two trading
partners (dyads) generates economic benefits for both parties, and that the anticipation of a
loss in the welfare gains reduces the willingness of both sides to fight (Hegre et al., 2010).
Implicitly, liberals assume that the opportunity costs of the forgone trade are sufficiently
high to prevent nations to engage in conflict with trading partners (Polachek and Xiang,
2010). They also infer that trade relations provide both parties with instruments to make
costly signals in order to avert militarised conflicts (Heilmann, 2016).
The realist argument postulates that economic interdependence can be used as an instrument
of coercion (Stein, 2003). Accordingly, the trading relationship entails costs that may result
in conflicts. The costs are especially disproportionate for the more dependent partner, since
the less dependent partner may be tempted to use economic coercion to exploit the other
party’s vulnerabilities and hence influence its behaviour on economic and security issues
(Barbieri and Levy, 1999). Dependency on trade partners for the provision of strategic
goods may trigger aggressive expansionist policies to guarantee access to resources and
markets, increasing the likelihood of conflicts (Reuveny, 2000). The pursuit of relative
gains, i.e. benefitting more from trade than a partner, also causes frictions between countries
and leads to trade disputes and trade wars (Souva and Prins, 2006).
Chapter 1
8
From this discussion it appears that there is no general conclusion on the effect trade has on
conflict (Dorussen, 2006). Trade has both a pacifying and generating effect on conflict. At
least three factors determine the direction of the trade effect on conflict. The first factor is
whether the trade relation is symmetrical or not. Symmetrical ties may promote peace, while
asymmetrical dependence fuels conflicts (Barbieri and Schneider, 1999). The second factor
is the distance between the two partners. As demonstrated by Chang et al. (2004), the more
the geographical distance between trading partners, the less the likelihood of conflicts. The
third factor is related to the cost of finding alternative markets (Goenner, 2010). If finding
alternative markets does not come at a high cost for importers and exporters, then the
deterrent effect of trade on conflict is small. In contrast, if trade between a pair of partners
is highly specific, the deterrent effect of trade on conflict is reinforced.
Another proposition to analyse the relations between trade and conflict is to separate
conflict initiation from conflict escalation. Morrow (1999) showed that the trade effect on
conflict initiation is mixed because trade relationships generate both gains and issues for
debate. However, trade reduces the likelihood for conflict escalation, as it provides the
actors with instruments to make costly signals and ultimately reach a peaceful settlement.
For their most part, the above-mentioned arguments have focused on the impact of trade on
conflict. However, there are concerns that unidirectional models of trade-conflict
relationships are miss-specified because trade is not an exogenous variable (Stein, 2003).
In fact, the intensity of trade reflects a certain level of inter-state cooperation, as
intergovernmental agreements are a pre-requisite for official trade. Moreover, trade can be
restricted between partners as part of a strategic signalling (Gartzke et al., 2001). This
intertwined link between trade and conflict has led scholars to apply the Granger causality
analysis and simultaneous equation systems to disentangle the trade effect on conflict and
the conflict effect on trade. However, the results of empirical studies that make both trade
and conflict endogenous diverge. Some studies found a statistically significant pacifying
effect of trade (e.g. Oneal, 2003; Hegre et al., 2010), while others found either no effect or
a conflict-generating effect of trade (Kim and Rousseau, 2005). Other studies reported either
a statistically insignificant effect of trade on conflict (Keshk et al., 2004) or mixed effects
(Goenner, 2010; Reuveny and Kang, 1998).
The diverging empirical results, though using in some cases the same data sources, is
possibly explained by the omission of different fundamental elements of the overall trade
and conflict picture (Reuveny, 2000). The validity of the theoretical assumptions that guide
the empirical research is also at stake. Subsequently, there is a need for analyses at a more
disaggregated level to incorporate differences in terms of commodity group, as well as
isolating import and export data, instead of pooling the two into total trade (Dorussen,
2006). Studies should also look at individual dyads instead of pooling all dyads together
because the relationship between trade and conflict is dyad-dependent.

General introduction
9
Most of the discussions on trade and conflict have also embedded the unitary-actor view of
the state (Stein, 2003). However, it is clear that trade is carried out by firms and reflects the
societal supply and demand conditions, while conflict is an inter-state phenomenon.
Therefore, it is important to disjoint the units of analysis. Finally the economic relations
between states are not limited to trade in goods and services as pointed out by Souva and
Prins (2006) and Gartzke et al. (2001). The bilateral flow of capital and labour should be
incorporated in the analysis.
While the empirical results on trade effect on conflict are still puzzling, there is a wide
consensus that conflict reduces trade (Heilmann, 2016; Long, 2008; Kim and Rousseau,
2005; Keshk et al., 2004). Although liberal and realist theories disagree about the effect of
trade on conflict, they appear to agree that conflict has a negative effect on trade (Reuveny,
2000). Along with this consensus, this thesis investigates the economic consequences of
political conflict. The thesis makes an empirical contribution to the understanding of the
relations between economic interdependence and conflict using a single dyad composed of
Israel and Palestine. The thesis does not limit itself to the relations between conflict and
trade of goods and services. Instead, it assesses the economy-wide effects of changes in the
conflict-related restrictions on labour movements and trade of goods and services on the
Palestinian economy. It makes use of a highly disaggregated database, in which firms and
households, who make production and consumption decisions are explicitly separated from
the government. The framework to conduct the empirical analysis is the computable general
equilibrium (CGE) model.
1.5.2. Computable general equilibrium modelling
The concept of economic equilibrium at the heart of the CGE model refers to a state of
balance between opposed forces acting upon the economic variables (Miller and Blair,
2009). Following the neoclassical theory of supply and demand, prices are assumed to clear
all markets simultaneously. The economic agents are assumed to be rational. Households
maximise their utility subject to a budget constraint, while firms maximise their profits
subject to specific production costs and limited resources (Bacchetta et al., 2012). The CGE
model recognises that events taking place in one sector of the economy may affect other
sectors, which could feedback into the original market through the price mechanisms. When
the economy is affected by an exogenous shock, a new set of prices is obtained, which in
turn determines production, consumption, employment and income levels.
The CGE model makes use of elaborated behavioural and technical relationships between
the variables to capture all relevant linkages between the different sectors of the economy.
The principle of accounting identities that underpins CGE models ensures that expenditures
Chapter 1
10
do not exceed incomes. Subsequently, the CGE model gets rid of “free lunches”. These
features of the CGE model make it well suitable for the assessment of a policy change on
the performance and structure of the whole economy (Arndt et al., 2012). Moreover, the
way equilibrium prices are set relies on the economic theory, which makes the CGE model
appealing for welfare analysis. Two theorems of welfare economics provide the background
for capturing welfare effects in the CGE model (Cardenete et al., 2017). The first is that any
Walrasian allocation is a Pareto efficient allocation.
The Walrasian equilibrium implies that prices drive the allocation of resources and clear all
markets. The Walrasian equilibrium corresponds to an allocation that lies on the contract
curve, representing a subset of Pareto efficient allocations, where all the agents do at least
as well as in their initial endowments. The second theorem is that a Pareto efficient
allocation can be implemented as a Walrasian allocation with the use of lump-sum transfers
from the winners to the losers. Following the second theorem, considerations of equity and
efficiency can be separated, since the same efficiency level can be achieved with different
allocations. The welfare measures that are widely used in a CGE model are the Hicksian
compensating and equivalent variations. Using these measures is attractive since they are
expressed in monetary units, making them intuitively comprehensible (Bacchetta et al.,
2012). Hence, they can be used for interpersonal comparisons of welfare.
1.6. Outputs of the thesis
This thesis has five outputs. The first is the Social Accounting Matrix (SAM) developed for
the West Bank. The others are four applications, in which additions to the Static Applied
General Equilibrium model, version 2 (STAGE-2), are conducted. These applications
demonstrate the potential of the database and the model developments for carrying out
empirical policy analysis. The SAM documentation has been published as a working paper,
and earlier versions of the four applications have been published as conference papers1.
The development of a comprehensive SAM relates to the first research objective of this
thesis. The newly constructed SAM addresses several shortcomings of the previously
elaborated SAMs for Palestine. It is more disaggregated, especially with respect to factor
markets, household accounts and Palestinian trade partners. It focuses on the West Bank
economy to acknowledge the reality that trade and labour movements between Israel and
Palestine are restricted to the West Bank since the Gaza blockade in 2007. In the SAM, the
Palestinian workers in Israel are identified and the labour income they earn in Israel is
1 The SAM documentation as well as the conference papers were published as multiple–author papers and
their full references are provided in the corresponding chapters of this thesis. For all papers, I am the first
author, who drafted all text and made the most significant contribution for data and model developments.
General introduction
11
channelled to their households. Decomposing the trade partners, in order to single out Israel
is also an important feature of the SAM that allows addressing policy related to trade in
Palestine. The reference year of the SAM is 2011 because 2011 was a relatively “normal
year” with a stable political situation between Israel and Palestine.
To calibrate the SAM and implement the four applications, the STAGE-2 model –
developed by McDonald and Thierfelder (2013) – is used as a starting point. The first
application addresses the second research objective of the thesis and investigates the
implications of different labour market conditions that can be used to capture the distortions
of labour markets in conflict-affected regions. This first application sets the platform for
more detailed analysis to be conducted in the next two applications using specific market
conditions to model labour movements between the West Bank and Israel.
The second application addresses the third research objective of the thesis and analyses the
short-term effects of changes in the level of Palestinian employment in Israel. For this
purpose, a surplus labour specification is used to model the labour market conditions in the
West Bank. This assumption captures the evidence of involuntary unemployment of labour
in the West Bank and the strong correlation between the level of Palestinian employment
in Israel and unemployment in the West Bank in the short-term.
The third application, associated with the fourth research objective of the thesis, assesses
the long-term effects of Palestinian employment in Israel. To this end, a factor mobility
function is introduced to depict that, in the long-term, labour markets are flexible.
Moreover, the surplus labour assumption is replaced by a labour-leisure trade-off. The
labour-leisure trade-off presumes the absence of involuntary unemployment in the long-
term as labour can always be either employed in the market activities within the production
boundary or in the non-market activities that produce services for the household’s own use.
The labour-leisure trade-off explicitly accounts for changes in the welfare generated in those
non-market activities that are often disregarded as they produce services that are not for sale
in the markets.
The fourth application addresses the fifth research objective of the thesis and investigates
policies related to the movement of goods and services. In this application, future trade
options for a sovereign Palestinian state – primarily with respect to Israel and secondarily
with respect to the rest of the world – are analysed. These policies all assume an exit from
the current customs union. The first policy option assumes the introduction of the most-
favoured-nation tariffs on imports from Israel, and the second simulates a liberalisation of
the Palestinian trade with respect to all trade partners. This application also acknowledges
the existence of tariff-rate-quotas on agricultural and food products in the West Bank which
are modelled explicitly. The model is modified to treat imports and exports from large and
small trade partners differently.

Chapter 1
12
1.7. Outline of the thesis
The thesis is organised as follows:
Chapter 2 reviews the theory of social accounting. The evolution of the concept of economic
interdependence between production sectors and institutions within the economy is
discussed together with an elaboration on the different formats for presenting such
economic interdependence; namely the Input-Output Table, the Supply and Use Table and
the social accounting matrix. Since a distinct feature of the SAM over the other formats is
its focus on households and their ownership of factors, a discussion of the arguments for
and against different approaches for classifying household and factor accounts is provided.
This chapter finally provides insight into the use of the SAM framework for policy analysis.
Chapter 3 draws on the theories of general equilibrium. A discussion of the alternative
approaches to modelling factor markets is provided in this chapter. The structure of the
STAGE-2 model is described. The questions of price definition and price normalization are
elaborated, and model closures that are a critical component of CGE modelling are
discussed. The use of CGE models to analyse policy issues is also explored.
Chapter 4 provides an overview of the West Bank economy in terms of its development
over time, the structure of its labour market and its trade relationships with Israel and with
the rest of the world. The evolution and operation of the multi-faceted restrictions
implemented by Israel are also reviewed in that chapter.
Chapter 5 documents the unique SAM compiled for the West Bank for this thesis.
The subsequent Chapter 6, Chapter 7, Chapter 8 and Chapter 9 cover the four applications
conducted in this thesis to demonstrate the potential of the database and the model in
addressing real-world policy issues. For a detailed description of the technical aspects
involved in the modifications that were introduced in the original STAGE-2 model for the
different applications, a technical appendix (Appendix 1) is attached to the main part of the
thesis.
The thesis concludes with Chapter 10, where a general discussion of the key findings and
the contributions made by this thesis are presented. This chapter also stresses the policy
implications of the thesis. The limitations of the research are highlighted in the chapter and
an outlook on potential areas for future research is provided.
13
2
SOCIAL ACCOUNTING MATRIX: ORIGINS, THEORY
AND APPLICATIONS

Chapter 2
14
Social accounting matrix: origins, theory and applications
15
Chapter 2 Social accounting matrix: origins, theory and
applications
2.1. Introduction
A social accounting matrix (SAM) is a comprehensive database which encompasses
information about the economic and social structure of a country or a region at a given point
of time (Thorbecke, 2000). It explicitly shows the interconnections between the structure of
production in the economy and the distribution of factor income to households as well as
the relationships between all institutions (households, enterprises, government, and trade
partners) in the economy. In addition to providing a useful framework to display
information and give a snapshot of an economy, a SAM is also used as a benchmark in
economic modelling to assess the socioeconomic impact of different policies (Breisinger et
al., 2009). Since the development of the first SAM by Stone in 1962, the SAM has been
used extensively for policy analysis (Round, 2003).
The SAM is a practical extension of the theory of economic interdependence, which
considers the whole economy as a single system of observable relationships. The theory of
economic interdependence goes back to the scholastic economic thought in the 1600s, with
the early notion of productive interdependence between different producers in a system
characterised by the division of labour (Kurz and Salvadori, 2000). It is important to look
through the historical lenses to understand the SAM and its evolution over time. Hence, in
Section 2.2, the origins of the SAM are discussed, and its structure is presented. The SAM,
compared to its predecessors is centred on institutions and the circulation of income,
especially between factors and households. Subsequently, Section 2.3 focuses on
decomposing the household and factor accounts. The use of the SAM as a basis for policy
modelling is introduced in Section 2.4. Section 2.5 shows some applications of the SAM
multipliers. Finally, Section 2.6 concludes this chapter.
2.2. Origins and structure of the social accounting matrix (SAM)
2.2.1. Origins of the SAM
The theory of economic interdependence can be traced back to William Petty, who coined
in 1662 a clear concept of the agricultural surplus as the difference between the corn output
and input including the subsistence of labourers measured in terms of corn. The unit of
exchange, which is corn, is directly observable and the magnitude of the output and the
inputs, in terms of corn, are also observable. About a century later, Francois Quesnay put
Chapter 2
16
together in the 1750s the first coherent framework to display the interdependencies in the
economy, called the Tableau Economique. The Tableau Economique is a “zigzag” table
that displays the flows of resources between the agricultural and manufacturing sectors.
Moreover, it shows the circulation of capital between property owners, cultivators and
artisans, along with the process of consumption and production.
While the Tableau Economique shows the interconnections between different economic
sectors in a coherent way, it considers the agricultural sector as the only productive sector.
The manufacturing sector is assumed sterile, i.e. yielding an output worth no more than the
agriculture input that goes into it (Miller and Blair, 2009). Achille-Nicolas Isnard
challenged this point of view in 1781, by arguing that the surplus is made of both
agricultural and manufacturing products. Isnard showed that the set of prices in the Tableau
Economique is a special system of prices, whereby the entire surplus originates in the
agricultural sector. Classical economists, such as Adam Smith, David Ricardo and Robert
Torrens share Isnard’s view that relative prices determine the surplus. Moreover, they argue
that the distribution of income originates not only from land rent but also from wages and
profits (Kurz et al., 1995).
The Tableau Economique was however praised by Karl Marx, as it casts light on the
reproduction function of capital. This concept implies that the capital given in return to
labour-power, i.e. wages, is converted into consumption expenditures in order to reproduce
the labour-power able to work for the owner of the capital (Baumol, 2000). Starting from a
representation of the economy similar to the Tableau Economique, Marx developed his own
theory of reproduction and determination of the rate of profit. However, his two-step
procedure – known as the successivist approach – cannot be sustained because the prices
cannot be determined before the rate of profit, while the rate of profit cannot be determined
before the prices. Hence, both the rate of profit and prices have to be determined
simultaneously. The simultaneous determination of prices and the rate of profit was
ultimately solved by Ladislaus von Bortkiewicz in 1907, by assuming the real wage rate to
be given and by fixing a standard value as numeraire (Miller and Blair, 2009). In 1928,
Leontief extended the Tableau Economique framework and the work of von Bortkiewicz
to provide a flexible tool to analyse complex policy issues (Baumol, 2000). The new
framework, called the Input-Output Table, describes in a tabular form the transactions
involved in the production and consumption within an economy.
The starting point in the input-output analysis is the aggregate production, which is broken
down into activities. These activities are interdependent since each needs outputs of the
others as inputs. The rows of the Input-Output Table display the distribution of output
throughout the economy, while the columns show the composition of inputs required by
each sector. In addition to the inter-industry transactions, there are additional columns for
the final demand, reporting sales of output to consumption as finished products by
Social accounting matrix: origins, theory and applications
17
households, the government and for the export market. There are also additional rows for
value added, which include the demand for labour, capital and land by the respective sectors
as well as the indirect taxes paid in the process of production. The basic square framework
of the Input-Output Table has evolved over time to reflect the potential for a single sector
to supply multiple products. The non-square matrix obtained is called commodity-by-
industry Input-Output Table. The accounts are generally kept in monetary units.
The advantage of the input-output analysis lies in its mathematical structure, consisting of
a set of linear equations. With this convenient framework, the input-output analysis has
become widely used especially as a policy analysis tool, by governments that wish to assess
the structure and performance of the economy. The data required to build the Input-Output
Tables became part of a routine collection of national economic statistics. In order to make
the data collected in different parts of the world consistent with each other, such that they
could be used to put together a multi-country or a world input-output system, common
conventions started to be adopted in the 1940s. Such conventions as well as standards in
dealing with the data collection process are included in the System of National Accounts
(SNA). The basic framework of the SNA was put forward by Sir Richard Stone in 1947 in
the landmark report of the United Nations titled: Measurement of national income and the
construction of social accounts. The full framework was produced by Stone and Associates
in 1968 and is regularly updated (Miller and Blair, 2009).
The SNA adopts an accounting system of double entry bookkeeping in which not only the
inter-industry transactions are recorded, but they are also reconciled with all relevant flows
of income and wealth. The SNA recognises that development is not the mere growth of
output, but it is about raising the living standards of people. Accordingly, to address policy
issues, the central point should not be the commodities but the people (Pyatt and Round,
1985). The SNA provides a coherent framework for measuring the social value of the
economic activity; in other words, the national welfare (Aronsson and Löfgren, 2010). The
framework of the SNA provides the basis for many forms of economic decision and can
handle more systematically extended versions of the Input-Output Table such as the
commodity-by-industry extension. The SNA also explicitly accounts for all transfers and
transactions with the rest of the world. The data in the SNA are organised in sheets, also
known as T-accounts, for individual sectors and institutions. All sheets are consolidated in
a national balance sheet. The consolidated balance sheet can also be represented in a matrix
form. The resulting matrix for production-consumption transactions is called the “Use”
matrix, while the one for industry production of commodities is called the “Make” matrix.
The “Make” and “Use” matrices can be consolidated to display information about the inter-
industry transactions. The obtained matrix is called the Supply and Use Table (SUT).
Chapter 2
18
The conventions adopted in the SNA are largely consistent with the input-output
framework. A notable difference is that the SNA system is closed, i.e. the value of total
production equals that of total consumption. Inventories are essentially a residual value,
clearing the market to ensure that the supply is equal to the demand. Similarly, savings are
residuals that clear the foreign account and the accounts for households and the government.
In general, total savings equal total investments. In the “Make” matrix, total output,
including home production for home consumption, is valued at the prevailing producer price
(Miller and Blair, 2009). The Social Accounting Matrix (SAM) is the framework
formulated specifically to represent all components of the closed system of national
accounts.
The SAM’s distinctive features as compared to the input-output and SNA frameworks
include its representation by a set of single entry accounts and the focus it places on the
roles of labour, households, and the social institutions in the economy (Round, 2003).
Hence, the SAM provides a complete accounting of the circular flow of income and
expenditure in the economy, and can be used to analyse social and economic policies in a
comprehensive way. It aims particularly at addressing issues such as employment, income
distribution, and social welfare. The SAM is a square matrix in which each sector or
institution in the economy is represented by an account with its own row and column. For
individual accounts, incomings and outgoings must balance to reflect the accounting
identities. It follows that the whole system is balanced (Thorbecke, 2000). Since a SAM
aims at reflecting the state of the economy in equilibrium, it should correspond to this by
an appropriate choice of the base year.
2.2.2. Structure of the SAM
The social accounting matrix aims at organising information about the economic and social
structures of a country or a region at a specific point of time, usually a year. A common way
of depicting all transfers and real transactions within an economy is to present them in a
circular flow diagram, as illustrated in Figure 2-1. In this diagram, expenditures made by
one account are incomes for other accounts, such that the system is closed.
In the production process, activities use goods and services as intermediate inputs in
addition to factors (labour, capital, natural resources). The final output is sold in the
commodity markets. The value retrieved from the sale is used to buy intermediate inputs
from the commodity markets, and to compensate factors. The remaining output value is
paid to production and factor use taxes. Net factor payments – i.e. factor returns received
from the domestic activities reduced by the depreciation plus the factor compensation from
Social accounting matrix: origins, theory and applications
19
abroad – constitute the factor income that accrues to the ultimate owners of factors which
are households, enterprises and sometimes other institutions.
In addition to the factor income, households derive income from remittances, inter-
household transfers, transfers of profits and dividends from enterprises, and transfers from
the government and the non-profit institutions serving the households (NPISH). Household
income is spent on goods and services, direct taxes to the government, and the rest is saved.
Government’s revenues are composed of indirect taxes on goods and services, and direct
taxes on enterprises and households. Those revenues are spent on services and transfers,
and the rest is saved. The NPISHs receive donations from abroad and from domestic
households. Their budget is spent on goods and services as well as in the form of transfers
to the households.
The interactions with the rest of the world are captured through the flow of imports and
exports, transfers and factor payments. The rest of the world account is cleared by the
foreign savings. In the domestic market, public and private savings are collected in the
capital account which is then used to satisfy the investment demand.
Finally, margins represent the costs for transferring a commodity from the source of
production to the place of final consumption. The margins are payments to trade and
transport services from commodities. Hence, they are considered to be inter-commodity
transactions.
A SAM is a numerical representation of the transactions depicted in the circular flow
diagram. It presents the information in a matrix form, where economic sectors and
institutions are represented each by one account. Each account is depicted by a row and a
column. The income to each account appears along the account’s row, while the expenditure
appears along its column. Hence, a cell entry in the matrix represents a particular transaction
within the economy flowing from the column account to the row account. The accounting
principle requires that for each SAM account, the income equates the expenditure (Croes
and Rivera, 2016).
Compiling a SAM requires a substantial effort. The number of accounts and the level of
detail to include in a SAM often depend on the available data and on the problem under
investigation (Pyatt and Round, 1985). Table 2.1 displays the standard structure of a SAM
as a 15x15 matrix, with a distinction between the domestic economy and the rest of the
world. Hence, it is assumed that the domestic economy is not closed. The SAM adopts a
commodity by industry set up. The production factors are disaggregated into labour, capital
and land. There are provisions for four domestic institutions: households, enterprises,
government and the NPISHs. The tax instruments are separated from the government
account and finally there is a saving-investment account.
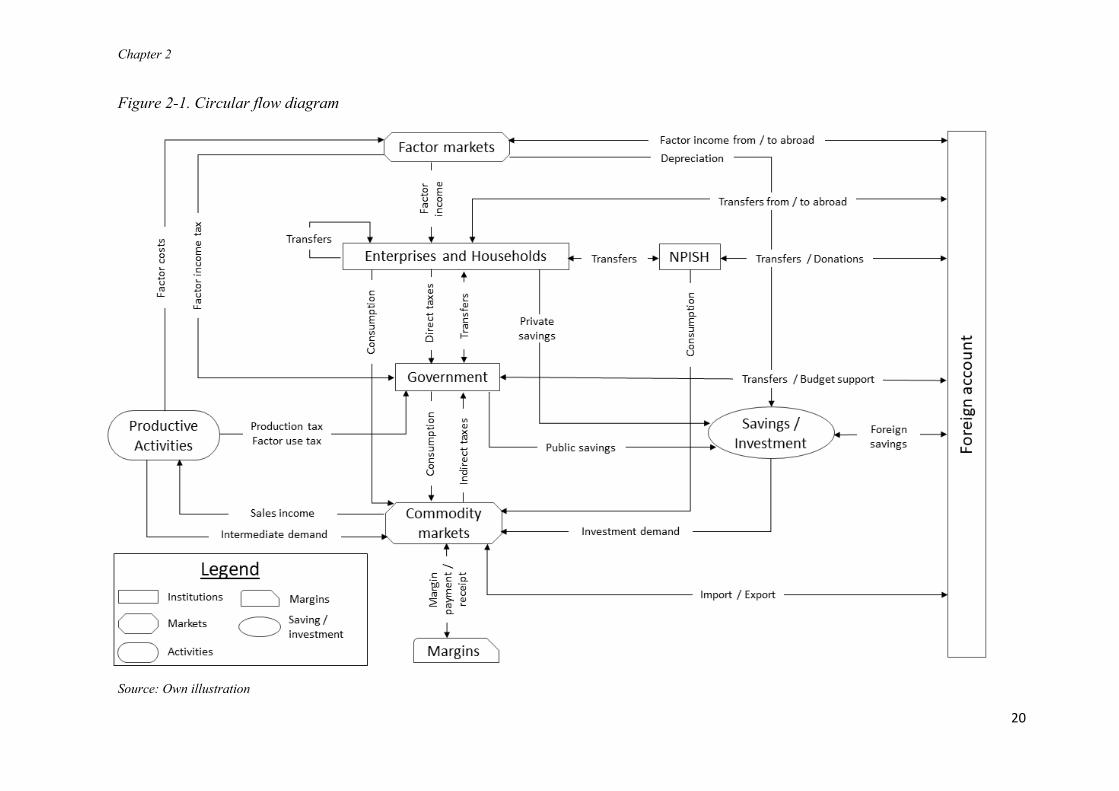
Chapter 2
20
Figure 2-1. Circular flow diagram
Source: Own illustration
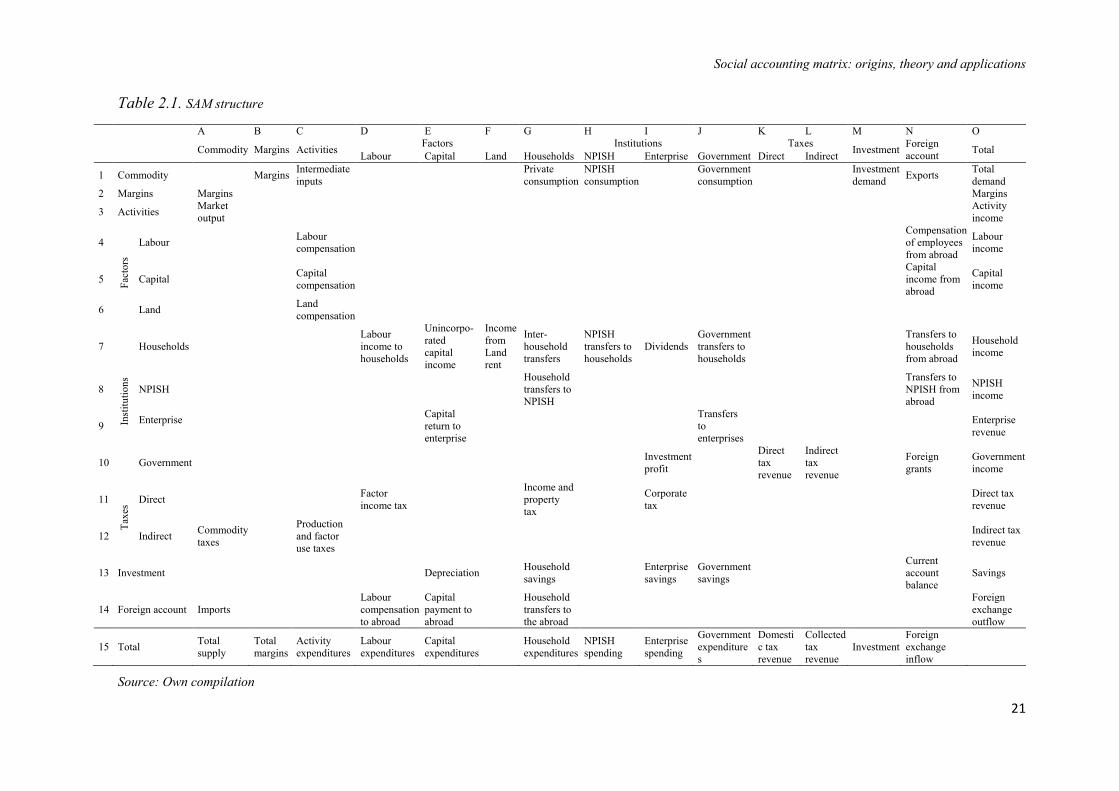
Social accounting matrix: origins, theory and applications
21
Table 2.1. SAM structure
A B C D E F G H I J K L M N O
Commodity Margins Activities Factors Institutions Taxes
Investment Foreign
account Total
Labour Capital Land Households NPISH Enterprise Government Direct Indirect
1 Commodity Margins Intermediate
inputs Private
consumption
NPISH
consumption Government
consumption Investment
demand Exports
Total
demand
2 Margins Margins Margins
3 Activities Market
output Activity
income
4
Fac
tors
Labour Labour
compensation
Compensation
of employees
from abroad
Labour
income
5 Capital Capital
compensation
Capital
income from
abroad
Capital
income
6 Land Land
compensation
7
Inst
itu
tio
ns
Households Labour
income to
households
Unincorpo-
rated
capital
income
Income
from
Land
rent
Inter-
household
transfers
NPISH
transfers to
households
Dividends
Government
transfers to
households
Transfers to
households
from abroad
Household
income
8 NPISH Household
transfers to
NPISH
Transfers to
NPISH from
abroad
NPISH
income
9 Enterprise
Capital
return to
enterprise
Transfers
to
enterprises
Enterprise
revenue
10 Government
Investment
profit
Direct
tax
revenue
Indirect
tax
revenue
Foreign
grants
Government
income
11
Tax
es Direct Factor
income tax
Income and
property
tax
Corporate
tax Direct tax
revenue
12 Indirect Commodity
taxes
Production
and factor
use taxes
Indirect tax
revenue
13 Investment Depreciation
Household
savings Enterprise
savings
Government
savings
Current
account
balance
Savings
14 Foreign account Imports Labour
compensation
to abroad
Capital
payment to
abroad
Household
transfers to
the abroad
Foreign
exchange
outflow
15 Total Total
supply
Total
margins
Activity
expenditures
Labour
expenditures
Capital
expenditures
Household
expenditures
NPISH
spending
Enterprise
spending
Government
expenditure
s
Domesti
c tax
revenue
Collected
tax
revenue
Investment
Foreign
exchange
inflow
Source: Own compilation
Chapter 2
22
2.3. Decomposing household and factor accounts
The focus of the social accounting matrix is on the people and their living standards. The
living standards are intimately related to the income households derive from factors they
own. Therefore, a special care must be paid to disaggregating households and their factors
of production. There are several classification schemes for disaggregating household and
factor accounts. However, the main principle is that each group should be homogenous and
distinct from the other groups. Given the interdependencies between households and
production factors, decomposing the household account should be consistent with the
disaggregation of factor markets.
An initial differentiation of production factors may refer to labour, natural resources, and
capital markets. Each of these production factors can be further disaggregated. Labour is
often classified by skill. The skill level is defined either by the number of years of formal
education or by the professional occupation. The International Labour Organisation (ILO),
in its classification ISO-08, distinguishes four levels of skill based on the educational level
(ILO, 2012). The skill level 1 includes workers who completed primary education. In terms
of occupations, this corresponds to manual and elementary jobs such as office cleaners,
freight handlers, garden labourers, etc. The skill level 2 requires the completion of the first
stage of secondary education and necessitates some technical abilities. Occupations
associated with this skill level include butchers, bus drivers, secretaries, sales assistants,
agricultural workers, etc.
Skill level 3 involves a high level of literacy, meaning the completion of the second stage
of secondary school as well as attending a higher educational institution for a period of one
to three years. Occupations classified at that skill level include shop managers, technicians,
legal secretaries, etc. The last level of skill requires extended levels of literacy and
numeracy. It corresponds to studying at a higher educational institution for a period of four
to six years with the award of a degree. Occupations at this level include professional sales
managers, engineers, teachers, medical practitioners, etc.
Labour can also be disaggregated based on employment status (employee, employer, own-
account worker), location (urban/rural or geographical region), gender, or employment
sector (agriculture, manufacturing, services). The main driver of the choice for a
classification should always be the amount of information available and the
motivation/purpose of the analysis.
Similarly, depending on the purpose of the research, capital can be disaggregated into public
and private, or is assumed sector-specific. Natural resources can also be assumed sector-
specific or region-specific. Land in particular can be classified into irrigated or non-irrigated
land, crop versus pastureland, fertile or non-fertile land, etc.
Social accounting matrix: origins, theory and applications
23
In the SAM framework, households are the units making saving and spending decisions.
Hence, disaggregating the household sector is desirable. Disaggregating households
depends on the particular focus of the analysis, the available data and the classification of
other accounts, notably the factor markets. There are many classifications that are applicable
to the household account. The classification criteria include the location (urban versus
rural), assets (size of land holding, properties), income level, and socioeconomic
characteristics of household members (e.g. household head, principal earner and
economically active members). A combination of these criteria is also possible. For
instance, urban households can be further classified by income level, while rural households
are further classified by the landholding size. Using the socioeconomic criteria ensures
homogeneity of behaviour and of interest among groups, while classifying households
based on their income level assumes homogeneity of income for distinct groups. Because
households are potentially mobile across income groups, the socioeconomic criteria are
often preferred for ex-ante analyses. However, classifying households along income groups
fits better cross-sectional comparisons where the focus is to assess income distribution
between classes of households (Round, 2003).
The choice of a classification is a defining moment in the SAM construction because the
choice made has strong implications on the analyses. Therefore, it is desirable to maintain
a high degree of flexibility in terms of detail available in the SAM in order to allow the user
the possibility to aggregate the SAM and choose alternative classifications (Thorbecke,
2000). Providing a SAM with sufficient details and flexibility has been made possible in
recent years by the powerful spreadsheet technology and the software capability.
Nevertheless, the main obstacle to a highly disaggregated SAM is often data availability,
especially as far as household and factor classifications are concerned. Disaggregating
households requires a multi-purpose household survey that provides detailed information
on income and expenditures. Similarly classifying factors, especially labour, is only feasible
if there are raw data or detailed publications of labour force surveys.
Including the interdependencies between households and factor markets in the SAM in a
consistent way requires the household income and expenditure survey to be consistent in
the first place with the labour force survey. Even when the two surveys are available and
consistent with one another, there are still challenges in reconciling the survey data with the
national economic statistics. Discrepancies between statistics in the national accounts and
the survey data can be large. To handle these discrepancies, one can rely either on local
expert judgments, or on mathematical algorithms or a combination of both.
Informed judgement of the relative reliability of the different data sources and local expert
insights are valuable but suffer the drawback of being subjective. By contrast, a formal
mathematical algorithm is less subjective in estimating the SAM and can enforce
Chapter 2
24
consistency of the whole system. However, its drawback is that the estimated figures may
deviate strongly from reality. Therefore, a combination of informed judgement and
mathematical algorithm should be preferred (Round, 2003). Informed judgement will be
used to improve the initial estimates and reconcile the data as much as possible. Then, the
mathematical method can be applied to carry out the relatively small remaining adjustments
and enforce consistency.
Another challenge is to disentangle the different sources of household income. A major
concern is the demarcation line between labour and capital income. A conventional measure
of labour income is the compensation of employees, which encompasses wages and salaries
in addition to other forms of non-wage compensation (commissions, bonuses, pensions,
family allowances, etc.). However, this measure underestimates the actual labour income as
it omits the labour compensation of the self-employed (Gollin, 2002). Such bias is especially
big in the developing countries, where there is a large informal sector. In such economies,
small family businesses also called household activities play an important role. The self-
employed are often engaged in such activities and the income they earn is often referred to
as mixed income. The concept of mixed income is usually calculated as a residual and makes
it difficult to evaluate the share of household income derived from capital or labour. The
inability to evaluate the factor shares of income does not make understanding income
distribution and inequality easy (Atkinson, 2009).
Different adjustment approaches have been suggested to address the issue. Guerriero (2012)
compared five adjustment approaches to the initial unadjusted measure. The first adjustment
approach is to impute two thirds of the mixed income to labour income, assuming that the
capital share of mixed income is one third. The main problem with this approach is the
arbitrary “two thirds” rule since the labour share of mixed income may be region-specific,
or sector-specific and may also vary over time. Hence, this rule cannot be universal. A
second adjustment approach is to attribute all the mixed income to labour. The rationale
being that in developing countries, the self-employed mostly provide labour services. An
obvious drawback of this method is that it overstates the labour income since most
household activities also require capital investment that in some cases can be substantial. A
third approach is to assume that mixed income has the same combination of labour and
capital as the rest of the economy. This approach has the merit of accounting for capital and
labour shares in mixed income using reasonable assumptions. However, the assumption that
income distribution is approximately the same in unincorporated family businesses and in
formal corporations is unrealistic as these are very different agents.
A fourth approach is based on the fact that the previous methods often estimate mixed
income as a residual and may not be reliable. Subsequently, this approach only builds on
the number of the self-employed, which is often available from labour force surveys and is
Social accounting matrix: origins, theory and applications
25
more reliable than earnings reported from mixed income that are computed at the national
level. Accordingly, the compensation of labour for the self-employed is imputed by
assigning to them the average compensation of employees. The drawback of assuming the
same earnings for wageworkers and the self-employed persists. Nevertheless, this approach
is preferred to the previous ones because it considers the regional composition of the
workforce. The fifth approach proposes an adjustment to the forth method. It proceeds from
the international classification of status in employment (ICSE-93) which assumes that the
self-employed can be associated with four worker categories: employers, own account
workers, members of producer cooperatives, and family workers (ILO, 2013). This
approach considers that the employers receive a negligible amount of labour income.
Therefore, it attributes the average compensation of employees to all self-employed
categories except employers. In this approach, neglecting the labour income received by
employers may underestimate the total labour income.
The two last approaches are often preferred to the first three. However, both rely on the
problematic assumption of identical average wages for the self-employed and wageworkers.
To attenuate the problem associated with this assumption, Young (1995) attributed the
wages of employees to the self-employed on the basis of sector of employment, gender, age,
and education. Matching wageworkers and self-employed using socioeconomic
characteristics reduces the systematic differences between the two categories, but the
drawbacks are the high data requirements and the omission of unobservable differences in
entrepreneurial ability. Gindling et al. (2016) addressed the problem from a different angle
by estimating econometrically the earnings premiums for the self-employed across 73
countries. Subsequently, they extrapolated their results to different regions of the world.
While this approach seems more accurate, the earnings premiums may change over time.
Hence, the estimates need to be regularly updated. Moreover, the earnings premiums are
estimated as averages at the national level, while they may differ across sectors.
In conclusion, decomposing household and factor accounts is an important step in the
process of constructing a SAM, since the main addition of the SAM over the other
accounting systems is the focus on institutions and the circulation of income. There are
several options and criteria along which the household sector and the factor markets can be
disaggregated. The main principle is to keep as much detail as possible for the framework
to be flexible to address multiple analytical questions. In the process of disaggregating
households and factors, several challenges arise. Some options to deal with such challenges
have been discussed. In Chapter 5, the way these problems have been dealt with in the
process of constructing the SAM for the West Bank is presented.
Chapter 2
26
2.4. SAM as a theoretical framework
The SAM is not only a framework for an empirical description of an economy, but also a
format to present the economic theory (Pyatt, 1988). By definition, the SAM displays in a
comprehensive way the economic transactions within the economy. To illustrate the SAM
as a theoretical framework, the transactions taking place are represented by algebraic
expressions instead of numbers. Those algebraic expressions describe in conceptual terms
how the value of each transaction is determined. Each transaction in the SAM has both
quantity and price dimensions, as illustrated in Equation [2.1].
𝑻𝒊𝒋 = 𝒑𝒊𝒋 ∗ 𝒒𝒊𝒋 [2.1]
Where 𝑇𝑖𝑗 is the SAM entry for row i and column j, while 𝑝𝑖𝑗 and 𝑞𝑖𝑗 are the price and the
quantity associated with that transaction respectively.
Since a SAM is balanced by definition, total cost should equal total revenue to reflect the
accounting identities. In other words, column totals should equal row totals, as illustrated
in Equation [2.2].
∑(𝑝𝑖𝑗 ∗ 𝑞𝑖𝑗)
𝑖
= ∑𝑇𝑖𝑗
𝑖
= ∑𝑇𝑖𝑗
𝑗
= ∑(𝑝𝑖𝑗 ∗ 𝑞𝑖𝑗)
𝑗
∀𝑖 = 𝑗 [2. 2]
According to the “Law of One Price”, identical goods sold in different markets should sell
for the same price (Funke and Koske, 2008). Subsequently, the row totals can be rewritten
as in Equation [2.3].
∑𝑻𝒊𝒋
𝒋
= ∑(𝒑𝒊𝒋 ∗ 𝒒𝒊𝒋)
𝒋
= 𝒑𝒊 ∗ 𝑸𝒊 𝒘𝒊𝒕𝒉 𝑸𝒊 = ∑𝒒𝒊𝒋
𝒋
[2. 3]
Where 𝑝𝑖 is the price and 𝑄𝑖 the total demand for i. Replacing the new insight from Equation
[2.3] in Equation [2.2], enables the rewriting of the column totals as follows:
∑(𝑝𝑖𝑗 ∗ 𝑞𝑖𝑗)
𝑖
= ∑𝑇𝑖𝑗
𝑖
= 𝑝𝑖 ∗ 𝑄𝑖 [2. 4]
Where 𝑝𝑖 now reads as the average cost.
It follows that in the SAM framework, price or average revenue (in the rows) equals average
cost (in the columns). Therefore, prices and costs are interconnected and the price in each
row is uniquely determined by the cost information contained in only one column.
Commodity and activity prices depend not only on each other but also on factor prices, the
exchange rate and income levels, as illustrated in Equation [2.5]:
Social accounting matrix: origins, theory and applications
27
𝑝 = 𝑝(𝑦; 𝑝, 𝑓, 𝜆) [2. 5]
Where 𝑝 is a vector of commodity prices, 𝑦 is the income vector, 𝑓 is a vector of factor
prices and 𝜆 is the exchange rate (domestic per world unit).
The set of Equations [2.5] is called the supply-side equations because it corresponds to a
summation along the column. Supply-side equations show how commodity prices are
determined in a way that clears the markets. They are linear homogenous and consistent
with the adding-up condition. The linear homogeneity condition implies that for a stable
level of production if all input prices double, then output prices will also double. The adding
up condition infers that income for any factor, for instance, is allocated in proportion to the
ownership of that factor by the different institutions, so that total income is allocated in
proportions that add up to 100 percent.
The specification of the supply-side equations allows for the specification of imports and
domestic supply to be perfect substitutes, or complements and also to implement the
Armington assumption of differentiated imports and domestic supply. Accordingly, policies
targeting tariffs, taxes, quotas and other trade restrictions can be implemented. Finally, the
equations allow the choice of the appropriate technology of production by solving a cost
minimisation problem.
The row summation provides the demand-side equations, representing the total income of
each account. Incomes are derived from both exogenous and endogenous sources, as
illustrated in Equation [2.6]:
𝒚 = 𝒏 + 𝒙 [2.6]
Where 𝑛 and 𝑥 refer to the sets of endogenous and exogenous income sources respectively.
Endogenous income sources are related to transactions whose values depend on prices and
are determined within the model. Exogenous sources are predetermined and taken as given.
The choice of which elements of the SAM to consider as exogenous is discussed in more
detail in the next section, Section 2.5. For any column containing one or more exogenous
cells, a balancing residual cell needs to be specified in order to satisfy the adding up
condition.
From Equation [2.5], it follows that there is a number of 𝑦 + 𝑝 + 𝑓 + 𝜆 variables, while
from Equations [2.5] and [2.6] there are only 𝑦 + 𝑝 equations. However, in equation [2.6],
one row is linearly dependent on the remainder (Pyatt, 1988). Therefore, the actual number
of equations becomes 𝑦 + 𝑝 − 1. Therefore, the system of equations contains 𝑓 + 𝜆 + 1
degrees of freedom. To solve such a system of equations, a third set of 𝑓 + 𝜆 + 1 equations
is needed. These are called the closure rules. A wide range of choices is available and is
Chapter 2
28
most often concerned with the factor markets, investment and government accounts. The
choice of closure rules within the framework of computable general equilibrium models is
discussed in more detail in Section 3.6 of Chapter 3. Noteworthy here is that at least one
closure rule must not be linear homogenous. Subsequently, a particular price is set as the
numeraire for the entire system.
To summarise, the SAM framework structures any theoretical specification into three parts:
the demand-side equations, the supply-side equations and the closure rules. This theoretical
framework of the SAM lays the ground for the specification of a model to capture the
behaviour of each cell of the SAM. The model of behaviour provides the tool for subsequent
applications and policy analyses.
2.5. Application of the social accounting matrix: SAM multiplier analysis
A major use of the information contained in a SAM is to assess the effect of an exogenous
shock on the structure and performance of the economy. The simplest specification of SAM-
based models is the SAM multiplier models, which assume both factor prices and exchange
rates to be fixed. The application of such models generally addresses descriptive and
predictive questions. The descriptive analysis aims at examining the interactions within the
economy, while the predictive analysis addresses changes resulting from exogenous shocks.
The SAM multiplier analysis rests upon a set of linear equations, with the numerical
magnitude of the coefficients of these equations reflecting the structural interdependence
among different sectors in the SAM. The coefficients are fixed and their ratio is constant.
Subsequently, the production system is assumed to reflect constant returns to scale. In other
words, whatever the change in the output, the relative composition of inputs is always the
same. By freezing the production structure, this class of models usually provides a starting
point for a policy debate with useful insights into the anatomy of the economy.
There are two types of multipliers: the simple and the total multipliers. The simple
multipliers capture the direct and indirect effects of an exogenous change, while the total
multipliers include the induced effects in addition to the direct and indirect effects (Miller
and Blair, 2009). Direct effects relate to changes in the sectors directly connected to the
exogenous shock. For instance, change in the output after the shock. Indirect effects record
how the effects are transmitted to households. Induced effects are associated with the
feedback effects associated with changes in factor income due to changes in factor demand
by the production sectors. By ignoring the induced effects, the simple multipliers – also
called open models – assume the final demand to remain constant.

Social accounting matrix: origins, theory and applications
29
In order to account for the induced effects, a decision is needed on which of the components
of the final demand to treat endogenously in the model. Often, households are included as
an endogenous sector, because household consumption is the single largest component of
the final demand with a share of about 60% (Round, 2003). A model that treats households
endogenously is considered closed with respect to households. By including the induced
effects, closed models generally tend to yield outcomes larger in magnitude than the open
models. While the closed models may be more useful to assess the wide impact of
exogenous shocks, the open models may be more attractive if the focus is on identifying
and ranking the sectors that are the most affected by a shock (Miller and Blair, 2009).
Closing models is associated with some challenges. First is the problem of fixed
coefficients. In a model that is closed with respect to households, the commodity shares of
household consumption and the distribution of factor income to households are fixed.
Subsequently, a drawback of the approach is to freeze the household behaviour, with
household consumption and income patterns remaining the same. Second, the model being
static means that it reflects a database that displays information on the economy in a given
period. Hence, the coefficients that are derived from the database can be seen as the average
behaviour during the observation period. However, these coefficients are assumed to hold
for the marginal changes occurring as the result of an exogenous shock. As an illustration,
the initial household consumption pattern is assumed to hold for the additional earnings
generated by new outputs. Such an assumption ignores cases where both established
residents and new residents (in-migrants) generate the new output. While for the new
migrants, the average initial consumption pattern might hold, for the established residents,
the spending of the new income along a marginal consumption pattern might be more
suitable. As the marginal spending pattern of a household depends on its income category,
it might be interesting to disaggregate households according to income groups.
Given the challenges associated with closing models, only one component of the final
demand, i.e. household, is usually made endogenous (Miller and Blair, 2009). For a
thorough analysis, the interaction of price changes and shifts in exogenous demand –
including variations in the exchange rates and in factor prices – should be embraced. These
steps are at the core of the equilibrium models and will be discussed in Chapter 3.
2.6. Conclusion
The SAM is a convenient approach to organise data and show the interdependencies within
an economy. It derives from a concept of economic interdependence in the production
structure that has evolved over time to incorporate more detail about institutions and the
circulation of income in the economy. Once the data are organised in the form of a SAM,
Chapter 2
30
they present a snapshot which reveals the economic structure of a region or a country at a
given point of time. The SAM is not only a framework to show the interconnections within
an economy, but it also has a theoretical background and a mathematical structure that
enables the assessment of the reaction of that economy to exogenous shocks. Based on a set
of linear equations that underlines the mathematical structure of the SAM, the multiplier
analysis provides a useful starting point to discuss the impact of policies, including the
welfare effects.
A major criticism of the SAM multiplier analysis is the temporal stability problem. The
technical coefficients used in the analysis are fixed and they reflect the state of the economy
in an earlier year. However, it is clear that the production structure and the consumption
patterns will change for a variety of reasons including technological progress, changes in
economies of scale, changes in relative prices, and changes in consumer preferences.
Although these changes are usually slow, ignoring them reduces the accuracy of the
analysis. Nevertheless, as argued by Miller and Blair (2009), from the perspective of the
macroeconomic indicators, the error associated with the use of “old” data for “new” times
may not be large. For such aggregated measures which contain a wide variety of individual
elements, substitution between those elements tends to stabilise those measures.
Another criticism of the SAM multiplier analysis is that it assumes prices to be constant,
and therefore cannot capture how the economic agents react to price changes due to an
external shock or a policy change. To deal with this issue, the SAM can serve as a
benchmark for a model that displays the causal relationships among variables. Such a model
enables the empirical assessment of the reaction of the economic agents to price changes by
capturing explicitly the behaviour of those agents. Using a SAM to calibrate such a model
provides a natural starting point for the search of a new solution when there is an exogenous
shock to the base year configuration. This class of models includes computable general
equilibrium models, which are the focus of the next chapter.

31
3 COMPUTABLE GENERAL EQUILIBRIUM MODELS:
THEORY AND APPLICATIONS

Chapter 3
32
General equilibrium models: theory and applications
33
Chapter 3 Computable general equilibrium models: theory
and applications
3.1. Introduction
The Computable General Equilibrium (CGE) model recognises that changes taking place in
one sector of the economy may affect other sectors, which could feedback into the original
market. The CGE model makes use of elaborated behavioural and technical relationships
between variables to capture all linkages between the different sectors of the economy. The
links between the sectors in the economy are controlled by equations that ensure expenditure
not to exceed income, and income to be determined by factor earnings. Similarly, the sum
of factor amounts used in the production does not exceed the amount of factor endowments.
Subsequently, a CGE model gets rid of “free lunches” by including budget constraints
(Bacchetta et al., 2012).
The CGE modelling is based on the Walrasian theory of general equilibrium. In Section 3.2,
the theoretical framework of general equilibrium modelling is presented. Section 3.3
discusses in more detail how to model labour markets. Section 3.4 shows how the theoretical
framework of general equilibrium can be applied to policy issues, especially by making use
of social accounting matrices. Then, Section 0 displays the typology of CGE models, while
Section 3.7 highlights the basic structure of a comparative static model, which is later
extended in the applications conducted in the thesis. Finally, Section 3.7 concludes this
chapter and elaborates on the limitations of CGE models.
3.2. Theory of CGE models
The concept of economic equilibrium is at the heart of the CGE model. An economic
equilibrium refers to a state of balance between opposed forces acting upon economic
variables (Miller and Blair, 2009). The concept was first introduced by Leon Walras. To
describe Walras’ law and the Walrasian equilibrium, we assume first a pure exchange
economy, where all agents are given an initial endowment of commodities to trade. The
agents are rational, meaning that they participate in trade as long as they are better off than
not trading. This implies that they maximise their utility subject to a budget constraint. The
agents’ demand functions can be derived by solving this utility maximisation problem. The
obtained demand functions are continuous and homogenous of degree zero in prices. This
implies that doubling all prices and incomes will leave the quantity demanded the same.
Chapter 3
34
To close the system, a condition that for each agent the value of total consumption equals
the value of the agent’s endowment is imposed. This condition implies that at the whole
economy level, the value of market excess demand is zero at all prices (Equation [3.1]).
∑𝑝𝑖
𝑁
𝑖=1
∗ 𝛿𝑖(𝑝) = 0 [3. 1]
Where 𝑝𝑖 is the price of commodity i, 𝛿𝑖(𝑝) is the market excess demand, and N the number
of commodities.
The equality in equation [3.1], also called the Walras’ law, implies that if all markets but
one are cleared, then the remaining market must also be cleared. This is a necessary
condition for a market equilibrium, but it is not sufficient because it holds for all prices,
whether they are equilibrium prices or not. For a set of prices to become equilibrium prices,
the sufficient condition is that demand is no greater than supply at the equilibrium as in
Equation [3.2]:
𝛿𝑖(𝑝∗) = 𝜒𝑖(𝑝
∗) − 𝑒𝑖 ≤ 0 ∀𝑖 𝑎𝑛𝑑 𝑝∗ > 0 [3. 2]
Where 𝑝∗ is the equilibrium price, 𝜒𝑖(𝑝∗) is the market demand at the equilibrium price,
and 𝑒𝑖 is the market supply.
Under this condition, prices drive the allocation of resources and clear the market. This is
the general form of the Walrasian equilibrium. In case of strict equality, there is no excess
demand. In case the supply is greater than the demand, there are “free goods” in the market,
whose prices – following equation [2.6] – should be zero (Cardenete et al., 2017).
Equation [3.1] implies that one out of the N equations is redundant. Hence, there are N
variables with N-1 equations. To solve the system of equations, one price needs to be fixed
as a numeraire. Then, the whole system solves for relative prices. The uniqueness of the
Walrasian equilibrium is an important condition for comparative static analyses. For a pure
exchange economy, a sufficient condition for the uniqueness of the equilibrium is that the
aggregate excess demand functions satisfy the gross substitutability property, i.e. the
elasticity of substitution in consumption for each agent is larger than one (Cardenete et al.,
2017).
Moving from the abstract exchange economy to a real economy with production
possibilities, the agents’ rationality assumption is extended to producers. Hence, consumers
maximise their utility while producers maximise their profit. The equilibrium price clears
the market and ensures that both households and firms achieve their objectives
simultaneously. When the economy is affected by an exogenous shock or a policy change,
General equilibrium models: theory and applications
35
a new set of prices is obtained, which in turn determines production, consumption,
employment and incomes. In addition to the agents’ rationality, prefect competition
conditions are usually postulated for the working of the market. Perfect competition implies
a large number of participants and no barriers to the circulation of information in the market.
Hence, prices are known to all participants and they are all price takers, meaning that they
cannot individually exert any influence over prices. When markets are perfectly
competitive, there is the implicit assumption that the production technology is governed by
constant returns to scale and that profits are driven to zero (Bacchetta et al., 2012). A
necessary and sufficient condition for optimality in perfectly competitive markets is that the
ratio of prices equals the marginal rate of transformation. Subsequently, the way equilibrium
prices are set relies on an efficient mechanism with implications for welfare analysis.
The inference of welfare effects from the CGE model is appealing because the material
resources of any economy are there to satisfy human needs. Two theorems of welfare
economics provide the background for capturing welfare effects in a CGE model. The first
is that any Walrasian allocation is a Pareto efficient allocation. The second is that a Pareto
efficient allocation can be implemented as a Walrasian allocation with the use of lump-sum
transfers (Cardenete et al., 2017). A Pareto efficient allocation is one where nobody can be
made better off without making at least one individual worse off. As such, a Pareto
efficiency only depends on total endowments and individual preferences. However, the
Walrasian equilibrium depends on individual preferences, individual endowments and on
prices. Therefore, not all Pareto efficient allocations can be a Walrasian equilibrium.
The first theorem implies that in the Walrasian equilibrium, all the agents reach a collective
optimal welfare, such that departing from the equilibrium will generate more welfare losses
than gains. Subsequently, the Walrasian equilibrium lies on the contract curve, representing
a subset of the Pareto efficient allocations, where all the agents do at least as well as in their
initial endowments. The second theorem implies that any Pareto efficient allocation can be
made equivalent to the Walrasian equilibrium by providing a lump sum to the looser from
the winner, under the assumption of convexity in preferences and in production technology.
Following the second theorem, the considerations of equity and efficiency can be separated,
since the same efficiency level can be achieved with different distribution of endowments.
The welfare measures that are widely used are the Hicksian compensating and equivalent
variations. The compensating variation considers the new equilibrium incomes and prices,
and calculates how much must be taken away or added in order to maintain households at
their initial utility level. In contrast, the equivalent variation takes the old equilibrium prices
and incomes, calculates how much must be added or taken away in order to bring
households to their new utility level after the policy change. Using these measures is
attractive since they are expressed in monetary units, making them intuitively
Chapter 3
36
comprehensible (Bacchetta et al., 2012). Hence, they could be used for interpersonal
comparisons of welfare at country and multi-country levels. Aggregating welfare benefits
and costs using the compensating or equivalent variations builds on the principle that lump-
sum transfers from the winners to the losers is possible, such that the whole economy will
be at least as well off as before.
3.3. Modelling labour markets in CGE models
Labour markets are usually differentiated in CGE models to ensure imperfect
substitutability based on the skill level or the social characteristics (age, gender, etc.) of
workers. Two common issues that necessitate the modeller’s attention are how to depict
labour mobility across sectors and how does the labour supply responds to changes in
wages. This section discusses different options for dealing with these two issues. All the
evaluated options have their merits and shortcomings. Subsequently, choosing an option
depends on the characteristics of the economy under investigation and on the specific
research question.
3.3.1. Modelling labour mobility in CGE models
Labour mobility across sectors is a core aspect of structural changes in the economy. In the
CGE literature, it is usually dealt with using one of the two extreme assumptions. Labour is
either perfectly mobile across sectors or specific to individual sectors. Perfect mobility of
labour implies that workers can move between sectors, until wages in all sectors equalise.
Hence, it is assumed that labour is homogenous and should be paid the same irrespective of
the sector of employment. However, empirical data show that workers with similar skill
level or education who are employed in different sectors receive significantly different
wages (Flaig et al., 2013b). This suggests the existence of differences in the marginal
productivity of labour according to the sector of employment. Subsequently, different
approaches have been developed to account for labour heterogeneity.
A first approach relies on the segmentation of the labour markets and the use of a CET
function to transform the labour used in one segment into the labour used in the other
segment. Keeney and Hertel (2005) and Banse et al. (2013) segmented the labour markets
into farm and non-farm segments and used a CET specification to transform farm labour
into non-farm labour. The CET specification has the advantage not to assume homogenous
labour since labour is differentiated by segments. However, it normalises wages to unity
and reallocates labour in terms of efficiency units based on relative wages and the elasticity
of the CET function. Hence, the factor market clearing condition becomes opaque as labour
is no longer measured in physical units.
General equilibrium models: theory and applications
37
A second approach is to account explicitly for labour heterogeneity using a sector-based
classification. This approach keeps the market clearing condition transparent since labour
is measured in physical units and a unique price definition for each labour class is ensured.
A first limitation to this approach is the amount of data required to reach such a level of
disaggregation. A second limitation is that for this level of disaggregation, labour becomes
sector-specific and there is no possibility to reallocate workers between sectors.
A way-out for the later limitation is the labour mobility function developed by McDonald
and Thierfelder (2009). This function allows physical units of labour to transit across sectors
based on response elasticities and the ratio between the wage the worker could earn in his
sector of origin and the wage this worker could earn in any other sector. Under this
approach, labour moves either to pools linked to multiple segments (with perfect mobility
within each pool) or between predefined pairs of segments, where each segment represents
the labour employed in one or more sectors. Workers who belong to a notionally identical
group and working in the same market segment receive the same wage, which reflects a
long-term equilibrium situation.
An alternative to the labour mobility function is the proximity index approach of Lofgren
and Cicowiez (2017). This approach retains the principle of reallocation of labour to other
sectors based on changes in relative wages. However, by contrast to McDonald and
Thierfelder (2009), Lofgren and Cicowiez (2017) consider that workers migrating to a new
market segment are less productive than workers previously in that segment. Firms consider
the gap between efficient and physical labour in their hiring decisions. Accordingly, wages
are determined in productivity terms and the productivity of a worker depends on the
seniority. Hence, firms pay lower wages (per physical unit) to a new worker than to another
one with notionally the same personal characteristics, except seniority in the sector.
Although this approach is suitable to capture the reallocation costs and the productivity loss
associated with labour mobility, it only fits a short-term perspective. Arguably, in the long-
term, new workers will adapt and reach the level of productivity of workers who are already
in the sector, and hence they would receive the same wage.
3.3.2. Modelling labour supply response to changes in the wage rates
The assumptions embedded in the model regarding how responsive is the labour supply to
changes in wages have several implications for the operation of the labour market.
Conventionally, one of two extreme specifications of the labour market is used in CGE
models. The supply of labour is either assumed perfectly inelastic (fixed supply) or perfectly
elastic (surplus labour). In recent years, an intermediate solution with an upward-sloping
labour supply curve has been included in several models. Finally, a fourth way of specifying
Chapter 3
38
the labour markets has emerged with the labour-leisure trade-off. This section discusses
these four stylized specifications of the labour market conditions and clarifies the theoretical
implications for the welfare analysis.
The fixed labour supply specification considers the time allocated by households to the
market activities, i.e. activities within the SNA production boundary, and asserts the labour
supply to be fixed at that level. While households are the active agents in the labour markets,
their decisions are indifferent to changes in the price of labour. Accordingly, the labour
supply curve is perfectly inelastic. This specification implies a strong separability between
the uses of labour within and outside the SNA boundary. Hence, this treatment is neutral
with respect to the welfare generated outside the boundary, since there is no transfer of
labour across the boundary. Despite its merit of neutrality to welfare generated outside the
boundary and its consistency with standard economic theories that consider households to
be the active agents in the operation of labour markets, the assumption of strong separability
between uses of labour within and outside the boundary is open to challenges, even in
economies with no involuntary unemployment. In fact, it is reasonable to assume that
household decisions in labour markets are influenced by changes in the real wages.
The surplus labour specification recognises the presence of involuntary unemployment. It
assumes the existence of a spare capacity of labour that can be drawn into employment
within the production boundary at zero marginal cost. Accordingly, employment in the
market activities can be increased, while keeping the real wages fixed. This assumption is
challenged by the empirical evidence that changes in the level of employment are correlated
with changes in the real wage rate (Blanchflower and Oswald, 1995). On the other hand,
the surplus labour specification is neutral to changes in the welfare generated outside the
boundary by assuming labour to have zero opportunity cost outside the production
boundary. However, this apparent neutrality renders this specification open to challenges as
labour outside the boundary is often engaged in activities producing services for the use of
households. This is particularly the case in the developing countries, where there are no
unemployment benefits and labour not employed within the production boundary is often
engaged in low-productivity activities producing services for the entire household (Aragie
et al., 2017). An additional criticism of the surplus labour is that it presumes factors to be
the active agents making decisions in the operation of markets. Once the quantity of labour
needed in the market activities is determined, part of the surplus labour is drawn into the
market from each household in the same proportions as recorded in the base year. However,
in standard economic theories, the decision-making agents are the owners of labour, i.e.
households, who decide the amount of labour to allocate to the market activities based on
changes in wage levels, and based on their respective labour endowments and the utility
they each derive from time uses in the non-market activities (McDonald, 2018).
General equilibrium models: theory and applications
39
The upward-sloping curve specification derives from the empirical evidence that changes
in the wage rates influence the supply of labour within the production boundary. This
treatment considers that labour enters the production boundary at a positive marginal cost.
However, it implicitly assumes the opportunity cost of labour outside the production
boundary to be zero. Hence, this specification is not neutral with respect to the welfare
generated outside the boundary. When a transfer across the boundary takes place, the utility
forgone outside the boundary is presumed to be zero, while absorption increases as activities
within the boundary pay a positive price for the additional labour supplied, which increases
labour and household income. Subsequently, part of increases in the measured absorption
is realised from the reduction of welfare generated outside the boundary (McDonald, 2018).
Moreover, the theoretical and behavioural foundations of the upward-sloping curve are not
supported by standard economic theories. Its use may be rationalised with non-competitive
theories of the labour market such as the union bargaining power, efficiency wage and
labour contract analytical frameworks (Blanchflower and Oswald, 1995). Finally, similar to
the surplus labour specification, this specification assumes households to be passive agents
in the operation of labour markets, which runs counter standard economic theories.
The labour-leisure trade-off accounts for household use of time within and outside the
production boundary. The opportunity cost of labour outside the boundary is explicitly
provided in the model. Its value equals the wage rate paid within the production boundary.
Since the price of labour across activities either within or outside the boundary is the same,
the labour-leisure trade-off specification complies with the “Law of One Price” which is
presumed to hold in any price driven whole-economy model. The household utility is
defined at full consumption recognising that households do not only derive utility from the
consumption of goods and services purchasable from the markets, but also from services
they produce for their own use outside the production boundary. The services produced
outside the boundary are referred to by the generic term leisure. By defining household
labour at full time endowment and household utility at full consumption, this model
specification captures the trade-off facing households while allocating time within and
outside the production boundary and links their consumption outcomes to the decisions
made in the labour markets. This model specification measures the welfare generated on
both sides of the production boundary. When transfers of labour occur, the positive and
negative welfare effects on both sides of the boundary are recorded. The model specification
is consistent with standard economic theories and assumes households and activities to be
the active decision-making agents in the operation of labour markets. A critical point of the
labour-leisure trade-off is its incompatibility with involuntary unemployment, as labour can
always be employed either within or outside the boundary.
Chapter 3
40
3.4. Application of CGE modelling
To apply the CGE theoretical framework to empirical policy experiments, modellers need
data that display in a comprehensive way all the interdependencies at play within the
economy. For this purpose, they make use of social accounting matrices. The typical steps
involved in any applied CGE model are depicted in Figure 3-1.
Figure 3-1. Steps in an applied CGE model
Source: Own illustration
The first two steps (SAM development and model specification) are independent and do not
necessarily follow a definite order.
The SAM – step 1 in the diagram – is a framework to organise the data on the structure of
an economy and display all fundamental interactions taking place in that economy. It
provides the essential data required to operationalise a CGE model. For a CGE application,
it may be needed to develop a SAM from scratch. Even when a SAM is available, there is
often a need to aggregate or disaggregate some sectors of interest or to update the SAM to
a reference year that is more suitable for the analysis. The SAM framework has been
presented in Chapter 2 and the construction of a SAM is documented in Chapter 5.
The model formulation – step 2 in the diagram – provides the functional form of the
behaviour of each agent in the economy. Most applied CGE models allow intra-industry
trade by assuming that goods differ by country of origin, which is known as the Armington
assumption. Firms are assumed to maximise profits subject to limited production factors
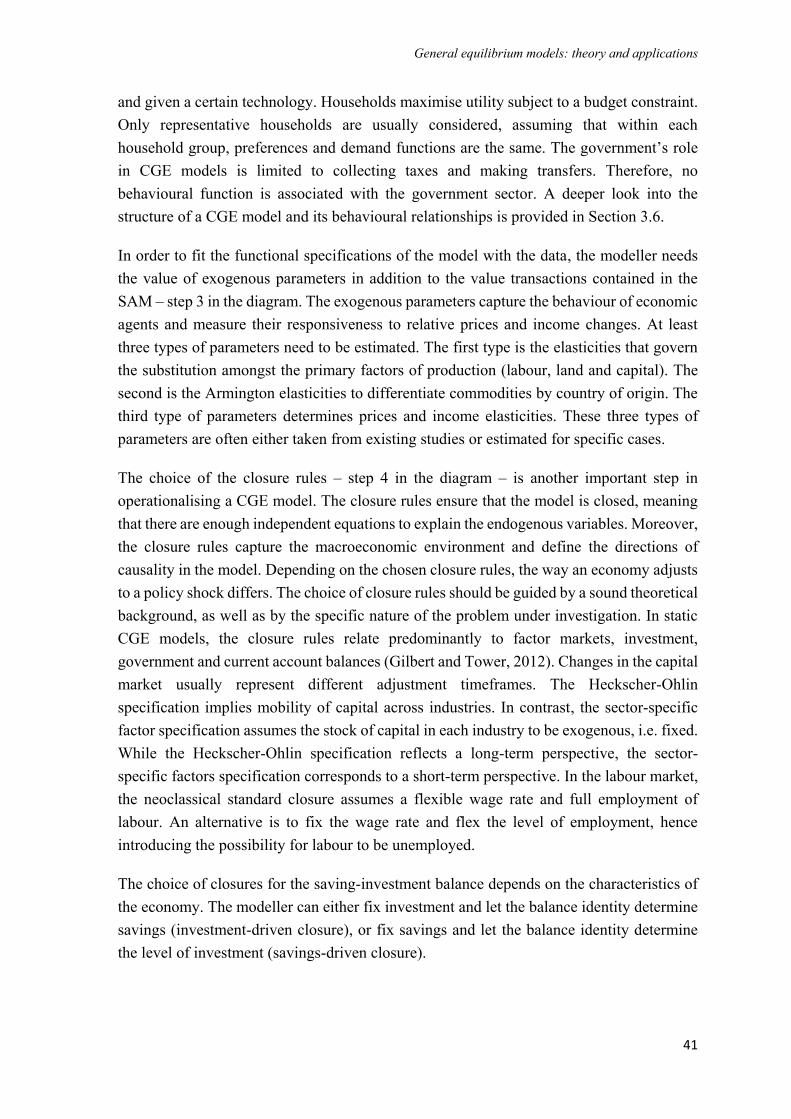
General equilibrium models: theory and applications
41
and given a certain technology. Households maximise utility subject to a budget constraint.
Only representative households are usually considered, assuming that within each
household group, preferences and demand functions are the same. The government’s role
in CGE models is limited to collecting taxes and making transfers. Therefore, no
behavioural function is associated with the government sector. A deeper look into the
structure of a CGE model and its behavioural relationships is provided in Section 3.6.
In order to fit the functional specifications of the model with the data, the modeller needs
the value of exogenous parameters in addition to the value transactions contained in the
SAM – step 3 in the diagram. The exogenous parameters capture the behaviour of economic
agents and measure their responsiveness to relative prices and income changes. At least
three types of parameters need to be estimated. The first type is the elasticities that govern
the substitution amongst the primary factors of production (labour, land and capital). The
second is the Armington elasticities to differentiate commodities by country of origin. The
third type of parameters determines prices and income elasticities. These three types of
parameters are often either taken from existing studies or estimated for specific cases.
The choice of the closure rules – step 4 in the diagram – is another important step in
operationalising a CGE model. The closure rules ensure that the model is closed, meaning
that there are enough independent equations to explain the endogenous variables. Moreover,
the closure rules capture the macroeconomic environment and define the directions of
causality in the model. Depending on the chosen closure rules, the way an economy adjusts
to a policy shock differs. The choice of closure rules should be guided by a sound theoretical
background, as well as by the specific nature of the problem under investigation. In static
CGE models, the closure rules relate predominantly to factor markets, investment,
government and current account balances (Gilbert and Tower, 2012). Changes in the capital
market usually represent different adjustment timeframes. The Heckscher-Ohlin
specification implies mobility of capital across industries. In contrast, the sector-specific
factor specification assumes the stock of capital in each industry to be exogenous, i.e. fixed.
While the Heckscher-Ohlin specification reflects a long-term perspective, the sector-
specific factors specification corresponds to a short-term perspective. In the labour market,
the neoclassical standard closure assumes a flexible wage rate and full employment of
labour. An alternative is to fix the wage rate and flex the level of employment, hence
introducing the possibility for labour to be unemployed.
The choice of closures for the saving-investment balance depends on the characteristics of
the economy. The modeller can either fix investment and let the balance identity determine
savings (investment-driven closure), or fix savings and let the balance identity determine
the level of investment (savings-driven closure).
Chapter 3
42
There are different options to close the government account depending on the economic
reality the modeller wants to depict. If the government faces a binding budget constraint,
the government balance needs to be fixed. Either the government expenditure or income
varies to keep the balance. In case the choice is made to let the government’s income vary,
a tax rate is chosen to adjust endogenously. Often the income tax is chosen for its income
distribution effect, which is absent from other tax instruments.
Finally, to close the current account balance that reflects savings/borrowing from the rest of
the world two options are often considered. Either the current account balance is fixed and
the exchange rate adjusts, or the exchange rate is fixed and the current account is flexible.
When a fixed current account is specified, it represents an economy with limited access to
foreign credit. This closure ensures that all the welfare effects are kept in the solution period.
By contrast, a flexible current account – by allowing extensive foreign borrowing –
increases consumption in the current period but does not account for paying back the debt.
Hence, the welfare effects are biased in this closure.
The model calibration – step 5 in the diagram – is the process of estimating all parameters
that remain unknown, such that together with the value transactions from the SAM and the
values of the behavioural parameters, the model is able to reproduce exactly the data of the
reference year. This estimation of the unknown parameters could be done empirically if the
required data are available. In most CGE applications, the procedure adopted to estimate
those parameters is to use the information contained in the SAM. The model calibration is
a mathematical procedure, whereby parameters such as shares and scale parameters are
calibrated using the SAM coefficients. Subsequently, the benchmark data contained in the
SAM are considered to represent the initial equilibrium. Some consistency checks should
be incorporated to help identifying possible errors.
When the model calibration is completed and the consistency checks do not reveal any
leakage in the system, the model is ready for policy experiments – step 6 in the diagram.
The policy change to be simulated should potentially have economy-wide effects on sectors
other than the one where the initial shock is implemented. The parameters whose values
need to be changed exogenously to implement the policy change as a shock to the model
should be identified. While choosing the variables to be turned into parameters, the
researcher needs to keep the equality between the number of equations and the number of
variables. After running the policy experiments, the model analysis consists in a pairwise
comparison between the counterfactual equilibrium and the benchmark (initial equilibrium).
The assessment of welfare changes is usually one of the main outcomes of a CGE model,
since the final goal of any policy is to improve people’s livelihoods. Welfare is usually
measured in terms of Hicksian compensating or equivalent variation. The net welfare is
obtained by summing up welfare gains and losses across individuals and across regions. For
General equilibrium models: theory and applications
43
a comparison across household groups, the welfare effects measured in monetary units tend
to be larger for wealthy households. Subsequently, a better basis for comparison across
income groups is to use the ratio of the welfare change to the initial household income.
3.5. Typology of CGE models
CGE models differ by their geographical scope, temporal structure and underlying
assumptions.
With respect to the geographical scope, it is possible to differentiate between single-country
(i.e. single-region) and multi-country (i.e. multi-regional) CGE models. While single-
country models are suitable to assess the effects of policy changes and external shocks on
the economy of a particular country/region, multi-country models are more appropriate to
investigate the welfare implications of global issues.
From the temporal structure perspective, static and dynamic CGE models are available. A
static model assesses the effects of a policy shock on the economy at only one point in time,
i.e. the results show the difference between two alternative future states of the economy
(with and without the policy shock). By contrast, a dynamic CGE involves multiple periods
and shows the timepath of the policy effects (Bacchetta et al., 2012). The dynamic group of
CGE models can be further differentiated into recursive dynamic and inter-temporal
models. While a recursive dynamic CGE model solves a sequence of static equilibria, in
which the agents’ behaviour is based on backward-looking adaptative expectations, the
inter-temporal CGE model is based on forward-looking rational expectations whereby
consumers and firms face an inter-temporal utility and profit maximisation function,
respectively.
As far as the underlying assumptions are concerned, there are CGE models with perfect or
imperfect competition, as well as CGE models with homogenous or heterogeneous firm
characteristics.
In the subsequent Section 3.7, the basic structure of the Static Applied General Equilibrium
model, version 2 (STAGE-2), which serves as a starting point for the applications run in
this thesis is presented. This model belongs to the class of static single-country models. It
has been selected because first, the applications conducted in this thesis focus on a single
region – the West Bank – and hence, a single country model is more suitable for the analysis.
Second, while dynamic models may provide rich insights on the timepath of policy effects,
they need to simplify the structure of the economy to remain computationally tractable
(Bacchetta et al., 2012). Moreover, dynamic models only matter if the policy shock is
Chapter 3
44
expected to affect the inter-temporal behaviour of consumption as well as the flow of
investment and changes in the capital stock. Therefore, for the analysis intended in the
applications conducted in Chapter 6, Chapter 7, Chapter 8 and Chapter 9 of this thesis, a
static model such as the STAGE-2 model is reasonable.
3.6. Basic structure of the STAGE-2 single-country model2
The STAGE-2 model belongs to a suite of single-country SAM-based static CGE models.
It is developed by McDonald and Thierfelder (2013) and coded in the General Algebraic
Modelling System (GAMS) software. The model is based on the microeconomic theory of
utility and profit maximisation, and assumes all markets to be in equilibrium. This section
presents the core components of the model.
As a static model, the STAGE-2 assesses the effects of a policy shock on the entire economy
at only one point in time, i.e. the results show the difference between two alternative future
states of the economy (with and without the policy shock). The main features of the STAGE-
2 model include: the differentiation between products by origin (Armington assumption),
the separation between activities and commodities that permits the modelling of multiple
product activities, the explicit treatment of transaction costs (trade and transport margins),
a differentiation between competitive imports/exports, commodities that are only
imported/exported and commodities that are not traded. In addition, the model relaxes the
Harberger convention of homogeneous labour by capturing labour in physical units.
Subsequently, heterogeneous labour can be modelled with workers receiving different
returns in different activities.
The remainder of this section is organised as follows: the first Sub-section, 3.6.1, presents
the behavioural relationships captured in the model. The second Sub-section, 3.6.2,
discusses the price definitions and the price normalisation process. The Sub-section 3.6.3
describes the quantity system in the model. The Sub-section 3.6.4 reviews the major
accounts in the SAM and highlights the accounting identities underpinning those accounts.
Finally, the Sub-section 3.6.5 discusses market clearing conditions and closure rules in the
STAGE-2 model. For a detailed documentation of the model equations, the reader can refer
to McDonald and Thierfelder (2013).
2 This section draws on the extended model description for STAGE by McDonald and Thierfelder (2013)
General equilibrium models: theory and applications
45
3.6.1. The behavioural relationships in the model
The model uses a combination of linear and non-linear relationships to represent the
behaviour of the economic agents that are identified within the SAM. These relationships
are illustrated in Table 3.1 where rows are labelled by numbers and columns by letters. As
an illustration, the cell (4,C) depicts the behavioural specification of production by activities
using factors.
The production structure (4,C) assumes firms to maximise profits using a three-stage
production technology. In the first stage, different types of labour are combined to form an
aggregate labour input. In the second stage, aggregate labour is combined with capital and
land to form a new composite called “value added”, while goods are used as inputs to form
a composite intermediate good. At the top level, in the third stage, the two composites (value
added and intermediate goods) are combined to produce the final output. Different degrees
of substitution can be specified at each stage using a Constant Elasticity of Substitution
(CES) or Leontief (fixed proportions) technologies. Usually, the different types of labour
are considered substitutable in the first stage of the production. At the second stage, the
intermediate inputs (1,C) are considered to be used in fixed proportions to form the
composite intermediate good, while the natural factors can be substitutable. At the top level,
substitutability is also considered between composite intermediate goods and value added.
The domestic output (3,A) is divided between the domestic and export markets, assuming
an imperfect substitutability that uses a Constant Elasticity of Transformation (CET)
technology (1,I). Hence, the domestic producer allocates his domestic output to the domestic
or export market based on relative prices of commodities in the two markets. The model
can be specified to fit the small country assumption by assuming the domestic producer to
be a price taker. However, this assumption can be relaxed for selected export commodities
for which the country might be a large player in the international markets.
Households in the model are assumed to maximise their utility subject to preferences
represented by a Stone-Geary function, which is a linear expenditure system (1,E). the
domestic demand is satisfied by composite commodities that are formed from the domestic
production sold on the domestic market and the composite imports (9,A). Imports and
domestic production for domestic market are assumed to be imperfect substitutes
(Armington assumption). A CES technology is applied to combine the domestically
produced commodities and imports with their respective quantities being determined by
their relative prices. In the model, institutions are the owners of factors. Factorial income
accrues to them through a functional distribution that is determined in the model. In its
simplest specification, quantities of factors supplied by each institution are fixed.
Subsequently, the functional distribution is in fixed proportions (5,D), (6,D), (9,D).
Chapter 3
46
Beside the previously listed behavioural specifications, the remaining relationships in the
model are linear. All tax rates are declared as variables with scaling factors either declared
as variables or as parameters to allow the user to vary them equiproportionately and/or
additively. Commodity and activity taxes (7,A), (7,C) are expressed as ad valorem tax rates,
while income taxes are defined as proportions of the household and enterprise incomes
(7,E), (7,F). Import duties and export taxes apply to imports and exports respectively, while
sales taxes are applied to all domestic absorption. Production taxes are levied on the value
of output by each activity, while activities also pay taxes on the use of specific factors.
Factor income taxes are charged on factor income after allowance of depreciation (8,C) and
prior to the distribution of residual income to households (5,D).
Households, enterprises and the government are assumed to save a fixed proportion of their
disposable income (8,E), (8,F) and (8,G). Enterprise and government expenditures consist
of commodity demand (1,F) (1,G), which are assumed to be in fixed proportions in real or
volume terms and transfers that are also assumed to be in fixed shares (5,F), (5,G), (6,G).
The domestic margins (1,B), (2,A) are transactions between commodities and are retained
in fixed shares. The rest of the world makes transfers to domestic institutions (4,I), (5,I),
(6,I), and (7,I) that are fixed exogenously. The foreign savings or current account balance
(8,I) clears the rest of the world account. Scaling factors are available for a number of key
parameters to enable the user to vary them exogenously. For example, technology changes
can be introduced by varying the scaling factors associated with the activity-specific
efficiency variables. Finally, the model can accommodate a large range of closure rules to
allow the user to experiment with various permutations.
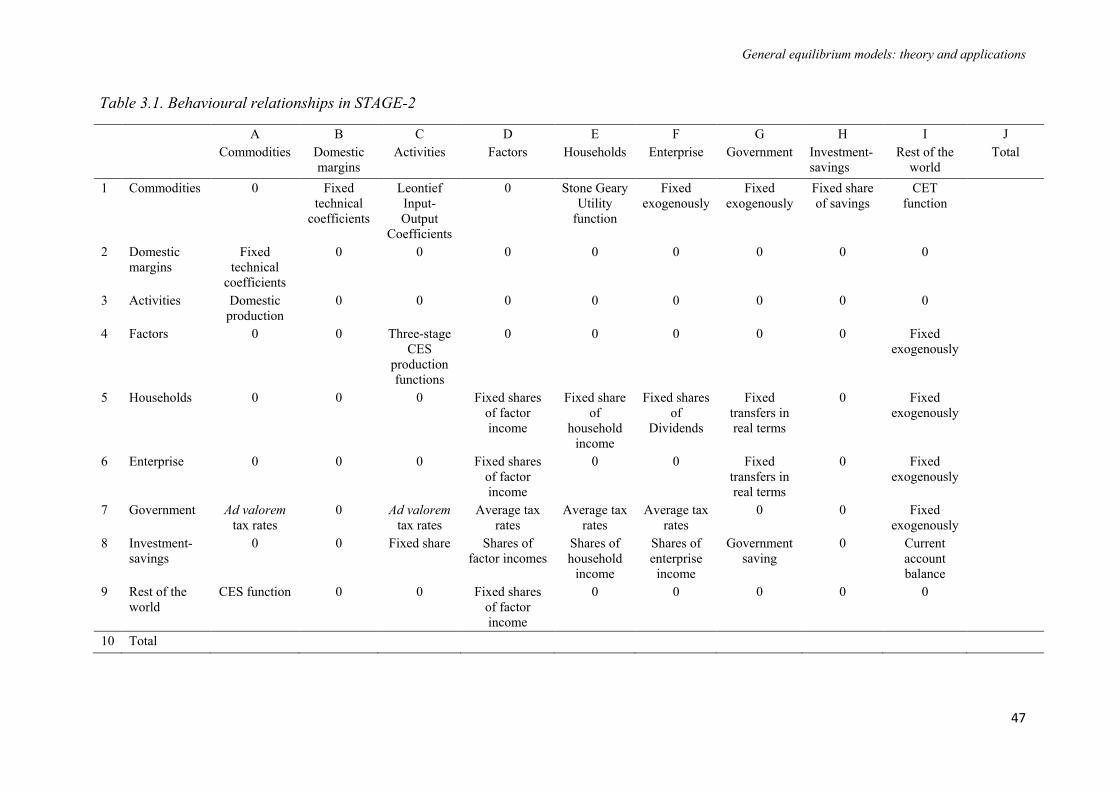
General equilibrium models: theory and applications
47
Table 3.1. Behavioural relationships in STAGE-2
A B C D E F G H I J
Commodities
Domestic
margins
Activities Factors Households Enterprise Government Investment-
savings
Rest of the
world
Total
1 Commodities 0 Fixed
technical
coefficients
Leontief
Input-
Output
Coefficients
0 Stone Geary
Utility
function
Fixed
exogenously
Fixed
exogenously
Fixed share
of savings
CET
function
2 Domestic
margins
Fixed
technical
coefficients
0 0 0 0 0 0 0 0
3 Activities Domestic
production
0 0 0 0 0 0 0 0
4 Factors 0 0 Three-stage
CES
production
functions
0 0 0 0 0 Fixed
exogenously
5 Households 0 0 0 Fixed shares
of factor
income
Fixed share
of
household
income
Fixed shares
of
Dividends
Fixed
transfers in
real terms
0 Fixed
exogenously
6 Enterprise 0 0 0 Fixed shares
of factor
income
0 0 Fixed
transfers in
real terms
0 Fixed
exogenously
7 Government Ad valorem
tax rates
0 Ad valorem
tax rates
Average tax
rates
Average tax
rates
Average tax
rates
0 0 Fixed
exogenously
8 Investment-
savings
0 0 Fixed share Shares of
factor incomes
Shares of
household
income
Shares of
enterprise
income
Government
saving
0 Current
account
balance
9 Rest of the
world
CES function 0 0 Fixed shares
of factor
income
0 0 0 0 0
10 Total
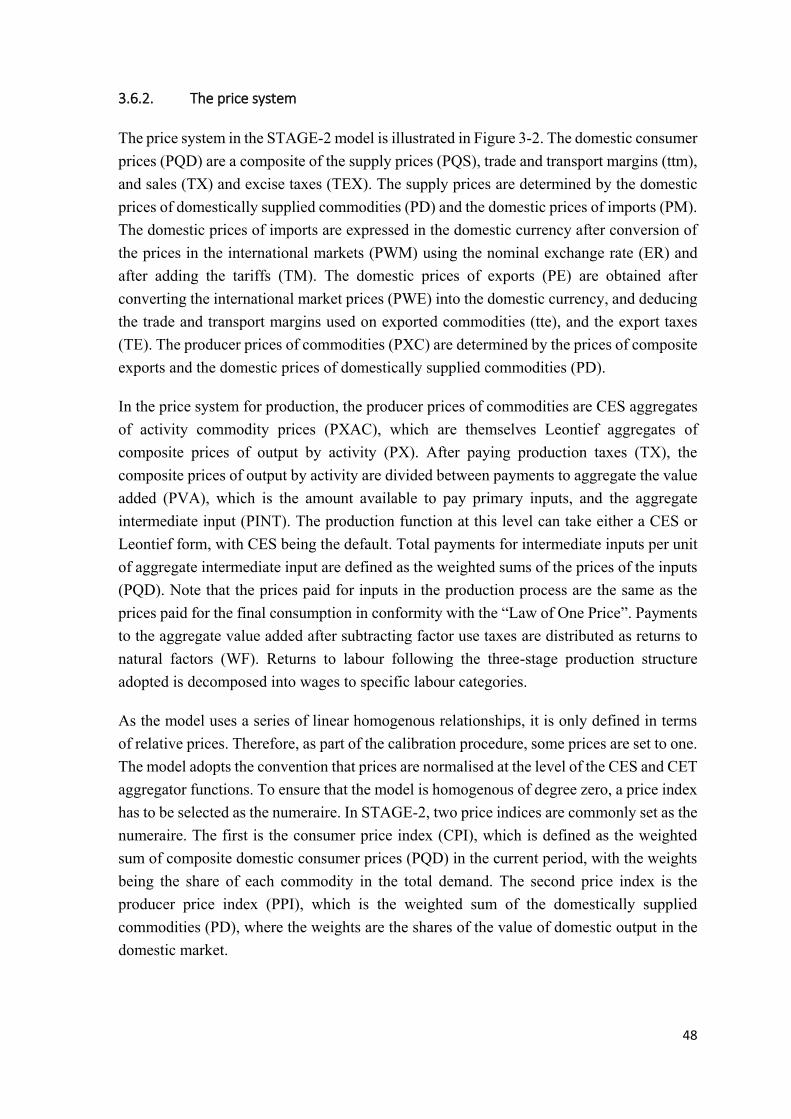
48
3.6.2. The price system
The price system in the STAGE-2 model is illustrated in Figure 3-2. The domestic consumer
prices (PQD) are a composite of the supply prices (PQS), trade and transport margins (ttm),
and sales (TX) and excise taxes (TEX). The supply prices are determined by the domestic
prices of domestically supplied commodities (PD) and the domestic prices of imports (PM).
The domestic prices of imports are expressed in the domestic currency after conversion of
the prices in the international markets (PWM) using the nominal exchange rate (ER) and
after adding the tariffs (TM). The domestic prices of exports (PE) are obtained after
converting the international market prices (PWE) into the domestic currency, and deducing
the trade and transport margins used on exported commodities (tte), and the export taxes
(TE). The producer prices of commodities (PXC) are determined by the prices of composite
exports and the domestic prices of domestically supplied commodities (PD).
In the price system for production, the producer prices of commodities are CES aggregates
of activity commodity prices (PXAC), which are themselves Leontief aggregates of
composite prices of output by activity (PX). After paying production taxes (TX), the
composite prices of output by activity are divided between payments to aggregate the value
added (PVA), which is the amount available to pay primary inputs, and the aggregate
intermediate input (PINT). The production function at this level can take either a CES or
Leontief form, with CES being the default. Total payments for intermediate inputs per unit
of aggregate intermediate input are defined as the weighted sums of the prices of the inputs
(PQD). Note that the prices paid for inputs in the production process are the same as the
prices paid for the final consumption in conformity with the “Law of One Price”. Payments
to the aggregate value added after subtracting factor use taxes are distributed as returns to
natural factors (WF). Returns to labour following the three-stage production structure
adopted is decomposed into wages to specific labour categories.
As the model uses a series of linear homogenous relationships, it is only defined in terms
of relative prices. Therefore, as part of the calibration procedure, some prices are set to one.
The model adopts the convention that prices are normalised at the level of the CES and CET
aggregator functions. To ensure that the model is homogenous of degree zero, a price index
has to be selected as the numeraire. In STAGE-2, two price indices are commonly set as the
numeraire. The first is the consumer price index (CPI), which is defined as the weighted
sum of composite domestic consumer prices (PQD) in the current period, with the weights
being the share of each commodity in the total demand. The second price index is the
producer price index (PPI), which is the weighted sum of the domestically supplied
commodities (PD), where the weights are the shares of the value of domestic output in the
domestic market.
General equilibrium models: theory and applications
49
Figure 3-2. Price system in the STAGE-2 model
Source: Own illustration
3.6.3. The quantity system
Figure 3-3 provides an illustration of the quantity system in STAGE-2. The composite
consumption commodity (QQ) consists of demands for intermediate inputs (QINTD),
consumption by households (QCD), government (QGD), and enterprise (QED), gross fixed
capital formation (QINVD) and stock changes (dstoc). An equilibrium condition ensures
that total demand equals total supply, which is a mix of the domestically produced
Chapter 3
50
commodities (QD) and imports (QM). Domestic and imported commodities as imperfect
substitutes are represented by a CES technology. The domestic commodity output (QXC)
is allocated between the domestic market (QD) and the composite export (QE) under the
maintained assumption of imperfect transformation.
The model allows for multiple product activities meaning that domestically produced
commodities can come from multiple activities. Hence, the total production of a commodity
is defined as the sum of the amount of that commodity produced by each activity. The
domestic production of a commodity (QXC) is a CES aggregate of the quantities of
commodity produced by different activities (QXAC) which are produced in fixed
proportions by each activity. Subsequently, the output of QXAC is a Leontief aggregate of
the output of each activity (QX). Following the three-stage production structure adopted,
the output of each activity, at the top level of the nesting, is a CES aggregate of the quantities
of aggregate intermediate input (QINT) and value added (QVA). At the second level of the
nesting, the aggregate intermediate input is composed of different inputs combined in fixed
proportions, while the quantity of value added is a CES aggregate of factor demand by each
activity (FD). At the lowest level of the nesting, labour demand is a CES function of the
specific demand of various labour categories.
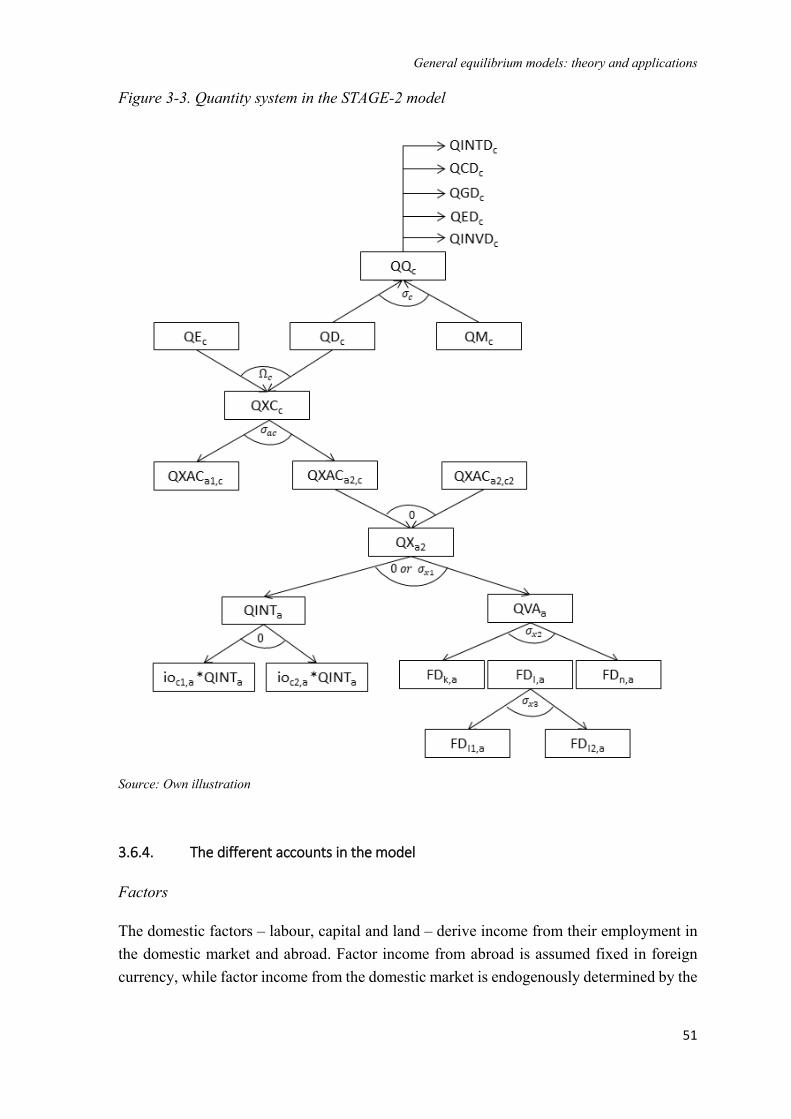
General equilibrium models: theory and applications
51
Figure 3-3. Quantity system in the STAGE-2 model
Source: Own illustration
3.6.4. The different accounts in the model
Factors
The domestic factors – labour, capital and land – derive income from their employment in
the domestic market and abroad. Factor income from abroad is assumed fixed in foreign
currency, while factor income from the domestic market is endogenously determined by the
Chapter 3
52
forces of demand and supply. The total factor income is distributed to institutions who own
the factors in fixed shares, after accounting for depreciation and factor taxes. The model
includes the assumption that factor prices are averages. The possibility that payments to
notionally identical factors in different activities is captured with the variable “sectoral
proportions for factor prices”. These proportions are assumed fixed by default. Foreign
factors employed in the domestic economy receive a compensation in fixed proportions of
factor income after depreciation and payment of factor taxes.
Factor unemployment is introduced in the model as a mixed complementarity problem. The
total supply of a natural factor consists of the total demand and a stock that is currently
unemployed. The neoclassical assumption that treats unemployment as a spare capacity is
used and hence, firms can employ as much of the unemployed factor they wish without
needing to increase wages. When the pool of unemployed factor is empty, then the real
wage can increase again and clear the factor market. Thus, two segments of the labour
supply function are generated: a horizontal one until the pool of unemployed factor becomes
empty, and a vertical one from that point onwards, reflecting full employment.
Households
Households receive income from different sources, including the factors they own, transfers
from the government, from enterprises, from other households and remittances from abroad.
This income is distributed among households in fixed proportions. Household income is
used for consumption of goods and services, for which households are assumed to maximise
their utility according to a Sone-Geary function. Part of the income is used to pay transfers
to other households, and transfers abroad, which are defined in fixed proportions after
deducting direct tax to household income. Household savings are also defined as shares of
household income after tax.
Enterprise
The enterprise income is made of factor income – essentially returns to capital – and
earnings abroad that are fixed in foreign currency as well as transfers (subsidies) from the
government that are fixed in real terms. The enterprise income is spent in fixed proportions
on commodities, and transfers (dividends and profits) to households and government.
Savings in the enterprise account are fixed shares of the enterprise income after tax.
Government
The government derives income from taxes, factors it owns, dividends from state
enterprises, and budget support from abroad. Several tax instruments are specified in the
General equilibrium models: theory and applications
53
model: income tax, import tariff, export tax, sales tax, excise tax, value added tax, indirect
tax on production, factor use tax, factor income tax, to name a few. Each tax instrument is
associated with adjustment parameters to allow the modeller to simulate any government
intervention by scaling up/down taxes either additively of multiplicatively. The government
consumes commodities in fixed proportions, and makes fixed transfers to households and
enterprises in real terms, while its savings balance the account.
Trade and transport margins
Trade and transport margins record the costs of delivering a commodity from its source of
production to its final consumption place. The model represents margins by the quantity of
trade and transport services required to transfer a unit of the commodity to its domestic or
foreign consumer. Thus, the quantity of trade and transport services required by the
economy is equal to by the quantity of commodities demanded times the quantity of margin
services per unit of delivered commodity. The quantity of the commodity required to
produce a unit of margin is defined by a Leontief technology where the input coefficient
defines the quantities of commodity c required to produce a unit of the margin service.
Given the Leontief technology, the unit cost of the margin service is a simple weighted
average of the costs of the commodities used in its production.
Saving and investment accounts
Total savings in the economy are composed of household savings, enterprise savings,
government savings, and the current account balance. Household and enterprise savings are
defined as shares of household, and enterprise income after tax respectively. Government
savings (internal balance) and the current account balance (external balance) are defined as
residuals that equate income and expenditures in the two respective accounts.
In the investment block, the proportions of the investment demand in the base period are
fixed and can be varied using an adjustment parameter. The value of investment demand is
equal to the volume of investment demand valued at current prices plus the current priced
value of stock changes also defined as fixed proportions of their levels in the base period.
3.6.5. The market clearing equations and closure rules
The market clearing equations in the model ensure the simultaneous clearing of all markets
and accounts. There are six relevant markets and accounts: the factor market, commodity
market, enterprise, government, capital, and rest of the world accounts. By default, the
Chapter 3
54
model adopts a full employment assumption for the factor market, implying that demand
equals supply, and any change in the factor demand results in changes in its price. The
alternative is that factor prices are fixed and any change in factor demand is met with a
change in the pool of unemployed factor. Hence, the factor supply can either be infinite or
be capped with an upper bound given the amount of the unemployed factor. In case of a
definite pool of unemployed factor, the factor supply curve has two segments: one that is
horizontal until the pool of unemployed factor is emptied, and one that is vertical from that
point onwards.
By default, factors are also assumed perfectly mobile across sectors, reflecting a long-term
time horizon. Alternatively, factors can be assumed to be activity-specific to reflect a short-
term perspective. This requires fixing factor demand for the selected factors and relaxing
the returns to this factor in different activities. The condition of fixed total factor supply
becomes redundant and can be relaxed, while at least one of the sectoral proportions for
factor prices must be fixed.
The market clearing condition in the commodity markets require the supply of the
composite commodity (QQ) to be equal to the total of domestic demands (QINTD, QCD,
QED, QGD, QINVD, and the stock changes). By default, government savings and the
current account balance clear the government and rest of the world accounts. Alternatively,
the current account balance can be fixed. In that case, the exchange rate is set flexible to
clear the rest of the world account. Government savings can also be fixed, and then either
government revenues or expenditures must adjust. To allow government revenues to vary,
one of the tax rates can be set flexible. To allow government expenditures to vary, the
volume of commodities demanded by the government, the value of government
consumption expenditure, or the share of government expenditure in total value of domestic
final demand should be variable.
To close the enterprise account, the volumes of commodities demanded by enterprises must
be fixed. An alternative is to make the volume of enterprise consumption flexible and fix
its value or share in total value of domestic final demand.
To clear the capital market, total savings must equal the value of total investment. In order
to provide a check on the model specification, a slack variable is introduced in the equation.
It returns a zero value when all markets are cleared and the model is fully closed.
The closure rules for the savings-investment account are such that the determinants of either
savings or investment must be fixed. The model offers different options to achieve that
outcome: fixing savings so that investment adjust can be considered as a neoclassical
approach, while fixing investment and letting savings to adjust corresponds to a Keynesian
approach.

General equilibrium models: theory and applications
55
3.7. Conclusion
A CGE model accounts for all interdependencies in the economy. Hence, it is well suited
for the assessment of a policy change or an exogenous shock on the performance and
structure of the whole economy through all individual impact channels. The model assumes
that all markets in the base period are in equilibrium. When there is an exogenous shock, a
new set of prices is obtained, which in turn determines the levels of production,
consumption, employment and income in the new equilibrium. Static CGE models, such as
the STAGE-2 model, allow the comparative analysis of alternative future equilibrium states
of the economy (with and without the policy shock). While this class of models can
incorporate a lot of detail about the structure of the economy under investigations, it does
not capture the process of adjustment to the new equilibrium. By contrast, dynamic CGE
models capture the adjustment path but need to simplify the structure of the economy to
remain computationally tractable.
The CGE modelling requires closing the system to avoid “free lunches” and to ensure that
the number of equations is equal to the number of variables such that the model can solve.
Different closures rules can be adopted. As the choice of closure rules can drive the model
results, it is a good practice to state explicitly the closure rules adopted and the reasons
behind their choices, in order to let the reader evaluate these choices and reflect on the
model results accordingly. The use of alternative closures should often be explored to
provide a sensitivity analysis of how different closure choices affect the simulation results
instead of pinning faith on a single set of assumptions.
Most CGE applications rely on agent rationality and perfectly competitive markets. Modern
literature on behavioural economics demonstrates that individuals may not be fully rational
(Aronsson and Löfgren, 2010). Moreover, in many cases, markets are not perfectly
competitive. Some products are highly differentiated and their production exhibits
increasing returns to scale. Existing firms have a market power that allows them to influence
prices. Such complexities are now accounted for in a few CGE applications by incorporating
product and firm differentiation as well as monopolistic competition.
In most models where perfect competition is assumed with homogenous products, intra-
industry trade is explained by assuming goods to differ by country of origin, also referred
to as Armington assumption. Accordingly, each country is the unique supplier of its
differentiated product. A consequence of this assumption is the large terms of trade (ratio
of a country’s export and import prices) effects of trade liberalisation simulations.
A corollary of the Armington assumption in CGE models is that trade expands only at the
intensive margin. In other words, the volume of exports increases but neither the set of
destinations nor the set of exporters changes. Following liberalisation, trade expands at both
Chapter 3
56
intensive and extensive margins. The omission of the extensive margin effects in
Armington-type CGE models is the well-known “stuck on zero trade” problem (Bacchetta
et al., 2012). This implies that sectors with little or no trade are locked in the pre-existing
trade patterns. Similarly, countries with zero or small bilateral trade flows will always have
zero or small trade flows, even under significant reductions in trade barriers. Therefore,
such model specification does not suit countries with limited trade with the rest of the world
that are resulting from trade barriers.
The starting point in a CGE model is that the economy in the base year is in equilibrium.
The database provided by the SAM that serves as a benchmark for a CGE model, however,
embodies the rigidities and market distortions present in the base year. Assuming that those
rigidities and distortions remain in the experiment creates results that should be seen as
second-best situations (Bacchetta et al., 2012). Moreover, the quality of the information
used to derive the behavioural parameters (elasticities) which are needed to fit the functional
form of the model with the data is often questionable. Since the parameters govern the
responsiveness of economic agents, they play an important role in determining the outcome
of CGE simulations. However, they are often derived from previous studies that may not
be related to the country or the topic under investigation. In some cases, these parameters
only rely on guesstimates. The usual way to deal with the problem is to provide a sensitivity
analysis on a reasonable range of values for selected parameters. Another solution is to
assume a probability distribution of all estimated parameters and proceed to simultaneous
sensitivity analysis on all of them which results in generating probability distributions for
the output variables. However, these approaches also carry some limitations. First, the
reasonable range of each parameter or the a priori distributions still have to be guesstimated.
Second, a full unconstrained sensitivity analysis of all parameters simultaneously produces
a spread of results too large for practical use (Bacchetta et al., 2012).
Notwithstanding these limitations, the general equilibrium framework offers several
advantages. It provides a rigorous analytical framework to assess the economy-wide impact
of policy changes. It imposes income, expenditure and resource constraints to get rid of
“free lunches”. It has suitable properties to analyse the welfare effects of policies, and hence
is able to provide policymakers with a powerful tool to choose among alternative policies.
57
4
ECONOMIC CONSEQUENCES OF CONFLICTS: THE
CASE OF THE PALESTINIAN ECONOMY

Chapter 4
58
Economic consequences of conflicts
59
Chapter 4 Economic consequences of conflicts: the case of
the Palestinian economy
4.1. Introduction
The Palestinian-Israeli conflict attracts substantial attention in the media for the number of
causalities and its political developments. This conflict offers a unique natural experiment
field to assess the economic consequences of conflicts as the two economies in this conflict
are intertwined in many aspects. Two key areas that best epitomise the relations between
the two economies are: the trade regime and the labour market situation. The conflict is also
a good case to examine asymmetric relations between two trade partners in conflict, with
Palestine being heavily dependent on Israel for both trade and employment opportunities.
While there is a substantial literature on the political and violence dimensions of the conflict
(e.g. Benmelech et al., 2010; Bhavnani et al., 2011; Jaeger and Paserman, 2008), research
on the effects of the security-related restrictions imposed on the movement of goods,
services and labour is rather limited (Ihle and Rubin, 2013).
This thesis aims at exploring and quantifying the effects of changes in the conflict-related
barriers to trade and labour movements on the West Bank economy. To provide a
background for the policy scenarios, which are conduced in Chapter 6, Chapter 7, Chapter
8 and Chapter 9, this chapter reviews the existing literature describing the Palestinian
economy, the trade and labour market links with the Israeli economy and the consequences
of the conflict.
The next Section, 4.2, considers the evolution of the Palestinian economy in the aftermath
of the Six-day war in 1967 until 1987 – the first year of the uprising that resulted in a violent
conflict with Israel. The period before 1987 marks the beginning of the economic relations
between Israel and Palestine, which developed into an asymmetric economic integration. In
Section 4.3, details about the Oslo agreements and especially the Paris protocol on
economic relations between Israel and Palestine are reviewed. The Oslo agreements mark
the end of the first Palestinian uprising as well as the creation of the Palestinian National
Authority to meet the right of the Palestinian people to self-determination and self-
governance. The Paris protocol, which is part of the Oslo agreements, is a central piece for
understanding the economic relations between Palestine and Israel, and the Palestinian trade
and labour market policies.
Section 4.4 provides an overview of the security measures introduced or enforced by Israel
following the first Palestinian uprising. While these measures aim at improving security for
Israel, they effectively restrict movement of goods, services and people, not only between
Israel and the Palestinian territories, but also within the Palestinian territories. The
Chapter 4
60
consequences of these measures on the Palestinian economy are reviewed in Section 4.5.
Section 4.6 presents the roadmap for peace which promotes the end of the conflict with a
two-state solution for the final status. The political roadmap is supported by the international
community, and most political leaders in both Israel and Palestine are still committed to the
two-state solution. With the political roadmap is associated an economic roadmap which is
elaborated jointly by a group of scholars from both Israel and Palestine. This economic
roadmap sets the stage for the scenarios implemented in the three applications of this thesis,
with the specification of the scenarios provided in the Section 4.7 along with some
concluding comments.
4.2. The Palestinian economy from 1967 to 1987: asymmetric integration
with Israel
The course of economic development and trade performance in Palestine have been shaped
by the unusual links with the Israeli economy. These links are best illustrated by the labour
flows and the bilateral trade regime. After the 1967 war, Israel implemented a policy of
partial economic integration between itself and the occupied Palestinian territories
(Missaglia and Valensisi, 2014). The customs union consisted of a trade regime that was
ostensibly free and without customs borders within the geographical area comprising Israel,
the West Bank and Gaza from 1972 onwards (Arnon, 2007). Moreover, the Palestinian
labour was granted free access to the affluent Israeli economy. Nearly a third of the
Palestinian workers were employed in Israel over the 1970s and 1980s (UNCTAD, 2012).
This situation benefitted both sides. From the Israeli perspective, the Palestinian workers
are a cheap source of labour. Wages for Palestinian workers in Israel are 20 – 40% lower
than those of Israeli workers for the same jobs (Arnon and Bamya, 2007). Moreover, the
Palestinian labour hardly competes with the Israeli labour because most of the Palestinians
working in Israel are concentrated in a few sectors, where the domestic Israeli labour supply
falls short of demand (Rosenhek, 2006). From the Palestinian perspective, employment in
Israel is an important source of income that used to generate more than a quarter of the
Palestinian Gross National Product (Farsakh, 2002). The Palestinian average wage in Israel
is substantially higher than wages in the domestic market. Moreover, employment in Israel
is an important spillway for the growing Palestinian labour force as growth in the domestic
labour demand has been insufficient to absorb the rising labour force (Kock et al., 2012).
However, this economic integration is widely acknowledged as asymmetric as all decisions
were made by Israel, and predominantly served the Israeli interests (Dessus, 2004). While
Israeli products benefitted from free access to the Palestinian markets, Palestinian exports
to the Israeli markets were subject to strict regulations (Botta, 2010). The development of a
Economic consequences of conflicts
61
productive capacity in the Palestinian economy was held back by restrictions and
regulations of different sorts (Botta, 2010). Palestinian entrepreneurs had to apply for
licenses from the Israeli authorities before initiating economic activities, and were
confronted with uncertainty in the legal and tax frameworks. The expansion of the
Palestinian agricultural and industrial sectors was restricted by limitations on the use of
water and other natural resources (Dessus, 2004). The Israeli authorities also discouraged
Palestinian initiatives that had the potential to compete in the Israeli market with the existing
Israeli firms (UNCTAD, 2009). Moreover, Palestinian production for the domestic market
was undercut by economies of scale that are realised by the technologically advanced Israeli
manufacturers (Naqib, 2003). Subsequently, the Palestinian economy evolved into a captive
market for the Israeli products and developed structural trade deficits with Israel.
The trade dependency of Palestine on Israel is best illustrated by the shares of Israel in the
Palestinian imports and exports. As of 1987, 90% of the Palestinian import of goods came
from Israel, and 75% of its exports went to Israel (Kanafani, 2001). The asymmetric nature
of the Palestinian-Israeli trade relations is reflected in imports to Palestine making 11% of
the Israeli exports and the Palestinian exports making a mere 2% of the Israeli imports in
1987 (Kanafani, 2001; World Bank, 2017a). Hence, the Palestinian trade deficit amounted
to 50% of GDP, of which the quasi-totality was with respect to Israel (UNCTAD, 2009).
This large trade deficit was primarily financed by the labour income earned in Israel.
Subsequently, the Palestinian economy developed a high dependency on the Israeli labour
market. Although the Palestinian employment in Israel improves household income in
Palestine as most of the income earned in Israel is repatriated and consumed domestically
(UNCTAD, 2016), the employment of Palestinians in Israel negatively affects the domestic
production and exports by exerting an upward pressure on domestic wages and prices.
Because of higher reservation wages, there are less candidates for low-wage jobs in
Palestine. Moreover, the high reservation wages reduce the attractiveness of the Palestinian
economy to investors or technology that would increase productivity (Aix Group, 2004).
4.3. The Palestinian first uprising and the Oslo agreements
The asymmetric market relations with Israel and the various administrative restrictions
combined with a resentment against the occupation ultimately triggered the first Palestinian
uprising, lasting from 1987 to 1993. Following the uprising, it became clear that the nature
of the economic links between Israel and Palestine needed re-evaluation. After a process of
political negotiations aimed at ending the hostilities and fulfilling the right of the Palestinian
people to self-determination, the Oslo agreements were signed in 1993, providing an official
recognition of the Palestinian Liberation Organisation (PLO). Following the political
Chapter 4
62
agreement, an economic agreement known as the Paris Protocol3 was signed in 1994
between the government of Israel and the PLO. This protocol was initially agreed for a
transitional period of five years (1994 – 1999).
The vision of the protocol was to create favourable conditions for the development of the
Palestinian economy through three channels. The first is a free access for the Palestinian
labour to the Israeli labour market. The free movement of labour to Israel would continue
to provide the Palestinian households with substantial income, while creating opportunities
for the Palestinian economy to reach full employment. The second is a transfer of the tax
revenues that are collected by Israel to the Palestinian National Authority (PNA). This
mechanism, known as tax clearance, aimed at providing the new Authority with an
immediate source of revenue while building the internal capacity to operate the institutions
of a state (Aix Group, 2005; Frisch and Hofnung, 1997). Finally, the third channel is the
considerable aid pledges by donor countries and organisations to support the financing of
infrastructure and investment within the Palestinian economy (Arnon and Weinblatt, 2001).
The protocol, while formalising the economic relations between Israel and Palestine as two
distinct entities, did not entail any structural break with respect to the pre-Oslo period
(Dessus, 2004). During the negotiations, the architects of the Protocol avoided difficult
issues of sovereignty, such as the creation of a Palestinian state with full control of external
borders and ownership of fiscal and monetary policies, which were deferred to the final
status negotiations. Instead, an interim agreement was designed in a way that the two
economies would coexist under Israeli-controlled external borders (Arnon and Weinblatt,
2001). The protocol is imperfect in many regards, in part due to its transitional nature and
in another part due to the asymmetry of power between the two parties (Missaglia and
Valensisi, 2014). In contrast to many economic integration agreements, which give more
weight to the interests of the smaller parties than their relative economic power would
suggest, the customs union between Israel and the Palestine continued to reflect the Israeli
customs and was not bilaterally coordinated (Vaggi and Baroud, 2005). While it recognised
that the two parties might have different interests and priorities, it only offered the
Palestinians limited policy space. The PNA could only set tariffs on a few imported goods
and within certain limits (World Bank, 2002).
The Protocol provisions also granted Israel the right to amend the common tariff book, with
the only restriction being to give the PNA prior notice of the change (UNCTAD, 2012).
While the Protocol provisions grant the PNA the possibility to enter into bilateral trade
agreements with other countries, the implementation of the agreements signed by the PNA
is undermined by the lack of Palestinian control over its external borders (World Bank,
3 The terms “Paris protocol” and „Protocol“ are used interchangeably in this thesis
Economic consequences of conflicts
63
2008). The only working trade agreements in Palestine are those signed by Israel with other
countries and thus benefitting Palestine because of being in a customs union with Israel.
Most of these agreements involve tariff-rate-quotas. However, the quotas in Palestine are
not determined by the PNA alone. They are instead the outcome of negotiations with the
Israeli Trade Authority. As of 2012, the Palestinian quotas for imports from countries
outside the customs union were set at 20% of the Israeli pledges (MAS, PCBS, PMA, 2013).
A consequence of Palestine’s limited access to global markets is a trade diversion and a
continued dependency on Israel (Astrup and Dessus, 2005). Between 2007 and 2011, trade
with Israel accounted for 70 – 90 % of Palestinian total trade, and the trade deficit with
Israel accounted for 75% of the Palestinian total trade deficit (Elkhafif et al., 2014).
4.4. The Israeli security measures: closure policy and work permit system
The roots of the closure policy implemented by Israel go back to the Six-Day war of 1967.
In the aftermath of the war, the Palestinian territories were declared closed military areas
with restricted mobility of goods and persons. Later in 1972, in order to promote the
integration of the Israeli and Palestinian territories, Israel issued general exit orders allowing
free mobility into Israel and East Jerusalem as well as between the West Bank and Gaza
(Akkaya et al., 2008). This policy of free mobility within the geographical area comprising
the Israeli and Palestinian territories was halted in the advent of the first Palestinian uprising
of 1987. From 1989 onwards, the closure policy was tightened and was progressively
enforced by a series of checkpoints and roadblocks.
There are three categories of closures. The first consists of internal closures which restrict
the mobility of goods and people inside the West Bank4. The second category is composed
of external closures which restric movements between the West Bank and Gaza, and from
Palestine to Israel, the settlements and East Jerusalem. The third category consists of
external international closures at the border between the West Bank and Jordan, and
between Gaza and Egypt. Closures are often declared on short notice and for different
periods of time (Ihle and Rubin, 2013). The building of a physical barrier that began in
September 2000 marked a further step in the move towards economic and physical
separation between Israel and the Palestinian territories (Del Sarto, 2014).
For nearly all movement outside their greater area of residence, Palestinians are required to
obtain permits to cross the checkpoints. For movement within the West Bank, permit
requirements are lower than for movement between the West Bank and Gaza, from the
4 Internal closures in Gaza were completely removed following the Israeli unilateral withdrawal from Gaza
in 2005.
Chapter 4
64
Palestinian territories into Israel, the settlements and East Jerusalem (World Bank, 2007).
Permits to Palestinians are issued for purposes of work, trade, medical treatment, etc.
Requirements for the permits can change from one day to another day, according to the
Israeli political objectives and perceived security risks (Fischer et al., 2001).
As the functioning of the labour market is a focus in this thesis, more attention is devoted
to the work permit system. The individual work permit system was first introduced in 1991.
It requires every Palestinian who wants to work in Israel to be equipped with a permit. Work
permits are granted to Palestinians who get a security clearance from the Israeli military
establishment and have in advance a request of employment from an Israeli employer. The
security clearance is bound to personal status criteria presumed to reduce the likelihood of
the Palestinian worker to be involved in attacks against Israelis. The conditions for this
security clearance change frequently without prior notice. At the height of the second
Palestinian uprising (2001 – 2004), the criteria required the Palestinian worker to be married
with children, and aged more than 35 years (Etkes, 2012). As of 2014, the main criteria are
to be married and aged more than 24 years (COGAT, 2014).
The work permits restrict the number of Palestinian workers in the Israeli economy and
limit their employment opportunities to specific sectors through a quota system. Most
Palestinians employed in Israel are confined to the low-skill and manual jobs in sectors such
as construction, agriculture, some low-tech industries and services (Miaari and Sauer,
2011). The number of work permits issued is based neither on the supply nor on the demand
for Palestinian labour in the Israeli economy. As a result, a black market for Palestinian
labour in Israel and the settlements developed mainly in the West Bank. Between 2005 and
2015, on average 38% of Palestinian workers in Israel and the settlements were unpermitted
(PCBS, 2016a).
The closure policy as well as the work permit system are unilaterally decided and
implemented by Israel without coordination with the PNA. When the conflict reaches its
heights, Israel imposes – at times – complete closures, where even permit holders are not
allowed to clear the internal or external checkpoints (Rubin and Ihle, 2016). This situation
is a violation of one of the principles of the Paris Protocol, according to which the two
parties pledged to maintain the normality of labour movement between them and to
coordinate the flows of goods and services (Elkhafif et al., 2014).

Economic consequences of conflicts
65
4.5. Consequences of the restrictions and the economic environment in the
post-Oslo era
The Israeli security measures impose costs on both the Israeli and the Palestinian
economies. The Israeli economy faced a shortage of low-skilled labour. Initially, the Israeli
government has responded by importing more foreign labour, especially from Asia. While
this policy effectively reduced the negative effects of the restrictions on the Israeli economy,
substitution between Palestinian and other foreign workers is far from perfect. The
Palestinian workers enjoy a preference in the Israeli labour markets over other foreign
workers, because they are more experienced and have a longer employment history with
Israeli employers (Arnon and Weinblatt, 2001). Moreover, in contrast to Palestinian
workers who commute on quasi-daily basis, the other foreign workers require a longer
period of stay. The likelihood of other foreign workers settling permanently in Israel is also
viewed by large segments of the Israeli society as a potential threat to the Jewish character
of Israel (Rosenhek, 2006).
While the effects of the restrictions on the Israeli economy are relatively small, they are
considerable for the Palestinian economy, undercutting its current and future development
capacity (Akkaya et al., 2008). Figure 4-1 shows a striking negative correlation between
the real Gross National Income (GNI) per capita in Palestine and the number of closure days
over time. The period after the Oslo agreements came into force (1996 – 1999) is
characterised by a lower intensity of the conflict, a downward trend in the number of closure
days and an increasing real GNI per capita in Palestine. However, since the outbreak of the
second Palestinian uprising5 in late 2000, the conflict reached new heights with intensified
closures, and the economic recovery was halted. Although the uprising ended officially in
2004, the number of closure days decreased significantly only from 2007 onwards, with a
later improvement in the Palestinian GNI per capita.
5 The second Palestinian uprising is attributed to the failure of the Camp David negotiations on a final status
and the visit of the Israeli opposition leader Ariel Sharon to the Temple Mount, a move seen by Palestinians
as a provocation.
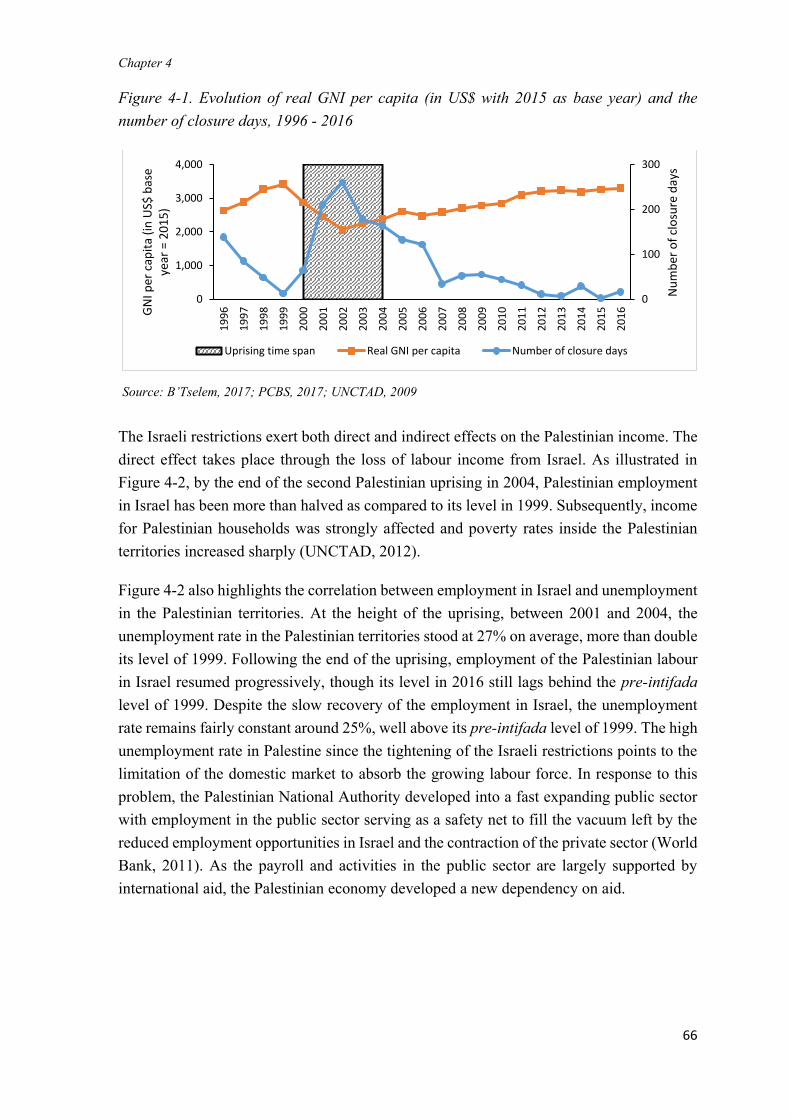
Chapter 4
66
Figure 4-1. Evolution of real GNI per capita (in US$ with 2015 as base year) and the
number of closure days, 1996 - 2016
Source: B’Tselem, 2017; PCBS, 2017; UNCTAD, 2009
The Israeli restrictions exert both direct and indirect effects on the Palestinian income. The
direct effect takes place through the loss of labour income from Israel. As illustrated in
Figure 4-2, by the end of the second Palestinian uprising in 2004, Palestinian employment
in Israel has been more than halved as compared to its level in 1999. Subsequently, income
for Palestinian households was strongly affected and poverty rates inside the Palestinian
territories increased sharply (UNCTAD, 2012).
Figure 4-2 also highlights the correlation between employment in Israel and unemployment
in the Palestinian territories. At the height of the uprising, between 2001 and 2004, the
unemployment rate in the Palestinian territories stood at 27% on average, more than double
its level of 1999. Following the end of the uprising, employment of the Palestinian labour
in Israel resumed progressively, though its level in 2016 still lags behind the pre-intifada
level of 1999. Despite the slow recovery of the employment in Israel, the unemployment
rate remains fairly constant around 25%, well above its pre-intifada level of 1999. The high
unemployment rate in Palestine since the tightening of the Israeli restrictions points to the
limitation of the domestic market to absorb the growing labour force. In response to this
problem, the Palestinian National Authority developed into a fast expanding public sector
with employment in the public sector serving as a safety net to fill the vacuum left by the
reduced employment opportunities in Israel and the contraction of the private sector (World
Bank, 2011). As the payroll and activities in the public sector are largely supported by
international aid, the Palestinian economy developed a new dependency on aid.
0
100
200
300
0
1,000
2,000
3,000
4,000
19
96
19
97
19
98
19
99
20
00
20
01
20
02
20
03
20
04
20
05
20
06
20
07
20
08
20
09
20
10
20
11
20
12
20
13
20
14
20
15
20
16
Nu
mb
er o
f cl
osu
re d
ays
GN
I per
cap
ita
(in
US$
bas
e ye
ar =
20
15
)
Uprising time span Real GNI per capita Number of closure days
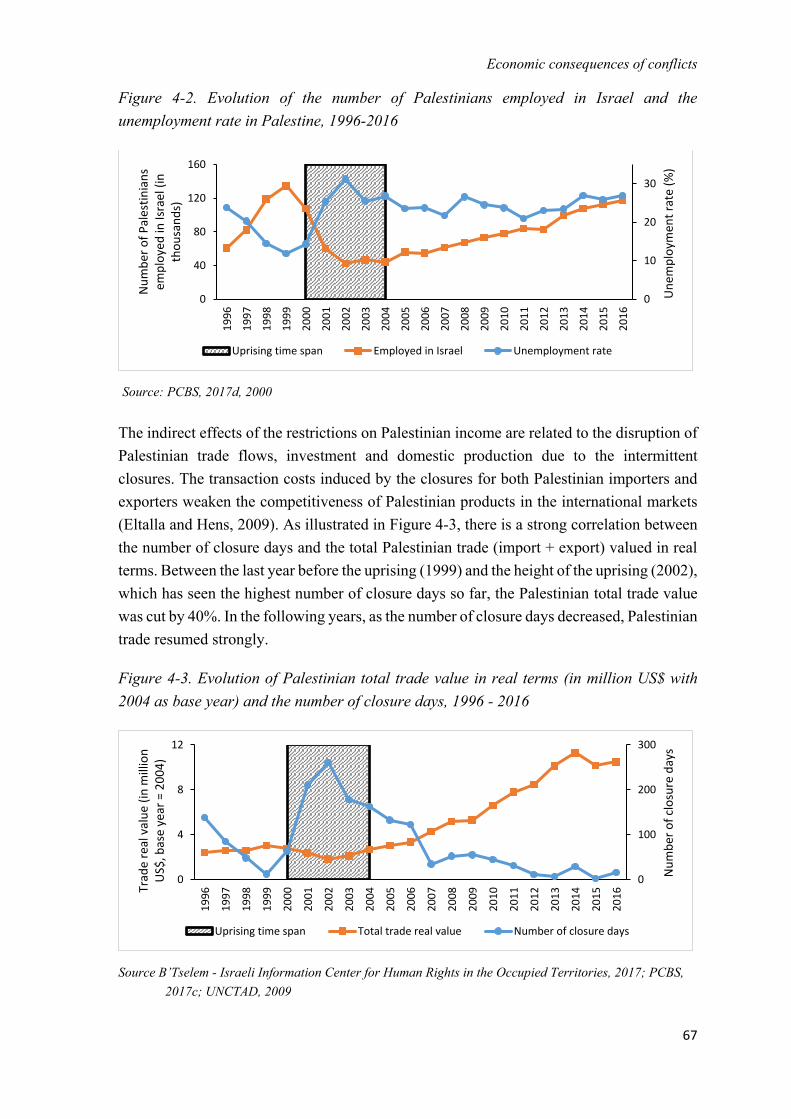
Economic consequences of conflicts
67
Figure 4-2. Evolution of the number of Palestinians employed in Israel and the
unemployment rate in Palestine, 1996-2016
Source: PCBS, 2017d, 2000
The indirect effects of the restrictions on Palestinian income are related to the disruption of
Palestinian trade flows, investment and domestic production due to the intermittent
closures. The transaction costs induced by the closures for both Palestinian importers and
exporters weaken the competitiveness of Palestinian products in the international markets
(Eltalla and Hens, 2009). As illustrated in Figure 4-3, there is a strong correlation between
the number of closure days and the total Palestinian trade (import + export) valued in real
terms. Between the last year before the uprising (1999) and the height of the uprising (2002),
which has seen the highest number of closure days so far, the Palestinian total trade value
was cut by 40%. In the following years, as the number of closure days decreased, Palestinian
trade resumed strongly.
Figure 4-3. Evolution of Palestinian total trade value in real terms (in million US$ with
2004 as base year) and the number of closure days, 1996 - 2016
Source B’Tselem - Israeli Information Center for Human Rights in the Occupied Territories, 2017; PCBS,
2017c; UNCTAD, 2009
0
10
20
30
0
40
80
120
160
19
96
19
97
19
98
19
99
20
00
20
01
20
02
20
03
20
04
20
05
20
06
20
07
20
08
20
09
20
10
20
11
20
12
20
13
20
14
20
15
20
16
Un
emp
loym
ent
rate
(%
)
Nu
mb
er o
f P
ales
tin
ian
s em
plo
yed
in Is
rael
(in
th
ou
san
ds)
Uprising time span Employed in Israel Unemployment rate
0
100
200
300
0
4
8
12
19
96
19
97
19
98
19
99
20
00
20
01
20
02
20
03
20
04
20
05
20
06
20
07
20
08
20
09
20
10
20
11
20
12
20
13
20
14
20
15
20
16
Nu
mb
er o
f cl
osu
re d
ays
Trad
e re
al v
alu
e (i
n m
illio
n
US$
, bas
e ye
ar =
20
04
)
Uprising time span Total trade real value Number of closure days
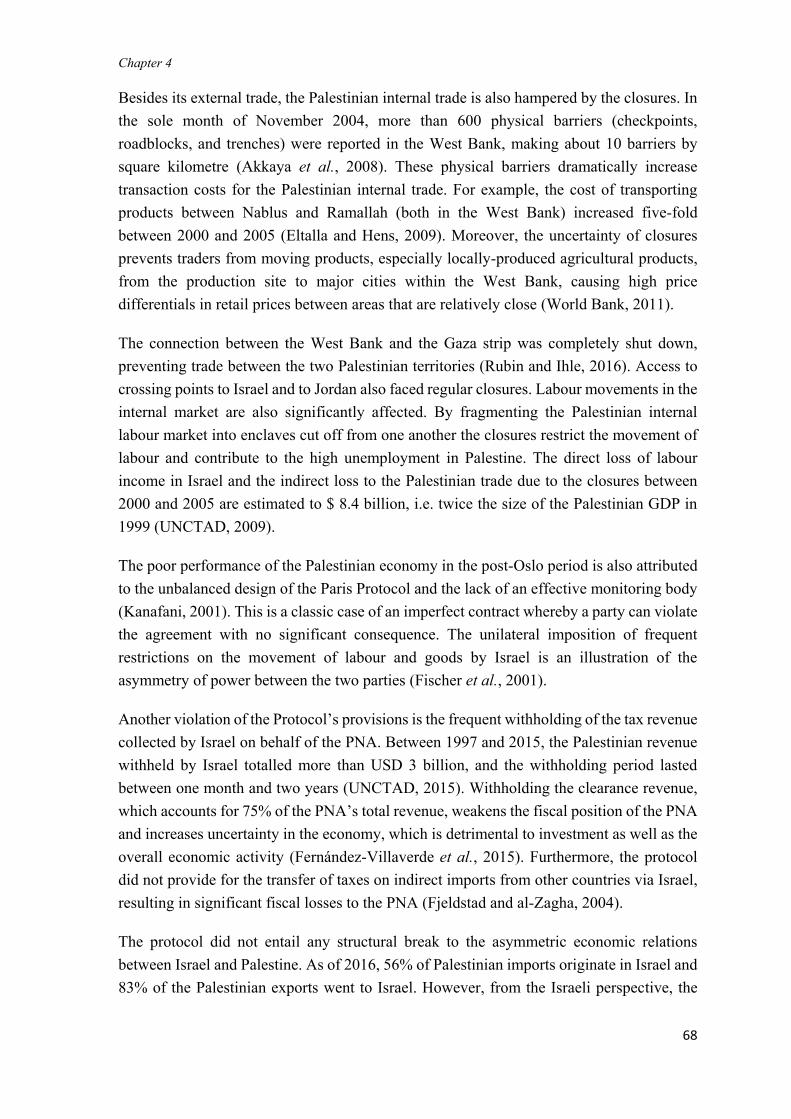
Chapter 4
68
Besides its external trade, the Palestinian internal trade is also hampered by the closures. In
the sole month of November 2004, more than 600 physical barriers (checkpoints,
roadblocks, and trenches) were reported in the West Bank, making about 10 barriers by
square kilometre (Akkaya et al., 2008). These physical barriers dramatically increase
transaction costs for the Palestinian internal trade. For example, the cost of transporting
products between Nablus and Ramallah (both in the West Bank) increased five-fold
between 2000 and 2005 (Eltalla and Hens, 2009). Moreover, the uncertainty of closures
prevents traders from moving products, especially locally-produced agricultural products,
from the production site to major cities within the West Bank, causing high price
differentials in retail prices between areas that are relatively close (World Bank, 2011).
The connection between the West Bank and the Gaza strip was completely shut down,
preventing trade between the two Palestinian territories (Rubin and Ihle, 2016). Access to
crossing points to Israel and to Jordan also faced regular closures. Labour movements in the
internal market are also significantly affected. By fragmenting the Palestinian internal
labour market into enclaves cut off from one another the closures restrict the movement of
labour and contribute to the high unemployment in Palestine. The direct loss of labour
income in Israel and the indirect loss to the Palestinian trade due to the closures between
2000 and 2005 are estimated to $ 8.4 billion, i.e. twice the size of the Palestinian GDP in
1999 (UNCTAD, 2009).
The poor performance of the Palestinian economy in the post-Oslo period is also attributed
to the unbalanced design of the Paris Protocol and the lack of an effective monitoring body
(Kanafani, 2001). This is a classic case of an imperfect contract whereby a party can violate
the agreement with no significant consequence. The unilateral imposition of frequent
restrictions on the movement of labour and goods by Israel is an illustration of the
asymmetry of power between the two parties (Fischer et al., 2001).
Another violation of the Protocol’s provisions is the frequent withholding of the tax revenue
collected by Israel on behalf of the PNA. Between 1997 and 2015, the Palestinian revenue
withheld by Israel totalled more than USD 3 billion, and the withholding period lasted
between one month and two years (UNCTAD, 2015). Withholding the clearance revenue,
which accounts for 75% of the PNA’s total revenue, weakens the fiscal position of the PNA
and increases uncertainty in the economy, which is detrimental to investment as well as the
overall economic activity (Fernández-Villaverde et al., 2015). Furthermore, the protocol
did not provide for the transfer of taxes on indirect imports from other countries via Israel,
resulting in significant fiscal losses to the PNA (Fjeldstad and al-Zagha, 2004).
The protocol did not entail any structural break to the asymmetric economic relations
between Israel and Palestine. As of 2016, 56% of Palestinian imports originate in Israel and
83% of the Palestinian exports went to Israel. However, from the Israeli perspective, the
Economic consequences of conflicts
69
Palestinian imports only account for 5% of the Israeli exports and the Palestinian exports
account for a mere 1% of the Israeli imports (PCBS, 2016a; World Bank, 2017a, 2017b).
Compared to 1987, the trade deficit with Israel more than tripled. The Protocol also failed
to provide the newly created Palestinian Monetary Authority with the power to issue an
independent currency. The absence of its own currency deprives the PNA of seigniorage
revenues that could amount to up to 4.2% of the Palestinian gross national income
(UNCTAD, 2009). The lack of a national currency also removes options from the PNA to
use monetary policies to address specific economic needs and external shocks (IMF, 2013).
In conclusion, the desired outcome of rapid growth of the Palestinian economy envisioned
in the Oslo agreements – and particularly in the Paris protocol – did not materialise (Astrup
and Dessus, 2001). Among the three channels which are supposed to bring economic growth
and lift the living standards of the Palestinian populations, only the international aid flow
was sustained at reasonable levels, though below the pledges (Arnon and Weinblatt, 2001).
The free movement of labour was altered by the permit system and the closure policy. The
transfer of tax collected to the PNA also suffered from frequent withholding episodes
reducing the availability of public revenues and complicating the planning and
implementation of a coherent public expenditure policy (UNCTAD, 2009). Subsequently,
the living standards of the Palestinian population regressed in the post-Oslo period and
economic growth was weak and unstable.
The Paris protocol was designed for a temporary period of five years but has been in place
for more than two decades and still governs the Palestinian trade relations with Israel and
with the rest of the world. Under the current situation, the Protocol is outdated and no longer
addresses the challenges faced by the Palestinian economy (UNCTAD, 2016). A final
political settlement to generate a more balanced agreement for long-term healthier
economic relations between Israel and Palestine may contribute to improving the situation.
4.6. Pathway towards a two-state solution
The roadmap for peace supported by the Middle East Quartet (US, EU, Russia and the UN)
provides for three phases that would ultimately lead to a final solution to the conflict. Phase
I (December 2002 to May 2003) includes the end of violence by both sides, the cessation
of settlement activities by Israel and a comprehensive security reform by the Palestinian
Authority. In Phase II (June to December 2003), a Palestinian state with provisional borders
and a new constitution should be established. Finally, phase III (2004 – 2005), should
foresee the conclusion of a permanent status agreement and the creation of a sovereign
Palestinian state with final borders. However, the roadmap reached a deadlock early in the
process as neither Palestinians nor Israelis fulfilled the requirements of Phase I.
Chapter 4
70
According to a group of scholars and observers, the failure of the roadmap is partly
attributed to its definition solely in political terms, while a clear vision of the economic
arrangements in a final status associated with Phase III could provide momentum for the
implementation of the content of Phases I and II (Aix Group, 2004). As most officials in
both Israel and Palestine are still committed to the two-state solution, and as the
international community has reaffirmed its commitment to the two-state solution, in the UN
Security Council’s Resolution 2334 of December 2016, research-based evidence is needed
to provide a clear vision to the economic arrangements in the final status.
Among scholars and observers, there is a wide consensus that the final status needs to entail
the creation of economic borders and to grant the Palestinians full control over their trade
and monetary policies (Malul et al., 2008). While promoting independence in economic
policy-making, the final arrangements should acknowledge the economic interdependence
(Aix Group, 2004). With respect to labour markets, the Palestinian employment in Israel is
likely to remain sizeable, at least in the short-term. In the long-term, i.e. in a final status
perspective, a group of Israeli and Palestinian academics and experts elaborated the
“Economic Roadmap” where they call for a restored flow of Palestinian workers into Israel
that is stable, predictable, and coordinated with the PNA, with security restrictions kept at
the minimum necessary (Aix Group, 2004). With respect to trade, independence of policy-
making means for Palestine an exit from the customs union with Israel. Subsequently, the
Palestinian authorities could choose among several trade options including: a free trade area
with Israel, a non-discriminatory liberal trade regime, or treating Israel the same way
countries with no preferential trade agreement with Palestine are currently treated.
4.7. Conclusion
The Palestinian economy is asymmetrically linked to that of Israel. The two economies
coexist within a customs union that was formalised by the Paris protocol. This customs
union is largely based on the Israeli rules and, due to structural differences between the two
economies, those rules are not favourable to the Palestinian economy. Moreover, the work
permit policy and closures introduced by Israel – as security measures – have altered the
flow of the Palestinian workers and the goods to and through Israel with substantial negative
consequences on both the employment and economic development in Palestine.
Several Palestinian and Israeli experts argue that for a permanent solution to the conflict,
the establishment of a sovereign Palestinian state, which would eventually have full control
over trade and monetary policies, as well as a restored flow of Palestinian workers to the
Israeli economy are needed. However, few studies were designed to quantify the effects of
the required changes in trade and labour market policies on the Palestinian economy. This
Economic consequences of conflicts
71
thesis aims at filling that gap by presenting four CGE applications with policy simulations,
which are focusing on West Bank trade and labour markets, in order to identify political
and administrative options for the Palestinian National Authority.
In the first application, Chapter 6, the effect of a return of Palestinian employment in Israel
to its pre-intifada level of 1999 is investigated under different model specifications. This
application aims at identifying which model specification fits the West Bank labour markets
and under which conditions.
In the second application, Chapter 7, the short-term effects of changes in the employment
of Palestinians in Israel are investigated, assuming segmented factor markets and the
existence of a surplus labour. Four counterfactual scenarios are simulated. The first scenario
considers a return of Palestinian employment in Israel to its pre-intifada level of 1999 while
keeping its composition as in the base year of 2011. This corresponds to an increase in
Palestinian employment in Israel by 36%. The second scenario contemplates a return of
Palestinian employment in Israel to its 1999 levels with the additional labour being only
sourced from males who are eligible for a work permit in Israel. The third scenario increases
Palestinian employment in Israel to its 1999 levels while increasing the supply of the labour
force assuming labour previously outside the labour force would have incentives to
participate the labour force. The last scenario reduces the number of Palestinian workers in
Israel by 36%, which corresponds to the assumption that Israel tightens further the access
to its market for Palestinian workers.
The third application, Chapter 8, investigates the long-term effects of a return of Palestinian
employment in Israel to its 1999 levels. To this end, a mobility function is included in the
model and the labour-leisure trade-off specification is used to model the labour market
conditions.
Finally, the fourth application, Chapter 9, assesses the effects of changes in the trade regime.
Two trade options are simulated, assuming an exit from the customs union with Israel and
trade policy in the West Bank being solely determined by the Palestinian authorities. The
first scenario is the elimination of tariffs on imports from all trade partners, and the second
scenario simulates the imposition of high tariffs on imports from Israel, assuming that Israel
is treated the same as countries with no preferential trade agreements with Palestine.
Moreover, the performance of three exchange rate regimes is compared in order to inform
the choice of a monetary policy that a sovereign Palestinian state with its own currency may
want to pursue.
For all four applications, a unique and comprehensive social accounting matrix for the West
Bank described in the next chapter is used.

72
A SAM for the West Bank
73
5 A SOCIAL ACCOUNTING MATRIX FOR THE WEST
BANK6
6 Parts of this chapter have been published as a working paper: Agbahey, J., Siddig, K., Grethe, H., 2016. A 2011
Social Accounting Matrix for the West Bank with detailed representation of households and labour accounts.
Berlin: Humboldt University of Berlin, Department of Agricultural Economics, Working Paper No. 93/2016, p.69.

Chapter 5
74
A SAM for the West Bank
75
Chapter 5 A social accounting matrix for the West Bank
5.1. Introduction
The development of a comprehensive database for the West Bank, which can be used as a
benchmark for simulation models, meets the first research objective of this thesis. The
newly developed Social Accounting Matrix (SAM) fills two gaps. First, previous SAMs for
the Palestinian territories by Astrup and Dessus (2001), Bayar (2013), and Missaglia and
Valensisi (2014) are highly aggregated, especially with regard to household, factor and
activity accounts. The nature of the interaction between the Palestinian and Israeli
economies and the complexity of the labour and commodity movements between them
require a SAM with detailed representation of labour and household accounts, as well as
the production structure to capture the implications of changes in labour movements on the
Palestinian economy. Second, the previous SAMs merge the two Palestinian territories, the
West Bank and Gaza. Given the empirical evidence that movements of goods, services and
labour with Israel are limited to the West Bank since the Gaza blockade in 2007, it is
reasonable for the purpose of this thesis to focus exclusively on the West Bank.
Since the development of the first SAM for the United Kingdom by Stone in 1962, SAMs
have been constructed and used extensively for policy analysis (Round, 2003). The SAM
for the West Bank developed in this thesis has several distinctive features which are
presented in the next Section, 5.2. For the SAM construction, a top-down approach – as
suggested by Reinert and Roland-Holst (1997) – is followed. First, a macro-SAM including
only 15 accounts is assembled and estimated. The steps involved in the construction of the
macro-SAM are documented in Section 5.3. Afterwards, the macro-SAM is disaggregated
into a detailed SAM comprising 376 accounts. The selection of the disaggregation criteria
and the steps involved in constructing the detailed SAM are documented in Section 5.4.
Section 5.5 describes the structure of the West Bank economy in light of the SAM, while
Section 5.6 draws conclusions and provides an outlook on the caveats for improving the
quality of the resulting SAM.
5.2. Main features of the SAM for the West Bank
Compared to the existing SAMs developed for Palestine, the newly developed SAM has
various unique aspects as follows:
1. It focuses on the West Bank, which is currently the only Palestinian territory with
workers employed in Israel, while other SAMs consider the whole Palestine – i.e. the
West Bank and Gaza together.
Chapter 5
76
2. It is much more disaggregated as it comprises 376 accounts. Such a level of detail
enables future users to aggregate this SAM to one or more alternative classifications.
The list of this SAM accounts is provided in Appendix 2.
3. It includes 83 commodity groups and 49 activity sectors. The separation between
activities and commodities allows for an activity to produce several commodities and
for a commodity to be produced by several activities. It also enables the valuation of
income and expenditure flows in the activity accounts at producer prices, while the
flows in the commodity accounts are valued at market prices.
4. It recognises the importance of the agricultural sector in the West Bank through its
explicit representation of agriculture by eight commodities and four activities.
5. It provides comprehensive information on transaction costs represented by three margin
accounts respectively for wholesale, retail trade and transport.
6. It includes a separate account for non-profit institutions serving households (NPISH).
These institutions play a significant role in the West Bank economy, which heavily
relies on the services they provide. The NPISHs are depicted in the SAM in two ways.
First, as an institution, they consume goods and services and make transfers to
households. Second, as a productive activity, they employ labour and capital to produce
services that are consumed by the households.
7. To our knowledge, this is the first SAM to include an explicit account for the religious
transfer payments that flow from the rich to the poor households (Zakat). In most
Muslim-majority regions, like the West Bank, Zakat contributions are voluntary, though
considered in principle as a religious charitable obligation. The size of the contributions
is not negligible, as it is customarily about 2.5% of a household’s total savings and
wealth above a certain minimum.
8. The West Bank SAM that is constructed differentiates 59 factor classes and 110
household groups with clear interconnections between the two classifications. This high
disaggregation of factor and household accounts aims at providing a good basis for the
analysis of distributional effects of trade integration as well as changes in the factor
markets.
9. It exhibits transactions with seven trade partners: Israel, Jordan, Turkey, the Greater
Arab Free Trade Area (GAFTA), USA, EU-28 and the European Free Trade Area
(EFTA) zones, and the rest of the world. This separation builds on the major trade
agreements of which Palestine is a member and on the customs union with Israel. The
differentiation of Palestine’s trade partners allows for a detailed analysis of future trade
policy options for the West Bank.
A SAM for the West Bank
77
10. This SAM takes proper account of the remuneration of labour for the self-employed,
who make about 36% of the total number of workers in the West Bank. Restricting the
labour share of value added to the compensation of employees suffers from a major
limitation, as it omits the contribution of the self-employed to labour income as
discussed in Section 2.3 of Chapter 2. A combination of the Gindling et al. (2016) and
the Young (1995) approaches is adopted in this thesis to estimate the labour share of
value added. First, the self-employed are identified from the labour force survey
database and are matched with wage-workers based on socioeconomic characteristics
such as the sector of employment, age, gender, and the education level. Then, the wages
for the wage-workers are attributed to the self-employed, plus the earning premium
estimated by Gindling et al. (2016) for the Middle-East region.
11. This SAM also recognises that households derive income from unincorporated capital.
Household activity is often disregarded as it usually refers to small-scale, informal and
non-market activities (Round, 2003). Household activity includes both family
enterprises (which employ family members) and micro enterprises (which hire
employees). The income earned by such an activity clearly represents both returns to
labour and to capital. The extent to which earlier SAMs have taken proper consideration
for household income from unincorporated capital is unclear in most cases. However,
this problem is explicitly tackled in constructing this SAM.
12. This SAM is based on the most recent set of data available about the structure of the
West Bank economy, consumption and expenditure behaviour of households and the
structure of the labour force. The reference year for this SAM is 2011.
The SAM provides data for 59 production factor groups including 57 labour groups, one
factor capital and one factor land. The labour factor is well disaggregated in order to capture
the participation of the West Bank labour in different labour markets. The domestic labour
is first disaggregated by labour market considering that Palestinians are either employed in
the domestic market or the Israeli market. In the domestic market, labour is either employed
by domestic employers or foreign employers, mainly foreign diplomatic missions residing
in the West Bank. Labour employed in the domestic market by domestic employers is
further disaggregated by activity and according to their eligibility to obtain a work permit
in Israel. This detailed disaggregation allows for the simulation of various degrees of
relaxing the restrictions on labour movements between Israel and the West Bank.
Households are extensively disaggregated so as to assess the distributional effects of various
policies. The SAM provides data on 110 household groups classified according to
consumption quintiles, the skill level of the household members and the labour market
which employs them. Tax accounts are also well disaggregated in order to capture the
different sources of government revenue. In total, 58 tax accounts are incorporated, among
Chapter 5
78
which 45 are factor use taxes, nine are commodity taxes, three are direct taxes, and one is
production tax.
East Jerusalem is not included in this SAM, because it is excluded from the main data
sources used, which are the national accounts and the balance of payments. Moreover, from
a theoretical point of view, the East Jerusalem economy is more connected to the Israeli
economy than to the rest of the West Bank. Therefore, it is reasonable to exclude it from a
West Bank SAM.
5.3. Constructing the macro-SAM
This section describes the process followed in constructing the macro-SAM. First, it states
the sources of data used to generate the unbalanced prior macro-SAM. Then, the technique
used to estimate a final balanced macro-SAM is presented.
5.3.1. Data sources for assembling the prior SAM
The information used to compile the prior macro-SAM is derived from different sources,
with the Palestinian Central Bureau of Statistics (PCBS) being the main data source. Other
data sources include the Palestinian Ministry of Finance, the United Nations Commodity
Trade Statistics (UN Comtrade), the International Monetary Fund (IMF) and peer-reviewed
papers. PCBS data include the national accounts, the Supply and Use Table, the balance of
payments, the labour force survey data, the expenditure and consumption survey data, the
economic survey report, the living standards report and the demographics report. Not all
these datasets were available for the reference year of 2011. Therefore, some adjustments
had to be made to obtain a consistent SAM. The key set of data to which all the other sources
are compared to is the West Bank national accounts of 2011.
Table 5.1 summarises the main data sources for each cell of the macro-SAM. The
identification of the SAM cells follows the description provided in Table 3.1. A detailed
description of the steps followed in assembling the macro-SAM is provided in Appendix 3.
The outcome of this process – the prior macro-SAM – is presented in Table 5.2. with all
transactions recorded in Million US$.
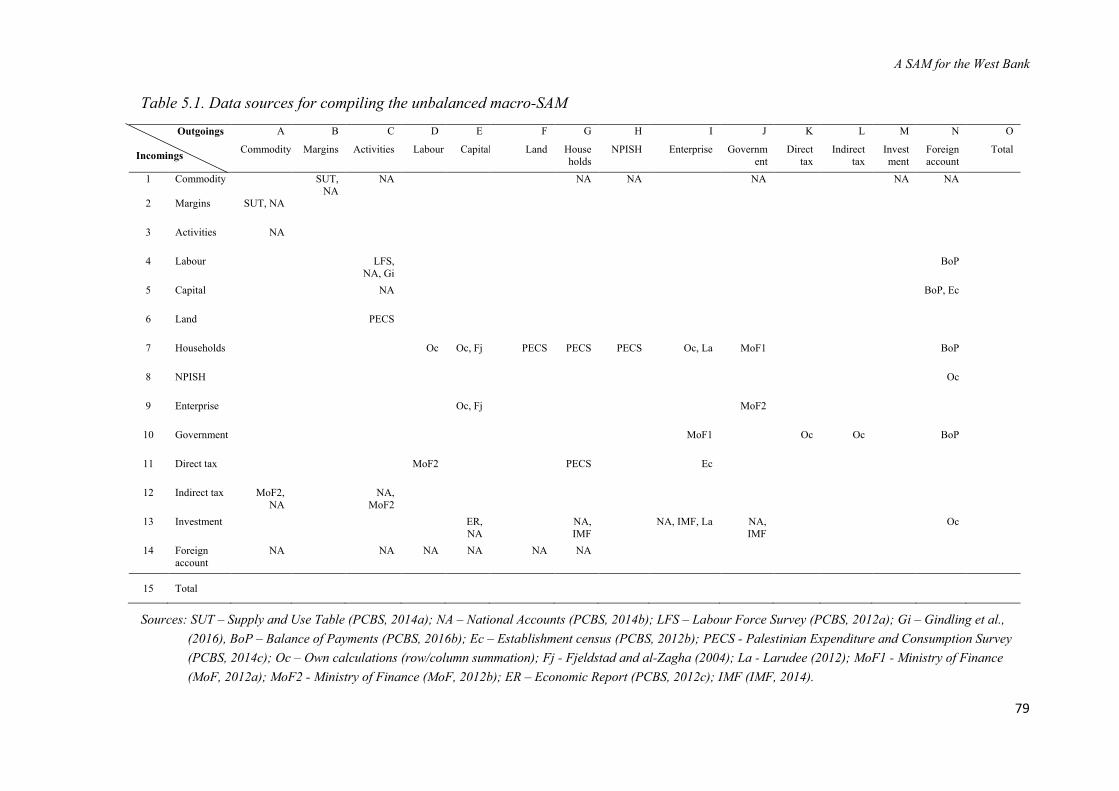
A SAM for the West Bank
79
Table 5.1. Data sources for compiling the unbalanced macro-SAM
Outgoings
Incomings
A B C D E F G H I J K L M N O
Commodity Margins Activities Labour Capital Land House
holds
NPISH Enterprise Governm
ent
Direct
tax
Indirect
tax
Invest
ment
Foreign
account
Total
1 Commodity
SUT,
NA
NA
NA NA
NA
NA NA
2 Margins SUT, NA
3 Activities NA
4 Labour
LFS,
NA, Gi
BoP
5 Capital
NA
BoP, Ec
6 Land
PECS
7 Households
Oc Oc, Fj PECS PECS PECS Oc, La MoF1
BoP
8 NPISH
Oc
9 Enterprise
Oc, Fj
MoF2
10 Government
MoF1
Oc Oc
BoP
11 Direct tax
MoF2
PECS
Ec
12 Indirect tax MoF2,
NA
NA,
MoF2
13 Investment
ER,
NA
NA,
IMF
NA, IMF, La NA,
IMF
Oc
14 Foreign
account
NA
NA NA NA NA NA
15 Total
Sources: SUT – Supply and Use Table (PCBS, 2014a); NA – National Accounts (PCBS, 2014b); LFS – Labour Force Survey (PCBS, 2012a); Gi – Gindling et al.,
(2016), BoP – Balance of Payments (PCBS, 2016b); Ec – Establishment census (PCBS, 2012b); PECS - Palestinian Expenditure and Consumption Survey
(PCBS, 2014c); Oc – Own calculations (row/column summation); Fj - Fjeldstad and al-Zagha (2004); La - Larudee (2012); MoF1 - Ministry of Finance
(MoF, 2012a); MoF2 - Ministry of Finance (MoF, 2012b); ER – Economic Report (PCBS, 2012c); IMF (IMF, 2014).
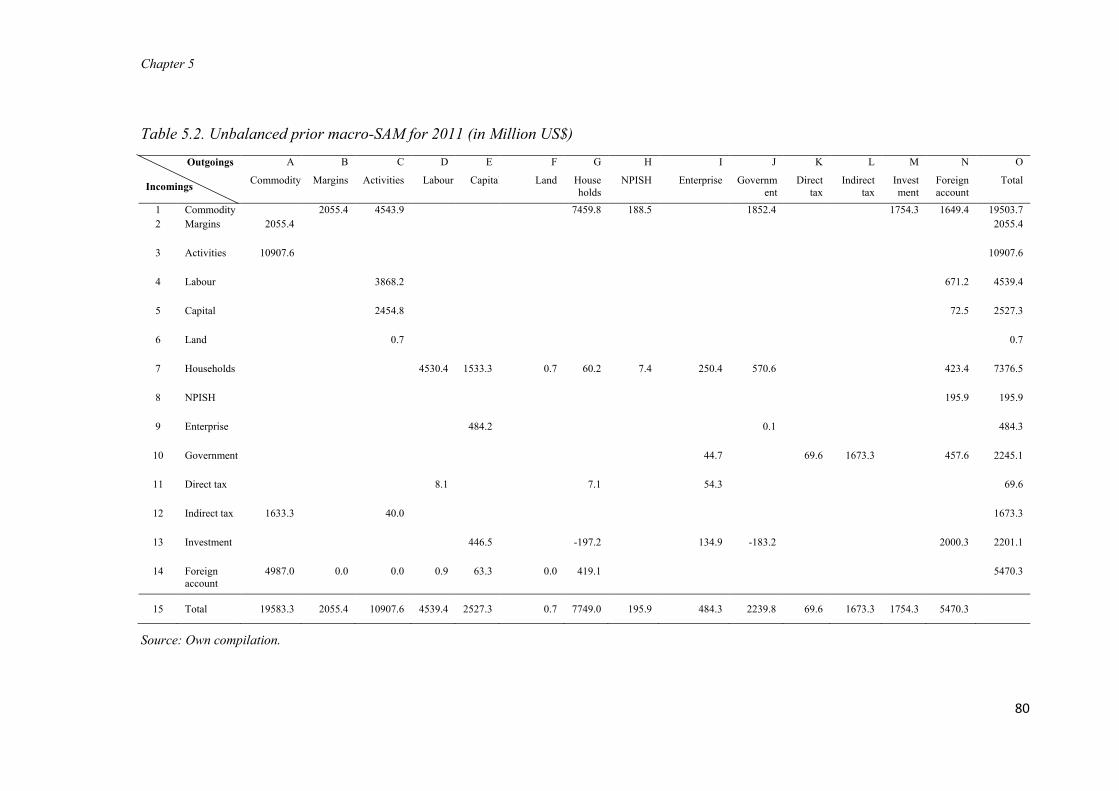
Chapter 5
80
Table 5.2. Unbalanced prior macro-SAM for 2011 (in Million US$)
Outgoings
Incomings
A B C D E F G H I J K L M N O
Commodity Margins Activities Labour Capital Land House
holds
NPISH Enterprise Governm
ent
Direct
tax
Indirect
tax
Invest
ment
Foreign
account
Total
1 Commodity
2055.4 4543.9
7459.8 188.5
1852.4
1754.3 1649.4 19503.7
2 Margins 2055.4
2055.4
3 Activities 10907.6
10907.6
4 Labour
3868.2
671.2 4539.4
5 Capital
2454.8
72.5 2527.3
6 Land
0.7
0.7
7 Households
4530.4 1533.3 0.7 60.2 7.4 250.4 570.6
423.4 7376.5
8 NPISH
195.9 195.9
9 Enterprise
484.2
0.1
484.3
10 Government
44.7
69.6 1673.3
457.6 2245.1
11 Direct tax
8.1
7.1
54.3
69.6
12 Indirect tax 1633.3
40.0
1673.3
13 Investment
446.5
-197.2
134.9 -183.2
2000.3 2201.1
14 Foreign
account
4987.0 0.0 0.0 0.9 63.3 0.0 419.1
5470.3
15 Total 19583.3 2055.4 10907.6 4539.4 2527.3 0.7 7749.0 195.9 484.3 2239.8 69.6 1673.3 1754.3 5470.3
Source: Own compilation.
A SAM for the West Bank
81
5.3.2. Estimation of a balanced macro-SAM
A cross entropy program is used to estimate a balanced macro-SAM from the prior macro-
SAM of Table 5.2. The cross entropy program is a technique to estimate a SAM, assuming
that the initial data are measured with error (Robinson and McDonald, 2006). The
estimation philosophy is Bayesian and interactive. This approach treats every cell in the
SAM as being specified with an error support set whose weights are estimated. There is a
prior, which is specified for each error distribution. Additionally, fixed constraints are
achieved by setting standard errors to zero. The cross entropy program used in this thesis
was developed by Robinson and McDonald (2006).
For the estimation process, constraints are imposed on the prior macro-SAM such that row
sums and corresponding column sums must equal. Additionally, relevant macro totals from
the 2011 National Accounts (NA) are fixed so that the final SAM reproduces these figures.
For the estimation of the 2011 West Bank macro-SAM, fixed totals are GDP, total savings,
net current transfers from abroad, transfers from government, NPISH and household
consumption, investment demand, intermediate inputs, market output and depreciation. The
estimated balanced macro-SAM is shown in Table 5.3.
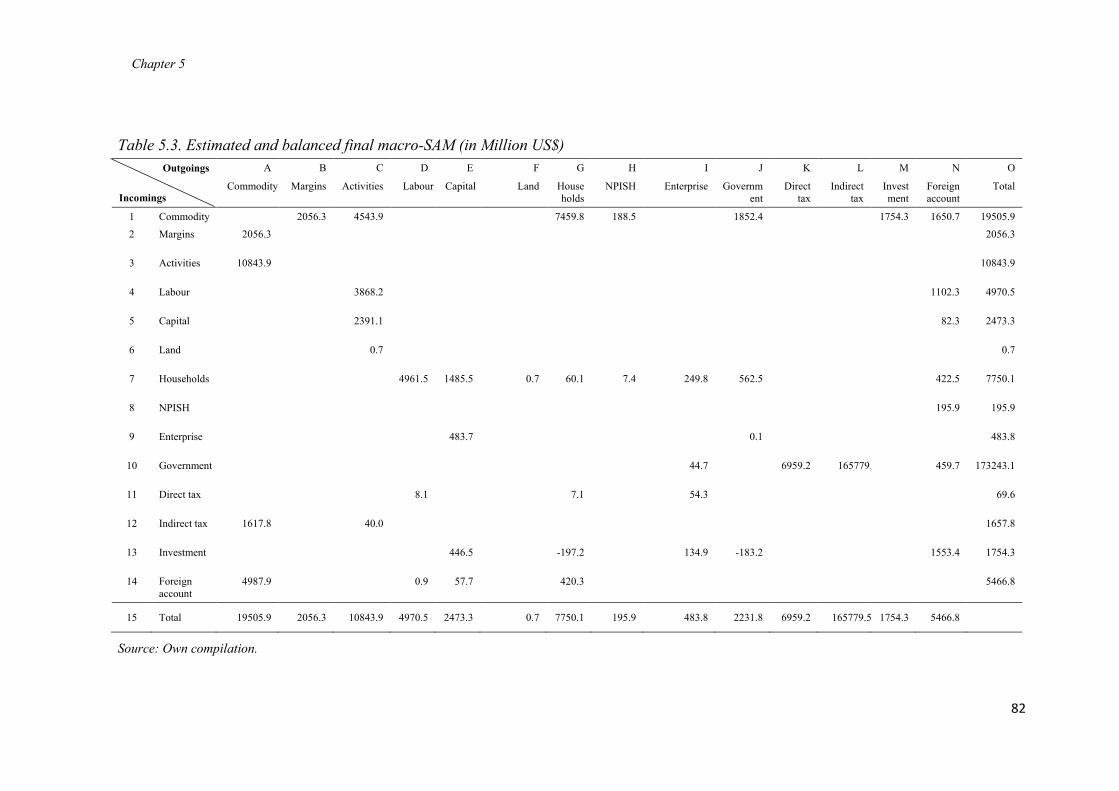
Chapter 5
82
Table 5.3. Estimated and balanced final macro-SAM (in Million US$)
Outgoings
Incomings
A B C D E F G H I J K L M N O
Commodity Margins Activities Labour Capital Land House
holds
NPISH Enterprise Governm
ent
Direct
tax
Indirect
tax
Invest
ment
Foreign
account
Total
1 Commodity
2056.3 4543.9
7459.8 188.5
1852.4
1754.3 1650.7 19505.9
2 Margins 2056.3
2056.3
3 Activities 10843.9
10843.9
4 Labour
3868.2
1102.3 4970.5
5 Capital
2391.1
82.3 2473.3
6 Land
0.7
0.7
7 Households
4961.5 1485.5 0.7 60.1 7.4 249.8 562.5
422.5 7750.1
8 NPISH
195.9 195.9
9 Enterprise
483.7
0.1
483.8
10 Government
44.7
6959.2 165779.5
459.7 173243.1
11 Direct tax
8.1
7.1
54.3
69.6
12 Indirect tax 1617.8
40.0
1657.8
13 Investment
446.5
-197.2
134.9 -183.2
1553.4 1754.3
14 Foreign
account
4987.9
0.9 57.7
420.3
5466.8
15 Total 19505.9 2056.3 10843.9 4970.5 2473.3 0.7 7750.1 195.9 483.8 2231.8 6959.2 165779.5 1754.3 5466.8
Source: Own compilation.
A SAM for the West Bank
83
5.3.3. Differences between the prior and the estimated macro-SAM
A major outcome of the estimation procedure is the increase of labour income from abroad.
This result was expected as no constraint was put on that cell during the estimation process.
In fact, the prior used for labour income from Israel that is derived from the balance of
payment was too small and does not match the evidence collected from other sources. The
initial value for labour income from Israel, according to the balance of payments, only
makes 15% of the total labour income in the West Bank (cell “7, D”). By contrast, the labour
force survey (PCBS, 2012a) shows that the share of the West Bank working population
employed in Israel is 14% and the average wage in Israel is 91% higher the average wage
in the domestic West Bank market. Therefore, the expecte share of labour income from
Israel should be roughly 27% of the total labour income in the West Bank. In the final
estimated SAM, this share has increased to 23% that is closer to the expected share.
Adopting this new figure alters the net factor income from abroad that deviates from the
national accounts value by 71%. However, the effect of this change on the macroeconomic
aggregates is minor. The gross national income (GNI) and the gross disposable income
(GDI) deviate respectively by 6% and 5%, while the Gross Domestic Product (GDP) and
the net current transfers from abroad are unaffected. In fact, for the later two aggregates,
their values during the estimation procedure have been fixed to what is found in the national
accounts.
Beside the labour income from Israel, other entries also changed, but with no effect on the
macro aggregates, which were fixed in the estimation procedure. This is the case for imports
and exports, where the new values slightly depart from their initial entries, but the net export
remains the same in both the prior and the final SAM. This is also the case for transfers
between households, NPISH and the government with the rest of the world, where the gross
values changed, but the net remains constant. The same happens for individual components
of domestic savings (households, enterprise and government savings), but total savings are
kept constant. Finally, a noticeable change took place in government transfers to households
and in foreign savings (current account balance). However, these values were either
residuals or taken from sources that were not consistent with the national accounts in the
first place.
5.4. Constructing the detailed SAM
The detailed SAM developed for the West Bank for the year 2011 has 376 accounts. This
section describes the disaggregation of the macro-SAM entries and the processing of the
raw data conducted to estimate the detailed SAM.
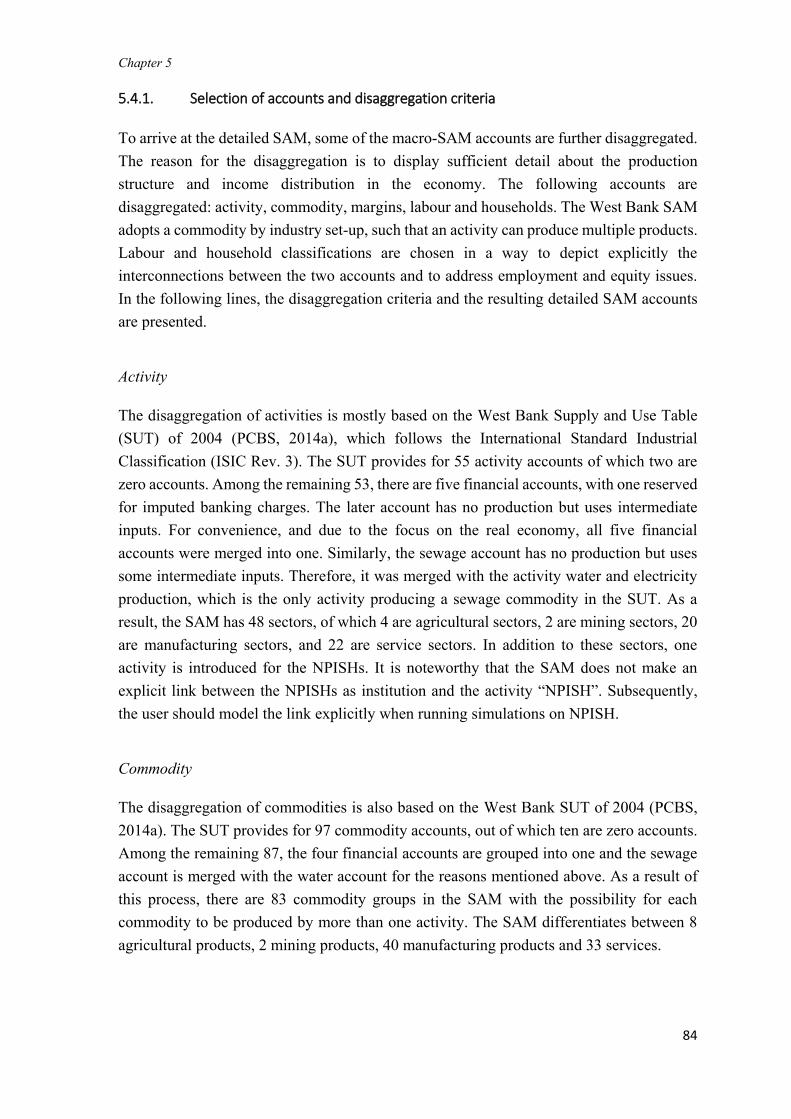
Chapter 5
84
5.4.1. Selection of accounts and disaggregation criteria
To arrive at the detailed SAM, some of the macro-SAM accounts are further disaggregated.
The reason for the disaggregation is to display sufficient detail about the production
structure and income distribution in the economy. The following accounts are
disaggregated: activity, commodity, margins, labour and households. The West Bank SAM
adopts a commodity by industry set-up, such that an activity can produce multiple products.
Labour and household classifications are chosen in a way to depict explicitly the
interconnections between the two accounts and to address employment and equity issues.
In the following lines, the disaggregation criteria and the resulting detailed SAM accounts
are presented.
Activity
The disaggregation of activities is mostly based on the West Bank Supply and Use Table
(SUT) of 2004 (PCBS, 2014a), which follows the International Standard Industrial
Classification (ISIC Rev. 3). The SUT provides for 55 activity accounts of which two are
zero accounts. Among the remaining 53, there are five financial accounts, with one reserved
for imputed banking charges. The later account has no production but uses intermediate
inputs. For convenience, and due to the focus on the real economy, all five financial
accounts were merged into one. Similarly, the sewage account has no production but uses
some intermediate inputs. Therefore, it was merged with the activity water and electricity
production, which is the only activity producing a sewage commodity in the SUT. As a
result, the SAM has 48 sectors, of which 4 are agricultural sectors, 2 are mining sectors, 20
are manufacturing sectors, and 22 are service sectors. In addition to these sectors, one
activity is introduced for the NPISHs. It is noteworthy that the SAM does not make an
explicit link between the NPISHs as institution and the activity “NPISH”. Subsequently,
the user should model the link explicitly when running simulations on NPISH.
Commodity
The disaggregation of commodities is also based on the West Bank SUT of 2004 (PCBS,
2014a). The SUT provides for 97 commodity accounts, out of which ten are zero accounts.
Among the remaining 87, the four financial accounts are grouped into one and the sewage
account is merged with the water account for the reasons mentioned above. As a result of
this process, there are 83 commodity groups in the SAM with the possibility for each
commodity to be produced by more than one activity. The SAM differentiates between 8
agricultural products, 2 mining products, 40 manufacturing products and 33 services.
A SAM for the West Bank
85
Margins
The disaggregation of margins is also derived from the West Bank SUT of 2004, which
provides for three types of margins: wholesale, retail sale and transport margins.
Factors
The SAM includes 59 factor groups among which 57 are labour-groups, one is the factor
capital and one is the factor land. Labour is disaggregtaed in order to capture the
participation of the Palestinian labour force in different labour markets. First total labour in
the West Bank is split between foreign and Palestinian domestic labour. The domestic
labour is further differentiated by labour markets to differentiate between the labour
commuting to Israel for work, labour working inside the West Bank for domestic
employers, and labour employed by foreign diplomatic missions residing in the West Bank.
The internal domestic market employs most of the workforce, while the Israeli market also
employs a significant share (Figure 5-1). The labour groups are further disaggregated by
skill level distinguishing between low and high-skilled workers based on the number of
years of education with the cutting edge set at 12 years of formal education. Workers with
higher education (more than 12 years of schooling) are considered as high-skilled. This
classification is consistent with the International Standard Classification of Occupations
(ISCO-08), which has four skill levels with the highest two reserved for workers who visited
a higher educational institution (ILO, 2012). Following this criterion, 71% of the working
population are low-skilled and 29% are high-skilled (PCBS, 2014d).
Figure 5-1. Distribution of West Bank working population by labour market
Source: PCBS, 2014d.
Domestic labour groups employed in the domestic market are disaggregated by employment
sectors. Six employment sectors are considered in the 2011 Labour Force Survey data (LFS)
(PCBS, 2014d), namely: agriculture, manufacturing, construction, commerce and hotels,
86%
14% 0%Working for domesticemployers
Working in Israel
Working for foreigngovernments
Chapter 5
86
transport, and services. Moreover, the labour in the domestic market is further differentiated
by gender and eligibility for a work permit in Israel. According to the 2011 LFS, 25% of
the working population employed in the domestic market is composed of females, while
75% are males (PCBS, 2014d). Only male workers are further classified according to the
eligibility for a work permit in Israel as the share of female workers employed in Israel is
negligible (1%) (PCBS, 2012a).
Permits for working in Israel are granted to Palestinians based on personal and civil status
criteria presumably associated with a lower likelihood for them to be involved in attacks
against Israelis. These criteria differ over time according to the intensity of the conflict
between the two regions. At the height of the second Palestinian uprising (2000-2004), the
main requirements were to be married with children, and be above the age of 34 years
(Etkes, 2012). West Bank workers meeting these high requirements are classified as highly
eligible (or qualified) for a work permit. In a period of low conflict like in 2014, the main
criteria were to be married, and be above the age of 23 years (COGAT, 2014). West Bank
workers only fulfilling these criteria are categorised as weakly eligible for a work permit.
The remaining workers are classified as ineligible (or unqualified). Based on these criteria,
53% of the West Bank labour employed in the domestic market are ineligible, 15% only
meet the weak eligibility requirements and 32% are highly eligible (PCBS, 2014d).
West Bank workers employed in Israel are classified according to their permit situation.
Among them, 62% work with a permit, while 38% do not have any work permit (PCBS,
2016a). The domestic labour employed by foreign diplomatic missions residing in the West
Bank is also differentiated according to the eligibility for a work permit in Israel. This
criterion is relevant when it comes to simulating the switch of employment to Israel in case
the mobility of Palestinian labour to Israel is eased. Based on this criterion, 55% of the
working population employed by foreign diplomatic missions residing in the West Bank
are ineligible for a work permit in Israel, 14% meet the weak eligibility requirements and
31% meet the high requirements (PCBS, 2014d).
Figure 5-2 illustrates the disaggregation of factor accounts.
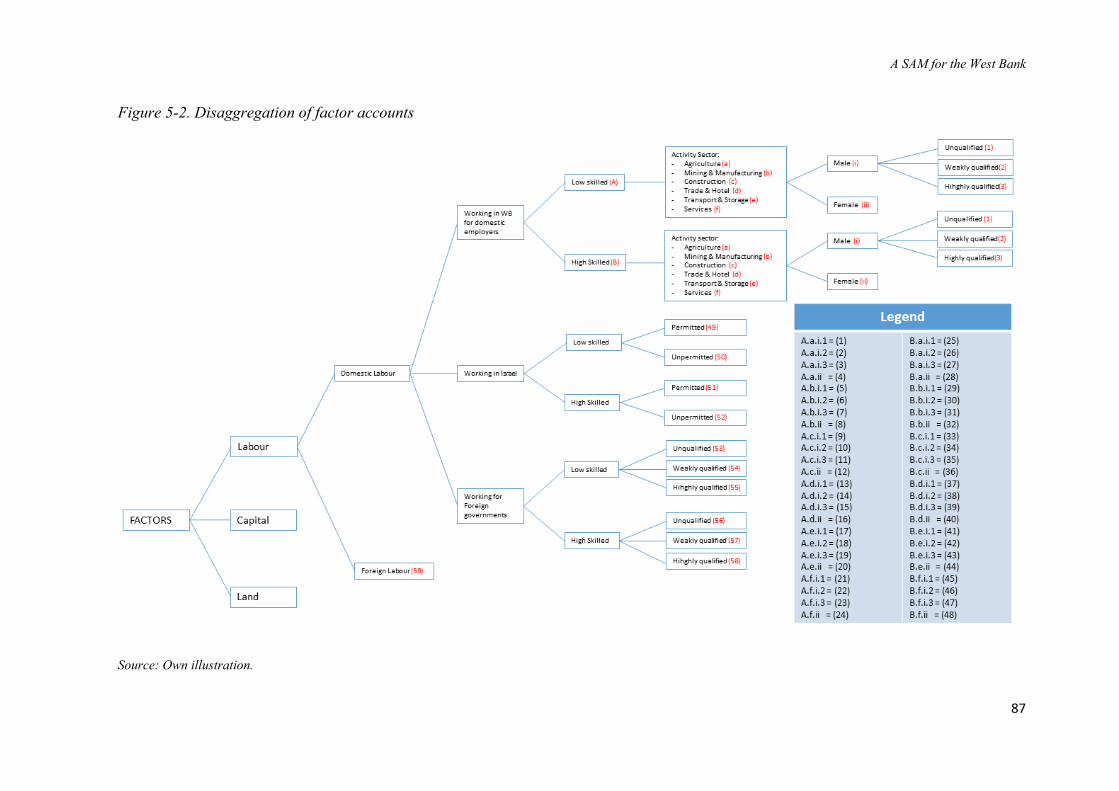
A SAM for the West Bank
87
Figure 5-2. Disaggregation of factor accounts
Source: Own illustration.

Chapter 5
88
Household groups
Household data are derived from the Palestinian Expenditure and Consumption Survey
(PECS) of 2011 (PCBS, 2014c). Households in the SAM are disaggregated in order to
incorporate sufficient details allowing for policy analysis that addresses income distribution
and household livelihoods. In this SAM, households in the West Bank are first
disaggregated into expenditure quintiles for the purpose of cross-sectional comparisons.
The quintiles are defined based on consumption expenditure per adult equivalent.
Consumption expenditure is used instead of income, as income in developing regions like
the West Bank is often underreported. By contrast, consumption expenditure, which
includes both goods and services that are purchased, and those that are produced for the
home consumption, shows current standards of living and reflects better the long-term
average well-being (Haughton and Khandker, 2009). The equivalence scale is used for
grouping households. Using such an equivalence scale captures the economies of scale that
arise from sharing some living conditions such as the housing space. The consumption per
adult equivalent used is based on the square root scale (OECD, 2012). This equivalence
scale divides household consumption by the square root of household size.
The second differentiation level is by the average skill level of the economically active
household members. This criterion is introduced in order to have a good mapping between
the labour classes and household groups. Household members who are at least age 15
(minimum age to enter the active population) are selected and their average number of years
of schooling is calculated. When this average at household level is lower than 12 years, the
household is considered as “low-skilled” household; otherwise, it is considered as “high-
skilled” household. Low-skilled households are more represented in the poorer quintiles
than in the richer ones (Table 5.4).
Table 5.4. Distribution of West Bank households by consumption quintiles and skill
Low-skilled households High-skilled households Total
Number of
households
Share Number of
households
Share Number of
households
Share
Quintile 1 484 20% 45 2% 529 22%
Quintile 2 440 19% 91 4% 531 23%
Quintile 3 384 16% 104 4% 488 20%
Quintile 4 333 14% 134 6% 467 20%
Quintile 5 204 9% 154 6% 358 15%
Total 1,846 78% 527 22% 2,373 100%
Source: PCBS, 2014c.
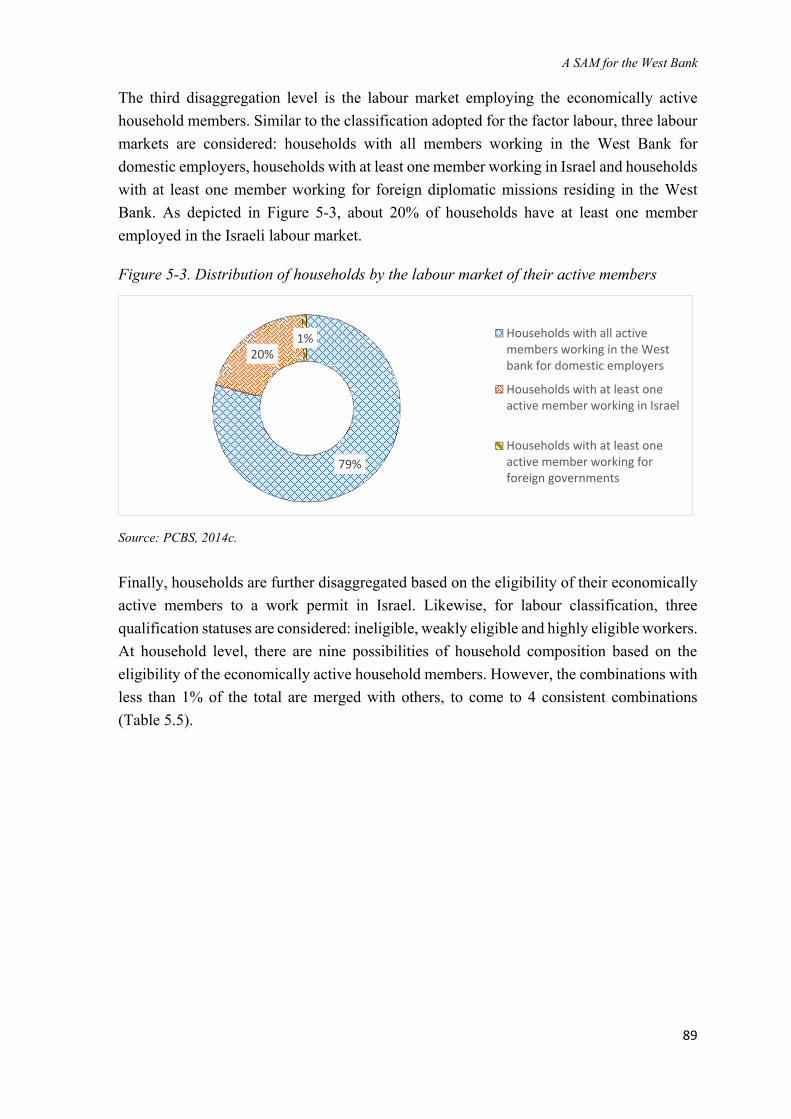
A SAM for the West Bank
89
The third disaggregation level is the labour market employing the economically active
household members. Similar to the classification adopted for the factor labour, three labour
markets are considered: households with all members working in the West Bank for
domestic employers, households with at least one member working in Israel and households
with at least one member working for foreign diplomatic missions residing in the West
Bank. As depicted in Figure 5-3, about 20% of households have at least one member
employed in the Israeli labour market.
Figure 5-3. Distribution of households by the labour market of their active members
Source: PCBS, 2014c.
Finally, households are further disaggregated based on the eligibility of their economically
active members to a work permit in Israel. Likewise, for labour classification, three
qualification statuses are considered: ineligible, weakly eligible and highly eligible workers.
At household level, there are nine possibilities of household composition based on the
eligibility of the economically active household members. However, the combinations with
less than 1% of the total are merged with others, to come to 4 consistent combinations
(Table 5.5).
79%
20%1% Households with all active
members working in the Westbank for domestic employers
Households with at least oneactive member working in Israel
Households with at least oneactive member working forforeign governments
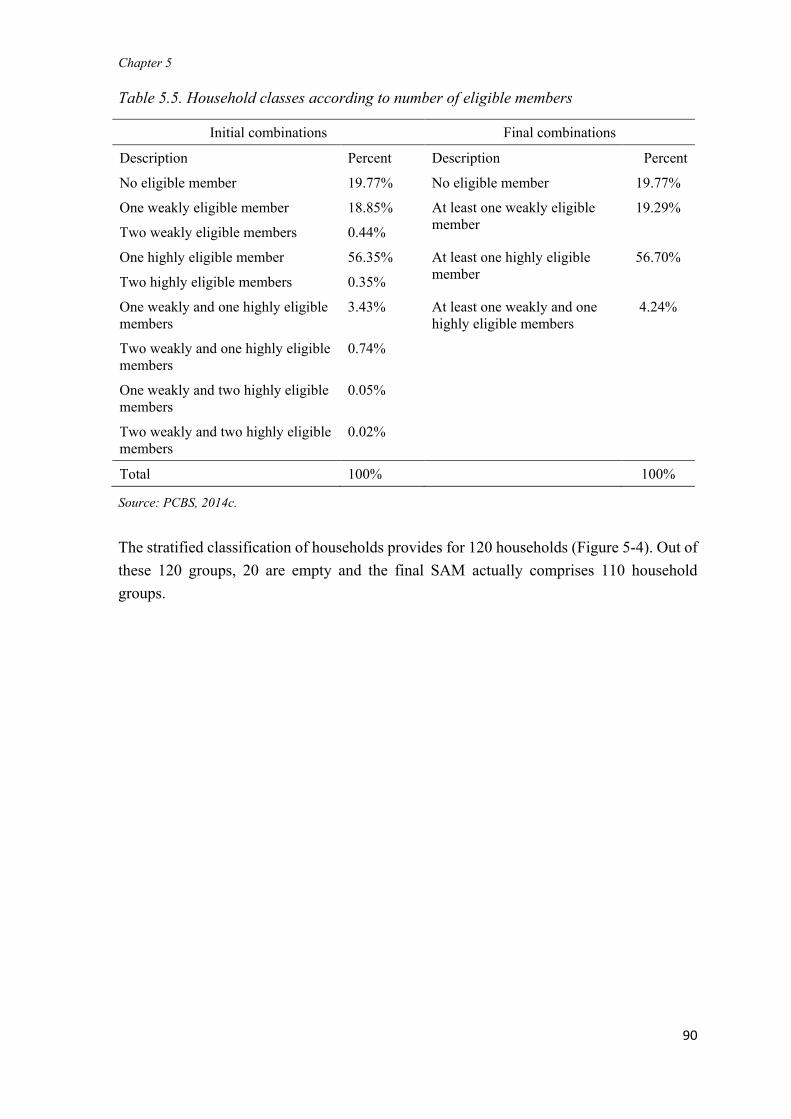
Chapter 5
90
Table 5.5. Household classes according to number of eligible members
Initial combinations Final combinations
Description Percent Description Percent
No eligible member 19.77% No eligible member 19.77%
One weakly eligible member 18.85% At least one weakly eligible
member
19.29%
Two weakly eligible members 0.44%
One highly eligible member 56.35% At least one highly eligible
member
56.70%
Two highly eligible members 0.35%
One weakly and one highly eligible
members
3.43% At least one weakly and one
highly eligible members
4.24%
Two weakly and one highly eligible
members
0.74%
One weakly and two highly eligible
members
0.05%
Two weakly and two highly eligible
members
0.02%
Total 100%
100%
Source: PCBS, 2014c.
The stratified classification of households provides for 120 households (Figure 5-4). Out of
these 120 groups, 20 are empty and the final SAM actually comprises 110 household
groups.
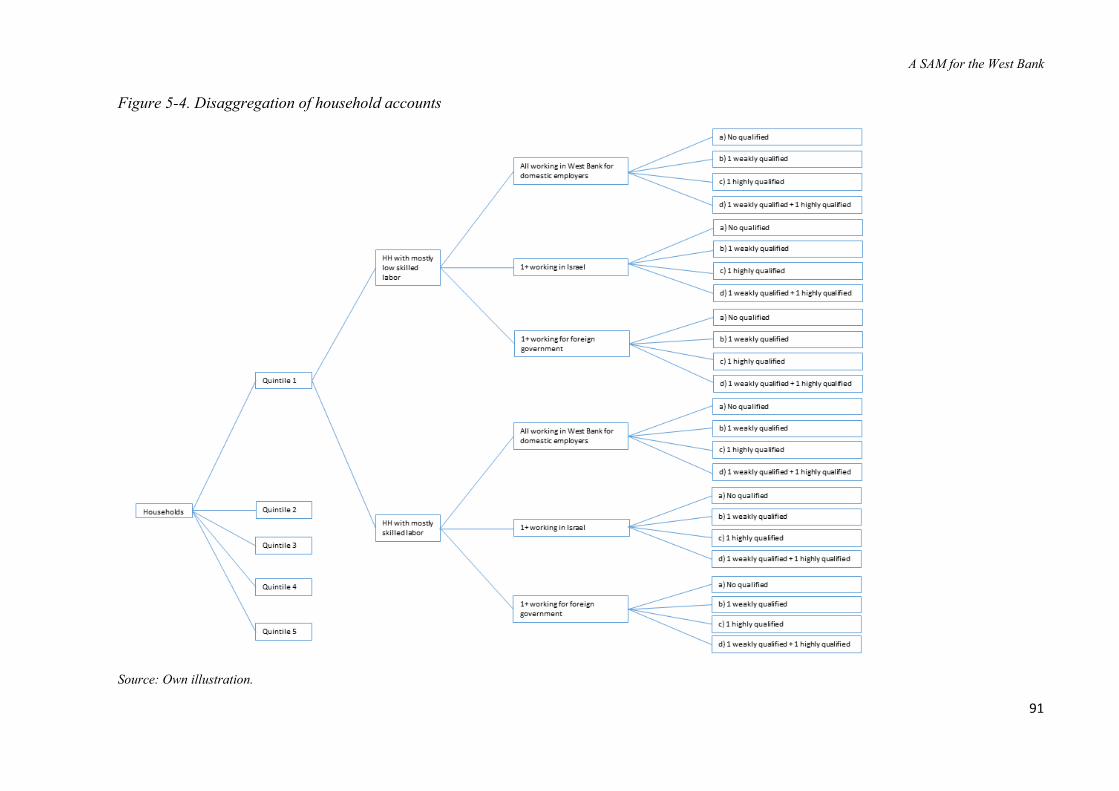
A SAM for the West Bank
91
Figure 5-4. Disaggregation of household accounts
Source: Own illustration.
Chapter 5
92
5.4.2. Processing of the raw data to assemble the prior detailed SAM
The breakdown of the macro-SAM cells to arrive at the detailed SAM involves the
processing of different sets of raw data. The initial values entered for the detailed SAM are
derived from the Supply and Use Table of 2004 (PCBS, 2014a), the national accounts for
2011 (PCBS, 2014b), the Palestinian expenditure and consumption survey (PCBS, 2014c),
the UN Comtrade database (UN Contrade, 2015) and the Palestinian Labour Force Survey
(PCBS, 2014d). Supplementary information from other sources, including the WTO tariff
book (WTO, 2016), the Balance of Payments (PCBS, 2016b), the Ministry of finance
reports (MoF, 2012a, 2012b), the land use statistics (PCBS, 2016c), the inbound visitors
survey (PCBS, 2009), the hotel activity survey of 2011 (PCBS, 2012d), and the foreign
investment statistics in Palestine (PCBS, 2016d) is used. The detailed description of the
process of imputing the initial values for the detailed SAM is provided in Appendix 3.
5.4.3. Estimation of a balanced detailed SAM
To come to a final balanced SAM, the total of each submatrix is first scaled up to the value
of the corresponding entry in the macro-SAM. Thus, the detailed SAM was made consistent
with the macro-SAM. However, individual SAM accounts presented discrepancies.
Therefore, the challenge was to remove these discrepancies in the individual SAM accounts,
while keeping the consistency with the macro-SAM. To achieve this goal, the SAM is
estimated using the cross entropy program developed by Robinson and McDonald (2006).
In the estimation process, macro totals such as GDP are fixed with zero standard error.
Additionally, the macro-SAM totals are used as controls with zero standard errors.
Individual SAM elements and account totals are also specified as controls so as to arrive at
a final estimated SAM consistent with the macro-SAM, balanced in every single SAM
account and overall consistent with the 2011 NA (PCBS, 2014b).
After the estimation with the cross-entropy program, a second round of estimation was
conducted to remove the imputed banking charges, which were present in the SAM as
negative capital compensation in the finance sector. As most CGE models require the values
of all factor usage to be positive, these imputed banking charges were removed following a
procedure described in the problem area of the GTAP Database contributor’s website7.
7 https://www.gtap.agecon.purdue.edu/databases/contribute/bankingsect.asp. This procedure has been fully
automatized in GAMS and the code can be shared with interested researchers.
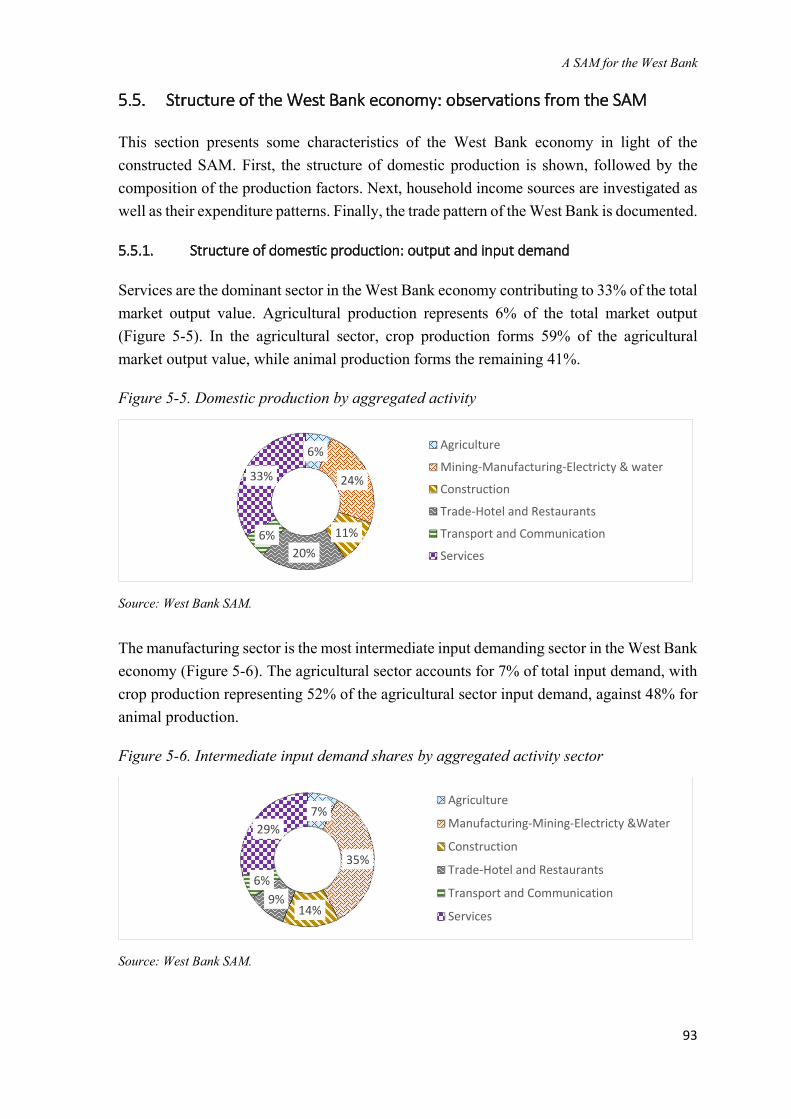
A SAM for the West Bank
93
5.5. Structure of the West Bank economy: observations from the SAM
This section presents some characteristics of the West Bank economy in light of the
constructed SAM. First, the structure of domestic production is shown, followed by the
composition of the production factors. Next, household income sources are investigated as
well as their expenditure patterns. Finally, the trade pattern of the West Bank is documented.
5.5.1. Structure of domestic production: output and input demand
Services are the dominant sector in the West Bank economy contributing to 33% of the total
market output value. Agricultural production represents 6% of the total market output
(Figure 5-5). In the agricultural sector, crop production forms 59% of the agricultural
market output value, while animal production forms the remaining 41%.
Figure 5-5. Domestic production by aggregated activity
Source: West Bank SAM.
The manufacturing sector is the most intermediate input demanding sector in the West Bank
economy (Figure 5-6). The agricultural sector accounts for 7% of total input demand, with
crop production representing 52% of the agricultural sector input demand, against 48% for
animal production.
Figure 5-6. Intermediate input demand shares by aggregated activity sector
Source: West Bank SAM.
6%
24%
11%20%
6%
33%
AgricultureMining-Manufacturing-Electricty & waterConstructionTrade-Hotel and RestaurantsTransport and CommunicationServices
7%
35%
14%9%
6%
29%
Agriculture
Manufacturing-Mining-Electricty &Water
Construction
Trade-Hotel and Restaurants
Transport and Communication
Services
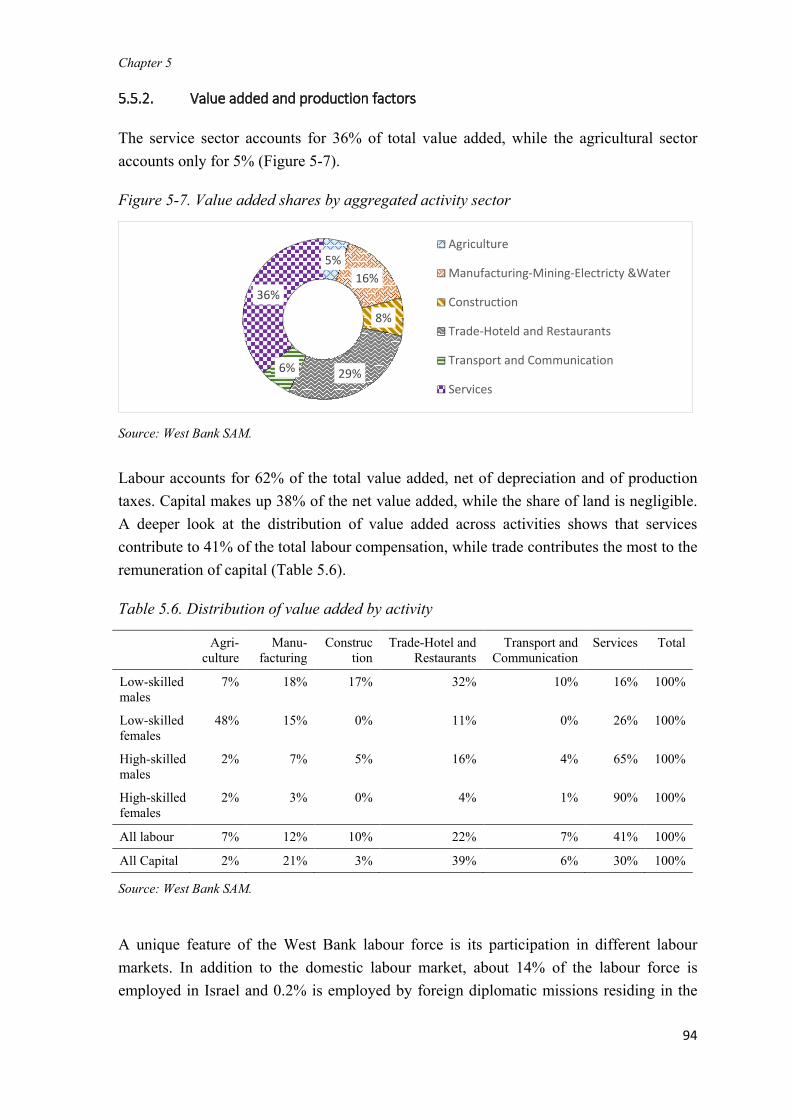
Chapter 5
94
5.5.2. Value added and production factors
The service sector accounts for 36% of total value added, while the agricultural sector
accounts only for 5% (Figure 5-7).
Figure 5-7. Value added shares by aggregated activity sector
Source: West Bank SAM.
Labour accounts for 62% of the total value added, net of depreciation and of production
taxes. Capital makes up 38% of the net value added, while the share of land is negligible.
A deeper look at the distribution of value added across activities shows that services
contribute to 41% of the total labour compensation, while trade contributes the most to the
remuneration of capital (Table 5.6).
Table 5.6. Distribution of value added by activity
Agri-culture
Manu-facturing
Construction
Trade-Hotel and Restaurants
Transport and Communication
Services Total
Low-skilled males
7% 18% 17% 32% 10% 16% 100%
Low-skilled females
48% 15% 0% 11% 0% 26% 100%
High-skilled males
2% 7% 5% 16% 4% 65% 100%
High-skilled females
2% 3% 0% 4% 1% 90% 100%
All labour 7% 12% 10% 22% 7% 41% 100%
All Capital 2% 21% 3% 39% 6% 30% 100%
Source: West Bank SAM.
A unique feature of the West Bank labour force is its participation in different labour
markets. In addition to the domestic labour market, about 14% of the labour force is
employed in Israel and 0.2% is employed by foreign diplomatic missions residing in the
5%16%
8%
29%6%
36%
Agriculture
Manufacturing-Mining-Electricty &Water
Construction
Trade-Hoteld and Restaurants
Transport and Communication
Services
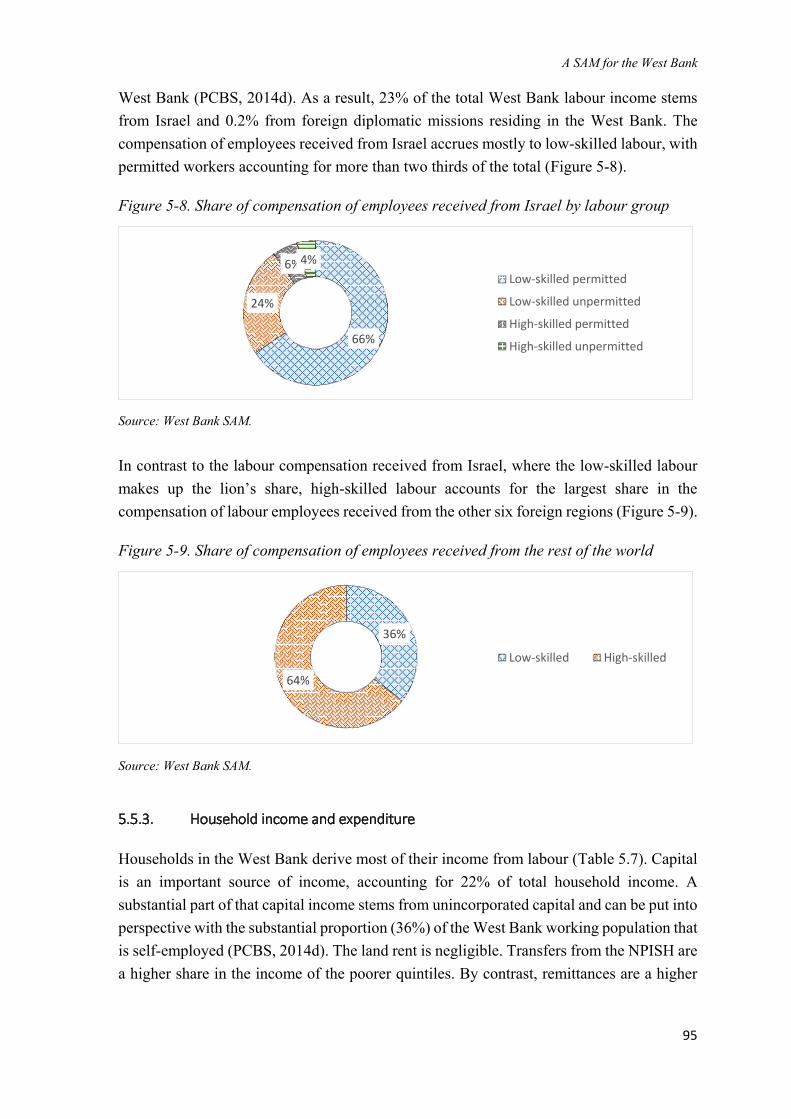
A SAM for the West Bank
95
West Bank (PCBS, 2014d). As a result, 23% of the total West Bank labour income stems
from Israel and 0.2% from foreign diplomatic missions residing in the West Bank. The
compensation of employees received from Israel accrues mostly to low-skilled labour, with
permitted workers accounting for more than two thirds of the total (Figure 5-8).
Figure 5-8. Share of compensation of employees received from Israel by labour group
Source: West Bank SAM.
In contrast to the labour compensation received from Israel, where the low-skilled labour
makes up the lion’s share, high-skilled labour accounts for the largest share in the
compensation of labour employees received from the other six foreign regions (Figure 5-9).
Figure 5-9. Share of compensation of employees received from the rest of the world
Source: West Bank SAM.
5.5.3. Household income and expenditure
Households in the West Bank derive most of their income from labour (Table 5.7). Capital
is an important source of income, accounting for 22% of total household income. A
substantial part of that capital income stems from unincorporated capital and can be put into
perspective with the substantial proportion (36%) of the West Bank working population that
is self-employed (PCBS, 2014d). The land rent is negligible. Transfers from the NPISH are
a higher share in the income of the poorer quintiles. By contrast, remittances are a higher
66%
24%
6%4%Low-skilled permitted
Low-skilled unpermitted
High-skilled permitted
High-skilled unpermitted
36%
64%
Low-skilled High-skilled
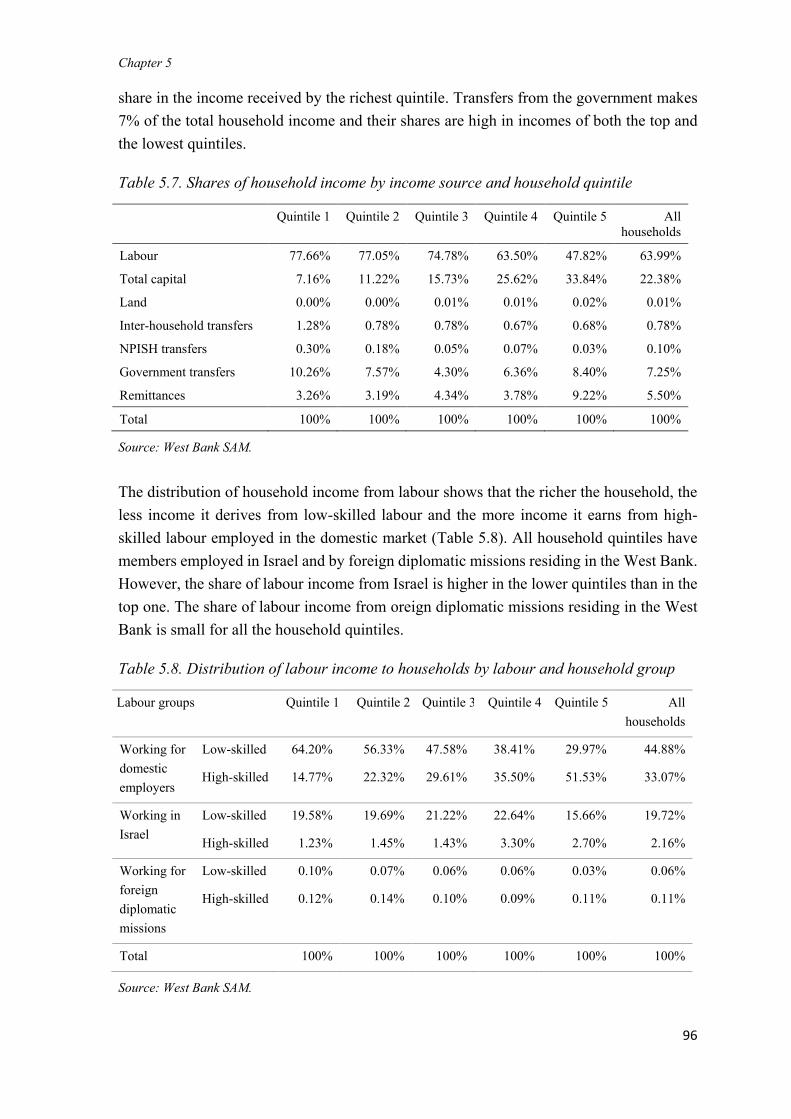
Chapter 5
96
share in the income received by the richest quintile. Transfers from the government makes
7% of the total household income and their shares are high in incomes of both the top and
the lowest quintiles.
Table 5.7. Shares of household income by income source and household quintile
Quintile 1 Quintile 2 Quintile 3 Quintile 4 Quintile 5 All
households
Labour 77.66% 77.05% 74.78% 63.50% 47.82% 63.99%
Total capital 7.16% 11.22% 15.73% 25.62% 33.84% 22.38%
Land 0.00% 0.00% 0.01% 0.01% 0.02% 0.01%
Inter-household transfers 1.28% 0.78% 0.78% 0.67% 0.68% 0.78%
NPISH transfers 0.30% 0.18% 0.05% 0.07% 0.03% 0.10%
Government transfers 10.26% 7.57% 4.30% 6.36% 8.40% 7.25%
Remittances 3.26% 3.19% 4.34% 3.78% 9.22% 5.50%
Total 100% 100% 100% 100% 100% 100%
Source: West Bank SAM.
The distribution of household income from labour shows that the richer the household, the
less income it derives from low-skilled labour and the more income it earns from high-
skilled labour employed in the domestic market (Table 5.8). All household quintiles have
members employed in Israel and by foreign diplomatic missions residing in the West Bank.
However, the share of labour income from Israel is higher in the lower quintiles than in the
top one. The share of labour income from oreign diplomatic missions residing in the West
Bank is small for all the household quintiles.
Table 5.8. Distribution of labour income to households by labour and household group
Labour groups Quintile 1 Quintile 2 Quintile 3 Quintile 4 Quintile 5 All
households
Working for
domestic
employers
Low-skilled 64.20% 56.33% 47.58% 38.41% 29.97% 44.88%
High-skilled 14.77% 22.32% 29.61% 35.50% 51.53% 33.07%
Working in
Israel
Low-skilled 19.58% 19.69% 21.22% 22.64% 15.66% 19.72%
High-skilled 1.23% 1.45% 1.43% 3.30% 2.70% 2.16%
Working for
foreign
diplomatic
missions
Low-skilled 0.10% 0.07% 0.06% 0.06% 0.03% 0.06%
High-skilled 0.12% 0.14% 0.10% 0.09% 0.11% 0.11%
Total 100% 100% 100% 100% 100% 100%
Source: West Bank SAM.
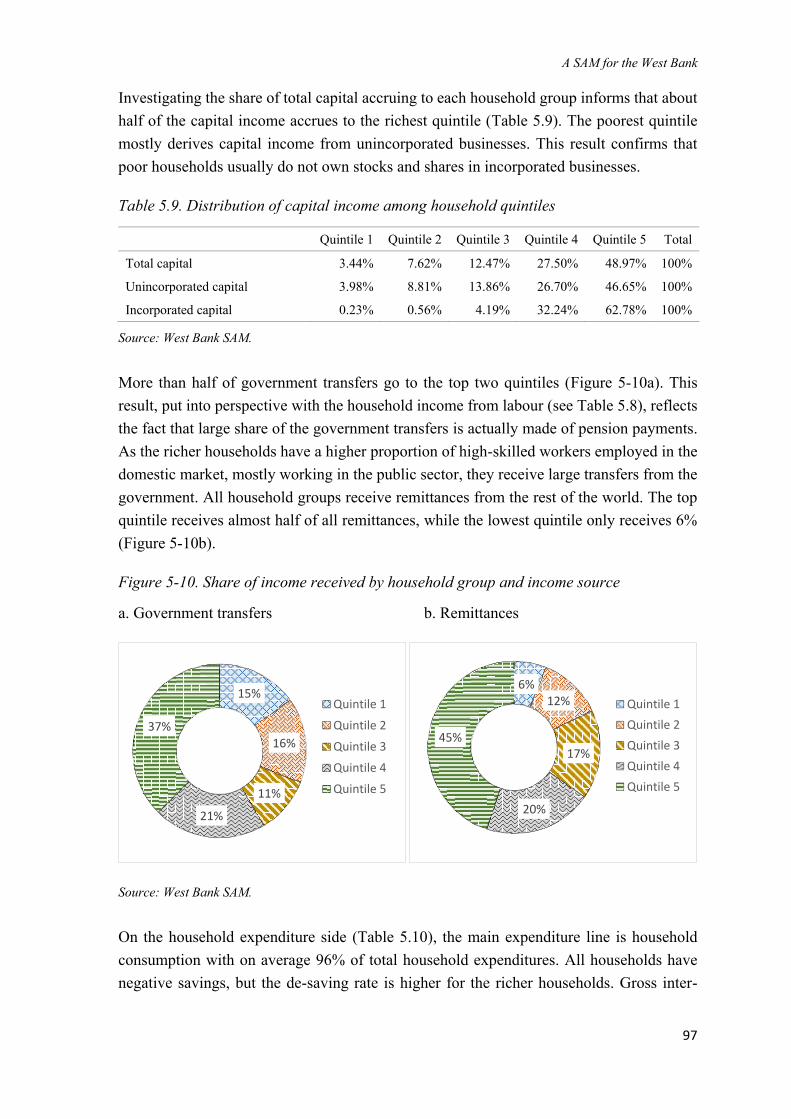
A SAM for the West Bank
97
Investigating the share of total capital accruing to each household group informs that about
half of the capital income accrues to the richest quintile (Table 5.9). The poorest quintile
mostly derives capital income from unincorporated businesses. This result confirms that
poor households usually do not own stocks and shares in incorporated businesses.
Table 5.9. Distribution of capital income among household quintiles
Quintile 1 Quintile 2 Quintile 3 Quintile 4 Quintile 5 Total
Total capital 3.44% 7.62% 12.47% 27.50% 48.97% 100%
- Unincorporated capital 3.98% 8.81% 13.86% 26.70% 46.65% 100%
- Incorporated capital 0.23% 0.56% 4.19% 32.24% 62.78% 100%
Source: West Bank SAM.
More than half of government transfers go to the top two quintiles (Figure 5-10a). This
result, put into perspective with the household income from labour (see Table 5.8), reflects
the fact that large share of the government transfers is actually made of pension payments.
As the richer households have a higher proportion of high-skilled workers employed in the
domestic market, mostly working in the public sector, they receive large transfers from the
government. All household groups receive remittances from the rest of the world. The top
quintile receives almost half of all remittances, while the lowest quintile only receives 6%
(Figure 5-10b).
Figure 5-10. Share of income received by household group and income source
a. Government transfers b. Remittances
Source: West Bank SAM.
On the household expenditure side (Table 5.10), the main expenditure line is household
consumption with on average 96% of total household expenditures. All households have
negative savings, but the de-saving rate is higher for the richer households. Gross inter-
15%
16%
11%
21%
37%
Quintile 1Quintile 2Quintile 3Quintile 4Quintile 5
6%12%
17%
20%
45%
Quintile 1Quintile 2Quintile 3Quintile 4Quintile 5
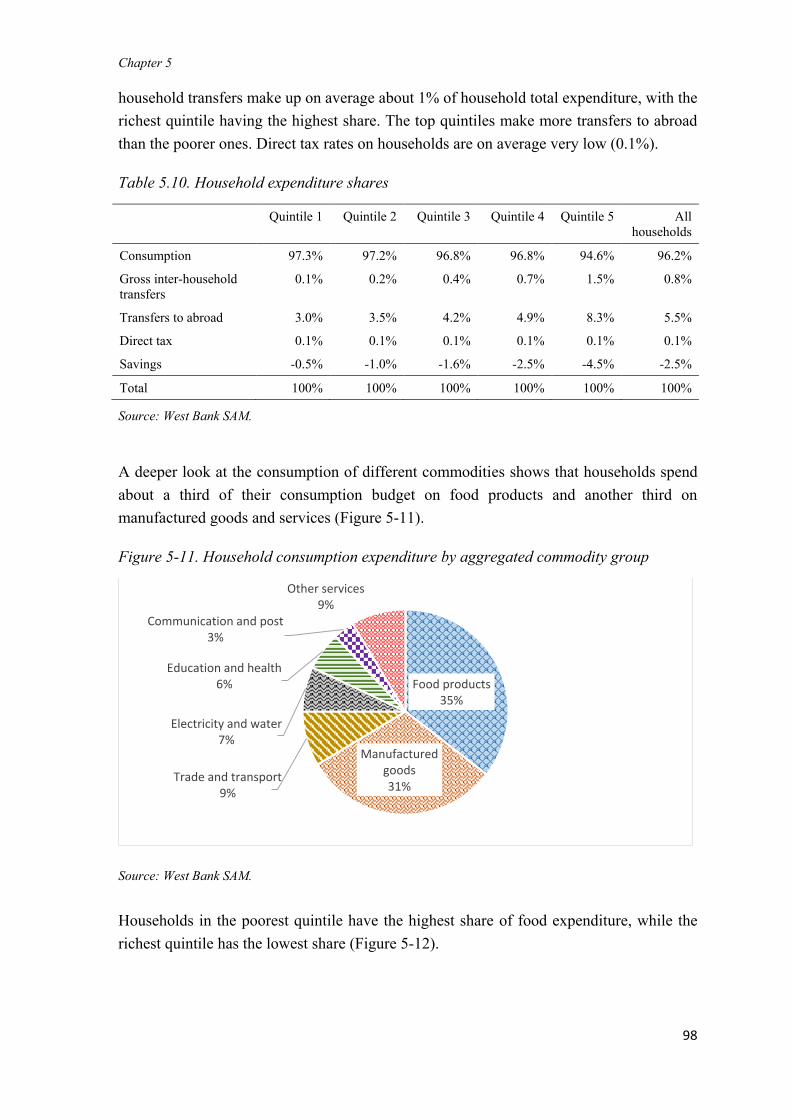
Chapter 5
98
household transfers make up on average about 1% of household total expenditure, with the
richest quintile having the highest share. The top quintiles make more transfers to abroad
than the poorer ones. Direct tax rates on households are on average very low (0.1%).
Table 5.10. Household expenditure shares
Quintile 1 Quintile 2 Quintile 3 Quintile 4 Quintile 5 All
households
Consumption 97.3% 97.2% 96.8% 96.8% 94.6% 96.2%
Gross inter-household
transfers
0.1% 0.2% 0.4% 0.7% 1.5% 0.8%
Transfers to abroad 3.0% 3.5% 4.2% 4.9% 8.3% 5.5%
Direct tax 0.1% 0.1% 0.1% 0.1% 0.1% 0.1%
Savings -0.5% -1.0% -1.6% -2.5% -4.5% -2.5%
Total 100% 100% 100% 100% 100% 100%
Source: West Bank SAM.
A deeper look at the consumption of different commodities shows that households spend
about a third of their consumption budget on food products and another third on
manufactured goods and services (Figure 5-11).
Figure 5-11. Household consumption expenditure by aggregated commodity group
Source: West Bank SAM.
Households in the poorest quintile have the highest share of food expenditure, while the
richest quintile has the lowest share (Figure 5-12).
Food products35%
Manufactured goods31%
Trade and transport9%
Electricity and water7%
Education and health6%
Communication and post 3%
Other services9%
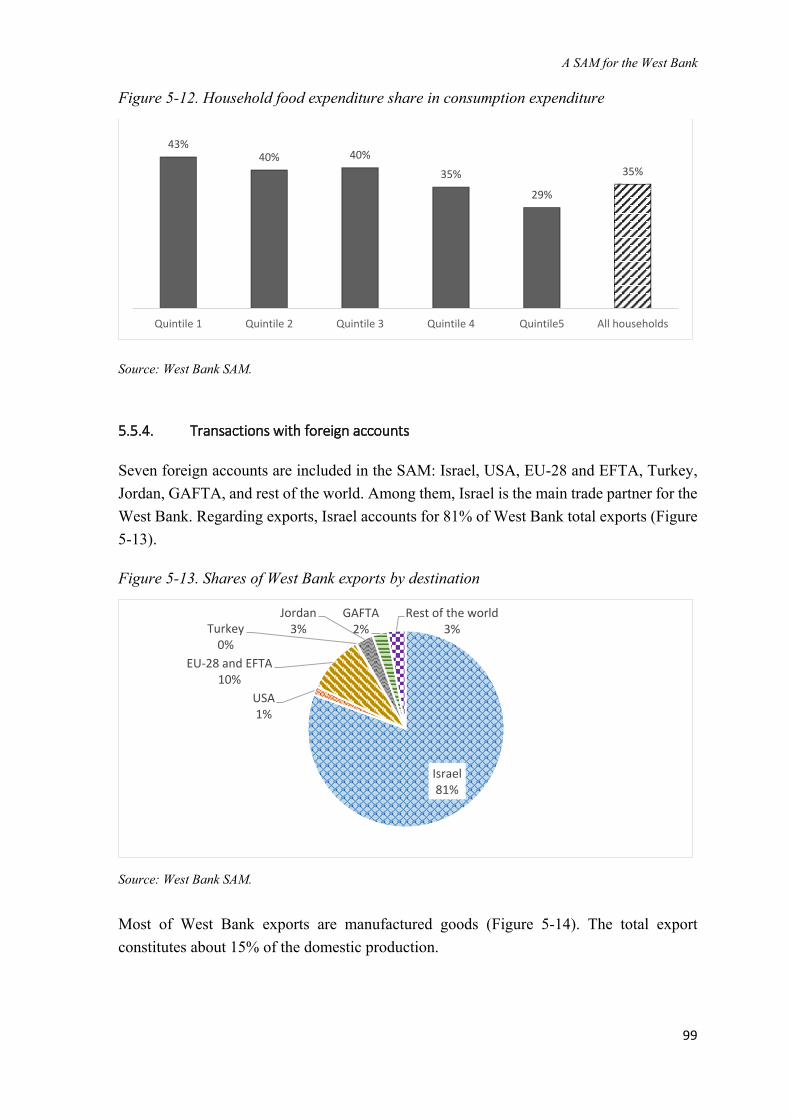
A SAM for the West Bank
99
Figure 5-12. Household food expenditure share in consumption expenditure
Source: West Bank SAM.
5.5.4. Transactions with foreign accounts
Seven foreign accounts are included in the SAM: Israel, USA, EU-28 and EFTA, Turkey,
Jordan, GAFTA, and rest of the world. Among them, Israel is the main trade partner for the
West Bank. Regarding exports, Israel accounts for 81% of West Bank total exports (Figure
5-13).
Figure 5-13. Shares of West Bank exports by destination
Source: West Bank SAM.
Most of West Bank exports are manufactured goods (Figure 5-14). The total export
constitutes about 15% of the domestic production.
43%40% 40%
35%
29%
35%
Quintile 1 Quintile 2 Quintile 3 Quintile 4 Quintile5 All households
Israel81%
USA1%
EU-28 and EFTA10%
Turkey0%
Jordan3%
GAFTA2%
Rest of the world3%
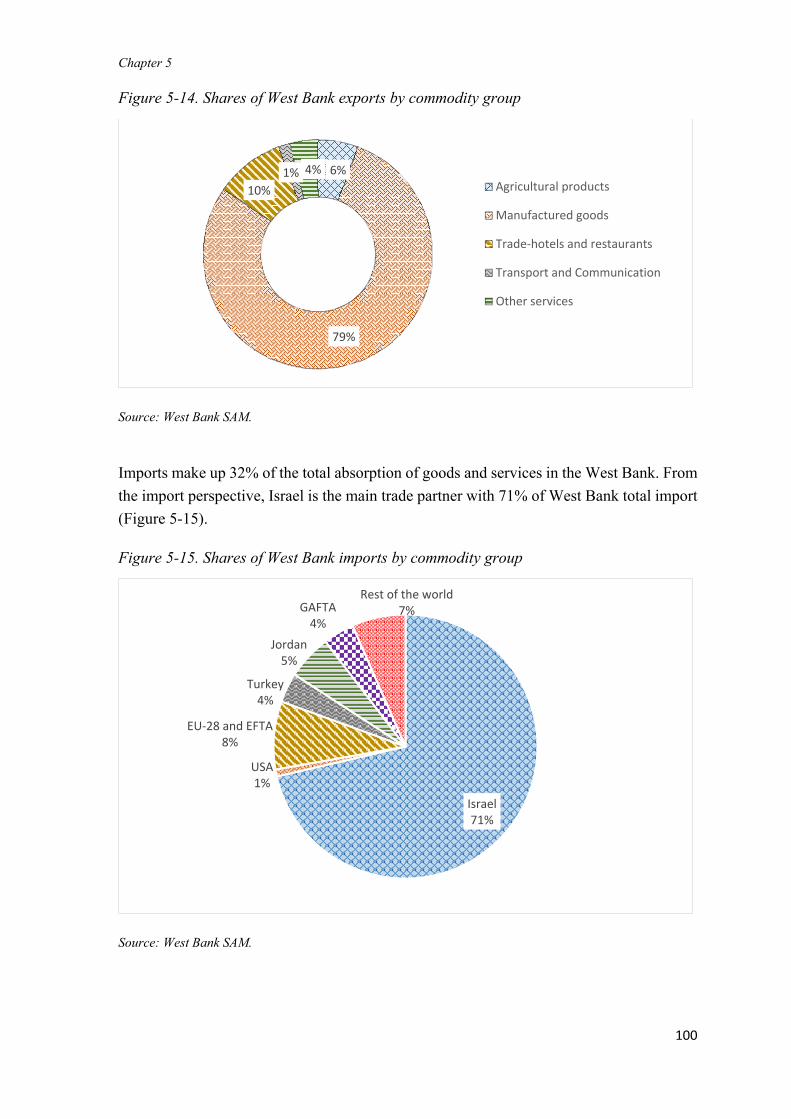
Chapter 5
100
Figure 5-14. Shares of West Bank exports by commodity group
Source: West Bank SAM.
Imports make up 32% of the total absorption of goods and services in the West Bank. From
the import perspective, Israel is the main trade partner with 71% of West Bank total import
(Figure 5-15).
Figure 5-15. Shares of West Bank imports by commodity group
Source: West Bank SAM.
6%
79%
10%1% 4%
Agricultural products
Manufactured goods
Trade-hotels and restaurants
Transport and Communication
Other services
Israel71%
USA1%
EU-28 and EFTA8%
Turkey4%
Jordan5%
GAFTA4%
Rest of the world7%
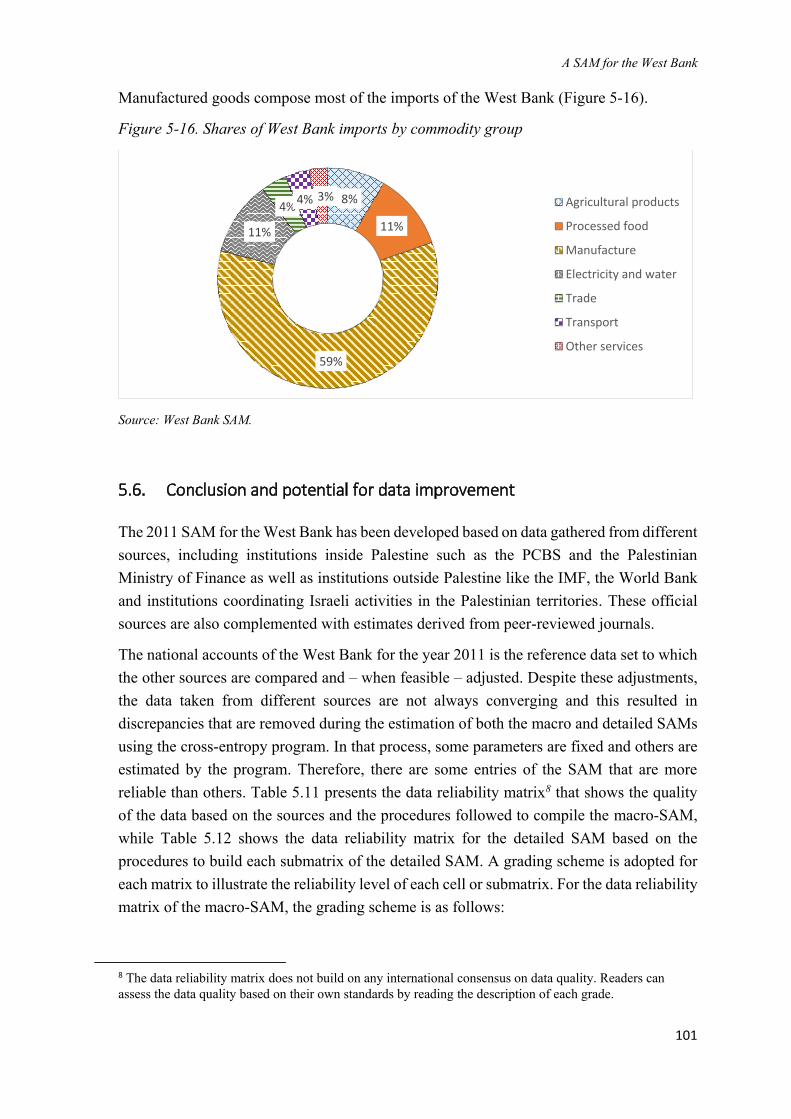
A SAM for the West Bank
101
Manufactured goods compose most of the imports of the West Bank (Figure 5-16).
Figure 5-16. Shares of West Bank imports by commodity group
Source: West Bank SAM.
5.6. Conclusion and potential for data improvement
The 2011 SAM for the West Bank has been developed based on data gathered from different
sources, including institutions inside Palestine such as the PCBS and the Palestinian
Ministry of Finance as well as institutions outside Palestine like the IMF, the World Bank
and institutions coordinating Israeli activities in the Palestinian territories. These official
sources are also complemented with estimates derived from peer-reviewed journals.
The national accounts of the West Bank for the year 2011 is the reference data set to which
the other sources are compared and – when feasible – adjusted. Despite these adjustments,
the data taken from different sources are not always converging and this resulted in
discrepancies that are removed during the estimation of both the macro and detailed SAMs
using the cross-entropy program. In that process, some parameters are fixed and others are
estimated by the program. Therefore, there are some entries of the SAM that are more
reliable than others. Table 5.11 presents the data reliability matrix8 that shows the quality
of the data based on the sources and the procedures followed to compile the macro-SAM,
while Table 5.12 shows the data reliability matrix for the detailed SAM based on the
procedures to build each submatrix of the detailed SAM. A grading scheme is adopted for
each matrix to illustrate the reliability level of each cell or submatrix. For the data reliability
matrix of the macro-SAM, the grading scheme is as follows:
8 The data reliability matrix does not build on any international consensus on data quality. Readers can assess the data quality based on their own standards by reading the description of each grade.
8%
11%
59%
11%
4%4% 3% Agricultural products
Processed food
Manufacture
Electricity and water
Trade
Transport
Other services

Chapter 5
102
– Grade A: data of best reliability. This includes entries that are exclusively based on the
national accounts for the West Bank for the year 2011.
– Grade B: data of second best reliability. This includes entries in the macro-SAM whose
values stem from the PCBS data sets other than the national accounts. This comprises
the balance of payments and the Ministry of finance statement that were initially
available for the whole Palestine, from which the share of the West Bank is derived based
on other official statistics. It also includes data taken from the Supply and Use Table of
2004 that were extrapolated to 2011, and data from official surveys such as the labour
force survey and the Palestinian expenditure and consumption survey that were scaled
up to the entire West Bank population.
– Grade C: this grade is attributed to entries in the macro-SAM that involved external data,
assumptions and expert judgment.
For the data reliability matrix of the detailed SAM, the grading scheme is as follows:
– Grade 0: this grade is attributed to entries in the detailed SAM that did not involve any
disaggregation, i.e. their values in the macro and detailed SAMs are identical.
– Grade A: data of best reliability. This includes the submatrices for which disaggregation
is entirely based on the PCBS Supply and Use Table for the West Bank in 2004.
– Grade B: data of second best reliability. This includes submatrices whose disaggregation
is based on PCBS surveys such as the expenditure and consumption survey or the labour
force survey. For most of these submatrices, a mapping between their initial
classification and the SAM classification was required.
– Grade C: this grade is attributed to submatrices whose disaggregation has involved
external data, assumptions and expert judgment.
In the data reliability matrix for the macro-SAM, two of the entries with a grade C are
related to the mixed income of self-employed. The first is the labour share in value added,
including the self-employed, and the second is household income from unincorporated
capital. The estimation of these parameters has been overlooked in the existing SAM
literature. These issues are addressed with a specific methodology, which has been shown
in Section 5.2 of this chapter. However, this methodology can be improved, especially if
the data availability constraints are overcome. Data quality for cells with grade B that were
generated from data initially aggregated at national level could also be improved if the
corresponding data for the West Bank were readily available.

A SAM for the West Bank
103
In the data reliability matrix for the detailed SAM, most of the cells with a grade C refer to
the foreign accounts. In fact, collecting detailed information on transactions between the
West Bank and individual trade partner, especially for trade in services, was constrained by
the lack of such detailed data. Therefore, data quality could be improved if more detailed
data are availed. The quality of entries with grade B in the detailed SAM could also be
improved as these submatrices are disaggregated based on the Supply and Use Table of
2004. Subsequently, they can be updated whenever a more recent Supply and Use Table is
available.
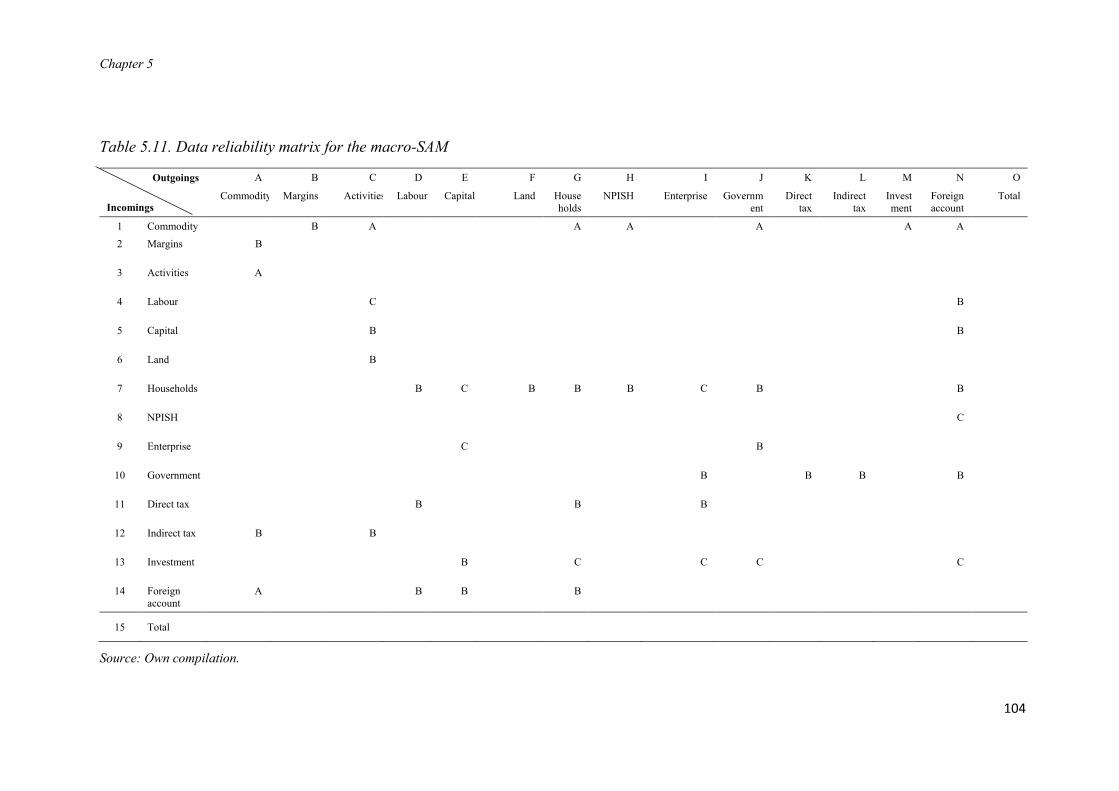
Chapter 5
104
Table 5.11. Data reliability matrix for the macro-SAM
Outgoings
Incomings
A B C D E F G H I J K L M N O
Commodity Margins Activities Labour Capital Land House
holds
NPISH Enterprise Governm
ent
Direct
tax
Indirect
tax
Invest
ment
Foreign
account
Total
1 Commodity
B A
A A
A
A A
2 Margins B
3 Activities A
4 Labour
C
B
5 Capital
B
B
6 Land
B
7 Households
B C B B B C B
B
8 NPISH
C
9 Enterprise
C
B
10 Government
B
B B
B
11 Direct tax
B
B
B
12 Indirect tax B
B
13 Investment
B
C
C C
C
14 Foreign
account
A
B B
B
15 Total
Source: Own compilation.

A SAM for the West Bank
105
Table 5.12. Data reliability matrix for the detailed SAM
Outgoings
Incomings
A B C D E F G H I J K L M N O
Commodity Margins Activities Labour Capital Land House
holds
NPISH Enterprise Governm
ent
Direct
tax
Indirect
tax
Invest
ment
Foreign
account
Tot
al
1 Commodity A A B A A A C
2 Margins A
3 Activities A
4 Labour B C
5 Capital A C
6 Land B
7 Households B C B C B B B C
8 NPISH C
9 Enterprise 0 0
10 Government 0 0 0 B
11 Direct tax B B 0
12 Indirect tax C B
13 Investment 0 B 0 0 C
14 Foreign
account
C C C C
15 Total
Source: Own compilation.

106
107
6
EMPIRICAL ANALYSIS OF THE IMPLICATIONS OF
DIFFERENT LABOUR MARKET CONDITIONS IN
CGE MODELS: THE CASE OF THE WEST BANK9
9 Parts of this chapter have been published as a conference paper: Agbahey, J., Siddig, K., Grethe, H., 2018.
Implications of different factor market conditions in CGE: an application to Palestinian employment in Israel and
its impact on the West Bank economy. In: 2018 Annual Conference on Economic Modelling (EcoMod). Venice:
EcoMod, p.23.

Chapter 6
108
Implications of different labour market conditions in CGE models
109
Chapter 6 Empirical analysis of the implications of different
labour market conditions in CGE models: the case of the West
Bank
6.1. Introduction
The sensitivity of simulation results is a well known challenge to CGE modellers. While
there is an extensive literature on the role of macroeconomic closure conditions and the
effect of parameter values, especially trade elasticities, little is known about the
implications of different factor market clearing conditions (McDonald, 2018). A starting
point in the discussion is the definition of a production boundary. The production boundary
determines the economic activities that are included in the model and those that are
excluded. In price-driven whole economy models, like CGE models, the production and
consumption boundaries follow the approach adopted by the System of National Accounts
(SNA). Accordingly, production and consumption decisions relating to goods and services
take place within the boundary only if those goods and services can have uniquely
determined prices. Subsequently, the activities within the production boundary are the ones
using inputs and that are controlled and organised by institutions (United Nations, 2009).
Activities producing goods and services for sale on the markets, i.e. the market activities,
satisfy the SNA condition that prices can be uniquely defined, whether or not the goods
and services that are produced are actually sold (McDonald, 2018). By contrast, the
activities undertaken by household members to produce services that are consumed by the
household at home, i.e. the non-market activities, are excluded from the SNA definition.
Those services do not satisfy the condition that their prices be determined in a unique way,
because there are no suitable market prices to value such services. The main input for the
production of services by the household for its own use that is excluded from the SNA
accounting is “labour”.
The delimitation of a production boundary has important implications for the definition of
macroeconomic aggregates and for the welfare analysis. By convention, macroeconomic
aggregates such as absorption and GDP are defined with reference to goods and services
produced and consumed within the SNA boundary. However, it is evident that households
derive utility not only from the consumption of goods and services purchasable from the
market, but also from services produced outside the SNA boundary. Hence, for a full
accountability of the welfare effects, changes within and outside the boundary need to be
reported. This is especially important when there are transfers of labour across the
boundary. When a policy shock leads to increases in the wage rates within the production
boundary, households allocate more labour to the market activities at the expense of the
Chapter 6
110
non-market activities. Consequently, absorption is increased and welfare gains are realised
within the boundary. However, as labour is reallocated away from the non-
market.activities, welfare losses take place outside the boundary. Therefore, there are
positive and negative welfare effects occurring, and limiting the analysis to what happens
within the production boundary is prone to biases.
This chapter aims at investigating the implications of different labour market conditions
and assessing the biases of limiting the analysis of simulation results to what happens
within the production boundary. Four stylized specifications of the labour market
conditions are considered. The case study is the West Bank labour markets, which are
described in detail in Chapter 4 of this thesis. The labour markets in the West Bank are a
typical case of dual markets with Palestinian labour employed in the domestic West Bank
markets as well as in Israel. Due to the importance of labour income earned in Israel for the
Palestinian households, changes in the level of Palestinian employment in Israel have
considerable effects on the West Bank economy. Moreover, depending on the time horizon
of the analysis, different assumptions can be made about the labour market conditions in
the West Bank. Subsequently, the case of the labour markets in the West Bank is well suited
for the analysis intended in this chapter.
The next Section, 6.2, provides a brief overview of the four stylized specifications of the
labour markets. Section 6.3 presents the data used as benchmark, the model, the closures
and factor market clearing equations in each of the model specifications. Section 6.4
describes the simulation implemented. Section 6.5 analyses the main results, while Section
6.6 draws on the main conclusions and policy implications of the case study.
6.2. Stylized specifications of the labour market conditions
This section provides a brief overview of four stylized specifications of the labour market
conditions that are: i) fixed supply, ii) surplus labour, iii) upward-sloping labour curve, and
iv) labour-leisure trade-off. A more detailed description of these market conditions is
provided in Section 3.3.2 of Chapter 3.
The fixed supply specification assumes a perfectly inelastic labour supply curve, implying
that households are indifferent to changes in wages when making decisions in the labour
markets. This assumption excludes the possibility for labour to be unemployed and ignores
the alternative uses of time other than employment in the market activities. Traditionally,
this has been relaxed by the assumption of a surplus labour that can be drawn into
employment at no marginal cost. This assumption corresponds to a perfectly elastic labour
Implications of different labour market conditions in CGE models
111
supply curve, implying that once the quantities of labour needed in the market activities are
determined, households must supply the corresponding quantities of labour.
A common limitation of the fixed labour supply and surplus labour assumptions is that they
assume a superficial neutrality between labour uses within and outside the SNA production
boundary. The fixed labour supply assumption achieves this neutrality by assuming a strict
separability between labour uses within and outside the boundary. This treatment is open
to challenges, even in economies with no involuntary unemployment, as it makes
household decisions on the allocation of labour indifferent to changes in the wage rates.
The surplus labour assumption achieves the neutrality by assuming labour to have zero
opportunity cost outside the production boundary. This assumption is unlikely to hold,
since labour not employed within the production boundary is often engaged in activities
producing services for the use of the household. Subsequently, transferring labour across
the boundary creates welfare losses outside the boundary that are not accounted for
(McDonald, 2018).
The upward-sloping curve, similar to the surplus labour assumption, also implies a transfer
of labour across the SNA production boundary. While this approach recognises that
additional employment within the SNA production boundary has a positive price, it
assumes the opportunity cost of that labour outside the SNA boundary to be zero (Aragie
et al., 2017). Hence, this treatment is not neutral to the welfare generated outside the
boundary. Additionally, the theoretical and behavioural assumptions for the use of the wage
curve are not supported by standard economic theories.
The labour-leisure trade-off approach is a way for accounting for households’ full time
endowment. It allows the substitution between uses of labour within and outside the
production boundary. Accordingly, it reflects the trade-off facing households in the
determination of the amount of labour to supply to the market. The approach also defines
household utility at full consumption by considering household consumption of services
produced by the activities outside the production boundary. The opportunity cost of labour
use outside the production boundary is explicit and corresponds to the market wage. The
labour-leisure trade-off is consistent with the standard economic theories and accounts
explicitly for welfare changes within and outside the production boundary.
Chapter 6
112
6.3. Methods
6.3.1. Data
The SAM used as a benchmark for the models in this chapter is an aggregated version of
the detailed SAM described in Chapter 5. It comprises 183 accounts, among which 48 are
commodity groups produced by 36 activities. Two foreign accounts are included for Israel
and the rest of the world to depict the customs envelope between Palestine and Israel and
the interdependency of their labour markets. The SAM encompasses 33 production factor
accounts of which 31 are labour groups, besides two accounts for capital and land. Foreign
labour is separated from the domestic labour, which is further disaggregated based on the
skill level and gender. Male workers who represent the quasi totality of Palestinian labour
in Israel are further categorised based on eligibility for a work permit in Israel. Three levels
of eligibility are considered based on social characteristics such as age and marital status:
ineligible, weakly eligible and highly eligible. There are 20 household groups classified
based on income quintile (measured as expenditure per adult equivalent), and
socioeconomic characteristics of their economically active members.
This database is used to calibrate the models with fixed supply, surplus labour and upward-
sloping curve specifications. For the model specification with labour-leisure trade-off, a
few changes to the database are required to incorporate leisure activities and commodities.
Each representative household is paired with a unique activity that uses the household’s
own time as input to produce leisure that is consumed only by that household. The factor
ownership matrix also has to be extended to account for the labour each household uses to
produce leisure, in addition to the labour that is supplied to the market. For the
comparability of this model results with the results of the other model specifications, the
time available to households as leisure time is limited to the time endowment for their
members who are not employed within the production boundary. Accordingly, the unit of
labour either in employment within or outside the boundary is kept in physical number of
persons. Table 6.1 summarises the employment data in the base year in the four model
specifications.

Implications of different labour market conditions in CGE models
113
Table 6.1. Employment data in the base year (unit = physical person)
Model with
fixed labour
supply
Model with
surplus labour
Model with
upward-
sloping curve
Model with
labour-leisure
trade-off
Employment
within the SNA
boundary
Domestic
market
activities
519,148 519,148 519,148 519,148
Foreign market
activities
74,814 74,814 74,814 74,814
Unemployment/ Employment
outside the SNA boundary
0 123,892 123,892 123,892
Total 593,962 717,854 717,854 717,854
6.3.2. Model
The model used in this chapter is a modified version of the STAGE-2 model developed by
McDonald and Thierfelder (2013). The basic structure of STAGE-2 is described in Section
3.6 of Chapter 3. For this chapter, the STAGE-2 model is modified to depict some special
features of the Palestinian economy and its interactions with the rest of the world. First, a
multiple trade partner specification is introduced to separate Israel from other trade
partners. This model extension is set up in a generalised way that can support more than
two trade partners. The elasticities used to account for imperfect substitution between
import/export from/to different trade partners as well as between import/export and
domestic supply are provided in Appendix 4. Second, the domestic production module is
modified to accommodate a seven-level production process that reflects the composition of
the labour force in the West Bank. Each level of the production process involves Constant
Elasticity of Substitution (CES) functions. The values of the elasticities used at each stage
of the production module are reported in Appendix 5.
A mobility function is incorporated in the model and is activated by changes in relative
wages. The intensity of mobility is governed by a response elasticity, which is defined for
each pair of market segments and captures the influence of structural features such as
transaction costs, efficiency of factor markets and preferences to stay with the current
occupation on labour mobility. By allowing labour to be mobile, the standard assumption
of labour income being distributed to households in fixed proportions is no longer valid.
Accordingly, the matrix of share coefficients controlling the functional distribution of
income is replaced by a matrix of variables that tracks changes in the supply of labour in
each sector and makes the labour income distribution endogenous.
Chapter 6
114
6.3.3. Macroeconomic closures
The reality of the West Bank being a small player in the international markets is depicted
with the small country assumption, which implies that importers and exporters in the West
Bank are price takers. The model is investment-driven as investments in the Palestinian
economy are largely exogenous. The share of investments in the final demand is fixed. To
keep the balance between savings and investments, household and enterprise savings rates
vary equiproportionately. Government savings are fixed and the direct tax rate adjusts
multiplicatively to maintain the balance. Government consumption is a fixed share of the
final demand. The nominal exchange rate (defined in domestic per world unit) is fixed in
the model, as the Israeli Shekel is the main currency in the West Bank and given that Israel
is the West Bank’s main trading partne. To avoid future consumption effects, the current
account balance is fixed. The consumer price index serves as the numeraire, meaning that
transfers and wages are in real terms.
6.3.4. Factor market closures
The factor market closures common to all four model specifications are such that capital
and land are fully employed as well as mobile across sectors and their prices are flexible.
The choice of pairs of market segments and the direction of labour mobility between them
follows the Kuznets’ structural transformation process (Herrendorf et al., 2014).
Accordingly, labour can move from the agricultural sector to the manufacturing and
construction sectors; from the manufacturing sector to the construction and tertiary sectors
and from the construction sector to the tertiary sector. The assumption of one-way
movement between the sectors follows the rationale that a labour movement to sectors at
the top of the structural process is associated with changes in the living conditions.
Subsequently, even with stronger positive changes in wages in the sectors at the bottom of
the structural transformation process (e.g. agricultural sector), a backward movement of
labour my not take place, as the workers enjoy the city life and do not see future prospects
in the rural areas.
The closures governing the shape of the labour supply curve vary from one model
specification to the other. In the fixed supply specification, the labour market is at full
employment. Hence, the supply curve is perfectly inelastic (vertical). In the labour-leisure
trade-off specification, the labour markets are also at full employment, as labour can always
be employed either in the activities within the production boundary or outside the boundary.
In contrast to the fixed supply specification, the supply of labour to the activities within the
boundary is not perfectly inelastic, since the labour-leisure trade-off allows transfers across
the boundary.
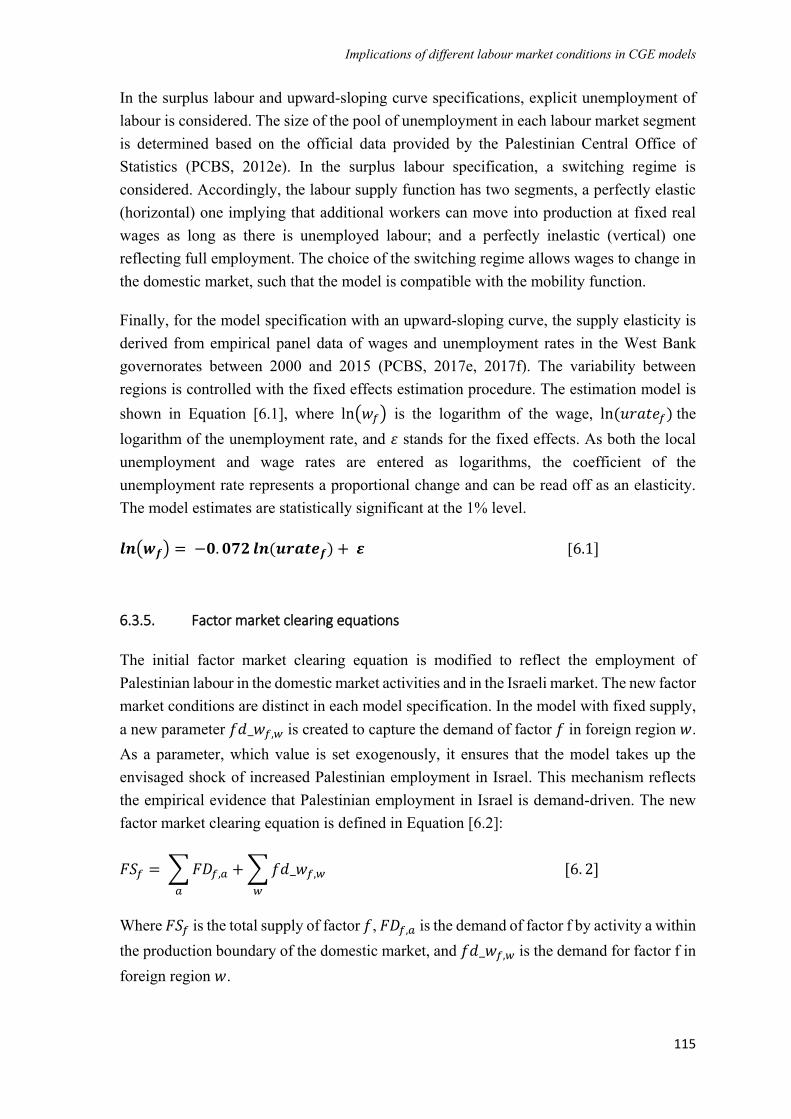
Implications of different labour market conditions in CGE models
115
In the surplus labour and upward-sloping curve specifications, explicit unemployment of
labour is considered. The size of the pool of unemployment in each labour market segment
is determined based on the official data provided by the Palestinian Central Office of
Statistics (PCBS, 2012e). In the surplus labour specification, a switching regime is
considered. Accordingly, the labour supply function has two segments, a perfectly elastic
(horizontal) one implying that additional workers can move into production at fixed real
wages as long as there is unemployed labour; and a perfectly inelastic (vertical) one
reflecting full employment. The choice of the switching regime allows wages to change in
the domestic market, such that the model is compatible with the mobility function.
Finally, for the model specification with an upward-sloping curve, the supply elasticity is
derived from empirical panel data of wages and unemployment rates in the West Bank
governorates between 2000 and 2015 (PCBS, 2017e, 2017f). The variability between
regions is controlled with the fixed effects estimation procedure. The estimation model is
shown in Equation [6.1], where ln(𝑤𝑓) is the logarithm of the wage, ln(𝑢𝑟𝑎𝑡𝑒𝑓) the
logarithm of the unemployment rate, and 𝜀 stands for the fixed effects. As both the local
unemployment and wage rates are entered as logarithms, the coefficient of the
unemployment rate represents a proportional change and can be read off as an elasticity.
The model estimates are statistically significant at the 1% level.
𝒍𝒏(𝒘𝒇) = −𝟎. 𝟎𝟕𝟐 𝒍𝒏(𝒖𝒓𝒂𝒕𝒆𝒇) + 𝜺 [6.1]
6.3.5. Factor market clearing equations
The initial factor market clearing equation is modified to reflect the employment of
Palestinian labour in the domestic market activities and in the Israeli market. The new factor
market conditions are distinct in each model specification. In the model with fixed supply,
a new parameter 𝑓𝑑_𝑤𝑓,𝑤 is created to capture the demand of factor 𝑓 in foreign region 𝑤.
As a parameter, which value is set exogenously, it ensures that the model takes up the
envisaged shock of increased Palestinian employment in Israel. This mechanism reflects
the empirical evidence that Palestinian employment in Israel is demand-driven. The new
factor market clearing equation is defined in Equation [6.2]:
𝐹𝑆𝑓 = ∑𝐹𝐷𝑓,𝑎
𝑎
+ ∑𝑓𝑑_𝑤𝑓,𝑤
𝑤
[6. 2]
Where 𝐹𝑆𝑓 is the total supply of factor 𝑓, 𝐹𝐷𝑓,𝑎 is the demand of factor f by activity a within
the production boundary of the domestic market, and 𝑓𝑑_𝑤𝑓,𝑤 is the demand for factor f in
foreign region 𝑤.

Chapter 6
116
In the surplus labour and upward-sloping curve specifications, a variable is added to the
market clearing equation to capture the pool of labour not employed within the production
boundary
𝐹𝑆𝑓 = ∑𝐹𝐷𝑓,𝑎
𝑎
+ ∑𝑓𝑑_𝑤𝑓,𝑤
𝑤
+ 𝑈𝑁𝐸𝑀𝑃𝑓 [6. 3]
Where 𝑈𝑁𝐸𝑀𝑃𝑓 is the pool of the unemployed factor 𝑓. In the labour surplus specification,
unemployment is defined as an inequality. This allows the unemployment of each factor to
change subject to the condition that unemployment cannot be negative and that if there is
unemployment of a factor then the real wage rate for that factor is fixed (Equation [6.4])
𝑈𝑁𝐸𝑀𝑃𝑓 > 0 [6.4]
In the upward-sloping curve specification, unemployment is defined by a log-linear
equation (Equation [6.5]), which implies the unemployment of each factor to change
subject to changes in real wages and to the pre-determined supply elasticity.
𝒍𝒏 (𝑾𝑭𝒇∗(𝟏−𝑻𝒀𝑭𝒇)
𝑪𝑷𝑰) = 𝜶𝟎 + 𝜶𝟏 𝒍𝒏 (
𝑼𝑵𝑬𝑴𝑷𝒇
𝑭𝑺𝒇) [6.5]
where 𝑇𝑌𝐹𝑓 are factor taxes, 𝐶𝑃𝐼 the consumer price index, 𝛼0 the intercept of the function
and 𝛼1 the wage curve elasticity for Palestine (-0.072).
In the labour-leisure trade-off specification, the market clearing equation is further
modified to reflect the use of labour in activities outside the boundary, as shown in Equation
[6.6]:
𝑭𝑺𝒇 = ∑ 𝑭𝑫𝒇,𝒂𝒂𝒍𝒆𝒊𝒏 + ∑ 𝒇𝒅_𝒘𝒇,𝒘𝒘 + ∑ 𝑭𝑺𝑰𝑬𝒊𝒏𝒔𝒘,𝒇𝒊𝒏𝒔𝒘 ∀𝒂𝒍𝒆𝒊𝒏𝒂 𝒂𝒏𝒅 𝒇𝒇𝒇 [6.6]
Where the factor demand 𝐹𝐷𝑓,𝑎 is only aggregated over the set 𝑎𝑙𝑒𝑖𝑛, which refers to
activities within the production boundary of the domestic market. 𝐹𝑆𝐼𝐸𝑖𝑛𝑠𝑤,𝑓 is the pool of
factor 𝑓 supplied by institution 𝑖𝑛𝑠𝑤 to activities outside the boundary. The demand of
labour in activities outside the production boundary is defined in the Equation [6.7], where
the mapping (map_hh_alei) pairs the leisure activities 𝑎𝑙𝑒𝑖 with households (hh), while the
set 𝑎𝑙𝑒𝑖 refers to leisure activities.
𝑭𝑺𝑰𝑬𝒊𝒏𝒔𝒘,𝒇 = ∑ 𝑭𝑫𝒇,𝒂𝒂$𝒎𝒂𝒑_𝒉𝒉_𝒂𝒍𝒆𝒊(𝒊𝒏𝒔𝒘,𝒂) ∀𝒂𝒍𝒆𝒊𝒂 𝒂𝒏𝒅 𝒇𝒇𝒇 [6.7]
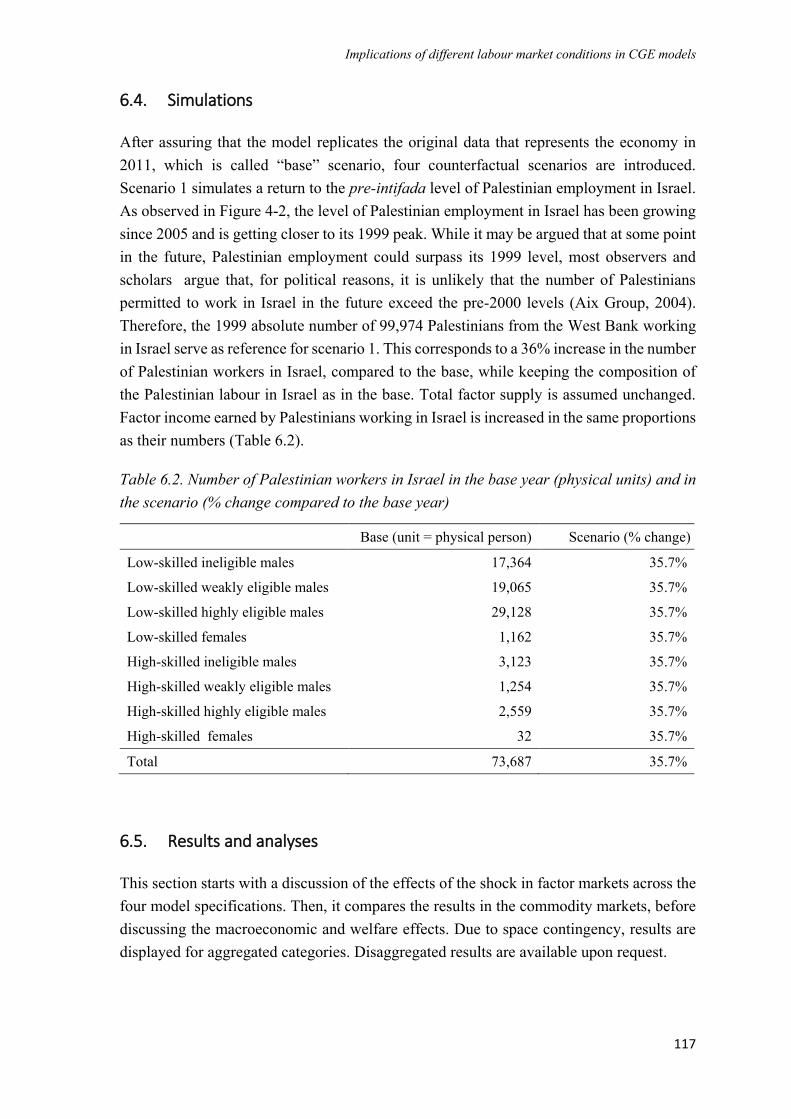
Implications of different labour market conditions in CGE models
117
6.4. Simulations
After assuring that the model replicates the original data that represents the economy in
2011, which is called “base” scenario, four counterfactual scenarios are introduced.
Scenario 1 simulates a return to the pre-intifada level of Palestinian employment in Israel.
As observed in Figure 4-2, the level of Palestinian employment in Israel has been growing
since 2005 and is getting closer to its 1999 peak. While it may be argued that at some point
in the future, Palestinian employment could surpass its 1999 level, most observers and
scholars argue that, for political reasons, it is unlikely that the number of Palestinians
permitted to work in Israel in the future exceed the pre-2000 levels (Aix Group, 2004).
Therefore, the 1999 absolute number of 99,974 Palestinians from the West Bank working
in Israel serve as reference for scenario 1. This corresponds to a 36% increase in the number
of Palestinian workers in Israel, compared to the base, while keeping the composition of
the Palestinian labour in Israel as in the base. Total factor supply is assumed unchanged.
Factor income earned by Palestinians working in Israel is increased in the same proportions
as their numbers (Table 6.2).
Table 6.2. Number of Palestinian workers in Israel in the base year (physical units) and in
the scenario (% change compared to the base year)
Base (unit = physical person) Scenario (% change)
Low-skilled ineligible males 17,364 35.7%
Low-skilled weakly eligible males 19,065 35.7%
Low-skilled highly eligible males 29,128 35.7%
Low-skilled females 1,162 35.7%
High-skilled ineligible males 3,123 35.7%
High-skilled weakly eligible males 1,254 35.7%
High-skilled highly eligible males 2,559 35.7%
High-skilled females 32 35.7%
Total 73,687 35.7%
6.5. Results and analyses
This section starts with a discussion of the effects of the shock in factor markets across the
four model specifications. Then, it compares the results in the commodity markets, before
discussing the macroeconomic and welfare effects. Due to space contingency, results are
displayed for aggregated categories. Disaggregated results are available upon request.
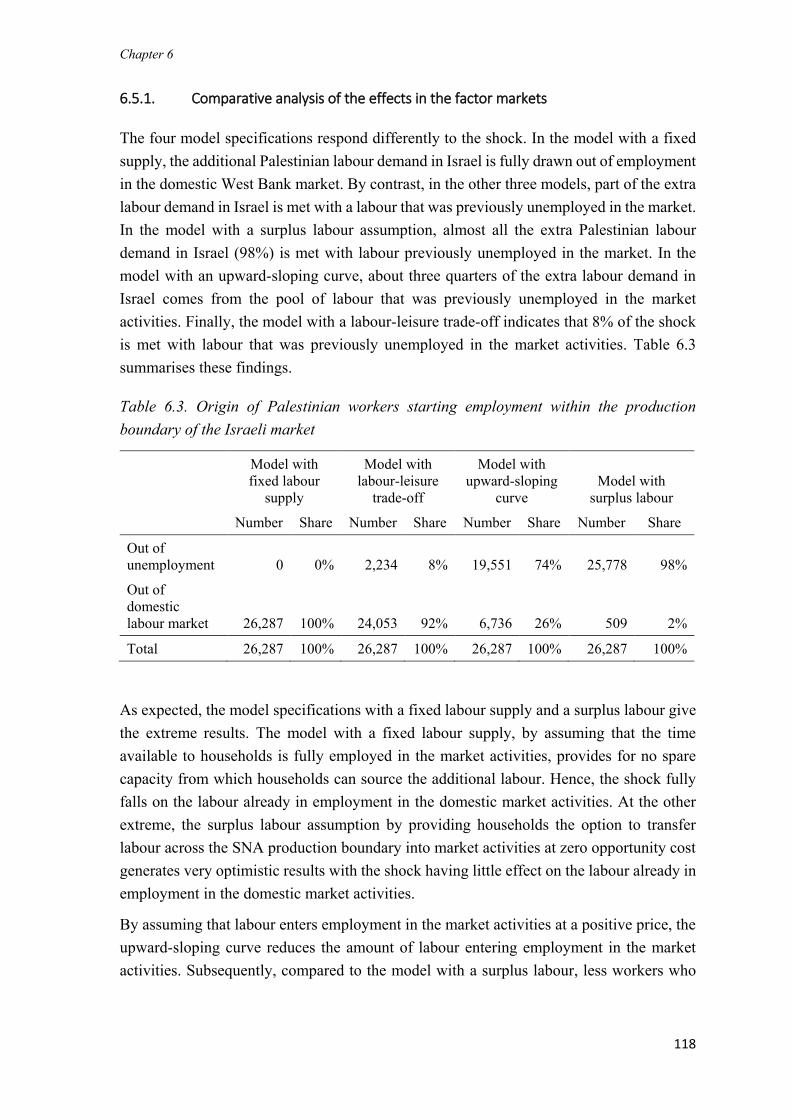
Chapter 6
118
6.5.1. Comparative analysis of the effects in the factor markets
The four model specifications respond differently to the shock. In the model with a fixed
supply, the additional Palestinian labour demand in Israel is fully drawn out of employment
in the domestic West Bank market. By contrast, in the other three models, part of the extra
labour demand in Israel is met with a labour that was previously unemployed in the market.
In the model with a surplus labour assumption, almost all the extra Palestinian labour
demand in Israel (98%) is met with labour previously unemployed in the market. In the
model with an upward-sloping curve, about three quarters of the extra labour demand in
Israel comes from the pool of labour that was previously unemployed in the market
activities. Finally, the model with a labour-leisure trade-off indicates that 8% of the shock
is met with labour that was previously unemployed in the market activities. Table 6.3
summarises these findings.
Table 6.3. Origin of Palestinian workers starting employment within the production
boundary of the Israeli market
Model with
fixed labour
supply
Model with
labour-leisure
trade-off
Model with
upward-sloping
curve
Model with
surplus labour
Number Share Number Share Number Share Number Share
Out of
unemployment 0 0% 2,234 8% 19,551 74% 25,778 98%
Out of
domestic
labour market 26,287 100% 24,053 92% 6,736 26% 509 2%
Total 26,287 100% 26,287 100% 26,287 100% 26,287 100%
As expected, the model specifications with a fixed labour supply and a surplus labour give
the extreme results. The model with a fixed labour supply, by assuming that the time
available to households is fully employed in the market activities, provides for no spare
capacity from which households can source the additional labour. Hence, the shock fully
falls on the labour already in employment in the domestic market activities. At the other
extreme, the surplus labour assumption by providing households the option to transfer
labour across the SNA production boundary into market activities at zero opportunity cost
generates very optimistic results with the shock having little effect on the labour already in
employment in the domestic market activities.
By assuming that labour enters employment in the market activities at a positive price, the
upward-sloping curve reduces the amount of labour entering employment in the market
activities. Subsequently, compared to the model with a surplus labour, less workers who
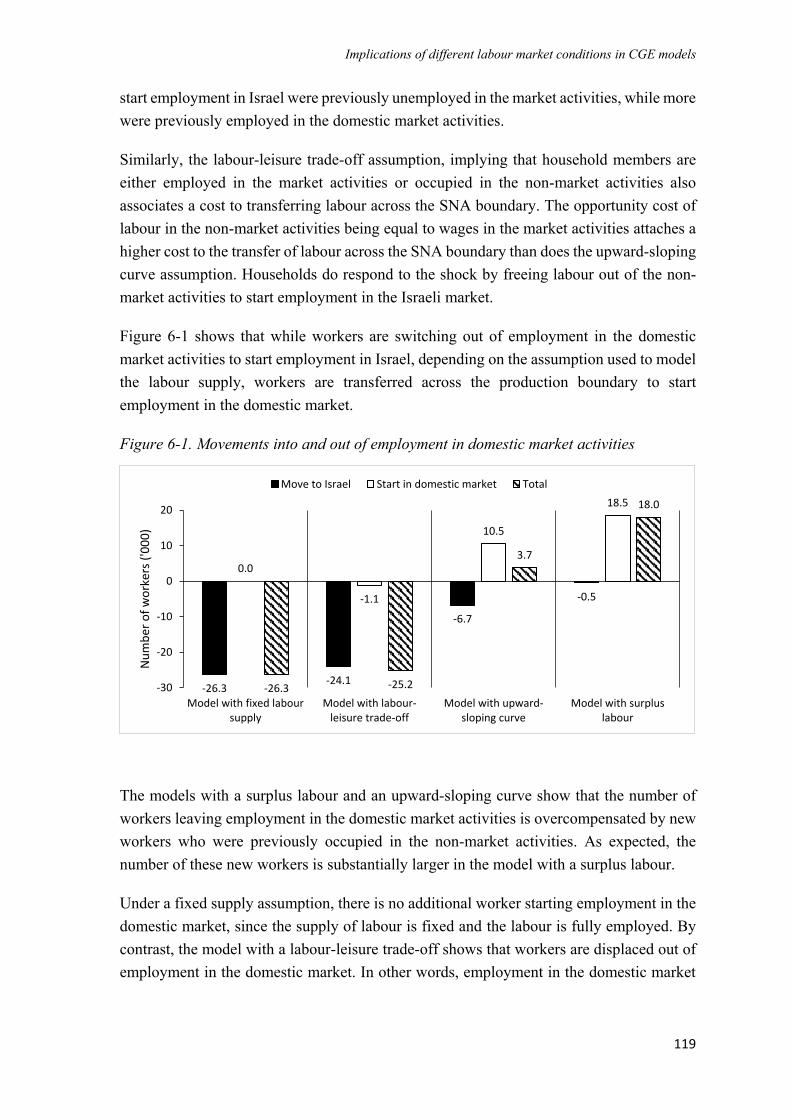
Implications of different labour market conditions in CGE models
119
start employment in Israel were previously unemployed in the market activities, while more
were previously employed in the domestic market activities.
Similarly, the labour-leisure trade-off assumption, implying that household members are
either employed in the market activities or occupied in the non-market activities also
associates a cost to transferring labour across the SNA boundary. The opportunity cost of
labour in the non-market activities being equal to wages in the market activities attaches a
higher cost to the transfer of labour across the SNA boundary than does the upward-sloping
curve assumption. Households do respond to the shock by freeing labour out of the non-
market activities to start employment in the Israeli market.
Figure 6-1 shows that while workers are switching out of employment in the domestic
market activities to start employment in Israel, depending on the assumption used to model
the labour supply, workers are transferred across the production boundary to start
employment in the domestic market.
Figure 6-1. Movements into and out of employment in domestic market activities
The models with a surplus labour and an upward-sloping curve show that the number of
workers leaving employment in the domestic market activities is overcompensated by new
workers who were previously occupied in the non-market activities. As expected, the
number of these new workers is substantially larger in the model with a surplus labour.
Under a fixed supply assumption, there is no additional worker starting employment in the
domestic market, since the supply of labour is fixed and the labour is fully employed. By
contrast, the model with a labour-leisure trade-off shows that workers are displaced out of
employment in the domestic market. In other words, employment in the domestic market
-26.3-24.1
-6.7
-0.5
0.0
-1.1
10.5
18.5
-26.3 -25.2
3.7
18.0
-30
-20
-10
0
10
20
Model with fixed laboursupply
Model with labour-leisure trade-off
Model with upward-sloping curve
Model with surpluslabour
Nu
mb
er o
f w
ork
ers
('0
00
)
Move to Israel Start in domestic market Total
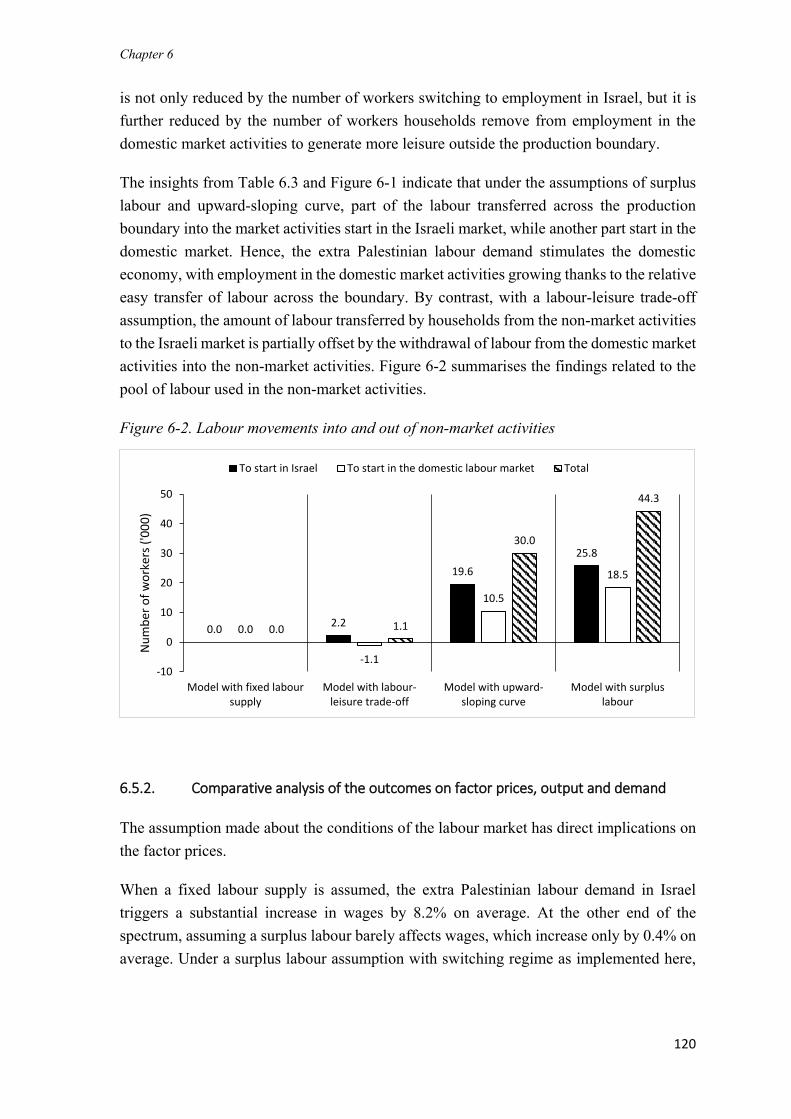
Chapter 6
120
is not only reduced by the number of workers switching to employment in Israel, but it is
further reduced by the number of workers households remove from employment in the
domestic market activities to generate more leisure outside the production boundary.
The insights from Table 6.3 and Figure 6-1 indicate that under the assumptions of surplus
labour and upward-sloping curve, part of the labour transferred across the production
boundary into the market activities start in the Israeli market, while another part start in the
domestic market. Hence, the extra Palestinian labour demand stimulates the domestic
economy, with employment in the domestic market activities growing thanks to the relative
easy transfer of labour across the boundary. By contrast, with a labour-leisure trade-off
assumption, the amount of labour transferred by households from the non-market activities
to the Israeli market is partially offset by the withdrawal of labour from the domestic market
activities into the non-market activities. Figure 6-2 summarises the findings related to the
pool of labour used in the non-market activities.
Figure 6-2. Labour movements into and out of non-market activities
6.5.2. Comparative analysis of the outcomes on factor prices, output and demand
The assumption made about the conditions of the labour market has direct implications on
the factor prices.
When a fixed labour supply is assumed, the extra Palestinian labour demand in Israel
triggers a substantial increase in wages by 8.2% on average. At the other end of the
spectrum, assuming a surplus labour barely affects wages, which increase only by 0.4% on
average. Under a surplus labour assumption with switching regime as implemented here,
0.02.2
19.6
25.8
0.0
-1.1
10.5
18.5
0.0 1.1
30.0
44.3
-10
0
10
20
30
40
50
Model with fixed laboursupply
Model with labour-leisure trade-off
Model with upward-sloping curve
Model with surpluslabour
Nu
mb
er o
f w
ork
ers
('0
00
)
To start in Israel To start in the domestic labour market Total
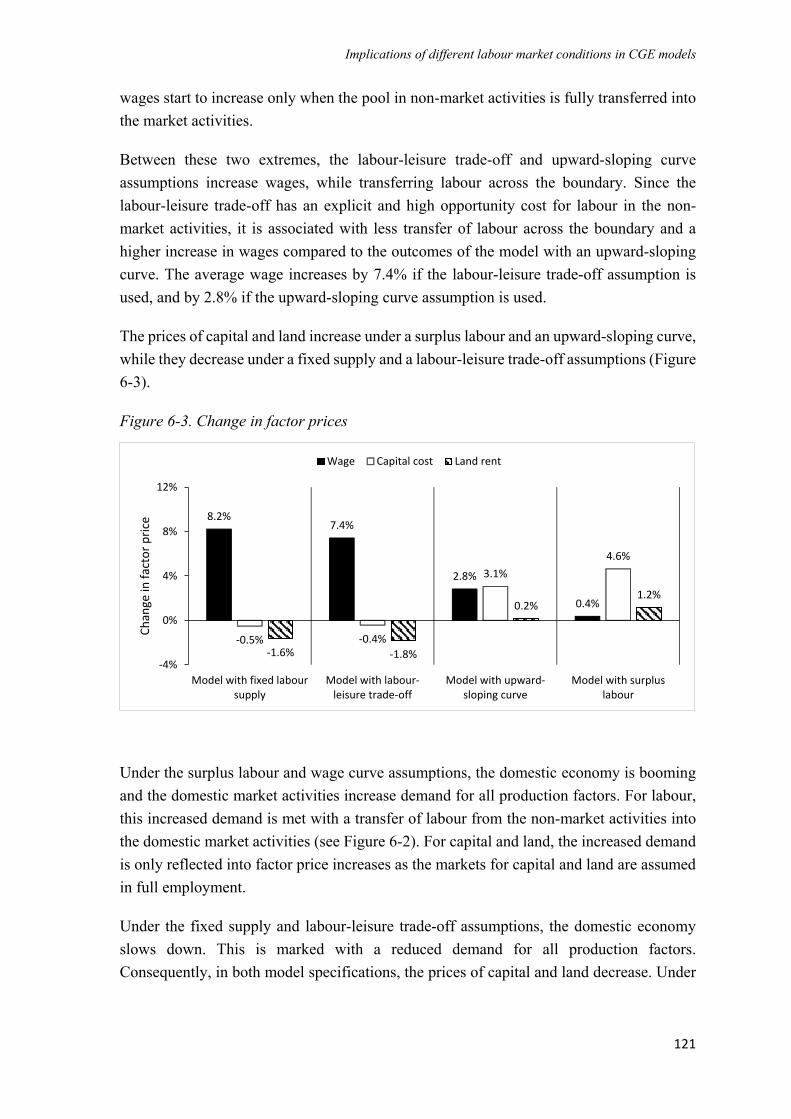
Implications of different labour market conditions in CGE models
121
wages start to increase only when the pool in non-market activities is fully transferred into
the market activities.
Between these two extremes, the labour-leisure trade-off and upward-sloping curve
assumptions increase wages, while transferring labour across the boundary. Since the
labour-leisure trade-off has an explicit and high opportunity cost for labour in the non-
market activities, it is associated with less transfer of labour across the boundary and a
higher increase in wages compared to the outcomes of the model with an upward-sloping
curve. The average wage increases by 7.4% if the labour-leisure trade-off assumption is
used, and by 2.8% if the upward-sloping curve assumption is used.
The prices of capital and land increase under a surplus labour and an upward-sloping curve,
while they decrease under a fixed supply and a labour-leisure trade-off assumptions (Figure
6-3).
Figure 6-3. Change in factor prices
Under the surplus labour and wage curve assumptions, the domestic economy is booming
and the domestic market activities increase demand for all production factors. For labour,
this increased demand is met with a transfer of labour from the non-market activities into
the domestic market activities (see Figure 6-2). For capital and land, the increased demand
is only reflected into factor price increases as the markets for capital and land are assumed
in full employment.
Under the fixed supply and labour-leisure trade-off assumptions, the domestic economy
slows down. This is marked with a reduced demand for all production factors.
Consequently, in both model specifications, the prices of capital and land decrease. Under
8.2%7.4%
2.8%
0.4%
-0.5% -0.4%
3.1%4.6%
-1.6% -1.8%
0.2%1.2%
-4%
0%
4%
8%
12%
Model with fixed laboursupply
Model with labour-leisure trade-off
Model with upward-sloping curve
Model with surpluslabour
Chan
ge in
fact
or p
rice
Wage Capital cost Land rent
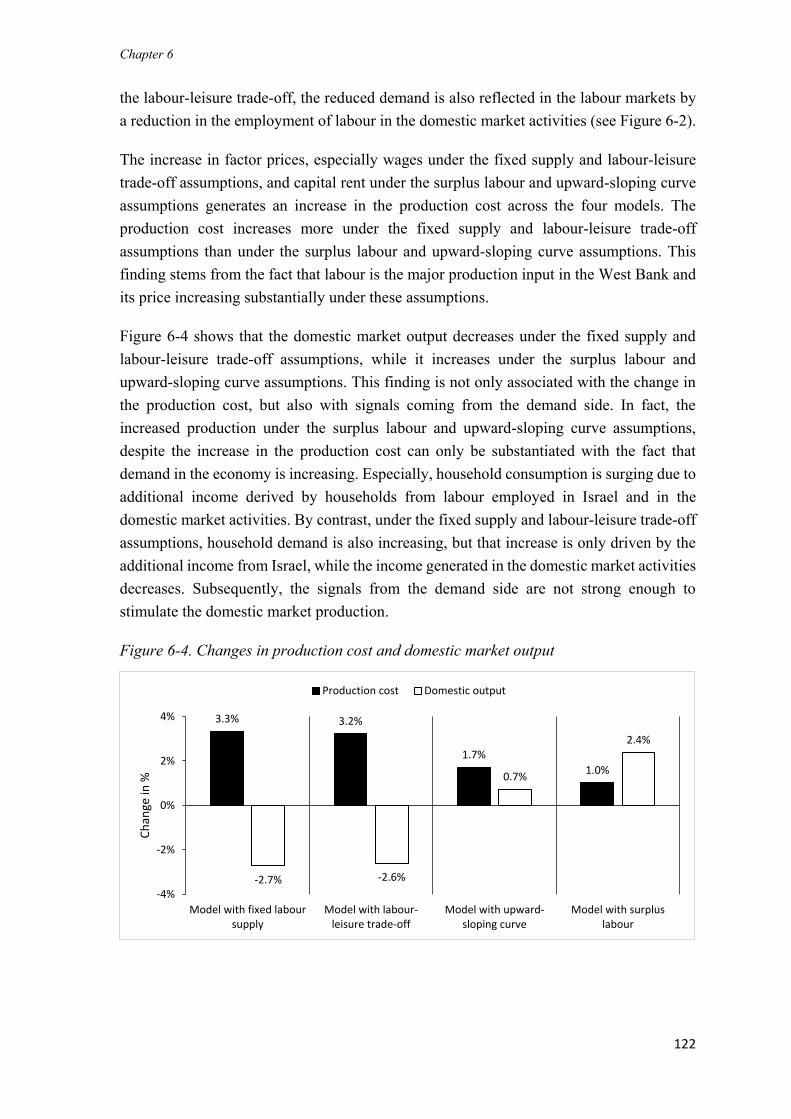
Chapter 6
122
the labour-leisure trade-off, the reduced demand is also reflected in the labour markets by
a reduction in the employment of labour in the domestic market activities (see Figure 6-2).
The increase in factor prices, especially wages under the fixed supply and labour-leisure
trade-off assumptions, and capital rent under the surplus labour and upward-sloping curve
assumptions generates an increase in the production cost across the four models. The
production cost increases more under the fixed supply and labour-leisure trade-off
assumptions than under the surplus labour and upward-sloping curve assumptions. This
finding stems from the fact that labour is the major production input in the West Bank and
its price increasing substantially under these assumptions.
Figure 6-4 shows that the domestic market output decreases under the fixed supply and
labour-leisure trade-off assumptions, while it increases under the surplus labour and
upward-sloping curve assumptions. This finding is not only associated with the change in
the production cost, but also with signals coming from the demand side. In fact, the
increased production under the surplus labour and upward-sloping curve assumptions,
despite the increase in the production cost can only be substantiated with the fact that
demand in the economy is increasing. Especially, household consumption is surging due to
additional income derived by households from labour employed in Israel and in the
domestic market activities. By contrast, under the fixed supply and labour-leisure trade-off
assumptions, household demand is also increasing, but that increase is only driven by the
additional income from Israel, while the income generated in the domestic market activities
decreases. Subsequently, the signals from the demand side are not strong enough to
stimulate the domestic market production.
Figure 6-4. Changes in production cost and domestic market output
3.3% 3.2%
1.7%
1.0%
-2.7% -2.6%
0.7%
2.4%
-4%
-2%
0%
2%
4%
Model with fixed laboursupply
Model with labour-leisure trade-off
Model with upward-sloping curve
Model with surpluslabour
Ch
ange
in %
Production cost Domestic output
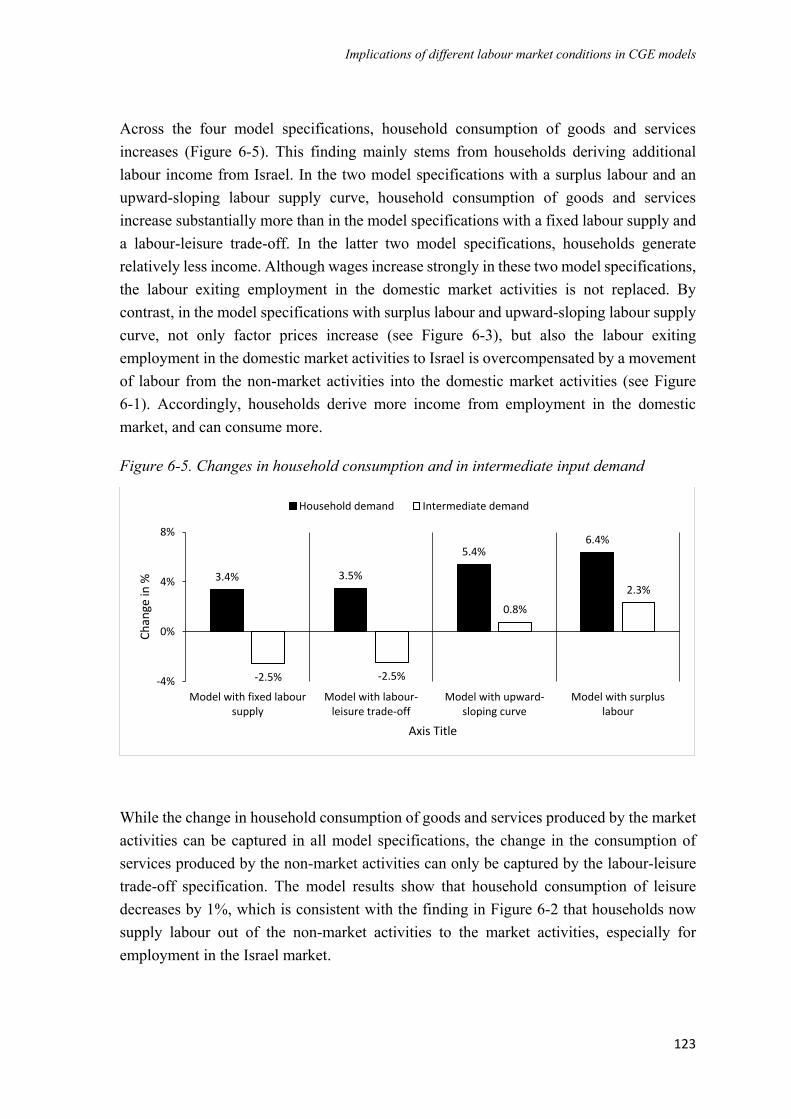
Implications of different labour market conditions in CGE models
123
Across the four model specifications, household consumption of goods and services
increases (Figure 6-5). This finding mainly stems from households deriving additional
labour income from Israel. In the two model specifications with a surplus labour and an
upward-sloping labour supply curve, household consumption of goods and services
increase substantially more than in the model specifications with a fixed labour supply and
a labour-leisure trade-off. In the latter two model specifications, households generate
relatively less income. Although wages increase strongly in these two model specifications,
the labour exiting employment in the domestic market activities is not replaced. By
contrast, in the model specifications with surplus labour and upward-sloping labour supply
curve, not only factor prices increase (see Figure 6-3), but also the labour exiting
employment in the domestic market activities to Israel is overcompensated by a movement
of labour from the non-market activities into the domestic market activities (see Figure
6-1). Accordingly, households derive more income from employment in the domestic
market, and can consume more.
Figure 6-5. Changes in household consumption and in intermediate input demand
While the change in household consumption of goods and services produced by the market
activities can be captured in all model specifications, the change in the consumption of
services produced by the non-market activities can only be captured by the labour-leisure
trade-off specification. The model results show that household consumption of leisure
decreases by 1%, which is consistent with the finding in Figure 6-2 that households now
supply labour out of the non-market activities to the market activities, especially for
employment in the Israel market.
3.4% 3.5%
5.4%6.4%
-2.5% -2.5%
0.8%
2.3%
-4%
0%
4%
8%
Model with fixed laboursupply
Model with labour-leisure trade-off
Model with upward-sloping curve
Model with surpluslabour
Ch
ange
in %
Axis Title
Household demand Intermediate demand
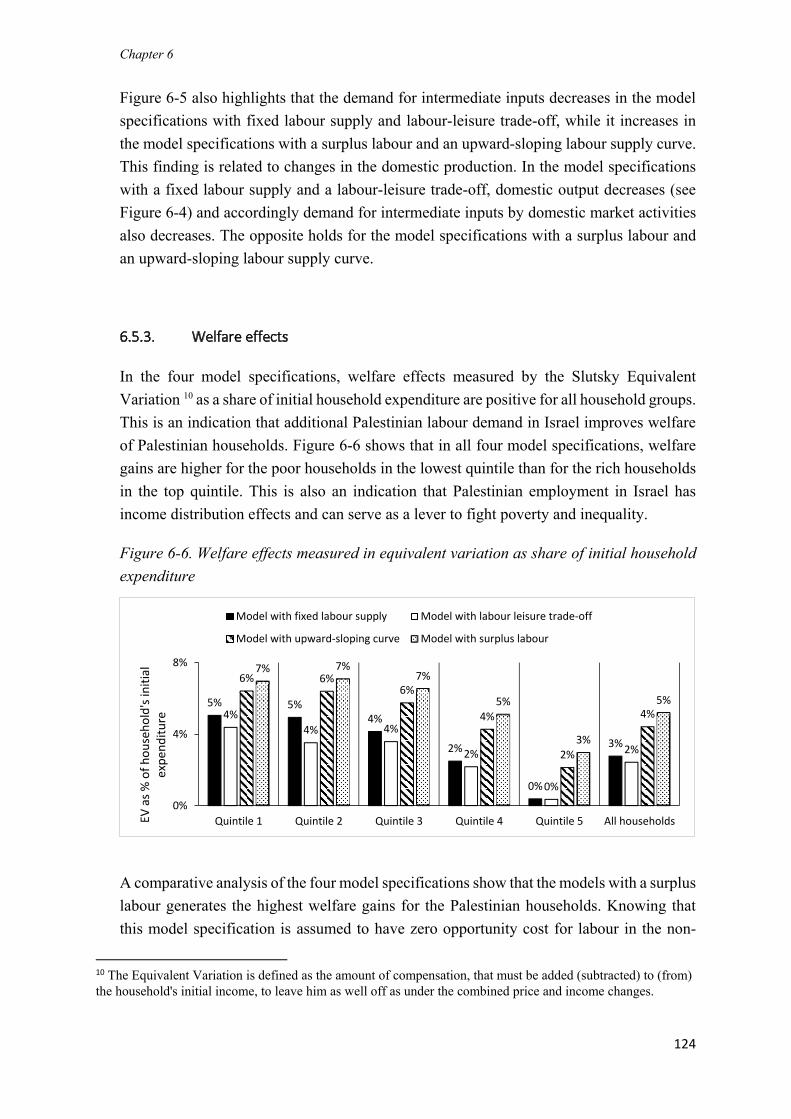
Chapter 6
124
Figure 6-5 also highlights that the demand for intermediate inputs decreases in the model
specifications with fixed labour supply and labour-leisure trade-off, while it increases in
the model specifications with a surplus labour and an upward-sloping labour supply curve.
This finding is related to changes in the domestic production. In the model specifications
with a fixed labour supply and a labour-leisure trade-off, domestic output decreases (see
Figure 6-4) and accordingly demand for intermediate inputs by domestic market activities
also decreases. The opposite holds for the model specifications with a surplus labour and
an upward-sloping labour supply curve.
6.5.3. Welfare effects
In the four model specifications, welfare effects measured by the Slutsky Equivalent
Variation 10 as a share of initial household expenditure are positive for all household groups.
This is an indication that additional Palestinian labour demand in Israel improves welfare
of Palestinian households. Figure 6-6 shows that in all four model specifications, welfare
gains are higher for the poor households in the lowest quintile than for the rich households
in the top quintile. This is also an indication that Palestinian employment in Israel has
income distribution effects and can serve as a lever to fight poverty and inequality.
Figure 6-6. Welfare effects measured in equivalent variation as share of initial household
expenditure
A comparative analysis of the four model specifications show that the models with a surplus
labour generates the highest welfare gains for the Palestinian households. Knowing that
this model specification is assumed to have zero opportunity cost for labour in the non-
10 The Equivalent Variation is defined as the amount of compensation, that must be added (subtracted) to (from) the household's initial income, to leave him as well off as under the combined price and income changes.
5% 5%4%
2%
0%
3%
4%4% 4%
2%
0%
2%
6% 6%6%
4%
2%
4%
7% 7%7%
5%
3%
5%
0%
4%
8%
Quintile 1 Quintile 2 Quintile 3 Quintile 4 Quintile 5 All householdsEV a
s % o
f hou
seho
ld's
initi
al
expe
nditu
re
Model with fixed labour supply Model with labour leisure trade-off
Model with upward-sloping curve Model with surplus labour
Implications of different labour market conditions in CGE models
125
market activities and that the surplus labour can enter employment in the market activities
at fixed real wages, it is expected to lead to optimistic results. The expected biases of this
model specification tend to overestimate household welfare gains (McDonald, 2018).
The model specification with an upward-sloping curve gives the second highest household
welfare gains. While this model specification acknowledges that labour enters employment
in the market activities at a positive price, it considers labour to have zero opportunity cost
in the non-market activities. Hence, the utility foregone by households when transferring
labour across the boundary is zero. Subsequently, the welfare estimates are also high.
The model specification with a fixed supply assumes a strict separability between the
contributions to welfare from activities within and outside the production boundary
(McDonald, 2018). Hence, this treatment is neutral with respect to the welfare generated
outside the production boundary. Nevertheless, the assumption that there are no trade-offs
between uses of labour within and outside the production boundary is open to challenges
and the welfare results are – thus – not optimal estimates of the household welfare gains.
The model specification with a labour-leisure trade-off generates the welfare results that
account for changes occurring both within and outside the SNA production boundary. As
additional Palestinian employment in Israel increases domestic wages, households allocate
more labour to market activities at the expense of non-market activities. This reallocation
enables households to generate more income and increase consumption of goods and
services, which increases their utility. However, the utility derived from services produced
by the non-market activities decreases. The outcome is an increase in welfare at the level
of all household groups. The net welfare effects, which include the losses occurring outside
the production boundary, have a lower magnitude than the welfare estimates found in the
other model specifications.
6.5.4. Macroeconomic aggregates
The macroeconomic aggregates show that, in the four model specifications, absorption
increases at constant domestic prices. This increased absorption is met with increased
import demand and a partial reallocation of domestic production towards domestic
consumption at the expense of the export market. The export supply falls in all model
specifications. This result is consistent with both empirics and theory, since the inflow of
labour income from Israel has “Dutch disease” effects through a real appreciation of the
domestic currency and a reduced competitiveness of the Palestinian exports in the
international markets. The real GDP declines in the model specifications with a fixed
supply and a labour-leisure trade-off, and increases in the model specifications with a
surplus labour and an upward-sloping curve (Table 6.4).
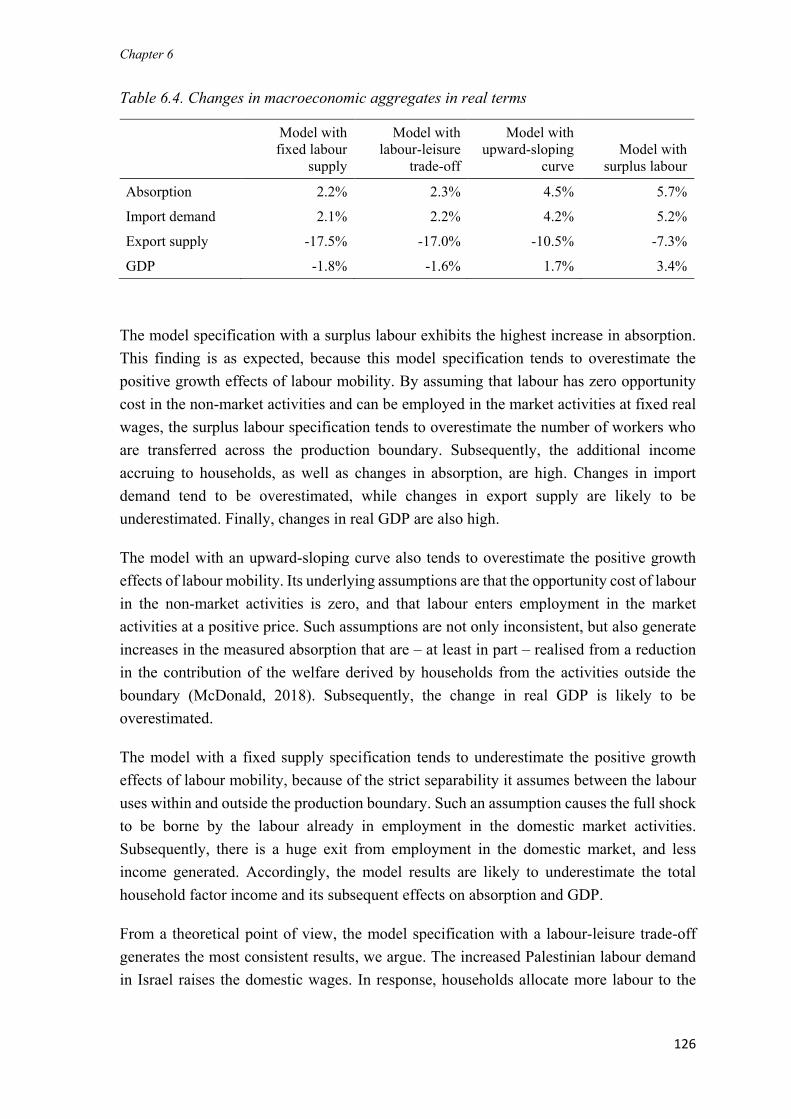
Chapter 6
126
Table 6.4. Changes in macroeconomic aggregates in real terms
Model with
fixed labour
supply
Model with
labour-leisure
trade-off
Model with
upward-sloping
curve
Model with
surplus labour
Absorption 2.2% 2.3% 4.5% 5.7%
Import demand 2.1% 2.2% 4.2% 5.2%
Export supply -17.5% -17.0% -10.5% -7.3%
GDP -1.8% -1.6% 1.7% 3.4%
The model specification with a surplus labour exhibits the highest increase in absorption.
This finding is as expected, because this model specification tends to overestimate the
positive growth effects of labour mobility. By assuming that labour has zero opportunity
cost in the non-market activities and can be employed in the market activities at fixed real
wages, the surplus labour specification tends to overestimate the number of workers who
are transferred across the production boundary. Subsequently, the additional income
accruing to households, as well as changes in absorption, are high. Changes in import
demand tend to be overestimated, while changes in export supply are likely to be
underestimated. Finally, changes in real GDP are also high.
The model with an upward-sloping curve also tends to overestimate the positive growth
effects of labour mobility. Its underlying assumptions are that the opportunity cost of labour
in the non-market activities is zero, and that labour enters employment in the market
activities at a positive price. Such assumptions are not only inconsistent, but also generate
increases in the measured absorption that are – at least in part – realised from a reduction
in the contribution of the welfare derived by households from the activities outside the
boundary (McDonald, 2018). Subsequently, the change in real GDP is likely to be
overestimated.
The model with a fixed supply specification tends to underestimate the positive growth
effects of labour mobility, because of the strict separability it assumes between the labour
uses within and outside the production boundary. Such an assumption causes the full shock
to be borne by the labour already in employment in the domestic market activities.
Subsequently, there is a huge exit from employment in the domestic market, and less
income generated. Accordingly, the model results are likely to underestimate the total
household factor income and its subsequent effects on absorption and GDP.
From a theoretical point of view, the model specification with a labour-leisure trade-off
generates the most consistent results, we argue. The increased Palestinian labour demand
in Israel raises the domestic wages. In response, households allocate more labour to the
Implications of different labour market conditions in CGE models
127
market activities. From this reallocation, more income is generated, and absorption as well
as import demand increase. The export supply decreases, because the large inflows of
labour income from Israel cause a real appreciation of the domestic currency. Moreover,
the “Dutch disease” effects of Palestinian employment in Israel reduce incentives to work
in the domestic market activities, with as outcome a decline in the domestic market output.
Ultimately, the GDP decreases.
6.6. Conclusions and policy implications
The objective of this chapter is to analyse empirically how different labour market
specifications affect the simulation results in CGE models, using the case study of
Palestinian employment in Israel. Four model specifications are considered: a fixed labour
supply, a surplus labour, an upward-sloping curve and a labour-leisure trade-off. The shock
implemented in the four models is a return of the Palestinian employment in Israel to its
pre-intifada level of 1999. This corresponds to a 36% increase in the level of Palestinian
employment in Israel in the reference year of the social accounting matrix (year 2011).
The results show some common trends across the four model specifications. First, the
increased Palestinian labour demand in Israel increases domestic wages. Second, the
additional inflow of labour income from Israel improves household welfare in the West
Bank. Third, increasing employment of Palestinians in Israel exhibits the “Dutch disease”
effects through a real appreciation of the domestic currency, which reduces the
competitiveness of Palestinian exports in the international markets.
Beside these common trends, several differences are observed in the results of the four
model specifications. Although these differences partially depend on the parametrization
of each of the model specifications, several conclusions can be drawn.
In the model specification with a surplus labour, the estimated change in wage rates is low
because under this specification, wages start to increase only after the pool of labour in
non-market activities is emptied. The estimated number of workers transferred across the
SNA boundary is high because the assumption that labour in the non-market activities has
zero opportunity cost and can be transferred into the market activities at zero marginal cost
is too optimistic. Subsequently, the estimated welfare gains are high, as well as changes in
absorption and GDP.
The model specification with an upward-sloping curve assumes also that labour in the non-
market activities has zero opportunity cost, but this labour enters employment in the market
activities at a positive price. Hence, the framework has some inconsistencies, and changes
Chapter 6
128
in labour supplies are introduced as “manna from heaven” (McDonald, 2018). As increased
employment of Palestinians in Israel increases domestic wages, additional labour is
supplied to the market activities. Increases in absorption are – in part – realised from a
reduction of welfare that is generated outside the production boundary. Subsequently, the
estimated welfare gains, as well as changes in absorption and real GDP, are high.
The fixed supply specification assumes a strict separability between the labour uses within
and outside the production boundary. Hence, this treatment is neutral to welfare changes
occurring outside the production boundary. However, the presumption that the labour
supply is inflexible is open to challenges, even in societies with no involuntary
unemployment. A consequence of this assumption is that the full shock of increased
demand for Palestinian labour in Israel has to be drawn out of the pool of employment in
the domestic West Bank market activities. Accordingly, there is a huge exit from the
domestic market, such that the estimated changes in wage rates are high. The welfare
estimates are not optimal. Changes in absorption and in real GDP are underestimated.
The labour-leisure trade-off explicitly attaches an opportunity cost to labour in the non-
market activities. As increased demand for Palestinian employment in Israel increases
domestic wages, households allocate more labour to the market activities. This reallocation
enables households to derive additional income and to increase consumption.
Consequently, household utility is increased and welfare gains are generated. However, as
less labour is used in the non-market activities, the welfare derived by households from
services produced by these non-market activities decreases. The outcome is – nonetheless
– an increase in the household welfare.
The labour-leisure trade-off is the most appealing framework to model labour markets
because it explicitly recognises the trade-off facing households between consuming more
leisure (i.e. services produced by the non-market activities) and supplying more labour to
the market activities. This trade-off facing households in the real life is absent from the
other model specifications. Moreover, the labour-leisure trade-off recognises households
as the active agents in the operation of labour markets. They allocate labour based on
changes in wage rates as well as changes in their total utility, including the utility derived
from the non-market services.
While the fixed labour supply assumption also recognises households as the active agents,
it assumes that households allocate the same amount of labour regardless of the changes in
wage rates in the market. This assumption is open to challenges.
The two specifications of surplus labour and upward-sloping curve implicitly assume
households to be passive agents in the operations of the labour markets. This behavioural
relation runs counter to the theoretical foundations of CGE modelling (McDonald, 2018).
Implications of different labour market conditions in CGE models
129
Moreover, while the fixed supply specification assumes a perfectly inelastic labour supply,
the surplus labour assumes a perfectly elastic one. The two specifications can be regarded
as extreme cases, with the fixed supply representing a society with no involuntary
unemployment, while the surplus labour represents a society with plenty of involuntary
unemployment. The upward-sloping curve is regarded as an intermediate solution
providing some reflection of the empirical evidence that changes in the wage rates influence
the supply of labour. However, its behavioural and theoretical foundations are not located
in standard economic theories and its use can only be rationalised with the non-competitive
theories of the labour market such as the union bargaining power, efficiency wage and
labour contract analytical frameworks (Blanchflower and Oswald, 1995). Moreover, the
opportunity costs of changing the quantities of labour supplied to the market activities are
not included in the model, leading to welfare leakages. In this respect, the labour-leisure
trade-off provides a theoretically consistent specification for reproducing the empirical
evidence that changes in wage rates influence household decisions in the labour markets.
Two problems associated with the use of the labour-leisure trade-off are worth mentioning.
The first is the incompatibility with involuntary unemployment since labour can always be
employed either in the market or non-market activities. The second problem is that the
definition of price in the labour-leisure trade-off approach may be subject to criticism. The
valuation of the appropriate opportunity cost of labour in the non-market activities is open
to challenges. By default, the market wage rates are used for the valuation of the
opportunity cost of labour in the non-market activities. This valuation ignores potential
non-monetary benefits of employment, and its value overstates the real opportunity cost of
labour outside the boundary if involuntary unemployment is present in the economy
(Posnet and Ian, 1996). In part, the criticisms about the valuation of the opportunity cost of
labour are offset by using linear homogenous models, implying that only changes in relative
prices determine changes in allocations (McDonald, 2018).
The choice of the relevant specification to use depends on the particularities of the economy
under investigation and on the time horizon of the analysis. In the context of the Palestinian
economy, in the short-term, several empirical studies show a close correlation between the
employment of Palestinians in Israel and the involuntary unemployment in the West Bank
(Bulmer, 2003; Etkes, 2012). The limited number of work permits and the high wage
premium offered in Israel create incentives for Palestinian workers to queue for jobs in
Israel instead of looking for employment in the domestic market. Moreover, the small size
of the domestic market and the volatility of employment in Israel at times of conflict
between the two parties create a large pool of involuntary unemployment that cannot be
absorbed by the domestic market. Since the labour-leisure trade-off is incompatible with
involuntary unemployment, the labour surplus specification is a suitable alternative to
representing the labour markets in the West Bank in the short-term.
Chapter 6
130
In the long-term, however, assuming that the level of Palestinian employment in Israel is
stable, and that the factor markets are fully flexible – such that the allocation of labour
between the market and non-market activities is unconstrained by the access to paid
employment or self-employment – then the use of the labour-leisure trade-off is suitable.
Under these considerations, the analysis of the short-term effects with the labour surplus
specification shows that the West Bank economy benefits from an increased Palestinian
employment in Israel. The unemployment rate decreases as more labour starts employment
in the market activities either in Israel or in the domestic market. Both the domestic market
output and total absorption increase. Ultimately, real GDP increases. By contrast, long-
term analysis, using the labour-leisure trade-off, shows that the supply of labour by
households to the market activities is quite stable in the long-term. Only few workers are
taken out of the non-market activities. Most of the increased Palestinian employment in
Israel is met with workers who are shifted from employment in the domestic market to the
Israeli market. This finding stems from the “Dutch disease” effects of the Palestinian
employment in Israel, which reduces incentives to work within the production boundary by
increasing the price of non-traded commodities, of which leisure is the most non-traded.
Consequently, domestic output drops and real GDP decreases.
These findings highlight the empirical evidence of short-term benefits from the increased
Palestinian employment in Israel and the long-term harm to the West Bank economy.
While, in the short-term, the large inflows of labour income from Israel boost absorption
and stimulate the growth of the West Bank economy, in the long-term the wage premium
received in Israel raises the reservation wage in the domestic market. Subsequently,
investors and domestic employers have less incentives to hire labour and invest in the
domestic production. Moreover, the real appreciation of the domestic currency, due to the
inflow of labour income from Israel, reduces the competitiveness of the West Bank export
industry.
In addressing the challenge of maximising the benefits of Palestinian employment in Israel
for the Wet Bank economy, while minimising the negative impact in the long-term, the
Palestinian National Authority could introduce a tax on Palestinian labour that is employed
in Israel. The tax revenue will be used to finance policy schemes that incentivise domestic
employers in upgrading their production technologies. Such policy schemes will restore the
competitiveness of the Palestinian export industry in the international markets, enlarge the
size of the domestic market such that it can offer more job opportunities for returning
workers displaced from employment in the Israeli market. Moreover, the tax – by reducing
the wage premium for Palestinians in Israel – could gradually reduce the attractiveness of
Palestinian employment in Israel, especially for the most skilled Palestinian workers, and
reduce the dependency on the Israeli labour markets.
131
7
SHORT-TERM EFFECTS OF PALESTINIAN
EMPLOYMENT IN ISRAEL ON THE WEST BANK
ECONOMY11
11 Parts of this chapter have been published as a conference paper: Agbahey, J., Siddig, K., Grethe, H., McDonald,
S., 2018. Labour exports from Palestine to Israel: a boon or bane for the West Bank economy. In: 30th International
Conference of Agricultural Economists (ICAE). Vancouver: International Association of Agricultural Economists
(IAAE), p.25.

Chapter 7
132
Short-term effects of Palestinian employment in Israel
133
Chapter 7 Short-term effects of Palestinian employment in
Israel on the West Bank economy
7.1. Introduction
A significant share of the employment opportunities for West Bank workers is located in
the Israeli labour market. In 2011, some 14 percent of the employed persons in the West
Bank were employed in Israel and accounted for some 22 percent of all labour income
realised by West Bank workers; even though it has been estimated that wages for West
Bank workers in Israel are 20 – 40% lower than those of Israeli workers for the same jobs
(Arnon and Bamya, 2007). Despite the wages earned in Israel being relatively low by the
Israeli standards, they are relatively high compared to wages in the West Bank.
Consequently, there are strong incentives for Palestinians to seek employment in Israel. On
the other hand, West Bank workers are a relatively cheap source of labour to the Israeli
economy. The competition between West Bank and Israeli labour is limited due to the fact
that West Bank employees in Israel are largely confined to the manual sectors of
construction and agriculture (Miaari and Sauer, 2011), where the domestic Israeli labour
supply falls short of demand (Rosenhek, 2006).
Although Palestinian employment in Israel is beneficial for both sides, for security reasons,
Israel started to impose strict restrictions on the free movement of people, goods and
services between the Israeli and Palestinian territories in 1991 during the Gulf war (Aranki,
2006). For Palestininas, individual work permits control access to the Israeli labour market.
The permits are issued in response to requests from Israeli employers and are conditional
upon a security clearance from the Israeli military establishment. Accordingly, for
Palestinians, the labour market in Israel is an administered market and the operation of
which is subject to political decisions taken in Israel over which the Palestinian National
Authority (PNA) has little or no control. Thus, the West Bank labour market and economy
experience substantial fluctuations when access for Palestinians to the Israeli labour market
is changed by a legislative fiat. Nevertheless, the Palestinian workers enjoy a preference in
the Israeli labour markets over other foreign workers, because they have a longer
employment history with Israeli employers and are considered more experienced (Arnon
and Weinblatt, 2001). Subsequently, employment of Palestinian labour in Israel is likely to
remain sizeable.
This chapter explores the short-term implications for the West Bank economy consequent
upon changes in the number and composition of Palestinian labour employed in Israel.
Previous studies that addressed this question either did not account for the multiplier effects
of the additional labour income earned in Israel (Bulmer, 2003; Etkes, 2012; Mansour,
Chapter 7
134
2010) or addressed it from the perspective of the Israeli economy (Flaig et al., 2013a).
Subsequently, this thesis recognises the importance of developing a model for the West
Bank with detailed representation of the linkages between the Israeli and Palestinian labour
markets in order to investigate adequately the economy-wide effects of increased
Palestinian labour flows to Israel.
The rest of this chapter is organised as follows: the next Section, 7.2, provides details about
the database, the model, the macroeconomic closures, and factor market clearing equations.
Section 7.3 describes the simulations. The results and their analyses are reported in section
7.4, which also includes a subsection that reports on the results of the sensitivity analyses.
The last section, 7.5, considers the policy implications and some concluding remarks.
7.2. Methods
7.2.1. Data
The database used in this chapter is an aggregated version of the detailed SAM described
in Chapter 5. The aggregation is identical to the one in Chapter 6 and the only difference is
that capital markets are segmented, as a matter of consistency with the short-term
perspective of the analysis. In the same way as for labour markets, four blocks of sectors
are defined for capital: agriculture, manufacturing, construction and services.
7.2.2. Model description
The model used in this chapter is a modified version of the STAGE-2 model developed by
McDonald and Thierfelder (2013). The multi-trade specification introduced to the STAGE-
2 model is identical to the one in Chapter 6. The elasticities used to account for imperfect
substitution are the same as in Chapter 6 (see Appendix 4). The domestic production
module is modified to account for the segmentation of labour and capital markets. Each
level of the production process involves CES functions (Figure 7-1). The values of the
elasticities used at each stage of the production module are reported in Appendix 5.
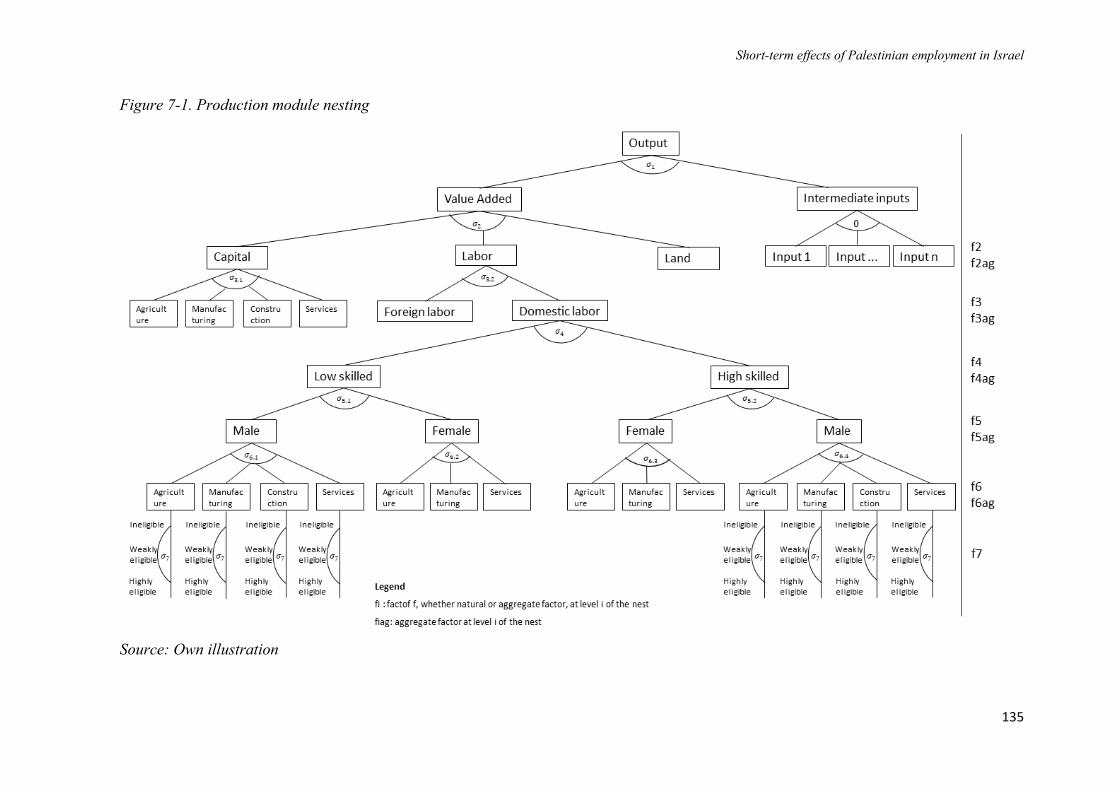
Short-term effects of Palestinian employment in Israel
135
Figure 7-1. Production module nesting
Source: Own illustration

Chapter 7
136
The model represents the West Bank economy in the short-term. Accordingly, factor
markets are segmented with restricted mobility. In the labour markets, homogenous labour
types as defined by skill, and gender are allocated to different blocks of activities. For the
male workers, four blocks of activities are considered: agriculture, manufacturing,
construction and services. As less than 1% of the female workers are employed in the
construction sector, only three blocks of activities are considered for them: agriculture,
manufacturing and services. An advantage of the segmentation approach is that it explicitly
accounts for labour heterogeneity and ensures that workers with notionally identical
characteristics earn different wages depending on their sector of employment. However,
this approach restricts workers to their initial market segment. When the market segment
includes several activities, the worker can respond to wage changes and move between
activities within the segment but there is no cross-segment mobility. This short-term
presumption is justified by the nature of the research question, as Palestinian employment
in Israel is volatile. Similar to the labour market, the capital market is segmented into four
blocks of activities: agriculture, manufacturing, construction and services, while land is
only used in the agricultural sector.
7.2.3. Macroeconomic closure conditions
The reality of the West Bank being a small player in the international markets is depicted
with exogenous international market prices. The model is investment-driven as investments
in the Palestinian economy are largely exogenous. The share of investments in the final
demand is fixed because a better economic environment in the West Bank and lower
tension with Israel will generate an economic growth, higher final demand, and provide a
secured environment that will attract more foreign investments. To keep the balance
between savings and investments, household and enterprise savings rates vary
equiproportionately. Government savings are fixed, while direct tax and value added tax
rates adjust multiplicatively to maintain the balance. Government consumption is a fixed
share of the final demand, such that when the final demand increases as the economy
expands, the government consumption follows. This assumption is grounded in the
tendency of the public sector in the West Bank to expand quickly (UNCTAD, 2006). To
close the foreign market, the current account is fixed to avoid any changes in borrowing
from foreign funds, while keeping all the welfare effects in the solution period. A fixed
exchange rate is considered as the Israeli Shekel is the main currency in circulation in the
West Bank and Israel is the dominant trade partner of the West Bank economy. Finally, the
consumer price index serves as numeraire in the model.
Short-term effects of Palestinian employment in Israel
137
7.2.4. Factor market closures
The factor market closures are chosen in consistency with the short-term presumption of
the analysis. The labour markets are assumed rigid with the presence of involuntary
unemployment. This reflects the conditions in the West Bank labour markets where highly
paid but unstable employment in Israel combined with the low capacity of the domestic
economy generates a high level of involuntary unemployment and above-equilibrium
wages. The closures are such that labour supply and demand in the West Bank are
determined given fixed real wages. This implies that the market wages in the West Bank
are above equilibrium, and the unemployed labour would take employment at the current
real wage rates if there were employment opportunities. A regime switching specification
is adopted to avoid an infinite supply of labour. As long as there is unemployed labour,
the supply curve is perfectly elastic and real wages are fixed. Once the pool of unemployed
labour is empty, the supply curve becomes perfectly inelastic and any further labour
demand is translated into wage increases. The size of unemployed labour in each market
segment is determined based on official statistics for the West Bank in 2011 (PCBS,
2012a). In contrast to the labour markets, where there are official statistics on
unemployment, there is no evidence of spare capital and land. Consequently, capital and
land are assumed fully employed in their respective market segments.
7.2.5. Factor market clearing equations
To allow factor mobility between the West Bank and Israeli markets, the clearing equation
for the factor market equilibrium is modified to incorporate the demand for domestic factor
abroad. Accordingly, a new parameter 𝑓𝑑_𝑤𝑓,𝑤 is created to capture the demand of factor
𝑓 in foreign region 𝑤. The new factor market clearing equation is therefore as follows:
𝐹𝑆𝑓 = ∑𝐹𝐷𝑓,𝑎
𝑎
+ ∑𝑓𝑑_𝑤𝑓,𝑤
𝑤
+ 𝑈𝑁𝐸𝑀𝑃𝑓
Where 𝐹𝑆𝑓 is the total supply of factor 𝑓, 𝐹𝐷𝑓,𝑎 is the demand of factor 𝑓 by activity 𝑎 in
the domestic market, 𝑈𝑁𝐸𝑀𝑃𝑓 is the size of the unemployed factor 𝑓, and 𝑓𝑑_𝑤𝑓,𝑤 is the
demand for factor 𝑓 in foreign region 𝑤.
The initial value of the parameter 𝑓𝑑_𝑤𝑓,𝑤 is calibrated to the base year data through a
satellite account that captures the physical quantities of factor used in both the domestic
and foreign markets. As a parameter, the demand for domestic factor in the foreign market
can be increased or decreased exogenously. This assumes that change in the demand for
domestic factor in foreign markets is met, regardless of the domestic conditions. While
Chapter 7
138
such assumption might not fit all the cases, it reflects well the Palestinian employment in
Israel, which is mostly driven by the demand in the Israeli economy. In fact, the wages
received by Palestinian workers in Israel are substantially higher than the average wage in
the West Bank. Moreover, the high unemployment in the West Bank ensures that any
increase in the labour demand in Israel will be met.
7.3. Simulations
After assuring that the model replicates the original data representing the economy in 2011,
which is called “base” scenario, four counterfactual scenarios are introduced. Scenario 1
simulates a return to the pre-intifada level of Palestinian employment in Israel. The shock
implemented here is the same as described in Section 6.4 of Chapter 6. Factor income from
Israel for each labour group is increased in the same proportions as their numbers.
Scenario 2 assesses the effect of the same increase in the total number of Palestinians
working in Israel with the only difference that for male workers, the additional number of
commuters to Israel is only sourced from those who are eligible for a work permit in Israel.
Scenario 3 simulates the same shock as in scenario 1, assuming an increase in the total
labour force. In fact, there is a consensus among experts from the Palestinian Central
Bureau of Statistics (PCBS) that an increase in the number of Palestinians commuting to
Israel for work will stimulate people currently outside the labour force to join the labour
force. This assessment is supported by the low participation rate12 in the labour force, which
stands at 46% in 2011 for the West Bank (PCBS, 2012a). Evidence for growth in the
Palestinian labour force in case Israel grants more work permits for Palestinians is also
found in Etkes (2012), who shows that part of the new permit holders come from outside
the labour force. Based on these insights, scenario 3 replicates the same shock as in scenario
1 with an increase of the total labour force by an exemplary amount of 5%.
Scenario 4 simulates a reduction in the number of Palestinian workers in Israel by 36%,
assuming that Israel tightens further the conditions for Palestinian access to its market by
reducing the number of permits and reinforcing the control of unpermitted workers.
Table 7.1 summarises the base values and simulations conducted on the size of Palestinian
labour employed in Israel, factor income received by Palestinian households from Israel
and the size of total labour force. The table presents values for aggregated labour groups.
12 This rate is especially low among women (19%) as compared to men (71%) (PCBS, 2012a)

Short-term effects of Palestinian employment in Israel
139
Table 7.1. Base values of and shocks to the number of Palestinians working in Israel, factor income from Israel and size of the labour force
Palestinians working in Israel (base in
absolute numbers; scenarios in % change)
Factor income from Israel (base in million
US$; scenarios in % change)
Total labour force (base in absolute
numbers; scenarios in % change)
Base Scen.
1
Scen.
2
Scen.
3
Scen.
4 Base
Scen.
1
Scen.
2
Scen.
3
Scen.
4 Base Scen. 3
Low-skilled
ineligible males 17,364 36% - 36% -36% 240 36% - 36% -36% 159,210 5%
Low-skilled
weakly eligible
males
19,065 36% 50% 36% -36% 279 36% 50% 36% -36% 92,588 5%
Low-skilled
highly eligible
males
29,128 36% 50% 36% -36% 442 36% 50% 36% -36% 182,310 5%
Low-skilled
females 1,162 36% 36% 36% -36% 18 36% 36% 36% -36% 62,451 5%
High-skilled
ineligible males 3,123 36% - 36% -36% 47 36% - 36% 36% 50,137 5%
High-skilled
weakly eligible
males
1,254 36% 50% 36% -36% 21 36% 50% 36% -36% 25,667 5%
High-skilled
highly eligible
males
2,559 36% 50% 36% -36% 47 36% 50% 36% -36% 60,498 5%
High-skilled
females 32 36% 36% 36% -36% 1 36% 36% 36% -36% 84,993 5%
Total 73,687 36% 36% 36% -36% 1,094 36% 36% 36% -36% 717,855 5%

140
7.4. Results and analyses
This section starts by discussing the effects of scenario 1 on the factor markets, domestic
output and consumption. Afterwards, it discusses the macroeconomic and welfare effects.
The section ends with a discussion of the effects of scenarios 2, 3 and 4, compared to those
of scenario 1. In this section, due to space contingency results are mostly displayed for
aggregated categories. Disaggregated results are available upon request.
7.4.1. Effects on the factors markets
The extra Palestinian labour demand in Israel is met in one part with labour moving out of
unemployment and in another part with labour switching from employment in the domestic
market to employment in Israel. Figure 7-2 shows that the majority (98%) of Palestinians
starting employment in Israel move out of unemployment. Figure 7-2 also highlights that
those who switch out of domestic employment for employment in Israel are all males
previously employed in the construction sector and are mostly low-skilled workers.
Figure 7-2. Characteristics of workers starting to work in Israel (in 1,000) and shares with
respect to selected characteristics (in %)
The number of Palestinian workers who switch from employment in the domestic market
to the Israeli market represent 0.1% of the initial number of workers in the domestic market.
This finding is arguably a lower bound estimate of what will happen in the real world,
because the surplus labour assumption used to depict the labour market conditions in the
West Bank first matches the extra labour demand in Israel with the unemployed labour.
While this assumption may overstate the effect on the pool of labour starting employment
in Israel, it reflects the empirical evidence of a strong short-term correlation between
unemployment in the West Bank and the access of Palestinian labour to the Israeli markets
(see Figure 4-2). Unemployment in the West Bank is mostly involuntary. Subsequently, an
25.8
0.5 0.5 0.3 0.2 0.5
98%
2%
100%
69%
31%
100%
0%
40%
80%
120%
0
20
40
Out ofunemployment
Out of domesticemployment
Males Low-skilled High-skilled Construction
Gender Skill Sector
Starting working in Israel Switching from domestic employment
Per
cen
t ch
ange
(%
)
Nu
mb
er o
f w
ork
ers
(in
1,0
00
)
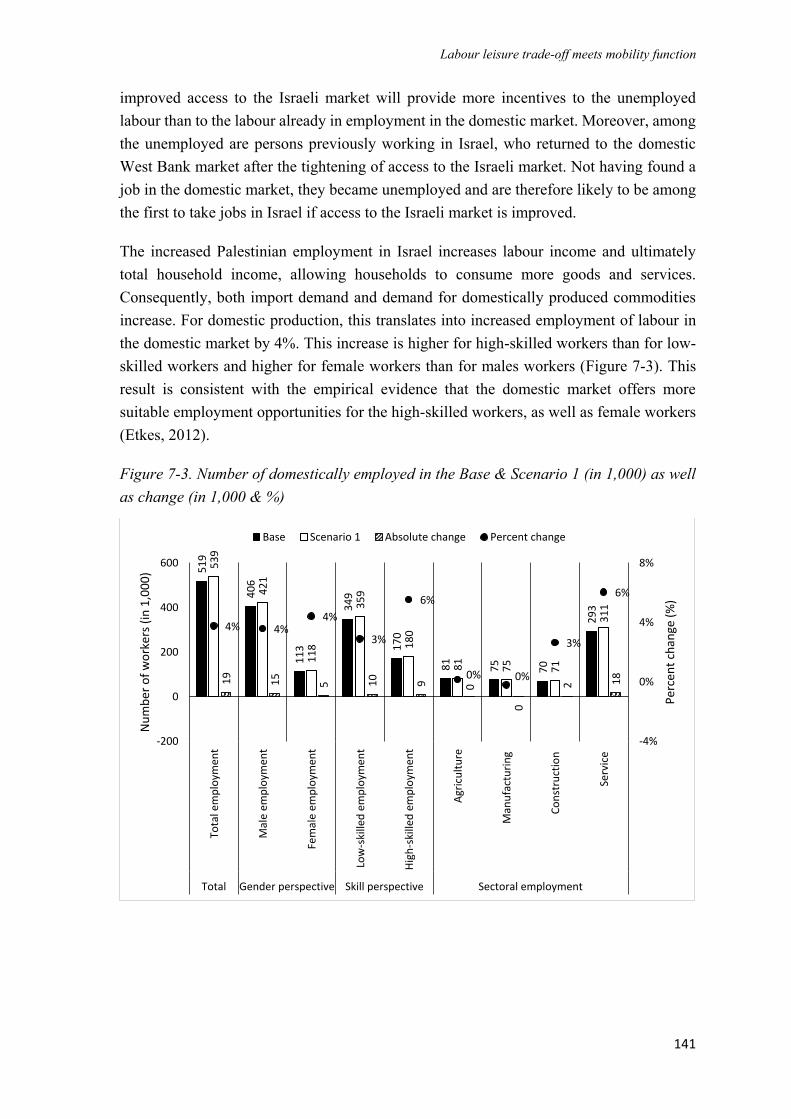
Labour leisure trade-off meets mobility function
141
improved access to the Israeli market will provide more incentives to the unemployed
labour than to the labour already in employment in the domestic market. Moreover, among
the unemployed are persons previously working in Israel, who returned to the domestic
West Bank market after the tightening of access to the Israeli market. Not having found a
job in the domestic market, they became unemployed and are therefore likely to be among
the first to take jobs in Israel if access to the Israeli market is improved.
The increased Palestinian employment in Israel increases labour income and ultimately
total household income, allowing households to consume more goods and services.
Consequently, both import demand and demand for domestically produced commodities
increase. For domestic production, this translates into increased employment of labour in
the domestic market by 4%. This increase is higher for high-skilled workers than for low-
skilled workers and higher for female workers than for males workers (Figure 7-3). This
result is consistent with the empirical evidence that the domestic market offers more
suitable employment opportunities for the high-skilled workers, as well as female workers
(Etkes, 2012).
Figure 7-3. Number of domestically employed in the Base & Scenario 1 (in 1,000) as well
as change (in 1,000 & %)
51
9
40
6
11
3
34
9
17
0
81
75
70
29
3
53
9
42
1
11
8
35
9
18
0
81
75
71
31
1
19
15
5 10
9 0
0
2 18
4% 4%4%
3%
6%
0% 0%
3%
6%
-4%
0%
4%
8%
-200
0
200
400
600
Tota
l em
plo
ymen
t
Mal
e em
plo
ymen
t
Fem
ale
emp
loym
ent
Low
-ski
lled
em
plo
ymen
t
Hig
h-s
kille
d e
mp
loym
ent
Agr
icu
ltu
re
Man
ufa
ctu
rin
g
Co
nst
ruct
ion
Serv
ice
Total Gender perspective Skill perspective Sectoral employment
Per
cen
t ch
ange
(%
)
Nu
mb
er o
f w
ork
ers
(in
1,0
00
)
Base Scenario 1 Absolute change Percent change
Chapter 7
142
Employment in the domestic market increases strongly in the service sector and moderately
in the construction sector. However, it remains almost unchanged in the manufacturing and
agricultural sectors. These findings partially stem from the income elasticities (see
Appendix 6), which are higher for services than for agricultural products. Subsequently,
the increased household income due to additional labour income from Israel generates a
higher demand for services than for agricultural products. The unchanged employment
level in the manufacturing sector, despite relatively high income elasticities is due to this
sector being the most export-oriented in the West Bank (see Appendix 7). Subsequently, it
is the most negatively affected by the “Dutch disease” effects of large inflows of labour
income from Israel, which are associated with a real appreciation of the domestic currency.
As a result, the competitiveness of West Bank exports in the international markets and the
output in the manufacturing sector are reduced (see Section 7.4.2). Increasing employment
in the construction sector shows that the inflow of workers coming out of unemployment
to start working in the domestic market surpasses the outflow of workers leaving the
domestic market to be employed in Israel.
Among the previously unemployed moving into employment, 56% start working in Israel,
while 44% start in the domestic economy (Table 7.2). While more men move out of
unemployment to join the Israeli market, the vast majority of women moving out of
unemployment takes a job in the domestic market. This finding stems from a negligible
Palestinian female employment in Israel (1% of total female employment) as compared to
male employment in Israel (17% of total male employment). With this gender-
differentiated pattern of Palestinian employment in Israel, increasing the demand for
Palestinian labour in Israel has a substantial effect on female employment as many women
move out of unemployment to start working in the domestic economy.
Table 7.2 shows that while most of the low-skilled workers, who move out of
unemployment start working in Israel, the majority of high-skilled workers moving out of
unemployment starts working in the domestic market. This result is in line with the
empirical evidence that the domestic market offers more suitable opportunities for high-
skilled workers, while the Israeli market mostly provides low-skill jobs.
Across production sectors, the reduced employment in the domestic manufacturing sector
is overcompensated by the movement of labour out of unemployment to start working in
Israel. In the other sectors, labour moves out of unemployment to join both the Israeli and
domestic markets. In the service sector, the majority of the labour moving out of
unemployment starts working in the domestic market, while in the agricultural and
construction sectors, the majority is being employed in the Israeli economy. This finding
reflects the concentration of the Palestinian employment in Israel in manual sectors, while
in the domestic market the service sector is preponderant.
Labour leisure trade-off meets mobility function
143
Table 7.2. Changes in employment status among labour categories
Moving out of
unemployment to
employment in
Israel
Moving out of
unemployment to
employment in the
domestic market
Total moving out of
unemployment
Aggregate Labour 25,778 (56%) 20,009 (44%) 45,787 (100%)
Gender perspective
Male population 25,352 (63%) 15,038 (37%) 40,390 (100%)
Female population 426 (8%) 4,971 (92%) 5,397 (100%)
Skill perspective
Low-skilled 23,452 (69%) 10,415 (31%) 33,866 (100%)
High-skilled 2,327 (20%) 9,594 (80%) 11,921 (100%)
Sector of employment
Agriculture 2,250 (95%) 129 (5%) 2,379 (100%)
Manufacturing 2,955 (106%) -157 (-6%) 2,798 (100%)
Construction 14,315 (86%) 2,346 (14%) 16,661 (100%)
Services 6,258 (26%) 17,691 (74%) 23,949 (100%)
Compared to its initial level, the pool of unemployed labour is reduced by 37% (Figure
7-4). This reflects a drop in the unemployment rate from the initial 17% to 11% of the
labour force. Unemployment drops more for the low-skilled (by 43%) than for the high-
skilled labour (by 31%). This finding stems from the fact that two thirds of Palestinian
workers in Israel are low-skilled. Subsequently, increasing Palestinian labour demand in
Israel has a stronger effect on unemployment of the low-skilled workers.
Figure 7-4 also points to unemployment decreasing more for the male population (by 46%)
than for the female population (by 19%). This finding has to be related to the fact that the
majority of Palestinian labour in Israel is male and that females’s participation rate in the
labour force is low. Across sectors, unemployment decreases the most in absolute terms for
workers in the service sector, because this is the largest sector in the West Bank, including
public administration. However, in relative terms, unemployment falls so sharply in the
construction sector that full employment is achieved. This finding needs to be put into
perspective with the construction sector being the main employer of Palestinians in Israel.
In the base, 56% of all Palestinians employed in Israel work in the construction sector.
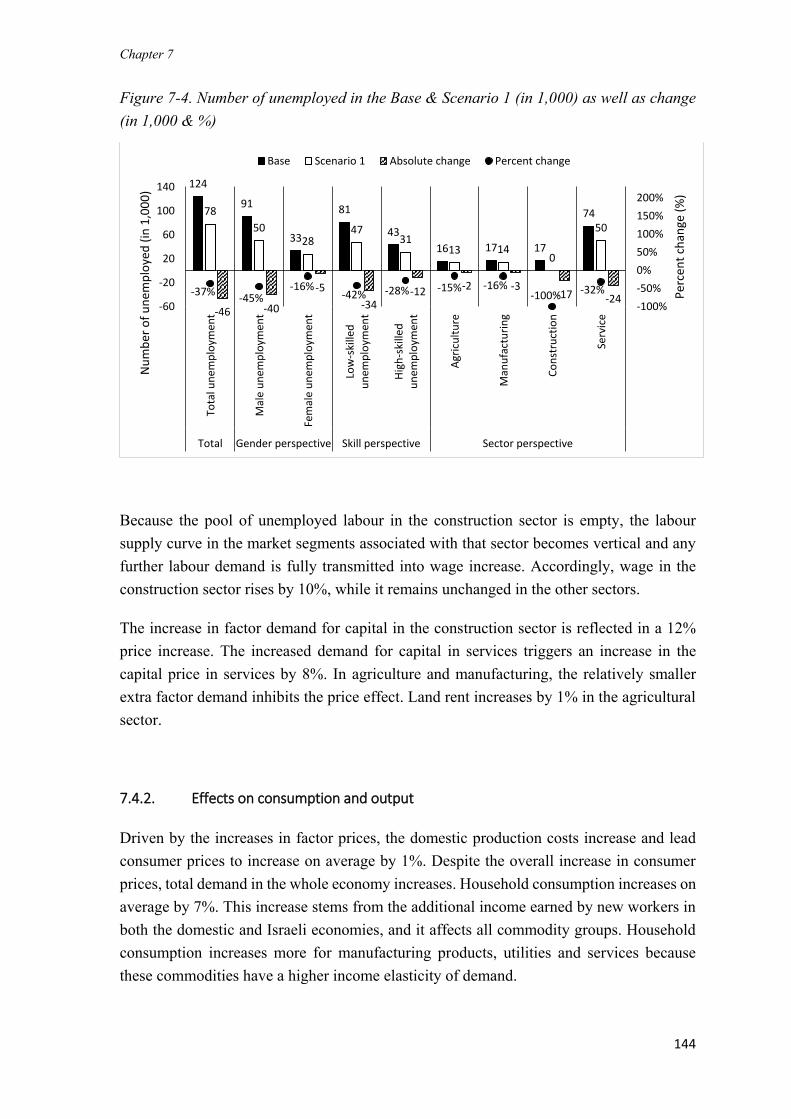
Chapter 7
144
Figure 7-4. Number of unemployed in the Base & Scenario 1 (in 1,000) as well as change
(in 1,000 & %)
Because the pool of unemployed labour in the construction sector is empty, the labour
supply curve in the market segments associated with that sector becomes vertical and any
further labour demand is fully transmitted into wage increase. Accordingly, wage in the
construction sector rises by 10%, while it remains unchanged in the other sectors.
The increase in factor demand for capital in the construction sector is reflected in a 12%
price increase. The increased demand for capital in services triggers an increase in the
capital price in services by 8%. In agriculture and manufacturing, the relatively smaller
extra factor demand inhibits the price effect. Land rent increases by 1% in the agricultural
sector.
7.4.2. Effects on consumption and output
Driven by the increases in factor prices, the domestic production costs increase and lead
consumer prices to increase on average by 1%. Despite the overall increase in consumer
prices, total demand in the whole economy increases. Household consumption increases on
average by 7%. This increase stems from the additional income earned by new workers in
both the domestic and Israeli economies, and it affects all commodity groups. Household
consumption increases more for manufacturing products, utilities and services because
these commodities have a higher income elasticity of demand.
124
91
33
81
43
16 17 17
7478
5028
4731
13 140
50
-46 -40
-5
-34-12 -2 -3
-17 -24-37%
-45%-16%
-42% -28% -15% -16%-100% -32%
-100%
-50%
0%
50%
100%
150%
200%
-60
-20
20
60
100
140
Tota
l un
emp
loym
ent
Mal
e u
nem
plo
ymen
t
Fem
ale
un
emp
loym
ent
Low
-ski
lled
un
emp
loym
ent
Hig
h-s
kille
du
nem
plo
ymen
t
Agr
icu
ltu
re
Man
ufa
ctu
rin
g
Co
nst
ruct
ion
Serv
ice
Total Gender perspective Skill perspective Sector perspective
Per
cen
t ch
ange
(%
)
Nu
mb
er o
f u
nem
plo
yed
(in
1,0
00
)
Base Scenario 1 Absolute change Percent change
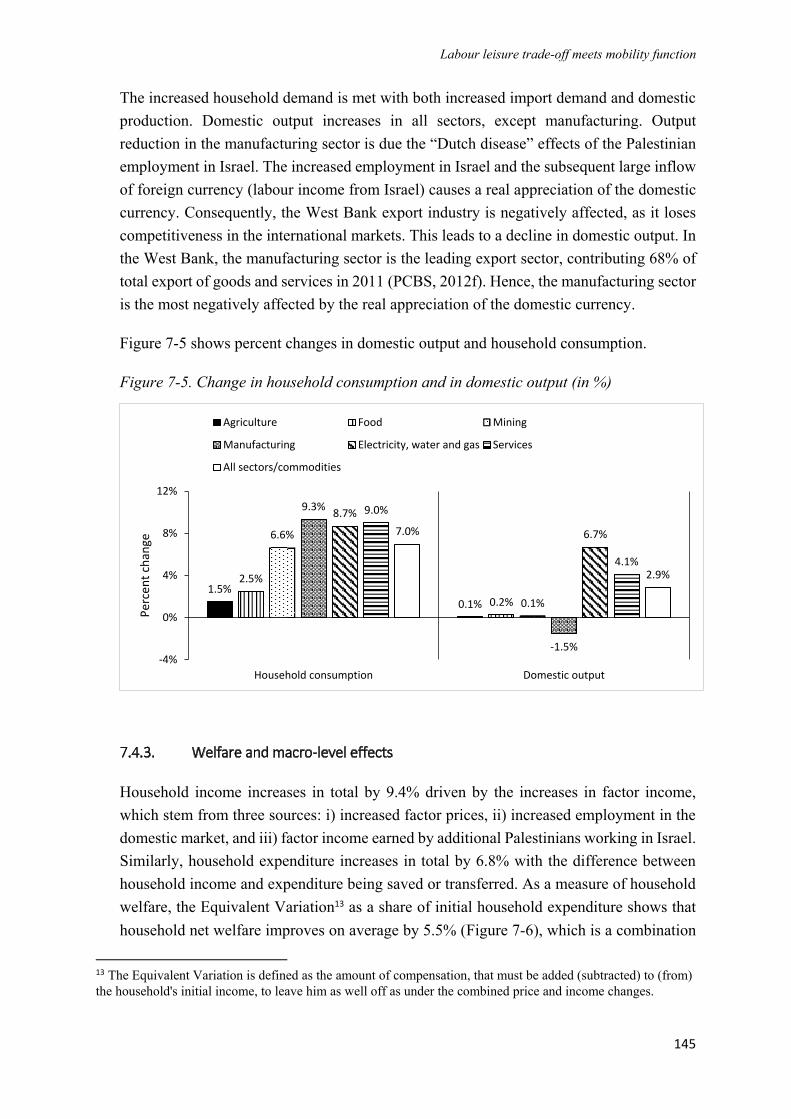
Labour leisure trade-off meets mobility function
145
The increased household demand is met with both increased import demand and domestic
production. Domestic output increases in all sectors, except manufacturing. Output
reduction in the manufacturing sector is due the “Dutch disease” effects of the Palestinian
employment in Israel. The increased employment in Israel and the subsequent large inflow
of foreign currency (labour income from Israel) causes a real appreciation of the domestic
currency. Consequently, the West Bank export industry is negatively affected, as it loses
competitiveness in the international markets. This leads to a decline in domestic output. In
the West Bank, the manufacturing sector is the leading export sector, contributing 68% of
total export of goods and services in 2011 (PCBS, 2012f). Hence, the manufacturing sector
is the most negatively affected by the real appreciation of the domestic currency.
Figure 7-5 shows percent changes in domestic output and household consumption.
Figure 7-5. Change in household consumption and in domestic output (in %)
7.4.3. Welfare and macro-level effects
Household income increases in total by 9.4% driven by the increases in factor income,
which stem from three sources: i) increased factor prices, ii) increased employment in the
domestic market, and iii) factor income earned by additional Palestinians working in Israel.
Similarly, household expenditure increases in total by 6.8% with the difference between
household income and expenditure being saved or transferred. As a measure of household
welfare, the Equivalent Variation13 as a share of initial household expenditure shows that
household net welfare improves on average by 5.5% (Figure 7-6), which is a combination
13 The Equivalent Variation is defined as the amount of compensation, that must be added (subtracted) to (from) the household's initial income, to leave him as well off as under the combined price and income changes.
1.5%0.1%
2.5%
0.2%
6.6%
0.1%
9.3%
-1.5%
8.7%
6.7%
9.0%
4.1%
7.0%
2.9%
-4%
0%
4%
8%
12%
Household consumption Domestic output
Perc
ent c
hang
e
Agriculture Food Mining
Manufacturing Electricity, water and gas Services
All sectors/commodities
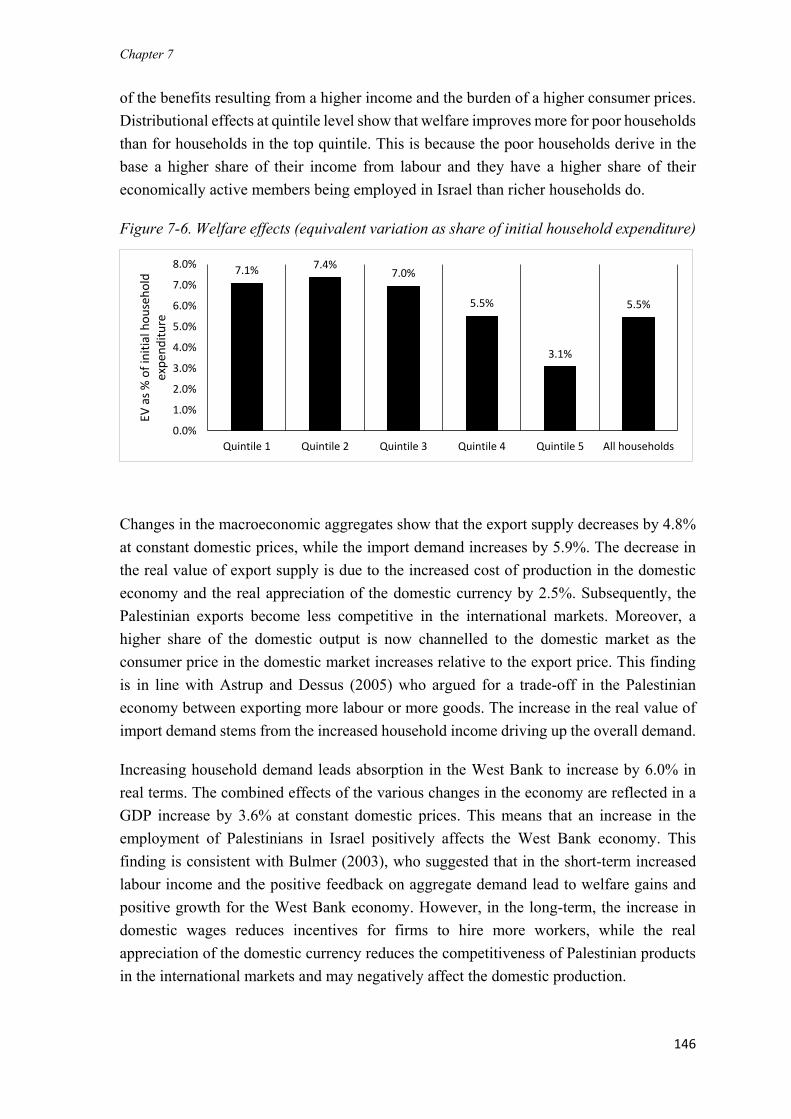
Chapter 7
146
of the benefits resulting from a higher income and the burden of a higher consumer prices.
Distributional effects at quintile level show that welfare improves more for poor households
than for households in the top quintile. This is because the poor households derive in the
base a higher share of their income from labour and they have a higher share of their
economically active members being employed in Israel than richer households do.
Figure 7-6. Welfare effects (equivalent variation as share of initial household expenditure)
Changes in the macroeconomic aggregates show that the export supply decreases by 4.8%
at constant domestic prices, while the import demand increases by 5.9%. The decrease in
the real value of export supply is due to the increased cost of production in the domestic
economy and the real appreciation of the domestic currency by 2.5%. Subsequently, the
Palestinian exports become less competitive in the international markets. Moreover, a
higher share of the domestic output is now channelled to the domestic market as the
consumer price in the domestic market increases relative to the export price. This finding
is in line with Astrup and Dessus (2005) who argued for a trade-off in the Palestinian
economy between exporting more labour or more goods. The increase in the real value of
import demand stems from the increased household income driving up the overall demand.
Increasing household demand leads absorption in the West Bank to increase by 6.0% in
real terms. The combined effects of the various changes in the economy are reflected in a
GDP increase by 3.6% at constant domestic prices. This means that an increase in the
employment of Palestinians in Israel positively affects the West Bank economy. This
finding is consistent with Bulmer (2003), who suggested that in the short-term increased
labour income and the positive feedback on aggregate demand lead to welfare gains and
positive growth for the West Bank economy. However, in the long-term, the increase in
domestic wages reduces incentives for firms to hire more workers, while the real
appreciation of the domestic currency reduces the competitiveness of Palestinian products
in the international markets and may negatively affect the domestic production.
7.1% 7.4%7.0%
5.5%
3.1%
5.5%
0.0%
1.0%
2.0%
3.0%
4.0%
5.0%
6.0%
7.0%
8.0%
Quintile 1 Quintile 2 Quintile 3 Quintile 4 Quintile 5 All households
EV a
s %
of
init
ial h
ou
seh
old
ex
pen
dit
ure
Labour leisure trade-off meets mobility function
147
7.4.4. Results with the alternative assumptions on labour movement and labour force
(Scenarios 2, 3 and 4)
Restricting the movement of additional labour commuting to Israel to Palestinian men who
are eligible for a work permit in Israel (scenario 2) draws more than nine times as much
workers out of employment in the domestic market as in scenario 1 (Figure 7-7). This is
because, in scenario 1, the number of workers who are ineligible for a work permit make
7,219 workers corresponding to 28% of the labour moving out of unemployment to start
working in Israel. As the workers in this category are not allowed to move to Israel in
scenario 2, all the extra demand for Palestinian labour in Israel falls on the eligible
categories where the pool of unemployed labour becomes empty and more workers have to
be sourced from the domestic market. Consequently, 4,748 workers are taken out of the
domestic market in scenario 2, as compared to 509 workers in scenario 1. Because more
workers switch from employment in the domestic market to employment in Israel in
scenario 2 than in scenario 1, less workers move out of unemployment to employment in
Israel (the extra demand for Palestinian labour in Israel is the same in scenarios 1 and 2).
In other words, the restriction introduced in scenario 2 has the effect of increasing the
number of people moving out of unemployment to start working in the domestic market
(Figure 7-7). While in scenario 1, 20,009 workers move out of unemployment to start
working in the domestic market, in scenario 2 they make 24,395 workers. As expected, the
size of the unemployed labour moving into employment (either in Israel or in the domestic
market) is larger for categories of eligible Palestinian male workers in scenario 2 as
compared to scenario 1. Nevertheless, the shock also has a strong effect on the employment
of ineligible Palestinians as many of them move out of unemployment to work exclusively
in the domestic market.
Employment opportunities for female workers are concentrated in the domestic market.
Because of the increased number of vacancies in the domestic market in scenario 2
compared to scenario 1, the total number of female workers who move out of
unemployment is slightly larger in scenario 2 than in scenario1.
At the aggregate level, the net increase in the size of labour moving out of unemployment
is similar in scenario 2 and scenario 1.

Chapter 7
148
Figure 7-7. Comparison of the results on employment in scenario 2 to scenario 1 (in 1,000
workers)
As more workers leave the domestic market, especially in the construction sector, domestic
wages increase more in scenario 2 than in scenario 1. Substitution effects due to more
workers, previously unemployed, being employed in the domestic market in scenario 2
ultimately result in similar changes in the macroeconomic aggregates for the two scenarios.
Real GDP increases by 3.5% in scenario 2, compared to 3.6% in scenario 1. Although the
difference is small, it points that restricting mobility of Palestinian workers to those who
are eligible to receive a work permit in Israel reduces the positive effects of easing the
Palestinian access to the Israeli market.
Scenario 3 stems from considering that improved access to the Israeli market can stimulate
labour force participation in the West Bank, and accordingly increasing the labour supply
by 5% which adds 35,893 people to the labour force in the base. This additional labour
force can be considered as unemployed, hence increasing the unemployed population by
29%. The results of scenario 3 show that the extra demand for Palestinian labour in Israel
is met only with the unemployed labour. Increasing the total supply of labour makes the
pool of unemployed labour large enough to meet all the extra demand in Israel. Moreover,
the increased pool of unemployed labour makes the horizontal segment of the labour supply
curve longer, meaning that employers can employ more labour without needing to increase
wages. Accordingly, the number of workers moving out of unemployment to start working
in the domestic market is 12% higher in scenario 3 than in scenario 1 (Figure 7-8). The net
inflow to the domestic market is 14% higher in scenario 3 than in scenario 1. Consequently,
the total number of Palestinians moving out of unemployment in scenario 3 is 6% higher
than that in scenario 1 (Figure 7-8). This higher influx is completely attributed to the
25
.8
20
.0
0.5
13
.5
9.8 1
7.2
5.4
45
.8
21
.5
24
.4
4.7 10
.1
11
.1 19
.1
5.6
45
.9
0
40
80O
ut
of
un
emp
loym
ent
for
emp
loym
ent
inIs
rael
Ou
t o
f u
nem
plo
ymen
tfo
r em
plo
ymen
t in
do
mes
tic
mar
ket
Swit
ch f
rom
emp
loym
ent
ind
om
esti
c m
arke
t to
Isra
el
Mal
e in
elig
ible
Mal
e w
eakl
y el
igib
le
Mal
e h
igh
ly e
ligib
le
Fem
ale
wo
rker
s
Tota
l
Number of Palestinians moving in thedomestic or the Israeli market
Number of Palestinians moving out of unemployment
Nu
mb
er o
f w
ork
ers
(in
1,0
00
)
Scenario 1 Scenario 2
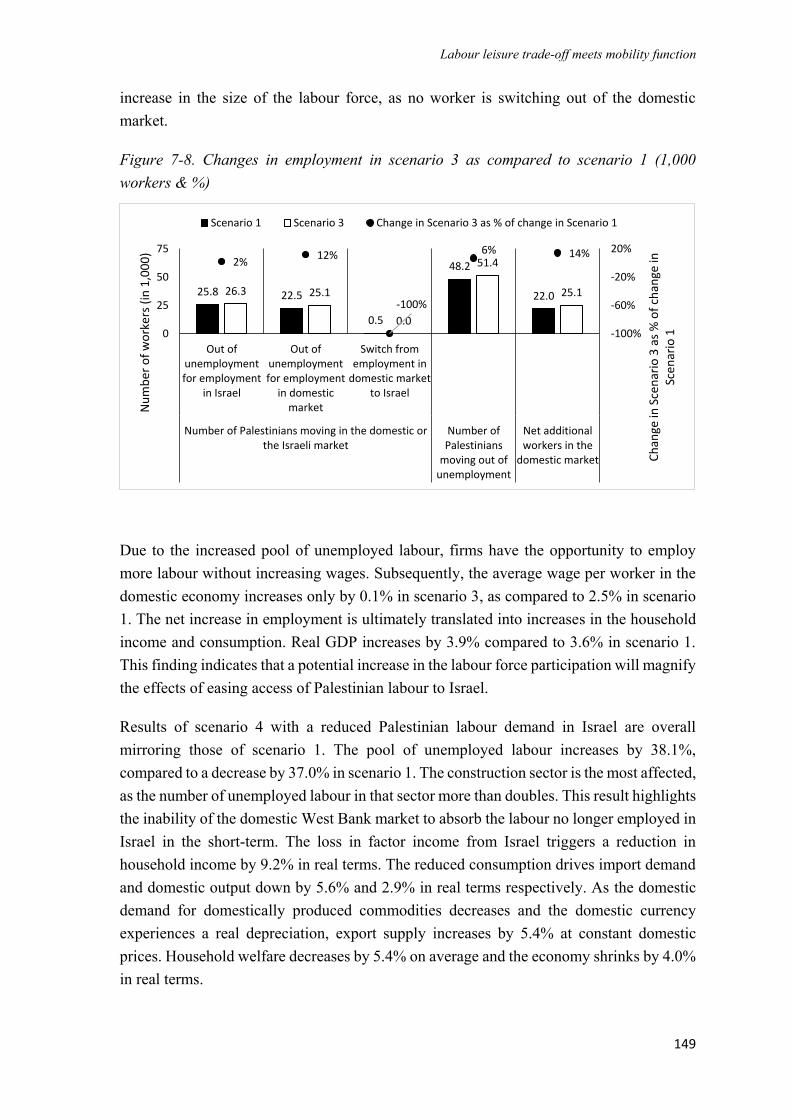
Labour leisure trade-off meets mobility function
149
increase in the size of the labour force, as no worker is switching out of the domestic
market.
Figure 7-8. Changes in employment in scenario 3 as compared to scenario 1 (1,000
workers & %)
Due to the increased pool of unemployed labour, firms have the opportunity to employ
more labour without increasing wages. Subsequently, the average wage per worker in the
domestic economy increases only by 0.1% in scenario 3, as compared to 2.5% in scenario
1. The net increase in employment is ultimately translated into increases in the household
income and consumption. Real GDP increases by 3.9% compared to 3.6% in scenario 1.
This finding indicates that a potential increase in the labour force participation will magnify
the effects of easing access of Palestinian labour to Israel.
Results of scenario 4 with a reduced Palestinian labour demand in Israel are overall
mirroring those of scenario 1. The pool of unemployed labour increases by 38.1%,
compared to a decrease by 37.0% in scenario 1. The construction sector is the most affected,
as the number of unemployed labour in that sector more than doubles. This result highlights
the inability of the domestic West Bank market to absorb the labour no longer employed in
Israel in the short-term. The loss in factor income from Israel triggers a reduction in
household income by 9.2% in real terms. The reduced consumption drives import demand
and domestic output down by 5.6% and 2.9% in real terms respectively. As the domestic
demand for domestically produced commodities decreases and the domestic currency
experiences a real depreciation, export supply increases by 5.4% at constant domestic
prices. Household welfare decreases by 5.4% on average and the economy shrinks by 4.0%
in real terms.
25.8 22.5
0.5
48.2
22.026.3 25.1
0.0
51.4
25.1
2%12%
-100%
6% 14%
-100%
-60%
-20%
20%
0
25
50
75
Out ofunemploymentfor employment
in Israel
Out ofunemploymentfor employment
in domesticmarket
Switch fromemployment in
domestic marketto Israel
Number of Palestinians moving in the domestic orthe Israeli market
Number ofPalestinians
moving out ofunemployment
Net additionalworkers in the
domestic market Ch
ange
in S
cen
ario
3 a
s %
of
chan
ge in
Sc
enar
io 1
Nu
mb
er o
f w
ork
ers
(in
1,0
00
)
Scenario 1 Scenario 3 Change in Scenario 3 as % of change in Scenario 1
Chapter 7
150
7.5. Conclusions and policy implications
7.5.1. General conclusions and areas for future model developments
Employment in Israel has been a distinct feature of the Palestinian labour force for several
decades. In recent years, the restrictions on both the number and characteristics of
Palestinians eligible for a work permit in Israel have altered the flow of Palestinians
commuting to Israel for work with significant implications for unemployment and
economic growth in the Palestinian territories. This chapter assesses the short-term effects
of changes in the number and composition of Palestinian workers in Israel on the West
Bank economy. A modified version of the STAGE-2 model is used and calibrated to a
version of the SAM that includes the essential economic sectors in the West Bank that
would potentially be affected by a cross-border movement of workers.
The results show that a return of Palestinian employment in Israel to its pre-intifada level,
as simulated in scenario 1, improves household welfare by 5.5% on average and triggers a
GDP growth by 3.6%. This finding shows that, in the short-term, the increased labour
income from Israel has a positive effect on aggregate demand and is beneficial for the West
Bank economy. However, in the long-term, the increase in domestic wages reduces
incentives for firms to hire more workers, while the real appreciation of the domestic
currency reduces the competitiveness of Palestinian products in the international markets
and may negatively affect the domestic production. In order to capture the long-term effects
of the extra labour demand in Israel on the West Bank economy different specifications
would need to be incorporated in the model. First, in the long-term, factors should be
allowed to be mobile across market segments. Second, factors should be considered at full
employment by including the possibility of employment in activities beyond the production
boundary. Third, total factor supply within the production boundary should be flexible.
Factor mobility between market segments in the long-term is supported by the finding that
wages increase by 10% in the construction sector, while remaining unchanged in the other
sectors. Similarly, the price of capital increases by 12% and 8% in the construction and
service sectors respectively, while remaining unchanged in the agricultural and
manufacturing sectors. Whereas these findings are consistent with the short-term time
horizon of the analysis, in the long-term the increase in factor prices in the construction and
service sectors will lead to a movement of factors into these sectors and factor prices in all
sectors will converge. Allowing cross-segment mobility in the model requires the definition
of pairs of segments between which mobility is allowed and the specification for each pair
of a response elasticity. Then, the mobility function embedded in the model can be activated
by relative changes in factor prices. This approach has the advantage of recording the flows
of factors in physical units (Flaig, 2014).
Labour leisure trade-off meets mobility function
151
In order to represent the economy at full employment and include the activities beyond the
production boundary, a suitable specification to use is the labour-leisure trade-off, as shown
in Chapter 6. The labour-leisure trade-off extends the production boundary by adding to
the market activities the production of leisure by households using their own labour as
input. Labour ownership by households is considered at full time endowment, including
both the working and non-working time. Household utility is also defined at full
consumption by accounting for household consumption of leisure. Subsequently,
households maximise their utility by consuming a basket of commodities and leisure
subject to budget and time constraints. The decision to work instead of consuming leisure
is associated with an opportunity cost. Hence, this approach allows households to respond
to exogenous shocks by allocating more or less labour to market activities.
The representation of the labour market conditions with a surplus labour specification has
the drawback that the unemployed labour has no opportunity cost for the employer and it
has no opportunity cost outside the production boundary. Additionally, the functional form
of the labour supply curve with fixed real wages first matches the extra demand of labour
in Israel with the unemployed labour. While this mechanism is consistent with the empirical
evidence that in the short-term, unemployment in the West Bank and labour access to the
Israeli market are highly correlated, assuming that workers are drawn out of the domestic
employment only when the pool of unemployed labour is empty may understate the effect
of the shock on domestic employment. Consequently, the finding that only 2% of the extra
labour demand in Israel is met with workers previously employed in the domestic West
Bank market can be considered as the lower bound estimate of the outcome of the shock in
the real world.
To have a sense of the magnitude of the effects if more workers switch out of the domestic
market, the same shock as in scenario 1 is run assuming a vertical (inelastic) labour supply
curve. The results show a sharper increase in wages, higher production costs and ultimately
a decline in the domestic output by 2.2%. Because of the additional inflow of labour income
from Israel, households experience a welfare gain by 3.1% on average. However, the
economy as a whole is negatively affected, with GDP shrinking by 2.0%. These results can
be considered as the upper bound estimate since the new assumption draws all the extra
labour demand in Israel from the domestic market. In conclusion, alternative approaches to
depict unemployment and control the previous status of Palestinian workers who join the
Israeli market need to be explored by future research.
The results show that in the domestic market, the loss of workers who switch to
employment in Israel is overcompensated by the entry of workers moving out of
unemployment. The model implicitly assumes that the new entrants have the same
productivity as those already in employment. Accordingly, the model does not account for
Chapter 7
152
experience accumulation and hence the qualitative loss for the domestic production due to
experienced workers switching to the Israeli market. Similarly, for labour movement
between the domestic sectors, and from unemployment to the domestic market, assuming
that the new comers are as productive as those who are already in employment may
overestimate the effects of labour mobility. Therefore, another area for model improvement
is to account for the reallocation costs and productivity losses associated with labour
movement in the short-term. A first approach is that of Flaig (2014) who defines
productivity to be partly worker-specific and partly sector-specific. A second approach by
Lofgren and Cicowiez (2017) considers workers who are already in a sector to be more
efficient and to earn higher wages than the new comers.
Finally, the results indicate that household income increases on average by 9.4% with net
welfare gains for all household groups. These results hold at the aggregate household level.
However, the model is inadequate to draw deeper insights about distributional effects at
representative household group level. Following the standard approach of distributing
factor income based on the initial shares, the model assumes that the additional labour
income from Israel is distributed to households who in the base year have members working
in Israel. However, in the real world, it is likely that a substantial share of the new jobs in
Israel will be taken by workers whose households of origin initially have no worker
employed in Israel. Hence, the composition of income at the level of individual household
groups may change compared to the base year. To address this issue, endogenous factor
income distribution as suggested by Aragie et al. (2017) should be considered.
7.5.2. Policy implications for the Palestinian National Authority
The analysis shows that, in the Palestinian context, increasing the demand of Palestinian
labour in Israel has beneficial effects on the West Bank economy. Unemployment decreases
substantially, household welfare improves and the economy in general expands as captured
by the real GDP increase in scenario 1. The results of scenario 2 shows that restricting
Palestinian access to Israel only to workers who are eligible for work permits in Israel
reduces the positive effects of easing the Palestinian access to the Israeli market very
slightly. Moreover, the results of scenario 4, which reduces the number of Palestinians
working in Israel, corroborate the inability of the West Bank domestic market to absorb in
the short-term the returning workers previously employed in Israel.
Seen the limited development options in the West Bank, and its relative isolation due to the
Israeli control over external borders and the Israeli restrictions in place, it is interesting for
the Palestinian National Authority to seek more labour movement to Israel. However, as
highlighted by the results of scenarios 1 and 4, exporting more labour to Israel comes at the
Labour leisure trade-off meets mobility function
153
cost of exporting less goods that could have earned foreign currency and reduced the trade
deficit. Moreover, more Palestinian employment in Israel drives the reservation wage up
and reduces incentives to invest in the domestic market.
To mitigate those negative effects, the Palestinian National Authority (PNA) could levy a
tax on Palestinians employed in Israel. Such a tax would generate revenue for the PNA that
could be used to invest in the domestic market to support domestic enterprises in rebuilding
their eroded productive capacity and upgrading their production technologies in order to
generate more employment opportunities in the domestic market. The tax would also
reduce the reservation wage in the domestic market caused by the high wages received in
Israel and would stimulate more employment and investment in the domestic market. The
tax, by reducing the income for Palestinian workers in Israel, will reduce the attractiveness
of employment in Israel for workers already employed in the domestic market. Ultimately,
it will reduce the heavy dependence on Israeli labour markets, while building employment
opportunities in the domestic market, such that unemployment could be reduced and
household income will not be negatively affected by the loss of labour income from Israel.

154
155
8
LONG-TERM EFFECTS OF PALESTINIAN
EMPLOYMENT IN ISRAEL ON THE WEST BANK
ECONOMY14
14 Parts of this chapter have been published as a conference paper: Agbahey, J., Siddig, K., Grethe, H., 2018.
Labour leisure trade-off meets a mobility function to model cross-border movements of labour between Palestine
and Israel. In: 21st Annual Conference on Global Economic Analysis. Cartagena: Global Trade Analysis Project
(GTAP), p.27.

Chapter 8
156
Long-term effects of Palestinian employment in Israel
157
Chapter 8 Long-term effects of Palestinian employment in
Israel on the West Bank economy
8.1. Introduction
The movement of persons to supply services abroad has been a sensitive issue in
international trade negotiations for a long time (Stephenson and Hufbauer, 2010). While
tariff rates were significantly reduced through bilateral and multilateral trade agreements
in the last five decades, still restrictions of various kinds limit the mobility of labour and
impede trade in services (Orefice, 2017). These restrictions mostly target the low and semi-
skilled workers and include quantitative regulations (quotas of workers), rules for obtaining
work permits, and inefficiencies in processing the applications for work permits (Cattaneo
et al., 2010).
The restrictions on labour mobility are often tightened when a political conflict arises
between the trade partners. Political conflicts affect international labour mobility in two
ways. First, workers and employers across the borders depend on continuity and stability
to maintain long-term employment links. The expectation or outbreak of conflicts destroys
those links (Long, 2008). Second, international labour flows give states a set of instruments
to signal their resolve in a political conflict (Heilmann, 2016).
While both the sanctioning and sanctioned parties are negatively affected, the capacity of
the economy to absorb the effects depends on the relative importance of the link for each
partner. Small countries, for which international remittances account for a substantial part
of the Gross National Income (GNI), are particularly vulnerable (Di Giovanni et al., 2015).
A thorough literature review of how conflicts affect trade and inter-state economic relations
is provided in Section 1.5.1 of this thesis and the specific case of how the Palestinian-Israeli
conflict affects the Palestinian economy is reviewed in Chapter 4 of this thesis.
In Chapter 7, the economy-wide effects of a return of the Palestinian employment in Israel
to its pre-intifada level of 1999 – which is seen by many observers and both Palestinian
and Israeli officials as a desirable outcome – are investigated using a short-term
perspective. Accordingly, the labour markets were assumed rigid with limited labour
mobility and persistent involuntary unemployment. The supply and demand of labour were
determined given fixed real wages, as long as the pool of unemployment was not emptied.
In order to assess the long-term effects of increased Palestinian employment in Israel,
further development of the model specifications are needed to incorporate a cross-segment
factor mobility and enable wages to adjust to the labour market conditions.
Chapter 8
158
Building on the discussion about how to depict imperfect labour mobility in CGE models
(see Section 3.3.1 of Chapter 3), a labour mobility function is introduced here as this model
specification keeps the market clearing equation transparent. Moreover, this specification
fits the long-term time horizon of the analysis as it assumes new workers to be as productive
as workers already in employment. Based on the insights from Chapter 6, the labour market
conditions are represented with a labour-leisure trade-off assumption, as this model
specification is consistent with standard economic theories and allows transfers of labour
across the production boundary, while accounting explicitly for welfare changes within and
outside the boundary.
The next Section, 8.2, presents the data and the model used in the chapter. Section 8.3
describes the simulation implemented. Section 8.4 analyses the main results, while Section
8.5 draws on the main conclusions and policy implications.
8.2. Methods
8.2.1. Data
The database used in this chapter is an aggregated version of the detailed SAM described
in Chapter 5. The aggregation process is identical to the one in Chapter 6 and the only
difference is the inclusion of leisure. To implement the labour-leisure trade-off, changes to
the database are required in order to incorporate leisure activities and commodities. Each
representative household is paired with a unique activity that uses the household’s own
time as input to produce leisure that is consumed only by that household. The factor
ownership matrix also has to be extended to account for the labour each household uses to
produce leisure, in addition to the labour that is supplied to the market.
Leisure in this chapter is equivalent to the non-working time, including the time available
to the household members who are unemployed within the SNA boundary. In practical
terms, one employed person within the SNA boundary in the original database corresponds
to eight working hours and a person unemployed within the SNA boundary counts for eight
non-working hours. Next, every person has twelve active hours per day after excluding the
time required for vital functions such as sleeping. Accordingly, the leisure time at disposal
for every person, whether employed within the SNA boundary or not, amounts to four non-
working hours. Subsequently, every person employed within the SNA boundary has eight
working hours and four non-working hours, while every person who is unemployed within
the SNA boundary has in total twelve non-working hours.
Table 8.1 reports the employment data in the base year.
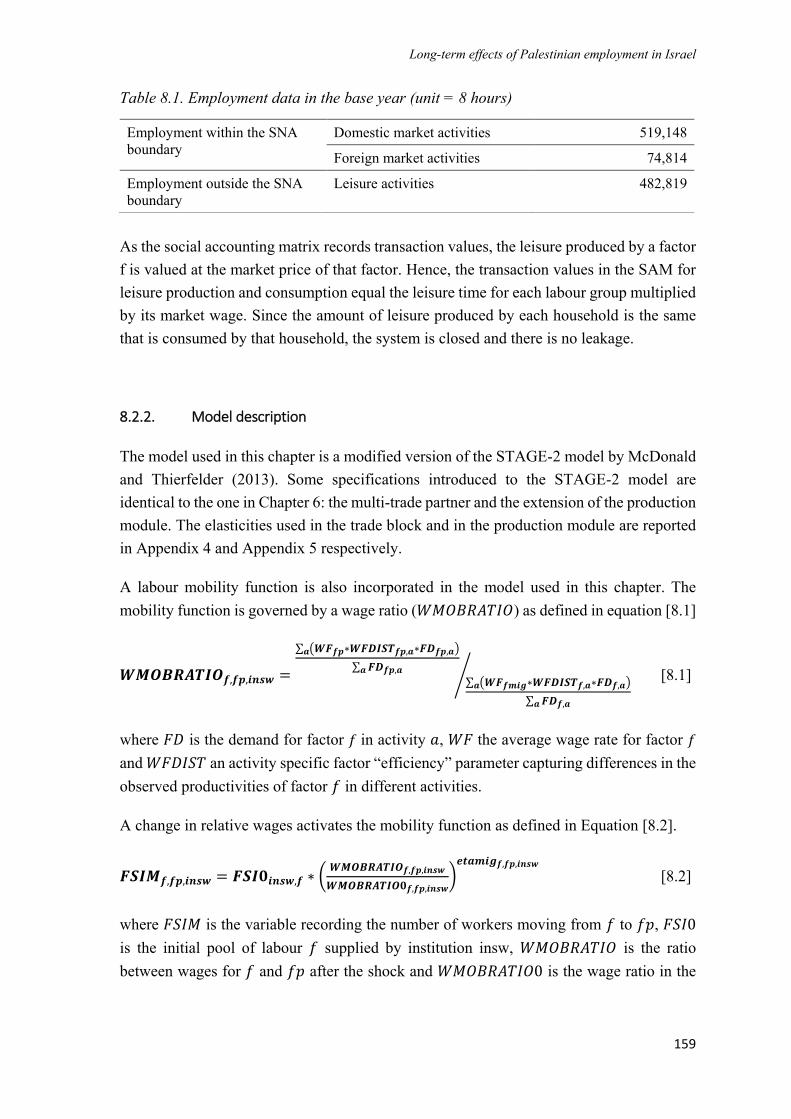
Long-term effects of Palestinian employment in Israel
159
Table 8.1. Employment data in the base year (unit = 8 hours)
Employment within the SNA
boundary
Domestic market activities 519,148
Foreign market activities 74,814
Employment outside the SNA
boundary
Leisure activities 482,819
As the social accounting matrix records transaction values, the leisure produced by a factor
f is valued at the market price of that factor. Hence, the transaction values in the SAM for
leisure production and consumption equal the leisure time for each labour group multiplied
by its market wage. Since the amount of leisure produced by each household is the same
that is consumed by that household, the system is closed and there is no leakage.
8.2.2. Model description
The model used in this chapter is a modified version of the STAGE-2 model by McDonald
and Thierfelder (2013). Some specifications introduced to the STAGE-2 model are
identical to the one in Chapter 6: the multi-trade partner and the extension of the production
module. The elasticities used in the trade block and in the production module are reported
in Appendix 4 and Appendix 5 respectively.
A labour mobility function is also incorporated in the model used in this chapter. The
mobility function is governed by a wage ratio (𝑊𝑀𝑂𝐵𝑅𝐴𝑇𝐼𝑂) as defined in equation [8.1]
𝑾𝑴𝑶𝑩𝑹𝑨𝑻𝑰𝑶𝒇,𝒇𝒑,𝒊𝒏𝒔𝒘 =
∑ (𝑾𝑭𝒇𝒑∗𝑾𝑭𝑫𝑰𝑺𝑻𝒇𝒑,𝒂∗𝑭𝑫𝒇𝒑,𝒂)𝒂
∑ 𝑭𝑫𝒇𝒑,𝒂𝒂
∑ (𝑾𝑭𝒇𝒎𝒊𝒈∗𝑾𝑭𝑫𝑰𝑺𝑻𝒇,𝒂∗𝑭𝑫𝒇,𝒂)𝒂
∑ 𝑭𝑫𝒇,𝒂𝒂
⁄ [8.1]
where 𝐹𝐷 is the demand for factor 𝑓 in activity 𝑎, 𝑊𝐹 the average wage rate for factor 𝑓
and 𝑊𝐹𝐷𝐼𝑆𝑇 an activity specific factor “efficiency” parameter capturing differences in the
observed productivities of factor 𝑓 in different activities.
A change in relative wages activates the mobility function as defined in Equation [8.2].
𝑭𝑺𝑰𝑴𝒇,𝒇𝒑,𝒊𝒏𝒔𝒘 = 𝑭𝑺𝑰𝟎𝒊𝒏𝒔𝒘,𝒇 ∗ (𝑾𝑴𝑶𝑩𝑹𝑨𝑻𝑰𝑶𝒇,𝒇𝒑,𝒊𝒏𝒔𝒘
𝑾𝑴𝑶𝑩𝑹𝑨𝑻𝑰𝑶𝟎𝒇,𝒇𝒑,𝒊𝒏𝒔𝒘)𝒆𝒕𝒂𝒎𝒊𝒈𝒇,𝒇𝒑,𝒊𝒏𝒔𝒘
[8.2]
where 𝐹𝑆𝐼𝑀 is the variable recording the number of workers moving from 𝑓 to 𝑓𝑝, 𝐹𝑆𝐼0
is the initial pool of labour 𝑓 supplied by institution insw, 𝑊𝑀𝑂𝐵𝑅𝐴𝑇𝐼𝑂 is the ratio
between wages for 𝑓 and 𝑓𝑝 after the shock and 𝑊𝑀𝑂𝐵𝑅𝐴𝑇𝐼𝑂0 is the wage ratio in the
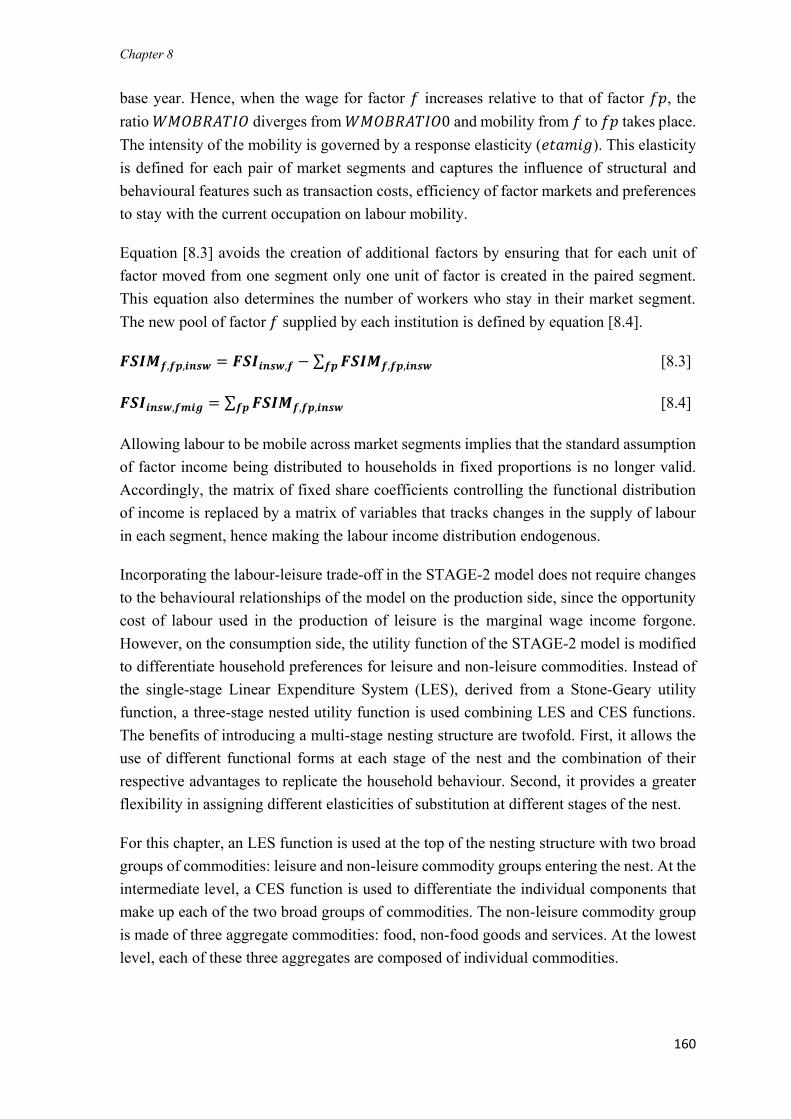
Chapter 8
160
base year. Hence, when the wage for factor 𝑓 increases relative to that of factor 𝑓𝑝, the
ratio 𝑊𝑀𝑂𝐵𝑅𝐴𝑇𝐼𝑂 diverges from 𝑊𝑀𝑂𝐵𝑅𝐴𝑇𝐼𝑂0 and mobility from 𝑓 to 𝑓𝑝 takes place.
The intensity of the mobility is governed by a response elasticity (𝑒𝑡𝑎𝑚𝑖𝑔). This elasticity
is defined for each pair of market segments and captures the influence of structural and
behavioural features such as transaction costs, efficiency of factor markets and preferences
to stay with the current occupation on labour mobility.
Equation [8.3] avoids the creation of additional factors by ensuring that for each unit of
factor moved from one segment only one unit of factor is created in the paired segment.
This equation also determines the number of workers who stay in their market segment.
The new pool of factor 𝑓 supplied by each institution is defined by equation [8.4].
𝑭𝑺𝑰𝑴𝒇,𝒇𝒑,𝒊𝒏𝒔𝒘 = 𝑭𝑺𝑰𝒊𝒏𝒔𝒘,𝒇 − ∑ 𝑭𝑺𝑰𝑴𝒇,𝒇𝒑,𝒊𝒏𝒔𝒘𝒇𝒑 [8.3]
𝑭𝑺𝑰𝒊𝒏𝒔𝒘,𝒇𝒎𝒊𝒈 = ∑ 𝑭𝑺𝑰𝑴𝒇,𝒇𝒑,𝒊𝒏𝒔𝒘𝒇𝒑 [8.4]
Allowing labour to be mobile across market segments implies that the standard assumption
of factor income being distributed to households in fixed proportions is no longer valid.
Accordingly, the matrix of fixed share coefficients controlling the functional distribution
of income is replaced by a matrix of variables that tracks changes in the supply of labour
in each segment, hence making the labour income distribution endogenous.
Incorporating the labour-leisure trade-off in the STAGE-2 model does not require changes
to the behavioural relationships of the model on the production side, since the opportunity
cost of labour used in the production of leisure is the marginal wage income forgone.
However, on the consumption side, the utility function of the STAGE-2 model is modified
to differentiate household preferences for leisure and non-leisure commodities. Instead of
the single-stage Linear Expenditure System (LES), derived from a Stone-Geary utility
function, a three-stage nested utility function is used combining LES and CES functions.
The benefits of introducing a multi-stage nesting structure are twofold. First, it allows the
use of different functional forms at each stage of the nest and the combination of their
respective advantages to replicate the household behaviour. Second, it provides a greater
flexibility in assigning different elasticities of substitution at different stages of the nest.
For this chapter, an LES function is used at the top of the nesting structure with two broad
groups of commodities: leisure and non-leisure commodity groups entering the nest. At the
intermediate level, a CES function is used to differentiate the individual components that
make up each of the two broad groups of commodities. The non-leisure commodity group
is made of three aggregate commodities: food, non-food goods and services. At the lowest
level, each of these three aggregates are composed of individual commodities.
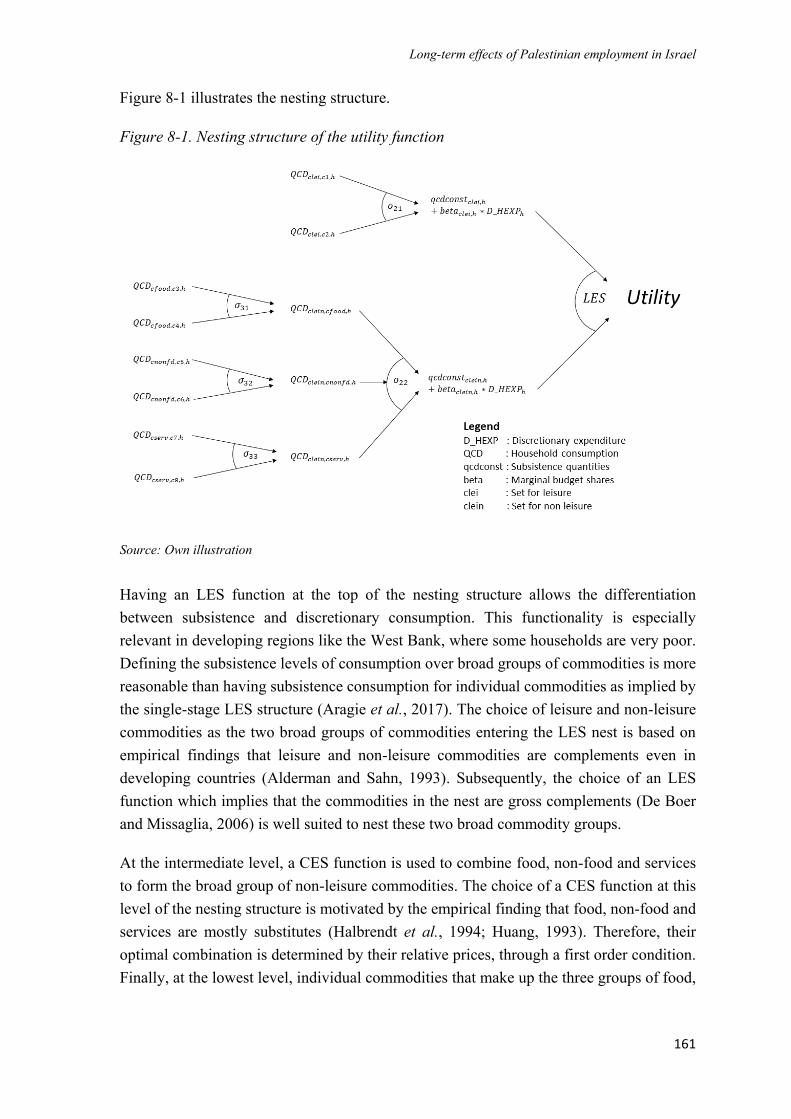
Long-term effects of Palestinian employment in Israel
161
Figure 8-1 illustrates the nesting structure.
Figure 8-1. Nesting structure of the utility function
Source: Own illustration
Having an LES function at the top of the nesting structure allows the differentiation
between subsistence and discretionary consumption. This functionality is especially
relevant in developing regions like the West Bank, where some households are very poor.
Defining the subsistence levels of consumption over broad groups of commodities is more
reasonable than having subsistence consumption for individual commodities as implied by
the single-stage LES structure (Aragie et al., 2017). The choice of leisure and non-leisure
commodities as the two broad groups of commodities entering the LES nest is based on
empirical findings that leisure and non-leisure commodities are complements even in
developing countries (Alderman and Sahn, 1993). Subsequently, the choice of an LES
function which implies that the commodities in the nest are gross complements (De Boer
and Missaglia, 2006) is well suited to nest these two broad commodity groups.
At the intermediate level, a CES function is used to combine food, non-food and services
to form the broad group of non-leisure commodities. The choice of a CES function at this
level of the nesting structure is motivated by the empirical finding that food, non-food and
services are mostly substitutes (Halbrendt et al., 1994; Huang, 1993). Therefore, their
optimal combination is determined by their relative prices, through a first order condition.
Finally, at the lowest level, individual commodities that make up the three groups of food,
Chapter 8
162
non-food goods and services are also considered as substitutes. Subsequently, their optimal
combination is determined by their relative prices. The substitution at the lowest nest is
considered to be higher than that at the intermediate level of the nesting structure.
8.2.3. Macroeconomic closures
The reality of the West Bank being a small player in the international markets is depicted
with the small country assumption. The nominal exchange rate (defined in domestic per
world unit) is fixed to reflect the reality that Palestine does not have its own currency and
uses the Israeli Shekel over which it has no influence. The current account balance is also
fixed to avoid any changes in borrowing from foreign funds, while keeping all the welfare
effects in the solution period. The consumer price index is fixed and serves as the
numeraire, meaning that transfers and wages are in real terms.
The model is investment driven, as investments in the Palestinian economy are largely
exogenous. The level of investment is defined in terms of final demand because economic
growth in the West Bank is likely to be correlated with a lower tension with Israel providing
a secured environment that will attract more foreign investments (Naqib, 2003). To keep
the balance between savings and investments, household and enterprise savings rates vary
equiproportionately. The government savings are fixed, while direct tax and value added
tax rates adjust multiplicatively to maintain the balance. Government consumption is a
fixed share of the final demand, such that when final demand increases as the economy
expands, government consumption follows suit. This assumption stems the tendency of the
public sector in the West Bank to expand quickly (UNCTAD, 2006).
8.2.4. Factor closures
All factors are fully employed. Additionally, capital and land are fully mobile across
activities while labour is mobile within a market segment across all activities, but only
mobile across segments that are controlled with a positive elasticity of mobility. The choice
of pairs of market segments and the direction of labour mobility between them follows the
Kuznets’ structural transformation process (Herrendorf et al., 2014). Accordingly, labour
can move from the agricultural sector to the manufacturing and construction sectors; from
the manufacturing sector to the construction and tertiary sectors and from the construction
sector to the tertiary sector. The assumption of one-way movement between the sectors
follows the rationale that a labour movement to sectors at the top of the structural
transformation process is associated with changes in living conditions. Subsequently, even
Long-term effects of Palestinian employment in Israel
163
with stronger positive changes in wages in the sectors at the bottom of the structural process
(e.g. agricultural sector), a backward movement of labour my not take place, as the workers
enjoy the city life and do not see future prospects in the rural areas.
8.2.5. Factor market clearing equations
The initial factor market clearing equation is modified to reflect the employment of
Palestinian labour in domestic market activities, in the Israeli market and in the production
of leisure, as shown in Equation [8.5]
𝑭𝑺𝒇 = ∑ 𝑭𝑫𝒇,𝒂𝒂𝒍𝒆𝒊𝒏 + ∑ 𝒇𝒅_𝒘𝒇,𝒘𝒘 + ∑ 𝑭𝑺𝑰𝑬𝒊𝒏𝒔𝒘,𝒇𝒊𝒏𝒔𝒘 ∀𝒂𝒍𝒆𝒊𝒏𝒂 𝒂𝒏𝒅 𝒇𝒇𝒇 [8.5]
Where 𝐹𝑆𝑓 is the total supply of labour. Factor demand 𝐹𝐷𝑓,𝑎 is only aggregated over the
set 𝑎𝑙𝑒𝑖𝑛, which refers to the domestic market activities. The parameter 𝑓𝑑_𝑤𝑓,𝑤 captures
the demand for Palestinian labour in Israel. As a parameter which is set exogenously, it
ensures that the model takes up the envisaged shock of increased Palestinian employment
in Israel. This mechanism reflects the empirical evidence that the employment of
Palestinians in Israel is demand-driven. The wage premium in Israel ensures that any
increased demand is met, while the permit system and the closures enforce any drop in
demand. 𝐹𝑆𝐼𝐸𝑖𝑛𝑠𝑤,𝑓 is the amount of factor 𝑓 supplied by institution insw for the production
of leisure. The demand of labour in the production of leisure is defined in the equation
[8.6], where the mapping (𝑚𝑎𝑝_ℎℎ_𝑎𝑙𝑒𝑖) pairs leisure activities 𝑎𝑙𝑒𝑖 with households (hh),
while the set 𝑎𝑙𝑒𝑖 refers to leisure activities.
𝑭𝑺𝑰𝑬𝒊𝒏𝒔𝒘,𝒇 = ∑ 𝑭𝑫𝒇,𝒂𝒂$𝒎𝒂𝒑_𝒉𝒉_𝒂𝒍𝒆𝒊(𝒊𝒏𝒔𝒘,𝒂) ∀𝒂𝒍𝒆𝒊𝒂 𝒂𝒏𝒅 𝒇𝒇𝒇 [8.6]
8.3. Simulation
After assuring that the model replicates the original data that represents the economy in
2011, which is called “base” scenario, a counterfactual scenario of a return to the pre-
intifada level of Palestinian employment in Israel is introduced. The shock implemented
here is the same as described in Section 6.4 of Chapter 6.
Table 8.2 summarises the number of Palestinian workers in Israel in the base year in
physical units and in the scenario as percentage change compared to the base. Factor
income from Israel for each labour group is increased in the same proportions as their
numbers.
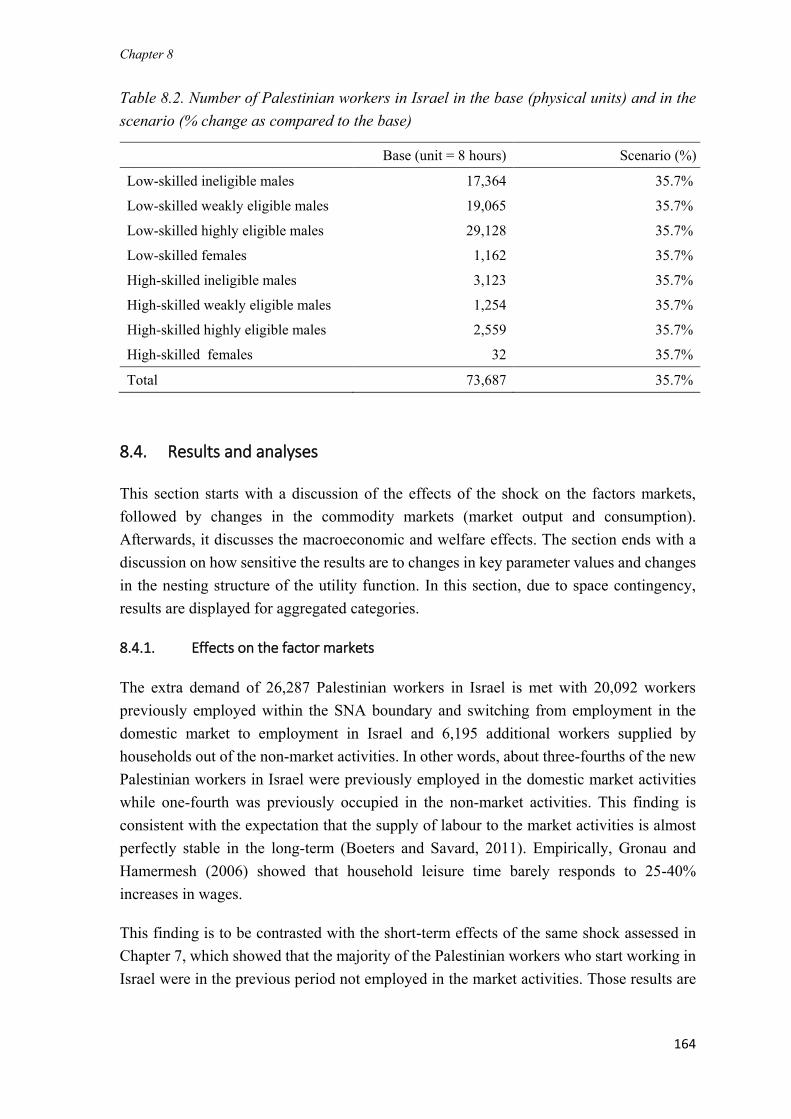
Chapter 8
164
Table 8.2. Number of Palestinian workers in Israel in the base (physical units) and in the
scenario (% change as compared to the base)
Base (unit = 8 hours) Scenario (%)
Low-skilled ineligible males 17,364 35.7%
Low-skilled weakly eligible males 19,065 35.7%
Low-skilled highly eligible males 29,128 35.7%
Low-skilled females 1,162 35.7%
High-skilled ineligible males 3,123 35.7%
High-skilled weakly eligible males 1,254 35.7%
High-skilled highly eligible males 2,559 35.7%
High-skilled females 32 35.7%
Total 73,687 35.7%
8.4. Results and analyses
This section starts with a discussion of the effects of the shock on the factors markets,
followed by changes in the commodity markets (market output and consumption).
Afterwards, it discusses the macroeconomic and welfare effects. The section ends with a
discussion on how sensitive the results are to changes in key parameter values and changes
in the nesting structure of the utility function. In this section, due to space contingency,
results are displayed for aggregated categories.
8.4.1. Effects on the factor markets
The extra demand of 26,287 Palestinian workers in Israel is met with 20,092 workers
previously employed within the SNA boundary and switching from employment in the
domestic market to employment in Israel and 6,195 additional workers supplied by
households out of the non-market activities. In other words, about three-fourths of the new
Palestinian workers in Israel were previously employed in the domestic market activities
while one-fourth was previously occupied in the non-market activities. This finding is
consistent with the expectation that the supply of labour to the market activities is almost
perfectly stable in the long-term (Boeters and Savard, 2011). Empirically, Gronau and
Hamermesh (2006) showed that household leisure time barely responds to 25-40%
increases in wages.
This finding is to be contrasted with the short-term effects of the same shock assessed in
Chapter 7, which showed that the majority of the Palestinian workers who start working in
Israel were in the previous period not employed in the market activities. Those results are
Long-term effects of Palestinian employment in Israel
165
consistent with the empirical evidence of a close correlation between employment in Israel
and the unemployment rate in the West Bank in the short-term. In fact, the volatility of
employment in Israel combined with the low capacity of the domestic economy to absorb
in the short-term large numbers of workers displaced from the Israeli economy by the
conflict creates a pool of involuntary unemployment, which supports the close correlation
between employment in Israel and the unemployment rate in the West Bank. However, in
the long-term, as labour is either employed in the market activities or self-employed in the
non-market activities, there is no involuntary unemployment and the supply of labour by
households to the market activities is quite stable. Consequently, the correlation between
employment in Israel and unemployment in the market activities in the West Bank is less
strong in the long-term. Instead of reducing substantially their leisure time to supply more
labour to the market activities, households rather shift their members who are employed in
the domestic market activities to Israel, where wages are higher.
The higher wages offered in Israel do not only displace workers out of employment in the
domestic market, they also raise real wages by 6.1% in the West Bank. Domestic wages
increase relatively more for the low-skilled workers (by 7.3%) than for the high-skilled
workers (by 4.8%). This result is consistent with the empirical findings of Mansour (2010)
that employment in Israel has stronger effects on wages for the low-skilled workers in the
domestic West Bank market. Increased demand for Palestinian labour in Israel improves
employment opportunities for Palestinian workers, so that to retain workers in the domestic
market, employers have to raise wages. Because the availability of employment in Israel is
concentrated in low-skill sectors, domestic wages for low-skilled workers experience a
stronger increase.
The implementation of the mobility function allows workers to move across the market
segments. Table 8.1 points that workers move from the agricultural and manufacturing
sectors into the construction sector. This finding is related to the composition of Palestinian
employment in Israel, which is concentrated in the manual sectors. About 56% of all
Palestinians working in Israel are employed in the construction sector in the base. The
experiment by preserving the initial composition of Palestinian employment in Israel
imposes a stronger shock on the labour employed in the construction sector. Therefore,
wages increase more rapidly in the construction sector than in other sectors. Consequently,
provided the possibility for labour to be mobile upon changes in relative wages, there is a
labour movement from the other sectors into the construction sector.
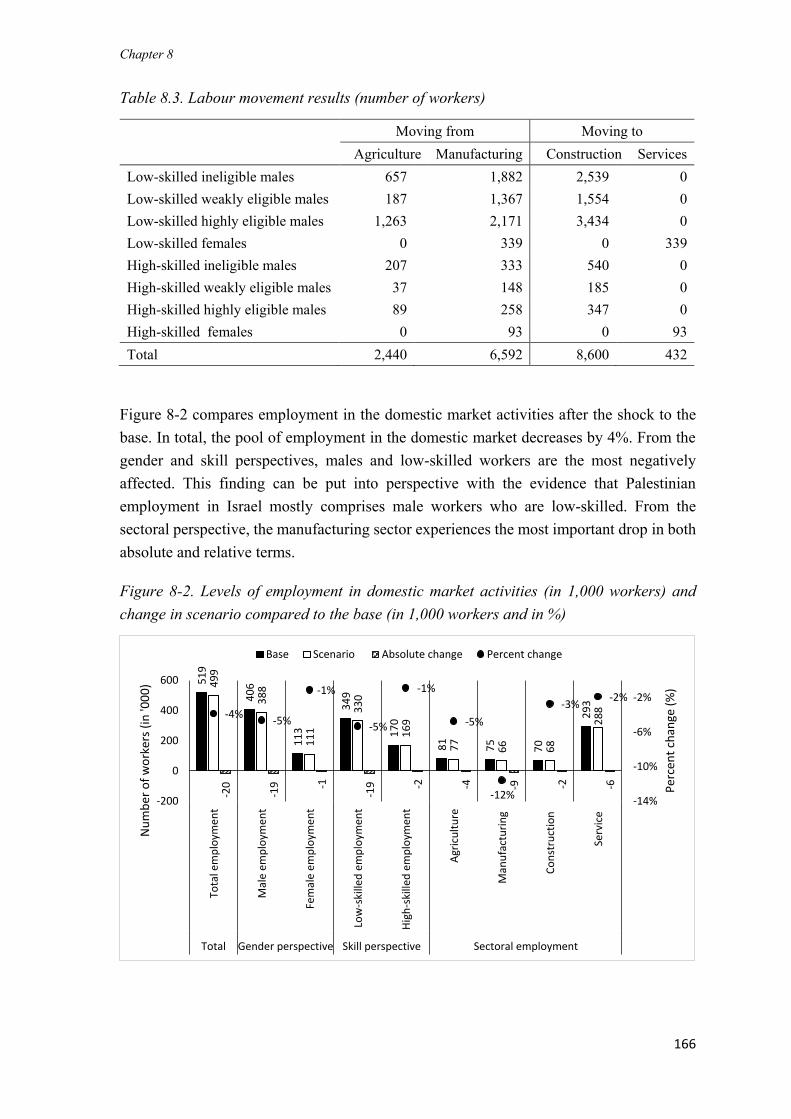
Chapter 8
166
Table 8.3. Labour movement results (number of workers)
Moving from Moving to
Agriculture Manufacturing Construction Services
Low-skilled ineligible males 657 1,882 2,539 0
Low-skilled weakly eligible males 187 1,367 1,554 0
Low-skilled highly eligible males 1,263 2,171 3,434 0
Low-skilled females 0 339 0 339
High-skilled ineligible males 207 333 540 0
High-skilled weakly eligible males 37 148 185 0
High-skilled highly eligible males 89 258 347 0
High-skilled females 0 93 0 93
Total 2,440 6,592 8,600 432
Figure 8-2 compares employment in the domestic market activities after the shock to the
base. In total, the pool of employment in the domestic market decreases by 4%. From the
gender and skill perspectives, males and low-skilled workers are the most negatively
affected. This finding can be put into perspective with the evidence that Palestinian
employment in Israel mostly comprises male workers who are low-skilled. From the
sectoral perspective, the manufacturing sector experiences the most important drop in both
absolute and relative terms.
Figure 8-2. Levels of employment in domestic market activities (in 1,000 workers) and
change in scenario compared to the base (in 1,000 workers and in %)
51
9
40
6
11
3
34
9
17
0
81
75
70
29
3
49
9
38
8
11
1
33
0
16
9
77
66 68
28
8
-20
-19 -1
-19 -2 -4 -9 -2 -6
-4%-5%
-1%
-5%
-1%
-5%
-12%
-3%-2%
-14%
-10%
-6%
-2%
-200
0
200
400
600
Tota
l em
plo
ymen
t
Mal
e em
plo
ymen
t
Fem
ale
emp
loym
ent
Low
-ski
lled
em
plo
ymen
t
Hig
h-s
kille
d e
mp
loym
ent
Agr
icu
ltu
re
Man
ufa
ctu
rin
g
Co
nst
ruct
ion
Serv
ice
Total Gender perspective Skill perspective Sectoral employment
Per
cen
t ch
ange
(%
)
Nu
mb
er o
f w
ork
ers
(in
'00
0)
Base Scenario Absolute change Percent change
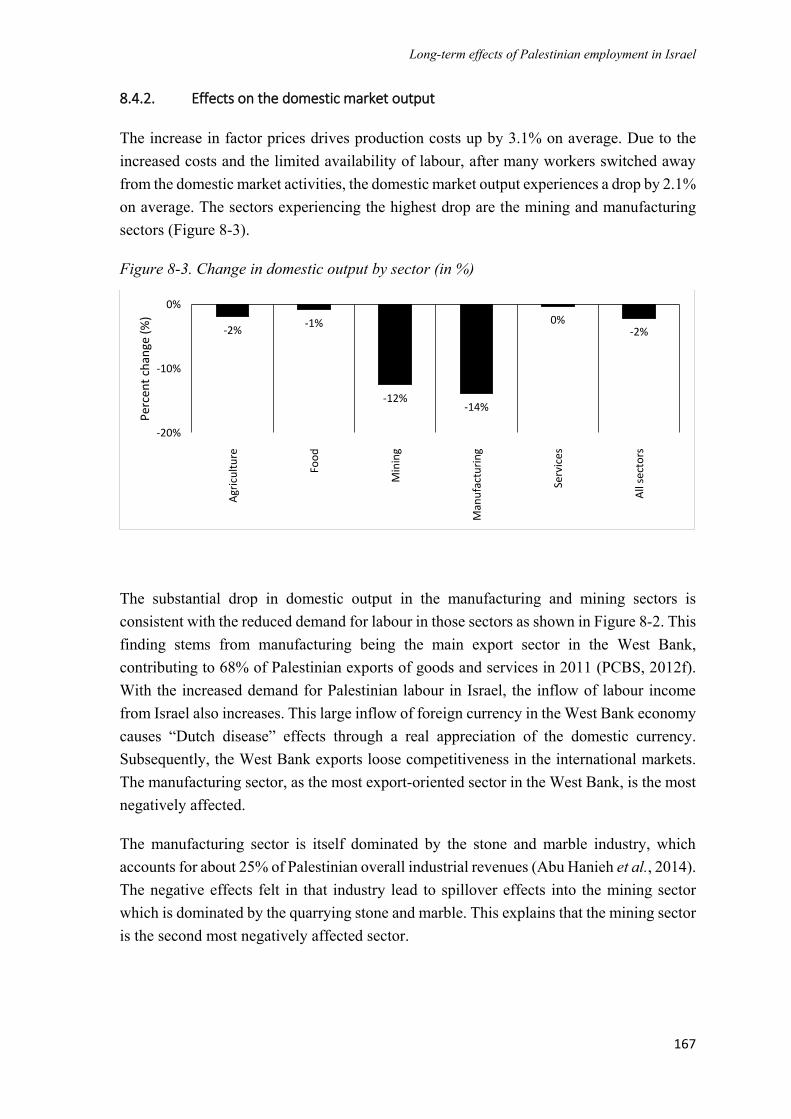
Long-term effects of Palestinian employment in Israel
167
8.4.2. Effects on the domestic market output
The increase in factor prices drives production costs up by 3.1% on average. Due to the
increased costs and the limited availability of labour, after many workers switched away
from the domestic market activities, the domestic market output experiences a drop by 2.1%
on average. The sectors experiencing the highest drop are the mining and manufacturing
sectors (Figure 8-3).
Figure 8-3. Change in domestic output by sector (in %)
The substantial drop in domestic output in the manufacturing and mining sectors is
consistent with the reduced demand for labour in those sectors as shown in Figure 8-2. This
finding stems from manufacturing being the main export sector in the West Bank,
contributing to 68% of Palestinian exports of goods and services in 2011 (PCBS, 2012f).
With the increased demand for Palestinian labour in Israel, the inflow of labour income
from Israel also increases. This large inflow of foreign currency in the West Bank economy
causes “Dutch disease” effects through a real appreciation of the domestic currency.
Subsequently, the West Bank exports loose competitiveness in the international markets.
The manufacturing sector, as the most export-oriented sector in the West Bank, is the most
negatively affected.
The manufacturing sector is itself dominated by the stone and marble industry, which
accounts for about 25% of Palestinian overall industrial revenues (Abu Hanieh et al., 2014).
The negative effects felt in that industry lead to spillover effects into the mining sector
which is dominated by the quarrying stone and marble. This explains that the mining sector
is the second most negatively affected sector.
-2%-1%
-12%-14%
0%-2%
-20%
-10%
0%
Agr
icu
ltu
re
Foo
d
Min
ing
Man
ufa
ctu
rin
g
Serv
ices
All
sect
ors
Per
cen
t ch
ange
(%
)
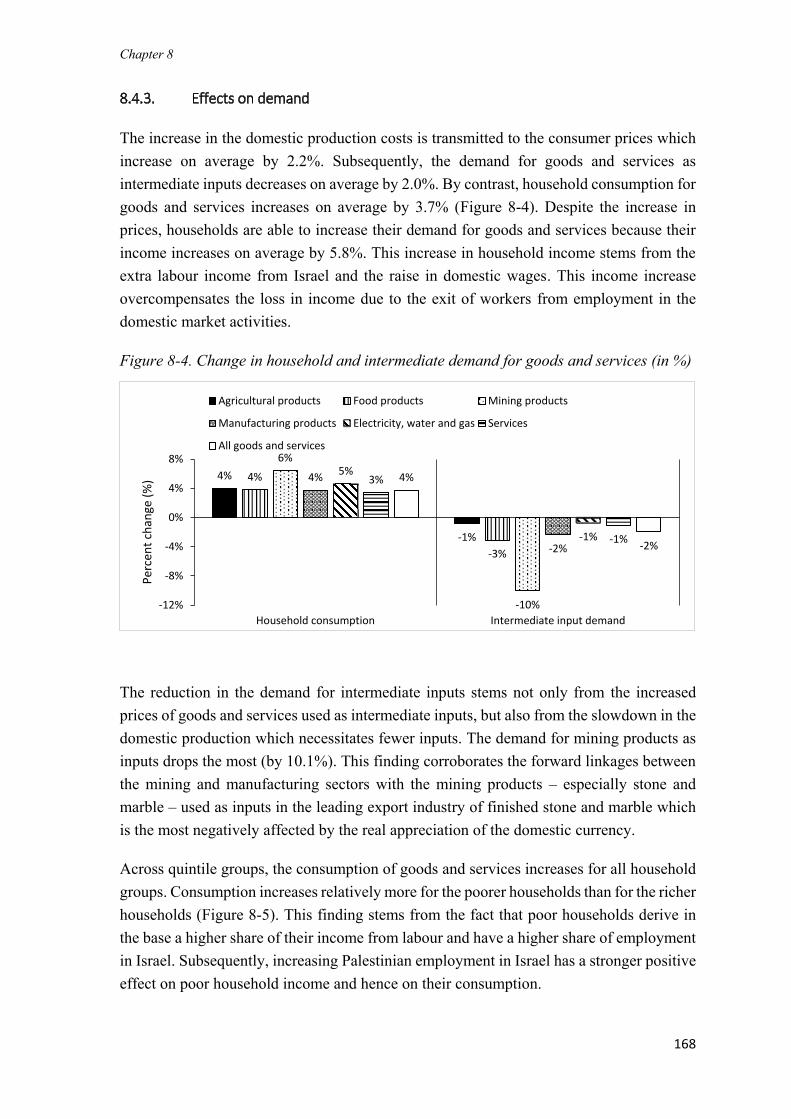
Chapter 8
168
8.4.3. Effects on demand
The increase in the domestic production costs is transmitted to the consumer prices which
increase on average by 2.2%. Subsequently, the demand for goods and services as
intermediate inputs decreases on average by 2.0%. By contrast, household consumption for
goods and services increases on average by 3.7% (Figure 8-4). Despite the increase in
prices, households are able to increase their demand for goods and services because their
income increases on average by 5.8%. This increase in household income stems from the
extra labour income from Israel and the raise in domestic wages. This income increase
overcompensates the loss in income due to the exit of workers from employment in the
domestic market activities.
Figure 8-4. Change in household and intermediate demand for goods and services (in %)
The reduction in the demand for intermediate inputs stems not only from the increased
prices of goods and services used as intermediate inputs, but also from the slowdown in the
domestic production which necessitates fewer inputs. The demand for mining products as
inputs drops the most (by 10.1%). This finding corroborates the forward linkages between
the mining and manufacturing sectors with the mining products – especially stone and
marble – used as inputs in the leading export industry of finished stone and marble which
is the most negatively affected by the real appreciation of the domestic currency.
Across quintile groups, the consumption of goods and services increases for all household
groups. Consumption increases relatively more for the poorer households than for the richer
households (Figure 8-5). This finding stems from the fact that poor households derive in
the base a higher share of their income from labour and have a higher share of employment
in Israel. Subsequently, increasing Palestinian employment in Israel has a stronger positive
effect on poor household income and hence on their consumption.
4%
-1%
4%
-3%
6%
-10%
4%
-2%
5%
-1%
3%
-1%
4%
-2%
-12%
-8%
-4%
0%
4%
8%
Household consumption Intermediate input demand
Perc
ent c
hang
e (%
)
Agricultural products Food products Mining products
Manufacturing products Electricity, water and gas Services
All goods and services
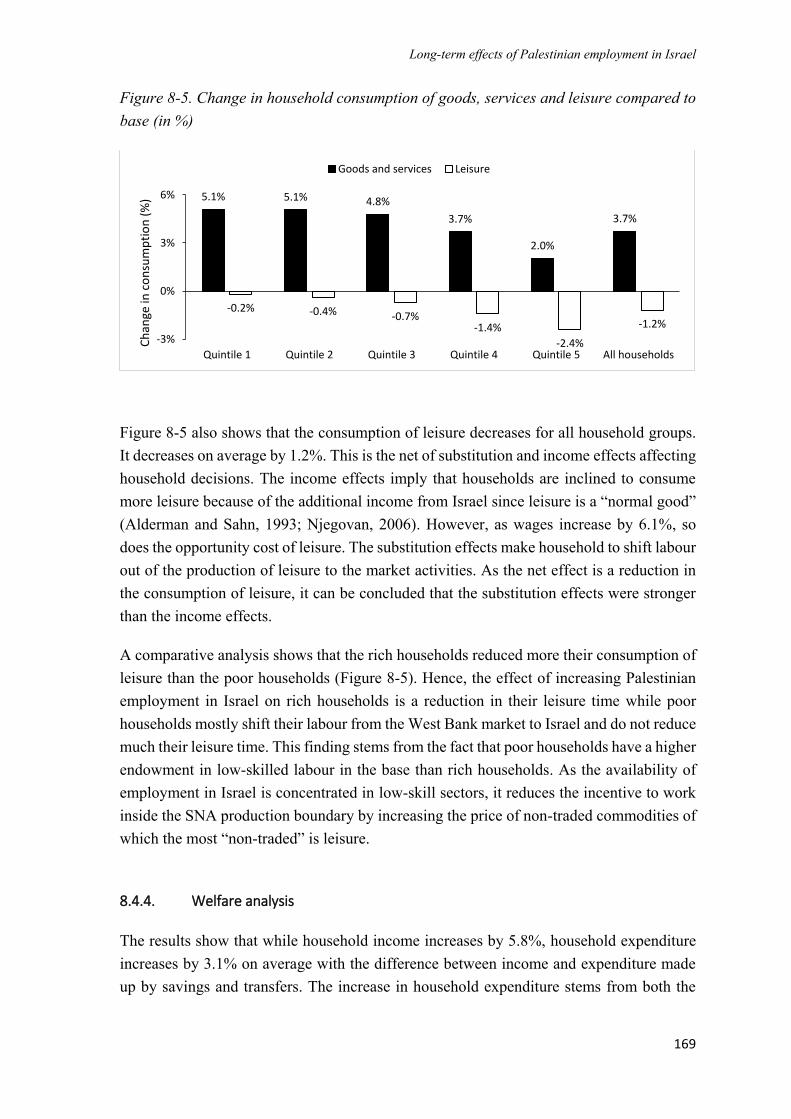
Long-term effects of Palestinian employment in Israel
169
Figure 8-5. Change in household consumption of goods, services and leisure compared to
base (in %)
Figure 8-5 also shows that the consumption of leisure decreases for all household groups.
It decreases on average by 1.2%. This is the net of substitution and income effects affecting
household decisions. The income effects imply that households are inclined to consume
more leisure because of the additional income from Israel since leisure is a “normal good”
(Alderman and Sahn, 1993; Njegovan, 2006). However, as wages increase by 6.1%, so
does the opportunity cost of leisure. The substitution effects make household to shift labour
out of the production of leisure to the market activities. As the net effect is a reduction in
the consumption of leisure, it can be concluded that the substitution effects were stronger
than the income effects.
A comparative analysis shows that the rich households reduced more their consumption of
leisure than the poor households (Figure 8-5). Hence, the effect of increasing Palestinian
employment in Israel on rich households is a reduction in their leisure time while poor
households mostly shift their labour from the West Bank market to Israel and do not reduce
much their leisure time. This finding stems from the fact that poor households have a higher
endowment in low-skilled labour in the base than rich households. As the availability of
employment in Israel is concentrated in low-skill sectors, it reduces the incentive to work
inside the SNA production boundary by increasing the price of non-traded commodities of
which the most “non-traded” is leisure.
8.4.4. Welfare analysis
The results show that while household income increases by 5.8%, household expenditure
increases by 3.1% on average with the difference between income and expenditure made
up by savings and transfers. The increase in household expenditure stems from both the
5.1% 5.1% 4.8%
3.7%
2.0%
3.7%
-0.2% -0.4% -0.7%-1.4%
-2.4%
-1.2%
-3%
0%
3%
6%
Quintile 1 Quintile 2 Quintile 3 Quintile 4 Quintile 5 All households
Ch
ange
in c
on
sum
pti
on
(%
)
Goods and services Leisure
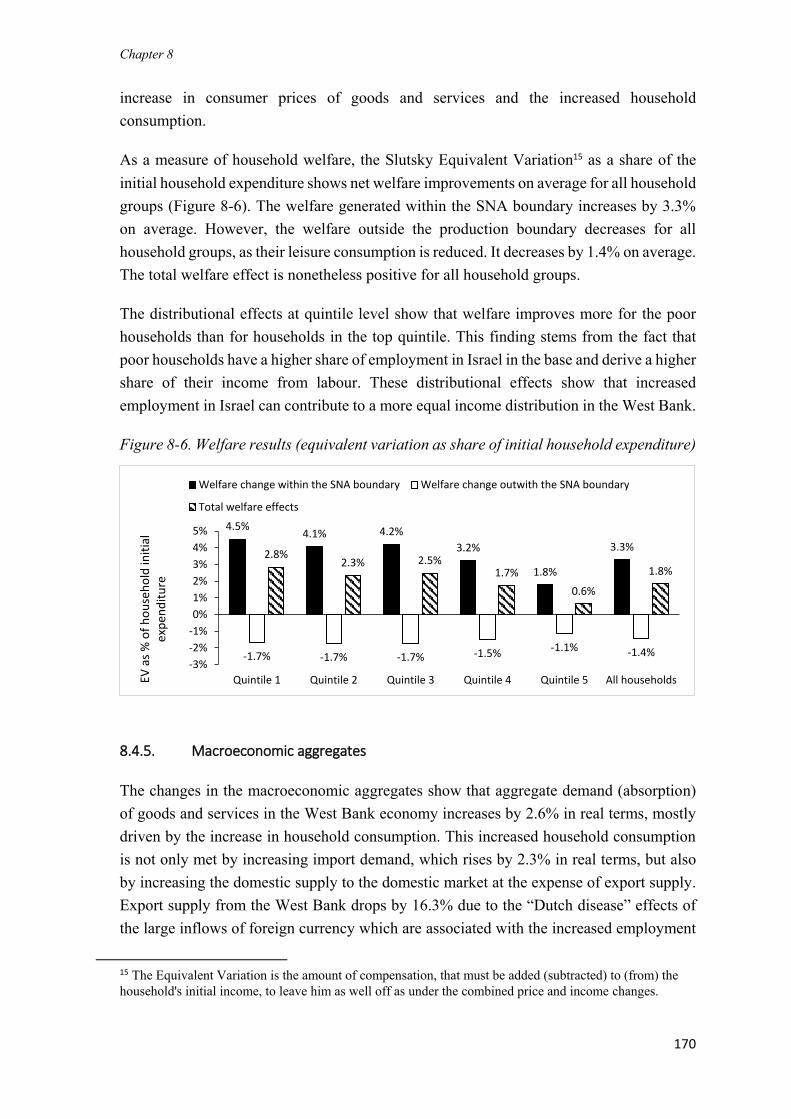
Chapter 8
170
increase in consumer prices of goods and services and the increased household
consumption.
As a measure of household welfare, the Slutsky Equivalent Variation15 as a share of the
initial household expenditure shows net welfare improvements on average for all household
groups (Figure 8-6). The welfare generated within the SNA boundary increases by 3.3%
on average. However, the welfare outside the production boundary decreases for all
household groups, as their leisure consumption is reduced. It decreases by 1.4% on average.
The total welfare effect is nonetheless positive for all household groups.
The distributional effects at quintile level show that welfare improves more for the poor
households than for households in the top quintile. This finding stems from the fact that
poor households have a higher share of employment in Israel in the base and derive a higher
share of their income from labour. These distributional effects show that increased
employment in Israel can contribute to a more equal income distribution in the West Bank.
Figure 8-6. Welfare results (equivalent variation as share of initial household expenditure)
8.4.5. Macroeconomic aggregates
The changes in the macroeconomic aggregates show that aggregate demand (absorption)
of goods and services in the West Bank economy increases by 2.6% in real terms, mostly
driven by the increase in household consumption. This increased household consumption
is not only met by increasing import demand, which rises by 2.3% in real terms, but also
by increasing the domestic supply to the domestic market at the expense of export supply.
Export supply from the West Bank drops by 16.3% due to the “Dutch disease” effects of
the large inflows of foreign currency which are associated with the increased employment
15 The Equivalent Variation is the amount of compensation, that must be added (subtracted) to (from) the
household's initial income, to leave him as well off as under the combined price and income changes.
4.5%4.1% 4.2%
3.2%
1.8%
3.3%
-1.7% -1.7% -1.7% -1.5% -1.1% -1.4%
2.8%2.3% 2.5%
1.7%
0.6%
1.8%
-3%
-2%
-1%
0%
1%
2%
3%
4%
5%
Quintile 1 Quintile 2 Quintile 3 Quintile 4 Quintile 5 All householdsEV a
s %
of
ho
use
ho
ld in
itia
l ex
pen
dit
ure
Welfare change within the SNA boundary Welfare change outwith the SNA boundary
Total welfare effects
Long-term effects of Palestinian employment in Israel
171
in Israel. Subsequently, the domestic currency experiences a real appreciation which
negatively affects the domestic export industry. In addition, a rise in prices for products
sold domestically contributes to lower exports.
The aggregate domestic output decreases by 2.1% in real terms, due to the increased
production costs and a reduced availability of labour in the domestic West Bank market.
Ultimately, the economy shrinks and GDP declines by 1.1%. This finding illustrates the
trade-off associated with the employment of Palestinians in Israel for the West Bank in the
long-term. While households benefit from an increased income and achieve welfare gains,
the domestic economy shrinks as employment opportunities in Israel reduce incentives to
work and invest in the domestic market.
8.4.6. Sensitivity analysis
In the absence of reliable data series to estimate country-specific values of key parameters
used in the model, a sensitivity analysis is needed to check for the robustness of the
simulation results. This section is articulated around two poles: i) the sensitivity of the
simulation results to key elasticities, and ii) the sensitivity of the results to a different
nesting structure for household utility.
Testing for the sensitivity of the results to key elasticities
Testing the sensitivity of the results to selected parameters is performed by varying their
values independently. The key parameters that are considered are the following: the
marginal utility of income (so-called Frisch parameter), the income elasticities of demand
for leisure relative to the demand for goods and services, the CES elasticities in the utility
function and the labour mobility elasticity.
For the sake of keeping the outcomes of the sensitivity analysis clear and concise, Table
8.4 presents the values assumed for the parameters in the initial model (in bold) and the
shifts operated in the sensitivity analysis as well as the findings of the robustness checks
for selected macroeconomic results. For the labour mobility and the CES elasticities, the
shifts operated consisted in halving and/or doubling the values of the parameters in the
initial model. For the income elasticities of demand, the check consisted in assuming that
households have a higher income elasticity for leisure relative to goods and services, which
is the opposite of the assumption incorporated in the initial model. For the Frisch parameter,
the subsistence share of household expenditure was increased and decreased to the extent
that is possible to avoid negative subsistence consumption, and the corresponding values
of the Frisch parameters were computed.
Chapter 8
172
The findings of the sensitivity analysis show that the model is marginally sensitive to
changes in the values of the parameters of concern. Changing the labour mobility elasticity
affects the movements of labour across market segments but hardly changes the welfare
outcomes and the macroeconomic aggregates. Doubling and/or halving the substitution
elasticities along the nesting structure of the utility function mainly affects the composition
of household consumption but leaves the aggregate volume of consumption unchanged as
compared to the initial model results. Shifting the values of the Frisch parameter and the
income elasticity of demand affects the number of additional workers supplied by
households to the market activities by less than +/- 10% compared to the initial model
results.
In conclusion, the overall macroeconomic picture is not very sensitive to variations in key
parameter values. No qualitative change is observed in the direction of the effects of
increased Palestinian employment in Israel on the West Bank economy. Subsequently, the
results can be seen as robust.
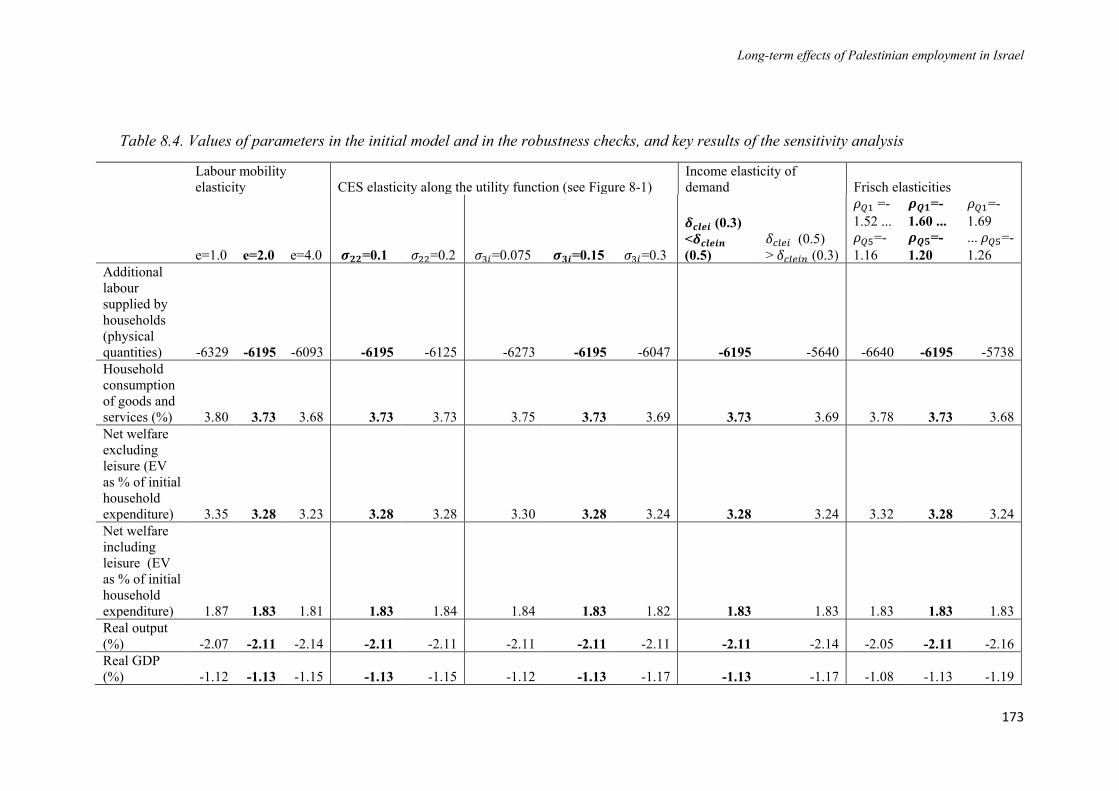
Long-term effects of Palestinian employment in Israel
173
Table 8.4. Values of parameters in the initial model and in the robustness checks, and key results of the sensitivity analysis
Labour mobility
elasticity CES elasticity along the utility function (see Figure 8-1)
Income elasticity of
demand Frisch elasticities
e=1.0 e=2.0 e=4.0 𝝈𝟐𝟐=0.1 𝜎22=0.2 𝜎3𝑖=0.075 𝝈𝟑𝒊=0.15 𝜎3𝑖=0.3
𝜹𝒄𝒍𝒆𝒊 (0.3)
<𝜹𝒄𝒍𝒆𝒊𝒏
(0.5)
𝛿𝑐𝑙𝑒𝑖 (0.5)
> 𝛿𝑐𝑙𝑒𝑖𝑛 (0.3)
𝜌𝑄1 =-
1.52 ...
𝜌𝑄5=-
1.16
𝝆𝑸𝟏=-
1.60 ...
𝝆𝑸𝟓=-
1.20
𝜌𝑄1=-
1.69
... 𝜌𝑄5=-
1.26
Additional
labour
supplied by
households
(physical
quantities) -6329 -6195 -6093 -6195 -6125 -6273 -6195 -6047 -6195 -5640 -6640 -6195 -5738
Household
consumption
of goods and
services (%) 3.80 3.73 3.68 3.73 3.73 3.75 3.73 3.69 3.73 3.69 3.78 3.73 3.68
Net welfare
excluding
leisure (EV
as % of initial
household
expenditure) 3.35 3.28 3.23 3.28 3.28 3.30 3.28 3.24 3.28 3.24 3.32 3.28 3.24
Net welfare
including
leisure (EV
as % of initial
household
expenditure) 1.87 1.83 1.81 1.83 1.84 1.84 1.83 1.82 1.83 1.83 1.83 1.83 1.83
Real output
(%) -2.07 -2.11 -2.14 -2.11 -2.11 -2.11 -2.11 -2.11 -2.11 -2.14 -2.05 -2.11 -2.16
Real GDP
(%) -1.12 -1.13 -1.15 -1.13 -1.15 -1.12 -1.13 -1.17 -1.13 -1.17 -1.08 -1.13 -1.19
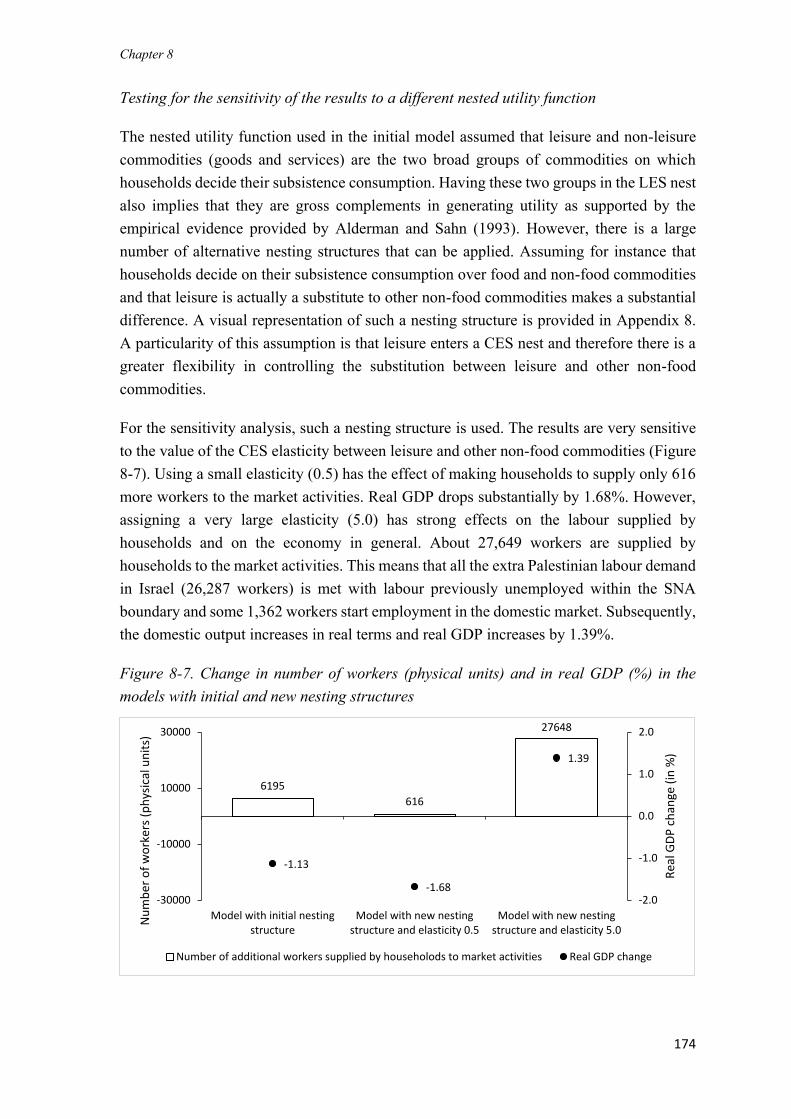
Chapter 8
174
Testing for the sensitivity of the results to a different nested utility function
The nested utility function used in the initial model assumed that leisure and non-leisure
commodities (goods and services) are the two broad groups of commodities on which
households decide their subsistence consumption. Having these two groups in the LES nest
also implies that they are gross complements in generating utility as supported by the
empirical evidence provided by Alderman and Sahn (1993). However, there is a large
number of alternative nesting structures that can be applied. Assuming for instance that
households decide on their subsistence consumption over food and non-food commodities
and that leisure is actually a substitute to other non-food commodities makes a substantial
difference. A visual representation of such a nesting structure is provided in Appendix 8.
A particularity of this assumption is that leisure enters a CES nest and therefore there is a
greater flexibility in controlling the substitution between leisure and other non-food
commodities.
For the sensitivity analysis, such a nesting structure is used. The results are very sensitive
to the value of the CES elasticity between leisure and other non-food commodities (Figure
8-7). Using a small elasticity (0.5) has the effect of making households to supply only 616
more workers to the market activities. Real GDP drops substantially by 1.68%. However,
assigning a very large elasticity (5.0) has strong effects on the labour supplied by
households and on the economy in general. About 27,649 workers are supplied by
households to the market activities. This means that all the extra Palestinian labour demand
in Israel (26,287 workers) is met with labour previously unemployed within the SNA
boundary and some 1,362 workers start employment in the domestic market. Subsequently,
the domestic output increases in real terms and real GDP increases by 1.39%.
Figure 8-7. Change in number of workers (physical units) and in real GDP (%) in the
models with initial and new nesting structures
6195
616
27648
-1.13
-1.68
1.39
-2.0
-1.0
0.0
1.0
2.0
-30000
-10000
10000
30000
Model with initial nestingstructure
Model with new nestingstructure and elasticity 0.5
Model with new nestingstructure and elasticity 5.0
Rea
l GD
P c
han
ge (
in %
)
Nu
mb
er o
f w
ork
ers
(ph
ysic
al u
nit
s)
Number of additional workers supplied by householods to market activities Real GDP change
Long-term effects of Palestinian employment in Israel
175
Given this sensitivity of the results to the elasticity of substitution between leisure and other
non-food commodities, if one chooses to use such a nesting structure, the choice of the
elasticity should be properly documented.
8.5. Conclusions and policy implications
This chapter combines the labour-leisure trade-off and a factor mobility function to assess
the long-term effects of an increased demand for Palestinian labour in Israel. The model
also features a nested utility function combining the benefits of linear expenditure systems
and constant elasticity of substitution functions by depicting the household behaviour with
different functional forms at each stage of the nest.
The analysis shows that an increased Palestinian labour demand in Israel affects the amount
of labour supplied by households. About one-fourth of the Palestinians who start working
in Israel were in the previous period occupied in the non-market activities. In other words,
they were used by households for the production of leisure. The remaining three-fourths
were already employed within the SNA boundary in the previous period and are now
shifted from the domestic market activities to the Israeli market. The reduced employment
in the domestic market activities in the long-term negatively affects the domestic
production. Ultimately, the economy shrinks and real GDP decreases by 1.13%.
These results confirm the findings of other studies (Astrup and Dessus, 2005; UNCTAD,
2016) that an increased Palestinian employment in Israel hurts the domestic economy in
the long-term. Increased employment in Israel does not only displace workers from
employment in the domestic market activities, it also raises wages in real terms in the
domestic market. Subsequently, domestic employers have less incentives to invest and hire
more labour. Moreover, the large inflow of labour income from Israel has “Dutch disease”
effects through a real appreciation of the domestic currency. Consequently, the Palestinian
exports loose competitiveness in the international markets and this puts a burden on the
domestic production.
The increased labour income from Israel increases household income by 5.8% on average
and enables households to increase consumption of goods and services. Ultimately,
Palestinian households enjoy welfare gains. While the gains generated by the consumption
of goods and services from the market are substantial, the net welfare is reduced by losses
linked to the consumption of leisure. The ability to separate the welfare effects generated
within the SNA boundary from those outside the boundary is one of the benefits of using
the labour-leisure trade-off framework. This explicitly accounts for welfare changes taking
place outside the SNA production boundary.
Chapter 8
176
The results show that in the long-term, the supply of labour to the market by households is
relatively inelastic. Moreover, the “Dutch disease” effects of large inflows of labour income
from Israel reduce incentives to work inside the SNA production boundary by increasing
the price of non-traded commodities of which the most “non-traded” is leisure. Using the
labour-leisure trade-off framework proved suitable to capture this mechanism. By contrast,
in the short-term, the empirical evidence supports a close correlation between employment
in Israel and unemployment in the West Bank labour market (Bulmer, 2003; Etkes, 2012).
In fact, the small capacity of the domestic economy does not provide sufficient employment
opportunities to absorb in the short-term all the workers previously employed in Israel who
are laid off from employment in Israel during the conflict. Hence, there is a pool of
involuntary unemployment, ready to take employment opportunities at current wage rates.
A suitable framework to model this short-term empirical evidence is the labour surplus
assumption used in Chapter 7.
In Chapter 7, the same increase in Palestinian labour demand in Israel as simulated in this
chapter is mostly met with labour previously unemployed in the market activities.
Additionally, employment in the domestic market activities is increased as the additional
household income derived from employment in Israel increases demand, which stimulates
the domestic production. Subsequently, in the short-term, not only households derive
welfare gains but the economy as a whole benefits from the improved labour access to the
Israeli markets with real GDP increasing by 3.6%. Contrasting the long and short-term
effects of the shock shows that the time dimension matters in assessing the effects of
increased Palestinian employment in Israel.
Using a mobility function to captures labour movements across market segments shows
that labour mainly moves from the agricultural and manufacturing sectors into the
construction sector which is the most affected sector by the shock since most Palestinians
employed in Israel work in the construction sector. Adopting the labour mobility function
distributes the effects of the shock more evenly across sectors, as otherwise wages would
have surged in the construction sector without triggering a movement from the other
sectors.
The sensitivity analysis performed shows that the results are robust and are hardly affected
by a systematic change in the values of the following parameters: Frisch parameter, income
demand elasticities, substitution elasticities along the utility function and the labour
mobility elasticity. However, the results are sensitive to changes in the nesting structure of
the utility function, especially if one considers leisure to be a substitute to goods and
services in consumption. In this case, and with high substitution elasticities, the share of
labour moving out of the non-market activities may substantially increase.
Long-term effects of Palestinian employment in Israel
177
This chapter makes three contributions. First, the method that is used allows accounting for
the household’s full time endowment comprising work and leisure time. This reflects the
trade-off between allocating time for leisure or for work in the market activities. The
welfare generated from the consumption of leisure is explicitly accounted for with leisure
entering the household utility function. In addition to the labour-leisure trade-off, this
chapter assumes an imperfect labour mobility which is a core aspect of structural changes
in the economy. Labour heterogeneity is explicitly recognised and a mobility function is
used to control labour movements across market segments. Combining the labour-leisure
trade-off and the mobility function allows the debate of the long-term effects of increased
Palestinian employment in Israel to be addressed within a theoretical framework capable
of generating robust empirical results.
Second, this chapter contributes to the ongoing debate on the costs of Israeli occupation of
the Palestinian territories and the potential effects of a negotiated solution to the conflict.
The results show that an increased Palestinian labour demand in Israel has in the long-term
negative effects on the West Bank economy but positive welfare effects for the Palestinian
households, especially the poor ones. This finding demonstrates both the contribution of
Palestinian employment in Israel to a more equal income distribution in the West Bank and
its deteriorating effect on the Palestinian economic growth by bidding up wages,
reallocating labour away from the tradable activities and reducing the competitiveness of
the Palestinian export sector.
Third, the simulation results have important policy implications. Seen the limited
development options for Palestine, it may be interesting for the Palestinian National
Authority (PNA) to seek increased Palestinian employment in Israel in order to improve
welfare of Palestinian households. However, the negative effects of this on the domestic
economy should be mitigated. To do so, the PNA could levy a tax on Palestinians employed
in Israel. This tax will generate additional revenue for the PNA. With this revenue,
incentives could be given to domestic employers to invest and restore their competitiveness
in the international markets. The tax would also reduce the attractiveness of employment
in Israel, keep some workers in the domestic market activities and limit the structural
dependence on the Israeli labour market. Ultimately, the Palestinian economy may want to
shift from a labour-export to a goods-export development strategy.

178
Chapter 9
179
9
PALESTINIAN TRADE POLICY IN A FINAL
SETTLEMENT16
16 Parts of this chapter have been published as a conference paper: Agbahey, J., Siddig, K., Grethe, H., Luckmann,
J., 2018. Trade policy in a sovereign Palestinian state: what are the options in a final status? In: 24th Annual
Conference of the Economic Research Forum (ERF). Cairo: ERF, p.35.

Chapter 9
180
Palestinian trade policy in a final settlement
181
Chapter 9 Palestinian trade policy in a final settlement
9.1. Introduction
The assessment of different trade options in a future Palestinian state has mostly been
addressed with a descriptive analysis in the existing literature. Arnon and Bamya (2007),
Vaggi and Baroud (2005), and Elmusa and El-Jaafari (1995) recommended a free trade
agreement between Palestine and Israel on the premise that clear borders are needed
between the two economies but that Palestine would benefit from a free access to the Israeli
market. The authors also argue that Palestine should independently set taxes on trade with
countries other than Israel. Another group of studies (e.g. Kanafani, 1996; Abed, 1996)
favoured a better implementation of the customs union with Israel, arguing that the absence
of customs borders and a proper working customs union with Israel would secure a
smoother flow of the Palestinian trade. A third group of studies (e.g. Fischer et al., 2001)
suggested that the future Palestinian economy should adopt a liberal and non-
discriminatory trade regime.
Besides these descriptive studies, a few estimates of the impact of different trade regimes
have been produced for Palestine. Schiff (2002) used a cost-benefit analysis to compare
different trade options. While such analysis offers first insights into the effects of different
trade regimes, it misses the multiplier and economy-wide effects that trade policy may
generate. Other estimates were produced by UNCTAD (2009) using a macro-econometric
model. Such a model is suitable to analyse the outcomes of policy change at the
macroeconomic level, it lacks the micro-optimisation dimension that can be found in a CGE
model. The first CGE model to analyse trade policy changes in Palestine was developed by
Astrup and Dessus (2001, 2005). However, the model had some rigidities, such as the
imbedded assumption of the economy being at full employment, which sits at odds with
the observed level of unemployment in Palestine. Some of these rigidities were addressed
by Missaglia and Valensisi (2014), who extended the previous model by incorporating
several of the specificities of the Palestinian macroeconomic context. Nevertheless, the new
model – similar to the previous – does not incorporate a detailed production structure as
well as differentiated labour and household accounts to enable a detailed analysis of the
effects of different trade options.
Most of the previous studies also ignored the physical and economic separation of Gaza
from the West Bank since the beginning of the second Palestinian uprising in 2000. This
chapter examines the effects of two alternative trade regimes on the West Bank economy
as compared to the current customs union with Israel. For this purpose, a modified version
of the STAGE-2 model is calibrated to the detailed West Bank SAM compiled in this thesis.
Chapter 9
182
The next Section, 9.2, provides an overview of the current trade pattern in the West Bank.
Section 9.3 presents the specifications of the model used and the features of the database
that are relevant for the analysis conducted in this chapter. Section 9.4 describes the trade
options that are simulated. In Section 9.5 the key results of the simulations are discussed.
Finally, Section 9.6 draws the main conclusions.
9.2. Overview of the trade conditions in the West Bank
This section provides an overview of the current trade regime in the West Bank. A detailed
description of the evolution of trade policies in the West Bank is provided in Chapter 4.
The trade regime in the West Bank is governed by the Protocol on Economic Relations
signed by the government of Israel and the Palestine Liberation Organisation in 1994. The
protocol was initially intended to cover a transitory period of five years after which the
Palestinian National Authority (PNA) would gradually be empowered with the full control
over trade and economic policies and eventually the provision of clear borders for a
sovereign Palestinian state. Against its vision to create favourable conditions for the
development of the Palestinian economy, the protocol did not entail any structural break
(Roy, 2002). Instead, it formalised the one-sided customs union prevailing between Israel
and the Palestinian territories since 1972. While the protocol recognises that the two parties
might have different interests and priorities, it only offered the Palestinians a limited policy
space. The customs union is not bilaterally coordinated. The trade regime in the Palestinian
territories continues to follow the Israeli customs and the PNA can only set tariffs on a few
imported goods and within certain limits (Vaggi and Baroud, 2005).
The Protocol provisions grant the PNA the possibility to enter into bilateral trade
agreements with other countries. However, the implementation of the agreements signed
by the PNA is undermined by the lack of Palestinian control over its external borders
(World Bank, 2008). The only working trade agreements in Palestine are those signed by
Israel with other countries and which benefit Palestine because of being in a customs union
with Israel. Most of these agreements involve tariff-rate-quotas. However, the quotas in
Palestine are not determined by the PNA alone. They are rather negotiated within a joint
committee with the Israeli Trade Authority. As of 2012, Palestinian quotas for imports from
countries having trade agreements with Israel (and Palestine) were set at 20% of the Israeli
pledges (MAS, PCBS, PMA, 2013).
The limited access of Palestine to global markets promotes trade diversion and a high
dependency on Israel (Astrup and Dessus, 2005). In 2011 Israel accounted for 70% of total
Palestinian imports and 86% of its exports (PCBS, 2012a). As the value of imports is
Palestinian trade policy in a final settlement
183
considerably larger than the value of exports, the Palestinian economy carries a huge trade
deficit representing 44% of its GDP (PCBS, 2014). The trade deficit with Israel alone
makes up two-thirds of the total. A consequence of this unbalanced trade pattern is the
transformation of the Palestinian economy into a captive market for Israeli products.
Palestinian production for the domestic market was undercut by the economies of scale
realised by the technologically advanced Israeli manufacturers (Naqib, 2003). Moreover,
the development of a productive capacity in Palestine was held back by restrictions and
regulations imposed on Palestinian entrepreneurs by the Israeli administration (Botta,
2010).
The Protocol also suffers from a selective application of its basic provisions (Elkhafif et
al., 2014). Against the presupposed free movement of labour and goods, political and
military reality imposed a different path. Following a series of terrorist attacks in 1993,
Israel started implementing a closure policy, which consists of roadblocks and curfews
restricting the movement of goods, services and people between Israel and the Palestinian
territories, between the West Bank and the Gaza Strip, and within the West Bank (Eltalla
and Hens, 2009). Closures were declared on short notice and for different lengths of time,
hence disrupting the Palestinian trade flows, increasing transaction costs and creating more
uncertainty in the Palestinian economy (Ihle and Rubin, 2013).
While Israel is the main entry point for most Palestinian imports from the rest of the world,
often taxes on indirect import from other countries via Israel are not transferred to the PNA.
This leads to significant fiscal losses for the PNA (Fjeldstad and al-Zagha, 2004). The
Protocol also failed to provide the Palestinian Monetary Authority the power to issue an
independent currency. The absence of its own currency deprives the PNA of seigniorage
revenues and removes a policy tool that could be used to respond to the economy’s specific
needs and to external shocks (IMF, 2013).
Whereas Israeli policies and the asymmetric relationships enshrined in the Oslo agreements
and Paris Protocol were major factors behind the deterioration of the economic
environment in Palestine, the PNA also played a damaging role. The establishment of
import monopolies, and the failure to establish an appropriate legal and regulatory
framework environment to attract investments exacerbated the sluggish economic
conditions (Roy, 2001).
In conclusion, the determinants of the Palestinian low trade performance are multiple. The
protocol on economic relations with Israel – projected to develop an export-oriented
Palestinian economy that would generate domestic jobs and lessen dependence on Israel –
failed to bear the desired fruit (Astrup and Dessus, 2001). Although it was designed for a
temporary period of five years, it has been in place for more than two decades and still
governs the Palestinian trade relations with Israel and with the rest of the world. Under the
Chapter 9
184
current situation, the Protocol is outdated and no longer addresses the challenges faced by
the Palestinian economy (UNCTAD, 2016). In this view, a final political settlement – to
generate a more balanced agreement for long-term healthier economic relations between
Israel and a sovereign Palestinian state – may contribute to improving the situation. Among
scholars and observers, there is a wide consensus that the economic integration with no
internal border largely failed (Arnon and Weinblatt, 2001). Consequently, the final
settlement needs to entail the creation of economic borders and grant the Palestinians full
control over trade and monetary policies (Malul et al., 2008). After exiting the customs
union with Israel, Palestinian authorities could choose among several trade options.
Conceding that the choice of a future trade regime for Palestine would not be determined
by economic criteria alone and that political choices as well as thorny issues – such as the
right of return and the status of Jerusalem – are likely to affect the range of possible options,
this study provides a quantitative assessment of the potential impact of different trade
options from a purely economic perspective in order to inform the debate.
9.3. Methods
9.3.1. Data
The SAM used in this chapter is an aggregated version of the detailed SAM described in
Chapter 5. It comprises 161 accounts, and incorporates a multiple product activity setup
with 38 commodity groups produced by 28 activities. It features seven foreign regions
based on the major trade agreements in which Palestine is a member. These include the
customs union with Israel, the preferential trade agreements with the EU-28, EFTA17, USA,
Turkey, Jordan and the Greater Arab Free Trade Area (GAFTA). The other countries –
with the majority not having a specific trade agreement with Palestine – are classified under
the umbrella “rest of the world”. The SAM includes 34 tax accounts among which are seven
import tariffs and seven export taxes associated with each trade partner. This detailed
disaggregation of trade partners and import/export tax accounts allows for a thorough
assessment of different trade options of the West Bank economy.
Table 9.1 presents the trade shares in the base period (2011) for the seven regions involved
in trade with the West Bank. It highlights the predominance of Israel for both West Bank
imports and exports. Given these uneven trade shares, the model used is modified to apply
a differentiated treatment to regions that account for large and small trade shares of a
commodity import and export (see Section 9.3.2). This treatment recognises the influence
17 EU-28 refers to the 28 members of the European political and economic Union, while EFTA stands for
the European Free Trade Association formed by Iceland, Liechtenstein, Norway, and Switzerland.
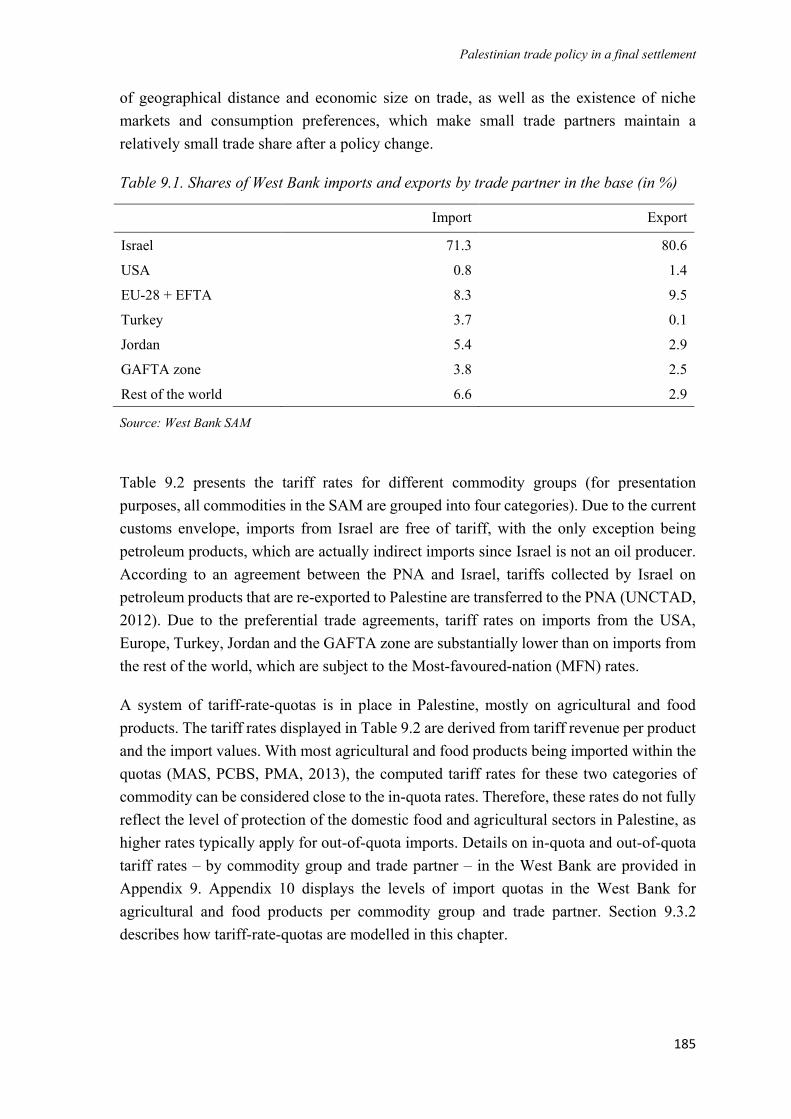
Palestinian trade policy in a final settlement
185
of geographical distance and economic size on trade, as well as the existence of niche
markets and consumption preferences, which make small trade partners maintain a
relatively small trade share after a policy change.
Table 9.1. Shares of West Bank imports and exports by trade partner in the base (in %)
Import Export
Israel 71.3 80.6
USA 0.8 1.4
EU-28 + EFTA 8.3 9.5
Turkey 3.7 0.1
Jordan 5.4 2.9
GAFTA zone 3.8 2.5
Rest of the world 6.6 2.9
Source: West Bank SAM
Table 9.2 presents the tariff rates for different commodity groups (for presentation
purposes, all commodities in the SAM are grouped into four categories). Due to the current
customs envelope, imports from Israel are free of tariff, with the only exception being
petroleum products, which are actually indirect imports since Israel is not an oil producer.
According to an agreement between the PNA and Israel, tariffs collected by Israel on
petroleum products that are re-exported to Palestine are transferred to the PNA (UNCTAD,
2012). Due to the preferential trade agreements, tariff rates on imports from the USA,
Europe, Turkey, Jordan and the GAFTA zone are substantially lower than on imports from
the rest of the world, which are subject to the Most-favoured-nation (MFN) rates.
A system of tariff-rate-quotas is in place in Palestine, mostly on agricultural and food
products. The tariff rates displayed in Table 9.2 are derived from tariff revenue per product
and the import values. With most agricultural and food products being imported within the
quotas (MAS, PCBS, PMA, 2013), the computed tariff rates for these two categories of
commodity can be considered close to the in-quota rates. Therefore, these rates do not fully
reflect the level of protection of the domestic food and agricultural sectors in Palestine, as
higher rates typically apply for out-of-quota imports. Details on in-quota and out-of-quota
tariff rates – by commodity group and trade partner – in the West Bank are provided in
Appendix 9. Appendix 10 displays the levels of import quotas in the West Bank for
agricultural and food products per commodity group and trade partner. Section 9.3.2
describes how tariff-rate-quotas are modelled in this chapter.
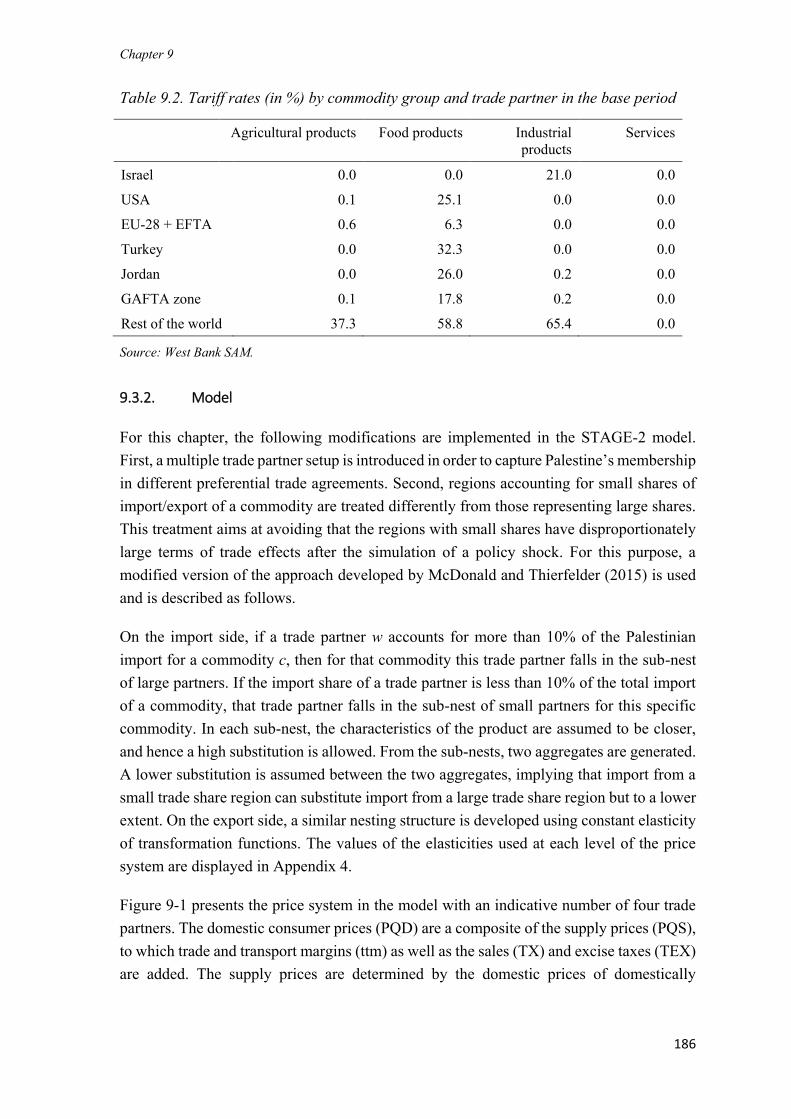
Chapter 9
186
Table 9.2. Tariff rates (in %) by commodity group and trade partner in the base period
Agricultural products Food products Industrial
products
Services
Israel 0.0 0.0 21.0 0.0
USA 0.1 25.1 0.0 0.0
EU-28 + EFTA 0.6 6.3 0.0 0.0
Turkey 0.0 32.3 0.0 0.0
Jordan 0.0 26.0 0.2 0.0
GAFTA zone 0.1 17.8 0.2 0.0
Rest of the world 37.3 58.8 65.4 0.0
Source: West Bank SAM.
9.3.2. Model
For this chapter, the following modifications are implemented in the STAGE-2 model.
First, a multiple trade partner setup is introduced in order to capture Palestine’s membership
in different preferential trade agreements. Second, regions accounting for small shares of
import/export of a commodity are treated differently from those representing large shares.
This treatment aims at avoiding that the regions with small shares have disproportionately
large terms of trade effects after the simulation of a policy shock. For this purpose, a
modified version of the approach developed by McDonald and Thierfelder (2015) is used
and is described as follows.
On the import side, if a trade partner w accounts for more than 10% of the Palestinian
import for a commodity c, then for that commodity this trade partner falls in the sub-nest
of large partners. If the import share of a trade partner is less than 10% of the total import
of a commodity, that trade partner falls in the sub-nest of small partners for this specific
commodity. In each sub-nest, the characteristics of the product are assumed to be closer,
and hence a high substitution is allowed. From the sub-nests, two aggregates are generated.
A lower substitution is assumed between the two aggregates, implying that import from a
small trade share region can substitute import from a large trade share region but to a lower
extent. On the export side, a similar nesting structure is developed using constant elasticity
of transformation functions. The values of the elasticities used at each level of the price
system are displayed in Appendix 4.
Figure 9-1 presents the price system in the model with an indicative number of four trade
partners. The domestic consumer prices (PQD) are a composite of the supply prices (PQS),
to which trade and transport margins (ttm) as well as the sales (TX) and excise taxes (TEX)
are added. The supply prices are determined by the domestic prices of domestically
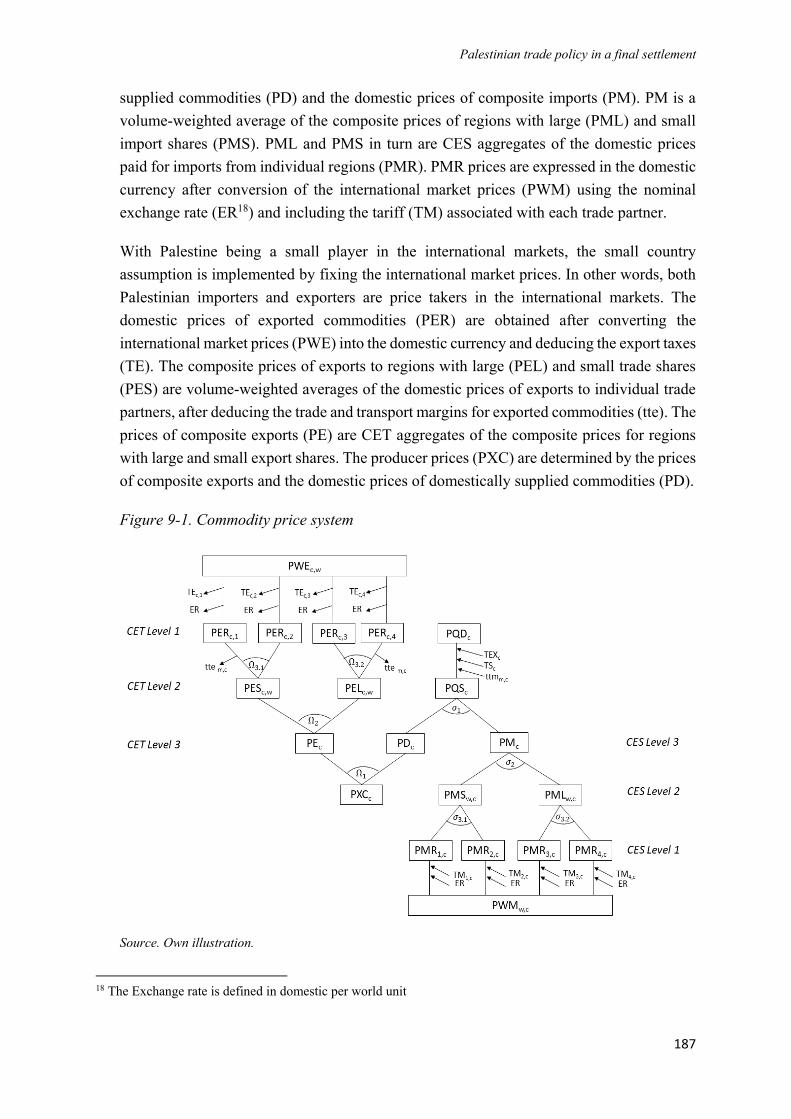
Palestinian trade policy in a final settlement
187
supplied commodities (PD) and the domestic prices of composite imports (PM). PM is a
volume-weighted average of the composite prices of regions with large (PML) and small
import shares (PMS). PML and PMS in turn are CES aggregates of the domestic prices
paid for imports from individual regions (PMR). PMR prices are expressed in the domestic
currency after conversion of the international market prices (PWM) using the nominal
exchange rate (ER18) and including the tariff (TM) associated with each trade partner.
With Palestine being a small player in the international markets, the small country
assumption is implemented by fixing the international market prices. In other words, both
Palestinian importers and exporters are price takers in the international markets. The
domestic prices of exported commodities (PER) are obtained after converting the
international market prices (PWE) into the domestic currency and deducing the export taxes
(TE). The composite prices of exports to regions with large (PEL) and small trade shares
(PES) are volume-weighted averages of the domestic prices of exports to individual trade
partners, after deducing the trade and transport margins for exported commodities (tte). The
prices of composite exports (PE) are CET aggregates of the composite prices for regions
with large and small export shares. The producer prices (PXC) are determined by the prices
of composite exports and the domestic prices of domestically supplied commodities (PD).
Figure 9-1. Commodity price system
Source. Own illustration.
18 The Exchange rate is defined in domestic per world unit
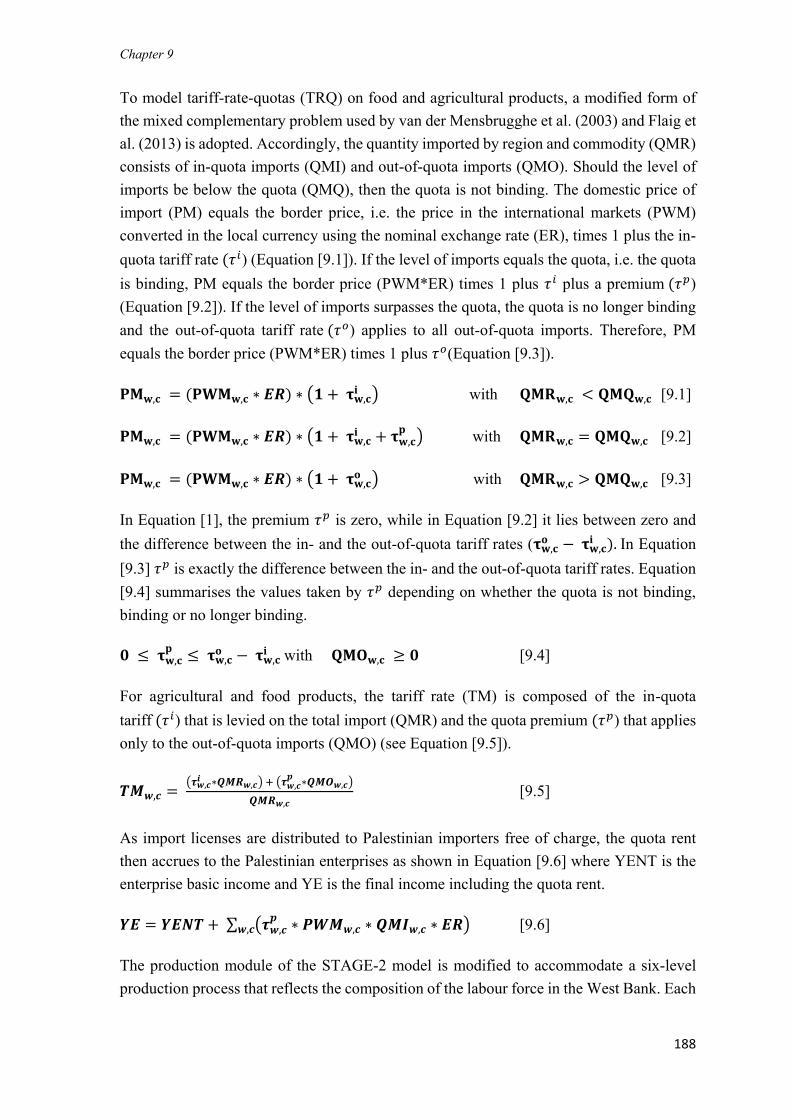
Chapter 9
188
To model tariff-rate-quotas (TRQ) on food and agricultural products, a modified form of
the mixed complementary problem used by van der Mensbrugghe et al. (2003) and Flaig et
al. (2013) is adopted. Accordingly, the quantity imported by region and commodity (QMR)
consists of in-quota imports (QMI) and out-of-quota imports (QMO). Should the level of
imports be below the quota (QMQ), then the quota is not binding. The domestic price of
import (PM) equals the border price, i.e. the price in the international markets (PWM)
converted in the local currency using the nominal exchange rate (ER), times 1 plus the in-
quota tariff rate (𝜏𝑖) (Equation [9.1]). If the level of imports equals the quota, i.e. the quota
is binding, PM equals the border price (PWM*ER) times 1 plus 𝜏𝑖 plus a premium (𝜏𝑝)
(Equation [9.2]). If the level of imports surpasses the quota, the quota is no longer binding
and the out-of-quota tariff rate (𝜏𝑜) applies to all out-of-quota imports. Therefore, PM
equals the border price (PWM*ER) times 1 plus 𝜏𝑜(Equation [9.3]).
𝐏𝐌𝐰,𝐜 = (𝐏𝐖𝐌𝐰,𝐜 ∗ 𝑬𝑹) ∗ (𝟏 + 𝛕𝐰,𝐜𝐢 ) with 𝐐𝐌𝐑𝐰,𝐜 < 𝐐𝐌𝐐𝐰,𝐜 [9.1]
𝐏𝐌𝐰,𝐜 = (𝐏𝐖𝐌𝐰,𝐜 ∗ 𝑬𝑹) ∗ (𝟏 + 𝛕𝐰,𝐜𝐢 + 𝛕𝐰,𝐜
𝐩) with 𝐐𝐌𝐑𝐰,𝐜 = 𝐐𝐌𝐐𝐰,𝐜 [9.2]
𝐏𝐌𝐰,𝐜 = (𝐏𝐖𝐌𝐰,𝐜 ∗ 𝑬𝑹) ∗ (𝟏 + 𝛕𝐰,𝐜𝐨 ) with 𝐐𝐌𝐑𝐰,𝐜 > 𝐐𝐌𝐐𝐰,𝐜 [9.3]
In Equation [1], the premium 𝜏𝑝 is zero, while in Equation [9.2] it lies between zero and
the difference between the in- and the out-of-quota tariff rates (𝛕𝐰,𝐜𝐨 − 𝛕𝐰,𝐜
𝐢 ). In Equation
[9.3] 𝜏𝑝 is exactly the difference between the in- and the out-of-quota tariff rates. Equation
[9.4] summarises the values taken by 𝜏𝑝 depending on whether the quota is not binding,
binding or no longer binding.
𝟎 ≤ 𝛕𝐰,𝐜𝐩
≤ 𝛕𝐰,𝐜𝐨 − 𝛕𝐰,𝐜
𝐢 with 𝐐𝐌𝐎𝐰,𝐜 ≥ 𝟎 [9.4]
For agricultural and food products, the tariff rate (TM) is composed of the in-quota
tariff (𝜏𝑖) that is levied on the total import (QMR) and the quota premium (𝜏𝑝) that applies
only to the out-of-quota imports (QMO) (see Equation [9.5]).
𝑻𝑴𝒘,𝒄 = (𝝉𝒘,𝒄
𝒊 ∗𝑸𝑴𝑹𝒘,𝒄) + (𝝉𝒘,𝒄𝒑
∗𝑸𝑴𝑶𝒘,𝒄)
𝑸𝑴𝑹𝒘,𝒄 [9.5]
As import licenses are distributed to Palestinian importers free of charge, the quota rent
then accrues to the Palestinian enterprises as shown in Equation [9.6] where YENT is the
enterprise basic income and YE is the final income including the quota rent.
𝒀𝑬 = 𝒀𝑬𝑵𝑻 + ∑ (𝝉𝒘,𝒄𝒑
∗ 𝑷𝑾𝑴𝒘,𝒄 ∗ 𝑸𝑴𝑰𝒘,𝒄 ∗ 𝑬𝑹)𝒘,𝒄 [9.6]
The production module of the STAGE-2 model is modified to accommodate a six-level
production process that reflects the composition of the labour force in the West Bank. Each
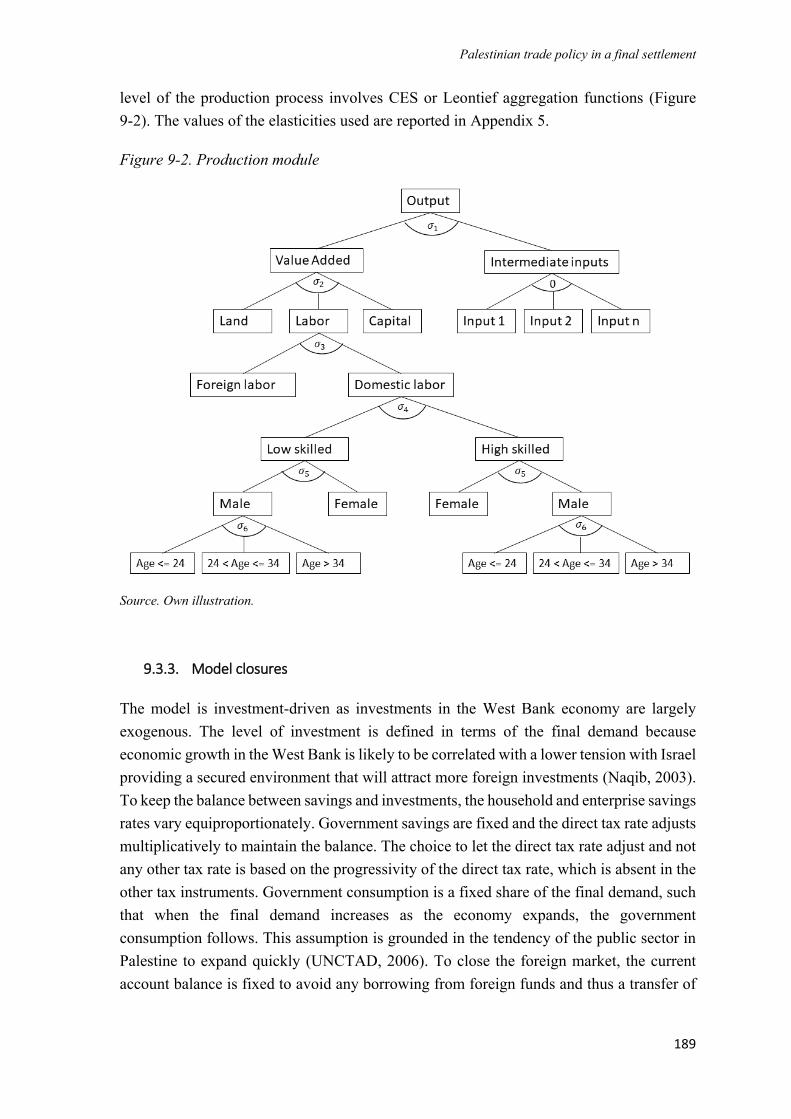
Palestinian trade policy in a final settlement
189
level of the production process involves CES or Leontief aggregation functions (Figure
9-2). The values of the elasticities used are reported in Appendix 5.
Figure 9-2. Production module
Source. Own illustration.
9.3.3. Model closures
The model is investment-driven as investments in the West Bank economy are largely
exogenous. The level of investment is defined in terms of the final demand because
economic growth in the West Bank is likely to be correlated with a lower tension with Israel
providing a secured environment that will attract more foreign investments (Naqib, 2003).
To keep the balance between savings and investments, the household and enterprise savings
rates vary equiproportionately. Government savings are fixed and the direct tax rate adjusts
multiplicatively to maintain the balance. The choice to let the direct tax rate adjust and not
any other tax rate is based on the progressivity of the direct tax rate, which is absent in the
other tax instruments. Government consumption is a fixed share of the final demand, such
that when the final demand increases as the economy expands, the government
consumption follows. This assumption is grounded in the tendency of the public sector in
Palestine to expand quickly (UNCTAD, 2006). To close the foreign market, the current
account balance is fixed to avoid any borrowing from foreign funds and thus a transfer of
Chapter 9
190
welfare effects to future periods. For international trade, it is assumed that, after exiting the
customs union with Israel, Palestine also leaves the currency union and creates its own
currency. A floating exchange rate is implemented as this currency regime provides the
highest monetary autonomy (Yoshino et al., 2004). Finally, the consumer price index
serves as the numeraire in the model.
All factors are mobile across activities. Capital and land are fully employed, as there is no
evidence of a spare capacity for these factors in the West Bank economy. By contrast, the
official statistics report a substantial unemployment rate of labour caused by the volatility
of Palestinian employment in Israel and the low capacity of the domestic market. Moreover,
the higher wages paid to Palestinian workers in Israel drive wages in the domestic market
above their equilibrium level. To replicate this empirical evidence within the model, the
surplus labour assumption is used. This assumption corresponds to a horizontal labour
supply curve, implying that additional labour can be drawn into employment at zero
marginal cost. Hence, the assumption is that the unemployed labour would take
employment at the current real wage rates if there were employment opportunities.
In this model, a regime switching specification of the surplus labour assumption is adopted.
As long as there is unemployed labour, the supply curve is perfectly elastic, i.e. horizontal,
and real wages are fixed. Once the pool of unemployed labour is emptied, the supply curve
becomes perfectly inelastic, i.e. vertical, and any further labour demand is translated into
increasing wages. This specification avoids an infinite supply of labour by restricting the
size of the unemployed labour. The number of unemployed persons in the West Bank is
determined based on official statistics for 2011 (PCBS, 2012a).
Regarding international trade and foreign market closures, two alternatives to a floating
exchange rate combined with a fixed current account balance are explored and the results
are reported as sensitivity analysis:
1. In the first alternative, called Alternative 1, a Palestinian currency is considered, but
instead of a floating exchange rate regime, a currency-peg against a basket of foreign
currencies19 is implemented. This alternative closure is implemented by fixing the real
exchange rate. The producer price index serves as the numeraire in the model. The
current account balance is kept flexible implyinf that Palestine has extensive access to
foreign capital markets.
2. In the second alternative closure, called Alternative 2, Palestine is assumed to still peg
its currency against a basket of foreign currencies but cannot borrow indefinitely from
19 A basket-peg is widely seen as more desirable than a bilateral-peg for a small economy (see Schenk and
Singleton, 2011; Yoshino et al., 2004 and Argy et al., 1989)
Palestinian trade policy in a final settlement
191
the foreign capital markets. Subsequently, both the exchange rate and current account
balance are fixed. The exchange rate serves as the numeraire in the model.
9.4. Simulations
The analysis compares the outcomes of the current policy framework (the status quo
represented by a base scenario that reflects the base data in the SAM) to two different trade
policy scenarios, both assuming the exit from the customs union with Israel. The two
scenarios can be regarded as extreme and were chosen on purpose to reflect the range of
effects a change in trade policy could have on the West Bank economy.
Scenario 1 simulates the elimination of tariffs on imports from all trade partners. It
represents a non-discriminatory liberalisation of the West Bank external trade and is called
ND-Lib scenario. To keep the scenario realistic, only the in-quota tariff rates are removed
for agricultural and food products. The size of the quotas and the out-of-quota tariffs rates
are left unchanged to reflect a certain protection of the domestic agricultural and food
sectors. Later in the sensitivity analysis, a change in the size of the quotas is simulated to
assess the effects of protecting the domestic agricultural and food sectors on the whole
economy.
Scenario 2 introduces high tariffs on imports from Israel. It considers the West Bank to exit
the customs union without forming any other preferential trade agreement with Israel. Israel
is treated similar to other trade partners without specific trade agreement and falls under
the MFN trade regime. Scenario 2 is referred to as MFN scenario. The tariff structure with
respect to the other trade partners is unchanged20. Table 9.3 presents the weighted tariff
rates, where the weights are the volumes of imports for the respective commodities in the
base situation, as well as the rates in the different scenarios.
20 Exiting the current customs envelope with Israel is likely to be associated with more restricted access for
Palestinians to the Israeli labour market, which is not captured in this chapter for simplicity reasons. Similarly,
the ceteris paribus assumption applies regarding potential changes in Israeli trade policy towards Palestine.
A sovereign Palestinian state with full control over its territory is likely to be associated with reduced
transaction costs related to removing the existing internal closures. Likewise, building and maintaining a
customs administration at the borders involves costs. These different aspects are ignored in this study for
simplicity reasons. Changes in the access of Palestinian labour to Israeli markets are simulated in Chapter 6,
Chapter 7 and Chapter 8 of this thesis.
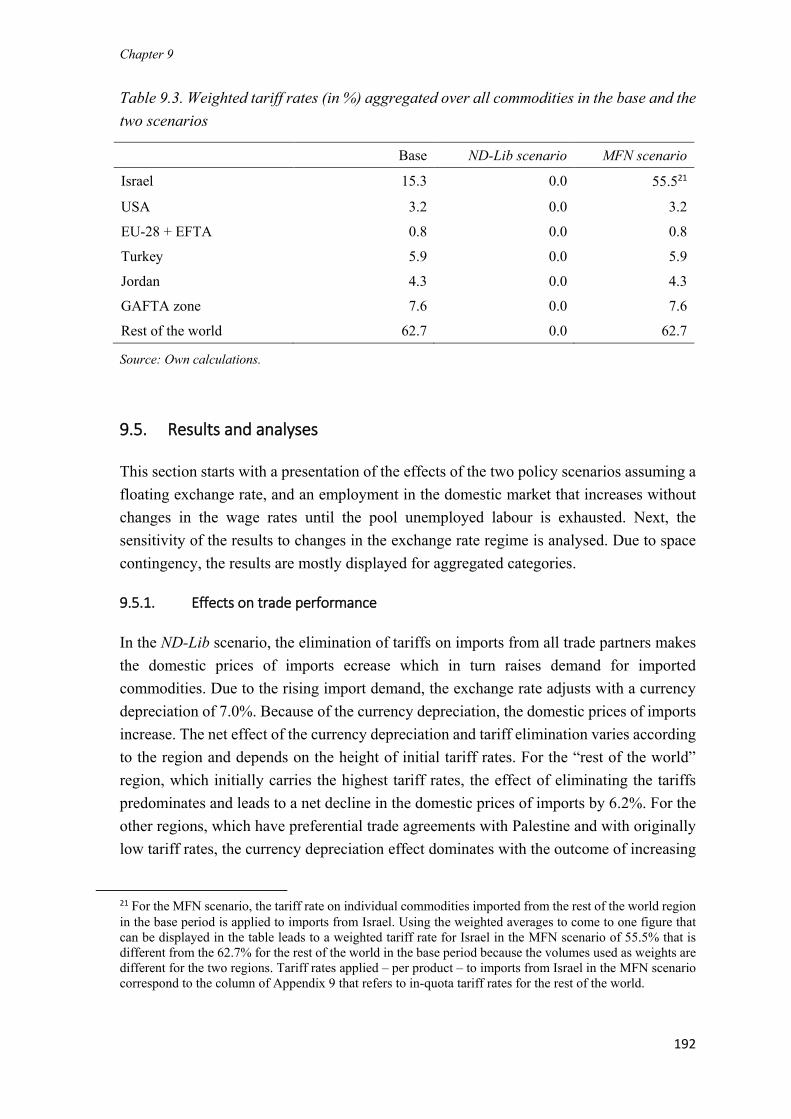
Chapter 9
192
Table 9.3. Weighted tariff rates (in %) aggregated over all commodities in the base and the
two scenarios
Base ND-Lib scenario MFN scenario
Israel 15.3 0.0 55.521
USA 3.2 0.0 3.2
EU-28 + EFTA 0.8 0.0 0.8
Turkey 5.9 0.0 5.9
Jordan 4.3 0.0 4.3
GAFTA zone 7.6 0.0 7.6
Rest of the world 62.7 0.0 62.7
Source: Own calculations.
9.5. Results and analyses
This section starts with a presentation of the effects of the two policy scenarios assuming a
floating exchange rate, and an employment in the domestic market that increases without
changes in the wage rates until the pool unemployed labour is exhausted. Next, the
sensitivity of the results to changes in the exchange rate regime is analysed. Due to space
contingency, the results are mostly displayed for aggregated categories.
9.5.1. Effects on trade performance
In the ND-Lib scenario, the elimination of tariffs on imports from all trade partners makes
the domestic prices of imports ecrease which in turn raises demand for imported
commodities. Due to the rising import demand, the exchange rate adjusts with a currency
depreciation of 7.0%. Because of the currency depreciation, the domestic prices of imports
increase. The net effect of the currency depreciation and tariff elimination varies according
to the region and depends on the height of initial tariff rates. For the “rest of the world”
region, which initially carries the highest tariff rates, the effect of eliminating the tariffs
predominates and leads to a net decline in the domestic prices of imports by 6.2%. For the
other regions, which have preferential trade agreements with Palestine and with originally
low tariff rates, the currency depreciation effect dominates with the outcome of increasing
21 For the MFN scenario, the tariff rate on individual commodities imported from the rest of the world region
in the base period is applied to imports from Israel. Using the weighted averages to come to one figure that
can be displayed in the table leads to a weighted tariff rate for Israel in the MFN scenario of 55.5% that is
different from the 62.7% for the rest of the world in the base period because the volumes used as weights are
different for the two regions. Tariff rates applied – per product – to imports from Israel in the MFN scenario
correspond to the column of Appendix 9 that refers to in-quota tariff rates for the rest of the world.
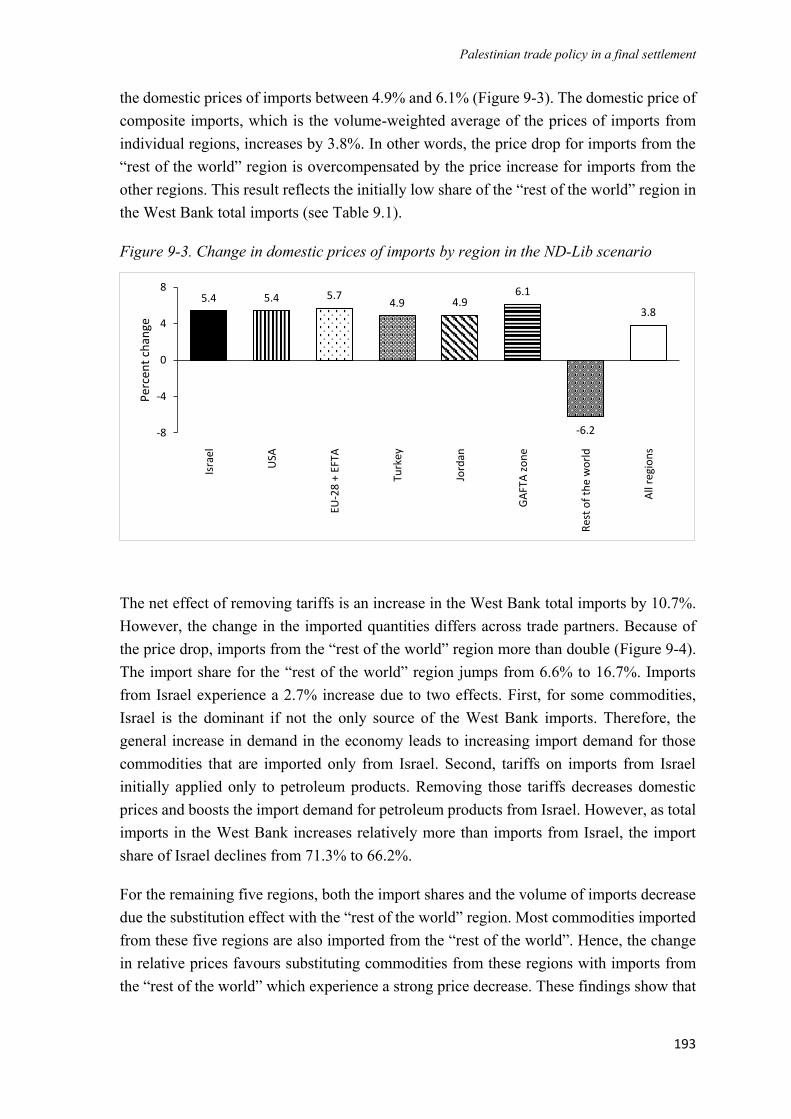
Palestinian trade policy in a final settlement
193
the domestic prices of imports between 4.9% and 6.1% (Figure 9-3). The domestic price of
composite imports, which is the volume-weighted average of the prices of imports from
individual regions, increases by 3.8%. In other words, the price drop for imports from the
“rest of the world” region is overcompensated by the price increase for imports from the
other regions. This result reflects the initially low share of the “rest of the world” region in
the West Bank total imports (see Table 9.1).
Figure 9-3. Change in domestic prices of imports by region in the ND-Lib scenario
The net effect of removing tariffs is an increase in the West Bank total imports by 10.7%.
However, the change in the imported quantities differs across trade partners. Because of
the price drop, imports from the “rest of the world” region more than double (Figure 9-4).
The import share for the “rest of the world” region jumps from 6.6% to 16.7%. Imports
from Israel experience a 2.7% increase due to two effects. First, for some commodities,
Israel is the dominant if not the only source of the West Bank imports. Therefore, the
general increase in demand in the economy leads to increasing import demand for those
commodities that are imported only from Israel. Second, tariffs on imports from Israel
initially applied only to petroleum products. Removing those tariffs decreases domestic
prices and boosts the import demand for petroleum products from Israel. However, as total
imports in the West Bank increases relatively more than imports from Israel, the import
share of Israel declines from 71.3% to 66.2%.
For the remaining five regions, both the import shares and the volume of imports decrease
due the substitution effect with the “rest of the world” region. Most commodities imported
from these five regions are also imported from the “rest of the world”. Hence, the change
in relative prices favours substituting commodities from these regions with imports from
the “rest of the world” which experience a strong price decrease. These findings show that
5.4 5.4 5.74.9 4.9
6.1
-6.2
3.8
-8
-4
0
4
8
Isra
el
USA
EU-2
8 +
EFT
A
Turk
ey
Jord
an
GA
FTA
zo
ne
Res
t o
f th
e w
orl
d
All
regi
on
s
Per
cen
t ch
ange

Chapter 9
194
adopting a non-discriminatory trade policy will change the pattern of Palestinian trade by
reducing trade diversion caused by the customs union and existing trade agreements.
Nevertheless, Israel will remain West Bank’s main trade partner. This finding confirms the
prediction of Arnon and Weinblatt (2001) that Israel, due to the size of its economy and its
proximity to the West Bank, will remain the West Bank’s major trade partner.
Figure 9-4. Volume of imports by region of origin in the ND-Lib scenario as compared to
the Base (in million US$ and % change)
In the MFN scenario, the most-favoured-nation tariffs are applied to imports from Israel
and they trigger an increase in the domestic price of imports from Israel by 11.8% (Figure
9-5). For the other regions, whose tariff rates remained unchanged, the decrease in the
domestic price of imports stems from the appreciation of the local currency by 10%. The
net increase in the price of composite import by 4.5% reflects the large initial share of Israel
in the West Bank’s total imports.
3%-27% -19% -15% -7% -11%
179%
11%
-70%
0%
70%
140%
210%
-2
0
2
4
6
Israe
l
USA
EU-2
8 +
EFTA
Turk
ey
Jord
an
GAFT
A zo
ne
Rest
of t
he w
orld
All r
egio
ns
Perc
ent c
hang
e (%
)
Impo
rts i
n m
illio
n US
$
Base values Absolute change Percent change
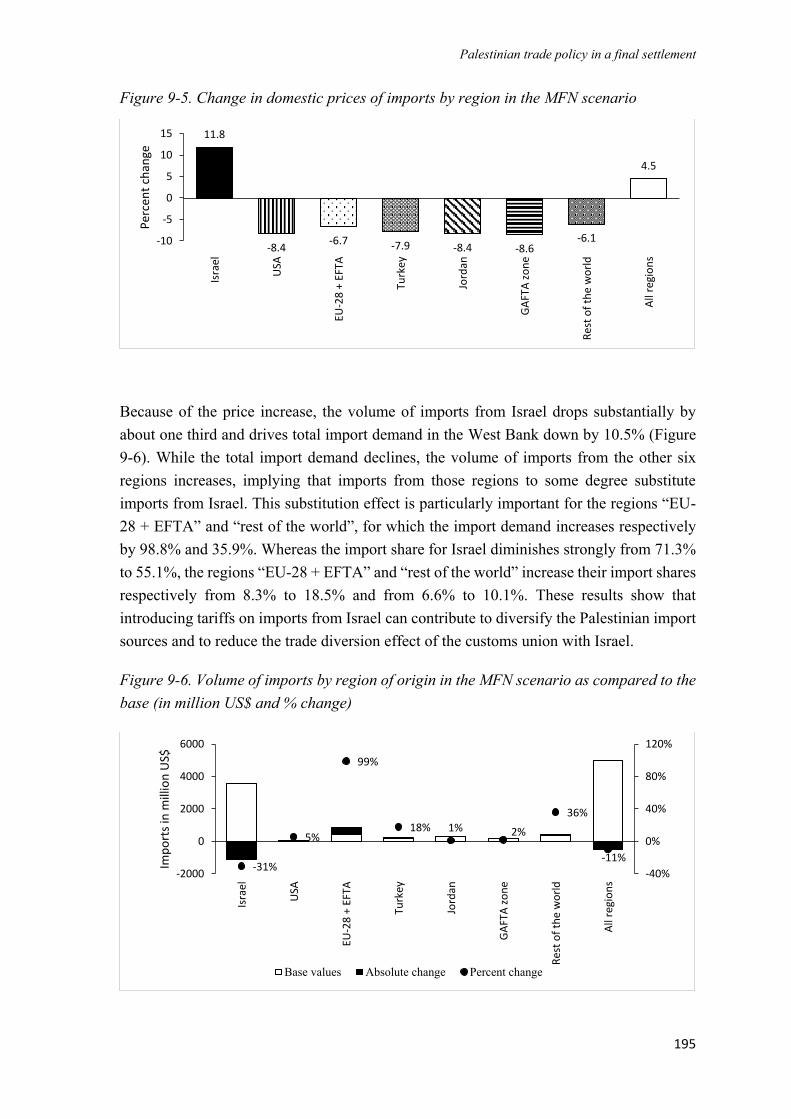
Palestinian trade policy in a final settlement
195
Figure 9-5. Change in domestic prices of imports by region in the MFN scenario
Because of the price increase, the volume of imports from Israel drops substantially by
about one third and drives total import demand in the West Bank down by 10.5% (Figure
9-6). While the total import demand declines, the volume of imports from the other six
regions increases, implying that imports from those regions to some degree substitute
imports from Israel. This substitution effect is particularly important for the regions “EU-
28 + EFTA” and “rest of the world”, for which the import demand increases respectively
by 98.8% and 35.9%. Whereas the import share for Israel diminishes strongly from 71.3%
to 55.1%, the regions “EU-28 + EFTA” and “rest of the world” increase their import shares
respectively from 8.3% to 18.5% and from 6.6% to 10.1%. These results show that
introducing tariffs on imports from Israel can contribute to diversify the Palestinian import
sources and to reduce the trade diversion effect of the customs union with Israel.
Figure 9-6. Volume of imports by region of origin in the MFN scenario as compared to the
base (in million US$ and % change)
11.8
-8.4-6.7 -7.9 -8.4 -8.6
-6.1
4.5
-10
-5
0
5
10
15
Isra
el
USA
EU-2
8 +
EFT
A
Turk
ey
Jord
an
GA
FTA
zo
ne
Res
t o
f th
e w
orl
d
All
regi
on
s
Per
cen
t ch
ange
-31%
5%
99%
18% 1% 2%
36%
-11%
-40%
0%
40%
80%
120%
-2000
0
2000
4000
6000
Isra
el
USA
EU-2
8 +
EFT
A
Turk
ey
Jord
an
GA
FTA
zo
ne
Res
t o
f th
e w
orl
d
All
regi
on
s
Imp
ort
s in
mill
ion
US$
Base values Absolute change Percent change
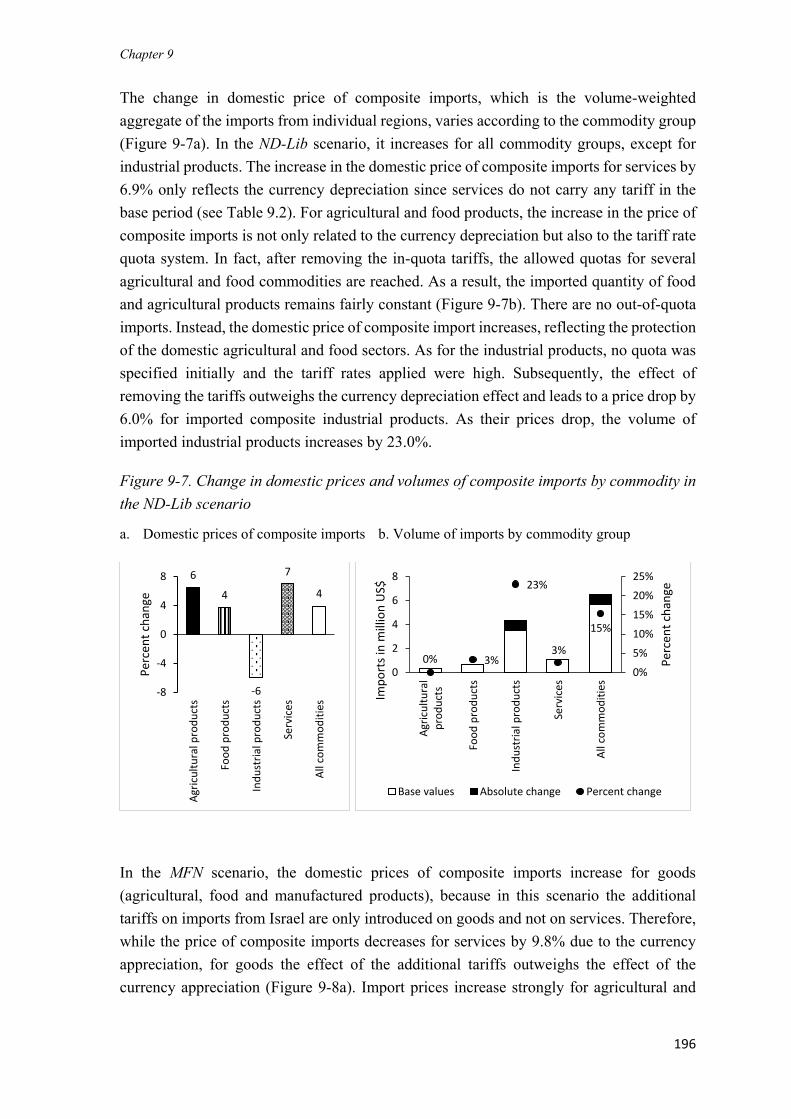
Chapter 9
196
The change in domestic price of composite imports, which is the volume-weighted
aggregate of the imports from individual regions, varies according to the commodity group
(Figure 9-7a). In the ND-Lib scenario, it increases for all commodity groups, except for
industrial products. The increase in the domestic price of composite imports for services by
6.9% only reflects the currency depreciation since services do not carry any tariff in the
base period (see Table 9.2). For agricultural and food products, the increase in the price of
composite imports is not only related to the currency depreciation but also to the tariff rate
quota system. In fact, after removing the in-quota tariffs, the allowed quotas for several
agricultural and food commodities are reached. As a result, the imported quantity of food
and agricultural products remains fairly constant (Figure 9-7b). There are no out-of-quota
imports. Instead, the domestic price of composite import increases, reflecting the protection
of the domestic agricultural and food sectors. As for the industrial products, no quota was
specified initially and the tariff rates applied were high. Subsequently, the effect of
removing the tariffs outweighs the currency depreciation effect and leads to a price drop by
6.0% for imported composite industrial products. As their prices drop, the volume of
imported industrial products increases by 23.0%.
Figure 9-7. Change in domestic prices and volumes of composite imports by commodity in
the ND-Lib scenario
a. Domestic prices of composite imports b. Volume of imports by commodity group
In the MFN scenario, the domestic prices of composite imports increase for goods
(agricultural, food and manufactured products), because in this scenario the additional
tariffs on imports from Israel are only introduced on goods and not on services. Therefore,
while the price of composite imports decreases for services by 9.8% due to the currency
appreciation, for goods the effect of the additional tariffs outweighs the effect of the
currency appreciation (Figure 9-8a). Import prices increase strongly for agricultural and
6
4
-6
7
4
-8
-4
0
4
8
Agr
icu
ltu
ral p
rod
uct
s
Foo
d p
rod
uct
s
Ind
ust
rial
pro
du
cts
Serv
ices
All
com
mo
dit
ies
Per
cen
t ch
ange
0% 3%
23%
3%
15%
0%
5%
10%
15%
20%
25%
0
2
4
6
8
Agr
icu
ltu
ral
pro
du
cts
Foo
d p
rod
uct
s
Ind
ust
rial
pro
du
cts
Serv
ices
All
com
mo
dit
ies
Per
cen
t ch
ange
Imp
ort
s in
mill
ion
US$
Base values Absolute change Percent change
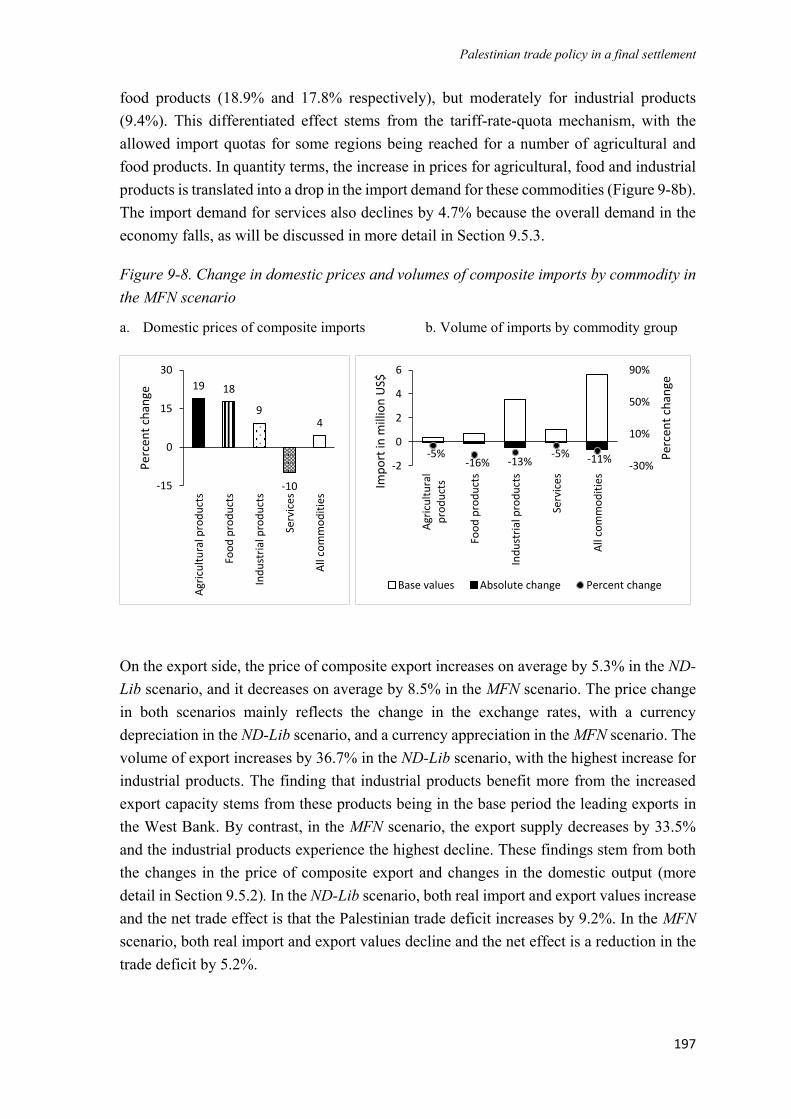
Palestinian trade policy in a final settlement
197
food products (18.9% and 17.8% respectively), but moderately for industrial products
(9.4%). This differentiated effect stems from the tariff-rate-quota mechanism, with the
allowed import quotas for some regions being reached for a number of agricultural and
food products. In quantity terms, the increase in prices for agricultural, food and industrial
products is translated into a drop in the import demand for these commodities (Figure 9-8b).
The import demand for services also declines by 4.7% because the overall demand in the
economy falls, as will be discussed in more detail in Section 9.5.3.
Figure 9-8. Change in domestic prices and volumes of composite imports by commodity in
the MFN scenario
a. Domestic prices of composite imports b. Volume of imports by commodity group
On the export side, the price of composite export increases on average by 5.3% in the ND-
Lib scenario, and it decreases on average by 8.5% in the MFN scenario. The price change
in both scenarios mainly reflects the change in the exchange rates, with a currency
depreciation in the ND-Lib scenario, and a currency appreciation in the MFN scenario. The
volume of export increases by 36.7% in the ND-Lib scenario, with the highest increase for
industrial products. The finding that industrial products benefit more from the increased
export capacity stems from these products being in the base period the leading exports in
the West Bank. By contrast, in the MFN scenario, the export supply decreases by 33.5%
and the industrial products experience the highest decline. These findings stem from both
the changes in the price of composite export and changes in the domestic output (more
detail in Section 9.5.2). In the ND-Lib scenario, both real import and export values increase
and the net trade effect is that the Palestinian trade deficit increases by 9.2%. In the MFN
scenario, both real import and export values decline and the net effect is a reduction in the
trade deficit by 5.2%.
19 18
9
-10
4
-15
0
15
30
Agr
icu
ltu
ral p
rod
uct
s
Foo
d p
rod
uct
s
Ind
ust
rial
pro
du
cts
Serv
ices
All
com
mo
dit
ies
Per
cen
t ch
ange
-5%-16% -13%
-5% -11%-30%
10%
50%
90%
-2
0
2
4
6
Agr
icu
ltu
ral
pro
du
cts
Foo
d p
rod
uct
s
Ind
ust
rial
pro
du
cts
Serv
ices
All
com
mo
dit
ies
Per
cen
t ch
ange
Imp
ort
in m
illio
n U
S$
Base values Absolute change Percent change
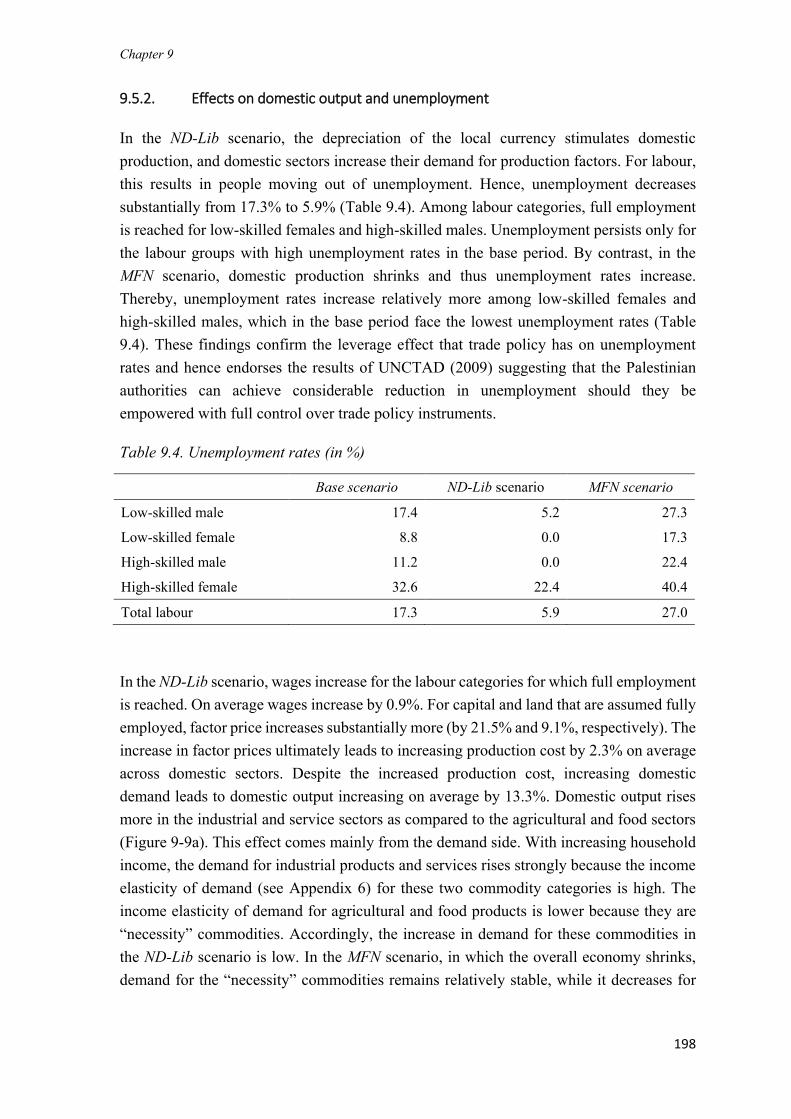
Chapter 9
198
9.5.2. Effects on domestic output and unemployment
In the ND-Lib scenario, the depreciation of the local currency stimulates domestic
production, and domestic sectors increase their demand for production factors. For labour,
this results in people moving out of unemployment. Hence, unemployment decreases
substantially from 17.3% to 5.9% (Table 9.4). Among labour categories, full employment
is reached for low-skilled females and high-skilled males. Unemployment persists only for
the labour groups with high unemployment rates in the base period. By contrast, in the
MFN scenario, domestic production shrinks and thus unemployment rates increase.
Thereby, unemployment rates increase relatively more among low-skilled females and
high-skilled males, which in the base period face the lowest unemployment rates (Table
9.4). These findings confirm the leverage effect that trade policy has on unemployment
rates and hence endorses the results of UNCTAD (2009) suggesting that the Palestinian
authorities can achieve considerable reduction in unemployment should they be
empowered with full control over trade policy instruments.
Table 9.4. Unemployment rates (in %)
Base scenario ND-Lib scenario MFN scenario
Low-skilled male 17.4 5.2 27.3
Low-skilled female 8.8 0.0 17.3
High-skilled male 11.2 0.0 22.4
High-skilled female 32.6 22.4 40.4
Total labour 17.3 5.9 27.0
In the ND-Lib scenario, wages increase for the labour categories for which full employment
is reached. On average wages increase by 0.9%. For capital and land that are assumed fully
employed, factor price increases substantially more (by 21.5% and 9.1%, respectively). The
increase in factor prices ultimately leads to increasing production cost by 2.3% on average
across domestic sectors. Despite the increased production cost, increasing domestic
demand leads to domestic output increasing on average by 13.3%. Domestic output rises
more in the industrial and service sectors as compared to the agricultural and food sectors
(Figure 9-9a). This effect comes mainly from the demand side. With increasing household
income, the demand for industrial products and services rises strongly because the income
elasticity of demand (see Appendix 6) for these two commodity categories is high. The
income elasticity of demand for agricultural and food products is lower because they are
“necessity” commodities. Accordingly, the increase in demand for these commodities in
the ND-Lib scenario is low. In the MFN scenario, in which the overall economy shrinks,
demand for the “necessity” commodities remains relatively stable, while it decreases for
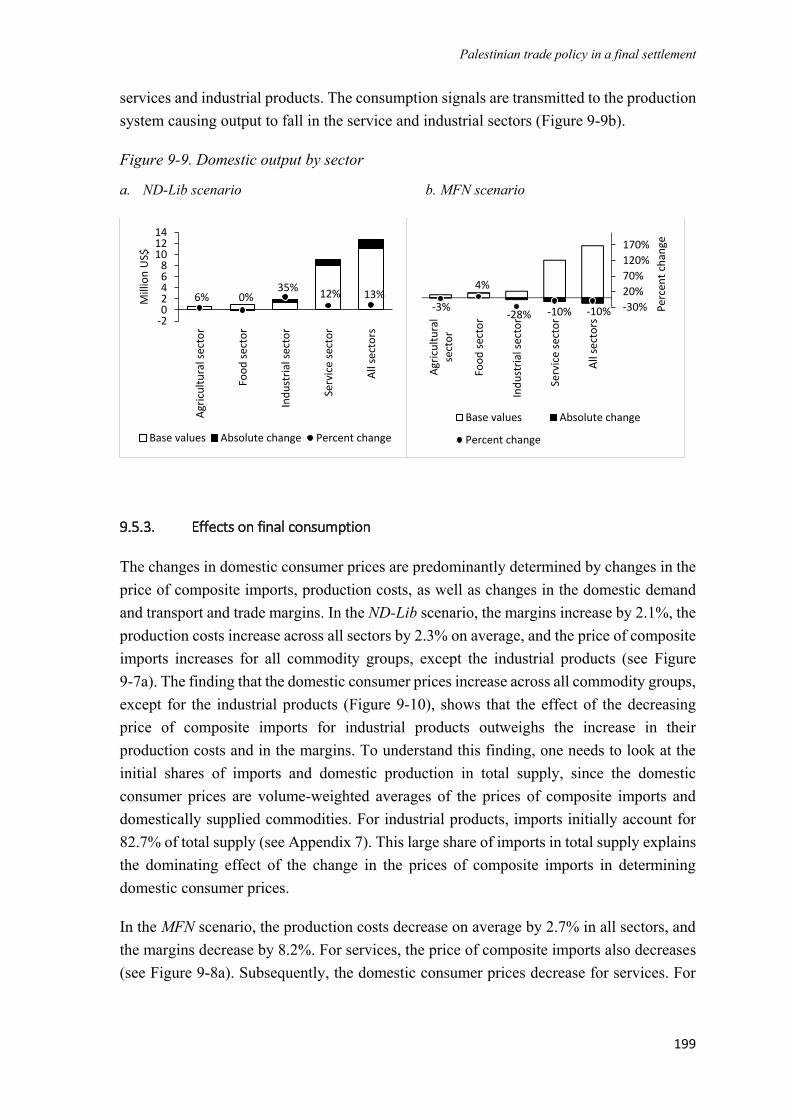
Palestinian trade policy in a final settlement
199
services and industrial products. The consumption signals are transmitted to the production
system causing output to fall in the service and industrial sectors (Figure 9-9b).
Figure 9-9. Domestic output by sector
a. ND-Lib scenario b. MFN scenario
9.5.3. Effects on final consumption
The changes in domestic consumer prices are predominantly determined by changes in the
price of composite imports, production costs, as well as changes in the domestic demand
and transport and trade margins. In the ND-Lib scenario, the margins increase by 2.1%, the
production costs increase across all sectors by 2.3% on average, and the price of composite
imports increases for all commodity groups, except the industrial products (see Figure
9-7a). The finding that the domestic consumer prices increase across all commodity groups,
except for the industrial products (Figure 9-10), shows that the effect of the decreasing
price of composite imports for industrial products outweighs the increase in their
production costs and in the margins. To understand this finding, one needs to look at the
initial shares of imports and domestic production in total supply, since the domestic
consumer prices are volume-weighted averages of the prices of composite imports and
domestically supplied commodities. For industrial products, imports initially account for
82.7% of total supply (see Appendix 7). This large share of imports in total supply explains
the dominating effect of the change in the prices of composite imports in determining
domestic consumer prices.
In the MFN scenario, the production costs decrease on average by 2.7% in all sectors, and
the margins decrease by 8.2%. For services, the price of composite imports also decreases
(see Figure 9-8a). Subsequently, the domestic consumer prices decrease for services. For
6% 0%35% 12% 13%
-202468
101214
Agric
ultu
ral s
ecto
r
Food
sect
or
Indu
stria
l sec
tor
Serv
ice se
ctor
All s
ecto
rs
Mill
ion
US$
Base values Absolute change Percent change
-3%
4%
-28% -10% -10% -30%20%70%120%170%
Agric
ultu
ral
sect
or
Food
sect
or
Indu
stria
l sec
tor
Serv
ice se
ctor
All s
ecto
rs
Perc
ent c
hang
e
Base values Absolute change
Percent change
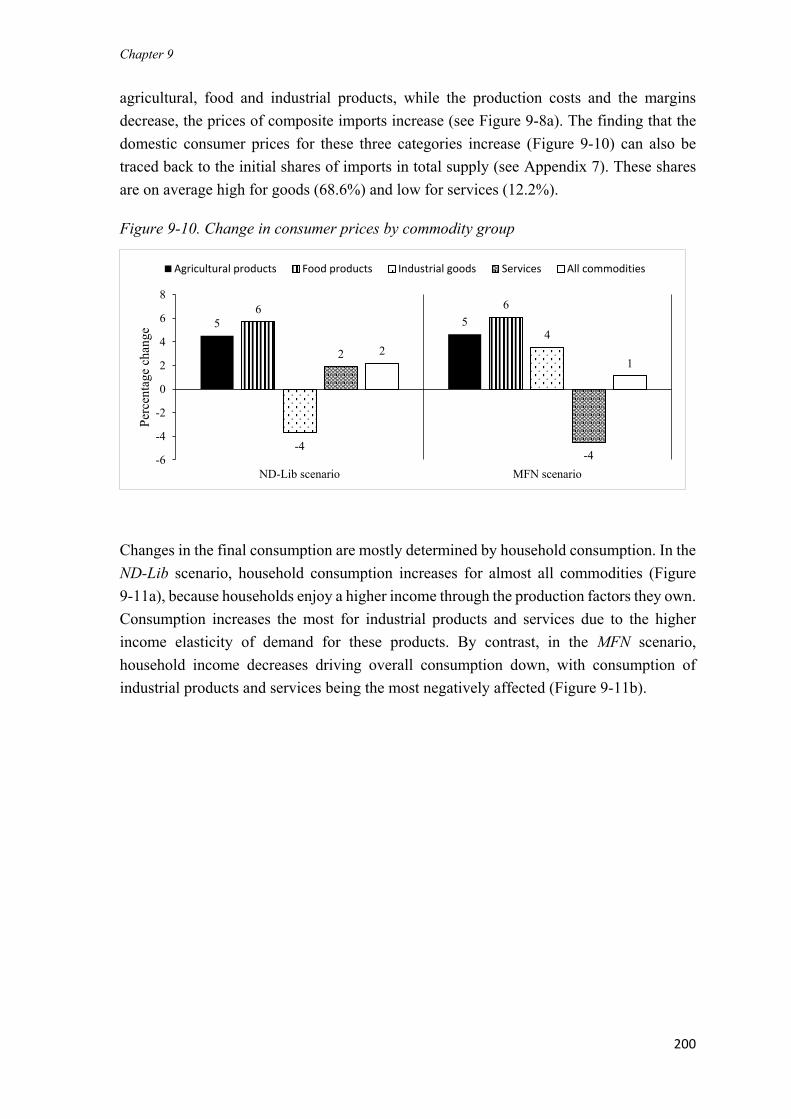
Chapter 9
200
agricultural, food and industrial products, while the production costs and the margins
decrease, the prices of composite imports increase (see Figure 9-8a). The finding that the
domestic consumer prices for these three categories increase (Figure 9-10) can also be
traced back to the initial shares of imports in total supply (see Appendix 7). These shares
are on average high for goods (68.6%) and low for services (12.2%).
Figure 9-10. Change in consumer prices by commodity group
Changes in the final consumption are mostly determined by household consumption. In the
ND-Lib scenario, household consumption increases for almost all commodities (Figure
9-11a), because households enjoy a higher income through the production factors they own.
Consumption increases the most for industrial products and services due to the higher
income elasticity of demand for these products. By contrast, in the MFN scenario,
household income decreases driving overall consumption down, with consumption of
industrial products and services being the most negatively affected (Figure 9-11b).
5 56 6
-4
4
2
-4
21
-6
-4
-2
0
2
4
6
8
ND-Lib scenario MFN scenario
Per
cen
tag
e ch
ang
e
Agricultural products Food products Industrial goods Services All commodities
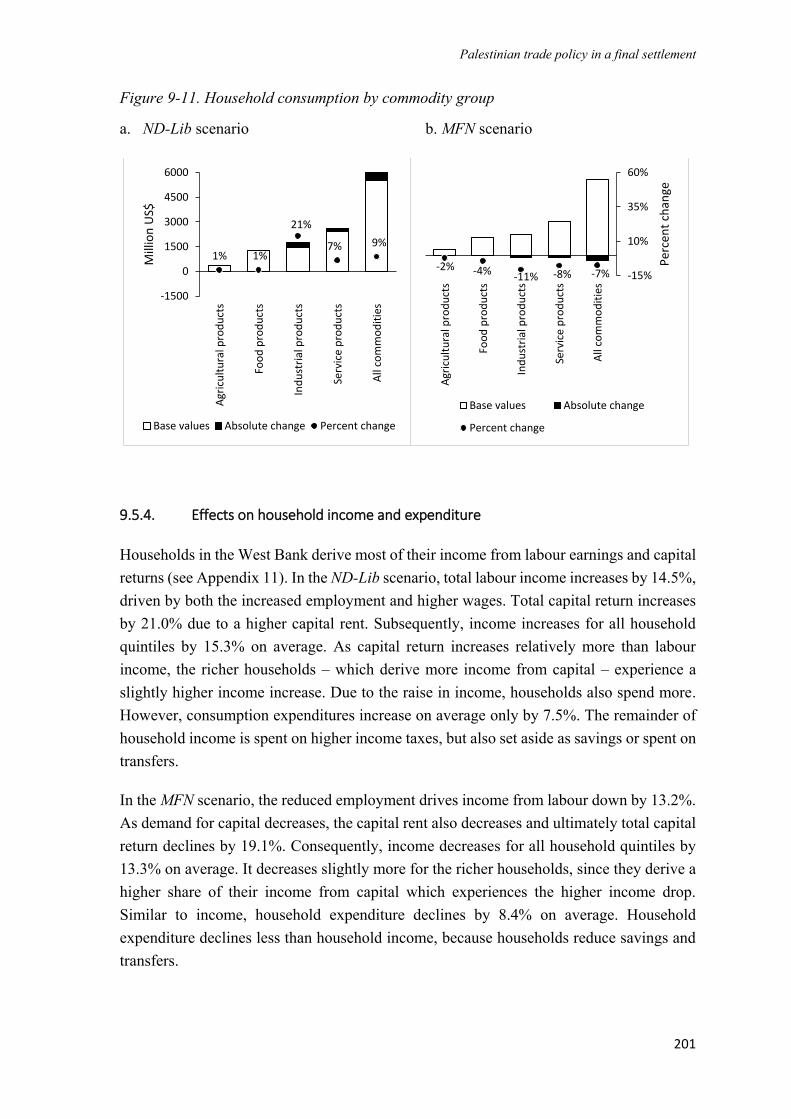
Palestinian trade policy in a final settlement
201
Figure 9-11. Household consumption by commodity group
a. ND-Lib scenario b. MFN scenario
9.5.4. Effects on household income and expenditure
Households in the West Bank derive most of their income from labour earnings and capital
returns (see Appendix 11). In the ND-Lib scenario, total labour income increases by 14.5%,
driven by both the increased employment and higher wages. Total capital return increases
by 21.0% due to a higher capital rent. Subsequently, income increases for all household
quintiles by 15.3% on average. As capital return increases relatively more than labour
income, the richer households – which derive more income from capital – experience a
slightly higher income increase. Due to the raise in income, households also spend more.
However, consumption expenditures increase on average only by 7.5%. The remainder of
household income is spent on higher income taxes, but also set aside as savings or spent on
transfers.
In the MFN scenario, the reduced employment drives income from labour down by 13.2%.
As demand for capital decreases, the capital rent also decreases and ultimately total capital
return declines by 19.1%. Consequently, income decreases for all household quintiles by
13.3% on average. It decreases slightly more for the richer households, since they derive a
higher share of their income from capital which experiences the higher income drop.
Similar to income, household expenditure declines by 8.4% on average. Household
expenditure declines less than household income, because households reduce savings and
transfers.
1% 1%
21%
7% 9%
-1500
0
1500
3000
4500
6000
Agr
icu
ltu
ral p
rod
uct
s
Foo
d p
rod
uct
s
Ind
ust
rial
pro
du
cts
Serv
ice
pro
du
cts
All
com
mo
dit
ies
Mill
ion
US$
Base values Absolute change Percent change
-2% -4% -11% -8% -7% -15%
10%
35%
60%
Agr
icu
ltu
ral p
rod
uct
s
Foo
d p
rod
uct
s
Ind
ust
rial
pro
du
cts
Serv
ice
pro
du
cts
All
com
mo
dit
ies
Per
cen
t ch
ange
Base values Absolute change
Percent change
Chapter 9
202
9.5.5. Changes in the Government revenue
The changes of tariff rates affect the tax revenue and hence total government revenue. Tariff
revenue initially accounted for 29.3% of the government revenue. In the ND-Lib scenario,
the government revenue increases by 6.4%, meaning that the loss in tariff revenue is
overcompensated by the additional revenue from other tax instruments. Making
government consumption a fixed share of the final demand in the model drives government
expenditure up as final demand increases in the ND-Lib scenario. To finance the additional
expenditure, government revenue has to increase. This model mechanism actually reflects
a long-term adjustment, whereby the removal of tariffs stimulates consumption which
increases the tax base for value added and sales taxes. The additional consumption also
stimulates domestic production (see Figure 9-9) and household income (see Section 9.5.4),
hence increasing the tax base for factor use and income taxes.
As all tax rates are kept fixed except the income tax rate, a substantial increase in the
government income happens through the income tax instrument, which increases tenfold.
This change is equivalent to an increase in the income tax rate from 0.9% in the base year
to 8.9%. This rate change is substantial and it needs to be highlighted that the effective
income tax rate in Palestine is much lower than the official rates, which are 5% for the
lowest income bracket, 10% for the middle income bracket and 15% for the top income
bracket (PIPA, 2017). Fjeldstad and al-Zagha (2004) show that the collection of income
tax in Palestine is subject to negotiations in virtually all cases, and that the tax base is eroded
by generous exemptions. Moreover, the tax administration suffers from insufficient
resource allocation, and lack of human capital. Therefore, raising income tax rates
effectively would require substantial institutional reforms.
In the MFN scenario, the introduction of tariffs on imports from Israel, which retains a
share of 55.1% of the West Bank imports, together with increasing imports from the other
trade partners (see Figure 9-6) generate a 66.8% increase in the tariff revenue. Nevertheless,
as final demand decreases in the economy, tax revenue collected from the other instruments
declines and ultimately government revenue decreases by 7.2%. Through the model
mechanism, income tax revenue decreases the most and becomes negative, implying that
the central government makes additional transfers to households and enterprises.
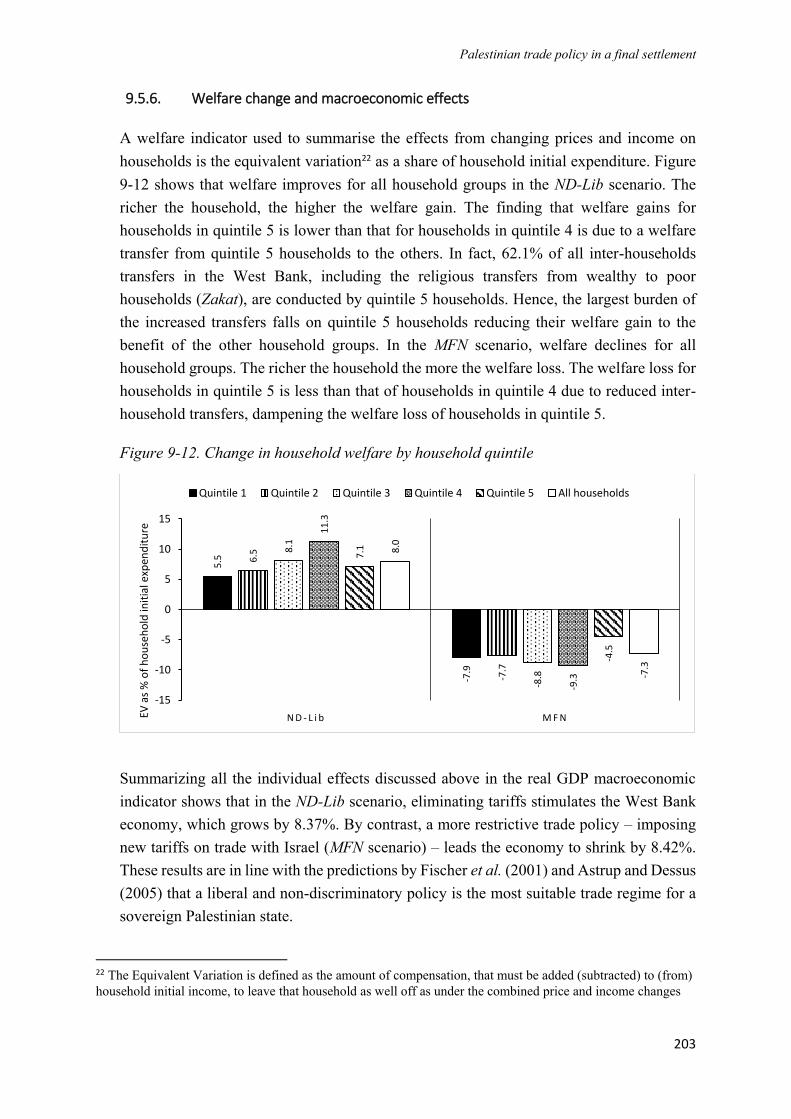
Palestinian trade policy in a final settlement
203
9.5.6. Welfare change and macroeconomic effects
A welfare indicator used to summarise the effects from changing prices and income on
households is the equivalent variation22 as a share of household initial expenditure. Figure
9-12 shows that welfare improves for all household groups in the ND-Lib scenario. The
richer the household, the higher the welfare gain. The finding that welfare gains for
households in quintile 5 is lower than that for households in quintile 4 is due to a welfare
transfer from quintile 5 households to the others. In fact, 62.1% of all inter-households
transfers in the West Bank, including the religious transfers from wealthy to poor
households (Zakat), are conducted by quintile 5 households. Hence, the largest burden of
the increased transfers falls on quintile 5 households reducing their welfare gain to the
benefit of the other household groups. In the MFN scenario, welfare declines for all
household groups. The richer the household the more the welfare loss. The welfare loss for
households in quintile 5 is less than that of households in quintile 4 due to reduced inter-
household transfers, dampening the welfare loss of households in quintile 5.
Figure 9-12. Change in household welfare by household quintile
Summarizing all the individual effects discussed above in the real GDP macroeconomic
indicator shows that in the ND-Lib scenario, eliminating tariffs stimulates the West Bank
economy, which grows by 8.37%. By contrast, a more restrictive trade policy – imposing
new tariffs on trade with Israel (MFN scenario) – leads the economy to shrink by 8.42%.
These results are in line with the predictions by Fischer et al. (2001) and Astrup and Dessus
(2005) that a liberal and non-discriminatory policy is the most suitable trade regime for a
sovereign Palestinian state.
22 The Equivalent Variation is defined as the amount of compensation, that must be added (subtracted) to (from)
household initial income, to leave that household as well off as under the combined price and income changes
5.5
-7.9
6.5
-7.7
8.1
-8.8
11
.3
-9.3
7.1
-4.5
8.0
-7.3
-15
-10
-5
0
5
10
15
N D - L i b M F NEV a
s %
of
ho
use
ho
ld in
itia
l exp
end
itu
re
Quintile 1 Quintile 2 Quintile 3 Quintile 4 Quintile 5 All households
Chapter 9
204
9.5.7. Results with alternative exchange rate regimes
Two alternatives to the initial closure rules of a floating exchange rate regime combined
with a fixed current account balance are simulated as described in Section 9.3.3. The two
alternatives assume a fixed exchange rate or currency-peg. Alternative 1 assumes in
addition a flexible current account balance, while Alternative 2 incorporates a fixed current
account balance.
The results show that adopting a currency-peg, as assumed in both alternatives cause the
domestic prices of imports to fall for all trade partners in the ND-Lib scenario, due to the
removal of tariffs. In both alternatives, the domestic prices of imports drop relatively more
for the region “rest of the world” because that region carries in the base period the highest
tariffs. As compared to the initial model, where a floating exchange rate is assumed, the
currency depreciation effect driving the domestic prices of imports from individual trade
partners up does not play any role in the two alternative models. Similarly, in the MFN
scenario, the currency appreciation depressing the domestic prices of imports in the initial
model is absent. Only the additional tariffs introduced drive the domestic prices of imports
from Israel substantially up and the domestic prices of imports from the other regions up
as well.
While the price effects are similar in the two alternative models, the effects on the imported
quantities differ considerably. In Alternative 1, the total import demand increases sharply
in the ND-Lib scenario. The additional imports are financed by foreign borrowing, with the
current account deficit increasing by 61.8%. However, in Alternative 2, the increase in
import demand is much smaller because a fixed current account balance is assumed
removing the possibility to borrow foreign money to finance imports. The additional import
demand in Alternative 2 only originates from the “rest of the world” region, where the price
drop is the strongest. In the MFN scenario, results of the Alternative 1 show a sharp decline
in the import demand, which is associated with a reduction in the current account deficit by
54.8%. By contrast, the results of Alternative 2 indicate a more moderate decline in the
total import demand. Table 9.5 summarises and compares the results of the original model
with its two alternatives on domestic prices of import and total import demand in the West
Bank.
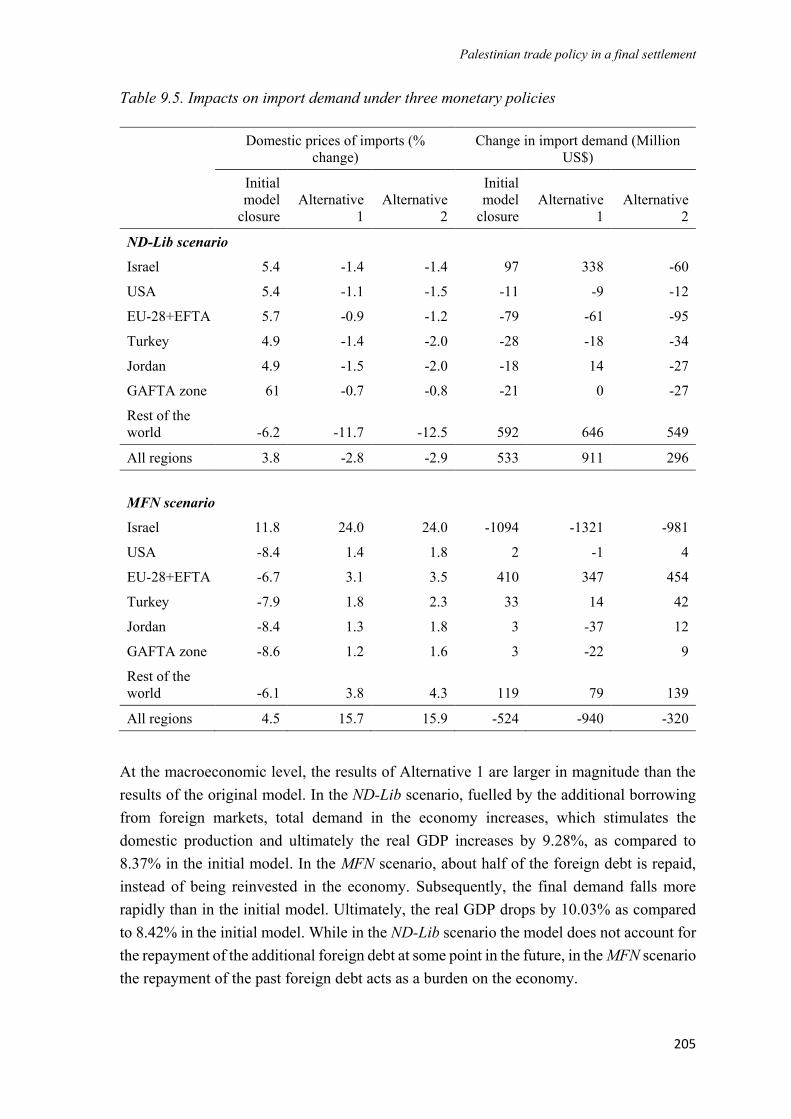
Palestinian trade policy in a final settlement
205
Table 9.5. Impacts on import demand under three monetary policies
Domestic prices of imports (%
change)
Change in import demand (Million
US$)
Initial
model
closure
Alternative
1
Alternative
2
Initial
model
closure
Alternative
1
Alternative
2
ND-Lib scenario
Israel 5.4 -1.4 -1.4 97 338 -60
USA 5.4 -1.1 -1.5 -11 -9 -12
EU-28+EFTA 5.7 -0.9 -1.2 -79 -61 -95
Turkey 4.9 -1.4 -2.0 -28 -18 -34
Jordan 4.9 -1.5 -2.0 -18 14 -27
GAFTA zone 61 -0.7 -0.8 -21 0 -27
Rest of the
world -6.2 -11.7 -12.5 592 646 549
All regions 3.8 -2.8 -2.9 533 911 296
MFN scenario
Israel 11.8 24.0 24.0 -1094 -1321 -981
USA -8.4 1.4 1.8 2 -1 4
EU-28+EFTA -6.7 3.1 3.5 410 347 454
Turkey -7.9 1.8 2.3 33 14 42
Jordan -8.4 1.3 1.8 3 -37 12
GAFTA zone -8.6 1.2 1.6 3 -22 9
Rest of the
world -6.1 3.8 4.3 119 79 139
All regions 4.5 15.7 15.9 -524 -940 -320
At the macroeconomic level, the results of Alternative 1 are larger in magnitude than the
results of the original model. In the ND-Lib scenario, fuelled by the additional borrowing
from foreign markets, total demand in the economy increases, which stimulates the
domestic production and ultimately the real GDP increases by 9.28%, as compared to
8.37% in the initial model. In the MFN scenario, about half of the foreign debt is repaid,
instead of being reinvested in the economy. Subsequently, the final demand falls more
rapidly than in the initial model. Ultimately, the real GDP drops by 10.03% as compared
to 8.42% in the initial model. While in the ND-Lib scenario the model does not account for
the repayment of the additional foreign debt at some point in the future, in the MFN scenario
the repayment of the past foreign debt acts as a burden on the economy.
Chapter 9
206
The results of Alternative 2 show more moderate effects of both trade scenarios on the
economy. In the ND-Lib scenario, real GDP grows only by 2.02%, while in the MFN
scenario it declines by only 0.90%.
In conclusion, these results indicate that the monetary policy adopted has a considerable
impact on the outcomes of any trade policy. Therefore, the Palestinian authorities may want
to have the fullest control over exchange rate and monetary policies.
9.6. Conclusions and policy implications
The Paris Protocol, which governs the economic relations between Israel and Palestine,
formalised the customs union between the two parties. This customs union is largely based
on Israeli rules. Due to the structural differences between the two economies, those rules
are not favourable to the Palestinian economy. The Paris Protocol as a transitional
agreement was supposed to pave the way for a final settlement, where a sovereign
Palestinian state would eventually have full control over its trade and monetary policies. In
the context of such a final settlement, this chapter simulates two trade options in which the
customs union with Israel is assumed to be removed and trade policy is solely determined
by the Palestinian authorities. The first scenario is the elimination of tariffs on imports from
all trade partners (ND-Lib scenario), and the second scenario simulates the imposition of
high tariffs on imports from Israel (MFN scenario).
Of the two analysed trade policy options, only the abolishment of tariffs on import from all
trade partners, as simulated in the ND-Lib scenario, improves all macroeconomic indicators
of the West Bank economy as compared to the status quo of a continued customs union.
By contrast, introducing new tariffs on imports from Israel, as simulated in the MFN
scenario, hurts the West Bank economy. Consequently, a sovereign Palestinian state may
prefer to adopt a liberal and non-discriminatory trade regime. Adopting such a trade policy
can diversify Palestinian trade and reduce the trade diversion caused by the current customs
union and other trade agreements. Nevertheless, Israel is likely to remain the main corridor
for the Palestinian trade, due to the size of its economy and its geographical position.
In the long-term, removing the customs union and its associated trade distortions will
provide Palestine with more trade options than can be captured by the model. In fact, the
model construction – while depicting well the current trade pattern – imbeds some of the
distortions caused by the customs union. These distortions are twofold. First, there are
indirect imports shown as imports from Israel which fully originate from other countries.
A good example of this is petroleum products which constitute 23.5% of West Bank
imports from Israel. Assuming an exit from the customs union and the possibility for
Palestinian trade policy in a final settlement
207
Palestine in the long-term to source these products directly from their origins will
significantly reduce the trade share of Israel. Second, the initial position of Israel as the
dominant trade partner is partly a result of trade diversion due to the customs union, with
some products being sourced mostly or only from Israel. Hence, when the import demand
increases, as in the ND-Lib scenario, the model setup only allows the additional demand
for these products to be sourced from Israel, due to the Armington trade specification.
However, exiting the customs union and removing its distortions may provide Palestine in
the long-term with more possibilities to source those products from third countries.
The results show that eliminating tariffs on agricultural and food products hardly affects
the imported quantities, because the domestic agricultural and food sectors are protected
with a system of tariff-rate-quotas. The findings that quotas become binding and that there
are no out-of-quota imports demonstrate the importance of modelling explicitly these tariff-
rate-quotas. While the tariff-rate-quota system effectively protects domestic agricultural
and food sectors against import competition, this protection comes at a cost for the whole
economy. While farmers are better off, consumers are worse-off, and the economy as a
whole bears a net welfare loss. To assess the effect of the tariff-rate-quota system on the
economy, the two analysed trade options are simulated along with an increase in the import
quotas by 50%. The results indicate that the outcome of both trade policy options is
improved if the quotas are increased. In fact, increasing the quotas reduces the constraint
imposed upon the economy and in both trade policy options more imports take place.
Ultimately, real GDP increases in the ND-Lib scenario by 8.7% as compared to 8.4% when
the quotas are not increased.
In the MFN scenario, real GDP decreases by 8.1%, while it decreases by 8.4% when quotas
are not increased. A complete removal of the tariff-rate-quota system is likely to further
magnify the positive benefits of the simulated trade policies for the economy as a whole,
although domestic producers of agricultural and food products are hurt. Therefore, a
revision of the tariff-rate-quota system is a political decision the Palestinian authorities
should make depending on whether the national interest is to protect domestic producers
and ensure domestic supply of food or to enhance the overall economic benefits that are
achieved through trade. Revising the level of the tariff-rate-quotas will also depend on the
final agreement with Israel, since the current levels are negotiated with Israel because of
the two entities forming a customs union. If Palestine gains full control over trade and
economic policy instruments in the final status, the Palestinian authorities may decide
freely on the levels of their tariff-rate-quotas.
The results also highlight that trade policy in Palestine has a substantial leverage on
unemployment. In the ND-Lib scenario, unemployment decreases from 17.3% to 5.9%.
Hence, empowering the Palestinian authorities with full control over trade policy
Chapter 9
208
instruments can improve their capacity to tackle the unemployment problem. Changes in
the employment rates have direct effects on household income, and thereby on household
welfare. In the ND-Lib scenario, household welfare improves for all household groups by
19.9% on average. However, welfare gains are higher for richer households than for poorer
households. Therefore, if the Palestinian authorities aim at a fairer distribution of the
welfare gains, they should increase transfers to poorer households. Government revenue is
expected to increase despite the loss of tariff revenue because the tax base for other tax
instruments (VAT, income tax, sales tax) increases and income tax rate increases.
It is pertinent to note that the surplus labour assumption used in the model is likely to
overstate the changes in employment, absorption, and in welfare gains in the ND-Lib
scenario as the shock implemented increases wages. By contrast, this assumption is
expected to understate the outcomes in the MFN scenario, as the shock implemented there
reduces wages. These biases are due to the implicit assumption that employment within the
System of National Accounts (SNA) production boundary, i.e. the market activities, can be
increased at no marginal costs and the opportunity cost of labour outside the SNA
boundary, i.e. the “unemployed” labour, is zero.
Because the two simulated trade options are arguably extreme cases, a moderate variant of
the MFN scenario is simulated assuming that after the exit from the customs union,
Palestine signs a preferential trade agreement (PTA) with Israel. In this PTA scenario, the
average tariff on trade partners having already trade agreements with Palestine is applied
to imports from Israel. In addition, the introduction of rules of origin causing higher
transaction costs is assumed through an increase in prices for imports originating from
Israel by 3.0% and a reduction in prices for exports to Israel by 3.0%. The results – as
expected – are moderate as compared to those of the MFN scenario. As illustration, GDP
decreases by 3.5% in the PTA scenario, as compared to 8.4% in the MFN scenario. This
finding first shows that both PTA and MFN scenarios are less desirable than the status quo
of continued customs union with Israel, since in both cases GDP decreases relative to the
status quo. Second, this finding shows that the higher the tariffs introduced on imports from
Israel, the worse the outcome for the West Bank economy. Hence, concluding a trade
agreement with Israel is more desirable than trading with Israel under the most-favoured-
nation trade regime.
In another variant of the MFN scenario, it was assessed whether forming a new customs
union with the Arab countries members of the GAFTA free trade area could compensate
the economic costs of imposing high tariffs on imports from Israel. In this GAFTA customs
union scenario, tariffs on imports from the GAFTA members (GAFTA zone and Jordan)
are removed, while applying the most-favoured-nation tariff rates to Israel. However, the
results of the GAFTA customs union scenario hardly differ from those of the MFN scenario.
Palestinian trade policy in a final settlement
209
This finding reflects the fact that the GAFTA members only make a tiny share of the
Palestinian trade and entering a GAFTA customs union will not compensate for imposing
high tariffs on imports from Israel, which is likely to remain Palestine’s main trade partner.
Consequently, a greater integration with other Arab countries is important, but it cannot be
a substitute to the economic links with Israel.
Finally, the monetary policy adopted has a substantial impact on the magnitude of the trade
policy effects. Therefore, the PNA may want to gain the fullest control over its national
currency and its exchange rate. The highest overall welfare gains could be achieved with
the most liberal and non-discriminatory trade policy, i.e. abolishing tariffs and quotas with
respect to all trade partners. Yet, for a fairer distribution of welfare gains, Palestinian
authorities may want to compensate the losers, especially domestic producers of
agricultural and food products, and may consider transfers to poor households, for whom
welfare gains are smaller.

210

211
10
CONCLUDING REMARKS

Chapter 10
212

Concluding remarks
213
Chapter 10 Concluding remarks
The movement of goods, services and labour is disrupted when political conflicts arise. In
the case of the Palestinian-Israeli conflict, the asymmetry of power between the two parties
in conflict leaves the Palestinian economy in a vulnerable position. Policies implemented
by Israel, such as the work permit scheme and the closure policy, altered the flow of labour,
goods and services between the two regions. Moreover, the agreement on economic
relations signed by the two parties in 1994 which is supposed to enable a trade-led growth
of the Palestinian economy actually provides the Palestinian National Authority only with
limited policy space. Exploring the economy-wide implications of changes in the
movement of goods, services and labour in conflict-affected regions, taking the case of the
West Bank economy, is the core objective of this thesis.
This thesis uses a CGE model, as this class of models is well-suited to investigate the
economy-wide effects of changes in policies and other external shocks. The next Section,
10.1, presents the main findings related to the research objectives. Section 10.2 highlights
the contributions of this thesis to method development, while Section 10.3 pinpoints its
policy implications. Finally, Section 10.4 discusses the limitations of the analysis and
makes suggestions for future research.
10.1. Key findings and answers to the research questions
This thesis aimed at five research objectives, which are as follows:
a) Develop a detailed database to use in simulation models for assessing the economy-
wide effects of policies in the West Bank
b) Identify the model specifications that capture the labour market conditions in the West
Bank and quantify their implications for the simulation results
c) Analyse the short-term effects of changes in the employment of Palestinians in Israel
on the West Bank economy
d) Assess the long-term effects of an increased employment of Palestinians in Israel on
the West Bank economy
e) Investigate the effects of changes in the trade regime on the West Bank economy
To achieve the first research objective, a detailed Social Accounting Matrix (SAM) was
developed for the West Bank and is documented in Chapter 5. This is the first social
accounting matrix for the West Bank, which is currently the only Palestinian territory with
Chapter 10
214
official trade relations with Israel and with workers employed in the Israeli economy. The
development of this database was the pre-requisite for the applications intended to be
conducted. The West Bank SAM is sufficiently disaggregated in order to allow its future
users to consider alternative classifications depending of the research question. The SAM
explicitly distinguishes seven trade partners, among which Israel, the regions having
preferential trade agreements with Palestine (USA, EU28 + EFTA, Turkey, Jordan and
GAFTA countries) and the rest of the world.
The SAM has several distinctive features. It takes proper account of the remuneration of
labour for the self-employed and of household income from unincorporated capital, and it
explicitly includes an account for non-profit institutions serving households as well as the
religious transfer (Zakat) flowing voluntarily from the rich households to the poor. It has a
detailed representation of commodities and activities producing them. Labour markets and
household accounts are well differentiated to allow assessing the effects of policy changes
in the movement of labour, goods and services on the West Bank economy as well as their
distributive effects on household welfare. The SAM was developed for the year 2011, for
data availability reasons and also because the year 2011 can be considered as a year of
relative stability, which can serve as a benchmark for simulation models.
The second research objective aimed at identifying the model specifications that can
capture the labour market conditions in the West Bank and quantify the implications of
using different assumptions on the simulation results. Chapter 6 first identifies four stylized
specifications of labour market conditions: the fixed labour supply (full employment),
surplus labour, upward-sloping labour supply curve and labour-leisure trade-off. Among
the four specifications, the upward-sloping curve is found not to be neutral to welfare
generated outside the SNA production boundary, as labour enters the SNA boundary at a
positive price but has a zero opportunity cost outside the boundary (Aragie et al., 2017).
The fixed supply and surplus labour assumptions achieve a superficial neutrality with
respect to welfare generated outside the production boundary. The fixed supply
specification assumes a strict separability between uses of labour within and outside the
boundary and considers households to be indifferent to changes in the wage rates in their
decisions in the labour markets (McDonald, 2018). The surplus labour specification is also
open to challenges as it assumes that labour has a zero opportunity cost outside the
production boundary and employment can be increased within the boundary without
increasing real wages (Boeters and Savard, 2011). The labour-leisure trade-off
specification, in contrast to the others, accounts explicitly for welfare changes within and
outside the boundary and is consistent with standard economic theories. However, it
implicitly assumes the absence of involuntary unemployment.

Concluding remarks
215
After calibrating the West Bank SAM to a modified version of the comparative static
single-country CGE model STAGE-2, the implications of using these four different model
specifications on the simulation results were assessed. The shock implemented was a revert
of the Palestinian employment in Israel to its 1999 pre-intifada level. This represents a 36%
increase in the number of Palestinian workers in Israel as compared to the base year of
2011. The findings show that the surplus labour specification is arguably a better
framework to depict the market conditions in the West Bank in the short-term as it produces
results that reflect the empirical evidence of a closer correlation between the employment
of Palestinians in Israel and the unemployment in the West Bank. This model specification
captures the distortions in the West Bank labour markets which are in part caused by the
volatility in Palestinian employment in Israel due to the conflict. This volatility combined
with the small size of the internal market generates involuntary unemployment which
cannot be properly captured by the fixed supply and labour-leisure trade-off specifications.
The upward-sloping curve can also capture involuntary unemployment. Compared to the
surplus labour specification, it generates relatively moderate results. While it is
acknowledged that the surplus labour specification is likely to overstate the policy effects
on absorption, employment and welfare, this specification is preferred to the upward-
sloping curve, because it is neutral to welfare generated outside the production boundary
and it is more consistent with the standard economic theories.
For a long-term analysis, the labour-leisure trade-off is the preferred specification because
it explicitly accounts for welfare changes within and outside the production boundary.
Moreover, in the long-term it is assumed that the labour markets are flexible and that labour
can always be employed in the activities either within or outside the boundary. As
compared to the fixed supply specification, the labour-leisure trade-off allows for transfers
of labour across the boundary and hence supply of labour to the market activities is not
perfectly inelastic. After reaching these conclusions, a thorough assessment of the effects
of changes in the Palestinian employment level in Israel was carried out from a short-term
perspective (Chapter 7) and from a long-term perspective (Chapter 8) to achieve the
research objectives three and four.
In Chapter 7, the short-term effects of changes in the employment of Palestinians in Israel
are assessed using the surplus labour assumption together with a segmentation of the factor
markets. Hence, the mobility of labour is limited and factors are restricted to their initial
market segments. The results of the first scenario show that increasing the employment of
Palestinians in Israel to its pre-intifada level improves, in the short-term, the welfare of
West Bank households by 5.5% on average. The majority (98%) of Palestinians from the
West Bank who start employment in Israel are previously unemployed in the market
activities. The increased labour income from Israel stimulates household consumption and
both import demand and domestic production. To meet the additional demand for
Chapter 10
216
domestically produced commodities, domestic activities use more labour which leads to
more labour starting employment in the domestic market. The total effect is a reduction in
the unemployment rate from 17.3% to 10.9%. Ultimately, the West Bank economy grows
with real GDP increasing by 3.6%.
The opposite scenario, reducing Palestinian employment in Israel by 36%, leads to a surge
in the unemployment rate as those who are laid off from employment in Israel do not find
opportunities in the domestic market. Moreover, the contraction of the economic activity
due to a reduced household consumption leads to a reduction in labour demand by the
domestic activities.
Increasing the employment of Palestinians in Israel, while restricting the access to the
Israeli markets to male workers having a valid work permit for Israel, slightly reduces the
benefits for the West Bank economy and for household welfare.
Assuming that the increased employment of Palestinians in Israel may stimulate the labour
market participation in the West Bank, which is extremely low especially for women,
magnifies the benefits to the economy and to household welfare.
In Chapter 8, the long-term implications of increased Palestinian employment in Israel are
investigated using the labour-leisure trade-off specification. Additionally, the household
utility function is modified and instead of a single-stage LES function, a three-stage LES-
CES-CES function is used. This model specification is assumed to better reflect household
preferences, assuming that households decide their subsistence consumption levels over
two broad groups of commodities. Within each group, they substitute among the
components of the group by choosing the optimal combination of commodities based on
their relative prices. To reflect the long-term presumption of the analysis, a mobility
function is incorporated into the model so that labour is no longer restricted to the initial
market segments. The mobility function is controlled by a response elasticity and can be
triggered by changes in relative wages.
The results show that only 23.6% of the Palestinian workers who start working in Israel
were previously unemployed in the domestic market. This result confirms the finding of
Boeters and Savard (2011) and Gronau and Hamermesh (2006) that household supply of
labour to the market activities is fairly stable in the long-term. In the case of Palestinian
employment in Israel, the additional inflow of labour income from Israel reduces incentives
to work inside the SNA production boundary by increasing the price of non-traded
commodities, of which the most “non-traded” is leisure, i.e. the services produced by
activities outside the production boundary.
Concluding remarks
217
The results also show an increase in the domestic wages across all sectors by 6.1% on
average. The increase in factor prices drives up the production cost, which coupled with
the exit of labour out of the domestic market to take employment in the Israeli market,
generate a decline in the domestic output by 2.1% on average. Output declines the most in
the manufacturing sector which is the leading export sector in the West Bank. As the
increased labour income from Israel causes a real appreciation of the domestic currency,
the competitiveness of the West Bank export industry in the international markets is
reduced. This finding highlights the trade-off between exporting more labour to Israel and
exporting more goods and services to the rest of the world.
Due to the additional labour income from Israel, household consumption of goods and
services increases on average by 3.7%, while consumption of services produced outside the
boundary (leisure) decreases by 1.2%. Subsequently, there are welfare benefits generated
within the production boundary, while there are welfare losses outside the boundary. The
net effect is nevertheless a welfare gain for all household groups by 1.8% on average. At
the aggregate economy level, real GDP declines by 1.1%. Hence, in the long-term, the
employment of Palestinians in Israel poses a trade-off between household welfare gains
and a shrinking production capacity for the West Bank economy.
Contrasting the long and short-term effects, this thesis shows that increased employment
of Palestinians in Israel improves household welfare in both cases. While it stimulates the
domestic economy in the short-term by absorbing a large fraction of the unemployed labour
and by boosting household consumption, in the long-term it increases the domestic wages
and removes incentives for domestic employers to invest and hire. Moreover, the inflow of
labour income from Israel has “Dutch disease” effects through a real appreciation of the
domestic currency, reducing the competitiveness of the West Bank export industry in the
international markets. This in turn reduces incentives for domestic firms and contributes to
shrinking the domestic economy. This finding has important policy implications as
policymakers would aim at keeping the welfare gains of Palestinian employment in Israel
while reducing its negative effects on domestic production.
In Chapter 9, the question of the optimal trade regime in a future Palestinian state (research
objective five) has been investigated. Compared to previous studies which mostly used a
descriptive analysis, this thesis allows for the quantification of the implications of different
trade regimes on the West Bank economy. The chapter uses the newly developed SAM
with a detailed representation of the West Bank trade partners to analyse the effects of
differentiated policies towards specific trade partners. The simulation results show that the
elimination of tariffs on imports from all trade partners outperforms the other simulated
trade regimes. Liberalising trade in the West Bank improves all macroeconomic indicators
as compared to the status quo of a continued customs union with Israel. In contrast,
218
Chapter 10
introducing new tariffs on imports from Israel hurts the West Bank economy and generates
an outcome that is worse than a continued customs union with Israel. Consequently, a
sovereign Palestinian state may want to adopt a liberal and non-discriminatory trade
regime. Adopting such a trade policy can diversify Palestinian trade and reduce trade
diversion, which is caused by the current customs union.
The results also show that eliminating the in-quota tariffs hardly affects the import of
agricultural and food products, as the import quotas become binding and the domestic
agricultural and food sector are shielded against import competition. However, doubling
the import quotas improves consumer welfare, though it reduces the welfare of producers
of those products. The net effect is a welfare gain in the West Bank. This finding highlights
the trade-off between food sovereignty and net welfare improvements through trade.
The assessment of alternative trade regimes, assuming that after the exit from the customs
union with Israel, the West Bank concludes a preferential trade agreement with Israel or
enters a Greater Arab customs union, all yield moderate results compared to the scenario
with the introduction of high (most-favoured-nation) tariffs on imports from Israel.
However, both scenarios are worse than the status quo and hence are less desirable than a
continued customs union with Israel. This highlights the importance of “free” trade with
Israel for the West Bank economy as, from both economic and geographic perspectives,
Israel is the main outlet for Palestinian trade. Finally, the results show that monetary
policies have a substantial impact on the magnitude of trade policy effects.
10.2. Contributions to the state of knowledge
The contributions of this thesis to the state of knowledge are threefold: i) the construction
of a SAM for the West Bank; ii) the assessment of the implications of different labour
market conditions for simulation results; and iii) the extension of trade and production
modules in CGE models to capture the particularities of trade and labour markets in
conflict-affected regions, especially the West Bank, and the modelling of multi-stage utility
functions to represent household preferences.
The West Bank SAM is a contribution to the global effort to build reliable databases that
can serve as benchmarks for simulation models and inform policy decisions. This SAM is
highly disaggregated and flexible to allow its future users to adopt alternative
classifications depending on the research question. An Input-Output Table is derived from
the SAM and is submitted to the Global Trade Analysis Project (GTAP) to be included in
their global database. Hence, it will be available to the international community of
researchers to address policy-relevant questions in the West Bank.
Concluding remarks
219
In the process of compiling the SAM, this thesis takes proper account of the remuneration
of labour for the self-employed. Restricting the labour share of value added to the
compensation of employees suffers from a major limitation because it omits the
contribution of the self-employed to labour income. In this thesis, a combination of the
Gindling et al. (2016) and the Young (1995) approaches is adopted. First, the self-employed
are identified from the labour force survey database and are matched with wage-workers
based on socioeconomic characteristics such as sector of employment, age, gender, and
education level. Then, wages for the wage-workers are attributed to the self-employed plus
the earning premium estimated by Gindling et al. (2016).
The West Bank SAM, unlike most of the existing social accounting matrices recognises
that households derive income from unincorporated capital. Household activity is often
disregarded as it usually refers to small-scale, informal and non-market activities (Round,
2003). Household activity includes both family enterprises (which employ family
members) and micro enterprises (which hire employees). The income earned by such an
activity clearly represents both returns to labour and to capital. The extent to which earlier
SAMs have taken proper consideration of household income from unincorporated capital
is unclear in most cases. However, this problem is explicitly tackled in this thesis.
This thesis makes another contribution to knowledge by assessing – in Chapter 6 – the
implications of different model specifications to depict the labour market conditions in
conflict-affected regions, especially in the West Bank. The STAGE-2 model was used as a
starting point. The technical tasks required to extend the production module and introduce
these model specifications are described in Appendix 1. The results highlight that the
assumptions embedded in each model specification have substantial effects on the
simulation results. All the model specifications have their merits and demerits. Hence, the
choice of a specification should be backed up with an economic theory, the empirical
evidence of the market conditions to be captured, and the time horizon of the analysis.
In Chapter 8, this thesis innovates by adopting a nested utility function combining the
benefits of LES and CES functions to depict households preferences with differentiated
functional forms and achieve a greater flexibility in assigning elasticity of substitution at
each stage of the nest. Although the use of multi-stage utility functions is not new, the
combination of LES and CES functions has been rarely contemplated (Aragie et al., 2017).
The study results show how sensitive simulation results could be to the choice of the nested
utility structure, which is demonstrated regarding the substitution of leisure and non-leisure
commodities. Hence, the choice of a nested utility structure should be backed up with
theory and empirical studies, especially with regard to which commodities are considered
substitutes or complements.
Chapter 10
220
In terms of modelling the trade relations in conflict-affected regions, this thesis combines
several existing methods in an innovative way. The thesis – in Chapter 9 – explicitly
accounted for a multi-trade partner set-up, the differentiation between large and small trade
partners, and the presence of tariff-rate-quotas on agricultural and food products. These
model specifications increased the relevance of the model for policy analysis.
10.3. Policy implications
The thesis shows that reducing barriers to the movement of goods, services and labour in
conflict-affected regions has substantial economic implications, especially for the
vulnerable party engaged in the conflict. In the case of the Palestinian-Israeli conflict, the
applications conducted in this thesis contributed to the identification of administrative and
political options for the Palestinian National Authority to regulate the labour markets and
design an optimal trade regime.
The findings in Chapter 7 and Chapter 8 highlight that increasing Palestinian employment
in Israel improves household welfare and can contribute to a more equal income
distribution in the West Bank. While in the short-term the shock stimulates both
consumption and production in the West Bank economy, in the long-term, it reduces
economic growth by bidding up wages and reducing the competitiveness of the West Bank
export industry. Seen the limited development options in the West Bank, it may be
interesting for the Palestinian National Authority to seek an increased Palestinian
employment in Israel in order to improve the welfare of Palestinian households, while
simultaneously mitigating the negative effects on the domestic economy in the long-term.
In order to achieve this goal, the PNA could levy a tax on Palestinian workers employed in
Israel. This tax will generate additional revenue for the PNA. With this revenue, incentives
could be given to domestic employers to invest and upgrade their production technologies
in order to restore their competitiveness in the international markets. The tax would also
reduce the attractiveness of employment in Israel, keep some workers in the domestic
market activities and limit the structural dependence on the Israeli labour market. By
incentivising the private sector, employment opportunities would be generated in the
domestic market and the eventual loss of employment in Israel, subsequent to the
implementation of the tax, would be compensated by employment in the domestic market.
With respect to an optimal trade regime, this thesis points out that the West Bank would be
better off with a liberal and non-discriminatory trade policy. The results show that Israel is
likely to remain the dominant trade partner for the West Bank. Therefore, the Palestinian
National Authority should seek the freest possible movement of goods and services
Concluding remarks
221
between the West Bank and Israel. A preferential trade regime with Israel, assuming the
introduction of moderate tariffs on imports/exports from/to Israel – though worse than the
current status quo – is more desirable than trading with Israel under the most-favoured-
nation trade regime. Though a greater integration of the West Bank, and Palestine as a
whole, with the other Arab countries is important, it cannot be a substitute to the economic
links with Israel, since Israel will remain – for both economic and geographic reasons – the
main trade partner for the West Bank. The thesis results also show that the monetary policy
adopted has strong implications for the magnitude of the effects of any trade regime.
Subsequently, the Palestinian National Authority should seek the fullest control over its
national currency and exchange rate in the future. Finally, the tariff-rate-quota system on
agricultural and food products effectively shields the domestic sectors against import
competition, but at the cost of consumer welfare. Hence, maintaining the system or
changing the tariff-rate-quotas is a political decision between achieving a certain level of
food sovereignty or taking advantage of the benefits of trade.
10.4. Limitations of the thesis and suggestions for future research
This thesis left some caveats that could be explored with future research endeavours.
With respect to the labour markets, the two applications conducted in Chapter 7 and
Chapter 8 used the “best” available model specifications to represent the market conditions
in the West Bank in relation to the time horizon of the analysis. However, as shown in
Chapter 6, each of these model specifications has its demerits. The labour surplus
specification is likely to overstate the effect of the simulated policy change on employment,
absorption and welfare. The implicit assumption that labour has zero opportunity cost
outside the SNA production is unlikely to hold as households derive welfare from the
services produced by those activities outside the boundary (McDonald, 2018). Moreover
the assumption that labour can enter the boundary at fixed wages is open to challenges, as
the empirical evidence shows that wages increase together with the level of employment at
least in the medium to long-term (Boeters and Savard, 2011).
The labour-leisure trade-off has the inconvenience of being inconsistent with involuntary
unemployment. While it may be reasonable to assume for a normal economy that, in the
long-term, labour has always the possibility to be either employed within the SNA
boundary or be self-employed in the activities outside the boundary, in a troubled economy
like that of the West Bank, involuntary unemployment is a structural problem that could
persist even in the long-term. The Palestinian economy achieved a state close to full
employment only during the years of the open borders policy between Israel and the
Palestinian territories. The free movement of labour in the 70s and 80s, with the Israeli
Chapter 10
222
economy absorbing about one third of the Palestinian labour force, compensated for the
small size of the domestic Palestinian economy to employ the relatively large and young
labour force (Arnon and Bamya, 2007). However, this state of “free” movement into the
Israeli market is unlikely to hold even in a final solution to the conflict. Therefore, the
labour-leisure trade-off specification, by assuming no involuntary unemployment, is likely
to understate the effect of the policy change on employment and absorption.
Given these insights, future research is needed to come up with a model specification that
is consistent with standard economic theories, allows labour transfer across the production
boundary while capturing the welfare changes generated outside the boundary, and
accounts for involuntary unemployment.
With respect to the trade policy implemented in Chapter 9, in order to assess the isolated
effects of various trade regimes in the West Bank, the analysis ignored some aspects that
may affect the range of possibilities. The analysis did not account for any retaliation policy
Israel may take against the West Bank, whether related to trade or to labour movement, if
Palestine exits the current customs union. The assumption that everything else than the
levels of tariffs remain as in the base (ceteris paribus) was applied. Hence, the benefits of
removing the existing internal closures if Palestine gained sovereignty are not modelled,
and the costs of keeping a customs administration at the borders are also not accounted for.
Future research could address these questions in an isolated way to investigate their
individual effects on the West Bank economy, and in a combined way to evaluate the net
effect.
Finally, the applications conducted in this thesis focused on a particular conflict, and on the
specificities of the West Bank economy. Hence, the conclusions cannot be generalised to
other cases without caution. The debate on conflict and trade, including the movement of
labour to supply services abroad, is very case-specific.

223
REFERENCES

References
224
References
225
References
Abed, G.T., 1996. The prospects for long-term sustainable growth. In: Conference on the
Palestinian economy: Towards a Vision. Ramallah: Arab Economists Association (AEA), p.
45.
Abu Hanieh, A., AbdElall, S., Hasan, A., 2014. Sustainable development of stone and marble sector
in Palestine. J. Clean. Prod., Special Volume: The sustainability agenda of the minerals and
energy supply and demand network: an integrative analysis of ecological, ethical, economic,
and technological dimensions 84, pp. 581–588. DOI:
https://doi.org/10.1016/j.jclepro.2013.10.045
Aix Group, 2005. Israel and Palestine: Between Disengagement and the economic road map.
[Online] Marseille: Aix Group, p.30. Available at http://www.aix-group.org [Accessed 10
November 2013].
Aix Group, 2004. Economic Road Map: An Palestinian-Israeli perspective on permanent status.
[Online] Marseille: Aix Group, p. 28. Available at http://www.aix-group.org [Accessed 10
November 2013].
Akkaya, S., Fiess, N., Kaminski, B., Raballand, G., 2008. Economics of Policy-Induced
Fragmentation: The Costs of Closures Regime to West Bank and Gaza. [Online] Washington
DC: The World Bank, Middle East and North Africa Working Paper No. 50, p. 43. Available
at http://documents.worldbank.org [Accessed 20 November 2013].
Alderman, H., Sahn, D.E., 1993. Substitution between goods and leisure in a developing country.
Am. J. Agric. Econ. 75, pp. 875–883.
Aragie, E., Dudu, H., Ferrari, E., Mainar, A., McDonald, S., Thierfelder, K., 2017. STAGE_DEV.
A variant of the STAGE model to analyse developing countries, EUR 28627 EN;
doi:10.2760/90737.
Aranki, T.N., 2006. The effect of Israeli closure policy on wage earnings in the West Bank and
Gaza Strip. [Online] Örebro: Örebro University, Working Paper No 4, 2004, p. 39. Available
at http://www.oru.se/esi/wps [Accessed 17 March 2014].
Argy, V., McKibbin, W.J., Siegloff, E., 1989. Exchange-rate regimes for a small economy in a
multi-country world. [Online] Princeton: Princeton University, Studies in the international
finance No. 67, p. 56. Available at https://www.princeton.edu [Accessed 06 April 2017].
Arndt, C., Chinowsky, P., Strzepek, K., Thurlow, J., 2012. Climate change, growth and
infrastructure investment: the case of Mozambique. Rev. Dev. Econ. 16, pp. 463–475.
Arnon, A., 2007. Israeli policy towards the occupied Palestinian territories: The economic
dimension, 1967-2007. Middle East J. 61, pp. 573–595.
Arnon, A., Bamya, S., 2007. Economic Dimensions of a Two-State Agreement Between Israel and
Palestine. [Online] Marseille: Aix Group, p. 257. Available at http://www.aix-group.org
[Accessed 10 April 2014].
Arnon, A., Weinblatt, J., 2001. Sovereignty and Economic Development: The Case of Israel and
Palestine. Econ. J. 111, pp. 291–308.
Aronsson, T., Löfgren, K.-G., 2010. An introduction to the theory of social accounting. In:
Handbook of environmental accounting, [eds] T. Aronsson & K.-G. Löfgren, Cheltenham:
Edward Elgar Publishing, pp. 1-27. DOI: https://doi.org/10.4337/9781849805704.00006
Astrup, C., Dessus, S., 2005. Exporting goods or exporting labor?: long-term implications for the
palestinian economy. Rev. Middle East Econ. Finance 3, pp. 39–61.

References
226
Astrup, C., Dessus, S., 2001. Trade options for the Palestinian economy: some orders of magnitude.
[Online] Washington DC: The World Bank, Middle East and North Africa Working Paper
No. 21, p. 52. Available at http://documents.worldbank.org [Accessed 27 October 2013].
Atkinson, A.B., 2009. Factor shares: the principal problem of political economy? Oxf. Rev. Econ.
Policy 25, 3–16.
Bacchetta, M., Beverelli, C., Cadot, O., Fugazza, M., Grether, J.-M., Helble, M., Nicita, A.,
Piermartini, R., 2012. A practical guide to trade policy analysis. [Online] Geneva: United
Nations and World Trade Organization, p. 236. Available at http://vi.unctad.org/tpa
[Accessed 02 October 2013].
Banse, M., Shutes, L., Dixon, P., Van Meijl, H., Rimmer, M., Tabeau, A., Woltjer, G., Rothe, A.,
others, 2013. Factor Markets in General Computable Equilibrium Models. [Online] Brussels:
Centre for European Policy Studies, p. 64. Available at www.ceps.eu [Accessed 10 October
2017].
Barbieri, K., Levy, J.S., 1999. Sleeping with the enemy: The impact of war on trade. J. Peace Res.
36, pp. 463–479.
Barbieri, K., Schneider, G., 1999. Globalization and peace: Assessing new directions in the study
of trade and conflict. J. Peace Res. 36, pp. 387–404.
Baumol, W.J., 2000. Leontief’s great leap forward: beyond Quesnay, Marx and von Bortkiewicz.
Econ. Syst. Res. 12, pp. 141–152.
Bayar, A., 2013. Social Accounting Matrix for Palestine, reference year 2011. Ramallah:
Palestinian Central Bureau of Statistics, Unpublished database.
Benmelech, E., Berrebi, C., Klor, E.F., 2010. The Economic Cost of Harboring Terrorism. J. Confl.
Resolut. 54, pp. 331–353.
Bhavnani, R., Miodownik, D., Choi, H.J., 2011. Three two tango: Territorial control and selective
violence in Israel, the West Bank, and Gaza. J. Confl. Resolut. 55, pp. 133–158.
Blanchflower, D.G., Oswald, A.J., 1995. An introduction to the wage curve. J. Econ. Perspect. 9,
pp. 153–167.
Boeters, S., Savard, L., 2011. The labour market in CGE models. [Online] Mannheim: ZEW -
Centre for European Economic Research, Discussion Paper No 11-079, p. 100. Available at
https://www.zew.de/ [Accessed 27 March 2014].
Botta, A., 2010. The Palestinian economy and its trade pattern: Stylized facts and alternative
modelling strategies. [Online] Munich: MPRA - Munich Personal RePEc Archive,
Discussion Paper No 29719, p. 35. Available at https://mpra.ub.uni-muenchen.de/29719/
[Accessed 12 April 2015].
Breisinger, C., Thomas, M., Thurlow, J., 2009. Social accounting matrices and multiplier analysis:
An introduction with exercises. [Online] Washington DC: IFPRI - International Food Policy
Research Institute, p. 35. Available at www.ifpri.org DOI: 10.2499/9780896297838fsp5
B’Tselem - Israeli Information Center for Human Rights in the Occupied Territories, 2017. Figures
on comprehensive closure days. [Online]
https://www.btselem.org/freedom_of_movement/siege_figures [Accessed 17 January 2018].
Bulmer, Elizabeth Ruppert, 2003. The Impact of Israeli Border Policy on the Palestinian Labor
Market. Econ. Dev. Cult. Change 51, pp. 657–676. https://doi.org/10.1086/374801
Cardenete, M.A., Guerra, A.-I., Sancho, F., 2017. Applied general equilibrium: an introduction.
Heidelberg: Springer, p. 118. DOI 10.1007/978-3-642-24746-0
References
227
Cattaneo, O., Engman, M., Sáez, S., Stern, R.M., 2010. International trade in services: New trends
and opportunities for developing countries. Washington DC: The World Bank. p. 388. DOI:
10.1596/978-0-8213-8353-7
Chang, Y.-C., Polachek, S.W., Robst, J., 2004. Conflict and trade: the relationship between
geographic distance and international interactions. J. Socio-Econ. 33, pp. 491–509.
COGAT - Coordination of Government Activities in the Territories, 2014. Status of permits for
Palestinians wishing to enter Israel, travel abroad or cross from the Judea and Samaria Area
to the Gaza Strip: The situation regarding permits in the Judea and Samaria Area, March 16,
2014. [Online] http://www.cogat.mod.gov.il/en/ [Accessed 01 August 2015].
Crivelli, P., Gröschl, J., 2016. The impact of sanitary and phytosanitary measures on market entry
and trade flows. World Econ. 39, pp.444–473.
Croes, R., Rivera, M.A., 2016. Tourism's potential to benefit the poor: a Social Accounting Matrix
model applied to Ecuador. Tour. Econ. 23(1), pp. 29 - 48. DOI: 10.5367/te.2015.0495
De Boer, P., Missaglia, M., 2006. Estimation of income elasticities and their use in a CGE model
in Palestine. [Online] Rotterdam: Econometric Institute, Report EI 2006-12, p. 17. Available
at https://repub.eur.nl/pub/ [Accessed 23 March 2018].
Dee, P., Hanslow, K., Phamduc, T., 2014. Measuring the cost of barriers to trade in services. In: Trade in Services in the Asia Pacific Region, NBER East Asia Seminar on Economics
(EASE), Volume11, [eds] T. Ito & A. Krueger, Chicago: University of Chicago Press, pp.
11-46.
Del Sarto, R.A., 2014. Defining borders and people in the borderlands: EU policies, Israeli
prerogatives and the Palestinians. JCMS J. Common Mark. Stud. 52, pp. 200–216.
Dessus, S., 2004. A Palestinian growth history, 1968-2000. J. Econ. Integr. pp. 447–469.
Di Giovanni, J., Levchenko, A.A., Ortega, F., 2015. A global view of cross-border migration. J.
Eur. Econ. Assoc. 13, pp. 168–202.
Dorussen, H., 2006. Heterogeneous trade interests and conflict: What you trade matters. J. Confl.
Resolut. 50, pp. 87–107.
Elkhafif, M.A., Mussayaf, M., Elagraa, M., 2014. Palestinian Fiscal Revenue Leakage to Israel
under the Paris Protocol on Economic Relations. United Nations Conference on Trade and
Development. [Online] Geneva: UNCTAD - United Nations Conference on Trade and
Development, p. 58. Available at http://unctad.org [Accessed 13 April 2015].
Elmusa, S.S., El-Jaafari, M., 1995. Power and trade: The Palestinian-Israeli economic protocol. J.
Palest. Stud. 24, pp. 14–32.
Eltalla, H., Hens, L., 2009. The Impact of Trade Transaction Costs on Palestine. In: International
Trade and Finance Association Conference, p. 16. Available at http://services.bepress.com/itfa/19th/art4 [Accessed 10 April 2015]
Etkes, H., 2012. The Impact of Employment in Israel on the Palestinian Labor Force. Peace Econ.
Peace Sci. Public Policy 18, Issue 2, pp. 1 - 36.
Farsakh, L., 2002. Palestinian Labor Flows to the Isreali Economy: A Finished Story? J. Palest.
Stud. 32, pp. 13–27.
Fernández-Villaverde, J., Guerrón-Quintana, P., Kuester, K., Rubio-Ramírez, J., 2015. Fiscal
volatility shocks and economic activity. Am. Econ. Rev. 105, pp. 3352–3384.
Fischer, S., Alonso-Gamo, P., Von Allmen, U.E., 2001. Economic developments in the West Bank
and Gaza since Oslo. Econ. J. 111, pp. 254–275.
References
228
Fjeldstad, O.-H., al-Zagha, A., 2004. Taxation during State Formation: Lessons from Palestine,
1994–2000, in: Forum for Development Studies. Taylor & Francis, pp. 89–113.
Flaig, D., 2014. Factor mobility and heterogeneous labour in computable general equilibrium
modelling. PhD. University of Hohenheim.
Flaig, D., Siddig, K., Grethe, H., Luckmann, J., McDonald, S., 2013a. Relaxing Israeli restrictions
on Palestinian labour: Who benefits? Econ. Model. 31, pp. 143–150.
Flaig, D., Grethe, H., McDonald, S., 2013b. Imperfect Labour Mobility in a CGE Model: Does
Factor Specific Productivity Matter. In 2013 Annual Conference on Global Economic
Analysis (GTAP-2013), p. 24. Available at https://www.gtap.agecon.purdue.edu/resources/
[Accessed 12 October 2014]
Flaig, D., Rubin, O., Siddig, K., 2013c. Imperfect competition, border protection and consumer
boycott: The future of the dairy industry in Israel. J. Policy Model. 35, pp. 838–851.
Frisch, H., Hofnung, M., 1997. State formation and international aid: The emergence of the
Palestinian authority. World Dev. 25, 1243–1255. https://doi.org/10.1016/S0305-
750X(97)00028-4
Funke, K., Koske, I., 2008. Does the law of one price hold within the EU? A panel analysis. Int.
Adv. Econ. Res. 14, pp. 11–24.
Gartzke, E., Li, Q., Boehmer, C., 2001. Investing in the peace: Economic interdependence and
international conflict. Int. Organ. 55, pp. 391–438.
Gilbert, J., Tower, E., 2012. Introduction to Numerical Simulation for Trade Theory and Policy.
Singapore: World Scientific Publishing Company.
Gindling, T.H., Mossaad, N., Newhouse, D.L., 2016. Earnings premiums and penalties for self-
employment and informal employees around the world. [Online] Washington DC: The World
Bank, Policy Research Working Paper 7530, p. 42. Available at
http://documents.worldbank.org [Accessed 27 September 2017].
GISHA - Legal center for freedom of movement, 2015. Exit of goods from Gaza via Kerem Shalom
Crossing. [Online] http://gisha.org/graph/2401, [Accessed 25 September 2015].
Goenner, C.F., 2010. From toys to warships: Interdependence and the effects of disaggregated trade
on militarized disputes. J. Peace Res. 47, pp. 547–559.
Gollin, D., 2002. Getting income shares right. J. Polit. Econ. 110, pp. 458–474.
Gronau, R., Hamermesh, D.S., 2006. Time vs. goods: The value of measuring household production
technologies. Rev. Income Wealth 52, pp. 1–16.
Guerriero, M., 2012. The labour share of income around the world. Evidence from a panel dataset.
Dev. Econ. Public Policy Work. Pap. 32, 2012.
Halbrendt, C., Gempesaw, C., Dolk-Etz, D., Tuan, F., 1994. Rural Chinese food consumption: the
case of Guangdong. Am. J. Agric. Econ. 76, pp. 794–799.
Haughton, J., Khandker, S.R., 2009. Handbook on poverty and inequality. Washington DC: The
World Bank, p. 446. DOI: 10.1596/978-0-8213-7613-3
Hegre, H. avard, Oneal, J.R., Russett, B., 2010. Trade does promote peace: New simultaneous
estimates of the reciprocal effects of trade and conflict. J. Peace Res. 47, pp. 763–774.
Heilmann, K., 2016. Does political conflict hurt trade? Evidence from consumer boycotts. J. Int.
Econ. 99, pp. 179–191.
Herrendorf, B., Rogerson, R., Valentinyi, Á., 2014. Growth and structural transformation. In:
Handbook of Economic Growth, [eds] P. Aghion & N. Durlauf. New-York: Elsevier, pp.
855–941. DOI: https://doi.org/10.1016/B978-0-444-53540-5.00006-9
References
229
Huang, K.S., 1993. A complete system of US demand for food. Washington DC: United States
Department of Agriculture, Economic Research Service Technical Bulletin No 1821, p. 76.
Ihle, R., Rubin, O.D., 2013. Consequences of unintended food policies: Food price dynamics
subject to the Israeli–Palestinian conflict. Food Policy 42, pp. 96–105.
ILO - International Labour Office, 2013. Revision of the International Classification of Status in
Employment (ICSE-93). In: 19th International Conference of Labour Statisticians. Geneva:
ILO, p.47.
ILO, 2012. International Standard Classification of Occupations (ISCO-08): structure, group
definitions and correspondence tables. [Online] Geneva: ILO, p. 433. Available at
https://www.ilo.org [Accessed 01 August 2017].
IMF - International Monetary Fund, 2016. West Bank and Gaza: Report to the Ad Hoc Liaison
Committee. [Online] Washington DC: IMF, p. 52. Available at https://www.imf.org/wbg
[Accessed 07 September 2017].
IMF, 2014. West Bank and Gaza, report on macroeconomic developments and outlook. [Online]
Washington DC: IMF, p. 39. Available at https://www.imf.org/wbg [Accessed 13 April
2015].
IMF, 2013. Staff report prepared for the September 2013 meeting of the ad hoc liaison committee.
[Online] Washington DC: IMF, p. 39. Available at https://www.imf.org/wbg [Accessed 05
May 2015].
Jaeger, D.A., Paserman, M.D., 2008. The cycle of violence? An empirical analysis of fatalities in
the Palestinian-Israeli conflict. Am. Econ. Rev., pp. 1591–1604.
Kanafani, N., 2001. Trade–A Catalyst for Peace? Econ. J., pp. 276–290.
Kanafani, N., 1996. Trade relations between Palestine and Israel. Jerusalem: Palestinian Economic
Policy Research Institute (MAS), p. 74.
Keeney, R., Hertel, T., 2005. GTAP-AGR: A framework for assessing the implications of
multilateral changes in agricultural policies. [Online] West-Lafayette: Global Trade Analysis
Project (GTAP), Technical paper 25, p. 62. Available at
https://docs.lib.purdue.edu/gtaptp/25/ [Accessed 12 October 2016].
Keshk, O.M., Pollins, B.M., Reuveny, R., 2004. Trade still follows the flag: The primacy of politics
in a simultaneous model of interdependence and armed conflict. J. Polit. 66, pp. 1155–1179.
Kim, H.M., Rousseau, D.L., 2005. The Classical Liberals Were Half Right (or Half Wrong): New
Tests of the ‘Liberal Peace’, 1960-88. J. Peace Res. 42, pp. 523–543.
Kock, U., Qassis, H., 2011. West Bank and Gaza: recent developments in clearance revenues.
[Online] Washington DC: IMF, p. 5. Available at https://www.imf.org/wbg [Accessed 13
April 2014].
Kock, U., Sumlinski, M., Qassis, H., 2012. West Bank and Gaza: Labor markets trends, growth and
unemployment. [Online] Washington DC: IMF, p. 7. Available at https://www.imf.org/wbg
[Accessed 19 October 2014].
Kurz, H.D., Salvadori, N., 2000. ’Classical’roots of input-output analysis: A short account of its
long prehistory. Econ. Syst. Res. 12, pp. 153–179.
Kurz, H.D., Salvadori, N., others, 1995. Theory of production. Long-Period Analysis. Cambridge:
Cambridge University Press, p. 592.
Larudee, M., 2012. Who shared the fruits of growth in the Palestinian economy, 2006-2010?
Jerusalem: Palestinian Economic Policy Research Institute (MAS), p. 144.
References
230
Lofgren, H., Cicowiez, M., 2017. A proximity-based approach to labor mobility in CGE models
with an application to Sub-Saharan Africa. J. Glob. Econ. Anal. 2, pp. 120–165.
Long, A.G., 2008. Bilateral trade in the shadow of armed conflict. Int. Stud. Q. 52, pp. 81–101.
Malul, M., Mansury, Y., Hara, T., Saltzman, S., 2008. An Economic Development Road Map for
Promoting Palestinian-Israeli Cooperation. Peace Econ. Peace Sci. Public Policy 14, Issue 1,
pp. 1-24.
Mansfield, E.D., Reinhardt, E., 2003. Multilateral determinants of regionalism: The effects of
GATT/WTO on the formation of preferential trading arrangements. Int. Organ. 57, pp. 829–
862.
Mansour, H., 2010. The effects of labor supply shocks on labor market outcomes: Evidence from
the Israeli–Palestinian conflict. Labour Econ. 17, pp. 930–939.
MAS - Palestinian Economic Policy Research Institute, PCBS - Palestinian Central Bureau of
Statistics, PMA - Palestinian Monetary Authority, 2013. Economic and Social Monitor
Annual Volume 2012. [Online] Ramallah: MAS, PCBS, PMA, p. 168. Available at
https://www.mas.ps [Accessed 07 September 2015].
McDonald, S., 2018. The labour market and production boundary in CGE models. Berlin:
Humboldt University of Berlin. Unpublished paper.
McDonald, S., Thierfelder, K., 2009. STAGE_LAB: An applied general equilibrium model with
enhanced labour markets: technical documentation. [Online] Oxford: Oxford Brookes
University, p. 81. Available at https://www.cgemod.org.uk [Accessed 16 November 2013].
McDonald, S., Thierfelder, Karen, 2013. A Static Applied General Equilibrium Model: Technical
Documentation - STAGE Version 2. [Online] Oxford: Oxford Brookes University, p. 87.
Available at https://www.cgemod.org.uk [Accessed 10 April 2014].
McDonald, Scott, Thierfelder, Karen, 2015. Globe v1: A SAM based Global CGE Model using
GTAP Data. [Online] Berlin: Humboldt University of Berlin, p. 104. Available at
https://www.cgemod.org.uk [Accessed 25 November 2015].
Miaari, S.H., Sauer, R.M., 2011. The labor market costs of conflict: closures, foreign workers, and
Palestinian employment and earnings. Rev. Econ. Househ. 9, pp. 129–148.
Miller, R.E., Blair, P.D., 2009. Input-output analysis: foundations and extensions. Cambridge:
Cambridge University Press, p. 768.
Missaglia, M., Valensisi, G., 2014. Trade policy in Palestine: A reassessment. J. Policy Model. 36,
pp. 899–923.
MoF - Ministry of Finance, 2012a. Fiscal development and macroeconomic performance: Fourth
quarter and fiscal year 2011. [Online] Ramallah: Palestinian National Authority, Ministry of
Finance, Macro Fiscal Unit, p. 18. Available at http://www.pmof.ps/en [Accessed 18
December 2014].
MoF - Ministry of Finance, 2012b. Annual financial report for fiscal year 2011. [Online] Ramallah:
Palestinian National Authority, Ministry of Finance, Macro Fiscal Unit, p. 5. Available at http://www.pmof.ps/en [Accessed 18 November 2014]
MoF - Ministry of Finance, 2012c. Report on fiscal operations in 2011. [Online] Ramallah:
Palestinian National Authority, Ministry of Finance, Macro Fiscal Unit, p. 18. Available at http://www.pmof.ps/en [Accessed 27 August 2014].
Morrow, J.D., 1999. How could trade affect conflict? J. Peace Res. 36, pp. 481–489.
Naqib, F.M., 2003. Economic aspects of the Palestinian—Israeli conflict: the collapse of the Oslo
Accord. J. Int. Dev. 15, pp. 499–512.

References
231
Njegovan, N., 2006. Elasticities of demand for leisure air travel: A system modelling approach. J.
Air Transp. Manag. 12, pp. 33–39.
OECD - Organization for Economic Cooperation and Development, 2012. What are equivalence
scales? [Online] Paris: OECD, p. 2. Available at http://www.oecd.org/ [Accessed 20 October
2013].
Oneal, J.R., 2003. Measuring interdependence and its pacific benefits: A reply to Gartzke & Li. J.
Peace Res. 40, pp. 721–725.
Oneal, J.R., Russett, B.M., 2015. The Kantian peace: The pacific benefits of democracy,
interdependence, and international organizations, 1885–1992. In: Bruce M. Russett: Pioneer
in the Scientific and Normative Study of War, Peace, and Policy, [ed] H. Starr, Heidelberg:
Springer, pp. 74–108. DOI 10.1007/978-3-319-13850-3.
Orefice, G., 2017. Non-Tariff Measures, Specific Trade Concerns and Tariff Reduction. World
Econ. 40, pp. 1807–1835.
PCBS - Palestinian Central Bureau of Statistics, 2017a. Registered Foreign Trade Statistics: goods
and services in 2016. [Online] Ramallah: PCBS, p. 182. Available at http://www.pcbs.gov.ps
[Accessed 14 December 2017]
PCBS, 2017b. National accounts at current and constant prices, 2016. [Online] Ramallah: PCBS,
p. 121. Available at http://www.pcbs.gov.ps [Accessed 14 December 2017]
PCBS, 2017c. Major national accounts variables in Palestine for 1994 - 2016. [Online] Ramallah:
PCBS. Available at http://www.pcbs.gov.ps [Accessed 17 January 2018]
PCBS, 2017d. Labour Force Survey: Annual report 2016. [Online] Ramallah: PCBS, p. 162.
Available at http://www.pcbs.gov.ps [Accessed 14 December 2017]
PCBS, 2017e. Unemployment Rate Among labour Force Participants of Persons Aged 15 Years
and Above in Palestine by Sex and Governorate, 2000-2015. [Online] Ramallah: PCBS.
Available at http://www.pcbs.gov.ps [Accessed 30 October 2017]
PCBS, 2017f. Average Daily Wage in NIS for Wage Employees Aged 15 Years and Above in
Palestine by Region and Governorate (Israel and Settlements are Excluded), 2000-2015.
[Online] Ramallah: PCBS. Available at http://www.pcbs.gov.ps [Accessed 30 October 2017]
PCBS, 2016a. Number and percentage of employed persons aged 15 years and above who are
working in Israel and Settlements from Palestine by possession of the work permit, 2005 -
2015. [Online] Ramallah: PCBS. Available at http://www.pcbs.gov.ps [Accessed 01 August
2017]
PCBS, 2016b. Balance of Payments for the Palestinian territories 1994 – 2014. [Online] Ramallah:
PCBS. Available at http://www.pcbs.gov.ps [Accessed 20 May 2017]
PCBS, 2016c. Land Use statistics 2000 - 2011. [Online] Ramallah: PCBS, p. 18. Available at http://www.pcbs.gov.ps [Accessed 20 May 2017]
PCBS, 2016d. Foreign investment statistics in Palestine. [Online] Ramallah: PCBS. Available at http://www.pcbs.gov.ps [Accessed 20 May 2017]
PCBS, 2014a. Supply and Use Table for the West Bank territory for the year 2004. Ramallah:
PCBS. Unpublished data.
PCBS, 2014b. National Accounts at Current and Constant Prices 1994 – 2012. [Online] Ramallah:
PCBS, p. 157. Available at http://www.pcbs.gov.ps [Accessed 14 September 2015]
PCBS, 2014c. Database of the Palestinian Expenditure and Consumption Survey of 2011.
Ramallah: PCBS. Unpublished data.
References
232
PCBS, 2014d. Database for the Palestinian Labour Force Survey of 2011. [Online] Ramallah:
PCBS. Available at http://www.pcbs.gov.ps [Accessed 15 April 2015]
PCBS, 2013. Outbound visitor survey. [Online] Ramallah: PCBS, p. 67. Available at http://www.pcbs.gov.ps [Accessed 14 December 2016]
PCBS, 2012a. Labour Force Survey Annual Report 2011. [Online] Ramallah: PCBS, p. 151.
Available at http://www.pcbs.gov.ps [Accessed 15 April 2015]
PCBS, 2012b. Establishment Census 2012, Census Preliminary Results. Ramallah, Palestine.
[Online] Ramallah: PCBS, p. 53. Available at http://www.pcbs.gov.ps [Accessed 27 January
2015]
PCBS, 2012c. Economic report 2011. [Online] Ramallah: PCBS, p. 168. Available at http://www.pcbs.gov.ps [Accessed 23 February 2015]
PCBS, 2012d. Hotel activity survey in 2011. [Online] Ramallah: PCBS, p. 76. Available at http://www.pcbs.gov.ps [Accessed 14 December 2016]
PCBS, 2012e. Palestinian Labor Force Survey 2011, database. [Online] Ramallah: PCBS. Available
at http://www.pcbs.gov.ps [Accessed 26 January 2014]
PCBS, 2012f. Foreign trade statistics in 2011, database. [Online] Ramallah: PCBS. Available at http://www.pcbs.gov.ps [Accessed 15 April 2014]
PCBS, 2012g. Palestinians at the end of year 2011. [Online] Ramallah: PCBS, p. 63. Available at http://www.pcbs.gov.ps [Accessed 01 December 2014]
PCBS, 2012h. Living standards in the Palestinian territory. Expenditure, Consumption and Poverty,
2011. [Online] Ramallah: PCBS, p. 156. Available at http://www.pcbs.gov.ps [Accessed 18
November 2014].
PCBS, 2009. Inbound visitor survey. [Online] Ramallah: PCBS, p. 68. Available at http://www.pcbs.gov.ps [Accessed 14 December 2016]
PCBS, 2000. Palestinian Labor Force Survey: Annual report 1999. [Online] Ramallah: PCBS, p.
127. Available at http://www.pcbs.gov.ps [Accessed 31 July 2015]
PCBS - Palestinian Central Bureau of Statistics and PMA - Palestinian Monetary Authority, 2017.
Balance of payments 2016, preliminary results, Ramallah, Palestine. [Online] Ramallah:
PCBS & PMA, p. 51. Available at http://www.pcbs.gov.ps [Accessed 12 December 2017]
PIPA - Palestinian Investment Promotion Agency, 2017. Taxes in Palestine. [Online]
http://www.pipa.ps/page.php?id=1bc27fy1819263Y1bc27f [Accessed 12 December 2015].
Polachek, S., Xiang, J., 2010. How opportunity costs decrease the probability of war in an
incomplete information game. Int. Organ. 64, pp. 133–144.
Posnet, J., Ian, S., 1996. Indirect cost in economic evaluation: the opportunity cost of unpaid inputs.
Health Econ 5, 13–23.
Pyatt, G., 1988. A SAM approach to modeling. J. Policy Model. 10, pp. 327–352.
Pyatt, G., Round, J.I., 1985. Social accounting matrices: A basis for planning. Washington DC: The
World Bank, p. 298.
Reuveny, R., 2000. The trade and conflict debate: A survey of theory, evidence and future research.
Peace Econ. Peace Sci. Public Policy 6, Issue 1, pp. 23 - 49.
Reuveny, R., Kang, H., 1998. Bilateral trade and political conflict/cooperation: do goods matter? J.
Peace Res. 35, pp. 581–602.
Robinson, S., McDonald, S., 2006. User Guide for the SAM estimation program. Oxford: Oxford
Brookes University.
References
233
Rosenhek, Z., 2006. Incorporating Migrant Workers into the Israeli Labour Market? [Online]
Fiesole: European University Institute, CARIM Analytical and Synthetic Notes 2006/10, p.
7. Available at http:// cadmus.eui.eu [Accessed 01 May 2015]
Round, J., 2003. Constructing SAMs for development policy analysis: lessons learned and
challenges ahead. Econ. Syst. Res. 15, pp. 161–183.
Rubin, O.D., Ihle, R., 2016. Measuring Temporal Dimensions of the Intensity of Violent Political
Conflict. Soc. Indic. Res., pp. 1–22.
Schenk, C., Singleton, J., 2011. Basket Pegs and Exchange Rate Regime Change: Australia and
New Zealand in the Mid-Seventies. Aust. Econ. Hist. Rev. 51, pp. 120–149.
https://doi.org/10.1111/j.1467-8446.2011.00327.x
Schiff, M., 2002. Trade Policy and Labor Services: Final Status Options for the West Bank and
Gaza [Online] Washington DC: The World Bank, Policy Research Working Paper 2824, p.
44. Available at http://documents.worldbank.org [Accessed 10 April 2014].
Souva, M., Prins, B., 2006. The liberal peace revisited: The role of democracy, dependence, and
development in militarized inter-state dispute initiation, 1950–1999. Int. Interact. 32, pp.
183–200.
Stein, A.A., 2003. Trade and conflict: Uncertainty, strategic signaling, and inter-state disputes.
Econ. Interdepend. Int. Confl. New Perspect. Endur. Debate, pp. 111–126.
Stephenson, S., Hufbauer, G., 2010. Increasing Labor Mobility: Options for Developing Countries.
Int. Trade Serv. New Trends Oppor. Dev. Ctries, pp. 29–66.
Stone, R., 1962. A social accounting matrix for 1960. London: Chapman and Hall, p. 69.
Thorbecke, E., 2000. The use of social accounting matrices in modeling. In: 26th General
Conference of the International Association for Research in Income and Wealth. Cracow:
International Association for Research in Income and Wealth, p. 48.
UN Contrade - United Nations Commodity and Trade Statistics, 2015. Palestinian trade with Israel
and the rest of the world. [Online] Available at http://comtrade.un.org/data/ [Accessed 28
August 2015].
UNCTAD - United Nations Conference on Trade and Development, 2016. Economic costs of the
Israeli occupation for the Palestinian people. [Online] Geneva: UNCTAD, p. 22. Available
at http://www.unctad.org/ [Accessed 06 January 2017].
UNCTAD, 2015. Report on UNCTAD assistance to the Palestinian people: Developments in the
economy of the Occupied Palestinian Territories. [Online] Geneva: UNCTAD, p. 18.
Available at http://www.unctad.org/ [Accessed 13 April 2016].
UNCTAD, 2012. The Palestinian economy: Macroeconomic and trade policymaking under
occupation. [Online] Geneva: UNCTAD, p. 56. Available at http://www.unctad.org/
[Accessed 04 November 2014].
UNCTAD, 2009. Policy Alternatives for Sustained Palestinian Development and State Formation.
[Online] Geneva: UNCTAD, p. 66. Available at http://www.unctad.org/ [Accessed 17 April
2015].
UNCTAD, 2006. Integrated Simulation Framework for Palestinian macroeconomic, trade and
labour policy. [Online] Geneva: UNCTAD, p. 58. Available at http://www.unctad.org/
[Accessed 01 August 2014].
United Nations, 2009. System of National Accounts 2008. [Online] Available at
https://unstats.un.org/unsd/nationalaccount/sna2008.asp [Accessed 28 November 2017].

References
234
Vaggi, G., Baroud, S., 2005. Asymmetries and economic interaction between Israel and Palestine.
[Online] Pavia: University of Pavia, p. 28. Available at http://economia.unipv.it/eco-
pol/abs/abs173.html [Accessed 12 April 2014]
van der Mensbrugghe, D., Beghin, J.C., Mitchell, D., 2003. Modeling tariff rate quotas in a global
context: the case of sugar markets in OECD countries. CARD Working Papers No. 368.
https://lib.dr.iastate.edu/card_workingpapers/368.
World Bank, 2017a. World Bank development indicators: Israel. [Online] Available at
https://data.worldbank.org [Accessed 17 January 2017].
World Bank, 2017b. World Bank development indicators: West Bank and Gaza. [Online] Available
at https://data.worldbank.org [Accessed 17 January 2017].
World Bank, 2015. Bilateral remittances matrix in 2013. [Online] Available at
http://www.worldbank.org/en/topic/migrationremittancesdiasporaissues/brief/migration-
remittances-data [Accessed 21 May 2016].
World Bank, 2011. West Bank and Gaza coping with conflict? Poverty and Inclusion in the West
Bank and Gaza. [Online] Washington DC: The World Bank, Report No. 61293-GZ, p. 204.
Available at http://documents.worldbank.org [Accessed 11 January 2014].
World Bank, 2008. Palestinian Trade: West Bank Routes. [Online] Washington DC: The World
Bank, Report No. 46807-GZ, p. 29. Available at http://documents.worldbank.org [Accessed
05 May 2015]
World Bank, 2007. Movement and access restrictions in the West Bank: uncertainty and
inefficiency in the Palestinian economy. [Online] Washington DC: The World Bank, Report
No. 40445, p. 18. Available at http://documents.worldbank.org [Accessed 13 April 2015]
World Bank, 2002. Long-term policy options for the Palestinian economy. [Online] Washington
DC: The World Bank, p. 164. Available at http://documents.worldbank.org [Accessed 15
September 2016]
WTO - World Trade Organization, 2016. Israeli tariff book. [Online] Available at
https://ww.wto.org [Accessed 21 May 2015].
Yoshino, N., Kaji, S., Suzuki, A., 2004. The basket-peg, dollar-peg, and floating: A comparative
analysis. J. Jpn. Int. Econ. 18, pp.183–217. https://doi.org/10.1016/S0889-1583(03)00051-0
Young, A., 1995. The tyranny of numbers: confronting the statistical realities of the East Asian
growth experience. Q. J. Econ. 110, pp. 641–680.

235
APPENDICES

Appendices
236
Appendices
237
Appendix 1. Model modifications
The model described in Section 3.6 of Chapter 3 is modified in different ways to depict
some special features of the Palestinian economy that are relevant for the four applications
conducted in this thesis. The model modifications are related to the factor market, the
production, consumption and trade modules. Each section of this appendix deals with one
of the model modifications with all the technical details. The first section presents the
modifications required to introduce a mobility function in the model, and the changes to
the market clearing equations to depict the different specifications examined in Chapter 6.
The second section deals with the modifications incorporated in the model code to extend
the production module, in order to reflect the differentiated composition of the labour force
in the West Bank. This extension is used across all four applications. The third section
describes the model code for depicting households’ preferences via a nested utility function,
as used in Chapter 9. The fourth and last section shows the multi-trade partners
specification used in all four applications. In this section the differentiated treatment
applied to trade partners with small and large shares as well as the modelling of tariff-rate-
quotas in a multi-trade partner context, used in Chapter 9, are also described.
1. Model modifications related to factor markets
1.1. Integration of a mobility function
The labour mobility function used in Chapter 6 and Chapter 8 allows labour to move
between pools or pairs of market segments – i.e. labour employed in a block of sectors –
based on a response elasticity and a wage ratio. This modelling approach was initially
developed by McDonald and Thierfelder (2013) and was later extended by Flaig (2014).
For its implementation, a new set “𝑓𝑚𝑖𝑔” and its alias “𝑓𝑚𝑖𝑔p” are defined for factors that
are assumed to be mobile. In a satellite account, the pairs of market segments between
which a labour mobility is considered are defined. Every worker in a market segment has
the possibility to move, meaning that labour mobility depends on the factor supply in the
base period. The mobility function is governed by a wage ratio (𝑊𝑀𝑂𝐵𝑅𝐴𝑇𝐼𝑂) as defined
in equation [MF1], where 𝐹𝐷 is the demand for factor 𝑓𝑚𝑖𝑔 in activity 𝑎, 𝑊𝐹 the average
wage rate for factor 𝑓𝑚𝑖𝑔, and 𝑊𝐹𝐷𝐼𝑆𝑇 an activity specific factor “efficiency” parameter
capturing differences in the observed productivities of factor 𝑓𝑚𝑖𝑔 in different activities.
The mobility function is activated by a change in relative wages as defined in Equation
[MF2] where 𝐹𝑆𝐼𝑀 is the variable recording the number of workers moving from 𝑓𝑚𝑖𝑔 to

Appendices
238
𝑓𝑚𝑖𝑔. 𝐹𝑆𝐼0 is the initial pool of labour 𝑓 supplied by institution 𝑖𝑛𝑠𝑤, 𝑊𝑀𝑂𝐵𝑅𝐴𝑇𝐼𝑂 is
the wage ratio between wages for 𝑓𝑚𝑖𝑔 and 𝑓𝑚𝑖𝑔𝑝 after the shock and 𝑊𝑀𝑂𝐵𝑅𝐴𝑇𝐼𝑂0 is the wage ratio in the base period.
When the wage for factor 𝑓𝑚𝑖𝑔 increases relative to factor 𝑓𝑚𝑖𝑔𝑝, the ratio 𝑊𝑀𝑂𝐵𝑅𝐴𝑇𝐼𝑂 diverges from 𝑊𝑀𝑂𝐵𝑅𝐴𝑇𝐼𝑂0 and factor mobility from 𝑓𝑚𝑖𝑔 to 𝑓𝑚𝑖𝑔𝑝 takes place. The
intensity of the mobility is governed by a response elasticity (𝑒𝑡𝑎𝑚𝑖𝑔), which is defined
for each pair of market segments and captures the influence of structural features such as
transaction costs and efficient factor markets on the labour mobility.
Equation [MF3] avoids the creation of additional factors by ensuring that for each unit of
factor moved from one segment only one unit of factor is created in the paired segment.
This equation also determines the number of workers who stay in their market segment.
The new pool of factor fmig supplied by each institution is defined by the equation [MF4].
Name Equation Variable
MF1
𝑊𝑀𝑂𝐵𝑅𝐴𝑇𝐼𝑂𝑓𝑚𝑖𝑔,𝑓𝑚𝑖𝑔𝑝,𝑖𝑛𝑠𝑤
=
∑ (𝑊𝐹𝑓𝑚𝑖𝑔𝑝 ∗ 𝑊𝐹𝐷𝐼𝑆𝑇𝑓𝑚𝑖𝑔𝑝,𝑎 ∗ 𝐹𝐷𝑓𝑚𝑖𝑔𝑝,𝑎)𝑎
∑ 𝐹𝐷𝑓𝑚𝑖𝑔𝑝,𝑎𝑎
∑ (𝑊𝐹𝑓𝑚𝑖𝑔 ∗ 𝑊𝐹𝐷𝐼𝑆𝑇𝑓𝑚𝑖𝑔,𝑎 ∗ 𝐹𝐷𝑓𝑚𝑖𝑔,𝑎)𝑎
∑ 𝐹𝐷𝑓𝑚𝑖𝑔,𝑎𝑎
⁄ 𝑊𝑀𝑂𝐵𝑅𝐴𝑇𝐼𝑂
MF2
𝐹𝑆𝐼𝑀𝑓𝑚𝑖𝑔,𝑓𝑚𝑖𝑔𝑝,𝑖𝑛𝑠𝑤
= 𝐹𝑆𝐼0𝑖𝑛𝑠𝑤,𝑓𝑚𝑖𝑔
∗ (𝑊𝑀𝑂𝐵𝑅𝐴𝑇𝐼𝑂𝑓𝑚𝑖𝑔,𝑓𝑚𝑖𝑔𝑝,𝑖𝑛𝑠𝑤
𝑊𝑀𝑂𝐵𝑅𝐴𝑇𝐼𝑂0𝑓𝑚𝑖𝑔,𝑓𝑚𝑖𝑔𝑝,𝑖𝑛𝑠𝑤)
𝑒𝑡𝑎𝑚𝑖𝑔𝑓𝑚𝑖𝑔,𝑓𝑚𝑖𝑔𝑝,𝑖𝑛𝑠𝑤
𝐹𝑆𝐼𝑀
MF3 𝐹𝑆𝐼𝑀𝑓𝑚𝑖𝑔,𝑓𝑚𝑖𝑔𝑝,𝑖𝑛𝑠𝑤 = 𝐹𝑆𝐼𝑖𝑛𝑠𝑤,𝑓𝑚𝑖𝑔 − ∑ 𝐹𝑆𝐼𝑀𝑓𝑚𝑖𝑔,𝑓𝑚𝑖𝑔𝑝,𝑖𝑛𝑠𝑤
𝑓𝑚𝑖𝑔𝑝
𝐹𝑆𝐼𝑀
MF4 𝐹𝑆𝐼𝑖𝑛𝑠𝑤,𝑓𝑚𝑖𝑔 = ∑ 𝐹𝑆𝐼𝑀𝑓𝑚𝑖𝑔,𝑓𝑚𝑖𝑔𝑝,𝑖𝑛𝑠𝑤
𝑓𝑚𝑖𝑔𝑝
𝐹𝑆𝐼
1.2. Factor market clearing equations
The market clearing equation in the STAGE-2 model (Equation FMC1) equates the supply
of factor 𝑓 (𝐹𝑆𝑓) to its demand across all activities (𝐹𝐷𝑓,𝑎). In Chapter 6, four market
clearing equations that involve modifying the initial equation are contemplated.
To model the market condition with a fixed supply of labour, while allowing for labour
movement between the West Bank and Israeli markets, a new parameter 𝑓𝑑_𝑤𝑓,𝑤 is
introduced to capture the demand for factor 𝑓 in foreign region 𝑤 (Equation [FMC2]).
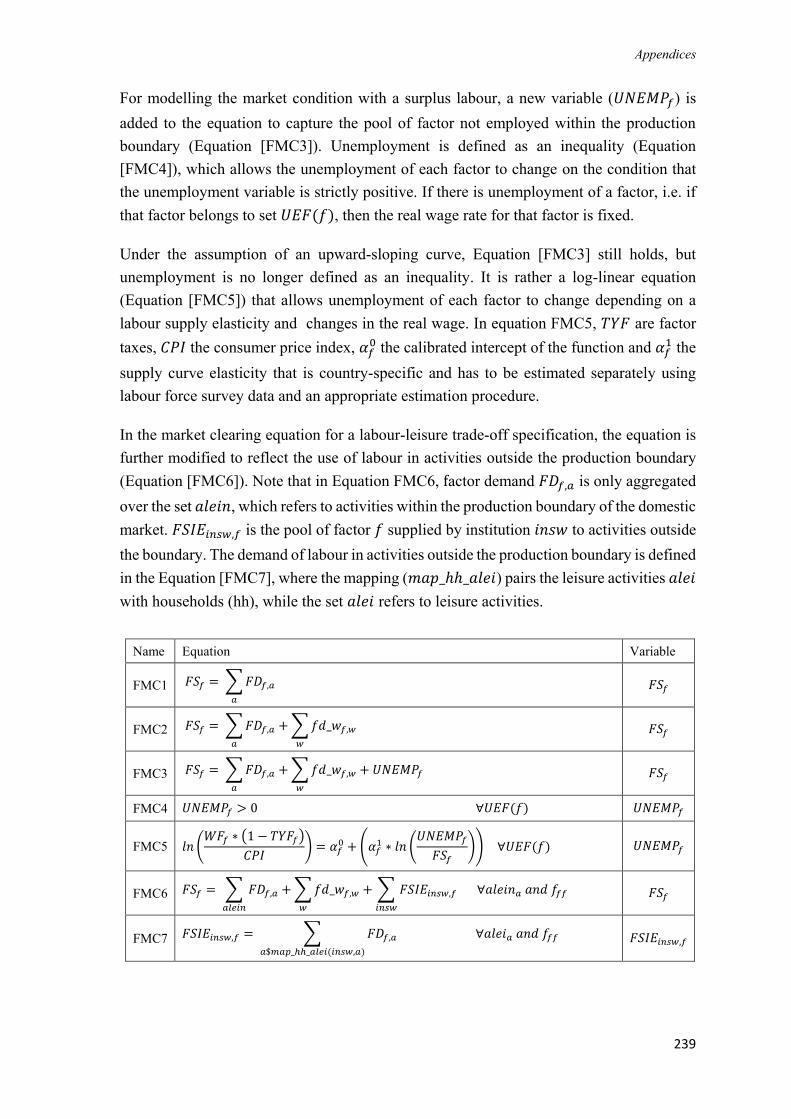
Appendices
239
For modelling the market condition with a surplus labour, a new variable (𝑈𝑁𝐸𝑀𝑃𝑓) is
added to the equation to capture the pool of factor not employed within the production
boundary (Equation [FMC3]). Unemployment is defined as an inequality (Equation
[FMC4]), which allows the unemployment of each factor to change on the condition that
the unemployment variable is strictly positive. If there is unemployment of a factor, i.e. if
that factor belongs to set 𝑈𝐸𝐹(𝑓), then the real wage rate for that factor is fixed.
Under the assumption of an upward-sloping curve, Equation [FMC3] still holds, but
unemployment is no longer defined as an inequality. It is rather a log-linear equation
(Equation [FMC5]) that allows unemployment of each factor to change depending on a
labour supply elasticity and changes in the real wage. In equation FMC5, 𝑇𝑌𝐹 are factor
taxes, 𝐶𝑃𝐼 the consumer price index, 𝛼𝑓0 the calibrated intercept of the function and 𝛼𝑓
1 the
supply curve elasticity that is country-specific and has to be estimated separately using
labour force survey data and an appropriate estimation procedure.
In the market clearing equation for a labour-leisure trade-off specification, the equation is
further modified to reflect the use of labour in activities outside the production boundary
(Equation [FMC6]). Note that in Equation FMC6, factor demand 𝐹𝐷𝑓,𝑎 is only aggregated
over the set 𝑎𝑙𝑒𝑖𝑛, which refers to activities within the production boundary of the domestic
market. 𝐹𝑆𝐼𝐸𝑖𝑛𝑠𝑤,𝑓 is the pool of factor 𝑓 supplied by institution 𝑖𝑛𝑠𝑤 to activities outside
the boundary. The demand of labour in activities outside the production boundary is defined
in the Equation [FMC7], where the mapping (𝑚𝑎𝑝_ℎℎ_𝑎𝑙𝑒𝑖) pairs the leisure activities 𝑎𝑙𝑒𝑖
with households (hh), while the set 𝑎𝑙𝑒𝑖 refers to leisure activities.
Name Equation Variable
FMC1 𝐹𝑆𝑓 = ∑𝐹𝐷𝑓,𝑎
𝑎
𝐹𝑆𝑓
FMC2 𝐹𝑆𝑓 = ∑𝐹𝐷𝑓,𝑎
𝑎
+ ∑𝑓𝑑_𝑤𝑓,𝑤
𝑤
𝐹𝑆𝑓
FMC3 𝐹𝑆𝑓 = ∑𝐹𝐷𝑓,𝑎
𝑎
+ ∑𝑓𝑑_𝑤𝑓,𝑤
𝑤
+ 𝑈𝑁𝐸𝑀𝑃𝑓 𝐹𝑆𝑓
FMC4 𝑈𝑁𝐸𝑀𝑃𝑓 > 0 ∀𝑈𝐸𝐹(𝑓) 𝑈𝑁𝐸𝑀𝑃𝑓
FMC5 𝑙𝑛 (𝑊𝐹𝑓 ∗ (1 − 𝑇𝑌𝐹𝑓)
𝐶𝑃𝐼) = 𝛼𝑓
0 + (𝛼𝑓1 ∗ 𝑙𝑛 (
𝑈𝑁𝐸𝑀𝑃𝑓
𝐹𝑆𝑓)) ∀𝑈𝐸𝐹(𝑓) 𝑈𝑁𝐸𝑀𝑃𝑓
FMC6 𝐹𝑆𝑓 = ∑ 𝐹𝐷𝑓,𝑎
𝑎𝑙𝑒𝑖𝑛
+ ∑𝑓𝑑_𝑤𝑓,𝑤
𝑤
+ ∑ 𝐹𝑆𝐼𝐸𝑖𝑛𝑠𝑤,𝑓
𝑖𝑛𝑠𝑤
∀𝑎𝑙𝑒𝑖𝑛𝑎 𝑎𝑛𝑑 𝑓𝑓𝑓 𝐹𝑆𝑓
FMC7 𝐹𝑆𝐼𝐸𝑖𝑛𝑠𝑤,𝑓 = ∑ 𝐹𝐷𝑓,𝑎
𝑎$𝑚𝑎𝑝_ℎℎ_𝑎𝑙𝑒𝑖(𝑖𝑛𝑠𝑤,𝑎)
∀𝑎𝑙𝑒𝑖𝑎 𝑎𝑛𝑑 𝑓𝑓𝑓 𝐹𝑆𝐼𝐸𝑖𝑛𝑠𝑤,𝑓
Appendices
240
2. Production module
2.1. Production module in the STAGE-2 model
The STAGE-2 model allows modelling multiple-product activities. Equation X1 expresses
the composite price of output (𝑃𝑋𝑎) by activity 𝑎 as a weighted average of the prices paid
for the commodities produced by each activity (𝑃𝑋𝐴𝐶𝑎,𝑐). The weights are the quantities
of each commodity produced by each activity (𝑖𝑜𝑞𝑥𝑎𝑐𝑞𝑥𝑎,𝑐). The model specifies
production as a three-stage process, in which each stage can be formulated as a CES or
Leontief technology. At the top level of the nest, Equation [X2] expresses the definition of
𝑃𝑋𝑎 if a CES technology is imposed. Accordingly, 𝑃𝑋𝑎 is a volume weighted aggregate of
the prices of the inputs after deducing the ad valorem production taxes (𝑇𝑋𝑎). The inputs
in the top nest are the aggregate of factors used (value added) and the aggregate of
commodities used (intermediate inputs).
In Equation [X3], the price of aggregate intermediate inputs (𝑃𝐼𝑁𝑇𝑎) is defined as the
weighted sum of the purchaser prices of individual commodities used as inputs (𝑃𝑄𝐷𝑐),
where the weights are the input coefficients of demand for commodity 𝑐 by activity 𝑎
(𝑖𝑜𝑞𝑡𝑑𝑞𝑑𝑐,𝑎). With the CES technology, the quantity of output (𝑄𝑋𝑎) of activity 𝑎 is a
volume-weighted average of value added (𝑄𝑉𝐴𝑎) and aggregate intermediate input
(𝑄𝐼𝑁𝑇𝑎) (Equation [X5]), where 𝛿𝑎𝑥 is the share parameter, 𝜌𝑎
𝑐𝑥 the substitution parameter
and ADX the efficiency variable. The efficiency variable is defined in Equation [X4] with
an adjustment mechanism for additive (𝐷𝐴𝐷𝑋) and multiplicative (𝐴𝐶𝑋𝐴𝐷𝐽) scaling of the
activity efficiency. The optimal ratio of 𝑄𝐼𝑁𝑇𝑎 to 𝑄𝑉𝐴𝑎 is defined by the first order
conditions for profit maximisation (Equation [X6]), considering relative prices of value
added (𝑃𝑉𝐴𝑎) and aggregate intermediate input (𝑃𝐼𝑁𝑇𝑎).
Equations [X7] express the case if a Leontief technology is assumed in the top nest. Both
the value added and the aggregate intermediate inputs are fixed volume shares of output.
The choice of the top level aggregation is controlled by the membership in either the set
𝑎𝑞𝑥 for activities with CES aggregation function, or in the set 𝑎𝑞𝑥𝑛 for activities with a
Leontief aggregation function.

Appendices
241
Production Block – Top Level
Name Equation Variable
X1 𝑃𝑋𝑎 = ∑𝑖𝑜𝑞𝑥𝑎𝑐𝑞𝑥𝑎,𝑐 ∗ 𝑃𝑋𝐴𝐶𝑎,𝑐
𝑐
𝑃𝑋𝑎
X2 𝑃𝑋𝑎 ∗ (1 − 𝑇𝑋𝑎) ∗ 𝑄𝑋𝑎 = (𝑃𝑉𝐴𝑎 ∗ 𝑄𝑉𝐴𝑎) + (𝑃𝐼𝑁𝑇𝑎 ∗ 𝑄𝐼𝑁𝑇𝑎) 𝑃𝑉𝐴𝑎
X3 𝑃𝐼𝑁𝑇𝑎 = ∑𝑖𝑜𝑞𝑡𝑑𝑞𝑑𝑐,𝑎 ∗ 𝑃𝑄𝐷𝑐
𝑐
𝑃𝐼𝑁𝑇𝑎
X4 𝐴𝐷𝑋𝑎 = ((𝑎𝑑𝑥𝑎 + 𝑑𝑎𝑏𝑎𝑑𝑥𝑎) ∗ 𝐴𝐷𝑋𝐴𝐷𝐽) + (𝐷𝐴𝐷𝑋 ∗ 𝑎𝑑𝑥01𝑎) 𝐴𝐷𝑋𝑎
X5 𝑄𝑋𝑎 = 𝐴𝐷𝑋𝑎 ∗ ((𝛿𝑎𝑥 ∗ 𝑄𝑉𝐴𝑎
−𝜌𝑎𝑐𝑥
) + ((1 − 𝛿𝑎𝑥) ∗ 𝑄𝐼𝑁𝑇𝑎
−𝜌𝑎𝑐𝑥
))−
1𝜌𝑎
𝑐𝑥
∀ 𝑎𝑞𝑥𝑎 𝑄𝑋𝑎
X6 𝑄𝑉𝐴𝑎
𝑄𝐼𝑁𝑇𝑎= [
𝑃𝐼𝑁𝑇𝑎
𝑃𝑉𝐴𝑎∗
𝛿𝑎𝑥
(1 − 𝛿𝑎𝑥)
]
1(1+𝜌𝑎
𝑐𝑥) ∀ 𝑎𝑞𝑥𝑎 𝑄𝐼𝑁𝑇𝑎
X7a 𝑄𝐼𝑁𝑇𝑎 = 𝑖𝑜𝑞𝑥𝑎𝑐𝑞𝑥𝑎,𝑐 ∗ 𝑄𝑋𝑎 ∀ 𝑎𝑞𝑥𝑎 𝑄𝐼𝑁𝑇𝑎
X7b 𝑄𝑉𝐴𝑎 = 𝑖𝑜𝑞𝑣𝑎𝑞𝑥𝑎 ∗ 𝑄𝑋𝑎 ∀ 𝑎𝑞𝑥𝑛𝑎 𝑄𝑉𝐴𝑎
The second level of the nest has two arms. In the first arm, the value added is an aggregation
of the set 𝑓2 (factors in the second level of the nest), which consist of capital, land and
labour. This aggregation is defined in Equation [X9] where 𝛿𝑓2,𝑎𝑣𝑎 is the share parameter,
𝜌𝑎𝑣𝑎 the elasticity parameter and 𝐴𝐷𝑉𝐴𝑎 the efficiency variable which is defined in
Equation [X8] with both additive (𝐷𝐴𝐷𝑉) and multiplicative (𝐴𝐷𝑉𝐴𝐴𝐷𝐽) adjustment
parameters. The optimal ratio of the different factors 𝑓2 is defined by the first order
conditions for profit maximisation (Equation [X10]) which determine the wage rate of
factor 𝑓2 in a specific activity 𝑎. That wage rate is composed of the average wage rate for
factor 𝑓2 (𝑊𝐹𝑓2) and a factor and activity specific efficiency parameter (𝑊𝐹𝐷𝐼𝑆𝑇𝑓2,𝑎). The
ratios 𝑊𝐹𝐷𝐼𝑆𝑇𝑓2,𝑎 are included in the equation to allow for non-homogenous factors, and
are derived from the first order conditions for profit maximisation as equalities between the
wage rates for each factor in each activity and the values of the marginal products of those
factors in each activity. The actual return to factor is adjusted for the factor use taxes
(𝑇𝐹𝑓2,𝑎).
In the second arm of the nest (Equation [X11]), the aggregate intermediate input is defined
by a Leontief technology where the intermediate demand (𝑄𝐼𝑁𝑇𝐷𝑐) of commodity 𝑐 is a
fixed volume share of the aggregate intermediate input (𝑄𝐼𝑁𝑇𝑎) demanded by activity 𝑎.
The weights are the input coefficients of demand for commodity 𝑐 by activity 𝑎
(𝑖𝑜𝑞𝑡𝑑𝑞𝑑𝑐,𝑎).
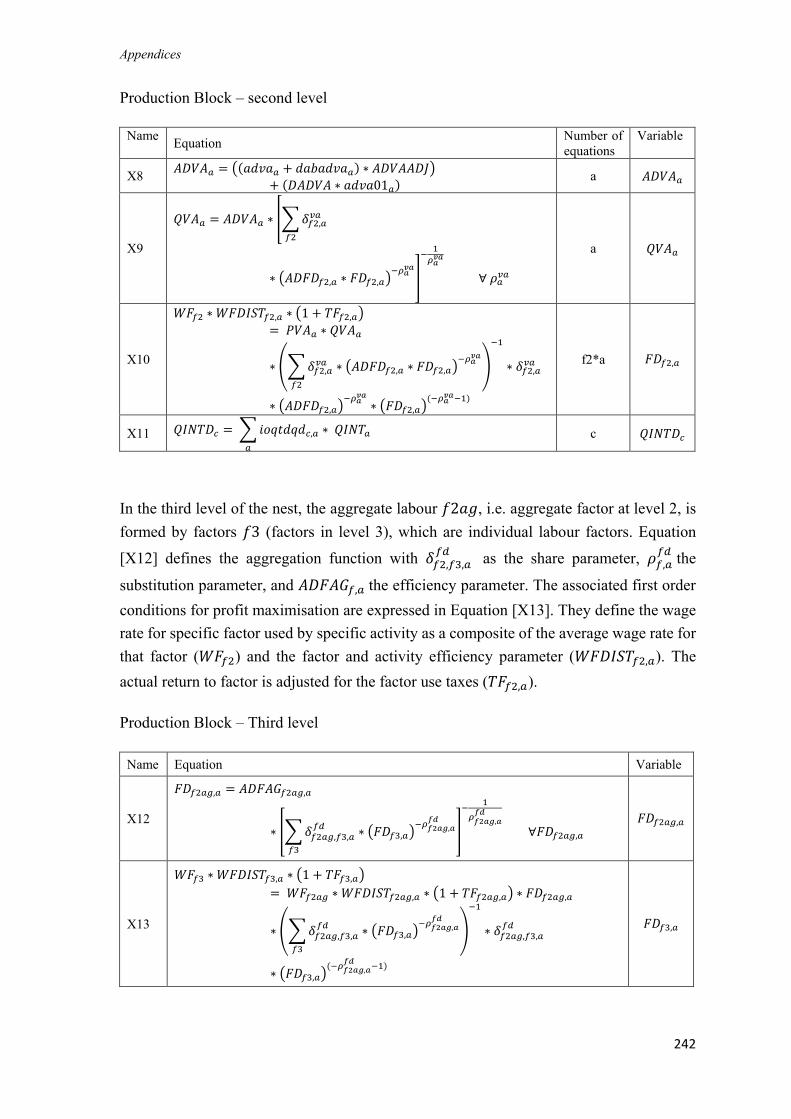
Appendices
242
Production Block – second level
Name Equation
Number of
equations
Variable
X8 𝐴𝐷𝑉𝐴𝑎 = ((𝑎𝑑𝑣𝑎𝑎 + 𝑑𝑎𝑏𝑎𝑑𝑣𝑎𝑎) ∗ 𝐴𝐷𝑉𝐴𝐴𝐷𝐽)
+ (𝐷𝐴𝐷𝑉𝐴 ∗ 𝑎𝑑𝑣𝑎01𝑎) a 𝐴𝐷𝑉𝐴𝑎
X9
𝑄𝑉𝐴𝑎 = 𝐴𝐷𝑉𝐴𝑎 ∗ [∑𝛿𝑓2,𝑎𝑣𝑎
𝑓2
∗ (𝐴𝐷𝐹𝐷𝑓2,𝑎 ∗ 𝐹𝐷𝑓2,𝑎)−𝜌𝑎
𝑣𝑎
]
−1
𝜌𝑎𝑣𝑎
∀ 𝜌𝑎𝑣𝑎
a 𝑄𝑉𝐴𝑎
X10
𝑊𝐹𝑓2 ∗ 𝑊𝐹𝐷𝐼𝑆𝑇𝑓2,𝑎 ∗ (1 + 𝑇𝐹𝑓2,𝑎)
= 𝑃𝑉𝐴𝑎 ∗ 𝑄𝑉𝐴𝑎
∗ (∑𝛿𝑓2,𝑎𝑣𝑎 ∗ (𝐴𝐷𝐹𝐷𝑓2,𝑎 ∗ 𝐹𝐷𝑓2,𝑎)
−𝜌𝑎𝑣𝑎
𝑓2
)
−1
∗ 𝛿𝑓2,𝑎𝑣𝑎
∗ (𝐴𝐷𝐹𝐷𝑓2,𝑎)−𝜌𝑎
𝑣𝑎
∗ (𝐹𝐷𝑓2,𝑎)(−𝜌𝑎
𝑣𝑎−1)
f2*a 𝐹𝐷𝑓2,𝑎
X11 𝑄𝐼𝑁𝑇𝐷𝑐 = ∑𝑖𝑜𝑞𝑡𝑑𝑞𝑑𝑐,𝑎 ∗ 𝑄𝐼𝑁𝑇𝑎
𝑎
c 𝑄𝐼𝑁𝑇𝐷𝑐
In the third level of the nest, the aggregate labour 𝑓2𝑎𝑔, i.e. aggregate factor at level 2, is
formed by factors 𝑓3 (factors in level 3), which are individual labour factors. Equation
[X12] defines the aggregation function with 𝛿𝑓2,𝑓3,𝑎𝑓𝑑
as the share parameter, 𝜌𝑓,𝑎𝑓𝑑
the
substitution parameter, and 𝐴𝐷𝐹𝐴𝐺𝑓,𝑎 the efficiency parameter. The associated first order
conditions for profit maximisation are expressed in Equation [X13]. They define the wage
rate for specific factor used by specific activity as a composite of the average wage rate for
that factor (𝑊𝐹𝑓2) and the factor and activity efficiency parameter (𝑊𝐹𝐷𝐼𝑆𝑇𝑓2,𝑎). The
actual return to factor is adjusted for the factor use taxes (𝑇𝐹𝑓2,𝑎).
Production Block – Third level
Name Equation Variable
X12
𝐹𝐷𝑓2𝑎𝑔,𝑎 = 𝐴𝐷𝐹𝐴𝐺𝑓2𝑎𝑔,𝑎
∗ [∑𝛿𝑓2𝑎𝑔,𝑓3,𝑎𝑓𝑑
∗ (𝐹𝐷𝑓3,𝑎)−𝜌𝑓2𝑎𝑔,𝑎
𝑓𝑑
𝑓3
]
−1
𝜌𝑓2𝑎𝑔,𝑎𝑓𝑑
∀𝐹𝐷𝑓2𝑎𝑔,𝑎 𝐹𝐷𝑓2𝑎𝑔,𝑎
X13
𝑊𝐹𝑓3 ∗ 𝑊𝐹𝐷𝐼𝑆𝑇𝑓3,𝑎 ∗ (1 + 𝑇𝐹𝑓3,𝑎)
= 𝑊𝐹𝑓2𝑎𝑔 ∗ 𝑊𝐹𝐷𝐼𝑆𝑇𝑓2𝑎𝑔,𝑎 ∗ (1 + 𝑇𝐹𝑓2𝑎𝑔,𝑎) ∗ 𝐹𝐷𝑓2𝑎𝑔,𝑎
∗ (∑𝛿𝑓2𝑎𝑔,𝑓3,𝑎𝑓𝑑
∗ (𝐹𝐷𝑓3,𝑎)−𝜌𝑓2𝑎𝑔,𝑎
𝑓𝑑
𝑓3
)
−1
∗ 𝛿𝑓2𝑎𝑔,𝑓3,𝑎𝑓𝑑
∗ (𝐹𝐷𝑓3,𝑎)(−𝜌𝑓2𝑎𝑔,𝑎
𝑓𝑑−1)
𝐹𝐷𝑓3,𝑎

Appendices
243
2.2. Model extension
The production module used in the first application is extended from a three-stage process
to a seven-stage process as displayed in Figure A1. Accordingly, in the top level of the nest,
output of each activity is formed by two aggregates: one for factors (value added) and one
for commodities used as inputs (aggregate intermediate input). The second level of the nest
has two branches. In the first branch, the aggregate intermediate input is composed of
demand for individual commodities in fixed proportions. In the second branch, value added
is an aggregate of the set 𝑓2, consisting of capital, land and aggregate labour.
Aggregate labour is modelled as a multi-stage aggregate to reflect the composition of the
Palestinian labour force. Hence, in the third level of the nest, the aggregate labour (𝑓2𝑎𝑔)
is formed of set 𝑓3, composed of foreign and domestic labour employed in the Palestinian
economy. In the fourth level, demand for domestic labour (𝑓3𝑎𝑔) is a CES aggregate of
set 𝑓4 factors, which are low and high-skilled labour. In the fifth level, both low and high-
skilled labour (𝑓4𝑎𝑔) are CES functions of set 𝑓5, which includes male and female
workers. The categories of male workers (𝑓5𝑎𝑔) are aggregates of set 𝑓6 factors, which
classifies workers into ineligible, weakly eligible and highly eligible to receive a work
permit in Israel.
The models used in the first and third applications further extend the nesting structure with
female labour (𝑓5𝑎𝑔) considered as an aggregate of 𝑓6 factors who are female workers
employed in three blocks of sectors: agriculture, manufacturing and services. The three
branches of male ineligible, weakly and highly eligible (𝑓6𝑎𝑔) are themselves aggregates
of set 𝑓7 factors, which include workers employed in four blocks of sectors: agriculture,
manufacturing, construction and services.
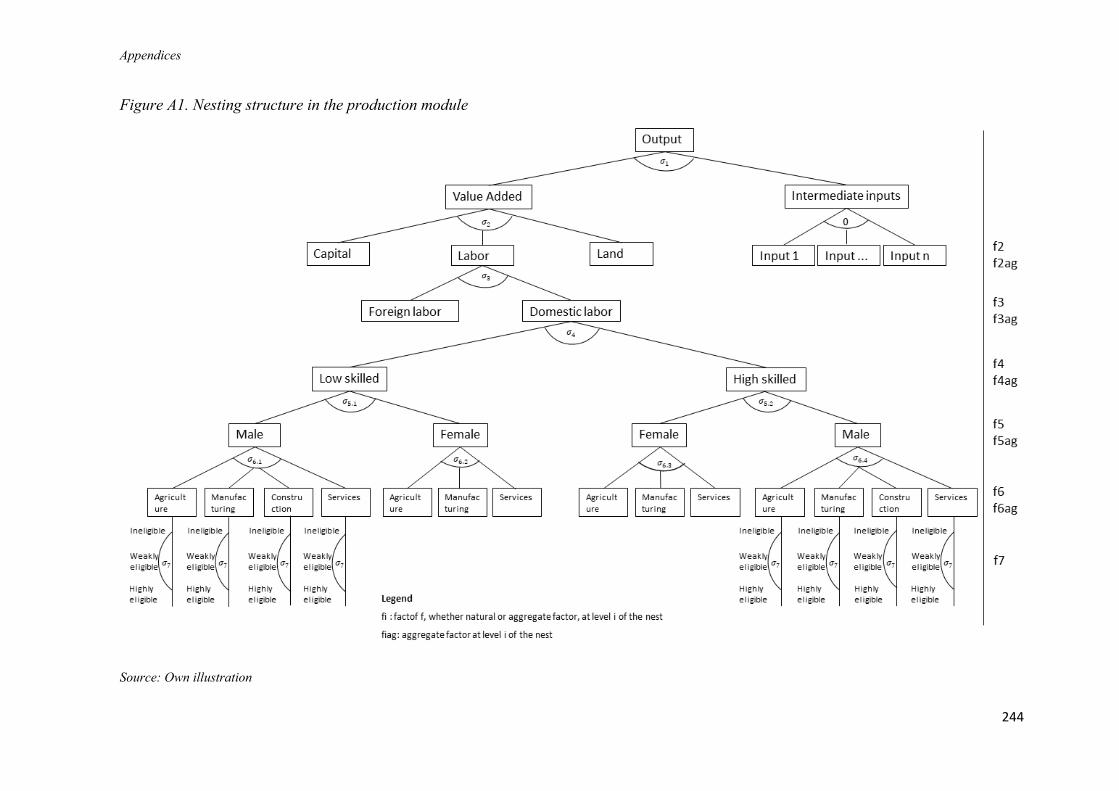
Appendices
244
Figure A1. Nesting structure in the production module
Source: Own illustration
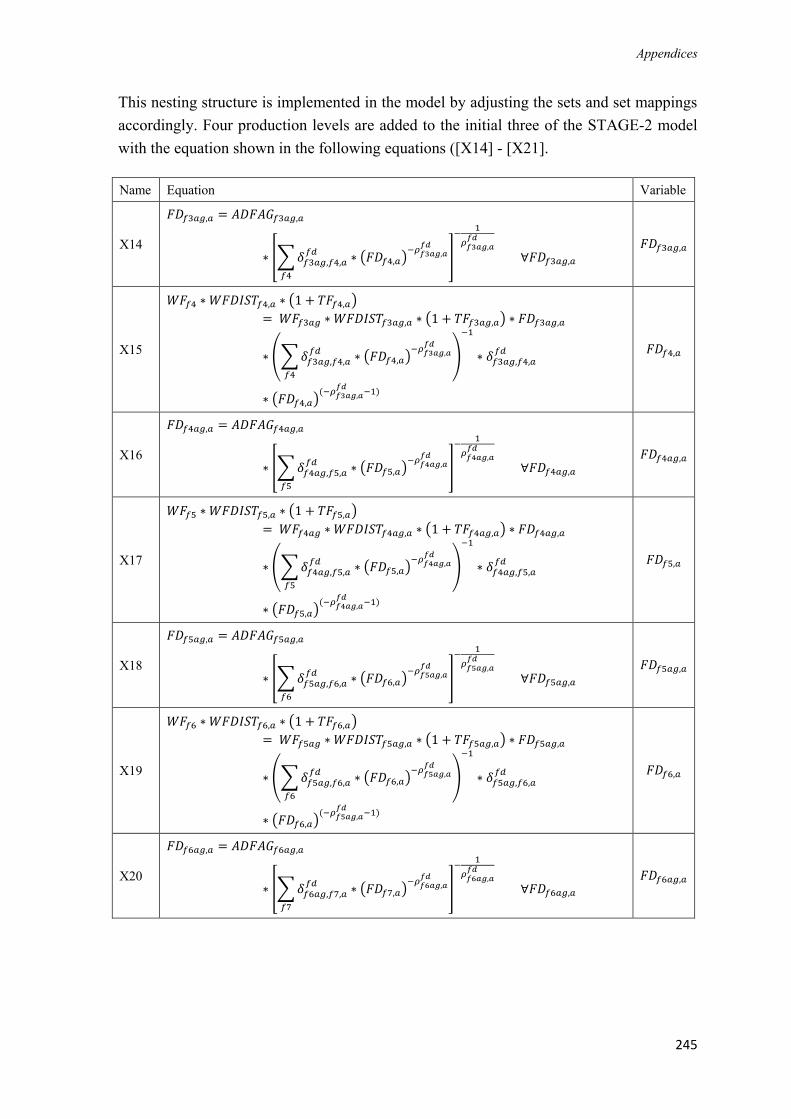
Appendices
245
This nesting structure is implemented in the model by adjusting the sets and set mappings
accordingly. Four production levels are added to the initial three of the STAGE-2 model
with the equation shown in the following equations ([X14] - [X21].
Name Equation Variable
X14
𝐹𝐷𝑓3𝑎𝑔,𝑎 = 𝐴𝐷𝐹𝐴𝐺𝑓3𝑎𝑔,𝑎
∗ [∑𝛿𝑓3𝑎𝑔,𝑓4,𝑎𝑓𝑑
∗ (𝐹𝐷𝑓4,𝑎)−𝜌𝑓3𝑎𝑔,𝑎
𝑓𝑑
𝑓4
]
−1
𝜌𝑓3𝑎𝑔,𝑎𝑓𝑑
∀𝐹𝐷𝑓3𝑎𝑔,𝑎 𝐹𝐷𝑓3𝑎𝑔,𝑎
X15
𝑊𝐹𝑓4 ∗ 𝑊𝐹𝐷𝐼𝑆𝑇𝑓4,𝑎 ∗ (1 + 𝑇𝐹𝑓4,𝑎)
= 𝑊𝐹𝑓3𝑎𝑔 ∗ 𝑊𝐹𝐷𝐼𝑆𝑇𝑓3𝑎𝑔,𝑎 ∗ (1 + 𝑇𝐹𝑓3𝑎𝑔,𝑎) ∗ 𝐹𝐷𝑓3𝑎𝑔,𝑎
∗ (∑𝛿𝑓3𝑎𝑔,𝑓4,𝑎𝑓𝑑
∗ (𝐹𝐷𝑓4,𝑎)−𝜌𝑓3𝑎𝑔,𝑎
𝑓𝑑
𝑓4
)
−1
∗ 𝛿𝑓3𝑎𝑔,𝑓4,𝑎𝑓𝑑
∗ (𝐹𝐷𝑓4,𝑎)(−𝜌𝑓3𝑎𝑔,𝑎
𝑓𝑑−1)
𝐹𝐷𝑓4,𝑎
X16
𝐹𝐷𝑓4𝑎𝑔,𝑎 = 𝐴𝐷𝐹𝐴𝐺𝑓4𝑎𝑔,𝑎
∗ [∑𝛿𝑓4𝑎𝑔,𝑓5,𝑎𝑓𝑑
∗ (𝐹𝐷𝑓5,𝑎)−𝜌𝑓4𝑎𝑔,𝑎
𝑓𝑑
𝑓5
]
−1
𝜌𝑓4𝑎𝑔,𝑎𝑓𝑑
∀𝐹𝐷𝑓4𝑎𝑔,𝑎 𝐹𝐷𝑓4𝑎𝑔,𝑎
X17
𝑊𝐹𝑓5 ∗ 𝑊𝐹𝐷𝐼𝑆𝑇𝑓5,𝑎 ∗ (1 + 𝑇𝐹𝑓5,𝑎)
= 𝑊𝐹𝑓4𝑎𝑔 ∗ 𝑊𝐹𝐷𝐼𝑆𝑇𝑓4𝑎𝑔,𝑎 ∗ (1 + 𝑇𝐹𝑓4𝑎𝑔,𝑎) ∗ 𝐹𝐷𝑓4𝑎𝑔,𝑎
∗ (∑𝛿𝑓4𝑎𝑔,𝑓5,𝑎𝑓𝑑
∗ (𝐹𝐷𝑓5,𝑎)−𝜌𝑓4𝑎𝑔,𝑎
𝑓𝑑
𝑓5
)
−1
∗ 𝛿𝑓4𝑎𝑔,𝑓5,𝑎𝑓𝑑
∗ (𝐹𝐷𝑓5,𝑎)(−𝜌𝑓4𝑎𝑔,𝑎
𝑓𝑑−1)
𝐹𝐷𝑓5,𝑎
X18
𝐹𝐷𝑓5𝑎𝑔,𝑎 = 𝐴𝐷𝐹𝐴𝐺𝑓5𝑎𝑔,𝑎
∗ [∑𝛿𝑓5𝑎𝑔,𝑓6,𝑎𝑓𝑑
∗ (𝐹𝐷𝑓6,𝑎)−𝜌𝑓5𝑎𝑔,𝑎
𝑓𝑑
𝑓6
]
−1
𝜌𝑓5𝑎𝑔,𝑎𝑓𝑑
∀𝐹𝐷𝑓5𝑎𝑔,𝑎 𝐹𝐷𝑓5𝑎𝑔,𝑎
X19
𝑊𝐹𝑓6 ∗ 𝑊𝐹𝐷𝐼𝑆𝑇𝑓6,𝑎 ∗ (1 + 𝑇𝐹𝑓6,𝑎)
= 𝑊𝐹𝑓5𝑎𝑔 ∗ 𝑊𝐹𝐷𝐼𝑆𝑇𝑓5𝑎𝑔,𝑎 ∗ (1 + 𝑇𝐹𝑓5𝑎𝑔,𝑎) ∗ 𝐹𝐷𝑓5𝑎𝑔,𝑎
∗ (∑𝛿𝑓5𝑎𝑔,𝑓6,𝑎𝑓𝑑
∗ (𝐹𝐷𝑓6,𝑎)−𝜌𝑓5𝑎𝑔,𝑎
𝑓𝑑
𝑓6
)
−1
∗ 𝛿𝑓5𝑎𝑔,𝑓6,𝑎𝑓𝑑
∗ (𝐹𝐷𝑓6,𝑎)(−𝜌𝑓5𝑎𝑔,𝑎
𝑓𝑑−1)
𝐹𝐷𝑓6,𝑎
X20
𝐹𝐷𝑓6𝑎𝑔,𝑎 = 𝐴𝐷𝐹𝐴𝐺𝑓6𝑎𝑔,𝑎
∗ [∑𝛿𝑓6𝑎𝑔,𝑓7,𝑎𝑓𝑑
∗ (𝐹𝐷𝑓7,𝑎)−𝜌𝑓6𝑎𝑔,𝑎
𝑓𝑑
𝑓7
]
−1
𝜌𝑓6𝑎𝑔,𝑎𝑓𝑑
∀𝐹𝐷𝑓6𝑎𝑔,𝑎 𝐹𝐷𝑓6𝑎𝑔,𝑎
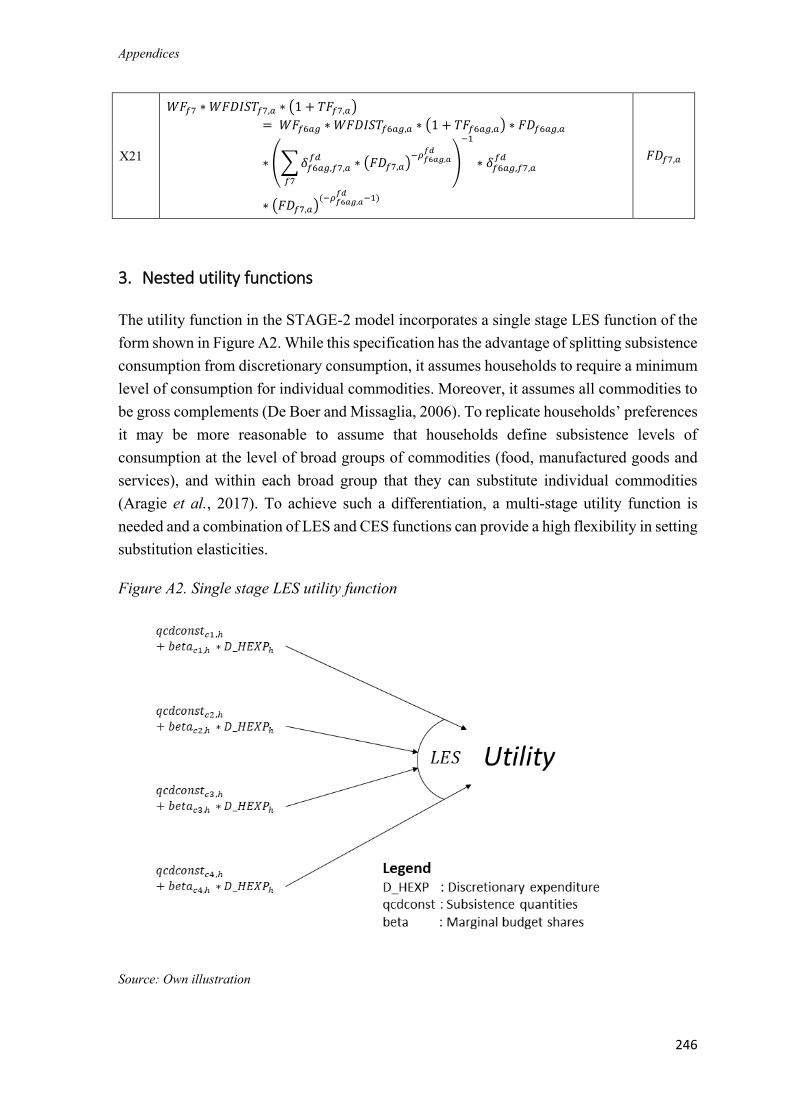
Appendices
246
X21
𝑊𝐹𝑓7 ∗ 𝑊𝐹𝐷𝐼𝑆𝑇𝑓7,𝑎 ∗ (1 + 𝑇𝐹𝑓7,𝑎)
= 𝑊𝐹𝑓6𝑎𝑔 ∗ 𝑊𝐹𝐷𝐼𝑆𝑇𝑓6𝑎𝑔,𝑎 ∗ (1 + 𝑇𝐹𝑓6𝑎𝑔,𝑎) ∗ 𝐹𝐷𝑓6𝑎𝑔,𝑎
∗ (∑𝛿𝑓6𝑎𝑔,𝑓7,𝑎𝑓𝑑
∗ (𝐹𝐷𝑓7,𝑎)−𝜌𝑓6𝑎𝑔,𝑎
𝑓𝑑
𝑓7
)
−1
∗ 𝛿𝑓6𝑎𝑔,𝑓7,𝑎𝑓𝑑
∗ (𝐹𝐷𝑓7,𝑎)(−𝜌𝑓6𝑎𝑔,𝑎
𝑓𝑑−1)
𝐹𝐷𝑓7,𝑎
3. Nested utility functions
The utility function in the STAGE-2 model incorporates a single stage LES function of the
form shown in Figure A2. While this specification has the advantage of splitting subsistence
consumption from discretionary consumption, it assumes households to require a minimum
level of consumption for individual commodities. Moreover, it assumes all commodities to
be gross complements (De Boer and Missaglia, 2006). To replicate households’ preferences
it may be more reasonable to assume that households define subsistence levels of
consumption at the level of broad groups of commodities (food, manufactured goods and
services), and within each broad group that they can substitute individual commodities
(Aragie et al., 2017). To achieve such a differentiation, a multi-stage utility function is
needed and a combination of LES and CES functions can provide a high flexibility in setting
substitution elasticities.
Figure A2. Single stage LES utility function
Source: Own illustration
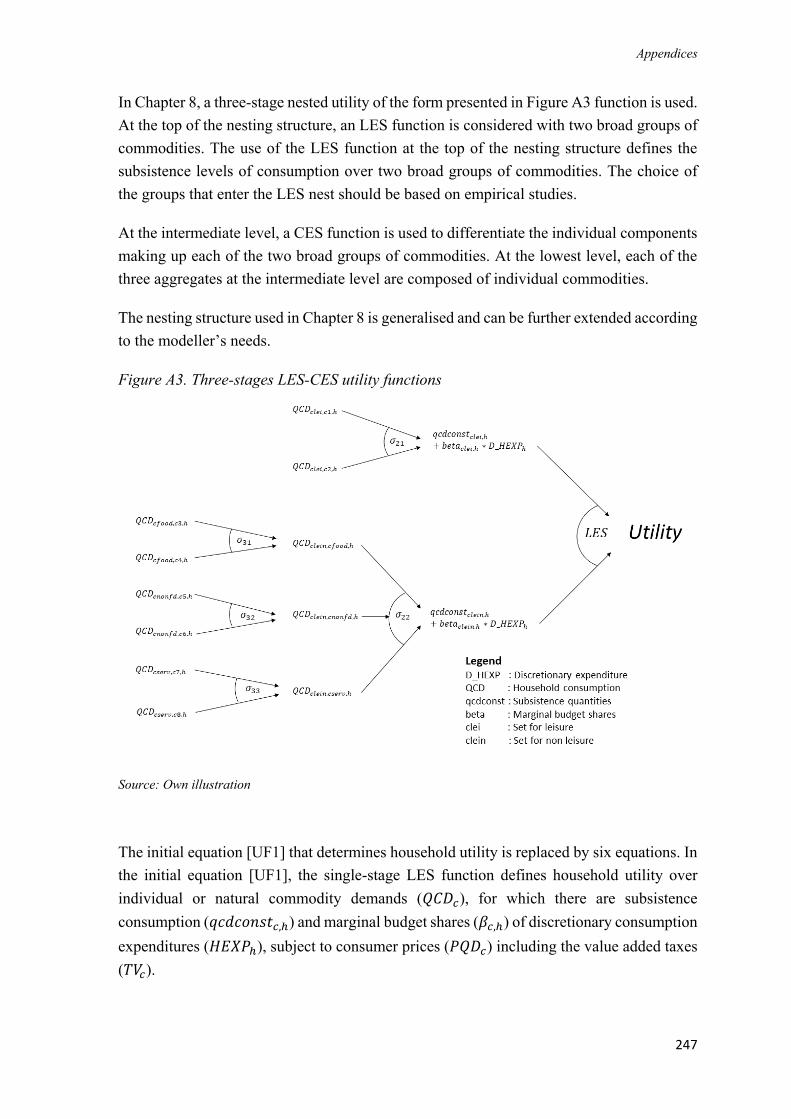
Appendices
247
In Chapter 8, a three-stage nested utility of the form presented in Figure A3 function is used.
At the top of the nesting structure, an LES function is considered with two broad groups of
commodities. The use of the LES function at the top of the nesting structure defines the
subsistence levels of consumption over two broad groups of commodities. The choice of
the groups that enter the LES nest should be based on empirical studies.
At the intermediate level, a CES function is used to differentiate the individual components
making up each of the two broad groups of commodities. At the lowest level, each of the
three aggregates at the intermediate level are composed of individual commodities.
The nesting structure used in Chapter 8 is generalised and can be further extended according
to the modeller’s needs.
Figure A3. Three-stages LES-CES utility functions
Source: Own illustration
The initial equation [UF1] that determines household utility is replaced by six equations. In
the initial equation [UF1], the single-stage LES function defines household utility over
individual or natural commodity demands (𝑄𝐶𝐷𝑐), for which there are subsistence
consumption (𝑞𝑐𝑑𝑐𝑜𝑛𝑠𝑡𝑐,ℎ) and marginal budget shares (𝛽𝑐,ℎ) of discretionary consumption
expenditures (𝐻𝐸𝑋𝑃ℎ), subject to consumer prices (𝑃𝑄𝐷𝑐) including the value added taxes
(𝑇𝑉𝑐).
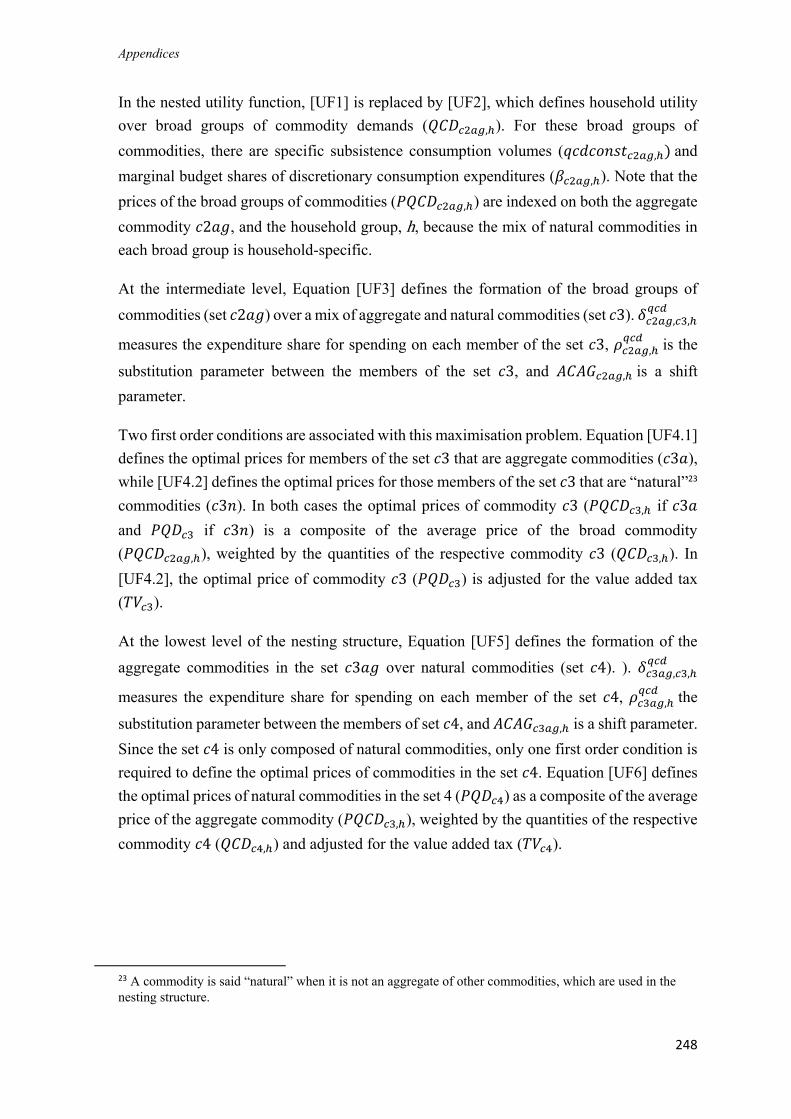
Appendices
248
In the nested utility function, [UF1] is replaced by [UF2], which defines household utility
over broad groups of commodity demands (𝑄𝐶𝐷𝑐2𝑎𝑔,ℎ). For these broad groups of
commodities, there are specific subsistence consumption volumes (𝑞𝑐𝑑𝑐𝑜𝑛𝑠𝑡𝑐2𝑎𝑔,ℎ) and
marginal budget shares of discretionary consumption expenditures (𝛽𝑐2𝑎𝑔,ℎ). Note that the
prices of the broad groups of commodities (𝑃𝑄𝐶𝐷𝑐2𝑎𝑔,ℎ) are indexed on both the aggregate
commodity 𝑐2𝑎𝑔, and the household group, h, because the mix of natural commodities in
each broad group is household-specific.
At the intermediate level, Equation [UF3] defines the formation of the broad groups of
commodities (set 𝑐2𝑎𝑔) over a mix of aggregate and natural commodities (set 𝑐3). 𝛿𝑐2𝑎𝑔,𝑐3,ℎ𝑞𝑐𝑑
measures the expenditure share for spending on each member of the set 𝑐3, 𝜌𝑐2𝑎𝑔,ℎ𝑞𝑐𝑑
is the
substitution parameter between the members of the set 𝑐3, and 𝐴𝐶𝐴𝐺𝑐2𝑎𝑔,ℎ is a shift
parameter.
Two first order conditions are associated with this maximisation problem. Equation [UF4.1]
defines the optimal prices for members of the set 𝑐3 that are aggregate commodities (𝑐3𝑎),
while [UF4.2] defines the optimal prices for those members of the set 𝑐3 that are “natural”23
commodities (𝑐3𝑛). In both cases the optimal prices of commodity 𝑐3 (𝑃𝑄𝐶𝐷𝑐3,ℎ if 𝑐3𝑎
and 𝑃𝑄𝐷𝑐3 if 𝑐3𝑛) is a composite of the average price of the broad commodity
(𝑃𝑄𝐶𝐷𝑐2𝑎𝑔,ℎ), weighted by the quantities of the respective commodity 𝑐3 (𝑄𝐶𝐷𝑐3,ℎ). In
[UF4.2], the optimal price of commodity 𝑐3 (𝑃𝑄𝐷𝑐3) is adjusted for the value added tax
(𝑇𝑉𝑐3).
At the lowest level of the nesting structure, Equation [UF5] defines the formation of the
aggregate commodities in the set 𝑐3𝑎𝑔 over natural commodities (set 𝑐4). ). 𝛿𝑐3𝑎𝑔,𝑐3,ℎ𝑞𝑐𝑑
measures the expenditure share for spending on each member of the set 𝑐4, 𝜌𝑐3𝑎𝑔,ℎ𝑞𝑐𝑑
the
substitution parameter between the members of set 𝑐4, and 𝐴𝐶𝐴𝐺𝑐3𝑎𝑔,ℎ is a shift parameter.
Since the set 𝑐4 is only composed of natural commodities, only one first order condition is
required to define the optimal prices of commodities in the set 𝑐4. Equation [UF6] defines
the optimal prices of natural commodities in the set 4 (𝑃𝑄𝐷𝑐4) as a composite of the average
price of the aggregate commodity (𝑃𝑄𝐶𝐷𝑐3,ℎ), weighted by the quantities of the respective
commodity 𝑐4 (𝑄𝐶𝐷𝑐4,ℎ) and adjusted for the value added tax (𝑇𝑉𝑐4).
23 A commodity is said “natural” when it is not an aggregate of other commodities, which are used in the
nesting structure.
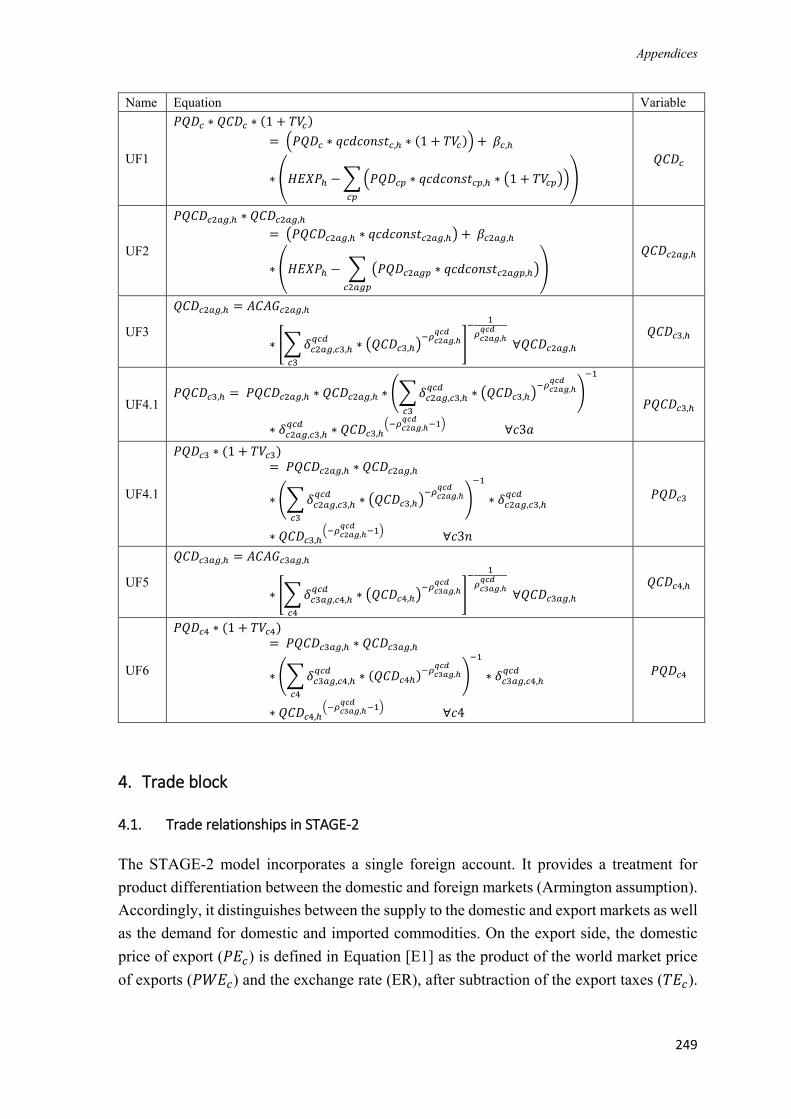
Appendices
249
Name Equation Variable
UF1
𝑃𝑄𝐷𝑐 ∗ 𝑄𝐶𝐷𝑐 ∗ (1 + 𝑇𝑉𝑐)
= (𝑃𝑄𝐷𝑐 ∗ 𝑞𝑐𝑑𝑐𝑜𝑛𝑠𝑡𝑐,ℎ ∗ (1 + 𝑇𝑉𝑐)) + 𝛽𝑐,ℎ
∗ (𝐻𝐸𝑋𝑃ℎ − ∑(𝑃𝑄𝐷𝑐𝑝 ∗ 𝑞𝑐𝑑𝑐𝑜𝑛𝑠𝑡𝑐𝑝,ℎ ∗ (1 + 𝑇𝑉𝑐𝑝))
𝑐𝑝
)
𝑄𝐶𝐷𝑐
UF2
𝑃𝑄𝐶𝐷𝑐2𝑎𝑔,ℎ ∗ 𝑄𝐶𝐷𝑐2𝑎𝑔,ℎ
= (𝑃𝑄𝐶𝐷𝑐2𝑎𝑔,ℎ ∗ 𝑞𝑐𝑑𝑐𝑜𝑛𝑠𝑡𝑐2𝑎𝑔,ℎ) + 𝛽𝑐2𝑎𝑔,ℎ
∗ (𝐻𝐸𝑋𝑃ℎ − ∑ (𝑃𝑄𝐷𝑐2𝑎𝑔𝑝 ∗ 𝑞𝑐𝑑𝑐𝑜𝑛𝑠𝑡𝑐2𝑎𝑔𝑝,ℎ)
𝑐2𝑎𝑔𝑝
)
𝑄𝐶𝐷𝑐2𝑎𝑔,ℎ
UF3
𝑄𝐶𝐷𝑐2𝑎𝑔,ℎ = 𝐴𝐶𝐴𝐺𝑐2𝑎𝑔,ℎ
∗ [∑𝛿𝑐2𝑎𝑔,𝑐3,ℎ𝑞𝑐𝑑
∗ (𝑄𝐶𝐷𝑐3,ℎ)−𝜌𝑐2𝑎𝑔,ℎ
𝑞𝑐𝑑
𝑐3
]
−1
𝜌𝑐2𝑎𝑔,ℎ𝑞𝑐𝑑
∀𝑄𝐶𝐷𝑐2𝑎𝑔,ℎ 𝑄𝐶𝐷𝑐3,ℎ
UF4.1 𝑃𝑄𝐶𝐷𝑐3,ℎ = 𝑃𝑄𝐶𝐷𝑐2𝑎𝑔,ℎ ∗ 𝑄𝐶𝐷𝑐2𝑎𝑔,ℎ ∗ (∑𝛿𝑐2𝑎𝑔,𝑐3,ℎ
𝑞𝑐𝑑∗ (𝑄𝐶𝐷𝑐3,ℎ)
−𝜌𝑐2𝑎𝑔,ℎ𝑞𝑐𝑑
𝑐3
)
−1
∗ 𝛿𝑐2𝑎𝑔,𝑐3,ℎ𝑞𝑐𝑑
∗ 𝑄𝐶𝐷𝑐3,ℎ(−𝜌𝑐2𝑎𝑔,ℎ
𝑞𝑐𝑑−1)
∀𝑐3𝑎
𝑃𝑄𝐶𝐷𝑐3,ℎ
UF4.1
𝑃𝑄𝐷𝑐3 ∗ (1 + 𝑇𝑉𝑐3)= 𝑃𝑄𝐶𝐷𝑐2𝑎𝑔,ℎ ∗ 𝑄𝐶𝐷𝑐2𝑎𝑔,ℎ
∗ (∑𝛿𝑐2𝑎𝑔,𝑐3,ℎ𝑞𝑐𝑑
∗ (𝑄𝐶𝐷𝑐3,ℎ)−𝜌𝑐2𝑎𝑔,ℎ
𝑞𝑐𝑑
𝑐3
)
−1
∗ 𝛿𝑐2𝑎𝑔,𝑐3,ℎ𝑞𝑐𝑑
∗ 𝑄𝐶𝐷𝑐3,ℎ(−𝜌𝑐2𝑎𝑔,ℎ
𝑞𝑐𝑑−1)
∀𝑐3𝑛
𝑃𝑄𝐷𝑐3
UF5
𝑄𝐶𝐷𝑐3𝑎𝑔,ℎ = 𝐴𝐶𝐴𝐺𝑐3𝑎𝑔,ℎ
∗ [∑𝛿𝑐3𝑎𝑔,𝑐4,ℎ𝑞𝑐𝑑
∗ (𝑄𝐶𝐷𝑐4,ℎ)−𝜌𝑐3𝑎𝑔,ℎ
𝑞𝑐𝑑
𝑐4
]
−1
𝜌𝑐3𝑎𝑔,ℎ𝑞𝑐𝑑
∀𝑄𝐶𝐷𝑐3𝑎𝑔,ℎ 𝑄𝐶𝐷𝑐4,ℎ
UF6
𝑃𝑄𝐷𝑐4 ∗ (1 + 𝑇𝑉𝑐4)= 𝑃𝑄𝐶𝐷𝑐3𝑎𝑔,ℎ ∗ 𝑄𝐶𝐷𝑐3𝑎𝑔,ℎ
∗ (∑𝛿𝑐3𝑎𝑔,𝑐4,ℎ𝑞𝑐𝑑
∗ (𝑄𝐶𝐷𝑐4ℎ)−𝜌𝑐3𝑎𝑔,ℎ
𝑞𝑐𝑑
𝑐4
)
−1
∗ 𝛿𝑐3𝑎𝑔,𝑐4,ℎ𝑞𝑐𝑑
∗ 𝑄𝐶𝐷𝑐4,ℎ(−𝜌𝑐3𝑎𝑔,ℎ
𝑞𝑐𝑑−1)
∀𝑐4
𝑃𝑄𝐷𝑐4
4. Trade block
4.1. Trade relationships in STAGE-2
The STAGE-2 model incorporates a single foreign account. It provides a treatment for
product differentiation between the domestic and foreign markets (Armington assumption).
Accordingly, it distinguishes between the supply to the domestic and export markets as well
as the demand for domestic and imported commodities. On the export side, the domestic
price of export (𝑃𝐸𝑐) is defined in Equation [E1] as the product of the world market price
of exports (𝑃𝑊𝐸𝑐) and the exchange rate (ER), after subtraction of the export taxes (𝑇𝐸𝑐).
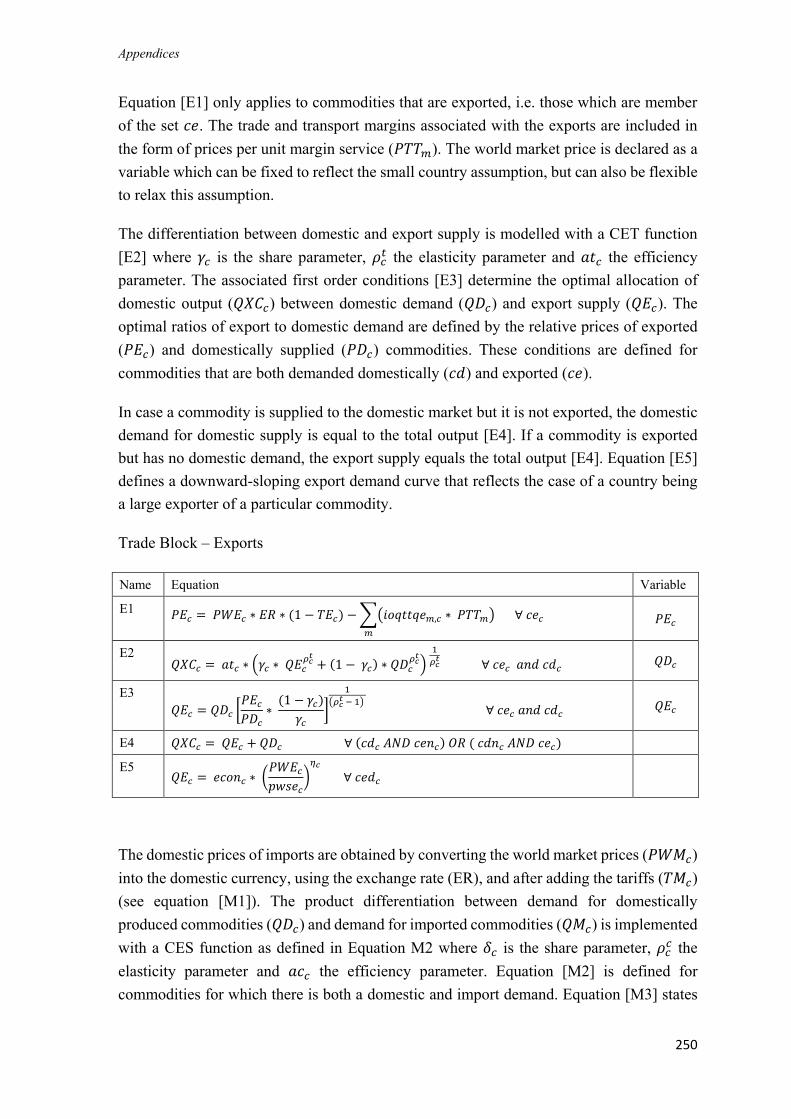
Appendices
250
Equation [E1] only applies to commodities that are exported, i.e. those which are member
of the set 𝑐𝑒. The trade and transport margins associated with the exports are included in
the form of prices per unit margin service (𝑃𝑇𝑇𝑚). The world market price is declared as a
variable which can be fixed to reflect the small country assumption, but can also be flexible
to relax this assumption.
The differentiation between domestic and export supply is modelled with a CET function
[E2] where 𝛾𝑐 is the share parameter, 𝜌𝑐𝑡 the elasticity parameter and 𝑎𝑡𝑐 the efficiency
parameter. The associated first order conditions [E3] determine the optimal allocation of
domestic output (𝑄𝑋𝐶𝑐) between domestic demand (𝑄𝐷𝑐) and export supply (𝑄𝐸𝑐). The
optimal ratios of export to domestic demand are defined by the relative prices of exported
(𝑃𝐸𝑐) and domestically supplied (𝑃𝐷𝑐) commodities. These conditions are defined for
commodities that are both demanded domestically (𝑐𝑑) and exported (𝑐𝑒).
In case a commodity is supplied to the domestic market but it is not exported, the domestic
demand for domestic supply is equal to the total output [E4]. If a commodity is exported
but has no domestic demand, the export supply equals the total output [E4]. Equation [E5]
defines a downward-sloping export demand curve that reflects the case of a country being
a large exporter of a particular commodity.
Trade Block – Exports
Name Equation Variable
E1 𝑃𝐸𝑐 = 𝑃𝑊𝐸𝑐 ∗ 𝐸𝑅 ∗ (1 − 𝑇𝐸𝑐) − ∑(𝑖𝑜𝑞𝑡𝑡𝑞𝑒𝑚,𝑐 ∗ 𝑃𝑇𝑇𝑚)
𝑚
∀ 𝑐𝑒𝑐 𝑃𝐸𝑐
E2 𝑄𝑋𝐶𝑐 = 𝑎𝑡𝑐 ∗ (𝛾𝑐 ∗ 𝑄𝐸𝑐
𝜌𝑐𝑡
+ (1 − 𝛾𝑐) ∗ 𝑄𝐷𝑐𝜌𝑐
𝑡
) 1
𝜌𝑐𝑡 ∀ 𝑐𝑒𝑐 𝑎𝑛𝑑 𝑐𝑑𝑐 𝑄𝐷𝑐
E3
𝑄𝐸𝑐 = 𝑄𝐷𝑐 [𝑃𝐸𝑐
𝑃𝐷𝑐∗
(1 − 𝛾𝑐)
𝛾𝑐]
1
(𝜌𝑐𝑡 − 1)
∀ 𝑐𝑒𝑐 𝑎𝑛𝑑 𝑐𝑑𝑐 𝑄𝐸𝑐
E4 𝑄𝑋𝐶𝑐 = 𝑄𝐸𝑐 + 𝑄𝐷𝑐 ∀ (𝑐𝑑𝑐 𝐴𝑁𝐷 𝑐𝑒𝑛𝑐) 𝑂𝑅 ( 𝑐𝑑𝑛𝑐 𝐴𝑁𝐷 𝑐𝑒𝑐)
E5 𝑄𝐸𝑐 = 𝑒𝑐𝑜𝑛𝑐 ∗ (
𝑃𝑊𝐸𝑐
𝑝𝑤𝑠𝑒𝑐)
𝜂𝑐
∀ 𝑐𝑒𝑑𝑐
The domestic prices of imports are obtained by converting the world market prices (𝑃𝑊𝑀𝑐)
into the domestic currency, using the exchange rate (ER), and after adding the tariffs (𝑇𝑀𝑐)
(see equation [M1]). The product differentiation between demand for domestically
produced commodities (𝑄𝐷𝑐) and demand for imported commodities (𝑄𝑀𝑐) is implemented
with a CES function as defined in Equation M2 where 𝛿𝑐 is the share parameter, 𝜌𝑐𝑐 the
elasticity parameter and 𝑎𝑐𝑐 the efficiency parameter. Equation [M2] is defined for
commodities for which there is both a domestic and import demand. Equation [M3] states

Appendices
251
the first order conditions that determine the optimal ratio between domestically supplied
commodities and imported commodities. This optimal ratio is determined by the relative
prices of imports (𝑃𝑀𝑐) and domestically supplied commodities (𝑃𝐷𝑐). For commodities,
that are only imported and not domestically supplied, the total supply (𝑄𝑄𝑐) is equal to the
import quantity. Similarly, for commodities that are not imported, the total supply is equal
to the domestic supply, as defined by equation [M4].
Trade Block – Imports
Name Equation Variable
M1 𝑃𝑀𝑐 = 𝑃𝑊𝑀𝑐 ∗ 𝐸𝑅 ∗ (1 + 𝑇𝑀𝑐) ∀ 𝑐𝑚𝑐 𝑃𝑀𝑐
M2 𝑄𝑄𝑐 = 𝑎𝑐𝑐 ∗ (𝛿𝑐 ∗ 𝑄𝑀𝑐−𝜌𝑐
𝑐
+ (1 − 𝛿𝑐)
∗ 𝑄𝐷𝑐−𝜌𝑐
𝑐
)−(
1𝜌𝑐
𝑐) ∀ 𝑐𝑚𝑐 𝐴𝑁𝐷 𝑐𝑥𝑐
𝑄𝑀𝑐
M3
𝑄𝑀𝑐 = 𝑄𝐷𝑐 ∗ [𝑃𝐷𝑐
𝑃𝑀𝑐 ∗
𝛿𝑐
1 − 𝛿𝑐]
1𝜌𝑐
𝑐 + 1 ∀ 𝑐𝑚𝑐 𝐴𝑁𝐷 𝑐𝑥𝑐 𝑃𝐷𝑐
M4 𝑄𝑄𝑐 = 𝑄𝑀𝑐
+ 𝑄𝐷𝑐 ∀ (𝑐𝑚𝑛𝑐 𝐴𝑁𝐷 𝑐𝑥𝑐) 𝑂𝑅 ( 𝑐𝑥𝑛𝑐 𝐴𝑁𝐷 𝑐𝑚𝑐)
4.2. Model modification to incorporate a multi-trade partner setup
The multi-trade partner set up is introduced in STAGE-2 by extending the Armington
assumption to differentiate import by the country of origin. The modelling approach used
by McDonald and Thierfelder (2015) in the multi-country GLOBE model is adapted to the
single-country model of this thesis. Accordingly, the export supply to different partners is
modelled as a two-level CET functions, while the import demand is modelled with a two-
stage CES functions. A visual representation of the nest structure is provided in Figure A4
with an exemplary number of three trade partners.
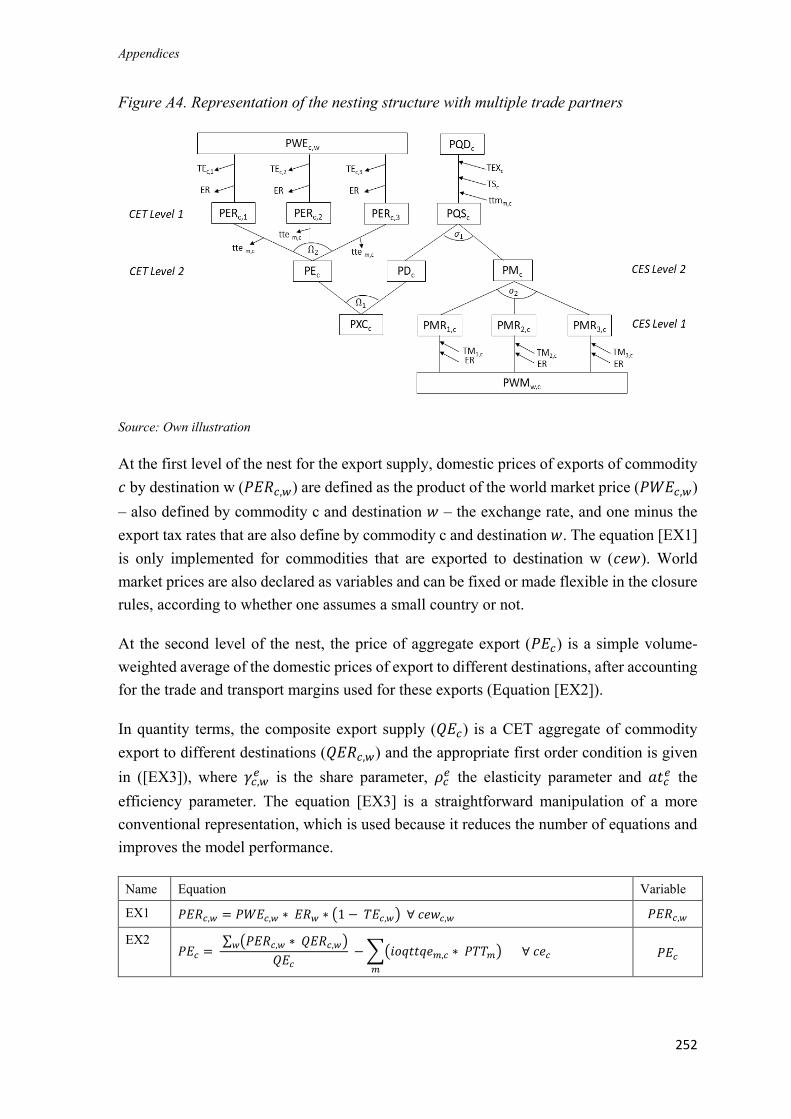
Appendices
252
Figure A4. Representation of the nesting structure with multiple trade partners
Source: Own illustration
At the first level of the nest for the export supply, domestic prices of exports of commodity
𝑐 by destination w (𝑃𝐸𝑅𝑐,𝑤) are defined as the product of the world market price (𝑃𝑊𝐸𝑐,𝑤)
– also defined by commodity c and destination 𝑤 – the exchange rate, and one minus the
export tax rates that are also define by commodity c and destination 𝑤. The equation [EX1]
is only implemented for commodities that are exported to destination w (𝑐𝑒𝑤). World
market prices are also declared as variables and can be fixed or made flexible in the closure
rules, according to whether one assumes a small country or not.
At the second level of the nest, the price of aggregate export (𝑃𝐸𝑐) is a simple volume-
weighted average of the domestic prices of export to different destinations, after accounting
for the trade and transport margins used for these exports (Equation [EX2]).
In quantity terms, the composite export supply (𝑄𝐸𝑐) is a CET aggregate of commodity
export to different destinations (𝑄𝐸𝑅𝑐,𝑤) and the appropriate first order condition is given
in ([EX3]), where 𝛾𝑐,𝑤𝑒 is the share parameter, 𝜌𝑐
𝑒 the elasticity parameter and 𝑎𝑡𝑐𝑒 the
efficiency parameter. The equation [EX3] is a straightforward manipulation of a more
conventional representation, which is used because it reduces the number of equations and
improves the model performance.
Name Equation Variable
EX1 𝑃𝐸𝑅𝑐,𝑤 = 𝑃𝑊𝐸𝑐,𝑤 ∗ 𝐸𝑅𝑤 ∗ (1 − 𝑇𝐸𝑐,𝑤) ∀ 𝑐𝑒𝑤𝑐,𝑤 𝑃𝐸𝑅𝑐,𝑤
EX2 𝑃𝐸𝑐 =
∑ (𝑃𝐸𝑅𝑐,𝑤 ∗ 𝑄𝐸𝑅𝑐,𝑤)𝑤
𝑄𝐸𝑐 − ∑(𝑖𝑜𝑞𝑡𝑡𝑞𝑒𝑚,𝑐 ∗ 𝑃𝑇𝑇𝑚)
𝑚
∀ 𝑐𝑒𝑐 𝑃𝐸𝑐
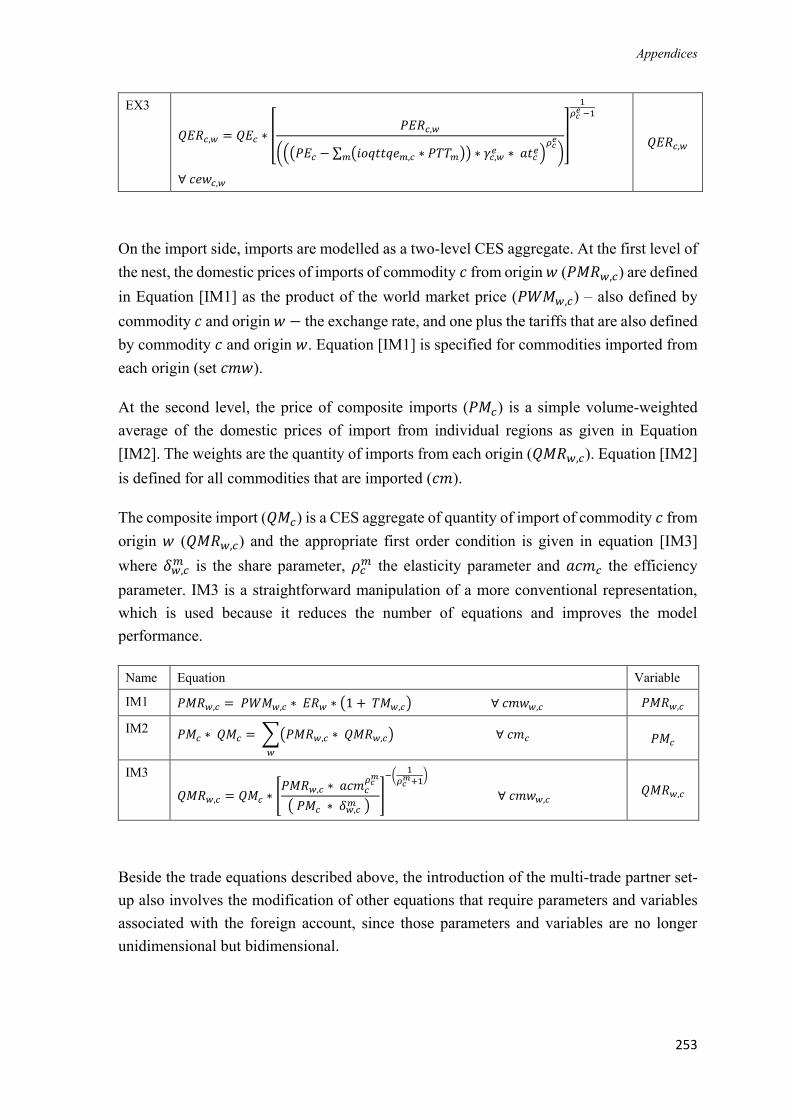
Appendices
253
EX3
𝑄𝐸𝑅𝑐,𝑤 = 𝑄𝐸𝑐 ∗ [𝑃𝐸𝑅𝑐,𝑤
(((𝑃𝐸𝑐 − ∑ (𝑖𝑜𝑞𝑡𝑡𝑞𝑒𝑚,𝑐 ∗ 𝑃𝑇𝑇𝑚)𝑚 ) ∗ 𝛾𝑐,𝑤𝑒 ∗ 𝑎𝑡𝑐
𝑒)𝜌𝑐
𝑒
)
]
1𝜌𝑐
𝑒 −1
∀ 𝑐𝑒𝑤𝑐,𝑤
𝑄𝐸𝑅𝑐,𝑤
On the import side, imports are modelled as a two-level CES aggregate. At the first level of
the nest, the domestic prices of imports of commodity 𝑐 from origin 𝑤 (𝑃𝑀𝑅𝑤,𝑐) are defined
in Equation [IM1] as the product of the world market price (𝑃𝑊𝑀𝑤,𝑐) – also defined by
commodity 𝑐 and origin 𝑤 − the exchange rate, and one plus the tariffs that are also defined
by commodity 𝑐 and origin 𝑤. Equation [IM1] is specified for commodities imported from
each origin (set 𝑐𝑚𝑤).
At the second level, the price of composite imports (𝑃𝑀𝑐) is a simple volume-weighted
average of the domestic prices of import from individual regions as given in Equation
[IM2]. The weights are the quantity of imports from each origin (𝑄𝑀𝑅𝑤,𝑐). Equation [IM2]
is defined for all commodities that are imported (𝑐𝑚).
The composite import (𝑄𝑀𝑐) is a CES aggregate of quantity of import of commodity 𝑐 from
origin 𝑤 (𝑄𝑀𝑅𝑤,𝑐) and the appropriate first order condition is given in equation [IM3]
where 𝛿𝑤,𝑐𝑚 is the share parameter, 𝜌𝑐
𝑚 the elasticity parameter and 𝑎𝑐𝑚𝑐 the efficiency
parameter. IM3 is a straightforward manipulation of a more conventional representation,
which is used because it reduces the number of equations and improves the model
performance.
Name Equation Variable
IM1 𝑃𝑀𝑅𝑤,𝑐 = 𝑃𝑊𝑀𝑤,𝑐 ∗ 𝐸𝑅𝑤 ∗ (1 + 𝑇𝑀𝑤,𝑐) ∀ 𝑐𝑚𝑤𝑤,𝑐 𝑃𝑀𝑅𝑤,𝑐
IM2 𝑃𝑀𝑐 ∗ 𝑄𝑀𝑐 = ∑(𝑃𝑀𝑅𝑤,𝑐 ∗ 𝑄𝑀𝑅𝑤,𝑐)
𝑤
∀ 𝑐𝑚𝑐 𝑃𝑀𝑐
IM3
𝑄𝑀𝑅𝑤,𝑐 = 𝑄𝑀𝑐 ∗ [𝑃𝑀𝑅𝑤,𝑐 ∗ 𝑎𝑐𝑚𝑐
𝜌𝑐𝑚
( 𝑃𝑀𝑐 ∗ 𝛿𝑤,𝑐𝑚 )
]
−(1
𝜌𝑐𝑚+1
)
∀ 𝑐𝑚𝑤𝑤,𝑐 𝑄𝑀𝑅𝑤,𝑐
Beside the trade equations described above, the introduction of the multi-trade partner set-
up also involves the modification of other equations that require parameters and variables
associated with the foreign account, since those parameters and variables are no longer
unidimensional but bidimensional.
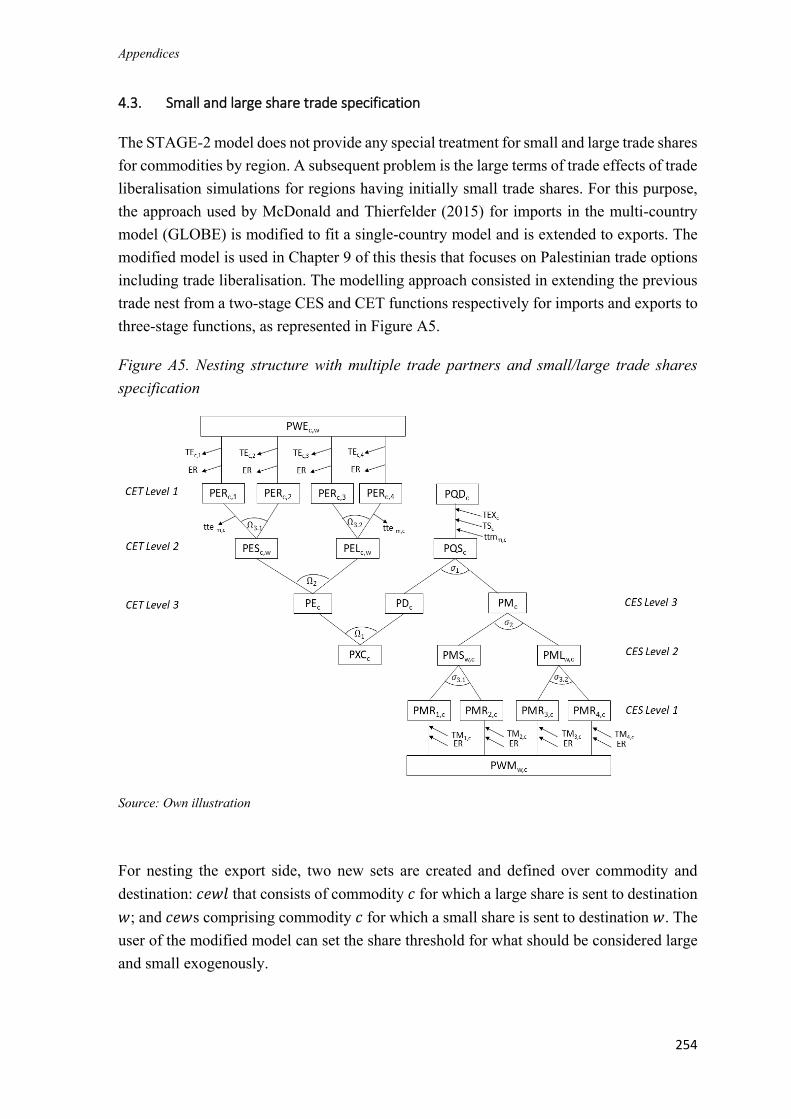
Appendices
254
4.3. Small and large share trade specification
The STAGE-2 model does not provide any special treatment for small and large trade shares
for commodities by region. A subsequent problem is the large terms of trade effects of trade
liberalisation simulations for regions having initially small trade shares. For this purpose,
the approach used by McDonald and Thierfelder (2015) for imports in the multi-country
model (GLOBE) is modified to fit a single-country model and is extended to exports. The
modified model is used in Chapter 9 of this thesis that focuses on Palestinian trade options
including trade liberalisation. The modelling approach consisted in extending the previous
trade nest from a two-stage CES and CET functions respectively for imports and exports to
three-stage functions, as represented in Figure A5.
Figure A5. Nesting structure with multiple trade partners and small/large trade shares
specification
Source: Own illustration
For nesting the export side, two new sets are created and defined over commodity and
destination: 𝑐𝑒𝑤𝑙 that consists of commodity 𝑐 for which a large share is sent to destination
𝑤; and 𝑐𝑒𝑤s comprising commodity 𝑐 for which a small share is sent to destination 𝑤. The
user of the modified model can set the share threshold for what should be considered large
and small exogenously.
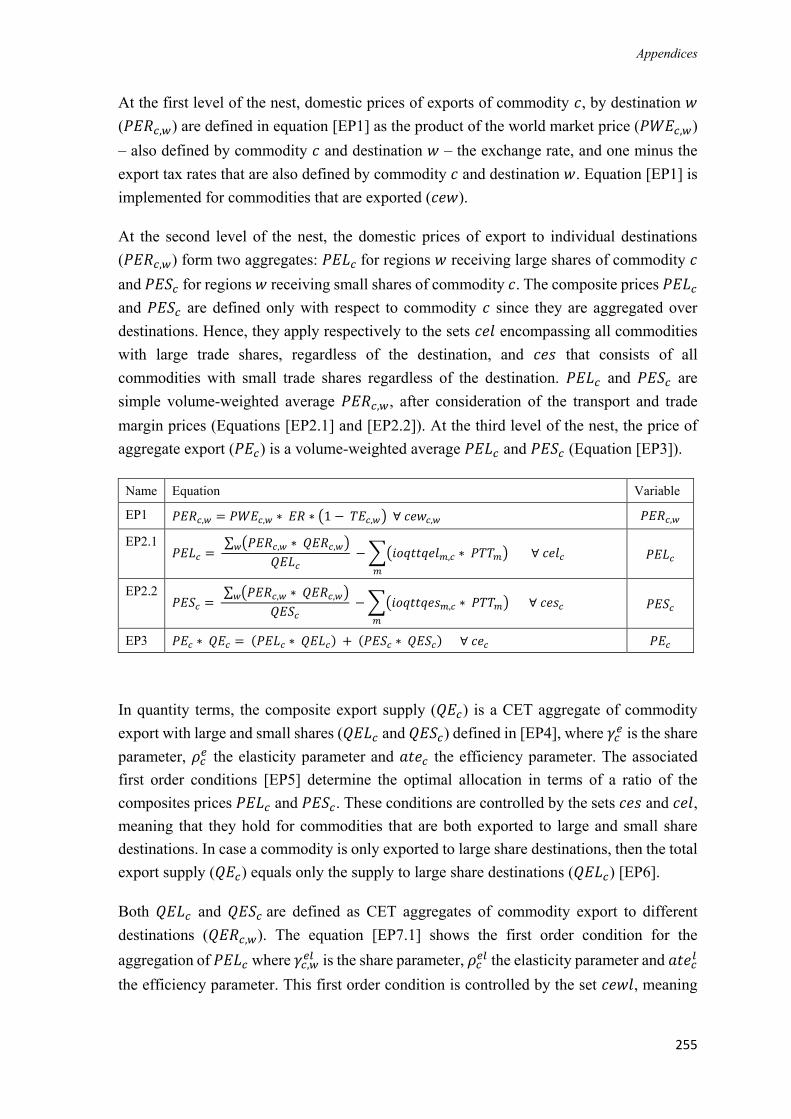
Appendices
255
At the first level of the nest, domestic prices of exports of commodity 𝑐, by destination 𝑤
(𝑃𝐸𝑅𝑐,𝑤) are defined in equation [EP1] as the product of the world market price (𝑃𝑊𝐸𝑐,𝑤)
– also defined by commodity 𝑐 and destination 𝑤 – the exchange rate, and one minus the
export tax rates that are also defined by commodity 𝑐 and destination 𝑤. Equation [EP1] is
implemented for commodities that are exported (𝑐𝑒𝑤).
At the second level of the nest, the domestic prices of export to individual destinations
(𝑃𝐸𝑅𝑐,𝑤) form two aggregates: 𝑃𝐸𝐿𝑐 for regions 𝑤 receiving large shares of commodity 𝑐
and 𝑃𝐸𝑆𝑐 for regions 𝑤 receiving small shares of commodity 𝑐. The composite prices 𝑃𝐸𝐿𝑐
and 𝑃𝐸𝑆𝑐 are defined only with respect to commodity 𝑐 since they are aggregated over
destinations. Hence, they apply respectively to the sets 𝑐𝑒𝑙 encompassing all commodities
with large trade shares, regardless of the destination, and 𝑐𝑒𝑠 that consists of all
commodities with small trade shares regardless of the destination. 𝑃𝐸𝐿𝑐 and 𝑃𝐸𝑆𝑐 are
simple volume-weighted average 𝑃𝐸𝑅𝑐,𝑤, after consideration of the transport and trade
margin prices (Equations [EP2.1] and [EP2.2]). At the third level of the nest, the price of
aggregate export (𝑃𝐸𝑐) is a volume-weighted average 𝑃𝐸𝐿𝑐 and 𝑃𝐸𝑆𝑐 (Equation [EP3]).
Name Equation Variable
EP1 𝑃𝐸𝑅𝑐,𝑤 = 𝑃𝑊𝐸𝑐,𝑤 ∗ 𝐸𝑅 ∗ (1 − 𝑇𝐸𝑐,𝑤) ∀ 𝑐𝑒𝑤𝑐,𝑤 𝑃𝐸𝑅𝑐,𝑤
EP2.1 𝑃𝐸𝐿𝑐 =
∑ (𝑃𝐸𝑅𝑐,𝑤 ∗ 𝑄𝐸𝑅𝑐,𝑤)𝑤
𝑄𝐸𝐿𝑐 − ∑(𝑖𝑜𝑞𝑡𝑡𝑞𝑒𝑙𝑚,𝑐 ∗ 𝑃𝑇𝑇𝑚)
𝑚
∀ 𝑐𝑒𝑙𝑐 𝑃𝐸𝐿𝑐
EP2.2 𝑃𝐸𝑆𝑐 =
∑ (𝑃𝐸𝑅𝑐,𝑤 ∗ 𝑄𝐸𝑅𝑐,𝑤)𝑤
𝑄𝐸𝑆𝑐 − ∑(𝑖𝑜𝑞𝑡𝑡𝑞𝑒𝑠𝑚,𝑐 ∗ 𝑃𝑇𝑇𝑚)
𝑚
∀ 𝑐𝑒𝑠𝑐 𝑃𝐸𝑆𝑐
EP3 𝑃𝐸𝑐 ∗ 𝑄𝐸𝑐 = (𝑃𝐸𝐿𝑐 ∗ 𝑄𝐸𝐿𝑐) + (𝑃𝐸𝑆𝑐 ∗ 𝑄𝐸𝑆𝑐) ∀ 𝑐𝑒𝑐 𝑃𝐸𝑐
In quantity terms, the composite export supply (𝑄𝐸𝑐) is a CET aggregate of commodity
export with large and small shares (𝑄𝐸𝐿𝑐 and 𝑄𝐸𝑆𝑐) defined in [EP4], where 𝛾𝑐𝑒 is the share
parameter, 𝜌𝑐𝑒 the elasticity parameter and 𝑎𝑡𝑒𝑐 the efficiency parameter. The associated
first order conditions [EP5] determine the optimal allocation in terms of a ratio of the
composites prices 𝑃𝐸𝐿𝑐 and 𝑃𝐸𝑆𝑐. These conditions are controlled by the sets 𝑐𝑒𝑠 and 𝑐𝑒𝑙,
meaning that they hold for commodities that are both exported to large and small share
destinations. In case a commodity is only exported to large share destinations, then the total
export supply (𝑄𝐸𝑐) equals only the supply to large share destinations (𝑄𝐸𝐿𝑐) [EP6].
Both 𝑄𝐸𝐿𝑐 and 𝑄𝐸𝑆𝑐 are defined as CET aggregates of commodity export to different
destinations (𝑄𝐸𝑅𝑐,𝑤). The equation [EP7.1] shows the first order condition for the
aggregation of 𝑃𝐸𝐿𝑐 where 𝛾𝑐,𝑤𝑒𝑙 is the share parameter, 𝜌𝑐
𝑒𝑙 the elasticity parameter and 𝑎𝑡𝑒𝑐𝑙
the efficiency parameter. This first order condition is controlled by the set 𝑐𝑒𝑤𝑙, meaning
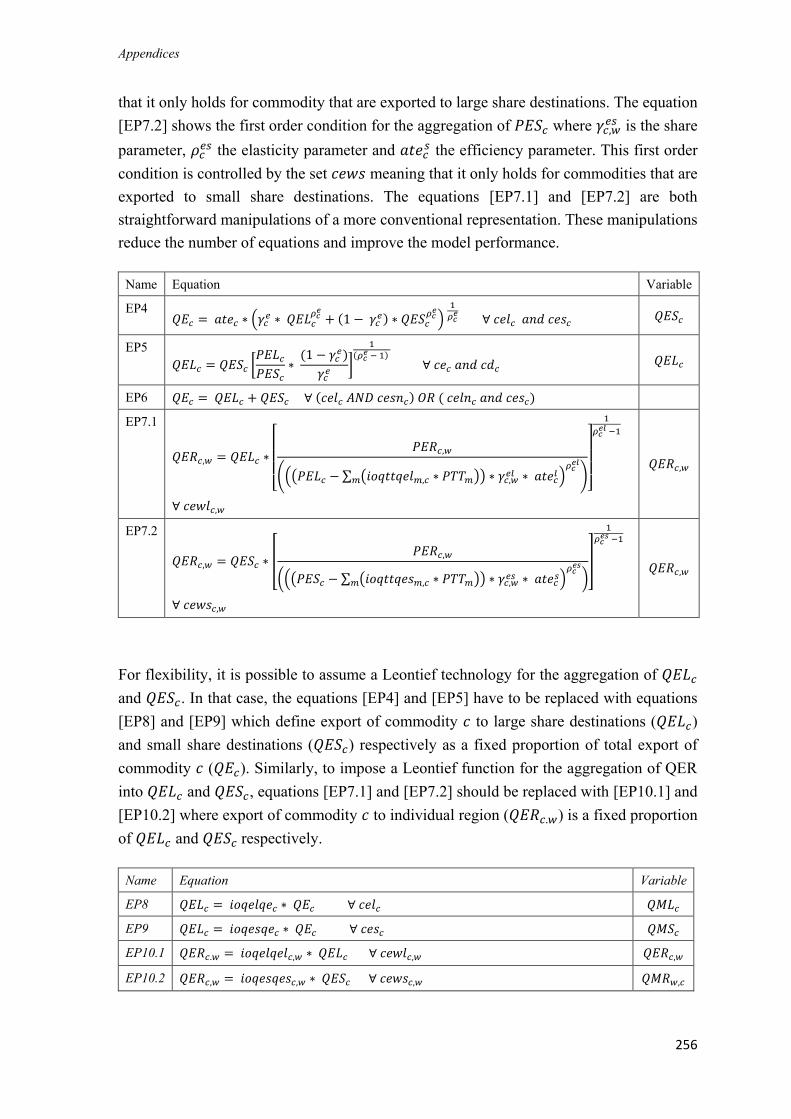
Appendices
256
that it only holds for commodity that are exported to large share destinations. The equation
[EP7.2] shows the first order condition for the aggregation of 𝑃𝐸𝑆𝑐 where 𝛾𝑐,𝑤𝑒𝑠 is the share
parameter, 𝜌𝑐𝑒𝑠 the elasticity parameter and 𝑎𝑡𝑒𝑐
𝑠 the efficiency parameter. This first order
condition is controlled by the set 𝑐𝑒𝑤𝑠 meaning that it only holds for commodities that are
exported to small share destinations. The equations [EP7.1] and [EP7.2] are both
straightforward manipulations of a more conventional representation. These manipulations
reduce the number of equations and improve the model performance.
Name Equation Variable
EP4 𝑄𝐸𝑐 = 𝑎𝑡𝑒𝑐 ∗ (𝛾𝑐
𝑒 ∗ 𝑄𝐸𝐿𝑐𝜌𝑐
𝑒
+ (1 − 𝛾𝑐𝑒) ∗ 𝑄𝐸𝑆𝑐
𝜌𝑐𝑒
) 1𝜌𝑐
𝑒 ∀ 𝑐𝑒𝑙𝑐 𝑎𝑛𝑑 𝑐𝑒𝑠𝑐 𝑄𝐸𝑆𝑐
EP5
𝑄𝐸𝐿𝑐 = 𝑄𝐸𝑆𝑐 [𝑃𝐸𝐿𝑐
𝑃𝐸𝑆𝑐∗
(1 − 𝛾𝑐𝑒)
𝛾𝑐𝑒
]
1(𝜌𝑐
𝑒 − 1) ∀ 𝑐𝑒𝑐 𝑎𝑛𝑑 𝑐𝑑𝑐 𝑄𝐸𝐿𝑐
EP6 𝑄𝐸𝑐 = 𝑄𝐸𝐿𝑐 + 𝑄𝐸𝑆𝑐 ∀ (𝑐𝑒𝑙𝑐 𝐴𝑁𝐷 𝑐𝑒𝑠𝑛𝑐) 𝑂𝑅 ( 𝑐𝑒𝑙𝑛𝑐 𝑎𝑛𝑑 𝑐𝑒𝑠𝑐)
EP7.1
𝑄𝐸𝑅𝑐,𝑤 = 𝑄𝐸𝐿𝑐 ∗
[
𝑃𝐸𝑅𝑐,𝑤
(((𝑃𝐸𝐿𝑐 − ∑ (𝑖𝑜𝑞𝑡𝑡𝑞𝑒𝑙𝑚,𝑐 ∗ 𝑃𝑇𝑇𝑚)𝑚 ) ∗ 𝛾𝑐,𝑤𝑒𝑙 ∗ 𝑎𝑡𝑒𝑐
𝑙)𝜌𝑐
𝑒𝑙
)]
1
𝜌𝑐𝑒𝑙 −1
∀ 𝑐𝑒𝑤𝑙𝑐,𝑤
𝑄𝐸𝑅𝑐,𝑤
EP7.2
𝑄𝐸𝑅𝑐,𝑤 = 𝑄𝐸𝑆𝑐 ∗ [𝑃𝐸𝑅𝑐,𝑤
(((𝑃𝐸𝑆𝑐 − ∑ (𝑖𝑜𝑞𝑡𝑡𝑞𝑒𝑠𝑚,𝑐 ∗ 𝑃𝑇𝑇𝑚)𝑚 ) ∗ 𝛾𝑐,𝑤𝑒𝑠 ∗ 𝑎𝑡𝑒𝑐
𝑠)𝜌𝑐
𝑒𝑠
)
]
1𝜌𝑐
𝑒𝑠 −1
∀ 𝑐𝑒𝑤𝑠𝑐,𝑤
𝑄𝐸𝑅𝑐,𝑤
For flexibility, it is possible to assume a Leontief technology for the aggregation of 𝑄𝐸𝐿𝑐
and 𝑄𝐸𝑆𝑐. In that case, the equations [EP4] and [EP5] have to be replaced with equations
[EP8] and [EP9] which define export of commodity 𝑐 to large share destinations (𝑄𝐸𝐿𝑐)
and small share destinations (𝑄𝐸𝑆𝑐) respectively as a fixed proportion of total export of
commodity 𝑐 (𝑄𝐸𝑐). Similarly, to impose a Leontief function for the aggregation of QER
into 𝑄𝐸𝐿𝑐 and 𝑄𝐸𝑆𝑐, equations [EP7.1] and [EP7.2] should be replaced with [EP10.1] and
[EP10.2] where export of commodity 𝑐 to individual region (𝑄𝐸𝑅𝑐.𝑤) is a fixed proportion
of 𝑄𝐸𝐿𝑐 and 𝑄𝐸𝑆𝑐 respectively.
Name Equation Variable
EP8 𝑄𝐸𝐿𝑐 = 𝑖𝑜𝑞𝑒𝑙𝑞𝑒𝑐 ∗ 𝑄𝐸𝑐 ∀ 𝑐𝑒𝑙𝑐 𝑄𝑀𝐿𝑐
EP9 𝑄𝐸𝐿𝑐 = 𝑖𝑜𝑞𝑒𝑠𝑞𝑒𝑐 ∗ 𝑄𝐸𝑐 ∀ 𝑐𝑒𝑠𝑐 𝑄𝑀𝑆𝑐
EP10.1 𝑄𝐸𝑅𝑐.𝑤 = 𝑖𝑜𝑞𝑒𝑙𝑞𝑒𝑙𝑐,𝑤 ∗ 𝑄𝐸𝐿𝑐 ∀ 𝑐𝑒𝑤𝑙𝑐,𝑤 𝑄𝐸𝑅𝑐,𝑤
EP10.2 𝑄𝐸𝑅𝑐,𝑤 = 𝑖𝑜𝑞𝑒𝑠𝑞𝑒𝑠𝑐,𝑤 ∗ 𝑄𝐸𝑆𝑐 ∀ 𝑐𝑒𝑤𝑠𝑐,𝑤 𝑄𝑀𝑅𝑤,𝑐
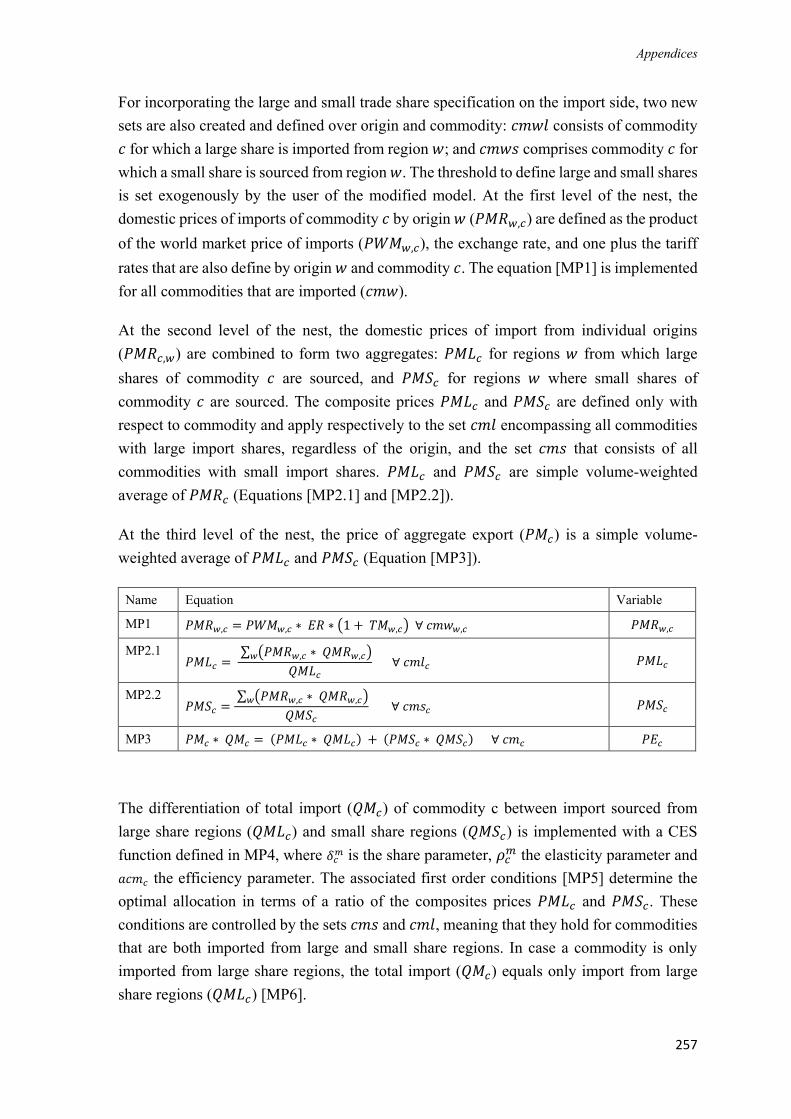
Appendices
257
For incorporating the large and small trade share specification on the import side, two new
sets are also created and defined over origin and commodity: 𝑐𝑚𝑤𝑙 consists of commodity
𝑐 for which a large share is imported from region 𝑤; and 𝑐𝑚𝑤𝑠 comprises commodity 𝑐 for
which a small share is sourced from region 𝑤. The threshold to define large and small shares
is set exogenously by the user of the modified model. At the first level of the nest, the
domestic prices of imports of commodity 𝑐 by origin 𝑤 (𝑃𝑀𝑅𝑤,𝑐) are defined as the product
of the world market price of imports (𝑃𝑊𝑀𝑤,𝑐), the exchange rate, and one plus the tariff
rates that are also define by origin 𝑤 and commodity 𝑐. The equation [MP1] is implemented
for all commodities that are imported (𝑐𝑚𝑤).
At the second level of the nest, the domestic prices of import from individual origins
(𝑃𝑀𝑅𝑐,𝑤) are combined to form two aggregates: 𝑃𝑀𝐿𝑐 for regions 𝑤 from which large
shares of commodity 𝑐 are sourced, and 𝑃𝑀𝑆𝑐 for regions 𝑤 where small shares of
commodity 𝑐 are sourced. The composite prices 𝑃𝑀𝐿𝑐 and 𝑃𝑀𝑆𝑐 are defined only with
respect to commodity and apply respectively to the set 𝑐𝑚𝑙 encompassing all commodities
with large import shares, regardless of the origin, and the set 𝑐𝑚𝑠 that consists of all
commodities with small import shares. 𝑃𝑀𝐿𝑐 and 𝑃𝑀𝑆𝑐 are simple volume-weighted
average of 𝑃𝑀𝑅𝑐 (Equations [MP2.1] and [MP2.2]).
At the third level of the nest, the price of aggregate export (𝑃𝑀𝑐) is a simple volume-
weighted average of 𝑃𝑀𝐿𝑐 and 𝑃𝑀𝑆𝑐 (Equation [MP3]).
Name Equation Variable
MP1 𝑃𝑀𝑅𝑤,𝑐 = 𝑃𝑊𝑀𝑤,𝑐 ∗ 𝐸𝑅 ∗ (1 + 𝑇𝑀𝑤,𝑐) ∀ 𝑐𝑚𝑤𝑤,𝑐 𝑃𝑀𝑅𝑤,𝑐
MP2.1 𝑃𝑀𝐿𝑐 =
∑ (𝑃𝑀𝑅𝑤,𝑐 ∗ 𝑄𝑀𝑅𝑤,𝑐)𝑤
𝑄𝑀𝐿𝑐 ∀ 𝑐𝑚𝑙𝑐 𝑃𝑀𝐿𝑐
MP2.2 𝑃𝑀𝑆𝑐 =
∑ (𝑃𝑀𝑅𝑤,𝑐 ∗ 𝑄𝑀𝑅𝑤,𝑐)𝑤
𝑄𝑀𝑆𝑐 ∀ 𝑐𝑚𝑠𝑐 𝑃𝑀𝑆𝑐
MP3 𝑃𝑀𝑐 ∗ 𝑄𝑀𝑐 = (𝑃𝑀𝐿𝑐 ∗ 𝑄𝑀𝐿𝑐) + (𝑃𝑀𝑆𝑐 ∗ 𝑄𝑀𝑆𝑐) ∀ 𝑐𝑚𝑐 𝑃𝐸𝑐
The differentiation of total import (𝑄𝑀𝑐) of commodity c between import sourced from
large share regions (𝑄𝑀𝐿𝑐) and small share regions (𝑄𝑀𝑆𝑐) is implemented with a CES
function defined in MP4, where 𝛿𝑐𝑚 is the share parameter, 𝜌𝑐
𝑚 the elasticity parameter and
𝑎𝑐𝑚𝑐 the efficiency parameter. The associated first order conditions [MP5] determine the
optimal allocation in terms of a ratio of the composites prices 𝑃𝑀𝐿𝑐 and 𝑃𝑀𝑆𝑐. These
conditions are controlled by the sets 𝑐𝑚𝑠 and 𝑐𝑚𝑙, meaning that they hold for commodities
that are both imported from large and small share regions. In case a commodity is only
imported from large share regions, the total import (𝑄𝑀𝑐) equals only import from large
share regions (𝑄𝑀𝐿𝑐) [MP6].
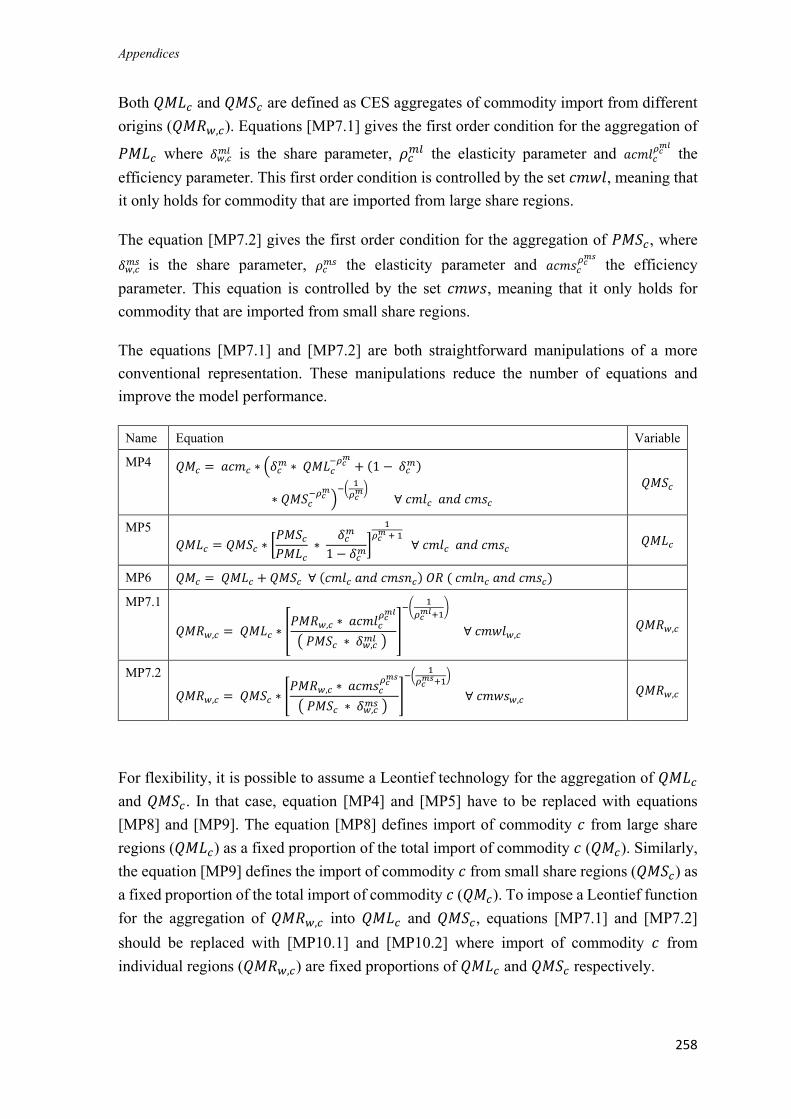
Appendices
258
Both 𝑄𝑀𝐿𝑐 and 𝑄𝑀𝑆𝑐 are defined as CES aggregates of commodity import from different
origins (𝑄𝑀𝑅𝑤,𝑐). Equations [MP7.1] gives the first order condition for the aggregation of
𝑃𝑀𝐿𝑐 where 𝛿𝑤,𝑐𝑚𝑙 is the share parameter, 𝜌𝑐
𝑚𝑙 the elasticity parameter and 𝑎𝑐𝑚𝑙𝑐𝜌𝑐
𝑚𝑙
the
efficiency parameter. This first order condition is controlled by the set 𝑐𝑚𝑤𝑙, meaning that
it only holds for commodity that are imported from large share regions.
The equation [MP7.2] gives the first order condition for the aggregation of 𝑃𝑀𝑆𝑐, where
𝛿𝑤,𝑐𝑚𝑠 is the share parameter, 𝜌𝑐
𝑚𝑠 the elasticity parameter and 𝑎𝑐𝑚𝑠𝑐𝜌𝑐
𝑚𝑠
the efficiency
parameter. This equation is controlled by the set 𝑐𝑚𝑤𝑠, meaning that it only holds for
commodity that are imported from small share regions.
The equations [MP7.1] and [MP7.2] are both straightforward manipulations of a more
conventional representation. These manipulations reduce the number of equations and
improve the model performance.
Name Equation Variable
MP4 𝑄𝑀𝑐 = 𝑎𝑐𝑚𝑐 ∗ (𝛿𝑐𝑚 ∗ 𝑄𝑀𝐿𝑐
−𝜌𝑐𝑚
+ (1 − 𝛿𝑐𝑚)
∗ 𝑄𝑀𝑆𝑐−𝜌𝑐
𝑚
)−(
1𝜌𝑐
𝑚)
∀ 𝑐𝑚𝑙𝑐 𝑎𝑛𝑑 𝑐𝑚𝑠𝑐
𝑄𝑀𝑆𝑐
MP5
𝑄𝑀𝐿𝑐 = 𝑄𝑀𝑆𝑐 ∗ [𝑃𝑀𝑆𝑐
𝑃𝑀𝐿𝑐 ∗
𝛿𝑐𝑚
1 − 𝛿𝑐𝑚
]
1𝜌𝑐
𝑚 + 1 ∀ 𝑐𝑚𝑙𝑐 𝑎𝑛𝑑 𝑐𝑚𝑠𝑐 𝑄𝑀𝐿𝑐
MP6 𝑄𝑀𝑐 = 𝑄𝑀𝐿𝑐 + 𝑄𝑀𝑆𝑐 ∀ (𝑐𝑚𝑙𝑐 𝑎𝑛𝑑 𝑐𝑚𝑠𝑛𝑐) 𝑂𝑅 ( 𝑐𝑚𝑙𝑛𝑐 𝑎𝑛𝑑 𝑐𝑚𝑠𝑐)
MP7.1
𝑄𝑀𝑅𝑤,𝑐 = 𝑄𝑀𝐿𝑐 ∗ [𝑃𝑀𝑅𝑤,𝑐 ∗ 𝑎𝑐𝑚𝑙𝑐
𝜌𝑐𝑚𝑙
( 𝑃𝑀𝑆𝑐 ∗ 𝛿𝑤,𝑐𝑚𝑙 )
]
−(1
𝜌𝑐𝑚𝑙+1
)
∀ 𝑐𝑚𝑤𝑙𝑤,𝑐 𝑄𝑀𝑅𝑤,𝑐
MP7.2
𝑄𝑀𝑅𝑤,𝑐 = 𝑄𝑀𝑆𝑐 ∗ [𝑃𝑀𝑅𝑤,𝑐 ∗ 𝑎𝑐𝑚𝑠𝑐
𝜌𝑐𝑚𝑠
( 𝑃𝑀𝑆𝑐 ∗ 𝛿𝑤,𝑐𝑚𝑠 )
]
−(1
𝜌𝑐𝑚𝑠+1
)
∀ 𝑐𝑚𝑤𝑠𝑤,𝑐 𝑄𝑀𝑅𝑤,𝑐
For flexibility, it is possible to assume a Leontief technology for the aggregation of 𝑄𝑀𝐿𝑐
and 𝑄𝑀𝑆𝑐. In that case, equation [MP4] and [MP5] have to be replaced with equations
[MP8] and [MP9]. The equation [MP8] defines import of commodity 𝑐 from large share
regions (𝑄𝑀𝐿𝑐) as a fixed proportion of the total import of commodity 𝑐 (𝑄𝑀𝑐). Similarly,
the equation [MP9] defines the import of commodity 𝑐 from small share regions (𝑄𝑀𝑆𝑐) as
a fixed proportion of the total import of commodity 𝑐 (𝑄𝑀𝑐). To impose a Leontief function
for the aggregation of 𝑄𝑀𝑅𝑤,𝑐 into 𝑄𝑀𝐿𝑐 and 𝑄𝑀𝑆𝑐, equations [MP7.1] and [MP7.2]
should be replaced with [MP10.1] and [MP10.2] where import of commodity 𝑐 from
individual regions (𝑄𝑀𝑅𝑤,𝑐) are fixed proportions of 𝑄𝑀𝐿𝑐 and 𝑄𝑀𝑆𝑐 respectively.
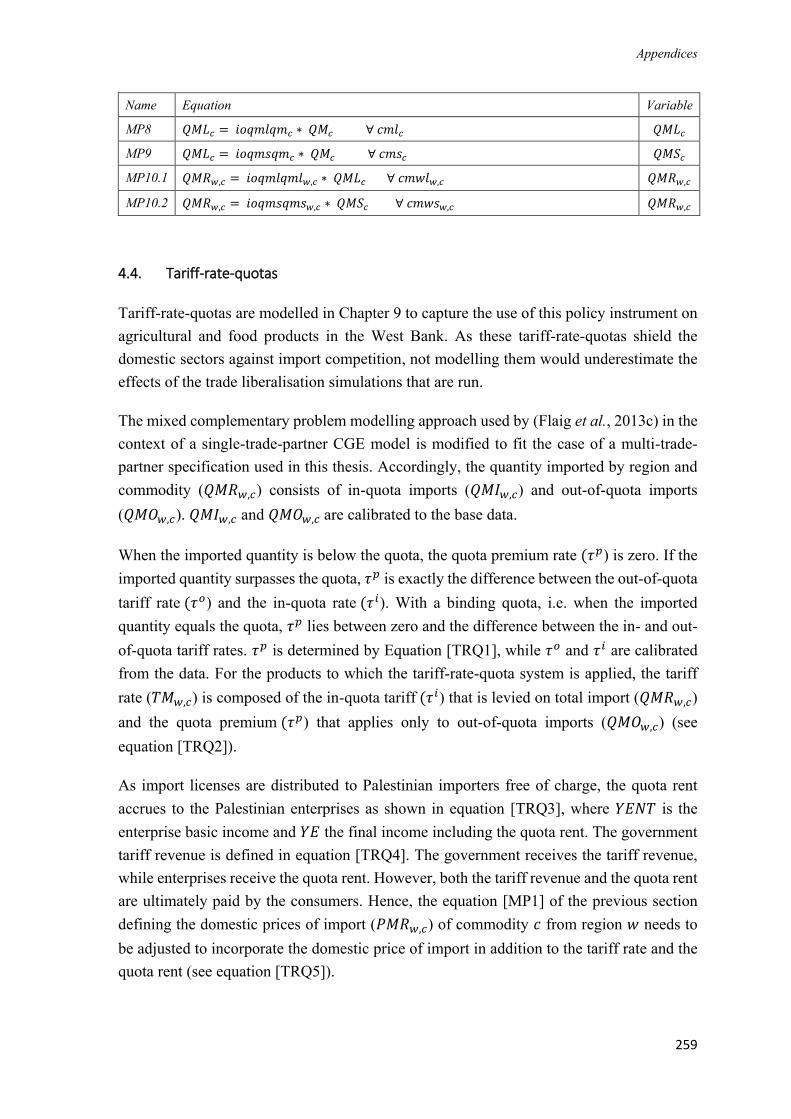
Appendices
259
Name Equation Variable
MP8 𝑄𝑀𝐿𝑐 = 𝑖𝑜𝑞𝑚𝑙𝑞𝑚𝑐 ∗ 𝑄𝑀𝑐 ∀ 𝑐𝑚𝑙𝑐 𝑄𝑀𝐿𝑐
MP9 𝑄𝑀𝐿𝑐 = 𝑖𝑜𝑞𝑚𝑠𝑞𝑚𝑐 ∗ 𝑄𝑀𝑐 ∀ 𝑐𝑚𝑠𝑐 𝑄𝑀𝑆𝑐
MP10.1 𝑄𝑀𝑅𝑤,𝑐 = 𝑖𝑜𝑞𝑚𝑙𝑞𝑚𝑙𝑤,𝑐 ∗ 𝑄𝑀𝐿𝑐 ∀ 𝑐𝑚𝑤𝑙𝑤,𝑐 𝑄𝑀𝑅𝑤,𝑐
MP10.2 𝑄𝑀𝑅𝑤,𝑐 = 𝑖𝑜𝑞𝑚𝑠𝑞𝑚𝑠𝑤,𝑐 ∗ 𝑄𝑀𝑆𝑐 ∀ 𝑐𝑚𝑤𝑠𝑤,𝑐 𝑄𝑀𝑅𝑤,𝑐
4.4. Tariff-rate-quotas
Tariff-rate-quotas are modelled in Chapter 9 to capture the use of this policy instrument on
agricultural and food products in the West Bank. As these tariff-rate-quotas shield the
domestic sectors against import competition, not modelling them would underestimate the
effects of the trade liberalisation simulations that are run.
The mixed complementary problem modelling approach used by (Flaig et al., 2013c) in the
context of a single-trade-partner CGE model is modified to fit the case of a multi-trade-
partner specification used in this thesis. Accordingly, the quantity imported by region and
commodity (𝑄𝑀𝑅𝑤,𝑐) consists of in-quota imports (𝑄𝑀𝐼𝑤,𝑐) and out-of-quota imports
(𝑄𝑀𝑂𝑤,𝑐). 𝑄𝑀𝐼𝑤,𝑐 and 𝑄𝑀𝑂𝑤,𝑐 are calibrated to the base data.
When the imported quantity is below the quota, the quota premium rate (𝜏𝑝) is zero. If the
imported quantity surpasses the quota, 𝜏𝑝 is exactly the difference between the out-of-quota
tariff rate (𝜏𝑜) and the in-quota rate (𝜏𝑖). With a binding quota, i.e. when the imported
quantity equals the quota, 𝜏𝑝 lies between zero and the difference between the in- and out-
of-quota tariff rates. 𝜏𝑝 is determined by Equation [TRQ1], while 𝜏𝑜 and 𝜏𝑖 are calibrated
from the data. For the products to which the tariff-rate-quota system is applied, the tariff
rate (𝑇𝑀𝑤,𝑐) is composed of the in-quota tariff (𝜏𝑖) that is levied on total import (𝑄𝑀𝑅𝑤,𝑐)
and the quota premium (𝜏𝑝) that applies only to out-of-quota imports (𝑄𝑀𝑂𝑤,𝑐) (see
equation [TRQ2]).
As import licenses are distributed to Palestinian importers free of charge, the quota rent
accrues to the Palestinian enterprises as shown in equation [TRQ3], where 𝑌𝐸𝑁𝑇 is the
enterprise basic income and 𝑌𝐸 the final income including the quota rent. The government
tariff revenue is defined in equation [TRQ4]. The government receives the tariff revenue,
while enterprises receive the quota rent. However, both the tariff revenue and the quota rent
are ultimately paid by the consumers. Hence, the equation [MP1] of the previous section
defining the domestic prices of import (𝑃𝑀𝑅𝑤,𝑐) of commodity 𝑐 from region 𝑤 needs to
be adjusted to incorporate the domestic price of import in addition to the tariff rate and the
quota rent (see equation [TRQ5]).
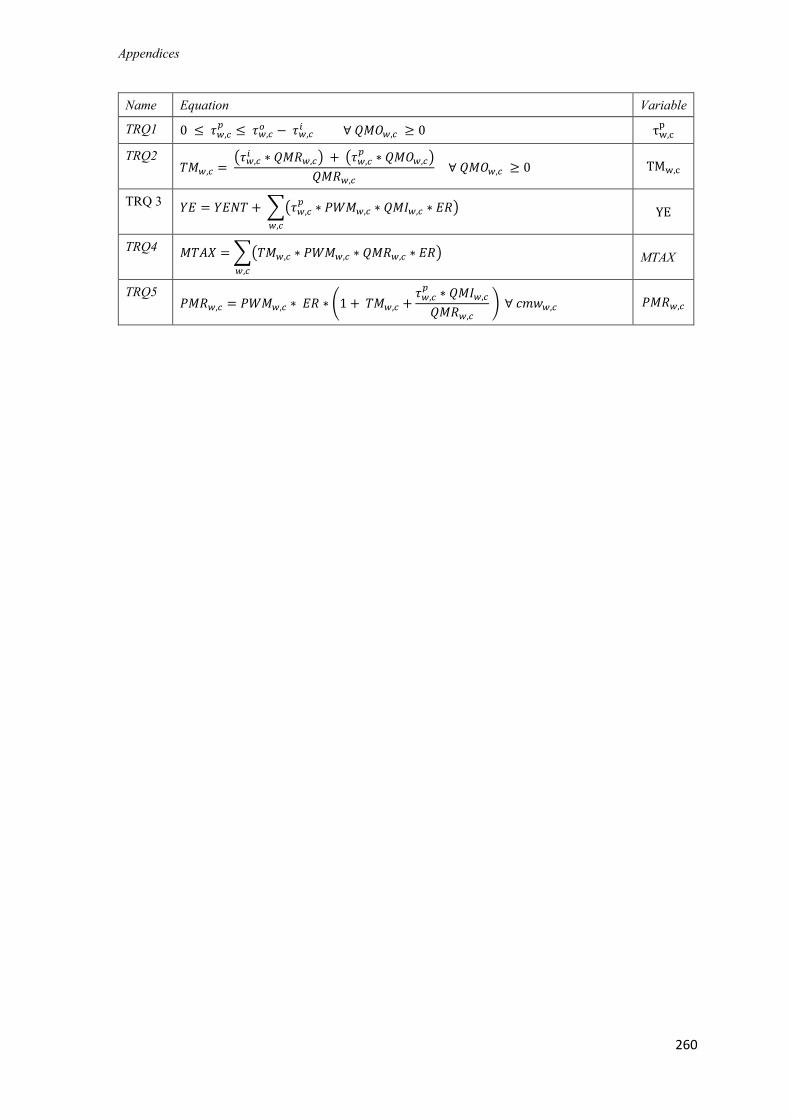
Appendices
260
Name Equation Variable
TRQ1 0 ≤ 𝜏𝑤,𝑐𝑝
≤ 𝜏𝑤,𝑐𝑜 − 𝜏𝑤,𝑐
𝑖 ∀ 𝑄𝑀𝑂𝑤,𝑐 ≥ 0 τw,cp
TRQ2 𝑇𝑀𝑤,𝑐 =
(𝜏𝑤,𝑐𝑖 ∗ 𝑄𝑀𝑅𝑤,𝑐) + (𝜏𝑤,𝑐
𝑝∗ 𝑄𝑀𝑂𝑤,𝑐)
𝑄𝑀𝑅𝑤,𝑐
∀ 𝑄𝑀𝑂𝑤,𝑐 ≥ 0 TMw,c
TRQ 3 𝑌𝐸 = 𝑌𝐸𝑁𝑇 + ∑(𝜏𝑤,𝑐𝑝
∗ 𝑃𝑊𝑀𝑤,𝑐 ∗ 𝑄𝑀𝐼𝑤,𝑐 ∗ 𝐸𝑅)
𝑤,𝑐
YE
TRQ4 𝑀𝑇𝐴𝑋 = ∑(𝑇𝑀𝑤,𝑐 ∗ 𝑃𝑊𝑀𝑤,𝑐 ∗ 𝑄𝑀𝑅𝑤,𝑐 ∗ 𝐸𝑅)
𝑤,𝑐
MTAX
TRQ5 𝑃𝑀𝑅𝑤,𝑐 = 𝑃𝑊𝑀𝑤,𝑐 ∗ 𝐸𝑅 ∗ (1 + 𝑇𝑀𝑤,𝑐 +
𝜏𝑤,𝑐𝑝
∗ 𝑄𝑀𝐼𝑤,𝑐
𝑄𝑀𝑅𝑤,𝑐 ) ∀ 𝑐𝑚𝑤𝑤,𝑐 𝑃𝑀𝑅𝑤,𝑐
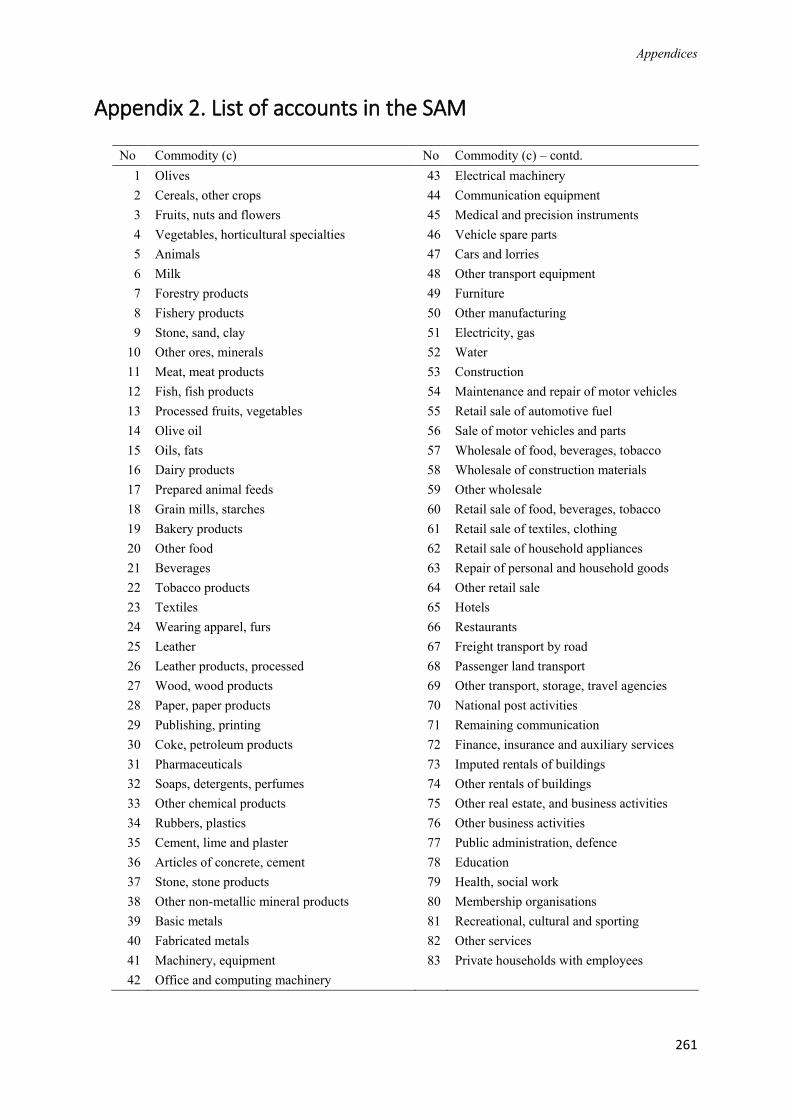
Appendices
261
Appendix 2. List of accounts in the SAM
No Commodity (c) No Commodity (c) – contd.
1 Olives 43 Electrical machinery
2 Cereals, other crops 44 Communication equipment
3 Fruits, nuts and flowers 45 Medical and precision instruments
4 Vegetables, horticultural specialties 46 Vehicle spare parts
5 Animals 47 Cars and lorries
6 Milk 48 Other transport equipment
7 Forestry products 49 Furniture
8 Fishery products 50 Other manufacturing
9 Stone, sand, clay 51 Electricity, gas
10 Other ores, minerals 52 Water
11 Meat, meat products 53 Construction
12 Fish, fish products 54 Maintenance and repair of motor vehicles
13 Processed fruits, vegetables 55 Retail sale of automotive fuel
14 Olive oil 56 Sale of motor vehicles and parts
15 Oils, fats 57 Wholesale of food, beverages, tobacco
16 Dairy products 58 Wholesale of construction materials
17 Prepared animal feeds 59 Other wholesale
18 Grain mills, starches 60 Retail sale of food, beverages, tobacco
19 Bakery products 61 Retail sale of textiles, clothing
20 Other food 62 Retail sale of household appliances
21 Beverages 63 Repair of personal and household goods
22 Tobacco products 64 Other retail sale
23 Textiles 65 Hotels
24 Wearing apparel, furs 66 Restaurants
25 Leather 67 Freight transport by road
26 Leather products, processed 68 Passenger land transport
27 Wood, wood products 69 Other transport, storage, travel agencies
28 Paper, paper products 70 National post activities
29 Publishing, printing 71 Remaining communication
30 Coke, petroleum products 72 Finance, insurance and auxiliary services
31 Pharmaceuticals 73 Imputed rentals of buildings
32 Soaps, detergents, perfumes 74 Other rentals of buildings
33 Other chemical products 75 Other real estate, and business activities
34 Rubbers, plastics 76 Other business activities
35 Cement, lime and plaster 77 Public administration, defence
36 Articles of concrete, cement 78 Education
37 Stone, stone products 79 Health, social work
38 Other non-metallic mineral products 80 Membership organisations
39 Basic metals 81 Recreational, cultural and sporting
40 Fabricated metals 82 Other services
41 Machinery, equipment 83 Private households with employees
42 Office and computing machinery
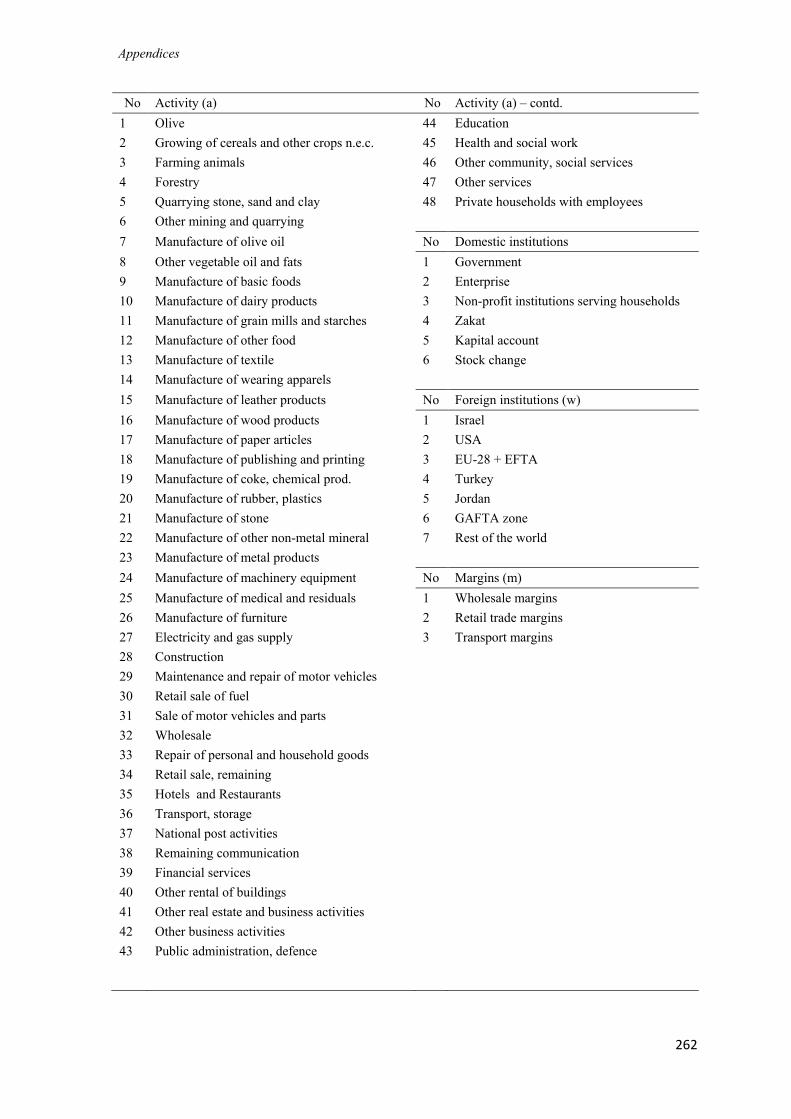
Appendices
262
No Activity (a) No Activity (a) – contd.
1 Olive 44 Education
2 Growing of cereals and other crops n.e.c. 45 Health and social work
3 Farming animals 46 Other community, social services
4 Forestry 47 Other services
5 Quarrying stone, sand and clay 48 Private households with employees
6 Other mining and quarrying
7 Manufacture of olive oil No Domestic institutions
8 Other vegetable oil and fats 1 Government
9 Manufacture of basic foods 2 Enterprise
10 Manufacture of dairy products 3 Non-profit institutions serving households
11 Manufacture of grain mills and starches 4 Zakat
12 Manufacture of other food 5 Kapital account
13 Manufacture of textile 6 Stock change
14 Manufacture of wearing apparels
15 Manufacture of leather products No Foreign institutions (w)
16 Manufacture of wood products 1 Israel
17 Manufacture of paper articles 2 USA
18 Manufacture of publishing and printing 3 EU-28 + EFTA
19 Manufacture of coke, chemical prod. 4 Turkey
20 Manufacture of rubber, plastics 5 Jordan
21 Manufacture of stone 6 GAFTA zone
22 Manufacture of other non-metal mineral 7 Rest of the world
23 Manufacture of metal products
24 Manufacture of machinery equipment No Margins (m)
25 Manufacture of medical and residuals 1 Wholesale margins
26 Manufacture of furniture 2 Retail trade margins
27 Electricity and gas supply 3 Transport margins
28 Construction
29 Maintenance and repair of motor vehicles
30 Retail sale of fuel
31 Sale of motor vehicles and parts
32 Wholesale
33 Repair of personal and household goods
34 Retail sale, remaining
35 Hotels and Restaurants
36 Transport, storage
37 National post activities
38 Remaining communication
39 Financial services
40 Other rental of buildings
41 Other real estate and business activities
42 Other business activities
43 Public administration, defence
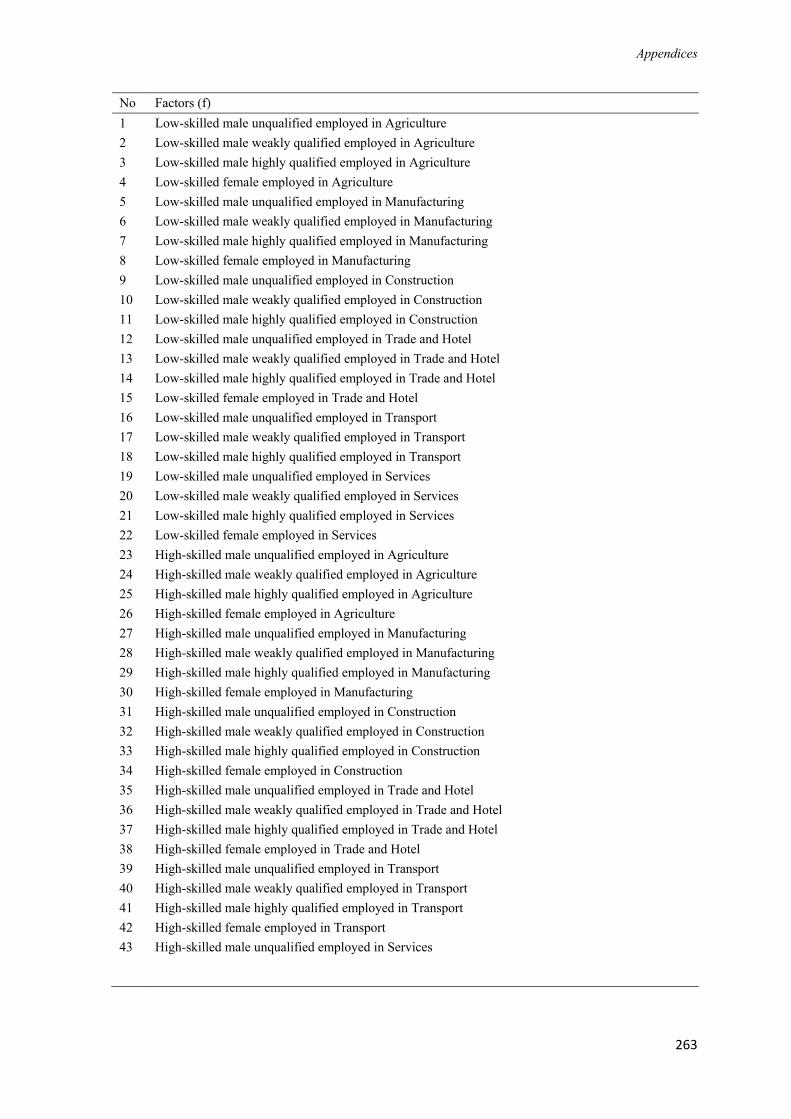
Appendices
263
No Factors (f)
1 Low-skilled male unqualified employed in Agriculture
2 Low-skilled male weakly qualified employed in Agriculture
3 Low-skilled male highly qualified employed in Agriculture
4 Low-skilled female employed in Agriculture
5 Low-skilled male unqualified employed in Manufacturing
6 Low-skilled male weakly qualified employed in Manufacturing
7 Low-skilled male highly qualified employed in Manufacturing
8 Low-skilled female employed in Manufacturing
9 Low-skilled male unqualified employed in Construction
10 Low-skilled male weakly qualified employed in Construction
11 Low-skilled male highly qualified employed in Construction
12 Low-skilled male unqualified employed in Trade and Hotel
13 Low-skilled male weakly qualified employed in Trade and Hotel
14 Low-skilled male highly qualified employed in Trade and Hotel
15 Low-skilled female employed in Trade and Hotel
16 Low-skilled male unqualified employed in Transport
17 Low-skilled male weakly qualified employed in Transport
18 Low-skilled male highly qualified employed in Transport
19 Low-skilled male unqualified employed in Services
20 Low-skilled male weakly qualified employed in Services
21 Low-skilled male highly qualified employed in Services
22 Low-skilled female employed in Services
23 High-skilled male unqualified employed in Agriculture
24 High-skilled male weakly qualified employed in Agriculture
25 High-skilled male highly qualified employed in Agriculture
26 High-skilled female employed in Agriculture
27 High-skilled male unqualified employed in Manufacturing
28 High-skilled male weakly qualified employed in Manufacturing
29 High-skilled male highly qualified employed in Manufacturing
30 High-skilled female employed in Manufacturing
31 High-skilled male unqualified employed in Construction
32 High-skilled male weakly qualified employed in Construction
33 High-skilled male highly qualified employed in Construction
34 High-skilled female employed in Construction
35 High-skilled male unqualified employed in Trade and Hotel
36 High-skilled male weakly qualified employed in Trade and Hotel
37 High-skilled male highly qualified employed in Trade and Hotel
38 High-skilled female employed in Trade and Hotel
39 High-skilled male unqualified employed in Transport
40 High-skilled male weakly qualified employed in Transport
41 High-skilled male highly qualified employed in Transport
42 High-skilled female employed in Transport
43 High-skilled male unqualified employed in Services
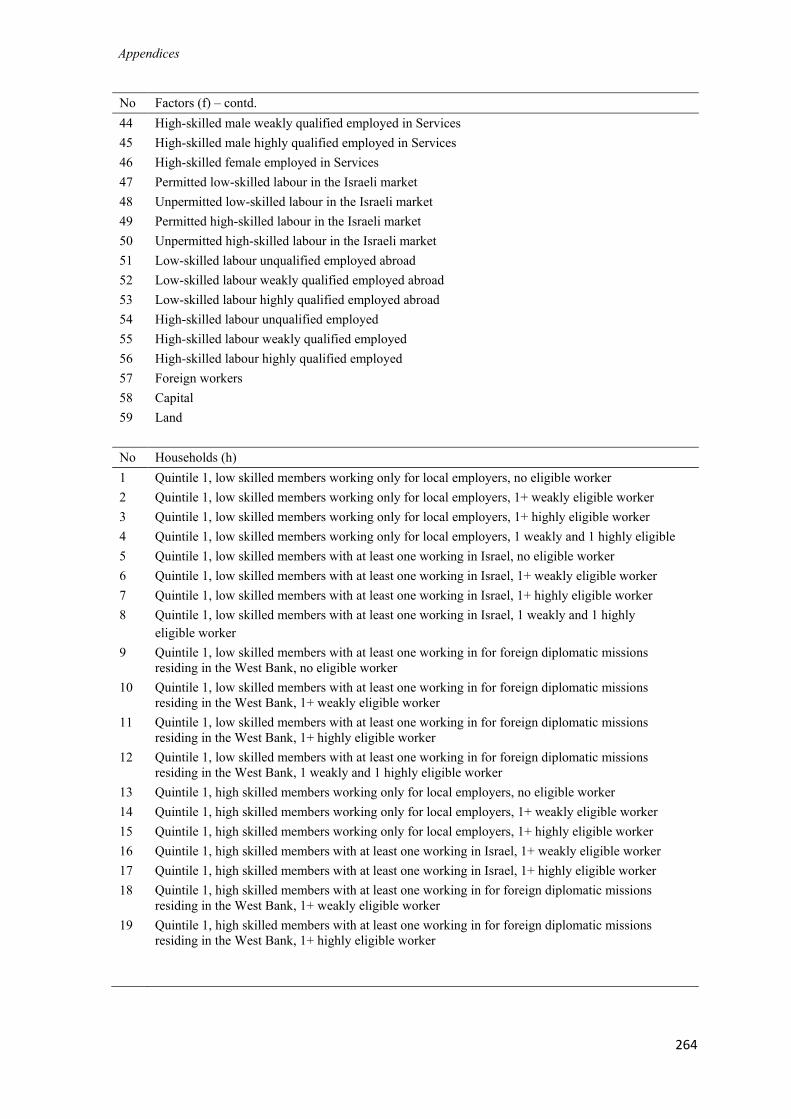
Appendices
264
No Factors (f) – contd.
44 High-skilled male weakly qualified employed in Services
45 High-skilled male highly qualified employed in Services
46 High-skilled female employed in Services
47 Permitted low-skilled labour in the Israeli market
48 Unpermitted low-skilled labour in the Israeli market
49 Permitted high-skilled labour in the Israeli market
50 Unpermitted high-skilled labour in the Israeli market
51 Low-skilled labour unqualified employed abroad
52 Low-skilled labour weakly qualified employed abroad
53 Low-skilled labour highly qualified employed abroad
54 High-skilled labour unqualified employed
55 High-skilled labour weakly qualified employed
56 High-skilled labour highly qualified employed
57 Foreign workers
58 Capital
59 Land
No Households (h)
1 Quintile 1, low skilled members working only for local employers, no eligible worker
2 Quintile 1, low skilled members working only for local employers, 1+ weakly eligible worker
3 Quintile 1, low skilled members working only for local employers, 1+ highly eligible worker
4 Quintile 1, low skilled members working only for local employers, 1 weakly and 1 highly eligible
5 Quintile 1, low skilled members with at least one working in Israel, no eligible worker
6 Quintile 1, low skilled members with at least one working in Israel, 1+ weakly eligible worker
7 Quintile 1, low skilled members with at least one working in Israel, 1+ highly eligible worker
8 Quintile 1, low skilled members with at least one working in Israel, 1 weakly and 1 highly
eligible worker
9 Quintile 1, low skilled members with at least one working in for foreign diplomatic missions
residing in the West Bank, no eligible worker
10 Quintile 1, low skilled members with at least one working in for foreign diplomatic missions
residing in the West Bank, 1+ weakly eligible worker
11 Quintile 1, low skilled members with at least one working in for foreign diplomatic missions
residing in the West Bank, 1+ highly eligible worker
12 Quintile 1, low skilled members with at least one working in for foreign diplomatic missions
residing in the West Bank, 1 weakly and 1 highly eligible worker
13 Quintile 1, high skilled members working only for local employers, no eligible worker
14 Quintile 1, high skilled members working only for local employers, 1+ weakly eligible worker
15 Quintile 1, high skilled members working only for local employers, 1+ highly eligible worker
16 Quintile 1, high skilled members with at least one working in Israel, 1+ weakly eligible worker
17 Quintile 1, high skilled members with at least one working in Israel, 1+ highly eligible worker
18 Quintile 1, high skilled members with at least one working in for foreign diplomatic missions
residing in the West Bank, 1+ weakly eligible worker
19 Quintile 1, high skilled members with at least one working in for foreign diplomatic missions
residing in the West Bank, 1+ highly eligible worker
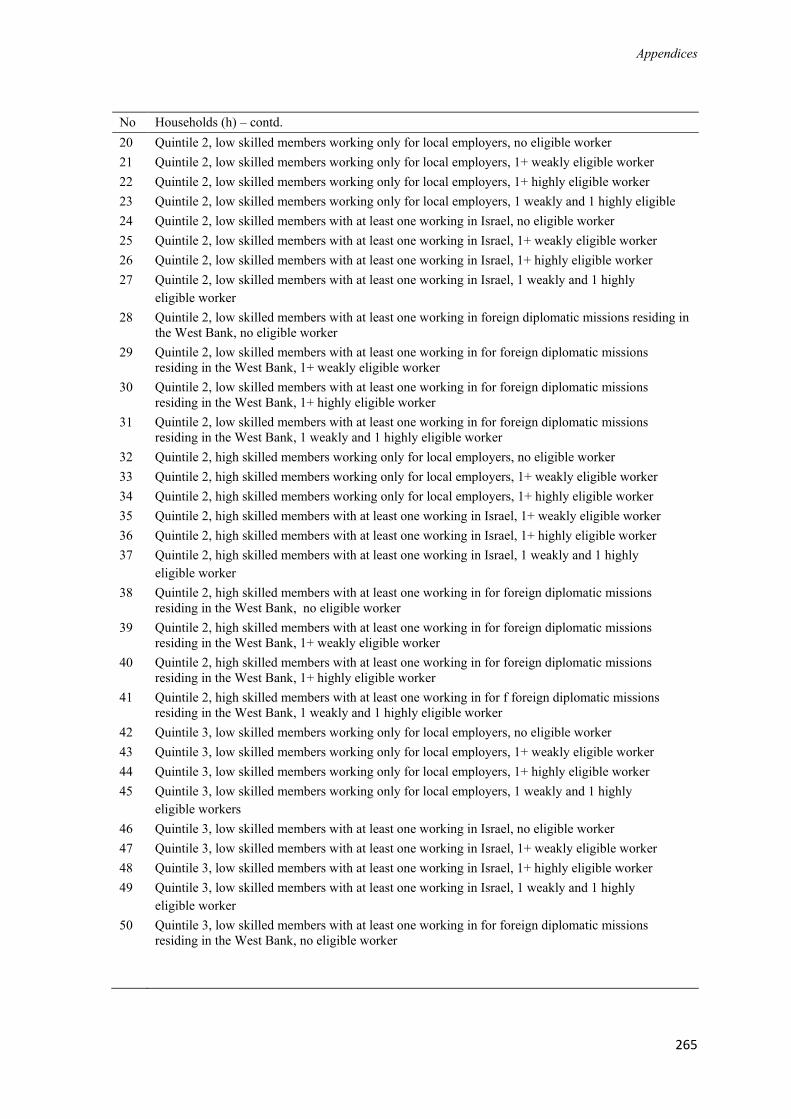
Appendices
265
No Households (h) – contd.
20 Quintile 2, low skilled members working only for local employers, no eligible worker
21 Quintile 2, low skilled members working only for local employers, 1+ weakly eligible worker
22 Quintile 2, low skilled members working only for local employers, 1+ highly eligible worker
23 Quintile 2, low skilled members working only for local employers, 1 weakly and 1 highly eligible
24 Quintile 2, low skilled members with at least one working in Israel, no eligible worker
25 Quintile 2, low skilled members with at least one working in Israel, 1+ weakly eligible worker
26 Quintile 2, low skilled members with at least one working in Israel, 1+ highly eligible worker
27 Quintile 2, low skilled members with at least one working in Israel, 1 weakly and 1 highly
eligible worker
28 Quintile 2, low skilled members with at least one working in foreign diplomatic missions residing in
the West Bank, no eligible worker
29 Quintile 2, low skilled members with at least one working in for foreign diplomatic missions
residing in the West Bank, 1+ weakly eligible worker
30 Quintile 2, low skilled members with at least one working in for foreign diplomatic missions
residing in the West Bank, 1+ highly eligible worker
31 Quintile 2, low skilled members with at least one working in for foreign diplomatic missions
residing in the West Bank, 1 weakly and 1 highly eligible worker
32 Quintile 2, high skilled members working only for local employers, no eligible worker
33 Quintile 2, high skilled members working only for local employers, 1+ weakly eligible worker
34 Quintile 2, high skilled members working only for local employers, 1+ highly eligible worker
35 Quintile 2, high skilled members with at least one working in Israel, 1+ weakly eligible worker
36 Quintile 2, high skilled members with at least one working in Israel, 1+ highly eligible worker
37 Quintile 2, high skilled members with at least one working in Israel, 1 weakly and 1 highly
eligible worker
38 Quintile 2, high skilled members with at least one working in for foreign diplomatic missions
residing in the West Bank, no eligible worker
39 Quintile 2, high skilled members with at least one working in for foreign diplomatic missions
residing in the West Bank, 1+ weakly eligible worker
40 Quintile 2, high skilled members with at least one working in for foreign diplomatic missions
residing in the West Bank, 1+ highly eligible worker
41 Quintile 2, high skilled members with at least one working in for f foreign diplomatic missions
residing in the West Bank, 1 weakly and 1 highly eligible worker
42 Quintile 3, low skilled members working only for local employers, no eligible worker
43 Quintile 3, low skilled members working only for local employers, 1+ weakly eligible worker
44 Quintile 3, low skilled members working only for local employers, 1+ highly eligible worker
45 Quintile 3, low skilled members working only for local employers, 1 weakly and 1 highly
eligible workers
46 Quintile 3, low skilled members with at least one working in Israel, no eligible worker
47 Quintile 3, low skilled members with at least one working in Israel, 1+ weakly eligible worker
48 Quintile 3, low skilled members with at least one working in Israel, 1+ highly eligible worker
49 Quintile 3, low skilled members with at least one working in Israel, 1 weakly and 1 highly
eligible worker
50 Quintile 3, low skilled members with at least one working in for foreign diplomatic missions
residing in the West Bank, no eligible worker
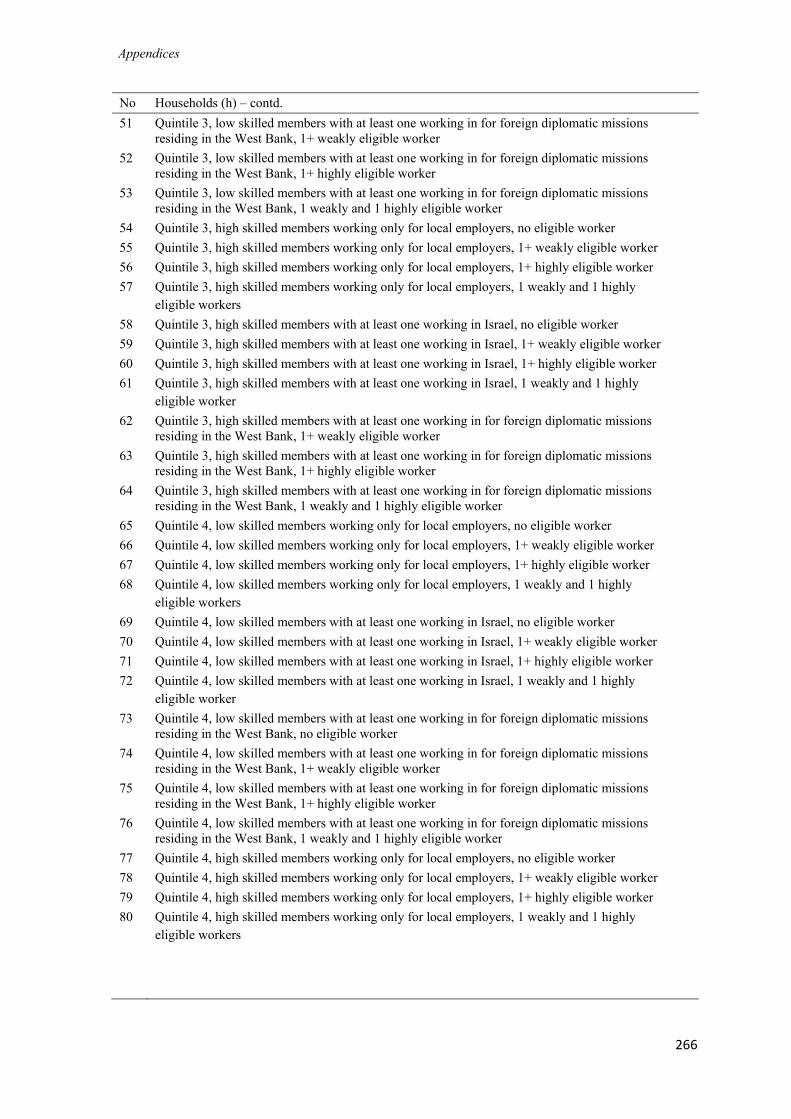
Appendices
266
No Households (h) – contd.
51 Quintile 3, low skilled members with at least one working in for foreign diplomatic missions
residing in the West Bank, 1+ weakly eligible worker
52 Quintile 3, low skilled members with at least one working in for foreign diplomatic missions
residing in the West Bank, 1+ highly eligible worker
53 Quintile 3, low skilled members with at least one working in for foreign diplomatic missions
residing in the West Bank, 1 weakly and 1 highly eligible worker
54 Quintile 3, high skilled members working only for local employers, no eligible worker
55 Quintile 3, high skilled members working only for local employers, 1+ weakly eligible worker
56 Quintile 3, high skilled members working only for local employers, 1+ highly eligible worker
57 Quintile 3, high skilled members working only for local employers, 1 weakly and 1 highly
eligible workers
58 Quintile 3, high skilled members with at least one working in Israel, no eligible worker
59 Quintile 3, high skilled members with at least one working in Israel, 1+ weakly eligible worker
60 Quintile 3, high skilled members with at least one working in Israel, 1+ highly eligible worker
61 Quintile 3, high skilled members with at least one working in Israel, 1 weakly and 1 highly
eligible worker
62 Quintile 3, high skilled members with at least one working in for foreign diplomatic missions
residing in the West Bank, 1+ weakly eligible worker
63 Quintile 3, high skilled members with at least one working in for foreign diplomatic missions
residing in the West Bank, 1+ highly eligible worker
64 Quintile 3, high skilled members with at least one working in for foreign diplomatic missions
residing in the West Bank, 1 weakly and 1 highly eligible worker
65 Quintile 4, low skilled members working only for local employers, no eligible worker
66 Quintile 4, low skilled members working only for local employers, 1+ weakly eligible worker
67 Quintile 4, low skilled members working only for local employers, 1+ highly eligible worker
68 Quintile 4, low skilled members working only for local employers, 1 weakly and 1 highly
eligible workers
69 Quintile 4, low skilled members with at least one working in Israel, no eligible worker
70 Quintile 4, low skilled members with at least one working in Israel, 1+ weakly eligible worker
71 Quintile 4, low skilled members with at least one working in Israel, 1+ highly eligible worker
72 Quintile 4, low skilled members with at least one working in Israel, 1 weakly and 1 highly
eligible worker
73 Quintile 4, low skilled members with at least one working in for foreign diplomatic missions
residing in the West Bank, no eligible worker
74 Quintile 4, low skilled members with at least one working in for foreign diplomatic missions
residing in the West Bank, 1+ weakly eligible worker
75 Quintile 4, low skilled members with at least one working in for foreign diplomatic missions
residing in the West Bank, 1+ highly eligible worker
76 Quintile 4, low skilled members with at least one working in for foreign diplomatic missions
residing in the West Bank, 1 weakly and 1 highly eligible worker
77 Quintile 4, high skilled members working only for local employers, no eligible worker
78 Quintile 4, high skilled members working only for local employers, 1+ weakly eligible worker
79 Quintile 4, high skilled members working only for local employers, 1+ highly eligible worker
80 Quintile 4, high skilled members working only for local employers, 1 weakly and 1 highly
eligible workers
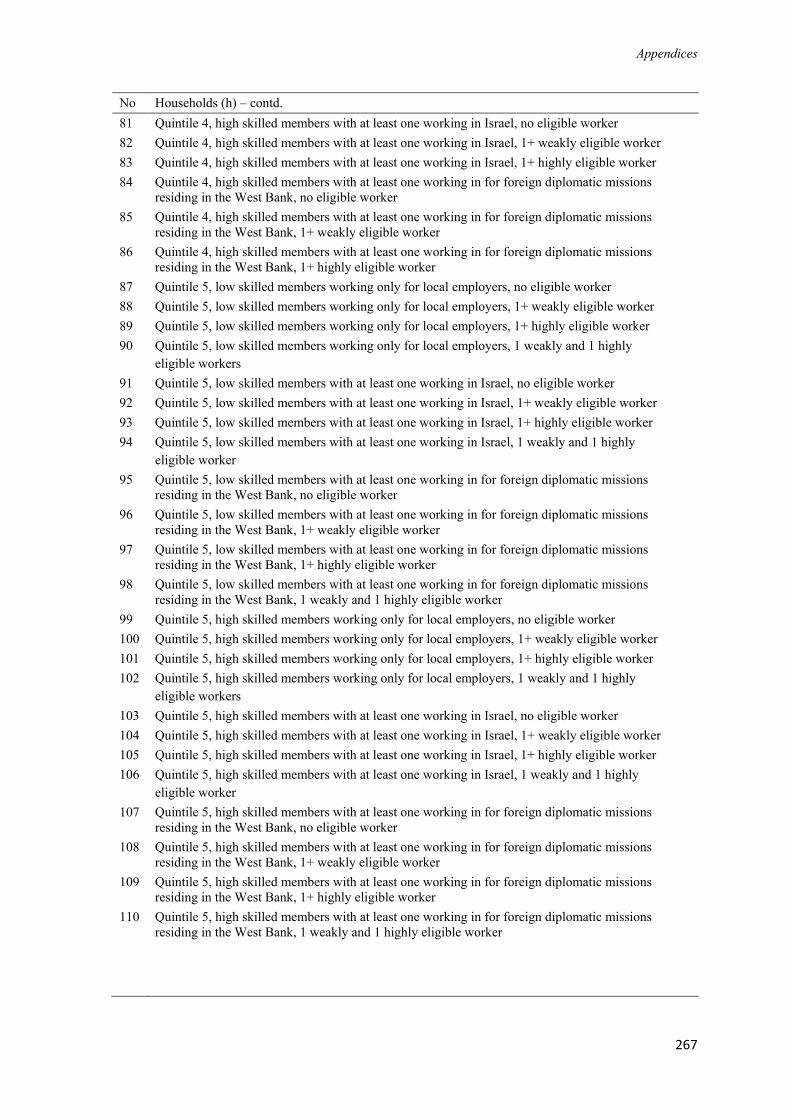
Appendices
267
No Households (h) – contd.
81 Quintile 4, high skilled members with at least one working in Israel, no eligible worker
82 Quintile 4, high skilled members with at least one working in Israel, 1+ weakly eligible worker
83 Quintile 4, high skilled members with at least one working in Israel, 1+ highly eligible worker
84 Quintile 4, high skilled members with at least one working in for foreign diplomatic missions
residing in the West Bank, no eligible worker
85 Quintile 4, high skilled members with at least one working in for foreign diplomatic missions
residing in the West Bank, 1+ weakly eligible worker
86 Quintile 4, high skilled members with at least one working in for foreign diplomatic missions
residing in the West Bank, 1+ highly eligible worker
87 Quintile 5, low skilled members working only for local employers, no eligible worker
88 Quintile 5, low skilled members working only for local employers, 1+ weakly eligible worker
89 Quintile 5, low skilled members working only for local employers, 1+ highly eligible worker
90 Quintile 5, low skilled members working only for local employers, 1 weakly and 1 highly
eligible workers
91 Quintile 5, low skilled members with at least one working in Israel, no eligible worker
92 Quintile 5, low skilled members with at least one working in Israel, 1+ weakly eligible worker
93 Quintile 5, low skilled members with at least one working in Israel, 1+ highly eligible worker
94 Quintile 5, low skilled members with at least one working in Israel, 1 weakly and 1 highly
eligible worker
95 Quintile 5, low skilled members with at least one working in for foreign diplomatic missions
residing in the West Bank, no eligible worker
96 Quintile 5, low skilled members with at least one working in for foreign diplomatic missions
residing in the West Bank, 1+ weakly eligible worker
97 Quintile 5, low skilled members with at least one working in for foreign diplomatic missions
residing in the West Bank, 1+ highly eligible worker
98 Quintile 5, low skilled members with at least one working in for foreign diplomatic missions
residing in the West Bank, 1 weakly and 1 highly eligible worker
99 Quintile 5, high skilled members working only for local employers, no eligible worker
100 Quintile 5, high skilled members working only for local employers, 1+ weakly eligible worker
101 Quintile 5, high skilled members working only for local employers, 1+ highly eligible worker
102 Quintile 5, high skilled members working only for local employers, 1 weakly and 1 highly
eligible workers
103 Quintile 5, high skilled members with at least one working in Israel, no eligible worker
104 Quintile 5, high skilled members with at least one working in Israel, 1+ weakly eligible worker
105 Quintile 5, high skilled members with at least one working in Israel, 1+ highly eligible worker
106 Quintile 5, high skilled members with at least one working in Israel, 1 weakly and 1 highly
eligible worker
107 Quintile 5, high skilled members with at least one working in for foreign diplomatic missions
residing in the West Bank, no eligible worker
108 Quintile 5, high skilled members with at least one working in for foreign diplomatic missions
residing in the West Bank, 1+ weakly eligible worker
109 Quintile 5, high skilled members with at least one working in for foreign diplomatic missions
residing in the West Bank, 1+ highly eligible worker
110 Quintile 5, high skilled members with at least one working in for foreign diplomatic missions
residing in the West Bank, 1 weakly and 1 highly eligible worker
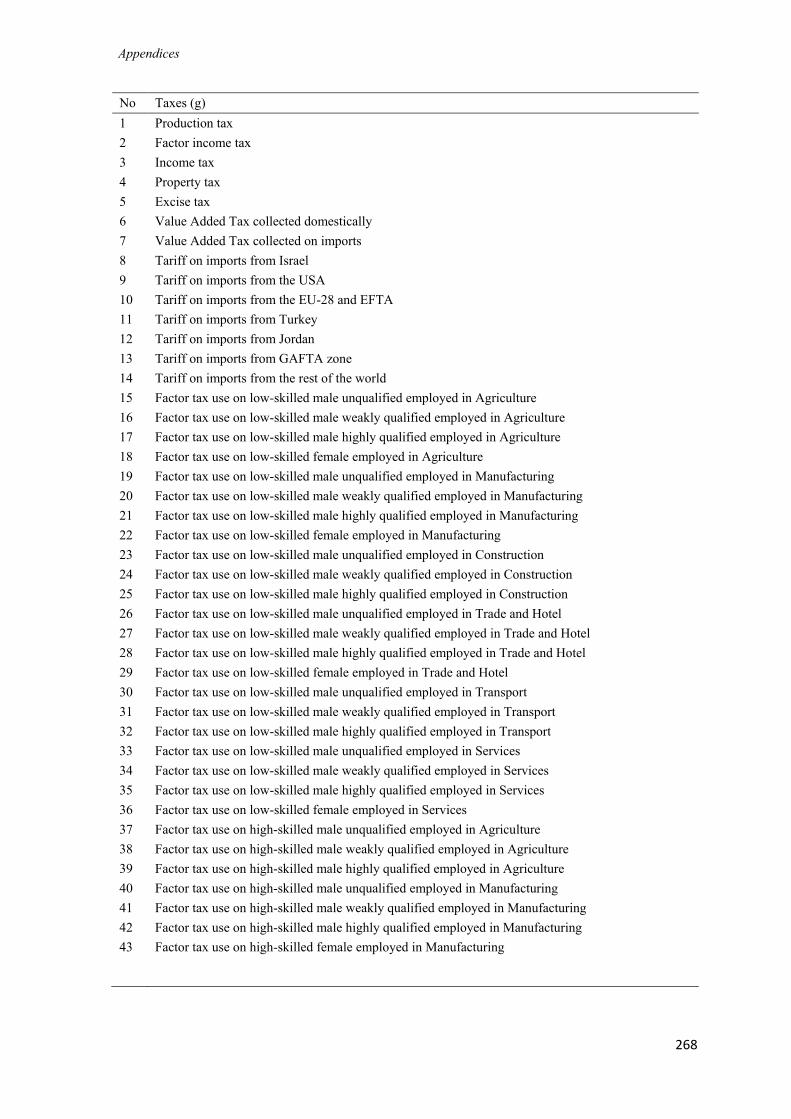
Appendices
268
No Taxes (g)
1 Production tax
2 Factor income tax
3 Income tax
4 Property tax
5 Excise tax
6 Value Added Tax collected domestically
7 Value Added Tax collected on imports
8 Tariff on imports from Israel
9 Tariff on imports from the USA
10 Tariff on imports from the EU-28 and EFTA
11 Tariff on imports from Turkey
12 Tariff on imports from Jordan
13 Tariff on imports from GAFTA zone
14 Tariff on imports from the rest of the world
15 Factor tax use on low-skilled male unqualified employed in Agriculture
16 Factor tax use on low-skilled male weakly qualified employed in Agriculture
17 Factor tax use on low-skilled male highly qualified employed in Agriculture
18 Factor tax use on low-skilled female employed in Agriculture
19 Factor tax use on low-skilled male unqualified employed in Manufacturing
20 Factor tax use on low-skilled male weakly qualified employed in Manufacturing
21 Factor tax use on low-skilled male highly qualified employed in Manufacturing
22 Factor tax use on low-skilled female employed in Manufacturing
23 Factor tax use on low-skilled male unqualified employed in Construction
24 Factor tax use on low-skilled male weakly qualified employed in Construction
25 Factor tax use on low-skilled male highly qualified employed in Construction
26 Factor tax use on low-skilled male unqualified employed in Trade and Hotel
27 Factor tax use on low-skilled male weakly qualified employed in Trade and Hotel
28 Factor tax use on low-skilled male highly qualified employed in Trade and Hotel
29 Factor tax use on low-skilled female employed in Trade and Hotel
30 Factor tax use on low-skilled male unqualified employed in Transport
31 Factor tax use on low-skilled male weakly qualified employed in Transport
32 Factor tax use on low-skilled male highly qualified employed in Transport
33 Factor tax use on low-skilled male unqualified employed in Services
34 Factor tax use on low-skilled male weakly qualified employed in Services
35 Factor tax use on low-skilled male highly qualified employed in Services
36 Factor tax use on low-skilled female employed in Services
37 Factor tax use on high-skilled male unqualified employed in Agriculture
38 Factor tax use on high-skilled male weakly qualified employed in Agriculture
39 Factor tax use on high-skilled male highly qualified employed in Agriculture
40 Factor tax use on high-skilled male unqualified employed in Manufacturing
41 Factor tax use on high-skilled male weakly qualified employed in Manufacturing
42 Factor tax use on high-skilled male highly qualified employed in Manufacturing
43 Factor tax use on high-skilled female employed in Manufacturing
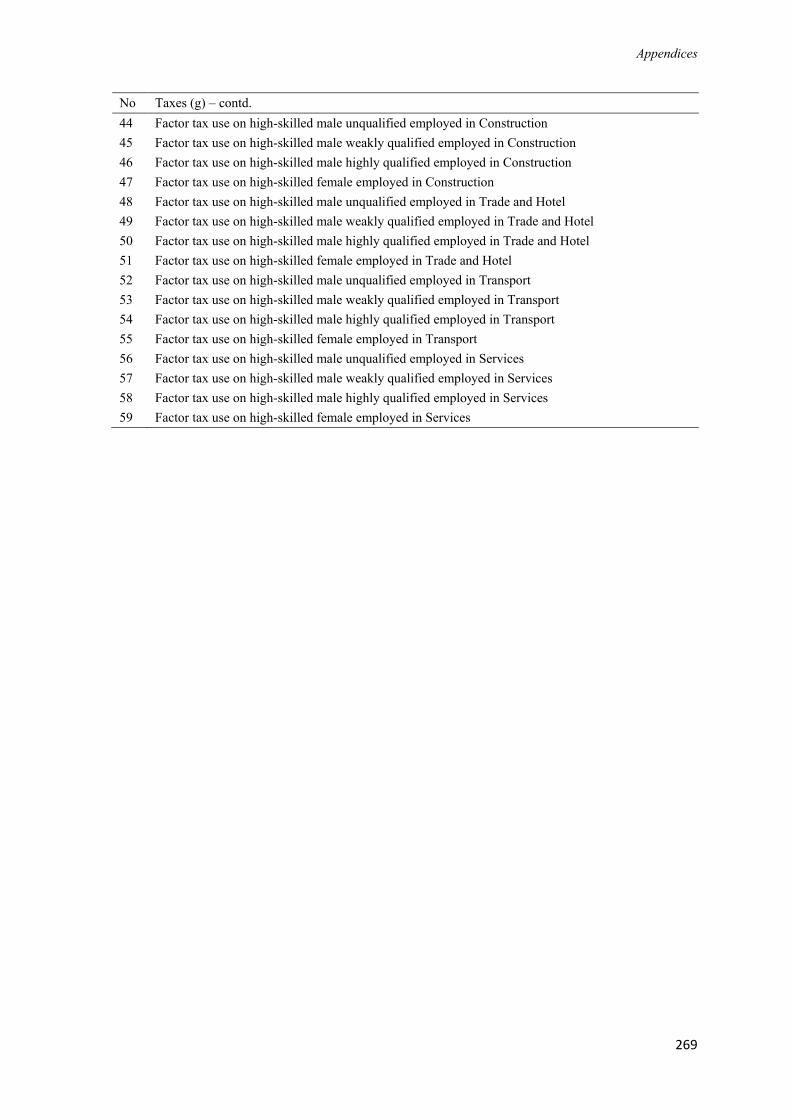
Appendices
269
No Taxes (g) – contd.
44 Factor tax use on high-skilled male unqualified employed in Construction
45 Factor tax use on high-skilled male weakly qualified employed in Construction
46 Factor tax use on high-skilled male highly qualified employed in Construction
47 Factor tax use on high-skilled female employed in Construction
48 Factor tax use on high-skilled male unqualified employed in Trade and Hotel
49 Factor tax use on high-skilled male weakly qualified employed in Trade and Hotel
50 Factor tax use on high-skilled male highly qualified employed in Trade and Hotel
51 Factor tax use on high-skilled female employed in Trade and Hotel
52 Factor tax use on high-skilled male unqualified employed in Transport
53 Factor tax use on high-skilled male weakly qualified employed in Transport
54 Factor tax use on high-skilled male highly qualified employed in Transport
55 Factor tax use on high-skilled female employed in Transport
56 Factor tax use on high-skilled male unqualified employed in Services
57 Factor tax use on high-skilled male weakly qualified employed in Services
58 Factor tax use on high-skilled male highly qualified employed in Services
59 Factor tax use on high-skilled female employed in Services
Appendices
270
Appendix 3. Description of West Bank SAM construction
This appendix describes in detail, cell by cell, the process of assembling the prior macro-
SAM, and the breakdown of the macro-SAM accounts into the detailed SAM.
3.1. Assembling the prior macro-SAM
This subsection presents the data sources and procedures followed to derive the values for
each entry of the macro-SAM. The rows of the macro-SAM are labelled with numbers –
from 1 to 15 – while columns are labelled with letters – from A to O – as in Table 3.1. The
cell carrying the value of total intermediate inputs, for instance, is labelled (1, C). This
section is organised by cell entry. It starts with the top row of the macro-SAM – i.e. Row 1
– and it covers all cells in this row from cell (1,B) to cell (1,N). Then, it moves to the second
row and so on until the last cell in the bottom row, i.e. Row 15.
(1, B) Margins
This entry includes trade and transport margins, for which estimates in 2004 are available
in the West Bank Supply and Use Table (SUT) (PCBS, 2014a). These 2004 estimates are
then updated to the year 2011 – which is the reference year of the SAM- by using the 2011
National Accounts (NA) for the West Bank (PCBS, 2014b) and by assuming that the
margins are a constant share of production cost in the trade and transport sectors.
(1, C) Intermediate inputs
This entry reports the demand for intermediate inputs by productive activities. Its value is
computed by summing up the sectoral intermediate consumption which is provided in the
NA for the year 2011 (PCBS, 2014b).
(1, G) Household Consumption
The value of household consumption in 2011 is derived from the NA (PCBS, 2014b).
(1, H) NPISH consumption
The value of NPISH consumption is taken from the 2011 NA (PCBS, 2014b).
(1, J) Government consumption
The value of government consumption stems from the 2011 NA (PCBS, 2014b).
(1, M) Investment demand
The value of gross fixed capital formation and change in inventories are from the 2011 NA
(PCBS, 2014b).
Appendices
271
(1, N) Exports
The value of total export from the West Bank is taken from the 2011 NA (PCBS, 2014b).
(2, A) Margins
This cell reports the value of trade and transport margins paid by all commodities. This
value equals the one displayed in cell (1, B).
(3, A) Market output
This is the sum of output of individual production sectors according to the 2011 NA (PCBS,
2014b).
(4, C) Labour compensation
The labour compensation is the part of labour income in total value added. It includes in
addition to the compensation of employees, the compensation for self-employed labour.
The compensation of employees is computed by multiplying the average wage in the West
Bank in 2011 by the number of wage-workers (see Table A1). The data used are based on
the labour force survey report of 2011 (PCBS, 2012a). The labour compensation of the self-
employed is computed by multiplying the number of self-employed workers by their
average earning (see Table A1). This average earning is calculated by adding to the average
wage of wage-workers the earning premium associated with self-employment in the Middle
East.
(4, N) Compensation of employees from abroad
The total compensation of employees from abroad stems from the Balance of payments
(BoP) of 2011 (PCBS, 2016b).
(5, C) Capital Compensation
This is the part of value added accruing to the factor capital. It is computed by subtracting
labour compensation (4, C) and land compensation (6, C) from the total value added (see
Table A1). The total value added itself is computed by summing up the sectoral value added
from the 2011 NA (PCBS, 2014b).
(5, N) Capital income from abroad
The value of investment income from abroad to the whole Palestine – i.e. the aggregate of
West Bank and Gaza – stem from the 2011 BoP (PCBS, 2016b). The share that accrues to
the West Bank is derived by applying to the total value the share of the West Bank in the
total number of establishments in Palestine. Data on establishments is provided by the
establishment census (PCBS, 2012b).
Appendices
272
(6, C) Land Compensation
The value of land compensation is derived from the Palestinian Expenditure and
Consumption Survey (PECS) of 2011 (PCBS, 2014c) and is scaled up to the entire West
Bank population.
(7, D) Household income from labour
Household income from labour is obtained by subtracting from the total labour income
factor taxes and the labour compensation paid to the rest of the world.
(7, E) Household income from unincorporated capital
Household income from unincorporated capital is the part of the net capital income directly
received by households. The net capital income is computed by adding to capital
compensation (5, C) the investment income received from abroad (5, N) and subtracting the
investment income paid to abroad (14, E) as well as depreciation (13, E). The share of net
capital income that accrues to households is computed based on the share of unincorporated
businesses in the West Bank economy. According to Fjeldstad and al-Zagha (2004), this
share is about 76% in the West Bank.
(7, F) Household income from land
Household income derived from land ownership is computed from the 2011 PECS (PCBS,
2014c) and is scaled up to the entire West Bank population.
(7, G) Inter-household transfers
These are transfers made by some households to other households, including the religious
transfers to poor households (Zakat). The aggregate value of these transfers is derived from
the 2011 PECS (PCBS, 2014c) and is scaled up to the entire West Bank population.
(7, H) NPISH transfers to households
Total transfers made by non-profit institutions to households is derived from the 2011 PECS
(PCBS, 2014c) and is scaled up to the entire West Bank population.
(7, I) Household income from dividends
Income to households from enterprises is computed as a share of the enterprise income
before savings. The enterprise income is computed by adding to the return of capital to
enterprise (9, E) transfers received from the government (9, J), and subtracting the dividends
paid to the government (10, I) as well as corporate taxes (11, I). The share of enterprise
income distributed in dividends to households is computed based on the example of the
Paltel Group (Larudee, 2012). The Paltel Group is the major telecommunication company
in Palestine. Over the period from 2009 to 2010, the company shared 65% of its profit as
Appendices
273
dividends. Accordingly, that share is also applied to the net enterprise income in the macro-
SAM to come to the value of enterprise payments to households as dividends.
(7, J) Government transfers to households
This entry includes all kinds of transfers made by the government to households, namely
pensions, gratuities, allowances, etc. The total value of government transfers in the whole
Palestine is taken from the Ministry of Finance’s fiscal development and macro
performance report (MoF, 2012a). This value is adjusted for the West Bank, using the share
of the West Bank in the total number of households in Palestine. The number of households
stems from the demographics report (PCBS, 2012g).
(7, N) Transfers to households from abroad
The value of transfers (remittances) to the whole Palestine stems from the 2011 BoP (PCBS,
2016b). The share that accrues to the West Bank is derived by applying to the total value
the share of the West Bank in the total number of households in Palestine (PCBS, 2012g).
(8, N) Transfers to NPISH from abroad
Non-profit institutions serving households are funded by international organisations and
foreign donors. The value for this entry is computed by summing up NPISH consumption
(1, H) and NPISH transfers to households (7, H).
(9, E) Enterprise income from capital
Capital return to corporate enterprises is computed using the share of corporate businesses
in total businesses in the West Bank based on Fjeldstad and al-Zagha (2004). Accordingly,
corporate share of capital income is about 24%.
(9, J) Transfers to enterprises by government
This is the value of subsidies transferred by the government to private enterprises. It is taken
from the annual financial report of the Ministry of Finance (MoF, 2012b).
(10, I) Investment profit accruing to government
This entry shows the total value of dividends received by the government from state-owned
enterprises. This value is taken from the Ministry of Finance’s fiscal development and
macro performance report (MoF, 2012a)
(10, K) Direct tax revenue
Direct tax revenue received by the government includes the factor income tax (11, D),
income tax on households (11, G) and corporate tax on enterprises (11, I). Data for these
cells are obtained from the annual financial report of the Ministry of Finance (MoF, 2012b).
Appendices
274
(10, L) Indirect tax revenue
This includes the commodity and activity taxes. Commodity taxes (12, A) are composed of
excise taxes, VAT and import taxes, while activity taxes (12, C) are composed of production
taxes and factor use taxes.
(10, N) Foreign grants
Foreign grants to the government in the context of the West Bank usually take the form of
budget support. The value of transfers to the government sector from abroad for the whole
Palestine stems from the 2011 BoP (PCBS, 2016b). The share that accrues to the West Bank
is derived by applying to the total value the share of the West Bank in the total Palestinian
population (PCBS, 2012g).
(11, D) Factor income tax
This includes the payroll tax levied on West Bank residents working in Israel. The tax is
levied by the Israeli administration and transferred to the PNA via the tax clearance
mechanism. The value of this tax stems from the annual financial report of the Ministry of
Finance (MoF, 2012b). Given that no Gazan worker was admitted in Israel in 2011, the
value of this tax for the whole Palestine is attributed to the West Bank.
(11, G) Income and property tax
The value of income tax levied on Palestinian households is derived from the annual
financial report of the Ministry of Finance (MoF, 2012b). Adjustments are made in order to
derive their values for the West Bank by weighting the total value by the share of the West
Bank in the total number of Palestinian households (PCBS, 2012g).The value of property
tax is computed from the 2011 PECS (PCBS, 2014c) and is scaled up to the entire West
Bank population.
(11, I) Corporate tax
The value of corporate tax collected in the whole Palestine is derived from the annual
financial report of the Ministry of Finance (MoF, 2012b).Its value for the West Bank is
calculated by weighting the total value with the share of the West Bank in the total number
of establishments in Palestine (PCBS, 2012b).
(12, A) Commodity taxes
They include several tax instruments, namely the excise, value added and import taxes.
Their values for the whole Palestine stem from the annual financial report of the Ministry
of Finance (MoF, 2012b). Various adjustments were made to derive the shares that accrue
to the West Bank. For the value added tax (VAT), the share of the West Bank in the total
Palestinian value added is used as a weight factor. For the import taxes, the share of the
Appendices
275
West Bank in the total Palestinian import is used as a weight factor, while for the excise
tax, the share of the West Bank in final consumption is used. Data on value added, import
and final consumption are taken from the NA (PCBS, 2014b).
(12, C) Production and factor use taxes
The total value of tax on production activities is computed by taking the tax rate from the
2004 SUT (PCBS, 2014a) and applying it to the tax base (total activity output) of 2011
taken from the 2011 NA (PCBS, 2014b). The total value of factor use tax for the whole
Palestine stems from the annual financial report of the Ministry of Finance (MoF, 2012b).
Its value for the West Bank is derived by applying to the total value the share of West Bank
workers in the total number of Palestinian workers. The labour force data stem from the
2011 labour force survey report (PCBS, 2012a).
(13, E) Depreciation
Depreciation in the West Bank economy in 2011 as a share in value added is derived from
the economic survey report (PCBS, 2012c). This share is applied to the total value added
taken from the 2011 NA (PCBS, 2014b) to come to the final value for this entry.
(13, G) Household savings
Gross domestic savings in 2011 are taken from the NA (PCBS, 2014b) and the share of
private savings in total savings is derived from the IMF report on macroeconomic
development and outlook (IMF, 2014). Private savings comprise household savings and
enterprise savings. Thus, total private savings are computed and household savings are
derived by subtracting the enterprise savings (12, H) from the total private savings.
(13, I) Enterprise savings
Enterprise savings are computed based on the example of Paltel Group over 2009-2010
(Larudee, 2012) where the company kept 35% of its profit as savings. That share is applied
to the enterprise income to arrive at the enterprise savings in the macro-SAM.
(13, J) Government savings
Gross domestic savings in 2011 stem from the NA (PCBS, 2014b) and the share of public
savings in total savings is derived from the IMF report on macroeconomic development and
outlook (IMF, 2014). This share is applied to the gross domestic savings to come to the
government savings in 2011.
(13, N) Current account balance
This value is computed as residual in the rest of the world account.
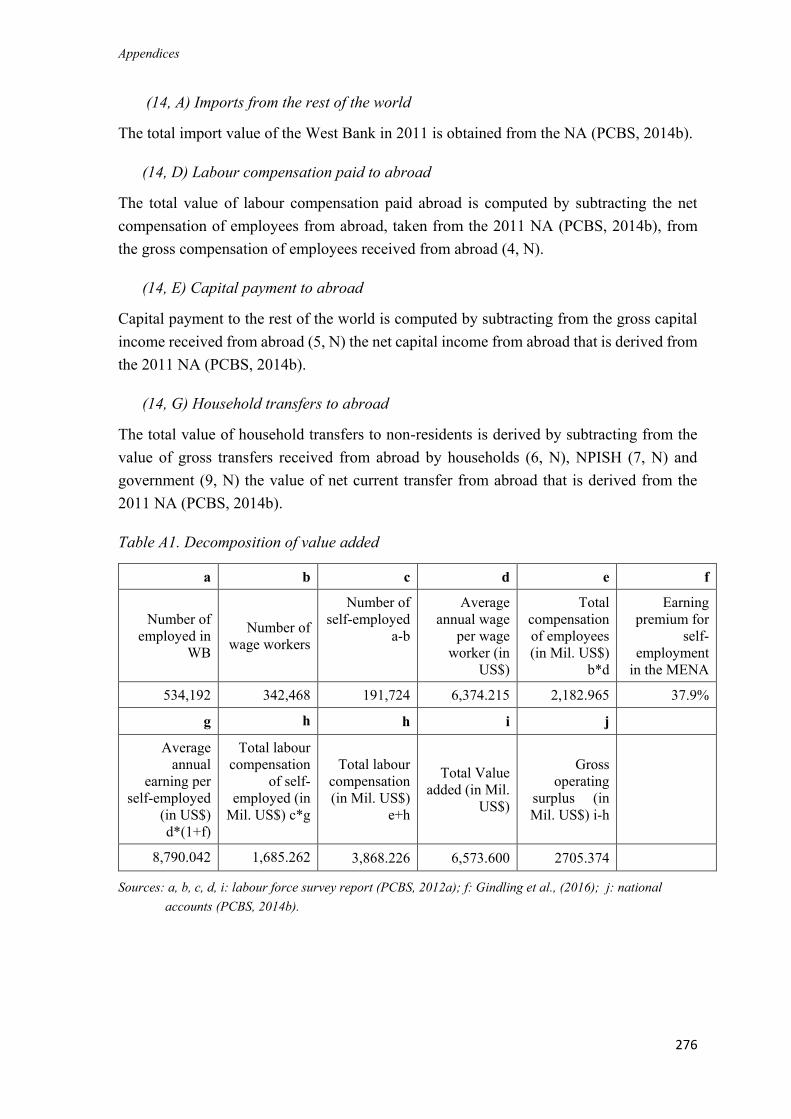
Appendices
276
(14, A) Imports from the rest of the world
The total import value of the West Bank in 2011 is obtained from the NA (PCBS, 2014b).
(14, D) Labour compensation paid to abroad
The total value of labour compensation paid abroad is computed by subtracting the net
compensation of employees from abroad, taken from the 2011 NA (PCBS, 2014b), from
the gross compensation of employees received from abroad (4, N).
(14, E) Capital payment to abroad
Capital payment to the rest of the world is computed by subtracting from the gross capital
income received from abroad (5, N) the net capital income from abroad that is derived from
the 2011 NA (PCBS, 2014b).
(14, G) Household transfers to abroad
The total value of household transfers to non-residents is derived by subtracting from the
value of gross transfers received from abroad by households (6, N), NPISH (7, N) and
government (9, N) the value of net current transfer from abroad that is derived from the
2011 NA (PCBS, 2014b).
Table A1. Decomposition of value added
a b c d e f
Number of
employed in
WB
Number of
wage workers
Number of
self-employed
a-b
Average
annual wage
per wage
worker (in
US$)
Total
compensation
of employees
(in Mil. US$)
b*d
Earning
premium for
self-
employment
in the MENA
534,192 342,468 191,724 6,374.215 2,182.965 37.9%
g h h i j
Average
annual
earning per
self-employed
(in US$)
d*(1+f)
Total labour
compensation
of self-
employed (in
Mil. US$) c*g
Total labour
compensation
(in Mil. US$)
e+h
Total Value
added (in Mil.
US$)
Gross
operating
surplus (in
Mil. US$) i-h
8,790.042 1,685.262 3,868.226 6,573.600 2705.374
Sources: a, b, c, d, i: labour force survey report (PCBS, 2012a); f: Gindling et al., (2016); j: national
accounts (PCBS, 2014b).
Appendices
277
3.2. Processing the raw data to assemble the detailed SAM
This section describes the steps followed to disaggregate each entry of the macro-SAM to
arrive at the fully articluated SAM. Each entry of the macro-SAM is referred to by two
indices, a number for its row and a letter for its column.
(1, B) Margins
In the detailed SAM, trade margins appear as payments from the margin accounts
“wholesale” and “retail trade” to the commodity accounts “wholesale” and “retail trade”
respectively. Transport margins appear as payments from the account “transport margin” to
the commodity account “transportation by road”. The initial values are derived from the
2004 SUT (PCBS, 2014a).
(1, C) Intermediate inputs
The intermediate input matrix is derived by summing up the input demand by activity and
commodity for all economic agents in the economy except the NPISH. The input demand
of NPISH is sorted by commodity and aggregated over activities and assigned to the activity
account “anpish”. The initial values stem from the 2004 SUT (PCBS, 2014a). Next, these
initial values are adjusted to match the 2011 NA values (PCBS, 2014b). The NA provides
for 20 sectors of economic activity. In a first instance, the NA sectors are mapped to the 49
SAM activity accounts. Subsequently, the SAM activity accounts with one-to-one mapping
to the NA activity sectors, the shares across commodity accounts are kept constant and only
the total is updated to the total input demand of that sector in the NA. In case of a mapping
between one NA sector and several SAM activity accounts, the shares across activities and
commodities are kept constant and the total is updated to the total input demand in the NA.
(1, G) Household Consumption
Initial values for the household consumption matrix are derived from the 2011 PECS
(PCBS, 2014c). In the PECS, commodities are grouped based on the classification of
individual consumption according to purpose. First, the commodity groups in the PECS are
mapped to the SAM commodity accounts. For each household group, total consumption by
commodity group is calculated. However, the initial values derived from the raw data were
inconsistent. In fact, the aggregated food expenditure made up only 12.4% of all household
consumption expenditures, while the living standards report (PCBS, 2012h) shows for the
year 2011 that food expenditure makes up 35% of all household consumption expenditure
in the West Bank. Subsequently, the initial values derived from the raw data are adjusted
using the living standards report.
Appendices
278
(1, H) NPISH consumption
NPISH institutions consume services such as education, health and social work. The initial
values of NPISH consumption are derived from the SUT of 2004 (PCBS, 2014a).
(1, J) Government consumption
The initial values for government consumption stem from the SUT of 2004 (PCBS, 2014a).
(1, M) Investment demand
Initial values for the Gross Fixed Capital Formation (GFCF) and change in inventories are
taken from the 2004 SUT (PCBS, 2014a).
(1, N) Exports
The data on export of goods by destination are derived from the UN Comtrade database
(UN Contrade, 2016). Goods in this database are listed according to the Harmonised System
(HS) classification. Therefore, a concordance table between the HS classification and the
83 SAM commodity accounts is first established. Next, Palestinian export of goods to the
seven destinations considered in the SAM is derived. Given that no export from Gaza was
allowed to be sold in Israel in 2011 – because of the blockade (GISHA, 2015) – the total
value of Palestinian export to Israel is allocated to the West Bank.
The relative shares of the other destinations in the remaining of the Palestinian export of
goods are applied to the West Bank total export of goods – derived from the NA (PCBS,
2014b) – after excluding the imputed export value to Israel so as to arrive at the export
values to the other six destinations.
The total value of West Bank export of services stems from the NA (PCBS, 2014b). The
disaggregated Palestinian export of services according to the extended balance of payments
services classification (EBOPS) is derived from UN Comtrade database (UN Contrade,
2016). First, a mapping between the EBOPS and the SAM commodity classification was
established. Second, the split of the total value of export of services across the seven trade
partners is conducted based on the inbound visitors survey (PCBS, 2009), hotel activity
survey of 2011 (PCBS, 2012d) complemented with PCBS experts’ assumptions.
(2, A) Margins
Income to margin accounts comes mostly from agricultural and manufacturing commodity
accounts. The initial values are derived from the SUT (PCBS, 2014a).
(3, A) Market output
The “Make matrix” is derived by summing up the market output by activity and commodity
for all economic agents except the NPISH. The market output of NPISH is sorted by
Appendices
279
commodity. Then, it is aggregated over activities and assigned to the activity account
“anpish”. The initial values are derived from the SUT of 2004 (PCBS, 2014a). Next, these
values are updated to match the 2011 NA figures (PCBS, 2014b). The NA provides data for
20 activity sectors. In the first instance, the NA sectors are mapped to the 49 SAM activity
accounts. Subsequently, for the SAM activity accounts with one-to-one mapping to NA
activity sectors, the shares across commodity accounts are kept constant and only the total
is updated to the total market output of each sector based on the 2011 NA. In case of a
mapping between one NA sector and several SAM activity accounts, the shares across
activities and commodities are kept constant and the total is updated to the total market
output in the NA.
(4, C) Labour compensation
The 2011 PECS (PCBS, 2014c) provides detailed information on economically active
household members. The characteristics of these active household members are used to
classify them along the criteria set for labour categories. The survey provides for six
production sectors: agriculture, commerce and restaurants, construction, manufacturing and
mining, transportation and communication, and services. First, total income for each labour
class is calculated by sector24. Second, the six sectors of the survey are mapped to the 49
SAM activity accounts. In case one PECS production sector is mapped to several SAM
activity accounts, the value of the labour compensation earned by one labour class from that
PECS sector is split equally across all SAM activity accounts. The resulting matrix of initial
values is adjusted to discriminate the labour compensation across sectors. The adjustment
process uses the distribution of value added across sectors from the SUT (PCBS, 2014a).
The obtained values are scaled up to match the totals of the 2011 NA (PCBS, 2014b). As
the NA only has 20 sectors, while the SAM has 49, a correspondence table between the two
is established and for each sector, the total from the NA is used.
To compute the part of labour compensation paid by activity “anpish”, workers employed
by non-profit organisations and the United Nations Relief and Work Agency for Palestine
refugees in the Near East (UNRWA) are selected from the PECS and their total income is
calculated for each labour class. The obtained values are adjusted to match the share of
NPISH in total value added in 2011. That share is calculated from the SUT (PCBS, 2014a),
while the value added figure is taken from the 2011 NA (PCBS, 2014b).
With regard to labour income accruing to foreign workers, as no information on the sectors
employing foreign labour is available, the total value of labour compensation paid to abroad
24 Wage data for active household members are missing in the 2011 PECS (PCBS, 2014c). Therefore, the
average wage per labour class is calculated from the 2011 LFS (PCBS, 2014d) and assigned to workers
belonging to the same labour classes in the PECS. Compensation of labour for the own-account workers is
directly imputed in the PECS for the respective workers by adding to the average wage received by their
counterparts with similar demographic characteristics who are wage workers the earning premium estimated
by (Gindling et al., 2016b).
Appendices
280
from the macro-SAM is split across all sectors based on their respective shares in the total
value added taken from the SUT (PCBS, 2014a).
(4, M) Compensation of employees from abroad
The value of labour income earned by Palestinians working in Israel stems from the 2011
BoP (PCBS, 2016b). Because Gazan workers were banned from working in Israel in 2011,
the total value of compensation of employees from Israel is attributed to the West Bank.
The matrix of staring values for the factor income from Israel for each labour group stems
from the 2011 PECS (PCBS, 2014c). Household members employed in Israel are classified
according to the criteria defined for the corresponding labour groups. The total income by
labour group for workers employed in Israel is calculated and used as starting value.
The value of compensation of employees from the other regions is computed by subtracting
from total compensation of employees from abroad accruing to the West Bank the value of
compensation from Israel. Given that this value corresponds to the payroll of Palestinians
working for foreign diplomatic missions in the West Bank, the obtained value is split across
the six foreign regions based on their respective shares in the total number of diplomatic
missions present in the West Bank25. The matrix of starting values for the compensation of
employee from abroad across the various labour groups is derived from the 2011 PECS
(PCBS, 2014c). Household working members are classified according to the criteria defined
for the corresponding labour groups. The total income received by household members
employed abroad (other than in Israel) is used.
(5, C) Capital compensation
The initial value for capital compensation paid by each activity is the sectoral gross
operating surplus derived from the SUT (PCBS, 2014a).
(5, N) Capital income from abroad
This is the investment income received from abroad. The total value in the macro-SAM is
split across the seven foreign regions according to their respective shares in the total foreign
direct investment received in Palestine (PCBS, 2016d).
(6, C) Land compensation
Land is considered a production factor only for agricultural activities. The total land
compensation is distributed over the four agricultural activities based on their respective
shares in total land use. Data on land use are derived from PCBS statistics (PCBS, 2016c).
25 https://en.wikipedia.org/wiki/List_of_diplomatic_missions_in_Palestine
Appendices
281
(7, D) Household income from labour
This submatrix stems from the 2011 PECS (PCBS, 2014c) which provides information on
West Bank workers and their households. The initial values for this submatrix are calculated
as the total income earned by the household working members classified by labour classes
and mapped to their respective household groups.
(7, E) Household income from unincorporated capital
This submatrix is also derived from the 2011 PECS (PCBS, 2014c), which provides detailed
information on household income sources. The returns from capital to households not
transiting through enterprises is the unincorporated capital income. This includes a share of
the mixed income as well as rent from buildings. The 2011 PECS provides for household
mixed income and rent from buildings. As only a fraction of the mixed income accrues to
capital and acknowledging that this fraction is higher for the rich households than it is for
the poor households, it is assumed a range from 0.2 to 0.6, with 0.2 being the share of capital
in mixed income for the poorest quintile and 0.6 the one for the richest quintile.
(7, F) Household income from land
The matrix of starting values for household income from land is derived from the 2011
PECS (PCBS, 2014c). Income derived by households from land is explicitly provided in
the raw data.
(7, G) Inter-household transfers
The transfers received by each household group from other households in the West Bank is
calculated from the 2011 PECS (PCBS, 2014c). Using the consumption per adult-equivalent
as a wealth indicator, the household groups are ranked from rich to poor. Subsequently, a
household group with a lower rank (i.e. a poorer household) receives equal transfers from
all household groups with higher ranks. Thus, the wealthiest household group makes
transfers to all the others and does not receive any transfer. On the expenditure side, the size
of the household group is used as a weight factor to adjust the initial values and make sure
that a household group with a smaller size carries less of the burden of the transfers than a
larger household group, certeris paribus. After this first round of adjustments, a second
round of adjustments is conducted to recover the values of total inter-household transfers
received by the different household groups, as this is the primal information.
With regard to Zakat transfers, the 2011 PECS (PCBS, 2014c) provides information on
Zakat payment made by households. Total Zakat payments by household group is first
calculated. The Zakat revenue is assumed to accrue only to the lowest income quintile
households, since it is a religious transfer from rich to poor households. Again, households
are ranked according to consumption per adult-equivalent, and households in the upper four
quintiles make identical payments to households in the lowest quintile.
Appendices
282
(7, H) NPISH transfers to households
The 2011 PECS (PCBS, 2014c) includes household income from transfers made by non-
governmental institutions. This information serves as proxy for the household income from
NPISH transfers. Households are sorted by group and the transfers they receive from the
non-governmental institutions are calculated and used as initial values for this submatrix.
(7, I) Household income from dividends
The initial values for this submatrix are derived from the 2011 PECS (PCBS, 2014c) which
includes household income from stocks, bonds and shares. The total income from these
sources is calculated for each household group and is used as a starting value.
(7, J) Government transfers to households
The 2011 PECS (PCBS, 2014c) includes household income from government aid.
Subsequently, the total income received by households from government transfers is
calculated for each household group and is used as a starting value.
(7, N) Transfers to households from abroad
First, the share of remittances received from each of the seven foreign regions is derived
from the bilateral remittance estimate for 2013 (World Bank, 2015). Second, the initial
values for remittances received by individual household group are derived from the 2011
PECS (PCBS, 2014c).
(8, N) Transfers to NPISH from abroad
The value of donations to NPISH from each of the seven foreign regions is computed based
on their respective shares in donations to the UN Relief and Works Agency for Palestine
Refugees (UNRWA).
(9, E) Enterprise income from capital
The returns from capital to corporate enterprises is a one-to-one transaction between the
accounts “Enterprise” and “Capital”. Therefore, the value of this transaction is identical in
the macro and detailed SAMs.
(9, J) Transfers to enterprises by government
The value of subsidies transferred by the government to private enterprises is a one-to-one
transaction between institutions “Enterprise” and “Government”. The value of this
transaction is identical to that of the macro-SAM.
Appendices
283
(10, I) Investment profit accruing to government
The total value of dividends received by the government from fully or partially state-owned
enterprises is a one-to-one transaction between institutions “Government” and “Enterprise”.
Hence, the value of this transaction is the same as in the macro-SAM.
(10, K) Direct tax revenue
Direct tax revenue received by the government includes the factor income tax (11, D),
income tax on households (11, G) and corporate tax on enterprises (11, I). These are one-
to-one transactions between the respective accounts and institution “Government”. Their
values are identical in the macro and detailed SAMs.
(10, L) Indirect tax revenue
This includes the commodity and activity taxes. Commodity taxes (12, A) and activity taxes
(12, C) taxes. These are also one-to-one transactions between the respective accounts and
institution “Government”.
(10, N) Foreign grants
The shares of foreign grants received from the seven foreign regions stems from the
Ministry of Finance report on fiscal operations (MoF, 2012c).
(11, D) Factor income tax
Initial values for tax on payroll levied on West Bank workers employed in the Israeli labour
market is derived from the 2011 LFS (PCBS, 2014d). Workers employed in registered
businesses in Israel are sorted by labour group and the total income by labour group is used
as the initial value, under the assumption that the tax paid is a fixed share of the wage.
(11, G) Income and property tax
The matrix for property tax paid by each household group stems from the 2011 PECS
(PCBS, 2014c). Income tax on households also stems from the 2011 PECS (PCBS, 2014c).
As the survey does not provide explicitly for income tax, the proxy used is household total
income as income tax is proportional to the total household income.
(11, H) Corporate tax
This is a one-to-one transaction between institution “Enterprise” and the tax account “direct
tax”. Its value in the macro and detailed SAMs is identical.
(12, A) Commodity taxes
They encompass the following tax instruments: value added tax (VAT), excise and import
taxes. The initial values for the VAT revenue are based on the SUT (PCBS, 2014a). The
Appendices
284
excise duty revenue in 2011 is derived from the Ministry of Finance fiscal development and
macro performance report (MoF, 2012a). The import tax revenue is split according to the
origin of import. Some adjustments were required. First, the import taxes are composed of
customs duties and value added tax on import. Their respective total values stem from the
NA (PCBS, 2014b) and the share of tax on import from Israel in these values stem from the
Ministry of Finance fiscal development and macro performance report (MoF, 2012a).
The value added tax is applied to all import of goods regardless of the origin. Hence, the
relative shares of import by origin and by good is used as proxies to derive the starting
values for the matrix of value added tax on imports. As for the customs duties, the economic
agreement between Israel and the Palestine provides for duty-free import and export
between the two partners. However, since most of the petroleum import to the West Bank
is actually a re-export from Israel, the agreement provides for Israel to transfer some of the
customs duties levied on petroleum products to the PNA (UNCTAD, 2012).
Except for Israel, customs duties are fully levied on imports from the other foreign regions
according to the existence of trade agreements. To determine the tariff revenue collected on
each commodity group and according to the origin of the imports, the most recent Israeli
tariff book is used (WTO, 2016). The Israeli tariff book is also used in Palestine, since the
two partners form a customs union. From the tariff book, the tariff rates by commodity and
for each foreign region is estimated.
Both Palestine and Israel have trade agreements with the USA, EU-28, EFTA, Turkey, and
Jordan. Hence, for these regions, the tariff rates specified along the trade agreements are
used. Only Palestine has a trade agreement with GAFTA countries. Since Jordan also
belongs to the GAFTA, the same tariff rates are used for Jordan and GAFTA countries. For
the region “rest of the world”, the Most-favoured-nation (MFN) rates are used. Then, the
estimated rates are applied to the import value by commodity and by origin so as to arrive
at the starting values for the tariff revenue. Finally, the starting values for the tariff revenue
and for the value added tax on import are summed up to arrive at the initial values for the
import tax revenue by commodity group and by origin of import.
(12, C) Production and factor use taxes
For the production tax, the initial values are derived from the SUT (PCBS, 2014a). The
factor use tax is disaggregated to generate for each labour category a factor use tax account.
The initial values for the factor use tax matrix is derived from the 2011 LFS (PCBS, 2014d).
First, workers employed in registered firms are selected, as registered firms are likely to pay
taxes. Next, the workers are sorted by labour category and by the productive sectors
employing them. Assuming that the factor use tax is a fixed share of wages received by the
workers, total labour income is calculated for each labour group and is used as initial value
for the matrix.
Appendices
285
(13, E) Depreciation
Depreciation is a one-to-one transaction between the accounts “Capital” and “Investment-
Savings”. Its value is identical in the macro and detailed SAMs.
(13, G) Household savings
The initial values for household savings are computed from the 2011 PECS (PCBS, 2014c),
by subtracting for each household group the total expenditure from total income.
(13, I) Enterprise savings
Enterprise savings is a one-to-one transaction between institution “Enterprise” and
“Investment-Savings” account. Its value is the same in the macro and detailed SAMs.
(13, J) Government savings
Government savings is a one-to-one transaction between the institution “Government” and
the “Investment-Savings” account. Its value is identical in the macro and detailed SAMs.
(12, N) Current account balance
The current account balance is estimated for each of the foreign regions as a residual in their
respective accounts.
(14, A) Imports from Israel
Initial data on import of goods by origin is derived from the UN Comtrade database (UN
Contrade, 2016). Goods in this database are listed according to the Harmonised System
(HS) classification. Therefore, a concordance table between the HS classification and the
83 SAM commodity accounts is first established.
Next, Palestinian import of goods from the seven regions considered in the SAM is derived.
Since most of the import from Israel actually go to the West Bank, the shares resulting from
the UN Comtrade are adjusted for all Palestinian imports. Based on the share of the West
Bank in the total clearance revenue related to import tax being transferred by Israel to the
PNA (Kock and Qassis, 2011), that was about 95% in 2011, the share of total Palestinian
import value from Israel that actually accrues to the West Bank is estimated. Then, the
relative shares of the other regions in the remaining of the Palestinian import of goods are
applied to the West Bank total import of goods derived from the NA (PCBS, 2014b), after
excluding the imputed import value from Israel, so as to arrive at the import values from
the other six regions.
As for services, the total value of West Bank import also stems from the NA (PCBS, 2014b).
The disaggregated Palestinian import of services according to the extended balance of
payments services classification (EBOPS) is derived from UN Comtrade database (UN
Appendices
286
Contrade, 2016). Firstly, a mapping between the EBOPS and the SAM commodity
classification is established. Secondly, the split of the total value of import of services across
the seven foreign regions is conducted based on the outbound visitors survey (PCBS, 2013),
complemented with PCBS experts’ assumptions.
(14, D) Labour compensation to abroad
The value in the corresponding entry in the macro-SAM is assigned as a payment from the
labour group “foreign workers” to the seven foreign regions. The split across the foreign
regions is conducted based on their respective shares in the total foreign direct investment
received by Palestine (PCBS, 2016d), assuming that the foreign investors will also export
to Palestine their domestic labour.
(14, E) Capital payment to abroad
The value in the corresponding entry of the macro-SAM is split across the seven foreign
regions based on their respective shares in the foreign direct investment made by Palestinian
residents abroad (PCBS, 2016d).
(14, G) Household transfers to abroad
The value of transfers made by each household stems from the 2011 PECS (PCBS, 2014c).
Households are sorted by household group and the total value of transfers they make is
calculated and is used as the starting value.
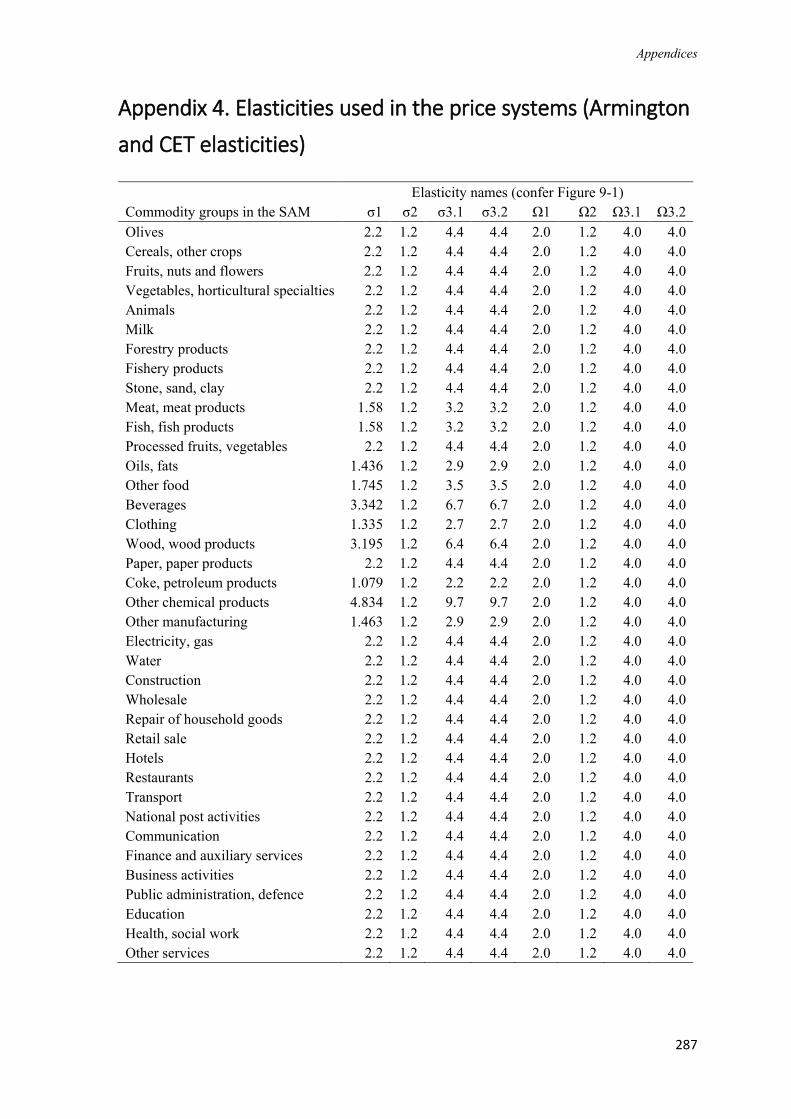
Appendices
287
Appendix 4. Elasticities used in the price systems (Armington
and CET elasticities)
Elasticity names (confer Figure 9-1)
Commodity groups in the SAM σ1 σ2 σ3.1 σ3.2 Ω1 Ω2 Ω3.1 Ω3.2
Olives 2.2 1.2 4.4 4.4 2.0 1.2 4.0 4.0
Cereals, other crops 2.2 1.2 4.4 4.4 2.0 1.2 4.0 4.0
Fruits, nuts and flowers 2.2 1.2 4.4 4.4 2.0 1.2 4.0 4.0
Vegetables, horticultural specialties 2.2 1.2 4.4 4.4 2.0 1.2 4.0 4.0
Animals 2.2 1.2 4.4 4.4 2.0 1.2 4.0 4.0
Milk 2.2 1.2 4.4 4.4 2.0 1.2 4.0 4.0
Forestry products 2.2 1.2 4.4 4.4 2.0 1.2 4.0 4.0
Fishery products 2.2 1.2 4.4 4.4 2.0 1.2 4.0 4.0
Stone, sand, clay 2.2 1.2 4.4 4.4 2.0 1.2 4.0 4.0
Meat, meat products 1.58 1.2 3.2 3.2 2.0 1.2 4.0 4.0
Fish, fish products 1.58 1.2 3.2 3.2 2.0 1.2 4.0 4.0
Processed fruits, vegetables 2.2 1.2 4.4 4.4 2.0 1.2 4.0 4.0
Oils, fats 1.436 1.2 2.9 2.9 2.0 1.2 4.0 4.0
Other food 1.745 1.2 3.5 3.5 2.0 1.2 4.0 4.0
Beverages 3.342 1.2 6.7 6.7 2.0 1.2 4.0 4.0
Clothing 1.335 1.2 2.7 2.7 2.0 1.2 4.0 4.0
Wood, wood products 3.195 1.2 6.4 6.4 2.0 1.2 4.0 4.0
Paper, paper products 2.2 1.2 4.4 4.4 2.0 1.2 4.0 4.0
Coke, petroleum products 1.079 1.2 2.2 2.2 2.0 1.2 4.0 4.0
Other chemical products 4.834 1.2 9.7 9.7 2.0 1.2 4.0 4.0
Other manufacturing 1.463 1.2 2.9 2.9 2.0 1.2 4.0 4.0
Electricity, gas 2.2 1.2 4.4 4.4 2.0 1.2 4.0 4.0
Water 2.2 1.2 4.4 4.4 2.0 1.2 4.0 4.0
Construction 2.2 1.2 4.4 4.4 2.0 1.2 4.0 4.0
Wholesale 2.2 1.2 4.4 4.4 2.0 1.2 4.0 4.0
Repair of household goods 2.2 1.2 4.4 4.4 2.0 1.2 4.0 4.0
Retail sale 2.2 1.2 4.4 4.4 2.0 1.2 4.0 4.0
Hotels 2.2 1.2 4.4 4.4 2.0 1.2 4.0 4.0
Restaurants 2.2 1.2 4.4 4.4 2.0 1.2 4.0 4.0
Transport 2.2 1.2 4.4 4.4 2.0 1.2 4.0 4.0
National post activities 2.2 1.2 4.4 4.4 2.0 1.2 4.0 4.0
Communication 2.2 1.2 4.4 4.4 2.0 1.2 4.0 4.0
Finance and auxiliary services 2.2 1.2 4.4 4.4 2.0 1.2 4.0 4.0
Business activities 2.2 1.2 4.4 4.4 2.0 1.2 4.0 4.0
Public administration, defence 2.2 1.2 4.4 4.4 2.0 1.2 4.0 4.0
Education 2.2 1.2 4.4 4.4 2.0 1.2 4.0 4.0
Health, social work 2.2 1.2 4.4 4.4 2.0 1.2 4.0 4.0
Other services 2.2 1.2 4.4 4.4 2.0 1.2 4.0 4.0
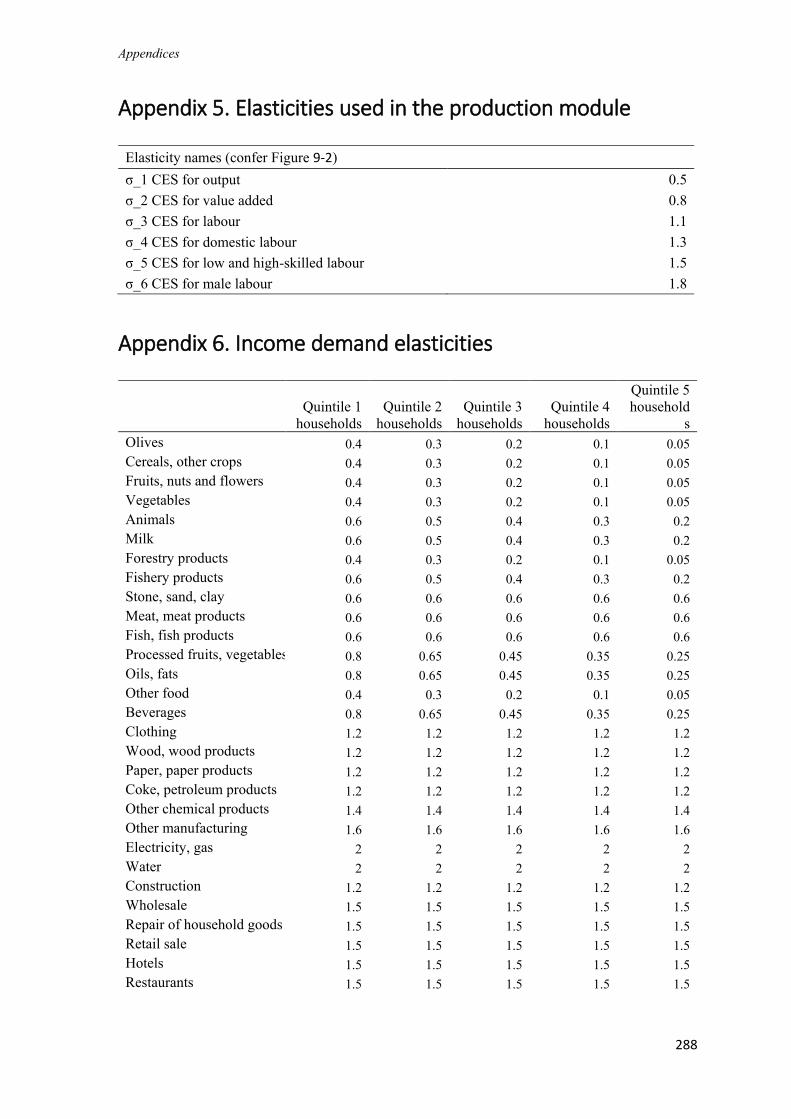
Appendices
288
Appendix 5. Elasticities used in the production module
Elasticity names (confer Figure 9-2)
σ_1 CES for output 0.5
σ_2 CES for value added 0.8
σ_3 CES for labour 1.1
σ_4 CES for domestic labour 1.3
σ_5 CES for low and high-skilled labour 1.5
σ_6 CES for male labour 1.8
Appendix 6. Income demand elasticities
Quintile 1
households
Quintile 2
households
Quintile 3
households
Quintile 4
households
Quintile 5
household
s
Olives 0.4 0.3 0.2 0.1 0.05
Cereals, other crops 0.4 0.3 0.2 0.1 0.05
Fruits, nuts and flowers 0.4 0.3 0.2 0.1 0.05
Vegetables 0.4 0.3 0.2 0.1 0.05
Animals 0.6 0.5 0.4 0.3 0.2
Milk 0.6 0.5 0.4 0.3 0.2
Forestry products 0.4 0.3 0.2 0.1 0.05
Fishery products 0.6 0.5 0.4 0.3 0.2
Stone, sand, clay 0.6 0.6 0.6 0.6 0.6
Meat, meat products 0.6 0.6 0.6 0.6 0.6
Fish, fish products 0.6 0.6 0.6 0.6 0.6
Processed fruits, vegetables 0.8 0.65 0.45 0.35 0.25
Oils, fats 0.8 0.65 0.45 0.35 0.25
Other food 0.4 0.3 0.2 0.1 0.05
Beverages 0.8 0.65 0.45 0.35 0.25
Clothing 1.2 1.2 1.2 1.2 1.2
Wood, wood products 1.2 1.2 1.2 1.2 1.2
Paper, paper products 1.2 1.2 1.2 1.2 1.2
Coke, petroleum products 1.2 1.2 1.2 1.2 1.2
Other chemical products 1.4 1.4 1.4 1.4 1.4
Other manufacturing 1.6 1.6 1.6 1.6 1.6
Electricity, gas 2 2 2 2 2
Water 2 2 2 2 2
Construction 1.2 1.2 1.2 1.2 1.2
Wholesale 1.5 1.5 1.5 1.5 1.5
Repair of household goods 1.5 1.5 1.5 1.5 1.5
Retail sale 1.5 1.5 1.5 1.5 1.5
Hotels 1.5 1.5 1.5 1.5 1.5
Restaurants 1.5 1.5 1.5 1.5 1.5
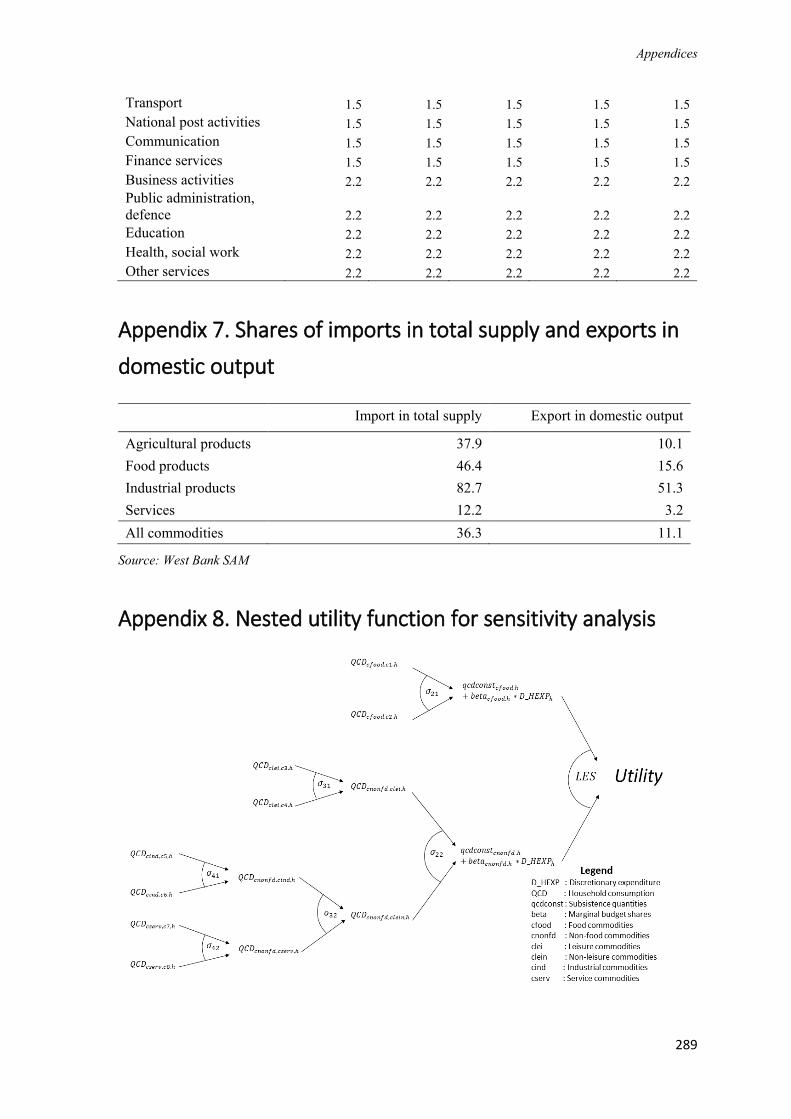
Appendices
289
Transport 1.5 1.5 1.5 1.5 1.5
National post activities 1.5 1.5 1.5 1.5 1.5
Communication 1.5 1.5 1.5 1.5 1.5
Finance services 1.5 1.5 1.5 1.5 1.5
Business activities 2.2 2.2 2.2 2.2 2.2
Public administration,
defence 2.2 2.2 2.2 2.2 2.2
Education 2.2 2.2 2.2 2.2 2.2
Health, social work 2.2 2.2 2.2 2.2 2.2
Other services 2.2 2.2 2.2 2.2 2.2
Appendix 7. Shares of imports in total supply and exports in
domestic output
Import in total supply Export in domestic output
Agricultural products 37.9 10.1
Food products 46.4 15.6
Industrial products 82.7 51.3
Services 12.2 3.2
All commodities 36.3 11.1
Source: West Bank SAM
Appendix 8. Nested utility function for sensitivity analysis
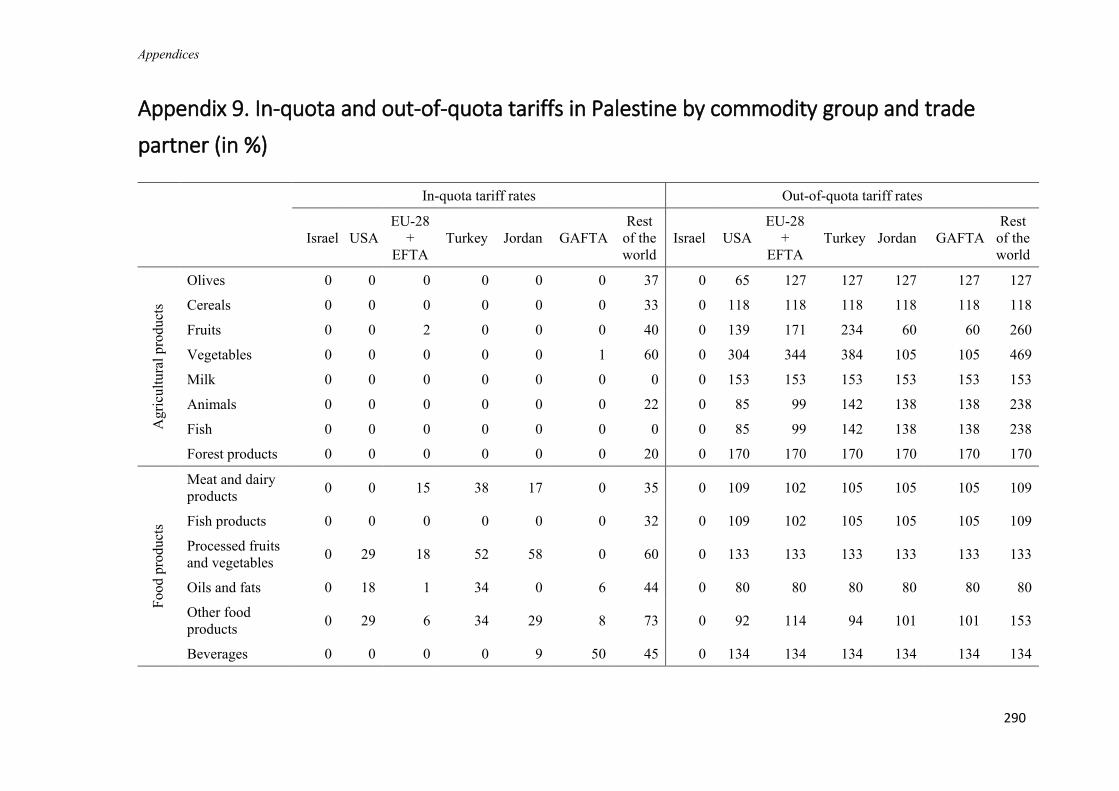
Appendices
290
Appendix 9. In-quota and out-of-quota tariffs in Palestine by commodity group and trade
partner (in %)
In-quota tariff rates Out-of-quota tariff rates
Israel USA
EU-28
+
EFTA
Turkey Jordan GAFTA
Rest
of the
world
Israel USA
EU-28
+
EFTA
Turkey Jordan GAFTA
Rest
of the
world
Agri
cult
ura
l p
rodu
cts
Olives 0 0 0 0 0 0 37 0 65 127 127 127 127 127
Cereals 0 0 0 0 0 0 33 0 118 118 118 118 118 118
Fruits 0 0 2 0 0 0 40 0 139 171 234 60 60 260
Vegetables 0 0 0 0 0 1 60 0 304 344 384 105 105 469
Milk 0 0 0 0 0 0 0 0 153 153 153 153 153 153
Animals 0 0 0 0 0 0 22 0 85 99 142 138 138 238
Fish 0 0 0 0 0 0 0 0 85 99 142 138 138 238
Forest products 0 0 0 0 0 0 20 0 170 170 170 170 170 170
Fo
od
pro
du
cts
Meat and dairy
products 0 0 15 38 17 0 35 0 109 102 105 105 105 109
Fish products 0 0 0 0 0 0 32 0 109 102 105 105 105 109
Processed fruits
and vegetables 0 29 18 52 58 0 60 0 133 133 133 133 133 133
Oils and fats 0 18 1 34 0 6 44 0 80 80 80 80 80 80
Other food
products 0 29 6 34 29 8 73 0 92 114 94 101 101 153
Beverages 0 0 0 0 9 50 45 0 134 134 134 134 134 134
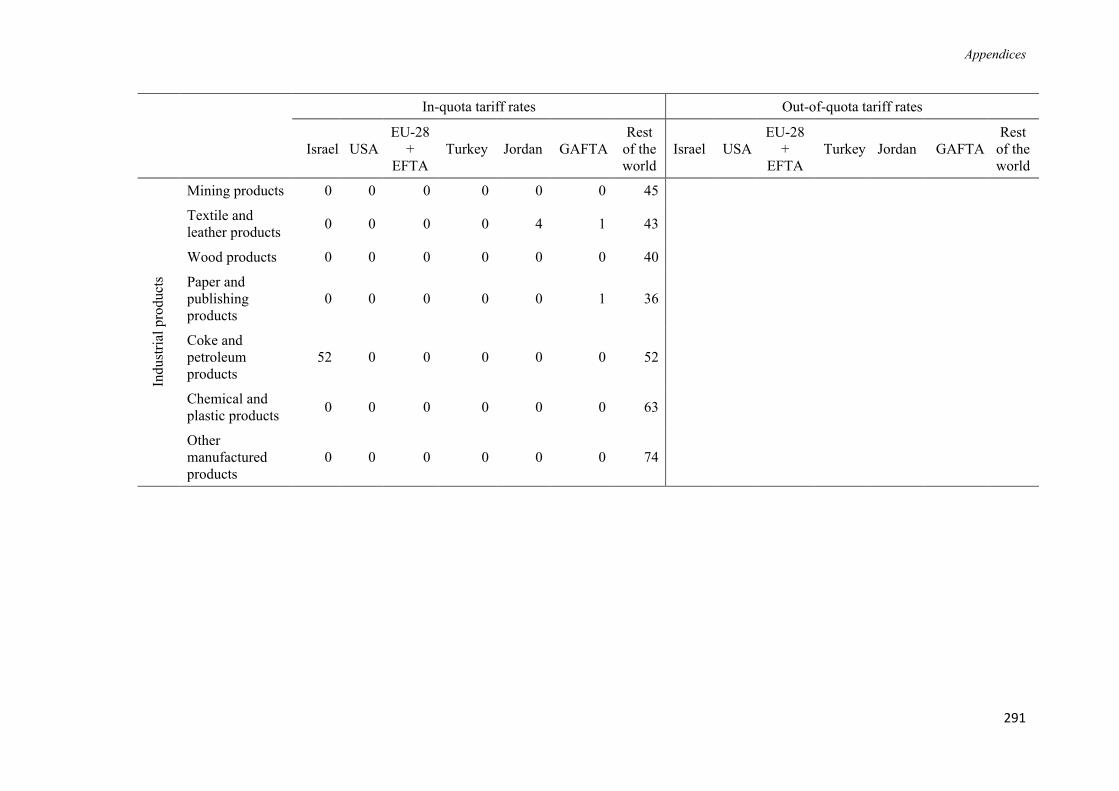
Appendices
291
In-quota tariff rates Out-of-quota tariff rates
Israel USA
EU-28
+
EFTA
Turkey Jordan GAFTA
Rest
of the
world
Israel USA
EU-28
+
EFTA
Turkey Jordan GAFTA
Rest
of the
world In
du
stri
al p
rodu
cts
Mining products 0 0 0 0 0 0 45
Textile and
leather products 0 0 0 0 4 1 43
Wood products 0 0 0 0 0 0 40
Paper and
publishing
products
0 0 0 0 0 1 36
Coke and
petroleum
products
52 0 0 0 0 0 52
Chemical and
plastic products 0 0 0 0 0 0 63
Other
manufactured
products
0 0 0 0 0 0 74
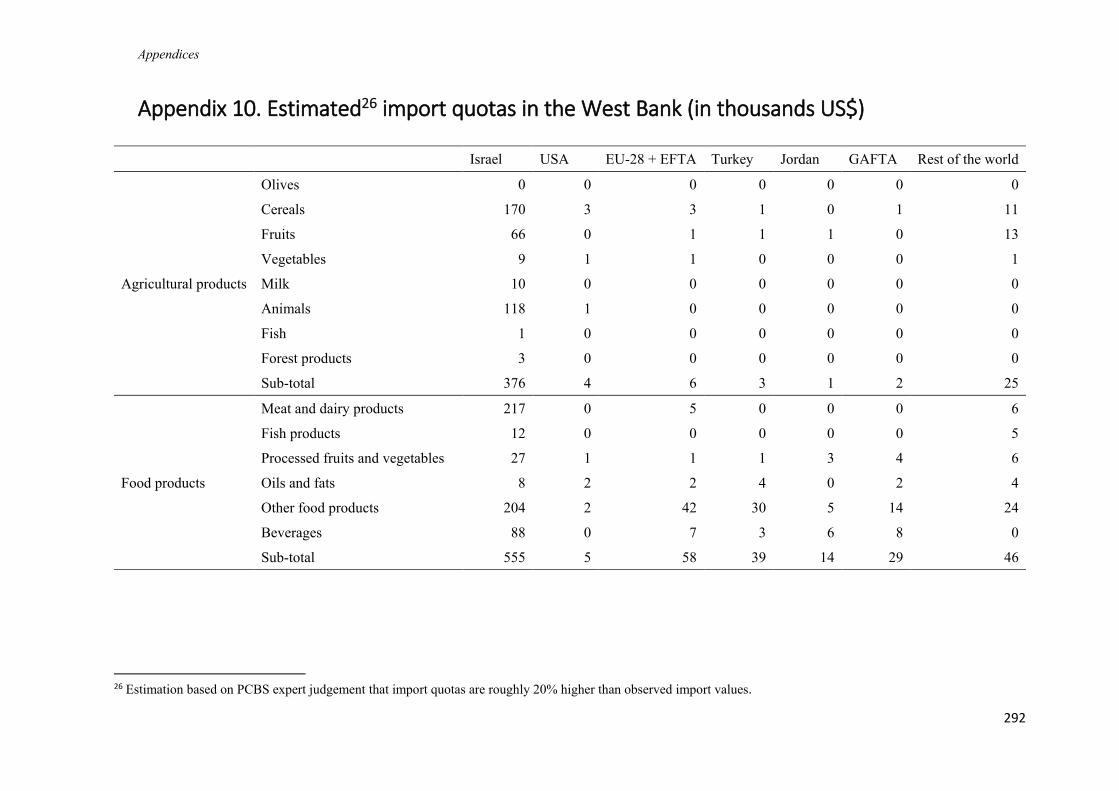
Appendices
292
Appendix 10. Estimated26 import quotas in the West Bank (in thousands US$)
Israel USA EU-28 + EFTA Turkey Jordan GAFTA Rest of the world
Agricultural products
Olives 0 0 0 0 0 0 0
Cereals 170 3 3 1 0 1 11
Fruits 66 0 1 1 1 0 13
Vegetables 9 1 1 0 0 0 1
Milk 10 0 0 0 0 0 0
Animals 118 1 0 0 0 0 0
Fish 1 0 0 0 0 0 0
Forest products 3 0 0 0 0 0 0
Sub-total 376 4 6 3 1 2 25
Food products
Meat and dairy products 217 0 5 0 0 0 6
Fish products 12 0 0 0 0 0 5
Processed fruits and vegetables 27 1 1 1 3 4 6
Oils and fats 8 2 2 4 0 2 4
Other food products 204 2 42 30 5 14 24
Beverages 88 0 7 3 6 8 0
Sub-total 555 5 58 39 14 29 46
26 Estimation based on PCBS expert judgement that import quotas are roughly 20% higher than observed import values.
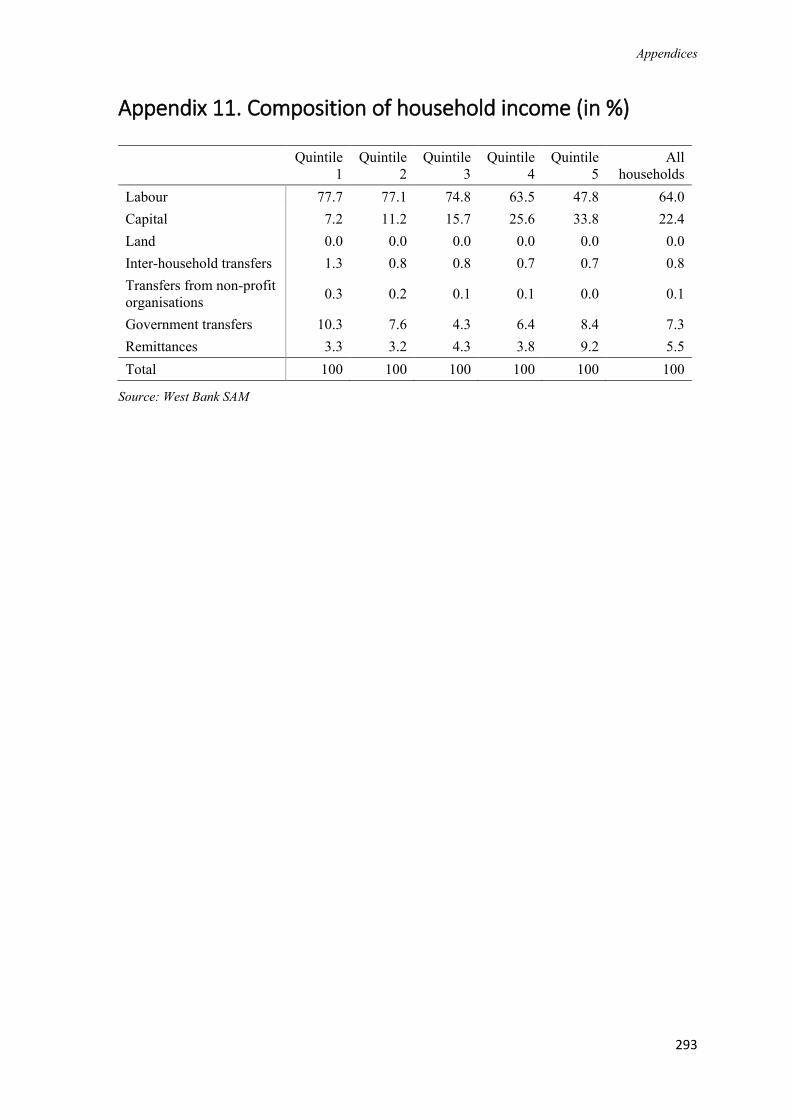
Appendices
293
Appendix 11. Composition of household income (in %)
Quintile
1
Quintile
2
Quintile
3
Quintile
4
Quintile
5
All
households
Labour 77.7 77.1 74.8 63.5 47.8 64.0
Capital 7.2 11.2 15.7 25.6 33.8 22.4
Land 0.0 0.0 0.0 0.0 0.0 0.0
Inter-household transfers 1.3 0.8 0.8 0.7 0.7 0.8
Transfers from non-profit
organisations 0.3 0.2 0.1 0.1 0.0 0.1
Government transfers 10.3 7.6 4.3 6.4 8.4 7.3
Remittances 3.3 3.2 4.3 3.8 9.2 5.5
Total 100 100 100 100 100 100
Source: West Bank SAM
Statement of authorship
294
Statement of authorship Selbständigkeitserklärung
I expressly declare that the work I have submitted was written independently and without
external help.
Ich erkläre ausdrücklich, dass es sich bei der von mir eingereichten Arbeit um eine von mir selbstständig und
ohne fremde Hilfe verfasste Arbeit handelt.
I expressly declare that all sources used in the abovementioned work – including those from
the Internet (including tables, graphic and suchlike) – have been marked as such. In
particular, I declare that I have stated, without exception, the source for any statements
quoted verbatim and/or unmodified tables, graphics etc. (i.e. quotations) of other authors.
Ich erkläre ausdrücklich, dass ich sämtliche in der oben genannten Arbeit verwendeten fremden Quellen, auch
aus dem Internet (einschließlich Tabellen, Grafiken u. Ä.) als solche kenntlich gemacht habe. Insbesondere
bestätige ich, dass ich ausnahmslos sowohl bei wörtlich übernommenen Aussagen bzw. unverändert
übernommenen Tabellen, Grafiken o. Ä. (Zitaten) als auch bei in eigenen Worten wiedergegebenen Aussagen
bzw. von mir abgewandelten Tabellen, Grafiken o.Ä. anderer Autorinnen und Autoren die Quelle angegeben
habe.
I am aware that violations against the principles of academic independence are considered
deception and are punished accordingly.
Mir ist bewusst, dass Verstöße gegen die Grundsätze der Selbstständigkeit als Täuschung betrachtet und
entsprechend geahndet werden.
02.07.2018
Date
Datum
Signature of the doctoral student
Unterschrift Doktorand