


Bahasa
Halaman
Hukum

, _ _ _ _ . - . _ _ _ _ _ _ _ _ _ _ _ _ . _ _ _ . . - _ _ _ _ _
l
!
c r
NUR EG/ CR-2141, Vol. 3ORNL/TM 8145
i =,
t
!~
.
. .
i .':
; t
; .
| Heavy-Section Steel Technology |! Program Quarterly Progress !| UNION '
! CARBIDE Report for July-September 1981 !
l |
{ G. D. Whitman R. H. Bryan |
I!
,
ii
!
!
|.. t
[! 12C555078877 1 ANRF Ii LS NRC '
# 'A0f DIV CF IICCPCLICY C PUBLICATICNS MGI OR IFOR ALREG CCPY :LA 212 {hASHIhGTON DC 2055S
t
,
f
;
{
Prepared for the U.S Nuclear Regulatory CommissionOffice of Nuclear Regulatory Research '
Under Interagency Agreements DOE 40 55175 and 40 552-75
,
*
.
9
_ . - - _ _ . - - . .
e
v
Printed in the United States of America Available fromNational Technical Information Service
U.S Department of Commerce5285 Port Royal Road. Springfield. Virginia 22161
_ . . . _ . _ _ _ . _ _ . _ . _ _ _ _ _ _ _ _ _ _ _ _ _ _,
!' Avmlable f rom|
|GPO Sales Program
De,is,on of Trrhnical Inf ormation and Document Controli
! U S Nuchw f Mulatory CommissionWashin.iton, D.C 20555
_ -_ . . .. -- . -__-
P
S, hb (j h %,, - b
Un'tM States Governrr ent Ne,ther the U n ted Statos Gas ernment r ar any aaencyitcre2,nM ani Gf the:f e T phyy t Ps. rnak es an y warrant y, es press or ir"phed. Orf
l DC hty Cf f t%Gn5 I3 tht/ iCrthe'CCJTA y ( Of" plCIP PP55. O fa 5 5.J rn o S d n y C]A $ijgef .!np55 rt a n 'y ir f O r rPat On of pardhl% O FOdaf ! Of process desC!Osed Oft
f rp' ESP'It5 th At i?S uSP W U |1001 FihngA ph.3!0 / O Ano1 r ght3 he Hence hereini f
10 d'ly b["C.f i. C '' f T C(C GI f P O 3 JC t. ['r gr( %, (;f $0f w ;Ce t1Y f f s.le F.h Te. tr 3COftd f hP'Anu'a C t t,r e' Of O' h e rw i s e d(es r. Q t noressaf dy C Omt ! Lie Or tr9 p) / i',s
t M $NWF oni ftCrrm?endahOn Of 13,9 tir ; t>y the U r'sted $!W$ G Overnrr0 n! Off T P C g ic A *3 An j opinerts of auth0rs Pep Pssed h*'f em do nCtany 3gr-n(y thef pG
r etes$d d y $t t!O Of reh "(.i thOw ot the Un te 15tates Ge.ernrrent or any agencyi t
t he r PL;f
- . . - . - - _ - -
9
- . _ _ _ _ _ . , . _ . . . . _ - . - . . - _ . - - . _ _, . _ - - - - _ _ -_.,. --- _ , . - .
NUREG/CR-2141, Vol. 3ORNL/TM-8145
*Dist. Category RF
e
Contract No. V-7405-eng-26
Engineering Technology Division
HEAVY-SECTION STEEL TECHNOLOGY PROGRAM QUARTERLYPROGRESS REPORT FOR JULY-SEPTEMBER 1981
G. D. Whitman R. H. Bryan
Hanuscript Completed - January 29, 1982.
Date Published: February 19829
NOTICE This document contains information of a prelirninary nature.It is subject to revision or correction and therefore does not represent afinal report.
Prepared for theU.S. Nuclear Regulatory Commission
Office of Nuclear Regulatory ResearchUnder Interagency Agreements DOE 40-551-75 and 40-552-75
NRC FIN No. B0119
Prepared by the0AK RIDGE NATIONAL LABORATORY.Oak Ridge, Tennessee 37830
operated byUNION CARBIDE CORPORATION,
for theDEPARTMENT OF ENERGY
__ _ _ _ _ __
. - . _ - . . . - _ . _ . . .. . _ . .. . _ - - .. . . .-- - .
1
i
i
11 !
4
i
4
. a
l. 9ia
!4
1
!W
; ERRA1TN
!
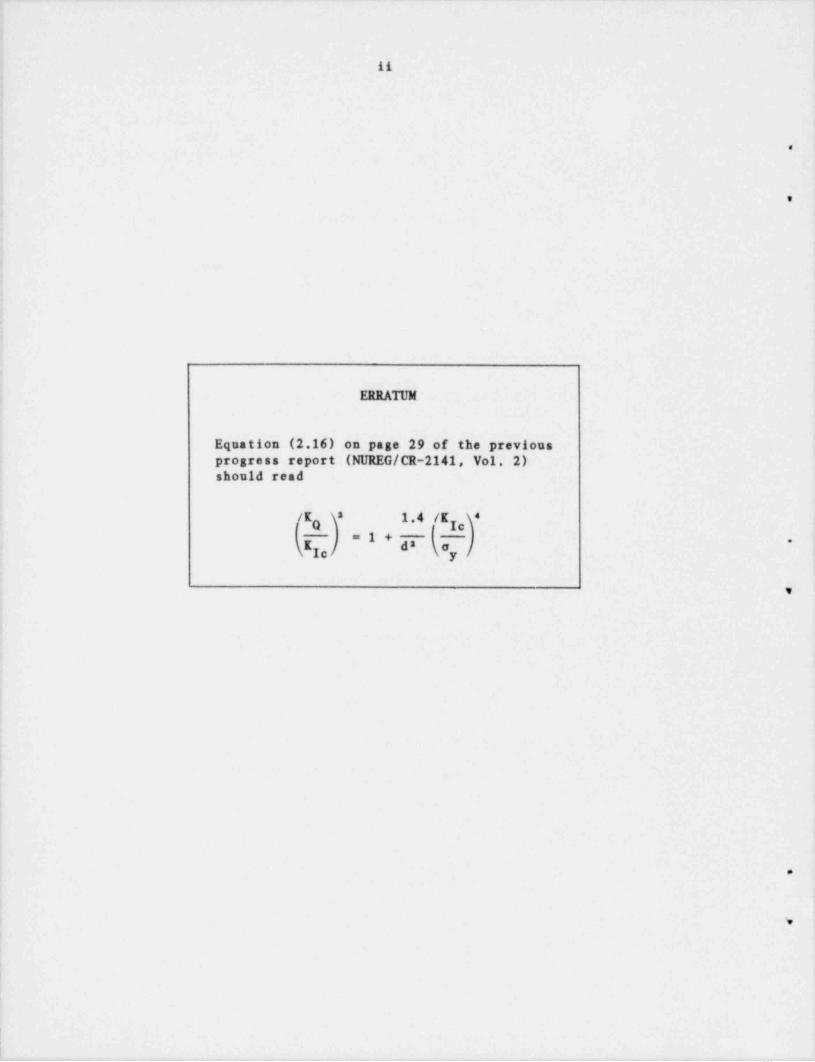
Equation (2.16) on page 29 of the previous; progress report (NUREG/CR-2141, Vol. 2)
should read
(Kg 38 1.4 /K ,)*gI l =1+d8 l -
\ Ic) (ay) r
3 -
}
i
i
ff
i
1
!
i
i
i
!
!
!*
,
9
'i wI i
t
|_ _ . _ . , , _ . .. . - . -- - - - . . _ - _ _ _ .
. - . . . _ .
ill
CONTENTS
.
f.111
.
PREFACE ............................................................ v
SUNNARY ............................................................ vii
ABSTRACT ........................................................... I
1. PROGRAN ADMINISTRATION AND PROCUREMENT ......................... 1
References ..................................................... 2
2. FRACTURE NECHANICS ANALYSES AND INVESTIGATIONS ................. 3
2.1 Computational Nethods in Three-Dimensional NonlinearFracture Mechanics ........................................ 3
2.1.1 Plate in tension with surface crack ................ 3
2.1.2 Intermediate test vessel V-8 with outer meridionalsurface crack ...................................... 7
2.2 BCL HSST Support Program .................................. 10
2.2.1 Introduction and summary ........................... 10
2.2.2 Task 1. Analysis of crack propagation and arrest 11..
2.2.3 Task 2. Lower-bound toughness values .............. 19
2.2.4 Task 3. Crack-arrest toughness of TSE-6 steel ..... 39
2.3 Investigation of Damping and of Cleavage-Fibrous*
Tran s ition in Rea c tor-Grade S te el . . . . . . . . . . . . . . . . . . . . . . . . . 43
2.3.1 Introduction ....................................... 431 ,
| 2.3.2 Cleavage-fibrous transition studies ................ 45
2.3.3 Frictional effects due to wedge loading ............ 46
2.3.4 Numerical computations ............................. 56
2.3.5 Photoelastic determination of higher-order terms ... 56
65References .....................................................
3. INVESTIGATION OF IRRADIATED MATERIALS .......................... 68
3.1 Second and Third 4T Compact-Specimen Irradiation Study .... 68
68i 3.2 Fourth HSST Irradiation Series ............................
68Reference ......................................................
4. THERNAL-SHOCK INVESTIGATIONS ................................... 69
694.1 Analysis of PWR Overcooling Accidents .....................
4.2 Effect of Temperature Dependence of Material Properties87on 17 .....................................................,
4.3 Development of a More Efficient Method for Computing K*90Values ....................................................
4.4 Stress-Intensity Factors for Subclad Cracks ............... 91*
934.5 Development of COD Gage for Large CODS ....................
___ _, _ _ .__ _ _ - . . _ _ . _ _ _ _ . _ _ _ _ _ _ _ . .- . _ _ - - - - - -
- _ - - .
iv
EBM.
4.6 Heat-Treating and Flawing of Thermal-Shock Test CylinderTSC-3..................................................... 93
4.7 Residual Stresses in the TSE-6 Test Cylinder .............. 95 *
4.8 Thermal-Shock Naterials Characterization .................. 97
.
References ..................................................... 1021
5. PRES SURE VES SEL INVESTIGATIONS . . . . . . . . . . . . . . . . . . . . . . . . . . . . . . . . . 104,
5.1 Int e rme d i a t e Te s t Ve s s e l V-8 A . . . . . . . . . . . . . . . . . . . . . . . . . . . . . 1 04
5.1.1 B&W vessel preparation ............................. 1045.1.2 Naterial characterization .......................... 1 045.1.3 Vessel flawing development 105; .........................
5.2 Pressurized Thermal-Shock Test Studies 105....................
5.2.1 Test facility design studies ....................... 1055.2.2 Pressurized thermal-shock stress and fracture
analysis ........................................... 108
References ..................................................... 122*
APPENDIX A. TABULATION OF BACKGROUND DATA ......................... 123
APPENDIX B. CHOICE OF INITIAL NOTCH LENGTH IN THECOMPACT-CRACK-ARREST SPECINEN ......................... 127
.
e
0
,,, - - . , - . , . .- - - - . . - - - - . - - . . . - , , - - - . - . , . , . , ,,, - . - - - , , , - - - - , - , - . , . - - ,
- - _ _- - ___ .- .-.
y.
PREFACE
.
n o Heavy-Section Steel Technology (HSST) Program, which is sponsoredby the Nuclear Regulatory Commission, is an engineering research activitydevoted to extending and developing the technology for assessing the mar-*
gin of safety against fracture of the thick-walled steel pressure vesselsused in light-water-cooled nuclear power reactors. The program is beingcarried out in close cooperation with the nuclear power industry. This
report covers HSST work performed in July-September 1981. The work per-formed by Oak Ridge National Laboratory (ORNL) and by subcontractors ismanaged by the Engineering Technology Division. Major tasks at ORNL arecarried out by the Engineering Technology Division and the Metals andCeramics Division. Prior progress reports on this program are ORNL-4176,ORNL-4315, ORNL-4377, ORNL-4463, ORNL-4512, ORNL-4590, ORNL-4653, ORNL-4681, ORNL-4764, ORNL-4816, ORNL-4855, ORNL-4918, ORNL-4971, ORNL/IM-4655(Vol. II), ORNL/IM-4729 (Vol. II), ORNL/IM-4805 (Vol. II), ORNL/IM-4914(Vol. II), ORNL/1M-5021 (Vol. II), ORNL/1M-5170, ORNL/NUREG/IM-3, ORNL/NUREG/IM-28, ORNL/NUREG/IM-49, ORNL/NUREG/IM-64, ORNL/NUREG/IM-94, ORNL/NUREG/1M-120, ORNL/NUREG/IM-147, ORNL/NUREG/IM-166, ORNL/NUREG/IM-194,ORNL/NUREG/IM-209, ORNL/NUREG/IM-239, NUREG/CR-0476 (ORNL/NUREG/1M-275),NUREG/CR-0656 (ORNL/NUREG/IM-298), NUREG/CR-0818 (ORNL/NUREG/IM-324),NUREG/CR-0980 (ORNL/NUREG/1M-347), NUREG/CR-1197 (ORNL/NUREG/1M-370),NUREG/CR-1305 (ORNL/NUREG/1M-380), NUREG/CR-1477 (ORNL/NUREG/1M-393),NUREG/CR-1627 (ORNL/NUREG/IM-401), NUREG/CR-1806 (ORNL/NUREG/IM-419),NUREG/CR-1941 (ORNL/NUREG/IM-437), NUREG/CR-2141/Vol. 1 (ORNL/11-7822),and NUREG/CR-2141, Vol. 2 (ORNL/IM-7955).
; .
v
!
l
i
e
V
_ . _ _ . . _ _ _ _ _. __ _ . _ . . _ _ _ _ _ _ _ _ . _ _ _ _ _
,
._ - - - - - _
|
| v11,
SUMMARY
.
1. PROGRAM ADMINIS11tATION AND PROCUREMENT
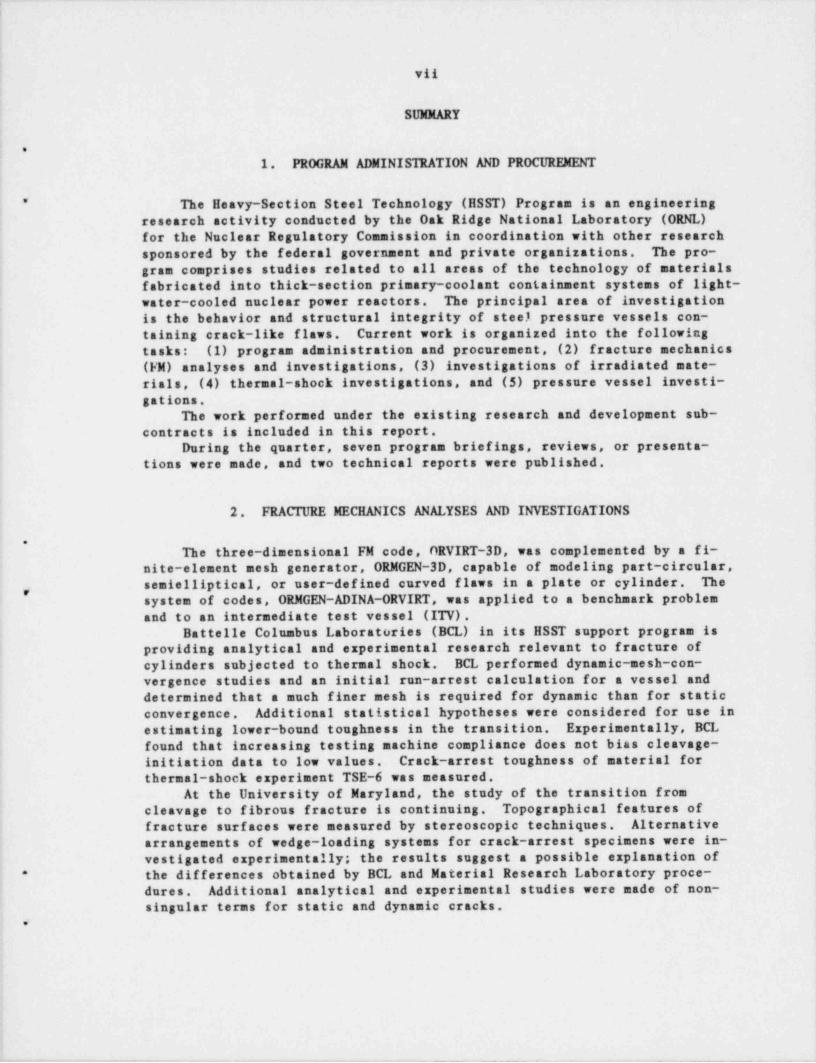
The Heavy-Section Steel Technology (HSST) Program is an engineering*
research activity conducted by the Oak Ridge National Laboratory (ORNL)4
! for the Nuclear Regulatory Commission in coordination with other researchsponsored by the federal government and private organizations. The pro-gram comprises studies related to all areas of the technology of materialsfabricated into thick-section primary-coolant containment systems of light-water-cooled nuclear power reactors. The principal area of investigation;
is the behavior and structural integrity of steel pressure vessels con-taining crack-like flaws. Current work is organized into the followingtasks: (1) program administration and procurement, (2) fracture mechanics(FM) analyses and investigations, (3) investigations of irradiated mate-rials, (4) thermal-shock investigations, and (5) pressure vessel investi-gations.
The work performed under the existing research and development sub- !
contracts is included in this report.During the quarter, seven program briefings, reviews, or presenta-
tions were made, and two technical reports were published.
2. FRACTURE MECHANICS ANALYSES AND INVESTIGATIONS
.The three-dimensional FM code, ORVIRT-3D, was complemented by a fi-
nite-element mesh generator, ORNGEN-3D, capable of modeling part-circular,semielliptical, or user-defined curved flaws in a plate or cylinder. The
,system of codes, ORNGEN-ADINA-ORVIRT, was applied to a benchmark problemand to an intermediate test vessel (ITV).
Battelle Columbus Laboratories (BCL) in its HSST support program isproviding analytical and experimental research relevant to fracture ofcylinders subjected to thermal shock. BCL performed dynamic-mesh-con-vergence studies and an initial run-arrest calculation for a vessel anddetermined that a much finer mesh is required for dynamic than for staticconvergence. Additional statistical hypotheses were considered for use inestimating lower-bound toughness in the transition. Experimentally, BCLfound that increasing testing machine compliance does not bias cleavage-initiation data to low values. Crack-arrest toughness of material forthermal-shock experiment TSE-6 was measured.
At the University of Maryland, the study of the transition fromcleavage to fibrous fracture is continuing. Topographical features offracture surfaces were measured by stereoscopic techniques. Alternativearrangements of wedge-loading systems for crack-arrest specimens were in-vestigated experimentally; the results suggest a possible explanation ofthe differences obtained by BCL and Material Research Laboratory proce-*
dures. Additional analytical and experimental studies were made of non-singular terms for static and dynamic cracks.
.
. . - - - .- .- -- - . - .. _ _ _ _ _ . _ _ _ _ _ _ _ _ _ . - _ _ - _ _ - _ _ _ -
._ . . . ..
i
'
vill
3. INVESTIGATION OF IRRADIATED MATERIALS
Charpy V-notch impact test results for the second and third 4T CS *
Irradiation Esperiments were reanalyzed statistically to determine thedependence of radiation-induced changes in transition temperature andupper-shelf energy on several factore. At present, irradiation tempera- =
ture does not appear to have a consistent effect, but the studies arecontinuing.
Irradiation of the third capsule of the fourth HSST Irradiation Se-ries continued, and assembly of the fourth capsule was almost completed.
4. THERMAL-SHOCK INVESTIGATIONS
Preparations for thermal-shock experiment TSE-6 are continuing. Anew crack-opening displacement gage has been tested, the test cylinder washeat treated and flawed, residual stresses in the prolongation of the testcylinder were measured, and fracture-toughness characterization of theprolongation was completed.
Additional studies related to the use of the OCA-I computer code wereperformed. Several types of overcooling accidents in a pressurized-waterreactor (PWR) wers analyzed, the effects of using temperature-independentthermo-elastic properties were investigated, an efficient method forcomputing E values for unit loads was developed, and a simple model of
7underclad cracks was studied..
5. PRESSURE VESSEL INVESTIGATIONS
9
Preparations at Babcock & Wilcox Company (B&W) and ORNL are continu-ing for the test of intermediate test vessel V-8A. During the quarter,B&W removed and replaced the special seam weld, which was specially de-veloped for its low-upper-shelf properties. B&W completed testing ofCharpy impact and IT compact J specimens of three characterization seamwelds. On the basis of the Charpy impact properties, ORNL tentativelyselected a vessel test temperature of 150*C. The first attempt to fatiguesharpen a part-circular flaw in low-upper-shelf weld material produced anunsatisfactory flaw shape. Consequently, a second practice flaw is beingprepared.
Pressurized thermal-shock (PTS) design studies are continuing. In
addition, parameter studies of PTS experimental conditions were performedby means of the OCA-I computer code. These two-dimensional analyses showthat it is practical to attain, in an ITV, stress fields and K distribu-ytions essentially like those of a PWR vessel subjected to PTS
.
W
. _ _ , _ . _ _ _ - _ . . . . _ . . - -. - -. .. -
_ _ _- - .
.
HEAVY-SECTION STEEL TECHNOLOGY PROGRAM QUARTERLYPROGRESS REPORT FOR JULY-SEPTEMBER 1981*
.
G. D. Whitman R. H. Bryan
|
e
ABSTRACT
The Heavy-Section Steel Technology Program is an ensi-neering research activity conducted by the Oak Ridge NationalLaboratory for the Nuclear Regulatory Commission. The programcomprises studies related to all areas of the technology ofmaterials fabricated into thick-section. primary-coolant con-tainment systems of light-water-cooled nuclear power reactors.The investigation focuses on the behavior and structural in-tegrity of steel pressure vessels contain;ng crtck-like flaws.Current work is organized into five tasks. (1) program ad-ministration and procurement, (2) fractuse mechanics analysesand investigations, (3) investigations cf irradiated materi-als, (4) thermal-shock investigations, and (5) pressure vesselinvestigations.
Three-dimensional fracture mechanics codes were appliedto benchmark and vessel problems. Subcontractors investigateddynamic fracture analysis and transitional toughness behavior.Investigations of properties of irradiated material include
i statistical analysis of Charpy data and continued irradiationof specimens. Preparations for thermal-shock experiment TSE-6
,
continued, and further overcooling accident problems werestudied. Preparations for the low-upper-shelf intermediatevessel test V-8A are continuing. Further work on design and'
analyses related to the pressurized thermal-shock test programwere performed.
1. PROGRAM ADMINISTRATION AND PROCUREMENT
G. D. Whitman
The Heavy-Section Steel Technology (HSST) Program, a major safetyprogram sponsored by the Nuclear Regulatory Commission (NRC) at the OakRidge National Laboratory (ORNL), is concerned with the structural intes-rity of the primary systems (particularly the reactor pressure vessels)of light-water-cooled nuclear power reactors. The structural integrity ofthese vessels is ensured by (1) designing and fabricating them accordingto standards set by the code for nuclear pressure vessels, (2) detecting
, flaws of significant size that occur during fabrication and in service,
i* Conversions from SI to English units for all SI quantities are.
listed on a foldout page at the end of this report.
|t
| . - _ - _ . _ _ _ _ _ _ _ _ _ _ _ . _ _ - , _ - . . _ , _ - _ - _ _ , , , _ , - . . ,.. , _ _ , _ _ , _ . _ _ _ , _ _ _ . . _ . _ , , - _ , _ ,
i
2
and (3) developing methods of producing quantitative estimates of condi-tions under which fractures could occur. The program is coa 3rned mainlywith developing pertinent fracture technology, including knowledge of
*
(1) the material used in these thick-walled vessels, (2) the flaw growthrate, and (3) the combination of flaw size and load that would cause frac-ture and thus limit the life and/or operating conditions of this type of =
reactor plant.The program is coordinated with other government agencies and with
the manufacturing and utility sectors of the nuclear power industry inthe United States and abroad. The overall objective is a quantificationof safety assessments for regulatory agencies, for professional code-writing bodies, and for the nuclear power industry. Several activitiest.re conducted under subcontracts by research facilities in the UnitedStates and through informal cooperative efforts on an international ba-sis. Two research and development subcontracts are currently in force.
Administrative 1y, the program is organized into five tasks, asrefiscted in this report: (1) program administration and procurement,(2) fracture mechanics (FM) analyses and investigations, (3) ir.ve s t i-gations of irradiated material, (4) thermal-shock investigations, and(5) pressure vessel investigations.
During this quarter, seven program briefings, reviews, or presenta-tions were made by the HSST staff at technical meetings and at programreviews for the NRC staff or visitors. Two technical reports were pub-lished.1,8
,
References .
l
1. A. Shukla, W. L. Fourney, and G. R. Irwin, Study of Energy Loss andIts Mechanisms in Romatite 100 During Crack Propagation and Arrest, '
NUREG/CR-2150 (ORNL/Sub-7778/1), University of Maryland (August 1981).
2. R. J. Sanford et al., A Photoetastic Study of the Influence of Non-Singular Stresses in Fracture Test Specimens, NUREG/CR-2179 (ORNL/Sub-7778/2), University of Maryland (August 1981).
|!
1
.
.
-_.
_- _ _ _ _ _ .- .-. . _ -
3
2. FRACTURE MECHANICS ANALYSES AND INVESTIGATIONS
.
2.1 Commutational Methods in Three-DimensienalNonlinear Fracture Mechanics
.
B. R. Bass * J. W. Bryson
Previous reports 1,s have described implementation of deLorenzi's:three-dimensional virtual crack extension technique in the Oak Ridge pro-gram ORVIRT-3D. The program functions as a postprocessor of a conven-tional finite-element solution obtained from the ADINA (Ref. 4) program.'
For each load step, average values and pointwise variations of the energyrelease rate are evaluated from a natural extension of the volume integra-tion already performed in a finite-element analysis. The formulation isvalid for general fracture behavior, including nonplanar fracture, and
| applies to elastic as well as deformation theory plasticity models. Ap-plications of ORVIRT-3D have been reported 1,8 for three-dimensional elas-tic and elastic-plastic models of compact-tension (CT) specimens contain-
;
ing flat straight-through crack fronts.During this quarter, a three-dimensional finite-element mesh generat- *
j ing program, ORNGEN-3D, was written at Osk Ridge by the Technical Applica-tions Engineering Department, Computer Sciences Division, to complementthe ADINA-ORVIRT system. The program requires only three input data cardsto produce a complete finite-element model compatible with the ADINA inputformat. The generated model incorporates the appropriate collapsed prism
,
singular elementss around the crack front. Geometric dimensions and meshrefinement specifications are controlled by user input. Currently, OENGEN-3D can model a plate or cylinder containing a part-circular, semiellipti-
,cal, or user-defined curved crack flaw. Future additions to the geometrylibrary of ORNGEN-3D are planned, including a nozzle-cylinder intersectioncontaining a corner crack fisw.
The ORNGEN-ADINA-ORVIRT system is applied here to the analysis ofsurface flaws in two different geometries. The first problem, a semi-elliptical surface flaw in a plate, represents one of the Battelle bench-mark problems.8,' The second application is to a part-circular outermeridional surf ace flaw in an intermediate test vessel (ITV) . These rep-
resent the first applications of the ORVIRT system to curved flaw shapes.
2.1.1 Plate in tension with surface crack
A 1976 workshop * was held at Battelle Columbus Laboratories (BCL) toconsider methods of three-dimensional fracture analysis. The workshop se-1ected three benchmark problems of particular significance as standardsfor comparing analysis methods. One of the geometries chosen was the semi-elliptical surface flaw in a plate subjected to remote uniform tension, as*
shown in Fig. 2.1. Solutions to this problem were obtained independently
* Computer Sciences Division, Union Carbide Corporation-Nuclear*
Division (UCC-ND).
|
_ , - _ . - - _ - _ , - - . - _ _ . . - . - . . _ _ _ . . . . _
4
ORNL-0WG 81-18171
JL
Om =
"/|4 - I h
Y 1j, ,
IN o /l h
|
I
/ |Ik ' ,'~/,
/ '%,'
/ l z o y ,,,
[ H/W > 2g
I a c 0.25I * alt = 0.25 AND 0.751
'f ' ' ~ - ,j' ~ ~ , 'i n
it /p it*=
~~)\r
/oo
N,4l'yom
Ift
M -
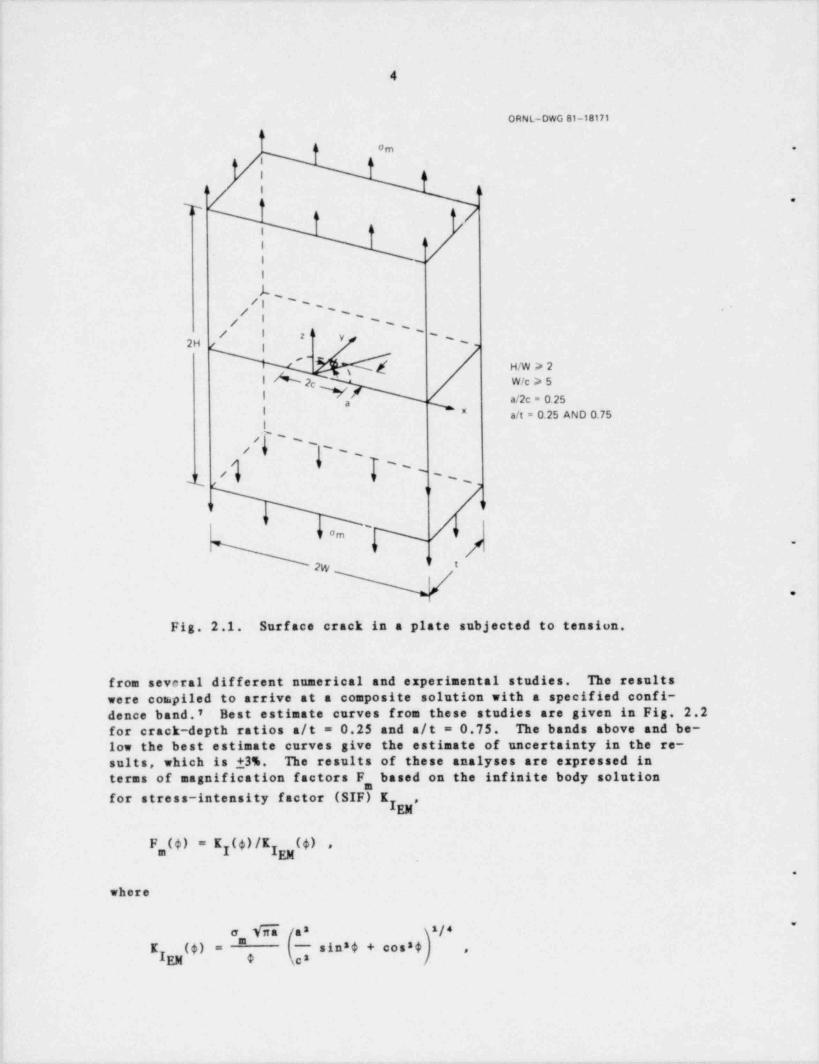
Fig. 2.1. Surface crack in a plate subjected to tension.
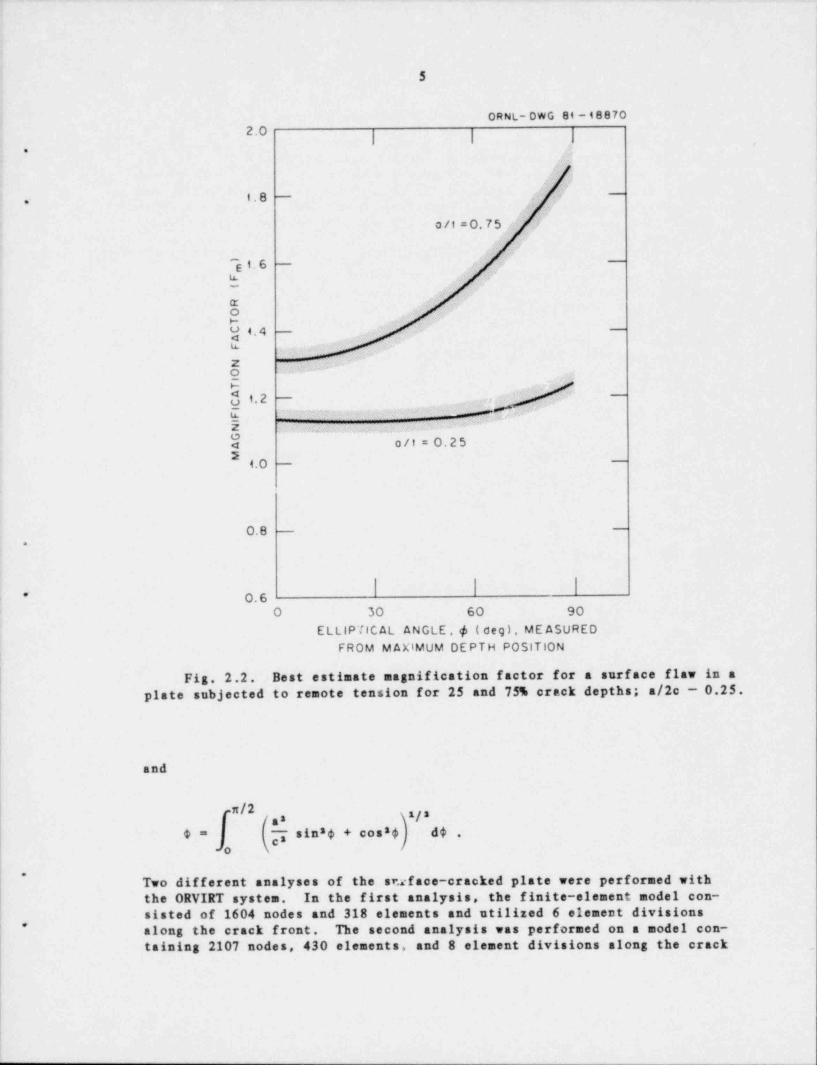
from several different numerical and experimental studies. The resultswere compiled to arrive at a composite solution with a specified confi-dence band.' Best estimate curves from these studies are given in Fig. 2.2for crack-depth ratios a/t = 0.25 and a/t = 0.75. The bands above and be-low the best estimate curves give the estimate of uncertainty in the re-suits, which is 13%. The results of these analyses are expressed in
terms of magnification factors F, based on the infinite body solutionfor stress-intensity factor (SIF) K ,
F,(4) = K (4)/Kg (4) ,y
.
where
*
f ia~ (a* ) */*a"
l sin 4 + cos 4 jsK ($) = ,
IEN 0 (c8 /
.
5
OR NL- DWG 81-18870'
I I I.
''
,
1~
s -
I.8 -,.
o it = 0. 7 5 /
'
~ 1. 6 - -
E
Ecr
?y 4.4 - -
u
2 ' , .
9'2 ~ .-
^
' "
b s
['.wa.;. ::a
< o/t=0.25
4.0 - -
0.8 --
.
* O.60 30 60 90
ELLIPTICAL ANGLE,4 ( deg), ME ASUREDFROM MAXIMUM DEPTH POSITION
;
Fig. 2.2. Best estimate magnification factor for a surface flaw in aplate subjected to remote tension for 25 and 75% crack depths; a/2c - 0.25.
and
Fn/2 ,, gj,sin 4 + cos8$ d$ .8@ =
* Two different analyses of the sr.eface-cracked plate were performed withthe ORVIRT system. In the first analysis, the finite-element model con-sisted of 1604 nodes and 318 elements and utilized 6 element divisions
' * along the crack front. The second analysis was performed on a model con-taining 2107 nodes, 430 elements, and 8 element divisions along the crack .
6
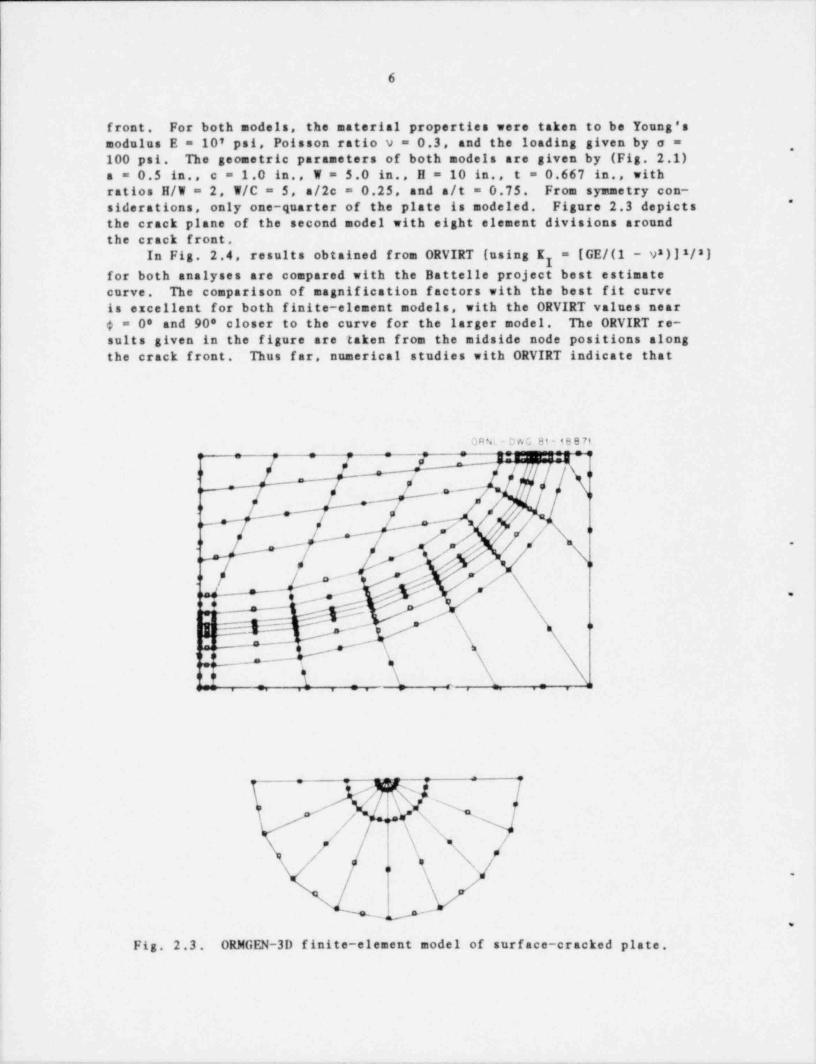
front. For both models, the material properties were taken to be Young'smodulus E = 10' psi, Poisson ratio v = 0.3, and the loading given by a =
,
100 psi. The geometric parameters of both models are given by (Fig. 2.1)a = 0.5 in. , c = 1.0 in. , W = 5.0 in. , H = 10 in. , t = 0.667 in. , withratios H/W = 2, W/C = 5, a/2c = 0.25, and a/t = 0.75. From symmetry con- <
*siderations, only one quarter of the plate is modeled. Figure 2.3 depictsthe crack plane of the second model with eight element divisions aroundthe crack front.
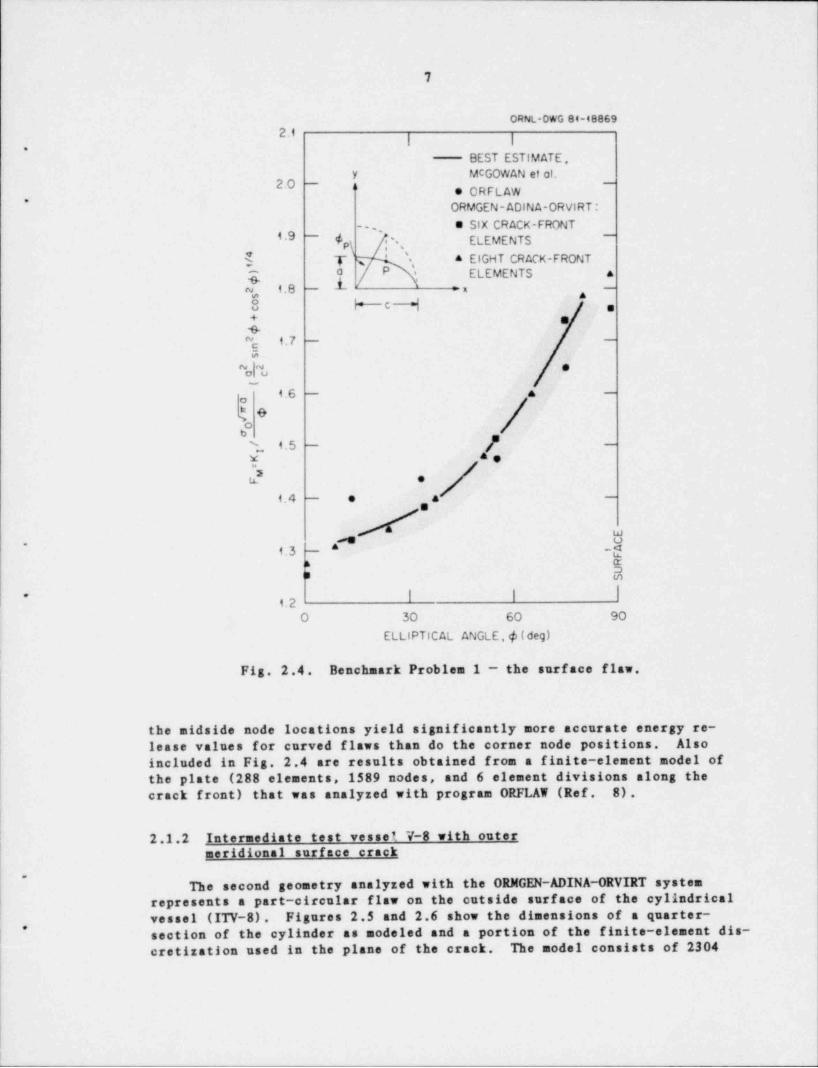
In Fig. 2.4, results obtained from ORVIRT (using K = [GE/(1 - v8)]2/8)yfor both analyses are compared with the Battelle project best estimatecurve. The comparison of magnification factors with the best fit curveis excellent for both finite-element models, with the ORVIRT values near4 = 0* and 90* closer to the curve for the larger model. The ORVIRT re-suits given in the figure are taken from the midside node positions alongthe crack front. Thus far, numerical studies with ORVIRT indicate that
C ANL - OwG 81-18 871- : p : ; : 3 * _ ___ . i; e :
M C/p N"
/~ W ' #'
/ s,/"
/7i s'- /'" ,,
~ ,/~ y- -
,/,/|/ / / h, /' ,
-
., , .
.e p - f-
i seres - ..
4,- #, \- o
_ l _ __ _ _
h'
\\ /-
/-a
. .
,/.
Fig. 2.3. ORMGEN-3D finite-element model of surface-cracked plate.
7
ORNL-DWG 84-488692a
, i,
BEST ESTIMATE,y McGOWAN et al.
2.0 - ~" * ORFLAW
,
ORMGEN- ADINA-ORVIRT :
e SIX CRACK-FRONT-..' ,'9 - 4 .' ELEMENTS-
p
3 T w ', a EIGHT CRACK-FRONT'-
a P ELEMENTS .5 ,
m 1.8 - 1 -: x
$ |+---c H ,+ e4"c i7 - -
F.
%|% *
1.6 - a -
oO
e1 4.5 - / -
y *e2 e
i.4 - . . -
w
1.3 -^4 o. -g
$IB m
I I I-1.2
O 30 60 90ELLIPTICAL ANGLE,4 (deg)
!
Fig. 2.4. Benchmark Problem 1 - the surface flaw.
the midside node locations yield significantly more accurate energy re-lease values for curved flaws than do the corner node positions. Alsoincluded in Fig. 2.4 are results obtained from a finite-element model ofthe plate (288 elements, 1589 nodes, and 6 element divisions along thecrack front) that was analyzed with program ORFLAW (Ref. 8).
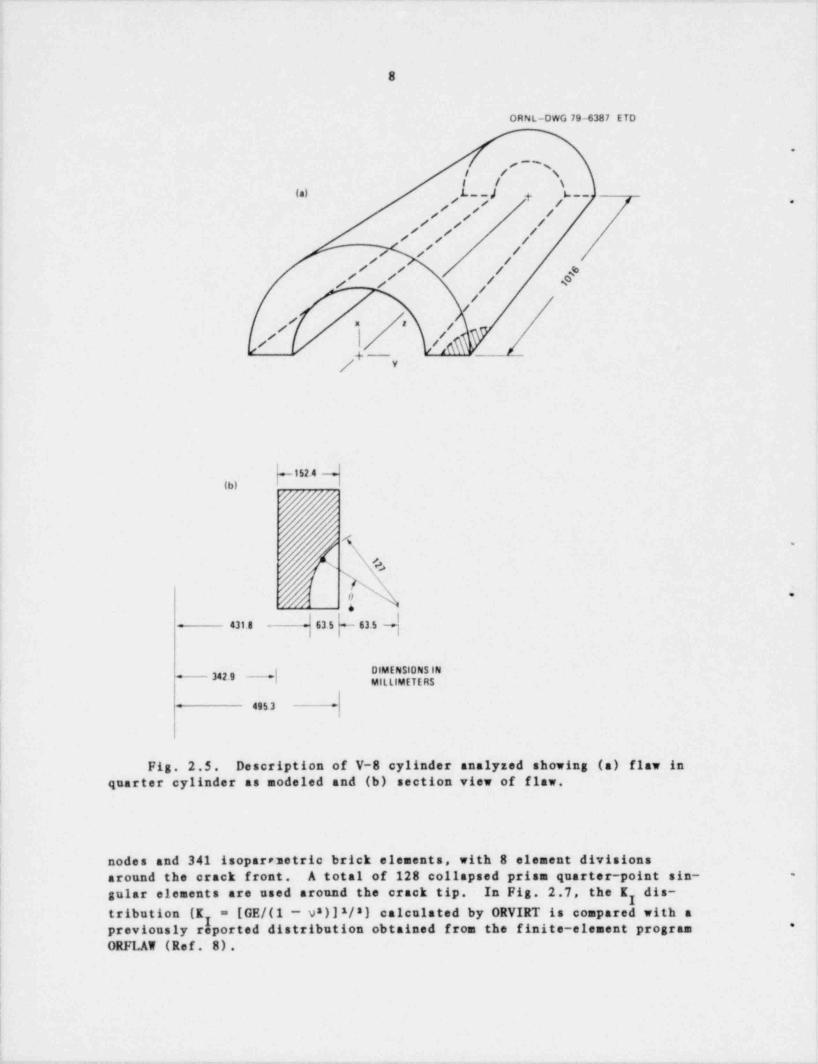
2.1.2 Intermediate test vesset V-8 with outermeridional surface crack
.
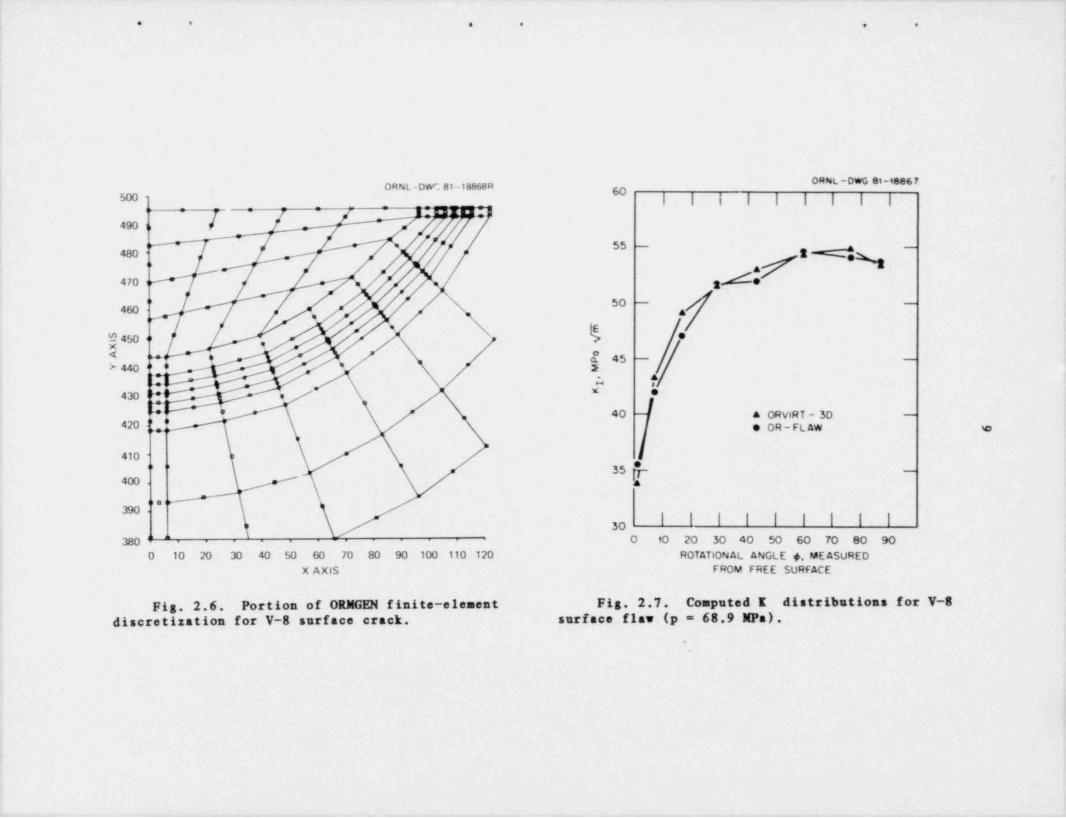
The second geometry analyzed with the ORNGEN-ADINA-ORVIRT systemrepresents a part-circular flaw on the cutside surface of the cylindricalvessel (ITV-8). Figures 2.5 and 2.6 show the dimensions of a quarter-section of the cylinder as modeled and a portion of the finite-element dis-,
cretization used in the plane of the crack. The model consists of 2304
i
8
ORNL-DWG 79-6387 ETD
.
%i / \
# / \
(a) ,L__/ ,L__,,
| ,' /
/ p' // / // /
/ / / 4s' | / &/
//
,/ x t y
| / /
/+ Y
b"'*du
.
/x. 4
'A :-
431 s 63 5 -- 615
| DIME NSIONS IN2.9 i MIL LIMETE RSj
495.3 =:
i
(,
i Fig. 2.5. Description of V-8 cylinder analyzed showing (a) flaw in
! quarter cylinder as modeled and (b) section view of flaw.1
f nodes and 341 isopar netric brick elements, with 8 element divisions
| around the crack front. A total of 128 collapsed prisa quarter-point sin- -
|gular elements are used around the crack tip. In Fig. 2.7, the K dis-y
= [GE/(1 v )]s/s) calculated by ORVIRT is compared with atribution (K s
previouslyrhporteddistributionobtainedfromthefinite-elementprogram *
ORFLAW (Ref. 8).
|
|
__ . . _ _ _ . - - . _ _ . . _ - _ . _ .
_ _ _ _ _ - _ _ _ _ . _ _ _ _ _ - _-. _ _ _ . ___
. . . . . .
OWL-OwG 81-98867ORNL-OWC 81-18868R g500 | | | | | | | | |
_
[__ _ _
_
490 1 ,
#= ss -
s <,q -
480,,
Me470 i = , 3
,gg " 50 - / -
,
\ 'E /*
g43o, 5 e,
,
440 * *
C1 :. ** *430 ll'I e
* ' 40 & ORVIRT - 3D -
420i[[ e OR-FLAW e
410' ' 35 -
m.,,
l i I I I I I I I30380 - O 10 20 30 40 50 60 70 80 90
0 10 20 30 40 50 60 70 80 90 100 110 120 ROTATIONAL ANGLE (, MEASUREDX AXIS FROM FREE SURFACE
Fig. 2.6. Portion of ORMGEN finite-element Fig. 2.7. Computed I distributions for V-8
discretization for V-8 surface crack. surface flaw (p = 68.9 MPa).
',
.__ _
10
2.2 BCL ESST Snoport Proaram*
A. R. Rosenfieldi A. J. Markworthi*
T. A. Bishopi C. W. MarschalliJ. Jungi P..N. Mincert
.
2.2.1 Introduction and summary
The objective of the BCL HSST Support Program is to provide analyti-cal and experimental research relevant to the fracture of steel cylinderssubjected to thermal shocks. Particular attention is focused on analyzingcrack initiation, propagation, and arrest using appropriate material prop-erty data. The program consists of three research tasks:
1. dynamic FM analyses,2. Iower-bound toughness determinations, and3. determination of fracture behavior of steel from TSE-6.
fIn the current period, Task 1 research included dynamic-mesh-conver-
sion studies and an initial run-arrest calculation for a full-scale vesselsubject to thermal shock to simulate a loss-of-coolant accident (LOCA).It was found that a finer mesh is required for dynamic convergence than isrequired for static convergence. However, because of computer-time consid-erstions, the second-finest mesh investigated in the static-mesh-conver-gence studies was used in the full-scale analysis. This latter calcula-tion resulted in a crack travel ~13% longer than obtained from a static -
,
analysis indicating that dynamic effects may play a role in large-vesceli
i fracture.Task 2 research included development of methods for estimating lower- .
bound toughness for crack initiation and arrest. Both phenomena require astatistical interpretation because of the large data scatter. In the caseof initiation, the scatter arises from variations in the amount of stable-crack growth prior to mode conversion to cleavage. The evidence gained inthis period continues to support a weak-spot hypothesis: cleavage is ini-tinted when the advancing stable crack encounters a trigger point.
Experiments involving the use of soft-loading systems are consistentwith such an analysis. It was found that increasing the load-train com-pliance (up to dead-weight loading) did not bias the cleavage-initiationdata to low values. It appears that the effects of specimen-to-specimenvariability overwhelm those due to machine compliance.
The variability in crack-arrest data has no such ready explanation asfor initiation. However, a straight-forward statistical analysis was de-veloped, which successfully uses the compact-specimen data generated atBCL to encompass the thermal shock experiment (TSE) data from ORNL. Theanalysis is an extension of the K - urve c n *Pt, which normalizes the
IR.
* Work sponsored. by HSST Program under UCC-ND Subcontract 85B-13876Cbetween UCC-ND and BCL. ,
IDattelle Columbus Laboratories, Columbus, Ohio.
1
_ _ _ . _ . _ . . . - _ . _ _ , _ _ _ . _ _ _ _ _ _ _ _ _ _ _ _ _ _- m__. _ _ . _ _
. _. . __ ._ . _ _ _ .
1
11
data to the measured crack-arrest toughness at the ductile-brittle transi-tion temperature.
*
Task 3 results show that the crack-arrest toughness, K ,, from theysteel being used in TSE-6 is quite close to that for the TSE-5 steel. Theagreement was improved by shifting the TSE-5 data to account for the dif-
,
forence in Charpy transition temperature between the two steels. The re-sulting prediction for TSE-6 is
K , (KPa.Vm) = 57.1 + 0.275T (*C) ,y
with a statistical spread of 115 KPa rds around the above regression line.
2.2.2 Task 1. Analysis of crack nrocamation and arrest,
Ansivsis amoroach for an LOCA-ECC dynamic-FM analysis. All previous
thermal-shock dynamic analyses have been for the TSE series of experi-monts. These were conducted using cylinders with relatively thick wallsin comparison with their radii. For example, the TSE-5 vessel had a wall-thickness-to-radius ratio, t/R, of 0.36; the TSE-4 vessel had a t/R ratio
of 0.75. In contrast, the ORNL pressurized-water reactor (PWR) referencei vessel' pcssesses a t/R ratio of 0.11. As the vessel wall-thickness-to-
radius ratio decreases, the vessel becomes more compliant. It would beexpected that the possibility of dynamic effects having a significant in-fluence on the fracture event would then increase.*
Because the thickness-to-radius ratio of the PWR reference vessel issmall, care must be taken to model the comp 31ance of the system correctly.Thus, as a prelude to the actual LOCA-Emersency Core Coolang (ECC) analy-*
sis, finite-element mesh-convergence studies were performed for (1) a
statically loaded, uncracked cylinder; (2) a statically loaded, crackedcylinder; and (3) a dynamically loaded, cracked vessel. Items (1) and (2)were completed and reported in a previous report.1' This progress reportcovers the work performed for item (3) and the actual LOCA-ECC analysis.
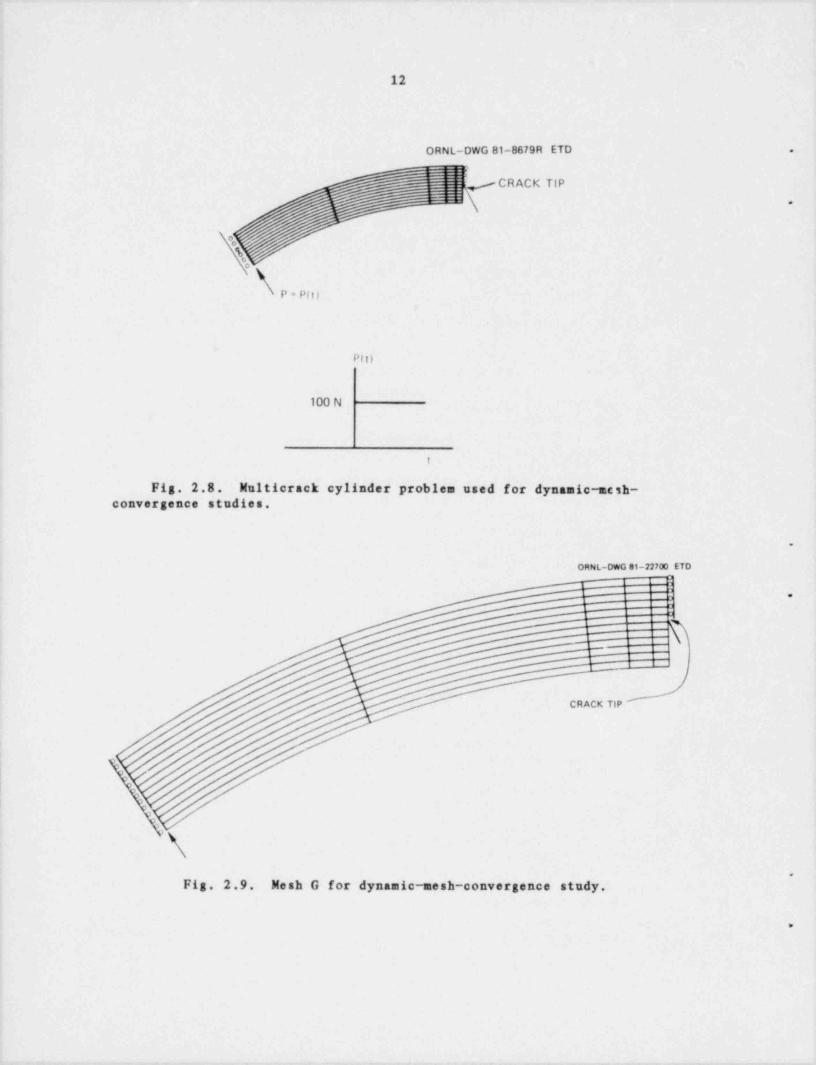
Mesh convermence for dynamic analysis. To study the adequacy of thefinite-element mesh to model dynamic loadings, a hypothetical multicrackcylinder was analyzed (Fig. 2.8). The advantage of using a multicrack
cylinder is that less time is required for stress waves from the loadpoint and boundary reflections to reach the crack tip than is the case forthe full cylinder.
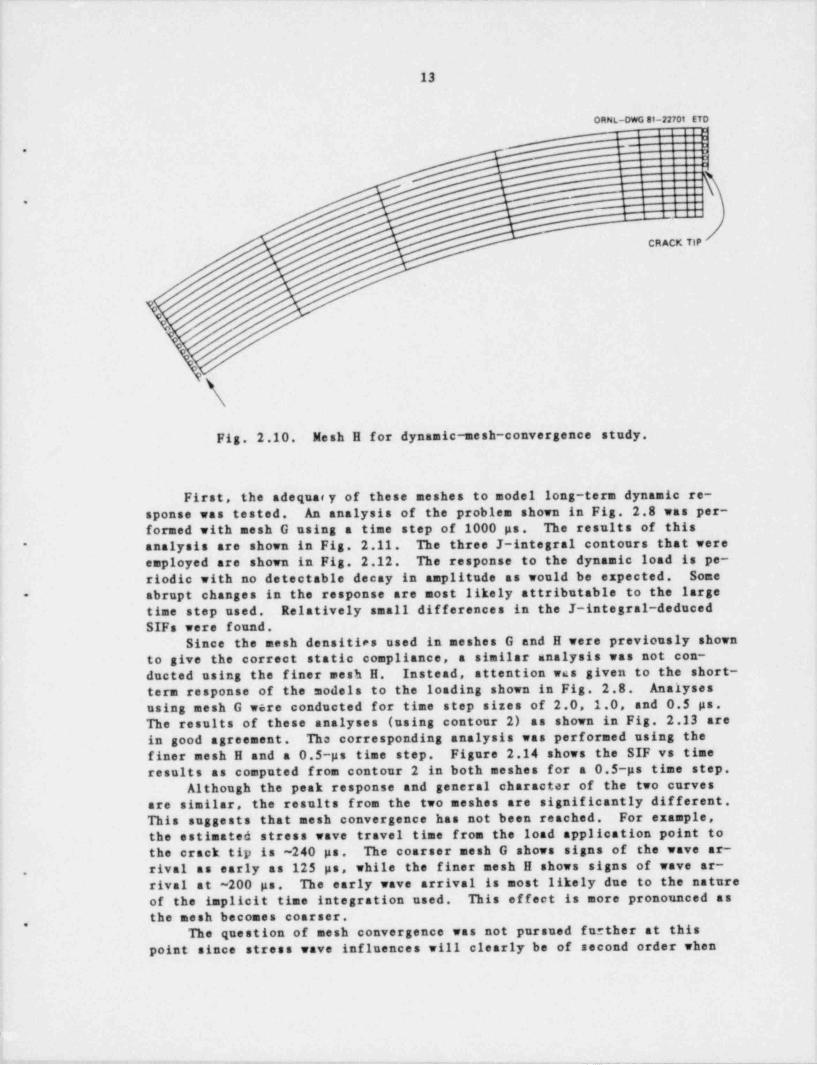
Two meshes were used for the study (Figs. 2.9 and 2.10) . The coarserof these two meshes, mesh G, was a 34.1-degree segment of mesh D used inthe static-convergence studies. This particular mesh density was selectedbecause it was from a mesh that showed convergence to the correct staticcompliance.2* This mesh was composed of 215 nodes and 60 eight-noded iso-parametric elements. Mesh H, Fig. 2.10, had twice as many elements (120)-
in the theta direction than mesh G and 405 nodes. Attention was focusedon these two meshes since these mesh densities, when extended to cover theentire vessel and used for an LOCA-dynamic analysis, will require computer
.
run times approaching practical limits for existing conventional computers,
l- - - - - - .. -- - - - - , . - _ . - - - - ._ . . . _ _ - - - - . - - - _ _ _ . _ _ _ _ _ _ _ - _
12
RNL-DWG 81-ag 9R ETO .
3r -_ ; -CRACK TIP
\a *
o, ,
\o
P . pg,,
P(t)
100 N
t
N '*Ck cy)g,4,* Proby,, used fOr dynang' Nesh.*
3*nce ag* dies,
.
***'%o et-ny,
?
'| .
'1'
~
-
JCRAcg7,,
$
s/'
>
.
Fig. 2.9. Mesh G for dynamic-mesh-convergence study.
.
. _ - . .
13
ORNL-DWG 81-22701 ETD
7 '1 !'
.3
.
I \.
!
CR ACK TIP
\,
\Fig. 2.10. Nesh H for dynamic-mesh-convergence study.
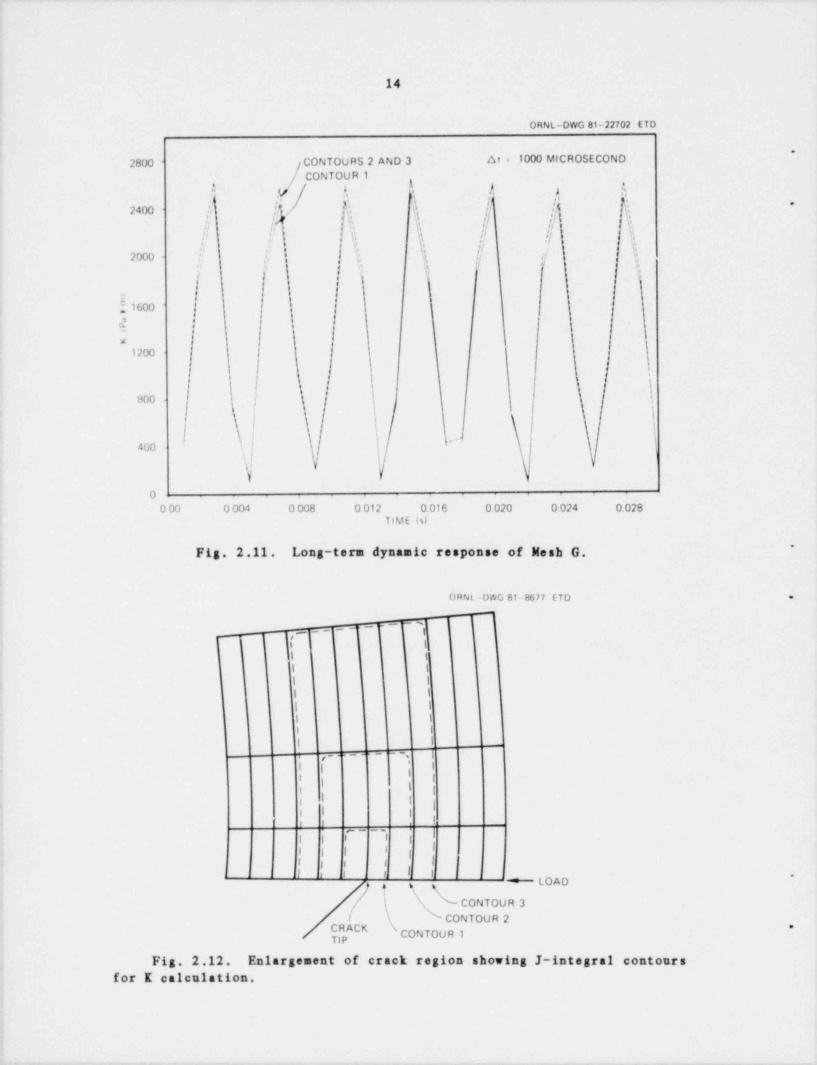
; First, the adequary of these meshes to model long-term dynamic re-sponse was tested. An analysis of the problem shown in Fig. 2.8 was per-formed with mesh G using a time step of 1000 ps. The results of this
analysis are shown in Fig. 2.11. The three J-integral contours that were-
employed are shown in Fig. 2.12. The response to the dynamic load is pe-riodic with no detectable decay in amplitude as would be expected. Some
abrupt changes in the response are most likely attributable to the large-
time step used. Relatively small differences in the J-integral-deducedSIFs were found.
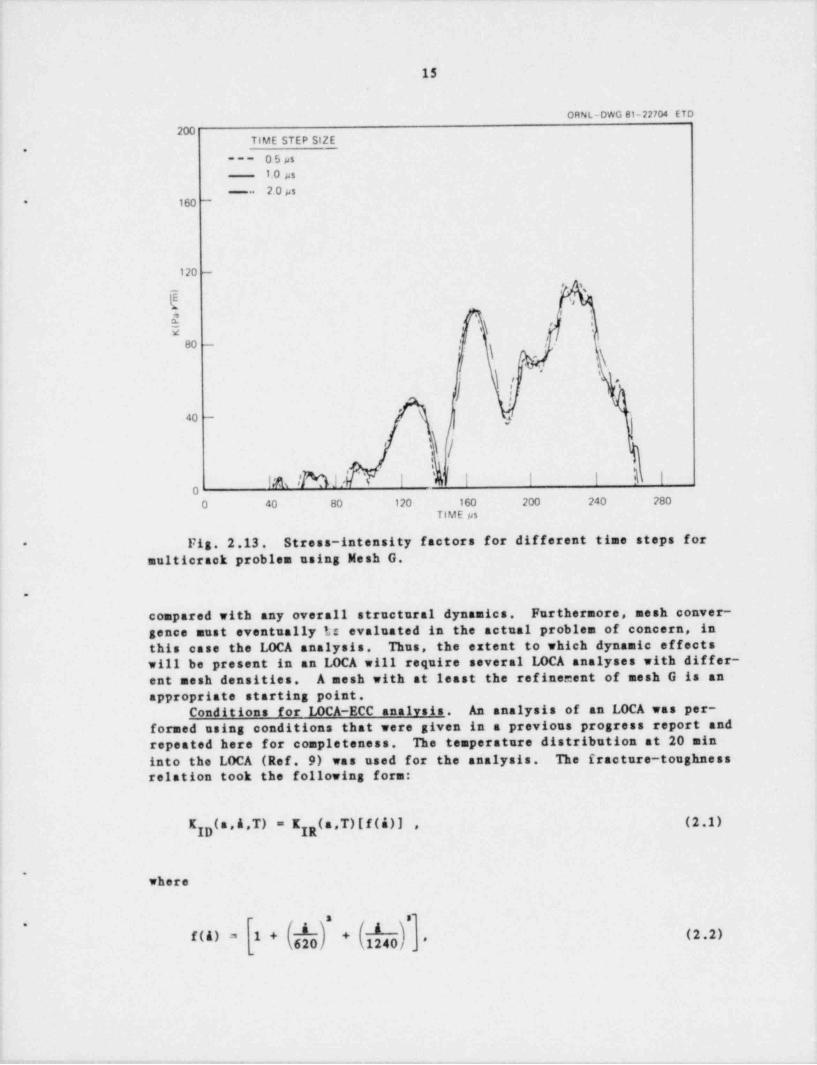
Since the mesh densities used in meshes G and H were previously shownto give the correct static compliance, a similar analysis was not con-ducted using the finer mesh H. Instead, attention was given to the short-
term response of the models to the loading shown in Fig. 2.8. Analysesusing mesh G were conducted for time step sizes of 2.0, 1.0, and 0.5 ps.The results of these analyses (using contour 2) as shown in Fig. 2.13 arein good agreement. The corresponding analysis was performed using thefiner mesh H and a 0.5 ps time step. Figure 2.14 shows the SIF vs timeresults as computed from contour 2 in both meshes for a 0.5 ps time step.
Although the peak response and general character of the two curvesare similar, the results from the two meshes are significantly different.This suggests that mesh convergence has not been reached. For example,the estimated stress wave travel time from the load application point to
the crack tip is ~240 ps. The coarser mesh G shows signs of the wave ar-
rival as early as 125 ps, while the finer mesh H shows signs of wave ar-.
rival at ~200 ps. The early wave arrival is most likely due to the natureof the implicit time integration used. This effect is more pronounced asthe mesh becomes coarser.
,
The question of mesh convergence was not pursued further at thispoint since stress wave influences will clearly be of second order when
t
I
. - - . - - , . . - - --_-__.- , - - - , - . , , . _ - - , . . . . , - _. - . _ . - _ _ _ _ _
14
ORNL-DWG 81-22702 ETD
*
CONTOURS 2 AND 3 at= 1000 MICROSECOND2800
/ CONTOUR 1. A , .-~s
|q.v e. . ,..
\ [ |{ %.i, 'f.-
24w\,f .I },
,|!!|| |, ii|| |{ e.: :, ; e s.
':. 'i b||
; i ,
I ; t (,( ;i
. < rh '
|y,
2000 | ||*
- | \ k
f[1600 |1 1
{ } Ia :; I {
I1200
i |'\sw ! \ ;
'
I \;
~l400 - I'
\l
00 00 0 004 0 008 0 012 0.016 0 020 0 024 0 028
TIME h)
*
Fig. 2.11. Long-term dynamic response of Mesh G.
ORNL-DWG 81 8677 fTD .
1 1___ --r ';
I I i |1 i
I 1
1 I
I i
1 I
I i
i i
l I
;, ,_ . _ . - --,
'
II (I
t |gI |t
| 1| !1 I |
8! !
~
II I i l |
I I I 3 I|
I I i | I
i 11 o c I, 1; ; ; * LOAD *
. g
CONTOUR 3
CONTOUR 2^ *
CONTOUR 1,p
Fig. 2.12. Enlargement of crack region showing J-integral contours
for K calculation.
._ .- _ _ - _ - _
15
ORNL-DWG 81-22704 ETD
200TIME STEP SIZE
.
0 5 ps---
1.0 us2.0 ps--
_
120 -
g ' ,JN
a
h '.\'
'
'!.80 - |.
\ - \,
J. |)' Q
'i,,
'
40 - j
,.
1 !N I ' i I fi I I k Ig
O 40 80 120 160 200 240 280TIME us
Fig. 2.13. Stress-intensity factors for different time steps for-
multicrack problem using Mesh G.
.
compared with any overall structural dynamics. Furthermore, mesh conver-gence must eventually L: evaluated in the actual problem of concern, inthis case the LOCA analysis. Thus, the extent to which dynamic effectswill be present in an LOCA will require several LOCA analyses with dif fer-ent mesh densities. A mesh with at least the refinement of mesh G is anappropriate starting point.
Conditions for LOCA-ECC analysis. An analysis of an LOCA was per-formed using conditions that were given in a previous progress report andrepeated here for completeness. The temperature distribution at 20 mininto the LOCA (Ref. 9) was used for the analysis. The fracture-toughnessrelation took the following form:
('" IR **KID *****
'
where
s :-
f(A) = 1+ + (2.2),
16
ORNL-DWG 81-22705 ETD
6t = 0 5 us ,
i
COARSE MESH il p
8lFINE MESH Ig e%---
| | 1 I *
I | 1 Ii Ii g
I I
200 - f,I g
i ,i l l
[E-0 | |g g g
Ii I
's$ 8 iji i _ _ . ,
I I f g
| | J I
100 - 3', a e i i'I | lts
8 'ti | '
It gi t, I/t is g a
gfi , s| 8
I e I flhft 1 13
.' '| '* ', (~. V./ li e i t tI L' I \
'L'''- ~''! i ! \I' '^ '
OO 100 200 300 400 500
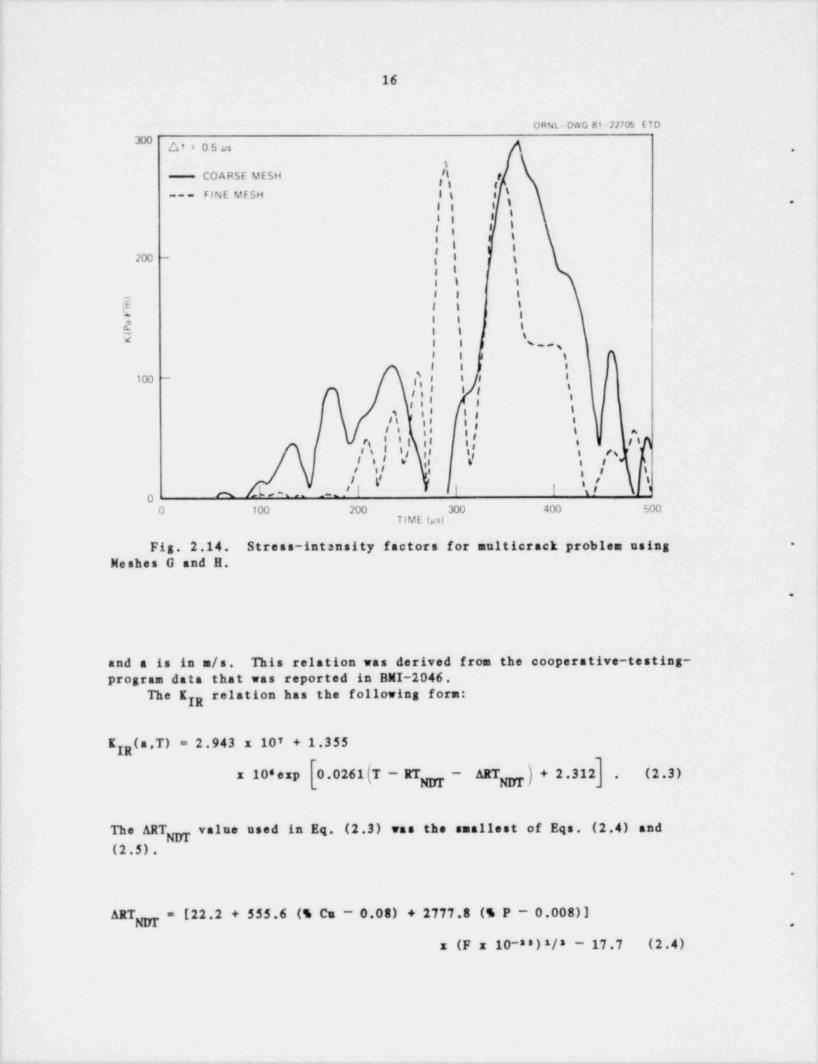
TIME fus)
Fig. 2.14. Stress-intsnsity factors for multicrack problem using -
Meshes G and H.
.
and a is in m/s. This relation was derived from the cooperative-testing-,
| program data that was reported in BMI-2046.The K relati n has the following form:
IR
!
' +KIR "' ' " * **
. -
x 10'exp 0.0261(T-RT - ARTa)+2.312_ (2.3).a
The ART value used in Eq. (2.3) was the smallest of Eqs. (2.4) andg(2.5).
.
ART = [22.2 + 555.6 (% Cu - 0.08) + 2777.8 (% P - 0.008)]g
x (F x 10-ss)s/s - 17.7 (2.4)
. - _ ._ _ __ _ _ . - . - . _ - - . _ .
_ - - _ _
17
or.
ART = 157.2 (F x 10-88)* 81H - 17.7 , (2.5)NUT
.
where F is fluenci'and is given by
p.p .-ss.esa ,
and
F = 4.0 x 1088 neutrons /a ,s
RT = -17.78'C,NUT
% Cu = 0.25,
% P = 0.012.
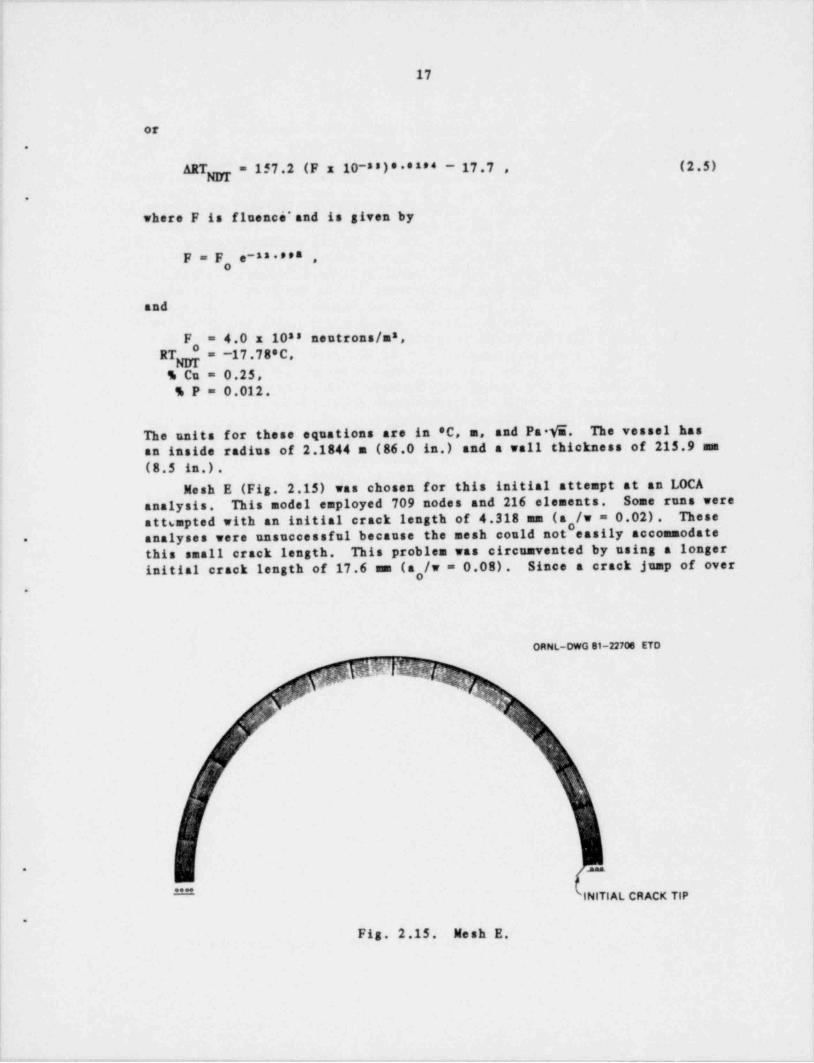
The units for these equations are in 'C, m, and Pa Va. The vessel hasan inside radius of 2.1844 m (86.0 in.) and a wall thickness of 215.9 mm(8.5 in.).
Mesh E (Fig. 2.15) was chosen for this initial attempt at an LOCAanalysis. This model employed 709 nodes and 216 elements. Some runs wereatt6mpted with an initial crack length of 4.318 mm (a,/w = 0.02). These
analyses were unsuccessful because the mesh could not easily accommodate-
this small crack length. This problem was circumvented by using a longerinitial crack length of 17.6 mm (a,/w = 0.08). Since a crack jump of over
.
ORNL-DWG 81-22706 ETD
W5?$& 1.eQ % y.'
|
-
INITIAL CRACK TIP
|'
Fig. 2.15. Nesh E.'
||
- _ - - -
!
18
100 mm was anticipated, this adjustment of initial conditions was not ex-pected to affect the determination of whether dynamic effects are present .
In the problem.After the adjustment of the laitial crack length, a successful dynamic
analysis was performed. A time step of 1.0 ps was used with a Newmark .
implicit integration scheme. In these computations the SIF was calculated
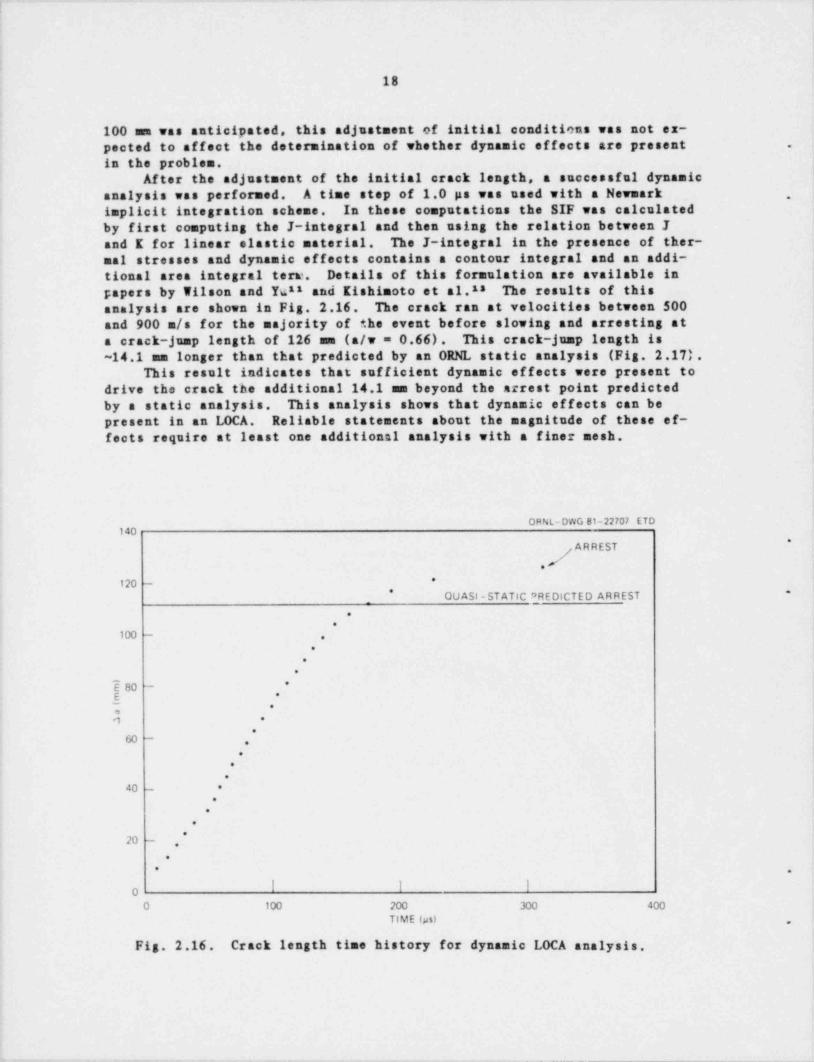
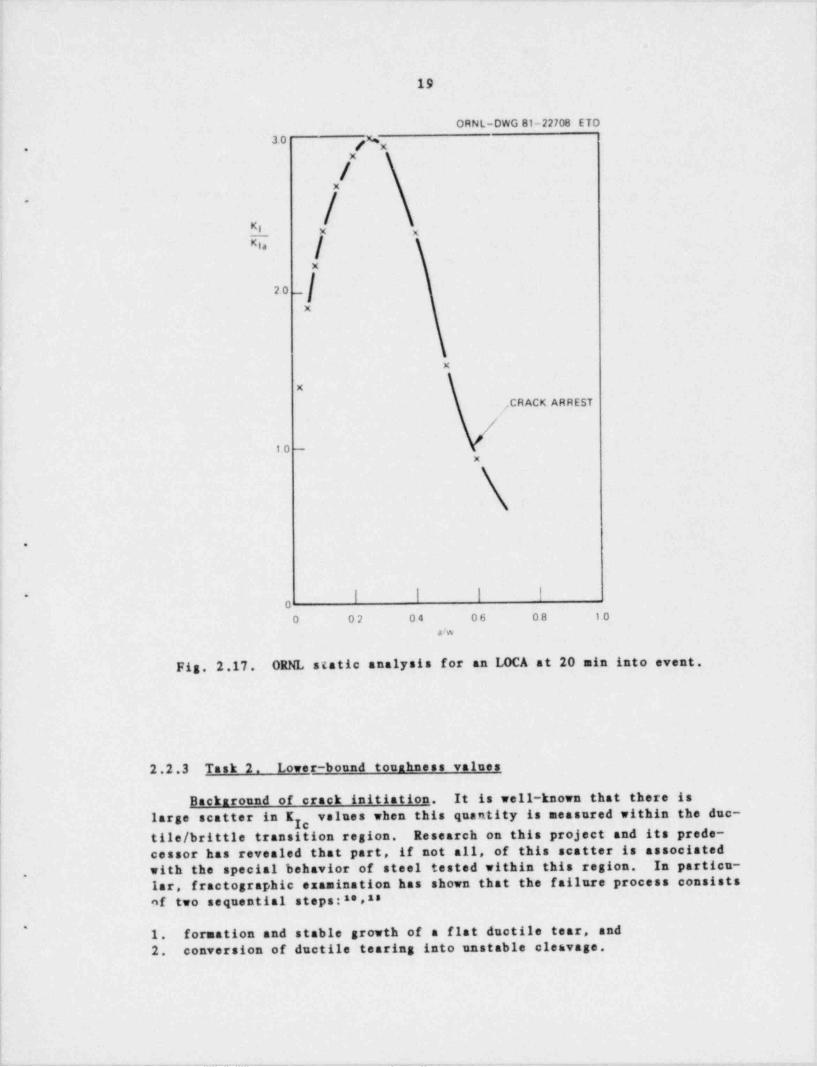
by first computing the J-integral and then using the relation between Jand K for linear elastic material. The J-integral in the presence of ther-mal stresses and dynamic effects contains a contour integral and an addi-tional area integral terr. Details of this formulation are available inpapers by Wilson and Yu11 and Kishimoto et al.ss The results of thisanalysis are shown in Fig. 2.16. The crack ran at velocities between 500and 900 m/s for the majority of the event before slowing and arresting ata crack-jump length of 126 mm (a/w = 0.66). This crack-jump length is~14.1 mm longer than that predicted by an ORNL static analysis (Fig. 2.17).
This result indicates that sufficient dynamic effects were present todrive the crack the additional 14.1 mm beyond the arrest point predictedby a static analysis. This analysis shows that dynamic effects can bepresent in an LOCA. Reliable statements about the magnitude of these ef-fects require at least one additional analysis with a finer mesh.
ORNL-DWG 81-22707 ETD140
*
A R R EST
120 -*
* *
OUASI-STATIC P_REDICTED ARREST.
.
100 -.
.
.
.
80 - ,'
; -
1 *
% ~.
.
.
.
40 - *
.
.
.
*
20 -
.
.
* .
! !O
O 100 200 300 400TIME (ps) ,
Fig. 2.16. Crack length time history for dynamic LOCA analysis.
- - - ._
_ __
_
I
19
ORNL-DWG 81-22708 ETO30 %/x.
X
/X
/~
X xKg,
X
20X
x
" xCRACK ARRESTp
10 -
X
.
I \ | \-
,
0 02 04 06 08 1.0
alw
Fig. 2.17. ORNL static analysis for an LOCA at 20 min into event.
I
2.2.3 Task 2. Lower-bound touahness values
Backaround of crack initiation. It is well-known that there islarge scatter in K values when this quantity is measured within the duc-
htile / brittle transition region. Research on this project and its prede-cessor has revealed that part, if not all, of this scatter is associatedwith the special behavior of steel tested within this region. In partica-
,
lar, fractographic examination has shown that the failure process consists18of two sequential steps:2*e
1. formation and stable growth of a flat ductile tear, and'
2. conversion of ductile tearing into unstable cleavage.
_ _ _ _ _ _ . . _ _ - . _ _ _ _ _ .__ . _ . . . - - . . _ _ . _ _ _ _ _ _ _ _ _ _.
20
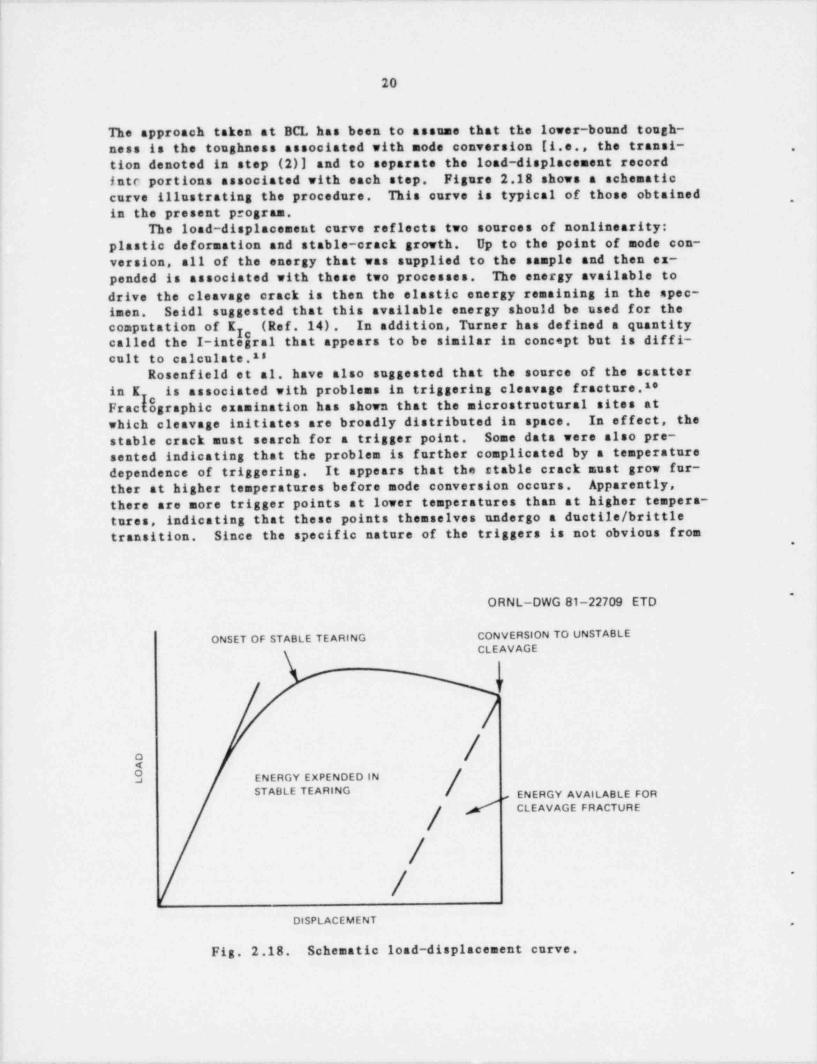
The approach taken at BCL has been to assume that the lower-bound tough-ness is the toughness associated with mode conversion (i.e., the transi- .
tion denoted in step (2)] and to separate the load-displacement recordinte portions associated with each step. Figure 2.18 shows a schematiccurve illustrating the procedure. This curve is typical of those obtained ,
in the present program.The load-displacement curve reflects two sources of nonlinearity:
plastic deformation and stable-crack growth. Up to the point of mode con-version, all of the energy that was supplied to the sample and then ex-pended is associated with these two processes. The energy available todrive the cleavage crack is then the elastic energy remaining in the spec-imen. Seid1 suggested that this available energy should be used for thecomputation of K , (Ref. 14). In addition, Turner has defined a quantityycalled the I-integral that appears to be similar in concept but is diffi-
cult to calculate.asRosenfield et al. have also suggested that the source of the scatter
in I is associated with problems in triggering cleavage fracture.1'Frackographicexaminationhasshownthatthemicrostructuralsitesatwhich cleavage initiates are broadly distributed in space. In effect, thestable crack must search for a trigger point. Some data were also pre-sented indicating that the problem is further complicated by a temperaturedependence of triggering. It appears that the stable crack must grow fur-ther at higher temperatures before mode conversion occurs. Apparently,there are more trigger points at lower temperatures than at higher tempera-tures, indicating that these points themselves undergo a ductile / brittletransition. Since the specific nature of the triggers is not obvious from
.
~
ORNL-DWG 81-22709 ETD
ONSET OF STABLE TEARING CONVERSION TO UNSTABLECLEAVAGE
V
/n<
[3 ENERGY EXPENDED INSTABLE TEARING / ENERGY AVAILABLE FOR
[, CLEAVAGE FRACTURE
//
~
DISPLACEMENT ,
Fig. 2.18. Schematic load-displacement curve.
-_ __. - _ _ . _ _ _ _ - .
21
'
fractography, further insight into the laws covering their behavior is notavailable.,
An important naresolved question is the effect of machine stiffnesson mode conversion. Is triggering facilitated in a soft machine with itsattenient higher displacement rates beyond maximum load? A partial nega-
~
tive answer to this question was obtained in experiments where a largehoop was inserted in series with the specimen.1' The hoop was designed tominimize both stiffness and mass. Despite this, there was an apparenttendency for larger lengths of dactile crack growth prior to instability,and no strong indication of lower toughness levels was associated withmode conversion. Research in the past quarter involved an even sof ter-
'
loading system and confirmed the results obtained using the hoop.Constraction of a dead-load machine. While the hoop provides a means
of greatly increasing the load train, it still does not provide for per-fact softness. Calenlations in the previous report suggest that both themass and stiffness of the hoop are on the order of those for a hydraulicsystem.1* Therefore any improvements that can be made would involveeither pnenmatic loading or dead-weight loading. Because of safety con-siderations, dead-weight loading was chosen.
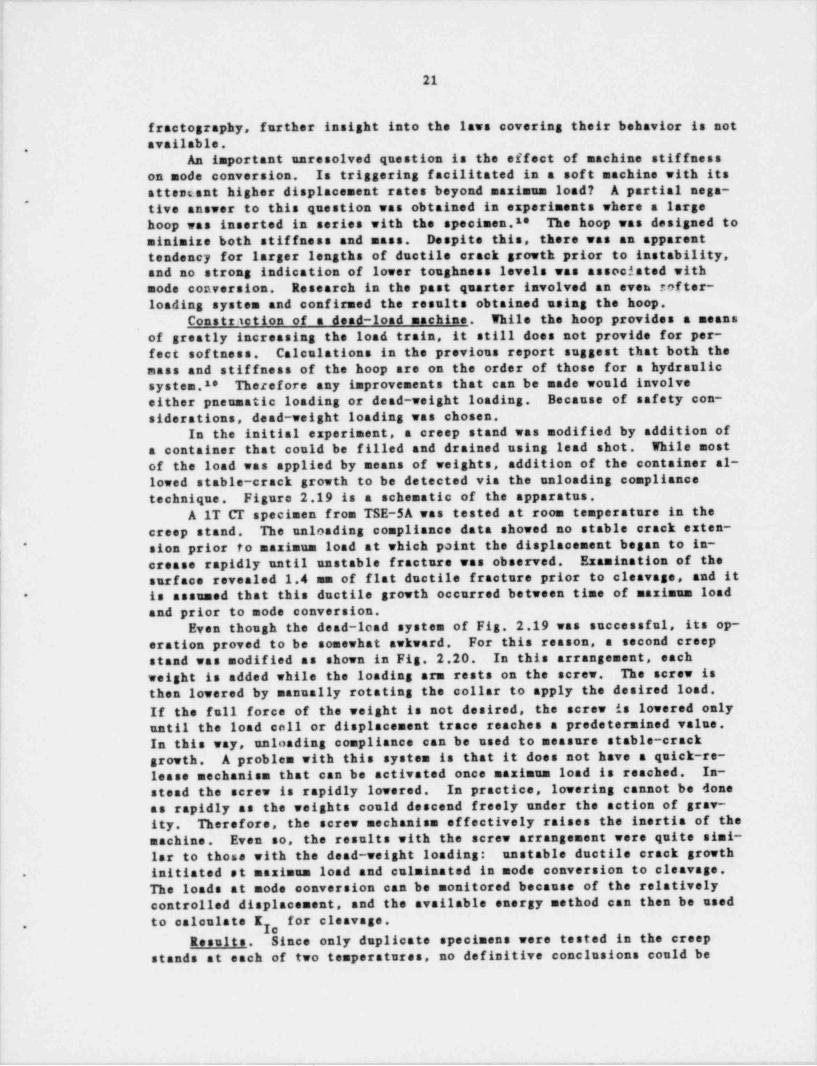
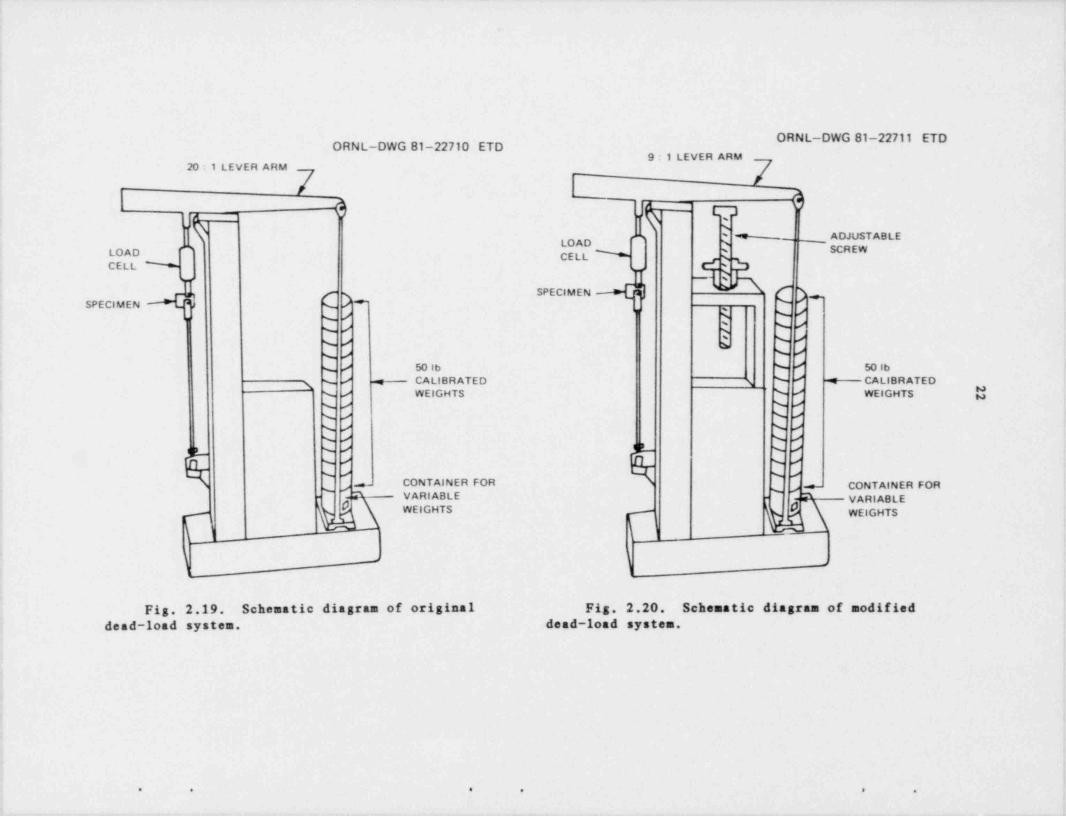
In the initial experiment, a creep stand was modified by addition ofa container that could be filled and drained using lead shot. While mostof the load was applied by means of weights, addition of the container al-lowed stable-crack growth to be detected via the unloading compliancetechnique. Figure 2.19 is a schematic of the apparatus.
|A IT CT specimen from TSE-5A was tested at room temperature in the
,
creep stand. The unloading compliance data showed no stable crack exten-i
sion prior to maximum load at which paint the displacement began to in-*
crease rapidly natil anstable fracture was observed. Examination of thesurface revealed 1.4 mm of flat ductile fracture prior to cleavage, and itis assumed that this ductile growth occurred between time of maximum load-
and prior to modo conversion.Even though the dead-1 cad system of Fig. 2.19 was successful, its op-
erstion proved to be somewhat awkward. For this reason, a second creepstand was modified as shown in Fig. 2.20. In this arrangement, each
weight is added while the loading arm rests on the screw. The screw isthen lowered by manually rotating the collar to apply the desired load.If the in11 force of the weight is not desired, the screw is lowered onlynatil the load en11 or displacement trace reaches a predetermined value.In this way, unloading compliance can be used to measure stable-crackgrowth. A problem with this system is that it does not have a quick-re-lease mechanism that can be activated once maximum load is reached. In-
|stead the screw is rapidly lowered. In practice, lowering cannot be doneas rapidly as the weights could descend freely under the action of grav-ity. Therefore, the screw mechanism effectively raises the inertia of themachine. Even so, the results with the screw arrangement were quite sini-
| lar to those with the dead-weight loading: unstable ductile crack growthInitiated et maximum load and culminated in mode conversion to cleavage..
The loads at mode conversion can be monitored because of the relatively| controlled displacement, and the available energy method can then be used
to calculate E , for cleavage.g,
Results. Since only duplicate specimens were tested in the creepstands at each of two temperatures, no definitive concInsions conid be
- - . - - - - . . _ - . - . _ . _ . - -- . , _ _ _ _ _ _ _ _ - - .__ - _ - _ , -. _.
. - _ _ _ _ _ _ _ _ _ _ _ _ _ _ _ _ _ _ _ _ _ _ _ _ - _ _ _ _ _ _ _ _ _ _ _ _ _ _ _ _ _ _ _ _ _ _ _ _ _ _ _ _ - _ _ _ _ _ _ _ - _ _ _ _ _ _ _
ORNL-DWG 81-22711 ETDORNL-DWG 81-22710 ETD
g20 : 1 LEVER ARM
B3 1.
Uk- 9- o
Rq __ ADJUSTABLEm,
'
LOAD CELL % $CELL % '
%,
,
g SPECIMEN !) ( ).*SPECIMEN / % j| % |
r y y% # 2 s ,% / k% d ,
% / 50lb % d 50lb% d% / e CAllBRATED N e CAllBRATED
% / WEIGHTS % ) WElGHTS p% / % #
% / d
% / % d% / % d
q p % d ' '- % d_
--
% d % d
% J % dCONTAINER FOR - CONTAINER FOR--j j
_? VARIABLE - - ? VARIABLE-
h WEIGHTS WEtGHTS
y \-
-
Fig. 2.19. Schematic diagram of original Fig. 2.20. Schematic diagram of modifieddead-load system. dead-load system.
. . . . . .
23
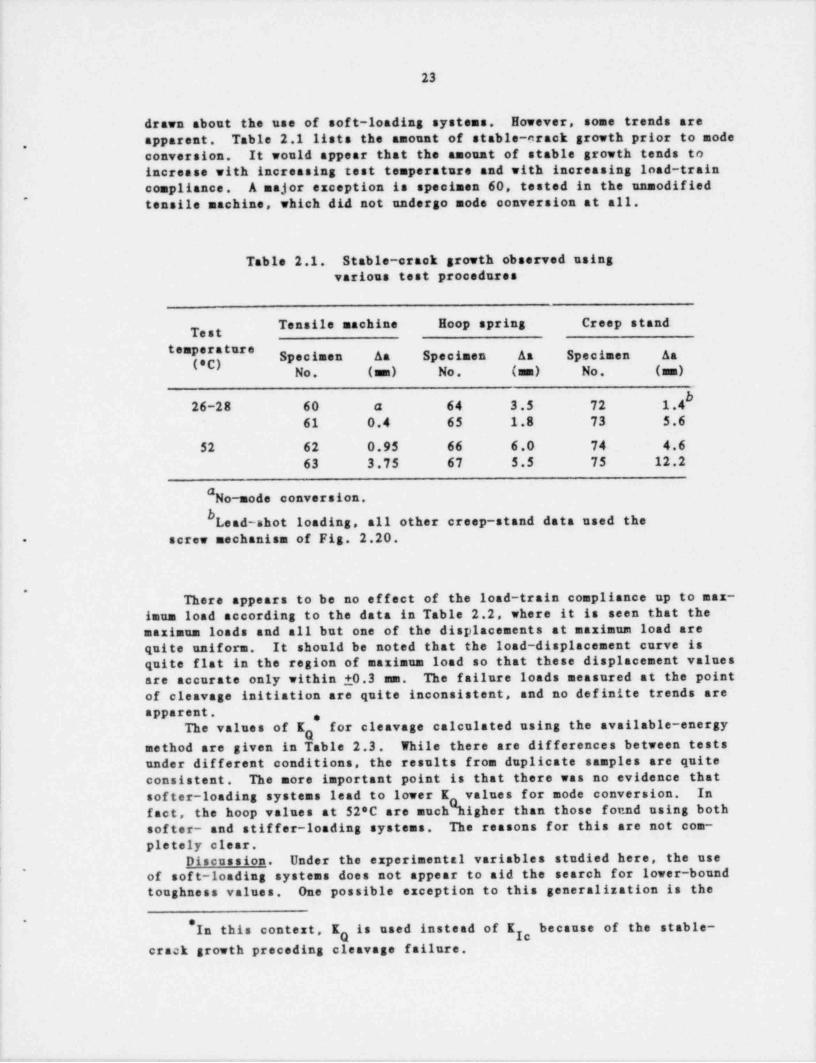
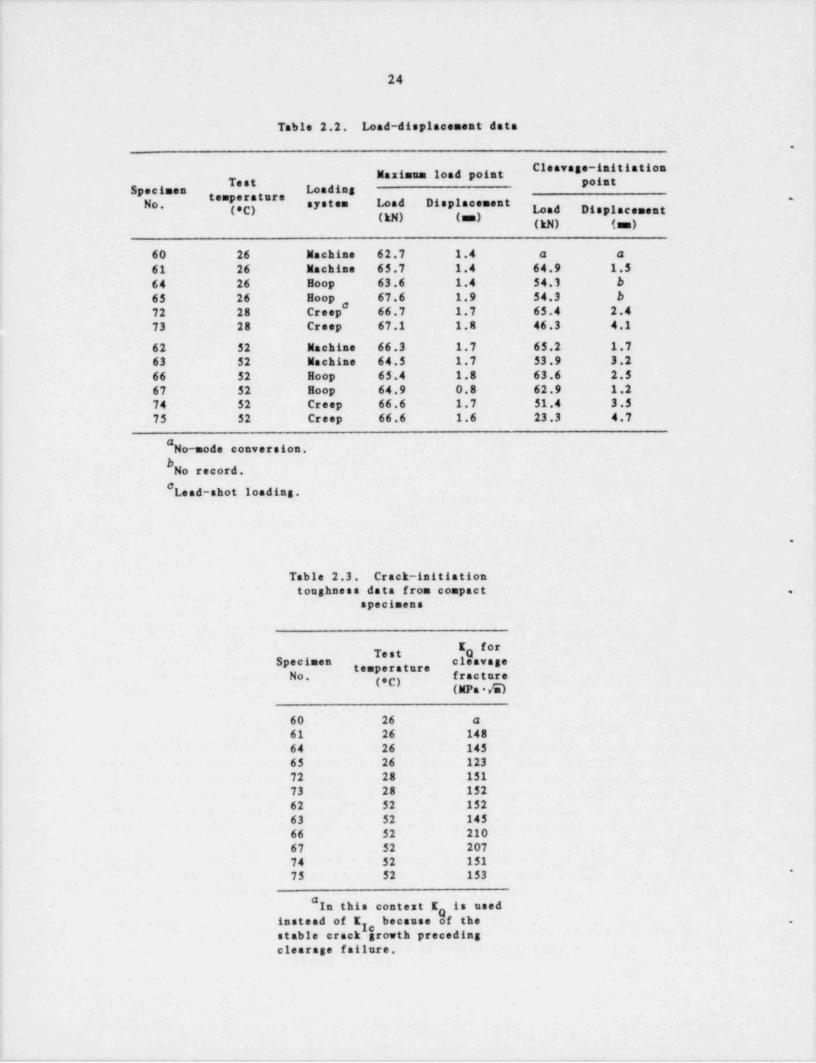
drawn about the use of soft-loading systems. However, some trends areapparent. Table 2.1 lists the amount of stable-crack growth prior to mode
oconversion. It would appear that the amount of stable growth tends toincrease with increasing test temperature and with increasing load-traincompliance. A major exception is specimen 60, tested in the unmodifiedtensile machine, which did not undergo modo conversion at all.
~
Table 2.1. Stable-crack growth observed usingvarious test procedures
Tensile machine Hoop spring Creep standTest
**{*[*"#* Specimen Aa Specimen As Specimen AsNo. (mm) No. (mm) No. (mm)
b26-28 60 a 64 3.5 72 1.4
61 0.4 65 1.8 73 5.6
52 62 0.95 66 6.0 74 4.663 3.75 67 5.5 75 12.2
"No-mode conversion,bLead-shot loading, all other creep-stand data used the
screw mechanism of Fig. 2.20.o
.
There appears to be no effect of the load-train compliance up to max-inum load according to the data in Table 2.2, where it is seen that themaximum loads and all but one of the displacements at maximum load arequite uniform. It should be noted that the load-displacement curve is
quite flat in the region of maximum load so that these displacement valuesare accurate only within 10.3 mm. The failure loads measured at the point
of cleavage initiation are quite inconsistent, and no definite trends areapparent. ,
The values of I for cleavage calculated using the available-energyqmethod are given in Table 2.3. While there are differences between testsunder different conditions, the results from duplicate samples are quiteconsistent. The more important point is that there was no evidence thatsofter-loading systems lead to lower I values for mode conversion. In
fact, the hoop values at 52*C are much igher than those found using bothsofter- and stiffer-loading systems. The reasons for this are not com-pletely clear.
Discussion. Under the experimental variables studied here, the use,
, of soft-loading systems does not appear to aid the search for lower-bound'
toughness values. One possible exception to this generalization is the
,In this context, K is used instead of K because of the stable-.
g 7crack growth preceding cleavage failure.
24
Table 2.2. Load-displacement data
.
Cleavase-initiationMaximan load point''' point
Specimen Loading
***{|****#* system Load DisplacementNo. Load Displacement(kN) (mm)
60 26 Machine 62.7 1.4 a a61 26 Machine 65.7 1.4 64.9 1.564 26 Hoop 63.6 1.4 54.3 b65 26 Hoop # 67.6 1.9 54.3 b72 28 Creep 66.7 1.7 65.4 2.473 28 Creep 67.1 1.8 46.3 4.1
62 52 Machine 66.3 1.7 65.2 1.763 52 Machine 64.5 1.7 53.9 3.266 52 Hoop 65.4 1.8 63.6 2.567 52 Hoop 64.9 0.8 62.9 1.274 52 Creep 66.6 1.7 51.4 3.575 52 Creep 66.6 1.6 23.3 4.7
"No-mode conversion,bNo record.#Lead-shot loading.
.
Table 2.3. Crack-initiationtoughness data from compact .
specimens
##Test Q
Specimen *I''''8'temperatureNo. fracture(*C) (MPa /m)
60 26 a61 26 14864 26 14565 26 12372 28 15173 28 15262 52 15263 52 14566 52 21067 52 20774 52 151
*
75 52 153
"In this context K is usedginstead of K because of the .
stable crack growth precedingclearage failure.
25
observation of no-mode conversion in a sample loaded in the tensile ma-chine at room temperature; all other samples, including the duplicate of.
the no-mode conversion one, did eventually fall by unstable cleavage.Furthermore, there was no evidence that decreased load-train stiff-
ness leads to lower K values. Evan though this result is based on theg,
available-energy analysis, the same judgment would follow from the equiva-lent-energy analysis,18 since there was no systematic variation of maximum
load and displacement with load-train compliance. However, it is not tobe expected that the equivalent-energy method would give insight into modeconversion since the unloading compliance data show that its measurementpoir+ (i.e., maximum load) only reflects the plasticity and stable-crackgrowt/ trocursors to mode conversion.
The observations made here are consistent with the trigger-point ex-planation discussed earlier. According to this explanation, mode conver-sion occurs when the growing ductile crack encounters a trigger point. Itis also reasonable to assume that there must be a sufficiently high stressintensity to cause triggering. It follows from these two conditions thatany advantage of a compliant load train would be confined to the regionbeyond maximum load and would be reflected in a higher load when the duc-tile crack encounters the trigger. Therefore, compliant load trains mightbe more likely to lead to mode conversion than would stiff load trains.However, triggers seem to be sufficiently widely dispersed at the tempera-tures used in this research that the specimen-to-specimen variabilityoverwhelms the load-train effect. In other words, when the ductile crackencounters the trigger point, the stress intensity may be much larger thanthe minimum to cause cleavage. Viewed in this light, controlled unload-
,
ing, such as obtained with an unmodified machine, may be useful for deter-mining lower-bound toughness values. The reason is that the load at modeconversion can be less than would be attained in the same specimen tested
~
in a softer machine.While this discussion is somewhat speculative, there are some guide-
lines for lower-bound cleavage-fracture-toughness determination:
1. The extent of stable crack growth in the sampic should be minimized.2. The contribution of stable growth to the measured load-displacement
curve should be factored out.
Based on these criteria, the available-energy method appears to bethe best current approach. Further details concerning its application andmore extensive experimental evidence are required before an exact procc-
| dure is formulated.
| Backaround of crack arrest. The current method of assessing lower-' ' ""#** * *** ** "*~bound K , values employs the KIR *"##**
7tile / brittle transition temperature, a fixed value of K , at that tempera-7
ture, and an explicit temperature dependence of K ,. When the K ****7 IR
- was developed, it was an actual lower bound in that no data fell below it.However, in the intervening years, several hundred crack-arrest data
| 'points have been generated, about 1% of which f all below the K "#***IRThis result suggests that lower-bound toughness must be defined in a sta-.
tistical sense. In contrast, if K s efined in a deterministic sense,IR
l
|
I,
_
26
it will have to be continually decreased as new low data points are re-
ported. While the deterministic approach to K is appealing from a .
safety viewpoint, it places inordinate importak!eondatathatmighthavebeen generated or reported incorrectly. The statistical approach to lower-bound toughness advocated by Roenfield et al.18 is based on a current Air ,
Force procedure (MIL-HDBK-SC, Ref.19) . This procedure requires determi-nation of the point for which there is 95% confidence that some fractionof all specimens will not fail. The point f or a 99% survival probabilityis called the "A-Allowable" and lies about 2.75 standard deviations belowthe mean, while the 90% poiat is called the "B-Allowable" and lies about1.5 standard deviations below the mean. Based on the BCL data bank, the
"##* '** * * *" * ^~ "" ~ ** ***KIR * Variability within a sinale heat. In evaluating the allowables, it
is important to know the shape of the distribution curve. This can bedone with the aid of the Cooperative Test Program (CTP) Data.8' Accord-
ingly, the chi-square test was applied to the CTP data for ASTM- A533 Btested at both room temperature and 0*C. The result, as shown by the cal-
culations in Appendix A, was that both data sets can be considered Gauss-lan. The standard deviations for these two data sets, as well as for theSAE 1018 tested on the CTP, were all close to 13 MPa.ym, which can be con-
sidered a provisional value for all steels.Hea t-t o-heat variability. A major problem in a sse s sing hea t-to-hea t
variability within the ductile / brittle transition range is choosing anappropriate reference temperature. It is not clear that any of the con-ventional definitions of ductile-brittle transition temperature have rele-vance to crack arrest, since the Charpy- and NUT geometries have less con-
*
straint than the compact-crack-arrest specimen. However, Charpy specimensin particular will continue to be used to specify transition temperaturebecause their small size makes them suitable for surveillance capsules.
Values of K , measured at BCL vere analyzed to assess heat-to-heat-
yvariability. Within the constraint of using standard transition tempera-ture definitions, only those heats were included for which all potential
(i.e., NDT, RT CV30, and CV50).transition temperatures were availablevstemperaturedatawerefittedbylinearreg!S[s,iontodetermineThe K Itheir *alues at the various transition temperatures. Table 2.4 is a sus-
mary of the calculation. Several important points emerge:
1. The heat-to-heat variability of base plate does not depend on thechoice of transition temperature as evidenced by the relative con-stancy of the standard deviations.
2. None of the transition temperatures appear to be clearly superior to
any other. In particular, use of CV30 and RT Produces essentiallyNDT
the same result.3. Because of the limited amount of weldment data and the large differ-
ence s be tween the two weldments, no firm conclusions can be drawnabout the relative behavior of base plate and welds. However, since alower-bound criterion relevant to both base plates and weldments is -
desired, the combined distributions in the last row of Table 2.4should be used for further estimates.
.
The material-to-material variability can also be described by Gauss-inn curves as shown in Fig. 2.21 for the data referenced to RT and
NUT
. . _ _
27
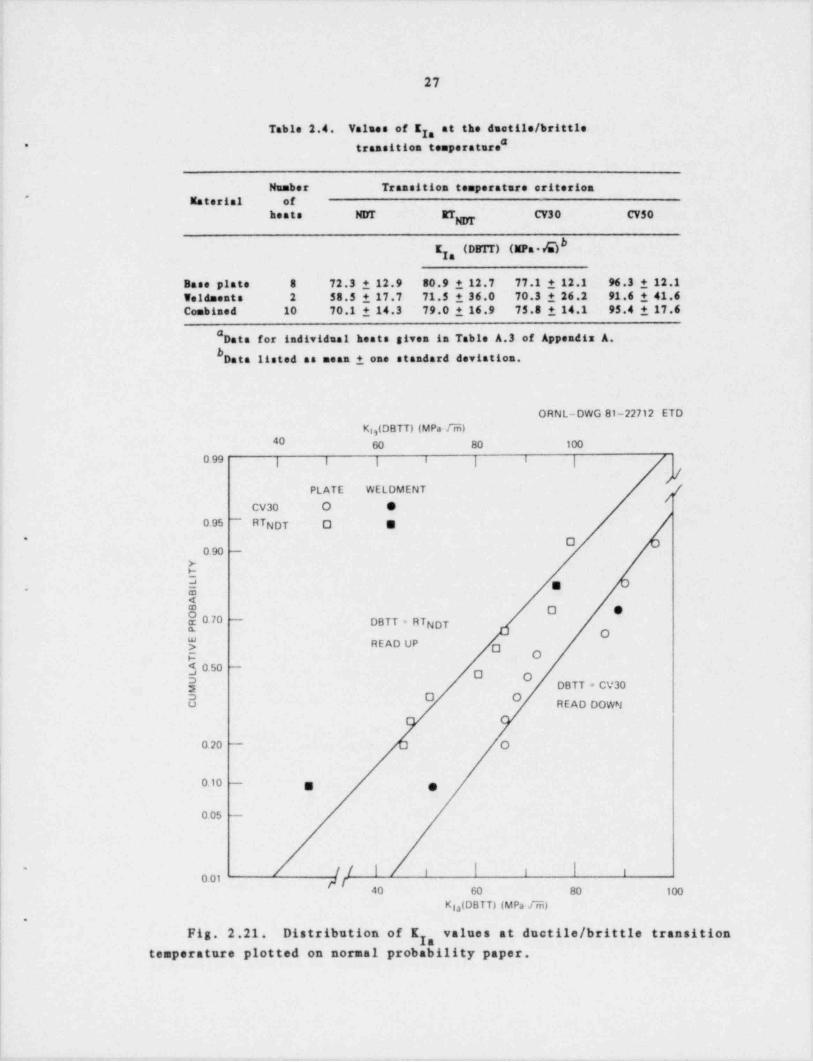
Yalses of E , at the doetile/ brittleTable 2.4. g
transition temperature"*
Number Transition temperature criterion*
Material of
heate NIrr RT CV30 CV50g
K , (DFIT) (MPa vi)g
Base plate 8 72.3 1 12.9 80.9 1 12.7 77.1 1 12.1 96.3 1 12.1Weldments 2 58.5 1 17.7 71.5 1 36.0 70.3 1 26.2 91.6 1 41.6Combined 10 70.1 1 14.3 79.0 1 16.9 75.8 1 14.1 95.4 1 17.6
#Data for individual heats given in Table A.3 of Appendix A.
Data listed as mesa 1 one standard deviation.
ORN L-DWG 81-22712 ETDK ,(DBTT) (MPa 5)i
40 60 80 100
0.99 | | | i|
I |
)|PLATE WELDMENT /#
cv30 o e0.95 ~ RTNDT C E
' D0.90 -
b_. g a
<t
8 .70 -
DBTT=RTNDTo e
0o
$ READ UP ga o$ 0.50
-
O$ DBTT - cv30
b READ DOWN
0.20 - O
I
( 0.10 - g g
0 05 -'
// I i ! ! |'1
0 01 g740 60 80 100
Kla(DBTT) (MPa.G).
Fig. 2.21. Distribution of E , values at ductile / brittle transition7temperature plotted on normal probability paper.I
28
CV30. An interesting point derived from this figure is that there is a 1%
probability that any plate or weldsent will have a mean K , value on they ,
order of 40 MPa.fm at its reference ductile / brittle transition temperatureregardless of whether RT or CV30 is used as the reference. For compari-
* * '"# ** * ***** *I " * * **son, K '" ** *
IRby Rosenfield et al.,18 that the K utve represents a saan ht UniteIR
failure probability.Combined variability. If materials from many sources are analyzed
as if they were all from the same population, the analysis becomes more'
complicated. It has been shown previously that the BCL data bank can bedescribed by equations of the following form:
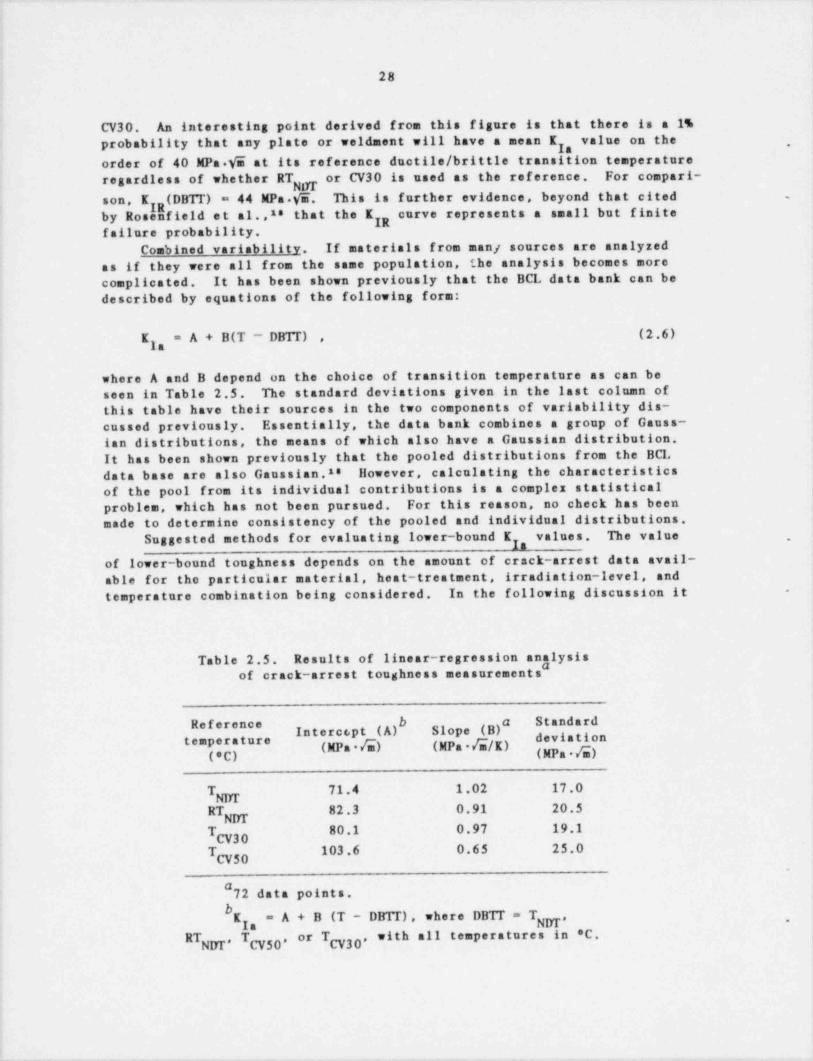
(2.6)K , = A + B(T - DBTT) ,g
where A and B depend on the choice of transition temperature as can beseen in Table 2.5. The standard deviations given in the last column ofthis table have their sources in the two components of variability dis-
cussed previously. Essentially, the data bank combines a group of Gauss-inn distributions, the means of which also have a Gaussian distribution.It has been shown previously that the pooled distributions from the BCLdata base are also Gaussian.se However, calculating the characteristicsof the pool from its individual contributions is a complex statisticalproblem, which has not been pursued. For this reason, no check has beenmade to determine consistency of the pooled and individual distributions.
Suggested methods for evaluating lower-bound K , values. The value ,
7
of lower-bound toughness depends on the amount of crack-arrest data avail-able for the particular material, heat-treatment, irradiation-level, andtemperature combination being considered. In the following discussion it -
,
of crack-arrest toughness measurements" ysisResults of linear-regression analTable 2.5.
Intercept (A) Slope (B)" *" *** '#*" *
* *'"temperature (MPa 6) (MPa 6/K)(*C) (MPa 6)
T 71.4 1.02 17.0gRT 82.3 0.91 20.5
NIYrT 0.1 0.M 19.1
CV30T 103.6 0.65 25.0
CV50.
#72 data points,
bK , = A + B (T - DBTT) , where DBTT = TNIYr * -g
RTg,TCV50' CV30, with all temperatures in 'C.#
_. _ - . _ _ ._ . . _ _ _ , , _ _ . _ . - - _ . . - . , _ _ . . , ___ _ _ , .
29
is assumed that one or more of the previously discussed transition ten-
peratures are known.Case 1. If there are no independently determined crack-arrest data,*
the K curve provides a lower-bound toughness about as conservative asIR
that calculated using aerospace standards. However, it is important to- note that the data base on which this statement rests does not extend
above (DBTT + 65'C) so that the degree of conservatism in KIR * I '#
temperatures is not known.Case 2. If there are crack-arrest data at the temperature of inter-
est, the lower-bound toughness can be derived from MIL-HDBK-5C (Ref.19)and set at 1.5 standard deviations (lon failure probability with 95% con-fidence) or 2.75 standard deviations (1% failure probability with 95% con-
fidence) below the measured mean of K ,. Taking this value (13 KPa. gad asythe representative value of standard deviation independent of temperature,the resulting lower bounds are 20 and 35 MPa.Yai, respectively, below themean.
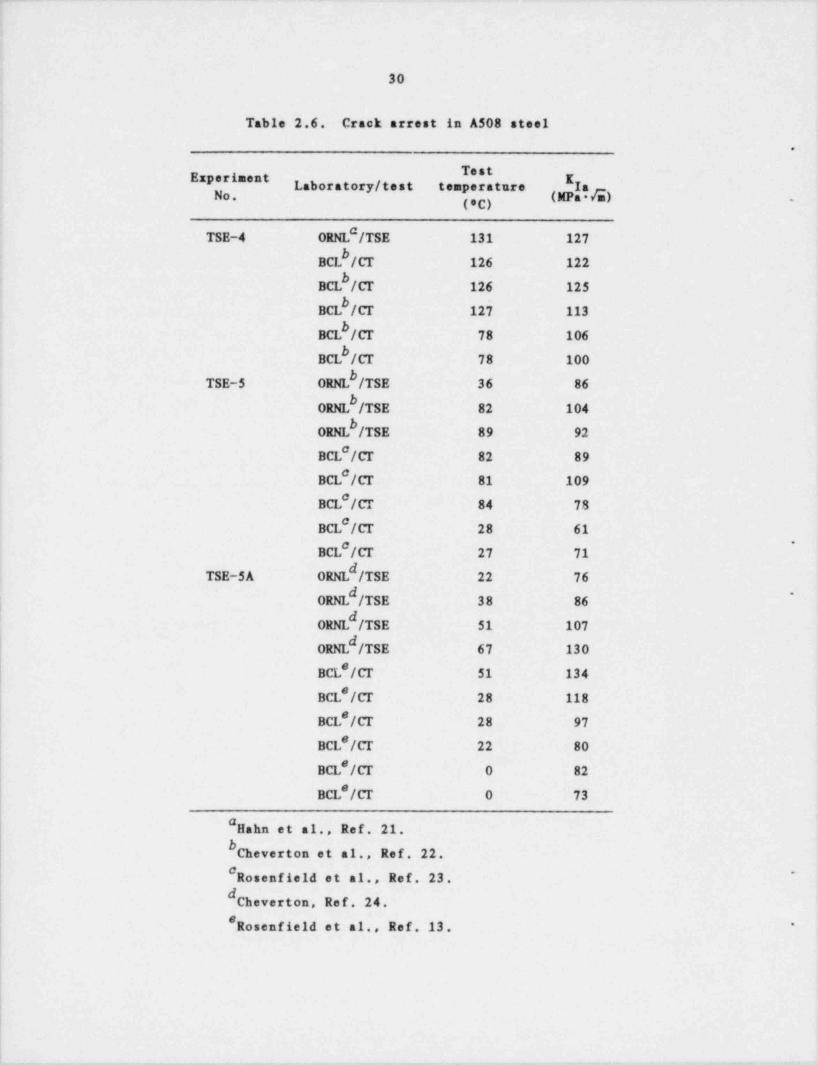
Case 3. If the available crack-arrest data were not determined atthe temperature of interest, a reference equation is required. Since theremainder of this section describes the application of BCL generated E ,gvalues to the ORNL TSEs, an equation appropriate to the steels in thosevessels has been developed. Both the BCL and ORNL data are summarized inTable 2.6 (Ref s.13 and 21-24) . Based on previous experience,se a linearrelation was judged adequate over the temperature range of interest, andthe BCL data were found to fit the relation
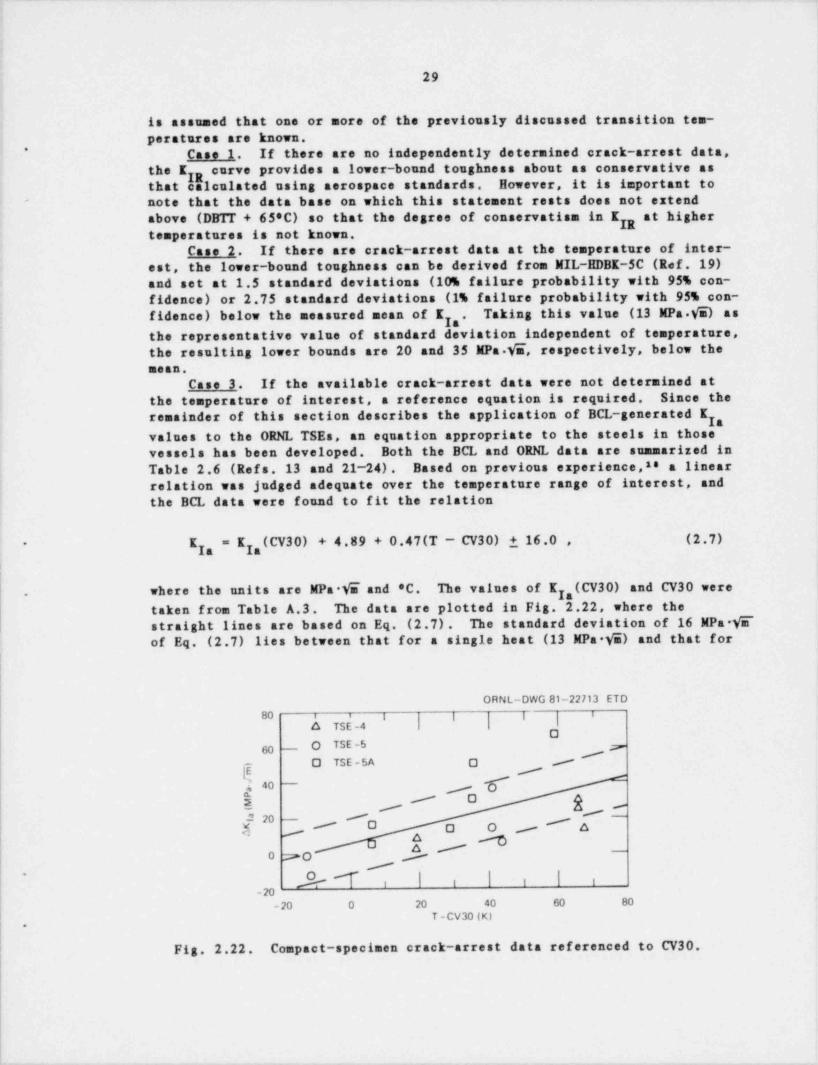
K , = K , ( CV3 0) + 4.89 + 0.47(T - CV30) i 16.0 , (2.7)-y g
. where the units are KPa V~ and 'C. The values of E ,(CV30) and CV30 wereg
taken from Table A.3. The data are plotted in Fig. 2.22, where thestraight lines are based on Eq. (2.7) . The standard deviation of 16 MPa*VE"of Eq. (2.7) lies between that for a single heat (13 MPa VE) and that for
|
l
,
ORNL-DWG 81-22713 ETD80 i i i i | 1 | 1 i
a TSE -4 i i iO
60 -- O TSE-5 7
- O TSE - 5A O /
[k AO~ sWE p
' U $E - -
f20 ,,,,,,#OO O ~~~''' o
k'0 2O -
___
/
Oi | | !t | 1 t-m
-20 0 20 40 60 80
T - CV30 (K).
Fig. 2.22. Compact-specimen crack-arrest data referenced to CV30.
30
Table 2.6. Crack arrest in A508 steel
.
* **" Laboratory / test tem ature la
('C) _
#TSE-4 ORNI /TSE 131 127
BCL /W 126 122
BCbW 126 125
BCL /CT 127 113
BCbCT 78 106
BCL /CT 78 100
TSE-5 ORNL /TSE 36 86
ORE /TSE 82 104
i ORE /TSE 89 92#
BCL /CT 82 89#
BCL /Cr 81 109#BCL /Cr 84 78#
BCL /Cr 28 61'#BCL /Cr 27 71
TSE-5A ORE /TSE 22 76
| ORE /TSE 38 86'
ORNL /TSE 51 107
ORNL /TSE 67 130#BCL /Cr 51 134
BCL*/CT 28 118#BCl /Cr 28 97
BCL*/CT 22 80#BCl /Cr 0 82
BCL*/Cr 0 73
"Hahn et al., Ref. 21.Cheverton et al., Ref. 22.
# ~
Rosenfield et al., Ref. 23.
[ Cheverton, Ref. 24.#Rosenfield et al., Ref.13. *
|
. - . - . .. . - . . - - . . -. -- --
31
all heats when the E ,(CV30) term is not included (19 MPa Tm). Roughlygspeaking, the inclusion of K W 30 in Eq. (2.0 accounts for about half.
7the heat-to-heat variability." If CV30 were a perfect reference tempera-ture, the standard deviation in Eq. (2.7) would be 13 MPa Ti.
. Use of the MIL-HDBK-5C procedures" for the case where the tempera-ture of interest (T) is different from the temperature at which the mean
of K , is known (T,) involves rewriting Eq. '2.7):y
(2.8)) + 0.47 (T - T,)" .
Ia In o
The lower bound would then be K ,(T) - 24 MPa.in cr K ,(T) - 44 MPa W7 ydepending on the predetermined f ailure probability.
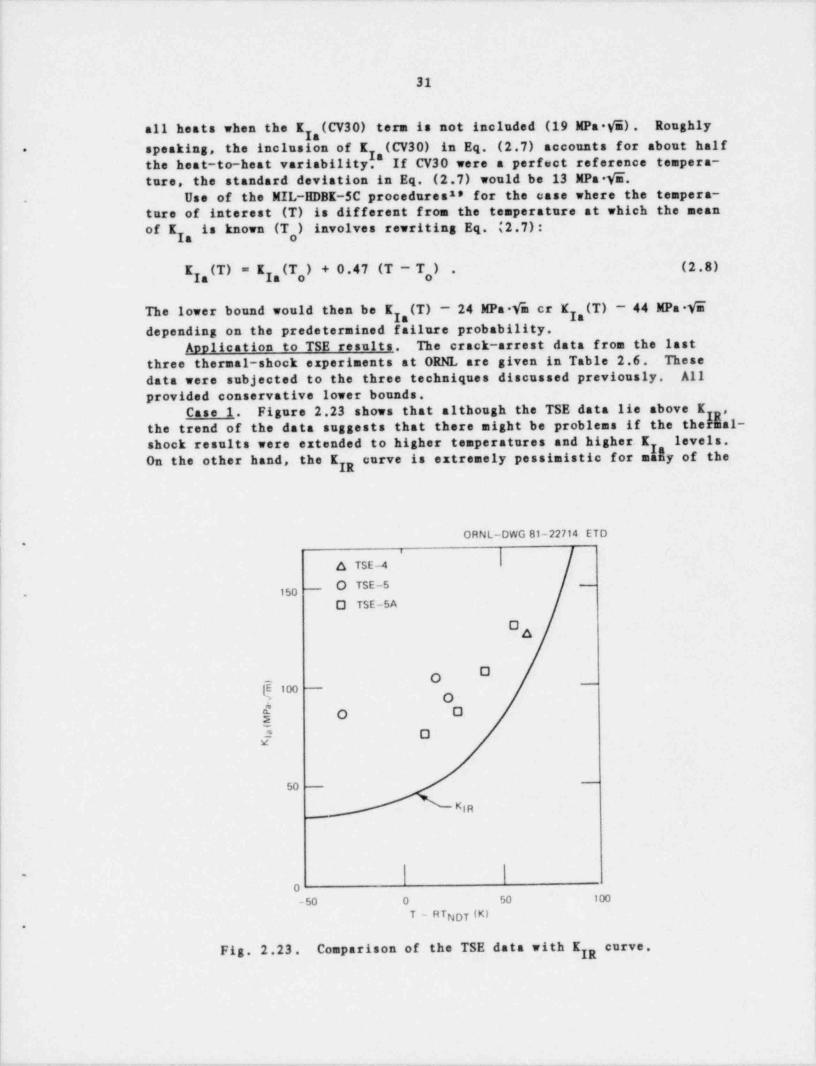
Anolication to TSE results. The crack-arrest data from the lastthree thermal-shock experiments at ORNL are given in Table 2.6. Thesedata were subjected to the three techniques discussed previously. Allprovided conservative lower bounds.
Case 1. Figure 2.23 shows that although the TSE data lie above K ,
the trend of the data suggests that there might be problems if the theNial-shock results were extended to higher temperatures and higher K levels.
On the other hand, the K urveisextremelypessimisticformIIyoftheIR
;
! ORNL-DWG 81- 22714 ETD
6 TSE-4
, 330- O TSE-5 -
O TSE-5A
A
O^ O -
| ion _
O
$ 0 0-
f O
50 --
KIR
0-50 0 50 100
T - RTNDT (K).
Fig. 2.23. Comparison of the TSE data with IIR *"##**
I
,- _- . _ _ ____ _ _ _ _ _ _ _ . _ _ , _ . _. _ _ _ . _ _ _
32
data points, supporting the need for including independently measured E ,gvalues in determining lower-bound toughness. .
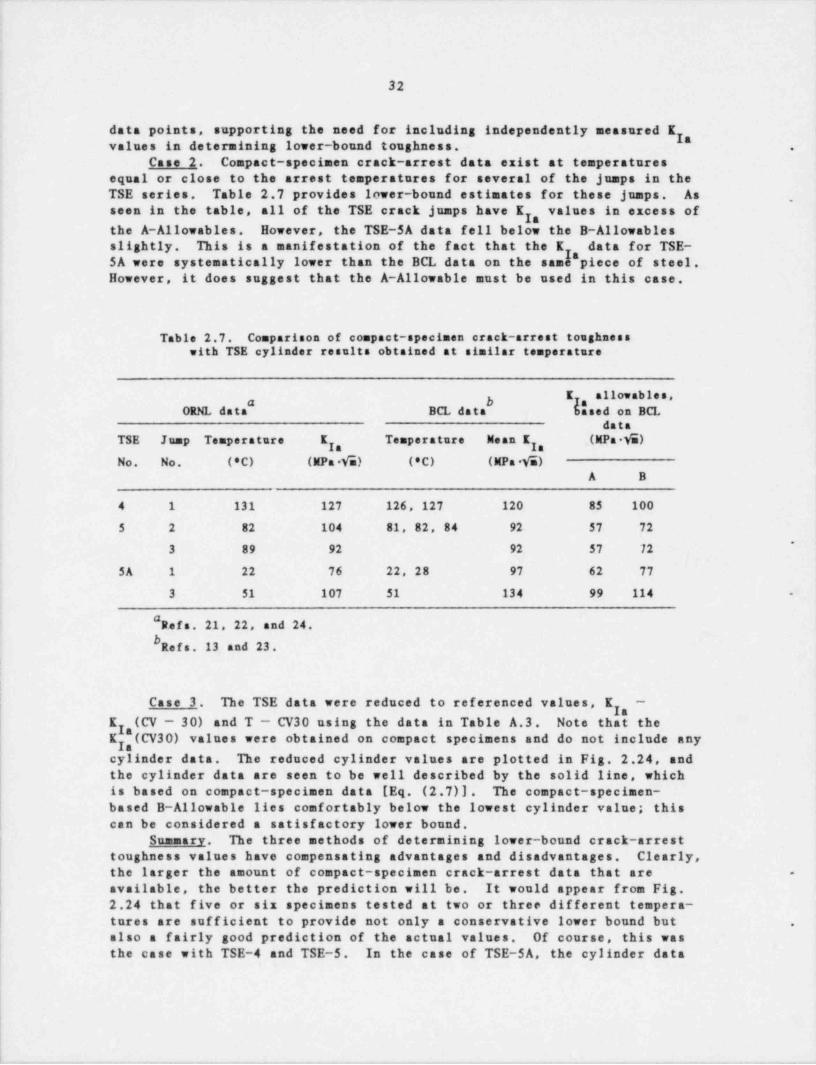
Case 2. Compact-specimen crack-arrest data exist at temperaturesequal or close to the arrest temperatures for several of the jumps in theTSE series. Table 2.7 provides lower-bound estimates for these jumps. As
,
seen in the table, all of the TSE crack jumps have E , values in excess of7the A-Allowables. However, the TSE-5A data fell below the B-Allowablesslightly. This is a manifestation of the fact that the I data for TSE-5AweresystematicallylowerthantheBCLdataonthesamI"pieceofsteel.However, it does suggest that the A-Allowable must be used in this case.
Table 2.7. Comparison of compact-specimen crack-arrest toughnesswith TSE cylinder results obtained at similar temperature
K all wables,, 3 h
ORNL data BCL data based on BCLdata
TSE Jump Temperature K Temperature Mean K (MPa W)h hNo. No. (*C) (MPa 6) (*C) (MPa 6)
A B
4 1 131 127 126, 127 120 85 100
5 2 82 104 81, 82, 84 92 57 72*
3 89 92 92 57 72
SA 1 22 76 22, 28 97 62 77
3 51 107 51 134 99 114 -
#Refs. 21, 22, and 24.
Refs. 13 and 23.
;
|
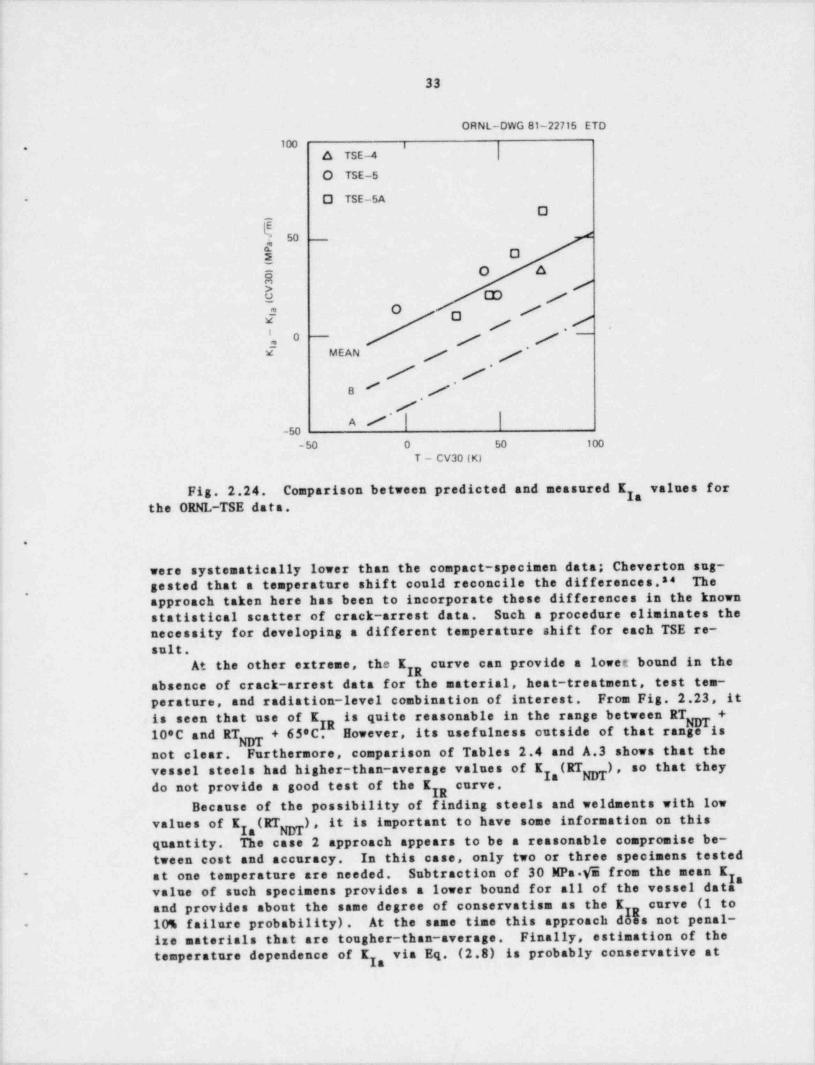
| Case 3. The TSE data were reduced to referenced values, E -
E (CV - 3 0) and T - CV30 using the data in Table A.3. Note that theK "(CV30) values were obtained on compact specimens and do not include any
acylinder data. The reduced cylinder values are plotted in Fig. 2.24, andthe cylinder data are seen to be well described by the solid line, whichis based on compact-specimen data [Eq. (2.7)]. The compact-specimen-based B-Allowable lies comfortably below the lowest cylinder value; thiscan be considered a satisfactory lower bound.
Summary. The three methods of determining lower-bound crack-arresttoughness values have compensating advantages and disadvantages. Clearly,the larger the amount of compact-specimen crack-arrest data that are -
available, the better the prediction will be. It would appear from Fig.2.24 that five or six specimens tested at two or three different tempera-tures are sufficient to provide not only a conservative lower bound but .
also a fairly good prediction of the actual values. Of course, this wasthe case with TSE-4 and TSE-5. In the case of TSE-5A, the cylinder data,
|
|
|'
|
|
1\
- - - -
- .
33
|
ORNL-DWG 81-22715 ETD
100 i.
A TSE-4O TSE-5
- O TSE-5A
k_
O
50 _4
$ 0O Ag
/>e CD /a O #O
/ ./j~'' / / ~0
2x MEAN / y'
'
/ /e' ./
*
/A / | |-50
-50 0 50 100
T - CV30 (K)
Fig. 2.24. Comparison between predicted and measured K values for"
the ORNL-TSE data.
.
were systematically lower than the compact-specimen data; Cheverton sus-gested that a temperature shift could reconcile the differences.s* Theapproach taken here has been to incorporate these differences in the known
,
statistical scatter of crack-arrest data. Such a procedure eliminates thenecessity for developing a different temperature shift for each TSE re-sult.
At the other extreme, the K curve can Provide a lowet bound in theIRabsence of crack-arrest data for the material, heat-treatment, test ten-
perature, and radiation-level combination of interest. From Fig. 2.23, itis seen that use of K s qu e reas na e in t e range between RTNDT +
g + 65'C.R However, its usefulness outside of that range isI
10*C and RTnot clear. Furthermore, comparison of Tables 2.4 and A.3 shows that thevessel steels had higher-than-average values of E ,(RT ), so that they
gdo not provide a good test of the KIR ** "**
Because of the possibility of finding steels and weldsents with lowvalues of E ,(RTg) , it is important to have some information on thisgquantity. The case 2 approach appears to be a reasonable compromise be-
:
|tween cost and accuracy. In this case, only two or three specimens testedat one temperature are needed. Subtraction of 30 MPa.Vm from the mean E- gvalue of such specimens provides a lower bound for all of the vessel data,
curve (1 toand provides about the same degree of conservatism as the I10% failure probability). AtthesametimethisapproachdNsnotpenal--
ize materials that are tougher-than-average. Finally, estimation of thetemperature dependence of E , via Eq. (2.0 is probaMy conservative atg
. _ - _ _ - - . - . _ _ _ _ - _ _ _ .. __ _ . _ . . _ - - -- -_ _ . - . .
34
higher temperatures (above CV30 + 65'C), and this is a possible improve-ment in conservatism over the IIR ** * * -
Statistical analysis of data. Part of th' Jroblem with definingreference temperatures from Charpy impact data lies in the scatter in suchdata. As a result, a statistical description of transition curves was
,
developed. This description has the capability of defining probabilisticlower bounds consistent with those used for crack-arrest data.
The analysis depends on the well-known fact that the Charpy V-notch(CVN) energy displays an essentially sigmoidal dependence on temperature.Specifically, this energy exhibits little temperature dependence at lowtemperatures, then undergoes a relatively rapid increase within a rather
| narrow temperature range to a higher value and is then relatively insensi-' tive to further temperature changes, although this " upper-shelf" energy
may actually exhibit a gradual decrease with increasing temperature. The| objective of this analysis is to estimate, for a given set of such sigmoi-
Odal temperature-energy data, the 100 p percentile of the distribution ofi energies as a function of temperature.
The procedure that was developed during this report period differsfrom that described in the last progress report.2' This newer procedure
provides a straightforward and more satisfactory means for obtaining thedesired percentile curves. The details are summarized in the followingdiscussion.
Let E.T be the observed (i.e., measured) energy at temperature T. For
a fixed temperature, it is assumed that a population of energies existsthat is defined by the distribution function F (x) s.ch thatT
.
F.r(x) = P(F.T 1 x)(2.9).
N ~
The 100 p percentile of the distribution F,7 is defined as the parame-ter C (T) which, using Eq. (2.9), satisfies the relation
p = P[E i C (T)] = F [C (T)] (2.10).
7 p T
Equivalently, it follows f20m Eq. (2.10) that
1 p = P[E.7 > C (T)] = 1 - F,7[C (T)] .
p
The goal of this study is to estimate C (T) as a function of T forpthe various sets of experimental data. These data often consist, however,
of only one observation, F.r, at any f the given values of T, rather thana sizable sample of g values. Consequently, further structure must be,
| introduced into the problem to be able to efficiently estimate C (T).This structure is introduced via a theoretical model associated ith the .
Weibull distribution discussed in the following paragraphs.
It is assumed that F,r belongs to the family of Weibull distributions,,
which have distribution functions given by ,
1
F(x) = 1 exp[-(x/S)"] (2.11),
__ ._._-
35
with x ).O. The parameters a and $ pro the shape and scale parameters,respectively. In this case, a and $ both may depend on temperature T, in'
,
which case Eq. (2.9) assumes the form
~ r ha(T)~~
P[E 1 x] = F (x) = 1 exp (2.12),
T T p
again with x ). O. This family is extremely flexible in terms of providingadequate fits to data and a broad range of possible probability distribu-tions.
The parameter of interest, C (T), is obtained by setting F [C (T)] = pTandsolvingtheresultantexpress$onforC(T). Following this procedure
pwith Eq. (2.12), one obtains
*C (T) = p(T)[-In (1 p)] (2.13).
p
The problem of estimating C (T) is thus reduced to that of estimating thep
functions p(T) and a(T). As will be seen in the following discussion, thefunctions $(T) and a(T) control the behavior of the observed values of theenergy data, F . Therefore, these values contain information about thefunctions a(T)7and $(T), and they can be used to derive estimates of thesetwo functions.
Of the various possible ways to estimate S(T) and a(T), based on agiven data set (E ), an approach is used here that requires a minimal num-T.
ber of assumptions and uses only linear-least-squares procedures (in con-trast to the nonlinear procedure discussed in the last progress' report).
,
Toward this end, let (Z ) be independent and identically distributed ran-T
dom variables characterized by the distribution function
F(z) = 1 - exp(-z) .
are 8 imp e exponential random variables with unit scalelThus, the ZT
paran ter, so that
j E(h) = 1,|
Var (Z ) ~ 1 *T
The random variable (E ) can be modeled byT
*-
E = $(T)2 (2.14),
T 7
.
. . - - - - - - _ _ . _ ._-_f,.. , - y , - _ _ . . ., - -,_.m ... _ _ . - . . _ - - - _ _ . , _ . _ _ _ _ _ _ _ _ . _ _ .
-
36
with Eq. (2.14) being valid since
.
F (x) = P[E I *l-T T
= P [$(T) ' 1 x]*
=P|Z 1 [x/p(T)]*( hT
= 1 exp -[x/$(T)]" ,
the latter expression clearly being the distribution function for theWeibull distribution with scale and shape parameters a(T) and p(T), re-spectively.
The data contain information about a(T) and $(T), as can be seen fromthe fact that Eq. (2.14) can be recast in the form of a simple regression .
model as follows:
In F7 = In p(T) T,+e (2.15) -
where
1l" Z (2.16)eT " M T) T.
Therefore, the data In E c ntain int raati n about $(T) since in E l~T Tlows p(T), after Eq. (2.15), apart from the random variation introduced
| by e In addition, the random variation contains information about a(T),T.! after Eq. (2.16), due to its a(T) dependence. As will be seen, this
information can be extracted by analyzing the residuals of a least-squaresfit of the in E data to in p(T).
TExpanding in Z in a Taylor series about its unit mean, one obtainsT
.
1 - 1 -
F (, k ~ I) ~ ~ Ik ~ II*,=
7 T) *
.
-_ - - - - - - , , , . . . , , , , , , . - - - - . - . - - . , , , - - - , , -c-,
37
in which case
.
1
E(e } ~ ~ 2a(T) 'T.
and
-1 -:
Var (e ) ~ *
T .a(T).
Furthermore, it is required that a(T) > 1, so that E(e ) = 0.TThe estimation procedure is begun by considering Eq. (2.15), and
initially ignoring that E(e ) is n t exactly zero as well as the possi-Tbility that the (e ) do not have temperature-independent variance. IfTa(T) were known, corrections could be made for these deficiencies. Theapproach used in this analysis is to obtain initial estimates of a(T) andS(T) and to use these estimates to make the appropriate corrections. Theprocess is iterated until convergence is achieved.
Using a polynomial approximation for in $(T), the following model,
oE E in E = In $(T) +e7 T T*
is fitted gsing usual least-squares procedures. The predicted values from*
3the fit, E , are estimates of in $(T). Consequently, the initial estimateT
of p(T) is given by.
p(T) =exp(b) (2.17).
It follows that the residuals, R , are give byT
In Z (2.18)- - =T,
The second step in the analysis provides more quantitative evidencerelative to the nature of a(T). Returning to Eq. (2.18),
1In ZR ~
T a(T) T'.
and
*
1
|R.7| = a(T) |l" Z | *T
__
38
Therefore,
.
Inl RT | " l"i 2T | -In a(T) (2.19).
.
Setting ej E Inl g | , Eq. (2.19) becomes
EjE Inl RT|=-Ina(T)+ep,
where, as before, one can demonstrate that
E(ep)=-1/2
and
Var (ej)=1.
To adjust for E(c') ~ -1/2, the quantity in| Rted to a polynomial ap roximation for -In a(T)T |As a result of this fit,+ 1/2 was actually fit-
.,
the predicted values, , estimate -In a(T). Consequently, a(T) is esti-'
mated by
A(2.20)a(T) =exp(g) .
The results of this analysis can be used to judge whether a(T) is indepen-dent of temperature. Specifically, if the coefficients for the polynomialapproximation of -In a(T) are not significant, then a(T) is assumed to beconstant, and the intercept of the fitted polynomial is used as the esti-mate of a(T).
As this point, estimatow for both p(T) and a(T) exist, and combiningEqs. (2.13), (2.17), and (2.20), C (T) is estimated by
C (T) =h(T)[-In(1-p)] (2.21).
p
Depending on whether this initial analysis indicates that a(T) is con-I stant or increases with T, the same steps in the analysis can be repeated .
adjusting for the effects of a(T) by fitting in E t in $(T) using a .
Tj weighted-least-squares procedure with weights a*(T). This adjusts for the
unequal variances of the error term, e This process is repeated until .T.convergence is achieved.
.- ___ _ - - _ - _ , - . . _ - _ _ - -- . _ - _ _ _ _ _ - _ _ _ _ . _ _ . _ - . _ _
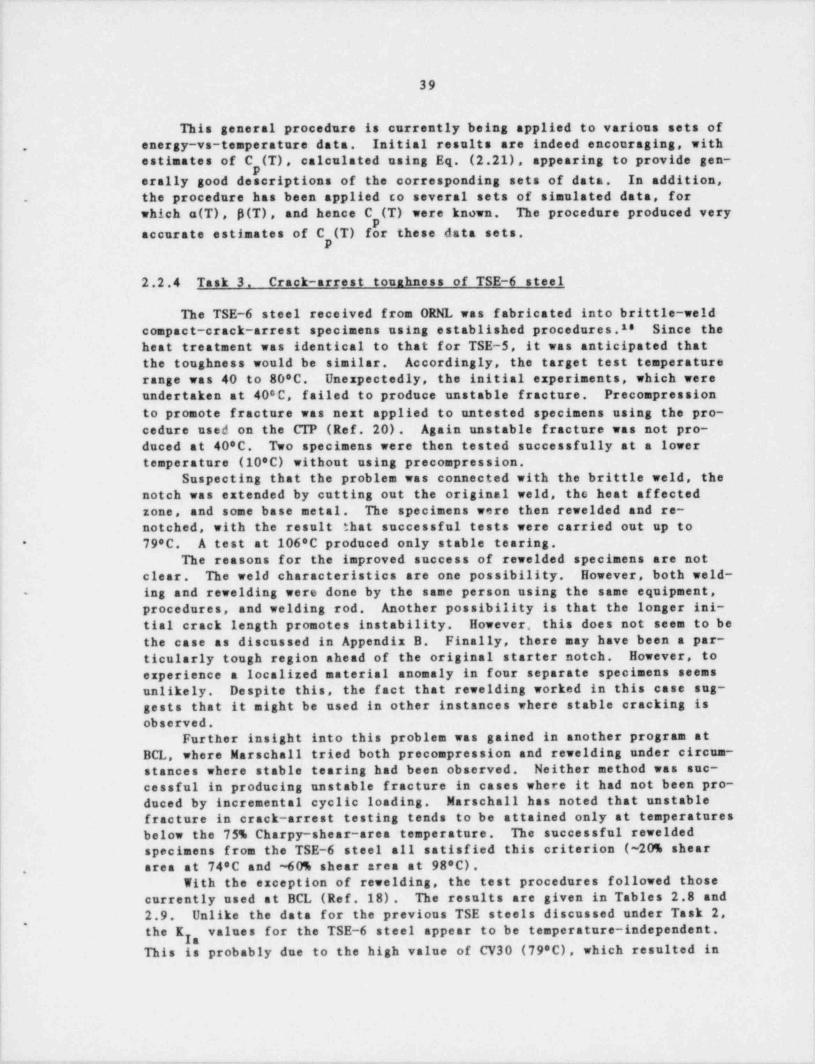
_ _ _ _ _
39
This general procedure is currently being applied to various sets oft
energy-vs-temperature data. Initial results are indeed encouraging, with.
estimates of C (T), calculated using Eq. (2.21), appearing to provide gen-p
erally good descriptions of the corresponding sets of data. In addition,. the procedure has been applied to several sets of simulated data, for
which a(T), p(T), and hence C (T) were known. The procedure produced very, paccurate estimates of C (T) for these data sets.' P
2.2.4 Task 3. Crack-arrest tounhness of TSE-6 steel
The TSE-6 steel received from ORNL was f abricated into brittle-weldcompact-crack-arrest specimens using established procedures.2e Since the
; heat treatment was identical to that for TSE-5, it was anticipated thatI the toughness would be similar. Accordingly, the target test temperature
i range was 40 to 80*C. Unexpectedly, the initial experiments, which were
| undertaken at 40*C, f ailed to produce unstable fracture. Precompression
to promote fracture was next applied to untested specimens using the pro-
{cedure used on the CTP (Ref. 20) . Again unstable fracture was not pro-
| duced at 40*C. Two specimens were then tested successfully at a lowertemperature (10*C) without using precompression.'
Suspecting that the problem was connected with the brittle weld, thenotch was extended by cutting out the original weld, the heat affectedzone, and some base metal. The specimens were then rewelded and re-notched, with the result that successful tests were carried out up to
79'C. A test at 106*C produced only stable tearing.-
The reasons for the improved success of rewelded specimens are notclear. The weld characteristics are one possibility. However, both weld-ing and rowelding were done by the same person using the same equipment,-
procedures, and welding rod. Another possibility is that the longer ini- ,
tial crack length promotes instability. However. this does not seem to bethe case as discussed in Appendix B. Finally, there may have been a par-
ticularly tough region ahead of the original starter notch. However, toexperience a localized material anomaly in four separate specimens seemsunlikely. Despite this, the fact that rewelding worked in this case sus-gests that it might be used in other instances where stable cracking isobserved.
Further insight into this problem was gained in another program atBCL, where Marschall tried both precompression and rewelding under circum-stances where stable tearing had been observed. Neither method was suc-cessful in producing unstable fracture in cases where it had not been pro- ,
duced by incremental cyclic loading. Marschall has noted that unstablefracture in crack-arrest testing tends to be attained only at temperaturesbelow the 75% Charpy-shear-area temperature. The successful roweldedspecimens from the TSE-6 steel all satisfied this criterion (~20% sheararea at 74*C and ~60% shear area at 98'C)..
With the exception of rewelding, the test procedures followed thosecurrently used at BCL (Ref. 18). The results are given in Tables 2.8 and2.9. Unlike the data for the previous TSE steels discussed under Task 2,
,
the E , values for the TSE-6 steel appear to be temperature-independent.g
This is probably due to the high value of CV30 (79'C), which resulted in
- _ _ _ _ - - - _ - _ _ . . ,. , _ _ . - - _ . _ _ . _ _ .- . - _ _ _ _ _ . _ . _ _ . - . . _ - - - . _ _ - - _ _ _ _ ,
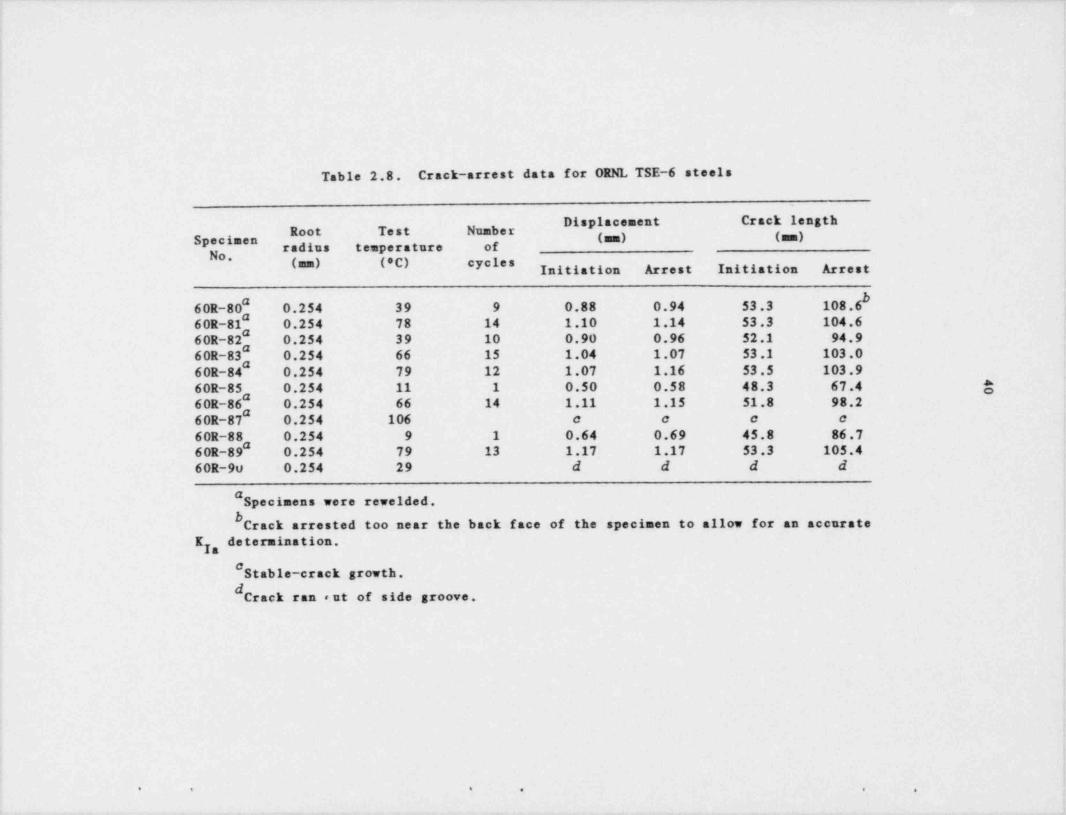
._ _ __ ______ -_ _ _ _ _ - _ _ _ _ _ _ _ _ _ . _ _ _ _ _ _ _ _ - _ _ _ _ _ _ _ _ _ _ _ _ _ _ _ _ _ .
Table 2.8. Crack-arrest data for ORNL TSE-6 steels
'E * ''*" *** '"IRoot Test Number
Specimen " "radius temperature of
(m) ('C) cycles*
g y ,
60R-80" 0.254 39 9 0.88 0.94 53.3 108.660R-81" 0.254 78 14 1.10 1.14 53.3 104.660R-82" 0.254 39 10 0.90 0.96 52.1 94.960R-83" 0.254 66 15 1.04 1.07 53.1 103.060R-84" 0.254 79 12 1.07 1.16 53.5 103.960R-85 0.254 11 1 0.50 0.58 48.3 67.4 g60R-86, 0.254 66 14 1.11 1.15 51.8 98.260R-87" 0.254 106 e o e c60R-88 0.254 9 1 0.64 0.69 45.8 86.760R-89" 0.254 79 13 1.17 1.17 53.3 105.460R-90 0.254 29 d d d d
" Specimens were rewelded,bCrack arrested too near the back face of the specimen to allow for an accurate
I , determination.g
#Stable-crack growth.
dCrack ran eut of side groove.
. . . . . .
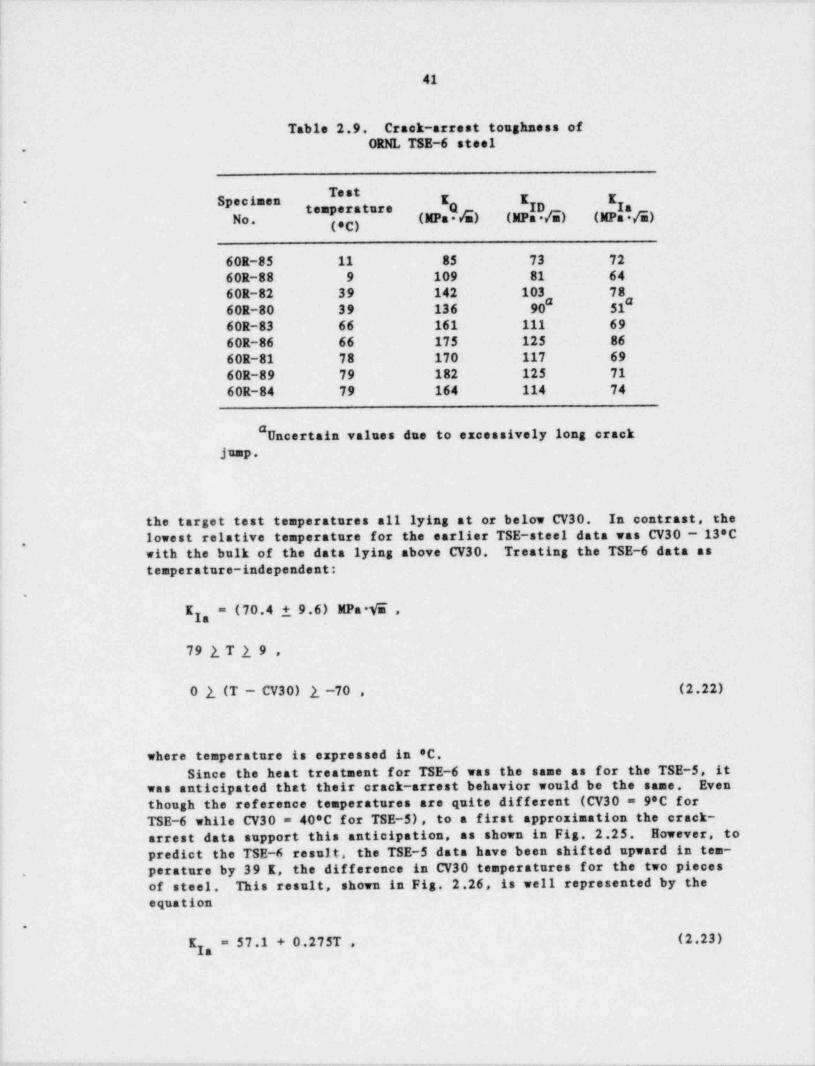
._
41
Table 2.9. Craok-arrest toughness ofORNL TSE-6 steel
.
**- Specimen K K K
No. (MPs /d) (MP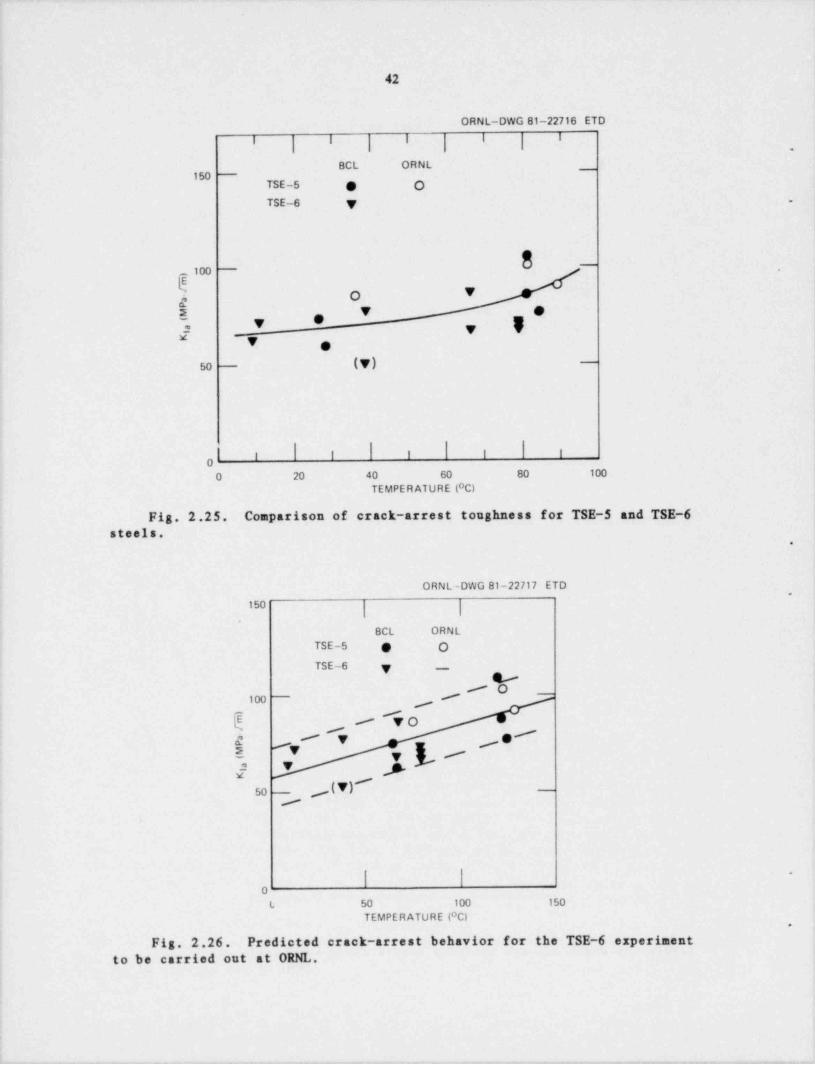
42
ORNL-DWG 81-22716 ETD
| l' '
|'''
l .
BCL ORNL_
_
TSE-5 e OTSE-6 , -
_ 100 - 8 -.
ItO Y
.
B v ei V *
v 5x , .
50 - (v) -
' ' '0O 20 40 60 80 100
TEMPERATURE (OC)
Fig. 2.25. Comparison of crack-arrest toughness for TSE-5 and TSE-6steels.
.
ORNL-DWG 81-22717 ETD.
j150
BCL ORNLTSE-5 S OTSE-6 y ._,
D'O
3gg _ - _
',0LE- vp
p= - y 'g#$- 'T y /
I $50 - p(Y) -
/
0L 50 100 150
TEMPERATURE ( C).
Fig. 2.26. Predicted crack-arrest behavior for the TSE-6 experiment
to be carried out at ORNL.
_
43
which is the predicted relation for TSE-6. (Units, as always, are MPa Vmand 'C.) The scatter bands, encompassing virtually all of the data, have
,
been drawn at 115 MPa*Vm around Eq. (2.23).
.
2.3 Investination of Dancina and of Cleavame-FibrousTransition in Reactor-Grade Steel'
W. L. Fourneyi
2.3.1 Introduction
The aim of the research program is to investigate la detail the tran-sition region from cleavage to fibrous fracture and its effect on tough-ness determinations. A complete understanding of this phenomenon is ex-tremely important in predicting fast fracture behavior in a structure.
Within the upper area of the transition temperature range, it is pos-sible to observe onset of rapid cleavage fracturing due to increases ofstrain rate at a point of tearing instability. Likewise, in the lowerportion of the transition range, one could expect that sudden fracture ofregions of local weakness will cause a conversion from slow fibrous tear-ing to rapid cleavage prior to the instability point as estimated in termsof R-curve considerations.
Studies of run-arrest fracturing in crack-arrest specimens have shownthat tough late-breaking regions and a diffuse nature of the crack frontoccur to an increasing degree with increase of toughness and test tempera-*
ture. There are plausible ways in which behaviors of this kind can elimi-nate conditions necessary for dominant cleavage fracturing. Thus, infor-
' mation from crack-arrest research is related to cleavage-fibrous transi-tion research in a natural way.
The expected flaw probability influence on scatter of toughness val-ues in the lower regions of the transition temperature range, conditionsgoverning onset of cleavage in higher regions of the transition tempera-ture range, and the determination of a temperature, T , high enough toAexclude dominant cleavage fracturing are important aspects of transitionbehavior and are expected results from the research program.
The general topic of cleavage-fibrous transition is complex and dif-ficult, but the importance of advancement of understanding in this area is
;
widely recognized. In addition to the research at the University of Mary-'
land, other research groups can be attracted and involved in cleavage-fibrous transition studies.
i
! Research program. To obtain measurement data and a reasonable under-standing of the aspects of cleavage-fibrous transition, which are of main
* Work sponsored by HSST Program under UCC-ND Subcontract 7778 betweenUCC-ND and the University of Maryland.
IDepartment of Mechanical Engineering, University of Maryland,*
College Park.
.
mm.. - . . , -. - m ,---
44;
importance, the following tasks make up the research program during 1980-1981: .
A. tearing instability fracture-toughness experiments,B. investigation of statistical aspects of slow and rapid E , toughness ,g
values,
C. development of a mechanistic model for cleavage-fibrous behavior, and
D. coordination of related work performed at other interested laborato-
ries.
Task A
The purpose of Task A is (1) to collect information illustrative ofthe role of tearing instability in causing the onset of dominant cleavagefracturing in the upper portion of the transient temperature range and(2) to explore the loss of tearing instability control with reduction oftesting temperature. Much of the information needed can be obtainedthrough attracted interest at other laboratories or from samples previ-onsly tested elsewhere, but some testing will be conducted at the Univer-sity of Maryland. Tests to be conducted for a selected material wouldinclude:
1. notch bend tests to determine the temperature, T , high enough toA
exclude dominant cleavage fracturing,2. IT compact tests within the upper region of the transient range to
establish the J-R curve for the material chosen, -
3. IT and 2T compact tests within the transition range to obtain cleavagefracture induced by J-R instability, and
4. IT and 2T compact tests at lower temperature to demonstrate loss of -
J-R controlled instability.
Task B
With Task B, the purpose is to:
1. collect data from other laboratories that would be pertinent to this
study - this would include reviewing previous studies of KI* varia-tions (e.g., Westinghouse, Alcoa, and NASA-Lewis), and
2. use data from Task A to measure test result scatter at a selectedtemperature.
Work will be conducted in the most efficient manner considering suchdata and information a6 can be obtained from closely related research atother laboratories. Modifications of the test program, as necessary andappropriate, can occur.
~
Task C
Model development for the transition behavior would involve both*
photoelastic tests (with polymeric models and birefringent-coated steel,
. _ _ __. - - . - _ - . . - _ _ - _ . . . .__ _ - _ __ _ ___
45
samples) as well as 2-D dynamic calculations. This task would:
1. continue development and refinement of a theoretical model to describe'
the fibrous-cleavage transition taking into account weak region (sta-tistical) variations and quenching of cleavage by an increase in late-breaking ligaments;'
2. continue trials of computer models of late-breaking ligaments, explor-ing the effects of locally weak or tough regions;
3. explore photoelastically the effect of local regions of tough or weakmaterial in a specimen and the effect of nonuniform crack fronts oncrack advance; and
4. obtain estimates of the closing forces due to late-breaking ligamentsby fractography and by using photoelastic coatings on steel specimens.
Task D
As a topic, the cleavage-fibrous transition has been of interest tofracture researchers for a very long time. Recent findings suggest thata substantial advance in understanding, particularly of significant prac-tical aspects, is possible. To proceed efficiently toward realization ofthese possibilities, the University of Maryland project is intended toprovide enough examples of clarification so as to attract wider interestin similar work and to provide coordination and information exchange be-tween those laboratories that are engaged in a cleavage-fibrous researcheffort. Task D is devoted to coordination and information exchange rela-tive to enhanced understanding of cleavage-fibrous transition behaviorswith particular emphasis on aspects of current practical importance to-
NRC.
.
2.3.2 Cleavane-fibrous transition studies
During the past quarter, matching fracture surfaces of a 6-in.-widemidsection from the ORNL thermal-shock test TSE-5A test cylinder and fivehalves of K , specimens from BCL were received. A study of fracture-sur-yface features and fracture-surface topographical characterization was ini-tlated. Objectives of the study were (1) to establish processes in anactual pressure vessel and in small laboratory scale specimens to estab-lish the range of applicability of laboratory test results in analysis ofan actual vessel; (2) to obtain complementary data, such as crack-openingdisplacement (COD) and unbroken ligament stretch, directly from the frac-ture surface through topographical characterization to aid ORNL analysis;and (3) to collect information on deformation and fracture processes suchas cleavage undercuts, cleavage plane distortion, twinning formation, un-broken ligament formation, unbroken ligament size and distribution, andthe amount of unbroken ligament stretch, to aid in formulating a model ofthe fracture process observed in cleavage-fibrous transition.-
Visus 1 observation of fracture surfaces of TSE-5A and of BCL K ,7
specimens indicate a significant difference in crack-propagation mode. InTSE-5A, although there was a long axial crack front, actual crack propaga--
tion initiated at distinct points, and the crack ran from these initiation
. - _. . . _ ,_ - -. . _ - . -_. .
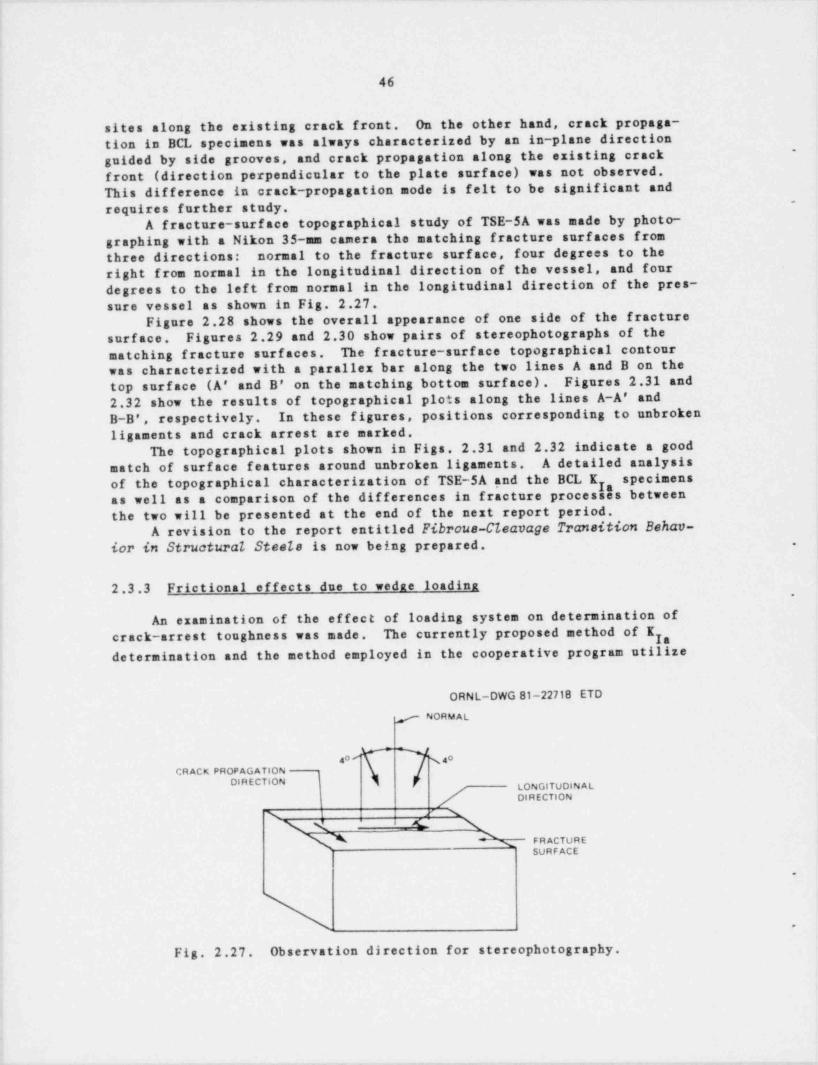
- - - _ _
46
sites along the existing crack front. On the other hand, crack propaga-tion in BCL specimens was always characterized by an in-plane directionguided by side grooves, and crack propagation along the existing crack
-
front (direction perpendicular to the plate surface) was not observed.This dif ference in crack-propagation mode is felt to be significant andrequires further study.
-
A fracture-surface topographical study of TSE-5A was made by photo-graphing with a Nikon 35-am camera the matching fracture surfaces fromthree directions: normal to the fracture surface, four degrees to theright from normal in the longitudinal direction of the vessel, and fourdegrees to the left from normal in the longitudinal direction of the pres-sure vessel as shown in Fig. 2.27.
Figure 2.28 shows the overall appearance of one side of the fracturesurface. Figures 2.29 and 2.30 show pairs of stereophotographs of thematching fracture surfaces. The fracture-surface topographical contourwas characterized with a parallex bar along the two lines A and B on thetop surface (A' and B' on the matching bottom surface). Figures 2.31 and2.32 show the results of topographical plots along the lines A-A' andB-B', respectively. In these figures, positions corresponding to unbrokenligaments and crack arrest are marked.
The topographical plots shown in Figs. 2.31 and 2.32 indicate a goodmatch of surface features around unbroken ligaments. A detailed analysisof the topographical characterization of TSE-5A and the BCL E , specimens7as well as a comparison of the differences in fracture processes betweenthe two will be presented at the end of the next report period.
A revision to the report entitled Fibrous-Cleavage Transition Behav-for in Structural SteeIs is now being prepared. .
2.3.3 Frictional effects due to wedae loading,
An examination of the effect of loading system on determination ofcrack-arrest toughness was made. The currently proposed method of K ,7determination and the method employed in the cooperative program utilize
ORNL-DWG 81-22718 ETD
, - NORMAL
40' N40CRACK PROPAGATION
DIRECTION LONGITUDIN AL,p/ DIRECTION
x i > x
FRACTUREsSURFACE
.
.
Fig. 2.27. Observation direction for stereophotography.
_ _ _ _ _______ _ . _ _ _ - _, ._.
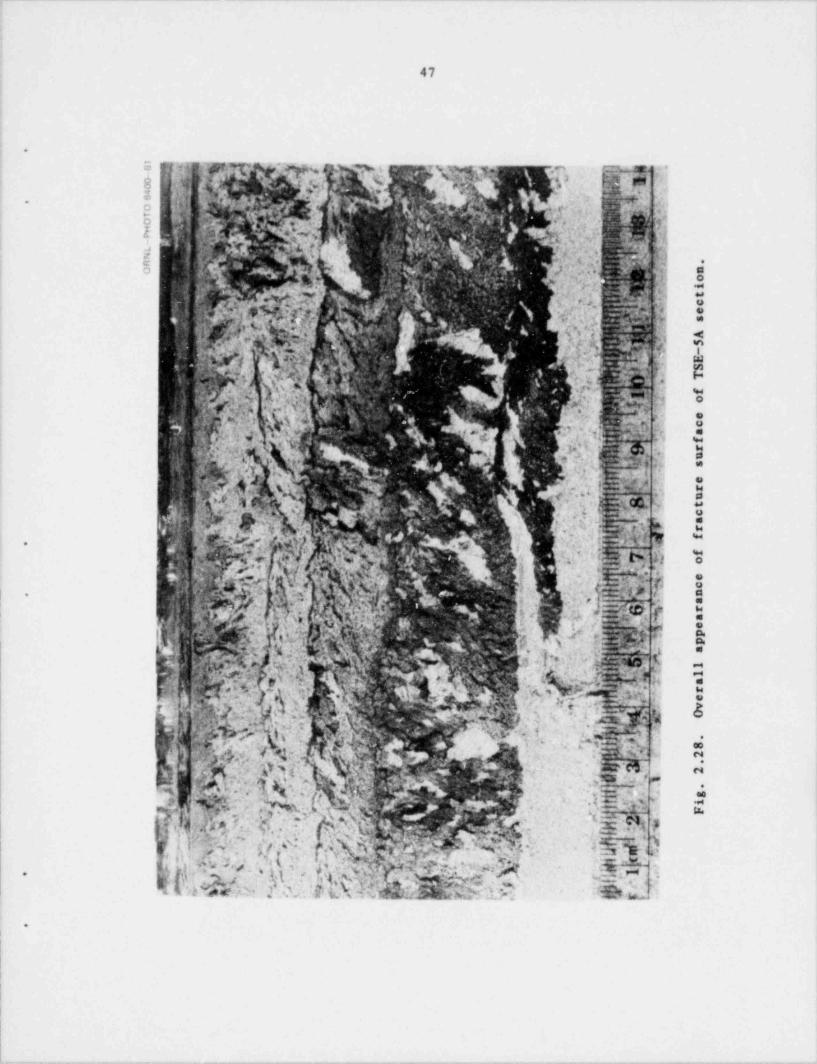
- _ _ _ - A. . _ * _ _ _ _ _ .-- m a , --
47
.
|,
*:.
9 .-y, y ,.r, fO s,
.z'';c'.s f1 ,tf ,
m: <.
A C.' iU Eg.
P', }'; O.
+
7,y f4 . . a.
" .ru.. r*,f 4
f 3'c., ,. .
|||,
-q-3.. , pv .
. .fr Q 'f E~ .li R -
f ,1 & & N C1, y.; 10$ df' h ,].,
. y.aw a
5. GAG' v ~ *
y Rp.a\ Q4 p'[N '
.- ~ >
@ l;r, c.
-
/: fp *,L I,' J - 3 N
g. v.., .. t v:-,
"
. .,s[)J*
' ' .-,r., c J f Q4 ,
3t:::: g :;.,
i 3}T;';;I[, '
i 7 I[. A% 3,
e9 v2
% @op , y
-y ., r.
. k ' I 8 k[tib Yi ''
v- 3
2 (;., ^* p - ' * y a,,x., ma* y :t > ..y .u.
,.
k <
f. %. [p f |.d,.N
~. $f Q':c } 'Y 8:;*g ,pu.. . . r. > t av.
-m .c.
,-f .
.
s-e m.m.m :.
g1;r . r w h-
.u. c . .: ..~,3,
T a, h;f y y. -r.p ' '
, .3.-
-
. .s.~
,
, V. . ' :- < ~^ , t% . -- ,h, ao.r V Y g/ . |M Y
. , ,*
< .i 046
, '* ,bd. et
-- I,k fj. . q q, 2
. , .em e's
* ~, ,
d s" ' ' 'h$- -
# QW;4.2%p);f .. . 2%:.|
:: .g<, 4.xy mg,y
'yy;.gp[U.ftR,.3vidt.edg'
,''i,
@ 4 % ?; . MHsi>f E$L~
g 'E7 :da,
W .
-,
|
|
. - . . - - -_, . - - - _ - _ - _ _ . . . - . - _ - . _ - _ _ _ _ - . - - _ . _ - - . - . - . _ _ _ , _. .. - _ _ _ _ - . - - . _ - - . - - . .
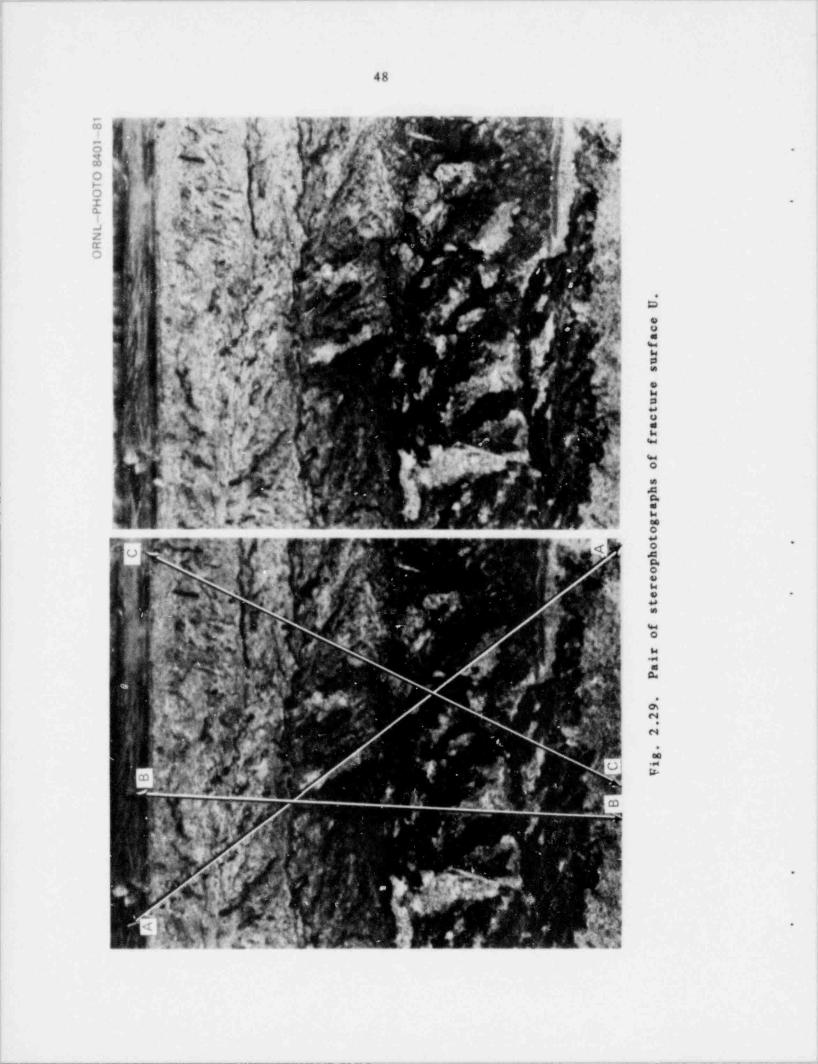
t|I! ; |'t , ((|[jr ,
-
__.
_
-* --_
_-
_
-
s,& 7 as,M f;<-s.. N ': .[ -M>..('-- 3 -,. 1
,,' u ,._
8_ -
f ,_ 1 .
M- p0 .
- O _N k f ~'* s *4
.
8_ .
c , g . - <b...
H -
n_w. s Qg_' *
%~m:.T ,
_
YO 3_ m .- ,sP e- >. '- s- j - '
. b'LN ,;"
. ''
. . ^ .
e. lG.u 5[ 9. ~ %
R ' ,. E.,O .e 4
* , " : *. . ~. M_ ,d ^._
y-
.
dg'^'.,
,
. . %- ' j .. . ,
,. v;A ' .
4 ' h', )uw.''iv%a
,- .h U'.
.. .
. s e._ * s c&_
.
.' f
9j r_
% '. u_
. ~
g. s j.
~. ih r
s'_ - r _
.e_
ws. .g. ' *-
- . u' - t,
. S.a-
n.' ' *
* c_
4-4a_
' r.
%- f-fe,.g f
- 4 c o_
.', .
.
. % N.'
sh.
3'. p_
h e,e ' #
' N1 - w '4 8 . ar
# - C: ,- g
g ot.. .oA hp
~ o' - e
r"
, e .
' .ts
~~
,.
f' o.
ri
.aP
.
$ 9 _
* 2
2
.
g
_. i
F
.
__-
.
.. .
r .
I
.[ A' N. y -a h
.
__- _
_
| ,| || ;i.!| i ,:3; ' ,14 i :a -1l.
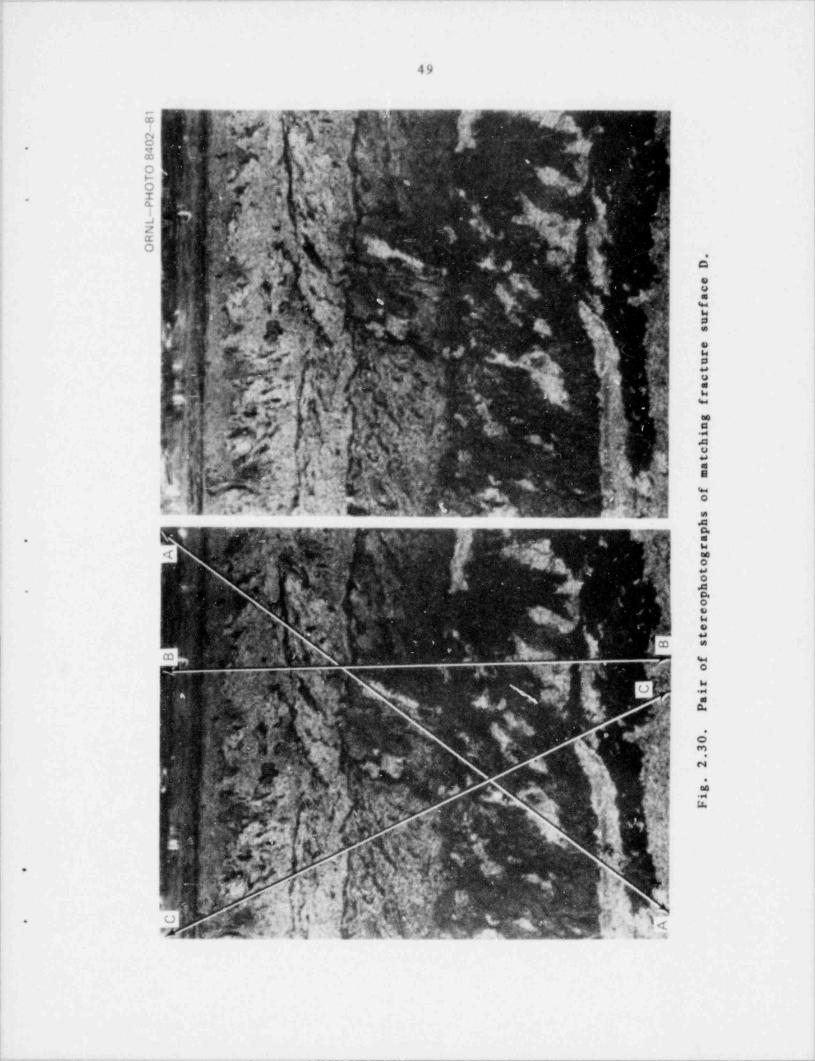
i| .i ! 6iI!i :
_
,-
m' ,,d '
-
';_ . ., * '1
,'8
*-
$-- ,
20
. 4 .
8_
O ; -
TOH.P
- -
4 a_
L
y." i
_N '-R-O
pg .
h..a -
? .
- D _
,. p e. , g. **
'
u
c,
, f. 4 r
)4 . s 'I_ s_* e
~.%
.
r
[' k . '.'.
^ u
. ~Y' t
c*a
._[3a.r_ *$,~ '
~g
r'-
: f
'* .-
g
g'; n
~- i
b, h-
c
i . s. p.- t
a ,'%,'. '-f ,
a _
mlf
; o,
s* .
hp,. 'a
Y. -
.S r
s ~;",' h
Y g' P od t
.
- o.
'- poere, n.=, ' B st
.
'
, , fi o'-.
ri
. h's 4,a*
wY'P
g/ . 0.,
NkP N*
3< F
2
.
?; G g
'f.-i~ i: $~' F
a i'z. d
I. i* ss Lr '
,.v.
o
. __
& pm_.
,
,. .
'
.
' .
__.
__
__
____
_
. |
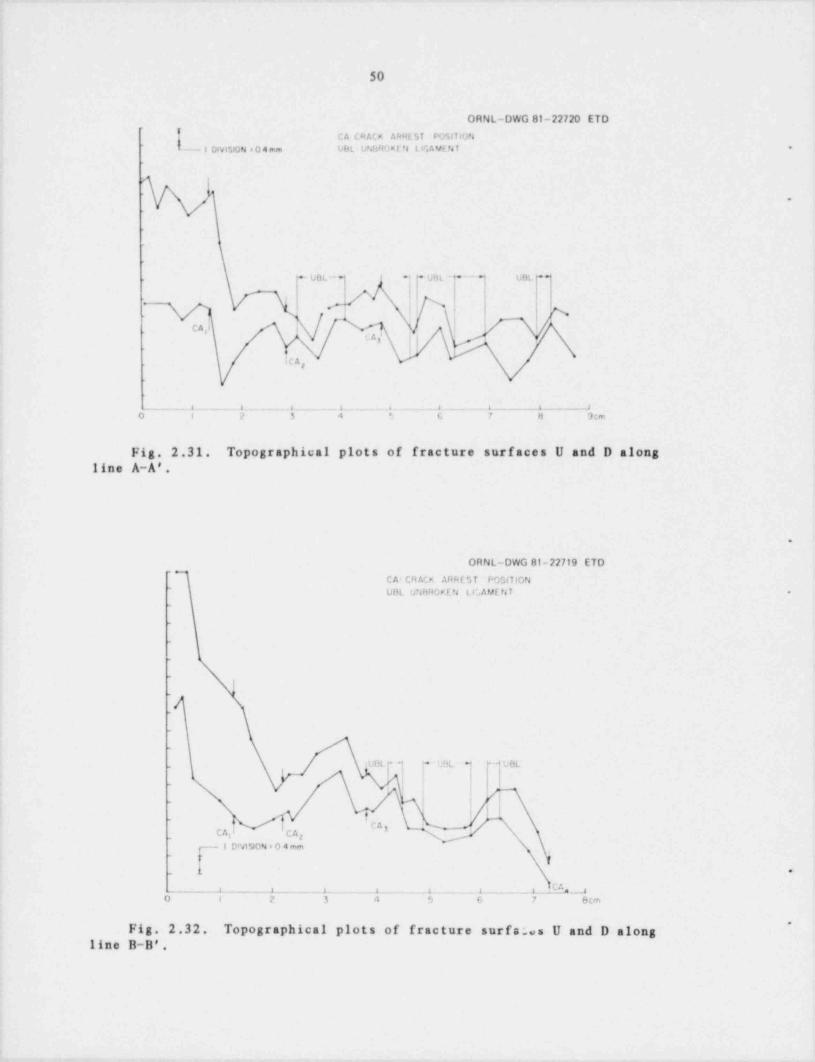
. _ _ - - .- . _ .__ ., .
!
iI
50
ORNL-DWG B1-22720 ETD
L DivislON =04mmCA CRACK ARREST PO5tTION
I VHL UNDRout'N LIGAVENT .
r
.
+ yg t -,+-+ ugt ..Ust-. .
CA'3
CA,
a t a a a i n . a
O I ? 5 4 * 6 7 8 Scm,
Fig. 2.31. Topographical plots of fracture surfaces U and D alongline A-A'.
i
.
ORN L-DWG 81-22719 ETD_
CA CRACK ARREST POStilON~
UBL UNBROnEN LIGAMENT .
.
.
'.
.
.
_
b
-
. UOL ** +-USL- * - VOL4
|'
_
ICA CA g
- 1 DMsiON * 0 4 mm.
'
1
- e
CAi i i i t , , y0 1 2 3 4 5 6 7 8cm
*Fig. 2.32. Topographical plots of fracture surfs;.s U and D along
line B-B'.
4
, - - - - r n ~ - , , < _ . - . - ..-,r. - - . - - - . -
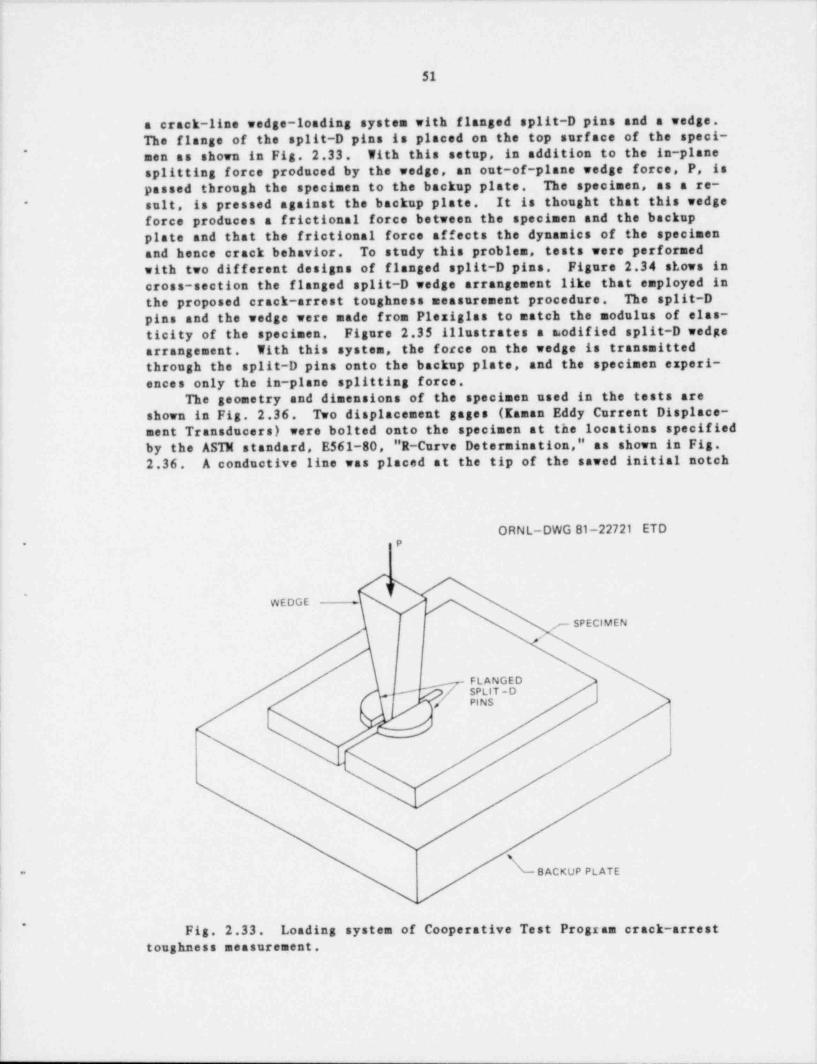
51
a crack-line wedge-loading system with flanged split-D pins and a wedge.The flange of the split-D pins is placed on the top surface of the speci-men as shown in Fig. 2.33. With this setup, in addition to the in-plane*
splitting force produced by the wedge, an out-of plane wedge force, P, ispassed through the specimen to the backup plate. The specimen, as a re-suit, is pressed against the backup plate. It is thought that this wedge*
force produces a frictional force between the specimen and the backupplate and that the frictional force affects the dynamics of the specimenand hence crack behavior. To study this problem, tests were performedwith two different designs of flanged split-D pins. Figure 2.34 shows incross-section the flanged split-D wedge arrangement like that employed inthe proposed crack-arrest toughness measurement procedure. The split-Dpins and the wedge were made from Plexiglas to match the modulus of elas-ticity of the specimen. Figure 2.35 111ustrates a modified split-D wedgearrangement. With this system, the force on the wedge is transmittedthrough the split-D pins onto the backup plate, and the specimen experi-ences only the in-plane splitting force.
The geometry and dimensions of the specimen used in the tests areshown in Fig. 2.36. Two displacement sages (Kaman Eddy Current Displace-ment Transducers) were bolted onto the specimen at the locations specifiedby the ASTM standard, E561-80, "R-Curve Determination," as shown in Fig.2.36. A conductive line was placed at the tip of the sawed initial notch
ORNL-DWG 81- 22721 ETDP*
if,
WEDGE - jte
,r- SPECIMEN/
FLANGED# SPLIT -Dj PINS
l
'- BACKUP PLATE*
*
Fig. 2.33. Loading system of Cooperative Test Program crack-arresttoughness measurement.
_ _ _ _ _ _ _ _ __
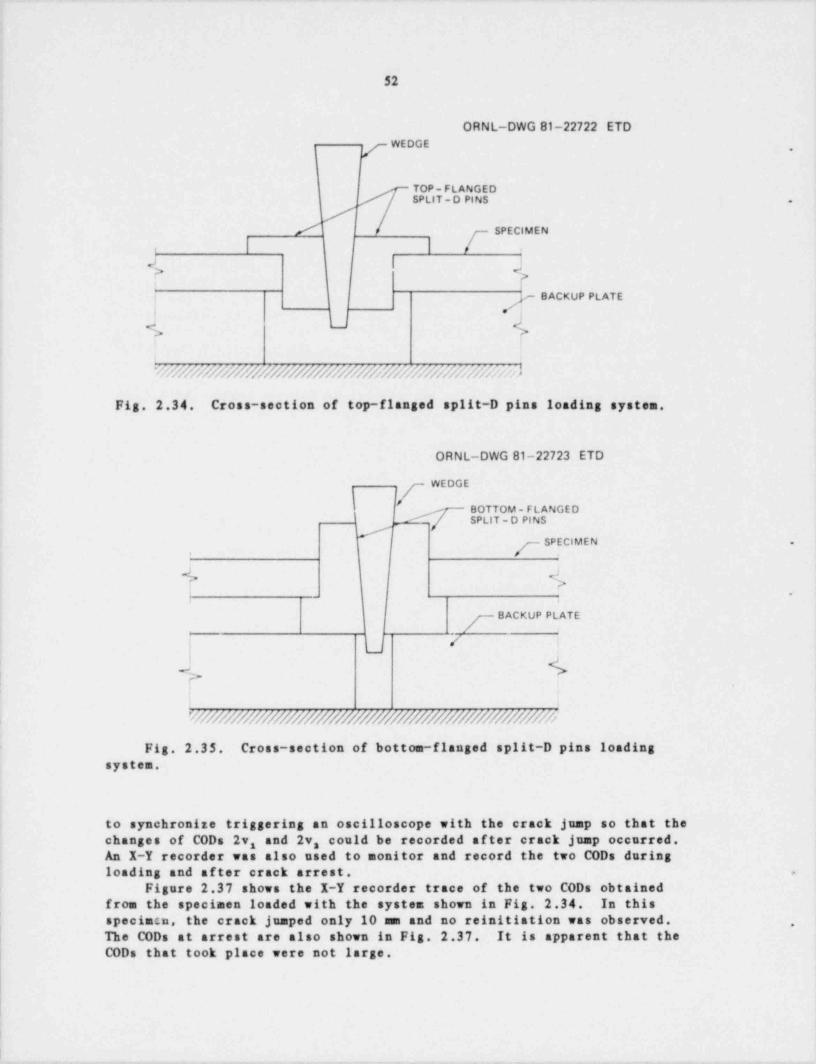
52
ORNL-DWG 81-22722 ETDWEDGE
,
TOP-FLANGEDSPLIT-D PINS .
//
l l [ SPECIMENi ,
J | Jf fj g BACKUP PLATEj .
O->;
!; i
'GbbknRN##O/07/07070RMD}OnRN% WAND
Fig. 2.34. Cross-section of top-flanged split-D pins loading system.
ORNL-DWG 81-22723 ETD
WEDGE
'BOTTOM - F L ANGE DSPLIT-D PINS~
d SPECIMEN .
7,
+ +.
. .
BACKUP PLATE
y / i
i|
.'
WM7##/#######/##/#/####/#7###7##hFig. 2.35. Cross-section of bottom-flanged split-D pins loading
system,
to synchronize triggering an oscilloscope with the crack jump so that the
changes of CODS 2v, and 2v, could be recorded af ter crack jump occurred.An X-Y recorder was also used to monitor and record the two CODS duringloading and after crack arrest. .
Figure 2.37 shows the X-Y recorder trace of the two CODS obtainedfrom the specimen loaded with the system shown in Fig. 2.34. In this
'
specimen, the crack jumped only 10 mm and no reinitiation was observed. .
The CODS at arrest are also shown in Fig. 2.37. It is apparent that theCODS that took place were not large.
|
|. - . _ _ _ _ _ - . . _ . . - . . _ - . .
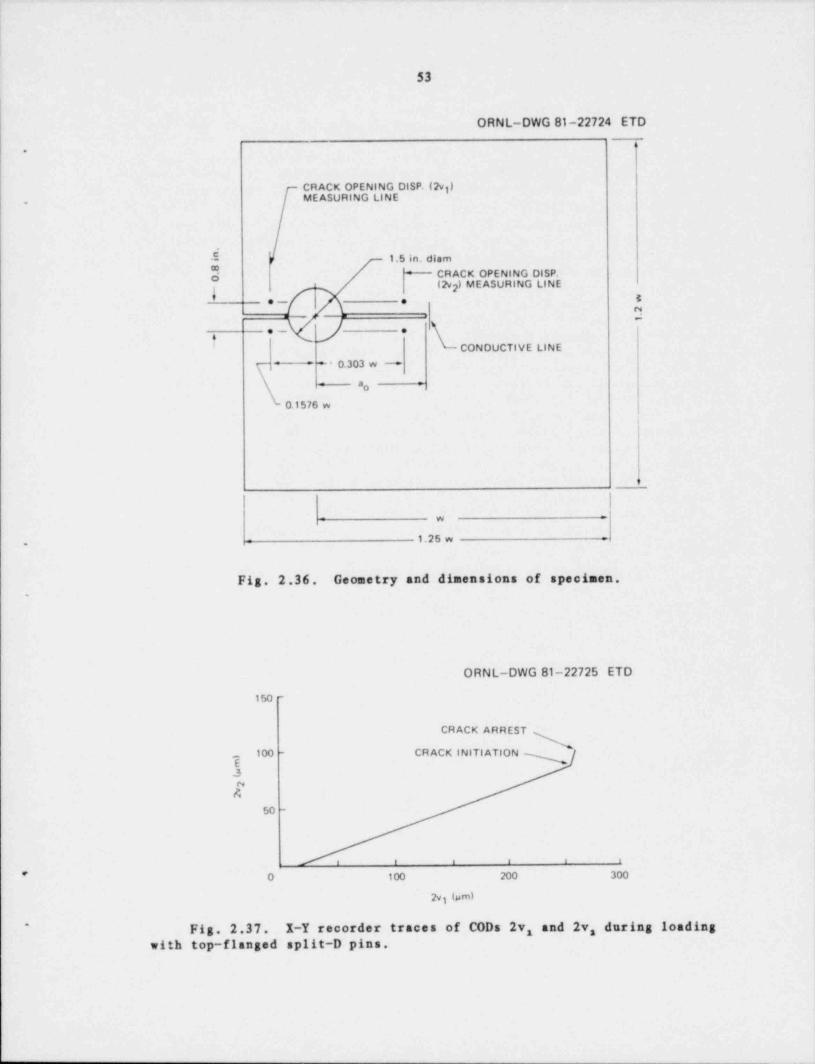
- .--
53
ORNL-DWG 81-22724 ETD
.
CRACK OPENING DISP. (2vg)MEASURING LINE.
- 1.5 in, diam
6 CRACK OPENING DISP.(2v2) MEASURING LINE
-j y CONDUCTIVE LINE..-
,
I
-
' O.303 w -
*o
0.1576 w
w
.- 1.25 w
Fig. 2.36. Geometry and dimensions of specimen..
ORNL-DWG 81-22725 ETD
150 -
CRACK ARREST
100 - CRACK INITI ATION7s
50 -
t f I t t 1
' O 100 200 300
2vi tum)
Fig. 2.37. I-Y recorder traces of CODS 2v, and 2v, during loading~
with top-fisnged split-D pins,
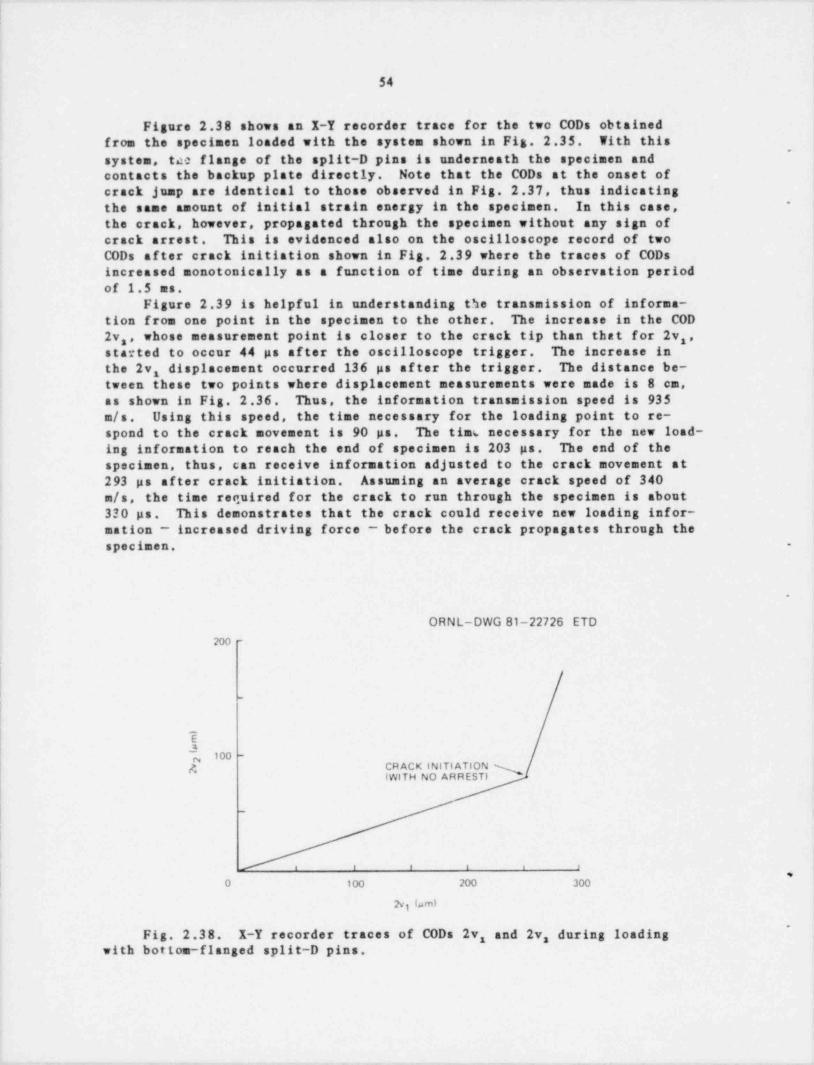
l
54
Figure 2.38 shows an X-Y recorder trace for the two CODS obtainedfrom the specimen loaded with the system shown in Fig. 2.35. With this
'
system, tac flange of the split-D pins is underneath the specimen andcontacts the backup plate directly. Note that the CODS at the onset ofcrack jump are identical to those observed in Fig. 2.37, thus indicatingthe same amount of initial strain energy in the specimen. In this case,
'
the crack, however, propagated through the specimen without any sign ofcrack arrest. This is evidenced also on the oscilloscope record of twoCODS after crack initiation shown in Fig. 2.39 where the traces of CODSincreased monotonically as a function of time during an observation periodof 1.5 ms.
Figure 2.39 is helpful in understanding the transmission of informa-tion from one point in the specimen to the other. The increase in the COD
2v,, whose measurement point is closer to the crack tip than that for 2v ,3started to occur 44 ps after the oscilloscope trigger. The increase in
the 2v, displacement occurred 136 ps after the trigger. The distance be-tween these two points where displacement measurements were made is 8 cm,as shown in Fig. 2.36. Thus, the information transmission speed is 935
m/s. Using this speed, the time necessary for the loading point to re-spond to the crack movement is 90 ps. The tins necessary for the new load-ing information to reach the end of specimen is 203 ps. The end of thespecimen, thus, can receive information adjusted to the crack movement at293 ps af ter crack initiation. Assuming an average crack speed of 340m/s, the time required for the crack to run through the specimen is about330 ps. This demonstrates that the crack could receive new loading infor-nation - increased driving force - before the crack propagates through thespecimen. -
.
ORNL-DWG 81-22726 ETDno -
_
i100 -
A CR ACK INITI ATION(WITH NO ARREST)
I-
|
!
;, , , , , ,
,
t 0 100 200 300
2vi 4,n)
~
Fig. 2.3 8. X-Y recorder traces of CODS 2v and 2v, during loading3with bottom-flanged split-D pins.
_, _ _ _ _ . _ . . . . _ .
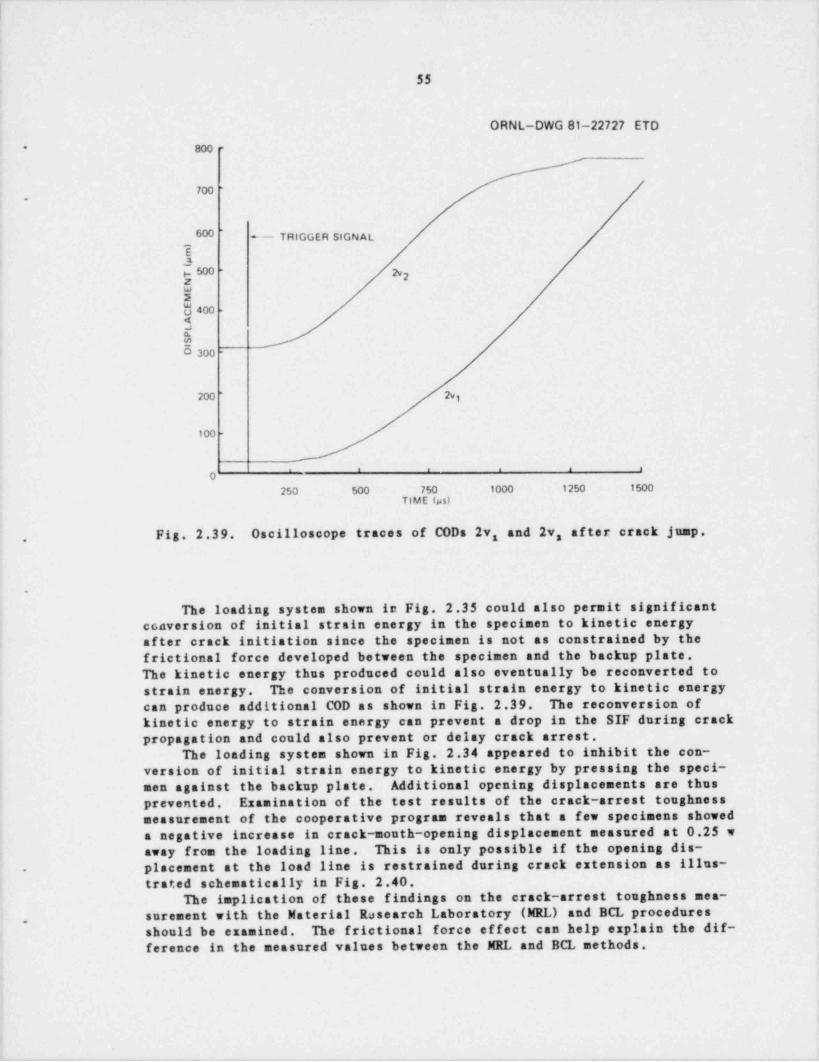
$5
ORNL-DWG 81-22727 ETO
800 **
700 '
,
600 ._-- TRIGGER SIGN AL,
E3p. 500 -
2v252$400 -
5%6 300 -
200"
2vg
100 -
. 1 a , n n
n
250 500 750 1000 1250 1500TIME 4s)
Fig. 2.3 9. Oscilloscope traces of CODS 2v and 2v, af ter crack jump.3.
.
The loading system shown in Fig. 2.35 could also permit significantconversion of initial strain energy in the specimen to kinetic energyafter crack initiation since the specimen is not as constrained by thefrictional force developed between the specimen and the backup plate.The kinetic energy thus produced could also eventually be reconverted tostrain energy. The conversion of initial strain energy to kinetic energycan produce additional COD as shown in Fig. 2.39. The reconversion ofkinetic energy to strain energy can prevent a drop in the SIF during crackpropagation and could also prevent or delay crack arrest.
The loading system shown in Fig. 2.34 appeared to inhibit the con-version of initial strain energy to kinetic energy by pressing the speci-men against the backup plate. Additional opening displacements are thusprevented. Examination of the test results of the crack-arrest toughnessmeasurement of the cooperative program reveals that a few specimens showeda negative increase in crack-mouth-opening displacement measured at 0.25 waway from the loading line. This is only possible if the opening dis-placement at the load line is restrained during crack extension as illus--
trated schematically in Fig. 2.40.The implication of these findings on the crack-arrest toughness mea-
surement with the Material Rusearch Laboratory (MRL) and BCL procedures.
should be examined. The frictional force effect can help explain the dif-
ference in the measured values between the NRL and BCL methods.
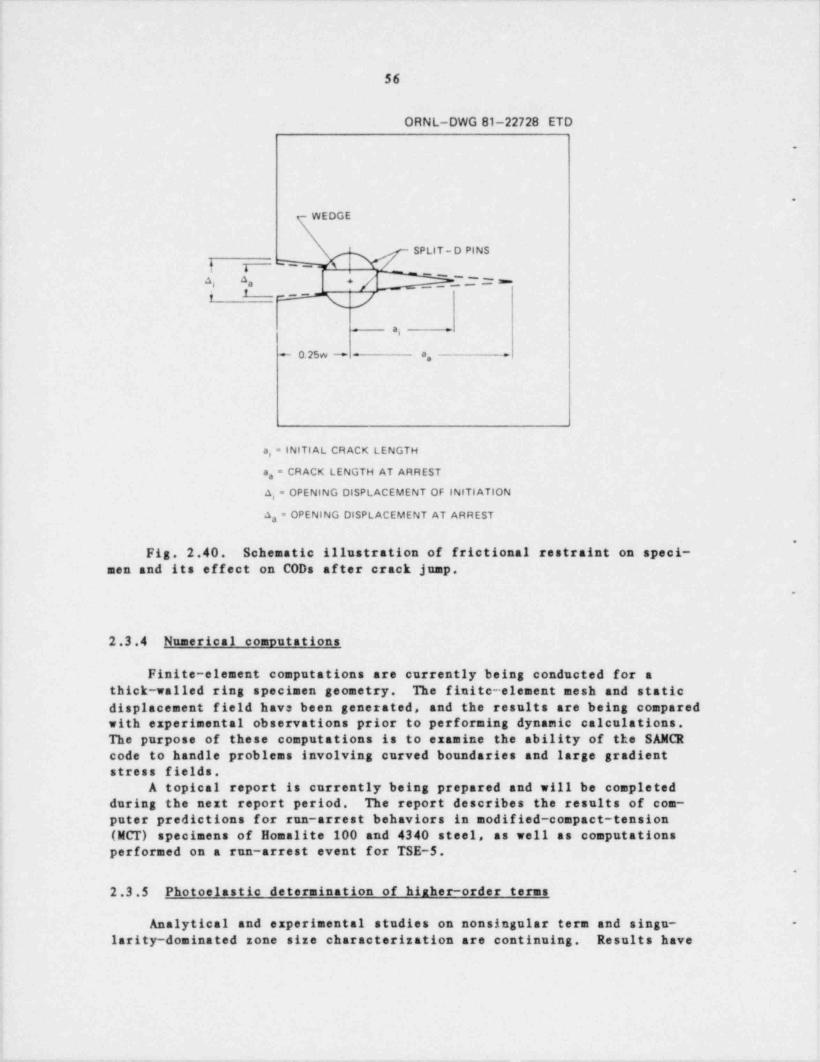
I
$6
ORNL-DWG 81-22728 ETD
.
.
WEDGE
SPLIT-D PINS
I 4
+/ .'.'O*a Oa'+ -v
*e
+ 0.25vv - - a, =
a, = INITI AL CRACK LENGTH
a, = CRACK LENGTH AT ARREST
a, = OPENING DISPLACEMENT OF INITI ATION
a, = OPENING DISPLACEMENT AT ARREST
.
Fig. 2.40. Schematic illustration of frictional restraint on speci-men and its effect on CODS af ter crack jump.
.
2.3.4 Numerical connutations
Finite-element computations are currently being conducted for athick-walled ring specimen geometry. The finite-element mesh and staticdisplacement field have been generated, and the results are being comparedwith experimental observations prior to performing dynamic calculations.The purpose of these computations is to examine the ability of the SAMCRcode to handle problems involving curved boundaries and large gradientstress fields.
A topical report is currently being prepared and will be completedduring the next report period. The report describes the results of com-puter predictions for run-arrest behaviors in modified-compact-tension(MCT) specimens of Homalite 100 and 4340 steel, as well as computationsperformed on a run-arrest event for TSE-5.
.
2.3.5 Photoelastic determination of hither-order terms
Analytical and experimental studies on nonsingular term and singu- -
larity-dominated zone size characterization are continuing. Results have
._.
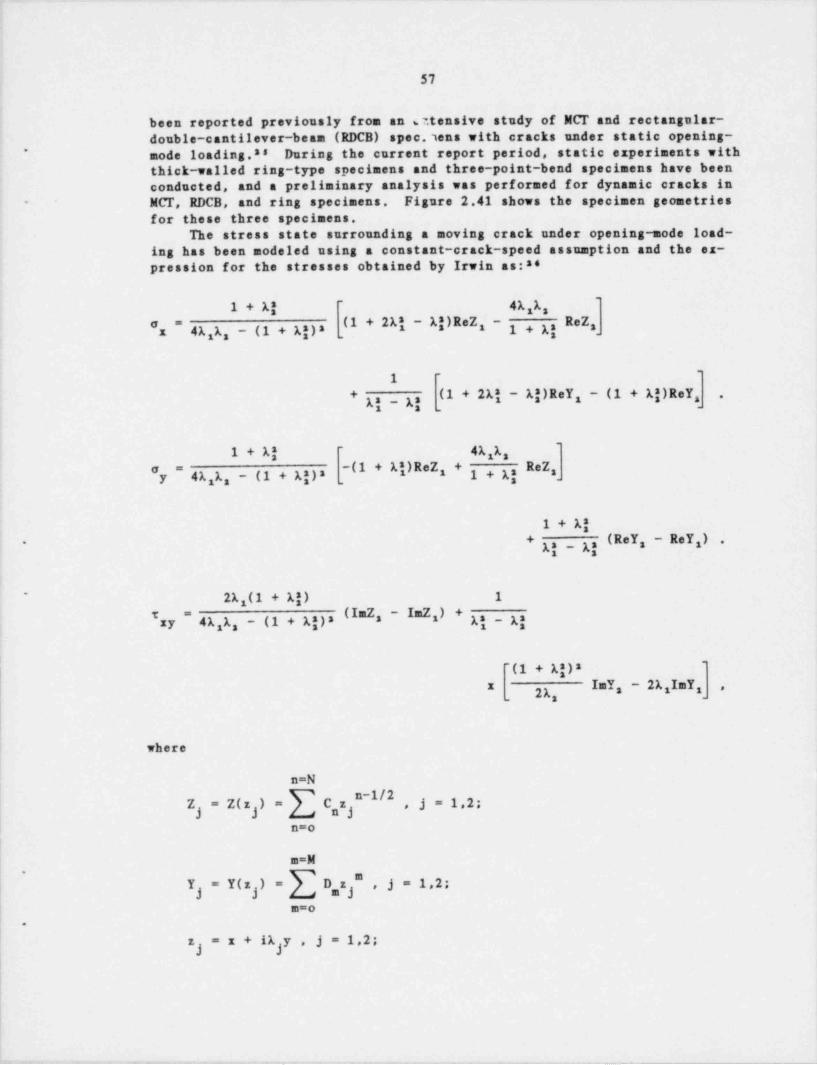
. _ - . -
57
been reported previously from an 7. tensive study of MCT and rectangular-double-cantilever-beam (RDCB) spec.7 ens with cracks under static opening-node loading.ss During the current report period, static experiments with*
thick-walled ring-type specimens and three point-bend specimens have beenconducted, and a preliminary analysis was performed for dynamic cracks inMCT, RDCB, and ring specimens. Figure 2.41 shows the specimen geometries-
for these three specimens.The stress state surrounding a moving crack under opening-mode load-
ing has been modeled using a constant-crack-speed assumption and the ex-pression for the stresses obtained by Irwin as:ss
1 + Aj-
4 A 1,3
x " 4A,A, _ (1 + As}s ,U + 2Ai - Aj meZ, 1 , A| ReZ8 s
1.
-
(1 + 2Aj - Aj) rey - (1 + Aj) rey,+ y,: _q .3
1 + A8 - 4A A,3
-(1 + AiMeZ + ReZ,'y " 4A,1, - (1 + Aj)*,
3,A3
1 + Aj+ y,s _ A, (rey, - rey ) .- 3
s
2A (1 + Aj) 1*
3U"Z - ImZ ) + A _ Aj*xy " 4A,A, - (1 + Aj): s 3
~(1 + A8):-
ImY, - 2A ImY,x 3 ,
2(
where
n=N I
Z) = Z( z ) = C,z "~ , j = 1,2;|y
n=oll
I ==M
Y = Y(z ) = D,z " , j = 1,2;n=o
.
z = x + iA y , j = 1,2;y j
. - . - . _ _ - _ . _ _- .. - - - - - - _ _ _ _ _ _ _ _ . _ - _ _ _ _ _ _ _ _ _ _
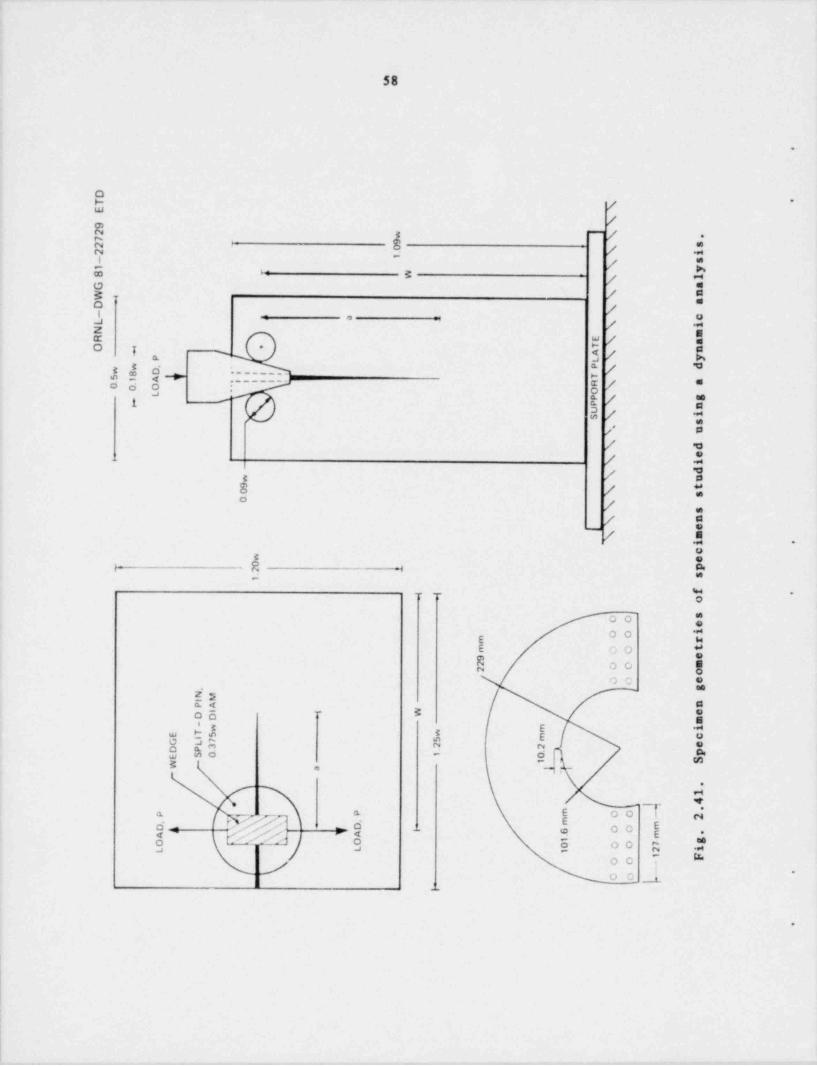
n8t. 0
.
DT \
.
E\9
2 w \|.7 9 s2 0 \2 i
1
- s\ y1
8 W l\G aW \ n
aD \- cL \ iN m\ aR E
TO w A \ ynP Lw P d
w D. ..|e ' \85 1 A .|T
0 O O .
4 ' R \ aOL P \ g
r P nU \ iS s\ u\ d
e\ id
w \ u9 t\0 s0
\ s\ n
e|
\ mi .
cn e0 p2-
s1
| f .
osO O eiO O
m rm OO t9 e2 OO m2 o
OO eN.
gM
PI A nO D
, W eI
m-w m i
T wE 57 5 m c
G IL eD P 3 2 2 pE S O 1 0
1 SW a }
.
14
P P m OO 2\'. I.
Af D. mD, '
A- 6 OO ma (
m .I
\\
YgO 1O 0 OO 7
L 2 iL 1
F1
OO -
- .C O
|
.
.
_
_
__.
_.
_
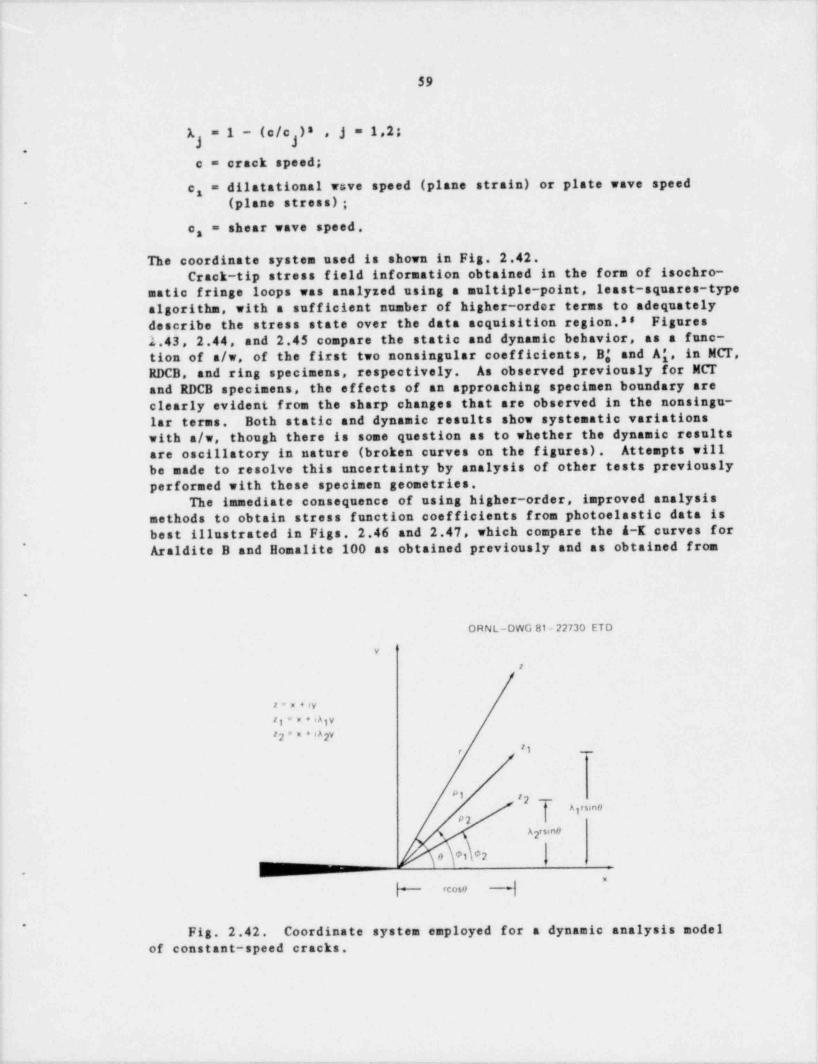
_ - _ - .
59
1 - (c/c )8 1,2;jA == ,jc = crack speed;
dilatational vsve speed (plane strain) or plate wave speedc =1(plane stress) ;-
e, = shear wave speed.
The coordinate system used is shown in Fig. 2.42.Crack-tip stress field information obtained in the form of isochro-
matic fringe loops was analyzed using a multiple point, least-squares-typealgorithm, with a suf ficient number of higher-order terms to adequatelydescribe the stress state over the data acquisition region.ss Figures1.43, 2.44, and 2.45 compare the static and dynamic behavior, as a func-tion of a/w, of the first two nonsingular coefficients, B' and A', in MCT,
RDCB, and ring specimens, respectively. As observed previously for MCTand RDCB specimens, the effects of an approaching specimen boundary areclearly evident from the sharp changes that are observed in the nonsingu-lar terms. Both static and dynamic results show systematic variationswith a/w, though there is some question as to whether the dynamic resultsare oscillatory in nature (broken curves on the figures). Attempts willbe made to resolve this uncertainty by analysis of other tests previouslyperformed with these specimen geometries.
JThe immediate consequence of using higher-order, improved analysismethods to obtain stress function coefficients from photoelastic data isbest illustrated in Figs. 2.46 and 2.47, which compare the A-K curves forAraldite B and Homalite 100 as obtained previously and as obtained from*
.
ORNL-DWG 81-22730 ETD
y
E
- +,y
ig= x +iAgy22**''A2V
'tr --
A f 51n0 <jP2
A '5'no2
0 01 02.
"
dH rcose
~
Fig. 2.42. Coordinate system employed for a dynamic analysis modelof constant-speed cracks.
- - - - ._ _ _-
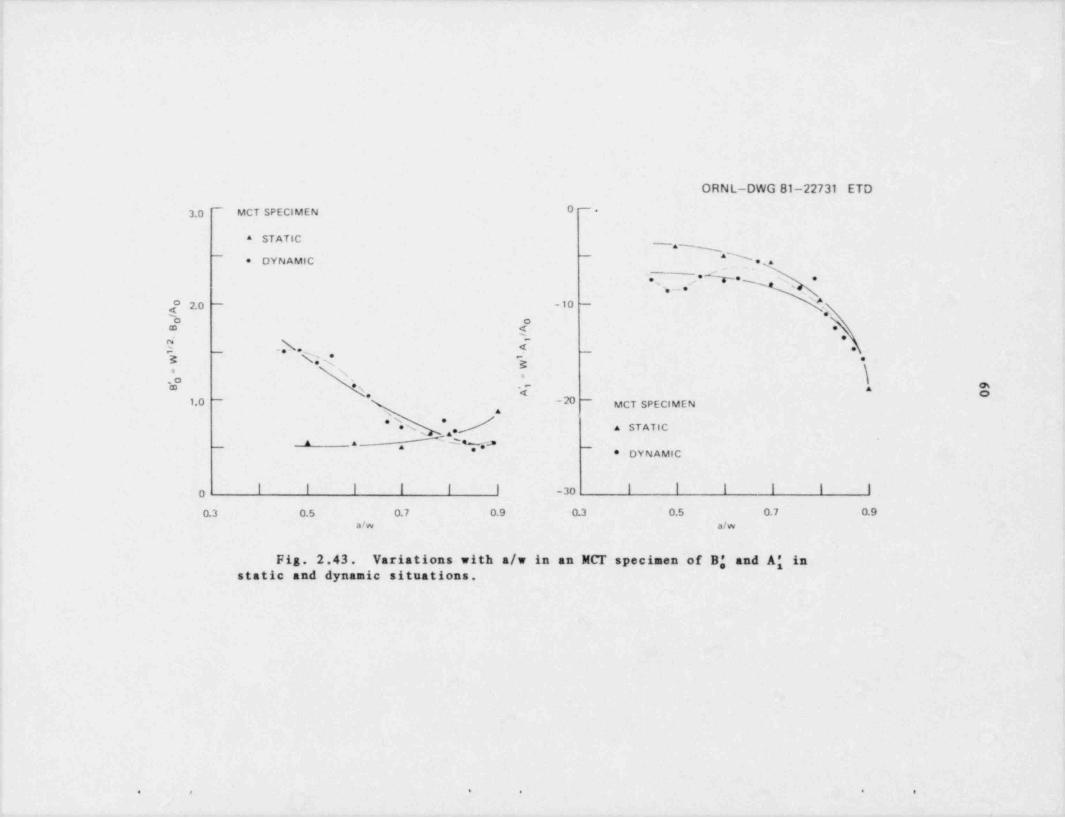
__. . . _ _ _ . _ _ _ _ _ _ . . . _ _ _ ._ _. _ ._. ._ . _ . _ _ . _ _ _ _ . . _ m_. _ . _ . . _..
it
[
11
j
|
ORNL-DWG 81-22731 ETD,
| 3.0 ~ MCT SPECtMEN O.
* STATIC
i-
* OYNAMIC-
~aw, 'N . ..
i '. *%. x .s._.,; - ~
2.0 - -10 -\
.
t4 e.g ,i
m < ., ' .I d .
.h.t << .-
t a , .
\* N.o -
# g** 0%E
1.0 - \. < gCD
- 20 -
MCT SPECIMENas
N A STATIC.sa W 'e v.- _
* DYNAMIC| _
i
l
I I ! ! ! I -30 l | | | | |.
O
0.3 0.5 0.7 0.9 0.3 0.5 0.7 0.9* alw af, .
!
Fig. 2.43. Variations with a/w in an NCT specimen of B; and A' in!
static and dynamic situations.
|.
.
,
,
4
0 I G 8 5
- -_ . . - _ , -
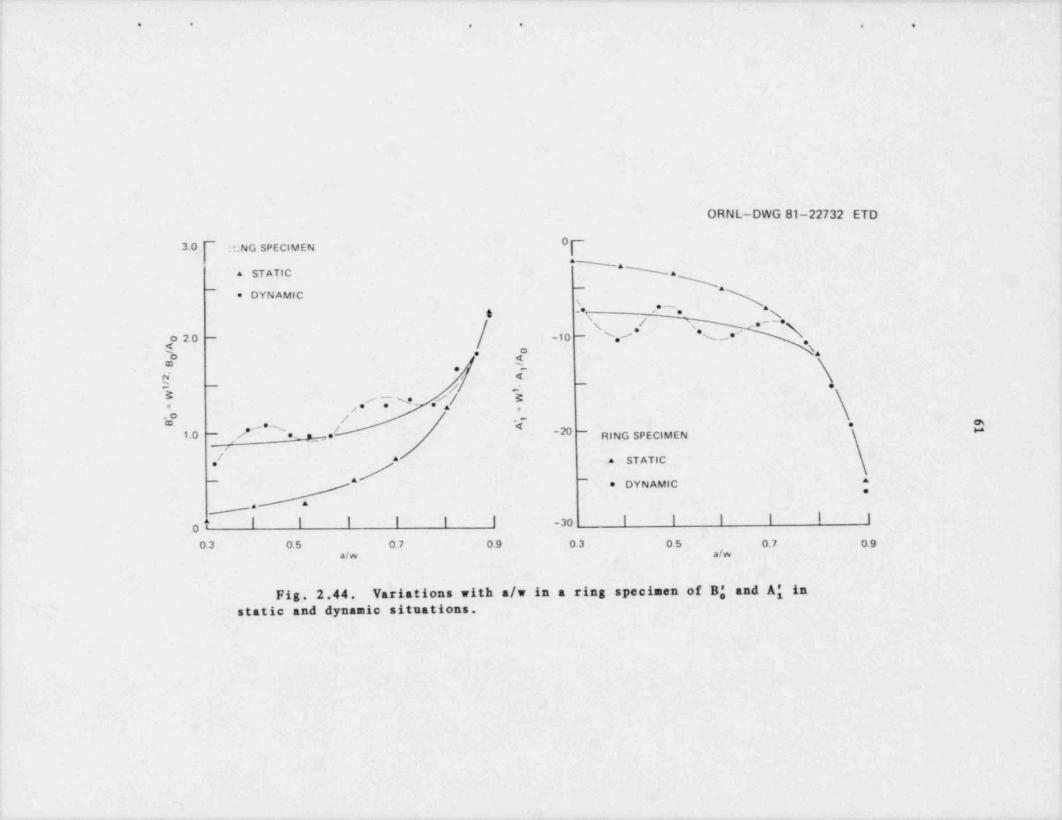
. . - . - _ _ - - - - - .. . - . . - .. . - _ - . _ . . - .
4
* * . . , , ,
d
,
|
ORNL-DWG 81-22732 ETD'
I
O3.0 - UNG SPECIMEN
I _~NN;
i a STATIC,
o DYN AMIC\.* ,''.'4 g A
/ e -eg s
o 2.0 - -10 - N s, 's ,7, e- <
# '.i } e
-
! U.. -.
4/ -g.
.N e'/ E
/.' ;-.
-:- . .1.0 - [e, -20 - RING SPECIMEN |
"e .__s , e-
,
i
# ^ a STATICe
: _ . ./ _
e DYNAMIC ^.
AA
j o" I I I I I | -30 I I I I I I
0.3 0.5 0.7 0.9 0.3 0.5 0.7 0.9a/w a/w
Fig. 2.44. Variations with s/w in a ring specimen of B' and A' instatic and dynamic situations.
i|
.
|'
l
i
.- . - - . _
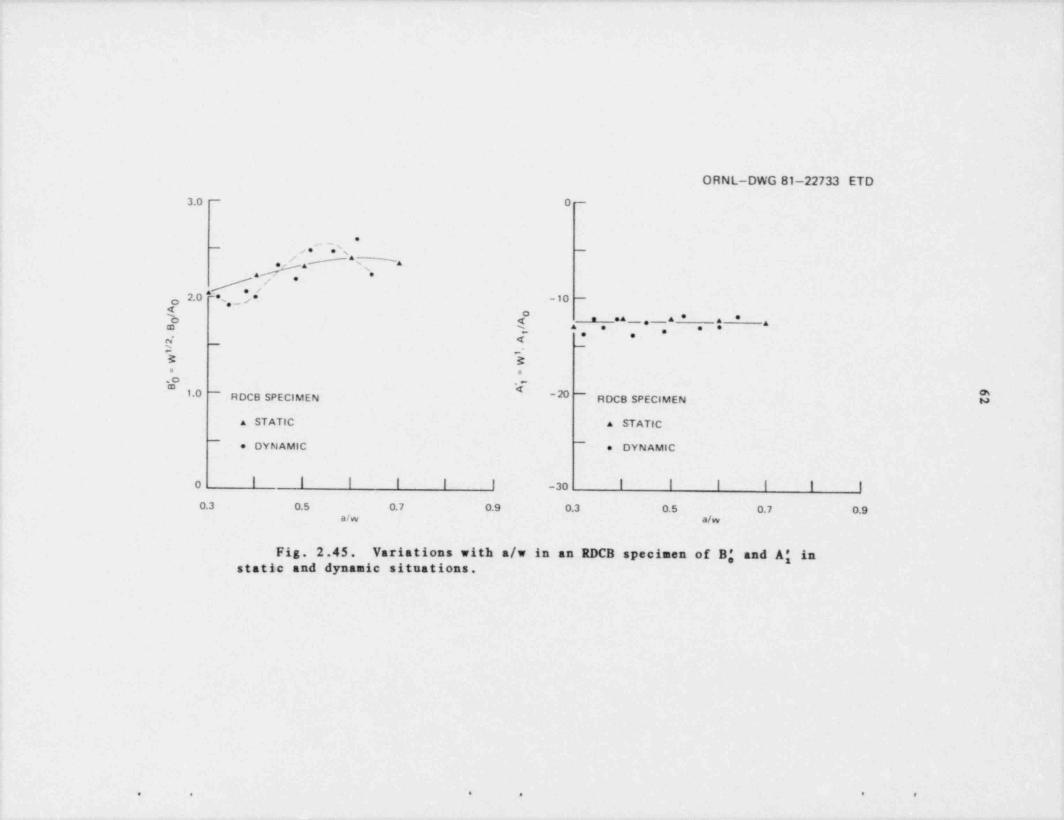
_ . _ _ . _ ____ _ _ . _ _ _ _ . . _ . . . _ _ . . _ . _ . - _ _ _ _ _ . _ . , _ _ _ . _ _ ___
!
i
i
*
ORNL-DWG 81-22733 ETD3.0 - 0-
: - .w' -
i / #^&aI '
a '*/
2.0 * a -10 -o ,, j,
b s . '' - ;' ' :* --a, .
- -
1 -e -
- -
E Ea m
.o .-
1.0 - RDCB SPECIMEN - 20 - ROC 8 SPECIMEN bt
a STATIC a STATIC-
* DYNAMIC~
e DYN AMIC
~!
O l ! ! l I I -30 I I I | | |
0.3 0.5 0.7 0.9 0.3 0.5 0.7 0.9a/w a/w
Fig. 2.45. Variations with m/w in an RDCB specimen of B; and A' instatic and dynamic situations.
!
,
e p 4 a 8 0
.-
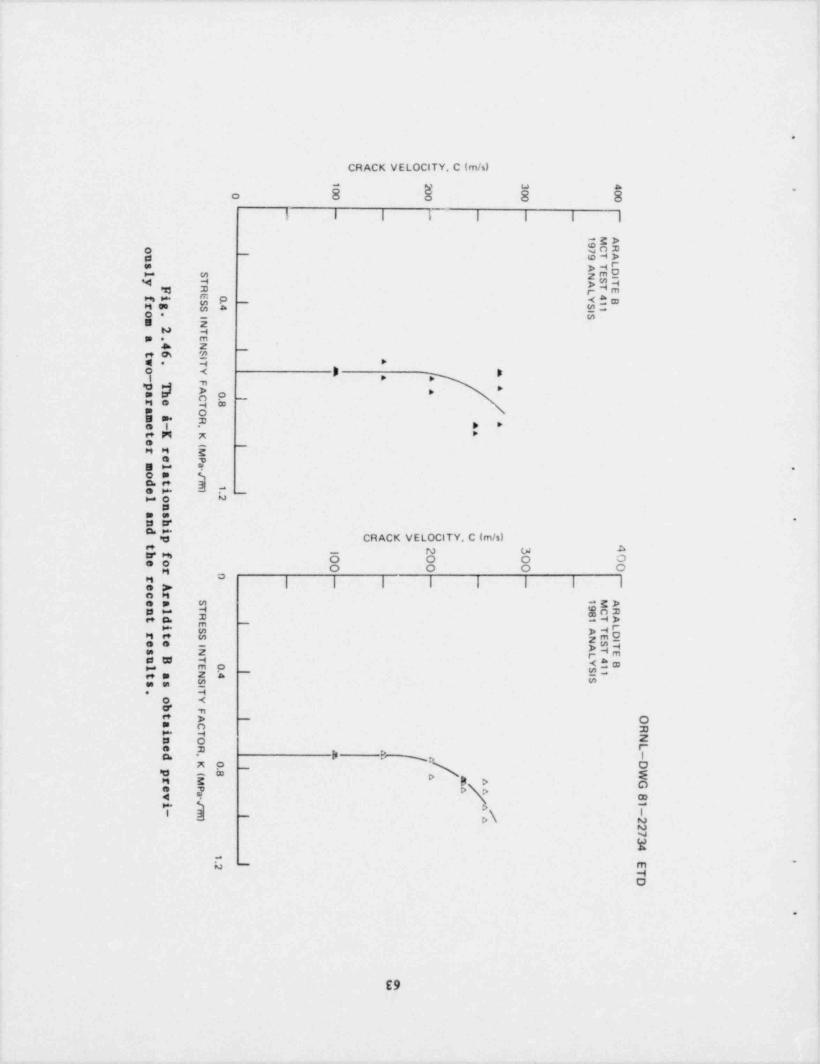
| | 1
.
5 W 2 5 3 3 ">. L i1 2 3 40 0 0 0
., 0 0 0 0
- - - - - - - -
MA1
9 CRo I 9TA7
nLs AT
l S N E DIy T S TA TF R L Efi E 0 I
SY 4 BS .4 I 1
1rg So. I Sm N
a .2 TE
4 N IS
w .6 I
.t
To Y = m- . *
Fp T .Are T 8
|
*ah C 0a Omi ,Re - . .t K K .e ( |
rr Me Pml a
- .
oa /dt 7
t
ei n 1|
l o 2n
as .nhdi
p 5<6 $gGF> ; ,-t
1 2 3 4hf 0 0 0 0eo
r 0 0 0 00r - - _ - - - - -eA
crMAea S 1
nl T 9 CR8t d R
11 TAE Li S ATrt S N E DIee I A TS Ts N L E
uB T Y 4 Bl E 0 1
t a N .4l SI 1
.s I
Ss ST
o Yb Ft A l Oa C Ri Tn O N
Le ,Rm -
,
dK 0 Dp ( 8
l
War M = ^ Ge Pv - ^ /^a 8i / 1
- fi ^p7 -D ^ 2
2734
1..
I E2TD
.
C
.
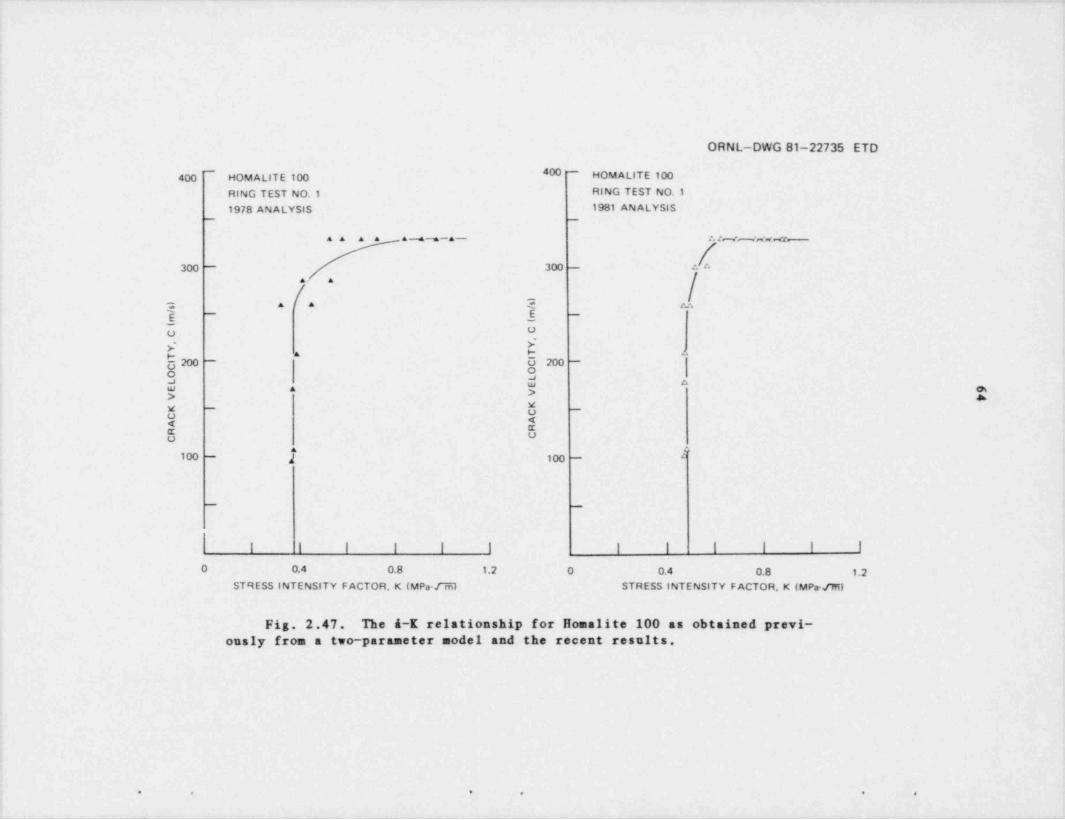
--- .- __ ..
ORNL-DWG 81-22735 ETD
400 - HOMALITE 100400 ~ HOMALITE 100RING TEST NO.1 RING TEST NO. I
1978 ANALYSIS 1981 ANALYSIS- -
ss s a s --s -s -s- t. tawac,e arn
f300 - 300 -
fAA
.. s
. t. , -=2 - s -
.
0U,
y' >p
-ba 4,
g200 200 -
W A S> b
g - 0 -
!<5 o
e A100 - 2 100 - I'
- -
| | | I | | | | | | | |
0 0.4 0.8 1.2 0 0.4 0.8 1.2STRESS INTENSITY FACTOR, K (MPa.f75) STRESS INTENSITY FACTOR, K (MPa /m)
Fig. 2.47. The A-K relationship for Rosalite 100 as obtained previ-onsly from a two parameter model and the recent resnits.
,
.
1
. . . . . .
.
- _ . -
;
65 ;
!
the recent analysis. In both cases, the scatter in the data is substan- |tially reduced, and an A-K relationship for the material is formulated i
with greater confidence. This is of importance for later work, such as~
finite-element crack propagation predictions, which require the material ,
'
1-K as an input quantity. Notice that the curves for Araldite B (Fig.2.46) do not define the plateau region of the curve due to insufficient-
data at high velocities in the particular test analyzed.Static experiments have been completed using a three point-bend speci-
men of standard geometry 1 fabricated from 6.1-am-thick polycarbonate ma-8
terial. The results are crrrently being analyzed to obtain the function,f(a/w), required by the published SIF expressions t,se for this specimen.s
Detailed results will be available during the next report period.
I
References
(' 1. B. R. Bass " Nonlinear Computational Fracture Mechanics," Heavy-
Section Steet Technology Program Quart. Prog. Rep. January-N rcha| 1981, NUREG/CR-2141/V1 (ORNL/TM-7822), pp. 3-10.'
2. B. R. Bass and J. W. Bryson, " Computational Methods for 3-D Nonlinear'
Fracture Mechanics," Heavy-Section Steet Technology Program Quart.Prog. Rep. April-June 1981, NUREG/CR-2141, Vol. 2 (ORNL/TM-7955),pp. 7-10.
'
3. R. G. deLorenzi, On the Energy Release Rate and the J-Integrat for3-D Crack Configurations, TIS Report 80CRD113, General ElectricCompany, Schenectady, N.Y. (June 1980).
,
4. K. J. Bathe, ADINA - A Finite Element Program for Automatic DynamicIncremental Nonlinear Analysis, Report 82448-1, Mechanical Engineer-
| ing Department, Massachusetts Institute of Technology (May 1977).
5. R. S. Barsoum, " Triangular Quarter-Point Elements as Elastic andPerfectly-Plastic Crack Tip Elements," Int. J. Numer. MethodaEngr. 11, 85-98 (1977).
6. L. E. Hulbert, " Benchmark Problems for Three-Dimensional Fracture
j Analysis," Int. J. Fract. 13, 87-91 (1977).
7. J. J. McGowan et al., Comparison of Numerical Solutions to the Sur-face Flawed Plate: Benchmark Problem 1, Society for Experimental
I Stress Analysis, Fracture Committee (November 1979).
8. J. W. Bryson, B. R. Bass, and R. H. Bryan, " Determination of K-Fac-- tors for Surface Flaws in Cylinders Under Combined Pressure-Thermal
Loading," Heavy-Section Steet Technology Program Quart. Prog. Rep.Octcher-December 1980, NUREG/CR-1941 (ORNL/NUREG/TM-437), pp. 3-11.
.
. - - - - - - - - - r ,- . , , , - . -+ , _ , , - - . - - - - - - - - - - - ,nn,,,n,--- .----v--,. - - - , . - - , - - - - - - - - - - - - - - - - - ,
66
9. R. D. Cheverton, S. K. Iskander, and S. E. Bolt, Applicability ofLEFM to Analysis of PWR Vessets Under LOCA-ECC Thermat Shock Condi- .
tions, NUREG/CR-0107 (ORNL/NUREG-40) (1978).
10. A. R. Rosenfield et al., Quarterly Report, Battelle-Columbus HSST,
Support Program for March 1981-May, 1981.
11. W. K. Wilson and I. W. Yu, "The Use of the J-Integral in ThermalStress Crack Problems," Inc. J. Fract. 15, 377-387 (1979).
32. K. Kishimoto, S. Aoki, and M. Sakata, " Dynamic Stress Intensity Fac-tors Using J-Integral and the Finite Element Method," Eng. Fract.Nech. 13, 387-394 (1980).
13. A. R. Rosenfield and D. K. Shetty, " Lower-Bound Fracture Toughnessof a Reactor-Pressure-Vessel Steel," Eng. Frect. Mech. 114, 833-42(1981).
14. W. Seidi, " Specimen Size Effects on the Determination of E ,-Valuesgin the Range of Elastic-Plastic Material Behavior," Eng. Fract. Nach.12, 581-597 (1979).
15. C. E. Turner, "A J-Based Engineering Usage of Fracture Mechanics,"pp. 1167-1189 in Advances in Fracture Research, D. Francois et al.(Eds.), Pergamon Press, Oxford, 1981.
.
16. F. J. Witt, "The Equivalent Energy Method: An Engineering Approachto Fracture," Eng. Fract. Nech. 14, 171-187 (1981).
.
17. Welding Research Council, PVRC Recommendations on Toughness Require-ments for Ferritic Naterials, Bulletin 175 (1972).
18. A. R. Rosenfield et al., Critical Experiments, M'easurements, andAnalyses to Establish a Crack Arrest Methodology for Nuclear PressureVesset Stests, NUREG/CR-1887 (BMI-2071) (1981).
19. MIL-HDBK-5C, Military Standardization Handbook, Metattic Materiateand Elements for Aerospace Vehicle Structures, AFML-MIE, Wright-Patterson AFB, Ohio (1978).
20. P. B. Crosley et al., Final Report on Cooperative Test Program onCrack Arrest Toughness Measurement (to be issued by NRC).
21. G. T. Hahn, R. G. Hoagland, and R. D. Cheverton, " Crack ArrestMethodology for Thick Sections," pp. 1043-1050 in Advances in Frac-ture Research, D. Francois et al. (Eds.), Pergamon Press, Oxford, .
1981.
22. R. D. Cheverton et nl., Application of Crack Arrest Theory to a~
Thermat Shock Experiment, ASTM STP 711, pp. 392-421 (1980).
__ ___ - . - - - _. _. _ _ _ ._ .
|
I
67
23. A. R. Rosenfield et al., Critical Experiments, Neasurements, andAnalyses to Establish a Crack-Arrest N'ethodology for Nuclear-Pressure.
Fesset Stests, NUREG/CR-1555 (BMI-2046) (1980).
24. R. D. Cheverton, " Experimental Verification of Behavior of SurfaceFlaws in Thick-Wall Cylinders During Thermal Shock: TSE-5 and TSE-.
5A," paper presented at 8th Water Reactor Safety Research InformationMeeting, Gaithersburg, Md. (1980).
25. R. J. Sanford et al., " A Photoelastic Study of the Influence ofNon-Singular Stresses in Fracture Test Specimens," Report to ORNL-BSST Program by University of Maryland Photomechanics Laboratory,March 1981.
26. G. R. Irwin, " Lecture Series on Fracture Mechanics," IPST, Universityof Maryland, 1980.
27. ASTM Standard E-399, Annual Book of ASTM Standards," Part 10 (1980).
28. J. E. Srawley, " Wide Range Stress Intensity Factor Expressions forASTME-399 Standard Fracture Toughness Specimens," Int. J. Fract.12,475-476 (1976).
.
6
e
.
_ _ _
r
68
3. INVESTIGATION OF IRRADIATED MATERIALS
.
3.1 Second and Third 4T Connact-Soecimen Irradiation Study
R. G. Berggren Randy K. Nanstad -
F. W. Stallman
The Second and Third 4T CS Irradiation Experiments contained fracture-
toughness specimens of seven low-upper-shelf weldments. The CVN test re-suits for these experiments were reported in the previous quarterly.1Since the test specimens had been exposed to varied fast neutron fluencesand temperature histories, the test results were grouped by fast neutronfluence and median irradiation temperature and estimated irradiation-induced transition temperature shifts and upper-shelf energy decreases.Graphical analyses of the effects of irradiation temperature did not re-veal any consistent trends. Currently, statistical analyses of the CVNdata are being conducted with the CVN transition and upper-shelf data be-ing analyzed separately. For the priment, it is assumed that the fractureenergy-test temperature relationship is linear in the transition and upper-shelf regions. The data sets used in the transition temperature analysesinclude only tests for which fracture energies were between 20 and 80%of the upper-shelf energies and in the upper-shelf analyses include onlytests in which there was no indication of any fast load-drop. At thepresent level of sophistication in the analysis, irradiation temperature,fast neutron fluence, and copper content are considered as independent,
-
linear components contributing to irradiation embrittlement. Analyticalresults are encouraging, but the available data set may not permit agreater level of analytical sophistication. Results of the analyses areexpected to be reported in the next quarterly report. -
3.2 Fourth HSST Irradiation Series
J. W. Woods R. G. Berggren
T. N. Jones Randy K. Nanstad
Irradiation of the third capsule of this series continued throughthis quarter. Irradiation should be completed in December 1981.
Assembly of the fourth capsule of this series is near completion, andirradiation is expected to start in October 1981.
Reference1
1. R. G. Berggren, R. K. Nanstad, and T. N. Jones, " Investigation of .
Irradiated Materials," Heavy-Section Steet Technology Program Quart.Prog. Rep. Aprit, Tune 1982, NUREG/CR-2141, Vol. 2 (ORNL/TM-7955) ,pp. 53-56. ,
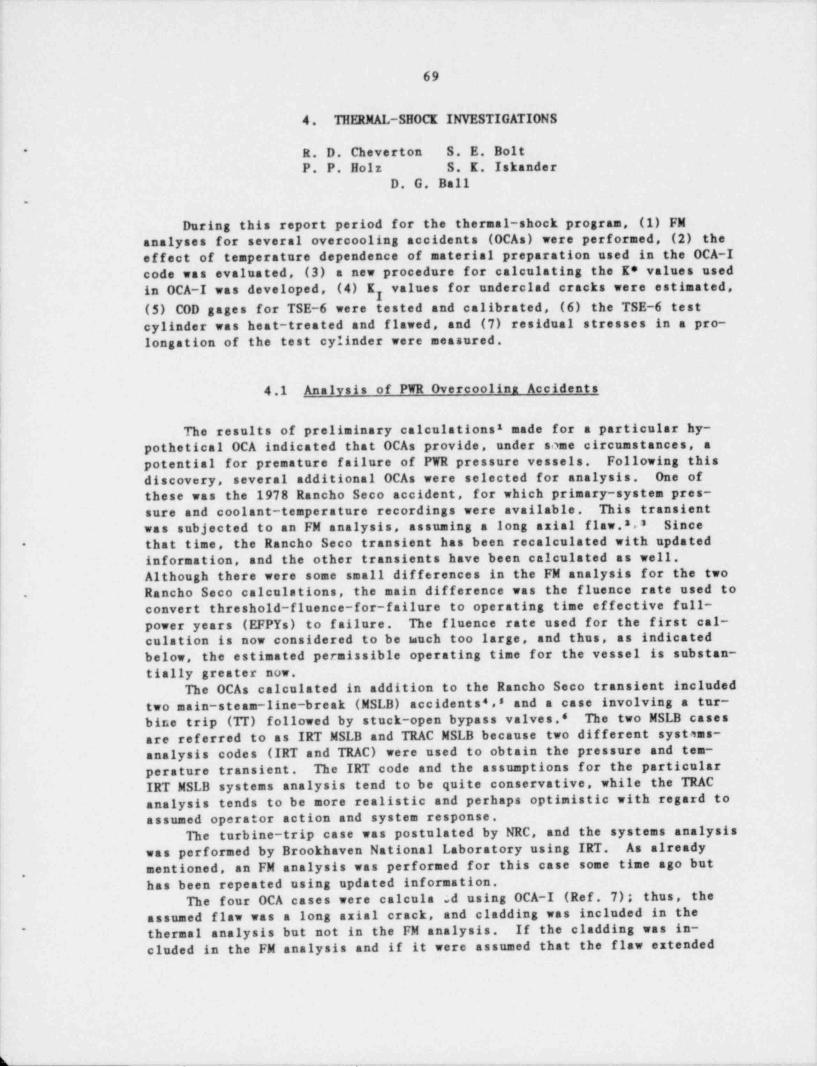
. _ _ .
69
4. THERMAL-SHOCK INVESTIGATIONS
R. D. Cheverton S. E. BoltP. P. Holz S. K. Iskander
D. G. Ball.
During this report period for the thermal-shock program, (1) FManalyses for several overcooling accidents (OCAs) were performed, (2) theeffect of temperature dependence of material preparation used in the OCA-Icode was evaluated, (3) a new procedure for calculating the K* values used'
in OCA-I was developed, (4) K values for underclad cracks were estimated,y
i (5) COD gages for TSE-6 were tested and calibrated, (6) the TSE-6 testcylinder was heat-treated and flawed, and (7) residual stresses in a pro-longation of the test cylinder were measured.
,
i 4.1 Analysis of PWR Overcoolina Accidents
|
The results of preliminary calculations * made for a particular hy-
( pothetical OCA indicated that OCAs provide, under some circumstances, apotential for premature failure of PWR pressure vessels. Following thisdiscovery, several additional DCAs were selected for analysis. One ofthese was the 1978 Rancho Seco accident, for which primary-system pres-sure and coolant-temperature recordings were available. This transientwas subjected to an FM analysis, assuming a long axial flaw.8.2 Sincethat time, the Rancho Seco transient has been recalculated with updated-
information, and the other transients have been calculated as well.Although there were some small differences in the FM analysis for the twoRancho Seco calculations, the main difference was the fluence rate used to.
convert threshold-fluence-for-failure to operating time effective full-
power years (EFPYs) to failure. The fluence rate used for the first cal-culation is now considered to be auch too large, and thus, as indicated
|
|below, the estimated permissible operating time for the vessel is substan-tially greater now.
The OCAs calculated in addition to the Rancho Seco transient includedtwo main-steam-line-break (MSLB) accidents 4, s and a case involving a tur-bine trip (IT) followed by stuck-open bypass valves.* The two MSLB casesare referred to as IRT MSLB and TRAC MSLB because two different systems-
| analysis codes (IRT and TRAC) were used to obtain the pressure and tem-perature transient. The IRT code and the assumptions for the particularIRT MSLB systems analysis tend to be quite conservative, while the TRACanalysis tends to be more realistic and perhaps optimistic with regard toassumed operator action and system response.
The turbine-trip case was postulated by NRC, and the systems analysiswas performed by Brookhaven National Laboratory using IRT. As alreadymentioned, an FM analysis was performed for this case some time ago but
.
has been repeated using updated information.The four OCA cases were calcula';d using OCA-I (Ref. 7); thus, the
! assumed flaw was a long axial crack, and cladding was included in thethermal analysis but not in the FM analysis. If the cladding was in-' '
cluded in the FM analysis and if it were assumed that the flaw extended
;
Y-- . - _ - - .- - - _ _ _ _ _ _ _ , _ -__ , _ _,____
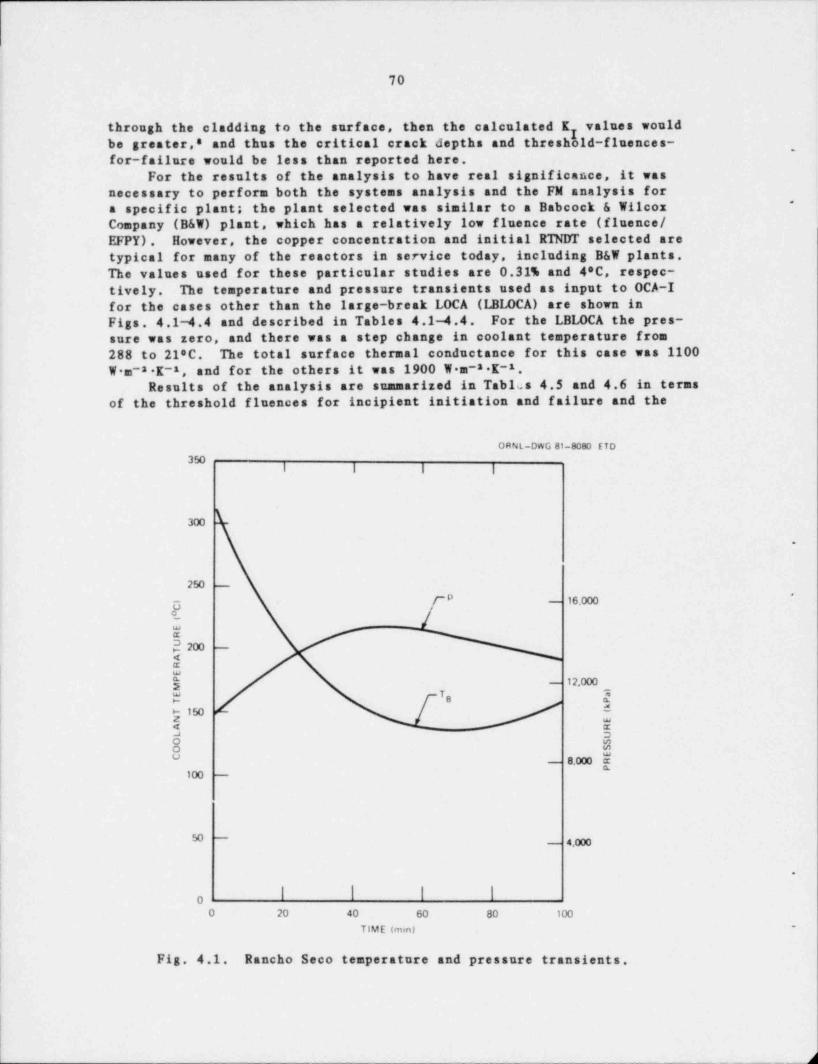
70
through the cladding to the surface, then the calculated K vaines would7
be greater,8 and thus the critical crack depths and threshcid-fluences-,
for-failure would be less than reported here.For the results of the analysis to have real significance, it was
necessary to perform both the systems analysis and the FM analysis for*a specific plant; the plant selected was similar to a Babcock & Wilcox
Company (B&W) plant, which has a relatively low fluence rate (fluence /EFPY). However, the copper concentration and initial RDUT selected aretypical for many of the reactors in service today, including B&W plants.The vaines used for these particular studies are 0.31% and 4*C, respec-
tively. The temperature and pressure transients used as input to OCA-Ifor the cases other than the large-break LOCA (LBLOCA) are shown inFigs. 4.1-4.4 and described in Tables 4.1-4.4. For the LBLOCA the pres-sure was zero, and there was a step change in coolant temperature from
288 to 21*C. The total surface thermal conductance for this case was 1100W m-2 K-1, and for the others it was 1900 W a-8 E-1
Results of the analysis are summarized in Tabics 4.5 and 4.6 in termsof the threshold fluences for incipient initiation and failure and the
ORNL-DWG 81-8080 ETD350
I I I I
300
.
250 -
*
g TP - 16.000
/:E' -
5$ - 12,000
# e 2T
kN"o
o"
- 8.000 $*
100 -
50 -
j- 4,000
l
.
,
00 20 40 60 80 100
| TIME (mm)-
t
|Fig. 4.1. Rancho Seco temperature and pressure transients,
li
/
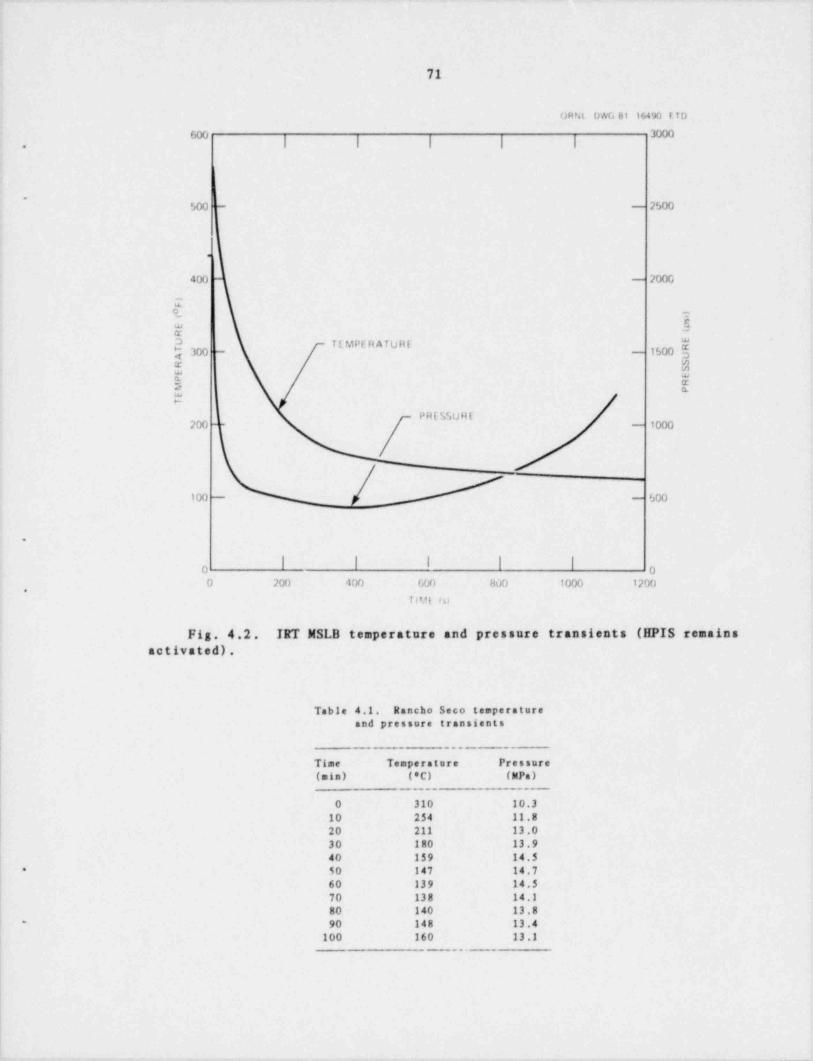
71
ORNL OWG81 16490 E TD
" *l I I I I.
.
500 - - 2500
.
400 - 2000
Co- =
$
$ 300 -TE MPE H ATURE $3
- 1500 3* $t wD E
PRESSUHE200 - - 1000
100 - - 500
.
0 00 200 400 W) 800 1000 1200
,
Tivt au
Fig. 4.2. IRT MSLB temperature and pressure transients (HPIS remainsactivated).
Table 4.1. Rancho Seco temperatureand pressure transients
!..
Time Temperature Pressure(min) ('C) (MPs)
- __
0 310 10.310 254 11.820 211 13.030 180 13.940 159 14.510 147 14.7*
60 139 14.570 138 14.180 140 13.890 148 13.4*
100 160 13.1..
I
_ _ _ _ _

72
Table 4.2. IRT main-steam-line-breaktemperature and pressure transients
,
[high pressure injection system(HPIS) remains activated]
.
rg- r;:g*- "::''::(MPa)
0 291 14.8781 291 14.7495 268 13.545
10 249 11.56315 248 9.93020 249 9.12725 243 8.38930 237 7.62735 225 6.23940 214 5.24145 203 5.12650 191 5.00060 165 4.75170 150 4.48380 148 4.21090 144 3.989
100 143 3.858120 136 3.657 .
140 128 3.541| 160 123 3.610
180 117 3.571,
200 106 3.499220 98 3.432240 92 3.364260 87 3.298280 82 3.233300 78 3.169
| 350 73 3.026| 400 70 2.963
450 68 3.057500 66 3.167550 64 3.299600 62 3.455650 61 3.637700 59 3.852750 57 4.103800 57 4.395850 56 4.736900 55 5.151950 54 5.644 -
1000 53 6.2321050 53 6.9391103.58 53 7.859 _
1123.18 53 8.245
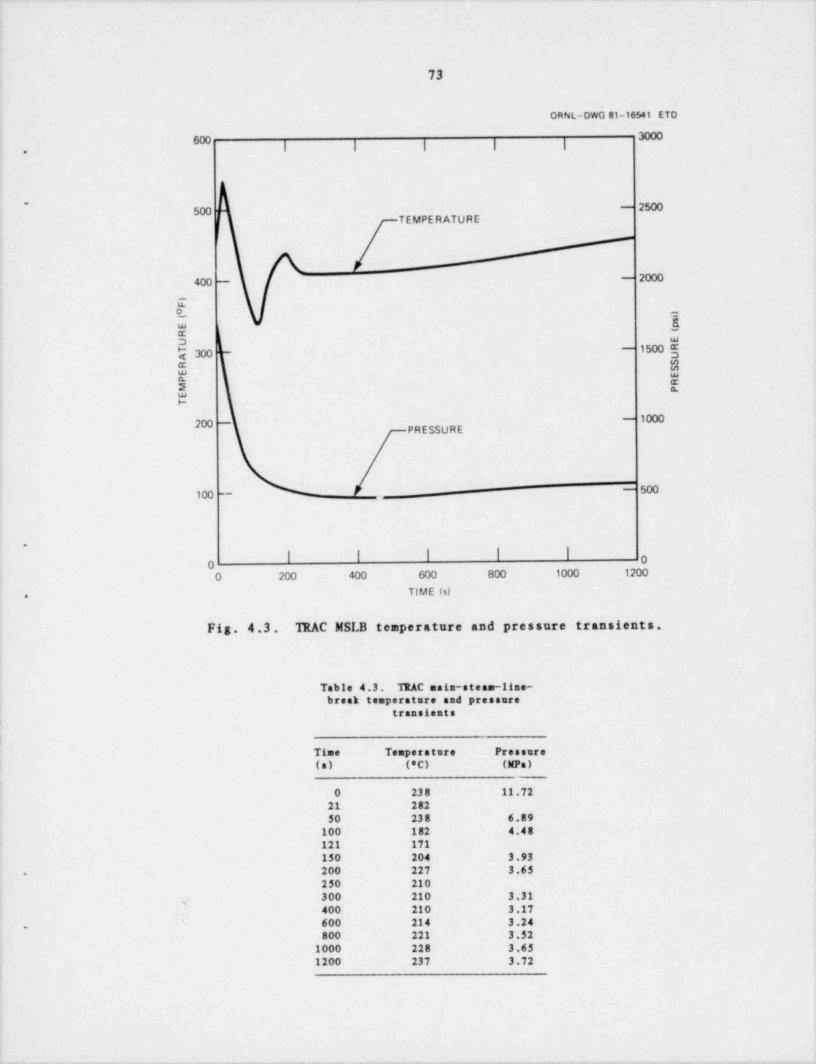
73
ORNL-OwG 81-16541 ETO
6I I I I I.
.2500-500'
TEMPE R ATU RE
400 -- 2000
C9L _
E w3y 300 - i5m g5 12
& E'
PRESSUR E
100 -- 500
.
000 200 400 000 800 1000 1200
TIME (s)e
Fig. 4.3. IRAC MSLB temperature and pressure transients.
Table 4.3. TRAC main-steam-line-break temperature and pressure
transients
|Time Temperature Pressure(s) ('C) (MPa)
0 238 11.7221 28250 23 8 6.89
100 182 4.48121 171150 204 3.93200 227 3.65.
250 210300 210 3.31
,
400 210 3.17. 600 214 3.24-
800 221 3.521000 228 3.651200 237 3.72
__ , _ _
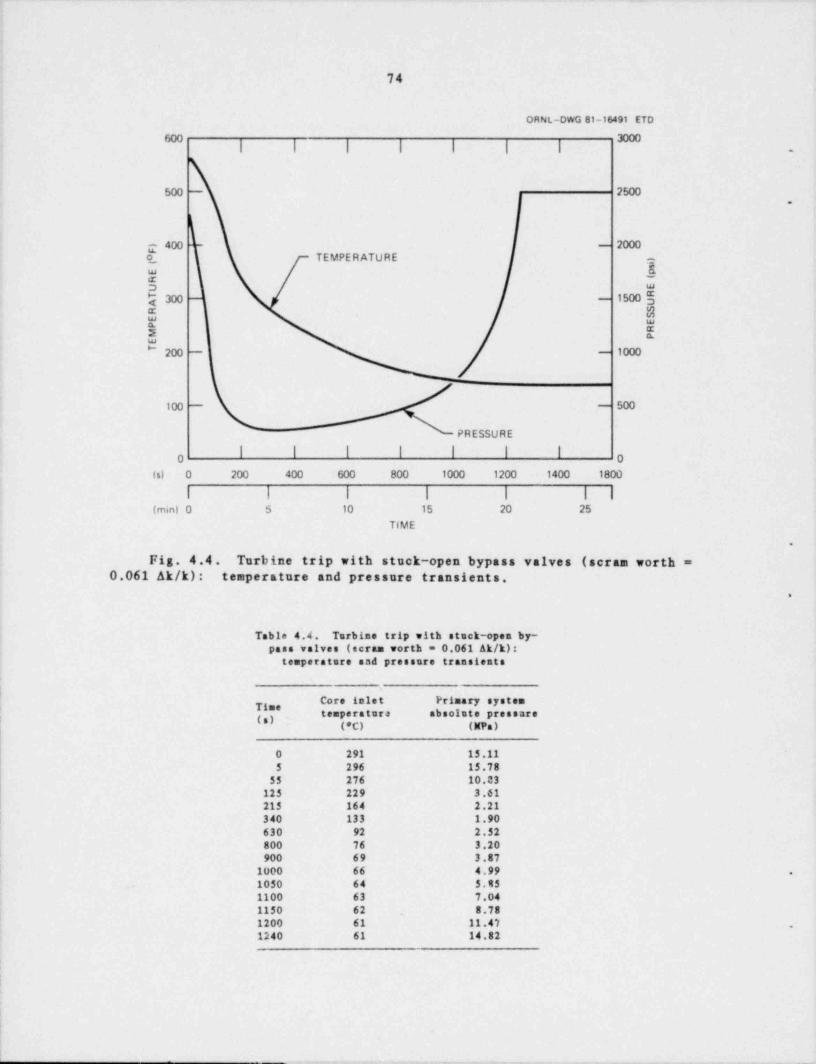
74
ORNL-DWG 81-16491 ETD
* "I I I I I | | -
500 - 2500,
c 400 - 2000o_ TEMPE R ATU R E e
IE3 w
Q 300 - 1500$t2=
E "s tw* 200 - - 1000
100 - - 500
PRESSURE
'O 0
(s) 0 200 400 600 800 1000 1200 1400 1800
I I I I I I I(min) 0 5 10 15 20 25
TIME
.
Fig. 4.4. Turbine trip with stuck-open bypass valves (scram worth =0.061 Ak/k): temperature and pressure transients.
.
Table 4.4. Turbine trip with stack-open by-pass valves (scram worth = 0.061 Ak/k):
temperature sad pressure transients
I
! Core inlet Primary systemTime
; temperature absolute pressureg,)' ('C) (NPa)
0 291 15.115 296 15.78
55 276 10.23125 229 3.61215 164 2.21
| 340 133 1.90'
630 92 2.52800 76 3.20900 69 3.87
1000 66 4.99 .
1050 64 5.851100 63 7.041150 62 . 8.781200 61 11.47 .
1240 61 14.82
|
|
||
t. __ _ _ _ ___
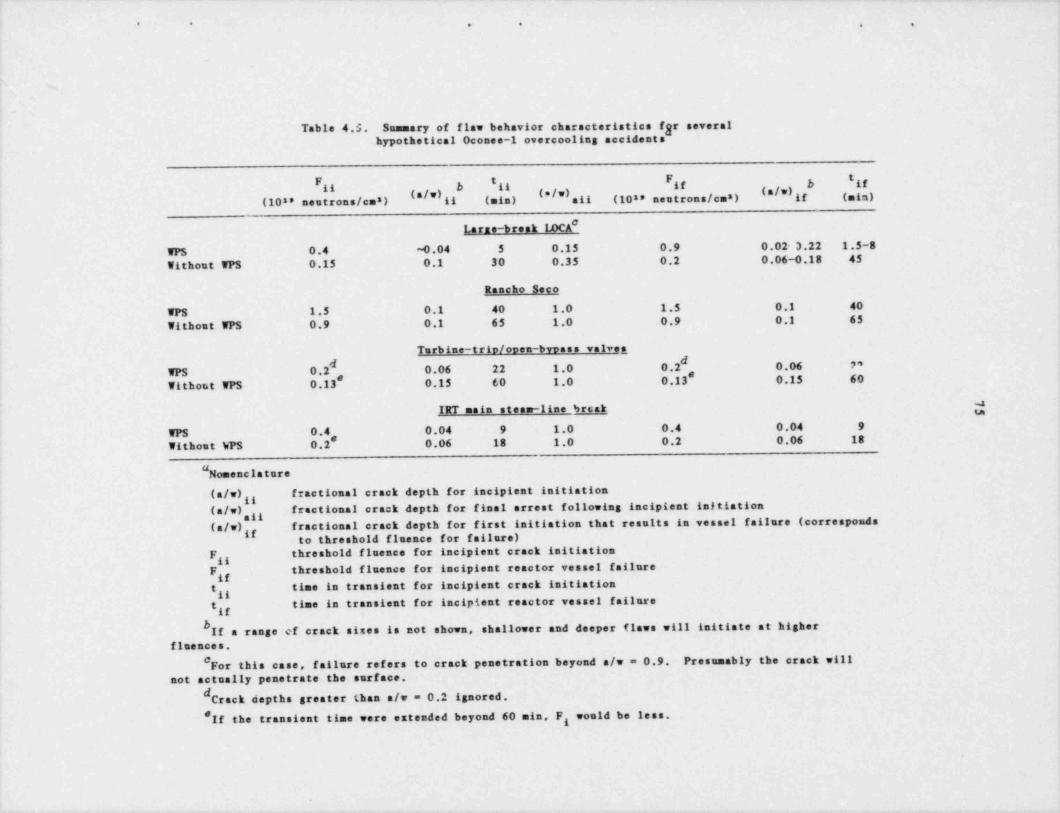
_ _ _ _ _ _ _ _ _ _ _ _ - _ _ _ _ _ . _ _ _ _ _ _ _ _ . _ _-_ _ _ _ _ _ _ _ - . _ -
' * . . , ,
.,.
Table 4.5. Sammary of flaw behavior characteristics fgr severalhypothetical Oconee-1 overcooling accidents
11 b *11 if b if
(10" neutrons /cm8) * ' 11 (min) ''ali (10** neutrons /cm*) if (min)*
#Larne-break 1DCA
WPS 0.4 4).04 5 0.15 0.9 0.02 3.22 1.5-8
Without WPS 0.15 0.1 30 0.35 0.2 0.06-0.18 45
Rancho Seco
WPS 1.5 0.1 40 1.0 1.5 0.1 40
Without WPS 0.9 0.1 65 1.0 0.9 0.1 65
Turbine-trio /onen-byness valves
WPS 0.2 * 0.06 22 1.0 0.2 0.06 ?*#
Without WPS 0.13 0.15 60 1.0 0.13 0.15 60
-8IRT main steam-line break
WPS 0.4 0.04 9 1.0 0.4 0.04 9
Without hPS 0.2 0.06 18 1.0 0.2 0.06 18#
" Nomenclature
(a/w)gg fractional crack depth for incipient initiation
(a/w) g fractional crack depth for final arrest following incipient initiation
(a/w)gg fractional crack depth for first initiation that results in vessel failure (correspondsto threshold finance for failure)
F threshold H uence for incipient crack initiationgg
F threshold fluence for incipient reactor vessel failureg
t time in transient for incipient crack initiationg
t time in transient for inciM ent reactor vessel failuregg
bIf a range of crack sizes is not shown, shallower and deeper flaws will initiate at higherfloences.
For this case, failure refers to crack penetration beyond a/w = 0.9. Presumably the crack will#
not actually penetrate the surface.dCrack oopths greater than a/w = 0.2 ignored.# If the transient time were extended beyond 60 min, F would be less.g
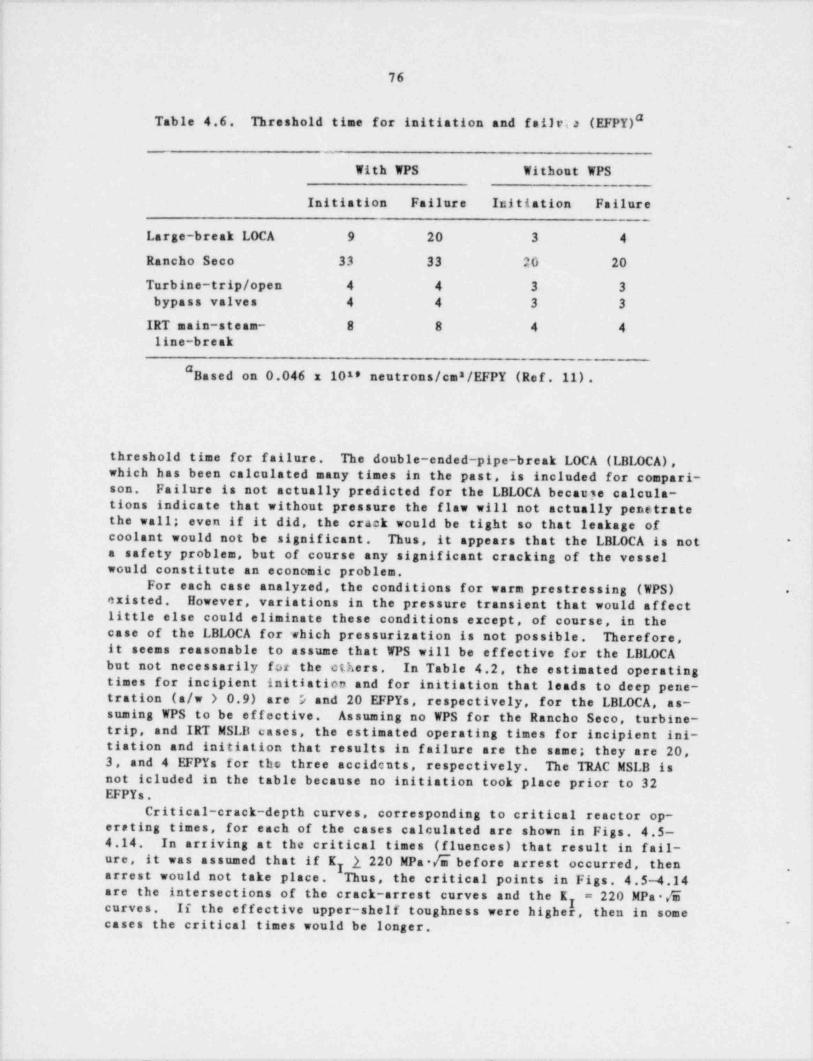
_ -
76
Table 4.6. Threshold time for initiation and failvsa (EFPY)".
With WPS Without WPS|
*Initiation Failure Initiation Failure
Large-break LOCA 9 20 3 4
Rancho Seco 33 33 20 20
Turbine-trip /open 4 4 3 3 )bypass valves 4 4 3 3
;
IRT main-steam- 8 8 4 4 l
line-break
" Based on 0.046 x 10¹⁸ neutrons /cm8/EFPY (Ref. 11),
threshold time for failure. The double-ended pipe-break LOCA (LBLOCA),which has been calculated many times in the past, is included for compari-son. Failure is not actually predicted for the LBLOCA becau3e calcula-tions indicate that without pressure the flaw will not actually penetratethe wall; even if it did, the crack would be tight so that leakage ofcoolant would not be significant. Thus, it appears that the LBLOCA is not *
safety problem, but of course any significant cracking of the vessela
would constitute an economic problem.For each case analyzed, the conditions for warm prestressing (WPS) -
existed. However, variations in the pressure transient that would affectlittle else could eliminate these conditions except, of course, in thecase of the LBLOCA for which pressurization is not possible. Therefore,it seems reasonable to assume that WPS will be effective for the LBLOCA
; but not necessarily for the others. In Table 4.2, the estimated operatingi times for incipient initiation and for initiation that leads to deep pene-
tration (a/w > 0.9) are y and 20 EFPYs, respectively, for the LBLOCA, as-| suming WPS to be effective. Assuming no WPS for the Rancho Seco, turbine-| trip, and IRT MSLB cases, the estimated operating times for incipient ini-! tiation and initiation that results in failure are the same; they are 20,
3, and 4 EFPYs for the three accidents, respectively. The TRAC MSLB isnot icluded in the table because no initiation took place prior to 32EFPYs.
| Critical-crack-depth curves, corresponding to critical reactor op-'
creting times, for each of the cases calculated are shown in Figs. 4.5-4.14. In arriving at the critical times (fluences) that result in fail-ure, it was assumed that if K 1220 MPa */m before arrest occurred, then,
7 .
| arrest would not take place. Thus, the critical points in Figs. 4.5-4.14'
are the intersections of the crack-arrest curves and the K = 220 MPa * /mycurves. If the effective upper-shelf toughness were higher, then in somecases the critical times would be longer. ,
_ _
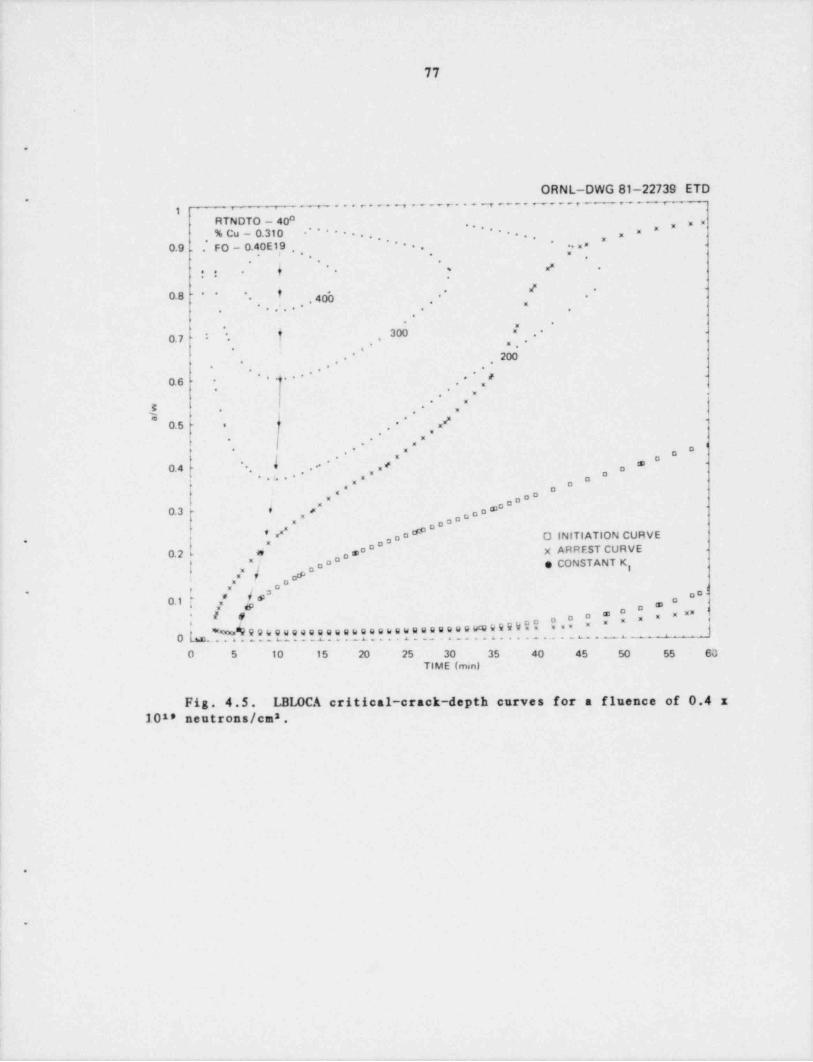
.
77
.
ORNL-DWG 81-22739 ETD.
_ , .....~w.-.....m-----,- e-- -
0RTNDTO - 40 , ,
% Cu - 0.310 **** ...*** .****...* ""=,"* *
0.9 . FO - 0.40E19 ,. *.. m=. =
. ,. . .
j #* .=.. . .
#t *
,.**
0.8 * * *
,40o ..
=. . .... .. .,
* .,.
0.7 f 300 = ** .
,.. m.-.
s,
200**
. ,., .*"**..- .**0.6 *
* =. ,
=.* "
E ..* =s, *
a"x0.5 e ' *,
,s"*. ,.
I
.- = a*"
l
*.l..',.*,m#"
* a. 8.
0.4 ' a*.
,a O| *
a" o= oo
0.3 - i e" s""o,
ao= a'oa
' , " " o"# 0 INITIATION CURVE,a=o x ARREST CURVE0.2 e ,s
| ,"# o" e CONSTANT K,ot ," ,8
/ !8 o*'
O.1 I sp " i
aax o xxf ( e , x*
0 6.%.k. e s.m . e s e e..s. s..e n e s s e s. s e s s e s e ve k k E W I I E m E o" " " "
kene.. ...... ... 4 . . . c. . . u
.. . ....
O 5 10 15 20 25 30 35 40 45 50 55 63TIME (mm)
[ Fig. 4.5. LBLOCA critical-crack-depth curves for a fluence of 0.4 x
1018 neutrons /cm .8
|
Ii
' .
I
,
i
.
i5
- _ _ - - _ .
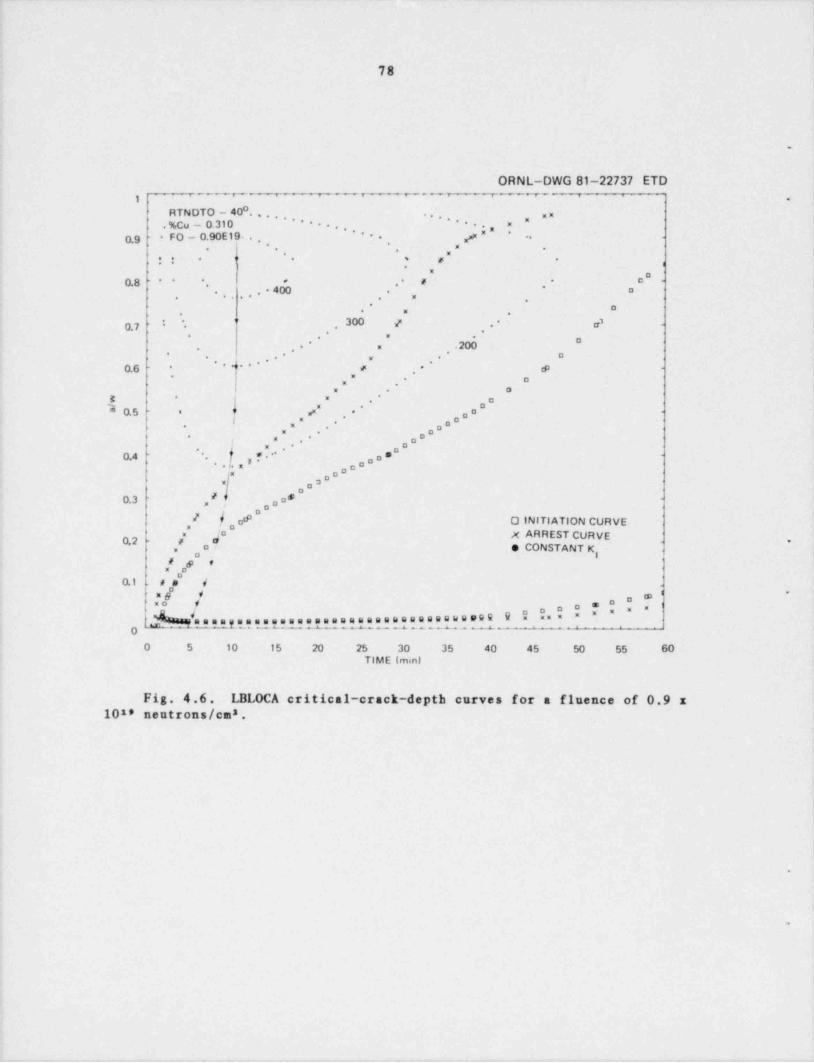
._
78
.
ORNL-DWG 81-22737 ETD--i
-_
'
0
RTN DTO - 40 . . , , , * * . . . * ,,,**.. " ,,=
.%Cu - 0.310 ,
0.9 * FO - 0.90E19. . , **.., p= *..
, s ,. . ,
: : ,-,"*
* ' * .,
=o"0.8 ** * * .- # .
.
. . . 400* a
.....
.. .=
om. ,
I 300 / .. g* "
0.7 - .**
- = .. "* = .200*
. . *,
, - ..' ax .,.- ,1 as ,.
, ,, .- o
* "," .3 . >
o"a"3 a5 ,x" ** .
*
t ," ,. o.
*o",o*,= ...*
= ...
0.4 a.' o,,a*e*. ,y*.
un"D
O
0.3 ,# o""'
# 0 INITI ATION CURVE
0,2 a' a[ , x ARREST CURVE,
*
.' s CONSTANT K'Ia
| ,e so
a1 #e /i=e v @
.
OED I ' 'ammagenessaamasaamenesenessassess99 9 I != 0
i m - - - ' + " - - * - - - - - *,1 0'
O 5 10 15 20 25 30 35 40 45 50 55 60TIME (min)
Fig. 4.6. LBLOCA critical-crack-depth curves for a fluence of 0.9 x10** neutrons /cm .2
i
.
D

_
79
.
ORNL-DWG 81-22738 ETD.- - ---,. ..,..--,... , ,...---,.- . ,- -. . , - - , - _,
RTN DTO - 40 . . . . * * * * . . . , ***...i .. ,*
. % Cu - 0.310 i"' ". FO - 0.15E19.. , ***., ,=..
0.9 ,
.-.. :... . .
.
.
.. . s . ** *
. 6. . , . 400 ...*
.. .
* ..
300* . =. .* *
0.7 * *
.. ...
.200*.
. , **
. . .= .
' * * * * " * "*0.6 ...
.
E . .**e .
*I * *0.5 *.
* .. . .
*
.=. ..
*. =.
t ." *0.4 *,. . =....- , ,
"=
M
0.3 4 , = " gN
, ", |O INITIATION CURVE"
=
,= t X ARREST CURVE."
0.2 4 e CONSTANT K,= 8,
." i,
' #= gj
n
6! 0.1 e 4.
-"
,-, aMM''l p g
gWENEM ENENMM N N M M EM N33 NENBE E Sg NEM EME
i-.-om...m....m_.....u._...........u.0 5 10 15 20 25 30 35 40 45 50 55 60
TIME (min)
i
Fig. 4.7. LBLOCA critical-crack-depth curves for a fluence of 0.15 x
1018 neutrons /cm .8
:
!
,
I
) -
i
i'
i1
1
e
!i
-- - - - - - - - - . _ _ _ _ _ ,, . . . _ , _
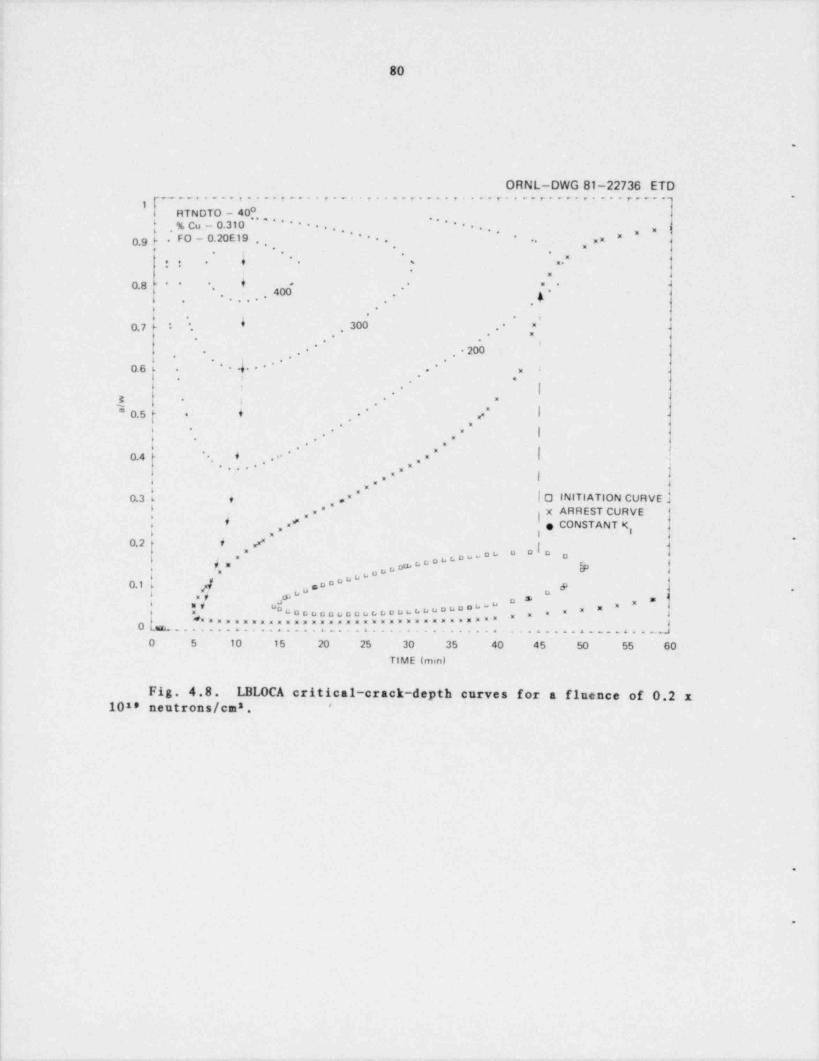
- - - _ . _
80
.
4
ORNL-DWG 81-22736 ETDn--, ...,....,.-...e... .,. . ..r....,. ....r....r..e....r--,.-
1 0
RTN DTO - 40. . . . * * * . . . , ..***..,,; , % Cu - 0.310 , i-
,0.9 p . FO - 0.20E19 . , ,,* .. ,
* ., . ...,
. . ., ,.,
4. . . . . ..' *i .'
(gg . . . . . . .*
, .... 400 ,. ,4-.
[- ..
.
. ...
E
.. 300 ...0.7 F : * '*.
..
,*
200-. . ** *
g ..
*4 **.0.6 $ * *. . . .
l .- -.
I,' ...-, ..
s
./ |' "
4*
O.5 [* -
,,
.. ... -). 6 .
i-
g . ..
4 ." !* '
0.4. . . . . . . ' ,..
*.
.
,.." |,6
b -4... | 0 INITIATION CURVE a. 0.36 ,
( , ,."* g x ARREST CURVEf , . " e CONSTANT Ke
6 . 6 8*
0.2 i"
D|DDLDb"Db D.
-f 00.
0 ub'D6
./, .~".0ai t , .#.
sD , , .
, g . . . . . . . . . . . . . . . . D. D. D. D. D. D. u. b b p h s, L u u g u n D b "4* D D . . * * 4. . . ............... ............g..t. ......... . .. . . .. . ......
i 0 5 10 15 20 25 30 35 40 45 50 55 60'
TIME (mm)
Fig. 4.8. LBLOCA critical-crack-depth curves for a finence of 0.2 x10ss neutrons /cm8 '
,
i
i. .
|,
.
|
,
___ , , _ . . _ . - __ ._
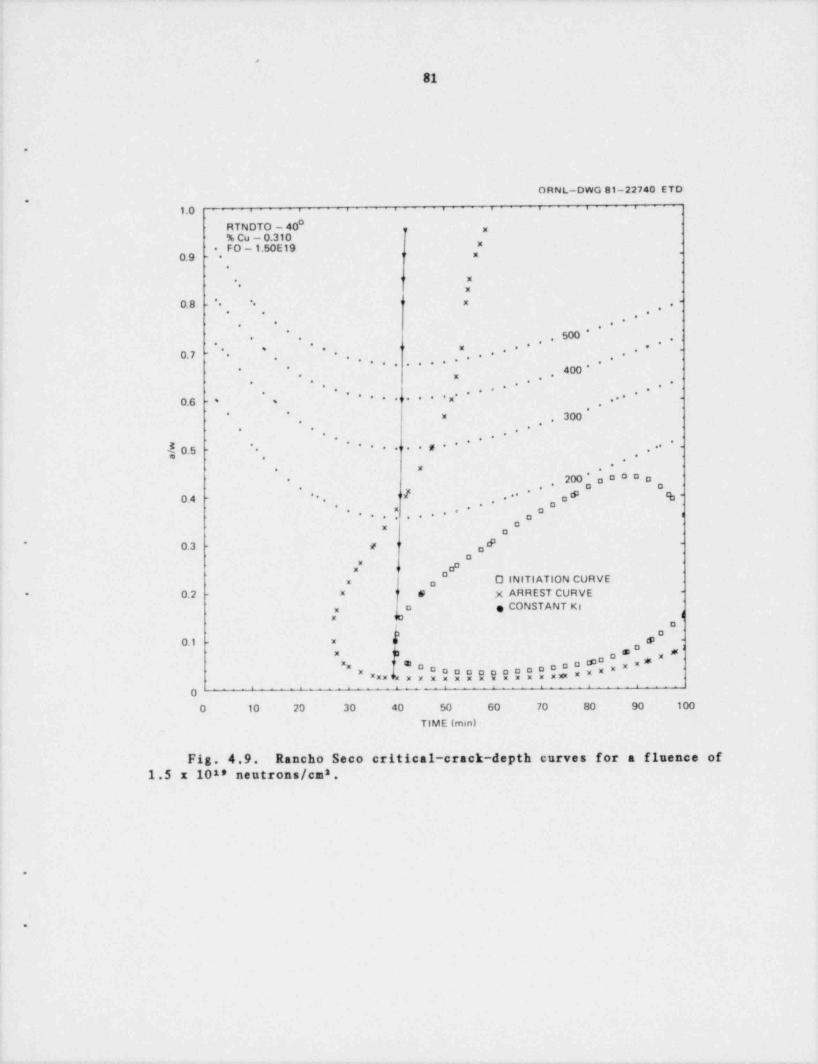
- .-. .
>
81
a
.
ORNL-DWG 81-22740 ETD.
1.0 . . . . . . . . .
RTNDTO - 40 ,, ,
% Cu - 0.310*FO - 1.50E19*
xO.9 *
.
' x*. x
0.8 - * ** " x , . . -*
. . *..* *
500 * ..
. .
*'", .***''. *
0.7 - *. .
-***. * * *
. . . . . . . .
400 ** *
**..*,. ,
. . ,. .** .. . .
* x* .** * -* * * *"* * *0.6 * **
* *300n
, *..,. ,
**.*,*'
J. o.s. * . . . .. . n .. -
.. **x ..
200 * a o oo a** o o*.*
0.4 - ** 'E . * * o* 'b -. ,. . o-.: ,o- -
. ,. . . . .
,0x
, cP -'O.3 - p "
ox" gP<>
oO INITIATION CURVEx o
0.2 8 8 X ARREST CURVE -*
x o e CONSTANT Kidx to
D3 o
! 0.1 - x it s -
D Jx <a ,o ,aO@ x#"x 8 OO O O O O O D D DoDD x,x xxM
"xx1k xxxx xx x x x x x x x gg' ' '
0O 10 20 30 40 50 60 70 80 90 100
I TIME (mm)l
Fig. 4.9. Rancho Seco critical-crack-depth curves for a fluence of.
1.5 x 10¹⁸ neutrons /ca ,s
,
.
S
f
. _ . _ . . _ _ _ . - ._. _ . _ _ _ _ . . _ . . . . _ . _ . . _ _ _ _ . _ _ _ _ _ . ~ . . - _ _ _ _ . .
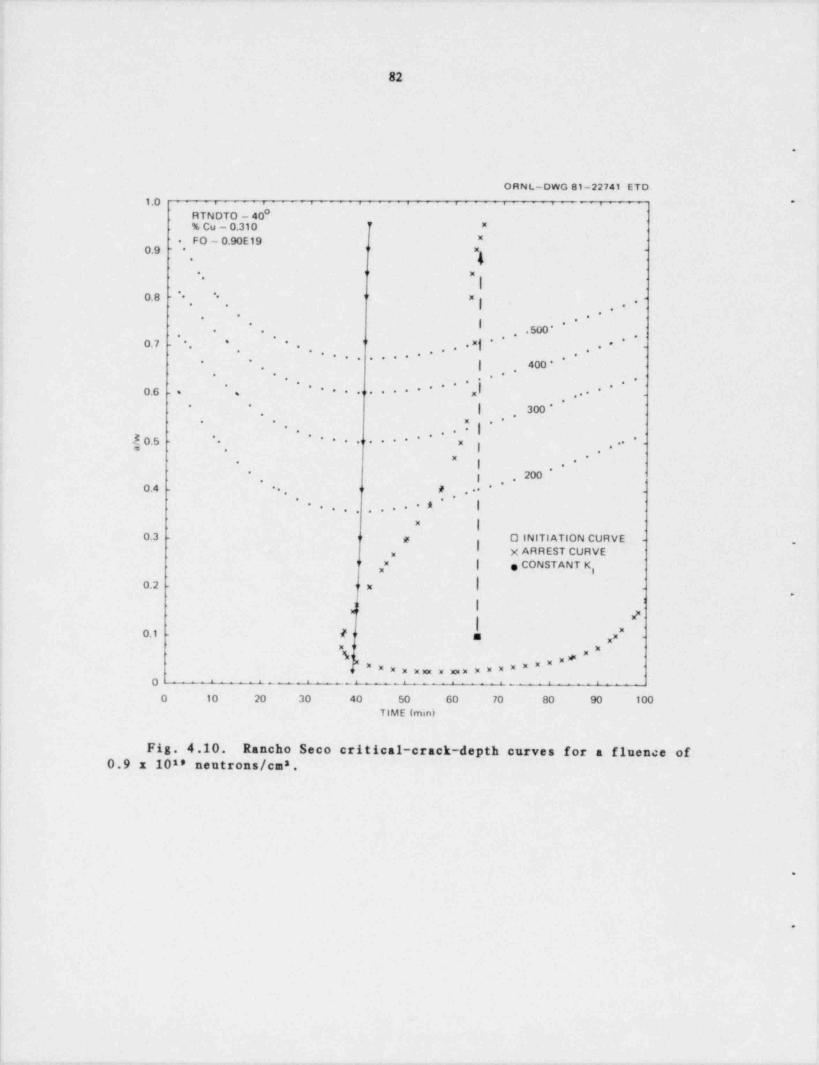
- . . . . . - - .
82
.
I ORNL-DWG 81-22741 ETD1.0 *. . . . . .
RTN DTO - 40% Cu - 0.310 7 "
"FO - 0.90E19.
0.9 - * ",
* ' M
l,
* *0.8 * * '
x| ..
.. .,
,.-..
! 500* **
. .
. . . * * . . , ."j * . . .. . .
*0.7 - * * * '' *. . .
.-
j .**...
,.*, .
, ..*.,
***** '.****** x! . ... ** "
0.6 .* .,
. .
| 300 *j . .x *
; . .
..*|.' **
30.5 - . ...,,. . . . - -, ..
| . . -.
" *
g ,..,
. l 200
... * . .0.4 * . , #>
**..,, .*** |, , .
|"
0.3 s O INITIATION CURVE - .! X ARREST CURVEx
," | e CONSTANT K,''
|0.2 - ' x-
4 ,,
"' /,I ,x"0.1 7< a
M| V' ' "k
,," " " m x xx, ,,,za m x= " " " ,*
O ^ > -~^ ^ > >
O 10 20 30 40 50 60 70 80 90 100,.
TIME (min),
t
i
Fig. 4.10. Rancho Seco critical-crack-depth curves for a fluence of0.9 x 101' neutrons /ca ,s
.
.
- --~,-r. r.-, ,, y , . . - - - .-,,.,v.--- . . - - . . - --,.,n< ,--e, - , ...w- - - - - - - , -
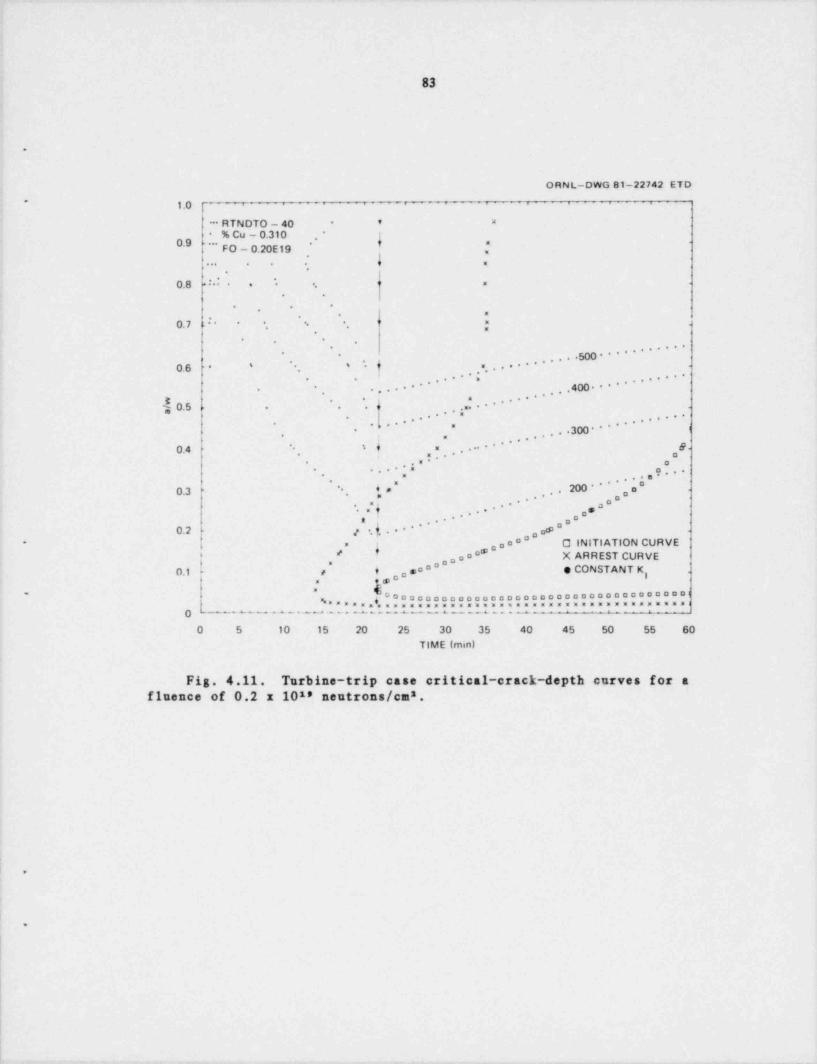
- - -_
83
i
.
ORNL-DWG 81-22742 ETD*
1.0
' ~ RTNDTO - 40 * ' =
* % Cu - 0.310 t*
*
O*9 ..FO - 0.20E19 t. =
; ,,
4 .. . . . . .,.
0.8 : *
.=<- . -
. .
. . .,
m... =0.7 ** - * s-- =
.
. .
=,...***...500****.......*
. *
.f.
* ' ..4 *0.6
.,... *.....,, ,,,400...**.........
. ,
. ..***.. -g ...
g 0.5 - . . .
,,...****," ,,..... **, , ,
. 300 * * 1*
*.. **** .....
; =
e.** * * =0.4 a* m.. *. a-
. *.= o,..*. , ..o
,...200**....
4*. o'*
0.3 - =,o=
if ,,...-
''o,.on
y.{.. **..o**,,s0.2 .
O INITIATION CURVE*
4 a "* , a=
#I X ARREST CURVEo
I 0.1 a 4o*,,o e CONSTANT K
,
o,s I= es(m
g,=====4"ooooooooooooooooooooooooooooooooonnoi.
=====una======unsaaa===aunaumxxamasamai0 ' --*--"----"---+----c-------
0 5 10 15 20 25 30 35 40 45 50 55 60TIME (min)
.
Fig. 4.11. Turbine-trip case critical-crack-depth curves for afinance of 0.2 x 10¹⁸ neutrons /ca ,s
i
1 .i
!o
. _ , _ - . _ , , ___ _ _ _ _ __. ____ , _ ,__ _ ___ __. _ _ _
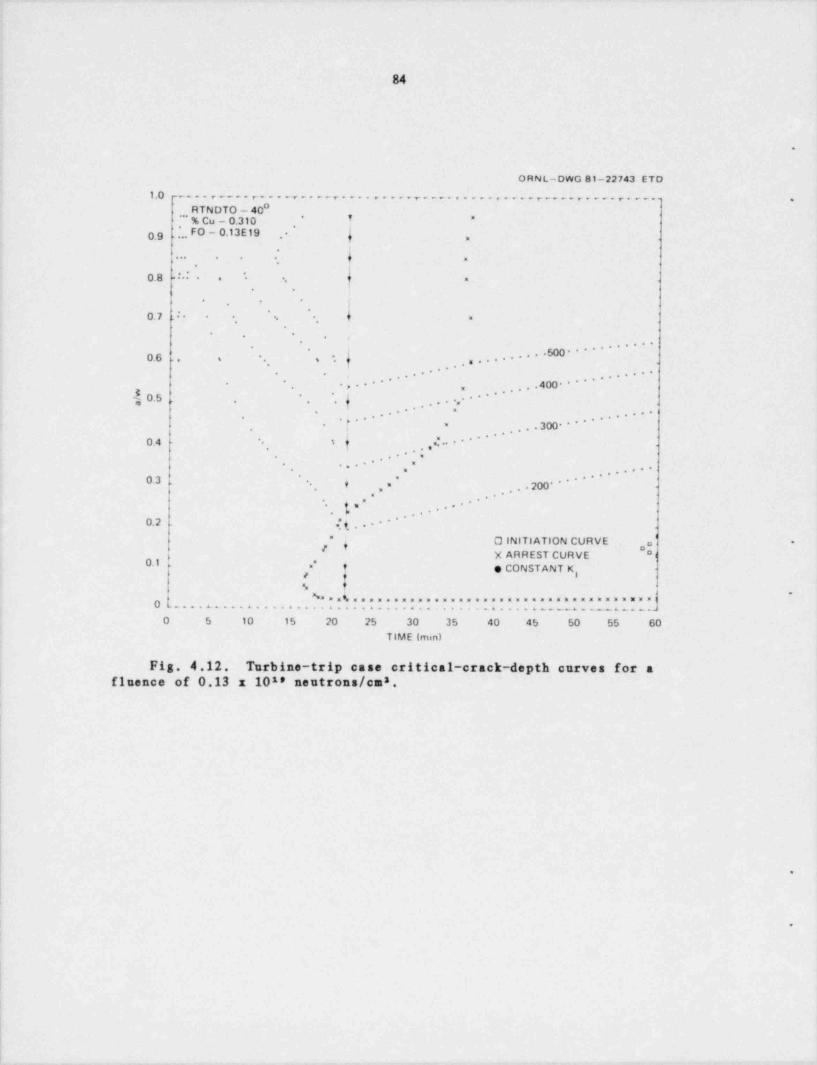
. - - _ . . - . .--
f
J
84
d
.
1
ORNL-DWG 81-22743 ETD1.0----r----r----,----v.-..v----r----.----r----r----r----r-----
RTNDTO - 40*** % Cu - 0.310 I '*
*
0.9 FO - 0.13E19 .., .- o ,t
.
. . . . . n ..,
** * '
0.8 - s ' "
. .
'. . .
,
'* *
0.7 - - * s " =, .
* *, . . ,, .
500 * * * * * * . . . . ..
, .
. .. **....**...... * *...0.6 * *. * .*.. o
, .
,,..... *. .,
*
* * ' , , . 400 * *., ,
i 30.5 {- , . . , **. . .
| t*'... ,4 =
*'* ....-
* * . . _ _ , . . 300. . -. .
,
.0.4.
*S
.. **.. *..m=.-=.
", ,,,,...,
*0.3 ( .
*
.200****^-
." ,. -, tm' ..
*-
."{.. **_ ...0.2i"
4 O INITIATION CURVE a - *'#
X ARREST CURVE *|| 0.1 *
. " e CONSTANT Ki o Ig o
-Na0 . . . . u . . . . . . . . . . . . . s a 4 =. m a. a = = = = a a e a m a = = = m a = = = = = a u m a a a m a a = m m a l
d
3 ... . ........... .......u..-.. ~ u..-~
0 5 10 15 20 25 30- 35 40 45 50 55 60 '
f TIME (mm) r
!
; Fig. 4.12. Turbine-trip case critical-crack-depth curves for ai finence of 0.13 x 101' neutrons /ca ,s,
n
I
i
* i
|t
I -
>>
I,
?
. . - _ _ . _ . - . - - - . . . - . . . - - - . - - - - - - - - - - . - - - - - - - - - ~ -- -- - - - - - - - - - - ~~~ ' ' ~ ~ -'
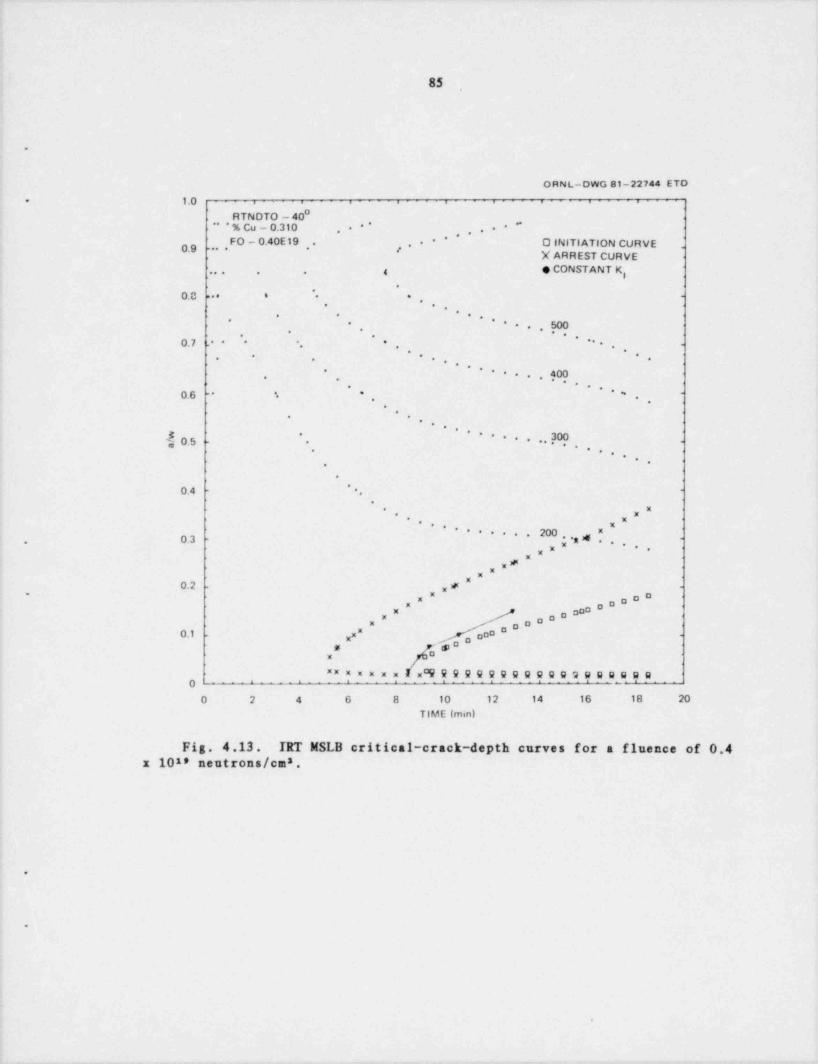
85,
.
ORNL-DWG 81-22744 ETD
1.0= - - - - - - -
RTNDTO - 40~
* % Cu - 0.310 ** **** ... .,
*FO - 0.40E19 O INITIATION CURVE*. .
#. .0.9 -.. * *
X ARREST CURVEe CONSTANT K,, , , , , 4
.*
0.0 ..a * * * -
.. . .
*. . . .
. *. . ., 500
* * *
0.1 * * * * * * * * -. . .* ,
. * *. . . ., , ,
* *
* * . . , 4. @.. .,
* *' ~0.6 %*.. .
*.
. .,
* * * *
fo.3 _ . . . 700 .
*
,. ,
. . ,*
.,
.
0.4 -*
~*.
*
. m*
* x".. , *
200 *** * " . . , , "
* * ....0.31 *.,
x
,xx
0.2 - x* -
* E 00x D Dx 000 DOx gOx oa
x"0.1 - x coo -
a0s ,8x
xx x = xxx mgggggggggggggggagaga' ' ' ' ' ^ ' " ' "0
0 2 4 6 8 10 12 14 16 18 20
TIME (min)
Fig. 4.13. IRT MSLB critical-crack-depth curves for a fluence of 0.4x 10¹⁸ neutrons /cm*.
2
!
.
.
4
-, . . - . _ , , -- -. . - , - - - - - --,r----. -
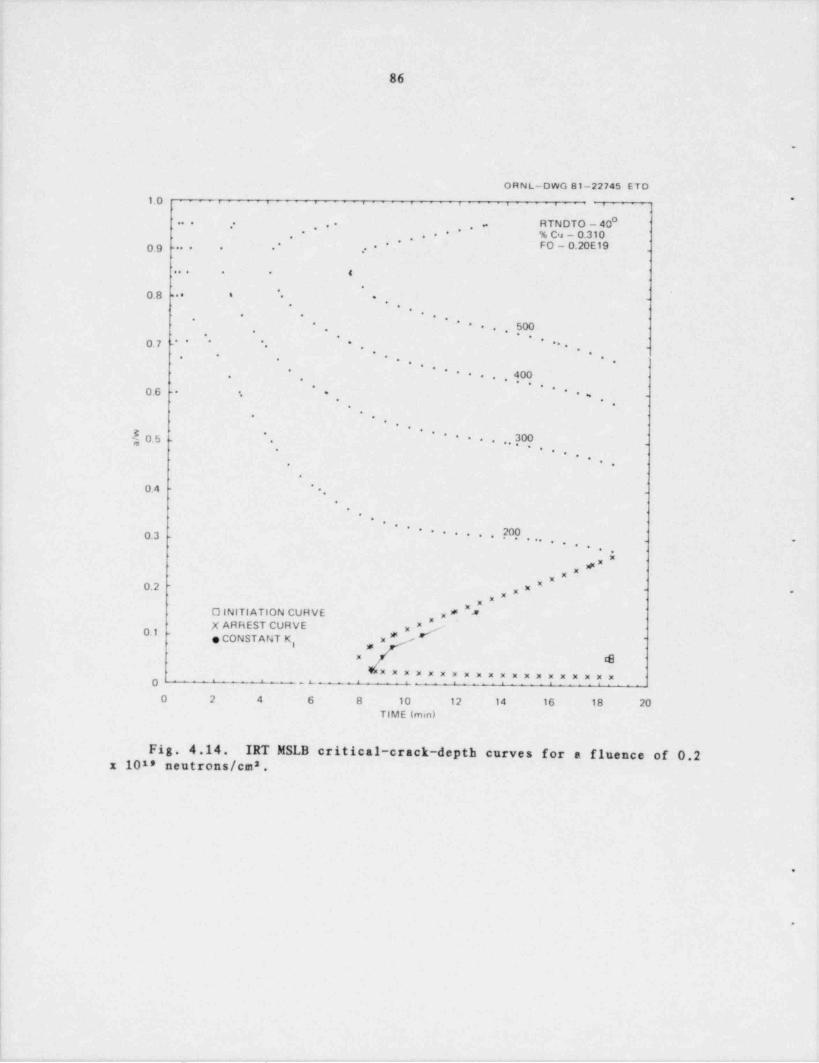
__. . . .. . _ . _ . _ . _ . .
i
1
!
'86.
1
s
.1
.
..
.
! O R N L-OWG 81-22745 ETO
[ - 1.0 *. . . . .
* ' ~. . * . . RTNDTO - 40* *** % Cu - 0.310..**,.**.
FO - 0.20E19** 0.9 * * * * * ,,
. . . . . e4
.
| 0.8 . * * * *. ., .
* *; .,* * *
. .
, * . . * .500**.
. , .
* * * .** * * *0.7 . .* *
-
.! *. * *. . , , * *. . .
400. .
.
*;.
. ,
' ****.O.6 * =
.* *
-
.,
*. .
*.,
j 0.5 - .
* * * * * . . 300.
.,
..,*.,..
*i
*'
O.4 *-.
.
*.
*.
,
**** N...,,,,*.* *0.3 .
6~
,**Nj 0.2 x"M - .x
NN
O lNITI ATION CURVE * " *X arf 1EST CURVE a**x '
-
1 0.1 -e CONSTANT K z#
| 8 s' x g
*xnnunnnnxxxxxx xxxxuO ' ' '
O 2 4 6 8 10 12 14 16 18 20TIME (min)
Fig. 4.14. IRT NSLB critical-crack-depth curves for a fluence of 0.2x 10¹⁸ neutrons /ca ,s
.
0*
L . _- . __ _ . .. . . - .
_ _ .,_.
87
4.2 Effect of Tennerature Denendence ofMaterial Properties on Kg
,
Temperature-independent material properties are being used in theFM part of OCA-I (Ref. 7) for evaluating PWR pressure vessel integrity-
during thermal-shock loading of the vessel. In so doing, it is necessary !to have a basis for selecting the particular mean values used, and it is !
also necessary to have a feel for the error introduced by using the par-ticular mean values. The material properties of concern are Young's modu-
i las (E) and the coefficiert of thermal expansion (a); an estimate of theerror in the parameter of concern, K , can be obtained by comparing the
7thermal stresses in the wall calculated with and without temperature-
dependent properties.The tangential thermal stress for the case of plane strain and ten-
perature-independent properties can be calculated with the following equa-tion:'
En 1 r8 + c8 d r
t " 1 - v r8 d2 -c8 ) j# # # #~ #a * *
i where
r = radial distance;c,d = inner and outer radii of the cylinder, respectively;T' = change in temperature at r from an initial uniform temperature;
*
v = Poisson ratio.
There is no simple closed-form solution for the case of temperature--
dependent properties. However, if only a is temperature dependent, Eq.(4.1) can be written as follows:
E 1 r8 + c8 d Tf a dT rdr#t"1-98 r8 ds.e c JTs* o
+ a dT rdr - rs adT (4.2),
o o
where a = f(T). From Eq. (4.2), a mean value of a apparently cannot befactored out, and this same type of reasoning applies to E and v as well.Nevertheless, the use of temperature-dependent properties complicates theanalysis excessively, and thus mean values of E, a, and v must be used inmany cases. Values of E, a, and v vs temperature for A533 and over a ten-
,
perature range of interest for the OCA analysis are shown in Table 4.7.Also included in Table 4.7 are (1) mean values of a over the temperaturerange 288*C to T, (2) the product of the mean value of a, and (3) the
modulus at temperatures T, that is, a,E. It is of interest to note that-
, _ _ _ _ ~ _ _ _ . - - ,_ __ _ ._ _ . . , ... . _ _ _ . _ . _ . _ . - - - _ _ _ . _ _ _ _ _ . _ _
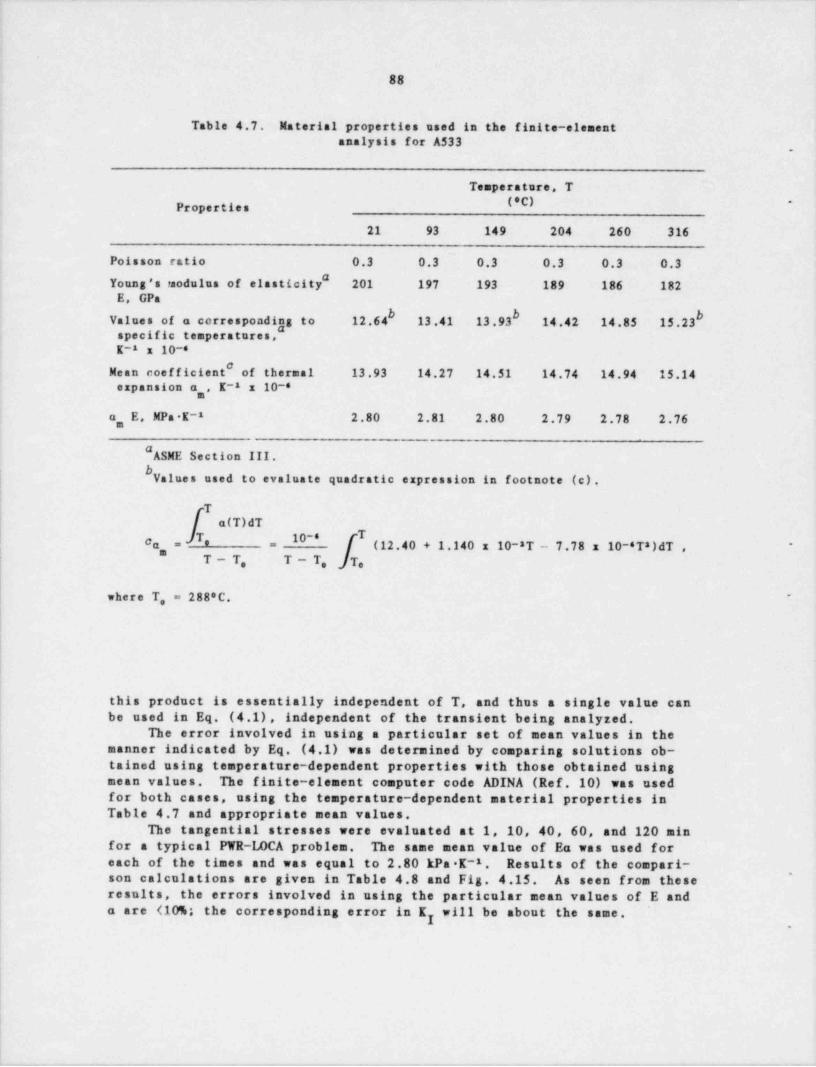
_ ~
88
Table 4.7. Material properties used in the finite-elementanalysis for A533
,
Temperature, T"
Properties
21 93 149 204 260 316^
Poisson ratio 0.3 0.3 0.3 0.3 0.3 0.3Young's raodulus of elasticity" 201 197 193 189 186 182
E, GPab b bValues of a corresponding to 12.64 13.41 13.93 14.42 14.85 15.23
specific temperatures,"K-1 x 10⁻⁸
#Mean coefficient of thermal 13.93 14.27 14.51 14.74 14.94 15.14expansion a,, K-1 x 10⁻⁸
a, E, MPs E-1 2.80 2.81 2.80 2.79 2.78 2.76
"ASME Section III.b,
| Values used to evaluate quadratic expression in footnote (c).,
li T
a(T)dT10-e T
C * (12.40 + 1.140 x 10-*T - 7.78 x 10-*T*)dT , "a = ="
T-T, T - T. T.
where T, = 288'C. ~
this product is essentially independent of T, and thus a single value canbe used in Eq. (4.1), independent of the transient being analyzed.
The error involved in using a particular set of mean values in themanner indicated by Eq. (4.1) was determined by comparing solutions ob-tained using temperature-dependent properties with those obtained usingmean values. The finite-element computer code ADINA (Ref.10) was usedfor both cases, using the temperature-dependent material properties inTable 4.7 and appropriate mean values.
The tangential stresses were evaluated at 1, 10, 40, 60, and 120 minfor a typical PWR-lhCA problem. The same mean value of Ea was used for
. each of the times and was equal to 2.80 kPa K-1 Results of the compari-,
| son calculations are given in Table 4.8 and Fig. 4.15. As seen from theseresults, the errors involved in using the particular mean values of E anda are (10%; the corresponding error in K will be about the same.y
_
l
- . . - . .. _ ._ _ ___ . - - . - .
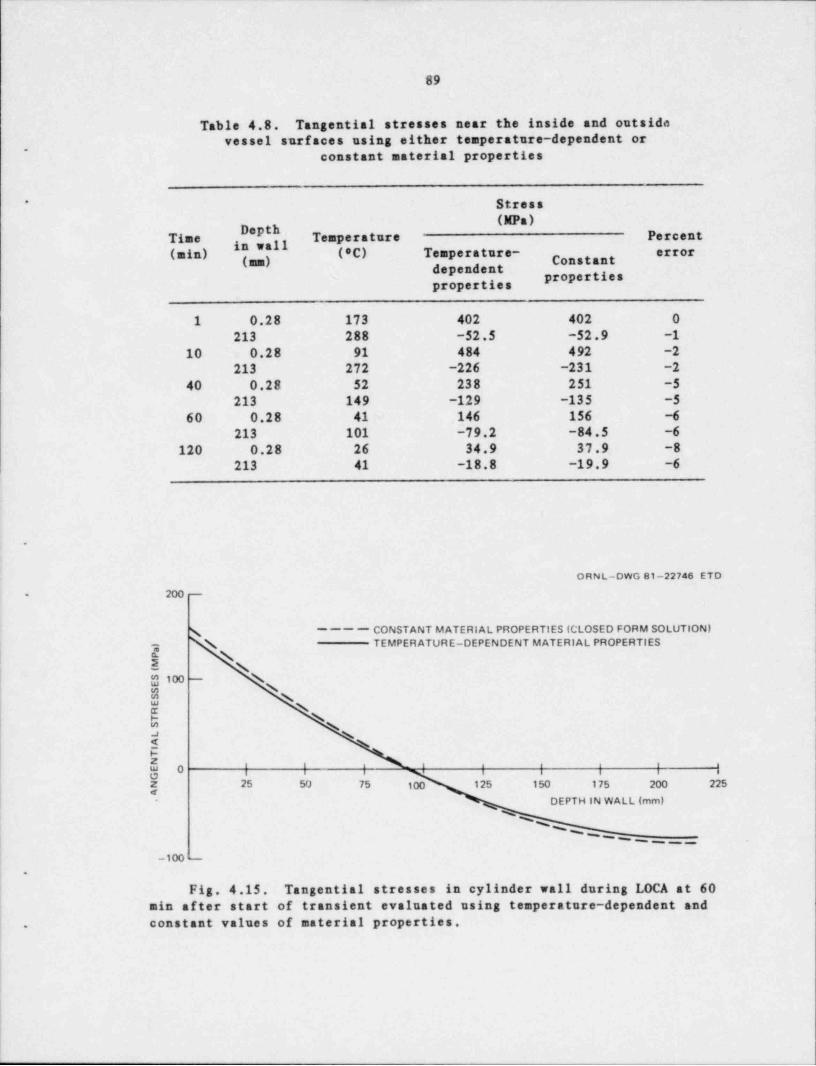
89
Table 4.8. Tangential stresses near the inside and outsidevessel surfaces using either temperature-dependent or
,
constant material properties
Stress*
(MPa)DepthTime Temperature Percent
(a n ( P are- *** *Constant
Properde s'
properties
1 0.28 173 402 402 0213 288 -52.5 -52.9 -1
10 0.28 91 484 492 -2
213 272 -226 -231 -2
40 0.28 52 238 251 -5
213 149 -129 -135 -5
60 0.28 41 146 156 -6213 101 -79.2 -84.5 -6
120 0.28 26 34.9 37.9 -8
213 41 -18.8 -19.9 -6
.
ORNL-DWG 81-22746 ETD
200 ---.
N ---- CONSTANT MATERIAL PROPERTIES (CLOSED FORM SOLUTION)' - \ TEMPER ATURE-DEPENDENT MATERI AL PROPERTIES
|E Na s* 100 - N
NE Nm N s# 'I
O | | | | | | | |'
25 50 75 100 125 150 175 200 225g* DEPTH IN WALL (mm)
N| % %
%''- ~ _ _ _
-100 -
.
Fig. 4.15. Tangential stresses in cylinder wall during LOCA at 60min after start of transient evaluated using temperature-dependent andconstant values of material properties..
|
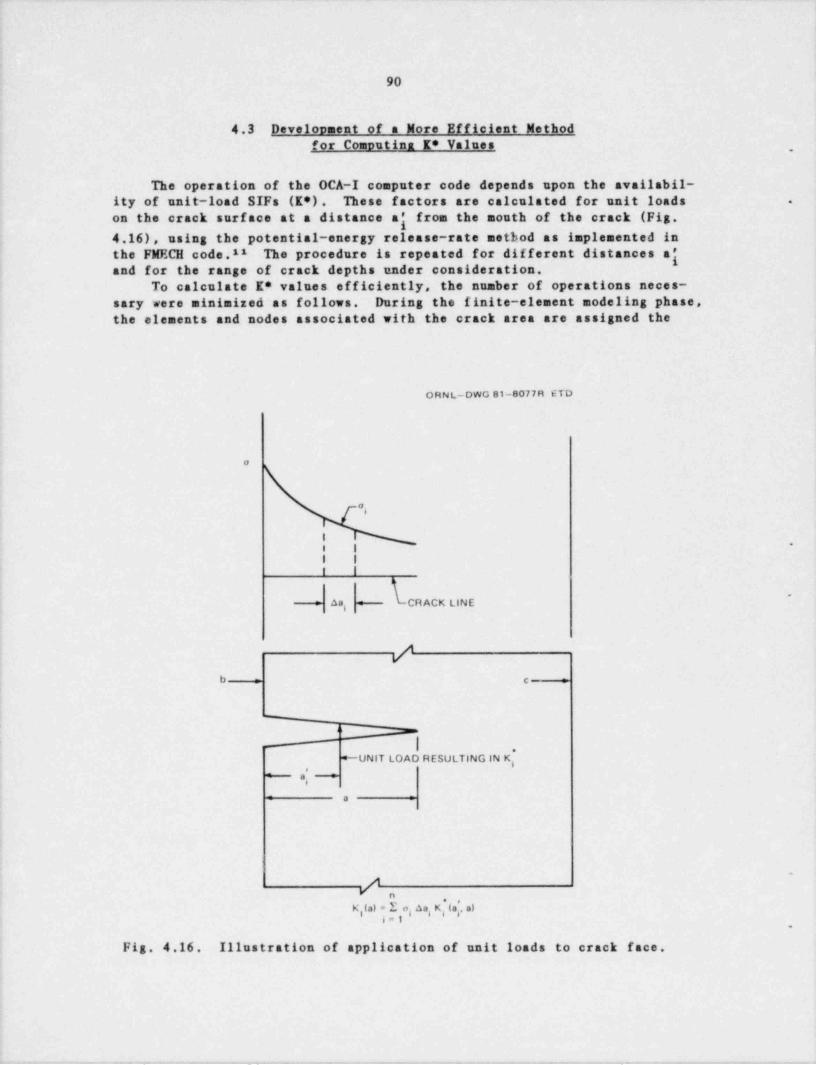
90
4.3 Develonnent of a More Efficient Methodfor Comnutina K* Values .
The operation of the OCA-I computer code depends upon the availabil-ity of unit-load SIFs (K*). These factors are calculated for unit loads .
onthecracksurfaceatadistanceajfromthemouthofthecrack(Fig.4.16), using the potential-energy release-rate method as implemented in
the FMECH code.11 Theprocedureisrepeatedfordifferentdistancesajand for the range of crack depths under consideration.
To calculate K* values efficiently, the number of operations neces-sary were minimized'as follows. During the finite-element modeling phase,the elements and nodes associated with the crack area are assigned the
ORNL-DWG 81-8077R ETD
o
#4
i*
e 1
1 1I |
~
Aa, CRACK LINE
/b c
_
l .
* UNIT LOAD RESULTING IN K,
a[ ~a
.
v/ n
K,(a) = 1 o, Aa, K, (a , a)6-1
,
Fig. 4.16. Illustration of application of unit loads to crack face.
_ _ __ . _ - - .. _ _ _ _ , _ - _ . _ _ _ _ _ _ _ _ __ _ _ - _._ .__ _ . . _ _ _
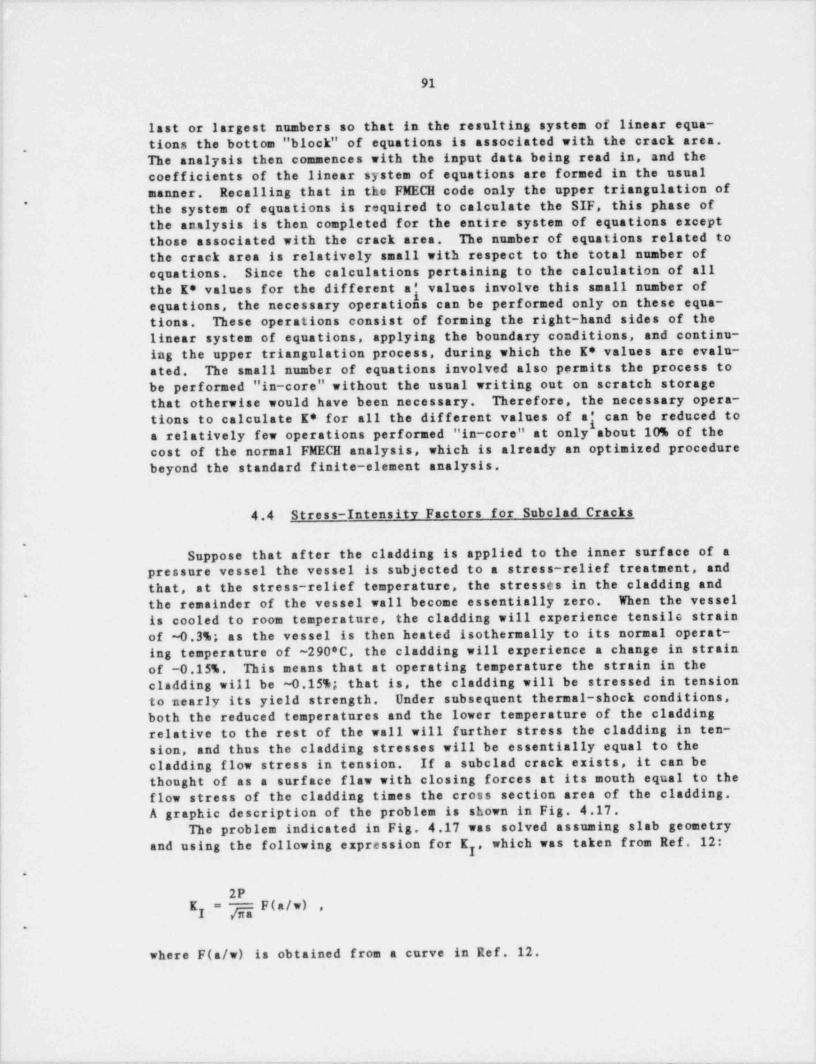
91
last or largest numbers so that in the resulting system of linear equa-tions the bottom " block" of equations is associated with the crack area.
.
The analysis then commences with the input data being read in, and thecoefficients of the linear system of equations are formed in the usual
Recalling that in the FMECH code only the upper triangulation ofmanner.the system of equations is required to calculate the SIF, this phase of*
the analysis is then completed for the entire system of equations exceptthose associated with the crack area. The number of equations related tothe crack area is relatively small with respect to the total number ofequations. Since the calculations pertaining to the calculation of alltheK*valuesforthedifferenta{valuesinvolvethissmallnumberofequations, the necessary operations can be performed only on these equa-tions. These operations consist of forming the right-hand sides of thelinear system of equations, applying the boundary conditions, and continu-
,
ing the upper triangulation process, during which the K* values are evalu-,
ated. The small number of equations involved also permits the process tobe performed "in-core" without the usual writing out on scratch storagethat otherwise would have been necessary. Therefore, the necessary opera-
can be reduced totionstocalculateK*forallthedifferentvaluesofa[ bout 10%ofthea relatively few operations performed "in-core" at only acost of the normal FMECH analysis, which is already an optimized procedurebeyond the standard finite-element analysis.
4.4 Stress-Intensity Factors for Subclad Cracks'
.
Suppose that after the cladding is applied to the inner surface of apressure vessel the vessel is subjected to a stress-relief treatment, andthat, at the stress-relief temperature, the stresses in the cladding andthe remainder of the vessel wall become essentially zero. When the vessel,
is cooled to room temperature, the cladding will experience tensile strainof ~0.3%; as the vessel is then heated isothermally to its normal operat-ing temperature of ~290*C, the cladding will experience a change in strainof -0.15%. This means that at operating temperature the strain in thecladding will be ~0.15%; that is, the cladding will be stressed in tensionto nearly its yield strength. Under subsequent thermal-shock conditions,both the reduced temperatures and the lower temperature of the claddingrelative to the rest of the wall will further stress the cladding in ten-sion, and thus the cladding stresses will be essentially equal to thecladding flow stress in tension. If a subclad crack exists, it can be
thought of as a surface flaw with closing forces at its month equal to theflow stress of the cladding times the cross section area of the cladding.A graphic description of the problem is shown in Fig. 4.17.
The problem indicated in Fig. 4.17 was solved assuming slab geometryand using the following expression for K , which was taken from Ref. 12:
7
.
2P= jg F(a/w)E ,
7.
where F(a/w) is obtained from a curve in Ref. 12.
___ _ _ _._ _ _ _. __. _ _ __ ___ _ _ _ __ _ _____ ._
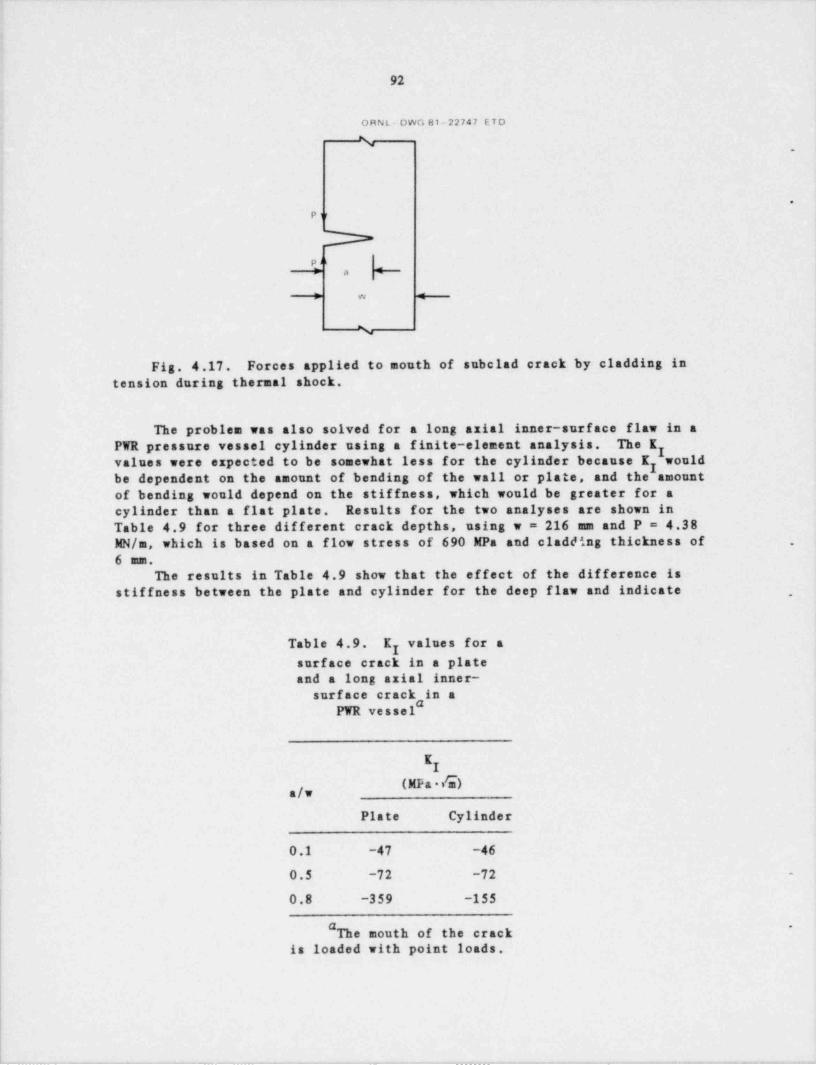
. -
92
ORNL - DWG 81-22747 ETD
%.
.
Pir
d a *--
M w 4----
%
Fig. 4.17. Forces applied to mouth of subclad crack by cladding intension during thermal shock.
The problem was also solved for a long axial inner-surface flaw in aPWR pressure vessel cylinder using a finite-element analysis. The K7values were expected to be somewhat less for the cylinder because K wouldybe dependent on the amount of bending of the wall or plate, and the amountof bending would depend on the stiffness, which would be greater for acylinder than a flat plate. Results for the two analyses are shown inTable 4.9 for three different crack depths, using w = 216 mm and P = 4.38MN/s, which is based on a flow stress of 690 MPa and cladding thickness of .
6 mm.The results in Table 4.9 show that the effect of the difference is
stiffness between the plate and cylinder for the deep flaw and indicate .
Table 4.9. K values for agsurface crack in a plateand a long axial inner-
surface crack in aPWR vessel
I
(MFa /m),j,
Plate Cylinder
0.1 -47 -46
0.5 -72 -72 -
0.8 -359 -155
# "
The mouth of the crackis loaded with point loads.
_ . . _ _ _ _ _ _ _ _ _ . _ . . _ _ _ _ . . . . _ _ _ _ _ _ ._.__ -- - _ _ _ _ _ _ _ _ . - _ _ _ _ , _ . _ _ _ _ . _ - - .--
. _ _ __
93
that the cladding would have a big effect on the K values for subclad7cracks during severe thermal-shock loading conditi$ns. The effect would
~ be a much smaller K value than calculated ignoring the cladding, as hasybeen done thus far
.
4.5 Develoosent of COD Game for Larne CODS
Weldable strain gages have been used in all thermal-shock experimentsas event detectors and with a unique installation technique as a COD gagein TSE-4, TSE-5, and TSE-5A. The sage used was the Ailtech SG-125, whichis a quarter-bridge, 120-0, self-compenstated, hermetically sealed straingage using a nickel-chrome alloy as a strain filament. The installationtechnique was unique because a portion (10 mm) of the gage directly overthe flaw was left unbonded to the specimen, effectively increasing the
gage length locally and thus the displacement-measuring capability of thegage.18
A pretest analysis of the thermal-shock experiment designated TSE-6indicates that the COD will exceed the strain limit of the SG-125 whenapplied as previously indicated. Due to the physical dimensions of thisgage, it does not appear practical to extend its capability beyond the ear-lier work. Therefore, an effort to adapt another strain gage to satisfac-
torily measure much larger CODS was initiated. The gage selected ini-tially was a modified form of the Alltech CG 126, which is normally usedas a concrete embedment strain gage. The embedment spiders were replaced
,
with conventional stainless steel flanges for welding to the surface. The'
strain tube was ~50 mm in length with a 38-am section left unbonded to thespecimen. On a basis of four gages tested to failure, two at room tem-
'
perature and two at liquid nitrogen temperature, it was concluded thatCODS >3 mm can be effectively measured. Only a small amount of work onlead-wire configurations and several more calibration tests need to be con-ducted to complete the development of this useful tool.
4.6 Heat-Treatina and Flawina of Thermal-ShockTest Cylinder TSC-3
The test cylinder for thermal-shock experiment TSE-6, which is des-Ignated TSC-3, was heat-treated (tempered) and then flawed in preparationfor TSE-6. TSC-3 is the last of three test cylinders to be cut from a
| single forged cylinder. The other two cylinders, TSC-1 and TSC-2, wereused in experiaants TSE-5 and TSE-5A, respectively. At the time these cyl-inders were quenched in water from 871*C, the OD was 1.04 m, and the wallthickness was ~205 mm. Prior to tempering, TSC-1 and TSC-2 were machinedto an OD of 991 mm and a wall thickness of 153 mm, while TSC-3 was ma-chined to an OD of 991 mm and a wall thickness of 76 mm. The excess mate-
|.
rial was included so that residual stresses and surface effects on tough-ness could be removed.
The test cylinder material is A508 with class-2 chemistry. TSC-1 andTSC-3 were tempered at 613*C and TSC-2 at 679'C. In each case, the time,
;
i at temperature was 4 h, and this was followed by cooling in air. Efforts|
|
- - - _ - . - - - _ _ _ - - . - - - - - . - - - . - - - - - -_- - __ . - - --- -
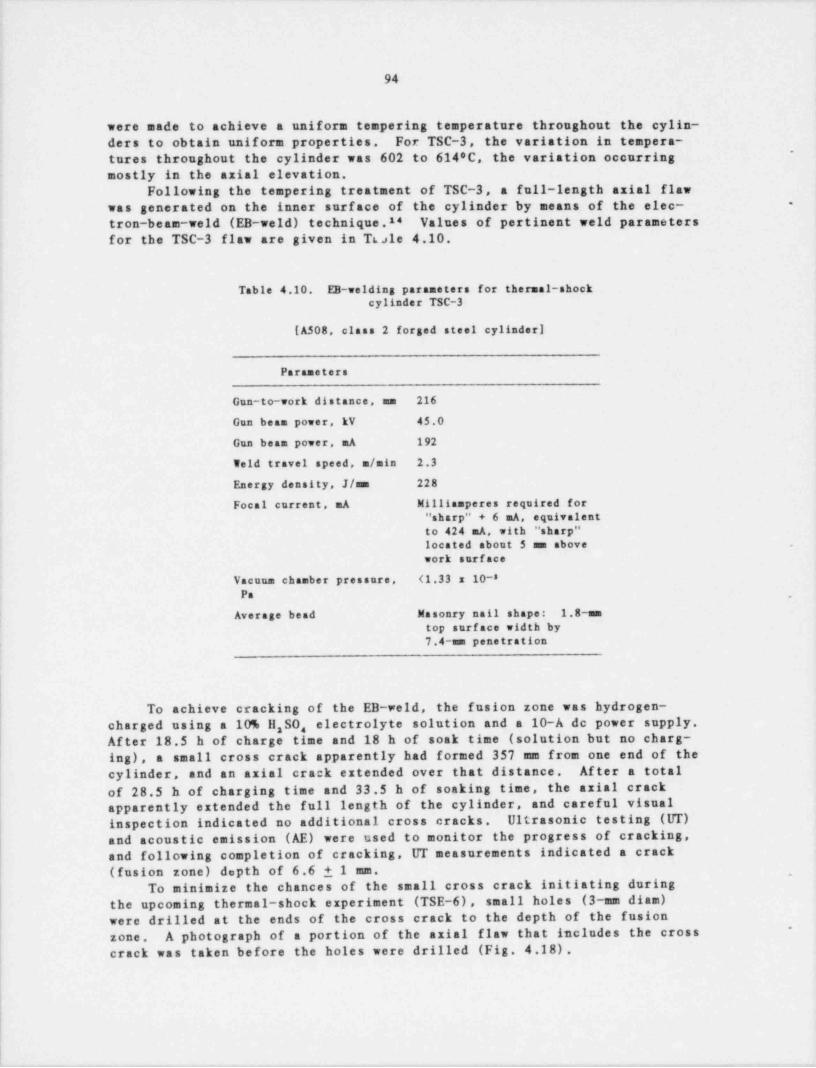
94
were made to achieve a uniform tempering temperature throughout the cylin-ders to obtain uniform properties. For TSC-3, the variation in tempera-
~
tures throughout the cylinder was 602 to 614*C, the variation occurringmostly in the axial elevation.
Following the tempering treatment of TSC-3, a full-length axial flawwas generated on the inner surface of the cylinder by means of the elec- -
tron-beam-weld (EB-weld) technique.14 Values of pertinent weld parametersfor the TSC-3 flaw are given in T6sle 4.10.
Table 4.10. EB-welding parameters for thermal-shockcylinder TSC-3
[A508, class 2 forged steel cylinder]
Parameters
Gun-to-work distance, um 216
Gun beam power, kV 45.0
Gun beam power, mA 192
Weld travel speed, m/ min 2.3
Energy density, J/am 228
Focal current, mA M1111 amperes required for" sharp" + 6 mA, equivalentto 424 mA, with " sharp"
located about 5 mm above .
work surface
Vacuum chamber pressure, <1.33 x 10-sPa ,
Average bend Masonry nail shape: 1.8-amtop surf ace width by7.4-am penetration
To achieve cracking of the EB-veld, the fusion zone was hydrogen-charged using a 10% H SO, electrolyte solution and a 10-A de power supply.3After 18.5 h of charge time and 18 h of soak time (solution but no charg-ing), a small cross crack apparently had formed 357 mm from one end of thecylinder, and an axial crack extended over that distance. After a totalof 28.5 h of charging time and 33.5 h of soaking time, the axial crackapparently extended the full length of the cylinder, and careful visualinspection indicated no additional cross cracks. Ultrasonic testing (UT)and acoustic emission (AE) were used to monitor the progress of cracking,and following completion of cracking, UT measurements indicated a crack(fusion zone) depth of 6.6 1 1 mm. ,
To minimize the chances of the small cross crack initiating duringthe upcoming thermal-shock experiment (TSE-6), small holes (3-am diam)were drilled at the ends of the cross crack to the depth of the fusion
-
A photograph of a portion of the axial flaw that includes the crosszone.crack was taken before the holes were drilled (Fig. 4.18).
-- ._ - -. -- ~~. . - _ - - - - -
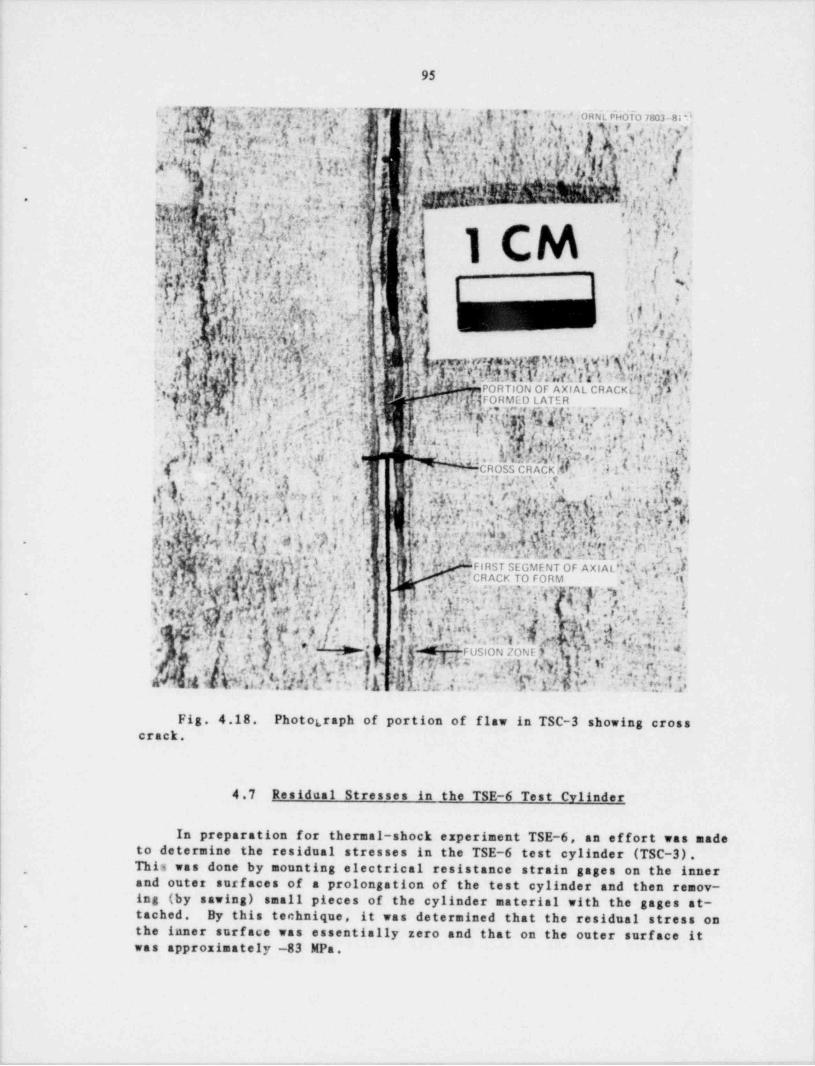
95
..Y ., ;e . . . ,w;w y - 7F1 . j; p5 *' < w .osisiofo isoa-sip%,%,,|.-%;Tah+': i
'fCf'Lig*p.,.'.;({;&t$.['4 (| %)\ *|;*;9},,'}frd n@y :%' t, ' i .y.g,|| :. ' .y s : 'j: 1,
'f: ;|W..' ... Q -
. ' '
s[y$ e 1 CM &,9/'\ 2 w3 MA .i
t
Q .;.ni.' m%$m%u' ):h*+
9 3
%k.. ~(.V.
}v!;,4,} i '{.%&P| ! 5. Q.. ,.4. c|G .
.'
a 9' p' f.:,9 - .
$. h q M'+"
W f % ) $ p' [,; M, .pj. /.;g'
.!if - . .s
r,,,~ ' "ybpg'l ,.y )f. %g.,,.V'CiO
.- m.a ?'h..
Wr.wy.:e. y(/, .
.
.
>
"d wjid fiO2 pig: (!J,.
i < i :? A PORTION OF AXfAL CRACKi.
' ,[email protected] ,4J QnL. c ,3 z,g s. -), *-
|[a ,. 4 a .~ ..,q ui *f .,' g,!e%{|3*f.f:gA *ORMED LATER
'
.</~ .~n
p{ %,.Qm ,.', y p'jy h7'Q'' .. A:n.1' - T. ?) ,h. u .L 4W K. ,p; o ,,s :
. .
1 ;%'m r.9.,,1,;$n, f $y;i}.''j.
''
p.$&y ,o. ,,9 9.1 ;'m't.a: /:
.
,,.1 ;Sa., ..*.c.A, .
is 51;,'. 8 7, a :. .
,'4n.ao g. w p e w, yi.
s 4
4.::gh.1r'P.ty#7 p ...3yh;p, # ').2 ,r.s,o
. . ' y.7 .: 9 : , .m . , ' CROSS CRACK; .1/ ' > f. .|..H ; g,'.9,jtp; c;'V[..|. . , ' ' bl-.' M' 13, IT'n .
.;, :. ~t, ,;;
.y ' p[3'y/ 9,q g g pp.g';g['y.gp?,'.',, W{ii .w g y.[ N opd k I
'
f Y.Q4f,' ,k k- h'
,
-
.j . t u f U ( 5,M, h'[! ;j ' ' [ ...
~hi'.'( T d 3 [.f 1tjb*M ~ ' FIRST SEGMENT OF AXIAL',Q(* jf|'O.
,w p.1 ', <;.y , ; W cR ACK TO FORM ,.
n y*rs ]- p.. J
At[[v.2, (7,* h''.y.
o*_a.
,, it %y, -
2,.P-. * w ,a :. ye ;;;.ys e gy:ay .; . % . n..,iaMf*' h) i, y Q
,
3,w , .1ws eYJ MfN'N h;k h.5. I,[i
e f, s a
5 .4gm. .p:.
9..,5; ; r,!),
A pd. 4.h $ ;e. 'fi 4T4 . . A-... -, ' ,.d4 4: ..? g %,c g ;;;.;'
.
g * gm W.r.. e',; ;g. , - :. eh . - y+i %..y )d$ 4A.W9%[A(Al6
,.,
,
FUSION ZONE ) :/,
- 'o C
e#, g:. ,q ) d qL W ' g* '' MriJR ,YDh$lEdN 6 Mi E 2 'Ul
i
Fig. 4.18. Photograph of portion of flaw in TSC-3 showing cross
4.7 Residual Stresses in the TSE-6 Test Cylinder
In preparation for thermal-shock experiment TSE-6, an effort was madeto determine the residual stresses in the TSE-6 test cylinder (TSC-3).
, This was done by mounting electrical resistance strain gages on the innerand outer surfaces of a prolongation of the test cylinder and then remov-ing (by sawing) small pieces of the cylinder material with the gages at-tached. By this technique, it was determined that the residual stress on
- the inner surface was essentially zero and that on the outer surface it1
was approximately -83 MPa.
- - -_
.
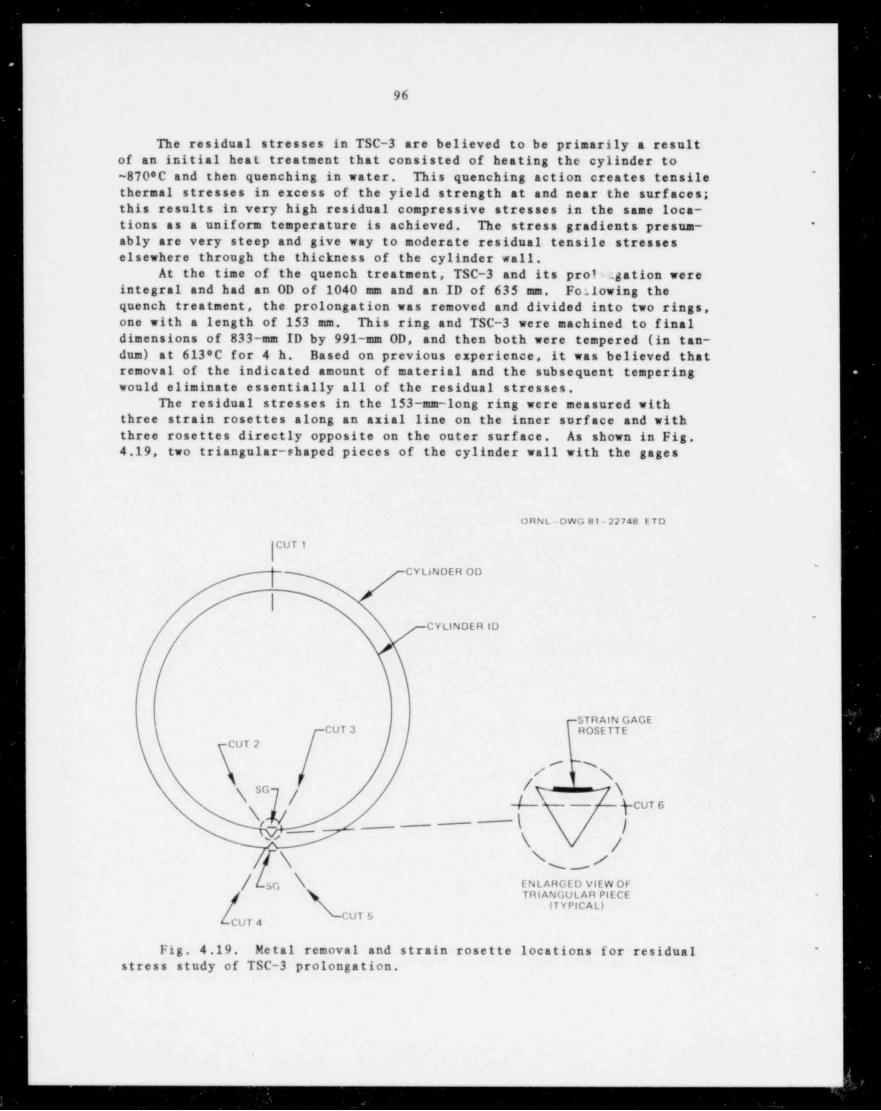
.
. . . . . . . __
96
The residual stresses in TSC-3 are believed to be primarily a resultof an initial heat treatment that consisted of heating the cylinder to
~
~870*C and then quenching in water. This quenching action creates tensilethermal stresses in excess of the yield strength at and near the surfaces;this results in very high residual compressive stresses in the same loca-tions as a uniform temperature is achieved. The stress gradients presun- *
ably are very steep and give way to moderate residual tensile stresseselsewhere through the thickness of the cylinder wall.
At the time of the quench treatment, TSC-3 and its proinagation wereintegral and had an OD of 1040 mm and an ID of 635 mm. Following thequench treatment, the prolongation was removed and divided into two rings,one with a length of 153 mm. This ring and TSC-3 were machined to finaldimensions of 833-mm ID by 991-mm OD, and then both were tempered (in tan-dum) at 613*C for 4 h. Based on previous experience, it was believed thatremoval of the indicated amount of material and the subsequent temperingwould eliminate essentially all of the residual stresses.
The residual stresses in the 153-am-long ring were measured withthree strain rosettes along an axial line on the inner surface and withthree rosettes directly opposite on the outer surface. As shown in Fig.4.19, two triangular-ehaped pieces of the cylinder wall with the gages
O R N L-DWG 81- 22748 ETD
CUT 1
- CYLINDER OD'
|.
CYLINDER ID
STRAIN GAGEFROSETTECUT 3
CUT 2
- s/ s
q sSG \
,- pCUT 6
<_ - 1 j_--- y ,s
\ \ s/[ SG \ ENLARGED VIEW OF
TRIANGULAR PIECE
/-
(TYPICAL)
CUT 4
Fig. 4.19. Metal removal and strain rosette locations for residual *
stress study of TSC-3 prolongation.
_.
. . _ ..
97
attached were removed by sawing, and then these pieces were subdivided to- yield six pieces 38 mm long, each with a rosette located at midlength.
Finally, an 8-mm-thick section with a sage attached was removed from eachof these six pieces. The 8-am-thick sections were assumed to be essen-tially stress free; thus, a comparison of the sage readings before mate-
.
rial removal commenced and after final sawing provided a measurement of
the residual stresses.
4.8 Thermal-Shock Materials Charautorization
W. J. Stelzman Randy K. NanstadR. L. Swain
The fracture-toughness characterization of the prolongation (TSP-3)of thermal-shock vessel TSC-3 over the temperature range of interest hasbeen completed. These data will be used to determine the test temperaturefor thermal-shock experiment TSE-6. The IT compact specimens (IT CS) usedin the fracture-toughness characterization were machined from TSP-3 afterreceiving the same temper treatment as vessel TSC-3: 4 h at 613*C fol-
lowed by cooling in air. Two specimen depth locations were chosen thatput the fatigue crack tips at the 0.23-t and 0.58-t depth locations fromthe inner surface of the 152-mm-thick wall. All the specimens were fa-
tigue precracked to an average a/w = 0.555 and tested to failure in astroke control mode. The opening displacement was measured at the load
- line of the specimen. Calculation of the J-integral was made using thearea to maximum load and a correction for the tensile component afterMerkle and Corten.2s The static fracture toughness (K ) was then calcu-y
.lated from the relationship Es = EJ. Multiple specimens of CT orienta-tion were tested at three temperatures: 10, -46, and -73*C (Ref. 16).
The results from all the specimens are listed in Table 4.11 and plottedin Fig. 4.20.
A total of 35 1T CS were tested, resulting in the distribution and
ranges of fracture-toughness values (K ) provided in Table 4.12. Alsoyincluded in Fig. 4.20 are the estimated lower bound of the TSP-1 (alsotempered at 613*C and 4 h) and fracture-toughness results that were de-termined with 0.394T, IT, and 2T CS and reported previously.27 The rangeof K values from these specimens is also listed in Table 4.12. Note that
yall the values reported are K , not the K Values reported earlier.17-28y IcdThe lowest fracture-toughness values from TSP-3 lie close to the lower-bound curve for the TSP-1 results, although lower values are indicated.
During the testing of the IT compact specimens from TSP-3, a slightdrop in load or " pop-in" was observed in the elastic loading region of thecurve accompanied by an audible response from the specimen. After arrest,the loading resumed until failure occurred with only slight devistion fromlinearity. The load-displacement record and a photograph of the resultant*
specimen fracture surface are shown in Fig. 4.21. Estimations of thecrack extension due to the pop-in were performed by measuring slopes andcalculating ccupliances from the load-displacement record before and after-
the pop-in event. The pop-in size was also measured (displacement changemeasured at the load value at the time of pop-in) and used to estimate the
|,
I
t
|
. _ _ _ . - _ . _ , _ _ - _ _ , _ . _ .__.._. . _ . _ . _ _ _ _ . _ , ,_ _ _ _ _ _ _ .
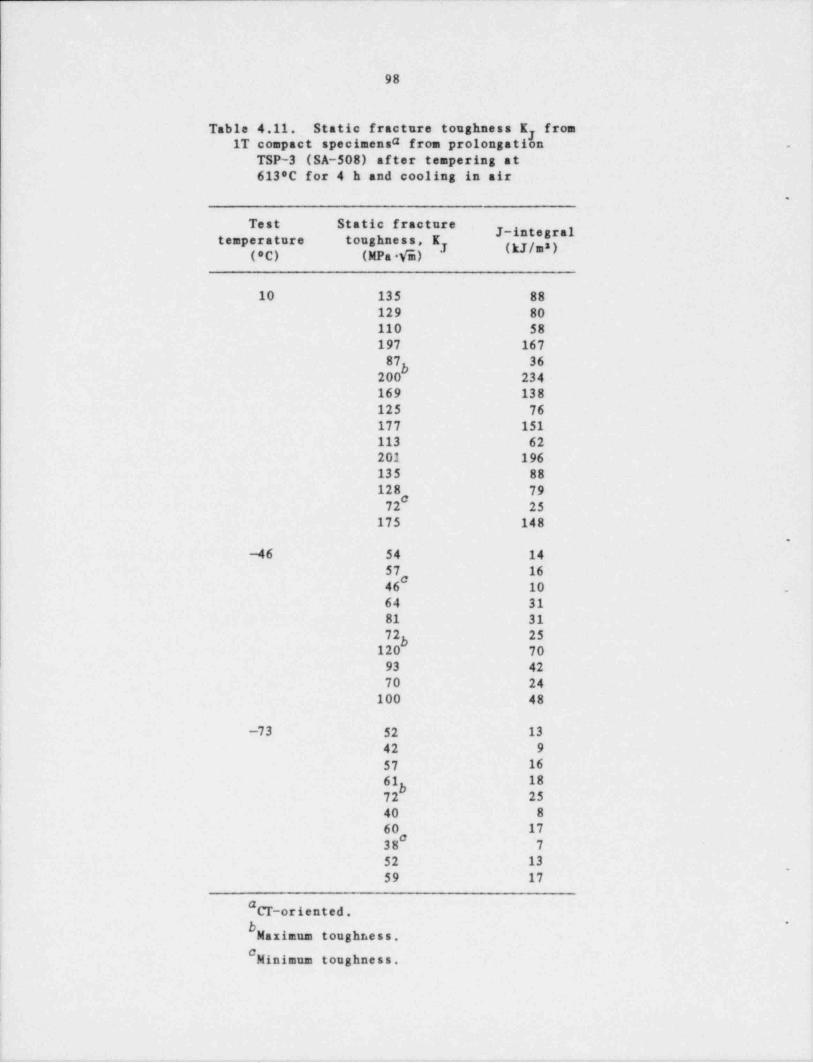
__
98
Table 4.11. Static fracture toughness K fromyIT compact specimensa from prolongation .
TSP-3 (SA-508) after tempering at613*C for 4 h and cooling in air
.
Test Static fractureJ-integral
temperature toughness, Ky {gj,3)(*C) (MPa Wi)
10 135 88129 80110 58197 167
87 363200 234169 138125 76177 151113 62201 196135 88128 79
72 25175 148
.
-46 54 1457 16
#46 10 .
64 3181 3172 253
120 7093 4270 24
100 48
-73 52 13;
42 9
57 1661 18
372 25
| 40 8
60 17#
38 7
52 13,
59 17
#Cr-or ient ed .
Maximum toughness.#Minimum toughness.
|
_ ..
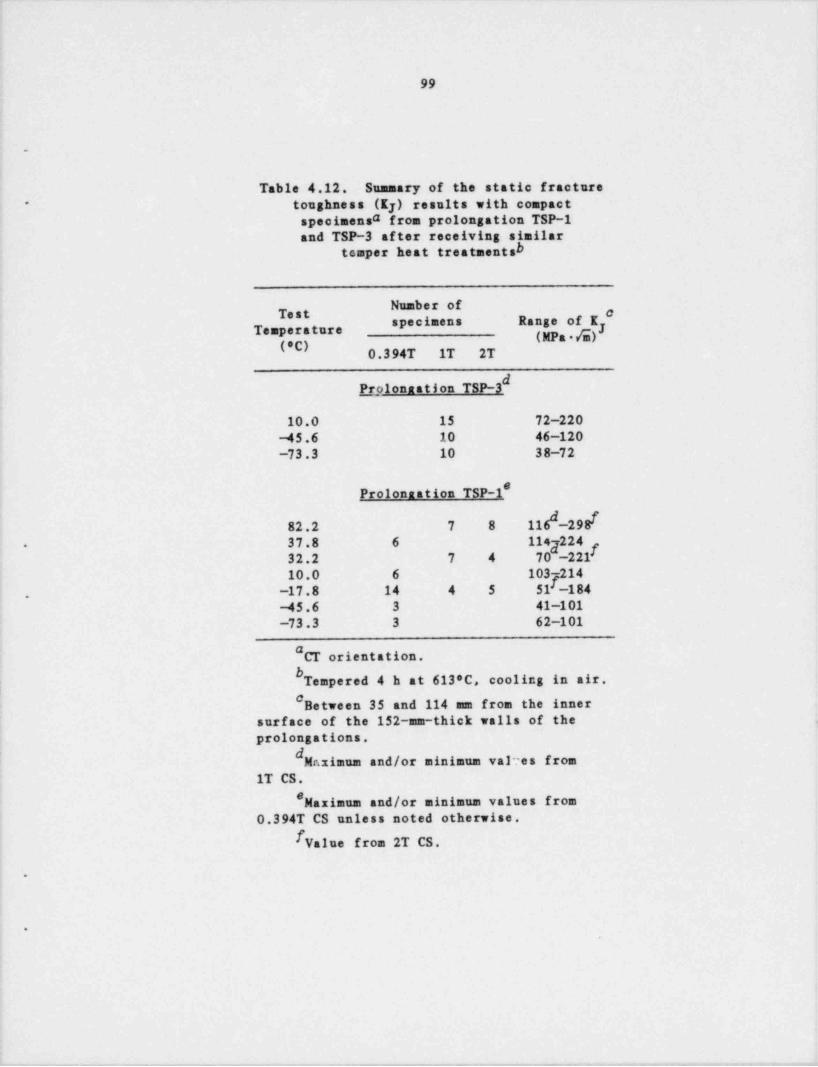
99
.
Table 4.12. Summary of the static fracture
toughness (Ky) results with compact*
specimensa from prolongation TSP-1and TSP-3 af ter receiving similar
temper heat treatmentsh
"" '#Test c
specimens Range of KTemperature y
" ' '(.C) O.3 94T IT 2T
Prplonnation TSP-3
10.0 15 72-220-45.6 10 46-120-73.3 10 38-72
#Prolonastion TSP-1
I82.2 7 8 116 -29B37.8 6 114g224 I.
32.2 7 4 70 -221103 21410.0 6
7-17.8 14 4 5 51 -184.
-45.6 3 41-101-73.3 3 62-101
"CT orientation,bTempered 4 h at 613*C, cooling in air.#Between 35 and 114 mm from the inner
surface of the 152-mm-thick walls of the ,
prolongations,dMaximum and/or minimum valres from
1T CS.#Maximum and/or minimum values from
0.394T CS unless noted otherwise.IValue from 2T CS,
.
D
Y
,, - - , . ..- , . , . . .- . . . , . e-, ,, . - - -.,-.-..,,n_, - - - - - - - , - ,-.,y - . - - - , . , , - - . . - - - - - , ,, , - --
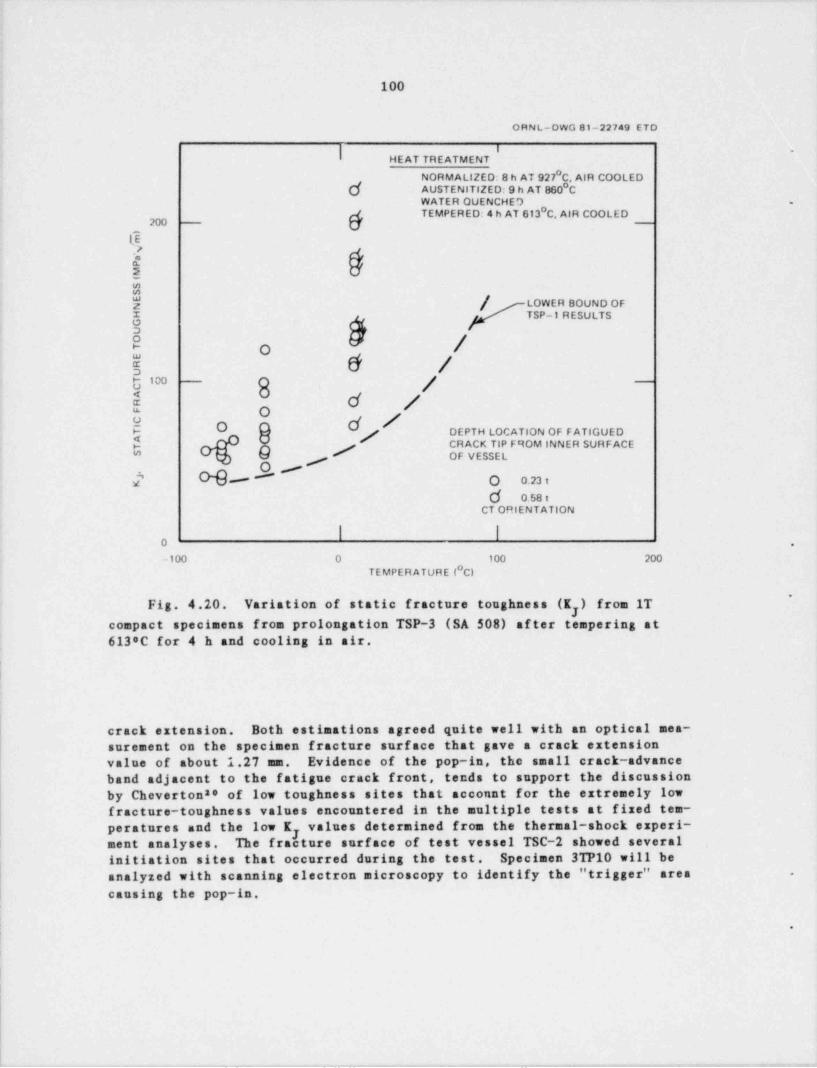
100
O R N L-OWG 81-22749 ETD
~
HEAT TREATMENT
NORMALIZED: 8 h AT 927 C, AIR COOLEDd AUSTENITIZED: 9 h AT 860 C
WATER OUENCHEO -
,./ TEMPERED: 4 h AT 613 C, AIR COOLED200 - y -
LE>
U;ay [ LOWER BOUND OF
TSP-1 RESULTS
R /o$ 6 /t i= g / -
a d /E d /o DEPTH LOCATION OF FATlGUEDg / CRACK TIP FttOM INNER SURFACEs b OF VESSEL*
yoI '- O o.23 :
d 0.ss iCT ORIENTATION
O .
-100 0 100 200TEMPERATURE ( Cl
~
Fig. 4.20. Variation of static fracture toughness (K ) from ITycompact specimens from prolongation TSP-3 (SA 508) af ter tempering at613*C for 4 h and cooling in air.
crack extension. Both estimations agreed quite well with an optical mea-surement on the specimen fracture surface that gave a crack extensionvalue of about 1.27 mm. Evidence of the pop-in, the small crack-advance
band adjacent to the fatigue crack front, tends to support the discussionby Cheverton88 of low toughness sites that account for the extremely lowfracture-toughness values encountered in the multiple tests at fixed tem-peratures and the low K values determined from the thermal-shock experi-y
I ment analyses. The fracture surface of test vessel TSC-2 showed severalinitiation sites that occurred during the test. Specimen 3TP10 will beanalyzed with scanning electron microscopy to identify the " trigger" area -
causing the pop-in.
.
i
_ . . _ . - - - . _ . - _ _ . . _ _ . _ _. . . , . _ _ . _ , , _ - . . _.
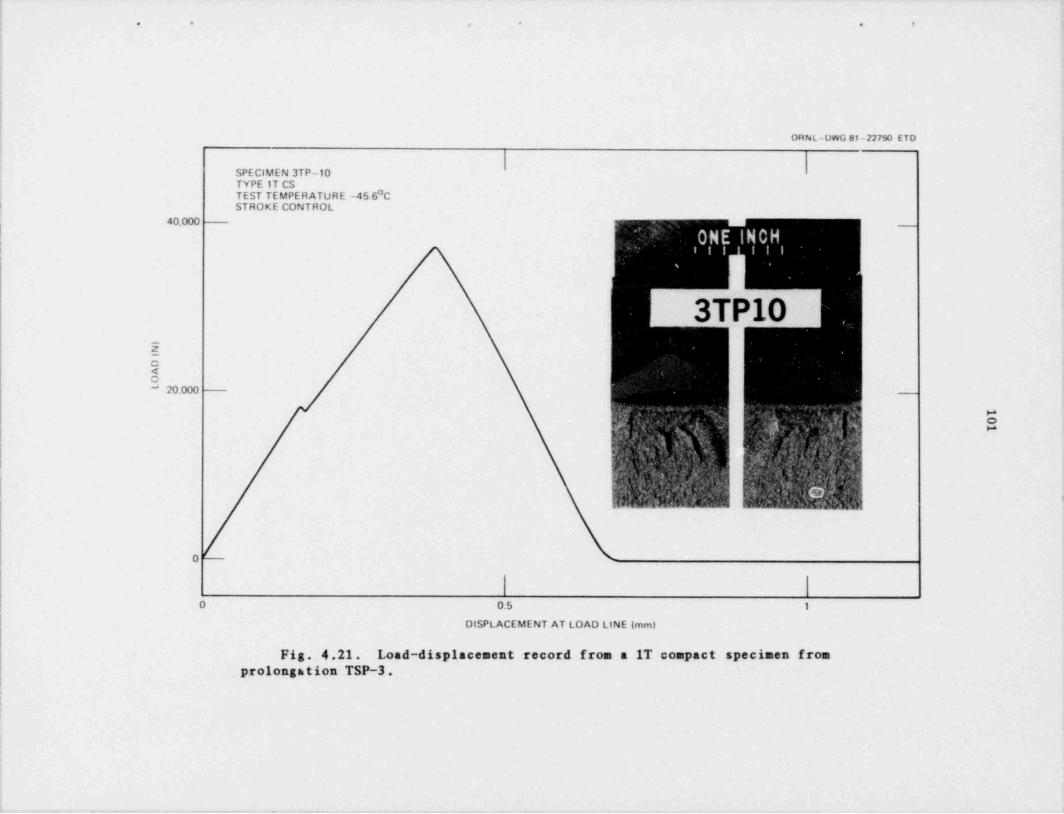
!
!
; . . . . . .
.
II
i ORNL-DWG81-22790 ETD[
l
|'
SPECIMEN 3TP-10TYPE IT CSTEST TEMPERATURE -45.6 C
i, STROKE CONTROL
40.000,
|
-
|
,
3TP105_O<O" 20.000 _
>*o
|
l sa ,
0
0 0.5 1
DISPLACEMENT AT LOAD LINE (mm)
Fig. 4.21. Load-displacement record from a 1T compact specimen fromprolongation TSP-3. 1
1
*
,
k ,,
' 4' .s
102
REFERENCES
.
1. Letters from R. D. Cheverton, Oak Ridge National Laboratory, toM. Vagins, Nuclear Regulatory Commission, September 5, October 29,and November 7, 1980; Subject: Oconee Overcooling Transient. -
2. Letter from R. D. 'Cheverton, Oak Ridge National Laboratory, toM. Vagins, Nuclear Regulatory Commission, March 3, 1981; Subject:Parametric Analysis of Rancho Seco Overcooling Accident.
3. R. D. Cheverton', " Thermal Shock Investigations," Heavy-Section SteetTechnology Program Quart. Prog. Rep. January-March 1981, NUREG/CR-
.
2141/V1 (ORNL/IM-7822), pp. 76-83.
4. Letter from R. J. Carbone, Nuclear Regulatory Commission, to R.Kryter, Oak Ridge National Laboratory, January 30, 1981.
5. Letter from S. Tabia, Nuclea'r Regulatory Commission, to C. Z. Serpan,Nuclear Regulatory Commission, June 22, 1981.
6. Le tter from M. M. Levine',' Brookhave'n National Laboratory, to R. D.Cheverton, Osk Ridge F-+1onalsLaboratory, August 11, 1980.
7. S. K. Iskander, R. I .arton, and D. G. Ball, OCA-I, A Code forCalculating the Behavwr of Flava on the Inner Surface of a PressureVesset Subjected to Temperature and Pressure Transients, ORNL/NUREG- .
84 (August 1981)..
8. R. Ahlstrand, P. PEEliisinen, and H. Raiko, "LEFM Analysis of Irradi-.
ated Nuclear Components Having Welded Cladding," Vol. G, paper G 1/4in Transactions of the 6th International Conference on StructuralMechanics in Reactor Technology, August 1981.
9. S. Timoshenko, Strength of Materials, Part II, 2nd ed., D. Van| Nostrand Co., Inc., New York, March 1951.I
10. K. J. Bathe, ADINA - A Finite Element Program for Automatic DynamicIncremental Nonlinear Analysis, Report 82448-1, Mechanical Engineer-its Department, Massachusetts Institute of Technology (May 1977).
11. S. K. Iskander, Two Finite Element Techniques for Computing M' ode IStress Intensity Factors In Two- or Three-Dimensional Problems,ORNL/NUREG/CSD/TM-14 (February 1980).
12. Hiroshi Tada, The Stress Analysis of Cracks Handbook, Del ResearchCorporation, 1973.
,
13. R. D. Cheverton, Heavy-Section Steet Technology Program Quart. Prog.Rep. October-December 1979, NUREG/CR-1305 (ORNL/NUREG/TM-380) , pp.63-67. *
. . - . - -. . ~. . _ _ . _ . - . _ - , _ - _ . - - _ . - . _ - . - - . . . - - . - - _ .
103,
14. P. P. Holz, Flav Preparations for HSST Program Vessel Fracture-Mechanics Testing Nechanical Cyclic Pumping and Electron-Beam Weld.
Hydrogen-Charge Cracking Schemes, ORNL/NUREG/TM-369 (hay 1980).
.' 15. J. G. Merkle and H. T. Corten, "A J-Integral Analysis for the Compact* Specimen, Considering Axial Force as Well as Bending Effects," J.
Press. Vessel Technot., Series J, of Transactions of the ASVE, 96(4),286-92 (1974).
16. W. J. Stelsman and D. A. Canonico, " Thermal Shock-Temper Study,"Heavy-Section Steet Technology Program Quart. Prog. Rep. January-# arch 1979, NUREG/CR-0818 (ORNL/NUREG/TM-324), pp. 104-10.
17. W. J. Stelsman and D. A. Canonico, " Dermal Shock Material Charac-terization," Heavy-Section Steet Technology Program Quart. Prog.Rep. Aprit-June 1980, NUREG/CR-1627 (ORNL/NUREG/TM-401), pp. 42-55.
18. W. J. Stelzman and D. A. Canonico, " Thermal Shock Material Charac- .
terization," Heavy-Section Steet Technology Program Quart. Prog.Rep. October-December 1978, NUREG/CR-1305 (ORNL/NUREG/TM-380), pp.81-87.
19. W. J. Stelzman and D. A. Canonico, " Thermal Shock Material Charac-terization," Heavy-Section Steet Technology Progran Quart. Prog.Rep. January-Narch 1960, NUREG/CR-1477 (ORNL/NUREG/TM-393), pp.31-35.
.
20. R. D. Cheverton and S. K. Iskander, " Thermal Shock Investigations,"
Heavy-Section Steet Technology Program Quart. Prog. Rep. January-j
- March 1981, NUREG/CR-2141/V1 (ORNL/TM-7822), pp. 87-93.
|
-
,
1 -
1
1
-
__ . . _ _ _ _ __. ._ . . . . _ _ _ _ _ _ _ _ _ _ _ _ . __ _ _ _ _._
:
1044
5. PRESSURE VESSEL INVESTIGATIONS.
5.1 Intermediate Test Vessel V-gA
*P. P. Holz R. H. Bryan
5.1.1 B&W vessel nrenaration
The Babcock and Wilcox Company (B&W) is repairing and modifying i'
intermediate test vessel (ITV) V-8 in preparation for the next test, V-8A.The test will be a study of tearing behavior at upper-shelf temperature ofmaterial having low-upper-shelf toughness. The special properties, sini-lar to those projected for some irradiated PWR vessel materials, are beingattained in a special seam weld developed by B&W for this purpose.2-*'
B&W completed the special asam weld deposit during the previousreport period. Subsequeatly, the vessel was heat-treated and radio-graphed. This final radiographic examination disclosed an indication atone end of the seam that exceeded the acceptance criteria specified in the
j contract.
The indication had a projected area on the radial-axial plane of theweld that was roughly elliptical and extended ~50 mm (radially) by ~30 mm(axially). Under the terms of the contract, B&W agreed to remove theweld seam by machining and to replace the entire seam. The replacementweld seam has been completed and is being ground preparatory to the radio- ,
graphic examination to be conducted before postweld heat trsatment.;.
The complete replacement of the vessel seam weld entails subjectingthe vessel to an additional 50 h of postweld heat-treatment. A piece ofthe V-10 prolongation, which has already been heat treated for 50 h, willaccompany the vessel during the additional host treatment to provide base
.
; metal stock for determining the tensile properties of the bsse setal of'
V-SA as fabricated.
5.1.2 Material charact2_rJAaM o_nri
The testing of the 50 Charpy impact specimens from three of the four'* 8A characterization welds was completed. The onset of upper shelf as,-
defined by 100% shear appearance is at ~115'C. It was considered nec-! essary to set the vessel test temperature no less than 35 K above the on-! set of Charpy upper shelf to avoid conversion of stable tearing to cleav-'
age. Accordingly, ORNL has now established 150*C as the tentative vesseltest tamperature.
B&W completed J-testing of IT compact specimens from three of thefour characterization seam welds. J , and R-curve values are generally7,
l higher than those determined from earlier trial weld specimens, but the( vaines still fall in the range of toughness measured by the Naval Research -
Laboratory for the irradiated high copper welds.: B&W also completedtensile and drop-weight tests of the fourth characterization seam weld as
, well as testing of 2T-J specimens. B&W is analyzing and plotting results. ,
i K tests are stra' in progress.7
_ . _ _ _ __ _. _ - _ - _. _ __ . _ . _ _ _ . - - - - . _ _ _ - - - - - - . _ _ _ _ _ . _ _ _ _ _ _ _ _ _ __ _
_-
. _ _ _ . - _ . _ _ _ _ _ _ _ _ - . ___ _ - - - -- - .-_
a
l'
105
5 .1. 3 Vessel flowina develoament
The flawing practice piece described in the previous report 4 was used-
to check out equipment and procedures for fatigue sharpening a V-8A-typeflaw. A part-circular notch was machined into the block, the notch wassealed, and cyclic pressure was applied to the notch until it had grown by,
fatigue to the desired depth.During this report period, the practice piece was chilled and bro-
ken open to reveal the fatigue crack extension. The notch and fracturesurfaces are shown in Fig. 5.1. This photograph shows that crack exten-
J sion at the deepest point was about as had been estimated from ultrasonicj measurements (~13 mm), but growth was highly asymmetrical. Since this isj an undesirable crack shape for the test vessel, additional trials were
planned. The spare characterization seam weld, V872, was shipped to ORNL! and is being machined for another flawing trial. Cyclic loading will be] carried to a greater number of cycles, and more extensive ultrasonic men-
surements of the fatigue crack will be made.1
! 5.2 Pressurized Thermal-Shock Test Studies
| 5.2.1 Test facility desian studies (G. C. Robinson)
The pressurized thormal-shock (PTS) test concept described in earlierreports ,e provides a facility for subjecting an HSST ITV to concurrents
pressure and thermal loads by subjecting the outside surface of the cylin-| . drical section of the vessel to a sudd3n flow of chilled liquid. The test! vessel is situated in a test tank (Fig. 5.2) that has two primary func-
tions. In the pretest phase of an experiment, the tank serves as an ovenfor preheating the test vessel to a uniform initial temperature; during'
the thermal-shock phase, it provides a channel for directing coolant flow,
| along the outer wall of the test vessel.Among engineering analyses performed for detailed design of the test
tank, calculations of heat transfer during pretest heating were made in aparametric analysis using the HEATING-5 computer program. These calcula-tions were made to confirm earlier manual calculations and to establish aset of input-response curves to be used in designing a controller for theelectrical heaters on the test tank.
The geometry of the problem is shown in Fig. 5.3. In each case ana-lyzed, all regions of the test vessel and test tank are assumed to be iso-thermal initially. At time t = 0, a step change in temperature is imposedon the outer, heated surface of the test tank.
Figures 5.4 and 5.5 show the responses of the outer and inner sur-faces, respectively, of the test vessel for five cases covering initialtemperatures from 21.1 to 260*C and test tank temperatures from 537.8 to315.6*C. As the test vessel heat-up progresses, the electrical heater con-troller will sequentially pass through conditions similar to those sian-
*
1ated by curves 1 through 5 of Figs. 5.4 and 5.5 and thereby provide asmooth transition to the design test temperature of 290'C. The controllerwill be required to limit the temperature differential in the test vesselwall to :ome small value. Evidently an equilibrium temperature condition-
can be attained in ~8 h.
|
i
. , _ - - . . _ _ _ _ _ _ _ , _ _ . _ , _ __ , _ _ . _ . _ , _ _ , _ . . _ _ _
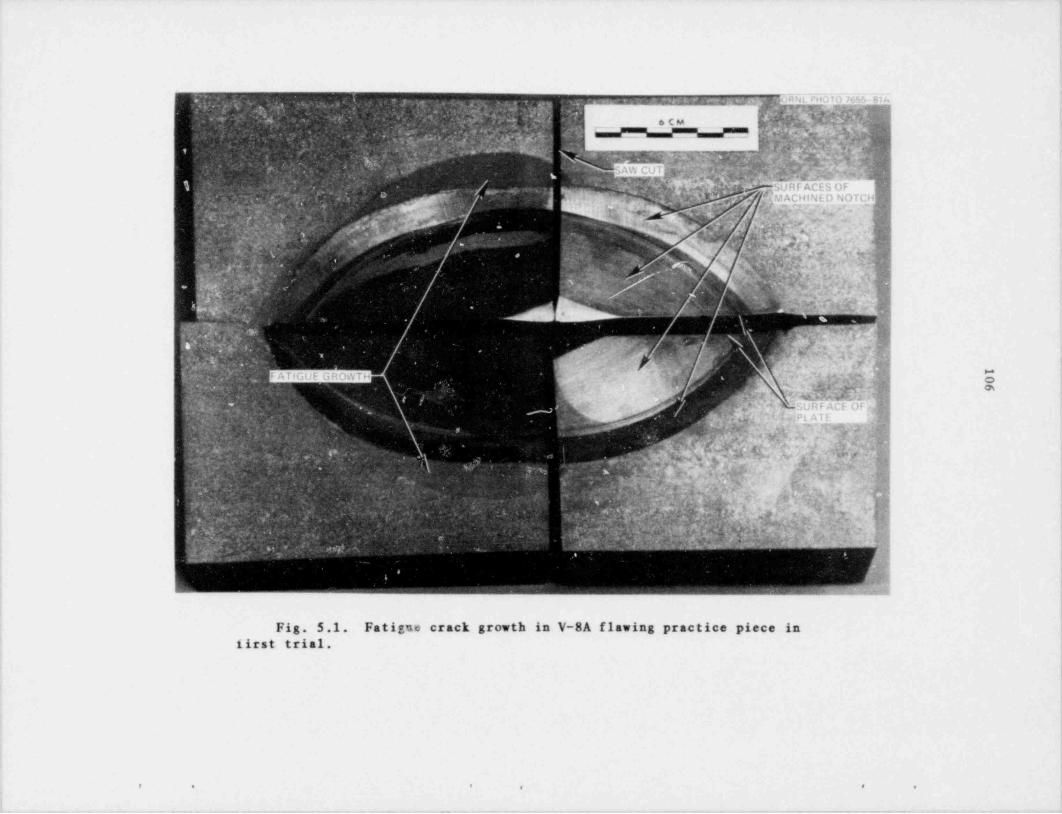
_ _ _ _ _ _ _ _ _ _ _ _ _ _ _ _ _ _ . __ _ _ _ _ _ _ _ . _. _ _ _ _ -
|
1,
I<
s' *-% '.y .
"%. 4j.. m N t PHO T O 7,w R 1 AvnW 't'y;; jam g. ' * * , ,a . 3.
Q '.% g> ,,'1;t .~9 .' - ' .' '
- ;
u , ., - - .<, _ ;,.p. . h. a .:W; L Q6 -;n,m,e g'g rw:<? Y ^!. , . 6Cu <
,p 4 se r .z'y,{|. q,;j 5. . ; ~;.3y. ,,,n.,s' .n} ~ m
~ . q. #",, )4 . ,, d, ., N |*g.3. ,v g5 ,.e.*n.,
, ,,- -
.> f .re ~ n. i ,,n, -e'
1. ..
h ' .,.', n . ~ , '. . . ,,
, .o .
..
; s-~ M ?.YM,. .m.d,&.;y''4d.g2,-y,;-Y~Mid
- .- .'jsY..7 ..
-
SAW CUT (g~. %;,=ty*G 'r5URF ACES OF-yo - V t * + *1
*
,%.4; i;M., Ma;> UCt , W-@ 'e e "\
' %
. . . n' %.t .AW is , -..
$,
/, " . .j - e. g 3
,
. - *'m '
4gr .ir* p .>O,1 AC H I N E D N.O T C R =, ,.. -' ,
e ..'.
y, a, , , '4, 3-- - f, %.
e,,,, , ,,
g 7,.;a ;, , J > * g.% . k . .. , : ~ - .r? .: f* * 5 ., < .t-~-'. ... . .
-p,_, g,a, $r.
.o.' % '*. e -- , ..
, 6,% ='t.?p r ....-8
e 1-
.~' * 2 3. . .
-
..
- i - c.. g*=% . e' ' g'.g 2 - j ,..
'., , ,*.
= g( ;; U -M . y% Q.'"*
, - - r f ss. %. ' ,s e tyy%.r,,,ff _s < . ,, ,
* <?-
*
~, , .
. f.( . g . '
y w'-' .. , wi-
~7- . ),. g " t; N, ,,h. %~ >/)d,#. 3, a ';''. J .]
-e. -
m s,.n m,a ,g ; j<
. . .~ ,f-- u.. WQe t
-. .
:--
u>.
.&,.., . .
,~ .
;f Y %' .,s
, - . | Q'T* . ,, , ,,3 :6 |. . - ,- ' - -
* -' ' ' ' . . . M::
. . [ N" 6Y.'@$Nd' . ' '' ; J._ . . . Q' ' yf5 ~ f|
',
.V >*, ' ;, ,j. . , ,, ,nt
. _,,-['.* - g - - .'g 3;
- .) O_ 4..,,
Mn,w . . > > > :t;; t...& ~ ,_ f mi
-
t . ., .??, UQY US$ A, 3 h.;a. .. ,< > y*4 , 'su9F Act og _]: ' w
.
e . /.. ~ ' > . -
. / . ..
-
., s , % . P L A T T j :4j. ;.
g. .,.
. . , . n ; ' M- v. .<'sy ~;,,, ,. + p :v :: .;; . . , : J, -cs~~w<.4., .
. .. ..
., , . . g. . ' ' k;I , ' - p(*S_ . .\ . 1
. n- ., n- +e w; ,: - 4g:;na., , s , ,n_m t ,_ >
0.. S '.
?
' , h =[k*ggg[S[; .i h 1,, Qfp.. 3
'
fty S M :7u | Q C r: f W;t- 'p(jn. Vv ~ c: s nn w. . - r 2 . g
n K-
- % #) ?.A W T4 [;; v.ce; W ;N,
*. : .J mae -w y; n ., :. )11
s NE - .- .C" Q >:% . , g . @* C "Y M;* C 6 q ", ^ 3 . . pA .
,..
-jWT- .
, , , , _ .
M; - - ' '*
.t 'y' . ,
i. .;
3
- - . . . . _ _ u. ;
Fig. 5.1. Fatipe crack growth in V-8A flawing practice piece infirst trial.
. . . . . .
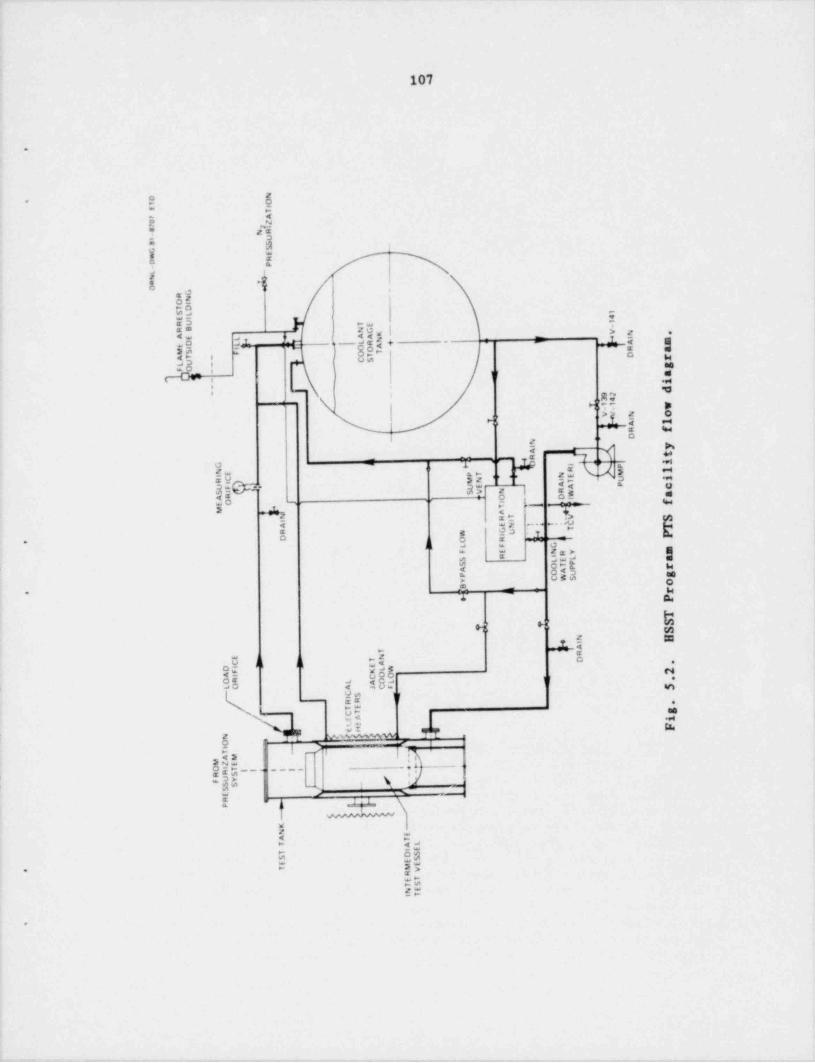
-
-_
.
_
_.
pS -
e
NOT OeE
I
T7 A0 Z7at
NR-
Us S
._SG Ew hp
. Pt ,n gaD _- .GR NOi
TD1SL
EI 41RU E
-I
-R S GN
f
V N .KAEt I
gM _- AA+ t J A m
MS ,' ."D, O R a
i RT
T D rAT -
M-SLU - gFO -
_ ' a- i-
_d- 92
34<_ ' -
V - N oA11 w-
I
T_ 'R fA l
DNI yA t
l Rg l q 6 i
R lgE T NE,
' i,C N I1A A cFI - E
I V N R
O I DM|aR - O
a
y A j*1f
4 T
I R tV Sf
A EN TR W GU
II !
TI N PD O R i,
=eL F GF E NRy m
R I L aS LE PS OTP rA OA U gP CWSe
|I "
oYB r
ii
Pt
TT t'' S
SH
TNE
- " A .TC - EDI LW 2F KAI COOA O _ 'OR LLO A JCn 5
C$ _I
.RRET gCT
&A iT
si FtNN $O , J'
3*
I
_ _l
.jTAMM2E
.Q*OlT g' fI|'RSR _
_ UY 'II
F .$S __ J I
SER
*P
3,,''j'|'/
KN EA TT A L
I ET DSS SEE ET M Ve R
ETTSNEIT
e
.i
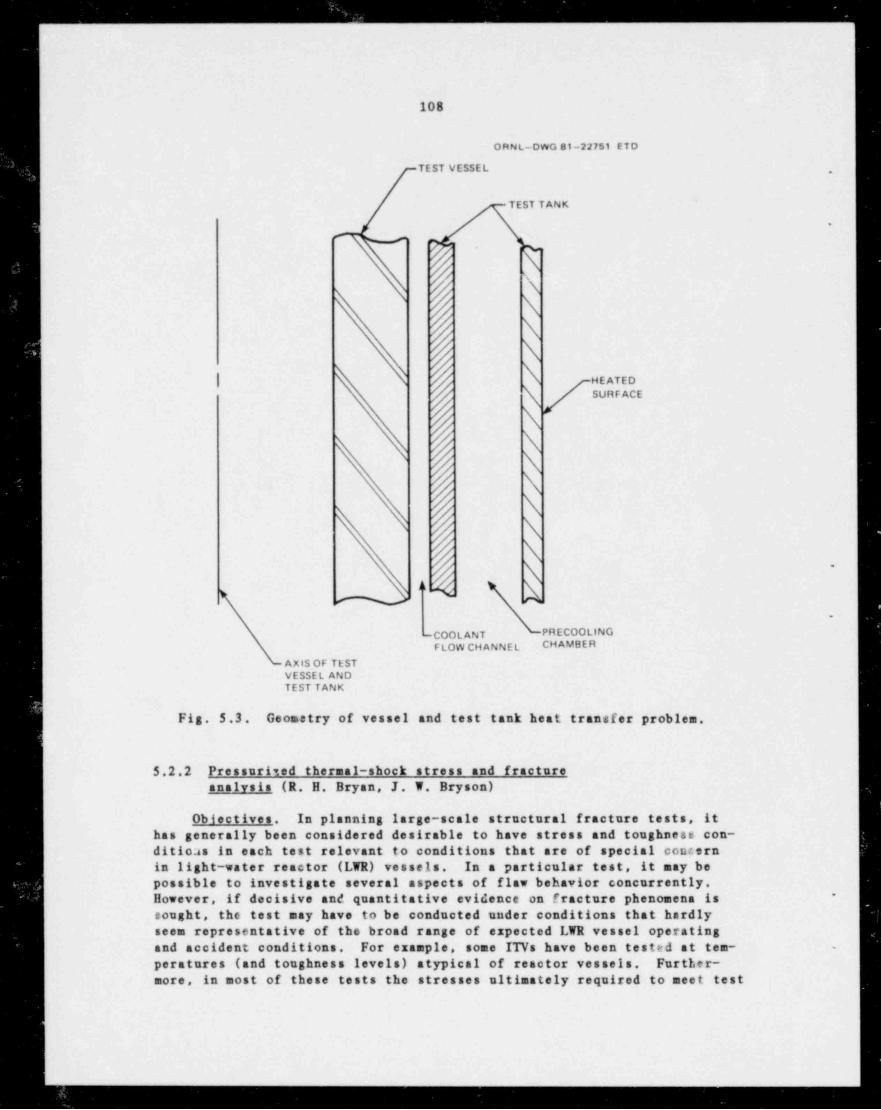
_ _ _ _ .
I
108
ORNL-DWG 81-22751 ETD
TEST VESSEL ,
TEST TANK
.
N.\NNN\
| HEATED
\ SURFACE
NN\\\\\\
'
n .
.
-COOLANT PRECOOLING
F LOW CH ANNE L CHAMBER
AXIS OF TESTVESSEL ANDTEST TANK
Fig. 5.3. Geometry of vessel and test tank heat transfer problem.
5.2.2 Pressurised thermal-shock stress and fractureanalysis (R. H. Bryan, J. W. Bryson)
Obloctives. In planning large-scale structural fracture tests, ithas generally been considered desirable to have stress and toughness con-diticas in each test relevant to conditions that are of special concernin light-water reactor (LWR) vessels. In a particular test, it may bepossible to investigate several aspects of flaw behavior concurrently.However, if decisive and quantitative evidence on fracture phenomena is *
sought, the test may have to be conducted under conditions that hardly j
seem representative of the broad range of expected LWR vessel operatingand accident conditions. For example, some ITVs have been tested at ten- -
peratures (and toughness levels) atypical of reactor vessels. Further-more, in most of these tests the stresses ultimately required to meet test
_ _ - _ _ _ - _ _ _ _ _ _ _ _ _
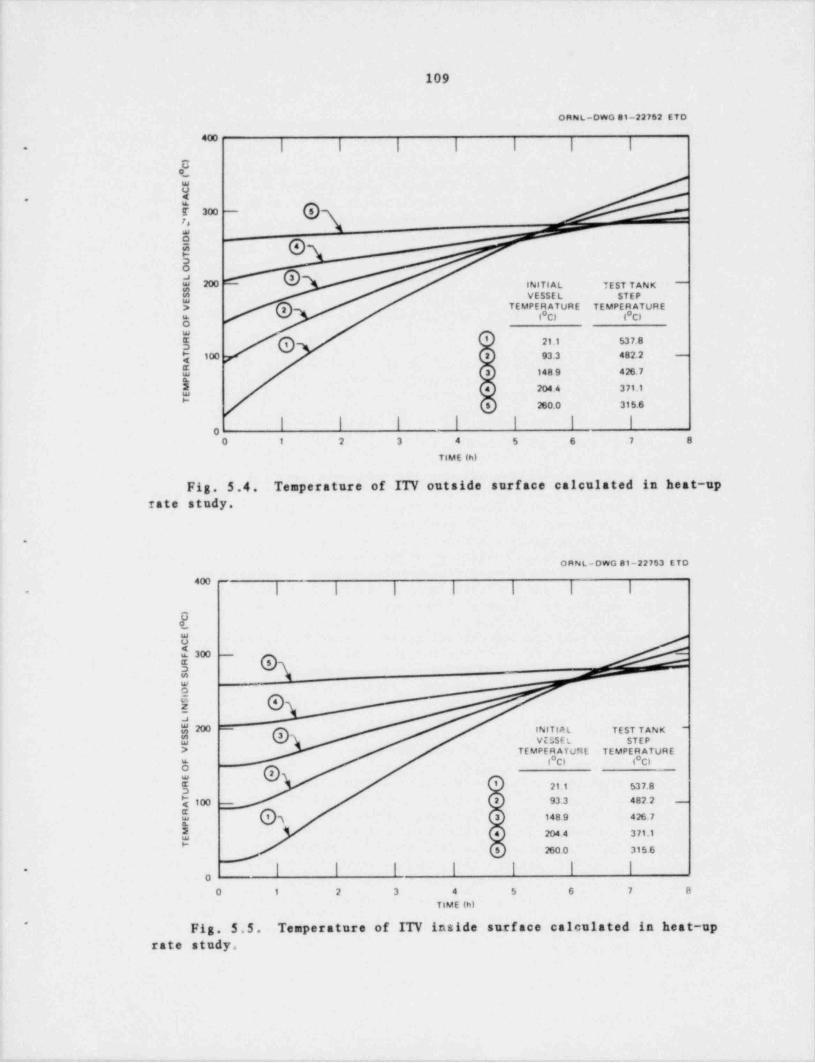
109
ORNL-DWG $1-22752 ETO
*I I I I I I I-
Uo
U
, , ' -
b]O
5 @8
*200 INITIAL TEST TANK
-
g V ESSE L STEPTEMPER ATURE TEMPERATURE> 2
('C) ('Clgw
@ Q 21.1 537.8
y 100 93.3 482.2 -
148 9 426.7
3 204.4 371.1
260.0 315.6
I I I I I I I,
0 1 2 3 4 5 6 7 8
TIME (h)
Fig. 5.4. Temperature of ITV outside surface calculated in heat-uprate study.
;
.
ORNL-DWG81-22753 ETD
*I I I I I l l-
OOU
f' -
@T -
s.
8 -
g200 g, INITIAL TEST TANK ~-
w v VESSE L STEP> TE MPE R ATURE T E MPE R ATUR E
l*C) ('Cl*
O$ 21.1 537.8
k100 - 93.3 482.2 -
h h3 148.9 426.7 ,
3 204 4 3 71.1
260.0 315 6
I I I i l I I-,
O 1 2 3 4 5 6 7 8
TIME (h)
Fig. 5.5. Temperature of ITV inside surface calculated in heat-up'
rate study.
_ _ .
_ _ _ _ _ _ _ _ _ _ . _ _ _ _
110
objectives were abnormally high. Some tests must inevitably involve ex-treme conditions to validate methods of analysis for more realistic situa-
~
tions.Plans for PTS tests using ITVs were promised on embedding the flaw
within material having relevant fracture toughness and subjecting it to arealistic stress state. Both analysis and experience with vessel tests -
supported the practicality of this plan. During this report period, fur-ther analyses have been made to confirm this position. Performance capa-bilities of the PTS test f acility permit the investigation of severalfracture phenomena with a vessel of nearly full-scale thickness, thus pre-senting the flaw with realistic conditions of constraint that cannot beattained with conventional test specimens.
Fracture phenomena that need investigation under the PTS combinedload are
1. cleavage initiation with arrest by virtue of upper shelf;
2. prevention of initiation by warm prestressing (WPS);3. prevention of cleavage initiation by virtue of upper shelf;
4. stable tearing - (a) following cleavage arrest and (b) initiated insharpened (initial) crack; and
5. unstable tearing and arrest.
During this report period, work continued on the development of com-puter programs for this study. Two- and three-dimensional finite-eltmentcodes were used. A two-dimensional study of test conditions was under-taken with the OCA-I code. The computer programs immediately availableare described in Refs, 7-11 and Sect. 2.1 of this report, -
The two-dimensional studies show the capability of the PTS facilityto produce, in an ITV, stress states having the essential features of aPWR vessel under accident conditions. Potential test conditions (i.e., .
materiel toughness and temperature pressure transients) were identifiedfor long outside-surface flaws.
The results of two-dimensional analyses must be confirmed by three-dimensional analyses that ac6ount for the flaw actually being finite andfor the cylinder of the test vessel being restrained by closed ends. Fur-ther code development will also permit elastic plastic analysis to be ap-plied to both two- and three-dimensional thermal shock problems.
Inside-outside study. Two-dimensional analyses of an ITV were per-formed to show how location of a flaw (i.e.. inside vs outside surface)affects stress intensities. A two-dimensional idealization of the problem
is more efficient and convenient for visualization of the influence ofparameter variation on flaw behavior than three-dimensional analysis wouldbe. The OCA-I code,18 which has been used for PWP. accident studies, wasused in this investigation. Iskander, Cheverton, and Ball, who developedOCA-1, modified the code and calculated new sets of K* values (K for unitycrack-face loads) to permit analysis of ITV geometry ar.d outside flaws.Temperature, stress, and K distributions were determined for the 12g ,
thermal-shock cases defined in Table 5.1 for inside and outside flaws. Ineach case, the vessel is assumed to be at constant pressure, and the ther-mal shock is produced by reducing the coolant temperature on the flawed
'
surface of tre vessel by AT at time zero. A constant heat transfer coef-ficient h is assumed.
I1
.. ..
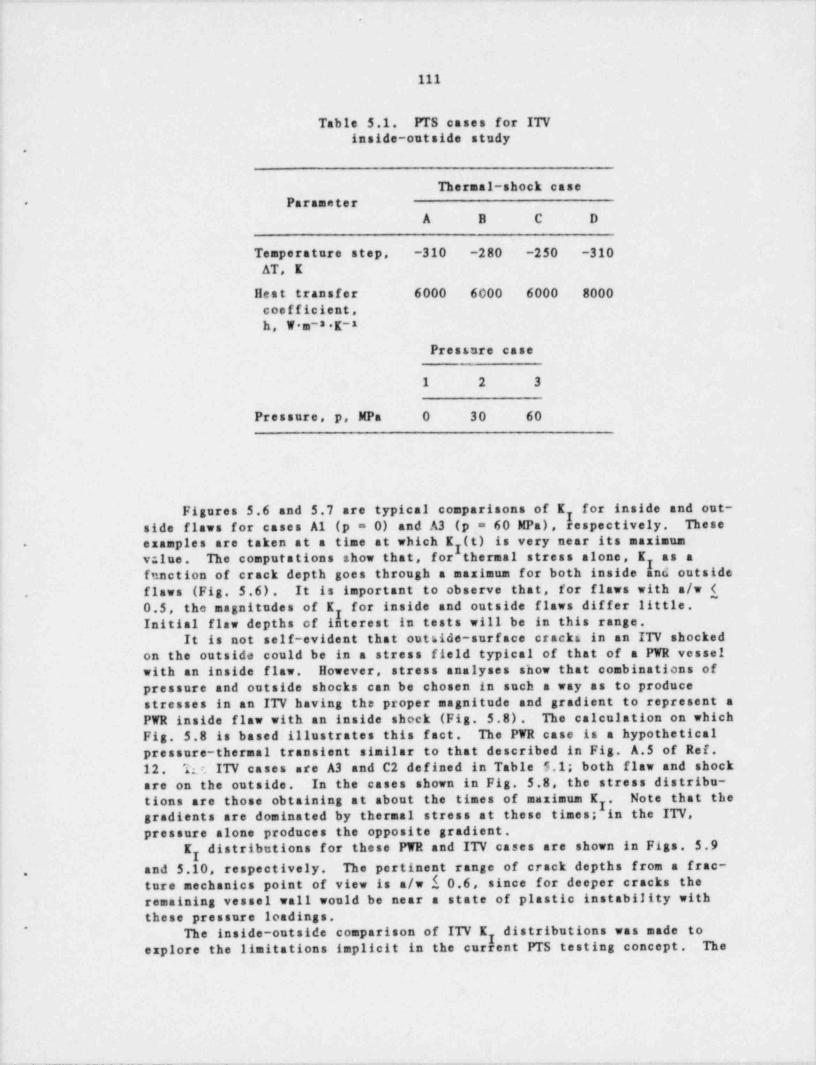
._ . . . _ . __ __ __
.
111
Table 5.1. PTS cases for ITVinside-outside study
.
Thermal-shock caseParameter*
,
Temperature step. -310 -280 -250 -310AT, K
Heat transfer 6000 6000 6000 8000coefficient,h, W a-8 K-1
Pressure case
1 2 3
Pressure, p, MPa 0 30 60
Figures 5.6 and 5.7 are typical comparisons of K for inside and out-gside flaws for cases A1 (p = 0) and A3 (p = 60 MPa), respectively. Theseexamples are taken at a time at which E (t) is very near its maximum- gvalue. The computations show that, for thermal stress alone, K as agfunction of crack depth goes through a maximum for both inside and outsideflaws (Fig. 5.6). It is important to observe that, for flaws with a/w {.
0.5, the magnitudes of K for inside and outside flaws differ little.Initial flaw depths of interest in tests will be in this range.
It is not self-evident that outside-surface cracks in an ITV shockedon the outside could be in a stress field typical of that of a PWR vesselwith an inside flaw. However, stress analyses show that combinations of
pressure and outside shocks can be chosen in such a way as to producestresses in an ITV having the proper magnitude and gradient to represent aPWR inside flaw with an inside shock (Fig. 5.8). The calculation on whichFig. 5.8 is based illustrates this fact. The PWR case is a hypotheticalpressure-thermal transient similar to that described in Fig. A.5 of Ref.12. Tit ITV cases are A3 and C2 defined in Table 5.1; both flaw and shockare on the outside. In the cases shown in Fig. 5.8, the stress distribu-tions are those obtaining at about the times of maximum I . Note that the
'
gradients are dominated by thermal stress at these times; in the ITV,pressure alone produces the opposite gradient.
K distributions for these PWR and ITV cases are shown in Figs. 5.9g
and 5.10, respectively. The pertinent range of crack depths from a frac-.
ture mechanics point of view is a/w I 0.6, since for deeper cracks theremaining vessel wall would be near a state of plastic instability withthese pressure loadings.
The inside-outside comparison of ITV K distributions was made to"
gexplore the limitations implicit in the current PTS testing concept. The
_ _ _ - - _ _ _ _ - _ __ - - - - - - . . . ~ . - -- _ _ . - - _ _ _ , _ - _ _ _ _ _ ,
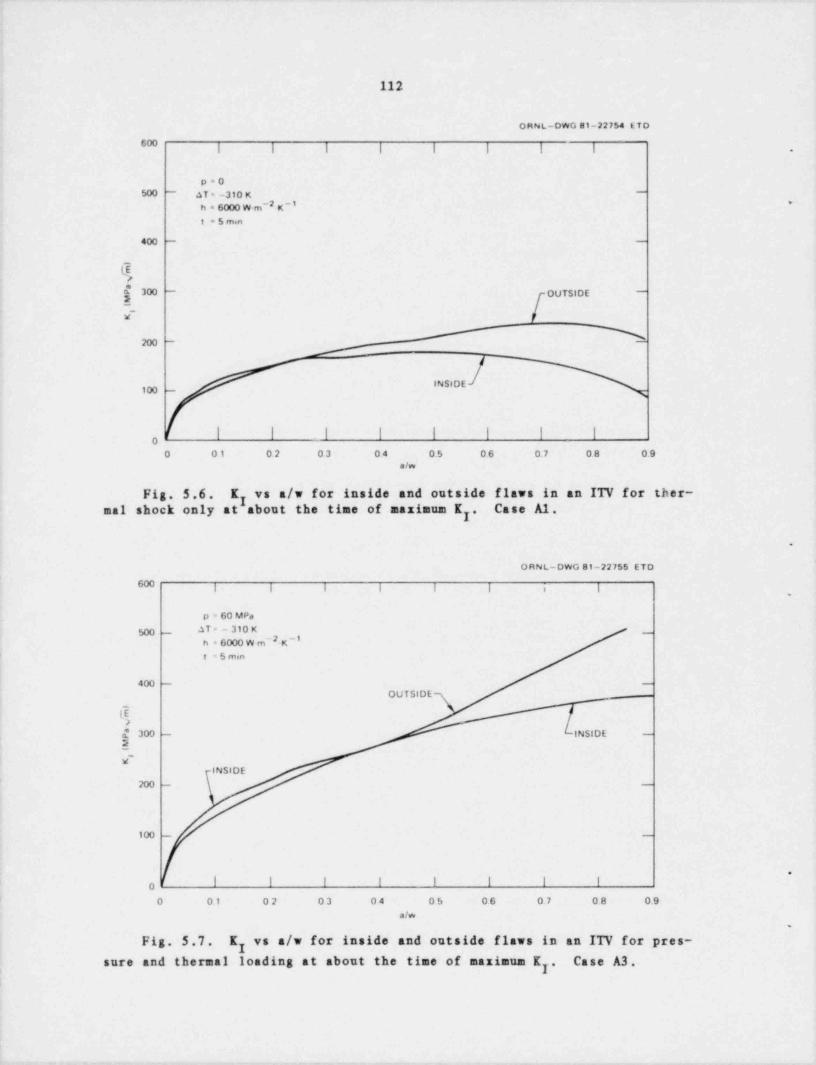
112
ORNL-OWG 81-227S4 E TD
'I I I I I I I i .
p*O500 - aT = -310 K -
-2 -t .h = 6000 W m g
t = 5 men
400 - -
LE?
f300-
[OUTSIDE-
-
. -
f"
200 - -
100 -INSIDE
00 01 02 03 04 0.5 06 0. 7 08 09
a/w
Fig. 5.6. K vs a/w for inside and outside flaws in an ITV for ther-ymal shock only at about the time of maximum K . Case A1.y
.
ORNL-DWG 81-227SS ETD
i l | | | | i (,
p = 60 MPa
500 _ .1T = - 310 K _
-2 -1h = 6000 W m g
=5mm
400 - -
OUTSIDE
(E>
300 - INSIDE -
w_INSIDE
200 -- -
100 -
*
| I I I I I I |o
0 0.1 02 03 04 05 06 0. 7 0.8 09a/w
.
Fig. 5.7. K vs a/w for inside and outside flaws in an ITV for pres-ysure and thermal loading at about the time of maximum K . Case A3.y
_ . ._ , - - _ , -- .- -
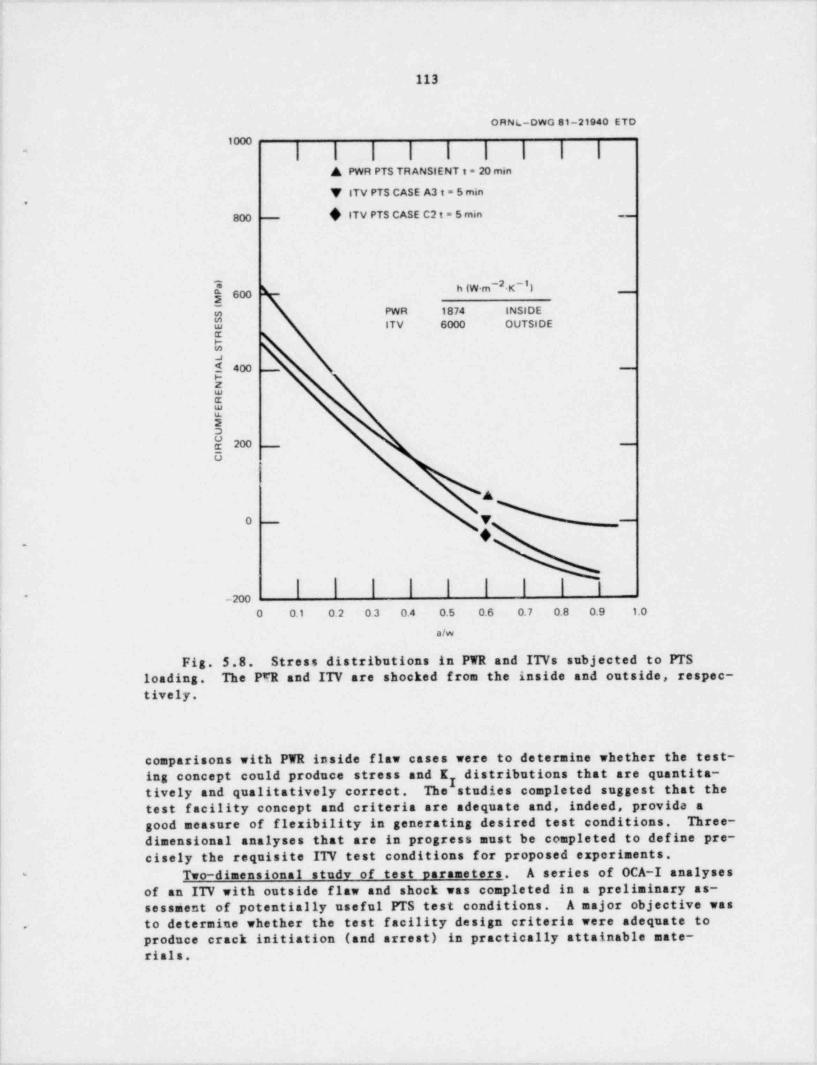
113
ORNL-oWG 81-21940 ETD
'"| I I I I I I I I-
A PWR PTS TRANSIENT t = 20 min
Y ITV PTS CASE A3 t = 5 min,
800 - $ ITV PTS CASE C2 t = 5 min
h (W m-2.gg600 _
E PWR 1874 INSIDEITV 6000 OUTSIDE
_ .w __
55Eag 2x --
o
A
0 - V -
.+
I | | | | | | | |. ,,
0 0.1 0.2 0.3 0.4 0.5 0.6 0.7 0.8 0.9 1.0
alw
Fig. 5.8. Stress distributions in PWR and ITVs subjected to PTSloading. The PrR and ITV are shocked from the inside and outside, respec-tively,
comparisons with PWR inside flaw cases were to determine whether the test-ing concept could produce stress and K dist d utions that are quantita-gtively and qualitatively correct. The studies completed suggest that thetest facility concept and criteria are adequate and, indeed, provida agood measure of flexibility in generating desired test conditions. Three-dimensional analyses that are in progress must be completed to define pre-cisely the requisite ITV test conditions for proposed experiments.
Two-dimensional study of test narameters. A series of OCA-I analyses'
of an ITV with outside flaw and shock was completed in a preliminary as-sessment of potentially useful PTS test conditions. A major objective wasto determine whether the test facility design criteria were adequate to.
produce crack initiation (and arrest) in practically attainable mate-rials.
|!
||
- - - _- - -__ _--__ . - - .. __ __ ,_
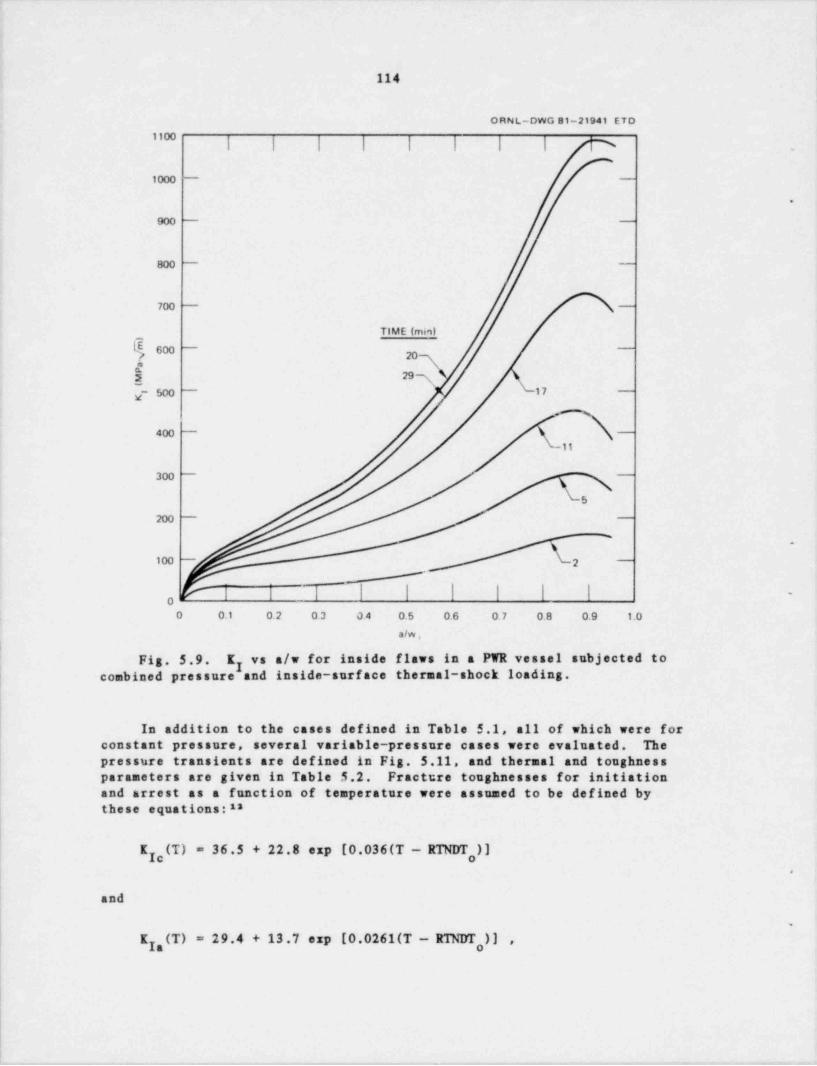
'
!
j114)
ORNL-DWG 81-21941 ETD
""l I I I I I I I _
iOw - -
.
900 - -
800 - -
700 - -
TIME (min)
6@ -
gx-
-
k "m'- 500 - 17 -
g
400 - -
300 - -
5
200 - -
100 - -
0'
O 0.1 0.2 0.3 a4 0.5 0.6 0.7 0.8 0.9 1.0
a/w ,
| Fig. 5.9. K vs a/w for inside' flaws in a PWR vessel subjected toycombined pressure and inside-surface thermal-shock loading.
In addition to the cases defined in Table 5.1, all of which were forconstant pressure, several variable pressure cases were evaluated. Thepressure transients are defined in Fig. 5.11, and thermal and toughnessparameters are given in Table 5.2. Fracture toughnesses for initiationand arrest as a function of temperature were assumed to be defined bythese equations: 18
K ,(T) = 36.5 + 22.8 exp [0.036(T - RTNIrr )]g,
and
,
K ,(T) = 29.4 + 13.7 exp [0.0261(T - RINITT,)] ,y
.. . , . - . - . _ - - - - - - .- _ - - . ..
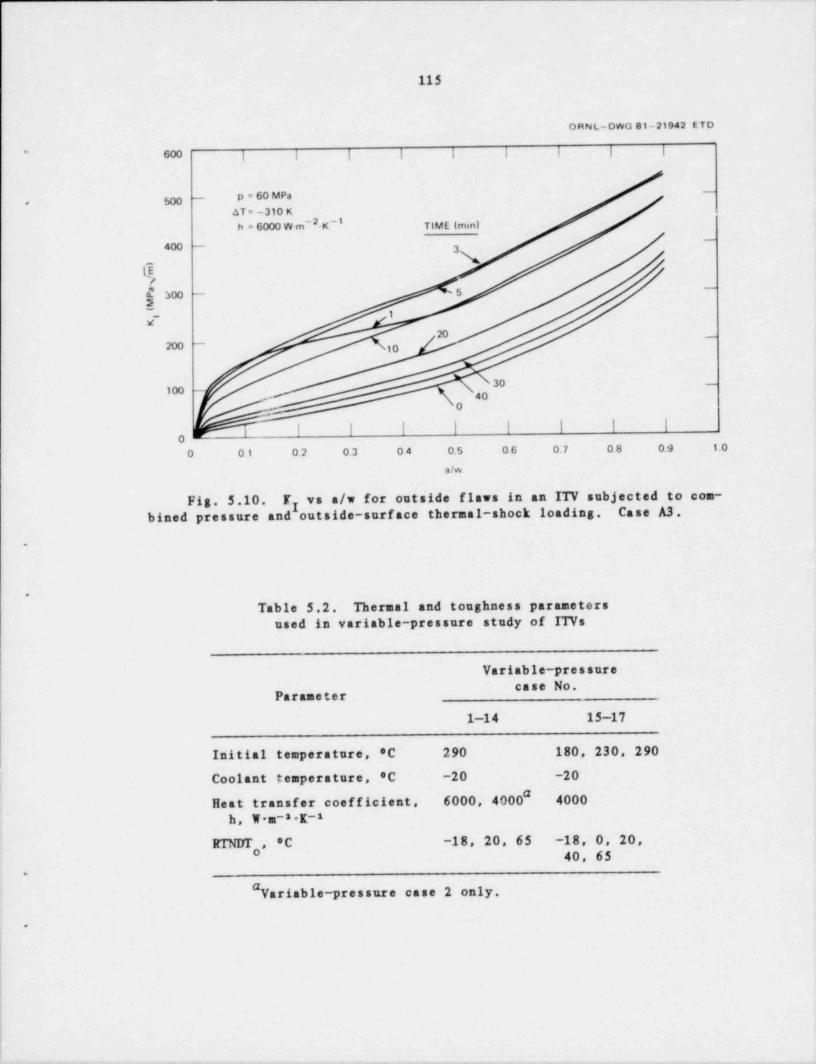
115
ORNL-DWG 81-21942 ETO
6M | | | | | | | | |*
g - p = 60 MPa-
,
AT = -310 Kh = 6000 W m-2 g-1 TIME (min)
-
4@ -
3- \$
-jsw - s
_ iw
200 -
10
30 -
im -
,,,
0
1 I I I I I I I,-O 0.1 0.2 0.3 04 0.5 06 0.7 0.8 0.9 1.0
a/w
Fig. 5.10. tr vs a/w for outside flaws in an IW subjected to com-y
bined pressure and outside-surface thermal-shock loading. Case A3..
.
Table 5.2. Thermal and toughness parametersused in variable pressure study of IWs
Variable-pressure**** *
Parameter
1-14 15-17
Initial temperature, 'C 290 180, 230, 290
Coolant temperature, 'C -20 -20
Heat transfer coefficient, 6000, 4000" 4000h, W a-8.K-1
RTNIrr , *C -18, 20, 65 -18, 0, 20,40, 65
.
" Variable pressure case 2 only.
.
. __ _ ._ . - _ _ _ , - _ .
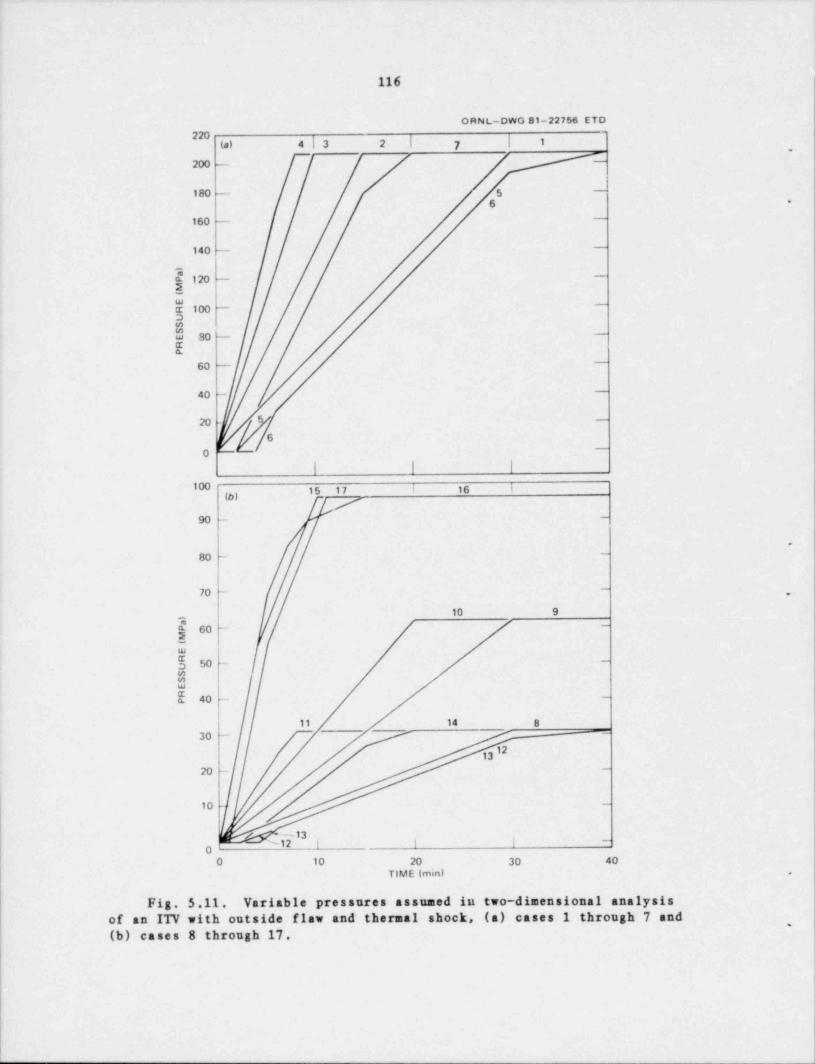
116
ORNt.-DWG 81-22756 ETD220
(a) 4I3 2 | 7 | 1-
200 --
180 - 5 -
6 -
160 --
140 --
-{120-
-
;e 300 -
-
30 80 -
-
E
60 --
40 --
20 5 _
60
-
1 I I
l 15 17 | 16 I(b)
90 __
'
80 --
70 --
,
10 9gg 60 -
-
;
$ 50 --
EuJ
E 40 --
11 14 830 -
-
1213
20 --
10 --
x 2 | 1 |-
00 10 20 30 40
TIME (mm) .
Fig. 5.11. Variable pressures assumed in two-dinensional analysisof an ITV with outside flaw and thermal shock, (a) cases 1 through 7 and
,
(b) cases 8 through 17.
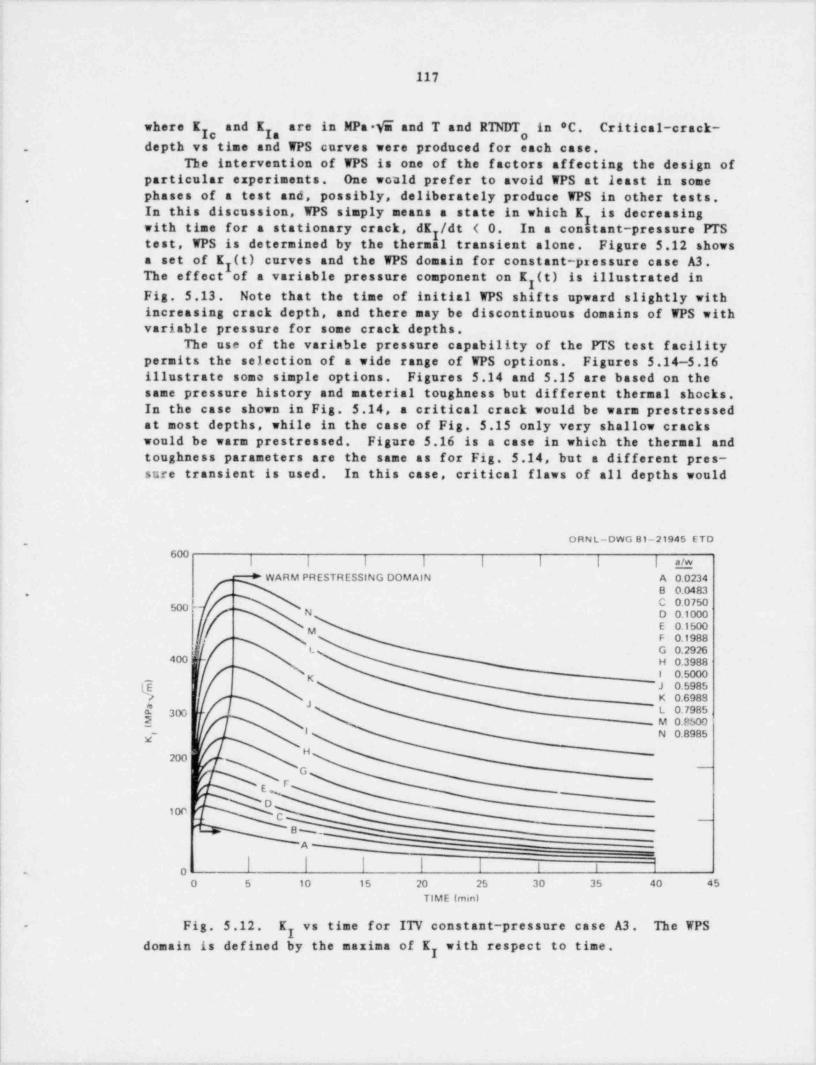
117
where K , and K , are in Ra W and T and R N , in 'C. Critical-crack-y ydepth vs time and WPS curves were produced for each case..
The intervention of WPS is one of the factors affecting the design ofparticular experiments. One would prefer to avoid WPS at least in somePhases of a test and, possibly, deliberately produce WPS in other tests..
In this discussion, WPS simply means a state in which K is decreasingywith time for a stationary crack, dK /dt ( 0. In a constant pressure MSytest, WPS is determined by the thermal transient alone. Figure 5.12 showsa set of K (t) curves and the WPS domain for constant pressure case A3.yThe effect of a variable pressure component on K (t) is illustrated inyFig. 5.13. Note that the time of initial WPS shifts upward slightly withincreasing crack depth, and there may be discontinuous domains of WPS withvariable pressure for some crack depths.
The use of the variable pressure capability of the PTS test facilitypermits the selection of a wide range of WPS options. Figures 5.14-5.16illustrate some simple options. Figures 5.14 and 5.15 are based on thesame pressure history and material toughness but different thermal shocks.In the case shown in Fig. 5.14, a critical crack would be warm prestressedat most depths, while in the case of Fig. 5.15 only very shallow crackswould be warm prestressed. Figure 5.16 is a case in which the thermal andtoughness parameters are the same as for Fig. 5.14, but a different pres-sure transient is used. In this case, critical flaws of all depths would
ORNL-DWG 81-21945 ETD,
6I I I I I I I I a!n
* WARM PRESTRESSING DOMAIN A 0.0234*
g. . 50N D 0.1000
E 0.1500MF 0.1988
L G 0.2926400 H 0.3988
I a5000l K
@ ~J 0.5985i
( r K 0.6989j2 3gg L 0.7985.2 _ M 0.8600
]~ l N 0.8985H
G-
'< -,
#_
A-
I I0-
O 5 10 15 20 25 30 35 40 45TIME (mml
Fig. 5.12. K vs time for ITV constant pressure case A3. The WPS, -
ydomain is defined by the maxima of K with respect to time.y
. - _ _ _ _ _ . -
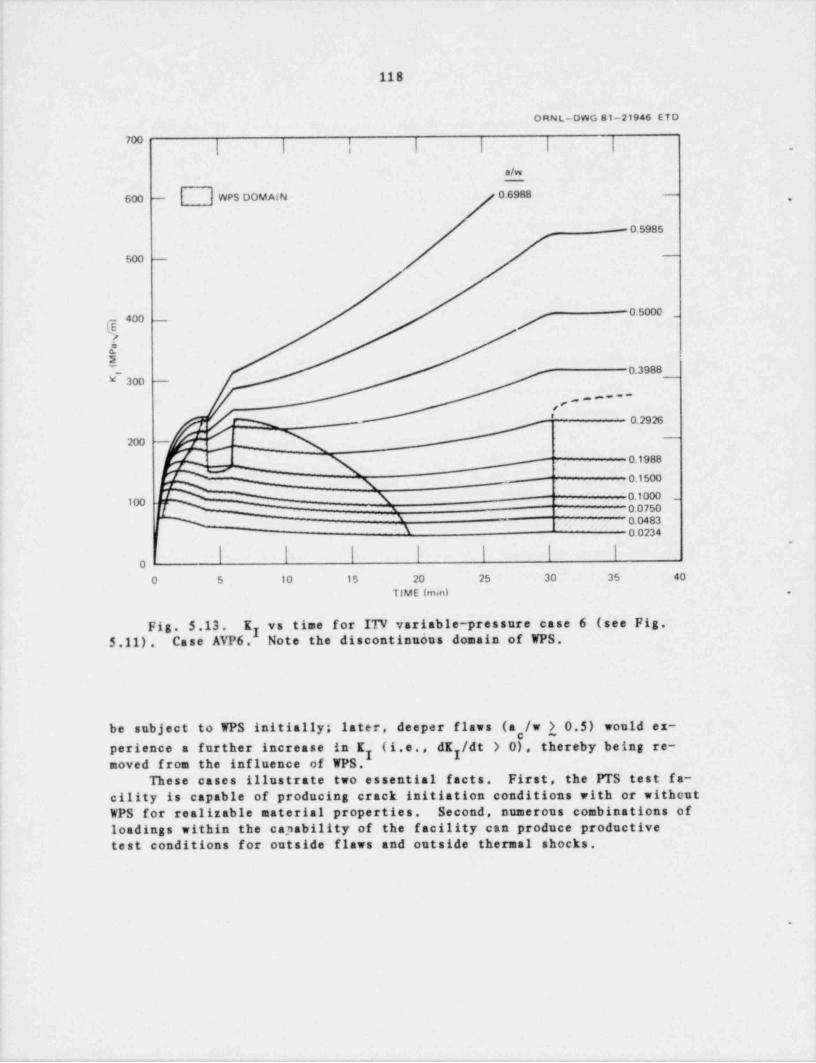
118
ORNL-DWG 81-21946 ETD
'"l I I I I I I _
d600 - WPS DOMAIN 0.6988 -
,
- 0.5985
500 --
OM400 - _
?E3g- 0.3988 _
_
,,,,,,. e * ~ -
[N - O.2926'
2m - / X -
_,0.1988
-0.1500g\ 0.1000100
0.0750s1 0.0483\ 0.0234
0
0 5 10 15 20 25 30 35 40
TIME (rmn) .
Fig. 5.13. K vs time for ITV variable pressure case 6 (see Fig.
5.11). Case AVP6.y Note the discontinu6us domain of WPS.
be subject to WPS initially; later, deeper flaws (a /w 1 0.5) would ex-y (i.e., dK /dt > 0), thereby being re-perience a further increase in K
7moved from the influence of WPSThese cases illustrate two essential facts. First, the PTS test fa-
cility is capable of producing crack initiation conditions with or withoutWPS for realizable material properties. Second, numerous combinations ofloadings within the capability of the facility can produce productivetest conditions for outside flaws and outside thermal shocks.
.
>
. ~ - - - , , , - - - w-- ,--, . ,- - ,. ~,
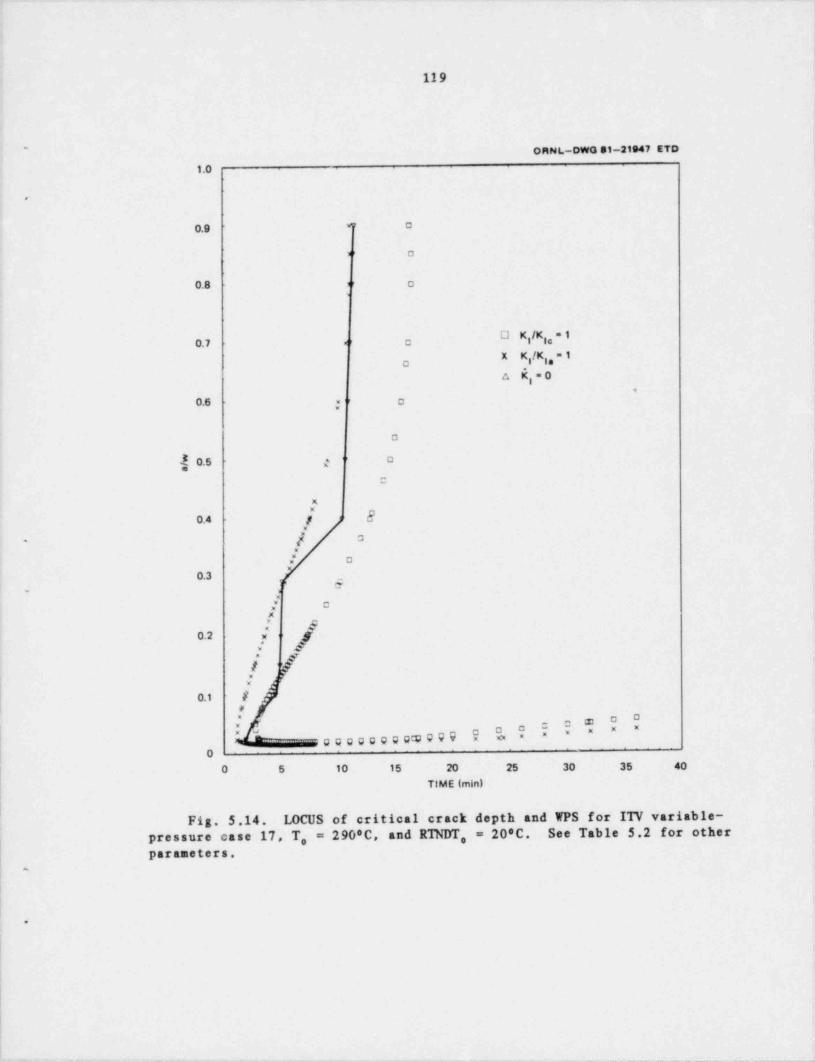
.
119
ORNL-DWG S1-21e47 ETD.
1.0
.
*r a0.9
v' a
0.8 i' o
O K,/K,, = 10.7 w r oX K,/K,, = 1g
A K, = 09
0.6 =-, o
O
j0.5 O
C
A
[ 80.4x
| a-
N
x" a
0.3 _
?. ,
x" CA
5 E0.2 w g
|'f0.1 /
e
$Oo o a O UJ " *gggggggg3999 x o =
O
I O 5 10 15 20 25 30 35 40
TIME (min)
Fig. 5.14. LOCUS of critical crack depth and WPS for ITV variable-pressure case 17, T, = 290'C, and RINDT, = 20*C. See Table 5.2 for otherparameters.
t.
,. ~ - ~ - - - . _ . . - - - . - - - - . - . _ - -
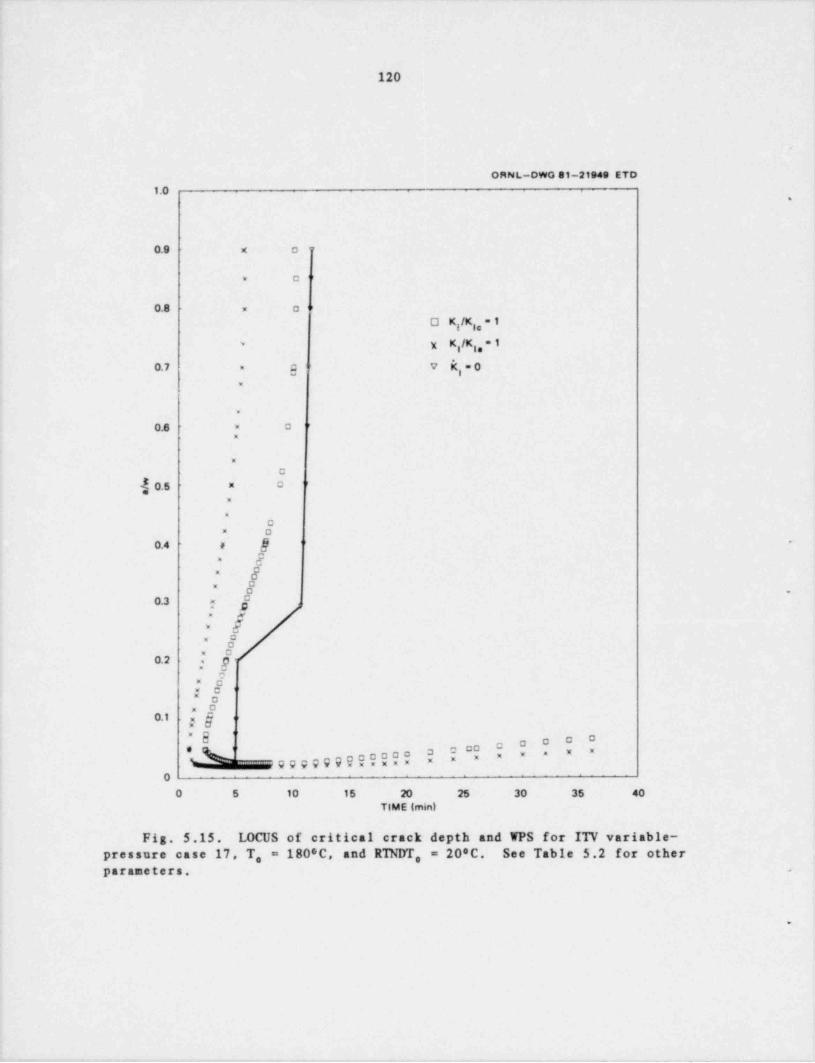
- .
120
-
ORNI.-DWO 81-21949 ETD
1.0.
0.9 x o <r
u O
0.8 = a i
O KIK,,=1g
K,/K , = 1* x g
v K, . 00.7 g=
.
.
0.8 = 0 '
=
M
C
j 0.5 x 0 '
E
R
08 0
8-
0.4 #
2-
8'
a=
0.3 ; y~
s'
&'
E"
x 00.2 ,. g-
-
5Kw C '"
0ax
: 5"'
*8' a o a om gggggg?????? EE " * * *
00 5 10 15 20 25 30 35 40
TIME (min)
Fig. 5.15. LOCUS of critical crack depth and WPS for IIV variable-
pressure case 17, T, = 180*C, and RTNDT, = 20'C. See Table 5.2 for otherparameters. -
.
,, _ ., - - . _ , _ . _-
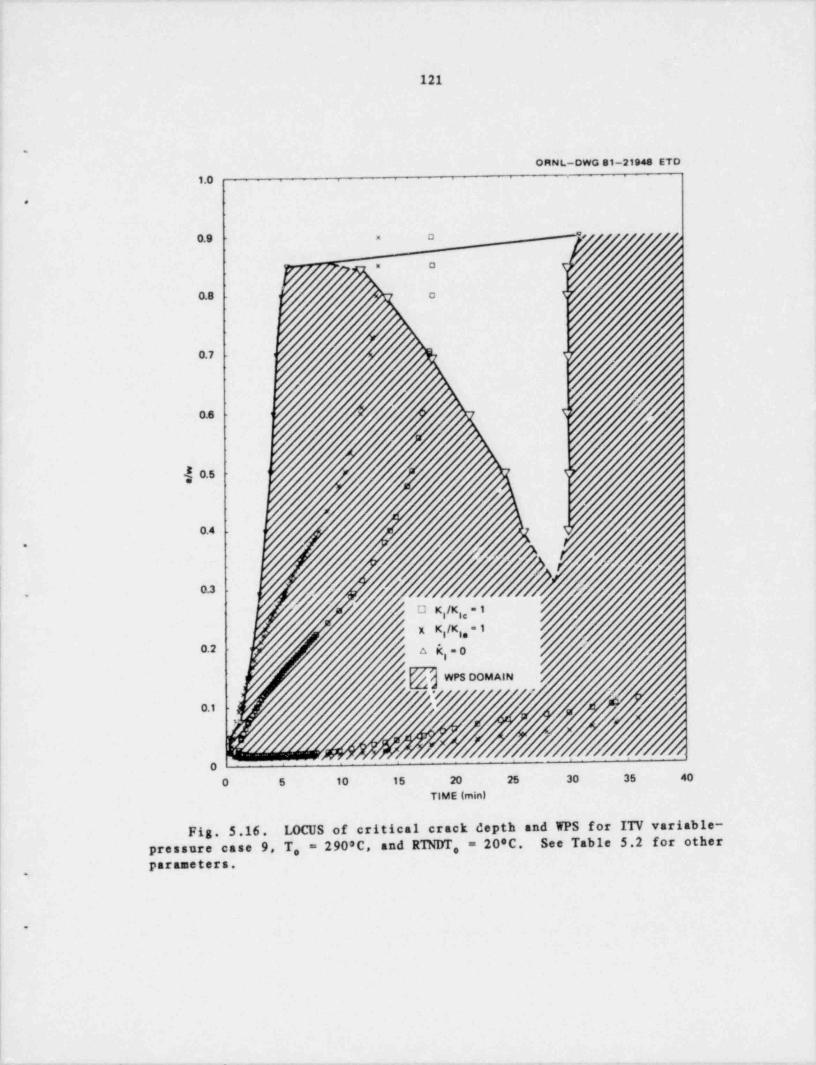
121
O R N L-DWG 81-21948 ETD
1.0
a
0.9
0.8 o
0.7 3<
0.6 z
j0.5 5
0.4
[0.3
.
O K,/K,, =X K,/K,,a 1
0.2 A K, = 0
U',
0 5 10 15 20 25 30 35 40
TIME (min)
Fig. 5.16. LOCUS of critical crack depth and WPS for ITV variable-pressure case 9, T, = 2908C, and RINDT, = 20*C. See Table 5.2 for otherparameters.
,
.
122
References
'
1. R. H. Bryan and P. P. Holz, " Intermediate Test Vessel V-8A," Heavy-Section Steet Technology Program Quart. Prog. Rep. Jut d eptember1980, NUREG/CR-1806 (ORNL/NUREG/TM-419), p. 53.
.
2. P. P. Holz and R. H. Bryan, " Intermediate Test Vessel V-8A," Heavy-Section Steet Technology Program Quart. Prog, Rep. October-December1980, NUREG/CR-1941 (ORNL/NUREG/TM-437), pp. 55-57.
3. P. P. Holz and R. H. Bryan, " Intermediate Test Vessel V-8A," Heavy-Section Steet Technology Program Quart. Prog. Rep. January-March1981, NUREG/CR-2141/V1 (ORNL/M-7822), pp. 97-102.
4. P. P. Holz and R. H. Bryan, " Intermediate Test Vessel V-8A," Heavy-Section Steet Technology Program Quart. Prog. Rep. April-June 1981,NUREG/CR-2141/V2 (ORNL/TM-7955), pp. 71-74.
5. R. H. Bryan and G. C. Robinson, " Pressurized Thermal Shock Studies,"Heavy-Section Steet Technology Program Quart. Prog. Rep. January-March 1981, NUREG/CR-2141/V1 (ORNL/TM-7822), pp. 102-104.
6. G. C. Robinson, " Pressurized Thermal Shock," Heavy-Section SteetTechnology Program Quart. Prog. Rep. April-June 1981, NUREG/CR-2141/V2 (ORNL/TM-7955), pp. 74-85.
7. J. W. Bryson and B. R. Bass, " Computer Program Development," Heavy- -
Section Steet Technology Program Quart. Prog. Rep. Aprit-June 1981,NUREG/CR-2141/V2 (ORNL/TM-7955), pp. 3-6.
.
8. S. K. Iskander, Tuo Finite-Element Techniques for Computing Mode IStress Intensity Factorc in Two- and Three-Dimensional Problems,ORNL/NUREG/CSD/TM-14 (February 1981).
9. B. R. Bass and J. W. Bryson, " Computational Methods for Elastic-Plas-tic Fracture Mechanics," Heavy-Section Steet Technology ProgramQuart. Prog. Rep. October-December 1980, NUREG/CR-1941 (ORNL/NUREG/TM-437), pp. 8-11.
10. B. R. Bass, " Nonlinear Computational Fracture Mechanics," Heavy-Sec-tion Steet Technology Program Quart. Prog. Rep. Januar & arch 1981,NUREG/CR-2141/V1 (ORNL/M-7822), pp. 3-10.
11. B. R. Bass and J. W. Bryson, " Computational Methods for 3-D NonlinearFracture Mechanics," Heavy-Section Steet Technology Program Quart.Prog. Rep. Aprit-June 1981, NUREG/CR-2141/V2 (ORNL/ H -7955), pp.7-10.
,
12. S. K. Iskander, R. D. Cheverton, and D. G. Ball, OCA-I, A Code forCatet.tating the Behavior of Flave on the Inner Surface of a Pressure
,
Vesset Subjected to Temperature and Pressure Transients, ORNL/NUREG-84 (August 1981).
_. _ .
123
Appendix A
TABULATION OF BACKGROUND DATA
.
o
4h
e
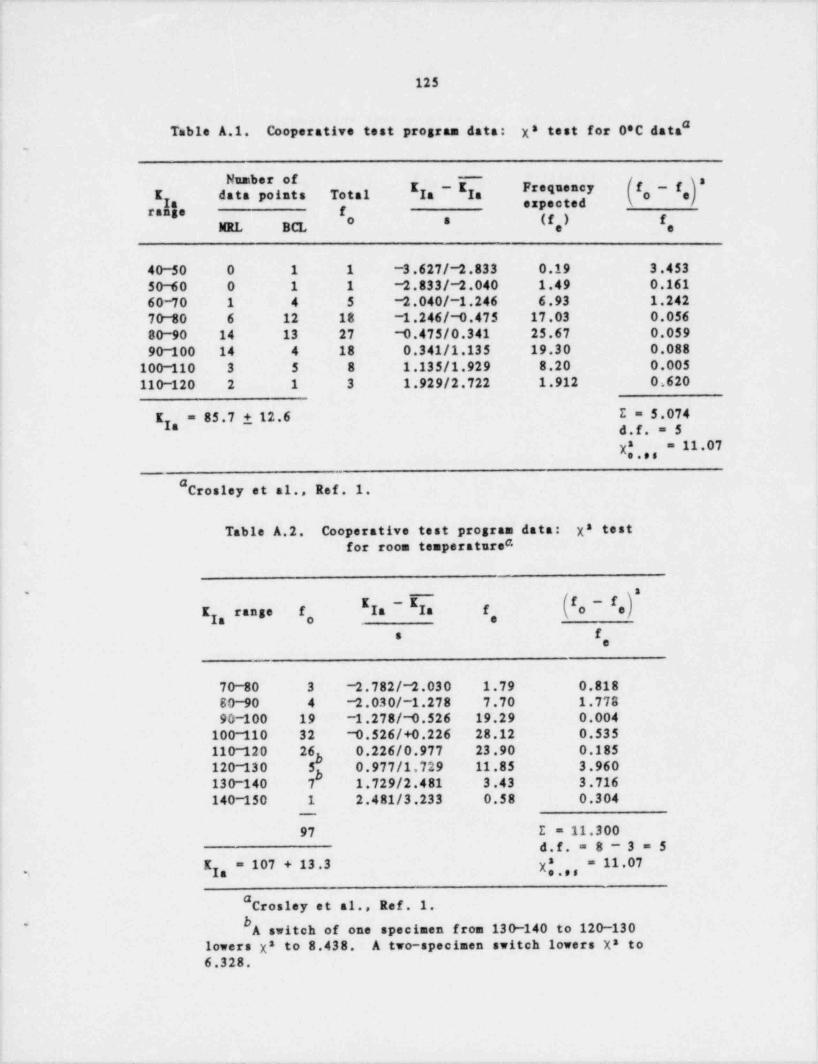
125
Table A.1. Cooperative test program data: X * test for O'C data".
Number ofE,-K, Frequency f, - f, aK data points Total g y
**pectedrange f * II ) fMEL BCL e e
40-50 0 1 1 -3.627/-2.833 0.19 3.45350-60 0 1 1 -2.833/-2.040 1.49 0.16160-70 1 4 5 -2.040/-1.246 6.93 1.24270-80 6 12 18 -1.246/-0.475 17.03 0.05680-90 14 13 27 -0.475/0.341 25.67 0.05990-100 14 4 18 0.341/1.135 19.30 0.088
100-110 3 5 8 1.135/1.929 8.20 0.005110-120 2 1 3 1.929/2.722 1.912 0,620
K = 85.7 ~+ 12.6 I = 5.074I* d.f. = 5
y* es = 11.07e.
Crosley et al., Ref. 1.
Table A.2. Cooperative test program data: X* test' for room temperature"
K , range f Ia - In f, 'o ~ oy
f,s
70-80 3 -2.782/-2.030 1.79 0.81880-90 4 -2.030/-1.278 7.70 1.77890-100 19 -1.278/-C.526 19.29 0.004
100-110 32 -0.526/+0.226 28.12 0.535110-120 26 0.226/0.977 23.90 0.185
3120-130 5 0.977/1.729 11.85 3.960
3130-140 7 1.729/2.481 3.43 3.716140-150 1 2.481/3.233 0.58 0.304
__
97 I = 11.300d.f. = 8 - 3 = 5
K , = 107 + 13.3 X* ,, = 11.07y, ,
"Crosley et al., Ref. 1.A switch of one specimen from 13 0-140 to 120-130'
lowers X* to 8.438. A two-specimen switch lowers X8 to
6.328.
__
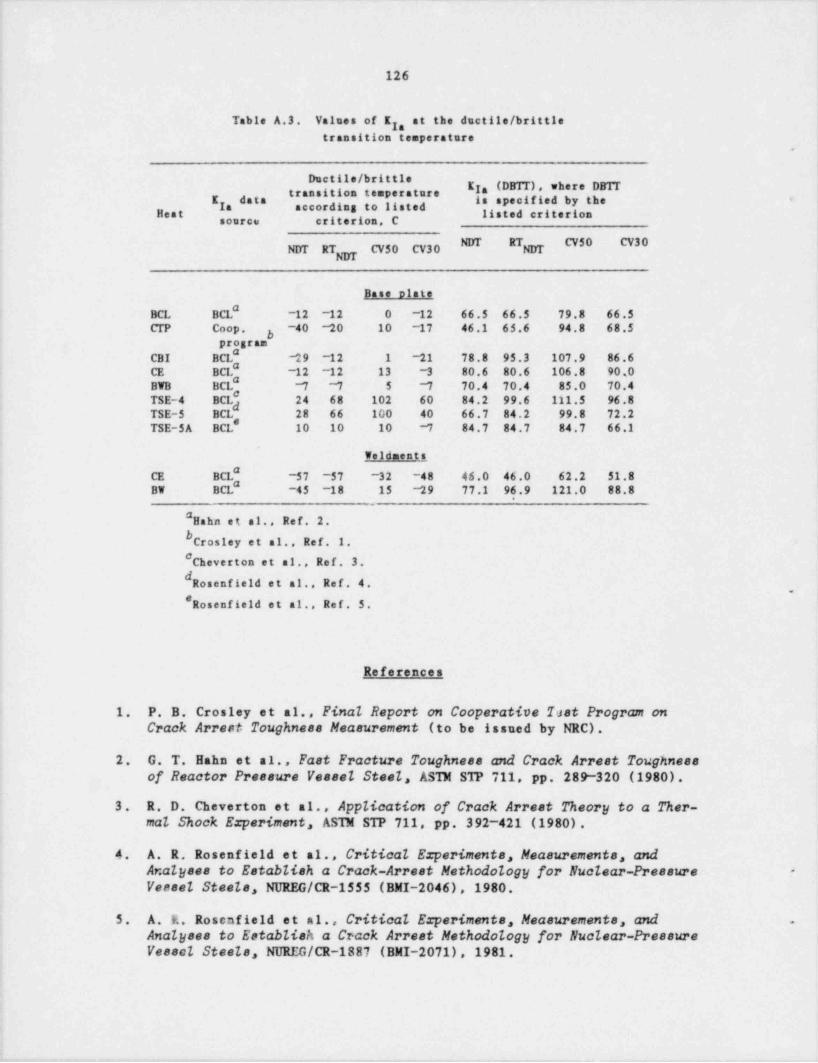
.
126
Values of E , at the dactile/ brittleTable A.3.3
transition temperature.
hetile/ brittle iia (DBTT), where DBIT**** * ***'''' "#'
I data is specified by the <
* *** # "I **Heat listed criterionsource criterion, C
NUT RT CV50 CV30 NDTNDT
Base olete
BCL BC1" -12 -12 0 -12 66.5 66.5 79.8 66.5CTP Coop. -40 -20 10 -17 46.1 65.6 94.8 68.53
prggramCBI BCL 19 -12 1 -21 78.8 95.3 107.9 86.6CE BCL" -12 -12 13 -3 80.6 80.6 106.8 90.0BWB BCL" -7 M 5 -7 70.4 70.4 85.0 70.4
#TSE-4 BCl 24 68 102 60 84.2 99.6 111.5 96.8dTSE-5 BCL 28 66 100 40 66.7 84.2 99.8 72.2TSE-5A BCL* 10 10 10 M 84.7 84.7 84.7 66.1
Weldments#
CE BCL -57 -57 -32 -48 46.0 46.0 62.2 51.8BW BCL" -45 -18 15 -29 77.1 96.9 121.0 88.8
#Hahn et al., Ref. 2.
Crosley et al., Ref. 1.#Cheverton et al., Ref. 3.
Rosenfleid et al., Ref. 4.,
#Rosenfield et al., Ref. 5.
References
1. P. B. Crosley et al., Final Report on Cooperative Tast Program onCrack Arrest Toughness Measurement (to be issued by NRC).
2. G. T. Enha et al., Fast Fracture Toughness and Crack Arrest Toughnessof Reactor Pressure Vesset Steet, ASTM SIP 711, pp. 289-320 (1980) .
3. R. D. Chevetton et nl., Application of Crack Arrest Theory to a Ther-mat Shock Experiment, ASIM STP 711, pp. 392-421 (1980) .
4. A. R. RosentLeld et al., Critical Experiments, Measurements, andAr.atyees to Establish a Crack-Arrest Methodology for Nuclear-Pressure -
Vesset Staats, NUREG/CR-1555 (BMI-2046), 1980.
5. A. K. Roscnfield et al., Critical Experiments, Measurements, and .
Analyses to Establish a Crack Arrest Methodology for Nuclear-PressureVesset Stests, NUREG/CR-1887 (BMI-2071), 1981.
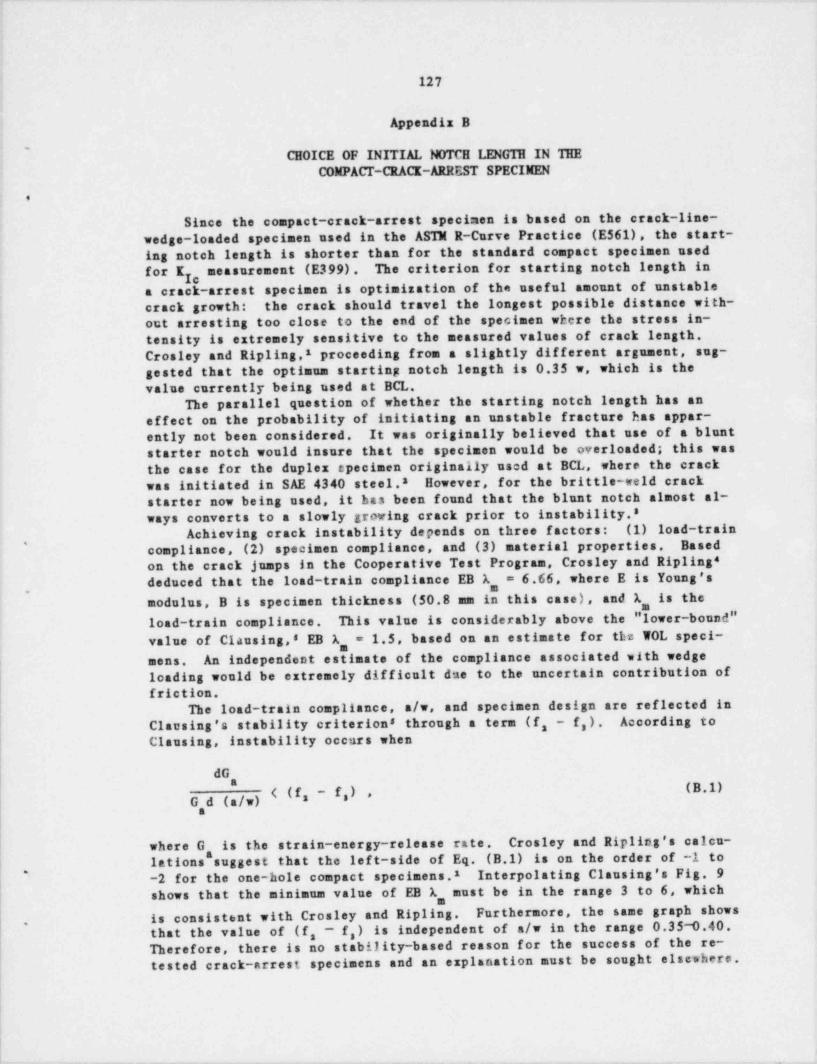
127
Appendix B'
CHOICE OF INITIAL NOTCH LENGH IN HECOMPACT-CRACK-ARREST SPECIMEN
4 ,
Since the compact-crack-arrest specimen is based on the crack-line-wedge-loaded specimen used in the ASTM R-Curve Practice (E561), the start-ing notch length is shorter than for the standard compact specimen usedfor K measurement (E399) . The criterion for starting notch length in
ha crack-arrest specimen is optimization of the useful amount of unstablecrack growth: the crack should travel the longest possible distance with-
out arresting too close to the end of the specimen where the stress in-tensity is extremely sensitive to the measured values of crack length.Crosley and Ripling,1 proceeding from a slightly different argument, sug-gested that the optimum starting notch length is 0.35 w, which is thevalue currently being used at BCL.
The parallel question of whether the starting notch length has aneffect on the probability of initiating an unstable fracture has appar-ently not been considered. It was originally believed that use of a blantstarter notch would insure that the specimen would be overloaded; this wasthe case for the duplex epecimen originally used at BCL, where the crackwas initiated in SAE 4340 steel.8 However, for the brittle-weld crackstarter now being used, it has been found that the blant notch almost al-ways converts to a slowly growing crack prior to instability.s
Achieving crack instability depends on three factors: (1) load-train
compliance, (2) specimen compliance, and (3) material properties. Based,
don the crack jumps in the Cooperative Test Program, Crosley and Riplingdeduced that the load-train compliance EB A,= 6.66, where E is Young's
,
modulus, B is specimen thickness (50.8 mm in this case), and A,is the,
load-train compliance. This value is considerably above the " lower-bound"value of Clausing,s EB A, = 1.5, based on an estimate for thz WOL speci-
An independent estimate of the compliance associated with wedgemens.loading would be extremely difficult due to the uncertain contribution offriction.
The load-train compliance, a/w, and specimen design are reflected inClausing's stability criterions through a term (f, - f,). According to
Clausing, instability occurs when
dG,~I) OU
G d (a/w) : s '
a
where G, is the strain-energy-release rate. Crosley and Ripling's calcu-lations suggest that the left-side of Eq. (B.1) is on the order of -1 to-2 for the one-hole compact specimens.1 Interpolating Clausing's Fig. 9,
shows that the minimum value of EB A,must be in the range 3 to 6, whichis consistent with Crosley and Ripling. Furthermore, the same graph showsthat the value of (f, - f,) is independent of a/w in the range 0.35-0.40..
Therefore, there is no stability-based reason for the success of the re-tested crack-arrest specimens and an explanation must be sought elsewhers.
1.- - -
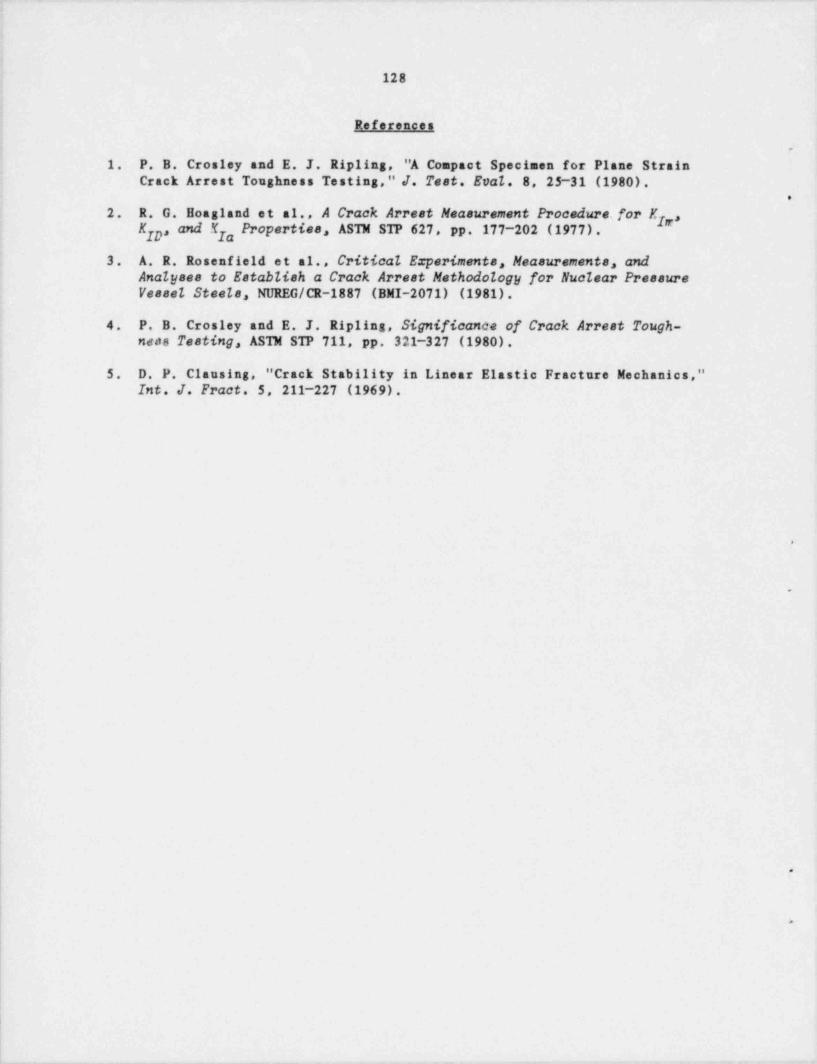
128
References.
1. P. B. Crosley and E. J. Ripling, "A Compact Specimen for Plane StrainCrack Arrest Toughness Testing," J. Test. Evat. 8, 25-31 (1980).
.
2. R. G. Boagland et al., A Crack Arrest Measurement Procedure for K ,,7Kyp, and X7 Properties, ASH STP 627, pp. 177-202 (1977).
3. A. R. Rosenfield et al., Critical Experiments, Neasurements, andAnalyses to Establish a Crack Arrest Methodology for Nuclear PressureVesset Stests, NUREG/CR-1887 (BMI-2071) (1981).
4. P. B. Crosley and E. J. Elpling, Significance of Crack Arrest Tough-nees Testing, AS H STP 711, pp. 321-327 (1980).
5. D. P. Clausing, " Crack Stability in Linear Elastic Fracture Mechanics,"Int. J. Fract. 5, 211-227 (1969).
,
e
0
0

b
v. e
l\
{129
|<
ao
e
f
I
6
.
e
d
%
4
%emum . w
e
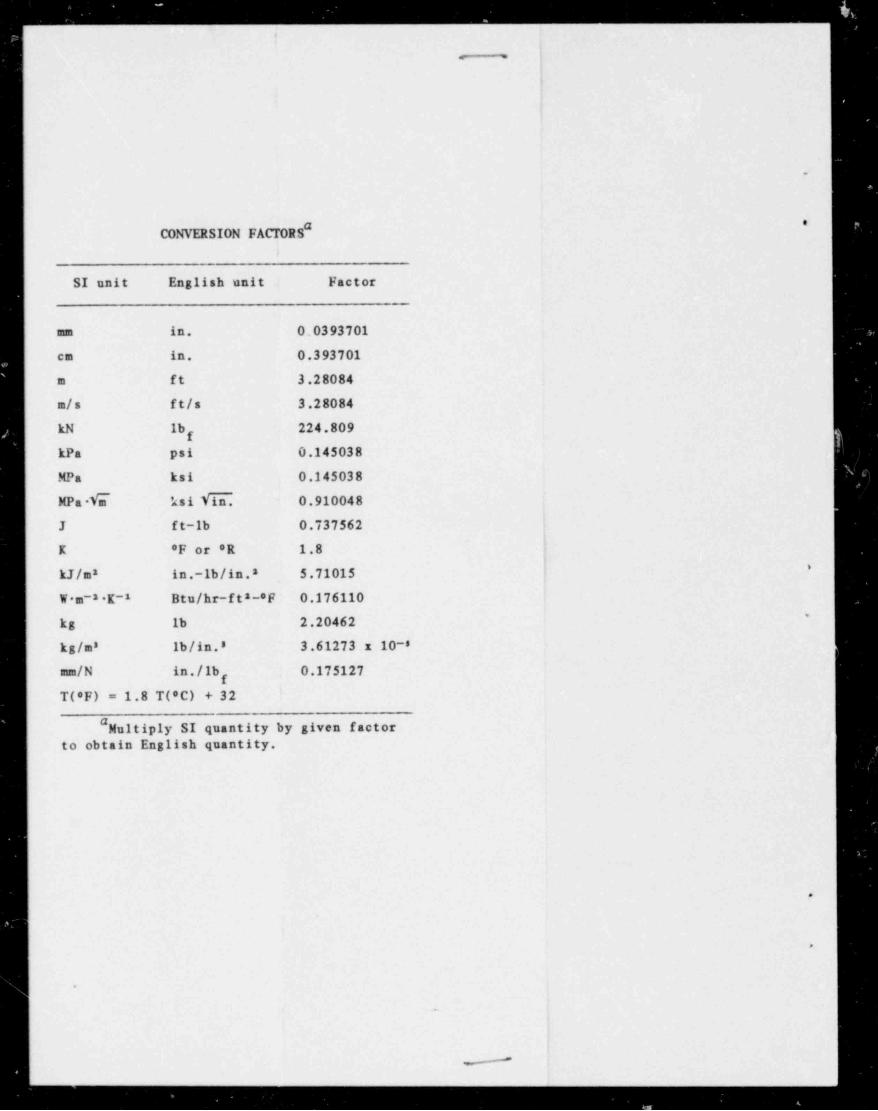
.
I
- -
||
|
.
*CONVERSION FACTORS"
t
SI unit English unit Factor
um in. 0.0393701
cm in. 0.393701
o ft 3.28084
c/s ft/s 3.28084
kN lb 224.809g
kPc psi 0.145038
MPa ksi 0.145038
MPc 6 ksi Vin. 0.910048
J ft-lb 0.737562
K 'F or 'R 1.8*
kJ/c2 in.-lb/in.* 5.71015
W*n-8 E-1 Btu /hr-ft8 *F 0.176110 ;'
kg Ib 2.20462
kg/c8 lb/in.: 3.61273 x 10-s
am/N in./lb 0.175127f
T(*F) = 1.8 T('C) + 32
" Multiply SI quantity by given factorto obtain English quantity.
.
9
.
-_ _ _
131
NUREG/CR-2141, Vol. 3ORNL/TM-8145
'' Dist. Category RF
'
Internal Distribution,
%
1, B. R. Bass 20. 'J. G. Merkle- 2. R. G. Berggren 21. R. K. Naastad
3. S. E. Bolt 22. D. J. Naus4-8. R. H. Bryan 23. G. C. Robinson
24-25. T. W. Robinson, Jr.9. J. W. Bryson >.
10. R. D. Cheverton 26. G. M. Sl<ughter
it. J. M. Corum .27. W. J. Stolzman12. W. R. Corwin 28. H. E. Trammell13. J. R. Dougan 29-33. G. D. Whitman14. R. C. Gwaltney 34. Patent Office
15. P. P. Holz 35. Central Research Library
16. S. K. Iskander 36. Document Reference Section17. K. K. Elindt 37-38. Laboratory Records Department18. A. L. Lotts 39. Laboratory Records (RC)19. S. S. Mansor
-,
,
-%
External Distribution,
s
40. C. Z. Serpan, Reactor Safety Research, Nuclear Regulatory Commis-sion, Washington, DC 20555
41. M. Vagins, Reactor Safety Research, Nuclear Regulatory Commis--
sion, Washington, DC 20555
42. Office of Assistant Manager for Energy Research and Development,DOE, ORO, Oak Ridge, TN 37830 '
43-44. Technical Information Center, DOE, Oak Ridge, TN 37830
45-344. Given distribution,as shown in category RF (NTIS - 10)
!
|
|
8
4
.- - - . - - . - . _ - _ _ . .__ _ ____ _ _ _ _ _ _ _ _ _ _ _ _
Top Related
Copyright © 2022 FDOKUMEN

