


Bahasa
Halaman
Hukum

Cómo citar este artículo/Citation: Gelin Su, Karen Kensek (2021). Fault-detection through integrating real-time sensor data into BIM. Informes de la Construcción, 73(564): e416. https://doi.org/10.3989/ic.85699
Copyright: © 2021 CSIC. This is an open-access article distributed under the terms of the Creative Commons Attribution 4.0 International (CC BY 4.0) License.
Recibido/Received: 27/10/2020Aceptado/Accepted: 08/03/2021
Publicado on-line/Published on-line: 26/11/2021
Informes de la ConstrucciónVol. 73, 564, e416
octubre-diciembre 2021ISSN-L: 0020-0883
https://doi.org/10.3989/ic.85699
Fault-detection through integrating real-time sensor data into BIMDetección de fallas en tiempo real por medio de la integración de sensores de información en BIM
Gelin Su (*), Karen Kensek (**)
ABSTRACT
Real-time sensor data in a building information model (BIM) can help facilities managers with daily monitoring and fault detection. A prototype BIM-based visualization tool Adafruit IO Reader (AIOR) was developed to interface real-time, inexpensive Internet of Things (IoT) sensor data feeds in Autodesk Revit. Data feeds were retrieved from the Adafruit IO server, saved as text files, and displayed both in tables and line graphs. Users are visually navigated to corresponding sensors in Revit. A fault detection algorithm based on comfort levels set by ASHRAE 55-2017 locates sensors with abnormal values and highlights them with alerting colors in 3d views. The key contributions with this prototype tool is that sensor data could be displayed in a BIM-based software program; data were compared against ASHRAE 55 comfort standards; and alerts were shown in Revit when they were missing or out-of-range.
Keywords: Building Information Modeling; BIM; IoT Sensors; Fault detection; Facilities management and operation; Revit API.
RESUMEN
Una herramienta prototipo-de-visualización-BIM Adafruit-IO-Reader-(AIOR), fue desarrollada para intervenir al instante, transfiriendo información crítica al programa de Revit diseñado por Autodesk. Una vez transferida la información es retribuida por medio de la computadora de Adafruit-IO y traducida como base de datos o gráficas lineales. AIOR es de bajo costo y pertenece a los sensores de datos del Internet of Things-(IoT). Los usuarios son guiados visualmente a los sensores correspondientes en Revit. El algoritmo de detección de fallas se basa en los niveles de comodidad establecidos por el ASHRAE-55-2017. El algoritmo localiza los sensores con valores anormales y los marca con diferentes colores en imágenes tridimensionales. El contribuidor clave para es el sensor de datos es visible dentro de un programa de BIM. La información puede ser comparada con los datos establecidos por el ASHRAE-55 y el sistema de alerta es visualizado en Revit cuando estos valores están fuera de los estándares establecidos.
Palabras clave: Modelos de Edificios e Información Virtual; BIM; Sensores IoT; Detección de Fallas; Manejo de Sistemas Opera-tivos de Edificios; Gerentes de Instalaciones; Revit API.
(*) Graduated Student Master of Building Science, University of Southern California, Los Angeles, CA, (USA).(**) Professor of Practice in Architecture, University of Southern California, Los Angeles, CA, (USA).Persona de contacto/Corresponding author: [email protected] (K. Kensek).ORCID: https://orcid.org/0000-0003-4770-6599 (G. Su); http://orcid.org/0000-0003-0937-9814 (K. Kensek)
Gelin Su, Karen Kensek
2 Informes de la Construcción, Vol. 73, 564, e416, octubre-diciembre 2021. ISSN-L: 0020-0883. https://doi.org/10.3989/ic.85699
1. INTRODUCTION
A building information model (BIM) can be used as a plat-form to track sensor data. One method is to use the Revit API (application programming interface) to integrate BIM and sensor data for facilities management (FM).
1.1. Leveraging BIM for FM
BIM is “a digital representation of physical and function-al characteristics of a facility” (1). This digital representa-tion (3d model) is rich in data and information which can be shared for multiple purposes, such as energy simulation, clash detection, cost evaluation, and facility operations and management. There are intrinsic synergies between BIM and FM (2). One of the biggest potential contributions of BIM for FM, however, lies in its long-term competence of providing FM services in the operation and maintenance (O&M) phase. The duration of O&M phase spans 30 years or even more, and the cost of building O&M makes up 75%-85% of the total cost, which imposes considerable influence on and offering possibilities of huge cost saving to the industry (3).
1.2. Integration of BIM and sensor data
One of the main purposes of sensor analytics is to find trends and patterns. By studying these, researchers can not only fig-ure out what happened and is happening, but also predict the change of data in the future. Another purpose is to discover anomalies. By examining deviations from a pre-established setpoint, people have a better understanding of what is not in good condition or out of control. This is significant for pro-actively preventing equipment failure, warning information can be generated for troubleshooting and maintenance when a part of heating, ventilation and air conditioning (HVAC) system does not function properly (4).
With the advent of “smart building” technology, more build-ings have been equipped with intelligent building automation systems (BAS). In a BAS system, several types of sensors are needed to continuously acquire a large amount of data (5). Real-time sensor data helps with evaluating building perfor-mance and data-driven decisions related to facility operation and management (6). The employment of BIM-and-sensor-data integration is not confined to buildings. It also applies to other structures that require daily monitoring and manage-ment, such as bridges and dams.
One of the strategies to integrate BIM and sensor data is to attach the real-time data to geometric and spatial informa-tion extracted from the model (6). Such a “dynamic” BIM goes beyond a static source of information that comprises only limited design and construction data. Through this dy-namic BIM, facility managers are able to visualize and mon-itor the status of sensors and facilities (7). Problems can also be detected and located immediately. Dynamic models have the potential to minimize the cost on facility operation and lowering the possibility of abnormal conditions that jeopard-ize the comfort and safety of building occupants.
1.3. BIM + sensor data + fault detection
The purpose of sensor fault detection is to identify faults and pinpoint the location and type of them. The definition of “faulty” can be described as the deviation from normal sensor
measurements, which indicates an abnormal working status of sensors due to hardware malfunction or failure. Howev-er, there is another interpretation of “faulty” based on the concept of thermal comfort. In the context of indoor thermal comfort, “faults” are detected on the basis of temperature and humidity, standards that are set by the ASHRAE and ISO. For example, RH data from a data feed is examined with the com-fort RH range (20%-80%) defined by ASHRAE 55-2017. Any RH values lower than 20% or higher than 80% will be defined as “faulty” and not desired for good thermal comfort. Types of “faults,” when defined with a comfort zone in a psychrometric chart, are linked with how people feel about the thermal con-dition in the space where they are. In this context, there can be up to eight types of faults as combinations of temperature and humidity: “hot,” “dry,” “cold,” humid,” “hot and dry,” “hot and humid,” “cold and humid,” and “cold and dry.”
Building information model can be used is to visually track sensor data and provide fault detection for comfort ranges (temperature and humidity). “Values out of ranges” indicates the existence of anomalous sensor data values. The definition of “ranges” is based on ASHRAE 55-2017 comfort zone, in which temperature ranges from 68ºF to 78ºF, and RH rang-es from 20% to 80%. ISO 7730 can also be used for defining ranges.
2. BACKGROUND RESEARCH
There have been several previous research projects and case studies of the application of BIM for FM including those for BAS (or BMS) and the integration of its real-time data into BIM models.
2.1. Understanding the framework of BIM for FM
The value of BIM application in FM lies in that BIM improves the current manual process of information handover and contributes to more accurate and accessible FM data for more efficient work order execution. However, BIM for FM faces challenges ranging from methodologies, shortage of knowl-edge about implementation requirements, and BIM expertise in FM industry (8). Three different universities showed how BIM could be used to simplify FM workflow (9), integrate an integrated multi-view visualizer for interfacing HVAC infor-mation to support troubleshooting (9), and use a third party software EcoDomus as the center of the BIM-FM framework, integrating information from BIM and other systems (10).
2.2. Integration of sensor data into BIM
Analyzing sensor data alone does not contribute much to understanding facility condition, since data makes far more sense when they are analyzed in a “context” (5). This context can be provided by spatial information from building infor-mation models, which enables a visualized and integrated way of data analysis. For instance, by integrating data into BIM from temperature sensors installed in HVAC systems, FM managers can look for discrepancies between tempera-tures in adjacent rooms to detect system faults (11).
Attempts of integration BIM with various sensing technologies and devices are made in past research projects regarding mul-tiple areas in building automation (12). For example, temper-ature, humidity, and energy consumption sensors were used to implement post occupancy evaluation and real-time energy
Fault-detection through integrating real-time sensor data into BIM
Detección de fallas en tiempo real por medio de la integración de sensores de información en BIM
Informes de la Construcción, Vol. 73, 564, e416, octubre-diciembre 2021. ISSN-L: 0020-0883. https://doi.org/10.3989/ic.85699 3
performance in a residential building (13). Data retrieved from fire sensors were utilized for establishing a fire alarm manage-ment system to determine the authenticity of fire alarms and to prevent disturbance because of false alarms (14).
The integration of sensor data with BIM is not confined to indoor environments shown by the application of RFID and GPS sensors for creating a model that estimates locations of tools, equipment, and materials in construction projects (15) or load sensors in a crane navigation system where the posi-tion of lifted objects is displayed with video cameras in the context of a building and surroundings (16).
The structure of sensor readings can vary, but key attributes such as sensor ID, reading ID, data value, and time stamps are always required. Sensor metadata can be considered as descriptions of data, or “data about data” (17). They provide necessary information for sensor discovery and data process-ing (5). One major purpose of the sensor metadata is to easily keep track of anomalies. For example, when faulty values are detected in data analysis, researchers want to find out which specific sensor is responsible for the abnormal data values. To locate the correct sensor, a database of sensor metadata including the sensor’s serial number and other categories of supporting metadata can be developed (17). Sensor place-ment is critical; “incorrect sensor [light] placement can com-promise system performance, cause discomfort to occupants and diminish savings” (18).
Kazado et al. makes the case that “the BIM model cannot show real-time information related to the performance of the building in the operational stage.” (19). Yet, an excellent ex-ample of BIM + BAS integration is Dasher 360 developed by Autodesk (20). Dasher 360 collects data from a wide range of sensors including temperature, RH, CO2 concentration, sound level and light intensity sensors. However, the loss of a large amount of data values one month should have been announced by warnings, either somewhere on the main in-terface or in the sensor list, in order to figure out the cause of this data value loss. Sensors have also been put in social housing and comfort parameter readings taken within the building information model (21), and augmented reality used to visualize sensor readings by programming Dynamo in Re-vit and using Unreal Engine (22). Another project used light sensors to control shades and louvers in BIM through Dyna-mo rather than the Revit API (23). BIM + sensor data is an expanding research area; these are just a few examples.
2.3. Fault detection algorithms
Fault detection has been successful in many engineering do-mains including automotive and industrial manufacturing for decades, but its application in AEC industry is still un-der development (24). Real-time data collection for detect-ing abnormalities is important ensure the proper function of facilities and equipment. Fault detection is achieved through algorithms. Some of them are quite simple and straightfor-ward, and many are advanced types such as the statistical generation model (SGM) (25), adaptive-neuro fuzzy infer-ence system (ANFIS) (26), and machine learning algorithms, for example, a “prediction-correction” process (24).
A fault detection algorithm does not have to be complex to be useful. It just has to be accurate within the bounds of its con-text. For example, a null reading from a temperature sensor
in a room is also a fault if a value is expected. Determining the reason for the null reading might be complex, but the al-gorithm (check for null readings) is not. Another example is checking for a value within a specified range. If the value is not in the range, it is a fault. For example, a temperature set point might be 72 oF (22.2 oC) and the float 3 oF (20.6 oC to 23.9 oC) to achieve comfortable working conditions. A temperature reading of 80 oF (26.7 oC) would be considered a fault in this case, but perhaps not for another set of conditions/ranges.
3. METHDOLOGY – ADAFRUIT IO READER (AIOR)
The Revit API allows users to add new features. One of the benefits of using Revit API is that it frees users from repet-itive manual operation with automatic batch processing de-veloped for particular functions (27). Adafruit IO is a free cloud-based service that serves primarily to display, store, and retrieve real-time data. It is compatible with both hard-ware and software such as Arduino and Python with projects connected to the Internet or Internet-enabled devices.
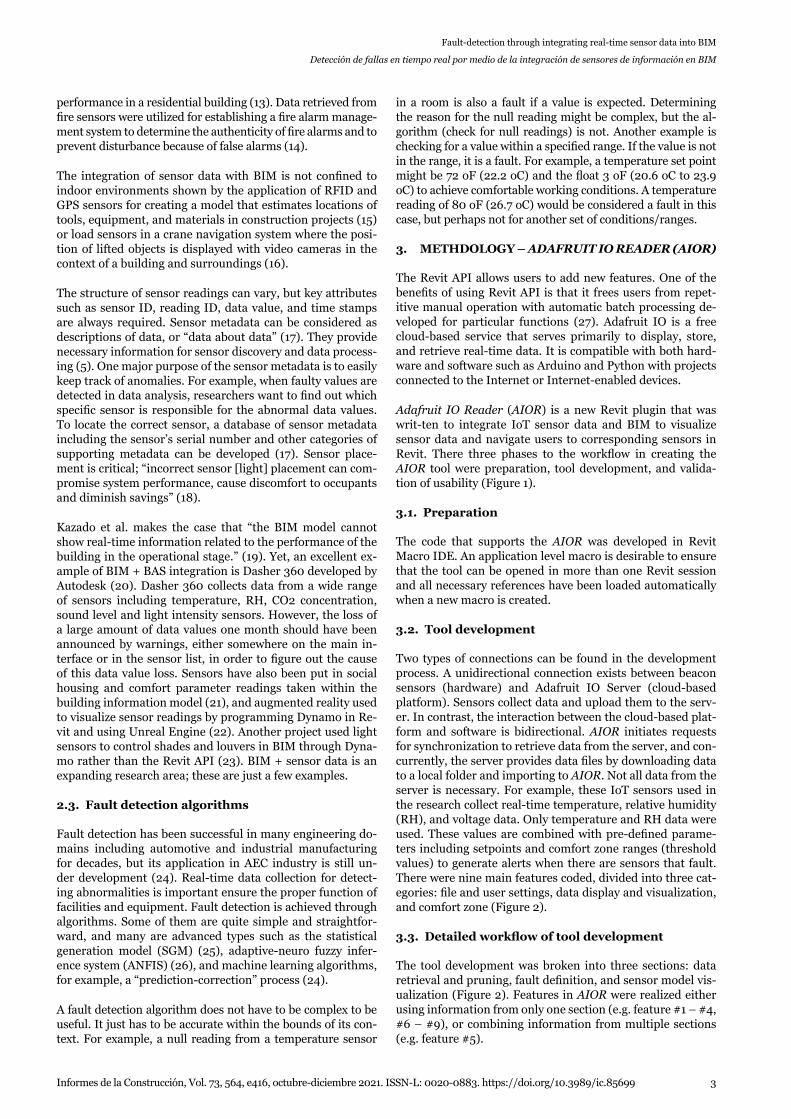
Adafruit IO Reader (AIOR) is a new Revit plugin that was writ-ten to integrate IoT sensor data and BIM to visualize sensor data and navigate users to corresponding sensors in Revit. There three phases to the workflow in creating the AIOR tool were preparation, tool development, and valida-tion of usability (Figure 1).
3.1. Preparation
The code that supports the AIOR was developed in Revit Macro IDE. An application level macro is desirable to ensure that the tool can be opened in more than one Revit session and all necessary references have been loaded automatically when a new macro is created.
3.2. Tool development
Two types of connections can be found in the development process. A unidirectional connection exists between beacon sensors (hardware) and Adafruit IO Server (cloud-based platform). Sensors collect data and upload them to the serv-er. In contrast, the interaction between the cloud-based plat-form and software is bidirectional. AIOR initiates requests for synchronization to retrieve data from the server, and con-currently, the server provides data files by downloading data to a local folder and importing to AIOR. Not all data from the server is necessary. For example, these IoT sensors used in the research collect real-time temperature, relative humidity (RH), and voltage data. Only temperature and RH data were used. These values are combined with pre-defined parame-ters including setpoints and comfort zone ranges (threshold values) to generate alerts when there are sensors that fault. There were nine main features coded, divided into three cat-egories: file and user settings, data display and visualization, and comfort zone (Figure 2).
3.3. Detailed workflow of tool development
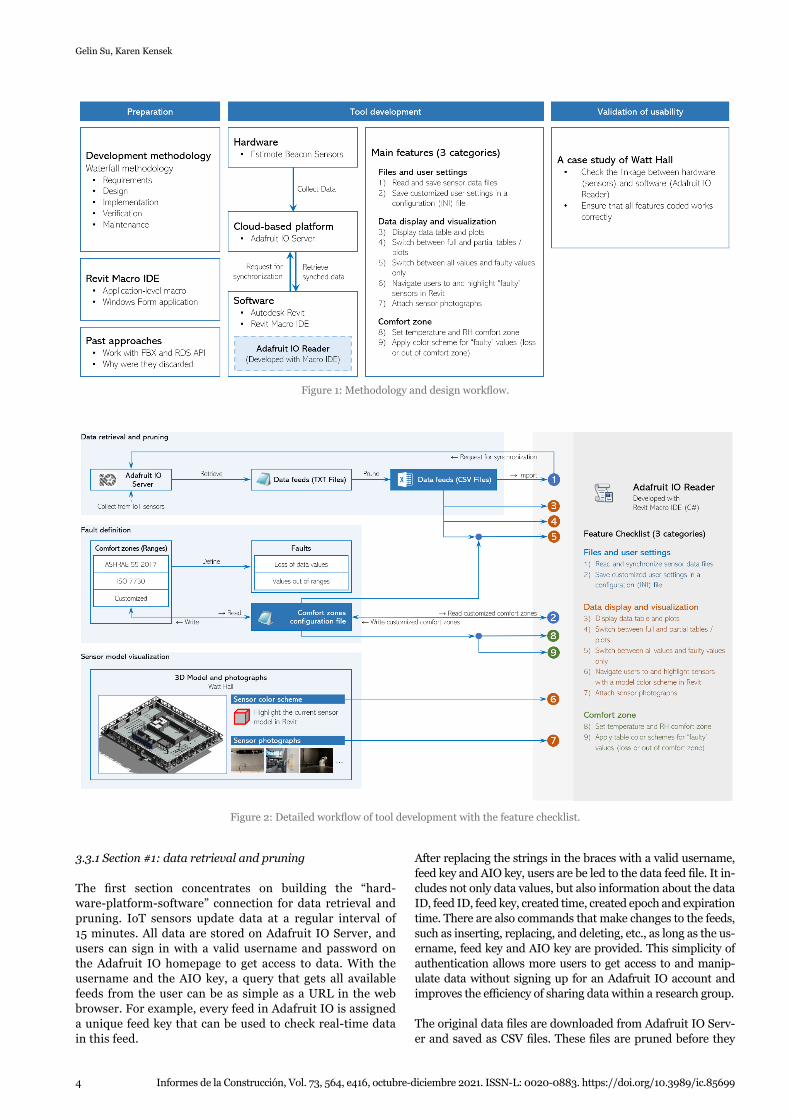
The tool development was broken into three sections: data retrieval and pruning, fault definition, and sensor model vis-ualization (Figure 2). Features in AIOR were realized either using information from only one section (e.g. feature #1 – #4, #6 – #9), or combining information from multiple sections (e.g. feature #5).
Gelin Su, Karen Kensek
4 Informes de la Construcción, Vol. 73, 564, e416, octubre-diciembre 2021. ISSN-L: 0020-0883. https://doi.org/10.3989/ic.85699
3.3.1 Section #1: data retrieval and pruning
The first section concentrates on building the “hard-ware-platform-software” connection for data retrieval and pruning. IoT sensors update data at a regular interval of 15 minutes. All data are stored on Adafruit IO Server, and users can sign in with a valid username and password on the Adafruit IO homepage to get access to data. With the username and the AIO key, a query that gets all available feeds from the user can be as simple as a URL in the web browser. For example, every feed in Adafruit IO is assigned a unique feed key that can be used to check real-time data in this feed.
After replacing the strings in the braces with a valid username, feed key and AIO key, users are be led to the data feed file. It in-cludes not only data values, but also information about the data ID, feed ID, feed key, created time, created epoch and expiration time. There are also commands that make changes to the feeds, such as inserting, replacing, and deleting, etc., as long as the us-ername, feed key and AIO key are provided. This simplicity of authentication allows more users to get access to and manip-ulate data without signing up for an Adafruit IO account and improves the efficiency of sharing data within a research group.
The original data files are downloaded from Adafruit IO Serv-er and saved as CSV files. These files are pruned before they
Figure 1: Methodology and design workflow.
Figure 2: Detailed workflow of tool development with the feature checklist.
Fault-detection through integrating real-time sensor data into BIM
Detección de fallas en tiempo real por medio de la integración de sensores de información en BIM
Informes de la Construcción, Vol. 73, 564, e416, octubre-diciembre 2021. ISSN-L: 0020-0883. https://doi.org/10.3989/ic.85699 5
are imported into the AIOR. The process is divided into three steps: prune (to reduce redundancy), reorganize (to pair the data properly), and translate date and time (for the correct time zone). All the steps above were accomplished by a C# function in AIOR. CSV files after pruning are ready to be im-ported into the tool and displayed in both tables and line plots. In addition, these files will be connected to sensor models in Revit to achieve the goal of visualization through combining real-time sensor data and 3D models.
3.3.2 Section #2: fault detection
Two types of faults are considered: loss of data values and val-ues out of ranges. “Loss of data values” means there is no valid temperature or RH data at a specific point of time. This results in a “nan” in a data table and it is often related to hardware glitches or battery power issues. “Values out of ranges” indi-cates the existence of abnormal sensor data values. The defini-tion of “ranges” is based on ASHRAE 55-2017 comfort zone, in which temperature ranges from 68ºF to 78ºF, and RH ranges from 20% to 80%. Besides ASHRAE 55-2017, ISO 7730 can also be used for defining ranges. All data values that do not fall in these ranges are treated as “faulty” and result in colored cells (orange – higher than the maximum; light blue – lower than the minimum in data tables on the main interface).
In addition to ASHRAE and ISO comfort zones, users are free to customize these own comfort zones. However, manually set numeric values will be reset to default values after the program is restarted. Therefore, an extra configuration file that stores these values. Customized values are written to this file from comfort zone dialog box in the tool, and they can be read back from the file.
3.3.3 Section #3: sensor model visualization
The third section focuses on various visualization strategies, including 3D models with color schemes and on-site photo-graphs. This visualized information is combined with data files to finally accomplish the main goal to integrate real-time sensor data into BIM.
4. WATT HALL CASE STUDY
4.1. Overview
Watt Hall on the USC campus was selected as the case study building. Five IoT sensors were installed in different locations for data collection. These sensors were originally installed for a project named TrojanSense (28). Temperature and RH data in Watt Hall third floor southeast corner (building science corner), upper Rosendin Gallery (two sensors), Watt 212, and Watt B1 was gathered and at the same time uploaded to Adafruit IO server. The intent was to demonstrate that the data from the five sensors could be retrieved by the Adafruit IO Reader, values shown in Revit as both tabular and line plots, and faults detected and highlighted in color with the corresponding sensor and its location.
4.2. Hardware
The hardware used in the case study were developed by the TrojanSense team. They consist of ASAIR AM2302 IoT sensors powered by AA batteries and connected to Arduino
ESP32 board with a Wi-Fi and Bluetooth microcontroller. These sensors collect temperature, relative humidity, and voltage data. Sensors were attached to the outside of the 3D-printed shells. Batteries supplied power to ESP32 boards and microcontrollers. These parts were put into the shells and installed under a studio desk, on a fire alerting device in upper Rosendin, on the staircase connecting lower and upper Rosendin, under the desk in Watt Hall 212, and on the wall in Watt Hall B1.
4.3. Software
The Revit model was provided by USC FMS. The opacity of some building elements and the viewing angles are adjusted to ensure that sensor models are visible. The model of IoT sensors were created as a Revit family to be added to the model based on “Sensor Photos” and measurement of sensor dimensions.
To work with Adafruit IO Reader, the first step is to get pro-gram files and copy them to the specified folder. The program is started with Macro Manager in Revit, in the “Manage” rib-bon. First, select “Application” tab control and any macro from A to E. Then, click on “Run” button to run the selected macro. Running the macro brings up the highlighted sensor model in a 3D view and the main interface of Adafruit IO Reader with real-time sensor data retrieved from the server.
In the main interface of the Adafruit IO Reader, most of the space on the main interface window is used for data table view panels and line plot view panels for visualizing sensor data. The interface is comprised of 12 modules:
1. Menu bar items: Commands related to synchronizing sensor data with Adafruit IO server, clearing data display on the interface, editing thermal comfort zone, and file path for storing sensor data files.
2. Sensor list: Dropdown list containing five IoT sensors in-stalled in Watt Hall. By selecting any sensor from the list, the program automatically loads temperature and RH data files and displays them in view panels. The program also takes users to the selected sensor model and zoom in to the view of that sensor.
3. Revit element ID: Every sensor model in Revit is assigned a six-digit Revit element ID. This is used in source code to create the many-to-one relationship between data feeds and the sensor model.
4. Update data: A shortcut button for synchronizing sensor data with data feed stored on Adafruit IO server.
5. Reset filter: A temporary button for developer’s testing and debugging only.
6. Temperature tab control: Switch between temperature data table and line plot.
7. Temperature view panel: Display temperature data table (by default) and line plot.
8. RH tab control: Switch between RH data table and line plot.
9. RH view panel: Display RH data table (by default) and line plot.
10. Room photo: Display the photo of the room where the sensor is installed.
11. Sensor photo: Display the close-up view of the sensor.12. Display settings: settings related to manipulating data ta-
bles such as filter values according to start and/or date, or the status of values (faulty or normal).
Gelin Su, Karen Kensek
6 Informes de la Construcción, Vol. 73, 564, e416, octubre-diciembre 2021. ISSN-L: 0020-0883. https://doi.org/10.3989/ic.85699
4.3.1 Data retrieval, pruning, and synchronization
Sensor data is not automatically synchronized with the latest version on the server. It must be done manually either from menu bar or the shortcut button on the interface. The aver-age time spent on data syncing in the tool is approximately 8 seconds, so it is not ideal to make tool users wait by synchro-nizing data every time the program is launched.
4.3.2 Save customized settings
The bidirectional interaction between the configuration file and Adafruit IO Reader can be used for customized comfort zones. The program reads the customized setting from the file and displays the setting in the Comfort Zone window, where users are free to adjust the threshold values for new settings.
4.3.3 Data tables and plots
Data tables and line plots take most of the space on the interface, and they serve as the basis of other program fea-tures. Data tables in AIOR share the same layout as those CSV files that can be opened with Excel. The most recent 1,000 data values are available in both data tables. This is the amount of data for approximately 15 days. Past values older than 15 days will be erased and replaced by new val-ues to dispose space for storage. Line plots, as a more visu-alized presentation, are generated based on data values in the second column. Users can switch between tables and graphs with tab controls at the upper left corner of view panels. Both data tables and line plots can be manipulated by different display settings to allow users to focus on a specified portion of data.
4.3.4 Full and partial tables / plots
Manipulation of data tables is completed by “Display Set-tings” on lower right corner of the main interface. One of the settings is named “Date Filter.” Sometimes, there may be a time range of interest where data values need special atten-tion. AIOR provides a date filter that allows users to focus on only an excerpt from the full table. Either start date or end date, or both dates can be used for setting a range. The filter works on not only to data tables, but also line plots. With such a filter, the line plot view looks like “zoomed in,” enabling the observation of data fluctuation in a more legi-ble manner with a smaller scale.
4.3.5 All values and faulty values
Another “Display Setting” is named “Faulty Values Only.” To enable this, users just need to check the “Faulty Values Only” box in “Display Settings.” This feature was designed for users to quickly locate faulty values defined by the current comfort zone at work. All values within the comfort zone are filtered out by this setting. A blank data table indicates that all values recorded are considered normal. When “Faulty Values Only” box is checked, line plots will be temporarily unavailable since the appearance of faulty values is, in most cases, spo-radic rather than continuous. Such data values with little or completely no chronological continuity are not sufficient for generating line plots.
4.3.6 Navigation to sensor models
When “Run” button is clicked, Revit will begin to execute codes in the selected macro and switch current view to the sensor model associated with this macro. Meanwhile, the main interface will show up, providing a wide range of infor-mation including sensor data value tables, line plots, current-ly working comfort zone, etc. Users can also take advantage of features introduced in previous sections, such as “Display Settings,” to manipulate the display of data.
4.3.7 On-site photographs
For every sensor in the list, “Room Photo” and “Sensor Pho-to” are displayed next to data tables. These photographs were stored in a separate folder, and they can be updated by re-placing files at any time. Photographs are tied up with data tables; every time a sensor is chosen from the combo box and corresponding data tables loaded, these photographs are dis-played next to the tables.
4.3.8 Comfort zone presets
The comfort zone options define an acceptable range for data values that can be considered as “normal.” Two major stand-ards of thermal comfort zone, ASHRAE 55-2017 and ISO 7730 (including summer and winter), are provided in the tool for needs in different indoor environment. Threshhold values for ASHRAE and ISO comfort zones are read from psycho-metric charts and saved as presets.
4.3.9 Color schemes
Color schemes are associated with the definition of comfort zones. With a comfort zone set, data values can be catego-rized as “too high,” “normal,” or “too low.” Values higher than the maximum threshold value are marked with orange; lower than the minimum are colored with light blue. Users can easi-ly distinguish “faulty” values and when these values occurred, which can help with figuring out the reason for faults.
5. DISCUSSION AND FUTURE WORK
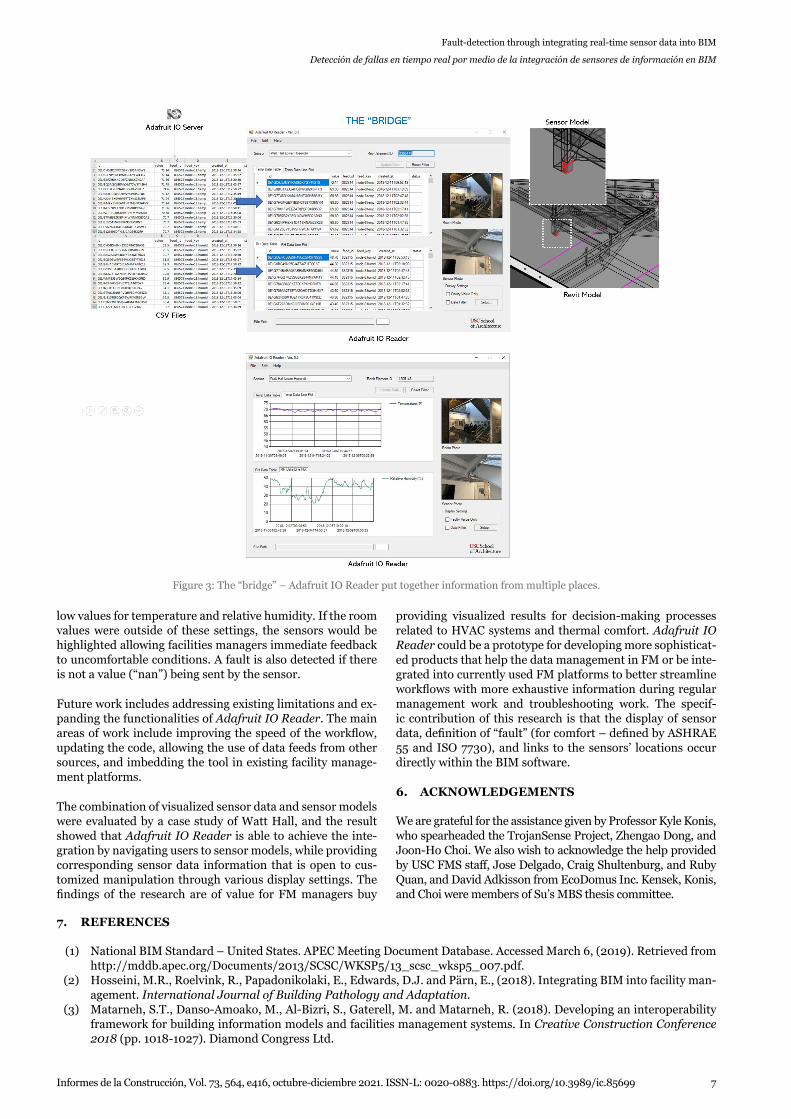
Adafruit IO Reader is a new plugin that provides users ac-cess to temperature and humidity data and visualization of fault detection in Revit by interfacing with real-time IoT sensor data feeds stored on an Adafruit IO server. By putting together information from different sources, the tool works as a “bridge” between sensors and data feeds on the cloud, navigating users to sensor models in Revit while loading data feeds to the main interface from the server (Figure 3).
AIOR is composed of nine main features separated into three categories as previously mentioned. These features are exam-ined with the case study of Watt Hall, and most of the fea-tures performed satisfactorily by always producing desired outputs, except for some minor issues with the navigation to sensor models. Of particular note is the integration of the data within a building information model. FM personnel can use Revit to check the sensor list, discover the location of the sensors in the digital model and by the room photographs linked to each sensor, and show the data as tables or line plots. Settings can be created to define a “fault.” In the case study, ASHRAE 55 and ISO 7730 were used to set high and
Fault-detection through integrating real-time sensor data into BIM
Detección de fallas en tiempo real por medio de la integración de sensores de información en BIM
Informes de la Construcción, Vol. 73, 564, e416, octubre-diciembre 2021. ISSN-L: 0020-0883. https://doi.org/10.3989/ic.85699 7
low values for temperature and relative humidity. If the room values were outside of these settings, the sensors would be highlighted allowing facilities managers immediate feedback to uncomfortable conditions. A fault is also detected if there is not a value (“nan”) being sent by the sensor.
Future work includes addressing existing limitations and ex-panding the functionalities of Adafruit IO Reader. The main areas of work include improving the speed of the workflow, updating the code, allowing the use of data feeds from other sources, and imbedding the tool in existing facility manage-ment platforms.
The combination of visualized sensor data and sensor models were evaluated by a case study of Watt Hall, and the result showed that Adafruit IO Reader is able to achieve the inte-gration by navigating users to sensor models, while providing corresponding sensor data information that is open to cus-tomized manipulation through various display settings. The findings of the research are of value for FM managers buy
providing visualized results for decision-making processes related to HVAC systems and thermal comfort. Adafruit IO Reader could be a prototype for developing more sophisticat-ed products that help the data management in FM or be inte-grated into currently used FM platforms to better streamline workflows with more exhaustive information during regular management work and troubleshooting work. The specif-ic contribution of this research is that the display of sensor data, definition of “fault” (for comfort – defined by ASHRAE 55 and ISO 7730), and links to the sensors’ locations occur directly within the BIM software.
6. ACKNOWLEDGEMENTS
We are grateful for the assistance given by Professor Kyle Konis, who spearheaded the TrojanSense Project, Zhengao Dong, and Joon-Ho Choi. We also wish to acknowledge the help provided by USC FMS staff, Jose Delgado, Craig Shultenburg, and Ruby Quan, and David Adkisson from EcoDomus Inc. Kensek, Konis, and Choi were members of Su’s MBS thesis committee.
Figure 3: The “bridge” – Adafruit IO Reader put together information from multiple places.
7. REFERENCES
(1) National BIM Standard – United States. APEC Meeting Document Database. Accessed March 6, (2019). Retrieved from http://mddb.apec.org/Documents/2013/SCSC/WKSP5/13_scsc_wksp5_007.pdf.
(2) Hosseini, M.R., Roelvink, R., Papadonikolaki, E., Edwards, D.J. and Pärn, E., (2018). Integrating BIM into facility man-agement. International Journal of Building Pathology and Adaptation.
(3) Matarneh, S.T., Danso-Amoako, M., Al-Bizri, S., Gaterell, M. and Matarneh, R. (2018). Developing an interoperability framework for building information models and facilities management systems. In Creative Construction Conference 2018 (pp. 1018-1027). Diamond Congress Ltd.
Gelin Su, Karen Kensek
8 Informes de la Construcción, Vol. 73, 564, e416, octubre-diciembre 2021. ISSN-L: 0020-0883. https://doi.org/10.3989/ic.85699
(4) Sensor analytics. IoT Agenda. Accessed March 6, (2019). https://internetofthingsagenda.techtarget.com/definition/sensor-analytics
(5) Liu, X. and Akinci, B. (2009). Requirements and evaluation of standards for integration of sensor data with building information models. In Computing in Civil Engineering (pp. 95-104).
(6) Suprabhas, K. and Dib, H.N. (2017). Integration of BIM and utility sensor data for facilities management. In Computing in Civil Engineering (pp. 26-33).
(7) Chen, J., Bulbul, T., Taylor, J.E. and Olgun, G. (2014). A case study of embedding real-time infrastructure sensor data to BIM. In Construction Research Congress 2014: Construction in a Global Network (pp. 269-278).
(8) Love, P.E., Matthews, J., Lockley, S., Kassem, M., Kelly, G., Dawood, N. and Serginson, M. (2015). BIM in facilities man-agement applications: a case study of a large university complex. Built Environment Project and Asset Management.
(9) Yang, X., Koehl, M. and Grussenmeyer, P. (2017). Parametric modelling of as-built beam framed structure in BIM en-vironment. International Archives of the Photogrammetry, Remote Sensing & Spatial Information Sciences, XLII-2/W3, 651–657. https://doi.org/10.5194/isprs-archives-XLII-2-W3-651-2017.
(10) Teicholz, P. ed. (2013). BIM for facility managers. John Wiley & Sons.(11) Teicholz, E. (2001). Facility design and management handbook. McGraw Hill Professional.(12) Riaz, Z., Arslan, M., Kiani, A.K. and Azhar, S. (2014). CoSMoS: A BIM and wireless sensor based integrated solu-
tion for worker safety in confined spaces. Automation in construction, (45): 96-106. https://doi.org/10.1016/j.aut-con.2014.05.010.
(13) Ozturk, Z., Arayici, Y. and Coates, S.P. (2012). Post occupancy evaluation (POE) in residential buildings utilizing BIM and sensing devices: Salford energy house example.
(14) Shiau, Y.C. and Chang, C.T. (2012). Establishment of fire control management system in building information modelling environment. In The 1st International Conference on Software Technology.
(15) Razavi, S.N. and Haas, C. (2009). A data fusion model for location estimation in construction. In Proc, the International Symposium for Automation and Robotics in Construction (ISARC).
(16) Lee, G., Cho, J., Ham, S., Lee, T., Lee, G., Yun, S.H. and Yang, H.J. (2012). A BIM-and sensor-based tower crane nav-igation system for blind lifts. Automation in construction, (26): 1-10. https://doi.org/10.1016/j.autcon.2012.05.002.
(17) Dawes, N., Kumar, K.A., Michel, S., Aberer, K. and Lehning, M. (2008). Sensor metadata management and its applica-tion in collaborative environmental research. In 2008 IEEE Fourth International Conference on eScience (pp. 143-150). IEEE.
(18) Hu, J. and Patel, M., 2014. Optimized selection and placement of sensors using building information models (BIM). In IES Annual Conference.
(19) Kazado, D., Kavgic, M. and Eskicioglu, R. (2019). Integrating Building Information Modeling (BIM) and sensor technol-ogy for Facility Management. Journal of Information Technology in Construction (ITcon), 24(23): 440-458.
(20) Autodesk Dasher 360. Autodesk. Accessed March 18, 2019. https://dasher360.com/(21) Penna, P., Regis, G.L., Schweigkofler, A., Marcher, C. and Matt, D., 2019, October. From Sensors to BIM: Monitoring
Comfort Conditions of Social Housing with the KlimaKit Model. In International Conference on Cooperative Design, Visualization and Engineering (pp. 108-115). Springer, Cham.
(22) Natephraa, W. and Motamedib, A. (2019). Live data visualization of IoT sensors using Augmented Reality (AR) and BIM. In ISARC. Proceedings of the International Symposium on Automation and Robotics in Construction (Vol. 36, pp. 632-638). IAARC Publications.
(23) Kensek, K. M. (2014). Integration of Environmental Sensors with BIM: case studies using Arduino, Dynamo, and the Revit API. Informes de la Construcción, 66(536): e044, doi: http://dx.doi.org/10.3989/ic.13.151.
(24) Bonvini, M., Sohn, M.D., Granderson, J., Wetter, M. and Piette, M.A., 2014. Robust on-line fault detection diagnosis for HVAC components based on nonlinear state estimation techniques. Applied Energy, 124: 156-166.
(25) Sallans, B., Bruckner, D. and Russ, G. (2006). August. Statistical detection of alarm conditions in building automation systems. In 2006 4th IEEE International Conference on Industrial Informatics (pp. 257-262). IEEE.
(26) Liu, H., Huang, M., Janghorban, I., Ghorbannezhad, P. and Yoo, C. (2011). Faulty sensor detection, identification and reconstruction of indoor air quality measurements in a subway station. In 2011 11th International Conference on Con-trol, Automation and Systems (pp. 323-328). IEEE.
(27) Yang, X. and Ergan, S. (2016). Design and evaluation of an integrated visualization platform to support corrective main-tenance of HVAC problem–related work orders. Journal of Computing in Civil Engineering, 30(3): 04015041.
(28) Dong, Z. (2019). Exploring Participatory Sensing and the Internet of Things to Develop Data-Driven Thermal Comfort Models on the USC Campus. USC, MBS thesis.
Top Related
Copyright © 2022 FDOKUMEN

