


Bahasa
Halaman
Hukum

Exposure to PM10 and NO2 and Association with
Respiratory Health among Primary School
Children Living Near Petrochemical Industry
Area at Kertih, Terengganu
Ayuni N. A. and Juliana J. Department of Environmental and Occupational Health, Faculty of Medicine and Health Sciences,
Universiti Putra Malaysia, Serdang, Selangor, Malaysia
Email: [email protected]
Ibrahim M. H TATi University College, Jalan Panchor, Teluk Kalong, 24000 Kemaman, Terengganu, Malaysia
Abstract—This study was carried out to determine the level
of exposure to PM10 and NO2 and its relation to respiratory
health among primary school children living near
petrochemical industry area at Kertih, Terengganu. This
cross sectional comparative study was conducted among 60
children from studied group and 60 children from
comparative group. The respondents were selected based on
inclusive criteria’s for this study. Level of exposure of PM10
was measured using DustTrak Aerosol Monitor while level
of exposure of NO2 was measured using LaMotte Air
Sampling Pump. Questionnaire was used to collect
information on respondent’s socio-demography background
and respiratory symptoms. Lung function test was
performed using Spirometer. Results showed that the mean
concentration of PM10 (79 µg/m3) and NO2 (3.73 ppm) for
studied group was higher compared to comparative group,
PM10 (49 µg/m3) and NO2 (0.14 ppm). As overall, reported
respiratory symptoms were significantly higher among
studied group compare to comparative group. Significant
reduction value of FEV1/FVC% showed that there was
airways obstruction for studied group. Findings from this
study indicated that exposure to indoor PM10 and NO2
concentrations may increase risk of getting respiratory
symptoms and reduction of lung function among primary
school children living near petrochemical industry area.
Index Terms—PM10, NO2, respiratory symptoms, lung
function, primary school children
I. INTRODUCTION
There is growing concern about indoor air quality
especially in the classroom [1]. School that is situated
near to industry area has been the most concern due to
prolong exposure to air pollutants that may cause health
effect to children. One of the major industry sectors that
produce air pollutants is petrochemical industries [2].
Child’s respiratory system is the primary target for air
pollutants such as PM10 and NO2 [3]. Compared to adults,
children are one of the most sensitive population
Manuscript received July 22, 2013; revised September 23, 2013.
subgroups since they may receive an increased dose of
particulate matter to their lungs. In previous study carried
out in China [2], it was demonstrated that school children
that living near petrochemical industrial area have
significantly more respiratory symptoms compared to
control area. This great concern of pollutant emitted by
petrochemical industries recently triggered local
researchers to conduct preliminary air pollution
simulation at this research site [4]. Further exercises
focusing on NO2 emitted by point source emission
revealed that the maximum yearly out door concentration
of NO2 range from 6.91 to 8.49 ug/m3
for a 5 years period
from 2004 to 2008 [5]. Though the result obtained
comparatively below the WHO guideline which is at
40ug/m3, it is an intended of this paper to further explore
the exposure of indoor air condition in related to
respiratory health as the indoor air is well influenced by
the outdoor air condition.
II. METHODOLOGY
A. Study Background
This cross sectional comparative study was conducted
among 120 primary school children and the entire
respondents were Malay. Total of 60 school children
from Sekolah Kebangsaan Paka III, Kertih were selected
as a studied group and total of 60 school children from
Sekolah Kebangsaan Serdang, Dungun were selected as a
comparative group. Random sampling method was used
to select the respondents based on inclusive criteria’s
such as aged between 10 to 12 years old, boys and girls
and living near, which was 1 km from petrochemical
industry area for studied group and living far, which was
10 km from petrochemical industry area for comparative
group.
B. Questionnaire Form
Questionnaire was given based on standard
questionnaire by American Thoracic Society for children.
Journal of Medical and Bioengineering Vol. 3, No. 4, December 2014
282©2014 Engineering and Technology Publishingdoi: 10.12720/jomb.3.4.282-287
It focused on respiratory symptoms, home environment
exposures, history of lung disease and socio-demographic
information.
C. Monitoring in School
Measurement of the indoor air pollutant (PM10 and
NO2) inside the classroom of schools were performed for
5 hours during school hours by using Dust Track Aerosol
Monitor to measure the concentrations of PM10 and
LaMotte Air Sampling Pump to measure the
concentrations of NO2 that were placed 1.5m (same level
of breathing zone of children) above floor level [1] at the
back of the classroom. The area was selected to avoid any
disruption of sound from instruments during learning
session and avoid attraction from children.
D. Lung Function Test
Based on standardized procedure by American
Thoracic Society, researcher explained and demonstrated
to school children and asked them to inhale deeply in
standing position and blew rapidly and completely into
calibrated spirometer. The abnormalities are categorized
according to American Thoracic Society Standard.
E. Statistical Analysis
Data collected in this study was analyzed using
Statistical Packages for Social Sciences (SPSS, version
13). Anthropometric data were analyzed by using Mann-
Whitney U and Independent T-Test. Mann-Whitney U
was used to make comparison of lung function and indoor
PM10 concentrations. Independent T-Test was also used to
compare and to determine association between
categorical variables. Results of the associations were
also expressed as prevalence ratio (PR) and 95%
confidence interval. Continuous variables were presented
as mean and standard deviation (SD).
III. RESULTS
A. Background and Selection of Respondent
This study was conducted to determine the relationship
of exposure to PM10 and NO2 with respiratory health
among primary school children living near petrochemical
industry area at Kertih, Terengganu. There were 45%
boys ad 55% girls from the studied group while there
were 46.67% boys and 53.33% girls from the
comparative group who participated in this study.
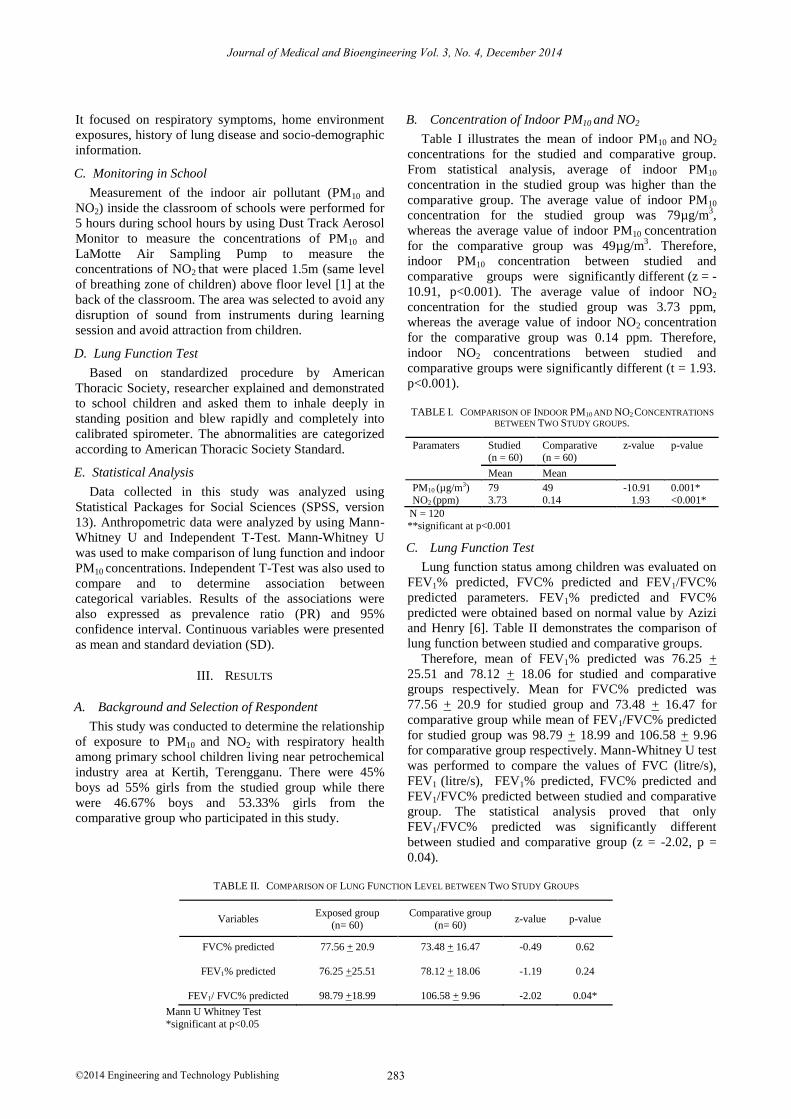
B. Concentration of Indoor PM10 and NO2
Table I illustrates the mean of indoor PM10 and NO2
concentrations for the studied and comparative group.
From statistical analysis, average of indoor PM10
concentration in the studied group was higher than the
comparative group. The average value of indoor PM10
concentration for the studied group was 79µg/m3,
whereas the average value of indoor PM10 concentration
for the comparative group was 49µg/m3. Therefore,
indoor PM10 concentration between studied and
comparative groups were significantly different (z = -
10.91, p<0.001). The average value of indoor NO2
concentration for the studied group was 3.73 ppm,
whereas the average value of indoor NO2 concentration
for the comparative group was 0.14 ppm. Therefore,
indoor NO2 concentrations between studied and
comparative groups were significantly different (t = 1.93.
p<0.001).
TABLE I. COMPARISON OF INDOOR PM10 AND NO2 CONCENTRATIONS
BETWEEN TWO STUDY GROUPS.
Paramaters Studied (n = 60)
Comparative (n = 60)
z-value p-value
Mean Mean
PM10 (µg/m3)
NO2 (ppm)
79
3.73
49
0.14
-10.91
1.93
0.001*
<0.001*
N = 120
**significant at p<0.001
C. Lung Function Test
Lung function status among children was evaluated on
FEV1% predicted, FVC% predicted and FEV1/FVC%
predicted parameters. FEV1% predicted and FVC%
predicted were obtained based on normal value by Azizi
and Henry [6]. Table II demonstrates the comparison of
lung function between studied and comparative groups.
Therefore, mean of FEV1% predicted was 76.25 +
25.51 and 78.12 + 18.06 for studied and comparative
groups respectively. Mean for FVC% predicted was
77.56 + 20.9 for studied group and 73.48 + 16.47 for
comparative group while mean of FEV1/FVC% predicted
for studied group was 98.79 + 18.99 and 106.58 + 9.96
for comparative group respectively. Mann-Whitney U test
was performed to compare the values of FVC (litre/s),
FEV1 (litre/s), FEV1% predicted, FVC% predicted and
FEV1/FVC% predicted between studied and comparative
group. The statistical analysis proved that only
FEV1/FVC% predicted was significantly different
between studied and comparative group (z = -2.02, p =
0.04).
TABLE II. COMPARISON OF LUNG FUNCTION LEVEL BETWEEN TWO STUDY GROUPS
Variables Exposed group
(n= 60)
Comparative group
(n= 60) z-value p-value
FVC% predicted
FEV1% predicted
FEV1/ FVC% predicted
77.56 + 20.9
76.25 +25.51
98.79 +18.99
73.48 + 16.47
78.12 + 18.06
106.58 + 9.96
-0.49
-1.19
-2.02
0.62
0.24
0.04*
Mann U Whitney Test
*significant at p<0.05
Journal of Medical and Bioengineering Vol. 3, No. 4, December 2014
283©2014 Engineering and Technology Publishing
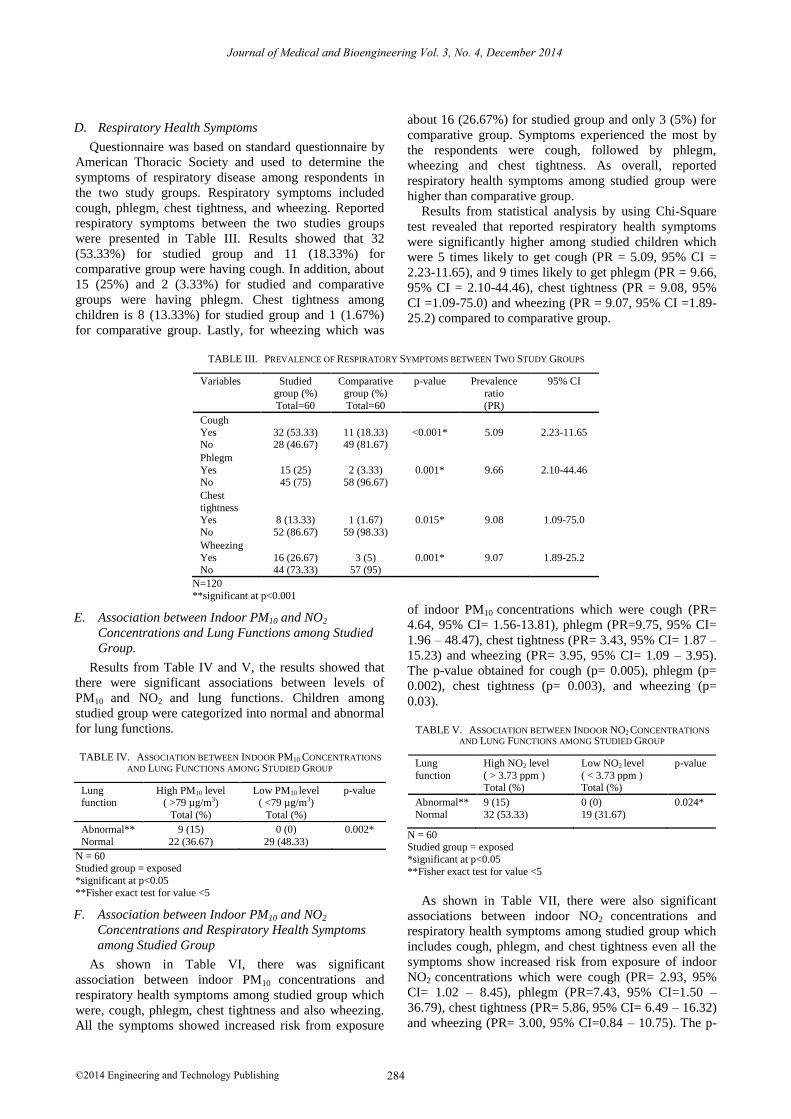
D. Respiratory Health Symptoms
Questionnaire was based on standard questionnaire by
American Thoracic Society and used to determine the
symptoms of respiratory disease among respondents in
the two study groups. Respiratory symptoms included
cough, phlegm, chest tightness, and wheezing. Reported
respiratory symptoms between the two studies groups
were presented in Table III. Results showed that 32
(53.33%) for studied group and 11 (18.33%) for
comparative group were having cough. In addition, about
15 (25%) and 2 (3.33%) for studied and comparative
groups were having phlegm. Chest tightness among
children is 8 (13.33%) for studied group and 1 (1.67%)
for comparative group. Lastly, for wheezing which was
about 16 (26.67%) for studied group and only 3 (5%) for
comparative group. Symptoms experienced the most by
the respondents were cough, followed by phlegm,
wheezing and chest tightness. As overall, reported
respiratory health symptoms among studied group were
higher than comparative group.
Results from statistical analysis by using Chi-Square
test revealed that reported respiratory health symptoms
were significantly higher among studied children which
were 5 times likely to get cough (PR = 5.09, 95% CI =
2.23-11.65), and 9 times likely to get phlegm (PR = 9.66,
95% CI = 2.10-44.46), chest tightness (PR = 9.08, 95%
CI =1.09-75.0) and wheezing (PR = 9.07, 95% CI =1.89-
25.2) compared to comparative group.
TABLE III. PREVALENCE OF RESPIRATORY SYMPTOMS BETWEEN TWO STUDY GROUPS
Variables Studied group (%)
Total=60
Comparative group (%)
Total=60
p-value Prevalence ratio
(PR)
95% CI
Cough
Yes No
32 (53.33) 28 (46.67)
11 (18.33) 49 (81.67)
<0.001*
5.09
2.23-11.65
Phlegm
Yes No
15 (25) 45 (75)
2 (3.33) 58 (96.67)
0.001*
9.66
2.10-44.46
Chest
tightness Yes
No
8 (13.33)
52 (86.67)
1 (1.67)
59 (98.33)
0.015*
9.08
1.09-75.0
Wheezing
Yes No
16 (26.67) 44 (73.33)
3 (5) 57 (95)
0.001*
9.07
1.89-25.2
N=120
**significant at p<0.001
E. Association between Indoor PM10 and NO2
Concentrations and Lung Functions among Studied
Group.
Results from Table IV and V, the results showed that
there were significant associations between levels of
PM10 and NO2 and lung functions. Children among
studied group were categorized into normal and abnormal
for lung functions.
TABLE IV. ASSOCIATION BETWEEN INDOOR PM10 CONCENTRATIONS
AND LUNG FUNCTIONS AMONG STUDIED GROUP
Lung function
High PM10 level ( >79 µg/m3)
Total (%)
Low PM10 level ( <79 µg/m3)
Total (%)
p-value
Abnormal**
Normal
9 (15)
22 (36.67)
0 (0)
29 (48.33)
0.002*
N = 60 Studied group = exposed
*significant at p<0.05
**Fisher exact test for value <5
F. Association between Indoor PM10 and NO2
Concentrations and Respiratory Health Symptoms
among Studied Group
As shown in Table VI, there was significant
association between indoor PM10 concentrations and
respiratory health symptoms among studied group which
were, cough, phlegm, chest tightness and also wheezing.
All the symptoms showed increased risk from exposure
of indoor PM10 concentrations which were cough (PR=
4.64, 95% CI= 1.56-13.81), phlegm (PR=9.75, 95% CI=
1.96 – 48.47), chest tightness (PR= 3.43, 95% CI= 1.87 –
15.23) and wheezing (PR= 3.95, 95% CI= 1.09 – 3.95).
The p-value obtained for cough (p= 0.005), phlegm (p=
0.002), chest tightness (p= 0.003), and wheezing (p=
0.03).
TABLE V. ASSOCIATION BETWEEN INDOOR NO2 CONCENTRATIONS
AND LUNG FUNCTIONS AMONG STUDIED GROUP
Lung
function
High NO2 level
( > 3.73 ppm ) Total (%)
Low NO2 level
( < 3.73 ppm ) Total (%)
p-value
Abnormal**
Normal
9 (15)
32 (53.33)
0 (0)
19 (31.67)
0.024*
N = 60 Studied group = exposed
*significant at p<0.05
**Fisher exact test for value <5
As shown in Table VII, there were also significant
associations between indoor NO2 concentrations and
respiratory health symptoms among studied group which
includes cough, phlegm, and chest tightness even all the
symptoms show increased risk from exposure of indoor
NO2 concentrations which were cough (PR= 2.93, 95%
CI= 1.02 – 8.45), phlegm (PR=7.43, 95% CI=1.50 –
36.79), chest tightness (PR= 5.86, 95% CI= 6.49 – 16.32)
and wheezing (PR= 3.00, 95% CI=0.84 – 10.75). The p-
Journal of Medical and Bioengineering Vol. 3, No. 4, December 2014
284©2014 Engineering and Technology Publishing
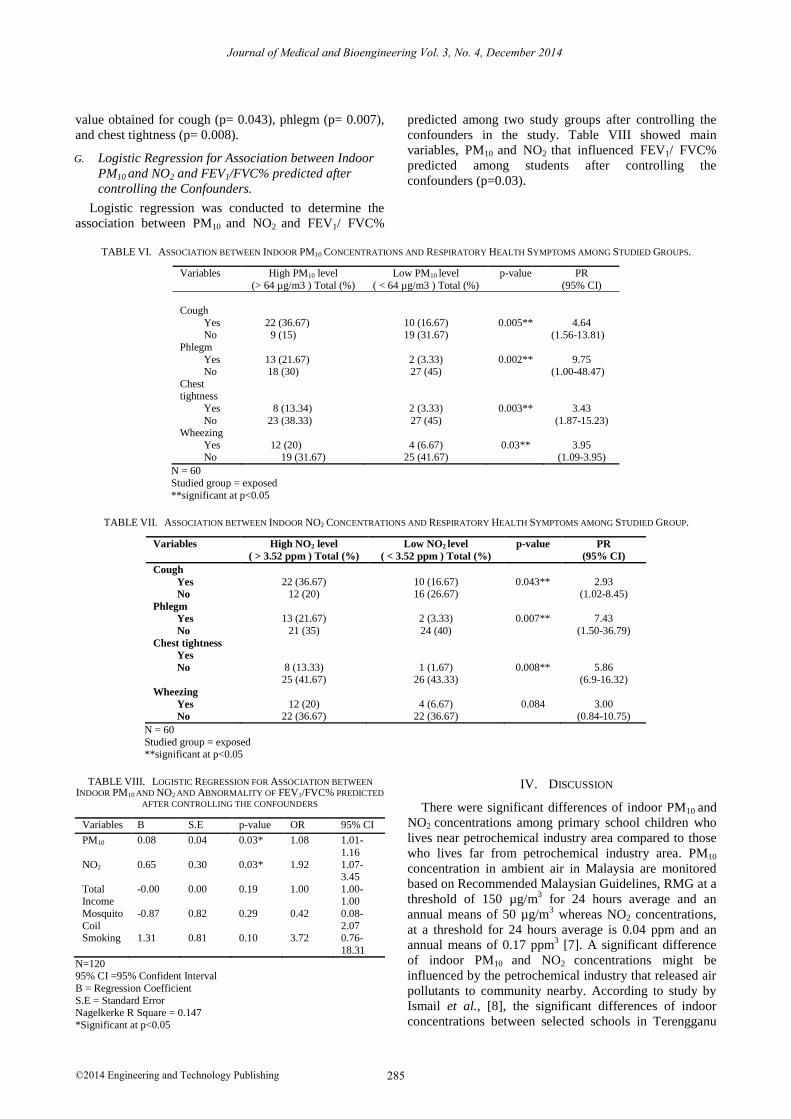
value obtained for cough (p= 0.043), phlegm (p= 0.007),
and chest tightness (p= 0.008).
G. Logistic Regression for Association between Indoor
PM10 and NO2 and FEV1/FVC% predicted after
controlling the Confounders.
Logistic regression was conducted to determine the
association between PM10 and NO2 and FEV1/ FVC%
predicted among two study groups after controlling the
confounders in the study. Table VIII showed main
variables, PM10 and NO2 that influenced FEV1/ FVC%
predicted among students after controlling the
confounders (p=0.03).
TABLE VI. ASSOCIATION BETWEEN INDOOR PM10 CONCENTRATIONS AND RESPIRATORY HEALTH SYMPTOMS AMONG STUDIED GROUPS.
Variables High PM10 level
(> 64 µg/m3 ) Total (%)
Low PM10 level
( < 64 µg/m3 ) Total (%)
p-value PR
(95% CI)
Cough
Yes
No
22 (36.67)
9 (15)
10 (16.67)
19 (31.67)
0.005**
4.64
(1.56-13.81)
Phlegm
Yes No
13 (21.67) 18 (30)
2 (3.33) 27 (45)
0.002**
9.75 (1.00-48.47)
Chest tightness
Yes
No
8 (13.34)
23 (38.33)
2 (3.33)
27 (45)
0.003**
3.43
(1.87-15.23) Wheezing
Yes No
12 (20) 19 (31.67)
4 (6.67) 25 (41.67)
0.03**
3.95 (1.09-3.95)
N = 60
Studied group = exposed
**significant at p<0.05
TABLE VII. ASSOCIATION BETWEEN INDOOR NO2 CONCENTRATIONS AND RESPIRATORY HEALTH SYMPTOMS AMONG STUDIED GROUP.
Variables High NO2 level
( > 3.52 ppm ) Total (%)
Low NO2 level
( < 3.52 ppm ) Total (%)
p-value PR
(95% CI)
Cough
Yes
No
22 (36.67) 12 (20)
10 (16.67) 16 (26.67)
0.043**
2.93 (1.02-8.45)
Phlegm
Yes
No
13 (21.67)
21 (35)
2 (3.33)
24 (40)
0.007**
7.43
(1.50-36.79)
Chest tightness
Yes
No
8 (13.33) 25 (41.67)
1 (1.67) 26 (43.33)
0.008**
5.86 (6.9-16.32)
Wheezing
Yes
No
12 (20) 22 (36.67)
4 (6.67) 22 (36.67)
0.084
3.00 (0.84-10.75)
N = 60
Studied group = exposed **significant at p<0.05
TABLE VIII. LOGISTIC REGRESSION FOR ASSOCIATION BETWEEN
INDOOR PM10 AND NO2 AND ABNORMALITY OF FEV1/FVC% PREDICTED
AFTER CONTROLLING THE CONFOUNDERS
Variables B S.E p-value OR 95% CI
PM10 0.08 0.04 0.03* 1.08 1.01-
1.16
NO2 0.65 0.30 0.03* 1.92 1.07-3.45
Total Income
-0.00 0.00 0.19 1.00 1.00-1.00
Mosquito
Coil
-0.87 0.82 0.29 0.42 0.08-
2.07 Smoking 1.31 0.81 0.10 3.72 0.76-
18.31
N=120 95% CI =95% Confident Interval
B = Regression Coefficient
S.E = Standard Error Nagelkerke R Square = 0.147
*Significant at p<0.05
IV. DISCUSSION
There were significant differences of indoor PM10 and
NO2 concentrations among primary school children who
lives near petrochemical industry area compared to those
who lives far from petrochemical industry area. PM10
concentration in ambient air in Malaysia are monitored
based on Recommended Malaysian Guidelines, RMG at a
threshold of 150 µg/m3 for 24 hours average and an
annual means of 50 µg/m3 whereas NO2 concentrations,
at a threshold for 24 hours average is 0.04 ppm and an
annual means of 0.17 ppm3 [7]. A significant difference
of indoor PM10 and NO2 concentrations might be
influenced by the petrochemical industry that released air
pollutants to community nearby. According to study by
Ismail et al., [8], the significant differences of indoor
concentrations between selected schools in Terengganu
Journal of Medical and Bioengineering Vol. 3, No. 4, December 2014
285©2014 Engineering and Technology Publishing
showed that pollutants has been released, influenced by
surrounding human activities. Statistical analysis proved that only FEV1/FVC%
predicted was significantly different between studied and
comparative group (Z = -2.02. p = 0.04). Significant
value for FEV1/FVC% predicted showed that there was
airways obstruction for lung function among studied
group compare to comparative group. Airway obstruction
is a blockage of respiration in the airway and may affect
children’s lung function. This finding was supported by a
study in California that lung function growth in children
is reduced in areas with high exposure of PM10 [9]. There
were also linking association by this study that, both
PM10 and NO2 have been associated with increases in the
frequency of asthma symptoms and also with lung
function reduction in children on a daily scale [10].
Symptoms that most experienced by the respondents
were cough (53.33%), followed by wheezing (26.67%),
phlegm (25%), and chest tightness (13.33%). As overall,
reported respiratory symptoms were significantly higher
among studied group compared to comparative group.
This finding was also supported by another research by
Abdul et al. [11] who concluded that PM10 affected
exposed children’s respiratory system in terms of lung
functions abnormality and also increased their respiratory
symptoms. Another study showed that short-term
exposures to the irritant gas which is NO2 may cause
airway responsiveness and lung function injury. Whereas,
for long-term exposure it may reduced immunity of body
and lead to respiratory infection involving more than 25
million inhabitants including children in Europe [12]. A
study done by Nazariah et al. [13] also showed a
significant association between indoor PM10 and reported
respiratory symptoms in urban area for cough (OR=1.81,
CI 95%=1.18-2.79), phlegm (OR=2.45, CI 95%=1.42-
4.24) and wheezing (OR=5.43, CI 95%=2.21-13.37).
Association between indoor PM10 and NO2
concentrations and lung functions were analyzed among
studied group in order to know how the level of indoor
PM10 and NO2 concentrations may influenced the exposed
group that living near petrochemical industry. Based on
median value, the level of indoor PM10 concentrations
were categorized into two groups, which were high PM10
level (>64 µg/m3) and low PM10 level (<64 µg/m3) and
for indoor NO2 concentrations, high NO2 level (>3.52
ppm) and low NO2 level (<3.52 ppm). For lung functions,
it was categorized into normal and abnormal functions
and associated with exposure of indoor air among studied
group. The result from Table 4 and 5, from Fisher’s Exact
test, p-value obtained that there were significant
associations between levels of PM10 and NO2 and lung
functions, which were for PM10 (x2 = 9.91, p = 0.002) and
NO2 (x2 = 4.91, p = 0.024).
This findings were also supported by study of Timonen
et al. [14] that showed the result of 33 children who
participated in the PEACE study in Kupio that performed
repeated lung function tests with maximum five times,
related with increased levels of PM10 and NO2 were
associated with impairment of lung functions among
children.
The association between indoor PM10 and NO2
concentrations and respiratory health symptoms were
analyzed among studied group in order to know how the
level of indoor PM10 and NO2 concentrations may
influenced the exposed group that live near petrochemical
industry. Median value was used to categorize the
concentrations of indoor PM10 and NO2. As shown in
Table VI and VII, there were also significant associations
between indoor PM10 and NO2 concentrations and
respiratory health symptoms among studied group.
Yang et al. [2] also claimed that the subjects living in
exposed area had higher rates of selected respiratory
symptoms (cough, phlegm, wheezing, and chronic
bronchitis) but had a lower rate of dyspnea. The
differences in phlegm production and dyspnea were
significant (p<0.05). Besides, this study also
demonstrated that schoolchildren living in exposed area
near petrochemical industry area have significantly more
respiratory symptoms compared in a control area.
Table VIII showed after controlling the confounders in
the study, PM10 and NO2 is the main factors influenced
FEV1/FVC predicted. There are few observations of an
association between exposures to high pollution with
reduced lung functions in all ages. Besides respiratory
illness, it was proven that lung function be a good
indicator of the health impacts of exposure to air
pollutants [15].
V. CONCLUSION
In summary, this study indicated that the exposure to
indoor PM10 and NO2 concentrations might increase the
risk of getting respiratory symptoms among primary
school children living near petrochemical industry.
Besides that, children living near to petrochemical
industry area might have reduction of lung function
impairment due to chronic exposure of PM10 and NO2
concentrations. On balance, responsibility of
petrochemical management can come out with more
effective control measures in order to minimize the
exposure from petrochemical area to community
surrounding.
ACKNOWLEDGEMENT
The author would like to express her utmost gratitude
to all respondents who have participated in this study and
also to all teachers and parents for their cooperation.
REFERENCES
[1] S. C. Lee and M. Chang, “Indoor and outdoor air quality
investigations at schools in Hong Kong,” Chemosphere., vol. 41,
no. 1-2, pp. 109-13, July 2000. [2] C. Y. Yang, J. D. Wang, and C. C. Chan, “Respiratory and irritant
health effects of a population living in a petrochemical-polluted
area in Taiwan,” Environmental Research, vol. 74, pp. 145–149, 1997.
[3] WHO – Report on a World Health Organization Working Group. (2003). Health aspects of air pollution with particulate matter,
ozone and nitrogen dioxide. [Online]. Available:
http://www.euro.who.int/document/e79097.pdf [4] M. H. Ibrahim, A. M. Abdullah, J. Juliana, and L. K. Chng,
“Sensitivity analysis of wind rotation in determining the correlation of pollutant concentration (NO2) with location in north
Journal of Medical and Bioengineering Vol. 3, No. 4, December 2014
286©2014 Engineering and Technology Publishing
east peninsular Malaysia,” in Contemporary Environmental Quality Management in Malaysia and Selected Countries, 2011,
pp. 209-221.
[5] M. H. Ibrahim, A. M. Abdullah, N. M. Adam, and M. H. S. Ismail, “The significance of point source emission (NO2) by
petrochemical plants at north east of peninsular Malaysia,” Research Journal of Chemistry and Environment, vol. 15, no. 2,
pp. 889-896, 2011.
[6] B. O. H. Azizi and R. L. Henry, “Ethic differences in normal spirometric lung functions of Malaysia children,” Respiratory
Medicine, vol. 88, pp. 349-56, 1991. [7] Department of Environmental, Recommended Malaysian Air
Quality Guidelines (RMAQG), Department of Environment,
Malaysia, 2010. [8] M. Ismail et al., “Indoor air quality in selected samples of primary
schools in Kuala Terengganu, Malaysia,” Environment Asia 3(special issue), pp. 103-108, 2010.
[9] W. J. Gauderman, F. Gilliland, S. London, D. Thomas, et al.,
“Association between air pollution and lung function growth in Southern California,” Results From a Second Cohort. Am. J. Resp.
Crit. Care Med., vol. 164, pp. 2067-2072, 2002. [10] J. S. Schildcrout, L. Sheppard, T. Lumley, J. C. Slaughter, et al.,
“Ambient air pollution and asthma exacerbations in children: An
eight-city analysis,” Am J Epidemiol, vol. 164, pp. 505–517, 2006. [11] A. A. Mujid, H. Zailina, J. Juliana, and M. T. S. Bahri,
“Respirable particulate matter (PM10) and its association with the respiratory systems at school children in Sungai Siput Utara,
Perak,” Malaysian Journal of Public Health Medicine, vol. 3, no.
2, pp. 23-32, 2003. [12] P. Hrelia, “A molecular epidemiological approach to health risk
assessment of urban air pollution,” Toxica Lett, vol. 149, PP. 261-
267, 2004. [13] S. S. N. Nazariah, J. Juliana, and M. A. Abdah, “Interleukin-6 via
sputum induction as biomarker of inflammation for indoor particulate matter among primary school children in Klang Valley,
Malaysia,” Global Journal of Health Science; vol. 5, no. 4, 2013.
[14] Timonen KL, et al., “Effects of air pollution on changes in lung function induced by exercise in children with chronic respiratory
symptoms,” Occupational and Environmental Medicine, vol. 59, pp. 129–134, 2002.
[15] J. Schwartz, “Lung function and chronic exposure to air pollution:
A cross-sectional analysis,” Environ.Res., vol. 50, pp. 309-21, 1994.
Ayuni N. A is from Dungun, Terengganu, Malaysia,
born on October 18, 1990. She had secondary
education from boarding school, Islamic Science College, Terengganu (2005), Selangor Science
School, Kuala Lumpur (2007). She had completed her foundation at Melaka Matriculation College
(2009) and degree education at Universiti Putra
Malaysia (UPM) with Bachelor of Science in Environmental and Occupational Health (2013). She is now furthering
her study in Master of Science in Environmental Health, UPM (2013). She had done industrial training at Department of Health, Safety and
Environment, PETRONAS Chemical Ethylene Sdn. Bhd. Kerteh,
Terengganu, Malaysia.
Juliana J. is a senior lecturer at the Universiti Putra Malaysia’s Faculty of Medicine & Health Sciences.
As a specialist in Environmental Health focusing
on Air Quality and Exposure Assessment, Dr Juliana has carried out much research and has
written numerous papers on indoor air quality and its impact on human respiratory health. For almost
a decade, her collaborative research papers and
findings have been presented at many international and local conferences on public health as well as on risk management for
preventative medicine. She has published over 70 articles and 60 proceedings papers. Many of the research papers that she was involved
in have won awards at these conferences. In 2003, for instance, her
collaborative paper developed with two other fellow colleagues on “Exposure to indoor PM10 and Respiratory Health among children in
Sungai Siput, Perak” that was published in the Malaysian Journal of Public Health Medicine 2003, won the Best Paper Publication Award
2003 at the National Public Health Colloquim. In 2007 she won the
award for Best Oral Presentation in Asia Pacific Conference. Her collaborative works have also been published in reputable publications
such as the Journal of Environmental Health Perspectives, Journal of Community Health, Malaysian Journal of Public Health Medicine,
Epidemiology and the Malaysian Journal of Child Health. Apart from
imparting her knowledge at the Universiti Putra Malaysia and being an active researcher and writer in her area of speciality, Dr Juliana is an
active member of the Chartered Institute of Environmental Health (CIEH) and the Malaysian Industrial Association Malaysia(MIHA).
She was also involved in the different committees at the University
including being part of the working group and the Internal Auditor for the ISO MS 9001:2000 for the Faculty of Medicine & Health Services;
Health Sciences Curriculum Committee; a Coordinator of Industrial Training Programme and Industrial Networking for Environmental &
Occupational Health and many more. She was also supervised more
than 100 undergraduates and post graduates students. Dr Juliana holds a Ph.D in Environmental Health (2004) from Universiti Kebangsaan
Malaysia (UKM), a Master of Science in Environmental Health (1998), and a Bachelor of Science in Human Development (1995) from
Universiti Putra Malaysia (UPM).
Ibrahim M. H was born on October 28, 1965 in
Pasir Puteh, Kelantan. He received his primary background from Sekolah Rendah Kebangsaan
Kamil II, Pasir Puteh Kelantan (1972-1978). He
completed his high school at Technical Institute of Terengganu on 1982. In year 1983, he studied
intensive English programme at Muar Science School prior to further his first degree study at the
Wichita State University, Kansas, U.S.A. and graduated with Degree in
Bachelor of Science in Industrial Engineering (1988). In 2003, he completed his degree in Master of Science in Emergency Response and
Planning at Universiti Putra Malaysia (UPM). He was conferred by Board of Engineer Malaysia as a Professional Engineer in 2005. To
complete his interest in safety, health and environment field, he pursues
his study in Philosophy Degree specialized in environmental modeling and risk assessment at Faculty of Environmental Studies, UPM. The
author has 22 years of working experience including industrial experience. Currently the author teaching at TATI University College,
the learning institution owned by the Terengganu State Government.
The author has served the institution for more than 10 years and was appointed at various managerial tasks including the Short Course
Programme Coordinator, Head of Department and lastly as Faculty Dean prior to his full time doctorate study in 2009. He has successfully
completed his doctorate study in 2012.
Journal of Medical and Bioengineering Vol. 3, No. 4, December 2014
287©2014 Engineering and Technology Publishing
Top Related
Copyright © 2022 FDOKUMEN

