


Bahasa
Halaman
Hukum

Chemical Geology 387 (2014) 101–110
Contents lists available at ScienceDirect
Chemical Geology
j ourna l homepage: www.e lsev ie r .com/ locate /chemgeo
Evidence for the control of the geochemistry of Amazonian floodplainsediments by stratification of suspended sediments in the Amazon
Martin Roddaz a,⁎, Jérôme Viers a, Patricia Moreira-Turcq b, Camille Blondel a, Francis Sondag a,Jean-Loup Guyot a, Luciane Moreira c
a GET, Université de Toulouse, CNRS-IRD-OMP, 14 avenue Edouard Belin, 31400 Toulouse, Franceb Institut de Recherche pour le Developpement (IRD), GET, Lima, Peruc Universidade Federal Fluminense, Departamento de Geoquimica, Niteroi, RJ, Brazil
⁎ Corresponding author. Tel.: +33 5 6133 2599.E-mail address: [email protected] (M. Rod
http://dx.doi.org/10.1016/j.chemgeo.2014.07.0220009-2541/© 2014 Elsevier B.V. All rights reserved.
a b s t r a c t
a r t i c l e i n f oArticle history:Received 30 November 2012Received in revised form 27 July 2014Accepted 30 July 2014Available online 23 August 2014
Editor: L. Reisberg
Keywords:Major and trace elementsNd–Sr isotopesProvenanceFloodplain sedimentsAmazon RiverBrazil
Holocene and historical Amazonian floodplain deposits collected from two cores of the “Varzea do Curuai”flooded area (Brazil) were analysed for major and trace element geochemistry as well as Nd–Sr isotopic compo-sitions (21 samples). The TA11 and TA14 cores (110 cm and 270 cm in depth, respectively) were collected at dif-ferent locations in the Varzea, near a channel inlet connecting the Amazon River to theVarzea and at the centre ofthe Varzea, respectively. The two cores represent records of sedimentation on different time-scales, with TA11covering the last 100 years and TA14 extending back to 5600 years cal BP. Although the sediments are generallycoarser in TA11 than in TA14, themajor and trace element concentrations, Cr/Th and Th/Sc and Eu anomalies andNd–Sr isotopic compositions in both cores fail to show any clear variationswith depth. However, there are chem-ical differences between the two analysed cores. The TA14 sediments have higher Al/Si and Chemical Index ofAlteration (CIA) values than those of TA11. The TA14 sediments are enriched in Th, U, Y, Nb, REE, Cs, Rb, V andNi but show slightly depleted MgO, CaO and Sr and more strongly depleted Na2O, Zr and Hf compared toTA11. In addition, the Nd–Sr isotopic compositions of the TA11 sediment core are on the whole similar to theSolimões suspended particulatematter (SPM), whereas TA14 has a similar Nd–Sr isotopic composition comparedwith the SPMof theAmazonRiver atObidos. These differences are best explained by chemical stratification of theSPM of the Amazon River. During flooding of the Amazon River, coarser grained particulates supplied by theSolimões River are deposited in the deepest environments near the channel inlet, as recorded in the TA11 sedi-ment core. By contrast, finer grained suspended sediments derived from the Madeira River are transported intothe shallower environments of the Varzea system and deposited as a result of flowexpansion and loss of carryingpower, as recorded in the TA14 sediment core. Using the Nd isotopic compositions and concentrations of eachsediment core, we calculate between ~20 and ~85% of the sediment input to the TA14 core site is derived fromthe Madeira River, while between 52% and 100% of the sediment input to the TA11 core sample is supplied bythe Solimões River. Similar calculation using the Sr isotopic compositions and concentrations of TA11 andTA14 sediments gave similar resultswith between ~32% and ~49% of TA14 sediments deriving from the SolimõesRiver while between ~70% and ~100% of TA11 sediments originate from the Solimões River. Finally, our findingslead us to question whether particular Amazon deposits that do not integrate the entire range of SPM present inthe river are representative of the overall sediment load provided today and in the past by global rivers.
© 2014 Elsevier B.V. All rights reserved.
1. Introduction
Large rivers are the main arteries that deliver the water and sedi-ment fluxes frommajor orogens or from large areas of the continent to-wards the oceans (Miall, 2006). It is essential to assess the sedimentbudgets of large rivers to reconstruct global geochemical cycles andnutrient input into the oceans, as well as fluxes of atmospheric CO2 by
daz).
silicate weathering and burial of organic carbon in floodplains(Meybeck, 1993; Gaillardet et al., 1999a,b; Galy et al., 2007). Big riverswith a sandy bed sequester a significant proportion of their sedimentload in the floodplain. Hence, floodplain areas are primary storagesites for river sediments. Consequently, constraining the processes con-trolling the geochemistry of floodplain deposits is of particular impor-tance for chemical weathering studies (e.g. Singh and Rajamani, 2001)because big riversflow through large floodplains that are subject to con-tinuous deposition and erosion of river sediments (Allison et al., 1998;Maurice-Bourgoin et al., 2007). This is also of importance to provenance
102 M. Roddaz et al. / Chemical Geology 387 (2014) 101–110
studies (Singh and Rajamani, 2001; Tripathi et al., 2007), since flood-plain sediments mainly result from the deposition of suspended sedi-ment load during flooding.
The Amazon River ranks number one in terms of global mass trans-fer from the continents to the oceans. Indeed, theAmazonRiver suppliesabout 20% of the water (Callède et al., 2004), ~10% of the dissolved load(Gaillardet et al., 2007) and ~3% of the suspended load (Milliman andSyvitski, 1992) to theworld's oceans.More than95% of themean annualsuspended sediment flux delivered by the Amazon is contributed byAndean tributaries (2/3 and 1/3 from the Solimões and Madeira rivers,respectively; Filizola and Guyot, 2004). The sediment contributions ofother large tributaries such as the Negro, Trombetas, Tapajos andXingu rivers (see Fig. 1 for location) are negligible, and account forless than 5%.
Suspended sediments currently exported by the Amazon River havebeen the object of studieswith various objectives. Some of these studiesaimed to estimate sediment fluxes and calculate present-day physicaldenudation rates (Milliman and Meade, 1983; Gaillardet et al., 1997;Filizola and Guyot, 2004). The chemical, isotopic and mineralogicalcharacterisations of Amazon River sediments have been used toi) trace their provenance (Basu et al., 1990; Martinelli et al., 1993;Guyot et al., 1999, 2007; Vital and Stattegger, 2000; Roddaz et al.,2005, 2006), ii) estimate the weathering conditions within the Andeanmountain chain or in the lowland shield (Gibbs, 1967; Allègre et al.,
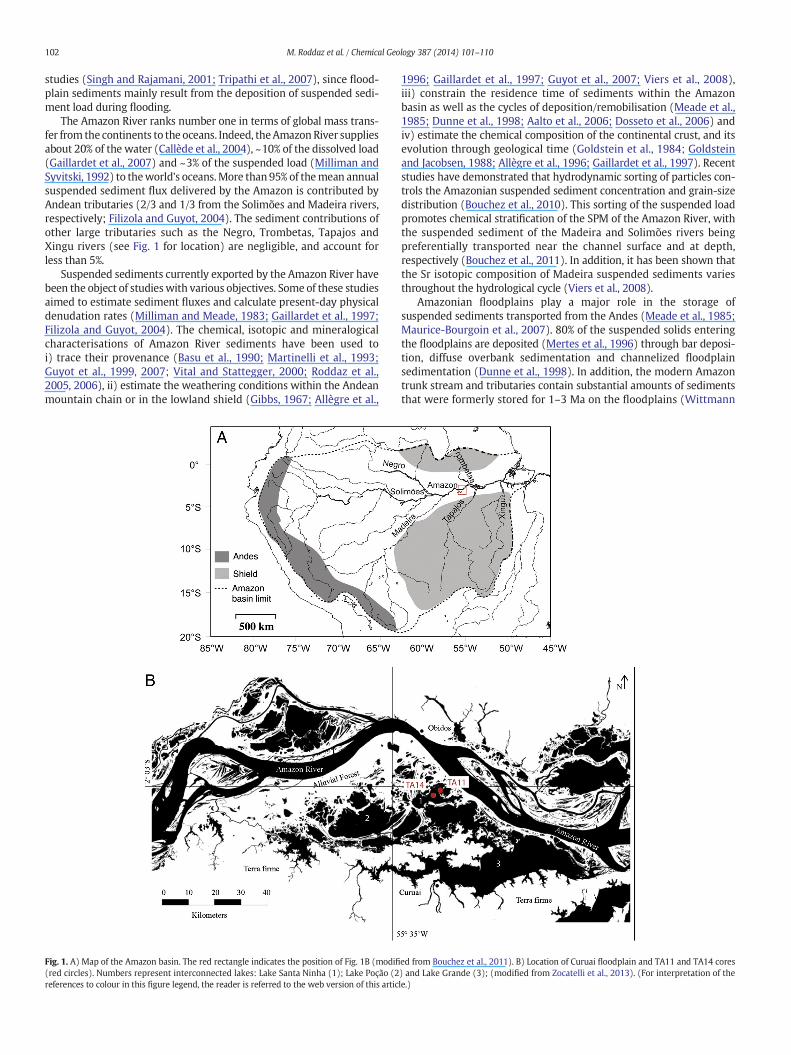
Fig. 1. A) Map of the Amazon basin. The red rectangle indicates the position of Fig. 1B (modifi(red circles). Numbers represent interconnected lakes: Lake Santa Ninha (1); Lake Poção (2references to colour in this figure legend, the reader is referred to the web version of this artic
1996; Gaillardet et al., 1997; Guyot et al., 2007; Viers et al., 2008),iii) constrain the residence time of sediments within the Amazonbasin as well as the cycles of deposition/remobilisation (Meade et al.,1985; Dunne et al., 1998; Aalto et al., 2006; Dosseto et al., 2006) andiv) estimate the chemical composition of the continental crust, and itsevolution through geological time (Goldstein et al., 1984; Goldsteinand Jacobsen, 1988; Allègre et al., 1996; Gaillardet et al., 1997). Recentstudies have demonstrated that hydrodynamic sorting of particles con-trols the Amazonian suspended sediment concentration and grain-sizedistribution (Bouchez et al., 2010). This sorting of the suspended loadpromotes chemical stratification of the SPM of the Amazon River, withthe suspended sediment of the Madeira and Solimões rivers beingpreferentially transported near the channel surface and at depth,respectively (Bouchez et al., 2011). In addition, it has been shown thatthe Sr isotopic composition of Madeira suspended sediments variesthroughout the hydrological cycle (Viers et al., 2008).
Amazonian floodplains play a major role in the storage ofsuspended sediments transported from the Andes (Meade et al., 1985;Maurice-Bourgoin et al., 2007). 80% of the suspended solids enteringthe floodplains are deposited (Mertes et al., 1996) through bar deposi-tion, diffuse overbank sedimentation and channelized floodplainsedimentation (Dunne et al., 1998). In addition, the modern Amazontrunk stream and tributaries contain substantial amounts of sedimentsthat were formerly stored for 1–3 Ma on the floodplains (Wittmann
ed from Bouchez et al., 2011). B) Location of Curuai floodplain and TA11 and TA14 cores) and Lake Grande (3); (modified from Zocatelli et al., 2013). (For interpretation of thele.)
103M. Roddaz et al. / Chemical Geology 387 (2014) 101–110
et al., 2011). However, little is known about the processes that controlthe geochemical composition of Amazonian floodplain sediments andits variability through time.
The present study is based on the major and trace elements andNd–Sr isotopic compositions of two cores sampled at different locationson the Amazonian floodplain (one near a channel inlet and the other atthe centre of the floodplain), with the aim of determining the mainfactors controlling the geochemical composition of Amazonian flood-plain sediments.
2. Materials and methods
2.1. Hydrological setting of study area
The Amazon basin is the world's largest Cenozoic fluvial basin, witha present-day drainage area of about 6.2 × 10⁶ km2 (Revenga et al.,1998). The “Varzeas” of the Amazonian floodplain area compriseabout 6500 lakes formed by river-level fluctuations, which lead to theaccumulation of bars and sediments supplied by diffuse overbank andchannelized flows (Dunne et al., 1998). Thus, significant amounts ofsediment can accumulate within these lakes on different time scales.The “Varzea do Curuai” is located between Lat. 1°50′–02°15′S andLong. 55°00′–56°05′W on the southern margin of the Amazon River,850 km from the mouth of the estuary (Fig. 1). This Varzea extendsover about 3500 km2 (Martinez and Le Toan, 2007), covering approxi-mately 13% of the total flooded area of the Amazon River betweenManaus and Óbidos (Maurice-Bourgoin et al., 2007). Water andsediment exchanges between this Varzea and the Amazon River arecontrolled by the main-stream hydrology, local precipitation regimesand the geomorphological characteristics of the channels and lakes.The annual sediment storage in the Curuai floodplain is estimated atabout 710.103 t yr−1, which represents between 41 and 53% of the an-nual flux of sediments entering the floodplain from the mainstream(Maurice-Bourgoin et al., 2007). This sediment budget shows that theAmazonian floodplain acts as a sediment trap, as observed byMoreira-Turcq et al. (2004). The Curuai floodplain includes more than30 interconnected lakes, all permanently connected to the Amazonmainstream by small channels. The flooded area ranges between 575and 2090 km2 with water levels varying between 3.03 and 9.61 m, themaximum and minimum recorded in the “Varzea do Curuai” since1997 (Bonnet et al., 2008). A maximum floodable area of 2430 km2 isdelimited by the boundary between “Terra Firme” (i.e. the non-floodedarea) and the Amazon, corresponding to awater level in Curuai of about11.5 m. The local catchment formed by the creeks coming from the“Terra Firme” covers a total area of 1370 km2 and is mostly covered byevergreen forest. Each year, the storage stage on the floodplain starts
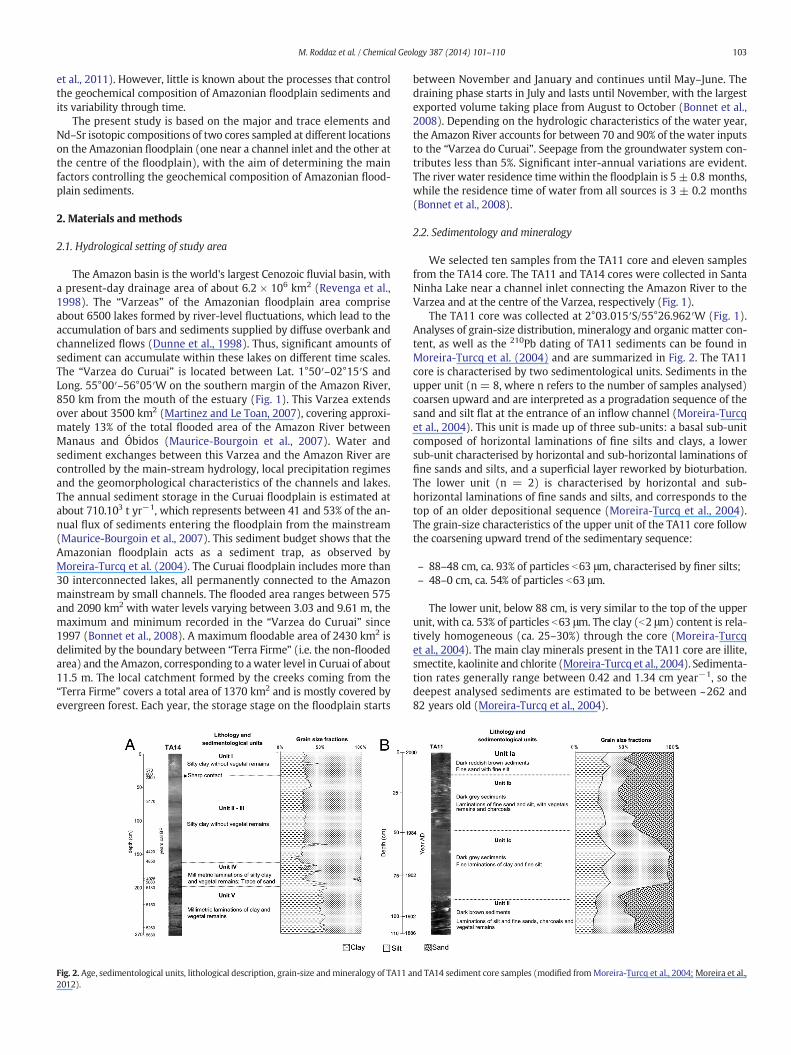
Fig. 2. Age, sedimentological units, lithological description, grain-size andmineralogy of TA11 a2012).
between November and January and continues until May–June. Thedraining phase starts in July and lasts until November, with the largestexported volume taking place from August to October (Bonnet et al.,2008). Depending on the hydrologic characteristics of the water year,the Amazon River accounts for between 70 and 90% of the water inputsto the “Varzea do Curuai”. Seepage from the groundwater system con-tributes less than 5%. Significant inter-annual variations are evident.The river water residence timewithin the floodplain is 5 ± 0.8 months,while the residence time of water from all sources is 3 ± 0.2 months(Bonnet et al., 2008).
2.2. Sedimentology and mineralogy
We selected ten samples from the TA11 core and eleven samplesfrom the TA14 core. The TA11 and TA14 cores were collected in SantaNinha Lake near a channel inlet connecting the Amazon River to theVarzea and at the centre of the Varzea, respectively (Fig. 1).
The TA11 core was collected at 2°03.015′S/55°26.962′W (Fig. 1).Analyses of grain-size distribution, mineralogy and organic matter con-tent, as well as the 210Pb dating of TA11 sediments can be found inMoreira-Turcq et al. (2004) and are summarized in Fig. 2. The TA11core is characterised by two sedimentological units. Sediments in theupper unit (n = 8, where n refers to the number of samples analysed)coarsen upward and are interpreted as a progradation sequence of thesand and silt flat at the entrance of an inflow channel (Moreira-Turcqet al., 2004). This unit is made up of three sub-units: a basal sub-unitcomposed of horizontal laminations of fine silts and clays, a lowersub-unit characterised by horizontal and sub-horizontal laminations offine sands and silts, and a superficial layer reworked by bioturbation.The lower unit (n = 2) is characterised by horizontal and sub-horizontal laminations of fine sands and silts, and corresponds to thetop of an older depositional sequence (Moreira-Turcq et al., 2004).The grain-size characteristics of the upper unit of the TA11 core followthe coarsening upward trend of the sedimentary sequence:
– 88–48 cm, ca. 93% of particles b63 μm, characterised by finer silts;– 48–0 cm, ca. 54% of particles b63 μm.
The lower unit, below 88 cm, is very similar to the top of the upperunit, with ca. 53% of particles b63 μm. The clay (b2 μm) content is rela-tively homogeneous (ca. 25–30%) through the core (Moreira-Turcqet al., 2004). The main clay minerals present in the TA11 core are illite,smectite, kaolinite and chlorite (Moreira-Turcq et al., 2004). Sedimenta-tion rates generally range between 0.42 and 1.34 cm year−1, so thedeepest analysed sediments are estimated to be between ~262 and82 years old (Moreira-Turcq et al., 2004).
nd TA14 sediment core samples (modified fromMoreira-Turcq et al., 2004; Moreira et al.,
104 M. Roddaz et al. / Chemical Geology 387 (2014) 101–110
The TA14 core was collected at 2°04.38′S/55°29.574′W (Fig. 1). De-tailed sedimentology, grain-size, mineralogy, organic carbon contentand radiocarbon dating results are available in Moreira et al. (2012),and are summarized in Fig. 2. The TA14 core contains five sedimentaryunits:
– Unit V (270–199 cm, 5600–5100 cal years BP, n = 3):– Unit IV (199–165 cm, 5100–5000 cal years BP, n = 1);– Unit III (165–125 cm, 5000–4000 cal years BP, n = 2);– Unit II (125–34 cm, 4000–2300 cal years BP, n = 3);– Unit I (34 cm to the top, 600 cal years BP, n= 2). Our analysed sam-
ples belong to Units V–I and range in age between 5600 cal years BPand the present-day.
The basal Unit V is characterised by thin horizontal laminations ofclays and plant remains. Unit IV is rich in plant remains and alsoshows laminations, but the grain size is coarser, composed of clay, siltand small amounts of sand. No plant remains are found in Unit III, andthe sediment mainly consists of silty clay (Fig. 2). Quantitative infraredanalyses of quartz reveal low abundances in Units V and IV, with anaverage value of 5.6% (Zocatelli et al., 2013). In Units III, II and I, thequartz abundance is high, with mean values of 14.7, 13.3 and 13.3%,respectively. The results of the bulk XRD analyses indicate the presenceof smectite, illite, kaolinite and chlorite. In Units V and IV, the meansmectite abundances are 23.7 and 26.1%, respectively. In the upperUnits III, II and I, the abundance is higher, with average values of 50.3,68 and 41.9%, respectively (Moreira et al., 2012). Illite and chlorite areless variable through the core, although both show a significant increasein Unit IV, associatedwith a decrease of smectite and kaolinite (Moreiraet al., 2012). These units are interpreted as recording various hydrologicphases in the evolution of the lake (Moreira et al., 2012). The periodbetween 5600 and 5100 cal years BP is characterised by a reducedAmazon River influence, with longer periods of low water level relatedto a drier climate. After 5100 cal years BP and up to 2300 cal years BP,the sediments are coarser and quartz increases in abundance, whichsuggest a higher inflow of the Amazon River associated with highwater levels and a wetter climate (Zocatelli et al., 2013). After600 cal years BP, the current characteristics of the lakewere established(Moreira et al., 2012).
2.3. Analytical methods
The twenty-one selected samples were finely crushed in an agatemortar. They were then analysed for major and trace element concen-trations and Nd–Sr isotopic compositions. Major, minor and traceelement concentrations were measured at the Service d'Analyse desRoches et Minéraux (SARM, INSU facility, Vandoeuvre-Les-Nancy,France, analytical details available on http://helium.crpg.cnrs-nancy.fr/SARM/), by ICP-AES and ICP-MS after alkali fusion. Uncertainties arelower than 5% for major elements, and lower than 10% for minor andtrace elements.
The analysed samples for Nd–Sr isotopic composition were firstlydigested in hydrogen peroxide for 24 h at ambient temperature, andthen dried down and re-digested in HNO3 for 24 h at 80 °C followedby Hf–HNO3 for 24 h at 80 °C, and, finally HCl + HNO3 for 24 h at115 °C. Aliquots containing about 1000 ng of Sr and Nd were loadedinto the ion exchange columns. Sr and Nd were separated using theSr-SPEC, TRU-SPEC and LN-SPEC resins (Eichrom). Nd and Sr isotopic ra-tios were measured using a Finnigan Mat 261 thermal ionization massspectrometer in dynamic mode. During the Nd run, the 146Nd/144Nd(=0.7219) was used to correct the signal for mass fractionation. Foreach sample, checksweremade for the absence of samarium (Sm). Dur-ing the period of measurement, repeated analyses of the La Jolla stan-dard gave 0.511847 ± 0.000010 (2σ, n = 10). During the Sr analyses,86Sr/88Sr (=0.1194) was used to correct the signal for mass fraction-ation. The accuracy of the measurements was checked against the NBS987 standard (=0.710240). During the period of analyses, the NBS
987 standard yielded values of 0.710261 ± 0.000012 (2σ, n = 9). Theaverage values fall within the ranges given for these standards, so thatno instrumental bias needs to be taken into account. The repeatabilityon these standards is around 15 ppm. This value is adopted for the over-all uncertainty of all measurements, even if some individual samplesyield results with a lower internal precision. Total blanks (acid digestionplus column chemistry) for Nd and Sr were checked by ICP-MS andfound to be negligible compared to the Nd and Sr amounts loaded ontothe columns (less than 250 pg and 30 pg for Nd and Sr respectively).The measured 143Nd/144Nd ratios are expressed as the fractional devia-tion in parts per 104 (units) from 143Nd/144Nd in a Chondritic UniformReservoir (CHUR) as measured at the present day:
εNd 0ð Þ ¼ 143Nd=144Nd� �
S=ICHUR 0ð Þ−1
h i�104;
where (143Nd/144Nd)S is the present-day ratio measured in the sampleand ICHUR(0) is the 143Nd/144Nd in the CHUR reference reservoir at thepresent (ICHUR(0) = 0.512638) (Jacobsen and Wasserburg, 1980).
3. Results
3.1. Major, minor and selected trace elements
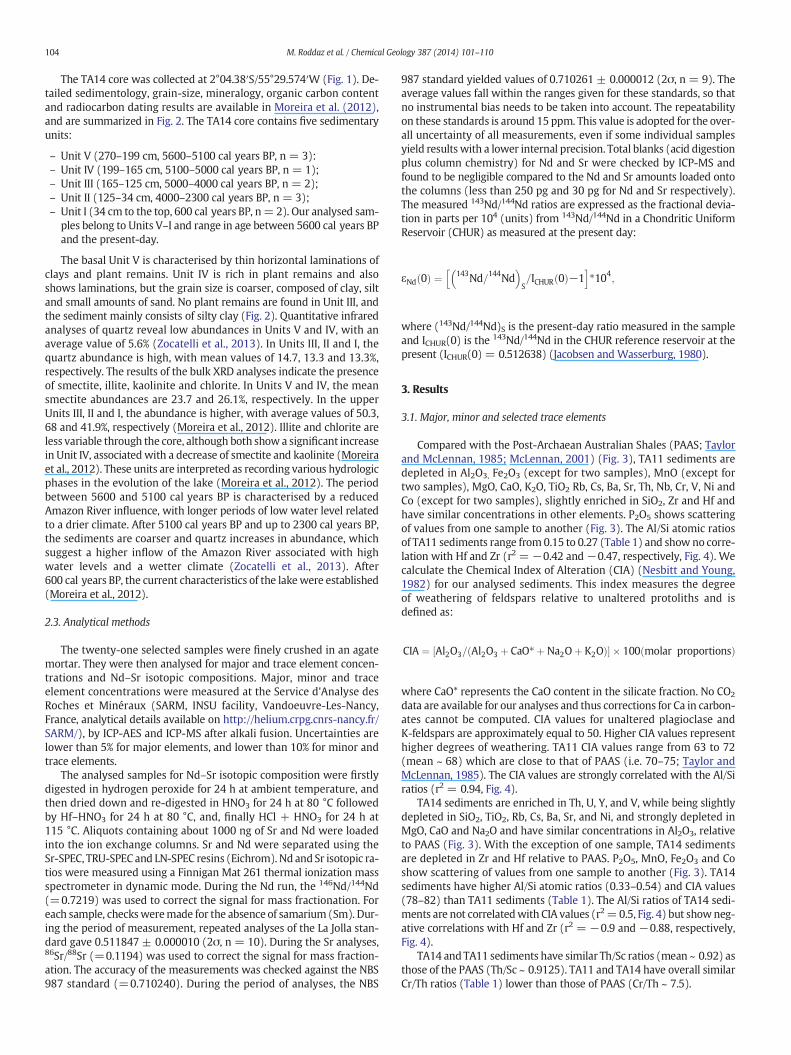
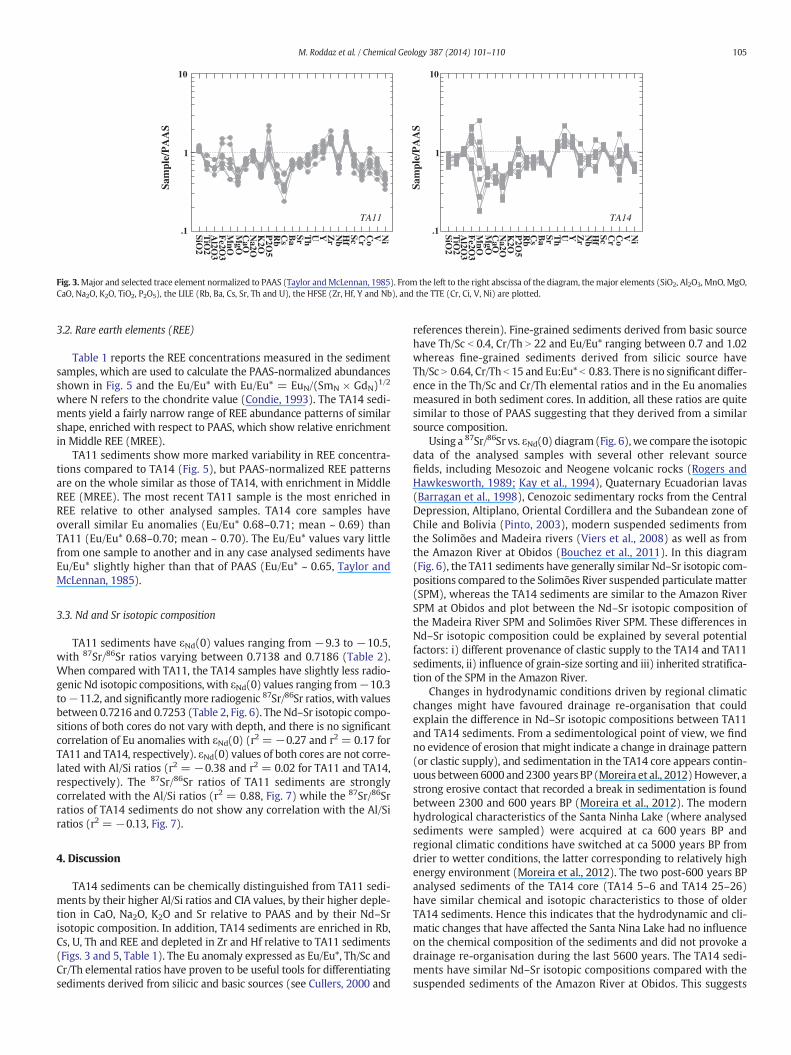
Compared with the Post-Archaean Australian Shales (PAAS; Taylorand McLennan, 1985; McLennan, 2001) (Fig. 3), TA11 sediments aredepleted in Al2O3, Fe2O3 (except for two samples), MnO (except fortwo samples), MgO, CaO, K2O, TiO2 Rb, Cs, Ba, Sr, Th, Nb, Cr, V, Ni andCo (except for two samples), slightly enriched in SiO2, Zr and Hf andhave similar concentrations in other elements. P2O5 shows scatteringof values from one sample to another (Fig. 3). The Al/Si atomic ratiosof TA11 sediments range from 0.15 to 0.27 (Table 1) and show no corre-lation with Hf and Zr (r2 = −0.42 and −0.47, respectively, Fig. 4). Wecalculate the Chemical Index of Alteration (CIA) (Nesbitt and Young,1982) for our analysed sediments. This index measures the degreeof weathering of feldspars relative to unaltered protoliths and isdefined as:
CIA ¼ Al2O3= Al2O3 þ CaO� þ Na2Oþ K2Oð Þ½ � � 100 molar proportionsð Þ
where CaO* represents the CaO content in the silicate fraction. No CO2
data are available for our analyses and thus corrections for Ca in carbon-ates cannot be computed. CIA values for unaltered plagioclase andK-feldspars are approximately equal to 50. Higher CIA values representhigher degrees of weathering. TA11 CIA values range from 63 to 72(mean ~ 68) which are close to that of PAAS (i.e. 70–75; Taylor andMcLennan, 1985). The CIA values are strongly correlated with the Al/Siratios (r2 = 0.94, Fig. 4).
TA14 sediments are enriched in Th, U, Y, and V, while being slightlydepleted in SiO2, TiO2, Rb, Cs, Ba, Sr, and Ni, and strongly depleted inMgO, CaO and Na2O and have similar concentrations in Al2O3, relativeto PAAS (Fig. 3). With the exception of one sample, TA14 sedimentsare depleted in Zr and Hf relative to PAAS. P2O5, MnO, Fe2O3 and Coshow scattering of values from one sample to another (Fig. 3). TA14sediments have higher Al/Si atomic ratios (0.33–0.54) and CIA values(78–82) than TA11 sediments (Table 1). The Al/Si ratios of TA14 sedi-ments are not correlatedwith CIA values (r2=0.5, Fig. 4) but showneg-ative correlations with Hf and Zr (r2 = −0.9 and −0.88, respectively,Fig. 4).
TA14 and TA11 sediments have similar Th/Sc ratios (mean ~ 0.92) asthose of the PAAS (Th/Sc ~ 0.9125). TA11 and TA14 have overall similarCr/Th ratios (Table 1) lower than those of PAAS (Cr/Th ~ 7.5).
Sam
ple/
PA
AS
Sam
ple/
PA
AS
TA11 TA14
SiO2 2
OiT
3O2
lA
3O2
eF
OnM
OgM
OaC
O2a
N K2O
P2O
5b
Rs
Ca
B Sr hT U Y
bN V
oC
rZ H
f rCSc SciN SiO
2 2Oi
T3
O2l
A3
O2e
FOn
MOg
MOa
CO2
aN
O2K P
2O5
bR
sC
aB Sr hT U Y
bN V
oC
rZ
fH
rC
iN.1
1
10
.1
1
10
Fig. 3.Major and selected trace element normalized to PAAS (Taylor andMcLennan, 1985). From the left to the right abscissa of the diagram, themajor elements (SiO2, Al2O3, MnO, MgO,CaO, Na2O, K2O, TiO2, P2O5), the LILE (Rb, Ba, Cs, Sr, Th and U), the HFSE (Zr, Hf, Y and Nb), and the TTE (Cr, Ci, V, Ni) are plotted.
105M. Roddaz et al. / Chemical Geology 387 (2014) 101–110
3.2. Rare earth elements (REE)
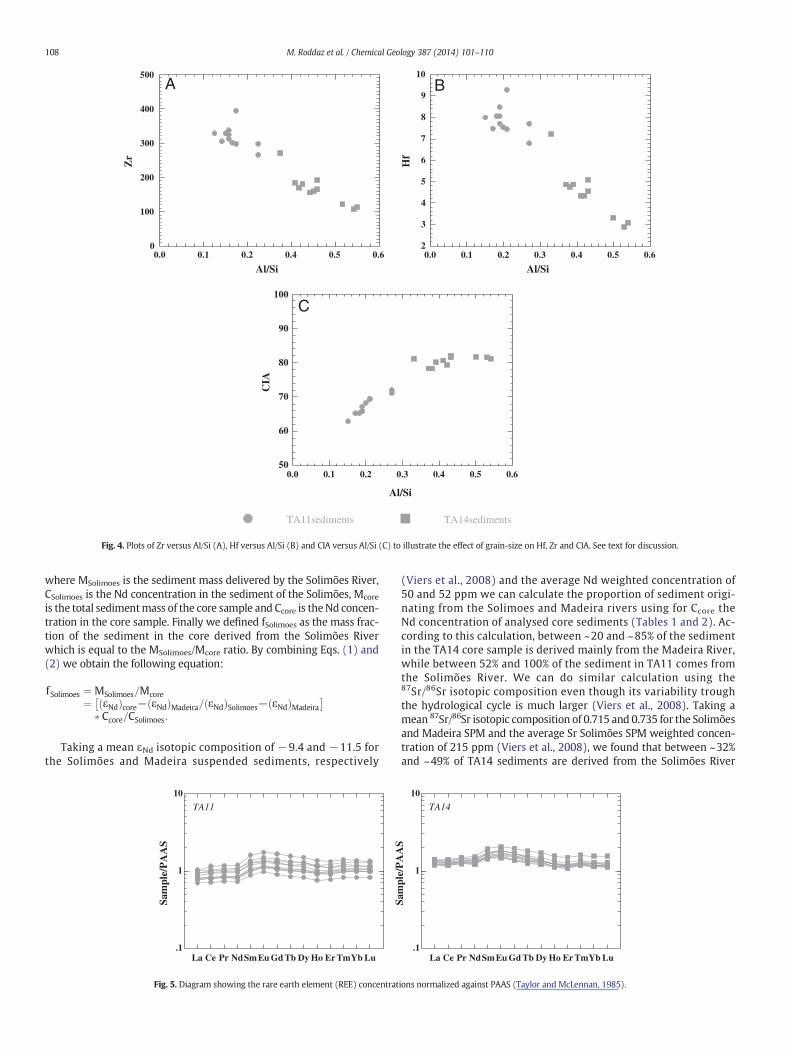
Table 1 reports the REE concentrations measured in the sedimentsamples, which are used to calculate the PAAS-normalized abundancesshown in Fig. 5 and the Eu/Eu* with Eu/Eu* = EuN/(SmN × GdN)1/2
where N refers to the chondrite value (Condie, 1993). The TA14 sedi-ments yield a fairly narrow range of REE abundance patterns of similarshape, enriched with respect to PAAS, which show relative enrichmentin Middle REE (MREE).
TA11 sediments show more marked variability in REE concentra-tions compared to TA14 (Fig. 5), but PAAS-normalized REE patternsare on the whole similar as those of TA14, with enrichment in MiddleREE (MREE). The most recent TA11 sample is the most enriched inREE relative to other analysed samples. TA14 core samples haveoverall similar Eu anomalies (Eu/Eu* 0.68–0.71; mean ~ 0.69) thanTA11 (Eu/Eu* 0.68–0.70; mean ~ 0.70). The Eu/Eu* values vary littlefrom one sample to another and in any case analysed sediments haveEu/Eu* slightly higher than that of PAAS (Eu/Eu* ~ 0.65, Taylor andMcLennan, 1985).
3.3. Nd and Sr isotopic composition
TA11 sediments have εNd(0) values ranging from −9.3 to −10.5,with 87Sr/86Sr ratios varying between 0.7138 and 0.7186 (Table 2).When compared with TA11, the TA14 samples have slightly less radio-genic Nd isotopic compositions, with εNd(0) values ranging from−10.3to−11.2, and significantly more radiogenic 87Sr/86Sr ratios, with valuesbetween 0.7216 and 0.7253 (Table 2, Fig. 6). The Nd–Sr isotopic compo-sitions of both cores do not vary with depth, and there is no significantcorrelation of Eu anomalies with εNd(0) (r2 = −0.27 and r2 = 0.17 forTA11 and TA14, respectively). εNd(0) values of both cores are not corre-lated with Al/Si ratios (r2 = −0.38 and r2 = 0.02 for TA11 and TA14,respectively). The 87Sr/86Sr ratios of TA11 sediments are stronglycorrelated with the Al/Si ratios (r2 = 0.88, Fig. 7) while the 87Sr/86Srratios of TA14 sediments do not show any correlation with the Al/Siratios (r2 = −0.13, Fig. 7).
4. Discussion
TA14 sediments can be chemically distinguished from TA11 sedi-ments by their higher Al/Si ratios and CIA values, by their higher deple-tion in CaO, Na2O, K2O and Sr relative to PAAS and by their Nd–Srisotopic composition. In addition, TA14 sediments are enriched in Rb,Cs, U, Th and REE and depleted in Zr and Hf relative to TA11 sediments(Figs. 3 and 5, Table 1). The Eu anomaly expressed as Eu/Eu*, Th/Sc andCr/Th elemental ratios have proven to be useful tools for differentiatingsediments derived from silicic and basic sources (see Cullers, 2000 and
references therein). Fine-grained sediments derived from basic sourcehave Th/Sc b 0.4, Cr/Th N 22 and Eu/Eu* ranging between 0.7 and 1.02whereas fine-grained sediments derived from silicic source haveTh/Sc N 0.64, Cr/Th b 15 and Eu:Eu* b 0.83. There is no significant differ-ence in the Th/Sc and Cr/Th elemental ratios and in the Eu anomaliesmeasured in both sediment cores. In addition, all these ratios are quitesimilar to those of PAAS suggesting that they derived from a similarsource composition.
Using a 87Sr/86Sr vs. εNd(0) diagram (Fig. 6),we compare the isotopicdata of the analysed samples with several other relevant sourcefields, including Mesozoic and Neogene volcanic rocks (Rogers andHawkesworth, 1989; Kay et al., 1994), Quaternary Ecuadorian lavas(Barragan et al., 1998), Cenozoic sedimentary rocks from the CentralDepression, Altiplano, Oriental Cordillera and the Subandean zone ofChile and Bolivia (Pinto, 2003), modern suspended sediments fromthe Solimões and Madeira rivers (Viers et al., 2008) as well as fromthe Amazon River at Obidos (Bouchez et al., 2011). In this diagram(Fig. 6), the TA11 sediments have generally similar Nd–Sr isotopic com-positions compared to the Solimões River suspended particulate matter(SPM), whereas the TA14 sediments are similar to the Amazon RiverSPM at Obidos and plot between the Nd–Sr isotopic composition ofthe Madeira River SPM and Solimões River SPM. These differences inNd–Sr isotopic composition could be explained by several potentialfactors: i) different provenance of clastic supply to the TA14 and TA11sediments, ii) influence of grain-size sorting and iii) inherited stratifica-tion of the SPM in the Amazon River.
Changes in hydrodynamic conditions driven by regional climaticchanges might have favoured drainage re-organisation that couldexplain the difference in Nd–Sr isotopic compositions between TA11and TA14 sediments. From a sedimentological point of view, we findno evidence of erosion that might indicate a change in drainage pattern(or clastic supply), and sedimentation in the TA14 core appears contin-uous between 6000 and 2300 years BP (Moreira et al., 2012)However, astrong erosive contact that recorded a break in sedimentation is foundbetween 2300 and 600 years BP (Moreira et al., 2012). The modernhydrological characteristics of the Santa Ninha Lake (where analysedsediments were sampled) were acquired at ca 600 years BP andregional climatic conditions have switched at ca 5000 years BP fromdrier to wetter conditions, the latter corresponding to relatively highenergy environment (Moreira et al., 2012). The two post-600 years BPanalysed sediments of the TA14 core (TA14 5–6 and TA14 25–26)have similar chemical and isotopic characteristics to those of olderTA14 sediments. Hence this indicates that the hydrodynamic and cli-matic changes that have affected the Santa Nina Lake had no influenceon the chemical composition of the sediments and did not provoke adrainage re-organisation during the last 5600 years. The TA14 sedi-ments have similar Nd–Sr isotopic compositions compared with thesuspended sediments of the Amazon River at Obidos. This suggests
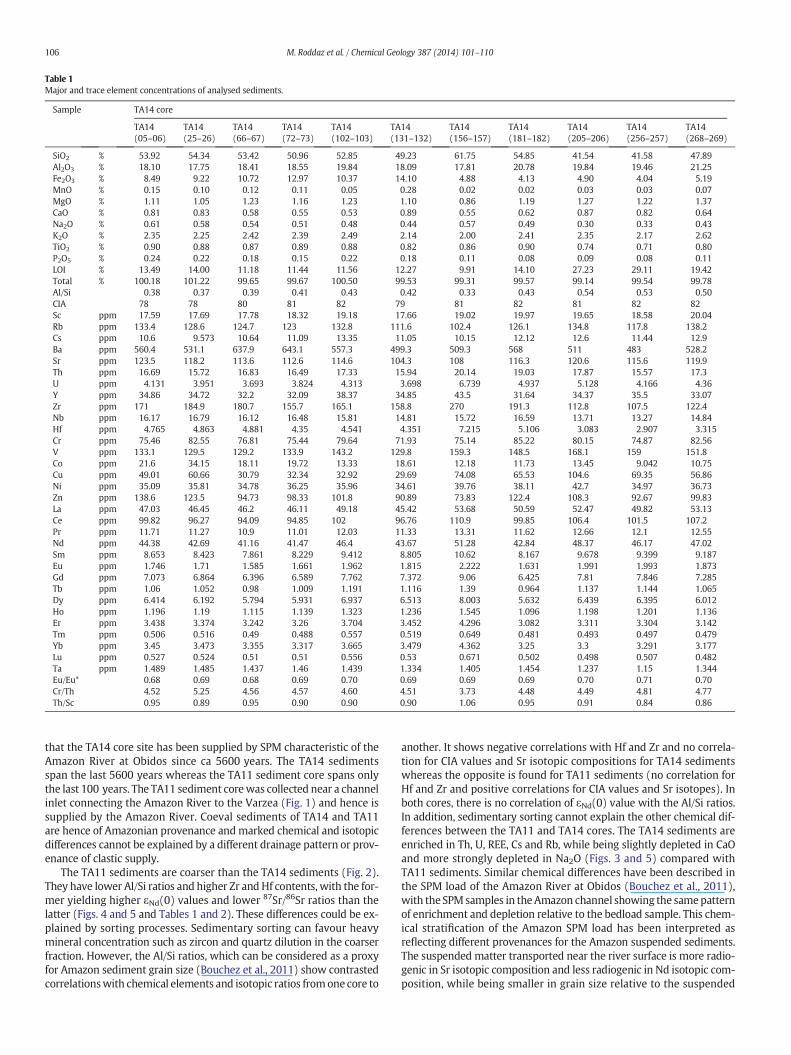
Table 1Major and trace element concentrations of analysed sediments.
Sample TA14 core
TA14(05–06)
TA14(25–26)
TA14(66–67)
TA14(72–73)
TA14(102–103)
TA14(131–132)
TA14(156–157)
TA14(181–182)
TA14(205–206)
TA14(256–257)
TA14(268–269)
SiO2 % 53.92 54.34 53.42 50.96 52.85 49.23 61.75 54.85 41.54 41.58 47.89Al2O3 % 18.10 17.75 18.41 18.55 19.84 18.09 17.81 20.78 19.84 19.46 21.25Fe2O3 % 8.49 9.22 10.72 12.97 10.37 14.10 4.88 4.13 4.90 4.04 5.19MnO % 0.15 0.10 0.12 0.11 0.05 0.28 0.02 0.02 0.03 0.03 0.07MgO % 1.11 1.05 1.23 1.16 1.23 1.10 0.86 1.19 1.27 1.22 1.37CaO % 0.81 0.83 0.58 0.55 0.53 0.89 0.55 0.62 0.87 0.82 0.64Na2O % 0.61 0.58 0.54 0.51 0.48 0.44 0.57 0.49 0.30 0.33 0.43K2O % 2.35 2.25 2.42 2.39 2.49 2.14 2.00 2.41 2.35 2.17 2.62TiO2 % 0.90 0.88 0.87 0.89 0.88 0.82 0.86 0.90 0.74 0.71 0.80P2O5 % 0.24 0.22 0.18 0.15 0.22 0.18 0.11 0.08 0.09 0.08 0.11LOI % 13.49 14.00 11.18 11.44 11.56 12.27 9.91 14.10 27.23 29.11 19.42Total % 100.18 101.22 99.65 99.67 100.50 99.53 99.31 99.57 99.14 99.54 99.78Al/Si 0.38 0.37 0.39 0.41 0.43 0.42 0.33 0.43 0.54 0.53 0.50CIA 78 78 80 81 82 79 81 82 81 82 82Sc ppm 17.59 17.69 17.78 18.32 19.18 17.66 19.02 19.97 19.65 18.58 20.04Rb ppm 133.4 128.6 124.7 123 132.8 111.6 102.4 126.1 134.8 117.8 138.2Cs ppm 10.6 9.573 10.64 11.09 13.35 11.05 10.15 12.12 12.6 11.44 12.9Ba ppm 560.4 531.1 637.9 643.1 557.3 499.3 509.3 568 511 483 528.2Sr ppm 123.5 118.2 113.6 112.6 114.6 104.3 108 116.3 120.6 115.6 119.9Th ppm 16.69 15.72 16.83 16.49 17.33 15.94 20.14 19.03 17.87 15.57 17.3U ppm 4.131 3.951 3.693 3.824 4.313 3.698 6.739 4.937 5.128 4.166 4.36Y ppm 34.86 34.72 32.2 32.09 38.37 34.85 43.5 31.64 34.37 35.5 33.07Zr ppm 171 184.9 180.7 155.7 165.1 158.8 270 191.3 112.8 107.5 122.4Nb ppm 16.17 16.79 16.12 16.48 15.81 14.81 15.72 16.59 13.71 13.27 14.84Hf ppm 4.765 4.863 4.881 4.35 4.541 4.351 7.215 5.106 3.083 2.907 3.315Cr ppm 75.46 82.55 76.81 75.44 79.64 71.93 75.14 85.22 80.15 74.87 82.56V ppm 133.1 129.5 129.2 133.9 143.2 129.8 159.3 148.5 168.1 159 151.8Co ppm 21.6 34.15 18.11 19.72 13.33 18.61 12.18 11.73 13.45 9.042 10.75Cu ppm 49.01 60.66 30.79 32.34 32.92 29.69 74.08 65.53 104.6 69.35 56.86Ni ppm 35.09 35.81 34.78 36.25 35.96 34.61 39.76 38.11 42.7 34.97 36.73Zn ppm 138.6 123.5 94.73 98.33 101.8 90.89 73.83 122.4 108.3 92.67 99.83La ppm 47.03 46.45 46.2 46.11 49.18 45.42 53.68 50.59 52.47 49.82 53.13Ce ppm 99.82 96.27 94.09 94.85 102 96.76 110.9 99.85 106.4 101.5 107.2Pr ppm 11.71 11.27 10.9 11.01 12.03 11.33 13.31 11.62 12.66 12.1 12.55Nd ppm 44.38 42.69 41.16 41.47 46.4 43.67 51.28 42.84 48.37 46.17 47.02Sm ppm 8.653 8.423 7.861 8.229 9.412 8.805 10.62 8.167 9.678 9.399 9.187Eu ppm 1.746 1.71 1.585 1.661 1.962 1.815 2.222 1.631 1.991 1.993 1.873Gd ppm 7.073 6.864 6.396 6.589 7.762 7.372 9.06 6.425 7.81 7.846 7.285Tb ppm 1.06 1.052 0.98 1.009 1.191 1.116 1.39 0.964 1.137 1.144 1.065Dy ppm 6.414 6.192 5.794 5.931 6.937 6.513 8.003 5.632 6.439 6.395 6.012Ho ppm 1.196 1.19 1.115 1.139 1.323 1.236 1.545 1.096 1.198 1.201 1.136Er ppm 3.438 3.374 3.242 3.26 3.704 3.452 4.296 3.082 3.311 3.304 3.142Tm ppm 0.506 0.516 0.49 0.488 0.557 0.519 0.649 0.481 0.493 0.497 0.479Yb ppm 3.45 3.473 3.355 3.317 3.665 3.479 4.362 3.25 3.3 3.291 3.177Lu ppm 0.527 0.524 0.51 0.51 0.556 0.53 0.671 0.502 0.498 0.507 0.482Ta ppm 1.489 1.485 1.437 1.46 1.439 1.334 1.405 1.454 1.237 1.15 1.344Eu/Eu* 0.68 0.69 0.68 0.69 0.70 0.69 0.69 0.69 0.70 0.71 0.70Cr/Th 4.52 5.25 4.56 4.57 4.60 4.51 3.73 4.48 4.49 4.81 4.77Th/Sc 0.95 0.89 0.95 0.90 0.90 0.90 1.06 0.95 0.91 0.84 0.86
106 M. Roddaz et al. / Chemical Geology 387 (2014) 101–110
that the TA14 core site has been supplied by SPM characteristic of theAmazon River at Obidos since ca 5600 years. The TA14 sedimentsspan the last 5600 years whereas the TA11 sediment core spans onlythe last 100 years. The TA11 sediment corewas collected near a channelinlet connecting the Amazon River to the Varzea (Fig. 1) and hence issupplied by the Amazon River. Coeval sediments of TA14 and TA11are hence of Amazonian provenance andmarked chemical and isotopicdifferences cannot be explained by a different drainage pattern or prov-enance of clastic supply.
The TA11 sediments are coarser than the TA14 sediments (Fig. 2).They have lower Al/Si ratios and higher Zr and Hf contents, with the for-mer yielding higher εNd(0) values and lower 87Sr/86Sr ratios than thelatter (Figs. 4 and 5 and Tables 1 and 2). These differences could be ex-plained by sorting processes. Sedimentary sorting can favour heavymineral concentration such as zircon and quartz dilution in the coarserfraction. However, the Al/Si ratios, which can be considered as a proxyfor Amazon sediment grain size (Bouchez et al., 2011) show contrastedcorrelationswith chemical elements and isotopic ratios fromone core to
another. It shows negative correlations with Hf and Zr and no correla-tion for CIA values and Sr isotopic compositions for TA14 sedimentswhereas the opposite is found for TA11 sediments (no correlation forHf and Zr and positive correlations for CIA values and Sr isotopes). Inboth cores, there is no correlation of εNd(0) value with the Al/Si ratios.In addition, sedimentary sorting cannot explain the other chemical dif-ferences between the TA11 and TA14 cores. The TA14 sediments areenriched in Th, U, REE, Cs and Rb, while being slightly depleted in CaOand more strongly depleted in Na2O (Figs. 3 and 5) compared withTA11 sediments. Similar chemical differences have been described inthe SPM load of the Amazon River at Obidos (Bouchez et al., 2011),with the SPMsamples in theAmazon channel showing the samepatternof enrichment and depletion relative to the bedload sample. This chem-ical stratification of the Amazon SPM load has been interpreted asreflecting different provenances for the Amazon suspended sediments.The suspended matter transported near the river surface is more radio-genic in Sr isotopic composition and less radiogenic in Nd isotopic com-position, while being smaller in grain size relative to the suspended
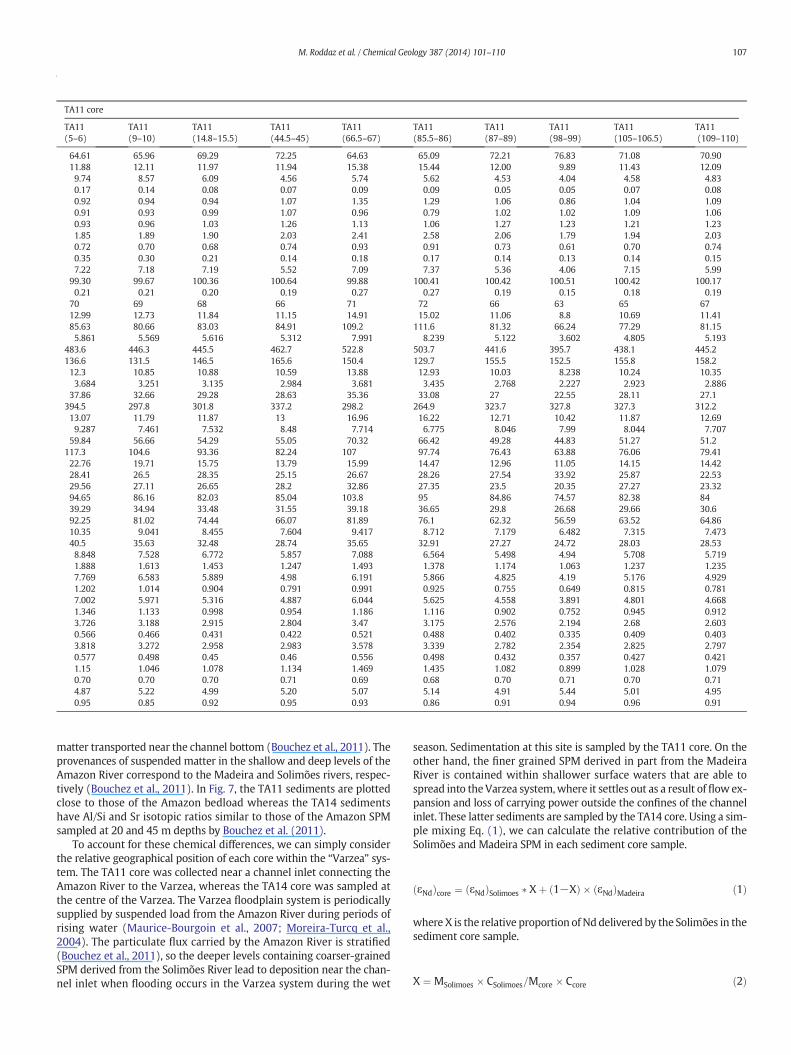
Table 1Major and trace element concentrations of analysed sediments.
TA11 core
TA11(5–6)
TA11(9–10)
TA11(14.8–15.5)
TA11(44.5–45)
TA11(66.5–67)
TA11(85.5–86)
TA11(87–89)
TA11(98–99)
TA11(105–106.5)
TA11(109–110)
64.61 65.96 69.29 72.25 64.63 65.09 72.21 76.83 71.08 70.9011.88 12.11 11.97 11.94 15.38 15.44 12.00 9.89 11.43 12.099.74 8.57 6.09 4.56 5.74 5.62 4.53 4.04 4.58 4.830.17 0.14 0.08 0.07 0.09 0.09 0.05 0.05 0.07 0.080.92 0.94 0.94 1.07 1.35 1.29 1.06 0.86 1.04 1.090.91 0.93 0.99 1.07 0.96 0.79 1.02 1.02 1.09 1.060.93 0.96 1.03 1.26 1.13 1.06 1.27 1.23 1.21 1.231.85 1.89 1.90 2.03 2.41 2.58 2.06 1.79 1.94 2.030.72 0.70 0.68 0.74 0.93 0.91 0.73 0.61 0.70 0.740.35 0.30 0.21 0.14 0.18 0.17 0.14 0.13 0.14 0.157.22 7.18 7.19 5.52 7.09 7.37 5.36 4.06 7.15 5.99
99.30 99.67 100.36 100.64 99.88 100.41 100.42 100.51 100.42 100.170.21 0.21 0.20 0.19 0.27 0.27 0.19 0.15 0.18 0.19
70 69 68 66 71 72 66 63 65 6712.99 12.73 11.84 11.15 14.91 15.02 11.06 8.8 10.69 11.4185.63 80.66 83.03 84.91 109.2 111.6 81.32 66.24 77.29 81.155.861 5.569 5.616 5.312 7.991 8.239 5.122 3.602 4.805 5.193
483.6 446.3 445.5 462.7 522.8 503.7 441.6 395.7 438.1 445.2136.6 131.5 146.5 165.6 150.4 129.7 155.5 152.5 155.8 158.212.3 10.85 10.88 10.59 13.88 12.93 10.03 8.238 10.24 10.353.684 3.251 3.135 2.984 3.681 3.435 2.768 2.227 2.923 2.886
37.86 32.66 29.28 28.63 35.36 33.08 27 22.55 28.11 27.1394.5 297.8 301.8 337.2 298.2 264.9 323.7 327.8 327.3 312.213.07 11.79 11.87 13 16.96 16.22 12.71 10.42 11.87 12.699.287 7.461 7.532 8.48 7.714 6.775 8.046 7.99 8.044 7.707
59.84 56.66 54.29 55.05 70.32 66.42 49.28 44.83 51.27 51.2117.3 104.6 93.36 82.24 107 97.74 76.43 63.88 76.06 79.4122.76 19.71 15.75 13.79 15.99 14.47 12.96 11.05 14.15 14.4228.41 26.5 28.35 25.15 26.67 28.26 27.54 33.92 25.87 22.5329.56 27.11 26.65 28.2 32.86 27.35 23.5 20.35 27.27 23.3294.65 86.16 82.03 85.04 103.8 95 84.86 74.57 82.38 8439.29 34.94 33.48 31.55 39.18 36.65 29.8 26.68 29.66 30.692.25 81.02 74.44 66.07 81.89 76.1 62.32 56.59 63.52 64.8610.35 9.041 8.455 7.604 9.417 8.712 7.179 6.482 7.315 7.47340.5 35.63 32.48 28.74 35.65 32.91 27.27 24.72 28.03 28.538.848 7.528 6.772 5.857 7.088 6.564 5.498 4.94 5.708 5.7191.888 1.613 1.453 1.247 1.493 1.378 1.174 1.063 1.237 1.2357.769 6.583 5.889 4.98 6.191 5.866 4.825 4.19 5.176 4.9291.202 1.014 0.904 0.791 0.991 0.925 0.755 0.649 0.815 0.7817.002 5.971 5.316 4.887 6.044 5.625 4.558 3.891 4.801 4.6681.346 1.133 0.998 0.954 1.186 1.116 0.902 0.752 0.945 0.9123.726 3.188 2.915 2.804 3.47 3.175 2.576 2.194 2.68 2.6030.566 0.466 0.431 0.422 0.521 0.488 0.402 0.335 0.409 0.4033.818 3.272 2.958 2.983 3.578 3.339 2.782 2.354 2.825 2.7970.577 0.498 0.45 0.46 0.556 0.498 0.432 0.357 0.427 0.4211.15 1.046 1.078 1.134 1.469 1.435 1.082 0.899 1.028 1.0790.70 0.70 0.70 0.71 0.69 0.68 0.70 0.71 0.70 0.714.87 5.22 4.99 5.20 5.07 5.14 4.91 5.44 5.01 4.950.95 0.85 0.92 0.95 0.93 0.86 0.91 0.94 0.96 0.91
107M. Roddaz et al. / Chemical Geology 387 (2014) 101–110
matter transported near the channel bottom (Bouchez et al., 2011). Theprovenances of suspended matter in the shallow and deep levels of theAmazon River correspond to the Madeira and Solimões rivers, respec-tively (Bouchez et al., 2011). In Fig. 7, the TA11 sediments are plottedclose to those of the Amazon bedload whereas the TA14 sedimentshave Al/Si and Sr isotopic ratios similar to those of the Amazon SPMsampled at 20 and 45 m depths by Bouchez et al. (2011).
To account for these chemical differences, we can simply considerthe relative geographical position of each core within the “Varzea” sys-tem. The TA11 core was collected near a channel inlet connecting theAmazon River to the Varzea, whereas the TA14 core was sampled atthe centre of the Varzea. The Varzea floodplain system is periodicallysupplied by suspended load from the Amazon River during periods ofrising water (Maurice-Bourgoin et al., 2007; Moreira-Turcq et al.,2004). The particulate flux carried by the Amazon River is stratified(Bouchez et al., 2011), so the deeper levels containing coarser-grainedSPM derived from the Solimões River lead to deposition near the chan-nel inlet when flooding occurs in the Varzea system during the wet
season. Sedimentation at this site is sampled by the TA11 core. On theother hand, the finer grained SPM derived in part from the MadeiraRiver is contained within shallower surface waters that are able tospread into the Varzea system,where it settles out as a result of flow ex-pansion and loss of carrying power outside the confines of the channelinlet. These latter sediments are sampled by the TA14 core. Using a sim-ple mixing Eq. (1), we can calculate the relative contribution of theSolimões and Madeira SPM in each sediment core sample.
εNdð Þcore ¼ εNdð ÞSolimoes � Xþ 1−Xð Þ � εNdð ÞMadeira ð1Þ
where X is the relative proportion of Nddelivered by the Solimões in thesediment core sample.
X ¼ MSolimoes � CSolimoes=Mcore � Ccore ð2Þ
50
60
70
80
90
100
Al/Si
CIA
0.0 0.10
100
200
300
400
500
Al/Si
Zr
0.02
3
4
5
6
7
8
9
10
Al/Si
Hf
TA11sediments TA14sediments
A B
C
0.2 0.4 0.5 0.6 0.1 0.2 0.3 0.4 0.5 0.6
0.0 0.1 0.2 0.3 0.4 0.5 0.6
Fig. 4. Plots of Zr versus Al/Si (A), Hf versus Al/Si (B) and CIA versus Al/Si (C) to illustrate the effect of grain-size on Hf, Zr and CIA. See text for discussion.
108 M. Roddaz et al. / Chemical Geology 387 (2014) 101–110
where MSolimoes is the sediment mass delivered by the Solimões River,CSolimoes is the Nd concentration in the sediment of the Solimões, Mcore
is the total sedimentmass of the core sample and Ccore is theNd concen-tration in the core sample. Finally we defined fSolimoes as the mass frac-tion of the sediment in the core derived from the Solimões Riverwhich is equal to the MSolimoes/Mcore ratio. By combining Eqs. (1) and(2) we obtain the following equation:
fSolimoes ¼ MSolimoes=Mcore¼ εNdð Þcore− εNdð ÞMadeira= εNdð ÞSolimoes− εNdð ÞMadeira
� �� Ccore=CSolimoes:
Taking a mean εNd isotopic composition of −9.4 and −11.5 forthe Solimões and Madeira suspended sediments, respectively
TA11
Sam
ple/
PA
AS
.1
1
10
La Ce Pr NdSmEu Gd Tb Dy Ho Er TmYb Lu
Fig. 5. Diagram showing the rare earth element (REE) concentrat
(Viers et al., 2008) and the average Nd weighted concentration of50 and 52 ppm we can calculate the proportion of sediment origi-nating from the Solimoes and Madeira rivers using for Ccore theNd concentration of analysed core sediments (Tables 1 and 2). Ac-cording to this calculation, between ~20 and ~85% of the sedimentin the TA14 core sample is derived mainly from the Madeira River,while between 52% and 100% of the sediment in TA11 comes fromthe Solimões River. We can do similar calculation using the87Sr/86Sr isotopic composition even though its variability troughthe hydrological cycle is much larger (Viers et al., 2008). Taking amean 87Sr/86Sr isotopic composition of 0.715 and 0.735 for the Solimõesand Madeira SPM and the average Sr Solimões SPM weighted concen-tration of 215 ppm (Viers et al., 2008), we found that between ~32%and ~49% of TA14 sediments are derived from the Solimões River
TA14
Sam
ple/
PA
AS
.1
1
10
La Ce Pr NdSmEu Gd Tb Dy Ho Er TmYb Lu
ions normalized against PAAS (Taylor and McLennan, 1985).
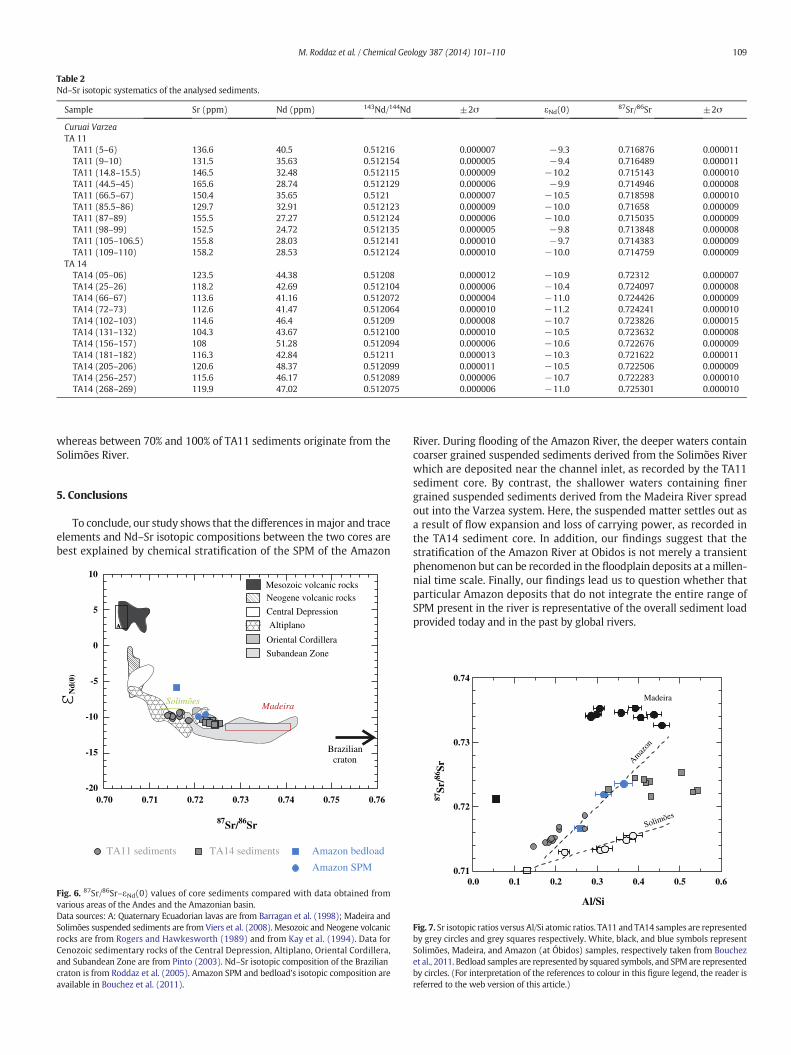
Table 2Nd–Sr isotopic systematics of the analysed sediments.
Sample Sr (ppm) Nd (ppm) 143Nd/144Nd ±2σ εNd(0) 87Sr/86Sr ±2σ
Curuai VarzeaTA 11
TA11 (5–6) 136.6 40.5 0.51216 0.000007 −9.3 0.716876 0.000011TA11 (9–10) 131.5 35.63 0.512154 0.000005 −9.4 0.716489 0.000011TA11 (14.8–15.5) 146.5 32.48 0.512115 0.000009 −10.2 0.715143 0.000010TA11 (44.5–45) 165.6 28.74 0.512129 0.000006 −9.9 0.714946 0.000008TA11 (66.5–67) 150.4 35.65 0.5121 0.000007 −10.5 0.718598 0.000010TA11 (85.5–86) 129.7 32.91 0.512123 0.000009 −10.0 0.71658 0.000009TA11 (87–89) 155.5 27.27 0.512124 0.000006 −10.0 0.715035 0.000009TA11 (98–99) 152.5 24.72 0.512135 0.000005 −9.8 0.713848 0.000008TA11 (105–106.5) 155.8 28.03 0.512141 0.000010 −9.7 0.714383 0.000009TA11 (109–110) 158.2 28.53 0.512124 0.000010 −10.0 0.714759 0.000009
TA 14TA14 (05–06) 123.5 44.38 0.51208 0.000012 −10.9 0.72312 0.000007TA14 (25–26) 118.2 42.69 0.512104 0.000006 −10.4 0.724097 0.000008TA14 (66–67) 113.6 41.16 0.512072 0.000004 −11.0 0.724426 0.000009TA14 (72–73) 112.6 41.47 0.512064 0.000010 −11.2 0.724241 0.000010TA14 (102–103) 114.6 46.4 0.51209 0.000008 −10.7 0.723826 0.000015TA14 (131–132) 104.3 43.67 0.512100 0.000010 −10.5 0.723632 0.000008TA14 (156–157) 108 51.28 0.512094 0.000006 −10.6 0.722676 0.000009TA14 (181–182) 116.3 42.84 0.51211 0.000013 −10.3 0.721622 0.000011TA14 (205–206) 120.6 48.37 0.512099 0.000011 −10.5 0.722506 0.000009TA14 (256–257) 115.6 46.17 0.512089 0.000006 −10.7 0.722283 0.000010TA14 (268–269) 119.9 47.02 0.512075 0.000006 −11.0 0.725301 0.000010
109M. Roddaz et al. / Chemical Geology 387 (2014) 101–110
whereas between 70% and 100% of TA11 sediments originate from theSolimões River.
5. Conclusions
To conclude, our study shows that the differences inmajor and traceelements and Nd–Sr isotopic compositions between the two cores arebest explained by chemical stratification of the SPM of the Amazon
A
0.70 0.76-20
-15
-10
0.75
-5
0
5
10
Braziliancraton
Mesozoic volcanic rocksNeogene volcanic rocks
Central Depression
Altiplano
Oriental Cordillera
Subandean Zone
0.71
87Sr/86Sr
A
MadeiraSolimões
TA11 sediments TA14 sediments Amazon bedload
Amazon SPM
0.72 0.73 0.74
Nd(
0)
Fig. 6. 87Sr/86Sr–εNd(0) values of core sediments compared with data obtained fromvarious areas of the Andes and the Amazonian basin.Data sources: A: Quaternary Ecuadorian lavas are from Barragan et al. (1998); Madeira andSolimões suspended sediments are from Viers et al. (2008). Mesozoic and Neogene volcanicrocks are from Rogers and Hawkesworth (1989) and from Kay et al. (1994). Data forCenozoic sedimentary rocks of the Central Depression, Altiplano, Oriental Cordillera,and Subandean Zone are from Pinto (2003). Nd–Sr isotopic composition of the Braziliancraton is from Roddaz et al. (2005). Amazon SPM and bedload's isotopic composition areavailable in Bouchez et al. (2011).
River. During flooding of the Amazon River, the deeper waters containcoarser grained suspended sediments derived from the Solimões Riverwhich are deposited near the channel inlet, as recorded by the TA11sediment core. By contrast, the shallower waters containing finergrained suspended sediments derived from the Madeira River spreadout into the Varzea system. Here, the suspended matter settles out asa result of flow expansion and loss of carrying power, as recorded inthe TA14 sediment core. In addition, our findings suggest that thestratification of the Amazon River at Obidos is not merely a transientphenomenon but can be recorded in the floodplain deposits at a millen-nial time scale. Finally, our findings lead us to question whether thatparticular Amazon deposits that do not integrate the entire range ofSPM present in the river is representative of the overall sediment loadprovided today and in the past by global rivers.
Amaz
on
Madeira
Solimões
0.00.71
0.72
0.73
0.74
Al/Si
87Sr
/86Sr
0.1 0.2 0.3 0.4 0.5 0.6
Fig. 7. Sr isotopic ratios versus Al/Si atomic ratios. TA11 and TA14 samples are representedby grey circles and grey squares respectively. White, black, and blue symbols representSolimões, Madeira, and Amazon (at Óbidos) samples, respectively taken from Bouchezet al., 2011. Bedload samples are represented by squared symbols, and SPMare representedby circles. (For interpretation of the references to colour in this figure legend, the reader isreferred to the web version of this article.)
110 M. Roddaz et al. / Chemical Geology 387 (2014) 101–110
Acknowledgements
This research was supported by the French Research Institute forDevelopment (IRD), through the HyBAm Research Program (Hydrologyand Geochemistry of the Amazonian Basin, www.mpl.ird.fr/hybam/) inthe framework of its cooperation agreementwith the Brazilian ResearchCentre (CNPq process nos. 492685/2004–05 and 690139/2003–09).Weacknowledge the CNRS/INSU Paleo2 PASCAL project. We thankMichaelCarpenter for editing the English style. We thank two anonymous re-viewers for their constructive reviews. The Editor is warmly thankedfor her helpful editorial handling.
References
Aalto, R., Dunne, T., Guyot, J.-L., 2006. Geomorphic controls on Andean denudation rates.J. Geol. 114 (1), 85–99.
Allègre, C.J., Dupré, B., Négrel, P., et al., 1996. Sr–Nd–Pb isotope systematics in Amazonand Congo River systems: constraints about erosion processes. Chem. Geol. 131(1–4), 93–112.
Allison,M.A., Kuehl, S.A., Martin, T.C., et al., 1998. Importance of flood-plain sedimentationfor river sediment budgets and terrigenous input to the oceans: insights from theBrahmaputra–Jamuna River. Geology 26 (2), 175–178.
Barragan, R., Geist, D., Hall, M., et al., 1998. Subduction controls on the compositions oflavas from the Ecuadorian Andes. Earth Planet. Sci. Lett. 154, 153–166.
Basu, A.R., Sharma, M., DeCelles, P.G., 1990. Nd, Sr-isotopic provenance and trace elementgeochemistry of Amazonian foreland basin fluvial sands, Bolivia and Peru: implica-tions for ensialic Andean orogeny. Earth Planet. Sci. Lett. 100 (1–3), 1–17.
Bonnet, M.P., Barroux, G., Martinez, J.M., et al., 2008. Floodplain hydrology in an Amazonfloodplain lake (Lago Grande de Curuai). J. Hydrol. 349 (1–2), 18–30.
Bouchez, J., Lajeunesse, E., Gaillardet, J., et al., 2010. Turbulent mixing in the AmazonRiver: the isotopic memory of confluences. Earth Planet. Sci. Lett. 290 (1–2), 37–43.
Bouchez, J., Gaillardet, J., France-Lanord, C., et al., 2011. Grain size control of riversuspended sediment geochemistry: clues from Amazon River depth profiles.Geochem. Geophys. Geosyst. 12.
Callède, J., Guyot, J.L., Ronchail, J., et al., 2004. Evolution du débit de l'Amazone à Obidos de1903 à 1999 (Evolution of the River Amazon's discharge at Obidos from 1903 to1999). Hydrol. Sci. J. 49 (1), 85–97.
Condie, K.C., 1993. Chemical composition and evolution of the upper continental crust;contrasting results from surface samples and shales. Chem. Geol. 104, 1–37.
Cullers, R.L., 2000. The geochemistry of shales, siltstones and sandstones of Pennsylvanian–Permian age, Colorado, USA: implications for provenance and metamorphic studies.Lithos 51, 181–203.
Dosseto, A., Bourdon, B., Gaillardet, J., et al., 2006. Time scale and conditions of weatheringunder tropical climate: study of the Amazon basin with U-series. Geochim. Cosmochim.Acta 70 (1), 71–89.
Dunne, T., Mertes, L.A.K., Meade, R.H., et al., 1998. Exchanges of sediment between the floodplain and channel of the Amazon River in Brazil. Geol. Soc. Am. Bull. 110 (4), 450–467.
Filizola, N., Guyot, J.L., 2004. L'utilisation des techniques Doppler pour la détermination dutransport solide de l'Amazone (The use of Doppler technology for suspended sedi-ment discharge determination in the River Amazon). Hydrol. Sci. J. 49 (1), 143–153.
Gaillardet, J., Dupre, B., Allègre, C.J., et al., 1997. Chemical and physical denudation in theAmazon River Basin. Chem. Geol. 142 (3–4), 141–173.
Gaillardet, J., Dupre, B., Allegre, C.J., 1999a. Geochemistry of large river suspendedsediments: silicate weathering or recycling tracer? Geochim. Cosmochim. Acta 63(23–24), 4037–4051.
Gaillardet, J., Dupré, B., Louvat, P., et al., 1999b. Global silicate weathering and CO2
consumption rates deduced from the chemistry of large rivers. Chem. Geol. 159(1–4), 3–30.
Gaillardet, J., Viers, J., Dupré, B., 2007. Trace element in river waters. In: Drever, J.I. (Ed.),Surface and Ground Water, Weathering, and SoilsTreatise on Geochemistry.Pergamon, pp. 225–272.
Galy, V., France-Lanord, C., Beyssac, O., et al., 2007. Efficient organic carbon burial in theBengal Fan sustained by the Himalayan erosional system. Nature 450 (7168),407–410.
Gibbs, R.J., 1967. The geochemistry of the Amazon River system: part I. The factors thatcontrol the salinity and the composition and concentration of the suspended solids.Geol. Soc. Am. Bull. 78 (10), 1203–1232.
Goldstein, S.J., Jacobsen, S.B., 1988. Nd and Sr isotopic systematics of river watersuspended material: implications for crustal evolution. Earth Planet. Sci. Lett. 87(3), 249–265.
Goldstein, S.L., O'Nions, R.K., Hamilton, P.J., 1984. A Sm–Nd isotopic study of atmosphericdusts and particulates from major river systems. Earth Planet. Sci. Lett. 70 (2),221–236.
Guyot, J.L., Jouanneau, J.M., Wasson, J.G., 1999. Characterisation of river bed andsuspended sediments in the Rio Madeira drainage basin (Bolivian Amazonia). J. S.Am. Earth Sci. 12 (4), 401–410.
Guyot, J.L., Jouanneau, J.M., Soares, L., et al., 2007. Clay mineral composition of riversediments in the Amazon Basin. Catena 71 (2), 340–356.
Jacobsen, S.B., Wasserburg, G.J., 1980. Sm–Nd isotopic evolution of chondrites. Earth Planet.Sci. Lett. 50 (1), 139–155.
Kay, S., Coira, B., Viramonte, J., 1994. Young mafic back arc volcanic rocks as indicators ofcontinental lithospheric delamination beneath the Argentina Puna Plateau, centralAndes. J. Geophys. Res. 99, 24323–24339.
Martinelli, L.A., Victoria, R.L., Dematte, J.L.I., et al., 1993. Chemical and mineralogicalcomposition of Amazon River floodplain sediments, Brazil. Appl. Geochem. 8 (4),391–402.
Martinez, J.-M., Le Toan, T., 2007. Mapping of flood dynamics and spatial distributionof vegetation in the Amazon floodplain using multitemporal SAR data. RemoteSens. Environ. 108 (3), 209–223.
Maurice-Bourgoin, L., Bonnet, M.-P., Martinez, J.-M., et al., 2007. Temporal dynamics ofwater and sediment exchanges between the Curuai floodplain and the AmazonRiver, Brazil. J. Hydrol. 335 (1–2), 140–156.
McLennan, S.M., 2001. Relationships between the trace element composition ofsedimentary rocks and upper continental crust. Geochem. Geophys. Geosyst. 2 (art.no.-2000GC000109).
Meade, R.H., Dunne, T., Richey, J.E., et al., 1985. Storage and remobilization of suspendedsediment in the lower Amazon River of Brazil. Science 228, 488–490.
Mertes, L.A.K., Dunne, T., Martinelli, L.A., 1996. Channel–floodplain geomorphology alongthe Solimões–Amazon River, Brazil. Geol. Soc. Am. Bull. 108 (9), 1089–1107.
Meybeck, M., 1993. Riverine transport of atmospheric carbon — sources, global typologyand budget. Water Air Soil Pollut. 70 (1–4), 443–463.
Miall, A.D., 2006. How do we identify big rivers? And how big is big? Sediment. Geol. 186(1–2), 39–50.
Milliman, J.D., Meade, R.H., 1983. World-wide delivery of river sediment to theoceans. J. Geol. 91, 1–21.
Milliman, J.D., Syvitski, J.P.M., 1992. Geomorphic/tectonic control of sediment discharge tothe ocean: the importance of small mountainous rivers. J. Geol. 100 (5), 525–544.
Moreira, L., Moreira-Turcq, P., Turcq, B., Caquineau, S., Cordeiro, R., 2012.Paleohydrological changes in an Amazonian floodplain lake: Santa Ninha Lake. J.Paleolimnol. 48 (2), 339–350.
Moreira-Turcq, P., Jouanneau, J.M., Turcq, B., et al., 2004. Carbon sedimentation at LagoGrande de Curuai, a floodplain lake in the low Amazon region: insights into sedimen-tation rates. Palaeogeogr. Palaeoclimatol. Palaeoecol. 214 (1–2), 27–40.
Nesbitt, H.W., Young, G.M., 1982. Early Proterozoic climates and plate motions inferredfrom major element chemistry of lutites. Nature 299, 715–717.
Pinto, L., 2003. Traçage de l'érosion Cénozoïque des Andes Centrales à l'aide delaminéralogie et de la géochmie des sédiements (Nord du Chili et Nord-Ouest de laBolivie)(PhD Thesis) University Paul Sabatier, Toulouse (196 pp.).
Revenga, C., Murray, S., Abramovitz, J., et al., 1998. Watersheds of the World — EcologicalValue and Vulnerability.
Roddaz, M., Viers, J., Brusset, S., et al., 2005. Sediment provenances and drainage evolutionof the Neogene Amazonian foreland basin. Earth Planet. Sci. Lett. 239 (1–2), 57–78.
Roddaz, M., Viers, J.R.M., Brusset, S.P., et al., 2006. Controls on weathering and provenancein the Amazonian foreland basin: insights from major and trace element geochemis-try of Neogene Amazonian sediments. Chem. Geol. 226 (1–2), 31–65.
Rogers, G., Hawkesworth, C.J., 1989. A geochemical traverse across the North ChileanAndes: evidence for crust generation from the mantle wedge. Earth Planet. Sci. Lett.91, 271–275.
Singh, P., Rajamani, V., 2001. REE geochemistry of recent clastic sediments from theKaveri floodplains, southern India: implication to source area weathering and sedi-mentary processes. Geochim. Cosmochim. Acta 65 (18), 3093–3108.
Taylor, S.R., McLennan, S.M. (Eds.), 1985. The Continental Crust: Its Composition andEvolution. Blackwell, Oxford (312 pp.).
Tripathi, J.K., Ghazanfari, P., Rajamani, V., et al., 2007. Geochemistry of sediments of theGanges alluvial plains: evidence of large-scale sediment recycling. Quat. Int. 159(1), 119–130.
Viers, J., Roddaz, M., Filizola, N., et al., 2008. Seasonal and provenance controls on Nd–Srisotopic compositions of Amazon rivers suspended sediments and implications forNd and Sr fluxes exported to the Atlantic Ocean. Earth Planet. Sci. Lett. 274 (3–4),511–523.
Vital, H., Stattegger, K., 2000. Major and trace elements of stream sediments from thelowermost Amazon River. Chem. Geol. 168, 151–168.
Wittmann, H., von Blanckenburg, F., Maurice, L., et al., 2011. Recycling of Amazon flood-plain sediment quantified by cosmogenic 26Al and 10Be. Geology 39 (5), 467–470.
Zocatelli, R., Moreira-Turcq, P., Bernardes, M., et al., 2013. Sedimentary evidence of soilorganic matter input to the Curuai Amazonian floodplain. Org. Geochem. 63, 40–47.
Top Related
Copyright © 2022 FDOKUMEN

