


Bahasa
Halaman
Hukum


ubmitted by:
End Line Evaluation of Soochna Seva prepared for
June 2019

2 | P a g e
Contents
End Line Evaluation of Soochna Seva ................................................................................................ 1
List of Tables ........................................................................................................................................... 4
List of Figures .......................................................................................................................................... 6
Executive Summary ................................................................................................................................ 7
Chapter -1 Introduction to Soochna Seva ........................................................................................... 13
1.1 Introduction to Soochna Seva .............................................................................................. 13
1.2 Objectives of Soochna Seva ................................................................................................. 14
1.3 Achievements of Soochna Seva ........................................................................................... 15
1.4 Need for End-Line Evaluation .............................................................................................. 16
Chapter -2 Research Methodology of End – Line Assessment ........................................................... 17
2.1 Specific Objectives of the assessment ..................................................................................... 17
2.2 Research Design ....................................................................................................................... 18
2.3 Target Respondents ................................................................................................................. 18
2.4 Geographical Coverage ............................................................................................................ 18
2.5 Sample Size ............................................................................................................................... 19
2.6 Development of Research Tools .............................................................................................. 19
2.6.1 End – Beneficiary Research Questionnaire.................................................................. 20
2.6.2 End – Beneficiary Research Questionnaire.................................................................. 20
2.7 Training of the Field Teams for Data Collection ...................................................................... 20
2.8 Data Collection ......................................................................................................................... 21
2.9 Analysis and Report Writing .................................................................................................... 21
2.10 Guidelines to read the report .................................................................................................. 22
Chapter – 3: Information Flow and Community Mobilization ........................................................... 24
3.1 Information Flow in the Community ................................................................................... 24
3.2 ICT Mediums used for Information Dissemination ............................................................. 26
3.3 Methods and Approaches used for Community Mobilization ........................................... 27
3.4 Grievance Redressal Mechanism ......................................................................................... 27
3.5 Management of Data about Information of Schemes ........................................................ 29
Chapter – 4: Operations of Soochna Seva .......................................................................................... 30
4.1 Role of Soochna Seva in Linkage of Information and its Benefits to the Community ....... 30
4.2 Coordination received by Soochna Seva Staff from Local Stakeholders ............................ 32
4.3 Soochna Seva as a Change Agent ......................................................................................... 32
4.4 Improvements Suggested in Soochna Seva ......................................................................... 33
Chapter – 5: Profile of the End – Beneficiaries ................................................................................... 36

3 | P a g e
5.1 Demographic Profile of the End – Beneficiaries .................................................................. 36
5.2 Socio-Economic Profile of the End – Beneficiaries .............................................................. 37
5.3 Caste and Religion ................................................................................................................ 39
5.4 Type of Family ...................................................................................................................... 40
Chapter – 6: Digital & Information Literacy ....................................................................................... 42
6.1 Type of ICT mediums owned ................................................................................................ 43
6.2 Awareness about Soochna Seva .......................................................................................... 45
6.3 ICT mediums learnt as part of Soochna Seva ...................................................................... 46
6.4 Accessibility of Information ................................................................................................. 47
6.5 Rating of Digital and Information Literacy Sessions ........................................................... 49
6.6 Awareness about MeraApp ................................................................................................. 50
6.7 Ever Used MeraApp.............................................................................................................. 51
6.8 Information accessed on Public Schemes............................................................................ 52
Chapter – 7: Accessibility to Soochna Seva Kendra ........................................................................... 55
7.1 Awareness about Soochna Seva Kendra ............................................................................. 55
7.2 Frequency of accessing Soochna Seva Kendra .................................................................... 56
7.3 Service Utilization at Soochna Seva Kendra ........................................................................ 57
7.4 Schemes Benefits taken from Soochna Seva Kendra .......................................................... 58
7.4.1 Type of Assistance Sought............................................................................................ 59
7.4.2 Number of Schemes for which Assistance Sought ...................................................... 62
7.5 Grievance Registration and Redressal ................................................................................. 63
Chapter – 8 Importance of Soochna Seva Services ............................................................................ 65
8.1 Rating of Benefits availed from Soochna Seva .................................................................... 65
8.1.1 Timeliness of Information ............................................................................................ 66
8.1.2 Completeness of Information ...................................................................................... 66
8.1.3 Accuracy of Information ............................................................................................... 67
8.1.4 Ease of Accessing Information ..................................................................................... 68
8.1.5 Overall Experience ........................................................................................................ 70
8.2 Ever paid for Sochna Seva Services ...................................................................................... 71
8.3 Amount Paid to avail Soochna Seva Services ...................................................................... 72
8.4 Willingness to pay for Soochna Seva Services ..................................................................... 73
8.5 Importance fo Soochna Seva Services ................................................................................. 74
Recommendations for further strategy development ........................................................................ 77
4 | P a g e
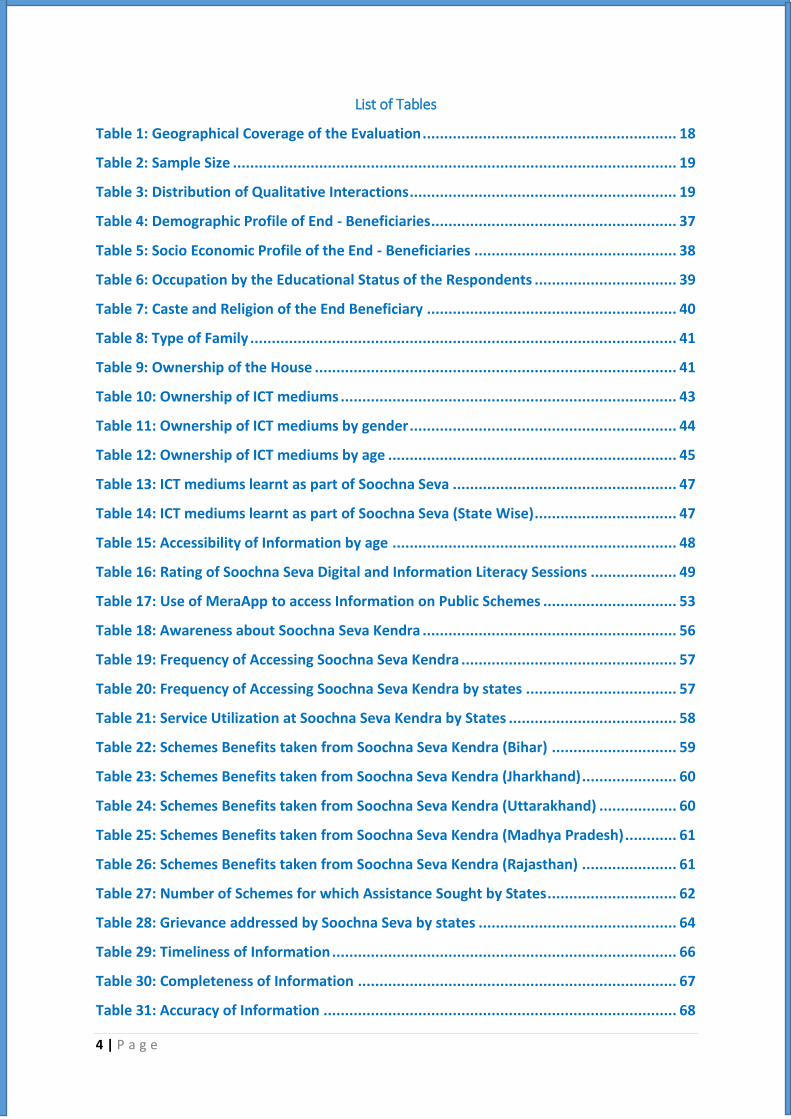
List of Tables
Table 1: Geographical Coverage of the Evaluation ........................................................... 18
Table 2: Sample Size ....................................................................................................... 19
Table 3: Distribution of Qualitative Interactions .............................................................. 19
Table 4: Demographic Profile of End - Beneficiaries ......................................................... 37
Table 5: Socio Economic Profile of the End - Beneficiaries ............................................... 38
Table 6: Occupation by the Educational Status of the Respondents ................................. 39
Table 7: Caste and Religion of the End Beneficiary .......................................................... 40
Table 8: Type of Family ................................................................................................... 41
Table 9: Ownership of the House .................................................................................... 41
Table 10: Ownership of ICT mediums .............................................................................. 43
Table 11: Ownership of ICT mediums by gender .............................................................. 44
Table 12: Ownership of ICT mediums by age ................................................................... 45
Table 13: ICT mediums learnt as part of Soochna Seva .................................................... 47
Table 14: ICT mediums learnt as part of Soochna Seva (State Wise) ................................. 47
Table 15: Accessibility of Information by age .................................................................. 48
Table 16: Rating of Soochna Seva Digital and Information Literacy Sessions .................... 49
Table 17: Use of MeraApp to access Information on Public Schemes ............................... 53
Table 18: Awareness about Soochna Seva Kendra ........................................................... 56
Table 19: Frequency of Accessing Soochna Seva Kendra .................................................. 57
Table 20: Frequency of Accessing Soochna Seva Kendra by states ................................... 57
Table 21: Service Utilization at Soochna Seva Kendra by States ....................................... 58
Table 22: Schemes Benefits taken from Soochna Seva Kendra (Bihar) ............................. 59
Table 23: Schemes Benefits taken from Soochna Seva Kendra (Jharkhand) ...................... 60
Table 24: Schemes Benefits taken from Soochna Seva Kendra (Uttarakhand) .................. 60
Table 25: Schemes Benefits taken from Soochna Seva Kendra (Madhya Pradesh) ............ 61
Table 26: Schemes Benefits taken from Soochna Seva Kendra (Rajasthan) ...................... 61
Table 27: Number of Schemes for which Assistance Sought by States .............................. 62
Table 28: Grievance addressed by Soochna Seva by states .............................................. 64
Table 29: Timeliness of Information ................................................................................ 66
Table 30: Completeness of Information .......................................................................... 67
Table 31: Accuracy of Information .................................................................................. 68

5 | P a g e
Table 32: Ease of Accessing information .......................................................................... 69
Table 33: Overall experience with Soochna Seva ............................................................. 70
Table 34: Ever Paid for Soochna Seva Services................................................................. 71
Table 35: Amount paid for availing Soocha Seva Services (in INR) .................................... 72
Table 36: Willingness to Pay for Soochna Seva Services by states .................................... 73
Table 37: Importance of Soochna Seva Services (by States) ............................................. 74

6 | P a g e
List of Figures
Figure 1: Rating of Flow of Information in the Block/Panchayat .......................................... 25
Figure 2: Awareness about Soochna Seva .............................................................................. 45
Figure 3:Awareness about Soochna Seva ............................................................................... 46
Figure 4: Accessibility of Information ..................................................................................... 48
Figure 5: Awareness about MeraApp ..................................................................................... 50
Figure 6: Awareness of MeraApp by states ........................................................................... 50
Figure 7: Ever used MeraApp .................................................................................................. 51
Figure 8: Ever used MeraApp by states .................................................................................. 52
Figure 9: Awareness about Soochna Seva Kendra by Gender ............................................... 56
Figure 10: Service Utilization at Soochna Seva Kendra.......................................................... 58
Figure 11: Number of Schemes for which SSK accessed ........................................................ 62
Figure 12: SSK helped in registration of grievance ................................................................ 63
Figure 13: Grievance addressed by Soochna Seva ................................................................. 63
Figure 14: Willingness to pay for Soochna Seva Services ...................................................... 73
Figure 15: Importance of Soochna Seva Services ................................................................... 74
7 | P a g e
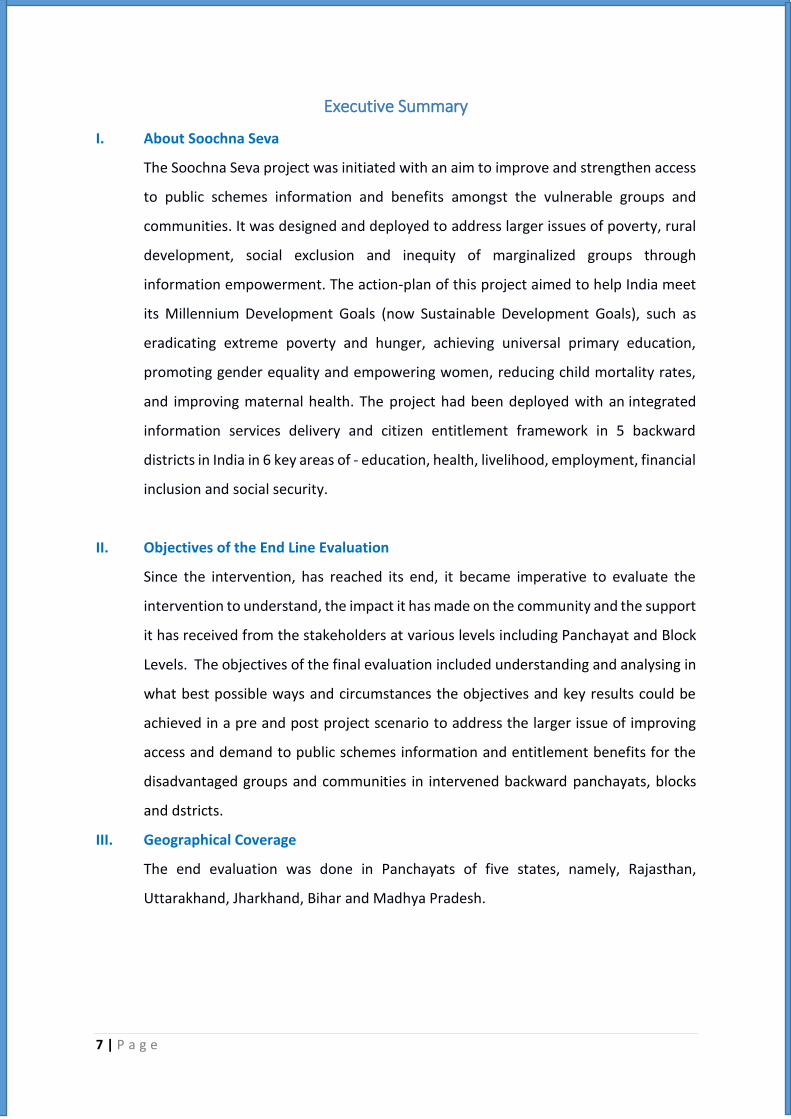
Executive Summary
I. About Soochna Seva
The Soochna Seva project was initiated with an aim to improve and strengthen access
to public schemes information and benefits amongst the vulnerable groups and
communities. It was designed and deployed to address larger issues of poverty, rural
development, social exclusion and inequity of marginalized groups through
information empowerment. The action-plan of this project aimed to help India meet
its Millennium Development Goals (now Sustainable Development Goals), such as
eradicating extreme poverty and hunger, achieving universal primary education,
promoting gender equality and empowering women, reducing child mortality rates,
and improving maternal health. The project had been deployed with an integrated
information services delivery and citizen entitlement framework in 5 backward
districts in India in 6 key areas of - education, health, livelihood, employment, financial
inclusion and social security.
II. Objectives of the End Line Evaluation
Since the intervention, has reached its end, it became imperative to evaluate the
intervention to understand, the impact it has made on the community and the support
it has received from the stakeholders at various levels including Panchayat and Block
Levels. The objectives of the final evaluation included understanding and analysing in
what best possible ways and circumstances the objectives and key results could be
achieved in a pre and post project scenario to address the larger issue of improving
access and demand to public schemes information and entitlement benefits for the
disadvantaged groups and communities in intervened backward panchayats, blocks
and dstricts.
III. Geographical Coverage
The end evaluation was done in Panchayats of five states, namely, Rajasthan,
Uttarakhand, Jharkhand, Bihar and Madhya Pradesh.

8 | P a g e
IV. Methodology
The study adopted a mix – methodology approach, with 30 qualitative interactions
planned and conducted with Panchayat and the Block Level and 250 quantitative end
– beneficiary interviews, conducted at the Panchayat level. The respondents for both
the set of interactions were facilitated by the Soochna Seva staff.
V. Analysis and Reporting
The qualitative data was subjected to detailed content analysis and the quantitative
data was analysed for frequency of responses, according to a set analysis plan. A
detailed report has been written, reflecting the findings of the evaluation.
VI. Summary of Findings
The ensuing text describes the summary of findings, of the end-line evaluation.
A) Findings from the Qualitative Interactions
A1. Information Flow and Community Mobilization
• Lack of clarity of information to be shared with the community and the media
to be used for communication, made the information flow in the community,
neither easy nor difficult.
• Verbal communication is the most sorted way of communication with the
community members. None of the stakeholders reported to use any mass
media for information communication.
• Community members are mobilized, using an active approach, where they
inform about the schemes relevant to them, and help them in getting more
information about it, and also assist them in filling forms, related to the
scheme.
• Grievances are managed, by routing the complaints to respective departments
at the block level, under the guidance of the local stakeholders.

9 | P a g e
A2. Operations of Soochna Seva
• Soochna Seva, through soochna van and soochna mitra, delivered information
related to government schemes, to the end – beneficiaries. Forms were
available at the Soochna Seva Kendra (SSKs), where the forms can be accessed
and assistance can be sought to fill the scheme related forms.
• Soochna Seva staff, has been working as a bridge between the local
government providers and the end – beneficiaries for their rightful
entitlements, and they receive support from the local government.
• Soochna Seva has been instrumental in bringing a change in the community, as
people are now more confident and aware of their rights for their entitlements.
A3. Changes Suggested for Soochna Seva Operations
• A public private partnership is suggested with NGOs/CBOs, and local
government to continue the provision of services, even if the intervention is
withdrawn.
• Soochna Staff needs to be trained for interpersonal communication, so that
they can strike a rapport with community members and local stakeholders.
• Digital literacy trainings have not reached all end – beneficiaries for self-
information and e-governance access, so such sessions should be organized at
frequent intervals.
B) Findings from the End – Beneficiaries Survey
B1. Profile of the Respondent
• A typical respondent for the end – beneficiary survey was a male, aged 40
years, who was married.
• More than three-fifths of the individuals reported to earn upto INR 5000 per
month. Less than two-fifths of them reported to work as a farmer on their own
fields.
• Close to 55% of the end – beneficiaries reported that they live in nuclear family
and majority of them live in their own household

10 | P a g e
B2. Information & Digital Literacy
• About 33% end – beneficiaries reported to own a mobile without an
internet connection, followed by 27%% who reported to own a television
with a dish connection. There is a significant difference in ownership of
mobiles with an internet connection among males (28%) than females
(16%).
• About 90% beneficiaries reported to be aware of Soochna Seva and of
these 30% of them reported to learn internet connected to a computer as
a part of their digital literacy classes.
• Six out of ten end – beneficiaries, reported to access information on a
scheme, which concerned their family welfare and to know more about
government schemes.
• Little more than a quarter of the respondents reported to be aware of
MeraApp (project deployed mobile based scheme app) and of them 69%
have been served with the App by the Soochna Mitras.
B3. Accessibility to Soochna Seva Kendra
• Nine out of ten respondents reported to be aware about Soochna Seva
Kendra and seven out of ten of them have ever accessed it.
• About 85% respondents reported to access the SSK for availing the scheme
form, followed by 70% of them who reported to access it for assistance in
filling the scheme forms.
• More than 60% end – beneficiaries accessed SSK services, for more than
three schemes.
• Close to three-fifths of the end – beneficiaries have registered their
grievance through SSKs and 51% of them reported that their grievance was
addressed by Soochna Seva Kendra.

11 | P a g e
B4. Importance of Soochna Seva Services
• End – beneficiaries expressed their satisfaction with Soochna Seva, on all
quality parameters of information – timeliness (92%), completeness (93%),
accuracy (89%), ease of accessing information (92%) and overall quality
(85%).
• About 16 people reported to pay to avail the services of Soochna Seva, and
the average amount paid was INR 287.
• There was mixed opinion on willingness to pay to avail Soochna Seva
services.
• Almost all end – beneficiaries reported that Soochna Seva services are
authentic for the community.
VII. Recommendations
The recommendations, for further strategy development are as follows:
• Gender Inclusion: Soochna Seva, needs to reach out to equal proportion of
females in comparison to men, to understand their needs and guide them to their
empowerment. This can be done, by deploying trained female staff, who can build
rapport with women and work with them.
• Training and Capacity Building: Refresher courses and in-service trainings of the
Soochna Mitras and Soochnapreneurs would be advantageous for the project.
They can be trained, for interpersonal communication, community mobilization
and stakeholder relationship management. The idea of engaging relevant and
active local beneficiaries of the project as end Soochnapreneurs to further reach
out to the community is a positive and relevant step.
• Sustainability of the Operations: In order to sustain the operations, Soochna Seva
can now start charging for services in providing information, facilitation, digital
services and for digital literacy classes; the charges can be decided by the
community time to time with DEF support.
• Replication and Scaling up of Soochna Seva Framework: It is recommended that
the Soochna Seva Framework be replicated and scaled up in new locations and
geographies in a public private partnership mode with incorporating key learning
and experiences from the Soochna Seva project interventions. It is suggested that

12 | P a g e
if some of the active and dynamic end beneficiaries wants to be part of the
Soochna Seva services network, they could be identified, trained and taken on
board to start the SSK work in their localities under DEF supervision and guidance.

13 | P a g e
Chapter -1
Introduction to Soochna Seva
1.1 Introduction to Soochna Seva
Good governance is vital to a viable and sustained socio-economic development. Keeping in
mind the widespread and diverse social and economic challenges, Indian policymakers have
designed several policies and programs to make its governance more accountable, inclusive
and responsive to the needs of its citizens. Various public welfare schemes have been
designed and being delivered to groups and communities across the country, especially with
focus on rural and backward regions. As such, free flow and accessibility of information is one
of the main factors that foster transparency of the governing structures. Right to Information
Act was based on the premise that citizens have a sovereign authority on the government.
Section 4 of the same act calls upon all governance bodies (state and central) to provide
information to the public at regular intervals through various means of communication. In
addition to planning and budgeting social welfare schemes, different sections of the
government are also responsible for actively promoting these schemes. Unfortunately, the
current state of affairs indicates that far more concrete and result oriented steps and actions
are required to improve schemes access and delivery.
Indian government, at both Central and State levels, acts as the largest service delivery
provider in India with multitude of schemes, benefits, plans and services. However, India’s
massive population size and chronic socio-demographic disparity make service delivery
process like maintaining a free flow of information regarding available public schemes,
extremely perplexing. Implementation of these schemes, especially from user citizen’s
perspective (distributing entitlements) presents an even bigger challenge. Shortage and
mismanagement of funds have stunted the benefit from even some of the best laid
development plans. For instance, more than two Crore families (out of 10.6 Crore applicants)
have been denied work in the last 8 months under the Mahatma Gandhi National Rural
Employment Guarantee Scheme because of shrinking funds.
DEF launched ‘Soochna Seva project with grant support from the European Union in January
2014 with an aim to spread awareness, using ICT/non-ICT tools, about existing public schemes
amongst the deprived sections and enable them to derive benefits from the same. The

14 | P a g e
Soochna Seva action, during 2014-2018, was a response to the poor access to information
and entitlement scenario in India and to the restricted call by the Contracting Authority
(European Union) in 2012 for Civil Society Organisations in Development in India on –
‘Improving Access to Information of Public Schemes in Backward Districts in India.’
In addition to empowering the masses with information, Soochna Seva had set its focus on
capacity building of the local communities, groups and citizens and advance cooperation
between the stakeholders and local administration to develop an operative framework for
public scheme information access, dissemination and entitlement gains.
Soochna Seva was founded with an intention of strengthening the community entitlement
related information ecosystem and to address larger issues of poverty, rural development,
social exclusion and inequity of marginalized groups through information empowerment. The
action-plan of this program also aimed to help India meet its Millennium Development Goals
(now Sustainable Development Goals) such as eradicating extreme poverty and hunger,
achieving universal primary education, promoting gender equality and empowering women,
reducing child mortality rates, and improving maternal health. The project had been deployed
along with an integrated information services delivery and citizen entitlement framework in
5 backward districts in India in 6 key areas of - education, health, livelihood, employment,
financial inclusion and social security. This initiative was further expected to strengthen the
governance structure at district administration level and below.
1.2 Objectives of Soochna Seva
The key objectives of Soochna Seva included:
i. Addressing the larger issues of poverty, social exclusion and inequity of marginalised
groups through information on public schemes and entitlement;
ii. Promoting and strengthening good governance practice by local administration;
iii. Providing enhanced channels and points for information services delivery to target
groups at their doorsteps towards informed choices, decisions and entitlement
benefits;
iv. Facilitating an integrated district-level public scheme information management
framework;
v. Developing a citizen engagement and entitlement mechanism in public scheme
administering process to bridge administration-citizen network deficits.
15 | P a g e
1.3 Achievements of Soochna Seva
Since 2014, Soochna Seva had made efforts to build and create a decentralized and
democratized architecture of information dissemination, processing, beneficiaries
undergoing the necessary process and system formalities to apply for entitlement benefits,
and corresponding with necessary grassroots authorities to ensure gains of entitlements and
recording the process.
This information-entitlement service model has overall led to set up more than 50 rural
information-entitlements access and delivery points by end of 2018 (Soochna Seva Kendras
/Yojana Banks) across 5 States in India including Bihar, Jharkhand, Rajasthan, Madhya
Pradesh, and Uttarakhand. These centres are run by selected and trained rural information
entrepreneurs (Soochna Mitras / SoochnaPreneurs / Information Entrepreneurs/ Soochna
Sevaks), identified from the local community to serve existing and emerging information and
entitlement needs and services. The sustainability of these points were sought to be ensured
through this method. These points were equipped digitally with basic Information
Communication Technology (ICT) tools, apparatus, and platforms locally including locally
accessed MIS platform, a dedicated government schemes App (MeraApp) being provided in
the hands of the Centre Operators cum entrepreneurs, call centre facility and mobile vans
equipped digitally as mobile units to reach out to more people with information and
entitlement services. This platform had made efforts to bridge the gap between the citizen
and administration through methods in information-entitlement camps, Soochna Seva Samiti
(Committee), Grievance Redress and Submission outlets on entitlements, advocacy and
media engagement. As an extension of the programme, more than 30 Panchayats have been
engaged to set up Soochna Seva Kendras / Yojana Bank outlets manned by 1-2 Soochna Mitras
/ Soochnapreneurs and serve the local community with necessary and relevant information
and entitlement services.
Further, the programme had generated a system of schemes monitoring, review, update,
validation and roll out at Panchayat level. It had created a methodology in status of schemes
delivered and benefitted to ensure relevance and utility of schemes and delivery mechanisms.
This is being done through both online MIS platform and offline review and audit of
beneficiaries. In the process, the programme has generated more than 1, 00,000 validated
data of beneficiaries, their portfolios that had become handy for the administration to

16 | P a g e
streamline delivery and access of further entitlements. Beneficiaries were further trained and
selected as Soochna Seva / Yojana Volunteers at village level to serve as Soochna Sevak /
Sevikas as community facilitators to strengthen rural information and entitlement networks.
The overall focus was how to contribute in strengthening the governance structure, processes
and systems at the local level in India in order to ensure timely, transparent, affordable,
reliable, and trustworthy information and entitlements to citizens.
The project partnership with Qualcomm1 in 2016 to roll out the Soochnapreneur (information
entrepreneurship programme to deliver information and services) in 4 districts in 4 States
helped to add much strength and value to the Soochna Seva project including developing and
roll out of the MeraApp scheme app in 2016. This collaborative partnership on co-funding
mode with DEF and the European Union project helped to reach out to more areas and
beneficiaries by December 2018 and beyond.
1.4 Need for End-Line Evaluation
Since, the intervention had
garnered attention, and has also
reached its end, the implementing
agency, Digital Empowerment
Foundation (DEF), wanted to
undertake an end-line evaluation
to understand the impact of
Soochna Seva. Thus, DEF engaged
IPSOS as a third party agency, to conduct an end line evaluation in five states – Bihar, Madhya
Pradesh, Jharkhand, Uttarakahnd and Rajasthan.
The following chapter describes the methodology of the end line evaluation.
1 Qualcomm Incorporated is a world leader in 3G and next-generation mobile technologies.

17 | P a g e
Chapter -2
Research Methodology of End – Line Assessment
Digital Empowerment foundation, wanted to assess the impact of Soochna Seva it has made
in the lives of targeted 1, 00,000 beneficiaries over a period of 5 years, in terms of facilitating
information of public schemes related to education, health, livelihoods and employment &
financial inclusion. Therefore, it engaged IPSOS Research Private Limited, to conduct an end-
line assessment among 200 end – beneficiaries and 24 stakeholders at the Block level and the
Panchayat level.
This chapter describes the specific objectives of the end – line evaluation, the methodology
followed for data collection, the geographical coverage, and analysis & reporting of data.
2.1 Specific Objectives of the assessment
The objectives of the final evaluation included
i. To understand and analyse in what best possible ways and circumstances the objectives
and key results could be achieved in a pre and post project scenario to address the larger
issue of improving access and demand to public schemes information and entitlement
benefits for the disadvantaged groups and communities in intervened backward
Panchayats, Blocks and Districts;
ii. To understand from the community members, whether and how they received key
scheme related information and end benefits and facilitating support from the Soochna
Seva project support;
iii. To apprehend from the community level service agencies, Block, Panchayat stakeholders
and authorities, the role played by Soochna Seva in facilitating and strengthening access
to public schemes information and benefits for the benefit of the community while
seeking to work closely with these agencies and authorities;
iv. To comprehend and understand the work and efforts of the project team to reach out to
the community, the project success, challenges, perceptions, level of support and
coordination extended to Soochna Seva team for implementation of this project;
v. To understand, analyse and evaluate key elements of a project in this context in terms of
– project model or a framework that could evolve for learning and reference in improving

18 | P a g e
and strengthening access, innovations if any, replication and scale up, sustainability,
project delivery gaps and issues and key learning that could strengthen a project like this.
2.2 Research Design
To achieve the stated objectives, a mix method approach for data collection was adopted.
The end - beneficiaries were interviewed using the survey technique while qualitative
interactions which included semi structured interviews were done with stakeholders at the
block and the Panchayat level.
2.3 Target Respondents
There were two set of target respondents of this study.
a) End – Beneficiaries
The end – beneficiaries for the purpose of this study has been defined as those who ever
availed the services of Soochna Seva, and have benefitted from it.
b) Stakeholders at the Panchayat and the Block Level
The stakeholders at the Panchayat and the Block level, have been defined as those, who
have been instrumental in coordinating with the Soochna Seva staff, to deliver the
benefits to the community members.
2.4 Geographical Coverage
The final evaluation was carried out in West Chamapran (Bihar), Guna (Madhya Pradesh),
Ranchi (Jharkhand), Barmer (Rajasthan) and Tehri (Uttarakhand). The below table details the
block and the panchayat covered in each district and state.
Table 1: Geographical Coverage of the Evaluation
State District Block Panchayat
Bihar West Chamapran Sitka Balthar
Jharkhand Ranchi Itki Kundi
Madhya Pradesh Guna Chamba Suyl
Rajasthan Barmer Guna Dhidra
Uttarakhand Tehri Kalyanpur Ghadoi Charnan

19 | P a g e
2.5 Sample Size
For the end – beneficiaries’ survey, the total sample size was 250, across 5 Panchayats, i.e. 50
beneficiaries per Panchayat.
The below grid details the sample size achieved for end – beneficiaries:
A total of 30 stakeholders, across 4 states were interviewed for the study. The distribution
of qualitative interviews, per state is as follows:
Table 3: Distribution of Qualitative Interactions
Stakeholders Madhya Pradesh
Bihar Ranchi Rajasthan Uttarakhand Total per
stakeholder Number of blocks in each state
1 1 1 1 1
PRI members and PRI staff 1 2 1 1 1 6
Project Staff and Project Fellow
1 0 1 1 2 5
Community Health Workers and others (AWW, ASHA worker, Ration card suppliers)
1 1 2 2 1 7
Block officials 2 1 1 1 1 6
Staff available at the NGO/CBO/ SHGs
1 2 1 1 1 6
Total per state 6 6 6 6 6 30
2.6 Development of Research Tools
Two diverse research tools, quantitative structured tool for end – beneficiaries and a semi-
structured interactive guide was prepared for the stakeholders at the Block & the Panchayat
level.
Table 2: Sample Size
State District Panchayat Sample Planned
Sample Achieved
Bihar West Chamapran
Balthar 50 58
Jharkhand Ranchi Kundi 50 52
Madhya Pradesh
Guna Suyl 50 55
Rajasthan Barmer Dhidra 50 56
Uttarakhand Tehri Ghadoi Charnan 50 54
250 275
20 | P a g e
2.6.1 End – Beneficiary Research Questionnaire
The quantitative structured tool, was developed in such a way that it captured the importance
of Soochna Seva services for the end – beneficiaries, the benefits they received from the
intervention and their willingness to pay, for the sustainability of the intervention.
The sections of the questionnaire are as follows:
a) Profile of the end – beneficiary
b) Information and Digital Literacy
c) Information and benefits received on Public Schemes
d) Awareness and Accessibility to Soochna Seva Kendras (SSKs)
e) Sustainability of Soochna Seva
The research questionnaire was signed off by DEF which was further translated in Hindi
and scripted in I – field (internal software of IPSOS) for data collection.
2.6.2 End – Beneficiary Research Questionnaire
The qualitative semi-structured tool was developed to understand the role played by
Soochna Seva to benefit the community members. Further, it took into account the
support and coordination extended to Soochna Seva team for implementation of the
intervention, by the block and the Panchayat officials.
The sections of the semi-structured tool are as follows:
a) Background Information of the Respondent
b) Information flow and Community Mobilization
c) Operations of Soochna Seva
d) Soochna Seva: Project Staff and Fellows (exclusively asked to the staff working
with Soohcna Seva)
e) Importance of Soochna Seva
Since this was a qualitative discussion tool, pen and paper approach was used for data
collection.
2.7 Training of the Field Teams for Data Collection
For the quantitative survey, field teams’ at all five locations, were trained for data collection.
The objective of the training was to familiarize the investigators with the research tool, so
21 | P a g e
that they do not face any difficulties, in the field during data collection. The teams were
trained for the end – beneficiary tool, section by section. They were explained the logic checks
and the skip patterns (though they are taken care of by CAPI).
For the qualitative discussions, a separate set of experienced moderators were trained. They
were also taken through the entire interactive and the logic behind each and every question
was explained. This was done to familiarise with the tool and to solve their doubts, if any.
During the training, they were told about the distribution of interactions, in each state.
2.8 Data Collection
The entire data collection was done over a period of ten-days, which included two days of
end – beneficiary survey in each state, and two days of qualitative data collection.
• Quantitative Data Collection
The quantitative data collection was done with end – beneficiaries who were
mobilized by Soochna Seva team. A mix of males and females end – beneficiaries was
gathered in one Panchayat, from different Panchayats.
• Qualitative Data Collection
The participants for qualitative data collection were recruited beforehand, and they
were informed of the exercise. The moderators coordinated with the field staff of
Soochna Seva, who in – turn helped them in reaching the right stakeholder, at the
scheduled time.
2.9 Analysis and Report Writing
The quantitative data was subjected to quantitative data analysis, in SPSS. The analysis was
done in accordance to an analysis plan, shared with the data processing team. The analysis
plan had the required breaks and the cross-tabs, for detailed data analysis.
The qualitative data was subjected to detailed content analysis, which was analysed
thematically, to be included in the report. Relevant verbatims have also been included, to
support the findings.
22 | P a g e
2.10 Guidelines to read the report
i. The report has been divided into two parts; first part presents findings from the
stakeholders, who have been involved in coordination with Soochna Seva staff, to deliver
the benefits to the community members. The second part focuses on presenting the
quantitative findings from the end – beneficiaries. The chapters are independent of each
other and should be read in isolation.
ii. In the findings of the end – beneficiary survey, a summary box has been included, which
at glance gives the summary of the findings of that chapter.
iii. Z-value test has been applied on the quantitative data to check the significant difference
in proportion to the base. This significance testing was done at a 95% confidence level. In
the tables, the significantly high is represented in GREEN and the significantly low is
represented by RED.
23 | P a g e
FINDINGS FROM THE STAKEHOLDER
INTERVIEWS
24 | P a g e
Chapter – 3:
Information Flow and Community Mobilization
Information flow and community mobilization is a crucial aspect in delivering the benefits of
the public schemes to the community members. Timeliness, accuracy and completeness of
information can go a long way to in delivering the rightful entitlements to the beneficiaries.
But, it has to go through the right channels and also using the right channels, so that the
intended information reaches the intended beneficiary.
Thus, this chapter understands the information flow from service agencies, authorities and
departments from District, Block, Panchayat to the community members. It also takes into
account the Information Communication Technology (ICT) mediums used for dissemination
of information. Further, it understands the community mobilization methods and approaches
used to assist the community members for availing the benefits of a scheme. While they may
mobilize the community for assisting them, they may also face situations where they have to
address the grievances of the community members. This section also understands how are
the grievances handled; also about mapping, identifying and selecting deserving
beneficiaries with various schemes based on various socio-economic indicators; data
management of beneficiaries for further information and communication and coordination
purpose and decision making for next level of benefits and entitlements selection and
delivery.
3.1 Information Flow in the Community
The information flow in the community, determines, what information is flowing and to what
extent. Further it understands, who are the messengers of information and what media do
they use for information flow. It has been divided into two sub–sections, the first section is
how all the stakeholders rate the information flow in the community, the reasons supporting
the rating and the ICT mediums used to disseminate information.

25 | P a g e
a) Rating of Information Flow in the Community
All the stakeholders were asked to rate the information flow in their community on a scale
of “1” to “5”, where “1” stood for “extremely difficult” and “5” for “extremely easy”.
Except the block department officials, who gave a rating of “4”, which stood for “easy”,
all other stakeholders gave a rating of “3”, which means, that the flow of information was
neither easy nor difficult.
Figure 1: Rating of Flow of Information in the Block/Panchayat
The common reasons for such a rating included, lack of clarity
of information to be disseminated, among the stakeholders
and if they had clarity then they were not aware which is the
right media to use, for information flow.
Some of the relevant verbatims, are presented in the text
below:
4
3 3 3 3
0
0.5
1
1.5
2
2.5
3
3.5
4
4.5
5
Block DevelopmentOfficer (n=4)
PRI member (n=5) NGO/CBO Staff (n=5) Community HealthWorkers (n=4)
Project Fellows (n=5)
Rating of Information Flow in the Block/Panchayat
Numbers reported in absolutes due to small base
• “Lack of information that needs to be given to the community member” – PRI member,
Bethia, BIhar
• “We are only here for managing the Anganwadi work and not giving information.
Anganwadi Worker”- Bethia, BIhar
• Only if we make some effort, we get the information, otherwise we do not know, what
to inform the community members” – NGO staff, Chamba
While this may be true for all
stakeholders, in all the states, in
Guna (Madhya Pradesh), the
project staff, use their “Soochna
Vaahan” and “Internet Saathi”
for mass communication

26 | P a g e
3.2 ICT Mediums used for Information Dissemination
There are many active and passive methods of information dissemination. Active methods
include interactive methods like one to one discussions, discussions on open platforms, and
putting up the information on a mass media, and then answering queries.
Passive methods include, making a public announcement, or passively informing the masses,
about a public scheme, and not answering queries or supplying more than required
information. Such methods, are traditional methods and are being used since years, without
change.
This section, tries to understand whether ICT mediums are used for information
dissemination and if yes, what mediums; if not, then what is the mode of information
dissemination.
It was reported that the use of ICT mediums was not very expansive in information
dissemination. Mostly the stakeholders relied on disseminating information through verbal
discussions, where the stakeholders met the group of beneficiaries and informed them about
new public schemes. They reported to use a cell phone, with an internet connection to call
and disseminate information, however, may not put something on the local website for mass
dissemination.
The project staff used the scheme App (MeraApp) to reach out to community members both
at centre level (Soochna Seva Kendras) and in field visiting households.
Some of the relevant verbatims, are presented in the text box below:
• “Through staff members” Block Official, Chamba
• “Through meetings” NGO staff, Barmer
• “Call people and meetings” PRI staff, Barmer
• “ Through MeraApp scheme app in Centres and in fields”, Project Staff, Soochna Seva
In Madhya Pradesh the block official and the project staff gave a scoring of “5” for information flow in the
block/Panchayat in comparison to other states.
They felt that the channels of information flow in their community were very well defined, which resulted in
clarity of information and the stakeholders were themselves aware of the information to be disseminated.
In Barmer, Rajasthan the Soochna Seva staff informed first they look into the matter, and then they register the
complaint, through a portal.

27 | P a g e
3.3 Methods and Approaches used for Community Mobilization
There are generally two approaches of community mobilization, for the welfare of the
community.
One, is the person centred approach, which ensures that the beneficiaries are at the centre
of the decisions, which relate to their life. The other is active support, which means giving the
right amount of support for them to avail benefits and build social relationships.
This section understands which approach of the two, do the stakeholders use for community
mobilization, or do they use any other approach, which may result in empowerment of the
community members.
The stakeholders informed that they provided active support to the community members, by
informing them about the new schemes, its benefits for the end – beneficiaries and even
helped them in filling forms related to the scheme. Among these, if the beneficiaries had any
grievances, the stakeholders helped them in raising them and getting them addressed at the
right platform.
The ensuing verbatim supports the above explanation.
3.4 Grievance Redressal Mechanism
The community members may have grievances when utilizing the benefits of a scheme. It may
range from not getting the rightful entitlements, or not having the authentic information to
access a scheme, etc.
• “Person Centered Approach: Services are provided in block as per need. People can come and
get benefits”. Block officer, West Chamapran, Bihar
• “We call meetings and inform all the agencies about the projects. We deliver services to the
beneficiaries” Block officer, Guna, Madhya Pradesh
• Schemes me jo Documents ki jarurt hoti unhe complete karne me help krte hai (We help to
complete the documents, that are required in taking the benefits of a scheme), PRI member,
Guna, Madhya Pradesh
• “ We meet people and provide full information to them. We support them in a way that they
can help others also”- Soochna Seva, project staff, Barmer.

28 | P a g e
Thus, they turn to the opinion leaders or the local government, to help them in grievance
redressal. This section, throws light on the approach of the stakeholders for grievance
redressal mechanism.
Different stakeholders reported to use different approaches to address the grievances. The
block officials of Tehri (Uttarakhand) and Guna
(Madhya Pradesh), reported to listen to the complaints
on CM helpline, through which it was routed to the
respective department. However, in Barmer, the block
official reported that complaints are solved through
“jan sunvai”, approach.
The approach followed by other stakeholders is generally that they try to solve the complaints
at their end, and if not successful, then either they involve the sarpanch or reach out to the
respective department, for grievance redressal.
• “Sambhandhit Vibhag ke saath coordination (we coordinate with the respective
department)”—Soochna Seva staff, Guna, Madhya Pradesh
• “Review the documents and go to respective departments” ---- PRI member, Barmer,
Rajasthan
• “Through Mukhya mantri helpline. For every complaint, we take it to the respective
department and get it resolved” – Block Development Officer, Chamba, Uttarakhand
• “CM HELPLINE 181 And Department level par jan sunavai” – Block Development Officer,
Barmer
In Tehri, Uttarakhand, the project
staff informed that they have a
register with all the data, and they
try to solve the complaints by
referring to that. In case of further
grievance, they deal with the
situation with the help of
respective departments

29 | P a g e
3.5 Management of Data about Information of Schemes
There is a large set of data available on schemes, its entitlements and the beneficiaries. This
information is helpful in making decisions for the development of the community members.
However, it is important to store the data, in right places, which can be used at the time of
the need, for reference and decision making. This section throws light on how different
stakeholders manage the large data and use it for the beneficiaries, for their empowerment.
All the stakeholders reported that the entire data management of schemes and its
beneficiaries was done, online.
However, the Soochna Seva team maintained it online (in computer), on MIS and MeraApp.
• “MIS, Computer, Reports” Soochna Seva Staff, Barmer
• “Management of data in MERA APP” Soochna Seva Staff, Guna, Madhya Pradesh
• “All systems are online”, PRI Member, Bethia, Bihar
30 | P a g e
Chapter – 4:
Operations of Soochna Seva
Soochna Seva, has been playing a crucial role, in linking the schemes benefits to the
community. They help the end – beneficiaries in communicating the public schemes to the
government, how will it benefit them and empower them. However, they can’t play this role
in isolation, and they need support from local stakeholders to reach out to people, bring them
on one platform and bridge the existing gap.
This chapter thus, understands from all the stakeholders what has been the local support
extended to and received by the Soochna Seva team and how in turn the team has
coordinated with them to facilitate the community with the scheme benefits.
This chapter, thus describes, the operations of Soochna Seva, the coordination and support it
requires from other stakeholders and provides to other stakeholders to enable the
community, for effective utilization of the schemes and its benefits.
4.1 Role of Soochna Seva in Linkage of Information and its Benefits to the Community
This section describes the role of Soochna Seva in linking the information and its benefits to
the community, from the perspective of stakeholders like – PRI members, block officials,
community health workers and NGO/CBO staff.
The stakeholders informed that Soochna Seva delivered information related to government
schemes, to all the beneficiaries. They further reported that they also provided online
services, for passport, aadhar card, birth certificate, income proof, etc. to community
members. The intervention also helps the community members, to access services related to
schemes, for their rightful entitlements.
While, the above was reported by all the stakeholders, the community health workers had a
different perspective altogether. They informed that, they got all the scheme forms from
Soochna Seva Kendra, and also briefed them on how to help the community,for avaialing the
scheme benefits.
The PRI members, like the community health workers, too had a different perspective about
Soochna Seva. They mentioned that, Soochna Seva organized camps to sensitize the

31 | P a g e
community about public schemes, and through the Soochna Van, the community members
were mobilized at one place, for community meetings.
Coordination of Soochna Seva Staff with the Local Government and Block Officers
This section describes the role of Soochna Seva in linking the information and its benefits to
the community, from the perspective of stakeholders like – PRI members, block officials,
community health workers and NGO/CBO staff.
They acted as a bridge between the community members and the stakeholders at the
Panchayat and the block level. They supported both community members and the service
providers, with their information needs and service utilization. The stakeholders further
reported that, they also receive support from Soochna Seva, on making important documents
of the community like - ration card, adhaar card etc. In case a new scheme was launched and
if the forms were not available in local offices, they accessed it from SSK.
The staff informed that they used own vehicle called “Soochna Van” to mobilize the
community and help service agencies and authorities to address the community at a common
platform.
• “We take all the forms from Soochna Seva office. We get all the services from SS office.
We trust them as we get cheap services here” Aanganwadi worker, Chamba,
Uttarakhand
• “We meet people directly. Soochna Seva van get the people and provide the services
free of cost.” PRI Member, Barmer, Rajasthan
• “They help us to connect with the community”. Block Development Officer, Barmer,
Rajasthan
• “Suchna Seva schemes ki jankari or schemes ka benifit dilane ki bhumika nibhati hai” –
NGO staff, Guna, Madhya Pradesh
• “They work as a mode between the department and beneficiaries” Block Development Officer,
Chamba, Uttarakhand
• “When we call them and inquire about a service, they support us in the ways possible.” Block
Development Officer, Barmer, Rajasthan
• “They support us also. If we don't have any information, we would find it with them. We also
suggest people to go to SS staff for any services.”.NGO/CBO staff, Chamba, Uttarakhand
• “It is good. For the services like ration card, adhaar card, we ask for their help”.” PRI member,
Barmer, Rajasthan
• “If anyone needs a birth certificate, we send them to SS office”—Community Health Worker,
Barmer, Rajasthan

32 | P a g e
4.2 Coordination received by Soochna Seva Staff from Local Stakeholders
The Soochna Seva project staffs, who were interviewed for this study, informed that the
stakeholders from the Panchayat and the block level, collaborated with them, in case any
information related to a public scheme was to be delivered. Other than that, they also got full
support from these stakeholders, related to grievances, as the block officials and the PRI
members, coordinated with the respective departments, and personally took care that
matters resolved timely.
4.3 Soochna Seva as a Change Agent
Sochna Seva has changed the lives of community members as it has made people aware of
their entitlement rights and has helped them to raise demands for schemes and benefits. It
has sensitized people about their rights and has made an effort for people to achieve their
rightful entitlements. It has helped the community members to get information at their door-
step, with avoiding the hassle to visit different departments, and gather information.
Community members now exhibit confidence and have become pro-active in information
gathering.
The intervention has been instrumental in getting the community members, their aadhar
cards and bank accounts for them. It has brought a change in the community!
• “All the members support us, at the personal level and at the department level. In case
of beneficiary grievance, block officers connect us to the respective departments, and
get the issues solved” – Project Staff of Soochna Seva – Madhya Pradesh
• “All departments support us at every level” Project Staff of Soochna Seva – Barmer
• “Now people know about documents, account opening” – Community Health Worker --- Barmer,
Rajasthan
• “Every beneficiary has a toilet now, their own aadhar cards and bank accounts, as a result of
Soochna Seva” – Community Health Worker --- Guna, Madhya Pradesh
• “Now people are aware, now people raise their voice for their rights” --- Block Development Officer,
Tehri, Uttarkahand
• “Now people have information, Now people can access services nearby rather than going to
different departments, Now they get all the information at home, People approach SS for all their
needs”. NGO/CBO staff, Uttarakhand
33 | P a g e
4.4 Improvements Suggested in Soochna Seva
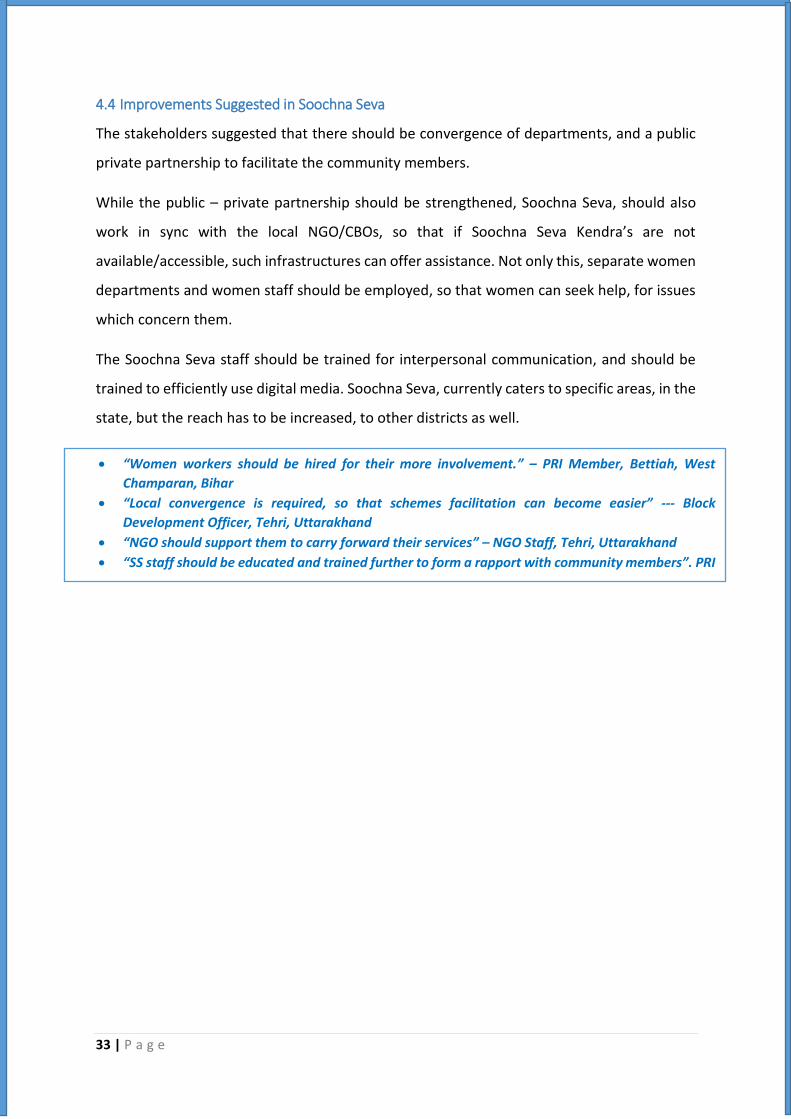
The stakeholders suggested that there should be convergence of departments, and a public
private partnership to facilitate the community members.
While the public – private partnership should be strengthened, Soochna Seva, should also
work in sync with the local NGO/CBOs, so that if Soochna Seva Kendra’s are not
available/accessible, such infrastructures can offer assistance. Not only this, separate women
departments and women staff should be employed, so that women can seek help, for issues
which concern them.
The Soochna Seva staff should be trained for interpersonal communication, and should be
trained to efficiently use digital media. Soochna Seva, currently caters to specific areas, in the
state, but the reach has to be increased, to other districts as well.
• “Women workers should be hired for their more involvement.” – PRI Member, Bettiah, West
Champaran, Bihar
• “Local convergence is required, so that schemes facilitation can become easier” --- Block
Development Officer, Tehri, Uttarakhand
• “NGO should support them to carry forward their services” – NGO Staff, Tehri, Uttarakhand
• “SS staff should be educated and trained further to form a rapport with community members”. PRI
member, Tehri, Uttarakhand
34 | P a g e
Moving on to the next part…
With not a well-defined information and awareness mechanism at the block and the
Panchayat level to reach out to the general public, for public schemes, Soochna Seva was
launched.
It was launched with an aim to spread awareness about existing public schemes, using
ICT/non-ICT tools, among the deprived sections and enable them to derive benefits from the
same.
Thus, the following section of the report, will now from the lens of the end – beneficiaries
will provide a perspective how Soochna Seva, has impacted their lives, for good.
35 | P a g e
FINDINGS FROM THE
END – BENEFICIARIES SURVEY

36 | P a g e
Chapter – 5:
Profile of the End – Beneficiaries
Soochna Seva, in a span of five years (2014-2018) has reached out to more than one lakh end
beneficiaries across 5 states of the country namely –Bihar, Madhya Pradesh, Jharkhand,
Rajasthan, Madhya Pradesh, and Uttarakhand.
They belong to deprived background, have limited means of income, and have limited access
to information. Soochna Seva, through its intervention has tried to get them their rightful
entitlements, so that they can lead a quality life,
In order to understand the benefits, the end – beneficiaries may have availed from Soochna
Seva, it is important to understand their profile first. An understanding of the profile of the
end – beneficiaries would help understand their perception about Soochna Seva, the benefits
received and how can the intervention be sustained.
This chapter focuses on the profile of the end – beneficiaries who were interviewed. It takes
into account the proportion of males and females end – beneficiaries interviewed, their age
group and their marital status. It further describes their education and occupational status,
their household income, their religion, caste, the type of house they live and the type of family
they live in.
5.1 Demographic Profile of the End – Beneficiaries
This section describes the gender, age and the marital status of the typical end – beneficiary
interviewed for the end –line evaluation.
As reported in the table below (table – 4), a typical respondent (who has been the end –
beneficiary) for the end evaluation was a married male, aged 40 years.
Profile of the End - Beneficiaries
➢ A typical end beneficiary was a married male, aged 40 years. He was an illiterate who was
working as an agricultural labourer on their own land, earning less than Rs. 5000 a month.
➢ Four out of ten beneficiaries reported to belong to scheduled tribe, and eight out of them
were followers of Hindu religion.

37 | P a g e
The soochna seva project has covered, more males than females, in over one lakh
beneficiaries which they have reached out over a period of 5 years. Consequently, the
coverage of males has been more than females, in the end – line evaluation as well.
5.2 Socio-Economic Profile of the End – Beneficiaries
The socio-economic profile of the end – beneficiaries, may have a direct impact on the type
of schemes they access, the information they require and the assistance required in gaining
the benefits of the scheme, depending on their educational status, occupation and their
monthly household income.
This section, describes the educational status, the occupation and the monthly household
income, of the end – beneficiaries interviewed.
Table 4: Demographic Profile of End - Beneficiaries
Base (n)
Overall
275
Gender
Males 53
Females 47
Age
18 – 25 years 14
26 – 32 years 20
33– 40 years 24
41– 48 years 17
49 years and above 25
Average age 40
Marital Status
Married 86
Single 8
Widow/ Widower 5
Divorced 0
*Numbers reported in percentages

38 | P a g e
Table 5: Socio Economic Profile of the End - Beneficiaries
Base (n)
Overall
275
Education Status
Illiterate 44
Educated up to 8th standard 16
Educated up to 5th standard 15
Secondary up to class 10 11
Senior Secondary up to class 12 7
Graduate 5
Post Graduate 1
Occupation
Agricultural labourer on own land 37
Agricultural Labourer on other’s land 15
Casual Labourer 15
Housewife 15
Unemployed 5
Salaried – Government service 4
Salaried – Private company / service 2
Petty Trade 2
Skilled worker 2
Business 2
Others 1
Average Monthly Household Income
Less than 5000 62
5001-10,000 28
10,001-15,000 2
15,001-20,000 2
More than 20,000 3
Don’t Know/Can’t Say 4
*Numbers reported in percentages
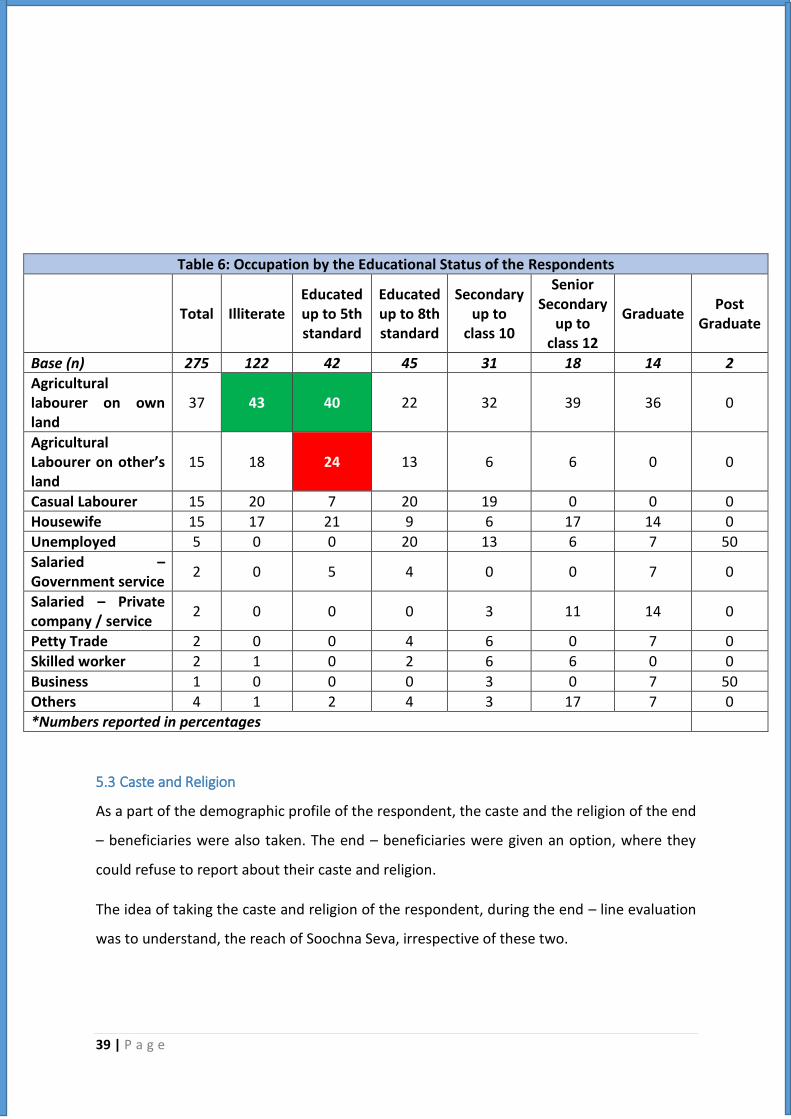
According to the table above (table – 5), the typical end – beneficiary was illiterate (44%) and
was an agricultural labourer on their own land (37%). The average monthly income of their
household was less than 5,000.
A significant proportion of respondents (43%) who reported to be an agricultural labourer on
their own land, were illiterate, in comparison to others who attained some education, ever.
Little less than a quarter of respondents, who were educated upto fifth standard, were
working as an agricultural labourer on somebody else’s land, which was significantly higher
than those who were illiterate (18%), as reported in table - 6.
39 | P a g e
Table 6: Occupation by the Educational Status of the Respondents
Total Illiterate Educated up to 5th standard
Educated up to 8th standard
Secondary up to
class 10
Senior Secondary
up to class 12
Graduate Post
Graduate
Base (n) 275 122 42 45 31 18 14 2
Agricultural labourer on own land
37 43 40 22 32 39 36 0
Agricultural Labourer on other’s land
15 18 24 13 6 6 0 0
Casual Labourer 15 20 7 20 19 0 0 0
Housewife 15 17 21 9 6 17 14 0
Unemployed 5 0 0 20 13 6 7 50
Salaried – Government service
2 0 5 4 0 0 7 0
Salaried – Private company / service
2 0 0 0 3 11 14 0
Petty Trade 2 0 0 4 6 0 7 0
Skilled worker 2 1 0 2 6 6 0 0
Business 1 0 0 0 3 0 7 50
Others 4 1 2 4 3 17 7 0
*Numbers reported in percentages
5.3 Caste and Religion
As a part of the demographic profile of the respondent, the caste and the religion of the end
– beneficiaries were also taken. The end – beneficiaries were given an option, where they
could refuse to report about their caste and religion.
The idea of taking the caste and religion of the respondent, during the end – line evaluation
was to understand, the reach of Soochna Seva, irrespective of these two.

40 | P a g e
Table 7: Caste and Religion of the End Beneficiary
Base (n)
Overall
275
Caste of the End-Beneficiary
General 26
Scheduled Caste 19
Scheduled Tribe 39
Other Backward Classes 17
Refused to answer 0
Religion of the End-Beneficiary
Hindu 86
Muslim 4
Christian 7
Other (please specify) 3
*Numbers reported in percentages
Close to two-fifths of the end – beneficiaries reported to belong to scheduled tribe, followed
by 26% of them, who reported to be belonging to general caste, as reported in the table above
(table – 7). About 86% end – beneficiaries reported to belong to the Hindu religion. This can
be attributed to the fact that, only those end – beneficiaries were interviewed who were
available at the time of the survey. They were not selected randomly, on the basis of their
caste, religion or income.
Thus, this sums up that, the project has reached out to rural poor, irrespective of their caste
and religion.
5.4 Type of Family
More than half of the end – beneficiaries reported to live in nuclear family (see table – 8)
and majority of them lived in their own house, as reported in the table-9.

41 | P a g e
Table 8: Type of Family
Base (n)
Overall Uttarakhand Madhya Pradesh
Bihar Jharkhand Rajasthan
275 54 55 58 52 56
Type of Family
Nuclear Family 53 69 27 64 85 23
Joint Family 47 31 73 36 15 77
*Numbers reported in percentages
Table 9: Ownership of the House
Base (n)
Overall Uttarakhand Madhya Pradesh
Bihar Jharkhand Rajasthan
275 54 55 58 52 56
Ownership of the Household
Rented 2 6 0 2 2 -
Own 98 94 100 98 96 100
Informal settlement 0 0 0 - 2 -
*Numbers reported in percentages

42 | P a g e
Chapter – 6:
Digital & Information Literacy
Soochna Seva, has organized digital and information literacy camps in the areas of
intervention, where the end – beneficiaries were trained to access different types of ICT
medium, to gain information on government schemes, which may benefit them.
Not only this, they have developed an app, titled “MeraApp” which provided rural India’s
vulnerable population with a catalogue of welfare schemes, with comprehensive information
on entitlements, in an effort to empower them with access to rights and benefits under the
core areas of Health, Education, Social security, Finance and Livelihood.
Thus, this chapter discusses the awareness of the end- beneficiaries about Soochna Seva,
uptake of digital and information literacy sessions and as a result of the sessions, the issues
on which they access information. Further, it throws light on the rating given by the end-
beneficiaries to the digital and information literacy sessions of Soochna Seva, with supporting
reasons. This chapter also covers the awareness among them about MeraApp, its usage for
accessing information related to public schemes.
Digital Literacy
➢ About 33% end – beneficiaries reported to own a mobile without an internet
connection, followed by 27%% who reported to own a television with a dish
connection. There is a significant difference in ownership of mobiles with an
internet connection among males (28%) than females (16%).
➢ Close to 90% end beneficiaries are aware of Soochna Seva. Except Uttarakhand,
the end – beneficiaries reported a high awareness of this intervention
➢ Three out of five respondents reported to access information on issues which
concern their personal welfare.
➢ Out of 275 total respondents, 203 were aware of MeraApp, However, only 72
(largely the project staff) had ever used this app to deliver information services,
to know the benefits of a particular scheme and to know about government
schemes.
43 | P a g e
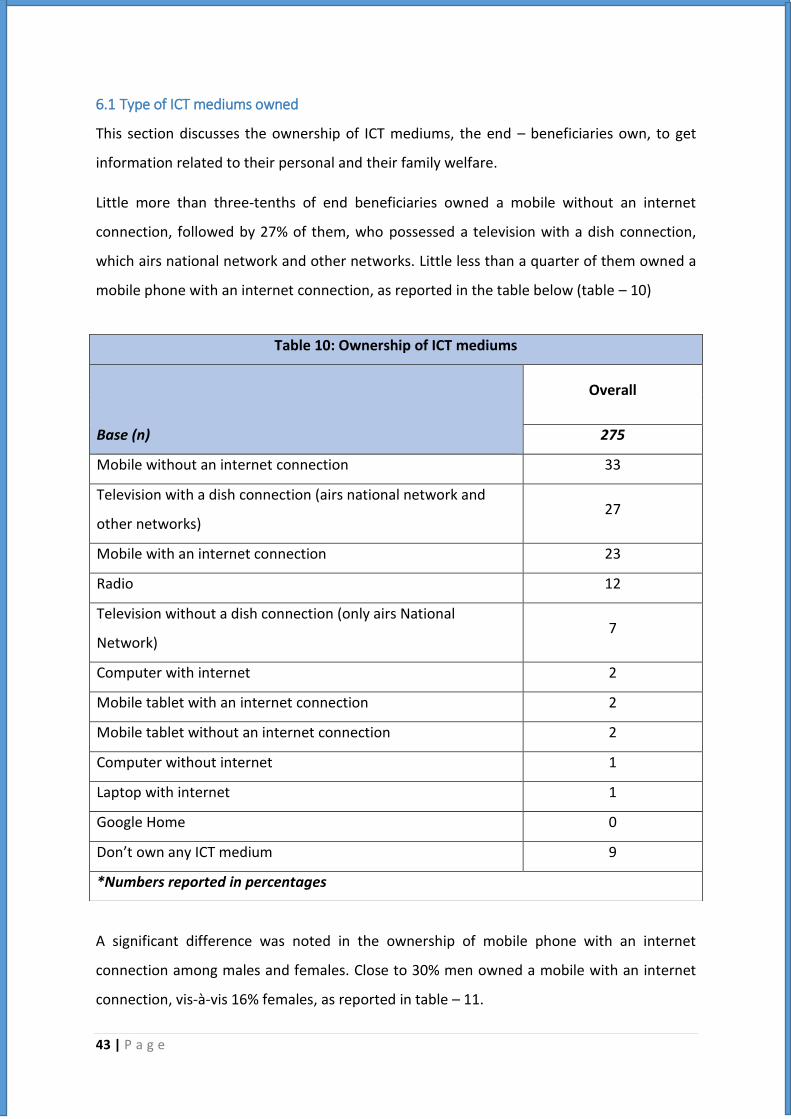
6.1 Type of ICT mediums owned
This section discusses the ownership of ICT mediums, the end – beneficiaries own, to get
information related to their personal and their family welfare.
Little more than three-tenths of end beneficiaries owned a mobile without an internet
connection, followed by 27% of them, who possessed a television with a dish connection,
which airs national network and other networks. Little less than a quarter of them owned a
mobile phone with an internet connection, as reported in the table below (table – 10)
A significant difference was noted in the ownership of mobile phone with an internet
connection among males and females. Close to 30% men owned a mobile with an internet
connection, vis-à-vis 16% females, as reported in table – 11.
Table 10: Ownership of ICT mediums
Base (n)
Overall
275
Mobile without an internet connection 33
Television with a dish connection (airs national network and
other networks) 27
Mobile with an internet connection 23
Radio 12
Television without a dish connection (only airs National
Network) 7
Computer with internet 2
Mobile tablet with an internet connection 2
Mobile tablet without an internet connection 2
Computer without internet 1
Laptop with internet 1
Google Home 0
Don’t own any ICT medium 9
*Numbers reported in percentages
44 | P a g e
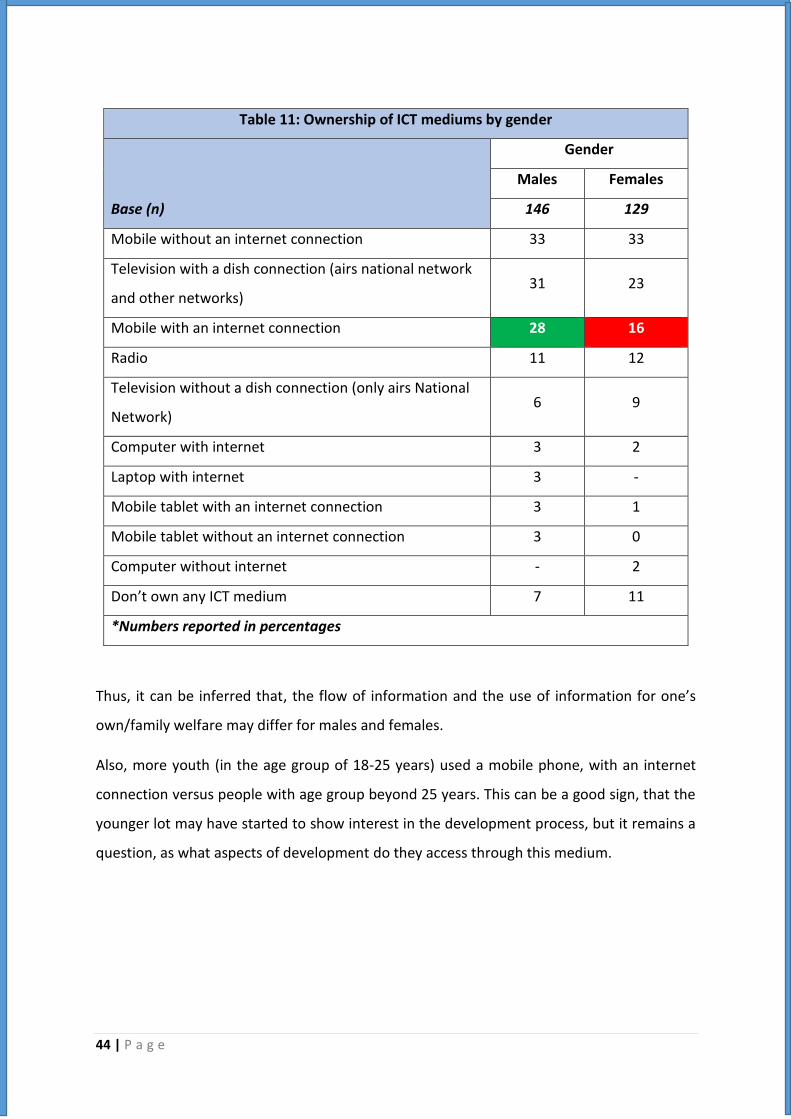
Thus, it can be inferred that, the flow of information and the use of information for one’s
own/family welfare may differ for males and females.
Also, more youth (in the age group of 18-25 years) used a mobile phone, with an internet
connection versus people with age group beyond 25 years. This can be a good sign, that the
younger lot may have started to show interest in the development process, but it remains a
question, as what aspects of development do they access through this medium.
Table 11: Ownership of ICT mediums by gender
Base (n)
Gender
Males Females
146 129
Mobile without an internet connection 33 33
Television with a dish connection (airs national network
and other networks) 31 23
Mobile with an internet connection 28 16
Radio 11 12
Television without a dish connection (only airs National
Network) 6 9
Computer with internet 3 2
Laptop with internet 3 -
Mobile tablet with an internet connection 3 1
Mobile tablet without an internet connection 3 0
Computer without internet - 2
Don’t own any ICT medium 7 11
*Numbers reported in percentages
45 | P a g e
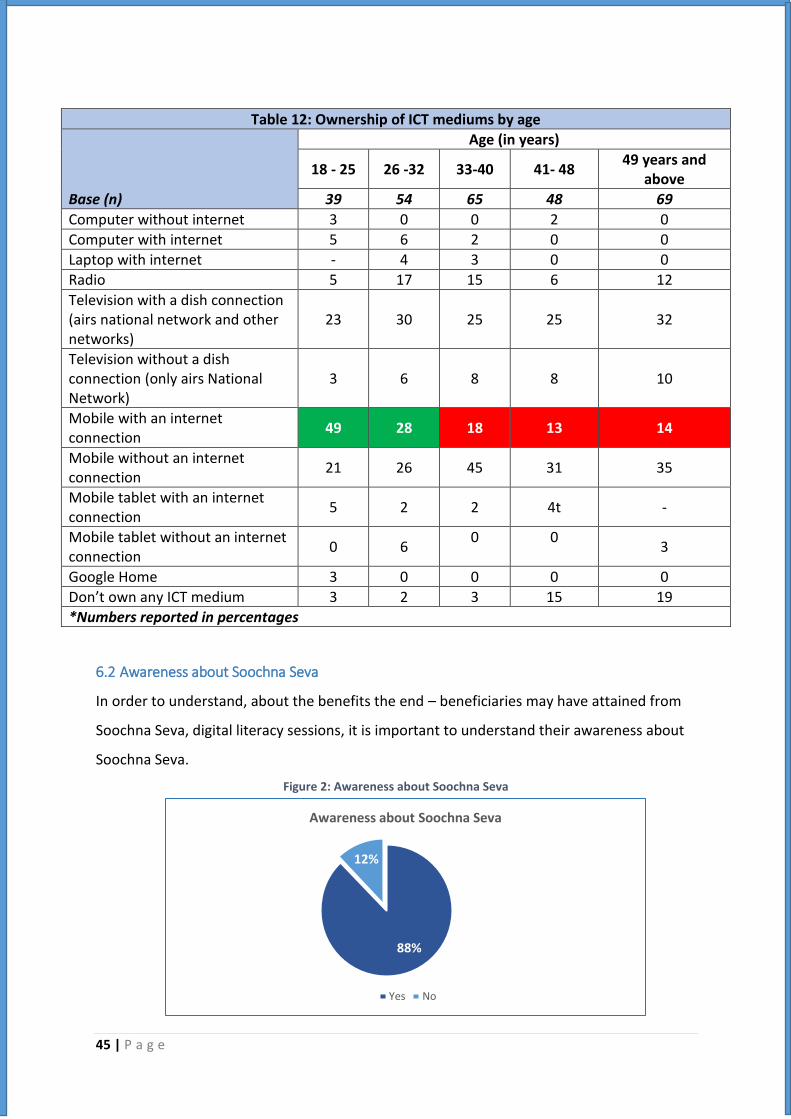
6.2 Awareness about Soochna Seva
In order to understand, about the benefits the end – beneficiaries may have attained from
Soochna Seva, digital literacy sessions, it is important to understand their awareness about
Soochna Seva.
Table 12: Ownership of ICT mediums by age
Base (n)
Age (in years)
18 - 25 26 -32 33-40 41- 48 49 years and
above
39 54 65 48 69
Computer without internet 3 0 0 2 0
Computer with internet 5 6 2 0 0
Laptop with internet - 4 3 0 0
Radio 5 17 15 6 12
Television with a dish connection (airs national network and other networks)
23 30 25 25 32
Television without a dish connection (only airs National Network)
3 6 8 8 10
Mobile with an internet connection
49 28 18 13 14
Mobile without an internet connection
21 26 45 31 35
Mobile tablet with an internet connection
5 2 2 4t -
Mobile tablet without an internet connection
0 6 0 0
3
Google Home 3 0 0 0 0
Don’t own any ICT medium 3 2 3 15 19
*Numbers reported in percentages
88%
12%
Awareness about Soochna Seva
Yes No
Figure 2: Awareness about Soochna Seva

46 | P a g e
Close to 90% end-beneficiaries reported to be aware about Soochna Seva, project, as
reported in figure – 2.
At the district level, significantly low awareness about Soochna Seva (57%) was reported
among end-beneficiaries in Uttarakhand, as compared to other states (see figure - 3).
Figure 3:Awareness about Soochna Seva
6.3 ICT mediums learnt as part of Soochna Seva
As a part of the Soochna Seva, project, the end – beneficiaries were taught to use the ICT
mediums, to access information, which could help them in their own empowerment, by
seeking benefits of schemes. Only those beneficiaries, who were aware about Soochna Seva,
were asked about the ICT mediums they learnt as part of Soochna Seva.
A little more than a quarter of the end-beneficiaries reported to learn access information from
a mobile device, connected to a computer, as reported in the table below (table - 13)
98% 96% 95% 93%
57%
0102030405060708090
100
Rajasthan Jharkhand Bihar Madhya Pradesh Uttarakhand
Awareness of Soochna Seva by States
n = 275

47 | P a g e
State wise, it was reported that, 61% respondents from Madhya Pradesh, reported to learn
to access internet connected to computer, which is significantly higher than other states,
where Soochna Seva intervention was implemented. (see table –14).
Since the awareness about Soochna Seva, was less among the respondents in Uttarakhand,
it can be seen that a significant proportion of respondents (48%), reported that they did not
learn to use any ICT medium.
6.4 Accessibility of Information
This section, discusses the issues on which the end – beneficiaries access information. Only
those end – beneficiaries have been covered, who learnt to access any ICT medium, during
the Soochna Seva, digital and information literacy sessions.
The beneficiaries reported to access information, on various issues, which concerned their
and the family’s welfare. When asked, on what issues, which they access information on,
more than three-fifths of the end – beneficiaries reported to access information, which
Table 13: ICT mediums learnt as part of Soochna Seva
Base (n)**
Overall
242
Internet connected to a mobile device 24
Internet connected to the computer 29
E Mitra 1
None of the above 29
*Numbers reported in percentages **Only those who reported to attend digital literacy sessions organized by Soochna Seva
Table 14: ICT mediums learnt as part of Soochna Seva (State Wise)
Base (n)
Uttarakhand Madhya Pradesh Bihar Jharkhand Rajasthan
31 51 55 50 55
Internet connected to the computer
10 61 24F 12 7
Internet connected to a mobile device
13 45 33 6 40
E Mitra 0 0 0 0 5
None of the above 48 2 38 64 0
*Numbers reported in percentages
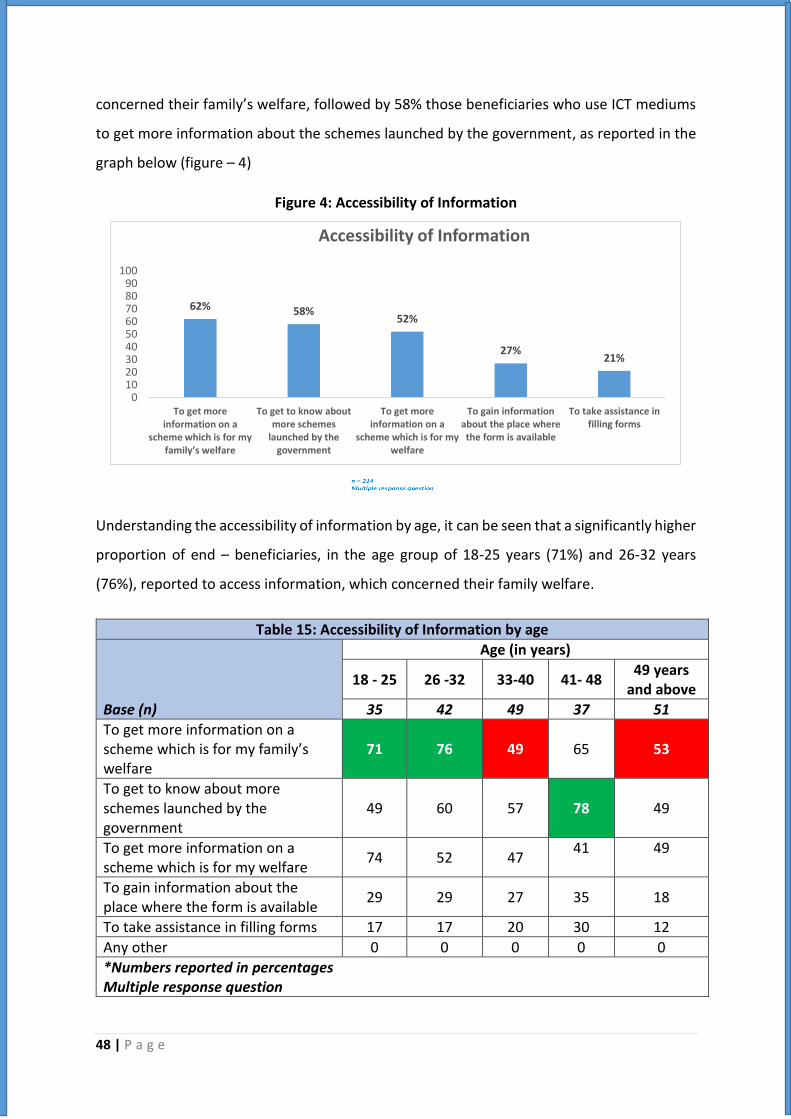
48 | P a g e
concerned their family’s welfare, followed by 58% those beneficiaries who use ICT mediums
to get more information about the schemes launched by the government, as reported in the
graph below (figure – 4)
Figure 4: Accessibility of Information
Understanding the accessibility of information by age, it can be seen that a significantly higher
proportion of end – beneficiaries, in the age group of 18-25 years (71%) and 26-32 years
(76%), reported to access information, which concerned their family welfare.
62% 58%52%
27%21%
0102030405060708090
100
To get more information on a
scheme which is for my family’s welfare
To get to know aboutmore schemes
launched by thegovernment
To get moreinformation on a
scheme which is for mywelfare
To gain informationabout the place wherethe form is available
To take assistance infilling forms
Accessibility of Information
Table 15: Accessibility of Information by age
Base (n)
Age (in years)
18 - 25 26 -32 33-40 41- 48 49 years
and above
35 42 49 37 51
To get more information on a scheme which is for my family’s welfare
71 76 49 65 53
To get to know about more schemes launched by the government
49 60 57 78 49
To get more information on a scheme which is for my welfare
74 52 47 41 49
To gain information about the place where the form is available
29 29 27 35 18
To take assistance in filling forms 17 17 20 30 12
Any other 0 0 0 0 0
*Numbers reported in percentages Multiple response question

49 | P a g e
Close to four-fifths of the end – beneficiaries, in the age group of 41-48 years, accessed
information related to government schemes, which is significantly higher than other age
groups, as reported in the table above (table – 15). This can be attributed to the fact, that at
this time, people want to learn more about the government schemes, which can help them
to secure their future, especially older years.
6.5 Rating of Digital and Information Literacy Sessions
In order to understand the quality of the digital and information literacy sessions, organized
by Soochna Seva, the end – beneficiaries rated the sessions on a scale of “1” to “5”, where
“1” stood, for poor and “5” stood for excellent.
Majority respondents, rated the digital literacy sessions, “good and above”, as reported in
the table below (table – 16).
All the end – beneficiaries, interviewed in Rajasthan, rated the sessions, “good and above”,
which was significantly higher than the end – beneficiaries, interviewed across other states,
as reported in table - 9.
The reasons cited by the end – beneficiaries for a good rating were; the sessions were very
informative & they were taught how to access information related to government schemes
(69%). Further such sessions helped them to explore information about their entitlements to
government schemes (49%).
Thus, it can be concluded that, digital literacy sessions, helped end-beneficiaries across
intervention states, to access information related to their empowerment.
Table 16: Rating of Soochna Seva Digital and Information Literacy Sessions
Overall** States
Uttarakhand Madhya Pradesh Bihar Jharkhand Rajasthan
214 19 55 34 50 56
Only top 2 rank %
Top 2 rank % 94 79 95 94 92 100
Excellent 31 21 40 38 14 36
Good 63 58 55 56 78 64
*Numbers reported in percentages **Only those who reported to attend digital literacy sessions organized by Soochna Seva

50 | P a g e
6.6 Awareness about MeraApp
MeraApp is a platform to empower rural & remote population with access to information and
bring them closer to their rightful entitlements, thus bridging the digital gap, by Soochna Seva.
This section understands the awareness about this app, overall and state wise. Further it
understands, whether beneficiaries have ever used this app, to avail information on
government schemes.
As reported in the chart above (figure – 5), only 26% end – beneficiaries reported to be aware
of MeraApp. This is due to the fact that MeraApp is a mobile platform only made available to
the information intermediaries / Soochna Mitras / Soochnapreneuers to deliver information
and linkages to community members using the App. The App has not be made open for
general public. While delivering information about schemes throug the App, it could have
been the case that many end beneficiaries then got to know about the App.
.
26%
74%
Awareness about MeraApp
Yes Non = 275
Figure 6: Awareness of MeraApp by states
Figure 5: Awareness about MeraApp
45% 40%
21%13% 10%
0
20
40
60
80
100
Bihar Madhya Pradesh Rajasthan Uttarakhand Jharkhand
Awareness of MeraApp by States
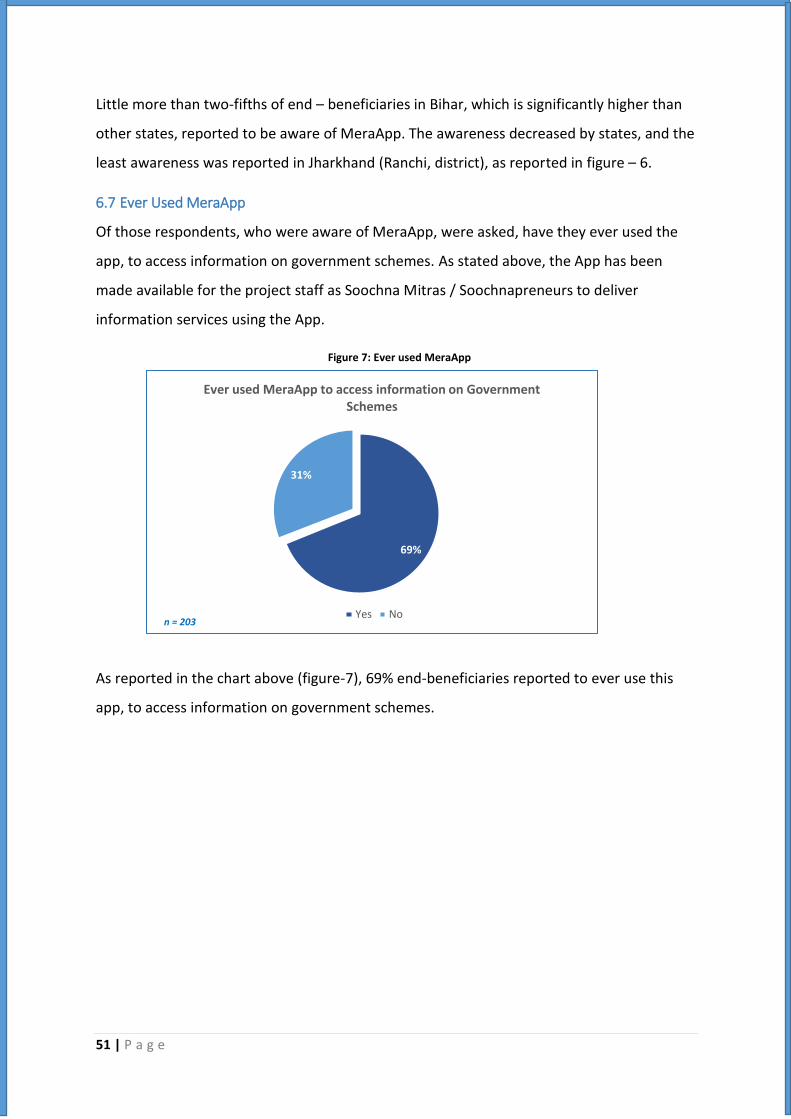
51 | P a g e
Little more than two-fifths of end – beneficiaries in Bihar, which is significantly higher than
other states, reported to be aware of MeraApp. The awareness decreased by states, and the
least awareness was reported in Jharkhand (Ranchi, district), as reported in figure – 6.
6.7 Ever Used MeraApp
Of those respondents, who were aware of MeraApp, were asked, have they ever used the
app, to access information on government schemes. As stated above, the App has been
made available for the project staff as Soochna Mitras / Soochnapreneurs to deliver
information services using the App.
As reported in the chart above (figure-7), 69% end-beneficiaries reported to ever use this
app, to access information on government schemes.
Figure 7: Ever used MeraApp
69%
31%
Ever used MeraApp to access information on Government Schemes
Yes Non = 203

52 | P a g e
State wise, as reported in the graph above (figure – 8) out of total 72 aware end –
beneficiaries, 21 from Bihar (West Champaran) and Madhya Pradesh (Guna), had ever used
MeraApp.
6.8 Information accessed on Public Schemes
Since MeraApp, is an app, which helps people to access information, related to their rightful
entitlements, it is imperative to understand the information end-beneficiaries may have
accessed, through the Soochna Mitras / Soochnapreneurs as information intermediaries,
using the app, in the past 6 months.
This section understands, the various type of information accessed by the end-beneficiaries,
using this app with the help of Soochna Mitras.
2115
10
2 2
0
10
20
30
40
50
60
70
Bihar(n= 26)
Madhya Pradesh(n= 22)
Rajasthan(n = 12)
Uttarakhand(n = 7)
Jharkhand(n = 5)
Every used MeraApp
Numbers reported in absolutes, due to low base
Figure 8: Ever used MeraApp by states

53 | P a g e
Out of 72 end – beneficiaries, 45 of them were aware of being benefited by using this App
through the Soochnapreneurs / Soochna Mitras, to know the benefits of a particular scheme.
Less than 35 beneficiaries were aware of accessing this app to know the type of scheme and
who are the potential beneficiaries of this scheme, as reported in the table above (table – 17).
However, different dynamics were observed state wise. In Madhya Pradesh, 18 out of 22 end
– beneficiaries aware of accessing this app, to know the benefits of a scheme, and 10 of them
aware of accessing this App to understand who are the potential beneficiaries of the scheme.
In Bihar, 14 out of 26 respondents were aware of accessing this app to know the type of the
scheme and its features. In Jharkhand all the five end-beneficiaries who were aware of
accessing this app, reported to access it to know the potential beneficiaries of the schemes.
All of the five project staff / fellows /Soochna Metras / Soochnapreneurs interacted, shared
that they have used the MeraApp to deliver schemes information to community members,
map beneficiaries with various schemes and linked beneficiaries for benefits.
Overall, it can be concluded that, the awareness about MeraApp needs to increase, which
can lead to better utilization of the services of the app, for the empowerment of the rural
poor. Selected beneficiaries of the project should be trained and oriented to use the App
Table 17: Use of MeraApp to access Information on Public Schemes
Base (n)
Overall** States
Uttarakhand Madhya Pradesh Bihar Jharkhand Rajasthan
72 7 22 26 5 12
Benefits of the scheme
45 3 18 13 4 7
Type of scheme and its features
33 2 7 14 4 6
Potential beneficiaries of the scheme
32 3 10 9 5 5
Duration of the scheme
17 3 7 4 1 2
Compensation involved in the scheme
15 1 2 6 3 3
*Numbers reported in absolutes due to small base **Only those who reported to be aware of MeraApp

54 | P a g e
(with their unique user password and Id) to reach out to communities further as extended
Soochna Mitras.
55 | P a g e
Chapter – 7:
Accessibility to Soochna Seva Kendra
In the Soochna Seva, intervention, Soochna Seva Kendras have been established, which run
integrated information services delivery and citizen entitlement framework in the five study
districts – namely Tehri Garhwal (Uttarakhand), West Champaran (Bihar), Ranchi (Jharkhand),
Guna (Madhya Pradesh) and Barmer (Rajasthan).
It was expected that this initiative will further strengthen the governance structure at district
administration level and below where — due to difficult social, economic, geographical, geo-
physical, poor development and weak infrastructures — it has become extremely difficult for
the public authorities and agencies to reach out to the maximum (deserving) beneficiaries.
This chapter, thus throws light on the awareness of the end – beneficiaries related to Soochna
Seva Kendra, frequency of its access, services availed at the Kendra and of which the schemes,
the benefits were availed. Also, it describes the grievance redressal mechanism of Soochna
Seva and whether Soochna Seva Kendra has helped register the grievances of the end –
beneficiaries.
7.1 Awareness about Soochna Seva Kendra
All the end – beneficiaries, were asked about their awareness of Soochna Seva Kendra. Of the
275 end – beneficiaries, 242 were aware about it, as reported in the table below (table – 18).
Accssibility to Soochna Seva Kendra
➢ Nine out of ten end – beneficiaries reported to be aware of Soochna Seva Kendra. Of
these, 77% have ever accessed SSK.
➢ The end – beneficiaries reported to access SSKs to avail the scheme form (85%) and to
take assistance in filling form (64%).
➢ Eight out of ten respondents have accessed the Soochna Seva Kendra, for availing the
scheme form and six out of ten have accessed SSKs for availing benefits for of more than
three schemes.
➢ Close to three-fifths of the end – beneficiaries reported that SSKs helped in registering
their grievances, which they had pertaining to a public scheme.
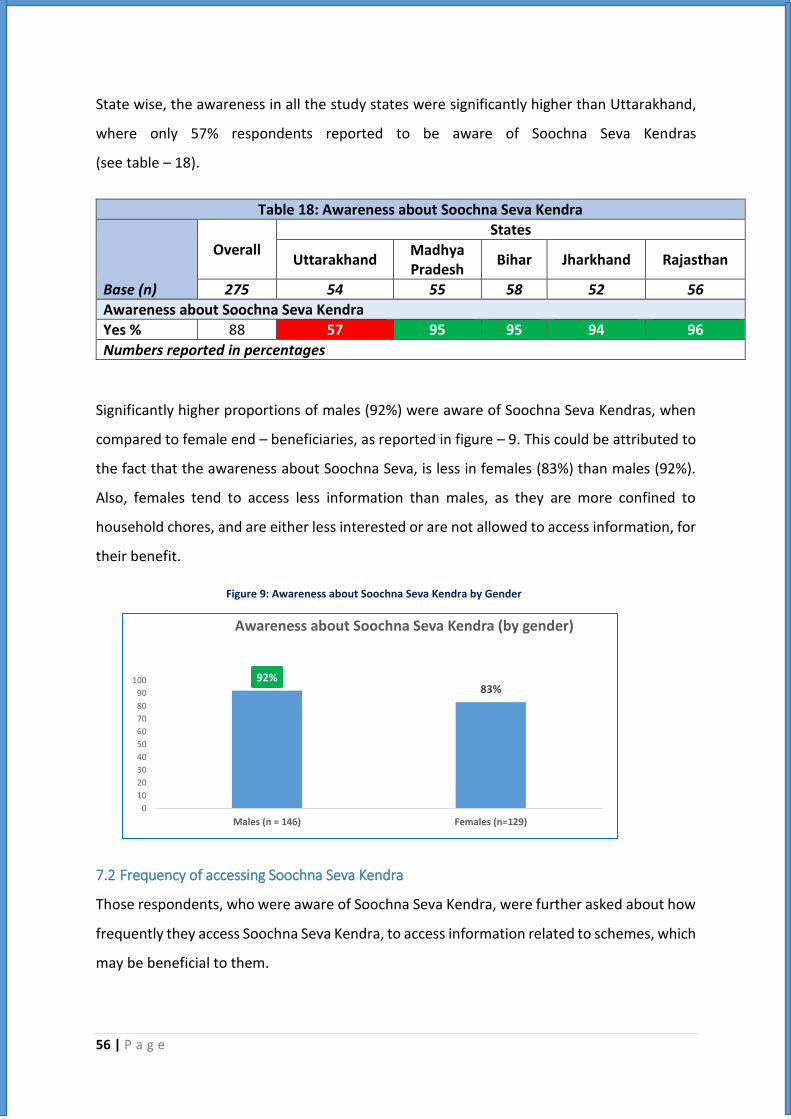
56 | P a g e
State wise, the awareness in all the study states were significantly higher than Uttarakhand,
where only 57% respondents reported to be aware of Soochna Seva Kendras
(see table – 18).
Significantly higher proportions of males (92%) were aware of Soochna Seva Kendras, when
compared to female end – beneficiaries, as reported in figure – 9. This could be attributed to
the fact that the awareness about Soochna Seva, is less in females (83%) than males (92%).
Also, females tend to access less information than males, as they are more confined to
household chores, and are either less interested or are not allowed to access information, for
their benefit.
7.2 Frequency of accessing Soochna Seva Kendra
Those respondents, who were aware of Soochna Seva Kendra, were further asked about how
frequently they access Soochna Seva Kendra, to access information related to schemes, which
may be beneficial to them.
Table 18: Awareness about Soochna Seva Kendra
Base (n)
Overall States
Uttarakhand Madhya Pradesh
Bihar Jharkhand Rajasthan
275 54 55 58 52 56
Awareness about Soochna Seva Kendra
Yes % 88 57 95 95 94 96
Numbers reported in percentages
92%83%
0
10
20
30
40
50
60
70
80
90
100
Males (n = 146) Females (n=129)
Awareness about Soochna Seva Kendra (by gender)
Figure 9: Awareness about Soochna Seva Kendra by Gender
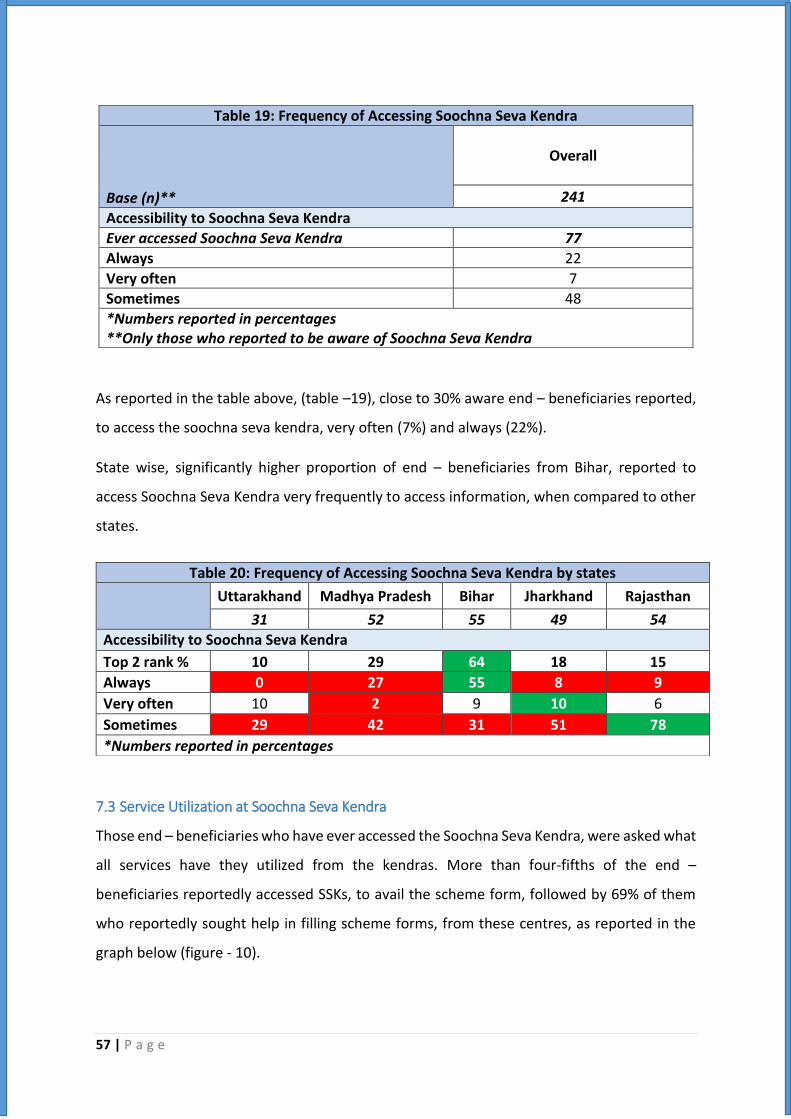
57 | P a g e
As reported in the table above, (table –19), close to 30% aware end – beneficiaries reported,
to access the soochna seva kendra, very often (7%) and always (22%).
State wise, significantly higher proportion of end – beneficiaries from Bihar, reported to
access Soochna Seva Kendra very frequently to access information, when compared to other
states.
7.3 Service Utilization at Soochna Seva Kendra
Those end – beneficiaries who have ever accessed the Soochna Seva Kendra, were asked what
all services have they utilized from the kendras. More than four-fifths of the end –
beneficiaries reportedly accessed SSKs, to avail the scheme form, followed by 69% of them
who reportedly sought help in filling scheme forms, from these centres, as reported in the
graph below (figure - 10).
Table 19: Frequency of Accessing Soochna Seva Kendra
Base (n)**
Overall
241
Accessibility to Soochna Seva Kendra
Ever accessed Soochna Seva Kendra 77
Always 22
Very often 7
Sometimes 48
*Numbers reported in percentages **Only those who reported to be aware of Soochna Seva Kendra
Table 20: Frequency of Accessing Soochna Seva Kendra by states
Uttarakhand Madhya Pradesh Bihar Jharkhand Rajasthan
31 52 55 49 54
Accessibility to Soochna Seva Kendra
Top 2 rank % 10 29 64 18 15
Always 0 27 55 8 9
Very often 10 2 9 10 6
Sometimes 29 42 31 51 78
*Numbers reported in percentages
58 | P a g e
A significantly higher proportion (81%) of end – beneficiaries in Rajasthan (Barmer, district)
reported to access SSKs, for taking assistance in filling forms, in comparison to Madhya
Pradesh (63%) and Bihar (52%), as reported in table – 21.
More than 90% end – beneficiaries in Jharkhand (98%) and Rajasthan (91%), reported to
access the SSKs to avail the scheme form.
7.4 Schemes Benefits taken from Soochna Seva Kendra
Soochna Seva Kendra helps community members, to help get information on a scheme, avail
the scheme form, and further assists them in filling the form.
Table 21: Service Utilization at Soochna Seva Kendra by States
Base (n)**
States
Uttarakhand Madhya Pradesh
Bihar Jharkhand Rajasthan
21* 49 52 48 54
To take assistance in filling forms
71 63 52 77 81
To avail the scheme form 57 80 83 98 91
To access services related to digital literacy and services
19 18 4 25 15
To get more information on a scheme
14 65 77 81 56
*small base Numbers reported in percentages
85%
69% 64%
16%
0102030405060708090
100
To avail the scheme form To take assistance in fillingforms
To get more informationon a scheme
To access services relatedto digital literacy and
services
Service Utilization at Soochna Seva Kendra
Figure 10: Service Utilization at Soochna Seva Kendra
n = 224

59 | P a g e
This section understands, state wise, how many end beneficiaries benefitted from SSK, for
the schemes they accessed. This section has been divided into two parts. The first part
understands, for which scheme, and what assistance was sought, while the second part
understands the number of schemes for which assistance was sought.
7.4.1 Type of Assistance Sought
a) Bihar
In Bihar, out of 40 end beneficiaries, 27 end beneficiaries reported to get more
information on Pradhan Mantri Ujjawala Yojana, while 29 out of 43 beneficiaries
availed the form for this scheme. Out of 27, 23 end – beneficiaries sought help from
the Soochna Seva Kendra, to fill form for this scheme, as reported in the table below
(table – 22).
b) Jharkhand
In Jharkhand, out of 39 end – beneficiaries, 23 end – beneficiaries reported to get
more information on Pradhan Mantri Ujjawala Yojana, while 30 out of 47 beneficiaries
availed the form for this scheme. Out of 37, 25 end – beneficiaries sought help from
the Soochna Seva Kendra, to fill form for this scheme, as reported in the table below
(table – 23).
Table 22: Schemes Benefits taken from Soochna Seva Kendra (Bihar)
Base
To get more information on a
scheme
To avail the scheme form
To take assistance in filling forms
40 43 27
Pradhan Mantri Ujjwala Yojana
27 29 23
Indira Awas Yojana 20 23 16
Pradhan Mantri Jan Dhan Yojana (New Account)
20 22 10
Kanya Vivah Yojna 16 14 11
Old Age Pension 8 9 5
Numbers reported in absolutes Only top 5 schemes reported

60 | P a g e
c) Uttarakhand
As reported in the table below (table – 24), 13 out of 15 people, reported to take
assistance in filling forms for Ration cards, from Soochna Seva Kendra and 9 out of 12
people sort help to make the ration card.
d) Madhya Pradesh
In Madhya Pradesh, the most common services for which people benefitted from
Soochna Seva Kendra were vaccination and aadhar card. Out of 32 people, 20 reported
to know more about vaccination and aadhar card. More than 50% end – beneficiaries
reported that they sought the forms for the above two mentioned schemes from SSK,
and took assistance in filling the forms, as reported in the table below (table – 25).
Table 23: Schemes Benefits taken from Soochna Seva Kendra (Jharkhand)
Base
To get more information on a
scheme
To avail the scheme form
To take assistance in filling forms
39 47 37
PM Ujjwala Yojna 23 30 25
Anti Phuleriya dose 14 14 10
Aadhar Card 13 14 9
Ration Card 12 15 8
Job Card 12 12 12
Numbers reported in absolutes Only top 5 schemes reported
Table 24: Schemes Benefits taken from Soochna Seva Kendra (Uttarakhand)
Base
To get more information on a
scheme
To avail the scheme form
To take assistance in filling forms
3 12 15
Ration Card 2 9 13
MGNREGA 2 2 5
Old Age/Widow Pension 1 2 3
Subsidy on Farmer's equipment 1 2 2
Labor Cards 1 3 4
Numbers reported in absolutes Only top 5 schemes reported
In Bihar and Jharkhand, more beneficiaries were inclined to PM Ujjawala Yojana, as they got more
information on this scheme, availed its scheme form and also sought assistance in filling forms for this
scheme.
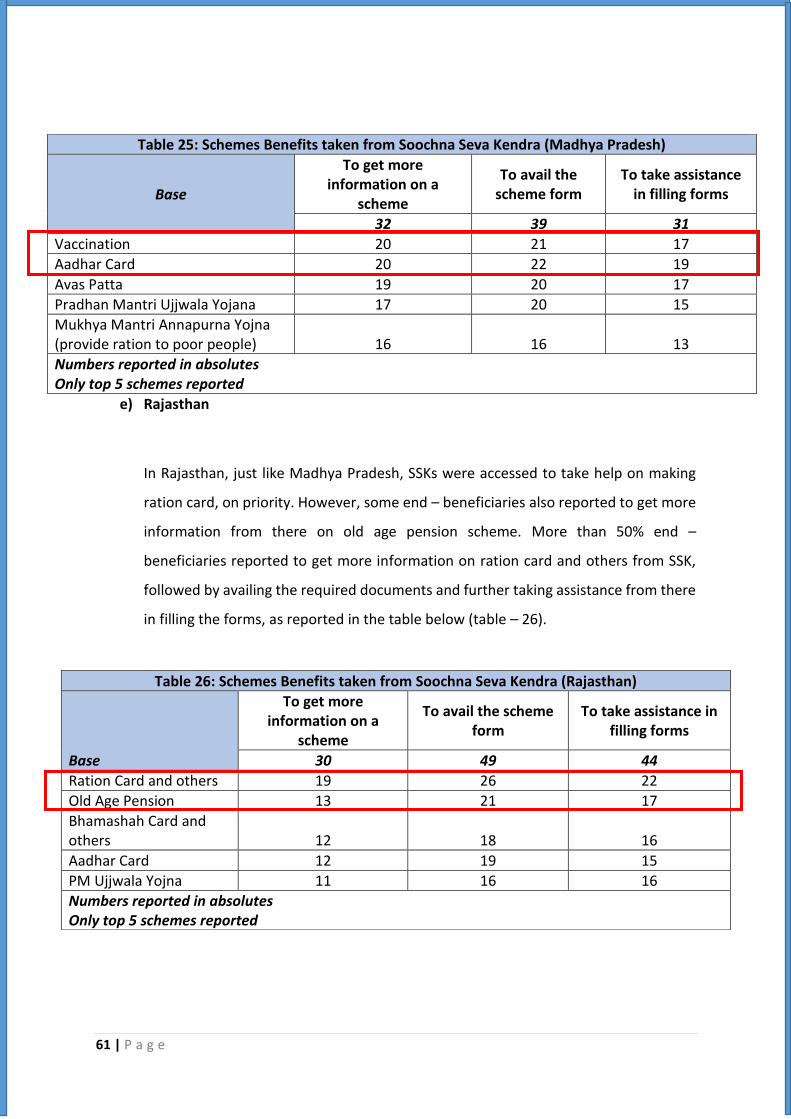
61 | P a g e
e) Rajasthan
In Rajasthan, just like Madhya Pradesh, SSKs were accessed to take help on making
ration card, on priority. However, some end – beneficiaries also reported to get more
information from there on old age pension scheme. More than 50% end –
beneficiaries reported to get more information on ration card and others from SSK,
followed by availing the required documents and further taking assistance from there
in filling the forms, as reported in the table below (table – 26).
Table 25: Schemes Benefits taken from Soochna Seva Kendra (Madhya Pradesh)
Base
To get more information on a
scheme
To avail the scheme form
To take assistance in filling forms
32 39 31
Vaccination 20 21 17
Aadhar Card 20 22 19
Avas Patta 19 20 17
Pradhan Mantri Ujjwala Yojana 17 20 15
Mukhya Mantri Annapurna Yojna (provide ration to poor people) 16 16 13
Numbers reported in absolutes Only top 5 schemes reported
Table 26: Schemes Benefits taken from Soochna Seva Kendra (Rajasthan)
Base
To get more information on a
scheme
To avail the scheme form
To take assistance in filling forms
30 49 44
Ration Card and others 19 26 22
Old Age Pension 13 21 17
Bhamashah Card and others 12 18 16
Aadhar Card 12 19 15
PM Ujjwala Yojna 11 16 16
Numbers reported in absolutes Only top 5 schemes reported

62 | P a g e
7.4.2 Number of Schemes for which Assistance Sought
This section describes the number of scheme benefits the end – beneficiaries may have
availed from the soochna seva Kendra. As reported in the chart below, little more than three-
fifths of the end – beneficiaries reported to take assistance for three or more schemes.
State wise also, end – beneficiaries reported to take assistance from Soochna Seva Kendras,
for more than three schemes. Amongst, all states, end – beneficiaries from Rajasthan
reported significantly higher proportion, who utilized more than three services from Soochna
Seva Kendra (see table – 27).
Table 27: Number of Schemes for which Assistance Sought by States
Base (n)**
States
Uttarakhand Madhya Pradesh
Bihar Jharkhand Rajasthan
21* 49 52 48 54
One 26 18 13 31 6
Two 32 16 27 23 11
Three or more 42 65 60 46 83
*Small base Numbers reported in percentages
Figure 11: Number of Schemes for which SSK accessed
18%
20%62%
Number of Schemes for which SSK accessed
One Two Three or more

63 | P a g e
7.5 Grievance Registration and Redressal
Soochna Seva Kendras, have been instrumental in registering grievances, of the end –
beneficiaries related to a public scheme. These could be related to their entitlement issues,
non – payment of subsidies or incomplete information about a scheme.
This section thus describes how many beneficiaries have been helped by SSKs, to register
grievances.
As reported in the figure – 12, close to three-fifths of the end – beneficiaries reported that
SSKs helped them to register their grievance, related to a public scheme.
Further, Soochna Seva Kendras also redress the grievances, of the end – beneficiaries, which
they may have related to a scheme, or may have with soochna seva fellow staff/their
operations. Little less than half of the end – beneficiaries reported that their grievances were
not addressed by Soochna Seva, as reported in figure – 13.
51%
49%
Grievance addressed by Soochna Seva
Yes No
Figure 13: Grievance addressed by Soochna Seva
Figure 12: SSK helped in registration of grievance
59%
41%
SSK helped in registration of grievance
Yes Non = 222
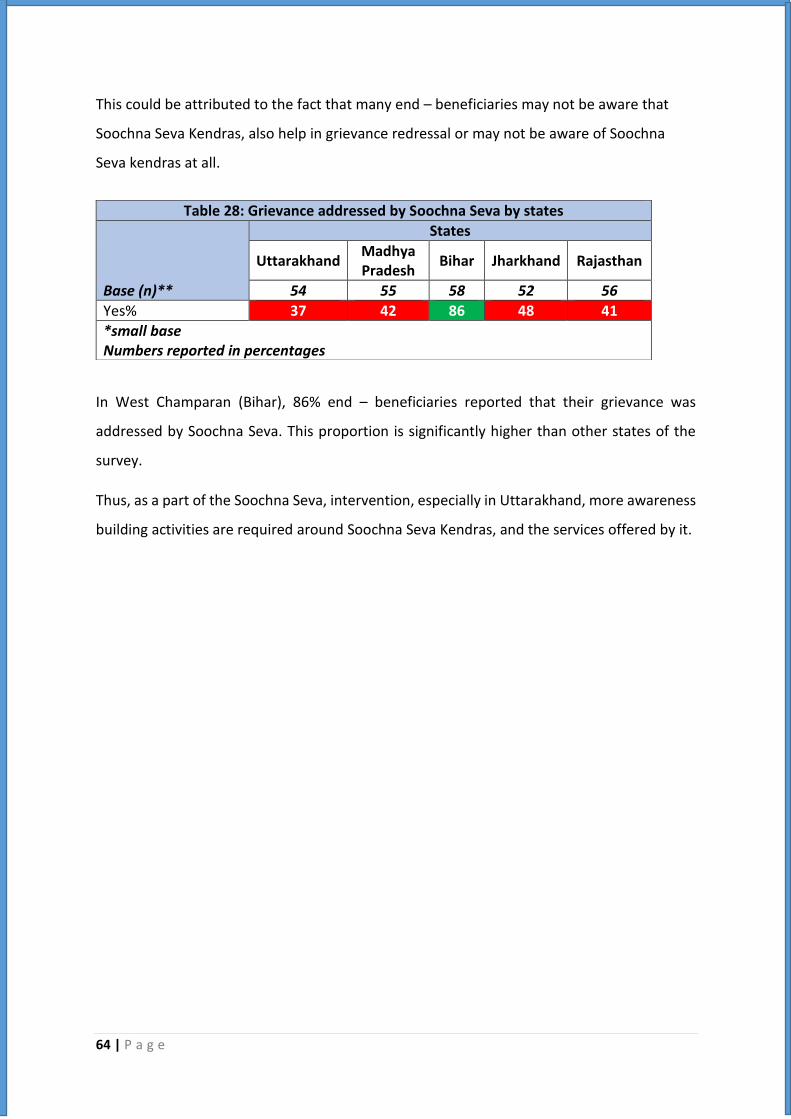
64 | P a g e
This could be attributed to the fact that many end – beneficiaries may not be aware that
Soochna Seva Kendras, also help in grievance redressal or may not be aware of Soochna
Seva kendras at all.
In West Champaran (Bihar), 86% end – beneficiaries reported that their grievance was
addressed by Soochna Seva. This proportion is significantly higher than other states of the
survey.
Thus, as a part of the Soochna Seva, intervention, especially in Uttarakhand, more awareness
building activities are required around Soochna Seva Kendras, and the services offered by it.
Table 28: Grievance addressed by Soochna Seva by states
Base (n)**
States
Uttarakhand Madhya Pradesh
Bihar Jharkhand Rajasthan
54 55 58 52 56
Yes% 37 42 86 48 41
*small base Numbers reported in percentages

65 | P a g e
Chapter – 8 Importance of Soochna Seva Services
Soochna Seva, has been an important rights based approach intervention, in bringing an
impact in the lives of people. Attributing to the intervention, many people have been able to
get entitlements, their documents made and digital literacy, which has been able to help them
participate in their own development.
This chapter, thus describes the experience of the end – beneficiaries of accessing Soochna
Seva services. Further it understands, if the end – beneficiaries have ever paid for availing
soochna seva services, average amount paid and their willingness to pay to avail soochna seva
services. To conclude, it understands, the importance of soochna seva services for the
individual and the community.
8.1 Rating of Benefits availed from Soochna Seva
This section, describes the satisfaction, expressed by the end – beneficiaries for availing
scheme benefits from soochna seva. The satisfaction rating has been taken on a scale of “1”
to “5” where “1” stands for “extremely dissatisfied” and “5” stands for “extremely satisfied”.
The parameters, on which satisfaction rating was taken are; timeliness of information,
completeness of information, accuracy of information, ease of accessing information, and
their overall experience with Soochna Seva, operations.
Importance of Soochna Seva
➢ End – beneficiaries expressed their satisfaction with Soochna Seva, on all quality
parameters of information – timeliness (92%), completeness (93%), accuracy (89%), ease
of accessing information (92%) and overall quality (85%).
➢ About 16 people reported to pay to avail the services of Soochna Seva, and the average
amount paid was INR 287.
➢ There was mixed opinion on willingness to pay to avail Soochna Seva services.

66 | P a g e
8.1.1 Timeliness of Information
Timeliness of information, refers to how quickly the information was provided to the
beneficiary, so they could take timely decision, which can have a direct impact on their life.
As reported in the table below, 92% end – beneficiaries reported their satisfaction, with
respect to timeliness of information provided by Soochna Seva. Seven out of ten end –
beneficiaries reported that the information provided to them was much before due date of
submission of application, as reported in the table below (table – 29).
State wise, significantly higher proportion of beneficiaries, from Bihar and Rajasthan (98%
each), reported to be satisfied with the timeliness of information. State wise, 85% end –
beneficiaries from Madhya Pradesh reported that they were provided information much
before the due date of submission of application.
In Jharkhand, close to 90% end – beneficiaries, reported that they were informed about the
application deadline, thus they were satisfied with the timeliness of the information provided,
as reported in the table above (table – 29).
8.1.2 Completeness of Information
Information will only be useful, if it is complete. If parts of the information are missing, then
one is not being able to make use of it or make accurate decisions. This, section thus takes
the experience rating from the end – beneficiaries for the completeness of information,
provided by Soochna Seva.
Table 29: Timeliness of Information
Base (n)**
Overall Districts
Uttarakhand Madhya Pradesh
Bihar Jharkhand Rajasthan
275 54 55 58 52 56
Timeliness of Information
Top 2 rank % 92 80 91 98 94 98
Extremely Satisfied 38 19 18 91 21 36
Satisfied 55 61 73 7 73 63
Reasons for Satisfaction Rating of Timeliness of Information
The information was provided much before the due date of submission of application
70 54 85 67 48 93
I was informed about the application deadline
49 35 51 53 88 21
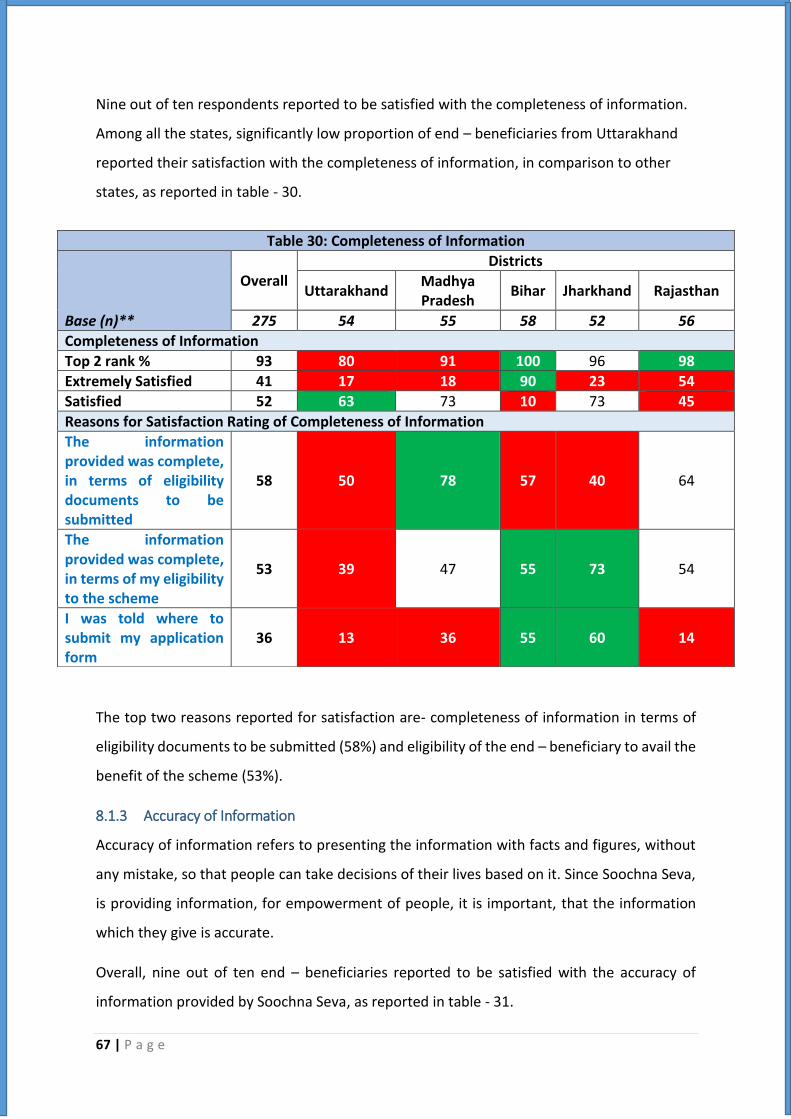
67 | P a g e
Nine out of ten respondents reported to be satisfied with the completeness of information.
Among all the states, significantly low proportion of end – beneficiaries from Uttarakhand
reported their satisfaction with the completeness of information, in comparison to other
states, as reported in table - 30.
The top two reasons reported for satisfaction are- completeness of information in terms of
eligibility documents to be submitted (58%) and eligibility of the end – beneficiary to avail the
benefit of the scheme (53%).
8.1.3 Accuracy of Information
Accuracy of information refers to presenting the information with facts and figures, without
any mistake, so that people can take decisions of their lives based on it. Since Soochna Seva,
is providing information, for empowerment of people, it is important, that the information
which they give is accurate.
Overall, nine out of ten end – beneficiaries reported to be satisfied with the accuracy of
information provided by Soochna Seva, as reported in table - 31.
Table 30: Completeness of Information
Base (n)**
Overall Districts
Uttarakhand Madhya Pradesh
Bihar Jharkhand Rajasthan
275 54 55 58 52 56
Completeness of Information
Top 2 rank % 93 80 91 100 96 98
Extremely Satisfied 41 17 18 90 23 54
Satisfied 52 63 73 10 73 45
Reasons for Satisfaction Rating of Completeness of Information
The information provided was complete, in terms of eligibility documents to be submitted
58 50 78 57 40 64
The information provided was complete, in terms of my eligibility to the scheme
53 39 47 55 73 54
I was told where to submit my application form
36 13 36 55 60 14
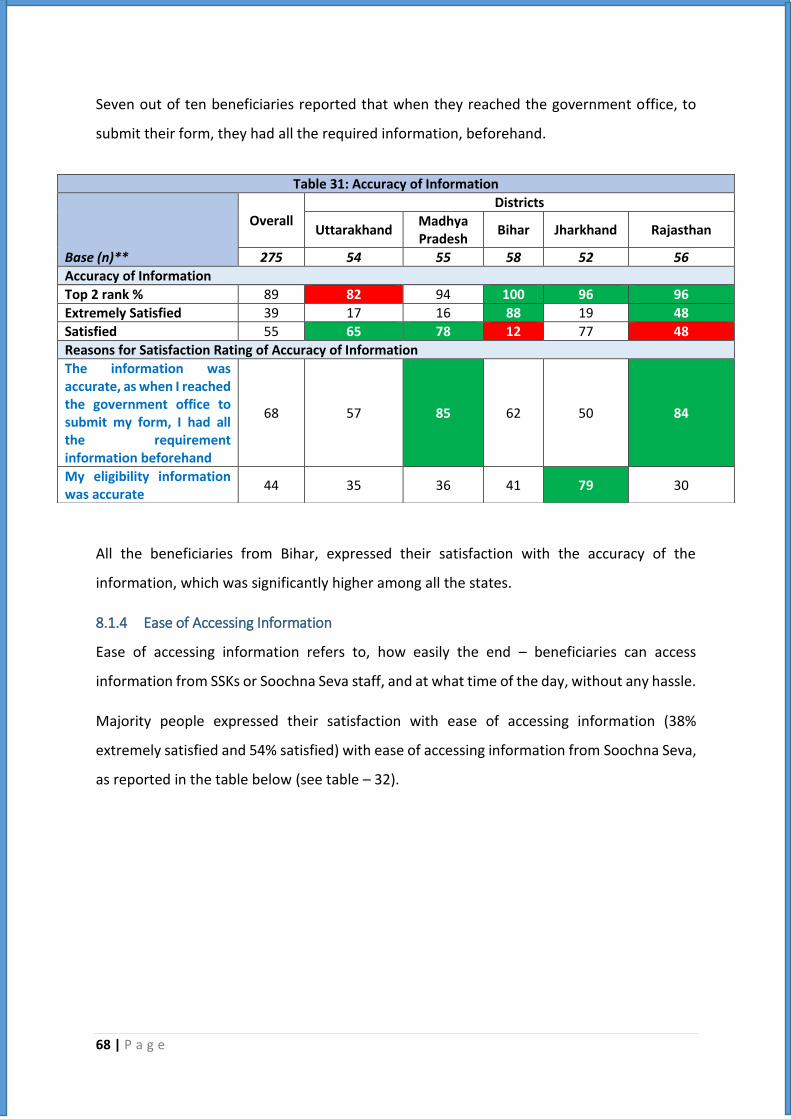
68 | P a g e
Seven out of ten beneficiaries reported that when they reached the government office, to
submit their form, they had all the required information, beforehand.
All the beneficiaries from Bihar, expressed their satisfaction with the accuracy of the
information, which was significantly higher among all the states.
8.1.4 Ease of Accessing Information
Ease of accessing information refers to, how easily the end – beneficiaries can access
information from SSKs or Soochna Seva staff, and at what time of the day, without any hassle.
Majority people expressed their satisfaction with ease of accessing information (38%
extremely satisfied and 54% satisfied) with ease of accessing information from Soochna Seva,
as reported in the table below (see table – 32).
Table 31: Accuracy of Information
Base (n)**
Overall Districts
Uttarakhand Madhya Pradesh
Bihar Jharkhand Rajasthan
275 54 55 58 52 56
Accuracy of Information
Top 2 rank % 89 82 94 100 96 96
Extremely Satisfied 39 17 16 88 19 48
Satisfied 55 65 78 12 77 48
Reasons for Satisfaction Rating of Accuracy of Information
The information was accurate, as when I reached the government office to submit my form, I had all the requirement information beforehand
68 57 85 62 50 84
My eligibility information was accurate
44 35 36 41 79 30

69 | P a g e
In Uttarakhand, 78% of respondents were reported to be satisfied with the ease of accessing
information, which was significantly lower than other states of intervention.
The prime reasons attributed to ease of accessing information were – responsible staff and
always willing to help (68%) and availability of staff at time, when the end – beneficiaries
wanted help (54%), as reported in the table above (table – 32).
Table 32: Ease of Accessing information
Base (n)**
Overall Districts
Uttarakhand Madhya Pradesh
Bihar Jharkhand Rajasthan
275 54 55 58 52 56
Accessing Information
Top 2 rank % 92 78 94 98 92 99
Extremely Satisfied 38 17 16 84 15 54
Satisfied 54 61 78 14 77 45
Reasons for Satisfaction Rating of Ease of accessing Information
The staff was responsible and was willing to help
68 50 80 71 54 84
The staff was available at any time, we went for help
54 48 53 48 87 38

70 | P a g e
8.1.5 Overall Experience
The overall experience of the end – beneficiaries was satisfying (33% extremely
satisfied and 52% satisfied). More than three-fifths of the end – beneficiaries were
reportedly satisfied because they could avail benefits of the schemes, for which they
were eligible.
In Rajasthan 96% end- beneficiaries were satisfied with their overall experience with Soochna
Seva, which is significantly higher than Uttarakhand and Bihar, where 87% and 61%, end
beneficiaries, respectively reported their satisfaction, as reported in table – 33.
Table 33: Overall experience with Soochna Seva
Base (n)**
Overall Districts
Uttarakhand Madhya Pradesh
Bihar Jharkhand Rajasthan
275 54 55 58 52 56
Overall Experience
Top 2 rank % 85 87 93 61 94 96
Extremely Satisfied 33 24 18 47 21 55
Satisfied 52 63 75 14 73 41
Reasons for Satisfaction Rating of Ease of accessing Information
My overall experience is satisfactory, because I could avail benefits of the schemes, for which I was eligible
63 69 80 24 58 88
Sochna seva was helpful to me, because I got the intended benefits
46 33 53 45 87 14

71 | P a g e
8.2 Ever paid for Sochna Seva Services
While Soochna Seva services, were largely free, it is important to understand, whether end –
beneficiaries, to avail any service paid to avail its services.
This section, understands, if any end – beneficiary paid to avail the services, and if yes, then
how much.
Overall, 6% end – beneficiaries reported to pay to avail Soochna Seva services, of which 11%
were from Madhya Pradesh (Guna district) and 12% from Jharkhand (Ranchi district), which
is significantly higher than Uttarakhand, where none of the respondents reported to pay to
avail Soochna Seva services (as reported in table – 34). However, it would be worth to make
two points here; a) the awareness about Soochna Seva is very low in Uttarakhand, hence the
values may not be comparable; b) further, it would be interesting to understand, for which
services did the end – beneficiaries pay and to whom.
Analysing the data by income levels, 11 out of 171 end – beneficiaries, who had income less
than 5,000 reported to pay some amount to avail the services of Soochna Seva. Two out of
five respondents, whose income was in the range of INR 15,000-20,000 also reported to pay
to avail services of Soochna Seva.
Here, it must be noted that the payment of services and revenue generated towards running
the centres on sustainability mode were discarded in mid and later part of the project period.
However, as it has been shared by the project team that the sustainability mode of running
the community facilities of Soochna Seva has now being rolled out in a post project period
Table 34: Ever Paid for Soochna Seva Services
Base (n)**
Overall Districts
Uttarakhand Madhya Pradesh
Bihar Jharkhand Rajasthan
275 54 55 58 52 56
Yes%
Only those paid for Sochna Seva Services
6 0 11 3 12 4
Ever paid for Sochna Seva Services by monthly household income
Base (n)
Monthly Household Income (in INR)
0-5,000 5001-10,000 10,001-15,000 15,001-20,000 More than 20,000
171 76 6 5 7
Yes% 6 1 17 40 0
*Numbers reported in percentages

72 | P a g e
situation. The Soochna Mitras / Soochnapreneurs are now being trained on an
entrepreneurship mode to run the services for the benefit of the community. And, DEF would
continue to oversee and monitor the facilities.
8.3 Amount Paid to avail Soochna Seva Services
Those who reported to ever pay, to avail the services of Soochna Seva, were asked how much
did they pay.
Out of 16 end-beneficiaries who reported to pay, 7 of them reported to pay upto Rs. 50,
while 7 of them reported to pay Rs. 500 and above, to avail the services of Soochna Seva.
The average amount paid to avail the services accounts to INR 287, as reported in the table
below (table – 35).
State wise, three end – beneficiaries each from Madhya Pradesh (Guna), Bihar (West
Champaran) and Jharkhand (Ranchi) reported to pay Rs. 500 and above to avail the services
of Soochna Seva. However, the average amount paid differs for each of these states. Among
them, end – beneficiaries in Madhya Pradesh, reported to INR 367, which is the highest, to
avail the services of Soochna Seva.
Though not captured during this survey, it would be interesting to understand, for which
services did they pay, and which services costed them to pay Rs. 500 and above.
Table 35: Amount paid for availing Soocha Seva Services (in INR)
Base (n)**
Overall States
Uttarakhand Madhya Pradesh Bihar Jharkhand Rajasthan
16 0 6 2 6 2
Amount Paid for Soochna Seva Services (in INR)
Upto Rs. 50 7 0 2 3 2 2
100-150 2 0 1 0 1 0
500 and above 7 0 3 3 3 0
Average amount paid 287 0 367 260 304 25
** Only those respondents who paid for availing Soochna Seva services *Numbers reported in absolutes, due to low base

73 | P a g e
8.4 Willingness to pay for Soochna Seva Services
About 94% end – beneficiaries did not pay anything to avail the soochna seva services, while
6% of them did pay, to avail the services.
But all of them were asked, if Soochna Seva starts charging for its services, were they willing
to pay. Mixed responses were received, where three out of five respondents expressed their
willingness to pay to avail Soochna Seva services and three out of ten expressed their
unwillingness to pay, as reported in the graph below (figure - 14).
Figure 14: Willingness to pay for Soochna Seva Services
End – beneficiaries in Rajasthan (84%) and Bihar 981%) are willing to pay for Soochna Seva
services, which is significantly higher than other states, of intervention, as reported in the
table below (see table – 36).
When probed for reasons, for unwillingness to pay, the end – beneficiaries cited their lower
income status. They further stated that information related to government schemes should
18%
41%
11% 9%21%
0
20
40
60
80
100
Extremely Willing Willing Neither willing norunwilling
Unwilling Extremelyunwilling
Willingess to pay for Soochna Services
Table 36: Willingness to Pay for Soochna Seva Services by states
Base (n)**
States
Uttarakhand Madhya Pradesh
Bihar Jharkhand Rajasthan
54 55 58 52 56
Top 2 Box % 42 64 81 20 84
Extremely Willing 9 2 40 8 30
Willing 33 62 41 12 54
Numbers reported in absolutes, due to low base

74 | P a g e
be provided for free. While the willingness reasons accounted for, if work done, they can
consider paying and soochna seva has been a great help in getting entitlements, thus can
consider paying.
8.5 Importance fo Soochna Seva Services
Soochna Seva services has proved to be an important platform, for citizens, to access and
deliver rights, entitlements, related to government services. Not only this, it has also helped
the end – beneficiaries to register their grievances, related to public schemes.
While, this has been achieved, more or less, it is also important to understand from the end
– beneficiaries how important do they perceive these services, which can lay a platform, for
its continuity. This section describes the importance of soochna seva.
As reported in the figure-15, 97% end – beneficiaries, stated that Soochna Seva services is
important for them (51% important and 46% extremely important).
Table 37: Importance of Soochna Seva Services (by States)
Base (n)**
States
Uttarakhand
Madhya Pradesh
Bihar Jharkhand Rajasthan
54 55 58 52 56
Top 2 Box % 93 98 100 100 96
Extremely Important 22 49 91 33 32
Important 70 49 9 67 64
Numbers reported in absolutes, due to low base
46% 51%
2% 0 00
20406080
100
Extremelyimportant
Important Neitherimportant norunimportant
Not important Not at allimportant
Importance of Soochna Seva Services
Figure 15: Importance of Soochna Seva Services

75 | P a g e
State wise, all the beneficiaries in Bihar and Jharkhand reported that the services of Soochna
are important for them, which is significantly higher by 7% in Uttarakhand, as reported in
table – 38 (see table above)
The top two reasons cited for the importance of Soochna Seva services were that the
individual/the community members have benefitted from the information provided (65%)
and the authenticity of the information (62%).
Thus, it can be concluded, that Socohna Seva has been a change - maker, and has been able to
bring a change in the lives of people. The end – beneficiaries look for a continued support from
Soochna Seva.

76 | P a g e
RECOMMENDATIONS
77 | P a g e
Recommendations for further strategy development
1. Community Outreach & Awareness: A program is successful, if the participants know
about it and are able to understand how will it help them in their development.
Programmes, like these, should first focus on sensitizing the masses about the
program, its duration of implementation, the infrastructure available and the staff
involved. Further, how can such a program benefit them, and form a path for their
development. This can in the long run, also ensure community involvement in
sustainability of the project, even after the external support is withdrawn.
2. Gender Inclusion: Soochna Seva, has been one such project, which has worked for and
with both genders. However, the reach to women has been limited. The percentage
of females who are aware of Soochna Seva, is significantly lesser than males. Such a
project should reach out to equal proportion of females in comparison to men, to
understand their needs and guide them to their empowerment. This can be done, by
deploying trained female staff, who can build rapport with women and work with
them.
3. Digital Literacy on Smartphones: Since the government is getting into the mode of e-
governance, it is imperative for such projects to empower the masses with digital
literacy. Such classes should aim to reach out to all masses and should be conducted
at frequent intervals. Also, these trainings can beyond usage of computers and
laptops, to smartphones, with internet, so that masses with limited facilities can still
avail the benefits of the government schemes.
4. Training and Capacity Building: A project like this requires regular and customised
training with value additions time to time. The Soochna Mitras and Soochnapreneurs
require regular engagement on their works, their learning and experiences and then
again feed into their capacity building. Regular trainings should be provided to
Soochna Seva staff, for interpersonal communication, community mobilization and
stakeholder relationship management. The idea of engaging relevant and active local
beneficiaries of the project as end Soochnapreneurs to further reach out to the
community is a positive and relevant step.

78 | P a g e
5. Sustainability of the Operations: In order to sustain the operations, Soochna Seva can
now start charging for services in providing information, facilitation, digital services
and for digital literacy classes; the charges can be decided by the community time to
time with DEF support; It has to be strictly ensured that the Soochnapreneurs do not
deviate and charge for services in an unreasonable and unaffordable manner. Further,
the Soochnapreneurs can be facilitated to get affiliations from various services
providers like the Common Services Centre (CSC) of the Government and various other
State governments and private service affiliations to provide services to communities
at door steps. Banking and educational services could be other possibilities.
6. Replication and Scaling up of Soochna Seva Framework: In places where Soochna
Seva Kendras have not been established, infrastructure like anganwadi center,
Panchayat meeting halls, and other local government infrastructure can be utilized
and can be used as SSKs. Awareness generation activities should be taken into
consideration, to sensitize the masses about SSKs, and the services available there.
They can tie up with community health workers, sarpanch and other opinion leaders,
who in their weekly meetings/household visit, can inform the community members
about SSKs. It is recommended that the Soochna Seva Framework be replicated and
scaled up in new locations and geographies in a public private partnership mode with
incorporating key learning and experiences from the Soochna Seva project
interventions. Already, there are trends visible as it has been shared with the
evaluation team including the NGO / CSO partnerships taking place with DEF to
replicate the SSK framework on a technical collaboration mode. Also, it is suggested
that if some of the active and dynamic end beneficiaries wants to be part of the
Soochna Seva services network, they could be identified, trained and taken on board
to start the SSK work in their localities under DEF supervision and guidance.

79 | P a g e
Top Related
Copyright © 2022 FDOKUMEN

