


Bahasa
Halaman
Hukum


DaltonTransactions
Dynamic Article Links
Cite this: Dalton Trans., 2011, 40, 472
www.rsc.org/dalton PAPER
DNA binding selectivity of oligopyridine-ruthenium(II)-lysine conjugate†
Katelitsa Triantafillidi,a Konstantina Karidi,a Olga Novakova,b Jaroslav Malinab and Achilleas Garoufis*a
Received 26th May 2010, Accepted 10th October 2010DOI: 10.1039/c0dt00554a
The synthesis, characterization and DNA binding properties of the complex[Ru(terpy)(4,4¢-(COLysCONH2)2bpy)Cl]3+ (1) have been studied. Complex (1) hydrolyzes to (2) with acalculated rate constant Kh = 2.35 ± 0.08 ¥ 10-4 s-1 and binds coordinatively to ct-DNA, with asaturation r-value at about 0.1. Stabilization of the ct-DNA helix at low electrolyte (NaClO4)concentration (10 mM) and destabilization at higher electrolyte concentrations (50–200 mM) wasobserved. Circular dichroism studies indicate that the hydrolyzed complex binds to DNA, increasingthe unwinding of the DNA helix with an unwinding angle calculated as U = 12 ± 2◦. The positive LDsignal observed at 350 nm indicates some kind of specificity in complex orientation towards the globalDNA axis. Complex (2) binds specifically to G4 on the central part of the oligonucleotide duplexesd(CGCGCG)2 and d(GTCGAC)2, as evidenced by NMR spectroscopy. Both lysine moieties werefound to interact most likely electrostatically with the DNA phosphates, assisting the coordinativebinding and increasing the DNA affinity of the complex. Photoinduced DNA cleavage by (2), uponUVA irradiation was observed, but despite its relative high DNA affinity, it was incomplete (~12%).
1. Introduction
The several side effects of cisplatin in cancer chemotherapy haveled in the development of metal-based antitumor agents with metalions other than platinum.1–5 Among them, ruthenium compoundsNAMI-A and KP1019 have shown the most promising resultsin preclinical and clinical trials.6,7 Organometallic Ru(II)-arenecompounds have stimulated an enormous research interest inthe last few years, due to the significant anticancer activitythey exhibit.8–13 In these complexes, the arene ring occupiesthree coordination sites, a diamine or other bidentate ligandoccupies two more sites, while a chloride occupies the remainingsite in a pseudo-octahedral “piano-stool” geometry. Hydrolysisof the above complexes produces aquated species, which aremore active with biological targets.14 These complexes havebeen reported to form strong adducts with DNA, acting bothcoordinatively through the ruthenium center and non-covalentlythrough hydrophobic interactions of the arene moiety with DNAbases.9 In contrast, similar octahedral ruthenium oligopyridinecomplexes, involving only one available coordination site (e.g.[Ru(trpy)(bpy)(H2O)]2+),15 have been reported to have relativelylow DNA affinity. However, this affinity is increased with modifica-tions of their ligands, which contribute the binding with additionalinteractions.15–17
aLaboratory of Inorganic Chemistry, Department of Chemistry, Universityof Ioannina, Ioannina, 45210, Greece. E-mail: [email protected]; Fax: +3026510 98786; Tel: +30 26510 98409bInstitute of Biophysics, Academy of Sciences of the Czech Republic, v.v.i.,Kralovopolska 135, CZ-61265, Brno, Czech Republic† Electronic supplementary information (ESI) available: Experimentaldetails. See DOI: 10.1039/c0dt00554a
Attempts to improve the DNA affinity of the oligo and polypyri-dine ruthenium complexes by tethering peptides 18–25 or aminoacids 26,27 to ruthenium ligands have been reported. However, onlythe complex [Ru(terpy)(4-CO-(GHK)4¢-Mebpy)Cl]+ (GHK = Gly-His-Lys) has the ability to bind coordinatively to DNA.25 In thiscase the binding is assisted by further interactions of the tetheredpeptide with the DNA molecule (only for the positional isomer Iof the complex), as evidenced from 31P NMR spectroscopy.
Herein, we aim to design and synthesise a complex similarto [Ru(terpy)(4-CO-(GHK)4¢-Mebpy)Cl]+, with the ligand 4,4¢-(COLysCONH2)2bpy, which involves two symmetrically conju-gated lysine moieties in both pyridine rings of bpy. The complexis designed to be able to bind coordinatively to the DNA bases,while the conjugated lysines could offer additional interactionswith the helix. The geometry of the complex allows amino-acidDNA interactions, since one of the two pyridine rings of ligand4,4¢-(COLysCONH2)2bpy, is close to the binding site. Also, theprepared complex [Ru(terpy)(4,4¢-(COLysCONH2)2bpy)Cl]3+ (1)is an alternative proposal to study synergistic interactions, otherthan intercalation, between ligands and DNA, in cases wherecomplexes are bound coordinatively to DNA. Electrostatic orother interactions with DNA, originated from ligands of complex(1), were studied in detail, in the basis of understanding the roleof the conjugated amino acids.
2. Experimental
2.1. Materials
2,2¢:6¢,2¢¢-Terpyridine was purchased from Aldrich ChemicalCompany and used without further purification. Hydrated
472 | Dalton Trans., 2011, 40, 472–483 This journal is © The Royal Society of Chemistry 2011
Dow
nloa
ded
by U
NIV
ER
SIT
Y O
F IO
AN
NIN
A o
n 13
Sep
tem
ber
2012
Publ
ishe
d on
26
Nov
embe
r 20
10 o
n ht
tp://
pubs
.rsc
.org
| do
i:10.
1039
/C0D
T00
554A
View Online / Journal Homepage / Table of Contents for this issue

ruthenium trichloride, RuCl3·3H2O, was purchased from PressureChemical Company (Pittsburgh, USA). Calf thymus DNA (ct-DNA 42% G + C, mean molecular mass 2 ¥107 D), agarose, ethid-ium bromide and PIPES (piperazine N,N¢-bis(2-ethanesulfonicacid)) were purchased from Sigma Chemical Company. PlasmidspUC19 (2686 bp) and pSP73KB (2455 bp) were isolated accordingto standard procedures. The deoxynucleotides d(5¢-CGCGCG-3¢)2 and d(5¢-GTCGAC-3¢)2 were purchased from Oswel DNA(University of Southampton U.K.) and purified by chromatog-raphy on a 120 ¥ 2.5 cm Sephadex G-25 superfine column.23
Oligonucleotide concentrations were quantified by measuringthe absorbance at 260 nm as previously reported.28 The Fmoc-protected Rink Amide resin (TentaGel S RAM) for the amino acidimmobilization and the protected amino acid Fmoc-Lys-(Boc)-OH were purchased from Rapp Polymere Ltd and CBL PatrasLtd respectively. All solvents were of analytical grade and wereused without further purification. The complex Ru(terpy)Cl3
29
and the ligand bpy¢ = 4,4¢-(CO LysCONH2)2bpy,26 were preparedaccording to the literature methods.
2.2. Synthesis
2.2.1. Synthesis of the [Ru(terpy)(4,4¢-(COLysCONH2)2bpy)-Cl]Cl3, (1). 300 mg (0.08 mmol) of the resin bound ligand 4,4¢-(COLysCONH2)2bpy (substitution 0.26 mmol g-1), was refluxedwith 175 mg (0.40 mmol) Ru(terpy)Cl3 in 8 mL of DMF/EtOH(3 : 1) for 8 h, under argon. After filtering, the resin with theimmobilized complex was carefully washed with DMF (5 ¥ 3 mL)and CH2Cl2 (3 ¥ 3 mL). The cleavage of the complex and theprotecting groups from the resin was achieved using 5 mL ofTFA/H2O (95/5, v/v). The crude product was precipitated by theaddition of 50 mL diethyl ether and cooling at 7 ◦C overnight. Thered-brown precipitate was filtered, dissolved in 1 mL of methanoland added to a saturated aqueous solution of NH4PF6 and thecomplex was precipitated as [PF6]- salt. Transformation to its [Cl]-
salt was obtained by dissolving the complex in a minimum amountof acetone and precipitated from a saturated acetonic solution ofLiCl. Finally, the complex was purified by reverse-phase HPLCon a Dionex chromatograph, with a Waters C18 column. Yield:~40%. Anal. Calcd. for C39H47N11O4Cl4Ru; C, 47.9; H, 4.8; N,15.8%, Found: C, 47.6; H, 4.9; N, 15.6%. ESI-MS: m/z = 290[Ru(terpy)(4,4¢-(COLysCONH2)2bpy)Cl]3+; 453, {[Ru(terpy)(4,4¢-(COLysCONH2)2 bpy)Cl]Cl}2+. 1H NMR (400.14 MHz, CD3OD,310 K, d in ppm); d = 10.33 (d, 1H, bpyH6), 9.30 (s, 1H, bpyH3),9.03 (s, 1H, bpyH3¢), 8.68 (d, 2H, terpyH3¢¢H5¢¢), 8.53 (d, 2H,terpyH6H6¢), 8.40 (d, 1H, bpyH5), 8.23 (t, 1H, terpyH4¢¢), 7.95 (t,2H, terpyH5H5¢), 7.63 (d, 2H, terpyH3H3¢), 7.62 (d, 1H, bpyH6¢),7.43 (d, 1H, bpyH5¢), 7.32 (t, 2H, terpyH4H4¢), 4.74 (d, 1H,LysHa), 4.54 (d, 1H, Lys¢Ha), 3.00 (d, 2H, LysHe), 2.96 (d, 2H,Lys¢He), 2.08 (m, 2H, LysHb), 1.92 (m, 2H, Lys¢Hb), 1.81 (m, 2H,LysHd ), 1.71 (m, 2H, Lys¢Hd ), 1.49 (m, 2H, LysHg ), 1.49 (m, 2H,Lys¢Hg ). UV-Vis (in MeOH); 278 nm (e = 25 ¥ 103 M-1 cm-1),319 nm (e = 28¥ 103 M-1 cm-1), 492 nm (e = 5 ¥ 102 M-1 cm-1), KM =240 ohm-1 cm2 mol-1.
2.2.2. [Ru(terpy)(4,4¢¢ - (COLysCONH2)2 bpy)(H2O)]Cl4,(2).The complex (2) was achieved from hydrolysis of (1) in bufferphosphates solutions. ESI-MS: m/z = 462, {[Ru(terpy)(4,4¢-(COLysCONH2)2bpy)H2O]Cl2}2+. 1H NMR (400.14 MHz, D2Obuffer phosphates 50 mM, pH = 7.0, 298 K, d in ppm); d = 9.73
(d, 1H, bpyH6), 9.12 (s, 1H, bpyH3), 8.77 (s, 1H, bpyH3¢), 8.60(d, 2H, terpyH3¢¢H5¢¢), 8.46 (d, 2H, terpyH6H6¢), 8.37 (d, 1H,bpyH6¢), 8.29 (t, 1H, terpyH4¢¢), 7.98 (t, 2H, terpyH5H5¢), 7.58(d, 1H, bpyH5), 6.97 (d, 1H, bpyH5¢), 7.72 (d, 2H, terpyH3H3¢),7.32 (t, 2H, terpyH4H4¢), 4.63 (d, 1H, LysHa), 4.42 (d, 1H,Lys¢Ha), 3.17 (d, 2H, LysHe), 3.04 (d, 2H, Lys¢He), 2.06 (m, 2H,LysHb), 1.85 (m, 2H, Lys¢Hb), 1.73 (m, 2H, Lys¢Hd ), 1.59 (m,2H, LysHd ), 1.43 (m, 2H, LysHg ), 1.43 (m, 2H, Lys¢Hg ), UV-Vis(aqueous buffer phosphates 50 mM, pH = 7.0); 274 nm (e = 23 ¥103 M-1 cm-1), 314 nm (e = 27¥ 103 M-1 cm-1), 480 nm (e = 4 ¥102 M-1 cm-1).
2.3. Physical measurements
2.3.1. General methods. C, H and N determinations wereperformed on a Perkin-Elmer 2400 Series II analyser. The con-ductivity measurements were performed in an E365B Conducto-scope, Metrohm Ltd., Herisau, Switzerland. The infrared spectrawere recorded on a Perkin-Elmer GX-FT IR spectrophotometerusing the diffuse reflectance technique. High performance liquidchromatography was used for the purification of the complexesusing a DIONEX chromatographic system and a Waters C18column. Electrospray ionisation mass spectra (ESI-MS) wereobtained on an Agilent Technology LC/MSD trap SL instrument.Absorption spectra were measured in a Beckmann DU-7400spectrophotometer. FAAS measurements were carried out on aVarian AA240Z Zeeman spectrometer equipped with a GTA 120graphite tube. CD and LD spectra were recorded on a Jasco J-720 in a 1-cm path length cuvette for the region 600–220 nm. Theirradiation of the solutions was carried out in a photoreactor LZC-ICH2 with a UVA lamp (4.3 mW cm-2; lmax = 350 nm). For theelectrophoretic mobility assay, the samples were analysed by gelelectrophoresis on 1% (w/v) agarose gel. The gels were stained withEtBr and photographed with a transluminator. The PAA gels werevisualized by using a BAS 2500. The DNA concentration ([DNA]),expressed as moles of nucleotides per litre, was determined fromthe absorbance at 260 nm (e260 = 6600 M-1cm-1, T = 298 K).
2.3.2. NMR analysis. NMR spectra were recorded onBruker Avance spectrometers operating at proton frequencies of400 and 500 MHz and were processed using Topspin 1.3 (BrukerAnalytik GmbH). The spectra of the complex were recorded inCD3OD or in D2O (50 mM phosphate buffer, pH = 7.0, 298 or310 K). The spectra of complex added to the oligonucleotideat increasing ratios were recorded at H2O/D2O (9 : 1) or D2O(99.96%) (50 mM phosphate buffer, pH 7.0, 298 K). Chemicalshifts are referenced to the HOD signal at 4.75 ppm. One-dimensional spectra were recorded for samples with oligonu-cleotide concentration of approximately 50 OD260 units, while2D NMR experiments were performed with more concentratedsamples (ca. 200 OD260).
2.3.3. DNA melting. Thermal denaturation experimentswere performed in quartz cuvettes. Samples were continuouslybeing heated, with a 0.5 ◦C min-1 rate of temperature increasewhile monitoring the absorbance changes at 260 nm, in a VarianCary 4000 instrument. The investigated interval of temperatureranged from 25 to 98 ◦C. Values for melting temperatures (Tm)and for the melting interval (DTm) were determined according tothe reported procedures.30
This journal is © The Royal Society of Chemistry 2011 Dalton Trans., 2011, 40, 472–483 | 473
Dow
nloa
ded
by U
NIV
ER
SIT
Y O
F IO
AN
NIN
A o
n 13
Sep
tem
ber
2012
Publ
ishe
d on
26
Nov
embe
r 20
10 o
n ht
tp://
pubs
.rsc
.org
| do
i:10.
1039
/C0D
T00
554A
View Online

2.3.4. DNA transcription by RNA polymerase in vitro. Tran-scription of the (NdeI/HpaI) restriction fragment of pSP73KBDNA with T7 RNA polymerase and electrophoretic analysis oftranscripts were performed according to the protocols recom-mended by Promega 31 and previously described in detail.32,33
Before the aliquots containing the transcripts were loaded onthe PAA gel, the radioactivity associated with these samples wasadjusted so that equal amounts of the radioactivity were loadedinto each well.
2.3.5. Unwinding of negatively supercoiled DNA. Unwindingof closed circular supercoiled pUC19 plasmid DNA was assayedby an agarose gel mobility shift assay.34 The unwinding angleU induced per ruthenium-DNA adduct was calculated upondetermination of the r value in which complete transformationof the supercoiled to the relaxed form of the plasmid was attained.A sample of pUC 19 plasmide DNA was incubated with theruthenium complex for 48 h, precipitated by ethanol and dissolvedin TAE buffer. An aliquot of the precipitated sample was subjectedto electrophoresis on 1% native agarose gel running at 25 ◦C inthe dark. The other aliquot was used for the determination of ther-values by FAAS .
2.3.6. Hydrolysis of the complex (1). The hydrolysis of com-plex (1) to (2) was monitored by 1H NMR spectroscopy at310 K in buffer phosphate solution (50 mM, pH = 7.0) andwas processed using TOPSPIN 1.3 (Bruker Analytik GmbH).The initial concentration of (1) was 2 mM and the spectrumwas recorded at cycles of 10 min. Integrating selected protonsignals of (1) and the hydrolyzed product (2), relative to (TMS)as an internal standard, gave their time depended concentrations.The equilibrium concentration Ceq of complex (1) was calculated(0.18 mM) from the plot of concentration of (1) vs. time, at t•.The graph of ln((C0 - Ceq)/(Ct - Ceq) vs. t, where C0 is the initialconcentration of (1) and Ct is the concentration of (1) at a giventime, provide a linear plot for at least the first hours of the reaction.The rate constant kh was determined by linear fitting of the graphtraces according to equation:
ln((C0 - Ceq)/(Ct - Ceq) = (C0/Ceq)kht.
2.3.7. ct-DNA binding kinetics. A solution of complex (1)(0.032 mM) in buffer phosphates (50 mM, pH = 7.0) was addedto a solution of ct-DNA (0.32 mM) (buffer phosphate 50 mM,pH = 7.0) at ratio 1/10. During the reaction time, aliquots of thereaction mixture were withdrawn and the reaction was stoppedby cooling at -30 ◦C. The DNA was then precipitated by theaddition of ethanol and centrifugation. Determination of the freeruthenium complex and DNA in the supernatant was obtained byatomic absorption spectroscopy (FAAS) and by UV-spectroscopy(A260), respectively.35
3. Results and discussion
3.1. Synthesis and characterization of[Ru(terpy)(4,4¢-(COLysCONH2)2 bpy)Cl]Cl3
The resin bound ligand 4,4¢-(COLysCONH2)2bpy reacted with thecomplex Ru(terpy)Cl3 through solid phase method to produce theimmobilized complex (1). This method has advantages over theliquid synthesis method eliminating the most of byproducts. The
use of DMF as component of the reaction solvent was proposed forthe resin unwrapping.25 The elemental analyses and mass spectra(ESI-MS) of the prepared compounds were found to be consistentwith the identified formula. Moreover, the molar conductivityvalue of (1) (Km = 240 ohm-1 cm2 mol-1) corresponds to 1 : 3electrolyte, indicating that the terminal amino groups of the lysinemoieties are most likely protonated. The solid phase syntheticmethod is presented in Fig. 1.
Fig. 1 Procedure of solid phase synthesis of the complex[Ru(terpy)(4,4¢-(CO LysCONH2)2bpy)Cl]Cl3.
The electronic spectrum of (1) in methanol exhibits two intensebands at 278 nm (e = 25 ¥ 103 M-1 cm-1) and 319 nm (e = 28¥103 M-1 cm-1), as well as a band of lower energy at 492 nm(e = 5 ¥ 102 M-1 cm-1). The high-energy bands at 278 and319 nm are assigned to intraligand p → p* transitions (e.g.p(terpy) → p*(terpy), p(4,4¢-(COLysCONH2)2 bpy)→ p*(4,4¢-(COLysCONH2)2bpy). The low-energy band at 492 nm is at-tributed to dp(Ru) → p*(COLysCONH2)2bpy) and dp(Ru) →p*(terpy) MLCT transitions.36 1H NMR spectra of (1) wererecorded at 298 K in MeOH-d4. Assignments of the resonanceswere assisted by homonuclear 1H–1H COSY and 1H–1H TOCSYexperiments. In the spectra of the complex (1) in MeOH-d4 onlyone set of terpy proton signals were observed, while separatedproton resonances of each of the two pyridine moieties of theligand 4,4¢-(COLysCONH2)2bpy appeared. Since both pyridinerings are chemically equivalent in the free ligand, the differencesin the electron density environment of their protons probably arisesfrom the placement of one pyridine ring over the terpy aromaticsystem and the other close to the coordinated chlorine. The higherdownfield signal at 10.33 ppm is assigned to the H6 neighboringto chlorine.37 Using the scalar couplings from the 1H–1H TOCSYprotons H3 and H5 were also assigned. The H6¢ resonance wasobserved at 7.62 ppm due to a strong shielding effect from theterpy aromatic ring system (Fig. 2).
3.2. Hydrolysis of complex (1)
Since the DNA binding of metal-based drugs containing chloro-ligands presupposes the hydrolysis of the M–Cl bonds, the kineticof chloro-ligand replacement with a water molecule in complex (1)
474 | Dalton Trans., 2011, 40, 472–483 This journal is © The Royal Society of Chemistry 2011
Dow
nloa
ded
by U
NIV
ER
SIT
Y O
F IO
AN
NIN
A o
n 13
Sep
tem
ber
2012
Publ
ishe
d on
26
Nov
embe
r 20
10 o
n ht
tp://
pubs
.rsc
.org
| do
i:10.
1039
/C0D
T00
554A
View Online

Fig. 2 Aromatic region (10.50–6.00 ppm) of 400 MHz 1H1H COSYspectrum of complex [Ru(terpy)(4,4¢-(COLysCONH2)2bpy)Cl]Cl3 inMeOH-d4 at 310 K, with schematic illustrating of the complex structure.
was studied in aqueous buffer phosphate solution (50 mM, pH =7.0) by 1H NMR spectroscopy at 310 K. In the spectrum of afreshly prepared solution of (1), double resonances were observedfor protons H6 and H5 of the one-pyridine ring of the ligand(COLysCONH2)2bpy, while the other signals of the spectrum wereslightly broadened. Over a time period of 15 h the hydrolysisreaction was completed, producing an almost clear spectrumof the complex [Ru(terpy)(4,4¢-(COLysCONH2)2bpy)(H2O)]4+
(2). Significant upfield shifts were observed for protons H6(d = 9.73 ppm) and H5 (d = 7.60 ppm), confirming the strongdeshielding effect of the chlorine to the neighboring pyridine ringin comparison with the H2O (Fig.S1, ESI†).
The hydrolytic process follows pseudo-first-order kinetics(Fig. 3) during the first hours of incubation, with a calculated rateconstant kh = 2.35 ± 0.08 ¥ 10-4 s-1, (R2 = 0.997) and t1/2 = 49 min.(see 2.3.6). This value is one order of magnitude lower than that ofthe bifunctional antitumor compound [Ru(h6-p-cymene)(pta)Cl2](pta = 1,3,5-triaza-7-phosphatricyclo[3.3.1.1]decane) 38 (3.33 ±0.02 ¥ 10-3 s-1 at 150 mM NaClO4, 298 K),39 indicatingthat complex (1) hydrolyzes significantly slower than [Ru(h6-p-cymene)(pta)Cl2]. Also, the monofunctional anticancer areneRu(II) complexes of the general formula [Ru(h6-arene)(en)Cl]+
(en = ethylenediamine) hydrolyze at least three times faster thancomplex (1), with values ranging from 3.95–6.84 ¥ 10-3 s-1 (100 mMNaClO4, 310 K).14 It is notable that for cis-[Pt(NH3)2Cl2] thehydrolysis rate constants were calculated to be 1.9 ± 0.2 ¥ 10-4 s-1 for
Fig. 3 Hydrolysis kinetics plot of [Ru(terpy)(4,4¢-(COLysCONH2)2-bpy)Cl]Cl3. Inset the graph of ln((C0 - Ceq)/(Ct-Ceq) vs. t, with linearfitting of the traces.
the first aquation process (k1) and 2.3 ± 0.2 ¥ 10-4 s-1 for the secondaquation process (k2) (100 mM NaClO4, 318.2 K),40 while Pt(II)amine monofunctional complexes were hydrolyzed much slower,with rate constants in the range of 10-5 s-1 (unbuffered aqueoussolutions, 4.2 < pH < 5.4, 293 K).41
3.3. DNA binding studies of complex (2)
3.3.1. DNA binding kinetics. A solution of ct-DNA(0.0032 mM) and a solution of complex (2) at ratio r = 0.1,were incubated at 37 ◦C in 50 mM buffer phosphates (pH =7.0). The percentage of the complex (2) bound to ct-DNA wascalculated as described in 2.3.7, increasing with time and boundalmost completely (~85%) after 2 h. Fig. 4, curve a presents thepercentage of ruthenated DNA as a function of the reaction time,in 50 mM buffer phosphates and in the additional presence of150 mM NaCl (Fig. 4, curve b). The plot traces were fitted bya non-linear optimization method using the software MicrocalOrigin v. 5.0 and second-order rate kinetic equations. The half-life time (t1/2) value was calculated from the plot and found tobe about 50 min. for curve (a). The observed t1/2 value is similarto that observed for the complex Na[trans-Cl4Im(DMSO)RuIII]
Fig. 4 Binding kinetics of [Ru(terpy)(4,4¢-(COLysCONH2)2bpy)(H2O)]Cl4
to ct-DNA at (�) 37◦ C, 50 mM buffer phosphates (pH = 7.0), r = 0.1 and(�) in the additional presence of 150 mM NaCl.
This journal is © The Royal Society of Chemistry 2011 Dalton Trans., 2011, 40, 472–483 | 475
Dow
nloa
ded
by U
NIV
ER
SIT
Y O
F IO
AN
NIN
A o
n 13
Sep
tem
ber
2012
Publ
ishe
d on
26
Nov
embe
r 20
10 o
n ht
tp://
pubs
.rsc
.org
| do
i:10.
1039
/C0D
T00
554A
View Online

(~ 1 h, 37 ◦C, 10 mM NaClO4),35 in which the hydrolysis of onlyone chloro-ligand is enough to bind to DNA.
In an attempt to confirm the above conclusion, the DNAbinding kinetic of complex (1) was studied in the presence of150 mM NaCl to inhibit the complex hydrolysis (Fig. 4, curve b).Clearly, the equilibrium between the M–Cl and M–OH2 movedto the side of M–Cl, giving a total percent of ruthenated DNAat about 35% (as calculated from the plot). This percentage mostprobably corresponds to the same percentage of the hydrolyzedcomplex, indicating that the M–Cl form is unable to bind toDNA. In addition, the t1/2 value was calculated again at about50 min., since it represents the half-life time for the same reaction.
3.3.2. DNA thermal denaturation (Tm) studies. The effect onct-DNA Tm of complex (2) at various ratios (r = 0.025 to r =0.125), as a function of the electrolyte (NaClO4) concentration(10 mM to 200 mM) was studied. Increasing the salt ionic strength,without addition of complex (2), causes an increase in the DNAmelting temperature, as a consequence of stabilization of thehelix. At high salt concentration, the repulsion of the negativelycharged DNA phosphates is reduced due to a “shield” effectof the electrolyte counter ions. Thus, the necessary energy toseparate the DNA strands is higher than needed in the casewhere the phosphates are less “shielded” from the electrolytepositively charged counter ions and consequently, the DNA helixis stabilized.42 Stabilization effects due to the positive charge ofa metal complex, located on the metal center or/and the ligandmoiety, upon binding to DNA strands have also been reported.43
Furthermore, formation of interstrand cross links caused bybifunctional metal complexes (e.g. cis-[Pt(NH3)2Cl2]) stabilize theDNA helix while conformational distortions due to the complexbinding destabilize the helix.43
Fig. 5 presents the ct-DNA DTm at various NaClO4 con-centrations upon addition of (2) at different ratios (r). At lowconcentration of NaClO4 (10 mM) the binding of the complexresulted in an increase of Tm (+ 2.5 ◦C for r = 0.1), indicating thatthe energy to separate the two strands is higher when the complexis bound to DNA. An explanation for this result is that the positivecharge of the bound complex additionally “shields” the negativelycharged DNA strands, stabilizing the DNA helix.
Fig. 5 DTm of ct-DNA modified by [Ru(terpy)(4,4¢-(COLysCONH2)2-bpy) (H2O)]Cl4 versus r, measured at different concentrations of NaClO4.
At higher concentrations of NaClO4 (50–200 mM) wherethe “shield” effect of Na+ counterions on DNA phosphates is
significant, the energy to separate the strands is expected to behigher. However, the measured values of DTm indicate that lessenergy is needed to separate the helix, as a consequence of complex(2) binding. In other words complex (2) destabilizes the DNAhelix at concentrations of NaClO4 between 50 and 200 mM. Thismeans that there should be a significant destabilization factor,over the positive charge of the bound complex and the elec-trolyte concentration. This factor should be considered amongdestabilization factors such as, (i) intrastrand conformationaldistortions, or/and (ii) difficulty to form C–W hydrogen bondsdue to the bulky shape of bound (2), or/and (iii) a positivecharge, which is introduced by (2) in DNA strands. The latter, inconjunction with the high electrolyte concentration, saturate thestrands with positive charges, which are repulsed. Thus, the well-known effect of DNA helix stabilization, due to high electrolyteconcentration, changes to a helix destabilization in cases wherepositive charges are introduced into DNA strands. This behavioris in contrast with that observed for cis-[Pt(NH3)2Cl2] in the sameconditions. cis-[Pt(NH3)2Cl2] modification of ct-DNA results in adecrease of Tm in a wide range of NaClO4 concentrations (10–200 mM),43 reflecting the destabilization of the helix due to localdenaturational changes in the DNA. No comparison can be madewith the complex [Ru(terpy)(bpy)(H2O)]2+ 15 which stabilizes thehelix of ct-DNA but in different conditions.
3.3.3. Circular dichroism (CD) spectroscopy studies. The in-teraction of complex (2) with ct-DNA was studied by circulardichroism spectroscopy in aqueous buffer solutions (pH = 7.0), atvarious ratios (r = [Ru]/[DNA]) r = 0.025, 0.050, 0.075, 0.100 and0.125). A solution of complex (2), incubated for 24 h, was added toa ct-DNA solution (1 ¥ 10-4 M) in such a way so as to produce thefinal ratios (r). The increasing amounts of (2), added to ct-DNA,clearly affect the CD spectrum of ct-DNA (Fig. 6).
Fig. 6 CD spectra of ct-DNA upon addition of [Ru(terpy)(4,4¢-(COLysCONH2)2 bpy)(H2O)]Cl4 at ratios r = 0, 0.025, 0.050, 0.075, 0.100and 0.125.
The intensities of the characteristic bands of ct-DNA at 245 nmand 277 nm changed and additionally a new positive CD bandat 320 nm appeared. The intensity of the positive band (277 nm),which reflects the stacking interactions between the DNA bases,44
decreases progressively at low ratios (r = 0.025–0.100), but remains
476 | Dalton Trans., 2011, 40, 472–483 This journal is © The Royal Society of Chemistry 2011
Dow
nloa
ded
by U
NIV
ER
SIT
Y O
F IO
AN
NIN
A o
n 13
Sep
tem
ber
2012
Publ
ishe
d on
26
Nov
embe
r 20
10 o
n ht
tp://
pubs
.rsc
.org
| do
i:10.
1039
/C0D
T00
554A
View Online
almost unaffected when the ratio increases from r = 0.100 to r =0.125. These results suggest that the DNA helix is untwisted,disrupting locally the base stacking, due to the binding of complex(2). However, this effect seems to be completed until r = 0.1,indicating that the saturation r-value of DNA modification bycomplex (2) is close to this value. This result is in agreement withthe results of DNA melting profiles (Fig. 6), where insignificantDTm changes were observed over r = 0.1. Moreover, the intensityof the DNA negative band (245 nm), which is related to theDNA helicity,44 remains almost unaffected indicating that theruthenated DNA adopts a B-type conformation. On the otherhand, at r = 0.100 and 0.125, where no more complexes bind toDNA, the intensity of negative CD band decreases drasticallyas a consequence of excess of (2) in the solution, suggesting anunwinding of the helix.45 Once again, the high positive chargeof complex [Ru(terpy)(4,4¢-(COLysCONH2)2bpy)(H2O)]4+ seemsto neutralize the polyanion phosphates by two ways; (i) nonreversibly, introducing positive charge to strands due to thebinding and (ii) electrostatically, distorting locally the B-typestructure of ct-DNA.46
Moreover, a new positive CD signal appears at 320 nm from r =0.025, increasing progressively with the ratio until r = 0.1. Over thisratio the intensity of this band remains constant, confirming thesuggestion of a saturation r-value close to 0.1. The CD spectrumof the free complex shows a weak and broad signal at about250 nm originated from the chiral carbon center in lysine moieties.Thus, the new signal at 320 nm should be induced from thecomplex binding to the DNA helix. In addition, the appearanceof such positive CD bands is related in the literature by non-intercalating DNA binders (e.g. Netropsin (320 nm r = 0.1),47
Distamicine-A (330 nm, r = 0.1)48 and bis-quaternary ammoniumheterocycle SN-16814 (310 nm, r = 0.1)49) which all bind to theDNA minor groove. Recently, it has been reported that a similarpositive CD band beyond 310 nm was observed for dinuclearRu(II) complexes selectively binding to guanine residues of ct-DNA. It is worth mentioning that these dinuclear complexes bindmonofunctionally to ct-DNA, through each Ru(II) center that theyinvolve.50
3.3.4 Linear dichroism (LD) spectroscopy studies. Flow ori-ented LD was used to give information about the relativeorientation of DNA bases along the DNA helix axis. Ct-DNAexhibits a negative absorption band, with a minimum at 258 nm,suggesting that the average orientation of the ct-DNA bases wasnear perpendicular relative to the flow direction. The addition, atincreasing amounts, of a solution of complex (2) which had beenincubated for 24 h, to a ct-DNA solution with constant concen-tration (1 ¥ 10-4 M), produces the final ratios (r = [Ru]/[DNA])r = 0.025, 0.050, 0.075, 0.100 and 0.125. In the spectra of theabove samples the LD signal at 258 nm decreases in magnitude ofthe initial signal at about 55% at r = 0.1 (Fig. S2†), indicating asignificant deviation of perpendicularity of the orientation of theDNA relative to the flow direction.
At least three major reasons could be responsible for theorientation loss of the DNA bases: (i) bending of the DNA axis,where the bases are locally oriented perpendicularly along anintrinsic axis, but globally oriented randomly along the DNAlength, (ii) coiling into a more compact structure, where thebases lose their orientation and (iii) alterations of the DNA
flexibility, where some of the nucleotides were unpaired, “melting”the helix locally, due to introduction of local positive charges.The introduction of local positive charges can also increase theflexibility of the DNA helix without disruption of the hydrogenbonds between the bases. However, the disruption of hydrogenbonds should be rather excluded as a consequence of complex (2)binding, since if this occurs, the energy to melt the DNA helixwould be significantly less than that observed in 3.3.2.
DNA bending/coiling has been reported to be mediated byhighly positively charged metallo-supramolecular cylinders ofruthenium(II)51,52 and iron(II)53–55 noticeably affecting the mag-nitude of the ct-DNA LD negative band. For iron(II) helicates,enantiomeric discrimination on the percentage of LD signaldecrease has been reported, ranging between 43–95% at low r =0.025.55 On the other hand, dinuclear ruthenium(II) complexes ofthe type [Ru2(L-L)L1]4+ (L = bpy or phe and L1 = bis(pyridylimine))bind to ct-DNA strongly (Kb = 3.6–5.1 ¥ 106 M-1) affectingmodestly the ct-DNA LD negative band (2–20% at low r = 0.33),which indicates they cause bending/coiling of the DNA less thaniron(II) helicates.56 In the case of complex (2) the decrease in themagnitude of the ct-DNA LD negative signal is about 25% atratio r = 0.33, somewhat higher than the most of [Ru2(L-L)L1]4+,indicating a higher degree of DNA coiling.
At about 350 nm, where DNA is silent, a new positive low in theintensity signal appears, increasing with ratio, probably originatingfrom p → p* intraligand transitions of complex (2). In principle,LD signals from small molecules bound to DNA are obtainedonly if they are orientated specifically due to interaction with theDNA.57 The positive LD signal observed in the case of (2) indicatesan orientation more parallel than perpendicular of the transitionmoment towards the alignment axis. However, which ligand planeof (2) (terpy or 4,4¢-(CO LysCONH2)2bpy) is oriented parallel tothe DNA axis can not be concluded, since their aromatic planesare perpendicular to each other and thus, no LD signal will occur.
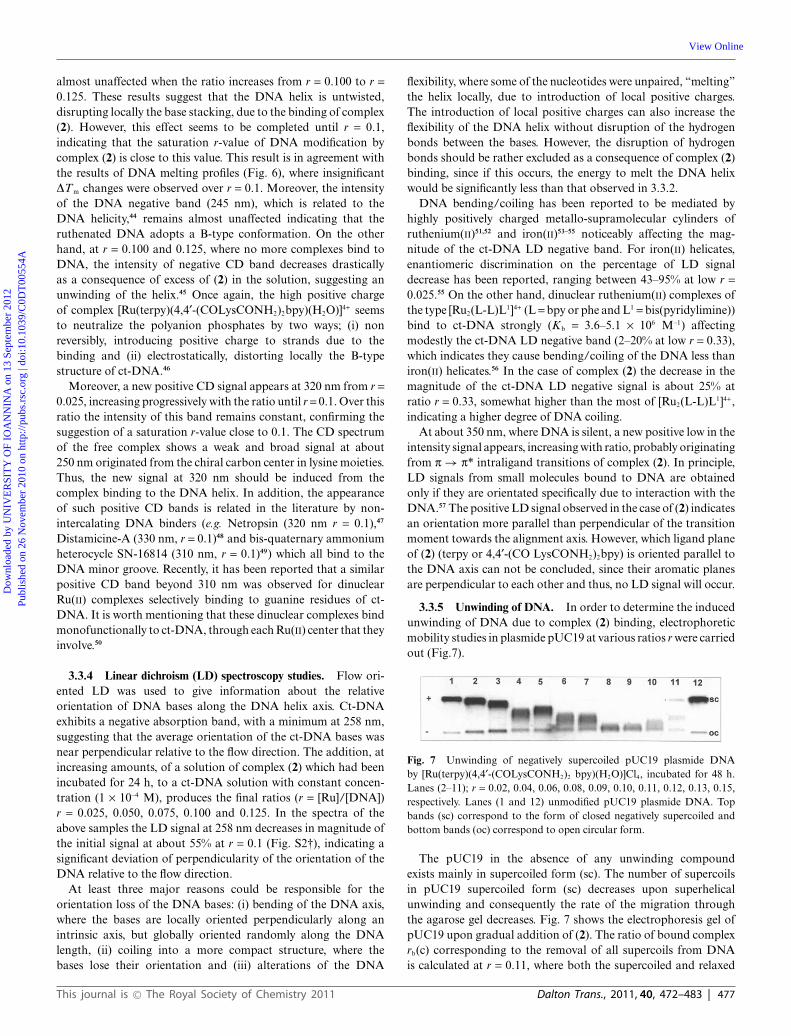
3.3.5 Unwinding of DNA. In order to determine the inducedunwinding of DNA due to complex (2) binding, electrophoreticmobility studies in plasmide pUC19 at various ratios r were carriedout (Fig.7).
Fig. 7 Unwinding of negatively supercoiled pUC19 plasmide DNAby [Ru(terpy)(4,4¢-(COLysCONH2)2 bpy)(H2O)]Cl4, incubated for 48 h.Lanes (2–11); r = 0.02, 0.04, 0.06, 0.08, 0.09, 0.10, 0.11, 0.12, 0.13, 0.15,respectively. Lanes (1 and 12) unmodified pUC19 plasmide DNA. Topbands (sc) correspond to the form of closed negatively supercoiled andbottom bands (oc) correspond to open circular form.
The pUC19 in the absence of any unwinding compoundexists mainly in supercoiled form (sc). The number of supercoilsin pUC19 supercoiled form (sc) decreases upon superhelicalunwinding and consequently the rate of the migration throughthe agarose gel decreases. Fig. 7 shows the electrophoresis gel ofpUC19 upon gradual addition of (2). The ratio of bound complexrb(c) corresponding to the removal of all supercoils from DNAis calculated at r = 0.11, where both the supercoiled and relaxed
This journal is © The Royal Society of Chemistry 2011 Dalton Trans., 2011, 40, 472–483 | 477
Dow
nloa
ded
by U
NIV
ER
SIT
Y O
F IO
AN
NIN
A o
n 13
Sep
tem
ber
2012
Publ
ishe
d on
26
Nov
embe
r 20
10 o
n ht
tp://
pubs
.rsc
.org
| do
i:10.
1039
/C0D
T00
554A
View Online
forms are comigrated.34 Beyond this point r > 0.11 and until r =0.15 the bands are diffused, probably due to a partial separationof the plasmide strands. The DNA unwinding can be quantifiedfrom the value of torsion angle U, calculated per bound moleculeof complex (2) to pUC19.
The unwinding angle can be calculated according to theequation U = -18s/rb(c), where s is the superhelical densityestimated to -0.063 for these experimental conditions58 and rb(c)is the ratio of the bound complex to DNA. According to theDNA binding kinetic studies of complex (2) (3.3.1) and the plotof Fig. 4, it can be suggested that the percentage of bound(2) is about 85% after 24 h of incubation. This gives a valueof the rb(c) = 0.11 ¥ 0.85 = 0.093 and therefore the value forthe average unwinding angle is U = 12 ± 2◦. Metal complexes,bound monofunctionally to DNA, induce small unwinding angles([Pt(NH3)3]2+ = 6 ± 1◦,58 [Pt(dien)]2+ = 6 ± 1◦)58 unless additionalDNA-ligand interactions take place. In cases where a ligand isspecifically oriented between the DNA bases, large unwindingangles were observed (cis-[Pt(NH3)2(N3-Etd)]2+ = 15 ± 1◦,58 cis-[Pt(NH3)2(N8-Etd)]2+ = 19 ± 3◦,58 [Ru(h6-p-terp)(en)]2+ = 14 ± 1◦)9
Also, complexes that monofunctionally bind to DNA, involvingligands able to intercalate but located away from the DNA helix,induced a small unwinding of DNA, such as trans-[Pt(NH3)2(N8-Etd)]2+ with U = 8◦.58 Based on the above-mentioned literatureresults it can be suggested that complex (2) is bound to DNA insuch a way, so as to interact with its ligands with the DNA helix.Taking into account that the complex [Ru(trpy)(bpy)Cl]+ unwindsinsignificantly the DNA (U � 7◦),59 it can be suggested that theconjugated lysine moieties of ligand 4,4¢-(COLysCONH2)2bpyinteracting with the DNA helix cause significant unwinding ofthe helix. Alternatively, it can also be suggested that the highlypositive charge of complex (2) introduced to DNA strands upon(2) binding, unwind the helix. These results are in accordancewith the observations of circular dichroism studies (3.3.3), whereunwinding of the DNA helix has been suggested. Moreover, itseems to be clear that the significant decrease in the intensity ofthe LD band observed in (3.3.4), reflects a bending of the DNAaxis rather than a coiling to a more compact structure.
3.4. NMR studies on the interactions of complex (2) with thehexanucleotides d(5¢-CGCGCG-3¢)2 and d(5¢-GTCGAC-3¢)2
In an attempt to further investigate the interactions of complex (2)with the DNA, NMR experiments with two different sequences ofhexanucleotide duplexes were performed.
3.4.1. 1H NMR assignments of d(5¢-CGCGCG-3¢)2 and d(5¢-GTCGAC-3¢)2. Both duplexes are self-complementary, andthe bases are numbered as d(5¢-C1G2C3G4C5G6-3¢)2 and d(5¢-G1T2C3G4A5C6-3¢)2. Assignments of exchangeable and non-exchangeable protons of the hexanucleotide duplexes were per-formed according to the approaches described previously 24,26,60
in H2O/D2O (9 : 1) at 298 K in 50 mM phosphate buffer, usingthe sequential connectivity of NOESY maps assisted by 2D1H, 1H TOCSY experiments. The spectra of the imino regionexhibit the expected W–C (Watson–Creek) imino signals for bothsequences. For the sequence d(5¢-CGCGCG-3¢)2 two signals, at12.98 ppm and 13.01 ppm, were observed, indicating that theterminal C-G base pairs of the duplex do not form W–C hydrogenbonding or these protons were exchange rapidly with the solvent.
The observed signals were assigned to G2-C5 and G4-C3 iminohydrogen bonding protons correspondingly. Furthermore, in theregion of 8–9 ppm two broad but clear signals at 8.32 ppm(G2) and 8.23 ppm (G4), corresponding to the hydrogen-bondedexocyclic amino group protons of guanine moieties were observed.The non-hydrogen-bonded protons of the same amino groupswere observed at a higher field (6–7.5 ppm). Similarly, in thespectrum of the sequence d(5¢-GTCGAC-3¢)2 two signals, at13.80 ppm and 12.76 ppm, were observed. These signals wereassigned to T2-A5 and G4-C3 imino hydrogen bonding protonscorrespondingly. Furthermore, in the region of 8–9 ppm one broadsignal at 8.49 ppm (G4) corresponding to the hydrogen-bondedexocyclic amino group protons of cytosine and guanine moietieswas observed, while the non-hydrogen-bonded protons of the sameamino group was observed at 6.83 ppm. However, the protonsignal corresponding to A5 amino group was not observed atthe region 8–9 ppm, indicating that the second W–C of the ATbase pair is either not formed or exchanged more rapidly with thesolvent. The characteristic assignments of the exchangeable andnon-exchangeable protons for both oligonucleotide sequences arepresented in Table S1 (ESI†).
3.4.2. Titration of the d(CGCGCG)2 with complex (2). 1D1H NMR spectra of samples containing the d(5¢-CGCGCG-3¢)2
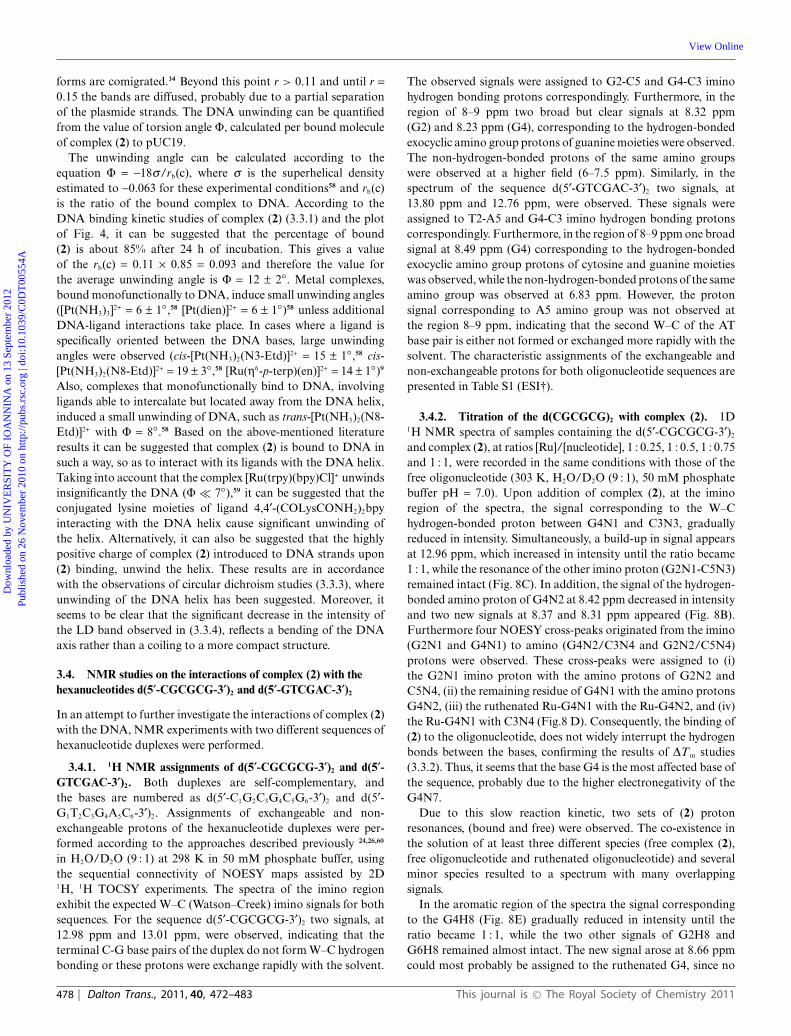
and complex (2), at ratios [Ru]/[nucleotide], 1 : 0.25, 1 : 0.5, 1 : 0.75and 1 : 1, were recorded in the same conditions with those of thefree oligonucleotide (303 K, H2O/D2O (9 : 1), 50 mM phosphatebuffer pH = 7.0). Upon addition of complex (2), at the iminoregion of the spectra, the signal corresponding to the W–Chydrogen-bonded proton between G4N1 and C3N3, graduallyreduced in intensity. Simultaneously, a build-up in signal appearsat 12.96 ppm, which increased in intensity until the ratio became1 : 1, while the resonance of the other imino proton (G2N1-C5N3)remained intact (Fig. 8C). In addition, the signal of the hydrogen-bonded amino proton of G4N2 at 8.42 ppm decreased in intensityand two new signals at 8.37 and 8.31 ppm appeared (Fig. 8B).Furthermore four NOESY cross-peaks originated from the imino(G2N1 and G4N1) to amino (G4N2/C3N4 and G2N2/C5N4)protons were observed. These cross-peaks were assigned to (i)the G2N1 imino proton with the amino protons of G2N2 andC5N4, (ii) the remaining residue of G4N1 with the amino protonsG4N2, (iii) the ruthenated Ru-G4N1 with the Ru-G4N2, and (iv)the Ru-G4N1 with C3N4 (Fig.8 D). Consequently, the binding of(2) to the oligonucleotide, does not widely interrupt the hydrogenbonds between the bases, confirming the results of DTm studies(3.3.2). Thus, it seems that the base G4 is the most affected base ofthe sequence, probably due to the higher electronegativity of theG4N7.
Due to this slow reaction kinetic, two sets of (2) protonresonances, (bound and free) were observed. The co-existence inthe solution of at least three different species (free complex (2),free oligonucleotide and ruthenated oligonucleotide) and severalminor species resulted to a spectrum with many overlappingsignals.
In the aromatic region of the spectra the signal correspondingto the G4H8 (Fig. 8E) gradually reduced in intensity until theratio became 1 : 1, while the two other signals of G2H8 andG6H8 remained almost intact. The new signal arose at 8.66 ppmcould most probably be assigned to the ruthenated G4, since no
478 | Dalton Trans., 2011, 40, 472–483 This journal is © The Royal Society of Chemistry 2011
Dow
nloa
ded
by U
NIV
ER
SIT
Y O
F IO
AN
NIN
A o
n 13
Sep
tem
ber
2012
Publ
ishe
d on
26
Nov
embe
r 20
10 o
n ht
tp://
pubs
.rsc
.org
| do
i:10.
1039
/C0D
T00
554A
View Online
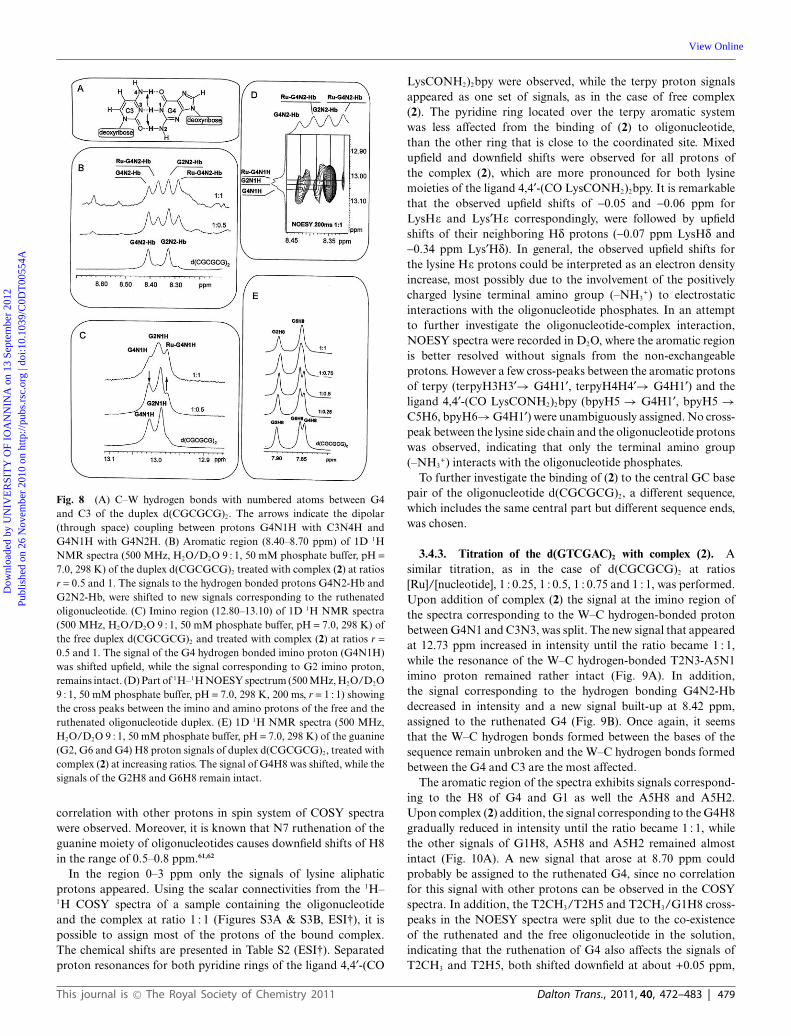
Fig. 8 (A) C–W hydrogen bonds with numbered atoms between G4and C3 of the duplex d(CGCGCG)2. The arrows indicate the dipolar(through space) coupling between protons G4N1H with C3N4H andG4N1H with G4N2H. (B) Aromatic region (8.40–8.70 ppm) of 1D 1HNMR spectra (500 MHz, H2O/D2O 9 : 1, 50 mM phosphate buffer, pH =7.0, 298 K) of the duplex d(CGCGCG)2 treated with complex (2) at ratiosr = 0.5 and 1. The signals to the hydrogen bonded protons G4N2-Hb andG2N2-Hb, were shifted to new signals corresponding to the ruthenatedoligonucleotide. (C) Imino region (12.80–13.10) of 1D 1H NMR spectra(500 MHz, H2O/D2O 9 : 1, 50 mM phosphate buffer, pH = 7.0, 298 K) ofthe free duplex d(CGCGCG)2 and treated with complex (2) at ratios r =0.5 and 1. The signal of the G4 hydrogen bonded imino proton (G4N1H)was shifted upfield, while the signal corresponding to G2 imino proton,remains intact. (D) Part of 1H–1H NOESY spectrum (500 MHz, H2O/D2O9 : 1, 50 mM phosphate buffer, pH = 7.0, 298 K, 200 ms, r = 1 : 1) showingthe cross peaks between the imino and amino protons of the free and theruthenated oligonucleotide duplex. (E) 1D 1H NMR spectra (500 MHz,H2O/D2O 9 : 1, 50 mM phosphate buffer, pH = 7.0, 298 K) of the guanine(G2, G6 and G4) H8 proton signals of duplex d(CGCGCG)2, treated withcomplex (2) at increasing ratios. The signal of G4H8 was shifted, while thesignals of the G2H8 and G6H8 remain intact.
correlation with other protons in spin system of COSY spectrawere observed. Moreover, it is known that N7 ruthenation of theguanine moiety of oligonucleotides causes downfield shifts of H8in the range of 0.5–0.8 ppm.61,62
In the region 0–3 ppm only the signals of lysine aliphaticprotons appeared. Using the scalar connectivities from the 1H–1H COSY spectra of a sample containing the oligonucleotideand the complex at ratio 1 : 1 (Figures S3A & S3B, ESI†), it ispossible to assign most of the protons of the bound complex.The chemical shifts are presented in Table S2 (ESI†). Separatedproton resonances for both pyridine rings of the ligand 4,4¢-(CO
LysCONH2)2bpy were observed, while the terpy proton signalsappeared as one set of signals, as in the case of free complex(2). The pyridine ring located over the terpy aromatic systemwas less affected from the binding of (2) to oligonucleotide,than the other ring that is close to the coordinated site. Mixedupfield and downfield shifts were observed for all protons ofthe complex (2), which are more pronounced for both lysinemoieties of the ligand 4,4¢-(CO LysCONH2)2bpy. It is remarkablethat the observed upfield shifts of -0.05 and -0.06 ppm forLysHe and Lys¢He correspondingly, were followed by upfieldshifts of their neighboring Hd protons (-0.07 ppm LysHd and-0.34 ppm Lys¢Hd). In general, the observed upfield shifts forthe lysine He protons could be interpreted as an electron densityincrease, most possibly due to the involvement of the positivelycharged lysine terminal amino group (–NH3
+) to electrostaticinteractions with the oligonucleotide phosphates. In an attemptto further investigate the oligonucleotide-complex interaction,NOESY spectra were recorded in D2O, where the aromatic regionis better resolved without signals from the non-exchangeableprotons. However a few cross-peaks between the aromatic protonsof terpy (terpyH3H3¢→ G4H1¢, terpyH4H4¢→ G4H1¢) and theligand 4,4¢-(CO LysCONH2)2bpy (bpyH5 → G4H1¢, bpyH5 →C5H6, bpyH6→ G4H1¢) were unambiguously assigned. No cross-peak between the lysine side chain and the oligonucleotide protonswas observed, indicating that only the terminal amino group(–NH3
+) interacts with the oligonucleotide phosphates.To further investigate the binding of (2) to the central GC base
pair of the oligonucleotide d(CGCGCG)2, a different sequence,which includes the same central part but different sequence ends,was chosen.
3.4.3. Titration of the d(GTCGAC)2 with complex (2). Asimilar titration, as in the case of d(CGCGCG)2 at ratios[Ru]/[nucleotide], 1 : 0.25, 1 : 0.5, 1 : 0.75 and 1 : 1, was performed.Upon addition of complex (2) the signal at the imino region ofthe spectra corresponding to the W–C hydrogen-bonded protonbetween G4N1 and C3N3, was split. The new signal that appearedat 12.73 ppm increased in intensity until the ratio became 1 : 1,while the resonance of the W–C hydrogen-bonded T2N3-A5N1imino proton remained rather intact (Fig. 9A). In addition,the signal corresponding to the hydrogen bonding G4N2-Hbdecreased in intensity and a new signal built-up at 8.42 ppm,assigned to the ruthenated G4 (Fig. 9B). Once again, it seemsthat the W–C hydrogen bonds formed between the bases of thesequence remain unbroken and the W–C hydrogen bonds formedbetween the G4 and C3 are the most affected.
The aromatic region of the spectra exhibits signals correspond-ing to the H8 of G4 and G1 as well the A5H8 and A5H2.Upon complex (2) addition, the signal corresponding to the G4H8gradually reduced in intensity until the ratio became 1 : 1, whilethe other signals of G1H8, A5H8 and A5H2 remained almostintact (Fig. 10A). A new signal that arose at 8.70 ppm couldprobably be assigned to the ruthenated G4, since no correlationfor this signal with other protons can be observed in the COSYspectra. In addition, the T2CH3/T2H5 and T2CH3/G1H8 cross-peaks in the NOESY spectra were split due to the co-existenceof the ruthenated and the free oligonucleotide in the solution,indicating that the ruthenation of G4 also affects the signals ofT2CH3 and T2H5, both shifted downfield at about +0.05 ppm,
This journal is © The Royal Society of Chemistry 2011 Dalton Trans., 2011, 40, 472–483 | 479
Dow
nloa
ded
by U
NIV
ER
SIT
Y O
F IO
AN
NIN
A o
n 13
Sep
tem
ber
2012
Publ
ishe
d on
26
Nov
embe
r 20
10 o
n ht
tp://
pubs
.rsc
.org
| do
i:10.
1039
/C0D
T00
554A
View Online
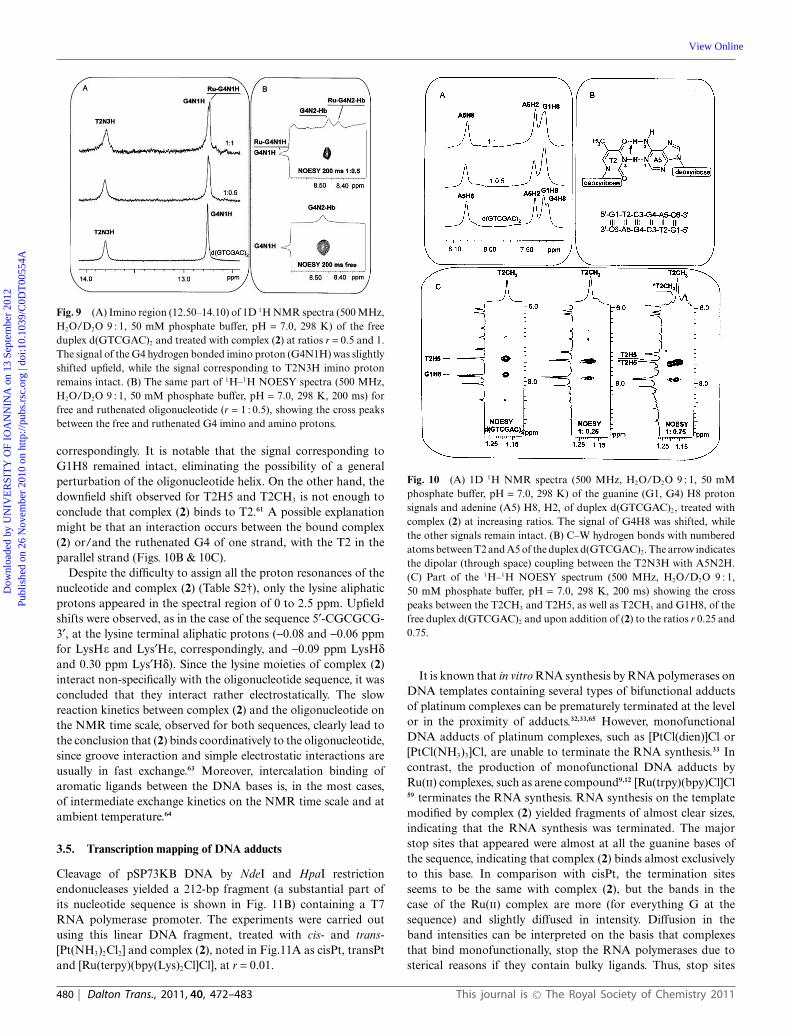
Fig. 9 (A) Imino region (12.50–14.10) of 1D 1H NMR spectra (500 MHz,H2O/D2O 9 : 1, 50 mM phosphate buffer, pH = 7.0, 298 K) of the freeduplex d(GTCGAC)2 and treated with complex (2) at ratios r = 0.5 and 1.The signal of the G4 hydrogen bonded imino proton (G4N1H) was slightlyshifted upfield, while the signal corresponding to T2N3H imino protonremains intact. (B) The same part of 1H–1H NOESY spectra (500 MHz,H2O/D2O 9 : 1, 50 mM phosphate buffer, pH = 7.0, 298 K, 200 ms) forfree and ruthenated oligonucleotide (r = 1 : 0.5), showing the cross peaksbetween the free and ruthenated G4 imino and amino protons.
correspondingly. It is notable that the signal corresponding toG1H8 remained intact, eliminating the possibility of a generalperturbation of the oligonucleotide helix. On the other hand, thedownfield shift observed for T2H5 and T2CH3 is not enough toconclude that complex (2) binds to T2.61 A possible explanationmight be that an interaction occurs between the bound complex(2) or/and the ruthenated G4 of one strand, with the T2 in theparallel strand (Figs. 10B & 10C).
Despite the difficulty to assign all the proton resonances of thenucleotide and complex (2) (Table S2†), only the lysine aliphaticprotons appeared in the spectral region of 0 to 2.5 ppm. Upfieldshifts were observed, as in the case of the sequence 5¢-CGCGCG-3¢, at the lysine terminal aliphatic protons (-0.08 and -0.06 ppmfor LysHe and Lys¢He, correspondingly, and -0.09 ppm LysHdand 0.30 ppm Lys¢Hd). Since the lysine moieties of complex (2)interact non-specifically with the oligonucleotide sequence, it wasconcluded that they interact rather electrostatically. The slowreaction kinetics between complex (2) and the oligonucleotide onthe NMR time scale, observed for both sequences, clearly lead tothe conclusion that (2) binds coordinatively to the oligonucleotide,since groove interaction and simple electrostatic interactions areusually in fast exchange.63 Moreover, intercalation binding ofaromatic ligands between the DNA bases is, in the most cases,of intermediate exchange kinetics on the NMR time scale and atambient temperature.64
3.5. Transcription mapping of DNA adducts
Cleavage of pSP73KB DNA by NdeI and HpaI restrictionendonucleases yielded a 212-bp fragment (a substantial part ofits nucleotide sequence is shown in Fig. 11B) containing a T7RNA polymerase promoter. The experiments were carried outusing this linear DNA fragment, treated with cis- and trans-[Pt(NH3)2Cl2] and complex (2), noted in Fig.11A as cisPt, transPtand [Ru(terpy)(bpy(Lys)2Cl]Cl], at r = 0.01.
Fig. 10 (A) 1D 1H NMR spectra (500 MHz, H2O/D2O 9 : 1, 50 mMphosphate buffer, pH = 7.0, 298 K) of the guanine (G1, G4) H8 protonsignals and adenine (A5) H8, H2, of duplex d(GTCGAC)2, treated withcomplex (2) at increasing ratios. The signal of G4H8 was shifted, whilethe other signals remain intact. (B) C–W hydrogen bonds with numberedatoms between T2 and A5 of the duplex d(GTCGAC)2. The arrow indicatesthe dipolar (through space) coupling between the T2N3H with A5N2H.(C) Part of the 1H–1H NOESY spectrum (500 MHz, H2O/D2O 9 : 1,50 mM phosphate buffer, pH = 7.0, 298 K, 200 ms) showing the crosspeaks between the T2CH3 and T2H5, as well as T2CH3 and G1H8, of thefree duplex d(GTCGAC)2 and upon addition of (2) to the ratios r 0.25 and0.75.
It is known that in vitro RNA synthesis by RNA polymerases onDNA templates containing several types of bifunctional adductsof platinum complexes can be prematurely terminated at the levelor in the proximity of adducts.32,33,65 However, monofunctionalDNA adducts of platinum complexes, such as [PtCl(dien)]Cl or[PtCl(NH3)3]Cl, are unable to terminate the RNA synthesis.33 Incontrast, the production of monofunctional DNA adducts byRu(II) complexes, such as arene compound9,12 [Ru(trpy)(bpy)Cl]Cl59 terminates the RNA synthesis. RNA synthesis on the templatemodified by complex (2) yielded fragments of almost clear sizes,indicating that the RNA synthesis was terminated. The majorstop sites that appeared were almost at all the guanine bases ofthe sequence, indicating that complex (2) binds almost exclusivelyto this base. In comparison with cisPt, the termination sitesseems to be the same with complex (2), but the bands in thecase of the Ru(II) complex are more (for everything G at thesequence) and slightly diffused in intensity. Diffusion in theband intensities can be interpreted on the basis that complexesthat bind monofunctionally, stop the RNA polymerases due tosterical reasons if they contain bulky ligands. Thus, stop sites
480 | Dalton Trans., 2011, 40, 472–483 This journal is © The Royal Society of Chemistry 2011
Dow
nloa
ded
by U
NIV
ER
SIT
Y O
F IO
AN
NIN
A o
n 13
Sep
tem
ber
2012
Publ
ishe
d on
26
Nov
embe
r 20
10 o
n ht
tp://
pubs
.rsc
.org
| do
i:10.
1039
/C0D
T00
554A
View Online

Fig. 11 Inhibition of RNA synthesis by T7 RNA polymeraseson the NdeI/HpaI fragment of pSP73KB plasmid modified by[Ru(terpy)(bpy(Lys)2)Cl]Cl. (A) Autoradiograms of 6% PAA/8 M ureasequencing gels showing inhibition of RNA synthesis by T7 RNA poly-merase on the NdeI/HpaI fragment containing adducts of complex (2) andselected platinum complexes. Lanes: control, unmodified template; dienPt,cisPt, transPt and [Ru(terpy)(bpy(Lys)2)Cl]Cl, the template modified bydienplatin, cisplatin, transplatin or (2) at r = 0.01, respectively; A, U, Gand C, chain terminated marker RNAs. (B) Schematic diagram showingthe portion of the sequence used to monitor inhibition of RNA synthesisby platinum complexes. The arrow indicates the start of the T7 RNApolymerase, which used as template the upper strand of NdeI/HpaIfragment of pSP73KB DNA. (�), major stop signals (from A) for DNAmodified by complex (2). The numbers correspond to the nucleotidenumbering in the sequence map of pSP73KB plasmid.
can be even 1 or 2 bases before the binding base, depending onthe bulk of the ligands. The termination sites corresponding totransPt are different from those of complex (2). TransPt formsdifferent adducts than complex (2) and, in particular, relativelylarge amount of interstrand cross-links between guanine andcytosine. This difference is more pronounced between bases 38and 58 of the sequence, where complex (2) most likely binds toguanines only.
3.6. DNA photoclevage
Agarose gel electrophoresis was applied to determine the cleavageof the plasmide DNA pUC19 upon addition of complex (2) atr = 0.04. The sample was incubated in the dark for 24 h at 37 ◦Cand irradiated with UVA for 15, 30, 60, 90 min. Then, it wasanalyzed by gel electrophoresis together with a sample of pUC19in the absence of complex (2) kept in the dark (k lane) and asample pUC19 irradiated with UVA for 90 min (*k lane). Fig. 12Apresents the gel electrophoresis of pUC19 treated by complex (2)and Fig.12B shows the % oc form of pUC19, which was measuredfor each experiment as function of the time. The results indicatethat complex (2) cleaves the plasmide DNA pUC19 with a yield atabout 12% after irradiation for 90 min.
Fig. 12 (A) Agarose gel electrophoresis of the plasmide DNA pUC19upon addition of complex (2) at r = 0.04 irradiated with UVA for 0, 15, 30,60 and 90 min. Also, pUC19 in the absence of complex (2) (k lane) andpUC19 irradiated with UVA for 90 min (*k lane). (B) % (oc) form of thepUC19, normalized after subtraction of the % (oc) form containing in thefree plasmide, as a function of the irradiation time.
This type of incomplete DNA photoclevage has been re-ported for the similar complex [Ru(terpy)(dpp)Cl]+ (dpp =2,3-bis(2-pyridyl)pyrazine), associated with the low value ofits DNA binding constant (Kb = 8.8 ¥ 102 M-1). More-over, the complex [Ru(MePhterpy)(dpp)Cl]+ (MePhterpy = 4¢-(4-methylphenyl) -2,2¢:6¢,2¢¢-terpyridine) with a higher Kb =6.2 ¥ 103 M-1, cleaves the DNA almost completely at thesame irradiation conditions.16 Efficient DNA cleavage, throughRu(IV) species generated electrochemically from Ru(II) complexes[Ru(bzimpy)(bpy)(OH2)]2+ and [Ru(bzimpy)(phen)(OH2)]2+, (bz-impy = 2,6-bis(benzimidazolyl)pyridine) has been reported 17 andtheir DNA affinities (Kb = 3.58 ± 0.25 ¥ 104 M-1and Kb =2.87 ± 0.2 ¥104 M-1, respectively) were found to be significantlyhigher than those of similar complexes. Despite the fact that thephotometrically determined (DS1, ESI†) Kb value of complex(2) is relatively high (Kb = 55 ± 1.5 ¥104 M-1), complex (2)cleaves the DNA incompletely. Comparing this Kb value with thatobserved for the complex [Ru(terpy)(bpy)(OH2)]2+ (Kb = 7.7 ¥102 M-1) it seems that the contribution from the conjugated lysine
This journal is © The Royal Society of Chemistry 2011 Dalton Trans., 2011, 40, 472–483 | 481
Dow
nloa
ded
by U
NIV
ER
SIT
Y O
F IO
AN
NIN
A o
n 13
Sep
tem
ber
2012
Publ
ishe
d on
26
Nov
embe
r 20
10 o
n ht
tp://
pubs
.rsc
.org
| do
i:10.
1039
/C0D
T00
554A
View Online

moieties of (2) affects its DNA affinity. However, a correlationbetween the binding affinity and the DNA cleavage is not observed,suggesting that the mechanism of the photoinduced DNA cleavageis governed more by factors related to the photoexcitation of theRu(II), and therefore by the structure of the ligands.66
4. Conclusions
The spectroscopic and analytical data presented herein showclearly that complex (2) is bound to DNA coordinatively (NMRdata), towards the global DNA axis (LD data), preferentially to theN7 of guanine bases (NMR and transcription mapping of DNA).The observation that the lysine moieties of complex (2) interactin the same manner (NOESY) with two different oligonucleotidesequences, leads to the conclusion that their interaction is notspecific and most likely electrostatic, increasing the DNA affinityof the complex. The conjugated lysines offer a +4 positivecharge to the whole complex, significantly affecting its bindingto DNA. Thus, slightly destabilizing the DNA helix (Tm data)and increasing its unwinding (CD data) with an unwinding anglecalculated as U = 12 ± 2◦. Finally, by comparing the DNA affinityof complex (2) with that of [Ru(terpy)(bpy)(OH2)]2+, it is suggestedthat it binds stronger, assisted by an additional interaction betweenthe positive charged terminal amino group of the lysines and theDNA phosphate backbone. Photoinduced DNA cleavage by (2)with UVA irradiation was observed, but despite its relatively highDNA affinity, it was incomplete (~12%).
Acknowledgements
The Greek General Secretariat of Research and Technology isthanked for financial support through the bilateral Greek–CzechResearch Program (2005–2008, no. 216).
References
1 M. J. Clarke, F. C. Zhu and D. R. Frasca, Chem. Rev., 1999, 99,2511.
2 W. H. Ang and P. J. Dyson, Eur. J. Inorg. Chem., 2006, 4003.3 P. J. Dyson and G. Sava, Dalton Trans., 2006, 1929.4 K. Strohfeldt and M. Tacke, Chem. Soc. Rev., 2008, 37, 1174.5 C. G. Hartinger and P. J. Dyson, Chem. Soc. Rev., 2009, 38,
391.6 J. M. Rademaker-Lakhai, D. van den Bongard, D. Pluim, J. H. Beijnen
and J. H. M. Schellens, Clin. Cancer Res., 2004, 10, 3717.7 C. G. Hartinger, M. A. Jakupec, S. Zorbas-Seifried, M. Groessl, A.
Egger, W. Berger, H. Zorbas, P. J. Dyson and B. K. Keppler, Chem.Biodiversity, 2008, 5, 2140.
8 W. Kandioller, C. G. Hartinger, A. A. Nazarov, C. Bartel, M. Skocic,M. A. Jakupec, V. B. Arion and B. K. Keppler, Chem.–Eur. J., 2009,15, 12283.
9 T. Bugarcic, O. Novakova, A. Halamikova, L. Zerzankova, O. Vrana,J. Kasparkova, A. Habtemariam, S. Parsons, P. J. Sadler and V. Brabec,J. Med. Chem., 2008, 51, 5310.
10 M. Melchart, A. Habtemariam, O. Novakova, S. A. Moggach, F. P. A.Fabbiani, S. Parsons, V. Brabec and P. J. Sadler, Inorg. Chem., 2007, 46,8950.
11 O. Novakova, J. Kasparkova, V. Bursova, C. Hofr, M. Vojtiskova, H. M.Chen, P. J. Sadler and V. Brabec, Chem. Biol., 2005, 12, 121.
12 O. Novakova, H. M. Chen, O. Vrana, A. Rodger, P. J. Sadler and V.Brabec, Biochemistry, 2003, 42, 11544.
13 A. Bergamo, A. Masi, A. F. A. Peacock, A. Habtemariam, P. J. Sadlerand G. Sava, J. Inorg. Biochem., 2010, 104, 79.
14 F. Wang, H. M. Chen, S. Parsons, L. D. H. Oswald, J. E. Davidson andP. J. Sadler, Chem.–Eur. J., 2003, 9, 5810.
15 G. A. Neyhart, N. Grover, S. R. Smith, W. A. Kalsbeck, T. A. Fairley,M. Cory and H. H. Thorp, J. Am. Chem. Soc., 1993, 115, 4423.
16 A. Jain, C. Slebodnick, B. S. J. Winkel and K. J. Brewer, J. Inorg.Biochem., 2008, 102, 1854.
17 V. G. Vaidyanathan and B. U. Nair, Dalton Trans., 2005, 2842.18 K. D. Copeland, A. M. K. Lueras, E. D. A Stemp and J. K. Barton,
Biochemistry, 2002, 41, 12785.19 K. D. Copeland, M. P. Fitzsimons, R. P. Houser and J. K. Barton,
Biochemistry, 2002, 41, 343.20 H. A. Wagenknecht, E. D. A. Stemp and J. K. Barton, J. Am. Chem.
Soc., 2000, 122, 1.21 A. Myari, N. Hadjiliadis, A. Garoufis, J. Malina and V. Brabec,
JBIC, J. Biol. Inorg. Chem., 2007, 12, 279.22 A. Myari, N. Hadjiliadis and A. Garoufis, Bioinorg. Chem. Appl., 2005,
3, 109.23 A. Myari, N. Hadjiliadis and A. Garoufis, J. Inorg. Biochem., 2005, 99,
616.24 A. Myari, N. Hadjiliadis and A. Garoufis, Eur. J. Inorg. Chem., 2004,
1427.25 K. Karidi, A. Garoufis, N. Hadjiliadis and J. Reedijk, Dalton Trans.,
2005, 728.26 K. Triantafillidi, K. Karidi, J. Malina and A. Garoufis, Dalton Trans.,
2009, 6403.27 K. Karidi, J. Reedijk, N. Hadjiliadis and A. Garoufis, J. Inorg. Biochem.,
2007, 101, 1483.28 A. Garoufis, J. G. Liu, L. N. Ji and N. Hadjiliadis, J. Inorg. Biochem.,
2003, 93, 221.29 B. P. Sullivan, J. M. Calvert and T. J. Meyer, Inorg. Chem., 1980, 19,
1404.30 W. D. Wilson, F. A. Tanios, M. Fernandez-Saiz, C. T. Rigl, in: Methods
in Molecular Biology, ed. K. R. Fox, Humana Press, Clifton, NJ, USA,1997, vol. 90.
31 Promega, Protocols and Applications.32 M. A. Lemaire, A. Schwartz, A. R. Rahmouni and M. Leng, Proc.
Natl. Acad. Sci. U. S. A., 1991, 88, 1982.33 V. Brabec and M. Leng, Proc. Natl. Acad. Sci. U. S. A., 1993, 90,
5345.34 M. V. Keck and S. J. Lippard, J. Am. Chem. Soc., 1992, 114,
3386.35 J. Malina, O. Novakova, B. K. Keppler, E. Alessio and V. Brabec,
JBIC, J. Biol. Inorg. Chem., 2001, 6, 435.36 G. M. Bryant, J. E. Fergusson and H. K. J. Powell, Aust. J. Chem., 1971,
24, 257.37 C. M. Hartshorn, K. A. Maxwell, P. S. White, J. M. DeSimone and T. J.
Meyer, Inorg. Chem., 2001, 40, 601.38 C. S. Allardyce, P. J. Dyson, D. J. Ellis and S. L. Heath, Chem. Commun.,
2001, 1396.39 C. Scolaro, C. G. Hartinger, C. S. Allardyce, B. K. Keppler and P. J.
Dyson, J. Inorg. Biochem., 2008, 102, 1743.40 M. Mikola and J. Arpalahti, Inorg. Chem., 1994, 33, 4439.41 N. Marti, G. H. B. Hoa and J. Kozelka, Inorg. Chem. Commun., 1998,
1, 439.42 C. Schildkraut and S. Lifson, Biopolymers, 1965, 3, 195.43 R. Zaludova, V. Kleinwachter and V. Brabec, Biophys. Chem., 1996, 60,
135.44 Y. F. Long, Q. G. Liao, C. Z. Huang, J. Ling and Y. F. Li, J. Phys. Chem.
B, 2008, 112, 1783.45 Y. M. Zhao, W. J. He, P. F. Shi, J. H. Zhu, L. Qiu, L. P. Lin and Z. J.
Guo, Dalton Trans., 2006, 2617.46 A. M. Liquori, L. Costantino, V. Crescenzi, V. Elia, E. Giglio, R.
Puliti, M. De, Santis Savino and V. Vitagliano, J. Mol. Biol., 1967, 24,113.
47 C. Zimmer and U. Wahnert, Prog. Biophys. Mol. Biol., 1986, 47,31.
48 G. Luck, C. Zimmer, K. E. Reinert and F. Arcamone, Nucleic AcidsRes., 1977, 4, 2655.
49 G. Burckhardt, C. Zimmer and B. Baguley, J. Biomol. Struct. Dyn.,1987, 4, 813.
50 Y. Nakabayashi, H. Inada, Y. Minoura, N. Iwamoto and O. Yamauchi,Inorg. Chim. Acta, 2009, 362, 869.
51 E. Corral, A. C. G. Hotze, H. den Dulk, A. Leczkowska, A. Rodger,M. J. Hannon and J. Reedijk, JBIC, J. Biol. Inorg. Chem., 2009, 14, 439.
52 J. Malina, M. J. Hannon and V. Brabec, Chem.–Eur. J., 2008, 14, 10408.53 E. Moldrheim, M. J. Hannon, I. Meistermann, A. Rodger and E.
Sletten, JBIC, J. Biol. Inorg. Chem., 2002, 7, 770.
482 | Dalton Trans., 2011, 40, 472–483 This journal is © The Royal Society of Chemistry 2011
Dow
nloa
ded
by U
NIV
ER
SIT
Y O
F IO
AN
NIN
A o
n 13
Sep
tem
ber
2012
Publ
ishe
d on
26
Nov
embe
r 20
10 o
n ht
tp://
pubs
.rsc
.org
| do
i:10.
1039
/C0D
T00
554A
View Online

54 I. Meistermann, V. Moreno, M. J. Prieto, E. Moldrheim, E. Sletten, S.Khalid, P. M. Rodger, J. C. Peberdy, C. J. Isaac, A. Rodger and M. J.Hannon, Proc. Natl. Acad. Sci. U. S. A., 2002, 99, 5069.
55 M. J. Hannon, V. Moreno, M. J. Prieto, E. Moldrheim, E. Sletten, I.Meistermann, C. J. Isaac, K. J. Sanders and A. Rodger, Angew. Chem.Int. Ed., 2001, 40, 880.
56 Y. Parajo, J. Malina, I. Meistermann, G. J. Clarkson, M. Pascu,A. Rodger, M. J. Hannon and P. Lincoln, Dalton Trans., 2009,4868.
57 A. Rodger and B. Norden, Circular and Linear Dichroism. 1997, Oxford:Oxford University Press.
58 W. Keller, Proc. Natl. Acad. Sci. U. S. A., 1975, 72, 2550.59 O. Novakova, J. Kasparkova, O. Vrana, P. M. Vanvliet, J. Reedijk and
V. Brabec, Biochemistry, 1995, 34, 12369.
60 S. Steinkopf, A. Garoufis, W. Nerdal and E. Sletten, Acta Chem. Scand.,1995, 49, 495.
61 A. Anagnostopoulou, E. Moldrheim, N. Katsaros and E. Sletten,JBIC, J. Biol. Inorg. Chem., 1999, 4, 199.
62 F. Zobi, M. Hohl, W. Zimmermann and R. Alberto, Inorg. Chem., 2004,43, 2771.
63 A. Garoufis, G. Malandirinos and N. Hadjiliadis, Eur. J. Inorg. Chem.,2004, 3326.
64 C. M. Dupureur and J. K. Barton, Inorg. Chem., 1997, 36,33.
65 J. Kasparkova, O. Novakova, O. Vrana, N. Farrell and V. Brabec,Biochemistry, 1999, 38, 10997.
66 A. Juris, V. Balzani, F. Barigelletti, S. Campagna, P. Belser and A.Vonzelewsky, Coord. Chem. Rev., 1988, 84, 85.
This journal is © The Royal Society of Chemistry 2011 Dalton Trans., 2011, 40, 472–483 | 483
Dow
nloa
ded
by U
NIV
ER
SIT
Y O
F IO
AN
NIN
A o
n 13
Sep
tem
ber
2012
Publ
ishe
d on
26
Nov
embe
r 20
10 o
n ht
tp://
pubs
.rsc
.org
| do
i:10.
1039
/C0D
T00
554A
View Online
Top Related
Copyright © 2022 FDOKUMEN

