


Bahasa
Halaman
Hukum


CENSUS OF INDIA 2001
SERIES-16 MIZORAM
DISTRICT CENSUS HANDBOOK
Part - A & B
KOLASIB DISTRICT
VILLAGE & TOWN DIRECTORY
VILLAGE AND TOWNWISE PRIMARY CENSUS ABSTRACT
P.K. Bhattacharjee of the Indian Administrative Service
Director of Census Operations, Mizoram


TUILUT / BAKPUK
Tuilut (unknown entry in water) which is also called Bakpuk by public as it is sheltered by innumerable bats all the time. This Tuilut name is also used as a name of riverine. Two persons had been drowned in this Tuilut on the 10th June 1970, their names are Lalengi 18 yrs. and Rangkhuma 12 yrs., children of Pu Vaia, Salem Veng, Kolasib, while coming home from their searching of Bamboo - shoots. Lalengi's corpse was searched out by Kolasib people but her brother Rangkhuma's corpse could not be found.
According to the report of 31 st YMA General Conference, Kolasib dated 30th
Sept. to 3rd Oct. 1976 the following infonnation is given: -
1. Tuilut I Bakpuk has three entrances.
2. Distance of the cave's entrance to the water is 71 ft.
3. Depth of the water is 77 ft.
4. Measurement from the water surface to the cave surface is 24 ft.
5. The length of the water under the cave is 53 ft.
6. The widest portion of the water under the cave is 15 ft.
7. Breadth of the water inside the cave is (approximately) 8 ft. to 15ft.


Foreword
Preface
Acknowledgements
District Highlight - 2001 Census
Important statistics in the district
Educational facilities at a glance
Medical facilities at a glance
Contents
List of medical institutions under Govt. of Mizoram
Number of health institutions in district under the Govt. of Mizoram
Number of post offices in Mizoram
Ranking of R.D. Blocks in the district
Statements 1-9
Statement 1 Name of the headquarters of districtIR.D. Block, their rural-urban
Pages ix
XI
XIl
xv
xix
xxi XXI
xxi
xxiii
XXIII
xxiv
status and distant from district headquarters, 2001 xxv
Statement 2 Name of the headquarters of districtIR.D. Block, their rural-urban status and distant from district Headquarters, 2001 xxv
Statement 3 Population of the district at each census from 1901 to 2001 xxv
Statement 4 Area, Number of villages/towns and population in district and R.D. Block,2001 xxvi
Statement 5 R.D. Block wise number of villages and rural population, 20.01 xxvii
Statement 6 Population of Urban Agglomerations/Towns, 2001 xxvii
Statement 7 Villages with population of 51000 and above at R.D. Block level as per 2001 census and amenities available XXVlll
Statement 8 Statutory towns with population less than 5,000 as per 2001 census and amenities available xxviii
Statement 9 Houseless and Institutional population of R.D. Blocks, rural and urban, 2001 xxviii
Analytical Note
(i) History and the scope of the District Census Hand Book
(ii) Brief history of the district
(iii) Adminstrative Setup
(iv) Physical features
Location and size Physiography Drainage Climate
3
4
4
4 4
5 5
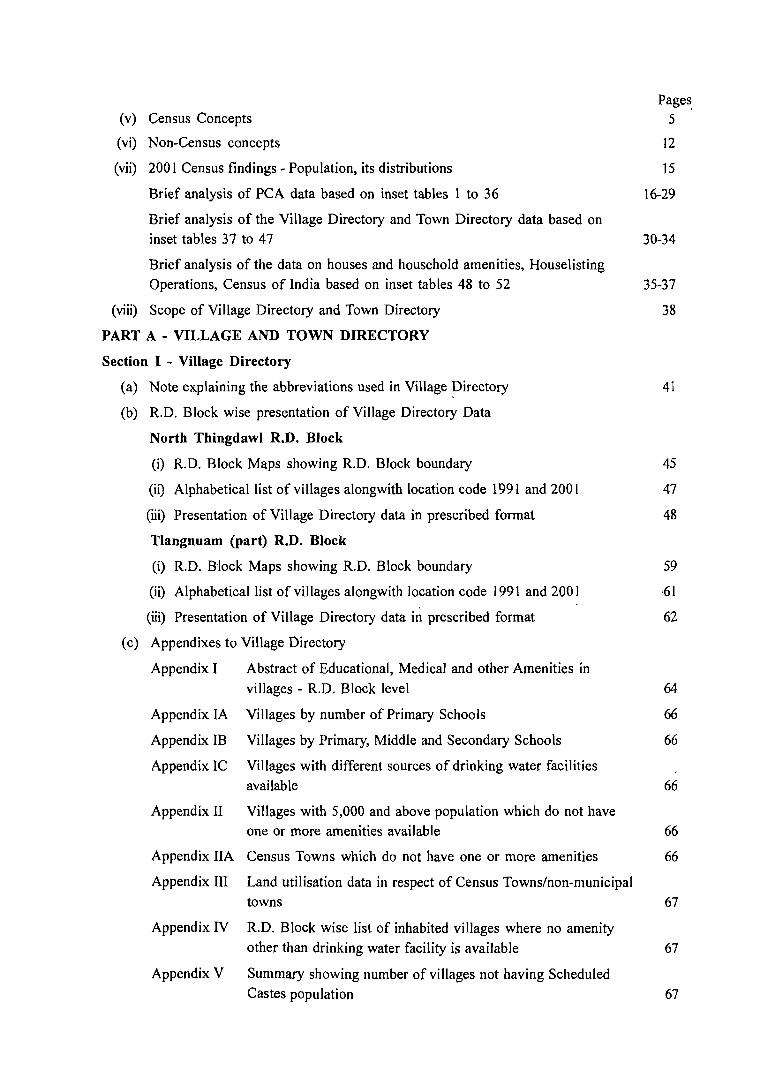
(v) Census Concepts
(vi) Non-Census concepts
(vii) 2001 Census findings - Population, its distributions
Brief analysis of PCA data based on inset tables 1 to 36
Brief analysis of the Village Directory and Town Directory data based on inset tables 37 to 47
Brief analysis of the data on houses and household amenities, Houselisting Operations, Census of India based on inset tables 48 to 52
(viii) Scope of Village Directory and Town Directory
PART A - VILLAGE AND TOWN DIRECTORY
Section I - Village Directory
(a) Note explaining the abbreviations used in Village Directory
(b) R.D. Block wise presentation of Village Directory Data
North Thingdawl R.D. Block
(i) R.D. Block Maps showing R.D. Block boundary
(ii) Alphabetical list of villages alongwith location code 1991 and 2001
(iii) Presentation of Village Directory data in prescribed format
Tlangnuam (part) R.D. Block
(i) R.D. Block Maps showing RD. Block boundary
(ii) Alphabetical list of villages alongwith location code 1991 and 2001
(iii) Presentation of Village Directory data in prescribed format
(c) Appendixes to Village Directory
Appendix I Abstract of Educational, Medical and other Amenities in villages - RD. Block level
Pages, 5
12
15
16-29
30-34
35-37
38
41
45
47
48
59
,61
62
64
Appendix IA Villages by number of Primary Schools 66
Appendix IB Villages by Primary, Middle and Secondary Schools 66
Appendix IC Villages with different sources of drinking water facilities availab Ie 66
Appendix II Villages with 5,000 and above population which do not have one or more amenities available 66
Appendix IIA Census Towns which do not have one or more amenities 66
Appendix III Land utilisation data in respect of Census Towns/non-municipal towns 67
Appendix IV RD. Block wise list of inhabited villages where no amenity other than drinking water facility is available 67
Appendix V Summary showing number of villages not having Scheduled Castes population 67

Pages Appendix VI Summary showing number of villages not having Scheduled
Tribes population 67
Appendix VIIA List of villages according to the proportion of the Scheduled Castes to the total population by ranges 68
Appendix VIIB List of villages according to the proportion of the Scheduled Tribes to the total population by ranges 68
Appendix VIII Number of villages under each Gram Panchayat (R.D.Block wise) 69
Appendix IX Statement showing number of girls schools in the villages 69
Section II - Town Directory
(a) Note explaining the abbreviations used in Town Directory 71
(b) Statement I Status and Growth History 75
(c) Statement II Physical aspects and location of towns 75
(d) Statement III Municipal finance 76
(e) Statement IV Civic and other amenities 77
(f) Statement V Medical, Educational, Recreational and cultural facilities 78
(g) Statement VI Trade, Commerce, Industry and banking 79
(h) Statement VII Civic and other amenities in slums 79
(i) Appendix to Town Directory - Towns showing their outgrowths with population 79
PART B - PRIMARY CENSUS ABSTRACT
(a) Brief note on Primary Census Abstract 83
(b) District Primary Census Abstract (General) 86
(c) Appendix to District Primary Census Abstract Le., Urban block wise figures of Total, SC and ST Population 92
Primary Census Abstract for Scheduled Caste 94
Primary Census Abstract for Scheduled Tribe 100
R.D. Block wise Village Primary Census Abstract 106
Urban Primary Census Abstract 118
Annexure I Number of villages under each Gram Panchayat 127
Annexure II Fertility and Mortality, 1991 Census 127
Annexure III Various measures of fertility and mean age at marriage,1991 Census 127
Annexure IV Percentage distribution of Migrants by place of birth/place of last residence, 2001 Census 128
Annexure V Brief account of main religions in the DistrictIR.D. Block as per 2001 Census 129
Annexure VI Marital Status of Population as per 2001 Census 130
Annexure VII Age, Sex and Education in the district, 2001 Census 132
Annexure VIII Distribution of different mother tongues returned in 2001 Census 136


Foreword
~e District Census Handbook (DCHB) published by Census Organisation since 1951 Census, is one of
lthe important publications in the context of planning and development at grass-root level. The publication, which is brought out for each district, contains several demographic and socio-economic characteristics villagewise and town-wise of the district alongwith the status'Ofavailability of civic amenities, infrastructural facilities,
etc.
2. The scope of the DCHB was initially confined to a few Census Tables and Primary Census Abstract (PCA) of each village and town within the district. Thereafter, at successive censuses, its scope and coverage
has been enlarged. The DCHB published at the 1961 census provided a descriptive account of the district, administrative statistics, census tables and a village and town directory including PCA. The 1971 census -DCHB series was in three parts : Part-A related to vilage and town directory, Part-B to village and town PCA and Part-C comprised analytical report, administrative statistics, district census tables and certain analytical'
tables based on PCA and amenity data in respect of villages. The 1981 census DCHB was in tow parts: PartA contained village and town directory and Part-B the PCA of village and town including the SCs and STs PCA upto tahsil/town levels. New features alongwith restusturing of the formats of village and town directory were added into it. In village Directory, all amenities except electricity were brought together and if any
amenity was not available in the referent village, the distance in broad ranges from the nearest place having such an amenity, was given. Information on new items such as adult literacy centres, primary health subcentres and community health workers in the village were provided so as to meet the requirements of some of the Revised Minimum Needs Programme. Information on approach to the village was provided for the first time in the Village Directory so as to give the details on number of inaccessible villages in each district. In
the Town Directory. a statement (IV-A) on slums was introduced to provide the details on civic and other amenities in the notifioed slums of Class I and Class II towns.
3. The 1991 census DCHB, by and large, followed the pattern of presentation of 1981 census, except the format of PCA was restructured. Nine-fold industrual classification of main workers was given against the four-fold industrial classification presented in the 1981 census. In addition, sex-wise population in 0-6 age group was included in the PCA for the first time with a view to enable the data users to compile more realistic
literacy rate as all children below 7 years of age had been treated as illeterate at the time of 1991 census. One of the important innovations in the 1991 census was the Community Development Block (CD block) level presentation of village directory and PCA data instead of the traditional tahsil/taluklPS level presentation. It was expected that the presentation of village directory and PCA data at CD block level will help the
planners in formulation of micro level development plans, CD block being lowest administrative unit.
4. The present series of the 200 I Census DCHB have been made more informative and exhaustive in terms of coverage and content. The Village Directory has been enlarged in scope by including a number of other facilities like banking, recreational and cultural facilities, newspapers and magazines and 'most important
commodity' manufactured in village. Income and expenditure of gram panchayat, wherever possible, has been
provided. Apart from these, more details on distance (s) at which basic amenities are available (if not available
in the village), are given. This includes educational facilities (namely primary and middle schools and college), medical facilities (viz. Allopathic Hospital, Maternity & Child Welfare Centre and Primary Health Centre), drinking water, post & telegraph (post office and phone), communication, bank, credit societies and recreational facilities. In town directory, the statement of Slums has been modified and its coverage enlarged by including
(ix)
details of all slums instead of 'notified slums'. The information is given in case of all statutory towns irrespective of their class, against only Class I and Class II towns in the 1981 and 1991 censuses. The basic amenities available in the villages and towns are analyzed in depth with the help of a number of cross-classified inset tables and statements. Two other significant additions in the publication are inclusion 'motif' highlighting significant characteristic of the district and analytical notes as annexures. The analytical notes on (i) fertility and mortality and (ii) various measures of fertility and mean age at marriage are prepared based on 1991 Census. Whereas, in the notes relating to (i) percentage distribution of migrants by place of birth/place of last residence, (ii) main religions, (iii) marital status of population, (iv) age, sex and education, and (v) distribution of spectrum of mother tongue, nature and extent of changes occured in the district in its basic socio-demographic features during the decade 1991-2001 are analysed. The eight digits permanent location code (PLCN) to all the villages and towns have been assigned keeping in view the future needs.
5. The village and town level amenity data have been collected, complied and computerized in prescribed record structure under the supervision of Shri P.K. Bhattacharjee, Director of Census of Operations, Mizoram. Thereafter, effort has been made to ensure comparability of the information with that of 1991 census data and the information brought out by the respective State Governments in their annual reports and statistical handbooks for various year~ after 1991. The task of planning, designing and coordination of this publication was carried out by Shri RG. Mitra, Deputy Registrar General (C&T) and Dr. I.C.Agrawal, Senior Research Officer of Social Studies Division. Dr. RP. Singh, Deputy Registrar General (Map) provided the technical guidance in the preparation of maps. Whereas, Shri Ani! Kumar Arora, Deputy Director of Data Processing Division who worked under the overall supervision of Shri Himakar, Add!. Director(EDP) helped in preparation of record structure for computerization of village and town direytory data and the programme for the generation of Village Directory and Town Directory statements including analytical inset tables. The draft DCHB. manuscripts received from the Census Directorates have been scrutinized in the Social Studies Division under the guidance of Shri S.L. Jain, Deputy Director and Shri R.K. Mehta, Assistant Director, I am thankful to all of them and others who have contributed to make this publication possible.
New Delhi 17th October 2003
(x)
D.K. Sikri Registrar General &
Census Commissioner, India
Preface
I n the forward to this publication a summary of the background, coverage and content to the District Census Handbook have been provided. This volume contains the salient features and information on
census and non-census data collected respectively during Census of India 2001 and from various states and Central Government Organisations so as to enable the data users to make full of fruitful utilisation of the data and various information presented herein. It is hoped that the micro level information incorporated in this publication will quench the thirst of planners and other users including research scholars for such details.
The publication of the District Census Handbooks for all eight districts of Mizoram is a joint ventures of the State Government of Mizoram and the Census Organisation of Government of India. The design layout and various formats presented in the District Census Handbook have been provided by the Census Commissioner India. The compilation of various data, preparation of the analytical notes and gathering of all relevant information for incorporation in the DCHB have been attempted by this Directorate and the cost of publication is borne by the State Government. It may be mentioned here that the process of compilation of various data initially collected mainly from the Block Development Officer and respective Deputy Commissioners was finalised after cross checking with data obtained from concerned State and Central Government agencies so that as far as practicable, the discrepancies could be reconciled, we are grateful to all Block Development Officers, Deputy Commissioners, various Heads of Departments of the State and Central Government for their whole-hearted help and co-operation. I am grateful to the Secretary to the Government of Mizoram, General Administration Department (GAD), Additional Secretary, GAD, Under Secretary, GAD and all their helpers for sparing their valuable time during the preparation and
publication of the District Census Handbook.
I convey my deep sense of gratitude to Shri J.K. Banthia, Registrar General and Census Commissioner, India for his valuable guidance and advice received from him right from the beginning. I am thankful to Shri R.G. Mitra, Dy. Registrar General (C & T) and Dr. I.C. Agrawal, Senior Research Officer, Social Studies Division of the Office of the Registra General and Census Commissioner, India, who have been a source of constant help and guidance to us on all technical matters including planning and designing the formats. Because of their continuous help to us this volume could be produced in all India pattern. My thanks are also due to Dr. RP. Singh, Deputy Registrar General (Map) for providing technical guidance in the preparation of maps as well as for printing of a large number of maps under his direct supervision and active guidance at the Headquarters office.
At the Directorate level, the preparation of this volume has been a product of a joint effort and team work of all my colleagues led by Shri Sylvester Kispotta, Dy. Director, Shri R Lalthlamuana, Assistant Director and Shri Lalhmingthanga, Statistical Investigator Gr. I. Because of their hardwork and dedication of duties this volume could be published in time. I also convey my deep feeling of appreciation to all the
officials of this Directorate who have put their efforts in the publication of the District Census Handbook.
Aizawl
8th July 2003
(xi)
P.K. Bhattacharjee Director of Census Operations.
Mizoram


Acknowledgements
Census Section
Map Section
Shri Lalhmingthanga
Shri Lalbuanga Sailo
Shri Saithuama Sailo
Shri Saithanthuarna
Shri Lalrosanga
Smt K. Laldawngliani
Shri Jeremiah L. Fanai
Shri Bikash Nath
Shri Sanjoy Das
Shri Lalnghinglova
Shri Lalrova
Com puter Section
Shri Rajib Sinha
(xiii)
Statistical Investigator Grade I
Statistical Investigator Grade II
Statistical Investigator Grade III
Statistical Investigator Grade III
Statistical Investigator Grade III
Statistical Investigator Grade III
Compiler
Compiler
Compiler
Sr. Draughtsman
Sr. Draughtsman
Compiler

District Highlights 2001 Census
l. Kolasib District is one of the new districts carved out of the then Aizawl District of Mizoram after 1991 Census.
2. It is the 4th most urbanized districts ofMizoram, the first being Aizawl and the 5th being Serchhip District.
3. In terms of literacy it is 3rd in the state.
4. Against the sex ratio of 935 of the state, the same for the district is 908 which is the 6th lowest in the state.
5. Bilkhawthlir village is the most populated village with population of 4.084 in the district while Chemphai village with a population of 48 is the smallest village in terms of population.
6. The percentage of tribal population of the district is 89.8% the same being 94.5% for the whole state.
(xv)


. .,. ; .i Buhchan
.~.
I i
" il \I ;1 •
Nar\~ :1 " ~
Thing~"elh
Ii " II
r I
I TOTAL AREA OF DISTRICT (IN SQ.KM) -. -. 1382.00 I TOTAL POPULmON OF DISTRICT 65960 I
I TOTAL NUMBER OF TOWNS IN DISTRICT
LTOTAL NUMBER OF ~ILLAGES IN DISTRICT ._ 48 ! I
_____j
\
MIZORAM (INDIA)
KOlASIB DISTRICT
KJI.OMETRES
5 0 5 10 15 20
t±±------L ____ :J ____ L __ ~=::l
,_
()
,_ A - TLANGNUAM (PART)
-c
BOUNDARY: STATE
DISTRICT
R.D. BLOCK
HEADQUARTERS: DISTRICT
R.D. BLOCK
NATlO'\AJ. HIGHWAY
METALLED ROAD
t:NMETALLED ROAD
RIVER ASD STREAM
VILLAGE HAVING 500 A:-lD ABOVE
POPUATIOl'>
TOWNS WITH POPULATION SIZE AND
CLASS IV, V, VI
DEGREE COLLEGE
@ NH 54
Bukpui . •••
Based upon Survey of India map with the permission of the Surveyor General of India. C Government of India copyright, 2005.


Important Statistics 2001
STATE DISTRICT NUMBER OF VILLAGES Total 817 49
Inhabited' 707 39 Uninhabited 110 10
NUMBER OF TOWNS Statutory Towns 22 4 Census Towns 0 0
NUMBER OF HOUSEHOLDS Normal 176,134 14,053 Institutional 518 35 Houseless 70 0
POPULATION TOTAL Persons 888,573 65,960 Males 459,109 34,562 Females 429,464 31,398
RURAL Persons 447,567 29,461 Males 232,726 15,561 Females 214,841 13,900
URBAN Persons 441,006 36,499 Males 226,383 19,001 Females 214,623 17,498
PERCENTAGE URBAN POPULATION 49.6% 55.3%
Number Percentage Number Percentage DECADAL POPULATION Persons 198,817 28.8 17,137 35.2 GROWTH 1991-2001 Males 100,131 27.9 9,137 35.9
Females 98,686 29.8 8,054 34.5
AREA (in sq. kIn.) 21,081 1,382
DENSITY OF POPULATION (Persons per square kilomemetre) 42 48
SEX RATIO Total 935 908 (Number of females per Rural 923 893 1000 males) Urban 948 921
LITERATES Persons 661,445 88.8 50,596 91.3 Males 350,105 90.7 26,969 92.3 Females 311,340 86.7 23,627 90.2
(xix)

STATE DISTRICT Number Percentage Number Percentage
SCHEDULED CASTE Persons 272 0.0 17 0.0 POPULATION Males 212 0.0 8 0.0
Females 60 0.0 9 0.0
SCHEDULED TRIBE Persons 839,310 94.5 59,221 89.8 POPULATION Males 422,963 92.1 30,173 87.3
Females 416,347 96.9 29,048 92.5
WORKERS AND NON-WORKERS TOTAL WORKERS Persons 467,159 52.6 35,510 53.8 (MAIN & MARGINAL) Males 263,008 57.3 20,262 58.6
Females 204,151 47.5 15,248 48.6
(I) MAIN WORKERS Persons 362,450 40.8 27,441 41.6 Males 225,428 49.l 18,019 52.l Females 137,022 31.9 9,422 30.0
(II) MARGINAL Persons 104,709 11.8 8,069 12.2 WORKERS Males 37,580 8.2 2,243 6.5
Females 67,129 15.6 5,826 18.6
(Ill) NON-WORKERS Persons 421,414 47.4 30,450 46.2 Males 196,101 42.7 14,300 41.4 Females 225,313 52.5 16,150 51.4
CATEGORY OF WORKERS (MAIN & MARGINAL) (I) CALTIVATORS Persons 256,332 54.9 20,407 57.5
Males 130,497 49.6 11,014 54.4 Females 125,835 61.6 9,393 61.6
(U) AGRICULTURAL Persons 26,783 5.7 3,173 8.9 LABOURERS Males 12,775 4.9 1,325 6.5
Females 14,008 6.9 1,848 12.1
(III) WORKERS IN Persons 7,100 1.5 405 l.1 HOUSEHOLD Males 3,476 1.3 277 1.4 INDUSTRY Females 3,624 1.8 128 0.8
(IV) OTHER WORKERS Persons 176,944 37.9 11,525 32.5 Males 116,260 44.2 7,646 37.7 Females 60684 29.7 3879 25.4
1. Definition of Census Town : All places which satisfy or arc expected to satisfy the following criteria are treated as Census Town:
(i) A minimum population of 5,000;
(ii) At least 75 per cent of the male working population engaged in non-agricultural pursuits, and
(iii) A density of population of at least 400 per square kilometre (1,000 per square mile).
2. Percentge figure in category of workers has been calculated from total workers.
(xx)

Educational facilities at a glance
Serial Number Type of Institution State
1. College 30
2. H.S.S.
3~~ 3. H.S.
4. M.S. 852
5. P.S. 1422
Medical facilities at a glance
Serial Number Type of Institution
1. Hospitals
2. State Referral Hospitals
3. Community Health Centre (CHC)
4. Primary Health Centre (PHC)
5. Main Centre
6. Sub Centre
State
10 1
7
56
14
78
District
1
22 47 87
District
1 (30 Bed)
6
7
27 Source: Status overview of various health programmes implemented in Mizoram - Health and Family Welfare Deparetment
- Government of Mizoram (Nov. 2000).
List of medical institutions under Government of Mizoram as on 31st March 2000
A: HOSPITALS
District
Aizawl
Serchhip
Champhai
Lunglei
Saiha
Mamit
1. 2. l.
1.
1. 2. 3. 1.
Name of Hospitals Bed Strength
Civil Hospital Aizawl 300 TB Hospital Zemabawk 50 Serchhip Hospital 50 Champhai Hospital 50 Civil Hospital Lungiei 100 Tlabung Hospital 30 Leprosy Hospital Tlabung 20 Civil Hospital Saiha 71 NIL NIL
(xxi)

B: PRIMARY HEALTH CENTRE (pHe-tO Bed each)
District Location District Location 1. Aizawl 1. Sialsuk 5. Champhai 1. Kawlkulh
2. Aibawk 2. Khawzawl 3. Sairang 3. Khawhai 4. Thingsulthliah 4. Khawbung 5. Sakawrdai 5. Farkawn 6. Khawruhlian 6. Mimbung 7. Suangpuilawn 7. Bungzung 8. Phuaibuang 8. Rabung 9. Darlawn 9. Hnahlan
10.N. E. Khawdungsei 2. Mamit I. Mamit
2. Lengpui 6. Lunglei 1. Chhipphir 3. West Phaileng 2. West Bunghmun 4. Kawrtethawvellg 3. Cherhlun 5. Reiek 4. Buarpui 6. Phuldungsei 5. Haulawng 7. Kanghmun 6. Lungsen 8. Zawlnuam 7. Tawipui
8. South Vanlaiphai 3. Kolasib 1. Bairabi
2. Lungdai 7. Lawngtlai I. Bor~pansury 3. Bukpui 2. Bungtlang (S) 4. Bilkhawthlir 3. Chawngte 5. Kawnpui 6. Vairengte 8. Saiha I. Tuipang
2. Lungpher 4. Serchhip 1. Chhingchhip 3. Chhuarlung
2. Thenzawl 4. Chakhang 3. Khawlailung 5. Bualpui 'NG' 4. Ngentiang 6. Sangau 5. East Lungdar 6. N. Vanlaiphai
Source : Same as mentioned below "Medical Facilities at a Glance",
c: COMMUNITY HEALTH CENTRE (CHC) - 7
District Location Bed Strength
Kolasib Kolasib 46
Mamit Kawrthah 30
Champhai 1. Biate 30 2. Ngopa 30
Lunglei Hnahthial 30
Lawngltai Lawngtlai 30
Aizawl Saitual 30
Source : Same as mentioned below "Medical Facilities at a Glance",
(xxii)

Number of Health Institutions in district under the Government of Mizoram (as on 31 st March 2000)
Serial Aizawl Serchhip Champhai Lunglei Lawngtlai Saiha Kolasib Mamit
Number Institution Dist. Dist. Dist. Dist. Dist. Dist. Dist. Dist. Total
1 2 3 4 5 6 7 8 9 10 11
General Hospital 2 2 7
2 Community Health Centre 2 7
3 Primary Health Centre 10 6 10 8 3 6 7 6 56
4 Main Centre 14 7 13 12 5 8 9 7 75
5 Sub-Centre 78 29 56 69 24 34 29 27 346
District Total 105 43 82 92 33 49 46 41 491
Source: Status overview of various health programmes implemented in Mizoram - Health and Family Welfare Deparetment - Government
of Mizoram (Nov. 2000).
Number of Post Offices in Mizoram Number of Post Offices
Serial No. Name of District Name ofR. D. Block Rural Urban Total
1 2 3 4 5 6
Mamit I. Zawlnuam 16 2 18
2. West Phaileng 14 14
3. Reiek 8 9
2 Kolasib I. North Thingdawl 12 5 17
3 Aizawl 1. Darlawn 19 20 2. Phullen 9 9 3. Thingsulthliah 13 3 16
4. Aibawk 16 16 5. Tlangnuam 7 34 41
4 Champhai I. Ngopa 14 14
2. Khawzawl 27 10 37
3. Khawbung 15 15
5 Serchhip I. Serchhip 8 3 II
2. East Lungdar 13 2 15
6 Lunglei I. West Bunghmun 14 14
2. Lungsen 15 I 16
3. Lunglei 15 II 26
4. Hnahthial 16 17
7 Lawngtlai I. Lawngtlai 21 21
2. Chawngte 9 9
8 Saiha 1. Tuipang 24 2 26
2. Sangau 9 9
Grand Total 320 76 396 (+) Aizawl HPO
397
(xxiii)

Ranking of R.D. Blocks in the district
Serial N. Thingdawl R. D. Block Tlangnuam (Eart) R. D. Block number In Tcrm of Value Rank Value Rank
2 3 4 5 6
Total Population 61,046 1 4,914 2
2 Total area (in sq. kms.) NA NA
3 Density of population per sq.km. NA NA
4 Sex Ratio 912 865 2
5 Proportion Urban 59.8 0.0
6 Proportion Scheduled Castes 0.0 0.0
7 Proportion Scheduled Tribes 89.3 2 95.8
8 Proportion Literate 91.2 2 92.7
9 Work participation rate (Main + Marginal Workers) 53.0 2 64.8
10 Percentage of villages having Primary School 71.9 2 100.0
II Percentage of villages having Primary Health Sub-Centre 43.8 42.9 2
12 Percentage of villages having Well 0.0 0.0
13 Percentage of villages having Post Office 28.1 2 57.1
14 Percentage of villages having Bus facility 34.4 2 85.7
15 Percentage of villages having approach by Pucca Road 21.9 2 85.7
16 Percentage ofvillages having Electricity for domestic purpose 75.0 2 85.7
17 Percentage of villages having forest area NA NA
18 Percentage of villages having Irrigated Area NA NA
(xxiv)

STATEMENT -1
NAMEOFTHE HEADQUARfERSOFDISfRICf, THEIRRVRAL-URBAN STATUS AND DISTANCE FROM DlSTRICfHEADQUARTERS, 2001
Name of district Whether urbani Distance to district headquarters Sl.No. Name of district headquarters rural by road (in kms.)
2 3 4 5
Kolasib· Kolasib Urban (NT) 0 Note : 1. NT - Notified Town.
2. As there is no Tahsil in the District, no information regarding this could be provided. 3. • indicates newly created district in 200 I Census. •
The District Headquarters is located on the National Highway 54 and is 82 km from Aizawl, the Capital of Mizoram. As mentioned above, like all other
towns of the state, Kolasib is also a Notified Town. As there is no Tahsil in the state/district relevant
information in this regard could not be compiled.
STATEMENT -2
NAME OFTHEHEADQUARTERSOFDISTRICfIR.D. BLOCK, THEIRRVRAL-URBAN STATUS AND DISTANCE FROM DISTRlCTHEADQUARTERS, 2001
Serial Name ofdistrictl Name ofdistrictIR.D. Whether urbani Distance from R. D. B lock headquarters number R.D.Block Block headquarters rural to district headquarters by road (in kms.)
2 3 4 5
Kolasib District· Kolasib District Urban 0
2 Thingdawl R. D. Block Thingdawl R. D. Block Rural 7
3 Tlangnuam {Part} Tlangnuam {Part~ R.D. Block Rural 56 Note: • indicates newly created district in 2001 Census.
Statement 2 above contain certain basic information regarding name of the district, name of the R.D. Block, location of headquarters and the distance of these from the district headquarters have been shown.
Although there are 4 notified towns in the district, Thingdawl, the headquarters of the only R.D. Block
of the district is still treated a rural area.
STATEMENT -3
District
Kolasib*
POPULATION OFTHE DISTRICT AT EACH CENSUS FROM 1901 TO 2001
Total! Rural/ Urban
2
Total
Census Year
3
1901
1911
1921
1931
1941
1951
1961
1971
1981
1991
2001
Persons
4
48,769
65,960
Males
(xxv)
5
25,425
34,562
Females
6
23,344
31,398
Decadal variation of population
Absolute Percentage
7 8
17,191 35.2

STATEMENT -3
POPULATION OF THE DISTRICT AT EACH CENSUS FROM 1901 TO 2001
TotalJ Decadal variation of population Rural! Census
District Urban Year Persons Males Females Absolute Percentage
2 3 4 5 6 7 8
Kolasib' Rural 1901
1911
1921
1931
1941
1951
1961
1971
1981
1991 21,969 11,664 10,305
2001 29,461 15.561 13,900 7,492 34.1
Urban 1901
1911
1921
1931
1941
1951
1961
1971
1981
1991 26,800 13,761 13,039
2001 36,499 19,001 17,498 9,699 36.2
Note: * indicates newly created district in 2001 Census.
Statement 3 contains the ruraVurban status of by taking the present jurisdiction of the district into
male and female population of the district during 1991 consideration.
and 2001 census since the district was created in the It can also be seen from the above that against
year 1998, details of population from the census of the growth of28.8% of the whole state, the population growth of the district during 1991-2001 is 35.2%
1901 could not be compiled. Even the population (Rural 34.1, Urban 36.2 - State Rural 21.0, Urban figures as shown against the year 1991 has calculated 38.7).
STATEMENT -4
AREA, NUMBEROFVlLLAGESIfOWNSAND POPULATION IN DISTRICT AND R.D. BLOCK, 2001
District! Total! Area in Population No. of villages No. of No. of Population S1. R.D.Block} Rural! square per square statutory census No. of No. UAffown Urban kilometers kilometers. Inhabited Un-inhabited towns towns households Persons Males Females
2 3 4 5 6 7 8 9 10 11 12 13
Kolasib* Total 1,382 48 39 10 4 0 14,053 65,960 34,562 31,398
Rural 1,278 23 39 10 0 0 6,205 29,461 15,561 13,900
Urban 104 351 0 0 4 0 7,848 36,499 19,001 17,498
(xxvi)

STATEMENT -4
AREA,NUMBEROFVllLAGESffOWNSAND POPULATION IN DlSTRICf AND R.D. BLOCK, 2001
District! Totall Area ill Population No. ofvillages No. of No. of Population Sl. R.D.Block! Rural! square per square statutory census No. of No. UAlTown Urban kilometers kilometers Inhabited Un-inhabited towns towns households Persons Males Females
2 3 4 5 6 7 8 9 10 11 12 13
2 N. Thingdawl Total NA NA 32 9 4 0 12,956 61,046 31,927 29,119
Rural NA NA 32 9 0 0 5,108 24,547 12,926 11,621
Urban 104 351 o • 0 4 0 7,848 36,499 19,001 17,498
3 Vairengte (NT) Urban 20 386 0 0 0 1,927 7,715 4,228 3,487
4 Bairabi (NT) Urban 26 217 0 0 0 639 3,304 1,734 1,570
5 Kolasib (NT) Urban 36 528 0 0 0 3,877 19,008 9,761 9,247
6 N.Kawnpui (NT)Urban 22 294 0 0 I 0 1,405 6,472 3,278 3,194
7 Tlangnuam Total NA NA 7 0 0 1,097 4,914 2,635 2,279
(Part) Rural NA NA 7 0 0 1,097 4,914 2,635 2,279
Urban 0 0 0 0 0 0 0 0 0 0
Note : • indicates newly created district in 2001 Census.
A scrutiny of the above statement will reveal that the total number of males outnumbered the females 39 villages were inhabited, 10 un-inhabited, all 4 towns in the district level and all R.D. Blocks and Town are notified towns and that there was not a single level. Census Town in the district. It can also be seen that
STATEMENT-5
R.D. BLOCK WISE NUMBER OF VILLAGES AND RURAL POPULATION, 2001
Number of villages Rural population
Sl. No. Name ofR.D. Block Total Inhabited Persons Males Females
2 3 4 5 6 7
North Thingdawl 41 32 24,547 12,926 11,62
2 Tlangnuam (Part) 8 7 4,914 2,635 2,279
District (Rural) Total : 49 39 29,461 15,561 13,900
It may be seen that there were 9 un-inhabited villages in North Thingdawl R.D. Block and only one in Tlangnuam (part) of the district. Since the data
incorporated above are very simple and self explanatory no further explanation may be necessary.
STATEMENT -6
POPULATION OFURBAN AGGLOMERATIONS (INCLUDINGCONSTITUENTUNITS)/fOWNS, 2001
Serial Number
2
3
4
NameofUAffown
2
Bairabi (NT)
Kolasib (NT)
N.Kawnpui (NT)
Vairengte (NT)
District (Urban) total:
Name ofR.D. Block where Urban status town is located
3 4
VI North Thingdawl
N North Thingdawl
V North Thingdawl
V North Thingdawl
(xxvii)
POEulation Persons Males Females
5 6 7
3,304 1,734 1,570
19,008 9,761 9,247
6,472 3,278 3,194
7,715 4,228 3,487
36,499 19,001 17,498

Details of urban areas (Towns), R.D. Block to which each of these areas belong, population with
male-female breakup of each town have been shown above.
STATEMENT-7
VILLAGES WITH POPULATION OF 5,000 AND ABOVE AT R.D. BLOCK LEVEL
AS PER 2001 CENSUS AND AMENITIES AVAILABLE
In Kolasib District out of 32 inhabited villages there is not a single village with population of 5000
and above. As such information to be incorporated in Statement 7 may be treated as NIL.
STATEMENT-8
STATUTORY TOWNS WITH POPULATION LESS THAN 5000 AS PER 2001
CENSUSANDAMENlTIESAVAILABLE
Amenities available Whether Whether Improved
it is it is Educational drinking Commu-
Location Tehsil R.D.Block Senior Medical water nication Banking Serial Name of code head- head- Secondary Health Tap Railway number Town number Population quarters quarters School College Hospital Centre water station Bank
2 3 4 5 6 7 8 9 10 11 12 13
Bairabi 40202000 3,304 No No No No No Yes No Yes Yes
It can be seen in the statement that there was only one town in Kolasib District with total population less than 5000. Various types of amenities which were available or not available were also indicated itemwise. It can be seen that no Hospital, College or Higher
Secondary School were located in Bairabi Town. Also no provision of supply of drinking water through pipeline/taps was available and only Health Centre, Railway Station and Banking were available in Bairabi Town.
STATEMENT -9
HOUSELESSAND INSTITUTIONAL POPULATION OFTEHSILS, RURALAND URBAN, 2001
District! TotaV Houseless EOEulation Institutional EOEulation
Serial R.D.Block! RuraV Number of Number of
Number UAlTown Urban households Persons Males Females households Persons Males Females
2 3 4 5 6 7 8 9 10 II
Kolasib" Total 35 638 447 191
Rural 12 108 108
Urban 23 530 339 191
2 North Thingdawl Total 35 638 447 191
Rural 12 108 108
Urban 23 530 339 191 3 Vairengte (NT) Urban 2 12 6 6
4 Bairabi (NT) Urban 1 6 3 3
5 Kolasib (NT) Urban 18 498 329 169 6 N.Kawnpui (NT) Urban 2 14 13 7 Tlangnuam (Part) Total
Rural
Urban Note: • indicates newly created district in 2001 Census.
(xxviii)
It can be seen from the above statement that number of Houseless population and Institutional Households population in the district at R.D. Block as well as towns. There is no Houseless population in the district. At the same time 35 institutional households were found in the district consisting of 638
population of447 males and 191 females respectively. It is also found that more institutional population are concentrate in urban areas. It is interesting to note that in rural areas only males institutional population are found. In urban areas the population of males is much higher than that of rural areas.
(xxix)


ANALYTICAL NOTE


Analytical Note
(i) History and scope of the District Census Handbook
After the completion of the Census of India 1951, the Government of India handed over a large number of Census Tables and other relevant information to the State Governments which were collected by the Census Organisation during the field operations of the Census of 1951 and compiled subsequently by the same organisation. It was further suggested to all concerned State Government authorities that these data along with any other relevant basic information pertaining to a particular district be published in a consolidated form. The respective State Governments accepted the above suggestion of the Government of India and the first addition of the District Census Handbook CDCHB) for each of the existing districts of those days was published through the respective State Governments. In Mizoram the District Census Handbook for all three districts of Aizawl, Lunglei and Chhimtuipui were publ ished for the first time by the newly established Directorate of the Census Operations, Mizoram, after 1981 Census. As the DCHB was found to be of immense help to the public in general and to the planners, social workers, researchers, administrators and Government officials in particular throughout the country, DCHBs were also published after the Census of 1961, 1971, 1981 and 1991 after making certain modification and improvement on its contents so that certaih basic economic data in respect of smallest administrative units i.e., the villages and towns in each district could be found in such handbooks. Since 1991, the DCHB has been made in two parts, namely Part A and Part B. Part A relates to the village and town directories of all the inhabited villages and towns of each district while Part B contains relevant information pertaining to the Primary Census Abstracts (PCA).ln the DCHB 2001, besides restructuring
the formats of the Directory, certain individual features have been adopted presuming that such presentation would be of better use of the planners in formulating socio-economic programmes.
As already mentioned else where the District Census Handbook continues to be ajoint ventured of the Census Organisation and the concerned State Governments. The scope of the District Census Handbook has been widely increased and restructured in 1981 to meet the minimum requirement of the revised Minimum Needs Programme of the Planning Commission. In this volume the poulation in the age group 0-6 has been compiled by sex and has been incorporated to enable computation to realistic literacy rate by taking all children below 7 years as illiterates. This time for the benefit of data users of Village Directories and PCA, data from floppies or from published records, the computer codes as well as the manual codes of 2001 and corresponding location code of 1991 Census are given in detail.
As already mentioned earlier, the District Census Handbook is being published in two parts - Part A and Part B but in one volume separately for each of the eight districts of Mizoram. In the process of collection of various data published in this volume, various State and Central Government Departments have extended their whole hearted help and cooperation particularly with regard to infrastructural amenities incorporated in Part A - Village and Town Directories. The PCA data presented in Part B of this volume were collected during Census Operations in February - March 2001, the reference date and time being 00:00 Hrs of 01 March 2001.
Scanning of Household Schedules have been done at Direct Data Entry Centre Guwahati. We are thankful to the Director Census Operations Assam and his officers and members of the staff for undertaking huge volume of works and enabling us to complete and include the present PCA in all the District Census Handbooks ofMizoram including that of Kolasib District.

4
(ii) Brief history of the district
Kolasib is a newly created district and is located on the northern tip of Mizoram sharing its northern border with Cachar District of the State of Assam. The District was created in the year 1998 by carving out of the then Aizawl District. In fact, the district was created simply by upgrading the existing subdivision under Aizawl District vide Government of Mizoram Notification No. A.600 11121195-GAD dated 29.07.1998. Two Rural Development Blocks namely N. Thingdawl and Tlangnuam (part) covers the whole district. At a later stage the district was further subdiveded into the following three sub-divisions:
1. Vairengte Sub-division with Headquarters at Vairengte.
2. Kawnpui Sub-division with Headquarters at Kawnpui.
3. Kolasib Sadar Sub-division with Headquarters at Kolasib.
In the absence of any written or any other form of authentic records, as in the case of al I other district of Mizoram nothing is authentically known about the ancient or mediavel ages of the history of the place. Written or authentic records were kept only after the State/district came under the occupationof the British rulers in the 2nd half of nineteenth century.
It can however be stated that during last 4 centuries and even after the occupation of this area by the British Administrators, the system of Chieftainship was wide spread in the region. Accordingly one such chief named Kawla was ruling the village now known as Kolasib. As such whenever this village was referred to, 'Kawla Chief Village' was most popularly mentioned. Thus from kawla Chief the name Kolasib was given by the Britishers and till date there has not been any change of this name.
(iii) Administrative setup
Kolasib District is situated on the northern tip of Mizoram. The district has been carved out of the then Aizawl district in the year 1998 vide Government of Mizoram Notification No. A.60011/21195-GAD dated 29 July 1998. Prior to this upgradation, it was a Sub-division under Kolasib Sadar Sub-division with Headquarters at Kolasib, there are two other subdivisions in the district. These are Kawnpui Civil Sub-
DISTRICT CENSUS HANDBOOK: KOLASIB
division and Vairengte Civil Sub-division. Till the end of the year 2001 Kawnpui Civil Sub-division was.not functional. So far as Rural Development Blocks are concerned, the whole area of the Kolasib District is covered by Thingdawl and Tlangnuam (Part) R.D. Block. The Deputy Commissioner of the district is the seniormost Civil Officer who is assisted by the Superintendent of Police and various other district and R.D. Block level Officers in running the day to day administration and development activities within the district.
During the Census of India 2001, there were 4 Statutory Towns i.e., Kolasib, N. Kawnpui, Vairengte and Bairabi, all notified by the State Government as urban/town areas. Similarly there were 49 vil1ages in the district out of which 39 villages were habited the remaining villages were found to be uninhabited. It may be of interest to note that although the aforementioned 4 places have been notified as towns by the State Government, no municipality or any urban body has been constituted in any of these towns including the district headquarters of Kolasib and as in the case of villages, Village Councils locally elected by the respective populations have been functioning in these towns also.
(iv) Physical features
Location and size :
The geographical location of Kolasib Dis·trict is between 92°30' and 92°45' East Longitude and 24° and 24° 15' North Latitude. The average height of the district is 722 mtrs. (2,370 ft.) above mean sea level. The district covers an area of 1,382 Sq. Kms. The district is flanked by Hailakandi and Cachar Districts of Assam in the north, Aizawl District in the south and east and Mamit District in the west.
The North-South extension of the district is 81.6 km. and East- West extension is 56 km.
Physiography :
The district is situated in a part of Aizawl Mountainous Region of Eastern Hill Zones. The topography of the district is rugged having steep hill slopes and the comparively low hill ranges run in the North-South direction intercepted by narrow strips of planes and as already mentioned elsewhere the average height of the district is 722 mtrs. (2,370 ft.)

ANALYTICAL NOTE
aginst the average height of 900 mtrs. for the whole state. The geology of the district belongs to Surma series and Baghmara (Garo Hills) formation of Miocene age and Tipam series and Chengapara (Garo Hills) formation of Pliocene age. (The Aizawl Mountanous Region covers not only the Thingdawl R.D. Block, it consists of Reiek, Aibawk, Tlangnuam and part of Serchhip R.D. Blocks.) The soil of the district are Orchrepts - Aquepts - Fluvents and UdalfOrchrepts. The area is rich in natural vagitation ,and teak, bamboo types of plantations grows abundantly in this area. In comparison with other interior districts this area is more developed in terms of surface communication. The only railway Station namely Bairabi is located in this district.
Drainage:
Two big rivers, namely Tlawng (Dhaleswari) and Tuirial (Sonai) flank the district on the western and eartern boundaries respectively. Both these rivers flow from south tow~rds the north and into the Cachar District of Assam. The district is washed by Meidum, Tuichhuahen and Chhimluang which are the tributaries of the river T.lawng and by Tuiawn lui and Hrachhek lui - the tributaries of the river Tuirial. Besides these, river Serlui with tributaries like Aitlang, Saihapui, Buarchep, Chern lui and Builum lui are also flowing in the district. Except artificial fisheries ponds, no natural lake or reservoir or waterfall is located in the district. It may be mentioned that the terrain being highly all these rivers and their tributories are turbulant when faid by rain water and swell rapidly during monsoons season but almost dry up during dry/ winter season.
Climate:
Temperature ranges from 20°c to 35°c in summer and between lOoc to 23°c in winter, the hottest and coldest months being the month of May and January respectively. Wind characteristic can be classified as mild. The district receives an average rainfall of2,889 mm. Normally the early monsoon rains start falling in the month of April but the heaviest rainfall experienced during July - August followed by occassional rainfall
upto the month of October. Due to this reason and continuous flow of mild wind, the temperature is kept within comfortable limit. However, during dry spells in summer the maximum temperature sometimes rises to 35°c. The climate is, therefore suitable for
5
cultivation of subtropical crops like paddy, maize and cash crops like sugarcane, ginger, cotton, chillies and oil seeds, pulses. Oranges and other citrous friuts are also grown in moderately large q!1antities, Wet Rice cultivation is practised in most of the low lying patches of land near the river beds by individual farmers under periodi lease system. Assured irrigation facilities are available for a small area only. Artificial ponds are also made for fisheries. However, Jhum (Shifting) cultivation continuous to be most widely practised cultivation of the people of the district. Animal husbandry mainly poultry and pigrearing are very popular and in many places large scale production of oranges are also practised. As already mentioned due to ruggedness of the terrain, no cheap mode of communication or transportation system could be established and hence industrial units are not found to be feasible and hence except one large size flour
mill no large scale industrial complex is established anywhere in the district. Trade and Commerce are also restricted to limited size and fruits, bamboo, timber etc. are sold to outsiders on a regular basis. As regards supply of power and electricity, most of the villages and all 4 towns are covered in the district by the Power and Electricity Department. As in other districts of the State, Panchayati Raj is not introduced but Village Councils constituted by elected members have been functioning in the district since long back. The Village Councils are established under provisions of relevant Acts and Rules and apart from functioning as a village level court for settlement of petty cases under customery laws these grassroot level institutions play an important role in the execution of all
developmental schemes within their respective jurisdictions. The Village Council is also responsible for orderly, important and free alloation of land for house construction establishment of commercial buildings,. schools, churches, medical and other Government establishments. It also allocate jhum land free of cahrge to all willing cultivators of the village. There are 33 such Village Councils in the district.
(v) Concepts and definitions
Census concepts
Building:
A "Building" is generally a single structure on the ground. Sometimes it is made up of more than
6
one Component Units, which are used or likely to be used as dwellings (residence) or establishment such as shops, business houses, offices, factories, workshops, worksheds, schools, places of entertainment, places of worship, godowns, stores, etc. It is also possible that building which have Component Units may be used for combination of purposes such as shop-cum-residence, workshop-cum-residence, officecum-residence, etc.
Usually a structure will have four walls and a roof. But in some areas, the very nature of construction of houses is such that there may not be any wall. Such is the case of conical structures where entrance is also provided but they may not have any wall. Therefore, such of the conical structures are also treated as separate buildings.
Permanent houses :
Houses, the walls and roof of which are made of permanent materials. The material of walls can be anyone from the following, namely, galvanized iron sheets or other metal sheets, asbestos sheets, burnt bricks, stones or concrete. Roof may be made of from anyone of the following materials, namely, tiles, slate, galvanized iron sheets, metal sheets, asbestos sheets, bricks, stones or concrete.
Semi-permanent houses :
Houses in which either the wall or the roof is made of permanent material and the other is made of temporary material.
Temporary houses :
Houses in which both walls and roof are made of materials, which have to be replaced frequently. Walls may be made from anyone of the following temporary materials, namely, grass, thatch, bamboo, plastic, polythene, mud, unburnt bricks or wood. Roof may be made from anyone of the temporary materials, namely, grass, thatch, bamboo, wood, mud, plastic or polythene.
Dwelling Room :
A room is treated as a dwelling room if it has walls with a doorway and a roof and should be wide and long enough for a person to sleep in, i.e. it should have a length of not less than 2 metres and a breadth of at least 1.5 metres and a height of 2 metres. A
DISTRICT CENSUS HANDBOOK: KOLASIB
dwelling room would include living room, bedroom, dining room, drawing room, study room, servant's room and other habitable rooms. Kitchen, bathroom, latrine, store room, passageway and verandah which are not normally usable for living are not considered as dwelling rooms. A room, used for multipurpose such as sleeping, sitting, dining, storing, cooking, etc., is regarded as a dwelling room. In a situation where a census house is used as a shop or office etc., and the household also stays in it then the room is not considered as a dwelling room. But if a garage or servant quarter is used by a servant and if she/ he also lives in it as a separate household, then this has been considered as a dwelling room available to the servant's household. Tent or conical shaped hut if used for living by any household is also considered as dwelling room.
A dwelling room, which is shared by more than one household, has not been counted for any ofthem. If two households have a dwelling room each but in addition also .share a common dwelling Loom, then the common room has not been counted for either of the households.
Census house
A 'census house' is a building or part of a building used or recognised as a separate unit because of having a separate main entrance from the road or common courtyard or staircase, et~. It may be occupied or vacant. It may be used for residential or non-residential purpose or both.
In certain peculiar situations, the manner in which buildings and census houses were identified for numbering in the field by the enumerators is described hereunder:
Sometimes, a series of different buildings are found along a street which are joined with one another by common walls on either side looking like a continuous structure. These different units are practically independent of one another and are likely to have been built at different times and owned by different persons. In such cases, though the whole structure with all the adjoining units apparently appears to be one building, each portion was treated as a separate building and its constituent units as separate census houses.
On the other hand, one may come across cases,

ANALYTICAL NOTE
particularly in large cities of multi-storeyed ownership flats. In. these cases while the structure looks like o~e building, different persons own the f1~ts. In case of such multi-storeyed structures, having a number of flats owned by different persons, the entire structure was treated as one building and each flat as a separate census house.
Ifwithin a large enclosed area, there are separate buildings owned by different persons then each such building is treated as a separate building. There .can be a situation where within an enclosed compound there are separate buildings owned by an undertaking or company or even government that are actually in occupation of different persons. For example, Indian Oil Corporation colony where the buildings are owned by the Corporation but these are in occupation of their employees. Each such building was treated as a separate building. But if in anyone of these buildings there were flats in occupation of different households, each such flat was reckoned as a separate census house.
Sometimes it becomes difficult to apply the definition of census house strictly in certain cases. For example, 'in an urban area, if a flat has five rooms, each room having direct entrance from the common staircase or courtyard. By definition, this has to be treated as five census houses. If all these five rooms are occupied by a single household it was not realistic to treat them as five census houses. In such a case,'singleness' of use of these rooms along with the main house should be considered and the entire flat was treated as one census house. On the other hand, if two independent households occupy these five rooms, the first household living in 3 rooms and the second household occupying 2 rooms, then considering the use, the first three rooms together were treated as one census house and the remaining rooms as another census house. But if each room was occupied by an independent household, then each such room was treated as a separate census house.
In case of hostels, hotels, etc., even if the door of each room in which an inmate lives opens to a common verandah, staircase, courtyard or a common room, as it happens almost invariably, the entire hostel! hotel building was treated as one census house but if such hostels/hotels have out-houses or other structures used for different purposes or the same purpose, then each such structure attached to the
7
main hostellhotel was treated as a separate census house.
In some parts of the country, in rural areas, the pattern of habitation is such that a group of huts, located in a compound, whether enclosed or unenclosed, is occupied by one household. While the main residence may be located in one hut, other huts may be used for sleeping, as a kitchen, bath room, baithak, etc. Though each of the huts was a separate structure, they form a single housing unit and therefore, have to be treated collectively as one building and one census house. If some of the huts are used by one household and the others by a second household as residence, then the two groups of huts were treated as separate census houses. However, if there were also other huts in the compound used for other purposes and not as part of the household's residence such as, cattle shed, workshed, etc., these were treated as separate census houses.
On the other hand, in urban areas, where more than one structure within an enclosed or open compound (premises) belonging to the same person, e.g., the main house, the servant's quarter, the garage, etc., only one building number was given for this group and each of the constituent a separate census house number.
Only cases where a structure with roof and pillars has come up was treated as a building.
Village:
The basic unit for rural areas is the revenue village which has definite surveyed boundaries. The revenue village may comprise of one or more hamlets but the entire village is treated as one unit for presentation of data. In unsurveyed areas, like villages within forest areas, each habitation area with locally recognized boundaries is treated as one village.
RurallUrban areas:
The data in tables on Houses, Household Amenities and Assets are presented separately for rural and urban areas. The unit of classification in this regard is 'town' for urban areas and 'village' for rural areas. In the Census of India 200 I, the definition of urban area adopted is as follows:-
(a) All places with a municipality, municipal corporation, cantonment board or notified town area committee, etc.

8
(b) A place satisfying the following three criteria
simultaneously:
(i) A minimum population of 5,000;
(ii) At least 75 per cent of the male working population engaged in nonagricultural pursuits; and
(iii) A density of population of at least 400 per square kilometre (l,000 per square mile).
For identification of places which would qualify to be classified as 'urban', all villages, which, as per the 1991 Census had a population of 4,000 and above, a population density of 400 persons per sq. km. and having at least 75 per cent of male working population engaged in non-agricultural activity were considered. To work out the proportion of male working population referred to above against (b) (ii), the data relating to main workers were taken into account.
Apart from these, the outgrowths(OGs) of cities and towns have also been treated as urban under 'Urban Agglomerations'. Examples of out-growths are railway colonies, university campuses, port areas, military camps, etc., that may have come up near a statutory town or city but within the revenue limits of a village or villages contiguous to the town or city. Each such individual area by itself may not satisfy the demographic criteria laid down at (b) above to qualify it to be treated as an independent urban unit but may deserve to be clubbed with the towns as a continuous urban spread. Thus, the town level data, wherever presented, also includes the data for
outgrowths of such towns.
City :
Towns with popUlation of 1,00,000 and above are called cities.
Urban Agglomeration :
An Urban Agglomeration is a continuous urban spread constituting a town and its adjoining urban outgrowths COGs) or two or more physically contiguous towns together and any adjoining urban outgrowths of such towns. In some cases railway colonies, university campuses, port areas, etc., may
come up near a city or statutory town outside its statutory limits but within the revenue limits of a village or villages contiguous to the town or city. Each
such individual area by itself may not satisfy the
DISTRICT CENSUS HANDBOOK: KOLASIB
minimum population limit to qualify it to be treated as an independent urban unit but may deserve to be clubbed with the town as a continuous urban spread.
For the purpose of delineation of Urban Agglomerations during Census of India 2001, following criteria are taken as pre-requisites:
(a) The core town or at'least one of the constituent towns of an urban agglomeration should necessarily be a statutory town; and
(b) The total population of all th~ constituents (Le., towns and outgrowths) of an Urban Agglomeration should not be less than 20,000 (as per the 1991 Census).
With these two basic criteria having been met, the following are the possible different situations in which Urban Agglomerations would be constituted:
(i) a city or town with one or more contiguous outgrowths;
(ii) two or more. adj oining towns with their outgrowths; and
(iii) a city and one or more adjoining towns with their outgrowths all of which form a continuous spread.
Household:
A 'household' is usually a group of persons who normally live together and take their meals from a common kitchen unless the exigencies of work prevent any of them from doing so, Persons in a household may be related or unrelated or a mix of both. However, if a group of unrelated persons live in a census house but do not take their meals from the common kitchen, then they are not constituents of a common household. Each such person was to
be treated as a separate household. The important link in finding out whether it was a household or not was a common kitchen. There may be one member households, two member households or multi-member
households.
Institutional household :
A group of unrelated persons who live in an
institution and take their meals from a common kitchen is called an Institutional Household. Examples of Institutional Households are boarding houses, messes, hostels, hotels, rescue homes, jails, ashrams, orphanages, etc. To make the definition more clearly

ANALYTICAL NOTE
perceptible to the enumerators at the Census 2001, it was specifically mentioned that this category of
. households would cover only those households where a group of unrelated persons live in an institution and share a common kitchen.
Houseless household :
Households who do not live in buildings or census houses but live in the open on roadside, pavements, in hume pipes, under fly-overs and staircases, or in the open in places of worship, mandaps, railway platforms, etc., are treated as Houseless Households.
Scheduled Caste and Scheduled Tribe:
Article 341 of the constitution provides that the President may, with respect to any State or Union Territory, specify the castes, races or tribes or parts of or groups within castes, races or tribes which shall for the purposes of the constitution be deemed to be Scheduled Caste in relation to that State or Union Territory. Article 342 similarly provides for specification of tribes or tribal communities or parts of or group within tribes or tribal communities which are to be deemed for the purposes of the Constitution to be Scheduled Tribes in relation to the various States or Union Territories. In pursuance to this provisions, the list of Scheduled Castes and Scheduled Tribes are notified for each State and Union Territory and are valid only within the jurisdiction of that State or Union Territory and not outside.
It is important to mention here that under the Constitution (Scheduled Castes) Order, 1950, no
person who professed a religion different from Hinduism was deemed to be a member of a Scheduled Caste in addition to every member of the Ramdasi, Kabirpanthi, Majhabi or Sikligar caste resident in Punjab or Patiala and East Punjab States Union were in relation to that State whether they professed the Hindu or the Sikh religion. Subsequently, in September 1956, by an amendment, the Presidential Order of 1950 and in all subsequent Presidential Orders relating to Scheduled Castes, the Hindu and the Sikh religions were placed on the same footing
with regard to the specification of Scheduled Castes. Later on, as per the amendment made in the Constitution (Scheduled Castes) Order 1990, the Hindu, the Sikh and the Buddhist were placed on the same footing with regard to the recognition of the Scheduled Castes.
9
The lists containing the names of the cheduled Castes and the Scheduled Tribes applicable for the Census of India 2001 in the StatelUnion Territory are given below :
Scheduled Castes
1. Bansphor
2. Bhuinmali, Mali
3. Brittial Bania, Bania
4. Dhupi, Dhobi
5. Dugla, Dholi
6. Hira
7. Jalkeot
8. Jhalo, Malo, Jhalo-Malo
9. Kaibartta, Jaliya
10. Lalbegi
11. Mahara
12. Mehtar, Bhangi
13. Muchi, Rishi
14. Namasudra
15. Patni
16. Sutradhar
Scheduled Tribes
I. Chakma
2. Dimasa (Kachari)
3. Garo
4. Hajong
5. Hmar
6. Khasi and Jaintia (including Khasi Synteng
or Pnar, War, Bhoi or Lyngngam)
7. Any Kuki Tribes, including:
(i) Biate, Biete
(ii) Changsan
(iii) Chongloi
(iv) Doungel
(v) Gamalhou
(vi) Gangte
(vii) Guite
(viii) Hanneng
(ix) Haokip, Haupit
(x) Haolai

10
(xi) Hengna
(xii) Hongsungh
(xiii) Hrangkhwal, Rangkhol
(xiv) Jongbe
(xv) Khawchung
(xvi) Khawathlang, Khothalong
(xvii) Khelma
(xviii) Kholhou
(xix) Kipgen
(xx) Kuki
(xxi) Lengthang
(xxii) Lhangum
(xxiii) Lhoujem
(xxiv) Lhouvun
(xxv) Lupheng
(xxvi) Mangjel
(xxvii) Misao
(xxviii) Riang
(xxix) Sairhem
(xxx) Selnam
(xxxi) Singson
(xxxii) Sitlhou
(xxxiii) Sukte
(xxxiv) Thada
(xxxv) Thangngeu
(xxxvi) Uibuh
(xxxvii) Viaphei
8. Lakher
9. Man (Tai speaking)
10. Any Mizo (Lushai) tribes
II. Mikir
12. Any Naga Tribes
13. Pawi
14. Synteng
Language and mother tongue
As per the census concept, each language is a group of mother tongues. The census questionnaire collects information on the mother tongue of each person and mother tongue is defined as the language spoken in childhood by the person's mother to the
DISTRICT CENSUS HANDBOOK: KOLASIB
person. If the mother died in infancy, the language mainly spoken in the person's home in childhood will be the mother tongue. In the case of infants and deaf mutes, the language usually spoken by the mother is considered as mother tongue. It is not necessary that the language spoken as mother tongue should have a script. The mother tongues returned by the respondents in census are classified and grouped under appropriate languages according to their linguistic characteristics.
Literate:
A person age 7 years and above who can both read and write with understanding in any language is taken as literate. A person who can only read but cannot write is not a literate. It is not necessary that to be considered as literate, a person should have received any formal education or passed any minimum educational standard. Literacy could have been achieved through adult literacy classes or through any non-formal educational system. People who are blind but can read in Braille are treated as literates.
Literacy rate :
Literacy rate of the population is defined as the percentage of literates in the age group seven years and above. For different age groups the percentage of literates in that age group gives the literacy rates.
Educational level :
The highest level of education a person has completed.
Work:
Work is defined as partIcIpation in any economically productive activity with or without compensation, wages or profit. Such participation may be physical andlor mental in nature. Work involves not only actual work but also includes effective supervision and direction of work. It even includes part time help or unpaid work on farm, family enterprise or in any other economic activity. All persons engaged in "work" as defined above are workers. Persons who are engaged in cultivation or milk production even solely for domestic consumption are also treated as workers.
Reference period for determining a person as worker and non-worker is one year preceding the date of enumeration.
ANALYTICAL NOTE
Main Worker :
A person who has worked for major part of the reference period (i.e., six months or more during the last one year preceding the date of enumeration) in any economically productive activity is termed as 'Main worker'.
Marginal Worker :
A person who worked for less than six (6) months of the reference period (i.e., in the last one year preceding the date of enumeration) in any economic activity is termed as 'Marginal worker'.
Non Worker:
A person who has not worked at all in any economically productive activity during the reference period (i.e., in the last one year preceding the date of enumeration) is termed as 'Non worker'.
Cultivator :
For purposes of the Census, a person is classified as Cultivator ifhe or she is engaged in cultivation on land owned or held from government or held from private persons or institutions for payment in money, kind or share. Cultivation includes effective supervision or direction in cultivation.
A person who has given out her/his land to another person or persons or institution(s) for cultivation for money or share of crop and who does not even supervise or direct the cultivation in exchange of land, is not treated as cultivator. Similarly, a person working on another person's land for wages in cash or kind or a combination of both (agricultural labourer) is not treated as cultivator.
Cultivation involves ploughing, sowing, harvesting and production of cereals cereal and millet crops such as wheat, paddy, jowar, bajra, ragi etc., and other crops such as sugarcane, tobacco, ground nuts, topioca etc., and pulses, raw jute and kindred fibre crop, cotton, cinchona and other medicinal plants, fruit growing, vegetable growing or keeping orchards or graves, etc .. Cultivation does not include the following plantation crops - tea, coffee, rubber, coconut and betel nuts (areca).
Agricultural Labourer :
A person who works on another person's land for wages in money or kind or share is regarded as
11
an agricultural labourer. Shelhe has no risk in the cultivation but merely works on another person's land for wages. An agricultural labourer has no right of lease or contract on land on which shelhe works.
Household Industry worker :
Household Industry is defined as an industry conducted by the head of the household herselflhimself and or by the members of the househQld at home or within the village in rural areas and only within the precincts of the house where the household lives in urban areas. The larger proportion of workers in household industry should consist of members of the household including the head. The industry should not be run on the scale of a registered factory which would qualifY or has to be registered under the Indian Factories Act and should be engaged in manufacturing, processing, servicing and repairs of goods.
It does not include professions such as a pleader, Doctor, Musicians, Dancer, Wash erman, Astrologer, Dhobi, Barber etc. or merely trade or business, even if such professions, trade or services are run at home by members of the household.
Other Worker :
A person who has been engaged in some economic activity during the reference period but not as a cultivator or agricultural labourer or in household industry is termed as a 'Other Workers (OW)'. The type of workers that come under this category of 'OW' include all government servants, municipal employees, teachers, factory workers, plantation workers, those engaged in trade, commerce, business, transport, banking, mining, construction, political or social work, priests, entertainment artist, etc. In effect, all those workers other than cultivators or agricultural labourers or household industry workers, are 'Other Workers'.
Work participation rate :
Percentage of workers (main + marginal) to total population.
Population Density :
Population density is the number of persons inhabited per square kilometre of the area.
Age:
Age is measured in terms of completed number of years.

12
Sex ratio
Number of females per 1000 males in a population.
(vi) Non-census concepts
Improved drinking water :
If the household had access to drinking water supplied from a tap, hand pump, tube well or well (protected or covered) situated within or outside the premises, it is considered as having access to improved drinking water.
It may be mentioned that such uniform definition may not be valid across all states.
System of sewerage :
Generally, a sewerage system means a network of mains and branches of underground conduits for the conveyance of sewerage to the point of disposal. Sewers that carry only household and industrial wastage are called separate sewers; those that carry storm water from roofs, streets and other surfaces are known as storm water drains, while those carrying both sewage and storm water are called combined sewers. However, in some towns which are not provided with such underground sewerage system, it is served by open surface drain, box drain, sylk pattern drain, etc., in those towns.
Type of latrine and method of disposal of night soil :
There are three prevalent systems of disposal of human wastes, viz. (i) underground sewerage, (ii) sanitary water flush latrines with individual disposal systems, like septic tank, leaching cess pool and collecting well and (iii) dry type oflatrines with manual scavenging.
The system of underground sewerage provides for the street sewerage with which are connected the sanitary latrines constructed in the houses having water closets and fitted with flushing cistern (or hand flushing). Through this sewer the faecal matter is transported without the need for scavenging. This system generally exists in cities and big towns.
Where the street sewer does not exist these sanitary water flush latrines are connected to a local septic tank with a sub-soil dispersion system or a
DISTRICT CENSUS HANDBOOK: KOLASIB
leaching pit. Here the liquid wastes from the water closet is disposed of locally in leaching pit, a septic tank with a soil dispersion system is constructed. This dispersion requires an optimum travel through the pores of the soil which renders the harmful liquid bacterially innocuous by the slow process of filtration through the soil traversed.
Where the soil is impermeable, collecting wells are constructed and the sanitary water flush latrines are connected with them. These wells are cleaned at periodic intervals by a suitable device. The dry type of latrines are of service type latrine from where human excreta is removed by scavengers from house to house, in most cases carrying it on their heads or shoulders or in baskets with handle or wheel barrows. These are then collected in bullock carts or trucks or tractors and trolleys for being carried to the dumping grounds.
Fertility :
In demography, the word fertility is used in relation to the actual production of children or occurrence of births specially live births. Fertility is a measure of rate at which population adds to itself by births and normally assessed by relating the number of births to a full or part of the population, such as number of married women or number of women of child bearing age. The d·efinitions of the terminology used in computing different fertility rates are mentioned below:
Crude birth rate (CBR) :
Ratio of the number of live births in a year to the mid year population, normally expressed per 1000 population.
Number of live births during the year CBR= x 1000
Mid-year Population
Crude death rate (CDR) :
Ratio of the number of live deaths in a year to the mid year population, normally expressed per 1000 population.
Number of deaths during the year CDR = x 1000
Mid-year Population
Natural growth rate:
Growth rate is obtained as the different between crude birth and crude death rate in the absence of migration.

ANALYTICAL NOTE
Age specific fertility rate (ASFR)
Number of live births in a year to female population in any specified age group normally expressed per 1000 women.
Number of live births in a particular age-group
ASFR ::; --------- x 1000 Mid-year female population
of the same age-group
Age specific marital fertility rate (ASMFR) :
Number of live births in a year to married femaie population in any specified age group normally expressed per 1000 women.
Number of live births in a particular age-group
ASMFR ::; x 1000 Mid-year married female population
of the same age-group
General fertility rate (GFR) :
Number of live births per 1000 women in the reproductive age-group (15-49) years in a given year.
Number of live births in a year GFR::; x 1000
Mid-year female population of the age-group (15-49) years
General marital fertility rate (GMFR) :
Number of live births per 1000 married women in reproductive age-group (15-49) years in a given
year.
Number of live births in a year GFR::; x 1000
Mid-year female population of the age-group (I5-49) years
Total Fertility rate (TFR) :
It is obtained as the total of the age specific fertility rates (number of children born per woman of the particular age) for the entire reproductive age span. It provides the average number of children that will be born to a woman under the fertility levels indicated by the age specific fertility rates assuming that there is no mortality of woman till the completion
of reproductive period.
45-49 5 XL ASFR
15-19 TFR=-----
1000
Total marital Fertility rate (TMFR)
Average number of children that would be born
13
to a married woman if she experiences the current fertility pattern throughout her reproductive span (15-49) years assuming that there is no mortality of woman till the completion of reproductive period.
TMFR =:
45-49 5 x L ASMFR
15-19
1000
Age specific mortality rate (ASMR)
Number of deaths in a particular age and sex group per 1000 population of the same age group.
Number of deaths in a particular
ASMR = age-group x 1000
ql :
Mid-year population of the same age-group
Probability of dying between birth and age 1. This can be used as approximate value ofInfant Mortality Rate (IMR) which gives the ratio of number of deaths in a year of children aged less than one year to the number of births in that year.
q2
Probability of dying between birth and age 2.
q5 :
Probability of dying between birth and age 5. This indicator is also known as Under Five Mortality Rate
(U5MR).
Infant mortality rate (IMR) :
Ratio of the number of infant deaths (deaths of children below one year) in a year to the number of
live births in that year.
Number of infant deaths during the year
IMR= x 1000 Number of live births during the year
Infant mortality rate comprises of two parts, viz., Neo-natal mortality rate and Post neD-natal mortality
rate. The neo-natal mortality rate also comprises of two parts viz., early neo-natal mortality rate and late neo-natal mortality rate. These are defined as:
Neo-natal mortality .rate (NMR) :
Number of infant dying within the first month of
life (28 days or under) in a tear per 1000 live births of the same year.

14
Number of infant deaths aged 28 days or under during the year
NMR =-----------x 1000 Number of live births during the year
Early Neo-natal mortality rate :
Number of infant deaths of less than 7 days during the year
-------------- x 1000 Number of live births during the year
Late Neo-natal mortality rate :
Number of infant deaths of 7 days to less than 29 days during the year
------------------------- x 1000 Number of live births during the year
Post Neo-natal mortality rate (PNMR)
Number of deaths of 29 days to less than one year during the year
== ------------- x 1000 Number of live births during the year
Peri Natal mortality rate (PMR) :
Number of still births plus deaths within 1 st week of delivery per 1000 births in a year.
Number of still births and infant deaths of less than 7 days during
the year ------------ x 1000 Number of live births and still births
during the year
Still birth rate (SBR) :
Number of still birth during the year ------------- x 1000
Number of live births and still births during the year
Maternal mortality rate(MMR) :
Number of deaths of woman in the age group 15-49 while pregnant or within 42 days of termination of pregnancy from any cause related to pregnancy and child birth per 100000 live births in a given year.
Number of maternal deaths to woman in the age group 15-49
MMR = ---------- x 100,000 Number of live birth
-Eligible couple (Couples per 1000 population) :
Number of currently married females in the age group 15-44 years per 1000 persons of all ages.
Child woman ratio (0-4) :
Number of children in the age group 0-4 years per 1000 woman in the age group 15-49 years.
Child woman ratio (5-9) :
Number of children in the age group 5-9 years per 1000 woman in the age group 15-49 years.
DISTRICT CENSUS HANDBOOK: KOLASIS
Migration:
Migration is the third component of population change, the other two being mortality and fertility.
A person is considered as a migrant by place of birth if the place in which he/she is enumerated during the census is other than hislher p lace of h is/her birth.
Similarly a person is considered as migrant by place of last residence if the place in which he/she is enumerated during the census is other than his/her place of immediate last residence outside the village or town and not simply in another house or locality in the same village or town.
Certain aspects concerning temporary movement! migration of people has been explained below as these are important components concerning migration:-
(i) Migration of persons in search of job is high in the country. In many cases such migrants are only seasonal in nature. People migrate to oth~r places for work in a particular season and come back again to their usual place residence after three or four months. All such workers are treated as migrants. Similarly, if a person moved to any other place for attending short term vocational or educational courses that lasted for only few months of a year, she/he too were considered as a migrant.
(ii) Where a person had merely gone out to another place or had been shifting from one to another purely on tour, pilgrimage, visit to hospital for treatment or for temporary business purposes, such persons are not deemed to have had another residence different from the place where she/he or her/ his family normally resides she/he is not considered as migrant.
(iii) A woman temporarily moves into a ~ospital or to her parents or other relative's house for delivery and if the hospital or the parents/ relative's houses is in a place where the hospital or parents/relative's house is the place of last residence of the child but not the mother.
A new response category 'Moved after birth' was added in Census of India 2001 in the question on 'reasons for migration' to bring out additional migration patterns. Natural calamities or distress

ANAL. YTICAL NOTE
migration as a reason for migration for last residence migrants included in 1991 Census, is covered under category of 'Others'. The reason for migration has been determined as applicable at the time of migration and not in reference to any point of time after that. For example, if a person had moved from the place of her/his last residence for the purpose of the education and subsequently at some point of time got employment there only, the reason for migration would be 'education' and not 'work/employment'.
Internal and International migration :
The migrational movements are of three types (i) Migration within the state itself with its components (a) Migration within the district of enumeration (intra district migration) (b) Migration from one district of state to another district of state (inter district migration), (ii) Migration from one state to another state of the country (inter state migration), (iii) Migration from one country to another country. The first two streams together constitute internal migration, while the last type of movement is called international migration. The present name of the country, state or district and not the name by which they were known at the time of her/his birth or last residence were recorded.
Rural-Urban components of migration:
Rural or urban status in respect of migrants have been determined as applicable at the time of migration and not with reference to any point of time after that.
The flow of migrants consists of four streams viz., rural to rural, rural to urban, Urban to rural and urban to urban.
Civic status of urban units :
Civic status of town/city is determined on the basis of Civic Administrative authority of the town e.g., Municipal Committee/Municipal Council, Municipality etc.
Size-class of UArrown :
Size-class ofUA/Town is based on the population size of the UA/City/Town UAs/Towns with 1,00,000 and above population are classified as Class I UAs/ Towns. These Class I UAs/Towns are now further sub classified in to seven sub classes namely MI to M7 depending on the population size of UA/City/ Town. These are M7 (5,000,000 and above); M6 (2,000,000 to 4,999,999); M5 (1,000,000 to 1,999,999); M4 (500,000 to 999,999); M3 (300,000 to 499,999);
15
M2 (200,000 to 299,999) and Ml (100,000 to 199,999) towns with 50,000 to 99,999 population are classified as Class II towns, 20,000 to 49,999 population are Class III towns, population with 10,000 - 19,999 are Class IV towns, population with 5000 and 9999 are Class V and towns with less than 5000 population are Class VI towns.
Slum area:
The SIUJp Areas (improvement and Clearance) Act, 1956 which was enacted by the Central Govt. defined slums as a) Areas where buildings are in any respect unfit for human habitation; or b) are by reasons of dilapidation, overcrowding, fault arrangement and design of such buildings, narrowness or faulty arrangement of streets, lack of ventilation, light or sanitation facilities, or any combination of these factors, are determined to safety, health or morals.
Mega city:
The concept of 'Mega City' is a recent phenomenon in the Urban Sociology and is defined in term of metropolitan city in form of large size, problem of management of civic amenities and capacity to absorb the relatively high growth of population. Indian Census in 1991 treated the population size of 5 million and above as the cut off point to identify a place as the mega city. Whereas, for the purpose of inclusion in Centrally Sponsored Scheme for Infrastucture Development in Mega Cities the Ministry of Urban Affairs and Employment, Department of Urban Development adopted the criteria of 4 million and above population as per 1991 Census for Mega Cities. In 2001 Census, cities with 10 millions and above population have been treated as Mega Cities.
(vii) 2001 Census findings - Population, its
distribution
a) As per 2001 Census the total population of Kolasib District is 65,960 out of which there are 34,562 males and 31,398 females. The rural - urban distribution of population shows that 29,461 persons were residing rural areas and as many as 36,499 persons were settled in urban areas of the district. As already mentioned earlier there is only one R.D. Block (excluding Tlangnuam part) in the district with its haedquarters as Thingdawl and the population covered by the Block area is 61,046 (Rural - 24,547; Urban - 36,499).
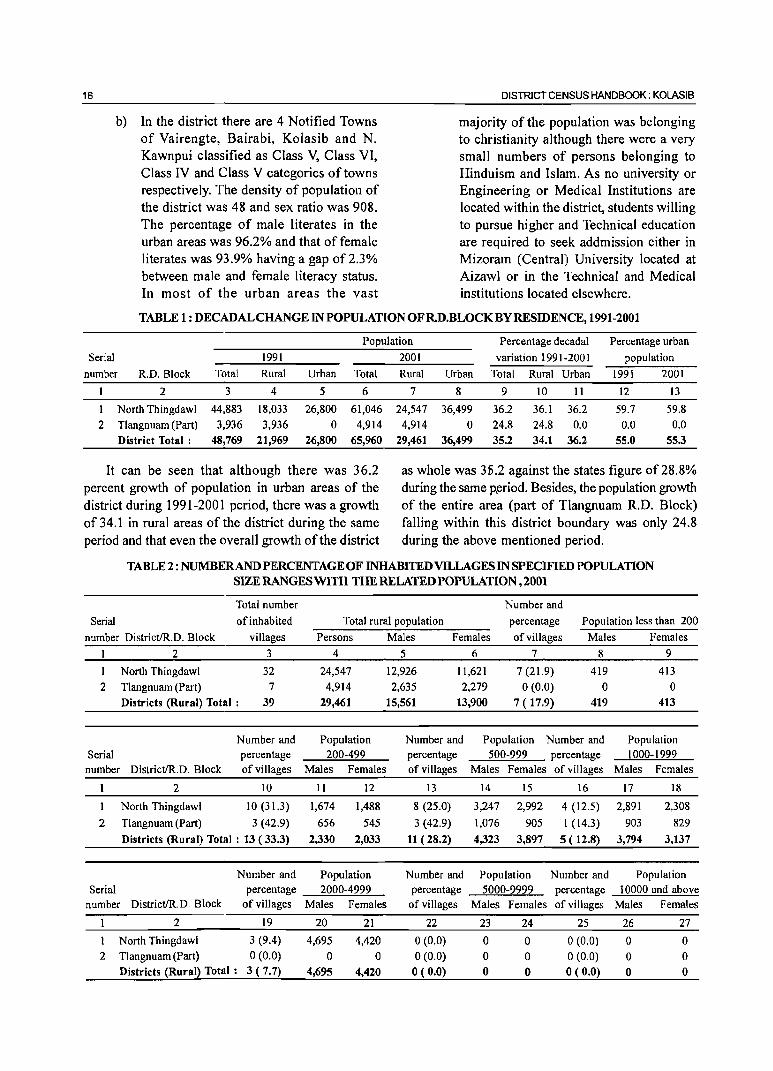
16
b) In the district there are 4 Notified Towns of Vairengte, Bairabi, Kolasib and N. Kawnpui classified as Class V, Class VI, Class IV and Class V categories of towns respectively. The density of population of the district was 48 and sex ratio was 908. The percentage of male literates in the urban areas was 96.2% and that offemale literates was 93.9% having a gap of2.3% between male and female literacy status. In most of the urban areas the vast
DISTRICT CENSUS HANDBOOK: KOLASIB
majority of the population was belonging to christianity although there were a very small numbers of persons belonging to Hinduism and Islam. As no university or Engineering or Medical Institutions are located within the district, students willing to pursue higher and Technical education are required to seek add mission either in Mizoram (Central) University located at Aizawl or in the Technical and Medical institutions located elsewhere.
TABLE 1 : DECADALCHANGE IN POPULATION OFR.D.BLOCK BY RESIDENCE, 1991-2001
Population Percentage decadal Percentage urban
Serial 1991
number R.D. Block Total Rural Urban Total
2 3 4 5 6
1 North Thingdawl 44,883 18,033 26,800 61,046
2 Tlangnuam (Part) 3,936 3,936 0 4,914
District Total : 48,769 21,969 26,800 65,960
It can be seen that although there was 36.2 percent growth of population in urban areas of the district during 1991-2001 period, there was a growth of 34.1 in rural areas of the district during the same period and that even the overall growth of the district
2001 variation 1991-2001 population
Rural Urban Total Rural Urban 1991 2001
7 8 9 10 11 12 13
24,547 36,499 36.2 36.1 36.2 59.7 59.8
4,914 ° 24.8 24.8 0.0 0.0 0.0 29,461 36,499 35.2 34.1 36.2 55.0 55.3
as whole was 35.2 against the states figure of28.8% during the same p.eriod. Besides, the population growth of the entire area (part of Tlangnuam R.D. Block) falling within this district boundary was only 24.8 during the above mentioned period.
TABLE 2: NUMBERAND PERCENTAGE OF INHABITED VILLAGES IN SPECIFIED POPULATION SIZE RANGES WITH THE RELATED POPULATION ,2001
Total number
Serial ofinhabited Total rural population
Number and
percentage
of villages
Population less than 200
number DistrictIR.D. Block villages
2 3
I North Thingdawl
2 Tlangnuam (Part)
32
7
Districts (Rural) Total: 39
Number and Serial percentage number DistrictIR.D. Block of villages
2 10
North Thingdawl
2 Tlangnuam (Part)
10 (31.3)
3 (42.9)
Districts (Rural) Total : 13 ( 33.3)
Persons
4
24,547
4,914
29,461
Population 200-499
Males
11
1,674
656
2,330
Females
12
1,488
545
2,033
Number and Population
Males
5
12,926
2,635
15,561
Females
6
11,621
2,279
13,900
7
7 (21.9)
0(0.0)
7(17.9)
Males Females
8 9
419 413
o ° 419 413
Number and percentage of villages
Population Number and Population
13
8 (25.0)
3 (42.9)
11 (28.2)
500-999 percentage 1000-1999 Males Females of villages Males Females
14
3,247
1,076
4,323
15
2,992
905
3,897
16
4 (12.5)
1(14.3)
5 ( 12.8)
17
2,891
903
3,794
18
2,308
829
3,137
Serial number District/R.D. Block
percentage _-=2""0.::..00=-.-.:..49,,,,9::...::9_ of villages Males Females
Number and percentage of villages
Population 5000-9999
Males Females
Number and percentage of villages
Population 10000 and above
Males Females
2
North Thingdawl 2 Tlangnuam (Part)
Districts (Rural) Total :
19
3 (9.4)
0(0.0) 3 (7.7)
20 21
4,695 4,420
o 0 4,695 4,420
22
0(0.0) 0(0.0)
0(0.0)
23 24
o 0 o 0 o 0
25
0(0.0) 0(0.0)
0(0.0)
26 27
o 0 o 0
° 0
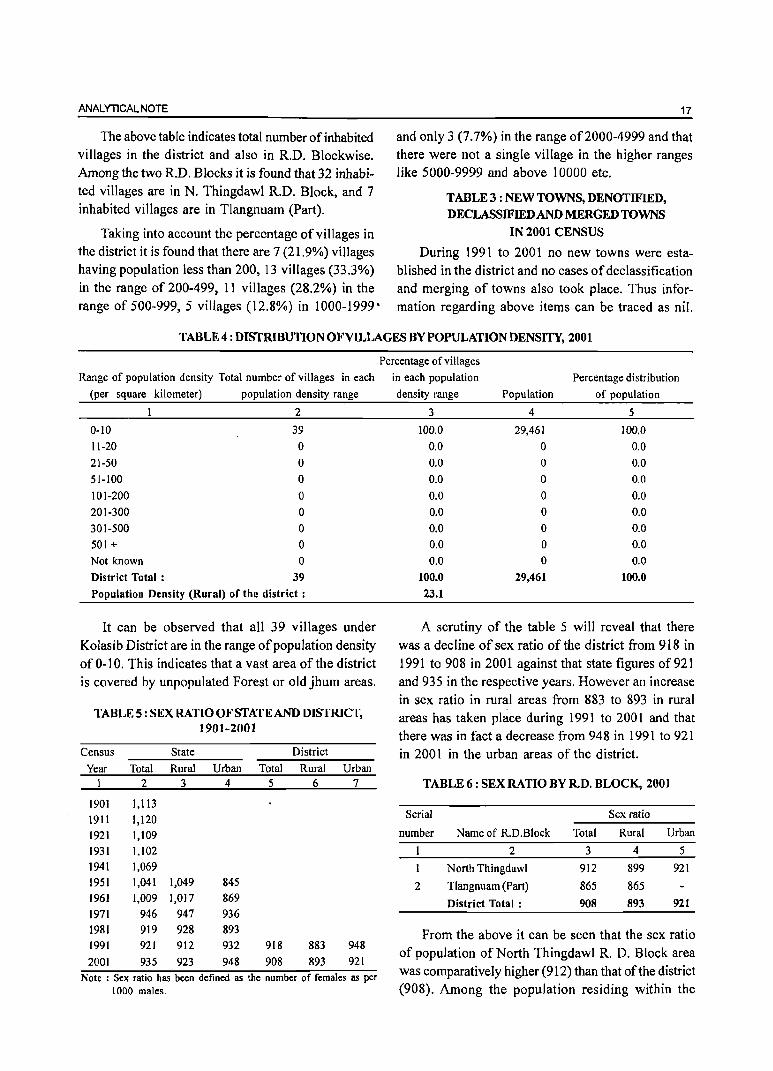
ANALYTICAL NOTE
The above table indicates total number of inhabited villages in the district and also in R.D. Blockwise. Among the two R.D. Blocks it is found that 32 inhabited villages are in N. Thingdawl R.D. Block, and 7 inhabited villages are in Tlangnuam (Part).
Taking into account the percentage of viII ages in the district it is found that there are 7 (21.9%) villages having population less than 200, 13 villages (33.3%) in the range of 200-499, 11 villages (28.2%) in the range of 500-999,5 villages (12.8%) in 1000-1999"
17
and only 3 (7.7%) in the range of2000-4999 and that there were not a single village in the higher ranges like 5000-9999 and above 10000 etc.
TABLE 3 : NEW TOWNS, DENOTIFIED, DECLASSIFIED AND MERGED TOWNS
IN 2001 CENSUS
During 1991 to 2001 no new towns were established in the district and no cases of declassification and merging of towns also took place. Thus information regarding above items can be traced as nil.
TABLE 4: DISTRIBUTION OF VILLAGES BY POPULATION DENSITY, 2001
Range of population density Total number of villages in each
(per square kilometer) population density range
1 2
0-10 39
11-20 0
21-50
51-100
101-200
201-300
301-500
501 + Not known
o o o o o o o
District Total : 39
Population Density (Rural) of the district:
It can be observed that all 39 villages under Kolasib District are in the range of population density of 0-10. This indicates that a vast area of the district is covered by unpopulated Forest or oldjhum areas.
TABLE 5: SEX RATIO OF STATE AND DISTRICT, 1901-2001
Census State District
Year Total Rural Urban Total Rural Urban
I 2 3 4 5 6 7
1901 1,113
1911 1,120
1921 1,109
1931 1,102
1941 1,069
1951 1,041 1,049 845
1961 1,009 1,017 869
1971 946 947 936
1981 919 928 893
1991 921 912 932 918 883 948
2001 935 923 948 908 893 921
Note : Sex ratio has been defined as the number of females as per 1000 males.
Percentage of villages
in each population Percentage distribution
density range Population of population
3 4 5
100.0 29,461 100,0
0.0 0 0,0
0.0 a 0,0
0,0 0 0,0
0.0 a 0,0
0.0 0 0.0
0.0 a 0,0
0,0 a 0.0
0,0 0 0,0
100.0 29,461 100.0
23.1
A scrutiny of the table 5 will reveal that there was a decline of sex ratio of the district from 918 in 1991 to 908 in 2001 against that state figures of92l and 935 in the respective years. However an increase in sex ratio in rural areas from 883 to 893 in rural areas has taken place during 1991 to 2001 and that there was in fact a decrease from 948 in 1991 to 921 in 2001 in the urban areas of the district.
TABLE 6: SEX RATIO BY R.D. BLOCK, 2001
Serial
number
2
Name of R,D.Block
2
North Thingdawl
Tlangnuam (Part)
District Total :
Total
3
912
865
908
Sex ratio
Rural Urban
4 5
899 921
865
893 921
From the above it can be seen that the sex ratio of population of North ThingdawI R. D. Block area was comparatively higher (912) than that of the district (908). Among the population residing within the

18
jurisdiction of R. D. Blocks rural areas although the figure 899 of North Thingdawl was higher than that of Tlangnuam (part) i.e., 865, both these figures as well that of the district (893) were much lower than the urban sex ratio of 921.
TABLE 7 : SEX RATIO BY RD BLOCKS, 2001
Serial number Name of R.D. Block Sex ratio
2 5
I North Thingdawl 899
2 Tlangnuam (Part) 865
District (Rural) Total : 893
Data compiled above are simple and self expla-natory. Hence no further analysis may be required.
TABLE 8: SEX RATIO OF RURAL POPULATION BY RANGES, 2001
Range of Number Percentage Population Percentage sex ratio of inhabited of villages 2001 distribution
for villages villages in each of range population
2 3 4 5
Less than 700 3 7.7 1,742 5.9
700-749 0 0.0 0 0.0
750-799 0 0.0 0 0.0
800-849 7 17.9 6,583 22.3
850-899 6 15.4 2,391 8.1
900-949 9 23.1 9,186 31.2
950-999 7 17.9 8,331 28.3
1000-1099 6 15.4 1,141 3.9
1100+ 2.6 87 0.3
District Total : 39 100.0 29,461 100.0
Sex ratio (Rural) for District: 893
Table 8 indicates sex ratio of rural population by ranges in the year 2001. It can be seen that in the
DISTRICT CENSUS HANDBOOK: KOLASIB
ranges of sex ratio of900-949, the highest number of 9 villages with percentage of villages as 23.1 were found and in terms of percentage distribution of population the figure is 31.2 which is the highest. among all ranges. It can also be seen that the sex ratio in the range of 700 - 749 and 750-799 there are no villages in the district and that in the range 1100+ there was one village in the district.
TABLE 9 : SEX RATIO OF URBAN AGGLOMERATIONSrrOWNS,2001
Serial Urban status number Name of U.A.lTown of town
I 2 3
Bairabi (NT) VI
2 Kolasib (NT) IV
3 N.Kawnpui (NT) V
4 Vairengte (NT) V
Sex ratio (Urban) for the district:
Note: NT - Notified Town
Sex ratio 4
905
947
974
825
921
Out of 4 Notified Towns as shown above, the sex ratio ofN. Kawnpui (974) was the highest and that ofVairengte (825) was the lowest. The sex ratio of the urban areas comprising of these four Notified Towns was 921 against the States average 935. It may be mentioned here that the Counter Insurgency and Jungle Welfare School, the largest of its kind in Asia is located in Vairengte and that almost all the participants/trainees of the school including the inspectors have left their families in their respective places of residence (homes) for which a very low sex ratio has resulted.
TABLE 10: SEX RATIO OF POPULATION IN THE AGE GROUP 0-6 FOR RD. BLOCK,200t
Total/
Serial Rural! Total population in 0-6 age group Sex ratio for 0-6
number Name of R. D. Block Urban Persons Males Females age group
2 3 4 5 6 7
North Thingdawl Total 9,838 4,977 4,861 977
Rural 4,454 2,242 2,212 987
Urban 5,384 2,735 2,649 969
2 Tlangnuam (Part) Total 728 379 349 921
Rural 728 379 349 921
Urban 0 0 0 0
District Total : Total 10,566 5,356 5,210 973
Rural 5,182 2,621 2,561 977
Urban 5,384 2,735 2,649 969

ANALYTICAL NOTE
It can be seen that in the age group of 0-6, among all two R. D. Blocks, the highest sex ratio of 977 was found in North Thingdawl R. D. Block and that
19
the sex ratio of the district in the same range of age was 973. The lowest sex ratio is found in Tlangnuam (part) R.D. Block rural area which is 921.
TABLE 11 : SEX RATIO OF POPULATION IN THE AGE GROUP 0-6 FORRD BLOCKS, 2001
Serial
number Name of R.D. Block Total population in 0-6 age group Sex ratio for 0-6 age group
Persons Males Females
2 3 4 5 6
North Thingdaw1 4,454 2,242 2,212 987
2 Tlangnuam (Part) 728 379 349 921
District (Rural) Total: 5,182 2,621 2,561 977
Data compiled above are simple and self expla-natory. Hence no further analysis may be required.
TABLE 12; SEX RATIO OF RURAL POPULATION IN THE AGE GROUP0-6 BY RANGES, 2001
Range of sex ratio Number of inhabited Percentage distribution Percentage distribution for vi1la~es villa~es ofvilla~es
1 2 3
Less than 700 I 2.6
700-749 0 0.0
750-799 0 0.0
800-849 3 7.7
850-899 3 7.7
900·949 9 23.1
950-999 3 7.7
1000-1099 11 28.2
1100+ 9 23.1
District (Rural) Total : 39 100.0
Sex ratio (Rural) for District:
The table 12 indicates the ranges of sex ratio in rural areas of the district in the age group of 0-6 population. The highest number of villages (11) fall in the range of 1000 -1099. Highest population and the
highest percentage distribution are in the rage of sex
POEulation 2001 of EOEulation
4 5
79 1.5
0 0.0
0 0.0
235 4.5
533 10.3
1,633 31.5
622 12.0
1,443 27.8
637 12.3
5,182 100.0
977
ratio of 900-949. It can also be seen that there were no villages in the district having sex ratio of700-749 and 750-799 and that the smallest population was found in the range of less than 700 with a population of 79 in only one village with percentage distribution of 1.5.
TABLE 13 : SEX RATIO OF POPULATION IN THE AGE GROUP0-6 OF URBAN AGGLOMERATIONffOWNS,2001
Serial Urban status Total population in 0-6 age group Sex ratio for 0-6
number Name of UAITown of town Persons
2 3 4
I Bairabi (NT) Vl 650
2 Kolasib (NT) IV 2,548
3 N.Kawnpui (NT) V 953
4 Vairengte (NT) V 1,233
District ~Urban~ Total: 5,384 Note: NT = Notified Town
It can be seen that against the sex ratio of 969 for the whole district North Kawnpui (NT) was with
Males Females age group
5 6 7
334 316 946
1,293 1,255 971
472 481 1,019
636 597 939
2,735 2,649 969
sex ratio of 1,019 was the highest among all the towns of the district. The lowest being 939 in Vairengte.

20 DISTRICT CENSUS HANDBOOK: KOLASIB
TABLE 14: NUMBER AND PERCENTAGE OF SCHEDULED CASTES AND SCHEDULED TRIBES POPULATION IN R.D. BLOCK, 2001
Percentage of Percentage of . Total/ Total Scheduled Total Scheduled Scheduled Castes Scheduled Tribes
Serial RuraV Total Castes Tribes population to total population to total number Name orR.D. Block Urban population population population population population
2 3 4 5
North Thingdawl Total 61,046 17
Rural 24,547 5
Urban 36,499 12
2 Tlangnuam (Part) Total 4,914 0
Rural 4,914 0
Urban 0 0
District Total : Total 65,960 17
Rural 29,461 5
Urban 36,499 12
From the above it can be seen that there were
on 17 Scheduled Caste population in the district and
that all these 17 persons were found in North
6 7 8
54,513 0 89.3
22,085 0 90.0
32,428 0 88.8
4,708 0 95.8
4,708 0 95.8
0 0 0.0
59,221 0 89.8
26,793 0 90.9
32,428 0 88.8
Thingdawl R. D. Block and that the Scheduled Caste
population in Tlangnuam R. D. Block (part) was nil.
TABLE 15: NUMBER AND PERCENTAGE OF SCHEDULED CASTES AND SCHEDULED TRIBES POPULATION INRD BLOCKS, 2001
Total
Scheduled
Serial Total Castes
number Name ofR.D. Block population population
2 3 4
I North Thingdawl 24,547 5
2 Tlangnuam (Part) 4,914 0 District (Rural) Total : 29,461 5
Data compiled above are simple and self explanatory. Hence no further analysis is necessary.
TABLE 16: PROPORTION OF SCHEDULED CASTES POPULATION TO TOTAL POPULATION
IN VILLAGES, 2001
Percentage Range of Scheduled
Castes population Number Percentage Scheduled Percentage
to total of villages Castes for villages population Population
2 3 4 5
Nil 37 94.9 0 0.0
Less than 5 2 5.1 5 100.0
5-10 0 0.0 0 0.0
11-20 0 0.0 0 0.0
21-30 0 0.0 0 0.0
31-40 0 0.0 0 0.0
41-50 0 0.0 0 0.0
Total Percentage of Percentage of
Scheduled Scheduled Castes Scheduled Tribes
Tribes population to total population to total
population population population
5 6 7
22,085 0 90.0
4,708 0 95.8
26,793 0 90.9
TABLE 16: PROPORTION OF SCHEDULED CASTES POPULATION TO TOTAL POPULATION
Percentage Range of Scheduled
IN VILLAGES, 2001
Number Percentage Scheduled Percentage Castes
population to total
population of villages Castes for villages
Population
I 2 3 4 5
51-75 0 0.0 0 0.0
76 and above 0 0.0 0 0.0
District Total : 39 100.0 5 100.0
The above table reveals that out of total 17 persons, belonging to Scheduled Caste population 5 persons were residing in 2 villages (rural areas) of the district and that there was no SC population in any other villages or in any other range of population.

ANALYTICAL NOTE
TABLE 17: PROPORTION OF SCHEDULED TRIBES POPULATION TO TOTALPOPULATION
Percentage Range of Scheduled
Tribes population
to total population
Nil
Less than 5
5-10
11-20
21-30
31-40
41-50
51-75
IN VILLAGES, 2001
Number Percentage Scheduled Percentage of villages Tribes for villages
Population
2 3 4 5
3 7.7 0 0.0
0 0.0 0 0.0
0 0.0 0 0.0
0 0.0 0 0.0
1 2.6 25 0.1
0 0.0 0 0.0
0 0.0 0 0.0
3 7.7 1,011 3.8
21
TABLE 17: PROPORTION OF SCHEDULED TRIBES POPULATION TO TOTAL POPULATION
Percentage Range of Scheduled
Tribes
IN VILLAGES, 2001
Number Percentage Scheduled Percentage population to total
population ofvillages Tribes for villages
Population
2 3 4 5
76 and above 32 82.1 25,757 96.1
District Total : 39 100.0 26,793 100.0
It can be seen that out of the total population of 26,793 ST populations in the district, the largest number of ST population are found at the range of 76 and above and were residing in 32 out of total 39 villages of the district, I village in the range of 21-30 and 3 villages are found at the range of 51-75.
TABLE 18: NUMBERAND PERCENTAGE OF SCHEDULED CASTES AND SCHEDULED TRIBES POPULATION IN URBANAGGWMERATIONSrrOWNS, 2001
Percentage of Percentage of Scheduled Castes Scheduled Tribes
Serial Total Scheduled Total Scheduled population to total population to total number Name ofUAf[own Total population Castes population Tribes population population population
2 3
Bairabi (NT) 3,304
2 Kolasib (NT) 19,008
3 N.Kawnpui (NT) 6,472
4 Vairengte (NT) 7,715
District (Urban) Total: 36,499 Note: NT = Notified Town
A scrutiny of the above table shows that there were only 2 persons belonging to SC in Vairengte Town, 6 in Bairabi Town and 4 in Kolasib Town and that there were no SC population in N. Kawnpui Town. It can also be seen that the highest percentage of ST population (92%) was in Bairabi, 9l.3% in Koiasib, 86% was in Vairengte Town and of 83.4% was residing in N. Kawnpui Town.
TABLE 19: SEX RATIO AMONG SCHEDULED CASTES AND SCHEDULED TRIBES IN
R.D.BLOCKS, 2001
Scheduled Scheduled Serial Castes Tribes
number Name ofR.D. Block sex ratio sex ratio 1 2 3 4
I North Thingdawl 667 947
2 Tlangnuam (Part) 0 907
District (Rural) Total: 667 939
As there was no SC population in Tlangnuam
4
6
4
0
2
12
5 6 7
3,039 0.2 92.0
17,358 0.0 91.3
5,398 0.0 83.4
6,633 0.0 86.0
32,428 0.0 88.8
(part) the corresponding figure is shown as nil in the above table in that area. The sex ratio of ST population in Tlangnuam (Part) was 907. The sex ratio ofSC population in North Thingdawl R.D. Block was 667 and ST population was 947 which was higher than the district average of 939.
TABLE 20 : SEX RATIO AMONG SCHEDULED CASTES AND SCHEDULED TRIBES IN URBAN
AGGLOMERATIONSrrOWNS, 2001
Scheduled Scheduled Serial Castes Tribes number Name ofU.A.rrown sex ratio sex ratio
I 2 3 4
I Bairabi (NT) 1,000 943
2 Kolasib (ND 1,000 990
3 N.Kawnpui (NT) 0 1,018
4 Vairengte (NT) 0 953
Sex ratio (Urban) for the district: 1,400 982
Note: NT = Notified Town

22
As mentioned earlier the SC population being
negligibly small in the district as a whole and there
were anly 12 such population in all urban areas of
the district the figures shown above in respect of SC
population may not indicate any significant data of the district although '0' and '1000' have been recorded
against the towns of the district.
DISTRICT CENSUS HANDBOOK: KOLASIB
In respect of the sex ratio of ST population in
the urban areas in the district, N. Kawnpui Town
with sex ratio of 1,018 was having the highest ratio
among all 4 Notified Towns of the district. Bairabi
Town with sex ratio of 943 was having the lowest
ratio. The sex ratio of the district (urban areas) was
982.
TABLE 21 : NUMBER AND PERCENTAGE OF LITERATES AND ILLETERATES BYRD. B~2001
Gap in male-
Total/ Number of literates and illiterates female Serial Name of R.D. Rural! Number of literates Number of illiterates Percentage of literates literacy
number Block Urban Persons Males Females Persons Males Females Persons Males Females rate
2 3 4 5 6 7 8 9 10 11 12 13
North Thingdawl Total 46,715 24,881 21,834 14,331 7,046 7,285 91.2 92.3 90.0 2.3
Rural 17,127 9,237 7,890 7,420 3,689 3,731 85.2 86.5 83.9 2.6
Urban 29,588 15,644 13,944 6,911 3,357 3,554 95.1 96.2 93.9 2.3
2 Tlangnuam (Part) Total 3,881 2,088 1,793 1,033 547 486 92.7 92.6 92.9 -0.4
Rural 3,881 2,088 1,793 1,033 547 486 92.7 92.6 92.9 -0.4
Urban 0 0 ° 0 0 0 0.0 0.0 0.0 0.0
District Total : Total 50,596 26,969 23,627 15,364 7,593 7,771 91.3 92.3 90.2 2.1
Rural 21,008 11,325 9,683 8,453 4,236 4,217 86.5 87.5 85.4 2.1
Urban 29,588 15,644 13,944 6,911 3,357 3,554 95.1 96.2 93.9 2.3
In the above table the total number of population Tlangnuam (part) rate being 92.6. It can also be seen
by rural and urban breakup and percentage of male that in the urban areas in general the literacy rate
female breakup have been incorporated. It can be was much higher (95.1 %) than the rural areas
seen that the literacy rate of Kolasib District was (86.5%). Same type oftrand can be noticed in respect
91.3% and there was no significant variation in the of urban and rural areas of North Thingdawl R.D.
literacy ratio between North Thingdawl (91.2%) and Block area.
TABLE 22 : NUMBER AND PERCENTAGEOFLITERATESAND ILLITERATES BY SEX IN RD BLOCKS, 2001
Number of literates and illiterates Gap in
Serial Name of Number of literates Number of illiterates Percentage of literates male-female
number R.D.Block Persons Males Females Persons Males Females Persons Males Females literacy rate
2 3 4 5 6 7 8 9 10 II 12
North Thingdawl 17,127 9,237 7,890 7,420 3,689 3,731 85.2 86.5 83.9 2.6
2 Tlangnuam (Part) 3,881 2,088 1,793 1,033 547 486 92.7 92.6 92.9 -0.3
District (Rural) Total: 21,008 11,325 9,683 8,453 4,236 4,217 86.5 87.5 85.4 2.1
Data compiled above are simple and self explanatory. Hence no further analysis is necessary.
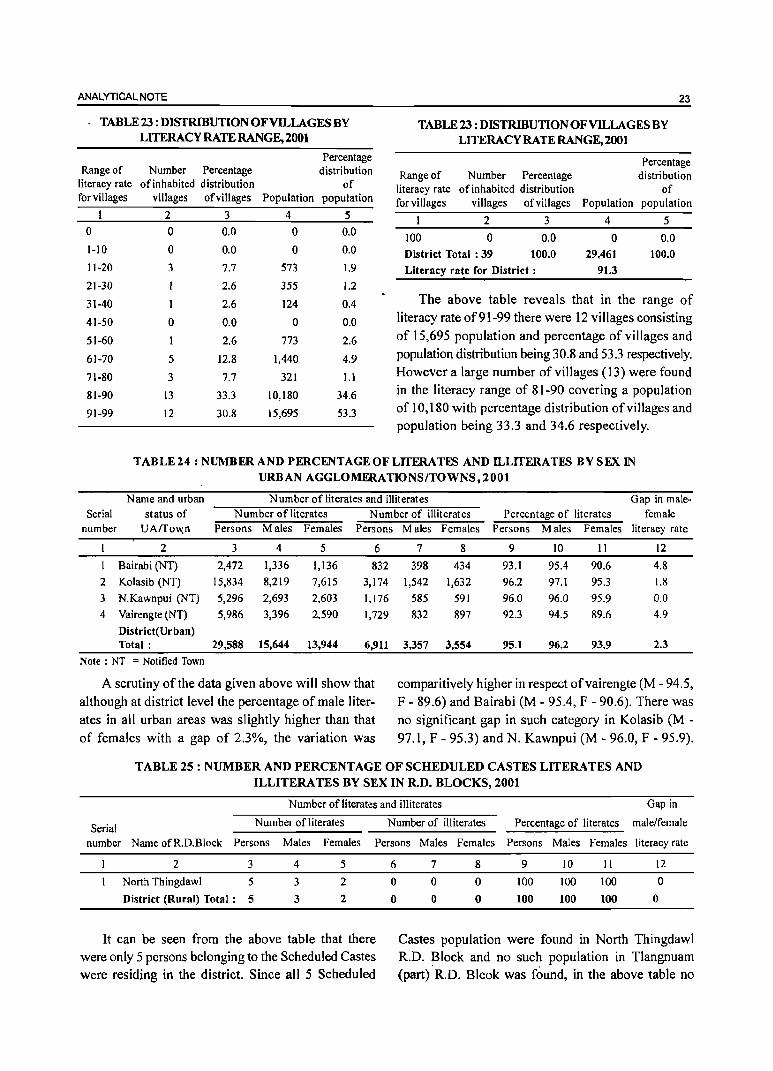
ANALYTICAL NOTE 23
TABLE 23 : DISTRIBUTION OF VILLAGES BY TABLE 23 : DISTRIBUTION OF VILLAGES BY LITERACY RATE RANGE,200l LITERACY RATE RANGE,200t
Percentage Percentage Range of Number Percentage distribution Range of Number Percentage distribution
literacy rate of inhabited distribution of literacy rate ofinhabited distribution of for villages villages of villages Population population for villages villages of villages Population population
I 2 3 4 5 I 2 3 4 5 0 0 0.0 0 0.0 100 0 0.0 0 0.0 1-10 0 0.0 0 0.0 District Total : 39 100.0 29,461 100.0 11-20 3 7.7 573 1.9 Literacy rate for District: 91.3 21-30 2.6 355 1.2
31-40 1 2.6 124 0.4 The above table reveals that in the range of
41-50 0 0.0 0 0.0 literacy rate of 91-99 there were 12 villages consisting
51-60 1 2.6 773 2.6 of 15,695 population and percentage of villages and
61-70 5 12.8 1,440 4.9 population distribution being 30.8 and 53.3 respectively.
71-80 3 7.7 321 1.1 However a large number of villages (13) were found
81-90 13 33.3 10,180 34.6 in the literacy range of 81-90 covering a population
91-99 12 30.8 15,695 53.3 of 10,180 with percentage distribution of villages and population being 33.3 and 34.6 respectively.
TABLE24: NUMBER AND PERCENTAGE OF LffERATFS AND ll..,LITERATFS BYSEX IN URBAN AGGLOMERATIONS/TOWNS,200t
N arne and urban Number of literates and illiterates Gap in male-Serial status of Number of lit crates Number of illiterates Percentage of literates female
number UArro\Xn Persons Males Females Persons Males Females Persons Males Females literacy rate
2 3 4 5 6 7 8 9 10 II 12
Bairabi (NT) 2,472 1,336 1,136 832 398 434 93.1 95.4 90.6 4.8
2 Kolasib (NT) 15,834 8,219 7,615 3,174 1,542 1,632 96.2 97.1 95.3 1.8
3 N.Kawnpui (NT) 5,296 2,693 2,603 1,176 585 591 96.0 96.0 95.9 0.0
4 Vairengte (NT) 5,986 3,396 2,590 1,729 832 897 92.3 94.5 89.6 4.9
District(Urban) Total: 29,588 15,644 13,944 6,911 3,357 3,554 95.1 96.2 93.9 2.3
Note : NT '" Notified Town
A scrutiny of the data given above will show that comparitively higher in respect ofvairengte (M - 94.5, although at district level the percentage of male liter- F - 89.6) and Bairabi (M - 95.4, F - 90.6). There was ates in all urban areas was slightly higher than that no significant gap in such category in Kolasib (M -of females with a gap of 2.3%, the variation was 97.1, F - 95.3) and N. Kawnpui (M - 96.0, F - 95.9).
TABLE 25 : NUMBER AND PERCENT AGE OF SCHEDULED CASTES LITERATES AND ILLITERATES BY SEX IN R.D. BLOCKS, 2001
Number of literates and illiterates Gap in
Serial Number of literates Number of illiterates Percentage of literates male/female
number Name ofR.D.Block Persons Males Females Persons Males Females Persons Males Females literacy rate
2 3 4 5
North Thingdawl 5 3 2
District (Rural) Total : 5 3 2
It can be seen from the above table that there were only 5 persons belonging to the Scheduled Castes were residing in the district. Since all 5 Scheduled
6
0
0
7 8 9 10 11 12
0 0 100 100 100 0
0 0 100 100 100 0
Castes population were found in North Thingdawl R.D. Block and no such population in Tlangnuam (part) ·R.D. Blcok was found, in the above table no
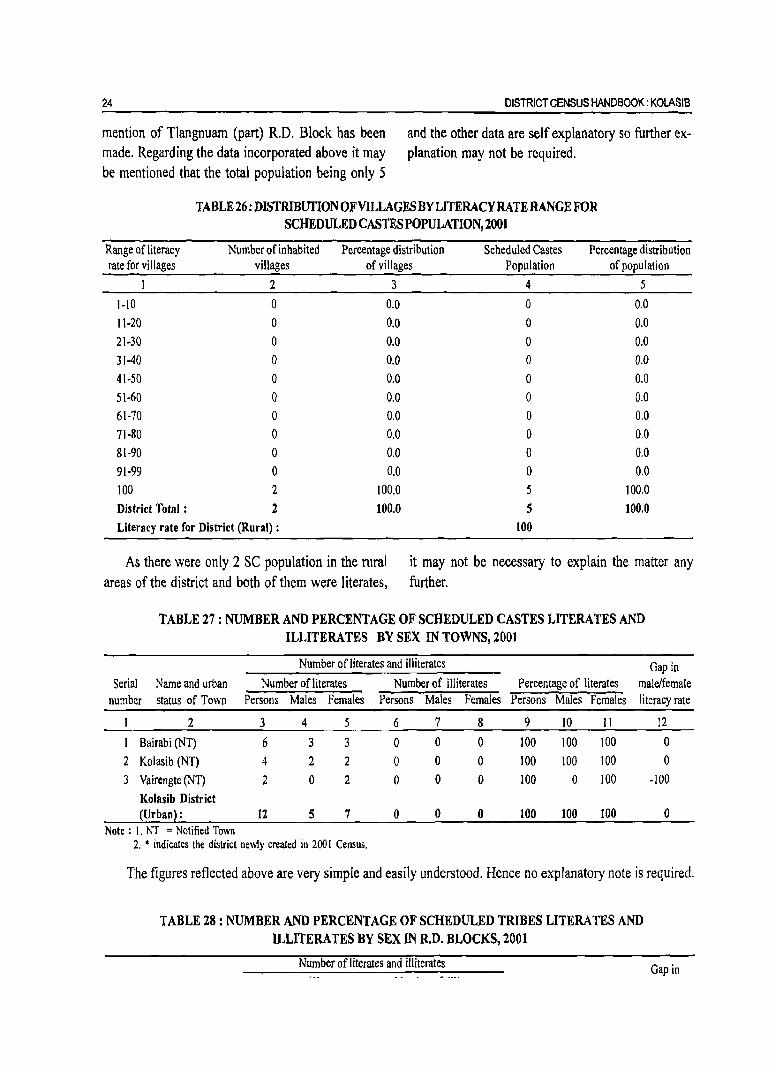
24 DISTRICT CENSUS HANDBOOK: KOLASIS
mention of Tlangnuam (part) R.D. Block has been made. Regarding the data incorporated above it may be mentioned that the total population being only 5
and the other data are self explanatory so further explanation may not be required.
TABLE 26: DISTRIBUTION OF VILLAGES BY LITERACY RATE RANGE FOR SCHEDULED CASTES POPULATION, 2001
Range of literacy Number of inhabited Percentage distribution Scheduled Castes Percentage distribution rate for villages villages of villages Population of population
1 2 3 4 5
1-10 0 0.0 0 0.0
11-20 0 0.0 0 0.0 21-30 0 0.0 0 0.0
31-40 0 0.0 0 0.0
41-50 0 0.0 0 0.0 51-60 0 0.0 0 0.0 61·70 0 0.0 0 0,0
71·80 0 0.0 0 0,0
81·90 0 0.0 a 0,0
91·99 0 0.0 0 0,0
100 2 100.0 5 100,0
District Total : 2 100.0 5 100.0 Literacy rate for District (Rural) : 100
As there were only 2 SC population in the rural areas of the district and both of them were literates,
it may not be necessary to explain the matter any further.
TABLE 27 : NUMBER AND PERCENTAGE OF SCHEDULED CASTES LITERATES AND ILLITERATES BY SEX IN TOWNS, 2001
Number of literates and illiterates Gap in Serial Name and urban Number of literates Number of illiterates Percentage of literates male/female
number status of Town Persons Males Females Persons Males Females Persons Males Females literacy rate
I 2 3 4 5 6 7 8 9 10 II 12
1 Bairabi (NT) 6 3 3 0 0 0 100 100 100 0
2 Kolasib (NT) 4 2 2 0 a 0 100 100 100 0
3 Vairengte (NT) 2 0 2 0 0 0 100 0 100 ·100 Kolasib District {Urban} : 12 S 7 0 0 0 100 100 100 0
Note : I. NT = Notified Town 2, * indicates the district newly created in 200 I Census,
The figures reflected above are very simple and easily understood, Hence no explanatory note is required.
TABLE 28 : NUMBER AND PERCENTAGE OF SCHEDULED TRIBES LITERATES AND ILLITERATES BY SEX IN R.D. BLOCKS, 2001
Number of literates and illiterates Gap in

ANALYTICAL NOTE 25
From the above it can be seen that as in the case of the total population of the district, the gap in malefemale category among the literate population of North
Thingdawl was 4.8 and that ofTlangnuam (part) was 1.5.
TABLE 29 : DISTRIBUTION OF VILLAGES BY LITERACY RATE RANGE FOR SCHEDULED TRIBES POPULATION, 2001
Range of literacy Number of inhabited Percentage distribution Scheduled Tribes Percentage distribution rate for villages villages of villages Population of population
2 3 4 5
0 0 0.0 0 0.0
1-10 0 1>.0 0 0.0
11-20 1 2.8 224 0.&
21-30 2.8 355 1.3
31-40 I 2.8 124 0.5
41-50 0 0.0 0 0.0
51-60 0 0.0 0 0.0
61-70 3 8.3 575 2.1
71-&0 4 11.1 670 2.5
81-90 10 27.8 6,660 24.9
91-99 15 41.7 17,604 65.7
100 2.8 581 2.2
District Total : 36 100.0 26,793 100.0
Literacy rate for District (Rural) : 90.4
A scrutiny of the data given above will reveal that as many as 65.7% of the population of the district were in the literacy range of91-99 followed by 24.9% in the range of 81-90 and that a very small number
of popUlation were found to be in the lower range of literacy. There was only one village where literacy was 100%.
TABLE 30 : NUMBER AND PERCENTAGE OF SCHEDULED TRIBES LITERATES AND ILLITERATES BY SEX IN TOWNS, 2001
Number ofliterates and illiterates Gap in
Serial Name and urban Number of literates Number of illiterates Percentage of literates male/female number status of Town Persons Males Females Persons Males Females Persons Males Females literacy rate
2 3 4 S 6 7 & 9 10 11 12
Bairabi (NT) 2,316 1,220 1,096 723 344 379 94.9 97.1 92.6 4.4
2 Kolasib (NT) 14,495 7,361 7,134 2,&63 1,362 1,501 96.7 97.& 95.6 2.2
3 N.Kawnpui (NT) 4,503 2,250 2,253 895 425 470 97.8 98.2 97.5 0.7
4 Vairengte (Nn 5,023 2,617 2,406 1,610 779 831 91.6 93.5 89.7 3.7
Kolasib * (Urban): 26,337 13,448 12,889 6,091 2,910 3,181 95.7 96.9 94.5 2.4
Note : I. NT = Notified Town 2. • indicates the district newly created in 200 I Census.
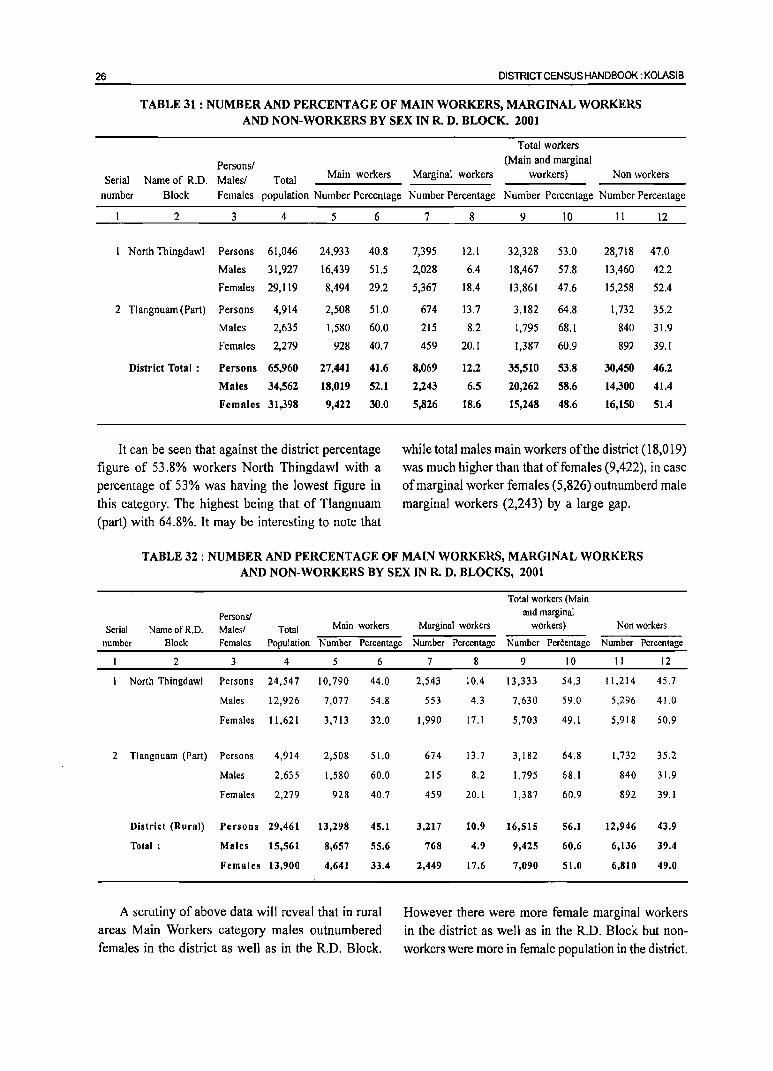
26 DISTRICT CENSUS HANDBOOK: KOLASIB
TABLE 31: NUMBER AND PERCENTAGE OF MAIN WORKERS, MARGINAL WORKERS AND NON-WORKERS BY SEX IN R. D. BLOCK. 2001
Total workers
Persons! (Main and marginal
Serial Name of R.D. Males! Total Main workers Marginal workers workers) Non workers
number Block Females population Number Percentage Number Percentage Number Percentage Number Percentage
2 3 4 5 6 7 8 9 10 II 12
North Thingdawl Persons 61,046 24,933 40.8 7,395 12.1 32,328 53.0 28,718 47.0
Males 31,927 16,439 51.5 2,028 6.4 18,467 57.8 13,460 42.2
Females 29,119 8,494 29.2 5,367 18.4 13,861 47.6 15,258 52.4
2 Tlangnuam (Part) Persons 4,914 2,508 51.0 674 13.7 3,182 64.8 1,732 35.2
Males 2,635 1,580 60.0 215 8.2 1,795 68.1 840 31.9
Females 2,279 928 40.7 459 20.1 1,387 60.9 892 39.1
District Total : Persons 65,960 27,441 41.6 8,069 12.2 35,510 53.8 30,450 46.2
Males 34,562 18,019 52.1 2,243 6.5 20,262 58.6 14,300 41.4
Females 31,398 9,422 30.0 5,826 18.6 15,248 48.6 16,150 51.4
It can be seen that against the district percentage while total males main workers of the district (18,019)
figure of 53.8% workers North Thingdawl with a was much higher than that of females (9,422), in case percentage of 53% was having the lowest figure in of marginal worker females (5,826) outnumberd male
this category. The highest being that of Tlangnuam marginal workers (2,243) by a large gap.
(part) with 64.8%. It may be interesting to note that
TABLE 32: NUMBER AND PERCENTAGE OF MAIN WORKERS, MARGINAL WORKERS AND NON-WORKERS BY SEX IN R. D. BLOCKS, 2001
Total workers (Main
Persons! and marginal
Serial NameofR.D. Malesl Total Main workers Marginal workers workers) Non workers
number Block Females Population Number Percentage Number Percentage Number Percentage Number Percentage
2 3 4 5 6 7 8 9 10 II 12
North Thingdawl Persons 24,547 10,790 44.0 2,543 10.4 13,333 54.3 11,214 45.7
Males 12,926 7,077 54.8 553 4.3 7,630 59.0 5,296 41.0
Females 11,621 3,713 32.0 1,990 17.1 5,703 49.1 5,918 50.9
2 Tlangnuam (Part) Persons 4,914 2,508 51.0 674 13.7 3,182 64.8 1,732 35.2
Males 2,635 1,580 60.0 215 8.2 1,795 68.1 840 31.9
Females 2,279 928 40.7 459 20.1 1,387 60.9 892 39.1
District (Rural) Persons 29,461 13,298 45.1 3,217 10.9 16,515 56.1 12,946 43.9
Total: Males 15,561 8,657 55.6 768 4.9 9,425 60.6 6,136 39.4
Females 13,900 4,641 33.4 2,449 17.6 7,090 51.0 6,810 49.0
A scrutiny of above data will reveal that in rural However there were more female marginal workers areas Main Workers category males outnumbered in the district as well as in the R.D. Block but non-females in the district as well as in the R.D. Block. workers were more in female population in the district.

ANALYTICAL NOTE
TABLE33 : NUMBER AND PERCENTAGE OF MAIN WORKERS, MARGINAL WORKERS
AND NON-WORKERS BYSEX IN URBAN AGGLOMERATIONS/TOWNS,200l
Persons/
27
Serial Name and urban Males/ Total Main workers Marginal workers workers) Non workers
number status of Town Females Population Number Percentage Num ber Percentage Number Percentage Number Percentage
2 3 4 5 6 7 8 9 10 11 12
Bairabi (NT) Persons 3,304 1,197 36.2 552 16.7 1,749 52.9 1,555 47.1
Males 1,734 831 47.9 147 8.5 978 56.4 756 43.6
Females 1,570 366 23.3 405 25.8 771 49.1 799 509
2 Kolasib (NT) Persons 19,008 6,645 35.0 2,960 15.6 9,605 50.S 9,403 495
Males 9,761 4,447 45.6 946 9.7 5,393 55.3 4,368 44.7
Females 9,247 2,19& 23.& 2,014 21.8 4,212 45.5 5,035 54.5
3 N.Kawnpui (NT) Persons 6,472 2,875 44.4 717 11.1 3,592 55.5 2,880 44.5
Males 3,278 1,808 55.2 143 4.4 1,951 59.5 1,327 40.5
Females 3,194 1,067 33.4 574 18.0 1,641 51.4 1,553 48.6
4 Vairengte (NT) Persons 7,715 3,426 44.4 623 8.1 4,049 52.5 3,666 47.5
Males 4,228 2,276 53.8 239 5.7 2,515 59.5 1,713 40.5
Females 3,487 1,1 SO 33.0 384 11.0 1,534 44.0 1,953 56.0
District (Urban) Persons 36,499 14,143 38.7 4,852 13.3 18,995 52.0 17,504 48.0
Total: Males 19,001 9,362 49.3 1,475 7.8 10,837 57.0 8,164 43.0
Females 17,498 4,781 27.3 3,377 19.3 8,158 46.6 9,340 53.4
Note: NT = Notified Town
In urban areas of the district it was found that was the highest followed by Bairabi 52.9% and the
the total number of workers in male category was lowest Kolasib 50.5% for Total Workers. Hence non-
higher than female worker. The same was the case workers were also proportionately distributed among
in respect of all four towns. N. Kawnpui with 55.5% these four towns.
TABLE 34 : DISTRIBUTION OF WORKERS BY SEX IN FOUR CATEGORIES OF
ECONOMIC ACTIVITY IN R.D. BLOCK. 2001
Persons! Total number of Categ0!i: of workers
Household Serial Name of R. D. Males! workers (Main + Agricultural Industry Other
number Block Females Total Population Marginal) Cultivators Labourers workers workers
2 3 4 5 6 7 8 9
North Thingdawl Persons 61,046 32,328 18,457 2,954 386 10,531
(53.0) (57.1) (9.1) (1.2) (32.6)
Males 31,927 18,467 9,994 1,232 261 6,980
(57.8) (54.1) (6.7) (1.4) (37.8)
Females 29,119 13,861 8,463 1,722 125 3,551
(47.6) (61.1) (12.4) (O.9) (25.6)

28 DISTRICT CENSUS HANDBOOK: KOLASIB
TABLE 34 : DISTRIBUTION OF WORKERS BY SEX IN FOUR CATEGORIES OF ECONOMIC ACTIVITY IN R.D. BLOCK. 2001
Persons! Total number of Catelo\0!1 of workers
Household Serial Name of R. D. Males! workers (Main + Agricultural Industry Other
number Block Females Total Population Marginal) Cultivators Labourers workers workers
2 3 4 5 6 7 8 9
2 Tlangnuam (Part) Persons 4,914 3,182 1,950 219 19 994
(64.8) (61.3) (6.9) (0.6) (31.2)
Males 2,635 1,795 1,020 93 16 666
(68.1) (56.8) (5.2) (0.9) (37.1 )
Females 2,279 1,387 930 126 3 328
(60.9) (67.1) (9.1) (0.2) (23.6)
District Total : Persons 65,960 35,510 20,407 3,173 405 11,525
(53.8) (57.5) (8.9) (1.1 ) (32.5)
Males 34,562 20,262 ll,O14 1,325 277 7,646
(58.6) (54.4) (6.5) (1.4) (37.7)
Females 31,398 15,248 9,393 1,848 128 3.879
( 48.6) (61.6) (12.1) (0.8) (25.4)
Note: Percent of Worker to total worker are given in brackets
It can be seen from the above table that 57.5% whereas the percentage of Other workers was highest of the workers in the district were Cultivators followed in N. Thingdawl R.D. Block (32.6%) followed by by Other workers (32.5%), Agricultural labourers Tlangnuam (part) (31.2%). It is worthwhile to note (8.9%) and those engaged in Household Industry that in all two RD Blocks there were more female (1.1 %). Among the two RD Blocks Tlangnuam (part) cultivators but less female workers in the category of was having the largest percentage of Cultivators Household Industry. (61.3%) followed by N. Thingdawl R.D. Block
TABLE 35 : DISTRIBUTION OF WORKERS BY SEX IN FOUR CATEGORIES OF ECONOMIC ACTIVITY IN R.D. BLOCK. 2001
Category of workers Persons! Total number of Household
Serial Name of R. D. Males! workers (Main + Agricultural Industry Other number Block Females Total Population Marginal) Cultivators Labourers workers workers
2 3 4 5 6 7 8 9
North Thingdawl Persons 24,547 13,333 10,201 809 105 2,218
(54.3) (76.5) (6.1) (0.8) (16.6)
Males 12,926 7,630 5,598 287 66 1,679
(59.0) (73.4) (3.8) (0.9) (22.0)
Females 11,621 5,703 4,603 522 39 539
(49.1) (80.7) (9.2) (0.7) (9.5)
2 Tlangnuam (Part) Persons 4,914 3,182 1,950 219 19 994
(64.8) (61.3) (6.9) (0.6) (31.2)
Males 2,635 1,795 1,020 93 16 666
(68.1) (56.8) (5.2) (0.9) (37.1)
Females 2,279 1,387 930 126 3 328
(60.9) (67.1) (9.1) (0.2) (23.6)

ANALYTICAL NOTE
TABLE 35 : DISTRIBUTION OF WORKERS BY SEX IN FOUR CATEGORIES OF ECONOMIC ACTIVITY IN R.D. BLOCK. 2001
Serial number
Persons! Name of R. D. Males!
Block Females
2 3
District (Rural) Persons
Total:
Males
Females
Total number of workers (Main +
Total Population Marginal) Cultivators
4
29.461
15,561
13,900
5
16,515
(56.1)
.9,425
(60.6)
7,090
(51.0)
6
12,151
(73.6)
6,618
(70.2)
5,533
(78.0)
Note: Percent of Worker to total worker are given in brackets
Category of workers Household
Agricultural Industry Labourers workers
7
1,028
(6.2)
380
(4.0)
648
(9.1)
8
124
(0.8)
82
(0.9)
42
(0.6)
29
Other workers
9
3,212
(19.4)
2,345
(24.9)
867
(12.2)
From the above table it can be seen that there were highest percentage of workers in Tlangnuam (part) (64.8%) followed by N. Thingdawl R.D. Block (54.3%). N. Thingdawl was having 76.5% Cultivators which was higher percentage in this category than
Tlangnuam (part) R.D. Block area of the district. However the percentage of Other workers was highest in Tlangnuam (part) (31.2%), followed by N. Thingdawl R.D. Block (16.6%).
TABLE 36: DISTRIBUTION OF WORKERS BY SEX IN FOUR CATEGORIES OF ECONOMIC ACTIVITY OF URBAN AGGLOMERA TIONSrrOWNS, 200t
Persons! Serial Name and urban Males!
number status ofUAffown Females
2 3
Bairabi (NT) Persons
Males
Females
2 Kolasib (NT) Persons
Males
Females
3 N.Kawnpui (NT) Persons
Males
Females
Total population
4
3,304
1,734
1,570
19,008
9,761
9,247
6,472
3,278
3,194
Total number of workers
(Main + Marginal)
5
1.749
(52.9)
978
(56.4)
771
(49.1)
9,605
(50.5)
5,393
(55.3)
4,212
(45.5)
3,592
(55.5)
1,951
(59.S)
1,641
(SI.4)
Category of workers
Agricultural Cultivators Labourers
6
862
(49.3)
474
(48.5)
388
(50.3)
3,042
(31.7)
1,66~
(30.9)
1,376
(32.7)
2,314
(64.4)
1,211
(62.1)
1,103
(67.2)
7
354
(20.2)
171
(17.5)
183
(23.7)
1,139
(11.9)
506
(9.4)
633
(15.0)
151
(4.2)
44
(2.3)
107
(6.5)
Household Industry workers
8
6
(0.3)
5
(0.5)
I
(0.1)
202
(2.1)
143
(2.7)
59
(I.4)
30
(0.8)
20
(1.0)
10
(0.6)
Other workers
9
S27
(30.1)
328
(33.5)
199
(25,8)
5,222
(54.4)
3,078
(S7, I)
2,144
(SO,9)
1,097
(30.5)
676
(34.6)
421
(2S.7)

30
Serial
DISTRICT CENSUS HANDBOOK: KOLASIB
TABLE 36: DISTRIBUTION OF WORKERS BY SEX IN FOUR CATEGORIES OF
ECONOMIC ACTIVITY OF URBAN AGGLOMERATIONSrrOWNS, 2001
Total number Category of workers
Persons! of workers Household Name and urban Males! Total (Main + Agricultural Industry Other
number status ofUAffown Females population Marginal) Cultivators Labourers workers workers
2 3 4 5 6 7 8 9
4 Vairengte (NT) Persons 7,715 4,049 2,038 501 43 1,467
(52.5) (50.3) (12.4) (1.1) (36.2)
Males 4,228 2,515 1,045 224 27 1,219
(59.5) (41.6) (8.9) (l.I ) (48.5)
Females 3,487 1,534 993 277 '16 248
(44.0) (64.7) (18.1) (1.0) (16.2)
District (U rban) Persons 36,499 18,995 8,256 2,145 281 8,313
Total: (52.0) (43.5) (11.3) (1.5) (43.8)
Males 19,001 10,837 4,396 945 195 5,301
(57.0) (40.6) (8.7) (1.8) (48.9)
Females 17,498 8,158 3,860 1,200 86 3,012
(46.6) (47.3) (14.7) (1.1) (36.9)
Note: NT = Notified Town
Among the urban areas of the district N. Kawnpui workers (54.4%) followed by Vairengte, N. Kawnpui was having highest percentage of main and marginal and Bairabi (36.2%), (30.5%) and (30.1%) workers (55.5%) followed by Bairabi (52.9%), respectively. In Bairabi the precentage of Agricultural Vairengte (52.5%) and Kolasib (50.5%). However labourers (20.2) was the highest followed by Vairengte Kolasib was having highest percentage of Other (12.4%), Kolasib (11.9%) and N. Kawnpui (4.2%).
TABLE 37 : DISTRIBUTION OF VILLAGES ACCORDING TO AVAILABILITY OF
DIFFERENT AMENITIES, 2001
Number Type of amenity available
of Improved Post Transport Agricultural Approach Serial NameofR.D. inhabited drinking Office Tele communic Credit bypucca Power
number Block villages Education Medical water* # phone ationsS Banks Societies road supply
2 3 4 5 6 7 8 9 10 II 12 13
North Thingdawl 32 23 15 29 9 2 II 0 7 24
(100) (71.9) (46.9) (90.6) (28.1) (6.3) (34.4) (3.1) (0.0) (21.9) (75.0)
2 Tlangnuam (Part) 7 7 4 3 4 2 6 I 0 6 6
(100) (100.0) (57.1) (42.9) (57.1) (28.6) (85.7) (14.3) (0.0) (85.7) (85.7)
District Total : 39 30 19 32 13 4 17 2 0 13 30
(100) (76.9) (48.7) (82.1) (33.3) (10.3) (43.6) (5.1) (0.0) (33.3) (76.9)
Note: Percentages are given in brackets. • Based on the improved drinking water source, .drinking water supply has been classified as 'Improved' or otherwise. If the household
has access to drinking water supplied from a tap or a hand pump/tube well situated within or outside the premises it is considered as having access to 'Improved drinking water source'. However, the concept of improved drinking water is state specific and this is to be considered accordingly.
# Post office includes Post office, telegraph office and Post and telegraph office. S Transport communication includes bus service, rail facility and navigable waterways.

ANALYTICAL NOTE
On going through the summery of data on various important amenities available in the two RD Blocks it can be seen that except educational and power supply all other basic amenities are not available in majority of the villages in the district. Since Tlangnuam
31
(part) consists of a very small number of villages (7), the data compiled for the district are concerning the vast majority of villages (32 out of total 39 villages) of the district.
TABLE 38: NUMBER AND PERCENT OF RURAL POPULATION SERVED BY DIFFERENT AMENITIES, 2001
Type of amenity available Total
population Improved Transport Agricultural Approach Serial Name of R.D. of inhabited drinking Post Tele communica Credit by pucca Power
supply number Block villages Education Medical water· Office# phone tions $ Banks Societies road
2 3 4 5 6 7 8 9 10 11 12 13
North Thingdawl 24,547 22,911 19,531 23,545 15,231 6,890 15,267 4,084 0 12,495 22.700
(100) (93.3) (79.6) (95.9) (62.0) (2&.1) (62.2) (16.6) (0.0) (50.9) (92 5)
2 Tlangnuam (Part) 4,914 4,914 3,713 1,626 3,713 2,145 4,572 1,732 0 4,572 4,468
(I ~O) (100.0) (75.6) (33.1) (75.6) (43.7) (93. D) (35.2) (O.D) (93.0) (90.9)
District Total ; 29,461 27,825 23,244 25,171 18,944 9,035 19,839 5,816 0 17,067 27,168
(100) (94.4) (78.9) (85.4) (64.3) (30.7) (67.3) (19.7) (O.O) (57.9) (92.2)
Note ; Percentages are given in brackets. • Based on the improved drinking water source. drinking water supply has been classified as . Improved ' or otherwise. If the household
has access to drinking water supplied from a tap or a hand pump/tube well situated within or outside the premises it is considered as having access to 'Improved drinking water source'. However, the concept of improved drinking water is state specific and this is to be considered accordingly.
# Post office includes Post office, telegraph office and Post and telegraph office. S Transport· communication includes bus service, rail facility and navigable waterways.
It can be seen from the above table that coverage of person by educational facilities in the two RD Blocks is extremely high (93.3%) and (100.0) for Sl. No. 1 and 2 above against average figure of percentage of population having district, medical,
Improved drinking water, Postal Service, Transport & Communication and Power supply facilities varies from high to low but Agricultural Credit Societies was nil. It may be noted that only 30.7% of the population was having Telephone facilities in the whole district.
TABLE 39: DISTRIBUTION OFVlLLAGES NOT HAVING CERTAIN AMENITIES, ARRANGED BY DISTANCE RANGES FROM THE PLACES WHERETHESEAREAVAILABLE, 2001
Distance range of place from the villages where the amenity is available
Village not having the amenity of Less than 5 kilometres 5-10 kilometres 10+ kilometres Total (Col. 2-4)
2 3 4 5
I. Education :-
(a) Primary School 3 0 6 9
(b) Middle School 0 4 11 15
(c) Degr~e College 0 I 38 39
2. Medical:-
(a) Hospital 0 38 39
(b) PHC 2 I 34 37 3. Post Office I 5 20 26
4. Telephone 0 2 33 35
5. Bus Service 0 1 21 22
6. Banks
(a) Commercial Bank 3 33 37
(b) Cooperative Bank 0 0 39 39
7. Agricultural Credit Societies 0 38 39

32 DISTRICT CENSUS HANDBOOK: KOLASIB
A scrutiny of the data incorporated in the table above will reveal that only three Primary Schools were located witin 5 kms. and 6 villages located at a distance of 10+ km. Similarly villages not having Medi
cal, Postal, Telephones, Bus Services, Banking and
Agricultural Credit Societies has also been shown in the same fashion in the relevant rows and columns of the table. As the data are self explanatory further elaboration is not attempted.
TABLE 40 : DISTRIBUTION OF VILLAGES ACCORDING TO THE DISTANCE FROM THE NEAREST STATUTORY TOWN AND AVAILABILITY OF DIFFERENT AMENITIES, 2001
Distance range from the nearest statutory town (in kilometres)
less than 5
5-15
16-50
51+
Unspecified
District total :
Number of inhabited villages
in each range
2
I
(100.0)
11
(100.0)
24
(100.0)
3
(100.0)
o o
39
(100.0)
Type of amenity available
Post Education Medical Office # Telephone
3 4 5 6
1
(100.0)
8
(72.7)
18
(75.0)
3
(100.0)
o o
30
(76.9)
1
(100.0)
4
(36.4)
13
(54.2)
o (0.0)
1
(9.1)
11
(45.8)
I 1
(33.3) (33.3)
o o
o o
19 I3
(48.7) (33.3)
o (0.0)
1
(9.1)
3
(12.5)
o (0.0)
o o 4
(10.3)
Transport communica
tions $
7
1
(100.0)
3
(27.3)
11
(45.8)
2
(06.7)
o o
17
(43.6)
Note: # Post office includes Post office, Telegraph office and Post and telegraph office. S Transport communication includes bus service, rail facility and navigable waterways.
Banks
8
o (0.0)
o (0.0)
2
(8.3)
o (0.0)
o o 2
(5.1)
Agricultural Approach Credit by pucca
Societies road
9 10
o (0.0)
o (0.0)
o (0.0)
o (0.0)
o o o
(0.0)
o (0.0)
3
(27.3)
10
(41.7)
o (0.0)
o o
13
(33.3)
It can be seen that from the above table that in the range of 16-50 km. distance the highest number of villages were located and that only a very few
villages were situated in other ranges like less than 5,
5-15 km, 51 + etc. and the figures for unspecified
category was nil.
TABLE 41: DISTRIBUTION OF VILLAGES ACCORDING TO POPULATION RANGE AND AMENITIES AVAILABLE, 2001
Population range
1-499
500-999
1000-1999
2000-4999
Number of inhabited villages in each range
2
20
(100.0)
11
Education Medical
3 4
Improved drinking water*
5
11 3 16
Type of amenity available Transport
Post Tele communica Office # phone tions $ Banks
6 7 8 9
4 0
(55.0) (15.0) (80.0) (5.0) (5.0) (20.0) (0.0)'
11 8 9 5 0 7 0
(100.0) (100.0) (72.7) (81.8) (45.5) (0.0) (63.6) (0.0)
5 5 5 4 4
(100.0) (100.0) (100.0) (80.0) (80.0) (20.0)
3
(100.0)
3 3 3 3 2
(100.0) (100.0) (IOO.O) (100.0) (66.7)
3
(60.0) (20.0)
3
(100.0) (33.3)
Agricultural Approach Credit by Pucca
Societies road
10 II
2
(10.0)
6
Power supply
12
II
(55.0)
11
o (0.0)
o (0.0)
o (0.0)
o (0.0)
(54.5) (100.0)
2 5
(40.0) (100.0)
3
(100.0) (100.0)

ANALYTICAL NOTE 33
TABLE 41: DISTRIBUTION OF VILLAGES ACCORDING TO POPULATION RANGE AND AMENITIES AVAILABLE, 2001
Number of T~e of amenit~ available inhabited Improved Transport Agricultural Approach
Population villages in drinking Post Tele comrnunica Credit by Pucca Power range each range Education Medical water· Office # phone tions $ Banks Societies road supply
2 3 4 5 6 7 8 9 10 II 12
5000-9999 0 0 0 0 0 0 0 0 0 0 0
0 0 0 0 0 0 0 0 0 0 0
10000 + 0 0 0 0 • 0 0 0 0 0 0 0
0 0 0 0 0 0 0 0 0 0 0
District total : 39 30 19 32 13 4 17 2 0 13 30
(100.0) (76.9) (48.7) (82.1) (33.3) (10.3) (43.6) (5.1) (0.0) (33.3) (76.9)
# Post office includes Post office, Telegraph office and Post and telegraph office. $ Transport communication includes bus service, rail facility and navigable waterways. • Based on the improved drinking water source, drinking water supply has been classified as 'Improved ' or otherwise. If the household has access to drinking water supplied from a tap or a hand pump/tube well situated within or outside the premises it is considered as having access to 'Improved drinking water source'. However, the concept of improved drinking water is state specific and this is to be considered accordingly.
A scrutiny of the data incorporated above will reveal that most of the villages having popUlation range of 500-999 and 1000-1999 were having basic facilities mentioned above and that the number of popu-
lation falling under other ranges were comparively very less. In fact there was no villages in the range of 5000-9999 and 10000+ population in the district.
:fABLE 42: DISTRIBUTION OF VILLAGES ACCORDING TO LAND USE, 2001
Serial Number of Percentage of cultivable Percentage of irrigated area
number Name of R. D. Block inhabited villages Total area area to total area to total cultivable area
2 3 4 5 6
North Thingdawl 32 0 0 0
2 Tlangnuam (Part) 7 0 0 0
District Total : 39 0 0 0
Note: - Cultivable area = irrigated area + un irrigated area
Since no data has been included, there is nothing to explain.
TABLE 43: PER CAPITA RECEIPT AND EXPENDITURE IN STATUTORY TOWNS
Per capita receipt Per capita expenditure
Class, name & From all Public health Serial urban status of the Through other General and Public Public
number Town Total taxes sources Total Administration conveniences works institutions Other(s)
2 3 4 5 6 7 8 9 10 II
VI Bairabi (NT) 0 0 0 0 0 0 0 0 0
2 V Kawnpui (NT) 0 0 0 0 0 0 0 0 0
3 IV Kolasib (NT) 0 0 0 0 0 0 0 0 0
4 V Vairengte (NT) 0 0 0 0 0 0 0 0 0
District Total : 0 0 0 0 0 0 0 0 0
Note: NT ~ Notified Town
Since municipality or town committee etc. have yet been introduced, respective data on coverage under this
item can be treated as NIL.

34 DISTRICT CENSUS HANDBOOK: KOLASIB
TABLE 44: SCHOOLS/COLLEGES PER 10,000 POPULATION IN STATUTORY TOWNS,2001
Type of educational institution
Serial Name and urban Senior number status of Town Primary Junior SecondarylMiddle SecondarylMatriculation Secondary College
2 3 4
Bairabi (NT) 12.1 6.1
2 Kawnpui (NT) 7.7 4.6
3 Kolasib (NT) 10.5 5.3
4 Vairengte (NT) 7.8 2.6
District Total : 9.6 4.7
The availability of schools and colleges per 10,000 urban populations in the towns of the district has been included in the above table. Hence it can be seen that in urban areas of Kolasib District 9.6 Primary Schools, 4.7 Middle Schools, 2.7 High Schools, 0.3 Secondary Schools and Colleges per 10,000 populations were located in this category.
In case of individual town Kolasih was having largest Higher Secondary School and College and all other towns were no having such institutions.
TABLE 45: NUMBER OF BEDS IN MEDICAL INSTITUTIONS IN TOWNS, 2001
Number of beds in Serial Name and urban medical institutions number status of the Town per 10,000 population
2 3
Bairabi(NT) 30
2 Kawnpui(NT) 15
3 Kolasib(NT) 32
4 Vairengte(NT) 39
Distrct Total : 30
It can be seen from the above table that there are average of only 30 beds per 10,000 population (urban) in Medical and that the highest number of beds (39) was available in Vairengte Town and the lowest bed strength among the towns in the district is found at N. Kawnpui Town (15) which is for below
district figure of 30.
5 6 7
3.0 0.0 0.0
3.1 0.0 0.0
2.6 0.5 0.5
2.6 0.0 0.0
2.7 0.3 0.3
TABLE 46: PROPORTION OF SLUM
POPULATION IN TOWNS, 2001
This table is not applicable as this district have no Slums.
TABLE 47 : MOST IMPORTANT COMMODITY EXPORTED OUT OF AND MANUFACTURED
IN TOWNS, 2001
Serial Name and urban Most important commodity
number status of Town Manufactured Exported
2 3
Bairabi (NT) Wooden Furniture
2 Kawnpui (NT) Wooden Furniture
Iron Fabrication
Tin Products
3 Kolasib (NT) Wooden Furniture
4 Vairengte (NT) Wooden Furniture
4
Firewood
Charcoal
Betel Leaves
The table indicated most important commodity exported and manufactured in the 4 Notified Towns.
One town N. Kawnpui is having all three items and three towns are having one item each under col.3. In N. Kawnpui Town items like Wooden furniture, Iron fabrication and tin products were manufactured whereas Bairabi, Kolasib and Vairengte towns only wooden furniture were manufactured.
Among the four towns, the only Vairengte was exporting firewood, charcoal and betel leaves.

ANALYTICAL NOTE 35
TABLE 48 : HOUSEHOLDS BY TENURE STATUS AND NUMBER OF ROOMS OCCUPIED IN THE DISTRICT, 2001
N umber of households Tenure Number of dwelling Total Scheduled Castes Scheduled Tribes status rooms Total Rural Urban Total Rural Urban Total Rural Urban
2
Owned No exclusive room
One room
Two rooms
Three rooms
3+ rooms
Median number of rooms
Rented No exclusive room
One room
Two rooms
Three rooms
3+ rooms
Median number of rooms
Others No exclusive room
One room
Two rooms
Three rooms
3+ rooms
Median number of rooms
3
83
2,711
3,507
1,785
546
2
27
1,332
1,233
434
122
2
11
224
121
141
84
2
4 5
73 10
1,585 1,126
1,993 1,514
668 1,117
107 439
2
16
344
330
lID
19
2
8
139
30
36
39
2
11
988
903
324
103
2
3
85
91
IDS
45
2
6
11
25
8
4
2
42
42
26
8
2
18
7
3
6
7
7
18
2
6
8
7
2
16
5
8
4
7
8
4
3
36
34
19
7
2
2
7
2
9
72
2,588
3,348
1,729
524
2
25
1,082
1,066
348
104
2
2
lID
102
III
10
62
1,543
1,882
658
105
2
16
271
281
81
17
2
38
25
34
32
3
II
10
1,045
1,466
1,071
419
2
9
811
785
267
87
2
2
72
77
77
38
2
District total: 12,361 5,497 6,864 201 70
2
131
70
2
11,281 5,045 6,236
Data source: Census of India 2001, H- series: "Tables on Houses, Household amenities and Assets."
As indicated in the table given above in 2001 census there were altogether 12,361 households in Kolasib District as per the result of houselisting operation conducted during May 2000. Out of the total households, 3,507 households were having two rooms and were living in their own houses and 2,711 household were having only one living rooms owned by them. Among the total of 201 SC households, 25 household were having 2 living rooms, while only 3,348 household of ST out of total of 11,281 were having only two living rooms at their respective houses.
In respect of households living in rented house, it can be seen that the out of total number of the household i.e., 3,148 households in this category, 1,332
households were having only one room and 1,233 with 2 rooms. The same trend has also been found in case of SC households. In case of ST household, 1,066 households were having 2 dwelling rooms and only a marginally lower number of household Le., 1,082 were having one dwelling room.
Among this other category Le., the households
not covered by the above mentioned two categories,
majority of the household were having only one room.
Same is the case of sub-category SC but in case of
ST households, 111 households were having three rooms which is marginally higher than those having
only one room (110).

36 DISTRICT CENSUS HANDBOOK: KOLASIB
TABLE 49 : PERCENTAGE DISfRIBUTlON OF HOUSEHOLDS LIVING IN PERMANENT, SEMIPERMANENT AND TEMPORARY HOUSES, 2001
Total Rural Urban
Serail DistricUR.D. Semi- Semi- Semi-number Block Permanent permanent Temporary Permanent permanent Temporary Permanent permanent Temporary
2 3 4 5 6 7 g 9 10 II
I N. Thingdawl 3,982 4,186 3,077 901 1,612 1,938 3,081 2,574 1,139
(35.1) (36.9) (27.1) (20.1 ) (35.9) (432) (44.9) (37.5) (16.6)
2 Tlangnuam (Part) 529 323 142 529 323 142
(52.5) (32.0) (14.1 ) (52.5) (32.0) (14.1)
District total: 4,511 4,509 3,219 1,430 1,935 2,080 3,081 2,574 1,139
(36.5) (36.5) (26.0) (26.01 (35.2) (37.8) (44.9) (37.5) (16.6)
Data source: Census of India 2001, H- series: "Tables on Houses, Household amenities and Assets."
This table shows percentage distribution of households living in permanent, semi - permanent and temporary houses in the district and Tlangnuam R.D. Block (Part) and N. Thingdawl R.D. Block.
In respect of household living semi-permanent houses the highest percentage (36.9%) was in N.
Thingdawl R.D. Block followed by permanent houses (35.1 %) and temporary houses (27.1 %) respectively.
TABLE 50 : PERCENT AGE OF HOUSEHOLDS HAVING IMPROVED DRINKING WATER SOURCE, ELECTRICITY, BATHROOM, TOILET AND DRAINAGE FACILITY, 2001
Totall Number and percentage of households having
Serial Rural! Number of Improved
number R. D. Block Urban households drinking water Electricity Bathroom Toilet Drainage
2 3 4 5 6 7 8 9
N. Thingdawl Total 11,353 4,089 8,603 4,420 10,890 5,151
(36.0) (75.8) (38.9) (59.9) (45.4)
Rural 4,489 1,127 2,684 1,160 4,179 1,411
(25.1) (59.8) (25.8) (93.1) (31.4)
Urban 6,864 2,962 5,919 3,260 6,711 3,740
(43.2) (86.2) (47.S) (97.8) (54.5)
2 T\angnuam (Part) Total 1,008 695 794 532 718 171
(69.0) (78.8) (52.8) (71.2) (17.0)
Rural 1,008 695 794 532 718 171
(69.0) (78.8) (52.8) (71.2) (17.0)
Urban
Kolasib District total: 12,361 4,784 9,397 4,952 11,608 5,322
(38.7) (76.0) (40.1) (93.9) (43.1)
Data source : Census of India 200 I, H- series: "Tables on Houses, Household amenities and Assets."
It can be seen in that Table 50 only 4,784 above facility a total of 4,952 households (40.1 %)
households were having improved drinking water were having attached bathroom in their houses
facility (38.7%) out of the total housenold of 12,361 whereas majority of the households in the district Le.,
in the district. In case of drainage facility 5,322 11,608 households were having toilet facilities which
(43.1 %) households were having this facility. Besides is 93.9% of the total households in the district.

ANALYTICAL NOTE 37
TABLE 51 : NUMBER AND PERCENTAGE OF HOUSEHOLDS BY TYPE OF FUEL USED FOR COOKING, 200J
Total! Coal! Cooking Serial Rural! Total Fire Crop Cowdung Lignite gas No
number RD. Block Urban households wood residue cake Electricity (charcoal) (L.P.G.) Bio-gas Kerosene Others cooking
2 3 4 5 6 7 8 9 10 II 12 13 14
1 N. Thingdawl Total 11,353 6,277 42 61 86 4,455 5 418 9
(55.2) (0.4) (0.5) (0.8) (39.2) (0.0) (3.7) (0.1)
Rural 4,489 3,560 12 27 1 829 4 53 3
(79.3) (0.3) (0.6) (0.0) (18.5) (0.1 ) ( 1.2) (0.1)
Urban 6,864 2,717 30 I 34 85 3,626 1 365 6
(39.6) (0.4) (0.1) (0.5) (1.2) (52.8) (0.0) (5.3) (0.1)
2 T1angnuarn Total 1,008 741 8 I 1 245 4 7 I
(part) (73.5) (0.8) (0.1) (0.1) (24.3) (0.4) (0.7) (0.1)
Rural 1,008 741 8 I I 245 4 7 I
(73.5) (0.8) (0.1 ) (0.1) (24.3) (0.4) (0.7) (0.1)
Urban
District tota I : 12,361 7,018 50 1 61 87 4,700 9 425 10
(56.8) (0.4) (0,0) (0.5) (0.7) (38.0) (0.1) (3.4) (0.1)
Data source: Census of India 2001, H- series: "Tables on Houses, Household amenities and Assets."
Among the different types of fuel used for 3S.0%. Only a very small numbers of households used cooking, 'Fire Wood' was used by maximum kerosene Le., 425 households of the (3.5%) to total households (7,0 IS) which was 56.8% to the total households of the district.
households (l~,361) followed by L.P.G. (4,700) with
TABLE 52 : NUMBER OF HOUSEHOLDS AVAILING BANKING SERVICES AND NUMBER OF HOUSEHOLDS HAVING EACH OF THE SPECIFIED ASSET, 2001
Availability of household assets
Total number of Scooter, None of Total! Total households Motor Car, the
Serial Rural! number of availing banking Radio! Tele Cycle, Jeep, specified number R. D. Block Urban households services Transistor Television phone Bicycle Moped Van assets
2 3 4 5 6 7 8 9 10 II 12
North Thingdawl Total 11,353 3,911 3,776 2,268 1,482 686 690 198 6,210
Rural 4,489 1,008 1,309 488 223 278 145 35 2,819
Urban 6,864 2,903 2,467 1,780 1,259 408 545 163 3,391
2 Tlangnuam (part) Total 1,008 356 546 149 135 17 58 8 425
Rural 1,008 356 546 149 135 17 58 8 425
Urban
District total : 12,361 4,267 4,322 2,417 1,617 703 748 206 6,635
Data souree : Census of India 200 I, H- series: "Tables on Houses, Household amenities and Assets."
In this table it can be seen that out of 12,361 a large number of households (4,322) followed by a
households only 4,267 households were availing small number of T. V. Sets (2,417 households) and
Banking services which is 34.5% of the total Scooter, Motor Cycle, Moped (748 households).
households availing such services. In case of Telephone was available only in 1,617 households.
availability of other amenities Radio was available in

38
(viii) Scope of Village and Town Directory
The Village Directory is the compilation of basic
information pertaining to a particular village. The format of the Directory has been revised from time
to time but it has been continued to remain as the
traditional source of village level basic data. It contains
a list of villages with Location Code Numbers,
Population, amenities namely Educational and Medical facilities, availability of Drinking Water, Post,
Telegraph and Telephone facilities, Commercial and Co-operative Banks, Agricultural and Non-agricultural
and other Credit Societies, Recreational and Cultural
facilities, Communication, Approach Roads to village,
Power Supply and Newspaper/Magazine etc .. The name of villages of each Rural Development Block
of the District has been arranged alphabetically and location codes number of the Census of India 2001
DISTRICT CENSUS HANDBOOK: KOLASIB
information as to the availability or otherwise of the basic amenities as mentioned in the preceding
paragraphs, following nine appendices have also been
included:
1. Appendix I
2. Appendix II
Abstract of Educational, Medical and other amenities in villages -R.D. Block level.
Villages with 5,000 and above population which do not have one or more amenities.
3. Appendix III Land Utilization Data in respect of Census TownslNon-Municipal Towns.
4. Appendix IV R.D. Block-wise list of inhabited villages where no amenities other than drinking water facility is available.
and corresponding code number of 1991 Census have 5. Appendix V Summary showing number of villages not having Scheduled Castes population.
been given for each village for easy reference.
Generally a 'village' is taken as a statutorily
recognised unit of an area having definite and recognised boundary and separate land records. Thus
in Census the basic unit of rural areas is taken as a
revenue village which has definite surveyed
boundaries. A revenue village may comprise of several
hamlets but the entire village is treated as one nit for
presentation of data. In Mizoram, however, the concept of village is different from what have been
mentioned above since there is no surveyed village in the State. Therefore an inhabited area with locally recognised boundaries and having a name of its own
is treated as a village. The un-inhabited villages i.e.,
the villages where no population was found during
Census Operations have also be included in the list
of villages and R.D. Block wise in the Village
Directory.
Although there is no Panchayat Institution in the
District, the villages have Village Councils which are democratically elected local bodies. In addition to the
6. Appendix VI Summary showing number of
villages not having Scheduled
Tribes population.
7. Appendix VII List of villages according to the
proportion of the Scheduled Caste
and the Scheduled Tribes to the
total population by ranges.
8. Appendix VIII Number of villages under each
Gram Panchayat (R.D. Block
wise)
9. Appendix IX State showing number of girls
schools in the villages.
Since a large number of abbreviations had to be
used due to space problems, a detail and explanatory
notes on each of these abbreviations has also been
incorporated for easy clarification of the subject
concerned.

PART-A VILLAGE AND TOWN DIRECTORY


Section-I: Village Directory
Note explaining the abbreviations used in the village directory :
The "Village Directory" is one of the traditional
compilations of the Census. It gives the list of villages,
their location numbers, their area, population, number
of households, amenities such as educational, medical, drinking water, post and telegraph, commercial and
co-operative banks, agricultural non-agricultural and
other credit societies, recreational and cultural
facilities, communication, approach to village, nearest
town with a distance, power supply, availability of
newspaper and magazines, most important commodity
manufactured and land use of each village.
Village is a statutory recognized unit having a
definite boundary. and separate land records. In case,
a complete village is trea~ed as an outgrowth of urban agglomeration, data on amenities for that village, have
not been given in the Village Directory but shown
along with the urban component. The villages which
are consider as a Census Town, the amenities data
are shown in the Town Directory. For those villages
which have partly merged in an outgrowth ofU.A.,
the amenities data are shown in the Village Directory
for that particular village.
The 'un-inhabited' villages ( villages with no
population) have been indicated as such after
furnishing details in columns I to 3 i.e., Serial number, Name of village & location code number and area
of the village against column no. 4 to 18. The land
use data for such villages are shown in col. 19 to 23.
The Village Directory format has 23 columns and
the details given under each column for the village
are as follows:-
Columns 1 : Serial Number
Self explanatory. All the villages within the RD
Block are presented serially in the ascending order
of their location code number.
Columns 2 : Name and Location Code Number of village.
The name and location code number of the village are shown against these columns. This also includes the forest and uninhabited villages.
Column 3 : Area of the village
The area of the villages in hectares are given. Wherever the area figures was not furnished by the concerned department the column is left blank.
Column 4 : Total population
The total population of the village as per 200 I Census is given against this column.
Column 5 : Number of households
The number of households as per 2001 Census is given in this column.
Amenities:
In column 6 to 23, availability in respect of different amenities such as education, medical, drinking water, post, telegraph, banks, credit societies,
communication, power, approach road etc. in each
village has been depicted with appropriate codes
against the column concerned. Wherever the
amenities are not available in the village, a dash (-)
is shown in the column and next to it in brackets the
distance in broad ranges viz.< 5 kms., 5-10 kms. and 10+ kms of the nearest place where the facility is available is given. Column - wise details are given
below:
Column 6 : Educational
Classes upto class V included in Primary School. This wiII include nursery school, kindergarten school.
Pre-basic school, pre-primary school, junior basic
school upto class V.
Classes from VI to VIII are included in the middle school.

42 DISTRICT CENSUS HANDBOOK: KOLASIB
Classes from IX and X included in High (vi) Health Centre HC secondary school. Classes XI and XII are included (vii) Primary Health Centre PHC in senior secondary school.
In case of composite schools like middle school (viii) Primary Health Sub-Centre PHS
with primary school or secondary school with middle (ix) Family Welfare Centre FWC
school, these are also included in the number of (x) T.B. Clinic TB primary and middle schools, respectively. (xi) Nursing Home NH
Accordingly any of the following types of (xii) Registered Private Medical RMP institutions if exists within the vi 1lage is shown as per
codes given below: Practitioner
(i) Primary School P (xiii) Subsidised Medical Practitioner SMP
(iO Middle School M (xiv) Community Health Worker CHW
(iii) Secondary School S (xv) Others 0
(iv) Senior Secondary School PUC More than one institution of a type in the village is indicated by the number within brackets against
(v) College C the abbreviations, e.g. H(3), D(4), etc.
(vi) Industrial School I Column 8 : Drinking Water
(vii) Training School Tr The type of the drinking water supply sources
(viii) Adult literacy class/centre AC available within the village are indicated by codes as
follows: (ix) Others (specify) e.g. Sanskrit 0
Pathshala, Senior basic school, (i) Tap Water T
Navodaya Vidyalaya, Makhtab, (ii) Well Water W etc. (iii) Tank Water TK
More than one institution of a type in the village (iv) Tubewell Water TW
is indicated by the number within brackets against the abbreviation, e.g. P(3), M( 4), etc. (v) Handpump HP
Column 7 : Medical (vi) River Water R
Availability of medical facility within the village (vii) Canal C
is indicated by following codes : (viii) Lake L
(i) Allopathic Hospital H (ix) Spring S Ayurvedic Hospital HA
(x) Others 0 Unani Hospital HU
Homeopathic Hospital HHom (xi) Summer Source SS-
(ii) Allopathic Dispensary D Column 9 : Post, Telegraph and Telephone
Ayurvedic Dispensary DA It is indicated by codes as shown below whether
Unani Dispensary DU within the village exists the following amenities:
Homeopathic Dispensary . D Hom (i) Post Office PO
(iii) Maternity & Child Welfare MCW (ii) Telegraph Office TO
(iv) Maternity Home MH (iii) Post & Telegraph Office PTO
(v) Child Welfare Centre CWC (iv) Telephone Connection PH
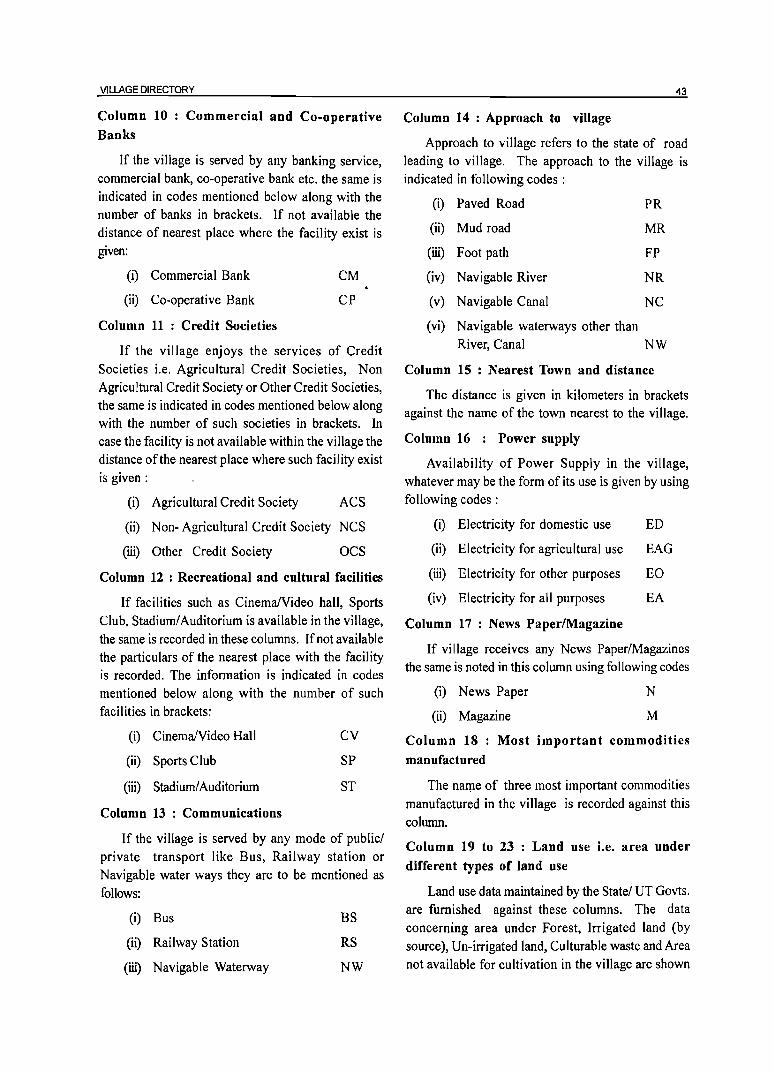
VILLAGE DIRECTORY
Column 10 : Commercial and Co-operative Banks
If the village is served by any banking service, commercial bank, co-operative bank etc. the same is indicated in codes mentioned below along with the number of banks in brackets. If not available the distance of nearest place where the facility exist is given:
(i) Commercial Bank
(ii) Co-operative Bank
Column 11 : Credit Societies
CM
CP
If the village enjoys the services of Credit Societies i.e. Agricultural Credit Societies, Non Agricultural Credit Society or Other Credit Societies, the same is indicated in codes mentioned below along with the number of such societies in brackets. In case the facility is not available within the village the distance of the nearest place where such facility exist is given:
(i) Agricultural Credit Society ACS
(li) Non- Agricultural Credit Society NCS
(iii) Other Credit Society OCS
Column 12 : Recreational and cultural facilities
If facilities such as CinemalVideo hall, Sports Club, Stadium! Auditorium is available in the village,
the same is recorded in these columns. Ifnot available the particulars of the nearest place with the facility is recorded. The information is indicated in codes mentioned below along with the number of such facilities in brackets:
(i) CinemalVideo Hall
(ii) Sports Club
(iii) Stadium! Auditorium
Column 13 : Communications
CV
SP
ST
If the village is served by any mode of public! private transport like Bus, Railway station or Navigable water ways they are to be mentioned as
follows:
(i) Bus
(ii) Railway Station
(iii) Navigable Waterway
BS
RS
NW
43
Column 14 : Approach to village
Approach to vi lIage refers to the state of road
leading to village. The approach to the village is indicated in following codes:
(i) Paved Road PR
(ii) Mud road MR
(iii) Foot path FP
(iv) Navigable River NR
(v) Navigable Canal NC
(vi) Navigable waterways other than River, Canal NW
Column 15 : Nearest Town and distance
The distance is given in kilometers in brackets against the name of the town nearest to the village.
Column 16 : Power supply
Availability of Power Supply in the village, whatever may be the form of its use is given by using following codes:
(i) Electricity for domestic use ED
(ii) Electricity for agricultural use EAG
(iii) Electricity for other purposes EO
(iv) Electricity for all purposes EA
Column 17 : News PaperlMagazine
If village receives any News Paper/Magazines the same is noted in this column using following codes
(i) News Paper
(ii) Magazine
N
M
Column 18 : Most important commodities
manufactured
The naqte of three most important commodities
manufactured in the village is recorded against this
column.
Column 19 to 23 : Land use i.e. area under
different types of land use
Land use data maintained by the State/ UT Govts. are furnished against these columns. The data concerning area under Forest, Irrigated land (by
source), Un-irrigated land, Culturable waste and Area not available for cultivation in the village are shown

44
against these columns. The area figures are given in hectare(s) up to one decimal. Desh '_I is recorded wherever the information is not made available by the concerned department. The codes used for different types of irrigation facilities available in the village are indicated below:
(i) Government Canal GC
(ii) Private Canal PC
(iii) Well (without electricity) W
(iv) Well (with electricity) WE
(v) Tubewell (without electricity) TW
(vi) Tubewell (with electricity) TWE
(vii) Tank TK
(viii) River R
(ix) Lake L
(x) Waterfall WF
(xi) Others 0
(xii) Total T
The village directory also carries the following appendices.
Appendix-I It gives the abstract of educational, medical and other amenities available in villages RD Block wise of the district.
Appendix-I-A Indicates number of villages RD Block wise having one or more primary schools.
Appendix-I-B Indicates number of villages RD Block wise having primary, middle and secondary schools.
DISTRICT CENSUS HANDBOOK: KOLASIB
Appendix-I-C Shows number of viII ages RD Block wise with different sources of drinking water facilities.
Appendix-II Indicates the list of villages with 5,000 and above population which do not have one or more important amenities.
Appendix-II-A Indicates list of Census Towns which do not have one or more amenities.
Appendix-III It gives the land utilization data in respect of Census Towns/nonmunicipal Towns.
Appendix-IV RD Block wise list of inhabited villages where no amenity other than drinking water facility is available.
Appendix-V Summary showing number of villages not having Scheduled Castes popUlation.
Appendix-VI Summary showing number of villages not having Scheduled Tribes popUlation.
Appendix-VII The appendix shows the list of villages according to proportion of the A, VII B Scheduled castes and Scheduled Tribes to the total popUlation by ranges.
Appendix-VIII Indicates RD Block wise number. of villages under each Gram Panchayat.
Appendix-IX Shows number of different types of girls school in a village.

TOTlL AREA OF nnTl.oPIIEJ,.,. BlOCK (II' '4X10 _ 'H "-
TOTAl. POPLUTIO~ O~' DEVELOPMENT BLOCK _ _ _ 61046
TOTAl. N\ I(BER OF TOWNS I~ DEVELOI'IIF.\r BLOC~
TOTAL MLlIlIER Of VILLAGE>; IN DtvELOPlIl:NT BLOCK." 41
DISTANCE fMI( nlmllr.'T 1I£A~AR11Xl 8
Q ...
i
,/' ,,,'
/~ ,,' 136 I' ~ .Thincl;an
/ 14.0.
/ i
{:" ~;:;!ibU.lavenl
157
o
0::: ,_
, ~S<th ... n \ . 158 ~ 00016400 '" Dumkhel , ' . ~
.. 155 i Diluu H ';'_ {
PO
(/)
o
MIZORAM (INDIA) NORTH THINGDAWL R.D. BLOCK
KOLASIB DISTRICT
143
P8 r9f!n('h hip t ,}
I' Th~iCb.n'bllo..{
tH X"
!I Tbm(lbdb
~ 146
(NOTIONAL)
\
I
i I
l '\
,_ o
a:: l
(/l
o
f )
f .._
II If 9ukplli
PO . tOO S /I
R
~l~" BOUNDARY In'ATE J.-11J DlSTRICT ~ , RD. BLOCJ(
~ II VILl..ICE "!TIl PEIUIANENT LC. NUlIBtR _
'" II. Ht:ADQIJ ARTERS: DISTRICT _ _ _ • _ N.CbalUani J
• 161 1 RD. BLOCJ(._ _ _ .
POPULATION SlZl! CLASS Of VILLAG~
BElOW 200, 200-4119, 50()-1199,
II r.J 1000 " ABOVE UNI~BAmnD VILLAGtS lIrrll PERIIA~f.lO'
LOCATION CODE NUlllIER- .. .•
PRBAN AREA lI'1TIl LOCATION CODS ~AlIE
. '\ , )l"A T10NAL HIGH .. Y _ _ •
OOOiZAOO
o • • •
1:rI X z.nl~~fn 1) i/~<~
\ ~ ...... .,
./~~. ~ ~~:'i )
lliPORTAKT IIETAl.LED ROAD UNIIETALUD ROAD _ .. _
NETIIlI CAUG! RAILWAY LINE _
RIVER .lID S'TRUII
TlANGNUAM R:i D, SlOC\<' (KOl ASIS 5 OI5iRICi )
I!.
Based upon Survey of lndia map with the permission of the Surveyor General of India.
POSr OffICE.. _ _ _ _ _
Sl:NIOR/HICHIJI S1OCOUARY SCHOOL
PRIIiARY HEALTH C£!ITR~ .. _ .'
BANKo COlIIIEltClAL/C()-{)I'I:I!ATIVE _
~~~ ... - :->--~
PO
B
© Government of India copyright. 2005.

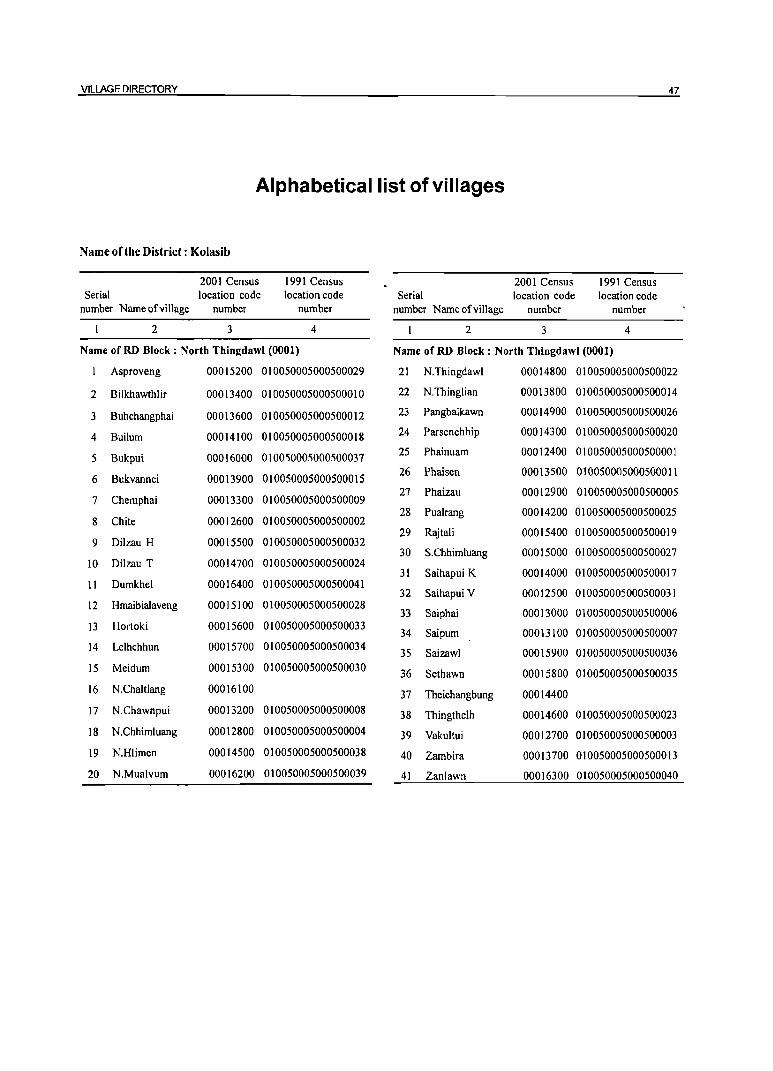
VILLAGE DIRECTORY 47
Alphabetical list of villages
Name of the District: Kolasib
2001 Census 1991 Census 2001 Census 1991 Census Serial location code location code Serial location code location code
number Name of village number number number Name of village number number
2 3 4 2 3 4
Name ofRD Block: North Thingdawl (0001) Name ofRD Block: North Thingdawl (0001)
Asproveng 00015200 010050005000500029 21 N.Thingdawl 00014800 010050005000500022
2 Bilkhawthlir 00013400 010050005000500010 22 N.Thinglian 00013800 010050005000500014
3 Buhchangphai 00013600 010050005000500012 23 Pangbalkawn 00014900 010050005000500026
4 Buihim 00014100 010050005000500018 24 Parscnchhip 00014300 010050005000500020
5 Bukpui 00016000 010050005000500037 25 Phainuam 00012400 010050005000500001
6 Bukvannei 00013900 010050005000500015 26 Phaisen 00013500 010050005000500011
7 Chemphai 00013300 010050005000500009 27 Phaizau 00012900 010050005000500005
28 Pualrang 00014200 010050005000500025 8 Chite 00012600 010050005000500002
29 Rajtali 00015400 010050005000500019 9 Dilzau H 00015500 010050005000500032
30 S.Chhimluang 00015000 010050005000500027 10 Dilzau T 00014700 010050005000500024
31 Saihapui K 00014000 010050005000500017 11 Dumkhel 00016400 010050005000500041
32 Saihapui V 00012500 010050005000500031 12 Hmaibialaveng 00015100 010050005000500028
33 Saiphai 00013000 010050005000500006 13 Hortoki 00015600 010050005000500033
34 Saipum 00013100 010050005000500007 14 Lelhchhun 00015700 010050005000500034
35 Saizawl 00015900 010050005000500036 15 Meidum 00015300 010050005000500030 36 Sethawn 00015800 010050005000500035 16 N.Chaltlang 00016100 37 Theichangbung 00014400 17 N.Chawnpui 00013200 010050005000500008 38 Thingthelh 00014600 010050005000500023 18 N.Chhimluang 00012800 010050005000500004 39 Vakultui 00012700 010050005000500003
19 N.Hlimen 00014500 010050005000500038 40 Zambira 00013700 010050005000500013
20 N.Mualvum 00016200 010050005000500039 41 Zanlawn 00016300 010050005000500040

48
2 3 4
o o C! '" "'" ~ ~ o .c:
""" o ... ~ OJ '" .0 ::l § :g Z~
5
DISTRICT CENSUS HANDBOOK: KOLASIS
Census of India 2001 Amenities and Land
Amenities available (if not available within the village, a dash (-) is shown in the column and next to it in brackets the distance in broad ranges viz. < 5 kms., 5-10 kms. and 10+ krns of the nearest place
where the facility is available is given)
6 7 8
OJ c: o
fr ]
9
" > .~ OJ
9-o u
] OJ .~ II)
e~ g a U.o
10 II 12 13'
RD Block: North Thingdawl (0001)
Phainuam (00012400)
2 Saihapui V (00012500)
3 Chite (00012600)
4 Vakultui (00012700)
5 N.Chhimluang (00012800)
Phaizau 6 (00012900)
7 Saiphai (00013000)
8 Saipum (00013100)
9 N.Chawnpui (00013200)
888
225
245
70
186
184 P(2) M C(lO+)
PHSH(IOt) TRSO _ PO(5-10)
MCW(IOt) SS-S PH(IOt) PHCCIOt)
ACS(IOt) CV(IOt) CM(IOt) NCS(IOt) SPClO+) CP(IOt) OCS(IOt) ST(IOt)
- H(IOt) -40 PM(5-10) MCW(lO+) TRSSS· - PO(IO+) CM(lO+) ACS(IO+) CV(IO+)
C(IO+) PHC(IOt) S PH(IO+) CP(lOt) NCS(IO+) SP(IOt) OCS(IO+) ST(IOt)
- P« 5) - H(IO+) -43 M(5-10) MCW(IOt) TRSO - PO(JOt) CM(IOt) ACS(lO+) CV(IOt)
CC I 0+) PHC(IOt) SS-S PH(IOt) CP(IOt) NCS(IOt) SP(IOt) OCS(IO+) ST(IO+)
II P(lO+) M(IOt) C(IOt)
45 P M(IO+) C(IO+)
- H(lO+) S SS-S - PO(1Ot) - ACS(IO+) CV(lOt) MCW(lOt) PH(IOt) CM(1Ot) NCS(IOt) SP(IO+) PHC(IO+) CP(IOt) OCS(IO+) ST(IOt)
- H(IO+) -MCW(1O+) TSOSS - PO(IOt) CM(IOt) ACS(IO+) CV(IO+)
PHC(IOt) S PH(1Ot) CP(IOt) NCS(IOt) SP(lO+) OCS(lO+) ST(1Ot)
------- Uninhabited --------
P(2) M S PHS H(IOt) T S 0 SS 1,483 331 MCW(IOt) PO PH(IO+)
C(IOt) S CM(IOt) ACS(IOt) CV(lOt) CP(IOt) NCS(IOt) SP(IO+)
OCS(IOt) ST(IOt) PHC(IO+)
P(2) M S PHS H(IOt) T S 0 SS 1,546 359 MCW(IOt) PO PH(IOt)
C(IOt) S PHC(IOt)
340 PHS H(IOt)
64 P MCCIO+) MCW(IOt) TSOSSpOPH(lOt)
PHCCIOt) S
CM(IOt) ACS(IOt) CV(IOt) CP(IOt) NCS(IOt) SP(lO+)
OCS(IOt) ST(IOt)
CM(IOt) ACS(IOt) CV(IOt) CP(IO+) NCS(IOt) SP(IOt)
OCS(IOt) ST(IOt)
BS(IOt) RS(lOt) NW(JOt)
BS(IO+) RS(IO+) NW(lO+)
8S(10+) RS(IO+) NW(IO+)
BS(lO+) RS(IOt) NW(IOt)
BS RS(IOt) NW(IO+)
8S(l0t) RS(IOt) NW(IOt)
BS(IOt) RS(1Ot) NW(IOt)
8S(IOt) RS(IOt) NW(IOt)

VILLAGE DIRECTORY
Village Directory Use (As on 1999)
OJ
~ ';;: .s ..c:
c:J
" E 0. 0. ::: 14
MR
FP
MRFP
MRFP
MRFP
]' 6 8 ~ ell
:a o'IJ
~ -a: .9 0.
:l 1;;
., ... ~ ~ " 0 6 Po,
15 16
Vairengte ED (12)
Vairengte ED (19)
Vairengte ED (15)
Vairengte (22)
Vairegte ED
(25)
., '~ bO
" ~ ..... ...
OJ g. 0.
~ " 6 17
N
N
~ :a 0
§ 0 <J
§'O t! e 8.~ ,5 <!9 ... ::s '" a 0 ~ E
18
-------- Uninhabited ------------
MRFP
MRFP
FP
Vairengte ED
(25)
Vairengte ED (30)
Kolasib (44)
ED
NM
N
N
Land use (i.e, area under different types of land use in
Cultivable
,.,. u 3 0
'" .e: § c:
,9 .~ • 't;j
> '';:: ::E a :l c:J
" " c:J u ... 'I: '" 'C e ., ~ 0 ~ ~ 0
19 20(a) 20(b~
hectare)"
§ ;:!:; ...
OJ '"0 § " c: ~ '~ - > " ,_ 0':::: f- 8 21 (a)
c: 0 '!§ ~ ._ 0
'"0 0 'C OJ
Po,
21 (b)
5-8 Years
5-10 Years
5-8 Years
5-8 Years
5-8 Years
5-8 Yaers
5-8 Yaers
5-8 Yaers
E :l ..c: ...., .. " '0 c: :l
'" 0.C: e .~ u 'iii .~ :E ~ 8
22
Paddy & Maize
Paddy & Maize
Paddy & Maize
Paddy & Maize
Paddy & Maize
Paddy & Maize
Paddy & Maize
Paddy & Maize
49
c: ,9 't;j > ::a :l c:J ...
...s
..!l ., ~ bO
~ ~ ... " > ';;: ..0
" E '0
._ ::s 0 c: c:
" ., .. §
~ 'C ...
6 rn 23 2 1
Phainuam
Saihapui V 2
Chile 3
Vakultui 4
N.Chhimluang 5
Phaizau 6
Saiphai 7
Saipum 8
N.Chawnpui 9

50 DISTRICT CENSUS HANDBOOK: KOLASIB
Census of India 2001 ' Amenities and Land
Amenities available (if not available within the village. a dash (-) is shoml in the column and next to it in brackets the distance in broad ranges viz. < 5 kms., 5-10 kms. and 10+ kms of the nearest place
where the facility is available is given)
'CO' ~ " " E
,,-c 5 0 t: > u 0 :§. 0 0 .~ a -a .~ ~ .~ U ~
..c - '" ..c " >. <> " .... P-
" " " _ 0
~ ~ ~ '" .B P.. <> ._
e~ .3 0 -0 .!l 0 ·~.2 8 0 -0 8
a ._ ::> " (! tIS <> C!l ~
o"<J .s: ..c -0 , 0 "5~ " ';'~ ., g c '" .;:: OJ " § III -0
g~ <> E .~ c
~ ..s " ... ..c § o d ... .~ 0 " o"<J " " ... OJ P..
]b _c -0 ''':::: 0
.0 .s: 0 ..c iil ~ iil ~.~ .. =' '" ._ § "5 ..... ~ '0 §S""§-( .>l ~ "' P.. 0 C " ... ... ~,., 0 .. ~ 0 iil
bO " ... 3-.S ',= ~ -0"8 c '" c 0 P- " til .~ C ] OJ ~ ~ -a " - !;l ~ ::> .~ ~ ~~ .~ 0 ~ :E ~ .2
§~ !3 1:) ~ E '" <> -0 'Of E}; .;:: " i;h-o (,)._ o"'d ., o '" " C -0 ~ .. 0 o u o...s o ._ on ~ 8 !=.s 1= ~8 ~ Cl p.., U.o :::: § e;,sonon u e 1 2 3 4 5 6 7 8 9 10 11 12 13
RD Block: North Thingdawl (0001)
Chemphai P(IO+) - H(lO+) T R S Ss. - PO(IO+) C~(lO+) ACS(lO+) CV(IO+) BS(lO+)
48 14 MCW(IO+) 10 (00013300) M(IO+) PHC(IO+) S PH(IO+) CP(lO+) NCS(IO+) SP(IO+) RS(lO+)
C(lO+) OCS(IO+) ST(lO+) NW(lO+)
Bilkhawthlir P(6) M(3) D PHC H(IO+) T S 0 SS PO PH CM ACS(IO+) CV(lO+) BS
II (00013400) 4,084 914 RS(lO+) S C(IO+) MCW(lO+) S CP(IO+) NCS(lO+) SP(lO+)
NW(IO+) OCS(IO+) ST(IO+)
Phaisen PHSH(IO+)
TSOSS - PO(IO+) - ACS(IO+) CV(IO+) BS(IO+) 12 (00013500) 412 85 P MC(IO+) MCW(IO+)
S PH(IO+) CM(IO+) NCS(IO+) SP(IO+) RS(IO+) PHC(IO+) CP(1o+)
OCS(lO+) ST(lO+) NW(1O+)
i3 Buhchangphai PM S PHS H(lO+)
ACS(IO+) CV(lO+) BS(lO+) 677 117 MCW(IO+) T S SS-S PO PH(IO+) CM(IO+)
(00013600) C(IO+) PHC(IO+) CP(IO+)
NCS(IO+) Sp(IO+) RS(IO+) OCS(IO+) ST(IO+) NW(IO+)
Zambira 14 (00013700)
-------- Uninhabited __ ---
N.Thingiian - P« 5) - H(IO+)
- 1'0(10+) - ACS(IO+) CV(IO+) BS(IO+) IS (00013800) 258 43 M(5-10) MCW(IO+) T S SS-S PH(IO+) CM(IO+) NCS(IO+) SP(IO+) RS(lO+)
C(10+) PHC(IO+) CP(IO+) OCS(IO+) ST(lO+) NW(IO+)
Bukvannei PM(IO+) - H(lO+) TSOSS - PO(lO+) - ACS(IO+) CV(IO+) BS(IO+)
16 (00013900) 158 31 C(10+)
MCW(IO+) S PH(IO+) CM(IO+) NCS(IO+) SP(IO+) RS(1O+)
PHC(IO+) CP(IO+) OCS(IO+) ST(IO+) NW(IO+)
Saihapui K PM(IO+) - H(1O+) TSOSS - PO(1O+) - ACS(lO+) CV(IO+) BS(lO+)
17 (00014000) 311 70 C(IO+)
MCW(IO+) S PH(IO+) CM(lO+) NCS(lO+) SP(IO+) RS(IO+)
PHC(IO+) CP(IO+) OCS(IO+) ST(lO+) NW(IO+)

VILLAGE DIRECTORY
Village Directory Use (As on 1999)
]' g 0 ., :0 OJ <J c: 0
B '~ ~ OJ
l til
~ :0 8 ~ o'IJ ~'O '>
~ .Q -..
9 "" .... t:: .,
"" ., o ....
-5 B go o..B :;:l ... 'iii til 0.. .5 .:s e ~ ... ~ ~ 'iii ::s
0.. a 0 0.. ., 0
., ~ ~ 6 !::l 6 §
14 15 16 17 18
FP Kolasib ED (42)
PRFP Kolasib ED N (29)
MRFP Vairengte ED N (21)
FP Kolasib ED (24)
------- Uninhabited ------------
FP
FP
FP
Kolasib (24)
Kolasib (15)
Kolasib (13)
NM
ED N
ED N
Land use (i.e. area under different types of land use in
Cultivable
1f .... :;:l 0
'" e = = 0 0 .~ ~ > > ~ '+:I
"8 <J
8 " <.)
'iii '1: 'I: ~ u i':' 0
~ ~ 0 19 20 ~a) 20 (b)
hectare)··
§ .:; .... '" '0 = ::s
~ ,~ -a .:: o~ I- g 21 (a)
c 0
'+:I
~ ..... 0 -0 0 'I: '" !:=
21 (b)
5 Years
5-8 Years
5-8 Yaers
5-10 Yaers
5-8 Yaers
5-8 Yaers
5-8 Yaers
E :;:l
..c: ...., .... OJ '0 c: ::s '" 0. = 2 .2 <.) OJ .~ :E ~ g
22
Paddy & Maize
Paddy & Maize
Paddy & Maize
Paddy & Maize
Paddy & Maize
Paddy & Maize
Paddy & Maize
51
c 0
'+:I ... >
'+:I "3 <J ....
<8 '" :0 .,
.!2 Cl)
~ .... 'OJ '" ~ '> ..c
E '0 ..... ::l
0 c = ~
';;j ... '" '1:
~ '" 6 CIl
23 2 I
Chemphai 10
Bilkhawthlir II
Phaisen 12
Buhchangphai 13
Zambira 14
N.Thinglian 15
Bukvannei 16
Saihapui K 17

52 DISTRICT CENSUS HANDBOOK: KOLASIS
Census of India 2001 -Amenities and Land
Amenities available (if not available within the village, a dash (-) is shown in the colwnn and next to it in brackets the distance in broad ranges viz. < 5 krns., 5-10 krns. and 10+ kms of the nearest place
where the facility is available is given)
~
'" " g ., E 1{ c '" c 0 .~ =a 'i g .,
0 _g .s 'E ~ U ~ ..0 ., >. 0. - '" ., ., " ., _ 0
~ ~ .3 ~ (5 '" ..!:! Q, o·_ .. u
.", ~ 9 '£: t) ... .", 8 0 '0 bJ)'_ .s ._
'" u ~ .;;: ~ .", 0 os 0 "5~ C!l 'id ..<:: [ij 0 , 0 " ';;~ u I':
., I': '" ·c
-5 '" .",
g~ o e . ~ c • OJ)
.~ is ... ..c:: [ij I; ~ ~ ~ u o c
'- ..<:: ~ _;~ _ c .", .;:: 0
-s .;;: 0 ~ ~ C':S ._ ..c = .. ._ "5 '- ~ E 0 o 'id .. 0. 0 C '(; .s ... 152,.2< ._ ...
s '- ~'O 0 ......... 0 bJ) ..!:! ... .z:: ~ u e c '" 0 0. ., '" .~ ~ I': ~
., "5-5 '" >. ~
., - :a .c " 0
~ ~~ ~ ;g t! .:: e '" ·c g-8 .'9 'Q ~ e '" " :a ti 'fi~ (')'u 0 ~ e ~
'" c ., ·c o fa 0:: .,
6 8 o .,
68 .",
~ Cl 0
:::!: fa ~<l'l~ci5 U ~ I/J I::::::.s ~ p., U.c I 2 3 4 5 6 7 8 9 10 II 12 13
RD Block: North Thingdawl (0001)
Builurn PHS H(IO+)
- PO(IO+) - ACS(IO+) CV(IO+) BS(IO+) 18 (00014100) 371 70 P M C(IO+) MCW(IO+) TSSS-SpH(IO+) CM(lO+) NCS(lO+) SP(IO+) RS(lO+)
PHC(IO+) CP(IO+) OCS(IO+) ST(lO+) NW{lO+)
Pualrang 19 (00014200) ---- Uninhabited -----------
Parsenchhip P(IO+) - H(IO+) TWSSS· - PO(lO+)C~(lO+) ACS(IO+) CV(IO+) BS(IO+)
20 (00014300) 124 21 MCW(IO+) M(IO+) S PH(lO+) CP(lO+) NCS(lO+) SP(lO+) RS(lO+) C(IO+)
PHC(IO+) OCS(lO+) ST(lO+) NW(lO+)
21 Theichangbung (00014400)
------ Uninhabited ---------
N.Hlimen P(2) M S PHSH(IO+)
ACS(IO+) SP(2) BS
22 (00014500) 1,074 342 C(lO+)
MCW(IO+) T S SS-S PO PH(IO+) CM(IO+) NCS(lO+)
CV(1O+) RS(lO+) PHC(IO+) CP(IO+)
OCS(IO+) ST(lO+) NW(lO+)
Thingthelh - H(IO+) HP S SS- - PO(IO+) C~(lO+) ACS{lO+) CV{IO+) BS(IO+)
513 99 P M C(IO+) MCW(IO+) 23 (00014600) S PH(lO+) CP(IO+) NCS(IO+) SP(IO+) RS(IO+) PHC(IO+)
OCS(IO+) ST(IO+) NW(IO+)
DilzauT 24 (00014700) -------- Uninhabited ------------
25 N.Thingdawl P(4) M(2) PHS H(5-IO)
THPS ACS(IO+) SP(2) BS
2,806 569 MCW(IO+) PO PH CM{IO+) CV(IO+) RS(lO+) (00014800) S C(5-IO)
PHC(IO+) SS-S
CP(lO+) NCS(IO+)
ST(IO+) NW(IO+) OCS(IO+)
Pangbalkawn PHS H(IO+) - PO(lO+) - ACS(IO+) CV(IO+) BS(lo+)
26 (00014900) 587 113 P MC(IO+) MCW(IO+) TSSS-S PH(IO+) CM(IO+) NCS(IO+) SP(IO+) RS(IO+) PHC(IO+) CP(IO+)
OCS(IO+) ST(IO+) NW(IO+)
27 S.Chhimluang PM(IO+) - H(IO+) - PO(IO+) - ACS(IO+) CV(JO+) BS(lO+)
355 62 MCW(lO+) TSSS-SPH(lO+) CM(IO+) (00015000) C(lO+) PHC(IO+)
NCS(lO+) SP(IO+) RS(IO+) CP(IO+)
OCS(IO+) ST(JO+) NW(IO+)

VILLAGE DIRECTORY
Village Directory Use (As on 1999)
" :W 0;;
B ..s:: <) ., e "'-"'-~ 14
FP
FP
PR
MR
PR
PR
FP
]' ~ ~ 8 .. c B o~ E e <II
~ :a 8 :::?3 o<!
=""0 .... ~
._ ~ ~ i5. ..
"'- .. o ;:I B "'-;:I "'--<II '" 05 oM 'v; '" ~ ~ ~ 'v; ;::I
0 iii .. 0 .. ~ ~ ;;g e
"'"' 15 16 17 1&
Kolasib NM
(II)
-------- Uninhabited -----------
Kolasib (10)
-------- Uninhabited ------------
Kawnpui ED NM
(22)
Kawnpui ED NM
(74)
-------- Uninhabited ----------
Kolasib (9) ED
Bairabi (13)
Kolasib (27)
ED
NM
NM
Land use (Leo area under different types of land use in
Cultivable ., ~ ;::I 0 <II .... e C C 0 0 .~ .~ ;.- ;.-
~ 0+=1 :;
<.> <J
8 8 'v; 01: 01: ~ 'ij i:-0
~ Q '"'"' 19 20 (a) 20 (b)
hectare)··
E ;::I
..s:: ..... ~
"0 c ;:I
'" c ~ .~ - ;.-S 0+=1
~B 21 (a)
'" 0
°E ~ ._ 0
""0 0 01: ..
"'"' 21 (b)
5-8 Yaers
5-8 Yaers
5-8 Yaers
6 Yaers
5 Yaers
5-8 Yaers
5-10 Yaers
e ;::I
..s:: ..., ... " ""0 C ;::I <II
"'-c e og <J .,
. ~ :E ::E i:l
22
Paddy & Maize
Paddy & Maize
Paddy & Maize
Paddy & Maize
Paddy & Maize
Paddy & Maize
Paddy & Maize
53
c 0 .~
;.-0+=1 :; <J .. .2 .. :g ..
I:>Il
=i ~ ... ., ~
0;; ..0 E ._
'0 ;::I 0 c
C ., .. «i
~ § 01:
~ ..
(/J
23 2 I
Builum 18
Pualrang 19
Parsenchhip 20
Theichangbung 21
NoHlimen 22
Thingthelh 23
DilzauT 24
NoThingdawl 25
Pangbalkawn 26
S.Chhimluang 27

54 DISTRICT CENSUS HANDBOOK: KOLASIB
Census of India 2001 -Amenities and Land
Amenities available (ifnot available within the village, a dash (-) is shown in the column and next to
it in brackets the distance in broad ranges viz.< 5 kms., 5-10 kms. and 10+ Ions of the nearest place where the facility is available is given)
<ii' .r ;::I .. .. -a " tn
0 <> " :: >
0 a 0 .~ ... -a 'E ~ .. 0 .3 .~ U .<:: .<::
~ 0- .. - til .. ~ <.> '" - .!l .. B .2
_ 0
;;: ~ .3 tlO 0 '" 0- o:! ..
~ 0 :g B 9 OJ: U "'-0 E .g~ t>I)'_
~~ C!- o 0 '" <.> Od 'S: ..Q -0 <> , 0 ;::I ';;~ ~ Iii " til
.t:
j '" :: -0 g~ u 6 ,g " .. -5 0 ;::I
~ -= Iii Od .. o ". .~ 0 "'- '.Q 0 OJ ..... ..Q '" -a i~
_" '0 ..0 'S: 0 -a t'>S ._ ..0" ::I '" '.p 6 '"
"3 ' .... :: ~ Sh '2 §~.a< <> '" "'- 0 .3 .. ,_ ....
@ ..... ~~ 0 tl.O OJ _ OJ '.p ~ <.> E " '" 0 0 .. ~
.~ -a " ] II) ;::I » e "'- Q) '" B-5 " .c ;::I <> ~ §~ ~ i§ t: .S E '" -a !H~ -a.s ] § ~
u :a ..r 't: 0 E~ 't: .... <> ;::I
'" 't:: '" o 1ii tlO-O ~'13 8.] " o '" ~
-0 0 o ._
<rJ 6 8 !-<,s 6 U I'1.l ~ 0 p... U.c ::; 1ii e:;~<rJ<rJ U ~ I 2 3 4 5 6 7 8 9 10 II 12 13
RD Block: North Thingdawl (0001)
28 Hmaibialaveng P(IO+) - H(lO+)
- PO(IO+) - ACS(IO+) CV(IO+) BS(lO+) 423 71 MCW(IO+) T S SS-S PH(1O+) CM(IO+) (00015100) M(lO+)
PHC(lO+) CP(1O+) NCS(IO+) SP(lO+) RS(lO+)
C(IO+) OCS(IO+) ST(lO+) NW(lO+)
Asproveng 29 (00015200) ------- Uninhabited -----------
Meidum - H(1O+) - PO(1O+) - ACS(IO+) CV(1O+) BS
30 (00015300) 773 144 P MC(IO+) MCW(1O+) S SS-S PH(IO+) CM(1O+) NCS(lO+) SP(IO+) RS(1O+)
PHC(IO+) CP(IO+) OCS(IO+) ST(IO+)
NW(IO+)
Rajtali • P« 5) - H(lO+)
- PO(IO+) - ACS(lO+) CV(IO+) BS(IO+) 31 (00015400) 159 34 M(5-10) MCW(IO+) S SS-S PH(IO+) CM(1O+) NCS(IO+) SP(IO+) RS(1O+)
C(lO+) PHC(IO+) CP(IO+) OCS(1O+) ST(lO+) NW(lO+)
Dilzau H P(IO+) - H(1O+) - PO(1O+) - ACS(lO+) CV(1O+) BS(1O+)
32 (00015500) 87 15 MCW(IO+) T S SS-S PH(IO+) CM(IO+) M(lO+) PHC(IO+) CP(IO+)
NCS(IO+) SP(lO+) RS(IO+) C(IO+) OCS(IO+) ST(IO+) NW(IO+)
Hortoki P(5) M(2) PHSH(IO+)
HPTKS ACS(IO+) CV(IO+) BS
33 (00015600) 2,225 379 S C(IO+)
MCW(IO+) o SS-S PO PH(lO+) CM(IO+) NCS(IO+) SP(IO+)
RS(IO+) PHC(IO+) CP(1O+)
OCS(lO+) ST(IO+) NW(lO+)
Lelhchhun 34 (00015700) -------- Uninhabited ------
- H(1O+) T S SS-S - PO(5-10) ACS(5-10)
- CV(S'BS Sethawn P(IO+) 10) SP(5- RS(lO+)
3S (00015800) 222 48 MCW(lO+) CM(S-IO) M(1O+)
PHC(IO+) PH(IO+)
CP(IO+) NCS(S-IO) 10) ST(S- NW(IO+)
C(JO+) OCS(IO+) 10)
Saizawl 36 (00015900) ---- Uninhabited -------
Bukpui P(2) M S PHSH(IO+)
THPS ACS(IO+) SP(2) BS
37 (00016000) 996 190 C(1O+)
MCW(IO+) SS-S
PO PH(IO+) CM(lO+) NCS(IO+)
CV(IO+) RS(IO+) PHC(IO+) CP(IO+)
OCS(lO+) ST(IO+) NW(IO+)

VILLAGE DIRECTORY
Village Directory Use (As on 1999)
]: e- o Il) :.a OJ u .: 0
~ oS § ~ :.a OIl 0
'" <J
<ill ~ 0;;: ~-g b .9 ~ --c.. ...
c.. OJ &.B ..c .9 go u ;:I
05 ~ '" - '" c.. <II ... 2 ~ ~ <II
1§ ;:I 0- ~ a 0- Il) 0 0( z ~ z ~ e 14 15 16 17 18
FP Kolasib (30)
---.--•• Uninhabited ------------
PRMR Ba[rabi ED N
FP (10)
Kolasib FP
(32)
FP Kawnpui (30)
PRMR Kawnpui ED NM
FP (38)
•• -•••• - Uninhabited .------.-.--
Kawnpui ED NM MR
(7)
-------- Uninhabited -----------
Kawnpui ED MRFP
(56) NM
Land use (i.eo area under different types of land use in hectare)""
Cultivable
8' 3 0 ., » E e E :::l
:::l -= .: .: ..., 0
.~ .:; .: ...
',;:::", 0 OJ
'" I; o~ -0 > C > -0 :::l
~ 0':: C
~ :; :::l <II C c.. C <J U '" ....
Il) OJ ~ o~ 0 e .~ u u <.> OJ -0 0; 0;: 0;: - > 0 .~ :E ~ '0 t' S 0':: 0;:
~ ~ bB OJ ~ 5 Q ~
19 20 (a) 20 (b) 21 (a) 21 (b) 22
5-8 Paddy & Maize
Years
5-10 Paddy & Maize
Yaers
5-8 Paddy & Maize
Yaers
5-8 Paddy & Maize
Years
5-8 Paddy & Maize
Yaers
5-8 Paddy & Maize
Yaers
5-8 Paddy & Maize
Yaers
55
.: 0 .~
> 0':: :; u ... ..s Il)
:0 Il)
'" OIl
~ ~ ... ., ~
0;;: .J:J E
'0 .... ;:I 0 C C
'" Il) OJ
OJ § 0;:: ... ., 0( z CIl
23 2 I
Hmaibialaveng 28
Asproveng 29
Meidum 30
Rajtali 31
Dilzau H 32
Hortoki 33
Lelhchhun 34
Sethawn 35
Saizawl 36
Bukpui 37

56
~
"' ::> c: ~ ·i g OJ
U C,) OJ -j bI) 0
~ 0 t!-c<! .;;:
OJ ., c:
'" ~ -5 'i <> ... .&> .;;: 0 "3 E os 0.
" ... ~'ii' 0 c: 0 Co
OJ OJ - t;! §~ S .;:: S ~
" ~ 8 ~:S 0
en I:::: I 2 3 4
RD Block: North Thingdawl (0001)
N.ChaltJang 38 (00016100) 859
N.Mualvum 39 (00016200)
1,096
Zanlawn 40 (00016300)
946
Dumkhel 41 (00016400)
Block Total 0.0 24547
:; 0 t!-'" "0 o -£ '" :: 0 .c: ... 0 ... ~ ILl '" .&> :: E til :: c: ~8
5
164
241
195
DISTRICT CENSUS HANDBOOK: KOLASIB
Census of India 2001 -Amenities and Land
Amenities available (if not available within the village, a dash (-) is shown in the column and next to it in brackets the distance in broad ranges viz.< 5 kms., 5-10 kms. and l(}t kms of the nearest place
where the facility is available is given)
OJ OJ OJ 8 c: .~ '" :;; 'E ~ 0 B .c: .c: Q) >, 0. - II) Q) OJ ::> OJ _ 0 '" '" 0.
C,) ._
'" " '" ~ 1l 0 'C 0 '""0 e " " 0 bI)'_ B ._
eo-"0 .. u :is; <J , 0 " -:~ [ij ::: II) .;:: "0 g:B ~ Ii .~ c: ... .c: [ij o .: ~ .. ~ OJ ...:e _::: "0 ',c 0
OJ ... - .r' " '" ._ ~ ~ <> <J ;; ::: 'u :: .... c: U ::> -< .- ...
0
1i bI) <> ....
~41 . g los c: ., .~ ::: 1l <>
" >, ~ EJl .g 0 ~ ;§ t! .2 E '" <J :a ..J' EZ '" OJ .;:: til § fa bI)"O U .- o-C
;2 ::E 8 0
~ ~ ~~ ~~ o 'a e; u.&> U !:::
6 7 8 9 10 II 12 13
P(2) M - H(IO+) THPS - PO(5-1O) ACS(IO+) CV(IO+)
BS
C(IO+) MCW(IO+)
SS-S PH(IO+) CM(IO+)
NCS(IO+) SP(IO+) RS(IO+)
PHCC I 0+) CP(IO+) OCS(lO+) ST(IO+)
NW(IO+)
P(2) M PHSH(lO+)
T S SS-S - PO(5-10) ACS(IO+) CV(IO+) BS
C(IO+) MCW(IO+)
PH(5-10) CM(IO+)
NCS(lo+) Sp(IO+) RS(IO+)
PHCC< 5) CP(lo+) OCS(IO+) ST(JO+)
NW(IO+)
PHSH(lO+) THPS - PO(IO+) - ACS(IO+) CV(IO+)
BS P MC(JO+) MCW(IO+). PH(IO+) CM(lO+) RS(IO+)
PHC(IO+) SS-S NCS(IO+) SP(S-IO)
NW(IO+) CP(lO+) OCS(IO+) ST(IO+)
------- Uninhabited .-----------
T(26) TK
P(42) D PHC HP(6) P0(9) PJI(2) CM 8P(6) BS(11) 5108 M(22) 8(8) PH8(14) 1W
R(4) 32

VILLAGE DIRECTORY 57
Village Directory Use (As on 1999)
Land use (Le. area under different types of land use in hectare)"
Cultivable
]' c:: "8 0
... .~
~ .0 '" > 0 .:::
" :.a til "3 " € e u c:: 0 u
~ . ~ e e '" ... ~ e c:: c:: ::l .:; <£
'" co ::; :.a 8 .9 .9 c:: ... .. ~ " 0 .. ::0
~ ~ (ii' 0; .. .~ ." ..
i-g .. " ~ .s: > > ~ c:: ... ~
.... ..... '';::: .::: c:: ~
::l :; .. B 0. .. "3 "3 :::> til
~ .;:: .D
Co " o .. u " c:: Co c a ..<: B ~ Q.ti u .... u '" 8 ~ .~ 0 e .2 0 .... ::I
'" ~ til P- .5 <IS 8 u OJ 0 c::
0 ~
.. - ·c ·c ~ c:: " .. ~ ~ t;; ::I '" - > 0 .S .~ " OJ
Q. a u '0 c:- " .- ·c § ·c 0 5 ~B " - ~ P- .. 0 .. ~ ~ OJ
~ 8 .. ~ 6 p.., 6 e IJ. Cl p.., 6 (/j
14 15 16 17 18 19 20 (a) 20 (b) 21 (a~ 21 (b) 22 23 2 I
MRFP Kawnpui
ED NM 5-8
Paddy & Maize N.ChaltJang 38 (56) Yaers
MRFP Kawnpui
ED NM 5-8
Paddy & Maize N.Mualvum 39 (2) Years
PRMR Kawnpui ED NM
5-8 Paddy & Maize Zanlawn 40
FP (41) Yeras
-------- Uninhabited ----------- Dumkhel 41
PR(7) N(22)
MR(15) ED(24) M(lJ)
0.0 0.0 0.0 0.0
FP(26)


VILLAGE DIRECTORY 59
8 (eight) villages with their PLC, as per 2001 Census indicated at next page are originally under Tlangnuam R.D. Block of Aizawl District falls to Kolasib District, due to overlapping boundary of the district and the R.D. Block. So, these has been indicated as Tlangnuam R.D. Block (Part) in Kolasib District.


VILLAGE DIRECTORY 61
Alphabetical list of villages
Name of the District: Kolasib
2001 Census Serial location code
number Name of village number
2 3
1991 Census • location code
number
4
Name of RD Block: Tlangnuam (Part) (0090)
BawngaVeng 00017000 010040004000400006
2 Khamrang 00016500 010040004000400001
3 Lungdai 00017200 010040004000400008
4 Lungmuat 00016600 010040004000400002
2001 Census Serial location code
1991 Census location code
number number Nameofvillage number
2 3 4
Name of RD Block: Tlangnuam (Part) (0090)
5 Mualkhang 00016900 0 I 0040004000400005
6 Nisapui
7 Sentlang
8 Serkhan
00016700 010040004000400003
00017100 010040004000400007
00016800 010040004000400004

62 DISTRICT CENSUS HANDBOOK: KOLASIB
Census of India 2001 -Amenities and Land
Amenities available (if not available within the village, a dash (-) is shown in the colwnn and next to it in brackets the distance in broad ranges viz. < 5 kms., 5-10 kms. and 10+ kms of the nearest place
where the facility is available is given)
"'" <II ;:I
" " OJ'
<II E c: c: 0 c: .~ u
0 5 " 0 0 3 0; 'E ~ .~ U e:!- .g, ... - ., ..c " ~ u " " " ;:I "
_ 0
:;: ~ j :W 0 '" 0-u ._
'" ., '0 ] 9 .~ ., "''0 a 0 '0
;:I ._ ;:I "
o'd .;; e:!- § 0 t':S '0 ~~
a:l ~ ..c u , 0 ;:I ~~
" " c: " "0 <:. '" 'r: ;g g~ U E ,g c:
:W oS 0 ... ..c § o c::-... .~ 0 B !ij- o'd " " .... ..c ~ E"~ _ <: "0 '';::: 0
..0 .s; 0 :; 0; ... 0; ~.~ .. ~ '" ._
E .... <: OJ) 'u §8.g<: u OJ
'" c.. 0 ;:I ... '2 ti ;:I .... 1:~ 0 ... ~ .~ .. OJ) " ... a-B ',= ~ '0"6 c: 0
~~ c.. " '" ~ ] " " >. .. " ..0 ;:I U E~ e ;E ~ .= E ..
~-8 ~ § ~ u :.0 c: ..r .~~ E ~ 'r: ~ " " " 'r: '" § § ~·o 8-] " 6 8 o " 6~ '0
~ 0 0 <: §
0:;::: VJ l::;:..c I-< ~ ~ u,£l ~<SVJVJ U e
2 3 4 5 6 7 8 9 10 II 12 13
RD Block: Tlangnuam (part) (0090)
Khamrang PM(lO+) - H(JO+) - PO(lO+) C~(1O+) ACS(IO+) CV(lO+)
BS 446 154 MCW(IO+) S SS-S RS(IO+)
(00016500) C(IO+) PH(lO+) CP(IO+) NCS(lO+) SP(IO+) PHC(lO+)
OCS(IO+) ST(IO+) NW«5)
Lungmuat PHS H(JO+)
HP S SS- PO PH(IO+) ACS(IO+) CV(IO+) BS
573 125 P M C(lO+) MCW(IO+) CM(IO+) RS(IO+) 2 (00016600)
PHC(lO+) S
CP(lO+) NCS(lO+) SP«5)
NW(lO+) OCS(lO+) ST(lO+)
Nisapui PM S PHS H(lO+)
ACS(IO+) CY(lO+) BS
3 (00016700)
768 166 C(IO+)
MCW(IO+) SSS-S PO PH(lo+) CM(5-10) NCS(JO+) SP(5-IO)
RS(IO+) PHC(1O+) CP(lO+)
OCS(IO+) ST(IO+) NW(lO+)
Serkhan PM S PHS H(IO+)
HP TK S PO PH(5-1O) ACS(IO+) CY(IO+) BS
4 (00016800)
640 154 C(1O+)
MCW(IO+) CM(5-IO) NCS(JO+) SP(IO+)
RS(lo+) PHC(IO+)
SS-S CP(IO+) NW(IO+)
OCS(JO+) ST(JO+)
Mualkhang - H(IO+)
TK S SS- - P0(5-1 0) ACS(lo+) CY(IO+) BS(5-10) 5 342 82 P MC(IO+) MCW(IO+) CM(IO+)
(00016900) PHC(5-JO)
S PH(IO+) CP(1O+)
NCS(lo+) SP(lO+) RS(lo+) OCS(IO+) ST(JO+) NW(IO+)
6 Bawnga Yeng (00017000)
----- Uninhabited -------
Sentlang PMS - H(1O+)
ACS(1o+) CY(IO+) BS
7 (00017100)
413 79 C(lO+)
MCW(lO+) T S SS-S PH PO« 5) CM«5) NCS(IO+) SP(IO+)
RS(lO+) PHC«5) CP(IO+)
OCS(IO+) ST(IO+) NW(IO+)
Lungdai P(4) M(3) PHCH(lO+) TK S SS- PO PH(230) CM ACS(JO+) CV BS
8 1,732 337 SP(IO+) RS(Jo+) (00017200) S C(IO+) MCW(IO+) S CP(IO+) NCS(IO+)
OCS(IO+) ST(JO+) NW(IO+)
T
Block Total 0.0 4914 1097 P(IO) M(8) PHC PHS(3) TK(3) P0(4) CM CV BS(6)
8(4) HP(2) PU(231) S

VILLAGE DIRECTORY 63
Village Directory Use (As on 1999)
Land use (Le. area under different types of land use in hectare)"
Cultivable
j ,...., c:: 0 CIJ .~
g 0 ~ .i?; 0
~ CIJ :a '" CIJ » E u <= 0 u
~ . ~ E e E ::3 ... E ::3 ..c: tZ CIJ § c:: ...
00 :a ~ 0 0 ;!:; c:: .... CIJ
~ U .~ "ia .~ CIJ :c
~ ~ .... -0 .,
~-o II) .. 00 ·s ;>
'E -g c:: ~ ....
~ ;>, -- .;::
~ ::3 =a '" s ]: ... 1:: e "3 "3 ::3 '" > ·s or>
" 8.g t) <= 0. c:: os E ..c: .s 0. u os ._ u ::3 .. 8 " ~ .~ 0 e .2 '0
._ ::3 .. r;; '" 0. .5 ~ u t) ~ 0 c:: e e .. ~ ·c ·c -0 c:: " " ~ ti ::3 '" - > 0 .5 of OJ 0. ;l: ij e .>
... _ .. § '" 0 " 0 0'::: ·c '" - e '1: c.. " 0 " ~ 0 ~ t:: a CIJ ~ a .,
~ ~ ~ ~ § ... 0 p.. ~ ~ V1
14 15 16 17 18 19 20 (a) 20 (b) 21 (a) 21 (b) 22 23 2 I
PR Sairang 5-8
Paddy & Maize Khamrang (20) Years
PR Aizawl
ED NM 5-8
Paddy & Maize Lungmuat (40) Years
2
PR Aizawl
ED NM 5-8
Paddy & Maize Nisapui 3 (35) Years
PR Aizawl
ED NM 5-8
Paddy & Maize Scrkhan 4 (30) Years
MR Sairang
ED 5-8 Paddy, Maize &
Mualkhang 5 (10) Years Ginger
-------- Uninhabited ------------ Bawnga Veng 6
PR Aizawl
ED 6 Years Paddy & Maize Sentlang 7 (38)
Aizawl ED EO NM
5-8 Paddy, Maize, Lungdai 8 PR
(25) Years Ginger & Chillie
PR(6) ED(6) N(4) 0.0 0.0 0.0 0.0
MR EO M(4)

64 DISTRICT CENSUS HANDBOOK: KOLASIB
APPENDIX 1-
ABSTARCT OF EDUCATIONAL, MEDICAL AND Name ofthe district: Kolasib
Total number Total Matriculation!
Serial Name of of inhabited population of Primary school Middle school Secondary school
number R.D.Block villages R.D. Block Villages Institutions Villages Institutions Villages Institutions
2 3 4 5 6 7 8 9 10
North Thingdawl 32 24,547 23 42 18 22 8 8
2 Tlangnuam (Part) 7 4,914 7 10 6 8 4 4
District(Rural) : 39 29,461 30 52 24 30 12 12
Medical institutions
Primary Health Centrcl Primary Health Sub-
Serial Name of Hospital Dispensary Health Centre centre
number R.D.Block Villages Institutions Villages Institutions Villages Institutions Villages Institutions
2 20 21 22 23 i4 25 26 27
North Thingdawl 0 0 14 14
2 Tlangnuam (Part) 0 0 0 0 3 3
District(Rural) : 0 0 1 2 2 17 17
Drinking water source (eonld.)
No drinking Serial Name of More than water
number R.D.Block Tap Well Tank Tubewell River Fountain Canal Others one source facilities
2 37 38 39 40 41 42 43 44 45 46
North Thingdawl 26 0 4 32 0 16 29 0
2 Tlangnuam (Part) 0 3 0 0 7 0 2 5 0
District (Rural) ; 27 0 4 1 4 39 0 18 34 0
Banks Power supply Credit societies
Number of Number of agricultural Number of non-
Serial Name of commercial and co· Not credit agricultural number R.D.Block Villages operative banks Available available Villages societies Villages credit societies
2 57 58 59 60 61 62 63 64
North Thingdawl 24 8 0 0 0 0
2 Tlangnuam (Part) 6 0 0 0 0
District (Rural) : 2 2 30 9 0 0 0 0

VILLAGE DIRECTORY 65
VILLAGE DIRECTORY
OTHER AMENITIES IN VILLAGES - R.D. BLOCK LEVEL
Educational institutions (contd.)
Higher Secondary/ PUc/Intermediate! College (graduate and Adult literacy No
Junior college above) classes/centres Others educational Name of Serial Villages Institutions Villages Institutions Villages Institutions Villages Institutions facilities R.D.Block number
11 12 13 14 15 16 17 18 19 2
0 0 0 0 0 ,0 0 0 9 North Thingdawl
0 0 0 0 0 0 0 0 0 Tlangnuam (Part) 2
0 0 0 0 0 0 0 0 9 District(Rural)
Medical institutions (contd.)
Maternity and Child Welfare Centre!
Maternity Home/Child Community Health No Welfare Centre Family Welfare Centre Workers Others medical Name of Serial
Villages Institutions Villages Instituti ons Villages Numbers Villages Institutions facilities R.D.Block number
28 29 30 31 32 33 34 35 36 2
0 0 0 0 0 0 0 0 17 North Thingdawl
0 0 0 0 0 0 0 0 3 Tlangnuam (Part) 2
0 0 0 0 0 0 0 0 20 District(Rural)
Post, Telegraph & Telephone Transport communications
Post, Post & Post Telegraph telegraph
Post Telegraph telegraph omce& omce& office & Bus Railway Navigable Name of Serial office office office phone phone phone Phone service station waterway R.D.Block number
47 48 49 SO 51 52 53 54 55 56 2
9 0 0 2 0 0 2 11 0 0 North Thingdawl
4 0 0 0 0 2 6 0 0 Tlangnuam (Part) 2
13 0 0 3 0 0 4 17 0 0 District (Rural)
Credit societies Recreational facility NewspaperlMagazine
Stadiurnl Number of Auditod JrnI other credit Cinema! Sports Community News News paper Namcof Serial
Villages societies Video hall club hall paper Magazine & Magazine R.D.Block number
65 66 67 68 69 70 71 72 2
0 0 0 6 0 22 13 13 North Thingdawl
0 0 0 0 4 4 4 Tlangnuam (Part) 2
0 0 1 6 0 26 17 17 District (Rural)

66 DISTRICT CENSUS HANDBOOK: KOLASIS
APPENDIX lA- Vll..LAGE DIRECfORY Vll..LAGES BY NUMBER OF PRIMARY SCHOOL
Name of the district : Kolasib
Total number of Number of primary schools Serial number Name of R.D. Block inhabited villages None One Two Three Four +
2
2 3 4 5 6
North Thingdawl 32 9 13 7
Tlangnuam (Part) 7 0 6 0
District Total : 39 9 ]9 7
APPENDIXIB-Vll..LAGEDIRECfORY VllLAGESBYP~~NUDDLEANDSECONDARYSCHOOL
7 8
0 3
0
0 4
Name of the district : Kolasib
Type of educational institutions available
Total number At least one primary At least one primary At least one middle Name of R.D. of inhabited school and no middle school and one school and one
Serial number Block villages No School school middle school secondary school
2 3 4 5 6 7
North Thingdawl 32 9 5 18 8
2 Tlangnuam (Part) 7 0 6 4
District Total : 39 9 6 24 12
APPENDIX IC-Vll..LAGEDIRECfORY VlLLAGES WfIH DIFFERENT SOURCES OFDRlNKINGWATER FACILITIES AVAlLABLE
Name of the district: Kolasib
Number of villages with different sources of drinking water available
Serial number Name ofR. D. Block
2
North Thingdawl
2 Tlangnuam (Part)
District Total :
Only Only tap Only well Only tube well handpump
3 4 5 6
0 0 0 0
0 0 0 0
0 0 0 0
APPENDIXll- VILLAGE DIRECTORY
More than one source only from tap, well, tube well,
handpump
7
4
0
4
VILLAGES WITH 5,000 ANDABOVEPOPULATIONWmCHDO NOT HAVE ONE OR MORE
This table is not required for this district as this district has no villages with 5,000 and above population.
APPENDIX ll- A CENSUS TOWN CENSUS TOWNS winCH DO NOT HAVE ONE OR MOREAMENITlES
This table is not required for this district as this district has no Census Town.

VILLAGE DIRECTORY
APPENDIXID - VILLAGE DIRECTORY LAND UTILISATIONDATAIN RESPECfOFCENSUS TOWNS/NON-MUNICIPAL TOWNS
This table is not required for this district as this district has no Census Towns or non-municipal towns.
APPENDIX IV: VILLAGE DIRECTORY
R.D. BLOCK WISE LIST OF INHABITED VILLAGES WHERE NO AMENITY OTHER THAN DRINKING WATER FACILITY IS AVAILABLE
Name of the District: Kolasib
Serial number
2
3
4
5
6
Location code number
2
Name of RD Block: North Thingdawl
00012700
00013800
00014300
00015100
00015400
00015500
Name of RD Block: Tlangnuam (Part)
Nil
Name of village
3
Vakultui
N.Thinglian
Parsenchhip
Hmaibialaveng
Rajtali
Dilzau H
APPENDIX V - VILLAGE DIRECTORY
67
SUMMARY SHOWING NUMBER OF VILLAGES NOT HAVING SCHEDULED CASTES POPULATION
Serial Uninhabited Inhabited Number of inhabited villages having no number Name ofR.D. Block Total villages villages villages Scheduled Castes population
2 3 4 5 6
North Thingdawl 41 9 32 30
2 Tlangnuam (Part) 8 7 7
District Total : 49 10 39 37
APPENDIX VI - VILLAGE DIRECTORY SUMMARY SHOWING NUMBER OF VILLAGES NOT HAVING SCHEDULED TRIBES POPULA nON
Serial Uninhabited Inhabited Number of inhabited villages having number Name of R. D. Block Total villages villages villages no Scheduled Tribes population
2 3 4 5 6
North Thingdawl 41 9 32 3
2 Tlangnuam (Part) 8 7 0
District Total: 49 10 39 3

68 DISTRICT CENSUS HANDBOOK: KOLASIB
APPENDIX VIIA-VILLAGE DIRECfORY LIST OF VILLAGES ACCORDING TO THE PROPORTION OFTHE SCHEDULED CASTES
TO THE lOTALPOPULATIONBYRANGES
Name of the district: Kolasib
Range of Scheduled Castes population (percentages)
Less than 5
Less than 5
Location code number
2
Name of RD Block: North Thingdawl
00013400
00016200
Name of RD Block: Tlangnuam (Part)
Nil
Note : Villages having NIL Scheduled Castes Population have been excluded.
APPENDIX VII B-VILLAGE DIRECTORY
Name of village
3
Bilkhawthlir
N.Mualvum
LIST OF VILLAGES ACCORDING TO THE PROPORTION OFTHE SCHEDULED TRIBES TO THE TOTAL POPULATION BY RANGES
Name of the district: Kolasib Range of Scheduled Tribes population
(percentages)
21-30
51-75
76 and above
Location code number
2
Name of RD Block: North Thingdawl
00015500
00015300
00014900
00012500
00014500
00013900
00013800
00014000
00016200
00013100
00013000
00013400
00012400
00015800
00014600
00013300
00013500
00016100
00014800
00016300
00016000
00015600
Name of village
3
Dilzau H
Meidum
Pangbalkawn
Saihapui V
N.Hlimen
Bukvannei
N.ThingJian
Saihapui K
N.Mualvum
Saipum
Saiphai
Bilkhawthlir
Phainuam
Sethawn
Thingthelh
Chemphai
Phaisen
N.Chaltlang
N.Thingdawl
Zan lawn
Bukpui
Hortoki

VILLAGE DIRECTORY
APPENDIX VIIB- VILLAGE DIRECfORY LIST OF VILLAGES ACCORDING TO THE PROPORTION OF THE SCHEDULED TRIBES
TO THE TOTALPOPULATION BY RANGES
Name ofthe district: Kolasib
Range of Scheduled Tribes population (percentages)
76 and above
Location code number
2
Name of RD Block: North Thingdawl
00012800
00013200
00013600
00014100
00014300
00015000
00015400
Name of RD Block: T1angnuam (Part)
00016500
00016800
00016700
00016600
000]7200
00016900
00017100
Note: Villages having NIL Scheduled Tribes Population have been excluded
APPENDIXVllI
Name of village
3
N.Chhimluang
N.Chawnpui
Buhchangphai
Builum
Parsenchhip
S.Chhimluang
Rajtali
Khamrang
Serkhan
Nisapui
Lungmuat
Lungdai
Mualkhang
Sentlang
NUMBEROFVILAGES UNDERFACHGRAMPANCHAYAT(R.D.BLOCKWlSE)
69
In Mizoram as per relevant Acts and Rules village Councils have been functioning in the whole district for which introduction of Panchayati Raj has
not yet been done any where in the District/State. Hence the above mentioned appendix could not be compiled.
APPENDIX IX
STATEMENfSHOWINGNUMBFR.OFGIRLS SCHOOLS IN THE VILLAGES
In Mizoram no school for girls only are established at yet. Hence such data can be treated as NIL in
respect of Kolasib District.


Section-II: Town Directory
Note explaining the abbreviations used in Town Directory :
Town Directory statements (I to VII)
Statement I : Status and Growth Histo.ry
Column (2) : Class, name and civic administration status of town :
Class has been introduced to facilitate analysis of town directory data at the state and all India levels. It is presented according to 200 I Census Population
of the town as follows :
Population Class
100,000 and above I
50,000 - 99,999 II
20,000 - 49,999 III
10,000 - 19,999 IV
5,000 - 9,999 V
Below 5,000 VI
Town with a population of one hundred thousand
(I,OO,OOO)and above is treated as a city.
The civic administration status of the towns is indicated within bracket against the name of the town. The following abbreviations are used to denote civic status of town.
(i) Municipal Corporation M. Corp.
(ii) Municipal Committee MC
(iii) Municipal Council MCI
(iv) City Municipal Council CMC
(v) Town Municipal Council TMC
(vi) Municipal Board MB
(vii) Municipality M
(viii) Cantonment Board/ Cantonment CB
(ix) Notified Area NA
(x) Notified Town NT
(xi) Notified Area Committee/ Notified Area Council NAC
(xii) Notified Town Area NTA
(xiii) Industrial Notified Area INA
(xiv) Industrial Township ITS
(xv) Township TS
(xvi) Town Panchayat TP
(xvii) Nagar Panchayat NP
(xviii) Town Committee/Town Area Committee TC
(xix) Small Town Committee ST
(xx) Estate office EO
(xxi) Gram Panchayat GP
(xxii) Census Town CT
Others columns need no comments.
Statement II - Physical Aspects and Location of
towns, 1999
Column 3 to 5 : Physical Aspects
In these columns the Rainfall and Maximum &
Minimum Temperature of the town is recorded.
Column 6, 7 and 8 :
Name of the State headquarters, District headquarters and Sub-Divisional headquarters with distance from the referent town in kilometers, is to be recorded respectively. If the names mentioned in these columns are the same as the referent town
itself, the distance is recorded as (0) zero.
Column 9 and 10 :
Name of the nearest city with one lakh and more
and five lakhs and more population are recorded.
Column 11, 12 and 13 :
If referent town enjoys the facility of railway station, bus route facility or navigable river/canal, its name is to be mentioned. If not available, then the

72
name of nearest place with distance, where such facility exists is to be mentioned.
Statement III : Mnnicipal Finance 1998 - 1999
Item-wise amount of receipt and expenditure in thousand rupees, relating to municipal finance of the town for the year 1998-99 is to be recorded.
Statement IV: Civic and other amenities, 1999
Column (1 to 5) : Self explanatory.
Column (6) : Road length (in kms.)
Information about kutchalpucca road is to be recorded separately for the roads within the limits of the referent town.
(i) Pucca Road
(ii) Kutcha Road
Column (7): System of Sewerage
PR
KR
Generally, by sewerage system is implied the network of mains and branches of underground conduits for the conveyance of sewerage to the point of disposal. Sewers that carry only household and industrial wastes are called separate sewers, those that carry storm water from roofs, streets and other surface are known as storm water drains, while those carrying both sewage and storm water are called combined sewers.
The codes used for different types of drainage system are as follows :
(i) Sewer S
(ii) Open Surface Drains OSD
(iii) Box Surface Drains BSD
(iv) Sylk Drains SD
(v) Cesspool method CP
(vi) Pit System Pt
(vii) Others 0
Column 8 to 11 : Number of latrines
Number of various types of latrines both Public and Private are given in these columns.
Column 12 : Method of disposal of night soil
The various prevalent method of disposal of night soil are given below with codes :
(i) Head Loads
(ii) Basket
HL
B
DISTRICT CENSUS HANDBOOK: KOLASIS
(iii) Wheel Barrows WB
(iv) Septic Tank ST
(v) Pit System Pt
(vi) Sewerage S
(vii) Others 0
Column 13 and 14 : Water supply
Source and capacity of storage system. The following codes are used in these columns:
Column 13 :
(i) Tap water T
(ii) Tube-well water TW
(iii) Tank Water TK
(iv) Well water W
Column 14 :
(v) Over Head Tank OHT
(vi) Service Reservoir SR
(vii) River Infiltration Gallery RIG
(viii) Bore Well Pumping System BWP
(ix) Pressure Tank PT
The information on major source of water supply are given in column 13 and the storage capacity against each in kilo-litres (in bracket) are presented in column 14.
Column 15 : Fire Fighting Service
In case the fire fighting service is available in the referent town 'yes' is recorded. If the facility is not available within the town, the name of the nearest place having this facility with its distance from the referent town has been recorded.
Column 16 to 20 : Electrification (Number of connections)
Different types of electric connections have been shown in these columns, i.e. Domestic, Industrial, Commercial, Road lighting (points) & others.
Statement V : Medical, Educational, Recreational and Cultural Facilities, 1999
Column 1 to 3 : Self explanatory.
Column 4 & 5 :
The data covers all such medical institutions run by or aided by Government!Semi Government!

TOWN DIRECTORY
Local bodies and Charitable institutions or Social agencies like the Missionaries. Where the family planning centres are attached to hospitals or maternity and child welfare centres or Primary Health Centres, may be treated as independent units and counted separately using following codes:
(i) Hospital H
(ii) Dispensary D
(iii) Health Centre HC
(iv) Family Welfare Centre FWC
(v) T.B. Clinic TB
(vi) Nursing Home NH
(vii) Others 0
In case of more than one institutions of any type, it is indicated within brackets the number of such institution (s) e.g. D(3), NH(8), etc. The institutions have further been distinguished by providing additional codes within the bracket as given below :
Ayurvedic
Unani
Homoeopathic
Column 6 to 9 :
A
U
Hom
The codes used for these columns are as follows
(i)
(ii)
(iii)
(iv)
(v)
(vi)
(vii)
(viii)
(ix)
Arts only
Science only
Commerce only
Arts & Science only
Arts & Commerce only
Combined for all categories-Arts, Science and Commerce
Law
University
Others
A
S
C
AS
AC
ASC
L
U
o Column 10 : Recognized shorthand, typewriting and vocational training institutes
"Recognised" should mean recognised by some statutory authority, like education department, commerce department, labour department etc. of the government or semi government or autonomous bodies, public sector undertakings etc.
73
The following codes are used :
(i) Shorthand SH
(ii) Typewriting Type
(iii) Shorthand & Typewriting SH Type
(iv) Others 0
The vocational institutions like - Applied Art}
Painting college, Pharmacy college, B.Ed. College, Teacher's Training Institute, MusicIDance School, Nursing Schoo I etc. are covered under 'Others'.
Column 11 to 14 :
Higher SecondarylIntermediate/Senior Secondary/ PUC/Junior College level, SecondarylMatriculation, Middle Schools! Junior Secondary and Primary Schools.
School up to class V are treated as Primary or elementary schools. These include Nursery schools, Kindergarten schools, Pre-Primary schools, Junior Basic schools upto class V and Primary schools upto class IV.
Schools upto VIII are considered as Middle school or Junior Secondary.
Schools upto class X are considered as Matriculation or Secondary schools.
Schools upto XI or XII classes are considered as Higher SecondaryllntermediatelPre University/Junior College etc. This would cover 10+2 classes whether held in schools or college.
If there are composite schools like middle schools with primary classes or Secondary schools with Middle classes, these are also included in the number of Primary and Middle schools, respectively. For example, if in a town, there are two Primary Schools and one Middle school with Primary classes, the number of Primary schools in the town is given as three and that of Middle schools as one though there are only three educational institutions.
If there are more institutions of a type in the town, the number is indicated within bracket along with the abbreviation, e.g. PC 4), M(3).
Column 15 : Adult literacy class/centres
This column has been introduced keeping in view the Minimum Needs Programme of the Planning Commission. There are number of Adult Education Centres which are included in these columns.

74
If an educational facility is not available in the town, the name of the nearest place and its distance in kilometres from the town where the facility is available is mentioned.
Column 16 : Working Women's hostels with number of seats
The number of working women's hostel if available in the referent town is mentioned with number of seats. If the facility is not available in the town the name of nearest place with distance where the facility is available is recorded.
Column 17 to 19 : Recreational and Cultural Facilities
Stadium, Cinema, Auditorium/DramalCommunity Hall are covered under recreational & cultural facilities. The particulars of permanent recreational facilities are considered for these columns.
Column 20 : Public Libraries, Reading Rooms
Number of public libraries and reading rooms available in the referent town are recorded in codes as follows:
(i) Public Library
(ii) Reading room
PL
RR
DISTRICT CENSUS HANDBOOK: KOLASIB
Statement VI : Trade, Commerce, Industry and
Banking, 1999
Column 3 to 8 :
Name of three most important commodities
exported and names of three most important
commodities manufactured in the town are recorded.
Column 9 : Number of Banks
Number of Banks available in the referent
town both Commercial and Co-operative banks are
recorded against this column.
Column 10 & 11 : Number of Agricultural Credit
Societies and Non Agricultural Credit Societies
The total number of Agricultural Credit Societies
and Non Agricultural Credit Societies in the referent
town are recorded against these columns.
Statement VII : Civic and other Amenities in Slums, 1999
This is the statement on civic and other amenities
in all slums whether notified or not and for all towns
having statutory bodies, like municipality, Municipal
Corporation, Town area committee etc.

TOWN DIRECTORY 75
STATEMENT - I STATUS AND GROWTH HISTORY
Name of Number of TalukITahsill households Population and growth rate (in
Location Police Area incl.houseless brackets) of the town at the
Serial Class, name and code Station!Island Name of (in sq. households Censuses of
number civic status of town number etc. R.D. block km.) (2001 Census) 1901 1911 1921 1931
2 3 4 5 6 7 8 9 10 11
V Vairengte (NT) 40201000 Kolasib N. Thingdawl 20.0 1,927
2 VI Bairabi (NT) 40202000 Kolasib N. Tbingdawl 26.0 639
3 IV Kolasib (NT) 40203000 Kolasib N. Thingdawl 36.0 3,877
4 V Kawnpui (NT) 40204000 Kolasib N. Thingdawl 22.0 1,405
Population and growth rate (in brackets) of the town at the
Serial Class, name and Censuses of Density Sex ratio
number civic status of town 1941 1951 1961 1971 1981 1991 2001 (2001 Census) 1981 1991 2001
2 12 13 14 15 16 17 18 19 20 21 22
V Vairengte (NT) 5,607 7,715 385.8 880 825
(+37.6)
2 VI Bairabi (NT) 2,421 3,304 127.1 896 905
(+36.5)
3 IV Kolasib (NT) 8,282 13,482 19,008 528.0 922 965 947
(+62.8) (+41.0)
4 V Kawnpui (NT) 5,290 6,472 294.2 1,002 974
(+22.3)
SfATEMENT -II PHYSICAL ASPECTS AND LOCATION OF TOWNS
Physical aspects Name of and road distance in kilometer(s) from
Temperature (in Sub-division! centigrade) TalukITahsillPolice
Serial Class, name and Rainfall stationlDevelopment Block!
number civic status of town (in mm) Maximum Minimum State HQ. District HQ. Island HQ.
2 3 4 5 6 7 8
V Vairengte (NT) 2,272 37 12 Aizawl Kolasib Thingdawl
(132) (48) (77)
2 VI Bairabi (NT) 2,009 38 15 Aizawl Kolasib Thingdawl
(120) (41) (32)
3 IV Kolasib (NT) 2,889 37 11 Aizawl Kolasib Thingdawl
(83) (0) (10)
4 V Kawnpui (NT) 2,010 32 10 Aizawl Kolasib Thingdawl
(54) (25) (20)

76
Serial Class, name and
number civic status of town
2
V Vairengte (NT)
2 VI Bairabi (NT)
3 IV Kolasib (NT)
4 V Kawnpui (NT)
Serial Class, name and civic
DISTRICT CENSUS HANDBOOK: KOLASIB
STATEMENT-II PHYSICAL ASPECTS AND LOCATION OF TOWNS
Name of and road distance in kilometer(s)
from
Nearest city with Nearest city with population of one population of five lakh
lakh and more and more Railway station
9
Aizawl
(132)
Aizawl
(120)
Aizawl
(83)
Aizawl
(54)
10
STATEMENT - ill MUNICIPAL FINANCE
11
Silchar
(48)
Bairabi
(0)
Silchar
(97)
Silchar
(69)
Receipt (in Rs.'OOO)
Revenue derived from Receipt municipal properties and through power apart from Government
Bus facility
12
Vairengte
(0)
Bairabi
(0)
Kolasib
(0)
Kawnpui
(0)
Navigable river/canal (if within
ten kilometers)
13
Other sources Total
number status of town taxes, etc. taxation grant Loan Advance (specify) receipt
2 3
V Vairengte (NT)
2 VI Bairabi (NT)
3 IV Kolasib (NT)
4 V Kawnpui (NT)
Serial Class, name and General number civic status of town administration
2 10
V Vairengte (NT)
2 VI Bairabi (NT)
3 IV Kolasib (NT)
4 V Kawnpui (NT)
4
Public safety
11
5 6 7 8 9
Expenditure (in Rs.'OOO)
Public health and
conveniences
12
Public works
13
Public institutions
14
Others (specify)
15
Total expenditure
16

TOWN DIRECTORY 77
STATEMENT - IV CMC AND OTHER AMENITIES
Population 2001 Road Population Census length Number of latrines
Serial Class, name and (2001 Scheduled Scheduled (inkm. System of Water number civic status of town Census) Castes Tribes (s) ) sewemge Total borne Service Others
2 3 4 5 6 7 8 9 10 II
V Vairengte (NT) 7,715 2 6,633 OSD
2 VI Bairabi (NT) 3,304 6 3,039 OSD
3 IV Kolasib (NT) 19,008 4 17,358 OSD
4 V Kawnpui (NT) 6,472 5,398 OSD
Water supply Electrification (number of connections)
Method System of of storage with
disposal Source capacity in Fire Road Serial Class, name and civic of night of kilolitres (in fighting lighting
number status .of town soil supply brackets) service Domestic Industrial Commercial (points) Others
2 12 13 14 15 16 17 18 19 20
V Vairengte (NT) Pt, S TK OHT Kolasib 950 5
(47)
2 VI Bairabi (NT) ST, Pt TK OHT Kolasib 269 9 7
(41)
3 IV Kolasib (NT) ST, Pt TK OHT Yes 2,343 15
4 V Kawnpui (NT) ST, Pt TK OHT Kolasib 818 3 45
(25)
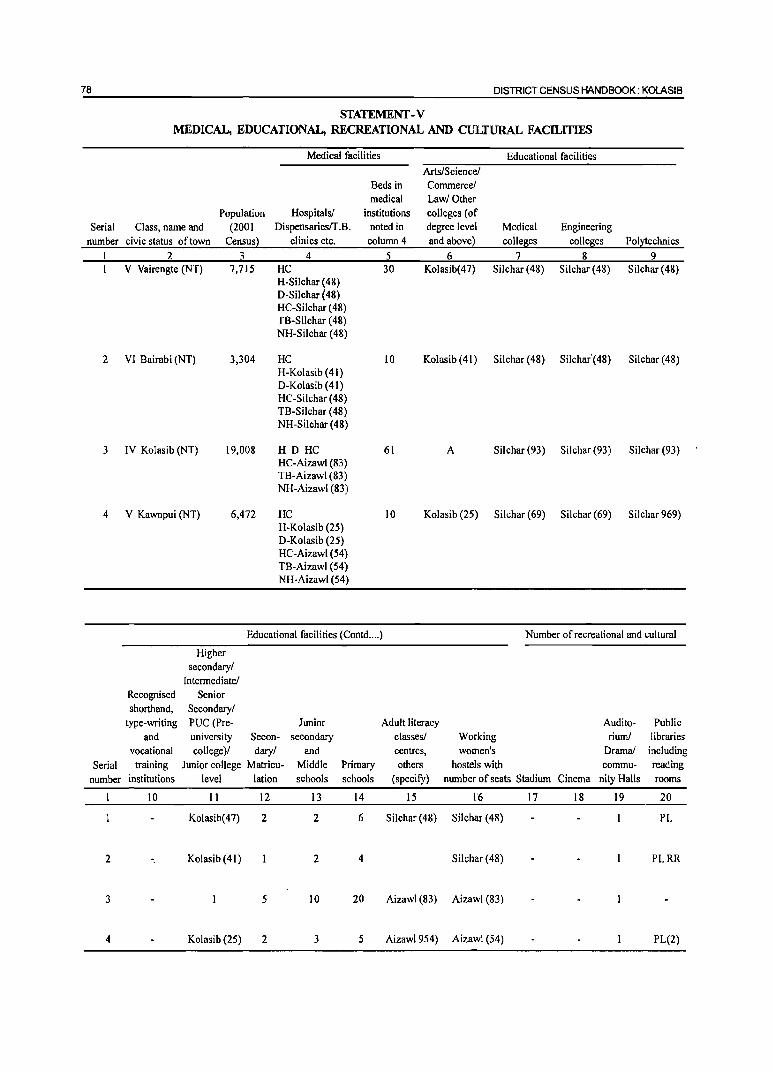
78 DISTRICT CENSUS HANDBOOK: KOLASIB
STATEMENT -V MEDICAL, EDUCATIONAL, RECREATIONAL AND CULTURAL FACll..ITIES
Medical facilities Educational facilities ArtslScience!
Beds in Commercel medical Law! Other
Population Hospitals! institutions colleges (of Serial Class, name and (2001 Dispensariesff.B. noted in degree level Medical Engineering
number civic status of town Census) clinics etc. column 4 nnd abovei colleges colleges Polytechnics 2 3 4 5 6 7 8 9
V Vairengte (NT) 7,715 HC 30 Kolasib(47) Silchar (48) Silchar (48) Silchar (48) H-Silchar (48) D-Silchar (48) HC-Silchar (48) TB-S il char (48) NH-Silchar (48)
2 VI Bairabi (NT) 3,304 HC 10 Kolasib(41) Silchar (4S) Silchar'(4S) Silchar (48) H-Kolasib (41) D-Kolasib (41) HC-Silchar (48) TB-Silchar (48) NH-Silchar (48)
3 IV Kolasib (NT) 19,008 H D He 61 A Silchar (93) Silchar (93) Silchar (93) HC-Aizawl (83) TB-Aizawl (83) NH-Aizawl (83)
4 V Kawnpui (NT) 6,472 HC 10 Kolasib (25) Silchar (69) Silchar (69) Silchar 969) H-Kolasib (25) D-Kolasib (25) HC-Aizawl (54) TB-Aizawl (54) NH-Aizawl (54)
Educational facilities (Contd .... ) Number of recreational and cultural
Higher secondary!
Intermediate! Recognised Senior shorthand, Secondary!
type-writing PUC (Pre- Junior Adult literacy Audito- Public and university Secon- secondary c1asses/ Working riuml libraries
vocational college)! daryl and centrcs, women's Drama! including Serial training Junior college Matricu- Middle Primary others hostels with commu- reading
number institutions level lation schools schools (specity) number of seats Stadium Cinema nity Halls rooms
10 II 12 13 14 IS 16 17 IS 19 20
Kolasib( 4 7) 2 2 6 Silchar (48) Silchar (48) PL
2 -. Kolasib (41 ) 2 4 Silchar (48) PLRR
3 5 10 20 Aizawl(83) Aizawl (S3)
4 Kolasib (25) 2 3 5 Aizawl954) Aizawl (54) PL(2)

TOWN DIRECTORY 79
SfATEMENT -VI TRADE, COMMERCE, INDUSTRY AND BANKING
Name of three most important commodities Name of three most important commodities
Serial Class, name and civic exported manufactured
number status of town 1 st 2nd 3rd 1st 2nd 3rd
2 3 4 5 6 7 8
V Vairengte (NT) Firewood Charcoal Betel Leaves Wooden Furniture
2 VI Bairabi (NT) Wooden Furniture
3 IV Kolasib (NT) Wooden Furniture
4 V Kawnpui (NT) '- Wooden Furniture Iron Fabrication Tin Products
Serial Class, name and civic Number of agricultural credit Number of non-agricultural
number status of town Number of banks societies credit societies
2 9 10 11
V Vairengte (NT) 2
2 VI Bairabi (NT)
3 IV Kolasib (NT) 3
4 V Kawnpui (NT) 7
STATEMENT VII CIVIC AND OTHER AMENITIES IN SLUMS
This statement is not applicable for this District.
APPENDIX TO TOWN DIRECTORY TOWNS SHOWING THEIR OUTGROWTH WITH POPULATION
As no Towns having any outgrowth in the District was found, relevant information could not be compiled and therefore may be treated as 'NIL'.


PARTB PRIMARY CENSUS ABSTRACT


Brief note on Primary Census Abstract
~e first census of the third millennium and twenty .1 first century the Census of India, 200 I was the
14th continuous and uninterrupted Indian census since 1872. Thus, 2001 Census will provide data.on population and its characteristics marking transition from one century and millennium to another.
The gigantic operation of Population Enumeration (considered by many to be the single largest and complex peace time administrative exercise in the world) was made possible due to the door to door universal canvassing of the Household Schedule by about 2 million enumerators and supervisors covering 593 districts, 5,463 sub-districts, 5,161 towns and 638,588 village~. The comprehensive Household Schedule which replaced the individual slip had three parts and two sides A and B. Part I contained the Location Particulars; Part II related to the Individual Particulars and Part III contained questions for Household engaged in CultivationIPlantation. The part II of the Household Schedule had 39 columns and 23 qu~stions all of which were universally canvassed and no sampling was resorted to during enumeration.
Data Processing
A quantum leap was made in the technology front while processing the Census 2001 data both for Houselisting and Population Enumeration. The Census schedules for hoth the phases were scanned through high speed scanners in fifteen data centers across the country and hand-written data from the schedules were converted into digitized form through Intelligent Character Reading (ICR) software for creation of ASCII records for further processing. The designing and formatting of the Household Schedule had to be
done very carefully using specialized software so as to ensure uniformity, which was an essential prerequisite for scanning. The selection of appropriate state-of-art technology in data processing has made it possible to produce all the Houselisting as well as Population Enumeration tables on full count basis for the first time in the history of Census. For Census
200 I, about 202 million schedules consisting of about 1,028 million records were scanned and processed within a span of only 10 months starting Octoher, 2002.
Task Force on Quality Assurance
After the data is processed, it is expedient on the part of the data producing agency tp satisfy itself about its quality before putting the same in public domain. This has to be done mainly through the process of internal consistency, comparison with similar data in the past and also through validation with likewise data ifavailable, from external sources. Quite often the local knowledge and perception has to be brought into play to understand both the existing and the new emerging trends of population distribution and characteristics. The other very important aspect of the data quality is to ensure complete coverage of all geographical areas especially for the popUlation enumeration phase where the data is disseminated right up to the village level in the rural areas and the ward level in the urban areas. Thus ensuring the complete coverage and correct geographical linkage of each enumeration block was one of the major planks of the quality control, specially for small area population statistics.
A very comprehensive check and edit mechanism was put in place to objectively examine the preliminary Census 200 1 Population Enumeration results and finally clear them for use. The responsibility of the final clearance of data was with the Task Force on Quality Assurance (TFQA), headed by the Registrar General and Census Commissioner, India. The other members of the TFQA were the Heads and senior officers of the Census Division, Data Processing Division, Map Division, Demography Division and Social Studies Division. The Directors of Census Operations were co-opted as members whenever the TFQA discussed the data for their StateslUnion territories. The Directors and their senior officers were required to make detailed presentations of data for their own state both in respect to the

84
quality and the coverage and only after the full possible cleared.
There has been a major departure in Census 2001 from the past in respect of the procedure followed for finalization of the Scheduled Castes and the Scheduled Tribes population. In the earlier censuses, the total Scheduled Castes and Scheduled Tribes populations were finalized at the time of the manual compilation of the Primary Census Abstracts (PCA) at the Regional Tabulation Offices which were specially set up for this purpose. The individual Scheduled Castes and the Scheduled Tribes population for each state was finalized much later based on manual coding done by the coders. In 2001 Census, each individual Scheduled Caste and the Scheduled Tribe have been coded directly on the computers by the Data Entry Operators through a process known as Computer Assisted Coding (CAC) and taken up along with the processing of PCA data. The CAC process involves pulling down, from the relevant dictionary of the Scheduled Castes and the Scheduled Tribes, on the computer screen and coding from the dictionary by referring to the image of the specific individual entry in the Household Schedule appearing on the screen. The CAC of the response on Religion wherever required, was also undertaken along with the processing of PC A. This is because the Scheduled Castes status had to be determined in relation to the religion of the individual. Two Special Task Forces, one on Religion and the other on Scheduled Castes/ Scheduled Tribes were constituted for scrutiny and appropriate classification of these responses.
The main task of the Special Task Force on Religion was to appropriately merge or group the new responses encountered and code it into the appropriate religious community based on available literature and local knowledge. The Special Task Force on Scheduled Castes and Scheduled Tribes examined the different Scheduled Castes and Scheduled Tribes entries encoun-tered and classified these into appropriate category of the Scheduled Castes or the Scheduled Tribes principally based on the Presidential Notification and the available literature. Thus a very systematic and scientific mechanism was operationalised to firm up the individual religion and the individual Scheduled Castes/Tribes returns. The Scheduled Castes and the Scheduled Tribes population in 200 I Census, is thus being finalized by aggregating the population data for individual Scheduled Castes
DISTRICT CENSUS HANDBOOK: KOLASIB
and the Scheduled Tribes at appropriate geographical levels.
The entire work relating to the data validation and scrutiny was completed by all the StateslUnion Territories under the overall supervision and monitoring of the Census Division of the Office of the Registrar General, India with active cooperation and support of the Social Studies Division, Data. Processing Division, Data Dissemination Division and Map Division.
Primary Census Abstract
The Primary Census Abstract which is yet another important publication of 2001 Census gives basic information on Area, Total Households, Total population, Scheduled Castes, Scheduled Tribes population, Population in the age group 0-6, Literates, Main workers and Marginal workers classified by the four broad industrial categories, namely, (i) Cultivators, (ii) Agricultural laborers, (iii) Household Industry Workers, and (iv) Other workers and also Nonworkers. The characteristics of the Total Population includes Scheduled Castes, Scheduled Tribes, Institutional and Houseless population and are presented by sex and rural-urban residence. This data is presented at different levels, namely, India, States/Union territories, Districts and Cities, Urban Agglomerations (Population 1,00,000 and above) in three different tables. In addition, the Appendix of said publication provides Houseless and Institutional Households and their population by residence and sex for 2001 for India, State and Union territory.
Apart from the India and StatelUnion Territory volumes for Primary Census Abstract, the District Census Handbook contains District Primary Census Abstract, Appendix to District Primary Census Abstract, Primary Census Abstract for Scheduled Castes, Primary Census Abstract for Scheduled Tribes, Village Primary Census Abstract and Urban Primary Census Abstract of the concerned district in the state.
It was for the first time at the 1981 Census that the Primary Census Abstract (PCA) was brought out for the Scheduled Castes and the Scheduled Tribes separately on the pattern of General Primary Census Abstract. This practice was continued in 1991 also. In the 1961 and 1971 Censuses, such data were made available in Table C-VIII-Social and Cultural table and to some extent in the series 'Special Tables for Scheduled Castes/Scheduled Tribes'.
PRIMARY CENSUS ABSTRACT
The format of Primal)' Census Abstract has been
restructured slightly in the 2001 Census as compared
to that of 1991 Census. The nine-fold industrial
classification of main workers given in the Primal)'
Census Abstract of 1991 Census has been
discontinued and its place, four-fold industrial
classification of both 'main workers' and 'marginal
workers' are included. In 1981 census only main
workers were presented in to four categories. One
of the novel features of the primal)' census abstract
N arne of the Primary Census Abstract
1. District Primary Census Abstract
85
of 1991 census was the presentation of data of the
popUlation of age group 0-6 is continued in 200 I
Census also. This will help the data users in better
analysis and understanding of this literacy data.
Level of presentation in District Census Handbooks :
The Primal)' Census Abstract data in different PC As are presented at different levels. The level of presentation of Primary Census Abstracts are as under:
Level of presentation
2. Primary Census Abstract for Scheduled Castes
DistrictIRD BlocklUNCity/Town
DistrictiRD Block/Town
DistrictIRD Block/Town 3. Primal)' Census Abstract for Scheduled Tribes
4. Village Primal)' Census Abstract
5. Urban Primal)' Census Abstract
The PCA Data for villages was presented RD Block wise for the first time in 1991 Census. This practice is continued in 200 I Census also. The data for each RD Block is presented both for rural and urb~n areas separately. All the villages within the RD Block constitute the rural portion and the Census Towns and Outgrowths are shown under the urban portion of the RD Block. In case a RD Block is spread over two or more districts, than portion which falls within the district is presented, the data pertaining to remaining portion of the RD Block is presented in the concerned District Census Handbook. The data in the Urban Primal)' Census Abstract for each town as well as for town with outgrowths in the district are presented. The data for all the wards and the outgrowths of the town(s) are also presented separately below the concerned town(s).
The District Primary Census Abstract is presented in 59 columns. The Primary Census Abstract for Schedu'led Castes and Primal)' Census Abstract for Scheduled Tribes are presented in 52 columns. The Village Primal)' Census Abstract and Urban Primary Census Abstract are presented in 58 columns.
The concepts and definitions used in the column heading are explained under the sub heading 'Census Concepts' in the Analytical Note. The term 'Total Population' includes the Scheduled Castes, the Scheduled Tribes, the Institutional and the Houseless populations. The explanation regarding area figures
RD BlockIVillage wise
Town/Ward level
presented at various level in the Primary Census Abstracts are as follows:
Area Figures
The area figures supplied by local revenue authorities of the district in respect of tehsils, Police Stations and by the local bodies in respect of towns are given in square kilometers. The area figures of the villages supplied by the Tahsildars in acres have been converted and shown in hectares. The area figures of the RD Block is the total of the village areas coming under each RD Block. The area figures for the district are the same as adopted by the Surveyor General of India to maintain uniformity at the national level. The total area figures of all the tahsilsIRD Blocks within the district may not tally with area figures of the district because former represents land use area only. Similarly, the total of all the villages may not tally with the entire rural of Police Station/ Tahsil. The difference may be due to the fact that while the area covered by hills, forests and rivers etc, have been accounted in the Tahsils and P.S. level the same may not be covered under the area of the villages. Apart from this it may also differ due to varying methods of computation adopted at different levels.
An appendix to District Primal)' Census Abstract has also been furnished showing urban enumeration block-wise particulars on Total Population, the Scheduled Castes Population and the Scheduled Tribes PopUlation for each town.
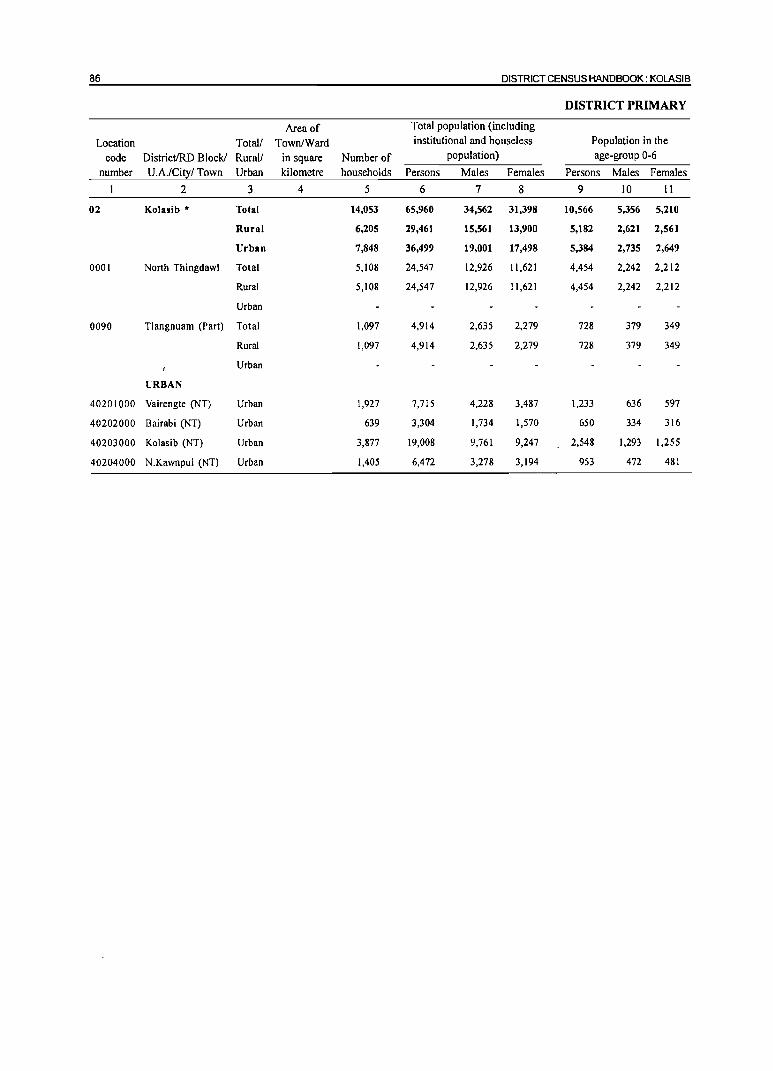
86 DISTRICT CENSUS HANDBOOK: KOLASIB
DISTRICT PRIMARY
Area of Total population (including
Location Total/ Town/Ward institutional and houseless Population in the
code DistrictIRD Block! Rural/ in square Number of population) age-group 0-6
number U.A.lCi!I/ Town Urban kilometre households Persons Males Females Persons Males Females
2 3 4 5 6 7 8 9 IO II
02 Kolasib * Total 14,053 65,960 34,562 31,398 10,566 5,356 5,210
Rural 6,205 29,461 15,561 13,900 5,182 2,621 2,561
Urban 7,848 36,499 19,001 17,498 5,384 2,735 2,649
0001 North Thingdawl Total 5,108 24,547 12,926 11,621 4,454 2,242 2,212
Rural 5,108 24,547 12,926 11,621 4,454 2,242 2,212
Urban
0090 Tlangnuam (Part) Total 1.097 4.914 2,635 2,279 728 379 349
Rural 1,097 4,914 2,635 2,279 728 379 349
Urban
URBAN
40201000 Vairengte (NT) Urban 1,927 7,715 4,228 3,487 1,233 636 597
40202000 Bairabi (NT) Urban 639 3,304 1,734 1,570 650 334 316
40203000 Kolasib (NT) Urban 3,877 19,008 9,761 9,247 2,548 1,293 1,255
40204000 N .Kawnpui (NT) Urban 1,405 6,472 3,278 3,194 953 472 481

PRIIlllARY CENSUS ABSTRACT 87
CENSUS ABSTRACT
Totall Scheduled Castes population Scheduled Tribes population Literates Rural! DistrictIRD Block!
Persons Males Females Persons Males Females Persons Males Females Urban U.A.fCit~rrown
12 13 14 15 16 17 18 19 20 3 2
17 8 9 59,221 30,173 29,048 50,596 26,969 23,627 Total Kolasib *
5 3 2 26,793 13,815 12,978 21,008 11,325 9,683 Rural
12 5 7 32,428 16,358 16,070 29,588 15,644 13,944 Urban
5 3 2 22,085 11,346 10,739 17,127 9,237 7,890 Total North Thingdawl
5 3 2 22,085 11,346 10,739 17,127 9,237 7,890 Rural
Urban
4,708 2,469 2,239 3,881 2,088 1,793 Total Tlangnuam (Part)
4,708 2,469 2,239 3,881 2,088 1,793 Rural
Urban
URBAN
2 2 6,633 3,396 3,237 5,986 3,396 2,590 Urban Vairengte (NT)
6 3 3 3,039 1,564 1,475 2,472 1,336 1,136 Urban Bairabi (NT)
4 2 2 17,358 8,723 8,635 15,834 8,219 7,615 Urban Kolasib (NT)
5,398 2,675 2,723 5,296 2,693 2,603 Urban N.Kawnpui (NT)

88 DISTRICT CENSUS HANDBOOK: KOLASIB
DISTRICT PRIMARY
Location District! RD TotaU code BlockiU.A.lCityl RuraU III iterates Total workers Main workers
number Town Urban Persons Males Females Persons Males Females Persons Males Females
2 3 21 22 23 24 25 26 27 28 29
02 Kolasib * Total 15,364 7,593 7,771 35,510 20,262 15,248 27,441 18,019 9,422
Rural 8,453 4,236 4,217 16,515 9,425 7,090 13,298 8,657 4,641
Urban 6,911 3,357 3,554 18,995 10,837 8,158 14,143 9,362 4,781
0001 North Thingdawl Total 7,420 3,689 3,731 13,333 7,630 5,703 10,790 7,077 3,713
Rural 7.420 3,689 3.731 13.333 7,630 5,703 10,790 7,077 3.713
Urban
0090 Tlangnuam (Part) Total 1,033 547 486 3,182 1,795 1,387 2.508 1,580 928
Rural 1,033 547 486 3,182 1,795 1,387 2,508 1,580 928
Urban
URBAN
40201000 Vairengte (NT) Urban 1,729 832 897 4,049 2,515 1,534 3,426 2,276 1,150
40202000 Bairabi (NT) Urban 832 398 434 1,749 978 771 1,197 831 366
40203000 Kolasib (NT) Urban 3,174 1,542 1,632 9,605 5,393 4,212 6,645 4,447 2,198
40204000 N.Kawnpui (NT) Urban 1,176 585 591 3,592 1,951 1,641 2,875 1,808 1,067

PRIMARY CENSUS ABSTRACT 69
CENSUS ABSTRACT
Industrial category of main workers
Household industry Totall DistrictIRD Cultivators Agricultural labourers workers Other workers Rural/ BlocklU.A.!
Persons Males Females Persons Males Females Persons Males Females Persons Males Females Urban CitylTown
30 31 32 33 34 35 36 37 38 39 40 41 3 2
16,881 10,120 6,761 1,051 656 395 310 242 68 9,199 7,001 2,198 Total Kolasib *
10,126 6,132 3,994 353 225 128 97 73 24 2,722 2,227 495 Rural
6,755 3,988 2,767 698 431 267 213 169 44 6,477 4,774 1,703 Urban
8,506 5,209 3,297 274 183 91 81 59 22 1,929 1,626 303 Total, North Thingdawl
8,506 5,209 3,297 274 183 91 81 59 22 1,929 1,626 303 Rural
Urban
1,620 923 697 79 42 37 16 14 2 793 601 192 Total Tlangnuam
1,620 923 697 79 42 37 16 14 2 793 601 192 Rural (Part)
Urban
URBAN
1,817 968 849 191 99 92 27 21 6 1,391 1,188 203 Urban Vairengte (NT)
639 422 217 162 115 47 4 4 392 290 102 Urban Bairabi (NT)
2,375 1,459 916 307 189 118 158 126 32 3,805 2,673 1,132 Urban Ko1asib (NT)
1,924 1,139 785 38 28 10 24 18 6 889 623 266 Urban N.Kawnpui (NT)

90 DISTRICT CENSUS HANDBOOK: KOLASIB
DISTRICT PRIMARY
Industrial category
Location Totall code DistrictIRD Block:! Rural! Marginal workers Cultivators Agricultural labourers
number U.A.lCityfTown Urban Persons Males Females Persons Males Females Persons Males Females
2 3 42 43 44 45 46 47 48 49 50
02 Kolasib • Total 8,069 2,243 5,826 3,526 894 2.632 2,122 669 1,453
Rural 3,217 768 2,449 2,025 486 1,539 675 ISS 520
Urban 4,852 1,475 3,377 1,501 408 1,093 1.447 514 933
0001 North Thingdawl Total 2,543 553 1,990 1,695 389 1,306 535 104 431
Rural 2,543 553 1,990 )'695 389 1,306 535 104 431
Urban
0090 Tlangnuam (Part) Total 674 215 459 330 97 233 140 51 89
Rural 674 215 459 330 97 233 140 51 89
Urban
URBAN
4020 I 000 Vairengte (NT) Urban 623 239 384 221 77 144 310 125 185
40202000 Bairabi (NT) Urban 552 147 405 223 52 171 192 56 136
40203000 Kolasib (NT) Urban 2,960 946 2,014 667 207 460 832 317 515
40204000 N.Kawnpui (NT) Urban 717 143 574 390 72 318 113 16 97

PRIMARY CENSUS ABSTRACT 91
CENSUS ABSTRACT
of marginal workers Household industry Total! Location
workers Other workers Non-workers Rural! DistrictIRD Block! code Persons Males Females Persons Males Females Persons Males Females Urban U.A.lCitylTown number
51 52 53 54 55 56 57 58 59 3 2
95 35 60 2,326 645 1,681 30,450 14,300 16,150 Total Kolasib • 02
27 9 18 490 U8 372 12,946 6,136 6,810 Rural
68 26 42 1,836 527 1,309 17,504 8,164 9,340 Urban
24 7 17 289 53 236 . 11,214 5,296 5,918 Total North Thingdawl 0001
24 7 17 289 53 236 11,214 5,296 5,918 Rural
Urban
2 201 65 136 1,732 840 892 Total Tlangnuam (Part) 0090
3 2 201 65 136 1,732 840 892 Rural
Urban
URBAN
16 6 10 76 31 4S 3,666 1,713 1,953 Urban Vairengtc (NT) 40201000
2 135 38 97 1,555 756 799 Urban Bairabi (NT) 40202000
44 17 27 1,417 405 1,012 9,403 4,368 5,035 Urban Kolasib (NT) 40203000
6 2 4 208 53 155 2,880 1,327 1,553 Urban N.Kawnpui (NT) 40204000
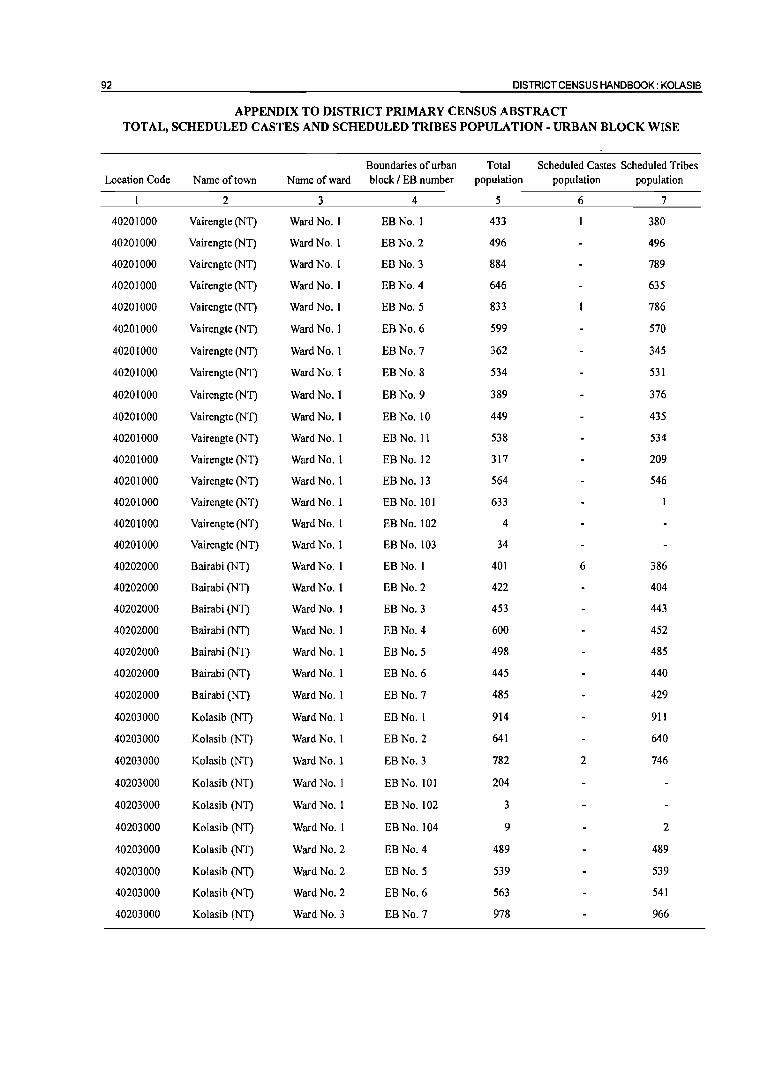
92 DISTRICT CENSUS HANDBOOK: KOLASIB
APPENDIX TO DISTRICT PRIMARY CENSUS ABSTRACT TOTAL, SCHEDULED CASTES AND SCHEDULED TRIBES POPULATION - URBAN BLOCK WISE
Boundaries of urban Total Scheduled Castes Scheduled Tribes Location Code Name of town Name of ward block I EB number population population population
2 3 4 5 6 7
40201000 Vairengte (NT) Ward No. I EBNo.1 433 380
40201000 Vairengte (NT) Ward No.1 EB No.2 496 496
40201000 Vairengte (NT) Ward No. I EB No.3 884 789
40201000 Vairengte (NT) Ward No. I EBNo.4 646 635
40201000 Vairengte (NT) Ward No. I EB No.5 833 786
40201000 Vairengte (NT) Ward No. I ED No.6 599 570
40201000 Vairengte (NT) Ward No. I ED No.7 362 345
40201000 Vairengte (NT) Ward No.1 ED No. 8 534 531
40201000 Vairengte (NT) Ward No.1 ED No. 9 389 376
40201000 Vairengte (NT) Ward No.1 ED No. 10 449 435
40201000 Vairengte (NT) Ward No. 1 EB No. 11 538 534
40201000 Vairengte (NT) Ward No. 1 ED No. 12 317 209
40201000 Vairengte (NT) Ward No. 1 ED No. 13 564 546
40201000 Vairengte (NT) Ward No.1 ED No. 101 633
40201000 Vairengte (NT) Ward No.1 ED No. 102 4
40201000 Vairengte (NT) Ward No. 1 ED No. 103 34
40202000 Bairabi (NT) Ward No. 1 ED No. 1 401 6 386
40202000 Dairabi (NT) Ward No. 1 EB No.2 422 404
40202000 Bairabi (NT) Ward No.1 ED No.3 453 443
40202000 Dairabi (NT) Ward No.1 ED No. 4 600 452
40202000 Bairabi (NT) Ward No. 1 ED No.5 498 485
40202000 Dairabi (NT) Ward No. 1 ED No.6 445 440
40202000 Dairabi (NT) Ward No.1 ED No.7 485 429
40203000 Kolasib (NT) Ward No.1 ED No. 1 914 911
40203000 Kolasib (NT) Ward No. 1 ED No.2 641 640
40203000 Kolasib (NT) Ward No. I EB NO.3 782 2 746
40203000 Kolasib (NT) Ward No. 1 ED No. 101 204
40203000 Kolasib (NT) Ward No. 1 EB No. 102 3
40203000 Kolasib (NT) Ward No. 1 EBNo.104 9 2
40203000 Kolasib (NT) Ward No. 2 ED No. 4 489 489
40203000 Kolasib (NT) Ward No. 2 ED No.5 539 539
40203000 Kolasib (NT) Ward No.2 EB No.6 563 541
40203000 Kolasib (NT) Ward No. 3 EB NO.7 978 966

PRIMARY CENSUS ABSTRACT 93
APPENDIX TO DISTRICT PRIMARY CENSUS ABSTRACT TOTAL, SCHEDULED CASTES AND SCHEDULED TRIBES POPULATION - URBAN BLOCK WISE
Boundaries of urban Total Scheduled Castes Scheduled Tribes Location Code Name of town Name of ward block I EB number population population population
2 3 4 5 6 7
40203000 Kolasib (NT) Ward No.3 EB No.8 789 788
40203000 Kolasib (NT) Ward No. 3 EB No.9 600 569
40203000 Kolasib (NT) Ward No. 3 EBNo.IO 540 516
40203000 Kolasib (NT) Ward No. 4 EBNo. II 754 718
40203000 Kolasib (NT) Ward No.5 EBNo.12 584 519
40203000 Kolasib (NT) Ward No. 5 EB No. 13 616 591
40203000 Kolasib (NT) Ward No.5 EBNo.14 942 879
40203000 Kolasib (NT) Ward No. 5 EB No. 15 678 589
40203000 Kolasib (NT) Ward No. 5 EB No. 16 869 839
40203000 Kolasib (NT) Ward No. 5 EB No. 17 671 641
40203000 Kolasib (NT) Ward No. 5 EBNo.18 504 486
40203000 Kolasib (NT) Ward No. 6 EB No. 19 869 687
40203000 Kolasib (NT) Ward No. 6 EB No. 20 811 788
40203000 Kolasib (NT) Ward No. 6 EBNo.21 527 447
40203000 Kolasib (NT) Ward No. 6 EBNo.22 712 2 613
40203000 Kolasib (NT) Ward No.7 EB No. 23 509 508
40203000 Kolasib (NT) Ward No.7 EBNo.24 724 602
40203000 Kolasib (ND Ward No.8 EB No. 25 927 869
40203000 Kolasib (NT) Ward No.9 EB No. 26 796 679
40203000 Kolasib (NT) Ward No. 9 EBNo.27 334 196
40203000 Kolasib (NT) Ward No.9 EB No. 103 130
40204000 N.Kawnpui (NT) Ward No. I EBNo.l 727 693
40204000 N.Kawnpui (NT) WardlNo. I EBNo.2 594 577
40204000 N.Kawnpui (NT) Ward No. I EB No.3 450 417
40204000 N.Kawnpui (NT) Ward No. I EB No.4 526 526
40204000 N.Kawnpui (NT) Ward No. I EB No.5 653 646
40204000 N.Kawnpui (NT) Ward No. I EBNo.6 278 278
40204000 N.Kawnpui (NT) Ward No. I EB No.7 752 728
40204000 N.Kawnpui (NT) Ward No. I EB No.8 489 488
40204000 N.Kawnpui (NT) Ward No. I EB No. 104 146
40204000 N.Kawnpui (NT) Ward No.2 EB No.9 479
40204000 N.Kawnpui (NT) Ward No. 2 EB No. 10 337 335
40204000 N.Kawnpui (NT) Ward No. 2 EBNo.11 508 481
40204000 N.Kawnpui (NT) Ward No.2 EBNo.12 533 229

94 DISTRICT CENSUS HANDBOOK: KOLASIB
PRIMARY CENSUS ABSTRACT
Number of households Total population (including
Location Totall with at least one institutional and houseless Population in the
code DistrictIRD Rural! Scheduled Caste population) age-group 0-6
number Blockffown Urban member Persons Males Females Persons Males Females
2 3 4 5 6 7 8 9 10
02 Kolasib • Total 9 17 8 9
Rural 3 5 3 2
Urball 6 12 5 7
0001 North Thingdawl Total 3 5 3 2
Rural 3 5 3 2
Urban
URBAN
40201000 Vairengte (NT) Urban 2 2 2
40202000 Bairabi (NT) Urban 2 6 3 3
40203000 Kolasib (NT) Urban 2 4 2 2

PRIMARY CENSUS ABSTRACT 95
FOR SCHEDULED CASTES
Total! Literates Illiterates Total workers Rural!
Persons Males Females Persons Males Females Persons Males Females Urban DistrietIRD BlockITown
II 12 13 14 15 16 17 18 19 3 2
17 8 9 8 5 3 Total Kolasib *
5 3 2 3 3 Rural
12 5 7 5 2 3 Urban
5 3 2 3 3 Total North Thingdawl
5 3 2 3 3 Rural
Urban
URBAN
2 2 Urban Vairengte (NT)
6 3 3 2 Urban Bairabi CNn 4 2 2 2 Urban Kolasib (NT)

96
Location code
number DistrictIRD Blockfrown
2
02 Kolasib *
000 I North Thingdawl
URBAN
4020 I 000 Vairengte (NT)
40202000 Bairabi (NT)
40203000 Kolasib (NT)
Total! Rural/ Urban
3
Total
Rural
Urban
Total
Rural
Urban
Urban
Urban
Urban
DISTRICT CENSUS HANDBOOK: KOLASIB
PRIMARY CENSUS ABSTRACT
Industrial category
Main workers Cultivators Agricultural labourers
Persons Males Females Persons Males Females Persons Males Females
20 21 22 23 24 25 26 27 28
6 5
3 3
3 2
3 3
3 3

PRIMARY CENSUS ABSTRACT
FOR SCHEDULED CASTES
of main workers
Other workers Household industry workers
Persons Males Females Persons Males Females
29 30 31 32 33 34
5 4
3 3
2
3 3
3 3
97
Total! Marginal workers Rural!
Persons Males Females Urban DistrictIRD BlockITown
35 36 37 3 2
2 2 Total Kolasib •
Rural
2 2 Urban
Total North Thingdawl
Rural
Urban
URBAN
Urban Vairengte (NT)
Urban Bairabi (NT)
Urban Kolasib (NT)

98
Location code
number DistrictIRD Blockffown
2
02 Kolasib *
000 I North Thingdawl
URBAN
40201000 Vairengte (NT)
40202000 Bairabi (NT)
40203000 Kolasib (NT)
DISTRICT CENSUS HANDBOOK: KOLASIB
PRIMARY CENSUS ABSTRACT
Totall Industrial category Rurall Household mdustry Urban Cultivators Agricultural labourers workers
Persons Males Females Persons Males Females Persons Males Females
3 38 39 40 41 42 43 44 45 46
Total
Rural
Urban
Total
Rural
Urban
Urban
Urban
Urban

PRIMARY CENSUS ABSTRACT 99
FOR SCHEDULED CASTES
of marginal workers Total! Location
Other workers Non-workers Rural/ code Persons Males Females Persons Males Females Urban DistrictIRD Blockf[own number
47 48 49 50 51 52 3 2
9 J 6 Total Kolasib • 02
2 2 Rural
7 J 4 Urban
2 2 Total North Thingdawl 0001
2 2 Rural
Urban
URBAN
Urban Vairengte (NT) 40201000
4 2 2 Urban Bairabi (NT) 40202000
2 Urban Kolasib (NT) 40203000

100 DISTRICT CENSUS HANDBOOK: KOLASIB
PRIMARY CENSUS ABSTRACT
Number of Total population (including
Location TotaV households with at institutional and houseless Population in the
code DistrictIRD Block! RuraV least one Scheduled population) age-group 0-6
number Town Urban Tribe member Persons Males Females Persons Males Females
2 3 4 5 6 7 8 9 10
02 Kolasib • Total 11,480 59,221 30,173 29,048 9,600 4,858 4,742
Rural 5,201 26,793 13,815 12,978 4,681 2,372 2,309
Urban 6,279 32,428 16,358 16,070 4,919 2,486 2,433
0001 North Thingdawl Total 4,208 22,085 11,346 10,739 3,964 2,000 1,964
Rural 4,208 22,085 11,346 10,739 3,964 2,000 1,964
Urban
0090 Tlangnuam (Part) Total 993 4,708 2,469 2,239 717 372 345
Rural 993 4,708 2,469 2,239 717 372 345
Urban
URBAN
40201000 Vairengte (NT) Urban 1,255 6,633 3,396 3,237 1,152 596 556
40202000 Bairabi (NT) Urban 582 3,039 1,564 1,475 599 307 292
40203000 Kolasib (NT) Urban 3,323 17,358 8,723 8,635 2,373 1,200 1,173
40204000 N.Kawnpui (NT) Urban 1,119 5,398 2,675 2,723 795 383 412

PRIMARY CENSUS ABSTRACT 101
FOR SCHEDULED TRIBES
Total! Literates Illiterates Total workers Rural!
Persons Males Females Persons Males Females Persons Males Females Urban DistrictIRD Blockffown
II 12 13 14 15 16 17 18 19 3 2
46,324 24,026 22,298 12,897 6,147 6,750 31,326 16,991 14,335 Total Kolasib •
19,987 10,578 9,409 6,806 3,237 3,569 14,760 8,089 6,671 Rural
26,337 13,448 12,889 6,091 2,910 3,181 16,566 8,902 7,664 Urban
16,213 8,580 7,633 5,872 2,766 • 3,106 11,733 6,444 5,289 Total North Thingdawl
16,213 8,580 7,633 5,872 2,766 3,106 11,733 6,444 5,289 Rural
Urban
3,774 1,998 1,776 934 471 463 3,027 1,645 1,382 Total Tlangnuam (Part)
3,774 1,998 1,776 934 471 463 3,027 1,645 1,382 Rural
Urban
URBAN
5,023 2,617 2,406 1,610 779 831 3,283 1,811 1,472 Urban Vairengte (NT)
2,316 1,220 1,096 723 344 379 1,590 857 733 Urban Bairabi (NT)
14,495 7,361 7,134 2,863 1,362 1,501 8,663 4,663 4,000 Urban Kolasib (NT)
4,503 2,.250 2,253 895 425 470 3,030 1,571 1,459 Urban N.Kawnpui (NT)

102 DISTRICT CENSUS HANDBOOK: KOLASIB
PRIMARY CENSUS ABSTRACT
Industrial category
Location Total/ code DistrictIRD Block! Rural! Main workers Cultivators Agricultural labourers
number Town Urban Persons Males Females Persons Males Females Persons Males Females
2 3 20 21 22 23 24 25 26 27 28
02 Kolasib * Total 23,939 14,915 9,024 16,234 9,640 6,594 806 478 328
Rural 11,956 7,420 4,536 9,764 5,830 3,934 180 92 88
Urban 11,983 7,495 4,488 6,470 3,810 2,660 626 386 240
0001 North Thingdawl Total 9,602 5,990 3,612 8,168 4,928 3,240 103 52 51
Rural 9,602 5,990 3,612 8,168 4,928 3,240 103 52 51
Urban
0090 Tlangnuam (Part) Total 2,354 1,430 924 1,596 902 694 77 40 37
Rural 2,354 1,430 924 1,596 902 694 77 40 37
Urban
URBAN
40201000 Vairengte (NT) Urban 2,692 1,583 1,109 1,775 946 829 181 95 86
40202000 Bairabi (NT) Urban 1,072 714 358 624 409 215 148 103 45
40203000 Kolasib (NT) Urban 5,824 3,754 2,070 2,341 1,438 903 270 168 102
40204000 N.Kawnpui (NT) Urban 2,395 1,444 951 1,730 1,017 713 27 20 7

PRIMARY CENSUS ABSTRACT 103
FOR SCHEDULED TRIBES
of main workers
Total! Household industry workers Other workers Marginal workers Rural! Persons Males Females Persons Males Females Persons Males Females Urban DistrictIRD BlockITown
29 30 31 32 33 34 35 36 37 3 2
255 187 68 6,644 4,610 2,034 7,387 2,076 5,311 Total Kolasib •
93 69 24 1,919 1,429 490 2,804 669 2,135 Rural
162 118 44 4,725 3,181 1,544 4,583 1,407 3,176 Urban
79 57 22 1,252 953 . 299 2,131 454 1,677 Total North Thingdawl
79 57 22 1,252 953 299 2,131 454 1,677 Rural
Urban
14 12 2 667 476 191 673 215 458 Total Tlangnuam (Part)
14 12 2 667 476 191 673 215 458 Rural
Urban
URBAN
21 15 6 715 527 188 591 228 363 Urban Vairengte (ND
2 2 298 200 9& 518 143 375 Urban Bairabi (NT)
120 88 32 3,093 2,060 1,033 2,839 909 1,930 Urban Kolasib (NT)
19 13 6 619 394 225 635 127 508 Urban N,Kawnpui (NT)

104 DISTRICT CENSUS HANDBOOK: KOLASIB
PRIMARY CENSUS ABSTRACT
Industrial category
Location TotaU Household industry
code Rural! Cultivators Agricultural labourers workers
number DistrictIRD Blockffown Urban Persons Males Females Persons Males Females Persons Males Females
2 3 38 39 40 41 42 43 44 45 46
02 Kolasib • Total 3,298 831 2,467 1,905 608 1,297 89 34 55
Rural 1,879 444 1,435 508 108 400 23 9 14
Urban 1,419 387 1,032 1,397 500 897 66 25 41
0001 North Thingdawl Total 1,549 347 1,202 369 57 312 20 7 13
Rural 1,549 347 1,202 369 57 312 20 7 J3
Urban
0090 Tlangnuam (Part) Total 330 97 233 139 51 &8 3 2
Rural 330 97 233 139 51 88 3 2
Urban
URBAN
40201000 Vairengte (NT) Urban 216 76 140 292 118 174 16 6 10
40202000 Bairabi (NT) Urban 208 51 157 174 53 121 2
40203000 Kolasib (NT) Urban 640 197 443 823 314 509 43 16 27
40204000 N.Kawnpui (NT) Urban 355 63 292 108 15 93 5 2 3

PRIMARY CENSUS ABSTRACT 105
FOR SCHEDULED TRIBES
of marginal workers
Total! Location Other workers Non-workers Rural! code
Persons Males Females Persons Males Females Urban DistrictfRD BlockITown number
47 48 49 50 51 52 3 2
2,095 603 1,492 27,895 13,182 14,713 Total Kolasib • 02
394 108 286 12,033 5,726 6,307 Rural
1,701 495 1,206 15,862 7,456 8,406 Urban
193 43 150 10,352 . 4,902 5,450 Total North Thingdawl 0001
193 43 150 10,352 4,902 5,450 Rural
Urban
201 65 136 1,681 824 857 Total T1angnuam (Part) 0090
201 65 136 1,681 824 857 Rural
Urban
URBAN
67 28 39 3,350 1,585 1,765 Urban Vairengte (NT) 40201000
134 38 96 1,449 707 742 Urban Bairabi (NT) 40202000
1,333 382 951 8,695 4,060 4,635 Urban Kolasib (NT) 40203000
167 47 120 2,368 1,104 1,264 Urban N.Kawnpui (NT) 40204000

106 DISTRICT CENSUS HANDBOOK: KOLASIS
Location code
Name of ViUageffownl
Total Population Area (including institutional and
in Total houseless population)
number Ward Hectares households Persons Males Females
2
0001
0001
North Thingdawl (Total)
North Thingdawl (Rural)
0001 North Thingdawl (Urban)
North Thingdawl (Rural)
00012400 Phainuam
00012500 Saihapui V
00012600 Chite
00012700 Vakultui
00012800 N.Chhimluang
00012900 Phaizau
00013000 Saiphai
00013100 Saipum
00013200 N.Chawnpui
00013300 Chemphai
00013400 Bilkhawthlir
00013500 Phaisen
00013600 Buhchangphai
00013700 Zambira
00013800 N.Thinglian
00013900 Bukvannei
00014000 Saihapui K
00014100 Builum
00014200 Pualrang
00014300 Parsenchhip
00014400 Theichangbung
00014500 N.Hlimen
00014600 Thingthelh
00014700 Dilzau T
00014800 N.Thingdawl
00014900 Pangba1kawn
00015000 S.Chhimluang
00015100 Hmalbialaveng
00015200 Asproveng
00015300 Meidum
00015400 Rajtali
00015500 Dilzau H
00015600 Hortoki
00015700 Lelhchhun
00015800 Sethawn
00015900 Saizawl
00016000 Bukpui
00016100 N.Chaltlang
00016200 N.Mualvum
00016300 Zan lawn
00016400 Dumkhel
3 4
5.108
5,108
184
40
43
11
45
5
24,547
24,547
888
225
245
70
186
6
12.926
12,926
454
114
123
34
93
-----Un-inhabited-----
331 1,483
359
64
14
914
85
117
1,546-
340 48
4,084
412
677
802
852
179
23
2,133
212 353
----Un-inhabited-----
43 258
31
70
70
158
311
371
141
84
164
183
-----Un-inhabited-----
21 124 62
----Un-inhabited-----
342 1,074
99 513
637 268
----Un-inhabitedl-----
569 2,806
113 587
62 355
423
----Un-inhabited,-----
71
1,424
312
189
222
144
34 773
159 87
2,225
----Un-inhabitedl-----
15
379
406
83 40
1,138
48 222 147
----Un-inhabitedl-----
190 996
164 859
241 1,096
195 946
510 467 600
477
----Un-inhabited-----
7
11,621
11,621
434 III
122
36
93
681
694
161
25
1,951
200
324
117
74
147 188
62
437
245
1,382
275 166
201
367
76
47
1,087
75
486
392 496
469
VILLAGE PRIMARY RDBLOCK-
Population 0-6
Persons Males Females
8
4,454
4,454
153
37 59
17
42
270
271
67
12
600 62
107
60 29
79
79
33
166
96
407 156
63
105
193 33 26
426
29
160
166
286
165
9
2.242
2,242
70
18
29
6
19
143
140
32
3
311
31
57
31
15
41
41
14
87
52
205
84
31
51
93 18
II
212
9
76
85
149
78
10
2.212
2,212
83
19
30
11
23
127
131
35
9
289
31
50
29
14
38
38
19
79 44
202
72
2
54
100
15
IS
214
20
84
81
137
87

PRIM4.RY CEr;lSUSABSTRACT 107
CENSUS ABSTRACT NORTHTHINGDAWL
Name of Scheduled Castes Scheduled Castes Literates ViUage!fown!
Persons Males Females Persons Males Females Persons Males Females Ward
11 12 13 14 15 16 17 18 19 2
5 3 2 22,085 11,346 10,739 17,127 9,237 7,890 North Thingdawl (Total)
5 3 2 22,085 11,346 10,739 17,127 9,237 7,890 North Thingdawl (Rural)
- North' Thingdawl (Urban)
North Thingdawl (Rural)
833 407 426 592 325 267 Phainuam
165 81 84 130 69 61 Saihapui V
22 IS 7 Chite
8 7 I Vakultui
186 93 93 112 62 50 N.Chhimluang
Un-inhabited Phaizau
1,384 709 675 1,081 580 501 Saiphai
1,415 731 684 1,048 570 478 Saipum
340 179 161 242 134 108 N.Chawnpui
46 21 25 26 14 12 Chemphai
3 2 3,817 1,917 1,900 3,268 1,695 1,573 Bilkhawthlir
404 207 197 312 166 146 Phaisen
677 353 324 472 255 217 Buhchangphai
Un-inhabited Zambira
224 121 103 21 19 2 N.Thinglian
136 74 62 81 50 31 Bukvannei
280 143 137 148 96 52 Saihapui K
371 183 188 274 134 140 Builum
Un-inhabited Pualrang
124 62 62 30 23 7 Parsenchh ip
Un-inhabited Theichangbung
852 443 409 759 436 323 N.Hlimen
488 250 238 354 192 162 Thingthelh
Un-inhabited Dilzau T
2,766 1,398 1,368 2,245 1,147 1,098 N.Thingdawl
413 217 196 262 157 lOS Pangbalkawn
355 189 166 89 67 22 S.Chhimluang
274 144 130 Hmalbialaveng
Un-inhabited Asproveng
433 224 209 344 197 147 Meidum
159 83 76 86 51 35 Rajtali
25 14 II 44 24 20 Dilzau H
2,222 1,135 1,087 1,736 908 828 Hortoki
Un-inhabited Lelhchhun
211 142 69 185 134 51 Seth awn
Un-inhabited Saizawl
990 507 483 760 401 359 Bukpui
844 455 389 617 348 269 N.Chalt1ang
2 990 536 454 801 448 353 N.Mualvum
935 472 463 704 369 335 Zanlawn
Un-inhabited Dumkhel

108
Illiterates Location
code
number
Name of Village!fownl
Ward Persons Males Females
001
0001
2
N. Thingdawl (Total)
N. Thingdawl (Rural)
0001 N. Thingdawl (Urban)
N. Thingdawl (Rural)
00012400 Phainuam
00012500 Saihapui V
00012600 Chite
00012700 Vakultui
00012800 N.Chhimluang
20
7,420
7,420
296
95
223
62 74
21
3,689 3,689
129
45
108
27
31
22
3,731
3,731
167
50
115
35
43
00012900 Phaizau ----Un-inhabited-----
00013000 Saiphai 402
00013100 Saipum 498
00013200 N.Chawnpui 98
00013300 Chemphai 22
00013400 Bilkhawthlir 816
000 \3500 Phaisen 100
00013600 Buhchangphai 205
222
282 45
9
438
46
98
180
216
53
13
378
54 107
00013700 Zambira ----Un-inhabited-----
00013800 N.Thinglian 237
00013900 Bukvannei 77
00014000 Saihapui K 163
00014100 Builum 97
122
34
68 49
115
43 95
48 00014200 Pualrang Un-inhabited-----
00014300 Parsenchhip 94 39 55
00014400 Theichangbung ----Un-inhabited-----
00014500 N.Hlimen 315 201
00014600 Thinglhelh 159 76
114
83 00014700 Dilzau T Un-inhabited-----
00014800 N.Thingdawl 561 277
00014900 Pangbalkawn 325 155
00015000 S.Chhimluang 266 122
00015100 Hmaibialaveng 149 78
284 170 144
71 00015200 Asproveng Un-inhabited-----
00015300 Meidum 429 209
00015400 Rajtali 73 32 00015500 Dilzau H 43 16
00015600 Hortoki 489 230
220
41 27
259
00015700 Lelhchhun Un-inhabitedl-----
00015800 Seth awn 37 13 24
00015900 Saizawl Un-inhabited-----
00016000 Bukpui 236
00016100 N.Chaltlang 242
00016200 N.Mualvum 295
00016300 Zanlawn 242
109 119
152 108
127 123
143
134
00016400 Dumkhel ----Un-inhabited-----
DISTRICT CENSUS HANDBOOK: KOLASIB
Total workers
Persons Males Females
23
13,333
13,333
457
126
141
45
107
716
892 190
24
2,003
263
374
157 87
170 214
66
692 300
1,449 402
256
204
506
105 53
1,204
93
609
506 319 603
24
7,630
7,630
240
62 78
23
63
432
523 103
16
1,226
143
191
86 46
95
109
33
453 161
808
211
140 113
273 56 27
628
55
337
285
294 320
25
5,703
5,703
217
64
63
22 44
284
369
87
8
777
120
183
71 41
75
105
33
239
139
641 191 116 91
233 49 26
576
38
272
221
25 283
VILLAGE PRIMARY RDBLOCK-
Main workers
Persons Males Females
26
10,790
10,790
330
95
72
23
78
667
877
188 20
1,684
194 334
157
70
170 214
58
635
290
1,224 200
189
103
276
85 35
850
62
399
506
291
414
27
7,077
7.077
229
57
59
15
54
422
515 103
15 1,148
135
190
86 42
95 109
32
433 158
771
158
105 101
213
51 22
582
46
271 285
287 288
28
3,713
3,713
101
38
13
8
24
245
362
85
5
536
S9
144
71
28 75
105
26
202 132
453 42
84 2
63
34 13
268
16
128
221
4
126
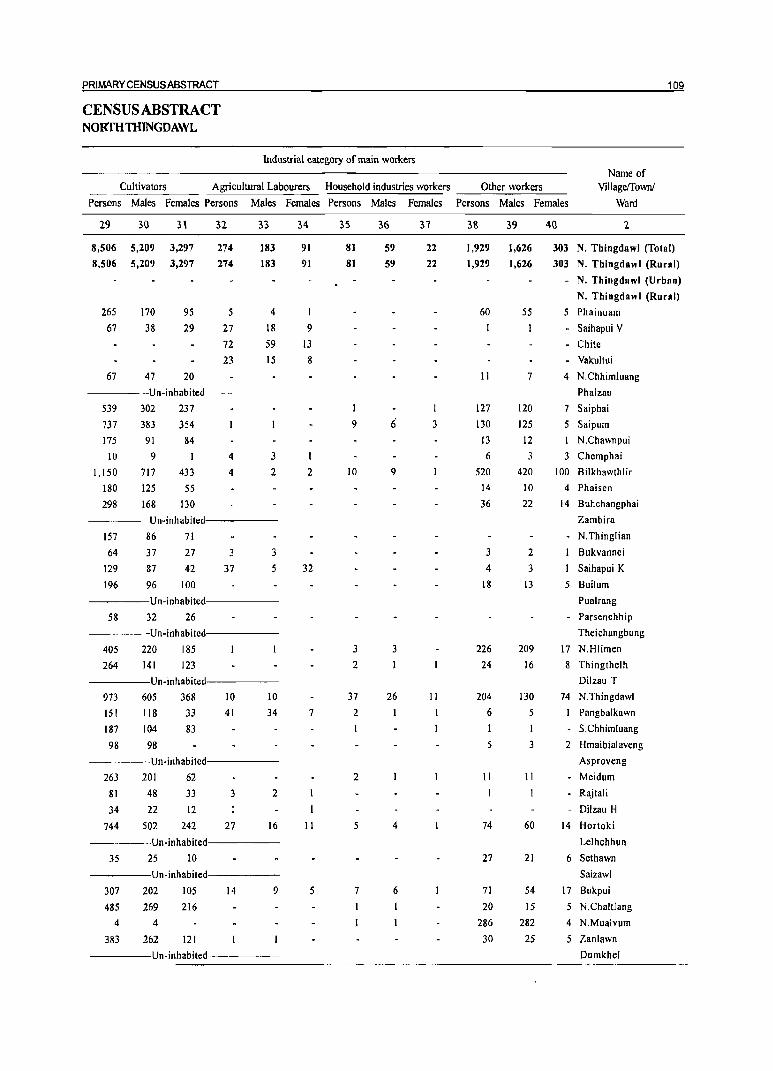
PRIMARY CENSUS ABSTRACT
CENSUS ABSTRACT NORfHTHINGDAWL
109
Industrial category of main workers
Cultivators Agricultural Labourers Household industries workers Other workers ----=-=.::.:....;_==--_ Name of
Villageffownl
Ward Persons Males Females Persons Males Females Persons Males Females Persons Males Females
29 30 3\
8,506 5,209 3,297 8,506 5,209 3,297
265
67
67
170
38
47
95 29
20
32
274 274
5
27 72
23
33
183
183
4
18
59 15
----Un-inhabited-----
539
737 175
10
1,150
180
298
302 237 383 354
91 84 9
717
125
168
433
55
130
4
4
3
2
----Un-inhabited-----
157 64
129 196
86
37 87
96
71
27 42
100
3
37 3
5
----Un-inhabited-----
58 32 26 ----Un-inhabited-----
405 264
220 141
185
123 ----Un-inhabited:-----
605 368 118 33
104 83
10
41
10
34 973 151
187 98 98
----Un-inhabited-----
263 81
34
744
201 62
48 33 22 12
502 242
3
I
27
2
16
----Un-inhabited,-----
35 25 10
----Un-inhabited,-----
307 485
4
383
202
269 4
262
105
216
121
14 9
----Un-inhabitedl-----
34
91 91
I
9
13 8
2
32
7
11
5
35
81
81
I
9
10
3
2
37 2
2
5
7
36
59 S9
9
3
26
4
6
37
22 22
1
3
II
38 39
1,929 1,626 1,929 1,626
60
11
127
130 13
6
520 14 36
3
4
18
226
24
204
6
1
5
II
74
27
71
20
286
30
55
7
120
125
12
3
420 10
22
2
3
13
209
16
130
5
I
3
11
60
21
54
15
282
25
40 2
303 N. Thingdawl (Total)
303 N. Thingdawl (Rural)
- N. Thingdawl (Urban)
N. Thingdawl (Rural)
5 Phainuam
- Saihapui V
- Chite
- Vakultui
4 N.ChhimIuang
Phaizau
7 Saiphai
5 Saipum
I N.Chawnpui
3 Chemphai
100 Bilkhawthlir
4 Phaisen
14 Buhchangphai
Zambira
- N.Thinglian
Bukvannei
1 Saihapui K
5 Builum
Pualrang
- Parsenchhip
Theichangbung
17 N.Hlimen
8 Thingthelh
Dilzau T
74 N.Thingdawl
Pangbalkawn
- S.Chhimluang
2 Hmaibialaveng
Asproveng
- Meidum
- Rajtali
Dilzau H
14 Hortoki
Lelhchhun
6 Sethawn
Saizawl
17 Bukpui
5 N.Chaltlang
4 N.Mualvum
5 Zanlawn
Dumkhel

110 DISTRICT CENSUS HANDBOOK: KOLASIB
VILLAGE PRIMARY RDBLOCK-
Industrial category of marginal workers Location
code Name of
Villageffown/ Marginal workers Cultivators Agricultural labourers
number Ward Persons Males Females Persons Males Females
0001 0001
0001
2 41
N. Thiogdawl (Total) 2,543
N. Thiogdawl (Rural) 2,543
N. Thiogdawl (Urban)
N. Thiogdawl (Rural)
00012400 Phainuam 127
00012500 SaihapuiV 31
00012600 Chite 69
00012700 Vaku1tui 22
00012800 N.Chhim1uang 29
42
553
553
11
5
19
8
9
43
1.990
1,990
116
26
50
14
20
00012900 Phaizau ----Un-inhabited-----
00013000 Saiphai 49
00013100 Saipum IS
00013200 N.Chawnpui 2
00013300 Chemphai 4
00013400 Bilkhawthlir 319
00013500 Phaisen 69
00013600 Buhchangphai 40
10 8
1
78
8
I
39
7
2
3
241
61
39
00013700 Zambira Un-inhabited-----
00013800 N.Thinglian
00013900 Bukvannei
00014000 Saihapui K
00014100 Builum
17 4 13
00014200 Pualrang ----Un-inhabited-----
00014300 Parsenchhip 8 7
00014400 Theichangbung Un-inhabited-----
00014500 N.Hlimen 57
00014600 Thingthe1h 10
20
3
37
7
00014700 Dilzau T ----Un-inhabite:d------
00014800 N.Thingdawl 225
00014900 Pangbalkawn 202
00015000 S.Chhimluang 67
37
53
35
00015100 Hmaibialaveng 101 12
188
149
32
89
00015200 Asproveng ----Un-inhabitedi-----
00015300 Meidum 230
00015400 Rajtali 20
00015500 Dilzau H 18
00015600 Hortoki 354
60
5
5
46
170
15
13
308
00015700 Lelhchhun ----Un-inhabitedl-----
00015800 Sethawn 31 9 22
00015900 Saizawl Un-inhabited-----
00016000 Bukpui 210 66 00016100 N.Chaltlang
00016200 N.Mualvum 28 7
000 16300 Zanlawn 189 32
00016400 Dumkhel ----Un~inhabited
144
21
157
44
1,695
1,695
121
23
27
47 3
2
270
68
38
16
8
53
100
147
61
230
8
146
174
2
150
45
389
389
10 4
7
10
3
69
7
3
20
18
40
33
60
25
53
22
46
1,306 1,306
III
19
20
37
2
201
61
37
13
7
33
82
107
28
170
7
121
121
128
Persons
47
535
535
5
8
69
22
3
2
76
53
2
12
18
195
30
34
3
Males Females
48
104
104
19
8
10
13
4
17
9
12
2
49
431
431
5
7
50
14
2
2
66 40
8
13
178
21
22

PRIMARY CENSUS ABSTRACT 111
CENSUS ABSTRACT NORIHTHINGDAWL
Industrial category of marginal workers Name of
Household industries workers Other workers Non-workers Village!fown!
Persons Males Females Persons Males Females Persons Males Females Ward
50 51 52 53 54 55 56 57 58 2
24 7 17 289 53 236 11,214 5,296 5,918 N. Thingdawl (Total)
24 7 17 289 53 236 11,214 5,296 5,918 N. Thingdawl (Rural)
N. Thingdawl (Urban)
N. Thingdawl (Rural)
431 214 217 Phainuam
99 52 47 Saihapui V
104 45 59 Chite
25 II 14 Vakultui
2 2 79 30 49 N.Chhimluang
Un-inhabited Phaizau
2 2 767 370 397 Saiphai
5 3 2 4 3 654 329 325 Saipum
150 76 74 N.Chawnpui
4 3 24 7 17 Chemphai
3 2 45 8 37 2,081 907 1,174 Bilkhawthlir
149 69 80 Phaisen
303 162 141 Buhchangphai
Un-inhabited Zambira
101 55 46 N.Thinglian
71 38 33 Bukvannei
141 69 72 Saihapui K
157 74 83 Builum
Un-inhabited Pualrang
58 29 29 Parsenchhip
Un-inhabited Theichangbung
2 2 382 184 198 N.Hlimen
10 3 7 213 107 106 Thingthelh
Un-inhabited Dilzau T
6 5 43 8 35 1,357 616 741 N.Thingdawl
I 185 101 84 Pangbalkawn
6 2 4 99 49 50 S.Chhimluang
3 3 95 10 85 219 109 110 Hmaibialaveng
Un-inhabited Asproveng
267 133 134 Meidum
54 27 27 Rajtali
34 13 21 Dilzau H
3 2 10 3 7 1,021 510 511 Hortoki
Un-inhabited Lelhchhun
129 92 37 Seth awn
Un-inhabited Saizawl 2 387 173 214 Bukpui
353 182 171 N.Chaltiang
23 4 19 777 306 471 N.Mualvum
38 9 29 343 157 186 Zanlawn
Un-inhabited Dumkhel

112 DISTRICT CENSUS HANDBOOK: KOLASIS
VILLAGE PRIMARY RDBLOCK-
Total Population Location Name of Area (including institutional and
code Villageffownl in Total houseless population) PopUlation 0-6
number Ward Hectares households Persons Males Females Persons Males Females
2 3 4 5 6 7 8 9 10
0090 Tlangnuam (P) (Total) 1,097 4,914 2,635 2,279 728 379 349
0090 Tlangnuam (P) (Rural) 1,097 4,914 2,635 2,279 728 379 349
0090 Tlangnuam (P) (Urban)
Tlangnuam (Part) (Rural)
00016500 Khamrang 154 446 271 175 79 50 29
00016600 Lungmuat 125 573 310 263 106 58 48
00016700 Nisapui 166 768 421 347 100 49 51
00016800 Serkhan 154 640 345 295 90 44 46
00016900 Mualkhang 82 342 171 171 49 25 24
00017000 8awnga Veng Un-inhabited
00017100 Sentlang 79 413 214 199 63 33 30
00017200 Lungdai 337 1.732 903 829 241 120 121

PRIMARY CENSUS ABSTRACT 113
CENSUS ABSTRACT TLANGNUAM(pAR1)
Name of Scheduled Castes Scheduled Castes Literates Village!fownl
Persons Males Females Persons Males Females Persons Males Females Ward
11 12 13 14 15 16 17 18 19 2
4,708 2,469 2,239 3,881 2,088 1,793 Tlangnuam (P) (Total)
4,708 2,469 2,239 3,881 2,088 1,793 Tlangnuam (P) (Rural)
- Tlangnuam (P) (Urban)
Tlangnuam (Part) (Rural)
354 195 159 303 175 128 Khamrang
559 296 263 411 229 182 Lungmuat
742 397 345 628 351 277 Nisapui
581 304 277 525 282 243 Serkhan
341 170 171 284 143 141 Mualkhang
Un-inhabited 8awnga Veng
413 214 199 318 167 151 Sentlang
1,718 893 825 1,412 741 671 Lungdai

114 DISTRICT CENSUS HANDBOOK: KOLASIB
VILLAGE PRIMARY RDBLOCK-
Location Name of code VillagefI'own/ III iterates Total workers Main workers
nwnber Ward Persons Males Females Persons Males Females Persons Males Females
2 20 21 22 23 24 25 26 27 28
0090 Tlangnuam (P) (Total) 1,033 547 486 3,182 1,795 1,387 2,508 1,580 928
0090 Tlangnuam (P) (Rural) 1,033 547 486 3,182 1,795 1,387 2,508 1,580 928
0090 Tlangnuam (P) (Urban)
Tlangnuam (P) (Rural)
00016500 Khamrang 143 96 47 310 205 105 258 189 69
00016600 Lungmuat 162 81 81 405 219 186 326 194 132 00016700 Nisapui 140 70 70 522 302 220 360 223 137
00016800 Serkhan 115 63 52 453 252 201 348 221 127
00016900 Mualkhang 58 28 30 218 112 106 208 112 96
000 I 7 000 Bawnga Veng Un-inhabited
00017100 Sentlang 95 47 48 234 12S 106 168 113 55
000172 0 0 Lungdai 320 162 158 1,040 577 463 840 528 312

PRIMARY CENSUS ABSTRACT 115
CENSUS ABSTRACT TLANGNUAM(pAR1)
lndustri al category 0 f main workers Name of
Cultivators Agricultural Labourers Household industries workers Other workers Villageffown/
Persons Males Females Persons Males Females Persons Males Females Persons Males Females Ward
29 30 31 32 33 34 35 36 37 38 39 40 2
1,620 923 697 79 42 37 16 14 2 793 601 192 Tlangnuam (P) (Total)
1,620 923 697 79 42 37 16 14 2 793 601 192 Tlangnuam (P) (Rural)
- Tlangnuam (P) (Urban)
Tlangnuam (Part) (Rural)
146 94 52 30 19 II 82 76 6 Khamrang
269 159 110 16 10 6 2 2 39 23 16 Lungmuat
275 149 126 3 3 7 7 75 64 II Nisapui
300 176 124 48 45 3 Serkhan
194 101 93 14 II 3 Mualkhang
Un-inhabited Bawnga Yeng
74 43 31 8 8 85 69 16 Sentlang
362 201 161 22 10 12 6 4 2 450 313 137 Lungdai
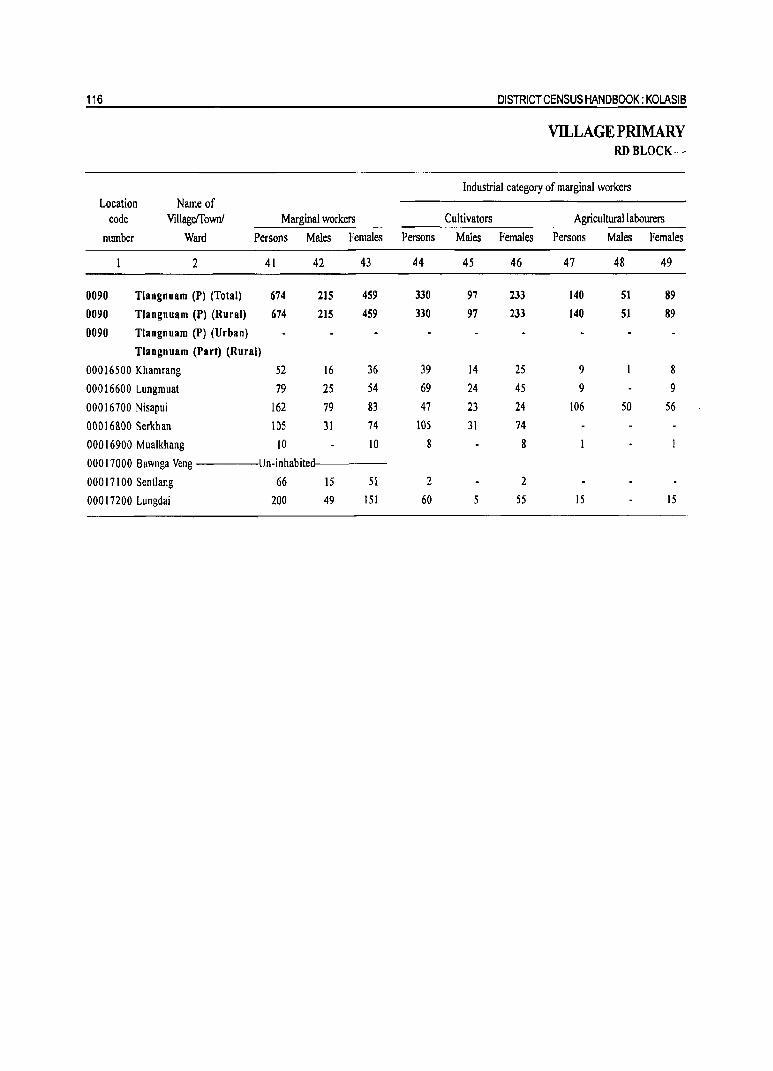
116 DISTRICT CENSUS HANDBOOK: KOLASIS
VILLAGE PRIMARY RDBLOCK-
Industrial category of marginal workers Location Name of
code Villageffownl Marginal workers Cultivators Agricultural labourers
number Ward Persons Males Females Persons Males Females Persons Males Females
2 41 42 43 44 45 46 47 48 49
0090 Tlangnuam (P) (Total) 674 :m 459 330 97 233 140 51 89
0090 Tlangnuam (P) (Rural) 674 215 459 330 97 233 140 51 89
0090 Tlangnuam (P) (Urban)
Tlangnuam (Part) (Rural)
00016500 Khamrang 52 16 36 39 14 25 9 8
00016600 Lungmuat 79 25 54 69 24 45 9 9
00016700 Nisapui 162 79 83 47 23 24 106 50 56
00016800 Serkhan IDS 31 74 105 31 74
ODD 16900 Mualkhang 10 10 8 g
00017000 8awnga Veng Un-inhabited
00017100 Sentlang 66 15 51 2 2
00017200 Lungdai 200 49 151 60 5 55 15 15

PRIMARY CENSYSABSTRACT 117
CENSUS ABSTRACT TLANGNUAM(pARI)
Industrial category of marginal workers Name of
Household industries workers Other workers Non-workers ViUageffownl
Persons Males Females Persons Males Females Persons Males Females Ward
50 51 52 53 54 55 56 57 58 2
3 2 1 201 65 136 1,732 840 892 Tlangnuarn (Part) (Total)
3 2 201 65 136 1,732 840 892 Tlangnuarn (Part) (Rural)
- Tlangnuarn (Part) (Urban) Tlangnuarn (Part) (Rural)
4 3 136 66 70 Khamrang
168 91 77 Lungmuat
2 7 5 2 246 119 127 Nisapui
187 93 94 Serkhan
124 59 65 Mualkhang
Un-inhabited Bawnga Veng
64 15 49 179 86 93 Sentlang
125 44 81 692 326 366 Lungdai

118 DISTRICT CENSUS HANDBOOK: KOLASIB
URBAN PRIMARY
Area of Total population (including
Location Town/Ward institutional and houseless Population in the
code in square Number of population) age-group 0-6
number Name ofTownfWard Kilometre households Persons Males Females Persons Males Females
2 3 4 5 6 7 8 9 10 40201000 Vairengtr (NT) 1927 7715 4228 3487 1233 636 597
0001 Ward No. I 1927 7715 4228 3487 1233 636 597
40202000 Bairabi (NT) 639 3304 1734 1570 650 334 316
0001 Ward No. I 639 3304 1734 1570 650 334 316
40203000 Kolasib (NT) 3877 19008 9761 9247 2548 1293 1255
0001 Ward No. I 589 2553 1394 1159 362 182 180
0002 Ward No.2 295 1591 779 812 217 99 118
0003 Ward No.3 557 2901 1441 1466 392 188 204
0004 Ward No.4 131 154 388 366 92 39 53
0005 Ward No.5 988 4864 2440 2424 635 340 295
0006 Ward No.6 553 2919 1494 1425 351 179 172
0007 Ward No.7 252 1233 629 604 163 89 74
0008 Ward No.8 169 927 506 421 167 91 76
0009 Ward No.9 337 1260 690 510 169 86 83
40204000 N.Kawnpui (NT) 1405 6472 3278 3194 953 472 481
0001 Ward No. I 1003 4615 2334 2281 651 324 333
0002 Ward No.2 402 1851 944 913 296 148 148

PRIMARY CENSUS ABSTRACT 119
CENSUS ABSTRACT
Scheduled Castes population Scheduled Tribes population Literates
Persons Males Females Persons Males Females Persons Males Females Name ofTownlWard
II 12 13 14 15 16 17 18 19 2
2 2 6633 3396 3237 5986 3396 2590 Vairengte (NT)
2 2 6633 3396 3237 5986 3396 2590 Ward No. I
6 3 3 3039 1564 1475 2472 1336 1136 Bairabi (NT)
6 3 3 3039 1564 1475 2472 1336 1136 Ward No. I
4 2 2 17358 8723 8635 15834 8219 7615 Kolasib (NT)
2 2299 1187 • 1112 2106 1180 926 Ward No. I
1569 765 804 1359 675 684 Ward No.2
2839 1396 1443 2403 1218 1185 Ward No.3
718 369 349 633 340 293 Ward No.4
4544 2232 2312 4130 2068 2062 Ward NO.5
2 2535 1292 1243 2502 1300 1202 Ward No.6
lIla 564 546 1036 525 511 Ward No.7
869 480 389 675 382 293 Ward No.8
875 43& 437 990 531 459 Ward No.9
5398 2675 2723 5296 2693 2603 N.Kawnpui (NT)
4353 2141 2212 3820 1934 1886 Ward No.1
1045 534 511 1476 759 717 Ward No.2

120 DISTRICT CENSUS HANDBOOK: KOLASIS
URBAN PRIMARY
Location code Illiterates Total workers Main workers
number Name ofTownlWard Persons Males Females Persons Males Females Persons Males Females
2 20 21 22 23 24 25 26 27 28 40201000 Vairengte (NT) 1729 832 897 4049 2515 1534 3426 2276 1150
0001 Ward No. I 1729 832 897 4049 2515 1534 3426 2276 1150
40102000 Bairabi (NT) 832 398 434 1749 978 771 1197 831 366
0001 Ward No.1 832 398 434 1749 978 771 1197 831 366
40203000 Ko1asib (NT) 3174 1542 1632 9605 5393 4212 6645 4447 2198
0001 Ward No.1 447 214 233 1304 799 505 890 705 185
0002 Ward No.2 232 104 128 814 425 389 642 389 253
0003 Ward No.3 504 223 281 1522 801 721 926 587 339
0004 Ward No.4 t2t 48 73 450 243 207 282 184 98
0005 Ward No.5 734 372 362 2412 1293 1119 1739 1115 624
0006 Ward No.6 417 194 223 1190 725 465 815 565 250
0007 Ward No.7 197 104 93 504 300 204 336 237 99
0008 Ward No.8 252 124 128 622 343 279 397 250 147
0009 Ward No.9 270 159 111 787 464 323 618 415 203
40204000 N.Kawnpui (NT) 1176 585 591 3592 1951 1641 2875 1808 1067
0001 Ward No. I 795 400 395 2570 1406 1164 2160 1306 854
0002 Ward No.2 381 185 196 1022 545 477 715 502 213

PRIMARY CENSUS ABSTRACT 121
CENSUS ABSTRACT
Industrial category of main workers
Household industry Cultivators Agricultural labourers workers Other workers
Persons Males Females Persons Males Females Persons Males Females Persons Males Females Name ofTownfWard
29 30 31 32 33 34 35 36 37 38 39 40 2 1817 968 849 191 99 92 27 21 6 1391 1188 2()3 Vairengte (NT)
1817 968 849 191 99 92 27 21 6 1391 1188 203 Ward No.1
639 422 217 162 115 47 4 4 392 290 1()2 Bairabi (NT)
639 422 217 162 115 47 4 4 392 290 102 Ward No.1 2375 1459 916 307 189 118 158 126 32 3805 2673 1132 Kolasib (NT)
278 193 85 41 37 4 21' 18 3 550 457 93 Ward No.1
302 164 138 26 18 8 17 II 6 297 196 101 Ward No.2
205 124 81 144 75 69 47 37 10 5)0 351 179 Ward No.3
172 105 67 2 7 5 2 101 73 28 Ward No.4
681 410 271 25 15 10 26 18 8 1007 672 335 Ward No.5
131 85 46 17 11 6 11 8 3 656 461 195 Ward No.6
91 56 35 9 7 2 4 4 232 170 62 Ward NO.7
285 173 112 13 10 3 4 4 95 63 32 Ward No.8
230 149 81 30 15 15 21 21 337 230 107 Ward No.9
1924 1139 785 38 28 10 24 18 6 889 623 266 N.Kawnpui (NT)
1462 801 661 5 3 2 20 14 6 673 488 185 Ward NO.1
462 338 124 33 25 8 4 4 216 135 81 Ward No 2
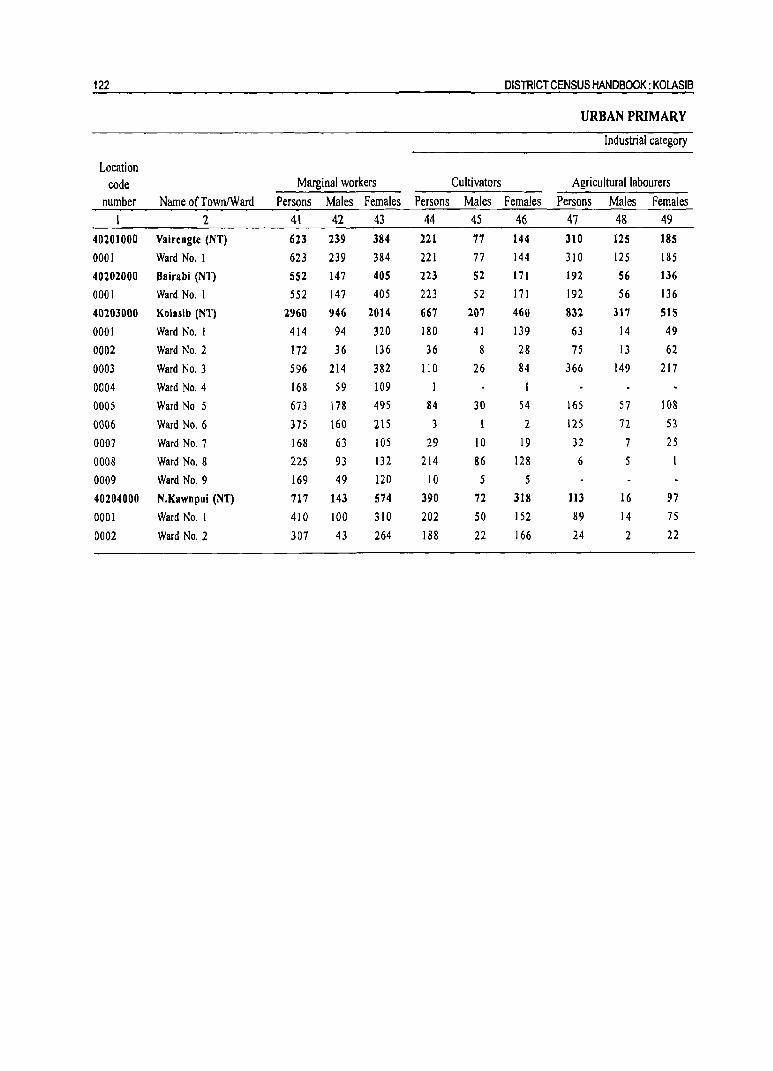
122 DISTRICT CENSUS HANDBOOK: KOLASIB
URBAN PRIMARY
Industrial category
Location code Marginal workers Cultivators Agricultural labourers
number Name ofTownIWard Persons Males Females Persons Males Females Persons Males Females 2 41 42 43 44 45 46 47 48 49
40201000 Yairengte (NT) 623 239 384 221 77 144 310 125 185
0001 Ward No. I 623 239 384 221 77 144 310 125 185
40202000 Bairabi (NT) 552 147 405 223 52 171 192 56 136
0001 Ward No.1 552 147 405 223 52 171 192 56 136
40203000 Kolasib (NT) 2960 946 2014 667 207 460 832 317 515
0001 Ward No. I 414 94 320 180 41 139 63 14 49
0002 Ward No.2 172 36 136 36 8 28 75 13 62
0003 Ward No.3 596 214 382 110 26 84 366 149 217
0004 Ward No.4 168 59 109
0005 Ward No.5 673 178 495 84 30 54 165 57 108
0006 Ward No.6 375 160 215 3 2 125 72 53
0007 Ward No.7 168 63 105 29 10 19 32 7 2S
0008 Ward No.8 225 93 132 214 86 128 6 S
0009 Ward NO.9 169 49 120 10 5 5
40204000 N.Kawnpui (NT) 717 143 574 390 72 318 113 16 97
0001 Ward No.1 410 100 310 202 50 152 89 14 75
0002 Ward No.2 307 43 264 188 22 166 24 2 22

PRIMARY CENSUS ABSTRACT 123
CENSUS ABSTRACT
of marginal workers
Household industry workers Other workers Non-workers Location
Persons Males Females Persons Males Females Persons Males Females Name ofTownlWard code number 50 51 52 53 54 5S 56 57 58 2
16 6 10 76 31 45 3666 1713 1953 Vairengte (NT) 40201000 16 6 10 76 31 45 3666 1713 1953 Ward No.1 0001 2 135 38 97 1555 756 799 Bairabi C'H) 40202000
2 135 38 97 1555 756 799 Ward No. I 0001 44 17 27 1417 405 lOll 9403 4368 5035 Kolasib (NT) 40203000
I I 170 39 131 . 1249 595 654 Ward No. I 0001
5 4 56 14 42 777 354 423 Ward No.2 0002
8 8 112 39 73 1385 640 745 Ward No.3 0003 167 59 108 304 145 159 Ward No.4 0004
3 2 421 90 331 2452 1147 1305 Ward No.5 0005
22 II II 225 76 149 1729 769 960 Ward No.6 0006
5 4 102 42 60 729 329 400 Ward No.7 0007
5 2 3 305 163 142 Ward No.8 0008
159 44 115 473 226 247 Ward No.9 0009
6 2 4 208 53 ISS 2880 1327 1553 N.Kawnpui (NT) 40204000
5 2 3 114 34 80 2045 928 1117 Ward No. I 0001
94 19 75 835 399 436 Ward No.2 0002


ANNEXURES


ANNEXURE 127
ANNEXURE-I NUMBER OFVILLAGFS UNDER EACH GRAMPANCHAYAT
This annexure is not applicable for this district as this district has no Gram Panchayat.
ANNEXURE-ll FERmITY AND MORTALITY, 1991 CENSUS
Serial State/ Persons Male Female
number District CBR lFR GFR q(J) q(2) q(3) q(5) q(J) q(2) q(3) q(5) q(l) q(2) q(3) q(5)
2 3 4 6 7 8 9 10 II 12 13 14 15 16 17 18
Mizoram 37.0 5.2 158 53 64 66 68 51 68 69 72 56 59 60 65
Aizawl 35.3 5.0 151 60 63 69 75 61 64 71 76 58 62 67 74
Note: As per 1991 Census present Kolasib District was located under Aizawl District. So the data of Kolasib District is not been able to shown seperately.
In 1991 census the question about the number of children born alive by ever married woman was asked of each of them and the question whether any child was born during the last year preceding the date of enumeration is asked of each currently married woman. On the answers given to their questions, the fertility of the woman are measured by various indices. The indices of fertility are many. The questions asked for obtaining important data for special fertility table were age at marriage, number of children survived, number of children ever born and whether any child was born during the last one year. While the first three questions were asked from all
ever married woman, the last one was meant only for currently married women.
In India it is observed that the Infant Mortality has shown drastic decline from 129 in 1971 to 80 in 1991. In Mizoram the child mortality rate was 53 and male and female mortality rates were S 1 and S6 respectively in 1991. However, due to the incomplete registration of births and deaths in the state latest mortality rate under Sample Registration System (SRS) and Civil Registration System (CRS) on an annual basis is not available at present. The Infant Mortality Rate in India was 79 in 1992 and in 2000 it was 68 that indicates a slight decline.
ANNEXURE-ill vARIous MEASURES OF FERTILITY AND MEAN AGE AT MARRIAGE, 1991 CENSUS
Various fertility measures for all the districts and the state (1991 census) Child No. of children ever
Serial Woman born per woman in Mean age at number StatelDistrict CBR TFR TMFR GFR GMFR Ratio age group 45-49 marriage
2 3 4 5 6 7 8 9 10
Mizoram 37.0 5.2 8.5 158 258 NA NA NA Aizawl 35.3 5.0 8.3 151 253 NA NA NA
Note: As per 1991 Census present Kolasib District was located under Aizawl District. So the data of Kolasib District is not been able to shown seperately.
Annexure III shows that the fertility measures (from CBR to GMFR) for 1991 census are lower for Aizawl District than the state figure. And the data
related to child woman ratio, number of children ever born per woman in age group 45-49 and Mean age at marriage are not available in the above annexure.

128 DISTRICT CENSUS HANDBOOK: KOLASIB
ANNEXURE· IV PERCENTAGE DISTRIBUTION OF MIGRANTS BYPLACEOFBffiW
PLACE OF LAST RESIDENCE, 2001 CENSUS
Name of State/ Migrants by place of birth
District From other district of the state From other StateslUTs From other countries
Total Male Female Total Male Female Total Male Female
2 3 4 5 6 7 8 9 10
Mizoram 84,851 43,061 41,790 38,570 25,266 13,304 17,160 8,842 8,318
9.5 9.4 9.7 4.3 5.5 3.1 1.9 1.9 1.9
Kolasib 6,655 3,431 3,224 5,645 3,226 2,419 328 218 110 10.1 9.9 10.3 8.6 9.3 1.1 0.5 0.6 0.4
Name of State/ Migrants by place of last residence
District From other district of the state From other StateslUTs From other countries
Total Male Female Total
2 3 4 5
Mizoram 42,459 41,963 40,496 35,293
9.3 9.1 9.4 4.0
Kolasib 6,351 3,278 3,073 4,610
9.6 9.5 9.8 7.0
It can be seen from the Annexure IV that as per 2001 Census in Kolasib District all migrant was categorised into two i.e., migrant by place of birth and migrant by place of last residence. These two reason of migration was again categorised into three, these are form other district of the State, from other StatelUTs and from other countries. Migration is one
Male Female Total Male Female
6 7 8 9 10
22,907 12,386 15,487 7,887 7,600
5.0 2.9 1.7 1.7 1.8
2,632 1,978 257 180 77
7.6 6.3 0.4 0.5 0.2
of the important component for measuring population growth in the State as well as the country. The above annexure indicate in detail that how many people were migrated within the State or outside the State. As the annexure is self explanatory no detail explanation is given at write up.

ANNEXURE 129
ANNEXUREV BRIEF ACCOUNT OF MAIN RELIGIONS IN THE DISTRICfIR.D.BLOCKSAS PER 2001 CENSUS
StatelDistrictIR.D.Block Population
Christians
2 3
Mi~oram 888,573 772,809
87.0
Kolasib District 65,960 59,098
89.6
North Thingdawl R.D, Block 61,046 54,443
89,2
T1angnuam (part) R.D, Block 4,914 4,655 94.7
Among six main religious groups in Mizoram in 2001 Census viz., Christian, Buddhist, Hindu, Muslims, Sikh and Jain, Christianity was the predominant religion (87%) of the State followed by Buddhist
Main religions 2001 Census
Buddhists Hindus Muslims Sikhs Jains
4 5 6 7 8
70,494 31,562 10,099 326 179
7.9 3.6 1.1 0.0 0.0
177 4,237 1,995 31 2
OJ 6.4 3.0 0,1 0,0
171 4,079 1,965 30 2
OJ 6,7 3.2 0.1 0.0
6 158 30 1 ° 0,1 3,2 0,6 . 0,0 0.0
(7,9%) where Hindu (3.6%) ranks the third position, As far as Kolasib District is concerned Christianity was first place with population of 59,098 (89,6%) followed by Hindu with 4,237 (6.4%),

130 DISTRICT CENSUS HANDBOOK: KOLASIB
ANNEXURE MARITALSTATUSOFPOPULATION
Marital Status Total Population Never married Married
Age group Total Males Females Total Males Females Total Males Females
1 2 3 4 5 6 7 8 9 10
All ages 65,960 34,562 31,398 37,710 20,614 17,096 24,476 12,758 11,718
0-9 15,049 7,586 7,463 15,049 7,586 7,463 0 0 0
10-14 8,286 4,204 4,082 8,244 4,187 4,057 37 15 22
15-19 7,148 3,761 3,387 6,660 3,690 2,970 439 68 371
20-24 6,651 3,432 3,219 4,034 2,545 1,489 2,379 839 1,540
25-29 5,969 3,131 2,838 1,870 1,299 571 3,798 1,749 2,049
30-34 4,517 2,493 2,024 672 487 185 3,553 1,904 1,649
35-39 4,402 2,464 1,938 412 324 88 3,651 2,019 1,632
40-44 3,698 1,992 1,706 258 191 67 3,084 1,685 1,399
45-49 2,655 1,422 1,233 151 107 44 2,225 1,228 997
50-54 2,340 1,265 1,075 99 58 41 1,909 1,114 795
55-59 1,540 859 681 53 29 24 1,226 752 474
60-64 1,208 649 559 48 27 21 864 537 327
65-69 912 480 432 27 16 II 609 373 236
70-74 661 368 293 29 13 16 347 232 115
75-79 381 198 183 16 10 6 188 125 63
80+ 463 215 248 19 6 13 158 115 43
Age not stated 80 43 37 69 39 30 9 3 6
Less than 18 27,647 14,081 13,566 27,498 14,048 13,450 133 31 102
Less than 21 32,395 16,516 15,879 31,311 16,290 15,021 986 217 769
The distribution of population according to marital This table present the age, sex and marital status status is useful and important in demographic analysis ("never married", "married", "widowed" and as it can easily reflect the existing demographic "divorced or separated") composition of popUlation conditions. Proportion of persons remaining unmarried, for Aizawl district. The age group adopted are 0-9, proportion married with further categorization as 10-14, 15-19,20-24,25-29,30-34,35-39,40-44,45-proportion currently married and proportion ever 49, 50-54,55-59, 60-64, 65-69,70-74, 75-79, 80+, age
married, widowed, divorced or separated are the not stated and less than 18 and also less than 21 are common classifications used to study marital presented at the annesure. As the data are self-composition (status) of the popUlation. explanatory further explanation is not attempted.
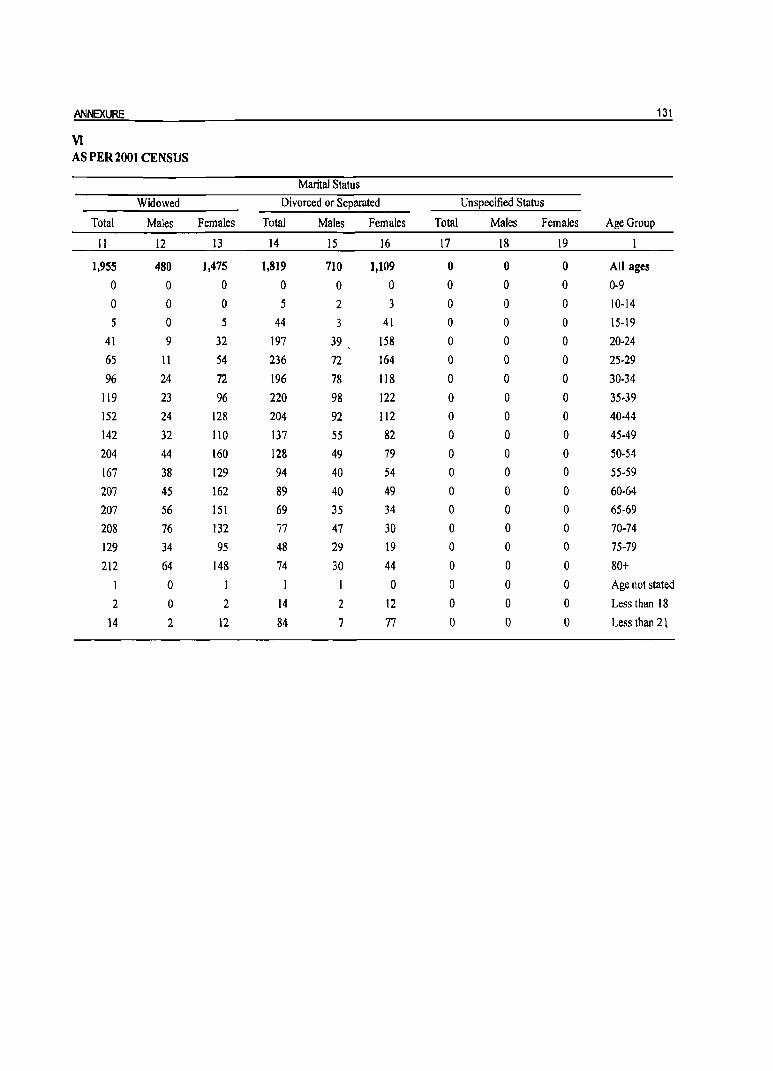
ANNEXURE 131
VI AS PER 2001 CENSUS
Marital Status
Widowed Divorced or Separated Unspecified Status
Total Males Females Total Males Females Total Males Females Age Group
II 12 13 14 15 16 17 18 19 I
1,955 480 1,475 1,819 710 1,109 0 0 0 All ages
0 0 0 0 0 0 0 0 0 0-9
0 0 0 5 2 3 0 0 0 10·14
5 0 5 44 3 41 0 0 0 15·19
41 9 32 197 39 158 0 0 0 20·24
65 II 54 236 72 164 0 0 0 25·29
96 24 72 196 78 118 0 0 0 30·34
119 23 96 220 98 122 0 0 0 35·39
152 24 128 204 92 112 0 0 0 40·44
142 32 110 137 55 82 0 0 0 45·49
204 44 160 128 49 79 0 0 0 50·54
167 38 129 94 40 54 0 0 0 55·59
207 45 162 89 40 49 0 0 0 60·64
207 56 151 69 35 34 0 0 0 65·69
208 76 132 77 47 30 0 0 0 70·74
129 34 95 48 29 19 0 0 0 75·79
212 64 148 74 30 44 0 0 0 80+
0 I 0 0 0 0 Age not stated
2 0 2 14 2 12 0 0 0 Less than 18
14 2 12 84 7 77 0 0 0 Less than 2 t

132 DISTRICT CENSUS HANDBOOK: KOLASIB
ANNEXURE AG~SEXANDEDUCATION
Educational Level
Total population Illiterate Literate Age group Total Male Female Total Male Female Total Male Female
1 2 3 4 5 6 7 8 9 10
All ages 65,960 34,562 31,398 15,364 7,593 7,771 50,596 26,969 23,627
0-6 10,566 5,356 5,210 10,566 5,356 5,210 0 0 0
7 1,582 778 804 456 226 230 1,126 552 574
8 1,548 758 790 309 148 161 1,239 610 629
9 1,353 694 659 152 72 80 1,201 622 579
10 1,969 1,017 952 178 91 87 1,791 926 865
11 1,449 742 707 64 35 29 1,385 707 678
12 1,772 911 861 120 55 65 1,652 856 796
13 1,543 767 776 66 34 32 1,477 733 744
14 1,553 767 786 54 21 33 1,499 746 753
15 1,619 849 770 83 33 50 1,536 816 720
16 1,453 755 698 61 28 33 1,392 727 665
17 1,240 687 553 41 17 24 1,199 670 529
18 1,699 868 831 76 36 40 1,623 832 791
19 1,137 602 535 47 27 20 1,090 575 515
20-24 6,651 3,432 3,219 453 256 197 6,198 3,176 3,022
25-29 5,969 3,131 2,838 499 308 191 5,470 2,823 2,647
30-34 4,517 2,493 2,024 326 162 164 4,191 2,331 1,860
35-39 4,402 2,464 1,938 323 160 163 4,079 2,304 1,775
40-44 3,698 1,992 1,706 274 124 150 3,424 1,868 1,556
45-49 2,655 1,422 1,233 208 92 116 2,447 1,330 1,117
50-54 2,340 1,265 1,075 182 68 114 2,158 1,197 961
55-59 1,540 859 681 157 56 101 1,383 803 580
60-64 1,208 649 559 152 54 98 1,056 595 461
65-69 912 480 432 152 40 112 760 440 320
70-74 661 368 293 113 34 79 548 334 214
75-79 381 198 183 74 14 60 307 184 123
80+ 463 215 248 135 25 110 328 190 138
Age not stated 80 43 37 43 21 22 37 22 15

ANNEXURE 133
vn AS PER 2001 CENSUS
Educational Level (Contd.)
Literate without any formal schooling including educational level
unclassified Below primary Primary Total Male Female Total Male Female Total Male Female A!:e l[oue
II 12 13 14 15 16 17 18 19 I
1,182 798 384 19,384 9,506 9,878 14,227 7,651 6,576 All ages
0 0 0 0 0 0 0 0 0 0-6 13 6 7 1,113 546 567 0 0 0 7 7 3 4 1,232 607 • 625 0 0 0 8 6 3 3 1,169 608 561 26 11 15 9 9 4 5 1,601 834 767 181 88 93 10 2 2 0 985 504 481 398 201 197 1I
8 5 3 865 446 419 755 389 366 12 4 3 I 480 260 220 926 443 483 13 5 3 2 357 199 158 902 438 464 14
11 7 4 303 161 142 790 438 352 15 5 4 1 220 119 101 555 301 254 16
6 5 172 108 64 406 239 167 17 22 14 8 311 162 149 513 258 255 18 15 8 7 180 82 98 324 166 158 19
172 141 31 991 50S 486 1,833 953 880 20-24 194 159 35 968 450 518 1,539 753 786 25-29 123 91 32 975 429 546 1,148 625 523 30-34 112 87 25 1,158 559 599 1,116 596 520 35-39
99 68 31 1,228 542 686 883 477 406 40-44
50 27 23 1,107 480 627 617 353 264 45-49
67 46 21 1,066 443 623 551 346 205 50-54
66 41 25 762 346 416 276 189 87 55-59 34 14 20 710 324 386 208 165 43 60-64
36 14 22 548 275 273 133 110 23 65-69 35 17 18 415 241 174 67 47 20 70-74 34 II 23 227 136 91 32 26 6 75-79 35 8 27 232 134 98 42 34 8 80+ 12 7 5 9 6 3 6 5 Age not stated

134 DISTRICT CENSUS HANDBOOK: KOLASIB
ANNEXURE AGE,SEXAND EDUCATION
Educational Level
Higher Sec.!IntermediatelPre-uni/Sr. Middle Matriculation! Secondary secondary
Age group Total Male Female Total Male Female Total Male Female
20 21 22 23 24 25 26 27 28
All ages 9,422 5,110 4,312 3,470 1,958 1,512 ),503 948 555 0-6 0 0 0 0 0 0 0 0 0
7 0 0 0 0 0 0 0 0 0 8 0 0 0 0 0 0 0 0 0 9 0 0 0 0 0 0 0 0 0 10 0 0 0 0 0 0 0 0 0 11 0 0 0 0 0 0 0 0 0 12 24 16 8 0 0 0 0 0 0 13 67 27 40 0 0 0 0 0 0 14 235 106 129 0 0 0 0 0 0 15 397 193 204 35 17 18 0 0 0 16 500 251 249 112 52 60 0 0 0 17 446 229 217 169 89 80 0 0 0 18 512 260 252 211 III 100 54 27 27
19 364 205 159 153 81 72 54 33 21 20-24 1,838 882 956 718 338 380 427 242 185 25-29 1,498 752 746 564 302 262 328 178 150 30-34 1,014 592 422 421 235 186 239 160 79 35-39 966 554 412 354 222 132 162 117 45
40-44 666 395 271 301 191 110 117 89 28 45-49 362 234 128 189 131 58 47 40 7 50-54 269 196 73 108 82 26 31 23 8
55-59 132 103 29 81 62 19 30 28 2 60-64 66 60 6 17 13 4 9 7 2
65-69 21 21 0 19 17 2 I 1 0
70-74 19 17 2 9 9 0 2 2 0 75-79 10 9 1 3 1 2 1 1 0 80+ 11 7 4 6 5 1 0 0 0
Age not stated 5 4 0 0 0 0
Literacy is one of the important demographic The absolute figure of literate for Kolasib at the time
characteristics. Apart from collecting data on number of 2001 census was the total of 50,596 for all ages
of literate, the level, nature and type of education with males 26,969 and females 23,627. This annexure
attained by the literates are also ascertained. The furnish information regarding absolute number of
concept of literacy adopted in the census has already illiterate and literate as well as the distribution of literate
been explained in the begining of this publication. by different level of education by different age groups. Out of total literates in Kolasib district the highest
A proper index for measuring literacy is proportion number (6,198) are found at the range of 20-24 and ofiiterate and educated persons to the total population. the lowest number (307) at the range of 75-79.

ANNEXURE 135
vn AS PER 2001 CENSUS
Educational Level
Non Technical Diploma or certificate Technical Diploma or certificate not not equal to degree equal to degree Graduate and above
Total Male Female Total Male Female Total Male Female Age group
29 30 31 32 33 34 35 36 37
1 0 54 49 5 1,351 946 405 All ages
0 0 0 0 0 0 0 0 0 0-6
0 0 0 0 0 0 0 0 0 7
0 0 0 0 0 0 0 0 0 8
0 0 0 0 0 0 0 0 0 9
0 0 0 0 0 0 0 0 0 10
0 0 0 0 0 0 0 0 0 II
0 0 0 0 0 0 0 0 0 \2
0 0 0 0 0 0 0 0 0 13
0 0 0 0 0 0 0 0 0 14
0 0 0 0 0 0 0 0 0 IS
0 0 0 0 0 0 0 0 0 16
0 0 0 0 0 0 0 0 0 17
0 0 0 0 0 0 0 0 0 18
0 0 0 0 0 0 0 0 0 19
0 0 0 5 4 1 214 III 103 20-24
0 0 0 11 11 0 367 217 150 25-29
0 0 0 7 6 264 193 71 30-34
0 0 0 16 15 194 153 41 35-39
0 0 0 4 4 0 126 102 24 40-44
0 0 0 4 4 0 71 61 10 45-49
0 0 0 5 4 61 57 4 50-54
1 1 0 I 0 34 33 1 55-59
0 0 0 0 0 0 12 12 0 60-64
0 0 0 0 0 0 2 2 0 65-69
0 0 0 1 1 0 0 0 0 70-74
0 0 0 0 0 0 0 0 0 75-79
0 0 0 0 0 0 2 2 0 80+
0 0 0 0 0 0 4 3 Age not stated

136 DISTRICT CENSUS HANDBOOK: KOLASIB
ANNEXUREVllI DISTRIBUTION OF DIFFERENT MOTHER TONGUES RETURNED IN 2001 CENSUS
Number of persons who returned the language as their mother tongue
Serial Percent to total Proportion
number Lan~age Total EOEulation Rural Urban Rural Urban 2 3 4 5 6 7 8
LushailMizo 53,819 81.6 22,745 31,074 42.3 57.7
2 Hmar 3,161 4.8 2,070 1,091 65.5 34.5
3 Bengali 2,428 3.7 1,648 780 67.9 32.1
4 Reang 1,934 2.9 1,706 228 88.2 11.8
5 Nepali 1,486 2.3 170 1,316 11.4 88.6
6 Hindi 732 1.1 129 603 17.6 82.4
7 Santali 425 0.6 318 107 74.8 25.2
8 Khasi 364 0.6 39 325 10.7 89.3
9 Malayalam 138 0.2 21 117 15.2 84.8
IO Manipuri 107 0.2 25 82 23.4 76.6
II Assamese 103 0.2 21 82 20.4 79.6
12 Gangte 95 0.1 5 90 5.3 94.7
13 Chakma 79 0.1 54 25 68.4 31.6
14 Sadan/Sadri 77 0.1 53 24 68.8 31.2
15 KhorthaiKhotta 69 0.1 59 10 85.5 14.5
16 Oriya 54 0.1 37 17 68.5 31.5
Total of Other Mother Tongues 889 1.3 361 528 40.6 59.4
All mother tongues total 65,960 100.0 29,461 36,499 44.7 55.3
The above annexure contains the distribution of tongues (on the basis of number of popUlation) are mother tongues returned in 2001 Census. There are shown in descending order in the table. LushailMizo number of languages returned as mother tongue in recorded the highest number of persons i.e., 53,819 Kolasib District in 2001 Census with the total (81.6%) followed by Hmar of 3,161 (4.8%) and population of65,960 and among them 16 major mother Bengali with population of 2,428 (3.7%).

Top Related
Copyright © 2022 FDOKUMEN

