


Bahasa
Halaman
Hukum


1Distributed Environmental Monitoring
2Dermot Diamond AU1, Fiachra Collins, John Cleary, Claudio Zuliani,
3and Cormac Fay
4Abstract With increasingly ubiquitous use of web-based technologies in society
5today, autonomous sensor networks represent the future in large-scale information
6acquisition for applications ranging from environmental monitoring to in vivo
7sensing. This chapter presents a range of on-going projects with an emphasis on
8environmental sensing; relevant literature pertaining to sensor networks is
9reviewed, validated sensing applications are described and the contribution of
10high-resolution temporal data to better decision-making is discussed.
11Keywords Air, Chemical sensors, Environmental monitoring, Sensor networks,
12Water
13Contents
141 Introduction
152 Gas Sensing: Autonomous Systems for Air Quality Monitoring
162.1 Introduction
172.2 Gas Sensing Technologies
182.3 Gas Sensing Application Case Studies
192.4 Conclusions
203 Water Sensing: Reagent-Based Systems Using Optical Detection for Water Monitoring
213.1 Introduction
223.2 Microfluidic-Based Water Monitoring Technologies
233.3 Water Monitoring Application Case Studies
243.4 Conclusions
254 Electrochemical Sensing: Potential and Challenges of Using Electrochemical Methods in
Remote Autonomous Instruments
264.1 Introduction
D. Diamond (*), F. Collins, J. Cleary, C. Zuliani, and C. Fay
CLARITY: Centre for Sensor Web Technologies, National Centre for Sensor Research,
Dublin City University, Glasnevin, Dublin 9, Ireland
e-mail: [email protected]
D. Filippini (ed.), Autonomous Sensor Networks: Collective Sensing Strategies for AnalyticalPurposes, Springer Series on Chemical Sensors and Biosensors,
DOI 10.1007/5346_2012_33, # Springer-Verlag Berlin Heidelberg 2012

27 4.2 Electrochemical Sensor Technologies Review
28 4.3 Conclusions
29 5 Instrumentation and Data Processing
30 5.1 Introduction
31 5.2 Data Processing Case Study
32 6 Conclusions and Future Perspectives
33 References
Abbreviations
mFIA34 Micro-flow injection analysis
mTAS35 Miniaturised total analysis system
ANN36 Artificial neural network
DCU37 Dublin City University
EPA38 Environmental Protection Agency
FET39 Field-effect transistor
GC40 Gas chromatography
GHG41 Greenhouse gas(es)
GPRS42 General packet radio service
GSM43 Global system for mobile communications
ICT44 Information and communication technology
IR45 Infra-red
ISE46 Ion selective electrode
LED47 Light emitting diode
LOD48 Limit of detection
MS49 Mass spectroscopy
OEJT50 Organic electrochemical junction transistors
PEDD51 Paired emitter detector diodes
SC-ISE52 Solid contact ion selective electrode
UME53 Ultra miniature electrode
VOC54 Volatile organic compound
WFD55 Water framework directive
WSN56 Wireless sensor network
57 1 Introduction
58 The past decade has witnessed a dramatic upsurge in activity and commercial
59 interest in the area of wireless sensor networks (WSNs). This is understandable
60 given the availability of infrastructure capable of providing a functioning
61 communications backbone for these devices. This infrastructure has already had
62 enormous impact on society, with people becoming accustomed to instantaneous
63 access to a wide range of information through mobile phones, laptops and digital
64 TV screens. This in turn has given rise to new industries providing services that
65 have profoundly changed how we function as individuals and how we collectively
66 function as a society. In order to survive, major industry players seek to predict
D. Diamond et al.
67where the next big opportunity will come from, in order to position themselves in
68this space as early as possible before the rapid growth phase begins. However, in a
69world wherein the dynamic of change is itself accelerating and financial
70uncertainties increase risk, predicting the next big win has become critical for the
71future stability of many companies. Given this context, it is unsurprising how many
72of these major corporations are predicting the emergence of WSNs as the next big
73opportunity for the ICT (information and communication technologies) sector. For
74example, Hewlett Packard’s visionary strategy [1] for globally connected sensor
75networks envisages heterogeneous sensor networks monitoring a multitude of
76parameters and feeding this information to the “cloud” from where a host of
77service-based applications can be realized. HP’s Thought Leader Peter Hartwell
78captures the excitement of the scale of the opportunity, albeit somewhat sensation-
79ally; “one trillion nanoscale sensors and actuators will need the equivalent of 1,000
80internets: the next huge demand for computing!” Predictions from companies like
81INTEL, IBM and Nokia lead to the same conclusion, with Nokia presenting a very
82convincing case for sensor networks in its strategic vision for sensor networks (the
83Nokia visionary video “Morph” is a conceptual graphic summary of what could
84happen over the coming decade as nanotechnology-based sensing technologies and
85communications technologies begin to merge the molecular and digital worlds [2]).
86Hence there is a driving force from major industry players to develop the basic
87building blocks of WSNs, i.e., sensors with integrated communications capabilities
88[3]. It has been envisaged that WSN developments will involve a “top-down”
89emergence of sensor nodes [4]. Under such a strategy, initial activity would focus
90on relatively sophisticated systems that would fully meet the criteria of the sensing
91operation though having associated drawbacks in terms of expense and power
92consumption; once established, the focus would shift to more densely distributed
93lower-cost and lower-power intensive nodes, albeit with lower functionality. Indeed
94these two levels of node complexity can co-exist as two distinct layers of sensing
95capability, where the simpler and more expansively deployed nodes can be used to
96adjust the operating characteristics of the less densely distributed but more sophis-
97ticated devices (e.g., wake up, increase sample rate), thus circumventing the
98limitations arising from expense and power consumption. The interaction between
99two layers of sensor networks with different levels of complexity enables the
100respective advantages of dense distribution (yielding extensive temporal and spatial
101data) and sophisticated capability (involving high accuracy and reliability) to be
102capitalized upon, thus allowing what has been termed “adaptive monitoring” [5–7].
103Our specific interest in sensor networks is related to the integration of chemical
104sensors and biosensors (autonomous instruments that provide information about the
105molecular world) into sensor networks [4, 8]. In particular, we seek to identify and
106overcome the obstacles that inhibit the full realization of widely deployed chemo/
107bio-sensors in sensor networks [5]. The WSN literature is predominantly concerned
108with sensors that target physical parameters such as temperature, pressure, move-
109ment, vibration, light level, sound and such like. This is understandable, as these
110sensors tend to be low-cost, rugged, durable and reliable, maintain calibration over
111time and consume little power. Such characteristics are essential for the massive
Distributed Environmental Monitoring
112 scale-up implicit in the WSN concept, as articulated above. In contrast, chemo/
113 biosensors are expensive to buy and maintain, are unreliable in autonomous opera-
114 tion, do not maintain calibration, have limited lifetime and consume considerable
115 power [9]. Our research focuses on understanding the factors underlying these very
116 considerable obstacles, and identifying strategies through which they may be
117 overcome [10].
118 Conventionally, chemical sensing begins in the laboratory under strictly con-
119 trolled conditions, which often involves the addition of chemical species that ideally
120 reacts selectively with a target analyte and subsequently changes in some measur-
121 able property that is proportional to the concentration of the target analyte; many
122 such examples exist in the literature [11–14]. More importantly to the context
123 presented here are practical examples of such chemical sensing capabilities. In
124 this contribution, we shall describe several sensing platforms that can provide
125 remote access to information arising from the molecular world of chemistry and
126 biology, and illustrate their use in several on-going environmental deployments.
127 Sections 2 and 3 shall discuss sensing technologies pertaining to gas and water
128 quality monitoring, respectively, with case studies provided to illustrate on-going
129 collaboration with relevant agencies and industrial partners. These efforts in envi-
130 ronmental monitoring endeavour to develop sophisticated sensor nodes with a view
131 to advancing to ubiquitous sensor nodes’ deployment—such networks would pro-
132 vide the flexibility, scope and comprehensiveness that simply cannot be achieved
133 from currently employed manual spot measurement techniques. The ability to
134 monitor air/water quality is essential for maintaining quality—this is exemplified
135 by the finding by Bernhardt et al. [15] that the effectiveness of $14–15bn on river
136 restoration projects in the USA between 1990 and 2005 is not fully known. Autono-
137 mous sensor networks featuring large-scale, dense distribution of sensor nodes
138 necessitate very low-cost sensor nodes with adequate reliability and longevity.
139 Such challenges are sought to be overcome by electrochemical sensors; the potential
140 of such sensors is outlined in Sect. 4. Section 5 outlines the end-to-end acquisition
141 and meaningful analysis of data collected fromWSNs. An example of an air quality
142 monitoring dataset is analyzed to illustrate the reasoning that can be derived from
143 such data and how it can be conducive to better informed decision-making based on
144 observed events. In the course of such discussion, we will demonstrate how even
145 limited scale deployments of these emerging technologies can give rise to entirely
146 new information accessible through web databases to industry, enforcement bodies,
147 government agencies and the general public alike.
148 2 Gas Sensing: Autonomous Systems for Air Quality
149 Monitoring
150 2.1 Introduction
151 Numerous motivations exist for gas detection: pollution minimization to reduce
152 emissions that adversely affect local ecosystem as well as having potential global
D. Diamond et al.
153implications; human risk mitigation in the form of characterizing toxic and/or odorant
154gases; and gas handling diagnosis, where the unintentional leaking of gases from
155industrial plants and transfer pipes holds financial loss ramifications, in addition to
156posing a risk with regard to flammable or toxic gases. The impact of industrially
157generated gas emissions on the environment has prevailed in the world media in
158recent years [16, 17]. The significance of this has been further reinforced with the
159formation of international legislation to quantify and subsequently reduce harmful
160emissions [18]. The emphasis of such international efforts and media attentions has
161been targeted at the so-called greenhouse gases (GHG): carbon dioxide (CO2) and
162methane (CH4) gases have been identified as contributors to the greenhouse effect
163[19], which has been linked to climate change through modification of the insulating
164properties of Earth’s atmosphere. In addition to their contribution to the greenhouse
165effects on a global scale, gas emissions can be detrimental to their local environment.
166CO2 poses an asphyxiation risk as it is denser than air [20], while excessive CH4
167levels results in the death of surrounding vegetation [21]. Sulphur dioxide (SO2) and
168mono-nitrogen oxides (NOx), principally arising from internal combustion in auto-
169motive vehicles [22], produce acid rain from reactions with oxygen and water vapour
170to form sulphuric acid (H2SO4) and nitric acid (HNO3), respectively [23]. Further-
171more, SO2 is contributory to the formation of smog in cities [24] while nitric oxide
172(NO) leads to excess nitrogen in water, affecting water quality and consuming
173oxygen content to kill fish stocks [25]. Other examples of toxic gases are carbon
174monoxide (CO), hydrogen sulphide (H2S) and volatile organic compounds (VOCs).
175In addition to these toxins, ammonia (NH3) and methane (CH4) are unpleasant
176odorants, with CH4 also posing a significant fire hazard when existing in the highly
177flammable range of 5–15% v/v in air [26].
178The use of autonomous sensor networks can effectively fulfil the sensing
179requirements of the aforementioned target gases, especially concerning remote
180monitoring in inaccessible areas and long-term continuous acquisition. Such acqui-
181sition would enable the characterization of trends in defining the dynamics of the
182target gas generation and migration. This is demonstrated in the following sections,
183where an overview of the predominant sensor devices is outlined. Furthermore,
184these technologies are discussed in the context of developed autonomous gas
185monitoring applications.
1862.2 Gas Sensing Technologies
187In selecting the sensor technologies to fit to a specific application, the most
188prevalent criterion tends to be the minimization of sensor cost. Gas sensors tend
189to be dominant proportion of overall cost of the monitoring device, thus the
190employment of low-cost sensors would serve to reduce the annual cost of routine
191air quality monitoring. In 2000, this expenditure was estimated to be in the region of
192€320,000 per year in Ireland, excluding special studies and research aspects [27].
193With greater industrialization and the substantial increase in the volume of vehicu-
194lar traffic since then, the cost of air monitoring today has undoubtedly increased
Distributed Environmental Monitoring
195 substantially in excess of this figure. Other general criteria for sensor selection are
196 power consumption and gas selectivity. Low power consumption is advantageous
197 for low operational costs and extended time deployments. Gas selectivity is appli-
198 cation dependent, where a high sensitivity for the target gas is desirable to prevent
199 interference with other gases present in the sample. The context of autonomous
200 sensor networks introduces a number of other criteria, driving the need for compact
201 and rapid acquisition devices. Traditionally, gas sensing involved the capturing of
202 an air sample either via bagging or absorption on an applicable chemical surface.
203 This sample is subsequently processed in a laboratory, using methods such as gas
204 chromatography (GC), mass spectroscopy (MS) and infrared spectroscopy [28, 29].
205 Such techniques have been used by the UK and USA environmental protection
206 agencies, whereby two methods are employed: the chamber method and the tracer
207 flux method [30–32]. The chamber method involves a volume of gas being col-
208 lected on-site using a sealed gas-tight enclosure, with the sample being transported
209 to a remote laboratory for analysis, e.g., by GC–MS. The tracer flux method
210 involves the controlled release of a tracer gas (selected to be readily distinguishable
211 from the target gas) at specific locations in the landfill, with samples being grabbed
212 at locations downwind to monitor the plume dispersion [26]. The effectiveness of
213 both methods has been reported to be comparable [33]. While these techniques
214 yield very accurate results, the laborious process and substantial time delay between
215 acquisition and results (typically spanning several days) would not be suitable for
216 critical events where a rapid detection and alerting would avert a potential catas-
217 trophe. The predominant sensor technologies employed to enable portable, real-
218 time measurements include semiconductor, pellistor, ionization, electrochemical,
219 infrared and colorimetric sensors.
220 Semiconductor sensors work on the principle that the sensor material (comprised
221 of one or more metal oxides) varies its electrical resistance depending on the
222 absorption of the target gas [34]. When no gas is present, the sensor resistance
223 returns to its default condition. Amongst other applications, these types of sensors
224 have been developed to measure NH3 with reasonably fast response times [35], SO2
225 [36] and gas compositions in catalytic convertors in car exhausts [37]. One of the
226 principle drawbacks of this type of sensor is its susceptibility to poisoning [38], i.e.,227 the metal oxide materials become unresponsive after reactions with certain types of
228 gases, thus incapacitating the sensor. Furthermore, the behaviour of these sensors is
229 dependent on sample temperature and humidity as well as requiring the presence of
230 oxygen to function [39], hence limiting its range of applicability for WSNs.
231 Pellistor sensors detect gases that have a significantly different thermal conduc-
232 tivity to that of air [40, 41]. Heating elements incorporated into the sensor ignite the
233 target gas; the generated heat produces a change in resistance in the catalyst-loaded
234 ceramic detecting elements. Since the target gas needs to be ignited, the selectivity
235 of the device is limited to combustible gases only. Furthermore, regular mainte-
236 nance is required and measurements can become unreliable over time [42]. As with
237 semiconductor sensors, poisoning is a possibility and the presence of oxygen is
238 required for proper functioning. These limitations signify that pellistor sensors are
239 not particularly suited to WSNs.
D. Diamond et al.

240There are two types of ionization detectors: flame-ionization and photo-
241ionization. The ionization of the target gas results in a change in electrical charge
242output, which is read as the sensor measurement [43]. The two methods differ by
243their means of ionization: flame-ionization employs a hydrogen-air flame to pro-
244duce the ions [44] while photo-ionization involves the gas being bombarded with
245high-energy photons (typically from the UV spectrum) [45]. These methods are
246effective at sensing organic compounds and VOCs, though the flame-ionization
247method is limited to combustible gases. Furthermore, flame-ionization has a disad-
248vantage in that it is a destructive detection method, thus not preserving the sample.
249Ionization methods involve expensive (ca. $2,500) and complex devices, thus not
250being viable as a basis for a large-scale network of nodes required for WSNs.
251The operation of electrochemical sensors is based on the oxidation or reduction
252reaction that occurs between the target gas and device electrodes [46]. Redox
253electrodes often employ amperometry, in which the electrodes are poised at a
254certain potential at which it is known the target gas can be oxidized or reduced,
255and the resulting current is proportional to the concentration; more sophisticated
256sensors use voltammetry in which the electrode voltage is varied and the resulting
257voltammogram used to quantify the concentration. The latter technique is predom-
258inantly used for aqueous samples rather than gas sensing applications. These
259sensors feature very low limits of detection in the region of parts-per-billion
260[47–50]. Electrochemical sensors have very small power consumption, an ideal
261feature when considering autonomous sensor networks. However, these sensors
262tend to have limited functional lifetime—like the other sensors based on an active
263surface, they tend to be poisoned or lose sensitivity as the surface composition
264changes over time in real environments. In addition, these sensors can experience
265interference from other gases [51]. Furthermore, the sensors’ performance is quite
266sensitive to temperature, requiring internal temperature compensation and thermal
267stability in the sample [52]. Electrochemical sensors have been used to successfully
268detect NO [47], NO2 [48, 52], H2S [49] and SO2 [50]. Developmental work in the
269area of electrochemical sensing is discussed in greater detail in Sect. 4.
270Infrared (IR) sensors are typically used to detect hydrocarbons, toxic and
271combustible gases, with limited sensitivity for VOCs [53]. The sensor is comprised
272of an IR radiation emitter and detector pair, wherein a specific portion of the IR
273bandwidth is absorbed based on the molecular vibrations of the target analyte. The
274detector is tuned to specific characteristic bands for each target gases, e.g.,2752,360 cm�1 for the O¼C¼O stretch in CO2 [54] and 3,017 cm�1 for the C–H
276stretch in CH4 [55]. The extent of the IR wavelength absorption, as identified by the
277detector, indicates the concentration of the target gas in the sample. These types of
278sensors have excellent selectivity, range (up to 100% v/v with resolution in the
279region of parts per million), rapid response time and immunity to poisoning. Such
280characteristics are advantageous for WSNs; however, these features result in the
281sensors being quite expensive and power intensive. The presence of water vapour in
282the gas sample can also affect the IR sensing capabilities due to the airborne
283moisture absorbing IR radiation, thus potentially masking the presence of the target
284gas in humid environments [56].
Distributed Environmental Monitoring

285 Colorimetric sensors involve the characterization of a colour change arising
286 from the reaction between the target gas and chemically sensitive colorimetric
287 layer [57, 58]. While the sensing surface is susceptible to changes that are not
288 due to interactions with the target (e.g., surface fouling, dye photobleaching), these289 sensors show promise in terms of very low-cost devices, particularly when coupled
290 with colour measurement approaches such as optical fibre transducers [59] and
291 paired emitter detector diodes (PEDD) [60, 61]. Recent research has been
292 concerned with optimizing colorimetic sensors in terms of achieving stable, revers-
293 ible reactions with a distinct colour difference between protonated and
294 deprotonated states of the colorimetric states [60–64]. Such research has indicated
295 positive results for sensing CO2 and NH3.
296 Gas sensing studies such as those by Shepherd et al. have demonstrated a WSN
297 set-up within an environmental sensing chamber and showed the ability to detect
298 and track the movement of chemical plumes in gas form [57]. This study allowed
299 for an intermediate step before real deployments where the dynamics of a plumes
300 movement could be studied and modelled [65] and thereby allowing for a more
301 comprehensive understanding of chemical plume movement and detector place-
302 ment. Fraser et al. [66] developed a sensor system for detecting airborne
303 contaminants such as ammonia concentrations via the response of coated piezo-
304 electric crystals. Similarly, Klinkhachorn et al. [67] have implemented a chemical
305 sensing system with five piezoelectric quartz crystals for the detection of chemical
306 spills in hazardous waste sites. Furthermore, the work by Barko et al. [68] has307 developed a chemical sensor array using this approach but applied the use of
308 Artificial Neural Networks (ANNs) and showed a promising way of differentiating
309 and identifying between volatile compounds (acetone, benzene, chloroform and
310 pentane). Another gas-based study based on sensor networks has been conducted by
311 Becher et al. [69] where they employed metal oxide gas sensors for the detection of
312 a multitude of evaporating hazardous materials including: organic solvents NO2,
313 O3, CH4, CO, H2S, NH3 along with other pollutants in air. Similar work was
314 reported by Somov et al. [70] with more of a focus on the sensing infrastructure
315 and methane detection. In addition, Fay et al. have placed multiple systems capable
316 of detecting greenhouse gas emissions from landfill sites for a period of ca. 3 years
317 [71] that were relatively low in cost compared to others. For instance, a study by
318 Karellas et al. [72] monitored air pollution emissions from a fire started at a factory
319 in Guelph, Ontario who manufactures chemicals for use in swimming pools. The
320 technology employed here was a mobile vehicle capable of monitoring hydrogen
321 chloride and chlorine gas emissions from the factory in real time; however, the cost
322 base for such an approach is not feasible for widespread detection systems. Fur-
323 thermore, a project known as “PROTECT” in the USA was launched where a
324 number of chemo/bio-sensing systems were installed in Penn and Grand Central
325 railway stations with each unit costing ca. $25,000 and a maintenance cost of $1.7
326 million over 3 years [73, 74]. Clearly, more widespread deployments of this kind
327 would be prohibitively expensive. The key to progress is therefore the realization of
328 lower cost, yet reliable, chemical sensing platforms that will form the basis of much
329 larger scale deployments.
D. Diamond et al.

3302.3 Gas Sensing Application Case Studies
331In recent years, Diamond and co-workers [71, 75, 76] have been involved in the
332development of autonomous platforms for the real-time monitoring of gases in the
333environment. Current applications include the monitoring of GHG and odorant gases,
334specifically CO2 and CH4 produced from the anaerobic decomposition of waste at
335landfill sites. Such monitoring is relevant to the mandatory licencing terms of landfill
336sites, as regulated by the Environmental Protection Agency (EPA). Infrared gas
337sensors (sourced from Dynament Ltd., UK) were chosen for this application due to
338their range of detection, rapid response time and poisoning immunity being best
339suited to the unpredictable composition and transient fluctuations associated with
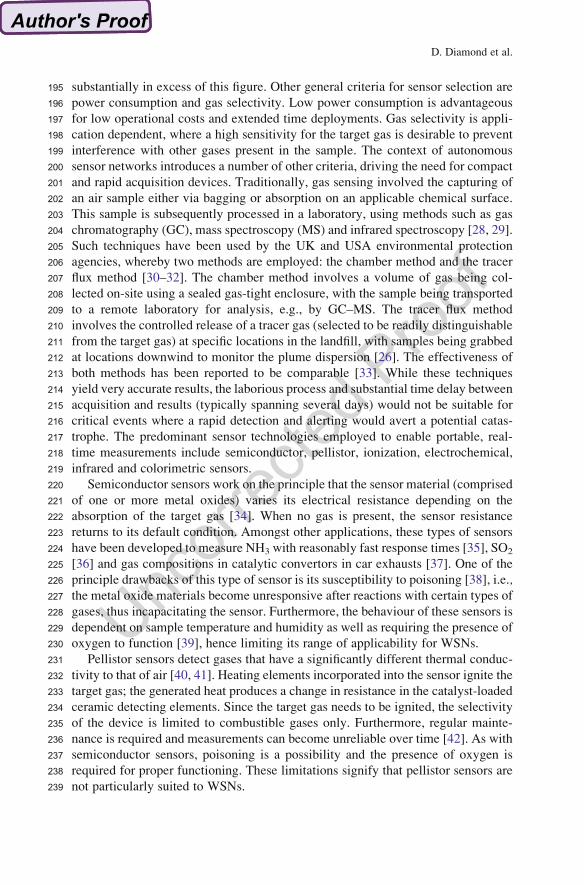
340landfill gas emissions. The compact and rugged construction of the platform, shown
341in Fig. 1, permits the platform to endure long-term deployment in inhospitable
342environments with continually successful operation [71, 75, 77].
343To date, extensive field deployment trials have been conducted at sites collabo-
344ratively selected with the Office of Environment Enforcement (OEE), the regu-
345latory division of the EPA. Systems were fitted to borehole wells located at the
346landfill perimeter to permit monitoring of any gas migration. Key deployments
347include two continuous monitoring durations in excess of 12 months (March 2010
348to March 2011): an active landfill site spanning 364 days/8,736 h in duration with
3491,148 data points collected; and a dormant site spanning 371 days/8,904 h, with
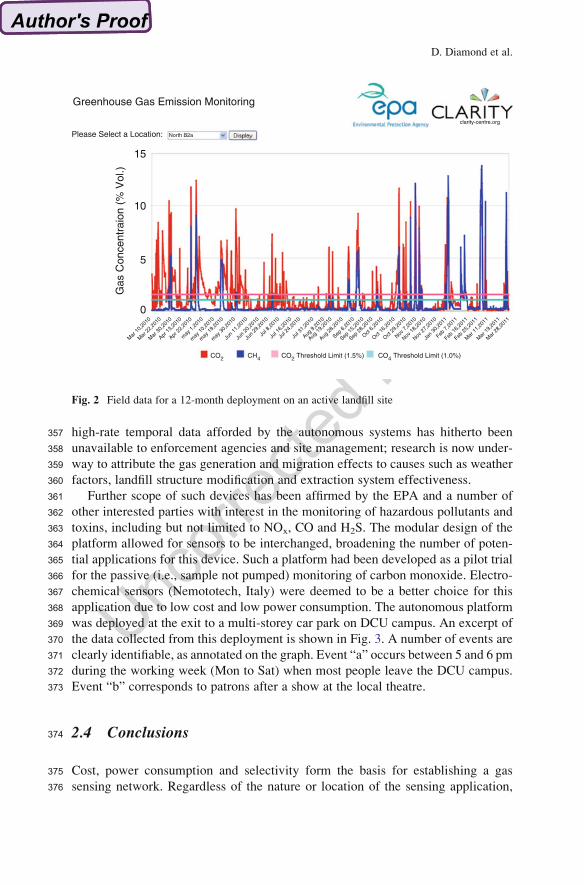
3501,255 data points collected. The full dataset from the active site, an operational
351landfill located in the north-east of Ireland, is shown in Fig. 2.
352Over the deployment duration, it can be seen that the measurements of CO2
353regularly exceeded the threshold level of 1.5% v/v as stipulated by the EPA.
354Measurements of CH4 in excess of the threshold level of 1% v/v were more
355intermittent; however, recurrent peaks can be observed that posed a particular
356concern when occupying the 5–15% v/v flammable range of CH4 in air. Such
Fig. 1 Developed autonomous landfill gas monitoring platform, (a) exploded view, (b) as
deployed on borehole well. (1) control board, (2) GSM module, (3) battery, (4) extraction pump,
(5) sample chamber and sensors, (6) protective casing
Distributed Environmental Monitoring
357 high-rate temporal data afforded by the autonomous systems has hitherto been
358 unavailable to enforcement agencies and site management; research is now under-
359 way to attribute the gas generation and migration effects to causes such as weather
360 factors, landfill structure modification and extraction system effectiveness.
361 Further scope of such devices has been affirmed by the EPA and a number of
362 other interested parties with interest in the monitoring of hazardous pollutants and
363 toxins, including but not limited to NOx, CO and H2S. The modular design of the
364 platform allowed for sensors to be interchanged, broadening the number of poten-
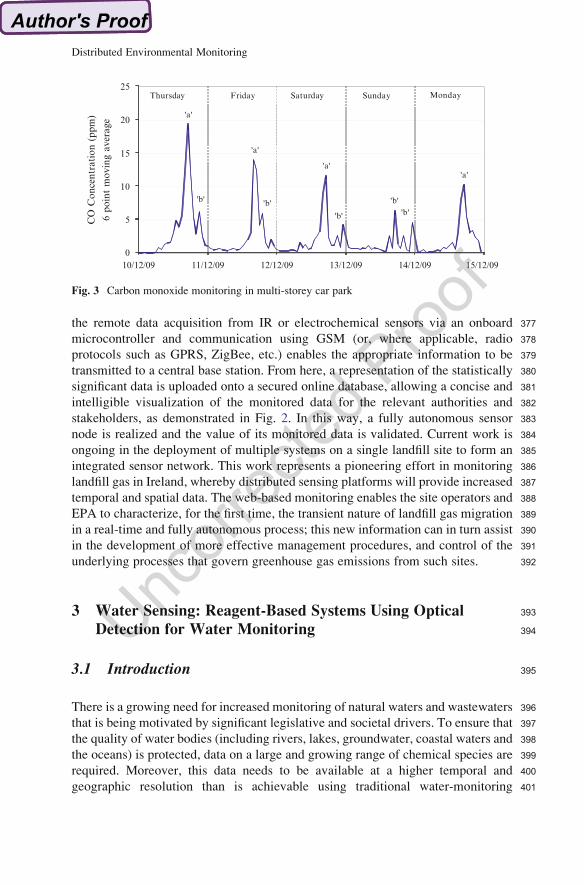
365 tial applications for this device. Such a platform had been developed as a pilot trial
366 for the passive (i.e., sample not pumped) monitoring of carbon monoxide. Electro-
367 chemical sensors (Nemototech, Italy) were deemed to be a better choice for this
368 application due to low cost and low power consumption. The autonomous platform
369 was deployed at the exit to a multi-storey car park on DCU campus. An excerpt of
370 the data collected from this deployment is shown in Fig. 3. A number of events are
371 clearly identifiable, as annotated on the graph. Event “a” occurs between 5 and 6 pm
372 during the working week (Mon to Sat) when most people leave the DCU campus.
373 Event “b” corresponds to patrons after a show at the local theatre.
374 2.4 Conclusions
375 Cost, power consumption and selectivity form the basis for establishing a gas
376 sensing network. Regardless of the nature or location of the sensing application,
Gas
Con
cent
raio
n (%
Vol
.)
15
Please Select a Location:
Greenhouse Gas Emission Monitoring
North B2a
clarity-centre.org
10
5
0
CO2
Mar
10,
2010
Mar
22,
2010
Mar
30,
2010
Apr 1
3,20
10
Sep 2
8,20
10
Mar
11,
2011
Mar
19,
2011
Mar
28,
2011
Feb 2
5,20
11
Feb 1
6,20
11
Feb 7
,201
1
Jan
30,2
011
Nov 2
7,20
10
Nov 1
8,20
10
Nov 7
,201
0
Oct 29
,201
0
Oct 16
,201
0
Oct 6,
2010
Sep 6
,201
0
Sep 1
5,20
10
Aug 2
8,20
10
Aug 1
9,20
10
Aug 9
,201
0
Jul 3
1,20
10
Jul 2
4,20
10
Jul 8
,201
0
Jul 1
6,20
10
Jun
29,2
010
Jun
20,2
010
Jun
11,2
010
may
30,
2010
may
19,
2010
may
10,
2010
may
1,2
010
Apr 2
2,20
10
CO2 Threshold Limit (1.5%) CO4 Threshold Limit (1.0%)CH4
Fig. 2 Field data for a 12-month deployment on an active landfill site
D. Diamond et al.
377the remote data acquisition from IR or electrochemical sensors via an onboard
378microcontroller and communication using GSM (or, where applicable, radio
379protocols such as GPRS, ZigBee, etc.) enables the appropriate information to be
380transmitted to a central base station. From here, a representation of the statistically
381significant data is uploaded onto a secured online database, allowing a concise and
382intelligible visualization of the monitored data for the relevant authorities and
383stakeholders, as demonstrated in Fig. 2. In this way, a fully autonomous sensor
384node is realized and the value of its monitored data is validated. Current work is
385ongoing in the deployment of multiple systems on a single landfill site to form an
386integrated sensor network. This work represents a pioneering effort in monitoring
387landfill gas in Ireland, whereby distributed sensing platforms will provide increased
388temporal and spatial data. The web-based monitoring enables the site operators and
389EPA to characterize, for the first time, the transient nature of landfill gas migration
390in a real-time and fully autonomous process; this new information can in turn assist
391in the development of more effective management procedures, and control of the
392underlying processes that govern greenhouse gas emissions from such sites.
3933 Water Sensing: Reagent-Based Systems Using Optical
394Detection for Water Monitoring
3953.1 Introduction
396There is a growing need for increased monitoring of natural waters and wastewaters
397that is being motivated by significant legislative and societal drivers. To ensure that
398the quality of water bodies (including rivers, lakes, groundwater, coastal waters and
399the oceans) is protected, data on a large and growing range of chemical species are
400required. Moreover, this data needs to be available at a higher temporal and
401geographic resolution than is achievable using traditional water-monitoring
010/12/09 11/12/09 12/12/09 13/12/09 14/12/09 15/12/09
5
10
15
20
25Thursday Friday Saturday MondaySunday
'a'
'a'
'a''a'
'b' 'b'
'b'
'b''b'
CO
Con
cent
ration
(pp
m)
6 po
int m
ovin
g av
erag
e
Fig. 3 Carbon monoxide monitoring in multi-storey car park
Distributed Environmental Monitoring

402 practices, which have been dominated by manual sample collection followed by
403 laboratory analysis using a range of techniques. While this approach, properly
404 implemented, can provide high-quality data, it is expensive due to the high man-
405 power requirements and in some cases the high cost of analysis, and the sampling
406 frequency is consequently typically quite limited. There is, therefore, a need for
407 portable, robust, accurate water monitoring systems which can be used to measure
408 water quality in situ at relatively high frequency over extended deployment times.
409 Since the “miniaturized total analysis system” (mTAS) concept was introduced410 by Manz et al. in 1990 [78], microfluidic or “lab-on-a-chip” technology has been
411 seen to offer a range of properties which make it suitable for the development of
412 compact, autonomous analytical devices. In this context, the advantages of
413 microfluidic sensing systems can be summarized as (1) small flow rates used,
414 typically in the mL min�1 range, which minimize sample size, reagent consumption
415 and waste generation, (2) small size, facilitating the development of compact and
416 portable analytical systems, (3) speed of analysis derived from performing chemi-
417 cal analysis on the mm scale, where diffusion-based mixing can be an efficient
418 process and (4) potential for low-cost devices. This combination of properties
419 makes microfluidic systems highly attractive as a basis for reagent-based monitor-
420 ing of chemical species in the aquatic environment.
421 There are, however, also drawbacks associated with operating at the micro-scale;
422 the small samples sizes have implications in terms of properly representing the
423 complete body of water which is to be measured, while the small size of the channels
424 and other features of micro-analytical systems means that they are susceptible to
425 blockage or interference by even fine particulate matter. The former issue can be
426 mitigated by the higher measurement frequency which is possible using in situ
427 systems, while the use of fine filters at the sampling point can minimize the latter
428 issue, although at the cost of limiting the analytical parameter to the dissolved
429 fraction of the target species. Nevertheless, issues such as these and others, including
430 interference caused by bubble formation/trapping within the analytical system, have
431 represented significant barriers to the development of truly successful microfluidics-
432 based in situ sensing systems. Although numerous and frequently highly sophisti-
433 cated micro-analytical systems have been developed and assessed under laboratory
434 conditions, examples of integrated micro-analytical devices which have been suc-
435 cessfully deployed for extended periods under real environmental conditions are
436 much scarcer. While the development of sensing nodes for the aquatic environment
437 which are sufficiently reliable and low in cost to form the basis of extensive WSNs
438 has been anticipated, realization of this goal has been more difficult to achieve. The
439 challenges to developing such systems include stability and reliability of the analyti-
440 cal system, cost and power consumption of the integrated device, robustness in harsh
441 environmental conditions and fouling due to particulate matter and microorganisms.
442 In developing an autonomous environmental monitoring device, deployable lifetimes
443 on the order of months to years are desirable, depending on the specific application.
444 Achieving such lifetimes without elevating the fabrication cost of the integrated
445 system to unviable levels can be described as the key challenge for developers. In
446 this section, we focus on integrated microfluidics-based systems for water quality
447 monitoring applications.
D. Diamond et al.

4483.2 Microfluidic-Based Water Monitoring Technologies
449As the fabrication of microfluidic systems has been reviewed elsewhere [79, 80],
450we will mention this topic only briefly. A wide variety of materials and techniques
451have been used for the fabrication of microfluidic analytical systems. Some of the
452most commonly used materials include silicon, glass, and polymers such as poly
453(dimethylsiloxane) (PDMS), poly(methylmethacrylate) (PMMA) and polycarbon-
454ate. Depending on the material, application, and size and aspect ratio of features
455required, fabrication techniques including photolithography, soft lithography,
456micro-milling, injection moulding and embossing have been used to form
457microfluidic chips with a range of components such as channels, mixers, separators,
458integrated detectors, valves and pumps.
459An area which has seen significant progress is the integration of colorimetric
460methods for nutrients such as phosphate, ammonia and nitrate/nitrite into
461microfluidic manifolds with LED/photodiode-based optical detection systems.
462Worsfold and co-workers developed a miniaturized, LED-based chemical analyzer
463for in situ monitoring of nitrate [81]. The limit of detection (LOD) with a 20 mm
464path length flow cell was 2.8 mg L�1. The linear range was adjustable to suit local
465conditions in the field by changing the flow cell path length and/or sample loop
466volume. The analyzer was used in shipboard mode for mapping nitrate concentra-
467tion in the North Sea and in submersible mode for a transect of Tamar Estuary
468(UK). Doku and Haswell [82] developed a micro-flow injection analysis (mFIA)469technique for orthophosphate based on the molybdenum blue reaction. The mFIA470manifold was formed by etching of borosilicate glass, and electro-osmotic flow was
471used both for the mobilization of reagents and for sample injection. An LOD of
4720.1 mg mL�1 was achieved, with a rapid analysis time of 60 s and low sample/
473reagent volume (total system volume of 0.6 mL). Greenway et al. [83] produced a
474similar mFIA system for the determination of nitrite, based on the Greiss reaction to
475form an azo dye. Following optimization of the electro-osmotic flow
476characteristics, reaction chemistry, and injection time, an LOD of 0.2 mmol L�1
477was achieved. A further progression of this work [84] was to incorporate a cadmium
478reductor column within the device to use the same method for the analysis of nitrate
479in water, producing an LOD of 0.51 mmol L�1. Daridon et al. [85] investigated the
480Berthelot reaction for the determination of ammonia in water utilizing a
481microfluidic device consisting of a silicon chip between two glass plates. The
482pathlength in this device was 400 mm, and the integrated system comprised fibre
483optics coupled to an LED. High aspect ratio channels (30 mmwide � 220 mm deep)
484were used for sample/reagent mixing in order to achieve efficient diffusional
485mixing.
486Azzarro et al. [86] described an automatic colorimetric analyzer prototype
487(MicroMAC FAST MP3) for high frequency measurement of nutrients in seawater.
488This system utilizes the Berthelot method for ammonia detection, the
489sulphanilamide/ethylendiamine method for nitrate detection, and the blue
490phosphomolybdate method for phosphate detection, and LODs of 5, 2.5 and
Distributed Environmental Monitoring
491 2.5 mg L�1 were reported for N-NH4, N-NO3 and P-PO4, respectively. The system
492 is based on loop flow analysis technology developed by Systea, an Italian company,
493 and has been further developed to provide a system more suited to deployment on
494 typical monitoring platforms [87]. This multi-nutrient analyzer system has been
495 trialled in collaboration with YSI Hydrodata at two locations in the UK
496 (Hannigfield Reservoir and River Blackwater Estuary) [88].
497 Other systems for in situ nutrient monitoring have been field tested by the
498 Alliance for Coastal Technologies (ACT), Chesapeake Biological Laboratory,
499 Maryland, USA [89–91]. The American Ecotech NUT 1000 was originally devel-
500 oped by Monash University and commercialized by Ecotech Pty. Ltd. The system
501 can achieve LODs for reactive phosphate of <3 mg L�1 with a response time of
502 30 s. The high sampling rate is due to the use of rapid sequenced reagent injection in
503 combination with a multi-reflection flow cell. Reagent injection also minimizes the
504 reagent consumption, allowing over 1,000 measurements to be performed with only
505 20 mL of reagent. In the ACT trials, the NUT 1000 (which is non-submersible) was
506 used for surface mapping onboard a research vessel in Monterey Bay, California
507 [90]. Very good correlation with validation samples was achieved, after correction
508 for a measurement offset of 50 mg L�1 P-PO4, which was attributed to differences
509 in refractive index of natural seawater versus the reagent grade water used for
510 preparation of internal standards and machine calibration. The ACT has also
511 reported on successful deployments of the WET Labs Cycle-P nutrient analyzer
512 [91] and the YSI 9600 Nitrate Monitor [89].
513 Vuillemin et al. [92] described a miniaturized chemical analyser (CHEMINI) for
514 dissolved iron and total sulphide, based on FIA and colorimetric analysis. Designed
515 for deep-sea applications, the system is submersible to a depth of 6,000 m, with
516 detection limits of 0.3 mM and 0.1 mM for iron and sulphide, respectively. It has
517 been used to document the chemical environment prevailing within mussel beds,
518 performing 8 assays/day over a 6-month deployment period.
519 Koch et al. [93] presented the individual microfluidic instrument components to
520 be used for an integrated micro-total-analysis device for in situ, colorimetric, water
521 quality monitoring. Components include a microfabricated filter, a passive
522 micromixer, a 1-cm pathlength microfluidic absorbance flow cell, mini-motor-
523 driven peristaltic micropumps, a miniature collapsible reagent storage bag, and
524 compact water-proof packaging.
525 Sieben and co-workers [94, 95] developed a stand-alone sensor platform with
526 integrated sub-systems, which is portable and capable of in situ reagent-based
527 nutrient analysis. The system is based on a continuous flow, microfluidic absorption
528 cell and a low cost optical detection method, together with an automated
529 microfluidic delivery. The system was characterized using the Griess reaction for
530 detection of nitrite, achieving an LOD of 14 nM. The platform can also be
531 configured to detect a range of parameters including nitrate, phosphate, iron and
532 manganese using appropriate colorimetric chemistries. In the nitrite-detection
533 configuration, the system was deployed at Southampton Dock and operated in
534 situ for 37 h, performing 284 discrete measurements.
D. Diamond et al.
535Reagent stability is often a major limitation when considering methods for
536environmental monitoring. Devices ideally need to be left in the field for a significant
537period of time and give reproducible results during this time frame. Sequeira et al.538[96] addressed the stability of the reagents for the Berthelot reaction for long-term
539monitoring applications. The three key reagents in the reaction are potassium sodium
540tartrate, phenol and hypochlorite. While potassium sodium tartrate and phenol are
541generally regarded as stable if stored properly, hypochlorite solutions are commonly
542unstable and typically decompose to form chlorate ion and oxygen over a period of
543days or weeks. It was shown that ensuring that the hypochlorite solution was free
544from contamination with Fe and Cu, which catalyze the decomposition, allowed
545long-term stable storage of the hypochlorite solution. Salicylate was also used as a
546replacement for phenol and was found to yield broadly similar analytical perfor-
547mance in terms of the sensitivity, and kinetics, while having the major advantages of
548being highly stable and non-toxic. Bowden et al. [97, 98] evaluated the vanadomo-
549lybdophosphoric acid method (yellow method) as an analytical method for the
550determination of phosphorus in water within a microfluidic device using stopped
551flow with the aim of producing an automated device with a field lifetime of 1 year. In
552this method ammonium molybdate, (NH4)6Mo7O24.7H2O, is reacted with ammo-
553nium metavanadate, NH4VO3, under acidic conditions. The combined reagent and
554sample containing orthophosphate react to form the vanadomolybdophosphoric acid
555complex, (NH4)3PO4NH4VO3.16MoO3. The resulting solution has a distinct yellow
556colour arising from the strong absorbance of this complex below 400 nm. It was
557shown that batches of the reagent could be used for over 1 year with no significant
558loss in performance [98]. This method was therefore selected in preference to the
559molybdenum blue method, due to the greater stability of the reagents used in the
560analysis, and resulted in an assay with an LOD of 0.2 mg L�1 and a dynamic linear
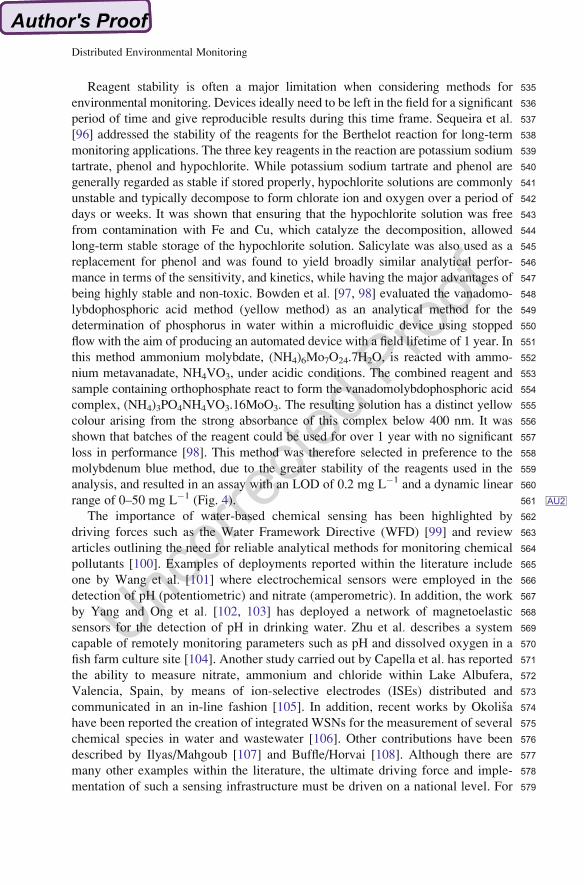
561range of 0–50 mg L�1AU2(Fig. 4).
562The importance of water-based chemical sensing has been highlighted by
563driving forces such as the Water Framework Directive (WFD) [99] and review
564articles outlining the need for reliable analytical methods for monitoring chemical
565pollutants [100]. Examples of deployments reported within the literature include
566one by Wang et al. [101] where electrochemical sensors were employed in the
567detection of pH (potentiometric) and nitrate (amperometric). In addition, the work
568by Yang and Ong et al. [102, 103] has deployed a network of magnetoelastic
569sensors for the detection of pH in drinking water. Zhu et al. describes a system
570capable of remotely monitoring parameters such as pH and dissolved oxygen in a
571fish farm culture site [104]. Another study carried out by Capella et al. has reported572the ability to measure nitrate, ammonium and chloride within Lake Albufera,
573Valencia, Spain, by means of ion-selective electrodes (ISEs) distributed and
574communicated in an in-line fashion [105]. In addition, recent works by Okolisa
575have been reported the creation of integrated WSNs for the measurement of several
576chemical species in water and wastewater [106]. Other contributions have been
577described by Ilyas/Mahgoub [107] and Buffle/Horvai [108]. Although there are
578many other examples within the literature, the ultimate driving force and imple-
579mentation of such a sensing infrastructure must be driven on a national level. For
Distributed Environmental Monitoring
580 example, in Ireland, challenges exist in this area for Irish governmental agencies
581 and a key example includes the “DEPLOY” project by O’Flynn et al. examining a
582 2-year deployment of 5 sensor stations along the length of a river in Ireland capable
583 of continuously measuring parameters such as pH, conductivity, turbidity,
584 dissolved oxygen amongst others with an aim to address the demands of the
585 WFD [109].
586 3.3 Water Monitoring Application Case Studies
587 Diamond and co-workers [110–112] have developed a prototype autonomous
588 integrated microfluidic analyzer based on this method whose performance has
589 been validated in field trials in wastewater and natural waters. More recently, a
590 substantial redesign has yielded a second generation system with similar analytical
591 specifications but with significant improvements in the areas of size and portability,
592 ease of deployment, deployable lifetime and fabrication cost. The current phosphate
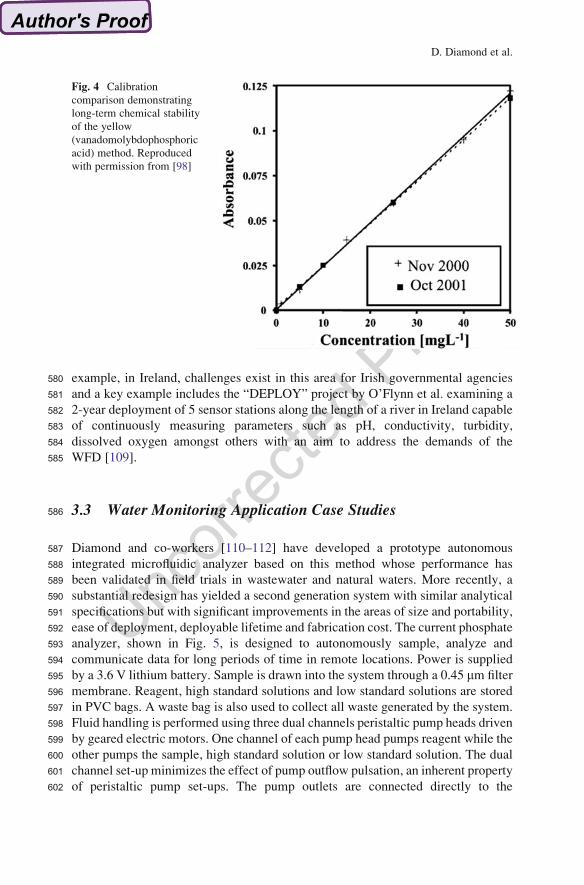
593 analyzer, shown in Fig. 5, is designed to autonomously sample, analyze and
594 communicate data for long periods of time in remote locations. Power is supplied
595 by a 3.6 V lithium battery. Sample is drawn into the system through a 0.45 mm filter
596 membrane. Reagent, high standard solutions and low standard solutions are stored
597 in PVC bags. A waste bag is also used to collect all waste generated by the system.
598 Fluid handling is performed using three dual channels peristaltic pump heads driven
599 by geared electric motors. One channel of each pump head pumps reagent while the
600 other pumps the sample, high standard solution or low standard solution. The dual
601 channel set-up minimizes the effect of pump outflow pulsation, an inherent property
602 of peristaltic pump set-ups. The pump outlets are connected directly to the
Fig. 4 Calibration
comparison demonstrating
long-term chemical stability
of the yellow
(vanadomolybdophosphoric
acid) method. Reproduced
with permission from [98]
D. Diamond et al.
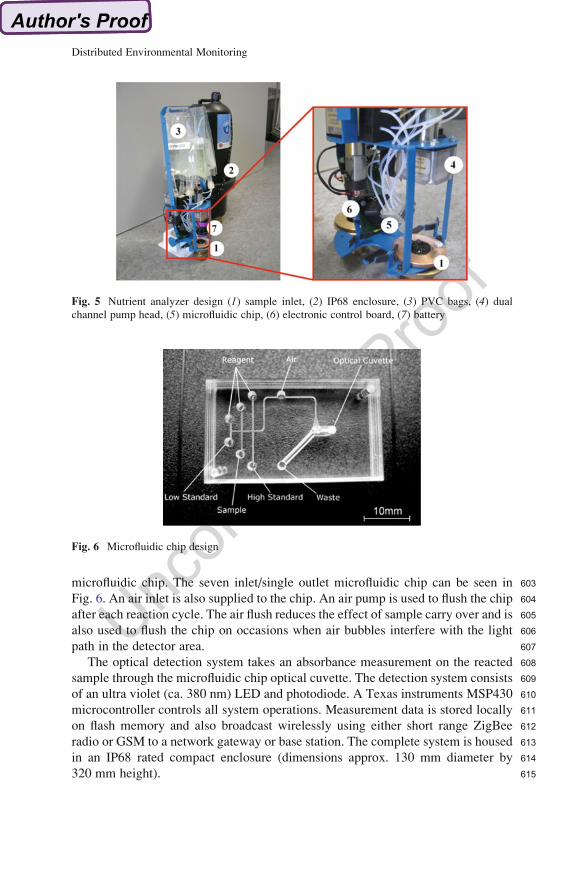
603microfluidic chip. The seven inlet/single outlet microfluidic chip can be seen in
604Fig. 6. An air inlet is also supplied to the chip. An air pump is used to flush the chip
605after each reaction cycle. The air flush reduces the effect of sample carry over and is
606also used to flush the chip on occasions when air bubbles interfere with the light
607path in the detector area.
608The optical detection system takes an absorbance measurement on the reacted
609sample through the microfluidic chip optical cuvette. The detection system consists
610of an ultra violet (ca. 380 nm) LED and photodiode. A Texas instruments MSP430
611microcontroller controls all system operations. Measurement data is stored locally
612on flash memory and also broadcast wirelessly using either short range ZigBee
613radio or GSM to a network gateway or base station. The complete system is housed
614in an IP68 rated compact enclosure (dimensions approx. 130 mm diameter by
615320 mm height).
Fig. 5 Nutrient analyzer design (1) sample inlet, (2) IP68 enclosure, (3) PVC bags, (4) dualchannel pump head, (5) microfluidic chip, (6) electronic control board, (7) battery
Fig. 6 Microfluidic chip design
Distributed Environmental Monitoring
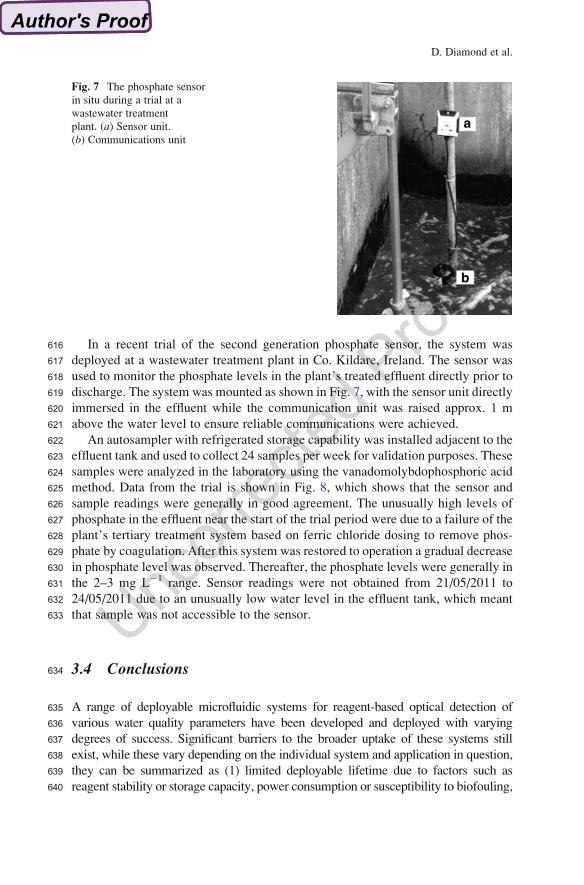
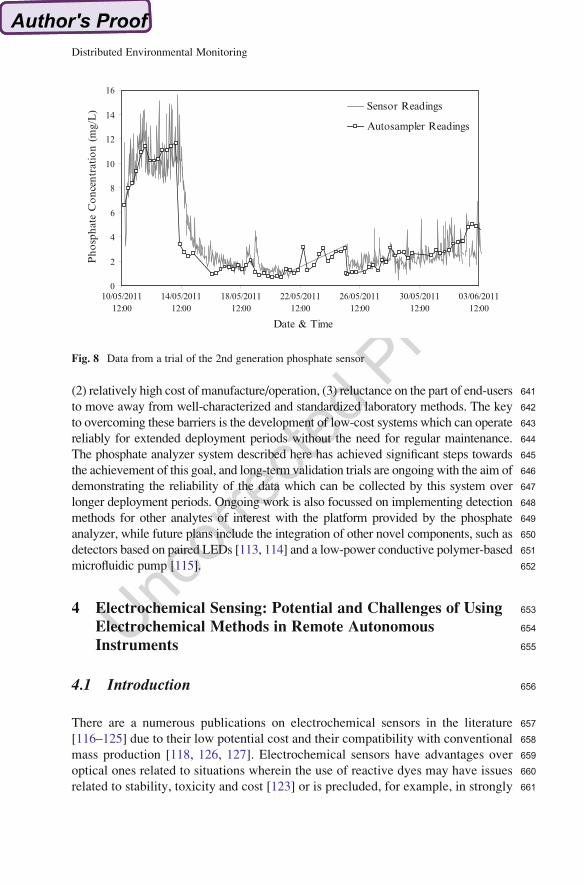
616 In a recent trial of the second generation phosphate sensor, the system was
617 deployed at a wastewater treatment plant in Co. Kildare, Ireland. The sensor was
618 used to monitor the phosphate levels in the plant’s treated effluent directly prior to
619 discharge. The system was mounted as shown in Fig. 7, with the sensor unit directly
620 immersed in the effluent while the communication unit was raised approx. 1 m
621 above the water level to ensure reliable communications were achieved.
622 An autosampler with refrigerated storage capability was installed adjacent to the
623 effluent tank and used to collect 24 samples per week for validation purposes. These
624 samples were analyzed in the laboratory using the vanadomolybdophosphoric acid
625 method. Data from the trial is shown in Fig. 8, which shows that the sensor and
626 sample readings were generally in good agreement. The unusually high levels of
627 phosphate in the effluent near the start of the trial period were due to a failure of the
628 plant’s tertiary treatment system based on ferric chloride dosing to remove phos-
629 phate by coagulation. After this system was restored to operation a gradual decrease
630 in phosphate level was observed. Thereafter, the phosphate levels were generally in
631 the 2–3 mg L�1 range. Sensor readings were not obtained from 21/05/2011 to
632 24/05/2011 due to an unusually low water level in the effluent tank, which meant
633 that sample was not accessible to the sensor.
634 3.4 Conclusions
635 A range of deployable microfluidic systems for reagent-based optical detection of
636 various water quality parameters have been developed and deployed with varying
637 degrees of success. Significant barriers to the broader uptake of these systems still
638 exist, while these vary depending on the individual system and application in question,
639 they can be summarized as (1) limited deployable lifetime due to factors such as
640 reagent stability or storage capacity, power consumption or susceptibility to biofouling,
Fig. 7 The phosphate sensor
in situ during a trial at a
wastewater treatment
plant. (a) Sensor unit.(b) Communications unit
D. Diamond et al.
641(2) relatively high cost of manufacture/operation, (3) reluctance on the part of end-users
642to move away from well-characterized and standardized laboratory methods. The key
643to overcoming these barriers is the development of low-cost systems which can operate
644reliably for extended deployment periods without the need for regular maintenance.
645The phosphate analyzer system described here has achieved significant steps towards
646the achievement of this goal, and long-term validation trials are ongoing with the aim of
647demonstrating the reliability of the data which can be collected by this system over
648longer deployment periods. Ongoing work is also focussed on implementing detection
649methods for other analytes of interest with the platform provided by the phosphate
650analyzer, while future plans include the integration of other novel components, such as
651detectors based on paired LEDs [113, 114] and a low-power conductive polymer-based
652microfluidic pump [115].
6534 Electrochemical Sensing: Potential and Challenges of Using
654Electrochemical Methods in Remote Autonomous
655Instruments
6564.1 Introduction
657There are a numerous publications on electrochemical sensors in the literature
658[116–125] due to their low potential cost and their compatibility with conventional
659mass production [118, 126, 127]. Electrochemical sensors have advantages over
660optical ones related to situations wherein the use of reactive dyes may have issues
661related to stability, toxicity and cost [123] or is precluded, for example, in strongly
0
2
4
6
8
10
12
14
16
10/05/201112:00
14/05/201112:00
18/05/201112:00
22/05/201112:00
26/05/201112:00
30/05/201112:00
03/06/201112:00
Date & Time
Phosp
hat
e C
once
ntr
atio
n (m
g/L
) Sensor Readings
Autosampler Readings
Fig. 8 Data from a trial of the 2nd generation phosphate sensor
Distributed Environmental Monitoring
662 coloured or turbid samples [122, 124], or in cases for which no appropriate dye
663 exists. Moreover, the combination of different sensor types can offer complimen-
664 tary information allowing the extraction of a richer set of data [118]. Presently,
665 screen printing appears to be a convenient technology for the preparation of
666 electrochemical biosensors which may allow commercialization of low cost
667 devices on a large scale [128–130]. This technique allows the preparation of
668 substrates in a variety of geometries at very low cost, especially when carbon
669 inks are used [131]. Translation from conventional electrodes to screen printed
670 designs has already succeeded in many cases, particularly for biosensors aimed at
671 biomedical, environmental and industrial applications [130, 131].
672 The issue of sensor calibration in keeping the response within an accurate
673 calibration domain is particularly significant in the development of chemo/
674 bio-sensor networks [9]. In this regard, changes in the conditions of the transducing
675 surface/layer cause changes in the response characteristics, necessitating the need
676 for regular recalibration. The integration of electrochemical sensors in deployable
677 WSN platform has to cope with the latter issue; this review will give particular
678 emphasis to this aspect. Detection schemes combined with separation techniques
679 such as microdialysis, electrophoresis, chromatography and laboratory-on-a-chip
680 approaches [132] are not included here as these significantly increase the overall
681 cost. Devices like electronic noses/tongues are also not covered because they are
682 essentially an array of non-specific sensors. It is worthwhile to note that the
683 response patterns obtained are not stable over time although their potential to
684 extract complex information from the sensor array seems very powerful [133].
685 Anodic and cathodic stripping voltammetry [134–136] is commonly used as
686 analytical method to detect ions with remarkable sensitivity, often in the ppb range
687 or below, thanks to the “built-in” pre-concentration step, i.e., accumulation of
688 analyte at the electrode [127]. Currently, anodic stripping analysis combined with
689 screen printed electrodes seems to represent the best candidate for monitoring
690 heavy-metals in remotely deployed submersible sensors. Work for the creation of
691 in situ metals sensing platform has been pursued extensively in Buffle’s and
692 Wang’s group [135, 137–140], and some commercial submersible voltammetric
693 probes for trace element monitoring, e.g., Idronaut. The latter device has been used
694 for in situ monitoring of heavy metals (Pb, Cd, Cu) at subnanomolar levels in
695 coastal waters and results compared to established laboratory methodologies
696 showing good accuracy over several days of monitoring [141]. However, calibra-
697 tion standards are stored within the device and the instrument is also quite bulky and
698 prohibitively costly.
699 Stripping peak currents are not only proportional to deposition period and metal
700 concentration but also depend on the area of electrode, diffusion coefficient of the
701 species and convection rate [135]. Thus, environmental factors which may affect
702 any of the latter properties would require a recalibration of the sensing device with
703 obvious difficulty and cost to do this remotely in situ. While changes in the
704 environmental temperature may be compensated by ex situ calibration at different
705 temperature and use of a temperature probe, careful device design is required to
706 avoid the other artefacts.
D. Diamond et al.
707An additional agent can be required for some substrate types, e.g., Cu2+ inhibits
708the stripping response of Pb2+ whose concentration correlated with ICP-MS method
709only after masking with 0.1 M ferricyanide as complexing agent [142, 143]. This
710necessitates extra complexity in the remotely deployed sensing platform, such as
711that described in Sect. 3.3, where the masking agent would have to be stored and
712added to the sample within the instrument prior to analysis with the sensor. The use
713of reagents, where avoidable, is undesirable due to the complexity and associated
714increase in cost of the microfluidic system. The use of solid-phase extraction has
715been found to limit the use of reagents [144–148], suggesting a greater suitability
716for remote applications such as WSNs.
7174.2 Electrochemical Sensor Technologies Review
7184.2.1 Potentiometric Sensors
719The principles of operation in potentiometric ISEs can be found elsewhere [149,
720150]. Potentiometric sensors represent an interesting approach to environmental
721monitoring thanks to the simplification in the software/hardware interface to the
722sensor [123, 151, 152] and the very small power consumption requirement. The
723field of potentiometric sensors has gone through a revolution in the last 10 years
724with a major effort focused in the theoretical developments [153–161] which has
725led not only to a deeper understanding of these devices, but also more significantly
726to dramatic improvements in the detection limits, which has opened up new
727opportunities in environmental monitoring [162–164]. Solid-state ISEs are more
728convenient for remote monitoring than liquid-filled ISEs as they are compatible
729with microfabrication technologies and they are easier to miniaturize [150, 160,
730165–167]. Conducting polymer-based solid-contact (SC) ISEs have produced sig-
731nificant results for the detection of Pb at concentrations comparable with current
732legislation requirements [168–170], i.e., down to 10 nM under laboratory
733conditions in simulated samples and down to ppb levels in real samples when
734standard addition methodology was employed [171, 172]. However, Radu et al.735[173] showed that the calibration trends of these sensors are significantly distorted
736upon exposure with environmental samples which may indicate that sensors can be
737used only in combination with standard addition to compensate for the matrix
738effects.
739Overall, these results confirmed that autonomous in situ environmental moni-
740toring with potentiometric ISEs may be feasible for Pb, as the Water Framework
741Directive (WFD) has fixed its upper limit to 35 nM as standard for the environ-
742mental water quality. However, regarding a realistic employment of ISEs for
743remote monitoring, several aspects deserve further consideration. In potentiometry,
744the dependence of the signal response on the logarithm of the analyte activity has
745been considered as an inherent drawback [117] though it also means that sensors
746have a wider dynamic range. Potentiometric methods detect the activity and not the
Distributed Environmental Monitoring
747 concentration of free ions, which can lead to ionic strength artefacts—this can also
748 be an advantage as the activity is often the more relevant property in terms of
749 bioavailability in many natural processes. One of the main hurdles for the use of
750 ISEs in autonomous in situ applications is the complications of the conditioning
751 protocols. Appropriate conditioning steps appear to be essential in order to achieve
752 the very low detection limits reported in the literature, though guidelines for
753 standardizing a protocol are not widely agreed upon [166]. Prolonged contact
754 with a sample containing a strong interferent causes completely different
755 reconditioning and subsequent distortion of the analytical response to the primary
756 ion [117, 174]. Therefore, it may be necessary to make measurements over a short
757 timescale, followed by longer storage periods in the conditioning media. The time
758 required for the conditioning operations prior to measurement (e.g., conditioning
759 step lasting several hours) may be a major drawback in terms of practicality of the
760 sensing platform, limiting the capability of the sensor to operate at a high sampling
761 rate. Using ISEs after long time periods of storage in a conditioning solution
762 without calibration (all sensors are perfectly predictable) or limited to one-point
763 calibration [175] (i.e., change in offset but not in sensitivity) would be very
764 desirable, as the resulting device would be very simple and low cost signifying
765 that they would be ideal for WSNs. In spite of extensive research in the area, it
766 seems that obtaining SC-ISEs with reproducible standard potentials is still a
767 substantial challenge [160] exhibiting very limited reproducibility of the
768 measurements without frequent recalibration [176]. However, encouraging results
769 on the sensor reproducibility and real samples analysis have been obtained by
770 Saltisza et al. [172] using ISEs based on screen AU3printed electrodes which may
771 open the opportunity of calibrationless devices for in situ applications. Interest-
772 ingly, Radu et al. [173] proposed the use of electrochemical impedance spectros-
773 copy as means of self-diagnostics for remotely deployed chemical sensors in order
774 to make a decision on whether a calibration is necessary or not, thus limiting the
775 need of in situ calibration.
776 4.2.2 Conductometric/Impedimetric Devices and Field-Effect Transistors
777 Conductometric devices measure the change in conductivity between electrodes or
778 reference nodes due to the presence of a certain analyte [118, 123]. These sensors
779 have been used in combination with enzymes, whose reaction with the analyte
780 changes the sample conductivity [117, 120, 123]. In impedimetric sensors, changes
781 in the resistive and capacitive properties of modified electrodes arising from the
782 recognition event are measured by perturbation of the system using a small ampli-
783 tude sinusoidal excitation signal [118]. Both the impedimetric and conductometric
784 approaches do not require a reference electrode, which simplifies the experimental
785 set-up and electronic circuitry [125, 152]. However, conductometric and
786 impedimetric devices seem to have limited applicability in real samples due to
787 their sensitivity to matrix effects such as changes in the ionic strength and the non-
788 specific nature of these techniques [118, 119, 123, 127].
D. Diamond et al.
789The field-effect transistor (FET) employs an electric field to control the conduc-
790tivity of a channel between two electrodes, i.e., source and drain, embedded in a
791semiconducting material by varying the potential of a third electrode, the gate [118,
792123, 177]. In biosensing applications, the metal layer at the gate is replaced by or
793coated with an appropriate biochemically sensitive surface, which is in contact with
794the analyte solution to produce the so-called ChemFET. ChemFETs, particularly ion-
795selective and enzyme FETs, have received considerable attention because they are
796suitable for weak signal and/or high impedance applications [118]. In addition, they
797seem strong candidates as disposable electronic biosensors particularly thanks to the
798low-power operation and the mass production capability [118, 125]. In particular,
799organic electrochemical junction transistors (OEJTs) have attracted certain interest
800for the construction of novel small, light weight, portable, disposable and low-cost
801sensor which seems suitable for mass production by using different way of printing
802[178]. However, a number of critical issues inhibit the feasibility of FET sensors for
803autonomous sensor networks. Firstly, establishing standard methods for the surface
804functionalization/patterning compatible with silicon-based device fabrication (e.g.,805enzyme immobilization and/or antifouling membranes) is a difficult and delicate task
806[118]. Secondly, the design of a miniaturized reference electrode compatible with the
807ChemFETs has yet to achieve the stability and performances comparable to the
808classical reference electrodes [179]. Thirdly, the detection sensitivity depends on
809solution ionic strength [180] and a desalting step would be an additional complication
810in an autonomous monitoring situation. Finally, the speed of the response, the
811recovery time, detection limit, and their cost as disposable platform compared to
812screen printing technology make them less attractive than they would appear to be
813conceptually [118, 123, 178].
8144.2.3 Miniaturized Sensors
815UltraMicroElectrodes (UMEs) have received substantial interest thanks to several
816favourable characteristics [181, 182]. For instance, decreasing the size of the
817electrode allows direct measurement in low ionic strength samples (e.g., freshwa-
818ter) [127] and smaller capacitance currents are obtained, which increases the signal/
819noise ratio [181–183] improving the detection limit. It is significant to note that
820Bond and co-workers reported that measuring concentrations of redox species in the
821order of 10 nM using UMEs proved to be very challenging [182]. Decreasing the
822size of the electrode to the nanometer range seems impractical as imperfect seals
823cause stray capacitance to increase [181, 182]. In addition, as the current depends
824on the electrode size, its decrease has the obvious disadvantage of generating
825progressively smaller currents whose measurement, especially in the short time
826scales, may be challenging [182]. Miniaturized sensors offer the advantage of
827reducing the amount of material used per device (which can be significant particu-
828larly for certain biosensors) but they tend to be more susceptible to long-term
829stability problems, e.g., loss of biological molecules is progressively more serious
830as the electrode size decreases [123]. Overall, a trade-off in decreasing the size of
831the electrode exists.
Distributed Environmental Monitoring
832 Arrays of sensors enable new analytical approaches, e.g., multiplexed or redun-
833 dant sensing, which are attractive features for cost-effective pollution control and
834 protection of the natural environment [180, 183–185]. In a microelectrode array
835 chip, simultaneous current measurements are possible using integrated circuits
836 where the addressing hardware is built onto each electrode [186]. For instance,
837 stripping analysis based on a gel integrated microelectrodes array have been
838 employed for remote in situ monitoring and are the sensing core of Idronaut device
839 [141, 183, 187]. On the other hand, potentiometric sensors array appear to have not
840 advanced beyond the stage of laboratory research with no practical application in
841 real samples being found [188].
842 The manufacturing of microelectrodes and microelectrodes arrays is still a
843 complex process [189–191]. Among several methods of preparation, silicon-based
844 microfabrication technology still offers probably the best results while micro-
845 contact printing could represent a cheaper method, although practical control of
846 the geometric features and reproducibility is inferior [182, 184–186]. However, the
847 long-term stability of microelectrodes and microelectrodes arrays is often question-
848 able, e.g., defects in the metal layer, poor resistance to corrosion together with
849 subsequent swelling and delamination of the metal layers [128]. Finally, multi-
850 calibration in an array becomes complicated and time consuming as the array
851 response pattern becomes important and, as each electrode drifts, the pattern is
852 unstable in use. In this regard, factorial regimes have been suggested to simplify
853 these issues [192].
854 4.2.4 Enzyme Sensors
855 Enzymes constitute one of the most attractive approaches to transduction, as they
856 facilitate amplification of the signal, due to the biological catalytic reaction, and
857 display excellent selectivity, due to the high specificity towards a particular sub-
858 strate [120, 123, 193]. As enzymes accelerate the equilibrium formation of a
859 chemical reaction, sensors based on enzymes are intrinsically reversible and may
860 be regenerated [123, 193], which is beneficial for lowering the cost basis. Screen
861 printing and inkjet formulations for the preparation of disposable enzyme-based
862 sensors have been explored [131]. The principal type of detection for these sensors
863 is amperometric and while potentiometric [174] and conductometric [193]
864 approaches have also been used, these tend to be more dependent on the ionic
865 strength and pH of the sample solution [123], i.e., less suitable for autonomous
866 remote monitoring. However, in sensors wherein the products of enzymatic reac-
867 tion are gaseous, conductometric detection can be very successful when coupled
868 with a gas-permeable membrane to remove most interferences [123].
869 It is important to note that it is preferable for a sensor to detect a specific analyte
870 rather than the total amount of similar compounds. This is the case of enzyme sensors
871 which respond to a class of compounds, e.g., phenols, organophosphate, carbamates,
872 etc., more than to one specific compound [3, 194–196]. For instance, detection of
873 common pesticides is based on the inhibitory effect that these chemicals have on
D. Diamond et al.
874acetyl-cholinesterase (AChE) [131, 197]. Yet, this type of sensors may be interesting
875as early-stage alarms. Thus, for instance, enzyme disposable biosensors proved useful
876for assaying a phenol “index” in wastewater, surface and river water with shelf
877stability up to months and detection limits down to nanomolar levels, although
878sensors responses differ in absolute magnitude and requires in situ calibration [3].
879Entrapment of enzymes in gel formulations and/or water-based carbon ink, compati-
880ble with screen printing and capable of improving the enzymatic stability, yet holds
881great promise for the preparation of enzyme biosensors [123, 130, 193]. General
882concerns for enzyme sensors are connected to the shelf-stability and cost of the
883biomaterial, co-substrate concentration changes in time and space, biofouling, redox
884interferents, reproducibility over time and operational lifetime of the device [118,
885123, 131, 198–202]. Despite the success of glucose sensors [3, 120, 193], the above
886reasons probably explain the lack of commercial enzyme-based analyzers applied to
887in situ environmental monitoring of specific targets.
888Whole-cell sensors have been reported for environmental monitoring in replace-
889ment of enzyme sensors because they obviate the need for enzyme purification and
890they may extend the lifetime of the device [203]. Overall, these sensors are
891probably more suitable for the evaluation of toxicity and an early stage alarm
892than sensing a particular analyte [116]. Nevertheless, it is important to note that
893Unisense offer a sensor based on a biofilm for NO3� and NO2
� monitoring with a
894month lifetime which is claimed to be suitable for in situ applications. The sensor
895has size comparable to a normal pH-meter but, with a cost of approximately €800,896its integration in deployable modules is quite costly and its operational continuous
897monitoring is said to be limited by the charge of the battery, i.e., up to 100 h without898need of repeated calibrations.
8994.2.5 Affinity Sensors: DNA and Immunosensors
900In environmental monitoring, DNA sensors have been applied to the detection of
901nucleic acids, e.g., Escherichia coli, environmental pollutants and carcinogenic
902compounds [116, 117, 121] while immunosensors have been mainly employed in
903order to monitor pesticides, herbicides and virus toxins [122, 124]. The specificity
904of the sensors is defined by the stability constant, which for antibody-antigen
905binding is in the order of 108–1010 LM�1, i.e., three orders of magnitude higher
906than enzyme-substrate binding [122]. Difficulties in patterning of the biomaterials
907on electrode substrates, i.e., functional orientation, cost, lifetime and reproducibil-
908ity of the biomaterial layers, even without considering the eventual labelling, are
909the main drawbacks for these sensors [118, 121, 122]. In addition, poor reproduc-
910ibility and low specificity of the sensors during operation have led to unsatisfactory
911results in terms of further commercialization for trace analysis, e.g., environmental
912pollutants [122, 124], and remote sensing platforms. Molecular imprinting may
913offer a cheap and valuable alternative as recognition element with longer shelf and
914operational lifetime [204]; however, their poor performances, especially in terms of
915selectivity, are still a main limiting factor [205].
Distributed Environmental Monitoring
916 4.3 Conclusions
917 Anodic stripping voltammetry in combination with screen printed electrodes (per-
918 haps also modified for solid-phase extraction), which may be regenerated and
919 reused without re-calibration, seems to be the best candidate for autonomous in
920 situ sensing of heavy metals thanks to very low detection limits achieved, fast
921 response time and relative low cost. It is significant that ISEs may allow monitoring
922 of Pb below the current legislation concentration limits as this detection mode
923 would further decrease the device’s power consumption. Regarding other toxic
924 chemicals targeted by WFD legislation, such as herbicides, it appears that research
925 is still focused on the fundamental studies and we are still far from a practical
926 device which can claim to detect a particular analyte excluding an eventual
927 interferent bias. Therefore, a priori knowledge of the interferents is required or
928 the sensor should be combined with separation techniques to avoid a large number
929 of false detections which, unfortunately, hampers the advent of deployed sensing
930 platform because of the increased costs.
931 It is significant to note that coulometry as a detection mode has not been
932 extensively applied to commercial devices although it may represent a viable
933 alternative for fast analysis when coupled to a microfluidic device able to accurately
934 control small sampling volumes i.e., mL and below. Indeed, the coulometric analy-
935 sis is independent from the kinetics parameters and the physical properties of the
936 system, e.g., enzyme activity, electrolyte concentration, temperature, viscosity, etc.937 which would render the device less prone to sample matrix changes and may not
938 require calibration. For instance, the Abbott FreeStyle™ glucose tester produced at
939 the rate of 109 devices/year is actually based on thin layer micro-coulometer with a
940 submicroliter fluidic sampling.
941 At the present state, the preparation of disposable sensors seems the simplest
942 solution in order to cope with needs and issues arising from a deployed platform but
943 new approaches are still required to increase ruggedness, shelf- and operational life-
944 time of the sensors. This conclusion emphasizes the fundamental research in
945 nanotechnology as the key strategy to design, engineer and control the sensing
946 layer at the electrode interface thus addressing these needs.
947 5 Instrumentation and Data Processing
948 5.1 Introduction
949 Although elements within the chemical sensor research community (such as gas,
950 water and electrochemical sensing) are excelling within their own fields, a key
951 question that often goes unanswered is how to make practical implementation of
952 such newfound sensing capabilities. The literature, in these cases, is rich with past
953 and current studies with demonstrations of highly selective and sensitive chemical
954 measurements [206]. Correspondingly, studies within the technological domain
D. Diamond et al.

955describe how sensing platforms can easily incorporate chemical sensors [102, 103].
956However, there are relatively few reports describing the application of chemical
957sensing capabilities outside the confines of the laboratory environment and even
958less so describing chemical sensor integration into autonomous WSNs for in situ
959deployments [5]; examples of these will be outlined within this section. Further-
960more, it has been widely recognized that many chemical parameters of interest vary
961broadly in the temporal and spatial domains and that the current manual-based
962sampling methods employed by government agencies is inadequate for understand-
963ing the underlying principles of these changes within the environment [207–209].
964Therefore, there is a need for the creation and deployment of chemical sensing
965systems capable of performing complex analytical measurements in situ i.e., to join
966these two independent domains [8]: the molecular and digital worlds. It has been
967generally recognized [210] that a practical environmental chemical sensing system
968must:
969• Be fully autonomous
970• Operate for long periods of time
971• Sample at periods when “events” occur
972• Reflect needs in terms of spatial and/or selective measurements
973• Successfully communicate the sensor data remotely
974• Present the data to relevant users in an easy to use and understandable manner
975In order to fully realize such a system, a multidisciplinary approach must be
976undertaken involving teams of chemists, electronic/mechanical/telecommu-
977nications engineers, computer scientists, middleware managers, visualization
978experts, web designers, etc. all working together towards a common goal. It is
979clear that this effort is not trivial and it is not surprising that few entities can achieve
980such an objective. The difficulties lie mainly in the nature of chemical sensors
981where they frequently encounter problems in their response characteristics such as
982baseline drift and changes in sensitivity (usually reduction effects) [9]. In fact, this
983goal has been identified in a recent Analytical Chemistry Editorial as the next
984“grand challenge” for analytical chemists [211]. However, there are those who have
985been fortunate with resources to include cross-disciplinary expertise, amongst
986others, and therefore have risen to the challenge of implementing WSNs.
987Clearly, distributed real-time chemical sensing is vital for air- and water-based
988areas at risk; however, the costs associated with current deployments place
989limitations on the spatial density and/or selectivity of these sensors for future
990demands. It is therefore important to drive down the cost of the sensing platforms
991and invest in energy scavenging capabilities [212], where possible, to maximize the
992sensing lifetime and minimize the persistent maintenance costs and initial cost base.
993To achieve this, every element within the architecture of such an end-to-end sensing
994system must be examined. A common approach adopted by those in this area has
995been largely based on standard WSN set-ups [6, 213] where nodes equipped with
996chemical sensing capabilities communicate through central gateways/coordinator
997nodes to remote storage centres and eventually to end users. Figure 9 depicts this
998approach showing the progression of information from a single node to the system’s
Distributed Environmental Monitoring
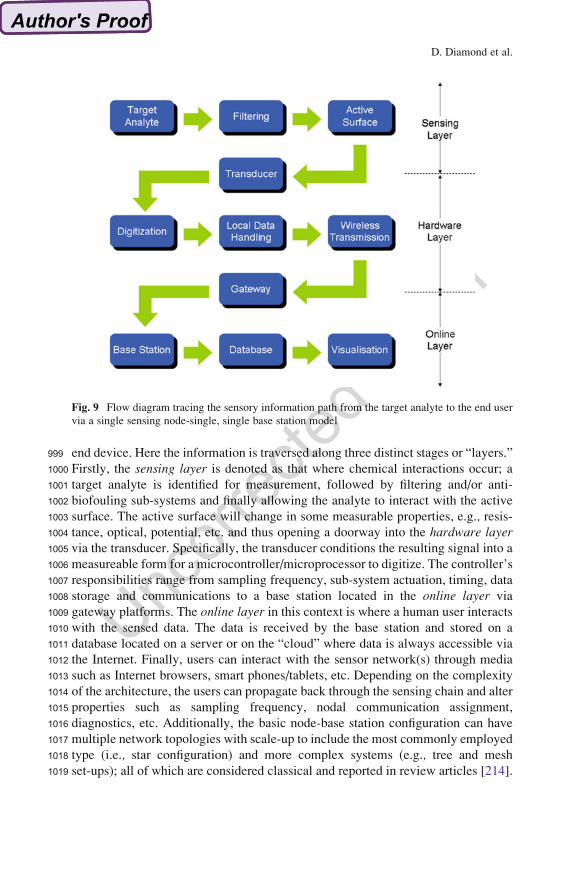
999 end device. Here the information is traversed along three distinct stages or “layers.”
1000 Firstly, the sensing layer is denoted as that where chemical interactions occur; a
1001 target analyte is identified for measurement, followed by filtering and/or anti-
1002 biofouling sub-systems and finally allowing the analyte to interact with the active
1003 surface. The active surface will change in some measurable properties, e.g., resis-1004 tance, optical, potential, etc. and thus opening a doorway into the hardware layer1005 via the transducer. Specifically, the transducer conditions the resulting signal into a
1006 measureable form for a microcontroller/microprocessor to digitize. The controller’s
1007 responsibilities range from sampling frequency, sub-system actuation, timing, data
1008 storage and communications to a base station located in the online layer via
1009 gateway platforms. The online layer in this context is where a human user interacts
1010 with the sensed data. The data is received by the base station and stored on a
1011 database located on a server or on the “cloud” where data is always accessible via
1012 the Internet. Finally, users can interact with the sensor network(s) through media
1013 such as Internet browsers, smart phones/tablets, etc. Depending on the complexity
1014 of the architecture, the users can propagate back through the sensing chain and alter
1015 properties such as sampling frequency, nodal communication assignment,
1016 diagnostics, etc. Additionally, the basic node-base station configuration can have
1017 multiple network topologies with scale-up to include the most commonly employed
1018 type (i.e., star configuration) and more complex systems (e.g., tree and mesh
1019 set-ups); all of which are considered classical and reported in review articles [214].
Fig. 9 Flow diagram tracing the sensory information path from the target analyte to the end user
via a single sensing node-single, single base station model
D. Diamond et al.
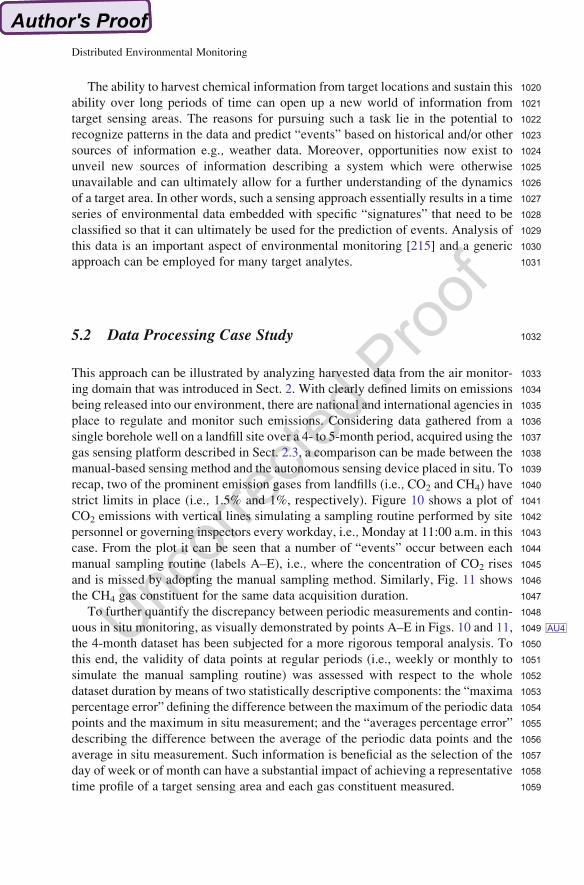
1020The ability to harvest chemical information from target locations and sustain this
1021ability over long periods of time can open up a new world of information from
1022target sensing areas. The reasons for pursuing such a task lie in the potential to
1023recognize patterns in the data and predict “events” based on historical and/or other
1024sources of information e.g., weather data. Moreover, opportunities now exist to
1025unveil new sources of information describing a system which were otherwise
1026unavailable and can ultimately allow for a further understanding of the dynamics
1027of a target area. In other words, such a sensing approach essentially results in a time
1028series of environmental data embedded with specific “signatures” that need to be
1029classified so that it can ultimately be used for the prediction of events. Analysis of
1030this data is an important aspect of environmental monitoring [215] and a generic
1031approach can be employed for many target analytes.
10325.2 Data Processing Case Study
1033This approach can be illustrated by analyzing harvested data from the air monitor-
1034ing domain that was introduced in Sect. 2. With clearly defined limits on emissions
1035being released into our environment, there are national and international agencies in
1036place to regulate and monitor such emissions. Considering data gathered from a
1037single borehole well on a landfill site over a 4- to 5-month period, acquired using the
1038gas sensing platform described in Sect. 2.3, a comparison can be made between the
1039manual-based sensing method and the autonomous sensing device placed in situ. To
1040recap, two of the prominent emission gases from landfills (i.e., CO2 and CH4) have
1041strict limits in place (i.e., 1.5% and 1%, respectively). Figure 10 shows a plot of
1042CO2 emissions with vertical lines simulating a sampling routine performed by site
1043personnel or governing inspectors every workday, i.e.,Monday at 11:00 a.m. in this
1044case. From the plot it can be seen that a number of “events” occur between each
1045manual sampling routine (labels A–E), i.e., where the concentration of CO2 rises
1046and is missed by adopting the manual sampling method. Similarly, Fig. 11 shows
1047the CH4 gas constituent for the same data acquisition duration.
1048To further quantify the discrepancy between periodic measurements and contin-
1049uous in situ monitoring, as visually demonstrated by points A–E in AU4Figs. 10 and 11,
1050the 4-month dataset has been subjected for a more rigorous temporal analysis. To
1051this end, the validity of data points at regular periods (i.e., weekly or monthly to
1052simulate the manual sampling routine) was assessed with respect to the whole
1053dataset duration by means of two statistically descriptive components: the “maxima
1054percentage error” defining the difference between the maximum of the periodic data
1055points and the maximum in situ measurement; and the “averages percentage error”
1056describing the difference between the average of the periodic data points and the
1057average in situ measurement. Such information is beneficial as the selection of the
1058day of week or of month can have a substantial impact of achieving a representative
1059time profile of a target sensing area and each gas constituent measured.
Distributed Environmental Monitoring
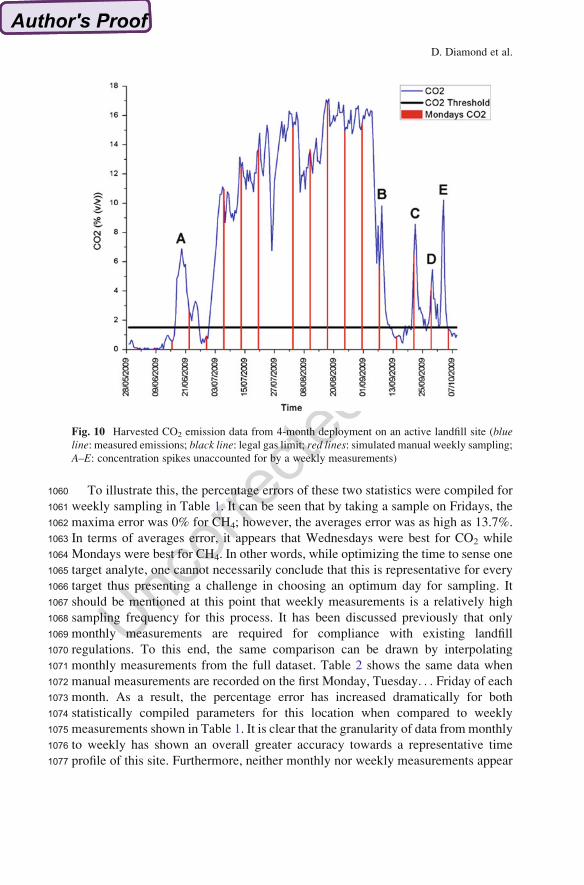
1060 To illustrate this, the percentage errors of these two statistics were compiled for
1061 weekly sampling in Table 1. It can be seen that by taking a sample on Fridays, the
1062 maxima error was 0% for CH4; however, the averages error was as high as 13.7%.
1063 In terms of averages error, it appears that Wednesdays were best for CO2 while
1064 Mondays were best for CH4. In other words, while optimizing the time to sense one
1065 target analyte, one cannot necessarily conclude that this is representative for every
1066 target thus presenting a challenge in choosing an optimum day for sampling. It
1067 should be mentioned at this point that weekly measurements is a relatively high
1068 sampling frequency for this process. It has been discussed previously that only
1069 monthly measurements are required for compliance with existing landfill
1070 regulations. To this end, the same comparison can be drawn by interpolating
1071 monthly measurements from the full dataset. Table 2 shows the same data when
1072 manual measurements are recorded on the first Monday, Tuesday. . . Friday of each1073 month. As a result, the percentage error has increased dramatically for both
1074 statistically compiled parameters for this location when compared to weekly
1075 measurements shown in Table 1. It is clear that the granularity of data from monthly
1076 to weekly has shown an overall greater accuracy towards a representative time
1077 profile of this site. Furthermore, neither monthly nor weekly measurements appear
Fig. 10 Harvested CO2 emission data from 4-month deployment on an active landfill site (blueline: measured emissions; black line: legal gas limit; red lines: simulated manual weekly sampling;
A–E: concentration spikes unaccounted for by a weekly measurements)
D. Diamond et al.
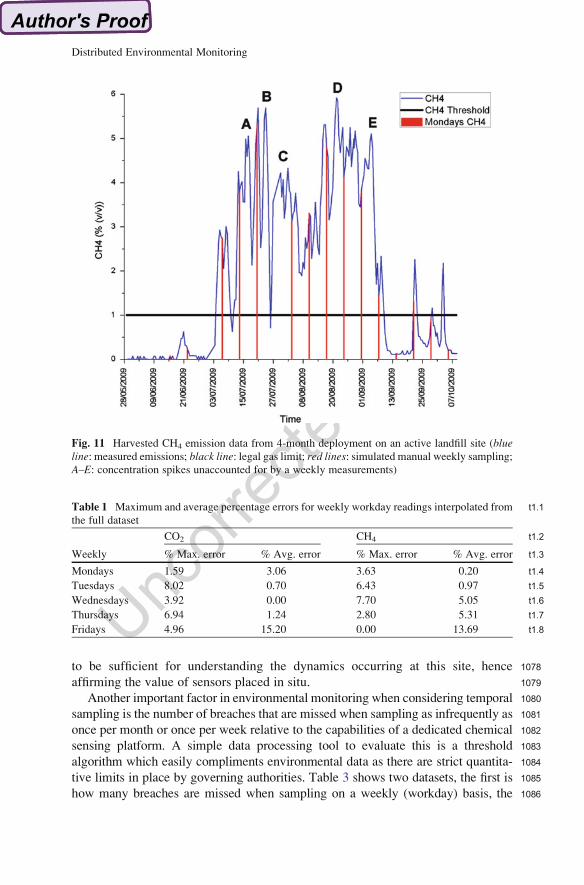
1078to be sufficient for understanding the dynamics occurring at this site, hence
1079affirming the value of sensors placed in situ.
1080Another important factor in environmental monitoring when considering temporal
1081sampling is the number of breaches that are missed when sampling as infrequently as
1082once per month or once per week relative to the capabilities of a dedicated chemical
1083sensing platform. A simple data processing tool to evaluate this is a threshold
1084algorithm which easily compliments environmental data as there are strict quantita-
1085tive limits in place by governing authorities. Table 3 shows two datasets, the first is
1086how many breaches are missed when sampling on a weekly (workday) basis, the
Fig. 11 Harvested CH4 emission data from 4-month deployment on an active landfill site (blueline: measured emissions; black line: legal gas limit; red lines: simulated manual weekly sampling;
A–E: concentration spikes unaccounted for by a weekly measurements)
t1:1Table 1 Maximum and average percentage errors for weekly workday readings interpolated from
the full dataset
Weekly
CO2 CH4 t1:2
% Max. error % Avg. error % Max. error % Avg. error t1:3
Mondays 1.59 3.06 3.63 0.20 t1:4
Tuesdays 8.02 0.70 6.43 0.97 t1:5
Wednesdays 3.92 0.00 7.70 5.05 t1:6
Thursdays 6.94 1.24 2.80 5.31 t1:7
Fridays 4.96 15.20 0.00 13.69 t1:8
Distributed Environmental Monitoring
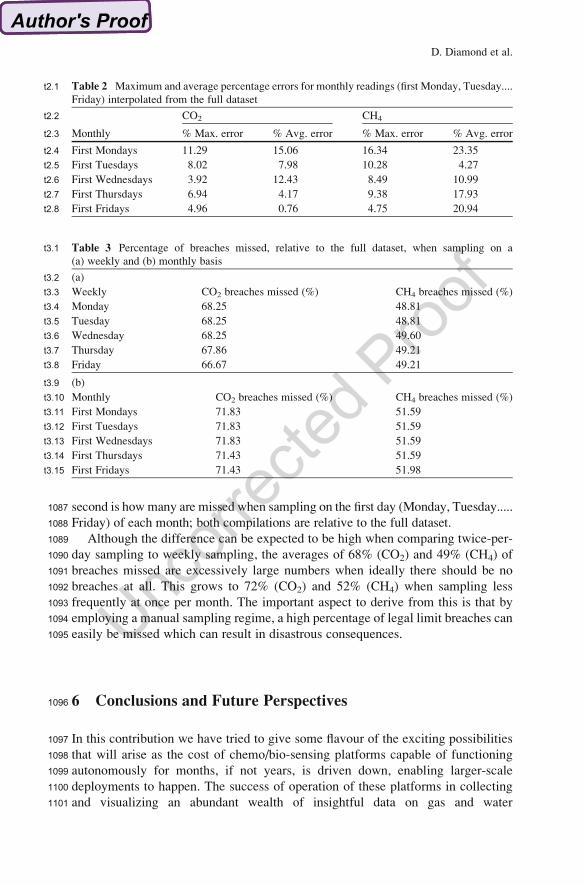
1087 second is how many are missed when sampling on the first day (Monday, Tuesday.....
1088 Friday) of each month; both compilations are relative to the full dataset.
1089 Although the difference can be expected to be high when comparing twice-per-
1090 day sampling to weekly sampling, the averages of 68% (CO2) and 49% (CH4) of
1091 breaches missed are excessively large numbers when ideally there should be no
1092 breaches at all. This grows to 72% (CO2) and 52% (CH4) when sampling less
1093 frequently at once per month. The important aspect to derive from this is that by
1094 employing a manual sampling regime, a high percentage of legal limit breaches can
1095 easily be missed which can result in disastrous consequences.
1096 6 Conclusions and Future Perspectives
1097 In this contribution we have tried to give some flavour of the exciting possibilities
1098 that will arise as the cost of chemo/bio-sensing platforms capable of functioning
1099 autonomously for months, if not years, is driven down, enabling larger-scale
1100 deployments to happen. The success of operation of these platforms in collecting
1101 and visualizing an abundant wealth of insightful data on gas and water
t2:1 Table 2 Maximum and average percentage errors for monthly readings (first Monday, Tuesday....
Friday) interpolated from the full dataset
Monthly
CO2 CH4t2:2
% Max. error % Avg. error % Max. error % Avg. errort2:3
First Mondays 11.29 15.06 16.34 23.35t2:4
First Tuesdays 8.02 7.98 10.28 4.27t2:5
First Wednesdays 3.92 12.43 8.49 10.99t2:6
First Thursdays 6.94 4.17 9.38 17.93t2:7
First Fridays 4.96 0.76 4.75 20.94t2:8
t3:1 Table 3 Percentage of breaches missed, relative to the full dataset, when sampling on a
(a) weekly and (b) monthly basis
(a)t3:2
Weekly CO2 breaches missed (%) CH4 breaches missed (%)t3:3
Monday 68.25 48.81t3:4
Tuesday 68.25 48.81t3:5
Wednesday 68.25 49.60t3:6
Thursday 67.86 49.21t3:7
Friday 66.67 49.21t3:8
(b)t3:9
Monthly CO2 breaches missed (%) CH4 breaches missed (%)t3:10
First Mondays 71.83 51.59t3:11
First Tuesdays 71.83 51.59t3:12
First Wednesdays 71.83 51.59t3:13
First Thursdays 71.43 51.59t3:14
First Fridays 71.43 51.98t3:15
D. Diamond et al.
1102characteristics, as exemplified by our collaborations with governmental and indus-
1103trial partners, demonstrates the usefulness of such platforms in any environmental
1104monitoring application. This work represents the realization of autonomous sensor
1105networks for environmental monitoring by developing sophisticated platform
1106technologies that form the basic building blocks of WSNs. The systems described
1107in Sects. 2.3 and 3.3 for air and water monitoring, respectively, have proven their
1108performance in terms of accurate consistency and reliability; the focus henceforth
1109will be the progression towards lower-cost and less power intensive systems such
1110that a denser distribution of sensor platforms can be attained. Information of
1111incredible value to individuals and society will become accessible for the first
1112time, providing a basis for better understanding of the processes that affect our
1113environment, and therefore enabling effective strategies for enhancing the quality
1114of the environment to be implemented. Clearly, ultra-low-cost, reliable, and durable
1115chemo/bio-sensing devices are the key to future massively scaled deployments of
1116such WSNs. Electrochemical sensors, as discussed in Sect. 4, show promise with
1117low cost and accuracy being readily achieved though continued development is
1118necessary to a longer-term consistency in sensing accuracy. Considering the big
1119picture, moving from the current state of the art to the futuristic vision will require
1120fundamental breakthroughs in materials science in order to dramatically reduce the
1121cost of implementing the lab-on-chip liquid handling technologies that underpins
1122the water quality analyzers described previously [216]. In contrast, future platforms
1123are likely to incorporate biomimetic polymer actuators more reminiscent of artifi-
1124cial muscles rather than conventional pumps and valves [217, 218]. This will
1125demand a close alignment of fundamental science and applied engineering research
1126effort—institutions that implement this on the ground through closely integrated
1127teams of researchers will be the places where these advances will happen.
1128Acknowledgements We acknowledge support for this research from Science Foundation Ireland
1129through the CLARITYCentre (grant code 07/CE/I1147), Enterprise Ireland (grant codes IP/2008/544
1130and CFTD/08/111) and the Irish Environmental Protection Agency (grant code 2010-ET-MS-10).
1131We also acknowledge support from Episensor Ltd. in project IP/2008/544.
1132References
11331. AU5Hartwell P, Stanley Williams R (2010) Cense: central nervous system for the earth.
1134www.slideshare.net/hewlettpackard/hp-cense-sensor-networks-and-the-pulse-of-the-planet AU6.
1135Accessed 2 Oct 2011
11362. Nokia (2010) Morph concept. http://research.nokia.com/news/9415. Accessed 2 Oct AU72011
11373. Wollenberger U, Lisdat F, Rose A, Streffer K (2008) Phenolic biosensors AU8bioelectro-
1138chemistry. Fundamentals, experimental techniques and applications. Wiley, Chichester AU9
11394. Diamond D, Lau KT, Brady S, Cleary J (2008) Integration of analytical measurements and
1140wireless communications. Current issues and future strategies. Talanta 75(3):606–612.
1141doi:10.1016/j.talanta.2007.11.022
11425. Diamond D, Coyle S, Scarmagnani S, Hayes J (2008) Wireless sensor networks and chemo-/
1143biosensing. Chem Rev 108(2):652–679. doi:10.1021/cr0681187
Distributed Environmental Monitoring
1144 6. Yick J, Mukherjee B, Ghosal D (2008) Wireless sensor network survey. Comput Network
1145 52(12):2292
1146 7. Hayes J, O’Hare G, Kolar H, Diamond D (2009) Building an adaptive environmental
1147 monitoring system using sensor web technology. ERCIM News 76:38–49
1148 8. Diamond D (2004) Internet-scale sensing. Anal Chem 76(15):278–286
1149 9. Byrne R, Diamond D (2006) Chemo/bio-sensor networks. Nat Mater 5(6):421–424
1150 10. Byrne R, Benito-Lopez F, Diamond D (2010) Materials science and the sensor revolution.
1151 Mater Today 13(7–8):16–23
1152 11. H€ubert T, Boon-Brett L, Black G, Banach U (2011) Hydrogen sensors – a review. Sens
1153 Actuators B Chem 157(2):329
1154 12. Rolfe P (1988) Review of chemical sensors for physiological measurement. J Biomed Eng 10
1155 (2):138
1156 13. Pretsch E (2007) The new wave of ion-selective electrodes. Trends Analyt Chem 26(1):46
1157 14. Bonne U (2008) Gas sensors. In: Yogesh G, Osamu T, Hans Z (eds) Comprehensive
1158 microsystems. Elsevier, Oxford, p 375
1159 15. Bernhardt ES, PalmerM,Allan J, Alexander G, Barnas K, Brooks S, Carr J, Clayton S, DahmC,
1160 Follstad-Shah J (2005) Synthesizing us river restoration efforts. Science 308(5722):636
1161 16. Dodman D (2009) Blaming cities for climate change? An analysis of urban greenhouse gas
1162 emissions inventories. Environ Urban 21(1):185
1163 17. Satterthwaite D (2008) Cities’ contribution to global warming: notes on the allocation of
1164 greenhouse gas emissions. Environ Urban 20(2):539
1165 18. European P, Council of the European U (2008) Directive 2008/50/ec of 21 may 2008 on
1166 ambient air quality and cleaner air for Europe
1167 19. Manning M, Reisinger A (2011) Broader perspectives for comparing different greenhouse
1168 gases. Philos Transact R Soc A Math Phys Eng Sci 369(1943):1891
1169 20. Hill PM (2000) Possible asphyxiation from carbon dioxide of a cross-country skier in eastern
1170 california: a deadly volcanic hazard. Wilderness Environ Med 11(3):192–195
1171 21. Matthews CJD, Joyce EM, Louis VLS, Schiff SL, Venkiteswaran JJ, Hall BD, Bodaly RA,
1172 Beaty KG (2005) Carbon dioxide and methane production in small reservoirs flooding upland
1173 boreal forest. Ecosystems 8(3):267–285
1174 22. Streets DG, Waldhoff ST (2000) Present and future emissions of air pollutants in china: So2,
1175 nox, and co. Atmos Environ 34(3):363–374
1176 23. Burtraw D, Krupnick A, Mansur E, Austin D, Farrell D (1998) Costs and benefits of reducing
1177 air pollutants related to acid rain. Contemp Econ Policy 16(4):379–400
1178 24. Finlayson-Pitts BJ, Pitts JN (2000) Chemistry of the upper and lower atmosphere: theory,
1179 experiments, and applications. Academic, San Diego
1180 25. Correll DL (1996) Buffer zones and water quality protection: general principles. Buffer Zones: 7
1181 26. Galle B, Samuelsson J, Svensson BH, B€orjesson G (2001) Measurements of methane
1182 emissions from landfills using a time correlation tracer method based on FTIR absorption
1183 spectroscopy. Environ Sci Technol 35(1):21–25
1184 27. McGettigan M, O’Donnell C, Toner P (2000) National air quality monitoring programme.
1185 Environmental Protection Agency, Ireland
1186 28. De Hoffmann E, Stroobant V (2007) Mass spectrometry: principles and applications. Wiley-
1187 Interscience, New York
1188 29. McNair HM, Miller JM (2009) Basic gas chromatography, vol 17. Wiley-Interscience, New
1189 York
1190 30. Ward RS, Williams GM, Hills CC (1996) Changes in major and trace components of landfill
1191 gas during subsurface migration. Waste Manag Res 14(3):243
1192 31. Eklund B, Anderson EP, Walker BL, Burrows DB (1998) Characterization of landfill gas
1193 composition at the fresh kills municipal solid-waste landfill. Environ Sci Technol 32
1194 (15):2233–2237
1195 32. Park JW, Shin HC (2001) Surface emission of landfill gas from solid waste landfill. Atmos
1196 Environ 35(20):3445–3451
D. Diamond et al.
119733. Mosher BW, Czepiel PM, Harriss RC, Joanne H, Kolb CE, McManus JB, Allwine E, Lamb BK
1198(1999) Methane emissions at nine landfill sites in the northeastern united states. Environ Sci
1199Technol 33(12):2088–2094
120034. Morrison SR (1987) Selectivity in semiconductor gas sensors. Sens Actuators 12(4):425–440
120135. Galdikas A, Mironas A, Strazdien V (2000) Room-temperature-functioning ammonia sensor
1202based on solid-state cuxs films. Sens Actuators B Chem 67(1–2):76–83
120336. Donnelly KM, Eggleston AG, Adkins WR, Clauss DA, Ramsier RD (2002) Solid state gas
1204sensors based on tunnel junction geometry. Meas Sci Technol 13:N57
120537. Meixner H, Gerblinger J, Lampe U, Fleischer M (1995) Thin-film gas sensors based on
1206semiconducting metal oxides. Sens Actuators B Chem 23(2–3):119–125
120738. Sberveglieri G (1995) Recent developments in semiconducting thin-film gas sensors. Sens
1208Actuators B Chem 23(2–3):103–109
120939. Lee AP, Reedy BJ (1999) Temperature modulation in semiconductor gas sensing. Sens
1210Actuators B Chem 60(1):35–42
121140. Moseley PT (1997) Solid state gas sensors. Meas Sci Technol 8:223
121241. Watson J, Ihokura K, Coles GSV (1993) The tin dioxide gas sensor. Meas Sci Technol 4:711
121342. Jones MG, Nevell TG (1989) The detection of hydrogen using catalytic flammable gas
1214sensors. Sens Actuators 16(3):215–224
121543. R€ock F, Barsan N, Weimar U (2008) Electronic nose: current status and future trends. Chem
1216Rev 108(2):705–725
121744. Porter K, Volman DH (1962) Flame ionization detection of carbon monoxide for gas
1218chromatographic analysis. Anal Chem 34(7):748–749
121945. Davenport JW (1976) Ultraviolet photoionization cross sections for N2 and CO. Phys Rev
1220Lett 36(16):945–949
122146. Bakker E (2004) Electrochemical sensors. Anal Chem 76(12):3285–3298
122247. Jacquinot P, Hodgson AWE, Hauser PC (2001) Amperometric detection of NO and NO2 in
1223the ppb range with solid-polymer electrolyte membrane supported noble metal electrodes.
1224Anal Chim Acta 443(1):53–61
122548. Ono M, Shimanoe K, Miura N, Yamazoe N (2000) Amperometric sensor based on nasicon
1226and NO oxidation catalysts for detection of total NOx in atmospheric environment. Solid
1227State Ionics 136:583–588
122849. Schiavon G, Zotti G, Toniolo R, Bontempelli G (1995) Electrochemical detection of trace
1229hydrogen sulfide in gaseous samples by porous silver electrodes supported on ion-exchange
1230membranes (solid polymer electrolytes). Anal Chem 67(2):318–323
123150. Hodgson AWE, Jacquinot P, Hauser PC (1999) Electrochemical sensor for the detection of
1232so2 in the low-ppb range. Anal Chem 71(14):2831–2837
123351. Anderson GL, Hadden DM (1999) The gas monitoring handbook. Avocet Press, New York
123452. Alberti G, Cherubini F, Palombari R (1996) Amperometric solid-state sensor for no and no2
1235based on protonic conduction. Sens Actuators B Chem 37(3):131–134
123653. Saito M, Kikuchi K (1997) Infrared optical fiber sensors. Opt Rev 4(5):527–538
123754. London JW, Bell AT (1973) Infrared spectra of carbon monoxide, carbon dioxide, nitric
1238oxide, nitrogen dioxide, nitrous oxide, and nitrogen adsorbed on copper oxide. J Catal 31
1239(1):32–40
124055. Horrocks AR, Price D, Akalin M (1996) Ftir analysis of gases evolved from cotton and flame
1241retarded cotton fabrics pyrolysed in air. Polym Degrad Stab 52(2):205–213
124256. Auble DL, Meyers TP (1992) An open path, fast response infrared absorption gas analyzer for
1243H2O and CO2. Boundary Layer Meteorol 59(3):243–256
124457. Shepherd R, Beirne S, Lau KT, Corcoran B, Diamond D (2007) Monitoring chemical plumes
1245in an environmental sensing chamber with a wireless chemical sensor network. Sens
1246Actuators B Chem 121(1):142–149
124758. Paschotta R (2008) Encyclopedia of laser physics and technology: A–M, vol 1. Wiley-VCH,
1248Weinheim
Distributed Environmental Monitoring
1249 59. Ohira S-I, Wanigasekara E, Rudkevich DM, Dasgupta PK (2009) Sensing parts per million
1250 levels of gaseous NO2 by a optical fiber transducer based on calix[4]arenes. Talanta 77
1251 (5):1814–1820
1252 60. O’Toole M, Shepherd R, Wallace GG, Diamond D (2009) Inkjet printed led based ph
1253 chemical sensor for gas sensing. Anal Chim Acta 652(1–2):308–314
1254 61. Orpen D, Beirne S, Fay C, Lau KT, Corcoran B, Diamond D (2010) The optimisation of a
1255 paired emitter-detector diode optical ph sensing device. Sens Actuators B Chem
1256 62. Shepherd RL, Yerazunis WS, Lau KT, Diamond D (2006) Low-cost surface-mount led gas
1257 sensor. IEEE Sens J 6(4):861–866
1258 63. Beirne S, Corcoran B, Lau KT, Diamond D (2008) Chemical event tracking using a low-cost
1259 wireless chemical sensing network. In: Sensors, 2008 IEEE, pp 1615–1618
1260 64. Lau KT, Baldwin S, O’Toole M, Shepherd R, Yerazunis WJ, Izuo S, Ueyama S, Diamond D
1261 (2006) A low-cost optical sensing device based on paired emitter-detector light emitting
1262 diodes. Anal Chim Acta 557(1–2):111–116
1263 65. Beirne S (2008) Development of a low power reactive wireless chemical sensing network.
1264 School of Mechanical & Manufacturing Engineering, Faculty of Engineering and Comput-
1265 ing, Dublin City University, Dublin
1266 66. Fraser SM, Edmonds TE, West TS (1986) Development of a multi-sensor system using
1267 coated piezoelectric crystal detectors. Analyst 111(10):1183–1188
1268 67. Klinkhachorn P, Huner B, Overton EB, Dharmasena HP, Gustowski DA (1990)
1269 Microprocessor-based piezoelectric quartz microbalance system for compound-specific
1270 detection. IEEE Trans Instrum Meas 39(1):264–268
1271 68. Barko G, Hlavay J (1997) Application of an artificial neural network (ann) and piezoelectric
1272 chemical sensor array for identification of volatile organic compounds. Talanta 44(12):2237
1273 69. Becher C, Kaul P, Mitrovics J, Warmer J (2010) The detection of evaporating hazardous
1274 material released from moving sources using a gas sensor network. Sens Actuators B Chem
1275 146(2):513
1276 70. AU10Somov A, Baranov A, Savkin A, Spirjakin D, Spirjakin A, Passerone R (2011) Development
1277 of wireless sensor network for combustible gas monitoring. Sens Actuators A Phys
1278 171:398–405
1279 71. Fay C, Doherty AR, Beirne S, Collins F, Foley C, Healy J, Kiernan BM, Lee H, Maher D,
1280 Orpen D (2011) Remote real-time monitoring of subsurface landfill gas migration. Sensors 11
1281 (7):6603–6628
1282 72. Karellas NS, Chen QF, Brou GBD, Milburn RK (2003) Real time air monitoring of hydrogen
1283 chloride and chlorine gas during a chemical fire. J Hazard Mater 102(1):105
1284 73. Neuman W (2006) M.T.A. To upgrade chemical-detection system
1285 74. Kiell J (2003) Program for response options and technology enhancements for chemical-
1286 biological terrorism. Department of Defense
1287 75. Beirne S, Kiernan BM, Fay C, Foley C, Corcoran B, Smeaton AF, Diamond D (2010)
1288 Autonomous greenhouse gas measurement system for analysis of gas migration on landfill
1289 sites. In: Sensors Applications Symposium (SAS), 2010 IEEE, pp 143–148
1290 76. Collins F, Orpen D, Maher D, Cleary J, Fay C, Diamond D (2011) Distributed chemical
1291 sensor networks for environmental sensing. In: SENSORDEVICES 2011, The Second
1292 International Conference on Sensor Device Technologies and Applications, 2011, pp 58–62
1293 77. Kiernan BM, Beirne S, Fay C, Diamond D (2008) Landfill gas monitoring at borehole wells
1294 using an autonomous environmental monitoring system. In: Proceedings of World Academy
1295 of Science, Engineering and Technology, 2008. World Academy of Science, Engineering and
1296 Technology, pp 166–171
1297 78. Manz A, Graber N, Widmer HM (1990) Miniaturized total chemical analysis systems: a novel
1298 concept for chemical sensing. Sens Actuators B 1:244–248
1299 79. Abgrall P, Gue AM (2007) Lab-on-chip technologies: making a microfluidic network and
1300 coupling it into a complete microsystem – a review. J Micromech Microeng 17:R15–R49
D. Diamond et al.
130180. Becker H, G€artner C (2008) Polymer microfabrication technologies for microfluidic systems.
1302Anal Bioanal Chem 390:89–111
130381. Gardolinski PCFC, David ARJ, Worsfold PJ (2002) Miniature flow injection analyser for
1304laboratory, shipboard and in situ monitoring of nitrate in estuarine and coastal waters. Talanta
130558:1015–1027
130682. Doku GN, Haswell SJ (1999) Further studies into the development of a micro-fia (mu fia)
1307system based on electroosmotic flow for the determination of phosphate as orthophosphate.
1308Anal Chim Acta 382:1–13
130983. Greenway GM, Haswell SJ, Petsul PH (1999) Characterisation of a micro-total analytical
1310system for the determination of nitrite with spectrophotometric detection. Anal Chim Acta
1311387:1–10
131284. Petsul PH, Greenway GM, Haswell SJ (2001) The development of an on-chip micro-flow
1313injection analysis of nitrate with a cadmium reductor. Anal Chim Acta 428:155–161
131485. Daridon A, Sequeira M, Pennarun-Thomas G, Dirac H, Krog JP, Gravesen P, Lichtenberg J,
1315Diamond D, Verpoorte E, de Rooij NF (2001) Chemical sensing using an integrated ufluidic
1316system based on colorimetrics: a comparative kinetic study of the bertholet reaction for
1317ammonia determination in microfluidic and spectrophotometric systems. Sens Actuators B
131876:235–243
131986. Azzaro F, Galletta M (2006) Automatic colorimetric analyzer prototype for high frequency
1320measurement of nutrients in seawater. Mar Chem 99:191–198
132187. Moscetta P (2009) The new in-situ chemical probes. In: Environmental RiskManagement tools
1322for water quality monitoring. National Oceanography Centre, Southampton, UK, 30 Mar 2009
132388. Thompson I (2009) Warmer project. In: Environmental Risk Management tools for water
1324quality monitoring. National Oceanography Centre, Southampton, UK, 30 Mar 2009
132589. Technologies AfC (2007) Act performance demonstration statement for the ysi 9600 nitrate
1326monitor
132790. Technologies AfC (2008) Act performance demonstration statement for the american ecotech
1328nut 1000
132991. Technologies AfC (2008) Act performance demonstration statement for the wet labs
1330cycle-p nutrient analyzer
133192. Vuillemin R, LeRoux D, Dorval P, Bucas K, Sudreau JP, Hamon M, LeGall C, Sarradin PM
1332(2009) Chemini: a new in situ chemical miniaturized analyzer. Deep Sea Res Part I Oceanogr
1333Res Pap 26:1391–1399
133493. Koch CR, Ingle JD, Remcho VT (2008) Miniaturizing the whole device: micrototal-analysis
1335system for in-situ colorimetric water quality monitoring. In: Twelfth International Conference
1336on Miniaturized Systems for Chemistry and Life Sciences, San Diego, CA, 12–16 Oct 2008
133794. Sieben VJ, Beaton AD, Floquet CFA, Kaed Bey SA, Ogilvie IRG, Waugh EM, Ang JKC,
1338Mowlem MC, Morgan H (2010) Autonomous microfluidic sensors for nutrient detection:
1339applied to nitrite, nitrate, phosphate, manganese and iron. In: 14th International Conference
1340on Miniaturized Systems for Chemistry and Life Sciences, Groningen, The Netherlands, 3–7
1341Oct 2010
134295. Sieben VJ, Floquet CFA, Ogilvie IRG, Mowlem MC, Morgan H (2010) Microfluidic
1343colourimetric chemical analysis system: application to nitrite detection. Anal Methods
13442:484–491
134596. Sequeira M, Diamond D (2002) Progress in the realisation of an autonomous environmental
1346monitoring device for ammonia. Trends Anal Chem 21:816–827
134797. Bowden M, Sequeira M, Krog JP, Gravesen P, Diamond D (2002) A prototype industrial
1348sensing system for phosphorus based on micro system technology. Analyst 127:1–4
134998. Bowden M, Sequiera M, Krog JP, Gravesen P, Diamond D (2002) Analysis of river water
1350samples utilising a prototype industrial sensing system for phosphorus based on micro-system
1351technology. J Environ Monit 4:767–771
135299. Environment TECft (2010) The eu water framework directive. 2010 (09/07)
Distributed Environmental Monitoring

1353 100. Lepom P, Brown B, Hanke G, Loos R, Quevauviller P, Wollgast J (2009) Needs for reliable
1354 analytical methods for monitoring chemical pollutants in surface water under the european
1355 water framework directive. J Chromatogr A 1216(3):302
1356 101. Wang W-S, Huang H-Y, Chen S-C, Ho K-C, Lin C-Y, Chou T-C, Hu C-H, Wang W-F,
1357 Wu C-F, Luo C-H (2011) Real-time telemetry system for amperometric and potentiometric
1358 electrochemical sensors. Sensors 11(9):8593–8610
1359 102. Yang X, Ong KG, Dreschel WR, Zeng K, Mungle CS, Grimes CA (2002) Design of a
1360 wireless sensor network for long-term, in-situ monitoring of an aqueous environment.
1361 Sensors 2(11):455–472
1362 103. Ong KG, Yang X, Mukherjee N, Surender HW, Shrawan GCA (2004) A wireless sensor
1363 network for long-term monitoring of aquatic environments: design and implementation. Sens
1364 Lett 2(1):48–57
1365 104. Zhu X, Li D, He D, Wang J, Ma D, Li F (2010) A remote wireless system for water quality
1366 online monitoring in intensive fish culture. Comput Electron Agric 71(Suppl 1):S3
1367 105. Capella JV, Bonastre A, Ors R, Peris M (2010) A wireless sensor network approach for
1368 distributed in-line chemical analysis of water. Talanta 80(5):1789
1369 106. Okolisa Z (2009) Wireless waste monitoring sensor network. Gradevinar 61(2):205–208
1370 107. Ilyas M, Mahgoub I (2004) Handbook of sensor networks: compact wireless and wired
1371 sensing systems. CRC Press, Boca Raton
1372 108. Buffle J, Horvai G (2000) In situ monitoring of aquatic systems: chemical analysis and
1373 speciation. Wiley, Chichester
1374 109. O’Flynn B, Regan F, Lawlor A, Wallace J, Torres J, O’Mathuna C (2010) Experiences and
1375 recommendations in deploying a real-time, water quality monitoring system. Meas Sci
1376 Technol 21(12):124004
1377 110. McGraw CM, Stitzel SE, Cleary J, Slater C, Diamond D (2007) Autonomous microfluidic
1378 system for phosphate detection. Talanta 71:1180–1185
1379 111. Slater C, Cleary J, McGraw CM, Yerazunis WS, Lau KT, Diamond D (2007) Autonomous
1380 field-deployable device for the measurement of phosphate in natural water. Proceedings of
1381 SPIE 6755:67550L67551–67550L67558
1382 112. Cleary J, Slater C, McGraw CM, Diamond D (2008) An autonomous microfluidic sensor for
1383 phosphate: on-site analysis of treated wastewater. IEEE Sens J 8:508–515
1384 113. Lau KT, Baldwin S, Shepherd RL, Dietz PH, Yerazunis WS, Diamond D (2004) Fused-led
1385 devices as optical sensors for colorimetric analysis. Talanta 63:167–173
1386 114. O’Toole M, Lau K-T, Diamond D (2005) Photometric detection in flow analysis systems
1387 using integrated pedds. Talanta 66:1340–1344
1388 115. Kim JH, Lau KT, Fay C, Diamond D (2008) Development of optical sensing system for
1389 detection of Fe ions using conductive polymer actuator based microfluidic pump. In: IEEE
1390 Sensors 2008, Lecce, Italy, 26–29 Oct 2008
1391 116. Farre M, Kantiani L, Perez S, Barcelo D (2009) Sensors and biosensors in support of eu
1392 directives. Trends Anal Chem 28(2):170–185. doi:10.1016/j.trac.2008.09.018
1393 117. Privett BJ, Shin JH, Schoenfisch MH (2008) Electrochemical sensors. Anal Chem 80
1394 (12):4499–4517. doi:10.1021/ac8007219
1395 118. Grieshaber D, MacKenzie R, V€or€os J, Reimhult E (2008) Electrochemical biosensors –
1396 sensor principles and architectures. Sensors 8(3):1400–1458
1397 119. Sassa F, Morimoto K, SatohW, Suzuki H (2008) Electrochemical techniques for microfluidic
1398 applications. Electrophoresis 29(9):1787–1800. doi:10.1002/elps.200700581
1399 120. Montornes JM, Vreeke MS, Katakis I (2008) Glucose biosensors. In: Bartlett PN (ed)
1400 Bioelectrochemistry. Fundamentals, experimental techniques and applications. Wiley,
1401 Chichester, pp 199–218
1402 121. Oliveira-Brett AM (2008) Electrochemical DNA assays. In: Bartlett PN (ed) Bioelectro-
1403 chemistry. Fundamentals, experimental techniques and applications. Wiley, Chichester,
1404 pp 430–442
D. Diamond et al.
1405122. Yakovleva J, Emneus J (2008) Electrochemical immunoassays. In: Bartlett PN (ed)
1406Bioelectrochemistry. Fundamentals, experimental, techniques and applications. Wiley,
1407Chichester, pp 376–410
1408123. Schuhmann W, Bonsen EM (2003) Biosensors. In: Bard AJ, Stratmann M, Unwin PR (eds)
1409Encyclopedia of electrochemistry: instrumentation and electroanalytical chemistry, vol 3.
1410Wiley-VCH, Weinheim, pp 350–383
1411124. Wijayawardhana CA, Halsall HB, Heineman WR (2002) Electrochemical immunoassay. In:
1412Bard AJ, Wilson GS, Stratmann M (eds) Encyclopedia of electrochemistry, bioelectro-
1413chemistry, vol 9. Wiley-VCH, Weinheim, pp 145–174
1414125. Bobacka J, Ivaska A (2010) Chemical sensors based on conducting polymers. In: Cosnier S,
1415Karyakin A (eds) Electropolymerization. Concepts, materials, and applications. Wiley-VCH,
1416Weinheim, pp 173–187
1417126. Yun K-S, Gil J, Kim J, Kim H-J, Kim K, Park D, Ms K, Shin H, Lee K, Kwak J, Yoon E
1418(2004) A miniaturized low-power wireless remote environmental monitoring system
1419based on electrochemical analysis. Sens Actuators B Chem 102(1):27–34. doi:10.1016/
1420j.snb.2003.11.008
1421127. Hanrahan G, Patil DG, Wang J (2004) Electrochemical sensors for environmental monitor-
1422ing: design, development and applications. J Environ Monit 6(8):657–664
1423128. Bakker E, Telting-Diaz M (2002) Electrochemical sensors. Anal Chem 74(12):2781–2800.
1424doi:10.1021/ac0202278
1425129. Morrin A, Killard AJ, Smyth MR (2003) Electrochemical characterization of commercial and
1426home-made screen printed carbon electrodes. Anal Lett 36(9):2021–2039
1427130. Renedo OD, Alonso-Lomillo MA, Martınez MJA (2007) Recent developments in the field of
1428screen-printed electrodes and their related applications. Talanta 73(2):202–219. doi:10.1016/
1429j.talanta.2007.03.050
1430131. Hart JP, Crew A, Crouch E, Honeychurch KC, Pemberton RM (2007) Chapter 23: screen-
1431printed electrochemical (bio) sensors in biomedical, environmental and industrial
1432applications. In: Alegret S, Merkoci A (eds) Comprehensive analytical chemistry, vol 49.
1433Elsevier, Amsterdam, pp 497–557
1434132. Wang J (2007) Electrochemical sensing of explosives. Electroanalysis 19(4):415–423.
1435doi:10.1002/elan.200603748
1436133. del Valle M (2007) Potentiometric electronic tongues applied in ion multidetermination. In:
1437Alegret S, Merkoci A (eds) Electrochemical sensor analysis. Comprehensive analytical
1438chemistry, vol 49. Elsevier, Amsterdam, pp 721–753
1439134. Bard AJ, Faulkner LR (2006) Stripping analysis. In: Electrochemical methods: fundamentals
1440and applications. Wiley India Pvt. Ltd., Delhi, pp 458–464
1441135. Wang J (2003) Stripping analysis. In: Bard AJ, Stratmann M, Unwin PR (eds) Encyclopedia
1442of electrochemistry: instrumentation and electroanalytical chemistry, vol 3. Wiley-VCH,
1443Weinheim, pp 125–132
1444136. Ward Jones SE, Chevallier FG, Paddon CA, Compton RG (2007) General theory of cathodic
1445and anodic stripping voltammetry at solid electrodes: mathematical modeling and numerical
1446simulations. Anal Chem 79(11):4110–4119. doi:10.1021/ac070046b
1447137. Fu X, Benson RF, Wang J, Fries D (2005) Remote underwater electrochemical sensing
1448system for detecting explosive residues in the field. Sens Actuators B Chem 106
1449(1):296–301. doi:10.1016/j.snb.2004.08.015
1450138. Wang J, Tian B, Wang J, Lu J, Olsen C, Yarnitzky C, Olsen K, Hammerstrom D, Bennett W
1451(1999) Stripping analysis into the 21st century: faster, smaller, cheaper, simpler and better.
1452Anal Chim Acta 385(1–3):429–435. doi:10.1016/s0003-2670(98)00664-3
1453139. Wang J (2007) Chapter 6: stripping-based electrochemical metal sensors for environmental
1454monitoring. In: Alegret S, Merkoci A (eds) Comprehensive analytical chemistry, vol 49.
1455Elsevier, Amsterdam, pp 131–141
1456140. Wang J (2002) Real-time electrochemical monitoring: toward green analytical chemistry.
1457Acc Chem Res 35(9):811–816. doi:10.1021/ar010066e
Distributed Environmental Monitoring
1458 141. Braungardt CB, Achterberg EP, Axelsson B, Buffle J, Graziottin F, Howell KA, Illuminati S,
1459 Scarponi G, Tappin AD, Tercier-Waeber M-L, Turner D (2009) Analysis of dissolved metal
1460 fractions in coastal waters: an inter-comparison of five voltammetric in situ profiling (VIP)
1461 systems. Mar Chem 114(1–2):47–55. doi:10.1016/j.marchem.2009.03.006
1462 142. Kadara RO, Tothill IE (2005) Resolving the copper interference effect on the stripping
1463 chronopotentiometric response of lead(ii) obtained at bismuth film screen-printed electrode.
1464 Talanta 66(5):1089–1093. doi:10.1016/j.talanta.2005.01.020
1465 143. Kadara RO, Tothill IE (2008) Development of disposable bulk-modified screen-printed
1466 electrode based on bismuth oxide for stripping chronopotentiometric analysis of lead (ii)
1467 and cadmium (ii) in soil and water samples. Anal Chim Acta 623(1):76–81. doi:10.1016/
1468 j.aca.2008.06.010
1469 144. Honeychurch KC, Hart JP (2003) Screen-printed electrochemical sensors for monitoring
1470 metal pollutants. Trends Anal Chem 22(7):456–469. doi:10.1016/s0165-9936(03)00703-9
1471 145. Trojanowicz M, Kozminski P, Dias H, Brett CMA (2005) Batch-injection stripping
1472 voltammetry (tube-less flow-injection analysis) of trace metals with on-line sample
1473 pretreatment. Talanta 68(2):394–400. doi:10.1016/j.talanta.2005.08.065
1474 146. Economou A (2010) Recent developments in on-line electrochemical stripping analysis—an
1475 overview of the last 12 years. Anal Chim Acta 683(1):38–51. doi:10.1016/j.aca.2010.10.017
1476 147. Nasraoui R, Floner D, Paul-Roth C, Geneste F (2010) Flow electroanalytical system based on
1477 cyclam-modified graphite felt electrodes for lead detection. J Electroanal Chem 638(1):9–14.
1478 doi:10.1016/j.jelechem.2009.10.028
1479 148. Nasraoui R, Floner D, Geneste F (2010) Improvement in performance of a flow electrochem-
1480 ical sensor by using carbamoyl-arms polyazamacrocycle for the preconcentration of lead ions
1481 onto the electrode. Electrochem Commun 12(1):98–100. doi:10.1016/j.elecom.2009.10.045
1482 149. Bard AJ, Faulkner LR (2006) Selective electrodes. In: Electrochemical methods:
1483 fundamentals and applications. Wiley India Pvt. Ltd., Delhi, pp 74–81
1484 150. Amemiya S (2007) Potentiometric ion-selective electrodes. In: Zoski CG (ed) Handbook of
1485 electrochemistry. Elsevier, Amsterdam, pp 261–294
1486 151. Bard AJ, Faulkner LR (2006) Electrochemical instrumentation. In: Electrochemical methods:
1487 fundamentals and applications. Wiley India Pvt. Ltd., Delhi, pp 632–658
1488 152. Wipf D (2007) Analog and digital instrumentation. In: Zoski CG (ed) Handbook of electro-
1489 chemistry. Elsevier, Amsterdam, pp 24–50
1490 153. Radu A, Peper S, Bakker E, Diamond D (2007) Guidelines for improving the lower detection
1491 limit of ion-selective electrodes: a systematic approach. Electroanalysis 19(2–3):144–154.
1492 doi:10.1002/elan.200603741
1493 154. Radu A, Meir AJ, Bakker E (2004) Dynamic diffusion model for tracing the real-time
1494 potential response of polymeric membrane ion-selective electrodes. Anal Chem 76
1495 (21):6402–6409. doi:10.1021/ac049348t
1496 155. Ceresa A, Radu A, Peper S, Bakker E, Pretsch E (2002) Rational design of potentiometric
1497 trace level ion sensors. A ag + �selective electrode with a 100 ppt detection limit. Anal
1498 Chem 74(16):4027–4036. doi:10.1021/ac025548y
1499 156. Telting-Diaz M, Bakker E (2001) Effect of lipophilic ion-exchanger leaching on the detection
1500 limit of carrier-based ion-selective electrodes. Anal Chem 73(22):5582–5589. doi:10.1021/
1501 ac010526h
1502 157. Bereczki R, Takacs B, Langmaier J, Neely M, Gyurcsanyi RE, Toth K, Nagy G, Lindner E
1503 (2005) How to assess the limits of ion-selective electrodes: method for the determination of
1504 the ultimate span, response range, and selectivity coefficients of neutral carrier-based cation
1505 selective electrodes. Anal Chem 78(3):942–950. doi:10.1021/ac050614s
1506 158. Sokalski T, Zwickl T, Bakker E, Pretsch E (1999) Lowering the detection limit of solvent
1507 polymeric ion-selective electrodes. 1. Modeling the influence of steady-state ion fluxes. Anal
1508 Chem 71(6):1204–1209. doi:10.1021/ac980944v
1509 159. Fibbioli M, Morf WE, Badertscher M, de Rooij NF, Pretsch E (2000) Potential drifts of solid-
1510 contacted ion-selective electrodes due to zero-current ion fluxes through the sensor
D. Diamond et al.
1511membrane. Electroanalysis 12(16):1286–1292. doi:10.1002/1521-4109(200011)
151212:16<1286::aid-elan1286>3.0.co;2-q
1513160. Bobacka J, Ivaska A, Lewenstam A (2008) Potentiometric ion sensors. Chem Rev 108
1514(2):329–351. doi:10.1021/cr068100w
1515161. Wardak C (2011) A highly selective lead-sensitive electrode with solid contact based on ionic
1516liquid. J Hazard Mater 186(2–3):1131–1135. doi:10.1016/j.jhazmat.2010.11.103
1517162. Radu A, Diamond D (2007) Chapter 2: ion-selective electrodes in trace level analysis of
1518heavy metals: potentiometry for the xxi century. In: Alegret S, Merkoci A (eds) Comprehen-
1519sive analytical chemistry, vol 49. Elsevier, Amsterdam, pp 25–52
1520163. Parra EJ, Blondeau P, Crespo GA, Rius FX (2011) An effective nanostructured assembly for
1521ion-selective electrodes. An ionophore covalently linked to carbon nanotubes for pb2+
1522determination. Chem Commun 47(8):2438–2440
1523164. Faridbod F, Norouzi P, Dinarvand R, Ganjali M (2008) Developments in the field of
1524conducting and non-conducting polymer based potentiometric membrane sensors for ions
1525over the past decade. Sensors 8(4):2331–2412
1526165. Bobacka J (2006) Conducting polymer-based solid-state ion-selective electrodes. Electro-
1527analysis 18(1):7–18. doi:10.1002/elan.200503384
1528166. Lindner E, Gyurcsanyi R (2009) Quality control criteria for solid-contact, solvent polymeric
1529membrane ion-selective electrodes. J Solid State Electrochem 13(1):51–68. doi:10.1007/
1530s10008-008-0608-1
1531167. McGraw CM, Radu T, Radu A, Diamond D (2008) Evaluation of liquid- and solid-contact,
1532pb2 + �selective polymer-membrane electrodes for soil analysis. Electroanalysis 20(3):
1533340–346. doi:10.1002/elan.200704068
1534168. Bobacka J, Ivaska A (2007) Chapter 4: ion sensors with conducting polymers as ion-to-
1535electron transducers. In: Alegret S, Merkoci A (eds) Comprehensive analytical chemistry,
1536vol 49. Elsevier, Amsterdam, pp 73–86
1537169. Veder J-P, De Marco R, Clarke G, Chester R, Nelson A, Prince K, Pretsch E, Bakker E (2008)
1538Elimination of undesirable water layers in solid-contact polymeric ion-selective electrodes.
1539Anal Chem 80(17):6731–6740. doi:10.1021/ac800823f
1540170. Sutter J, Lindner E, Gyurcsanyi RE, Pretsch E (2004) A polypyrrole-based solid-contact
1541pb-selective pvc-membrane electrode with a nanomolar detection limit. Anal Bioanal Chem
1542380(1):7–14. doi:10.1007/s00216-004-2737-4
1543171. Anastasova-Ivanova S, Mattinen U, Radu A, Bobacka J, Lewenstam A, Migdalski J,
1544Danielewski M, Diamond D (2010) Development of miniature all-solid-state potentiometric
1545sensing system. Sens Actuators B Chem 146(1):199–205. doi:10.1016/j.snb.2010.02.044
1546172. Anastasova S, Radu A, Matzeu G, Zuliani C, Diamond D, Mattinen U, Bobacka J (2011)
1547Calibrationless disposable solid-contact ion-selective electrodes for environmental monitor-
1548ing of lead with ppb limit-of-detection. Electrochimica Acta (submitted)
1549173. Radu A, Anastasova-Ivanova S, Paczosa-Bator B, Danielewski M, Bobacka J, Lewenstam A,
1550Diamond D (2010) Diagnostic of functionality of polymer membrane – based ion selective
1551electrodes by impedance spectroscopy. Anal Methods 2(10):1490–1498
1552174. Bakker E, Meyerhoff ME (2002) Ion-selective electrodes for measurements in bological
1553samples. In: Bard AJ, Wilson GS, Stratmann M (eds) Encyclopedia of electrochemistry,
1554bioelectrochemistry, vol 9. Wiley-VCH, Weinheim, Germany, pp 277–307
1555175. Phillips F, Kaczor K, Gandhi N, Pendley BD, Danish RK, Neuman MR, Toth B, Horvath V,
1556Lindner E (2007) Measurement of sodium ion concentration in undiluted urine with cation-
1557selective polymeric membrane electrodes after the removal of interfering compounds.
1558Talanta 74(2):255–264. doi:10.1016/j.talanta.2007.06.011
1559176. Bakker E, Bhakthavatsalam V, Gemene KL (2008) Beyond potentiometry: robust electro-
1560chemical ion sensor concepts in view of remote chemical sensing. Talanta 75(3):629–635.
1561doi:10.1016/j.talanta.2007.10.021
1562177. Janata J, Josowicz M (2003) Conducting polymers in electronic chemical sensors. Nat Mater
15632(1):19–24
Distributed Environmental Monitoring

1564 178. Mousavi Z, Ekholm A, Bobacka J, Ivaska A (2009) Ion-selective organic electrochemical
1565 junction transistors based on poly(3,4-ethylenedioxythiophene) doped with poly(styrene
1566 sulfonate). Electroanalysis 21(3–5):472–479. doi:10.1002/elan.200804427
1567 179. Guth U, Gerlach F, Decker M, Oelßner W, Vonau W (2009) Solid-state reference electrodes for
1568 potentiometric sensors. J Solid State Electrochem 13(1):27–39. doi:10.1007/s10008-008-0574-7
1569 180. Wei D, Bailey MJA, Andrew P, Ryhanen T (2009) Electrochemical biosensors at the
1570 nanoscale. Lab Chip 9(15):2123–2131
1571 181. Forster RJ, Keyes TE (2007) Ultramicroelectrodes. In: Zoski CG (ed) Handbook of electro-
1572 chemistry. Elsevier, Netherlands, pp 155–188
1573 182. Forster RJ (2003) Microelectrodes-retrospect and prospect. In: Bard AJ, Stratmann M,
1574 Unwin PR (eds) Encyclopedia of electrochemistry: instrumentation and electroanalytical
1575 chemistry, vol 3. Wiley-VCH, Weinheim, Germany, pp 160–195
1576 183. Tercier-Waeber M-L, Taillefert M (2008) Remote in situ voltammetric techniques to charac-
1577 terize the biogeochemical cycling of trace metals in aquatic systems. J Environ Monit
1578 10(1):30–54
1579 184. Orozco J, Fernandez-Sanchez C, Jimenez-Jorquera C (2010) Ultramicroelectrode array based
1580 sensors: a promising analytical tool for environmental monitoring. Sensors 10(1):475–490.
1581 doi:10.3390/s100100475
1582 185. Ordeig O, del Campo J, Munoz FX, Banks CE, Compton RG (2007) Electroanalysis utilizing
1583 amperometric microdisk electrode arrays. Electroanalysis 19(19–20):1973–1986.
1584 doi:10.1002/elan.200703914
1585 186. Szunerits S, Thouin L (2007) Microelectrode arrays. In: Zoski CG (ed) Handbook of
1586 electrochemistry. Elsevier, Netherlands, pp 391–428
1587 187. Pei J, Tercier-Waeber M-L, Buffle J, Fiaccabrino GC, Koudelka-Hep M (2001) Individually
1588 addressable gel-integrated voltammetric microelectrode array for high-resolution measure-
1589 ment of concentration profiles at interfaces. Anal Chem 73(10):2273–2281. doi:10.1021/
1590 ac000615e
1591 188. Bratov A, Abramova N, Ipatov A (2010) Recent trends in potentiometric sensor arrays–a
1592 review. Anal Chim Acta 678(2):149–159. doi:10.1016/j.aca.2010.08.035
1593 189. Mallon CT, Zuliani C, Keyes TE, Forster RJ (2010) Single nanocavity electrodes: fabrication,
1594 electrochemical and photonic properties. Chem Commun 46(38):7109–7111
1595 190. Zuliani C, Walsh DA, Keyes TE, Forster RJ (2010) Formation and growth of oxide layers at
1596 platinum and gold nano- and microelectrodes. Anal Chem 82(17):7135–7140. doi:10.1021/
1597 ac101728a
1598 191. Fan F-RF, Fernandez J, Liu B, Mauzeroll J, Zoski CG (2007) Ume fabrication/characteriza-
1599 tion basics. In: Zoski CG (ed) Handbook of electrochemistry. Elsevier, Amsterdam,
1600 pp 189–260
1601 192. Hartnett M, Diamond D (1997) Potentiometric nonlinear multivariate calibration with genetic
1602 algorithm and simplex optimization. Anal Chem 69(10):1909–1918. doi:10.1021/ac9604898
1603 193. Scheller FW,Wollenberger U (2002) Enzyme electrodes. In: Bard AJ,Wilson GS, StratmannM
1604 (eds) Encyclopedia of electrochemistry, bioelectrochemistry, vol 9. Wiley-VCH, Weinheim,
1605 pp 431–459
1606 194. Namour P, Lepot M, Jaffrezic-Renault N (2010) Recent trends in monitoring of European
1607 water framework directive priority substances using micro-sensors: a 2007–2009 review.
1608 Sensors 10(9):7947–7978
1609 195. Amine A, Mohammadi H (2007) Chapter 14: electrochemical biosensors for heavy metals
1610 based on enzyme inhibition. In: Alegret S, Merkoci A (eds) Comprehensive analytical
1611 chemistry, vol 49. Elsevier, Amsterdam, pp 299–310
1612 196. Badihi-Mossberg M, Buchner V, Rishpon J (2007) Electrochemical biosensors for pollutants
1613 in the environment. Electroanalysis 19(19–20):2015–2028. doi:10.1002/elan.200703946
1614 197. Shi M, Xu J, Zhang S, Liu B, Kong J (2006) A mediator-free screen-printed amperometric
1615 biosensor for screening of organophosphorus pesticides with flow-injection analysis (FIA)
1616 system. Talanta 68(4):1089–1095. doi:10.1016/j.talanta.2005.07.007
D. Diamond et al.
1617198. Cosnier S, Holzinger M (2010) Biosensors based on electropolymerized films. In: Cosnier S,
1618Karyakin A (eds) Electropolymerization. Concepts, materials and applications. Wiley-VCH,
1619Weinheim, pp 189–214
1620199. Yehezkeli O, Tel-Vered R, Raichlin S, Willner I (2011) Nano-engineered flavin-dependent
1621glucose dehydrogenase/gold nanoparticle-modified electrodes for glucose sensing and bio-
1622fuel cell applications. ACS Nano 5(3):2385–2391. doi:10.1021/nn200313t
1623200. Ricci F, Moscone D, Palleschi G (2007) Chapter 24: mediated enzyme screen-printed
1624electrode probes for clinical, environmental and food analysis. In: Alegret S, Merkoci A
1625(eds) Comprehensive analytical chemistry, vol 49. Elsevier, Amsterdam, pp 559–584
1626201. Wang J, Tangkuaram T, Loyprasert S, Vazquez-Alvarez T, Veerasai W, Kanatharana P,
1627Thavarungkul P (2007) Electrocatalytic detection of insulin at ruox/carbon nanotube-
1628modified carbon electrodes. Anal Chim Acta 581(1):1–6. doi:10.1016/j.aca.2006.07.084
1629202. Willner B, Katz E, Willner I (2006) Electrical contacting of redox proteins by nanotech-
1630nological means. Curr Opin Biotechnol 17(6):589–596. doi:10.1016/j.copbio.2006.10.008
1631203. Shiku H, Nagamine K, Kaya T, Yasukawa T, Matsue T (2008) Whole-cell biosensors. In:
1632Bartlett PN (ed) Bioelectrochemistry: fundamentals, experimental techniques and
1633applications. Wiley, Chichester, pp 249–266
1634204. Whitcombe MJ, Lakshmi D (2010) Imprited polymers. In: Cosnier S, Karyakin A (eds)
1635Electropolymerization. Concepts, materials and applications. Wiley-VCH, Weiheim, pp
1636133–151
1637205. Kr€oger S, Piletsky S, Turner APF (2002) Biosensors for marine pollution research, monitor-
1638ing and control. Mar Pollut Bull 45(1–12):24–34. doi:10.1016/s0025-326x(01)00309-5
1639206. Sequeira M, BowdenM, Minogue E, Diamond D (2002) Towards autonomous environmental
1640monitoring systems. Talanta 56(2):355
1641207. Prien R (2007) Technologies for new in situ chemical sensors. In: OCEANS 2007 – Europe,
16422007, p 1
1643208. Prien RD (2007) The future of chemical in situ sensors. Mar Chem 107(3, SI):422–432
1644209. Daly KL (2000) Meeting explores sensor technology for remote, interactive aquatic
1645experiments. EOS Transactions 81:580
1646210. Glasgow HB, Burkholder JM, Reed RE, Lewitus AJ, Kleinman JE (2004) Real-time remote
1647monitoring of water quality: a review of current applications, and advancements in sensor,
1648telemetry, and computing technologies. J Exp Mar Biol Ecol 300(1–2):409
1649211. Murray RW (2010) Challenges in environmental analytical chemistry. Anal Chem 82
1650(5):1569
1651212. Anastasi G, Conti M, Francesco MD, Passarella A (2009) Energy conservation in wireless
1652sensor networks: a survey. Ad Hoc Networks 7(3):537
1653213. Chong CY, Kumar SP (2003) Sensor networks: evolution, opportunities, and challenges.
1654Proceedings of the IEEE 91(8):1247–1256
1655214. Baronti P, Pillai P, Chook VWC, Chessa S, Gotta A, Hu YF (2007) Wireless sensor networks:
1656a survey on the state of the art and the 802.15.4 and zigbee standards. Comput Commun 30
1657(7):1655
1658215. Daly KL, Byrne RH, Dickson AG, Gallager SM, Perry MJ, Tivey MK (2004) Chemical and
1659biological sensors for time-series research: current status and new directions. Mar Technol
1660Soc J 38(2):121–143
1661216. Benito-Lopez F, Byrne R, Raduta AM, Vrana NE, McGuinness G, Diamond D (2009)
1662Ionogel-based light-actuated valves for controlling liquid flow in micro-fluidic manifolds.
1663Lab Chip 10(2):195–201
1664217. Ramirez-Garcia S, Diamond D (2007) Internet-scale sensing: are biomimetic approaches the
1665answer? J Intell Mater Syst Struct 18(2):159
1666218. Ramirez-Garcia S, Diamond D (2007) Biomimetic, low power pumps based on soft actuators.
1667Sens Actuators A Phys 135(1):229–235
Distributed Environmental Monitoring

Author QueriesChapter No.: 33
Query Refs. Details Required Author’s response
AU1 Please check if your indicated postaladdress is correct and complete sothat we can use it for your compli-mentary copy lateron.
AU2 Please check the inserted citation ofFig. 4.
AU3 Saltisza is not matched with Ref.[172]. Please check and providecorrect details if needed.
AU4 Figures 11 and 12 has been changedto Figures 10 and 11. Please check ifappropriate.
AU5 The Refs. 9 and 211 are duplicatereferences hence later one has beendeleted and subsequent occurrencesrenumbered in the text and list.
AU6 Please check the author names andprovide complete details for refer-ences [18, 89, 90, 91, 99].
AU7 Please provide complete details forreferences [25, 27, 61, 73, 74].
AU8 Please update reference [172].
AU9 Please check if the inserted publish-er’s locations in reference [108] isappropriate.
AU10 Please check if the author names arepresented correctly and also checkthe inserted page and volume num-ber.
Top Related
Copyright © 2022 FDOKUMEN

