Remote Monitoring Weaving Machine - CiteSeerX
52
Remote Monitoring Weaving Machine Vivek Kumar MSc Distributed Multimedia Systems Session (2002/2003) Supervisor: Dr. Andy Bulpitt The candidate confirms that the work submitted is his own and the appropriate credit has been given where reference has been made to the work of others. I understand that failure to attribute material, which is obtained from another source, may be considered as plagiarism. (Signature of student) ______________________
-
Upload
khangminh22 -
Category
Documents
-
view
1 -
download
0
Transcript of Remote Monitoring Weaving Machine - CiteSeerX

Remote Monitoring Weaving Machine
Vivek Kumar
MSc Distributed Multimedia Systems
Session (2002/2003)
Supervisor: Dr. Andy Bulpitt
The candidate confirms that the work submitted is his own and the appropriate credit has
been given where reference has been made to the work of others.
I understand that failure to attribute material, which is obtained from another source, may
be considered as plagiarism.
(Signature of student) ______________________

Summary
This project was done with an external company Xiros plc and the overall aim of the
project was to develop an automated system to monitor the product quality of weaving
machine. Xiros is a leading medical device company dedicated to the design and
manufacture of quality products. Previously, they have been monitoring the quality
parameters by installing an Axis Camera on the site location and manually observing the
product images from remote location. They wanted an automated system to monitor the
product continuously and inform the user automatically via Email/SMS if the quality
parameters fall out of standards.
Considering all the requirements, the final product involved a dedicated system
connected with Local Area Network and having access to the axis camera. This remote
monitoring system has been designed, implemented, tested and evaluated on various
product images under different lighting conditions with a satisfying outcome. The project
faced a number of technical and non-technical challenges. By the end of project, all the
challenges had been overcame successfully and all of the project objectives had been met
in a high standard.

Acknowledgements
I would like to thank a number of people who have given their time and effort to assist in
the various stages of this project:
Dr. Andy Bulpitt Project supervisor, for all of his advice, support and guidance
throughout the duration of the project.
Mr. Adrian Howe The managing director of Xiros, who discussed the problem and
spent a great deal of time offering advice.
Mr. Julian Bryant From Xiros, for his prompt replies, offering advice and providing
full support during the system development.
Mr. Angus Macrae The IT manager, Xiros, who spent his time and gave full support
while setting the system up at production area.
Mr. John Holrien IRI Research Systems Engineer, who helped in accessing
university axis cameras.
Dr. Eric Atwell Project assessor, for spending time to listen to the project
demonstration and providing helpful feedback.
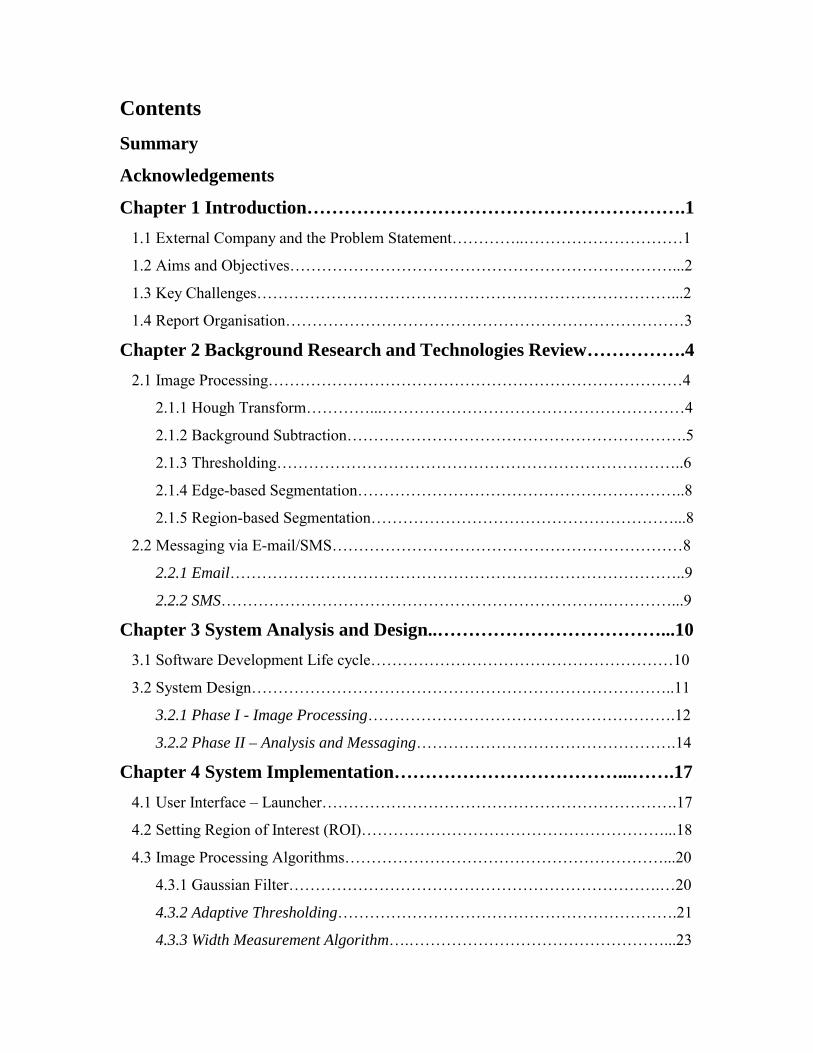
Contents Summary
Acknowledgements
Chapter 1 Introduction…………………………………………………….1 1.1 External Company and the Problem Statement…………..…………………………1
1.2 Aims and Objectives………………………………………………………………...2
1.3 Key Challenges……………………………………………………………………...2
1.4 Report Organisation…………………………………………………………………3
Chapter 2 Background Research and Technologies Review…………….4 2.1 Image Processing……………………………………………………………………4
2.1.1 Hough Transform…………...…………………………………………………4
2.1.2 Background Subtraction……………………………………………………….5
2.1.3 Thresholding…………………………………………………………………..6
2.1.4 Edge-based Segmentation……………………………………………………..8
2.1.5 Region-based Segmentation…………………………………………………...8
2.2 Messaging via E-mail/SMS…………………………………………………………8
2.2.1 Email…………………………………………………………………………..9
2.2.2 SMS……………………………………………………………….…………...9
Chapter 3 System Analysis and Design..………………………………...10 3.1 Software Development Life cycle…………………………………………………10
3.2 System Design……………………………………………………………………..11
3.2.1 Phase I - Image Processing………………………………………………….12
3.2.2 Phase II – Analysis and Messaging………………………………………….14
Chapter 4 System Implementation………………………………...…….17 4.1 User Interface – Launcher………………………………………………………….17
4.2 Setting Region of Interest (ROI)…………………………………………………...18
4.3 Image Processing Algorithms……………………………………………………...20
4.3.1 Gaussian Filter…………………………………………………………….…20
4.3.2 Adaptive Thresholding……………………………………………………….21
4.3.3 Width Measurement Algorithm….…………………………………………...23

4.4 Width Measurement Analysis……………………………………………………...25
4.5 System Modules Implementation………………………………………………….26
Chapter 5 Testing and Evaluation……………………………………….27 5.1 Evaluation against minimum objectives…………………………………………...27
5.2 Evaluation against design criteria………………………………………………….27
5.3 Testing (with test data)…………………………………………………………….28
5.3.1 Performance under different lighting conditions…………………………….29
5.3.2 Width measurements analysis………………………………………………..30
5.4 Real-time testing…………………………………………………………………...32
Chapter 6 Limitations and Future Work………………………………..33 6.1 Limitations and Improvements…………………………………………………….33
6.2 Future Work……………………………………………………………………..…35
Chapter 7 Conclusion……………………………………………………..36
References…………………………………………………………………37
Appendix A – Personal Reflection……………………………………….38
Appendix B – Interim Report…….……………………………………...39
Appendix C– Project Management……………………………………...41
Appendix D – Script Extractions……………………………………...…42
Appendix E – Screen Shorts……………………………………………...46

Remote Monitoring Weaving Machine 1
Vivek Kumar, MSc Distributed Multimedia Systems University of Leeds, 2002-03
Chapter 1 Introduction This report describes the building of a system for Xiros plc to automate monitoring of
weaving machine product in respect of quality control. The final product involved a
dedicated application that is supposed to run while the production is going on. The
system needs access to the axis camera to capture product images consistently and also
needs LAN to inform user via Email.
1.1 External Company and the Problem Statement Xiros is a leading medical device company dedicated to the design and manufacture of
quality products. To monitor the product quality, they had installed an Axis Camera on
the weaving machine and the images (shown in Fig 1.1) captured were monitored
manually from a remote location or office. This needed a dedicated manual effort to
observe the images continuously and take action if the product quality does not seem
according to standards. This way of monitoring was inefficient and there were more
chances of error due to manual observation. Moreover it was not easy to find the defects
in the product quality manually. One of the major defects, they were looking for, was
width of the product i.e. white bandage tape. Figure 1.1 (a) shows the ideal width of tape
and (b) More width (defected product).
(a) Ideal width of Weaving Product (b) Defected Product with more width
Figure 1.1 White Bandage Tape

Remote Monitoring Weaving Machine 2
Vivek Kumar, MSc Distributed Multimedia Systems University of Leeds, 2002-03
1.2 Aims and Objectives The aim of this project was to build an automated system to monitor the product quality
to remove the current manual processes. It should also inform the user automatically via
Email/SMS if the quality parameters fall out of standards.
Overall Objectives:
• To research in computer vision techniques to process the images and monitor
quality parameters such as overall appearance and dimensions of the product.
• To send immediate notification to operators at the main site, if there is a failure
(i.e. product quality not according to the standards).
• Evaluation of the system
Minimum Requirements:
• The minimum requirements are to monitor the dimensions (width) of the bandage
cloth (shown in fig 1.1) and if it falls outside the standards, i.e. if the width is
more than the required parameter, system should inform the operator either by
SMS or by email.
1.3 Key Challenges There were many technical as well as non-technical challenges to be faced in order to
make this project a success. Technical challenges include
• how to build a dedicated monitoring system for the product quality,
• the system should be robust enough to work in all environments and conditions,
• there should be no dependency of location or lighting assumptions while system
is running,
• how to measure the width dynamically and if error occurs then how to send the
notification immediately.
There were different mechanisms available to solve these types of problem Deciding
which technology would be applied for this specific problem was another challenge to the
project. Apart from these technical challenges, non-technical challenges also existed.
These include maintaining proper coordination with the external company and work

Remote Monitoring Weaving Machine 3
Vivek Kumar, MSc Distributed Multimedia Systems University of Leeds, 2002-03
according client requirements to provide customer satisfaction. The limited time
constraint to solve the problem was also one of the major challenges.
1.4 Report Organisation
While developing this system, several stages have been passed through. This report is
designed to cover all of these stages and is structured into three parts:
First: The first part shows problem statement and background research.
• Chapter 1 gives the introduction and explains the problem statement;
• Chapter 2 studies the literature review and background research for this project;
Second: The second part explains system’s development process.
• Chapter 3 explains the system design and analysis;
• Chapter 4 discusses the system implementation;
• Chapter 5 shows the system testing and evaluation.
Third: The last is the conclusion part.
• Chapter 6 discusses the limitations and future improvements of this system;
• Chapter 7 concludes the project.
Remote Monitoring Weaving Machine 4
Vivek Kumar, MSc Distributed Multimedia Systems University of Leeds, 2002-03
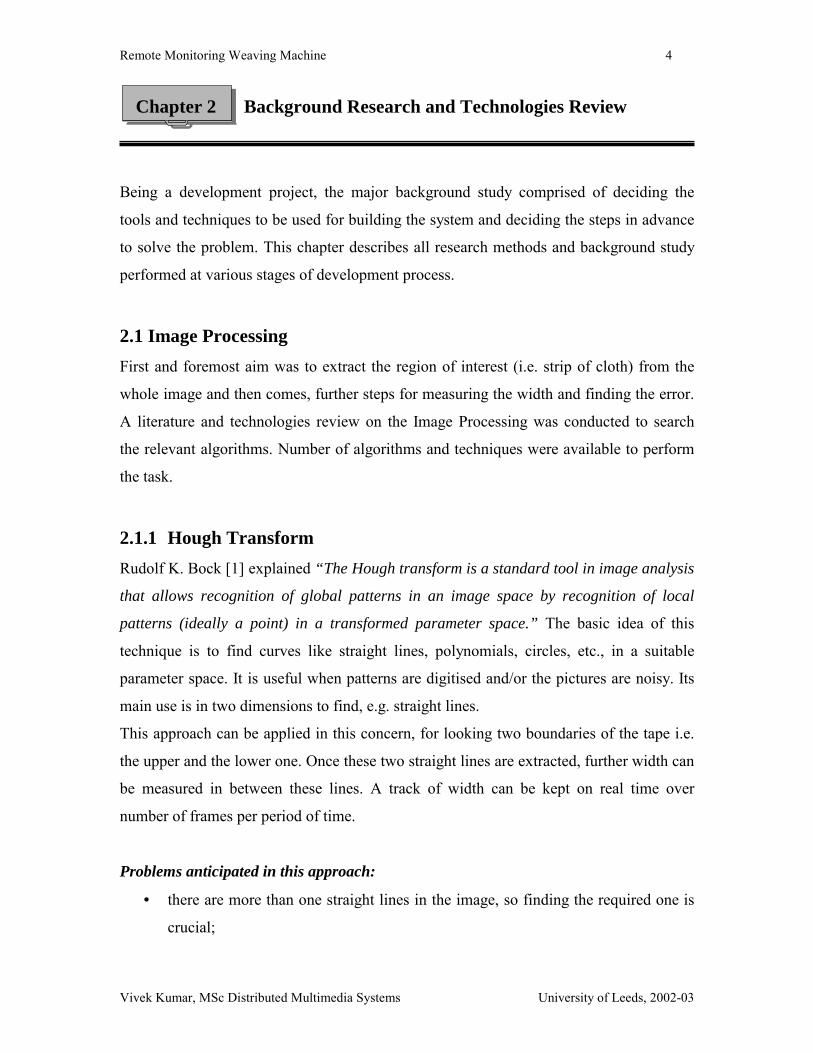
Chapter 2 Background Research and Technologies Review
Being a development project, the major background study comprised of deciding the
tools and techniques to be used for building the system and deciding the steps in advance
to solve the problem. This chapter describes all research methods and background study
performed at various stages of development process.
2.1 Image Processing First and foremost aim was to extract the region of interest (i.e. strip of cloth) from the
whole image and then comes, further steps for measuring the width and finding the error.
A literature and technologies review on the Image Processing was conducted to search
the relevant algorithms. Number of algorithms and techniques were available to perform
the task.
2.1.1 Hough Transform Rudolf K. Bock [1] explained “The Hough transform is a standard tool in image analysis
that allows recognition of global patterns in an image space by recognition of local
patterns (ideally a point) in a transformed parameter space.” The basic idea of this
technique is to find curves like straight lines, polynomials, circles, etc., in a suitable
parameter space. It is useful when patterns are digitised and/or the pictures are noisy. Its
main use is in two dimensions to find, e.g. straight lines.
This approach can be applied in this concern, for looking two boundaries of the tape i.e.
the upper and the lower one. Once these two straight lines are extracted, further width can
be measured in between these lines. A track of width can be kept on real time over
number of frames per period of time.
Problems anticipated in this approach:
• there are more than one straight lines in the image, so finding the required one is
crucial;
Remote Monitoring Weaving Machine 5
Vivek Kumar, MSc Distributed Multimedia Systems University of Leeds, 2002-03
• the (cross) pattern of cloth may also be a difficulty in finding straight lines
• and the border of the cloth is not exactly a straight line, so might not be a suitable
approach in this particular case.
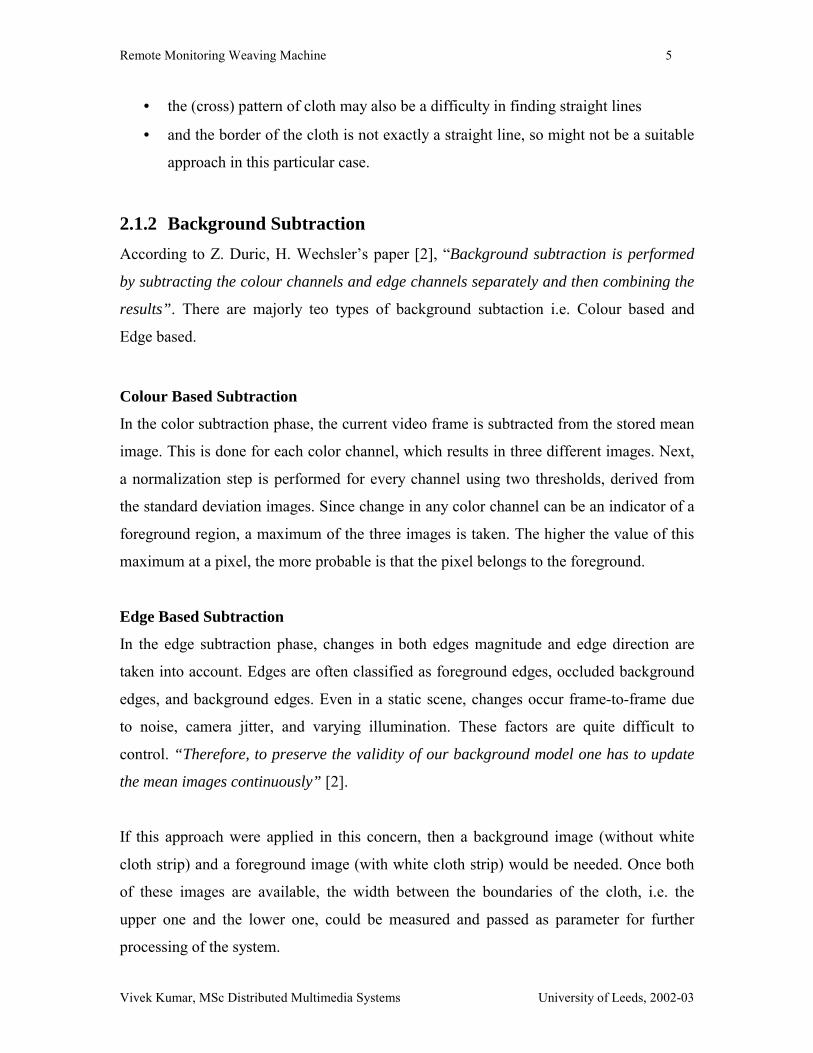
2.1.2 Background Subtraction According to Z. Duric, H. Wechsler’s paper [2], “Background subtraction is performed
by subtracting the colour channels and edge channels separately and then combining the
results”. There are majorly teo types of background subtaction i.e. Colour based and
Edge based.
Colour Based Subtraction
In the color subtraction phase, the current video frame is subtracted from the stored mean
image. This is done for each color channel, which results in three different images. Next,
a normalization step is performed for every channel using two thresholds, derived from
the standard deviation images. Since change in any color channel can be an indicator of a
foreground region, a maximum of the three images is taken. The higher the value of this
maximum at a pixel, the more probable is that the pixel belongs to the foreground.
Edge Based Subtraction
In the edge subtraction phase, changes in both edges magnitude and edge direction are
taken into account. Edges are often classified as foreground edges, occluded background
edges, and background edges. Even in a static scene, changes occur frame-to-frame due
to noise, camera jitter, and varying illumination. These factors are quite difficult to
control. “Therefore, to preserve the validity of our background model one has to update
the mean images continuously” [2].
If this approach were applied in this concern, then a background image (without white
cloth strip) and a foreground image (with white cloth strip) would be needed. Once both
of these images are available, the width between the boundaries of the cloth, i.e. the
upper one and the lower one, could be measured and passed as parameter for further
processing of the system.

Remote Monitoring Weaving Machine 6
Vivek Kumar, MSc Distributed Multimedia Systems University of Leeds, 2002-03
Problems anticipated in this approach are:
• Variation in lighting conditions could be a crucial in implementing this approach.
• the (cross) pattern of cloth may also be a difficulty and has to be handled (by
taking low resolution images)
2.1.3 Thresholding Thresholding is a process of segmenting image into two levels. For example, given a grey
level image, thresholding:
where g(i, j) is the pixel grey level at the position of (i, j) of the output image;
f(i, j) is the pixel grey level at the position of (i, j) of the input image;
T is grey level threshold.
Thresholding is very useful tool in image pre-processing and image sub-division. In the
concerned case, white (bright) tape region can be extracted from the captured images due
to significant change in contrast in-between background and the bright tape. Hence, this
approach seemed more relevant and simple to perform the task, but there were some
challenges to be faced:
• Grey level of tape and background vary over a period of time;
• Grey level of tape and background may become similar;
• Objects other than tape within the image have similar or same grey level.
Because of the above ambiguities, determining a single global threshold is the crucial
problem. To overcome this problem, research has been done on the available algorithms
to find adaptive threshold and variable threshold, that is, to divide the image into sub-
images and apply different threshold on each sub-image. But it also needs some prior
knowledge about the image, which is again not feasible here in this case.
Remote Monitoring Weaving Machine 7
Vivek Kumar, MSc Distributed Multimedia Systems University of Leeds, 2002-03
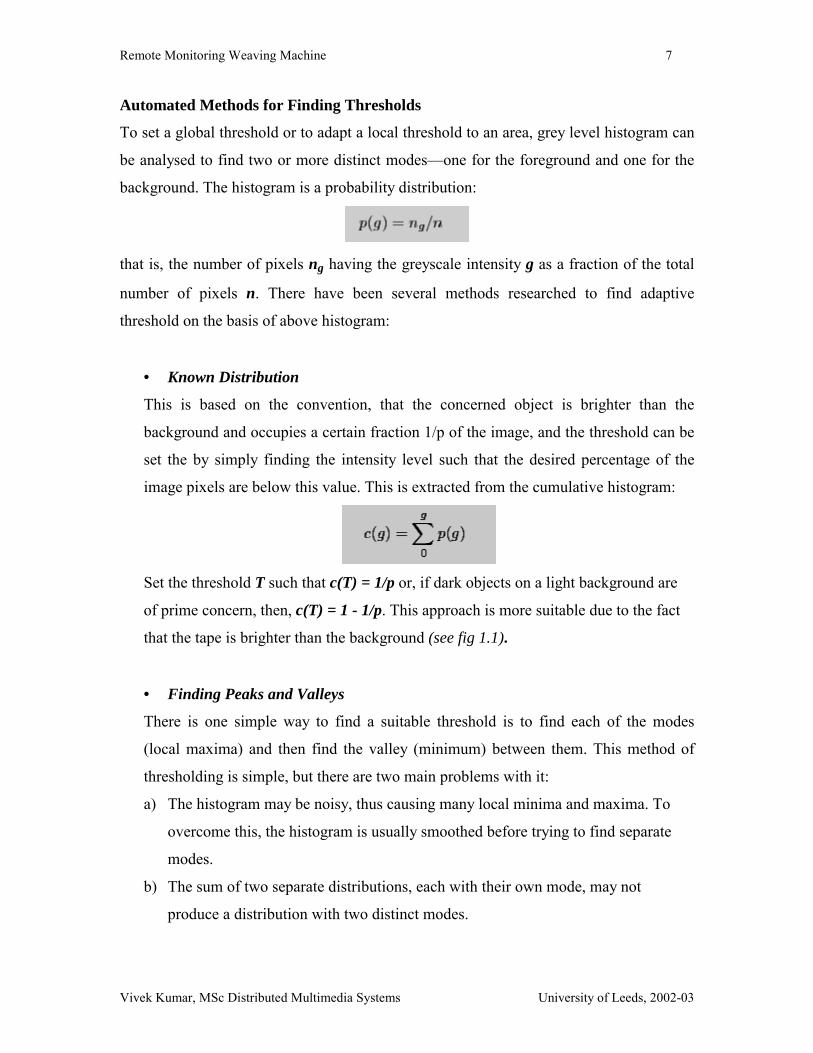
Automated Methods for Finding Thresholds
To set a global threshold or to adapt a local threshold to an area, grey level histogram can
be analysed to find two or more distinct modes—one for the foreground and one for the
background. The histogram is a probability distribution:
that is, the number of pixels ng having the greyscale intensity g as a fraction of the total
number of pixels n. There have been several methods researched to find adaptive
threshold on the basis of above histogram:
• Known Distribution
This is based on the convention, that the concerned object is brighter than the
background and occupies a certain fraction 1/p of the image, and the threshold can be
set the by simply finding the intensity level such that the desired percentage of the
image pixels are below this value. This is extracted from the cumulative histogram:
Set the threshold T such that c(T) = 1/p or, if dark objects on a light background are
of prime concern, then, c(T) = 1 - 1/p. This approach is more suitable due to the fact
that the tape is brighter than the background (see fig 1.1).
• Finding Peaks and Valleys
There is one simple way to find a suitable threshold is to find each of the modes
(local maxima) and then find the valley (minimum) between them. This method of
thresholding is simple, but there are two main problems with it:
a) The histogram may be noisy, thus causing many local minima and maxima. To
overcome this, the histogram is usually smoothed before trying to find separate
modes.
b) The sum of two separate distributions, each with their own mode, may not
produce a distribution with two distinct modes.

Remote Monitoring Weaving Machine 8
Vivek Kumar, MSc Distributed Multimedia Systems University of Leeds, 2002-03
2.1.4 Edge-based Segmentation
Edge-based segmentation is one of the major methods to segment the image, which rely
on edges found in an image by edge detecting operators such as Roberts, Sobel, and
Laplacian. Once these operators have been applied on image, this results in edge marks
on the image at the discontinuities in grey level, colour, texture, etc. Then the following
processing steps combine edges into edge chains that correspond with borders in the
image. This approach needs additional knowledge, about the segmented object, in
advance.
2.1.5 Region-based Segmentation
Region Growing is one of the most popular methods of segmenting images. The logic
behind this approach is segmenting the image on the basis of homogenous regions
present in the image. Here homogeneous refers to all the pixels within the region
containing similar grey levels. It may be started with a single or multiple pixel seeds. The
connectivity of the pixel usually has two kinds: 4-connectivity and 8-connectivity. In the
former one, the up, down, left and right pixels to the current pixel is examined. In the
latter one, besides the above pixels, the 4 diagonal pixels are also added. If one meets the
homogeneous criterion, it is added to the region. The region expands by absorbing more
neighbour pixels and it stops growing until no more neighbour pixels satisfy the
homogeneous criterion. Region growing techniques are generally better in noisy images
where edges are extremely difficult to detect than edge-based techniques.
In the concerned case, again the (cross) pattern of the cloth is major obstacle in applying
region-growing approach because it does not allow the region to grow within the whole
tape area and there are chances of not image not being segmented properly.
2.2 Messaging via E-mail/SMS Once the image is segmented and the variations in tape width are found, next step is to
send an immediate notification to operators at the main site either by email or by SMS.
Research shows that there are various methods/plug-in available to fire an email or SMS
programmatically to a specific destination. The selection of the method/plug-in depends
on the platform and the programming language used. Some of the existing tools are:

Remote Monitoring Weaving Machine 9
Vivek Kumar, MSc Distributed Multimedia Systems University of Leeds, 2002-03
2.2.1 Email The JavaMailTM API, a Java Standard Extension, is one of the most common
applications programming interface library. It provides a strictly protocol-independent
method of sending and receiving email. Java Mail’s layered architecture allows the use of
various message access protocols, like POP3 and IMAP, and message transfer protocols
like SMTP. JavaMail interacts with message content through the JavaBeans Activation
Framework (JAF). JAF provides a uniform way of determining message type and
encapsulating it [3]. This library provides methods to send messages along with
attachments using SMTP server. Sending attachment is a handy feature as when the
product quality is not up to standards, a snapshot of the current frame might be required
as an attachment file.
2.2.2 SMS There are two major ways of firing SMS programmatically, one is by using third party
APIs and other is using a dedicated mobile to the system. Both of these ways incur cost in
their own ways. Using third party API costs per message basis or rental charges for using
their libraries. Sending messages via dedicated mobile costs per message and depends on
the network charges.
SMS Library (API) for java allows to send SMS (GSM) from the Java platform. It gives
full control over the SMS including the UDH field so that EMS messages and images can
be created and sent. It provides a pluggable transport layer that allows it to be used with a
range of different SMS servers. It also gives full control to all parts of the SMS (UDH,
UD, DCS...). This makes it possible to create all types of SMS messages, including
picture messages and WAP push messages [4].

Remote Monitoring Weaving Machine 10
Vivek Kumar, MSc Distributed Multimedia Systems University of Leeds, 2002-03
Chapter 3 System Analysis and Design
This chapter illustrates the software development process model utilized in the project.
Later, it discusses the architectural design of the system, which has been considered as
the basis for further implementation.
3.1 Software Development Life cycle This section focuses on the waterfall life [5] cycle, which can be considered as
representations of traditional model of software development. Waterfall model is a well-
defined development process in which one phase has to be finished before the next phase.
Figure 3.1 - Waterfall life cycle model
This model can be used if the requirements are well understood and defined. It enables an
individual to break a large complicated project into small component of steps. In this
approach, development proceeds from requirements analysis through specification,
design, implementation, testing and maintenance (see Figure 3.1). The linear sequential
model is designed for straight-line development. This approach assumes that a complete
system will be delivered after the linear sequence is completed.
Remote Monitoring Weaving Machine 11
Vivek Kumar, MSc Distributed Multimedia Systems University of Leeds, 2002-03
The fundamental issue with this approach is that it increases risk forward in time. It is
neither too easy nor is it economical to make changes to the original plan once the design
has been carried out. Hence there is a need of proper project planning before undertaking
a large project.
Waterfall model has been chosen for the project due to the fact that the requirements for
the project are clearly defined in advance and does not change very often. To overcome
the disadvantage of “increases risk forward in time” in this approach, project schedule
has been made flexible enough to cope with more than one iteration of life cycle, if the
initial system fails to achieve the objectives. During the system development,
considerable amount of time has been given to each of the five phases. The process also
had to go through requirements analysis, system design and implementation.
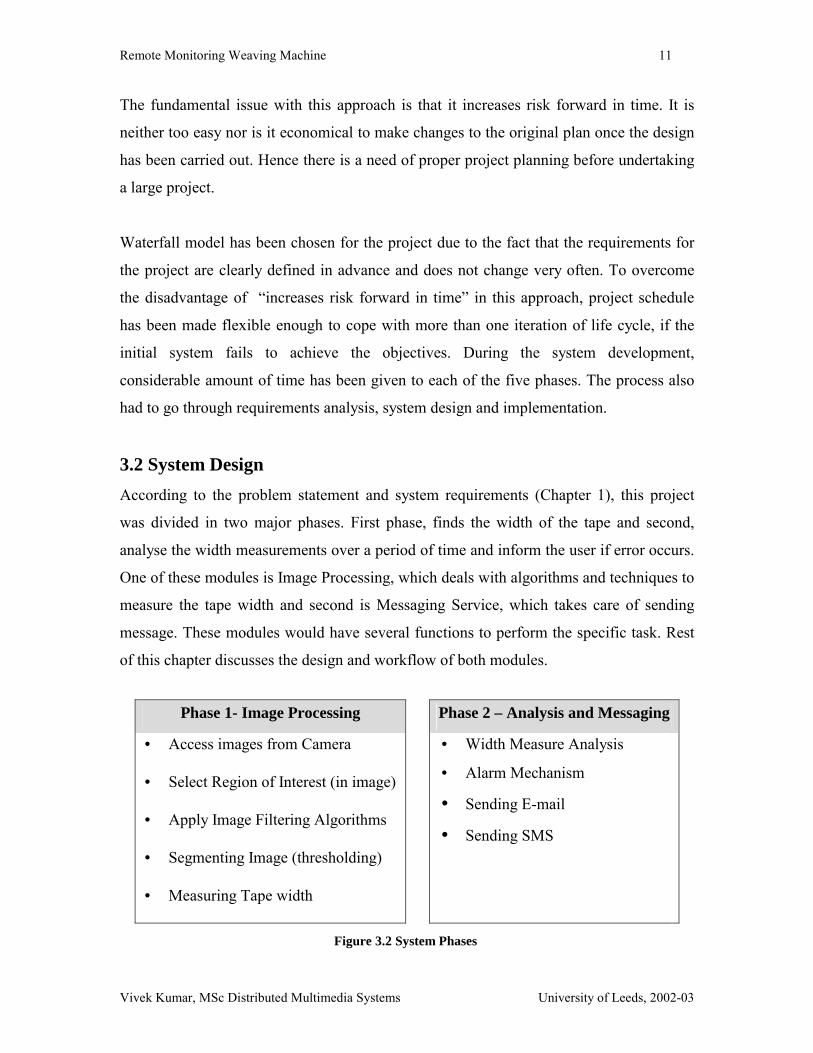
3.2 System Design
According to the problem statement and system requirements (Chapter 1), this project
was divided in two major phases. First phase, finds the width of the tape and second,
analyse the width measurements over a period of time and inform the user if error occurs.
One of these modules is Image Processing, which deals with algorithms and techniques to
measure the tape width and second is Messaging Service, which takes care of sending
message. These modules would have several functions to perform the specific task. Rest
of this chapter discusses the design and workflow of both modules.
Phase 1- Image Processing Phase 2 – Analysis and Messaging
• Access images from Camera
• Select Region of Interest (in image)
• Apply Image Filtering Algorithms
• Segmenting Image (thresholding)
• Measuring Tape width
• Width Measure Analysis
• Alarm Mechanism
• Sending E-mail
• Sending SMS
Figure 3.2 System Phases
Remote Monitoring Weaving Machine 12
Vivek Kumar, MSc Distributed Multimedia Systems University of Leeds, 2002-03
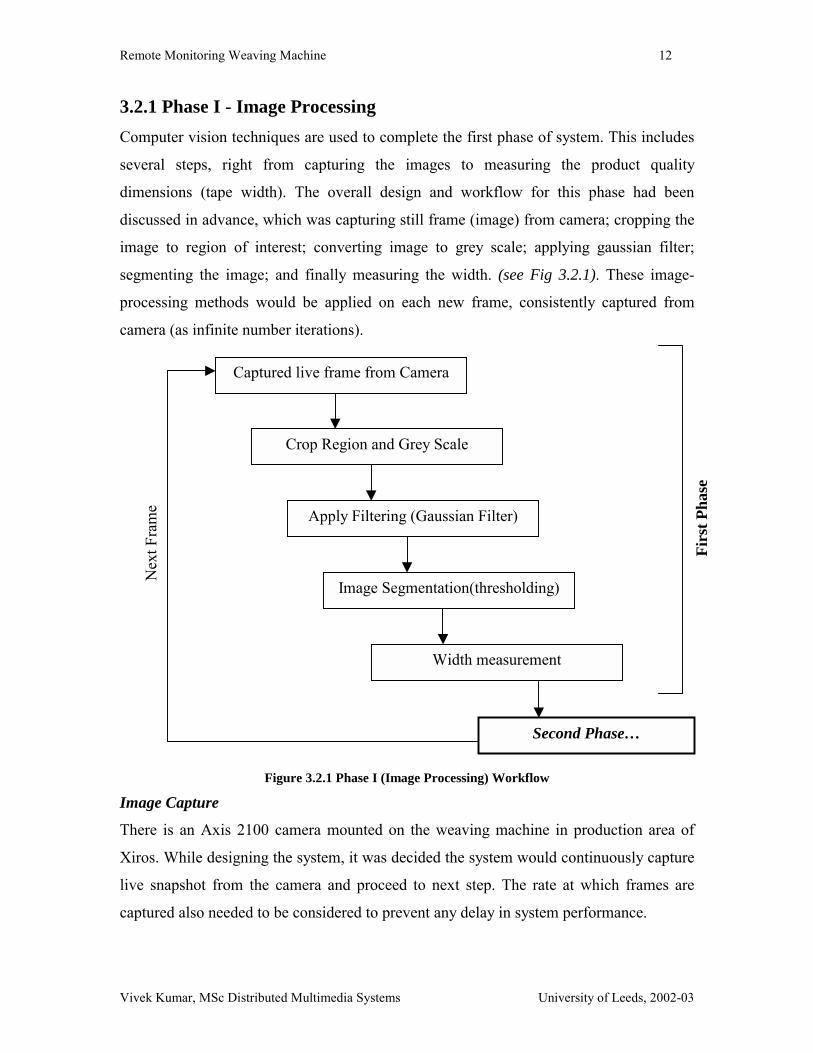
3.2.1 Phase I - Image Processing Computer vision techniques are used to complete the first phase of system. This includes
several steps, right from capturing the images to measuring the product quality
dimensions (tape width). The overall design and workflow for this phase had been
discussed in advance, which was capturing still frame (image) from camera; cropping the
image to region of interest; converting image to grey scale; applying gaussian filter;
segmenting the image; and finally measuring the width. (see Fig 3.2.1). These image-
processing methods would be applied on each new frame, consistently captured from
camera (as infinite number iterations).
Figure 3.2.1 Phase I (Image Processing) Workflow
Image Capture
There is an Axis 2100 camera mounted on the weaving machine in production area of
Xiros. While designing the system, it was decided the system would continuously capture
live snapshot from the camera and proceed to next step. The rate at which frames are
captured also needed to be considered to prevent any delay in system performance.
Captured live frame from Camera
Crop Region and Grey Scale
Apply Filtering (Gaussian Filter)
Image Segmentation(thresholding)
Width measurement
Second Phase…
Nex
t Fra
me
Firs
t Pha
se

Remote Monitoring Weaving Machine 13
Vivek Kumar, MSc Distributed Multimedia Systems University of Leeds, 2002-03
Image Crop and Grey Scale
If the whole frame or image, captured from camera, had been processed then it could
have led to false results due to the presence of unwanted objects in the scene. If the image
had got any other bright object apart from the white tape, it would have been difficult to
discard these ones. It was then necessary to crop the image and extract a region of interest
i.e. region surrounding the tape. This was one of the major steps in the design of phase
one because it would remove the unwanted region in the image.
Next major decision in this concern was to define the dimensions and co-ordinates of
region to crop. User while launching the system can locate this region according to the
tape location in the current frame. Locating this region dynamically could also be an
enhancement to the project and a major step towards system robustness. Image also needs
to be converted into grey-scale to enable image-processing algorithms to be applied later.
Image Segmentation
Before applying further image processing algorithms, the image should be made smooth
and noise free to certain extent. This would help in successful implementation of further
algorithms (Chapter 4). Then the grey level image would be converted segmented (black
and white) image. Selection of the most suitable approach for segmentation is crucial
because further steps are based on its output image. Chapter 2 discusses the algorithms
available for this task and shows that the thresholding was the most appropriate according
to the requirements and the test images. More than one approach can also be used here
and the result can be judged by having a vote from both approaches.
One major problem with thresholding is its static nature. To make a robust system, it was
very important to set the threshold value dynamically according to the contrast and grey-
level histogram of current frame. This is crucial because according to system
requirements, it should not have any assumption for lighting conditions while running.
An adaptive threshold value could serve the purpose. This has been discussed in
Chapter 4 in detail.

Remote Monitoring Weaving Machine 14
Vivek Kumar, MSc Distributed Multimedia Systems
Width Measurement
This was the last step of system’s first phase. Here the segmented image was supposed to
be measured. All of the above steps have been designed in this phase in order to provide a
segmented image showing tape region and background as opposite grey level values i.e.
black and white. A new algorithm needed to be designed and written to read this
segmented image and calculate the average width of tape across the image. This has been
discussed in Chapter 4 in detail.
Once all of the above functions are processed, the width measurement would be passed to
Phase 2 and the control should again go upwards to capture next frame from the camera.
This iteration will keep on going until the system is shut down.
3.2.2 Phase II – Analysis and Messaging This phase performs width measurements analysis and messaging service. The design and
workflow for this phase is shown in Fig 3.2.2.
Figure 3.2.2 Phase II (Analysis and M
Width Measure Analysis
Fire Ema
…First Phase
Alarm
On/OffNex
t Fra
me
ON
OFF
University of Leeds, 2002-03
essaging) Workflow
il/SMS

Remote Monitoring Weaving Machine 15
Vivek Kumar, MSc Distributed Multimedia Systems University of Leeds, 2002-03
Width Measure Analysis
This function has been designed to monitor the width measured above. Here the width
measurements for a number of frames would be analysed and compared with standard
measurements over a number of frames or time period. This analysis has been done to
prevent the system sending immediate messages to user on the basis of few undesired
(not according to standard) width measurements. This feature provides reliability to the
system and ensures there is sufficient number of measurement readings, which fall
outside standard parameter, before sending alert message.
This was one of the important features of system as discussed with Xiros while designing
system requirements and specifications. They wanted an alert message to be sent only if
system has made sure the quality is getting suffered. According to the information
supplied, this was due to fact that weaving machine starts producing over or under width
tape and at times it automatically comes back to normal width. If this happens, system
should take it into consideration and sends alert messages only if product width is varying
over a period of time or the length of product. There has been two ways to implement this
feature - the system should either monitor the measurements over a fix time period or for
specific number of frames. The implementation of this has been discussed in Chapter 4.
Alarm
Now a decision has to be made, whether to send an alert message or not. A virtual Alarm
has been made for this, which would be turned ON, if its quality falls beyond tolerance
levels and would remain OFF, if the product qualifies the standards in the above step.
The aim is to implement a switch mechanism here to simplify the process and hide all the
already done analysis and measurements from further steps. If Alarm is turned OFF, then
the control will flow back to the first phase and start next iteration. On the other hand if it
is turned ON, control goes to next step for message firing.
Messaging Service
The next and final step for the system is sending alert messages to the user, if the Alarm
has been turned ON in above step. According to the discussion with Xiros, there were
two main ways to inform the user remotely i.e. Email or SMS (short message service).

Remote Monitoring Weaving Machine 16
Vivek Kumar, MSc Distributed Multimedia Systems University of Leeds, 2002-03
Email was decided as the default method and if this works fine with initial system setups,
then sending SMS could be a possible enhancement. As discussed in Chapter 2, Java
libraries and activation framework has been used to send email via SMTP server.
Messages can be sent from anywhere using these libraries provided SMTP server is
accessible and the network is available. The email would contain the time and date details
and a message informing the user. It was also possible to send the measurement details of
analysed faulty frames in the email. This would help user in detecting the scope of error.
The java libraries can also be used for sending attachments. The image (captured frame)
of faulty product could be attached with email as an enhancement to the system for the
user assistance. Once the email has been sent, control should flow back to first phase and
move towards next iteration to analyse coming frames. This process keeps on going until
system is shut down.
After careful consideration of user requirements and analysis, a conceptual scenario in
which system would work is works is shown in Figure below.
ALERT
Camera Access via LAN
System
Weaving Machine
User (at remote location)
Remote Monitoring Weaving Machine 17
Vivek Kumar, MSc Distributed Multimedia Systems University of Leeds, 2002-03
Chapter 4 System Implementation
This chapter discusses the actual implementation and working of system in real time. I t
covers all user interfaces, system logics and image processing algorithms used/developed
at various stages of development process.
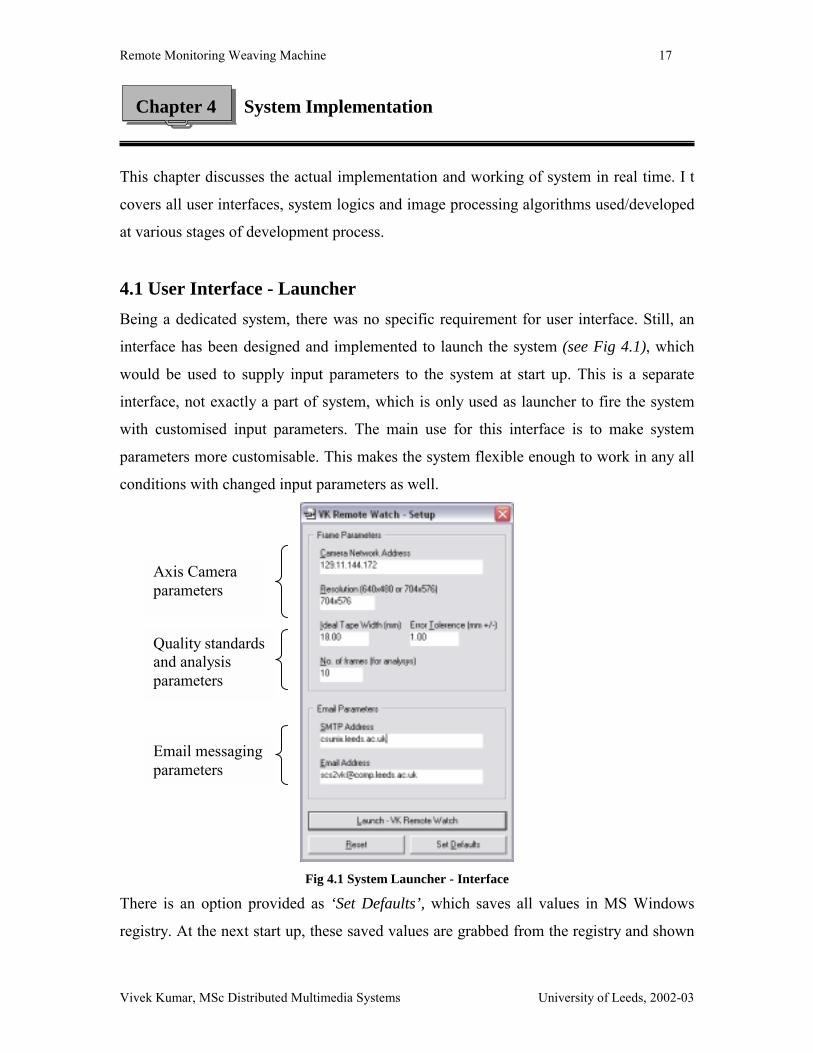
4.1 User Interface - Launcher Being a dedicated system, there was no specific requirement for user interface. Still, an
interface has been designed and implemented to launch the system (see Fig 4.1), which
would be used to supply input parameters to the system at start up. This is a separate
interface, not exactly a part of system, which is only used as launcher to fire the system
with customised input parameters. The main use for this interface is to make system
parameters more customisable. This makes the system flexible enough to work in any all
conditions with changed input parameters as well.
Fig 4.1 System Launcher - Interface
There is an option provided as ‘Set Defaults’, which saves all values in MS Windows
registry. At the next start up, these saved values are grabbed from the registry and shown
Axis Camera parameters
Email messaging parameters
Quality standards and analysis parameters

Remote Monitoring Weaving Machine 18
Vivek Kumar, MSc Distributed Multimedia Systems University of Leeds, 2002-03
by default. This prevents user feeding these input parameters each time at start up. There
are three major categories of parameters i.e. Camera details, product quality standards
and analysis details and Email messaging details. Their impact and usage in the system is
as follows:
Axis camera parameters
Axis camera has inbuilt web server and an assigned network IP address. Further, different
axis cameras support different image resolutions. Supplying these two parameters
provides flexibility and mobility to the system.
strImgURL = "http://" + <strCamIP> + "/cgi-bin/jpg/image.cgi?resolution=" + <strResolution>;
Both of these values are used to build a URL string (see above) to make request to CGI
script running on camera server, which gives live image snapshot in return.
Quality standards and analysis parameters
These values are required to feed the system with ideal or standard width and the
upper/lower tolerance limits. These are very important parameters and quite often
changed according to the product type, hence they need to be customised. “Number of
frames” parameter value is which is used as ‘count’ of frames to be analysed, while
measurement analysis step (Chapter 3). This gives flexibility if measurements readings
need to be studied for small period or long period (details in section 4.4).
Email messaging parameters
Details supplied here are destination email address and the SMTP server used for sending
email. These both parameters can also be customised accordingly.
4.2 Setting Region of Interest (ROI) As discussed in chapter 3, the image captured from camera has been cropped to a
particular region of interest and rest of the image is discarded. Selection of this area is
critical because this area should cover the tape region in the image with no other objects

Remote Monitoring Weaving Machine 19
Vivek Kumar, MSc Distributed Multimedia Systems University of Leeds, 2002-03
in the scene. One solution was, setting static x and y co-ordinates of the image with fixed
dimensions as region of interest, but it might fail if camera is shifted slightly. Though
according to Xiros, the camera position is not changed quite often. Still, to make system
robust enough to deal with this problem, a new feature has been added to the system that
enables user to manually set the area of interest in the image at the system start up (see
Fig 4.2). In this case, system would ask the operator or user to select the region of interest
at the system start up.
To implement this feature, a separate class Firstpr.java has been designed which opens a
window (java frame) showing the very first image captured from the camera and creates a
dummy green rectangular box in it. This box could be dragged by user and set to the best
suitable region, which covers the tape properly without any unwanted objects in the
box (a). While the user is selecting the region, system is in sleep mode and not
progressing further. Once user selects the region and clicks the Start in File menu, the
cropped region (b) is grabbed and sent back to main program. Here left (x) and top (y)
co-ordinates of this region have also been set globally to crop succeeding images from
the same values. So this selection process is done only once while system start up and
then it sets the base for next frames.
(a) Image captured from camera (b) Cropped Region (ROI) Figure 4.2 Selecting ROI
Remote Monitoring Weaving Machine 20
Vivek Kumar, MSc Distributed Multimedia Systems University of Leeds, 2002-03
4.3 Image Processing Algorithms Now onwards, all of the processing would be done on the already cropped region of
image only. Using this approach, further algorithms would not be applied on the
undesired sections of image, which leads dual benefit of preventing false results and
increase in processing speed. The algorithms extensively used are Gaussian Filter,
Adaptive Thresholding and Width Measurement. Their implementation in solving the
current problem has been discussed in this section of report.
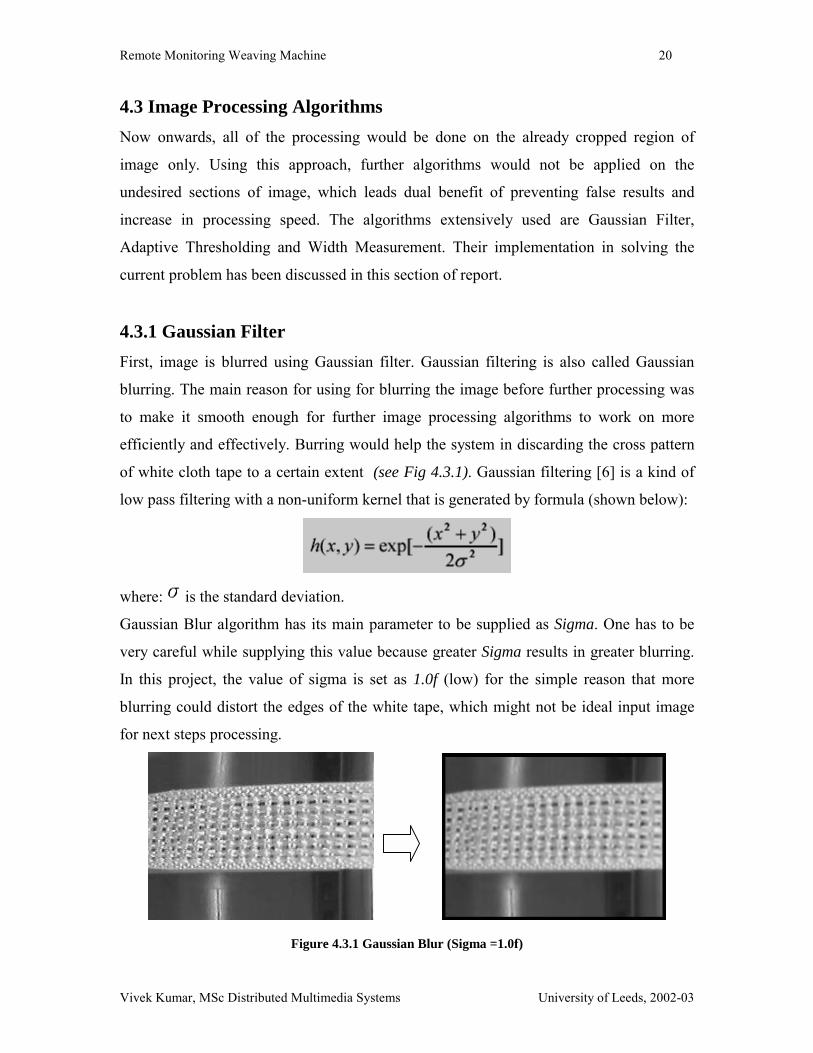
4.3.1 Gaussian Filter First, image is blurred using Gaussian filter. Gaussian filtering is also called Gaussian
blurring. The main reason for using for blurring the image before further processing was
to make it smooth enough for further image processing algorithms to work on more
efficiently and effectively. Burring would help the system in discarding the cross pattern
of white cloth tape to a certain extent (see Fig 4.3.1). Gaussian filtering [6] is a kind of
low pass filtering with a non-uniform kernel that is generated by formula (shown below):
where: is the standard deviation.
Gaussian Blur algorithm has its main parameter to be supplied as Sigma. One has to be
very careful while supplying this value because greater Sigma results in greater blurring.
In this project, the value of sigma is set as 1.0f (low) for the simple reason that more
blurring could distort the edges of the white tape, which might not be ideal input image
for next steps processing.
Figure 4.3.1 Gaussian Blur (Sigma =1.0f)

Remote Monitoring Weaving Machine 21
Vivek Kumar, MSc Distributed Multimedia Systems University of Leeds, 2002-03
The implementation of Gaussian blurring has three steps: i) setting the value of sigma,
here 1.0f; ii) generate gaussian kernel according to formula above; and iii) convolute
image with gaussian kernel (using Java Gaussian Kernel available with JDK). See the
code snippet below:
float sigma = 1.0f;
Kernel kernel = new GaussianKernel(sigma);
ConvolveOp blurOp = new ConvolveOp(kernel);
outimage = blurOp.filter(image, null);
This has been implemented in separate method called Blur which takes buffered image as
input parameter and returns blurred image as output.
4.3.2 Adaptive Thresholding An algorithm, Known Distribution (Chapter 2), is used for adaptive thresholding, which
is based on a convention, that the concerned object is brighter than the background and
occupies a certain fraction 1/p of the image. In this case, the white tape is brighter than
the background and occupies approximately half of the image area. The dimensions of
cropped region has already been customised on the basis of ideal tape width, which
allows the tape to be the only object in the scene covering its half of its region. So, the
convention can be duly followed in this case. The threshold can be set the by simply
finding the intensity level such that the desired percentage of the image pixels are below
this value, which is extracted from the cumulative grey level histogram.
Known Distribution Algorithm (implementation):
#Prepare grey level frequency histogram
FOR EACH pixel along Y axis
FOR EACH pixel along X axis
index = GET grey level
INCREMENT HistogramArray [index]
NEXT
NEXT
Remote Monitoring Weaving Machine 22
Vivek Kumar, MSc Distributed Multimedia Systems University of Leeds, 2002-03
#Calculating fraction of pixel value
totalpixels = Image Width * Image Height
FOR ALL grey levels
HistogramArray [greylevel] = HistogramArray [greylevel]/ totalpixels;
NEXT
#Calculate cumulative frequency
For ALL grey levels
HistogramArray [greylevel] = HistogramArray[greylevel] +
HistogramArray[greylevel - 1]
#Approx 50% of the image is bright area
IF HistogramArray [greylevel] >= 40% AND HistogramArray[greylevel] <= 60%
THEN
Threshold = threshold + greylevel
INCREMENT counter
END
NEXT
threshold = threshold / counter
This has been implemented in separate method called Adaptivethresh, which takes
already cropped buffered image as input parameter and returns a threshold integer value
as output. The main function of this method is to implement the Known Distribution
algorithm on the supplied input image and provide a dynamic value of threshold to
segment the image. This eliminates system dependency on any static threshold value.
This value is provided to the parent method for segmenting the image in black and white
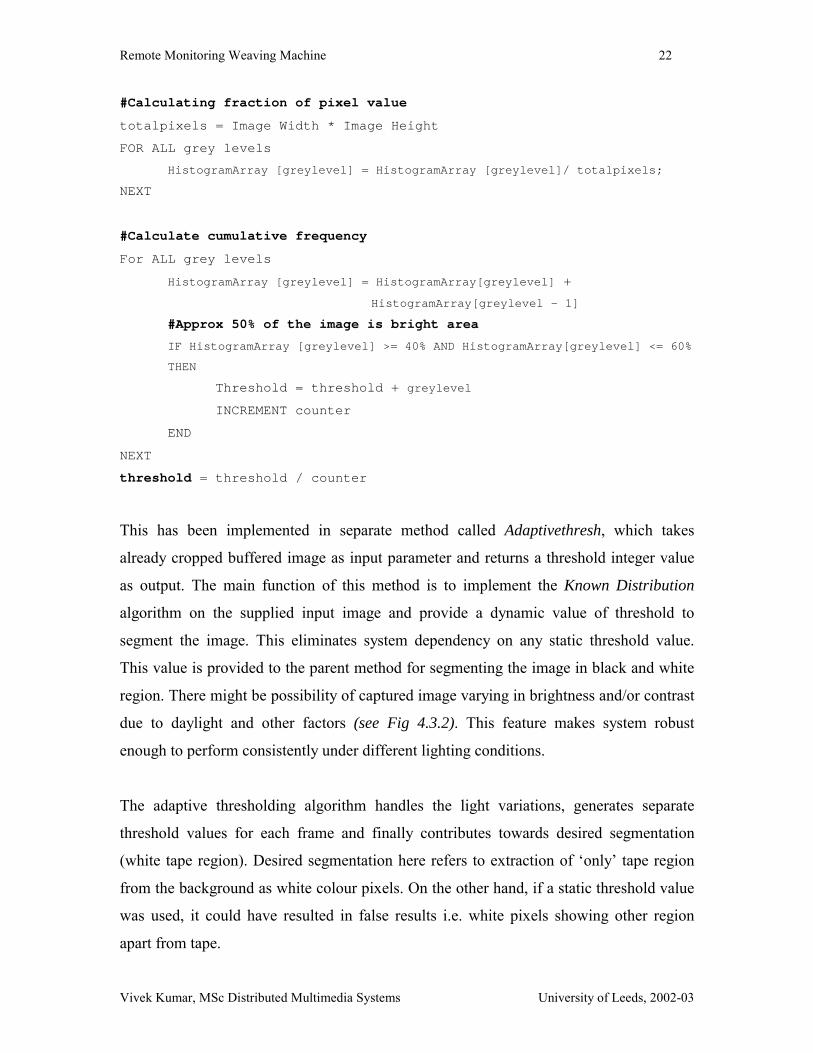
region. There might be possibility of captured image varying in brightness and/or contrast
due to daylight and other factors (see Fig 4.3.2). This feature makes system robust
enough to perform consistently under different lighting conditions.
The adaptive thresholding algorithm handles the light variations, generates separate
threshold values for each frame and finally contributes towards desired segmentation
(white tape region). Desired segmentation here refers to extraction of ‘only’ tape region
from the background as white colour pixels. On the other hand, if a static threshold value
was used, it could have resulted in false results i.e. white pixels showing other region
apart from tape.
Remote Monitoring Weaving Machine 23
Vivek Kumar, MSc Distributed Multimedia Systems University of Leeds, 2002-03
(threshold = 140) (threshold = 90) (threshold = 180)
4.3.2 Adaptive Segmentation (dynamic threshold value)
Still there was one minor problem i.e. presence light reflection behind the tape. It is
visible as bright vertical strip line behind the tape (see Fig 4.3.2). Since that area has also
got similar (bright) grey levels as the tape, it has also been segmented as white region.
This could create problems while measuring the width and this has been dealt in next step
of width measurement.
4.3.3 Width Measurement Algorithm An algorithm needed to be developed at this stage, which could measure the width of tape
from the segmented image. As whole the image has been converted into black and white
grey levels, it was relatively simpler to read the image programmatically and perform
checks on pixels values. The underlying logic was to scan all the white pixels in the
image, which should give the region covered by tape only. The algorithm designed and
followed as follows:
i) First scan the (horizontal) top edge of the tape and store in an array. This is
done by started scanning the whole image horizontally from top row of the
image. Then the pixel value of each row is checked per column

Remote Monitoring Weaving Machine 24
Vivek Kumar, MSc Distributed Multimedia Systems University of Leeds, 2002-03
(see Fig 4.3.3). If the pixel value is white then the algorithm stops scanning
that particular column and stores the (x,y) co-ordinates of that pixel in a (top)
array and starts scanning next column. This way it stores the top edge of the
tape in an array.
Figure 4.3.3 Width measurement algorithm
ii) Similarly scan the (horizontal) bottom edge of the tape and store in an
array. This time, scanning is started from the bottom row of the image. Then
the pixel value of each row is checked per column (see Fig 4.3.3). If the pixel
value is white then the algorithm stops for that particular column and stores
the (x,y) co-ordinates of that pixel in an (bottom) array and starts scanning
next column. This way it stores the bottom edge of the tape in an array.
iii) Find the difference in relative (y) co-ordinate of top array and bottom array.
Now, both arrays’ y co-ordinate is compared and difference would be the
width of tape per column. These difference values are stored in an array.
iv) Calculate Median of the width across all the columns. Next step is to find an
average value of width across the whole tape. There were three options
considered to find an average i.e. mean, median and mode. Mean is not
suitable for this case because few peak values can disturb the mean and may
not reflect the true average width. Mode is also not suitable because of lack of
high frequency of one particular value. Median has been found as a true
reflector of the average width in this case. This was because all the values are
sorted in ascending order and then the middle value is chosen as average,
while finding median. Its main is discarding any peak values present in the
width array. As shown in Fig 4.3.3, there is a white region that does not
belong to tape and still present in segmented image. The width value has been

Remote Monitoring Weaving Machine 25
Vivek Kumar, MSc Distributed Multimedia Systems University of Leeds, 2002-03
noticed much higher than others at these columns. This problem can be solved
by taking median as mean of calculating average.
Above mentioned algorithms have been implemented in order to process images captured
from camera and to find out the average width of tape.
4.4 Width Measurement Analysis As discussed in Chapter 3, this width has been then analysed over a period of production.
There has been two ways to implement this feature - the system should either monitor the
measurements over a fix time period or for specific number of frames. According to
information provided by Xiros, the production speed varies at times. Hence, the width
measurement was analysed on the basis of number of frames rather than time.
Fig 4.4 System Output (Measurement readings)
The user at the system launch supplies this parameter (Number of Frames) to the system.
The measured width is then compared with the standards and checked its scope under

Remote Monitoring Weaving Machine 26
Vivek Kumar, MSc Distributed Multimedia Systems University of Leeds, 2002-03
tolerance limits. This check continues till ‘Number of Frames’ have been analysed. If the
width falls outside standards, it is stored in an array. If the count of this array is more than
or equal to 50% of ‘Number of Frames’ then the quality is treated as suffered. System
makes sure the existence of error before sending alert. Hence, this analysis prevents
system sending alerts immediately on each unqualified measurement.
Fig 4.4 shows the system output with threshold and width measurements (pixels and
mm). This is clearly visible that system is analysing fixed number of frames before
coming to a result. In this particular test, the value of ‘Number of Frames’ is set as 5,
which result in ‘Ok’ or ‘Alert’ only after analysing five frames.
4.5 System Modules Implementation The system has been implemented using Java. The Java 2 Platform, Standard Edition
(J2SE) is at the core of Java technology providing the essential compiler, tools, runtimes,
and APIs for writing, deploying, and running applets and applications in the Java
programming language. It is divided in three major classes i.e AutoPr, FirstPr and Jmail.
Class Autopr contains the main function and instantiate FirstPr and Email classes. All of
the above-explained steps are performed in class AutoPr at various stages using basic
functions of Java Image processing libraries. Class FirstPr designs the frame and menu
interface, for selecting region of interest, using Java Swing. Class Jmail wraps all the
email messaging functions using javax.mail and javax.activation. The user interface, for
system input parameters, is designed in VB. Java system is called from VB with all the
values supplied as command line parameters.

Remote Monitoring Weaving Machine 27
Vivek Kumar, MSc Distributed Multimedia Systems University of Leeds, 2002-03
Chapter 5 Testing and Evaluation
This chapter is aimed at testing, reviewing and evaluating the system against some
evaluation criteria already decided in advance. Major criteria include objectives proposed
at the start of project, testing system with test data and evaluating against design criteria.
All of these criteria and the system performance against these have been discussed in
detail in the coming sections.
5.1 Evaluation against minimum objectives The system has successfully achieved the set minimum requirements (Chapter 1). It has
been a success in measuring and analysing the width of product (cloth tape) and sending
emails, if the product quality is getting suffered. Hence it automates the whole process of
monitoring a weaving machine remotely and eliminates the manual effort for watching
product quality remotely.
5.2 Evaluation against design criteria Apart from overall requirements in the design criteria, there was one possible
enhancement i.e. to send SMS, which has not been implemented in the current system.
There are two major ways for sending SMS. First, sending via dedicated mobile phone
connected to the system. Second, by using third party controls to send via Internet.
Research shows both of the methods are expensive. It depends on the frequency at which
messages are sent. If there is requirement of huge number of messages to be sent, then
using third party libraries proves to be a better option for the simple reason that the
charges would on rent basis instead of per SMS sent. On the other hand, if only few
messages are required to be sent, then dedicated mobile could be a better solution. If the
third party libraries are used, then a small module needs to be added in the system, which
wraps all the methods provided by the library, and then all these methods can be called
from the main program. Implementing dedicated mobile needs Software Development
Toolkit (SDK) to be installed on the system (PC) using which, all the mobile
functionality can be customised and hence messages can be sent programmatically.
Remote Monitoring Weaving Machine 28
Vivek Kumar, MSc Distributed Multimedia Systems University of Leeds, 2002-03
‘Nokia SDK for Java’ is one of the examples in this technology though which functions
of Nokia phone can be accessed programmatically.
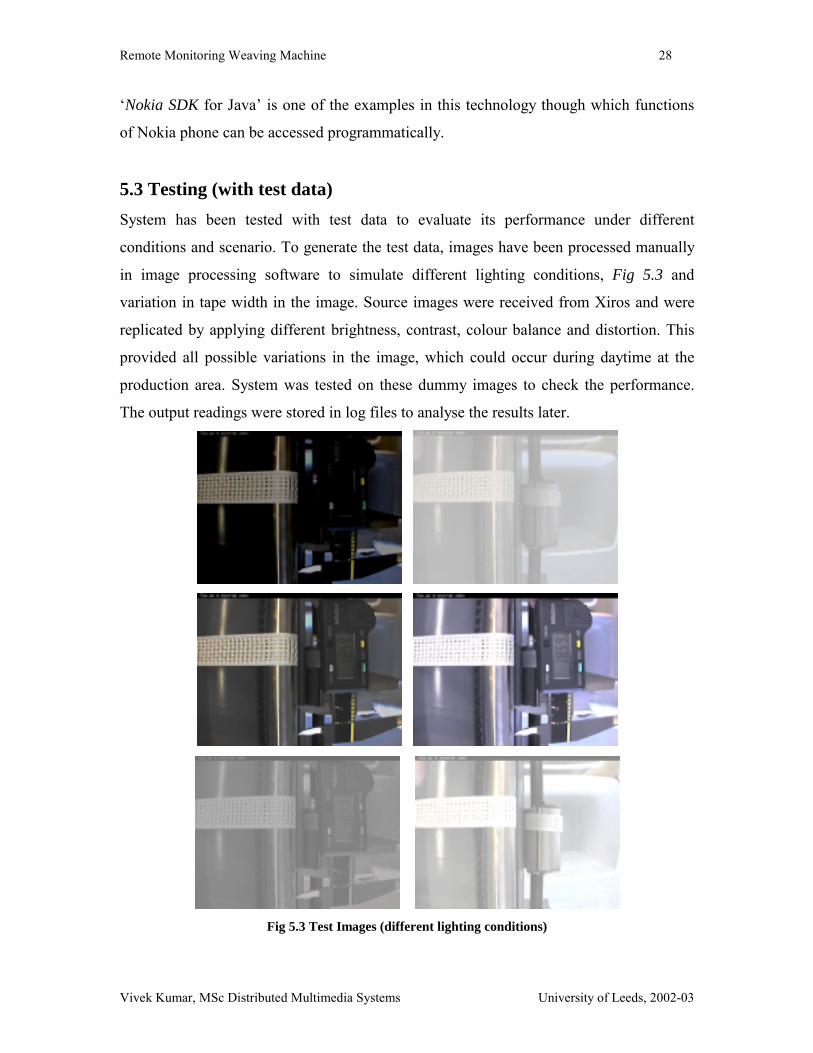
5.3 Testing (with test data) System has been tested with test data to evaluate its performance under different
conditions and scenario. To generate the test data, images have been processed manually
in image processing software to simulate different lighting conditions, Fig 5.3 and
variation in tape width in the image. Source images were received from Xiros and were
replicated by applying different brightness, contrast, colour balance and distortion. This
provided all possible variations in the image, which could occur during daytime at the
production area. System was tested on these dummy images to check the performance.
The output readings were stored in log files to analyse the results later.
Fig 5.3 Test Images (different lighting conditions)

Remote Monitoring Weaving Machine 29
Vivek Kumar, MSc Distributed Multimedia Systems University of Leeds, 2002-03
5.3.1 Performance under different lighting conditions This section shows the graphical representation of evaluating system under different
lighting conditions. The system was tested with 20 dummy images (discussed above),
which were saved on a network location. Then the system was launched with that
particular network address provided as parameter. Hence, each image simulated a frame
captured from the camera. In the real time, system would be getting images in the similar
manner from the camera.
Frame Width
(mm) Threshold
(pixel) 1 14.40 140 2 14.40 177 3 14.40 135 4 14.50 98 5 14.50 135 6 14.45 42 7 14.50 184 8 14.50 177 9 14.50 110
10 14.60 110 11 14.45 81 12 14.50 42 13 14.60 203 14 14.60 180 15 14.45 74 16 14.50 55 17 14.50 170 18 14.55 88 19 14.60 86 20 14.55 101
Fig 5.3.1 System measurement readings (width & threshold)
The width of tape has been kept under tolerance limits in all of these images. Aim was to
vary the lighting in the images but not the width. The major evaluation here was to check
whether it was reflected by the system or not. The system output readings were recorded
and shown in the Table (Fig 5.3.1), which are one threshold value and one width
measurement per frame. Frame vs Threshold graph shows that the value of threshold is
Frames vs Threshold measurements
0255075
100125150175200225250
1 3 5 7 9 11 13 15 17 19
Frame
Thre
shol
d (p
ixel
s)
Frames vs Width measurements
13.5013.7514.0014.2514.5014.7515.0015.2515.50
1 2 3 4 5 6 7 8 9 10 11 12 13 14 15 16 17 18 19 20
Frame
Wid
th(m
m)

Remote Monitoring Weaving Machine 30
Vivek Kumar, MSc Distributed Multimedia Systems University of Leeds, 2002-03
getting changed dynamically as the number of frames progress. This is according to the
grey-level intensities of the image. Brighter images are producing higher value of
threshold and vice versa. This dynamic adjustment of threshold gives consistency to the
segmentation and hence the correct width is measured. Frame vs Width Measurements
graph reflects the consistent width across all frames. There are still some variations in the
width, but these are under tolerance level. There is no major deviation in the width
measurements. Hence, this test proved that the system is able to measure width correctly
even under varied lighting conditions.
5.3.2 Width measurements analysis This test evaluates the system’s width measurement analysis feature, which is performed
once the width has been measured for specific number of frames. As discussed earlier,
this feature is important in the system to make sure the existence of error over a period of
time before sending alert message to the user. Again dummy images were created (from
the original source image obtained from Xiros), using image-processing software by
varying the width of the tape region in the scene (see Fig 5.3.2 a).
Fig 5.3.2 (a) Test Images (different width)
This test was performed to verify the system’s decision on faulty frames. To perform this
evaluation, 20 images were used with varying tape width. These images were then
accessed by the system via network location (as in previous test). All the system output
Remote Monitoring Weaving Machine 31
Vivek Kumar, MSc Distributed Multimedia Systems University of Leeds, 2002-03
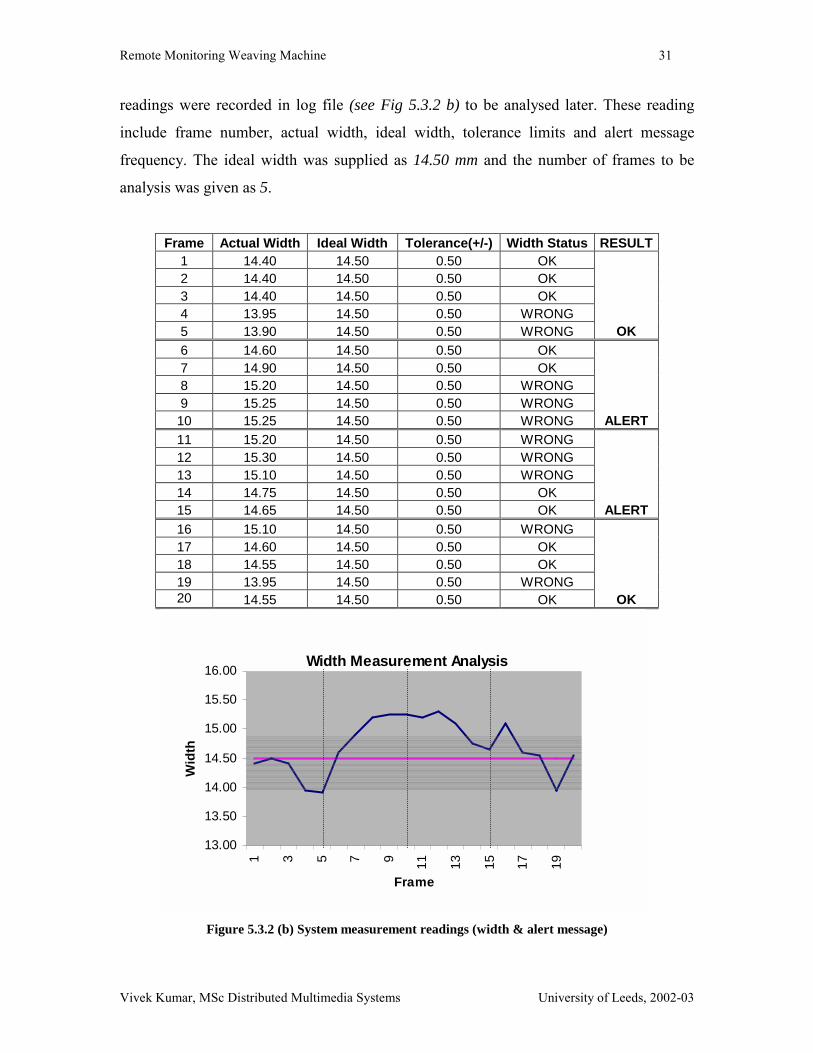
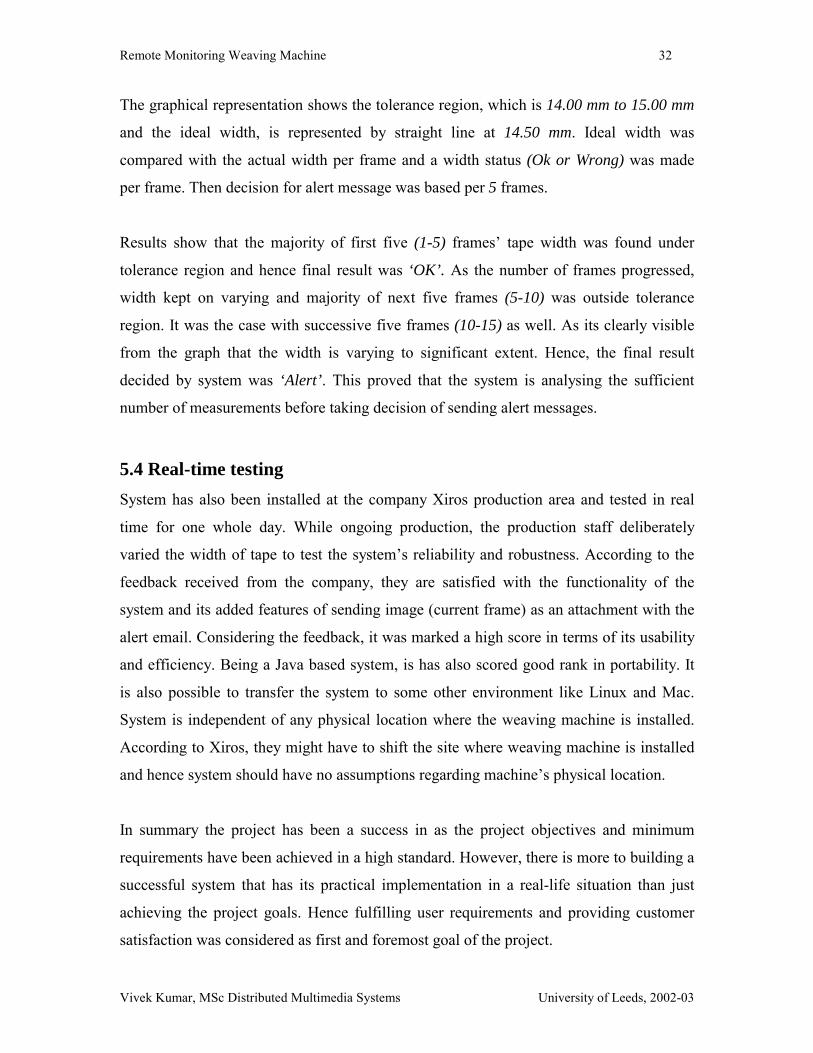
readings were recorded in log file (see Fig 5.3.2 b) to be analysed later. These reading
include frame number, actual width, ideal width, tolerance limits and alert message
frequency. The ideal width was supplied as 14.50 mm and the number of frames to be
analysis was given as 5.
Frame Actual Width Ideal Width Tolerance(+/-) Width Status RESULT 1 14.40 14.50 0.50 OK 2 14.40 14.50 0.50 OK 3 14.40 14.50 0.50 OK 4 13.95 14.50 0.50 WRONG 5 13.90 14.50 0.50 WRONG OK 6 14.60 14.50 0.50 OK 7 14.90 14.50 0.50 OK 8 15.20 14.50 0.50 WRONG 9 15.25 14.50 0.50 WRONG 10 15.25 14.50 0.50 WRONG ALERT 11 15.20 14.50 0.50 WRONG 12 15.30 14.50 0.50 WRONG 13 15.10 14.50 0.50 WRONG 14 14.75 14.50 0.50 OK 15 14.65 14.50 0.50 OK ALERT 16 15.10 14.50 0.50 WRONG 17 14.60 14.50 0.50 OK 18 14.55 14.50 0.50 OK 19 13.95 14.50 0.50 WRONG 20 14.55 14.50 0.50 OK OK
Figure 5.3.2 (b) System measurement readings (width & alert message)
Width Measurement Analysis
13.00
13.50
14.00
14.50
15.00
15.50
16.00
1 3 5 7 9 11 13 15 17 19
Frame
Wid
th
Remote Monitoring Weaving Machine 32
Vivek Kumar, MSc Distributed Multimedia Systems University of Leeds, 2002-03
The graphical representation shows the tolerance region, which is 14.00 mm to 15.00 mm
and the ideal width, is represented by straight line at 14.50 mm. Ideal width was
compared with the actual width per frame and a width status (Ok or Wrong) was made
per frame. Then decision for alert message was based per 5 frames.
Results show that the majority of first five (1-5) frames’ tape width was found under
tolerance region and hence final result was ‘OK’. As the number of frames progressed,
width kept on varying and majority of next five frames (5-10) was outside tolerance
region. It was the case with successive five frames (10-15) as well. As its clearly visible
from the graph that the width is varying to significant extent. Hence, the final result
decided by system was ‘Alert’. This proved that the system is analysing the sufficient
number of measurements before taking decision of sending alert messages.
5.4 Real-time testing System has also been installed at the company Xiros production area and tested in real
time for one whole day. While ongoing production, the production staff deliberately
varied the width of tape to test the system’s reliability and robustness. According to the
feedback received from the company, they are satisfied with the functionality of the
system and its added features of sending image (current frame) as an attachment with the
alert email. Considering the feedback, it was marked a high score in terms of its usability
and efficiency. Being a Java based system, is has also scored good rank in portability. It
is also possible to transfer the system to some other environment like Linux and Mac.
System is independent of any physical location where the weaving machine is installed.
According to Xiros, they might have to shift the site where weaving machine is installed
and hence system should have no assumptions regarding machine’s physical location.
In summary the project has been a success in as the project objectives and minimum
requirements have been achieved in a high standard. However, there is more to building a
successful system that has its practical implementation in a real-life situation than just
achieving the project goals. Hence fulfilling user requirements and providing customer
satisfaction was considered as first and foremost goal of the project.

Remote Monitoring Weaving Machine 33
Vivek Kumar, MSc Distributed Multimedia Systems University of Leeds, 2002-03
Chapter 6 Limitations and Future Work
This chapter discusses all the existing limitations in the system and enhancement features
that Xiros intend to implement in future, which would enable them to remotely monitor
some other quality measures of the product as well. Implementations of these new
features now seem more achievable once the first step is successfully passed towards
monitoring the product quality remotely.
6.1 Limitations and Improvements Although minimum requirements and the objectives of the project have been met
successfully, there are some limitations, which need to be addressed, and some
improvements that can be done as system’s enhancement features. These functionalities
could not be implemented in the existing system because of limited time constraint.
These features are:
• Automatic selection of ROI: In the existing system, user has to manually define
the region surrounding tape at the start-up. This functionality can be automated
and system could be made robust enough to find this region in the scene. This
needed some more time and research in the field of computer vision and image
processing.
• Check on Email: In the existing system, once it finds faulty frames (width not
according to the standard), it sends an alert message. The problem here was once
the system has sent alert message and error still exists for next many number of
frames then in that case it will keep on sending e-mails after analysing fixed
number of frames. This problem could have been sorted by putting a check on the
number of emails sent, but according to Xiros, sometimes it was required to
analyse the fault for a longer time periods. Then it would be necessary to check all
emails sent by system continuously, that provide the fault and date & time details.
• Efficient System: Being a dedicated system, it makes full use of available
hardware resources. It could be possible to make the system using hardware

Remote Monitoring Weaving Machine 34
Vivek Kumar, MSc Distributed Multimedia Systems University of Leeds, 2002-03
resources, such as processor and memory, efficiently. The aim is to make system
work on as economical hardware configuration as possible.
• Camera distance: In the existing system, user is allowed to customise the ROI in
the image if the camera location in changed and the tape region is not exactly the
same as before. The problem here was the distance between axis camera and the
tape. If this difference varies then the tape region would not be shown by same
number of pixels in both cases (see Fig 6.3). Hence the tape of similar width
would be measured different by the system.
Figure 6.1 Similar widths from different camera distance
The possible solution could be to allow the user supply camera distance from tape
as a parameter to the system and then it would automatically perform pixel to
millimeter mapping to measure the exact width consistently.
• Remote Controlling: Being a dedicated system, it is installed on a PC that is
connected to weaving machine via LAN. Once it has been started, it is supposed
to run continuously locally at that machine. There could be a possible
enhancement to control this system remotely by the user. Remote control here
refers to the functionalities such as - user could change the system parameters,
shut down and restart the system. To implement this functionality, a separate
architecture needs to be designed using Remote Method Invocation (RMI).
Remote Monitoring Weaving Machine 35
Vivek Kumar, MSc Distributed Multimedia Systems University of Leeds, 2002-03
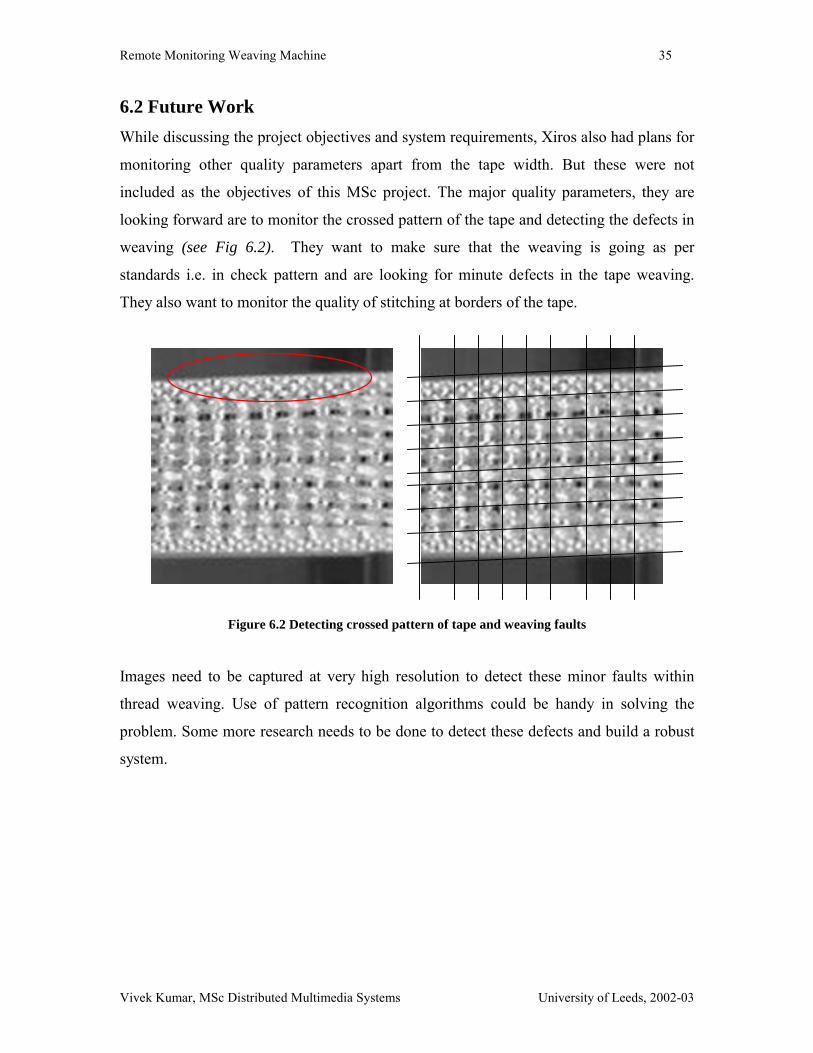
6.2 Future Work While discussing the project objectives and system requirements, Xiros also had plans for
monitoring other quality parameters apart from the tape width. But these were not
included as the objectives of this MSc project. The major quality parameters, they are
looking forward are to monitor the crossed pattern of the tape and detecting the defects in
weaving (see Fig 6.2). They want to make sure that the weaving is going as per
standards i.e. in check pattern and are looking for minute defects in the tape weaving.
They also want to monitor the quality of stitching at borders of the tape.
Figure 6.2 Detecting crossed pattern of tape and weaving faults
Images need to be captured at very high resolution to detect these minor faults within
thread weaving. Use of pattern recognition algorithms could be handy in solving the
problem. Some more research needs to be done to detect these defects and build a robust
system.
Remote Monitoring Weaving Machine 36
Vivek Kumar, MSc Distributed Multimedia Systems University of Leeds, 2002-03
Chapter 7 Conclusion
As discussed in Chapter 1, the project faced both technical and non-technical challenges
during the system development. There were many unexpected issues that have been
resolved and cannot be allowed to delay the final system. There has been several efforts
and methods devoted to achieve the project objectives. A research and background study,
related to the problem, was performed, once the company people defined the system
requirements and objectives. Then a system design was prepared on the basis of
requirement analysis and research study. This design was then implemented to actually
start building a system. Finally, an evaluation was performed against design criteria, once
all the functionalities were implemented and tested.
Overall, the project has been a success in both achieving project objectives and minimum
requirements and the practical implementation in a real-life situation. Being an external
project, customer satisfaction has been given more importance than anything else.
Remote Monitoring Weaving Machine 37
Vivek Kumar, MSc Distributed Multimedia Systems University of Leeds, 2002-03
References
[1] Rudolf K. Bock, Hough Transformation, 7 April 1998
[Electronic Version] Retrieved from http://rkb.home.cern.ch/rkb/AN16pp/node122.html
[2] S. Jabri, Z. Duric, H. Wechsler, Detection and Location of People in Video Images Using
Adaptive Fusion of Color and Edge Information.
[3] Vyjanthi Kuchibhatla and Jim Glennon, Email Web Application Using JSP Tag Libraries,
July 2001.
[4] Tecnhical Article, Sending A Wireless Text-Message With Java, 4/28/2001
[Electronic Version] Retrieved from
http://www.simplewire.com/developers/knowledge/articles/issue/010428.html
[5] Ian Sommerville, Software Engineering, 6th Edition Addison-Wesley 2000.
[6] Nick Efford, Digital image processing-a practical introduction using Java, Addison-
Wesley 2001.
[7] M Sonka, V Hlavac and R Boyle, Image Processing, Analysis And Machine Vision, 1999.
[8] C Torras , Computer vision : theory and industrial applications, Springer-Verlag, 1992.
[9] A.K.Jain, Fundamentals of digital image processing, Prentice Hall, NJ, 1989
[10] Sun Microsystems, Programming in Java Advanced Image,
[Electronic version] Retrieved from http://www.javasoft.com
[11] Sending Email using Java MailFrom, [Electronic version] Retrieved from
http://www.javacommerce.com/articles/sendingmail.htm
[12] Bryan S. Morse, Thresholding, Brigham Young University, 1998–2000.
[13] Andreas E. Savakis, Adaptive document image thresholding using foreground and
background clustering, International Conference on Image Processing, ICIP’98.
[14] S Loncarie & D Kovacevie, Semi-automatic active contour approach to segmentation of
computed tomography volumes. Franzes University, Austria.
[15] J.Lewis Dorrity, G. Vachtsevanos, Real-time fabric defect detection and control in weaving
processes, Project No. G94-2, Georgia Institute of Technology.
[16] Scripting in Axis Network Cameras and Video Servers, [Electronic Version] Retrieved
from http://www.axis.com/techsup/cam_servers/tech_notes/script_guide.pdf

Remote Monitoring Weaving Machine 38
Vivek Kumar, MSc Distributed Multimedia Systems University of Leeds, 2002-03
Appendix A – Personal Reflection
This MSc project has been a wonderful opportunity for me to show my efficiency and
capabilities. I had a very good personal experience at various stages while doing this MSc
Project, which are as follows:
Project scheduling: This project was proposed in March’03 and full time work has been
started since June’03. To perform the task more smoothly, project scheduling was
followed successfully. This project would not have been completed without the
scheduling. The experiences of proposing a reasonable project scheduling with several
measurable milestones are useful.
Knowledge preparation: Being a student of MSc Distributed Multimedia Systems
(DMS), this project proved to be an ideal match according to the modules studied during
the semesters. The involved knowledge in the project include the major contents of
perceptual systems, object oriented programming and numeric analysis. Knowledge
gained from the module Perceptual system has been directly applied in this project in
terms of Digital Image Processing and Computer Vision technologies. Being a Java
based system, OOP concepts are used while designing the system.
Professional experience: It was a great opportunity for me to work with an external
company Xiros. Numbers of meetings were arranged with related IT people at the
company during the project life cycle. I found people at the company very helpful and
responsive. They spent a great deal of their time at various stages, right from discussing
the requirements to installation of system. Overall, this provided me an invaluable
experience of dealing with the companies professionally, which would certainly prove to
be handy in the future.
Remote Monitoring Weaving Machine 39
Vivek Kumar, MSc Distributed Multimedia Systems University of Leeds, 2002-03
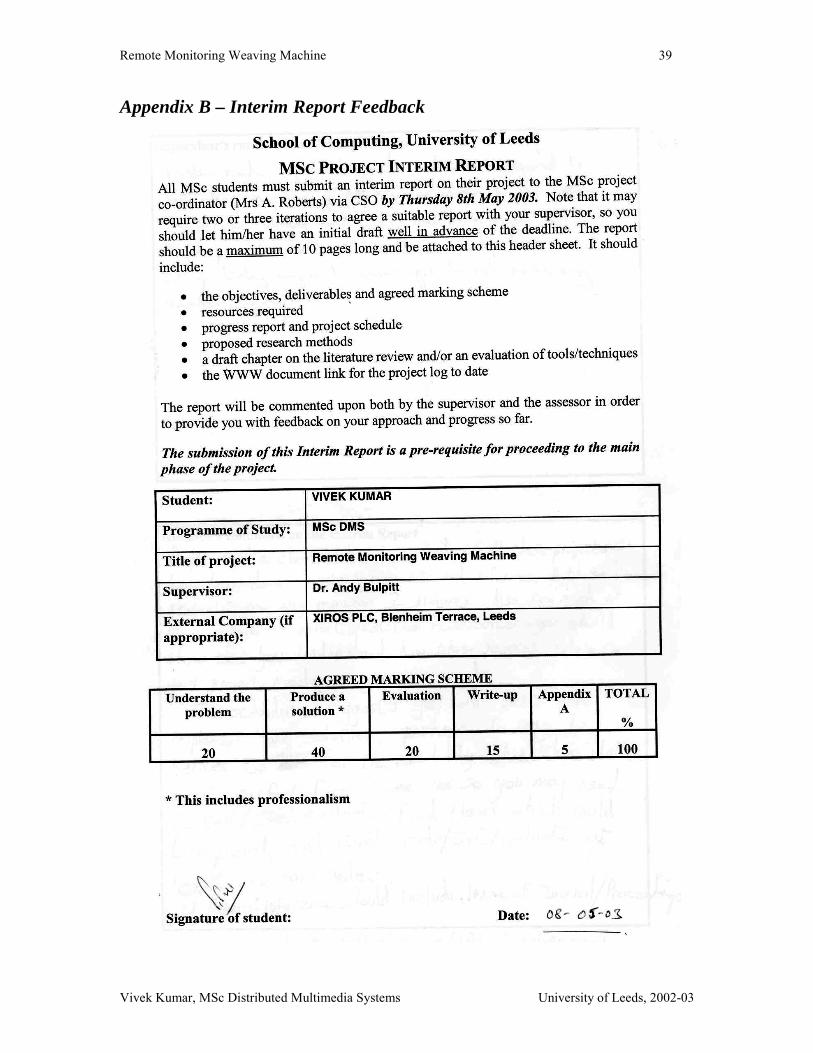
Appendix B – Interim Report Feedback
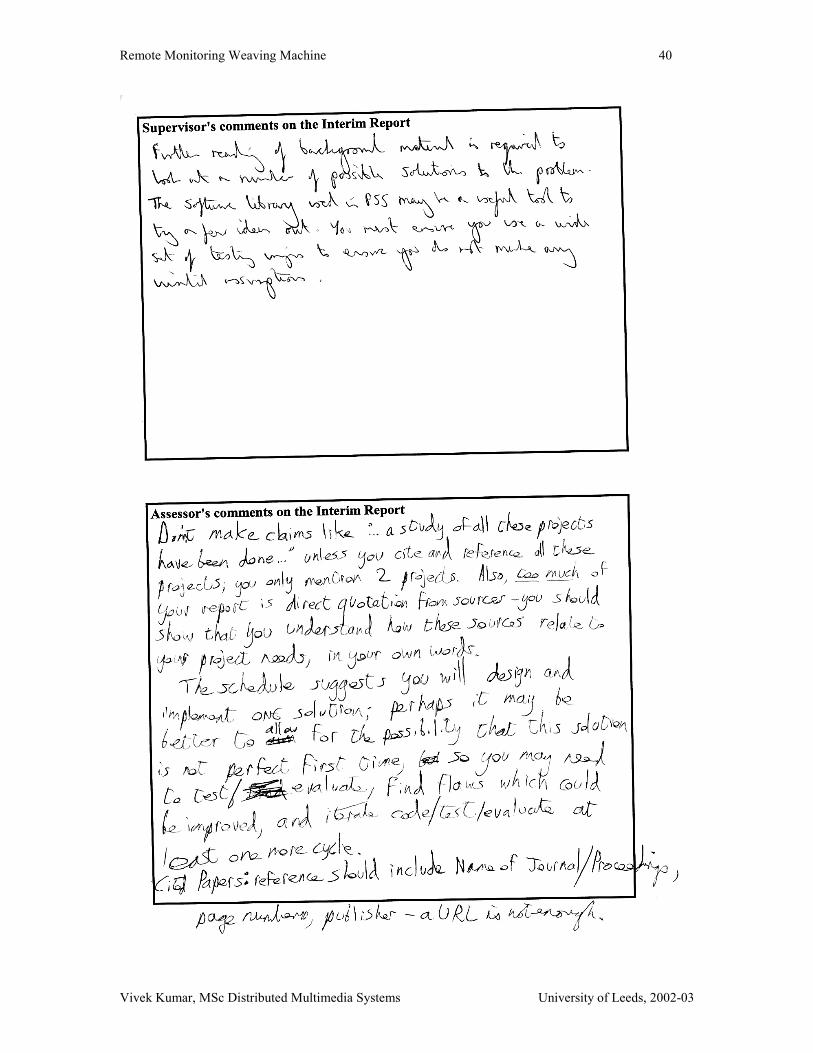
Remote Monitoring Weaving Machine 40
Vivek Kumar, MSc Distributed Multimedia Systems University of Leeds, 2002-03

Remote Monitoring Weaving Machine 41
Vivek Kumar, MSc Distributed Multimedia Systems University of Leeds, 2002-03
Appendix C - Project Management and Scheduling Revision The Project has been managed properly right from the very first meeting with Xiros,
requirements analysis, system design, and implementation, to write-up the final report. It
would be impossible to do a project like this without planning and self-motivation.
Initially, a project plan was drafted before Interim report submission. Since then it has
been revised once to make it flexible enough to deal with the future unexpected changes.
The major change made to the initial plan was providing one more iteration (see fig
below) of development process incase the first one does not produce satisfying results.
Rest all the task has been performed in accordance with plan.
Week /
Activities June W-1
JuneW-2
June
W-3JuneW-4
JulyW-1
JulyW-2
JulyW-3
JulyW-4
AugW-1
Aug W-2
Aug W-3
Aug W-4
SeptW-1
1. Problem Requirements
2. Research 3. Software Design 4. Writing Code 5. Debug/Test 6. Fixing Bugs 7. Report Writing 8. Demo Preparation
Tasks and their actual completion Dates
Scheduled task dates were regularly compared with the actual completion dates to assess
the effectiveness of time planning and time management.
Date Task
May 08, 2003 Handed the Interim report
June 16, 2003 Finished the Requirement Analysis
July 05, 2003 Finished the Design Analysis
July 30, 2003 Finished the Implementation (first Iteration)
August 5, 2003 Finished Testing and evaluation.
August 10, 2003 Finished the Implementation (second Iteration)
August 22, 2003 Finished Report Draft
September 03, 2003 Final report completed
Remote Monitoring Weaving Machine 42
Vivek Kumar, MSc Distributed Multimedia Systems University of Leeds, 2002-03
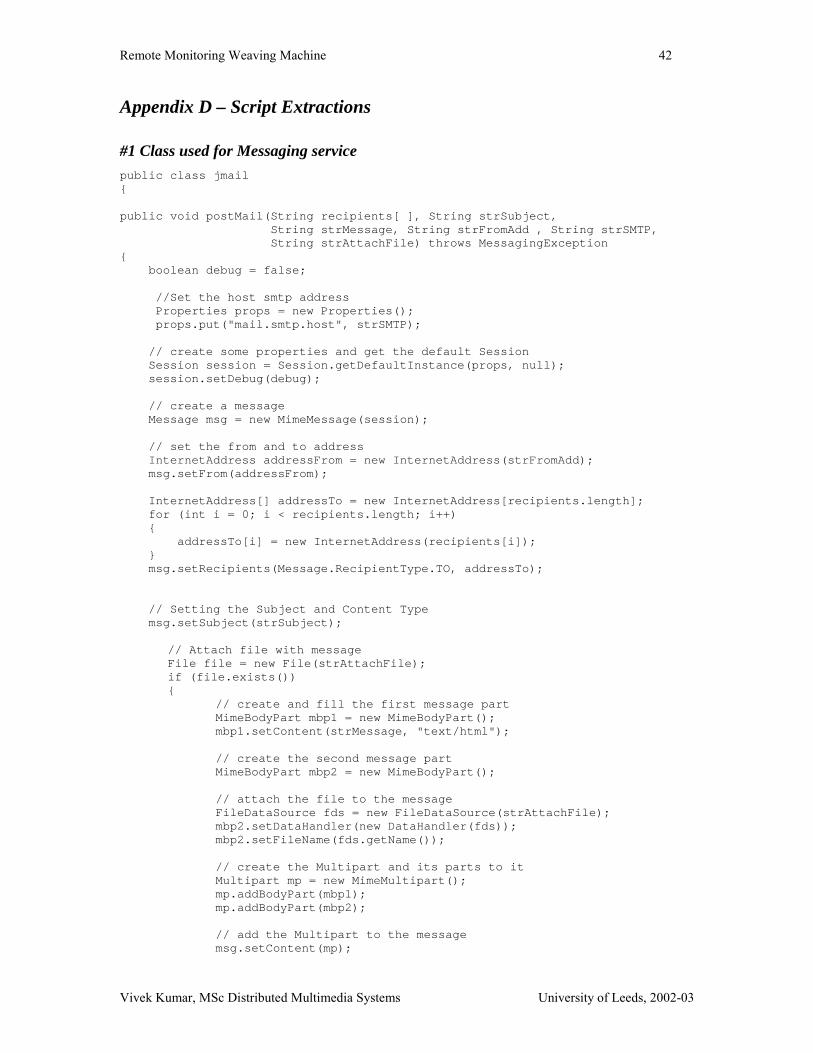
Appendix D – Script Extractions
#1 Class used for Messaging service public class jmail{
public void postMail(String recipients[ ], String strSubject,String strMessage, String strFromAdd , String strSMTP,String strAttachFile) throws MessagingException
{boolean debug = false;
//Set the host smtp addressProperties props = new Properties();props.put("mail.smtp.host", strSMTP);
// create some properties and get the default SessionSession session = Session.getDefaultInstance(props, null);session.setDebug(debug);
// create a messageMessage msg = new MimeMessage(session);
// set the from and to addressInternetAddress addressFrom = new InternetAddress(strFromAdd);msg.setFrom(addressFrom);
InternetAddress[] addressTo = new InternetAddress[recipients.length];for (int i = 0; i < recipients.length; i++){
addressTo[i] = new InternetAddress(recipients[i]);}msg.setRecipients(Message.RecipientType.TO, addressTo);
// Setting the Subject and Content Typemsg.setSubject(strSubject);
// Attach file with messageFile file = new File(strAttachFile);if (file.exists()){
// create and fill the first message partMimeBodyPart mbp1 = new MimeBodyPart();mbp1.setContent(strMessage, "text/html");
// create the second message partMimeBodyPart mbp2 = new MimeBodyPart();
// attach the file to the messageFileDataSource fds = new FileDataSource(strAttachFile);mbp2.setDataHandler(new DataHandler(fds));mbp2.setFileName(fds.getName());
// create the Multipart and its parts to itMultipart mp = new MimeMultipart();mp.addBodyPart(mbp1);mp.addBodyPart(mbp2);
// add the Multipart to the messagemsg.setContent(mp);
Remote Monitoring Weaving Machine 43
Vivek Kumar, MSc Distributed Multimedia Systems University of Leeds, 2002-03
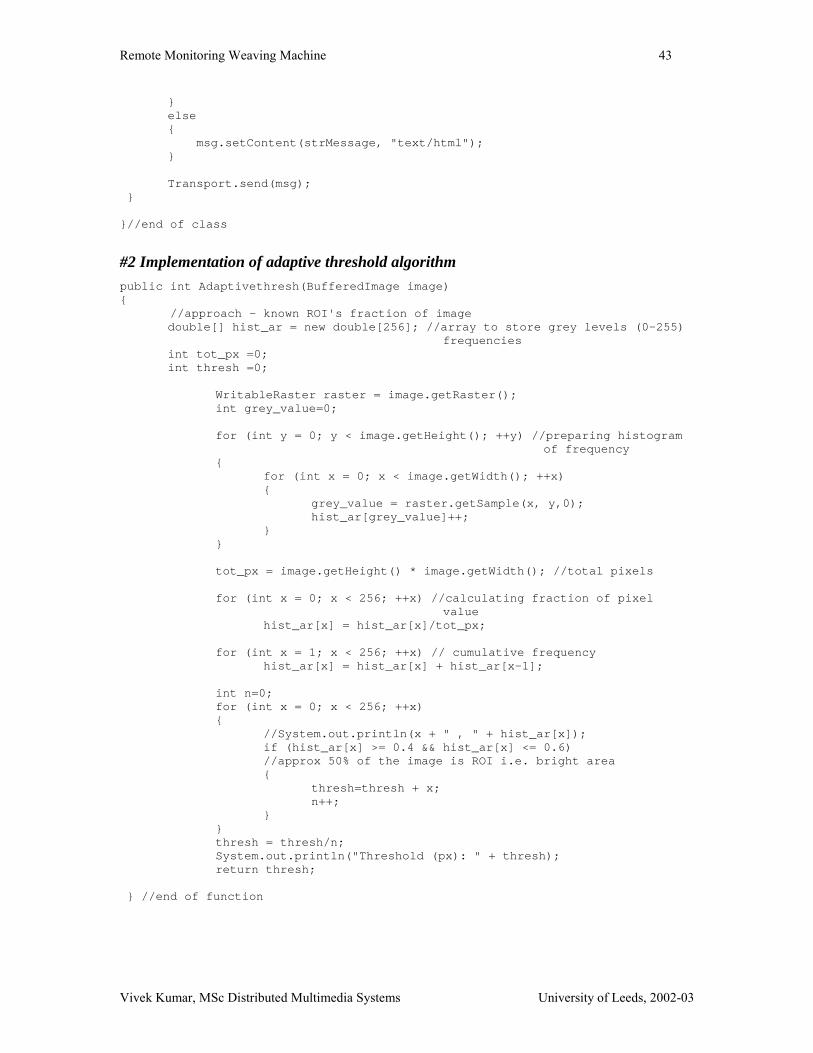
}else{
msg.setContent(strMessage, "text/html");}
Transport.send(msg);}
}//end of class
#2 Implementation of adaptive threshold algorithm public int Adaptivethresh(BufferedImage image){
//approach - known ROI's fraction of imagedouble[] hist_ar = new double[256]; //array to store grey levels (0-255)
frequenciesint tot_px =0;int thresh =0;
WritableRaster raster = image.getRaster();int grey_value=0;
for (int y = 0; y < image.getHeight(); ++y) //preparing histogramof frequency
{for (int x = 0; x < image.getWidth(); ++x){
grey_value = raster.getSample(x, y,0);hist_ar[grey_value]++;
}}
tot_px = image.getHeight() * image.getWidth(); //total pixels
for (int x = 0; x < 256; ++x) //calculating fraction of pixelvalue
hist_ar[x] = hist_ar[x]/tot_px;
for (int x = 1; x < 256; ++x) // cumulative frequencyhist_ar[x] = hist_ar[x] + hist_ar[x-1];
int n=0;for (int x = 0; x < 256; ++x){
//System.out.println(x + " , " + hist_ar[x]);if (hist_ar[x] >= 0.4 && hist_ar[x] <= 0.6)//approx 50% of the image is ROI i.e. bright area{
thresh=thresh + x;n++;
}}thresh = thresh/n;System.out.println("Threshold (px): " + thresh);return thresh;
} //end of function
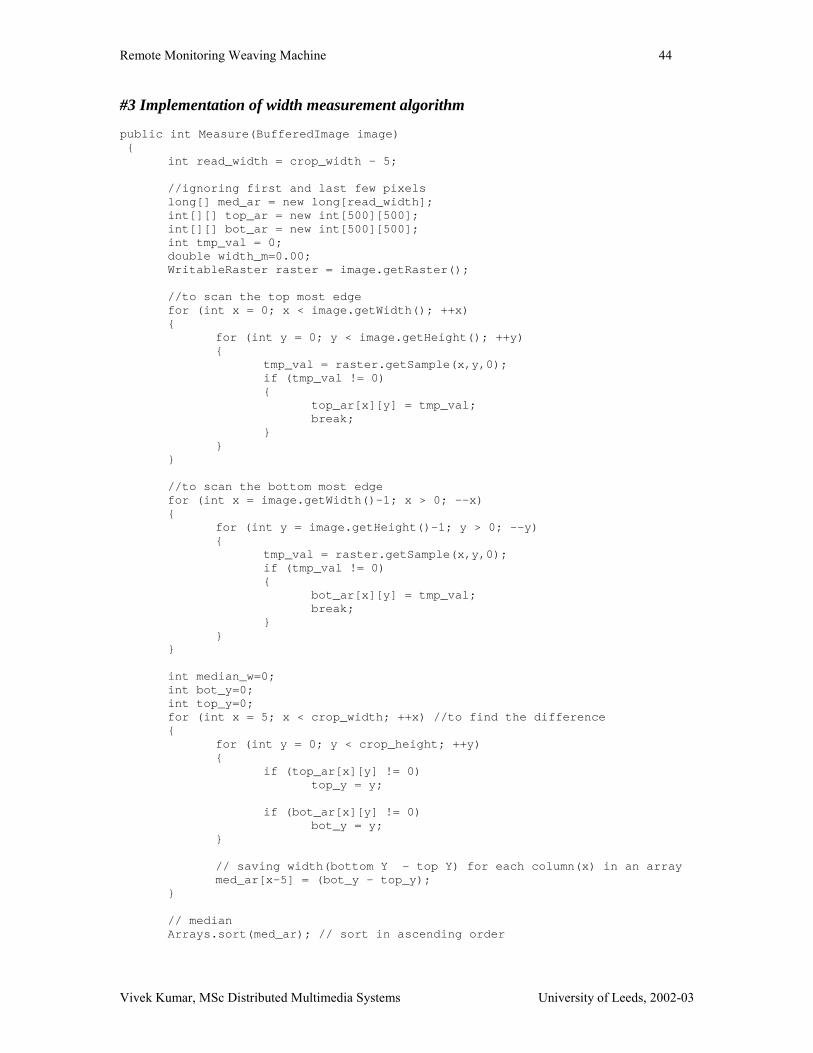
Remote Monitoring Weaving Machine 44
Vivek Kumar, MSc Distributed Multimedia Systems University of Leeds, 2002-03
#3 Implementation of width measurement algorithm
public int Measure(BufferedImage image){
int read_width = crop_width - 5;
//ignoring first and last few pixelslong[] med_ar = new long[read_width];int[][] top_ar = new int[500][500];int[][] bot_ar = new int[500][500];int tmp_val = 0;double width_m=0.00;WritableRaster raster = image.getRaster();
//to scan the top most edgefor (int x = 0; x < image.getWidth(); ++x){
for (int y = 0; y < image.getHeight(); ++y){
tmp_val = raster.getSample(x,y,0);if (tmp_val != 0){
top_ar[x][y] = tmp_val;break;
}}
}
//to scan the bottom most edgefor (int x = image.getWidth()-1; x > 0; --x){
for (int y = image.getHeight()-1; y > 0; --y){
tmp_val = raster.getSample(x,y,0);if (tmp_val != 0){
bot_ar[x][y] = tmp_val;break;
}}
}
int median_w=0;int bot_y=0;int top_y=0;for (int x = 5; x < crop_width; ++x) //to find the difference{
for (int y = 0; y < crop_height; ++y){
if (top_ar[x][y] != 0)top_y = y;
if (bot_ar[x][y] != 0)bot_y = y;
}
// saving width(bottom Y - top Y) for each column(x) in an arraymed_ar[x-5] = (bot_y - top_y);
}
// medianArrays.sort(med_ar); // sort in ascending order
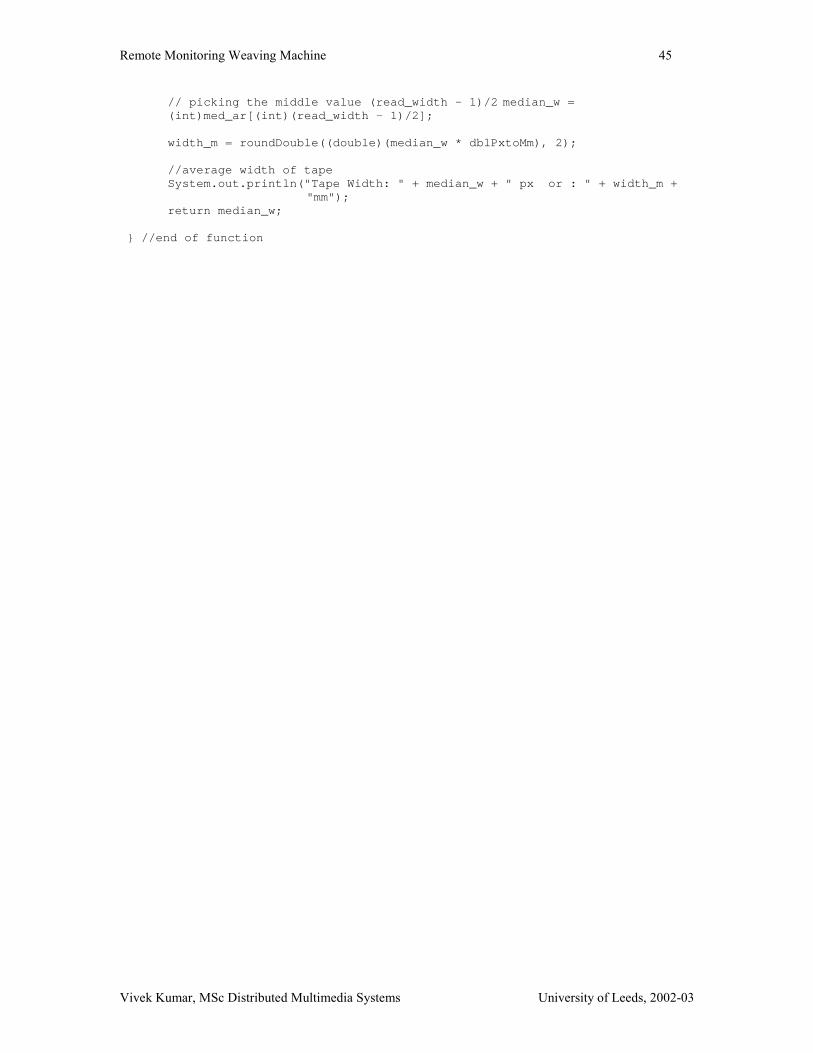
Remote Monitoring Weaving Machine 45
Vivek Kumar, MSc Distributed Multimedia Systems University of Leeds, 2002-03
// picking the middle value (read_width - 1)/2 median_w =(int)med_ar[(int)(read_width - 1)/2];
width_m = roundDouble((double)(median_w * dblPxtoMm), 2);
//average width of tapeSystem.out.println("Tape Width: " + median_w + " px or : " + width_m +
"mm");return median_w;
} //end of function
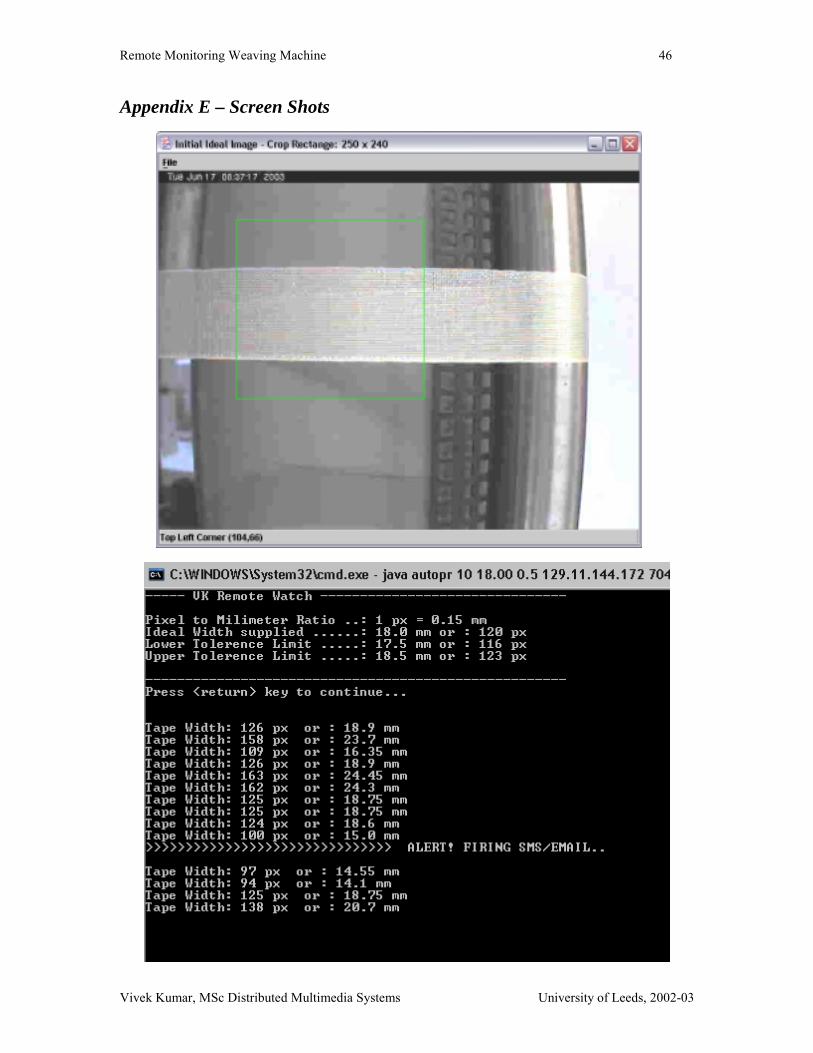
Remote Monitoring Weaving Machine 46
Vivek Kumar, MSc Distributed Multimedia Systems University of Leeds, 2002-03
Appendix E – Screen Shots

Remote Monitoring Weaving Machine 47
Vivek Kumar, MSc Distributed Multimedia Systems University of Leeds, 2002-03