WEAVING HOPES AFTER DISASTERS - Caritas international
204
WEAVINGHOPESAFTERDISASTERS Long-termImpactandBeneficiarySat isfactionof Relief,RehabilitationandDevelopmentProgrammesinIndia JOSEPH XAVIER
-
Upload
khangminh22 -
Category
Documents
-
view
3 -
download
0
Transcript of WEAVING HOPES AFTER DISASTERS - Caritas international
WEAVING�HOPES�AFTER�DISASTERSLong-term�Impact�and�Beneficiary�Sat isfaction�of�
Relief,�Rehabilitation�and�Development�Programmes�in�India
JOSEPH XAVIER

Indian Social Institute, New DelhiIn partnership with Caritas India and IGSSS, New Delhi
Supported by Caritas Germany
JOSEPH XAVIER Associates: Prarthana Borah, Kausiki Sarma
Research Team: Jeya, Joy Karayampuram, Muthumari, Pascal Tirkey, Paul D’Souza, Ponnusamy, Ranjit Tigga, Ratnesh Kumar, Ruben Minj, Sahayaraj, Sandhya, Siprian Kiro
Weaving Hopes after DisastersLong-term Impact and Beneficiary Satisfaction of Relief, Rehabilitation and Development Programmes in India
© Indian Social Institute, New Delhi Indo-Global Social Service Society, New Delhi Caritas India, New Delhi Caritas, Germany
First published in 2015
ISBN 978-81-89762-52-0
Published byIndian Social Institute10 Institutional AreaLodi Road, New Delhi - 110 003I N D I APh: (011) 49534000 / 49534126 / 49534127Fax: (011) 24690660 / 49534104E-mail: [email protected]: www.isidelhi.org.in
Cover DesignBro. John Messi SJ
This publication can be reproduced or transmitted in any form or by any means, with due acknowledement to the publishers.
2
Foreword ..............................................................................................................4Acknowledgements ..............................................................................................6Messages .............................................................................................................8Abbreviations ......................................................................................................14List of Tables ......................................................................................................16List of Charts ......................................................................................................20
Executive Summary............................................................................................22Chapter 1: Introduction ................................................................................25Chapter 2: Disaster Interventions ................................................................35Chapter 3: Major Interventions: Participation, Impact and Satisfaction ........................................50Chapter 4: Inclusion of the Excluded and the Vulnerable ............................81Chapter 5: Citizens and the State ................................................................87Chapter 6: Socio-economic and Cultural Changes: Transforming Narratives .............................................................95Chapter 7: LRRD – The Right Mix for Future Interventions .......................110
Select Bibliography ...........................................................................................124
Annexures:1. Caritas Interventions in Five States in India, 1999-2008 ...............................................................1262. List of Organizational Key Persons Interviewed ......................................1843. List of Government Personnel Interviewed ..............................................1864. Interview Schedule for Respondent / Beneficiary ....................................188
Endnotes ..........................................................................................................198
Contents .......................................
Weaving Hopes after Disasters 3
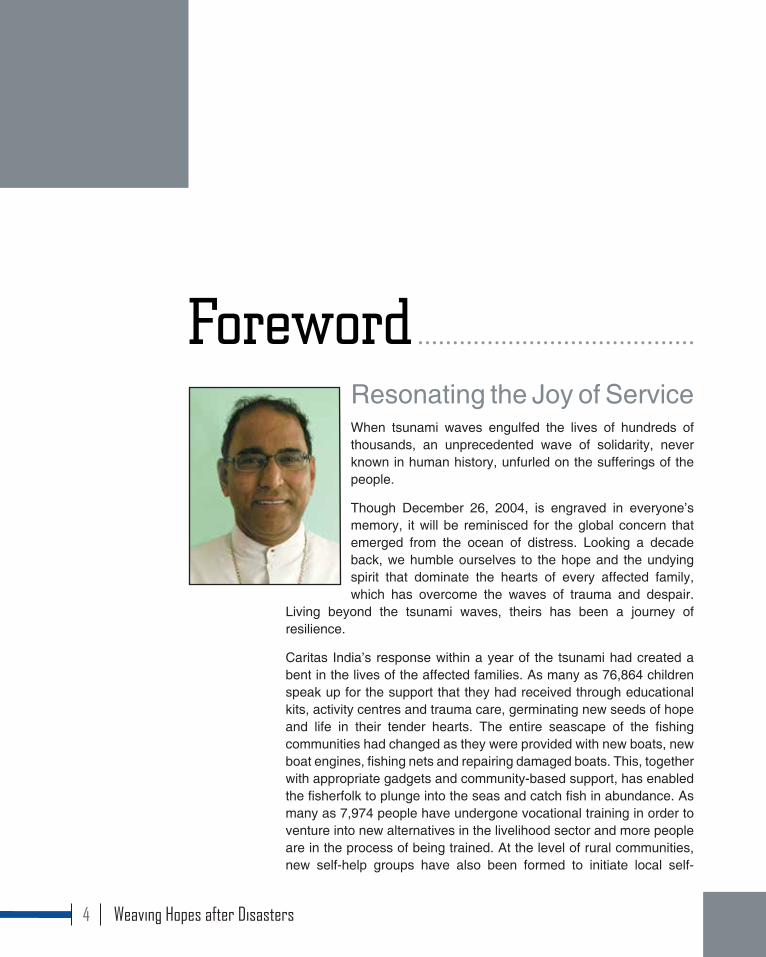
Resonating the Joy of ServiceWhen tsunami waves engulfed the lives of hundreds of thousands, an unprecedented wave of solidarity, never known in human history, unfurled on the sufferings of the people.
Though December 26, 2004, is engraved in everyone’s memory, it will be reminisced for the global concern that emerged from the ocean of distress. Looking a decade back, we humble ourselves to the hope and the undying spirit that dominate the hearts of every affected family, which has overcome the waves of trauma and despair.
Living beyond the tsunami waves, theirs has been a journey of resilience.
Caritas India’s response within a year of the tsunami had created a bent in the lives of the affected families. As many as 76,864 children speak up for the support that they had received through educational kits, activity centres and trauma care, germinating new seeds of hope and life in their tender hearts. The entire seascape of the fishing communities had changed as they were provided with new boats, new boat engines, fishing nets and repairing damaged boats. This, together with appropriate gadgets and community-based support, has enabled the fisherfolk to plunge into the seas and catch fish in abundance. As many as 7,974 people have undergone vocational training in order to venture into new alternatives in the livelihood sector and more people are in the process of being trained. At the level of rural communities, new self-help groups have also been formed to initiate local self-
Foreword ........................................
Weaving Hopes after Disasters4
governance in the areas of livelihood, permanent housing as well as psychosocial care. Further, an inter-disciplinary team undertook an integrated study of the interventions, the findings of which were developed into new learnings and incorporated in the community development programme. Efforts of linking relief and rehabilitation with long-term development programme of the communities was a beautiful merger of sustaining the programme.
As we arrive at the 10th year of the remembrance of tsunami, we are greatly inspired and motivated by the resilience and hope of the grassroot communities and the efforts of Caritas Network for such an outreach and assistance. We place on record our appreciation to all our network partners for their unconditional support, and to all our stakeholders and communities in service, for their heart and soul to this mission.
This publication, “Weaving Hopes after Disaster”, brings forth an insight from the various dimensions of linking relief and rehabilitation to development. It tries to focus on the process, knowledge, challenges and solutions to understand the significance of the efforts rendered and draw a strategic direction for the future.
As a member of the family of Caritas, we pledge our resolve in securing, rebuilding and enhancing lives, in which the hearts of the affected people resonate the joy of service
By Bishop Lumen Monteiro, Chairman, Caritas India
Weaving Hopes after Disasters 5
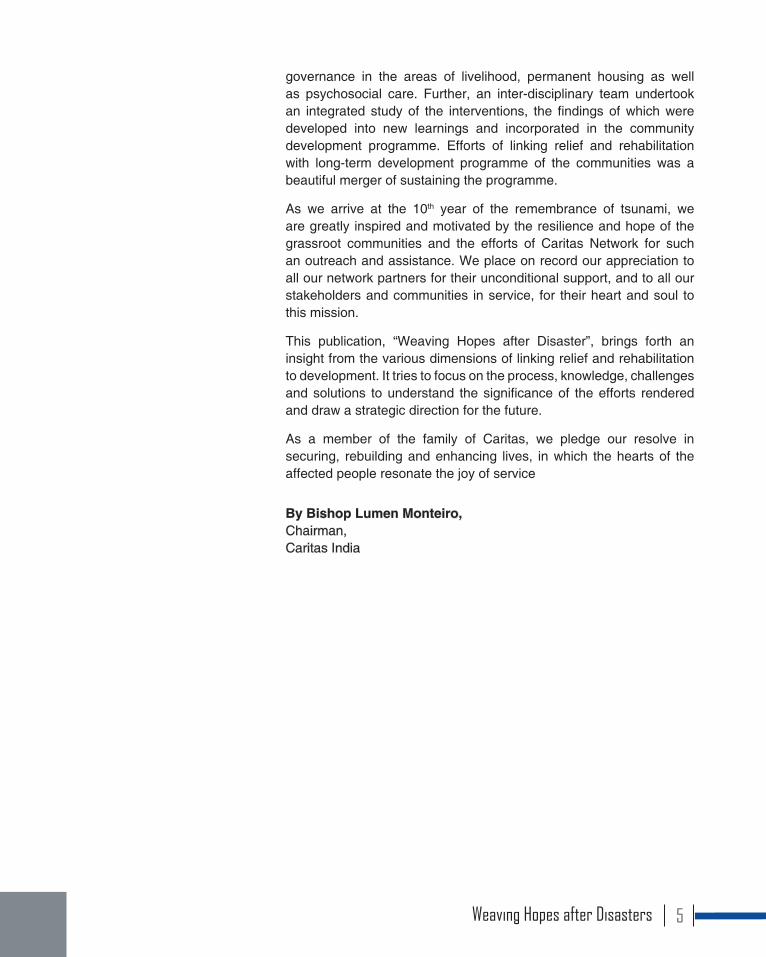
A study of this magnitude, spread across the country, would not have been possible in a short span of time, but for the active, wholehearted, collaboration of many.
From the time of conceptualization of this study till the end, Mr. Peter Seidel, Fr. Frederic D’Souza, Fr. Paul Moonjely, Mr. Nelson, Mr. Philip and Mr. Sunil Mammen from the Caritas family extended professional support and generously offered their inputs, especially in sampling, providing contacts at the time of the preparation of tools and offered valuable comments after reviewing the draft report. To each of them I express my sincere gratitude. Special thanks to Fr. Celestine, who tendered insightful
observations on the report.
The present and past directors of the ten diocesan social service societies, with whom we interacted closely, provided active support and collaboration. Every one of them was extremely cordial and helpful. It has been a joy to partner with them and listen to their inspirational narratives. Very specially, I also extend my appreciation to all the people of the sample villages, who frankly shared their views and perceptions and inspired the research team with their transformative accounts.
The elders of the sample villages, PRI members, government officials, and bishops of the partner organizations accepted our request and provided us with valuable insights from their personal experiences. I am grateful to all of them.
Sr. Jeya, Ms. Sandhya, Ms. Muthumari, Mr. Ponnusamy and Mr. Sahayaraj supported the research team in Andhra Pradesh and
Acknowledgements ....
Weaving Hopes after Disasters6
Tamil Nadu. Their presence helped us enormously to interact with the beneficiaries in local languages. I express my deep appreciation to each of them.
Ms. Prarthana Borah and Ms. Kausiki Sarma accompanied me in the preparation of the report. They also joined Sch. John Messi and Mr. K.A. Jacob in designing the report and making it visually gorgeous. I owe a lot to them.
My special thanks to the research team of the institute – Paul D’Souza, Ranjit Tigga, Ratnesh Kumar, Joy Karayampuram, Pascal Tirkey, Ruben Minj, and Siprian Kiro, who spent quality time in the field in capturing the perceptions of the beneficiaries, often stimulating their memories creatively. They were instrumental in preparing the state reports in a very short time.
My special gratitude to Ms. Felcy Rani for providing secretarial assistance and Ms. Nazeema for data entry.
Finally, I am deeply grateful to Caritas India, IGSSS and Caritas Germany for identifying the Indian Social Institute, New Delhi, to carry out this participative assessment study from the perspective of beneficiaries, a study that we hope will serve as a valuable material for humanitarian and emergency intervention agencies in India and the rest of the world.
Dr. Joseph Xavier SJExecutive Director
Weaving Hopes after Disasters 7
Dear Fr. Frederick D´Souza, dear friends of Caritas India, dear interested reader of this assessment report,
It is a great satisfaction for us to see the publication of this extensive document. It summarizes the beneficiary perceptions on the long-term impact of the most important emergency relief and rehabilitation programmes of Caritas in India within the last 20 years.
“What do you want me to do for you?” This question of Jesus to a man approaching him as per the Gospel of Mark 10,11 is also deeply questioning us when we look at the best way of supporting victims after disasters.
It is a question of respect and dignity to make the “beneficiaries” speak out their wishes, needs and dreams, and also to allow them taking their life again in their own hands.
What do they want us to do?
How do they appreciate what we have done and what we have supported?
What can we learn together for an appropriate disaster response in the future?
Disasters are causing death and misery. But they are also a crisis which can be an opportunity to share in solidarity and allow healing and social change.
Caritas Germany has been supporting Caritas India and the diocesan partners in most of the big calamities in India of the recent decades.
Message ......................................
Weaving Hopes after Disasters8
The tsunami was the worst of them and after ten years it is a moment for all of us to first of all remember the victims. But it is also an opportunity to look back with a critical analysis of the activities carried out in favour of the survivors.
So it is time to ask them again: “What do you think about what has been done?”
These reflections and suggestions of the persons affected by disasters are the most valuable feedback we can get. Within the international Caritas network we look forward to a sincere, open, broad and deep discussion about the meaning of our work.
With the best wishes for the commemorative event in Puducherry
Prelate Dr. Peter NeherPresident of Caritas Germany
Weaving Hopes after Disasters 9
Message ......................................
Translating Caritas into actionA decade we have traversed since the apocalyptic tsunami had devastated the coastal communities of India. For Caritas India, this has been a journey of reviving and reliving together with the traumatized millions, who have toiled tirelessly to resuscitate our hope in life and humanity.
The scale of tsunami was so wide; its effects had spread to the farthest islands. But as a family, we found courage in the actions of the survivors themselves and solidarity from the people who supported Caritas to provide succour to those who needed the most.
From the ruins, the communities built better futures for themselves. The spirit of these communities is heartwarming. While we rekindled the hope for the people, they in return re-fuelled hope in our efforts, by supporting us in all our interventions of relief, recovery, livelihoods and resilience building. Tsunami disaster response saw a manifestation of professionalism, stemming from the conviction that each individual has the right to a quality support and for a dignified living.
As we reflect through these 10 years, there is a humble feeling of satisfaction when we see the beaming faces of the communities who cherish their rights. However, at the same time, we remain alive to the future and realize that we have to challenge the globalization of indifference that is pushing the poor into more vulnerable positions. As nurtures of creation and the environment, we need to enhance building harmonious environment of communities that remain as integral components of a global society.
Weaving Hopes after Disasters10
This study report is an illustrative analysis of our efforts invested through the journey of risk to resilience. It would outline the different facets of change that has evolved through our actions in the emergency responses. However, it is a call for continued action with communities for resilience and capacity outcomes.
The movement of Caritas continues to live in our hearts and in the hearts of those whom we serve. We need to put Caritas in action every day of our lives. As we pave towards the horizon, Caritas as a family will remain dedicated to translating herself into action for the common good of all.
Fr. Frederick D’Souza, Executive Director, Caritas India
Weaving Hopes after Disasters 11
Learning to ListenAn interesting project called TIME TO LISTEN - Hearing People on the Receiving End of International Aid - carried out by Mary B. Anderson, Dayna Brown and Isabella Jean of CDA Collaborative Learning Projects was an inspiring one. The focus of this study is to listen to what people actually feel and say and not what aid agencies want to hear. This study is the starting point of discussion Caritas Germany began with me a year back and this discussion led firm up the present study which captures the people’s perception about our services.
The right to receive humanitarian assistance, and to offer it, is a fundamental humanitarian principle which should be enjoyed by all citizens of all countries. It is also equally important and fundamental to ensure the rights of people in expressing their level of satisfaction and happiness. From this perspective, this study is an attempt to go back to the communities and listen to them and learn from their experience.
Caritas globally is known for being the first to respond in disaster situations regardless of the race, creed or nationality of the recipients and without adverse distinction of any kind. Caritas Germany is a member of the Global Caritas family responding globally to the humanitarian crises and at the same time trying its best to learn from each experience to improve the quality of the service. And Caritas India has demonstrated her ability to respond in time and in quality throughout India over the last 50 years of her service.
Message ......................................
Weaving Hopes after Disasters12
I am very proud to be associated with the Caritas family for 25 years and have extensively involved in the major disaster responses of Caritas India. It is also a privilege to be part of the core group of this study and interacting with the Dr. Joseph Xavier, Executive Director of ISI, and Mr. Peter Seidel of Caritas Germany. Fr. Joe and his team has done a wonderful and very professional study. I am sure the findings and recommendations of this study will go a long way in responding to humanitarian crises, especially learning to listen to affected communities. Hope the report generates more intense and dynamic discussion among Caritas organisations, aid workers and development professionals.
Wishing all the very best
John Peter NelsonExecutive DirectorIndo Global Social Service Society
Weaving Hopes after Disasters 13
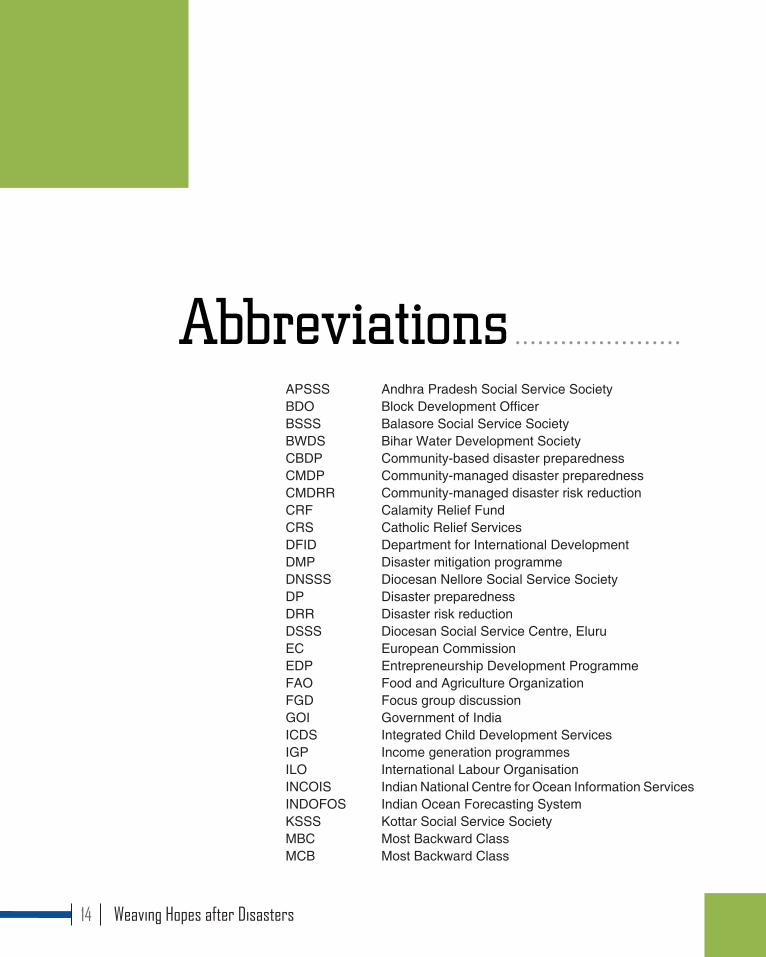
APSSS Andhra Pradesh Social Service Society BDO Block Development OfficerBSSS Balasore Social Service SocietyBWDS Bihar Water Development SocietyCBDP Community-based disaster preparednessCMDP Community-managed disaster preparednessCMDRR Community-managed disaster risk reductionCRF Calamity Relief FundCRS Catholic Relief ServicesDFID Department for International DevelopmentDMP Disaster mitigation programmeDNSSS Diocesan Nellore Social Service SocietyDP Disaster preparednessDRR Disaster risk reductionDSSS Diocesan Social Service Centre, EluruEC European CommissionEDP Entrepreneurship Development ProgrammeFAO Food and Agriculture Organization FGD Focus group discussionGOI Government of IndiaICDS Integrated Child Development ServicesIGP Income generation programmesILO International Labour OrganisationINCOIS Indian National Centre for Ocean Information ServicesINDOFOS Indian Ocean Forecasting SystemKSSS Kottar Social Service SocietyMBC Most Backward ClassMCB Most Backward Class
Abbreviations ......................
Weaving Hopes after Disasters14
Abbreviations ......................
MDSSS Muzaffarpur Diocesan Social Service SocietyNABARD National Bank for Agriculture and Rural DevelopmentNGO Non Government OrganisationOBC Other Backward ClassOSDMA Odisha State Disaster Management / Mitigation AuthorityPIME Planning, Implementation, Monitoring and EvaluationPMSSS Pondicherry Multipurpose Social Service SocietyPRI Panchayat Raj InstitutionsRBM Results Based ManagementSC Scheduled casteSHG Self help groupST Scheduled TribeTMSSS Thanjavur Multipurpose Social Service SocietyToT Training of TrainersUNICEF United Nations International Education FundUT Union Territory
Weaving Hopes after Disasters 15
Page No
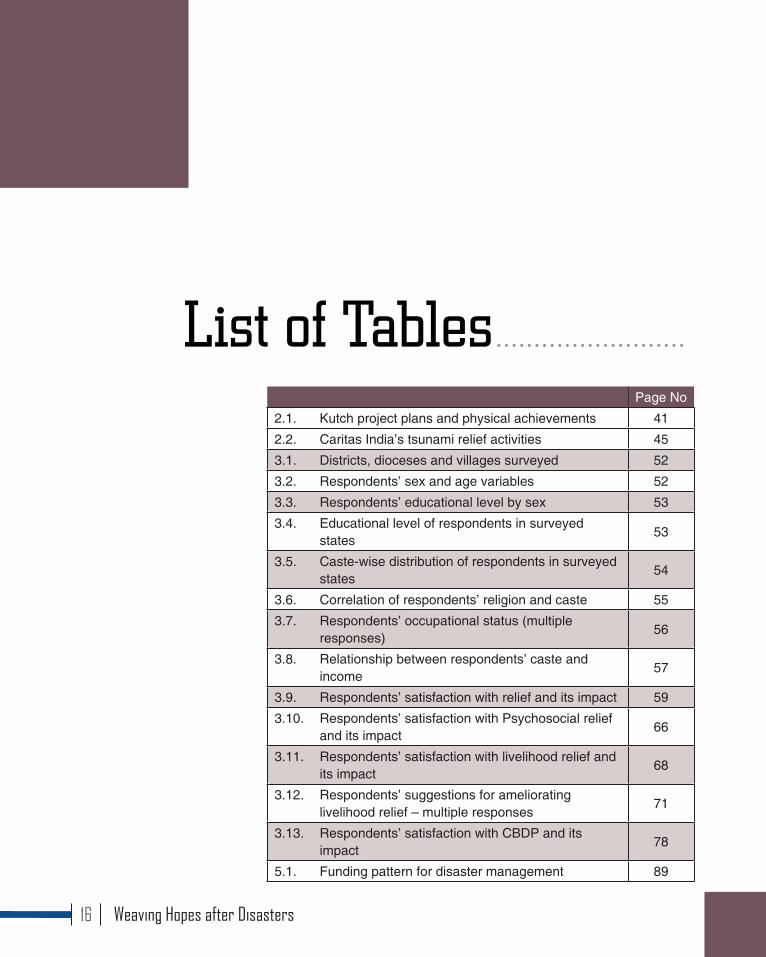
2.1. Kutch project plans and physical achievements 41
2.2. Caritas India’s tsunami relief activities 45
3.1. Districts, dioceses and villages surveyed 52
3.2. Respondents’ sex and age variables 52
3.3. Respondents’ educational level by sex 53
3.4. Educational level of respondents in surveyed states
53
3.5. Caste-wise distribution of respondents in surveyed states
54
3.6. Correlation of respondents’ religion and caste 55
3.7. Respondents’ occupational status (multiple responses)
56
3.8. Relationship between respondents’ caste and income
57
3.9. Respondents’ satisfaction with relief and its impact 59
3.10. Respondents’ satisfaction with Psychosocial relief and its impact
66
3.11. Respondents’ satisfaction with livelihood relief and its impact
68
3.12. Respondents’ suggestions for ameliorating livelihood relief – multiple responses
71
3.13. Respondents’ satisfaction with CBDP and its impact
78
5.1. Funding pattern for disaster management 89
List of Tables .........................
Weaving Hopes after Disasters16
Page No
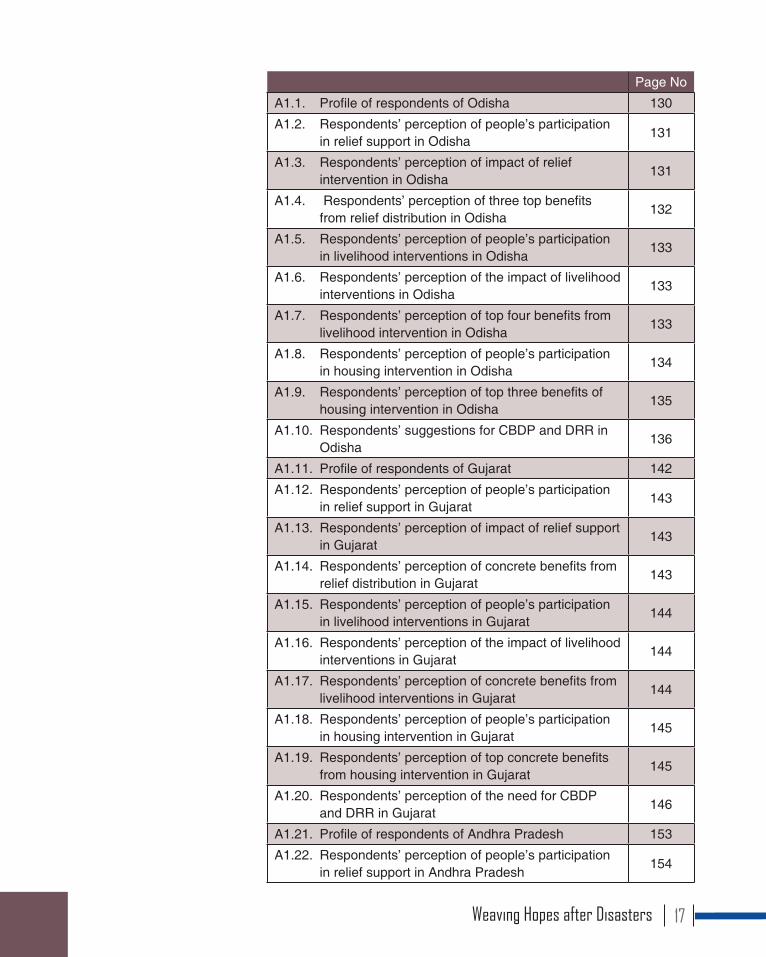
A1.1. Profile of respondents of Odisha 130
A1.2. Respondents’ perception of people’s participation in relief support in Odisha
131
A1.3. Respondents’ perception of impact of relief intervention in Odisha
131
A1.4. Respondents’ perception of three top benefits from relief distribution in Odisha
132
A1.5. Respondents’ perception of people’s participation in livelihood interventions in Odisha
133
A1.6. Respondents’ perception of the impact of livelihood interventions in Odisha
133
A1.7. Respondents’ perception of top four benefits from livelihood intervention in Odisha
133
A1.8. Respondents’ perception of people’s participation in housing intervention in Odisha
134
A1.9. Respondents’ perception of top three benefits of housing intervention in Odisha
135
A1.10. Respondents’ suggestions for CBDP and DRR in Odisha
136
A1.11. Profile of respondents of Gujarat 142
A1.12. Respondents’ perception of people’s participation in relief support in Gujarat
143
A1.13. Respondents’ perception of impact of relief support in Gujarat
143
A1.14. Respondents’ perception of concrete benefits from relief distribution in Gujarat
143
A1.15. Respondents’ perception of people’s participation in livelihood interventions in Gujarat
144
A1.16. Respondents’ perception of the impact of livelihood interventions in Gujarat
144
A1.17. Respondents’ perception of concrete benefits from livelihood interventions in Gujarat
144
A1.18. Respondents’ perception of people’s participation in housing intervention in Gujarat
145
A1.19. Respondents’ perception of top concrete benefits from housing intervention in Gujarat
145
A1.20. Respondents’ perception of the need for CBDP and DRR in Gujarat
146
A1.21. Profile of respondents of Andhra Pradesh 153
A1.22. Respondents’ perception of people’s participation in relief support in Andhra Pradesh
154
Weaving Hopes after Disasters 17
Page No
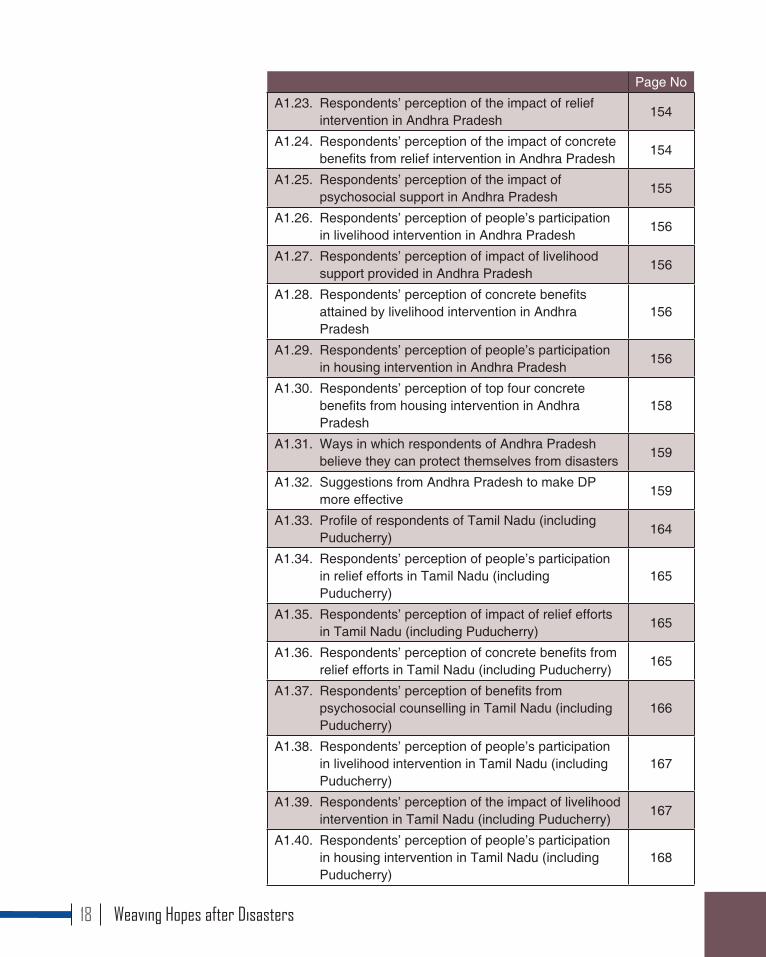
A1.23. Respondents’ perception of the impact of relief intervention in Andhra Pradesh
154
A1.24. Respondents’ perception of the impact of concrete benefits from relief intervention in Andhra Pradesh
154
A1.25. Respondents’ perception of the impact of psychosocial support in Andhra Pradesh
155
A1.26. Respondents’ perception of people’s participation in livelihood intervention in Andhra Pradesh
156
A1.27. Respondents’ perception of impact of livelihood support provided in Andhra Pradesh
156
A1.28. Respondents’ perception of concrete benefits attained by livelihood intervention in Andhra Pradesh
156
A1.29. Respondents’ perception of people’s participation in housing intervention in Andhra Pradesh
156
A1.30. Respondents’ perception of top four concrete benefits from housing intervention in Andhra Pradesh
158
A1.31. Ways in which respondents of Andhra Pradesh believe they can protect themselves from disasters
159
A1.32. Suggestions from Andhra Pradesh to make DP more effective
159
A1.33. Profile of respondents of Tamil Nadu (including Puducherry)
164
A1.34. Respondents’ perception of people’s participation in relief efforts in Tamil Nadu (including Puducherry)
165
A1.35. Respondents’ perception of impact of relief efforts in Tamil Nadu (including Puducherry)
165
A1.36. Respondents’ perception of concrete benefits from relief efforts in Tamil Nadu (including Puducherry)
165
A1.37. Respondents’ perception of benefits from psychosocial counselling in Tamil Nadu (including Puducherry)
166
A1.38. Respondents’ perception of people’s participation in livelihood intervention in Tamil Nadu (including Puducherry)
167
A1.39. Respondents’ perception of the impact of livelihood intervention in Tamil Nadu (including Puducherry)
167
A1.40. Respondents’ perception of people’s participation in housing intervention in Tamil Nadu (including Puducherry)
168
Weaving Hopes after Disasters18

Page No
A1.41. Respondents’ perception of concrete benefits from housing intervention in Tamil Nadu (including Puducherry)
168
A1.42. Profile of respondents of Bihar 174
A1.43. Respondents’ perception of people’s participation in relief efforts in Bihar
175
A1.44. Respondents’ perception of impact of relief effort in Bihar
175
A1.45. Respondents’ perception of concrete benefits from relief efforts in Bihar
175
A1.46. Respondents’ perception of people’s participation in livelihood interventions in Bihar
176
A1.47. Respondents’ perception of the impact of livelihood interventions in Bihar
176
A1.48. Respondents’ perception of the top three benefits from livelihood interventions in Bihar
177
A1.49. Respondents’ suggestions for improved livelihood interventions in Bihar
177
A1.50. Respondents’ perception of people’s participation in housing intervention in Bihar
178
A1.51. Respondents’ perception of concrete benefits from housing intervention in Bihar
178
A1.52. Respondents’ suggestions for improved intervention in housing in Bihar
178
A1.53. Respondents’ suggestions for CBDP/DRR in Bihar 179
Weaving Hopes after Disasters 19

Page No3.1. Participation of beneficiaries in PIME in relief 60
3.2. Participation of beneficiaries in PIME in livelihood intervention
69
3.3. Respondents’ satisfaction with housing relief, its impact and their participation
73
4.1. Discrimination based on caste, religion and gender and vulnerable
82
5.1. Citizens-State interface (%) 88
5.2. Satisfaction with government and NGO support compared
91
6.1. Overall satisfaction with key interventions and impact
96
6.2. State-wise comparison of overall satisfaction 97
7.1. Respondents’ views on most needed support 111
7.2. Respondents’ views on most needed and needed support
112
7.3. Caste correlation in terms of views on right mix of disaster relief
113
7.4. Income correlation with views on right mix of disaster relief
113
7.5. Determinants of right mix of elements in disaster relief
119
7.6. Right mix of disaster relief elements as a process 121
List of Charts ........................
Weaving Hopes after Disasters20
Page No7.7. Allocation of resources for a right mix of disaster
relief122
A1.1. Respondents’ perception of their satisfaction level of major relief interventions in Odisha
137
A1.2. Respondents’ perception of comparative support received from government and NGOs in Odisha
138
A1.3. Respondents’ perception of their satisfaction level of major interventions in Gujarat
146
A1.4. Respondents’ perception of comparative support received from government and NGOs in Gujarat 149
A1.5. Respondents’ perception of their satisfaction level of major interventions in Andhra Pradesh 159
A1.6. Respondents’ perception of comparative support received from government and NGOs in Andhra Pradesh
161
A1.7. Respondents’ perception of their satisfaction level of major interventions in Tamil Nadu (including Puducherry)
169
A1.8. Respondents’ perception of comparative support received from government and NGOs in Tamil Nadu (including Puducherry)
170
A1.9. Respondents’ perception of their satisfaction from major interventions in Bihar 180
A1.10.Respondents’ perception of comparative support received from government and NGOs in Bihar 181
Weaving Hopes after Disasters 21
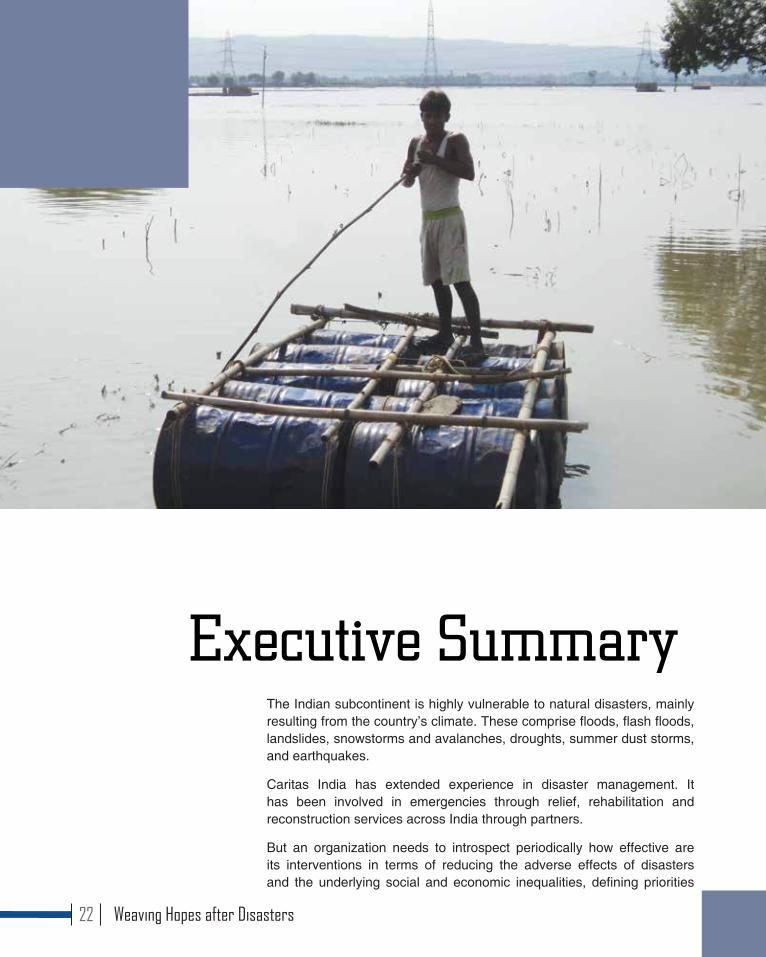
The Indian subcontinent is highly vulnerable to natural disasters, mainly resulting from the country’s climate. These comprise floods, flash floods, landslides, snowstorms and avalanches, droughts, summer dust storms, and earthquakes.
Caritas India has extended experience in disaster management. It has been involved in emergencies through relief, rehabilitation and reconstruction services across India through partners.
But an organization needs to introspect periodically how effective are its interventions in terms of reducing the adverse effects of disasters and the underlying social and economic inequalities, defining priorities
Executive Summary
Weaving Hopes after Disasters22
and facilitating people’s access to rights and entitlements from the government. For this, there is a need to get a systematized feedback from the beneficiaries on their perception and appreciation of these activities. This study aims to attain this objective.
This study mainly intends: To obtain a critical scientific analysis of the impact of different relief, rehabilitation and development activities within the Indian post-emergency rehabilitation programmes, focusing on the beneficiaries’ perceptions and satisfaction, with the aim to recommend priorities in the combination of different intervention strategies in future post-disaster programmes.
The research areas, selected after discussion with India partners, were the five regions in India that suffered from different kinds of disasters in the last fifteen years, as follows:
• Coastal Orissa: Super cyclone 1999 and floods in 2001 and 2003• Gujarat/Kutch: Earthquake in 2001• Andhra Pradesh: Tsunami in 2004• Tamil Nadu including the Union Territory of Puducherry:
Tsunami in 2004 • Bihar: Floods in 2007 and 2008
The study gives a brief overview of the impact of these disasters and the common and differentiated devastation they caused. It highlights the interventions of the government and NGOs, specifically Caritas India, focusing on the strategies adopted by all the intervening parties.
Four villages from each state were identified where Caritas India either directly or through its local partners implemented disaster response. From each village 40 respondents were interviewed. Some of the answers the study seeks are:
1. Did the intervention of Caritas India leave some indelible socio-economic changes among the beneficiaries?
2. Which type of interventions satisfied them most?
3. What would they suggest as the right mix of interventions in a possible disaster scenario?
While addressing these questions, more than an evaluation that would draw some conclusions, this participative assessment study intends to generate new knowledge, from long-term perspectives and satisfaction of beneficiaries and aims at facilitating disaster intervening agencies to develop a future disaster intervention framework to promote dignity, well being and citizenship entitlements of the disaster-affected persons and communities.
The report makes a comparative analysis, taking the state, diocese, sex, age, education, religion, caste, occupation and income as key variables.
Weaving Hopes after Disasters 23

The following five intervention variables were considered, namely relief, psychosocial, livelihood, housing, and disaster preparedness/disaster risk reduction. The beneficiaries’ extent of satisfaction was measured for each intervention, primarily for immediate impact, long-term usefulness and participation in planning, implementation, monitoring and evaluation (PIME). The variation in the extent of satisfaction and plausible reasons for the same in relation to sex, caste, education and income have been also analysed.
It has been established that the vulnerable and poor are the most affected in disasters. Among the poor in India, the Scheduled Castes (SCs/dalits) and Scheduled Tribes (STs), religious minorities, women, people with disability and widows are especially vulnerable due to caste exclusion, differential treatment based on religion, and gender discrimination. The report attempts to study whether the strategies for intervention have been inclusive and makes suggestions for taking into account issues of underprivileged communities, religious minorities, women, and people with disability.
The role of the State, the relationship between citizens and the State as well as the contributions by NGOs have been analysed with reference to the response received. The socio-economic and cultural changes in the lives of beneficiaries that have happened as a result of Caritas India interventions are also highlighted.
One objective of this study is to find out what the beneficiaries say about the right mix linking relief, rehabilitation and development from a long-term perspective. This is discussed in Chapter 7. The beneficiaries were informed that their responses would help agencies like Caritas, with their limited resources, to intervene better in future disaster scenarios, employing the new knowledge thus generated, to promote dignity, well-being and citizenship entitlements of the disaster-affected persons and communities.
State-wise analysis of data is presented as Annexure 1.
Weaving Hopes after Disasters24
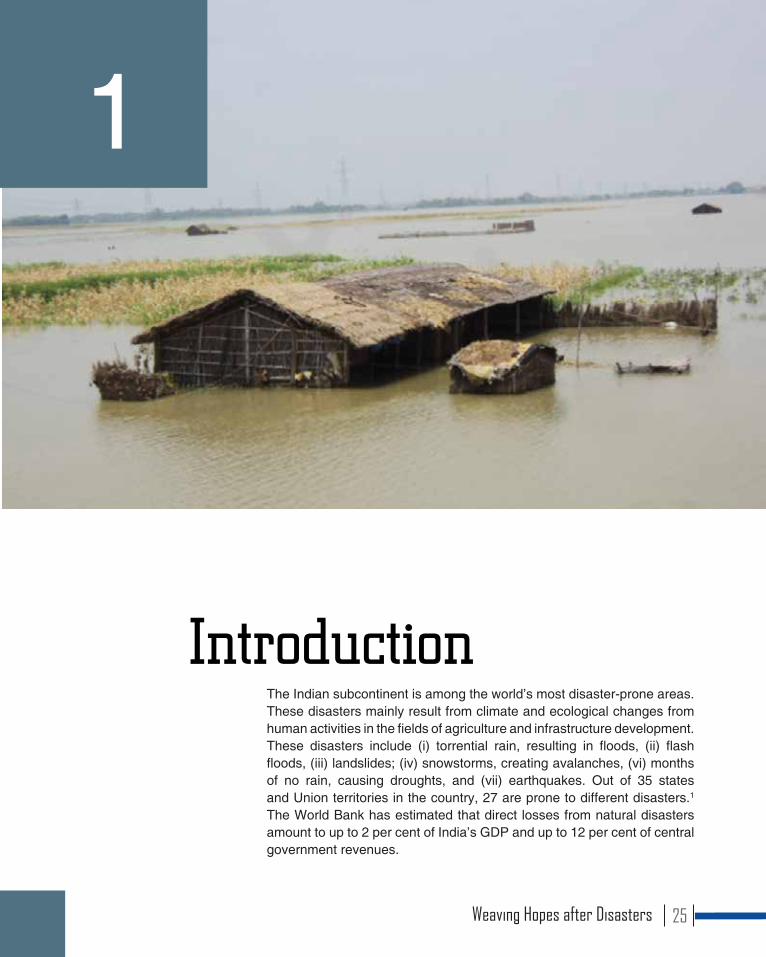
The Indian subcontinent is among the world’s most disaster-prone areas. These disasters mainly result from climate and ecological changes from human activities in the fields of agriculture and infrastructure development. These disasters include (i) torrential rain, resulting in floods, (ii) flash floods, (iii) landslides; (iv) snowstorms, creating avalanches, (vi) months of no rain, causing droughts, and (vii) earthquakes. Out of 35 states and Union territories in the country, 27 are prone to different disasters.1 The World Bank has estimated that direct losses from natural disasters amount to up to 2 per cent of India’s GDP and up to 12 per cent of central government revenues.
1
Introduction
Weaving Hopes after Disasters 25
In terms of geographic terrain, India has five distinctive regions, namely, (i) the Himalayan region, (ii) the alluvial plains, (iii) the hilly regions, (iv) the deserts, and (v) the coastal zone. The Himalayan region is prone to disasters like earthquakes and landslides. Floods affect the plains almost every year. Droughts affect the deserts. And the coastal zone is susceptible to storms and cyclones. According to J. Radhakrishnan, head of UNDP India’s Disaster Management Wing, almost 58.6 per cent of India’s landmass is prone to earthquakes of moderate to very high intensity; over 40 million hectares (12 per cent of land) are prone to floods and river erosion; of the 7,516 km long coastline, close to 5,700 km is prone to cyclones and tsunamis; and 68 per cent of the cultivable area is vulnerable to drought.2
During 2011-12, fourteen states (Assam, Bihar, Goa, Gujarat, Himachal Pradesh, Karnataka, Kerala, Maharashtra, Odisha, Punjab, Sikkim, Uttar Pradesh, Uttarakhand, and West Bengal) and the Union territory of Puducherry reported various natural disasters of varying dimensions.3 The states of Gujarat, Maharashtra, Andhra Pradesh, West Bengal, Karnataka and Bihar were among the top ten states for human lives lost, cattle lost, houses damaged and crop area damaged. Andhra Pradesh, Rajasthan and West Bengal recorded the highest cattle loss due to disasters.4 In the recent past there have been three major disasters, namely, floods in Uttarakhand (2013) and in Jammu and Kashmir (2014) and cyclone Hudhud in Andhra Pradesh (2014).
In the recent past, disasters have also been happening in places which were otherwise presumed to be not prone to disasters. For example, the generally drought-affected areas of North Karnataka have been affected by floods.
Why this StudyCaritas India is a voluntary organization registered under the Societies Registration Act XXI 1860 (the Punjab Amendment Act 1957). It was founded in 1962 as the official development arm of the Catholic Church in India. Founded on Gospel values, especially the commandment of love, Caritas India endeavours to be a sign of God’s love for the underprivileged and the marginalized. Caritas India is a member of Caritas Internationalis, a confederation of 168 Catholic relief and development organizations working in nearly 200 countries, the second-largest NGO network in the world.
Driven by the commitment to uphold the dignity and sacredness of the human person, Caritas India has been working for the emancipation of the underprivileged and the marginalized irrespective of their sex, caste, ethnicity and religion. It has reached out to millions of the poor
Weaving Hopes after Disasters26

and assisted them overcome poverty and deprivation. It is widely present across the country and involves itself in a large spectrum of development interventions, mobilizing and investing funds. Caritas India started its work in disaster relief response, but over the decades, it has extended its activities to various socio-economic objectives, such as livelihood, natural resource management, sustainable agriculture, good governance, anti-trafficking of women and children, peace-building, and healthcare, with focus on HIV/AIDS, malaria, TB and other communicable diseases.
It has also been helping hundreds of development organizations increase their capacities to achieve greater levels of effectiveness.
As a front-ranking organization in the sector of relief response, rehabilitation and disaster preparedness, Caritas India has rendered its services whenever disasters struck the country. It has worked to reach relief to people hit by disasters, such as the Bangladesh refugee crisis in 1971 to the Uttarakhand floods in 2013. Caritas India has so far built over 25,000 houses for calamity-struck families, including 13,410 houses that were constructed with an investment of Rs. 5,000 million under the tsunami rehabilitation programme.
The present report canvasses what Caritas India has done in five major disaster-affected areas, namely, (i) the Super Cyclone 1999 and floods in Orissa in 2001 and 2003; (ii) the earthquake in 2001 in Gujarat/Kutch; (iii) and (iv) the tsunami in 2004 in Andhra Pradesh and Tamil Nadu, including the Union territory of Puducherry; and (v) floods in Bihar in 2007 and 2008.
The intention is to introspect, to make sure that Caritas India is working in the right direction in terms of questioning the underlying social and economic inequalities, defining priorities and facilitating people’s access to rights and entitlements from the government. For this, feedback from the beneficiaries is essential.
The research areas, selected after discussion with India partners, were the five regions in India that suffered from different kinds of disasters in the last fifteen years, as follows:
• Coastal Orissa: Super cyclone 1999 and floods in 2001 and 2003• Gujarat/Kutch: Earthquake in 2001• Andhra Pradesh: Tsunami in 2004• Tamil Nadu (including the Union territory of Puducherry): Tsunami in
2004 • Bihar: Floods in 2007 and 2008
What makes Caritas unique is its presence in communities before, during and after the crisis situation. Its work is facilitated through its association with an extensive network of social development organizations in India and at the international level. Abiding with the NGO Code of Conduct (IFRC) that states, “Humanitarian imperative comes first”, Caritas India is
Weaving Hopes after Disasters 27
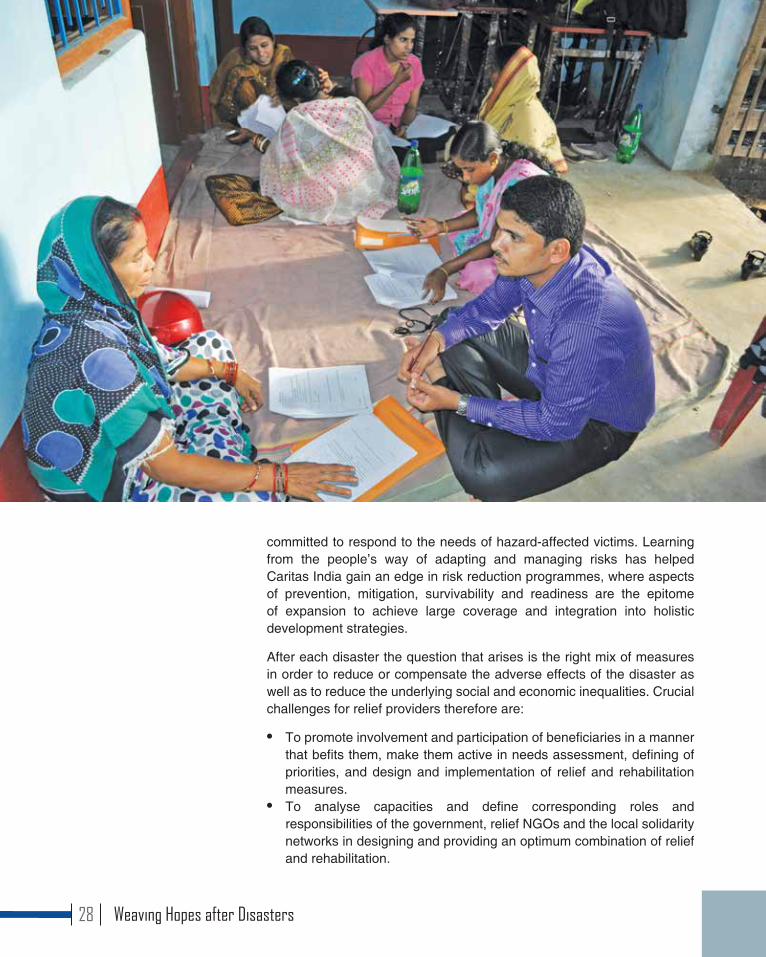
committed to respond to the needs of hazard-affected victims. Learning from the people’s way of adapting and managing risks has helped Caritas India gain an edge in risk reduction programmes, where aspects of prevention, mitigation, survivability and readiness are the epitome of expansion to achieve large coverage and integration into holistic development strategies.
After each disaster the question that arises is the right mix of measures in order to reduce or compensate the adverse effects of the disaster as well as to reduce the underlying social and economic inequalities. Crucial challenges for relief providers therefore are:
• To promote involvement and participation of beneficiaries in a manner that befits them, make them active in needs assessment, defining of priorities, and design and implementation of relief and rehabilitation measures.
• To analyse capacities and define corresponding roles and responsibilities of the government, relief NGOs and the local solidarity networks in designing and providing an optimum combination of relief and rehabilitation.
Weaving Hopes after Disasters28
• To ensure inclusion of the excluded communities and the most vulnerable persons and families.
According to the Catholic Social Teaching and SPHERE standards,5 the main concern of humanitarian aid-providing NGOs is the person in need of assistance. This ethical orientation leads to the imperative of promoting participation and self-help of the beneficiaries as key stakeholders of any rehabilitation programme.
There has also been a paradigm shift in the focus of disaster management, from response centred on rescue, relief, rehabilitation, and reconstruction to laying greater emphasis on the other elements of disaster management cycle – prevention, mitigation, and preparedness. The Hyogo Framework for Action (HFA), endorsed by the UN General Assembly in Resolution A/RES/60/195 following the 2005 World Disaster Reduction Conference, aims to substantially reduce disaster losses by 2015 by building the resilience of nations and communities to disasters.6
The Government of India also has established several committees and commissions to suggest how to deal with the problem of disaster management.7 The establishment of the High Power Committee on Disaster Management in 1999 resulted in the enactment of The Disaster Management Act, 2005. This act mandated creation of a National Disaster Management Authority (NDMA), and similar state- and district-level structures to spearhead and implement a holistic and integrated approach to disaster management in India. NDMA has prepared a disaster management policy framework.8 The Disaster Management Act also provided for the creation of a National Institution of Disaster Management.
Caritas India also evolved an Emergency and Disaster Management Policy in 2013. The policy is guided by five broad guiding principles, namely, (i) vulnerability, (ii) local community participation, (iii) transparency and flexibility, (iv) local capacity, and (v) long-term sustainability. Caritas India also has developed a contingency plan for interventions during emergencies and has contributed a lot in promoting SPHERE standards in India
Objective of the StudyThe main objective of the study has been formulated as follows:
To obtain a critical scientific analysis of the impacts of different LRRD (Linking Relief,9 Rehabilitation10 and Development11) activities within Indian post-emergency rehabilitation programmes, focusing on beneficiaries’ perceptions and satisfaction, with the aim to recommend priorities in the combination of different intervention strategies in future post-disaster programmes.
Weaving Hopes after Disasters 29
Areas of inquiryThe following were major areas of enquiry of the research.
(i) What is the beneficiaries’ level of satisfaction with the different services provided? • What, in their perception, has changed positively or negatively by
the intervention? • What would be their recommendations to improve specific services
like relief distribution, housing, livelihood, psychosocial support or disaster risk reduction (DRR)?
(ii) What is their level of satisfaction with the mix of measures provided and their prioritization?• What would they recommend as a good or ideal mix of relief and
rehabilitation measures?• Which measures were the most important?• Which measures could have been different, or were not so
necessary, or were not satisfying?
(iii) Which services have improved their socio-economic situation?• What would they recommend in this regard?
(iv) Which services have improved their participation12 in society and their self-determination and autonomy in life?
• What, in their perception, is the importance of community mobilization and animation13 in relief and rehabilitation programmes?
(v) Did the programmes and their specific components promote social equity, and improve cultural and political participation of different groups in society?• What are the key factors in rehabilitation programmes that enable
successfully increasing social equity?
(vi) Has the government changed its role during the relief operations and rehabilitation programmes?
• How is the “right to receive relief and rehabilitation”14 being advocated, respected and implemented?
• What are the learnings and recommendations for the trilateral cooperation between government, self-help initiatives in local solidarity networks, and supporting NGOs?
Weaving Hopes after Disasters30

Sources of Information and Classification of BeneficiariesBeneficiaries were classified in different groups as per the services received from Caritas India directly or through its partner organizations. There was a comparative analysis of the perceptions of people with and without special challenges, senior citizens, women and citizens, being classified as belonging to “SC” OBC” or “ST” communities.
(i) Beneficiaries of relief support: Those who received immediate and extended material support and psychosocial support. Caritas has been providing psychosocial support along with material relief from the time of the tsunami. During the tsunami this support was well organized and carried out systematically. During other disasters it was not termed as psychosocial, though it was done in some form and to some extent.
(ii) Beneficiaries of rehabilitation support: Those who received livelihood support in any form and those who received housing support in any form are considered to have received rehabilitation support.
Weaving Hopes after Disasters 31

(iii) Beneficiaries of development support: Those who have benefited by Community Based Disaster Preparedness (CBDP) and Disaster Risk Reduction (DRR) programmes along with community animation.
Universe The research areas, after a previous consideration process with the Indian partners, were the five regions in India that suffered from different kind of disasters in the last fifteen years:
• Coastal Orissa: Super Cyclone in 1999 and floods in 2001 and 2003• Gujarat/Kutch: Earthquake in 2001• Andhra Pradesh: Tsunami in 2004• Tamil Nadu (including the Union territory of Puducherry): Tsunami in
2004 • Bihar: Floods in 2007 and 2008
These disasters were selected both for their severity and the size of the response programmes.
SamplingFour villages15 from each of the five states were identified where Caritas India either directly or through its local partners implemented disaster response. From each village 40 respondents representing different sexes, castes, religions, and age groups were identified and interviewed. The minimum age of the respondents was kept at 35 in order to measure their satisfaction based on concrete experience.
In addition, four management staff from each organization (40 in number), three members of panchayati raj institution (PRI) or elders of the community from each village (numbering 60), and one person from block/district level (10 in number) were interviewed. The total sample size was 910.
The draft report was discussed in detail with select staff of Caritas India, IGSSS and key persons in the diocesan organizations for their feedback. Gaps identified were filled with their inputs.
MethodologyA mix of quantitative and qualitative methodology was deployed. Interview schedule and focused group discussions were used to assess the beneficiaries’ satisfaction; interviews were conducted for other
Weaving Hopes after Disasters32
respondents to align their views with those of the beneficiaries. Some case studies were collected to identify most significant change stories. Qualitative information was also collected through transect walk in the sampled villages and through informal interactions with some others who were not part of the samples.
The interview schedule included closed as well as open-ended questions (see Annexure 4). Stratified sampling technique was used to administer interview schedules. Every sample village was divided into homogeneous sub-groups either on the basis of streets in new housing settlements or on the basis of religious or caste community settlements, and then proportionate samples vis-à-vis the population were randomly chosen. The head of the family, male or female, was interviewed depending upon their availability. In order to have a good mix of sexes, when both male and female were available, one was consciously chosen. In some cases, one joined the other during the course of the interview. The data collected were processed using SPSS software.
Structured questions were prepared for in-depth interviews focusing on overall impact, satisfaction, inclusion of vulnerable persons, usefulness of common facilities, interface with government, etc. to study the convergence and divergence dimensions of the interview schedule. The elders and PRI members consisted of both sexes and were randomly chosen. The list of persons interviewed is given in Annexure 2. The same pattern was followed in interviewing the government officials (see Annexure 3).
Altogether, about thirty focused group discussions were conducted. The number of participants in each group varied from 8 to 25. The composition of the group varied according to the context, availability, and local sensitivity as men and women together, or in some cases separately, youth groups, and caste settlement-wise.
Some Observations and Comments1. At times, it is possible that Caritas India has not provided specific
support, for example, psychosocial support, in a planned manner in Odisha and Gujarat. However, some of the respondents in these states said that they received psychosocial support. The study has considered the data as expressed by the beneficiaries, since it is possible that they had received some support from others. In other words, while the study focus is on Caritas intervention, in some villages multiple agencies conducted out various interventions, whether in an organised manner or ad hoc. The respondents’ answers reflect this. These responses have been taken for analysis.
2. Many organizations partnered with Caritas India. Catholic Relief Services (CRS) partnered with Caritas India virtually in all interventions.
Weaving Hopes after Disasters 33
Caritas Germany provided the financial, technical and professional support along with many other Caritas partners in the world.
3. The tsunami being a major disaster in recent years, multiple agencies worked either through Caritas India or directly through Caritas India partners.
4. Puducherry, a Union territory, has been clubbed with Tamil Nadu for analytical convenience.
Limitations1. The sample size of 910 (800+110) is comparatively on the lower side.
2. For data collection the research team relied on local field investigators who were generally diocesan social service society workers, present or former. This may have resulted in some element of subjectivity in the data collection.
3. The study was carried out in Gujarati, Hindi, Oriya, Telugu and Tamil. At times there were difficulties in capturing the complete nuance of the respondents due to local linguistic variations and cultural sensitivities.
4. It was envisaged to choose villages where all interventions, namely relief, rehabilitation and development were carried out effectively. But in some villages some interventions were not carried out. For example, in three sample villages of Bihar, housing was not provided. Only the government has provided housing for some people under Indira Awas Yojana. Similarly, psychosocial support was not a major intervention in Odisha and Gujarat.
In the following chapter, an attempt is made to narrate the extent of the disasters selected for this study.
Weaving Hopes after Disasters34

Caritas India has continually moved on from one disaster response to another, the recent ones being the Phailin cyclone (2013), Uttarakhand floods (2013),16 Kashmir floods (2014)17 and Hudhud cyclone (2014).18 Each disaster posed unique and multiple challenges, which required contexualizing response strategies. In this chapter, five major disasters have been taken up for study, namely, (i) the super cyclone in Odisha in 1999 and floods in 2001 and 2003; (ii) the earthquake in 2001in the Bhuj area of Gujarat/Kutch; (iii) and (iv) the tsunami in 2004 in Andhra Pradesh and Tamil Nadu; and (v) the floods in Bihar in 2007 and 2008.19
2
Disaster Interventions
Weaving Hopes after Disasters 35

Odisha Super Cyclone (1999) and Floods (2001 and 2003)Odisha has witnessed several major cyclones and floods in the last fifteen years. In cyclone Phailin (2013), there was fortunately no loss of life due considerably to the pre-emptive action taken by the state government, though later on, more than 45 persons died due to the heavy rains that followed the cyclone.
Odisha witnessed a series of major natural disasters in 1999. There were severe floods in August, which affected the seven coastal districts. In October, in a span of eleven days, fourteen districts in the state were devastated by two cyclones. The first cyclone, which lasted overnight on 17-18 October, was classified as a very severe cyclonic storm with wind speeds reaching 200 km per hour. The second cyclone, 29-30 October, was the worst in meteorological history, with wind speeds recorded at 223 kmph. Lasting 24 hours (most cyclones last no longer than three hours), it swept the entire Odisha coast, affecting twelve districts and parts of neighbouring West Bengal, devastating a 250 km stretch of eastern Odisha’s coast. About 10,000 people were reported killed.
The super cyclone destroyed lives and life support systems in 15,420 villages, affecting 12.65 million people. There was loss of 4 lakh cattle; 17 lakh houses were demolished; and 12.5 lakh hectares of standing crop were damaged. 75 per cent of the affected people were farmers, of whom 98 per cent were small and marginal farmers, having less than 2 acres of land. The cyclone also saturated more than 1 million hectares of cropland under salty water and killed some 406,000 livestock.20 In July 2001 and September 2003 there were floods in the state.21
Government ResponseThe Chief Minister of Odisha appealed to individuals as well as national and international aid agencies to extend humanitarian support. The state also asked for assistance from the central government and defence and paramilitary forces. The Prime Minister created a task force headed by the Defence Minister to direct and coordinate rescue, relief, and rehabilitation efforts. The task force identified several priority areas, namely, drinking water, foodstuff and free kitchens, clothing, blankets, utensils, healthcare, temporary shelters, polythene sheets, cooking fuel, kerosene and disposal of bodies, carcasses for immediate action.
The Odisha State Disaster Mitigation Authority (OSDMA), which came into existence in the immediate aftermath of the cyclone, was entrusted with the task of restoring livelihoods, reconstructing damaged infrastructure
Weaving Hopes after Disasters36
and enhancing preparedness measures of the state to face calamities in the future.
The Government of Odisha supplied enough relief materials to the victims, but the main problem was their transportation to the affected villages. An amount of Rs. 25,000 by the state government and Rs. 50,000 from the Prime Minister’s Relief Fund were provided as ex-gratia payment to the legal heirs of the deceased persons. An amount of Rs. 2000 and Rs. 1000 was paid respectively towards fully damaged and partially damaged houses. Educational institutions, multipurpose cyclone shelters, public buildings like hospital and government offices were constructed; roads and bridges were repaired; irrigation was revived; electricity supply was restored; so also were livelihood sources like agriculture, dairy, fishery and non-farm sectors.
Role of Caritas IndiaCaritas India and CRS responded with food, clothes, vessels, temporary shelter, drinking water and sanitation measures. A total of 2,494 volunteers, including doctors, nurses, students, teachers, priests and religious workers reached out to 1,189 interior villages in fifty-three blocks of twelve districts. A total of 30,000 integrated family kits with clothes, vessels and vegetable seeds were distributed. Long-term rehabilitation programmes were conducted. Employment and livelihoods were provided for and houses were constructed. Construction work was done at a cost of Rs 2,13,33,829. Seventeen boats along with nets were provided to the fisher folk families in Puri. Each boat was owned and operated by ten families. Operation clean drive was efficiently carried out through disposal of 1,271 corpses and 1,770 carcasses in thirty-four villages in the most affected areas. A total of 11,000 wells were cleaned and sanitized in thirty-eight panchayats, benefiting about 6,00,000 persons. To provide irrigation and safe drinking water, 200 wells with Peddler pumps and thirty-two bore wells were dug.
Women’s Empowerment through SHGsCaritas and CRS experimented by channelling part of their relief distribution through 365 existing SHGs. This turned out to be an efficient measure, with a dramatic decrease in costs incurred in relief delivery. The SHGs also ensured that the poorest and most needy members of the community received relief supplies and also disbursed their own group savings to members to support the relief activities.
Weaving Hopes after Disasters 37

By 2002, an additional 1,850 new groups were formed, doubling the number of members to 35,000. Their cumulative savings reached Rs 9 lakh (US$180,000); 355 SHGs were linked to banks for credit, with 250 more in line for credit, and all the groups were linked to a bank for savings. Caritas and CRS provided them financial and technical support in the development of grain and seed banks and supported income-generating activities (funded by DFID) in order to address the problem of post-disaster food insecurity.
Livelihood interventionLivelihood support in the form of mechanized and manually operated fishing boats, agricultural and pisciculture support, distribution of livestock, support for small businesses and credit to SHGs for group-based income generation activities was extended through SHGs.
Socio-cultural interventionsVarious social issues like domestic violence, alcoholism, dowry demands, etc. were tackled by SHGs. Apart from these, SHGs implemented several government schemes for vulnerable groups like widows and senior citizens. Welfare and development programmes were availed by SHGs and the Federations for Individuals and Communities through panchayati raj institutions.
Intervention in Health and EducationIntervention in health was made in the form of awareness camps on preventable diseases and women’s healthcare by promoting linkages with government personnel and centres. Education intervention was made in order to ensure regular functioning and quality teaching in 60 ICDS centres, 64 upper primary schools, 25 middle schools, and 16 high schools with 355 teachers, with active school managing committees spread out in 11 Gram Panchayats under Astarang, Kakatpur, Balikuda and Erasama Blocks over a period of three years.
Weaving Hopes after Disasters38
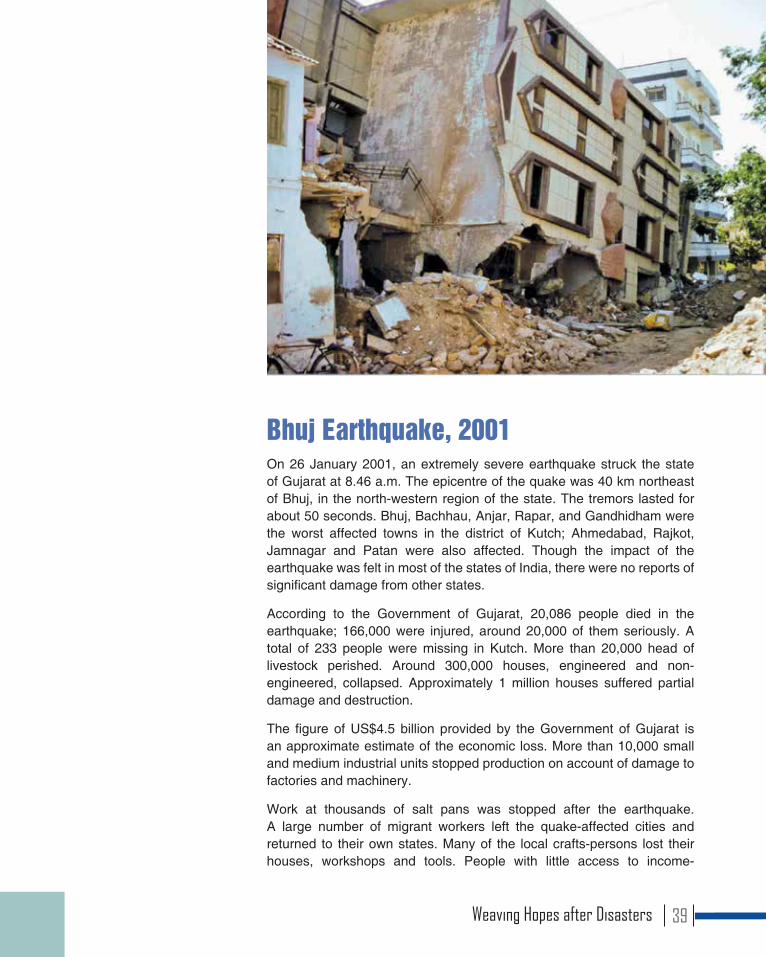
Bhuj Earthquake, 2001On 26 January 2001, an extremely severe earthquake struck the state of Gujarat at 8.46 a.m. The epicentre of the quake was 40 km northeast of Bhuj, in the north-western region of the state. The tremors lasted for about 50 seconds. Bhuj, Bachhau, Anjar, Rapar, and Gandhidham were the worst affected towns in the district of Kutch; Ahmedabad, Rajkot, Jamnagar and Patan were also affected. Though the impact of the earthquake was felt in most of the states of India, there were no reports of significant damage from other states.
According to the Government of Gujarat, 20,086 people died in the earthquake; 166,000 were injured, around 20,000 of them seriously. A total of 233 people were missing in Kutch. More than 20,000 head of livestock perished. Around 300,000 houses, engineered and non-engineered, collapsed. Approximately 1 million houses suffered partial damage and destruction.
The figure of US$4.5 billion provided by the Government of Gujarat is an approximate estimate of the economic loss. More than 10,000 small and medium industrial units stopped production on account of damage to factories and machinery.
Work at thousands of salt pans was stopped after the earthquake. A large number of migrant workers left the quake-affected cities and returned to their own states. Many of the local crafts-persons lost their houses, workshops and tools. People with little access to income-
Weaving Hopes after Disasters 39
earning opportunities were especially vulnerable. Along with shelter, the restoration of livelihood was a priority for the rehabilitation programme.
Response of the Government The government took immediate action, closing down schools and using its entire personnel for rescue and relief measures. The army assisted emergency workers and health teams as they sought to save people from the fallen rubble.
The state government announced an ex-gratia payment of Rs. 1,00,000 to those households where deaths had taken place due to the earthquake. An immediate relief of Rs. 5 crore each was allocated for Ahmedabad and Kutch districts and Rs. 1 crore each for Rajkot, Jamnagar, Surat, Surendranagar, Banaskantha and Mehsana. The government set up the Gujarat State Disaster Management Authority (GSDMA), which implemented reconstruction and rehabilitation, with support from various other agencies in the quake-hit area. The government announced four packages22 amounting to almost US$1 billion for reconstruction and economic rehabilitation of more than 3,00,000 families. The government also announced US$2.5 million package to revive small, medium and cottage industries.
Intervention by Caritas India The thrust areas of Caritas India were reconstruction, livelihood, health, education, organization and empowerment. The relief operations launched by Caritas India covered 600 villages in Kutch district. Following the immediate relief phase, Caritas India launched a three-year programme of reconstruction and rehabilitation in fourteen villages in the taluks of Bhuj and Bachau. Bypassing its policy of working through local church structures, on account of the magnitude of the disaster, Caritas India decided to directly operate the programme. Even so, Caritas India made every effort to involve the Rajkot Social Service Society, within whose jurisdiction Kutch district falls.
The aims and major physical achievements of the reconstruction and rehabilitation programme were as follows:
Weaving Hopes after Disasters40
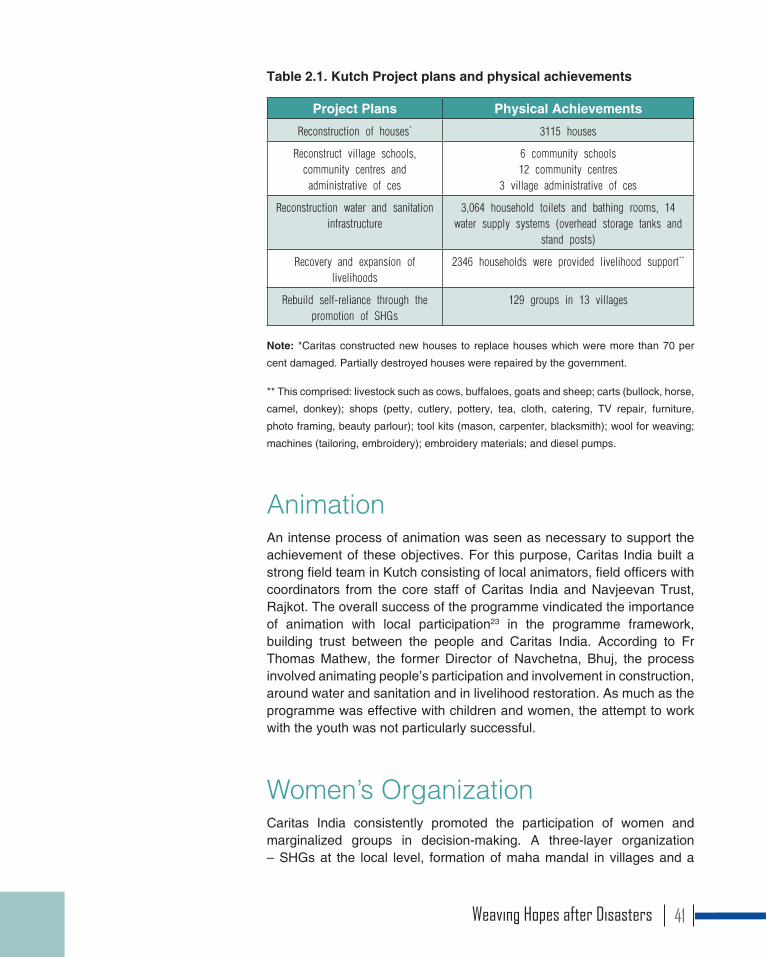
Table 2.1. Kutch Project plans and physical achievements
Project Plans Physical Achievements
Reconstruction of houses* 3115 houses
Reconstruct village schools, community centres and administrative offices
6 community schools12 community centres
3 village administrative offices
Reconstruction water and sanitation infrastructure
3,064 household toilets and bathing rooms, 14 water supply systems (overhead storage tanks and
stand posts)
Recovery and expansion of livelihoods
2346 households were provided livelihood support**
Rebuild self-reliance through the promotion of SHGs
129 groups in 13 villages
Note: *Caritas constructed new houses to replace houses which were more than 70 per
cent damaged. Partially destroyed houses were repaired by the government.
** This comprised: livestock such as cows, buffaloes, goats and sheep; carts (bullock, horse,
camel, donkey); shops (petty, cutlery, pottery, tea, cloth, catering, TV repair, furniture,
photo framing, beauty parlour); tool kits (mason, carpenter, blacksmith); wool for weaving;
machines (tailoring, embroidery); embroidery materials; and diesel pumps.
AnimationAn intense process of animation was seen as necessary to support the achievement of these objectives. For this purpose, Caritas India built a strong field team in Kutch consisting of local animators, field officers with coordinators from the core staff of Caritas India and Navjeevan Trust, Rajkot. The overall success of the programme vindicated the importance of animation with local participation23 in the programme framework, building trust between the people and Caritas India. According to Fr Thomas Mathew, the former Director of Navchetna, Bhuj, the process involved animating people’s participation and involvement in construction, around water and sanitation and in livelihood restoration. As much as the programme was effective with children and women, the attempt to work with the youth was not particularly successful.
Women’s OrganizationCaritas India consistently promoted the participation of women and marginalized groups in decision-making. A three-layer organization – SHGs at the local level, formation of maha mandal in villages and a
Weaving Hopes after Disasters 41

federation at the district level linking maha mandals – was formed. These organizations played a constructive role in housing as well as water and sanitation committees.
LivelihoodThe livelihood programme had a tremendous impact on the people’s incomes and lives. Majority of the households put the support they received from the projects to good use.
Health and EducationSome efforts were also made to provide healthcare and promote education of the children through water and sanitation programmes and construction of classrooms. This had a good effect in the long run.
Linking Relief and Rehabilitation to DevelopmentThe first phase of the project, comprising reconstruction of houses, building of the community structures and implementation of livelihood programmes was completed in July 2004. Considering the climatic condition, especially the severe winter months, within a short period of three months the housing project was initiated. Only after the construction of houses, animation works began. Project management was handed over to the Rajkot social works wing on 4 April 2004. Later, while Caritas India continued to support the development phase of the earthquake rehabilitation in Kutch district, CRS supported other districts where other organizations were doing social work. In the Kutch region, Kutch Jyoti Trust was made the district coordination agency and continued later development interventions.
In this phase, two major interventions took place:
• Formation of district-level federation as a registered entity, which continues to work on health, education, livelihood and village development with women’s participation.
• Navchetna Micro Finance System.
Weaving Hopes after Disasters42
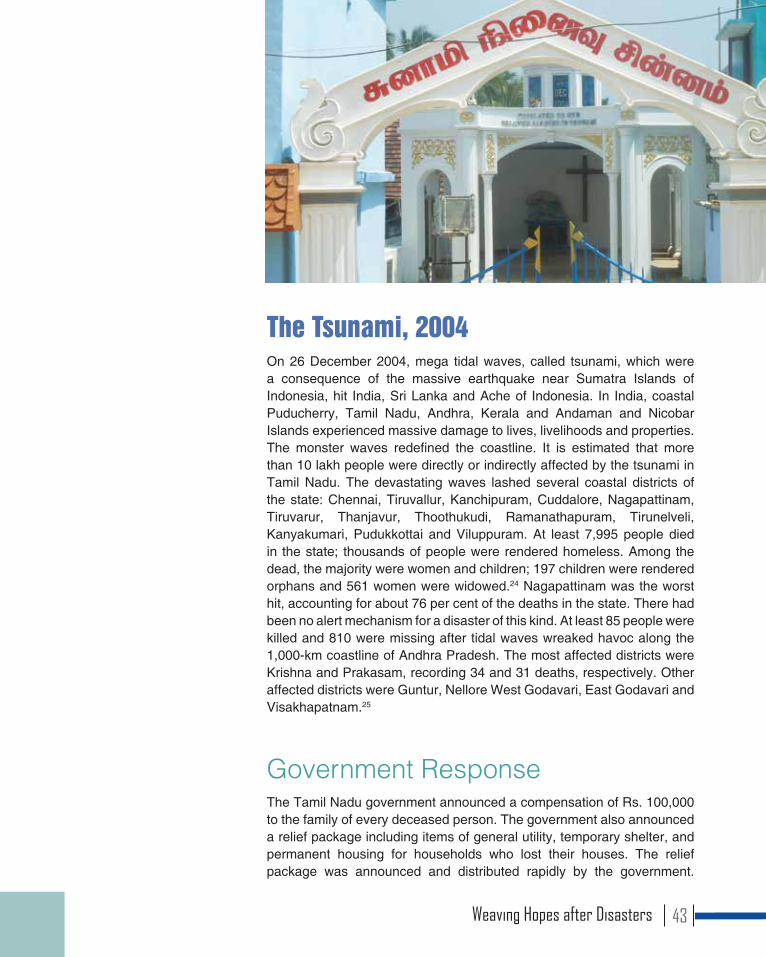
The Tsunami, 2004On 26 December 2004, mega tidal waves, called tsunami, which were a consequence of the massive earthquake near Sumatra Islands of Indonesia, hit India, Sri Lanka and Ache of Indonesia. In India, coastal Puducherry, Tamil Nadu, Andhra, Kerala and Andaman and Nicobar Islands experienced massive damage to lives, livelihoods and properties. The monster waves redefined the coastline. It is estimated that more than 10 lakh people were directly or indirectly affected by the tsunami in Tamil Nadu. The devastating waves lashed several coastal districts of the state: Chennai, Tiruvallur, Kanchipuram, Cuddalore, Nagapattinam, Tiruvarur, Thanjavur, Thoothukudi, Ramanathapuram, Tirunelveli, Kanyakumari, Pudukkottai and Viluppuram. At least 7,995 people died in the state; thousands of people were rendered homeless. Among the dead, the majority were women and children; 197 children were rendered orphans and 561 women were widowed.24 Nagapattinam was the worst hit, accounting for about 76 per cent of the deaths in the state. There had been no alert mechanism for a disaster of this kind. At least 85 people were killed and 810 were missing after tidal waves wreaked havoc along the 1,000-km coastline of Andhra Pradesh. The most affected districts were Krishna and Prakasam, recording 34 and 31 deaths, respectively. Other affected districts were Guntur, Nellore West Godavari, East Godavari and Visakhapatnam.25
Government ResponseThe Tamil Nadu government announced a compensation of Rs. 100,000 to the family of every deceased person. The government also announced a relief package including items of general utility, temporary shelter, and permanent housing for households who lost their houses. The relief package was announced and distributed rapidly by the government.
Weaving Hopes after Disasters 43
The Union territory of Puducherry appeared to be efficient in its rescue and relief, with the relief operations being administered by an efficient district collector. For the reconstruction work, the government laid down a framework for NGO-government coordination.
Role of Caritas IndiaTsunami response was the most massive intervention carried out by Caritas India in the last two decades, both in terms of volume of work and financial support. Caritas India in a joint action with CRS, supported 21 diocesan partners to organize and manage over 100 relief camps sheltering over 125,000 people along the Tamil Nadu and Andhra Pradesh coastlines.
A three-phase response concept was initiated. Phase 1 was for providing Immediate Humanitarian Relief over 1-3 weeks, by reaching out to 44,500 families (2,22,500 persons) with food, medical aid, clothing, sleeping mats, and water/sanitation support. Phase 2 aimed at Intermediate Resettlement Relief over 1-6 months to assist 25,000 displaced families with temporary shelters, household kits, access to clean water and sanitation, and cash-for-work as livelihood support. Phase 3 was planned to address Livelihood Rehabilitation and Reconstruction over 3 to 24 months aiming at assisting 25,000 affected families with permanent shelter, rebuilding their livelihoods and strengthening their resilience to future disasters through community-based disaster preparedness (CBDP) methodologies. Table 2.2 highlights the key relief-related achievements.
Livelihood SupportThis phase had twin objectives: Rehabilitation of the fisheries-based livelihoods and livelihood for non-fishing communities. Fishery-based livelihood included replacing crafts (all types), engines and nets; repairing crafts, engines, nets and providing or replacing accessories. A total of 2,116 boats, 899 catamarans, 2,234 engines and 21,592 fishing nets were distributed. About 1,626 boats were repaired and 434 salt pans were reclaimed.
Livelihood support for non-fishing communities included light vehicle driving – 392; heavy machinery – 169; shipping management – 66; office secretary-ship – 96; fibre boat repairing – 15; house wiring and training – 48; computer education – 26; diesel auto rickshaw – 4; financial assistance to start/restart business – 61; petty shops – 334; vessel rental – 92 and xerox copier shop – 1.
Weaving Hopes after Disasters44
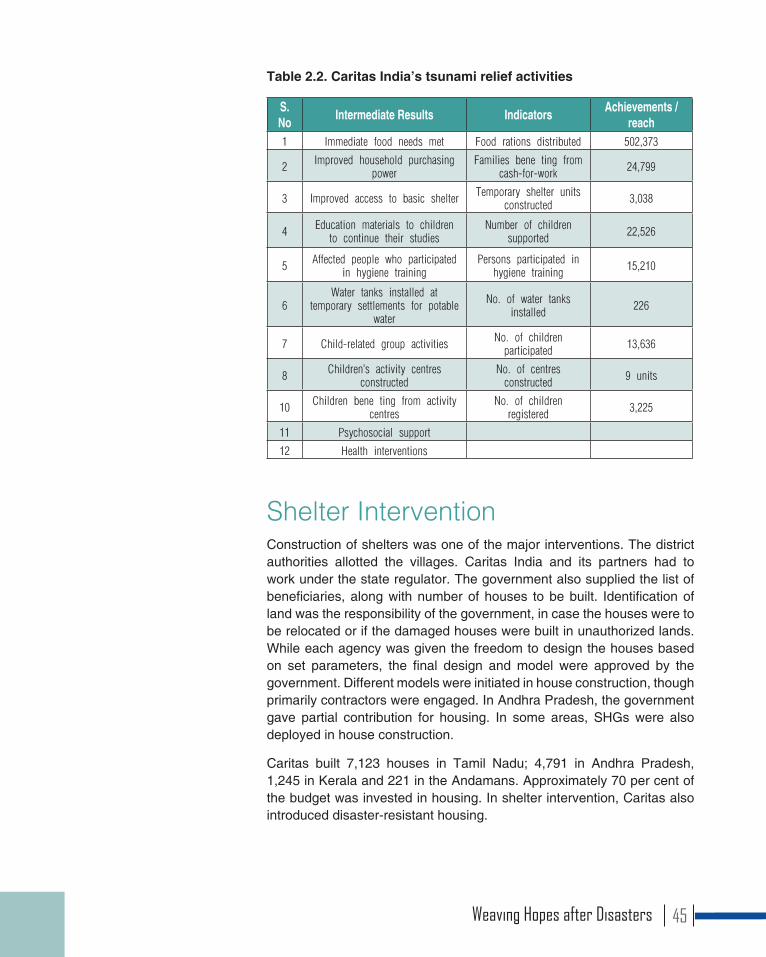
Table 2.2. Caritas India’s tsunami relief activities
S. No Intermediate Results Indicators Achievements /
reach1 Immediate food needs met Food rations distributed 502,373
2 Improved household purchasing power
Families benefiting from cash-for-work 24,799
3 Improved access to basic shelter Temporary shelter units constructed 3,038
4 Education materials to children to continue their studies
Number of children supported 22,526
5 Affected people who participated in hygiene training
Persons participated in hygiene training 15,210
6Water tanks installed at
temporary settlements for potable water
No. of water tanks installed 226
7 Child-related group activities No. of children participated 13,636
8 Children’s activity centres constructed
No. of centres constructed 9 units
10 Children benefiting from activity centres
No. of children registered 3,225
11 Psychosocial support
12 Health interventions
Shelter InterventionConstruction of shelters was one of the major interventions. The district authorities allotted the villages. Caritas India and its partners had to work under the state regulator. The government also supplied the list of beneficiaries, along with number of houses to be built. Identification of land was the responsibility of the government, in case the houses were to be relocated or if the damaged houses were built in unauthorized lands. While each agency was given the freedom to design the houses based on set parameters, the final design and model were approved by the government. Different models were initiated in house construction, though primarily contractors were engaged. In Andhra Pradesh, the government gave partial contribution for housing. In some areas, SHGs were also deployed in house construction.
Caritas built 7,123 houses in Tamil Nadu; 4,791 in Andhra Pradesh, 1,245 in Kerala and 221 in the Andamans. Approximately 70 per cent of the budget was invested in housing. In shelter intervention, Caritas also introduced disaster-resistant housing.
Weaving Hopes after Disasters 45
CBDPCommunity-based Disaster Preparedness (CBDP) programmes were organized extensively to expand the capability of the existing fishing communities to cope with the disasters at sea as well as develop appropriate mechanisms to improve sea safety. This resulted in developing mechanisms to mitigate disasters at the grassroots level through the participation of communities. Communities, being the first respondent and having more contextual familiarity with hazards and available resources, were in a better position to plan and to execute immediate rescue-and-relief actions. CBDP was initiated in all the places to prepare communities to safeguard lives, livelihood and property. Caritas has attempted to link these structures with the government systems. A five-layer process was initiated and implemented, namely, (i) preparing the Diocesan Social Service Societies, (ii) issue analysis, (iii) consensus building, (iv) action plan, and (v) implementation.
With the completion of this process in 2012, the tsunami intervention was officially closed in all the areas.
Bihar Floods, 2007 and 2008As much as 76 per cent of the population in north Bihar is constantly living under the recurring threat of flood devastation. About 68,800 sq. km. out of the total geographical area of 94,160 sq. km. of the state (73.6 per cent) is flood affected. The plains of Bihar adjoining Nepal are drained by a number of rivers that have their catchments in the steep and geologically nascent Himalayas. The Kosi, Gandak, Burhi Gandak, Bagmati, Kamla, Balan, Mahananda and Adhwara originate in Nepal, carry high discharge and very high sediment load and drop it down in the plains of Bihar. The south-west monsoon has become a synonym for floods in the North Bihar districts.
Floods in 2007The floods in 2007 in the state were designated as unprecedented in their intensity, unpredictability, seasonality in their timing, their spatial coverage, their successive spells, and their extended duration.
Black Day 200818 August 2008 was marked as Black Day for the people of north-eastern
Weaving Hopes after Disasters46

Bihar. Prime Minister Manmohan Singh declared this catastrophe as a “national calamity”. The Government of India claimed that 3.24 million people were affected by the floods; 69 people and 179 animals lost their lives. However, private sources claim that over 2,000 humans died.
Response of the StateRescue of stranded persons, setting right the communication system and distributing relief materials was the major response of the state government. About 7000 boats were deployed to rescue stranded people in different villages. A number of critical areas that were difficult to reach by boats were served by dropping food packets from Air Force helicopters. Temporary shelters made with polythene sheets were also provided. Cash assistance was provided to partially and fully damaged 6 lakh houses by the central government through its Calamity Relief Fund (CRF). Later, through the Indira Awas scheme, monetary support was provided to the tune of Rs 25,000 per house to build pucca houses.
Intervention of Caritas IndiaThe flood of 2008 severely affected six districts in north-eastern Bihar. Caritas India through its partners intervened for relief support in 23 blocks comprising 95 Panchayats with 389 villages in four of these districts, namely, Darbhanga, Sitamarhi, Begusarai and Khagaria.
Relief and RehabilitationThe first response was mainly to provide food and temporary shelter to 17,000 households with the help of local church partners and NGOs like Bihar Dalit Vikas Samiti and Janshakthi International. Catholic Relief Services (CRS) outstretched its hands to support 17,000 households in three districts, namely Muzaffarpur, Samastipur and Madhubani. The European Commission and other Caritas International partners joined the relief work with financial and human resources. Along with dry ration, water containers were distributed to ensure people’s access to safe drinking water. Medical care was provided against possible outbreak of pandemics. Polythene-made makeshift houses were also provided. Later, livelihood support in the form of livestock, training on snack making, etc. was provided to certain villages. Housing support was also extended in a few places. A new bamboo model of housing was introduced in parts of Muzaffarpur.
Weaving Hopes after Disasters 47

CBDPLater, community-based disaster preparedness was initiated to capacitate the community members to analyse their own situation and plan for their own survival in the context of natural disaster in the most effective manner. The primary focus of the programme was to instil a change of mindset of community from dependence on external support (in the form of relief) to self-dependency and self-confidence of preparedness in the context of natural disasters. Women were considered to be especially vulnerable as well as the most potential group for practising family-level preparedness. Caritas India adopted different approaches, such as interpersonal communication, small group and tola/ward level meetings, and participatory learning appraisal to impart the importance of preparedness, with special focus on women. Various assessment reports have stated that a good number of households and villagers benefited by this intervention. As part of preparedness, task forces were formed to promote search and rescue, first aid, coordination, early warning, and protection. Sessions on CBDP were also held in schools for students and teachers.
Conclusion: Some General Characteristics of Disaster Interventions by Caritas India1. Disaster intervention, as a humanitarian response, has been a key
intervention of Caritas India for many years.
2. Though every disaster is unique in itself, posing multiple challenges, Caritas India seems to have developed capacities, systems and mechanisms to reach the neediest in the quickest possible time with an appropriate response.
3. In all interventions, the participation of the local community has been given paramount importance. In the last decade, CBDP has emerged as a core intervention area by Caritas India.
4. Though, initially, in all disaster interventions the men seemed to have had a greater say than the women at many levels, at the end of the interventions it was the women who were transformed more than men, with a deep impact in family life, socio-economic conditions, community life as well as in accessing entitlements from the government.
5. Caritas has also progressively transformed itself from being a charitable organization to a rights-based organization focusing on
Weaving Hopes after Disasters48
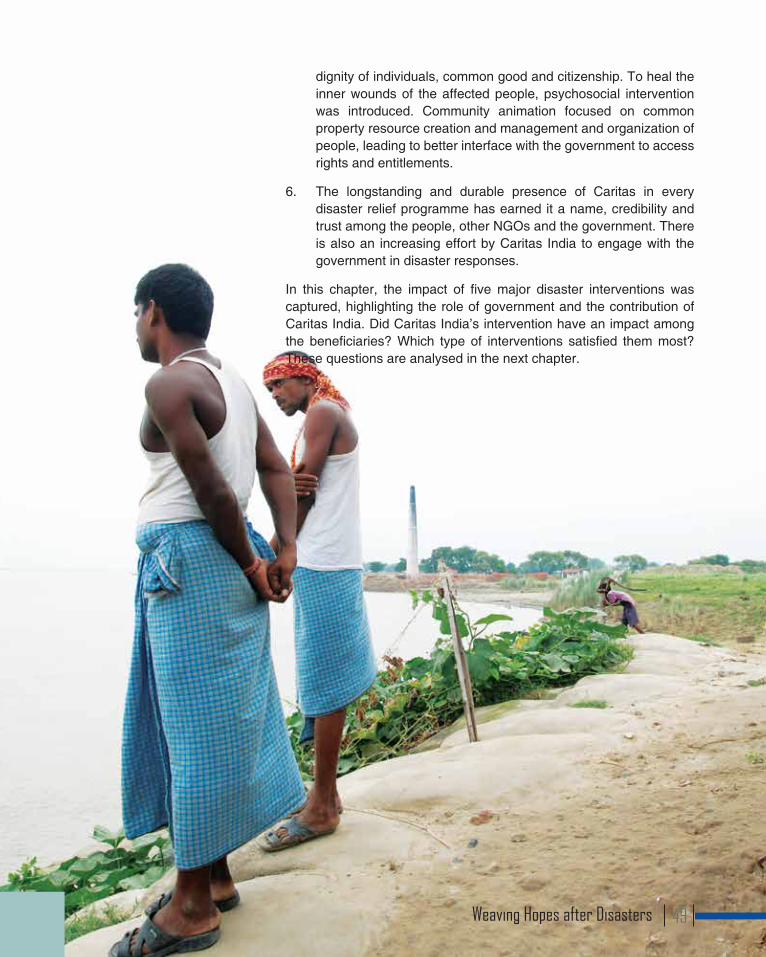
dignity of individuals, common good and citizenship. To heal the inner wounds of the affected people, psychosocial intervention was introduced. Community animation focused on common property resource creation and management and organization of people, leading to better interface with the government to access rights and entitlements.
6. The longstanding and durable presence of Caritas in every disaster relief programme has earned it a name, credibility and trust among the people, other NGOs and the government. There is also an increasing effort by Caritas India to engage with the government in disaster responses.
In this chapter, the impact of five major disaster interventions was captured, highlighting the role of government and the contribution of Caritas India. Did Caritas India’s intervention have an impact among the beneficiaries? Which type of interventions satisfied them most? These questions are analysed in the next chapter.
Weaving Hopes after Disasters 49
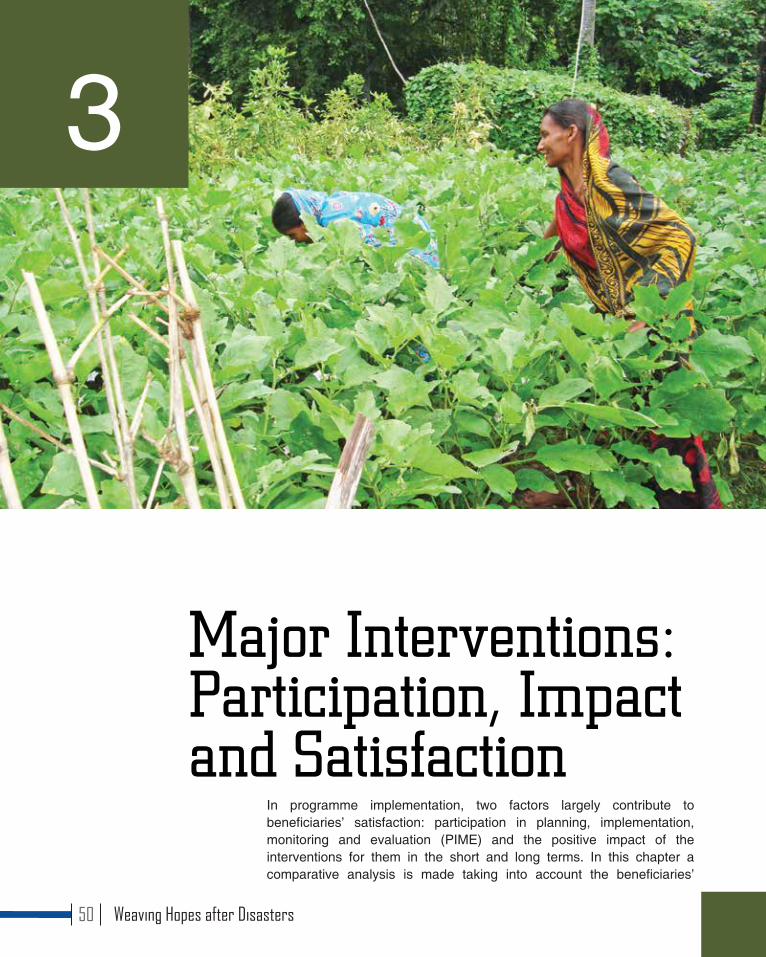
In programme implementation, two factors largely contribute to beneficiaries’ satisfaction: participation in planning, implementation, monitoring and evaluation (PIME) and the positive impact of the interventions for them in the short and long terms. In this chapter a comparative analysis is made taking into account the beneficiaries’
3
Major Interventions: Participation, Impact and Satisfaction
Weaving Hopes after Disasters50
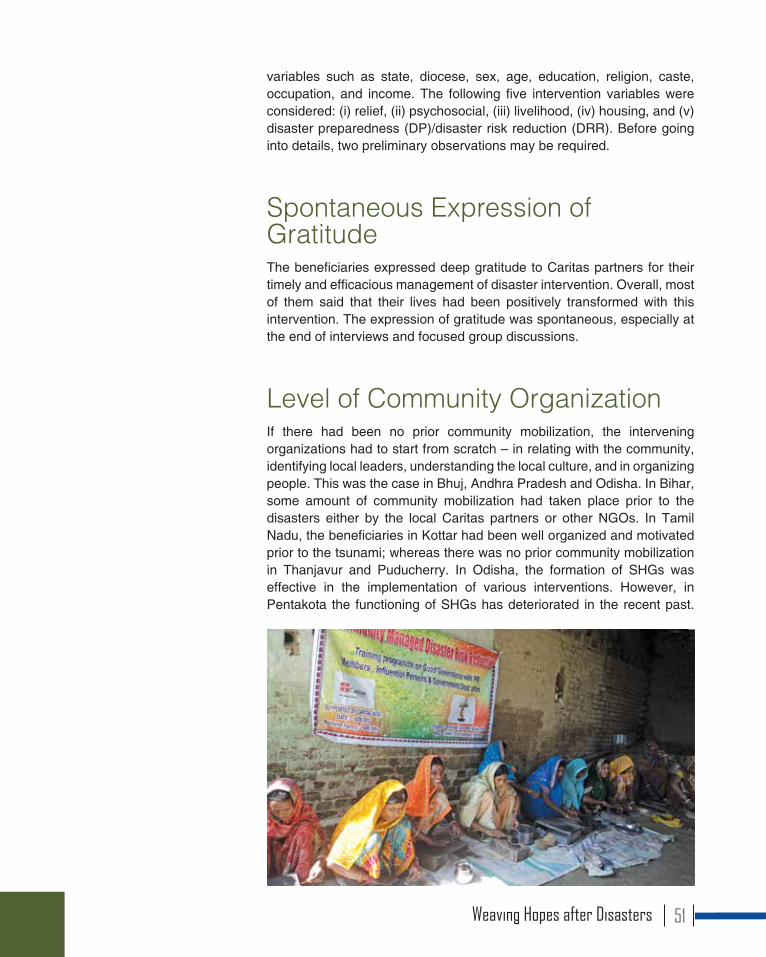
variables such as state, diocese, sex, age, education, religion, caste, occupation, and income. The following five intervention variables were considered: (i) relief, (ii) psychosocial, (iii) livelihood, (iv) housing, and (v) disaster preparedness (DP)/disaster risk reduction (DRR). Before going into details, two preliminary observations may be required.
Spontaneous Expression of GratitudeThe beneficiaries expressed deep gratitude to Caritas partners for their timely and efficacious management of disaster intervention. Overall, most of them said that their lives had been positively transformed with this intervention. The expression of gratitude was spontaneous, especially at the end of interviews and focused group discussions.
Level of Community OrganizationIf there had been no prior community mobilization, the intervening organizations had to start from scratch – in relating with the community, identifying local leaders, understanding the local culture, and in organizing people. This was the case in Bhuj, Andhra Pradesh and Odisha. In Bihar, some amount of community mobilization had taken place prior to the disasters either by the local Caritas partners or other NGOs. In Tamil Nadu, the beneficiaries in Kottar had been well organized and motivated prior to the tsunami; whereas there was no prior community mobilization in Thanjavur and Puducherry. In Odisha, the formation of SHGs was effective in the implementation of various interventions. However, in Pentakota the functioning of SHGs has deteriorated in the recent past.
Weaving Hopes after Disasters 51
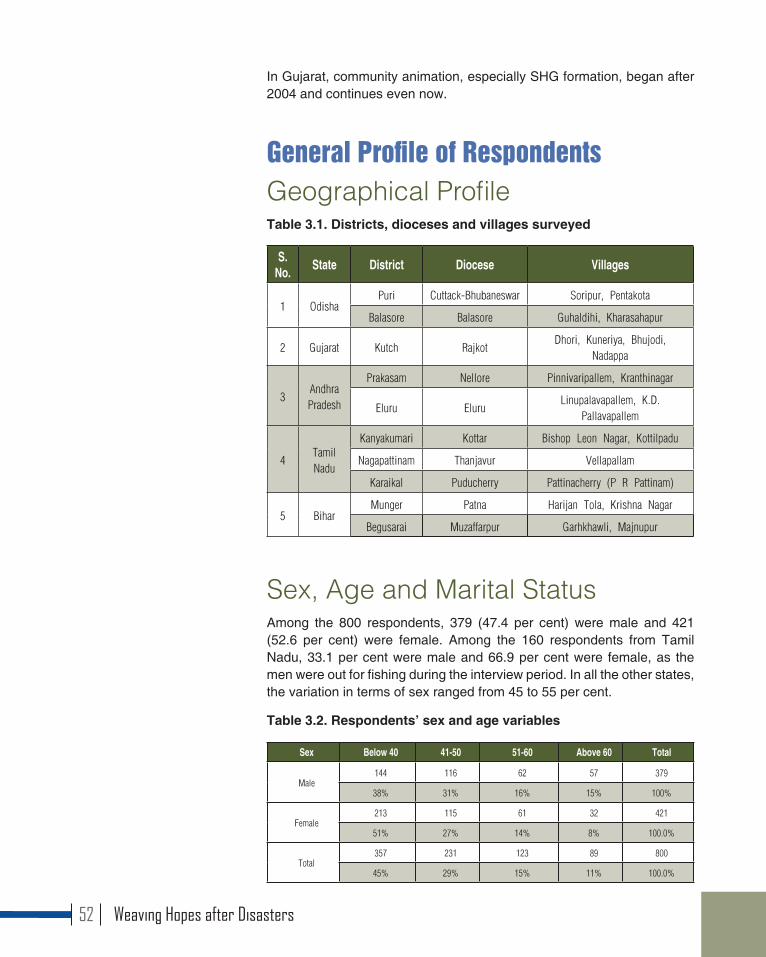
In Gujarat, community animation, especially SHG formation, began after 2004 and continues even now.
General Profile of RespondentsGeographical Profile Table 3.1. Districts, dioceses and villages surveyed
S. No. State District Diocese Villages
1 OdishaPuri Cuttack-Bhubaneswar Soripur, Pentakota
Balasore Balasore Guhaldihi, Kharasahapur
2 Gujarat Kutch RajkotDhori, Kuneriya, Bhujodi,
Nadappa
3Andhra Pradesh
Prakasam Nellore Pinnivaripallem, Kranthinagar
Eluru EluruLinupalavapallem, K.D.
Pallavapallem
4Tamil Nadu
Kanyakumari Kottar Bishop Leon Nagar, Kottilpadu
Nagapattinam Thanjavur Vellapallam
Karaikal Puducherry Pattinacherry (P R Pattinam)
5 BiharMunger Patna Harijan Tola, Krishna Nagar
Begusarai Muzaffarpur Garhkhawli, Majnupur
Sex, Age and Marital StatusAmong the 800 respondents, 379 (47.4 per cent) were male and 421 (52.6 per cent) were female. Among the 160 respondents from Tamil Nadu, 33.1 per cent were male and 66.9 per cent were female, as the men were out for fishing during the interview period. In all the other states, the variation in terms of sex ranged from 45 to 55 per cent.
Table 3.2. Respondents’ sex and age variables
Sex Below 40 41-50 51-60 Above 60 Total
Male144 116 62 57 379
38% 31% 16% 15% 100%
Female213 115 61 32 421
51% 27% 14% 8% 100.0%
Total357 231 123 89 800
45% 29% 15% 11% 100.0%
Weaving Hopes after Disasters52

Note: All percentages in the tables have been converted to the nearest whole number. Accordingly, at times the total percentage may vary slightly from 100. However, in the
running text percentages are given with a single decimal.
With regard to age, 44.6 per cent of the respondents were below 40, 28.9 per cent were in the age group 41 to 50, 15.4 per cent were in the age group 51-60, and about 11.1 per cent were above 60 years old. 91.1 per cent of the respondents were married; 1.6 per cent were either unmarried or separated; about 59 (7.4 per cent) were widow or widower. Gujarat had 17 respondents in the widow/er category.
EducationNearly half of the respondents (48.5 per cent) were illiterate; 59.3 per cent of them were females.
Table 3.3. Respondents’ educational level by sex
Sex Illiterate Primary Middle High and Higher Secondary
Technical/Graduation and above
Total
Male157 101 57 50 14 379
41% 27% 15% 13% 4% 100%
Female231 102 41 43 4 421
55% 24% 10% 10% 1% 100%
Total388 203 98 93 18 800
49% 25% 12% 12% 2% 100%
Table 3.4.Educational level of respondents in surveyed states
State Illiterate Primary Middle High/Higher Secondary
Technical/ Graduation and
aboveTotal
Odisha48 58 14 33 7 160
30% 36% 9% 21% 4% 100%
Gujarat101 25 20 10 4 160
63% 16% 13% 6% 3% 100%
Andhra Pradesh
69 45 24 18 4 160
43% 28% 15% 11% 3% 100%
Tamil Nadu
38 68 29 22 3 160
24% 43% 18% 14% 2% 100%
Bihar132 7 11 10 0 160
83% 4% 7% 6% 0% 100%
Total388 203 98 93 18 800
49% 25% 12% 12% 2% 100%
Weaving Hopes after Disasters 53
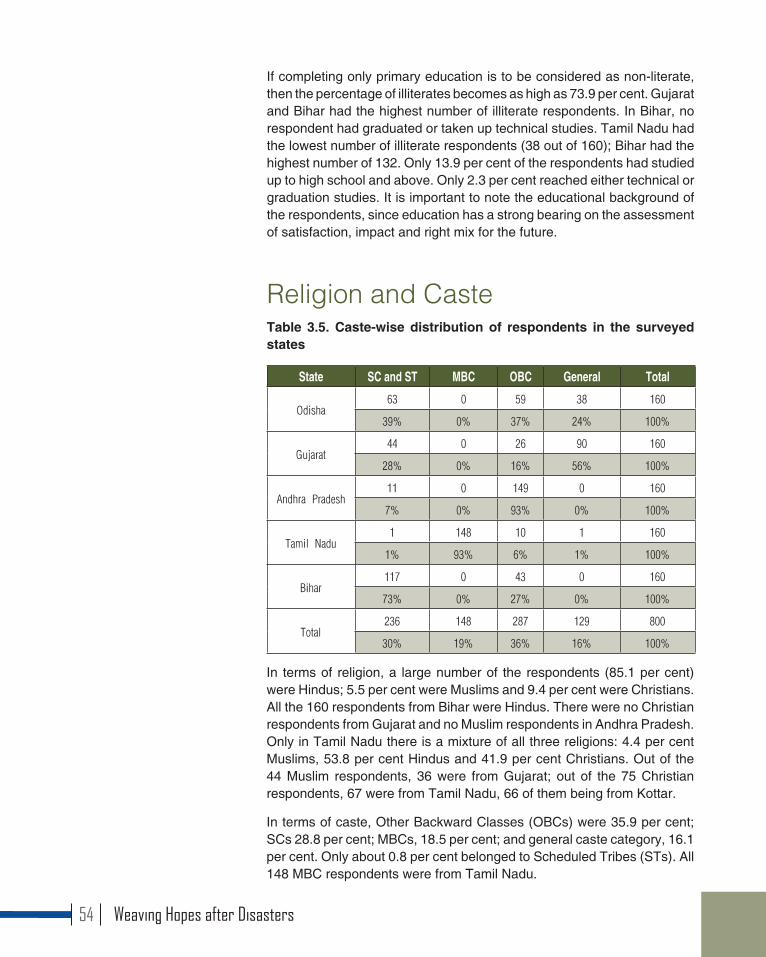
If completing only primary education is to be considered as non-literate, then the percentage of illiterates becomes as high as 73.9 per cent. Gujarat and Bihar had the highest number of illiterate respondents. In Bihar, no respondent had graduated or taken up technical studies. Tamil Nadu had the lowest number of illiterate respondents (38 out of 160); Bihar had the highest number of 132. Only 13.9 per cent of the respondents had studied up to high school and above. Only 2.3 per cent reached either technical or graduation studies. It is important to note the educational background of the respondents, since education has a strong bearing on the assessment of satisfaction, impact and right mix for the future.
Religion and CasteTable 3.5. Caste-wise distribution of respondents in the surveyed states
State SC and ST MBC OBC General Total
Odisha63 0 59 38 160
39% 0% 37% 24% 100%
Gujarat44 0 26 90 160
28% 0% 16% 56% 100%
Andhra Pradesh11 0 149 0 160
7% 0% 93% 0% 100%
Tamil Nadu1 148 10 1 160
1% 93% 6% 1% 100%
Bihar117 0 43 0 160
73% 0% 27% 0% 100%
Total236 148 287 129 800
30% 19% 36% 16% 100%
In terms of religion, a large number of the respondents (85.1 per cent) were Hindus; 5.5 per cent were Muslims and 9.4 per cent were Christians. All the 160 respondents from Bihar were Hindus. There were no Christian respondents from Gujarat and no Muslim respondents in Andhra Pradesh. Only in Tamil Nadu there is a mixture of all three religions: 4.4 per cent Muslims, 53.8 per cent Hindus and 41.9 per cent Christians. Out of the 44 Muslim respondents, 36 were from Gujarat; out of the 75 Christian respondents, 67 were from Tamil Nadu, 66 of them being from Kottar.
In terms of caste, Other Backward Classes (OBCs) were 35.9 per cent; SCs 28.8 per cent; MBCs, 18.5 per cent; and general caste category, 16.1 per cent. Only about 0.8 per cent belonged to Scheduled Tribes (STs). All 148 MBC respondents were from Tamil Nadu.
Weaving Hopes after Disasters54
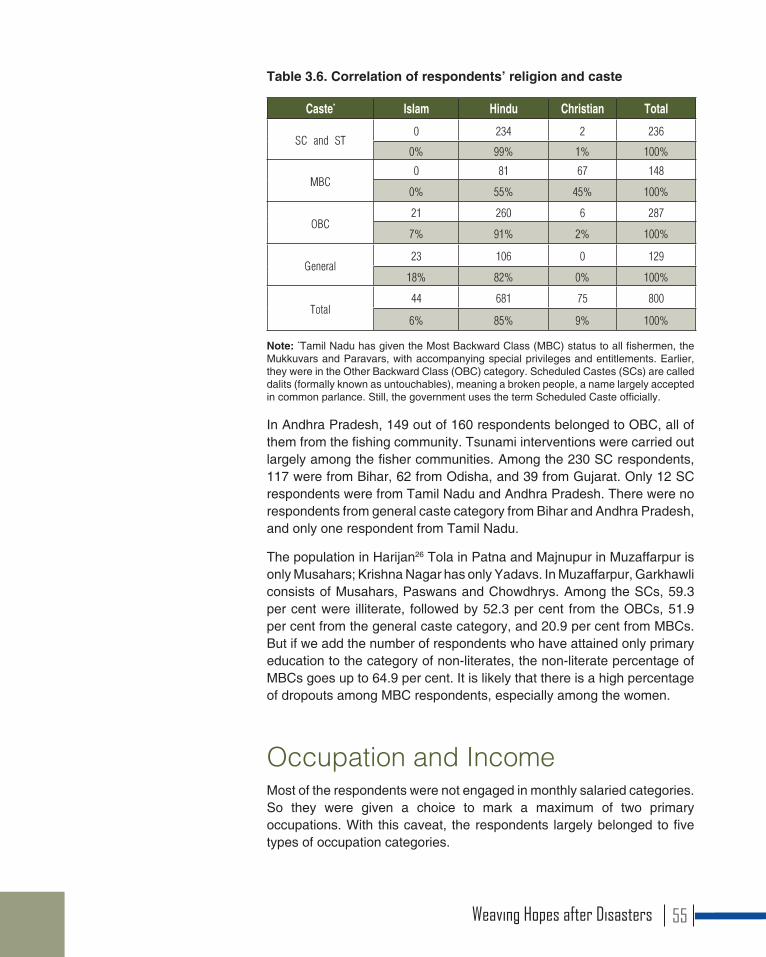
Table 3.6. Correlation of respondents’ religion and caste
Caste* Islam Hindu Christian Total
SC and ST0 234 2 236
0% 99% 1% 100%
MBC0 81 67 148
0% 55% 45% 100%
OBC21 260 6 287
7% 91% 2% 100%
General23 106 0 129
18% 82% 0% 100%
Total44 681 75 800
6% 85% 9% 100%
Note: *Tamil Nadu has given the Most Backward Class (MBC) status to all fishermen, the Mukkuvars and Paravars, with accompanying special privileges and entitlements. Earlier, they were in the Other Backward Class (OBC) category. Scheduled Castes (SCs) are called dalits (formally known as untouchables), meaning a broken people, a name largely accepted in common parlance. Still, the government uses the term Scheduled Caste officially.
In Andhra Pradesh, 149 out of 160 respondents belonged to OBC, all of them from the fishing community. Tsunami interventions were carried out largely among the fisher communities. Among the 230 SC respondents, 117 were from Bihar, 62 from Odisha, and 39 from Gujarat. Only 12 SC respondents were from Tamil Nadu and Andhra Pradesh. There were no respondents from general caste category from Bihar and Andhra Pradesh, and only one respondent from Tamil Nadu.
The population in Harijan26 Tola in Patna and Majnupur in Muzaffarpur is only Musahars; Krishna Nagar has only Yadavs. In Muzaffarpur, Garkhawli consists of Musahars, Paswans and Chowdhrys. Among the SCs, 59.3 per cent were illiterate, followed by 52.3 per cent from the OBCs, 51.9 per cent from the general caste category, and 20.9 per cent from MBCs. But if we add the number of respondents who have attained only primary education to the category of non-literates, the non-literate percentage of MBCs goes up to 64.9 per cent. It is likely that there is a high percentage of dropouts among MBC respondents, especially among the women.
Occupation and IncomeMost of the respondents were not engaged in monthly salaried categories. So they were given a choice to mark a maximum of two primary occupations. With this caveat, the respondents largely belonged to five types of occupation categories.
Weaving Hopes after Disasters 55
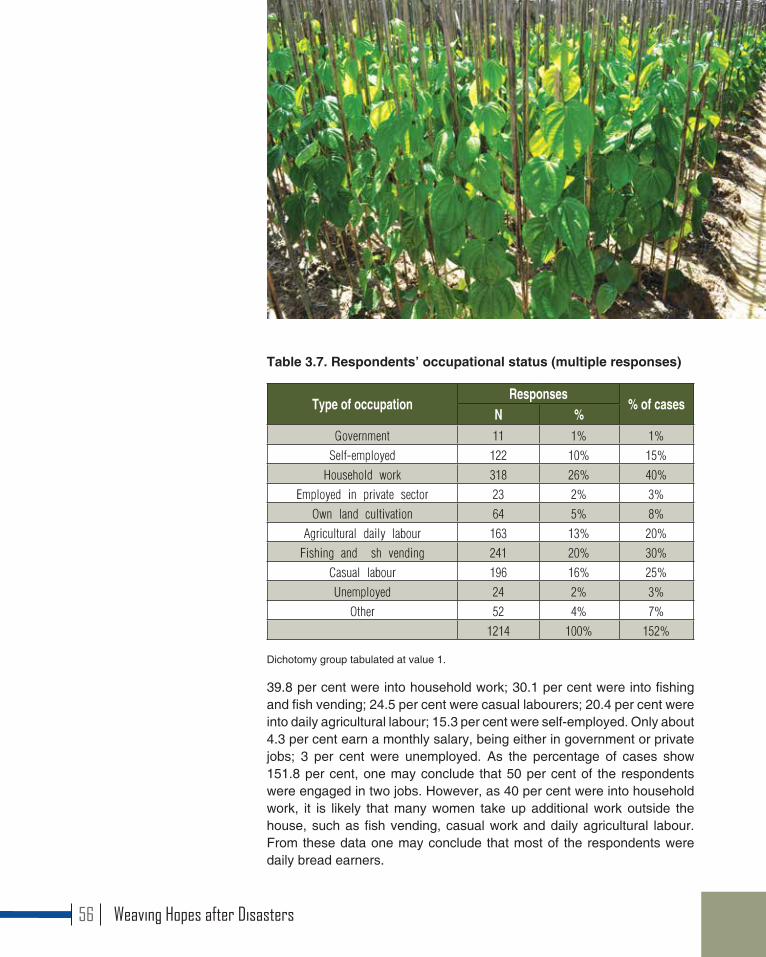
Table 3.7. Respondents’ occupational status (multiple responses)
Type of occupationResponses
% of casesN %
Government 11 1% 1%
Self-employed 122 10% 15%
Household work 318 26% 40%
Employed in private sector 23 2% 3%
Own land cultivation 64 5% 8%
Agricultural daily labour 163 13% 20%
Fishing and fish vending 241 20% 30%
Casual labour 196 16% 25%
Unemployed 24 2% 3%
Other 52 4% 7%
1214 100% 152%
Dichotomy group tabulated at value 1.
39.8 per cent were into household work; 30.1 per cent were into fishing and fish vending; 24.5 per cent were casual labourers; 20.4 per cent were into daily agricultural labour; 15.3 per cent were self-employed. Only about 4.3 per cent earn a monthly salary, being either in government or private jobs; 3 per cent were unemployed. As the percentage of cases show 151.8 per cent, one may conclude that 50 per cent of the respondents were engaged in two jobs. However, as 40 per cent were into household work, it is likely that many women take up additional work outside the house, such as fish vending, casual work and daily agricultural labour. From these data one may conclude that most of the respondents were daily bread earners.
Weaving Hopes after Disasters56
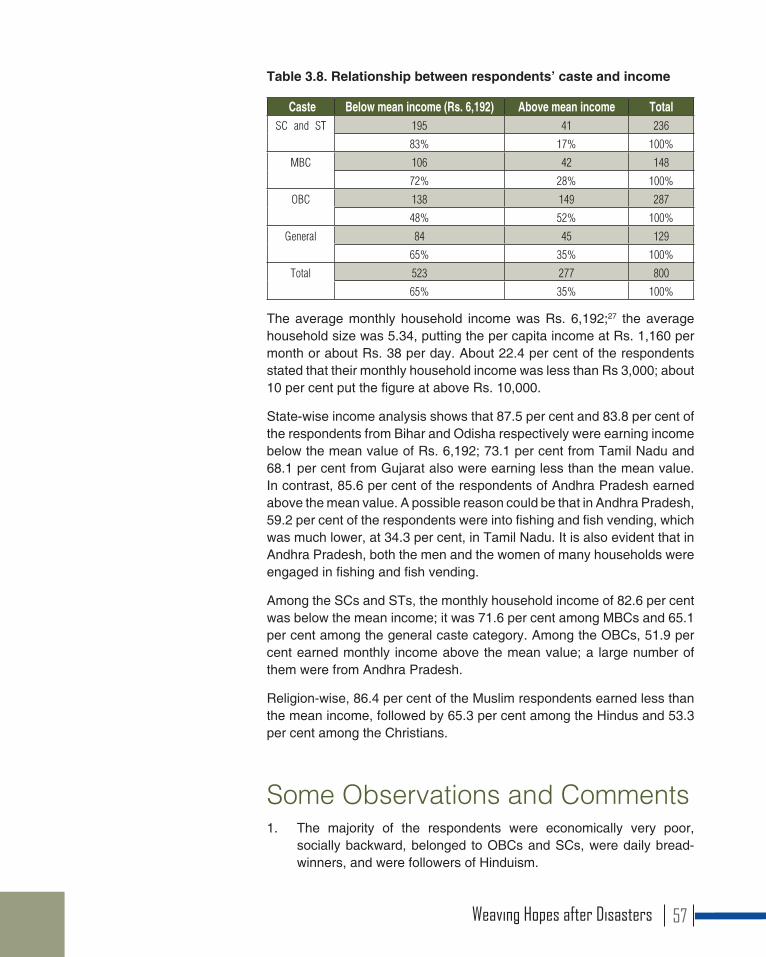
Table 3.8. Relationship between respondents’ caste and income
Caste Below mean income (Rs. 6,192) Above mean income TotalSC and ST 195 41 236
83% 17% 100%
MBC 106 42 148
72% 28% 100%
OBC 138 149 287
48% 52% 100%
General 84 45 129
65% 35% 100%
Total 523 277 800
65% 35% 100%
The average monthly household income was Rs. 6,192;27 the average household size was 5.34, putting the per capita income at Rs. 1,160 per month or about Rs. 38 per day. About 22.4 per cent of the respondents stated that their monthly household income was less than Rs 3,000; about 10 per cent put the figure at above Rs. 10,000.
State-wise income analysis shows that 87.5 per cent and 83.8 per cent of the respondents from Bihar and Odisha respectively were earning income below the mean value of Rs. 6,192; 73.1 per cent from Tamil Nadu and 68.1 per cent from Gujarat also were earning less than the mean value. In contrast, 85.6 per cent of the respondents of Andhra Pradesh earned above the mean value. A possible reason could be that in Andhra Pradesh, 59.2 per cent of the respondents were into fishing and fish vending, which was much lower, at 34.3 per cent, in Tamil Nadu. It is also evident that in Andhra Pradesh, both the men and the women of many households were engaged in fishing and fish vending.
Among the SCs and STs, the monthly household income of 82.6 per cent was below the mean income; it was 71.6 per cent among MBCs and 65.1 per cent among the general caste category. Among the OBCs, 51.9 per cent earned monthly income above the mean value; a large number of them were from Andhra Pradesh.
Religion-wise, 86.4 per cent of the Muslim respondents earned less than the mean income, followed by 65.3 per cent among the Hindus and 53.3 per cent among the Christians.
Some Observations and Comments1. The majority of the respondents were economically very poor,
socially backward, belonged to OBCs and SCs, were daily bread-winners, and were followers of Hinduism.
Weaving Hopes after Disasters 57
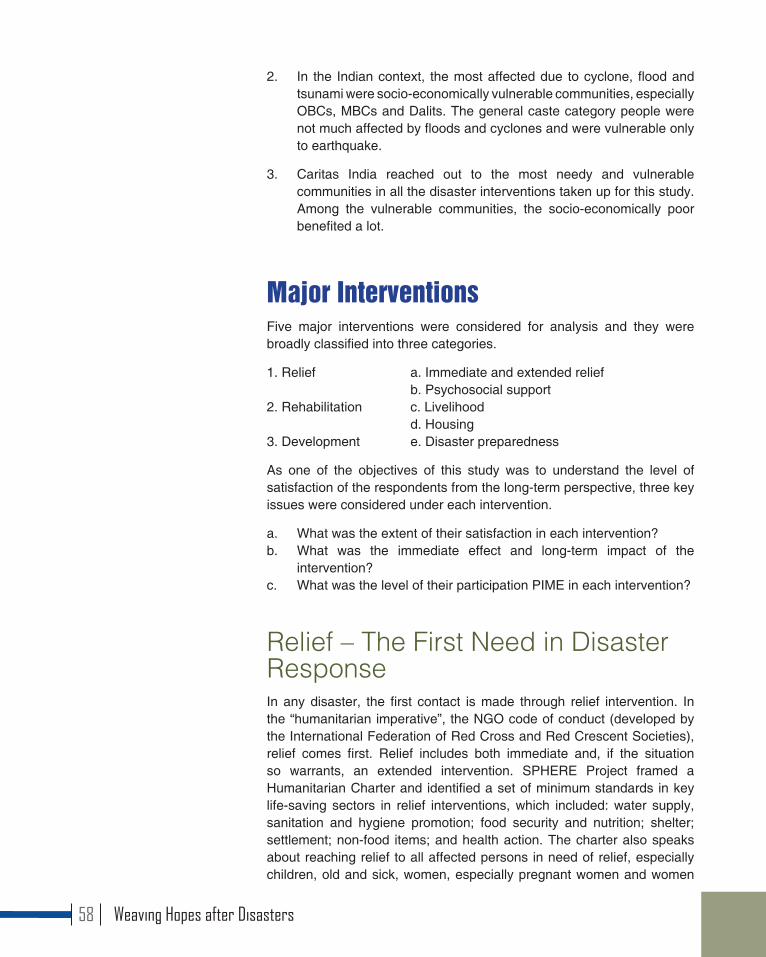
2. In the Indian context, the most affected due to cyclone, flood and tsunami were socio-economically vulnerable communities, especially OBCs, MBCs and Dalits. The general caste category people were not much affected by floods and cyclones and were vulnerable only to earthquake.
3. Caritas India reached out to the most needy and vulnerable communities in all the disaster interventions taken up for this study. Among the vulnerable communities, the socio-economically poor benefited a lot.
Major InterventionsFive major interventions were considered for analysis and they were broadly classified into three categories.
1. Relief a. Immediate and extended relief b. Psychosocial support2. Rehabilitation c. Livelihood d. Housing3. Development e. Disaster preparedness
As one of the objectives of this study was to understand the level of satisfaction of the respondents from the long-term perspective, three key issues were considered under each intervention.
a. What was the extent of their satisfaction in each intervention?b. What was the immediate effect and long-term impact of the
intervention?c. What was the level of their participation PIME in each intervention?
Relief – The First Need in Disaster ResponseIn any disaster, the first contact is made through relief intervention. In the “humanitarian imperative”, the NGO code of conduct (developed by the International Federation of Red Cross and Red Crescent Societies), relief comes first. Relief includes both immediate and, if the situation so warrants, an extended intervention. SPHERE Project framed a Humanitarian Charter and identified a set of minimum standards in key life-saving sectors in relief interventions, which included: water supply, sanitation and hygiene promotion; food security and nutrition; shelter; settlement; non-food items; and health action. The charter also speaks about reaching relief to all affected persons in need of relief, especially children, old and sick, women, especially pregnant women and women
Weaving Hopes after Disasters58
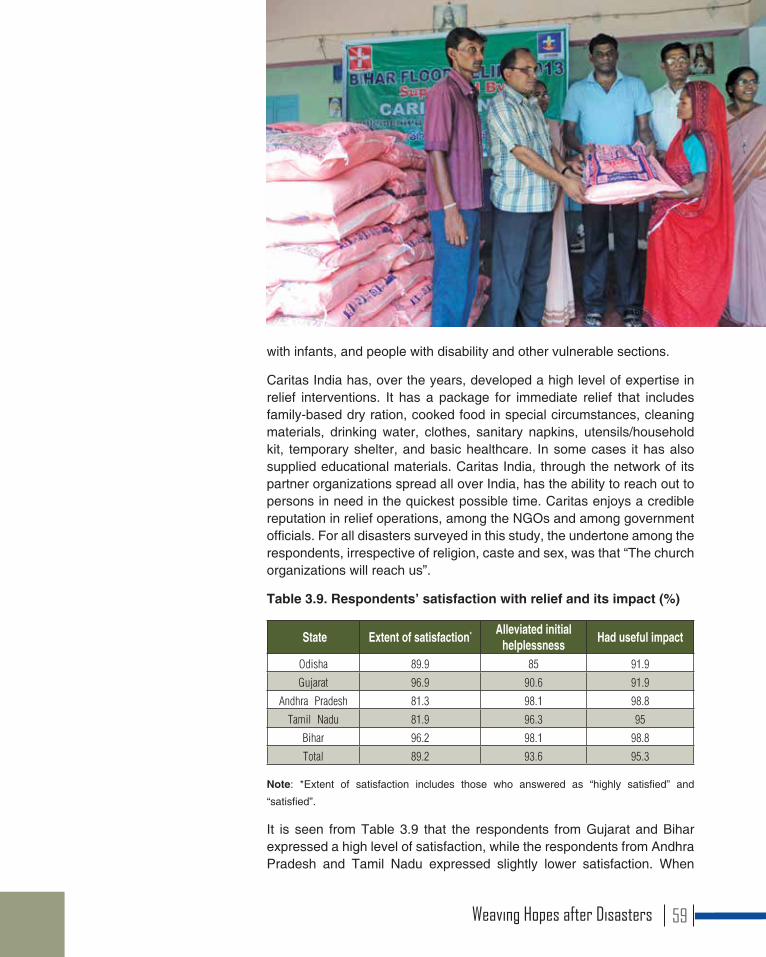
with infants, and people with disability and other vulnerable sections.
Caritas India has, over the years, developed a high level of expertise in relief interventions. It has a package for immediate relief that includes family-based dry ration, cooked food in special circumstances, cleaning materials, drinking water, clothes, sanitary napkins, utensils/household kit, temporary shelter, and basic healthcare. In some cases it has also supplied educational materials. Caritas India, through the network of its partner organizations spread all over India, has the ability to reach out to persons in need in the quickest possible time. Caritas enjoys a credible reputation in relief operations, among the NGOs and among government officials. For all disasters surveyed in this study, the undertone among the respondents, irrespective of religion, caste and sex, was that “The church organizations will reach us”.
Table 3.9. Respondents’ satisfaction with relief and its impact (%)
State Extent of satisfaction* Alleviated initial helplessness Had useful impact
Odisha 89.9 85 91.9
Gujarat 96.9 90.6 91.9
Andhra Pradesh 81.3 98.1 98.8
Tamil Nadu 81.9 96.3 95
Bihar 96.2 98.1 98.8
Total 89.2 93.6 95.3
Note: *Extent of satisfaction includes those who answered as “highly satisfied” and
“satisfied”.
It is seen from Table 3.9 that the respondents from Gujarat and Bihar expressed a high level of satisfaction, while the respondents from Andhra Pradesh and Tamil Nadu expressed slightly lower satisfaction. When
Weaving Hopes after Disasters 59
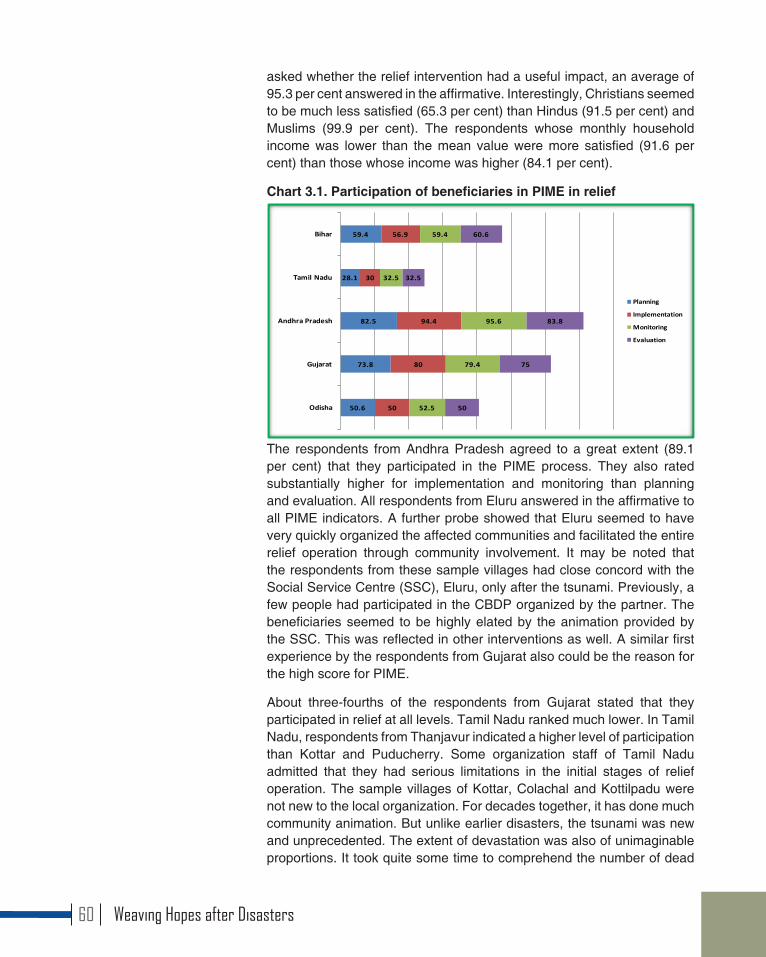
asked whether the relief intervention had a useful impact, an average of 95.3 per cent answered in the affirmative. Interestingly, Christians seemed to be much less satisfied (65.3 per cent) than Hindus (91.5 per cent) and Muslims (99.9 per cent). The respondents whose monthly household income was lower than the mean value were more satisfied (91.6 per cent) than those whose income was higher (84.1 per cent).
Chart 3.1. Participation of beneficiaries in PIME in relief
The respondents from Andhra Pradesh agreed to a great extent (89.1 per cent) that they participated in the PIME process. They also rated substantially higher for implementation and monitoring than planning and evaluation. All respondents from Eluru answered in the affirmative to all PIME indicators. A further probe showed that Eluru seemed to have very quickly organized the affected communities and facilitated the entire relief operation through community involvement. It may be noted that the respondents from these sample villages had close concord with the Social Service Centre (SSC), Eluru, only after the tsunami. Previously, a few people had participated in the CBDP organized by the partner. The beneficiaries seemed to be highly elated by the animation provided by the SSC. This was reflected in other interventions as well. A similar first experience by the respondents from Gujarat also could be the reason for the high score for PIME.
About three-fourths of the respondents from Gujarat stated that they participated in relief at all levels. Tamil Nadu ranked much lower. In Tamil Nadu, respondents from Thanjavur indicated a higher level of participation than Kottar and Puducherry. Some organization staff of Tamil Nadu admitted that they had serious limitations in the initial stages of relief operation. The sample villages of Kottar, Colachal and Kottilpadu were not new to the local organization. For decades together, it has done much community animation. But unlike earlier disasters, the tsunami was new and unprecedented. The extent of devastation was also of unimaginable proportions. It took quite some time to comprehend the number of dead
50.6
73.8
82.5
28.1
59.4
50
80
94.4
30
56.9
52.5
79.4
95.6
32.5
59.4
50
75
83.8
32.5
60.6
Odisha
Gujarat
Andhra Pradesh
Tamil Nadu
Bihar
Planning
Implementation
Monitoring
Evaluation
Weaving Hopes after Disasters60
Weaving Hopes after Disasters 61
and missing persons. Many days were spent in consoling those who had lost their family members, to perform the last rites, and to clear the debris. A large number of people were displaced: they were all to be provided with relief. In the meantime, many organizations came forward with more than needed relief materials. There were difficulties in coordinating this effort in the initial stages.
The organization staff of Bihar stated that due to many difficulties related to topography, spread and access, challenges were faced in reaching out the relief materials. Based on earlier relief interventions, the type of relief materials were identified and provided. This made it difficult to ensure participation of beneficiaries in relief operations. However, 95.7 per cent of the respondents from Patna were of the view that they had participated in PIME. The response from Muzaffarpur, however, was only 22.5 per cent. In Odisha, roads and bridges had been washed away, which made it i8mpossible to reach out materials by road, and it took time to get relief organized. Even so, 79.4 per cent of the respondents from Balasore expressed a high level of participation in the relief phase; the response from Cuttack-Bhubaneswar was only 22.2 per cent. The respondents in both Balasore and Cuttack-Bhubaneswar admitted that this scenario changed during subsequent flood relief operations in 2001 and 2003, since the women were organized as SHGs and they facilitated relief operations. Involvement of SHGs also substantially reduced the per-head operation cost in providing relief.
In the Christian-dominated villages in Tamil Nadu – Bishop Leon Nagar and Kottilpadu – the parish priests played a pivotal role in the distribution of relief materials. The Basic Christian Communities (Anbiams) were instrumental in regulating the distribution of relief materials and supervision of relief operations.
Deep concern was expressed in some focused group discussions in Kottar, especially among the men groups, that more than needed relief materials were dumped on the community. As a result, dependency on NGOs, hoarding and begging attitudes seemed to have crept into the lives of the fishing community, which was not the case before the tsunami. This community, despite its poor socio-economic status, generally has been a giving community rather than a receiving one. After the tsunami, a big change seemed to have occurred in their attitude.
Highly Benefiting and Least Benefiting Relief Item65.9 per cent of the respondents were of the view that dry ration was highly helpful, followed by clothes (14.4 per cent), temporary shelter
Weaving Hopes after Disasters62
(10.1 per cent) and utensils (5.8 per cent). Only 3.7 per cent of the respondents stated that water and healthcare were highly beneficial. Clothes assistance was seen as least beneficial by 31.3 per cent of the respondents. Other items seen as least beneficial were utensils (19.9 per cent), temporary shelter (18.6 per cent), healthcare (14.9 per cent) and drinking water (11.3 per cent). Contrary to the opinion of other states, the respondents of Andhra Pradesh (63 per cent) were more impressed by clothes than dry ration (30.8 per cent). Temporary shelter was considered as highly beneficial by 24.5 per cent of the respondents of Gujarat. State-wise, items considered to be least beneficial were clothes in Gujarat (62.3 per cent) and Tamil Nadu (39.4 per cent), utensils in Bihar (64.3 per cent), and temporary shelter in Andhra Pradesh (66 per cent).
Clothes came in the category of being least beneficial mainly because they were hand-me-downs and climatically unsuitable. In Bihar, while some felt that materials like buckets and mugs were not useful, others were of the view that everything that was provided was helpful. During FGD, the tsunami respondents highlighted that there was colossal wastage of medicines and medical-related materials. They also said that medical support without proper diagnosis by professional staff was not of much value.
Clearing the DebrisVarious reports suggest that, generally, clearing of dead bodies, animal carcasses and debris was one of the major works of the local governance bodies. Mrs. Amalapushpam of Kottar sheds some light on this aspect. She says:
“It took me about fifteen days to grapple with the shock of the tsunami and to recover from the pain, trauma and loss of my near and dear ones. The stink was all around. It was sickening, and I could not eat anything for days on end. There was decomposed flesh all around. The manual scavengers and sweepers, largely from the SC communities, were sent by the government to clean up the area. Despite their hard work, the stink remained overpowering. Many of my relatives had died, but I could not dare to approach their corpses. Then, many young girls and boys came from somewhere and finally cleaned up the entire area and made it habitable. I can never forget their services. They tied a cloth around their nose, searched every nook and corner and bushy areas, collected all decomposed pieces, and buried them in demarcated places. I may not be able to support financially disaster victims in the future, but I have decided to send my children to clean up the area.”
Weaving Hopes after Disasters 63
How was the Relief Support Helpful?When asked how the relief support helped the respondents in more than one way, the cumulative responses were: initial basic needs were met (79.4 per cent), anxieties got resolved (48.2 per cent), was able to move forward in life (35.6 per cent), and gained confidence (33.2 per cent). The respondents from Andhra Pradesh strongly voted for two dimensions, namely, initial needs were met and people were able to move forward in life. Respondents from other states were impacted in terms of resolving initial needs and anxieties. In Odisha, 85 per cent of the respondents indicated that the relief interventions helped alleviate their initial helplessness; this was more so amongst the SC respondents (33.1 per cent), who were more satisfied with relief support than general caste category respondents. Relief support was also perceived by the lower-income respondents as being more beneficial in alleviating their initial helplessness.
Suggestion for Better Implementation of Relief in the Future68.8 per cent responses highlight planning with the community as an important aspect, along with making a proper assessment (64.3 per cent). Only about 19.4 per cent responses express the view that NGOs know better, so let them decide. About 15 per cent responses point out that “materials should not be dumped”. Dumping caused many people to hoard. Wastage of medicines was very high in Tamil Nadu. More than 90 per cent of the respondents recommended that the beneficiaries should be adequately consulted in terms of relief needs.
It also transpires that dumping resulted in selling out the relief received (especially during the tsunami relief operations). There is also a perception among some of the respondents that healthcare, which includes sanitation and water supply, was not given adequate attention during relief. The most affected by this lack were women, children, the aged, and the sick.
It was also observed by the respondents of Gujarat, Tamil Nadu and Andhra Pradesh that influential persons hogged the relief material.
Psychosocial Support – Relief to Mental Health of a ‘Person’SPHERE standards and Catholic Social Teaching give importance to caring of persons, especially persons in special need of assistance. Mental
Weaving Hopes after Disasters64

care is one of the major dimensions in providing humanitarian assistance. Psychosocial intervention has been given importance by Caritas India whenever there was considerable loss of lives in a disaster, but only after the tsunami. Not much was done in a systematic and organized manner in Odisha and Gujarat earlier. Psychosocial support was also not given due importance in Bihar even after the tsunami experience, though family visits and personal meetings with the victims were done. The underlying concept of Caritas seems to be that only huge loss of lives requires psychosocial support. In the light of new insights in terms of new experiences in disaster management over the years, this requires a revisit. Essentially, not simply the loss of lives, but the experience of trauma, helplessness, depression, etc. require psychosocial support.
In terms of the extent of satisfaction received through psychosocial support, it is pertinent to state at the outset that huge variations in responses were found among the respondents. This is partly because they were not very clear about the purpose of psychosocial support. However, it may be noted that some respondents from Gujarat wept bitterly during the interview as they recollected the horrific day, especially those who had lost their family members. Clearly, there were still mental injuries that had not healed. In Tamil Nadu, despite huge loss of lives, the respondents stated categorically that psychosocial support had helped them immensely to move forward in life. It may therefore be inferred that material support in the form of relief, livelihood and housing could not adequately heal the inner wounds of the affected persons.
It is seen from Table 3.10 that on a scale of 0 to 9, where 0 denotes “no satisfaction” or “no response” and 9 indicates “highest level of satisfaction”, except for Andhra Pradesh, in all other states the mean value of satisfaction was much below 4. 75 per cent of the respondents from Tamil Nadu said that they were satisfied, against only 20 per cent from Andhra Pradesh: but they did not find this support making much change in their mental health. In the interviews, the initial enthusiasm faltered as the respondents came to the end of the interview.28
The organization staff and village leaders of Bihar agreed that not much psychosocial support was provided to the affected communities in Bihar. One cited reason was that, generally, loss of human lives is low, and floods in Bihar are a repeated phenomenon. Respondents, largely from SCs, said that they were used to it. What they needed was material assistance to tide over the loss of materials and livelihood.
The variation in response is to be seen against the backdrop of two factors: The field investigators and research staff found it difficult to make the respondents understand the meaning and purpose of psychosocial intervention. Some respondents considered the very presence of church agencies and their regular visits to the villages as highly strengthening and motivating.
Weaving Hopes after Disasters 65

Table 3.10. Respondents’ satisfaction with psychosocial relief and its impact
State Mean satisfaction on a scale of 0 to 9
Alleviated trauma/pain (%)
Useful in the long run (%)
Extent of satisfaction (%)
Odisha 2.3 46.3 47.5 33.1
Gujarat 1.5 38.1 58.8 23.1
Andhra Pradesh 6.4 92.5 96.9 20
Tamil Nadu 3.8 88.8 87.5 75
Bihar 3.3 52.5 48.8 36.9
Total 3.5 63.6 67.9 37.6
In Bihar, Neeraj Kumar, ward member of Harijan Tola, said: “Counselling was done in low scale only by Church members with individuals who were most affected. People felt good. They felt that there is at least someone to listen to them and give them ‘aswasan’, emotional support.”
In all the three areas of Tamil Nadu and Puducherry, training of trainers (ToT) programme was organized with the support of professionals. The trainees were then asked to go to the villages to spend time with the people and strengthen them. All the four villages, Colachal and Kottilpadu of Kottar, Vellapallam of Thanjavur, and Pattinacherry of Puducherry, were of the view that they highly benefited by the psychosocial support. At the same time, some said that because this component did not have material benefit, it was not taken seriously. Many stakeholders were of the view that there was lack of understanding about the need and importance of psychosocial support.
The intervening agencies also did not seem to have focussed on this intervention, barring tsunami. Some also stated that good many people were allergic towards counselling and consider it as a ‘waste of time’. In Bhuj for example, people were of the view that it is highly unlikely that another earthquake would strike the area in their lifetime. The intervening agencies need to consider breaking such a narrow understanding of psychosocial care.
How Psychosocial Intervention is HelpfulAmong the five closed-ended multiple options, 59.6 per cent responses identified gaining self-confidence as the primary effect of psychosocial intervention. About 40.4 per cent of the responses noted that this intervention helped them in finding solace, especially from pain and trauma, and gave hope to look to the future; 22 per cent indicated that it gave them new hope. It was consoling (38.4 per cent) and helped in relieving themselves of the mental agony and pain (36.3 per cent). About 86.5 per cent respondents expressed the view that there had to be
Weaving Hopes after Disasters66
psychosocial support in the future, but in an organized and professional manner.
The core philosophy of SPHERE is “Right to life with dignity”, from which the “right to assistance” flows. Caritas India’s Emergency and Disaster Management Policy, which evolved in 2013, points out that the ultimate goal of disaster interventions is to enable disaster-affected persons to live with dignity. This approach underlines the need for a focus on psychosocial interventions.
Livelihood InterventionLivelihood intervention has been one of the key engagements of Caritas India. Recently, Cyclone Thane in Puducherry and Phailin in Odisha destroyed to a great extent livelihood of the people and loss of human lives was minimum29. Moreover, it is to be mentioned that as much as loss of lives could be measured it is extremely difficult to measure loss of livelihood, since it covers a range of items from loss of household animals to destruction of agricultural fields / produce, salt pans and environmental destruction. The quantum of livelihood destruction is so huge that many times there is a long-term socio-economic impact in the lives of the disaster-affected persons.
It would appear that the focus of Caritas India in livelihood interventions is twofold: regaining the traditional economic resource base and promoting new employability skills and opportunities. If, for example, it was fishing related, the emphasis was given to repair of boats, providing different types of boats and nets, fishing equipment, and fish vending materials. Clearing the salt pans was another major intervention carried out in Andhra Pradesh. Assistance for animal husbandry was implemented in Gujarat and Andhra Pradesh. Assistance was also provided for individual-based income generation programmes such as setting up petty shops, home-based activities, etc. Skills were also provided in tailoring and embroidery, computer training, other allied technical skills like motor and engine repairing, etc. In all disasters, a substantial amount was invested in livelihood and income-generation activities to strengthen the economic base of the disaster-affected persons.
It is seen from Table 3.11, which presents the respondents’ satisfaction with livelihood relief and its impact, that the extent of satisfaction with the intervention stands at 59.3 per cent, which is significantly lower than the extent of relief satisfaction (89.2 per cent). The extent of satisfaction was very low in Andhra Pradesh and Bihar. It was high in Gujarat (77.5 per cent) and Odisha (70 per cent) and Tamil Nadu (67.5 per cent). The higher level of satisfaction was reflected in a number of transformative narratives, reflected in Chapter 6. In Gujarat and Odisha, this was reflected especially among the women through the formation of SHGs and federations. Many
Weaving Hopes after Disasters 67

respondents in Bihar complained about not receiving livelihood support. In terms of impact, an average of 79.4 per cent expressed the view that livelihood intervention helped them to regain initial economic loss and helplessness; about 76 per cent stated that their economic situation improved in the long run owing to livelihood interventions.
Table 3.11. Respondents’ satisfaction with livelihood relief and its impact (%)
State Extent of Satisfaction
Alleviated Initial economic helplessness
Improved economic condition
Odisha 70 80 81.9
Gujarat 77.5 83.8 85
Andhra Pradesh 34.4 88.1 87.5
Tamil Nadu 67.5 86.9 77.5
Bihar 46.9 58.1 48.1
Total 59.3 79.4 76
Unlike reaching out to a large number of beneficiaries through relief intervention, livelihood support is done systematically, based on assessment to select the number of persons. Generally, relief is given to all those who were affected in equal measure, without any distinction. What counts is the household. Livelihood is implemented after a couple of months, when the initial disaster shocks have been absorbed, on the basis of studied needs. After the need assessment, the organization does a mapping of the need and resources and then the deserving are supported.
Inter-organizational analysis of the extent of livelihood satisfaction brings out some specificity. In Tamil Nadu and Andhra Pradesh, the satisfaction of the respondents from Puducherry was at 87.5 per cent; in Thanjavur, 80 per cent; in Kottar, 51.3 per cent; in Nellore, 53.8 per cent; in Eluru, 15 per cent. Not much variation was seen between the respondents of Patna and Muzaffarpur as well as Cuttack-Bhubaneswar and Eluru.
In Pentakota of Cuttack-Bhubaneswar, huge investments were made to supply big and small boats. The project was implemented successfully for about five years. But once the organization closed down the project, the beneficiaries, due to lack of planning, management and accompaniment, went back to their earlier lower socio-economic status. In the same manner, the formation and organization of SHGs, which took up some livelihood activities, also stalled in some villages when the project was wound up. Clearly, sustainability has been a critical issue.
Caste-wise analysis shows that respondents from the general category of caste seem to be satisfied (73.6 per cent) more than MBCs (68.5 per cent), SCs and STs (59.7 per cent), and OBCs (47.4 per cent). In terms of religious affiliation, Hindus were less satisfied (58 per cent) than Muslims (77.3 per cent) and Christians (60 per cent). The lower-income group was
Weaving Hopes after Disasters68
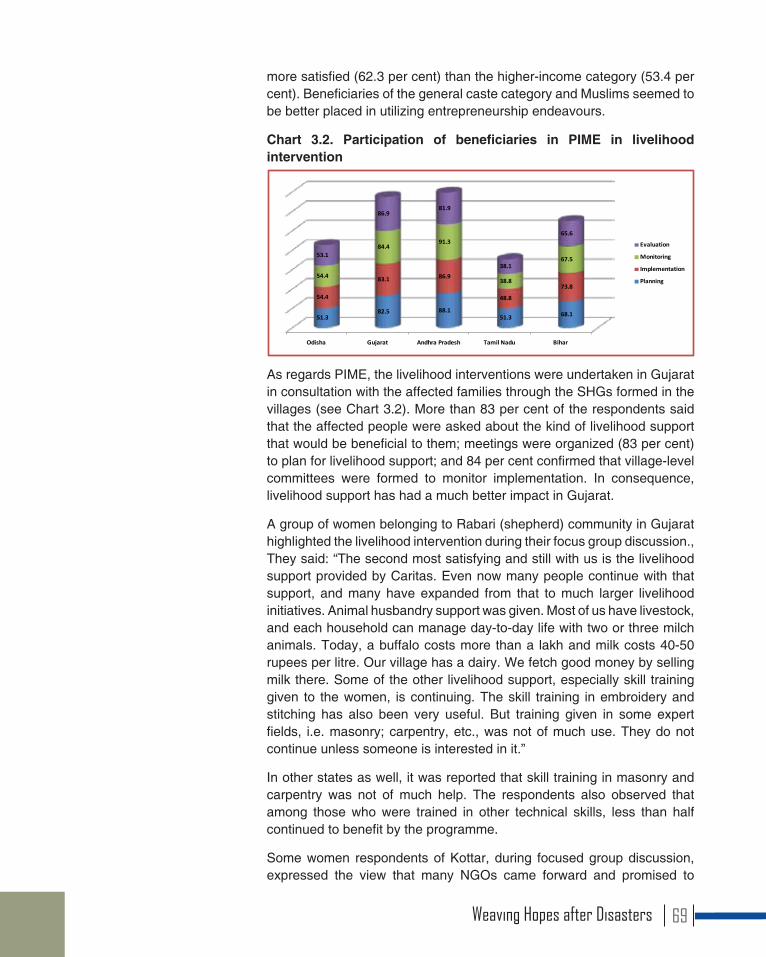
more satisfied (62.3 per cent) than the higher-income category (53.4 per cent). Beneficiaries of the general caste category and Muslims seemed to be better placed in utilizing entrepreneurship endeavours.
Chart 3.2. Participation of beneficiaries in PIME in livelihood intervention
Odisha Gujarat Andhra Pradesh Tamil Nadu Bihar
51.382.5 88.1
51.3 68.1
54.4
83.1 86.9
48.8
73.8
54.4
84.491.3
38.8
67.553.1
86.981.9
38.1
65.6
Evaluation
Monitoring
Implementation
Planning
As regards PIME, the livelihood interventions were undertaken in Gujarat in consultation with the affected families through the SHGs formed in the villages (see Chart 3.2). More than 83 per cent of the respondents said that the affected people were asked about the kind of livelihood support that would be beneficial to them; meetings were organized (83 per cent) to plan for livelihood support; and 84 per cent confirmed that village-level committees were formed to monitor implementation. In consequence, livelihood support has had a much better impact in Gujarat.
A group of women belonging to Rabari (shepherd) community in Gujarat highlighted the livelihood intervention during their focus group discussion., They said: “The second most satisfying and still with us is the livelihood support provided by Caritas. Even now many people continue with that support, and many have expanded from that to much larger livelihood initiatives. Animal husbandry support was given. Most of us have livestock, and each household can manage day-to-day life with two or three milch animals. Today, a buffalo costs more than a lakh and milk costs 40-50 rupees per litre. Our village has a dairy. We fetch good money by selling milk there. Some of the other livelihood support, especially skill training given to the women, is continuing. The skill training in embroidery and stitching has also been very useful. But training given in some expert fields, i.e. masonry; carpentry, etc., was not of much use. They do not continue unless someone is interested in it.”
In other states as well, it was reported that skill training in masonry and carpentry was not of much help. The respondents also observed that among those who were trained in other technical skills, less than half continued to benefit by the programme.
Some women respondents of Kottar, during focused group discussion, expressed the view that many NGOs came forward and promised to
Weaving Hopes after Disasters 69
provide livelihood support, but there was no coordination among them, which caused confusion on the ground. Many NGO leaders came and interacted only with some select persons and prepared the list of beneficiaries. In Gujarat and Eluru of Andhra Pradesh, for example, livelihood interventions were largely routed through SHGs and village committees. But the extent of satisfaction is low in Andhra Pradesh. Lack of coordination among NGOs appeared to be the major concern in livelihood interventions, especially during tsunami interventions.
In Odisha, the NGOs had their own assessment and provided livelihood support. In some villages, much money was invested. In Muzaffarpur, Bihar, the organization identified some useful livelihood programmes and initiated them. In both cases, participation of beneficiaries was minimum. The interventions were organization-driven, based on earlier experiences.
Livelihood intervention in Majnupur of Muzaffarpur was a big success. Livestock (cows) were distributed among the villagers, apart from providing training on detergent and papad making. The livestock seemed to be a good investment. The villagers in Majnupur still have them and are making a decent living from selling milk. The people involved were consulted and were asked to choose the cows themselves. However, the training programmes conducted have failed to have any long-term impact on account of lack of marketing skills and failure to identify markets for the finished products. At times, the raw material required had to be purchased from Patna, causing difficulty in procurement.
How the Livelihood Support was Helpful in Improving the Economic ConditionThe respondents’ multiple responses indicate two dimensions, namely, ability to earn a living (76.3 per cent) and ability to return to earlier work (54.5 per cent). Other responses indicate ability to explore new ways of earning (28.8 per cent), acquiring a new skill (19.1 per cent), and opening up of new employment opportunities (16.2 per cent). State-wise analysis shows that access to new opportunities was the highest in Gujarat (20.9 per cent). A striking aspect is the increasing number of households which got involved in making marketable products of china clay. This almost doubled their income. Getting back to earlier work was highly valued in Andhra Pradesh (40.8 per cent). Fishing equipment was given to groups rather than to individuals. Group bonding sustained the community in the long run.
In Odisha, it has been said that the fishing equipment assistance given after the cyclone of 1999, in due course got damaged or exhausted its life span. During these years, the respondents could not generate enough income to buy new boats: they have become daily labourers
Weaving Hopes after Disasters70
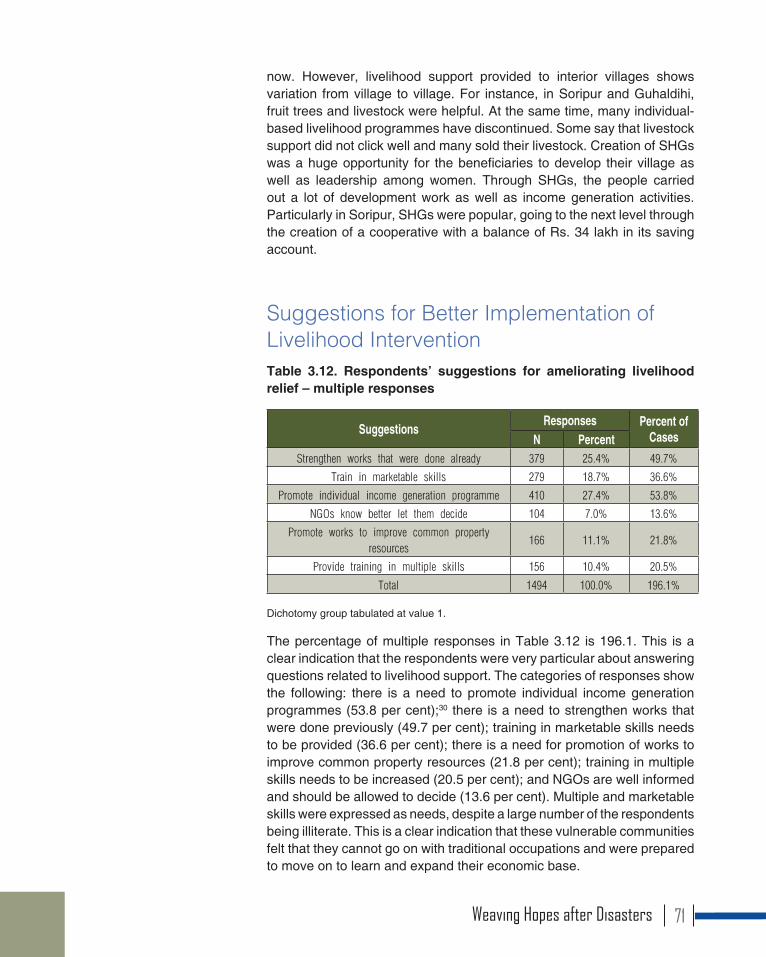
now. However, livelihood support provided to interior villages shows variation from village to village. For instance, in Soripur and Guhaldihi, fruit trees and livestock were helpful. At the same time, many individual-based livelihood programmes have discontinued. Some say that livestock support did not click well and many sold their livestock. Creation of SHGs was a huge opportunity for the beneficiaries to develop their village as well as leadership among women. Through SHGs, the people carried out a lot of development work as well as income generation activities. Particularly in Soripur, SHGs were popular, going to the next level through the creation of a cooperative with a balance of Rs. 34 lakh in its saving account.
Suggestions for Better Implementation of Livelihood InterventionTable 3.12. Respondents’ suggestions for ameliorating livelihood relief – multiple responses
Suggestions Responses Percent of CasesN Percent
Strengthen works that were done already 379 25.4% 49.7%
Train in marketable skills 279 18.7% 36.6%
Promote individual income generation programme 410 27.4% 53.8%
NGOs know better let them decide 104 7.0% 13.6%
Promote works to improve common property resources
166 11.1% 21.8%
Provide training in multiple skills 156 10.4% 20.5%
Total 1494 100.0% 196.1%
Dichotomy group tabulated at value 1.
The percentage of multiple responses in Table 3.12 is 196.1. This is a clear indication that the respondents were very particular about answering questions related to livelihood support. The categories of responses show the following: there is a need to promote individual income generation programmes (53.8 per cent);30 there is a need to strengthen works that were done previously (49.7 per cent); training in marketable skills needs to be provided (36.6 per cent); there is a need for promotion of works to improve common property resources (21.8 per cent); training in multiple skills needs to be increased (20.5 per cent); and NGOs are well informed and should be allowed to decide (13.6 per cent). Multiple and marketable skills were expressed as needs, despite a large number of the respondents being illiterate. This is a clear indication that these vulnerable communities felt that they cannot go on with traditional occupations and were prepared to move on to learn and expand their economic base.
Weaving Hopes after Disasters 71
During the focused group discussion, many concerns were pointed out. For example, the quality of country boats supplied did not suit the local needs in Tamil Nadu. It was also said that some beneficiaries received multiple livelihood benefits and sold them off. While some beneficiaries said that support for animal husbandry was helpful, the organization staff expressed the view that about 40 to 50 per cent of the beneficiaries sold off the livestock provided (cows and goats) soon after they acquired them. In a number of cases, direct assistance by the organization to individual beneficiaries seemed to have not worked well. But this assistance seemed to have worked well wherever the support was given through SHGs, micro-credit groups or under local community/committee monitoring.
In Tamil Nadu, the intervening organizations did not have full knowledge of the needs of the fishermen. They followed a uniform style of distribution of one type of nets, while the fishermen use multi-type nets for fishing (crab net, shrimp net, push net, nylon net, mono filament net, etc.). It would have been better if a short study or a discussion with the fishermen had been conducted before finalizing the livelihood options. The boats were not made with good materials; their quality was not monitored by the people who use them.
Housing – A Dream RealizedAccording to the SPHERE Charter, one of the dimensions of the right to life with dignity and right to assistance is the need for shelter.
Considering the quantum of money involved in building a house, assistance for housing is always considered by the beneficiaries as a dream project. Many beneficiaries noted that the tsunami and earthquake brought a big gift for them in the form of a house, which otherwise would not have been possible in their lifetime.
Caritas India, amidst various challenges in providing housing support, ranging from identification of beneficiaries, land, nature of the housing model, process and mode of carrying out the intervention, accessing support from government, etc., has put in 60 to 70 per cent of its budget in housing. Hence, from the finance point of view this intervention assumes greater significance than other interventions. Also, assistance for housing has generated the idea of “appropriate housing”, given the various types of disasters. The experience and ingenuity of Caritas has paved the way for new and appropriate housing models and techniques, which could be replicated in the future.
Weaving Hopes after Disasters72
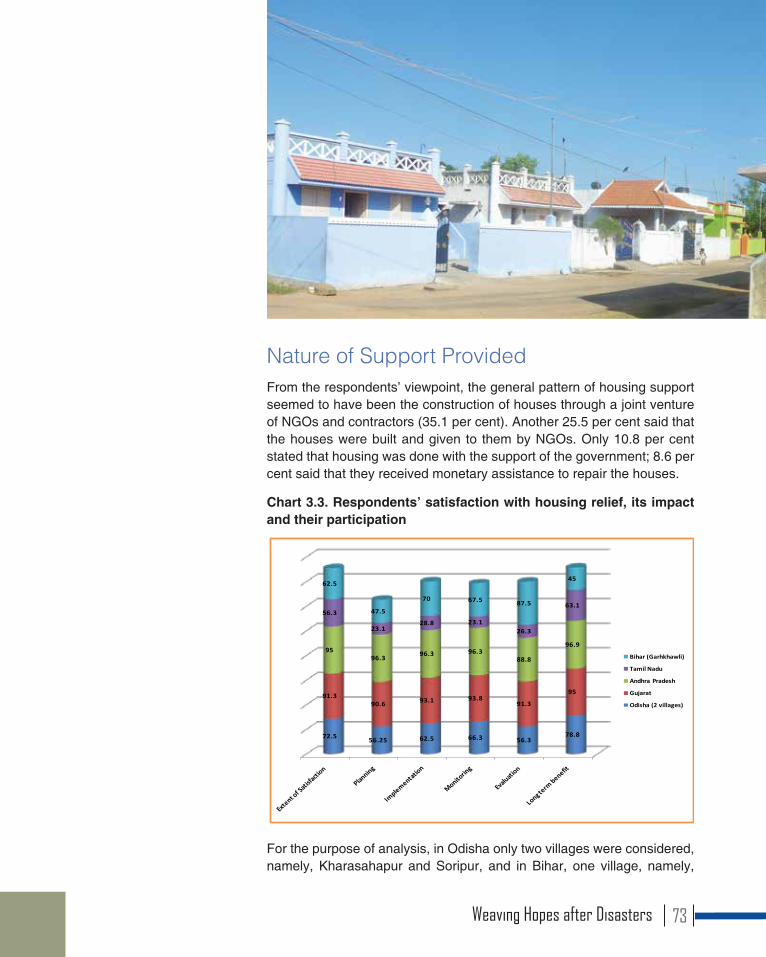
Nature of Support ProvidedFrom the respondents’ viewpoint, the general pattern of housing support seemed to have been the construction of houses through a joint venture of NGOs and contractors (35.1 per cent). Another 25.5 per cent said that the houses were built and given to them by NGOs. Only 10.8 per cent stated that housing was done with the support of the government; 8.6 per cent said that they received monetary assistance to repair the houses.
Chart 3.3. Respondents’ satisfaction with housing relief, its impact and their participation
72.5 56.25 62.5 66.3 56.378.8
91.390.6 93.1 93.8
91.3
95
9596.3 96.3 96.3
88.8
96.9
56.3
23.128.8 23.1
26.3
63.1
62.5
47.5
70 67.5 87.5
45
Bihar (Garhkhawli)
Tamil Nadu
Andhra Pradesh
Gujarat
Odisha (2 villages)
For the purpose of analysis, in Odisha only two villages were considered, namely, Kharasahapur and Soripur, and in Bihar, one village, namely,
Weaving Hopes after Disasters 73
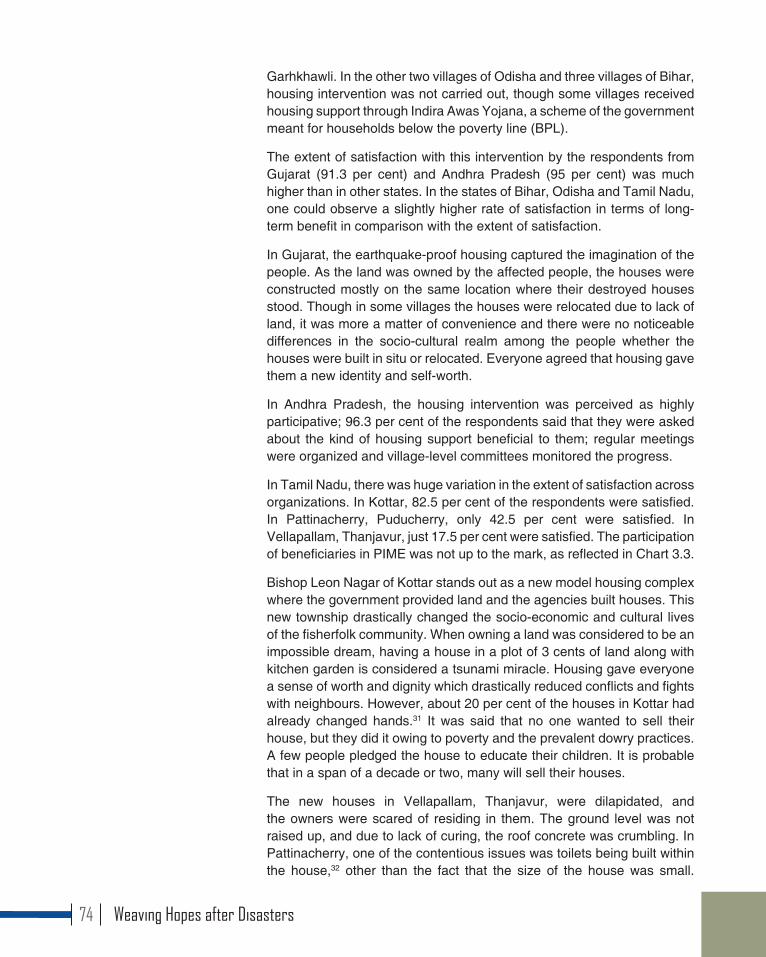
Garhkhawli. In the other two villages of Odisha and three villages of Bihar, housing intervention was not carried out, though some villages received housing support through Indira Awas Yojana, a scheme of the government meant for households below the poverty line (BPL).
The extent of satisfaction with this intervention by the respondents from Gujarat (91.3 per cent) and Andhra Pradesh (95 per cent) was much higher than in other states. In the states of Bihar, Odisha and Tamil Nadu, one could observe a slightly higher rate of satisfaction in terms of long-term benefit in comparison with the extent of satisfaction.
In Gujarat, the earthquake-proof housing captured the imagination of the people. As the land was owned by the affected people, the houses were constructed mostly on the same location where their destroyed houses stood. Though in some villages the houses were relocated due to lack of land, it was more a matter of convenience and there were no noticeable differences in the socio-cultural realm among the people whether the houses were built in situ or relocated. Everyone agreed that housing gave them a new identity and self-worth.
In Andhra Pradesh, the housing intervention was perceived as highly participative; 96.3 per cent of the respondents said that they were asked about the kind of housing support beneficial to them; regular meetings were organized and village-level committees monitored the progress.
In Tamil Nadu, there was huge variation in the extent of satisfaction across organizations. In Kottar, 82.5 per cent of the respondents were satisfied. In Pattinacherry, Puducherry, only 42.5 per cent were satisfied. In Vellapallam, Thanjavur, just 17.5 per cent were satisfied. The participation of beneficiaries in PIME was not up to the mark, as reflected in Chart 3.3.
Bishop Leon Nagar of Kottar stands out as a new model housing complex where the government provided land and the agencies built houses. This new township drastically changed the socio-economic and cultural lives of the fisherfolk community. When owning a land was considered to be an impossible dream, having a house in a plot of 3 cents of land along with kitchen garden is considered a tsunami miracle. Housing gave everyone a sense of worth and dignity which drastically reduced conflicts and fights with neighbours. However, about 20 per cent of the houses in Kottar had already changed hands.31 It was said that no one wanted to sell their house, but they did it owing to poverty and the prevalent dowry practices. A few people pledged the house to educate their children. It is probable that in a span of a decade or two, many will sell their houses.
The new houses in Vellapallam, Thanjavur, were dilapidated, and the owners were scared of residing in them. The ground level was not raised up, and due to lack of curing, the roof concrete was crumbling. In Pattinacherry, one of the contentious issues was toilets being built within the house,32 other than the fact that the size of the house was small.
Weaving Hopes after Disasters74
However, people have been overcoming their reservations in this regard, especially as the women members of the house are satisfied.
In Andhra Pradesh, a tripartite agreement was initiated in housing. Caritas India, through its local partner, worked closely with the government and ensured that the government put in its share for every house. SHGs were entrusted with the responsibility of PIME.
In Krantinagar and Pinnivaripallem in Nellore, all the respondents were satisfied with the housing assistance.33 With facilities like roads, streets, street lights, extra space, etc., the villages stood out. The respondents stated in focus group discussions: “The villages were identified by the government and given to the organization. The government put in a portion, about 40 per cent, of the required support and the rest was provided by the NGO. The local community, especially women groups, provided labour support. In order to make this intervention participatory, the organization worked out a clear strategy in consultation and participation of the beneficiaries. SHGs were formed with a group of ten women. The process of constructing the houses was discussed in detail and every member owned up the process. Every SHG agreed to engage in the construction of the houses of its members, with each member supporting the other nine members in more than one way. The NGO provided the plan, supplied the materials as well as provided masons. The rest was done by the SHGs. There were occasionally some problems between the SHG members and masons, but all disputes were settled amicably by the SHGs or by the housing committee, in which there were three male and two female members.”
In Garhkhawli, Muzaffarpur, Bihar, bamboo model houses were planned and built as the area was more prone to waterlogging due to floods. Bamboo houses were considered to be a better option than concrete houses, given the frequency of floods. However, the respondents did not see long-term benefits in bamboo housing. In other villages of Bihar, housing intervention was not done by Caritas India. Many of them had accessed and continued to access houses under Indira Awas Yojana.34 Correlation between caste and extent of satisfaction in housing intervention showed that the general category beneficiaries were much more satisfied (80.6 per cent) than OBCs (74.9 per cent), SCs and STs (57.2 per cent) and MBCs (56.8 per cent). Among the higher income group, 84.8 per cent were satisfied, whereas among the lower income group only 57.9 per cent were satisfied.
How the Housing Support was HelpfulWith the exception of Vellapallam in Thanjavur, wherever Caritas provided housing support, the respondents were extremely happy. Everyone stated that housing had given them identity and dignity, that housing would
Weaving Hopes after Disasters 75

benefit their children; and they already were into a new way of living and organizing their lives. The impact was seen in their motivation to study and making progress in education.
In Gujarat, 95 per cent of the respondents indicated that the housing intervention made a huge impact in their lives. The intervention, done by Caritas, was of high quality and well thought out. The material used was good. Earlier, they had thatched roof housing with mud platform; now it was concrete with lentil. Today, these houses would cost five times more and no one could afford to build houses like this.
In Tamil Nadu and Andhra Pradesh, the housing intervention had brought about a lot of visible cultural change in the lives of the people. Most of the people expressed the view that now they were rooted and secure. They had started kitchen gardens and planted fruit trees. Most of them had also built a compound wall. The women felt comfortable with their own toilets in the house.
82.6 per cent of the responses indicated the permanent nature of housing as a clear expression of their dream realized. Other responses pointed to different socio-economic dimensions of life, such as feeling of self-worth (40.8 per cent), dignity (28.2 per cent), fulfilment in life (23.9 per cent) and feeling dignified before others (10.9 per cent).
Suggestions for Better Implementation70.7 per cent of the respondents signified the importance of the beneficiary’s involvement in planning. 45.7 per cent indicated the importance of the household being part of the construction process. 30.6 per cent indicated that community leaders should take up the responsibility for house construction. 20.6 per cent suggested that housing need not be given to contractors. About 25 per cent of the responses favoured giving a free hand to NGOs, since housing required different type of expertise.
In Gujarat, a large number of respondents pointed out to the unhealthy nexus between corrupt leaders and contactors. Making community leaders responsible for implementation and giving the task of construction to contractors was not a preferred choice. Some of the respondents said, “Caritas gave houses according to our choices but the contractor did not build the houses properly. He was taking money from people to complete the houses.” This phenomenon was also found in other states.
Weaving Hopes after Disasters76

Disaster Preparedness and Management – Learning for the Future There has been a paradigm shift in disaster interventions from response-centric approach to laying greater emphasis on disaster management (DM) cycle, such as prevention, mitigation and preparedness as a means to avert or soften the impact of future emergencies. Globally, there is also increasing recognition that disasters affect growth and the poorer section of society take a major brunt of the impact. Accordingly, there is consensus that investing in prevention and mitigation is economically and socially more beneficial than expenditure in relief and rehabilitation.
The Food and Agriculture Organization (FAO) and the International Labour Organization (ILO) have helped countries to develop strategic frameworks and policy guidelines to strengthen disaster preparedness (DP) and the ability to mitigate the impact of emergencies that affect food security and the productive capacities of rural populations with special focus on livelihood recovery.
In India, the Disaster Management Act, 2005, lays greater emphasis on moving from disaster response to DP. While the Tenth Five Year Plan set in motion the process of shift in focus from relief and response-centric DM, the Eleventh Plan tried to consolidate the process by giving an impetus for projects and programmes that develop and nurture a culture of safety and mainstreaming of disaster prevention and mitigation in the development process. The Twelfth Plan focuses on institutionalizing DP.
DP, commonly termed as community-based/managed disaster preparedness (CBDP or CMDP), has been a key intervention of Caritas India in all these five study areas. The primary purpose of CBDP programme is to generate high-quality awareness among the people of disaster-prone areas and organize the community to have minimum systems and structures in place so that in an eventual situation the community has skills and capacities to handle the situation and reduce losses at all levels. In the last decade or so, a special focus was given to CBDP in all the study areas. Sustained and systematic processes were initiated in the tsunami-affected areas, including Kerala and Bihar. In Bihar, CMDP still continues. Very limited interventions were carried out in Gujarat and Odisha. CBDP has been implemented as part of community animation and organization by Caritas partners.
On a scale of 0 to 9, where 0 is nil satisfaction and 9 is very high level of satisfaction, the average mean value of CBDP satisfaction was 4.54. If only the tsunami-affected states and Bihar were taken into account, the mean value moved to 6, which indicated high level of satisfaction. On the other hand, when the respondents were asked about the extent
Weaving Hopes after Disasters 77
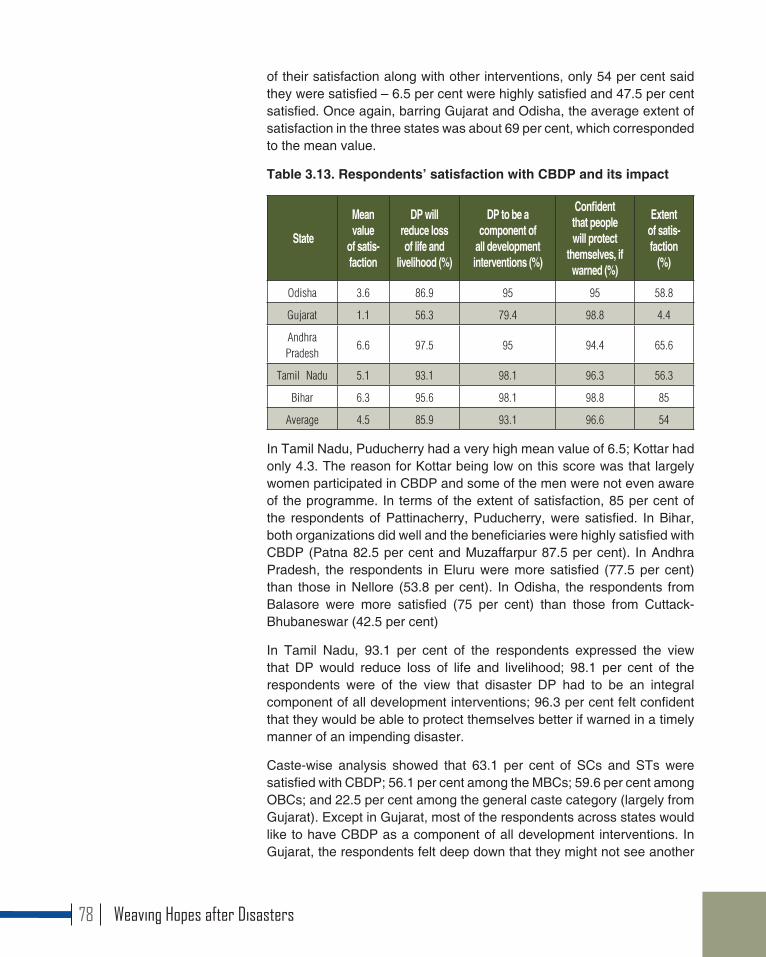
of their satisfaction along with other interventions, only 54 per cent said they were satisfied – 6.5 per cent were highly satisfied and 47.5 per cent satisfied. Once again, barring Gujarat and Odisha, the average extent of satisfaction in the three states was about 69 per cent, which corresponded to the mean value.
Table 3.13. Respondents’ satisfaction with CBDP and its impact
State
Mean value
of satis-faction
DP will reduce loss of life and
livelihood (%)
DP to be a component of
all development interventions (%)
Confident that people will protect
themselves, if warned (%)
Extent of satis-faction
(%)
Odisha 3.6 86.9 95 95 58.8
Gujarat 1.1 56.3 79.4 98.8 4.4
Andhra Pradesh
6.6 97.5 95 94.4 65.6
Tamil Nadu 5.1 93.1 98.1 96.3 56.3
Bihar 6.3 95.6 98.1 98.8 85
Average 4.5 85.9 93.1 96.6 54
In Tamil Nadu, Puducherry had a very high mean value of 6.5; Kottar had only 4.3. The reason for Kottar being low on this score was that largely women participated in CBDP and some of the men were not even aware of the programme. In terms of the extent of satisfaction, 85 per cent of the respondents of Pattinacherry, Puducherry, were satisfied. In Bihar, both organizations did well and the beneficiaries were highly satisfied with CBDP (Patna 82.5 per cent and Muzaffarpur 87.5 per cent). In Andhra Pradesh, the respondents in Eluru were more satisfied (77.5 per cent) than those in Nellore (53.8 per cent). In Odisha, the respondents from Balasore were more satisfied (75 per cent) than those from Cuttack-Bhubaneswar (42.5 per cent)
In Tamil Nadu, 93.1 per cent of the respondents expressed the view that DP would reduce loss of life and livelihood; 98.1 per cent of the respondents were of the view that disaster DP had to be an integral component of all development interventions; 96.3 per cent felt confident that they would be able to protect themselves better if warned in a timely manner of an impending disaster.
Caste-wise analysis showed that 63.1 per cent of SCs and STs were satisfied with CBDP; 56.1 per cent among the MBCs; 59.6 per cent among OBCs; and 22.5 per cent among the general caste category (largely from Gujarat). Except in Gujarat, most of the respondents across states would like to have CBDP as a component of all development interventions. In Gujarat, the respondents felt deep down that they might not see another
Weaving Hopes after Disasters78
earthquake in their lifetime. In other words, CBDP seems to have a greater appeal in cyclone- and flood-affected areas.
The result of CBDP intervention has actually been seen on the ground. At least on two occasions in Kanyakumari district, when cyclone warning was given, the people moved to safer places. Moreover, as part of the training, the beneficiaries were motivated to keep all major documents like certificates, ration cards, bank books, and other key documents and valuables safely in a packet in a particular place. They were instructed to take the packet with them when fleeing from the house. However, a point of view was expressed that everywhere in Tamil Nadu, the participants were mostly women, and the men did not go through proper CBDP training.
Puducherry has now gained greater visibility in DP. It set up an Indian Ocean Forecasting System (INDOFOS) at Pattinacherry village, Karaikal, in 2010. Ocean Weather Information Centre for Puducherry, Tamil Nadu and Kerala coast was jointly opened by the Puducherry Multipurpose Social Service Society (PMSSS) and the Indian National Centre for Ocean Information Services (INCOIS) at the PMSSS head office in March 2010. The centre disseminates information about weather, cyclone, tsunami, depression, wave height, potential fish-finding zone and the type of fishes that are available in that zone, etc. “Setting up Indian Ocean Forecasting System is a major achievement of PMSSS from disaster mitigation perspective”, said PMSSS Director, Fr Albert Thambidurai.
In Andhra Pradesh, various committees have been formed to respond to emergency disaster situations. The measures include committees for announcing, informing police, government officials, providing first aid, etc. Government officials also conducted mock drills. Some of these committee members seem to have been absorbed later by the PRI. In Nellore, Mr. Balshowri stated that some village committee people had developed special skills and were invited by government officials to help out in other villages in need. The Diocesan Social Service Societies of Nellore and Eluru have gained greater visibility and acceptance among the government officials for their expertise in disaster management skills.
In Kharasahapur, Orissa, the government sent the youth to Bhubaneswar for training. They learnt how to prepare drinkable water from flood water through sedimentation process and to convert plastic bottles into life-saving jackets. Later, they trained the villagers. The government also distributed some special mobile SIMs, through which instant warning messages of an impending disaster are made possible. The respondents have also gone through several trainings and gained knowledge about rescue operations and the priorities involved.
Weaving Hopes after Disasters 79
How DP was HelpfulAs regards the question how DP was helpful to them, the respondents provided multiple responses. About 75.4 per cent responses indicated that CBDP had created better awareness. They had learnt what had to be done in an emergency scenario (62.4 per cent); key community leaders, in some cases the committee members, were capacitated to handle emergency (34.6 per cent); due to CBDP, community resilience was high (16.3 per cent); and no one would take undue risk (10.9 per cent).
Suggestions for the Future• The respondents also made the following suggestions.
• Make CBDP training mandatory to all (65.2 per cent);
• Prepare the youth with special focus (37.8 per cent) who can be of great help in an emergency;
• Develop the future generation with a sense of disaster preparedness;
• Include key aspects of DRR in school curriculum (28.6 per cent);
• Provide ongoing training (37.2 per cent) and share and spread new knowledge about DP response (19.9 per cent).
As a case example, in Andhra Pradesh, on the question of making DP/DM more effective, 70.6 per cent of the respondents said that the youth should be prepared for this; 47.6 per cent were of the view that ongoing trainings should be continued; 38.8 wanted training to be made compulsory for all; 25.6 per cent wanted new knowledge about disaster response to be shared; 12.5 believed that DM programme was to be included in school syllabus.
In the following chapter inclusion of the excluded and vulnerable communities such as dalits, minorities, women, people with disability and widows are analysed.
4
Weaving Hopes after Disasters80

It has been established that the vulnerable and poor are the most affected in disasters. Among the poor in India, the Scheduled Castes (SCs or dalits) and Scheduled Tribes (STs), religious minorities, women, people with disability, and widows are considered to be especially vulnerable due
4
Inclusion of the Excluded and the Vulnerable
Weaving Hopes after Disasters 81
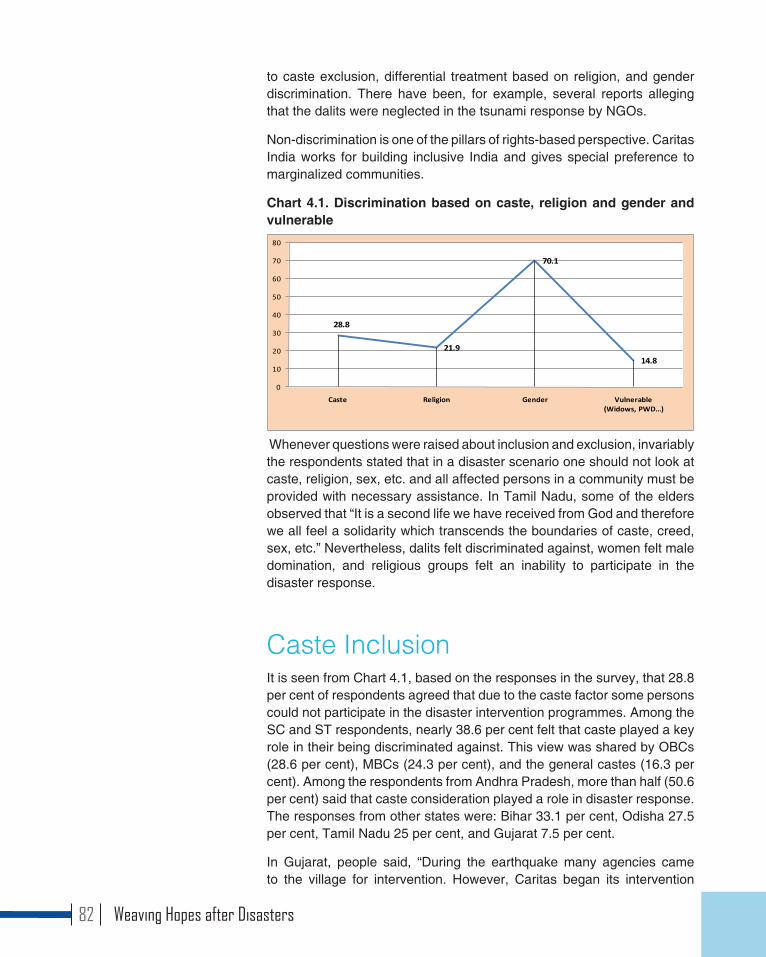
to caste exclusion, differential treatment based on religion, and gender discrimination. There have been, for example, several reports alleging that the dalits were neglected in the tsunami response by NGOs.
Non-discrimination is one of the pillars of rights-based perspective. Caritas India works for building inclusive India and gives special preference to marginalized communities.
Chart 4.1. Discrimination based on caste, religion and gender and vulnerable
28.8
21.9
70.1
14.8
0
10
20
30
40
50
60
70
80
Caste Religion Gender Vulnerable (Widows, PWD…)
Whenever questions were raised about inclusion and exclusion, invariably the respondents stated that in a disaster scenario one should not look at caste, religion, sex, etc. and all affected persons in a community must be provided with necessary assistance. In Tamil Nadu, some of the elders observed that “It is a second life we have received from God and therefore we all feel a solidarity which transcends the boundaries of caste, creed, sex, etc.” Nevertheless, dalits felt discriminated against, women felt male domination, and religious groups felt an inability to participate in the disaster response.
Caste InclusionIt is seen from Chart 4.1, based on the responses in the survey, that 28.8 per cent of respondents agreed that due to the caste factor some persons could not participate in the disaster intervention programmes. Among the SC and ST respondents, nearly 38.6 per cent felt that caste played a key role in their being discriminated against. This view was shared by OBCs (28.6 per cent), MBCs (24.3 per cent), and the general castes (16.3 per cent). Among the respondents from Andhra Pradesh, more than half (50.6 per cent) said that caste consideration played a role in disaster response. The responses from other states were: Bihar 33.1 per cent, Odisha 27.5 per cent, Tamil Nadu 25 per cent, and Gujarat 7.5 per cent.
In Gujarat, people said, “During the earthquake many agencies came to the village for intervention. However, Caritas began its intervention
Weaving Hopes after Disasters82
with vulnerable groups. They held meetings to consult the needy people and their needs were satisfied first. Among the vulnerable groups, Koli, Harijan and Rabaris were given priority and most of them got housing facilities.” However, there were also voices from different sections of the communities expressing dissatisfaction because of their exclusion. Nearly 18 per cent of the respondents were of the view that there were some restrictions on the participation of the beneficiaries because of their caste. This perception was mostly shared by respondents belonging to SC (31 per cent) and OBC (18 per cent) social groups.
In focus group discussions, representatives from dalit communities in Andhra Pradesh, particularly in Eluru, expressed a strong view that dalits were excluded from the tsunami intervention. Fr. Moses, the former Director of Eluru Social Service Society, said in an interview, “Dalits were left out in providing housing on technical and spatial grounds. For housing, government identified only coastal villages. So, only fishermen community benefited. Usually, dalits live in low-lying areas or along canals. Not only during the tsunami, but even during regular floods, dalit hamlets are the worst affected. During the tsunami relief operation, the diocesan organization could not provide assistance to the dalit hamlets since the government did not identify them as affected villages. A handful of dalit families were included in tsunami intervention.” He was of the view that specific support could have been given to the dalits through Caritas India, without linking it with government assessments.
Inclusion of MinoritiesGenerally, Caritas has reached out to people of all faiths. However, 11.4 per cent of the Muslim respondents, 22.6 per cent of the Christians and 22.5 per cent of the Hindus felt that religion was a block in participating in disaster intervention. During transect walk, one could hear highly inclusive narratives as well as some narratives where religious minorities felt excluded.
In Gujarat, although Muslim respondents were fully satisfied with relief support, they were less satisfied with the housing intervention. A Muslim member from Dhori village said: “Along with housing, very substantial livelihood support was provided by the agency. My only source of income was a cabin (petty shop) which kept sweets and candies for children. As part of the livelihood support I asked my wife to get a refrigerator from Caritas. We got a refrigerator and we began to sell chilled drinks. Over the years, I have worked hard with the support of my wife. Today I have a good shop and my economic condition is very stable. I am able to earn from this provision store for my family. My wife is a member of the SHG and saves money regularly.”
In Andhra Pradesh, one of the reasons for Hindus feeling alienated was that
Weaving Hopes after Disasters 83
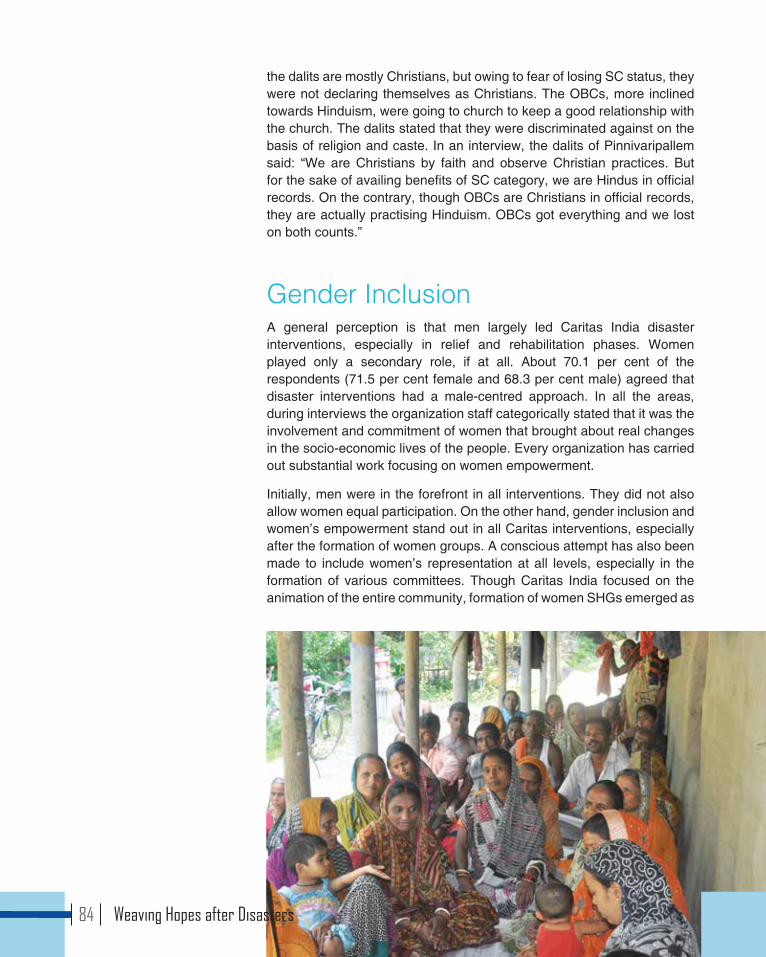
the dalits are mostly Christians, but owing to fear of losing SC status, they were not declaring themselves as Christians. The OBCs, more inclined towards Hinduism, were going to church to keep a good relationship with the church. The dalits stated that they were discriminated against on the basis of religion and caste. In an interview, the dalits of Pinnivaripallem said: “We are Christians by faith and observe Christian practices. But for the sake of availing benefits of SC category, we are Hindus in official records. On the contrary, though OBCs are Christians in official records, they are actually practising Hinduism. OBCs got everything and we lost on both counts.”
Gender InclusionA general perception is that men largely led Caritas India disaster interventions, especially in relief and rehabilitation phases. Women played only a secondary role, if at all. About 70.1 per cent of the respondents (71.5 per cent female and 68.3 per cent male) agreed that disaster interventions had a male-centred approach. In all the areas, during interviews the organization staff categorically stated that it was the involvement and commitment of women that brought about real changes in the socio-economic lives of the people. Every organization has carried out substantial work focusing on women empowerment.
Initially, men were in the forefront in all interventions. They did not also allow women equal participation. On the other hand, gender inclusion and women’s empowerment stand out in all Caritas interventions, especially after the formation of women groups. A conscious attempt has also been made to include women’s representation at all levels, especially in the formation of various committees. Though Caritas India focused on the animation of the entire community, formation of women SHGs emerged as
Weaving Hopes after Disasters84
a key intervention. Initially, the men had reservations about women going out of the house, forming groups, discussing issues of the village, etc. With the introduction of micro-credit, the women had something to offer to the development of households. Access to loans from the common pool and continued support by the intervening agencies for the community through SHGs gave a new fillip to women power. When women SHGs got organized as a federation in a particular geographic area, they imbibed the spirit of their collective power and as agents of transformation.
Women were in the forefront in approaching the government to access various government schemes. Women committees also monitored the quality of the work done. Government officials also recognized this change and accordingly changed their attitude towards women. After witnessing the success stories of the women, the men changed their attitude toward women and became supportive of women’s participation in village development.
Fr. Thomas Nadakalan of Navjeevan Trust, Rajkot, Gujarat, expresses the following view that is shared by many diocesan directors: “The mindset of the people has changed. Earlier, women were confined to the four walls. Now they are more open to the outside world and more participative in the family and village activities. With the help of Caritas, they have formed themselves as SHGs, financially becoming stronger, sending the girl child to the school. Initially, men were not happy with women coming forward but have slowly accepted the change and are now happy with their work and initiatives.”
The formation of SHGs in Odisha after the 1999 cyclone has had a very constructive and long-term impact. The SHG members became key players in relief and rehabilitation works in the subsequent disasters. However, when the project was closed, there was little follow-up by the intervening agencies. Owing to lack of sustainability mechanisms and systems, the SHGs and federations were left to fend for themselves. Many of them seemed to have drifted along the way, and in some instances political parties have captured the women power for political ends.
Vulnerable PersonsWhile 94.1 per cent of the respondents agreed that the most vulnerable like widows and people with disability are to be taken special care of, about 118 respondents (14.8 per cent) said that the vulnerable were not taken care of in the past disaster interventions. This could be a concern that Caritas India would need to look into. Key organization staff admitted that owing to the volume of work during disaster interventions they could not focus on the most vulnerable persons as much as they would have liked to, but whenever persons with disability or widows approached them, their needs were looked into. In other words, since generally the
Weaving Hopes after Disasters 85

poorer communities were chosen by Caritas for disaster interventions, a conscious attempt to reach out to vulnerable people was not given due attention.
To conclude, Caritas India and its partners need to redefine their disaster response paradigm on the basis of the inclusion criterion. While upholding the principle of non-discrimination, the principle of equity and social audit demands that Caritas takes special care of the socially excluded and vulnerable persons and communities. The following suggestions are offered in this regard:
• The intervening agency should select capable representatives from various social and religious groups while constituting the coordination committees, with 50 per cent representation for women, to ensure sensitivity to the needs of excluded and vulnerable people. For example, in Kottar and Eluru, where there has been equal representation of women in various committees, the programme success has been much higher than elsewhere.
• Separate meetings with the specially marginalized communities could be organized to take on board their views and suggestions.
• A special cell could be set up at the organization level to look specifically into the needs of the excluded and vulnerable to positively promote inclusion in all future disaster interventions.
• In case of external restrictions, as it happened in Andhra Pradesh during the tsunami, Caritas would need to find new avenues to reach out to the vulnerable, adhering to its vision of building an inclusive India.
In the following chapter the role of the State in disaster preparedness and response to assist the disaster affected persons is discussed. Respondents’ perception of satisfaction received from the interventions of Government and NGOs is also analysed to understand citizens’ challenges in accessing entitlements.
5
Weaving Hopes after Disasters86
While Caritas India engages in disaster response from the humanitarian perspective, its ultimate objective is to facilitate disaster-affected persons to become citizens, claiming their due rights and entitlements from the State.35 During the course of its interventions Caritas has made several attempts to instil the concept among the people that the State is the primary duty bearer in disaster response.
5
Citizens and the State
Weaving Hopes after Disasters 87
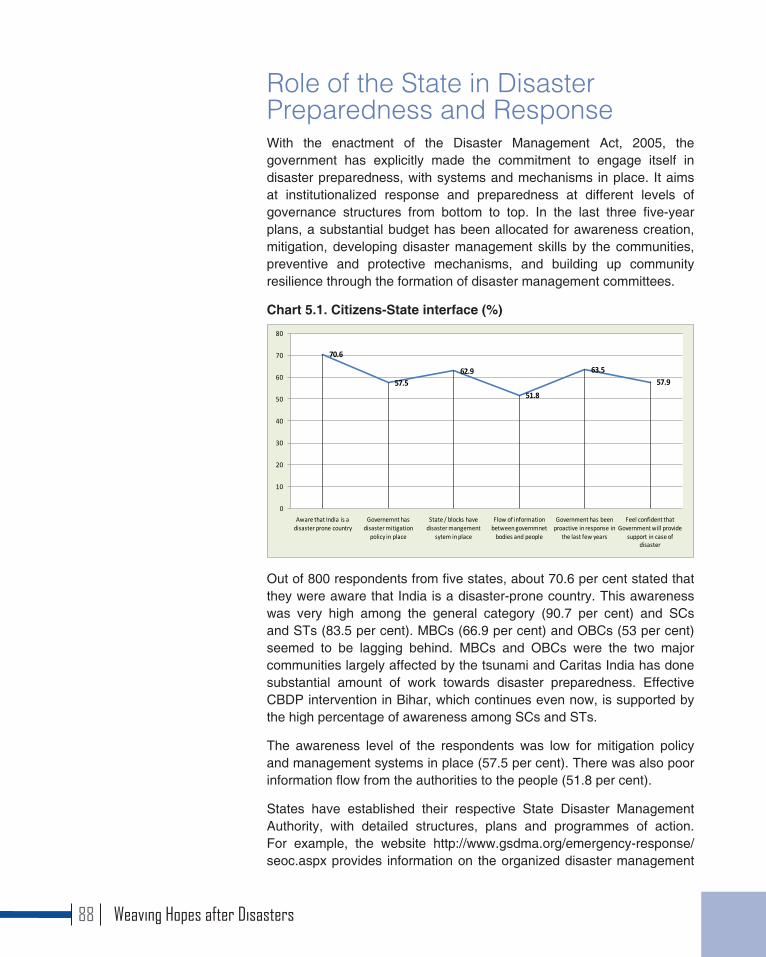
Role of the State in Disaster Preparedness and ResponseWith the enactment of the Disaster Management Act, 2005, the government has explicitly made the commitment to engage itself in disaster preparedness, with systems and mechanisms in place. It aims at institutionalized response and preparedness at different levels of governance structures from bottom to top. In the last three five-year plans, a substantial budget has been allocated for awareness creation, mitigation, developing disaster management skills by the communities, preventive and protective mechanisms, and building up community resilience through the formation of disaster management committees.
Chart 5.1. Citizens-State interface (%)
70.6
57.562.9
51.8
63.557.9
0
10
20
30
40
50
60
70
80
Aware that India is a disaster prone country
Governemnt has disaster mitigation
policy in place
State / blocks have disaster mangement
sytem in place
Flow of information between governmnet
bodies and people
Government has been proactive in response in
the last few years
Feel confident that Government will provide
support in case of disaster
Out of 800 respondents from five states, about 70.6 per cent stated that they were aware that India is a disaster-prone country. This awareness was very high among the general category (90.7 per cent) and SCs and STs (83.5 per cent). MBCs (66.9 per cent) and OBCs (53 per cent) seemed to be lagging behind. MBCs and OBCs were the two major communities largely affected by the tsunami and Caritas India has done substantial amount of work towards disaster preparedness. Effective CBDP intervention in Bihar, which continues even now, is supported by the high percentage of awareness among SCs and STs.
The awareness level of the respondents was low for mitigation policy and management systems in place (57.5 per cent). There was also poor information flow from the authorities to the people (51.8 per cent).
States have established their respective State Disaster Management Authority, with detailed structures, plans and programmes of action. For example, the website http://www.gsdma.org/emergency-response/seoc.aspx provides information on the organized disaster management
Weaving Hopes after Disasters88

system in Gujarat. Emergency response, disaster management plans, hazard risk mitigation studies, training which includes mock drills, disaster mitigation programmes, setting up of rapid action force, etc. are different components handled by the State Disaster Management Authority. Table 5.1 presents the funding pattern for disaster management in Tamil Nadu.
Table 5.1. Funding pattern for disaster management (in Rs. crore)
Year GOI contribution State government contribution Total2010-2011 220.14 73.38 293.52
2011-2012 231.15 77.05 308.20
2012-2013 242.71 80.90 323.61
2013-2014 254.84 84.95 339.79
2014-2015 267.59 89.19 356.78
Total 1216.43 405.47 1621.90
Source: Dept of Revenue Administration, Disaster Management and Mitigation, Government of Tamil Nadu, at http://www.agritech.tnau.ac.in/12th_fyp_tn/5.%20Natural%20Resource%20Management/5_5.pdf
From various focus group discussions and interviews with key stakeholders, it becomes apparent that there is a huge gap between government policies, structures and plans and their implementation. The government seems to believe that with a single mock drill and wide media coverage of the event, the people have been made aware of how to conduct themselves during disasters. Unfortunately, in many states, neither the organization staff nor the people are aware of the implementation of various disaster mitigation programmes in the villages that have been affected by earlier disasters.
The District Development Officer of Bhuj said that a line of authority has been created with clear roles and responsibilities to implement disaster preparedness and mitigation programmes. A disaster mitigation cell is located in the Collectorate of Bhuj, which is monitored by the resident collector, which conducts trainings to respond to various disasters like fire, drought, flood, etc. However, there is a difference of opinion about this among the other stakeholders. “The government has disaster preparedness cell and programmes. Vigilance committees are formed, but most of them are on paper only. Who are their members and what is their role is not known to the public. From the government there is not much information about disaster preparedness. A disaster management system should consider close collaboration among government, NGOs and people for effectiveness. Unfortunately, only when a disaster happens people and government realize the need for preparedness. In repeated flood situations preparedness might be effective”, says the Bishop of Rajkot.
After the tsunami, the Government of India has been proactive in setting up forecasting systems in different places. In an interview, an official in the
Weaving Hopes after Disasters 89

Andhra Pradesh government said: “We now have very good forecasting technology. We have set up a radar at Perupalam36 with a capacity to forecast a cyclone six to seven hours ahead. We can easily forecast any calamity. Our office is also equipped with information technology to spread any such warning to the remotest place. One of the most trusted ways is to make a call to community members on their mobile phones. We have a list of mobile numbers of all members of cooperative societies. In an emergency, our department takes utmost care to spread information. The other popular means of sharing information is radio. We also make announcements on megaphones and siren, but personal calls to the mobile phones are the most effective, immediate and trusted way of communication.”
Despite government claims and the visible role in disaster mitigation, respondents were not satisfied. In Prakasam district, Andhra Pradesh, for example, the amount allotted for disaster management was diverted to laying of roads along the coastal line, stating that during disaster, accessibility is a matter of great concern. In Tamil Nadu, women asked, “Where is the government?”
Respondents in general were not happy with the government initiatives. In some villages the people did not even allow government officials to enter their village for relief work. They were angry at the insensitivity and indifference of government officials towards the villagers and victims in general. The people also saw a clear difference between the government’s approach and that of the NGOs.
A government official, while agreeing with the views of the villagers, opined: “It is true that immediately after the tsunami the government did face initial difficulties in working in the villages. But very soon we won the hearts of the affected people. We served their needs by providing them immediate relief materials. For livelihood, we immediately provided them nets.”
Incidentally, all the government officials interviewed were aware of Caritas and they acknowledged its contribution.
Mr. Govind Jha, who works in the Block Development Office of Cheria Bariarpur, Bihar, said: “Apart from relief, the government is also focusing on housing, both temporary and permanent shelters. Indira Awas Yojana is utilized to help the flood-affected people. On preparedness too, the government has taken a new initiative to deploy chowkidars in flood-prone villages, who give daily updates on the status of water level. Apart from this, mapping of villages is also done. However, the officials feel that the focus should also be long-term relief and intervention.”
A sarpanch in Bihar complained of entrenched corruption in the Indira Awas Yojana. A respondent from Krishna Nagar, Bihar, said, “The government does not do much for the poor. Even if it does, the officials
Weaving Hopes after Disasters90
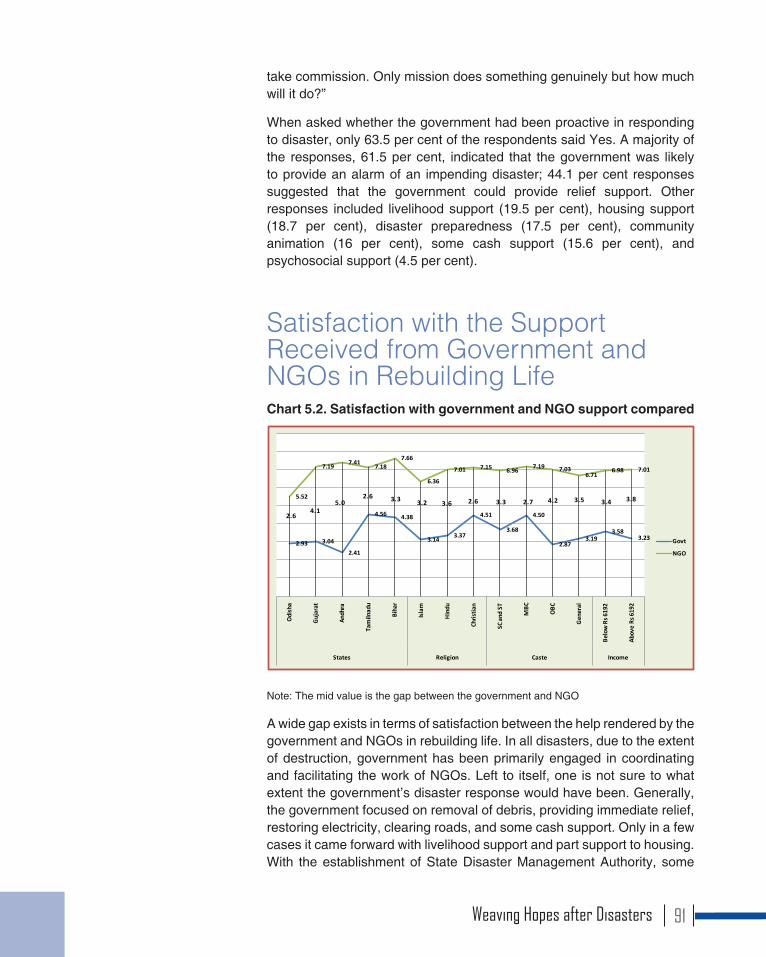
take commission. Only mission does something genuinely but how much will it do?”
When asked whether the government had been proactive in responding to disaster, only 63.5 per cent of the respondents said Yes. A majority of the responses, 61.5 per cent, indicated that the government was likely to provide an alarm of an impending disaster; 44.1 per cent responses suggested that the government could provide relief support. Other responses included livelihood support (19.5 per cent), housing support (18.7 per cent), disaster preparedness (17.5 per cent), community animation (16 per cent), some cash support (15.6 per cent), and psychosocial support (4.5 per cent).
Satisfaction with the Support Received from Government and NGOs in Rebuilding Life Chart 5.2. Satisfaction with government and NGO support compared
2.93 3.04
2.41
4.56 4.38
3.143.37
4.51
3.68
4.50
2.873.19
3.583.23
2.64.1
5.02.6 3.3 3.2 3.6 2.6 3.3 2.7 4.2 3.5 3.4 3.85.52
7.19 7.417.18
7.66
6.36
7.01 7.15 6.96 7.19 7.036.71
6.98 7.01
Odi
sha
Guj
arat
Andh
ra
Tam
ilnad
u
Biha
r
Isla
m
Hin
du
Chris
tian
SC a
nd S
T
MBC
OBC
Gen
eral
Belo
w R
s 619
2
Abov
e Rs
619
2
States Religion Caste Income
Govt
NGO
Note: The mid value is the gap between the government and NGO
A wide gap exists in terms of satisfaction between the help rendered by the government and NGOs in rebuilding life. In all disasters, due to the extent of destruction, government has been primarily engaged in coordinating and facilitating the work of NGOs. Left to itself, one is not sure to what extent the government’s disaster response would have been. Generally, the government focused on removal of debris, providing immediate relief, restoring electricity, clearing roads, and some cash support. Only in a few cases it came forward with livelihood support and part support to housing. With the establishment of State Disaster Management Authority, some
Weaving Hopes after Disasters 91
efforts are being made for disaster preparedness. Reaching out to the affected people with various humanitarian interventions was largely left to NGOs in all the disasters studied in this survey.
A great majority of the respondents (93.6 per cent) were of the view that better collaboration among government, NGOs and community would have benefited them more (“to a great extent”, 65.5 per cent; “to some extent”, 28.1 per cent). Also, 92.8 per cent were of the view that collaboration among government, NGOs and community was the right way forward in responding to disaster situations.
As seen in Chart 5.2, across states, the beneficiaries seem to be more satisfied with NGOs than government. The gap in mean value of satisfaction on a scale of 0 to 9 between government and NGOs is much higher in Andhra Pradesh, with 5 points; it is 4.14 in Gujarat, 3.28 in Bihar, and much less in Tamil Nadu and Odisha, with 2.6 points. As the mean value of satisfaction is higher for NGOs compared to the government, an increase in the gap could mean that the beneficiaries have developed some degree of dependency on NGOs. When the gap is minimum, it is likely that they will approach the government when the NGOs close their projects. The minimum gap is also a clear indication that the people are drawing benefits both from the government and NGOs. This may be the right way of strengthening citizenship rights and their access to entitlements from the State. The way the governments of Odisha and Tamil Nadu have been providing early warning to the people is stated as one of the major breakthroughs in disaster response by the government.
Among the religious communities, the gap is minimum among Christians, at 2.6 points. Across castes, the gap is maximum among OBCs, with 4.2 points difference, and minimum among SCs and STs, with 3.3 points difference. Between income categories, among those below the mean income the gap is less, with 3.4 points, than among those above the mean income, which is 3.8 points. These data also indicate that higher-income category of beneficiaries rely more on NGOs than on the government. The higher-income category of people, large samples of them being from Gujarat, looked for housing, which they believed only NGOs would provide. SCs and STs were much more interested in early warning and immediate relief, which they believed the government had been doing reasonably well, especially in Bihar.
The people’s level of awareness and experience-based perceptions regarding the government’s disaster preparedness appear to indicate that the government is not the main “actor” in disaster management system and in reaching out to people. Nevertheless, key stakeholders claimed that there was greater awareness among respondents about the “right to receive relief and rehabilitation” from the government. When the beneficiaries were asked what would be their response if the government did not intervene appropriately in a disaster situation, 60.4 per cent stated
Weaving Hopes after Disasters92
that they “will go to government office and demand”; 17.5 per cent said that they would mobilize people and express their dissatisfaction through protests; 8.3 per cent stated that they would go to NGOs; 6.7 per cent would consider this as their fate; and 5.7 per cent did not know what they would do.
This is a big challenge for NGOs, especially Caritas, as they wind up their operations in a particular place. While local organizations may be able to provide some handholding support, it is important that the beneficiaries’ access to rights and entitlements is strengthened. To facilitate this process there have to be inbuilt mechanisms, strategies and organizational structure among the people to continue to claim their entitlements from the government, with periodic guidance and support from NGOs.
NGO Institutional Arrangements to Strengthen Citizenship SpaceCaritas India, along with disaster interventions, spent a substantial amount of time, energy and finance in the development of partners. This was done with the twin intention of inculcating professionalism in programme implementation and also to ensure sustainability of the organization.
At the outset, one must duly recognize the contribution made by the local partners in carrying out disaster response. The impact is evident even now.
• Organizational development plan includes staff capacity building in
• Organizational Development Process
• Accounting and Finance management
• Results Based Management (RBM)
• Planning, Monitoring and Evaluation (PME) techniques
• Soft Skills development
• Documentation and Networking; and
• Infrastructural Expansion to promote sustainability of the organization
All partners agree that the exit strategy was well planned and executed. They also were of the view that “the organizations exited from the project at the right time”. People were informed of the exit plans in advance and were prepared enough to carry on the follow-up programmes. The organization staff was also capacitated with different skills. However, the plans did not work out both at the ground level among the people and at the level of organizations to the extent envisaged.
For one thing, as soon as the project came to an end, each organization
Weaving Hopes after Disasters 93

had to wind up the contract of the project staff. For a large number of the latter, their exit from the organization, though theoretically justified, was emotionally wrenching. In almost next to no time, the action-packed organization, humming with multiple activities, became inactive. Many of the well-trained staff were absorbed by other NGOs. But the cash-starved local organizations could not retain even the best of the core staff. Staff shortage resulted in reduced frequency of field visits, and consequently linkages with the people, with the result that the people were left to themselves to continue with the gains made. Village-level committees, disaster management committees, SHG groups and federations are making do in some places, without any follow-up provided by the organization. The result has been that the gains made in the last phase of the interventions, especially progress made through animation and organization, could not be cashed on later. In some cases, groups with vested interests have taken over the SHGs.
The organizations themselves feel somewhat lost and directionless, though they are looking for new ways of sustaining the gains made. They are pumping in money to maintain the training centres or to expand infrastructural facilities, which themselves have become untenable. Several of the new directors have lost the vision originally intended for the organization.
Despite these challenges and growing distance between organisations and beneficiaries even today the organisations are able to gather people in the name of Caritas for various celebrations and programmes. Some organisations are planning to revive some select activities like accompanying SHGs and federations.
It must be also noted that the new directors are taking efforts to mobilise resources in many ways. Some of them are accessing government funding; some are raising local resources and some continue to access funds through foreign agencies. These funds are mobilised for different purposes and programmes. Owing to this some organisations have changed their programmes and activities addressing the needs of poorer communities like children, women, dalits and tribals in other geographical areas, other than the disaster intervention areas, with new activities and plans.
Weaving Hopes after Disasters94
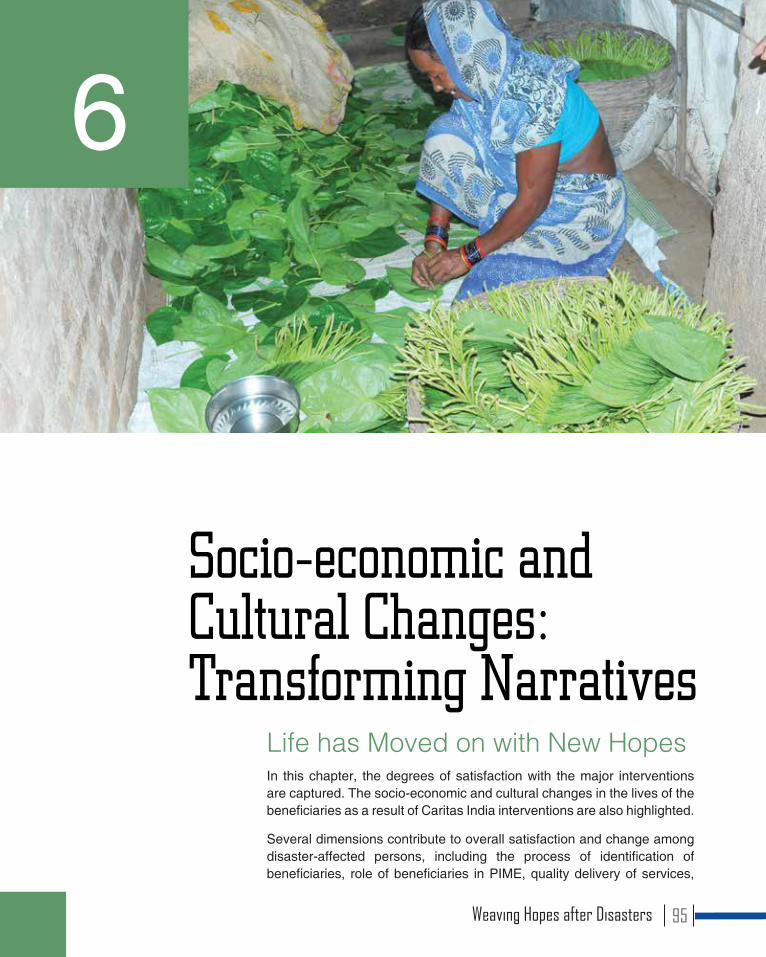
Life has Moved on with New HopesIn this chapter, the degrees of satisfaction with the major interventions are captured. The socio-economic and cultural changes in the lives of the beneficiaries as a result of Caritas India interventions are also highlighted.
Several dimensions contribute to overall satisfaction and change among disaster-affected persons, including the process of identification of beneficiaries, role of beneficiaries in PIME, quality delivery of services,
6
Socio-economic and Cultural Changes: Transforming Narratives
Weaving Hopes after Disasters 95

preparation of beneficiaries in facing future disaster scenarios, building up communities by reducing prejudices and discriminatory practices, feeling of non-discrimination by historically excluded and vulnerable communities, etc.
“The past has gone and life has moved on with new hopes” is the general view expressed by many beneficiaries. The majority of the respondents (93.5 per cent) stated that there had been considerable improvement in their socio-economic lives because of disaster interventions; the rest were either not sure whether their situation had improved or they were still struggling. Of those who responded positively, nearly 54 per cent stated that their situation had improved considerably.
When the respondents were asked whether some aspects of their life still remained to be healed, 64.4 per cent answered in the affirmative; about 18.6 per cent answered in the negative; 17 per cent say were “not sure”. Some still remain very affected by the loss of their family members, especially because the women and children could not run fast enough to save themselves during the tsunami. Some also expressed the pain of loss of their life earnings. Among those who said that some aspects are yet to be healed, 95 per cent were from Tamil Nadu, 94.4 per cent from Bihar, and 76.9 per cent from Odisha. Caste-wise, among those who said that some aspects were yet to be healed, the percentage was very high among MBCs (95.9 per cent) and SCs and STs (78.4 per cent). As regards different income categories, among those below mean income, 76.9 per cent said that there were areas which still required healing; among those who earned more than the mean value, the percentage was 40.8.
Satisfaction and Impact of the Major Interventions ComparedChart 6.1. Overall satisfaction with key interventions and impact
0
10
20
30
40
50
60
70
80
90
100
Relief Psycho-Social Livelihood Housing DP/CBDP
89.2
37.6
59.3
75.5
54
95.3
67.9
76 75.8
85.9
Satisfaction
Impact
Weaving Hopes after Disasters96
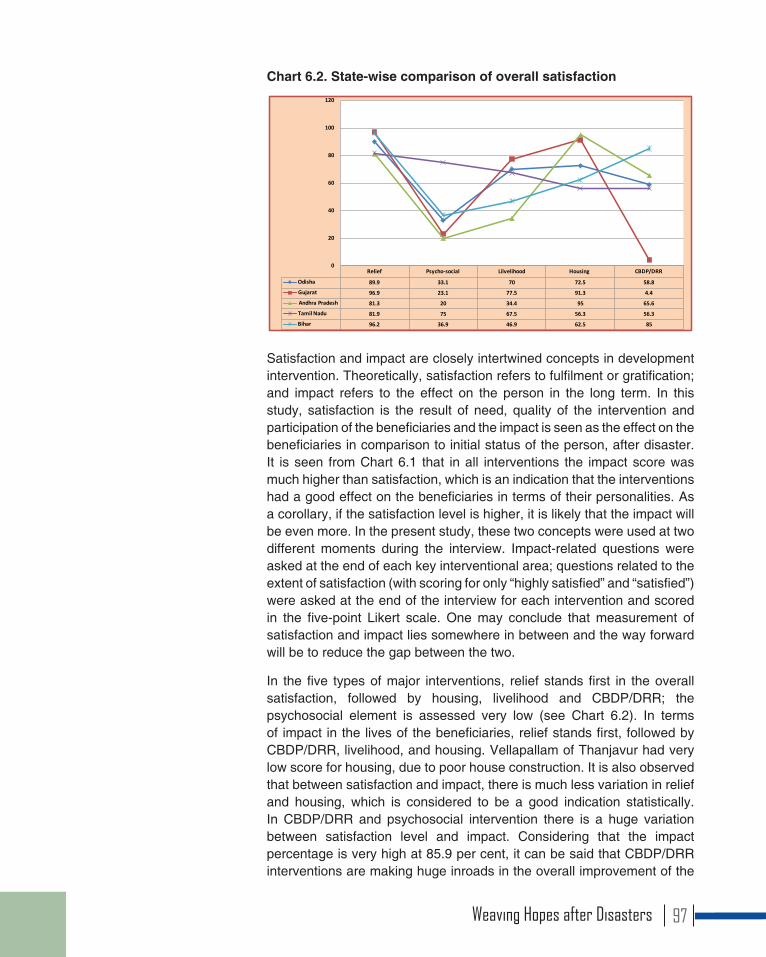
Chart 6.2. State-wise comparison of overall satisfaction
Relief Psycho-social Lilvelihood Housing CBDP/DRR
Odisha 89.9 33.1 70 72.5 58.8
Gujarat 96.9 23.1 77.5 91.3 4.4
Andhra Pradesh 81.3 20 34.4 95 65.6
Tamil Nadu 81.9 75 67.5 56.3 56.3
Bihar 96.2 36.9 46.9 62.5 85
0
20
40
60
80
100
120
Satisfaction and impact are closely intertwined concepts in development intervention. Theoretically, satisfaction refers to fulfilment or gratification; and impact refers to the effect on the person in the long term. In this study, satisfaction is the result of need, quality of the intervention and participation of the beneficiaries and the impact is seen as the effect on the beneficiaries in comparison to initial status of the person, after disaster. It is seen from Chart 6.1 that in all interventions the impact score was much higher than satisfaction, which is an indication that the interventions had a good effect on the beneficiaries in terms of their personalities. As a corollary, if the satisfaction level is higher, it is likely that the impact will be even more. In the present study, these two concepts were used at two different moments during the interview. Impact-related questions were asked at the end of each key interventional area; questions related to the extent of satisfaction (with scoring for only “highly satisfied” and “satisfied”) were asked at the end of the interview for each intervention and scored in the five-point Likert scale. One may conclude that measurement of satisfaction and impact lies somewhere in between and the way forward will be to reduce the gap between the two.
In the five types of major interventions, relief stands first in the overall satisfaction, followed by housing, livelihood and CBDP/DRR; the psychosocial element is assessed very low (see Chart 6.2). In terms of impact in the lives of the beneficiaries, relief stands first, followed by CBDP/DRR, livelihood, and housing. Vellapallam of Thanjavur had very low score for housing, due to poor house construction. It is also observed that between satisfaction and impact, there is much less variation in relief and housing, which is considered to be a good indication statistically. In CBDP/DRR and psychosocial intervention there is a huge variation between satisfaction level and impact. Considering that the impact percentage is very high at 85.9 per cent, it can be said that CBDP/DRR interventions are making huge inroads in the overall improvement of the
Weaving Hopes after Disasters 97
lives of the beneficiaries. However, livelihood intervention emerges as a matter of concern.
As to whether greater participation of the community in PIME would have resulted in better results and outcome, 95.6 per cent of the respondents answered in the affirmative. Based on their experiences, they expressed the need for greater participation at all levels. Some opined that this might slow down the implementation, but agreed that the results attained through community participation would have a lasting impact, since the community owns up the process. In their view, projects should be turned into process-oriented programmes, making them people-centric.
In terms of reduction in prejudices based on caste and religion, 80.8 per cent of the respondents said that the prejudices had declined; 8.6 per cent said that the prejudices still continued. In the formation of various committees, the NGOs took a clear stand to include representatives from various caste and religious groups and women, which in the longer run has helped in transcending traditional barriers. There is also increased participation by different community members in the various religious-cultural celebrations.
Women empowerment programmes through formation of SHGs and federations have been very effective in Odisha, Gujarat, Tamil Nadu and Andhra Pradesh. Women leadership is visible in the villages. Through SHGs and federations subsequently, a number of government schemes have reached the villages. Most importantly, there is a change in the attitude of men towards women, recognizing their power and contribution.
In terms of state-wise satisfaction with the elements of intervention, the respondents from Odisha and Gujarat expressed greater satisfaction with relief, housing and livelihood. In Bihar, the order of satisfaction was relief, CBDP/DRR and housing. In Andhra Pradesh, the ranking was housing, relief and CBDP/DRR, with livelihood and psychosocial interventions coming low in the scale; in Tamil Nadu, relief, psychosocial and livelihood were in a higher order, with housing and CBDP/DRR also ranked high. It may also be noted that in Tamil Nadu, the satisfaction of beneficiaries was above 50 per cent in all five interventions.
Changes in the Respondents’ Socio-economic LifeThough the tsunami and earthquake caused enormous destruction to people and properties it is ironic that the beneficiaries of Andhra Pradesh, Tamil Nadu and Gujarat stated that “tsunami washed away our poverty”, and “earthquake was a blessing in disguise”. These popular sentiments in a way sum up the transforming and affirmative changes among most
Weaving Hopes after Disasters98
of the beneficiaries. Disaster interventions facilitated a new life among the beneficiaries and promoted substantial changes in the social, economic and cultural aspects. The changes are visible in personal growth, relationship with others, quality of life, interaction with the outside world, collective bargaining, access to entitlements, etc. Some of these narratives are captured here.
Punnaih from Krantinagar says: “In the tsunami I lost everything other than the clothes I wore. But fortunately, my family members and I were benefited by the timely intervention of DNSSS. DNSSS provided us clothing and accommodation and even utensils and food. I was also provided with a net and boat. Owing to my poverty, DNSSS was sympathetic to me and also appointed me as an animator. I worked for Caritas side by side with my daily livelihood activities to augment my income. I am personally thankful to DNSSS but I am also sure that my entire fellow villagers are equally thankful to DNSSS for care and support.”
In Odisha, the respondents were satisfied with the livelihood programmes. The beneficiaries received goat, chickens, coconut, banana, mango saplings, potatoes and vegetable seeds. Establishment of SHGs played a vital role in strengthening the family economy.
Personality-related ChangesThe beneficiaries exhibit a tremendous amount of self-confidence and are looking towards a better future. After having witnessed the loss of many lives, many of them recognize the value of living a meaningful life here and now. “One clear expression of this can be seen in the interest taken in educating the children. Most of the children of the respondents are in school today. The parents are willing to make sacrifices in order to educate their children. It is good to see many students in higher and technical education”, said Bishop Remigius of Kottar. Virtually in every village, nearly all girls and boys go to school.
Sahaya Sajan from Bishop Leaon Nagar, Tamil Nadu, who lost his sister in the tsunami, was given a house. Sahaya did not think his future would be different from that of his fisher father. However, after watching young people from his new neighbourhood pursuing higher studies including engineering, he too dreams of a better future now and wishes to pursue higher studies.
Along with education, Caritas beneficiaries value cleanliness. The new housing areas as well as surroundings are kept clean and litter-free. Fr Maria Sooai, Director of KSSS, is of the view that “clean surroundings display the attitudinal changes in the fisherfolk community”. Also, the women are more articulate today and empowered. Many success stories are attributed to women power. Before the earthquake in Gujarat, for example, women were restricted in their movements, and were not
Weaving Hopes after Disasters 99
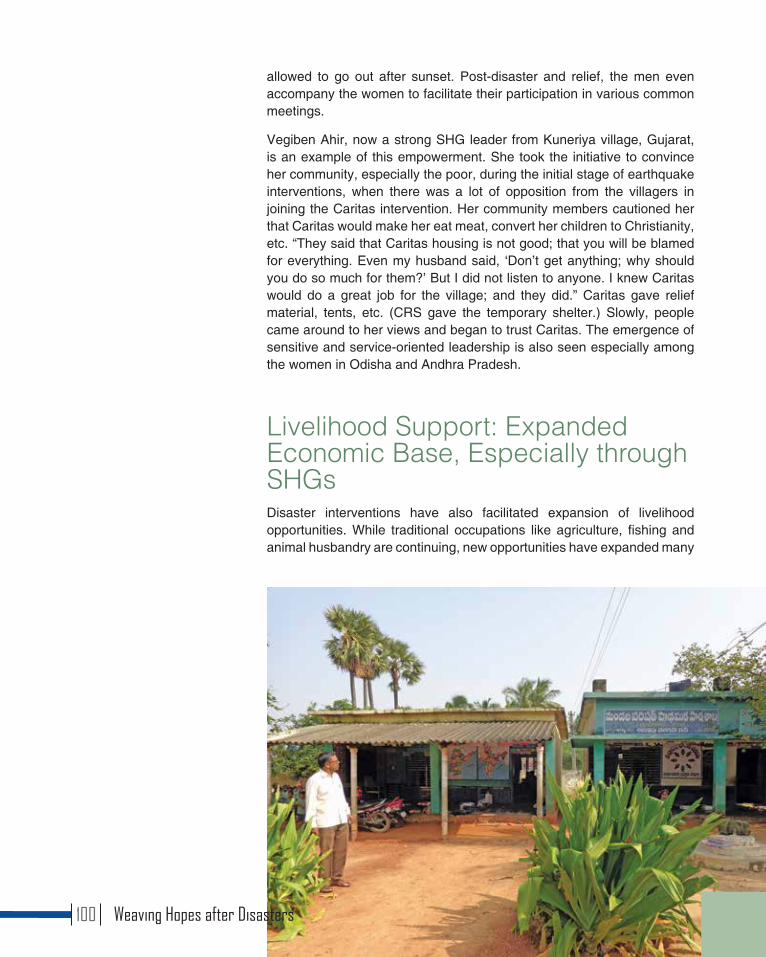
allowed to go out after sunset. Post-disaster and relief, the men even accompany the women to facilitate their participation in various common meetings.
Vegiben Ahir, now a strong SHG leader from Kuneriya village, Gujarat, is an example of this empowerment. She took the initiative to convince her community, especially the poor, during the initial stage of earthquake interventions, when there was a lot of opposition from the villagers in joining the Caritas intervention. Her community members cautioned her that Caritas would make her eat meat, convert her children to Christianity, etc. “They said that Caritas housing is not good; that you will be blamed for everything. Even my husband said, ‘Don’t get anything; why should you do so much for them?’ But I did not listen to anyone. I knew Caritas would do a great job for the village; and they did.” Caritas gave relief material, tents, etc. (CRS gave the temporary shelter.) Slowly, people came around to her views and began to trust Caritas. The emergence of sensitive and service-oriented leadership is also seen especially among the women in Odisha and Andhra Pradesh.
Livelihood Support: Expanded Economic Base, Especially through SHGsDisaster interventions have also facilitated expansion of livelihood opportunities. While traditional occupations like agriculture, fishing and animal husbandry are continuing, new opportunities have expanded many
Weaving Hopes after Disasters100
possibilities and strengthened the economic base of the households. A new entrepreneurial spirit is also seen. Establishing china clay factories has opened up new business opportunities and big income for families in Nadappa, Bhuj. The families provide employment to others. In Bhujodi, the embroidery business has reached the international market.
In Kutch, a large number of volunteers and field workers who assisted Caritas in interventions have been employed in good positions at various levels. They have had experience of handling difficult situations at a personal level and at the developmental level. Mavjibhai Ahir joined Caritas for a salary of Rs 1000 as field animator and left with a salary of Rs 6000 as field officer. He now has fifty workers and manages two china clay factories.
Livelihood intervention in Majnupur of Muzaffarpur was also a tremendous success. The livestock invested in Majnupur has contributed to the villagers making a dignified living out of selling milk.
In Kanyakumari district, there has been a drastic reduction in youth taking up fishing, opting instead for technical and professional city-based jobs such as engineering, nursing, lab technician, computer software and hardware, etc. The youth are also taking an interest in learning multiple skills such as soap making, tailoring, embroidery, motor mechanic, and so on. People welcome job-oriented skills and are interested in acquiring these. It is perceptibly clear that the new generation is looking various job opportunities beyond the traditional occupations.
The families desire to educate their children to enable them to move up on the economic ladder. A widow in Bishop Leon Nagar has, for example, pledged her comfortable tsunami house in order to educate her son. For her livelihood she works with another family, looking after an elderly person and resides with them.
Housing: Symbol of Identity, Dignity and Quality Life Concrete roofed stand-alone houses and two-floored houses are expressions of new narratives in the lives of the beneficiaries. Owning a house has raised the self-esteem and dignity of the people. Each house may cost Rs 5 lakh or more. Most of the beneficiaries stated that they cannot think of building a house. Owning a house is a big security and will benefit enormously the present and future generations for the next 25 to 30 years.
Lourdumary from Bishop Leon Nagar, Tamil Nadu lost her house at Colachal beach in the tsunami. With the new accommodation provided by KSSS, she expresses heartfelt gratitude and satisfaction. She has
Weaving Hopes after Disasters 101
extended her kitchen and built a compound wall, laying tiles on the front pathway. Her daughter Sajuna, 15 years old, keeps the surroundings green by planting trees and plants. “In our old house, we could not make a garden due to the brackish sand at the coast”, Lourdmary says. The new atmosphere away from the coast gives them peace. The new village with good neighbours gives them the feeling of born anew.
Facilities like drainage and toilets are very new in the lives of the beneficiaries. In fact, building toilets within the house has broken some traditional notions and mindsets. In Bhuj, according to the size of the land the people owned, houses have been provided. There is privacy, security and sufficient space around.
For Suamulu, a widow from Pinnivaripallem, Andhra Pradesh, housing gave her a sense of security and confidence to leave her children at home and venture out for work. Suamulu says, “At the time of tsunami, I had a small hut. Tsunami completely destroyed my hut and my family had no roof over our head. However, I got relief and support from DNSSS who took care of my family and other villagers for full two months. Seeing my condition I was given preference in the housing scheme. Thus I got a house constructed by DNSSS. Because of this house I am now confident to go out to work leaving my children at home.” Bishop D M Prakasam of Nellore said: “While it is a long way to go for the sustainable and integral development of the beneficiaries, housing has helped the poor to regain their self-confidence.”
“Housing has increased my identity and self-worth. Earlier, within a thatched roof setup which just had enclosures on four sides all sorts of activities like cooking, washing dishes, dress changing, studying, watching TV, talking to friends etc had to be done. In the new houses, life is very different and cooking does not affect studies of the children”, said a women leader from Puducherry. The young girls feel comfortable as they have enough privacy in the new house. There is cordial relationship with neighbours and there are fewer quarrels. People are more sensitive to the presence of others.
Resettlement areas such as Bishop Leon Nagar of Kottar, Linupalavapallem and K.D. Pallavapallem in Eluru stand out as models. Along with housing, resettlement locations have good streets and roads, kitchen gardens, drainage systems, drinking water facilities, and garbage disposal facility, etc.
Changes in Socio-Cultural PracticesA striking phenomenon is that the resort to drinking has declined reduced in some coastal villages in Tamil Nadu, Andhra Pradesh and Odisha. “Traditionally, the fisherfolk community is known for drinking and creating
Weaving Hopes after Disasters102
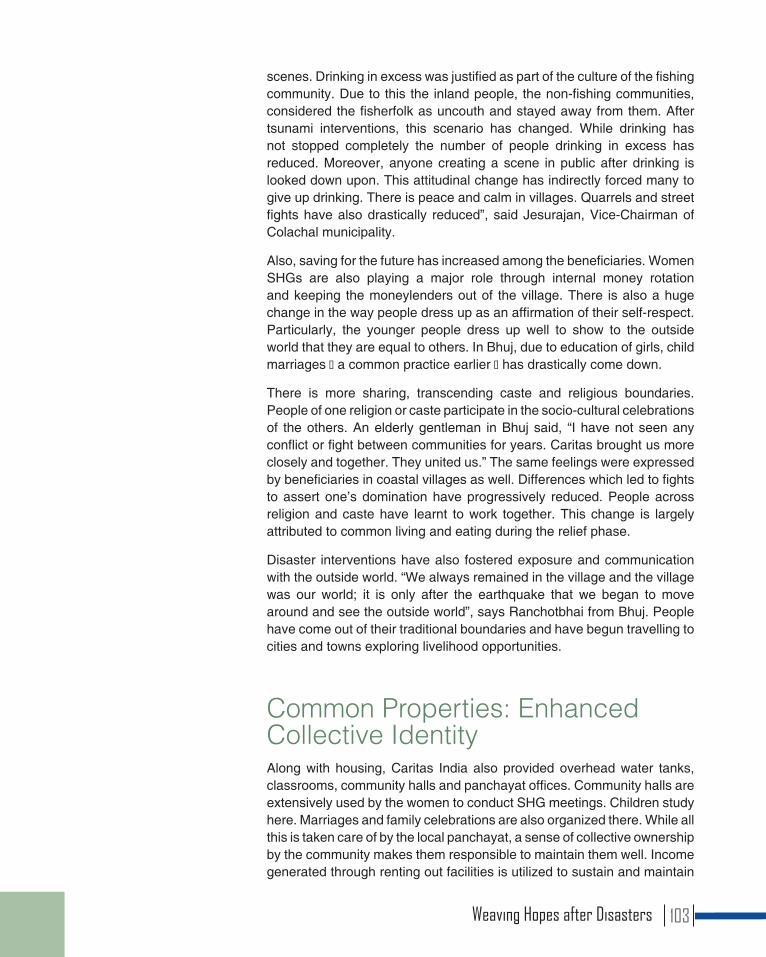
scenes. Drinking in excess was justified as part of the culture of the fishing community. Due to this the inland people, the non-fishing communities, considered the fisherfolk as uncouth and stayed away from them. After tsunami interventions, this scenario has changed. While drinking has not stopped completely the number of people drinking in excess has reduced. Moreover, anyone creating a scene in public after drinking is looked down upon. This attitudinal change has indirectly forced many to give up drinking. There is peace and calm in villages. Quarrels and street fights have also drastically reduced”, said Jesurajan, Vice-Chairman of Colachal municipality.
Also, saving for the future has increased among the beneficiaries. Women SHGs are also playing a major role through internal money rotation and keeping the moneylenders out of the village. There is also a huge change in the way people dress up as an affirmation of their self-respect. Particularly, the younger people dress up well to show to the outside world that they are equal to others. In Bhuj, due to education of girls, child marriages ─ a common practice earlier ─ has drastically come down.
There is more sharing, transcending caste and religious boundaries. People of one religion or caste participate in the socio-cultural celebrations of the others. An elderly gentleman in Bhuj said, “I have not seen any conflict or fight between communities for years. Caritas brought us more closely and together. They united us.” The same feelings were expressed by beneficiaries in coastal villages as well. Differences which led to fights to assert one’s domination have progressively reduced. People across religion and caste have learnt to work together. This change is largely attributed to common living and eating during the relief phase.
Disaster interventions have also fostered exposure and communication with the outside world. “We always remained in the village and the village was our world; it is only after the earthquake that we began to move around and see the outside world”, says Ranchotbhai from Bhuj. People have come out of their traditional boundaries and have begun travelling to cities and towns exploring livelihood opportunities.
Common Properties: Enhanced Collective IdentityAlong with housing, Caritas India also provided overhead water tanks, classrooms, community halls and panchayat offices. Community halls are extensively used by the women to conduct SHG meetings. Children study here. Marriages and family celebrations are also organized there. While all this is taken care of by the local panchayat, a sense of collective ownership by the community makes them responsible to maintain them well. Income generated through renting out facilities is utilized to sustain and maintain
Weaving Hopes after Disasters 103
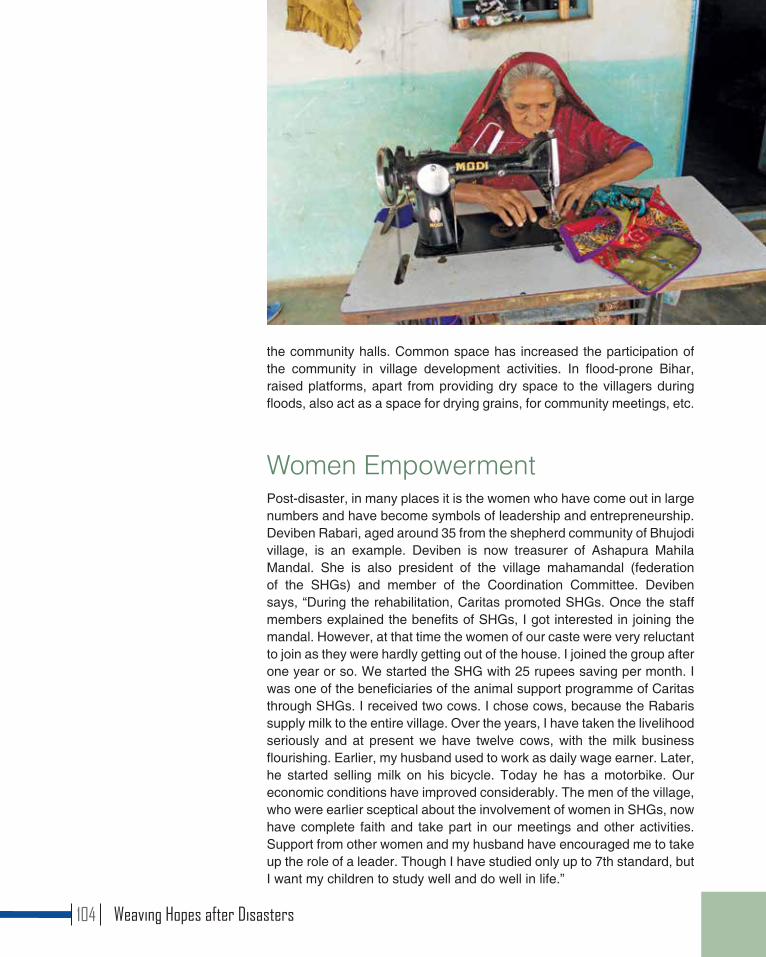
the community halls. Common space has increased the participation of the community in village development activities. In flood-prone Bihar, raised platforms, apart from providing dry space to the villagers during floods, also act as a space for drying grains, for community meetings, etc.
Women EmpowermentPost-disaster, in many places it is the women who have come out in large numbers and have become symbols of leadership and entrepreneurship. Deviben Rabari, aged around 35 from the shepherd community of Bhujodi village, is an example. Deviben is now treasurer of Ashapura Mahila Mandal. She is also president of the village mahamandal (federation of the SHGs) and member of the Coordination Committee. Deviben says, “During the rehabilitation, Caritas promoted SHGs. Once the staff members explained the benefits of SHGs, I got interested in joining the mandal. However, at that time the women of our caste were very reluctant to join as they were hardly getting out of the house. I joined the group after one year or so. We started the SHG with 25 rupees saving per month. I was one of the beneficiaries of the animal support programme of Caritas through SHGs. I received two cows. I chose cows, because the Rabaris supply milk to the entire village. Over the years, I have taken the livelihood seriously and at present we have twelve cows, with the milk business flourishing. Earlier, my husband used to work as daily wage earner. Later, he started selling milk on his bicycle. Today he has a motorbike. Our economic conditions have improved considerably. The men of the village, who were earlier sceptical about the involvement of women in SHGs, now have complete faith and take part in our meetings and other activities. Support from other women and my husband have encouraged me to take up the role of a leader. Though I have studied only up to 7th standard, but I want my children to study well and do well in life.”
Weaving Hopes after Disasters104
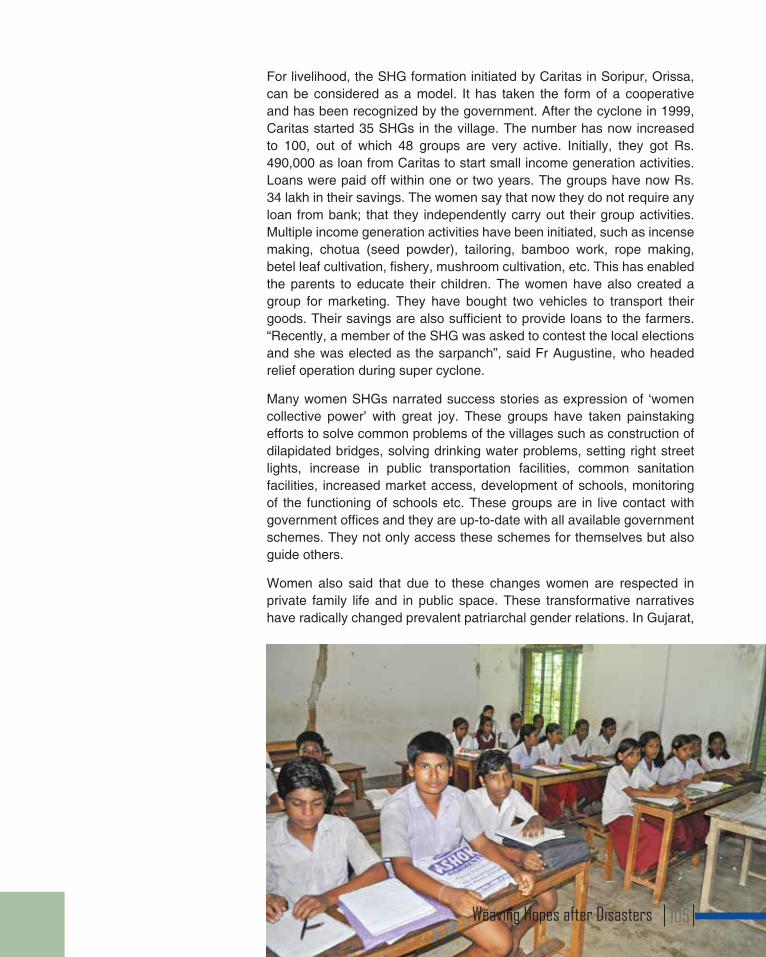
For livelihood, the SHG formation initiated by Caritas in Soripur, Orissa, can be considered as a model. It has taken the form of a cooperative and has been recognized by the government. After the cyclone in 1999, Caritas started 35 SHGs in the village. The number has now increased to 100, out of which 48 groups are very active. Initially, they got Rs. 490,000 as loan from Caritas to start small income generation activities. Loans were paid off within one or two years. The groups have now Rs. 34 lakh in their savings. The women say that now they do not require any loan from bank; that they independently carry out their group activities. Multiple income generation activities have been initiated, such as incense making, chotua (seed powder), tailoring, bamboo work, rope making, betel leaf cultivation, fishery, mushroom cultivation, etc. This has enabled the parents to educate their children. The women have also created a group for marketing. They have bought two vehicles to transport their goods. Their savings are also sufficient to provide loans to the farmers. “Recently, a member of the SHG was asked to contest the local elections and she was elected as the sarpanch”, said Fr Augustine, who headed relief operation during super cyclone.
Many women SHGs narrated success stories as expression of ‘women collective power’ with great joy. These groups have taken painstaking efforts to solve common problems of the villages such as construction of dilapidated bridges, solving drinking water problems, setting right street lights, increase in public transportation facilities, common sanitation facilities, increased market access, development of schools, monitoring of the functioning of schools etc. These groups are in live contact with government offices and they are up-to-date with all available government schemes. They not only access these schemes for themselves but also guide others.
Women also said that due to these changes women are respected in private family life and in public space. These transformative narratives have radically changed prevalent patriarchal gender relations. In Gujarat,
Weaving Hopes after Disasters 105
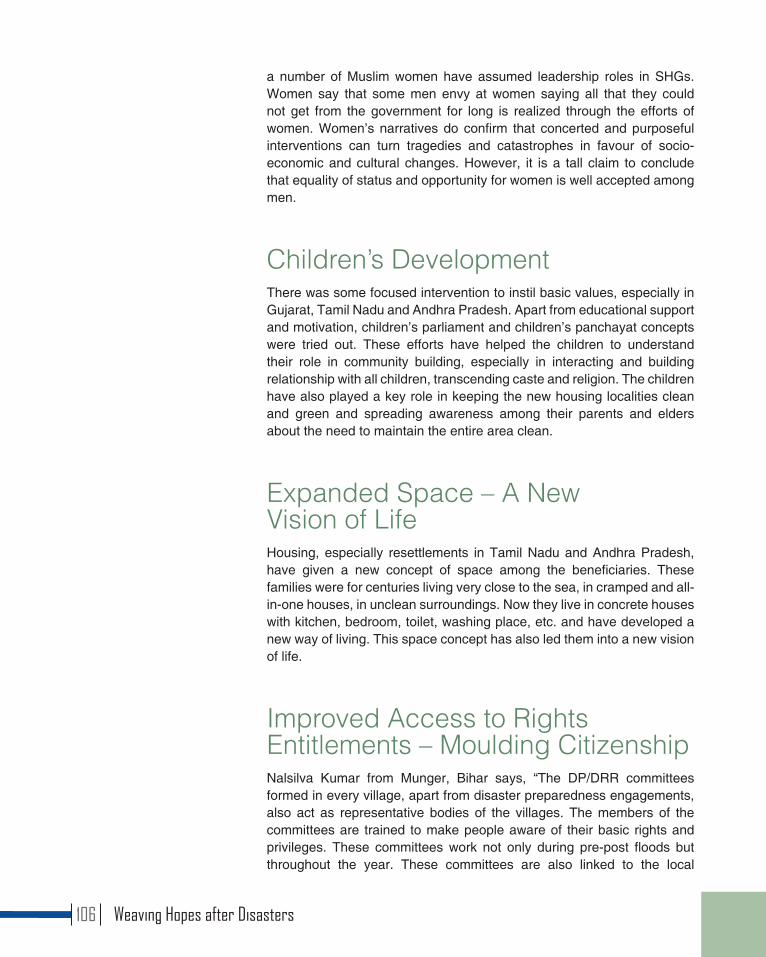
a number of Muslim women have assumed leadership roles in SHGs. Women say that some men envy at women saying all that they could not get from the government for long is realized through the efforts of women. Women’s narratives do confirm that concerted and purposeful interventions can turn tragedies and catastrophes in favour of socio-economic and cultural changes. However, it is a tall claim to conclude that equality of status and opportunity for women is well accepted among men.
Children’s DevelopmentThere was some focused intervention to instil basic values, especially in Gujarat, Tamil Nadu and Andhra Pradesh. Apart from educational support and motivation, children’s parliament and children’s panchayat concepts were tried out. These efforts have helped the children to understand their role in community building, especially in interacting and building relationship with all children, transcending caste and religion. The children have also played a key role in keeping the new housing localities clean and green and spreading awareness among their parents and elders about the need to maintain the entire area clean.
Expanded Space – A New Vision of LifeHousing, especially resettlements in Tamil Nadu and Andhra Pradesh, have given a new concept of space among the beneficiaries. These families were for centuries living very close to the sea, in cramped and all-in-one houses, in unclean surroundings. Now they live in concrete houses with kitchen, bedroom, toilet, washing place, etc. and have developed a new way of living. This space concept has also led them into a new vision of life.
Improved Access to Rights Entitlements – Moulding Citizenship Nalsilva Kumar from Munger, Bihar says, “The DP/DRR committees formed in every village, apart from disaster preparedness engagements, also act as representative bodies of the villages. The members of the committees are trained to make people aware of their basic rights and privileges. These committees work not only during pre-post floods but throughout the year. These committees are also linked to the local
Weaving Hopes after Disasters106
government bodies, NABARD and Krishi Vikas Kendra. Initially it has been very difficult to make the community understand the aims of these committees. Gradually immense progress has been made which has resulted in a strong networkbase now.”
The last phase of disaster intervention is marked by an increasing number of activities on rights and entitlements as a fruit of community animation process. Meeting government officers, submitting petitions, initiating campaigns, and dharnas and protests where necessary, are activities seen among the beneficiaries. This change is mainly among the women who were animated through SHG formation. However, there are serious sustainability concerns: already, defragmentation and non-functioning of these groups are visible.
Some Challenges and ConcernsAlong with many positive developments and changes in the lives of people, some unhealthy attitudes have also set in. Women groups pointed out, for example, “After the tsunami, as relief materials were provided, and dumped by different organizations, there was more than needed. Begging and hoarding and other vices have crept in among the fisher community. Today, if anyone visits the village, the first question is, what will you give us? This was not so earlier. The fisher community was always known for giving rather than receiving. Now, the culture of giving generously has diminished and more and more people are interested in getting and hoarding. Some people have even sold relief materials to others.” Selfishness has also led to a dependency attitude. “NGOs will provide if something happens” is a deeply prevalent attitude.
Some of the livelihood programmes, especially those that were given directly to individuals, such as animal support, ended badly. In Andhra Pradesh, Gujarat and Odisha, the respondents confirmed that about 30 to 40 per cent of the beneficiaries immediately sold off the animals. Income generation and livelihood support provided through SHGs had a much better impact. Some fisher community respondents also accepted that about 30 per cent of livelihood support received in the form of nets and fishing equipment was sold. Two major reasons pointed out were: (i) too much material support; and (ii) on account of poverty. In skill training the youth did not appreciate masonry and carpentry. Many dropped out from the training and those who completed did not pursue it.
In a model resettlement village like Bishop Leon Nagar and in Kottilpadu, Kottar, 20 per cent of the houses are no more with the beneficiaries. Many said that out of helplessness, people sold out. The dowry system mainly accounted for this phenomenon. To dissuade the dowry system, motivational programmes could be helpful. Bishop Remigius, then Caritas Chairman, made two important remarks: (i) Assistance, be it income
Weaving Hopes after Disasters 107

generation, livelihood or housing, unless accompanied by community animation and motivation in a sustained manner, may not last long since the fisher community faces multiple problems. It takes time to build a generation; what is needed is a new mindset among the people. (ii) Sea erosion is not considered as an emergency by the government. As the coastline is shrinking, the fishing community is facing impending dangers. However, this is not the responsibility of NGOs alone. NGOs have to play a liaison role so that people move from being beneficiaries to citizens.
Housing intervention, especially in Vellapallam (Tamil Nadu) and Garkhawli (Bihar) did not lead to a high level of satisfaction among the beneficiaries. One of the men in a focus group discussion in Vellapallam (Tamil Nadu) said: “We escaped from the tsunami only to die under the worst roofs of the new houses. We need the houses to live in, not to die in.” Most of the houses were dilapidated, with the roofs caving in. In Garkhawli, Bihar, though bamboo houses did relieve the beneficiaries initially, gradual wear and tear resulting from leaked roofs and unsuitable raw material used for house construction made many structures uninhabitable. In the overall context, most respondents also could not recall Caritas or the local NGO.
It may be particularly noted that in Bhuj, while the support of Caritas was well acknowledged by all stakeholders, the youth developed an aversion to the Caritas logo and immediately erased the logo wherever it appeared.
Differences between communities and castes too did not cease in certain areas. The observation of Pentarayam Nageswar Rao of Pinnivaripallem is an example: “Two dominant castes exist in my village. I belong to the dalit community of Malas, boycotted by the OBC community of Palliyars, in the past fifteen years as punishment for a dalit boy’s alleged love affair with an OBC girl. I fish for a living and live with my wife and two
Weaving Hopes after Disasters108
daughters and one son. After the tsunami, my family and community received immediate relief and support from DNSS and other NGOs in various forms. A sudden “we” feeling developed in our village and the social distance between dalits and majority OBCs was reduced, but this was short-lived. When DNSS came up with a facility of housing, we found that the dalits were totally left out. Barring four dalit families, all the 120 beneficiaries were OBCs. We were not only neglected in housing but in livelihood too. A senior diocesan priest advocated for us (the dalits) so that we might get a fibre boat. But this was sabotaged by fellow OBCs. They suddenly became friendly with us and our social boycott was lifted, but this was their game plan to fool us. By showing fraternity with us, they succeeded in manipulating other officials in declaring the boat as common village property. Thus, we lost. Later, I could build my own house with my earnings. But there are other dalits who still live in thatched houses.”
To summarize the foregoing discussion, it can be said that Caritas interventions have made deep impacts in the lives of the beneficiaries, particularly among women. These have opened up new possibilities and opportunities to dream of an improved quality of life, individually and collectively. Barring some negative experiences, overall, the respondents expressed genuine gratitude to Caritas. Based on their experiences, they also made recommendations in terms of the possible right mix of interventions that could be considered by the intervening agency in future.
Weaving Hopes after Disasters 109

After each disaster, the question arises on the right mix of measures deployed to minimize its adverse effects as well as to reduce the underlying social and economic inequalities. Multiple perspectives come into play in soliciting this answer. The focus in this study has been to find out what the beneficiaries say about the right mix linking relief, rehabilitation and development37 from a long-term perspective in terms of five key interventions, namely, (i) relief, (ii) psychosocial, (iii) livelihood, (iv) housing, and (v) CBDP/DRR.
7
LRRD: The Right Mix for Disaster Interventions
Weaving Hopes after Disasters110
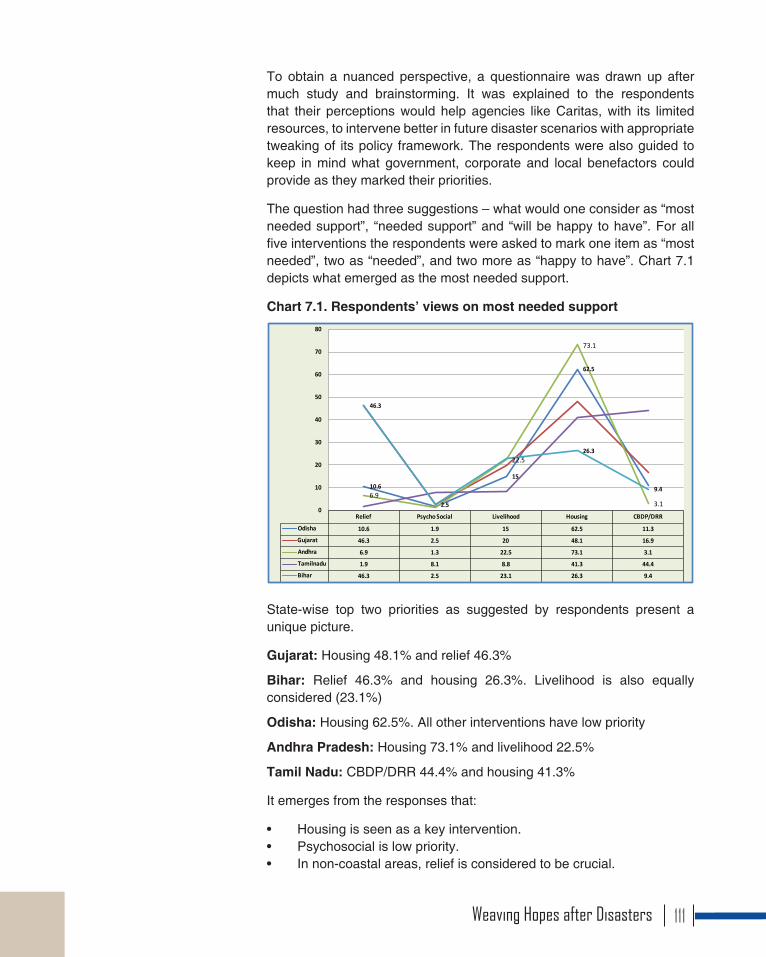
To obtain a nuanced perspective, a questionnaire was drawn up after much study and brainstorming. It was explained to the respondents that their perceptions would help agencies like Caritas, with its limited resources, to intervene better in future disaster scenarios with appropriate tweaking of its policy framework. The respondents were also guided to keep in mind what government, corporate and local benefactors could provide as they marked their priorities.
The question had three suggestions – what would one consider as “most needed support”, “needed support” and “will be happy to have”. For all five interventions the respondents were asked to mark one item as “most needed”, two as “needed”, and two more as “happy to have”. Chart 7.1 depicts what emerged as the most needed support.
Chart 7.1. Respondents’ views on most needed support
Relief Psycho Social Livelihood Housing CBDP/DRR
Odisha 10.6 1.9 15 62.5 11.3
Gujarat 46.3 2.5 20 48.1 16.9
Andhra 6.9 1.3 22.5 73.1 3.1
Tamilnadu 1.9 8.1 8.8 41.3 44.4
Bihar 46.3 2.5 23.1 26.3 9.4
10.615
62.5
6.9
22.5
73.1
3.1
46.3
2.5
26.3
9.4
0
10
20
30
40
50
60
70
80
State-wise top two priorities as suggested by respondents present a unique picture.
Gujarat: Housing 48.1% and relief 46.3%
Bihar: Relief 46.3% and housing 26.3%. Livelihood is also equally considered (23.1%)
Odisha: Housing 62.5%. All other interventions have low priority
Andhra Pradesh: Housing 73.1% and livelihood 22.5%
Tamil Nadu: CBDP/DRR 44.4% and housing 41.3%
It emerges from the responses that:
• Housing is seen as a key intervention.• Psychosocial is low priority.• In non-coastal areas, relief is considered to be crucial.
Weaving Hopes after Disasters 111

When the second priority, namely “needed” interventions were added to the “most needed”, the trends changed, which is acceptable, since many respondents found it difficult to propose one item as the topmost priority (see Chart 7.2).
Chart 7.2. Respondents’ views on most needed and needed support
0
10
20
30
40
50
60
70
80
90
100
Relief Psycho Social Livelihood Housing CBDP/DRROdisha 65.6 29.4 76.9 85.6 45.1
Gujarat 91.3 26.9 86.3 94.4 29.4
Andhra 52.5 35.1 86.3 92.5 43.1
Tamilnadu 47.5 65 48.8 74.4 82.5
Bihar 76.9 42.5 59.4 63.8 76.9
Odisha
Gujarat
Andhra
Tamilnadu
Bihar
Table 7.1. State priorities for support in disaster relief (%)
State 1st priority 2nd priority 3rd priorityOdisha Housing (85.6) Livelihood (76.9) Relief (66.6)
Gujarat Housing (94.4) Relief (91.3) Livelihood (86.3)
Andhra Pradesh Housing (92.5) Livelihood (86.3) Relief (52.5)
Tamil Nadu CBDP/DRR (82.5) Housing (74.4) Psychosocial (65)
Bihar Relief and CBDP (76.9) Housing (63.8)
Observations• While respondents in Gujarat, Odisha and Andhra Pradesh
recommended housing as the foremost priority, respondents in Bihar and Tamil Nadu considered it to be a second priority. It can therefore be surmised that housing will be a top priority in the future.
• CBDP/DRR was considered as top priority by respondents of Bihar and Tamil Nadu.
• Except respondents in Tamil Nadu, the others considered relief as second or third priority.
• Two States recommend livelihood as second and one state as third priority.
Weaving Hopes after Disasters112
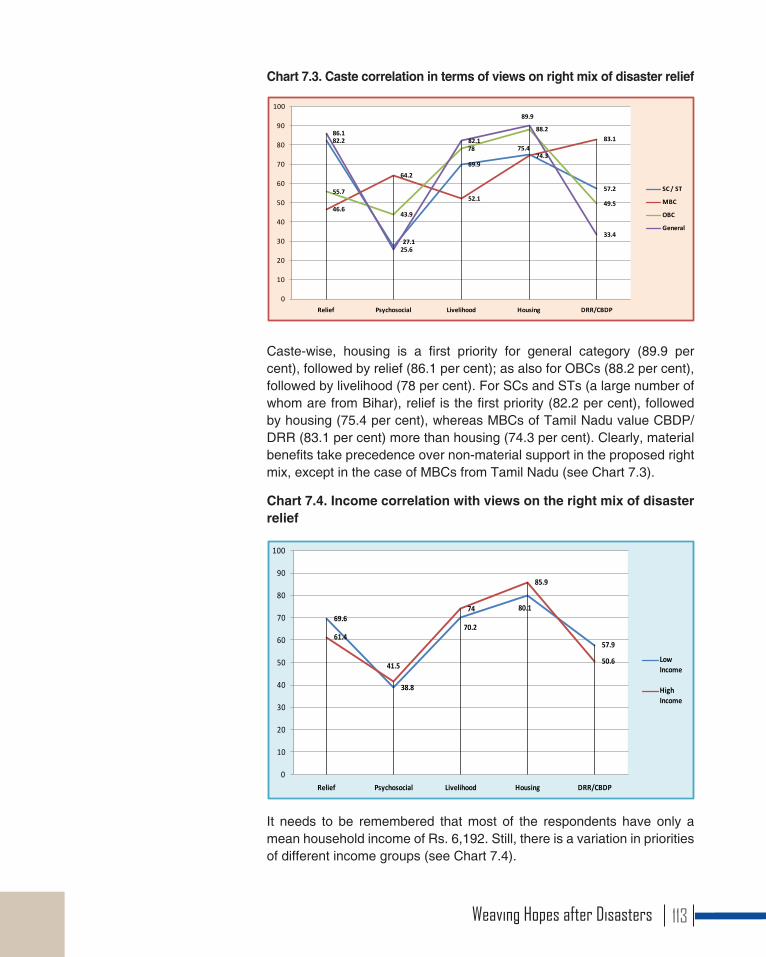
Chart 7.3. Caste correlation in terms of views on right mix of disaster relief
82.2
27.1
69.9
75.4
57.2
46.6
64.2
52.1
74.3
83.1
55.7
43.9
78
88.2
49.5
86.1
25.6
82.1
89.9
33.4
0
10
20
30
40
50
60
70
80
90
100
Relief Psychosocial Livelihood Housing DRR/CBDP
SC / ST
MBC
OBC
General
Caste-wise, housing is a first priority for general category (89.9 per cent), followed by relief (86.1 per cent); as also for OBCs (88.2 per cent), followed by livelihood (78 per cent). For SCs and STs (a large number of whom are from Bihar), relief is the first priority (82.2 per cent), followed by housing (75.4 per cent), whereas MBCs of Tamil Nadu value CBDP/DRR (83.1 per cent) more than housing (74.3 per cent). Clearly, material benefits take precedence over non-material support in the proposed right mix, except in the case of MBCs from Tamil Nadu (see Chart 7.3).
Chart 7.4. Income correlation with views on the right mix of disaster relief
69.6
38.8
70.2
80.1
57.961.4
41.5
74
85.9
50.6
0
10
20
30
40
50
60
70
80
90
100
Relief Psychosocial Livelihood Housing DRR/CBDP
Low Income
High Income
It needs to be remembered that most of the respondents have only a mean household income of Rs. 6,192. Still, there is a variation in priorities of different income groups (see Chart 7.4).
Weaving Hopes after Disasters 113
Conclusions and RecommendationsDuring interviews and focused group discussions, the beneficiaries articulated their right mix proposal much more sharply. Other key stakeholders like diocesan directors, bishops and organization staff also contributed their views. In the light of this learning exercise, the following conclusions and recommendations are presented here.
The Big PictureThere is a direct correlation between the need and satisfaction, the quality of intervention and satisfaction of the beneficiaries. For example, in Tamil Nadu, psychosocial intervention stands out; housing has given a high level of satisfaction in Andhra Pradesh and Gujarat; CBDP stands out in Bihar. In contrast, CBDP was not felt as a need by beneficiaries in Gujarat.
The extent of satisfaction depends on two major factors. 1. The beneficiaries feel that their real needs are met, and 2. Active participation of the beneficiaries in PIME in all interventions. So participative needs assessment is critical in disaster interventions and this forms the basis for appropriate selection of beneficiaries and their real needs, short-term and long-term. To arrive at quality improvement of life of people as dignified persons and community the starting point is community animation. Any intervention that is done without proper animation process, even if it is highly investment-oriented like housing, may not take Caritas intervention in disasters to its vision.
Any intervention begins with identification of beneficiaries and their needs. Multiple responses38 from the beneficiaries indicate that interventions were carried out using transparent procedures (55.5 per cent) and the most deserving were reached out to (54.3 per cent). 50.8 per cent of responses indicate that identification of beneficiaries was done scientifically. About 15.6 per cent responses indicate that those who have close connection with NGOs accessed more benefits than others; 12.4 per cent of the responses also show that there was favouritism. Among the caste categories, 23.6 per cent among general caste category complain about partiality and favouritism in the identification of beneficiaries; so do 17.3 per cent among MBCs, 12.5 per cent among SC/ST and 11.6 per cent among OBCs. Given the complexities this data can be seen as a pointer for future direction. While the beneficiaries are happy and satisfied with the process of identification of beneficiaries they seem to communicate some gaps which Caritas needs to look into in future.
Weaving Hopes after Disasters114
Mapping Vulnerable Areas and CommunitiesThere is an urgent need for Caritas India to engage in mapping of disaster-prone areas along with communities living there and potential risk factors. Models could be created and the outcomes utilized to lobby with the government to take up similar exercises. Such mapping will provide a clear roadmap for meaningful disaster preparedness programmes, which could be made part of community animation and development programmes by the organizations.
ReliefSome key persons noted that in a disaster scenario it is very difficult to organize the community and make the people participate in the planning of relief material identification and distribution. Delivery is the prime aspect. It also emerges from the study that all items were not found useful and the intended beneficiaries rejected some items. Dry ration is considered generally to be the most useful. For other items, the need has to be carefully studied; and if found useful, the distribution has to be well coordinated. Coordination becomes especially important when several agencies are supplying relief.
It is also important to have a contingency plan in place at the level of Caritas India and partner organizations for relief intervention in all the potential disaster areas. This will enhance the quality of relief intervention and professionalism in delivery.
There is also a need to distinguish between immediate relief and extended relief. To address immediate relief in disaster-prone areas, every local organization has to develop an Emergency Relief Fund. Relief by external agencies would be to complement the local funds, or if the magnitude of the disaster is phenomenally huge. It is best to organize and mobilize the people to access support from the government, the corporate sector and well-wishers. Caritas India could play a facilitating role in this process. Paul Harvey39 has made a strong plea for cash and vouchers rather than food over longer periods of time in emergency relief; but given that Caritas India reaches out to a large number of beneficiaries who are illiterate, this may not work out.
The Psychosocial AspectRespondents from Tamil Nadu set high value on this aspect; but other state respondents disagree, possibly due to lack of experience. This is an aspect that needs further investigation, in the light of the fact that even after many years of their experience of disaster, some victims of disasters
Weaving Hopes after Disasters 115
still live with unhealed wounds. Also, recent studies have revealed the need for better psychosocial support to disaster-affected persons. Perhaps, Caritas could promote a set of volunteers who are either trained or qualified to serve during emergencies in disaster-prone areas. This agenda also could be part of the contingency plan.
LivelihoodThe beneficiaries have clearly indicated that they need to see change from the charity-oriented approach to well thought-out, planned, participatory and monitored approach in livelihood promotion. This view is objectively supported by the fact that organizations directly providing livelihood support to individuals have had less impact in terms of their organizational objectives. Accordingly, all charity-oriented attempts to provide livelihood support have to be revisited, except in extraordinary situations. Livelihood support provided as structured response through SHGs, village committees, etc., where people take up the responsibility to plan, implement, monitor, and evaluate have shown a high level of impact and satisfaction. It has also been pointed out that when livelihood support was given directly to the beneficiaries by the organizations, there was no proper monitoring and evaluation. Also, some individuals with an entrepreneurial spirit benefited disproportionately from this phenomenon. Once livelihood support is provided, appropriate business strategies have to be incorporated. Caritas could look into marketing strategies along with Entrepreneurship Development Programme (EDP) and life skill training.
HousingGenerally, about 70 per cent of the disaster response budget had been spent on housing. But should this be a priority concern for Caritas India just because a house gives visibility? Today, CSR money is available in the country for social endeavours. Housing assistance goes well with branding their company. Caritas and its diocesan partners with their credibility are in a better place to tap CSR money for housing projects. Also, as was done in Eluru, good public relations work with government officials can bring in part or full assistance for housing. This suggestion came up strongly from organizational staff.
CBDP/DRRCaritas has made a big breakthrough in CBDP in the recent interventions, as can be seen from the data from Bihar and Tamil Nadu. This has also been recognized by the state governments. The work in Nellore was, for
Weaving Hopes after Disasters116
example, recognized by the state, which invited trained persons to help out when there was a need in other districts of Andhra Pradesh. There has been a new momentum to impart the importance of disaster preparedness along with community mobilization, formation and animation programmes. The importance of CBDP/DRR is still to percolate, especially among men. Women, more than men, were the participants in CBDP training. It is important that adequate knowledge of CBDP is imparted in all the disaster vulnerable areas. But given that emergency response is a state subject, Caritas could develop a network of task forces in potentially vulnerable areas, especially at the taluk and panchayat levels. As emergency response is one of the core areas of interventions by Caritas India and given that India is a highly disaster-prone country Caritas could develop sufficient personnel with necessary human resources in this regard at the national level.
Community AnimationCaritas has invested a substantial amount of time, energy and finance in animation. Formation of various committees and task forces and capacity building of these members have contributed a lot in disaster response as well as in building responsive communities. However, when the projects were closed, a clear downtrend was seen. Local diocesan organizations are not able to sustain the momentum, empowerment/community organizing process of the people after the project period. Only a few of those empowered people’s processes like task-forces, SHGs and committees continue to function with limited and at times ad hoc support from the organisation. In some instances managing common property resources got linked to local governance system. To address this, Caritas needs to critically look at the last phase of the project, namely, the transition period.
Documenting Best Practices and Lessons LearntIt was disheartening to note that despite massive investment leading to change and transformation, best practices and lessons learnt are not properly documented. This needs to change.
Sustainability, Institutionalization of the Outcomes and Exit StrategyAll diocesan directors appreciated well-planned exit strategy, but
Weaving Hopes after Disasters 117
expressed the view that the process of expanding citizenships rights, both civic and democratic, is a long process. Only in the last leg of the exit strategy, citizenship issues become primary concerns of the organizations and beneficiaries, breaking dependency from the NGO partners. It would be interesting to further explore why, despite a massive operation, an organization was not able to build up and sustain itself.
Governed by Policy FrameworkAfter a long process, Caritas has come out with an Emergency Disaster Management Policy. It would be a good initiative to have a similar policy framework at the level of partner organizations in potentially vulnerable areas. This would ensure that partner organizations have contingency plans, standard operating procedures, human resources policies, process documentation, better linkages with potential partners and government, updated knowledge, etc. and thus be better prepared to engage in systematic operation from the beginning. This would also ensure that in the quickest possible time all basic structures and systems are in place in an eventual disaster scenario. After many years of experience in this field, Caritas has much to offer to the partners and to other organizations.
Building an Inclusive SocietyThe vision of Caritas India is to build an inclusive society with special focus on the most needy and vulnerable communities. Gender inclusion emerges as a striking success. However, in terms of inclusion of SCs and STs in the process and outcome, there are perceptible gaps, often unintentional. Some key persons of the partner organizations are of the view that disasters affect all and they should not discriminate against anyone. But the principle of non-discrimination does not contradict affirmative action or positive discrimination of communities that have been historically discriminated against and excluded. Speaking at the Indian Council of World Affairs, UN Secretary-General Ban Ki-Moon stressed the need for inclusive growth for shared prosperity. In his view, “millions of Dalits, tribals and others still face discrimination, especially the women and girls.”
Setting up a special cell to focus on vulnerable communities in all disaster interventions, conducting social audit, social equity audit and gender audit would help Caritas to make the necessary midcourse corrections.
Right Mix LRRD FrameworkThe right mix of interventions has to be premised primarily on a new
Weaving Hopes after Disasters118
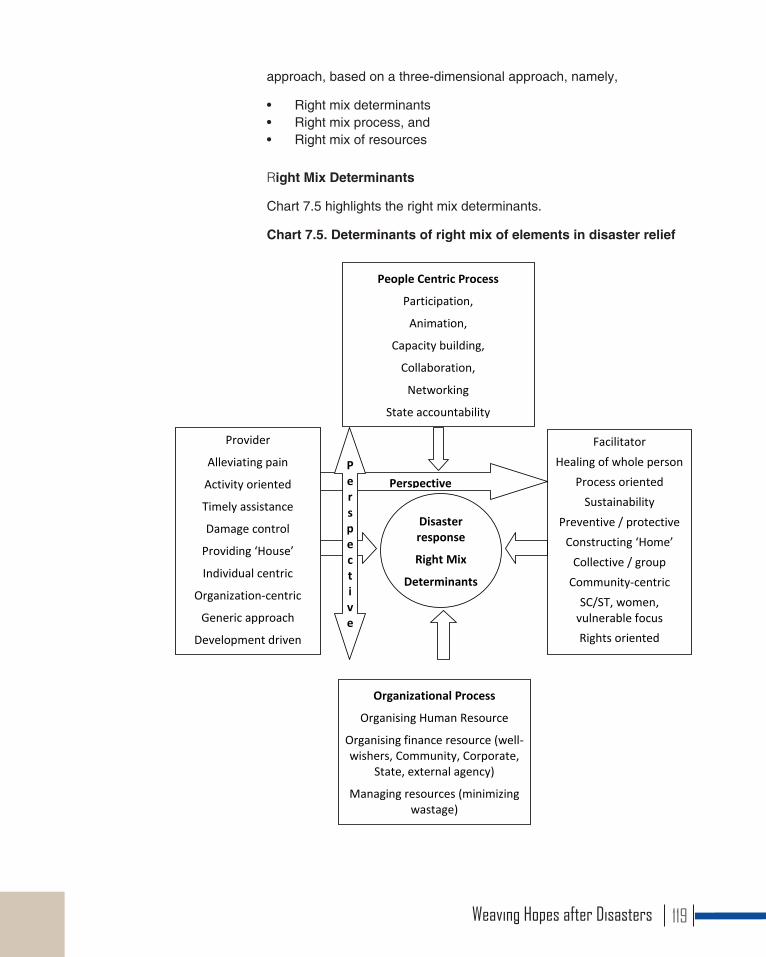
approach, based on a three-dimensional approach, namely,
• Right mix determinants• Right mix process, and• Right mix of resources
Right Mix Determinants
Chart 7.5 highlights the right mix determinants.
Chart 7.5. Determinants of right mix of elements in disaster reliefChart 7.5. Determinants of right mix of elements in disaster relief
The vertical boxes denote the movement towards. But in an emergency scenario the organizations have to keep a close watch and review the processes periodically from this perspective, lest they succumb to pressures of activism and fire-fighting.
The horizontal boxes indicate the need to merge people-centric process with organizational processes and linking external agencies and partners in the most
Provider
Alleviating pain
Activity oriented
Timely assistance
Damage control
Providing ‘House’
Individual centric
Organization-centric
Generic approach
Development driven
Facilitator Healing of whole person
Process oriented Sustainability
Preventive / protective Constructing ‘Home’
Collective / group Community-centric
SC/ST, women, vulnerable focus Rights oriented
People Centric Process
Participation,
Animation,
Capacity building,
Collaboration,
Networking
State accountability
Disaster response
Right Mix
Determinants
Perspective P e r s p e c t i v e
Organizational Process
Organising Human Resource
Organising finance resource (well-wishers, Community, Corporate,
State, external agency)
Managing resources (minimizing wastage)
Weaving Hopes after Disasters 119
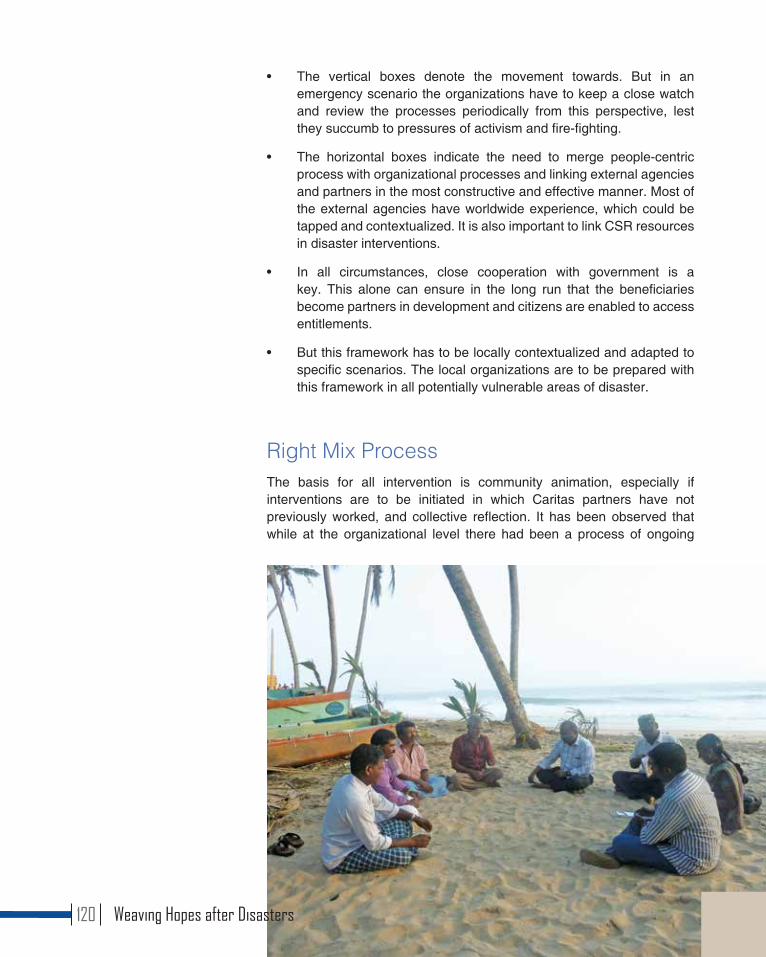
• The vertical boxes denote the movement towards. But in an emergency scenario the organizations have to keep a close watch and review the processes periodically from this perspective, lest they succumb to pressures of activism and fire-fighting.
• The horizontal boxes indicate the need to merge people-centric process with organizational processes and linking external agencies and partners in the most constructive and effective manner. Most of the external agencies have worldwide experience, which could be tapped and contextualized. It is also important to link CSR resources in disaster interventions.
• In all circumstances, close cooperation with government is a key. This alone can ensure in the long run that the beneficiaries become partners in development and citizens are enabled to access entitlements.
• But this framework has to be locally contextualized and adapted to specific scenarios. The local organizations are to be prepared with this framework in all potentially vulnerable areas of disaster.
Right Mix ProcessThe basis for all intervention is community animation, especially if interventions are to be initiated in which Caritas partners have not previously worked, and collective reflection. It has been observed that while at the organizational level there had been a process of ongoing
Weaving Hopes after Disasters120
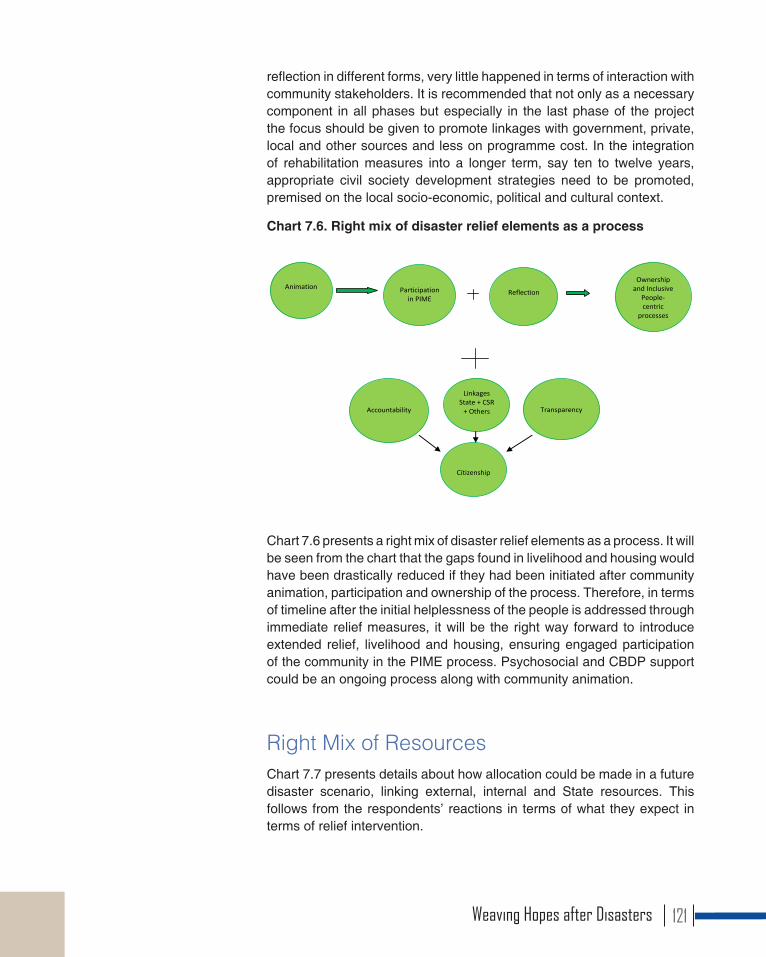
reflection in different forms, very little happened in terms of interaction with community stakeholders. It is recommended that not only as a necessary component in all phases but especially in the last phase of the project the focus should be given to promote linkages with government, private, local and other sources and less on programme cost. In the integration of rehabilitation measures into a longer term, say ten to twelve years, appropriate civil society development strategies need to be promoted, premised on the local socio-economic, political and cultural context.
Chart 7.6. Right mix of disaster relief elements as a processChart 7.6. Right mix of disaster relief elements as a process
Chart 7.6 presents a right mix of disaster relief elements as a process. It will be seen from the chart that the gaps found in livelihood and housing would have been drastically reduced if they had been initiated after community animation, participation and ownership of the process. Therefore, in terms of timeline after the initial helplessness of the people is addressed through immediate relief measures, it will be the right way forward to introduce extended relief, livelihood and housing, ensuring engaged participation of the community in the PIME process. Psychosocial and CBDP support could be an ongoing process along with community animation.
Animation
Accountability
Citizenship
Participation
in PIME
Reflection
Ownership and Inclusive
People- centric
processes
Transparency Linkages
State + CSR + Others
Chart 7.6 presents a right mix of disaster relief elements as a process. It will be seen from the chart that the gaps found in livelihood and housing would have been drastically reduced if they had been initiated after community animation, participation and ownership of the process. Therefore, in terms of timeline after the initial helplessness of the people is addressed through immediate relief measures, it will be the right way forward to introduce extended relief, livelihood and housing, ensuring engaged participation of the community in the PIME process. Psychosocial and CBDP support could be an ongoing process along with community animation.
Right Mix of ResourcesChart 7.7 presents details about how allocation could be made in a future disaster scenario, linking external, internal and State resources. This follows from the respondents’ reactions in terms of what they expect in terms of relief intervention.
Weaving Hopes after Disasters 121
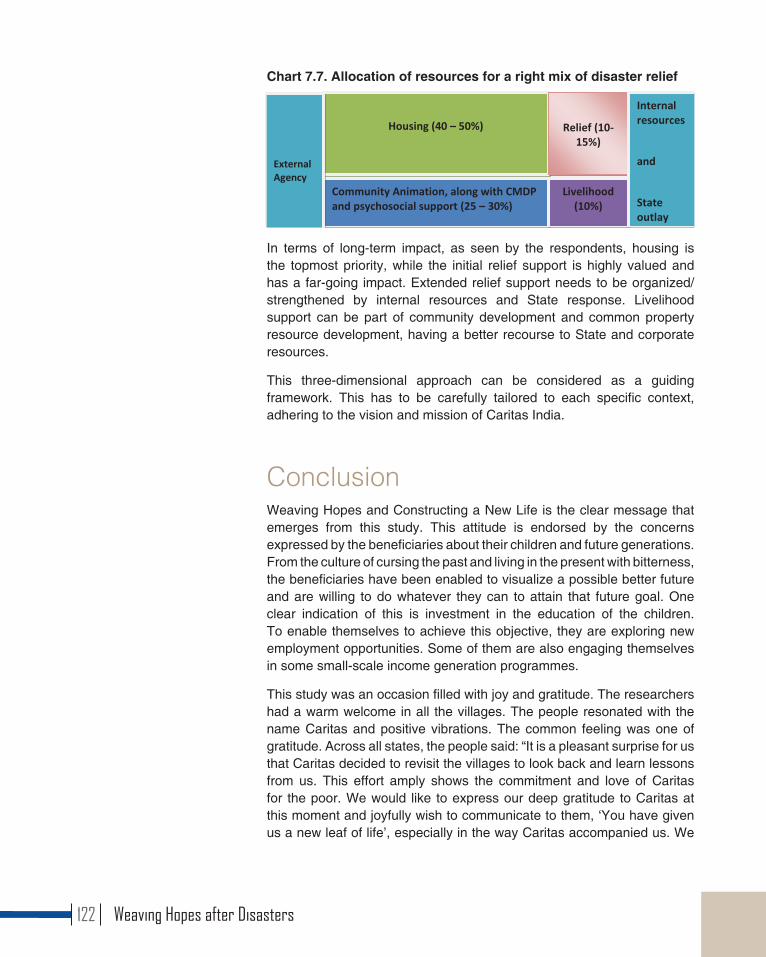
Chart 7.7. Allocation of resources for a right mix of disaster relief
Right Mix of Resources
Chart 7.7 presents details about how allocation could be made in a future disaster scenario, linking external, internal and State resources. This follows from the respondents’ reactions in terms of what they expect in terms of relief intervention.
Chart 7.7. Allocation of resources for a right mix of disaster relief
In terms of long-term impact, as seen by the respondents, housing is the topmost priority, while the initial relief support is highly valued and has a far-going impact. Extended relief support needs to be organized/strengthened by internal resources and State response. Livelihood support can be part of community development and common property resource development, having a better recourse to State and corporate resources.
This three-dimensional approach can be considered as a guiding framework. This has to be carefully tailored to each specific context, adhering to the vision and mission of Caritas India.
Conclusion
Weaving Hopes and Constructing a New Life is the clear message that emerges from this study. This attitude is endorsed by the concerns expressed by the beneficiaries about their children and future generations. From the culture of cursing the past and living in the present with bitterness, the beneficiaries have been enabled to visualize a possible better future and are willing to do whatever they can to attain that future goal. One clear indication of this is investment in the education of the children. To enable themselves to achieve this objective, they are exploring new employment opportunities. Some of them are also engaging themselves in some small-scale income generation programmes.
This study was an occasion filled with joy and gratitude. The researchers had a warm welcome in all the villages. The people resonated with the name Caritas and positive vibrations. The common feeling was one of gratitude. Across all states, the people said: “It is a pleasant surprise for us that Caritas decided to revisit the villages to look back and learn lessons from us. This effort amply shows the commitment and love of Caritas for the poor. We would like to express our deep gratitude to Caritas at this moment and joyfully wish to
Housing (40 – 50%)
Relief (10-
15%)
Community Animation, along with CMDP and psychosocial support (25 – 30%)
Livelihood (10%)
External Agency
Internal resources
and
State outlay
In terms of long-term impact, as seen by the respondents, housing is the topmost priority, while the initial relief support is highly valued and has a far-going impact. Extended relief support needs to be organized/strengthened by internal resources and State response. Livelihood support can be part of community development and common property resource development, having a better recourse to State and corporate resources.
This three-dimensional approach can be considered as a guiding framework. This has to be carefully tailored to each specific context, adhering to the vision and mission of Caritas India.
ConclusionWeaving Hopes and Constructing a New Life is the clear message that emerges from this study. This attitude is endorsed by the concerns expressed by the beneficiaries about their children and future generations. From the culture of cursing the past and living in the present with bitterness, the beneficiaries have been enabled to visualize a possible better future and are willing to do whatever they can to attain that future goal. One clear indication of this is investment in the education of the children. To enable themselves to achieve this objective, they are exploring new employment opportunities. Some of them are also engaging themselves in some small-scale income generation programmes.
This study was an occasion filled with joy and gratitude. The researchers had a warm welcome in all the villages. The people resonated with the name Caritas and positive vibrations. The common feeling was one of gratitude. Across all states, the people said: “It is a pleasant surprise for us that Caritas decided to revisit the villages to look back and learn lessons from us. This effort amply shows the commitment and love of Caritas for the poor. We would like to express our deep gratitude to Caritas at this moment and joyfully wish to communicate to them, ‘You have given us a new leaf of life’, especially in the way Caritas accompanied us. We
Weaving Hopes after Disasters122

will cherish these good memories for many years. The changes we have witnessed in our lives will benefit the future generation as well.”
A house can become a home, and a village can become a community. With the efforts of Caritas India, the beneficiaries have been capacitated to assert themselves as rights holders. In consequence, equity and social justice will be understood within the framework of equality. And inclusion of the vulnerable will be seen as a higher form of ethical value when accompanied by community animation, participation, reflection and public collective action, to gain citizenship rights and entitlements. Caritas has always done this in its disaster interventions to the extent its resources allowed. With its new Emergency Disaster Management Policy, Caritas is well on track to take the lessons learnt forward as a faith-inspired organization. The gains made have to be capitalized, sustained and nurtured in the future to build an inclusive society.
Weaving Hopes after Disasters 123

Caritas India, 2013. Caritas India Emergency and Disaster Management Policy, Caritas India.
Government of India, 2009. National Policy on Disaster Management.
Government of India. 2011. Report of the Working Group on Disaster Management: For the Twelfth Five Year Plan (2012-2017), New Delhi: Planning Commission.
High Power Committee on Disaster Management (HPCDM), 2001. Report of the High Power Committee on Disaster Management. New Delhi: National Centre of Disaster Management.
Kumar, K.J. Anandha et al., 2012. India Disaster Report 2011. New Delhi: National Institute of Disaster Management (NIDM).
Select Bibliography
Weaving Hopes after Disasters124
Parasuraman, S. and P.V. Unnikrishnan (eds.), 2000. India Disaster Report: Towards A Policy Initiative. New Delhi: Oxford University Press
Paul Harvey (2005): Cash and vouchers in emergencies. Humanitarian Policy Group. Overseas Development Institute. www.odi.org.uk/hpg
The Sphere Project Handbook (2011): Humanitarian Charter and Minimum Standards in Humanitarian Response. http://www.ifrc.org/PageFiles/95530/The-Sphere-Project-Handbook-20111.pdf
UNISDR (United Nations Office for Disaster Risk Reduction), 2013. Disaster Risk Reduction in the United Nations: Roles, mandates and results of key UN entities. Switzerland: UNISDR.
Weaving Hopes after Disasters 125
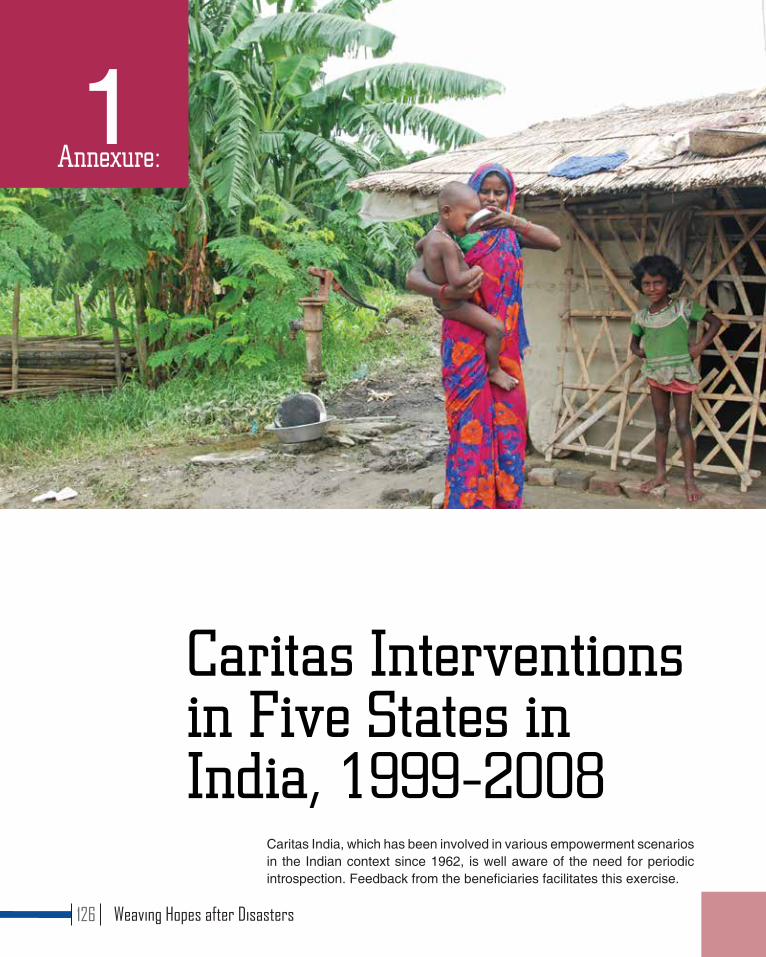
Caritas India, which has been involved in various empowerment scenarios in the Indian context since 1962, is well aware of the need for periodic introspection. Feedback from the beneficiaries facilitates this exercise.
1
Caritas Interventions in Five States in India, 1999-2008
Annexure:
Weaving Hopes after Disasters126
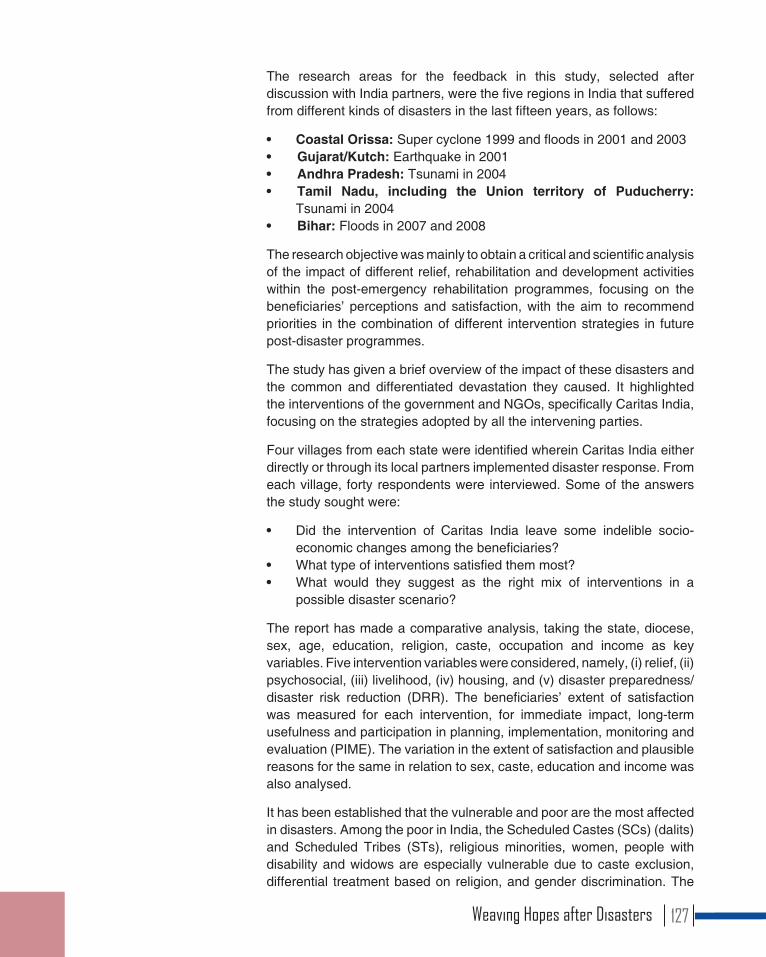
The research areas for the feedback in this study, selected after discussion with India partners, were the five regions in India that suffered from different kinds of disasters in the last fifteen years, as follows:
• Coastal Orissa: Super cyclone 1999 and floods in 2001 and 2003• Gujarat/Kutch: Earthquake in 2001• Andhra Pradesh: Tsunami in 2004• Tamil Nadu, including the Union territory of Puducherry:
Tsunami in 2004 • Bihar: Floods in 2007 and 2008
The research objective was mainly to obtain a critical and scientific analysis of the impact of different relief, rehabilitation and development activities within the post-emergency rehabilitation programmes, focusing on the beneficiaries’ perceptions and satisfaction, with the aim to recommend priorities in the combination of different intervention strategies in future post-disaster programmes.
The study has given a brief overview of the impact of these disasters and the common and differentiated devastation they caused. It highlighted the interventions of the government and NGOs, specifically Caritas India, focusing on the strategies adopted by all the intervening parties.
Four villages from each state were identified wherein Caritas India either directly or through its local partners implemented disaster response. From each village, forty respondents were interviewed. Some of the answers the study sought were:
• Did the intervention of Caritas India leave some indelible socio-economic changes among the beneficiaries?
• What type of interventions satisfied them most?• What would they suggest as the right mix of interventions in a
possible disaster scenario?
The report has made a comparative analysis, taking the state, diocese, sex, age, education, religion, caste, occupation and income as key variables. Five intervention variables were considered, namely, (i) relief, (ii) psychosocial, (iii) livelihood, (iv) housing, and (v) disaster preparedness/disaster risk reduction (DRR). The beneficiaries’ extent of satisfaction was measured for each intervention, for immediate impact, long-term usefulness and participation in planning, implementation, monitoring and evaluation (PIME). The variation in the extent of satisfaction and plausible reasons for the same in relation to sex, caste, education and income was also analysed.
It has been established that the vulnerable and poor are the most affected in disasters. Among the poor in India, the Scheduled Castes (SCs) (dalits) and Scheduled Tribes (STs), religious minorities, women, people with disability and widows are especially vulnerable due to caste exclusion, differential treatment based on religion, and gender discrimination. The
Weaving Hopes after Disasters 127

report has attempted to study whether the strategies for intervention have been inclusive and has offered suggestions for taking into account issues of underprivileged communities, religious minorities, women, and people with disability.
The role of the State, the relationship between citizens and the State as well as the contributions by NGOs were analysed in the light of the responses received. The socio-economic and cultural changes in the lives of beneficiaries that have happened as a result of Caritas India interventions were also highlighted.
One objective of this study was to find out what the beneficiaries said about the right mix linking relief, rehabilitation and development from a long-term perspective. This has been discussed in Chapter 7. The beneficiaries were informed that their responses would help agencies like Caritas, with their limited resources, to intervene better in future disaster scenarios, employing the new knowledge thus generated, to promote dignity, well-being and citizenship entitlements of the disaster-affected persons and communities. An analysis of the five interventions studied in this report follows.
Weaving Hopes after Disasters128

Super Cyclone 1999 and Floods in 2001 and 2003, Odisha The Balasore Social Service Society (BSSS) is the official socio-development wing of Balasore Diocese. Its main objective is the development of people, focusing on change and development of the marginalized and vulnerable people in its operational area. BSSS operates in 658 remote villages of twenty blocks in four districts of Odisha, namely, Balasore, Bhadrak, Mayurbhanj and Kendujhar. Kendujhar and Mayurbhanj are tribal-predominant, inhabited by Santal, Ho, Oraon, Munda, Bhumijo and Kulho tribes. The majority of the population in these districts lives below the poverty line. Balasore and Bhadrak are coastal districts predominantly inhabited by dalits and OBCs and are often worst affected by recurring floods and cyclones.
Catholic Charities is the diocesan social service society of the Archdiocese of Cuttack-Bhubaneswar. It is working in the field of micro-finance, agriculture, watershed, education and health. It works primarily in nine districts of the state, with tribals and dalits, especially among the most vulnerable sections of society like women, children, landless, agricultural labourers, and marginal farmers. Catholic Charities is currently addressing issues of livelihood, governance, dalit and tribal rights, emergency response, conflict transformation and peace building.
During the cyclone of 1999, relief, rehabilitation and development activities were implemented by Caritas and CRS from the Archdiocese office in Bhubaneswar. Later, relief, rehabilitation and development work was carried on by another entity called Fellowship, to manage the working capital generated from the rehabilitation programme, converting grant into credit with transparency and accountability, to ensure continuity and sustainability of the development process.
Weaving Hopes after Disasters 129
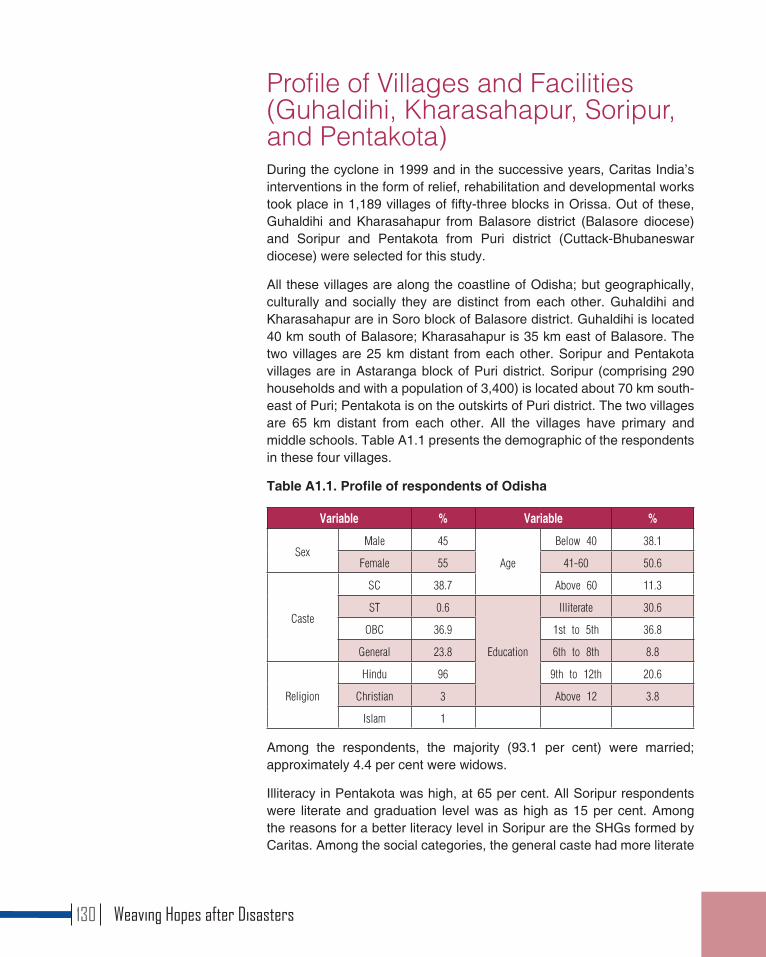
Profile of Villages and Facilities (Guhaldihi, Kharasahapur, Soripur, and Pentakota)During the cyclone in 1999 and in the successive years, Caritas India’s interventions in the form of relief, rehabilitation and developmental works took place in 1,189 villages of fifty-three blocks in Orissa. Out of these, Guhaldihi and Kharasahapur from Balasore district (Balasore diocese) and Soripur and Pentakota from Puri district (Cuttack-Bhubaneswar diocese) were selected for this study.
All these villages are along the coastline of Odisha; but geographically, culturally and socially they are distinct from each other. Guhaldihi and Kharasahapur are in Soro block of Balasore district. Guhaldihi is located 40 km south of Balasore; Kharasahapur is 35 km east of Balasore. The two villages are 25 km distant from each other. Soripur and Pentakota villages are in Astaranga block of Puri district. Soripur (comprising 290 households and with a population of 3,400) is located about 70 km south-east of Puri; Pentakota is on the outskirts of Puri district. The two villages are 65 km distant from each other. All the villages have primary and middle schools. Table A1.1 presents the demographic of the respondents in these four villages.
Table A1.1. Profile of respondents of Odisha
Variable % Variable %
SexMale 45
Age
Below 40 38.1
Female 55 41-60 50.6
Caste
SC 38.7 Above 60 11.3
ST 0.6
Education
Illiterate 30.6
OBC 36.9 1st to 5th 36.8
General 23.8 6th to 8th 8.8
Religion
Hindu 96 9th to 12th 20.6
Christian 3 Above 12 3.8
Islam 1
Among the respondents, the majority (93.1 per cent) were married; approximately 4.4 per cent were widows.
Illiteracy in Pentakota was high, at 65 per cent. All Soripur respondents were literate and graduation level was as high as 15 per cent. Among the reasons for a better literacy level in Soripur are the SHGs formed by Caritas. Among the social categories, the general caste had more literate
Weaving Hopes after Disasters130
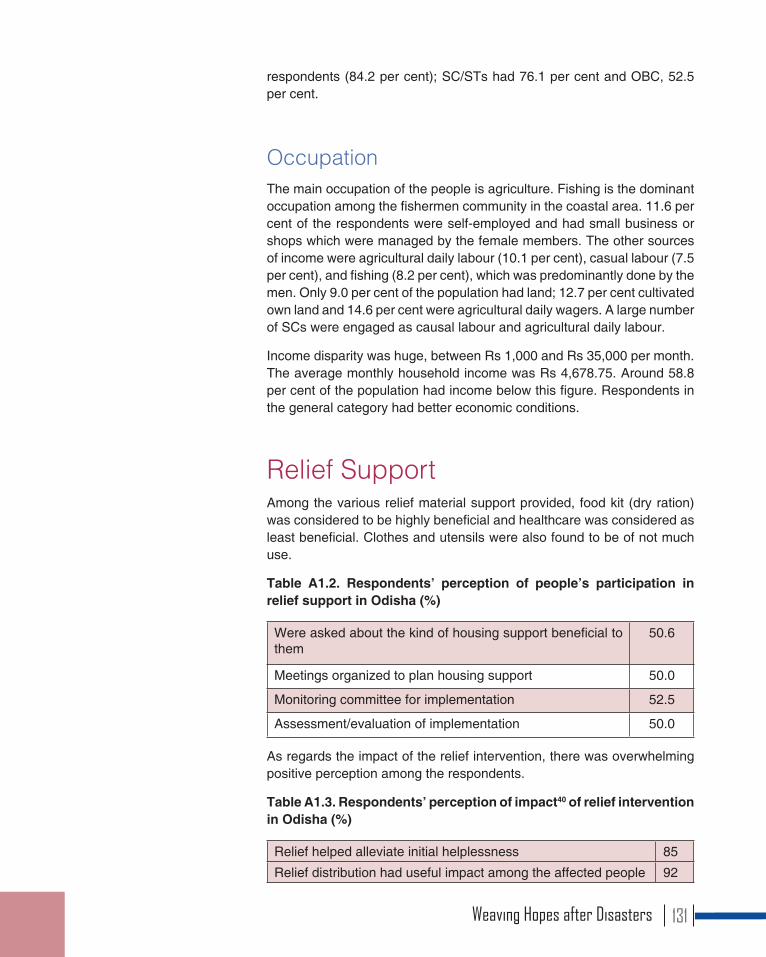
respondents (84.2 per cent); SC/STs had 76.1 per cent and OBC, 52.5 per cent.
OccupationThe main occupation of the people is agriculture. Fishing is the dominant occupation among the fishermen community in the coastal area. 11.6 per cent of the respondents were self-employed and had small business or shops which were managed by the female members. The other sources of income were agricultural daily labour (10.1 per cent), casual labour (7.5 per cent), and fishing (8.2 per cent), which was predominantly done by the men. Only 9.0 per cent of the population had land; 12.7 per cent cultivated own land and 14.6 per cent were agricultural daily wagers. A large number of SCs were engaged as causal labour and agricultural daily labour.
Income disparity was huge, between Rs 1,000 and Rs 35,000 per month. The average monthly household income was Rs 4,678.75. Around 58.8 per cent of the population had income below this figure. Respondents in the general category had better economic conditions.
Relief SupportAmong the various relief material support provided, food kit (dry ration) was considered to be highly beneficial and healthcare was considered as least beneficial. Clothes and utensils were also found to be of not much use.
Table A1.2. Respondents’ perception of people’s participation in relief support in Odisha (%)
Were asked about the kind of housing support beneficial to them
50.6
Meetings organized to plan housing support 50.0
Monitoring committee for implementation 52.5
Assessment/evaluation of implementation 50.0
As regards the impact of the relief intervention, there was overwhelming positive perception among the respondents.
Table A1.3. Respondents’ perception of impact40 of relief intervention in Odisha (%)
Relief helped alleviate initial helplessness 85
Relief distribution had useful impact among the affected people 92
Weaving Hopes after Disasters 131

Table A1.4. Respondents’ perception of three top benefits from relief distribution in Odisha (%)
Initial needs met 78.4
Confidence gained 72.0
Able to move forward in life 48.0
Observations across Variables
• The SC respondents were more satisfied with relief support than the general respondents.
• Relief support was also perceived by those whose income was below Rs. 4,678.75 as more beneficial in alleviating their initial helplessness.
Areas of Concern • Relief interventions should be planned with the local community,
based on the needs of the beneficiaries. • In Guhaldihi village, the SC community was located in the interior
part of the village where there is no approach road and the relief material did not reach them.
• In Kharasahapur, the general category community stated that the SC community was getting all the benefits and relief materials. Caste division was strong in the villages. However, this caste divide was not seen in Soripur and Pentakota, where the needy from all communities received relief materials.
Psychosocial Support 54.4 per cent of the respondents stated that psychosocial support was given and there were no specific or direct interventions for psychosocial support to the beneficiaries by Caritas. However, there were some indirect interventions by Caritas, the state health agencies and other NGOs like the Red Cross. The majority of the respondents (82.3 per cent) were of the view that the support provided to them gave them the needed self-confidence; 32.9 per cent were able to forget the past and look towards the future; 34.2 per cent were of the view that the support was consoling. Most of the respondents (96.3 per cent) expressed the view that more psychosocial support programmes would be helpful to disaster-affected persons.
Weaving Hopes after Disasters132
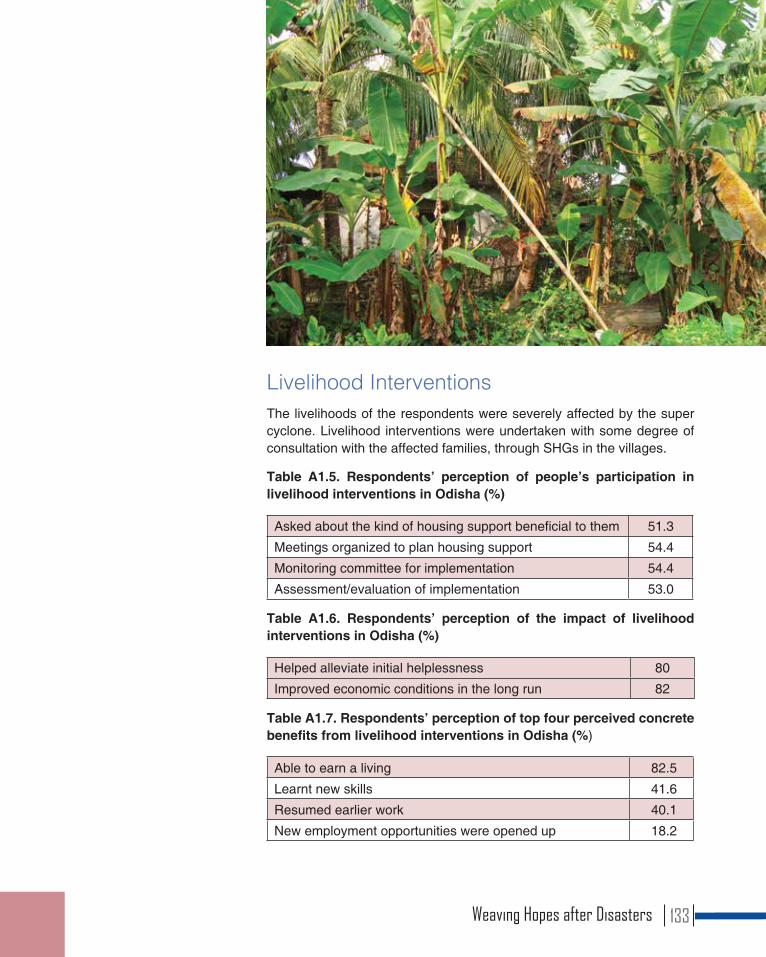
Livelihood InterventionsThe livelihoods of the respondents were severely affected by the super cyclone. Livelihood interventions were undertaken with some degree of consultation with the affected families, through SHGs in the villages.
Table A1.5. Respondents’ perception of people’s participation in livelihood interventions in Odisha (%)
Asked about the kind of housing support beneficial to them 51.3
Meetings organized to plan housing support 54.4
Monitoring committee for implementation 54.4
Assessment/evaluation of implementation 53.0
Table A1.6. Respondents’ perception of the impact of livelihood interventions in Odisha (%)
Helped alleviate initial helplessness 80
Improved economic conditions in the long run 82
Table A1.7. Respondents’ perception of top four perceived concrete benefits from livelihood interventions in Odisha (%)
Able to earn a living 82.5
Learnt new skills 41.6
Resumed earlier work 40.1
New employment opportunities were opened up 18.2
Weaving Hopes after Disasters 133
Observations across Variables
• Based on observation and interviews, livelihood support showed variation from village to village. For instance, in Soripur and Guhaldihi, fruit trees and animal support were helpful and they utilized these opportunities to generate some income. However, many of the individually owned livelihood programmes did not continue for long. Some said that livestock support did not click well and many sold their animals.
• Creation of SHGs was a huge opportunity for the beneficiaries to develop their village and their personal leadership quality. Through SHGs people carried out a considerable amount of developmental work and other income generation activities. Particularly in Soripur, SHGs made a major breakthrough in developmental activities by creating a cooperative society. They had a balance of Rs. 34 lakh in their savings account and they carried out various activities like providing loans to farmers, and developmental activities like road construction, education promotion, etc.
• The economic condition of Pentakota village was not as good as that of Kharasahapur and Guhaldihi. Caritas bought 17 fishing boats and distributed them among the beneficiaries. SHG groups were also formed. However, after five years the organization stopped giving loans. The respondents did mention that they were able to pay the interest on the loan but the sudden closure of the project resulted in the demise of SHGs and the small business they had started.
Housing InterventionHousing intervention was carried out by Caritas only in Kharasahapur and Soripur. However, a few people were given Indira Awas in Guhaldihi village. Construction and distribution of houses was undertaken according to categories finalized by the organization and contractors. The beneficiaries were not much involved in planning and decision-making.
Table A1.8. Respondents’ perception of people’s participation in housing intervention in Odisha (%)
Asked about the kind of housing support 40
Meetings organized to plan for housing support 42
Monitoring committee for implementation 45
Assessment/evaluation of implementation 43
When asked if housing support had long-term benefits, only 50 per cent said that it had made a good impact.
Weaving Hopes after Disasters134
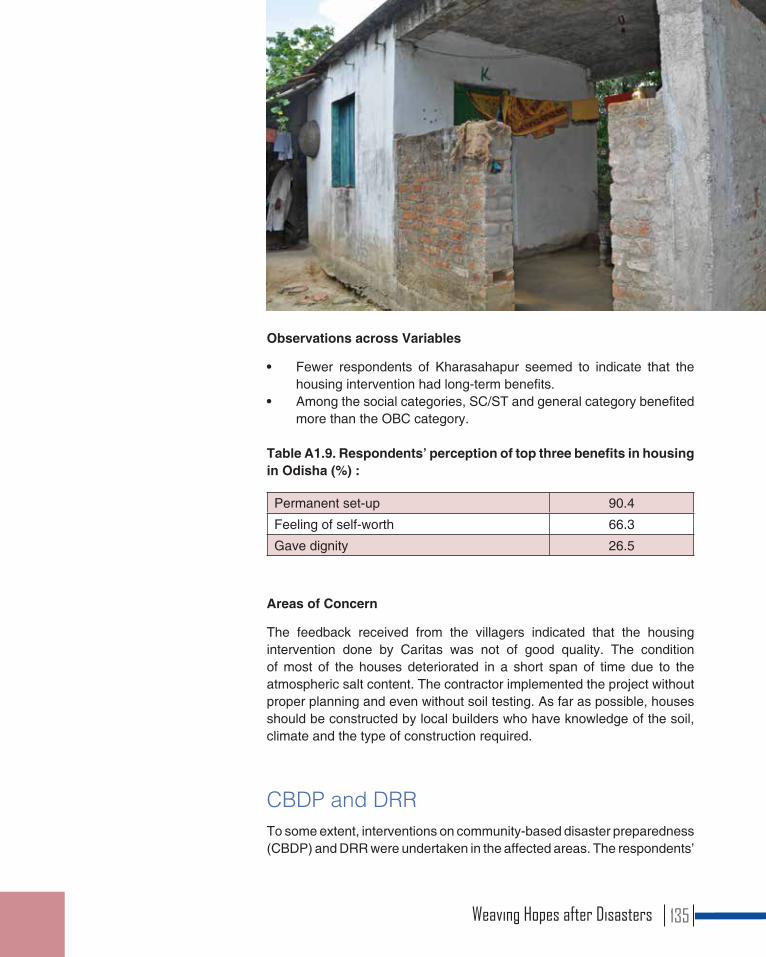
Observations across Variables
• Fewer respondents of Kharasahapur seemed to indicate that the housing intervention had long-term benefits.
• Among the social categories, SC/ST and general category benefited more than the OBC category.
Table A1.9. Respondents’ perception of top three benefits in housing in Odisha (%) :
Permanent set-up 90.4
Feeling of self-worth 66.3
Gave dignity 26.5
Areas of Concern
The feedback received from the villagers indicated that the housing intervention done by Caritas was not of good quality. The condition of most of the houses deteriorated in a short span of time due to the atmospheric salt content. The contractor implemented the project without proper planning and even without soil testing. As far as possible, houses should be constructed by local builders who have knowledge of the soil, climate and the type of construction required.
CBDP and DRRTo some extent, interventions on community-based disaster preparedness (CBDP) and DRR were undertaken in the affected areas. The respondents’
Weaving Hopes after Disasters 135

satisfaction from disaster preparedness (DP)/disaster management (DM) programmes was low. On an assessment scale of 0 to 9, the mean value shown was 3.63, indicating low satisfaction. As many as 63.1 per cent said DP/DM programmes were organized in their village; 68.5 per cent said that the people participated in these programmes; 53.8 per cent said that there was a follow-up of the programmes.
95 per cent of the respondents felt confident that they would be able to protect themselves if they were warned of an impending disaster; 86.9 per cent felt that the DP programme would mitigate the damage and loss of life. This would come about, they said, through (i) better awareness created (95.4 per cent); (ii) training for emergency (49.7 per cent); (iii) capacitating key community leaders to handle emergency (31.8 per cent); (iv) high community resilience (25.2 per cent); and (v) no one taking undue risk (0.7 per cent).
Table A1.10. Respondents’ suggestions for CBDP and DRR in Odisha (%)
Invest in DP 58.3
Involve the local community 48.7
Include component of CBDP/DRR in all programmes 36.5
Work closely with government and other organizations 27.6
Spread awareness on India being a disaster-prone country 23.7
Some respondents confirmed that the government tried to educate people regarding DP. From Kharasahapur, youth were sent to Bhubaneswar for
Weaving Hopes after Disasters136

training, which skills they later on imparted to the other villagers. The government also distributed some special mobile SIM cards where they could get an instant warning message; this proved very helpful. They had gone through several training sessions and workshops and gained knowledge in various aspects of rescue operation.
Overall Satisfaction Chart A1.1. Respondents’ satisfaction level of major interventions in Odisha (%)
89.9
33.1
70 72.5
58.8
0
10
20
30
40
50
60
70
80
90
100
Relief support Psychosocial Livelihood Housing DP - DRR
Note: Housing score is considered only for two villages.
It is seen from Chart A1.1 that the beneficiaries were very satisfied with the relief, housing and livelihood support, followed by training on DP.
Inclusion/Exclusion of Vulnerable GroupsThe majority of the respondents did not perceive exclusion in terms of caste (72.5 per cent) and religion (73.1 per cent). 27.5 per cent were of the view that there was some caste discrimination. This perception was mostly shared by respondents belonging to SC category (40.3 per cent) and, interestingly, around 39.5 per cent of the general category. The majority of the respondents (93.1 per cent) were of the view that women were discriminated against; 93.1 per cent also stated that women were not included in planning and implementation. As many as 80.6 per cent were of the view that the NGOs took special care of the most vulnerable like widows and people with disability. The majority (98.8 per cent) agreed that the most vulnerable like widows and people with disability should have special preference. 85.6 per cent were of the view that after disaster
Weaving Hopes after Disasters 137
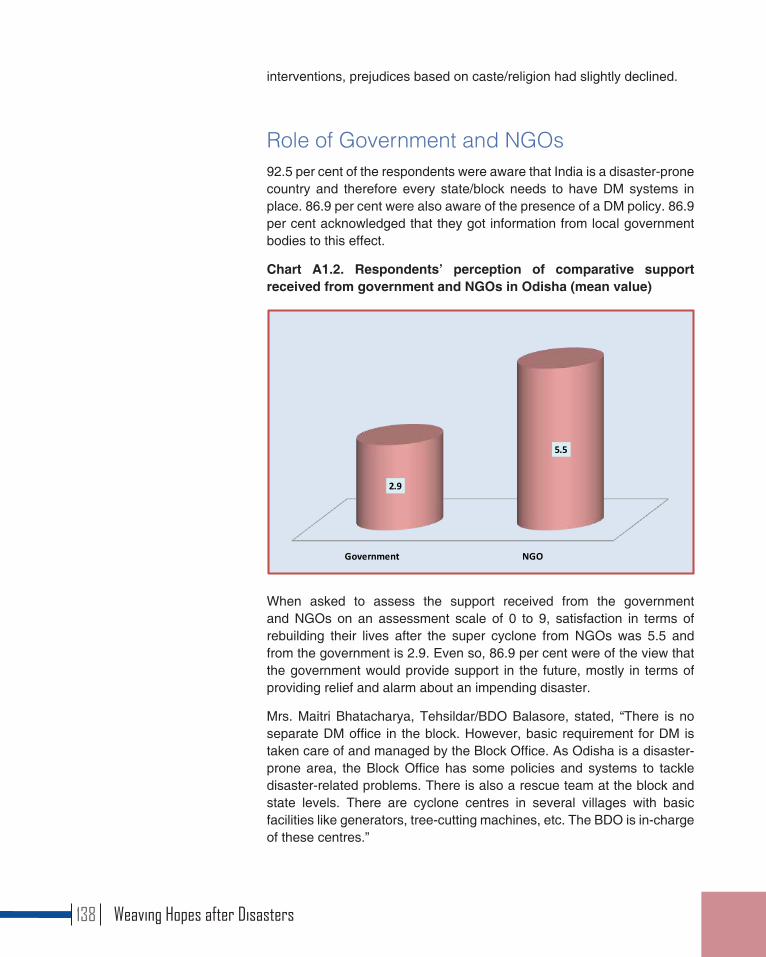
interventions, prejudices based on caste/religion had slightly declined.
Role of Government and NGOs92.5 per cent of the respondents were aware that India is a disaster-prone country and therefore every state/block needs to have DM systems in place. 86.9 per cent were also aware of the presence of a DM policy. 86.9 per cent acknowledged that they got information from local government bodies to this effect.
Chart A1.2. Respondents’ perception of comparative support received from government and NGOs in Odisha (mean value)
Government NGO
2.9
5.5
When asked to assess the support received from the government and NGOs on an assessment scale of 0 to 9, satisfaction in terms of rebuilding their lives after the super cyclone from NGOs was 5.5 and from the government is 2.9. Even so, 86.9 per cent were of the view that the government would provide support in the future, mostly in terms of providing relief and alarm about an impending disaster.
Mrs. Maitri Bhatacharya, Tehsildar/BDO Balasore, stated, “There is no separate DM office in the block. However, basic requirement for DM is taken care of and managed by the Block Office. As Odisha is a disaster-prone area, the Block Office has some policies and systems to tackle disaster-related problems. There is also a rescue team at the block and state levels. There are cyclone centres in several villages with basic facilities like generators, tree-cutting machines, etc. The BDO is in-charge of these centres.”
Weaving Hopes after Disasters138

There is also awareness among the respondents about their “right to receive relief and rehabilitation”. 44.4 per cent said that in case the government did not intervene, they “would go to the government office and demand its intervention”. Another 30 per cent said that they “will mobilize people and protest” if the government did not respond.
The Change FactorSocio-economic and Cultural Changes
After the cyclone of 1999 there have been some perceptible changes in the lives of the beneficiaries. Some prominent changes are captured here.
Physical Changes: Improved Facilities
Caritas built houses for many households whose houses had been destroyed. A number of cyclone centres were built in elevated areas by NGOs, Red Cross and the Odisha State Disaster Management Authority (OSDMA). Classrooms, drinking water facilities and public convenience facilities have added value to the villages.
Economic Changes: Improved Livelihoods
Several economic changes were visible in Soripur, Kharasahapur and Guhaldihi. Creation of the SHGs was a big opportunity for the beneficiaries to enhance their leadership qualities and develop their villages. SHGs had established their own cooperative society with its own office. Some groups also owned vehicles to market their produce.
Social Changes: Improved Education
Caritas built school buildings. SHGs played a great role in creating awareness and in some places they intervened and helped the schools to improve education. Due to the efforts of Caritas a large number of children enrolled in school and were regular in attendance. In the last one decade education among the girl children had increased. Education had also broadened the vision of the youth.
Cultural Changes: Role of Women
Until the cyclone of 1999, women were kept out of village committees. Today, they are almost equal partners in every activity in the village. SHGs had also enhanced their livelihood activities. Women were also evolving as a political force at the district level to demand their rights and
Weaving Hopes after Disasters 139
entitlements from the government. In Kharasahpur, women had formed SHGs according to their social groups, which may be a matter of concern.
ConclusionCaritas did an excellent job by constructing houses for many people. However, the beneficiaries had not done much for the improvement and maintenance of the houses. Fifteen years after their construction, nearly 50 per cent of the houses were either fully abandoned or were being used partially, which is a matter of concern.
At the same time, well-coordinated participation of the local community was seen as a key to the success of relief, rehabilitation and development interventions. Proactive participation of the local community in planning, implementation and monitoring of various interventions and collaborating with the government stood out as a key learning in the Odisha interventions. Through DP programmes, the beneficiaries seemed to have gained a lot from state intervention. Such efforts had increased their interaction with the government and gave them a better idea of citizenship.
Weaving Hopes after Disasters140
Earthquake 2001, Kutch-GujaratKutch Jyoti Trust, which functions under the Navjeevan Trust of the diocese of Rajkot with the support of Caritas India, carried out relief, rehabilitation and development programmes in fourteen villages after the massive earthquake in 2001. Later on, the disaster response paradigm was shifted to a rights-based approach for empowerment of the weaker sections of society.
The organization initiated the animation process “Linking Relief Rehabilitation to Development” in 84 villages, formed 720 SHGs, and assisted 2,597 households for livelihood and worked for integrated village development focusing on health, education, livelihood, empowerment and capacity building programmes and trainings at various levels. The major intervention was in the field of formation and strengthening of SHGs and its federation, micro-finance, micro-insurance, children’s group and vocational trainings. As part of the livelihoods work it started the Navchetna Micro Finance Systems and supported 4,421 households for their livelihood and development. The trust was rendering its services in 80 villages of Kutch. The trust also nurtured the Navjeevan Mahila Manch, a district federation of women in 63 villages of Kutch.
Profile of RespondentsFrom among the fourteen villages identified by Caritas India for intervention during the earthquake, four villages were selected for intensive study, namely Dhori, Bhujodi, Kuneriya and Naddappa. A total of 160 respondents, 40 from each village, were identified for the household survey.
Location and Facilities All four villages are around Bhuj town, the headquarters of the district. Dhori has around 1,000 households; Nadappa, one of the oldest villages, has 450 households; Kuneriya consists of 500 households; and Bhujodi has around 350 households. All four villages have a primary school; there is one high school as well. Bhujodi and Khori have separate schools for girls. Every village has places of worship like temples and mosques, but no police station or bank. One village has a post office. After the earthquake, all villages have acquired common properties like panchayat office, water tanks, community halls, anganwadis, etc.
Weaving Hopes after Disasters 141
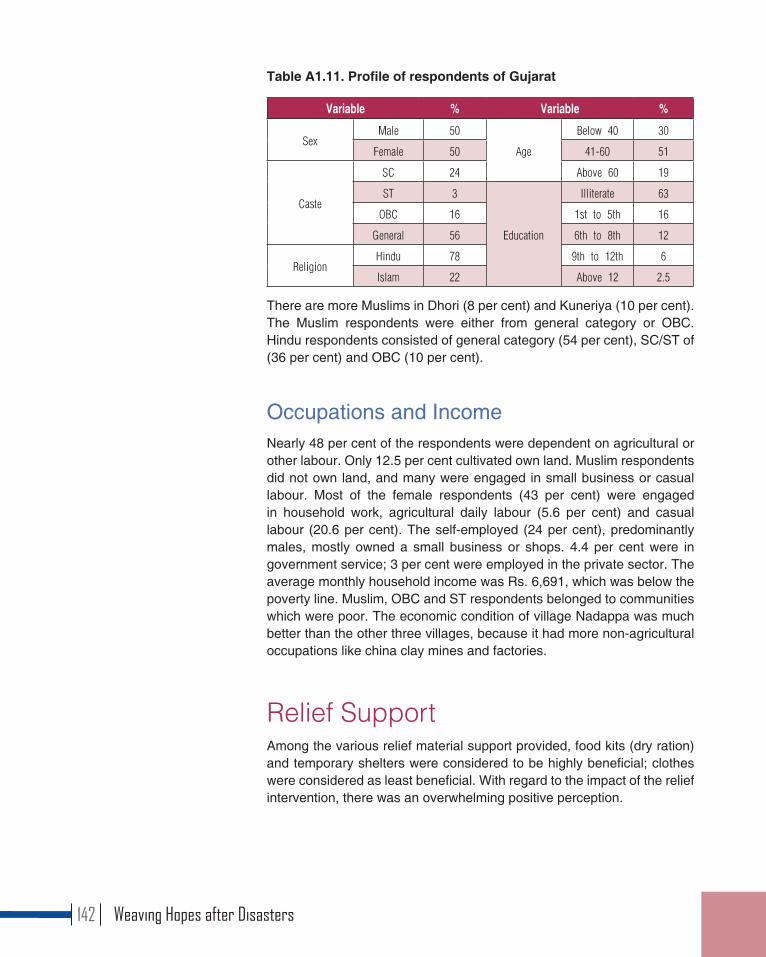
Table A1.11. Profile of respondents of Gujarat
Variable % Variable %
SexMale 50
Age
Below 40 30
Female 50 41-60 51
Caste
SC 24 Above 60 19
ST 3
Education
Illiterate 63
OBC 16 1st to 5th 16
General 56 6th to 8th 12
ReligionHindu 78 9th to 12th 6
Islam 22 Above 12 2.5
There are more Muslims in Dhori (8 per cent) and Kuneriya (10 per cent). The Muslim respondents were either from general category or OBC. Hindu respondents consisted of general category (54 per cent), SC/ST of (36 per cent) and OBC (10 per cent).
Occupations and IncomeNearly 48 per cent of the respondents were dependent on agricultural or other labour. Only 12.5 per cent cultivated own land. Muslim respondents did not own land, and many were engaged in small business or casual labour. Most of the female respondents (43 per cent) were engaged in household work, agricultural daily labour (5.6 per cent) and casual labour (20.6 per cent). The self-employed (24 per cent), predominantly males, mostly owned a small business or shops. 4.4 per cent were in government service; 3 per cent were employed in the private sector. The average monthly household income was Rs. 6,691, which was below the poverty line. Muslim, OBC and ST respondents belonged to communities which were poor. The economic condition of village Nadappa was much better than the other three villages, because it had more non-agricultural occupations like china clay mines and factories.
Relief SupportAmong the various relief material support provided, food kits (dry ration) and temporary shelters were considered to be highly beneficial; clothes were considered as least beneficial. With regard to the impact of the relief intervention, there was an overwhelming positive perception.
Weaving Hopes after Disasters142
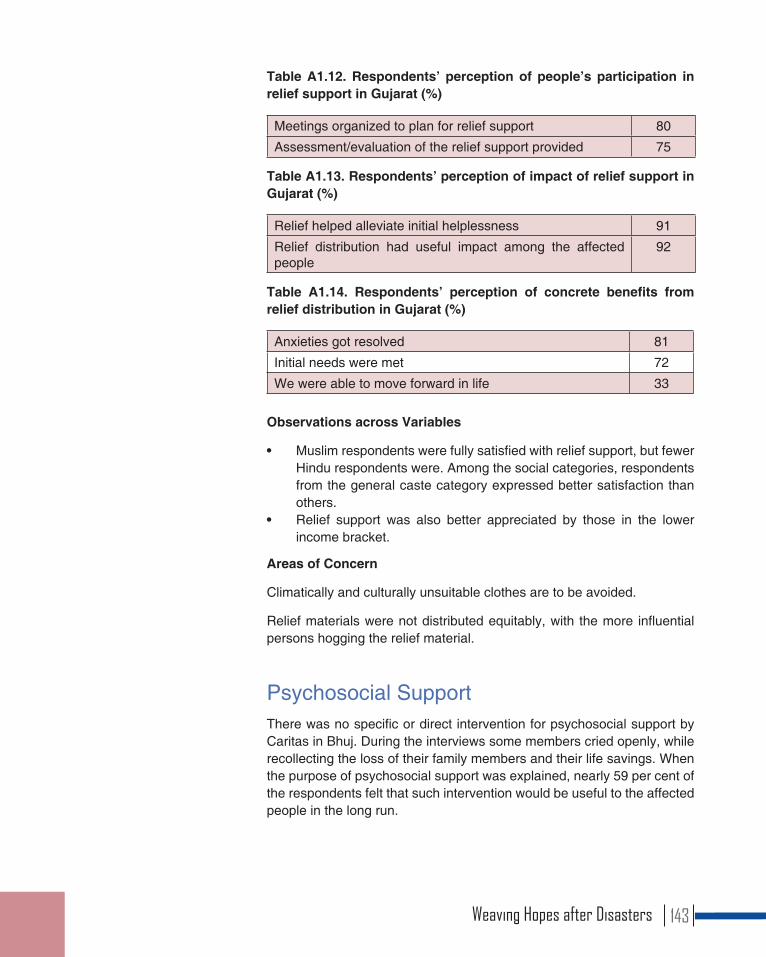
Table A1.12. Respondents’ perception of people’s participation in relief support in Gujarat (%)
Meetings organized to plan for relief support 80
Assessment/evaluation of the relief support provided 75
Table A1.13. Respondents’ perception of impact of relief support in Gujarat (%)
Relief helped alleviate initial helplessness 91
Relief distribution had useful impact among the affected people
92
Table A1.14. Respondents’ perception of concrete benefits from relief distribution in Gujarat (%)
Anxieties got resolved 81
Initial needs were met 72
We were able to move forward in life 33
Observations across Variables
• Muslim respondents were fully satisfied with relief support, but fewer Hindu respondents were. Among the social categories, respondents from the general caste category expressed better satisfaction than others.
• Relief support was also better appreciated by those in the lower income bracket.
Areas of Concern
Climatically and culturally unsuitable clothes are to be avoided.
Relief materials were not distributed equitably, with the more influential persons hogging the relief material.
Psychosocial Support There was no specific or direct intervention for psychosocial support by Caritas in Bhuj. During the interviews some members cried openly, while recollecting the loss of their family members and their life savings. When the purpose of psychosocial support was explained, nearly 59 per cent of the respondents felt that such intervention would be useful to the affected people in the long run.
Weaving Hopes after Disasters 143
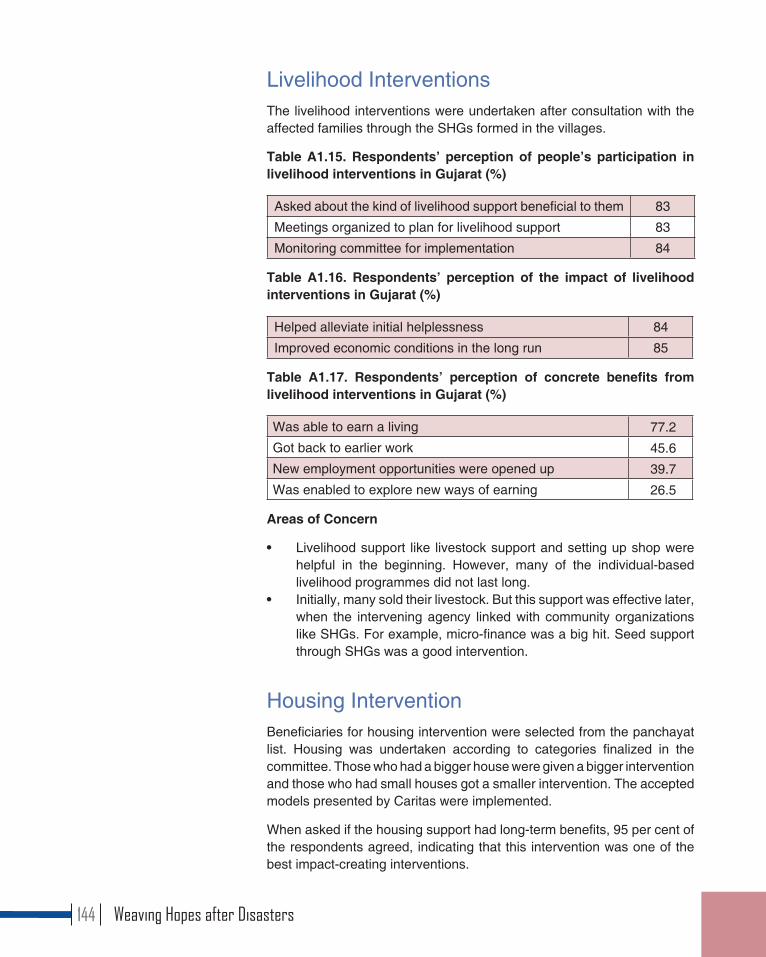
Livelihood InterventionsThe livelihood interventions were undertaken after consultation with the affected families through the SHGs formed in the villages.
Table A1.15. Respondents’ perception of people’s participation in livelihood interventions in Gujarat (%)
Asked about the kind of livelihood support beneficial to them 83
Meetings organized to plan for livelihood support 83
Monitoring committee for implementation 84
Table A1.16. Respondents’ perception of the impact of livelihood interventions in Gujarat (%)
Helped alleviate initial helplessness 84
Improved economic conditions in the long run 85
Table A1.17. Respondents’ perception of concrete benefits from livelihood interventions in Gujarat (%)
Was able to earn a living 77.2
Got back to earlier work 45.6
New employment opportunities were opened up 39.7
Was enabled to explore new ways of earning 26.5
Areas of Concern
• Livelihood support like livestock support and setting up shop were helpful in the beginning. However, many of the individual-based livelihood programmes did not last long.
• Initially, many sold their livestock. But this support was effective later, when the intervening agency linked with community organizations like SHGs. For example, micro-finance was a big hit. Seed support through SHGs was a good intervention.
Housing InterventionBeneficiaries for housing intervention were selected from the panchayat list. Housing was undertaken according to categories finalized in the committee. Those who had a bigger house were given a bigger intervention and those who had small houses got a smaller intervention. The accepted models presented by Caritas were implemented.
When asked if the housing support had long-term benefits, 95 per cent of the respondents agreed, indicating that this intervention was one of the best impact-creating interventions.
Weaving Hopes after Disasters144
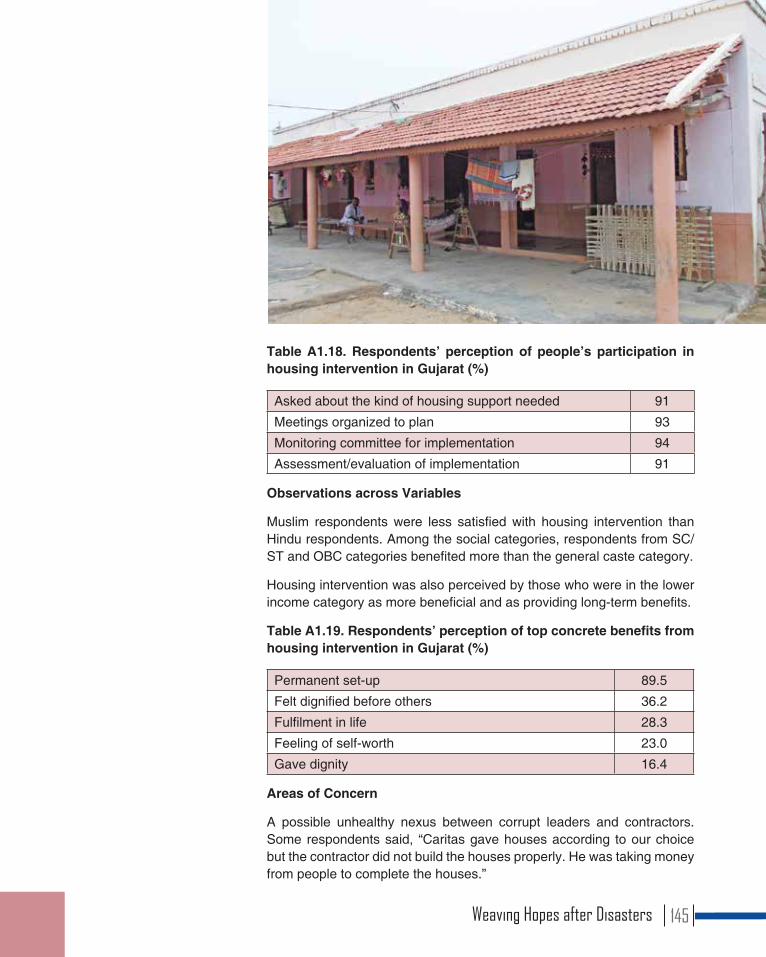
Table A1.18. Respondents’ perception of people’s participation in housing intervention in Gujarat (%)
Asked about the kind of housing support needed 91
Meetings organized to plan 93
Monitoring committee for implementation 94
Assessment/evaluation of implementation 91
Observations across Variables
Muslim respondents were less satisfied with housing intervention than Hindu respondents. Among the social categories, respondents from SC/ST and OBC categories benefited more than the general caste category.
Housing intervention was also perceived by those who were in the lower income category as more beneficial and as providing long-term benefits.
Table A1.19. Respondents’ perception of top concrete benefits from housing intervention in Gujarat (%)
Permanent set-up 89.5
Felt dignified before others 36.2
Fulfilment in life 28.3
Feeling of self-worth 23.0
Gave dignity 16.4
Areas of Concern
A possible unhealthy nexus between corrupt leaders and contractors. Some respondents said, “Caritas gave houses according to our choice but the contractor did not build the houses properly. He was taking money from people to complete the houses.”
Weaving Hopes after Disasters 145
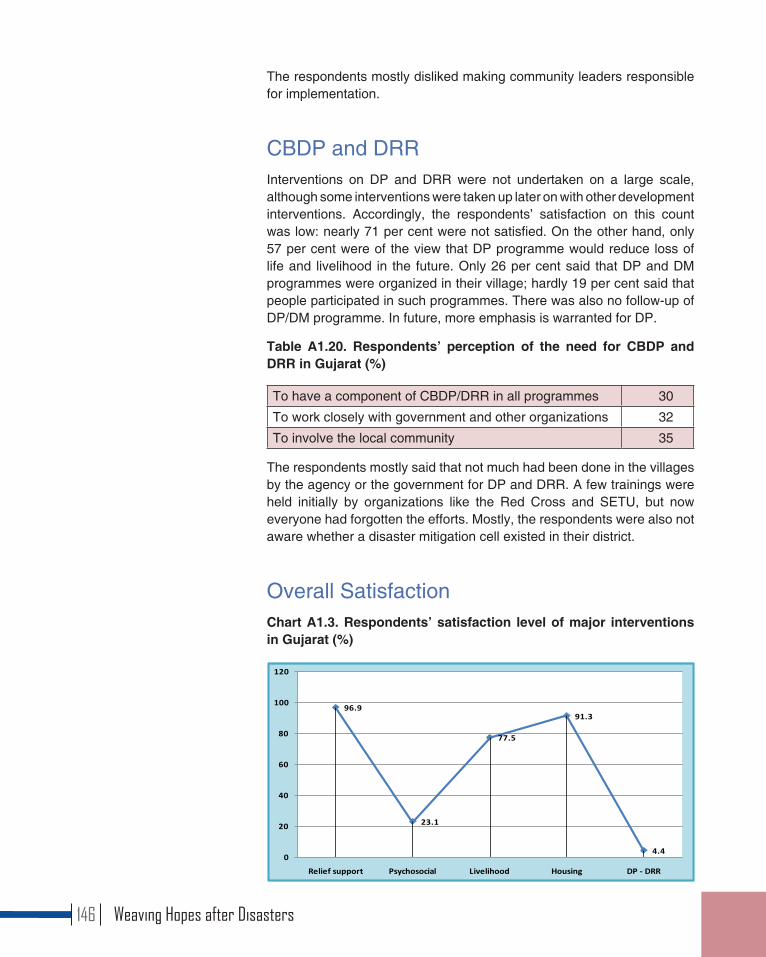
The respondents mostly disliked making community leaders responsible for implementation.
CBDP and DRRInterventions on DP and DRR were not undertaken on a large scale, although some interventions were taken up later on with other development interventions. Accordingly, the respondents’ satisfaction on this count was low: nearly 71 per cent were not satisfied. On the other hand, only 57 per cent were of the view that DP programme would reduce loss of life and livelihood in the future. Only 26 per cent said that DP and DM programmes were organized in their village; hardly 19 per cent said that people participated in such programmes. There was also no follow-up of DP/DM programme. In future, more emphasis is warranted for DP.
Table A1.20. Respondents’ perception of the need for CBDP and DRR in Gujarat (%)
To have a component of CBDP/DRR in all programmes 30
To work closely with government and other organizations 32
To involve the local community 35
The respondents mostly said that not much had been done in the villages by the agency or the government for DP and DRR. A few trainings were held initially by organizations like the Red Cross and SETU, but now everyone had forgotten the efforts. Mostly, the respondents were also not aware whether a disaster mitigation cell existed in their district.
Overall Satisfaction Chart A1.3. Respondents’ satisfaction level of major interventions in Gujarat (%)
96.9
23.1
77.5
91.3
4.40
20
40
60
80
100
120
Relief support Psychosocial Livelihood Housing DP - DRR
Weaving Hopes after Disasters146

It is seen from Chart A1.3 that the respondents were highly satisfied with the relief and housing, followed by livelihood support. Caritas did not provide organized psychosocial support but it did substantial amount of DP work. The finding that there is very low satisfaction among the respondents should be a cause for concern and improvement.
In a focus group discussion, the village leaders said: “When the houses were built, the cost of a house would have been around 1.25 lakh; but now the cost would be around 4 to 5 lakh. No one in our village can afford to build such a house. It is a big investment for us. The houses are strong and well built. These will benefit our next generations as well. Now that we have decent houses, we are peaceful.” The women also, in a focus group discussion, highlighted housing as the most satisfying intervention. They also appreciated the addition of toilet facility in the house.
A Muslim member from village Dhori said during an interview: “Along with the housing, very substantial livelihood support was provided by the agency. My only source of income was a petty shop which kept sweets and candies for children. As part of the livelihood I asked my wife to get a refrigerator from Caritas. I got the refrigerator and we began to sell chilled drinks. Over the years, I have worked hard with the support of my wife. Today I have a good shop and my economic condition is stable. I am able to earn from this provision store for my family. My wife is the member of SHG and saves money regularly.”
Inclusion/Exclusion of Vulnerable GroupsThe majority of the respondents did not perceive exclusion in the planning and implementation of the programme based on their caste (82 per cent)
Weaving Hopes after Disasters 147
and religion (87 per cent). However, there were voices from different sections of the communities that pointed to dissatisfaction because of the exclusion they had experienced.
• Nearly 18 per cent were of the view that there were some restrictions on their participation because of their caste. This perception was mostly shared by respondents belonging to SC (31 per cent) and OBC (18 per cent) social groups.
• Similarly, 13 per cent were of the view that some beneficiaries were not able to participate fully because of their religion. This perception was mostly shared by respondents belonging to the Hindu community (15 per cent).
• 89 per cent (female 91 per cent, male 74 per cent) were of the view that in disaster response men were in the forefront and women largely followed men. However, the scenario changed through SHG formation and federation, leading to changes in gender relations.
• As regards the inclusion of vulnerable sections, i.e. widows and people with disability, perceptions were divided. Nearly 52 per cent agreed that the NGO took special care of the most vulnerable sections in disaster response; 48 per cent did not agree.
Role of Government Nearly 86 per cent were aware that India is disaster-prone country and that each state/block had to have DM systems in place. At the same time, only 52 per cent were aware if a DM policy was really in place. Only 54 per cent answered in the affirmative that they had got information from local government bodies to that effect. This perception may also be attributed to the people’s experience about the government’s response to the disaster situation: only 55 per cent of them perceived government as having been proactive in responding to disaster situations in the last few years.
In terms of the support received from the government in rebuilding their lives after the earthquake, the satisfaction level was very low. On an assessment scale of 0 to 9, the mean value was only 3.04. Supporting this finding, only 65 per cent of the respondents were of the view that the government would provide support in a future disaster that affected them. The majority (61.1 per cent) were of the view that the government would provide them support mainly in terms of relief and in providing an alarm about an impending disaster (49.3 per cent). Very few expected support from government in DP (13.9 per cent), in livelihood support (21.5 per cent), in housing (27.8 per cent), in psychosocial support (6.2 per cent), in providing some cash support (15.3 per cent), and in community animation (2.8 per cent).
There was, nevertheless, greater awareness about the “right to receive relief and rehabilitation”, which they saw as an obligation on the part of the government: 56 per cent said that in case the government did
Weaving Hopes after Disasters148
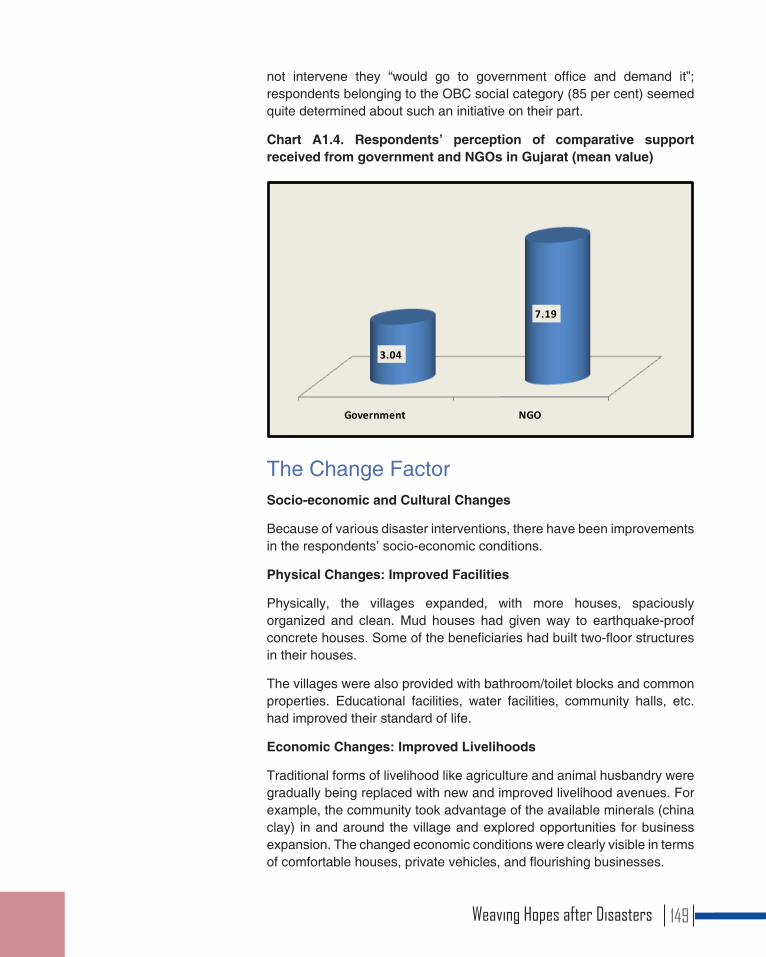
not intervene they “would go to government office and demand it”; respondents belonging to the OBC social category (85 per cent) seemed quite determined about such an initiative on their part.
Chart A1.4. Respondents’ perception of comparative support received from government and NGOs in Gujarat (mean value)
Government NGO
3.04
7.19
The Change FactorSocio-economic and Cultural Changes
Because of various disaster interventions, there have been improvements in the respondents’ socio-economic conditions.
Physical Changes: Improved Facilities
Physically, the villages expanded, with more houses, spaciously organized and clean. Mud houses had given way to earthquake-proof concrete houses. Some of the beneficiaries had built two-floor structures in their houses.
The villages were also provided with bathroom/toilet blocks and common properties. Educational facilities, water facilities, community halls, etc. had improved their standard of life.
Economic Changes: Improved Livelihoods
Traditional forms of livelihood like agriculture and animal husbandry were gradually being replaced with new and improved livelihood avenues. For example, the community took advantage of the available minerals (china clay) in and around the village and explored opportunities for business expansion. The changed economic conditions were clearly visible in terms of comfortable houses, private vehicles, and flourishing businesses.
Weaving Hopes after Disasters 149
Social Changes: Improved Education
There was higher school enrolment, with regular attendance, among both sexes. The increased attention to education had also resulted in a reduction in child marriages. Before the earthquake there was only one school, a two-room structure in Dhori village, where girls and boys studied together. The Ahir community married their girls in the village itself before they reached the age of ten and discontinued their education. After the earthquake, separate schools were built for girls and boys, and the girls continued their studies. Child marriage had declined, as a supplementary benefit.
Also, there were cordial relations among different communities of caste and creed. Common properties like halls and water tanks were under panchayat control, which all religious and caste communities used. At the same time, living quarters were clustered around religion and caste.
Cultural Changes: Improved Exposure to the Outside World
Ranchotbhai said in an interview: “We always remained in the village and the village was our world. It is only after the earthquake that we began to move around and saw the outside world. The communication and information systems have reached our village in a big way over the last five years. During the earthquake we were hardly in touch with the outside world and we had information about our villages only. Now we know much that is happening around.”
But this exposure has also had some negative impacts.
• With economic development, selfishness had increased. With increased economic activity, the time for social interaction had decreased. Maujibhai of Nadappa village said: “Earlier, we had plenty of time after the agricultural engagements to spend time in the village and with each other. Now, that social relationship is completely changed. We have no time for others and for village activities.”
• Corruption had also crept in as a result of the people’s interaction with outsiders and government offices. There were more corrupt leaders at the time of the survey and the people were not happy with the leadership.
• Tastes had changed, with more money available. A medical doctor from Nadappa village said, “The outside contact has influenced the village youth and men, especially travelling outside the village as truck drivers and on other business-related trips. Two cases of AIDS have already been identified in the villages. The evils of development have entered the villages in a big way.”
Weaving Hopes after Disasters150
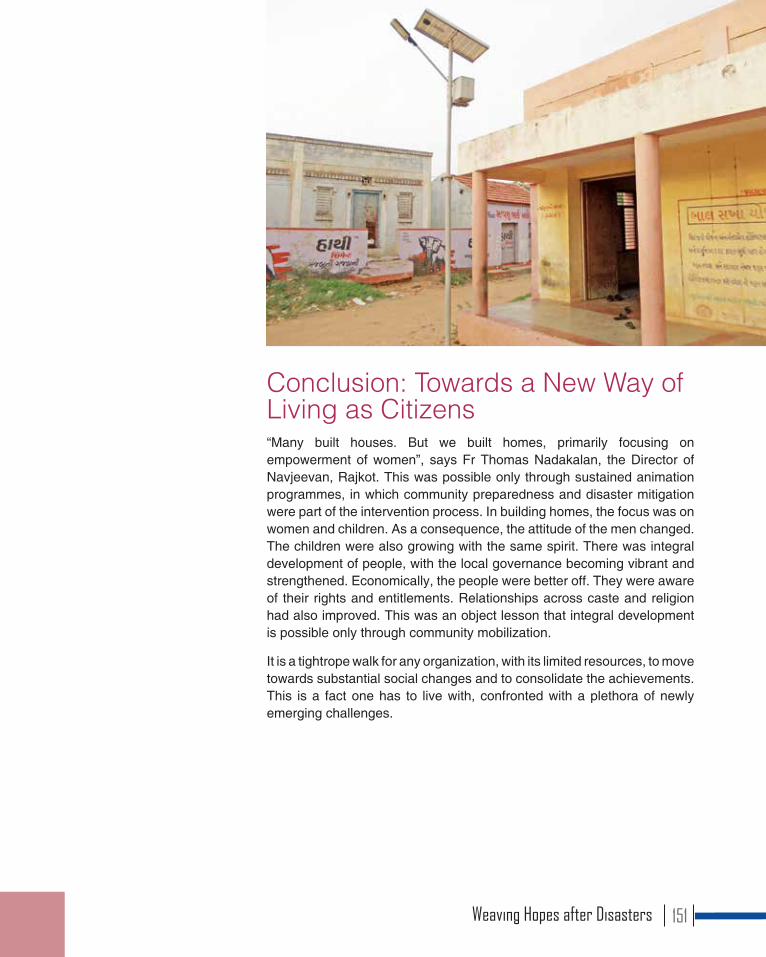
Conclusion: Towards a New Way of Living as Citizens“Many built houses. But we built homes, primarily focusing on empowerment of women”, says Fr Thomas Nadakalan, the Director of Navjeevan, Rajkot. This was possible only through sustained animation programmes, in which community preparedness and disaster mitigation were part of the intervention process. In building homes, the focus was on women and children. As a consequence, the attitude of the men changed. The children were also growing with the same spirit. There was integral development of people, with the local governance becoming vibrant and strengthened. Economically, the people were better off. They were aware of their rights and entitlements. Relationships across caste and religion had also improved. This was an object lesson that integral development is possible only through community mobilization.
It is a tightrope walk for any organization, with its limited resources, to move towards substantial social changes and to consolidate the achievements. This is a fact one has to live with, confronted with a plethora of newly emerging challenges.
Weaving Hopes after Disasters 151
Tsunami 2004, Andhra PradeshThe Diocesan Nellore Social Service Society (DNSSS) has been serving in the districts of Nellore and Prakasam since 1975. In response to the tsunami, DNSSS worked in nine villages, carrying out relief, psychosocial relief, livelihood, housing and disaster preparedness work. Direct beneficiaries included families, task force members, SHG members, youth, PRI members, schoolchildren, and beneficiaries of health and sanitation. The operations were carried out in the coastal belt. In some pockets, housing was still not complete, since the state government did not release the assured funds. In course of time, the focus shifted to the dalits and other poor communities. The work was being carried out by accessing some government projects, but with a thin budget.
Established in 1977, the Social Services Centre of Eluru is operational in West Godavari and part of East Godavari, the area locally known as Konaseema. It has constructed 1,380 houses. After the 1996 cyclone that affected East Godavari district, with assistance from Caritas Germany, it carried out massive relief and rehabilitation work, mostly among the dalits.
After the tsunami of 2004, SSC Eluru carried out a massive operation, linking relief, rehabilitation and development, with special focus on DP programmes, along with community animation. A new housing project, with part support from the government, stands out with a visually pleasing design and layout. About 1,340 houses were built. There has been community animation, especially in terms of formation of women SHGs. The consequent social changes were perceptible.
Profile of Selected Villages and RespondentsPinnivaripallem and Kranthinagar villages (Prakasam district, Nellore diocese) and Linupalavapallem and K.D. Pallavapallem villages (East Godavari district, Eluru diocese) were taken up for this study.
Facilities and InstitutionsAll the four villages are well connected by roads, but suffer from inadequate public transport facility. In Pinnivarepallem and Kranthinagar, shared auto rickshaws are available; in Linupalavapallem and K.D. Pallavapallem, the only available means of transport is a personal vehicle. Infrastructurally, all the four villages are well designed as an urban colony. The Eluru villages are better designed; the houses are made in a same pattern along neatly arranged lanes. There is a wide road passing in front of the main lane and
Weaving Hopes after Disasters152
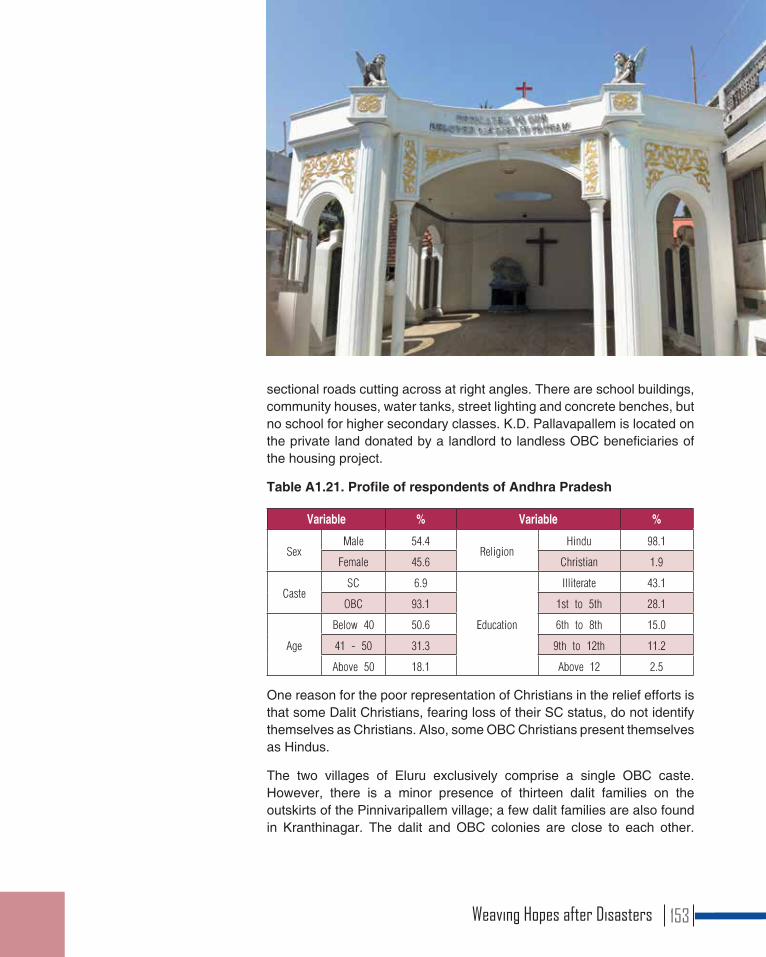
sectional roads cutting across at right angles. There are school buildings, community houses, water tanks, street lighting and concrete benches, but no school for higher secondary classes. K.D. Pallavapallem is located on the private land donated by a landlord to landless OBC beneficiaries of the housing project.
Table A1.21. Profile of respondents of Andhra Pradesh
Variable % Variable %
SexMale 54.4
ReligionHindu 98.1
Female 45.6 Christian 1.9
CasteSC 6.9
Education
Illiterate 43.1
OBC 93.1 1st to 5th 28.1
Age
Below 40 50.6 6th to 8th 15.0
41 - 50 31.3 9th to 12th 11.2
Above 50 18.1 Above 12 2.5
One reason for the poor representation of Christians in the relief efforts is that some Dalit Christians, fearing loss of their SC status, do not identify themselves as Christians. Also, some OBC Christians present themselves as Hindus.
The two villages of Eluru exclusively comprise a single OBC caste. However, there is a minor presence of thirteen dalit families on the outskirts of the Pinnivaripallem village; a few dalit families are also found in Kranthinagar. The dalit and OBC colonies are close to each other.
Weaving Hopes after Disasters 153
Because the government does not include the dalit colony in the tsunami-affected list of villages, the dalits continue to live in thatched-roof houses while the OBC community have well-constructed houses.
Occupation and IncomeFishing is the prevalent occupation of the respondents (90.6 per cent): 87.5 per cent OBCs and 3.1 per cent dalits. In terms of gender, 38.8 per cent male and 51.9 per cent female respondents were involved in fishing. The second important occupation was household work (36.9 per cent), involving only women. About 13 per cent of the respondents were engaged as daily agricultural labour, working mainly in coconut and fish farms. Some dalits were involved in casual labour.
Relief SupportAmong the various relief measures provided, clothes and food kit (dry ration) were considered to be highly beneficial; temporary shelter was considered as least beneficial.
The villagers of Pinnivaripallem and Kranthinagar said that dumping of old clothes should be avoided. But the villagers of Linupalavapallem and K.D. Pallavapallem said that everything was useful, including old clothes.
Table A1.22. Respondents’ perception of people’s participation in relief support in Andhra Pradesh (%)
Meeting for planning 95.0
Monitoring committee 95.0
Assessment/Evaluation 83.8
Table A1.23. Respondents’ perception of the impact of relief intervention in Andhra Pradesh (%)
Relief distribution had useful impact 98.8
Relief helped alleviate initial helplessness 98.0
Table A1.24. Respondents’ perception of the impact of concrete benefits from relief intervention in Andhra Pradesh (%)
Initial needs were met 80.0
Ability to move ahead in life 73.0
Anxieties resolved 24.4
Weaving Hopes after Disasters154
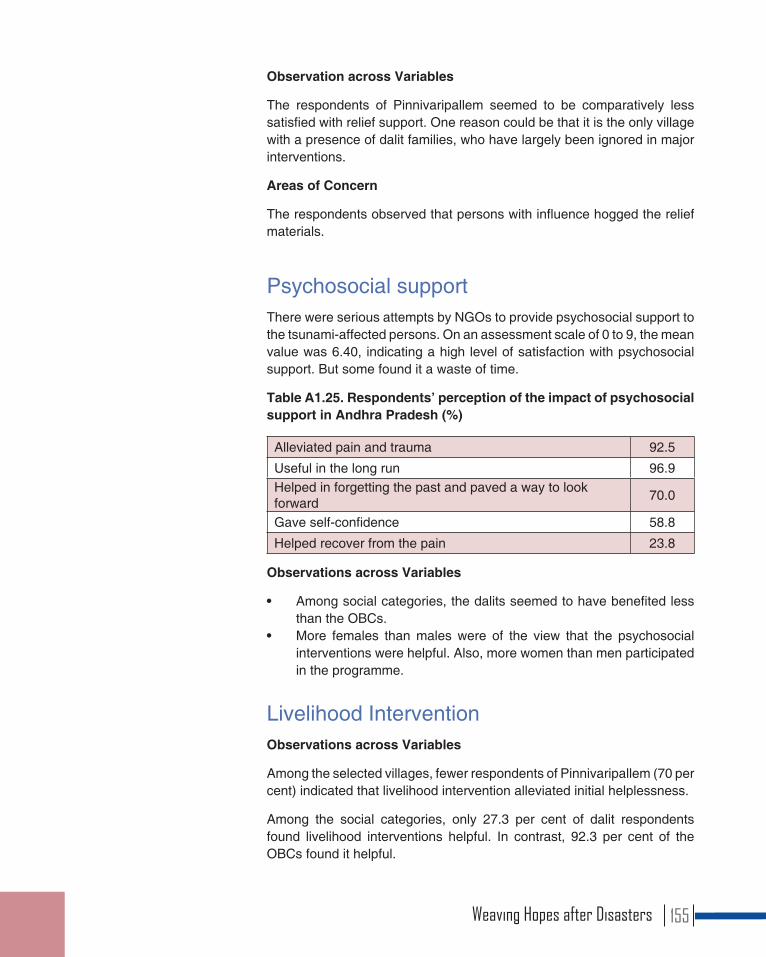
Observation across Variables
The respondents of Pinnivaripallem seemed to be comparatively less satisfied with relief support. One reason could be that it is the only village with a presence of dalit families, who have largely been ignored in major interventions.
Areas of Concern
The respondents observed that persons with influence hogged the relief materials.
Psychosocial supportThere were serious attempts by NGOs to provide psychosocial support to the tsunami-affected persons. On an assessment scale of 0 to 9, the mean value was 6.40, indicating a high level of satisfaction with psychosocial support. But some found it a waste of time.
Table A1.25. Respondents’ perception of the impact of psychosocial support in Andhra Pradesh (%)
Alleviated pain and trauma 92.5
Useful in the long run 96.9Helped in forgetting the past and paved a way to look forward 70.0
Gave self-confidence 58.8
Helped recover from the pain 23.8
Observations across Variables
• Among social categories, the dalits seemed to have benefited less than the OBCs.
• More females than males were of the view that the psychosocial interventions were helpful. Also, more women than men participated in the programme.
Livelihood InterventionObservations across Variables
Among the selected villages, fewer respondents of Pinnivaripallem (70 per cent) indicated that livelihood intervention alleviated initial helplessness.
Among the social categories, only 27.3 per cent of dalit respondents found livelihood interventions helpful. In contrast, 92.3 per cent of the OBCs found it helpful.
Weaving Hopes after Disasters 155
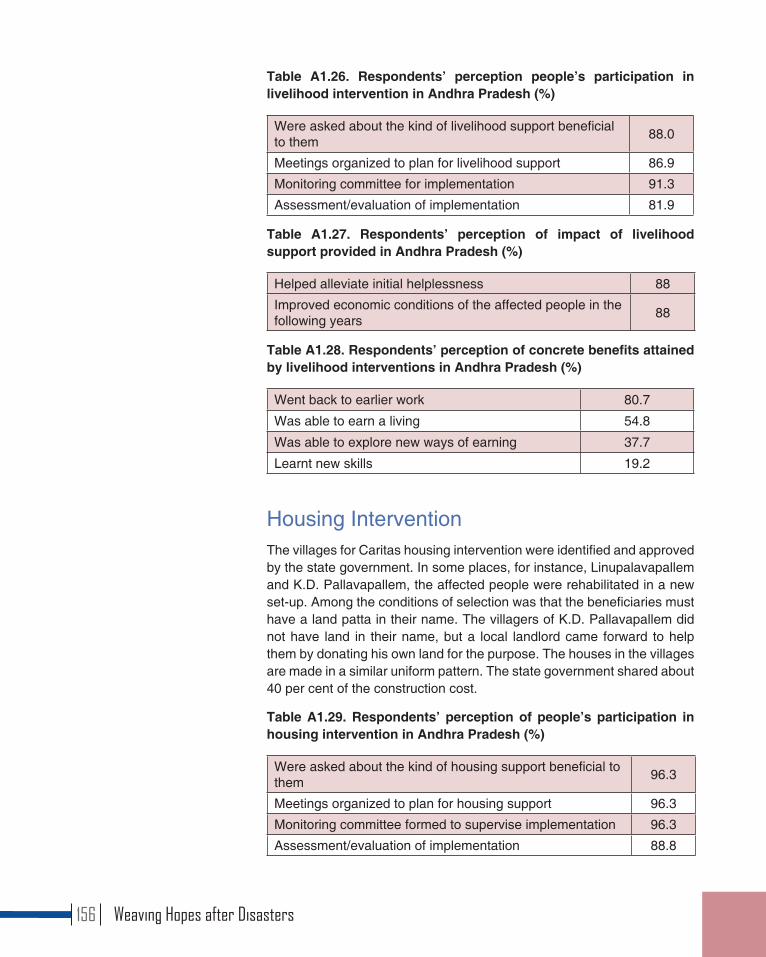
Table A1.26. Respondents’ perception people’s participation in livelihood intervention in Andhra Pradesh (%)
Were asked about the kind of livelihood support beneficial to them 88.0
Meetings organized to plan for livelihood support 86.9
Monitoring committee for implementation 91.3
Assessment/evaluation of implementation 81.9
Table A1.27. Respondents’ perception of impact of livelihood support provided in Andhra Pradesh (%)
Helped alleviate initial helplessness 88
Improved economic conditions of the affected people in the following years 88
Table A1.28. Respondents’ perception of concrete benefits attained by livelihood interventions in Andhra Pradesh (%)
Went back to earlier work 80.7
Was able to earn a living 54.8
Was able to explore new ways of earning 37.7
Learnt new skills 19.2
Housing InterventionThe villages for Caritas housing intervention were identified and approved by the state government. In some places, for instance, Linupalavapallem and K.D. Pallavapallem, the affected people were rehabilitated in a new set-up. Among the conditions of selection was that the beneficiaries must have a land patta in their name. The villagers of K.D. Pallavapallem did not have land in their name, but a local landlord came forward to help them by donating his own land for the purpose. The houses in the villages are made in a similar uniform pattern. The state government shared about 40 per cent of the construction cost.
Table A1.29. Respondents’ perception of people’s participation in housing intervention in Andhra Pradesh (%)
Were asked about the kind of housing support beneficial to them 96.3
Meetings organized to plan for housing support 96.3
Monitoring committee formed to supervise implementation 96.3
Assessment/evaluation of implementation 88.8
Weaving Hopes after Disasters156
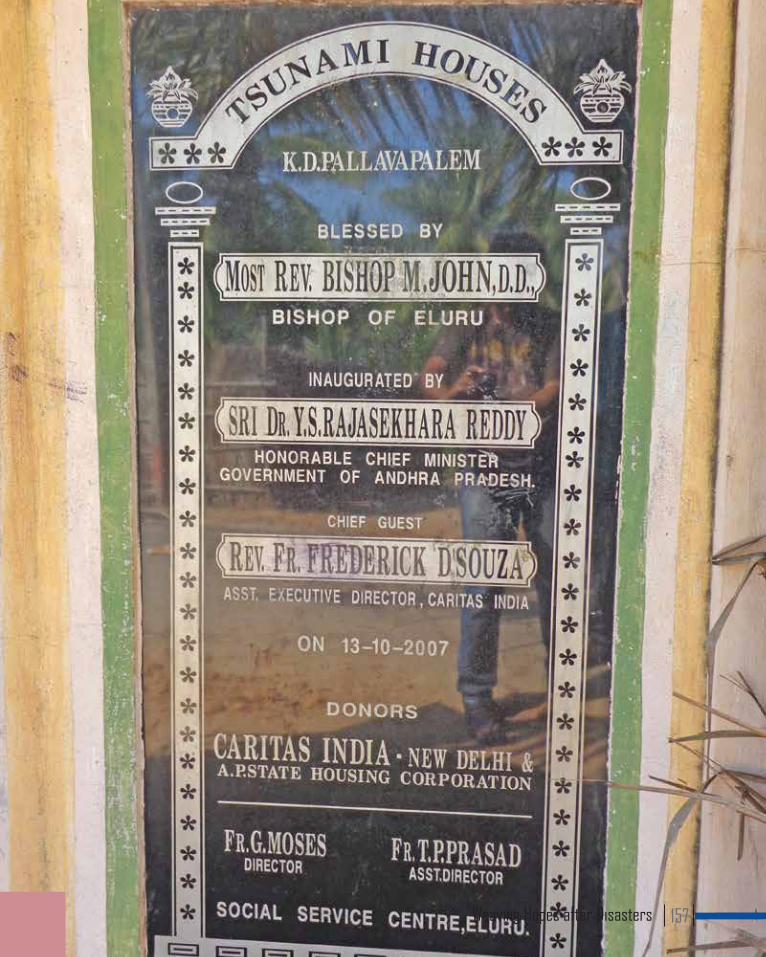
Weaving Hopes after Disasters 157
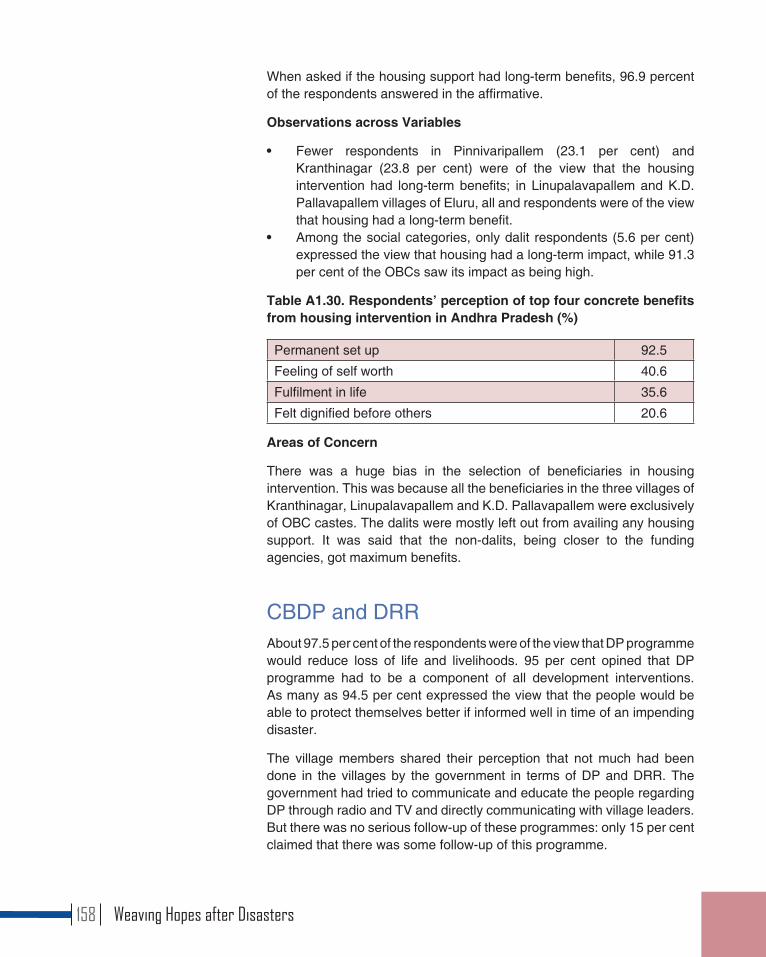
When asked if the housing support had long-term benefits, 96.9 percent of the respondents answered in the affirmative.
Observations across Variables
• Fewer respondents in Pinnivaripallem (23.1 per cent) and Kranthinagar (23.8 per cent) were of the view that the housing intervention had long-term benefits; in Linupalavapallem and K.D. Pallavapallem villages of Eluru, all and respondents were of the view that housing had a long-term benefit.
• Among the social categories, only dalit respondents (5.6 per cent) expressed the view that housing had a long-term impact, while 91.3 per cent of the OBCs saw its impact as being high.
Table A1.30. Respondents’ perception of top four concrete benefits from housing intervention in Andhra Pradesh (%)
Permanent set up 92.5
Feeling of self worth 40.6
Fulfilment in life 35.6
Felt dignified before others 20.6
Areas of Concern
There was a huge bias in the selection of beneficiaries in housing intervention. This was because all the beneficiaries in the three villages of Kranthinagar, Linupalavapallem and K.D. Pallavapallem were exclusively of OBC castes. The dalits were mostly left out from availing any housing support. It was said that the non-dalits, being closer to the funding agencies, got maximum benefits.
CBDP and DRRAbout 97.5 per cent of the respondents were of the view that DP programme would reduce loss of life and livelihoods. 95 per cent opined that DP programme had to be a component of all development interventions. As many as 94.5 per cent expressed the view that the people would be able to protect themselves better if informed well in time of an impending disaster.
The village members shared their perception that not much had been done in the villages by the government in terms of DP and DRR. The government had tried to communicate and educate the people regarding DP through radio and TV and directly communicating with village leaders. But there was no serious follow-up of these programmes: only 15 per cent claimed that there was some follow-up of this programme.
Weaving Hopes after Disasters158
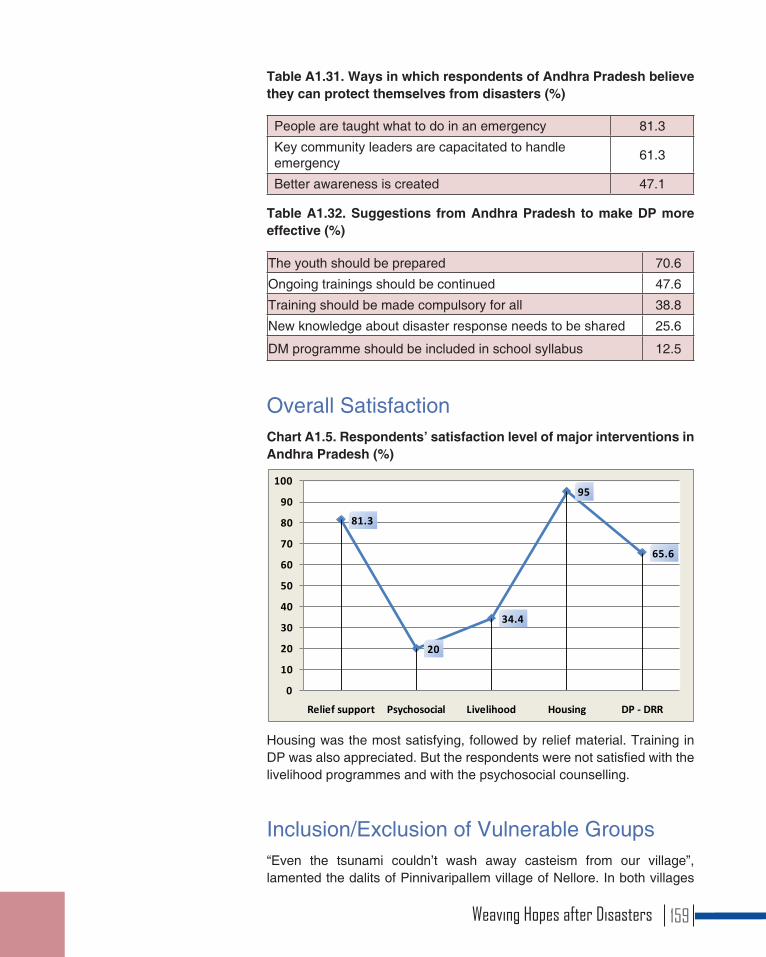
Table A1.31. Ways in which respondents of Andhra Pradesh believe they can protect themselves from disasters (%)
People are taught what to do in an emergency 81.3
Key community leaders are capacitated to handle emergency 61.3
Better awareness is created 47.1
Table A1.32. Suggestions from Andhra Pradesh to make DP more effective (%)
The youth should be prepared 70.6
Ongoing trainings should be continued 47.6
Training should be made compulsory for all 38.8
New knowledge about disaster response needs to be shared 25.6
DM programme should be included in school syllabus 12.5
Overall Satisfaction Chart A1.5. Respondents’ satisfaction level of major interventions in Andhra Pradesh (%)
81.3
20
34.4
95
65.6
0
10
20
30
40
50
60
70
80
90
100
Relief support Psychosocial Livelihood Housing DP - DRR
Housing was the most satisfying, followed by relief material. Training in DP was also appreciated. But the respondents were not satisfied with the livelihood programmes and with the psychosocial counselling.
Inclusion/Exclusion of Vulnerable Groups“Even the tsunami couldn’t wash away casteism from our village”, lamented the dalits of Pinnivaripallem village of Nellore. In both villages
Weaving Hopes after Disasters 159
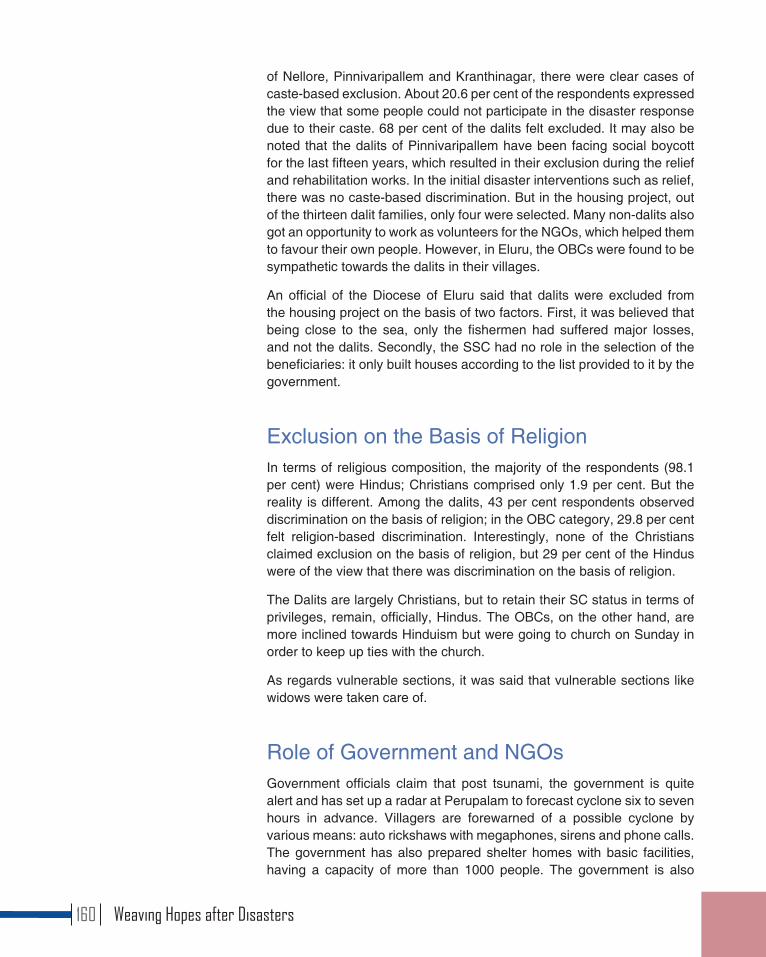
of Nellore, Pinnivaripallem and Kranthinagar, there were clear cases of caste-based exclusion. About 20.6 per cent of the respondents expressed the view that some people could not participate in the disaster response due to their caste. 68 per cent of the dalits felt excluded. It may also be noted that the dalits of Pinnivaripallem have been facing social boycott for the last fifteen years, which resulted in their exclusion during the relief and rehabilitation works. In the initial disaster interventions such as relief, there was no caste-based discrimination. But in the housing project, out of the thirteen dalit families, only four were selected. Many non-dalits also got an opportunity to work as volunteers for the NGOs, which helped them to favour their own people. However, in Eluru, the OBCs were found to be sympathetic towards the dalits in their villages.
An official of the Diocese of Eluru said that dalits were excluded from the housing project on the basis of two factors. First, it was believed that being close to the sea, only the fishermen had suffered major losses, and not the dalits. Secondly, the SSC had no role in the selection of the beneficiaries: it only built houses according to the list provided to it by the government.
Exclusion on the Basis of ReligionIn terms of religious composition, the majority of the respondents (98.1 per cent) were Hindus; Christians comprised only 1.9 per cent. But the reality is different. Among the dalits, 43 per cent respondents observed discrimination on the basis of religion; in the OBC category, 29.8 per cent felt religion-based discrimination. Interestingly, none of the Christians claimed exclusion on the basis of religion, but 29 per cent of the Hindus were of the view that there was discrimination on the basis of religion.
The Dalits are largely Christians, but to retain their SC status in terms of privileges, remain, officially, Hindus. The OBCs, on the other hand, are more inclined towards Hinduism but were going to church on Sunday in order to keep up ties with the church.
As regards vulnerable sections, it was said that vulnerable sections like widows were taken care of.
Role of Government and NGOsGovernment officials claim that post tsunami, the government is quite alert and has set up a radar at Perupalam to forecast cyclone six to seven hours in advance. Villagers are forewarned of a possible cyclone by various means: auto rickshaws with megaphones, sirens and phone calls. The government has also prepared shelter homes with basic facilities, having a capacity of more than 1000 people. The government is also
Weaving Hopes after Disasters160
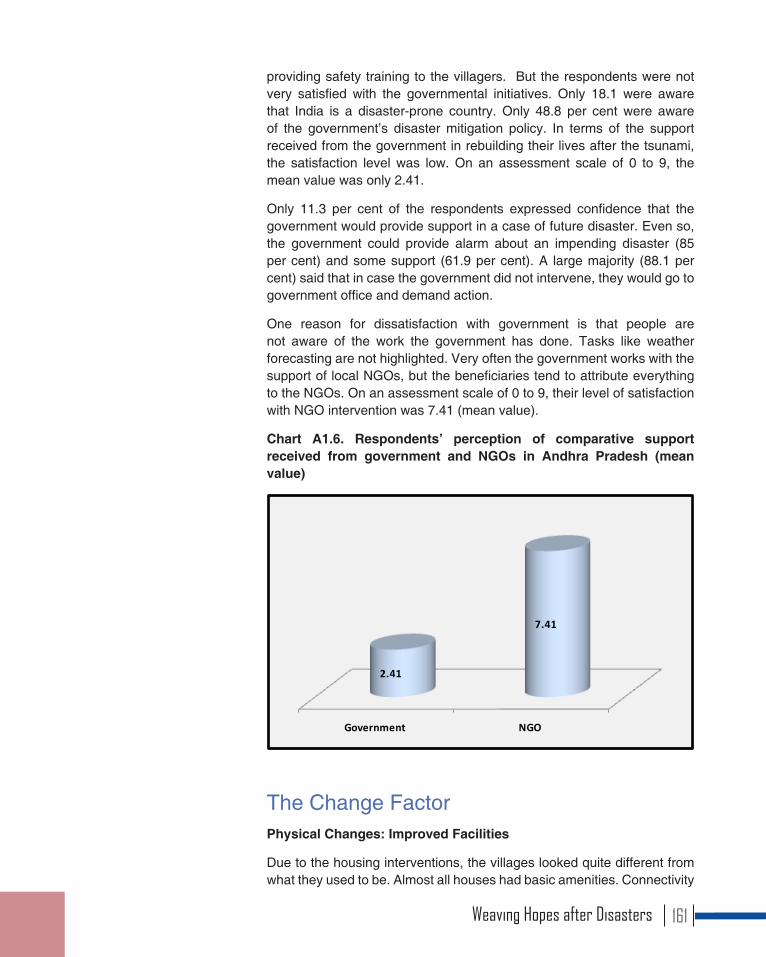
providing safety training to the villagers. But the respondents were not very satisfied with the governmental initiatives. Only 18.1 were aware that India is a disaster-prone country. Only 48.8 per cent were aware of the government’s disaster mitigation policy. In terms of the support received from the government in rebuilding their lives after the tsunami, the satisfaction level was low. On an assessment scale of 0 to 9, the mean value was only 2.41.
Only 11.3 per cent of the respondents expressed confidence that the government would provide support in a case of future disaster. Even so, the government could provide alarm about an impending disaster (85 per cent) and some support (61.9 per cent). A large majority (88.1 per cent) said that in case the government did not intervene, they would go to government office and demand action.
One reason for dissatisfaction with government is that people are not aware of the work the government has done. Tasks like weather forecasting are not highlighted. Very often the government works with the support of local NGOs, but the beneficiaries tend to attribute everything to the NGOs. On an assessment scale of 0 to 9, their level of satisfaction with NGO intervention was 7.41 (mean value).
Chart A1.6. Respondents’ perception of comparative support received from government and NGOs in Andhra Pradesh (mean value)
Government NGO
2.41
7.41
The Change FactorPhysical Changes: Improved Facilities
Due to the housing interventions, the villages looked quite different from what they used to be. Almost all houses had basic amenities. Connectivity
Weaving Hopes after Disasters 161

with main roads had also fostered the people’s livelihood income.
Economic Changes: Improved Livelihoods
There was not much visible economic change in the villages. Fishing remained a major source of livelihood. However, after the tsunami, the fishermen were provided improved boats and nets that enabled them to go far out into the sea. Generally, only a few family members were involved in fishing; other members of the family, especially the women, were involved in fish vending. Dearth of cold storage affected the livelihood of the respondents during seasonal unemployment. It was also pointed out that due to poverty some of the villagers were migrating to Chennai in search of livelihood.
Social Changes: Improved Education
Post-tsunami, the classrooms are well built. Both the teachers and the students are regular in attendance. The absence of a secondary school is, however, a big discouraging factor.
Cultural Changes: Caste and Gender Relations
Although differences between the different caste groups still existed, on a positive side, there was increased participation of the villagers in developmental activities. Due to the settlement of the villages on the basis of caste, there was a feeling of togetherness among the various castes in the village community.
Gender relations had also improved. In Kranthinagar, a clear gender divide was still seen. NGO intervention, particularly in the form of formation of SHGs and psychosocial activities, helped in building confidence among the women, which also helped the men to overcome their gender bias. Preferential treatment to widows also helped in building their confidence and to earn their livelihood.
Weaving Hopes after Disasters162

Tsunami 2004, Tamil Nadu and Puducherry In the wake of the tsunami on 26 December 2004, the dioceses of Kottar, Thanjavur and Puducherry swung into action. Thousands of those who died on that dark Sunday had to be buried in mass graves.
For this study, two villages from Kottar diocese and one each from Thanjavur diocese and Puducherry diocese were chosen. Post-tsunami, the Kottar Social Service Society (KSSS) of Kottar diocese, with the help of Caritas India, CRS and many other partner agencies, strove to meet this unprecedented challenge to rebuild the lives and livelihoods of the affected people. The Thanjavur Multipurpose Social Service Society (TMSSS) constructed many temporary shelters and distributed clothes, utensils, etc. to the affected with the help of many donors from India and abroad. More than 2,400 houses were constructed with the help of the state government and donor agencies like Caritas India, CRS, CNEWA and the Carmelite Society. The Archdiocese of Puducherry and Cuddalore through the Puduchedrry Multipurpose Social Service Society (PMSSS) embarked upon a coherent plan of short- and long-term measures with the support of Caritas, ECHO (European Commission for Humanitarian Aid Office) and CRS.
Facilities and InstitutionsThe land for Bishop Leon Nagar was given by the government, where
Weaving Hopes after Disasters 163
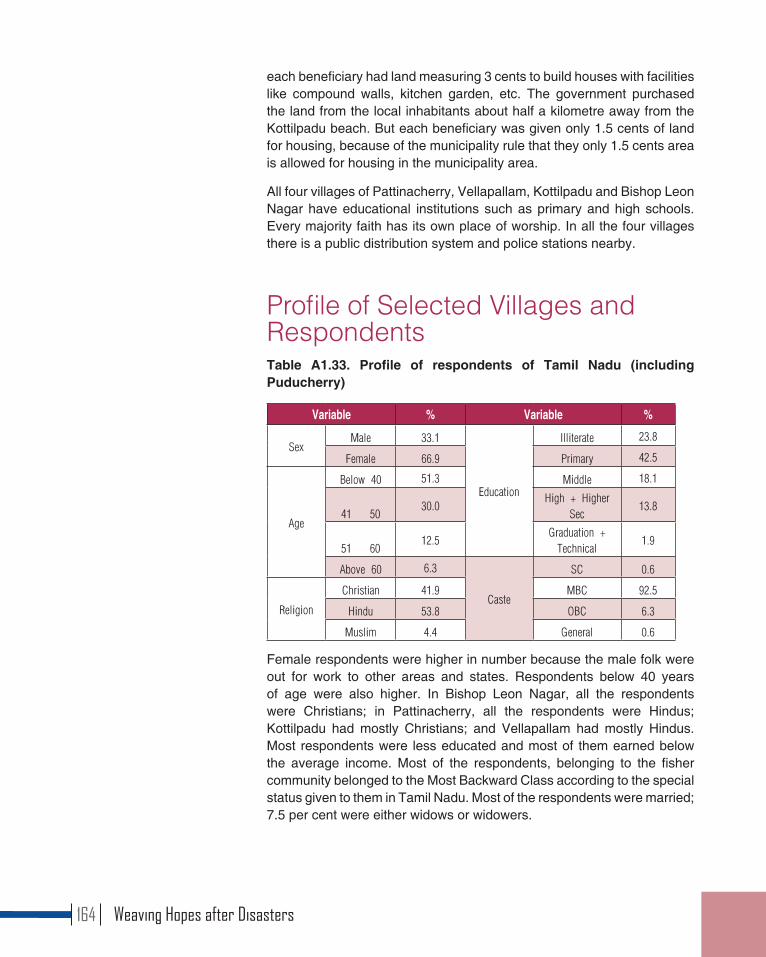
each beneficiary had land measuring 3 cents to build houses with facilities like compound walls, kitchen garden, etc. The government purchased the land from the local inhabitants about half a kilometre away from the Kottilpadu beach. But each beneficiary was given only 1.5 cents of land for housing, because of the municipality rule that they only 1.5 cents area is allowed for housing in the municipality area.
All four villages of Pattinacherry, Vellapallam, Kottilpadu and Bishop Leon Nagar have educational institutions such as primary and high schools. Every majority faith has its own place of worship. In all the four villages there is a public distribution system and police stations nearby.
Profile of Selected Villages and RespondentsTable A1.33. Profile of respondents of Tamil Nadu (including Puducherry)
Variable % Variable %
SexMale 33.1
Education
Illiterate 23.8
Female 66.9 Primary 42.5
Age
Below 40 51.3 Middle 18.1
41 – 5030.0
High + Higher Sec
13.8
51 – 6012.5
Graduation + Technical
1.9
Above 60 6.3
Caste
SC 0.6
Religion
Christian 41.9 MBC 92.5
Hindu 53.8 OBC 6.3
Muslim 4.4 General 0.6
Female respondents were higher in number because the male folk were out for work to other areas and states. Respondents below 40 years of age were also higher. In Bishop Leon Nagar, all the respondents were Christians; in Pattinacherry, all the respondents were Hindus; Kottilpadu had mostly Christians; and Vellapallam had mostly Hindus. Most respondents were less educated and most of them earned below the average income. Most of the respondents, belonging to the fisher community belonged to the Most Backward Class according to the special status given to them in Tamil Nadu. Most of the respondents were married; 7.5 per cent were either widows or widowers.
Weaving Hopes after Disasters164
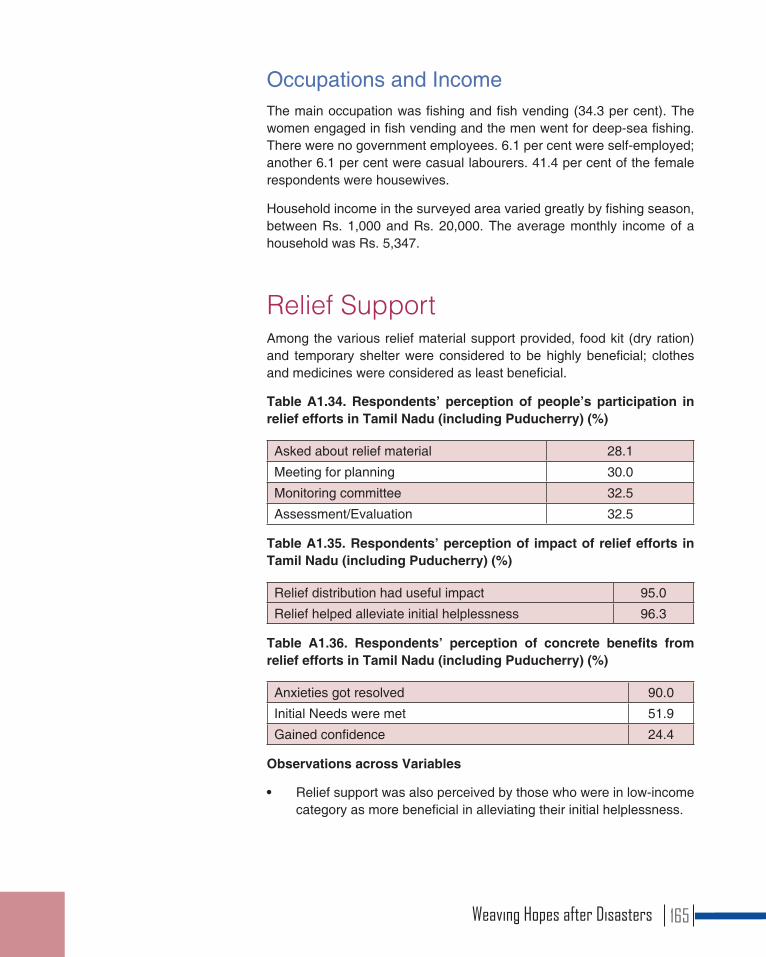
Occupations and IncomeThe main occupation was fishing and fish vending (34.3 per cent). The women engaged in fish vending and the men went for deep-sea fishing. There were no government employees. 6.1 per cent were self-employed; another 6.1 per cent were casual labourers. 41.4 per cent of the female respondents were housewives.
Household income in the surveyed area varied greatly by fishing season, between Rs. 1,000 and Rs. 20,000. The average monthly income of a household was Rs. 5,347.
Relief SupportAmong the various relief material support provided, food kit (dry ration) and temporary shelter were considered to be highly beneficial; clothes and medicines were considered as least beneficial.
Table A1.34. Respondents’ perception of people’s participation in relief efforts in Tamil Nadu (including Puducherry) (%)
Asked about relief material 28.1
Meeting for planning 30.0
Monitoring committee 32.5
Assessment/Evaluation 32.5
Table A1.35. Respondents’ perception of impact of relief efforts in Tamil Nadu (including Puducherry) (%)
Relief distribution had useful impact 95.0
Relief helped alleviate initial helplessness 96.3
Table A1.36. Respondents’ perception of concrete benefits from relief efforts in Tamil Nadu (including Puducherry) (%)
Anxieties got resolved 90.0
Initial Needs were met 51.9
Gained confidence 24.4
Observations across Variables
• Relief support was also perceived by those who were in low-income category as more beneficial in alleviating their initial helplessness.
Weaving Hopes after Disasters 165

• Almost all the respondents expressed the view that they should be consulted in identifying relevant relief needs, which could avoid wastage of materials.
Areas of Concern
Dumping relief material that was least beneficial should be avoided. It was also commented that in the initial stage much relief material was dumped by many NGOs and people were simply gathering and hoarding things. Similarly, medicines were dumped in the camps without finding out the beneficiaries’ medical needs. Medical support has to be done with professional teams in place and under their supervision.
Psychosocial Support 92.5 per cent of the respondents said that they received psychosocial support during the disaster. 87.5 per cent were of the view that the psychosocial support provided during the disaster was extremely useful in many ways. 99.4 per cent were of the view that psychosocial support should be an integral part of disaster intervention. In one focus group discussion, the group narrated an incident to illustrate the point. “During the tsunami, a woman who was struggling for life was rescued by a young boy. She was in deep mental distress for a long time, because she was nude when she was rescued. But she was brought back to normalcy by the constant psychosocial support given to her.”
In the Hindu-dominated villages of Vellapallam and Pattinacherry, the nuns were prevented from entering the village to give psychosocial support because of the fear that they would induce the Hindus to convert to Christianity. Still, they continued to counsel, wearing saris, as did other women. Now people appreciate the great help they provided. However, a few respondents mentioned that the pain still existed. The prominent areas mentioned by the respondents were pain of death of family members and the extensive destruction and damage to property and livelihood resources. They still cherished the way psychosocial support was offered to them.
Table A1.37. Respondents’ perception of benefits from psychosocial counselling in Tamil Nadu (including Puducherry) (%)
Ability to get out of pain 63.4
Gave them the needed self-confidence 58.5
Was very consoling 45.1
Weaving Hopes after Disasters166

Livelihood InterventionSince all the affected people were fishermen and everyone knew the kind of livelihood support they needed, there was no organized way of communicating with the beneficiaries. What they needed were nets, boats and other fishing-related materials. But since livelihood intervention was made taking into account the existing livelihood of the people, the beneficiaries were satisfied to a great extent.
Table A1.38. Respondents’ perception of people’s participation in livelihood intervention in Tamil Nadu (including Puducherry) (%)
Were asked about the kind of livelihood support beneficial to them
51.3
Meetings organized to plan for support 48.8
Monitoring committee for implementation 38.8
Assessment/evaluation of implementation 38.1
Table A1.39. Respondents’ perception of the impact of livelihood intervention in Tamil Nadu (including Puducherry) (%)
Livelihood interventions helped alleviate initial helplessness 86.9
Improved economic conditions of the affected people in the following years 77.5
Areas of Concern
• The idea of joint ownership of boats seemed to have not worked. As a result, the partners sold their rights to the other partners and bought their own boats and nets.
• Dispensing of livelihood material without gauging the actual ground situation led to dissatisfaction among the beneficiaries. They followed a uniform style of distribution of one type of nets, while the fishermen use multi-type nets such as crab net, shrimp net, push net, nylon net, mono-filament net, etc. It would have been better if a short study or a discussion with the fishermen were conducted before finalizing the livelihood options.
• The boats were not made of good material.
Housing InterventionHousing was provided to all the affected people without looking at their socio-economic background. In Bishop Leon Nagar and Kottilpadu, the Anbiams (small Christian communities) were of great help in identifying
Weaving Hopes after Disasters 167

and monitoring the relief and rehabilitation work. In Vellapallam and Pattinacherry, the beneficiaries seemed to have been selected at random. Whoever was in need of help was selected and given housing. 63.1 per cent of the respondents expressed the view that the housing support had a long-term benefit, but the level of satisfaction varied across villages. Most of the respondents were very satisfied with the houses they got.
Table A1.40. Respondents’ perception of people’s participation in housing intervention in Tamil Nadu (including Puducherry) (%)
Were asked about the kind of housing support beneficial to them
23.1
Meetings organized to plan for housing support 28.8
Monitoring committee for implementation 23.1
Assessment/evaluation of implementation 26.3
Table A1.41. Respondents’ perception of concrete benefits from housing intervention in Tamil Nadu (including Puducherry) (%)
Permanent set-up 82.4
Dignity given 54.9
Feeling of self-worth 37.3
Areas of Concern
• Most of the respondents from Vellapallam and Pattinacherry did not see much long-term benefit from the housing intervention. There was no proper supervision. Many of the houses were dilapidated, with even the roof caving in.
• In Pattinacherry, the houses seemed to be smaller than what the respondents really needed.
CBDP and DRRIn all the four villages, CBDP and DRR programmes were conducted. 58 per cent of the respondents felt that there was some follow-up of the CBDP/DRR programmes. 93.1 per cent opined that DP would reduce loss of life and livelihood. 98.1 per cent were of the view that DP had to be an integral component of all development interventions in their area. 96.3 per cent expressed the view that they would be able to protect themselves, if warned of a disaster in advance.
The responses may be classified as follows: the people will protect themselves in the future, since they have been taught what to do in an emergency (77.4 per cent); better awareness is created among the people (59.4 per cent); and key community leaders are capacitated to
Weaving Hopes after Disasters168
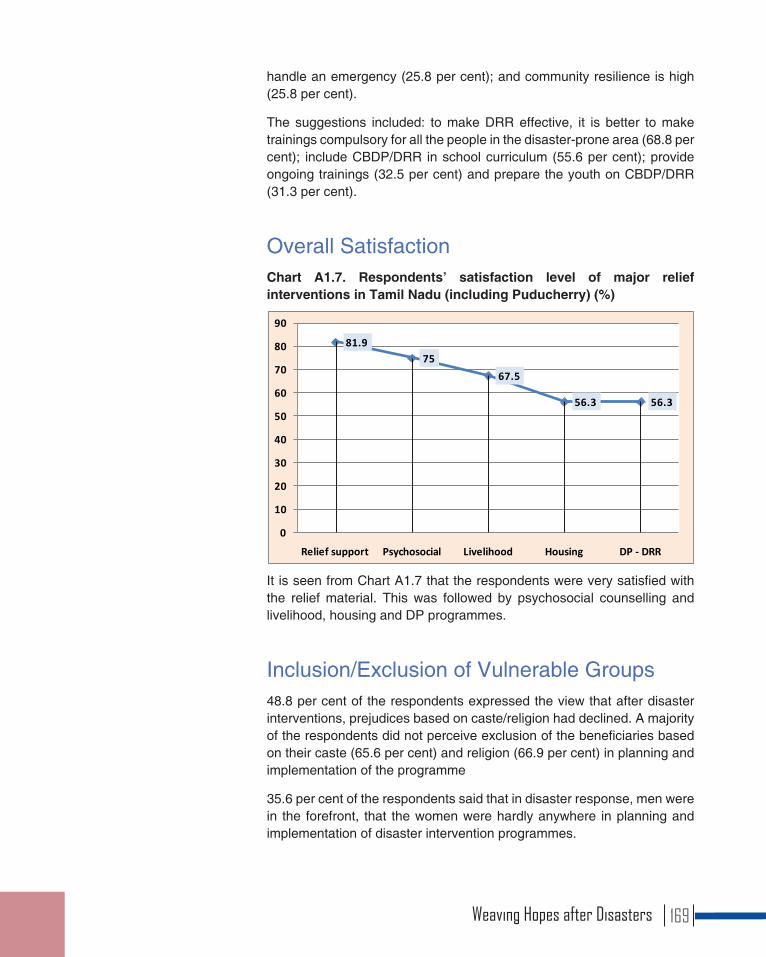
handle an emergency (25.8 per cent); and community resilience is high (25.8 per cent).
The suggestions included: to make DRR effective, it is better to make trainings compulsory for all the people in the disaster-prone area (68.8 per cent); include CBDP/DRR in school curriculum (55.6 per cent); provide ongoing trainings (32.5 per cent) and prepare the youth on CBDP/DRR (31.3 per cent).
Overall Satisfaction Chart A1.7. Respondents’ satisfaction level of major relief interventions in Tamil Nadu (including Puducherry) (%)
81.975
67.5
56.3 56.3
0
10
20
30
40
50
60
70
80
90
Relief support Psychosocial Livelihood Housing DP - DRR
It is seen from Chart A1.7 that the respondents were very satisfied with the relief material. This was followed by psychosocial counselling and livelihood, housing and DP programmes.
Inclusion/Exclusion of Vulnerable Groups48.8 per cent of the respondents expressed the view that after disaster interventions, prejudices based on caste/religion had declined. A majority of the respondents did not perceive exclusion of the beneficiaries based on their caste (65.6 per cent) and religion (66.9 per cent) in planning and implementation of the programme
35.6 per cent of the respondents said that in disaster response, men were in the forefront, that the women were hardly anywhere in planning and implementation of disaster intervention programmes.
Weaving Hopes after Disasters 169
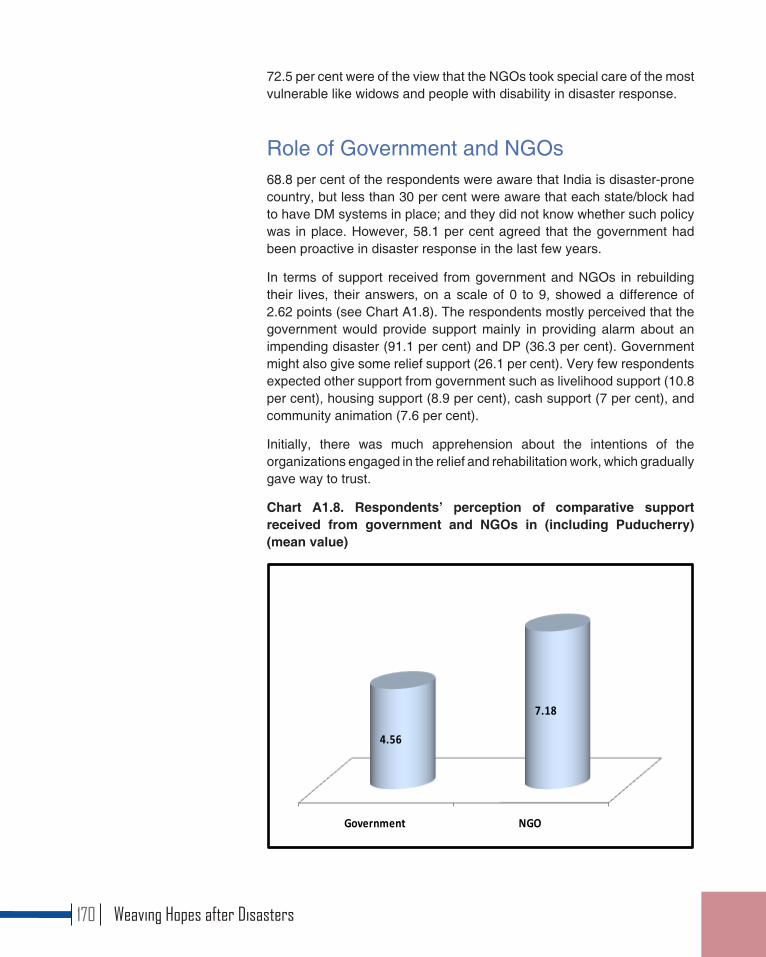
72.5 per cent were of the view that the NGOs took special care of the most vulnerable like widows and people with disability in disaster response.
Role of Government and NGOs68.8 per cent of the respondents were aware that India is disaster-prone country, but less than 30 per cent were aware that each state/block had to have DM systems in place; and they did not know whether such policy was in place. However, 58.1 per cent agreed that the government had been proactive in disaster response in the last few years.
In terms of support received from government and NGOs in rebuilding their lives, their answers, on a scale of 0 to 9, showed a difference of 2.62 points (see Chart A1.8). The respondents mostly perceived that the government would provide support mainly in providing alarm about an impending disaster (91.1 per cent) and DP (36.3 per cent). Government might also give some relief support (26.1 per cent). Very few respondents expected other support from government such as livelihood support (10.8 per cent), housing support (8.9 per cent), cash support (7 per cent), and community animation (7.6 per cent).
Initially, there was much apprehension about the intentions of the organizations engaged in the relief and rehabilitation work, which gradually gave way to trust.
Chart A1.8. Respondents’ perception of comparative support received from government and NGOs in (including Puducherry) (mean value)
Government NGO
4.56
7.18
Weaving Hopes after Disasters170
The Change FactorImproved Facilities
“We never thought that we would have a dignified life after we lost everything in the tsunami”, said one of the elders from Pattinacherry village. Now most of them have their own house with a toilet attached. The villages are spacious, organized and clean. The housing is strong and long-lasting. Most of the householders have built a compound wall and have started their own kitchen garden and have planted fruit trees. The villages also have some common spaces, such as good educational facilities, water facilities, community halls, etc. Civic cleanliness has also become a habit with them.
Improved Livelihoods
The traditional economy, which primarily depended on fishing, is slowly seeing a change. Many of the youngsters have been migrating to the Gulf countries for a livelihood. Some youths have picked up new skills like computer, nursing, etc. and are employed in small towns in the district.
The women also are going out of the house and are becoming financially productive in terms of household income. They are able to save and get a loan from their SHG.
Improved Education
School enrolment and attendance has improved. Though many boys stop their studies after the +2 stage and go for the traditional occupations, the girls tend to continue with their education.
Improved Social Interaction
Relations among the different communities of caste and creed have also improved. Interactions with other communities during tsunami interventions enlarged the understanding of the culture of other groups and communities. Common properties like hall and water tanks are under panchayat control and are used for common benefit. There is a temple and church in most of the villages and they help each other during the religious festivals and celebrations.
Some Concerns
With economic development, selfishness has visibly increased among the people. Dependency on NGOs has also crept in. At several places, the money received was used for alcohol. In Bishop Leon Nagar and Kottilpadu villages, dowry demand is a big problem.
Weaving Hopes after Disasters 171

ConclusionA far-going institutional change after the tsunami has been local self-governance of the people. Each village now has a decision-making system for its better administration. In Bishop Leon Nagar and Kottilpadu villages the Anbiams (small Christian communities) play a major role. The parish council member wields a lot of influence on the decision-making of the village. In Pattinacherry, the people have adopted a panchayat system to administer the village: four members of the community are selected as leader, assistant, secretary and a bursar. Similarly, in Vellapallam, five elders of the community make decisions.
Weaving Hopes after Disasters172
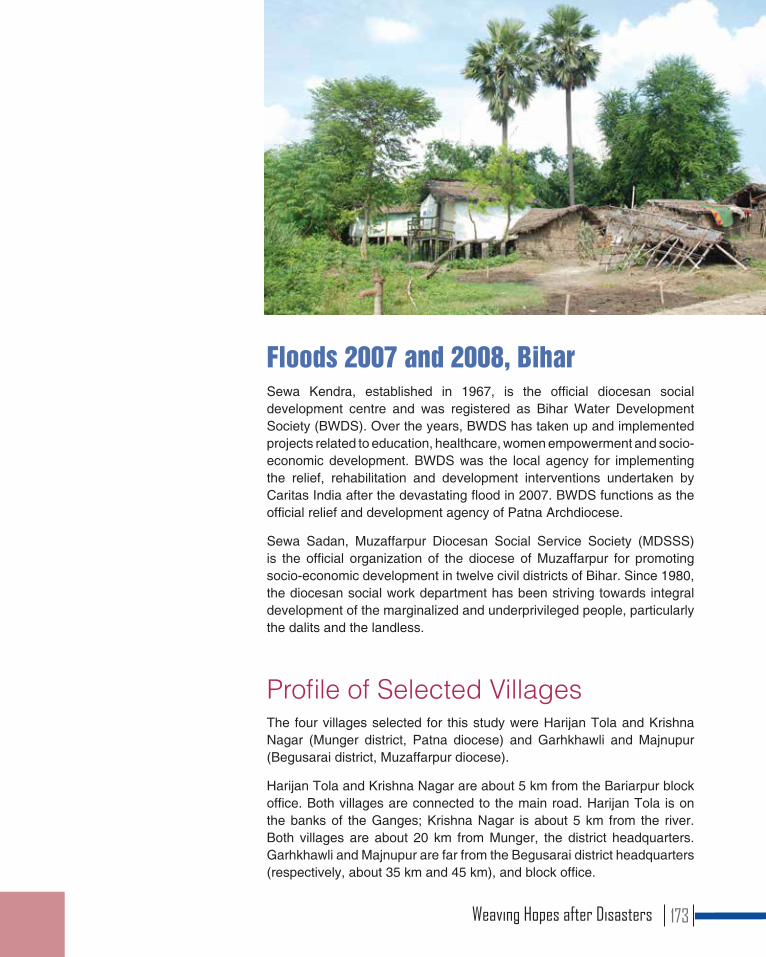
Floods 2007 and 2008, Bihar Sewa Kendra, established in 1967, is the official diocesan social development centre and was registered as Bihar Water Development Society (BWDS). Over the years, BWDS has taken up and implemented projects related to education, healthcare, women empowerment and socio-economic development. BWDS was the local agency for implementing the relief, rehabilitation and development interventions undertaken by Caritas India after the devastating flood in 2007. BWDS functions as the official relief and development agency of Patna Archdiocese.
Sewa Sadan, Muzaffarpur Diocesan Social Service Society (MDSSS) is the official organization of the diocese of Muzaffarpur for promoting socio-economic development in twelve civil districts of Bihar. Since 1980, the diocesan social work department has been striving towards integral development of the marginalized and underprivileged people, particularly the dalits and the landless.
Profile of Selected VillagesThe four villages selected for this study were Harijan Tola and Krishna Nagar (Munger district, Patna diocese) and Garhkhawli and Majnupur (Begusarai district, Muzaffarpur diocese).
Harijan Tola and Krishna Nagar are about 5 km from the Bariarpur block office. Both villages are connected to the main road. Harijan Tola is on the banks of the Ganges; Krishna Nagar is about 5 km from the river. Both villages are about 20 km from Munger, the district headquarters. Garhkhawli and Majnupur are far from the Begusarai district headquarters (respectively, about 35 km and 45 km), and block office.
Weaving Hopes after Disasters 173
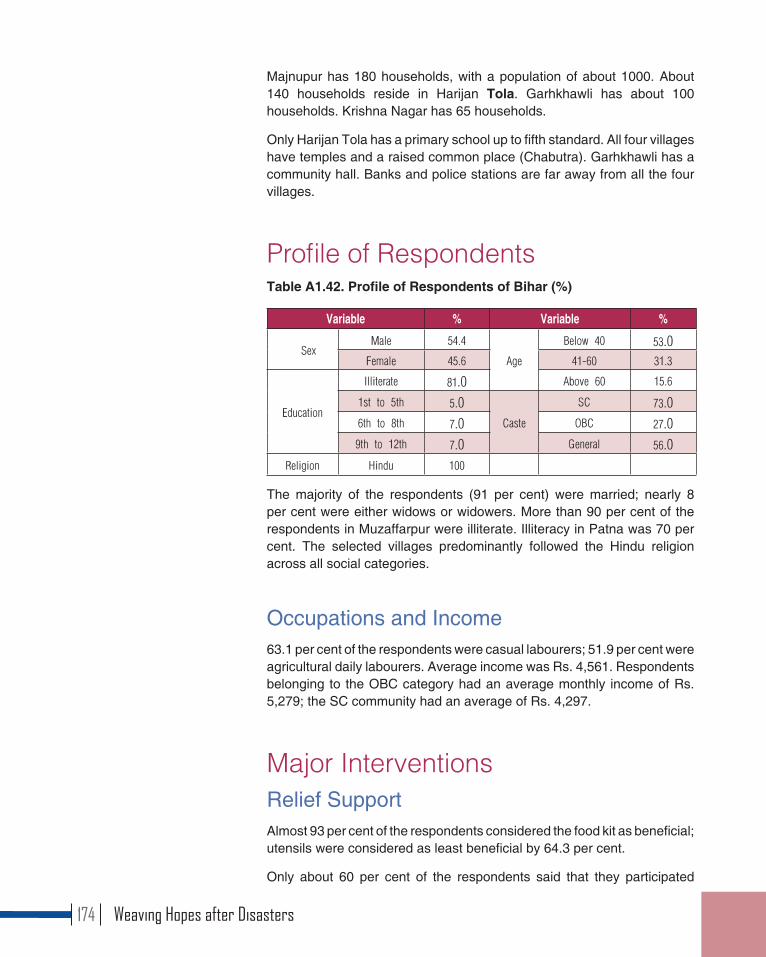
Majnupur has 180 households, with a population of about 1000. About 140 households reside in Harijan Tola. Garhkhawli has about 100 households. Krishna Nagar has 65 households.
Only Harijan Tola has a primary school up to fifth standard. All four villages have temples and a raised common place (Chabutra). Garhkhawli has a community hall. Banks and police stations are far away from all the four villages.
Profile of RespondentsTable A1.42. Profile of Respondents of Bihar (%)
Variable % Variable %
SexMale 54.4
Age
Below 40 53.0Female 45.6 41-60 31.3
Education
Illiterate 81.0 Above 60 15.6
1st to 5th 5.0Caste
SC 73.06th to 8th 7.0 OBC 27.09th to 12th 7.0 General 56.0
Religion Hindu 100
The majority of the respondents (91 per cent) were married; nearly 8 per cent were either widows or widowers. More than 90 per cent of the respondents in Muzaffarpur were illiterate. Illiteracy in Patna was 70 per cent. The selected villages predominantly followed the Hindu religion across all social categories.
Occupations and Income63.1 per cent of the respondents were casual labourers; 51.9 per cent were agricultural daily labourers. Average income was Rs. 4,561. Respondents belonging to the OBC category had an average monthly income of Rs. 5,279; the SC community had an average of Rs. 4,297.
Major InterventionsRelief Support Almost 93 per cent of the respondents considered the food kit as beneficial; utensils were considered as least beneficial by 64.3 per cent.
Only about 60 per cent of the respondents said that they participated
Weaving Hopes after Disasters174
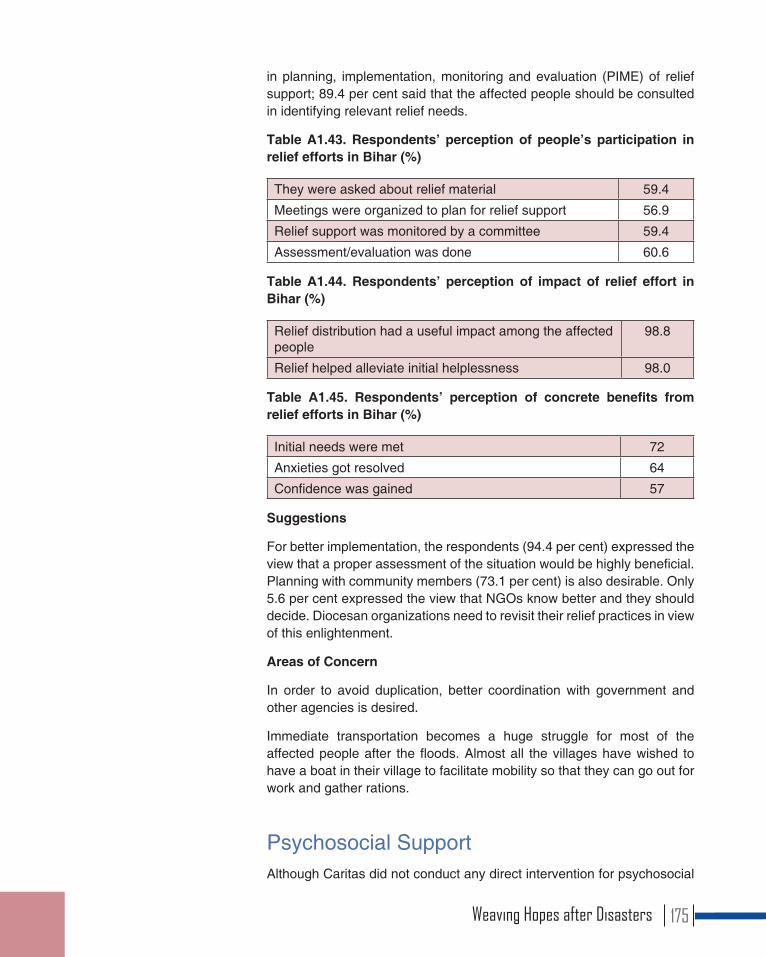
in planning, implementation, monitoring and evaluation (PIME) of relief support; 89.4 per cent said that the affected people should be consulted in identifying relevant relief needs.
Table A1.43. Respondents’ perception of people’s participation in relief efforts in Bihar (%)
They were asked about relief material 59.4
Meetings were organized to plan for relief support 56.9
Relief support was monitored by a committee 59.4
Assessment/evaluation was done 60.6
Table A1.44. Respondents’ perception of impact of relief effort in Bihar (%)
Relief distribution had a useful impact among the affected people
98.8
Relief helped alleviate initial helplessness 98.0
Table A1.45. Respondents’ perception of concrete benefits from relief efforts in Bihar (%)
Initial needs were met 72
Anxieties got resolved 64
Confidence was gained 57
Suggestions
For better implementation, the respondents (94.4 per cent) expressed the view that a proper assessment of the situation would be highly beneficial. Planning with community members (73.1 per cent) is also desirable. Only 5.6 per cent expressed the view that NGOs know better and they should decide. Diocesan organizations need to revisit their relief practices in view of this enlightenment.
Areas of Concern
In order to avoid duplication, better coordination with government and other agencies is desired.
Immediate transportation becomes a huge struggle for most of the affected people after the floods. Almost all the villages have wished to have a boat in their village to facilitate mobility so that they can go out for work and gather rations.
Psychosocial Support Although Caritas did not conduct any direct intervention for psychosocial
Weaving Hopes after Disasters 175
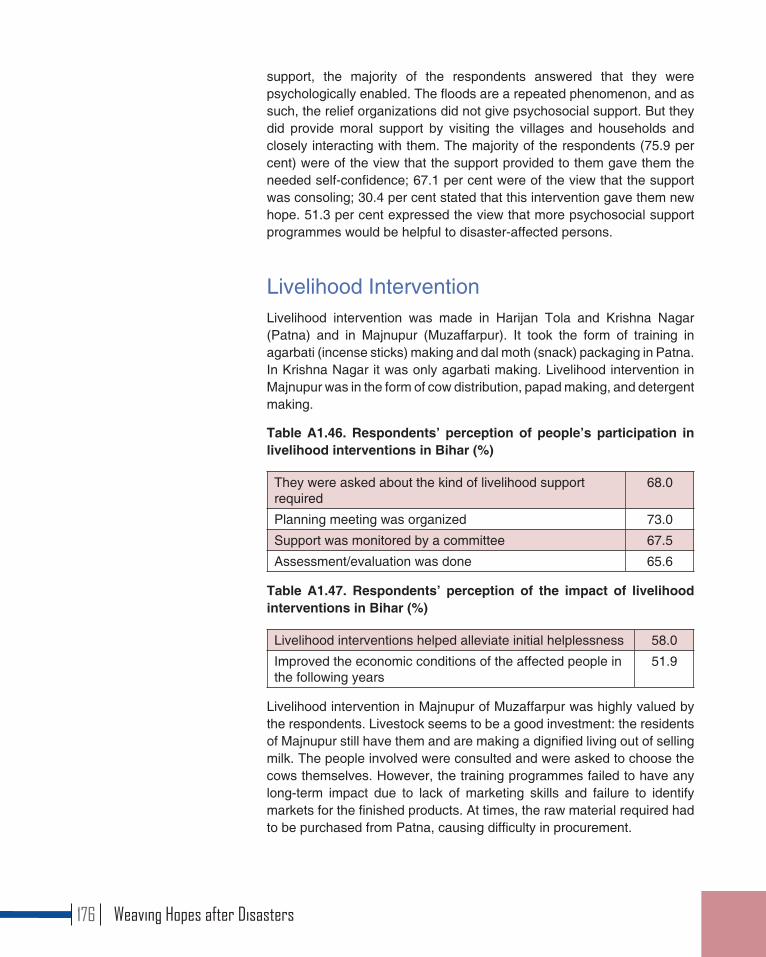
support, the majority of the respondents answered that they were psychologically enabled. The floods are a repeated phenomenon, and as such, the relief organizations did not give psychosocial support. But they did provide moral support by visiting the villages and households and closely interacting with them. The majority of the respondents (75.9 per cent) were of the view that the support provided to them gave them the needed self-confidence; 67.1 per cent were of the view that the support was consoling; 30.4 per cent stated that this intervention gave them new hope. 51.3 per cent expressed the view that more psychosocial support programmes would be helpful to disaster-affected persons.
Livelihood InterventionLivelihood intervention was made in Harijan Tola and Krishna Nagar (Patna) and in Majnupur (Muzaffarpur). It took the form of training in agarbati (incense sticks) making and dal moth (snack) packaging in Patna. In Krishna Nagar it was only agarbati making. Livelihood intervention in Majnupur was in the form of cow distribution, papad making, and detergent making.
Table A1.46. Respondents’ perception of people’s participation in livelihood interventions in Bihar (%)
They were asked about the kind of livelihood support required
68.0
Planning meeting was organized 73.0
Support was monitored by a committee 67.5
Assessment/evaluation was done 65.6
Table A1.47. Respondents’ perception of the impact of livelihood interventions in Bihar (%)
Livelihood interventions helped alleviate initial helplessness 58.0
Improved the economic conditions of the affected people in the following years
51.9
Livelihood intervention in Majnupur of Muzaffarpur was highly valued by the respondents. Livestock seems to be a good investment: the residents of Majnupur still have them and are making a dignified living out of selling milk. The people involved were consulted and were asked to choose the cows themselves. However, the training programmes failed to have any long-term impact due to lack of marketing skills and failure to identify markets for the finished products. At times, the raw material required had to be purchased from Patna, causing difficulty in procurement.
Weaving Hopes after Disasters176
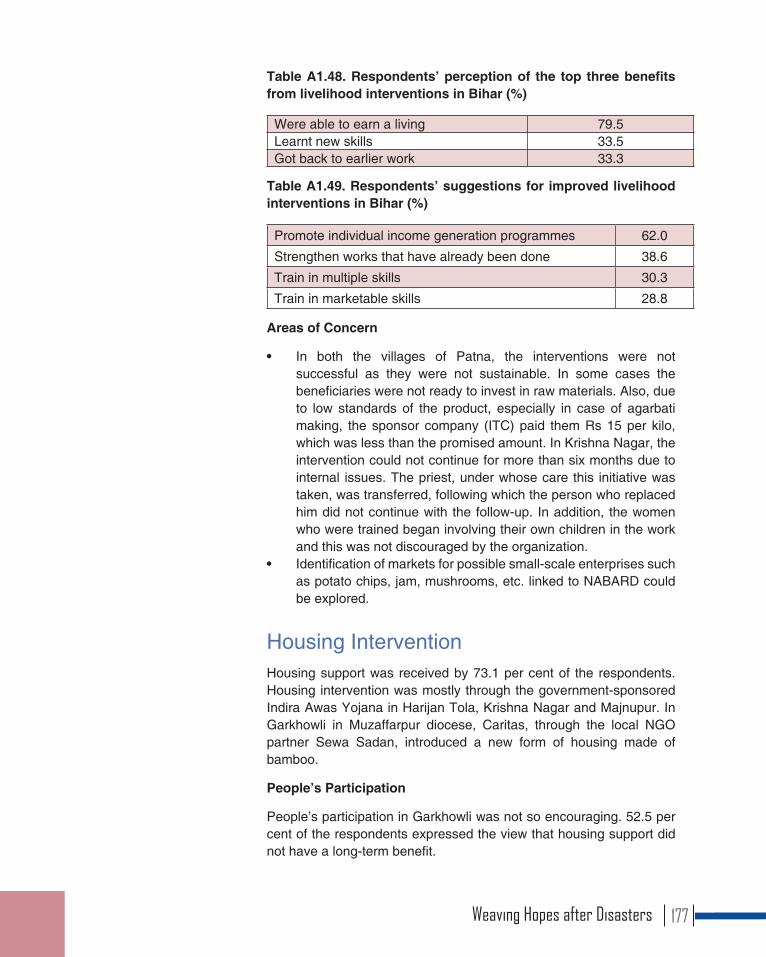
Table A1.48. Respondents’ perception of the top three benefits from livelihood interventions in Bihar (%)
Were able to earn a living 79.5Learnt new skills 33.5Got back to earlier work 33.3
Table A1.49. Respondents’ suggestions for improved livelihood interventions in Bihar (%)
Promote individual income generation programmes 62.0
Strengthen works that have already been done 38.6
Train in multiple skills 30.3
Train in marketable skills 28.8
Areas of Concern
• In both the villages of Patna, the interventions were not successful as they were not sustainable. In some cases the beneficiaries were not ready to invest in raw materials. Also, due to low standards of the product, especially in case of agarbati making, the sponsor company (ITC) paid them Rs 15 per kilo, which was less than the promised amount. In Krishna Nagar, the intervention could not continue for more than six months due to internal issues. The priest, under whose care this initiative was taken, was transferred, following which the person who replaced him did not continue with the follow-up. In addition, the women who were trained began involving their own children in the work and this was not discouraged by the organization.
• Identification of markets for possible small-scale enterprises such as potato chips, jam, mushrooms, etc. linked to NABARD could be explored.
Housing Intervention Housing support was received by 73.1 per cent of the respondents. Housing intervention was mostly through the government-sponsored Indira Awas Yojana in Harijan Tola, Krishna Nagar and Majnupur. In Garkhowli in Muzaffarpur diocese, Caritas, through the local NGO partner Sewa Sadan, introduced a new form of housing made of bamboo.
People’s Participation
People’s participation in Garkhowli was not so encouraging. 52.5 per cent of the respondents expressed the view that housing support did not have a long-term benefit.
Weaving Hopes after Disasters 177
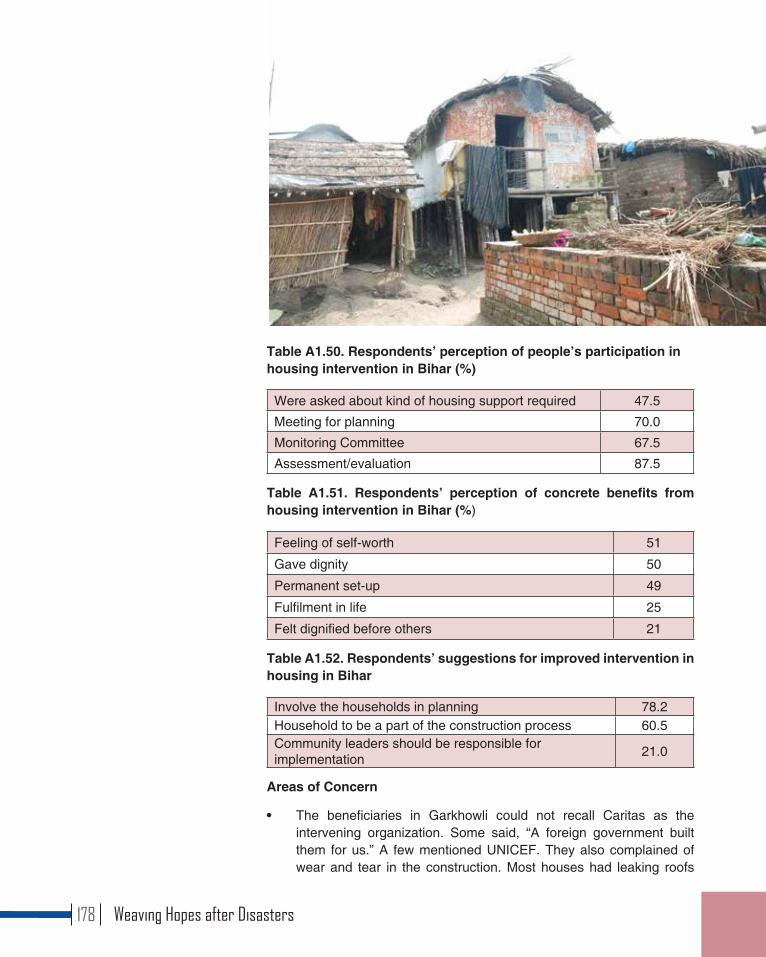
Table A1.50. Respondents’ perception of people’s participation in housing intervention in Bihar (%)
Were asked about kind of housing support required 47.5
Meeting for planning 70.0
Monitoring Committee 67.5
Assessment/evaluation 87.5
Table A1.51. Respondents’ perception of concrete benefits from housing intervention in Bihar (%)
Feeling of self-worth 51
Gave dignity 50
Permanent set-up 49
Fulfilment in life 25
Felt dignified before others 21
Table A1.52. Respondents’ suggestions for improved intervention in housing in Bihar
Involve the households in planning 78.2Household to be a part of the construction process 60.5Community leaders should be responsible for implementation 21.0
Areas of Concern
• The beneficiaries in Garkhowli could not recall Caritas as the intervening organization. Some said, “A foreign government built them for us.” A few mentioned UNICEF. They also complained of wear and tear in the construction. Most houses had leaking roofs
Weaving Hopes after Disasters178
and rotting bamboo poles. The life of a bamboo hut is five years. Sewa Sadan workers said that there was a verbal agreement with the beneficiaries that the beneficiaries would change the roof after five years, but none of them had done so. Rain water had destroyed the floor as well. Strong winds had also caused the huts to slant. The respondents pointed out that Garkhowli is a low-lying area and not as flood-prone as other villages, and hence this model was not suitable for them. A more useful incentive may be in the form of raw materials for pucca house construction.
• Fr. Rakesh Roshan of Bariarpur, Munger, said, “As most houses are in very low-lying areas, rather than spending funds on temporary structures including bamboo structures, investment should be made to raise the level of land. Even if this work is done in phases it will be long lasting and successful.”
CBDP/DRR CBDP and DRR programmes were held in all the four villages, with 97 per cent participation.
Most respondents (76 per cent) rated these programmes at 6 and above on a scale of 0 to 9. 95.6 per cent expressed the view that DP programmes would reduce loss of life and livelihood; 98 per cent expressed the view that DP programmes had to be a part of all development interventions; 99 per cent were confident that they were in a better position to protect themselves if warned of a disaster, for the following reasons: (i) better awareness created (96.8 per cent); (ii) people were taught what to do in an emergency (67.1 per cent); (iii) key community leaders were capacitated to handle an emergency (31.6 per cent); (iv) community resilience was high (1.3 per cent); and (v) no one would take undue risk (1.3 per cent).
Table A1.53. Respondents’ suggestions for improved CBDP/DRR in Bihar (%)
To have a CBDP/DRR component in all programmes 72.0
To include DRR in school curriculum 37.5
Prepare youth for DP/DM 31.2
It is seen from Chart A1.9 that the respondents were highly satisfied with the relief material and DP but not so much with housing, livelihood and psychosocial support provided.
Inclusion/Exclusion of Vulnerable GroupsHarijan Tola and Majnupur have only Musahar population; Krishna Nagar has only Yadavs. Garkhowli consists of Musahars, Paswans and
Weaving Hopes after Disasters 179
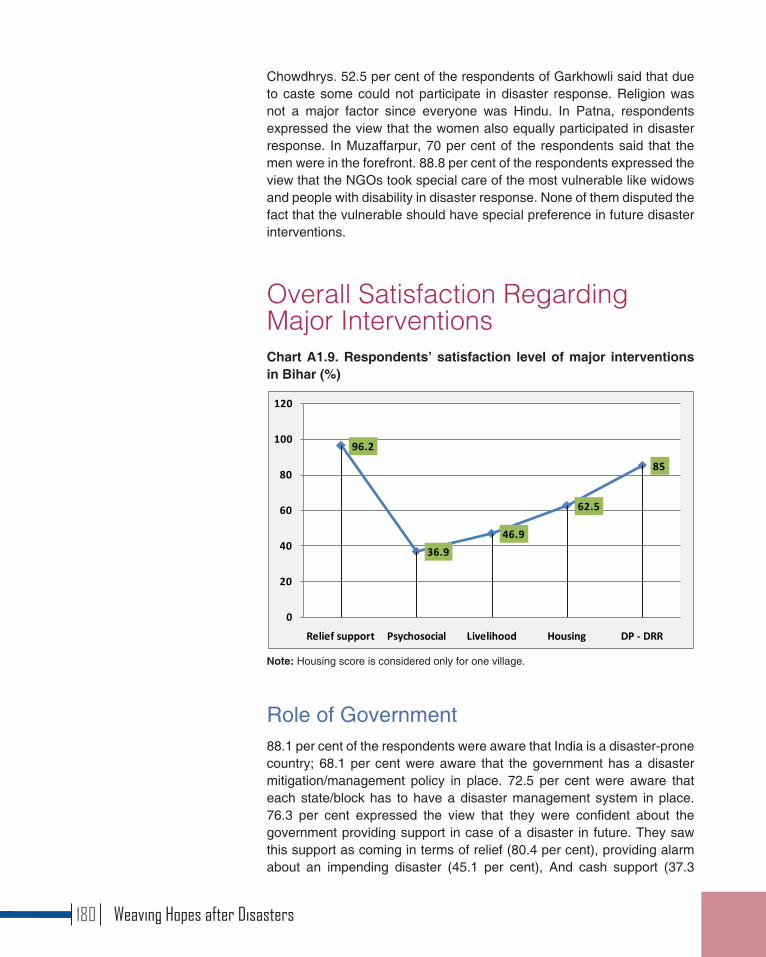
Chowdhrys. 52.5 per cent of the respondents of Garkhowli said that due to caste some could not participate in disaster response. Religion was not a major factor since everyone was Hindu. In Patna, respondents expressed the view that the women also equally participated in disaster response. In Muzaffarpur, 70 per cent of the respondents said that the men were in the forefront. 88.8 per cent of the respondents expressed the view that the NGOs took special care of the most vulnerable like widows and people with disability in disaster response. None of them disputed the fact that the vulnerable should have special preference in future disaster interventions.
Overall Satisfaction Regarding Major InterventionsChart A1.9. Respondents’ satisfaction level of major interventions in Bihar (%)
96.2
36.946.9
62.5
85
0
20
40
60
80
100
120
Relief support Psychosocial Livelihood Housing DP - DRR
Note: Housing score is considered only for one village.
Role of Government 88.1 per cent of the respondents were aware that India is a disaster-prone country; 68.1 per cent were aware that the government has a disaster mitigation/management policy in place. 72.5 per cent were aware that each state/block has to have a disaster management system in place. 76.3 per cent expressed the view that they were confident about the government providing support in case of a disaster in future. They saw this support as coming in terms of relief (80.4 per cent), providing alarm about an impending disaster (45.1 per cent), And cash support (37.3
Weaving Hopes after Disasters180
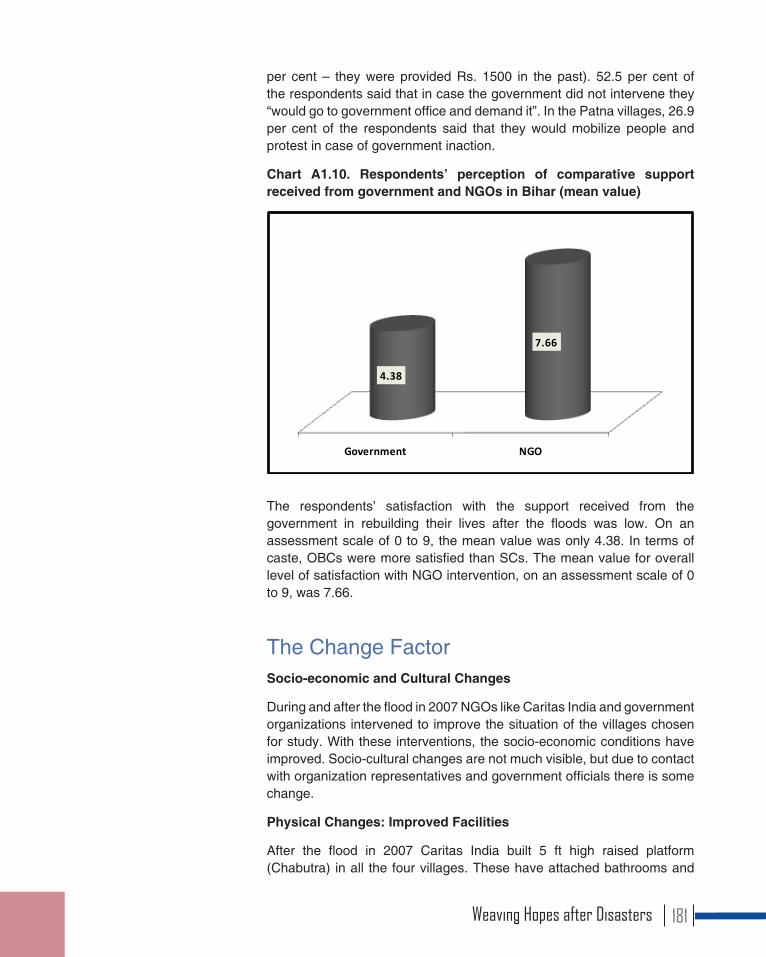
per cent – they were provided Rs. 1500 in the past). 52.5 per cent of the respondents said that in case the government did not intervene they “would go to government office and demand it”. In the Patna villages, 26.9 per cent of the respondents said that they would mobilize people and protest in case of government inaction.
Chart A1.10. Respondents’ perception of comparative support received from government and NGOs in Bihar (mean value)
Government NGO
4.38
7.66
The respondents’ satisfaction with the support received from the government in rebuilding their lives after the floods was low. On an assessment scale of 0 to 9, the mean value was only 4.38. In terms of caste, OBCs were more satisfied than SCs. The mean value for overall level of satisfaction with NGO intervention, on an assessment scale of 0 to 9, was 7.66.
The Change FactorSocio-economic and Cultural Changes
During and after the flood in 2007 NGOs like Caritas India and government organizations intervened to improve the situation of the villages chosen for study. With these interventions, the socio-economic conditions have improved. Socio-cultural changes are not much visible, but due to contact with organization representatives and government officials there is some change.
Physical Changes: Improved Facilities
After the flood in 2007 Caritas India built 5 ft high raised platform (Chabutra) in all the four villages. These have attached bathrooms and
Weaving Hopes after Disasters 181

raised tube wells. After this construction, the people remain in the villages even if water enters their houses. Scarcity of potable water was one of the main issues during the flood. With raised tube wells, this problem has been solved to a large extent.
Economic Changes: Improved Livelihoods
The economic conditions of the villages are changing. Due to the intervention of NGOs the villagers have become aware and are looking for various possibilities to improve their family economic conditions. The people have begun going to big cities for work where they get better pay.
Social Changes: Awareness and Empowerment
Due to the frequent visits of NGO representatives and government officials, the people have become aware of their rights and are empowered to demand their rights. The implementation of the embankment project in Harijan Tola is a good example. One of the elders in the village said, “As a result of the repeated visits of mission representatives, we started discussing about the need for an embankment near the village. The villagers were organized and demanded an embankment. After many difficulties, the Bihar government approved the project and implemented it. After this we have felt encouraged to visit the block office to get our rights.”
Cultural Changes: Women’s Empowerment
In Patna diocese, under the CMDRR programme, a task force comprising young men and women, SHGs, and a farmers’ club were formed. This initiative has given the women opportunities to express themselves and come forward in day-to-day life.
Areas of Concern
Dasrath Mandal, husband of Sarpanch Kunti Devi, said: “The people’s economic improvement has made them more individualistic and they have become less caring towards each other. Before the flood of 2007, people would share food during a flood and spend time together somewhere on an elevated location. There was a feeling of belonging to a large family. This feeling has evaporated.” During the relief distribution, there are fights among the beneficiaries to grab the maximum, said Sr. Patricia of Begusarai, Muzaffarpur diocese.
Conclusion: A New Way of Living as CitizensThere is an attitudinal change among both men and women in all the four villages. The number of men going to the big cities as contract labourers
Weaving Hopes after Disasters182
is increasing. While migration is a concern, in the absence of the men folk, the women have to manage the household. This has given them the opportunity to exercise their abilities. They have gained more say in the community and society, which is very well accepted by men.
In Muzaffarpur diocese, not much attention is being given to education. Education could be one of the means to improve the villagers’ economic and social status. Formation of task forces under CMDRR programmes, SHGs and farmers’ club is still going on in both the dioceses, but it is not there in the selected villages in Muzaffarpur.
95 per cent of the respondents, being landless and unskilled daily labourers, expressed the view that the government and NGOs could focus on sustainable livelihood. Most of the time, the women in the villages are without any remunerative work. Some kind of income-generating programmes are much needed. These could be monitored by SHGs. Candle-making, detergent-making and agarbati making training programmes were conducted but it remained only training, without contributing much to generating livelihood. Source of raw materials, marketing and networking were not planned well, and people could not move forward. The respondents expressed the view that the NGOs have to accompany them in facilitating them to access materials and marketing. They are ready to give any amount of labour, but without this support, they are helpless. The SHGs formed in the villages are weak and are unable to function on their own.
To quote Nalsiva Kumar of Patna diocese, “The main learning has been that in any disaster situation, a bottom-up approach works better than a top-down approach.” This learning, if adopted in any future interventions, will help prevent the gap between the actual need and assumed need, which has been observed in most of the interventions. Background research before any intervention is made, can go a long way in ensuring the efficacy of interventions.
Weaving Hopes after Disasters 183
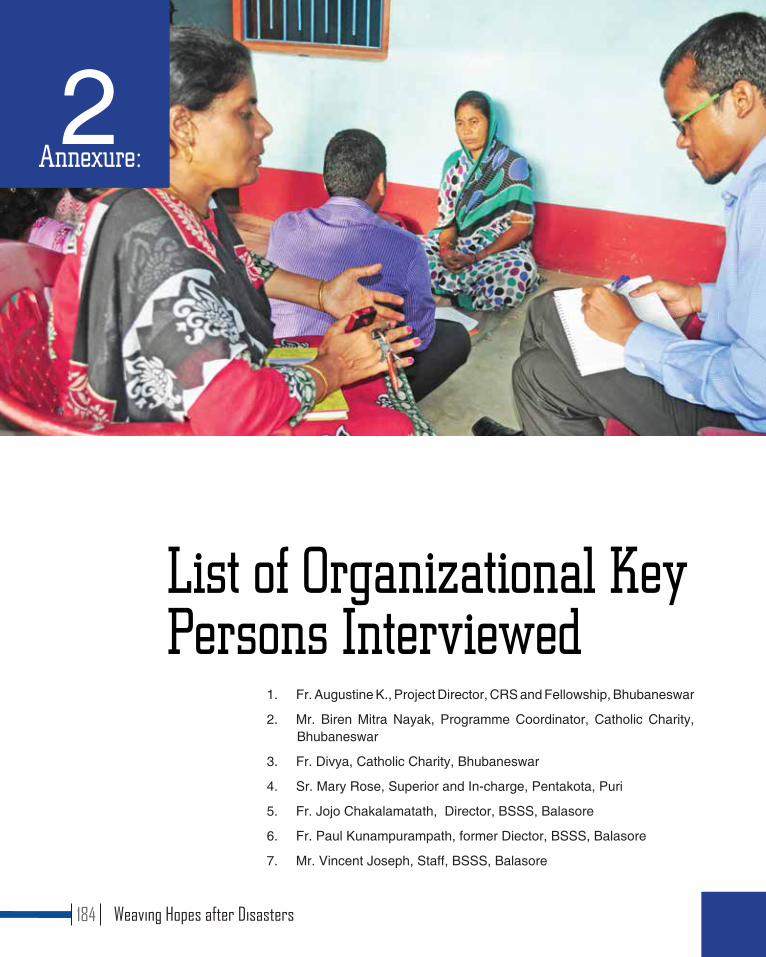
1. Fr. Augustine K., Project Director, CRS and Fellowship, Bhubaneswar
2. Mr. Biren Mitra Nayak, Programme Coordinator, Catholic Charity, Bhubaneswar
3. Fr. Divya, Catholic Charity, Bhubaneswar
4. Sr. Mary Rose, Superior and In-charge, Pentakota, Puri
5. Fr. Jojo Chakalamatath, Director, BSSS, Balasore
6. Fr. Paul Kunampurampath, former Diector, BSSS, Balasore
7. Mr. Vincent Joseph, Staff, BSSS, Balasore
2Annexure:
List of Organizational Key Persons Interviewed
Weaving Hopes after Disasters184
8. Fr. P.V. Lawrence, former Director, BSSS, Balasore
9. Fr. Titus Mandy, Director, KJT, Kutch Jyoti Trust, Bhuj
10. Fr. George Elavunkal, CMI, Director, Kutch Vikas Trust
11. Fr. Thomas Nadakalan, Director, Diocesan Social Service Society, Rajkot
12. Bishop C.C. Jose, CMI, Bishop of Rajkot
13. Bishop Prakasam, Diocese of Nellore
14. Fr. George William, Director, DNSSS, Nellore
15. Mr. Balshowri, Project Coordinator, DNSSS, Nellore
16. Ms. Vijaya, Mr. Subharao, Mr. Rajarao, Mr. Sridhar – staff, DNSSS, Nellore
17. Fr. Adanki Raju, Director, DSSS, Eluru
18. Fr. Moses Gorremuchu, former Director, DSSS, Eluru
19. Mr. Thirumanu Sreevasu, Mrs. Kollati Sailja, Mr. Andaraju Ramanna – Ward members, Eluru
20. Bishop Remigius, Kottar
21. Fr. Maria Soosai, Director, KSSS, Kottar
22. Mrs. Jesu Mary, Mrs. Mary Isabella, Mrs. Mana Lemta – staff members, KSSS, Kottar
23. Fr. Adaikala Raj, Director, TMSSS, Tanjavur
24. Mr. David Arockiasamy, Mr. Shenlil Kumar, Mrs. Selvarani, Mrs. Stella – staff, TMSSS, Tanjavur
25. Fr. Albert Thambidurai, Director, PMSSS, Puducherry
26. Mr. Rock, Ms. Bridget, Mr. Christopher, Mr. Ravi – staff, PMSSS, Puducherry
27. Fr. Amal Raj, Director, Seva Kendra, Patna
28. Mr. Nalshiva Kumar, Project Coordinator, Seva Kendra, Patna
29. Fr. Rakesh Roshan, parish priest, Bariyarpur, Munger
30. Mr. John D’Cruz, Relief Distribution In-charge, Seva Kendra, Patna
31. Mr. Subhash Kumar, Project Coordinator, Seva Sadan, Muzaffarpur
32. Sr. Patricia, Social Worker, Seva Sadan, Muzaffarpur
33. Mr. Abhisek, Animator, Seva Sadan, Muzaffarpur
Weaving Hopes after Disasters 185
1. Mr. Sunakar Sharma, BDO, Astarang Block, Puri
2. Mr. Maitri Bhatacharya, BDO and Tehsildar, Bahanaga, Balasore
3. Mr. Bhalara, IAS, BDO, Bhuj
4. Mr. Brahmanand, Tehsildar, Eluru
5. Mr. V. Prasad Rao, Fishery Development Officer, Sigray Konda, Prakasam Dist., AP
6. Mrs. Puvaneswari, District Special Telsildar (Disaster Management), Kanyakumari
List of Government Personnel Interviewed
3Annexure:
Weaving Hopes after Disasters186

7. Mr. Ilaya Perumal, District Level Officer, Tsunami, Karaikal
8. Mr. Sathya Moorthy, District In-charge (Disaster Management), Nagapattinam
9. Mr. Ranjan Kumar, Circle Officer, Kharagpur, Munger
10. Mr. Santosh K. Shrivastva, Circle Officer, Bhakhri block, Munger
11. Ms. Vina Kumari, BDO, Cherya, Bariyarpur Block, Munger
12. Mr. Suresh Kumar Singh, Circle Officer, Cherya Bariyarpur Block, Munger
13. Mr. Govind Jha, Upper Divisional Clerk, Cherya Bariyarpur Block, Munger
14. Mr. Hemant Kumar, Circle Officer, Nowkothi, Begusarai, Bihar
Weaving Hopes after Disasters 187
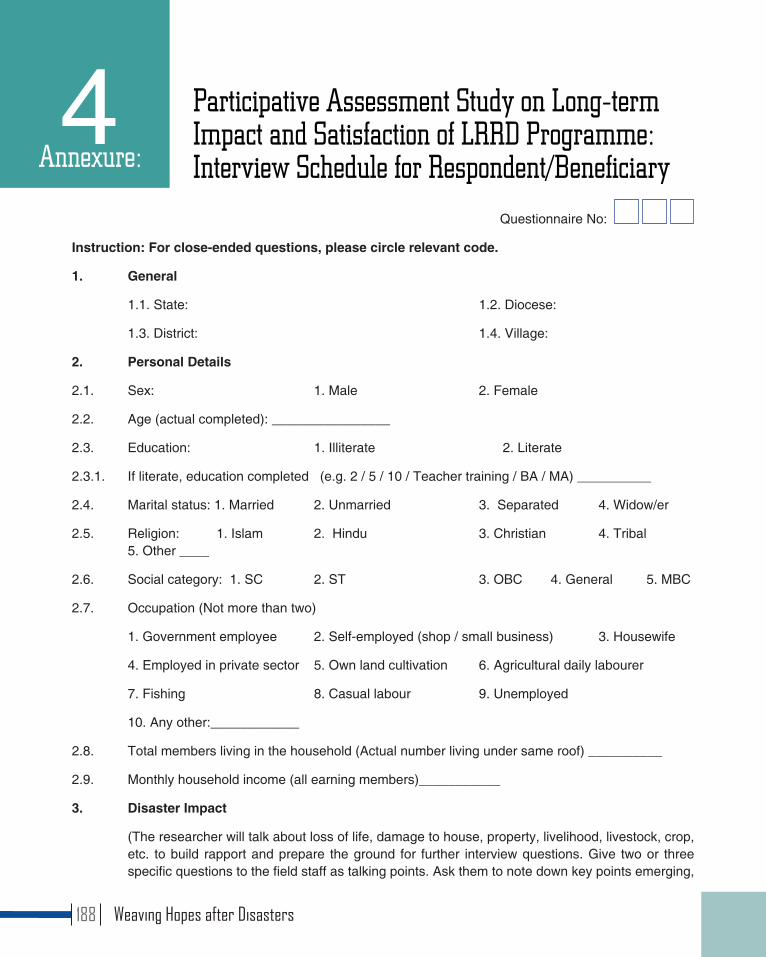
Questionnaire No:
Instruction: For close-ended questions, please circle relevant code.
1. General
1.1. State: 1.2. Diocese:
1.3. District: 1.4. Village:
2. Personal Details
2.1. Sex: 1. Male 2. Female
2.2. Age (actual completed): ________________
2.3. Education: 1. Illiterate 2. Literate
2.3.1. If literate, education completed (e.g. 2 / 5 / 10 / Teacher training / BA / MA) __________
2.4. Marital status: 1. Married 2. Unmarried 3. Separated 4. Widow/er
2.5. Religion: 1. Islam 2. Hindu 3. Christian 4. Tribal 5. Other ____
2.6. Social category: 1. SC 2. ST 3. OBC 4. General 5. MBC
2.7. Occupation (Not more than two)
1. Government employee 2. Self-employed (shop / small business) 3. Housewife
4. Employed in private sector 5. Own land cultivation 6. Agricultural daily labourer
7. Fishing 8. Casual labour 9. Unemployed
10. Any other:____________
2.8. Total members living in the household (Actual number living under same roof) __________
2.9. Monthly household income (all earning members)___________
3. Disaster Impact
(The researcher will talk about loss of life, damage to house, property, livelihood, livestock, crop, etc. to build rapport and prepare the ground for further interview questions. Give two or three specific questions to the field staff as talking points. Ask them to note down key points emerging,
4Annexure:
Participative Assessment Study on Long-term Impact and Satisfaction of LRRD Programme: Interview Schedule for Respondent/Beneficiary
Weaving Hopes after Disasters188

separately, which will be useful for further discussion.)
4. Programme Support and Satisfaction: Relief material support
4.1. Did your village receive relief material support?
1. Yes 2. No
4.1.1. If yes, which specific item did you feel was highly beneficial? (Mark one)
1. Food kit (ration) 2. Healthcare 3. Drinking water
4. Clothes 5. Utensils / Household kit 6. Temporary shelter
4.1.2. If yes, which specific item did you feel was the least beneficial? (Mark only one)
1. Food kit (ration) 2. Healthcare 3. Drinking water
4. Clothes 5. Utensils / Household kit 6. Temporary shelter
4.1.3. Why was this item the least beneficial? ________________________________________
4.2. Were the affected people asked about the kind of relief material that would be beneficial to them?
1. Yes 2. Not sure 3. No
4.3. Was there any meeting organized to plan for relief support for the affected persons?
1. Yes 2. Not sure 3. No
4.4. Was there a committee to monitor the implementation?
1. Yes 2. Not sure 3. No
4.5. Was there an assessment / evaluation of implementation of relief support?
1. Yes 2. Not sure 3. No
4.6. Do you believe that the affected people need to be consulted in identifying relevant relief needs?
1. Yes 2. Not Sure 3. No
4.7. Did relief intervention improve / alleviate your initial helplessness?
1. Yes 2. Not sure 3. No
4.8. Do you think that the relief distribution had a useful impact?
1. Yes 2. Not sure 3. No
4.8.1. If yes, how? (Choose not more than two)
1. Initial needs were met 2. Anxieties got resolved 3. Gained confidence
4. Was able to move forward in life
4.8.2. If not sure or no, why? ________________________________
Weaving Hopes after Disasters 189
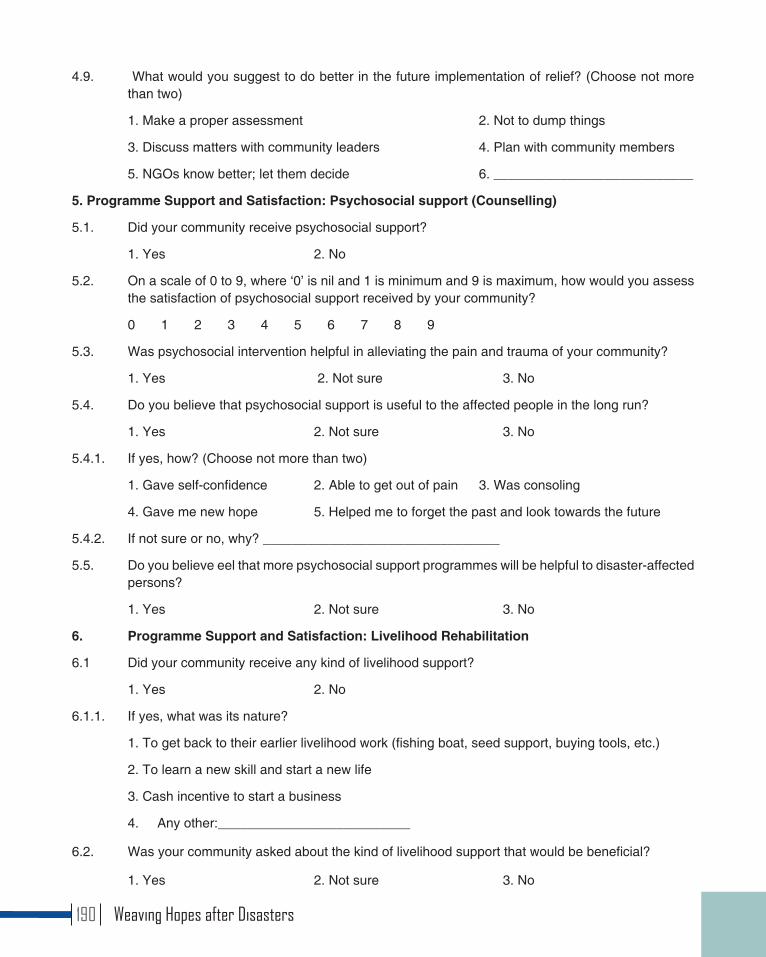
4.9. What would you suggest to do better in the future implementation of relief? (Choose not more than two)
1. Make a proper assessment 2. Not to dump things
3. Discuss matters with community leaders 4. Plan with community members
5. NGOs know better; let them decide 6. ___________________________
5. Programme Support and Satisfaction: Psychosocial support (Counselling)
5.1. Did your community receive psychosocial support?
1. Yes 2. No
5.2. On a scale of 0 to 9, where ‘0’ is nil and 1 is minimum and 9 is maximum, how would you assess the satisfaction of psychosocial support received by your community?
0 1 2 3 4 5 6 7 8 9
5.3. Was psychosocial intervention helpful in alleviating the pain and trauma of your community?
1. Yes 2. Not sure 3. No
5.4. Do you believe that psychosocial support is useful to the affected people in the long run?
1. Yes 2. Not sure 3. No
5.4.1. If yes, how? (Choose not more than two)
1. Gave self-confidence 2. Able to get out of pain 3. Was consoling
4. Gave me new hope 5. Helped me to forget the past and look towards the future
5.4.2. If not sure or no, why? ________________________________
5.5. Do you believe eel that more psychosocial support programmes will be helpful to disaster-affected persons?
1. Yes 2. Not sure 3. No
6. Programme Support and Satisfaction: Livelihood Rehabilitation
6.1 Did your community receive any kind of livelihood support?
1. Yes 2. No
6.1.1. If yes, what was its nature?
1. To get back to their earlier livelihood work (fishing boat, seed support, buying tools, etc.)
2. To learn a new skill and start a new life
3. Cash incentive to start a business
4. Any other:__________________________
6.2. Was your community asked about the kind of livelihood support that would be beneficial?
1. Yes 2. Not sure 3. No
Weaving Hopes after Disasters190
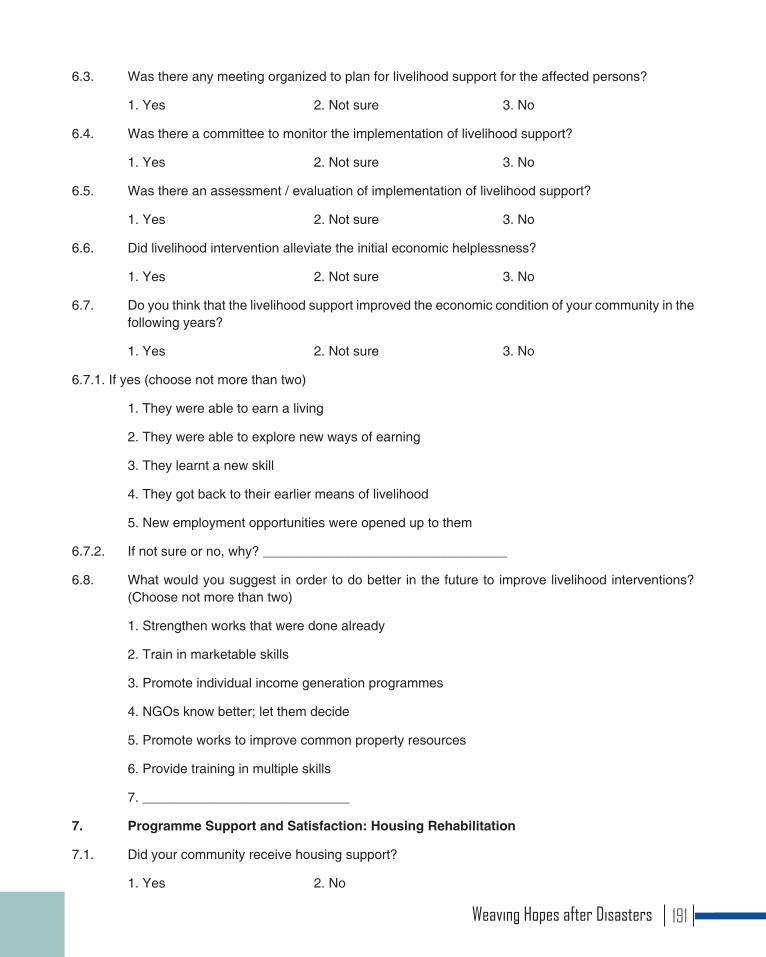
6.3. Was there any meeting organized to plan for livelihood support for the affected persons?
1. Yes 2. Not sure 3. No
6.4. Was there a committee to monitor the implementation of livelihood support?
1. Yes 2. Not sure 3. No
6.5. Was there an assessment / evaluation of implementation of livelihood support?
1. Yes 2. Not sure 3. No
6.6. Did livelihood intervention alleviate the initial economic helplessness?
1. Yes 2. Not sure 3. No
6.7. Do you think that the livelihood support improved the economic condition of your community in the following years?
1. Yes 2. Not sure 3. No
6.7.1. If yes (choose not more than two)
1. They were able to earn a living
2. They were able to explore new ways of earning
3. They learnt a new skill
4. They got back to their earlier means of livelihood
5. New employment opportunities were opened up to them
6.7.2. If not sure or no, why? _________________________________
6.8. What would you suggest in order to do better in the future to improve livelihood interventions? (Choose not more than two)
1. Strengthen works that were done already
2. Train in marketable skills
3. Promote individual income generation programmes
4. NGOs know better; let them decide
5. Promote works to improve common property resources
6. Provide training in multiple skills
7. ____________________________
7. Programme Support and Satisfaction: Housing Rehabilitation
7.1. Did your community receive housing support?
1. Yes 2. No
Weaving Hopes after Disasters 191
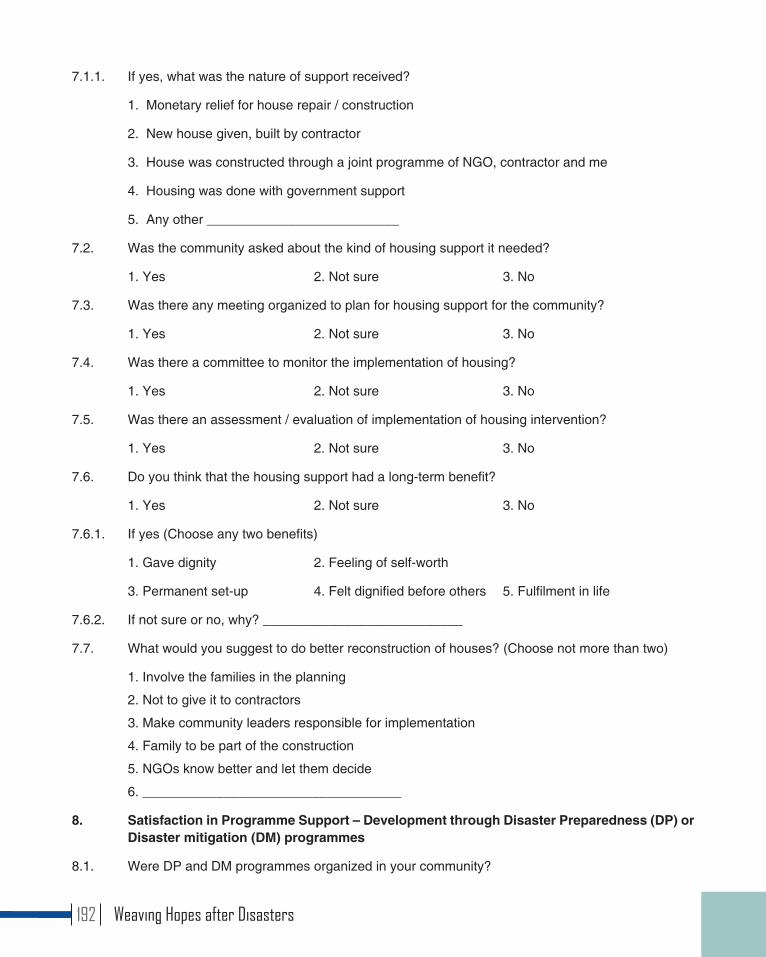
7.1.1. If yes, what was the nature of support received?
1. Monetary relief for house repair / construction
2. New house given, built by contractor
3. House was constructed through a joint programme of NGO, contractor and me
4. Housing was done with government support
5. Any other __________________________
7.2. Was the community asked about the kind of housing support it needed?
1. Yes 2. Not sure 3. No
7.3. Was there any meeting organized to plan for housing support for the community?
1. Yes 2. Not sure 3. No
7.4. Was there a committee to monitor the implementation of housing?
1. Yes 2. Not sure 3. No
7.5. Was there an assessment / evaluation of implementation of housing intervention?
1. Yes 2. Not sure 3. No
7.6. Do you think that the housing support had a long-term benefit?
1. Yes 2. Not sure 3. No
7.6.1. If yes (Choose any two benefits)
1. Gave dignity 2. Feeling of self-worth
3. Permanent set-up 4. Felt dignified before others 5. Fulfilment in life
7.6.2. If not sure or no, why? ___________________________
7.7. What would you suggest to do better reconstruction of houses? (Choose not more than two)
1. Involve the families in the planning
2. Not to give it to contractors
3. Make community leaders responsible for implementation
4. Family to be part of the construction
5. NGOs know better and let them decide
6. ___________________________________
8. Satisfaction in Programme Support – Development through Disaster Preparedness (DP) or Disaster mitigation (DM) programmes
8.1. Were DP and DM programmes organized in your community?
Weaving Hopes after Disasters192

1. Yes 2. Not sure 3. No
8.1.1. If yes, did the people participate in the programme?
1. Yes 2. Not sure 3. No
8.2. How would you assess the satisfaction received from DP / DM programmes on a scale of 0 to 9?
0 1 2 3 4 5 6 7 8 9
8.3. Was there any follow-up of DP / DM programmes?
1. Yes 2. Not sure 3. No
8.4. Do you believe that DP programme will reduce loss of life and livelihood?
1. Yes 2. Not sure 3. No
8.5. Do you believe that DP programme has to be a component of all development interventions?
1. Yes 2. Not sure 3. No
8.6. Do you believe that people will be able to protect themselves better if warned of a disaster?
1. Yes 2. Not sure 3. No
8.6.1. If yes, how? (Choose not more than two):
1. Better awareness created
2. People are taught what to do in an emergency
3. Key community leaders are capacitated to handle an emergency
4. Community resilience is heightened
5. No one will take undue risks
8.6.2. If not sure or no, why? ___________________________
8.7. What would you suggest to make DP / DM effective? (Choose not more than two)
1. Make training compulsory for all
2. Prepare youth on DP / DM 3. Include DRR in school curriculum
4. Provide ongoing training
5. Share new knowledge about disaster response
6. ____________________
9. Government preparedness and Citizens’ rights
9.1. Are you aware that India is disaster-prone country?
1. Yes 2.Not sure 3. No
Weaving Hopes after Disasters 193
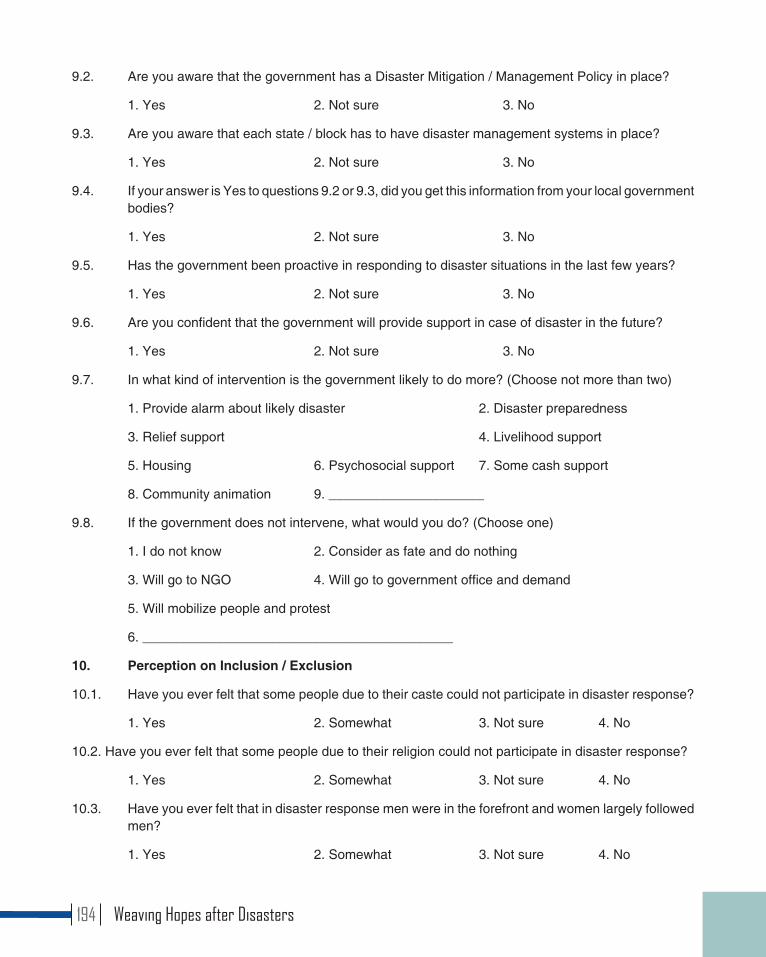
9.2. Are you aware that the government has a Disaster Mitigation / Management Policy in place?
1. Yes 2. Not sure 3. No
9.3. Are you aware that each state / block has to have disaster management systems in place?
1. Yes 2. Not sure 3. No
9.4. If your answer is Yes to questions 9.2 or 9.3, did you get this information from your local government bodies?
1. Yes 2. Not sure 3. No
9.5. Has the government been proactive in responding to disaster situations in the last few years?
1. Yes 2. Not sure 3. No
9.6. Are you confident that the government will provide support in case of disaster in the future?
1. Yes 2. Not sure 3. No
9.7. In what kind of intervention is the government likely to do more? (Choose not more than two)
1. Provide alarm about likely disaster 2. Disaster preparedness
3. Relief support 4. Livelihood support
5. Housing 6. Psychosocial support 7. Some cash support
8. Community animation 9. _____________________
9.8. If the government does not intervene, what would you do? (Choose one)
1. I do not know 2. Consider as fate and do nothing
3. Will go to NGO 4. Will go to government office and demand
5. Will mobilize people and protest
6. __________________________________________
10. Perception on Inclusion / Exclusion
10.1. Have you ever felt that some people due to their caste could not participate in disaster response?
1. Yes 2. Somewhat 3. Not sure 4. No
10.2. Have you ever felt that some people due to their religion could not participate in disaster response?
1. Yes 2. Somewhat 3. Not sure 4. No
10.3. Have you ever felt that in disaster response men were in the forefront and women largely followed men?
1. Yes 2. Somewhat 3. Not sure 4. No
Weaving Hopes after Disasters194
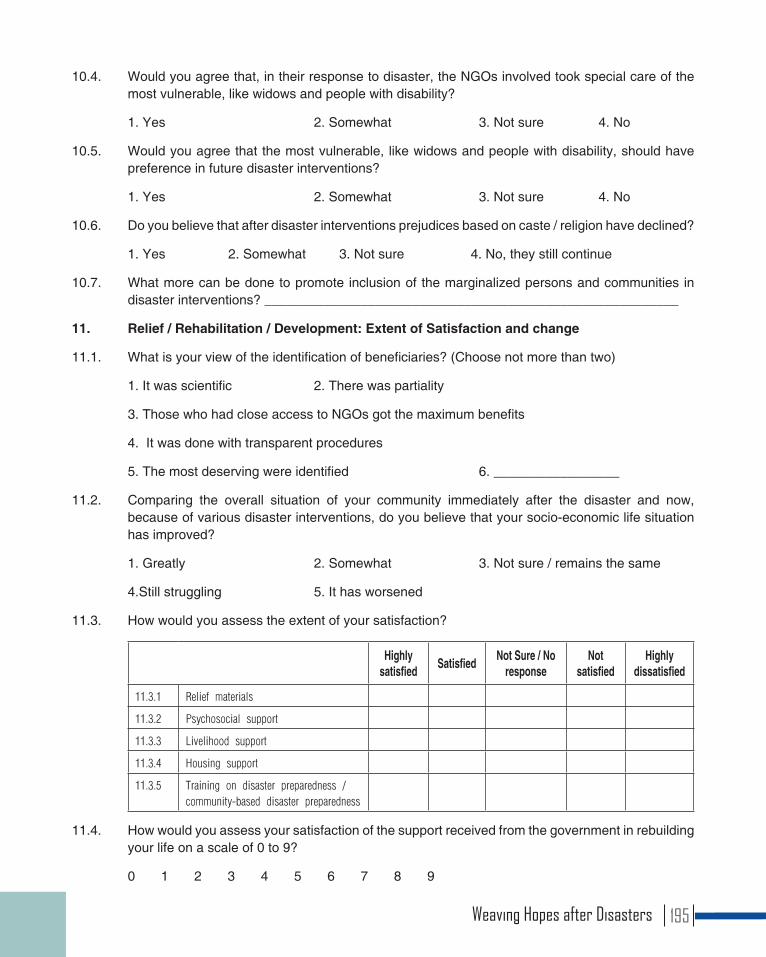
10.4. Would you agree that, in their response to disaster, the NGOs involved took special care of the most vulnerable, like widows and people with disability?
1. Yes 2. Somewhat 3. Not sure 4. No
10.5. Would you agree that the most vulnerable, like widows and people with disability, should have preference in future disaster interventions?
1. Yes 2. Somewhat 3. Not sure 4. No
10.6. Do you believe that after disaster interventions prejudices based on caste / religion have declined?
1. Yes 2. Somewhat 3. Not sure 4. No, they still continue
10.7. What more can be done to promote inclusion of the marginalized persons and communities in disaster interventions? ________________________________________________________
11. Relief / Rehabilitation / Development: Extent of Satisfaction and change
11.1. What is your view of the identification of beneficiaries? (Choose not more than two)
1. It was scientific 2. There was partiality
3. Those who had close access to NGOs got the maximum benefits
4. It was done with transparent procedures
5. The most deserving were identified 6. _________________
11.2. Comparing the overall situation of your community immediately after the disaster and now, because of various disaster interventions, do you believe that your socio-economic life situation has improved?
1. Greatly 2. Somewhat 3. Not sure / remains the same
4.Still struggling 5. It has worsened
11.3. How would you assess the extent of your satisfaction?
Highly satisfied Satisfied Not Sure / No
responseNot
satisfiedHighly
dissatisfied
11.3.1 Relief materials
11.3.2 Psychosocial support
11.3.3 Livelihood support
11.3.4 Housing support
11.3.5 Training on disaster preparedness / community-based disaster preparedness
11.4. How would you assess your satisfaction of the support received from the government in rebuilding your life on a scale of 0 to 9?
0 1 2 3 4 5 6 7 8 9
Weaving Hopes after Disasters 195

11.5 How would you assess your satisfaction of the support received from NGOs in rebuilding your life on a scale of 0 to 9?
0 1 2 3 4 5 6 7 8 9
(Questions 11.6, 11.7 and 11.8 relate to personality traits like self-confidence, courage, socio-economic aspects like better relationship across caste/religious communities, entrepreneurship skills, new employment opportunities, cultural dimensions such as respect for other religions, better understanding of practices and traditions of other communities, people’s institutions like SHG, local organizations, micro-credit federation, etc.)
11.6. What has changed in your personality, socio-economic and cultural life after disaster interventions?
1. ____________________________________________________
2. ____________________________________________________
11.7. What has remained the same?
1. ____________________________________________________
2. ____________________________________________________
11.8. What aspects have worsened?
1. ____________________________________________________
2. ____________________________________________________
11.9. Do you believe that the community’s greater participation in planning, implementation, monitoring and evaluation would have benefitted more in terms of results and outcomes?
1. Greatly 2. Somewhat 3. Not sure
4. No, the community is not prepared
11.10. Do you believe that greater collaboration among government, NGOs and community would have benefited your community more?
1. Greatly 2. Somewhat 3. Not sure 4. No, not practical
11.11. Do you believe that greater collaboration among government, NGOs and community is the right way forward in disaster interventions?
1. Greatly 2. Somewhat 3. Not sure 4. No
12. Right Mix of RRD in Future
12.1. Intervention areas priorities: Given your assessment of the responsibility and ability of the government to respond to disasters, what would you suggest would be the right mix of response by external non-governmental agencies?
(First choose the one best as “most needed”, then two for “needed”; and then two for “will be happy to have”)
Weaving Hopes after Disasters196
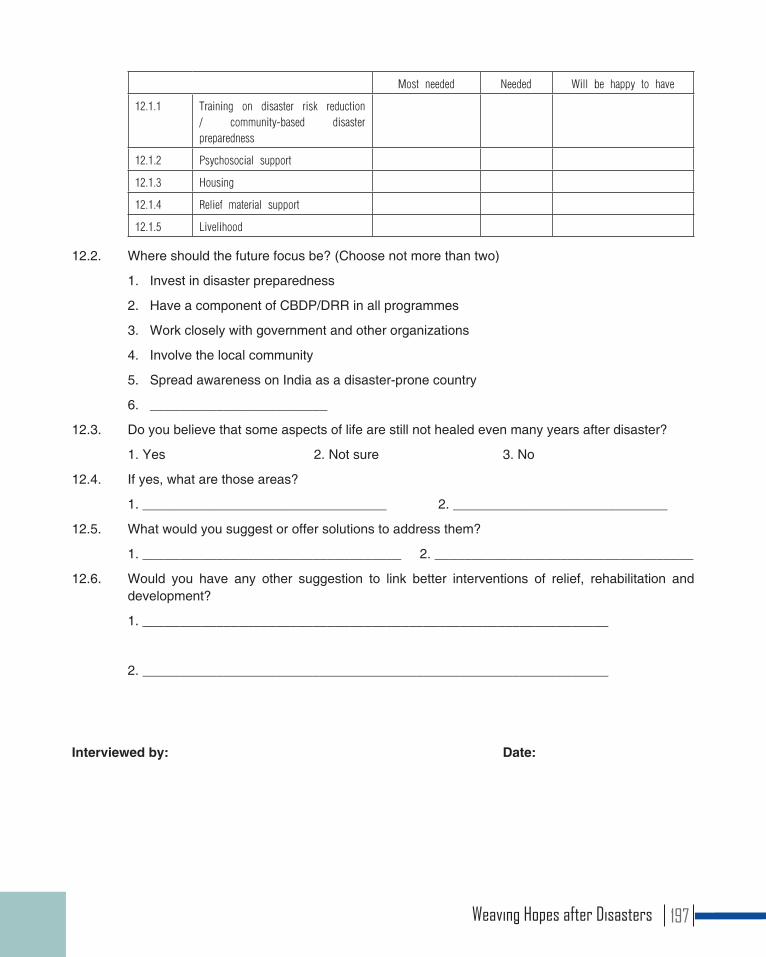
Most needed Needed Will be happy to have
12.1.1 Training on disaster risk reduction / community-based disaster preparedness
12.1.2 Psychosocial support
12.1.3 Housing
12.1.4 Relief material support
12.1.5 Livelihood
12.2. Where should the future focus be? (Choose not more than two)
1. Invest in disaster preparedness
2. Have a component of CBDP/DRR in all programmes
3. Work closely with government and other organizations
4. Involve the local community
5. Spread awareness on India as a disaster-prone country
6. ________________________
12.3. Do you believe that some aspects of life are still not healed even many years after disaster?
1. Yes 2. Not sure 3. No
12.4. If yes, what are those areas?
1. _________________________________ 2. _____________________________
12.5. What would you suggest or offer solutions to address them?
1. ___________________________________ 2. ___________________________________
12.6. Would you have any other suggestion to link better interventions of relief, rehabilitation and development?
1. _______________________________________________________________
2. _______________________________________________________________
Interviewed by: Date:
Weaving Hopes after Disasters 197
End Notes :1 Government of India, 2011. Report of the Working Group on Disaster Management for the Twelfth
Five Year Plan (2012-2017), New Delhi: Planning Commission, p. 10, at http://ndma.gov.in/images/pdf/Working%20Group%20Report%20on%20Disaster%20Management%20for%2012th%20FYP.pdf.
2 https://in.news.yahoo.com/india-loses-nearly-18-bn-disasters-expert-075747312.html.
3 http://nidm.gov.in/PDF/pubs/India%20Disaster%20Report%202011.pdf.
4 Report of the Working Group on Disaster Management …, n. 1, p. 13.
5 SPHERE’s philosophy is based on two core beliefs: first, that those affected by disaster or conflict have a right to life with dignity and, therefore, a right to assistance; and second, that all possible steps should be taken to alleviate human suffering arising out of disaster or conflict. The Protection Principles and the Core Standards articulate SPHERE’s rights-based and a people-centred approach to humanitarian response with special focus on vulnerability issues and communities.
6 http://www.unisdr.org/we/coordinate/hfa.
7 The Tenth Five-Year Plan (2002-2007) for the first time had a detailed chapter entitled Disaster Management: The Development Perspective. The plan emphasized that development cannot be sustainable without mitigation being built into the development process. Disaster mitigation and prevention were adopted as essential components of the development strategy. The Eleventh Plan aimed at consolidating the process by giving an impetus to projects and programmes that develop and nurture the culture of safety and the integration of disaster prevention and mitigation into the development process. The Twelfth Plan document took note of the lessons learnt globally, that investing in prevention and mitigation is economically and socially more beneficial than expenditure in relief and rehabilitation, and chalked out programmes to promote a “whole of government, whole of society” approach.
8 The themes underpinning this policy are: community-based disaster management, including integration of the policy, plans and execution at the grassroots level, capacity development in all related areas, consolidation of past initiatives and best practices, cooperation with agencies at national, regional and international levels, compliance, and coordination to generate a multi-sectoral synergy.
9 Relief is understood as need assessment, planning process, organization and distribution of relief materials.
10 Rehabilitation includes assessment, planning process, implementation of livelihood and housing programmes.
11 Development includes animation programmes through community-based disaster preparedness
Weaving Hopes after Disasters198

(CBDP), disaster risk reduction (DRR) and follow-up programmes leading to strengthening of individual and community resilience in responding to disasters.
12 Participation is understood as active engagement of the beneficiaries in discussion, deliberations and decision-making processes and beneficiaries feeling that their views are being considered and they are taken into confidence by the organization in PIME processes.
13 Animation is a process of conscientizing and capacitating individuals and communities and ensuring their active participation in all developmental activities, especially in planning, implementing, monitoring, and evaluating. Animation facilitates people to become subjects of social change and transformation.
14 Changing policies and programmes of the state governments with respect to disaster preparedness and response.
15 criterion for selecting a village as a unit was that it had a minimum of 100 families and had experienced maximum number of interventions.
16 This disaster has largely been attributed to human-induced climate change.
17 In this disaster, some 2600 villages were reported to be affected, out of which 390 villages in the Kashmir division were completely submerged and 1225 were partially affected; a further 1000 villages were affected in the Jammu Division.
18 Hudhud affected about 20.93 lakh families; see http://timesofindia.indiatimes.com/india/20-93-lakh-families-affected-by-cyclone-Hudhud-in-Andhra-Pradesh-Report/articleshow/44932425.cms.
19 Facts and figures collated from various reports of Caritas India.
20 About 11 million people, nearly a third of the state’s population of 35 million, were estimated by the UN agencies to have been directly affected, having lost their shelter, crops, cattle, and livelihood. Another 7 million were partly affected due to the large-scale collapse of infrastructure, including communications and surface transport. The worst affected coastal districts of Puri, Cuttack, Kendrapada, Nayagarh, Khorda, Bhadrak, Jagatsinghpur, Jajpur, Balasore, and Ganjam constitute Odisha’s most fertile belt. Kendrapada, Jagatsinghpur and Puri suffered saltwater inundation from a 5-metre tide that penetrated 26 km inland, further affecting agricultural cropland. The districts of Gajapati, Kendujhar, Mayurbhanj, and Dhenkanal were also partly affected.
21 The floods of September 2003 were more destructive than the floods of July 2001, according to Government of India reports, though overall losses were less. These floods affected 6,175 villages and 3,264,658 people. Fifty-four people lost their lives in 2003 as compared to 102 people in 2001.
22 The first package took care of 229 villages where more than 70 per cent of the houses collapsed. The second package was for villages with less than 70 per cent destruction and whose residents did not wish to be shifted to a new location. The third package was for villages which were situated far away from the epicentre but where individual houses had been destroyed. The fourth package was meant to take care of the middle-class flats and houses wrecked by the earthquake in Ahmedabad, Rajkot, and Surat.
23 Participation is understood as the beneficiaries’ active engagement in discussion, deliberations and decision-making processes, the beneficiaries feeling that their views are being considered, and that they are taken into confidence by the organization in PIME processes.
Weaving Hopes after Disasters 199
24 http://www.tn.gov.in/tsunami/digitallibrary/ebooks-web/TOTPART1 /02_impact.pdf
25 http://reliefweb.int/report/india/india-undmt-situation-report-earthquake-and-tsunami-28-dec-2004
26 Harijan refers to SC, a nomenclature considered derogatory by the dalits. Musahars and Paswans are sub-castes among the SC. Yadavs and Chowdhrys belong to OBC.
27 INR 6192 = € 88 (1€ = INR 70)
28 Housing provided the biggest satisfaction in Andhra Pradesh. This had a spill-over effect in their response to other interventions. This could be one of the reasons for the inconsistency in the responses.
29 There were some loss of lives subsequently due to collapse of building, falling of tree, electrocution etc
30 In all states, generally there is a clamour for individual-based income generation programmes rather than collective engagements. For example, in Bihar, 62 per cent beneficiaries wanted interventions that could promote individual income-generation programmes.
31 As no house can be sold legally for about ten years, agreements are drafted and signed. Possession of the property has changed hands. Registration of sale deed will take place after ten years.
32 There has been a cultural barrier to building a toilet within the house in the rural areas.
33 In Nellore, in some villages even after many years, the housing project was not complete since the government had not released the promised amount.
34 Indira Awas Yojana has been severely criticized on the ground that the works are given to contractors and generally the ruling political class has a stake in it.
35 In this chapter, the terms State and Government are used interchangeably.
36 A similar forecasting system has also been set up in Pattinacherry, Karaikal and Tamil Nadu jointly by the Puducherry Diocesan Social Service Society and Ocean Weather Information Centre.
37 LRRD stands for Linking Relief, Rehabilitation and Development.
38 The beneficiaries were given five close-ended answers and one open-ended and they were asked to choose two. Total number of percentage of cases is 188.6. This means that nearly 95 per cent of the respondents have chosen two among the close-ended.
39 Paul Harvey, 2005. Cash and Vouchers in Emergencies. Humanitarian Policy Group, Overseas Development Institute, at www.odi.org.uk/hpg
40 In Annexure 1, respondents’ perception of impact, benefits gained and suggestions are multiple responses.
Weaving Hopes after Disasters200

Printed by : Jyoti Printers, Noida - 9971407120
Indian Social Institute
Indian Social Institute10 Institutional Area, Lodi Road, New Delhi - 110 003, I N D I APh: (011) 49534000 / 49534126 / 49534127 Fax: (011) 24690660 / 49534104E-mail: [email protected] • Web: www.isidelhi.org.in
Caritas Germany See a need and act on it
Indo-Global Social Service Society