Reducing defects in textile weaving by applying Six Sigma methodology: a case study
10
Int. J. Six Sigma and Competitive Advantage, Vol. 8, No. 2, 2014 95 Copyright © 2014 Inderscience Enterprises Ltd. Reducing defects in textile weaving by applying Six Sigma methodology: a case study Tanveer Hussain*, Hafsa Jamshaid and Ateeb Sohail Faculty of Engineering & Technology, National Textile University, Faisalabad 37610, Pakistan E-mail: [email protected] E-mail: [email protected] E-mail: [email protected] *Corresponding author Abstract: Textile and clothing account for more than 50% of Pakistan’s exports. However, total share of Pakistani exports in the global textile and clothing market is less than 1%. One of the reasons of this low share is the manufacturing of less value-added products; another reason is the poor quality of some product categories. Although the country produces some of the world’s best quality yarns due to well-organised spinning sector, the quality of some fabric categories produced in the country is not as good because of the sector being less-organised and poorly managed. The objective of this study was to explore the application of Six Sigma methodology for reducing the defect percentage in fabric manufacturing sector. A representative textile weaving unit was selected for this study and it was found that by the suitable application of Six Sigma tools, the sigma level was improved from 2.2 to 3. Profit per month was observed to be increased worth $26,000. Keywords: Six Sigma; DMAIC methodology; weaving unit; loom settings. Reference to this paper should be made as follows: Hussain, T., Jamshaid, H. and Sohail, A. (2014) ‘Reducing defects in textile weaving by applying Six Sigma methodology: a case study’, Int. J. Six Sigma and Competitive Advantage, Vol. 8, No. 2, pp.95–104. Biographical notes: Tanveer Hussain is Professor of Textile Engineering. He Received his PhD in Textile Engineering from Heriot-Watt University Scotland. Currently, He is working as Dean Faculty of Engineering & Technology. He also works as a freelance consultant for the Textile Industry. Hafsa Jamshaid received her BS in Textile Engineering from National Textile University and MS in Engineering Management from University of Engineering & Technology Pakistan. Currently, she is head of the weaving department of the university. Ateeb Sohail is a Textile Engineer currently working in a weaving mill.
-
Upload
independent -
Category
Documents
-
view
0 -
download
0
Transcript of Reducing defects in textile weaving by applying Six Sigma methodology: a case study

Int. J. Six Sigma and Competitive Advantage, Vol. 8, No. 2, 2014 95
Copyright © 2014 Inderscience Enterprises Ltd.
Reducing defects in textile weaving by applying Six Sigma methodology: a case study
Tanveer Hussain*, Hafsa Jamshaid and Ateeb Sohail Faculty of Engineering & Technology, National Textile University, Faisalabad 37610, Pakistan E-mail: [email protected] E-mail: [email protected] E-mail: [email protected] *Corresponding author
Abstract: Textile and clothing account for more than 50% of Pakistan’s exports. However, total share of Pakistani exports in the global textile and clothing market is less than 1%. One of the reasons of this low share is the manufacturing of less value-added products; another reason is the poor quality of some product categories. Although the country produces some of the world’s best quality yarns due to well-organised spinning sector, the quality of some fabric categories produced in the country is not as good because of the sector being less-organised and poorly managed. The objective of this study was to explore the application of Six Sigma methodology for reducing the defect percentage in fabric manufacturing sector. A representative textile weaving unit was selected for this study and it was found that by the suitable application of Six Sigma tools, the sigma level was improved from 2.2 to 3. Profit per month was observed to be increased worth $26,000.
Keywords: Six Sigma; DMAIC methodology; weaving unit; loom settings.
Reference to this paper should be made as follows: Hussain, T., Jamshaid, H. and Sohail, A. (2014) ‘Reducing defects in textile weaving by applying Six Sigma methodology: a case study’, Int. J. Six Sigma and Competitive Advantage, Vol. 8, No. 2, pp.95–104.
Biographical notes: Tanveer Hussain is Professor of Textile Engineering. He Received his PhD in Textile Engineering from Heriot-Watt University Scotland. Currently, He is working as Dean Faculty of Engineering & Technology. He also works as a freelance consultant for the Textile Industry.
Hafsa Jamshaid received her BS in Textile Engineering from National Textile University and MS in Engineering Management from University of Engineering & Technology Pakistan. Currently, she is head of the weaving department of the university.
Ateeb Sohail is a Textile Engineer currently working in a weaving mill.

96 T. Hussain et al.
1 Introduction
Pakistan is the fourth largest cotton producer and the third largest cotton consumer in the world (Economic Survey of Pakistan, 2011–2012). The textile and clothing industry of Pakistan has been a main driver of the national exports and the GDP for the last 60 years. In recent years, the textile and clothing share in exports has declined from 66% in 2004 to 54% in 2012. Owing to weaknesses in processes and systems, the textile industry of Pakistan has been unable to reap benefits in the post-quota international regime, in comparison with its competitor countries of the region.
To improve the performance of its manufacturing processes, the industry is turning towards effective management techniques and quality improvement methodologies such as Six Sigma. Six Sigma is a proved methodology used to evaluate, analyse and improve problematic areas in manufacturing and service industries (Goh and Xie, 2003; Rajaney and Mayee, 2004; Sagar, 2005). It is the methodology which can increase organisation’s profitability as well as customer satisfaction (Gijo and Scaria, 2010; Sambhe and Dalu, 2011). Six Sigma methodology aims at developing production processes resulting in less than 3.4 defects per million opportunities (Breyfogle, 2003; McCarty et al., 2004; Pyzdek and Keller, 2005). Six Sigma helps in the identification of process problems, their analysis, rectification and control (Suh, 2004).
Six Sigma methodologies have been applied in various areas of textiles for improving product quality and reducing defects (Kumar, 2010). Mukhopadhyay and Ray (2006) applied Six Sigma methodology for reducing yarn packing defects. Das and Roy (2007) applied Six Sigma to reduce lot-to-lot shade-variation of linen fabrics. Focus of this paper is the application of Six Sigma methodology in reducing defects in textile weaving industry of Pakistan.
The work is based upon a case study of a textile weaving mill facing problem of B-grade fabric production due to high number of defects in the fabric.
2 Define phase
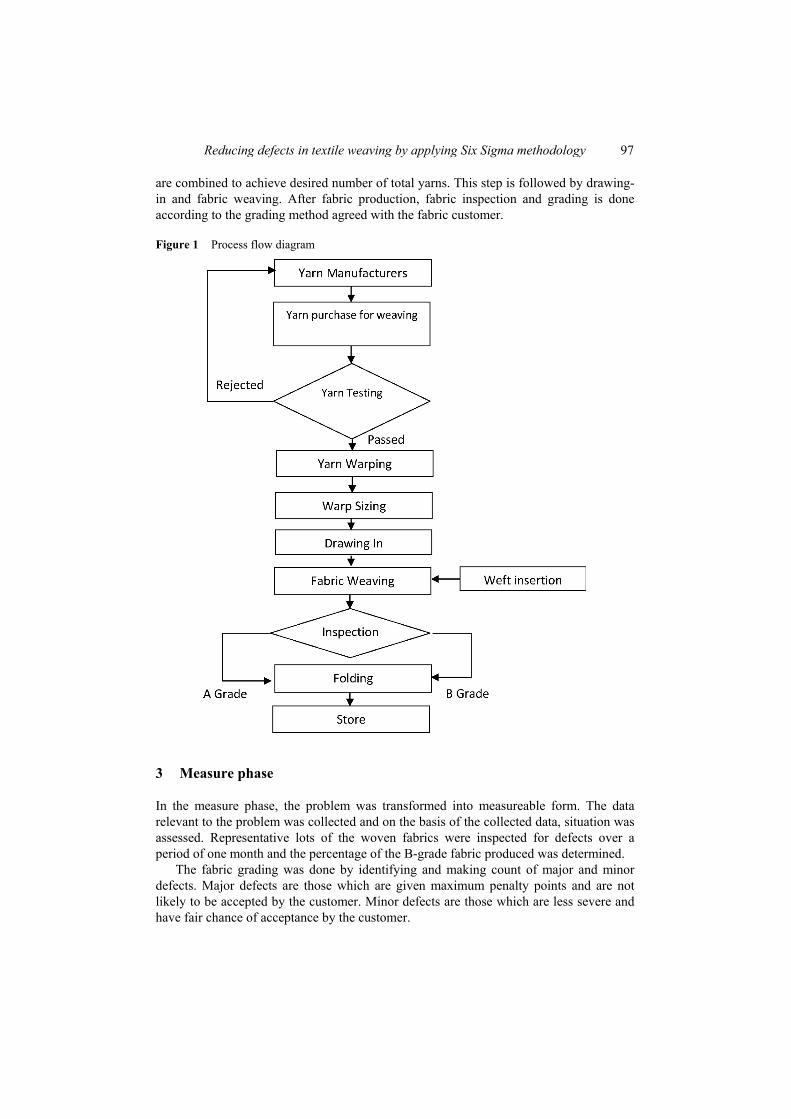
The define phase of the Six Sigma methodology involves the definition of the problem, project scope, objective, project team and the work schedule. The problem for this study was defined as “a high percentage of B-grade fabric production in the weaving mill due to high number of defects in the fabric”. The objective of the project was to reduce the percentage of B-grade fabric production. A team comprising members from the fabric production department, quality control personnel, management and the investigators was formed to complete the project. The weaving process flow diagram was established and is given in Figure 1. The yarn is produced by yarn manufacturers, which is purchased by weaving mill for making the fabric. Before the use of yarn in the weaving mill, yarn is tested for physical and mechanical properties as well as any imperfections. In yarn testing, total imperfection (IPI), single yarn strength, CV% and count/lea strength product (CLSP) are specifically important for production of good quality fabrics. The approved yarn is sent to warping department after complete testing, to be transformed into warping beam. Warping is the process where the required number and length of yarns are taken on beams for the desired fabric length. The warping beams are sent to sizing department where sizing agents such as starch or polyvinyl co-polymers are applied on the yarns to improve strength of yarn. On sizing beam, all the yarn on more than one warping beams
Reducing defects in textile weaving by applying Six Sigma methodology 97
are combined to achieve desired number of total yarns. This step is followed by drawing-in and fabric weaving. After fabric production, fabric inspection and grading is done according to the grading method agreed with the fabric customer.
Figure 1 Process flow diagram
3 Measure phase
In the measure phase, the problem was transformed into measureable form. The data relevant to the problem was collected and on the basis of the collected data, situation was assessed. Representative lots of the woven fabrics were inspected for defects over a period of one month and the percentage of the B-grade fabric produced was determined.
The fabric grading was done by identifying and making count of major and minor defects. Major defects are those which are given maximum penalty points and are not likely to be accepted by the customer. Minor defects are those which are less severe and have fair chance of acceptance by the customer.
98 T. Hussain et al.
On the basis of the fabric defect data, the existing sigma level of the weaving process was calculated as follows:
Total fabric length inspected = 70,189 m
Total major defects = 3025
Total minor defects = 12,910
Total defects = 15,935
Defects per unit (DPU) = Total defects/ total length inspected = 15,935/70,189 = 0.227.
Hence,
Yield = e–DPU = e–0.227 = 0.7969
PPM = –ln(yield) × 10,00,000 = –ln(0.7969) × 10,00,000 = 2,27,026.
Consulting the table for sigma level, the existing sigma level was calculated as 2.2.
4 Analyse phase
In the analyse phase, cause and effect diagram was developed through brainstorming to analyse all the factors that may affect the woven fabric quality. The cause and effect diagram is given in Figure 2. Listing all the causes for a given effect in a clear, organised way makes it easier to separate out potential problems and target areas for improvement.
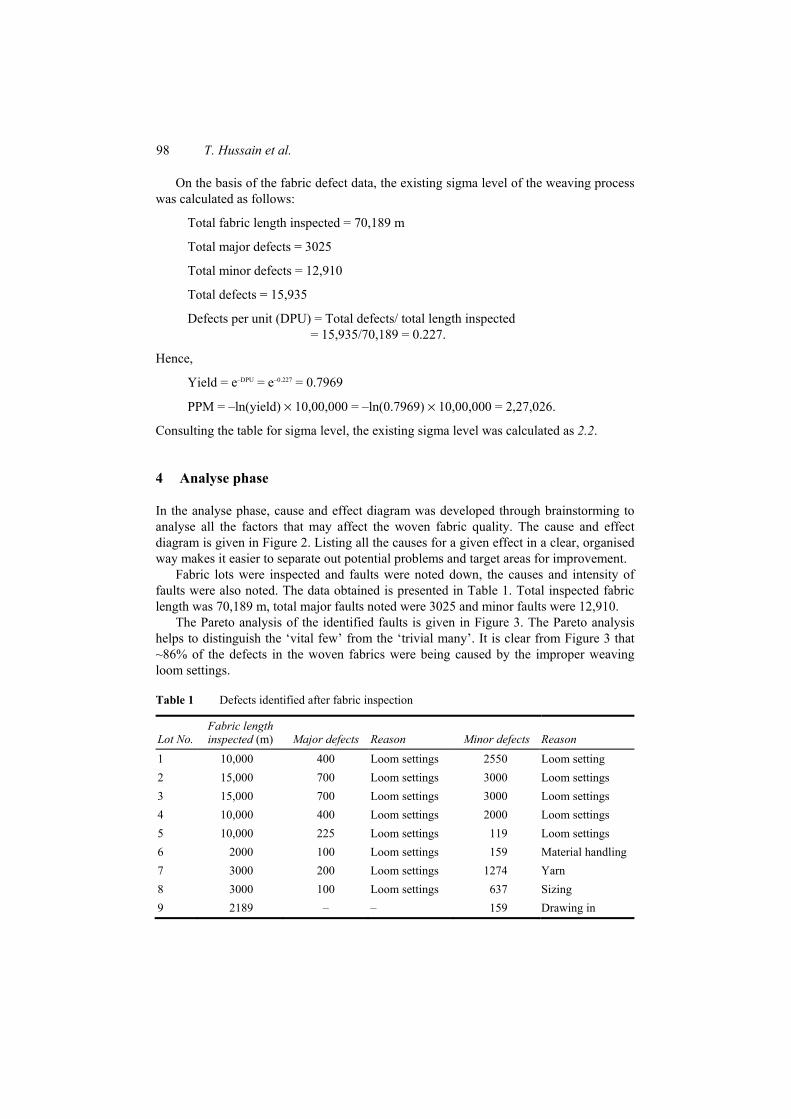
Fabric lots were inspected and faults were noted down, the causes and intensity of faults were also noted. The data obtained is presented in Table 1. Total inspected fabric length was 70,189 m, total major faults noted were 3025 and minor faults were 12,910.
The Pareto analysis of the identified faults is given in Figure 3. The Pareto analysis helps to distinguish the ‘vital few’ from the ‘trivial many’. It is clear from Figure 3 that ~86% of the defects in the woven fabrics were being caused by the improper weaving loom settings.
Table 1 Defects identified after fabric inspection
Lot No. Fabric length inspected (m) Major defects Reason Minor defects Reason
1 10,000 400 Loom settings 2550 Loom setting 2 15,000 700 Loom settings 3000 Loom settings 3 15,000 700 Loom settings 3000 Loom settings 4 10,000 400 Loom settings 2000 Loom settings 5 10,000 225 Loom settings 119 Loom settings 6 2000 100 Loom settings 159 Material handling 7 3000 200 Loom settings 1274 Yarn 8 3000 100 Loom settings 637 Sizing 9 2189 – – 159 Drawing in

Reducing defects in textile weaving by applying Six Sigma methodology 99
Figure 2 Cause and effect diagram
Figure 3 Pareto chart of defects (see online version for colours)
5 Improve phase
Improve phase involves tasks for the elimination of root causes of the problem, and design and implementation of the improved process. Risk matrix table was drawn to indicate the risk, likelihood of occurrence of problem and impact of the possible

100 T. Hussain et al.
problems (Table 2). These problems were marked and corrective actions possible for all the faults were defined. The major area of concern as found by the Pareto analysis was inappropriate loom settings leading to mainly three fabric defects viz. starting marks, double picks and miss picks. All the possible rectifications of the loom settings were explored and those with better results were implemented in consultation with the loom manufacturer.
Table 2 Risk matrix table
Activity Risk Likelihood Impact Level of risk Yarn quality Slubby weft Possible Minor Low
Cockled yarn Rarely Minor Moderate Count variation Possible Major Extreme
Sizing Sizing stain Likely Major Moderate Sizing balls Possible Moderate Low Hard size Possible Major Extreme
Drawing in Wrong denting Rarely Major Extreme Loom settings Starting mark Likely Major Extreme
Double pick Likely Major Extreme Miss pick Likely Moderate Moderate Stain Possible Moderate Moderate Wrong weft Rarely Major Extreme Floats Possible Moderate Moderate
Material handling Improper equipment Possible Moderate Moderate Arrangement pattern Likely Major Extreme Method (auto/manual) Possible Major Extreme
The machine manufacturer suggested the use of easing motion on all the machines. This easing motion was used to compensate the additional tension on warp sheet helping in less stressed yarn. In addition to this the starting marks observed were seen to be open starting marks. These marks were settled down by upgrading the settings on all the machines. The setting point was adjusted so that at the point of re-starting of machine, the fell of cloth was set to move towards beam, resulting in prevention of open starting marks. This resulted in elimination of starting marks up to 95%.
It was observed that the double picks were full double picks, which were mainly due to cutters not working in time resulting in missing in cutting of the picks which lead to production of double picks. All the cutters were ground, the defective blades were replaced and it was seen that the proportion of double picks was reduced to 80% than the previous value. It was further found that the weaving mill was using defective filling detector (FD) cables that were resulting in malfunctioning of FDs. FD was responsible for correct detection of weft yarn, absence of which lead to miss picks. The cables were replaced by original FD cables, and in the next fabric inspection, it was observed that miss picks were reduced to 75% than the previous level.

Reducing defects in textile weaving by applying Six Sigma methodology 101
Other corrective actions that could be taken for the faults which are mentioned in the risk matrix table are given as under:
• For all the problems related to yarn quality, spinning/yarn manufacturing process could be improved. Testing of the yarn prior to use in weaving could also help in selection of the right quality yarn for the fabric. The extent of yarn faults could be determined to see whether it was in the acceptable range.
• For sizing faults, proper ventilation of the sizing room, cleaning of size boxes and exhaust fans could be done to avoid sizing stains. Proper sizing recipe selection, accurate and precise measure of size materials could help in avoiding sizing beads and balls.
• Training of work force could help in avoiding any fault that may occur due to drawing in.
• Loom beat up, position of fell of cloth, settings from i-board of loom and tension settings could be improved to avoid starting marks defect. The starting marks defect is a major fault that is more likely to occur in most of the fabrics, leading to fabric rejection.
By eliminating three major defects due to loom settings and the other improvement measures, the percentage of B-grade fabric was reduced dramatically than the previous level resulting in improvement in sigma level from 2.2 to 3, and increase in profits of $26,000 per month.
A-grade fabric was sold at rupees 500 per metre. Mill production was 1,500,000 metres per month. Rejected fabric was 2% of the total production of mill, which meant 30,000 m out of total produced fabric was B-grade. This B-grade fabric was sold out at rupees 255 per metre. By implementing the improvement processes, rejection was brought down to 0.75% from 2%. This improvement lead to 10,230 m fabric to be sold at A-grade fabric price, i.e., 500 rupees per month which was previously sold at the cost of B-grade. This improvement of grade meant generation of rupees 25 lakhs per month by transforming B-grade to A-grade fabric. This figure was found to be equivalent to $26,000 per month.
6 Control phase
In the control phase, a process is adjusted, managed and controlled to make sure that the incorporated improvements are sustained. Tools for the control phase include Control Plan (Poka Yoke), statistical process control (SPC) and failure mode and effect analysis (FMEA). In the control stage, the project team had meetings to conduct the FMEA, identifying potential failure modes, their effects and severity, causes, risk priority numbers (RPN) and preventive actions. For performing FMEA analysis it was required to bring together all the data of the defects that have occurred in the past during the whole process flow. The completed FMEA is given in Table 3.

102 T. Hussain et al.
Table 3 FMEA for woven fabrics
Issues Potential failure
Potential effect of failure mode S
Potential cause of failure mode O D RPN
Preventive action
Yarn Cockled yarn
Short length fault in fabric
3 Improper spinning/yarn selection
1 1 3 Proper spinning/yarn selection
Double cone
Repping mark in the fabric
4 Improper rewinding process
1 1 4 Proper rewinding
Slubby weft
Poor appearance of the fabric
2 Improper spinning/yarn selection
1 1 2 Proper spinning/yarn selection
Wrong weft
Repping mark in the fabric
5 Negligence of the workers
3 3 45 Training of the workers
Warping Less lbs/brk.
Increased stoppages on the machine
3 Less yarn strength. Improper machine settings
0 0 0 Proper spinning and rewinding
Sizing Hard size Yarn breakages due to increased yarn brittleness
5 Improper size concentration and drying after sizing
0 0 0 Appropriate size % and temperature of the drying cylinders
Sizing stain
Stains on the fabric
4 Improper exhaust system of evaporated steam
2 2 16 Proper cleaning of the exhausting chimneys
Sizing kinks/balls
Increased warp breakages on loom. Reed damage
5 Improper method used for cooking the size solution
1 1 5 Proper cooking of the size solution
Drawing in
Wrong denting
Improper weave design.
4 Poorly skilled workers
1 1 4 Training of the workers
Loom Starting mark
Streak on fabric throughout the weft.
5 Improper beat up force by reed or bumping
32 32 5120 Proper setting of loom parts
Double pick
Repping mark 4 Malfunctioning cutter or yarn accumulator
42 42 7056 Grinding of cutter
Miss pick Streak on fabric throughout the weft.
5 Malfunctioning of FD or FD cable or magnet pin
0 0 0 Proper setting and functioning of FD
Irregular selvedge
Defective fabric selvedge is formed
4 Damaged selvedge device requiring to be maintained
0 0 0 Proper setting of selvedge device
7 Conclusion
The study was initiated with the aim of reducing defects in textile weaving. Accurate data collection plays a vital role in finding a solution for any problem. The data were collected

Reducing defects in textile weaving by applying Six Sigma methodology 103
to mark the areas where major focus was needed to achieve the desired objective. The prime aim was to find out all the possible defects and areas which were associated with the defects. The data proved out to be very fruitful in identification of the problem and leading to the practical solutions which led to the improvement.
The nature of defects that were observed in the analyse phase and improved in the improve phase was discussed and communicated to the entire weaving team so that the corrective measures taken could be practiced continuously to keep the process in control. The key recommendations of the project team are summarised as follows:
• new loom settings should be noted, implemented and monitored routinely on daily basis
• as per machine manufacturer’s advice, weft cutter’s degree should be checked on weekly basis
• the grinding and/or polishing, as needed, of cutter blades should be done after every three months
• filling detectors (FDs) should be checked daily and immediate replacement of FDs or associated part should be made in case of any malfunction to avoid any miss picks.
From the study it is evident that the study helped in finding the exact remedies of the problems and ultimately improved the results. The initial sigma level of the process was calculated at 2.2 that was improved to 3 by the end of the study. This helped in improving the rejection of woven fabric from 2% to 0.75%, resulting in savings of 25 lakh rupees per month. It was observed that by reducing just three major defects associated with the fabric rejection, process sigma level and profit margins could be improved. For the future course of work, it was recommended to focus on other defects for further improvement in the sigma level.
References Breyfogle, F.W. (2003) Implementing Six Sigma: Smarter Solutions using Statistical Method,
2nd ed., John Wiley and Sons, New York. Das, P. and Roy, S. (2007) ‘An application of six sigma methodology to reduce lot to lot shade
variation of Linen fabrics’, Journal of Industrial Textiles, Vol. 36, No. 3, pp.227–251. Economic Survey of Pakistan (2011–2012) http://www.finance.gov.pk Gijo, E.V. and Scaria, J. (2010) ‘Reducing rejection and rework by application of Six Sigma
methodology in manufacturing process’, International Journal of Six Sigma and Competitive Advantage, Vol. 6, Nos. 1–2, pp.77–90.
Goh, T.N. and Xie, M. (2003) ‘Statistical control of a Six Sigma process’, Quality Engineering, Vol. 15, No. 4, pp.587–592.
Kumar, R.S. (2010) Six Sigma in the Textile Industry, www.fibre2fashion.com Mccarty, T., Bremer, M., Daniels, L. and Gupta, P. (2004) The Six Sigma Black Belt Handbook,
McGraw-Hill Professional, USA. Mukhopadhyay, A.R. and Ray, S. (2006) ‘Reduction of yarn packing defects using Six Sigma
methods: a case study’, Quality Engineering, Vol. 18, No. 2, pp.189–206. Pyzdek, T. and Keller, P. (2005) The Six Sigma Handbook, 3rd ed., McGraw-Hill Professional,
USA.

104 T. Hussain et al.
Rajaney, P.J. and Mayee, P.R. (2004) ‘Six Sigma-problem solving tools to improve productivity and performance’, Textile Magazine, Vol. 45, No. 5, pp.44–48.
Sagar, R.V. (2005) ‘Six Sigma helps improve management and communication skills’, Textile Magazine, Vol. 46, No. 5, pp.77–79.
Sambhe, U.R. and Dalu, S. (2011) ‘Six Sigma implementation in Indian medium-scale automotive enterprises – a review and agenda for future research’, International Journal of Six Sigma and Competitive Advantage, Vol. 6, No. 3, pp.224–242.
Suh, M.W. (2004) ‘Quality, will it win over price and policy?’, Textile-Asia, Vol. 35, No. 9, pp.34–40.