


Bahasa
Halaman
Hukum

Reports
/ sciencemag.org/content/early/recent / 5 February 2015 / Page 1 / 10.1126/science.1259591
The ability to navigate is critical for survival of all animals and relies on a broad network of hippocampal and limbic brain circuits (1, 2). The parahippocampal cortex contains grid cells, which fire at multiple locations forming a hexag-onal pattern covering the entire environment (3, 4). Compu-tational models try to explain grid cell generation from combined inputs of distance and direction displacement, which can subsequently be used for path integration (5–7). Theta rhythm is thought to be necessary for the computa-tion of distance in grid cell models, and disruption of this signal eliminates grid-like firing patterns (8, 9). HD cells fire as a function of an animal’s directional orientation in the horizontal plane and are thought to convey the directional heading component to grid cells. However, some models utilize movement-direction cells, which have yet to be exper-imentally verified (10). The HD cell signal is generated sub-cortically and then projected rostrally via the anterior thalamic nuclei (ATN) to the parahippocampal cortices (2, 11, 12). Two nuclei within the ATN are known to contain HD cells – the anterodorsal and anteroventral thalamic nuclei (13, 14). We tested the role of the HD signal in generating grid cell activity in the parahippocampal cortices.
Experiment 1 recorded from parahippocampal cortex, in-cluding medial entorhinal cortex (MEC) and parasubiculum (PaS), while female Long-Evans rats (n = 3) received infu-sions of lidocaine bilaterally into the ATN (15), which served to inactivate HD cell activity within this region. Lidocaine
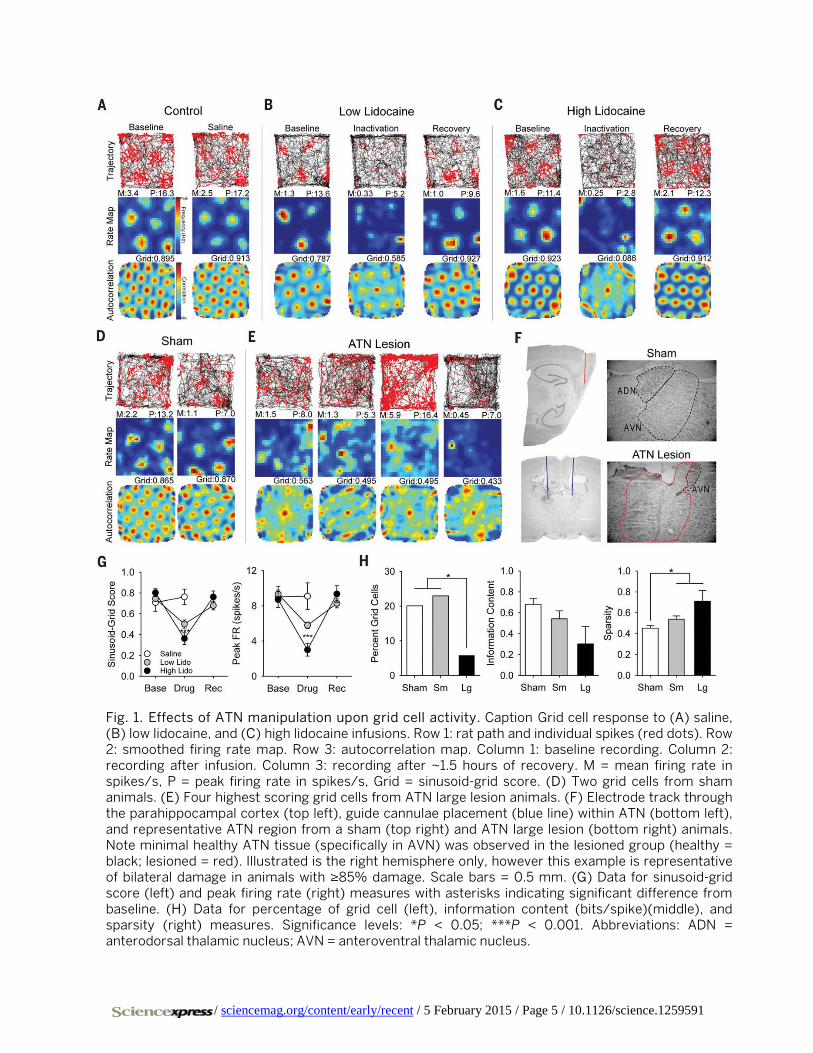
infusion resulted in a significant reduction of grid scores (Fig. 1G left) at low doses (n = 55 cells; baseline mean ± standard error: 0.746 ± 0.025; low inactivation: 0.502 ± 0.039; t(54) = 6.807, P < 0.001) (Fig. 1B) and high doses of lidocaine (n = 17 cells; baseline: 0.803 ± 0.038; high inactivation: 0.363 ± 0.056; t(16) = 7.112, P < 0.001) (Fig. 1C). For the high dose group, 10 of 17 cells had reduced grid scores > 60% com-pared to baseline (> 2 std. dev.); the remaining cells all had de-creased grid scores and most of them had no discernible grid pattern during the inactivation session (Figs. 1C and 2C and fig. S6). Recovery of grid scores oc-curred ~1.5 hours after the infu-sion (n = 35 cells; low recovery: 0.680 ± 0.041; t(34) = 2.446, n.s.; n = 17 cells; high recovery: 0.762 ± 0.057; t(16) = 0.793, n.s.). Grid scores were spared by saline in-fusions (n = 10 cells; baseline: 0.709 ± 0.084; saline: 0.763 ±
0.074; t(9) = 0.488, n.s.) (Fig. 1A). Lidocaine had the same effect upon peak firing rate (Fig. 1G right), which was signif-icantly decreased by lidocaine infusions at low doses (n = 55 cells; baseline: 9.33 ± 0.46; low inactivation: 5.79 ± 0.37; t(54) = 6.696, P < 0.001) and high doses (n = 17 cells; baseline: 8.71 ± 0.89; high inactivation: 3.01 ± 0.72; t(16) = 7.162, P < 0.001), and recovered within ~1.5 hours (low: n = 35 cells; recovery: 8.28 ± 0.51; t(34) = 2.604, n.s.; high: n = 17 cells; recovery: 9.35 ± 0.95; t(16) = 0.693, n.s.). Decreased firing rates cannot account for the loss of the grid signal observed during inactivation as sub-sampling firing rates during baseline spared grid scores (fig. S4).
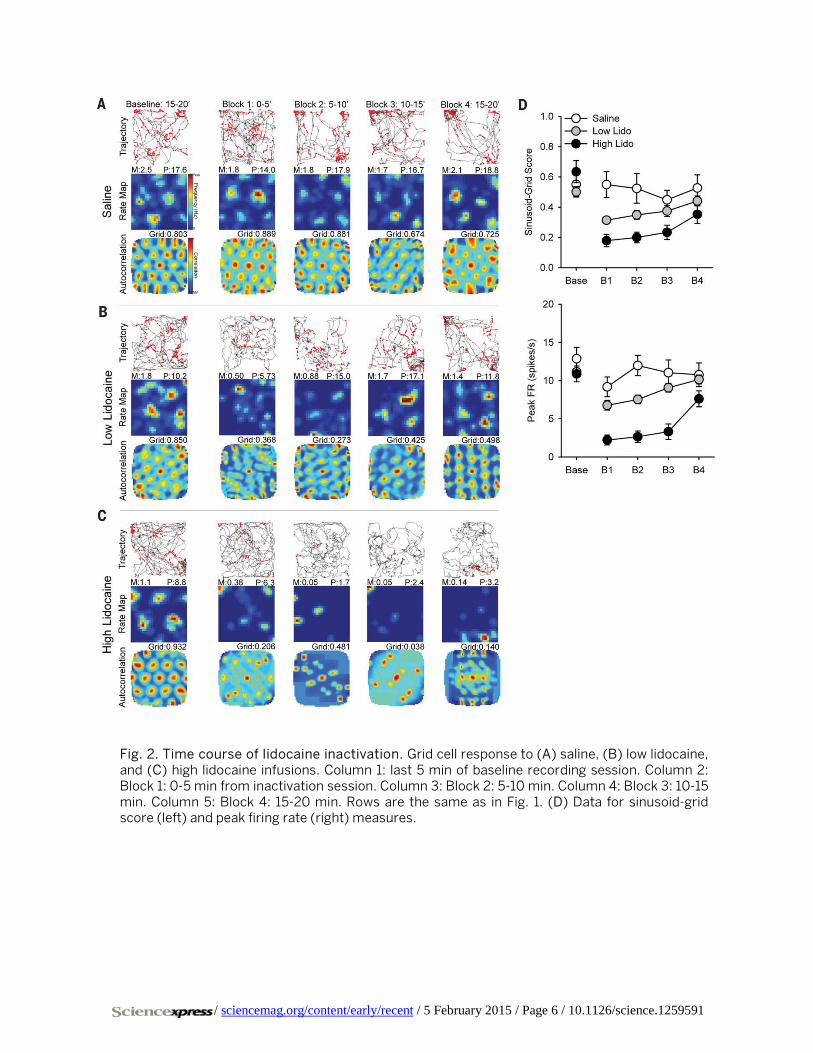
To understand the relationship between the concentra-tion of lidocaine and time course of inactivation, the inacti-vation session was divided into four consecutive blocks of 5 min. Saline infusion had no effect upon grid scores or peak firing rates (Fig. 2, A and D). Low doses of lidocaine signifi-cantly impaired grid scores for the first three blocks and scores recovered by the last block (n = 55 cells; baseline 5 min: 0.501 ± 0.034; F(4,216) = 7.647, P < 0.001; low inactiva-tion block 1: 0.314 ± 0.021, P < 0.001; block 2: 0.349 ± 0.029, P < 0.001; block 3: 0.374 ± 0.036, P < 0.010; block 4: 0.441 ± 0.033, n.s.) (Fig. 2, B and D). High doses significantly im-paired grid scores that never recovered within the session (n = 17 cells; baseline 5 min: 0.634 ± 0.073; F(4,64) = 11.389, P < 0.001; high inactivation block 1: 0.179 ± 0.041, P < 0.001; block 2: 0.200 ± 0.035, P < 0.001; block 3: 0.234 ± 0.047, P <
Disruption of the head direction cell network impairs the parahippocampal grid cell signal Shawn S. Winter,* Benjamin J. Clark,* Jeffrey S. Taube†
Department of Psychological and Brain Sciences, Center for Cognitive Neuroscience, Dartmouth College, Hanover, NH 03755, USA.
*These authors contributed equally to this work.
†Corresponding author. E-mail: [email protected]
Navigation depends on multiple neural systems that encode the moment-to-moment changes in an animal’s direction and location in space. These include head direction (HD) cells representing the orientation of the head and grid cells that fire at multiple locations, forming a repeating hexagonal grid pattern. Computational models hypothesize that generation of the grid cell signal relies upon HD information that ascends to the hippocampal network via the anterior thalamic nuclei (ATN). We inactivated or lesioned the ATN and subsequently recorded single units in the entorhinal cortex and parasubiculum. ATN manipulation significantly disrupted grid and HD cell characteristics while sparing theta rhythmicity in these regions. These results indicate that the HD signal via the ATN is necessary for the generation and function of grid cell activity.
/ sciencemag.org/content/early/recent / 5 February 2015 / Page 2 / 10.1126/science.1259591
0.010; block 4: 0.352 ± 0.061, P < 0.010) (Fig. 2, C and D). Low doses significantly impaired peak firing rates for the first three blocks and recovered by the last block (n = 55 cells; baseline 5 min: 11.15 ± 0.50; F(3.061,165.305) = 14.035, P < 0.001; low inactivation block 1: 6.77 ± 0.65, P < 0.001; block 2: 7.54 ± 0.56, P < 0.001; block 3: 7.54 ± 0.56, P < 0.010; block 4: 10.15 ± 0.58, n.s.). High doses significantly impaired peak firing rates for the first three blocks and recovered by the last block (n = 17 cells; baseline 5 min: 10.88 ± 1.04; F(2.475,39.596) = 30.301, P < 0.001; high inactivation block 1: 2.22 ± 0.65, P < 0.001; block 2: 2.65 ± 0.75, P < 0.001; block 3: 3.32 ± 1.01, P < 0.001; block 4: 7.62 ± 1.05, n.s.). These results are also consistent with mean firing rate (fig. S9), and over-all suggests a dissociation between grid-specific firing and peak firing rate.
In experiment 2 we tested whether permanent damage to the ATN disrupts grid cell generation. Short-term inacti-vation could impair network processing necessary for grid cell expression while sparing the mechanisms for genera-tion. Recovery following permanent damage may allow for a compensatory mechanism to provide input suitable for grid cell generation. Sham and small (including < 85% loss) ATN lesioned animals had comparable numbers of grid cells ex-ceeding the 95th percentile of a shuffled distribution (criteri-on = 0.439) of grid scores (sham, 48 of 239 = 20.8%; small lesion, 31 of 135 = 23.0%); however, large ATN lesions (in-cluding ≥ 85% loss) had significantly fewer cells pass the grid score criterion (large lesion, 3 of 52 = 5.8%; χ2(1) = 4.62, P < 0.05) (Fig. 1, E and H left). The effect was even more pronounced when using the 99th percentile criterion (fig. S3). Overall, grid cells recorded in lesioned animals dis-played appreciably lower information content (bits/spike) measures (sham: 0.682 ± 0.058; small lesion: 0.542 ± 0.076, W = 1067, P = 0.087; large lesion: 0.302 ± 0.166, W = 36, P = 0.097) (Fig. 1H middle) and significantly higher sparsity scores (sham: 0.452 ± 0.025; small lesion: 0.537 ± 0.033, W = 1469, P < 0.05; large lesion: 0.710 ± 0.103, W = 132, P < 0.05) (Fig. 1H right), suggesting that these cells fired across a broader range of spatial locations relative to sham ani-mals. In addition, we failed to detect significant differences in the peak firing rates of grid cells between groups (sham: 5.78 ± 0.583; small lesion: 5.21 ± 0.533; W = 1226, P = 0.892; large lesion: 9.89 ± 3.33; W = 115, P = 0.144).
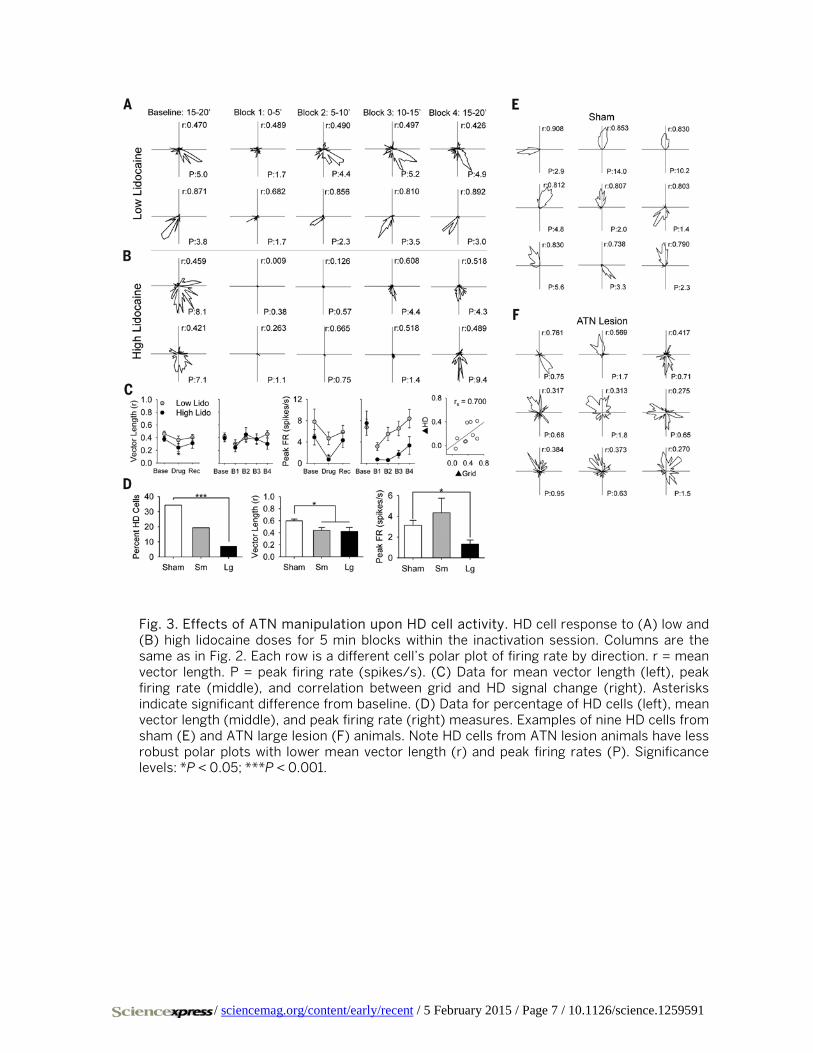
We additionally recorded from cells that contained di-rectional tuning (16). Most of these cells are better consid-ered directionally-modulated rather than ‘classic’ HD cells because of their low peak firing rate and broad tuning curve. Experiment 1 lidocaine infusions produced a similar pattern of results on HD cells as they did on grid cells; how-ever, a small sample size did not provide the power neces-sary to produce significant effects with an adjusted alpha, but there was a significance below P < 0.05. Mean vector length of HD cells was reduced at low doses (n = 12 cells; baseline: 0.461 ± 0.041; low inactivation: 0.364 ± 0.063; t(11) = 1.730, n.s.) (Fig. 3, A and C left), but was significantly re-
duced at high doses of lidocaine (n = 5 cells; baseline: 0.378 ± 0.036; high inactivation: 0.244 ± 0.063; t(4) = 4.538, P < 0.05) (Fig. 3, B and C left). Peak firing rate of HD cells was reduced at low doses (baseline: 7.80 ± 2.37; low inactivation: 4.68 ± 1.19; t(11) = 1.248, n.s.) (Fig. 3C middle) but was signifi-cantly reduced at high doses of lidocaine (baseline: 4.89 ± 1.45; high inactivation: 0.72 ± 0.23; t(4) = 3.006, P < 0.05) (Fig. 3C middle). When analyzed by 5 min blocks across the inactivation session there was no effect of lidocaine at either concentration upon mean vector length. However, there was a tendency for decreased mean vector length during the first block (low inactivation: baseline 5 min: 0.419 ± 0.056; block 1: 0.303 ± 0.065; F(2.308,25.384) = 2.490, n.s.; high inactivation: baseline: 0.394 ± 0.057; block 1: 0.244 ± 0.066; F(4,16) = 1.050, n.s.) (Fig. 3C left). In contrast, peak firing rate was signifi-cantly decreased for the first block with low doses (baseline 5 min: 6.77 ± 1.52; F(2.063,22.696) = 7.091, P < 0.010.; block 1: 3.17 ± 0.72, P < 0.05; block 2: 5.50 ± 1.25, n.s.; block 3: 6.53 ± 1.38, n.s.; block 4: 8.37 ± 1.72, n.s.) and for three blocks with high doses of lidocaine (baseline: 7.53 ± 2.25; F(4,16) = 5.167, P < 0.010; block 1: 0.73 ± 0.13, P < 0.05; block 2: 0.60 ± 0.12, P < 0.05; block 3: 1.70 ± 0.70, P < 0.05; block 4: 3.36 ± 1.65, n.s.) (Fig. 3C middle). Lidocaine’s effect upon peak firing rate likely influenced the measure of mean vector length, which is susceptible to reporting high values with few spikes (17). Although there were modest effects upon HD cell mean vector length, simultaneously recorded cells had changes in mean vector length and grid score that were significantly correlated (rs = 0.700, P < 0.05) (Fig. 3C far right). Addition-ally, the effect of inactivation upon grid and HD cell peak firing rates was highly correlated across sessions (low: r = 0.933; high: r = 0.976) and blocks (low: r = 0.828; high: r = 0.970). In cases where it was possible to examine the time course of recovery of HD-specific firing for HD cells or con-junctive grid x HD cells, the time of recovery generally cor-related well with the time of recovery for grid cell characteristics (fig. S11).
Experiment 2 also observed a disruption in HD cell activ-ity in parahippocampal cortices following ATN lesions. In lesioned rats, the number of cells that passed the 95th per-centile criterion of a shuffled distribution (criterion = 0.292) of mean vector length was not reduced for small lesions but were significantly reduced for large lesions (sham: 35 of 102 = 34.3%; small lesion: 6 of 31 = 19.4%; n.s.; large lesion: 7 of 97 = 7.2%; χ2(1) = 14.55, P < 0.001) (Fig. 3D left and E and F). Furthermore, cells that were classified as HD cells in le-sioned animals showed significantly lower mean vector length (sham: 0.599 ± 0.030; small lesion: 0.442 ± 0.045, W = 206, P < 0.001; large lesion: 0.421 ± 0.067, W = 89, P < 0.05) (Fig. 3D middle). HD cell peak firing rates were signif-icantly reduced following large but not small lesions (sham: 3.13 ± 0.47; small lesion: 4.34 ± 1.41, n.s.; large lesion: 1.33 ± 0.39, W = 85, P < 0.05) (Fig. 3D right).
Theta rhythm oscillations (6-10 Hz) in the MEC play a critical role in grid cell generation (8, 9). Experiment 1 as-
/ sciencemag.org/content/early/recent / 5 February 2015 / Page 3 / 10.1126/science.1259591
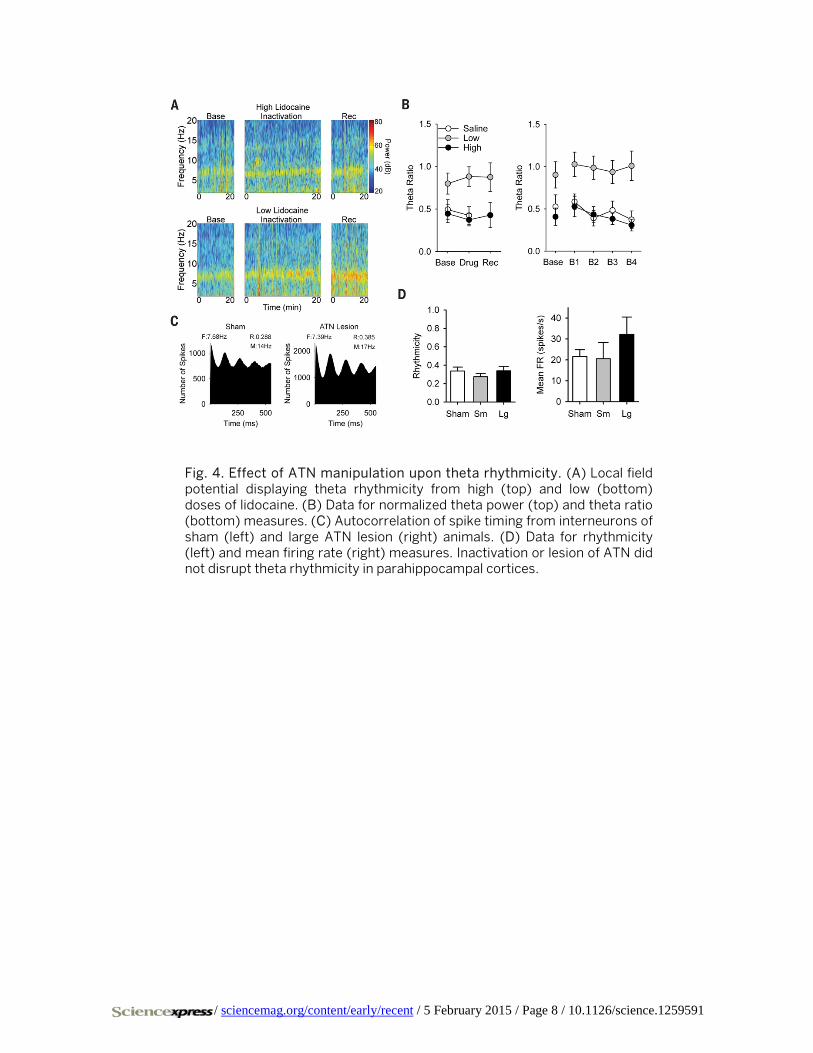
sessed theta rhythmicity in the local field potential by com-puting a theta ratio (theta power/delta power) (8, 18). There was no significant effect of lidocaine upon theta ratio at low doses across sessions (low baseline: 0.799 ± 0.123; low inac-tivation: 0.881 ± 0.114; t(17) = 0.860, n.s.) (Fig. 4, A and B, saline illustrated) or blocks (low baseline: 0.903 ± 0.156; F(2.424,41.201) = 0.194, n.s.; low block 1: 1.027 ± 0.144; low block 2: 0.987 ± 0.137; low block 3: 0.937 ± 0.138; low block 4: 1.010 ± 0.175). There was no significant effect of lidocaine upon theta ratio at high doses across sessions (high base-line: 0.445 ± 0.105; high inactivation: 0.373 ± 0.071; t(6) = 1.453, n.s.) or blocks (high baseline: 0.408 ± 0.103; F(1.446,8.677) = 1.666, n.s.; high block 1: 0.529 ± 0.121; high block 2: 0.434 ± 0.093; high block 3: 0.382 ± 0.067; high block 4: 0.308 ± 0.069). Experiment 2 assessed theta rhythmicity in inter-neurons (firing rate > 10 Hz) by computing the depth of modulation within spike timing autocorrelograms. There was no significant effect of ATN lesion upon interneuron rhythmicity (sham: 0.336 ± 0.044; small lesion: 0.275 ± 0.036, n.s.; large lesion: 0.339 ± 0.048, n.s.) (Fig. 4, C and D left). There was no effect of lesion upon interneuron mean firing rate (sham: 21.59 ± 3.26; small lesion: 20.51 ± 7.82, n.s.; large lesion: 32.17 ± 8.30, n.s.) (Fig. 4D, right).
The present study supports three conclusions. First, ma-nipulation of ATN significantly reduced the spatial periodic-ity of grid cells. High concentrations of lidocaine abolished grid-like firing patterns, and large lesions significantly re-duced the number of grid cells. Second, manipulation of ATN significantly influenced the HD signal. Inactivation reduced direction-specific firing properties, and lesions sig-nificantly reduced the number of HD cells and their charac-teristics. Third, ATN manipulation spared theta modulation. These effects cannot be attributed to nearby damage from the injections or lesions as the ATN is over 10 mm in dis-tance away from the grid cell areas recorded. Our findings are consistent with the hypothesis that HD cell inputs from the ATN are involved in parahippocampal grid cell genera-tion; these data are also consistent with the hypothesis that cosine directionally-tuned theta cells in the ATN are neces-sary for grid cell generation (19). In addition to HD and the-ta inputs, hippocampal projections from CA1 are necessary for grid cell expression in the MEC (17). HD cells in ADN (20) or MEC (17) remained unaffected by CA1 disruption, and many grid cells developed directional tuning even when no HD preference was identified prior to inactivation. This observation suggests that CA1 input likely does not contrib-ute directional information to grid cells, but instead conveys some additional necessary form of processing. Behavioral studies provide support for the importance of these signals and brain regions in navigation. Lesions of the ATN produce significant deficits on spatial tasks dependent upon either environmental (21) or self-movement cues (22). Similarly, lesions of the grid cell region of MEC produce significant spatial deficits (23, 24); however, self-movement cues ap-pear to be selectively impaired in distance processing (25).
In contrast, hippocampal lesions produce significant im-pairments in both distance and direction processing (25–27). These results suggest that the functional role of grid cell activity may be related to providing a distance metric whose computations are dependent upon direction inputs rather than supporting path integration as some models posit.
REFERENCES AND NOTES 1. E. I. Moser, E. Kropff, M.-B. Moser, Place cells, grid cells, and the brain’s spatial
representation system. Annu. Rev. Neurosci. 31, 69–89 (2008). Medline doi:10.1146/annurev.neuro.31.061307.090723
2. J. S. Taube, The head direction signal: Origins and sensory-motor integration. Annu. Rev. Neurosci. 30, 181–207 (2007). Medline doi:10.1146/annurev.neuro.29.051605.112854
3. C. N. Boccara, F. Sargolini, V. H. Thoresen, T. Solstad, M. P. Witter, E. I. Moser, M. B. Moser, Grid cells in pre- and parasubiculum. Nat. Neurosci. 13, 987–994 (2010). Medline doi:10.1038/nn.2602
4. T. Hafting, M. Fyhn, S. Molden, M.-B. Moser, E. I. Moser, Microstructure of a spatial map in the entorhinal cortex. Nature 436, 801–806 (2005). Medline doi:10.1038/nature03721
5. N. Burgess, C. Barry, J. O’Keefe, An oscillatory interference model of grid cell firing. Hippocampus 17, 801–812 (2007). Medline doi:10.1002/hipo.20327
6. M. E. Hasselmo, L. M. Giocomo, E. A. Zilli, Grid cell firing may arise from interference of theta frequency membrane potential oscillations in single neurons. Hippocampus 17, 1252–1271 (2007). Medline doi:10.1002/hipo.20374
7. B. L. McNaughton, F. P. Battaglia, O. Jensen, E. I. Moser, M.-B. Moser, Path integration and the neural basis of the ‘cognitive map’. Nat. Rev. Neurosci. 7, 663–678 (2006). Medline doi:10.1038/nrn1932
8. M. P. Brandon, A. R. Bogaard, C. P. Libby, M. A. Connerney, K. Gupta, M. E. Hasselmo, Reduction of theta rhythm dissociates grid cell spatial periodicity from directional tuning. Science 332, 595–599 (2011). Medline doi:10.1126/science.1201652
9. J. Koenig, A. N. Linder, J. K. Leutgeb, S. Leutgeb, The spatial periodicity of grid cells is not sustained during reduced theta oscillations. Science 332, 592–595 (2011). Medline doi:10.1126/science.1201685
10. F. Raudies, M. P. Brandon, G. William Chapman, M. E. Hasselmo, Head direction is coded more strongly than movement direction in a population of entorhinal neurons. Brain Res. (2014). 10.1016/j.brainres.2014.10.053 Medline doi:10.1016/j.brainres.2014.10.053
11. J. P. Bassett, M. L. Tullman, J. S. Taube, Lesions of the tegmentomammillary circuit in the head direction system disrupt the head direction signal in the anterior thalamus. J. Neurosci. 27, 7564–7577 (2007). Medline doi:10.1523/JNEUROSCI.0268-07.2007
12. J. P. Goodridge, J. S. Taube, Interaction between the postsubiculum and anterior thalamus in the generation of head direction cell activity. J. Neurosci. 17, 9315–9330 (1997). Medline
13. J. S. Taube, Head direction cells recorded in the anterior thalamic nuclei of freely moving rats. J. Neurosci. 15, 70–86 (1995). Medline
14. M. Tsanov, E. Chah, S. D. Vann, R. B. Reilly, J. T. Erichsen, J. P. Aggleton, S. M. O’Mara, Theta-modulated head direction cells in the rat anterior thalamus. J. Neurosci. 31, 9489–9502 (2011). Medline doi:10.1523/JNEUROSCI.0353-11.2011
15. Materials and methods are available as supporting materials on Science Online. 16. A. Burgalossi, L. Herfst, M. von Heimendahl, H. Förste, K. Haskic, M. Schmidt, M.
Brecht, Microcircuits of functionally identified neurons in the rat medial entorhinal cortex. Neuron 70, 773–786 (2011). Medline doi:10.1016/j.neuron.2011.04.003
17. T. Bonnevie, B. Dunn, M. Fyhn, T. Hafting, D. Derdikman, J. L. Kubie, Y. Roudi, E. I. Moser, M. B. Moser, Grid cells require excitatory drive from the hippocampus. Nat. Neurosci. 16, 309–317 (2013). Medline doi:10.1038/nn.3311
18. A. Terrazas, M. Krause, P. Lipa, K. M. Gothard, C. A. Barnes, B. L. McNaughton, Self-motion and the hippocampal spatial metric. J. Neurosci. 25, 8085–8096 (2005). Medline doi:10.1523/JNEUROSCI.0693-05.2005
19. A. C. Welday, I. G. Shlifer, M. L. Bloom, K. Zhang, H. T. Blair, Cosine directional tuning of theta cell burst frequencies: Evidence for spatial coding by oscillatory interference. J. Neurosci. 31, 16157–16176 (2011). Medline doi:10.1523/JNEUROSCI.0712-11.2011
/ sciencemag.org/content/early/recent / 5 February 2015 / Page 4 / 10.1126/science.1259591
20. E. J. Golob, J. S. Taube, Head direction cells and episodic spatial information in rats without a hippocampus. Proc. Natl. Acad. Sci. U.S.A. 94, 7645–7650 (1997). Medline doi:10.1073/pnas.94.14.7645
21. E. C. Warburton, J. P. Aggleton, Differential deficits in the Morris water maze following cytotoxic lesions of the anterior thalamus and fornix transection. Behav. Brain Res. 98, 27–38 (1999). Medline doi:10.1016/S0166-4328(98)00047-3
22. R. J. Frohardt, J. P. Bassett, J. S. Taube, Path integration and lesions within the head direction cell circuit: Comparison between the roles of the anterodorsal thalamus and dorsal tegmental nucleus. Behav. Neurosci. 120, 135–149 (2006). Medline doi:10.1037/0735-7044.120.1.135
23. C. Parron, B. Poucet, E. Save, Entorhinal cortex lesions impair the use of distal but not proximal landmarks during place navigation in the rat. Behav. Brain Res. 154, 345–352 (2004). Medline doi:10.1016/j.bbr.2004.03.006
24. C. Parron, E. Save, Evidence for entorhinal and parietal cortices involvement in path integration in the rat. Exp. Brain Res. 159, 349–359 (2004). Medline doi:10.1007/s00221-004-1960-8
25. S. S. Winter, J. R. Köppen, T. B. N. Ebert, D. G. Wallace, Limbic system structures differentially contribute to exploratory trip organization of the rat. Hippocampus 23, 139–152 (2013). Medline doi:10.1002/hipo.22075
26. E. J. Golob, J. S. Taube, Head direction cells in rats with hippocampal or overlying neocortical lesions: Evidence for impaired angular path integration. J. Neurosci. 19, 7198–7211 (1999). Medline
27. H. Maaswinkel, I. Q. Whishaw, Homing with locale, taxon, and dead reckoning strategies by foraging rats: Sensory hierarchy in spatial navigation. Behav. Brain Res. 99, 143–152 (1999). Medline doi:10.1016/S0166-4328(98)00100-4
28. J. A. Ainge, M. Tamosiunaite, F. Woergoetter, P. A. Dudchenko, Hippocampal CA1 place cells encode intended destination on a maze with multiple choice points. J. Neurosci. 27, 9769–9779 (2007). Medline doi:10.1523/JNEUROSCI.2011-07.2007
29. J. L. Kubie, A driveable bundle of microwires for collecting single-unit data from freely-moving rats. Physiol. Behav. 32, 115–118 (1984). Medline doi:10.1016/0031-9384(84)90080-5
30. S. Royer, A. Sirota, J. Patel, G. Buzsáki, Distinct representations and theta dynamics in dorsal and ventral hippocampus. J. Neurosci. 30, 1777–1787 (2010). Medline doi:10.1523/JNEUROSCI.4681-09.2010
31. E. Batschelet, Circular Statistics in Biology (Academic Press, New York, 1981). 32. R. F. Langston, J. A. Ainge, J. J. Couey, C. B. Canto, T. L. Bjerknes, M. P. Witter, E.
I. Moser, M. B. Moser, Development of the spatial representation system in the rat. Science 328, 1576–1580 (2010). Medline
33. T. J. Wills, F. Cacucci, N. Burgess, J. O’Keefe, Development of the hippocampal cognitive map in preweanling rats. Science 328, 1573–1576 (2010). Medline doi:10.1126/science.1188224
34. R. M. Yoder, J. S. Taube, Head direction cell activity in mice: Robust directional signal depends on intact otolith organs. J. Neurosci. 29, 1061–1076 (2009). Medline doi:10.1523/JNEUROSCI.1679-08.2009
35. B. J. Clark, J. E. Brown, J. S. Taube, Head direction cell activity in the anterodorsal thalamus requires intact supragenual nuclei. J. Neurophysiol. 108, 2767–2784 (2012). Medline doi:10.1152/jn.00295.2012
36. L. M. Giocomo, T. Stensola, T. Bonnevie, T. Van Cauter, M. B. Moser, E. I. Moser, Topography of head direction cells in medial entorhinal cortex. Curr. Biol. 24, 252–262 (2014). Medline doi:10.1016/j.cub.2013.12.002
37. F. Sargolini, M. Fyhn, T. Hafting, B. L. McNaughton, M. P. Witter, M. B. Moser, E. I. Moser, Conjunctive representation of position, direction, and velocity in entorhinal cortex. Science 312, 758–762 (2006). Medline doi:10.1126/science.1125572
ACKNOWLEDGMENTS
The authors thank J. Marcroft, S. Valerio, and J. Barry for technical support. This research was supported through the National Institute of Health grant NS053907 (J.S.T.), a PGS-D postgraduate scholarship from the Natural Sciences and Engineering Research Council of Canada (B.J.C.), and an American Psychological Association Dissertation Research Award (B.J.C.). Data will be made available upon request.
SUPPLEMENTARY MATERIALS www.sciencemag.org/cgi/content/full/science.1259591/DC1 Materials and Methods Figs. S1 to S12 Table S1 References (28–37) 4 August 2014; accepted 26 January 2015 Published online 5 February 2015 10.1126/science.1259591
/ sciencemag.org/content/early/recent / 5 February 2015 / Page 5 / 10.1126/science.1259591
Fig. 1. Effects of ATN manipulation upon grid cell activity. Caption Grid cell response to (A) saline, (B) low lidocaine, and (C) high lidocaine infusions. Row 1: rat path and individual spikes (red dots). Row 2: smoothed firing rate map. Row 3: autocorrelation map. Column 1: baseline recording. Column 2: recording after infusion. Column 3: recording after ~1.5 hours of recovery. M = mean firing rate in spikes/s, P = peak firing rate in spikes/s, Grid = sinusoid-grid score. (D) Two grid cells from sham animals. (E) Four highest scoring grid cells from ATN large lesion animals. (F) Electrode track through the parahippocampal cortex (top left), guide cannulae placement (blue line) within ATN (bottom left), and representative ATN region from a sham (top right) and ATN large lesion (bottom right) animals. Note minimal healthy ATN tissue (specifically in AVN) was observed in the lesioned group (healthy = black; lesioned = red). Illustrated is the right hemisphere only, however this example is representative of bilateral damage in animals with ≥85% damage. Scale bars = 0.5 mm. (G) Data for sinusoid-grid score (left) and peak firing rate (right) measures with asterisks indicating significant difference from baseline. (H) Data for percentage of grid cell (left), information content (bits/spike)(middle), and sparsity (right) measures. Significance levels: *P < 0.05; ***P < 0.001. Abbreviations: ADN = anterodorsal thalamic nucleus; AVN = anteroventral thalamic nucleus.
/ sciencemag.org/content/early/recent / 5 February 2015 / Page 6 / 10.1126/science.1259591
Fig. 2. Time course of lidocaine inactivation. Grid cell response to (A) saline, (B) low lidocaine, and (C) high lidocaine infusions. Column 1: last 5 min of baseline recording session. Column 2: Block 1: 0-5 min from inactivation session. Column 3: Block 2: 5-10 min. Column 4: Block 3: 10-15 min. Column 5: Block 4: 15-20 min. Rows are the same as in Fig. 1. (D) Data for sinusoid-grid score (left) and peak firing rate (right) measures.
/ sciencemag.org/content/early/recent / 5 February 2015 / Page 7 / 10.1126/science.1259591
Fig. 3. Effects of ATN manipulation upon HD cell activity. HD cell response to (A) low and (B) high lidocaine doses for 5 min blocks within the inactivation session. Columns are the same as in Fig. 2. Each row is a different cell’s polar plot of firing rate by direction. r = mean vector length. P = peak firing rate (spikes/s). (C) Data for mean vector length (left), peak firing rate (middle), and correlation between grid and HD signal change (right). Asterisks indicate significant difference from baseline. (D) Data for percentage of HD cells (left), mean vector length (middle), and peak firing rate (right) measures. Examples of nine HD cells from sham (E) and ATN large lesion (F) animals. Note HD cells from ATN lesion animals have less robust polar plots with lower mean vector length (r) and peak firing rates (P). Significance levels: *P < 0.05; ***P < 0.001.
/ sciencemag.org/content/early/recent / 5 February 2015 / Page 8 / 10.1126/science.1259591
Fig. 4. Effect of ATN manipulation upon theta rhythmicity. (A) Local field potential displaying theta rhythmicity from high (top) and low (bottom) doses of lidocaine. (B) Data for normalized theta power (top) and theta ratio (bottom) measures. (C) Autocorrelation of spike timing from interneurons of sham (left) and large ATN lesion (right) animals. (D) Data for rhythmicity (left) and mean firing rate (right) measures. Inactivation or lesion of ATN did not disrupt theta rhythmicity in parahippocampal cortices.
Top Related
Copyright © 2022 FDOKUMEN

