


Bahasa
Halaman
Hukum


TSC-MT 11-014
Development of High Speed Rail in Pakistan
Stockholm, June 2011
Master Thesis
Abdul Majeed Baloch

KTH |Development of High Speed Rail In Pakistan 2
KTH |Development of High Speed Rail In Pakistan 3
Foreword
I would like to express my sincere gratitude to my supervisors, Anders Lindahl, Bo-Lennart
Nelldal & Oskar Fröidh for their encouragement, patience, help, support at different stages &
excellent guidance with Administration, unique ideas, feedback etc.
Above all I would like to thank my beloved parents ’Shazia Hassan & Dr. Ali Hassan’, my
brothers, sisters from soul of my heart, for encouragement & support to me through my stay in
Sweden, I wish to say my thanks to all my friends specially ‘Christina Nilsson’ for her
encouragement, and my Landlord ‘Mikeal & Ingmarie’ in Sweden.
Finally I would like to say bundle of thanks from core of my Heart to KTH, who has given me a
chance for higher education & all people who has been involved directly or in-directly with
completion of my thesis work
Stockholm, June 2011
Abdul Majeed Baloch

KTH |Development of High Speed Rail In Pakistan 4
KTH |Development of High Speed Rail In Pakistan 5
Summary
Passenger Railway service are one of the key part of the Pakistan Railway system. Pakistan
Railway has spent handsome amount of money on the Railway infrastructure, but
unfortunately tracks could not be fully utilized. Since last many years due to the fall of the
Pakistan railway, road transport has taken an advantage of this & promised to revenge. Finally
road transport has increased progressive amount of share in his account. In order to get the
share back, in 2006 Pakistan Railway decided to introduce High speed train between
Rawalpindi-Lahore1.According Pakistan Railway year book 2010, feasibility report for the high
speed train between Rawalpindi-Lahore has been completed.
This research project is to investigate the expected demand of the existing tracks with the
improvements and with the idea of the High speed train w.r.t expected Cost analysis, travel
time, waiting time, demand & frequency. Expected passenger demand are calculated with the
help of the elasticity’s i.e travel time & frequency elasticity’s from literature and with basic
formulas as discussed in table in chapter 1
Five diffent scenarios have been discussed in this work. 1st
scenario is about current system, 2nd
scenario is discussed with the speed improvements & demand calculated on the basis of the
elasticity’s w.r.t reduction in travel time, 3rd
scenario totally focused on the implementation of
the High speed train instead of current system, 4th
scenario for the mixed traffic i.e High speed
train & exiting medium trains and finally, 5th
scenario is about implementation of HST in 2025.In
all these five scenarios the main aim is to find out how the present & future market of the train
demand look like, the main factors for evaluation are i.e travel time, frequency, average speed,
number of stops, waiting time & etc. Following table shows the elasticity’s used in this project.
Travel Time
Elasticity
(Minutes)
120-180 = -0.45
180-280 = -0.80
280-More = -0.9
Frequency -0.1- -0.3
Table shows the Travel time & Frequency elasticity’s
1 Pakistan Railway, year Book 2006
KTH |Development of High Speed Rail In Pakistan 6
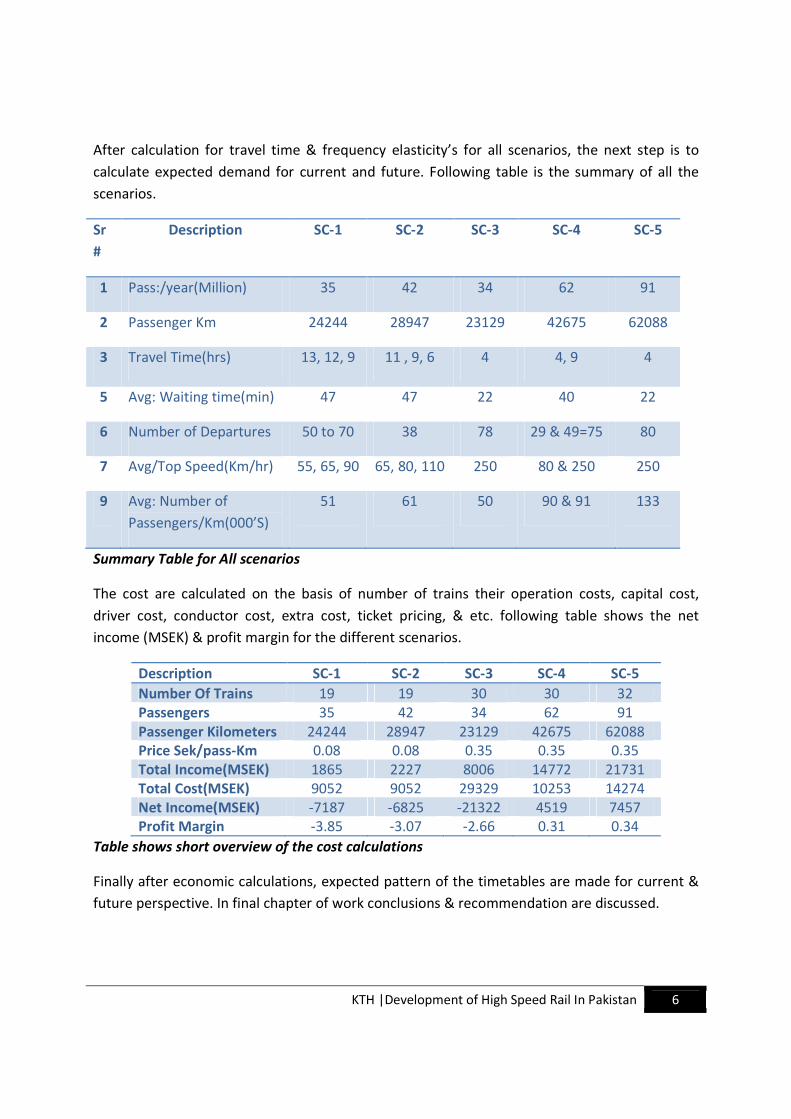
After calculation for travel time & frequency elasticity’s for all scenarios, the next step is to
calculate expected demand for current and future. Following table is the summary of all the
scenarios.
Sr
#
Description SC-1 SC-2 SC-3 SC-4 SC-5
1 Pass:/year(Million) 35 42 34 62 91
2 Passenger Km 24244 28947 23129 42675 62088
3 Travel Time(hrs) 13, 12, 9 11 , 9, 6 4 4, 9 4
5 Avg: Waiting time(min) 47 47 22 40 22
6 Number of Departures 50 to 70 38 78 29 & 49=75 80
7 Avg/Top Speed(Km/hr) 55, 65, 90 65, 80, 110 250 80 & 250 250
9 Avg: Number of
Passengers/Km(000’S)
51 61 50 90 & 91 133
Summary Table for All scenarios
The cost are calculated on the basis of number of trains their operation costs, capital cost,
driver cost, conductor cost, extra cost, ticket pricing, & etc. following table shows the net
income (MSEK) & profit margin for the different scenarios.
Description SC-1 SC-2 SC-3 SC-4 SC-5
Number Of Trains 19 19 30 30 32
Passengers 35 42 34 62 91
Passenger Kilometers 24244 28947 23129 42675 62088
Price Sek/pass-Km 0.08 0.08 0.35 0.35 0.35
Total Income(MSEK) 1865 2227 8006 14772 21731
Total Cost(MSEK) 9052 9052 29329 10253 14274
Net Income(MSEK) -7187 -6825 -21322 4519 7457
Profit Margin -3.85 -3.07 -2.66 0.31 0.34
Table shows short overview of the cost calculations
Finally after economic calculations, expected pattern of the timetables are made for current &
future perspective. In final chapter of work conclusions & recommendation are discussed.
KTH |Development of High Speed Rail In Pakistan 7
Table of Contents
Foreword ...........................................................................................................................................3
Summary ...........................................................................................................................................5
1- Introduction ............................................................................................................................. 13
1.1 – Background ............................................................................................................................... 13
1.2- Aim ............................................................................................................................................. 15
1.3- Methodology .............................................................................................................................. 15
1.4 - Limitations ................................................................................................................................. 18
2- Pakistan Transport Market ....................................................................................................... 21
2.1- Pakistan Railway Infrastructure .................................................................................................. 21
2.2- Pakistan Railway Connections ..................................................................................................... 22
2.3- Railway Track Conditions ............................................................................................................ 23
2.1-Todays and Yesterdays Transport ................................................................................................ 24
2.3-Freight Transportation BY Pakistan Railway ................................................................................. 27
2.6- Pakistan Aviation Authority ........................................................................................................ 30
2.8-Ports ............................................................................................................................................ 32
3- Definition & Evaluation of Scenarios ......................................................................................... 37
3.1- Scenario 1: Do Nothing........................................................................................................... 37
3.2- Scenario 2: Improvement of Current System .......................................................................... 51
3.3- Scenario 3:New High Speed Trains ......................................................................................... 61
3.4- Scenario 4: Mixed Train Scenario (High speed + Medium) ...................................................... 65
3.5- Scenario 5: High Speed Train In Future ................................................................................... 68
4- Expected Economic Calculations & Time Tables.......................................................................... 73
4.1- Scenario 1: Do Nothing Scenario ............................................................................................ 74
4.2- Scenario 2: Improvements ..................................................................................................... 75
4.3- Scenario 3: New Trains (High speed) ...................................................................................... 76
4.4- Scenario 4: Mixed (Medium + High Speed ) ........................................................................... 77
4.5- Scenario 5: High Speed Trains ................................................................................................ 78
4.6- Conclusion ............................................................................................................................. 79
4.7- Summary Table ...................................................................................................................... 79
KTH |Development of High Speed Rail In Pakistan 8
5- Conclusions & Recommendations .............................................................................................. 87
5.1- Conclusion ............................................................................................................................. 87
5.2- Recommendations ................................................................................................................. 89
Appendices ...................................................................................................................................... 91
Bibliography .................................................................................................................................... 95
List of Figures & Tables
Figure 1.1 shows the Railway Network of Pakistan Railway. .................................................................. 14
Table 1.1 shows the elasticity’s ............................................................................................................. 17
Figure 2.1 shows the Railway Infrastructure of Pakistan ........................................................................ 21
Figure 2.2 shows the different connections of Railway lines ................................................................... 22
Figure 2.3 shows the %age of the track improvements ........................................................................... 23
Figure 2.4 Passenger/year (Millions) ...................................................................................................... 24
Figure 2.5 Passenger kilometers (Millions) ............................................................................................. 25
Figure 2.6 Average revenue/Passenger (Paisa) ...................................................................................... 25
Figure 2.7 shows the Passenger increase vs Population increase ............................................................ 26
Figure 2.8 Average tone carried (Thousands) ......................................................................................... 27
Figure 2.9 Average charge/ton .............................................................................................................. 28
Figure 2.10 Average Revenues/tonne..................................................................................................... 28
Figure 2.11 Passenger Class wise ........................................................................................................... 29
Figure 2.12 shows the overall location of airports .................................................................................. 30
Figure 2.13 Shows the Comparison of the domestic and international passenger traveled by air ............ 31
Figure 2.14 shows the Cargo service of both Domestic and International ............................................... 31
Figure 2.15 shows the Cargo handling volume in thousand tons ............................................................ 32
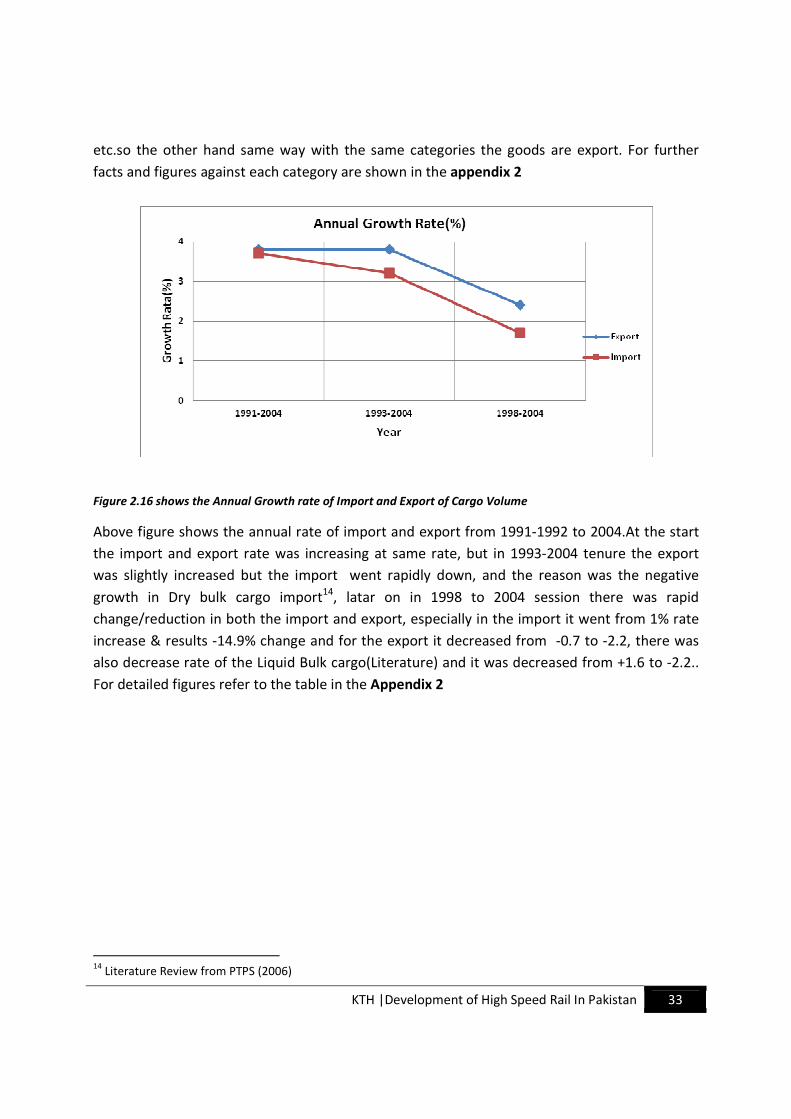
Figure 2.16 shows the Annual Growth rate of Import and Export of Cargo Volume ................................ 33
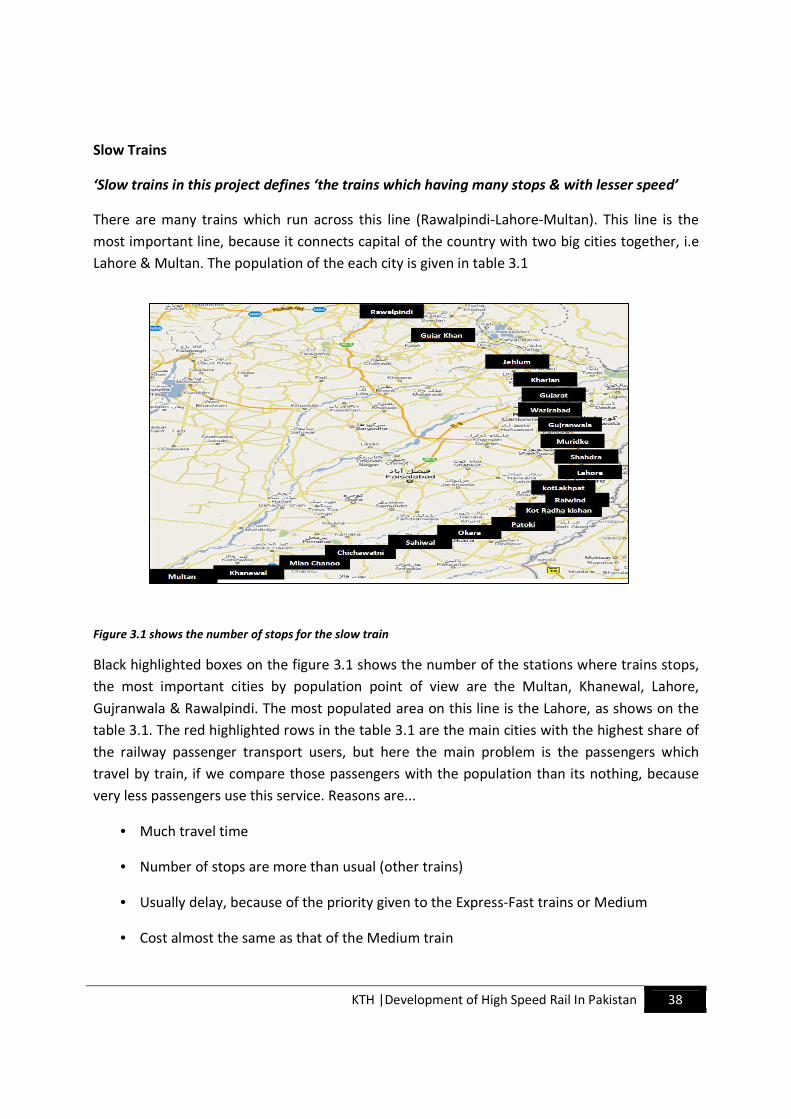
Figure 3.1 shows the number of stops for the slow train ........................................................................ 38
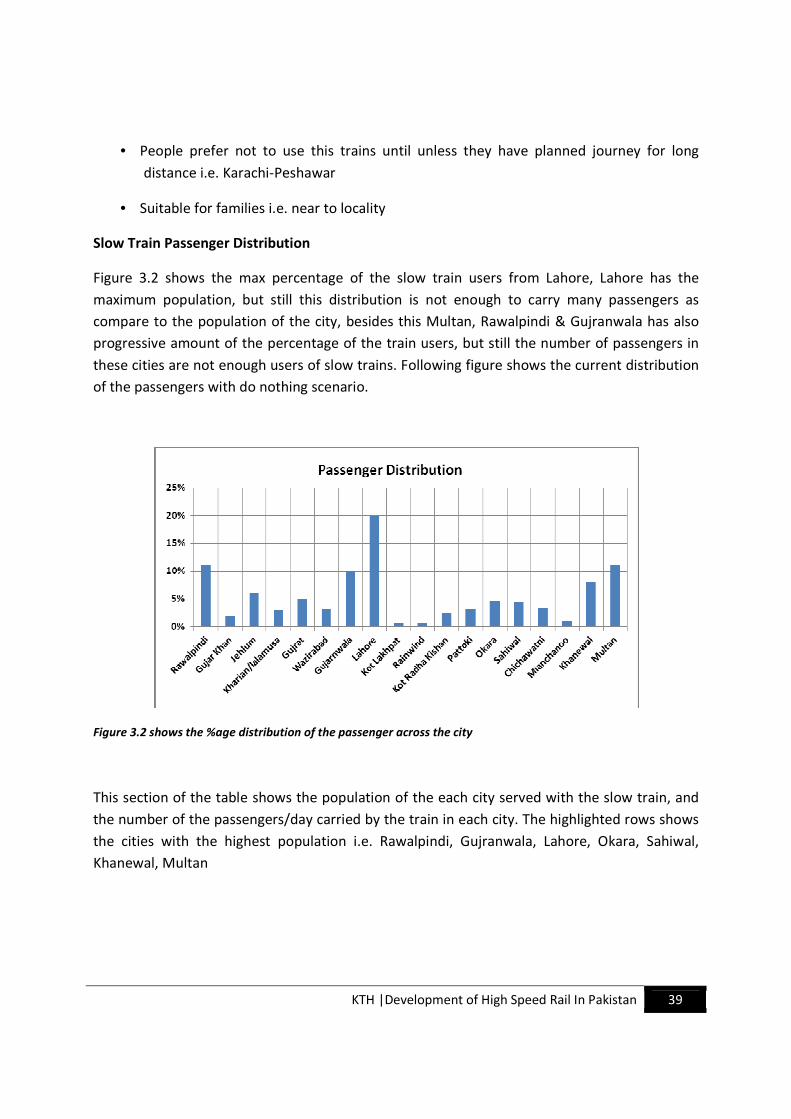
Figure 3.2 shows the %age distribution of the passenger across the city ................................................ 39
Table 3.1 shows the distribution and number of Pass: use the train/day at diff: cities ............................ 40
Table 3.2 shows the travel time covered with the slow trains/w Rawalpindi-Multan .............................. 41
Figure 3.3 shows the Number the stops the Medium train stops ............................................................ 42
Figure 3.4 shows the %age distribution of the passenger different stations carried by Train ................... 43
Table 3.3 shows the Passenger/day traveled by train ............................................................................. 43
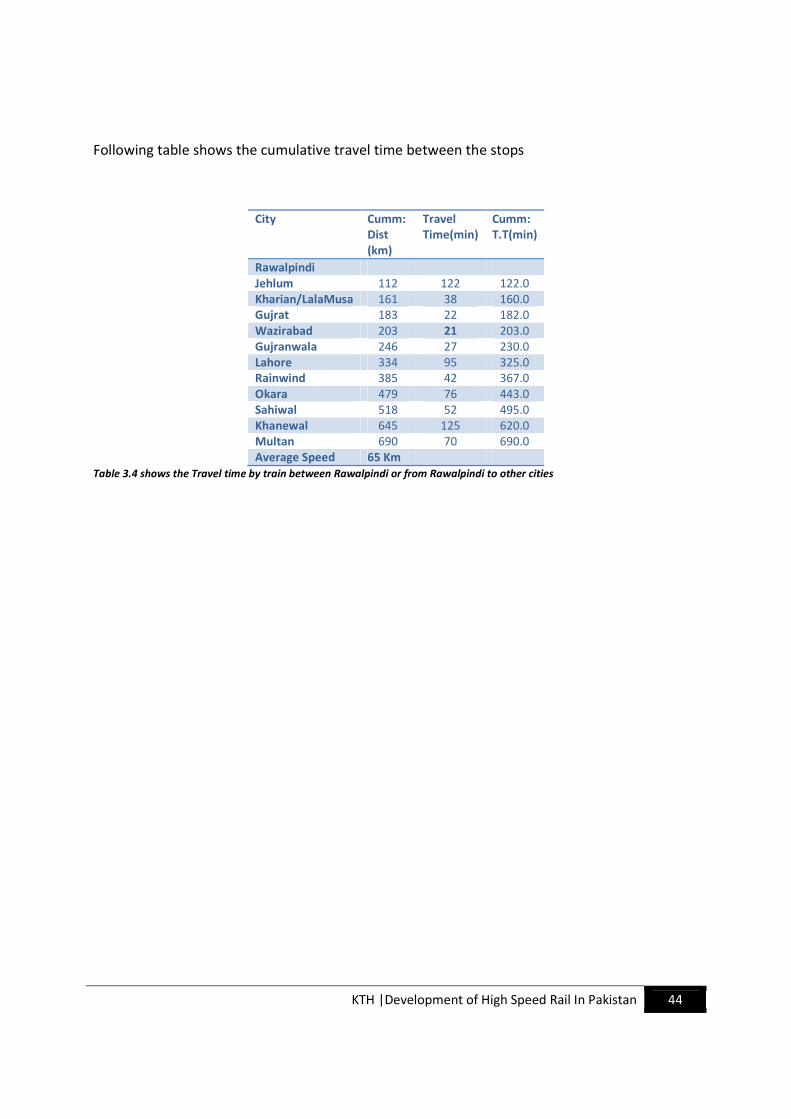
Table 3.4 shows the Travel time by train between Rawalpindi or from Rawalpindi to other cities ........... 44
Figure 3.5 shows the number of stops that the train stops ..................................................................... 45
Table 3.5 shows the Number of passengers travelled/day by train ......................................................... 45
Table 3.6 shows the T.T & distance from Rawalpindi, and Travel time in between two cities. ................. 46
Figure 3.6 shows the percentage share of the passengers taken by different trains ................................ 47
KTH |Development of High Speed Rail In Pakistan 9
Figure 3.7 shows the passenger distribution of all three trains ............................................................... 47
Figure 3.8 shows the relationship between Distance and time for each type of train’ ............................. 48
Table 3.7 shows the Minimum and maximum time taken by the train .................................................... 48
Figure 3.9 shows the %age of the passenger use train in big cities ......................................................... 49
Table 3.8 shows the Market share of the different cities as combine for all types of the trains ............... 50
Figure 3.10 shows the number of passengers carried by train/day (Slow Train) ...................................... 52
Table 3.9 shows the number of train users at different stations ............................................................. 53
Figure 3.11 shows the no of passengers carried by train/day (Medium Train) ........................................ 54
Table 3.10 shows the number of train users at different stations ........................................................... 54
Figure 3.12 shows the number of passengers carried by train/day (Express-Fast Train) .......................... 55
Table 3.11 shows the number of train users at different stations ........................................................... 55
Figure 3.13 shows the Time taken by the all type of the trains ............................................................... 56
Table 3.12 shows the travel time and the cumulative distance among all stations ................................. 57
Figure 3.14 shows the Time taken by the all type of the trains ............................................................... 57
Figure 3.15 Railway user shares of the major cities ................................................................................ 58
Table 3.23 shows the market share of each city w.r.t Population ........................................................... 58
Figure 3.16 shows the Comparision Passengers of both scenarios .......................................................... 59
Figure 3.17 shows the Comparison Passengers of both scenarios ........................................................... 60
Figure 3.18 shows the Passengers taken by High speed Train ................................................................. 63
Table 3.3 shows the number of passenger’s travel/day on different cities .............................................. 64
Table 3.15 shows the cumulative travel time & travel time b/w stations ................................................ 64
Figure 3.19 shows the Passengers taken by High speed Train ................................................................. 66
Table 3.46 shows the number of passenger’s travel/day on different cities ............................................ 66
Figure 3.20 shows the Passengers taken by medium Train ..................................................................... 67
Table 3.57 shows the number of passenger’s travel/day on different ..................................................... 67
Figure 3.21 shows the Passengers taken by High Speed Train/day ......................................................... 68
Table 3.68 shows the number of passenger’s travel/day on different cities ............................................ 69
Table 3.19 shows the cumulative travel time & travel time b/w stations ................................................ 69
Table 3.20 summary table for all scenarios ............................................................................................ 70
Figure 4.1 shows the profit margin for all scenarios ............................................................................... 79
Figure 4.2 Time table for the Scenario 1& typical for scenario 2 ............................................................. 81
Table 4.2 Shows the Minimum & Maximum Travel time for different routes for current scenario ........... 81
Table 4.3 shows the Minimum & Maximum Travel time for different routes for current scenario ........... 82
Figure 4.3 Time table for the Scenario 3 ................................................................................................. 82
Table 4.4 shows the Minimum & Maximum Travel time for different routes for current scenario ........... 83
Figure 4.4 Time table for the Scenario 5 ................................................................................................. 84
KTH |Development of High Speed Rail In Pakistan 10
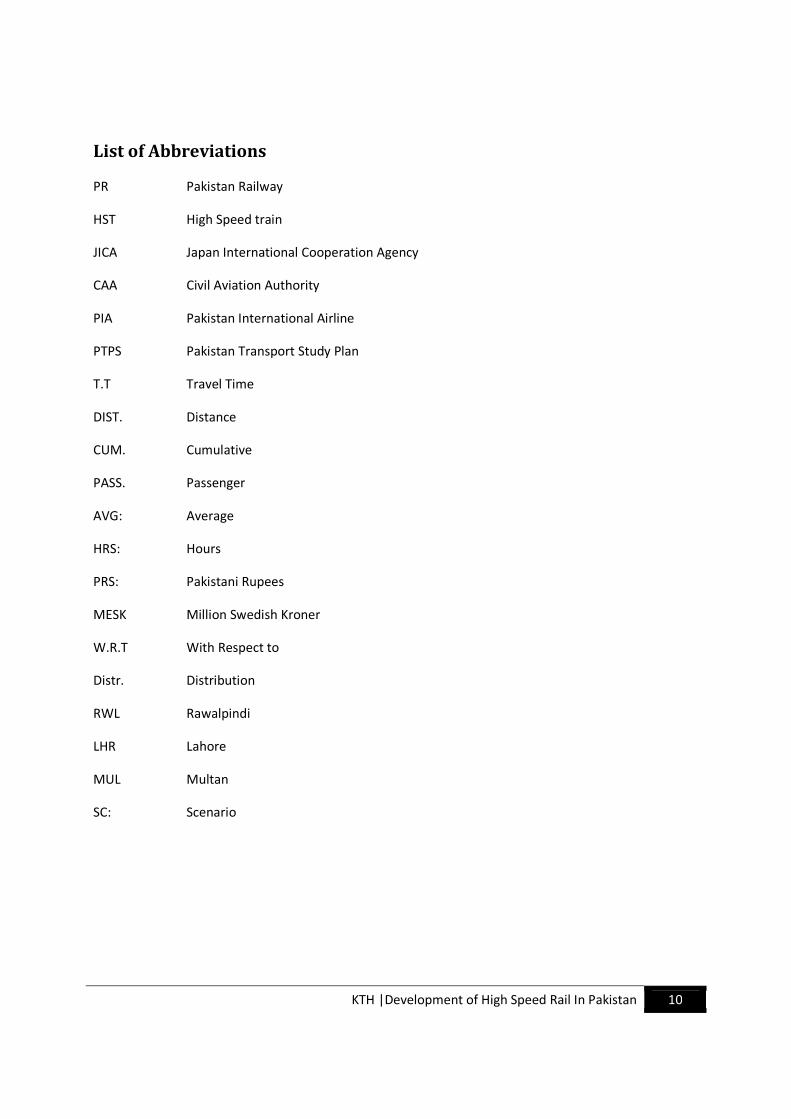
List of Abbreviations
PR Pakistan Railway
HST High Speed train
JICA Japan International Cooperation Agency
CAA Civil Aviation Authority
PIA Pakistan International Airline
PTPS Pakistan Transport Study Plan
T.T Travel Time
DIST. Distance
CUM. Cumulative
PASS. Passenger
AVG: Average
HRS: Hours
PRS: Pakistani Rupees
MESK Million Swedish Kroner
W.R.T With Respect to
Distr. Distribution
RWL Rawalpindi
LHR Lahore
MUL Multan
SC: Scenario
KTH |Development of High Speed Rail In Pakistan 11
Introduction
Project -Introduction
1

KTH |Development of High Speed Rail In Pakistan 12
KTH |Development of High Speed Rail In Pakistan 13
1- Introduction
Pakistan Railway is the state-owned company of Pakistan. It is a quite large organization with
collaboration of the Pakistani Government i.e. Ministry of Railway. Pakistan railway provides an
important mode of the transportation in the farthest corners of the country and brings them
closer for business, sightseeing, pilgrimage and education. It has been a great integrating force
and forms the life line of the country by catering to its needs for the large scale improvement of
people and freight2
1.1 – Background
Railway transport has long history in Pakistan, it was started in 18613, and it had a principal
position in the land transport. During past most of the transport (passenger and freight) was
transported by the rail, the road transport had not much demand , so road transport was just
used as short distance and feeder transport services. However the road transportation having
door to door access with the time flexibility. So now it is grown as the competitor of the railway
and it has occupied many major routes of the railway transport.
Since many years, due to the fall of the Pakistan railway, road transport has taken an advantage
of this, and promised to revenge. Pakistan road transport deals with all type of the passenger
transport including short-distance, long distance, multi-directional and point to point transport.
Therefore road transport is a vital mode as a fundamental land transport means in Pakistan.
However Railway has following advantages
• “Safe, punctual, comfortable and fast” as advantages in the service aspect
• “Inexpensive, low environmental impact, saving natural resources and saving space” as
advantages in the social aspect4
Trend has been started in the Railway transport for last many years. The trend can be described
in the term of the High speed trains. i.e. trains moving from place to place with higher speed
than the conventional trains. High speed trains are mostly need by the country which has
2 Maraj Nadeem ,(2007),Report on Pakistan Railway
3 http://history-of-rail-transport-in-pakistan.co.tv/ 16:48,110512
4 Pakistan Railway
KTH |Development of High Speed Rail In Pakistan 14
higher population and which are already developed5, but now the trend is more moving
towards the developing countries, developing countries got the more population but less
resources. Pakistan is one of the examples of the developing countries. Before 90’s the trains
were running very slow may be with the speed of 70 km/hr, and the journey was done in the
days, so as we ‘Necessity is the mother of inventions6’ so Pakistan has decided to upgrade their
trains in 20027. Pakistan Railway bought new trains from China, and journey converted to Hours
from days but still the speed offered by the Chinese trains are not sufficient to reduce the much
travel time.
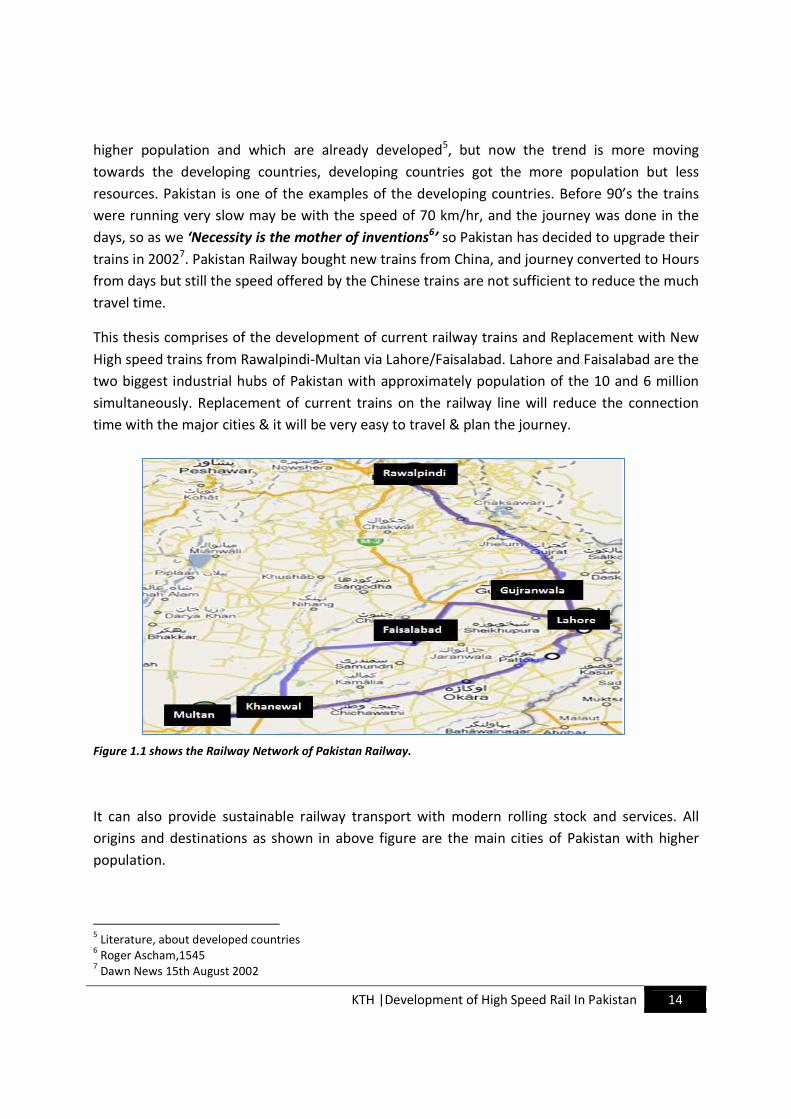
This thesis comprises of the development of current railway trains and Replacement with New
High speed trains from Rawalpindi-Multan via Lahore/Faisalabad. Lahore and Faisalabad are the
two biggest industrial hubs of Pakistan with approximately population of the 10 and 6 million
simultaneously. Replacement of current trains on the railway line will reduce the connection
time with the major cities & it will be very easy to travel & plan the journey.
Figure 1.1 shows the Railway Network of Pakistan Railway.
It can also provide sustainable railway transport with modern rolling stock and services. All
origins and destinations as shown in above figure are the main cities of Pakistan with higher
population.
5 Literature, about developed countries
6 Roger Ascham,1545
7 Dawn News 15th August 2002
KTH |Development of High Speed Rail In Pakistan 15
1.2- Aim
The idea behind this research project is improvement of the existing line and give an idea about
new high speed railway trains, in order to reduce the travel time, increase the comfort level and
give a best solution for the future.
The aim of this thesis project is to invest on the current railway trains and come with the idea of
the new High speed train, and evaluate both the system in the terms of the money, travel time,
Frequency, etc. and choose the system which provide most efficient and economic transport
system and it should have low environmental impacts and it should be specialized with the
following.
• High speed trains for long and middle distances
• High speed trains on the Main Line
• Reduce the no of the stops for the passenger
• Decrease the travel time
• Make more frequent service, so passengers can plan their journey
• Economically Viable
• Comfortable, less delays & etc.
1.3- Methodology Following are the steps to be followed for this thesis project
a- The first step consist of the search information
• Data from relevant departments i.e Pakistan Railway
• Data from different sources, i.e Authority Presentations, years books etc
• The use of the existing literature and data, in order to search information about
population, maps, existing infrastructure, working places etc
• Existing information about passengers i.e. Timetable and historical data
b- 2nd
step consist of Passenger Forecasting for Current & future
• Some figures given by the Pakistan Railway i.e. %age increments for the future
forecasts
KTH |Development of High Speed Rail In Pakistan 16
• For demand estimation travel time & frequency elasticity are calculated ,detailed
description is given as follow
c- Application of the elasticity concept: Demand Estimation
Elasticity–based demand help estimate the new demand levels for the particular transportation
mode in response to implementation of service attributes changes such as trip cost increases
and travel time decreases .for this it is assumed that the reimplementation demand level is
know, so after calculating the elasticity factors the new demand may be calculated8
There are two main types of the models
a- Non-Linear Demand function: For demand function of the from V=kx2,where x is the
activity or transportation system attribute, the elasticity of the demand with respect to
the attribute x can be calculated on the basis of two data points (x1,V1) & (x1,v2)as
1 2
1 2
log log
log logx
v ve a
x x
−= =−
The new demand Vnew, corresponding to a change in the attribute x, can be therefore be estimated as
11
ex
newnew
XV V
X
=
b- Linear Demand Function: A variation to this method of demand estimation is when the
demand function is assumed to be linear over the range of interest. In this case the
elasticity can be determined using equation as
/ /
/ /x
dV V V Ve
dx x x x= = △
△
When 1
1
/
/
V V
x x
△
△
when x1 is used as base point, and ex = 2
2
/
/
V V
x x
△
△
when x2 is used as base, clearly the value
of elasticity will depend on which coordinate it used as base point. If coordinate (x1, V1) is used as base
point, the (Vnew) corresponding to the change in the attribute x can be estimated as
11
1
1ex
newnew x
X XV V e
X
−= +
It is assumed that the travel time between the cities is 2nd
degree; it is not a linear line, but a
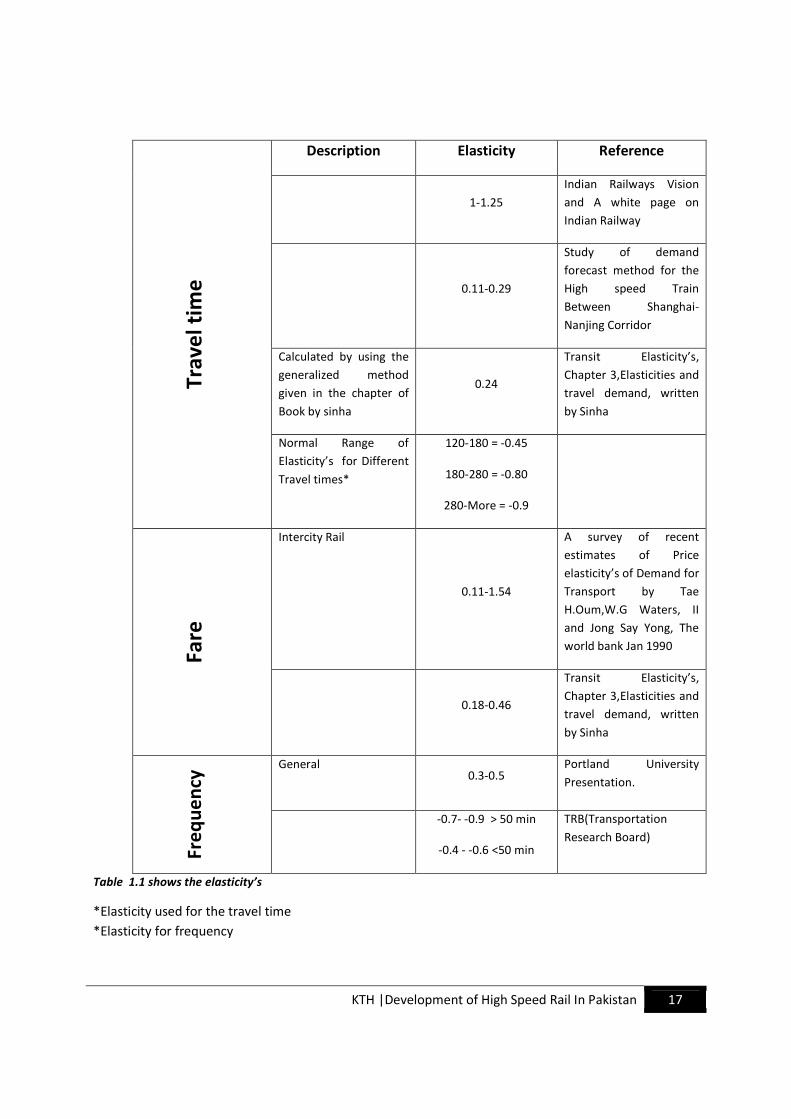
non-linear curve. Following table shows the different elasticity’s from different sources
8 Estimating transportation demand by Sinha
KTH |Development of High Speed Rail In Pakistan 17
Tra
ve
l ti
me
Description Elasticity Reference
1-1.25
Indian Railways Vision
and A white page on
Indian Railway
0.11-0.29
Study of demand
forecast method for the
High speed Train
Between Shanghai-
Nanjing Corridor
Calculated by using the
generalized method
given in the chapter of
Book by sinha
0.24
Transit Elasticity’s,
Chapter 3,Elasticities and
travel demand, written
by Sinha
Normal Range of
Elasticity’s for Different
Travel times*
120-180 = -0.45
180-280 = -0.80
280-More = -0.9
Fa
re
Intercity Rail
0.11-1.54
A survey of recent
estimates of Price
elasticity’s of Demand for
Transport by Tae
H.Oum,W.G Waters, II
and Jong Say Yong, The
world bank Jan 1990
0.18-0.46
Transit Elasticity’s,
Chapter 3,Elasticities and
travel demand, written
by Sinha
Fre
qu
en
cy General
0.3-0.5 Portland University
Presentation.
-0.7- -0.9 > 50 min
-0.4 - -0.6 <50 min
TRB(Transportation
Research Board)
Table 1.1 shows the elasticity’s
*Elasticity used for the travel time
*Elasticity for frequency
KTH |Development of High Speed Rail In Pakistan 18
d- Economic Calculations
• Based on the demand of i.e. 15 years, economy calculations will be done, the
main revenues/cost are the
i. Revenues from the Tickets
ii. Operating costs
iii. Driver & Conductor costs etc.
iv. Capital Cost
e- Recommendations & Conclusions
• Last step is to choose the best system, weather the current system can full fill
the requirements or we need to go for the new Trains system (High speed trains)
1.4 - Limitations
Following are the limitations for this Master thesis.
• Track Up gradation: Track up gradation is not a part of this Master thesis but on the
other hand Pakistan Railway has just finished (Lahore-Rawalpindi) the feasibility report
for the new track for the High speed train.
• Building Network: In this Master thesis it is assumed that there is no nead for the
building new network, so building new network is not part of this work.
• Signaling System: It is assumed that the signaling system is already fine, signaling
system is not a part of this master thesis.
KTH |Development of High Speed Rail In Pakistan 19
Transport Market
2
Pakistan Transport Market

KTH |Development of High Speed Rail In Pakistan 20
KTH |Development of High Speed Rail In Pakistan 21
2- Pakistan Transport Market
2.1- Pakistan Railway Infrastructure
As earlier it is discussed that passenger transport of Pakistan Railway is steady for express
service for middle / long distance intercity transport. The number of railway passengers, which
had been decreasing due to motorization, reached the bottom in 1998/999, and now it is on a
track of recovery. In this chapter the present passenger/freight transport situation in the study
area is defined by all mode of the transport, including the existing railway, road, air.
Total no of the track kilometers with Pakistan Railway is 11,515km and with route network
7,791Km, out of which 7,346 is Broad Gauge and 445 is Meter gauge. There are 625 stations in
the network out of which 550 stations working throughout the network in Pakistan.
Figure 2.1 shows the Railway Infrastructure of Pakistan10
out of total route11
kilometers, 1043Km are doubled track but in this study it is assumed that
the track is not a mean of delay (double track for primary A line).The track between Khanewal
and Lahore is an
9 Report on Pakistan Railway at his Glance (2008)
10 JICA Study Team(2006)
11 PTSP, Pakistan Transport Study Plan 2005
KTH |Development of High Speed Rail In Pakistan 22
2.2- Pakistan Railway Connections12
Figure 2.2 shows the different connections of Railway lines
The Main Line (official route name) connects the following major stations; Karachi, Multan,
Lahore, Rawalpindi and Peshawar
Import and export by sea in Pakistan are handled through Karachi port and port Qasim. A new
port known as deep-sea port is under construction in Gawader. Karachi Port handles
approximately 30 million tons of cargo, while port Qasim handles 11 million tons, and about
60% of the imported cargo is transported inland from two ports by road and rail throughout the
country.
The normal speed of the train is 90km/hr to 110 km/hr, in this section (primary A) from Karachi
to Lala Musa and bypass lines through Faisalabad. The maximum permissible speed is actually
varies from 95 to 105 km/hr, but in other lines it is slightly lower and usually from 50 to 15
km/hr. Pakistan Railway has strengthen and rehabilated the railway tracks and sleeper for all
12
http://www.findpk.com/yp/html/railways.html , 17:47,110512
KTH |Development of High Speed Rail In Pakistan 23
four line, lines are shown in the figure 2.2, table 1 in appendix 2 shows rehabilitation and
improvement of the railway tracks. Figure 2.3, shows the improvement in the Railway tracks.
2.3- Railway Track Conditions
Pakistan Railway has started many projects on the rehabilitation and strengthening of the
tracks works during 2000-2006, and approximately 83% of the tracks were improved. As far as
my study is concerns I assume that the current track is well enough for ride of new high speed
train. It is assumed that there are 4 types of tracks Primary –A, Primary – B, Secondary and
tertiary. (This division is accordance with the PR). The focus will be only being on one section of
main track i.e. Primary A. It has total length of 3031Km and 2634 “87%” is improved during
2006 and 397 “13%” which could not be improved much. Similarly Primary-B is 2674, improved
is 1365km “51%” and unimproved is 1309km “49%”,secondary is 1185, improved 680km “58%”
and unimproved “42%”, Tertiary is 1500km, improved 1239km “83%”, and unimproved is 1239
“17%”. Now my base assumption is that the track is well enough to bear stresses of new high
speed train. Following figure shows the current (2006) tracks improvements with percentage13
.
Figure 2.3 shows the %age of the track improvements
13
Percentages are calculated from Pakistan Railway Annual report(2006)
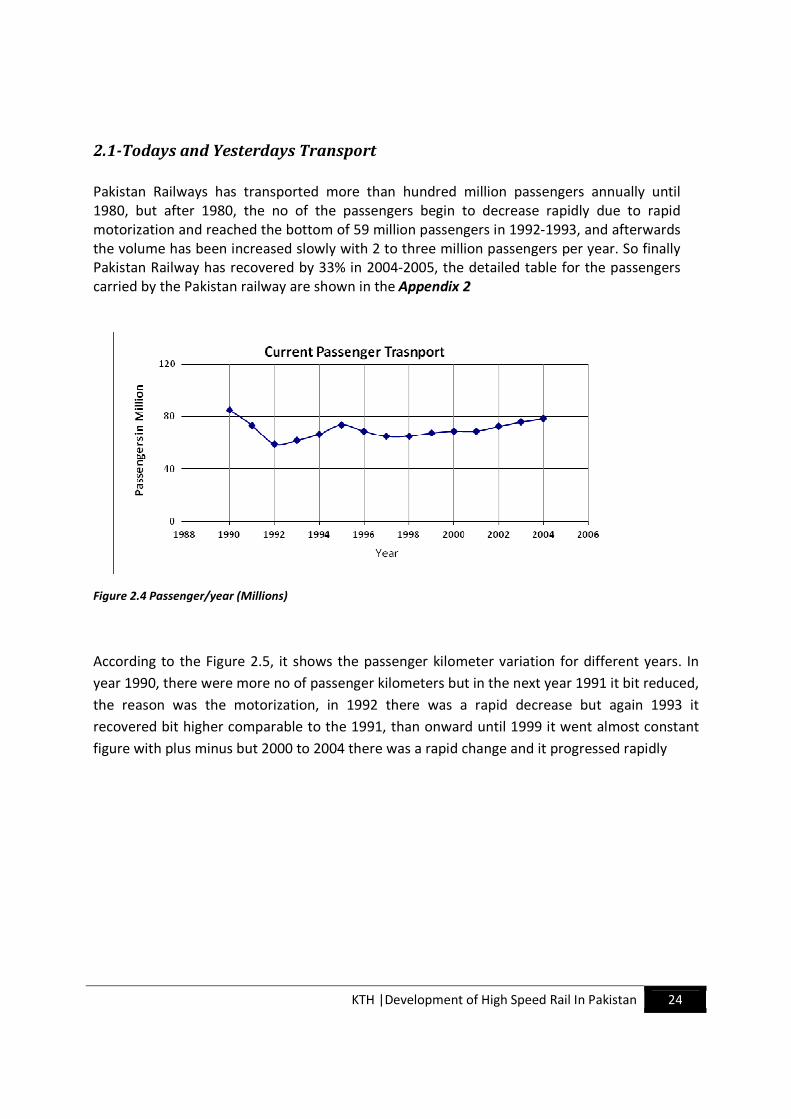
KTH |Development of High Speed Rail In Pakistan 24
2.1-Todays and Yesterdays Transport
Pakistan Railways has transported more than hundred million passengers annually until
1980, but after 1980, the no of the passengers begin to decrease rapidly due to rapid
motorization and reached the bottom of 59 million passengers in 1992-1993, and afterwards
the volume has been increased slowly with 2 to three million passengers per year. So finally
Pakistan Railway has recovered by 33% in 2004-2005, the detailed table for the passengers
carried by the Pakistan railway are shown in the Appendix 2
Figure 2.4 Passenger/year (Millions)
According to the Figure 2.5, it shows the passenger kilometer variation for different years. In
year 1990, there were more no of passenger kilometers but in the next year 1991 it bit reduced,
the reason was the motorization, in 1992 there was a rapid decrease but again 1993 it
recovered bit higher comparable to the 1991, than onward until 1999 it went almost constant
figure with plus minus but 2000 to 2004 there was a rapid change and it progressed rapidly
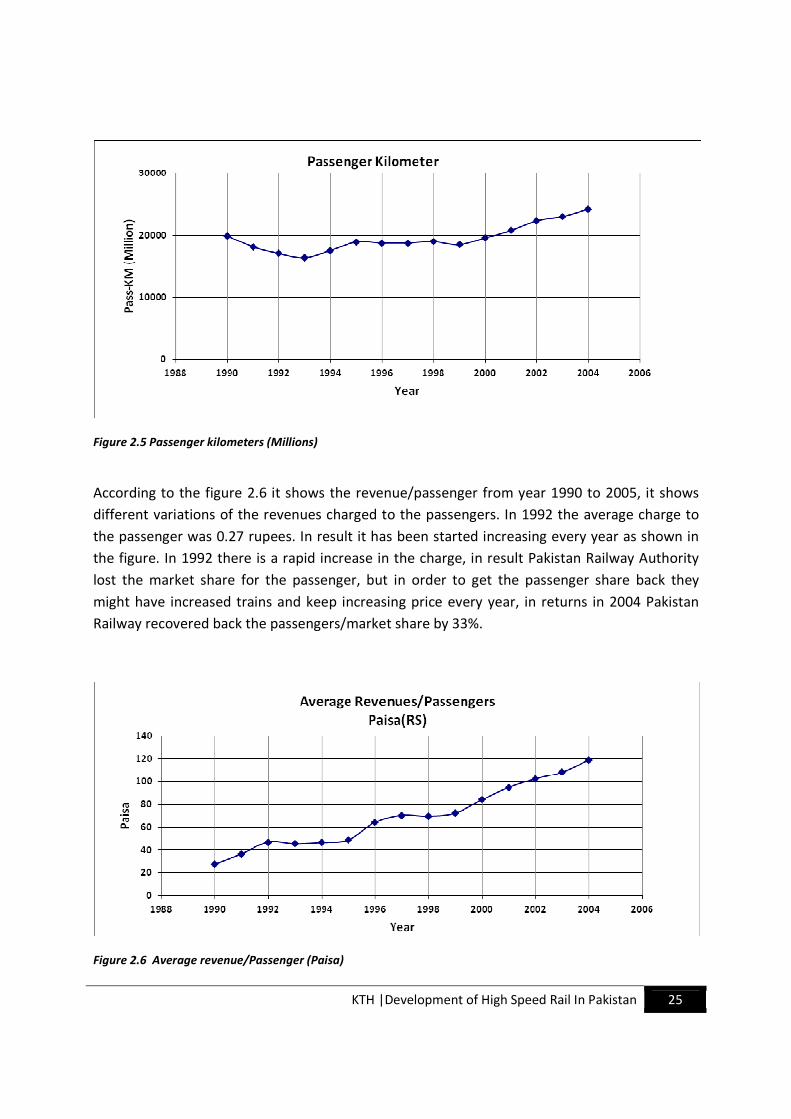
KTH |Development of High Speed Rail In Pakistan 25
Figure 2.5 Passenger kilometers (Millions)
According to the figure 2.6 it shows the revenue/passenger from year 1990 to 2005, it shows
different variations of the revenues charged to the passengers. In 1992 the average charge to
the passenger was 0.27 rupees. In result it has been started increasing every year as shown in
the figure. In 1992 there is a rapid increase in the charge, in result Pakistan Railway Authority
lost the market share for the passenger, but in order to get the passenger share back they
might have increased trains and keep increasing price every year, in returns in 2004 Pakistan
Railway recovered back the passengers/market share by 33%.
Figure 2.6 Average revenue/Passenger (Paisa)
KTH |Development of High Speed Rail In Pakistan 26
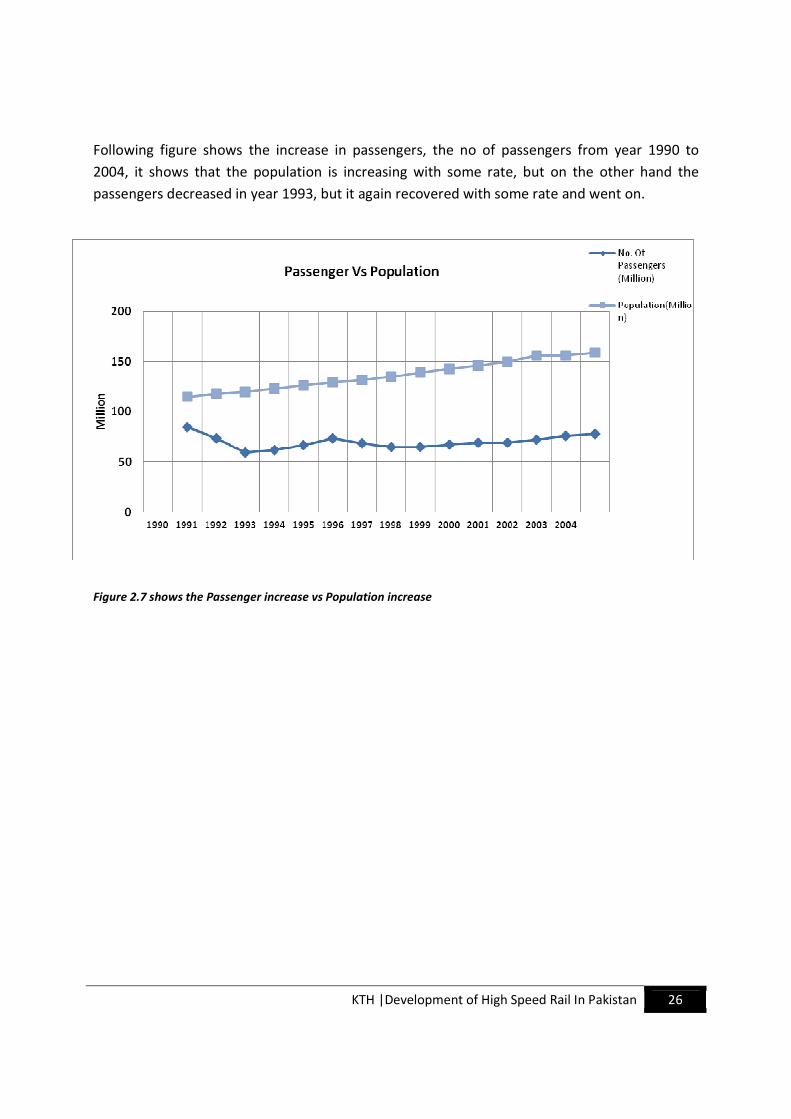
Following figure shows the increase in passengers, the no of passengers from year 1990 to
2004, it shows that the population is increasing with some rate, but on the other hand the
passengers decreased in year 1993, but it again recovered with some rate and went on.
Figure 2.7 shows the Passenger increase vs Population increase
KTH |Development of High Speed Rail In Pakistan 27
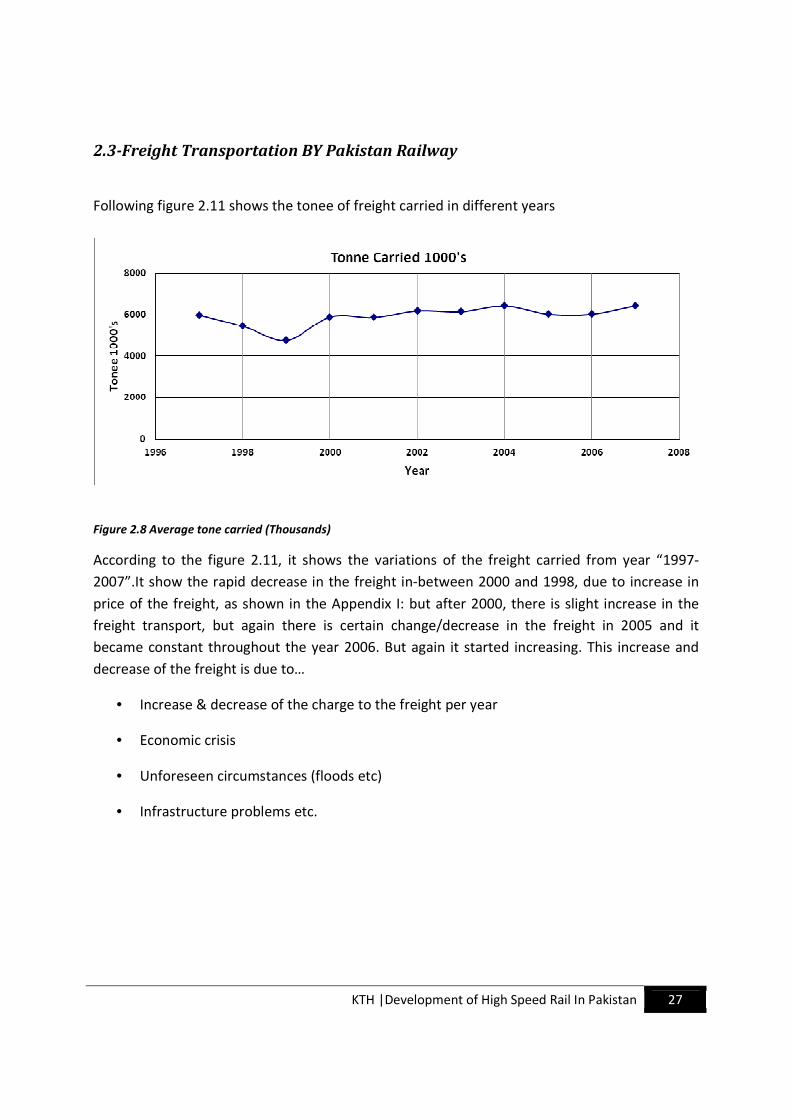
2.3-Freight Transportation BY Pakistan Railway
Following figure 2.11 shows the tonee of freight carried in different years
Figure 2.8 Average tone carried (Thousands)
According to the figure 2.11, it shows the variations of the freight carried from year “1997-
2007”.It show the rapid decrease in the freight in-between 2000 and 1998, due to increase in
price of the freight, as shown in the Appendix I: but after 2000, there is slight increase in the
freight transport, but again there is certain change/decrease in the freight in 2005 and it
became constant throughout the year 2006. But again it started increasing. This increase and
decrease of the freight is due to…
• Increase & decrease of the charge to the freight per year
• Economic crisis
• Unforeseen circumstances (floods etc)
• Infrastructure problems etc.
KTH |Development of High Speed Rail In Pakistan 28
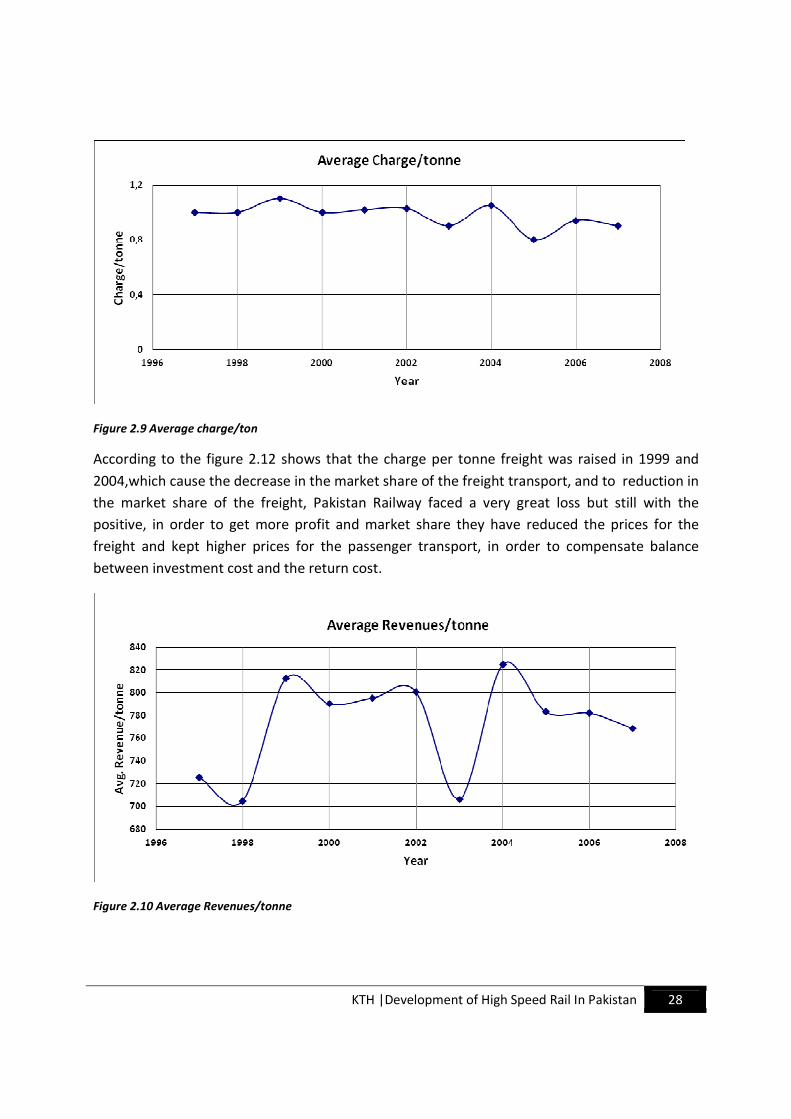
Figure 2.9 Average charge/ton
According to the figure 2.12 shows that the charge per tonne freight was raised in 1999 and
2004,which cause the decrease in the market share of the freight transport, and to reduction in
the market share of the freight, Pakistan Railway faced a very great loss but still with the
positive, in order to get more profit and market share they have reduced the prices for the
freight and kept higher prices for the passenger transport, in order to compensate balance
between investment cost and the return cost.
Figure 2.10 Average Revenues/tonne
KTH |Development of High Speed Rail In Pakistan 29
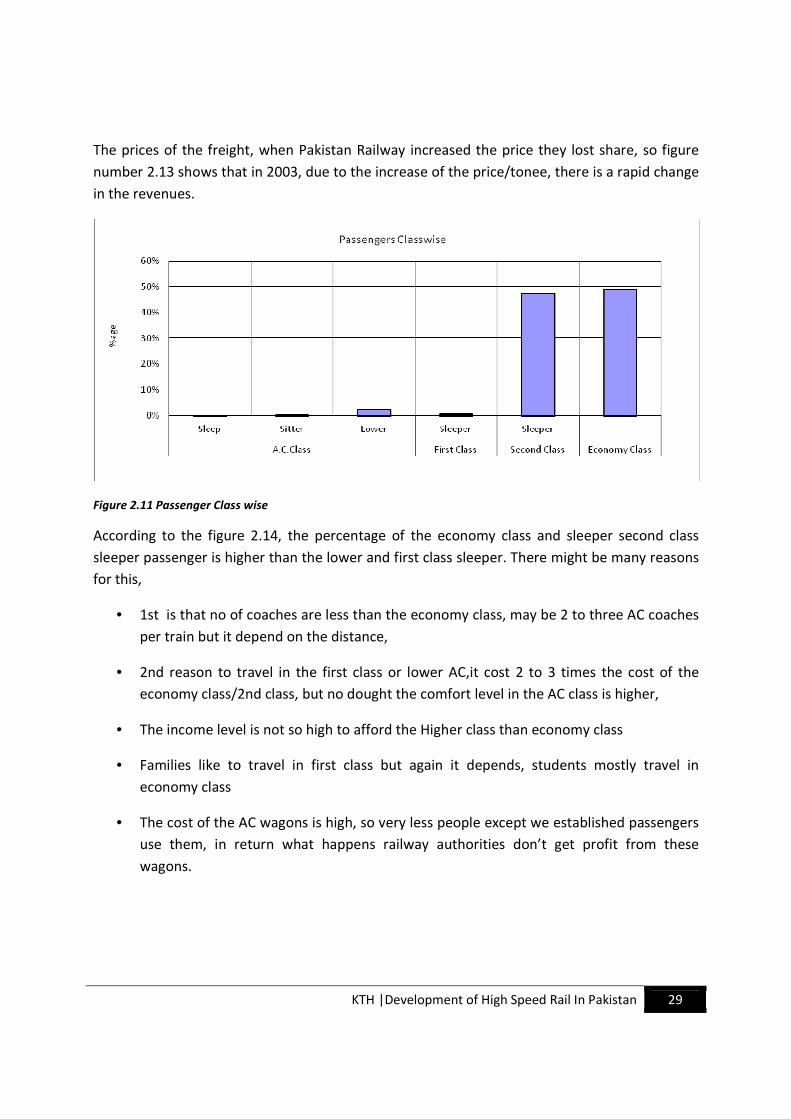
The prices of the freight, when Pakistan Railway increased the price they lost share, so figure
number 2.13 shows that in 2003, due to the increase of the price/tonee, there is a rapid change
in the revenues.
Figure 2.11 Passenger Class wise
According to the figure 2.14, the percentage of the economy class and sleeper second class
sleeper passenger is higher than the lower and first class sleeper. There might be many reasons
for this,
• 1st is that no of coaches are less than the economy class, may be 2 to three AC coaches
per train but it depend on the distance,
• 2nd reason to travel in the first class or lower AC,it cost 2 to 3 times the cost of the
economy class/2nd class, but no dought the comfort level in the AC class is higher,
• The income level is not so high to afford the Higher class than economy class
• Families like to travel in first class but again it depends, students mostly travel in
economy class
• The cost of the AC wagons is high, so very less people except we established passengers
use them, in return what happens railway authorities don’t get profit from these
wagons.

KTH |Development of High Speed Rail In Pakistan 30
2.6- Pakistan Aviation Authority
Pakistan airports are divided into different categories. There are 44 airports, out of which 5 are
international airports located in Islamabad, Karachi, Lahore, Peshawar and Gawader. The
airports are administrated by Pakistan Civil Aviation Authority (CAA).National flag carrier is
Pakistan International Airline(PIA).There are many other private operators i.e Shaheen Air
International, Aero Asia, Royal Airline and Air Blue. The maintenance work of Airports is done
by CAA, and the revenues are earned with the help of Landing fees and air navigation charges.
Following figure shows the all locations of the airports (National & International)
Figure 2.12 shows the overall location of airports
Following figure shows the comparison of the domestic and international passenger transport
by airlines. Figure shows that the domestic traffic was quite higher than the international traffic
at the start (1988-89) and it went constant till 1992, in year 1992 it went higher rapidly and
carried on till 1996, afterwards there was a sudden fall, and since 1997 it went falling down
rapidly, in result it has decreased its market share, in year 2002 ,the both the domestic and the
international passengers traffic were almost equal, but in 2003 domestic reduced bit, but in
2004 it(domestic) started raising up. As far as the international passengers are concerned, the
line is bit towards progression rather than towards fall, just it has little fall in year 1992 and
1994/95 due to the economic crisis, but still market share of the air traffic is slightly increasing
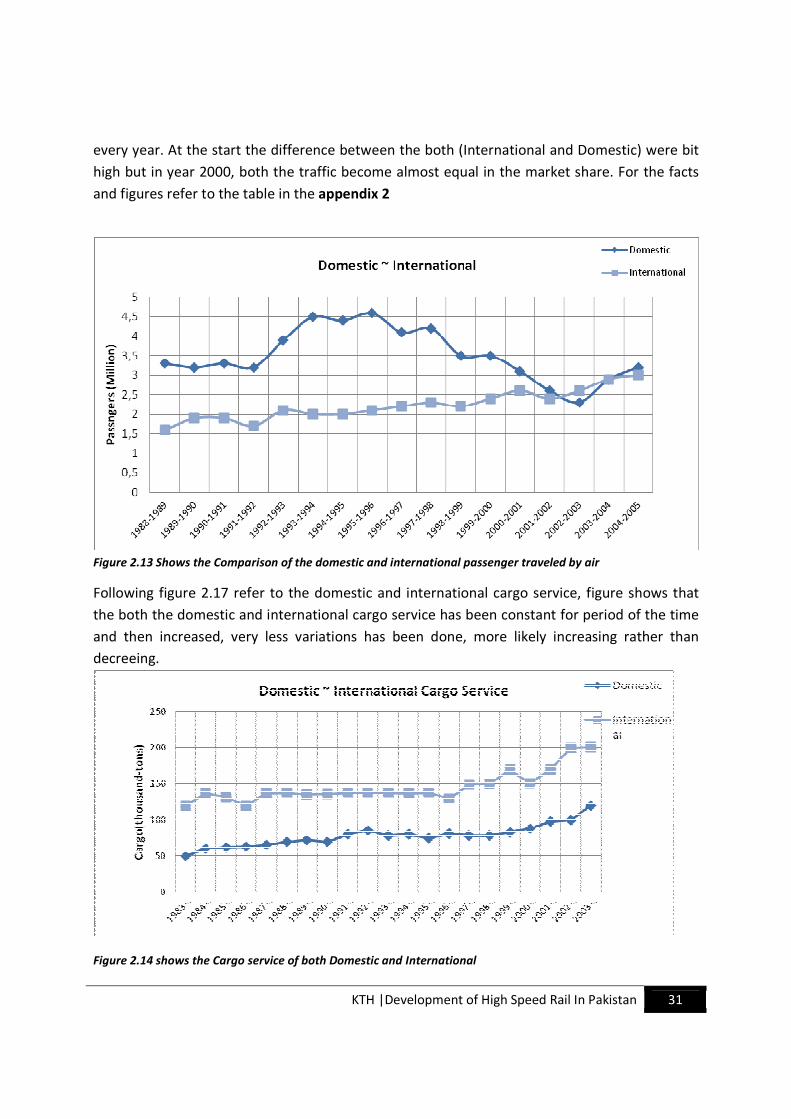
KTH |Development of High Speed Rail In Pakistan 31
every year. At the start the difference between the both (International and Domestic) were bit
high but in year 2000, both the traffic become almost equal in the market share. For the facts
and figures refer to the table in the appendix 2
Figure 2.13 Shows the Comparison of the domestic and international passenger traveled by air
Following figure 2.17 refer to the domestic and international cargo service, figure shows that
the both the domestic and international cargo service has been constant for period of the time
and then increased, very less variations has been done, more likely increasing rather than
decreeing.
Figure 2.14 shows the Cargo service of both Domestic and International
KTH |Development of High Speed Rail In Pakistan 32
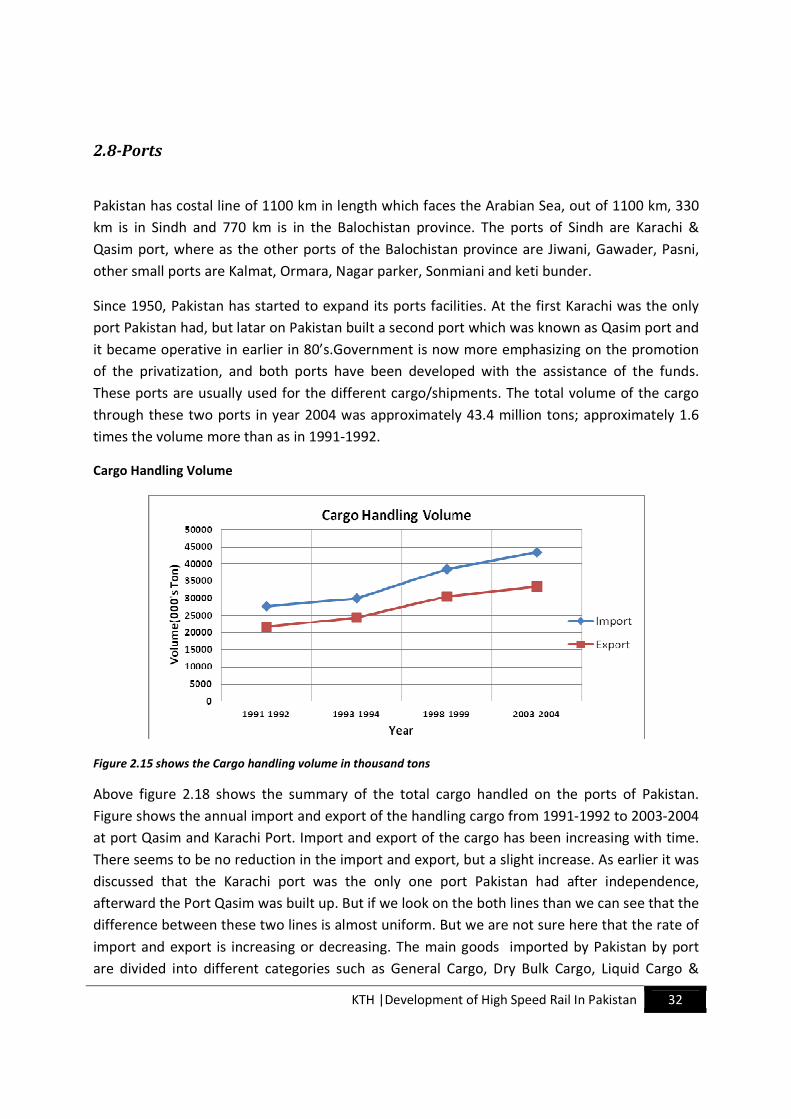
2.8-Ports
Pakistan has costal line of 1100 km in length which faces the Arabian Sea, out of 1100 km, 330
km is in Sindh and 770 km is in the Balochistan province. The ports of Sindh are Karachi &
Qasim port, where as the other ports of the Balochistan province are Jiwani, Gawader, Pasni,
other small ports are Kalmat, Ormara, Nagar parker, Sonmiani and keti bunder.
Since 1950, Pakistan has started to expand its ports facilities. At the first Karachi was the only
port Pakistan had, but latar on Pakistan built a second port which was known as Qasim port and
it became operative in earlier in 80’s.Government is now more emphasizing on the promotion
of the privatization, and both ports have been developed with the assistance of the funds.
These ports are usually used for the different cargo/shipments. The total volume of the cargo
through these two ports in year 2004 was approximately 43.4 million tons; approximately 1.6
times the volume more than as in 1991-1992.
Cargo Handling Volume
Figure 2.15 shows the Cargo handling volume in thousand tons
Above figure 2.18 shows the summary of the total cargo handled on the ports of Pakistan.
Figure shows the annual import and export of the handling cargo from 1991-1992 to 2003-2004
at port Qasim and Karachi Port. Import and export of the cargo has been increasing with time.
There seems to be no reduction in the import and export, but a slight increase. As earlier it was
discussed that the Karachi port was the only one port Pakistan had after independence,
afterward the Port Qasim was built up. But if we look on the both lines than we can see that the
difference between these two lines is almost uniform. But we are not sure here that the rate of
import and export is increasing or decreasing. The main goods imported by Pakistan by port
are divided into different categories such as General Cargo, Dry Bulk Cargo, Liquid Cargo &
KTH |Development of High Speed Rail In Pakistan 33
etc.so the other hand same way with the same categories the goods are export. For further
facts and figures against each category are shown in the appendix 2
Figure 2.16 shows the Annual Growth rate of Import and Export of Cargo Volume
Above figure shows the annual rate of import and export from 1991-1992 to 2004.At the start
the import and export rate was increasing at same rate, but in 1993-2004 tenure the export
was slightly increased but the import went rapidly down, and the reason was the negative
growth in Dry bulk cargo import14
, latar on in 1998 to 2004 session there was rapid
change/reduction in both the import and export, especially in the import it went from 1% rate
increase & results -14.9% change and for the export it decreased from -0.7 to -2.2, there was
also decrease rate of the Liquid Bulk cargo(Literature) and it was decreased from +1.6 to -2.2..
For detailed figures refer to the table in the Appendix 2
14
Literature Review from PTPS (2006)

KTH |Development of High Speed Rail In Pakistan 34

KTH |Development of High Speed Rail In Pakistan 35
Scenarios
3
Defination & Evaluation of Scenarios

KTH |Development of High Speed Rail In Pakistan 36
KTH |Development of High Speed Rail In Pakistan 37
3- Definition & Evaluation of Scenarios
Target Demand
As earlier in chapter 2, it is discussed that the number of Passenger carried by Pakistan Railways
were decreased due to motorization, during 1992/1993 but now after many years Pakistan
railway has recovered back the same passengers share i.e ‘approx.33%15
‘. According to the
Pakistan railway target, passenger demand in year 2010, 2015 and in 2025 will be increased by
16%, 37% and 95% respectively.16
After the discussion of the overall network Pakistan railway for current situation of Passenger &
Freight in chapter 2, now here in this chapter the discussion will not be for the whole Railway
network but focus will only be made on section between Rawalpindi-Lahore-Multan, the length
is approximately 690 Km railway line. Evaluation of the Railway network will be based on the
different scenarios. Following are the given scenarios which will be discussed in this chapter.
There are five different scenarios,
3.1- Scenario 1: Do Nothing Scenario
3.2- Scenario 2: Improvements(Speed)
3.3- Scenario 3: New High Speed Trains
3.4- Scenario 4: Mixed(Medium + High speed) Mixed Train Scenario
3.5- Scenario 5: High speed Train(2025 Demand)
3.1- Scenario 1: Do Nothing
‘Current Evaluation of Line from Rawalpindi-Lahore-Multan’
There are many types of the train which run across the land, but for the purpose of
understanding, in this thesis work they are divided into following three categories
� Slow Trains
� Medium Trains
� Express-Fast Trains
15
Calculations From chapter 2 16
Demand-Supply Analysis by PR Railway year book 2004/2005
KTH |Development of High Speed Rail In Pakistan 38
Slow Trains
‘Slow trains in this project defines ‘the trains which having many stops & with lesser speed’
There are many trains which run across this line (Rawalpindi-Lahore-Multan). This line is the
most important line, because it connects capital of the country with two big cities together, i.e
Lahore & Multan. The population of the each city is given in table 3.1
Figure 3.1 shows the number of stops for the slow train
Black highlighted boxes on the figure 3.1 shows the number of the stations where trains stops,
the most important cities by population point of view are the Multan, Khanewal, Lahore,
Gujranwala & Rawalpindi. The most populated area on this line is the Lahore, as shows on the
table 3.1. The red highlighted rows in the table 3.1 are the main cities with the highest share of
the railway passenger transport users, but here the main problem is the passengers which
travel by train, if we compare those passengers with the population than its nothing, because
very less passengers use this service. Reasons are...
• Much travel time
• Number of stops are more than usual (other trains)
• Usually delay, because of the priority given to the Express-Fast trains or Medium
• Cost almost the same as that of the Medium train
KTH |Development of High Speed Rail In Pakistan 39
• People prefer not to use this trains until unless they have planned journey for long
distance i.e. Karachi-Peshawar
• Suitable for families i.e. near to locality
Slow Train Passenger Distribution
Figure 3.2 shows the max percentage of the slow train users from Lahore, Lahore has the
maximum population, but still this distribution is not enough to carry many passengers as
compare to the population of the city, besides this Multan, Rawalpindi & Gujranwala has also
progressive amount of the percentage of the train users, but still the number of passengers in
these cities are not enough users of slow trains. Following figure shows the current distribution
of the passengers with do nothing scenario.
Figure 3.2 shows the %age distribution of the passenger across the city
This section of the table shows the population of the each city served with the slow train, and
the number of the passengers/day carried by the train in each city. The highlighted rows shows
the cities with the highest population i.e. Rawalpindi, Gujranwala, Lahore, Okara, Sahiwal,
Khanewal, Multan
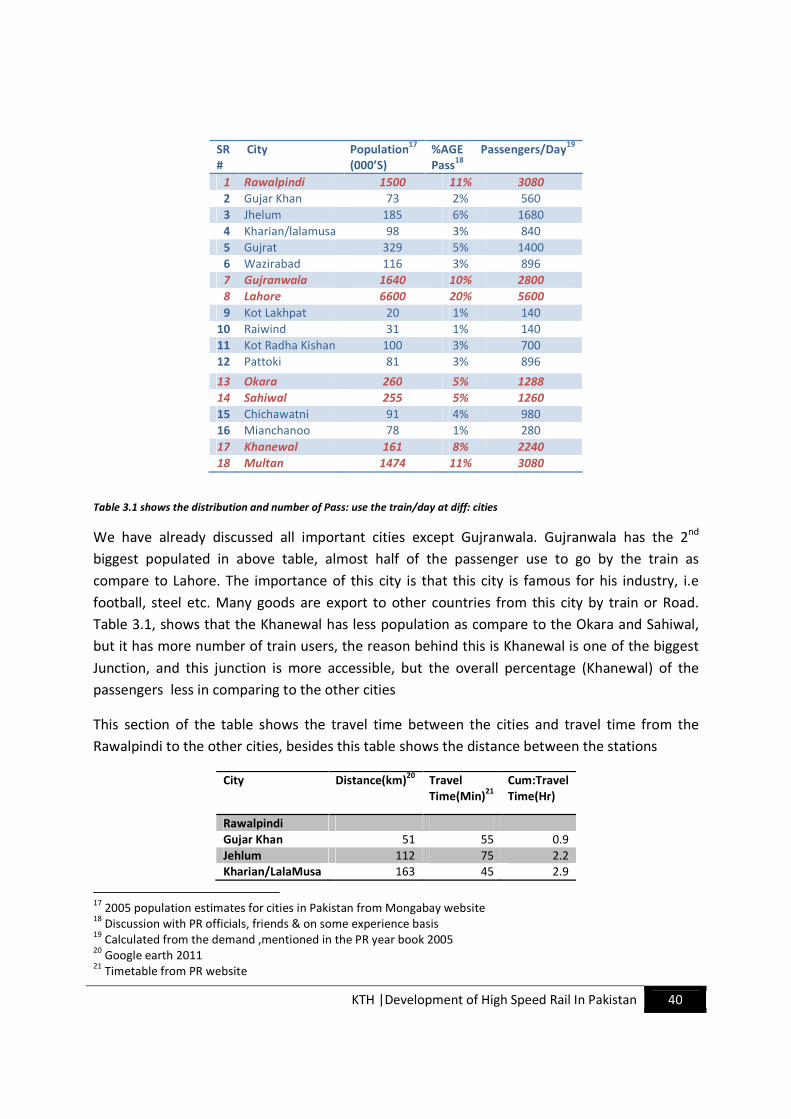
KTH |Development of High Speed Rail In Pakistan 40
SR
#
City Population17
(000’S)
%AGE
Pass18
Passengers/Day19
1 Rawalpindi 1500 11% 3080
2 Gujar Khan 73 2% 560
3 Jhelum 185 6% 1680
4 Kharian/lalamusa 98 3% 840
5 Gujrat 329 5% 1400
6 Wazirabad 116 3% 896
7 Gujranwala 1640 10% 2800
8 Lahore 6600 20% 5600
9 Kot Lakhpat 20 1% 140
10 Raiwind 31 1% 140
11 Kot Radha Kishan 100 3% 700
12 Pattoki 81 3% 896
13 Okara 260 5% 1288
14 Sahiwal 255 5% 1260
15 Chichawatni 91 4% 980
16 Mianchanoo 78 1% 280
17 Khanewal 161 8% 2240
18 Multan 1474 11% 3080
Table 3.1 shows the distribution and number of Pass: use the train/day at diff: cities
We have already discussed all important cities except Gujranwala. Gujranwala has the 2nd
biggest populated in above table, almost half of the passenger use to go by the train as
compare to Lahore. The importance of this city is that this city is famous for his industry, i.e
football, steel etc. Many goods are export to other countries from this city by train or Road.
Table 3.1, shows that the Khanewal has less population as compare to the Okara and Sahiwal,
but it has more number of train users, the reason behind this is Khanewal is one of the biggest
Junction, and this junction is more accessible, but the overall percentage (Khanewal) of the
passengers less in comparing to the other cities
This section of the table shows the travel time between the cities and travel time from the
Rawalpindi to the other cities, besides this table shows the distance between the stations
City Distance(km)20
Travel
Time(Min)21
Cum:Travel
Time(Hr)
Rawalpindi
Gujar Khan 51 55 0.9
Jehlum 112 75 2.2
Kharian/LalaMusa 163 45 2.9
17
2005 population estimates for cities in Pakistan from Mongabay website 18
Discussion with PR officials, friends & on some experience basis 19
Calculated from the demand ,mentioned in the PR year book 2005 20
Google earth 2011 21
Timetable from PR website
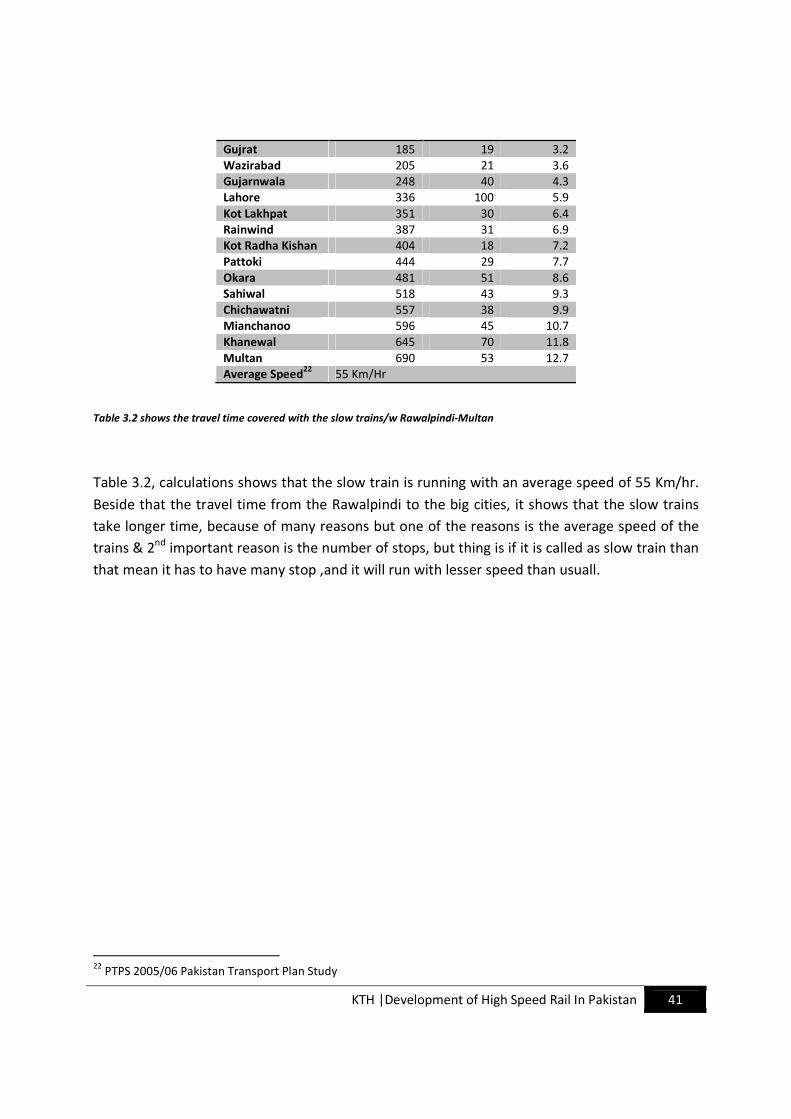
KTH |Development of High Speed Rail In Pakistan 41
Gujrat 185 19 3.2
Wazirabad 205 21 3.6
Gujarnwala 248 40 4.3
Lahore 336 100 5.9
Kot Lakhpat 351 30 6.4
Rainwind 387 31 6.9
Kot Radha Kishan 404 18 7.2
Pattoki 444 29 7.7
Okara 481 51 8.6
Sahiwal 518 43 9.3
Chichawatni 557 38 9.9
Mianchanoo 596 45 10.7
Khanewal 645 70 11.8
Multan 690 53 12.7
Average Speed22
55 Km/Hr
Table 3.2 shows the travel time covered with the slow trains/w Rawalpindi-Multan
Table 3.2, calculations shows that the slow train is running with an average speed of 55 Km/hr.
Beside that the travel time from the Rawalpindi to the big cities, it shows that the slow trains
take longer time, because of many reasons but one of the reasons is the average speed of the
trains & 2nd
important reason is the number of stops, but thing is if it is called as slow train than
that mean it has to have many stop ,and it will run with lesser speed than usuall.
22
PTPS 2005/06 Pakistan Transport Plan Study
KTH |Development of High Speed Rail In Pakistan 42
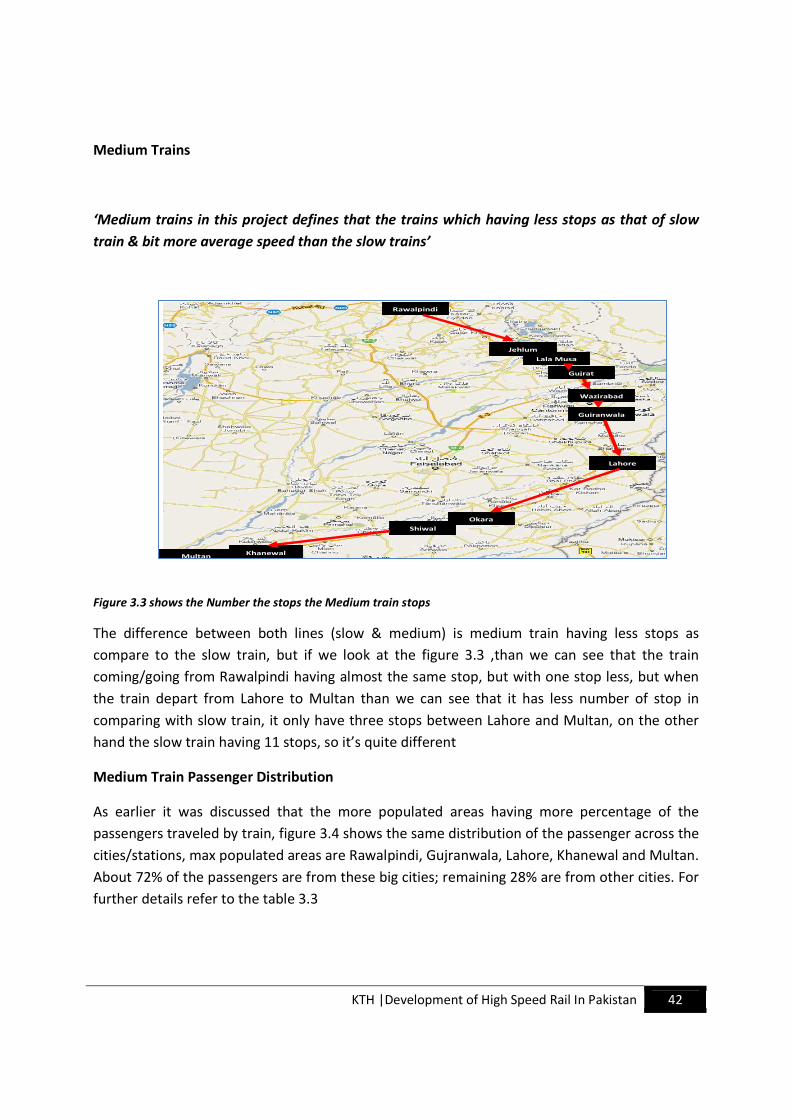
Medium Trains
‘Medium trains in this project defines that the trains which having less stops as that of slow
train & bit more average speed than the slow trains’
Figure 3.3 shows the Number the stops the Medium train stops
The difference between both lines (slow & medium) is medium train having less stops as
compare to the slow train, but if we look at the figure 3.3 ,than we can see that the train
coming/going from Rawalpindi having almost the same stop, but with one stop less, but when
the train depart from Lahore to Multan than we can see that it has less number of stop in
comparing with slow train, it only have three stops between Lahore and Multan, on the other
hand the slow train having 11 stops, so it’s quite different
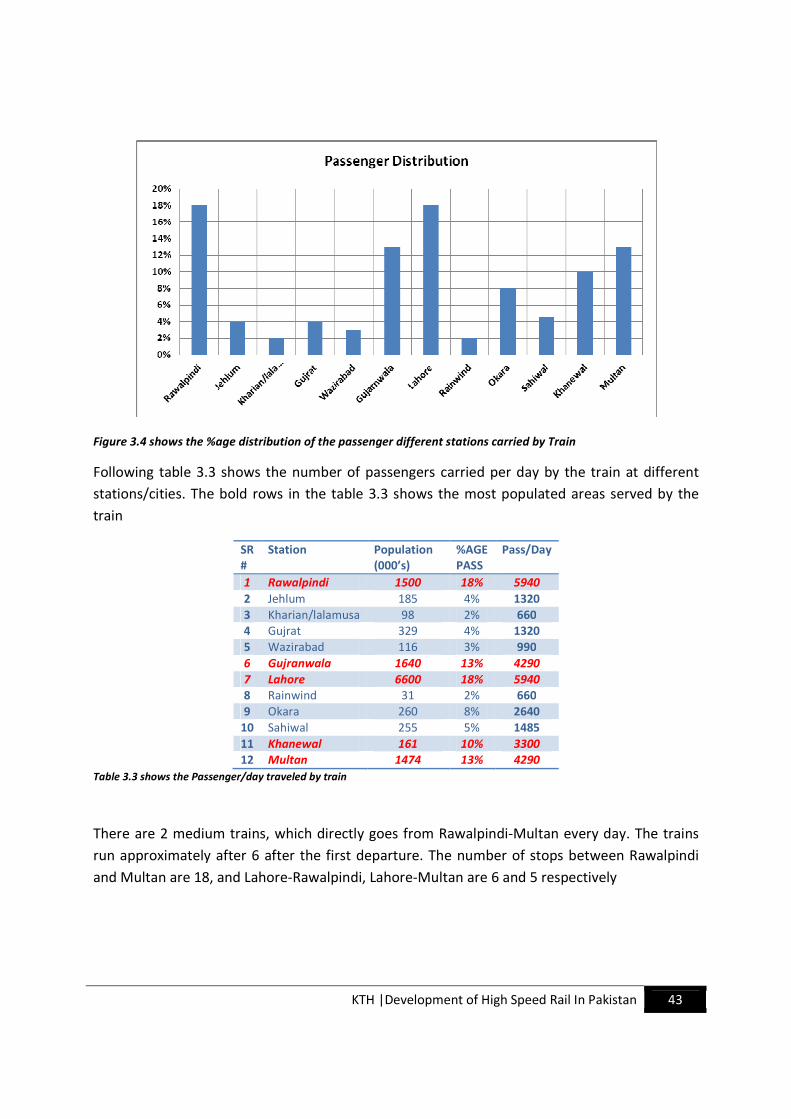
Medium Train Passenger Distribution
As earlier it was discussed that the more populated areas having more percentage of the
passengers traveled by train, figure 3.4 shows the same distribution of the passenger across the
cities/stations, max populated areas are Rawalpindi, Gujranwala, Lahore, Khanewal and Multan.
About 72% of the passengers are from these big cities; remaining 28% are from other cities. For
further details refer to the table 3.3
Rawalpindi
Gujranwala
Lahore
Khanewal Multan
Jehlum
Okara
Shiwal
Wazirabad
Gujrat
Lala Musa
KTH |Development of High Speed Rail In Pakistan 43
Figure 3.4 shows the %age distribution of the passenger different stations carried by Train
Following table 3.3 shows the number of passengers carried per day by the train at different
stations/cities. The bold rows in the table 3.3 shows the most populated areas served by the
train
SR
#
Station Population
(000’s)
%AGE
PASS
Pass/Day
1 Rawalpindi 1500 18% 5940
2 Jehlum 185 4% 1320
3 Kharian/lalamusa 98 2% 660
4 Gujrat 329 4% 1320
5 Wazirabad 116 3% 990
6 Gujranwala 1640 13% 4290
7 Lahore 6600 18% 5940
8 Rainwind 31 2% 660
9 Okara 260 8% 2640
10 Sahiwal 255 5% 1485
11 Khanewal 161 10% 3300
12 Multan 1474 13% 4290
Table 3.3 shows the Passenger/day traveled by train
There are 2 medium trains, which directly goes from Rawalpindi-Multan every day. The trains
run approximately after 6 after the first departure. The number of stops between Rawalpindi
and Multan are 18, and Lahore-Rawalpindi, Lahore-Multan are 6 and 5 respectively
KTH |Development of High Speed Rail In Pakistan 44
Following table shows the cumulative travel time between the stops
City Cumm:
Dist
(km)
Travel
Time(min)
Cumm:
T.T(min)
Rawalpindi
Jehlum 112 122 122.0
Kharian/LalaMusa 161 38 160.0
Gujrat 183 22 182.0
Wazirabad 203 21 203.0
Gujranwala 246 27 230.0
Lahore 334 95 325.0
Rainwind 385 42 367.0
Okara 479 76 443.0
Sahiwal 518 52 495.0
Khanewal 645 125 620.0
Multan 690 70 690.0
Average Speed 65 Km
Table 3.4 shows the Travel time by train between Rawalpindi or from Rawalpindi to other cities
KTH |Development of High Speed Rail In Pakistan 45
Express-Fast
‘Express-Fast trains in this project defines the trains which having less stops and having more
speed than Medium trains’
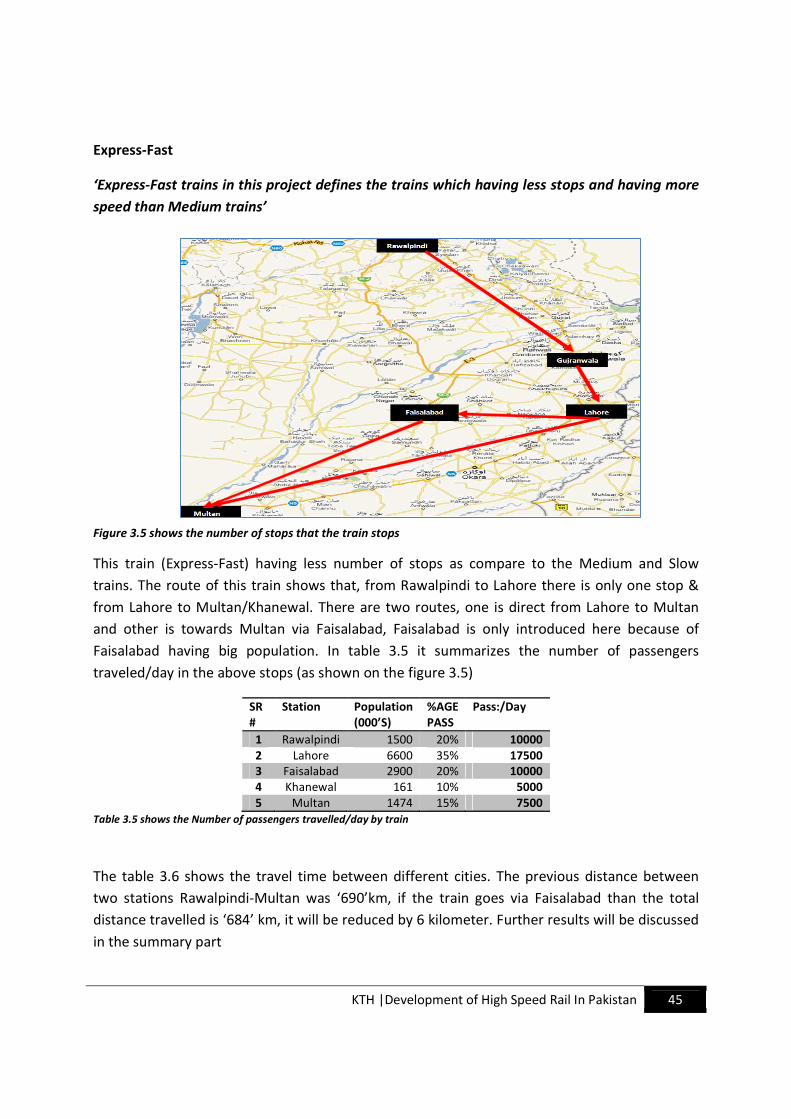
Figure 3.5 shows the number of stops that the train stops
This train (Express-Fast) having less number of stops as compare to the Medium and Slow
trains. The route of this train shows that, from Rawalpindi to Lahore there is only one stop &
from Lahore to Multan/Khanewal. There are two routes, one is direct from Lahore to Multan
and other is towards Multan via Faisalabad, Faisalabad is only introduced here because of
Faisalabad having big population. In table 3.5 it summarizes the number of passengers
traveled/day in the above stops (as shown on the figure 3.5)
SR
#
Station Population
(000’S)
%AGE
PASS
Pass:/Day
1 Rawalpindi 1500 20% 10000
2 Lahore 6600 35% 17500
3 Faisalabad 2900 20% 10000
4 Khanewal 161 10% 5000
5 Multan 1474 15% 7500
Table 3.5 shows the Number of passengers travelled/day by train
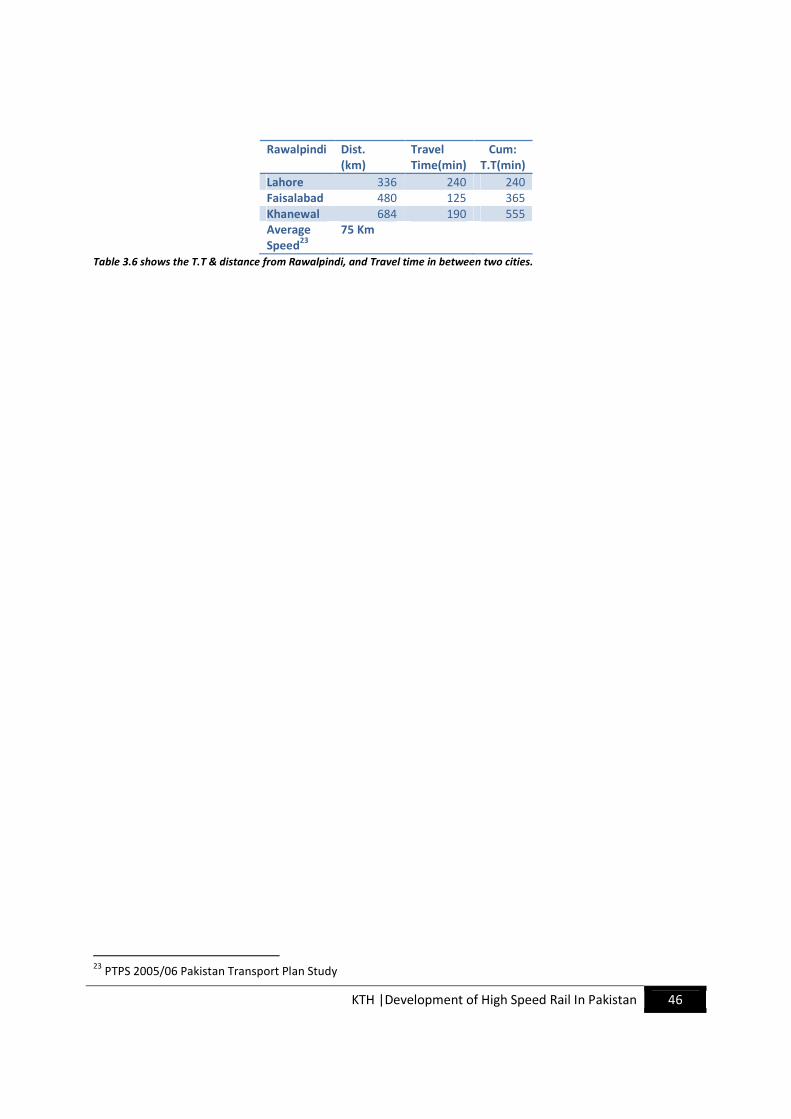
The table 3.6 shows the travel time between different cities. The previous distance between
two stations Rawalpindi-Multan was ‘690’km, if the train goes via Faisalabad than the total
distance travelled is ‘684’ km, it will be reduced by 6 kilometer. Further results will be discussed
in the summary part
KTH |Development of High Speed Rail In Pakistan 46
Rawalpindi Dist.
(km)
Travel
Time(min)
Cum:
T.T(min)
Lahore 336 240 240
Faisalabad 480 125 365
Khanewal 684 190 555
Average
Speed23
75 Km
Table 3.6 shows the T.T & distance from Rawalpindi, and Travel time in between two cities.
23
PTPS 2005/06 Pakistan Transport Plan Study
KTH |Development of High Speed Rail In Pakistan 47
Summary of Scenario 1
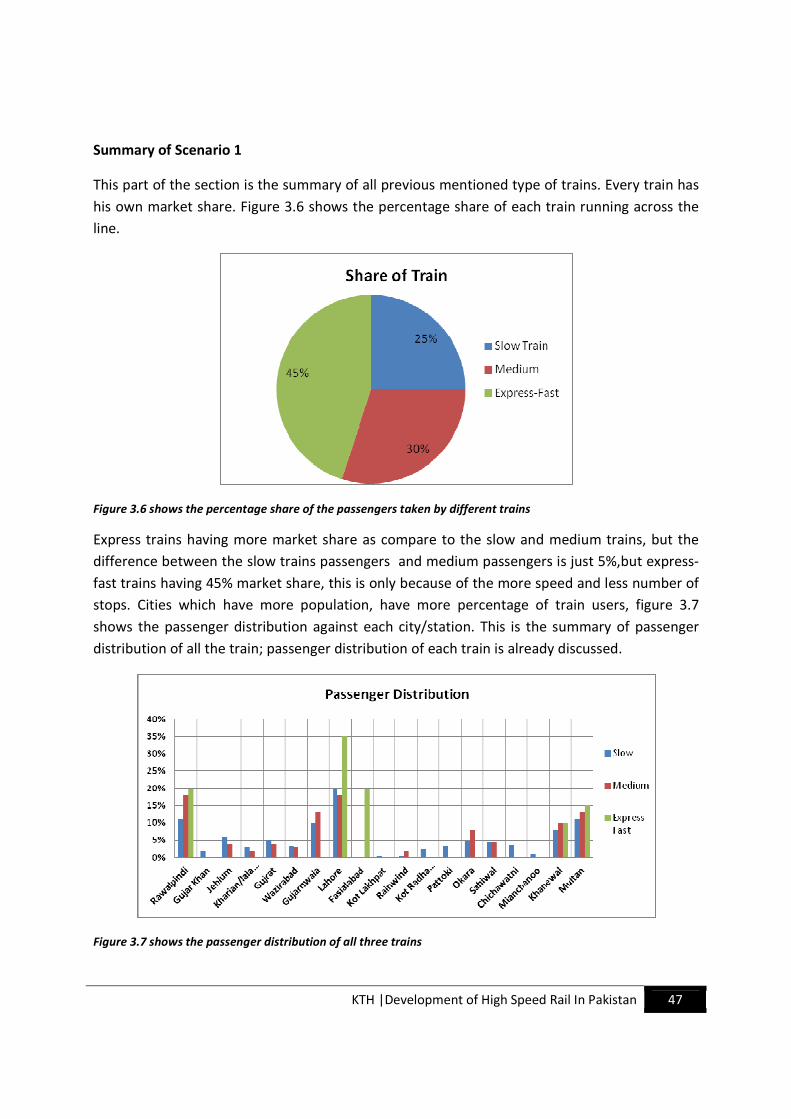
This part of the section is the summary of all previous mentioned type of trains. Every train has
his own market share. Figure 3.6 shows the percentage share of each train running across the
line.
Figure 3.6 shows the percentage share of the passengers taken by different trains
Express trains having more market share as compare to the slow and medium trains, but the
difference between the slow trains passengers and medium passengers is just 5%,but express-
fast trains having 45% market share, this is only because of the more speed and less number of
stops. Cities which have more population, have more percentage of train users, figure 3.7
shows the passenger distribution against each city/station. This is the summary of passenger
distribution of all the train; passenger distribution of each train is already discussed.
Figure 3.7 shows the passenger distribution of all three trains
KTH |Development of High Speed Rail In Pakistan 48
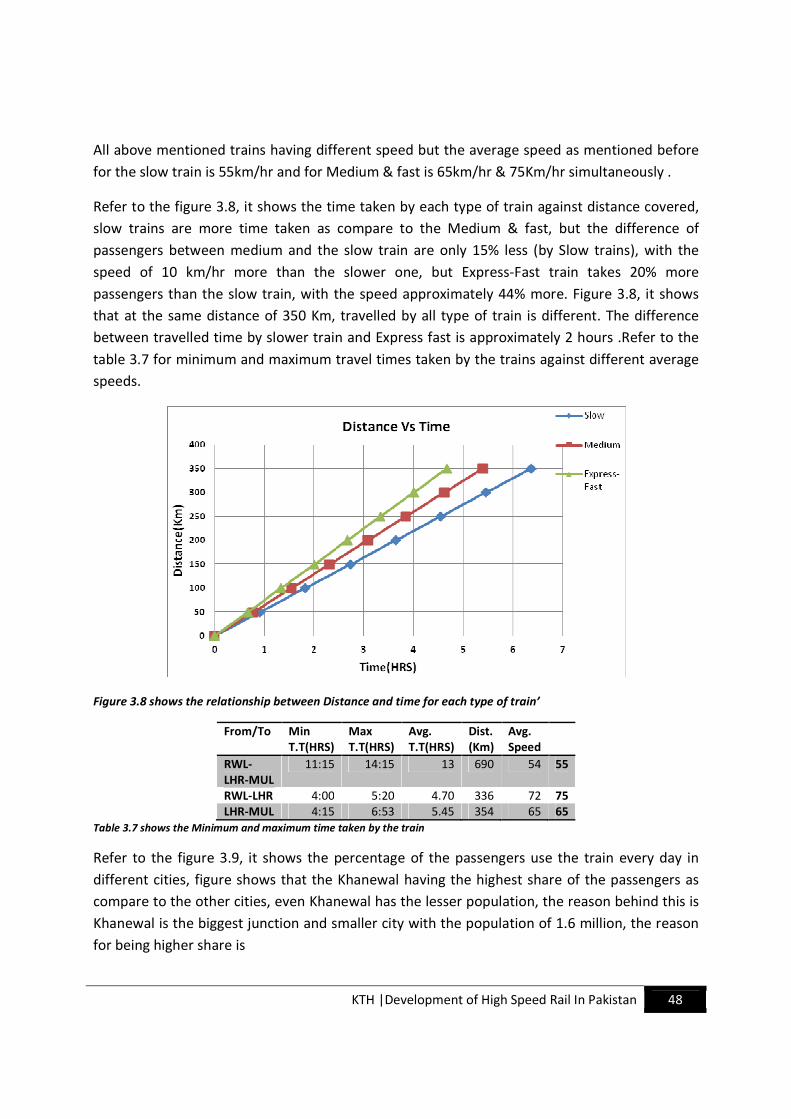
All above mentioned trains having different speed but the average speed as mentioned before
for the slow train is 55km/hr and for Medium & fast is 65km/hr & 75Km/hr simultaneously .
Refer to the figure 3.8, it shows the time taken by each type of train against distance covered,
slow trains are more time taken as compare to the Medium & fast, but the difference of
passengers between medium and the slow train are only 15% less (by Slow trains), with the
speed of 10 km/hr more than the slower one, but Express-Fast train takes 20% more
passengers than the slow train, with the speed approximately 44% more. Figure 3.8, it shows
that at the same distance of 350 Km, travelled by all type of train is different. The difference
between travelled time by slower train and Express fast is approximately 2 hours .Refer to the
table 3.7 for minimum and maximum travel times taken by the trains against different average
speeds.
Figure 3.8 shows the relationship between Distance and time for each type of train’
From/To Min
T.T(HRS)
Max
T.T(HRS)
Avg.
T.T(HRS)
Dist.
(Km)
Avg.
Speed
RWL-
LHR-MUL
11:15 14:15 13 690 54 55
RWL-LHR 4:00 5:20 4.70 336 72 75
LHR-MUL 4:15 6:53 5.45 354 65 65
Table 3.7 shows the Minimum and maximum time taken by the train
Refer to the figure 3.9, it shows the percentage of the passengers use the train every day in
different cities, figure shows that the Khanewal having the highest share of the passengers as
compare to the other cities, even Khanewal has the lesser population, the reason behind this is
Khanewal is the biggest junction and smaller city with the population of 1.6 million, the reason
for being higher share is
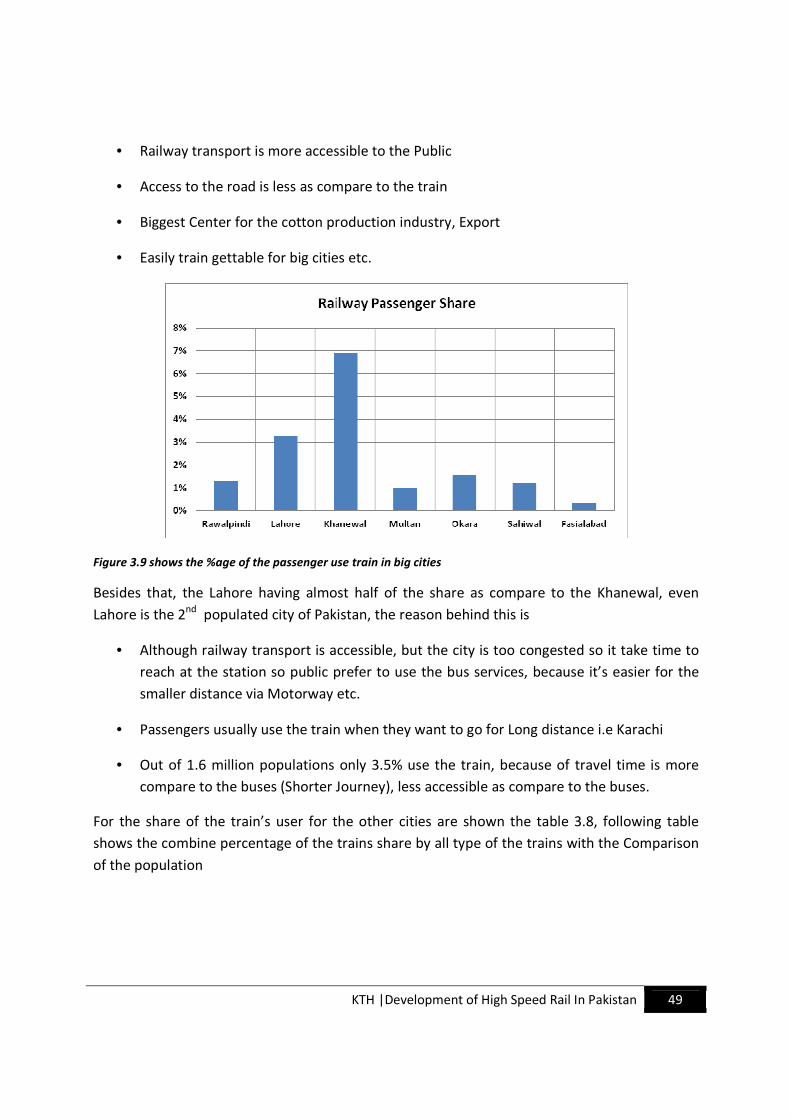
KTH |Development of High Speed Rail In Pakistan 49
• Railway transport is more accessible to the Public
• Access to the road is less as compare to the train
• Biggest Center for the cotton production industry, Export
• Easily train gettable for big cities etc.
Figure 3.9 shows the %age of the passenger use train in big cities
Besides that, the Lahore having almost half of the share as compare to the Khanewal, even
Lahore is the 2nd
populated city of Pakistan, the reason behind this is
• Although railway transport is accessible, but the city is too congested so it take time to
reach at the station so public prefer to use the bus services, because it’s easier for the
smaller distance via Motorway etc.
• Passengers usually use the train when they want to go for Long distance i.e Karachi
• Out of 1.6 million populations only 3.5% use the train, because of travel time is more
compare to the buses (Shorter Journey), less accessible as compare to the buses.
For the share of the train’s user for the other cities are shown the table 3.8, following table
shows the combine percentage of the trains share by all type of the trains with the Comparison
of the population
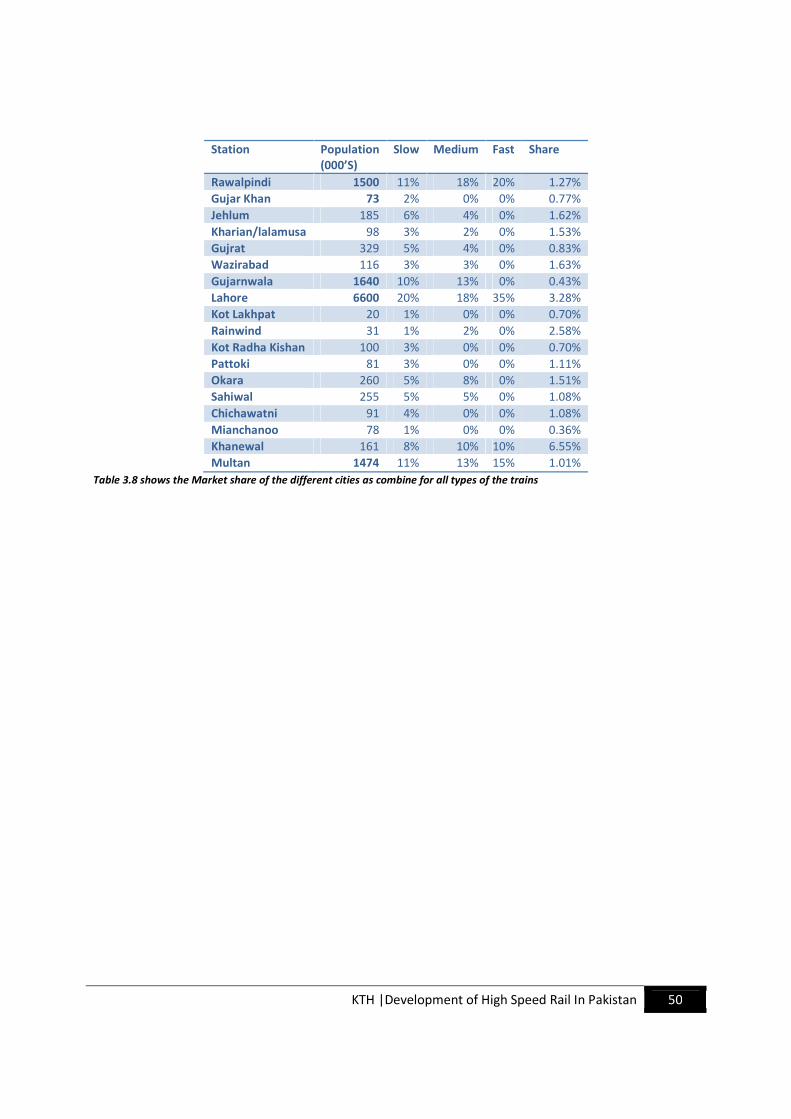
KTH |Development of High Speed Rail In Pakistan 50
Station Population
(000’S)
Slow Medium Fast Share
Rawalpindi 1500 11% 18% 20% 1.27%
Gujar Khan 73 2% 0% 0% 0.77%
Jehlum 185 6% 4% 0% 1.62%
Kharian/lalamusa 98 3% 2% 0% 1.53%
Gujrat 329 5% 4% 0% 0.83%
Wazirabad 116 3% 3% 0% 1.63%
Gujarnwala 1640 10% 13% 0% 0.43%
Lahore 6600 20% 18% 35% 3.28%
Kot Lakhpat 20 1% 0% 0% 0.70%
Rainwind 31 1% 2% 0% 2.58%
Kot Radha Kishan 100 3% 0% 0% 0.70%
Pattoki 81 3% 0% 0% 1.11%
Okara 260 5% 8% 0% 1.51%
Sahiwal 255 5% 5% 0% 1.08%
Chichawatni 91 4% 0% 0% 1.08%
Mianchanoo 78 1% 0% 0% 0.36%
Khanewal 161 8% 10% 10% 6.55%
Multan 1474 11% 13% 15% 1.01%
Table 3.8 shows the Market share of the different cities as combine for all types of the trains
KTH |Development of High Speed Rail In Pakistan 51
3.2- Scenario 2: Improvement of Current System
This scenario is about the improvements of the speed in scenario 1, the focus is on the travel
time & demand comparison of both scenarios, e.g. with increase in the speed how much travel
time is reduced and how many more passengers are attracted by each type of the train.
Following assumptions are made while working on the scenario 2
Assumptions/Limitations
- All type of trains remain running
- Share of the trains remains same as that of the do nothing scenario 1
- Distribution of passengers are remains same as per Scenario 1
- Number of Passengers remains the same
- Speed of the trains will be changed as
- Slow trains : 65 Km/hr
- Medium : 80 Km/hr
- Express Fast: 110 Km/hr
- More focus on the Travel times
- Frequency of the train remains the same in this scenario
- Number of stops/stations will remain same
KTH |Development of High Speed Rail In Pakistan 52
Slow Trains
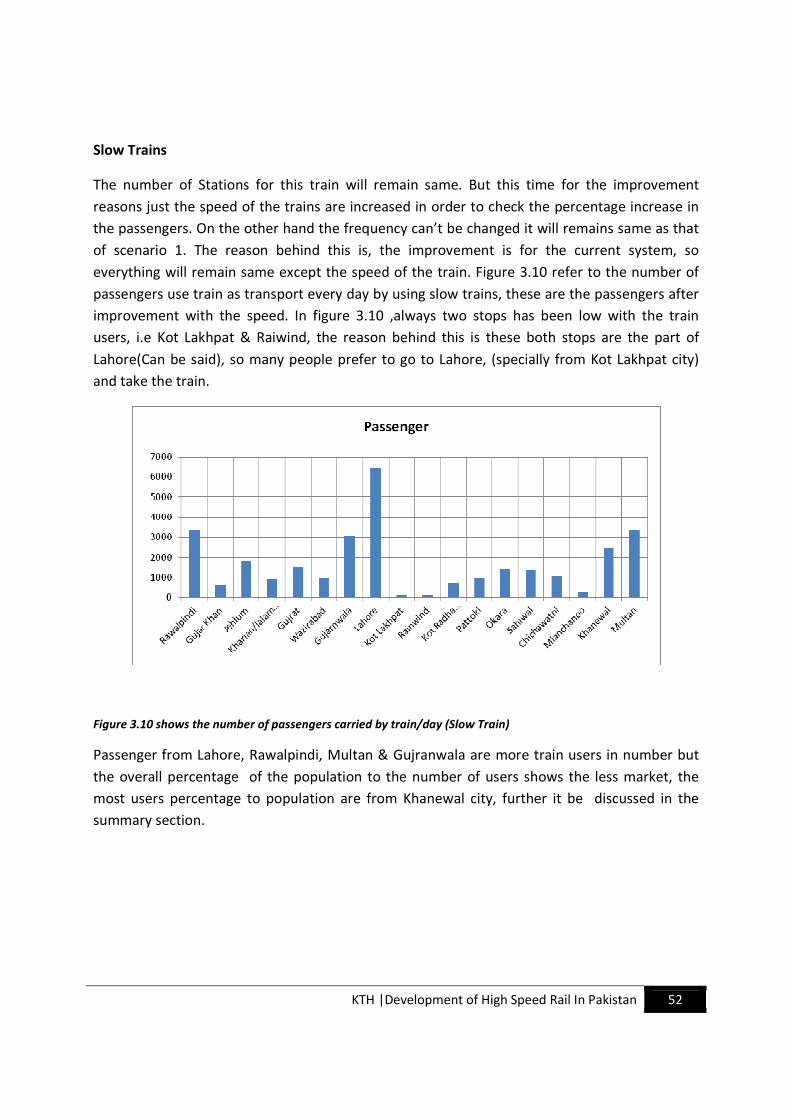
The number of Stations for this train will remain same. But this time for the improvement
reasons just the speed of the trains are increased in order to check the percentage increase in
the passengers. On the other hand the frequency can’t be changed it will remains same as that
of scenario 1. The reason behind this is, the improvement is for the current system, so
everything will remain same except the speed of the train. Figure 3.10 refer to the number of
passengers use train as transport every day by using slow trains, these are the passengers after
improvement with the speed. In figure 3.10 ,always two stops has been low with the train
users, i.e Kot Lakhpat & Raiwind, the reason behind this is these both stops are the part of
Lahore(Can be said), so many people prefer to go to Lahore, (specially from Kot Lakhpat city)
and take the train.
Figure 3.10 shows the number of passengers carried by train/day (Slow Train)
Passenger from Lahore, Rawalpindi, Multan & Gujranwala are more train users in number but
the overall percentage of the population to the number of users shows the less market, the
most users percentage to population are from Khanewal city, further it be discussed in the
summary section.
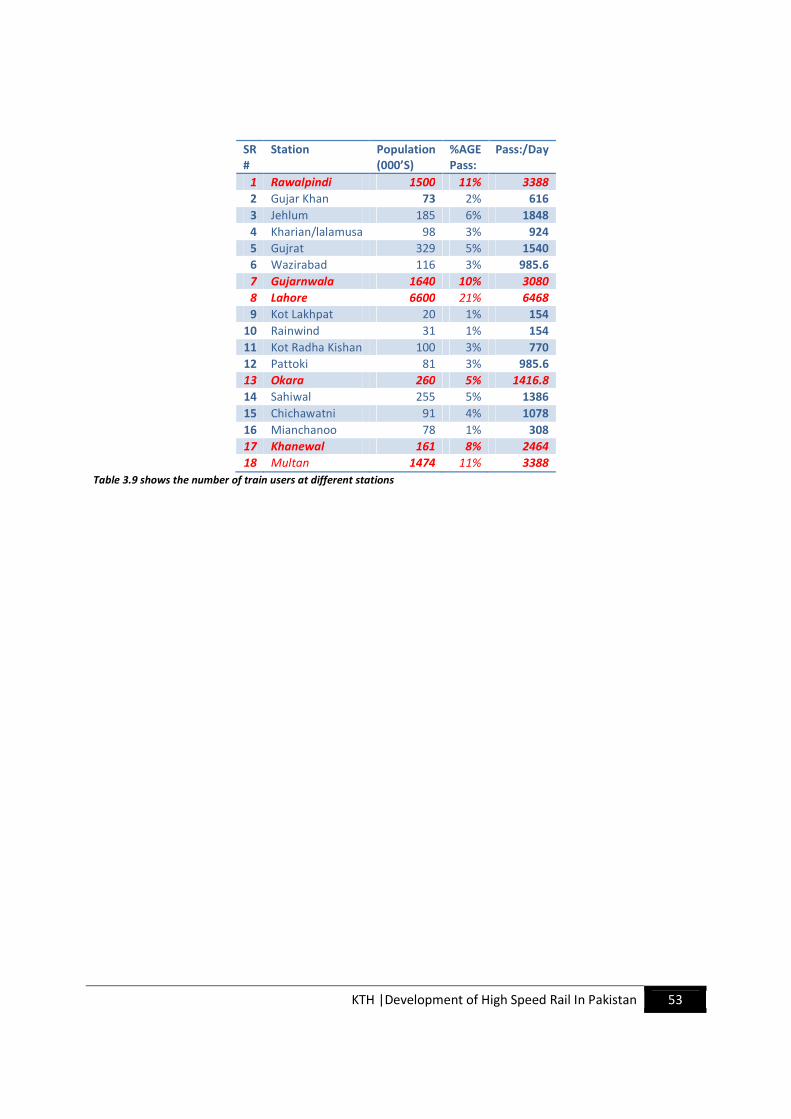
KTH |Development of High Speed Rail In Pakistan 53
SR
#
Station Population
(000’S)
%AGE
Pass:
Pass:/Day
1 Rawalpindi 1500 11% 3388
2 Gujar Khan 73 2% 616
3 Jehlum 185 6% 1848
4 Kharian/lalamusa 98 3% 924
5 Gujrat 329 5% 1540
6 Wazirabad 116 3% 985.6
7 Gujarnwala 1640 10% 3080
8 Lahore 6600 21% 6468
9 Kot Lakhpat 20 1% 154
10 Rainwind 31 1% 154
11 Kot Radha Kishan 100 3% 770
12 Pattoki 81 3% 985.6
13 Okara 260 5% 1416.8
14 Sahiwal 255 5% 1386
15 Chichawatni 91 4% 1078
16 Mianchanoo 78 1% 308
17 Khanewal 161 8% 2464
18 Multan 1474 11% 3388
Table 3.9 shows the number of train users at different stations
KTH |Development of High Speed Rail In Pakistan 54
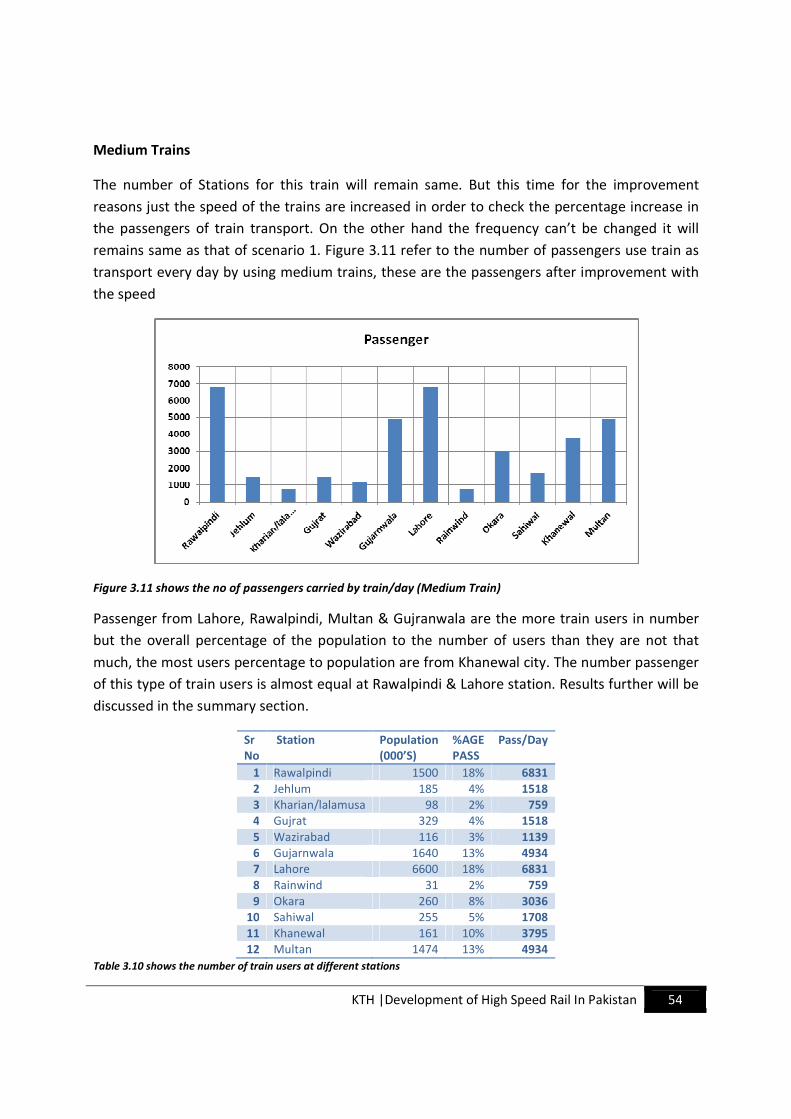
Medium Trains
The number of Stations for this train will remain same. But this time for the improvement
reasons just the speed of the trains are increased in order to check the percentage increase in
the passengers of train transport. On the other hand the frequency can’t be changed it will
remains same as that of scenario 1. Figure 3.11 refer to the number of passengers use train as
transport every day by using medium trains, these are the passengers after improvement with
the speed
Figure 3.11 shows the no of passengers carried by train/day (Medium Train)
Passenger from Lahore, Rawalpindi, Multan & Gujranwala are the more train users in number
but the overall percentage of the population to the number of users than they are not that
much, the most users percentage to population are from Khanewal city. The number passenger
of this type of train users is almost equal at Rawalpindi & Lahore station. Results further will be
discussed in the summary section.
Sr
No
Station Population
(000’S)
%AGE
PASS
Pass/Day
1 Rawalpindi 1500 18% 6831
2 Jehlum 185 4% 1518
3 Kharian/lalamusa 98 2% 759
4 Gujrat 329 4% 1518
5 Wazirabad 116 3% 1139
6 Gujarnwala 1640 13% 4934
7 Lahore 6600 18% 6831
8 Rainwind 31 2% 759
9 Okara 260 8% 3036
10 Sahiwal 255 5% 1708
11 Khanewal 161 10% 3795
12 Multan 1474 13% 4934
Table 3.10 shows the number of train users at different stations
KTH |Development of High Speed Rail In Pakistan 55
Express-Fast Trains
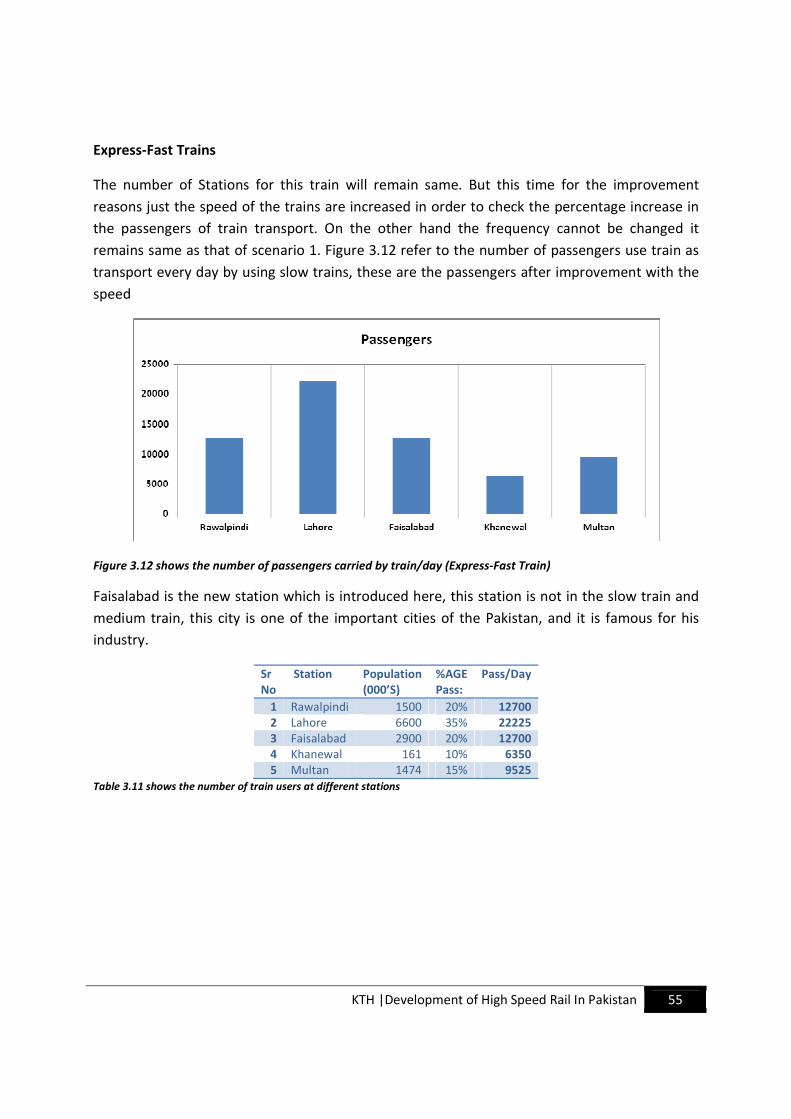
The number of Stations for this train will remain same. But this time for the improvement
reasons just the speed of the trains are increased in order to check the percentage increase in
the passengers of train transport. On the other hand the frequency cannot be changed it
remains same as that of scenario 1. Figure 3.12 refer to the number of passengers use train as
transport every day by using slow trains, these are the passengers after improvement with the
speed
Figure 3.12 shows the number of passengers carried by train/day (Express-Fast Train)
Faisalabad is the new station which is introduced here, this station is not in the slow train and
medium train, this city is one of the important cities of the Pakistan, and it is famous for his
industry.
Sr
No
Station Population
(000’S)
%AGE
Pass:
Pass/Day
1 Rawalpindi 1500 20% 12700
2 Lahore 6600 35% 22225
3 Faisalabad 2900 20% 12700
4 Khanewal 161 10% 6350
5 Multan 1474 15% 9525
Table 3.11 shows the number of train users at different stations
KTH |Development of High Speed Rail In Pakistan 56
Summary of Scenario 2
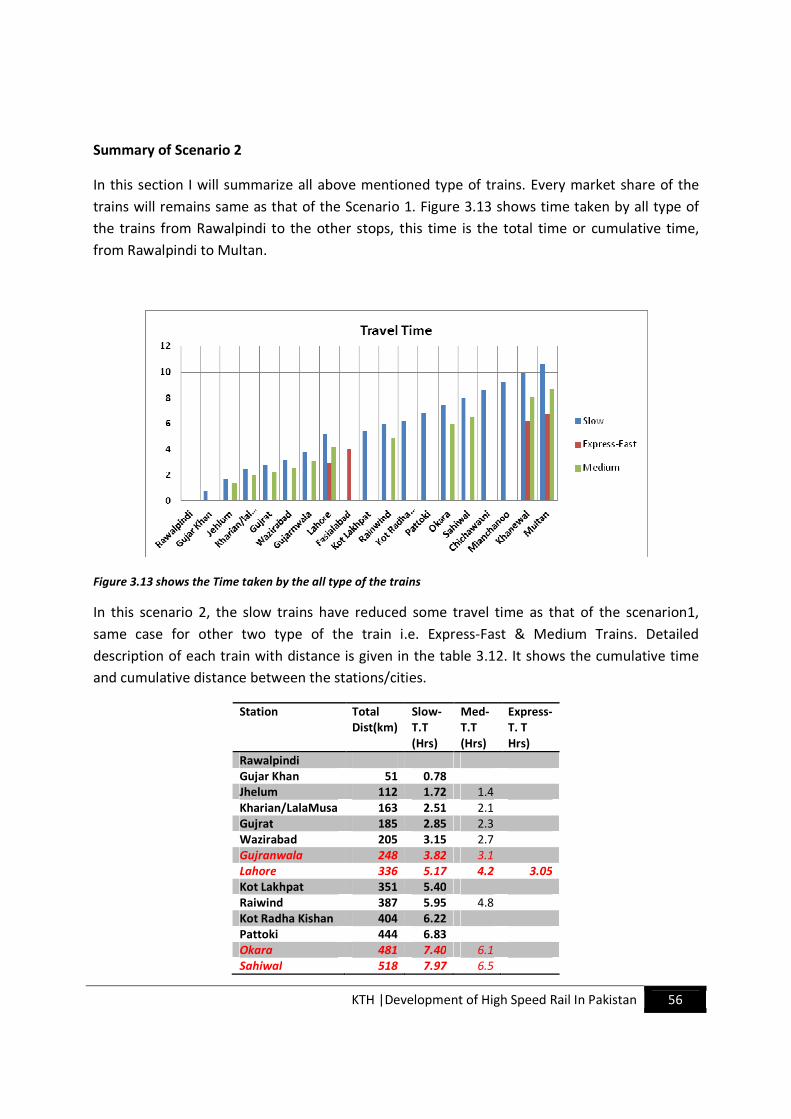
In this section I will summarize all above mentioned type of trains. Every market share of the
trains will remains same as that of the Scenario 1. Figure 3.13 shows time taken by all type of
the trains from Rawalpindi to the other stops, this time is the total time or cumulative time,
from Rawalpindi to Multan.
Figure 3.13 shows the Time taken by the all type of the trains
In this scenario 2, the slow trains have reduced some travel time as that of the scenarion1,
same case for other two type of the train i.e. Express-Fast & Medium Trains. Detailed
description of each train with distance is given in the table 3.12. It shows the cumulative time
and cumulative distance between the stations/cities.
Station Total
Dist(km)
Slow-
T.T
(Hrs)
Med-
T.T
(Hrs)
Express-
T. T
Hrs)
Rawalpindi
Gujar Khan 51 0.78
Jhelum 112 1.72 1.4
Kharian/LalaMusa 163 2.51 2.1
Gujrat 185 2.85 2.3
Wazirabad 205 3.15 2.7
Gujranwala 248 3.82 3.1
Lahore 336 5.17 4.2 3.05
Kot Lakhpat 351 5.40
Raiwind 387 5.95 4.8
Kot Radha Kishan 404 6.22
Pattoki 444 6.83
Okara 481 7.40 6.1
Sahiwal 518 7.97 6.5

KTH |Development of High Speed Rail In Pakistan 57
Chichawatni 557 8.57
Mianchanoo 596 9.17
Khanewal 645 9.92 8.1 6.22
Multan 690 10.62 8.7 6.72
Faisalabad 4.36
Average Speed 65
Km/hr
80
Km/hr
110
Km/hr
Table 3.12 shows the travel time and the cumulative distance among all stations
The speed of the each train is mentioned in table 3.12, these trains having different speed than
the scenario-1, the average speed as mentioned for the slow train is 65km/hr and for Medium
& fast is 80km/hr & 110Km/hr simultaneously .
Refer to the figure 3.14, it shows the time taken by each type of train against distance covered,
slow trains are more time taken as compare to the Medium and fast, but the difference of
passengers between medium and the slow train are only 23% less (by slow trains), with the
speed of 15 km/hr more than the slower one, but Express-Fast train takes 54% more
passengers than the slow train, with the speed approximately 70%. Figure 3.13 shows that
same distance of 350 Km travelled by all type of train is different, the difference between
travelled time by slower train and Express fast is approximately 2 hours. Refer to the table 3.18
for travel times taken by the trains against different average speeds.
Figure 3.14 shows the Time taken by the all type of the trains
Refer to the figure 3.15, it shows the percentage of the passengers use the train every day in
different cities, figure shows that the Khanewal having the highest share of the passengers as
compare to the other cities, the railway share of Khanewal is increasing, with the increase in
the average speed of the train it has increased the share of the Railway in major cities, in return
the travel time is also reduced and it has attracted more number of passengers. On other hand
the passengers at Lahore station are still less, approximately 45% less than the Khanewal
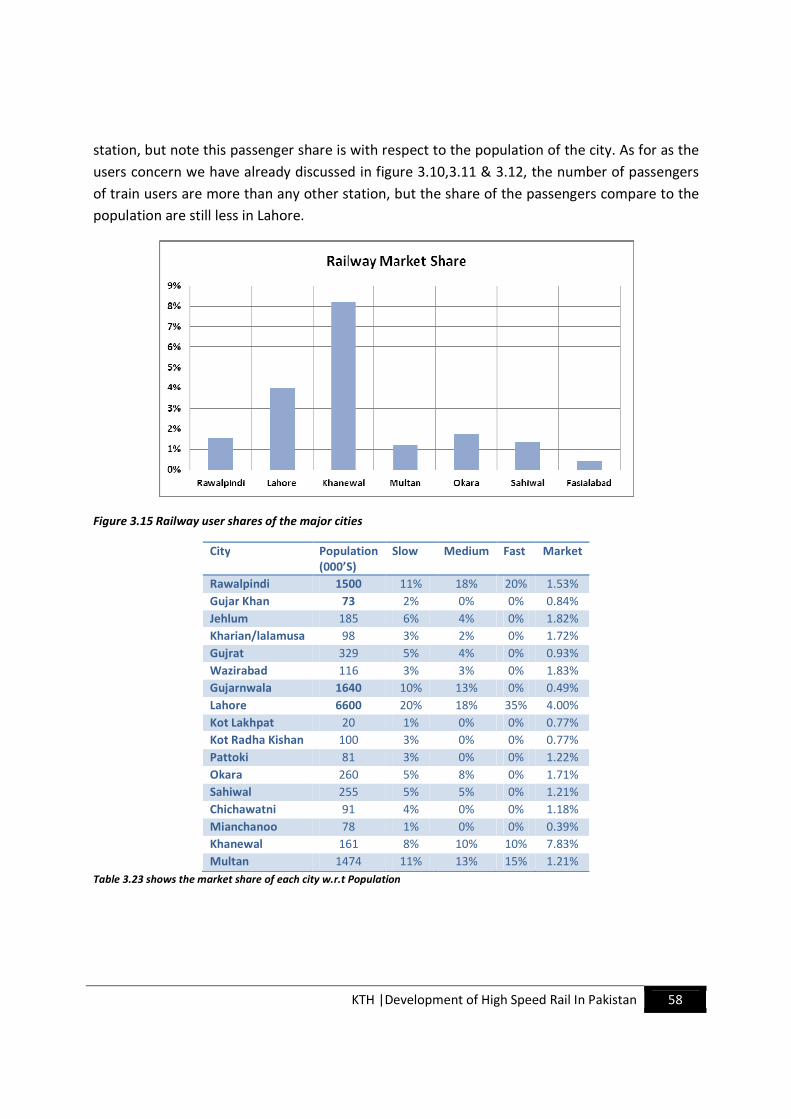
KTH |Development of High Speed Rail In Pakistan 58
station, but note this passenger share is with respect to the population of the city. As for as the
users concern we have already discussed in figure 3.10,3.11 & 3.12, the number of passengers
of train users are more than any other station, but the share of the passengers compare to the
population are still less in Lahore.
Figure 3.15 Railway user shares of the major cities
City Population
(000’S)
Slow Medium Fast Market
Rawalpindi 1500 11% 18% 20% 1.53%
Gujar Khan 73 2% 0% 0% 0.84%
Jehlum 185 6% 4% 0% 1.82%
Kharian/lalamusa 98 3% 2% 0% 1.72%
Gujrat 329 5% 4% 0% 0.93%
Wazirabad 116 3% 3% 0% 1.83%
Gujarnwala 1640 10% 13% 0% 0.49%
Lahore 6600 20% 18% 35% 4.00%
Kot Lakhpat 20 1% 0% 0% 0.77%
Kot Radha Kishan 100 3% 0% 0% 0.77%
Pattoki 81 3% 0% 0% 1.22%
Okara 260 5% 8% 0% 1.71%
Sahiwal 255 5% 5% 0% 1.21%
Chichawatni 91 4% 0% 0% 1.18%
Mianchanoo 78 1% 0% 0% 0.39%
Khanewal 161 8% 10% 10% 7.83%
Multan 1474 11% 13% 15% 1.21%
Table 3.23 shows the market share of each city w.r.t Population
KTH |Development of High Speed Rail In Pakistan 59
Comparison of Both Scenarios
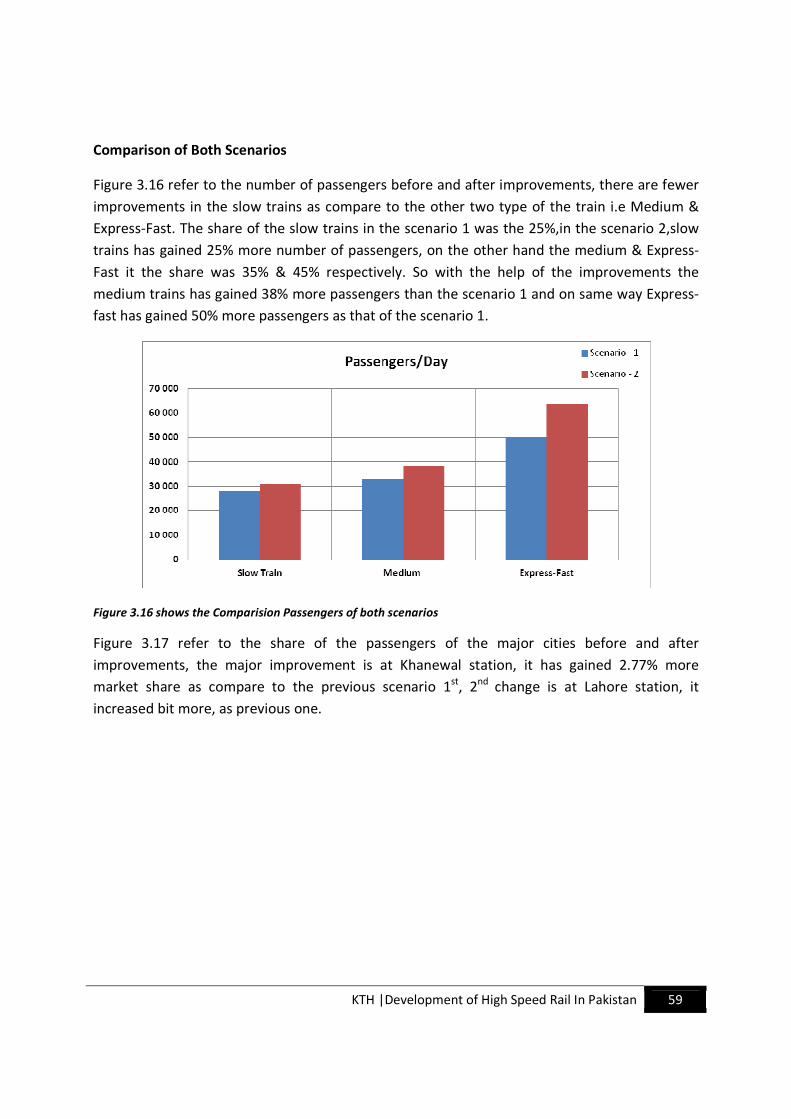
Figure 3.16 refer to the number of passengers before and after improvements, there are fewer
improvements in the slow trains as compare to the other two type of the train i.e Medium &
Express-Fast. The share of the slow trains in the scenario 1 was the 25%,in the scenario 2,slow
trains has gained 25% more number of passengers, on the other hand the medium & Express-
Fast it the share was 35% & 45% respectively. So with the help of the improvements the
medium trains has gained 38% more passengers than the scenario 1 and on same way Express-
fast has gained 50% more passengers as that of the scenario 1.
Figure 3.16 shows the Comparision Passengers of both scenarios
Figure 3.17 refer to the share of the passengers of the major cities before and after
improvements, the major improvement is at Khanewal station, it has gained 2.77% more
market share as compare to the previous scenario 1st
, 2nd
change is at Lahore station, it
increased bit more, as previous one.
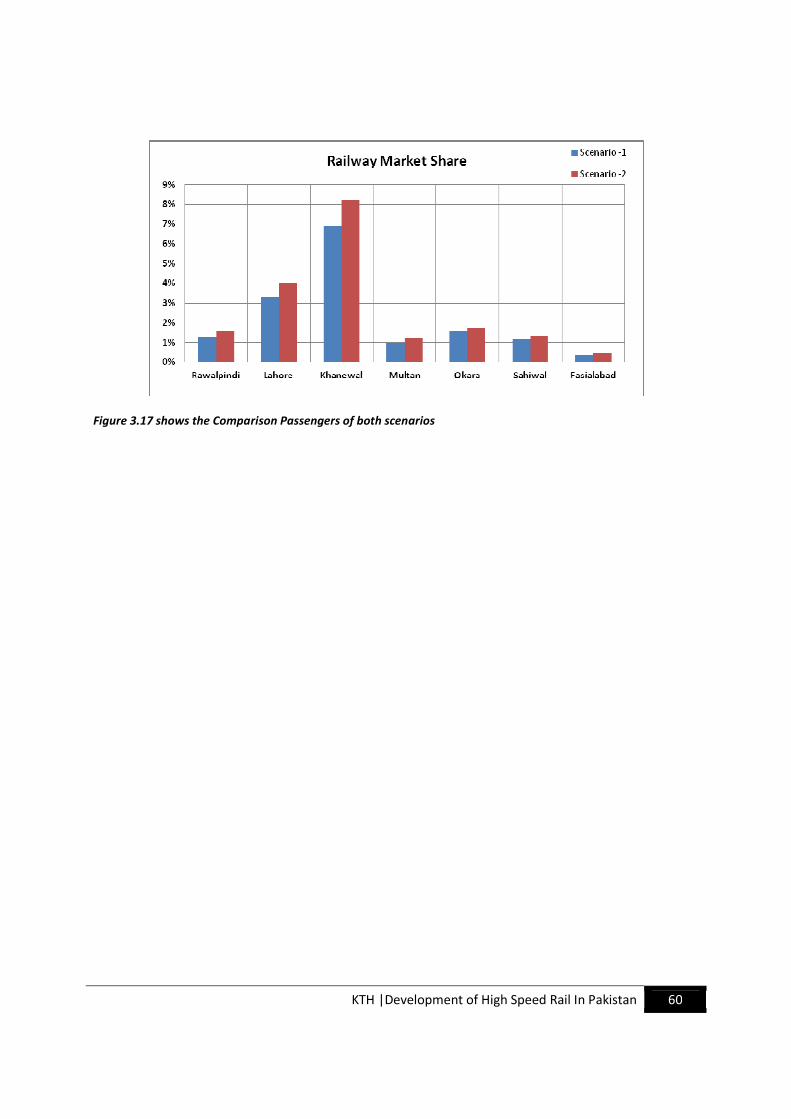
KTH |Development of High Speed Rail In Pakistan 60
Figure 3.17 shows the Comparison Passengers of both scenarios
KTH |Development of High Speed Rail In Pakistan 61
3.3- Scenario 3:New High Speed Trains
Assumptions/Framework
• Passengers Include from the main cities only
• 35% of the passengers will use the high speed train from the medium and slow
passengers
• The network is more focused on the high speed, it is assumed that the only high speed
trains run across
• Tracks are 100% fine and are load resistant of the high speed train
• Signaling system work fine
• Passengers are willing to pay for the High speed(New Train service)
KTH |Development of High Speed Rail In Pakistan 62
Target Groups
There are different types of the groups which will be using this service; I have divided them into
different categories
• Business class or Executives, These are those passengers which mostly prefer to
consider flying as first option, because of their sensitivity only
• Leisure travelers, these are those passengers which are service sensitive and hence may
switch a little less to no-frill airlines
• Emergency-Short notice travellers, who have time problems and want to be somewhere
urgent basis
• Middle-class traveler, those passengers which are not that service conscious, but may
be time sensitive
• None of time conscious
KTH |Development of High Speed Rail In Pakistan 63
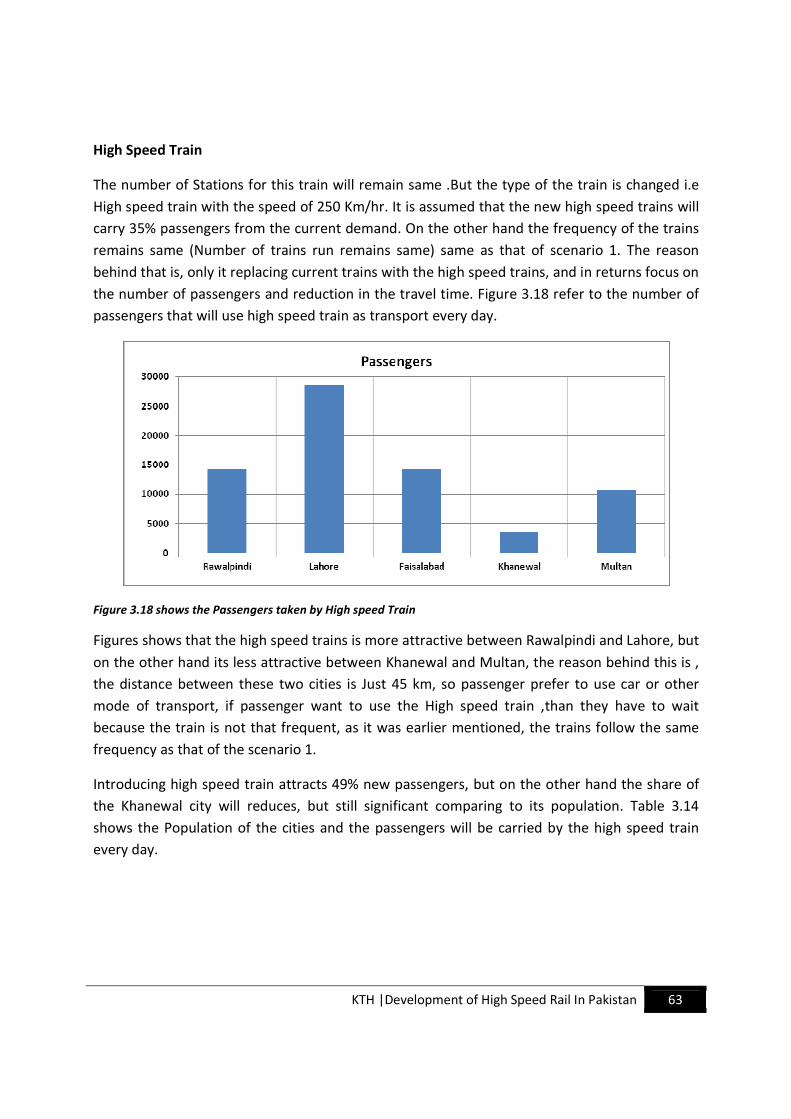
High Speed Train
The number of Stations for this train will remain same .But the type of the train is changed i.e
High speed train with the speed of 250 Km/hr. It is assumed that the new high speed trains will
carry 35% passengers from the current demand. On the other hand the frequency of the trains
remains same (Number of trains run remains same) same as that of scenario 1. The reason
behind that is, only it replacing current trains with the high speed trains, and in returns focus on
the number of passengers and reduction in the travel time. Figure 3.18 refer to the number of
passengers that will use high speed train as transport every day.
Figure 3.18 shows the Passengers taken by High speed Train
Figures shows that the high speed trains is more attractive between Rawalpindi and Lahore, but
on the other hand its less attractive between Khanewal and Multan, the reason behind this is ,
the distance between these two cities is Just 45 km, so passenger prefer to use car or other
mode of transport, if passenger want to use the High speed train ,than they have to wait
because the train is not that frequent, as it was earlier mentioned, the trains follow the same
frequency as that of the scenario 1.
Introducing high speed train attracts 49% new passengers, but on the other hand the share of
the Khanewal city will reduces, but still significant comparing to its population. Table 3.14
shows the Population of the cities and the passengers will be carried by the high speed train
every day.
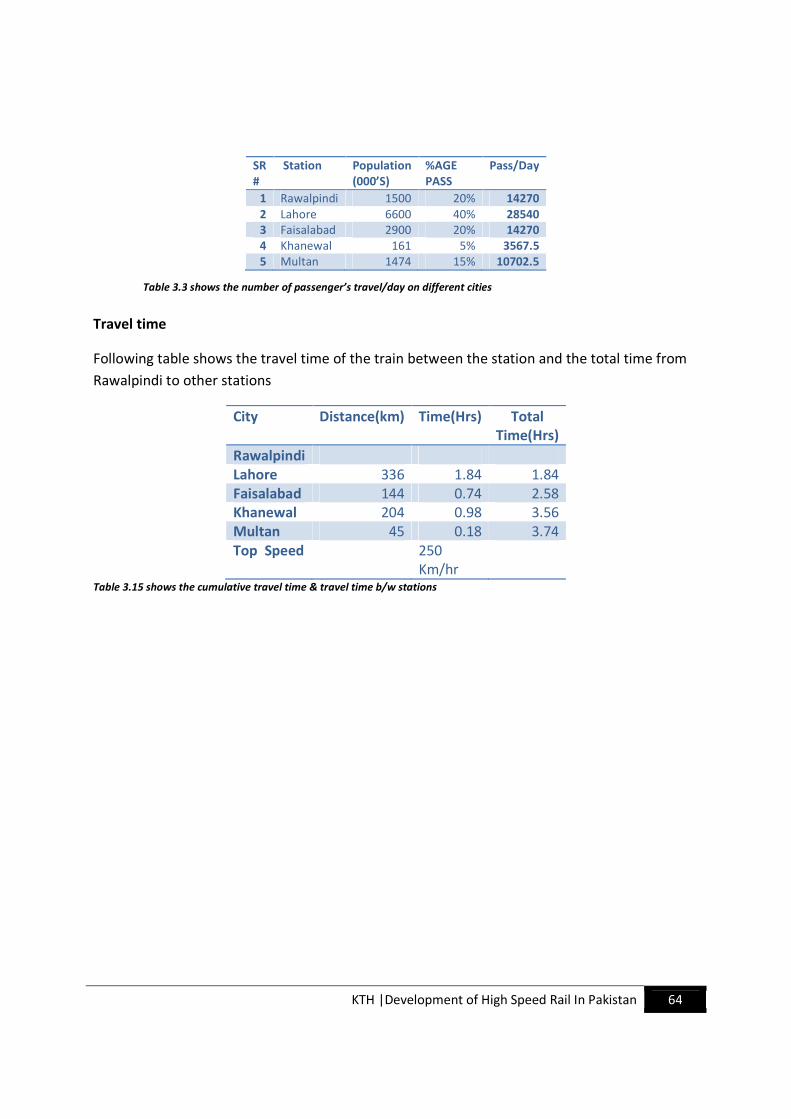
KTH |Development of High Speed Rail In Pakistan 64
Travel time
Following table shows the travel time of the train between the station and the total time from
Rawalpindi to other stations
City Distance(km) Time(Hrs) Total
Time(Hrs)
Rawalpindi
Lahore 336 1.84 1.84
Faisalabad 144 0.74 2.58
Khanewal 204 0.98 3.56
Multan 45 0.18 3.74
Top Speed 250
Km/hr
Table 3.15 shows the cumulative travel time & travel time b/w stations
SR
#
Station Population
(000’S)
%AGE
PASS
Pass/Day
1 Rawalpindi 1500 20% 14270
2 Lahore 6600 40% 28540
3 Faisalabad 2900 20% 14270
4 Khanewal 161 5% 3567.5
5 Multan 1474 15% 10702.5
Table 3.3 shows the number of passenger’s travel/day on different cities
KTH |Development of High Speed Rail In Pakistan 65
3.4- Scenario 4: Mixed Train Scenario (High speed + Medium)
Assumptions & Limitations
• The speed of the trains for High speed will remain 250 Km/hr
• Traffic will be as mixed traffic
• Only medium trains will provide services ,no slow trains run any more
• Fast Trains will be replaced by High speed trains
• Frequency of the High speed train will change but the Medium train frequency remains
same(Same number of trains)
• Data used is from year 2005
• Focus on the current improvement with the mix traffic
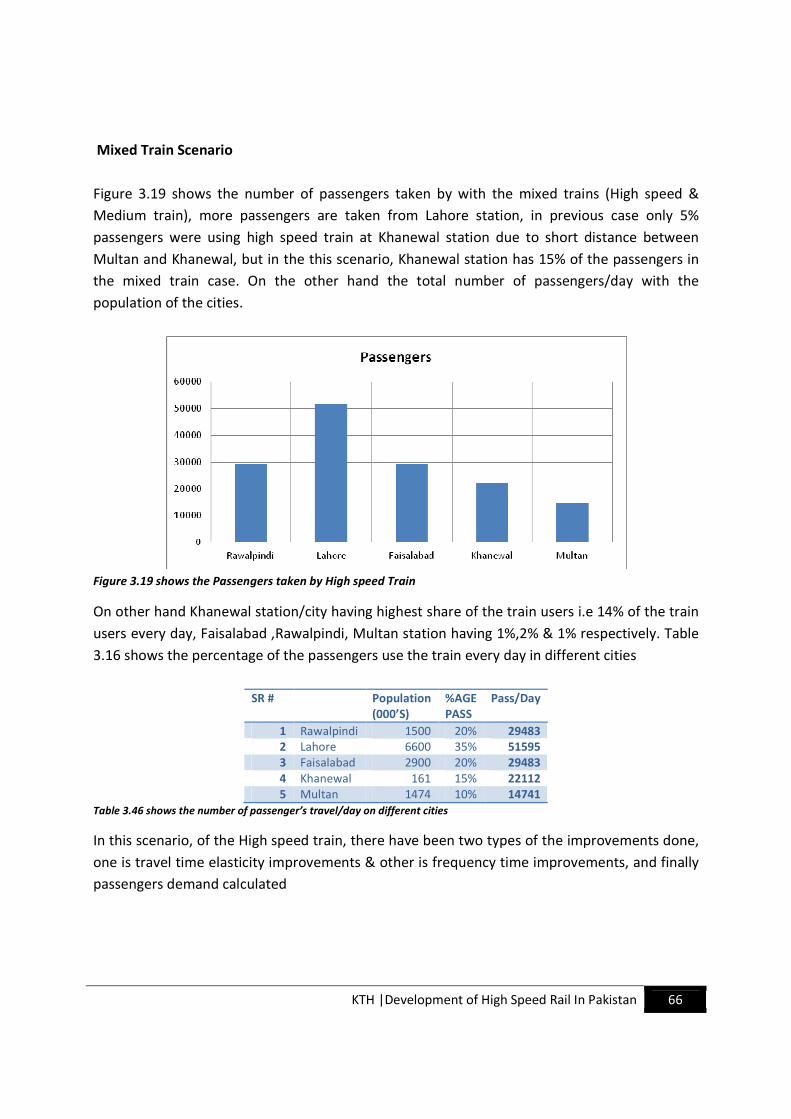
KTH |Development of High Speed Rail In Pakistan 66
Mixed Train Scenario
Figure 3.19 shows the number of passengers taken by with the mixed trains (High speed &
Medium train), more passengers are taken from Lahore station, in previous case only 5%
passengers were using high speed train at Khanewal station due to short distance between
Multan and Khanewal, but in the this scenario, Khanewal station has 15% of the passengers in
the mixed train case. On the other hand the total number of passengers/day with the
population of the cities.
Figure 3.19 shows the Passengers taken by High speed Train
On other hand Khanewal station/city having highest share of the train users i.e 14% of the train
users every day, Faisalabad ,Rawalpindi, Multan station having 1%,2% & 1% respectively. Table
3.16 shows the percentage of the passengers use the train every day in different cities
SR # Population
(000’S)
%AGE
PASS
Pass/Day
1 Rawalpindi 1500 20% 29483
2 Lahore 6600 35% 51595
3 Faisalabad 2900 20% 29483
4 Khanewal 161 15% 22112
5 Multan 1474 10% 14741
Table 3.46 shows the number of passenger’s travel/day on different cities
In this scenario, of the High speed train, there have been two types of the improvements done,
one is travel time elasticity improvements & other is frequency time improvements, and finally
passengers demand calculated
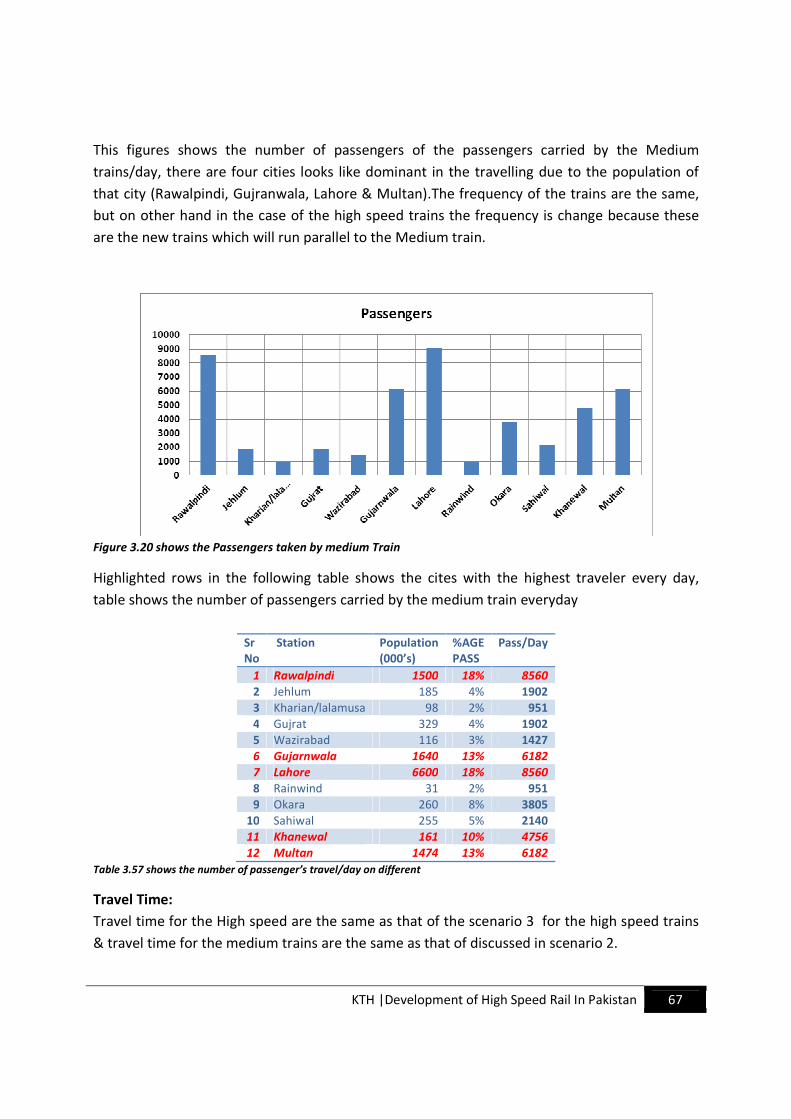
KTH |Development of High Speed Rail In Pakistan 67
This figures shows the number of passengers of the passengers carried by the Medium
trains/day, there are four cities looks like dominant in the travelling due to the population of
that city (Rawalpindi, Gujranwala, Lahore & Multan).The frequency of the trains are the same,
but on other hand in the case of the high speed trains the frequency is change because these
are the new trains which will run parallel to the Medium train.
Figure 3.20 shows the Passengers taken by medium Train
Highlighted rows in the following table shows the cites with the highest traveler every day,
table shows the number of passengers carried by the medium train everyday
Sr
No
Station Population
(000’s)
%AGE
PASS
Pass/Day
1 Rawalpindi 1500 18% 8560
2 Jehlum 185 4% 1902
3 Kharian/lalamusa 98 2% 951
4 Gujrat 329 4% 1902
5 Wazirabad 116 3% 1427
6 Gujarnwala 1640 13% 6182
7 Lahore 6600 18% 8560
8 Rainwind 31 2% 951
9 Okara 260 8% 3805
10 Sahiwal 255 5% 2140
11 Khanewal 161 10% 4756
12 Multan 1474 13% 6182
Table 3.57 shows the number of passenger’s travel/day on different
Travel Time:
Travel time for the High speed are the same as that of the scenario 3 for the high speed trains
& travel time for the medium trains are the same as that of discussed in scenario 2.
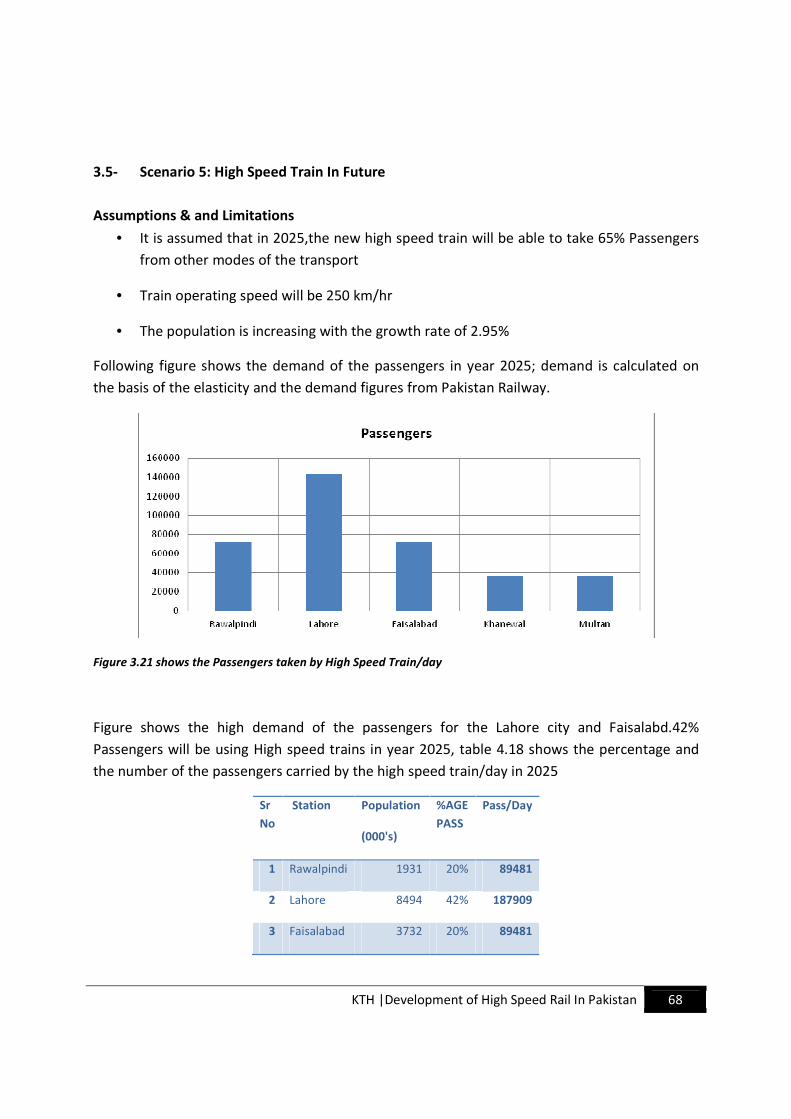
KTH |Development of High Speed Rail In Pakistan 68
3.5- Scenario 5: High Speed Train In Future
Assumptions & and Limitations
• It is assumed that in 2025,the new high speed train will be able to take 65% Passengers
from other modes of the transport
• Train operating speed will be 250 km/hr
• The population is increasing with the growth rate of 2.95%
Following figure shows the demand of the passengers in year 2025; demand is calculated on
the basis of the elasticity and the demand figures from Pakistan Railway.
Figure 3.21 shows the Passengers taken by High Speed Train/day
Figure shows the high demand of the passengers for the Lahore city and Faisalabd.42%
Passengers will be using High speed trains in year 2025, table 4.18 shows the percentage and
the number of the passengers carried by the high speed train/day in 2025
Sr
No
Station Population
(000's)
%AGE
PASS
Pass/Day
1 Rawalpindi 1931 20% 89481
2 Lahore 8494 42% 187909
3 Faisalabad 3732 20% 89481
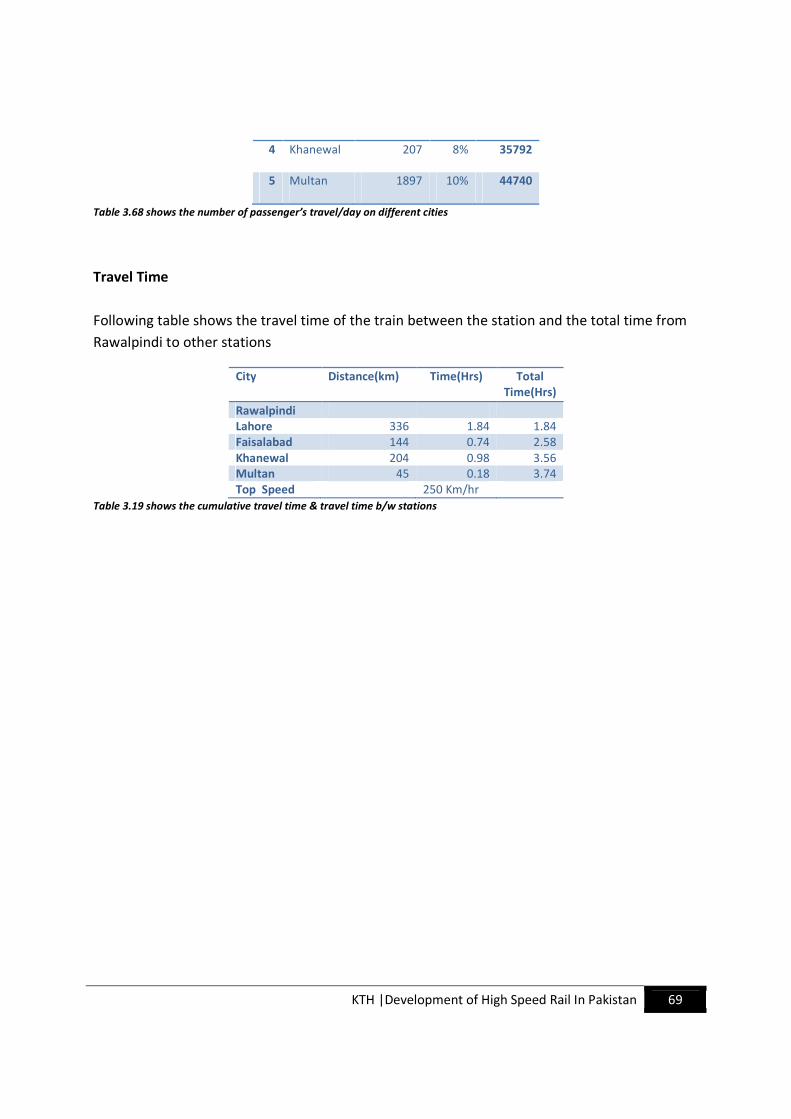
KTH |Development of High Speed Rail In Pakistan 69
4 Khanewal 207 8% 35792
5 Multan 1897 10% 44740
Table 3.68 shows the number of passenger’s travel/day on different cities
Travel Time
Following table shows the travel time of the train between the station and the total time from
Rawalpindi to other stations
City Distance(km) Time(Hrs) Total
Time(Hrs)
Rawalpindi
Lahore 336 1.84 1.84
Faisalabad 144 0.74 2.58
Khanewal 204 0.98 3.56
Multan 45 0.18 3.74
Top Speed 250 Km/hr
Table 3.19 shows the cumulative travel time & travel time b/w stations
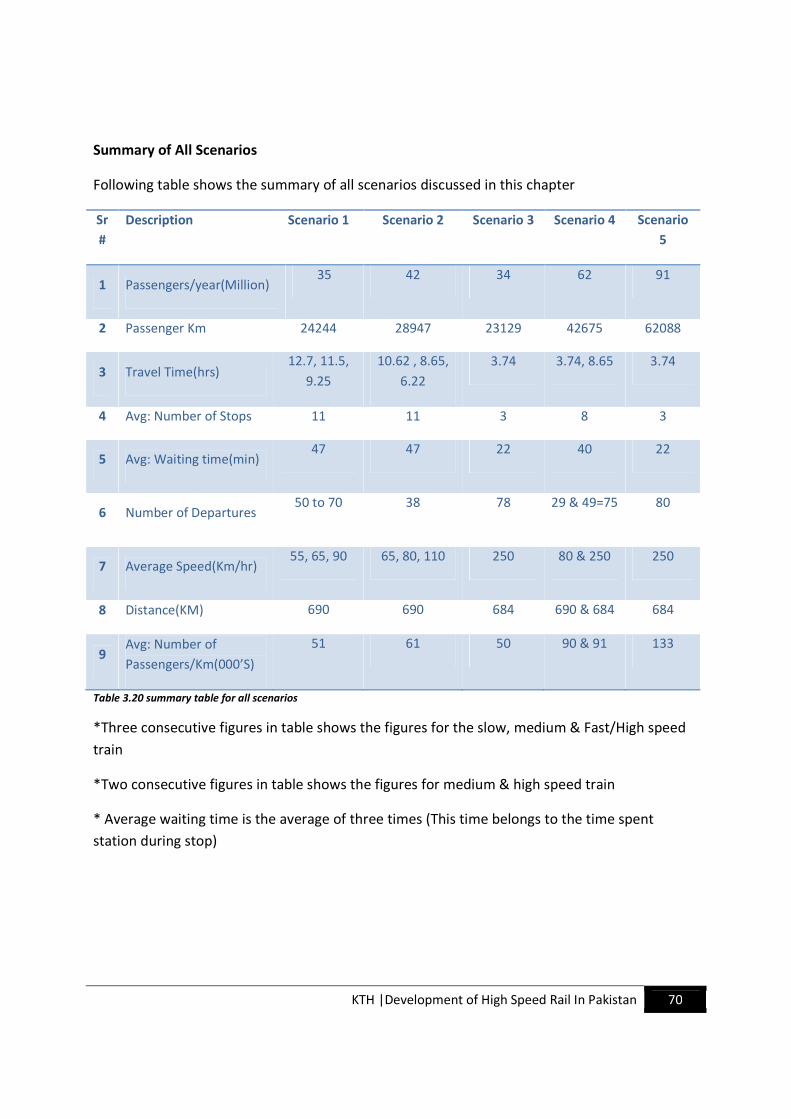
KTH |Development of High Speed Rail In Pakistan 70
Summary of All Scenarios
Following table shows the summary of all scenarios discussed in this chapter
Sr
#
Description Scenario 1 Scenario 2 Scenario 3 Scenario 4 Scenario
5
1 Passengers/year(Million) 35 42 34 62 91
2 Passenger Km 24244 28947 23129 42675 62088
3 Travel Time(hrs) 12.7, 11.5,
9.25
10.62 , 8.65,
6.22
3.74 3.74, 8.65 3.74
4 Avg: Number of Stops 11 11 3 8 3
5 Avg: Waiting time(min) 47 47 22 40 22
6 Number of Departures 50 to 70 38 78 29 & 49=75 80
7 Average Speed(Km/hr) 55, 65, 90 65, 80, 110 250 80 & 250 250
8 Distance(KM) 690 690 684 690 & 684 684
9 Avg: Number of
Passengers/Km(000’S)
51 61 50 90 & 91 133
Table 3.20 summary table for all scenarios
*Three consecutive figures in table shows the figures for the slow, medium & Fast/High speed
train
*Two consecutive figures in table shows the figures for medium & high speed train
* Average waiting time is the average of three times (This time belongs to the time spent
station during stop)
KTH |Development of High Speed Rail In Pakistan 71
Calculations
4
Expected Economic Calculations & Timetables

KTH |Development of High Speed Rail In Pakistan 72
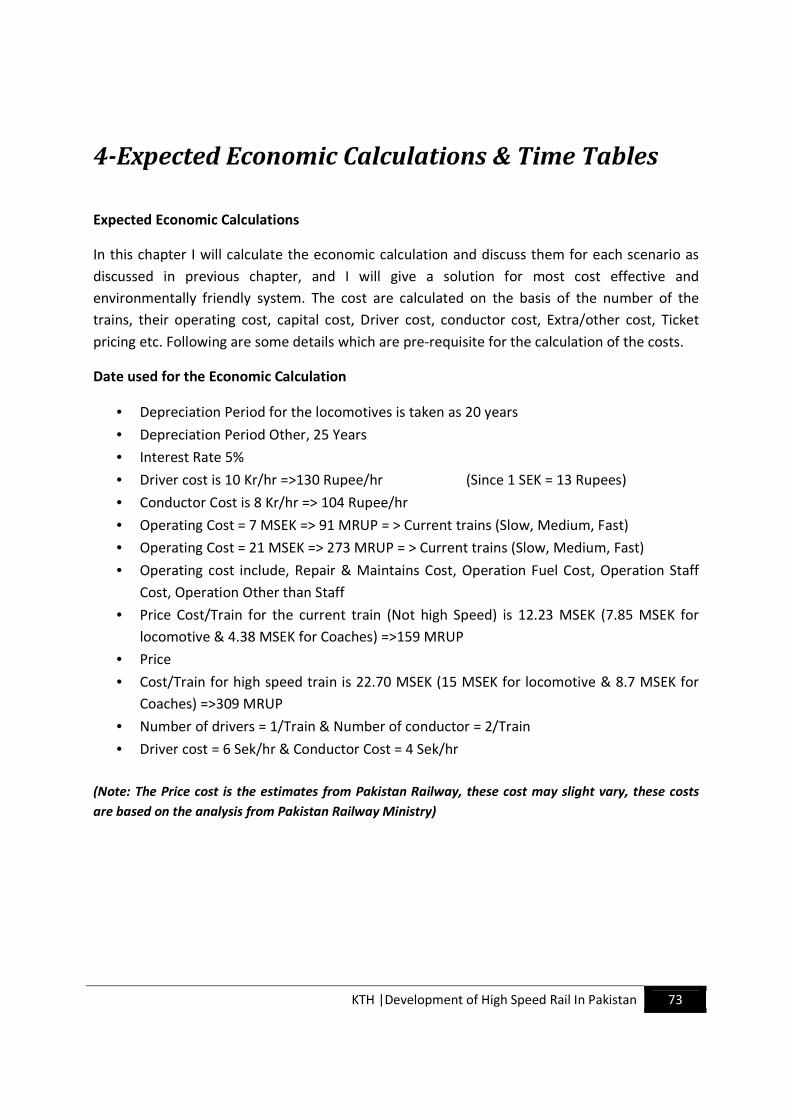
KTH |Development of High Speed Rail In Pakistan 73
4-Expected Economic Calculations & Time Tables
Expected Economic Calculations
In this chapter I will calculate the economic calculation and discuss them for each scenario as
discussed in previous chapter, and I will give a solution for most cost effective and
environmentally friendly system. The cost are calculated on the basis of the number of the
trains, their operating cost, capital cost, Driver cost, conductor cost, Extra/other cost, Ticket
pricing etc. Following are some details which are pre-requisite for the calculation of the costs.
Date used for the Economic Calculation
• Depreciation Period for the locomotives is taken as 20 years
• Depreciation Period Other, 25 Years
• Interest Rate 5%
• Driver cost is 10 Kr/hr =>130 Rupee/hr (Since 1 SEK = 13 Rupees)
• Conductor Cost is 8 Kr/hr => 104 Rupee/hr
• Operating Cost = 7 MSEK => 91 MRUP = > Current trains (Slow, Medium, Fast)
• Operating Cost = 21 MSEK => 273 MRUP = > Current trains (Slow, Medium, Fast)
• Operating cost include, Repair & Maintains Cost, Operation Fuel Cost, Operation Staff
Cost, Operation Other than Staff
• Price Cost/Train for the current train (Not high Speed) is 12.23 MSEK (7.85 MSEK for
locomotive & 4.38 MSEK for Coaches) =>159 MRUP
• Price
• Cost/Train for high speed train is 22.70 MSEK (15 MSEK for locomotive & 8.7 MSEK for
Coaches) =>309 MRUP
• Number of drivers = 1/Train & Number of conductor = 2/Train
• Driver cost = 6 Sek/hr & Conductor Cost = 4 Sek/hr
(Note: The Price cost is the estimates from Pakistan Railway, these cost may slight vary, these costs
are based on the analysis from Pakistan Railway Ministry)
KTH |Development of High Speed Rail In Pakistan 74
4.1- Scenario 1: Do Nothing Scenario
In previous chapter forecast of the current /Scenario 1 has been discussed, here in this chapter
economic costs of the different scenarios will be calculated.
Currently average 16 number of coaches/Vegans & 1 locomotive used as one train unit, and
cost of the each locomotive and vegan/coach is mentioned above, Based on economic
calculations there are 19 trains required for the current scenario, and there are 38 departures
(Total number of departures in Both directions),Number of the trains departure may vary from
current departures(less/more departures) because the capacity of the trains are too high,
approximately 150%(Current trains departures),due to less number of the seats & Coaches, the
passengers even sleep on the floor, not because they cannot pay, but just because reservation
of the seats is full. From PTPS (Pakistan Transport & Research Department) I found that there
are more than 50 to 70 train departures across above mentioned cities, not exactly all trains but
many trains between these cities (Hard to find out all trains) and connect these cities to the
branch line cities and come back to the main line (Main cities).from my own calculations I found
that that there should be 38 train departures which run between these cities @ of 100%
capacity of the trains.
As a conclusion, there will be 110 thousand passengers which will travel between these cities
(Rawalpindi-Multan), & there are 24243 million passenger kilometer. Number of the seats
served by one train is about 1440, Following is summary of the cost calculation.
Passenger Kilometer (M-Km):24243
Price Sek/Passenger/Km:0.08 Sek or 1 RS (PK)
Total Income (MSEK): 1865
Total Cost (MSEK):9051 Sek
Net Income (MSEK) :( Total Income-Total Cost) = -7187
Profit Margin: -3.85
The cost for the operation of this trains are higher than the revenues, from calculations it shows
that that the profit margin for this scenario (Slow, medium, fast trains) is negative, that means
the expenses are more than the revenues, so if the Government want to carry with this types of
trains than Government has too much to subsides, may be not as whole deficit amount, may be
half of it.
KTH |Development of High Speed Rail In Pakistan 75
4.2- Scenario 2: Improvements
In these trains there will be average 16 number of Vegans & 1 locomotive used as one train
unit, and cost of the each locomotive and vegan/coach is mentioned above, based on economic
calculations there are 19 trains required for the current scenario, The number of the departures
will remains same 38 departures (Total number of departures in Both directions).
As a conclusion, there are 132 thousand passengers which will travel between these cities
(Rawalpindi-Multan), & there are 28947 million passenger kilometer. This scenario has gained
22 thousand more passenger than the previous scenario due to the speed improvements,
Number of the seats served by one train is about 1440, Following are the cost calculation
summary of this scenario.
Passengers:
Passenger Kilometer (MSEK):28947
Price Sek/Passenger/Km:0.08 Sek or 1 RS (PK)
Total Income (MSEK): 2226
Total Cost (MSEK):9051 Sek
Net Income (MSEK) :( Total Income-Total Cost) = -6825
Profit Margin: -3.07
The cost for the operation of this trains are still higher than the revenues after the
improvements, from calculations it shows that the profit margin for this improved scenario 2
(Slow, medium, fast trains) is still negative, it means the expenses are more than the revenues,
so if the Government want to carry with this types of trains with improvements in speed than
Government has to subsides still a lot.

KTH |Development of High Speed Rail In Pakistan 76
4.3- Scenario 3: New Trains (High speed)
In this Scenario of High speed train there will be average 12 number of Vegans & 5
locomotive/Power Engines will be used as one train unit. The cost of the each locomotive and
vegan is mentioned above, based on economic calculations there are 30 trains required for this
scenario. There are 78 expected departures for this scenario (total number of departures in
both directions).
As a conclusion, there will be 105 thousand passengers/day which will travel between these
cities (Rawalpindi-Multan), & there will be 23129 million passenger kilometer. This scenario has
5 thousand less passenger from Scenario-1 & 27 thousand less passenger from scenario 2; this
is because of the less number of the stops. The number of the seats served by one train is about
1310, Following are the cost calculation summary of this scenario.
Passengers:
Passenger Kilometer (MSEK):23129
Price Sek/Passenger/Km:0.35Sek or 4.5 RS (PK)
Total Income (MSEK): 8007
Total Cost (MSEK):29328 Sek
Net Income (MSEK) :( Total Income-Total Cost) = -21322
Profit Margin: -2.66
The cost for the operation of this trains are still higher than the revenues after the removal of
the current trains with the High speed trains, from calculations it shows that the profit margin
for this scenario (High Speed Train) is still negative, that mean the expenses are still more than
the revenues, so if the Government want to carry with this types of trains than Government has
to subsides. The case of being negativity of the profit margin may be, because of the
accessibility, during the demand calculations it was assumed that the High speed trains will only
attract 35% of the passengers from the other type of the trains (Slow & Medium), so this is the
reason that the High speed trains has gained less number of the passengers, but on other hand
it has less travel time & waiting time, as a result the profit margin is still negative.
KTH |Development of High Speed Rail In Pakistan 77
4.4- Scenario 4: Mixed (Medium + High Speed)
This scenario is the combination of High speed & Medium train, in the case of the High speed
trains there will be average 12 number of Vegans & 4 locomotive/Power Engines will be used as
one train unit, on other hand for medium there will be average 14 number of Vegans & 1
locomotive/Power Engines will be used as one train unit, the cost of the each locomotive and
vegan is mentioned above, Based on economic calculations there are 20 trains required for
medium trains & 10 HST trains, The number of the departures for HST will be 26 & medium will
be 49.
As a conclusion, there are will be 147 thousand passengers/day which will be served by both
type of the trains between these cities (Rawalpindi-Multan), & there will be 42675 million
passenger kilometer. This scenario has gained 37 thousand more passengers compare to
Scenario-1 & 15 thousand more passengers compare to scenario 2; this is because of the less
number of the stops. Following are the cost calculation summary of this scenario
Passenger Kilometer (MSEK):42675
Price Sek/Passenger/Km:0.35Sek or 4.5 RS (PK)
Total Income (MSEK): 14772
Total Cost (MSEK):10252 Sek
Net Income (MSEK) :( Total Income-Total Cost) = 4519
Profit Margin: 0.31
In this case two type of the train will be run between these two cities (Rawalpindi-Multan). The
cost for the operation of these trains are less than the revenues, this scenario is the
combination of the removal of the fast trains with the high speed train & medium trains, from
calculations it shows that the profit margin for this scenario 4 (mixed scenario) is positive, it
means the expenses are less than the revenues. The high speed train service is assumed to be
more frequent, so this is the reason that the HST & medium train has gained 42 thousand more
number of the passengers due to less travel time & waiting time. So in return the profit margin
is positive.
KTH |Development of High Speed Rail In Pakistan 78
4.5- Scenario 5: High Speed Trains
In this scenario only HST trains will be run, the average 12 number of coaches/Vegans & 4
locomotive/Power Engines will be used as one train unit, the cost of the each locomotive and
vegan is mentioned above, based on economic calculations there will be 32 HST trains serving
between these two cities, expected number of the departures for HST are ‘90’
As a conclusion, there are 194 thousand passengers/day expected to be served by HST train
between these cities (Rawalpindi-Multan). This scenario has gained 47 thousand more
passengers comparing to Scenario-4, this is because of more frequent service & the less
number of the stops. Following are the cost calculation summary of this scenario
Passengers:
Passenger Kilometer (MSEK):62088
Price Sek/Passenger/Km:0.35Sek or 4.5 RS (PK)
Total Income (MSEK): 21731
Total Cost (MSEK):14274 Sek
Net Income (MSEK) :( Total Income-Total Cost) = 7457
Profit Margin: 0.34
In this case there is only one type of the train that run between these two cities (Rawalpindi-
Multan), the cost for the operation of this trains are less than the revenues, from calculations it
shows that the profit margin for this scenario 5 (HST) is positive, that mean the expenses are
less than the revenues. The high speed train service is assumed to be more frequent, so this is
the reason that the HST & medium train has gained more market share for passengers due to
less travel time & waiting time. So in return the profit margin is positive.
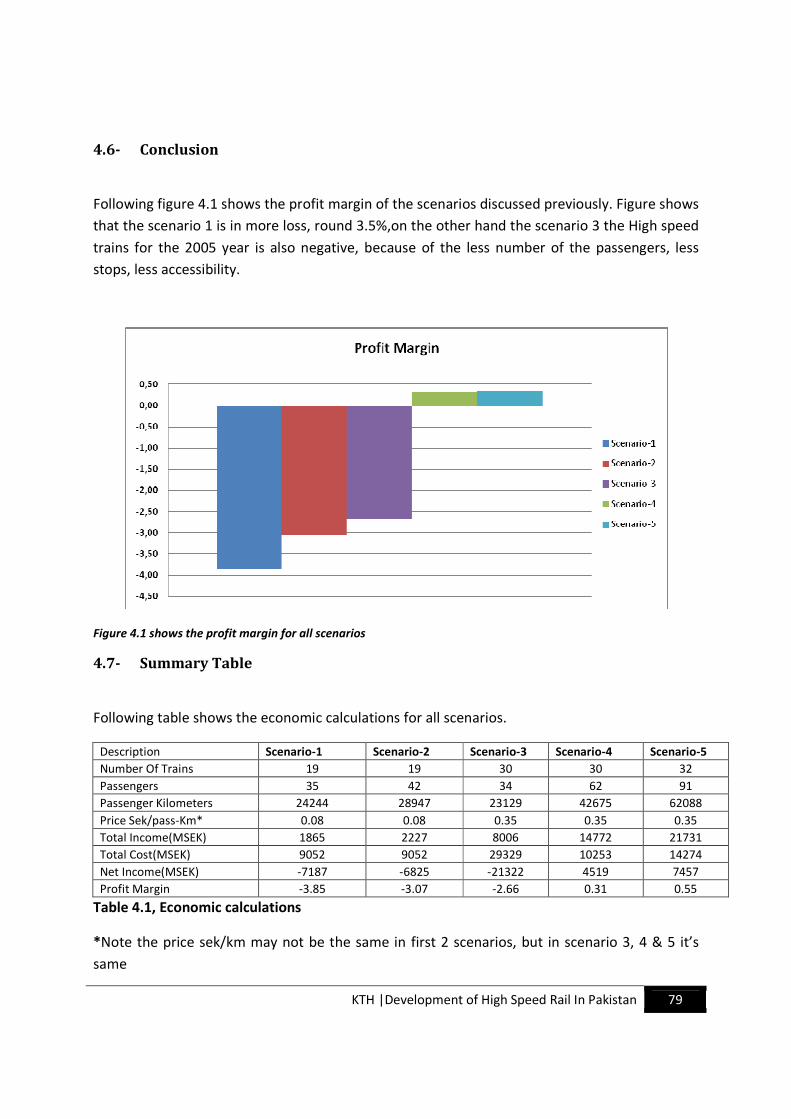
KTH |Development of High Speed Rail In Pakistan 79
4.6- Conclusion
Following figure 4.1 shows the profit margin of the scenarios discussed previously. Figure shows
that the scenario 1 is in more loss, round 3.5%,on the other hand the scenario 3 the High speed
trains for the 2005 year is also negative, because of the less number of the passengers, less
stops, less accessibility.
Figure 4.1 shows the profit margin for all scenarios
4.7- Summary Table
Following table shows the economic calculations for all scenarios.
Description Scenario-1 Scenario-2 Scenario-3 Scenario-4 Scenario-5
Number Of Trains 19 19 30 30 32
Passengers 35 42 34 62 91
Passenger Kilometers 24244 28947 23129 42675 62088
Price Sek/pass-Km* 0.08 0.08 0.35 0.35 0.35
Total Income(MSEK) 1865 2227 8006 14772 21731
Total Cost(MSEK) 9052 9052 29329 10253 14274
Net Income(MSEK) -7187 -6825 -21322 4519 7457
Profit Margin -3.85 -3.07 -2.66 0.31 0.55
Table 4.1, Economic calculations
*Note the price sek/km may not be the same in first 2 scenarios, but in scenario 3, 4 & 5 it’s
same
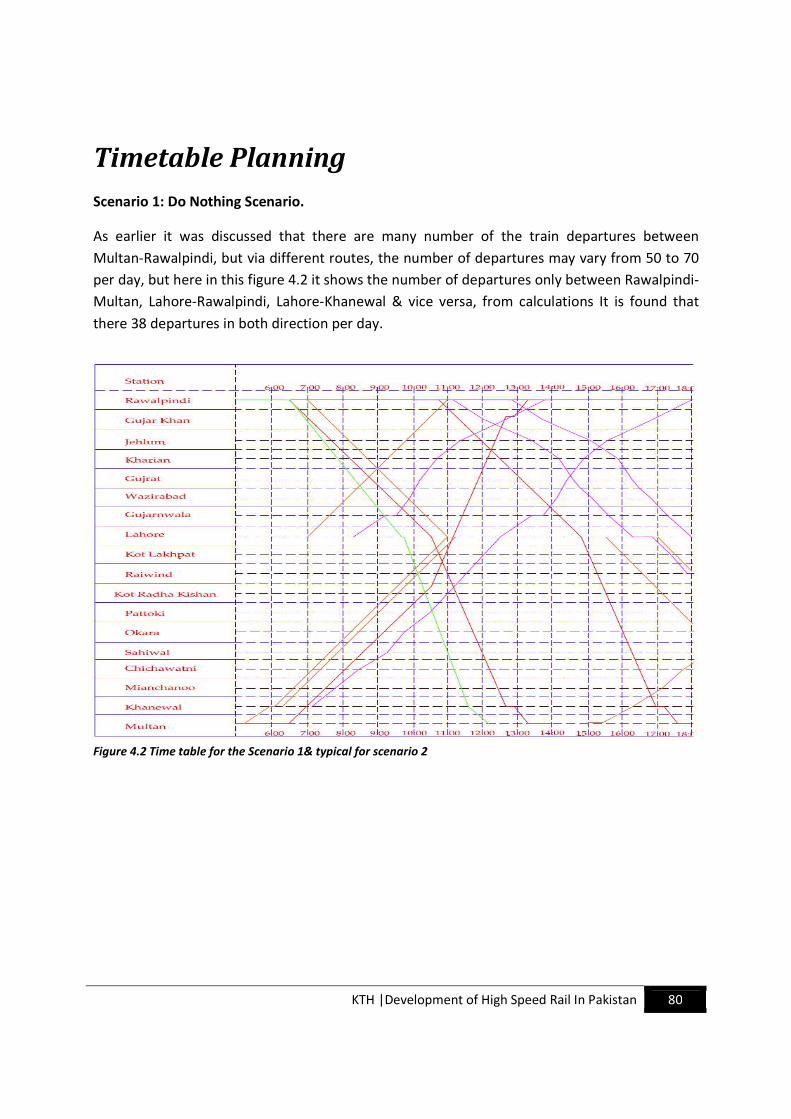
KTH |Development of High Speed Rail In Pakistan 80
Timetable Planning
Scenario 1: Do Nothing Scenario.
As earlier it was discussed that there are many number of the train departures between
Multan-Rawalpindi, but via different routes, the number of departures may vary from 50 to 70
per day, but here in this figure 4.2 it shows the number of departures only between Rawalpindi-
Multan, Lahore-Rawalpindi, Lahore-Khanewal & vice versa, from calculations It is found that
there 38 departures in both direction per day.
Figure 4.2 Time table for the Scenario 1& typical for scenario 2
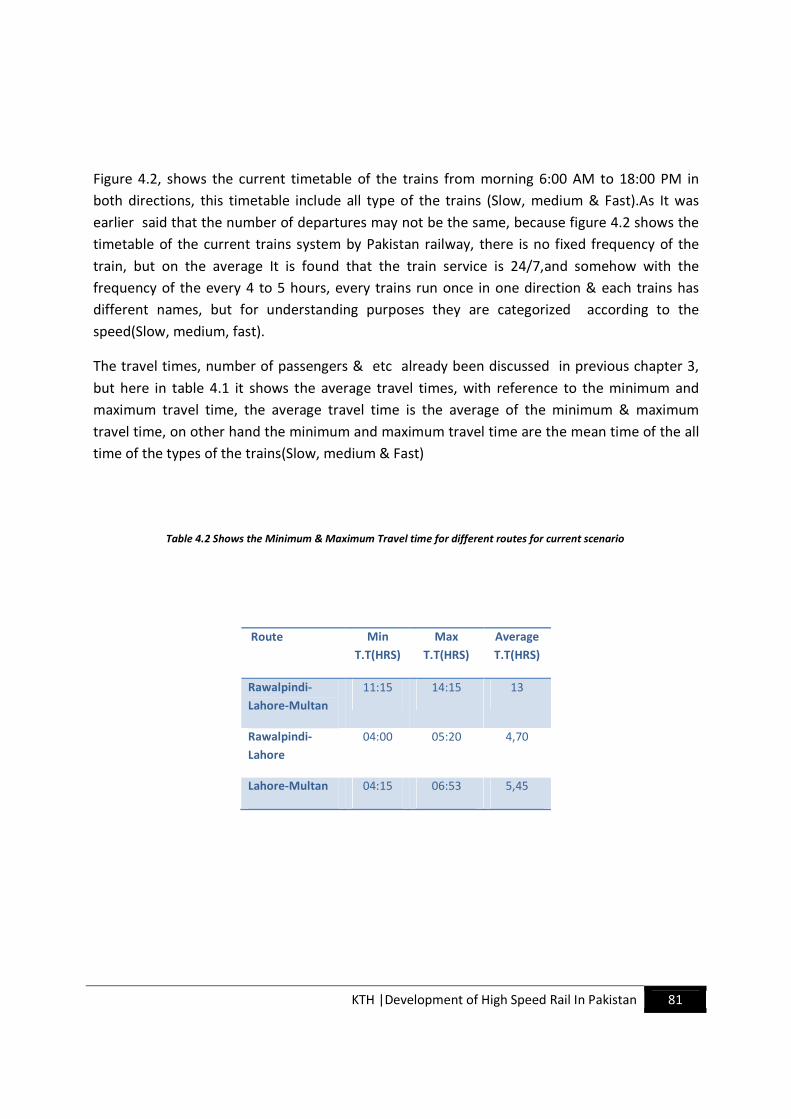
KTH |Development of High Speed Rail In Pakistan 81
Figure 4.2, shows the current timetable of the trains from morning 6:00 AM to 18:00 PM in
both directions, this timetable include all type of the trains (Slow, medium & Fast).As It was
earlier said that the number of departures may not be the same, because figure 4.2 shows the
timetable of the current trains system by Pakistan railway, there is no fixed frequency of the
train, but on the average It is found that the train service is 24/7,and somehow with the
frequency of the every 4 to 5 hours, every trains run once in one direction & each trains has
different names, but for understanding purposes they are categorized according to the
speed(Slow, medium, fast).
The travel times, number of passengers & etc already been discussed in previous chapter 3,
but here in table 4.1 it shows the average travel times, with reference to the minimum and
maximum travel time, the average travel time is the average of the minimum & maximum
travel time, on other hand the minimum and maximum travel time are the mean time of the all
time of the types of the trains(Slow, medium & Fast)
Route Min
T.T(HRS)
Max
T.T(HRS)
Average
T.T(HRS)
Rawalpindi-
Lahore-Multan
11:15 14:15 13
Rawalpindi-
Lahore
04:00 05:20 4,70
Lahore-Multan 04:15 06:53 5,45
Table 4.2 Shows the Minimum & Maximum Travel time for different routes for current scenario
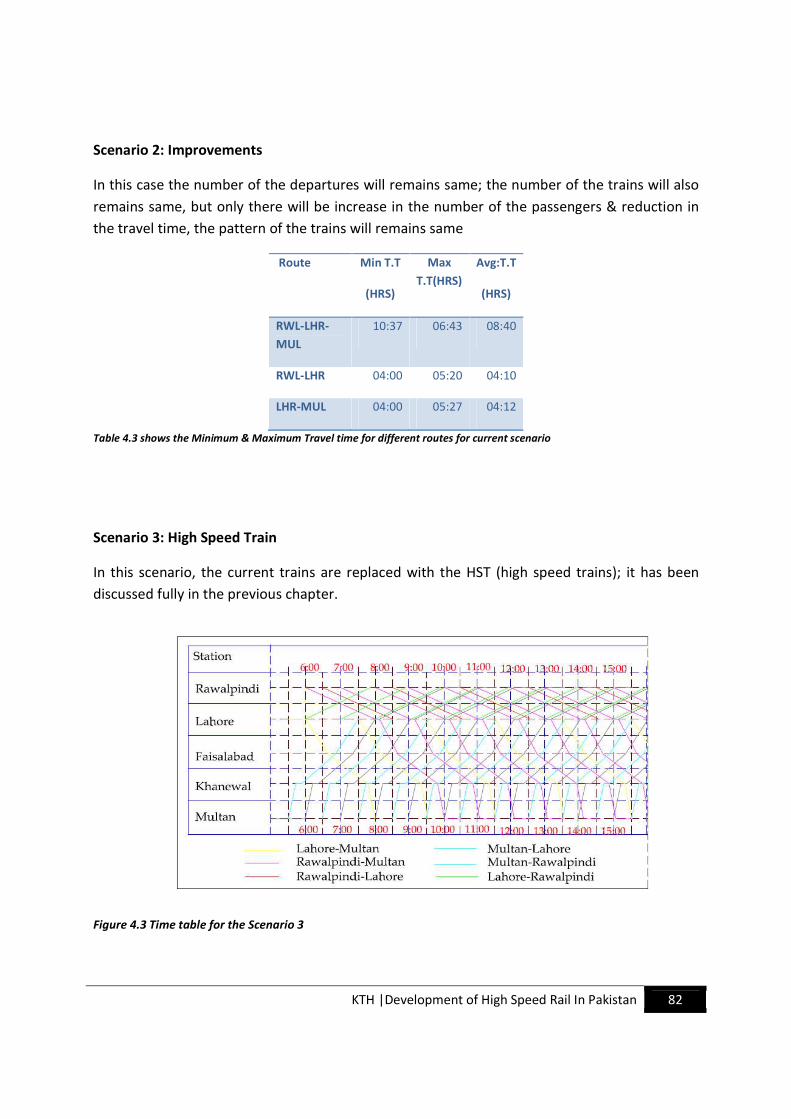
KTH |Development of High Speed Rail In Pakistan 82
Scenario 2: Improvements
In this case the number of the departures will remains same; the number of the trains will also
remains same, but only there will be increase in the number of the passengers & reduction in
the travel time, the pattern of the trains will remains same
Route Min T.T
(HRS)
Max
T.T(HRS)
Avg:T.T
(HRS)
RWL-LHR-
MUL
10:37 06:43 08:40
RWL-LHR 04:00 05:20 04:10
LHR-MUL 04:00 05:27 04:12
Table 4.3 shows the Minimum & Maximum Travel time for different routes for current scenario
Scenario 3: High Speed Train
In this scenario, the current trains are replaced with the HST (high speed trains); it has been
discussed fully in the previous chapter.
Figure 4.3 Time table for the Scenario 3
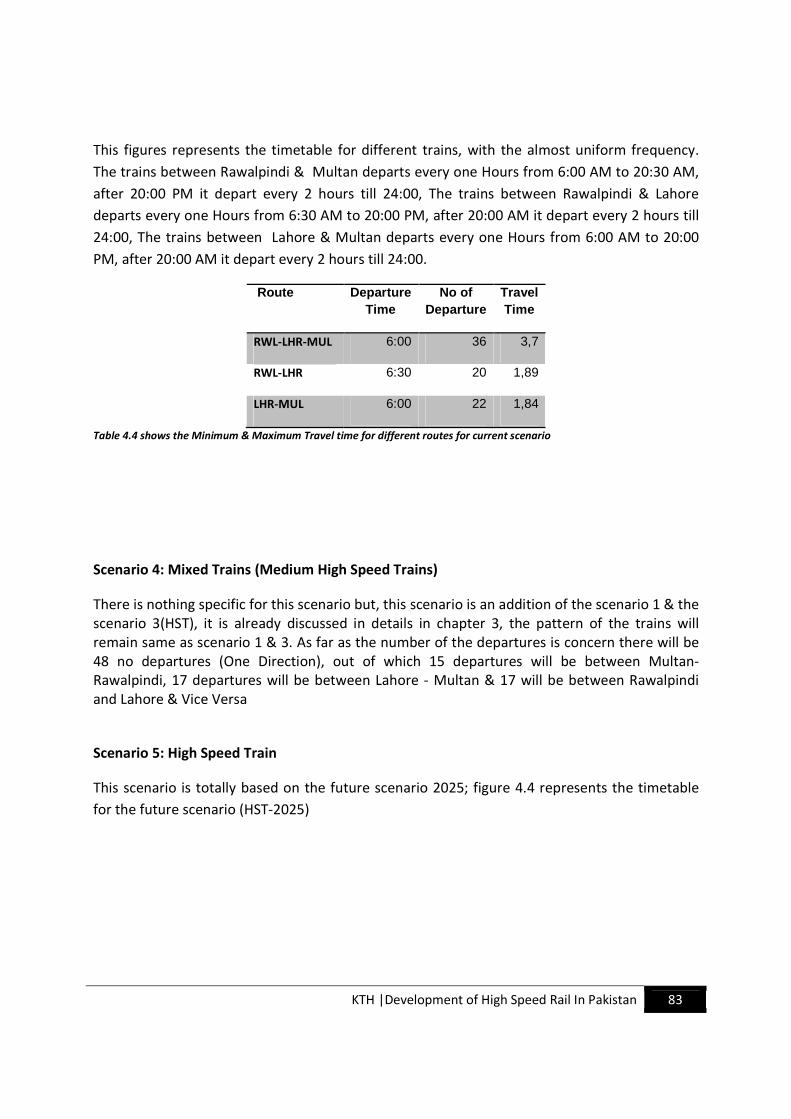
KTH |Development of High Speed Rail In Pakistan 83
This figures represents the timetable for different trains, with the almost uniform frequency.
The trains between Rawalpindi & Multan departs every one Hours from 6:00 AM to 20:30 AM,
after 20:00 PM it depart every 2 hours till 24:00, The trains between Rawalpindi & Lahore
departs every one Hours from 6:30 AM to 20:00 PM, after 20:00 AM it depart every 2 hours till
24:00, The trains between Lahore & Multan departs every one Hours from 6:00 AM to 20:00
PM, after 20:00 AM it depart every 2 hours till 24:00.
Route Departure Time
No of Departure
Travel Time
RWL-LHR-MUL 6:00 36 3,7
RWL-LHR 6:30 20 1,89
LHR-MUL 6:00 22 1,84
Table 4.4 shows the Minimum & Maximum Travel time for different routes for current scenario
Scenario 4: Mixed Trains (Medium High Speed Trains)
There is nothing specific for this scenario but, this scenario is an addition of the scenario 1 & the
scenario 3(HST), it is already discussed in details in chapter 3, the pattern of the trains will
remain same as scenario 1 & 3. As far as the number of the departures is concern there will be
48 no departures (One Direction), out of which 15 departures will be between Multan-
Rawalpindi, 17 departures will be between Lahore - Multan & 17 will be between Rawalpindi
and Lahore & Vice Versa
Scenario 5: High Speed Train
This scenario is totally based on the future scenario 2025; figure 4.4 represents the timetable
for the future scenario (HST-2025)
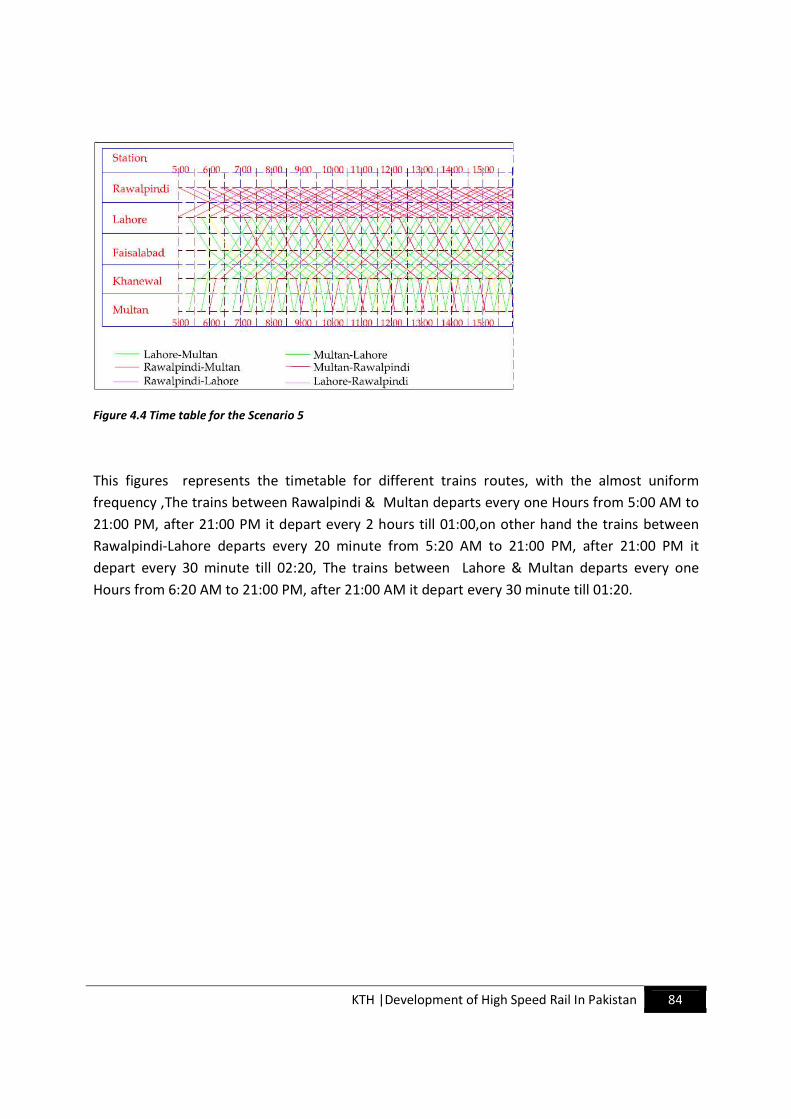
KTH |Development of High Speed Rail In Pakistan 84
Figure 4.4 Time table for the Scenario 5
This figures represents the timetable for different trains routes, with the almost uniform
frequency ,The trains between Rawalpindi & Multan departs every one Hours from 5:00 AM to
21:00 PM, after 21:00 PM it depart every 2 hours till 01:00,on other hand the trains between
Rawalpindi-Lahore departs every 20 minute from 5:20 AM to 21:00 PM, after 21:00 PM it
depart every 30 minute till 02:20, The trains between Lahore & Multan departs every one
Hours from 6:20 AM to 21:00 PM, after 21:00 AM it depart every 30 minute till 01:20.

KTH |Development of High Speed Rail In Pakistan 85
KTH |Development of High Speed Rail In Pakistan 86
Conclusion
5
KTH |Development of High Speed Rail In Pakistan 87
5-Conclusions & Recommendations
5.1- Conclusion
Conclusion may have many ways to express, there is not only one single solution for the
Railway system between (Rawalpindi-Multan or Vice versa).There has been five different
scenarios has been discussed earlier in the chapter three & four in detail. On the basis of the
discussion initially I will recommend Scenario 4 & scenario 5 as successful scenario, because in
these both scenarios the net cost is positive.
Scenario 1
It cannot be recommended for the future, or it can’t be the best railway service provided to the
people of Pakistan because the service is not that frequent, the trains run between these two
cities (Rawalpindi-Multan), very few trains run between these two cities, but there are many
departures via other cities between these two cities. The Operating costs of the service can not
generate the proper amount of the revenues so in return the net cost value/profit is negative.
Scenario 2
This scenario looks like the same as that of the scenario 1, but the difference was to increase
the operating speed of the trains and then look overall market share. In my opinion this
scenario also may not be recommended, because the effect of increase in passenger was not
that higher, so this scenario can be omitted for current improved situation.
Scenario 3
This scenario is only based on the high speed train ,and previously it was assumed that the
introducing high speed train just gain 35% of the passengers from other type of the trains, but
in my opinion to run only one type of the train may also not be a good solution, but on the
other hand it is quick service, and if we look on the figure 4.1, it shows that scenario 3 is bit less
negative than the scenario 1 & 2 ,but I think it is not enough to get it profitable, so It can’t be
recommend.
Scenario 4
It is the mixed railway transport, i.e High speed train + Medium speed trains with not many or
less no of the stops. I recommend this scenario because of the following reasons.
• The travel time between two cities is less than the scenario 1 & 2
KTH |Development of High Speed Rail In Pakistan 88
• More Frequent service(More departures)
• Attracted more no of passenger(More Market)
• The net cost is positive i.e refer figure 4.1
• Less waiting time
• Comfortable
• *Accessible to those who only pay fare
Scenario 5
It can be a good option to recommend, there is no harm in it, even it has more profit than
scenario 4 but this solution can’t be recommended because of many reasons. Following are a
few reasons
• People living between Lahore & Rawalpindi are quite rich as compare to the inhabitant
living between Lahore & Multan. So it might be hard to afford only one option i.e high
speed train in future
• There is more market share of the passenger between Lahore & Rawalpindi.
• Only running High speed train will reduce the accessibility for the people living between
Lahore & Rawalpindi, & some areas between Rawalpindi & Lahore i.e passengers from
Gujarnwala.
• Cost of the ticket for the high speed train may be more in the future but for the sake of
the comparison, in this study the price/pass-km for scenario 3, 4 & 5 are same.
KTH |Development of High Speed Rail In Pakistan 89
5.2- Recommendations
In the first chapter & at the start of each scenario there has been different assumptions has
been made. So following are the recommendations made for those assumptions
• Using the same track for the high speed & current system. To carry this work it was
essential to make such assumptions. But in reality may be it will be hard to use the same
track for High speed train, it has to have new track.
• The 2nd
assumptions which made in this project is the signaling system work absolutely
fine, but in reality the conditions are different, Pakistan railway having not good
signaling system
• The section between Khanewal & Lahore is electric but the section between Lahore &
Rawalpindi is non-electric, so Pakistan Railway must upgrade the system, because the
most of High speed trains are electric.
• There should be an up gradation of the tracks (No study made)
• Staff working with Pakistan railway costs more than the operating cost of the railway
system, so in order to make more profitable it could be a good idea to reduce the
number of employees in railway group.
• Government should subside Railway system i.e if Government choose to have scenario 1
or 2 in future
• Railway can be made more profitable if passenger trains run with the freight trains (no
study made for freight in this project work)
• If government want scenario 5 to be chosen as future scenario ,then the Government
should provide the feeder buses between the cities, because the High speed is not
accessible for every station
• From calculations & accessibility point of view scenario 4 can be recommended for this
study project.
KTH |Development of High Speed Rail In Pakistan 90
Further Studies
There has been many article written on the high speed train in Pakistan, but there has been no
proper studies done, I am the first Pakistani who has done this thesis work on the High speed
train , but right now Pakistan Railway is has started working on the implementation of the High
speed train between Lahore & Rawalpindi. The first study was done with the words in 2006, but
latar on there has been no progress. But according to the Pakistan Railway annual report 2010,
(available on website), the feasibility study for new high speed train between Rawalpindi-
Lahore (290 Kms)24
.
24
Pakistan Railway year book 2010 chapter Introduction to the operating unit
KTH |Development of High Speed Rail In Pakistan 91
Appendices
Contents
APPENDIX 1: Bibliography
APPENDIX 2: Tables-Data used for chapter 2
APPENDIX 3: Overall view of the Pakistan Railway Network
APPENDIX 4: Station description
APPENDIX 5: Expected Timetable

KTH |Development of High Speed Rail In Pakistan 92
KTH |Development of High Speed Rail In Pakistan 93
Appendix
Literature -Reference
1

KTH |Development of High Speed Rail In Pakistan 94
KTH |Development of High Speed Rail In Pakistan 95
Bibliography
[1] Pakistan Railway, year Book 2006
[2] Maraj Nadeem, (2007), Report on Pakistan Railway
[3] http://history-of-rail-transport-in-pakistan.co.tv/ 16:48, 110512
[4] Pakistan Railway
[5] Literature, about developed countries
[6 ] Roger Ascham, 1545
[7] Dawn News 15th August 2002
[8] Estimating transportation demand by Sinha
[9] Report on Pakistan Railway at his Glance (2008)
[10] JICA Study Team (2006)
[11] PTSP, Pakistan Transport Study Plan 2005
[12] http://www.findpk.com/yp/html/railways.html, 17:47, 110512
[13] Percentages are calculated from Pakistan Railway annual report (2006)
[14] Calculations From chapter 2
[15] Demand-Supply Analysis by PR Railway year book 2004/2005
[16] 2005 population estimates for cities in Pakistan from Mongabay website
[17] Discussion with PR officials, friends & on some experience basis
[18] Calculated from the demand, mentioned in the PR year book 2005
[19] Google earth 2011, Maps & Distance
[20] Timetable from PR website
[21] PTPS 2005/06 Pakistan Transport Plan Study
[22] Pakistan Railway year book 2010 chapter Introduction to the operating unit
[23]
Pakistan - City – Rawalpindi 110521
[24] True Knowledge 110521
[25] Population of Lahore from Mongabay
[26] Top three cities of Pakistan from blurtit 110521
[27] The News Newspaper 2006 & from defense pages of Pakistan 2006
KTH |Development of High Speed Rail In Pakistan 96
[28] Top three cities of Pakistan from blurtit 110521
[29] Faisalabad City district Government website
[30] Wikipedia 2010 Population for Multan
KTH |Development of High Speed Rail In Pakistan 97
Appendix
Tables
2

KTH |Development of High Speed Rail In Pakistan 98
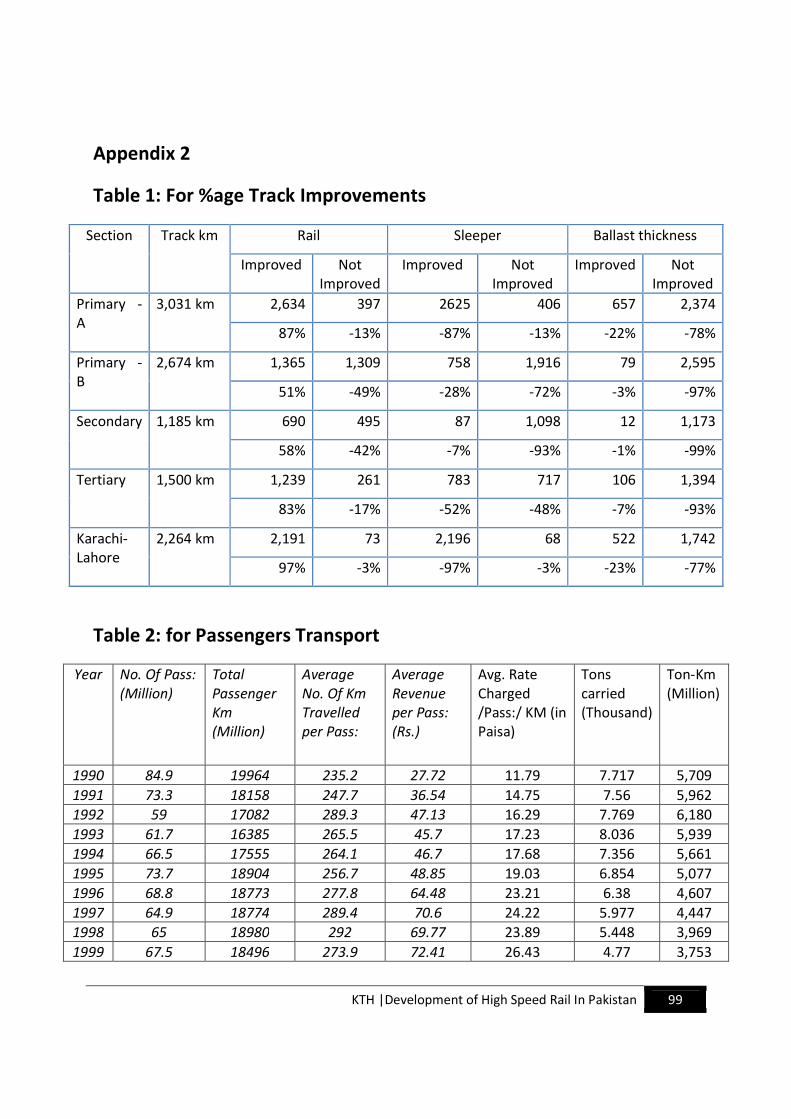
KTH |Development of High Speed Rail In Pakistan 99
Appendix 2
Table 1: For %age Track Improvements
Section Track km Rail Sleeper Ballast thickness
Improved Not
Improved
Improved Not
Improved
Improved Not
Improved
Primary -
A
3,031 km 2,634 397 2625 406 657 2,374
87% -13% -87% -13% -22% -78%
Primary -
B
2,674 km 1,365 1,309 758 1,916 79 2,595
51% -49% -28% -72% -3% -97%
Secondary 1,185 km 690 495 87 1,098 12 1,173
58% -42% -7% -93% -1% -99%
Tertiary 1,500 km 1,239 261 783 717 106 1,394
83% -17% -52% -48% -7% -93%
Karachi-
Lahore
2,264 km 2,191 73 2,196 68 522 1,742
97% -3% -97% -3% -23% -77%
Table 2: for Passengers Transport
Year No. Of Pass:
(Million)
Total
Passenger
Km
(Million)
Average
No. Of Km
Travelled
per Pass:
Average
Revenue
per Pass:
(Rs.)
Avg. Rate
Charged
/Pass:/ KM (in
Paisa)
Tons
carried
(Thousand)
Ton-Km
(Million)
1990 84.9 19964 235.2 27.72 11.79 7.717 5,709
1991 73.3 18158 247.7 36.54 14.75 7.56 5,962
1992 59 17082 289.3 47.13 16.29 7.769 6,180
1993 61.7 16385 265.5 45.7 17.23 8.036 5,939
1994 66.5 17555 264.1 46.7 17.68 7.356 5,661
1995 73.7 18904 256.7 48.85 19.03 6.854 5,077
1996 68.8 18773 277.8 64.48 23.21 6.38 4,607
1997 64.9 18774 289.4 70.6 24.22 5.977 4,447
1998 65 18980 292 69.77 23.89 5.448 3,969
1999 67.5 18496 273.9 72.41 26.43 4.77 3,753
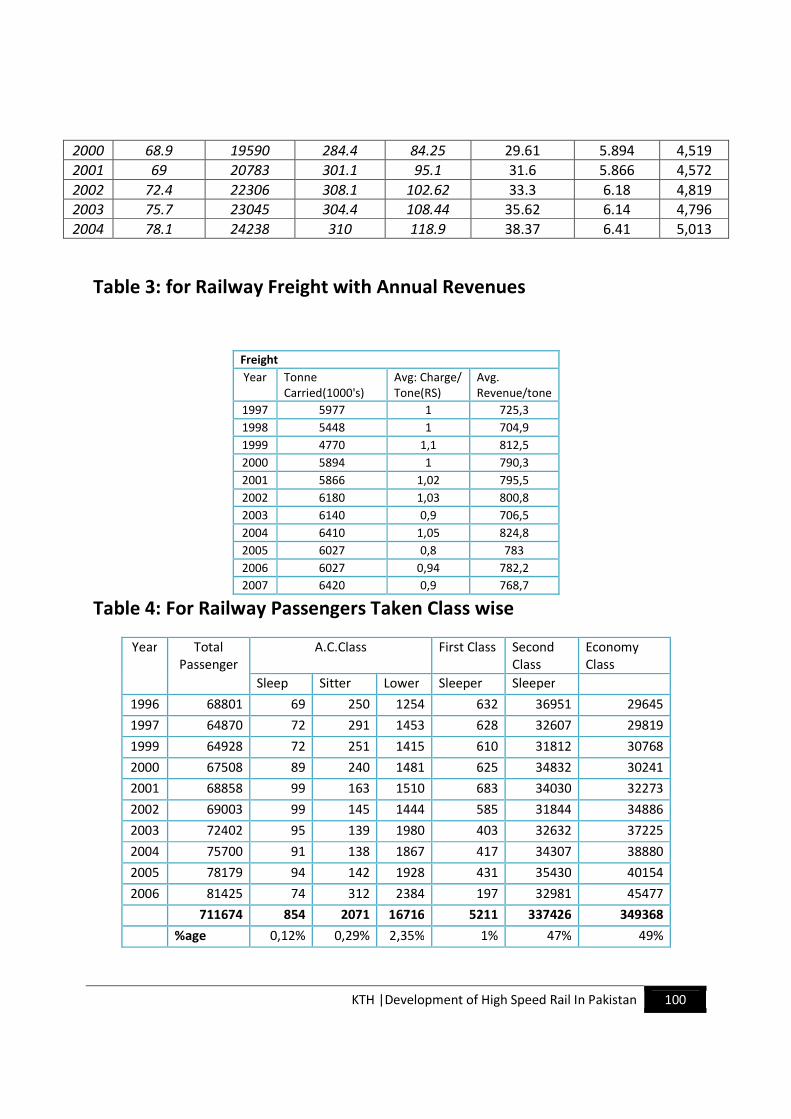
KTH |Development of High Speed Rail In Pakistan 100
2000 68.9 19590 284.4 84.25 29.61 5.894 4,519
2001 69 20783 301.1 95.1 31.6 5.866 4,572
2002 72.4 22306 308.1 102.62 33.3 6.18 4,819
2003 75.7 23045 304.4 108.44 35.62 6.14 4,796
2004 78.1 24238 310 118.9 38.37 6.41 5,013
Table 3: for Railway Freight with Annual Revenues
Freight
Year Tonne
Carried(1000's)
Avg: Charge/
Tone(RS)
Avg.
Revenue/tone
1997 5977 1 725,3
1998 5448 1 704,9
1999 4770 1,1 812,5
2000 5894 1 790,3
2001 5866 1,02 795,5
2002 6180 1,03 800,8
2003 6140 0,9 706,5
2004 6410 1,05 824,8
2005 6027 0,8 783
2006 6027 0,94 782,2
2007 6420 0,9 768,7
Table 4: For Railway Passengers Taken Class wise
Year Total
Passenger
A.C.Class First Class Second
Class
Economy
Class
Sleep Sitter Lower Sleeper Sleeper
1996 68801 69 250 1254 632 36951 29645
1997 64870 72 291 1453 628 32607 29819
1999 64928 72 251 1415 610 31812 30768
2000 67508 89 240 1481 625 34832 30241
2001 68858 99 163 1510 683 34030 32273
2002 69003 99 145 1444 585 31844 34886
2003 72402 95 139 1980 403 32632 37225
2004 75700 91 138 1867 417 34307 38880
2005 78179 94 142 1928 431 35430 40154
2006 81425 74 312 2384 197 32981 45477
711674 854 2071 16716 5211 337426 349368
%age 0,12% 0,29% 2,35% 1% 47% 49%
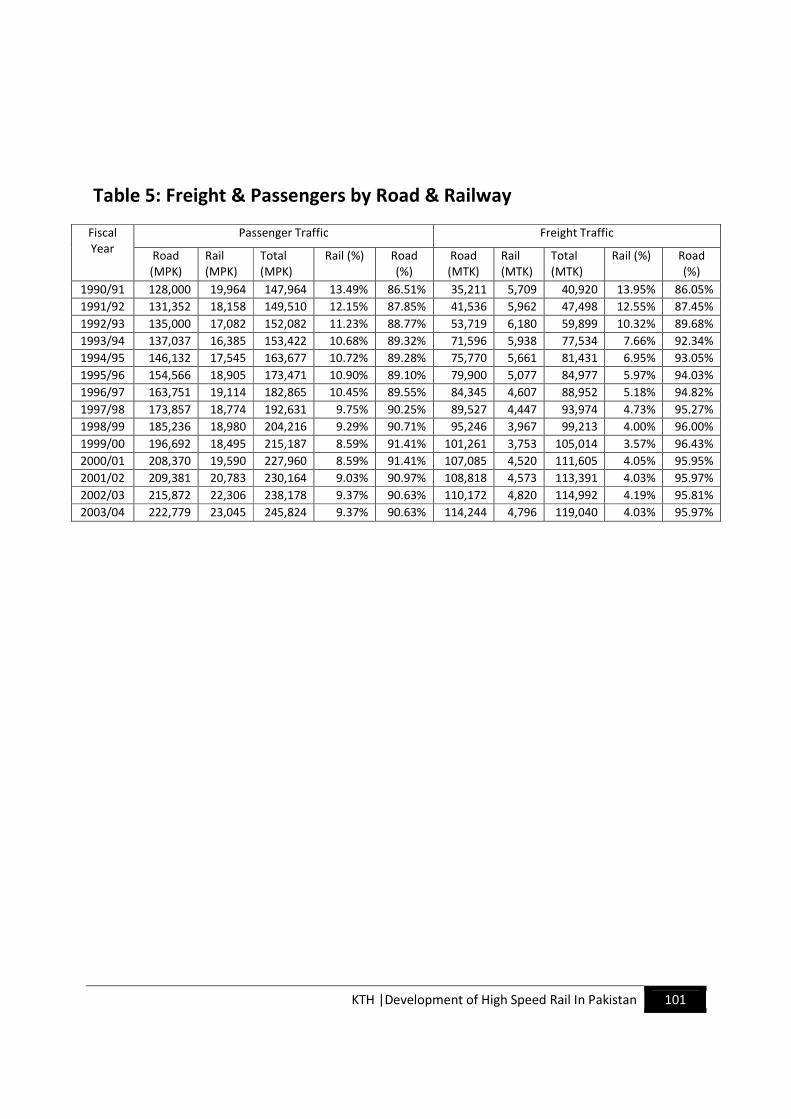
KTH |Development of High Speed Rail In Pakistan 101
Table 5: Freight & Passengers by Road & Railway
Fiscal
Year
Passenger Traffic Freight Traffic
Road
(MPK)
Rail
(MPK)
Total
(MPK)
Rail (%) Road
(%)
Road
(MTK)
Rail
(MTK)
Total
(MTK)
Rail (%) Road
(%)
1990/91 128,000 19,964 147,964 13.49% 86.51% 35,211 5,709 40,920 13.95% 86.05%
1991/92 131,352 18,158 149,510 12.15% 87.85% 41,536 5,962 47,498 12.55% 87.45%
1992/93 135,000 17,082 152,082 11.23% 88.77% 53,719 6,180 59,899 10.32% 89.68%
1993/94 137,037 16,385 153,422 10.68% 89.32% 71,596 5,938 77,534 7.66% 92.34%
1994/95 146,132 17,545 163,677 10.72% 89.28% 75,770 5,661 81,431 6.95% 93.05%
1995/96 154,566 18,905 173,471 10.90% 89.10% 79,900 5,077 84,977 5.97% 94.03%
1996/97 163,751 19,114 182,865 10.45% 89.55% 84,345 4,607 88,952 5.18% 94.82%
1997/98 173,857 18,774 192,631 9.75% 90.25% 89,527 4,447 93,974 4.73% 95.27%
1998/99 185,236 18,980 204,216 9.29% 90.71% 95,246 3,967 99,213 4.00% 96.00%
1999/00 196,692 18,495 215,187 8.59% 91.41% 101,261 3,753 105,014 3.57% 96.43%
2000/01 208,370 19,590 227,960 8.59% 91.41% 107,085 4,520 111,605 4.05% 95.95%
2001/02 209,381 20,783 230,164 9.03% 90.97% 108,818 4,573 113,391 4.03% 95.97%
2002/03 215,872 22,306 238,178 9.37% 90.63% 110,172 4,820 114,992 4.19% 95.81%
2003/04 222,779 23,045 245,824 9.37% 90.63% 114,244 4,796 119,040 4.03% 95.97%

KTH |Development of High Speed Rail In Pakistan 102
KTH |Development of High Speed Rail In Pakistan 103
Appendix
Railway Network
3

KTH |Development of High Speed Rail In Pakistan 104
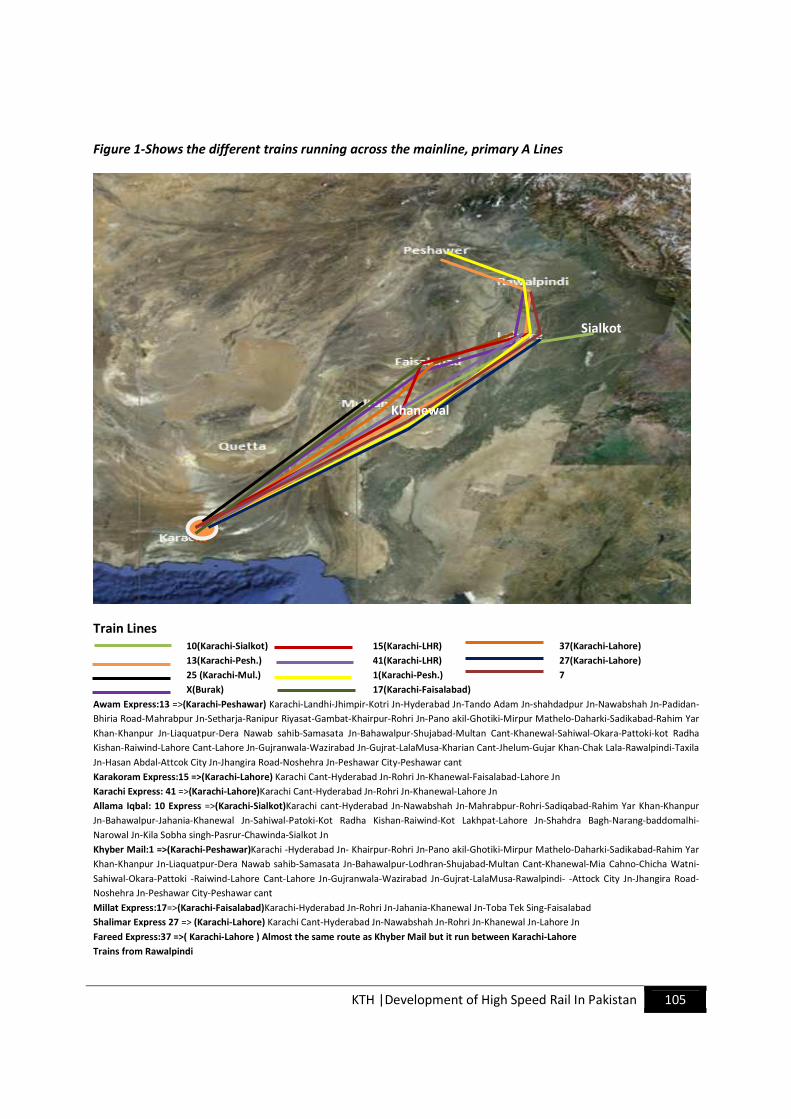
KTH |Development of High Speed Rail In Pakistan 105
Figure 1-Shows the different trains running across the mainline, primary A Lines
Train Lines
10(Karachi-Sialkot) 15(Karachi-LHR) 37(Karachi-Lahore)
13(Karachi-Pesh.) 41(Karachi-LHR) 27(Karachi-Lahore)
25 (Karachi-Mul.) 1(Karachi-Pesh.) 7
X(Burak) 17(Karachi-Faisalabad)
Awam Express:13 =>(Karachi-Peshawar) Karachi-Landhi-Jhimpir-Kotri Jn-Hyderabad Jn-Tando Adam Jn-shahdadpur Jn-Nawabshah Jn-Padidan-
Bhiria Road-Mahrabpur Jn-Setharja-Ranipur Riyasat-Gambat-Khairpur-Rohri Jn-Pano akil-Ghotiki-Mirpur Mathelo-Daharki-Sadikabad-Rahim Yar
Khan-Khanpur Jn-Liaquatpur-Dera Nawab sahib-Samasata Jn-Bahawalpur-Shujabad-Multan Cant-Khanewal-Sahiwal-Okara-Pattoki-kot Radha
Kishan-Raiwind-Lahore Cant-Lahore Jn-Gujranwala-Wazirabad Jn-Gujrat-LalaMusa-Kharian Cant-Jhelum-Gujar Khan-Chak Lala-Rawalpindi-Taxila
Jn-Hasan Abdal-Attcok City Jn-Jhangira Road-Noshehra Jn-Peshawar City-Peshawar cant
Karakoram Express:15 =>(Karachi-Lahore) Karachi Cant-Hyderabad Jn-Rohri Jn-Khanewal-Faisalabad-Lahore Jn
Karachi Express: 41 =>(Karachi-Lahore)Karachi Cant-Hyderabad Jn-Rohri Jn-Khanewal-Lahore Jn
Allama Iqbal: 10 Express =>(Karachi-Sialkot)Karachi cant-Hyderabad Jn-Nawabshah Jn-Mahrabpur-Rohri-Sadiqabad-Rahim Yar Khan-Khanpur
Jn-Bahawalpur-Jahania-Khanewal Jn-Sahiwal-Patoki-Kot Radha Kishan-Raiwind-Kot Lakhpat-Lahore Jn-Shahdra Bagh-Narang-baddomalhi-
Narowal Jn-Kila Sobha singh-Pasrur-Chawinda-Sialkot Jn
Khyber Mail:1 =>(Karachi-Peshawar)Karachi -Hyderabad Jn- Khairpur-Rohri Jn-Pano akil-Ghotiki-Mirpur Mathelo-Daharki-Sadikabad-Rahim Yar
Khan-Khanpur Jn-Liaquatpur-Dera Nawab sahib-Samasata Jn-Bahawalpur-Lodhran-Shujabad-Multan Cant-Khanewal-Mia Cahno-Chicha Watni-
Sahiwal-Okara-Pattoki -Raiwind-Lahore Cant-Lahore Jn-Gujranwala-Wazirabad Jn-Gujrat-LalaMusa-Rawalpindi- -Attock City Jn-Jhangira Road-
Noshehra Jn-Peshawar City-Peshawar cant
Millat Express:17=>(Karachi-Faisalabad)Karachi-Hyderabad Jn-Rohri Jn-Jahania-Khanewal Jn-Toba Tek Sing-Faisalabad
Shalimar Express 27 => (Karachi-Lahore) Karachi Cant-Hyderabad Jn-Nawabshah Jn-Rohri Jn-Khanewal Jn-Lahore Jn
Fareed Express:37 =>( Karachi-Lahore ) Almost the same route as Khyber Mail but it run between Karachi-Lahore
Trains from Rawalpindi
Sialkot
Khanewal
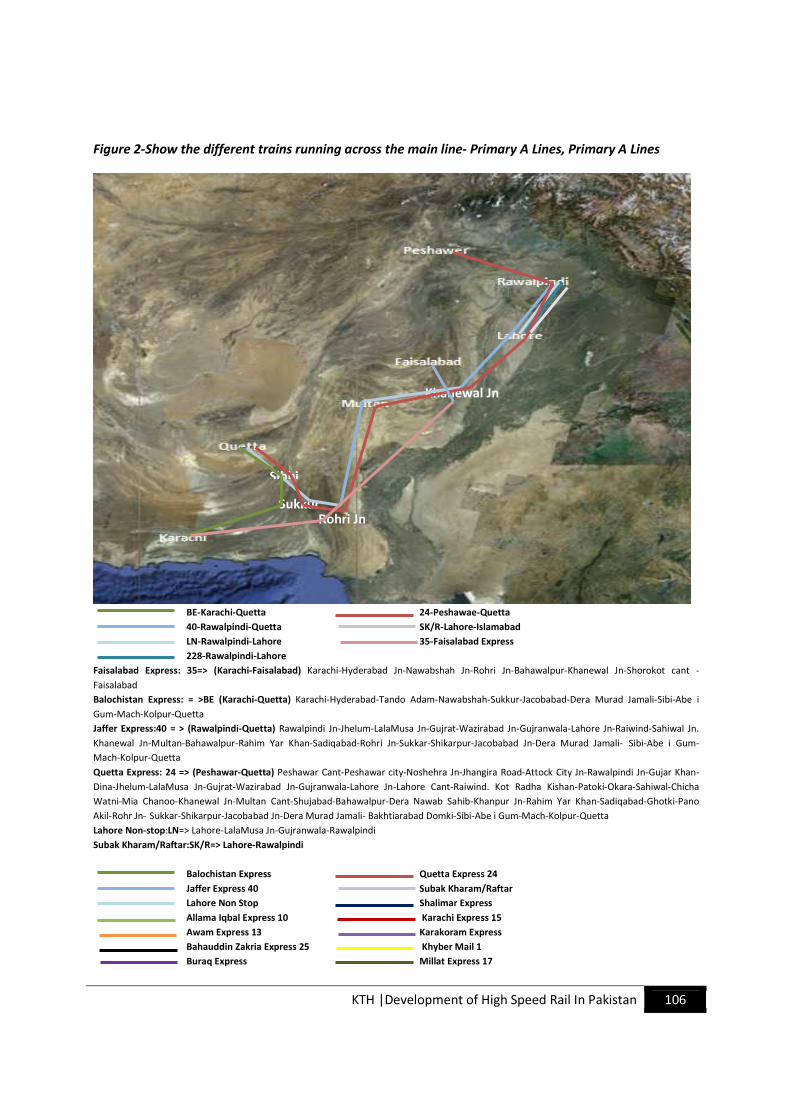
KTH |Development of High Speed Rail In Pakistan 106
Figure 2-Show the different trains running across the main line- Primary A Lines, Primary A Lines
BE-Karachi-Quetta 24-Peshawae-Quetta
40-Rawalpindi-Quetta SK/R-Lahore-Islamabad
LN-Rawalpindi-Lahore 35-Faisalabad Express
228-Rawalpindi-Lahore
Faisalabad Express: 35=> (Karachi-Faisalabad) Karachi-Hyderabad Jn-Nawabshah Jn-Rohri Jn-Bahawalpur-Khanewal Jn-Shorokot cant -
Faisalabad
Balochistan Express: = >BE (Karachi-Quetta) Karachi-Hyderabad-Tando Adam-Nawabshah-Sukkur-Jacobabad-Dera Murad Jamali-Sibi-Abe i
Gum-Mach-Kolpur-Quetta
Jaffer Express:40 = > (Rawalpindi-Quetta) Rawalpindi Jn-Jhelum-LalaMusa Jn-Gujrat-Wazirabad Jn-Gujranwala-Lahore Jn-Raiwind-Sahiwal Jn.
Khanewal Jn-Multan-Bahawalpur-Rahim Yar Khan-Sadiqabad-Rohri Jn-Sukkar-Shikarpur-Jacobabad Jn-Dera Murad Jamali- Sibi-Abe i Gum-
Mach-Kolpur-Quetta
Quetta Express: 24 => (Peshawar-Quetta) Peshawar Cant-Peshawar city-Noshehra Jn-Jhangira Road-Attock City Jn-Rawalpindi Jn-Gujar Khan-
Dina-Jhelum-LalaMusa Jn-Gujrat-Wazirabad Jn-Gujranwala-Lahore Jn-Lahore Cant-Raiwind. Kot Radha Kishan-Patoki-Okara-Sahiwal-Chicha
Watni-Mia Chanoo-Khanewal Jn-Multan Cant-Shujabad-Bahawalpur-Dera Nawab Sahib-Khanpur Jn-Rahim Yar Khan-Sadiqabad-Ghotki-Pano
Akil-Rohr Jn- Sukkar-Shikarpur-Jacobabad Jn-Dera Murad Jamali- Bakhtiarabad Domki-Sibi-Abe i Gum-Mach-Kolpur-Quetta
Lahore Non-stop:LN=> Lahore-LalaMusa Jn-Gujranwala-Rawalpindi
Subak Kharam/Raftar:SK/R=> Lahore-Rawalpindi
Balochistan Express Quetta Express 24
Jaffer Express 40 Subak Kharam/Raftar
Lahore Non Stop Shalimar Express
Allama Iqbal Express 10 Karachi Express 15
Awam Express 13 Karakoram Express
Bahauddin Zakria Express 25 Khyber Mail 1
Buraq Express Millat Express 17
Rohri Jn
Khanewal Jn
Sukkur
Sibbi
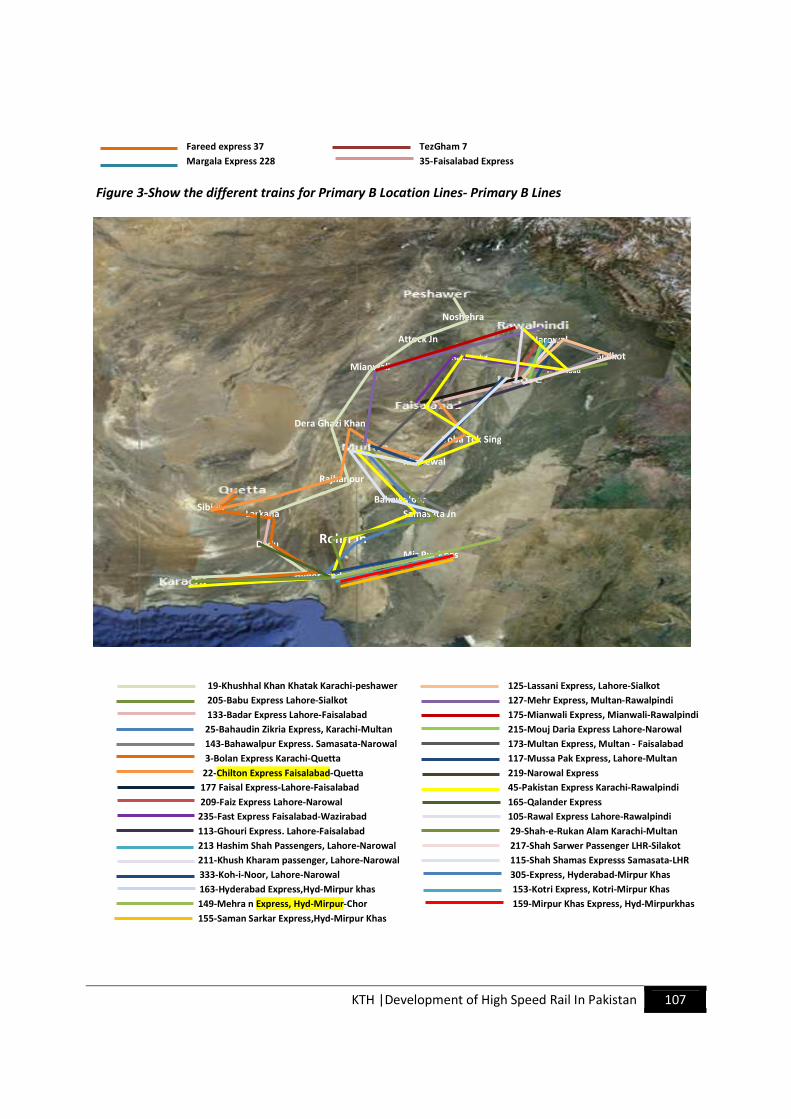
KTH |Development of High Speed Rail In Pakistan 107
Fareed express 37 TezGham 7
Margala Express 228 35-Faisalabad Express
Figure 3-Show the different trains for Primary B Location Lines- Primary B Lines
19-Khushhal Khan Khatak Karachi-peshawer 125-Lassani Express, Lahore-Sialkot
205-Babu Express Lahore-Sialkot 127-Mehr Express, Multan-Rawalpindi
133-Badar Express Lahore-Faisalabad 175-Mianwali Express, Mianwali-Rawalpindi
25-Bahaudin Zikria Express, Karachi-Multan 215-Mouj Daria Express Lahore-Narowal
143-Bahawalpur Express. Samasata-Narowal 173-Multan Express, Multan - Faisalabad
3-Bolan Express Karachi-Quetta 117-Mussa Pak Express, Lahore-Multan
22-Chilton Express Faisalabad-Quetta 219-Narowal Express
177 Faisal Express-Lahore-Faisalabad 45-Pakistan Express Karachi-Rawalpindi
209-Faiz Express Lahore-Narowal 165-Qalander Express
235-Fast Express Faisalabad-Wazirabad 105-Rawal Express Lahore-Rawalpindi
113-Ghouri Express. Lahore-Faisalabad 29-Shah-e-Rukan Alam Karachi-Multan
213 Hashim Shah Passengers, Lahore-Narowal 217-Shah Sarwer Passenger LHR-Silakot
211-Khush Kharam passenger, Lahore-Narowal 115-Shah Shamas Expresss Samasata-LHR
333-Koh-i-Noor, Lahore-Narowal 305-Express, Hyderabad-Mirpur Khas 163-Hyderabad Express,Hyd-Mirpur khas 153-Kotri Express, Kotri-Mirpur Khas
149-Mehra n Express, Hyd-Mirpur-Chor 159-Mirpur Khas Express, Hyd-Mirpurkhas
155-Saman Sarkar Express,Hyd-Mirpur Khas
Rohri Jn
Larkana
Dadu
Rajhanpur
Dera Ghazi Khan
Mianwali
Attock Jn
Noshehra
Hyderabad
Sialkot
Wazirabad
Bahawalpur
Narowal
Samasata Jn
Toba Tek Sing
Hafizababd
Sibi Jn
Khanewal
Mir Pur Khas

KTH |Development of High Speed Rail In Pakistan 108
KTH |Development of High Speed Rail In Pakistan 109
Appendix
Description-Stations
4

KTH |Development of High Speed Rail In Pakistan 110
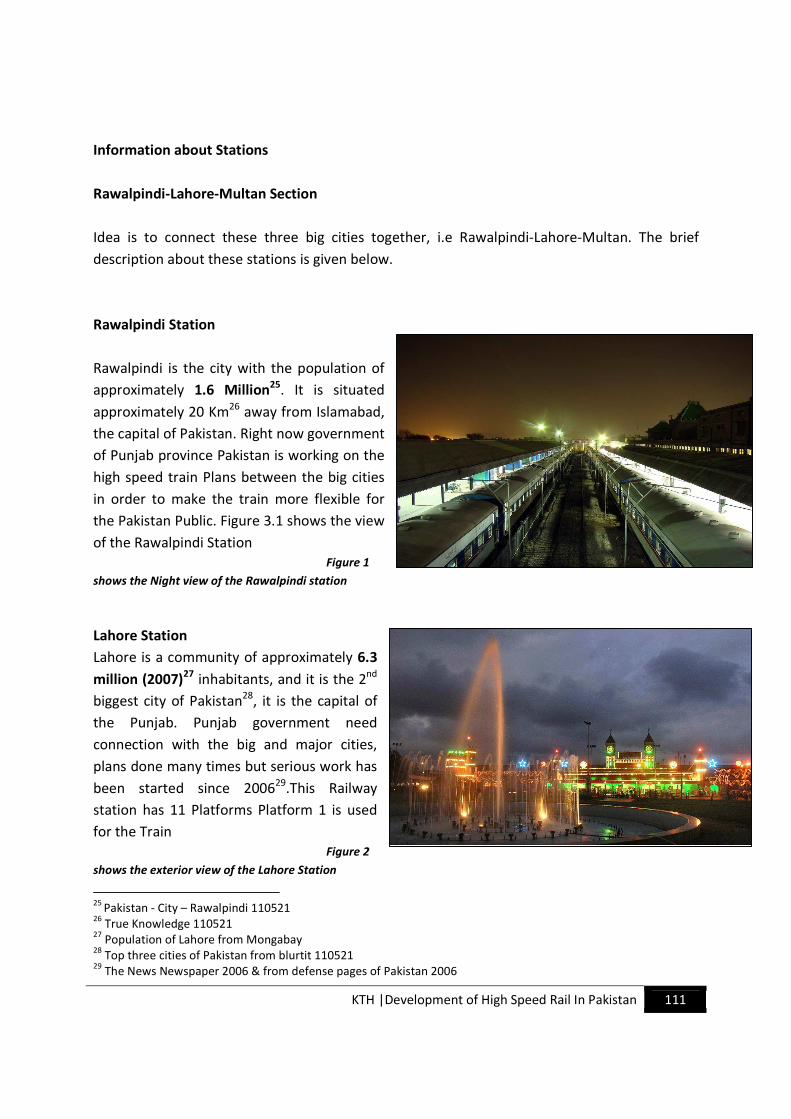
KTH |Development of High Speed Rail In Pakistan 111
Information about Stations
Rawalpindi-Lahore-Multan Section
Idea is to connect these three big cities together, i.e Rawalpindi-Lahore-Multan. The brief
description about these stations is given below.
Rawalpindi Station
Rawalpindi is the city with the population of
approximately 1.6 Million25
. It is situated
approximately 20 Km26
away from Islamabad,
the capital of Pakistan. Right now government
of Punjab province Pakistan is working on the
high speed train Plans between the big cities
in order to make the train more flexible for
the Pakistan Public. Figure 3.1 shows the view
of the Rawalpindi Station
Figure 1
shows the Night view of the Rawalpindi station
Lahore Station
Lahore is a community of approximately 6.3
million (2007)27
inhabitants, and it is the 2nd
biggest city of Pakistan28
, it is the capital of
the Punjab. Punjab government need
connection with the big and major cities,
plans done many times but serious work has
been started since 200629
.This Railway
station has 11 Platforms Platform 1 is used
for the Train
Figure 2
shows the exterior view of the Lahore Station
25
Pakistan - City – Rawalpindi 110521 26
True Knowledge 110521 27
Population of Lahore from Mongabay 28
Top three cities of Pakistan from blurtit 110521 29
The News Newspaper 2006 & from defense pages of Pakistan 2006
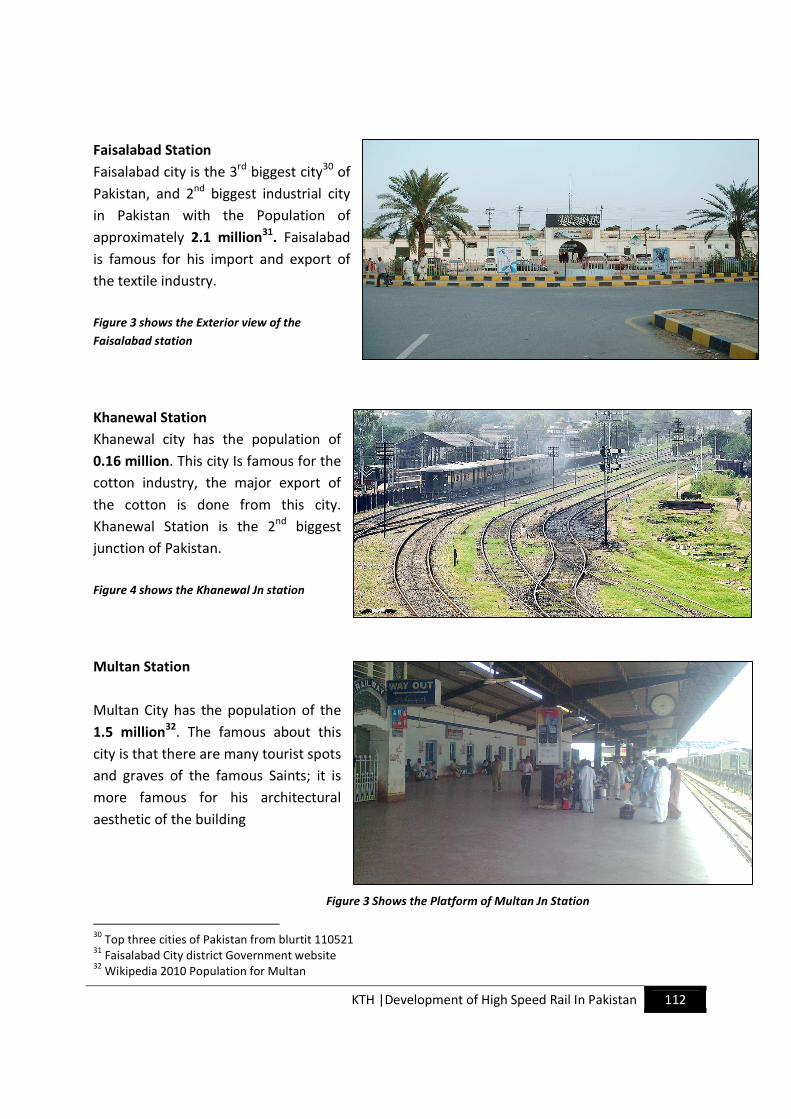
KTH |Development of High Speed Rail In Pakistan 112
Faisalabad Station
Faisalabad city is the 3rd
biggest city30
of
Pakistan, and 2nd
biggest industrial city
in Pakistan with the Population of
approximately 2.1 million31
. Faisalabad
is famous for his import and export of
the textile industry.
Figure 3 shows the Exterior view of the
Faisalabad station
Khanewal Station
Khanewal city has the population of
0.16 million. This city Is famous for the
cotton industry, the major export of
the cotton is done from this city.
Khanewal Station is the 2nd
biggest
junction of Pakistan.
Figure 4 shows the Khanewal Jn station
Multan Station
Multan City has the population of the
1.5 million32
. The famous about this
city is that there are many tourist spots
and graves of the famous Saints; it is
more famous for his architectural
aesthetic of the building
Figure 3 Shows the Platform of Multan Jn Station
30
Top three cities of Pakistan from blurtit 110521 31
Faisalabad City district Government website 32
Wikipedia 2010 Population for Multan
KTH |Development of High Speed Rail In Pakistan 113
Appendix
Timetabling
5

KTH |Development of High Speed Rail In Pakistan 114
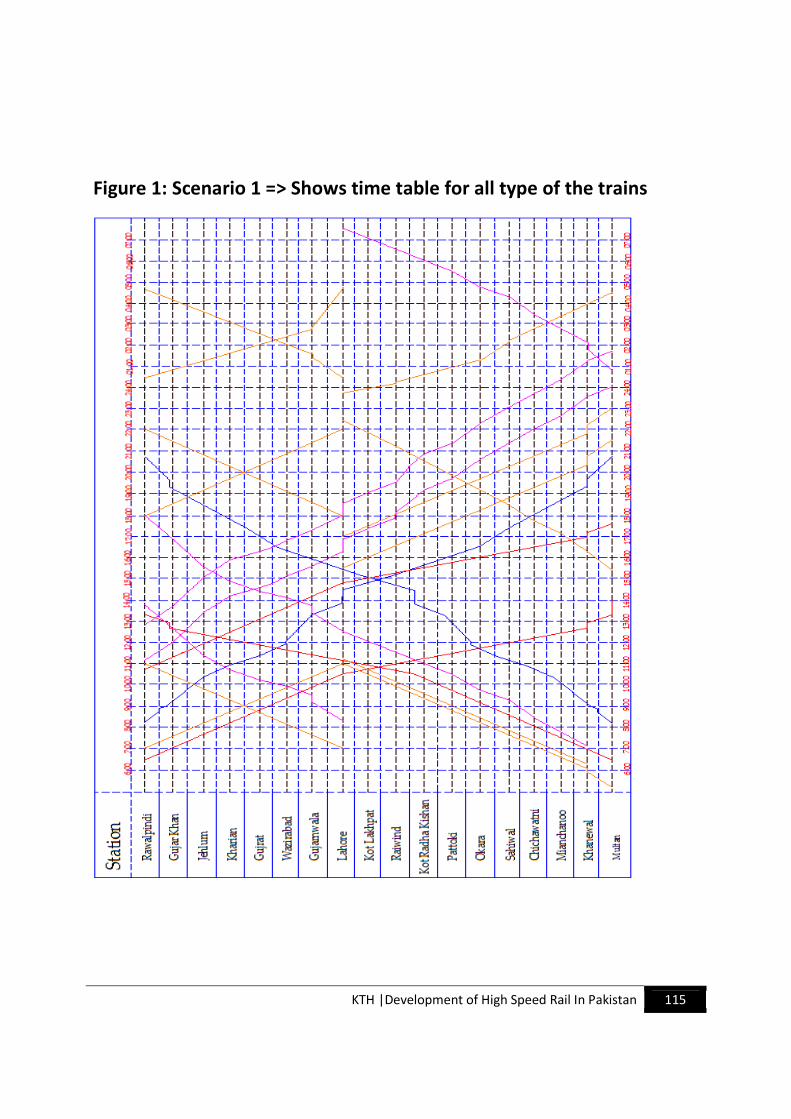
KTH |Development of High Speed Rail In Pakistan 115
Figure 1: Scenario 1 => Shows time table for all type of the trains
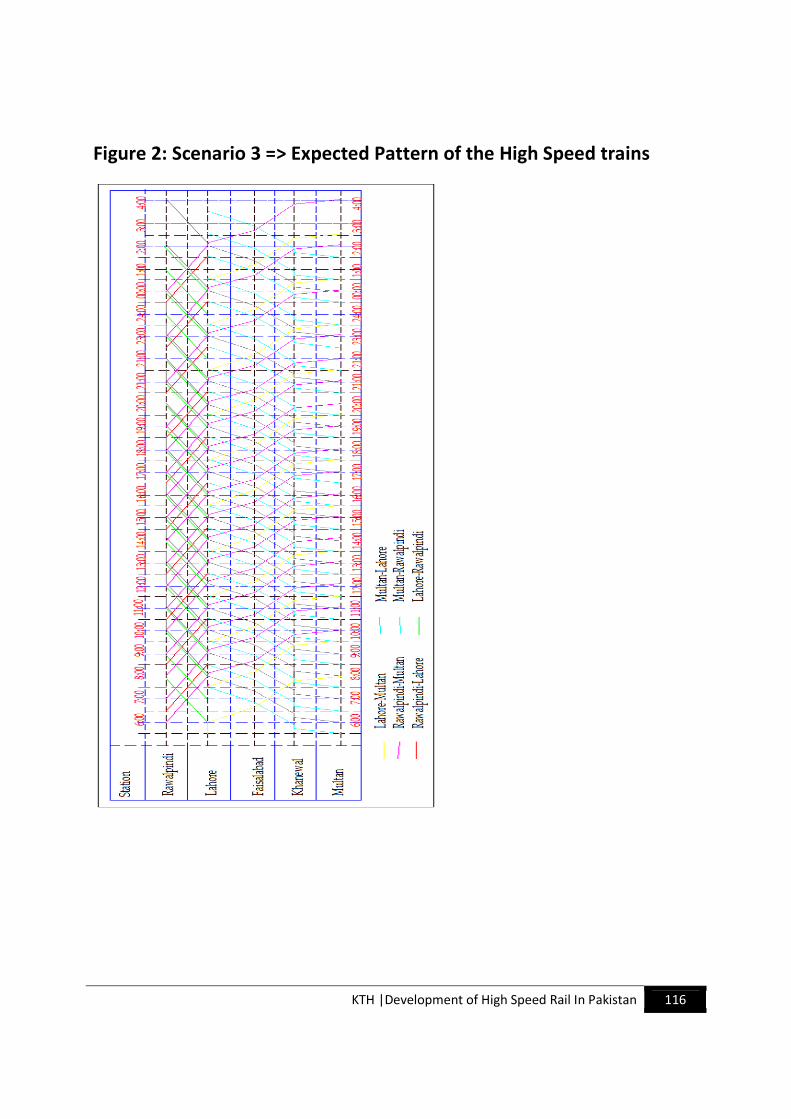
KTH |Development of High Speed Rail In Pakistan 116
Figure 2: Scenario 3 => Expected Pattern of the High Speed trains
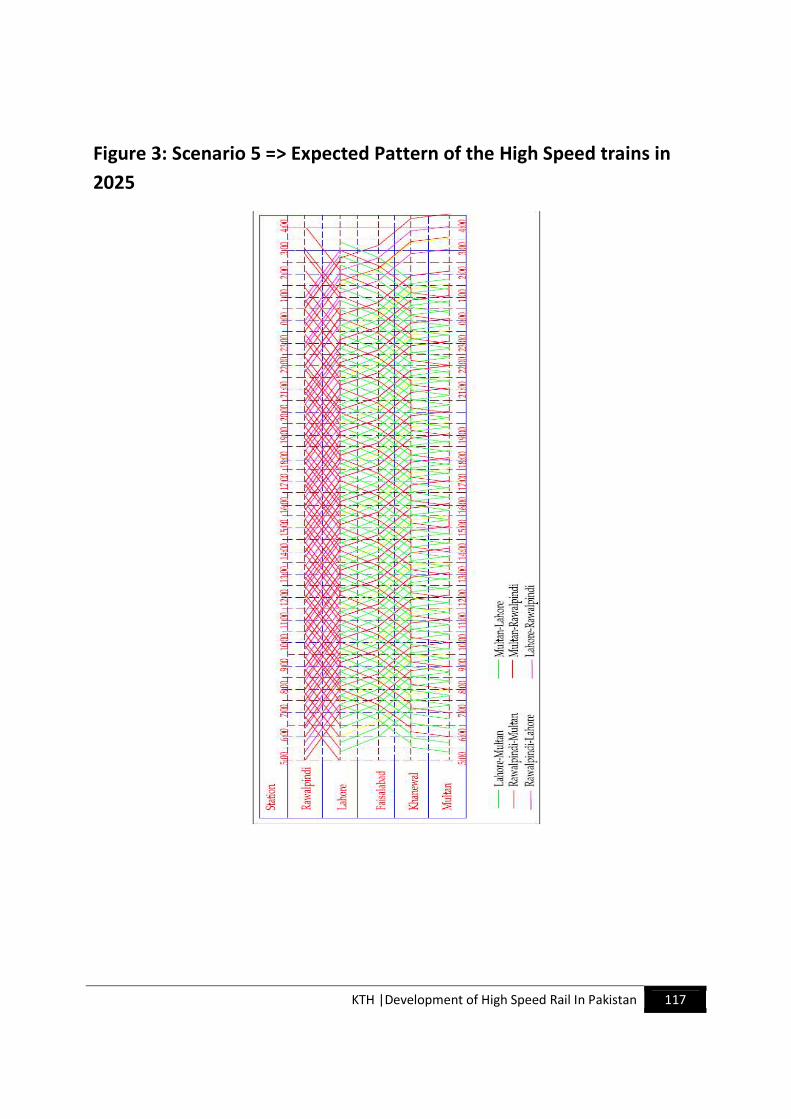
KTH |Development of High Speed Rail In Pakistan 117
Figure 3: Scenario 5 => Expected Pattern of the High Speed trains in
2025

KTH |Development of High Speed Rail In Pakistan 118

Top Related
Copyright © 2022 FDOKUMEN

