


Bahasa
Halaman
Hukum

J Seismol (2011) 15:487–506DOI 10.1007/s10950-010-9204-9
ORIGINAL ARTICLE
Detection capabilities of the BURAR seismicarray—contributions to the monitoringof regional and distant seismicity
Daniela Veronica Ghica
Received: 17 July 2009 / Accepted: 10 August 2010 / Published online: 1 September 2010© Springer Science+Business Media B.V. 2010
Abstract Data recorded with the BucovinaRomanian Seismic Array (BURAR) seismicarray between January 2005 and December2008 were analyzed to verify the monitoringcapabilities of regional and distant seismicity. Forthis time interval, nearly 35,000 events detectedby BURAR and identified in seismic bulletins(Preliminary Determination of Epicenters andRomanian Earthquake Catalogue) were investi-gated using parameters as backazimuth, epi-central distance and magnitude. A remarkablydetection capability is emphasized for teleseismicobservations (� > 20◦). BURAR onsets couldbe associated to almost 60% of all events in theteleseismic distance, with a magnitude detectionthreshold of 4.5 (mb). When no threshold mag-nitude is applied, the full detection capability ofBURAR is in the same order as the performanceof GERES array, which is one of the mostsensitive stations in Central Europe. For regionalevents, detection capability decreases to about16% of all events within regional distance
D. V. Ghica (B)National Data Center,National Institute for Earth Physics,12 Calugareni St., 077125 Magurele, Romaniae-mail: [email protected], [email protected]
range. The site conditions (crustal structure andhigh frequency cultural noise) as well as arraydimension, affect the signal coherency and reducethe array detection capability for regional events.For both teleseismic and regional distances,a monthly variation of BURAR detectioncapabilities has been found; the number of eventsdetected during the summer time is diminishedby the specific seasonal human activity andatmospheric conditions (thunderstorms). Toprove the good detection capability of theBURAR for teleseismic distances, a comparisonwith the observations of the Romanian Real TimeNetwork in terms of magnitude and epicentraldistance was carried out. The higher signaldetection capability of BURAR is due to thearray techniques applied in data processing,which enhance the signal-to-noise ratio. Themonitoring performed by the BURAR seismicarray provides a good azimuthal coverage of theregional and distant seismicity, in a large range ofepicentral distances.
Keywords Seismic array · Detection capability ·Seismic monitoring · Detection threshold
1 Introduction
The Bucovina Romanian Seismic Array(BURAR) was deployed in 2002, in the Northern

488 J Seismol (2011) 15:487–506
Fig. 1 Geographicallocation of the BURARarray in the northernRomania
Romania, under a joint effort of the Air ForceTechnical Applications Centre of the USA andthe National Institute for Earth Physics (NIEP),Romania. BURAR array is located in SuceavaCounty, near the border to Ukraine (Fig. 1). The
geographical coordinates of the reference station(BUR01) are 47.6088◦ N and 25.2168◦ E, with anelevation of 1,151 m.
BURAR consists of 10 seismometers located inboreholes and distributed over an area of 5 km2;
Fig. 2 Elementconfiguration of theBURAR array. Full blackcircles depictvertical-componentshort-periodseismometers; whitetriangle describes thethree-componentbroad-band seismometer
J Seismol (2011) 15:487–506 489
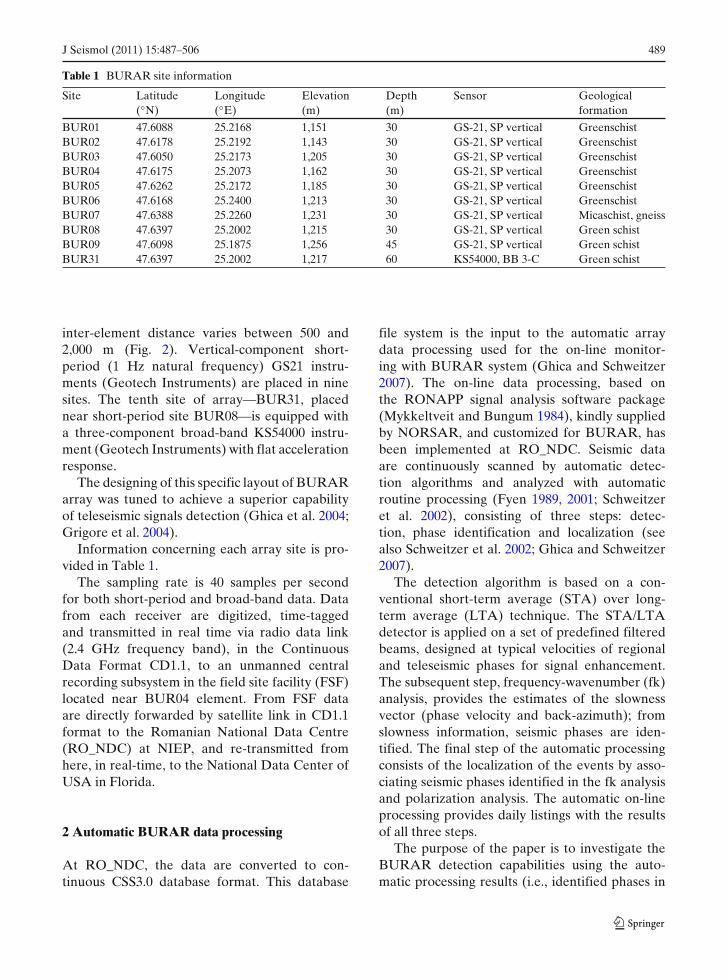
Table 1 BURAR site information
Site Latitude Longitude Elevation Depth Sensor Geological(◦N) (◦E) (m) (m) formation
BUR01 47.6088 25.2168 1,151 30 GS-21, SP vertical GreenschistBUR02 47.6178 25.2192 1,143 30 GS-21, SP vertical GreenschistBUR03 47.6050 25.2173 1,205 30 GS-21, SP vertical GreenschistBUR04 47.6175 25.2073 1,162 30 GS-21, SP vertical GreenschistBUR05 47.6262 25.2172 1,185 30 GS-21, SP vertical GreenschistBUR06 47.6168 25.2400 1,213 30 GS-21, SP vertical GreenschistBUR07 47.6388 25.2260 1,231 30 GS-21, SP vertical Micaschist, gneissBUR08 47.6397 25.2002 1,215 30 GS-21, SP vertical Green schistBUR09 47.6098 25.1875 1,256 45 GS-21, SP vertical Green schistBUR31 47.6397 25.2002 1,217 60 KS54000, BB 3-C Green schist
inter-element distance varies between 500 and2,000 m (Fig. 2). Vertical-component short-period (1 Hz natural frequency) GS21 instru-ments (Geotech Instruments) are placed in ninesites. The tenth site of array—BUR31, placednear short-period site BUR08—is equipped witha three-component broad-band KS54000 instru-ment (Geotech Instruments) with flat accelerationresponse.
The designing of this specific layout of BURARarray was tuned to achieve a superior capabilityof teleseismic signals detection (Ghica et al. 2004;Grigore et al. 2004).
Information concerning each array site is pro-vided in Table 1.
The sampling rate is 40 samples per secondfor both short-period and broad-band data. Datafrom each receiver are digitized, time-taggedand transmitted in real time via radio data link(2.4 GHz frequency band), in the ContinuousData Format CD1.1, to an unmanned centralrecording subsystem in the field site facility (FSF)located near BUR04 element. From FSF dataare directly forwarded by satellite link in CD1.1format to the Romanian National Data Centre(RO_NDC) at NIEP, and re-transmitted fromhere, in real-time, to the National Data Center ofUSA in Florida.
2 Automatic BURAR data processing
At RO_NDC, the data are converted to con-tinuous CSS3.0 database format. This database
file system is the input to the automatic arraydata processing used for the on-line monitor-ing with BURAR system (Ghica and Schweitzer2007). The on-line data processing, based onthe RONAPP signal analysis software package(Mykkeltveit and Bungum 1984), kindly suppliedby NORSAR, and customized for BURAR, hasbeen implemented at RO_NDC. Seismic dataare continuously scanned by automatic detec-tion algorithms and analyzed with automaticroutine processing (Fyen 1989, 2001; Schweitzeret al. 2002), consisting of three steps: detec-tion, phase identification and localization (seealso Schweitzer et al. 2002; Ghica and Schweitzer2007).
The detection algorithm is based on a con-ventional short-term average (STA) over long-term average (LTA) technique. The STA/LTAdetector is applied on a set of predefined filteredbeams, designed at typical velocities of regionaland teleseismic phases for signal enhancement.The subsequent step, frequency-wavenumber (fk)analysis, provides the estimates of the slownessvector (phase velocity and back-azimuth); fromslowness information, seismic phases are iden-tified. The final step of the automatic processingconsists of the localization of the events by asso-ciating seismic phases identified in the fk analysisand polarization analysis. The automatic on-lineprocessing provides daily listings with the resultsof all three steps.
The purpose of the paper is to investigate theBURAR detection capabilities using the auto-matic processing results (i.e., identified phases in
490 J Seismol (2011) 15:487–506
the fk analysis), in order to evaluate the arraycontribution to the monitoring of regional anddistant seismicity.
3 Data sources
To test the BURAR monitoring capabilities, datarecorded between January 2005 and December2008 have been analyzed. For this time period,automatically detected and identified phases wereinvestigated in association with the events listedin seismic bulletins. Automatic estimates of back-azimuth, phase velocity and arrival time for eachdetection, were obtained from the fk analysis stepof the on-line data processing.
Two kinds of lists with reference events areused to identify the events detected by BU-RAR using the automatically recognized phases.For teleseismic observations (� > 20◦) the listwas compiled from the Preliminary Determina-tion of Epicenters (PDE) bulletins, while for thelist of regional and local events (� ≤ 20◦), PDE
bulletins and Romanian Earthquake Catalogueare merged, the double entries being carefullyeliminated. Additionally, for teleseismic distancesa magnitude detection threshold has been set to4.5 (mb). No magnitude detection threshold is setfor regional distances (ML). Consequently, thefinal lists comprise 28,463 reference teleseismicevents and 23,894 reference regional events. Forall these events, the epicentral distances and thecorresponding back-azimuth values were calcu-lated.
3.1 Association of automatic observationsto reference events
To identify the automatically observed phaseswith BURAR from the reference events, a specialcode was used to associate the observed onsetswith the theoretical estimates calculated from thebulletins (Schweitzer 2001). This code consists ofan automatic program developed by Schweitzer(2001) and adapted for BURAR data. The pro-gram is based on the procedure described below.
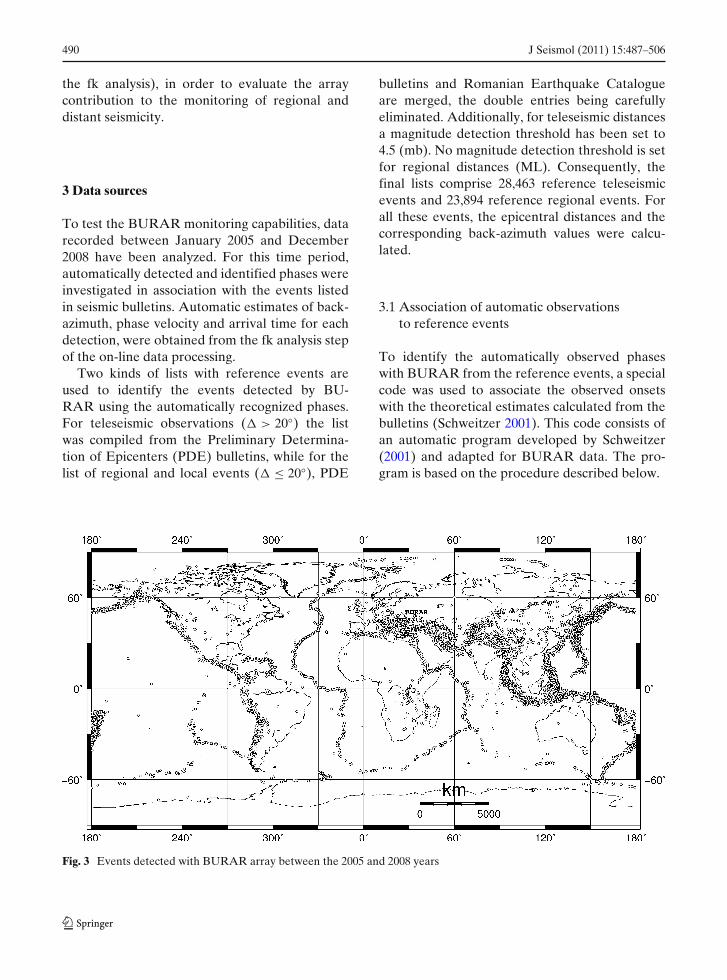
Fig. 3 Events detected with BURAR array between the 2005 and 2008 years
J Seismol (2011) 15:487–506 491
The procedure compares the possible phasescalculated from ak135 tables (Kennett et al. 1995)with the detected onsets. The absolute onset timesof first and later arrivals were estimated for BU-RAR array using distance, depth and origin timeof the event. To reduce the number of erroneousassociations some restrictions related to epicentraldistance and event magnitude are introduced inlist of phases used (see Table 2 in Schweitzer2001). Moreover, all theoretical phases to be con-sidered for comparison with the observed oneshad to be separated in time by at least threeseconds (Schweitzer 2001). The list of onsets wassubsequently compared with the parameters au-tomatically calculated for detected onsets withBURAR. For this study, only the first arrivalidentified by the above technique was used todefine the events observed with BURAR array.Secondary onsets observed for the same eventwere discarded from the analysis.
During the considered time interval, froma total amount of 34,679 events detected byBURAR (Fig. 3), 17,119 teleseismic events with
magnitude mb ≥ 4.5 and 3,925 regional events(with no magnitude threshold) were kept for thepresent study.
4 Results for regional and teleseismic detectioncapabilities of BURAR
To show the capabilities of BURAR, some resultsof evaluation of the array detection ability shouldbe discussed:
1. Regional Distances
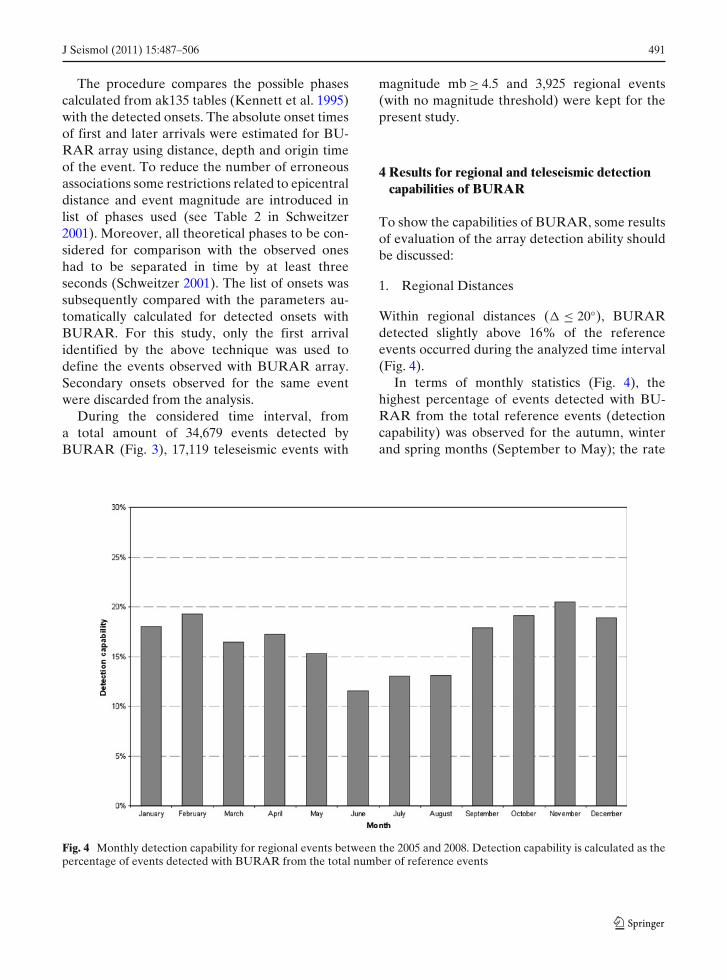
Within regional distances (� ≤ 20◦), BURARdetected slightly above 16% of the referenceevents occurred during the analyzed time interval(Fig. 4).
In terms of monthly statistics (Fig. 4), thehighest percentage of events detected with BU-RAR from the total reference events (detectioncapability) was observed for the autumn, winterand spring months (September to May); the rate
Fig. 4 Monthly detection capability for regional events between the 2005 and 2008. Detection capability is calculated as thepercentage of events detected with BURAR from the total number of reference events
492 J Seismol (2011) 15:487–506
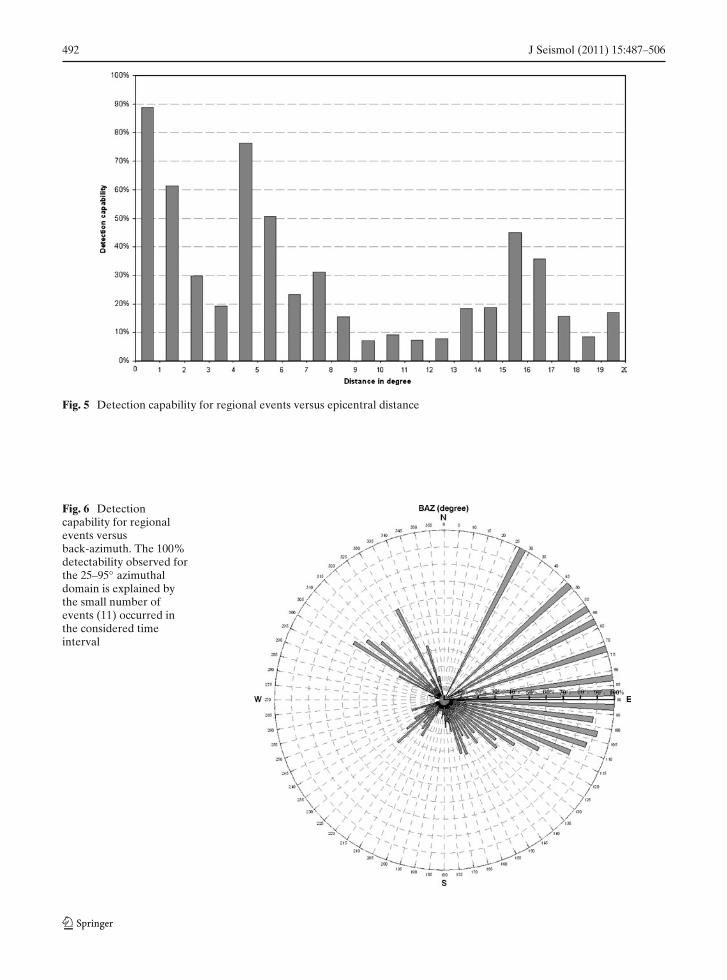
Fig. 5 Detection capability for regional events versus epicentral distance
Fig. 6 Detectioncapability for regionalevents versusback-azimuth. The 100%detectability observed forthe 25–95◦ azimuthaldomain is explained bythe small number ofevents (11) occurred inthe considered timeinterval
J Seismol (2011) 15:487–506 493
decreases to 12% in the summer season (June,July and August), when the thunderstorms associ-ated with lightning activity damaged the electricalequipment and introduced noise into the system,and the local roads traffic was increased.
In addition, the array detection capability forregional events is reduced because of the localsite conditions (crustal structure and high frequen-cies cultural noise), array dimension and inter-sensor distance which affect the signal coherency.Since the characteristics of the array, i.e. aper-ture, geometry, number of elements and sensortypes, determine the accuracy in slowness es-timation, BURAR station has a relative goodprecision in measuring seismic signals with largewavelengths (approximately 25 km), slowness val-ues around 0.05 s/km and frequency contentbetween 1 and 3 Hz. Moreover, inter-sensor sep-aration and maximum recordable frequency con-
trol the minimum wavelength that can be resolvedby the array.
Analysis of the seismograms recorded byBURAR clearly demonstrates the frequency de-pendence of the spatial signal coherence. Rel-atively high-frequency signals (i.e., greater than4 Hz), which describe local and regional sources,are typically incoherent over the dimension ofthis regional array. Such signals typically originatefrom local and regional sources, and have usu-ally no energy at low frequencies. Such signalsare strongly affected by the site conditions at thedifferent array sensors. The signal incoherency isalso caused by the large array dimension (5 kmaperture), and limits the coherency band to lowerfrequencies.
The variation of the detectability with epicen-tral distance is represented in Fig. 5. The spa-tial distribution of the detected regional events is
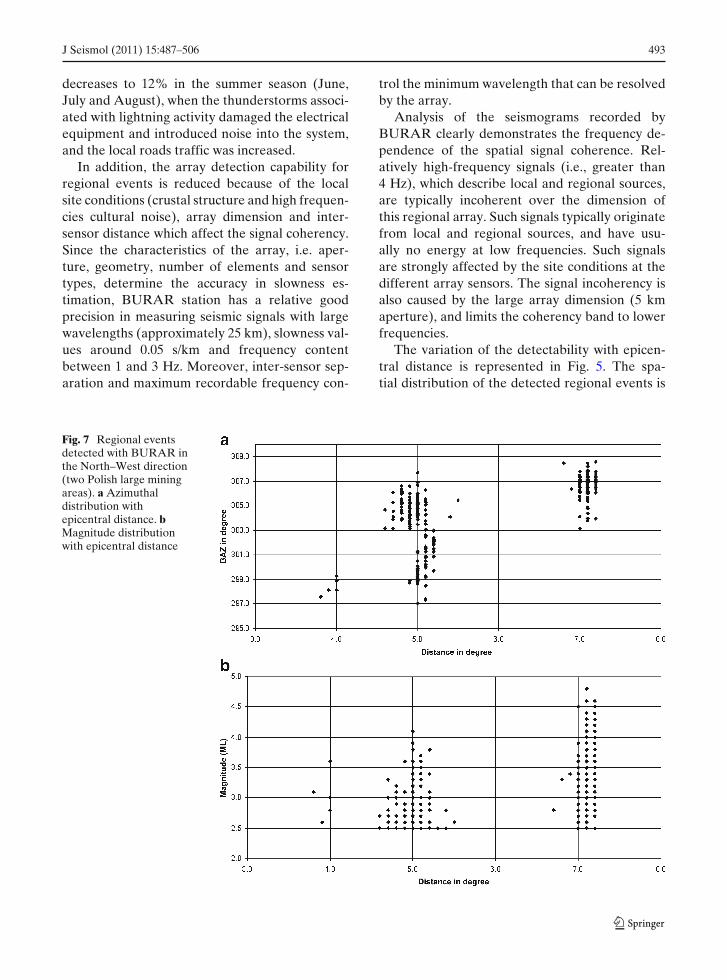
Fig. 7 Regional eventsdetected with BURAR inthe North–West direction(two Polish large miningareas). a Azimuthaldistribution withepicentral distance. bMagnitude distributionwith epicentral distance

494 J Seismol (2011) 15:487–506
Fig. 8 Detectioncapability for regionaldistances. Full red circlesshow events detected byBURAR; blue crosssymbols depict referenceevents reported inbulletins not detected atBURAR
influenced by the local seismic activity and propa-gation path.
Within local distances (� ≤ 5◦), BURAR ca-pability is relatively good, with a decline in the2◦ ÷ 4◦ range, for the earthquakes produced inthe south-western part of Romania (Banat andDanubian seismogenic zones) and in the south-eastern part of Romania (Predobrogean Depres-sion and Intramoesian Fault), where the rate ofseismic activity is moderate at a low magnitudelevel (Radulian et al. 2000).
In case of the local distances, a test of thedetection capability of the BURAR station for theearthquakes occurred on the Romanian territorywas carried out for the year 2005 by Borleanuet al. (2008). This investigation showed a rathervariable capacity of detection depending on theparticular seismogenic zone. The detection seemsto be better for the case of crustal events producedin the Banat and Transylvania areas. In the case
of Vrancea intermediate-depth earthquakes, thedetection is strongly improved (the detection iscomplete for MD > 4) (Borleanu et al. 2008).
The detection peak near 5◦ is related to theinduced seismicity in the Polish mining area. Thisarea, emphasized also by the azimuthal distri-bution for the BURAR capability (Fig. 6) ataround 300◦ ÷ 307◦ back-azimuth, could be corre-lated with the low attenuation in the lithospherestructure on that direction. After a strong de-creasing zone beyond 6◦, mainly corresponding tothe Greece and Italy area seismicity, the regionaldetection capability of BURAR raises again fordistances between 13◦ to 17◦ to reach a relativepeak near 16◦, which is coincident with the dis-tance range of caustic for regional P waves (Pn),according to the global velocity models.
The azimuthal variation of detection capacityfor BURAR array (Fig. 6) shows a very goodefficiency in detecting events from East–South–
J Seismol (2011) 15:487–506 495
East direction, for the 80◦ ÷ 115◦ back-azimuthrange (Caucasus, Anatolian region). This is mostlikely due to the high seismicity of the region,with large magnitude of the events, and to the lowattenuation along the travelling path.
A good detection capability of BURAR is alsoobserved for the regional events in North-Westdirection, which can be associated with the in-duced events occurred in two large mining areas(see also Wiejacz and Kowalski 2007; Stec 2007):Upper Silesian Coal Basin (distance around 5◦and back-azimuth range of 300◦ ÷ 307◦) and Lu-bin Copper Basin (distance about 7◦ and back-azimuth between 303◦ and 310◦; see Fig. 7).
On the contrary, the detection capability ofBURAR is highly decreasing in the West–South–West direction, corresponding to a 245◦ ÷ 295◦back-azimuth range and epicentral distance largerthan 8◦ (Italy and Western Europe area). Thissituation is probably caused by the low magni-tude of seismicity (magnitude below 5.0) and bythe lithosphere complex structure, i.e., tectonicsof the Dinarid–Pannonian Basin–Carpathians re-gion. A series of travel paths are crossing the thin
Hungarian Plain lithosphere, which overlies anastenospheric dome, with lower seismic velocitiesand higher attenuation (Posgay et al. 1996).
BURAR efficiency is also low for events orig-inating from South-South-Western direction, cor-responding to the azimuthal range of 165◦ ÷ 210◦and epicentral distance between 9◦ to 12◦. Thisdecrease of the array capability is matching theregion of Hellenic arc (Fig. 8), along which theAfrican plate subducts beneath the Aegean Seaplate. The area is characterized by shallow andintermediate depth earthquakes, with the mag-nitude threshold of events detected by BURARabove 3.5.
Within regional distances, for the North-Eastern azimuthal domain (back-azimuth rangeof 345◦ ÷ 80◦), which is characterized by a lowseismicity, very few BURAR detections are ob-served. Therefore, a statistical analysis for thisback-azimuth domain is not relevant.
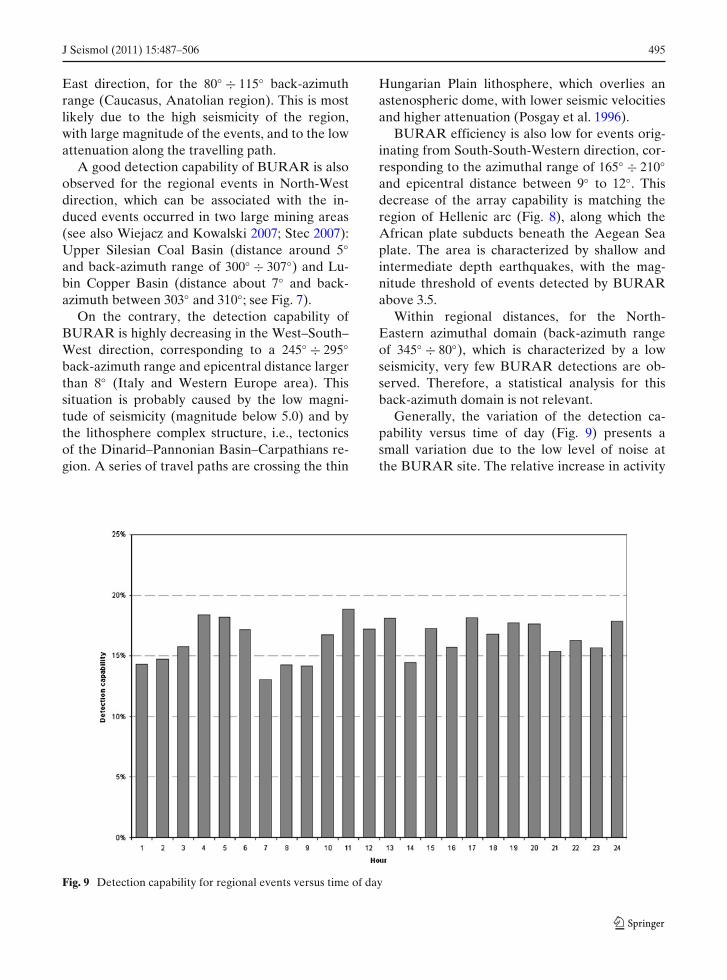
Generally, the variation of the detection ca-pability versus time of day (Fig. 9) presents asmall variation due to the low level of noise atthe BURAR site. The relative increase in activity
Fig. 9 Detection capability for regional events versus time of day
496 J Seismol (2011) 15:487–506
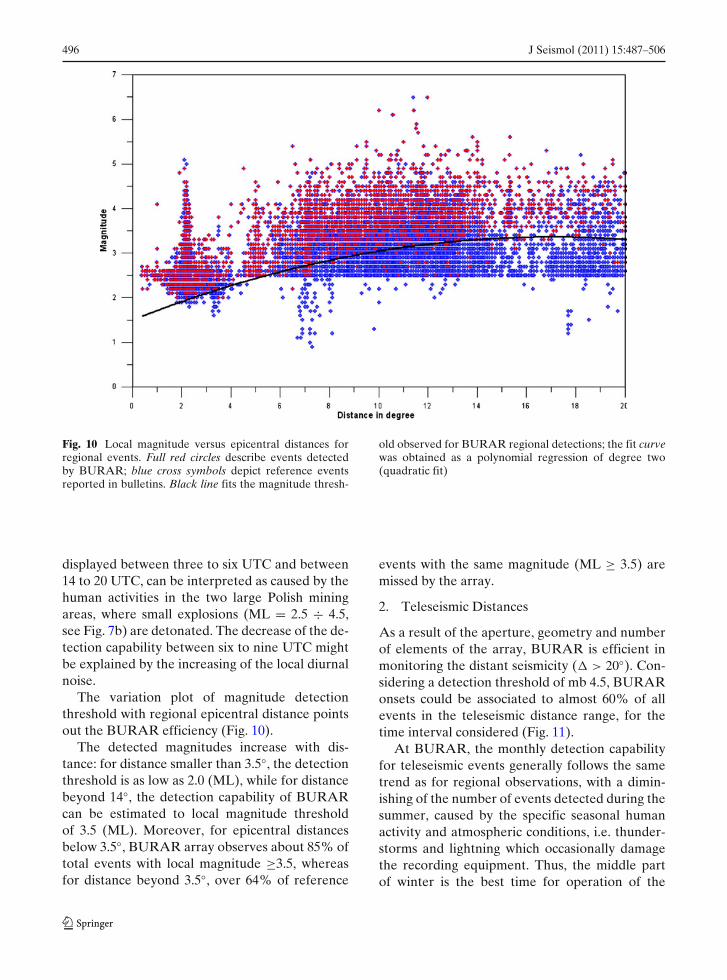
Fig. 10 Local magnitude versus epicentral distances forregional events. Full red circles describe events detectedby BURAR; blue cross symbols depict reference eventsreported in bulletins. Black line fits the magnitude thresh-
old observed for BURAR regional detections; the fit curvewas obtained as a polynomial regression of degree two(quadratic fit)
displayed between three to six UTC and between14 to 20 UTC, can be interpreted as caused by thehuman activities in the two large Polish miningareas, where small explosions (ML = 2.5 ÷ 4.5,see Fig. 7b) are detonated. The decrease of the de-tection capability between six to nine UTC mightbe explained by the increasing of the local diurnalnoise.
The variation plot of magnitude detectionthreshold with regional epicentral distance pointsout the BURAR efficiency (Fig. 10).
The detected magnitudes increase with dis-tance: for distance smaller than 3.5◦, the detectionthreshold is as low as 2.0 (ML), while for distancebeyond 14◦, the detection capability of BURARcan be estimated to local magnitude thresholdof 3.5 (ML). Moreover, for epicentral distancesbelow 3.5◦, BURAR array observes about 85% oftotal events with local magnitude ≥3.5, whereasfor distance beyond 3.5◦, over 64% of reference
events with the same magnitude (ML ≥ 3.5) aremissed by the array.
2. Teleseismic Distances
As a result of the aperture, geometry and numberof elements of the array, BURAR is efficient inmonitoring the distant seismicity (� > 20◦). Con-sidering a detection threshold of mb 4.5, BURARonsets could be associated to almost 60% of allevents in the teleseismic distance range, for thetime interval considered (Fig. 11).
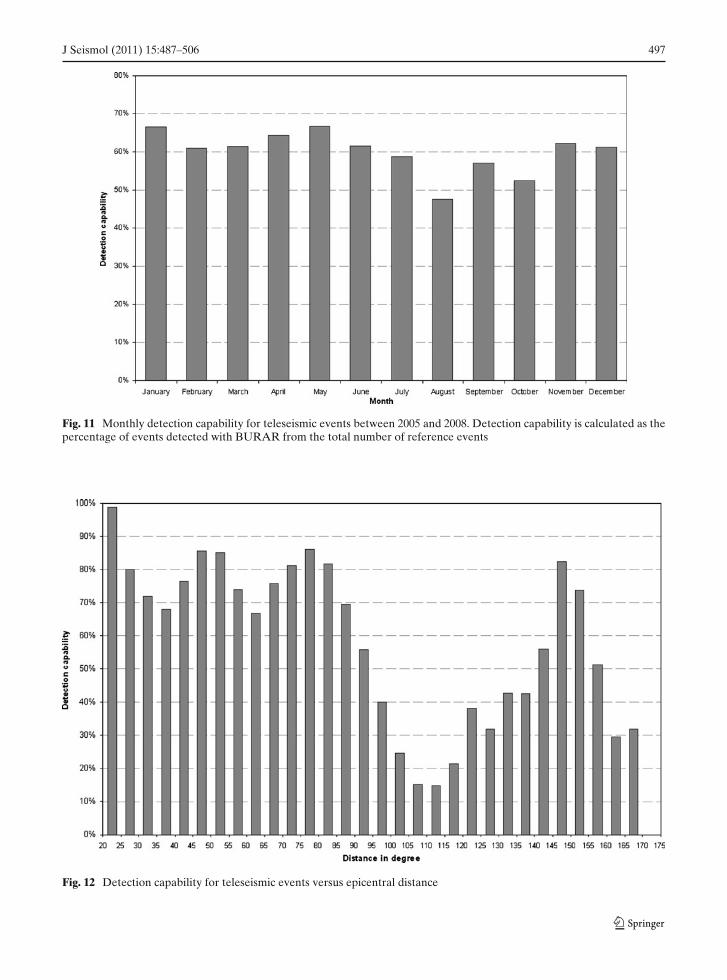
At BURAR, the monthly detection capabilityfor teleseismic events generally follows the sametrend as for regional observations, with a dimin-ishing of the number of events detected during thesummer, caused by the specific seasonal humanactivity and atmospheric conditions, i.e. thunder-storms and lightning which occasionally damagethe recording equipment. Thus, the middle partof winter is the best time for operation of the
J Seismol (2011) 15:487–506 497
Fig. 11 Monthly detection capability for teleseismic events between 2005 and 2008. Detection capability is calculated as thepercentage of events detected with BURAR from the total number of reference events
Fig. 12 Detection capability for teleseismic events versus epicentral distance
498 J Seismol (2011) 15:487–506
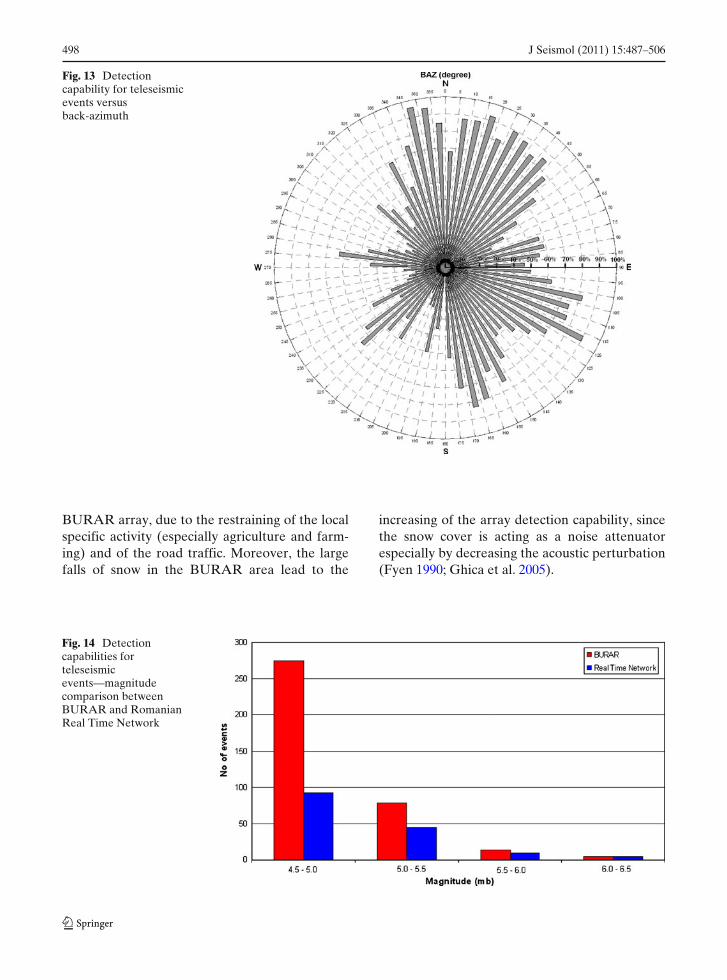
Fig. 13 Detectioncapability for teleseismicevents versusback-azimuth
BURAR array, due to the restraining of the localspecific activity (especially agriculture and farm-ing) and of the road traffic. Moreover, the largefalls of snow in the BURAR area lead to the
increasing of the array detection capability, sincethe snow cover is acting as a noise attenuatorespecially by decreasing the acoustic perturbation(Fyen 1990; Ghica et al. 2005).
Fig. 14 Detectioncapabilities forteleseismicevents—magnitudecomparison betweenBURAR and RomanianReal Time Network
J Seismol (2011) 15:487–506 499
When no threshold magnitude is applied, thefull detection capability of BURAR for theteleseismic distances, calculated as the percent-age of events detected with the station fromthe total number of reference events, is almost28%. This detectability could be compared withthe GERES array performance, considering therather similar aperture (about 4 km) of the twoarrays.
GERES is one of the most sensitive stations inCentral Europe as demonstrated by the results ofthe GSETT-2 experiment (Schweitzer 1992) andcontributed remarkably to the teleseismic obser-vations. GERES onsets could be associated tomore than 22% of all events in the teleseismicrange (Schweitzer 1992).
Therefore, it can be affirmed that BURARproves a good detection capability for teleseis-mic events. This good detection capability is duemainly to the general low level of backgroundnoise at low frequencies (below 3 Hz) (Ghica et al.2005), as well as to the application of the advancedarray techniques to recognize P and PKP onsets(fk analysis).
Regarding the rate of detected events ver-sus epicentral distance, BURAR detection ca-
pability clearly decreases beyond 90◦ (Fig. 12),and starts to increase from about 120◦ for PKPphases.
This decreasing part emphasizes the influenceof the core shadow zone on the BURAR record-ings. The rapid decaying of signal amplitudecould be observed and for body-waves defocusingeffects is expected at the array site.
On the other hand, the detection capability ishigher for the distances between 140◦ to 155◦,around the PKP caustic, along with the detectionpeak for PKP near 145◦, caused by the focusingeffect of the Earth’s outer core on the recordedamplitudes.
In terms of back-azimuth, the detection capa-bility of BURAR for teleseismic events is higherespecially for the 5◦ to 45◦ back-azimuth range(Fig. 13), generally corresponding to the Japan,Kamchatka, and Kuril regions (an epicentral dis-tance of around 75◦), and to the PKP caus-tic (Tonga region). The detection capability isalso increased in the 115◦ ÷ 120◦ back-azimuthrange, subsequent to a distance of 20◦ ÷ 30◦ (Iran,Pakistan, Afghanistan regions).
Towards the western direction, the detectioncapability is low, being strongly affected by the
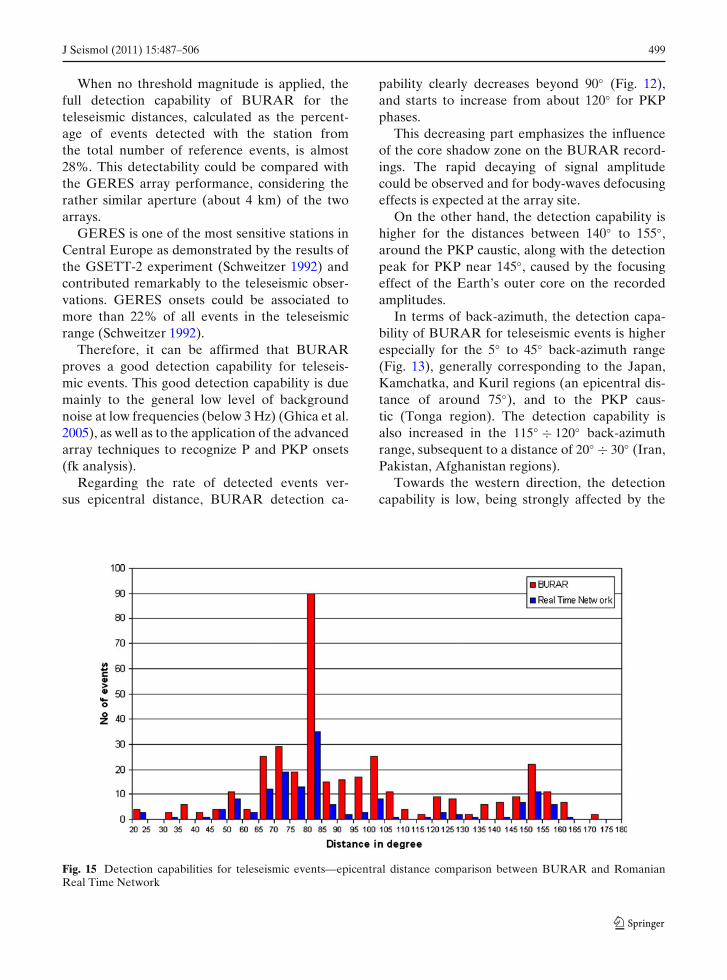
Fig. 15 Detection capabilities for teleseismic events—epicentral distance comparison between BURAR and RomanianReal Time Network
500 J Seismol (2011) 15:487–506
fact that the most of the earthquakes located inthis back-azimuth correspond to the core shadowzone (for the epicentral distance between 90◦ and120◦).
5 Testing of the BURAR efficiency in teleseismicobservation
To prove the good detection capability of theBURAR, a set of array teleseismic detectionsconsisting of one month data (1–30 June 2008) wascompared with the observations of the RomanianReal Time Network (70 single seismic stations),consisting of associated phases and bulletins pro-duced by the real-time data analysis and process-ing system running at the data centre in Bucharest,i.e. seismological software Antelope (BRTT) soft-ware, which provides real-time data acquisition,automatic event detection, arrival picking, eventlocation and magnitude calculation.
Statistical analysis of teleseismic events detec-tion for June 2008 shows, therefore, a superiorefficiency of the BURAR system in detectingteleseismic events in comparison with the seismicReal Time Network (Figs. 14 and 15).
In terms of magnitude, BURAR teleseismicdetectability is much better for mb = 4.5 ÷ 5.0range (Fig. 14).
In terms of epicentral distance, BURAR tele-seismic detectability is much better for the 80◦ ÷115◦ range (Fig. 15).
The higher signal detection capability of BU-RAR is obtained by applying the array techniquesin data processing, i.e. beamforming method,which suppresses the noise while preserving thesignal, thus enhancing the signal-to-noise ratio(SNR).
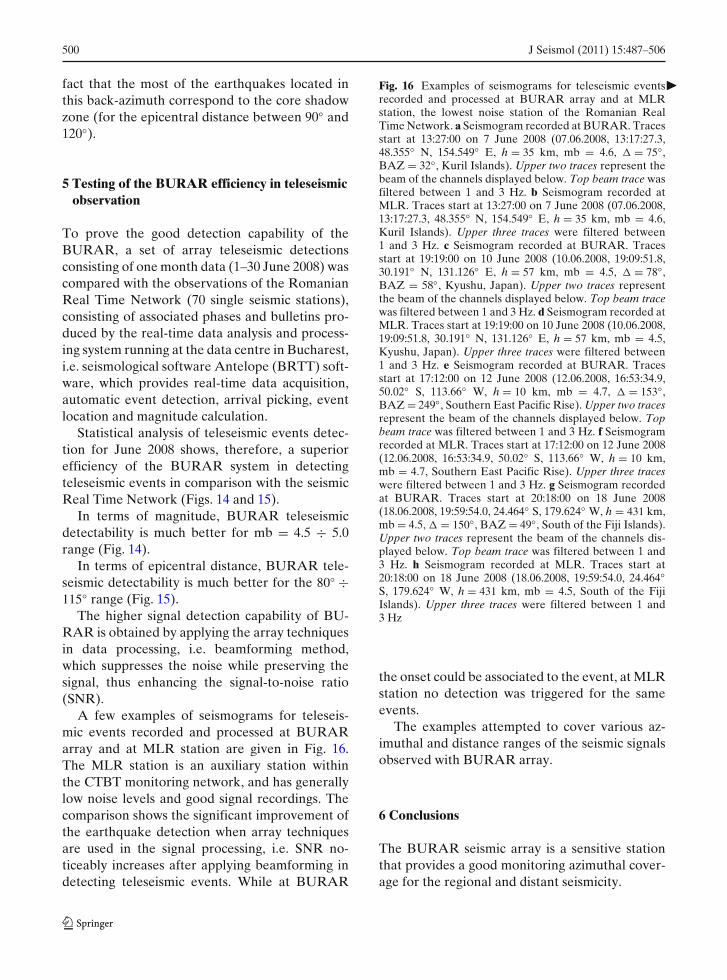
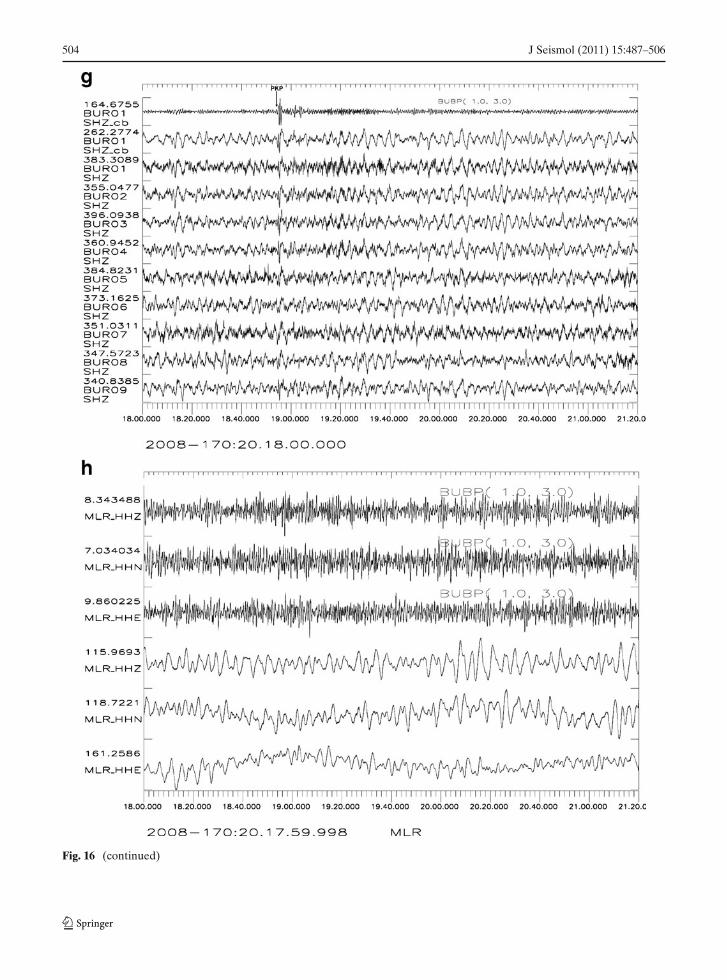
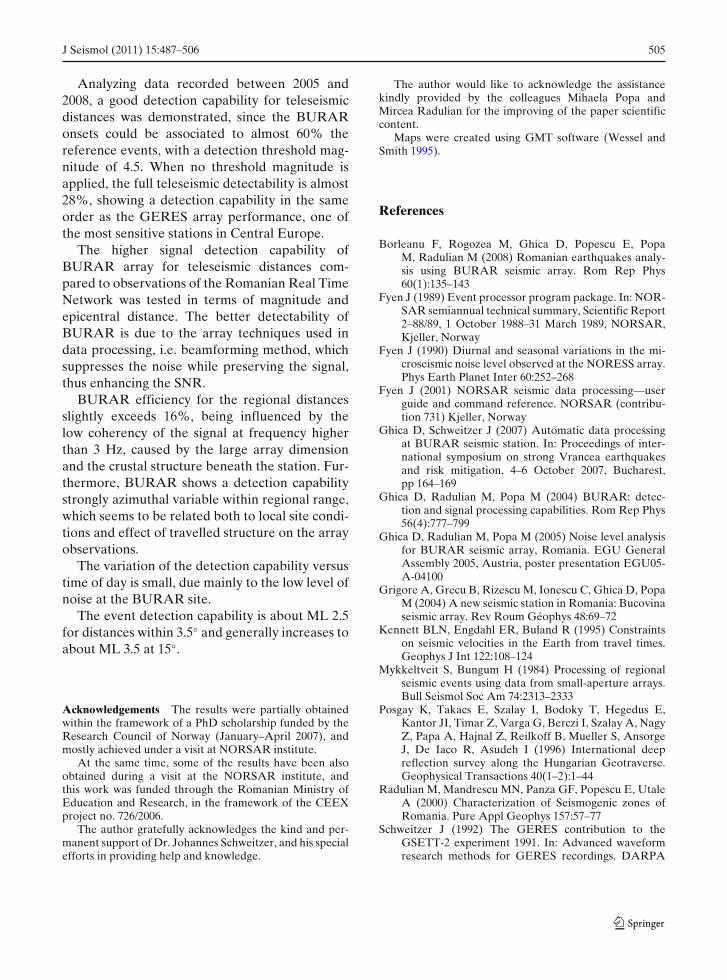
A few examples of seismograms for teleseis-mic events recorded and processed at BURARarray and at MLR station are given in Fig. 16.The MLR station is an auxiliary station withinthe CTBT monitoring network, and has generallylow noise levels and good signal recordings. Thecomparison shows the significant improvement ofthe earthquake detection when array techniquesare used in the signal processing, i.e. SNR no-ticeably increases after applying beamforming indetecting teleseismic events. While at BURAR
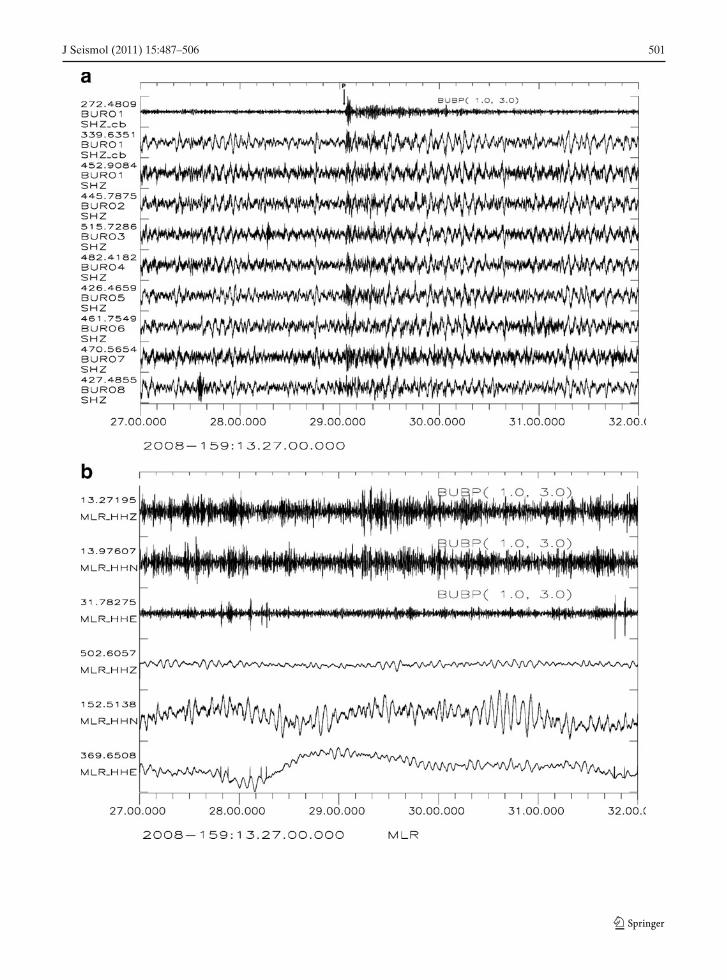
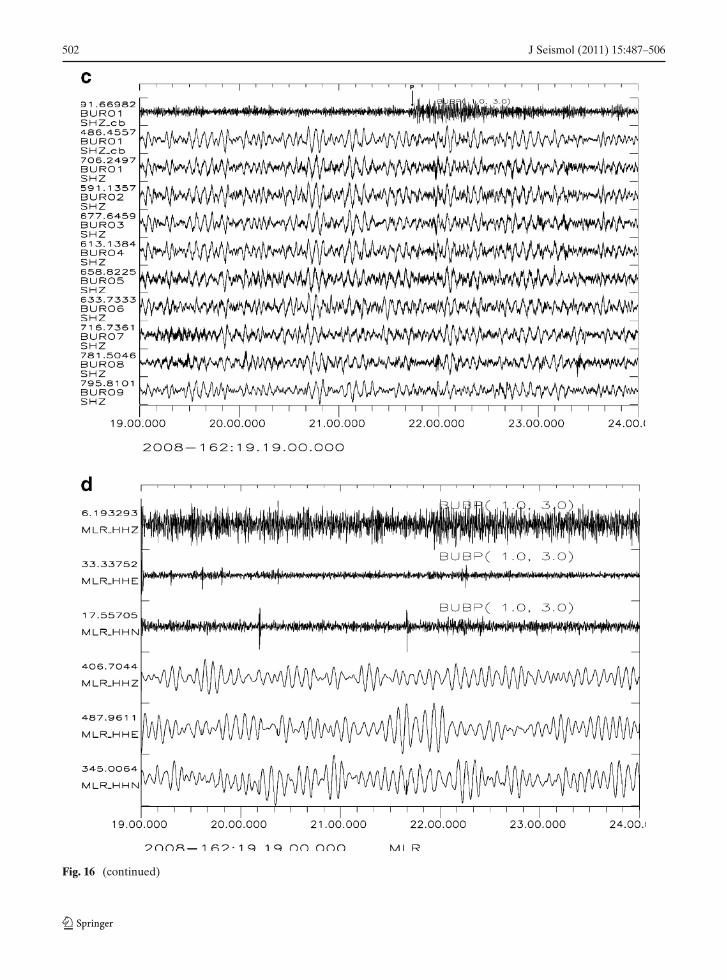
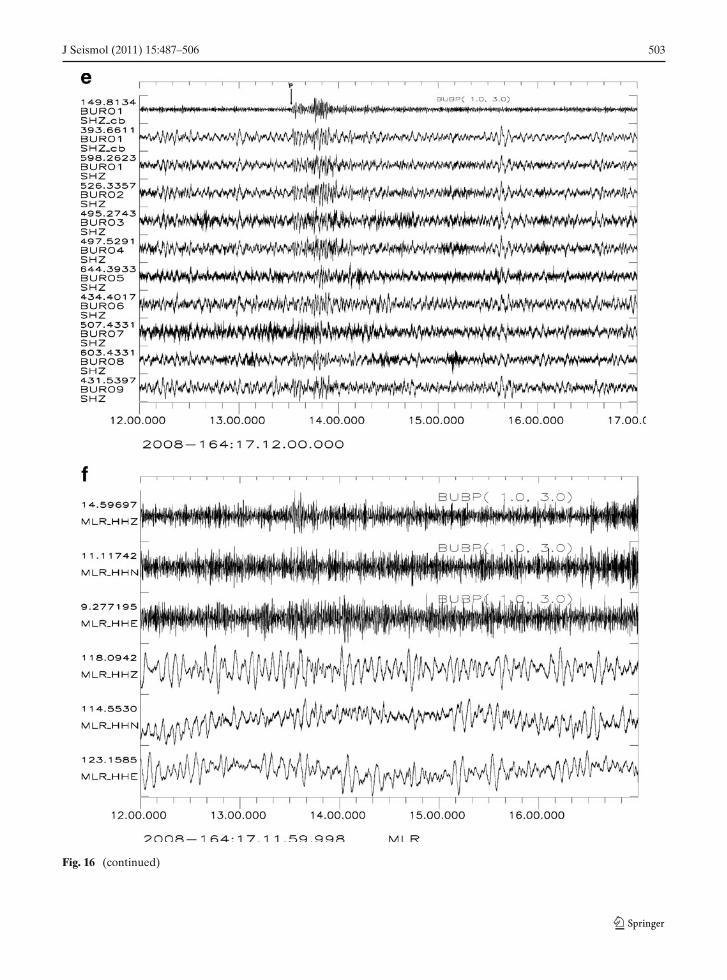
�Fig. 16 Examples of seismograms for teleseismic eventsrecorded and processed at BURAR array and at MLRstation, the lowest noise station of the Romanian RealTime Network. a Seismogram recorded at BURAR. Tracesstart at 13:27:00 on 7 June 2008 (07.06.2008, 13:17:27.3,48.355◦ N, 154.549◦ E, h = 35 km, mb = 4.6, � = 75◦,BAZ = 32◦, Kuril Islands). Upper two traces represent thebeam of the channels displayed below. Top beam trace wasfiltered between 1 and 3 Hz. b Seismogram recorded atMLR. Traces start at 13:27:00 on 7 June 2008 (07.06.2008,13:17:27.3, 48.355◦ N, 154.549◦ E, h = 35 km, mb = 4.6,Kuril Islands). Upper three traces were filtered between1 and 3 Hz. c Seismogram recorded at BURAR. Tracesstart at 19:19:00 on 10 June 2008 (10.06.2008, 19:09:51.8,30.191◦ N, 131.126◦ E, h = 57 km, mb = 4.5, � = 78◦,BAZ = 58◦, Kyushu, Japan). Upper two traces representthe beam of the channels displayed below. Top beam tracewas filtered between 1 and 3 Hz. d Seismogram recorded atMLR. Traces start at 19:19:00 on 10 June 2008 (10.06.2008,19:09:51.8, 30.191◦ N, 131.126◦ E, h = 57 km, mb = 4.5,Kyushu, Japan). Upper three traces were filtered between1 and 3 Hz. e Seismogram recorded at BURAR. Tracesstart at 17:12:00 on 12 June 2008 (12.06.2008, 16:53:34.9,50.02◦ S, 113.66◦ W, h = 10 km, mb = 4.7, � = 153◦,BAZ = 249◦, Southern East Pacific Rise). Upper two tracesrepresent the beam of the channels displayed below. Topbeam trace was filtered between 1 and 3 Hz. f Seismogramrecorded at MLR. Traces start at 17:12:00 on 12 June 2008(12.06.2008, 16:53:34.9, 50.02◦ S, 113.66◦ W, h = 10 km,mb = 4.7, Southern East Pacific Rise). Upper three traceswere filtered between 1 and 3 Hz. g Seismogram recordedat BURAR. Traces start at 20:18:00 on 18 June 2008(18.06.2008, 19:59:54.0, 24.464◦ S, 179.624◦ W, h = 431 km,mb = 4.5, � = 150◦, BAZ = 49◦, South of the Fiji Islands).Upper two traces represent the beam of the channels dis-played below. Top beam trace was filtered between 1 and3 Hz. h Seismogram recorded at MLR. Traces start at20:18:00 on 18 June 2008 (18.06.2008, 19:59:54.0, 24.464◦S, 179.624◦ W, h = 431 km, mb = 4.5, South of the FijiIslands). Upper three traces were filtered between 1 and3 Hz
the onset could be associated to the event, at MLRstation no detection was triggered for the sameevents.
The examples attempted to cover various az-imuthal and distance ranges of the seismic signalsobserved with BURAR array.
6 Conclusions
The BURAR seismic array is a sensitive stationthat provides a good monitoring azimuthal cover-age for the regional and distant seismicity.
J Seismol (2011) 15:487–506 501
502 J Seismol (2011) 15:487–506
Fig. 16 (continued)
J Seismol (2011) 15:487–506 503
Fig. 16 (continued)
504 J Seismol (2011) 15:487–506
Fig. 16 (continued)
J Seismol (2011) 15:487–506 505
Analyzing data recorded between 2005 and2008, a good detection capability for teleseismicdistances was demonstrated, since the BURARonsets could be associated to almost 60% thereference events, with a detection threshold mag-nitude of 4.5. When no threshold magnitude isapplied, the full teleseismic detectability is almost28%, showing a detection capability in the sameorder as the GERES array performance, one ofthe most sensitive stations in Central Europe.
The higher signal detection capability ofBURAR array for teleseismic distances com-pared to observations of the Romanian Real TimeNetwork was tested in terms of magnitude andepicentral distance. The better detectability ofBURAR is due to the array techniques used indata processing, i.e. beamforming method, whichsuppresses the noise while preserving the signal,thus enhancing the SNR.
BURAR efficiency for the regional distancesslightly exceeds 16%, being influenced by thelow coherency of the signal at frequency higherthan 3 Hz, caused by the large array dimensionand the crustal structure beneath the station. Fur-thermore, BURAR shows a detection capabilitystrongly azimuthal variable within regional range,which seems to be related both to local site condi-tions and effect of travelled structure on the arrayobservations.
The variation of the detection capability versustime of day is small, due mainly to the low level ofnoise at the BURAR site.
The event detection capability is about ML 2.5for distances within 3.5◦ and generally increases toabout ML 3.5 at 15◦.
Acknowledgements The results were partially obtainedwithin the framework of a PhD scholarship funded by theResearch Council of Norway (January–April 2007), andmostly achieved under a visit at NORSAR institute.
At the same time, some of the results have been alsoobtained during a visit at the NORSAR institute, andthis work was funded through the Romanian Ministry ofEducation and Research, in the framework of the CEEXproject no. 726/2006.
The author gratefully acknowledges the kind and per-manent support of Dr. Johannes Schweitzer, and his specialefforts in providing help and knowledge.
The author would like to acknowledge the assistancekindly provided by the colleagues Mihaela Popa andMircea Radulian for the improving of the paper scientificcontent.
Maps were created using GMT software (Wessel andSmith 1995).
References
Borleanu F, Rogozea M, Ghica D, Popescu E, PopaM, Radulian M (2008) Romanian earthquakes analy-sis using BURAR seismic array. Rom Rep Phys60(1):135–143
Fyen J (1989) Event processor program package. In: NOR-SAR semiannual technical summary, Scientific Report2–88/89, 1 October 1988–31 March 1989, NORSAR,Kjeller, Norway
Fyen J (1990) Diurnal and seasonal variations in the mi-croseismic noise level observed at the NORESS array.Phys Earth Planet Inter 60:252–268
Fyen J (2001) NORSAR seismic data processing—userguide and command reference. NORSAR (contribu-tion 731) Kjeller, Norway
Ghica D, Schweitzer J (2007) Automatic data processingat BURAR seismic station. In: Proceedings of inter-national symposium on strong Vrancea earthquakesand risk mitigation, 4–6 October 2007, Bucharest,pp 164–169
Ghica D, Radulian M, Popa M (2004) BURAR: detec-tion and signal processing capabilities. Rom Rep Phys56(4):777–799
Ghica D, Radulian M, Popa M (2005) Noise level analysisfor BURAR seismic array, Romania. EGU GeneralAssembly 2005, Austria, poster presentation EGU05-A-04100
Grigore A, Grecu B, Rizescu M, Ionescu C, Ghica D, PopaM (2004) A new seismic station in Romania: Bucovinaseismic array. Rev Roum Géophys 48:69–72
Kennett BLN, Engdahl ER, Buland R (1995) Constraintson seismic velocities in the Earth from travel times.Geophys J Int 122:108–124
Mykkeltveit S, Bungum H (1984) Processing of regionalseismic events using data from small-aperture arrays.Bull Seismol Soc Am 74:2313–2333
Posgay K, Takacs E, Szalay I, Bodoky T, Hegedus E,Kantor JI, Timar Z, Varga G, Berczi I, Szalay A, NagyZ, Papa A, Hajnal Z, Reilkoff B, Mueller S, AnsorgeJ, De Iaco R, Asudeh I (1996) International deepreflection survey along the Hungarian Geotraverse.Geophysical Transactions 40(1–2):1–44
Radulian M, Mandrescu MN, Panza GF, Popescu E, UtaleA (2000) Characterization of Seismogenic zones ofRomania. Pure Appl Geophys 157:57–77
Schweitzer J (1992) The GERES contribution to theGSETT-2 experiment 1991. In: Advanced waveformresearch methods for GERES recordings. DARPA

506 J Seismol (2011) 15:487–506
Annual Report No. AFOSR-90–0189 Scientific Re-port No. 2, PL-TR-92–2142, ADA253686, pp 25–49
Schweitzer J (2001) Slowness corrections—one way to im-prove IDC products. Pure Appl Geophys 158:375–396
Schweitzer J, Fyen J, Mykkeltveit S, Kværna T (2002)Seismic arrays. In: Bormann P (ed) New manual ofseismological observatory practice, Potsdam. IASPEI,Boulder, p 51
Stec K (2007) Characteristics of seismic activity of theUpper Silesian Coal Basin in Poland. Geophys J Int168:757–768
Wessel P, Smith WHF (1995) New version of the GenericMapping Tool released. EOS Trans. AGU, p 329 (seealso URL: gmt.soest.hawaii.edu)
Wiejacz P, Kowalski P (2007) Comparison of ISC seismicevent locations with data of Polish mining industry.IUGG General Assembly, Italy, presentation
Top Related
Copyright © 2022 FDOKUMEN

