Progress in air shower radio measurements: Detection of distant events
Upload
independentCategory
view
0download
0
arX
iv:1
110.
0008
v1 [
astr
o-ph
.CO
] 3
0 Se
p 20
11Accepted to ApJ: September 30, 2011Preprint typeset using LATEX style emulateapj v. 11/10/09
THE OPTX PROJECT V: IDENTIFYING DISTANT AGNS1
L. Trouille2, A. J. Barger3,4,5, and C. Tremonti3
Accepted to ApJ: September 30, 2011
ABSTRACT
The Baldwin, Phillips, and Terlevich emission-line ratio diagnostic ([OIII]/Hβ versus [NII]/Hα,hereafter BPT diagram) efficiently separates galaxies whose signal is dominated by star formation(BPT-SF) from those dominated by AGN activity (BPT-AGN). Yet this BPT diagram is limited toz < 0.5, the redshift at which [NII]λ6584 leaves the optical spectral window. Using the Sloan DigitalSky Survey (SDSS), we construct a new diagnostic, or TBT diagram, that is based on rest-frame g−zcolor, [NeIII]λ3869, and [OII]λλ3726 + 3729 and can be used for galaxies out to z < 1.4. The TBTdiagram identifies 98.7% of the SDSS BPT-AGN as TBT-AGN and 97% of the SDSS BPT-SF asTBT-SF. Furthermore, it identifies 97% of the OPTX Chandra X-ray selected AGNs as TBT-AGN.This is in contrast to the BPT diagram, which misidentifies 20% of X-ray selected AGNs as BPT-SF.We use the GOODS-N and Lockman Hole galaxy samples, with their accompanying deep Chandraimaging, to perform X-ray and infrared stacking analyses to further validate our TBT-AGN andTBT-SF selections; that is, we verify the dominance of AGN activity in the former and star formationactivity in the latter. Finally, we address the inclusion of the majority of the BPT-comp (sources lyingbetween the BPT-SF and BPT-AGN regimes) in our TBT-AGN regime. We find that the stackedBPT-comp source is X-ray hard (〈Γeff〉 = 1.0+0.4
−0.4) and has a high X-ray luminosity to total infraredluminosity ratio. This suggests that, on average, the X-ray signal in BPT-comp is dominated byobscured or low accretion rate AGN activity rather than by star formation, supporting their inclusionin the TBT-AGN regime.Subject headings: cosmology: observations — galaxies: active — galaxies: nuclei — galaxies: Seyfert
— galaxies: distances and redshifts — X-rays: galaxies
1. INTRODUCTION
The most commonly used optical emission-line diag-nostic for separating star-forming galaxies from type IIActive Galatic Nuclei (AGNs) relies on [OIII]λ5007/Hβversus [NII]λ6584/Hα (hereafter, BPT diagram –Baldwin et al. 1981; Veilleux & Osterbrock 1987). Thebasic idea is that the emission lines in star-forming galax-ies are powered by massive stars, so there is a well-defined upper limit on the intensities of the collisionallyexcited lines relative to the recombination lines (such asHα or Hβ). In contrast, AGNs are powered by a sourceof far more energetic photons, making the collisionallyexcited lines more intense relative to the recombinationlines. Two demarcations are commonly used for iden-tifying AGN-dominated galaxies versus star formationdominated galaxies – (1) the Kewley et al. (2001) theo-retical division between galaxies whose extreme ultravi-olet (EUV) ionizing radiation field is dominated by anAGN (> 50%) and those dominated by star formation
1 Some of the data presented herein were obtained at the W.M. Keck Observatory, which is operated as a scientific partner-ship among the California Institute of Technology, the Universityof California, and the National Aeronautics and Space Admin-istration. The observatory was made possible by the generousfinancial support of the W. M. Keck Foundation.
2 Center for Interdisciplinary Exploration and Research in As-trophysics (CIERA) and Department of Physics and Astronomy,2145 Sheridan Road, Evanston, IL 60208
3 Department of Astronomy, University of Wisconsin-Madison, 475 N. Charter Street, Madison, WI 53706
4 Department of Physics and Astronomy, University of Hawaii,2505 Correa Road, Honolulu, HI 96822
5 Institute for Astronomy, University of Hawaii, 2680 Wood-lawn Drive, Honolulu, HI 96822
and (2) the Kauffmann et al. (2003) empirical demarca-tion based on the location of the Sloan Digital Sky Survey(SDSS; York et al. 2000) star-forming galaxies. Galaxiesthat lie between these two curves are often referred toas composite galaxies. Hereafter, we refer to these cate-gories as BPT-AGN, BPT-SF, and BPT-comp.The BPT diagram is limited in its use with optical
spectra to galaxies with z < 0.5 (the redshift at which[NII] leaves the optical spectral window). A number ofgroups have tried to extend optical emission line diagnos-tics to higher redshifts by only using lines at the blue endof the spectrum. Lamareille (2010) replaced [NII]/Hαwith [OII]λ3726+λ3729/Hβ, creating the ‘blue diagram’,which can be used to classify galaxies out to z < 0.9 (seealso Tresse et al. 1996; Rola et al. 1997; Lamareille et al.2004). They find that this diagnostic is very success-ful at identifying star-forming galaxies (with > 99% ofthe BPT-SF still classified as SF-dominated) but that itrequires complementary diagnostics to robustly classifyBPT-AGN (see Marocco et al. 2011). We also note that[OII] and Hβ are relatively distant in wavelength, requir-ing more careful calibration and extinction corrections.Recently, Yan et al. (2011) and Juneau et al. (2011)
introduced the CEx and MEx diagnostics, respectively,in which they replaced [NII]/Hα with rest-frame U −B color (CEx) or with stellar mass (MEx; see alsoWeiner et al. 2007). Both diagnostics recover the BPT-AGN classification very well, with 95.7% and > 99% ofthe BPT-AGN still classified as AGNs in the CEx andMEx diagnostics, respectively. However, because thesediagnostics rely on Hβ at λ4861 A, their use with opticalspectra is limited to z < 1.
2 Trouille et al.
At higher redshifts the Stasinska et al. (2006) DEW di-agnostic, based on Dn[4000], [NeIII]λ3869, and [OII] (seealso Rola et al. 1997), can be used with optical spectraout to z < 1.4, at which point the lines move into theinfrared. While these emission lines are not as strong as[OIII] and Hβ, their ratio is the only choice for pushingoptical spectra to these higher redshifts. [NeIII] emissionindicates the presence of highly ionized gas and is muchstronger than [OII] in high-excitation AGNs. However,because Dn[4000] requires a sufficiently high signal-to-noise continuum (i.e., using SDSS, we find that the uncer-tainty on Dn[4000] ranges from 5% at SN/A = 5 to 25%at SN/A = 1; see also Cardiel et al. 1998) and requiresthe survey to be spectrophotometrically calibrated, itsusage with distant galaxies is limited.In this article we examine whether rest-frame g − z
color, which requires near-infrared imaging at the higherredshifts, is a compelling replacement for Dn[4000].While the ratio of [NeIII]/[OII] alone effectively separatesmetal-rich star-forming galaxies from AGNs, metal-poorstar-forming galaxies have high values of [NeIII]/[OII] (asa result of less line blanketing enabling a harder stellar ra-diation field). Fortunately, metal-poor galaxies also tendto be bluer (see Fig. 7 in Tremonti et al. 2004), so we canuse their color to distinguish them from AGNs (whichtend to be bulge dominated and redder, see Yan et al.2011). We refer to this new diagnostic as the TBT dia-gram.We first establish the reliability of the TBT di-
agnostic in reproducing the BPT classifications atlow redshifts using SDSS, the largest spectroscopicsample to date of emission-line galaxies. We thentest the TBT diagnostic at higher redshifts usingthe highly spectroscopically complete OPTX X-rayselected sample of AGNs (Trouille et al. 2008, 2009;Trouille & Barger 2010). The misidentification of X-ray selected AGNs as SF-dominated galaxies is a po-tential issue for all optical emission-line diagnostic di-agrams. In Trouille & Barger (2010) we found that∼ 20% of the LX > 1042 erg s−1 Chandra X-ray selectedAGNs in our OPTX sample that have [OIII], Hβ, [NII],and Hα fluxes with signal-to-noise greater than five aremisidentified by the BPT diagram as BPT-SF (see alsoWinter et al. 2010 for evidence of this in the Swift BATsample and Bongiorno et al. 2010 for evidence of this inthe XMM-COSMOS sample). Existing high-redshift op-tical emission-line diagnostics also misidentify a signif-icant fraction of X-ray selected AGNs, e.g., ∼ 8% and∼ 22% of X-ray selected AGNs in the MEx and CExdiagrams lie in the MEx-SF and CEx-SF regimes, re-spectively.Stacking techniques have been widely used in X-ray
astronomy to study the average properties of sourcepopulations selected to have certain well-defined prop-erties and which are too X-ray faint to be detectedindividually (e.g., Brandt et al. 2001; Alexander et al.2001; Hornschemeier et al. 2002; Nandra et al. 2002;Georgakakis et al. 2003; Laird et al. 2005; Lehmer et al.2005, 2008; Treister et al. 2009). As a proof-of-conceptof the TBT diagnostic, we perform an X-ray stackinganalysis of the TBT-SF and TBT-AGN in the highlyspectroscopically complete Great Observatories OriginsDeep Survey North (GOODS-N; Giavalisco et al. 2004)
with accompanying Chandra Deep Field North (CDFN;Alexander et al. 2003) imaging to determine whetherthey are, on average, X-ray soft or X-ray hard.An X-ray hard source is indicative of obscured AGN
activity or the presence of high-mass X-ray binaries(HMXBs) associated with ongoing star formation. AnX-ray soft source is indicative of unobscured AGN activ-ity or the presence of low-mass X-ray binaries (LMXBs)associated with old stellar populations. In order todistinguish between these scenarios, we perform an in-frared (IR) stacking analysis using the Spitzer SpaceTelescope 24µm data. Numerous studies have founda relation betwen the X-ray and IR luminosities forstar-forming galaxies and for AGNs (Ptak et al. 2003;Persic et al. 2004; Alexander et al. 2005; Teng et al.2005; Georgakakis et al. 2007). We compare the X-rayand IR luminosities for our stacked TBT-SF and stackedTBT-AGN with the results from these studies to verifythe dominance of star formation activity in the formerand AGN activity in the latter.We then perform X-ray and IR stacking analyses of
the BPT categories to confirm the presence of AGNactivity in BPT-comp, as suggested by the TBT diag-nostic. In most optical emission-line diagnostics, theBPT-comp lie in a transition region or within the SF-dominated regime. For example, Kewley et al. (2006)find that BPT-comp are indistinguishable from HII re-gions and are significantly distinct from Seyferts in an[OIII]/[OII] versus [OI]/Hα plot. In both the ‘blue di-agram’ and the CEx diagnostic, the majority of BPT-comp lie within their SF-dominated regimes (∼ 83% and∼ 75%, respectively). In contrast, the bulk of BPT-complie within our TBT-AGN regime (see also the MEx di-agnostic). Because BPT-comp are a significant percent-age of the overall low-redshift emission-line galaxy pop-ulation (e.g., in SDSS6, BPT-SF, BPT-comp, and BPT-AGN comprise 69%, 20%, and 11%, respectively, of theoverall population), inclusion or exclusion of BPT-compin AGN samples can have an important impact on re-sults. In order to have the necessary statistics required todo a robust stacking analysis, we combine our GOODS-N galaxy sample with galaxy samples from two LockmanHole (LH) fields, all of which have deep Chandra imag-ing.The structure of the paper is as follows. In Section 2
we briefly describe the SDSS sample, our OPTX X-rayselected sample of AGNs, and our optical spectroscopicsamples of the GOODS-N/LH fields. In Section 3 weuse the SDSS sample to calibrate our TBT diagnosticto match the BPT diagram. In Section 4 we determinehow well our TBT-AGN selection matches with an X-ray selection of AGNs. In Section 5 we do X-ray andIR stacking analyses to verify the reliability of our TBT-AGN and TBT-SF classes. In Section 6 we do X-rayand IR stacking analyses on our BPT-comp to determinewhether the implications of the TBT diagnostic with re-spect to the dominance of AGN activity in BPT-comp areconfirmed. In Section 7 we compare our TBT diagnosticto other diagnostics for separating star-forming galaxiesfrom AGNs. In Section 8 we summarize our results.
6 Here we have restricted the SDSS DR8 sample to emission-linegalaxies whose [NII], Hα, [OIII], and Hβ fluxes have a signal-to-noise ratio greater than five.
THE OPTX PROJECT V 3
All magnitudes are in the AB magnitude system. Weassume ΩM = 0.3,ΩΛ = 0.7, and H0 = 70 km s−1
Mpc−1.
2. SAMPLE
2.1. SDSS: Low-Redshift Galaxy Sample
SDSS has obtained deep, multi-color images coveringmore than a quarter of the sky with follow-up spec-troscopy of over a million objects. Here we use theSDSS spectroscopic data from Data Release 8 (DR8;Aihara et al. 2011). We use the emission-line fluxes mea-sured by the MPA-JHU group as described in Section4.3 of the data release paper. These fluxes are esti-mated from simultaneous Gaussian fits to the continuumsubtracted spectra to account for stellar absorption andline blending. DR8 provides spectra for 868,492 differentgalaxies. The SDSS spectral range is 3800 − 9200 A.Since the [OII] line lies at 3726 A and the [NII] linelies at 6584 A, we limit our SDSS samples to galaxieswith 0.02 < z < 0.35. Our SDSS BPT sample consistsof the 243,865 SDSS galaxies that have Hα, [NII], Hβ,and [OIII] fluxes with signal-to-noise ratio (SNR) greaterthan five (out of the 818,333 spectra for different galaxiesin the DR8 sample). Of these SDSS BPT galaxies, 23,048also have both [NeIII] and [OII] fluxes with SNR > 5. Werefer to these as our SDSS TBT sample.
2.2. OPTX: X-ray Selected Sample of AGNs
The OPTX sample consists of 1789 X-ray sources intwo intermediate depth wide-field surveys in the Lock-man Hole region of low galactic column density andone deep pencil-beam survey (CDFN; Brandt et al. 2001;Alexander et al. 2003). The Lockman Hole fields are theChandra Large Area Synoptic X-ray Survey (CLASXS;Yang et al. 2004) and the Chandra Lockman Area NorthSurvey (CLANS; Trouille et al. 2008, 2009; Wilkes et al.2009). We have spectroscopically observed 84% of theOPTX sources using the DEep Imaging Multi-ObjectSpectrograph (DEIMOS; Faber et al. 2003) on the KeckII 10 m telescope and the HYDRA multi-object spec-trograph on the WIYN 3.5 m telescope (for details ofthe observations and reduction process, see Trouille et al.2008).In Trouille et al. (2008, 2009) we used the X-ray fluxes
and spectroscopic redshifts to calculate rest-frame 2 −8 keV luminosities, LX . At z < 3 (which is all weconsider in this paper), we calculated the luminositiesfrom the observed-frame 2 − 8 keV fluxes, assumingan intrinsic X-ray spectral index of Γ = 1.8. Thatis, LX = f × 4πd2L × k−correction, where for z < 3,k−correction = (1 + z)Γ−2 and f = f2−8 keV. Using theindividual X-ray spectral indices (e.g., 〈Γ〉 ∼ 1.75 with adispersion of ≈ 0.33 derived by Tozzi et al. 2006 for theX-ray bright CDFS sources), rather than the universal X-ray spectral index of Γ = 1.8 adopted here, to calculatethe k−corrections would result in only a small difference(an average factor of 0.9) in the rest-frame luminosities.We have not corrected the X-ray luminosities for absorp-tion since these corrections are small in the 2 − 8 keVband (e.g., Barger et al. 2002), and we are only using theX-ray luminosities to identify sources as X-ray AGNs.In the following, we limit our study to the 561 OPTX
X-ray sources with spectroscopic redshifts, whose 2 −
8 keV flux has a significance greater than 3 σ, and whoseLX > 1042 erg s−1 (247, 163, and 151 sources fromthe CLANS, CLASXS, and CDFN fields, respectively).LX > 1042 erg s−1 is a commonly used conservativethreshold for AGN activity (Hornschemeier et al. 2001;Barger et al. 2002; Szokoly et al. 2004; Silverman et al.2005; Coil et al. 2009) that is based on energetic grounds(Zezas et al. 1998; Moran et al. 1999). Using the calibra-tion by Ranalli et al. (2003), one would need a star for-mation rate (SFR) of 200 M⊙ yr−1 to produce enoughX-ray luminosity from non-AGNs to cross this thresh-old. In Trouille & Barger (2010) we found a < 5% con-tamination rate of our OPTX sample by sources withSFR > 200 M⊙ yr−1. We determined this using theMagnelli et al. (2009) space densities at a range of red-shifts for ultraluminous infrared galaxies (ULIRGs) withestimated SFR > 172 M⊙.Our study focuses on optical emission-line ratio diag-
nostics based on flux ratios. We compute the relativeline fluxes from the spectra using the Tremonti et al.(2004) software. In brief, we subtract the stellar con-tinuum and absorption lines by fitting a linear combina-tion of single stellar population models of different ages(Bruzual & Charlot 2003). We remove any remainingresiduals from the continuum using a sliding 250 A me-dian. The relative line fluxes and errors are estimatedfrom simultaneous Gaussian fits to the continuum sub-tracted spectra.Our DEIMOS spectra are of high quality from ∼
4800 A to ∼ 9300 A, such that the [OII] and [NeIII] lineslie within our spectral window from z ∼ 0.3−1.4. Of our561 OPTX X-ray sources, 197 are non-broad-line AGNs(FWHM < 2000 km s−1; hereafter non-BLAGNs) and liewithin this redshift range. We only include non-BLAGNsin this analysis, since the narrow lines in BLAGNs areoverwhelmed by the emission from the broad-line region.We identify 103 OPTX X-ray selected AGNs that have[NeIII] and [OII] fluxes with SNR > 5.
2.3. GOODS-N/LH: Higher-Redshift Galaxy Sample
Each of the three OPTX fields is the focus of a com-prehensive spectroscopic follow-up of all galaxies in thefield. The CDFN encompasses the intensively studiedGOODS-N field, which we describe in more detail below.The CLANS and CLASXS fields reside in the LockmanHole (LH) region of low Galactic column density.A random spectroscopic sample of 3082 Ks,AB < 21.5
galaxies in these two LH fields was obtained usingDEIMOS on Keck II (L. Cowie, priv. comm.). We here-after refer to this combined sample as the LH galaxysample.The GOODS-N field has among the deepest images
ever obtained in a number of bandpasses, including theChandra 2 Ms CDFN image. It also has been the tar-get of extensive spectroscopic observations over the years(e.g., Cohen et al. 2000; Wirth et al. 2004; Cowie et al.2004; Barger et al. 2008; Cooper et al. 2011). With itshigh optical spectroscopic completeness and deep X-raycoverage, the GOODS-N catalog provides an ideal sam-ple for studying the average X-ray properties of opticallyselected samples of AGNs.Barger et al. (2008) presented a highly complete spec-
troscopic survey of the GOODS-N field. Over the years a
4 Trouille et al.
number of groups have made observations of this region,first primarily using the Low-Resolution Imaging Spec-trograph (LRIS; Oke et al. 1995) on the Keck I 10 mtelescope and later using DEIMOS. Barger et al. addedto these samples by observing all missing or unidenti-fied galaxies to date with DEIMOS. In order to pro-vide a uniform spectral database, they also re-observedsources where the original spectra were of poor qualityor where previous redshifts were obtained with instru-ments other than DEIMOS. The redshift identificationsare now greater than 90% complete to magnitudes ofF435WAB = 24.5 and Ks,AB = 21.5 and to 24 µm fluxesof 250 µJy. The final Barger et al. catalog provides spec-troscopic redshifts for 2710 galaxies in this field.We compute the relative line fluxes for the relevant
emission lines in the combined GOODS-N/LH galaxysample using the same method and software as de-scribed for the OPTX X-ray sample above. To cre-ate our GOODS-N/LH BPT diagram, we use the 727sources that have [OIII], Hβ, [NII], and Hα fluxes withSNR > 5. For our GOODS-N TBT diagram, we usethe 670 sources that have [NeIII] and [OII] fluxes withSNR > 5. As discussed in the previous subsection, be-cause of the DEIMOS spectral window, the GOODS-Nsources plotted in our TBT diagnostic have a redshiftrange from z = 0.3− 1.4.In Figure 1 we show the redshift distributions (out to
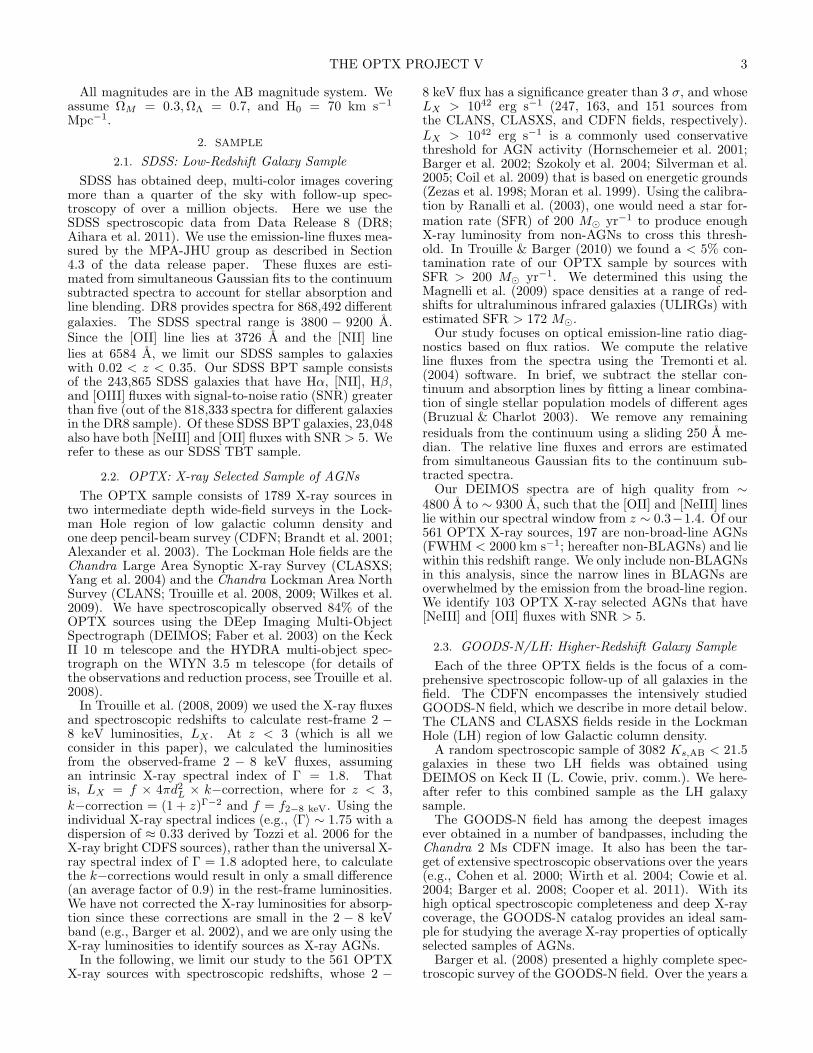
z = 1.5) for the SDSS, GOODS-N, LH, and OPTX sam-ples. The large SDSS sample has a median redshift of〈z〉 ∼ 0.1, whereas the GOODS-N, LH, and OPTX sur-veys allow us to test our TBT diagnostic out to z = 1.4.
Fig. 1.— Spectroscopic redshift distribution out to z = 1.5 for(a) the SDSS BPT sample, (b) the GOODS-N galaxy survey, (c)the LH galaxy survey, and (d) the OPTX survey. The differentredshift ranges seen in (a)-(c) reflect the magnitude limits of thedifferent surveys.
2.4. Rest-frame g, z Magnitudes
We have u, g, r, i, z magnitudes for the SDSS galaxies(Abazajian et al. 2009), g, r, i, z, J,H,Ks magnitudes for the OPTX AGNs and LHgalaxies (Trouille et al. 2008; Keenan et al. 2010), andB, V,R, I, Z, J,H,Ks magnitudes for the GOODS-N galaxies (Giavalisco et al. 2004; Barger et al. 2008;Keenan et al. 2010). We transform the observed pho-
tometry into g and z magnitudes at z = 0 using kcorrectv4 1 4 (Blanton & Roweis 2007). For z = 1.4 sources,the g−band (∼ 0.5µm) redshifts into the J−band (∼1.2µm) and the z−band (∼ 0.9µm) redshifts into theK−band (∼ 2.2µm). As a result, fields with ex-tensive photometric coverage use observed-frame band-passes that are very close to the rest-frame g− and z−bandpasses of interest, and so the k−corrections aresmall. For our TBT diagnostic, we subtract the rest-frame z−band from the rest-frame g−band to obtain therest-frame g − z color; hereafter, 0.0(g − z).To determine the error associated with the 0.0(g − z)
color for each sample, we randomly alter the magnitudesby an amount consistent with the photometric uncer-tainties and re-run the Blanton & Roweis (2007) soft-ware. We then determine the 1 σ standard deviationon ∆ = 0.0(g − z)original − 0.0(g − z)random. For ourSDSS sample, σ∆ = 0.21. For our GOODS-N/LH sam-ple, σ∆ = 0.07. The high-quality photometry and exten-sive coverage of our GOODS-N/LH fields ensures theselow k−correction errors.Chilingarian et al. (2010) compare the
Blanton & Roweis (2007) kcorrect code with theirown to explore the systematic error associated withk−correction software. For k−corrected optical colors(e.g., 0.0[g − r], 0.0[r − z]), the differences between theresulting colors from the two codes are relatively small(∼ 0.05 or less). Therefore, for our study, systematicerrors are not significant. However, we note here forcompleteness that for k−corrected colors in which oneband is in the rest-frame IR (e.g., 0.0[r−H ], 0.0[r−K]),the differences can be significant (∼ 0.15; see theirFig. 7), and the systematic error need be taken intoaccount.
3. A NEW Z < 1.4 EMISSION-LINE RATIO DIAGNOSTIC
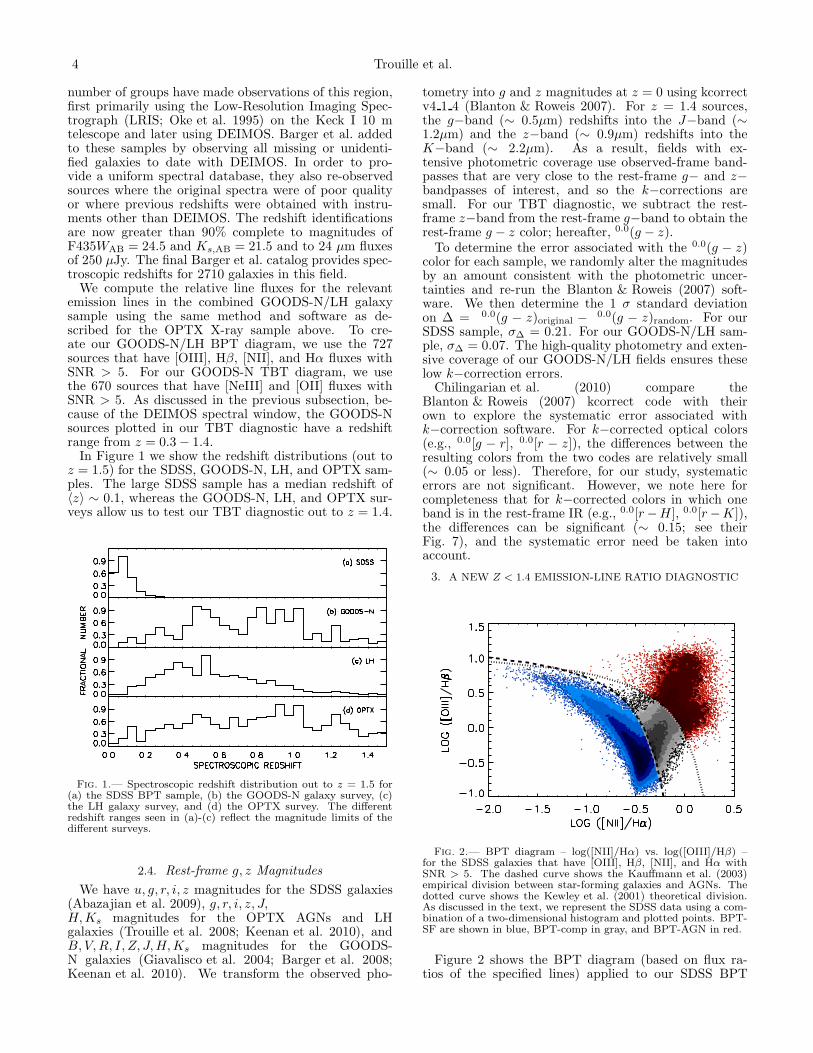
Fig. 2.— BPT diagram – log([NII]/Hα) vs. log([OIII]/Hβ) –for the SDSS galaxies that have [OIII], Hβ, [NII], and Hα withSNR > 5. The dashed curve shows the Kauffmann et al. (2003)empirical division between star-forming galaxies and AGNs. Thedotted curve shows the Kewley et al. (2001) theoretical division.As discussed in the text, we represent the SDSS data using a com-bination of a two-dimensional histogram and plotted points. BPT-SF are shown in blue, BPT-comp in gray, and BPT-AGN in red.
Figure 2 shows the BPT diagram (based on flux ra-tios of the specified lines) applied to our SDSS BPT
THE OPTX PROJECT V 5
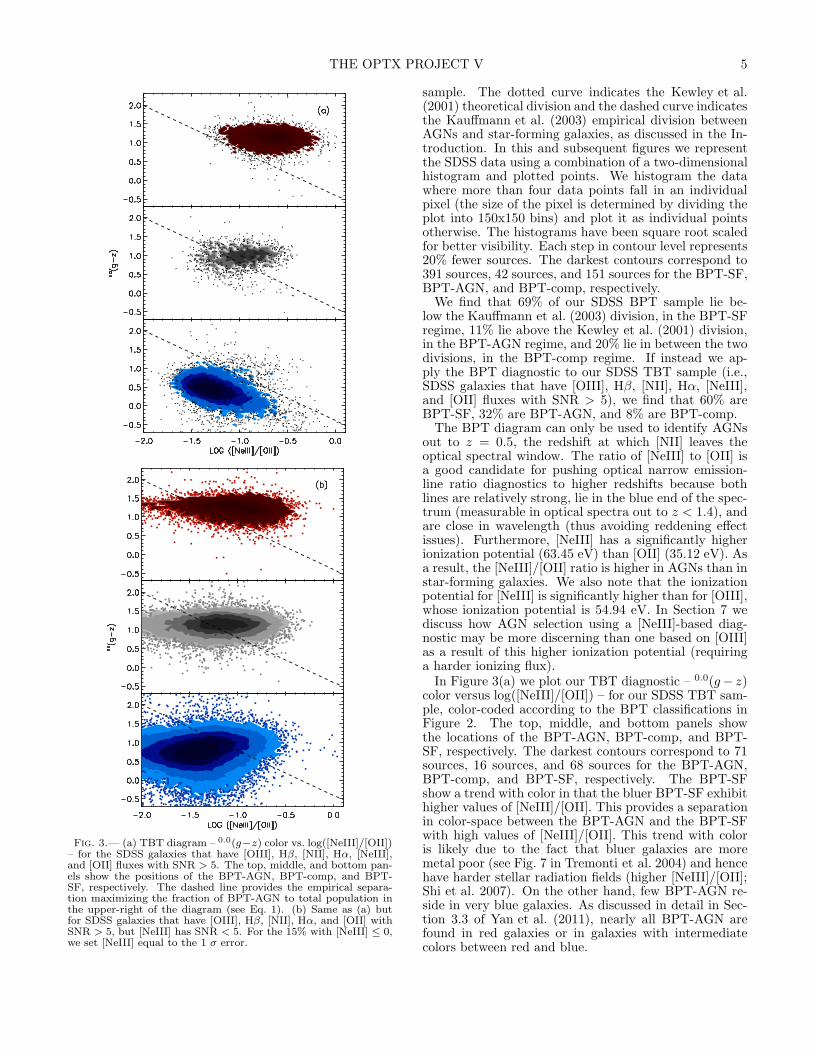
Fig. 3.— (a) TBT diagram – 0.0(g−z) color vs. log([NeIII]/[OII])– for the SDSS galaxies that have [OIII], Hβ, [NII], Hα, [NeIII],and [OII] fluxes with SNR > 5. The top, middle, and bottom pan-els show the positions of the BPT-AGN, BPT-comp, and BPT-SF, respectively. The dashed line provides the empirical separa-tion maximizing the fraction of BPT-AGN to total population inthe upper-right of the diagram (see Eq. 1). (b) Same as (a) butfor SDSS galaxies that have [OIII], Hβ, [NII], Hα, and [OII] withSNR > 5, but [NeIII] has SNR < 5. For the 15% with [NeIII] ≤ 0,we set [NeIII] equal to the 1 σ error.
sample. The dotted curve indicates the Kewley et al.(2001) theoretical division and the dashed curve indicatesthe Kauffmann et al. (2003) empirical division betweenAGNs and star-forming galaxies, as discussed in the In-troduction. In this and subsequent figures we representthe SDSS data using a combination of a two-dimensionalhistogram and plotted points. We histogram the datawhere more than four data points fall in an individualpixel (the size of the pixel is determined by dividing theplot into 150x150 bins) and plot it as individual pointsotherwise. The histograms have been square root scaledfor better visibility. Each step in contour level represents20% fewer sources. The darkest contours correspond to391 sources, 42 sources, and 151 sources for the BPT-SF,BPT-AGN, and BPT-comp, respectively.We find that 69% of our SDSS BPT sample lie be-
low the Kauffmann et al. (2003) division, in the BPT-SFregime, 11% lie above the Kewley et al. (2001) division,in the BPT-AGN regime, and 20% lie in between the twodivisions, in the BPT-comp regime. If instead we ap-ply the BPT diagnostic to our SDSS TBT sample (i.e.,SDSS galaxies that have [OIII], Hβ, [NII], Hα, [NeIII],and [OII] fluxes with SNR > 5), we find that 60% areBPT-SF, 32% are BPT-AGN, and 8% are BPT-comp.The BPT diagram can only be used to identify AGNs
out to z = 0.5, the redshift at which [NII] leaves theoptical spectral window. The ratio of [NeIII] to [OII] isa good candidate for pushing optical narrow emission-line ratio diagnostics to higher redshifts because bothlines are relatively strong, lie in the blue end of the spec-trum (measurable in optical spectra out to z < 1.4), andare close in wavelength (thus avoiding reddening effectissues). Furthermore, [NeIII] has a significantly higherionization potential (63.45 eV) than [OII] (35.12 eV). Asa result, the [NeIII]/[OII] ratio is higher in AGNs than instar-forming galaxies. We also note that the ionizationpotential for [NeIII] is significantly higher than for [OIII],whose ionization potential is 54.94 eV. In Section 7 wediscuss how AGN selection using a [NeIII]-based diag-nostic may be more discerning than one based on [OIII]as a result of this higher ionization potential (requiringa harder ionizing flux).In Figure 3(a) we plot our TBT diagnostic – 0.0(g− z)
color versus log([NeIII]/[OII]) – for our SDSS TBT sam-ple, color-coded according to the BPT classifications inFigure 2. The top, middle, and bottom panels showthe locations of the BPT-AGN, BPT-comp, and BPT-SF, respectively. The darkest contours correspond to 71sources, 16 sources, and 68 sources for the BPT-AGN,BPT-comp, and BPT-SF, respectively. The BPT-SFshow a trend with color in that the bluer BPT-SF exhibithigher values of [NeIII]/[OII]. This provides a separationin color-space between the BPT-AGN and the BPT-SFwith high values of [NeIII]/[OII]. This trend with coloris likely due to the fact that bluer galaxies are moremetal poor (see Fig. 7 in Tremonti et al. 2004) and hencehave harder stellar radiation fields (higher [NeIII]/[OII];Shi et al. 2007). On the other hand, few BPT-AGN re-side in very blue galaxies. As discussed in detail in Sec-tion 3.3 of Yan et al. (2011), nearly all BPT-AGN arefound in red galaxies or in galaxies with intermediatecolors between red and blue.
6 Trouille et al.
The dashed line designates
0.0(g − z) = −1.2× log([NeIII]/[OII])− 0.4 , (1)
our empirical separation maximizing the fraction ofBPT-AGN to total population in the upper-right of thediagram. Hereafter, we refer to the sources in the upper-right (lower-left) of our TBT diagnostic as TBT-AGN(TBT-SF).We find that 98.7% of the BPT-AGN lie in the TBT-
AGN regime and 97.2% of the BPT-SF lie in the TBT-SFregime. Likewise, we find that only 3.5% of the sources inthe TBT-AGN regime are BPT-SF and 1% of the sourcesin the TBT-SF regime are BPT-AGN. The BPT-complie on either side of the division, with 68.6% in the TBT-AGN regime. Overall the BPT-comp constitute 5% and16% of the TBT-SF and TBT-AGN, respectively.There are 200,712 galaxies in our SDSS BPT sam-
ple that have [OII] with SNR > 5 but [NeIII] withSNR < 5. In Figure 3(b) we show the TBT diagramfor these sources. For the 15% with [NeIII] ≤ 0, we set[NeIII] equal to the 1 σ error. The darkest contours cor-respond to 94 sources, 170 sources, and 546 sources forthe BPT-AGN, BPT-comp, and BPT-SF, respectively.We find that ∼ 85% of the BPT-SF lie within the TBT-SF regime, ∼ 86% of the BPT-AGN lie within the TBT-AGN regime, and ∼ 62% of the BPT-comp lie within theTBT-AGN regime. The trends follow those for our SDSSTBT sample. The 8% of SDSS BPT galaxies for whichneither [OII] nor [NeIII] has SNR > 5 and the < 1% ofSDSS BPT galaxies for which [NeIII] has SNR > 5 but[OII] has SNR < 5 are not considered here.We have trained our TBT diagnostic on the SDSS
galaxies, which have 〈z〉 ∼ 0.1. Because our TBT di-agnostic can be used with optical spectra out to z = 1.4,we examine the impact of metallicity evolution with red-shift on our empirical separation between TBT-AGNand TBT-SF. Galaxy metallicities decrease by a fac-tor of ∼ 0.3 dex between the local value and the valueat z ∼ 2 (Erb et al. 2006; see also Cowie & Barger2008; Kewley & Ellison 2008; Zahid et al. 2011). Foran Mstar = 1010M⊙ galaxy, this corresponds to ashift from 12 + log(O/H) = 8.6 to 8.3 (note thatmore massive galaxies undergo less metallicity evolu-tion). Using the Shi et al. (2007) relation between metal-licity and log([NeIII]/[OII]), we find that, in this case,log([NeIII]/[OII]) shifts by only ∼ 20%, from −0.89 to−0.72. Applying this 20% increase in the ratio of [NeIII]to [OII] to all SDSS BPT-SF, we find that an additional5% move to the TBT-AGN regime. This corresponds toan increase of only 5.5% in the number of TBT-AGN thatare BPT-SF. Similarly, there is only a 1.8% increase inthe number of TBT-AGN that are BPT-comp. Becausethe impact is relatively small, in this article we do notconsider any metallicity evolution with redshift in ourempirical separation between TBT-SF and TBT-AGN.We also considered the impact of color evolution on our
TBT diagnostic. At higher redshifts, galaxies are blueras a result of higher specific star formation rates. Purelypassive evolution models (Bruzual & Charlot 2003) withan instantaneous burst and a Chabrier (2003) initial massfunction predict a ∆0.0(g − z) ∼ 0.24 between z = 0 and1.4, for a formation redshift of 5. Applying this color evo-lution to all SDSS BPT-SF, the impact is in our favor.
The BPT-SF move down the y-axis in our TBT diagnos-tic to lie even further below our empirical separation, inthe TBT-SF regime. Applying this color evolution to allSDSS BPT-AGN, we find that an additional 3.6% moveto the TBT-SF regime. This corresponds to an increaseof 2.7% in the number of TBT-SF that are BPT-AGN.Similarly, there is only a 2.9% increase in the numberof TBT-SF that are BPT-comp. Because the impact issmall, in this article we do not consider any color evo-lution with redshift in our empirical separation betweenTBT-SF and TBT-AGN.
4. COMPARING THE TBT DIAGNOSTIC WITH AN X-RAYSELECTION OF AGNS
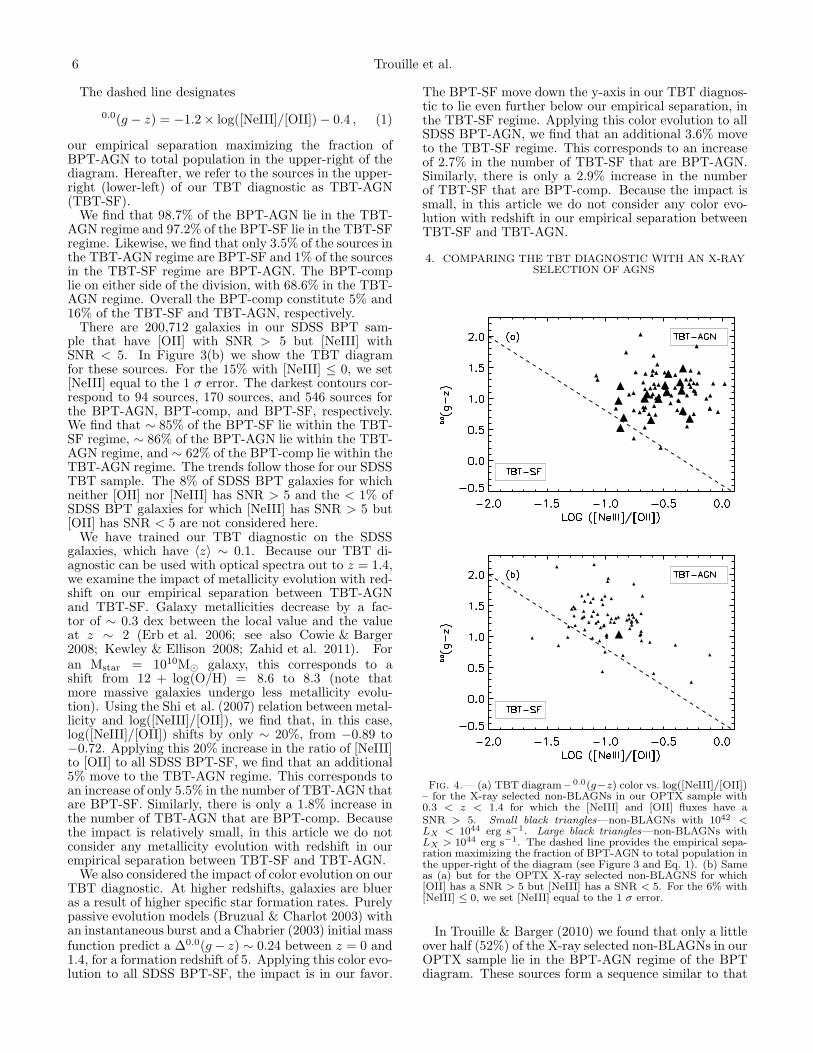
Fig. 4.— (a) TBT diagram – 0.0(g−z) color vs. log([NeIII]/[OII])– for the X-ray selected non-BLAGNs in our OPTX sample with0.3 < z < 1.4 for which the [NeIII] and [OII] fluxes have aSNR > 5. Small black triangles—non-BLAGNs with 1042 <LX < 1044 erg s−1. Large black triangles—non-BLAGNs withLX > 1044 erg s−1. The dashed line provides the empirical sepa-ration maximizing the fraction of BPT-AGN to total population inthe upper-right of the diagram (see Figure 3 and Eq. 1). (b) Sameas (a) but for the OPTX X-ray selected non-BLAGNS for which[OII] has a SNR > 5 but [NeIII] has a SNR < 5. For the 6% with[NeIII] ≤ 0, we set [NeIII] equal to the 1 σ error.
In Trouille & Barger (2010) we found that only a littleover half (52%) of the X-ray selected non-BLAGNs in ourOPTX sample lie in the BPT-AGN regime of the BPTdiagram. These sources form a sequence similar to that
THE OPTX PROJECT V 7
of the BPT-AGN, emerging from the HII region sequenceand extending to the upper-right hand side of the BPTdiagram.Of the X-ray selected non-BLAGNs in our OPTX
sample, 20% are misidentified as BPT-SF, i.e., as purestar-forming galaxies (Trouille & Barger 2010; see alsoWinter et al. 2010 for evidence of this in the Swift BATsample). Increased extinction does not account for these.Instead, in Trouille & Barger (2010) we note that thesemisidentified sources have lower L[OIII]/LX ratios thanthose that lie in the BPT-AGN regime. We postulatethat the low forbidden emission line strengths in themisidentified sources are a result of the complexity of thestructure of the narrow-line region, which causes ionizingphotons from the central engine to not be absorbed.The misidentification of X-ray selected AGNs as star-
forming galaxies is a potential issue for all opticalemission-line diagnostic diagrams, including our TBTdiagram. In Figure 4(a) we plot the TBT diagram –0.0(g − z) color versus log([NeIII]/[OII]) – for the 0.3 <z < 1.4 X-ray selected non-BLAGNs in our OPTX sam-ple that have [NeIII] and [OII] with SNR > 5. We findthat 97% (100/103) of our X-ray selected AGNs lie inthe TBT-AGN regime. Thus, the TBT diagnostic doesa much better job of correctly identifying X-ray selectedAGNs than the BPT diagnostic, misidentifying only 3%as TBT-SF compared to the BPT diagnostic’s misiden-tification of 20% as BPT-SF.As mentioned in Section 2.2, there are 94 0.3 < z < 1.4
OPTX non-BLAGNs that do not fulfill the criteria ofhaving both [NeIII] and [OII] with SNR > 5. Sixteenof these have neither [OII] nor [NeIII] with a SNR > 5.In Figure 4(b) we show the remaining 78 OPTX X-rayselected non-BLAGNs for which [OII] has a SNR > 5 but[NeIII] has a SNR < 5. No sources have only [NeIII] witha SNR > 5. We find that 92% (72/78) lie in the TBT-AGN regime. This supports our results for the OPTXsources in which both [NeIII] and [OII] have a SNR > 5.
5. VERIFICATION OF THE TBT DIAGNOSTIC: STACKINGANALYSES
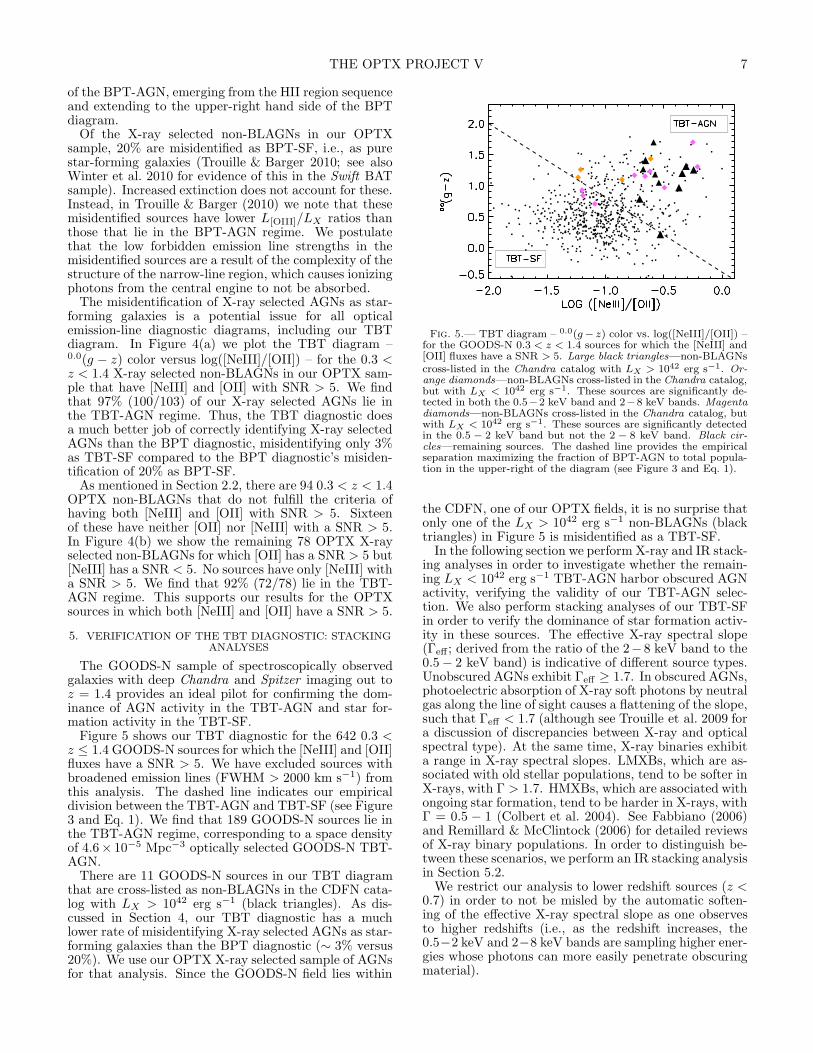
The GOODS-N sample of spectroscopically observedgalaxies with deep Chandra and Spitzer imaging out toz = 1.4 provides an ideal pilot for confirming the dom-inance of AGN activity in the TBT-AGN and star for-mation activity in the TBT-SF.Figure 5 shows our TBT diagnostic for the 642 0.3 <
z ≤ 1.4 GOODS-N sources for which the [NeIII] and [OII]fluxes have a SNR > 5. We have excluded sources withbroadened emission lines (FWHM > 2000 km s−1) fromthis analysis. The dashed line indicates our empiricaldivision between the TBT-AGN and TBT-SF (see Figure3 and Eq. 1). We find that 189 GOODS-N sources lie inthe TBT-AGN regime, corresponding to a space densityof 4.6× 10⁻⁵ Mpc−3 optically selected GOODS-N TBT-AGN.There are 11 GOODS-N sources in our TBT diagram
that are cross-listed as non-BLAGNs in the CDFN cata-log with LX > 1042 erg s−1 (black triangles). As dis-cussed in Section 4, our TBT diagnostic has a muchlower rate of misidentifying X-ray selected AGNs as star-forming galaxies than the BPT diagnostic (∼ 3% versus20%). We use our OPTX X-ray selected sample of AGNsfor that analysis. Since the GOODS-N field lies within
Fig. 5.— TBT diagram – 0.0(g− z) color vs. log([NeIII]/[OII]) –for the GOODS-N 0.3 < z < 1.4 sources for which the [NeIII] and[OII] fluxes have a SNR > 5. Large black triangles—non-BLAGNscross-listed in the Chandra catalog with LX > 1042 erg s−1. Or-ange diamonds—non-BLAGNs cross-listed in the Chandra catalog,but with LX < 1042 erg s−1. These sources are significantly de-tected in both the 0.5−2 keV band and 2−8 keV bands. Magentadiamonds—non-BLAGNs cross-listed in the Chandra catalog, butwith LX < 1042 erg s−1. These sources are significantly detectedin the 0.5 − 2 keV band but not the 2 − 8 keV band. Black cir-cles—remaining sources. The dashed line provides the empiricalseparation maximizing the fraction of BPT-AGN to total popula-tion in the upper-right of the diagram (see Figure 3 and Eq. 1).
the CDFN, one of our OPTX fields, it is no surprise thatonly one of the LX > 1042 erg s−1 non-BLAGNs (blacktriangles) in Figure 5 is misidentified as a TBT-SF.In the following section we perform X-ray and IR stack-
ing analyses in order to investigate whether the remain-ing LX < 1042 erg s−1 TBT-AGN harbor obscured AGNactivity, verifying the validity of our TBT-AGN selec-tion. We also perform stacking analyses of our TBT-SFin order to verify the dominance of star formation activ-ity in these sources. The effective X-ray spectral slope(Γeff ; derived from the ratio of the 2− 8 keV band to the0.5− 2 keV band) is indicative of different source types.Unobscured AGNs exhibit Γeff ≥ 1.7. In obscured AGNs,photoelectric absorption of X-ray soft photons by neutralgas along the line of sight causes a flattening of the slope,such that Γeff < 1.7 (although see Trouille et al. 2009 fora discussion of discrepancies between X-ray and opticalspectral type). At the same time, X-ray binaries exhibita range in X-ray spectral slopes. LMXBs, which are as-sociated with old stellar populations, tend to be softer inX-rays, with Γ > 1.7. HMXBs, which are associated withongoing star formation, tend to be harder in X-rays, withΓ = 0.5 − 1 (Colbert et al. 2004). See Fabbiano (2006)and Remillard & McClintock (2006) for detailed reviewsof X-ray binary populations. In order to distinguish be-tween these scenarios, we perform an IR stacking analysisin Section 5.2.We restrict our analysis to lower redshift sources (z <
0.7) in order to not be misled by the automatic soften-ing of the effective X-ray spectral slope as one observesto higher redshifts (i.e., as the redshift increases, the0.5−2 keV and 2−8 keV bands are sampling higher ener-gies whose photons can more easily penetrate obscuringmaterial).
8 Trouille et al.
5.1. X-ray Stacking
Quantitatively, if stacking a sample of ‘n’ objects yields‘Ns’ counts in a signal aperture of area ‘As’ and ‘Nb’smoothed background counts in that same area ‘As’, thenthe mean number of source counts per object in the signalregion is
〈N〉src =1
n[Ns −Nb] . (2)
We obtain an estimate of the mean spectral slope ofthe detected signal by performing the stacking in twoenergy bands, soft (0.5 − 2 keV) and hard (2 − 8 keV),and deriving an effective power-law photon index, 〈Γeff〉.Here we use the STACKFAST X-ray stacking program
(Hickox et al. 2007). In STACKFAST, ‘As’ is defined asthe area enclosed within r90 from the source position,where r90 is an approximation of the 90% point-spreadfunction (PSF) energy encircled radius at 1.5 keV, andvaries as1:
r90 = 1′′ + 10′′(θ/10′)2 , (3)
with θ equal to the off-axis angle. In order to maximizethe number of source counts, rather than limiting thestacking to only the central 6′ as in Hickox et al. (2007),we use the central 10′ around the pointing center for eachobservation.A few bright sources would dominate our estimate
of the mean spectral shape, so we exclude from ouranalysis sources that lie close to or are associated witha known X-ray detected source, hereafter called co-incidental contaminants (see also Hickox et al. 2007;Georgantopoulos et al. 2008; Fiore et al. 2008). To thisend, we first applied a mask to all known X-ray detectedsource positions. We used 3×r90 (see Eq. 3) as the maskaperture radius.We cross reference the ‘As’ for our sources of inter-
est with the X-ray photon locations from each Chandrapointing (i.e., each OBSID event file). We then createsmoothed 0.5 − 2 keV and 2 − 8 keV background mapsusing the CIAO WAVDETECT task and determine thebackground counts within the same ‘As’. Subtractingthis background and dividing by the number of sourcesbeing stacked, we obtain the average X-ray signal incounts per source. We create exposure maps using cus-tom routines (A. Vikhlinin, private communication) anddetermine the total exposure time for each source beingstacked. Dividing the total counts in the stacked sourceby the total exposure time, we derive the average countrate (counts per second) for the stacked source. We usethe ratio of the 2− 8 keV count rate to the 0.5− 2 keVcount rate to derive 〈Γeff〉.Count uncertainties are calculated using the approxi-
mation√X + 0.75+1, where X is the number of counts
in a given band (Gehrels 1986). We set a significancethreshold of 3 σ. Uncertainties in the hardness ratio and〈Γeff〉 are derived by propagating these count rate errors.Table 1 shows the results from our stacking analysis
for the GOODS-N TBT-SF and TBT-AGN. Column 2lists the total number of sources in each of these cate-gories. Column 3 provides the total number of sourcesused in the stacking analysis, after excluding individuallyX-ray detected sources and coincidental contaminants.
1 http://cxc.harvard.edu/proposer/POG
Columns 4 and 5 state fluxes and detection significancefor the given X-ray band. We consider that stackedsources with < 3 σ detection are not significantly de-tected. Column 6 provides the 〈Γeff〉 value for the stackedsource. In column 7 we list the volume-weighted redshiftfor the stacked source and in column 8 we list the de-rived 2−8 keV luminosity based on the f2−8 keV and thevolume-weighted redshift.We provide specifics for each category in the following
subsections.
5.1.1. TBT-SF
There are 155 z < 0.7 GOODS-N TBT-SF. As dis-cussed above, we restrict our analysis to these lower red-shifts in order to not be misled by the automatic soften-ing of the effective X-ray spectral slope as one observesto higher redshift. Only one of these z < 0.7 GOODS-NTBT-SF is directly X-ray detected, and then only in the0.5− 2 keV band. Using the 2− 8 keV flux limit for theCDFN image (see Table 2), we determine an upper limitto its hardness ratio and find that it is X-ray soft, withΓ > 1.7.After excluding this known X-ray source, as well as co-
incidental contaminants, we use the STACKFAST pro-gram to determine the average X-ray signal in the re-maining 148 TBT-SF. The stacked source is significantlydetected in the 0.5 − 2 keV band (4.7 σ) but not in the2 − 8 keV band (2.2 σ). We find a 〈Γeff〉 = 1.5+0.7
−0.4, al-though we caution that this is based on a low-significance2 − 8 keV signal. Given the large uncertainties, thestacked source could be X-ray soft (Γ > 1.7).
5.1.2. TBT-AGN
There are 72 z < 0.7 GOODS-N TBT-AGN. Six aredirectly X-ray detected in both the 0.5− 2 keV and 2−8 keV bands. Three of these are obvious X-ray selectedAGNs with LX > 1042 erg s−1. The three remaining X-ray detected sources have LX < 1042 erg s−1. All threeare X-ray hard, with Γ < 1.4.After excluding these known X-ray sources, as well
as coincidental contaminants, we use the STACKFASTprogram to determine the average X-ray signal in theremaining 54 TBT-AGN. The stacked source is signifi-cantly detected in both bands (5.4 σ in the 0.5 − 2 keVband and 4.0 σ in the 2 − 8 keV band). We finda 〈Γeff〉 = 1.0+0.3
−0.3, consistent with being X-ray hard(Γ < 1.4).
5.1.3. Monte-Carlo Simulation
We carried out a series of Monte Carlo (MC) stackingsimulations to assess false-detection probabilities empir-ically. For each category we performed 1000 trials andused the same number of stacked sources and the sameprocedure as in the original stacking, albeit with randomRA and Dec positions.In Section 5.1.1 we found that the TBT-SF are signif-
icantly detected in the 0.5 − 2 keV band but not in the2−8 keV band. In Section 5.1.2 we found that the TBT-AGN are significantly detected in both the 0.5 − 2 keVand 2− 8 keV bands.Our MC simulations yield a 0.1% probability of gen-
erating the observed 0.5 − 2 keV flux for our stackedTBT-SF source and a 52% probability of generating the
THE OPTX PROJECT V 9
TABLE 1TBT X-ray Stacking Analysis Results
Category Total # # used in stack f0.5−2 keVa f2−8 keV
a 〈Γeff〉 zb logL2−8 keV [erg s−1](1) (2) (3) (4) (5) (6) (7) (8)TBT-SFc 155 148 0.62 ± 0.13 (4.7 σ) 2.50± 1.1 (2.2 σ) 1.5+0.7
−0.4d 0.58 40.53d
TBT-AGNc 72 54 1.13 ± 0.2 (5.4 σ) 5.87± 1.4 (4 σ) 1.0+0.3−0.3 0.58 40.86
aIn units of 10−17 erg cm−2 s−1.
bVolume-weighted redshift for the stacked source.cOnly including sources with z < 0.7.dWe caution that this is based on a low significance 2 − 8 keV signal.
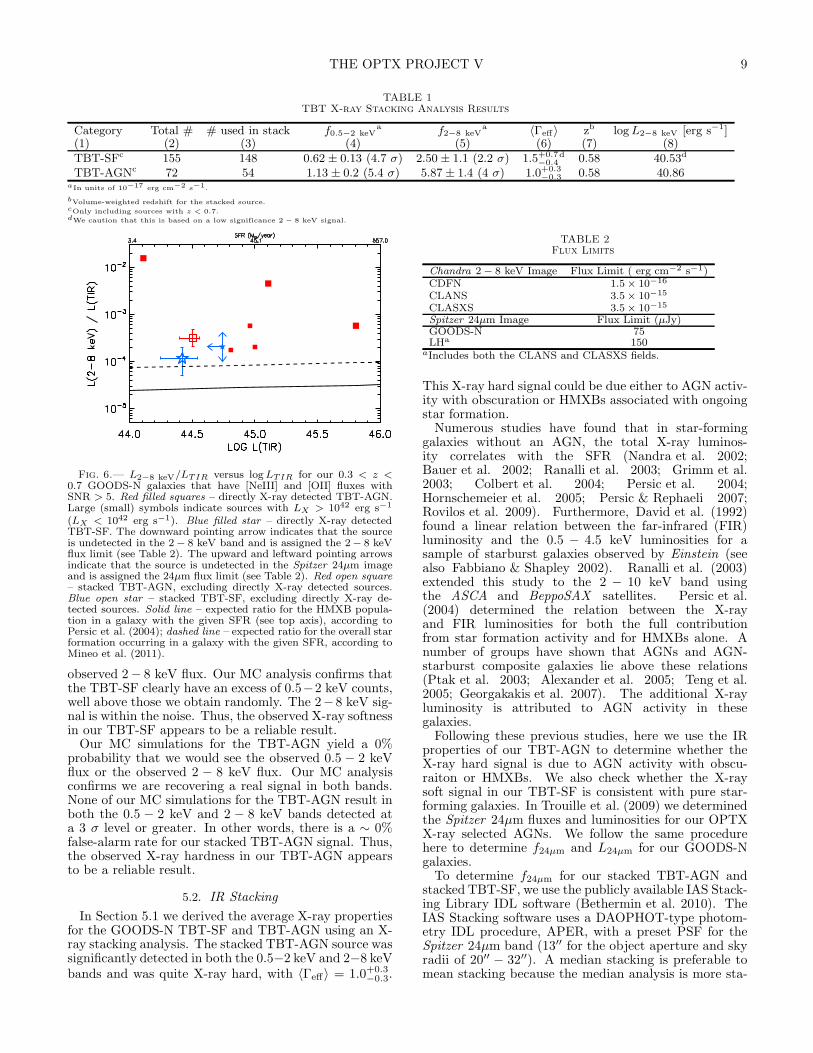
Fig. 6.— L2−8 keV/LTIR versus logLTIR for our 0.3 < z <0.7 GOODS-N galaxies that have [NeIII] and [OII] fluxes withSNR > 5. Red filled squares – directly X-ray detected TBT-AGN.Large (small) symbols indicate sources with LX > 1042 erg s−1
(LX < 1042 erg s−1). Blue filled star – directly X-ray detectedTBT-SF. The downward pointing arrow indicates that the sourceis undetected in the 2− 8 keV band and is assigned the 2− 8 keVflux limit (see Table 2). The upward and leftward pointing arrowsindicate that the source is undetected in the Spitzer 24µm imageand is assigned the 24µm flux limit (see Table 2). Red open square– stacked TBT-AGN, excluding directly X-ray detected sources.Blue open star – stacked TBT-SF, excluding directly X-ray de-tected sources. Solid line – expected ratio for the HMXB popula-tion in a galaxy with the given SFR (see top axis), according toPersic et al. (2004); dashed line – expected ratio for the overall starformation occurring in a galaxy with the given SFR, according toMineo et al. (2011).
observed 2− 8 keV flux. Our MC analysis confirms thatthe TBT-SF clearly have an excess of 0.5−2 keV counts,well above those we obtain randomly. The 2− 8 keV sig-nal is within the noise. Thus, the observed X-ray softnessin our TBT-SF appears to be a reliable result.Our MC simulations for the TBT-AGN yield a 0%
probability that we would see the observed 0.5 − 2 keVflux or the observed 2 − 8 keV flux. Our MC analysisconfirms we are recovering a real signal in both bands.None of our MC simulations for the TBT-AGN result inboth the 0.5 − 2 keV and 2 − 8 keV bands detected ata 3 σ level or greater. In other words, there is a ∼ 0%false-alarm rate for our stacked TBT-AGN signal. Thus,the observed X-ray hardness in our TBT-AGN appearsto be a reliable result.
5.2. IR Stacking
In Section 5.1 we derived the average X-ray propertiesfor the GOODS-N TBT-SF and TBT-AGN using an X-ray stacking analysis. The stacked TBT-AGN source wassignificantly detected in both the 0.5−2 keV and 2−8 keVbands and was quite X-ray hard, with 〈Γeff〉 = 1.0+0.3
−0.3.
TABLE 2Flux Limits
Chandra 2− 8 keV Image Flux Limit ( erg cm−2 s−1)CDFN 1.5× 10⁻¹⁶
CLANS 3.5× 10⁻¹⁵
CLASXS 3.5× 10⁻¹⁵
Spitzer 24µm Image Flux Limit (µJy)GOODS-N 75LHa 150
aIncludes both the CLANS and CLASXS fields.
This X-ray hard signal could be due either to AGN activ-ity with obscuration or HMXBs associated with ongoingstar formation.Numerous studies have found that in star-forming
galaxies without an AGN, the total X-ray luminos-ity correlates with the SFR (Nandra et al. 2002;Bauer et al. 2002; Ranalli et al. 2003; Grimm et al.2003; Colbert et al. 2004; Persic et al. 2004;Hornschemeier et al. 2005; Persic & Rephaeli 2007;Rovilos et al. 2009). Furthermore, David et al. (1992)found a linear relation between the far-infrared (FIR)luminosity and the 0.5 − 4.5 keV luminosities for asample of starburst galaxies observed by Einstein (seealso Fabbiano & Shapley 2002). Ranalli et al. (2003)extended this study to the 2 − 10 keV band usingthe ASCA and BeppoSAX satellites. Persic et al.(2004) determined the relation between the X-rayand FIR luminosities for both the full contributionfrom star formation activity and for HMXBs alone. Anumber of groups have shown that AGNs and AGN-starburst composite galaxies lie above these relations(Ptak et al. 2003; Alexander et al. 2005; Teng et al.2005; Georgakakis et al. 2007). The additional X-rayluminosity is attributed to AGN activity in thesegalaxies.Following these previous studies, here we use the IR
properties of our TBT-AGN to determine whether theX-ray hard signal is due to AGN activity with obscu-raiton or HMXBs. We also check whether the X-raysoft signal in our TBT-SF is consistent with pure star-forming galaxies. In Trouille et al. (2009) we determinedthe Spitzer 24µm fluxes and luminosities for our OPTXX-ray selected AGNs. We follow the same procedurehere to determine f24µm and L24µm for our GOODS-Ngalaxies.To determine f24µm for our stacked TBT-AGN and
stacked TBT-SF, we use the publicly available IAS Stack-ing Library IDL software (Bethermin et al. 2010). TheIAS Stacking software uses a DAOPHOT-type photom-etry IDL procedure, APER, with a preset PSF for theSpitzer 24µm band (13′′ for the object aperture and skyradii of 20′′ − 32′′). A median stacking is preferable tomean stacking because the median analysis is more sta-
10 Trouille et al.
ble and robust to small numbers of bright sources. Usingthe volume-weighted redshift for our stacked source, wetransform f24µm into L24µm. We then use the Rieke et al.(2009) eq. A6 to transform L24µm into the total infraredluminosity, LTIR.The IAS Stacking software provides the 1 σ standard
deviation on the stacked flux. However, given that theSpitzer image resolution is low, we need to consider thelikelihood of misidentifications and overlap. To assesshow well this 1 σ standard deviation reflects the contam-ination from spurious signals, we carry out a series ofMonte Carlo stacking. We perform 1000 trials and usethe same number of stacked sources and follow the sameprocedure as in the original stacking. The only differenceis that we use random RA and Dec positions. For bothour stacked TBT-AGN and our stacked TBT-SF, > 99%of our simulations result in stacked fluxes less than our1 σ error. While < 10% of the random RA, Dec positionsin each simulation do overlap with real 24µm sources (asexpected given the low image resolution), because we usea median stacking, these spuriously high fluxes are ex-cluded from the stacked signal.In Figure 6 we plot the ratio of the X-ray to total IR
luminosities, LX/LTIR, versus LTIR for our TBT cate-gories. The top axis shows the associated SFR for a givenLTIR, following Rieke et al. (2009). The solid line showsthe expected ratio derived by Persic et al. (2004) for theHMXB population in a galaxy with the given SFR. Thedashed line shows the Mineo et al. (2011) expected ra-tio for all star formation activity in a galaxy with thegiven SFR. The stacked TBT-SF (blue open star) wassignificantly detected in the 0.5 − 2 keV band (4.7 σ)but not in the 2 − 8 keV band (2.2 σ). Nonetheless,we use the derived LX from the stacking analysis (seeTable 1) and determine the 1 σ error on LX/LTIR bypropogating the errors on both the stacked X-ray andIR signal. The stacked TBT-SF LX/LTIR is consistentwith that expected for pure star-forming galaxies. Thiscorroborates what we find for the one individually X-ray detected TBT-SF (blue filled star). Since this sourceis undetected in both the Spitzer 24µm image and theCDFN 2 − 8 keV image, we assign it the flux limits forthese images (see Table 2) and use the arrows to des-ignate it as corresponding to upper limits. Given theseuncertainties, its LX/LTIR is not inconsistent with purestar-forming galaxies.The three X-ray detected TBT-AGN with LX >
1042 erg s−1 (large red filled squares) and the three X-raydetected TBT-AGN with LX < 1042 erg s−1 (small redfilled squares) lie clearly above the expected range forLX/LTIR for pure star-forming galaxies. The stackedTBT-AGN (red open square) also lies well above thisrange. We determine the 1 σ error on LX/LTIR for thestacked source by propagating the errors on both thestacked X-ray and IR signal. We find that the stackedTBT-AGN lies > 3 σ above the expected range forLX/LTIR for pure star-forming galaxies, supporting ourhypothesis that, on average, TBT-AGN harbor AGN ac-tivity.
6. BPT DIAGNOSTIC: STACKING ANALYSES
In Section 3 we found that the majority of the SDSSBPT-comp lie within the TBT-AGN regime. Here ourprimary goal is to do X-ray and IR stacking analyses to
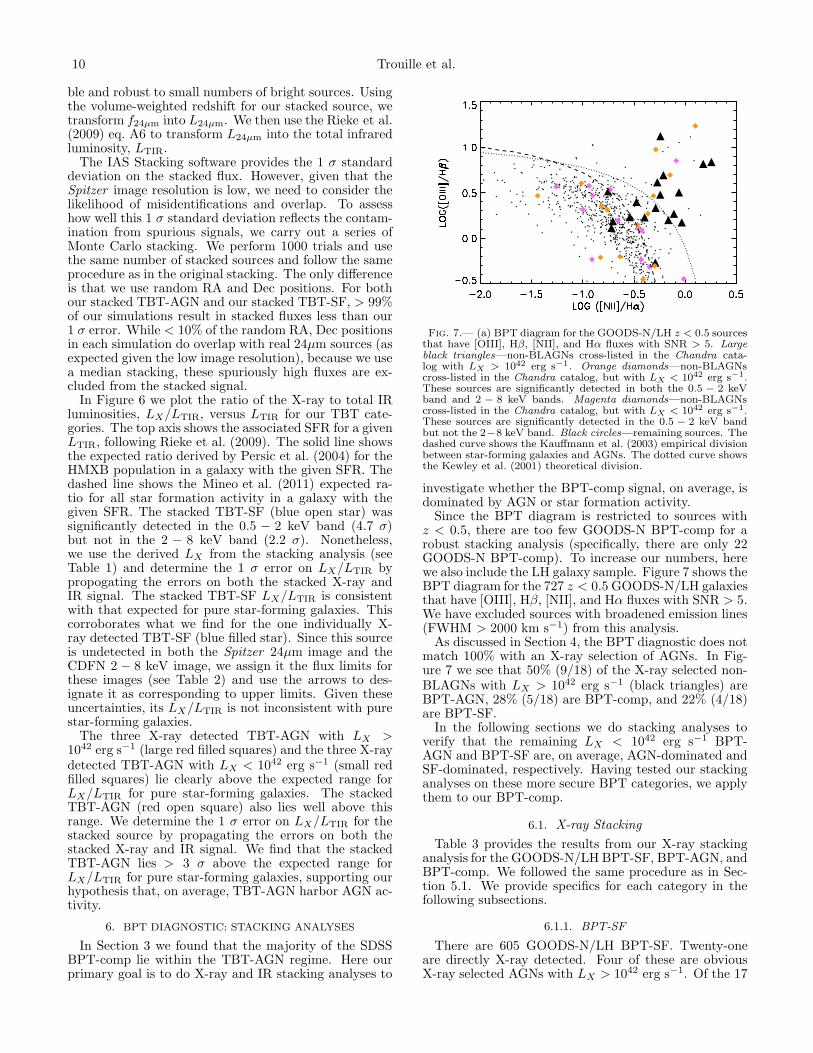
Fig. 7.— (a) BPT diagram for the GOODS-N/LH z < 0.5 sourcesthat have [OIII], Hβ, [NII], and Hα fluxes with SNR > 5. Largeblack triangles—non-BLAGNs cross-listed in the Chandra cata-log with LX > 1042 erg s−1. Orange diamonds—non-BLAGNscross-listed in the Chandra catalog, but with LX < 1042 erg s−1.These sources are significantly detected in both the 0.5 − 2 keVband and 2 − 8 keV bands. Magenta diamonds—non-BLAGNscross-listed in the Chandra catalog, but with LX < 1042 erg s−1.These sources are significantly detected in the 0.5 − 2 keV bandbut not the 2−8 keV band. Black circles—remaining sources. Thedashed curve shows the Kauffmann et al. (2003) empirical divisionbetween star-forming galaxies and AGNs. The dotted curve showsthe Kewley et al. (2001) theoretical division.
investigate whether the BPT-comp signal, on average, isdominated by AGN or star formation activity.Since the BPT diagram is restricted to sources with
z < 0.5, there are too few GOODS-N BPT-comp for arobust stacking analysis (specifically, there are only 22GOODS-N BPT-comp). To increase our numbers, herewe also include the LH galaxy sample. Figure 7 shows theBPT diagram for the 727 z < 0.5 GOODS-N/LH galaxiesthat have [OIII], Hβ, [NII], and Hα fluxes with SNR > 5.We have excluded sources with broadened emission lines(FWHM > 2000 km s−1) from this analysis.As discussed in Section 4, the BPT diagnostic does not
match 100% with an X-ray selection of AGNs. In Fig-ure 7 we see that 50% (9/18) of the X-ray selected non-BLAGNs with LX > 1042 erg s−1 (black triangles) areBPT-AGN, 28% (5/18) are BPT-comp, and 22% (4/18)are BPT-SF.In the following sections we do stacking analyses to
verify that the remaining LX < 1042 erg s−1 BPT-AGN and BPT-SF are, on average, AGN-dominated andSF-dominated, respectively. Having tested our stackinganalyses on these more secure BPT categories, we applythem to our BPT-comp.
6.1. X-ray Stacking
Table 3 provides the results from our X-ray stackinganalysis for the GOODS-N/LH BPT-SF, BPT-AGN, andBPT-comp. We followed the same procedure as in Sec-tion 5.1. We provide specifics for each category in thefollowing subsections.
6.1.1. BPT-SF
There are 605 GOODS-N/LH BPT-SF. Twenty-oneare directly X-ray detected. Four of these are obviousX-ray selected AGNs with LX > 1042 erg s−1. Of the 17
THE OPTX PROJECT V 11
TABLE 3BPT X-ray Stacking Analysis Results
Category Total # # used in stack f0.5 − 2 keVa f2−8 keVa 〈Γeff〉 zb logL2−8 keV [erg s−1]
(1) (2) (3) (4) (5) (6) (7) (8)BPT-SF 605 448 0.66± 0.12 (5.5 σ) 2.82 ± 1.23 (2.3 σ) 1.5+0.7
−0.3c 0.41 40.20c
BPT-AGNd 31 17 5.39± 3.37 (1.6 σ) 39.4 ± 22.9 (1.8 σ) 0.72+1.5−0.2
e 0.41 41.35c
BPT-Comp 91 76 1.71± 0.33 (5.2 σ) 8.92 ± 2.23 (4.0 σ) 1.0+0.4−0.4 0.41 40.70
aIn units of 10−17 erg cm−2 s−1.
bVolume-weighted redshift for the stacked source.cWe caution that this is based on a low significance 2 − 8 keV signal.dThree out of four GOODS-N BPT-AGN and 11 out of 27 LH BPT-AGN are directly detected in their respective Chandra image.
Stacking the remaining 17 GOODS-N/LH X-ray undetected BPT-AGN provides poor statistics for the stacking analysis.eWe caution that this is based on a low significance 0.5 − 2 keV and 2 − 8 keV signal.
X-ray detected sources with LX < 1042 erg s−1, ten areonly detected in the 0.5−2 keV band. Using the 2−8 keVflux limit for their Chandra image (see Table 2), we de-termine an upper limit to their hardness ratios and findthat all ten are X-ray soft, with Γ > 1.7. Of the sevenremaining sources that are detected in both bands, threeare X-ray soft, with Γ > 1.7. Therefore, the majority(13/17) of the X-ray detected, LX < 1042 erg s−1 sourcesare X-ray soft, with Γ > 1.7.After excluding these known X-ray sources, as well as
coincidental contaminants, we use the STACKFAST pro-gram to determine the average X-ray signal in the re-maining 448 BPT-SF. The stacked source is significantlydetected in the 0.5 − 2 keV band (5.5 σ) but not in the2 − 8 keV band (2.3 σ). We find a 〈Γ〉 = 1.5+0.7
−0.3, al-though we caution that this is based on a low-significance2 − 8 keV signal. Given the large uncertainties, thestacked source could be X-ray soft (Γ > 1.7).Our MC simulations (see Section 5.1.3 for details of the
procedure) yield a 2% probability of randomly generatingthe observed 0.5 − 2 keV flux for our stacked BPT-SFand a 96% probability of generating the observed 2 −8 keV flux. Our MC analysis confirms that these BPT-SF clearly have an excess of 0.5 − 2 keV counts, wellabove those we obtain randomly. The 2− 8 keV signal iswithin the noise.
6.1.2. BPT-AGN
There are 31 GOODS-N/LH BPT-AGN. Fourteen aredirectly X-ray detected. Nine of these are obvious X-rayselected AGNs with LX > 1042 erg s−1. Of the five X-ray detected sources with LX < 1042 erg s−1, one is onlydetected in the 0.5−2 keV band. Using the 2−8 keV fluxlimit for its Chandra image (see Table 2), we determinean upper limit to its hardness ratio and find that it is X-ray soft, with Γ > 1.7. The four remaining sources thatare detected in both bands are X-ray hard, with Γ < 1.4.After excluding these known X-ray sources, as well
as coincidental contaminants, we use the STACKFASTprogram to determine the average X-ray signal in theremaining 17 BPT-AGN. Given the small number ofsources in this stacking analysis, it is not surprising thatthe stacked source is neither significantly detected in the0.5−2 keV band (1.6 σ) nor in the 2−8 keV band (1.8 σ).We find a 〈Γ〉 = 0.72+1.5
−0.2, although we caution that thisis based on a low-significance 0.5− 2 keV and 2− 8 keVsignal. Given the large uncertainties, this stacked sourcecould be X-ray hard (Γ < 1.4).Our MC simulations (see Section 5.1.3 for details of
the procedure) yield a ∼ 98% probability of randomly
generating the observed 0.5−2 keV and 2−8 keV fluxes.Our MC analysis confirms that the 0.5− 2 keV and 2−8 keV signals are within the noise.
6.1.3. BPT-comp
There are 91 GOODS-N/LH BPT-comp. Eleven aredirectly X-ray detected. Five of these are obvious X-rayselected AGNs with LX > 1042 erg s−1. Of the six X-raydetected sources with LX < 1042 erg s−1, three are onlydetected in the 0.5−2 keV band. Using the 2−8 keV fluxlimit for their Chandra image (see Table 2), we determinean upper limit to their hardness ratios and find that allthree are X-ray soft, with Γ > 1.7. The remaining threesources are detected in both bands and are X-ray hard,with Γ < 1.4.After excluding known X-ray sources, as well as coinci-
dental contaminants, we use the STACKFAST programto determine the average X-ray signal in the remaining76 BPT-comp. The stacked source is significantly de-tected in both bands (5.2 σ in the 0.5− 2 keV band and4.0 σ in the 2− 8 keV band). We find a 〈Γeff〉 = 1.0+0.4
−0.4,i.e., the source is X-ray hard.Our MC simulations for the BPT-comp yield a 5%
probability that we would see the observed 0.5 − 2 keVflux and a 2% probability we would see the observed2 − 8 keV flux, confirming that we are recovering a realsignal in both bands. Fewer than 1% of our MC simula-tions for the BPT-comp result in both the 0.5−2 keV and2−8 keV bands detected at a 3 σ level or greater. In otherwords, there is a < 1% false-alarm rate for our stackedBPT-comp signal. Thus, the observed X-ray hardness inour BPT-comp appears to be a reliable result.
6.2. IR Stacking
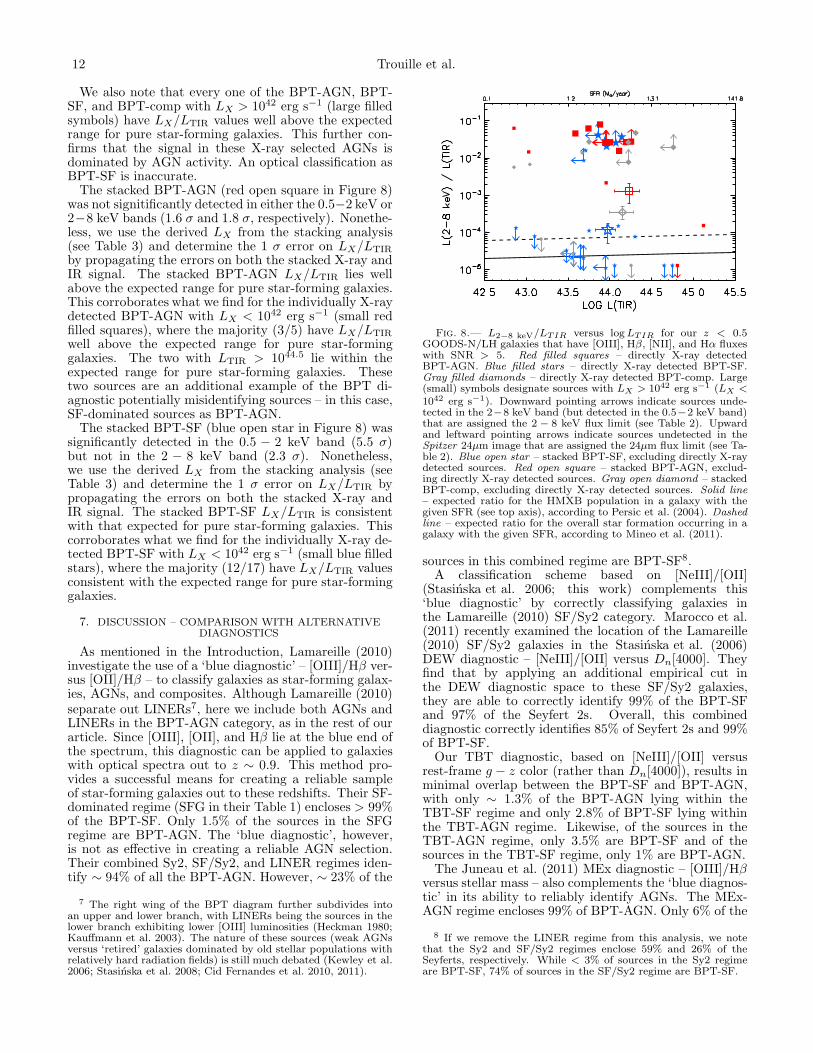
As discussed in Section 5.2, the X-ray hard signal inour stacked BPT-comp could be due either to HMXBsor to AGN activity with obscuration. We follow thesame procedure as in Section 5.2 to distinguish betweenthese scenarios using the IR. We determine the 1 σ erroron LX/LTIR for the stacked BPT-comp (gray open dia-mond) by propagating the errors on both the stacked X-ray and IR signal. Figure 8 shows that the stacked BPT-comp lies > 3 σ above the expected range for LX/LTIR
for pure star-forming galaxies (dashed line). This corrob-orates what we find for the individually X-ray detectedBPT-comp (gray filled diamonds), where the majority(8/11) have LX/LTIR values well above the expectedrange for pure star-forming galaxies. These results sup-port our TBT diagnostic inclusion of the bulk of BPT-comp in the TBT-AGN regime.
12 Trouille et al.
We also note that every one of the BPT-AGN, BPT-SF, and BPT-comp with LX > 1042 erg s−1 (large filledsymbols) have LX/LTIR values well above the expectedrange for pure star-forming galaxies. This further con-firms that the signal in these X-ray selected AGNs isdominated by AGN activity. An optical classification asBPT-SF is inaccurate.The stacked BPT-AGN (red open square in Figure 8)
was not signitificantly detected in either the 0.5−2 keV or2−8 keV bands (1.6 σ and 1.8 σ, respectively). Nonethe-less, we use the derived LX from the stacking analysis(see Table 3) and determine the 1 σ error on LX/LTIR
by propagating the errors on both the stacked X-ray andIR signal. The stacked BPT-AGN LX/LTIR lies wellabove the expected range for pure star-forming galaxies.This corroborates what we find for the individually X-raydetected BPT-AGN with LX < 1042 erg s−1 (small redfilled squares), where the majority (3/5) have LX/LTIR
well above the expected range for pure star-forminggalaxies. The two with LTIR > 1044.5 lie within theexpected range for pure star-forming galaxies. Thesetwo sources are an additional example of the BPT di-agnostic potentially misidentifying sources – in this case,SF-dominated sources as BPT-AGN.The stacked BPT-SF (blue open star in Figure 8) was
significantly detected in the 0.5 − 2 keV band (5.5 σ)but not in the 2 − 8 keV band (2.3 σ). Nonetheless,we use the derived LX from the stacking analysis (seeTable 3) and determine the 1 σ error on LX/LTIR bypropagating the errors on both the stacked X-ray andIR signal. The stacked BPT-SF LX/LTIR is consistentwith that expected for pure star-forming galaxies. Thiscorroborates what we find for the individually X-ray de-tected BPT-SF with LX < 1042 erg s−1 (small blue filledstars), where the majority (12/17) have LX/LTIR valuesconsistent with the expected range for pure star-forminggalaxies.
7. DISCUSSION – COMPARISON WITH ALTERNATIVEDIAGNOSTICS
As mentioned in the Introduction, Lamareille (2010)investigate the use of a ‘blue diagnostic’ – [OIII]/Hβ ver-sus [OII]/Hβ – to classify galaxies as star-forming galax-ies, AGNs, and composites. Although Lamareille (2010)separate out LINERs7, here we include both AGNs andLINERs in the BPT-AGN category, as in the rest of ourarticle. Since [OIII], [OII], and Hβ lie at the blue end ofthe spectrum, this diagnostic can be applied to galaxieswith optical spectra out to z ∼ 0.9. This method pro-vides a successful means for creating a reliable sampleof star-forming galaxies out to these redshifts. Their SF-dominated regime (SFG in their Table 1) encloses > 99%of the BPT-SF. Only 1.5% of the sources in the SFGregime are BPT-AGN. The ‘blue diagnostic’, however,is not as effective in creating a reliable AGN selection.Their combined Sy2, SF/Sy2, and LINER regimes iden-tify ∼ 94% of all the BPT-AGN. However, ∼ 23% of the
7 The right wing of the BPT diagram further subdivides intoan upper and lower branch, with LINERs being the sources in thelower branch exhibiting lower [OIII] luminosities (Heckman 1980;Kauffmann et al. 2003). The nature of these sources (weak AGNsversus ‘retired’ galaxies dominated by old stellar populations withrelatively hard radiation fields) is still much debated (Kewley et al.2006; Stasinska et al. 2008; Cid Fernandes et al. 2010, 2011).
Fig. 8.— L2−8 keV/LTIR versus logLTIR for our z < 0.5GOODS-N/LH galaxies that have [OIII], Hβ, [NII], and Hα fluxeswith SNR > 5. Red filled squares – directly X-ray detectedBPT-AGN. Blue filled stars – directly X-ray detected BPT-SF.Gray filled diamonds – directly X-ray detected BPT-comp. Large(small) symbols designate sources with LX > 1042 erg s−1 (LX <1042 erg s−1). Downward pointing arrows indicate sources unde-tected in the 2−8 keV band (but detected in the 0.5−2 keV band)that are assigned the 2 − 8 keV flux limit (see Table 2). Upwardand leftward pointing arrows indicate sources undetected in theSpitzer 24µm image that are assigned the 24µm flux limit (see Ta-ble 2). Blue open star – stacked BPT-SF, excluding directly X-raydetected sources. Red open square – stacked BPT-AGN, exclud-ing directly X-ray detected sources. Gray open diamond – stackedBPT-comp, excluding directly X-ray detected sources. Solid line– expected ratio for the HMXB population in a galaxy with thegiven SFR (see top axis), according to Persic et al. (2004). Dashedline – expected ratio for the overall star formation occurring in agalaxy with the given SFR, according to Mineo et al. (2011).
sources in this combined regime are BPT-SF8.A classification scheme based on [NeIII]/[OII]
(Stasinska et al. 2006; this work) complements this‘blue diagnostic’ by correctly classifying galaxies inthe Lamareille (2010) SF/Sy2 category. Marocco et al.(2011) recently examined the location of the Lamareille(2010) SF/Sy2 galaxies in the Stasinska et al. (2006)DEW diagnostic – [NeIII]/[OII] versus Dn[4000]. Theyfind that by applying an additional empirical cut inthe DEW diagnostic space to these SF/Sy2 galaxies,they are able to correctly identify 99% of the BPT-SFand 97% of the Seyfert 2s. Overall, this combineddiagnostic correctly identifies 85% of Seyfert 2s and 99%of BPT-SF.Our TBT diagnostic, based on [NeIII]/[OII] versus
rest-frame g − z color (rather than Dn[4000]), results inminimal overlap between the BPT-SF and BPT-AGN,with only ∼ 1.3% of the BPT-AGN lying within theTBT-SF regime and only 2.8% of BPT-SF lying withinthe TBT-AGN regime. Likewise, of the sources in theTBT-AGN regime, only 3.5% are BPT-SF and of thesources in the TBT-SF regime, only 1% are BPT-AGN.The Juneau et al. (2011) MEx diagnostic – [OIII]/Hβ
versus stellar mass – also complements the ‘blue diagnos-tic’ in its ability to reliably identify AGNs. The MEx-AGN regime encloses 99% of BPT-AGN. Only 6% of the
8 If we remove the LINER regime from this analysis, we notethat the Sy2 and SF/Sy2 regimes enclose 59% and 26% of theSeyferts, respectively. While < 3% of sources in the Sy2 regimeare BPT-SF, 74% of sources in the SF/Sy2 regime are BPT-SF.
THE OPTX PROJECT V 13
sources in the MEx-AGN regime are BPT-SF. Similarly,the Yan et al. (2011) CEx diagnostic – [OIII]/Hβ versusrest-frame U − B color – also complements the ‘blue di-agnostic’, with the CEx-AGN regime enclosing 95.7% ofBPT-AGN. Only 1.9% of the sources in the CEx-AGNregime are BPT-SF.An important difference between the MEx and CEx di-
agnostics and our TBT diagnostic is the classification ofX-ray selected AGNs. While 8% (8/101) of the Juneauet al. and 22% (30/126) of the Yan et al. X-ray selectedLX > 1042 erg s−1 AGNs lie in the MEx-SF and CEx-SF regimes of their diagnostics, respectively, only 3%(3/103) of our X-ray selected AGNs lie within our TBT-SF regime (see Section 4). This may be a result of thehigher ionization potential of the [NeIII] line (63.45 eV)as compared with the [OIII] line (54.94 eV). The higherionization potential appears to foster a more reliable se-lection of AGN-dominated galaxies, i.e., the weaker ion-izing flux in star-forming galaxies lessens their ability toexcite [NeIII] as compared to [OIII].We note that our approach does not address the
issue of classifying galaxies with very low equivalentwidth emission lines, where some of the lines are toonoisy for traditional line diagnostics to be used. SeeCid Fernandes et al. (2010, 2011) for their discussion ofthe WHAN diagram – WHα versus [NII]/Hα – and itsability to provide a more comprehensive emission lineclassification of galaxies.
7.1. BPT-comp: AGN-dominated sources
A critical difference between the Lamareille (2010)and CEx diagrams and our TBT diagnostic is the lo-cation of the BPT-comp (galaxies that fall between theKauffmann et al. 2003 and Kewley et al. 2001 divisionsin the BPT diagram). In the Lamareille (2010) dia-gram, ∼ 83% of BPT-comp lie within the SFG regime.In the combined Lamareille (2010) and Marocco et al.(2011) diagnostic, ∼ 60% of BPT-comp lie within theSFG+SFG/comp regimes. In the CEx diagram, ∼ 75%of BPT-comp lie within the CEx-SF regime. In ourTBT diagnostic, on the other hand, 65% of the BPT-comp lie within the TBT-AGN regime, with only 35%in the TBT-SF regime. Similarly, in the MEx diagnostic(Juneau et al. 2011), only 17% of BPT-comp lie withinthe MEx-SF regime.A number of optical emission-line studies have ar-
gued that the signal in BPT-comp is dominated bystar formation activity, rather than AGN activity. TheKewley et al. (2001) upper boundary to the BPT-compregime marks their theoretical prediction for galaxieswhose contribution from AGN activity to the extremeultraviolet ionizing radiation field just begins to exceed50%. According to this work, all sources to the lower-left of this boundary have their signal dominated by starformation activity. Similarly, Stasinska et al. (2006) usespectral synthesis modeling to argue that the contribu-tion from AGN activity to the emission-line signal inBPT-comp is 20% or less. Furthermore, Kewley et al.(2006) note that BPT-comp lie in the same parameterspace as HII regions in the [OIII]/[OII] versus [OI]/Hαdiagnostic (as well as within the SF-dominated regimeof the [OIII]/Hβ vs. [SII]/Hα diagnostic). They arguethat this provides further support for the idea that theionizing radiation field and ionization parameter in BPT-
comp are dominated by star formation activity.Here we argue that our TBT diagnostic’s reliance on
[NeIII], with its higher ionization potential than [OIII],[NII], or [SII], leads to a more reliable identification ofAGN-dominated sources. In Section 6 we tested whetherthe inclusion of the majority of BPT-comp in our TBT-AGN regime was justified. Of the individually X-raydetected BPT-comp, 70% are X-ray hard with LX/LTIR
ratios indicative of dominance by AGN activity (see Fig-ure 6). The stacked signal from X-ray undetected BPT-comp is also X-ray hard and exhibits an LX/LTIR ratio> 3 σ above the expected range for pure star-forminggalaxies. This supports our TBT diagnostic inclusion ofBPT-comp in the TBT-AGN regime and suggests that,on average, the X-ray and optical signal in BPT-comp isdominated by AGN activity.
8. SUMMARY
We have shown that the TBT diagnostic – rest-frame0.0(g − z) color versus [NeIII]/[OII] – reliably sepa-rates SDSS SF-dominated sources from AGN-dominatedsources, as classified according to the classic BPT dia-gram. Because both [NeIII] and [OII] are located in theblue end of the optical spectrum, we are able to clas-sify galaxies using this diagnostic out to z = 1.4. TheTBT diagnostic provides a significant extension in red-shift compared to the BPT diagram (limited in its usewith optical spectra to z < 0.5) and the more recent[OIII]/Hβ-based diagnostics (limited to z < 0.9 – ‘bluediagram’, Lamareille 2010, Marocco et al. 2011; CEx,Yan et al. 2011; MEx, Juneau et al. 2011).We find that the TBT selection of AGNs matches well
with an X-ray selection of AGNs, with 97% (100/103) ofour OPTX X-ray selected AGNs lying within the TBT-AGN regime. This suggests that the TBT diagnosticis more reliable than the BPT diagnostic in identifyingX-ray selected AGNs, since the BPT diagnostic misiden-tifies ∼ 20% of of our OPTX X-ray selected AGNs asBPT-SF, i.e., as star-forming galaxies. This may be aresult of the higher ionization potential of the [NeIII]line (63.45 eV) as compared with the [OIII] line (54.94eV). The higher ionization potential appears to foster amore reliable selection of AGN-dominated galaxies, i.e.,the weaker ionizing flux in star-forming galaxies lessenstheir ability to excite [NeIII] as compared to [OIII].We perform X-ray and IR stacking analyses of the
GOODS-N sample of galaxies with accompanying deepChandra imaging to verify the dominance of AGN ac-tivity in our TBT-AGN and star formation activity inour TBT-SF. We find that the TBT-AGN, on average,are X-ray hard with LX/LTIR > 3 σ above the expectedrange for pure star-forming galaxies. Their X-ray hard-ness and excess X-ray signal is likely due to obscured orweak AGN activity. The TBT-SF, on the other hand,are X-ray soft with LX/LTIR consistent with pure star-forming galaxies.We perform the same stacking analyses on the BPT
categories in order to confirm the selection of the ma-jority of BPT-comp as TBT-AGN. As expected, theBPT-SF are X-ray soft with LX/LTIR consistent withpure star-forming galaxies and the BPT-AGN are X-rayhard with LX/LTIR > 3 σ above the expected rangefor pure star-forming galaxies. Of the individually X-raydetected BPT-comp, 70% are X-ray hard with LX/LTIR
14 Trouille et al.
ratios indicative of dominance by AGN activity. Ourstacked BPT-comp is significantly detected in both the0.5 − 2 keV and 2 − 8 keV bands and is X-ray hard,with 〈Γeff〉 = 1.0+0.4
−0.4. Furthermore, the stacked BPT-comp LX/LTIR is > 3 σ above the expected range forpure star-forming galaxies. These findings support ourTBT diagnostic inclusion of BPT-comp in the TBT-AGNregime.The BPT-comp (individual and stacked) properties
suggest that, on average, both their X-ray and opticalsignal is dominated by obscured or weak AGN activity.This is in contrast to claims by previous optical emission-line studies that the signal in BPT-comp is dominatedby star formation activity. Therefore, we recommendthat groups carefully consider the impact of excludingor including BPT-comp on the interpretation of their re-sults. For example, for studies involving determining thebolometric contribution from AGN activity or the roleof AGN activity in galaxy evolution, we advise maximalinclusiveness. Since BPT-comp comprise a significantpercentage of the overall emission-line galaxy population(20% of the SDSS DR8 sample), inclusion of the BPT-comp would provide a more comprehensive picture of thetrue impact of AGN activity in these studies.On the other hand, for metallicity studies of star-
forming galaxies, we advise maximal conservativeness(e.g., Tremonti et al. 2004). Emission lines like [OIII] areboosted by AGN activity and can masquerade as indica-tors of low metallicity, leading to the misinterpretationof results. Therefore, in this case, it is optimal to use adiagnostic that reliably excludes all AGNs and AGN/SFcomposites.
The authors thank the referee for comments and sug-
gestions which helped to improve this manuscript. Wethank Ryan Hickox for helpful discussions and trainingin the use of his STACKFAST X-ray stacking code. Wegratefully acknowledge support from NSF grant AST0708793, the University of Wisconsin Research Commit-tee with funds granted by the Wisconsin Alumni Re-search Foundation, and the David and Lucile PackardFoundation (A. J. B.). LT acknowledges support througha CIERA postdoctoral fellowship.Funding for SDSS-III has been provided by the Alfred
P. Sloan Foundation, the Participating Institutions, theNational Science Foundation, and the U.S. Departmentof Energy Office of Science. The SDSS-III web site ishttp://www.sdss3.org/.SDSS-III is managed by the Astrophysical Research
Consortium for the Participating Institutions of theSDSS-III Collaboration including the University of Ari-zona, the Brazilian Participation Group, BrookhavenNa-tional Laboratory, University of Cambridge, Universityof Florida, the French Participation Group, the GermanParticipation Group, the Instituto de Astrofisica de Ca-narias, the Michigan State/Notre Dame/JINA Participa-tion Group, Johns Hopkins University, Lawrence Berke-ley National Laboratory, Max Planck Institute for As-trophysics, New Mexico State University, New York Uni-versity, Ohio State University, Pennsylvania State Uni-versity, University of Portsmouth, Princeton University,the Spanish Participation Group, University of Tokyo,University of Utah, Vanderbilt University, University ofVirginia, University of Washington, and Yale University.We wish to recognize and acknowledge the very sig-
nificant cultural role and reverence that the summit ofMauna Kea has always had within the indigenous Hawai-ian community. We are most fortunate to have the op-portunity to conduct observations from this mountain.
REFERENCES
Abazajian, K. N., et al. 2009, ApJS, 182, 543Aihara, H., et al. 2011, ApJS, 193, 29Alexander, D. M., Bauer, F. E., Chapman, S. C., Smail, I., Blain,
A. W., Brandt, W. N., & Ivison, R. J. 2005, ApJ, 632, 736Alexander, D. M., Brandt, W. N., Hornschemeier, A. E.,
Garmire, G. P., Schneider, D. P., Bauer, F. E., & Griffiths,R. E. 2001, AJ, 122, 2156
Alexander, D. M., et al. 2003, AJ, 126, 539Baldwin, J. A., Phillips, M. M., & Terlevich, R. 1981, PASP, 93, 5Barger, A. J., Cowie, L. L., Brandt, W. N., Capak, P., Garmire,
G. P., Hornschemeier, A. E., Steffen, A. T., & Wehner, E. H.2002, AJ, 124, 1839
Barger, A. J., Cowie, L. L., & Wang, W.-H. 2008, ApJ, 689, 687Bauer, F. E., Alexander, D. M., Brandt, W. N., Hornschemeier,
A. E., Vignali, C., Garmire, G. P., & Schneider, D. P. 2002, AJ,124, 2351
Bethermin, M., Dole, H., Beelen, A., & Aussel, H. 2010, VizieROnline Data Catalog, 351, 29078
Blanton, M. R., & Roweis, S. 2007, AJ, 133, 734Bongiorno, A., et al. 2010, A&A, 510, A56Brandt, W. N., Hornschemeier, A. E., Schneider, D. P.,
Alexander, D. M., Bauer, F. E., Garmire, G. P., & Vignali, C.2001, ApJ, 558, L5
Bruzual, G., & Charlot, S. 2003, MNRAS, 344, 1000Cardiel, N., Gorgas, J., & Aragon-Salamanca, A. 1998, MNRAS,
298, 977Chabrier, G. 2003, PASP, 115, 763Chilingarian, I. V., Melchior, A.-L., & Zolotukhin, I. Y. 2010,
MNRAS, 405, 1409Cid Fernandes, R., Stasinska, G., Mateus, A., & Vale Asari, N.
2011, MNRAS, 413, 1687
Cid Fernandes, R., Stasinska, G., Schlickmann, M. S., Mateus, A.,Vale Asari, N., Schoenell, W., & Sodre, L. 2010, MNRAS, 403,1036
Cohen, J. G., Hogg, D. W., Blandford, R., Cowie, L. L., Hu, E.,Songaila, A., Shopbell, P., & Richberg, K. 2000, ApJ, 538, 29
Coil, A. L., et al. 2009, ApJ, 701, 1484Colbert, E. J. M., Heckman, T. M., Ptak, A. F., Strickland,
D. K., & Weaver, K. A. 2004, ApJ, 602, 231Cooper, M. C., et al. 2011, ApJS, 193, 14Cowie, L. L., & Barger, A. J. 2008, ApJ, 686, 72Cowie, L. L., Barger, A. J., Hu, E. M., Capak, P., & Songaila, A.
2004, AJ, 127, 3137David, L. P., Jones, C., & Forman, W. 1992, ApJ, 388, 82Erb, D. K., Shapley, A. E., Pettini, M., Steidel, C. C., Reddy,
N. A., & Adelberger, K. L. 2006, ApJ, 644, 813Fabbiano, G. 2006, ARA&A, 44, 323Fabbiano, G., & Shapley, A. 2002, ApJ, 565, 908Faber, S. M., et al. 2003, Proc. SPIE, 4841, 1657Fiore, F., et al. 2008, ApJ, 672, 94Gehrels, N. 1986, ApJ, 303, 336Georgakakis, A., Georgantopoulos, I., Stewart, G. C., Shanks, T.,
& Boyle, B. J. 2003, MNRAS, 344, 161Georgakakis, A., Rowan-Robinson, M., Babbedge, T. S. R., &
Georgantopoulos, I. 2007, MNRAS, 377, 203Georgantopoulos, I., Georgakakis, A., Rowan-Robinson, M., &
Rovilos, E. 2008, A&A, 484, 671Giavalisco, M., et al. 2004, ApJ, 600, L93Grimm, H., Gilfanov, M., & Sunyaev, R. 2003, MNRAS, 339, 793Heckman, T. M. 1980, A&A, 87, 152Hickox, R. C., et al. 2007, ApJ, 671, 1365
THE OPTX PROJECT V 15
Hornschemeier, A. E., Brandt, W. N., Alexander, D. M., Bauer,F. E., Garmire, G. P., Schneider, D. P., Bautz, M. W., &Chartas, G. 2002, ApJ, 568, 82
Hornschemeier, A. E., Heckman, T. M., Ptak, A. F., Tremonti,C. A., & Colbert, E. J. M. 2005, AJ, 129, 86
Hornschemeier, A. E., et al. 2001, ApJ, 554, 742Juneau, S., Dickinson, M., Alexander, D. M., & Salim, S. 2011,
ApJ, 736, 104Kauffmann, G., et al. 2003, MNRAS, 346, 1055Keenan, R. C., Trouille, L., Barger, A. J., Cowie, L. L., & Wang,
W. 2010, ApJS, 186, 94Kewley, L. J., Dopita, M. A., Sutherland, R. S., Heisler, C. A., &
Trevena, J. 2001, ApJ, 556, 121Kewley, L. J., & Ellison, S. L. 2008, ApJ, 681, 1183Kewley, L. J., Groves, B., Kauffmann, G., & Heckman, T. 2006,
MNRAS, 372, 961Laird, E. S., Nandra, K., Adelberger, K. L., Steidel, C. C., &
Reddy, N. A. 2005, MNRAS, 359, 47Lamareille, F. 2010, A&A, 509, 53Lamareille, F., Mouhcine, M., Contini, T., Lewis, I., & Maddox,
S. 2004, MNRAS, 350, 396Lehmer, B. D., et al. 2005, AJ, 129, 1—. 2008, ApJ, 681, 1163Magnelli, B., Elbaz, D., Chary, R. R., Dickinson, M., Le Borgne,
D., Frayer, D. T., & Willmer, C. N. A. 2009, A&A, 496, 57Marocco, J., Hache, E., & Lamareille, F. 2011, A&A, 531, A71Mineo, S., Gilfanov, M., & Sunyaev, R. 2011, Astronomische
Nachrichten, 332, 349Moran, E. C., Lehnert, M. D., & Helfand, D. J. 1999, ApJ, 526,
649Nandra, K., Mushotzky, R. F., Arnaud, K., Steidel, C. C.,
Adelberger, K. L., Gardner, J. P., Teplitz, H. I., & Windhorst,R. A. 2002, ApJ, 576, 625
Oke, J. B., et al. 1995, PASP, 107, 375Persic, M., & Rephaeli, Y. 2007, A&A, 463, 481Persic, M., Rephaeli, Y., Braito, V., Cappi, M., Della Ceca, R.,
Franceschini, A., & Gruber, D. E. 2004, A&A, 419, 849Ptak, A., Heckman, T., Levenson, N. A., Weaver, K., &
Strickland, D. 2003, ApJ, 592, 782Ranalli, P., Comastri, A., & Setti, G. 2003, A&A, 399, 39Remillard, R. A., & McClintock, J. E. 2006, ARA&A, 44, 49
Rieke, G. H., Alonso-Herrero, A., Weiner, B. J., Perez-Gonzalez,P. G., Blaylock, M., Donley, J. L., & Marcillac, D. 2009, ApJ,692, 556
Rola, C. S., Terlevich, E., & Terlevich, R. J. 1997, MNRAS, 289,419
Rovilos, E., Georgantopoulos, I., Tzanavaris, P., Pracy, M.,Whiting, M., Woods, D., & Goudis, C. 2009, A&A, 502, 85
Shi, F., Zhao, G., & Liang, Y. C. 2007, A&A, 475, 409Silverman, J. D., et al. 2005, ApJ, 618, 123Stasinska, G., Cid Fernandes, R., Mateus, A., Sodre, L., & Asari,
N. V. 2006, MNRAS, 371, 972Stasinska, G., Vale Asari, N., Cid Fernandes, R., Gomes, J. M.,
Schlickmann, M., Mateus, A., Schoenell, W., & Sodre, Jr., L.2008, MNRAS, 391, L29
Szokoly, G. P., et al. 2004, ApJS, 155, 271Teng, S. H., Wilson, A. S., Veilleux, S., Young, A. J., Sanders,
D. B., & Nagar, N. M. 2005, ApJ, 633, 664Tozzi, P., et al. 2006, A&A, 451, 457Treister, E., Urry, C. M., & Virani, S. 2009, ApJ, 696, 110Tremonti, C. A., et al. 2004, ApJ, 613, 898Tresse, L., Rola, C., Hammer, F., Stasinska, G., Le Fevre, O.,
Lilly, S. J., & Crampton, D. 1996, MNRAS, 281, 847Trouille, L., & Barger, A. J. 2010, ApJ, 722, 212Trouille, L., Barger, A. J., Cowie, L. L., Yang, Y., & Mushotzky,
R. F. 2008, ApJS, 179, 1—. 2009, ApJ, 703, 2160Veilleux, S., & Osterbrock, D. E. 1987, ApJS, 63, 295Weiner, B. J., et al. 2007, ApJ, 660, L39Wilkes, B. J., et al. 2009, ApJS, 185, 433Winter, L. M., Lewis, K. T., Koss, M., Veilleux, S., Keeney, B., &
Mushotzky, R. F. 2010, ApJ, 710, 503Wirth, G. D., et al. 2004, AJ, 127, 3121Yan, R., et al. 2011, ApJ, 728, 38Yang, Y., Mushotzky, R. F., Steffen, A. T., Barger, A. J., &
Cowie, L. L. 2004, AJ, 128, 1501York, D. G., et al. 2000, AJ, 120, 1579
Zahid, H. J., Kewley, L. J., & Bresolin, F. 2011, ApJ, 730, 137Zezas, A. L., Georgantopoulos, I., & Ward, M. J. 1998, MNRAS,
301, 915
Copyright © 2022 FDOKUMEN