


Bahasa
Halaman
Hukum


Accepted Manuscript
Delamination process analysis of frp-to-parent material bonded joints with and
without anchorage systems using the distinct element method
Hugo C. Biscaia, Rui Micaelo, João Teixeira, Carlos Chastre
PII: S0263-8223(14)00188-3
DOI: http://dx.doi.org/10.1016/j.compstruct.2014.04.021
Reference: COST 5674
To appear in: Composite Structures
Please cite this article as: Biscaia, H.C., Micaelo, R., Teixeira, J., Chastre, C., Delamination process analysis of frp-
to-parent material bonded joints with and without anchorage systems using the distinct element method, Composite
Structures (2014), doi: http://dx.doi.org/10.1016/j.compstruct.2014.04.021
This is a PDF file of an unedited manuscript that has been accepted for publication. As a service to our customers
we are providing this early version of the manuscript. The manuscript will undergo copyediting, typesetting, and
review of the resulting proof before it is published in its final form. Please note that during the production process
errors may be discovered which could affect the content, and all legal disclaimers that apply to the journal pertain.

- 1 -
DELAMINATION PROCESS ANALYSIS OF FRP-TO-PARENT MATERIAL
BONDED JOINTS WITH AND WITHOUT ANCHORAGE SYSTEMS USING
THE DISTINCT ELEMENT METHOD
Hugo C. Biscaia1, Rui Micaelo2, João Teixeira2, Carlos Chastre3
Abstract
This study looks at the analysis of the interface between Fiber Reinforced Polymer
(FRP)-to-parent material bonded interfaces. The performance of FRP-to-parent material
bonded joints for the Externally Bonded Reinforcement (EBR) technique is numerically
modelled with the PFC2D software which is based on the Distinct Element Method
(DEM). It is believed that this represents the first time the DEM has been used to
simulate the delamination process of FRP-to-parent material bonded joints. In order to
validate the analysis performed with the DEM, a Pull-out test with no slip constrains
was modelled and different linear bond-slip laws were assumed. The numerical results
revealed that the DEM is capable of estimating with good accuracy the exact solutions
of bond stresses, strains or slippages along the bonded length for linear bond-slip laws.
The bi-linear law available in PFC2D was then compared to the numerical results
obtained from other another code developed by the author. The delamination process of
Pull-out tests with slip constrain at one of the free ends of the FRP plate is also
described and analyzed. The results obtained from the DEM revealed that the
delamination process ends with stiffness equal to the axial stiffness of the FRP plate.
[email protected] Tel: +351-21-2948580 Fax: +351-21-2948398 UNIC/ Faculdade de Ciências e Tecnologia/ Universidade Nova de Lisboa 2829-516 Caparica - Portugal 2 Faculdade de Ciências e Tecnologia/Universidade Nova de Lisboa 2829-516 Caparica - Portugal 3 UNIC/Faculdade de Ciências e Tecnologia/Universidade Nova de Lisboa 2829-516 Caparica - Portugal

- 2 -
This evidence highlights the need to design mechanical anchor devices capable of
preventing premature debonding which is known to occur on EBR systems.
Keywords: FRP; Delamination; Distinct Element Method; Interface; Bond-slip.
1. Introduction
The strengthening of structures with Fiber Reinforced Polymer (FRP) composites has
been a method frequently used by engineers. Different methods have been used: the
Externally Bonded Reinforcement (EBR), the Near Surface Mounted (NSM) using
plates and NSM rods. These methods all have advantages and disadvantages. For
instance, the premature debonding rupture is usually associated to the EBR method,
therefore being a very important drawback.
In the work developed by Carvalho et al. [1, [2], reinforced concrete (RC) beams
strengthened with Carbon Fiber Reinforced Polymers (CFRP) were used and both EBR
and NSM systems were studied. The studies mentioned reported that the EBR analyzed
systems debonded earlier than the NSM systems. Consequently, the RC beams
strengthened with NSM achieved the highest rupture loads. For that reason, the
performance of the EBR systems can be improved if conjugated with a mechanical
anchorage system. However, other issues arise, e.g. where should the mechanical
anchors be located? How does the delamination process develop in such circumstances?
Even with these anchor systems, does it mean that the strengthening of RC beams with
the EBR system is more efficient than the NSM system?
In order to give an answer to these questions, several authors, e.g. [13-[16], have
been developing experimental work. So far the studies, in general, have been focusing
on the modelling of the interface between the FRP plate and the bonded substrate. Of

- 3 -
course, the Finite Element Method (FEM) has been the most used method for the
estimation of the delamination process of FRP-to-parent material interfaces. Many
advantages can be enumerated for the use of FEM but some drawbacks are too
important to be ignored. For instance, in the case of FRP-to-concrete interfaces, the
approach adopted to simulate the cracking behaviour of concrete can affect the bond
stresses along the interface. As the discrete crack model shows a discrete separation
between elements, this seems to be a more realistic way to estimate the debonding
phenomenon. However, there are two important drawbacks with this model: one is the
implication that the mesh should be refined where the main cracks will occur, which is a
difficult task to carry out before the finite element (FE) analysis; the other drawback lies
in the reformulation of the mesh at each step, leading to a slow computational
calculation process. The smeared crack model has no disadvantages of this type.
According to Teng et al. [17] and Lu et al. [18], the smeared crack model can be used
but a fine mesh should be placed in the vicinity of the FRP-to-concrete interface. These
authors recommend that the dimension of the finite elements in the vicinity of the
interface should be similar to the thickness of concrete associated to the detachment
observed in bending tests.
The premature debonding phenomenon is frequently observed at the anchorage
region of RC beams EBR with FRP composites. In order to study this phenomenon,
some studies have been focused on double or simple pull-out tests [19-[27] that have the
purpose of isolate the Mode II (i.e. pure shear) debonding of FRP-to-parent materials
from the other two fracture modes I and III. The Mode II fracture energy is usually
associated to the debonding of FRP composites externally bonded to RC beams.
The FEM has been widely used but alternative and more efficient methods have
also been found. For instance, Ferracuti [24], Martinelli et al. [28] or Biscaia et al. [29,

- 4 -
[30] developed discrete models based on the Finite Difference Method (FDM), in which
the system of nonlinear equations was solved by the Newton-Raphson Method. This
kind of interface modelling has been an important tool in contributing to the knowledge
about the full range delamination process of FRP-to-parent materials. Other authors
[31], have developed other discrete methods where the interface is discretized with
interface elements based on non-linear springs.
As an alternative to all the numerical studies done previously on the
delamination process of FRP-to-parent material interfaces with FEM or FDM, the
Distinct Element Method (DEM) may have potentialities that have been neglected and
have not been well explored. This method demands less computational effort when
fracture and large displacements problems are combined with very fine discretized
systems. Thus, the constituents that compose the materials can be discretized up to the
micro-scale level. To date, there has been a noticeable lack of studies examining the
debonding phenomenon process with DEM. The method consists of the assembly of
small rigid particles which interact at soft contacts. From the contact between particles
the stresses and displacements are then calculated. During the problem simulation
course, the contacts may fail depending on the contact law and new contacts may be
created as well. The continuously increasing number of users and fields of application
demonstrates the potentialities of this numerical method. Some studies [32-[34],
modelled the FRP composites using the DEM model. Due to the advantages of the
DEM model in the microscopic modelling of the damage and fracture in composite
materials, Sheng et al. [33] simulated the transverse cracking initiation and propagation
of composite laminates under transverse tension (perpendicular to the direction of the
fibres). The use of rectangular, hexagonal and random fibre distributions were simulated
as well. The volume of fibres used was another parameter analysed in [33]. According

- 5 -
to those authors, the DEM model was capable of predicting the experimental findings
and allowed the authors to conclude that the distribution and volume fraction of fibres
affect the transverse cracking path and the mechanical behaviour of the composite.
Yang et al. [34] analyzed the fibre-to-matrix interface on composite materials
with the DEM model. The contact between the fibre and the matrix was simulated with
a bi-linear constitutive law and what they found was that the DEM model captured the
initiation and propagation of the interfacial debonding. The experimental results were
therefore estimated by the DEM model. Based on their findings, Yang et al. [34]
claimed that this type of modelling can be used on the simulation of other materials and
structural damages in more complicated reinforced composite systems.
Due to the absence of DEM applications for the modelling of FRP-to-parent
material (such as concrete, steel, glulam, among others) interfaces, this paper takes
advantage of the potentialities of this method to analyse the performance of such kinds
of interfaces applied on EBR strengthening systems, with and without anchorage
systems, i.e. with and without slip constraints, respectively. The Particle Flow Code in
Two Dimensions, PFC2D v3.0 [35], was used and a plain GFRP composite under
tension and two different Pull-out tests were simulated.
2. Numerical modelling
The DEM was initially presented by Cundall in 1971 for the study of blocky rock
systems [36]. During the last 4 decades many researchers have contributed to the
development and spread of the method in different engineering fields, from construction
to the pharmaceutical industry. The method is based on the interaction of a collection of
variable-size rigid discrete bodies, with finite displacements and rotations, which allows
full detachment/separation of bodies, and it is able to recognize new contacts as the

- 6 -
calculation proceeds. While in the field of mechanics it is considered that dimensions of
the body are negligible, and only represent a single point in space, in DEM formulation,
the body (particle) occupies/represents a certain volume of the represented space.
There are two main principles in the DEM formulation: (i) the force-
displacement law, where the contact force acting on two entities in contact is derived
from the relative displacement between the entities; (ii) the law of motion, where the
motion of a rigid particle is determined by the resulting force and moment vectors
acting upon it. Fig. 1 illustrates in a flowchart the general DEM calculation cycle. The
dynamic behaviour is numerically represented by an algorithm with explicit timestep
that uses central differentiation scheme for velocities and accelerations. The timestep
(Δt) adopted in the calculation has to be limited so that during a single timestep the
disturbances can only propagate to its immediate neighbours.
Fig. 1. General DEM calculation cycle. Adapted from [35].
The force-displacement law relates relative displacements and forces at each contact,
either being particle-to-particle or particle-to-wall contacts. As illustrated in Fig. 2, the
contact is described in terms of a point xi[c] lying on a contact plane that is defined by a
unit normal vector ni. The contact force is decomposed into a normal component (Fin)
acting in the direction of the normal vector and, a shear component (Fis) acting in the
contact plane. The magnitude of the normal contact force is calculated according to
���
��� ×= (1)

- 7 -
where, Kn is the normal stiffness and Un is the contact normal displacement (overlap).
Kn is a secant modulus, representing the total displacement and force, while the shear
stiffness (ks) is a tangent modulus, representing incremental displacement (ΔUs) and
force (ΔFs). Therefore, in each step, the shear component force increment is calculated
by
���
����� ×−= (2)
and added to the previous step’s shear contact force (Fis). The shear force is controlled
by the slip model defined as
��
��� ×=���
(3)
where Fsmax is the maximum shear force allowed; μ is the friction coefficient. If Fs >
Fsmax there is a slip and the shear force reduces to the maximum magnitude allowed.
Normal and shear stiffnesses are dependent on the selected contact model.
The motion of a single particle is described by a translation and a rotation
determined from the resultant moments and force acting upon it. The translation (x) is
determined with double integration of the Newton’s second law of motion
( )���
���� −×= �� (4)
where, Fi is the resulting force in i (1, 2, 3) co-ordinate directions; m is the particle total
mass; gi is the body force acceleration; �
��� is the particle translational acceleration. The

- 8 -
angular rotations about the principal axes of inertia of the particle are governed by
Euler’ equations of motion, as shown below:
���������������� −+⋅= � (5.a)
���������������� −+⋅= � (5.b)
���������������� −+⋅= � (5.c)
where M1, M2 and M3 are the components of the resulting moment on the principal axes;
��� ,
�
�� ,�
�� are the angular accelerations about the principal axes; I1, I2 and I3 are the
principal moments of inertia of the particle. The time integration scheme calculates the
velocities at Δt/2 while the positions and accelerations are determined at Δt.
Fig. 2. Particle-particle (a) and particle-wall (b) contacts notation (adapted from [35]).
In this study, the DEM modelling was developed with PFC2D that obeys the above-
mentioned conditions
[37]. In a two dimensional system there are only two force components and one moment
component. As PFC deals only with circular/spherical particles, the 2D modelled
assembly can be seen as a collection of variable-radius cylinders or, alternatively, as a
collection of variable-radius spheres whose centroids lie upon the same vertical plan.
The PFC includes two different bonding models, the contact-bond and the
parallel-bond, which can be implemented to model behaviour of contacts in tension.
The contact-bond corresponds to a point bond of infinitesimal size that can only

- 9 -
transmit force and inactivates the slip model while the parallel-bond is a finite-size
piece of cementitious material between particles that can transmit both forces and
moments, and does not preclude the possibility of slip. The parallel-bond can be
regarded as a set of elastic springs with normal and shear stiffness. In this study only
parallel-bonding was implemented. The constitutive behaviour is linear elastic and is
defined by the following five parameters: normal (kn) and shear (ks) stiffness
(stress/displacement); normal (σmax) and shear (τmax) strength (stress); bond radius (r).
Considering that the bond between particles corresponds to an elastic beam, the elastic
moduli in axial conditions is
[ ] [ ]( )���
���� +×= (6)
The PFC can deal with different contact constitutive models and several are already
included, e.g. the linear elastic, the Hertz-Mindlin, some viscoelastic models like the
Burgers model, displacement-softening model. In the present case study, the
delamination process of the FRP-to-parent material has the FRP composite under
tension whereas the interface contacts are subjected to positive shear loadings. The FRP
composite has a linear with fragile rupture constitutive behaviour which was modelled
with the parallel-bond model. The FRP-to-parent material interface was modelled using
the displacement-softening model. Fig. 3 illustrates these constitutive behaviours.
Fig. 3. Constitutive behaviours of the FRP composite and the contact between the FRP composite and
the bonded substrate.

- 10 -
In the case of the softening model, the contact between the FRP and the bonded
substrate is simulated similarly to the Cohesive Zone Model (CZM) in continuum
mechanics. The interfacial delamination is classified as Mode I, Mode II or Mixed
Mode (combination of Modes I and II) according to the stress field at the tip of the
crack. In the particular case of the delamination process of the FRP-to-parent material
under analysis, only Mode II is relevant. The Mode II fracture energy (GFII) released
during the delamination process is defined according to
�
��� �����
�
�
�
⋅= τ (7)
where Uult is the ultimate displacement (or slip) of the interface.
The simulation process is usually carried out with the following steps: (1)
assembly generation; (2) definition of contact models; (3) set-up of boundary
conditions, e.g. restriction of particles movements or assembly stresses; (4) loading; (5)
calculation; (6) analysis. Some of these tasks are not as straightforward as in other
numerical methods, especially the first one. The assembly generation consists of
positioning the collection of particles with various sizes and shapes in a specific
location and creating the contacts. The structure obtained from the particles and contacts
network determines the behaviour of the assembly to loading. It varies with the selected
combination of the particle’s size distribution and the method of bringing the particles
together in an assembly. Several methods for creating assemblies for DEM modelling
can be found in [37]. Some examples are illustrated in Fig. 4.
Fig. 4. Assembly examples used in DEM simulations with: quadrangular (a); linear (b); hexagonal (c);
and random (d) arrangements of the particles.

- 11 -
Loading is considered active when forces are defined to act on the particles’ gravity
centre or movements are imposed on particles (via wall movements or particle
displacements), while it is passive when disturbances are created in the assembly, e.g.
elimination and overlap generation of particles. The calculation phase is usually divided
into several parts with a certain number of calculation cycles and timestep values. Both
variables can either be defined by the user or determined automatically, with the
timestep given being a percentage of the predicted critical timestep that is related to the
maximum eigenvalue of the total system and, the required number of calculation cycles
can be set to stop the simulation when the sum of the out-of-balance forces is less than a
specified value.
Regarding the results analysis task, the contact forces and particle displacements
have a discrete distribution over the modelled medium. The computation of stresses and
strain-rates requires specific procedures as described in [37].
3. Modelling composite flat coupons under tension
The first step of the modelling with the DEM was to predict an FRP composite under
uniaxial tension. The GFRP composites consist of glass fibres impregnated by an epoxy
resin (matrix) but the proportions of each are not known. In order to reproduce its
behaviour in DEM, the final composite behaviour was used. For the assembly, different
arrangements were initially tested, namely the linear, the quadrangular with 2 layers and
the hexagonal, as there were no differences between them, for the uniaxial tension test,
the linear arrangement was adopted because of its simplicity.
The numerical results were compared with the Biscaia’s experiments [38] for
GFRP composites. The mechanical properties of the composite are listed in Table 1.

- 12 -
The radius of the particles was selected in each case such that the thickness of the GFRP
composite, 2.54 mm, is truly represented in the model (e.g. 2 layers, being 1.57 mm
each). The particles were bonded with the parallel-bond model. The simulation was
carried out in deformation control mode by defining a constant velocity for the particles
at the ends of the assembly. Given the high values of the contacts stiffness and the small
mass of the particles, the timestep adopted for the numerical calculations has to be tiny.
Timestep values in the range of 1e-9 to 1e-11 were tested, from which the value of 1e-
10 was adopted considering the balance between time of simulation and numerical
results accuracy.
Since displacement loading was always used in the modelling, the influence of loading
velocities on the solutions is analyzed by comparing the stress-strain curves from a
parallel-bond model submitted to different tensile loading velocities. From Fig. 5, the
range of loading velocities tested showed no significant changes on the global
constitutive behaviour of the GFRP composite. However, looking closer, the models
with lower loading velocities have more regular behaviour, as illustrated in the detailed
graph in Fig. 5. Even so, compared to the experimental data, the relative errors found
are less than 1.0%. The irregularities found in the cases with higher velocity loadings
can be attributed to the fact that the stresses are not uniformly distributed between
particles along the FRP length. Therefore, in the following simulations the adopted
deformation velocity was 0.05 to 0.10 m/s.
Fig. 5. Numerical and experimental results for the uniaxial tension tests.
4. Validation of the numerical modelling
In order to check the possibility of modelling the delamination process of FRP-to-parent
material interface with the Distinct Element Method (DEM) with PFC2D [35], the Pull-

- 13 -
out test shown in Fig 6 was modelled. The DEM model consists of a linear arrangement
of the FRP plate and the substrate in a two-layer system, with bonded length Lb, where
the parallel bond and the displacement softening models were adopted for interaction of
the two different particles. For the purpose of model validation the interface
performance was modelled using different contact model properties and the numerical
results were compared to exact solutions. To prevent undesired ruptures and/or stress
disturbances in the assembly, the loads were applied to the FRP plate with the minimum
velocity achieved in Section 3 (v=0.05 m/s). For the sake of simplicity, the constitutive
behaviour of the contacts between the FRP and the substrate elements were defined with
the linear and bi-linear laws.
Fig. 6. Pull-out test with no slip constrains at the opposite side of the loaded plate end with details of the
DEM used.
The governing equation of FRP-to-parent material interface for EBR systems is [24, [25,
[29-[31, [39[43]:
( ) ( )�
�
�
=⋅
−��
��
�
��
��� τ (8)
where Ef is Young's modulus of the FRP composite; tf is the thickness of the FRP
composite; s is the slippage and τ(s) is the shear stress defined by the local bond-slip
law; x is the horizontal distance to the FRP pull point. Linear bond-slip laws such as the
rigid-plastic, linear with a fragile rupture and rigid-softening linear laws were chosen to
validate the numerical modelling because, in such cases, Eq. (8) has an exact solution

- 14 -
and the numerical results can be compared to the exact solution. Independently of the
bond-slip law chosen, the boundary conditions are always the same, e.g. [29, [30]:
��
��
��
�
��
��
⋅−==
=�ε (9.a)
and
�===
���
�
��
�� ε (9.b)
where F is the load applied at the pull end of the FRP plate; Af is the cross section area
of the FRP composite; Lb is the effective bond length.
The full range delamination process of the FRP-to-parent material in a Pull-out
test is described in [24, [29, [44] with no slip constraints. The same behaviour is also
described in [41, [43] but in those cases the full range delamination process is based on a
Pull-out test that simulates two consecutive cracks, i.e. both ends of the FRP plate are
loaded.
Moreover, the snap-back effect after maximum load is reached, described in [24,
[44, [45], is a theoretical concept and, until now, has never been experimentally
observed. Mainly for that reason, the present work does not aim to represent such full
range delamination behaviour. Instead, as mentioned above, the aim is to understand the
capabilities of DEM in the estimation of the interface behaviour until maximum load
(Fmax) is reached. Up to this point, the delamination process can be represented by a
load-slip at x=0 mm graph. Depending on the bond-slip law used, the load increases
with the slippage of the interface. If the bonded length is equal to or longer than the

- 15 -
effective bond length (Leff) then when maximum load is reached a plateau is visible. If
the bonded length is shorter than the effective bond length then, the maximum load
transmitted to the FRP plate is lower than that obtained in the previous case and, at the
same time, no plateau can be seen in the load-slippage at x=0 mm graph. According to
equilibrium principle shown in Fig. 7, the load transmitted to the FRP plate is
determined according to:
( )∫ ⋅= ��
������
�
τ (10)
where bf is the width of the FRP plate and the slippage is determined by one of these
methods: (a) from the readings of a displacement transducer at x=0 mm; or (b) from the
measurements taken from strain gauges bonded to the FRP plate along the bonded
length. In this last case, the slippage at x=0 mm is obtained according to:
( ) ( ) ( )( )
( ) ( )��
��
��
������
�
��
��
�−⋅+
−⋅
−−
−= +++
+
++ ��
�
�
�
�
�
�
εεε (11)
where x corresponds to the axis parallel to the bonded length (see Fig. 7); (εi+1 - εi) and
(xi+1 - xi) are, respectively, the strain and the distance between two consecutive strain
gauges.
In the following sub-sections, the loads were monitored in two distinct ways: (a)
from the contact force between the first two particles of the FRP plate; and (b) from the
adhesion loads along the interface. Thus, the two terms of the first member of equation:
( )∫ Δ=⋅−⋅⋅ ��
����������
�
τε (12)

- 16 -
are constantly controlled throughout the delamination modelling. The second member in
Eq. (12) is the error obtained from the numerical measurements and, therefore, is the
error obtained in the modelling process. Ideally, Δ should be equal to zero (resulting Eq.
(10)) but in the validation of the numerical process the value of Δ is not exactly equal to
zero but is approximately zero.
The relative displacements between the FRP plate end and the substrate at x=0
mm were measured by the displacement monitoring of the first particle of the FRP
plate.
Fig. 7. Static equilibrium of the forces along the interface.
In the numerical examples presented in the following sub-sections, reference parameters
have been assumed unless otherwise stated, i.e. the thickness of the FRP plate is tf =
2.54 mm, the width is bf = 80 mm, the bonded length is Lb= 250 mm and Young’s
modulus is Ef = 23.35 GPa. For the definition of the bond-slip laws the reference
parameters are τmax = 4.24 MPa, smax = 0.101 mm and sult = 0.720 mm.
4.1. Rigid-plastic bond-slip law
In the first attempt to validate the model, the rigid-plastic bond-slip law was
implemented in the contacts between the particles of the FRP plate and the substrate.
The delamination process in such a case is described in [30]. The solution of Eq. (8) is:
( ) ⎟⎟⎠
⎞⎜⎜⎝
⎛ ⋅⋅−⋅+⋅−⋅
⋅⋅⋅
=��
�
�
����
��� ��
���
��
�����
�
���
��
ττ (13)

- 17 -
where a is the length where bond stresses are not zero and it can be determined by
considering that:
∫ ⋅=�
�����
�
������τ � � � � � � � � (14)
and, thereby [30]:
��
�
�
⋅=
���
τ (15)
The equations that define the bond stresses and the strains along the interface are
reported in [30].
Fig. 8 shows the load-slippage curve, as well as the slippage, the strains in the
FRP composite and the bond stresses along the bonded length. The numerical model
estimated accurately the exact solution derived from de solution of Eq. (8), which
proves that the performance of an interface with a local behaviour described by a rigid-
plastic bond-slip law can be modelled with DEM. Particularly the Fmax/FmaxT vs. Leff/Leff
T
graph, which compares the ratio between the maximum load transmitted to the FRP
plate obtained from the numerical analysis (Fmax) with the theoretical maximum load
transmitted to the FRP plate FmaxT, as:
��
��
��
�
����� ⋅⋅⋅= ����
(16)
and the effective bond length (Leff) determined from the numerical analysis and the
theoretical effective bond length (LeffT) defined according to [29-[30]:

- 18 -
��
�
��
���
�
��
�
��
��
⋅⋅=
�
(17)
where GFII is the fracture energy of the interface defined as:
( )∫= ����
��
�����
�
τ (18)
In this graph the numerical results show that the normalized maximum load (Fmax/FmaxT)
is always lower than that proposed by Neubauer and Rostásy [19] and Teng et al. [46],
whose recommendations are, respectively:
⎟⎟⎠
⎞⎜⎜⎝
⎛−⋅==
���
�
���
�
��
�
�
�
�
�
�
�
���
���β (19)
and
⎟⎟⎠
⎞⎜⎜⎝
⎛⋅==
���
�
��
�
�
�
�
�
���
���
���
πβ (20)
The numerical solution showed that both proposals [19, [46] overestimate the values of
βL defined in Eqs. (19) and (20). Moreover, the effective bond length defined in Eq. (17)
was accurately predicted.

- 19 -
Fig. 8: Performance of the FRP-to-parent material when a rigid-plastic bond-slip curve is used.
4.2. Linear with fragile rupture bond-slip law
The contacts between the particles of the FRP plate and the substrate were then
modelled with the linear with fragile rupture bond-slip law. The delamination process in
such cases is fully described in [30]. The solution of Eq. (8) is now:
( ) ( )( )
�
�
����
��
���
�
��
⋅⋅−⋅
⋅⋅⋅⋅
=�
��
�
����
����
ααα
α (21)
where
����� ⋅⋅
=���
����
�
τα (22)
Fig. 9: Performance of the FRP-to-parent material when a linear with fragile rupture bond-slip curve is
used.
In this particular case, the Fmax/FmaxT vs. Lb/Leff
T graph shows that the results of the
numerical model are slightly higher than the proposals made by Neubauer and Rostásy
[19] and Teng et al. [46]. This might be due to the assumption made in [30] where it
was assumed that tanh(4)≈1, which may lead to conservative effective bond lengths. For
instance, assuming that tanh(2)≈1, the effective bond length would be one half of the
effective bond length obtained with Eq. (23) and the numerical results in the Fmax/FmaxT
vs. Lb/LeffT graph would be closer to the proposals of Neubauer and Rostásy [19] and
Teng et al. [46]:

- 20 -
��
�
��
���
�
��
�
��
��
�
�
⋅⋅= (23)
4.3. Rigid-softening linear bond-slip law
In this case, the contacts between the particles of the FRP plate and the substrate were
modelled with the rigid-softening linear bond-slip law. The delamination process in
such cases is described in [30] as well. Introducing this bond-slip law into Eq. (8) the
solution is:
( ) ( )( ) ���
���
�
�
��
���
�
�� +⋅
⋅−⋅⋅
⋅⋅⋅−=
�
��
�
���
���
ααα
α (24)
where
�������� ⋅⋅
= ����
�
τα (25)
and a is the length corresponding to bond stresses different from zero defined by the
following expression:
⎟⎟⎠
⎞⎜⎜⎝
⎛
⋅⋅⋅⋅⋅=
����������
�
�
��
������
�
αα (26)
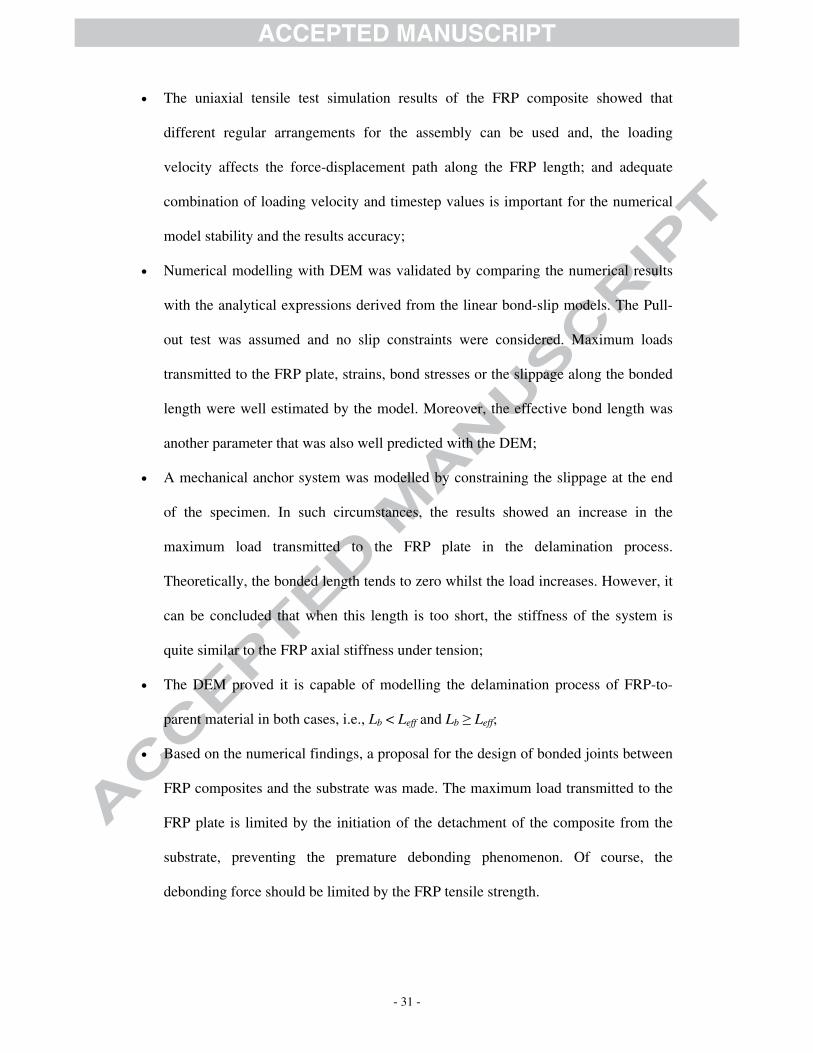
From Fig. 10, the numerical results show, once more, that DEM results are in agreement
with the exact solution. In this case, the results shown in the Fmax/FmaxT vs. Lb/Leff
T graph

- 21 -
are quite similar to the proposal made by Teng et al. [46]. Note that the maximum load
transmitted to the FRP plate (FmaxT) is defined according to Eq. (16) and the theoretical
effective bond length (LeffT) is determined by [30]:
��
�
��
���
�
��
�
��
��
��
⋅⋅⋅= π
(27)
Fig. 10: Performance of the FRP-to-parent material when a rigid-softening bond-slip curve is assumed.
4.4. In the choice between bilinear or nonlinear bond-slip laws
Several authors, e.g. [19, [40-[42, [47], have analysed the performance of FRP-to-parent
materials based on bi-linear bond-slip laws. However, other authors, e.g. [24, [29, [25,
[48], use nonlinear bond-slip laws based essentially on Popovics' formula [49] or the
exponential bond-slip laws [50, [51] for the particular analysis of FRP-to-concrete
interfaces. Nevertheless, the implementation of bi-linear bond-slip laws in some
situations where the bonded substrate is concrete has provided adequate results, e.g. [24,
[52-[55]. These curves are all graphically represented in Fig. 11 and are mathematically
defined as follows:
(i) Bi-linear:
( )
⎪⎪
⎩
⎪⎪
⎨
⎧
≤≤−
+⋅−
≤≤
=���������
���
���
���
���
���
�
�
���
�
�
�
��
�
�
�
�
�
��
�
�
�
���
���
���
���
ττ
(28)

- 22 -
(ii) Popovics' formula [49]:
( )
( )�
�
�
�
�
�
��
⎟⎟⎠
⎞⎜⎜⎝
⎛+−
⋅=
���
������
�
ττ
(29)
where n is a constant and, in a preliminary analysis, Nakaba et al. [48] recommend
n=3.0.
(iii) Mentioned in Dimande's work [50]:
( )���
�
������
�
�
�
�
��−
⋅=ττ
(30)
(iv) Based on the proposal of Dai et al. [51]:
( ) ( ) ( )
⎟⎟⎠
⎞⎜⎜⎝
⎛−⋅=
⋅−⋅−������
�������
���
�
�
�
�
�
��
�
ττ
(31)
where maximum bond stress and maximum slip are determined, respectively, according
to:
�
�
���
���
����� ⋅⋅⋅
=ε
τ (32)

- 23 -
where εmax is the maximum strain in the FRP composite experimentally obtained from
the Pull-out test and
( )�
�
���
���
= (33)
where B is a parameter defined from the experimental strain vs. slip curve.
Fig. 11. Comparison between different nonlinear bond-slip laws and the bi-linear law.
At this point, it is important to mention that the contact models available in PFC2D [35]
are based on linear and bi-linear laws. Therefore, in order to validate the approximation
made with bi-linear bond-slip laws, the numerical results obtained with the DEM were
compared to the numerical strategy adopted in [29, [30]. Fig. 12 and Table 2 illustrate
this comparison. It should be noted that, in general, it makes no significant difference
which of the bond-slip laws is adopted. The greatest differences found are on the
maximum load transmitted to the FRP plate and on the bond stress distribution along
the interface corresponding to the softening stage of the interface. The main reason for
this can be explained by the same point: the softening part of the bond-slip law is much
softer than in the other nonlinear bond-slip laws. The area beneath the bi-linear bond-
slip law (see Eq. (18)) leads to the highest values of fracture energy of the interface,
which increases the maximum load transmitted to the FRP plate (Eq. (16)). At the same
time, during the softening stage of the interface, and for the same slippage value, the
bond stresses are highest when the bi-linear bond-slip law is used.

- 24 -
The relative errors found on the maximum load transmitted to the FRP plate and on the
effective bond length are not so high (less than 16% in the case of Fmax and less than
13% in the case of Leff as listed in Table 2) and therefore, the bi-linear bond-slip law
may be a good and easier alternative to the nonlinear bond-slip laws. For all the reasons
explained above, the modelling made in the following section was based on a bi-linear
bond-slip law.
Fig. 12: Performance of the FRP-to-parent material when linear and nonlinear bond-slip curves are
assumed.
5. Delamination process of pull-out tests using a mechanical anchor device
Some publications, e.g. [24, [56], analysed the interface performance when a mechanical
fixing device is placed on the opposite side of the loaded plate end, as schematically
shown in Fig. 13. The use of a mechanical fixing device allows the constraining of the
relative displacements (or slips) between the FRP and the bonded substrate, thus
changing the delamination process discussed previously in section 4. Still, the process
that leads to the complete delamination of the FRP-to-parent material bonded joints is
dependent on the bonded length. Therefore, two different cases lead to two different
delamination processes of the interface performances: (1) the bonded length is the same
as or longer than the effective bond length (Lb ≥Leff) or (2) the bonded length is shorter
than the effective bond length (Lb < Leff). The resulting delamination processes are
described next, where the bilinear bond-slip law was always assumed.
Fig. 13. Scheme of the FRP anchorage region related to the pull-out test with a mechanical anchor device
placed at the end of the specimen.

- 25 -
5.1. Delamination process 1: with Lb ≥Leff
In this sub-section, the delamination process is based on the Pull-out test represented in
Fig. 14. Particular, the case of Lb ≥Leff is analysed. Two forces are now applied to the
FRP plate: one is the load applied to the FRP plate and the other one is the reaction at
x=Lb due to the slip constraints at that point. This reaction is insignificant (~0) for the
initial stages of the delamination process because the FRP-to-parent material interface
behaves similarly to the situations where no slip constraints are imposed on the opposite
side of the loaded plate end. This discussion is already widely reported in literature, e.g.
[29-[31, [38-[40, [44, [48].
Fig. 14. Pull-out test with no displacements at the opposite side of the loaded plate with details of the
DEM used.
When the maximum load transmitted to the FRP plate is achieved, the bond stress field
starts to migrate from the loaded end to the opposite plate end. During this process, the
maximum load transmitted to the FRP plate does not increase because the bond stress
field is the same and equilibrium equation defined in Eq. (10) should be respected. The
novelty of the delamination process comes when the bond stress field arrives to the slip
constraint placed at x=Lb. From this stage forward the resulting delamination failure
process is briefly described.
Fig. 15 highlights the equilibrium of the forces along the interface and the static
equilibrium equation is derived:

- 26 -
( ) ������
��
�+⋅= ∫
�
τ (34)
where R is the reaction force in the simple rolled support placed at x=Lb. Of course, Eq.
(34) is independent of the local bond-slip law and this equation is valid for any bonded
situation like that represented before. Moreover, Eq. (34) is always the same throughout
the delamination process and, in reality, it describes the problem more completely than
the one defined mathematically through Eq. (10).
Fig. 15. Static equilibrium of the forces along the interface.
The delamination failure process is now characterized by an increase of the load applied
to the FRP plate whereas the quantity obtained from the integral (I) defined in Eq. (34)
starts to decrease. The length where the bond stresses were different from zero becomes
shorter than Leff. The remaining bonded length becomes equal to the softening bonded
length (corresponding to the softening bond-slip law) and during the delamination
process, it approximates to zero. At the same time, the reaction force R increases in the
same proportion to the decrease of the integral in Eq. (32). The results are schematically
illustrated in Fig. 16. Note also that the stiffness (K) in this figure is:
�
��
�
��
�
⋅= (35)
which is the axial stiffness of the FRP plate under tension. Therefore, if the bonded
length increases then the represented plateau for maximum load transmitted to the plate
in Fig. 16 increases and K decreases. On the other hand, decreasing the bonded length

- 27 -
until Lb=Leff, only two stages are observed because the constant plateau found before
will no longer appear in this case.
Fig. 16. Performance of the interface at different loading stages for Lb ≥Leff.
5.2. Delamination process 2: with Lb < Leff
The delamination process 2 (bonded length is shorter than the effective bond length)
starts in the same way as the debonding failure process 1, i.e. for low loads, the reaction
force R is zero and during this phase the delamination process is equal to that which
occurred in a Pull-out test with no slip constraints. This subject is also discussed in
literature and therefore, the reader is advised to read e.g. [28-[30, [41-[44]. From the
instant that the bond stresses become different from zero in the vicinity of the slip
constraint, the delamination process becomes different from that discussed in [28-[30,
[44]. Here, two different cases can occur: the bonded length is in elastic and softening
stages (see Fig. 17 - case (a.1)); or the bond length is in an elastic stage (see Fig. 17 -
case (a.2)). From the moment either one of these cases occurs, the maximum load
transmitted to the FRP plate increases with the increase of the reaction load. However, if
at this stage the maximum load has not yet been reached, then the integral in Eq. (32)
continues increasing; otherwise this integral decreases. Either situation will depend on
the bonded length of the interface.
When the ultimate slip (sult) is reached at x=0 mm, the debonding of the interface
begins and increasing the load transmitted to the plate will increase the unbonded length
(Ldb) of the interface (see Fig. 17 - case (b)) where part of the interface begins to
debond. Of course, the length of the interface with bond stresses different from zero is
now shorter than the initial bonded length (Lb,i). This process will evolve until the

- 28 -
maximum bond stress is attained at the point x=Lb (see Fig. 17 - stage (c)). Here the
remaining bonded length is equal to corresponding bond of the softening bond-slip law
(Lb,sof). From this stage on, this bonded length decreases and, the load and the reaction
force will tend to the same value meaning that the FRP plate is fully debonded from the
substrate (see Fig. 17 - stage (d)). Regarding the load-slip at x=0 mm represented in Fig.
17, the ultimate stage of the delamination process is characterized by the tendency of
the load transmitted to the FRP plate (F) and the reaction force (R) becoming equal to a
stiffness equal to the axial stiffness of the FRP plate (K) earlier defined in Eq. (33).
Fig. 17. Performance of the interface at different loading stages for Lb < Leff.
Despite the reduced bonded length of the interface (less than the effective bond length),
two aspects are relevant to highlight in this delamination process: (i) at point x=Lb, the
slip is always zero and consequently the bond stress is zero due to the adopted bond-slip
law for FRP-to-parent material interface; and (ii) the FRP composite may collapse
before attaining the upper stage in the vicinity of stage (c) (see Fig. 17).
5.3. Examples
In order to illustrate the delamination processes discussed in the previous section, the
FRP-to-parent material interfaces were modelled with various bonded lengths (Lb),
namely, 50, 100, 150, 200 and 250 mm. Fig. 18 shows the load vs. slip at x=0 mm for
all bonded lengths obtained from the DEM modelling. The numerical results confirmed
what was described before, i.e. for short bonded lengths the stiffness is higher than that
obtained for long bonded lengths. Thus, if an ultimate slip (sult) of the interface is fixed,
i.e. if the initiation of the detachment of the FRP plate from the substrate is defined by
the ultimate slip, the debonding load (corresponding to the initiation of the detachment

- 29 -
of the FRP plate from the substrate) is much higher on short bonded lengths than on
long bonded lengths. Nevertheless, the strength of the FRP composite should be taken
into account because whilst premature debonding is avoided, rupture of the FRP
composite may occur.
Fig. 18: Delamination process of FRP-to-parent material for several bonded lengths.
Fig. 19 illustrates the delamination processes 1 (Lb= 250 mm) and 2 (Lb= 100 mm) for
stages a to d showing the bond stresses and the stress in the FRP composite. The
numerical examples show that with the increase of the transmitted load to the FRP
composite, the length of bond stresses tends to decrease while the reaction force tends to
increase.
Fig. 19: Bond and FRP composite stresses in the interface at different stages of the delamination process
of the FRP-to-parent material interface.
Another important aspect is that when the bonded length is short, the reaction force has
a fast increase for low loads transmitted to the FRP plate without promoting the
debonding of the FRP composite from the substrate. For designers, this aspect is
important and the design load is determined according to:
⎪⎩
⎪⎨⎧
≥⋅⋅⋅⋅
<⋅⋅⋅⋅⋅=
������
��
����
������
��
�����
��
������
������
�
���
���
β
ββ (36)
where Fdb is the load corresponding to the initiation of the detachment of the FRP plate
from the substrate; βL can be determined from Eqs. (19) or (20); and βdb is a coefficient

- 30 -
that takes into account the effect of the mechanical anchor on the load transmitted to de
FRP plate. The βdb coefficient was based on the trend line of the post-debonding
behaviour of the FRP-to-parent material interface with different bonded lengths
depicted in Fig. 20. In this figure, the bonded lengths with bond stresses different from
zero (Lbτ) were monitored throughout the delamination process of the interface and the
results show that Eq. (36) is able to predict the debonding initiation for all interfaces.
Thus, the βdb can be determined according to the following expression:
⎪⎩
⎪⎨
⎧
≥
<⎥⎥⎦
⎤
⎢⎢⎣
⎡+⎟⎟⎠
⎞⎜⎜⎝
⎛×⋅=
����
����
�
���
��
��
��
�
�
���
������
�
���
τβ (37)
where Lbτ is the bonded length with bond stresses different from zero. For short bonded
lengths (Lb < Leff), Lbτ is equal to the bonded length (Lb) because, in such cases, when the
debonding initiation occurs, all the bonded length is being mobilized.
Fig. 20: F/FmaxT vs Lb
τ/Leff relation along the delamination process of the FRP-to-parent material interfaces
for different bonded lengths of 50, 100, 150, 200, and 250 mm.
6. Conclusions
The numerical study herein presented is based on DEM and reports preliminary
numerical results about the delamination behaviour of FRP-to-parent material
interfaces. The study is based on a 2D analysis that allows us to come to the conclusions
summarized below:
- 31 -
• The uniaxial tensile test simulation results of the FRP composite showed that
different regular arrangements for the assembly can be used and, the loading
velocity affects the force-displacement path along the FRP length; and adequate
combination of loading velocity and timestep values is important for the numerical
model stability and the results accuracy;
• Numerical modelling with DEM was validated by comparing the numerical results
with the analytical expressions derived from the linear bond-slip models. The Pull-
out test was assumed and no slip constraints were considered. Maximum loads
transmitted to the FRP plate, strains, bond stresses or the slippage along the bonded
length were well estimated by the model. Moreover, the effective bond length was
another parameter that was also well predicted with the DEM;
• A mechanical anchor system was modelled by constraining the slippage at the end
of the specimen. In such circumstances, the results showed an increase in the
maximum load transmitted to the FRP plate in the delamination process.
Theoretically, the bonded length tends to zero whilst the load increases. However, it
can be concluded that when this length is too short, the stiffness of the system is
quite similar to the FRP axial stiffness under tension;
• The DEM proved it is capable of modelling the delamination process of FRP-to-
parent material in both cases, i.e., Lb < Leff and Lb ≥ Leff;
• Based on the numerical findings, a proposal for the design of bonded joints between
FRP composites and the substrate was made. The maximum load transmitted to the
FRP plate is limited by the initiation of the detachment of the composite from the
substrate, preventing the premature debonding phenomenon. Of course, the
debonding force should be limited by the FRP tensile strength.

- 32 -
The results obtained in this study provide an incentive to move forward with the
application of DEM to model the FRP-to-parent material debonding phenomenon. It is
intention of the authors to model this phenomenon using a 3D DEM formulation in the
future.
References
[1] Carvalho, T, Chastre, C, Biscaia, H and Paula, R. Flexural behaviour of RC T-beams strengthened
with different FRP materials. The Third International fib Congress and Exhibition "Think Globally,
Build Locally", Washington DC, 2010.
[2] Carvalho, T. Strengthening of reinforced concrete beams under bending with CFRP composites. MSc
Thesis, Nova University of Lisbon, 2010. (in portuguese)
[3] Ritchie, PA, Thomas, DA, Lu, LW and Connelly, GM. External reinforcement of concrete beams
using fiber reinforced plastics. ACI Structural Journal, 1991; 88(4):490-500.
[4] El-Mihilmy, MT and Tedesco, JW. Deflection of Reinforced Concrete Beams Strengthened with
Fiber-Reinforced Polymer (FRP) Plates. Structural Journal, 2000; 97(5):679-688.
[5] Sebastian, WM. Significance of midspan debonding failure in FRP-plated concrete beams. Journal of
Structural Engineering, 2001; 127(7):792-798.
[6] Buyukozturk, O, Gunes, O and Karaca, E. Characterization and modeling of debonding in RC beams
strengthened with FRP composites. 15th ASCE Engineering Mechanics Conference, Columbia
University, New York, June 2-5, 2002.
[7] Sebastian, WM. Prediction of interface shear stresses in elastoplastic moment-varying zones of
advanced composite material-strengthened concrete members. Journal of Structural Engineering,
2002; 128(9):1212-1221.
[8] Tan, KY. Evaluation of externally bonded CFRP systems for the strengthening of RC slabs. MSc
Thesis, Center for Infrastructure Engineering Studies, University of Missouri-Rolla, 2003.
[9] Buyukozturk, O, Gunes, O and Karaca, E. Progress on understanding debonding problems in
reinforced concrete and steel members strengthened using FRP composites. Construction and
Building Materials, 2004; 18(1):9-19.

- 33 -
[10] Abdelouahed, T. Improved theoretical solution for interfacial stresses in concrete beams strengthened
with FRP plate. International Journal of Solids and Structures, 2006; 43(14-15):4154-4174.
[11] Camata, G, Spacone, E, Zarnic, R. Experimental and nonlinear finite element studies of RC beams
strengthened with FRP plates. Composites Part B: engineering, 2007; 38(2):277-88.
[12] Schilde, K and Seim, W. Experimental and numerical investigations of bond between CFRP and
concrete. Construction and Building Materials, 2007; 21(4):709-726.
[13] Mendes, R. CFRP strip anchorage systems to reinforced concrete elements. MSc Thesis, Instituto
Superior Técnico, 2008. (in portuguese)
[14] Sümer, Y and Akta , M.. Bond length effect of fiber reinforced polymers bonded reinforced
concrete beams. International Journal of the Physical Sciences, 2011, 6(24): 5795-5803.
[15] Jankowiak, I. Analysis of RC beams strengthened by CFRP strips - Experimental and FEA study.
Archives of Civil and Mechanical Engineering, 2012; 12(3):376-388.
[16] Grelle, SV and Sneed, LH. Review of anchorage systems for externally bonded FRP laminates.
International Journal of Concrete Structures and Materials, 2013; 7(1):17-33.
[17] Teng, JG, Lu, XZ, Ye, LP and Jiang, JJ. Bond-slip models for interfaces between externally bonded
FRP and concrete. FRP Composites in Civil Engineering - CICE 2004, pp. 55-68.
[18] Lu, XZ, Ye, LP, Teng, JG, Huang, YL, Tan, Z and Zhang, ZX. Recent researches on interface
behavior of FRP sheets externally bonded to RC structures. FRP Composites in Civil Engineering -
CICE 2004 - Seracino (ed), 2005, pp. 389-397.
[19] Neubauer, U and Rostásy, FS. Design aspects of concrete structures strengthened with externally
bonded CFRP-plates. Proceedings of the 7th International Conference on Structural Faults and
Repairs, 1997; 2:109-118.
[20] Matthys, S. Structural behaviour and design of concrete members strengthened with externally
bonded FRP reinforcement. Thesis in Fulfilment of the requirements for the Degree of Doctor of
Applied Sciences, option Structural Engineering, Ghent University, Faculty of Applied Sciences
Department of Structural Engineering, Academic year 1999-2000.
[21] Lorenzis, L, Miller, B and Nanni, A. Bond of fiber-reinforced polymer laminates to concrete. ACI
Materials Journal, 2001; 98(3):256-264.
[22] Täljsten, B. Defining anchor lengths of steel and CFRP plates bonded to concrete. International
Journal of Adhesion and Adhesives, 2006; 17(4):319-327.

- 34 -
[23] Yang, DS, Hong, SN and Park, SK. Experimental observation on bond-slip behavior between
concrete and CFRP plate. International Journal of Concrete Structures and Materials, 2007; 1(1):37-
43.
[24] Ferracuti, B. Strengthening of RC structures by FRP: Experimental analyses and numerical
modelling. Doctoral Thesis, Università degli Studi di Bologna, Italy, 2006.
[25] Ferracuti, B, Savoia, M and Mazzotti, C. Interface law for FRP-concrete delamination. Composite
Structures, 2007; 10:523-531.
[26] Aiello, M and Leone, M. Interface analysis between FRP EBR system and concrete. Journal of
Composites Part B: Engineering, 2008; 39(4):618-626.
[27] Biscaia, HC, Chastre, C and Silva, MAG. A smeared crack analysis of reinforced concrete T-beams
strengthened with GFRP composites. Engineering Structures, 2013; 56:1346-1361.
[28] Martinelli, E, Czaderski, C and Montavalli, M. Modeling in-plane and out-of-plane displacement
fields in pull-off tests on FRP strips. Engineering Structures, 2011; 33(12):3715-3725.
[29] Biscaia, HC, Chastre, C and Silva, MAG. Nonlinear numerical analysis of the debonding failure
process of FRP-to-concrete interfaces. Composites Part B: Engineering, 2013; 50:210-223.
[30] Biscaia, HC, Chastre, C and Silva, MAG. Linear and nonlinear analysis of bond-slip models for
interfaces between FRP composites and concrete. Composites Part B: Engineering, 2013;
45(1):1554-1568.
[31] Dehghani, E, Daneshjoo, F, Aghakouchak, AA and Khaji, N. A new bond-slip model for adhesive in
CFRP–steel composite systems. Engineering Structures, 2012; 12:447-454.
[32] Kim, H, Wagoner, MP and Buttlar, WG. Simulation of fracture behavior in asphalt concrete using a
heterogeneous cohesive zone Discrete Element Model. Journal of Materials in Civil Engineering,
2008; 20(8):552-563.
[33] Sheng, Y, Yang, D, Tan, Y and Ye, J. Microstructure effects on transverse cracking in composite
laminae by DEM. Composites Science and Technology, 2010; 70(14):2093-2101.
[34] Yang, D, Sheng, Y, Ye, J and Tan, Y. Discrete element modeling of the microbond test of fiber
reinforced composite. Computational Materials Science, 2010; 49(2):253-259.
[35] Itasca. PFC2D User’s Guide. Consulting Group Inc., Minneapolis, Minnesota, 2002.
[36] Cundall, PA and Strack, ODL. A discrete numerical model for granular assemblies. Géotechnique,
1979; 29:47-65.

- 35 -
[37] Potyondy, DO and Cundall, PA. A Bonded-Particle Model for rock. International Journal of Rock
Mechanics and Mining Sciences, 2004; 41(8):1329-1364.
[38] Biscaia, HC. Behaviour and modeling of GFRP-to-concrete interfaces of reinforced concrete
elements exposed to aggressive environments. PhD Thesis, Nova University of Lisbon, 2012. (in
portuguese)
[39] Dai J, Ueda T and Sato Y. Development of the nonlinear bond stress-slip model of fiber reinforced
plastics sheet-concrete interfaces with a simple method. Journal of Composites for Construction,
2005; 9(1):52-62.
[40] Faella, C; Martinelli, E and Nigro, E. Interface behaviour in FRP Plates bonded to concrete:
Experimental tests and theoretical analyses. ECI Conference on Advance Materials for Construction
of bridges, buildings, and Other Structures III, 2003, Davos, Switzerland.
[41] Yuan, H; Teng, JG; Seracino; R; Wu, ZS and Yao, J. Full-range behavior of FRP-to-concrete bonded
joints. Engineering Structures, 2004; 26:553-565.
[42] Teng, JG; Yuan, H and Chen, JF. FRP-to-concrete interfaces between two adjacent cracks:
Theoretical model for debonding failure. International Journal of Solids and Structures, 2006;
43:5750-5778.
[43] Chen, JF; Yuan, H and Teng, JG. Analysis of debonding failure along a softening FRP-to-concrete
interface between two adjacent cracks. Proceedings of the International Symposium on Bond
Behaviour of FRP in Structures, BBFS, 2nd ed. John Chen and Teng, 2005.
[44] Cornetti, P and Carpinteri, A. Modelling the FRP-concrete delamination by means of an exponential
softening law. Engineering Structures, 2011; 33:1988-2001.
[45] Yuan, H, Lu, X, Hui, D and Feo, L. Studies on FRP-concrete interface with hardening and softening
bond-slip law. Composite Structures, 2012; 94(12):3781-3792.
[46] Teng, JG, Chen, JF, Smith, ST and Lam, L. FRP strengthened RC structures. John Wiley and Sons
Ltd. Chichester, England, 2001.
[47] Ibars, EO, Arco, DC and Bernat, ARM. Interface behavior in fiber-reinforced polymer-strengthened
beams subjected to transverse loads: Maximum transferred force. Journal of Composites for
Construction, 2009; 13(1):35-44.
[48] Nakaba, K, Kanakubo, T, Furuta, T and Yoshizawa, H. Bond behavior between fiber-reinforced
polymer laminates and concrete. ACI Structural, 2001, 98(3):359-367.

- 36 -
[49] Popovics, S. A numerical approach to the complete concrete stress-strain relation for concrete.
Cement and Concrete Research, 1973; 3(5):583-599.
[50] Dimande A. Influência da interface no reforço à flexão de estruturas de betão com sistemas de FRP.
PhD thesis, Faculdade de Engenharia, Universidade do Porto, Portugal, 2003. (in Portuguese).
[51] Dai J, Ueda T and Sato Y. Development of the nonlinear bond stress-slip model of fiber reinforced
plastics sheet-concrete interfaces with a simple method. Journal of Composites for Construction,
2005; 9(1):52-62.
[52] Neubauer, U and Rostásy, FS. Bond behaviour of CFRP-laminates for the strengthening of concrete
members. Proceedings of Composite for Construction - Conventional and Innovative, Innsbuck,
Austria, 16-18 September, pp. 717-724.
[53] Teng, JG, Lu, XZ, Ye, LP and Jiang, JJ. Bond-slip models for interfaces between externally bonded
FRP and concrete. FRP Composites in Civil Engineering - CICE 2004, pp. 55-68.
[54] Lu, XZ, Ye, LP, Teng, JG, Huang, YL, Tan, Z and Zhang, ZX. Recent researches on interface
behavior of FRP sheets externally bonded to RC structures. FRP Composites in Civil Engineering -
CICE 2004 - Seracino (ed). 2005, pp. 389-397.
[55] Oehlers, DJ. FRP Plates Adhesively Bonded to Reinforced Concrete Beams: Generic Debonding
Mechanisms. Advances in Structural Engineering, 2006; 9(6):737-750.
[56] Mazzotti, C, Savoia, M and Ferracuti, B. A new single-shear set-up for stable debonding of FRP-
concrete joints. Construction and Building Materials, 2009; 23(4):1529-1537.

- 37 -
Table 1. Mechanical properties of the GFRP composites [38]. GFRP flat
couponεfu(1)
(%)
εf m(2)
(%)
ff(3)
(MPa)ffm
(4)
(MPa)Ef
(5)
(MPa)Ef m
(6)
(MPa)
No. 1 2.25 2.20 487.2 513.9 22.14 23.49 No. 2 2.20 507.5 23.09 No. 3 2.14 551.1 25.78No. 4 2.22 509.9 22.96
(1)εf – rupture strain; (2)
εf – average rupture strain; (3) ff – tensile strength; (4) ff – average tensile strength; (5) Ef – Young’s modulus; Ef m – average Young’s modulus.
Table 2: Numerical results obtained from the nonlinear bond-slip laws defined in Fig. 12. Bond-slip law Maximum
load,Fmax (kN)
Relativeerror(%)
Fractureenergy,
GF (N/mm)
Relativeerror(%)
Effectivebond length,
Leff (mm)
Relativeerror(%)
Bi-linear 33.72 - 1.526 - 240 - Popovics' formula [49] 28.39 -15.81 1.231 -19.33 230 -4.17 Mentioned by Dimande [50] 29.32 -13.05 1.170 -23.33 225 -6.25 Proposal of Dai et al. [51] 30.16 -10.56 1.236 -19.00 210 -12.50

Figure_01

Figure_02

Figure_03

Figure_04

�
�
�
�
Figure_05

Figure_06

Figure_07

� �
Figure_08

� �
Figure_09
� �
Figure_10

0 1 2 3 4 5 6 7 8
0.0
0.2
0.4
0.6
0.8
1.0
1.2
s/smax
/max
1.0
1.2
/max Bi-linear
Popovics' formula [49] (n=3.0)
Mentioned by Dimande [50]
Proposal of Dai et al. [51]
Figure_11

� �
Figure_12

Figure_13

Figure_14

Figure_15

Figure_16

Figure_17

Figure_18

��
�
�
�
�
�
�
�
�
�
�
�
�
�
�
�
Figure_19

�
Figure_20
Top Related
Copyright © 2022 FDOKUMEN

