


Bahasa
Halaman
Hukum

Decoding Sequence Learning from Single-TrialIntracranial EEG in HumansMarzia De Lucia1,7*., Irina Constantinescu2,3., Virginie Sterpenich2,3, Gilles Pourtois4, Margitta Seeck5,
Sophie Schwartz2,3,6
1 Department of Radiology, Vaudois University Hospital Center and University of Lausanne, Lausanne, Switzerland, 2 Department of Neuroscience, University of Geneva,
Geneva, Switzerland, 3 Geneva Neuroscience Center, University of Geneva, Geneva, Switzerland, 4 Department of Experimental Clinical and Health Psychology, University
of Ghent, Ghent, Belgium, 5 Department of Clinical Neurology, Geneva University Hospitals, Geneva, Switzerland, 6 Swiss Center for Affective Sciences, University of
Geneva, Geneva, Switzerland, 7 Electroencephalography Brain Mapping Core, Center for Biomedical Imaging, Lausanne, Switzerland
Abstract
We propose and validate a multivariate classification algorithm for characterizing changes in human intracranialelectroencephalographic data (iEEG) after learning motor sequences. The algorithm is based on a Hidden Markov Model(HMM) that captures spatio-temporal properties of the iEEG at the level of single trials. Continuous intracranial iEEG wasacquired during two sessions (one before and one after a night of sleep) in two patients with depth electrodes implanted inseveral brain areas. They performed a visuomotor sequence (serial reaction time task, SRTT) using the fingers of their non-dominant hand. Our results show that the decoding algorithm correctly classified single iEEG trials from the trainedsequence as belonging to either the initial training phase (day 1, before sleep) or a later consolidated phase (day 2, aftersleep), whereas it failed to do so for trials belonging to a control condition (pseudo-random sequence). Accurate single-trialclassification was achieved by taking advantage of the distributed pattern of neural activity. However, across all the contactsthe hippocampus contributed most significantly to the classification accuracy for both patients, and one fronto-striatalcontact for one patient. Together, these human intracranial findings demonstrate that a multivariate decoding approachcan detect learning-related changes at the level of single-trial iEEG. Because it allows an unbiased identification of brain sitescontributing to a behavioral effect (or experimental condition) at the level of single subject, this approach could be usefullyapplied to assess the neural correlates of other complex cognitive functions in patients implanted with multiple electrodes.
Citation: De Lucia M, Constantinescu I, Sterpenich V, Pourtois G, Seeck M, et al. (2011) Decoding Sequence Learning from Single-Trial Intracranial EEG inHumans. PLoS ONE 6(12): e28630. doi:10.1371/journal.pone.0028630
Editor: Nicole Wenderoth, Katholieke Universiteit Leuven, Belgium
Received February 23, 2011; Accepted November 11, 2011; Published December 9, 2011
Copyright: � 2011 De Lucia et al. This is an open-access article distributed under the terms of the Creative Commons Attribution License, which permitsunrestricted use, distribution, and reproduction in any medium, provided the original author and source are credited.
Funding: This work was supported by Grants from the Swiss National Science Foundation (K-33K1_122518/1 to M.D.L. and 310000-114008 to SS). The fundershad no role in study design, data collection and analysis, decision to publish, or preparation of the manuscript.
Competing Interests: The authors have declared that no competing interests exist.
* E-mail: [email protected]
. These authors contributed equally to this work.
Introduction
In functional neuroimaging studies, the application of machine
learning techniques has recently become a popular method for
decoding stimulus-related information at the level of the single
response to external stimuli [1,2]. Most of the machine learning
techniques applied to neuroimaging data are intrinsically multi-
variate and therefore particularly suitable when the main
differences between experimental conditions are not in the
strength of the activity at specific brain regions, but rather in the
configuration or relative spatial locations of simultaneously
activated areas (for reviews see [3–7]). Indeed, recent applications
of machine learning techniques in hemodynamic (e.g. [8–13]) and
electrophysiological (e.g. [14–17]) studies have emphasized the
role of widespread activation patterns underlying many human
cognitive functions, shifting the focus from the description of
specialized brain regions to a network perspective. In addition,
because these methods typically exploit high-dimensional data,
they often offer a valid alternative to the preselection of a subset of
the available data prior to the analysis. In particular, electrophys-
iological studies often involve the a priori selection of specific
electrodes prior to statistics, thus severely limiting the possibility to
reveal robust effects outside regions of interest and preventing the
investigation of spatially distributed effects. In intracranial
electroencephalography studies in humans, the use of a very small
subset of the data, i.e. highly localized recording sites, is preferred
because it gets around the problem of variations in the patterns of
surgical implantation across patients (e.g. [18–20]).
Here we propose a machine learning approach for the analysis
of human iEEG which takes advantage of multiple recording sites
and high temporal resolution of brain activity. Following a
classification scheme, we aim at demonstrating the feasibility of
this method in capturing learning-related changes during a visuo-
motor task performed over two sessions.
We recorded iEEG from distributed cerebral locations in two
epileptic patients to identify spatio-temporal changes in neural
activity related to visuo-motor learning. To characterize the neural
activity during the execution of a trained sequence (as compared to
an untrained sequence), we employed a decoding algorithm that
classifies single-trial data by exploiting learning-related changes in
distributed patterns of neural activity. We then estimated which
electrodes mostly contributed to the discrimination power in order
PLoS ONE | www.plosone.org 1 December 2011 | Volume 6 | Issue 12 | e28630

to identify brain regions implicated in learning-related changes.
This approach is challenging because it aims at extracting
distinctive features of neural activity during a complex cognitive
paradigm at the single-trial level and with minimal a priori
constraints (for similar approaches in scalp EEG see [17,21–23]).
This effort is counterbalanced by the benefit of a statistical
assessment of datasets from single individuals, and by taking into
account unlocked activity that is overlooked when averaging peri-
stimulus epochs as in standard univariate approaches. This
approach would thus be particularly appropriate for the study of
clinical cases with heterogeneous anatomical and functional
characteristics.
The present results show that the proposed multivariate
algorithm can track learning-related changes, provides consistent
results in two distinct patients analyzed independently, and offers
the possibility to estimate in an unbiased way which neural
locations may critically contribute to motor sequence learning.
Materials and Methods
Experimental ParadigmEthics Statement. Patients provided written informed
consent to participate in this study, which was approved by the
ethical committee of the Geneva University Hospitals.
Patients description. We tested epileptic patients who had
depth-electrodes implanted in several brain regions for presurgical
evaluation purposes. Here we report the findings in two patients,
patient M.R. (male, left-handed, aged 35) and patient C.S. (female,
right-handed, aged 25) who completed the experimental protocol
without any major epileptic activity over the whole period of
recording (about 18 hours over 2 days, see Figure 1a). During the
whole experimental protocol, including one night of sleep, both
patients were free of any medication. The ictal semiology consisted
of generalized seizures alternating with partial seizures for patient
M.R and of complex partial seizures for patient C.S. None of the
patients had any detectable hippocampal damage (including
sclerosis): the magnetic resonance imaging (MRI) examination
was normal for patient M.R and showed bilateral occipital
periventricular heterotopia without any hippocampal abnormality
for patient C.S. Both patients had a good general clinical status, no
cognitive impairment, and no history of sleep disorders. None of
the patients had formerly exerted any activity that could influence
performance on the main experimental task (SRTT, see below),
such as playing a musical instrument or extensive practice with
typing on a keyboard. The patients could execute the task without
difficulty (see Results). Both patients judged the quality of the
night’s sleep during the experiment as good (St Mary’s Hospital
Sleep Questionnaire and verbal interview) and polysomnographic
sleep scoring showed good sleep efficiency (see Material S1).
Behavioral task and experimental procedureThe patients were tested on a serial reaction time task (SRTT)
[24,25]. During testing, the patients faced a computer screen (19
inches) displaying four grey rectangles (2.1564.30 degrees of visual
angle, each) arranged horizontally next to each other (2.15u gaps)
on a homogeneous, light blue background, with a fixation cross at
the center of screen (Figure 1b). The four rectangles and the
fixation cross remained on the screen throughout the experiment.
On each trial, one of the four grey rectangles briefly changed its
color to yellow for 200 ms. The patients had to react as quickly
and accurately as possible by pressing on a response-pad the key
that spatially corresponded to the flashed position within a
1000 ms interval. The patients responded with the four fingers of
their non-dominant hand (right for M.R. and left for C.S.).
Whenever they did not press the correct key or pressed no key
within the response interval, an error feedback was displayed
(background color turning to dark blue during 200 ms). The next
trial started 500 ms after the end of the response period. The inter-
stimulus interval was 1700 ms. On each trial in the sequence, the
reaction time (RT) and response accuracy were recorded. The
SRTT was programmed using the E-Prime software (Psychology
Software Tools, Inc., Pittsburg, PA) to allow high temporal
precision for stimulus presentation, RT data collection, and
marking of the events on the iEEG recording. Two types of
sequences were presented: a structured (S) sequence, requiring
eight keypresses in a specific pre-determined order and a control
(C) pseudo-random sequence. For both patients, the S-sequence
used was 2-4-3-1-4-2-1-3, where 1 refers to the left-most rectangle
and 4 to the right-most rectangle on the screen. The C-sequence
consisted of series of eight keypresses (as for the S-sequence)
formed by randomly shuffling two sub-sequences of the 1-2-3-4
positions. Hence, the two finger sequences differed but shared a
main global feature: the four distinct positions were flashed once in
each of the two successive quartets forming an 8-position
sequence. A short pause of 2500 ms was inserted after the last
trial of each sequence, i.e. after 8 keypresses. The patients were not
informed about the regularity of the S-sequence.
The patients were tested during two sessions on two successive
days, including one night of sleep between the sessions (Figure 1a).
On day 1, a training session started at 7.45 p.m. and lasted about
30 min. On day 2, a test session started at 9.30 a.m. and lasted
30 min. Each session consisted of three blocks of the S-sequence
(20 repetitions each) and one equivalent block of the C-sequence.
The C-sequence was introduced in both sessions to allow the
assessment of sequence-specific changes in behavior and neural
activity, independent of non-specific improvements in executing
the visuomotor task. The C-sequence was performed after two S-
blocks to ensure that the patients had acquired good practice with
the SRT task. The C-block was also followed by a last S-block to
limit the interference of the C-sequence on the consolidation of the
S-sequence. To obtain information about explicit knowledge of the
S-sequence, we asked the patients at the end of the second session
on day 2 whether they had noticed any regularity regarding the
succession of the positions (or key presses). We also invited them to
reproduce the motor sequence on the keypad.
Intracranial EEG recordingWe tested both patients while they underwent continuous long-
term iEEG recordings. Electrophysiological activity was recorded
over arrays of depth electrodes surgically implanted to identify the
epilepsy focus. Intracranial EEG was recorded (Ceegraph XL,
Biologic System Corps.) using electrode arrays with 8 stainless
contacts each (AD-Tech, electrode diameter: 3 mm, inter-contact
spacing: 10 mm), orthogonally implanted in several brain regions.
Patient M.R. had 64 contacts (8 arrays), covering, bilaterally, the
anterior and posterior hippocampal regions, the amygdala, and
the fronto-orbital cortex. For patient C.S., a total of 88 contacts
(11 arrays) covered anterior and posterior hippocampal regions,
the amygdala, the frontal-caudate area, and the occipital cortex,
bilaterally, as well as the right fronto-orbital cortex (Figure 2a). For
each patient, we determined precise electrode location by the co-
registration of a post-operative computed tomography scan (CT)
with a high-resolution anatomical MRI. For the iEEG recordings,
the reference in both patients was a scalp electrode, subcutane-
ously implanted, located at position Cz and the ground was
another scalp electrode at position FCz of the 10–20 international
EEG system. We sampled the iEEG signal at 512 Hz and band-
pass filtered between 0.1–200 Hz. We applied DC correction and
Decoding Learning-Related Neural Responses
PLoS ONE | www.plosone.org 2 December 2011 | Volume 6 | Issue 12 | e28630

a 50 Hz notch filter to the data. Intracranial EEG was recorded
continuously during the training period on day 1 and testing
period on day 2, as well as during the night between the two
sessions. Electrooculography using two electrodes placed on the
eyes’ external canthi and electromyography using chin muscle
electrodes were also performed during the sleep periods. Sleep
data were scored manually by two trained sleep scorers on 30 s
epochs based on Rechtschaffen and Kales standard scoring criteria
[26].
Data analysisWe first analyzed iEEG data from all implanted regions using a
classification method based on single-trial responses. This
approach aims at classifying single trials of iEEG (epochs
corresponding to single key presses) in the S-sequence as belonging
to day 1 or to day 2. We then performed a localization procedure
to detect which areas contributed significantly to the classification
accuracy.
We implemented a multivariate approach to investigate the
consolidation of a sequential motor skill based on distributed brain
signals. This method presents several advantages for the analysis of
intracranial recordings with respect to classic average event-related
potentials. First, it exploits single-trial measurement of a different
duration therefore accounting for possible latency shifts in the
electrophysiological response to similar stimuli and that are not
time-locked to the visual cue or motor response. Second, it
provides classification estimations for different conditions, whose
accuracy can be tested statistically. Finally, by a recurrent
Figure 1. Illustration of the experimental procedure. (a) The experimental protocol included one training session on day one, followed by onenight of sleep, and a test session on day 2. Each session lasted about 30 min and comprised 60 S-sequence (3 blocks) and 20 C-sequences (1 block).The task was performed with the non-dominant hand and the trained 8-item sequence is shown on the bottom: finger 1 corresponds to the indexand finger 4 to the little finger. (b) On each trial in the sequence, one of the four grey rectangles briefly flashed (yellow during 200 ms), indicatingwhich button to press next. One sequence in this serial reaction time task required 8 keypresses in a specific order.doi:10.1371/journal.pone.0028630.g001
Figure 2. Classification procedure. (a) Representation of the implanted areas in patient C.S, lateral view of both hemispheres; (b) intracranial EEG(iEEG) recorded over the N contacts at each time-frame form an N-dimensional vector; (c) iEEG measures are pooled together within an N-dimensionalspace irrespective of their temporal order and a GMM is used to estimate Q Gaussian parameters (here Q = 3); (d) a Hidden Markov Model with Qhidden states, initialized by the GMM parameters, is used to update the Gaussian estimations as well as the transition matrix between the hiddenstates.doi:10.1371/journal.pone.0028630.g002
Decoding Learning-Related Neural Responses
PLoS ONE | www.plosone.org 3 December 2011 | Volume 6 | Issue 12 | e28630

procedure it allows to assess the contribution of each measurement
site to the classification accuracy. The distinctive features of this
method are particularly appropriate for the study of single-patients
datasets, whose measurement quality can be affected to a different
degree and at different site locations, making it difficult to
statistically assess group-level effects. Moreover, in the context of
intracranial data, the averaging of iEEG epochs rarely generates
classical ERP components, thus preventing a straightforward use
of the knowledge derived from scalp EEG studies. While it
provides a stringent test for the classification of single-trial data
together with an identification of anatomical sites for condition-
dependent changes, this method also takes advantage of several
single-trial features simultaneously, including signal amplitude and
spatio-temporal pattern of activity (see Hidden Markov Model of
single-trial iEEG section for details).
In the following, we first describe in details the HHM model
estimation of single-trial iEEG and the accuracy estimation. We
then systematically investigate the relation between the classifica-
tion performance and the electrodes locations, as well as its
relation with the parameters of the HMM models.
Hidden Markov Model of single-trial iEEGTo model the neural response in the S-sequence, we used a
selection of contacts for each of the two patients, choosing the most
distant contacts on each electrode array. This data selection
procedure was motivated by the need to reduce the computational
time in training the model and is justified by the observation that
close contacts measure highly correlated brain activity. The
number of selected contacts N was 16 for M.R. and 22 for C.S. (for
Talairach coordinates of these contacts, see Table S1). To achieve
faster RTs, motor learning should predominantly modulate the
electrical activity preceding the key press. We therefore defined
each individual trial (corresponding to iEEG epochs) as starting
from the fixation cross and ending when the key press was
recorded. Because we aimed at characterizing neural responses
when the patients performed the S-sequence, irrespective of the
specific finger used, we pooled all the trials from the S-sequence in
separate datasets, one for each of the two days. This approach of
pooling together all the events corresponding to different fingers
was also essential for allowing the use of the same model when
classifying single trials of the C-sequence. Obviously, the model
was not informed by any feature of the sequence order.
For each patient, we therefore considered two datasets one for
day 1 and one for day 2 including a set of single trials (epochs)
from the S-sequence. Each of these epochs comprises a set of
voltage measurements Mtf at each time-frame tf, with Mtf = [v1(tf),
v2(tf),…,vN(tf)] (Figure 2b,c). The aim of the HMM algorithm is to
model the time series of vectors Mtf within each epoch {M1,
M2,…, ML}, where L is the length of one epoch. Previous
applications of HMM on electrophysiological data aimed at
characterizing the sequential pattern of specific features extracted
from the signal [27–29]. In our study we applied the HMM on the
raw signal directly in order to characterize the sequence of voltage
configuration across multiple sites of recordings that can subtend
sequence learning.
In an HMM, one considers a probabilistic model of two sets of
random variables {H1,…, HQ } and {M1, M2,…, ML} [30]. The
variables {H1,…, HQ }, called hidden states, represent a stochastic
process whose evolution over time cannot be observed directly.
The property of this process can only be inferred through the
realizations of the variables {M1, M2,…, ML}, that is to say, in our
case, the EEG signal recorded from several electrodes. The HMM
is characterized by the initial state probability vector p of elements
pi = P(H1 = i); the state transition matrix A, with aij = P(Htf =
i|Htf–1 = j) and the set of emission probability density function
B = {bi(Mtf) = p(Mtf|Htf = i)}, which is, in our case, modeled by a
Gaussian mixture (Gaussian mixture model; GMM). The choice of
a GMM for this probability density function is standard when
HMM is applied to a continuous variable [30].
The first step of the algorithm is a GMM estimation of the set of
voltage measurement for a given condition. Thus, the N-
dimensional vectors {Mtf}, representing the instantaneous voltage
measurement across the entire set of electrodes (Figure 2b), were
extracted and pooled together regardless of the timing at which
they were observed and of the trial to which they belonged
(Figure 2c). We initialized the GMM estimation itself by a K-
means clustering method [31], which provided a first guess of the
mean of each cluster, the prior probability for each of the clusters,
and associated covariance. The latter were calculated considering,
for each of the Q Gaussians, the set of vectors {Mtf} closest (on the
basis of Euclidean distance) to each mean. We estimated the
GMM parameters by an expectation-maximization algorithm for
mixture of Gaussians [32]. We used the resulting GMM
parameters to initialize an HMM model with Q hidden states.
In this second step we aimed at characterizing the temporal
structure of the response as a series of states. The HMM model
was estimated using Baum-Welch algorithm [33], an expectation-
maximization procedure which estimates the HMM parameters
by maximizing the probability of observation sequence given the
model. Both steps in the model estimation were computed using a
toolbox for Matlab written by Kevin Murphy (http://www.cs.ubc.
ca/,murphyk/Software/HMM/hmm.html).
In order to select the number of clusters Q providing the best
classification between the trials on day 1 and day 2, we considered
a range of possible values of Q between 3 and 8. We therefore
obtained six HMM (one model for each of the Q values
considered) for each of the two datasets and each of the patients.
Accuracy estimationTo select which HMM provided the best discrimination power
between day 1 and day 2, we tested the models ten times. Each
time, the S-sequence data was randomly divided into two parts:
one training set, which was nine tenths of the data, and one testing
set, which was the remaining one tenth. For each test, we
computed a Receiver Operating Characteristic (ROC), whose
underlying area provides an unbiased measure of the classification
accuracy [34]. After selecting the parameters corresponding to the
largest area lying beneath the ROC curve, we validated the
models on a set of single trials belonging to the S-sequence that
had not been previously used for the parameter selection
(validation dataset). Moreover, we used the same models to
compute the ROC curve as resulted from classifying single trials of
the C-sequence as belonging to day 1 or day 2. A significantly
lower performance in classifying trials belonging to the C-sequence
would confirm that the classification performance between day 1
and day 2 for the S-sequence was attributable to sequence-specific
effects related to learning and neural plasticity, and not to non-
specific task adaptation effects (e.g. more efficient visuomotor
mapping with practice) nor to general differences in measurement
conditions (e.g. different levels of fatigue or motivation of the
patient). For testing the model on the C-sequence, we considered
ten splits of the whole set of single trials and ran a test for each
split. It is worth noting that classifying isingle trials belonging to
the C-sequence based on models estimated on the S-sequence is a
sensible test because these models do not contain any information
about the grammar of the sequence itself.
As an additional estimation of the quality of the trained model,
we assessed the accuracy obtained for new test data by measuring
Decoding Learning-Related Neural Responses
PLoS ONE | www.plosone.org 4 December 2011 | Volume 6 | Issue 12 | e28630
the ratio of trials correctly classified and the total number of trials
when keeping the same priors as those obtained during the
training. Finally, to exclude that the discrimination power reached
when classifying the S-sequence could trivially be due to shorter
trial duration on day 2 compared to day 1, we performed a control
test by classifying the two datasets based on the reaction times
(RTs) only (i.e. based on the single-trial duration).
We compared the ROC curve areas based on reaction times
and those based on the HMM models using the ten estimations in
the cross validation procedure (t-tests; p,0.01). To further assess
any possible relation between the estimated model accuracy and
the RTs, we computed the Pearson correlation between the
difference of the logarithm of the likelihoods of each of the two
models (hereafter called discrimination function) and the RTs on a
trial-by-trial basis in the test dataset.
Estimating contacts with higher classification powerWe aimed at testing whether the classification performance was
equally driven by all the recording sites across the available
electrode arrays or whether some sites might contribute more to
the classification. We therefore dropped in turn each of the
available electrode arrays, one at a time, and in each of the two
subjects separately, and we recomputed the HMM models and the
corresponding classification accuracy. At this stage, we considered
each couple of electrodes together because they can reflect
correlated activity along the strip. For each of the electrode
selections, we estimated the parameters providing the highest
classification accuracy for the S-sequence as we did above. We
then compared the resulting classification performance with that
obtained previously when keeping all the contacts. The same
analysis was carried out with the data from the C-sequence based
on the models estimated in the structure sequence.
A further analysis was carried out focusing on those couple of
electrodes that produced a significant drop of the classification
accuracy. In the following we refer to the string of contacts
including this couple of electrodes as target string. In this further test,
we trained two set of new models for day 1 and day 2 taking into
account the same number of initially chosen selected contacts (i.e.
16 for M.R. and 22 for C.S.) but replacing one contact within the
target string with another contact in the same string. The goal was
to test how robust is the drop in classification accuracy against the
different choice of the electrodes along the strip and the critical
contribution of each single contact while keeping the same number
of total electrodes.
Relation between classification accuracy and parametersof the HMM models
One important step of multivariate decoding in neuroimaging
studies is the identification of the features that the classifier exploits
for achieving a good classification performance. We therefore
investigated which parameter(s) from the HMM models was most
informative in classifying single-trials from day 1 and day 2 and
what signal properties did the relevant parameter(s) reflect. For
each patient, we considered the set of HMM models (one model
for each training dataset) estimated during day 1 and day 2. We
considered here only the selected values of hidden variables
providing the best accuracy (i.e. Q1 = 3, Q2 = 4 for patient M.R.
and Q1 = 6, Q2 = 7 for patient C.S.). We investigated which
parameters (i.e. priors, means, covariances, and transition
probabilities), for each model was crucial for achieving a good
classification performance. We ran an exhaustive analysis by
considering all possible combinations for each set of parameters.
For example for testing whether the means estimated from day 1
or day 2 were carrying critical information for classification
performance, we swapped the values of the means of the first
model with those of the second model considering all the possible
permutation between the first and the second set. For each swap
we assessed the accuracy and we evaluated whether there was a
significant drop. The same analysis and the same tests for accuracy
assessment (as described in the ‘Accuracy estimation’ section) were
repeated for each set of parameters (i.e. priors, means, covariances,
and transition probabilities).
Finally we aimed at finding a neurophysiological interpretability
of the relevant parameters revealed by this procedure.
Results
BehaviorFor each patient, we first averaged the reaction times (RT) over
the 8 key presses of each sequence in each block (i.e. 20 sequences in
each block). Note that only hits were included in the analysis and
that the patients made very few errors (incorrect key pressed or
misses) in each block (% of all key presses 6SD; Patient M.R.: 262;
Patient C.S: 162). The data were then subjected to an ANOVA
with Day (day 1, day 2) and Blocks (3 blocks for the S-sequence, 1
block for the C-sequence) as factors. Additional t-tests were
performed whenever interactions were significant. Both patients
showed a main effect of Day (patient M.R.: F(1,152) = 4.89,
p,0.05; patient C.S.: F(1,152) = 15.72, p,0.001) due to the RTs
being faster on the second than the first day (mean 6SD; M.R. Day
1: 597 ms666 ms, Day 2: 575 ms666 ms, T(158) = 2.11, p,0.05;
C.S. Day 1: 401 ms638 ms, Day 2: 379 ms642 ms, T(158) = 3.38,
p,0.001). Critically, the analysis revealed a Day by Block
interaction (M.R.: F(3,152) = 3.62, p,0.05; C.S.: F(3,152) = 2.72,
p,0.05) due to greater performance improvement for the S-
sequence blocks than the C-sequence blocks on day 2 (RT
difference between day 1 versus day 2 for M.R. S-sequence:
24 ms, T(118) = 2.21, p,0.05, C-sequence: 15 ms, T(38) = 0.72,
p = 0.49; for C.S. S-sequence: 29 ms, T(118) = 5.16, p,0.001, C-
sequence: 21 ms, T(38) = 20.07, p = 0.95). Consistent with
previous studies [35,36], none of the patients exhibited any explicit
knowledge of the S-sequence or of fragmentary rule knowledge (i.e.
three successive positions in the sequence). They reported that they
did not notice any regularity in the succession of the yellow
rectangles or key presses.
Results from the multivariate decoding approach tosingle-trial iEEG
Classification accuracy results. For patient M.R., the best
classification performance was obtained for Q = 3 on day 1 and
Q = 4 on day 2. The ROC area was 0.8060.07 (mean 6SD;
Figure 3a). For patient C.S., the selected parameters were Q = 6
and Q = 7 for day 1 and day 2, respectively. The average ROC
curve area was 0.9060.06 (Figure 3b). Importantly, we obtained
the same results (indistinguishable ROC curves) when classifying
single trials of the validation dataset which was not used for
parameters selection. The accuracy obtained when keeping the
same priors as those obtained in the training, measured as the ratio
of the number of trials correctly classified to the total number of
trials, was 0.7060.06 and 0.8160.05 respectively. In both
patients, the accuracy for classifying the S-sequence was
significantly higher than that for classifying the control sequence
(p,0.01), because the average ROC curve area for the C-
sequence was 0.6660.04 and 0.6660.04 for day 1 and day 2,
respectively. The corresponding accuracy when keeping the same
bias as in the training was 0.6060.06 and 0.6360.04. When
classifying the trials in the S-sequence based on their reaction
times only, we obtained a classification accuracy considerably
Decoding Learning-Related Neural Responses
PLoS ONE | www.plosone.org 5 December 2011 | Volume 6 | Issue 12 | e28630
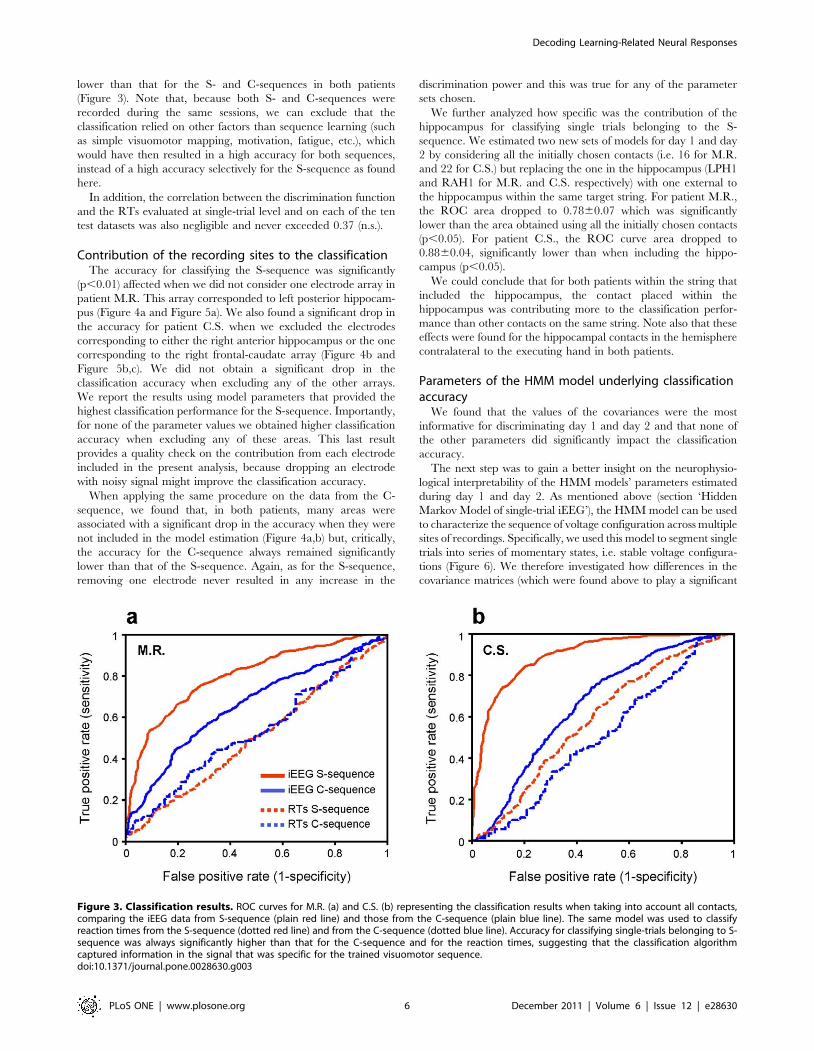
lower than that for the S- and C-sequences in both patients
(Figure 3). Note that, because both S- and C-sequences were
recorded during the same sessions, we can exclude that the
classification relied on other factors than sequence learning (such
as simple visuomotor mapping, motivation, fatigue, etc.), which
would have then resulted in a high accuracy for both sequences,
instead of a high accuracy selectively for the S-sequence as found
here.
In addition, the correlation between the discrimination function
and the RTs evaluated at single-trial level and on each of the ten
test datasets was also negligible and never exceeded 0.37 (n.s.).
Contribution of the recording sites to the classificationThe accuracy for classifying the S-sequence was significantly
(p,0.01) affected when we did not consider one electrode array in
patient M.R. This array corresponded to left posterior hippocam-
pus (Figure 4a and Figure 5a). We also found a significant drop in
the accuracy for patient C.S. when we excluded the electrodes
corresponding to either the right anterior hippocampus or the one
corresponding to the right frontal-caudate array (Figure 4b and
Figure 5b,c). We did not obtain a significant drop in the
classification accuracy when excluding any of the other arrays.
We report the results using model parameters that provided the
highest classification performance for the S-sequence. Importantly,
for none of the parameter values we obtained higher classification
accuracy when excluding any of these areas. This last result
provides a quality check on the contribution from each electrode
included in the present analysis, because dropping an electrode
with noisy signal might improve the classification accuracy.
When applying the same procedure on the data from the C-
sequence, we found that, in both patients, many areas were
associated with a significant drop in the accuracy when they were
not included in the model estimation (Figure 4a,b) but, critically,
the accuracy for the C-sequence always remained significantly
lower than that of the S-sequence. Again, as for the S-sequence,
removing one electrode never resulted in any increase in the
discrimination power and this was true for any of the parameter
sets chosen.
We further analyzed how specific was the contribution of the
hippocampus for classifying single trials belonging to the S-
sequence. We estimated two new sets of models for day 1 and day
2 by considering all the initially chosen contacts (i.e. 16 for M.R.
and 22 for C.S.) but replacing the one in the hippocampus (LPH1
and RAH1 for M.R. and C.S. respectively) with one external to
the hippocampus within the same target string. For patient M.R.,
the ROC area dropped to 0.7860.07 which was significantly
lower than the area obtained using all the initially chosen contacts
(p,0.05). For patient C.S., the ROC curve area dropped to
0.8860.04, significantly lower than when including the hippo-
campus (p,0.05).
We could conclude that for both patients within the string that
included the hippocampus, the contact placed within the
hippocampus was contributing more to the classification perfor-
mance than other contacts on the same string. Note also that these
effects were found for the hippocampal contacts in the hemisphere
contralateral to the executing hand in both patients.
Parameters of the HMM model underlying classificationaccuracy
We found that the values of the covariances were the most
informative for discriminating day 1 and day 2 and that none of
the other parameters did significantly impact the classification
accuracy.
The next step was to gain a better insight on the neurophysio-
logical interpretability of the HMM models’ parameters estimated
during day 1 and day 2. As mentioned above (section ‘Hidden
Markov Model of single-trial iEEG’), the HMM model can be used
to characterize the sequence of voltage configuration across multiple
sites of recordings. Specifically, we used this model to segment single
trials into series of momentary states, i.e. stable voltage configura-
tions (Figure 6). We therefore investigated how differences in the
covariance matrices (which were found above to play a significant
Figure 3. Classification results. ROC curves for M.R. (a) and C.S. (b) representing the classification results when taking into account all contacts,comparing the iEEG data from S-sequence (plain red line) and those from the C-sequence (plain blue line). The same model was used to classifyreaction times from the S-sequence (dotted red line) and from the C-sequence (dotted blue line). Accuracy for classifying single-trials belonging to S-sequence was always significantly higher than that for the C-sequence and for the reaction times, suggesting that the classification algorithmcaptured information in the signal that was specific for the trained visuomotor sequence.doi:10.1371/journal.pone.0028630.g003
Decoding Learning-Related Neural Responses
PLoS ONE | www.plosone.org 6 December 2011 | Volume 6 | Issue 12 | e28630

role in the classification) may be reflected in the spatio-temporal
pattern of these momentary states. We applied the two models
providing the best classification results to each trial belonging to day
1 or day 2. We found that the average duration of these states was
longer during day 2 and in comparison to day 1 only for those trials
belonging to the S-sequence in both patients. It is worth noting that
we always compared mean duration of the momentary states for
each single trial obtained by applying the same model, and therefore
the difference in mean duration was not due to different values of Q
between the two sessions. The average duration of these momentary
states for subject M.R. significantly differed between day1 and day2
(97 ms and 111 ms respectively; p,0.05; Figure 6). The average
duration for subject C.S. was 63 ms and 71 ms during day 1 and
day 2 (significantly different, p,0.05; Figure 6). Importantly, this
difference in the average duration was no longer significant when
considering single trials belonging to the random sequence in both
subjects (during day 1 and day 2 average duration was 75 ms and
75 ms for M.R.; 60 ms and 64 ms for C.S.). We could conclude that
the pattern of momentary states during the motor task and their
typical temporal duration were modulated by the learning stage of
the subject. In addition, when omitting the hippocampus contribu-
tion, for patient M.R. the difference in the average duration for the
S-sequence was not anymore significant (61 ms and 64 ms during
day 1 and day 2 respectively; p.0.05), and for patient C.S.,
although this difference was still significant, it was significantly lower
than when including all the contacts (58 ms and 62 ms during day 1
and day 2 respectively; p.0.05).
Discussion
Intracranial EEG recordings in humans provide spatially-
localized measurements of brain activity with a high temporal
resolution. In this study, we proposed an HMM-based multivariate
algorithm that takes advantage of the distributed neural signals
Figure 4. Localization results. ROC areas for M.R. (a) and C.S. (c), comparing classification performance when taking into account all implantedareas versus after dropping in turn one area. Red bars refer to the S-sequence, blue bars to the C-sequence (b and d). Significant differences betweenkeeping all the contacts and dropping in turn couples of electrodes were observed for the S-sequence only for the string including the hippocampusand right frontal caudate contact for C.S. By contrast for the C-sequence, a significant drop in the classification accuracy was evident for many areas.Importantly single-trial classification remains always lower in the C-sequence than in the S-sequence. Abbreviations: LA = left amygdala; RA = rightamygdala; LAH = left anterior hippocampus; LPH = left posterior hippocampus; RAH = right anterior hippocampus; RPH = right posteriorhippocampus; LFO = left fronto-orbital area; RFO = right fronto-orbital area; LO = left occipital; RO = right occipital; RFC = right frontal-caudate.Standard errors are shown.doi:10.1371/journal.pone.0028630.g004
Decoding Learning-Related Neural Responses
PLoS ONE | www.plosone.org 7 December 2011 | Volume 6 | Issue 12 | e28630

measured by iEEG at multiple recording sites. Although this
approach can in principle be used to characterize the neural
correlates of any cognitive functions, in this study we show that it
can be successfully applied to track a visuo-motor learning effect.
This dataset included recordings from two subjects who performed
the task before and after a night of sleep. Without the subjects
being aware of it, the two sessions included both a structured
sequence (S-sequence) and a pseudo-random control sequence (C-
sequence). Behavioral results from both patients showed that
motor performance improved selectively for the S-sequence after a
delay that included one night of sleep. These results are similar to
what has been shown with previous SRTT and motor learning
studies in normal subjects [37,38,39], and provide a strong
indication that patients underwent learning-related neural changes
in response to the structured sequence.
Consistently with the behavioral results, we showed that a
multivariate classification algorithm can accurately assign single-
trial iEEG responses to either the initial training phase (day 1) or to
the later consolidated phase (day 2), i.e. after sequence-specific
improvement occurred. Importantly, this classification result relied
on activity patterns selectively associated to the learning of the
regularity of the 8-item sequence (S-sequence), as evidenced by the
comparatively low classification accuracy obtained for single-trials
from the C-sequence. In addition we found that the classification
failed when applied to the single-trial reaction-times, thus
indicating that the learning-related changes captured by the
decoding algorithm cannot be trivially explained in terms of
speeding of motor response. Finally, while the localization of these
learning-related changes involved a distributed pattern of neural
activity, we identified the hippocampus as providing a major
contribution to the reliable classification of the trained sequence,
independently in each patient, with an additional contribution
from frontostriatal regions for the patient implanted with
electrodes in these brain areas.
Taken together, these results demonstrate the feasibility of the
application of a multivariate approach for the analysis of learning-
related changes in intracranial recordings in humans. This is
mainly supported by the accurate performance of the classifier in
tracking sequence learning at the level of single trials and by the
highly consistent pattern of results obtained in the two patients
analyzed independently. More specifically, independently in both
patients (i) we could classify single trials based on distributed
activity and only in relation to the S-sequence; (ii) the
hippocampus provided the highest contribution to the classifica-
tion accuracy compared to all the other sites; (iii) the distinct
learning stages were paralleled by a difference in the average
temporal duration of momentary neural states (see next section).
Learning-related changes the stability of momentaryneural states
The present study provides evidence of learning-related changes
of intracranial electrical activity corresponding to single events
(individual keypresses) belonging to a visuomotor sequence. The
analysis of the features used by the classifier showed that the
discrimination between different stages of the learning process
relies on differences of the spatio-temporal patterns of the raw
signal in relation to the learning stage. Specifically we showed that
responses to single visual cues can be represented as a sequence of
‘momentary states’, whose duration changed as a function of
learning, i.e. when comparing day 1 to day 2.
Indeed, this change in duration was observed only for trials
belonging to the S-sequence, and critically related to the presence
of the hippocampus in both subjects. The existence of short
periods of stability of voltage configurations (often referred to as
functional microstates) is a well-established empirical observation
at the level of the scalp electroencephalography [40–43]. Their
spatio-temporal properties have been extensively used to analyze
both event-related potentials [44,45] as well as resting state EEG
[46]. Our findings demonstrate that the statistical properties of
distributed voltage configurations are also detectable in intracra-
nial responses at the single-trial level. The significant change in
average duration of these momentary states suggests that the
temporal properties rather than the actual amplitude values of
these states are critically related to the learning stage. Variation of
microstates’ temporal duration has been reported at the level of
scalp EEG in relation to functional deficits in specific clinical
populations [47–49]. Very recently, it has been shown that resting
state in humans is characterized by a multi-fractal temporal
organization of the miscrostates whose degree of complexity is
Figure 5. Visualization of the areas most contributing to the classification. (a) Left posterior hippocampus for patient M.R. (b) Right anteriorhippocampus and (c) right frontal-caudate region for patient C.S. Electrodes localized by the CT scan were coregistered to the MRI T1-weighted brainvolumes.doi:10.1371/journal.pone.0028630.g005
Decoding Learning-Related Neural Responses
PLoS ONE | www.plosone.org 8 December 2011 | Volume 6 | Issue 12 | e28630

related to the temporal duration of the microstates [50]. These
studies together with our current findings suggest that the temporal
scale of momentary states carries crucial information about
cognitive states emphasizing the importance of investigating the
dynamics of brain activity together with its spatial distribution.
Distributed versus localized neural correlates underlyingsequence learning
Our results show that the underlying neural correlates of
sequence learning is distributed within a large network, involving
activities from multiple locations. However, in both subjects we
found a significant drop in the performance only when activity
recorded from the hippocampus (and from a frontostriatal region
for the patient implanted with electrodes in these brain areas) was
not included in the classification. These results suggest a major
contribution in sequence learning of these regions, among the
multiple sites at which electrodes were implanted. A more general
conclusion about the specific role of the hippocampus and fronto-
striatal activities is that sequence learning may require a larger
population of patients. At present, these results speak in favor of
the feasibility of the proposed algorithm; first in relation to the
high consistency of these results across the two patients analyzed
independently; second because the role of the hippocampus in
sequence learning is consistent with similar findings in associative
processes, including the integration of temporally- or spatially-
organized information [51–58]. Also consistent with the present
results, it has been suggested that the PFC may participate in the
extraction of regularities based on internal representations, so as to
improve behavioral control [59,60]. Finally, in support of the role
of hippocampal-prefrontal interactions in memory processes,
Peyrache and al. (2009) [61] recently demonstrated that following
the acquisition of new rules, PFC activity patterns reflected the
neural patterns that occurred during the training phase [62], and
that this reactivation occurred predominantly when hippocampal
and cortico-hippocampal interaction was enhanced [63–69].
While this could only be observed in one patient, the present
finding of a contribution of both the hippocampus and PFC
activity to the classification of learning stages would be consistent
with these findings.
Figure 6. Segmentation of single-trials belonging to the structured sequence into voltage configurations (‘momentary states’). Eachof these states is labeled in a gray scale gradation. The trials length (right-padded in black) is marked by a vertical line. For each subject (panel a andpanel b), and each day (from left to right, day 1 and day 2 respectively), we show a series of exemplar single trials and the segmentation provided bythe HMM algorithm. It should be noted that during day2 the average duration of these states is comparably longer that that during day 1 in bothsubjects. This observation was confirmed statistically in both subjects. The difference in duration length between day 1 and day 2 was highlysignificant and only during the structured sequence. This evidence provides new insight about spatio-temporal properties of neural activityunderlying sequence-learning.doi:10.1371/journal.pone.0028630.g006
Decoding Learning-Related Neural Responses
PLoS ONE | www.plosone.org 9 December 2011 | Volume 6 | Issue 12 | e28630
Advantages and limitations of multivariate decodingapproach to single-trial iEEG
The present study demonstrates that the proposed multivariate
decoding approach to single-trial iEEG datasets from individual
patients offers an important methodological alternative to group
studies of averaged data. Indeed, grouping iEEG data from
different patients can be extremely challenging because the
configuration of electrode placement varies across individuals
and pathological conditions (e.g. epilepsy, Parkinson disease), and
because iEEG data quality is often contaminated by artifacts at
different recording sites. The restricted availability of such iEEG
recordings is an additional factor motivating the development of
methods that fully exploit individual patient datasets. Following a
classification scheme, we made use of non-overlapping splits of the
available data to validate differences in the temporal and spatial
configuration of the signal. Such classification analysis exploits
stimulus-related information extracted from distributed activity
patterns (i.e. ‘pattern information analysis’) and avoids biases that
may arise when hypotheses and inferential analyses are not
independent [70] (e.g. selection of few electrodes in ERP studies).
Pattern information analysis has predominantly been developed
for neuroimaging studies based on fMRI [3–6]. Classification
analysis of electrophysiological data has been predominantly
developed in the context of Brain Computer Interface [71–74]
studies while less effort has been devoted to its application in
neuroimaging studies [7]. As illustrated by the present study, one
main advantage of this methodological framework is that it does
not require any a priori selection of the relevant neural sites or time-
window of activity measurements. We complemented our
approach by a localization procedure and showed that we can
identify the regions contributing most to the performance of the
classifier. Our results demonstrate that this methodological
strategy is particularly adapted to test the effect of learning-related
changes capturing task-related effects at the single-trial level, that
are not time-locked to the visual cue or motor response, and do
not require a fixed trial length.
The present findings could benefit from the simultaneous
recording of scalp EEG which could allow a useful comparison
with existing literature on the same topic [24,75]. This will be the
focus of future studies including a larger set of patients.
ConclusionsIntracranial EEG recordings in humans provide a unique
opportunity to investigate spatially localized neural activity with a
high temporal resolution, in particular for deep regions that
cannot be easily accessible to surface EEG recordings. These data
can thus provide an intermediate level of observation linking
animal cell-recording data and human neuroimaging findings.
However, much like cell-recordings in animals, iEEG studies have
a sparse distribution of recordings sites. In this study, we propose a
multivariate decoding strategy to optimize the use of such
distributed neural signals by allowing the full analysis of datasets
from individual patients at the single-trial level and by offering an
unbiased test for the contribution of individual electrodes to the
observed effects.
Acknowledgments
We thank Peter Dayan (University College London, UK) for
insightful theoretical and methodological comments. We also
thank Laurent Spinelli for technical support and the patients for
participating in the study.
Supporting Information
Material S1 Sleep parameters. Description of the sleep
parameters of the night between the two recordings for each of the
two patients.
(DOC)
Table S1 Talairach coordinates of the implanted elec-trodes. List of the normalized Talaraich coordinates of the
implanted electrodes for each of the two patients. We report here
all those coordinates that were included in the multivariate
decoding analysis.
(DOC)
Author Contributions
Conceived and designed the experiments: MDL IC SS GP MS. Performed
the experiments: IC SS GP VS. Analyzed the data: MDL IC SS GP.
Contributed reagents/materials/analysis tools: MDL MS. Wrote the
paper: MDL IC SS.
References
1. Haynes JD (2011) Multivariate decoding and brain reading: introduction to thespecial issue. (2011) Neuroimage 56: 385–6.
2. Van De Ville D, Seong-Whan L (2011) Brain decoding: Opportunities and
challenges for pattern recognition. Pattern Recognition;doi:10.1016/j.pat-
cog.2011.06.001.
3. Norman KA, Polyn SM, Detre GJ, Haxby JV (2006) Beyond mind-reading:multi-voxel pattern analysis of fMRI data. Trends Cogn Sci 10: 424–430.
4. O’Toole AJ, Jiang F, Abdi H, Penard N, Dunlop JP, et al. (2007) Theoretical,
statistical, and practical perspectives on pattern-based classification approachesto the analysis of functional neuroimaging data. J Cogn Neurosci 19: 1735–1752.
5. Pereira F, Mitchell T, Botvinick M (2009) Machine learning classifiers andfMRI: a tutorial overview. Neuroimage 45: S199–209.
6. Lemm S, Blankertz B, Dickhaus T, Muller KR (2011) Introduction to machine
learning for brain imaging. Neuroimage 56: 387–399.
7. Blankertz B, Lemm S, Treder M, Haufe S, MullerKlaus-Robert (2011) Single-trial analysis and classification of ERP components - A tutorial. Neuroimage
56(2): 814–825.
8. Formisano E, De Martino F, Bonte M, Goebel R (2008) ‘‘Who’’ is
saying ‘‘what’’? Brain-based decoding of human voice and speech. Science322: 970–3.
9. Mitchell TM, Shinkareva SV, Carlson A, Chang KM, Malave VL, et al. (2008)
Predicting human brain activity associated with the meanings of nouns. Science
320: 1191–5.
10. Yamashita O, Sato MA, Yoshioka T, Tong F, Kamitani Y (2008) Sparseestimation automatically selects voxels relevant for the decoding of fMRI activity
patterns. Neuroimage 42: 1414–29.
11. Ethofer T, Van De Ville D, Scherer K, Vuilleumier P (2009) Decoding of
emotional information in voice-sensitive cortices. Curr Biol 19: 1028–1033.
12. Staeren N, Renvall H, De Martino F, Goebel R, Formisano E (2009) Sound
categories are represented as distributed patterns in the human auditory cortex.Curr Biol 19: 498–502.
13. Nestor A, Plaut DC, Behrmann M (2011) Unraveling the distributed neural codeof facial identity through spatiotemporal pattern analysis. Proc Natl Acad
Sci U S A 108: 9998–10003.
14. Rieger JW, Reichert C, Gegenfurtner KR, Noesselt T, Braun C, et al. (2008)Predicting the recognition of natural scenes from single trial MEG recordings of
brain activity. Neuroimage 1: 1056–68.
15. Ratcliff R, Philiastides MG, Sajda P (2009) Quality of evidence for perceptualdecision making is indexed by trial-to-trial variability of the EEG. Proc Natl
Acad Sci USA 106(6): 6539–44.
16. Simanova I, van Gerven M, Oostenveld R, Hagoort P (2010) Identifying object
categories from event-related EEG: toward decoding of conceptual representa-
tions. PLoS One 5: e14465.
17. Tzovara A, Murray MM, Plomp G, Herzog MH, Michel CM, et al. (2011)
Decoding stimulus-related information from single-trial EEG responses based onvoltage topographies. Pattern Recognition;doi: 10.1016/j.patcog.2011.04.007.
18. Axmacher N, Henseler MM, Jensen O, Weinreich I, Elger CE, et al. (2010)
Cross-frequency coupling supports multi-item working memory in the humanhippocampus. Proc Natl Acad Sci U S A 107: 3228–3233.
19. Pourtois G, Spinelli L, Seeck M, Vuilleumier P (2010) Modulation of face
processing by emotional expression and gaze direction during intracranialrecordings in right fusiform cortex. J Cogn Neurosci 22(9): 2086–107.
20. Dastjerdi M, Foster BL, Nasrullah S, Rauschecker AM, Dougherty RF, et al.(2011) Differential electrophysiological response during rest, self-referential, and
non–self-referential tasks in human posteromedial cortex. Proc Natl Acad Sci
USA 108(7): 3023–8.
Decoding Learning-Related Neural Responses
PLoS ONE | www.plosone.org 10 December 2011 | Volume 6 | Issue 12 | e28630
21. De Lucia M, Michel CM, Clarke S, Murray MM (2007) Single-trial topographic
analysis of human EEG: A new ‘image’ of event-related potentials. In:Proceedings of the IEEE/EMBS region 8 international conference on
information technology applications in biomedicine, ITAB, art. no. 4407353.
pp 95–98.22. De Lucia M, Michel CM, Clarke S, Murray MM (2007) Single subject EEG
analysis based on topographic information. International Journal of Bioelec-tromagnetism. pp 168–117.
23. Murray MM, De Lucia M, Brunet D, Michel CM (2009) Principles of
Topographic Analyses for Electrical Neuroimaging. In: Handy TC, ed. BrainSignal Analysis: Advances in Neuroelectric and Neuromagnetic Methods.
Cambridge: Mass: MIT Press. pp 21–54.24. Andres FG, Gerloff C (1999) Coherence of sequential movements and motor
learning. J Clin Neurophysiol 16: 520–527.25. Halsband U, Matsuzaka Y, Tanji J (1994) Neuronal activity in the primate
supplementary, pre-supplementary and premotor cortex during externally and
internally instructed sequential movements. Neurosci Res 20(2): 149–55.26. Iber C, Ancoli-Israel S, Chesson A, Quan SF (2007) The AASM Manual for the
Scoring of Sleep and Associated Events: Rules, Terminology and TechnicalSpecifications. WestchesterIllinois, American Academy of Sleep Medicine.
27. Obermaier B, Neuper C, Guger C, Pfurtscheller G (2000) Information transfer
rate in a five-classes brain–computer interface IEEE Trans. Neural Syst RehabilEng 9: 283–826.
28. Obermaier B, Guger C, Neuper C, Pfurtscheller G (2001) Hidden Markovmodels for online classification of single trial EEG data. Pattern Recognition
Letters 22: 1299–1309.29. Cincotti F, Scipione A, Tiniperi A, Mattia D, Marciani MG, et al. (2003)
Comparison of different feature classifiers for brain computer interfaces Proc. 1st
Int. IEEE EMBS Conf. on Neural Engineering .30. Rabiner LR (1989) A tutorial on Hidden Markov Models and selected
applications in speech recognition. Proceedings of the IEEE 77: 257–286.31. Bishop CM (1995) Neural Networks for Pattern Recognition. Oxford, UK:
Oxford University Press.
32. Dempster A, Laird N, Rubin D (1977) Maximum likelihood from incompletedata via the EM algorithm. Journal of the Royal Statistical Society, Series B 39:
1–38.33. Baum LE, Petrie T, Soules G, Weiss N (1970) A maximization technique
occurring in the statistical analysis of probabilistic functions of Markov chains.Ann Math Statist 41: 164–171.
34. Swets JA, Pickett RM, Whitehead SF, Getty DJ, Schnur JA, et al. (1979)
Assessment of diagnostic technologies. Science 205: 753–759.35. Destrebecqz A, Peigneux P, Laureys S, Degueldre C, Del Fiore G, et al. (2005)
The neural correlates of implicit and explicit sequence learning: Interactingnetworks revealed by the process dissociation procedure. Learn Mem 12:
480–490.
36. Albouy G, Ruby P, Phillips C, Luxen A, Peigneux P, et al. (2006) Implicitoculomotor sequence learning in humans: Time course of offline processing.
Brain Res 1090: 163–171.37. Walker MP, Brakefield T, Morgan A, Hobson JA, Stickgold R (2002) Practice
with sleep makes perfect: sleep-dependent motor skill learning. Neuron 35:205–211.
38. Maquet P, Laureys S, Peigneux P, Fuchs S, Petiau C, et al. (2000) Experience-
dependent changes in cerebral activation during human REM sleep. NatNeurosci 3: 831–836.
39. Maquet P, Schwartz S, Passingham R, Frith C (2003) Sleep-relatedconsolidation of a visuomotor skill: brain mechanisms as assessed by functional
magnetic resonance imaging. J Neurosci 23(4): 1432–40.
40. Lehmann D (1987) Principles of spatial analysis. In: Gevins AS, Remond A, eds.Handbook of electroencephalography and clinical neurophysiology. Amsterdam:
Elsevier. pp 309–354.41. Michel CM, Thut G, Morand S, Khateb A, Pegna AJ, et al. (2001) Electric
source imaging of human brain functions. Brain Res Brain Res Rev 36:
108–118.42. Michel CM, Murray MM, Lantz G, Gonzalez S, Spinelli L, et al. (2004) EEG
source imaging. Clin Neurophysiol 115: 2195–2222.43. Lefevre J, Baillet S (2009) Optical flow approaches to the identification of brain
dynamics. Hum Brain Mapp 30: 1887–1897.44. Murray MM, Camen C, Gonzalez Andino SL, Bovet P, Clarke S (2006) Rapid
brain discrimination of sounds of objects. J Neurosci 26: 1293–1302.
45. De Lucia M, Clarke S, Murray MM (2010) A temporal hierarchy for conspecificvocalization discrimination in humans. J Neurosci 30: 11210–11221.
46. Britz J, Van De Ville D, Michel CM (2010) BOLD correlates of EEGtopography reveal rapid resting-state network dynamics. Neuroimage 52:
1162–1170.
47. Strik WK, Chiaramonti R, Muscas GC, Paganini M, Mueller TJ, et al. (1997)Decreased EEG microstate duration and anteriorisation of the brain electrical
fields in mild and moderate dementia of the Alzheimer type. Psychiatry Res 75:
183–191.
48. Lehmann D, Faber PL, Galderisi S, Herrmann WM, Kinoshita T, et al. (2005)
EEG microstate duration and syntax in acute, medication-naive, first-episode
schizophrenia: a multi-center study. Psychiatry Res 138: 141–156.
49. Kindler J, Hubl D, Strik WK, Dierks T, Koenig T (2010) Resting-state EEG in
schizophrenia: Auditory verbal hallucinations are related to shortening of
specific microstates. Clin Neurophysiol.
50. Van de Ville D, Britz J, Michel CM (2010) EEG microstate sequences in healthy
humans at rest reveal scale-free dynamics. Proc Natl Acad Sci U S A 107:
18179–18184.
51. Nadel L, Samsonovich A, Ryan L, Moscovitch M (2000) Multiple trace theory of
human memory: computational, neuroimaging, and neuropsychological results.
Hippocampus 10: 352–368.
52. Moscovitch M, Nadel L, Winocur G, Gilboa A, Rosenbaum RS (2006) The
cognitive neuroscience of remote episodic, semantic and spatial memory. Curr
Opin Neurobiol 16: 179–190.
53. Ryan L, Lin CY, Ketcham K, Nadel L. The role of medial temporal lobe in
retrieving spatial and nonspatial relations from episodic and semantic memory.
Hippocampus 20: 11–18.
54. Wallenstein GV, Eichenbaum H, Hasselmo ME (1998) The hippocampus as an
associator of discontiguous events. Trends Neurosci 21: 317–323.
55. Fortin NJ, Agster KL, Eichenbaum HB (2002) Critical role of the hippocampus
in memory for sequences of events. Nat Neurosci 5: 458–462.
56. Agster KL, Fortin NJ, Eichenbaum H (2002) The hippocampus and
disambiguation of overlapping sequences. J Neurosci 22: 5760–5768.
57. Ergorul C, Eichenbaum H (2004) The hippocampus and memory for ‘‘what,’’
‘‘where,’’ and ‘‘when’’. Learn Mem 11: 397–405.
58. Degonda N, Mondadori CR, Bosshardt S, Schmidt CF, Boesiger P, et al. (2005)
Implicit associative learning engages the hippocampus and interacts with explicit
associative learning. Neuron 46: 505–520.
59. Robertson EM, Tormos JM, Maeda F, Pascual-Leone A (2001) The role of the
dorsolateral prefrontal cortex during sequence learning is specific for spatial
information. Cereb Cortex 11: 628–635.
60. Shima K, Isoda M, Mushiake H, Tanji J (2007) Categorization of behavioural
sequences in the prefrontal cortex. Nature 445: 315–318.
61. Peyrache A, Khamassi M, Benchenane K, Wiener SI, Battaglia FP (2009)
Replay of rule-learning related neural patterns in the prefrontal cortex during
sleep. Nat Neurosci 12: 919–926.
62. Euston DR, Tatsuno M, McNaughton BL (2007) Fast-forward playback of
recent memory sequences in prefrontal cortex during sleep. Science 318:
1147–1150.
63. Ji D, Wilson MA (2007) Coordinated memory replay in the visual cortex and
hippocampus during sleep. Nat Neurosci 10: 100–107.
64. Qin YL, McNaughton BL, Skaggs WE, Barnes CA (1997) Memory reprocessing
in corticocortical and hippocampocortical neuronal ensembles. Philosophical
Transactions of the Royal Society of London 352: 1525–1533.
65. Frankland PW, Bontempi B (2005) The organization of recent and remote
memories. Nat Rev Neurosci 6: 119–130.
66. Clemens Z, Molle M, Eross L, Barsi P, Halasz P, et al. (2007) Temporal coupling
of parahippocampal ripples, sleep spindles and slow oscillations in humans.
Brain 130: 2868–2878.
67. Rasch B, Born J (2007) Maintaining memories by reactivation. Curr Opin
Neurobiol 17: 698–703.
68. Diekelmann S, Born J (2010) The memory function of sleep. Nat Rev Neurosci
11: 114–126.
69. Kali S, Dayan P (2004) Off-line replay maintains declarative memories in a
model of hippocampal-neocortical interactions. Nat Neurosci 7: 286–294.
70. Kriegeskorte N, Simmons WK, Bellgowan PS, Baker CI (2009) Circular analysis
in systems neuroscience: the dangers of double dipping. Nat Neurosci 12:
535–540.
71. Birbaumer N (2006) Brain-computer-interface research: coming of age. Clin
Neurophysiol 117: 479–483.
72. Wolpaw JR (2007) Brain-computer interfaces as new brain output pathways.
J Physiol 579: 613–619.
73. Lotte F, Congedo M, Lecuyer A, Lamarche F, Arnaldi B (2007) A review of
classification algorithms for EEG-based brain-computer interfaces. J Neural Eng
4: R1–R13.
74. Galan F, Nuttin M, Lew E, Ferrez PW, Vanacker G, et al. (2008) A brain-
actuated wheelchair: asynchronous and non-invasive Brain-computer interfaces
for continuous control of robots. Clin Neurophysiol 119: 2159–2169.
75. Nahum L, Gabriel D, Spinelli L, Momjian S, Seeck M, et al. (2011) Rapid
consolidation and the human hippocampus: Intracranial recordings confirm
surface EEG. Hippocampus 21: 689–693.
Decoding Learning-Related Neural Responses
PLoS ONE | www.plosone.org 11 December 2011 | Volume 6 | Issue 12 | e28630
Top Related
Copyright © 2022 FDOKUMEN

