


Bahasa
Halaman
Hukum

Ž .Geoderma 103 2001 307–334www.elsevier.comrlocatergeoderma
Clay mineral transformations in soils affected byfluorine and depletion of organic matter within a
time span of 24 years
M. Egli a,), A. Mirabellab, P. Fitzea
a Department of Physical Geography, Irchel Geographisches Institut, UniÕersity of Zurich,¨Winterthurerstrasse 190, 8057 Zurich, Switzerland¨
b Istituto Sperimentale per lo Studio e la Difesa del Suolo, Piazza D’Azeglio 30,50121 Florence, Italy
Received 25 May 2000; received in revised form 4 January 2001; accepted 13 February 2001
Abstract
Data on soil chemistry and especially on clay mineral changes are presented, which wereŽobtained from a soil monitoring site in a forested ecosystem near Mohlin north-western part of¨
. Ž .Switzerland in a time span of 24 years 1969–1993 . The development in soil chemistry and claymineralogy with respect to time was compared in two soil horizons at depths of 0–5 cm and30–35 cm. A striking feature of the chemical changes observed in the soil was the distinctdecrease of soil organic matter in the subsoil during the investigation period. These changes aremost presumably due to past pollution of the area with F caused by a nearby aluminium industry.The observed decomposition of organic matter strongly influenced the behaviour of major andminor chemical constituents of the soil. In the subsoil, mica was intensively weathered andcontributed, therefore, to the formation of smectites. The significant decrease in chlorites alsotraces the formation of smectite back to the weathering of chlorite. Al removal from the interlayersseemed to be enhanced by dissolved F and especially by organic complexing agents, which musthave been present in the soil solution during this period of organic matter decomposition in thesoil. Vermiculitic compounds had substantial changes towards lower content only in the topsoil,while minerals, such as interstratified chloriterHIS, remained more or less unaffected. Weconclude that the decomposition of organic matter and to a certain extent also changes in theacidity within the time span 1969–1993 have led to, or initiated, a kind of weathering, which hassimilarities to podzolisation. Due to the decrease in exchangeable F, the process of desaluminationhas additionally been enhanced by fluorine. Usually, mineralogical changes—under oxic environ-mental surrounding conditions—are believed to be a long-term process. Our investigation,
) Corresponding author. Fax:q41-1-635-6848.Ž .E-mail address: [email protected] M. Egli .
0016-7061r01r$ - see front matterq2001 Elsevier Science B.V. All rights reserved.Ž .PII: S0016-7061 01 00046-5
( )M. Egli et al.rGeoderma 103 2001 307–334308
however, clearly shows that significant clay mineral alterations may occur within relatively shortperiods of time.q2001 Elsevier Science B.V. All rights reserved.
Keywords: Clay mineral changes; Weathering; Fluorine; Smectite; Organic matter
1. Introduction
Weathering rates or rates of element depletion on the catchment scale areŽoften obtained by mass balance studies e.g. April et al., 1986; Johnson and
Lindberg, 1992; Bain et al., 1994; Wesselink, 1994; Wright et al., 1994;.Manderscheid et al., 1995; Likens and Bormann, 1997; Egli, 1998, etc. .
Time-averaged weathering rates can be derived for soils developed in homoge-nous parent material, e.g. by means of concentration profiles of immobile
Želements e.g. Eggenberger, 1995; Blaser and Zimmermann, 1993; Nieuwen-. Ž .huyse and van Breemen, 1997 . Depletion of elements net export , however,
Žoften does not disclose much information regarding the qualitative aspects e.g.. Ž .mineral transformations of chemical weathering Likens and Bormann, 1997 .
Insight into qualitative aspects of weathering of soils is obtained from ananalysis of soil mineral transformations. For monitoring sites, however, thiswould require a soil sampling over a long period of time. Consequently, soilmineralogical changes in sites over a period of years to several decades arerarely documented in the literature.
Mass balance studies of forest soils on loess were confirmed by soil miner-Ž .alogical analyses Veerhoff, 1992 . They show a decrease in the feldspar content
in the strongly acidified horizons and a relative enrichment of quartz. Investiga-tions with XRD and differential thermoanalytical methods prove that alsoweathering-resistant clay minerals are subjected to substantial transformationsŽ .Rampazzo and Blum, 1992; Veerhoff, 1992; Volkel, 1994 . Results of investi-¨gations of the clay mineralogy have shown that in many strongly acidified forestsoils, an increase of expandable minerals can be expected from the subsoil to thetopsoil. It is also known that in acid environments the formation of Al-chlorites
Žcomprises a further, typical and eminent change in the clay mineralogy Barnhisel. Ž .and Bertsch, 1989; Veerhoff et al., 1996 . Frank and Gebhart 1989 demon-
strated with a soilrmineral balance budget of a gleyic podzol and a podzoliccambisol that the feldspar and muscovite content increases from the topsoil to
Žthe subsoil. Furthermore, a comparison of archived soil samples 1968 and.1988 gave evidence that the content of muscovite in the silt fraction of the
A-horizon decreased by about 50–60% and the proportion of alkali-feldsparabout 21–26%. This significant change occurring within 20 years is explainedby the high load of acids.
Ž . ŽLeaching experiments within the Integrated Forest Study project IFS John-.son and Lindberg, 1992 revealed that under specific circumstances mineralogi-
cal transformations may occur within a short period. Results of the IFS showed
( )M. Egli et al.rGeoderma 103 2001 307–334 309
that some investigation sites had aAnegativeB weathering balance for certaincations, meaning that more of these cations were released from exchange sites
Žthan were measured leaving the soil columns in leachate solutions April and.Newton, 1992 . In these cases, it was hypothesised that the cations must have
been retained within the soil in non exchangeable sites, presumably as interlayercations in clay minerals. Additionally, experimental data obtained from naturalsystems also have shown that mineralogical transformations can occur within a
Ž .very short time span Ranger et al., 1991 .We presume, therefore, that soil mineral changes may also occur within rather
short periods of time and, thus, might also be observable under certain circum-stances in soil monitoring sites. The aim of our study is to determine whethermeasurable differences in the clay mineralogy in already acid soils of a specificmonitoring site, which was exposed to man-made immissions, can be detectedwithin the relatively short period of 24 years.
2. Investigation area
The soil samples were obtained during the course of an extended project onthe topic of element-household and -fluxes in a forested ecosystem near Mohlin,¨
Ž X X .in the northwestern part of Switzerland 47835 N, 7852 E . A total of 81 sitesŽ . Ž .were investigated Burri, 1996 . This forest ecosystem 173 ha , which can be
divided topographically into two subareas, was investigated in detail for itschemical fluxes, its soil properties and the quality of its drainage water.
Annual precipitation at the investigation site is approximately 1000 mmryearŽ .and the average temperature is 9.68C 1969–1993 . The underlying parent
material consists of mixed sediments deposited during the Pleistocene glaciation.Besides gravel terraces, there are thin layers of moraine. Their formation is due
Žto the furthest advance into the ‘Mohliner Feld’ area between Mohlin and the¨ ¨.neighbouring villages Wallbach, Zeiningen and Schworstadt by an alpine¨
Ž .glacier Kuhnen, 1984 . Loess is widespread on the Mohliner Feld, most¨ ¨Ž .probably dating from the last glaciation ca. 100,000–15,000 years BP . The
Žmost common soils in the investigation area are haplic alisols FAO classifica-.tion : they are found in more than 90% of this area. These strongly acidified
soils are normally well drained. Regarding vegetation, deciduous trees likeFraxinus excelsior, Acer pseudoplatanus, Quercus robur and coniferous treeslike Picea abies prevail in the canopy layer. In the middle layerA. pseudopla-tanus, Fagus silÕatica, Carpinus betulus, Tilia cordata, F. excelsior, and alsoQ. robur can be found. The partially observable ground layer consists ofFag.silÕatica, T. cordata, C. betulus, P. abies, Abies alba, Corylus aÕellana and A.
Ž .pseudoplatanus Egli, 1995 .The investigation area was exposed to man-made immissions: in the 1950s
and 1960s, high emissions of Fy have been recorded from the nearby aluminium
( )M. Egli et al.rGeoderma 103 2001 307–334310
Ž .industry Aluminium Rheinfelden, Germany . The surrounding area is predomi-nantly utilised for agriculture. The investigated forest ecosystem is also influ-enced by a long tradition of forest management.
This area has been chosen for investigation because a collection of soilŽ .samples from 1969 onwards Kuhn, 1990 provides a continuous library of soil
chemistry since that time.Some sites of one subarea, which is characterised by a pure loess substratum,
have been chosen for detailed mineralogical investigations.
3. Methods
3.1. Soil chemistry
Inventories of the soil chemistry were made for the sampling dates 1969,1988 and 1993. The sampling strategy was the same for all sampling dates: 7
Ž 2.soil samplesrparcel 100 m were excavated by means of a special coresampler. The soil cores had diameters of 7.5 cm and a length of 50 cm. At all
Žsampling dates, the organic litter layer was removed prior to excavation the.zero point of the soil profile begins under the organic litter layer . From the
seven soil samples, the soil depths 0–5 and 30–35cm were collected and eachdepth combined into one sample. For each sampling site, an end volume of 1550cm3 was obtained for the sampling depths 0–5 and 30–35 cm, respectively. A
Ž .total of 81 sites were investigated Burri, 1996 . These sites have been surveyed.The forest area comprises 173 ha and is situated on a flat position at 300 m.a.s.l.The investigation sites were determined by the sampling procedure in 1969 andare distributed over the whole forest area. Since the sampling depths in 1969covered only 0–5 cm and 30–35 cm, the following sampling strategies had todeal with this random condition. In order to minimize possible seasonal effectson the soil chemistry, sampling was done at all investigation periods in JuneŽ . Žafter the yellowing ofAnemone nemorosa . Exchangeable cations Ca, Mg, K,
. Ž .Na, Al, Fe, Mn in the soil were analysed with a 0.05 M NH Cl solution using4Ž . Ž .a method proposed by Truby 1989 and Truby and Aldinger 1989 . Further-¨ ¨
Žmore, the NH OAc-EDTA extractable fractions Ca, Mg, K, Na, Al, Fe, Mn,4. Ž .Pb, Zn were measured according to Lakanen and Ervio 1971 . Additionally,¨
Žthe dithionite-extractable fraction Fitze and Kagi, 1999 was measured for the¨elements Fe, Al and Mn and the oxalate extractable fraction for Al, Fe and SiŽ . ŽSchwertmann, 1964 . Element pools in the soil Ca, Mg, K, Na, Fe, Al, Mn, Si,
.Cd, Pb and Zn were determined by applying a method of total disintegration.Ž .Oven-dried 708C samples were dissolved with a mixture of HF, HCl, HNO3
Ž .and H BO , according to Fitze and Kagi 1999 . A part of the samples was, in¨3 3
addition, also analysed by XRF. Total C and N contents in the soil wereŽ .measured with a CHN analyser. Soil pH in 0.01 M CaCl was determined on2
air-dried samples using a soil:solution ratio of 1:2.5, and soluble F using a
( )M. Egli et al.rGeoderma 103 2001 307–334 311
soil:solution ratio of 1:50. Additionally, NaOH extractable F was determinedŽ .according to FAC 1989 .
Ž .To eliminate temporal shifts passive enrichment of concentrations, whichŽ .are due to the strong variability of humus see Results , the element concentra-
tions were referenced to a constant inorganic content. The samples of 1993 wereŽ .corrected by Eq. 1 :
100%yH1969EC 1993sEC 1993 , 1Ž . Ž . Ž .c m 100%yH1993
where ECs the corrected element content, ECs the measured element con-c mŽ .tent, andH s the humus contents in % of 1969 and 1993, respectively.1969r1993
The humus content was obtained by multiplying the org. C concentration by afactor of 1.72.
3.2. Soil mineralogy
The clay fraction of haplic alisols on loess was studied. The loess sitescomprise a homogeneous subarea of the whole forest ecosystem. The clayfraction was obtained from the soil after destruction of organic matter withdiluted and Na acetate buffered H O , by dispersion with calgon and sedimenta-2 2
tion in water. Specimens were then Mg-saturated, washed free of chlorides andfreeze-dried. In the first step, oriented clay samples were made by smearing the
Ž .material on glass slides. X-ray diffraction diagrams from 28 to 658 wereobtained with oriented clay specimens using a Philips APD 1700 diffractometerequipped with Cu Ka radiation. Data was analysed with DMSNT and MacDiffin order to have an overview of possible occurring minerals. In the second step,samples oriented on glass slides from a water suspension were analysed with a3-kW Rigaku DrMAX III C diffractometer, equipped with a horizontal go-niometer, a curved-beam graphite monochromator and Cu radiation. Slides werestep scanned from 28 to 158 2u , with steps of 0.028 2u at 2-s intervals. Thefollowing treatments were performed: Mg saturation, ethylene glycol solvationand K saturation, followed by heating for 2 h at 3358C and 5508C. Randompowder mounts were prepared by filling glass holders. Random mounts werestep scanned from 588 to 648 2u with steps of 0.028 2u at 10-s intervals.
Ž .Na-citrate treatment was performed to extract interlayered hydroxy-Al or FeŽ .contaminants. We applied a modified procedure according to Tamura 1958 , in
which a contact time of 24 h without extractant removal was obtained by heatingthe samples in an autoclave at 1358C. XRD diagrams of the treated sampleswere then compared with those of the corresponding untreated samples. Ifinterlayered materials are expected, the collapse of the interlayered 2:1 mineralsafter K saturation is greatly improved. Furthermore, the presence of HISŽ .hydroxy-interlayered smectites will be evidenced by a more pronounced peakat 1.65 nm, following ethylene glycol solvation. Additionnally, the Na-citrate
( )M. Egli et al.rGeoderma 103 2001 307–334312
treated clays were Mg-saturated, solvated with ethylene glycol, K-saturated andheated to 3358C and 5508C.
Digitized X-ray data was routinely smoothed and corrected for Lorentz andŽ .polarisation factors Moore and Reynolds, 1997 . An increasing number of
Žworkers decompose complex diffraction peaks into elementary peaks e.g..Mirabella et al., 1992; Righi et al., 1993; Hardy et al., 1999 . Here, this kind of
method was adapted. Peak separation and profile analysis were carried out bythe Origin PFMe using the Pearson VII algorithm after smoothing the diffrac-tion patterns by a Fourier transformation function. Initial estimates of peakpositions are supplied to the software by visual examination of the X-raypattern. Background values were calculated by means of a nonlinear functionŽ .polynomial function of second order; Lanson, 1997 . The program reconstructssingle peaks by fitting the envelope curve of overlapping peaks. This procedure
Ž .also outputs the position and the integral intensity area of each single peak. Onthe basis of these integrals, an estimate of sheet-silicate composition wasperformed. The sum of the areas between 28 to 158 2u , which were attributed to
Ž .hydroxy interlayered vermiculites HIV , smectite, vermiculite, mica, chloriteand kaolinite, were standardized to 100%. All treatments, including Mg satura-tion, ethylene glycol solvation, K saturation, heating to 3358C and 5508C, had tobe considered for these calculations. The relative change of the areas withrespect to the treatments enabled the above mineral phases to be distinguished.For the Mg-saturated and for the ethylene glycol solvation treatment, the area of
Ž .the following peaks d-spacings had to be corrected by a weighting factor,F:1.6 nm with Fs0.453, 1.4 nm withFs0.478, and 0.71 nm withFs0.16ŽGjems, 1967a; Laves and Jahn, 1972; Niederbudde and Kussmaul, 1978;
.Schwertmann and Niederbudde, 1993 . Through this procedure, relative concen-trations of sheet-silicates in the clay fraction could be estimated with quite highaccuracy.
3.3. Statistics
Due to the various distribution patterns of the chemical data, which, in mostŽ .cases, showed a nonnormal skewed or bimodal or, in some cases, a normal
distribution, correlation coefficients were calculated with a nonparametric proce-Ž .dure the Spearman rank correlation coefficient . This procedure was checked
with a two-sided test for significance.
4. Results
4.1. Soil chemistry
Soil chemistry data of the investigation site were discussed more in detail inŽ . Ž . Ž . Ž .Burri 1996 , Egli et al. 1997 , Egli 1998 and Egli et al. 1999 . Here, only a
brief summary of the results is presented.
( )M. Egli et al.rGeoderma 103 2001 307–334 313
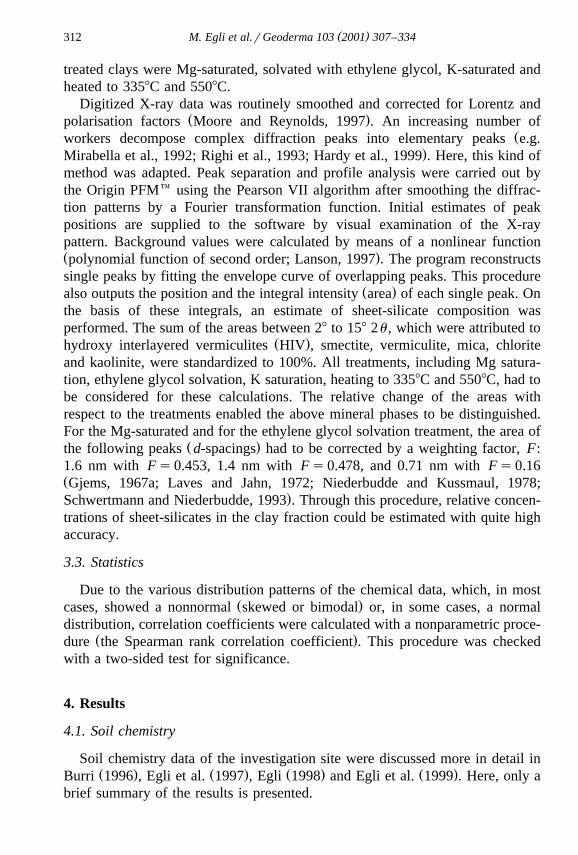
Table 1Detailed, characteristic properties of the haplic alisols on loess
y1Ž .Soil Org. C pH Exchangeable cations mmol kg Exchangeablecy1Ž . Ž .depth g kg CaCl 2q 2q q q a b2 Ca Mg K Na Sum Acidity CEC BS
Ž .cm Ž Ž Ž .mmol mmol %c cy1 y1. .kg kg
0–5 36.1 3.8 20.5 6.0 4.5 0.1 31.1 19.8 50.9 61.110–15 17.5 3.8 3.2 1.2 1.8 0.0 6.2 35.1 41.3 15.125–30 9.3 3.8 1.7 0.7 1.5 0.0 3.9 33.5 37.4 10.345–50 5.5 3.8 6.3 1.9 1.5 0.1 9.8 37.6 47.5 20.7
aCECscation exchange capacity.bBSsbase saturation.
Results of the soil clay mineralogy are presented in this paper, which wereŽobtained from seven sites four sites including both topsoil and subsoil samples
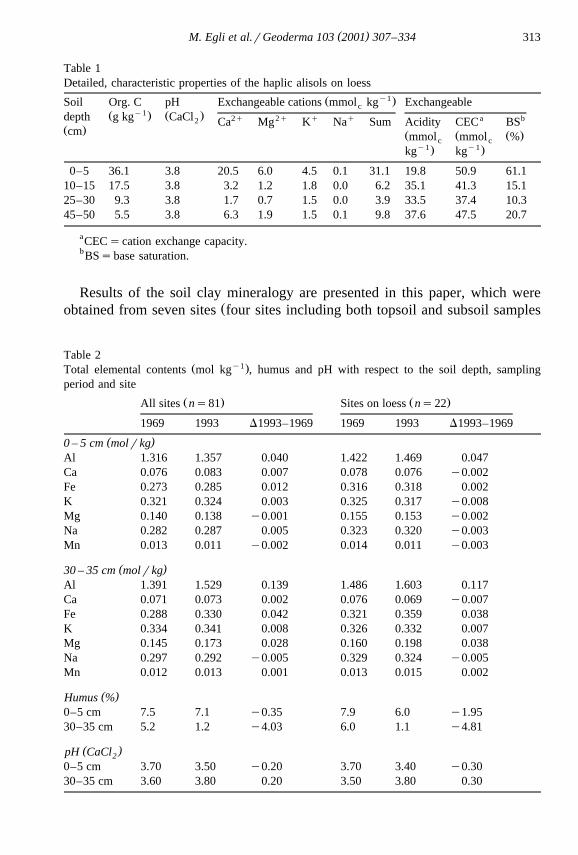
Table 2Ž y1.Total elemental contents mol kg , humus and pH with respect to the soil depth, sampling
period and site
Ž . Ž .All sites ns81 Sites on loessns22
1969 1993 D1993–1969 1969 1993 D1993–1969
( )0 – 5 cm molrkgAl 1.316 1.357 0.040 1.422 1.469 0.047Ca 0.076 0.083 0.007 0.078 0.076 y0.002Fe 0.273 0.285 0.012 0.316 0.318 0.002K 0.321 0.324 0.003 0.325 0.317 y0.008Mg 0.140 0.138 y0.001 0.155 0.153 y0.002Na 0.282 0.287 0.005 0.323 0.320 y0.003Mn 0.013 0.011 y0.002 0.014 0.011 y0.003
( )30 – 35 cm molrkgAl 1.391 1.529 0.139 1.486 1.603 0.117Ca 0.071 0.073 0.002 0.076 0.069 y0.007Fe 0.288 0.330 0.042 0.321 0.359 0.038K 0.334 0.341 0.008 0.326 0.332 0.007Mg 0.145 0.173 0.028 0.160 0.198 0.038Na 0.297 0.292 y0.005 0.329 0.324 y0.005Mn 0.012 0.013 0.001 0.013 0.015 0.002
( )Humus %0–5 cm 7.5 7.1 y0.35 7.9 6.0 y1.9530–35 cm 5.2 1.2 y4.03 6.0 1.1 y4.81
( )pH CaCl2
0–5 cm 3.70 3.50 y0.20 3.70 3.40 y0.3030–35 cm 3.60 3.80 0.20 3.50 3.80 0.30
( )M. Egli et al.rGeoderma 103 2001 307–334314
.and three with only subsoil samples of one subarea of the investigation area.This subarea is characterised by a pure loess substratum and comprises 22 sites.This procedure enables us to detect whether any significant changes haveoccurred on an identical lithology. Soil chemical data is, thus, split into theresults of the whole area and the selected subarea. Some typical characteristicsof the haplic alisols of the subarea are given in Table 1.
ŽA substantial amount of humus ca. 45% of the initial content over the profile. Ž .depth 0–35 cm was lost during the last 25 years cf. Table 2 especially in the
Ž .subsoil 30–35 cm . This trend was observed on all 81 parcels.ŽDuring the observation period, the changes in pH were also significant Table
.2 . In the topsoil, a tendency towards lower pH values was detected, indicatingan increasing acidity. This effect can be explained as a normal concomitantphenomenon of weathering and soil acidification. In the subsoil, however, acontrary effect was observed: the pH tended to increase during the period1969–1993. A decisive factor for this phenomenon could have been the humusdisintegration. The loss of humus presumably has led to a decrease in functionalacid groups in the subsoil and consequently to an increase in pH value. Thechanges in pH and org. C are especially pronounced and highly significant in the
Ž .subsoil 30–35 cm .Some elemental changes occurred as well. In the topsoil, the changes are
Žrather small. Despite the elimination of the diluting effect of organic matter cf.
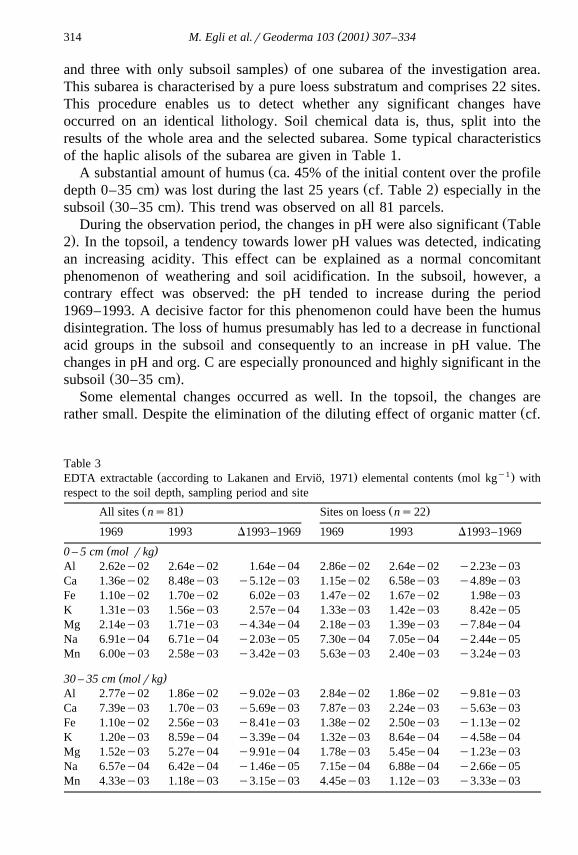
Table 3Ž . Ž y1.EDTA extractable according to Lakanen and Ervio, 1971 elemental contents mol kg with¨
respect to the soil depth, sampling period and site
Ž . Ž .All sites ns81 Sites on loessns22
1969 1993 D1993–1969 1969 1993 D1993–1969
( )0 – 5 cm mol rkgAl 2.62ey02 2.64ey02 1.64ey04 2.86ey02 2.64ey02 y2.23ey03Ca 1.36ey02 8.48ey03 y5.12ey03 1.15ey02 6.58ey03 y4.89ey03Fe 1.10ey02 1.70ey02 6.02ey03 1.47ey02 1.67ey02 1.98ey03K 1.31ey03 1.56ey03 2.57ey04 1.33ey03 1.42ey03 8.42ey05Mg 2.14ey03 1.71ey03 y4.34ey04 2.18ey03 1.39ey03 y7.84ey04Na 6.91ey04 6.71ey04 y2.03ey05 7.30ey04 7.05ey04 y2.44ey05Mn 6.00ey03 2.58ey03 y3.42ey03 5.63ey03 2.40ey03 y3.24ey03
( )30 – 35 cm molrkgAl 2.77ey02 1.86ey02 y9.02ey03 2.84ey02 1.86ey02 y9.81ey03Ca 7.39ey03 1.70ey03 y5.69ey03 7.87ey03 2.24ey03 y5.63ey03Fe 1.10ey02 2.56ey03 y8.41ey03 1.38ey02 2.50ey03 y1.13ey02K 1.20ey03 8.59ey04 y3.39ey04 1.32ey03 8.64ey04 y4.58ey04Mg 1.52ey03 5.27ey04 y9.91ey04 1.78ey03 5.45ey04 y1.23ey03Na 6.57ey04 6.42ey04 y1.46ey05 7.15ey04 6.88ey04 y2.66ey05Mn 4.33ey03 1.18ey03 y3.15ey03 4.45ey03 1.12ey03 y3.33ey03
( )M. Egli et al.rGeoderma 103 2001 307–334 315
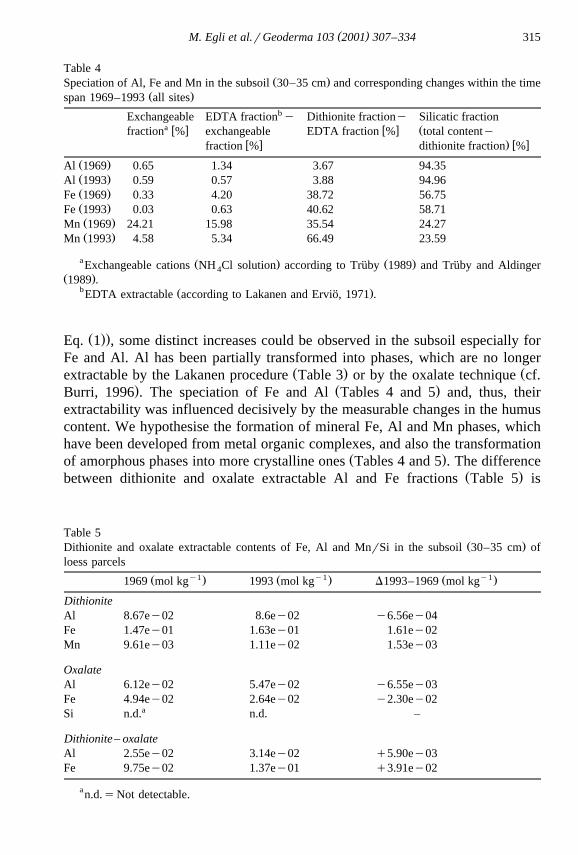
Table 4Ž .Speciation of Al, Fe and Mn in the subsoil 30–35 cm and corresponding changes within the time
Ž .span 1969–1993 all sitesbExchangeable EDTA fractiony Dithionite fractiony Silicatic fraction
a w x w x Žfraction % exchangeable EDTA fraction % total contentyw x . w xfraction % dithionite fraction %
Ž .Al 1969 0.65 1.34 3.67 94.35Ž .Al 1993 0.59 0.57 3.88 94.96Ž .Fe 1969 0.33 4.20 38.72 56.75Ž .Fe 1993 0.03 0.63 40.62 58.71Ž .Mn 1969 24.21 15.98 35.54 24.27Ž .Mn 1993 4.58 5.34 66.49 23.59
a Ž . Ž .Exchangeable cations NH Cl solution according to Truby 1989 and Truby and Aldinger¨ ¨4Ž .1989 .
b Ž .EDTA extractable according to Lakanen and Ervio, 1971 .¨
Ž ..Eq. 1 , some distinct increases could be observed in the subsoil especially forFe and Al. Al has been partially transformed into phases, which are no longer
Ž . Žextractable by the Lakanen procedure Table 3 or by the oxalate technique cf.. Ž .Burri, 1996 . The speciation of Fe and Al Tables 4 and 5 and, thus, their
extractability was influenced decisively by the measurable changes in the humuscontent. We hypothesise the formation of mineral Fe, Al and Mn phases, whichhave been developed from metal organic complexes, and also the transformation
Ž .of amorphous phases into more crystalline ones Tables 4 and 5 . The differenceŽ .between dithionite and oxalate extractable Al and Fe fractions Table 5 is
Table 5Ž .Dithionite and oxalate extractable contents of Fe, Al and MnrSi in the subsoil 30–35 cm of
loess parcelsy1 y1 y1Ž . Ž . Ž .1969 mol kg 1993 mol kg D1993–1969 mol kg
DithioniteAl 8.67ey02 8.6ey02 y6.56ey04Fe 1.47ey01 1.63ey01 1.61ey02Mn 9.61ey03 1.11ey02 1.53ey03
OxalateAl 6.12ey02 5.47ey02 y6.55ey03Fe 4.94ey02 2.64ey02 y2.30ey02
aSi n.d. n.d. –
Dithionite – oxalateAl 2.55ey02 3.14ey02 q5.90ey03Fe 9.75ey02 1.37ey01 q3.91ey02
an.d.sNot detectable.
( )M. Egli et al.rGeoderma 103 2001 307–334316
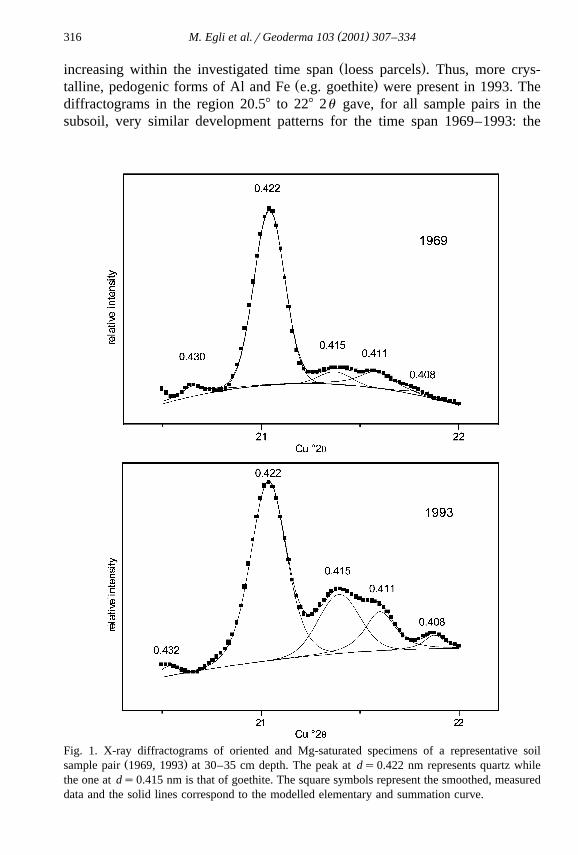
Ž .increasing within the investigated time span loess parcels . Thus, more crys-Ž .talline, pedogenic forms of Al and Fe e.g. goethite were present in 1993. The
diffractograms in the region 20.58 to 228 2u gave, for all sample pairs in thesubsoil, very similar development patterns for the time span 1969–1993: the
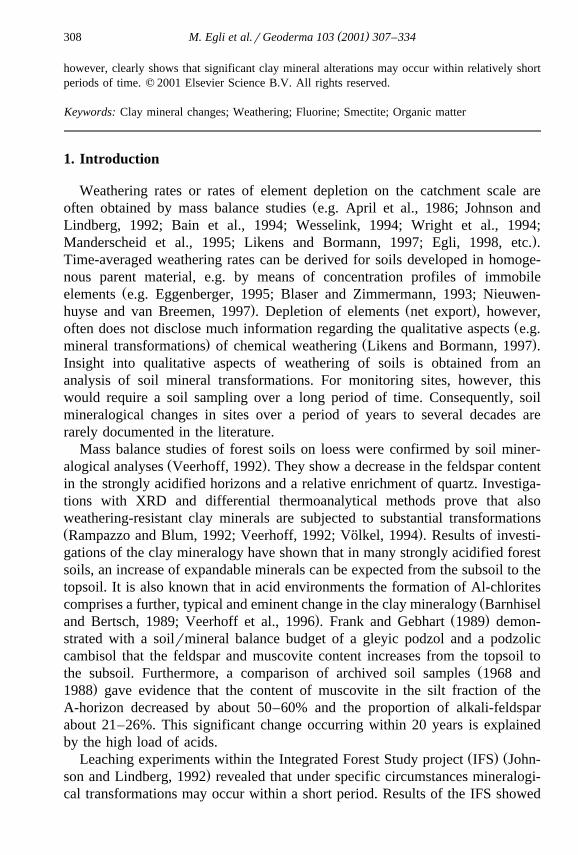
Fig. 1. X-ray diffractograms of oriented and Mg-saturated specimens of a representative soilŽ .sample pair 1969, 1993 at 30–35 cm depth. The peak atds0.422 nm represents quartz while
the one atds0.415 nm is that of goethite. The square symbols represent the smoothed, measureddata and the solid lines correspond to the modelled elementary and summation curve.
( )M. Egli et al.rGeoderma 103 2001 307–334 317
Ž .measured intensities of the goethite peakds0.415 nm were clearer andŽ .higher in 1993 Fig. 1 . Due to the high organic matter content in 1969, mostly
organic and amorphous phases of Fe were present, which have been conse-quently transformed into more crystallized forms after the removal of humusŽ .see also Schwertmann and Taylor, 1989 .
Due to the significant pH changes and decrease in organic matter, wehypothesised that the clay mineralogy must have also been affected within thistime period, although this would not be visible at first glance from the soilchemistry data.
4.2. Characterisation of phyllosilicates
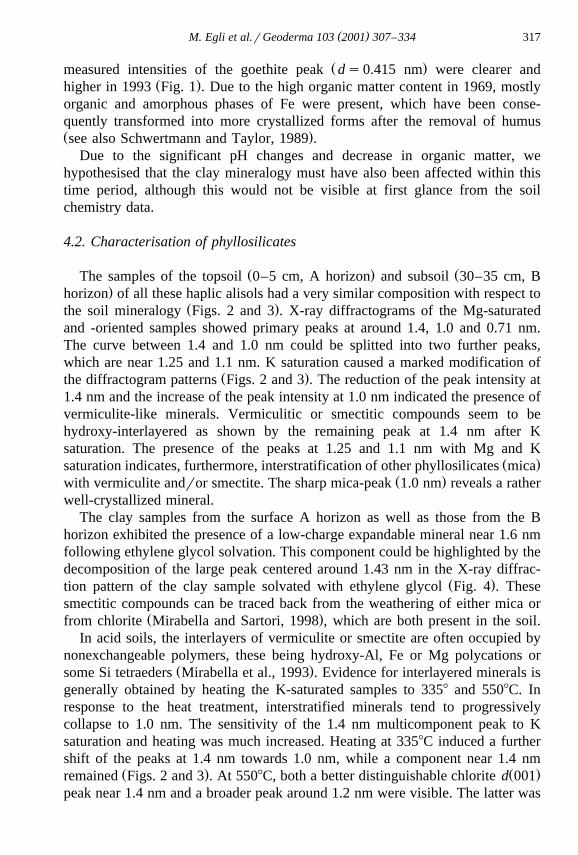
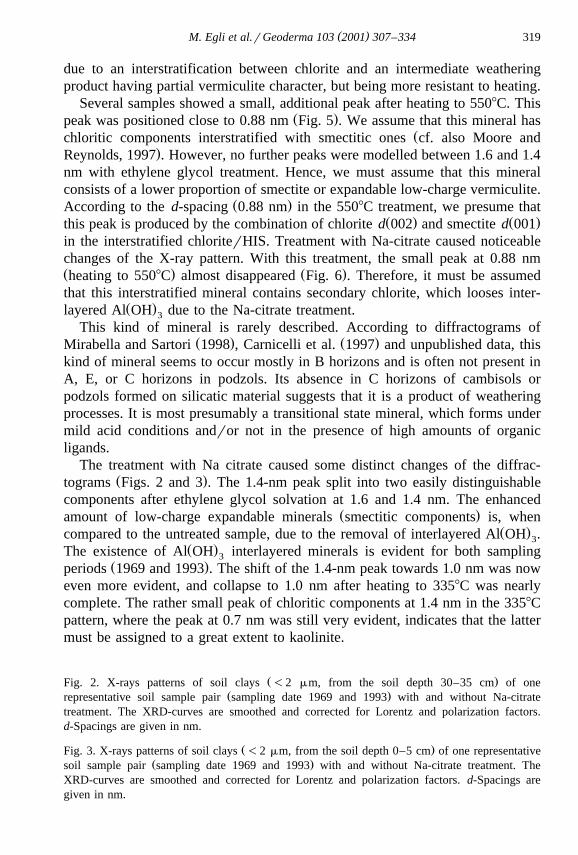
Ž . ŽThe samples of the topsoil 0–5 cm, A horizon and subsoil 30–35 cm, B.horizon of all these haplic alisols had a very similar composition with respect to
Ž .the soil mineralogy Figs. 2 and 3 . X-ray diffractograms of the Mg-saturatedand -oriented samples showed primary peaks at around 1.4, 1.0 and 0.71 nm.The curve between 1.4 and 1.0 nm could be splitted into two further peaks,which are near 1.25 and 1.1 nm. K saturation caused a marked modification of
Ž .the diffractogram patterns Figs. 2 and 3 . The reduction of the peak intensity at1.4 nm and the increase of the peak intensity at 1.0 nm indicated the presence ofvermiculite-like minerals. Vermiculitic or smectitic compounds seem to behydroxy-interlayered as shown by the remaining peak at 1.4 nm after Ksaturation. The presence of the peaks at 1.25 and 1.1 nm with Mg and K
Ž .saturation indicates, furthermore, interstratification of other phyllosilicates micaŽ .with vermiculite andror smectite. The sharp mica-peak 1.0 nm reveals a rather
well-crystallized mineral.The clay samples from the surface A horizon as well as those from the B
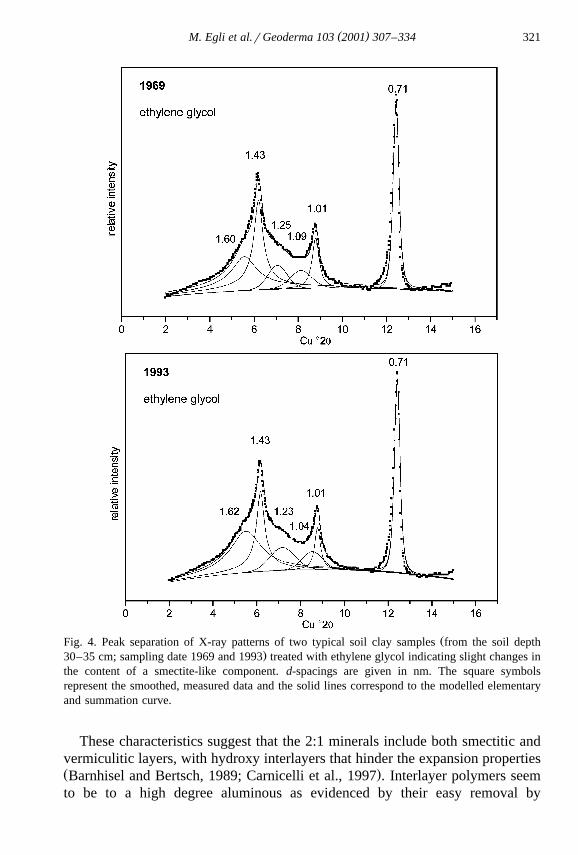
horizon exhibited the presence of a low-charge expandable mineral near 1.6 nmfollowing ethylene glycol solvation. This component could be highlighted by thedecomposition of the large peak centered around 1.43 nm in the X-ray diffrac-
Ž .tion pattern of the clay sample solvated with ethylene glycol Fig. 4 . Thesesmectitic compounds can be traced back from the weathering of either mica or
Ž .from chlorite Mirabella and Sartori, 1998 , which are both present in the soil.In acid soils, the interlayers of vermiculite or smectite are often occupied by
nonexchangeable polymers, these being hydroxy-Al, Fe or Mg polycations orŽ .some Si tetraeders Mirabella et al., 1993 . Evidence for interlayered minerals is
generally obtained by heating the K-saturated samples to 3358 and 5508C. Inresponse to the heat treatment, interstratified minerals tend to progressivelycollapse to 1.0 nm. The sensitivity of the 1.4 nm multicomponent peak to Ksaturation and heating was much increased. Heating at 3358C induced a furthershift of the peaks at 1.4 nm towards 1.0 nm, while a component near 1.4 nm
Ž . Ž .remained Figs. 2 and 3 . At 5508C, both a better distinguishable chlorited 001peak near 1.4 nm and a broader peak around 1.2 nm were visible. The latter was
( )M. Egli et al.rGeoderma 103 2001 307–334318
( )M. Egli et al.rGeoderma 103 2001 307–334 319
due to an interstratification between chlorite and an intermediate weatheringproduct having partial vermiculite character, but being more resistant to heating.
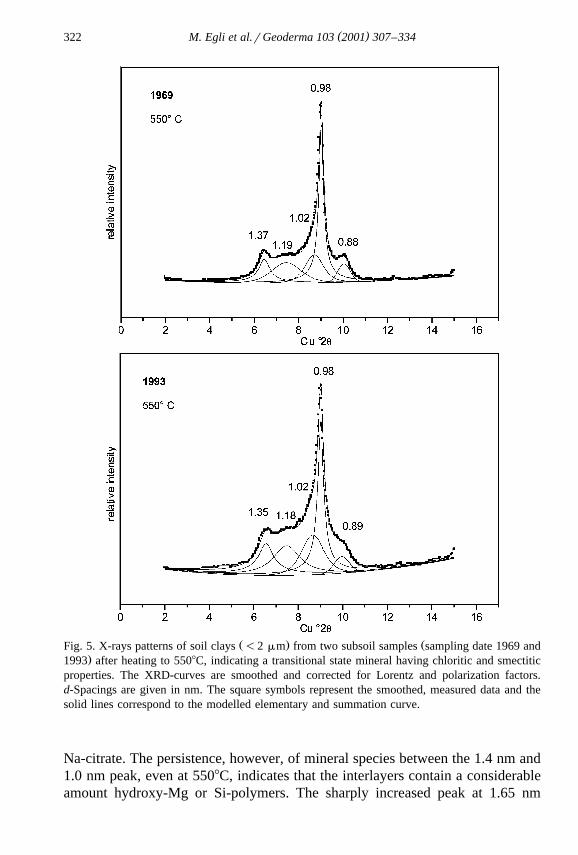
Several samples showed a small, additional peak after heating to 5508C. ThisŽ .peak was positioned close to 0.88 nm Fig. 5 . We assume that this mineral has
Žchloritic components interstratified with smectitic ones cf. also Moore and.Reynolds, 1997 . However, no further peaks were modelled between 1.6 and 1.4
nm with ethylene glycol treatment. Hence, we must assume that this mineralconsists of a lower proportion of smectite or expandable low-charge vermiculite.
Ž .According to thed-spacing 0.88 nm in the 5508C treatment, we presume thatŽ . Ž .this peak is produced by the combination of chlorited 002 and smectited 001
in the interstratified chloriterHIS. Treatment with Na-citrate caused noticeablechanges of the X-ray pattern. With this treatment, the small peak at 0.88 nmŽ . Ž .heating to 5508C almost disappeared Fig. 6 . Therefore, it must be assumedthat this interstratified mineral contains secondary chlorite, which looses inter-
Ž .layered Al OH due to the Na-citrate treatment.3
This kind of mineral is rarely described. According to diffractograms ofŽ . Ž .Mirabella and Sartori 1998 , Carnicelli et al. 1997 and unpublished data, this
kind of mineral seems to occur mostly in B horizons and is often not present inA, E, or C horizons in podzols. Its absence in C horizons of cambisols orpodzols formed on silicatic material suggests that it is a product of weatheringprocesses. It is most presumably a transitional state mineral, which forms undermild acid conditions andror not in the presence of high amounts of organicligands.
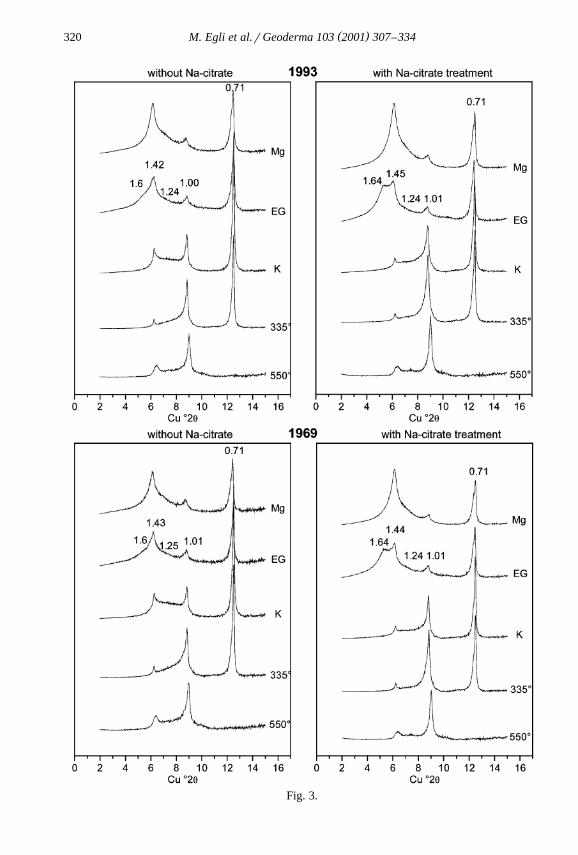
The treatment with Na citrate caused some distinct changes of the diffrac-Ž .tograms Figs. 2 and 3 . The 1.4-nm peak split into two easily distinguishable
components after ethylene glycol solvation at 1.6 and 1.4 nm. The enhancedŽ .amount of low-charge expandable minerals smectitic components is, when
Ž .compared to the untreated sample, due to the removal of interlayered Al OH .3Ž .The existence of Al OH interlayered minerals is evident for both sampling3
Ž .periods 1969 and 1993 . The shift of the 1.4-nm peak towards 1.0 nm was noweven more evident, and collapse to 1.0 nm after heating to 3358C was nearlycomplete. The rather small peak of chloritic components at 1.4 nm in the 3358Cpattern, where the peak at 0.7 nm was still very evident, indicates that the lattermust be assigned to a great extent to kaolinite.
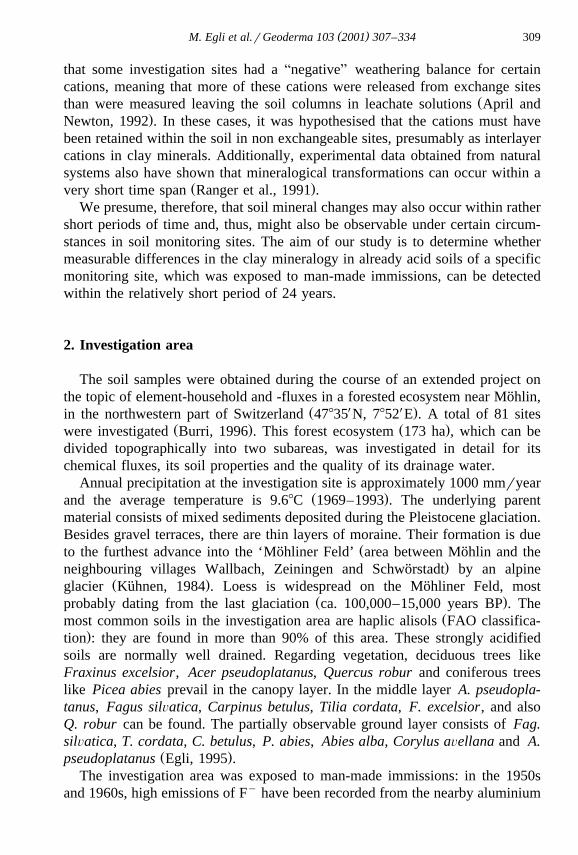
Ž .Fig. 2. X-rays patterns of soil clays-2 mm, from the soil depth 30–35 cm of oneŽ .representative soil sample pair sampling date 1969 and 1993 with and without Na-citrate
treatment. The XRD-curves are smoothed and corrected for Lorentz and polarization factors.d-Spacings are given in nm.
Ž .Fig. 3. X-rays patterns of soil clays-2 mm, from the soil depth 0–5 cm of one representativeŽ .soil sample pair sampling date 1969 and 1993 with and without Na-citrate treatment. The
XRD-curves are smoothed and corrected for Lorentz and polarization factors.d-Spacings aregiven in nm.
( )M. Egli et al.rGeoderma 103 2001 307–334320
Fig. 3.
( )M. Egli et al.rGeoderma 103 2001 307–334 321
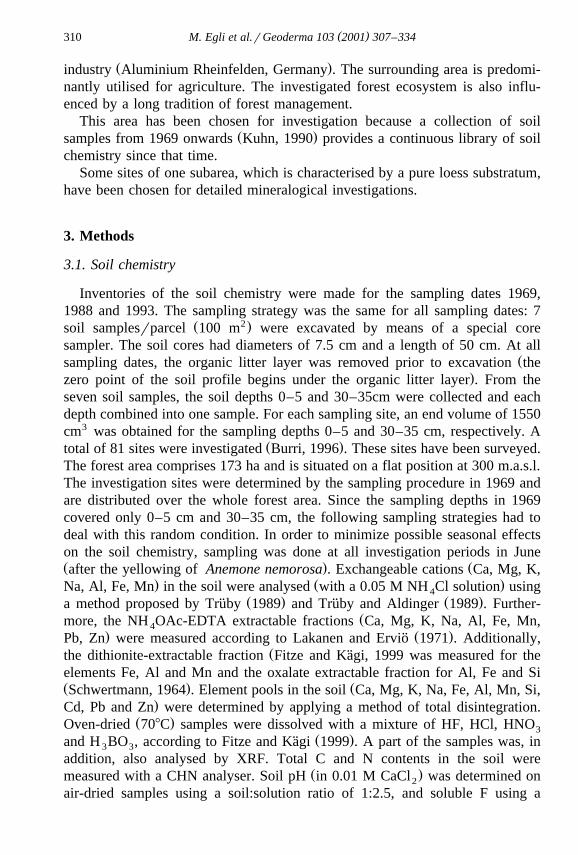
ŽFig. 4. Peak separation of X-ray patterns of two typical soil clay samples from the soil depth.30–35 cm; sampling date 1969 and 1993 treated with ethylene glycol indicating slight changes in
the content of a smectite-like component.d-spacings are given in nm. The square symbolsrepresent the smoothed, measured data and the solid lines correspond to the modelled elementaryand summation curve.
These characteristics suggest that the 2:1 minerals include both smectitic andvermiculitic layers, with hydroxy interlayers that hinder the expansion propertiesŽ .Barnhisel and Bertsch, 1989; Carnicelli et al., 1997 . Interlayer polymers seemto be to a high degree aluminous as evidenced by their easy removal by
( )M. Egli et al.rGeoderma 103 2001 307–334322
Ž . ŽFig. 5. X-rays patterns of soil clays-2 mm from two subsoil samples sampling date 1969 and.1993 after heating to 5508C, indicating a transitional state mineral having chloritic and smectitic
properties. The XRD-curves are smoothed and corrected for Lorentz and polarization factors.d-Spacings are given in nm. The square symbols represent the smoothed, measured data and thesolid lines correspond to the modelled elementary and summation curve.
Na-citrate. The persistence, however, of mineral species between the 1.4 nm and1.0 nm peak, even at 5508C, indicates that the interlayers contain a considerableamount hydroxy-Mg or Si-polymers. The sharply increased peak at 1.65 nm
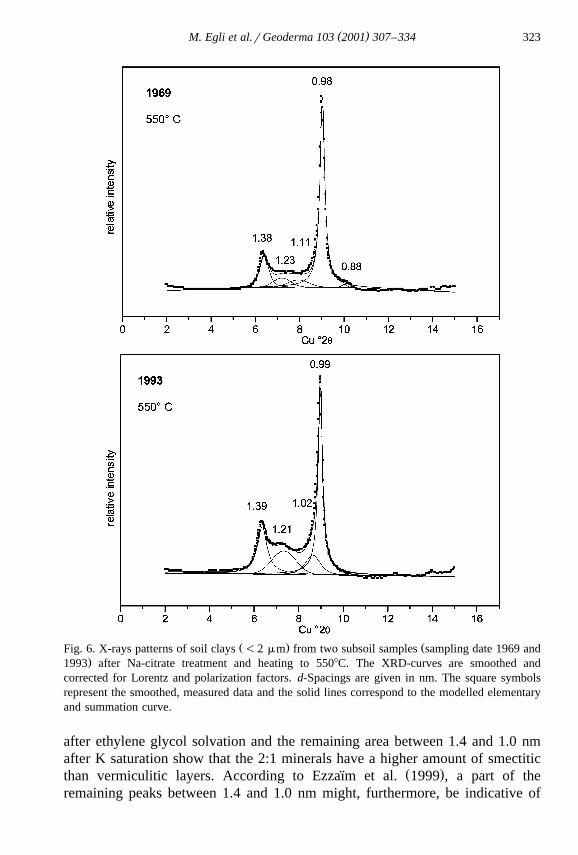
( )M. Egli et al.rGeoderma 103 2001 307–334 323
Ž . ŽFig. 6. X-rays patterns of soil clays-2 mm from two subsoil samples sampling date 1969 and.1993 after Na-citrate treatment and heating to 5508C. The XRD-curves are smoothed and
corrected for Lorentz and polarization factors.d-Spacings are given in nm. The square symbolsrepresent the smoothed, measured data and the solid lines correspond to the modelled elementaryand summation curve.
after ethylene glycol solvation and the remaining area between 1.4 and 1.0 nmafter K saturation show that the 2:1 minerals have a higher amount of smectitic
Ž .than vermiculitic layers. According to Ezzaım et al. 1999 , a part of the¨remaining peaks between 1.4 and 1.0 nm might, furthermore, be indicative of
( )M. Egli et al.rGeoderma 103 2001 307–334324
different types of mica-HIV interstratified minerals with different mica layerproportions.
4.3. ObserÕed changes in the phyllosilicate assemblage
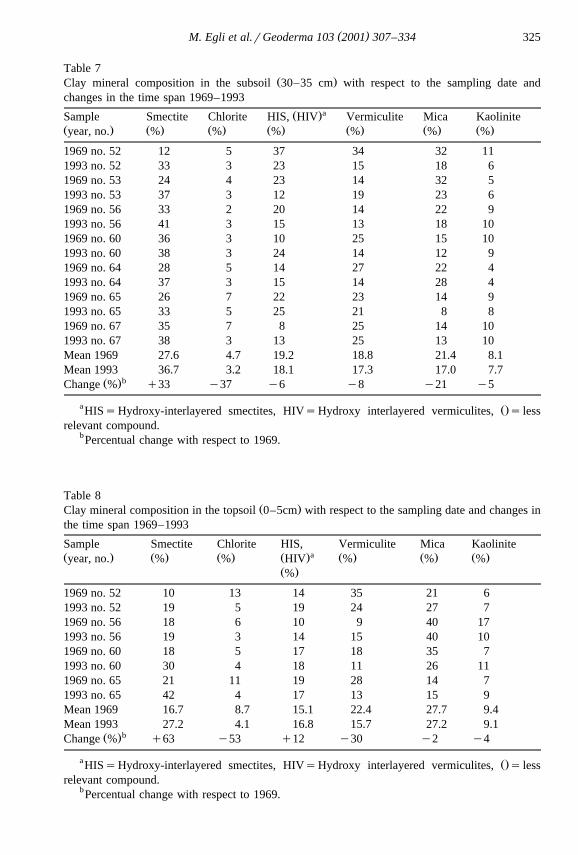
Integral intensities of peaks in the X-ray diffractograms can give an estimateof the minerals present in the sample. In order to calculate the content of several
Žclay mineral species, we reduced the system to the sum of HIV hydroxy.interlayered vermiculites , smectite, vermiculite, mica, chlorite and kaolinite,
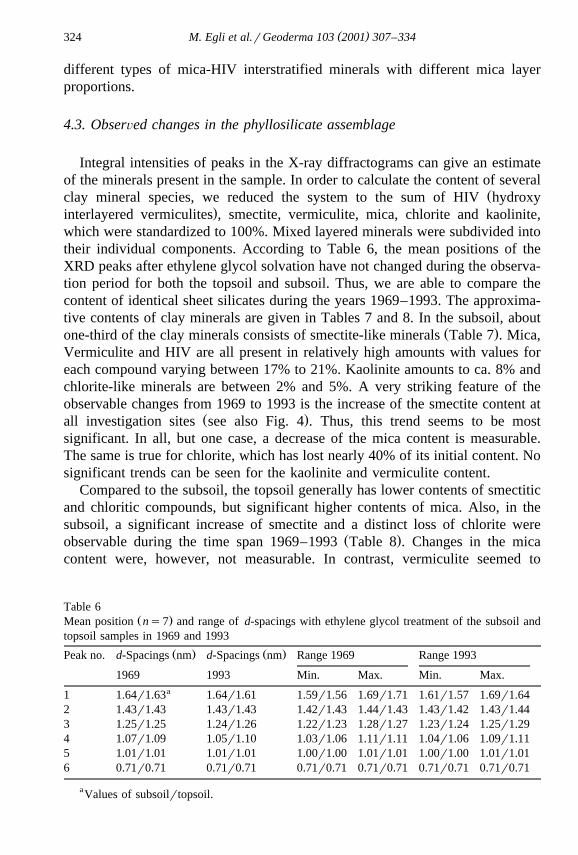
which were standardized to 100%. Mixed layered minerals were subdivided intotheir individual components. According to Table 6, the mean positions of theXRD peaks after ethylene glycol solvation have not changed during the observa-tion period for both the topsoil and subsoil. Thus, we are able to compare thecontent of identical sheet silicates during the years 1969–1993. The approxima-tive contents of clay minerals are given in Tables 7 and 8. In the subsoil, about
Ž .one-third of the clay minerals consists of smectite-like minerals Table 7 . Mica,Vermiculite and HIV are all present in relatively high amounts with values foreach compound varying between 17% to 21%. Kaolinite amounts to ca. 8% andchlorite-like minerals are between 2% and 5%. A very striking feature of theobservable changes from 1969 to 1993 is the increase of the smectite content at
Ž .all investigation sites see also Fig. 4 . Thus, this trend seems to be mostsignificant. In all, but one case, a decrease of the mica content is measurable.The same is true for chlorite, which has lost nearly 40% of its initial content. Nosignificant trends can be seen for the kaolinite and vermiculite content.
Compared to the subsoil, the topsoil generally has lower contents of smectiticand chloritic compounds, but significant higher contents of mica. Also, in thesubsoil, a significant increase of smectite and a distinct loss of chlorite were
Ž .observable during the time span 1969–1993 Table 8 . Changes in the micacontent were, however, not measurable. In contrast, vermiculite seemed to
Table 6Ž .Mean position ns7 and range ofd-spacings with ethylene glycol treatment of the subsoil and
topsoil samples in 1969 and 1993
Ž . Ž .Peak no. d-Spacings nm d-Spacings nm Range 1969 Range 1993
1969 1993 Min. Max. Min. Max.a1 1.64r1.63 1.64r1.61 1.59r1.56 1.69r1.71 1.61r1.57 1.69r1.64
2 1.43r1.43 1.43r1.43 1.42r1.43 1.44r1.43 1.43r1.42 1.43r1.443 1.25r1.25 1.24r1.26 1.22r1.23 1.28r1.27 1.23r1.24 1.25r1.294 1.07r1.09 1.05r1.10 1.03r1.06 1.11r1.11 1.04r1.06 1.09r1.115 1.01r1.01 1.01r1.01 1.00r1.00 1.01r1.01 1.00r1.00 1.01r1.016 0.71r0.71 0.71r0.71 0.71r0.71 0.71r0.71 0.71r0.71 0.71r0.71
aValues of subsoilrtopsoil.
( )M. Egli et al.rGeoderma 103 2001 307–334 325
Table 7Ž .Clay mineral composition in the subsoil 30–35 cm with respect to the sampling date and
changes in the time span 1969–1993aŽ .Sample Smectite Chlorite HIS, HIV Vermiculite Mica Kaolinite
Ž . Ž . Ž . Ž . Ž . Ž . Ž .year, no. % % % % % %
1969 no. 52 12 5 37 34 32 111993 no. 52 33 3 23 15 18 61969 no. 53 24 4 23 14 32 51993 no. 53 37 3 12 19 23 61969 no. 56 33 2 20 14 22 91993 no. 56 41 3 15 13 18 101969 no. 60 36 3 10 25 15 101993 no. 60 38 3 24 14 12 91969 no. 64 28 5 14 27 22 41993 no. 64 37 3 15 14 28 41969 no. 65 26 7 22 23 14 91993 no. 65 33 5 25 21 8 81969 no. 67 35 7 8 25 14 101993 no. 67 38 3 13 25 13 10Mean 1969 27.6 4.7 19.2 18.8 21.4 8.1Mean 1993 36.7 3.2 18.1 17.3 17.0 7.7
bŽ .Change % q33 y37 y6 y8 y21 y5
a Ž.HISsHydroxy-interlayered smectites, HIVsHydroxy interlayered vermiculites, s lessrelevant compound.
bPercentual change with respect to 1969.
Table 8Ž .Clay mineral composition in the topsoil 0–5cm with respect to the sampling date and changes in
the time span 1969–1993
Sample Smectite Chlorite HIS, Vermiculite Mica KaoliniteaŽ . Ž . Ž . Ž . Ž . Ž . Ž .year, no. % % HIV % % %
Ž .%
1969 no. 52 10 13 14 35 21 61993 no. 52 19 5 19 24 27 71969 no. 56 18 6 10 9 40 171993 no. 56 19 3 14 15 40 101969 no. 60 18 5 17 18 35 71993 no. 60 30 4 18 11 26 111969 no. 65 21 11 19 28 14 71993 no. 65 42 4 17 13 15 9Mean 1969 16.7 8.7 15.1 22.4 27.7 9.4Mean 1993 27.2 4.1 16.8 15.7 27.2 9.1
bŽ .Change % q63 y53 q12 y30 y2 y4
a Ž.HISsHydroxy-interlayered smectites, HIVsHydroxy interlayered vermiculites, s lessrelevant compound.
bPercentual change with respect to 1969.
( )M. Egli et al.rGeoderma 103 2001 307–334326
decrease. Smectite formation in the topsoil is, thus, due to the transformation ofchlorite and vermiculite.
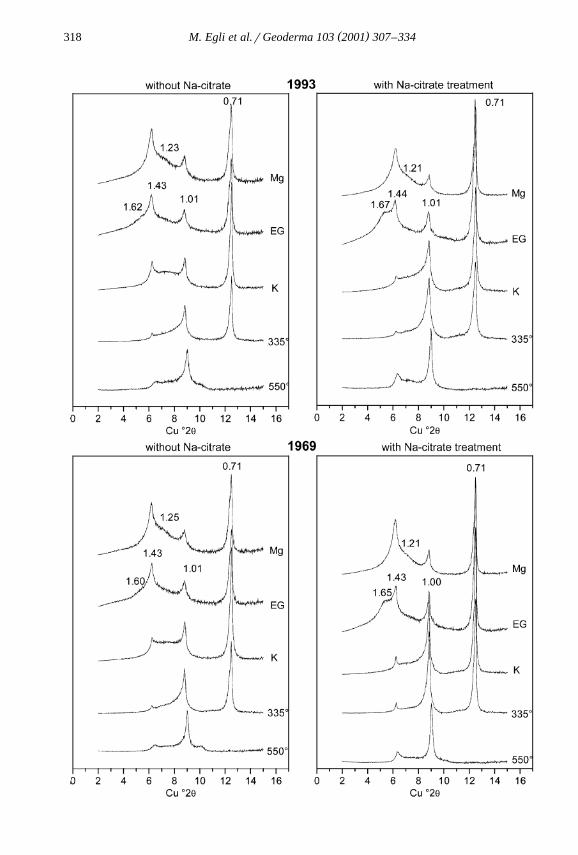
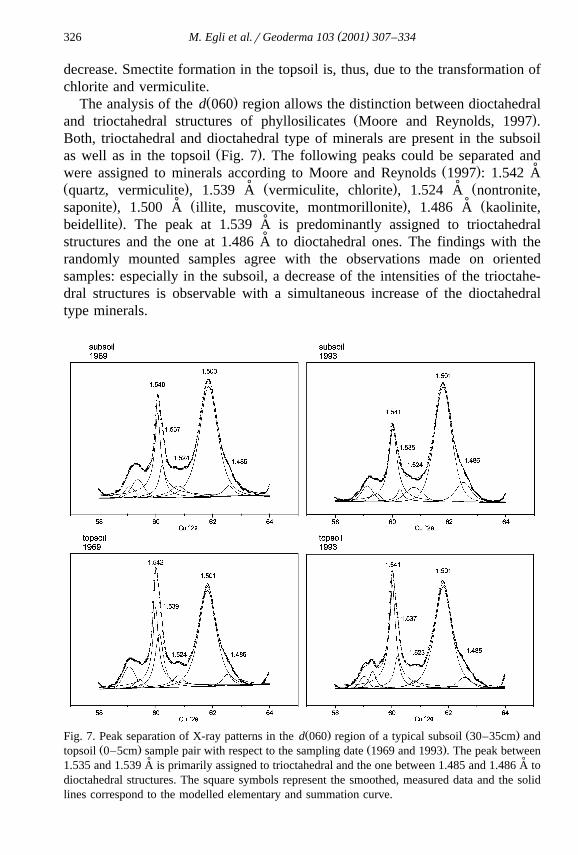
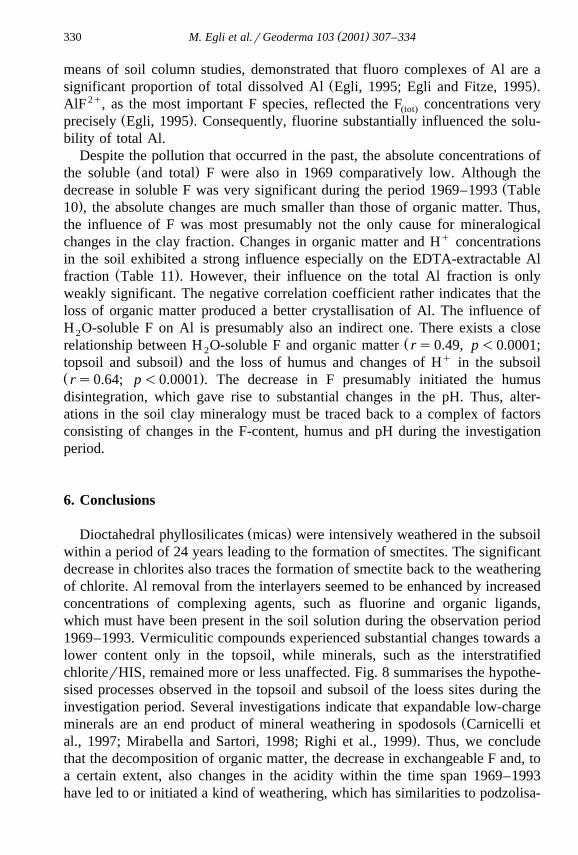
Ž .The analysis of thed 060 region allows the distinction between dioctahedralŽ .and trioctahedral structures of phyllosilicates Moore and Reynolds, 1997 .
Both, trioctahedral and dioctahedral type of minerals are present in the subsoilŽ .as well as in the topsoil Fig. 7 . The following peaks could be separated and
˚Ž .were assigned to minerals according to Moore and Reynolds 1997 : 1.542 A˚ ˚Ž . Ž . Žquartz, vermiculite , 1.539 A vermiculite, chlorite , 1.524 A nontronite,
˚ ˚. Ž . Žsaponite , 1.500 A illite, muscovite, montmorillonite , 1.486 A kaolinite,˚.beidellite . The peak at 1.539 A is predominantly assigned to trioctahedral˚structures and the one at 1.486 A to dioctahedral ones. The findings with the
randomly mounted samples agree with the observations made on orientedsamples: especially in the subsoil, a decrease of the intensities of the trioctahe-dral structures is observable with a simultaneous increase of the dioctahedraltype minerals.
Ž . Ž .Fig. 7. Peak separation of X-ray patterns in thed 060 region of a typical subsoil 30–35cm andŽ . Ž .topsoil 0–5cm sample pair with respect to the sampling date 1969 and 1993 . The peak between
˚ ˚1.535 and 1.539 A is primarily assigned to trioctahedral and the one between 1.485 and 1.486 A todioctahedral structures. The square symbols represent the smoothed, measured data and the solidlines correspond to the modelled elementary and summation curve.
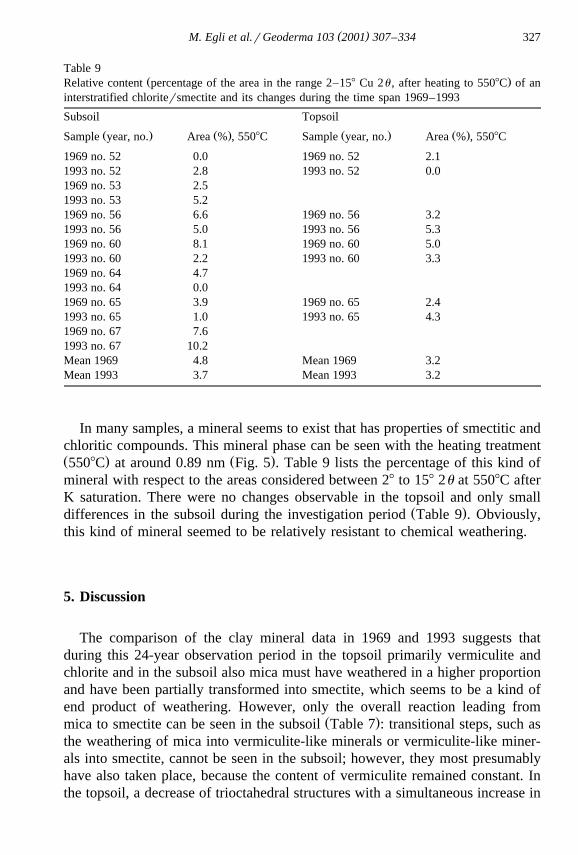
( )M. Egli et al.rGeoderma 103 2001 307–334 327
Table 9Ž .Relative content percentage of the area in the range 2–158 Cu 2u , after heating to 5508C of an
interstratified chloritersmectite and its changes during the time span 1969–1993
Subsoil Topsoil
Ž . Ž . Ž . Ž .Sample year, no. Area % , 5508C Sample year, no. Area % , 5508C
1969 no. 52 0.0 1969 no. 52 2.11993 no. 52 2.8 1993 no. 52 0.01969 no. 53 2.51993 no. 53 5.21969 no. 56 6.6 1969 no. 56 3.21993 no. 56 5.0 1993 no. 56 5.31969 no. 60 8.1 1969 no. 60 5.01993 no. 60 2.2 1993 no. 60 3.31969 no. 64 4.71993 no. 64 0.01969 no. 65 3.9 1969 no. 65 2.41993 no. 65 1.0 1993 no. 65 4.31969 no. 67 7.61993 no. 67 10.2Mean 1969 4.8 Mean 1969 3.2Mean 1993 3.7 Mean 1993 3.2
In many samples, a mineral seems to exist that has properties of smectitic andchloritic compounds. This mineral phase can be seen with the heating treatmentŽ . Ž .5508C at around 0.89 nm Fig. 5 . Table 9 lists the percentage of this kind ofmineral with respect to the areas considered between 28 to 158 2u at 5508C afterK saturation. There were no changes observable in the topsoil and only small
Ž .differences in the subsoil during the investigation period Table 9 . Obviously,this kind of mineral seemed to be relatively resistant to chemical weathering.
5. Discussion
The comparison of the clay mineral data in 1969 and 1993 suggests thatduring this 24-year observation period in the topsoil primarily vermiculite andchlorite and in the subsoil also mica must have weathered in a higher proportionand have been partially transformed into smectite, which seems to be a kind ofend product of weathering. However, only the overall reaction leading from
Ž .mica to smectite can be seen in the subsoil Table 7 : transitional steps, such asthe weathering of mica into vermiculite-like minerals or vermiculite-like miner-als into smectite, cannot be seen in the subsoil; however, they most presumablyhave also taken place, because the content of vermiculite remained constant. Inthe topsoil, a decrease of trioctahedral structures with a simultaneous increase in
( )M. Egli et al.rGeoderma 103 2001 307–334328
dioctahedral type minerals can be observed. The changes there, however, seemŽ .to be less pronounced Fig. 7 than in the subsoil.
Ž .Our findings are consistent with results of Righi et al. 1999 . Especially inpodzols, appreciable weathering of mica into mica-smectite mixed-layers andsmectite can be found. In strongly aggressive systems, Fe–Mg andror trioctahe-dral phyllosilicates were rapidly altered, their destruction being almost completeafter 3000 years of soil development. The transformation of K-bearing micasinto expandable 2:1 minerals has been evidenced by artificial weathering studies
Ž .and investigations under natural conditions Fanning et al., 1989 . The apprecia-ble transformation of mica into smectite-like minerals, which is observed in ourstudy is, thus, in strong agreement with this process. The overall weatheringtransformations might be more complicated, e.g. due to the formation of
Žtransitional phases, such as hydroxy-Al interlayers under acid conditions Fan-.ning et al., 1989 and their subsequent removal.
Ž .According to Mirabella and Sartori 1998 , low-charge expandable mineralsmay also be formed through the removal of hydroxy interlayers of chlorites orchloritervermiculite intergrades and the reduction of layer charge. Also, Carni-
Ž .celli et al. 1997 confirm with their investigations that chlorite can transformŽ . Žinto a low-charge expandable mineral. Gjems 1967b cited in Righi and
.Meunier, 1995 already deduced from XRD analysis of clay minerals of podzolsthat smectites form in the E horizon at the expense of chlorite and vermiculiteand that mixed-layer minerals become less chloritic upwards in the profile.
Ž .Additionally, Gjems 1967b shows that the smectite content increases upwardsin the soil profile inversely with trioctahedral mica, chlorite, micarchlorite andmicarvermiculite interstratified minerals. With respect to possible processes,
Ž .our findings fit well with the results of Gjems 1967b .There are, however, nearly no investigations showing substantial mineral
transformations within such a short time span. In long-term field experiments inDenmark, 60–90 years of K depletion by cropping caused weathering of mica to
Žsmectite and smectite-rich interstratified minerals Møberg and Dissing Nielson,.1983; Dissing Nielson and Møberg, 1984 . Neither different fertilizer treatments
nor continuous cropping for 140 years caused any significant changes in theXRD pattern of the-2 mm fraction of the soils of wheat experimental plots at
Ž .Rothamsted Singh and Goulding, 1997 .The changes in the clay mineralogy must be seen in the context of the
observed humus depletion from 1969 to 1993. Organic ligands, which wereproduced during the humus disintegration, removed interlayered Al of chloritesor interlayered minerals, which, consequently, transformed into smectites. Theattack of acids and organic ligands most presumably caused a decrease of micaand its transformation into smectite like minerals. Since the investigated soils
Ž .have accumulated F in the past 1950s and 60s , the decrease in the H O soluble2Ž .F content of the soils during the observation period Table 10 most presumably
made its contribution to the Al removal of interlayered Al: fluorine has a strong
( )M. Egli et al.rGeoderma 103 2001 307–334 329
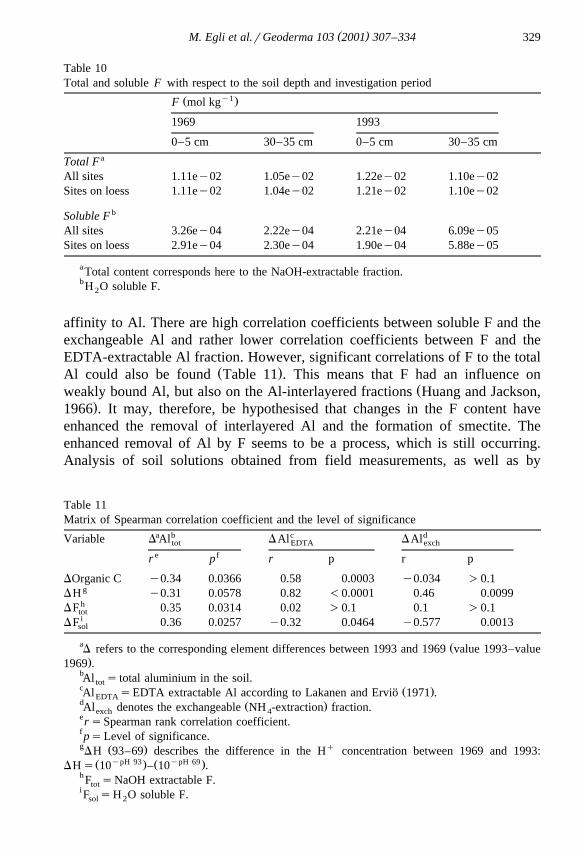
Table 10Total and solubleF with respect to the soil depth and investigation period
y1Ž .F mol kg
1969 1993
0–5 cm 30–35 cm 0–5 cm 30–35 cmaTotal F
All sites 1.11ey02 1.05ey02 1.22ey02 1.10ey02Sites on loess 1.11ey02 1.04ey02 1.21ey02 1.10ey02
bSoluble FAll sites 3.26ey04 2.22ey04 2.21ey04 6.09ey05Sites on loess 2.91ey04 2.30ey04 1.90ey04 5.88ey05
aTotal content corresponds here to the NaOH-extractable fraction.bH O soluble F.2
affinity to Al. There are high correlation coefficients between soluble F and theexchangeable Al and rather lower correlation coefficients between F and theEDTA-extractable Al fraction. However, significant correlations of F to the total
Ž .Al could also be found Table 11 . This means that F had an influence onŽweakly bound Al, but also on the Al-interlayered fractions Huang and Jackson,
.1966 . It may, therefore, be hypothesised that changes in the F content haveenhanced the removal of interlayered Al and the formation of smectite. Theenhanced removal of Al by F seems to be a process, which is still occurring.Analysis of soil solutions obtained from field measurements, as well as by
Table 11Matrix of Spearman correlation coefficient and the level of significance
a b c dVariable DAl DAl DAltot EDTA exch
e fr p r p r p
DOrganic C y0.34 0.0366 0.58 0.0003 y0.034 )0.1g
DH y0.31 0.0578 0.82 -0.0001 0.46 0.0099h
DF 0.35 0.0314 0.02 )0.1 0.1 )0.1toti
DF 0.36 0.0257 y0.32 0.0464 y0.577 0.0013sol
a ŽD refers to the corresponding element differences between 1993 and 1969 value 1993–value.1969 .
bAl s total aluminium in the soil.totc Ž .Al sEDTA extractable Al according to Lakanen and Ervio 1971 .¨EDTAd Ž .Al denotes the exchangeable NH -extraction fraction.exch 4ersSpearman rank correlation coefficient.f psLevel of significance.g Ž . qDH 93–69 describes the difference in the H concentration between 1969 and 1993:Ž ypH 93. Ž ypH 69.DHs 10 – 10 .
hF sNaOH extractable F.toti F sH O soluble F.sol 2
( )M. Egli et al.rGeoderma 103 2001 307–334330
means of soil column studies, demonstrated that fluoro complexes of Al are aŽ .significant proportion of total dissolved Al Egli, 1995; Egli and Fitze, 1995 .
AlF 2q, as the most important F species, reflected the F concentrations veryŽtot.Ž .precisely Egli, 1995 . Consequently, fluorine substantially influenced the solu-
bility of total Al.Despite the pollution that occurred in the past, the absolute concentrations of
Ž .the soluble and total F were also in 1969 comparatively low. Although theŽdecrease in soluble F was very significant during the period 1969–1993 Table
.10 , the absolute changes are much smaller than those of organic matter. Thus,the influence of F was most presumably not the only cause for mineralogicalchanges in the clay fraction. Changes in organic matter and Hq concentrationsin the soil exhibited a strong influence especially on the EDTA-extractable Al
Ž .fraction Table 11 . However, their influence on the total Al fraction is onlyweakly significant. The negative correlation coefficient rather indicates that theloss of organic matter produced a better crystallisation of Al. The influence ofH O-soluble F on Al is presumably also an indirect one. There exists a close2
Žrelationship between H O-soluble F and organic matterrs0.49, p-0.0001;2. qtopsoil and subsoil and the loss of humus and changes of H in the subsoil
Ž .rs0.64; p-0.0001 . The decrease in F presumably initiated the humusdisintegration, which gave rise to substantial changes in the pH. Thus, alter-ations in the soil clay mineralogy must be traced back to a complex of factorsconsisting of changes in the F-content, humus and pH during the investigationperiod.
6. Conclusions
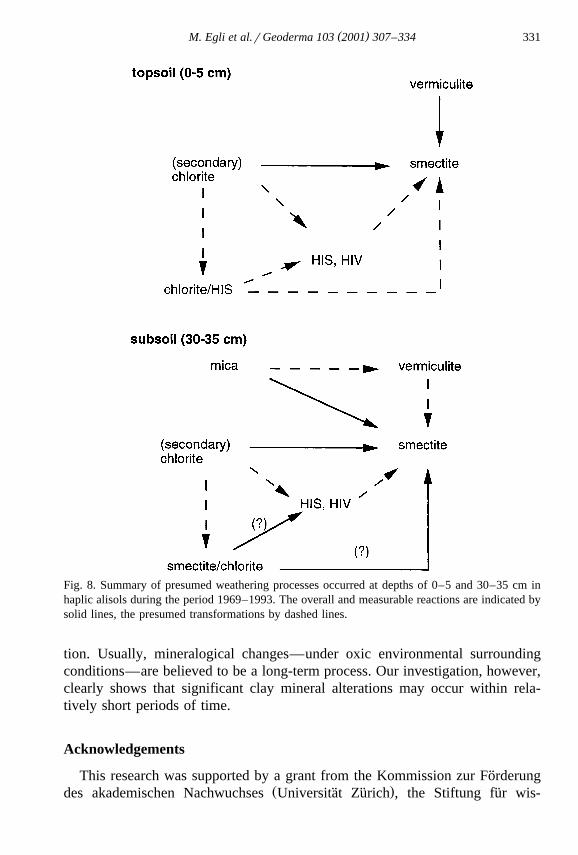
Ž .Dioctahedral phyllosilicates micas were intensively weathered in the subsoilwithin a period of 24 years leading to the formation of smectites. The significantdecrease in chlorites also traces the formation of smectite back to the weatheringof chlorite. Al removal from the interlayers seemed to be enhanced by increasedconcentrations of complexing agents, such as fluorine and organic ligands,which must have been present in the soil solution during the observation period1969–1993. Vermiculitic compounds experienced substantial changes towards alower content only in the topsoil, while minerals, such as the interstratifiedchloriterHIS, remained more or less unaffected. Fig. 8 summarises the hypothe-sised processes observed in the topsoil and subsoil of the loess sites during theinvestigation period. Several investigations indicate that expandable low-charge
Žminerals are an end product of mineral weathering in spodosols Carnicelli et.al., 1997; Mirabella and Sartori, 1998; Righi et al., 1999 . Thus, we conclude
that the decomposition of organic matter, the decrease in exchangeable F and, toa certain extent, also changes in the acidity within the time span 1969–1993have led to or initiated a kind of weathering, which has similarities to podzolisa-
( )M. Egli et al.rGeoderma 103 2001 307–334 331
Fig. 8. Summary of presumed weathering processes occurred at depths of 0–5 and 30–35 cm inhaplic alisols during the period 1969–1993. The overall and measurable reactions are indicated bysolid lines, the presumed transformations by dashed lines.
tion. Usually, mineralogical changes—under oxic environmental surroundingconditions—are believed to be a long-term process. Our investigation, however,clearly shows that significant clay mineral alterations may occur within rela-tively short periods of time.
Acknowledgements
This research was supported by a grant from the Kommission zur Forderung¨Ž .des akademischen Nachwuchses Universitat Zurich , the Stiftung fur wis-¨ ¨ ¨
( )M. Egli et al.rGeoderma 103 2001 307–334332
senschaftliche Forschung an der Universitat Zurich, by the Consiglio Nationale¨ ¨Ž .delle Ricerche Italy and by the Swiss National Foundation. We are indebted to
B. Kaegi and W. Dann for the laboratory work and to Dr. Robert and Dr. Righifor their helpful comments on an earlier version of the manuscript.
References
April, R., Newton, R., 1992. Mineralogy and mineral weathering. In: Johnson, D.W., Lindberg,Ž .S.E. Eds. , Atmospheric Deposition and Forest Nutrient Cycling. Springer-Verlag, New York,
pp. 378–425.April, R., Newton, R., Coles, L., 1986. Chemical weathering in two Adirondack watersheds: past
and present-day rates. Geol. Soc. Am. Bull. 97, 1232–1238.Bain, D.C., Mellor, A., Wilson, M.J., Duthie, D.M.L., 1994. Chemical and mineralogical
weathering rates and processes in an upland granitic till catchment in Scotland. Water, Air,Soil Pollut. 73, 11–27.
Barnhisel, R.I., Bertsch, P.M., 1989. Chlorites and hydroxy-interlayered vermiculite and smectite.Ž .In: Dixon, J.B., Weed, S.B. Eds. , Minerals in Soil Environments. 2nd edn. Soil Sci. Soc.
Am., Book Ser., vol. 1, pp. 729–788, Madison, WI, USA.Blaser, P., Zimmermann, S., 1993. Analytical problems in the determination of inorganic soil
Ž .contaminants. In: Schulin, R., Desaules, A., Webster, R., von Steiger, B. Eds. , SoilMonitoring—Early Detection and Surveying of Soil Contamination and Degradation.Birkhauser Verlag, Basel, pp. 201–218.¨
Burri, A., 1996. Retrospektive Erfassung von Veranderungen bodenchemischer Eigenschaften¨unter spezieller Berucksichtigung der Aziditat. PhD thesis, Universitat Zurich, Zurich, Switzer-¨ ¨ ¨ ¨ ¨land.
Carnicelli, S., Mirabella, A., Cecchini, G., Sanesi, G., 1997. Weathering of chlorite to alow-charge expandable mineral in a spodosol on the Apennine mountains, Italy. Clays ClayMiner. 45, 28–41.
Dissing Nielson, J., Møberg, J.P., 1984. The influence of K-depletion on mineralogical changes inpedons from two field experiments and in soils from four pot experiments. Acta Agric. Scand.34, 391–399.
Eggenberger, U., 1995. Mineral weathering in soils: experiments, field studies, and modeling. PhDthesis, University of Berne, Switzerland.
Egli, M., 1995. The influence of increased NHq deposition rates on aluminium chemistry and4
alkalinity in the percolate of acid soils. Schriftenr. Phys. Geogr. 37, Zurich.¨Egli, M., 1998. Estimates of current and historical fluxes of N, Ca, and K in the forest ecosystem
Mohlin. Geol. J. 44, 73–89.¨Egli, M., Fitze, P., 1995. The influence of increased NHq deposition rates on aluminium4
chemistry in the percolate of acid soils. Eur. J. Soil Sci. 46, 439–447.Egli, M., Burri, A., Fitze, P., 1997. Aktuelle und Vergangene Stoffflusse im Anthropogen¨
Beeinflussten Waldokosystem Mohlin. vdf-Verlag, Zurich.¨ ¨ ¨Egli, M., Fitze, P., Oswald, M., 1999. Changes in heavy metal contents in an acidic forest soil
affected by depletion of soil organic matter within the time span 1969–1993. Environ. Pollut.105, 367–379.
Ezzaım, A., Turpault, M.-P., Ranger, J., 1999. Quantification of weathering processes in an acid¨Ž .brown soil developed from tuff Beaujolais, France : Part II. Soil formation. Geoderma 87,
155–177.
( )M. Egli et al.rGeoderma 103 2001 307–334 333
Ž .FAC Eidgenossische Forschungsanstalt fur Agrikulturchemie und Umwelthygiene , 1989. Metho-¨ ¨den fur Bodenuntersuchungen. FAC, Liebefeld-Bern, Switzerland.¨
Fanning, D.S., Keramidas, V.Z., El-Desoky, M.A., 1989. Micas. In: Dixon, J.B., Weed, S.B.Ž .Eds. , Minerals in Soil Environments. 2nd edn. Soil Sci. Soc. Am., Book Series, vol. 1, pp.551–634, Madison, WI, USA.
Fitze, P., Kagi, B., 1999. Laboranleitung zur Untersuchung von Boden und Wasser. Geographis-¨ches Institut der Universitat Zurich, Zurich, Switzerland.¨ ¨ ¨
Frank, U., Gebhart, H., 1989. Mineralverwitterung, Tonmineralumwandlung und Tonzerstorung¨als Folge starker Bodenversauerung auf ausgewahlten Waldstandorten. Mitt. Dtsch. Bodenkd.¨
Ž .Ges. 59 II , 1163–1168.Gjems, O., 1967a. Studies on clay minerals and clay mineral formation in soil profiles in
Scandinavia. Nor. Skogfersoeksves., Medd. 81, 301–415.Gjems, O., 1967b. Studies on clay minerals and clay mineral formation in soil profiles in
Scandinavia. Med. Nor. Skogsgorsoeksues 21, 303–345.Hardy, M., Jamagne, M., Elsass, F., Robert, M., Chesneau, D., 1999. Mineralogical development
Ž .of the silt fractions of a podzoluvisol on loess in the Paris Basin France . Eur. J. Soil Sci. 50,443–456.
Huang, P.M., Jackson, M.L., 1966. Fluoride interaction with clays in relation to third buffer range.Nature 211, 779–780.
Johnson, W., Lindberg, E., 1992. Atmospheric Deposition and Forest Nutrient Cycling: ASynthesis of the Integrated Forest Study. Springer Verlag, New York.
Kuhn, N., 1990. Veranderung von Waldstandorten. Schlussberichte Programm Sanasilva 1984–¨1987, Bericht 319, WSL Birmensdorf.
Lakanen, E., Ervio, R., 1971. A comparison of eight extractants for the determination of¨plant-available micronutrients in soil. Acta Agral. Fenn. 123, 223–235.
Ž .Lanson, B., 1997. Decomposition of experimental X-ray diffraction patterns profile fitting : aconvenient way to study clay minerals. Clays Clay Miner. 45, 132–146.
Laves, D., Jahn, G., 1972. Zur quantitaiven rontgenographischen Bodenton-Mineralanalyse,¨Archiv fur Acker-. Pflanzenbau Bodenkd. 16, 735–739.¨
Likens, G.E., Bormann, F.H., 1997. Biogeochemistry of a Forested Ecosystem. 2nd edn.Springer-Verlag, New York.
Manderscheid, B., Matzner, E., Meiwes, K.-J., Xu, Y., 1995. Long-term development of elementŽ Ž . .budgets in a Norway sprucePicea abies L. Karst. forest of the German Solling area. In:
Ž .Cerny, J., Novak, M., Paces, T. Eds. , Biogeochemical monitoring in small catchments.Water, Air, Soil Pollut. 79, pp. 3–18, special issue.
Mirabella, A., Sartori, G., 1998. The effect of climate on the mineralogical properties of soils fromŽ .the Val Genova Valley–Trentino Italy . Fresenius Environ. Bull. 7, 478–483.
Mirabella, A., Constantini, E.A.C., Carnicelli, S., 1992. Genesis of a polycyclic Terra RossaŽ .chromic cambisol on rhodic nitisol at the Poggio del Commune in Central Italy. Z.Pflanzenernaehr. Bodenkd. 155, 407–413.
Mirabella, A., Carnicelli, S., Cecchnini, G., 1993. Determinazione dei principali elementi presentinegli intestrati di vermiculiti chloritizzate. Ann. Fac. Agrar., Univ. Sassari 35, 249–254.
Møberg, J.P., Dissing Nielson, J., 1983. Mineralogical changes in soils used for potassium-deple-tion experiments for some years in pots and in the field. Acta Agric. Scand. 33, 21–27.
Moore, D.M., Reynolds, R.C., 1997. X-Ray Diffraction and the Identification and Analysis ofClay Minerals. 2nd edn. Oxford Univ. Press, New York.
Niederbudde, E.A., Kussmaul, H., 1978. Tonmineraleigenschaften und-Umwadnlungen inParabraunerde-Profilpaaren unter Acker und Wald in Suddeutschland. Geoderma 20, 239–255.¨
Nieuwenhuyse, A., van Breemen, N., 1997. Quantitative aspects of weathering and neoformationin selected Costa Rican volcanic soils. Soil Sci. Soc. Am. J. 61, 1450–1458.
( )M. Egli et al.rGeoderma 103 2001 307–334334
Rampazzo, N., Blum, W., 1992. Changes in chemistry and mineralogy of forest soils by acid rain.Water, Air, Soil Pollut. 61, 209–220.
Ranger, J., Dambrine, E., Robert, M., Righi, D., Felix, C., 1991. Study of current soil-formingprocesses using bags of vermiculite and resins placed within soil horizons. Geoderma 48,335–350.
Righi, D., Meunier, A., 1995. Origin of clays by rock weathering and soil formation. In: Velde, B.Ž .Ed. , Origin and Mineralogy of Clays. Springer-Verlag, Berlin, pp. 43–161.
Righi, D., Petit, S., Boucher, A., 1993. Characterization of hydroxy-interlayered vermiculite andillitersmectite interstratified minerals from the weathering of chlorite in a cryorthod. ClaysClay Miner. 41, 484–495.
Righi, D., Huber, K., Keller, C., 1999. Clay formation and podzol development from postglacialmoraines in Switzerland. Clay Miner. 34, 319–332.
Schwertmann, U., 1964. Differenzierung der eisenoxide durch photochemische extraktion mitsaurer ammoniumoxalat-losung. Z. Pflanzenernaehr. Bodenkd. 105, 194–202.¨
Ž .Schwertmann, U., Taylor, R., 1989. Iron oxides. In: Dixon, J.B., Weed, S.B. Eds. , Minerals inSoil Environments. 2nd edn. Soil Sci. Soc. Am., Book Ser., vol. 1, pp. 729–788, Madison, WI,USA.
Schwertmann, U., Niederbudde, E., 1993. Tonmineralbestimmung in Boden. In: Jasmund, K.,¨Ž .Lagaly, G. Eds. , Tonminerale und Tone. Struktur, Eigenschaften, Anwendung und Einsatz in
Industrie und Umwelt. Steinkopff Verlag, Darmstadt, pp. 255–265.Singh, B., Goulding, W.K.T., 1997. Changes with time in the potassium content and phyllosili-
cates in the soil of the Broadbalk continous wheat experiment at Rothamsted. Eur. J. Soil Sci.48, 651–659.
Tamura, T., 1958. Identification of clay minerals from acid soils. J. Soil Sci. 9, 141–147.Truby, P., 1989. Eine Titrationsmethode zur simultanen Bestimmung von Hq und Aluminium in¨
NH4Cl-Bodenextrakten. Z. Pflanzenernaehr. Bodenkd. 152, 297–300.Truby, P., Aldinger, E., 1989. Eine Methode zur Bestimmung austauschbarer Kationen in¨
Waldboden. Z. Pflanzenernaehr. Bodenkd. 152, 301–306.¨Veerhoff, M., 1992. Silicatverwitterung und Veranderung des Tonmineralbestandes in Waldboden¨ ¨
als Folge von Versauerungsvorgangen. Bonner Bodenk. Abh. 8, Bonn, Germany.¨Veerhoff, M., Roscher, S., Brummer, G.W., 1996. Ausmass und okologische Gefahren der¨ ¨
Versauerung von Boden unter Wald. Umweltbundesamt, Forschungsbericht 107 02 004r14,¨Berlin, Germany.
Volkel, J., 1994. Periglaziale Deckschichten und Boden im Bayerischen Wald und seinen¨ ¨Randgebieten als geogene Grundlagen landschaftsokologischer Forschung im Bereich naturna-¨her Waldstandorte. Habilitations-Schrift, Universitat Regensburg, Regensburg, Germany.¨
Wesselink, L.G., 1994. Time trends and mechanisms of soil acidification. PhD thesis, Land-bouwuniversiteit te Wageningen, Wageningen, Netherlands.
Wright, R.F., Lotse, E., Semb, A., 1994. Experimental acidification of alpine catchments atSogndal, Norway: results after 8 years. Water, Air, Soil Pollut. 72, 297–315.
Top Related
Copyright © 2022 FDOKUMEN

