


Bahasa
Halaman
Hukum


www.elsevier.com/locate/surfcoat
Surface & Coatings Technolo
Characterization of thermal barrier coatings with a gradient in porosity
A. Portinhaa, V. Teixeiraa,*, J. Carneiroa, J. Martinsb, M.F. Costac, R. Vassend, D. Stoeverd
aGRF-Functional Coatings Group, Physics Department, University of Minho, Campus de Azurem, 4800 Guimaraes, PortugalbMechanical Engineering Department, University of Minho, Campus de Azurem, 4800 Guimaraes, Portugal
cPhysics Department, University of Minho, Campus de Gualtar, 4700 Braga, PortugaldInstitute for Materials and Processes in Energy Systems 1, Forschungszentrum Julich GmbH, D-52425 Julich, Germany
Received 11 February 2004; accepted in revised form 8 July 2004
Available online 11 September 2004
Abstract
A major problem in thermal barrier coatings (TBC) applied to gas turbine components is the spallation of ceramic coating under thermal
cycling processes. In order to prevent spallation and improve the thermomechanical behaviour of the TBC, graded ceramic coatings can be
produced. For this purpose we are developing a new concept of Thermal Barrier Coating (TBC) that consist of a conventional NiCoCrAlY
bond coat and an atmospheric plasma sprayed ZrO2–8 wt.%Y2O3 top coat graded in porosity on an Inconel 738 LC substrates. The aim of
this work is to produce coatings with low thermal conductivity and better thermomechanical behaviour due to the gradient in porosity which
reflects a gradient in the elastic properties. Absolute porosity was measured with a mercury porosimetry and by image analysis. The second
technique was also used to estimate the porosity variation along the cross-section. Optical Microscopy (OM) and Scanning Electron
Microscopy (SEM) were used to observe the morphology and coating microstructure. The microhardness was measured with a Vickers
indenter and 0.981 N load. The microhardness has been evaluated for coatings in as-sprayed condition and after annealing at 1100 8C during
100 h. The results show a fast increase of the hardness after annealing. After thermal shock heating at 1000 8C, 1 h and quickly cooling in
water no spallation was observed for 100 cycles.
D 2004 Published by Elsevier B.V.
Keywords: Stabilised zirconia coatings; Thermal barrier coatings; Graded in porosity; Microhardness
1. Introduction
Ceramic coatings of engineering materials such as
zirconia partially or totally stabilized are used for a variety
of technological applications requiring thermal insulation,
wear and erosion resistance or protection from oxidation,
sulfidation and hot corrosion. These kinds of coatings have
been applied as Thermal Barrier Coatings (TBCs) for
protection of metallic components in gas turbines (vanes,
blades, shrouds, etc.) and diesel engines, and improve
performance at high temperatures [1–3]. The TBC concept
allows increase in operating temperature and/or reducing the
cooling systems due to the temperature gradient across the
thick ceramic coating, that permit better thermodynamic
0257-8972/$ - see front matter D 2004 Published by Elsevier B.V.
doi:10.1016/j.surfcoat.2004.07.094
* Corresponding author. Tel.: +351 253510465/400; fax: +351
253510401.
E-mail address: [email protected] (V. Teixeira).
performance, lower emissions without requiring major alloy
development. Zirconia coatings are very interesting materi-
als because of their outstanding mechanical, thermal, optical
and electrical properties. Zirconia has a high melting point,
high resistance to oxidation, low thermal conductivity, high
hardness, and high coefficient of thermal expansion. These
ceramic coatings are widely use in many technological
applications such in components at high temperature and
adverse corrosive environments, oxygen sensors [4], optical
coatings [5], etc.
TBCs, traditionally, consist in a thick partially stabilized
ZrO2 top coating commonly deposited by atmospheric
plasma spraying (APS) on superalloys precoated with a
metallic bond coat (NiCoCrAlY) produced by vacuum
plasma spraying (VPS) [6]. The partially stabilized ZrO2
top coat has a porous and laminar structure and consists of
splats with cracks perpendicular to the surface, this porous
structure allows the increase in the thermal isolation and the
gy 195 (2005) 245–251
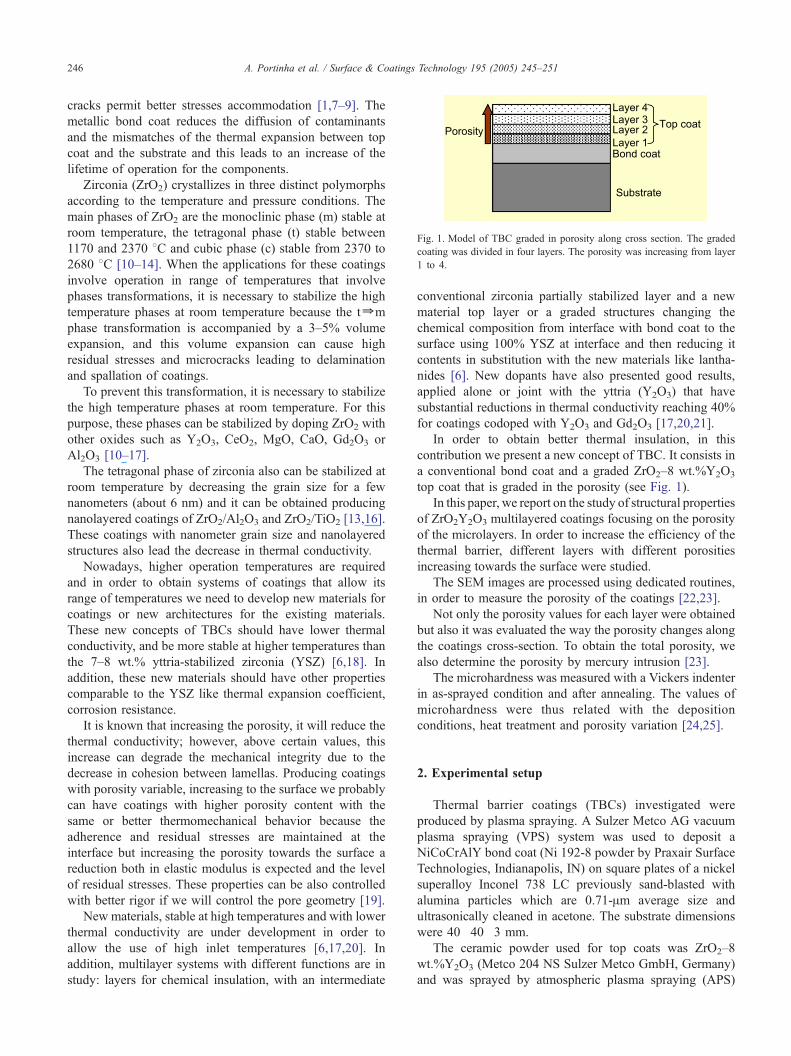
Fig. 1. Model of TBC graded in porosity along cross section. The graded
coating was divided in four layers. The porosity was increasing from layer
1 to 4.
A. Portinha et al. / Surface & Coatings Technology 195 (2005) 245–251246
cracks permit better stresses accommodation [1,7–9]. The
metallic bond coat reduces the diffusion of contaminants
and the mismatches of the thermal expansion between top
coat and the substrate and this leads to an increase of the
lifetime of operation for the components.
Zirconia (ZrO2) crystallizes in three distinct polymorphs
according to the temperature and pressure conditions. The
main phases of ZrO2 are the monoclinic phase (m) stable at
room temperature, the tetragonal phase (t) stable between
1170 and 2370 8C and cubic phase (c) stable from 2370 to
2680 8C [10–14]. When the applications for these coatings
involve operation in range of temperatures that involve
phases transformations, it is necessary to stabilize the high
temperature phases at room temperature because the tZm
phase transformation is accompanied by a 3–5% volume
expansion, and this volume expansion can cause high
residual stresses and microcracks leading to delamination
and spallation of coatings.
To prevent this transformation, it is necessary to stabilize
the high temperature phases at room temperature. For this
purpose, these phases can be stabilized by doping ZrO2 with
other oxides such as Y2O3, CeO2, MgO, CaO, Gd2O3 or
Al2O3 [10–17].
The tetragonal phase of zirconia also can be stabilized at
room temperature by decreasing the grain size for a few
nanometers (about 6 nm) and it can be obtained producing
nanolayered coatings of ZrO2/Al2O3 and ZrO2/TiO2 [13,16].
These coatings with nanometer grain size and nanolayered
structures also lead the decrease in thermal conductivity.
Nowadays, higher operation temperatures are required
and in order to obtain systems of coatings that allow its
range of temperatures we need to develop new materials for
coatings or new architectures for the existing materials.
These new concepts of TBCs should have lower thermal
conductivity, and be more stable at higher temperatures than
the 7–8 wt.% yttria-stabilized zirconia (YSZ) [6,18]. In
addition, these new materials should have other properties
comparable to the YSZ like thermal expansion coefficient,
corrosion resistance.
It is known that increasing the porosity, it will reduce the
thermal conductivity; however, above certain values, this
increase can degrade the mechanical integrity due to the
decrease in cohesion between lamellas. Producing coatings
with porosity variable, increasing to the surface we probably
can have coatings with higher porosity content with the
same or better thermomechanical behavior because the
adherence and residual stresses are maintained at the
interface but increasing the porosity towards the surface a
reduction both in elastic modulus is expected and the level
of residual stresses. These properties can be also controlled
with better rigor if we will control the pore geometry [19].
New materials, stable at high temperatures and with lower
thermal conductivity are under development in order to
allow the use of high inlet temperatures [6,17,20]. In
addition, multilayer systems with different functions are in
study: layers for chemical insulation, with an intermediate
conventional zirconia partially stabilized layer and a new
material top layer or a graded structures changing the
chemical composition from interface with bond coat to the
surface using 100% YSZ at interface and then reducing it
contents in substitution with the new materials like lantha-
nides [6]. New dopants have also presented good results,
applied alone or joint with the yttria (Y2O3) that have
substantial reductions in thermal conductivity reaching 40%
for coatings codoped with Y2O3 and Gd2O3 [17,20,21].
In order to obtain better thermal insulation, in this
contribution we present a new concept of TBC. It consists in
a conventional bond coat and a graded ZrO2–8 wt.%Y2O3
top coat that is graded in the porosity (see Fig. 1).
In this paper, we report on the study of structural properties
of ZrO2Y2O3 multilayered coatings focusing on the porosity
of the microlayers. In order to increase the efficiency of the
thermal barrier, different layers with different porosities
increasing towards the surface were studied.
The SEM images are processed using dedicated routines,
in order to measure the porosity of the coatings [22,23].
Not only the porosity values for each layer were obtained
but also it was evaluated the way the porosity changes along
the coatings cross-section. To obtain the total porosity, we
also determine the porosity by mercury intrusion [23].
The microhardness was measured with a Vickers indenter
in as-sprayed condition and after annealing. The values of
microhardness were thus related with the deposition
conditions, heat treatment and porosity variation [24,25].
2. Experimental setup
Thermal barrier coatings (TBCs) investigated were
produced by plasma spraying. A Sulzer Metco AG vacuum
plasma spraying (VPS) system was used to deposit a
NiCoCrAlY bond coat (Ni 192-8 powder by Praxair Surface
Technologies, Indianapolis, IN) on square plates of a nickel
superalloy Inconel 738 LC previously sand-blasted with
alumina particles which are 0.71-Am average size and
ultrasonically cleaned in acetone. The substrate dimensions
were 40�40�3 mm.
The ceramic powder used for top coats was ZrO2–8
wt.%Y2O3 (Metco 204 NS Sulzer Metco GmbH, Germany)
and was sprayed by atmospheric plasma spraying (APS)
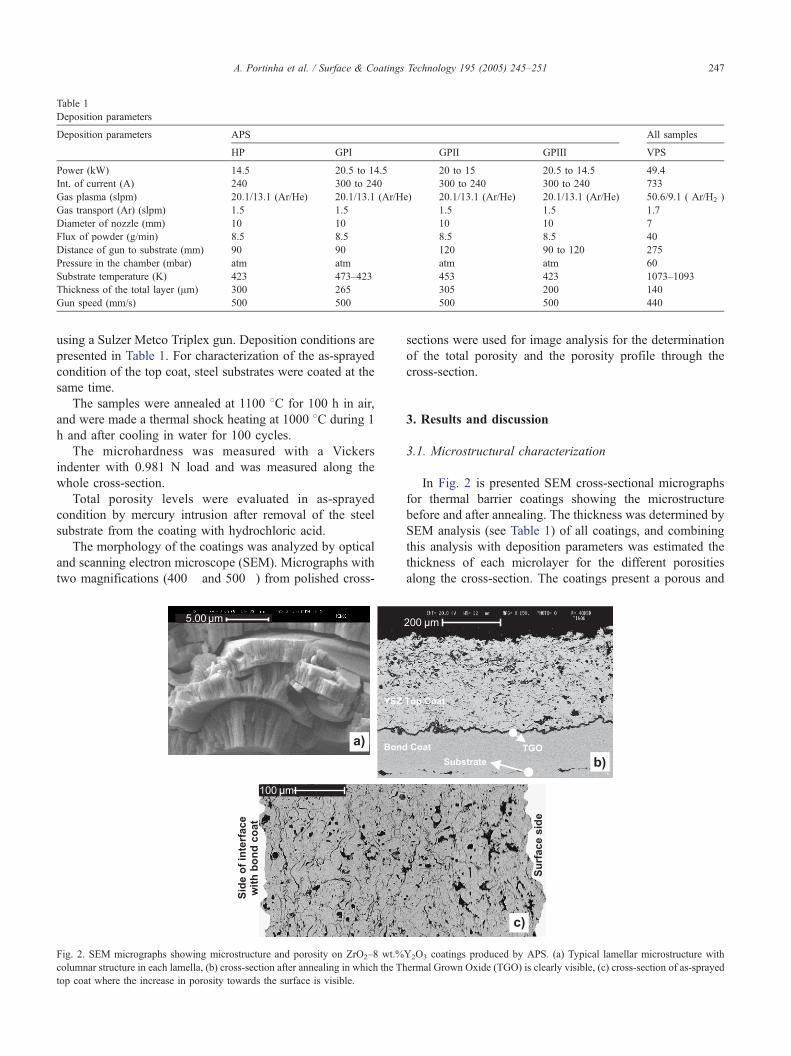
Table 1
Deposition parameters
Deposition parameters APS All samples
HP GPI GPII GPIII VPS
Power (kW) 14.5 20.5 to 14.5 20 to 15 20.5 to 14.5 49.4
Int. of current (A) 240 300 to 240 300 to 240 300 to 240 733
Gas plasma (slpm) 20.1/13.1 (Ar/He) 20.1/13.1 (Ar/He) 20.1/13.1 (Ar/He) 20.1/13.1 (Ar/He) 50.6/9.1 ( Ar/H2 )
Gas transport (Ar) (slpm) 1.5 1.5 1.5 1.5 1.7
Diameter of nozzle (mm) 10 10 10 10 7
Flux of powder (g/min) 8.5 8.5 8.5 8.5 40
Distance of gun to substrate (mm) 90 90 120 90 to 120 275
Pressure in the chamber (mbar) atm atm atm atm 60
Substrate temperature (K) 423 473–423 453 423 1073–1093
Thickness of the total layer (Am) 300 265 305 200 140
Gun speed (mm/s) 500 500 500 500 440
A. Portinha et al. / Surface & Coatings Technology 195 (2005) 245–251 247
using a Sulzer Metco Triplex gun. Deposition conditions are
presented in Table 1. For characterization of the as-sprayed
condition of the top coat, steel substrates were coated at the
same time.
The samples were annealed at 1100 8C for 100 h in air,
and were made a thermal shock heating at 1000 8C during 1
h and after cooling in water for 100 cycles.
The microhardness was measured with a Vickers
indenter with 0.981 N load and was measured along the
whole cross-section.
Total porosity levels were evaluated in as-sprayed
condition by mercury intrusion after removal of the steel
substrate from the coating with hydrochloric acid.
The morphology of the coatings was analyzed by optical
and scanning electron microscope (SEM). Micrographs with
two magnifications (400� and 500�) from polished cross-
Fig. 2. SEM micrographs showing microstructure and porosity on ZrO2–8 wt.%
columnar structure in each lamella, (b) cross-section after annealing in which the Th
top coat where the increase in porosity towards the surface is visible.
sections were used for image analysis for the determination
of the total porosity and the porosity profile through the
cross-section.
3. Results and discussion
3.1. Microstructural characterization
In Fig. 2 is presented SEM cross-sectional micrographs
for thermal barrier coatings showing the microstructure
before and after annealing. The thickness was determined by
SEM analysis (see Table 1) of all coatings, and combining
this analysis with deposition parameters was estimated the
thickness of each microlayer for the different porosities
along the cross-section. The coatings present a porous and
Y2O3 coatings produced by APS. (a) Typical lamellar microstructure with
ermal Grown Oxide (TGO) is clearly visible, (c) cross-section of as-sprayed
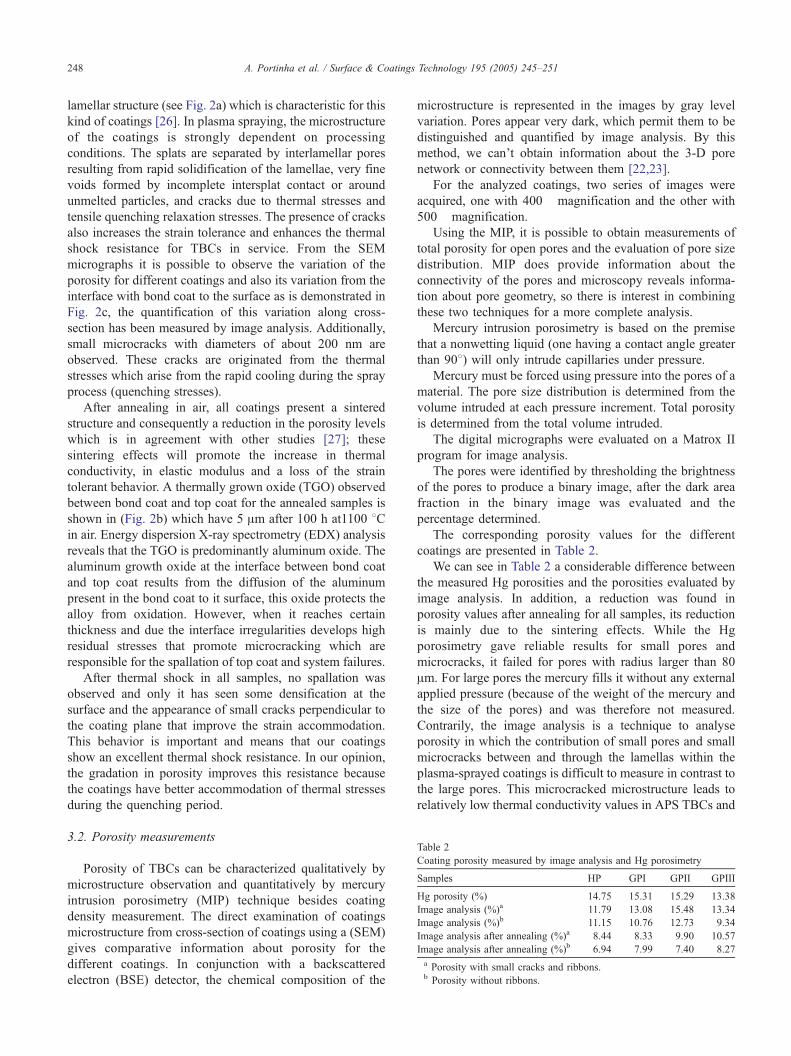
Table 2
Coating porosity measured by image analysis and Hg porosimetry
Samples HP GPI GPII GPIII
Hg porosity (%) 14.75 15.31 15.29 13.38
Image analysis (%)a 11.79 13.08 15.48 13.34
Image analysis (%)b 11.15 10.76 12.73 9.34
Image analysis after annealing (%)a 8.44 8.33 9.90 10.57
Image analysis after annealing (%)b 6.94 7.99 7.40 8.27
a Porosity with small cracks and ribbons.b Porosity without ribbons.
A. Portinha et al. / Surface & Coatings Technology 195 (2005) 245–251248
lamellar structure (see Fig. 2a) which is characteristic for this
kind of coatings [26]. In plasma spraying, the microstructure
of the coatings is strongly dependent on processing
conditions. The splats are separated by interlamellar pores
resulting from rapid solidification of the lamellae, very fine
voids formed by incomplete intersplat contact or around
unmelted particles, and cracks due to thermal stresses and
tensile quenching relaxation stresses. The presence of cracks
also increases the strain tolerance and enhances the thermal
shock resistance for TBCs in service. From the SEM
micrographs it is possible to observe the variation of the
porosity for different coatings and also its variation from the
interface with bond coat to the surface as is demonstrated in
Fig. 2c, the quantification of this variation along cross-
section has been measured by image analysis. Additionally,
small microcracks with diameters of about 200 nm are
observed. These cracks are originated from the thermal
stresses which arise from the rapid cooling during the spray
process (quenching stresses).
After annealing in air, all coatings present a sintered
structure and consequently a reduction in the porosity levels
which is in agreement with other studies [27]; these
sintering effects will promote the increase in thermal
conductivity, in elastic modulus and a loss of the strain
tolerant behavior. A thermally grown oxide (TGO) observed
between bond coat and top coat for the annealed samples is
shown in (Fig. 2b) which have 5 Am after 100 h at1100 8Cin air. Energy dispersion X-ray spectrometry (EDX) analysis
reveals that the TGO is predominantly aluminum oxide. The
aluminum growth oxide at the interface between bond coat
and top coat results from the diffusion of the aluminum
present in the bond coat to it surface, this oxide protects the
alloy from oxidation. However, when it reaches certain
thickness and due the interface irregularities develops high
residual stresses that promote microcracking which are
responsible for the spallation of top coat and system failures.
After thermal shock in all samples, no spallation was
observed and only it has seen some densification at the
surface and the appearance of small cracks perpendicular to
the coating plane that improve the strain accommodation.
This behavior is important and means that our coatings
show an excellent thermal shock resistance. In our opinion,
the gradation in porosity improves this resistance because
the coatings have better accommodation of thermal stresses
during the quenching period.
3.2. Porosity measurements
Porosity of TBCs can be characterized qualitatively by
microstructure observation and quantitatively by mercury
intrusion porosimetry (MIP) technique besides coating
density measurement. The direct examination of coatings
microstructure from cross-section of coatings using a (SEM)
gives comparative information about porosity for the
different coatings. In conjunction with a backscattered
electron (BSE) detector, the chemical composition of the
microstructure is represented in the images by gray level
variation. Pores appear very dark, which permit them to be
distinguished and quantified by image analysis. By this
method, we can’t obtain information about the 3-D pore
network or connectivity between them [22,23].
For the analyzed coatings, two series of images were
acquired, one with 400� magnification and the other with
500� magnification.
Using the MIP, it is possible to obtain measurements of
total porosity for open pores and the evaluation of pore size
distribution. MIP does provide information about the
connectivity of the pores and microscopy reveals informa-
tion about pore geometry, so there is interest in combining
these two techniques for a more complete analysis.
Mercury intrusion porosimetry is based on the premise
that a nonwetting liquid (one having a contact angle greater
than 908) will only intrude capillaries under pressure.
Mercury must be forced using pressure into the pores of a
material. The pore size distribution is determined from the
volume intruded at each pressure increment. Total porosity
is determined from the total volume intruded.
The digital micrographs were evaluated on a Matrox II
program for image analysis.
The pores were identified by thresholding the brightness
of the pores to produce a binary image, after the dark area
fraction in the binary image was evaluated and the
percentage determined.
The corresponding porosity values for the different
coatings are presented in Table 2.
We can see in Table 2 a considerable difference between
the measured Hg porosities and the porosities evaluated by
image analysis. In addition, a reduction was found in
porosity values after annealing for all samples, its reduction
is mainly due to the sintering effects. While the Hg
porosimetry gave reliable results for small pores and
microcracks, it failed for pores with radius larger than 80
Am. For large pores the mercury fills it without any external
applied pressure (because of the weight of the mercury and
the size of the pores) and was therefore not measured.
Contrarily, the image analysis is a technique to analyse
porosity in which the contribution of small pores and small
microcracks between and through the lamellas within the
plasma-sprayed coatings is difficult to measure in contrast to
the large pores. This microcracked microstructure leads to
relatively low thermal conductivity values in APS TBCs and
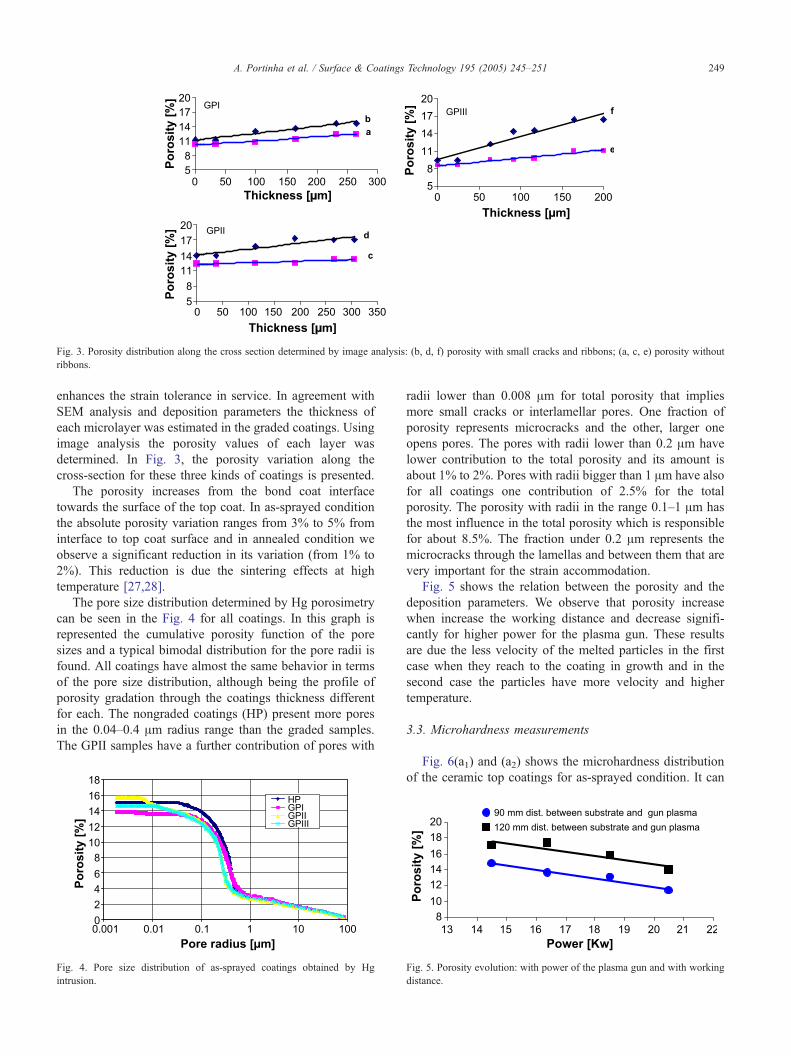
Fig. 3. Porosity distribution along the cross section determined by image analysis: (b, d, f) porosity with small cracks and ribbons; (a, c, e) porosity without
ribbons.
A. Portinha et al. / Surface & Coatings Technology 195 (2005) 245–251 249
enhances the strain tolerance in service. In agreement with
SEM analysis and deposition parameters the thickness of
each microlayer was estimated in the graded coatings. Using
image analysis the porosity values of each layer was
determined. In Fig. 3, the porosity variation along the
cross-section for these three kinds of coatings is presented.
The porosity increases from the bond coat interface
towards the surface of the top coat. In as-sprayed condition
the absolute porosity variation ranges from 3% to 5% from
interface to top coat surface and in annealed condition we
observe a significant reduction in its variation (from 1% to
2%). This reduction is due the sintering effects at high
temperature [27,28].
The pore size distribution determined by Hg porosimetry
can be seen in the Fig. 4 for all coatings. In this graph is
represented the cumulative porosity function of the pore
sizes and a typical bimodal distribution for the pore radii is
found. All coatings have almost the same behavior in terms
of the pore size distribution, although being the profile of
porosity gradation through the coatings thickness different
for each. The nongraded coatings (HP) present more pores
in the 0.04–0.4 Am radius range than the graded samples.
The GPII samples have a further contribution of pores with
Fig. 4. Pore size distribution of as-sprayed coatings obtained by Hg
intrusion.
radii lower than 0.008 Am for total porosity that implies
more small cracks or interlamellar pores. One fraction of
porosity represents microcracks and the other, larger one
opens pores. The pores with radii lower than 0.2 Am have
lower contribution to the total porosity and its amount is
about 1% to 2%. Pores with radii bigger than 1 Am have also
for all coatings one contribution of 2.5% for the total
porosity. The porosity with radii in the range 0.1–1 Am has
the most influence in the total porosity which is responsible
for about 8.5%. The fraction under 0.2 Am represents the
microcracks through the lamellas and between them that are
very important for the strain accommodation.
Fig. 5 shows the relation between the porosity and the
deposition parameters. We observe that porosity increase
when increase the working distance and decrease signifi-
cantly for higher power for the plasma gun. These results
are due the less velocity of the melted particles in the first
case when they reach to the coating in growth and in the
second case the particles have more velocity and higher
temperature.
3.3. Microhardness measurements
Fig. 6(a1) and (a2) shows the microhardness distribution
of the ceramic top coatings for as-sprayed condition. It can
Fig. 5. Porosity evolution: with power of the plasma gun and with working
distance.
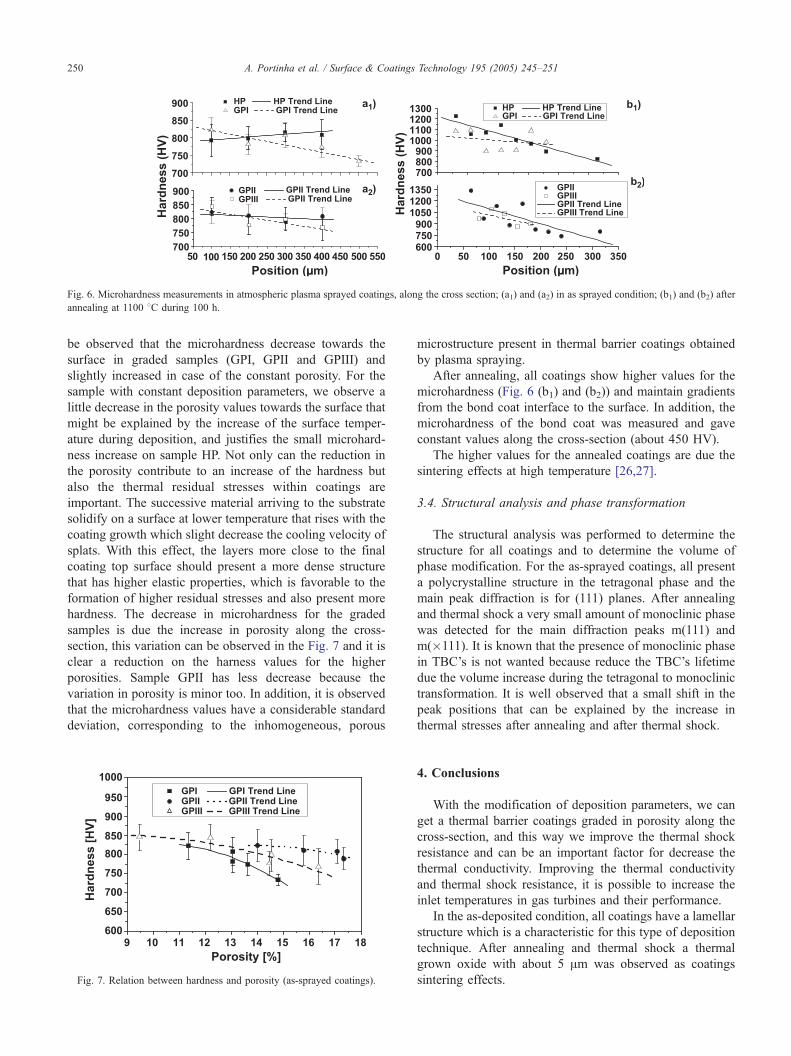
Fig. 6. Microhardness measurements in atmospheric plasma sprayed coatings, along the cross section; (a1) and (a2) in as sprayed condition; (b1) and (b2) after
annealing at 1100 8C during 100 h.
A. Portinha et al. / Surface & Coatings Technology 195 (2005) 245–251250
be observed that the microhardness decrease towards the
surface in graded samples (GPI, GPII and GPIII) and
slightly increased in case of the constant porosity. For the
sample with constant deposition parameters, we observe a
little decrease in the porosity values towards the surface that
might be explained by the increase of the surface temper-
ature during deposition, and justifies the small microhard-
ness increase on sample HP. Not only can the reduction in
the porosity contribute to an increase of the hardness but
also the thermal residual stresses within coatings are
important. The successive material arriving to the substrate
solidify on a surface at lower temperature that rises with the
coating growth which slight decrease the cooling velocity of
splats. With this effect, the layers more close to the final
coating top surface should present a more dense structure
that has higher elastic properties, which is favorable to the
formation of higher residual stresses and also present more
hardness. The decrease in microhardness for the graded
samples is due the increase in porosity along the cross-
section, this variation can be observed in the Fig. 7 and it is
clear a reduction on the harness values for the higher
porosities. Sample GPII has less decrease because the
variation in porosity is minor too. In addition, it is observed
that the microhardness values have a considerable standard
deviation, corresponding to the inhomogeneous, porous
Fig. 7. Relation between hardness and porosity (as-sprayed coatings).
microstructure present in thermal barrier coatings obtained
by plasma spraying.
After annealing, all coatings show higher values for the
microhardness (Fig. 6 (b1) and (b2)) and maintain gradients
from the bond coat interface to the surface. In addition, the
microhardness of the bond coat was measured and gave
constant values along the cross-section (about 450 HV).
The higher values for the annealed coatings are due the
sintering effects at high temperature [26,27].
3.4. Structural analysis and phase transformation
The structural analysis was performed to determine the
structure for all coatings and to determine the volume of
phase modification. For the as-sprayed coatings, all present
a polycrystalline structure in the tetragonal phase and the
main peak diffraction is for (111) planes. After annealing
and thermal shock a very small amount of monoclinic phase
was detected for the main diffraction peaks m(111) and
m(�111). It is known that the presence of monoclinic phase
in TBC’s is not wanted because reduce the TBC’s lifetime
due the volume increase during the tetragonal to monoclinic
transformation. It is well observed that a small shift in the
peak positions that can be explained by the increase in
thermal stresses after annealing and after thermal shock.
4. Conclusions
With the modification of deposition parameters, we can
get a thermal barrier coatings graded in porosity along the
cross-section, and this way we improve the thermal shock
resistance and can be an important factor for decrease the
thermal conductivity. Improving the thermal conductivity
and thermal shock resistance, it is possible to increase the
inlet temperatures in gas turbines and their performance.
In the as-deposited condition, all coatings have a lamellar
structure which is a characteristic for this type of deposition
technique. After annealing and thermal shock a thermal
grown oxide with about 5 Am was observed as coatings
sintering effects.
A. Portinha et al. / Surface & Coatings Technology 195 (2005) 245–251 251
Small cracks and interlamellar defects gave a rather small
contribution to the total porosity in image analysis measure-
ments, in contrast to Hg-intrusion investigations.
All coatings present a bimodal pore size distribution. The
porosity increases towards the surface in graded coatings,
decreases with increasing plasma gun power and increases
with increasing working distance.
The microhardness decreases from the interface to the
surface and increase after annealing. As it was expected, the
microhardness decreases when the porosity increases. Non-
graded, as-sprayed HP sample showed a slightly increase in
the hardness from the interface to the surface which was
explained by the increase of surface temperature during
deposition that implies a densification of the structure with
lower porosity and higher thermal residual stress within the
coating.
The annealed coatings showed reduced porosity levels
due the sintering effects.
After heat treatments, it was observed a very small
amount of monoclinic phase.
Acknowledgments
This work was financially supported by FCT-Portu-
guese Foundation for Science and Technology under the
project POCTI/EME/39316/2001: bPVDCOAT-Composite
and multilayered protective coatings for efficient energy
systemsQ. The cooperative work is also supported by
German–Portuguese Cooperative Programme ICCTI-
DAAD and European Commission-DG-XII under con-
tracts: ICCTI-DAAD/ 423/2000, bComposite Coatings for
high temperature applicationsQ and COST 522, WP2/SP2-
1999/01: bResidual stresses and failure in multilayered and
functionally graded coatings for advanced energy systemsQ(projects leader: V. Teixeira). A. Portinha is grateful for
the Research Grants supported by F.C.T.-Portuguese
Foundation for Science and Technology. The authors
acknowledge to Alcino Monteiro for some hardness
measurements.
References
[1] V. Teixeira, M. Andritschky, W. Fischer, H.P. Buchkremer, D. Stfver,Surf. Coat. Technol. 120–121 (1999) 103.
[2] Jeanine T. DeMasi-Marcin, Dinesh K. Gupta, Surf. Coat. Technol. 68/
69 (1994) 1.
[3] G. Johner, K.K. Schweitzer, J. Vac. Sci. Technol., A 3 (6) (1985)
2516.
[4] P. Schmidt-Zhang, K.-P. Sandow, F. Adolf, W. Gfpel, U. Guth, Sens.Actuators, B, Chem. 70 (1–3) (2000) 25.
[5] M. Ghanashyam Krishna, K. Narasimha Rao, S. Mohan, Thin Solid
Films 193–194 (1990) 690.
[6] R. Vahen, D. Stfver, Functional Gradient Materials and Surface
Layers Prepared by fine Particles Technology, Kluwer Academic
Publishers, Netherlands, 2001, p. 199.
[7] V. Teixeira, M. Andritschky, W. Fischer, H.P. Buchkremer, D. Stfver,J. Mater. Process. Technol. 92–93 (1999) 209.
[8] C. Funke, J.C. Mailand, B. Siebert, R. Vassen, D. Stover, Surf. Coat.
Technol. 94–95 (1997) 106.
[9] Lech Pawlowski, Didier Lombard, Pierre Fauchais, J. Vac. Sci.
Technol., A 3 (6) (1985) 2494.
[10] V. Teixeira, M. Andritschky, High Temp. High Press. 25 (1993) 213.
[11] J.S. Kih, H.A. Marzouk, P.J. Reucroft, Thin Solid Films 254 (1995)
33.
[12] R. Guinebretiere, B. Soulestin, A. Douger, Thin Solid Films 319
(1998) 197.
[13] C.R. Aita, M.D. Wiggins, R. Whig, C.M. Scanlan, J. Appl. Phys. 79
(2) (1996) 1176.
[14] Z. Ji, J.A. Haynes, M.K. Ferber, J.M. Rigsbee, Surf. Coat. Technol.
135 (2–3) (2001) 109.
[15] P. Gao, L.J. Meng, M.P. Santos, V. Teixeira, M. Andritschky, Thin
Solid Films 377–378 (2000) 32.
[16] V. Teixeira, A. Monteiro, J. Duarte, A. Portinha, Vacuum 67 (2002)
477.
[17] Noemı R. Rebollo, Olga Fabrichnaya, Carlos G. Levi, Z. Met.Kd. 94
(3) (2003) 163.
[18] D. Stfver, C. Funke, J. Mater. Process. Technol. 92–93 (1999) 195.
[19] V. Teixeira, Surf. Coat. Technol. 146–147 (2001) 79.
[20] S. Raghavan, H. Wang, W.D. Porter, R.B. Dinwiddie, M.J. Mayo,
Acta Mater. 49 (2001) 169.
[21] J.R. Nicholls, K.J. Lawson, A. Johnstone, D.S. Rickerby, Surf. Coat.
Technol. 151–152 (2002) 383.
[22] K. Mailhot, F. Gitzhofer, M.I. Boulos, Proceedings of the 15th
International Thermal Spray Conference, 25–29 May, Nice, France,
1998, p. 917.
[23] A.B. Abell, K.L. Willis, D.A. Lange, J. Colloid Interface Sci. 211 (1)
(1999) 39.
[24] T. Valent, Surf. Coat. Technol. 90 (1997) 14.
[25] C.K. Lin, C.C. Berndt, Proceedings of the 1993 National Thermal
Spray Conference, Anaheim, CA, 7–11 June, 1993, p. 561.
[26] C.J. Li, Y. He, A. Ohmuri, Proceedings of the 15th International
Thermal Spray Conference, 25–29 May, Nice, France, 1998, p. 717.
[27] B. Siebert, C. Funke, R. Vahen, D. Stfver, J. Mater. Process. Technol.
92–93 (1999) 217.
[28] R. Vahen, N. Czech, W. Mallener, W. Stamm, D. Stfver, Surf. Coat.Technol. 141 (2–3) (2001) 135.
Top Related
Copyright © 2022 FDOKUMEN

