


Bahasa
Halaman
Hukum

ORIGINAL ARTICLE
Automatic determination of traffic accidents based on KMC-basedattribute weighting
Kemal Polat • S. Savas Durduran
Received: 5 September 2010 / Accepted: 7 February 2011 / Published online: 24 February 2011
� Springer-Verlag London Limited 2011
Abstract In this study, the traffic accidents recognizing
risk factors related to the environmental (climatological)
conditions that are associated with motor vehicles acci-
dents on the Konya-Afyonkarahisar highway with the aid
of Geographical Information Systems (GIS) have been
determined using the combination of K-means clustering
(KMC)-based attribute weighting (KMCAW) and classifier
algorithms including artificial neural network (ANN) and
adaptive network-based fuzzy inference system (ANFIS).
The dynamic segmentation process in ArcGIS9.0 from the
traffic accident reports recorded by District Traffic Agency
has identified the locations of the motor vehicle accidents.
The attributes obtained from this system are day, temper-
ature, humidity, weather conditions, and month of occurred
traffic accidents. The traffic accident dataset comprises five
attributes (day, temperature, humidity, weather conditions,
and month of occurred traffic accidents) and 358 obser-
vations including 179 without accident and 179 with
accident. The proposed comprises two stages. In the first
stage, the all attributes of dataset have been weighted using
KMCAW method. The aims of this weighting method are
both to increase the classification performance of used
classifier algorithm and to transform from linearly non-
separable traffic accidents dataset to a linearly separable
dataset. In the second stage, after weighting process, ANN
and ANFIS classifier algorithms have been separately used
to determine the case of traffic accidents as with accident
or without accident. In order to evaluate the performance of
proposed method, the classification accuracy, sensitivity,
specificity and area under the ROC (Receiver Operating
Characteristic) curves (AUC) values have been used. While
ANN and ANFIS classifiers obtained the overall prediction
accuracies of 53.93 and 38.76%, respectively, the combi-
nation of KMCAW and ANN and the combination of
KMCAW and ANFIS achieved the overall prediction
accuracies of 74.15 and 55.06% on the prediction of traffic
accidents. The experimental results have demonstrated that
the proposed attribute weighting method called KMCAW
is a robust and effective data pre-processing method in the
prediction of traffic accidents on Konya-Afyonkarahisar
highway in Turkey.
Keywords Geographical information systems (GIS) �Traffic accident analysis � Prediction � K-means clustering
based attribute weighting � Artificial neural network �Adaptive network based fuzzy inference system
1 Introduction
Today, the most negative result of developing transporta-
tion systems is traffic accidents with injuries and loss of
lives. The tremendous social and economic costs associated
with traffic accidents have led many road authorities and
researchers to establish safety management programs that
aim to continually improve the safety performance of
highways [1]. So, traffic safety is the most critical issue in
agencies’ transportation strategy. The identification of
safety deficient areas on the highways is aimed to
K. Polat (&)
Engineering of Faculty, Electrical and Electronics Engineering
Department, Bartin University, 74100 Bartin, Turkey
e-mail: [email protected]
S. S. Durduran
Department of Geomatics Engineering, Selcuk University,
42035 Konya, Turkey
e-mail: [email protected]
123
Neural Comput & Applic (2012) 21:1271–1279
DOI 10.1007/s00521-011-0559-9
implement precautionary measures and provisions by
researchers and traffic officials [2].
Geographical Information System (GIS) technology is
becoming an increasingly popular tool for visualization and
analyses of accident data in highways. GIS has the ability
to hold a vast amount of data that can be easily stored,
shared, analyzed, and managed. It provides a platform for
spatial data analyses and visualization to explore relation-
ships between spatial and no spatial data [2].
The success of safety improvement programs in
reducing accident occurrence depends on the methods
used in the accident analyses. Today, many researchers
used different deterministic and statistical methods in the
studies that aiming to determine the high rate accident
locations and safety deficient areas on the highways
[2–4]. Many of these researches have explored the rela-
tionships between traffic accidents and geometric design
and operation of road segments. However, data relating to
accidents are widely available, but have received sur-
prisingly little analyses with respect to weather. The
complexity involved in establishing the exact cause-and-
effect relationship in traffic accidents acts as an obstacle,
because road accidents are the results of an intricate
driver–vehicle–environment matrix [5]. So, it is aimed to
decrease the accidents determining the effects of weather
and some environmental conditions on traffic accidents in
Konya-Afyonkarahisar highway with the aid of GIS and
artificial intelligence.
There are a few papers related to classification of traffic
accidents in literature. Among these, Durduran et al. have
proposed a decision making system (DMS) based on cor-
relation-based feature selection and classifier algorithms
including support vector machine (SVM) and artificial
neural network (ANN) has been proposed to predict the
traffic accidents in Konya-Afyonkarahisar highway. They
obtained the prediction accuracy of 61.79% with ANN
classifier and achieved the prediction accuracy of 67.42%
using SVM with RBF (radial basis function) kernel [20].
Polat et al. have used the classifier ensemble methods
including SVM (Support Vector Machine) ensemble, ANN
ensemble, and ANFIS ensemble methods. In the classifi-
cation of the traffic accidents, they obtained 70.22, 91.01,
91.01% success rates using geometrical mean, arithmetical
mean, and majority voting methods with SVM ensemble,
separately while they achieved 73.03, 82.55, 82.55% suc-
cess rates with ANN ensemble method. As for ANFIS
ensemble, they obtained the success rates of 66.85, 80.33,
and 80.89% using geometrical mean, arithmetical mean,
and majority voting methods, separately [21].
In this article, a novel hybrid system based on KMCAW
and classifier algorithms including ANN and ANFIS has
been proposed and applied to determination of traffic
accidents using GIS. The aims of this study are to increase
the discrimination ability of between without traffic acci-
dents and with traffic accidents using KMCAW prior to
classifier algorithm and to transform from linearly non-
separable dataset to linearly separable dataset. In training
and testing of ANN and ANFIS classifiers, the 50–50%
split of whole dataset has been randomly chosen. In order
to test the performance of proposed method, the classifi-
cation accuracy, sensitivity, specificity, and AUC (area the
ROC curve) values have been used. Two hybrid methods
called the combination of KMCAW–ANN and the com-
bination of KMCAW–ANFIS have been used and chosen
the combination of KMCAW–ANN as the best method in
determination of traffic accidents belonging to Konya-Af-
yonkarahisar highway.
The remaining of the paper is organized as follows. The
material is presented in the next section. The method is
explained in Sect. 3. The experimental data and results to
present the effectiveness of proposed method are given in
Sect. 4. Finally, the conclusions are given in Sect. 5 with
future directions.
2 Traffic accident database and used material
2.1 Traffic accidents dataset
Afyonkarahisar-Konya highway is a junction region in
Turkey connecting the industrial, tourism and agricultural
areas to each other. Especially in winter, weather-related
crashes happen frequently because of continental climate in
the region. The length of the highway is approximately
240 km. 65% of the road has two lanes. Traffic accident
reports of the highway are obtained on paper form by
District Traffic Agency Officers in Turkey. These records
include collected accident parameters such as the date,
hour/minutes, kilometer of crash, code of highway, age,
sex and alcohol consumption of driver, weather conditions,
lighting conditions, vehicle type, number of persons
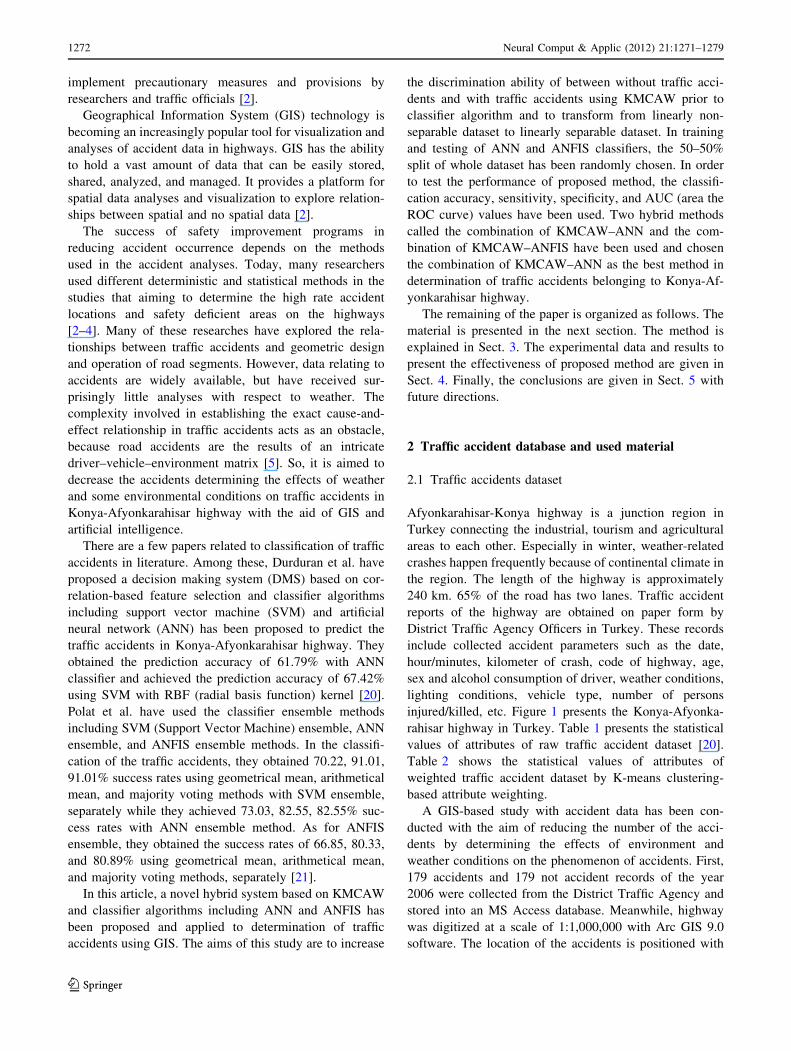
injured/killed, etc. Figure 1 presents the Konya-Afyonka-
rahisar highway in Turkey. Table 1 presents the statistical
values of attributes of raw traffic accident dataset [20].
Table 2 shows the statistical values of attributes of
weighted traffic accident dataset by K-means clustering-
based attribute weighting.
A GIS-based study with accident data has been con-
ducted with the aim of reducing the number of the acci-
dents by determining the effects of environment and
weather conditions on the phenomenon of accidents. First,
179 accidents and 179 not accident records of the year
2006 were collected from the District Traffic Agency and
stored into an MS Access database. Meanwhile, highway
was digitized at a scale of 1:1,000,000 with Arc GIS 9.0
software. The location of the accidents is positioned with
1272 Neural Comput & Applic (2012) 21:1271–1279
123
the ‘‘kilometer of crash’’ data on the route of highways
using the ‘‘linear referencing’’ toolset in Arc GIS 9.0 [20].
3 Method
In this paper, we have proposed a hybrid method com-
prising attribute weighting (KMCAW) and classification
stage (ANN and ANFIS classifier algorithms) to determine
the traffic accidents on Konya-Afyonkarahisar highway in
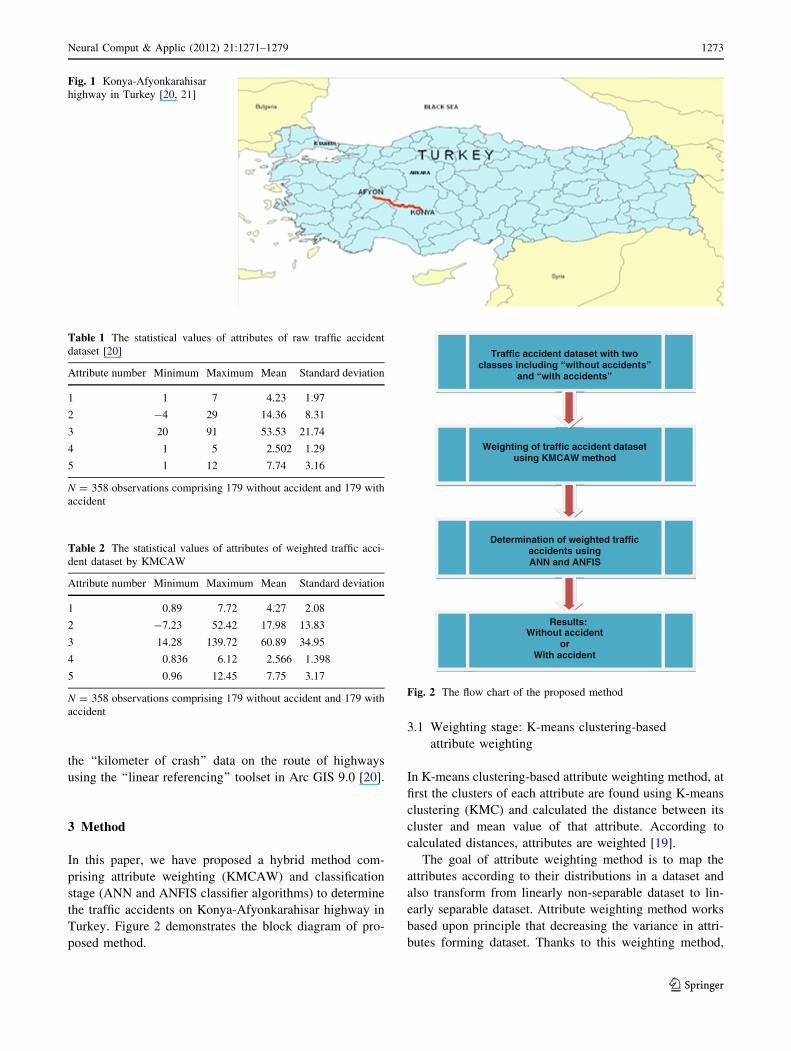
Turkey. Figure 2 demonstrates the block diagram of pro-
posed method.
3.1 Weighting stage: K-means clustering-based
attribute weighting
In K-means clustering-based attribute weighting method, at
first the clusters of each attribute are found using K-means
clustering (KMC) and calculated the distance between its
cluster and mean value of that attribute. According to
calculated distances, attributes are weighted [19].
The goal of attribute weighting method is to map the
attributes according to their distributions in a dataset and
also transform from linearly non-separable dataset to lin-
early separable dataset. Attribute weighting method works
based upon principle that decreasing the variance in attri-
butes forming dataset. Thanks to this weighting method,
Fig. 1 Konya-Afyonkarahisar
highway in Turkey [20, 21]
Table 1 The statistical values of attributes of raw traffic accident
dataset [20]
Attribute number Minimum Maximum Mean Standard deviation
1 1 7 4.23 1.97
2 -4 29 14.36 8.31
3 20 91 53.53 21.74
4 1 5 2.502 1.29
5 1 12 7.74 3.16
N = 358 observations comprising 179 without accident and 179 with
accident
Table 2 The statistical values of attributes of weighted traffic acci-
dent dataset by KMCAW
Attribute number Minimum Maximum Mean Standard deviation
1 0.89 7.72 4.27 2.08
2 -7.23 52.42 17.98 13.83
3 14.28 139.72 60.89 34.95
4 0.836 6.12 2.566 1.398
5 0.96 12.45 7.75 3.17
N = 358 observations comprising 179 without accident and 179 with
accident
Traffic accident dataset with two classes including “without accidents”
and “with accidents”
Weighting of traffic accident dataset using KMCAW method
Determination of weighted traffic accidents using ANN and ANFIS
Without accident or
With accident
Results:
Fig. 2 The flow chart of the proposed method
Neural Comput & Applic (2012) 21:1271–1279 1273
123
the similar data in same attribute are gathered and the
discrimination ability of classifier is increased [19].
K-means clustering also known as C-means clustering
has been applied to a variety of areas including image
segmentation, speech data compression, data mining, etc.
[6, 7, 8, 9, 10]. The working of KMC can be summarized as
follows [11, 19]:
Phase 1 Choose K initial cluster centers z1, z2,…,zK
randomly from the n points{X1, X2, X3,…,Xn}
Phase 2 Assign point Xi, i = 1, 2,…,n to the cluster Cj,
j [ {1, 2,…,K}
if Xi � zj
��
��\ Xi � zp
��
��; p ¼ 1; 2; . . .;K
and j 6¼ p
Phase 3 Compute new cluster centers as follows
znewi ¼ 1
ni
P
Xj2Ci
Xj i ¼ 1; 2; . . .;K
where ni is the number of elements belonging to
the cluster Ci
Phase 4 If znewi � zi
��
��\e; i ¼ 1; 2; . . .;K, then
terminate. Otherwise continue from phase 2
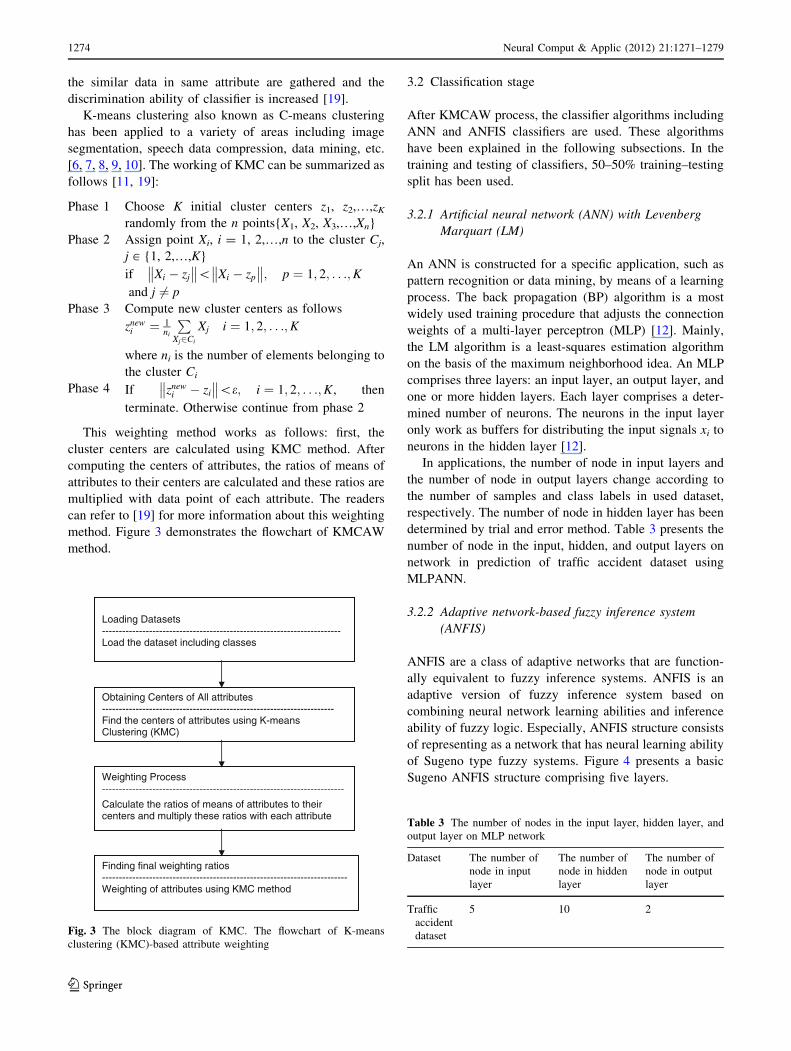
This weighting method works as follows: first, the
cluster centers are calculated using KMC method. After
computing the centers of attributes, the ratios of means of
attributes to their centers are calculated and these ratios are
multiplied with data point of each attribute. The readers
can refer to [19] for more information about this weighting
method. Figure 3 demonstrates the flowchart of KMCAW
method.
3.2 Classification stage
After KMCAW process, the classifier algorithms including
ANN and ANFIS classifiers are used. These algorithms
have been explained in the following subsections. In the
training and testing of classifiers, 50–50% training–testing
split has been used.
3.2.1 Artificial neural network (ANN) with Levenberg
Marquart (LM)
An ANN is constructed for a specific application, such as
pattern recognition or data mining, by means of a learning
process. The back propagation (BP) algorithm is a most
widely used training procedure that adjusts the connection
weights of a multi-layer perceptron (MLP) [12]. Mainly,
the LM algorithm is a least-squares estimation algorithm
on the basis of the maximum neighborhood idea. An MLP
comprises three layers: an input layer, an output layer, and
one or more hidden layers. Each layer comprises a deter-
mined number of neurons. The neurons in the input layer
only work as buffers for distributing the input signals xi to
neurons in the hidden layer [12].
In applications, the number of node in input layers and
the number of node in output layers change according to
the number of samples and class labels in used dataset,
respectively. The number of node in hidden layer has been
determined by trial and error method. Table 3 presents the
number of node in the input, hidden, and output layers on
network in prediction of traffic accident dataset using
MLPANN.
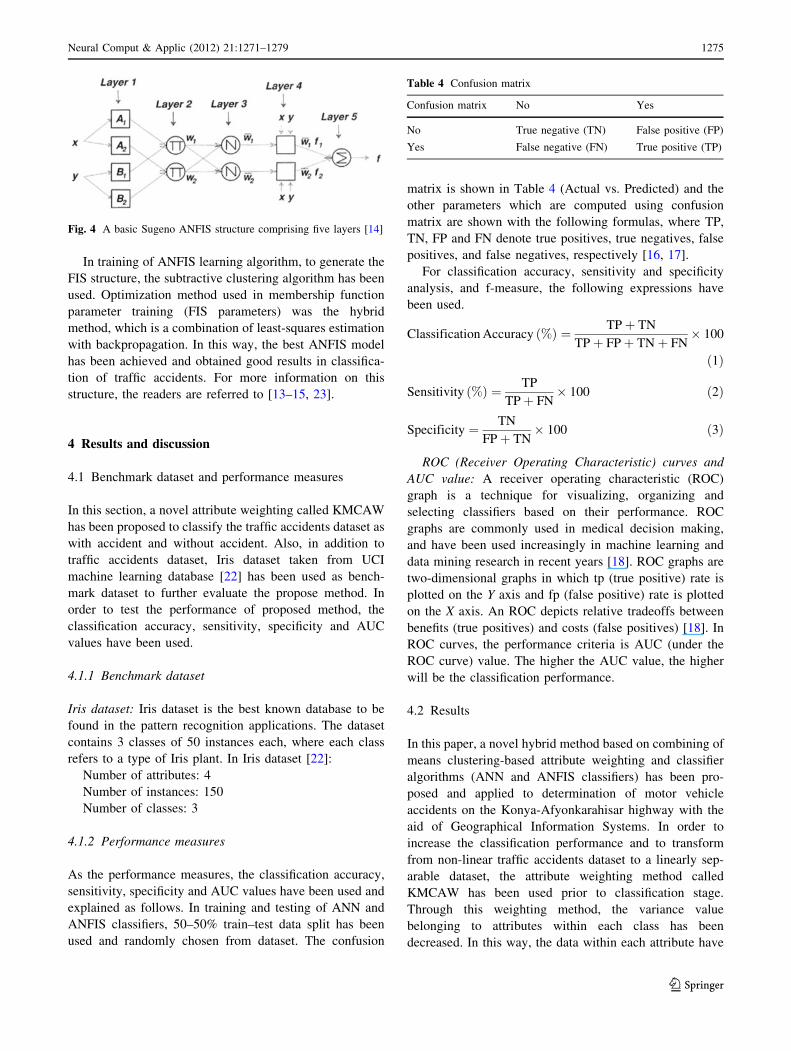
3.2.2 Adaptive network-based fuzzy inference system
(ANFIS)
ANFIS are a class of adaptive networks that are function-
ally equivalent to fuzzy inference systems. ANFIS is an
adaptive version of fuzzy inference system based on
combining neural network learning abilities and inference
ability of fuzzy logic. Especially, ANFIS structure consists
of representing as a network that has neural learning ability
of Sugeno type fuzzy systems. Figure 4 presents a basic
Sugeno ANFIS structure comprising five layers.
Loading Datasets ----------------------------------------------------------------------- Load the dataset including classes
Obtaining Centers of All attributes --------------------------------------------------------------------- Find the centers of attributes using K-means Clustering (KMC)
Weighting Process ------------------------------------------------------------------------
Calculate the ratios of means of attributes to their centers and multiply these ratios with each attribute
Finding final weighting ratios -------------------------------------------------------------------------Weighting of attributes using KMC method
Fig. 3 The block diagram of KMC. The flowchart of K-means
clustering (KMC)-based attribute weighting
Table 3 The number of nodes in the input layer, hidden layer, and
output layer on MLP network
Dataset The number of
node in input
layer
The number of
node in hidden
layer
The number of
node in output
layer
Traffic
accident
dataset
5 10 2
1274 Neural Comput & Applic (2012) 21:1271–1279
123
In training of ANFIS learning algorithm, to generate the
FIS structure, the subtractive clustering algorithm has been
used. Optimization method used in membership function
parameter training (FIS parameters) was the hybrid
method, which is a combination of least-squares estimation
with backpropagation. In this way, the best ANFIS model
has been achieved and obtained good results in classifica-
tion of traffic accidents. For more information on this
structure, the readers are referred to [13–15, 23].
4 Results and discussion
4.1 Benchmark dataset and performance measures
In this section, a novel attribute weighting called KMCAW
has been proposed to classify the traffic accidents dataset as
with accident and without accident. Also, in addition to
traffic accidents dataset, Iris dataset taken from UCI
machine learning database [22] has been used as bench-
mark dataset to further evaluate the propose method. In
order to test the performance of proposed method, the
classification accuracy, sensitivity, specificity and AUC
values have been used.
4.1.1 Benchmark dataset
Iris dataset: Iris dataset is the best known database to be
found in the pattern recognition applications. The dataset
contains 3 classes of 50 instances each, where each class
refers to a type of Iris plant. In Iris dataset [22]:
Number of attributes: 4
Number of instances: 150
Number of classes: 3
4.1.2 Performance measures
As the performance measures, the classification accuracy,
sensitivity, specificity and AUC values have been used and
explained as follows. In training and testing of ANN and
ANFIS classifiers, 50–50% train–test data split has been
used and randomly chosen from dataset. The confusion
matrix is shown in Table 4 (Actual vs. Predicted) and the
other parameters which are computed using confusion
matrix are shown with the following formulas, where TP,
TN, FP and FN denote true positives, true negatives, false
positives, and false negatives, respectively [16, 17].
For classification accuracy, sensitivity and specificity
analysis, and f-measure, the following expressions have
been used.
Classification Accuracy ð%Þ ¼ TPþ TN
TPþ FPþ TNþ FN� 100
ð1Þ
Sensitivity ð%Þ ¼ TP
TPþ FN� 100 ð2Þ
Specificity ¼ TN
FPþ TN� 100 ð3Þ
ROC (Receiver Operating Characteristic) curves and
AUC value: A receiver operating characteristic (ROC)
graph is a technique for visualizing, organizing and
selecting classifiers based on their performance. ROC
graphs are commonly used in medical decision making,
and have been used increasingly in machine learning and
data mining research in recent years [18]. ROC graphs are
two-dimensional graphs in which tp (true positive) rate is
plotted on the Y axis and fp (false positive) rate is plotted
on the X axis. An ROC depicts relative tradeoffs between
benefits (true positives) and costs (false positives) [18]. In
ROC curves, the performance criteria is AUC (under the
ROC curve) value. The higher the AUC value, the higher
will be the classification performance.
4.2 Results
In this paper, a novel hybrid method based on combining of
means clustering-based attribute weighting and classifier
algorithms (ANN and ANFIS classifiers) has been pro-
posed and applied to determination of motor vehicle
accidents on the Konya-Afyonkarahisar highway with the
aid of Geographical Information Systems. In order to
increase the classification performance and to transform
from non-linear traffic accidents dataset to a linearly sep-
arable dataset, the attribute weighting method called
KMCAW has been used prior to classification stage.
Through this weighting method, the variance value
belonging to attributes within each class has been
decreased. In this way, the data within each attribute have
Fig. 4 A basic Sugeno ANFIS structure comprising five layers [14]
Table 4 Confusion matrix
Confusion matrix No Yes
No True negative (TN) False positive (FP)
Yes False negative (FN) True positive (TP)
Neural Comput & Applic (2012) 21:1271–1279 1275
123
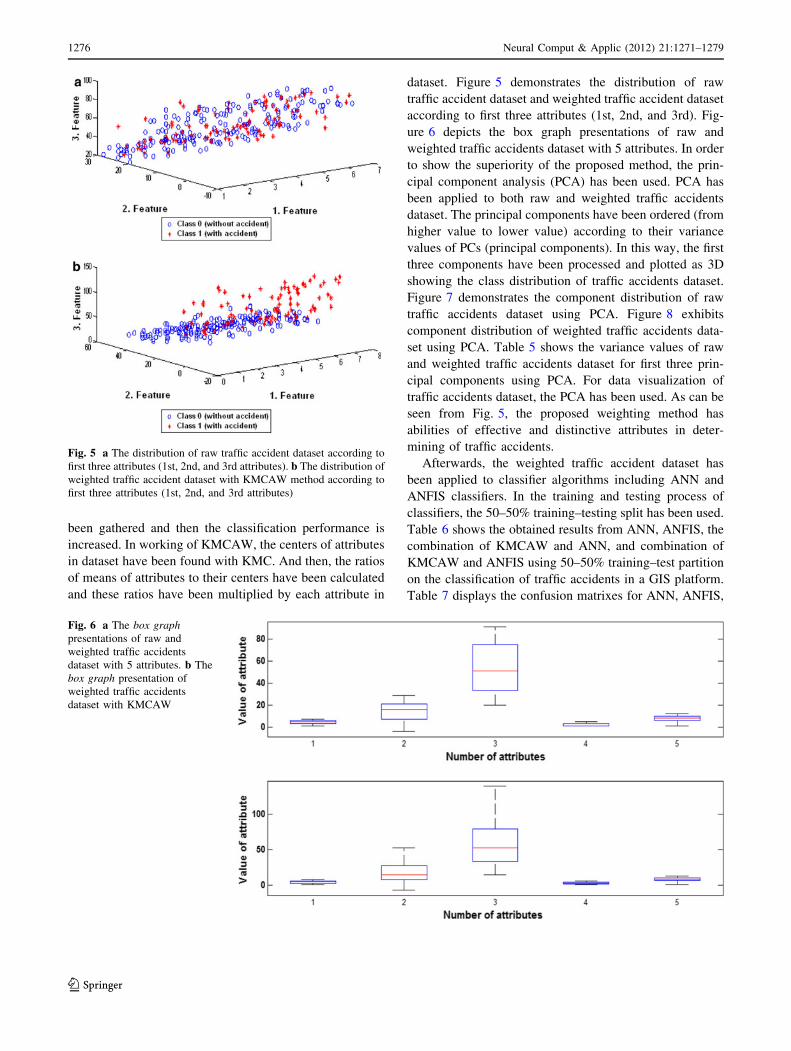
been gathered and then the classification performance is
increased. In working of KMCAW, the centers of attributes
in dataset have been found with KMC. And then, the ratios
of means of attributes to their centers have been calculated
and these ratios have been multiplied by each attribute in
dataset. Figure 5 demonstrates the distribution of raw
traffic accident dataset and weighted traffic accident dataset
according to first three attributes (1st, 2nd, and 3rd). Fig-
ure 6 depicts the box graph presentations of raw and
weighted traffic accidents dataset with 5 attributes. In order
to show the superiority of the proposed method, the prin-
cipal component analysis (PCA) has been used. PCA has
been applied to both raw and weighted traffic accidents
dataset. The principal components have been ordered (from
higher value to lower value) according to their variance
values of PCs (principal components). In this way, the first
three components have been processed and plotted as 3D
showing the class distribution of traffic accidents dataset.
Figure 7 demonstrates the component distribution of raw
traffic accidents dataset using PCA. Figure 8 exhibits
component distribution of weighted traffic accidents data-
set using PCA. Table 5 shows the variance values of raw
and weighted traffic accidents dataset for first three prin-
cipal components using PCA. For data visualization of
traffic accidents dataset, the PCA has been used. As can be
seen from Fig. 5, the proposed weighting method has
abilities of effective and distinctive attributes in deter-
mining of traffic accidents.
Afterwards, the weighted traffic accident dataset has
been applied to classifier algorithms including ANN and
ANFIS classifiers. In the training and testing process of
classifiers, the 50–50% training–testing split has been used.
Table 6 shows the obtained results from ANN, ANFIS, the
combination of KMCAW and ANN, and combination of
KMCAW and ANFIS using 50–50% training–test partition
on the classification of traffic accidents in a GIS platform.
Table 7 displays the confusion matrixes for ANN, ANFIS,
Fig. 6 a The box graphpresentations of raw and
weighted traffic accidents
dataset with 5 attributes. b The
box graph presentation of
weighted traffic accidents
dataset with KMCAW
Fig. 5 a The distribution of raw traffic accident dataset according to
first three attributes (1st, 2nd, and 3rd attributes). b The distribution of
weighted traffic accident dataset with KMCAW method according to
first three attributes (1st, 2nd, and 3rd attributes)
1276 Neural Comput & Applic (2012) 21:1271–1279
123
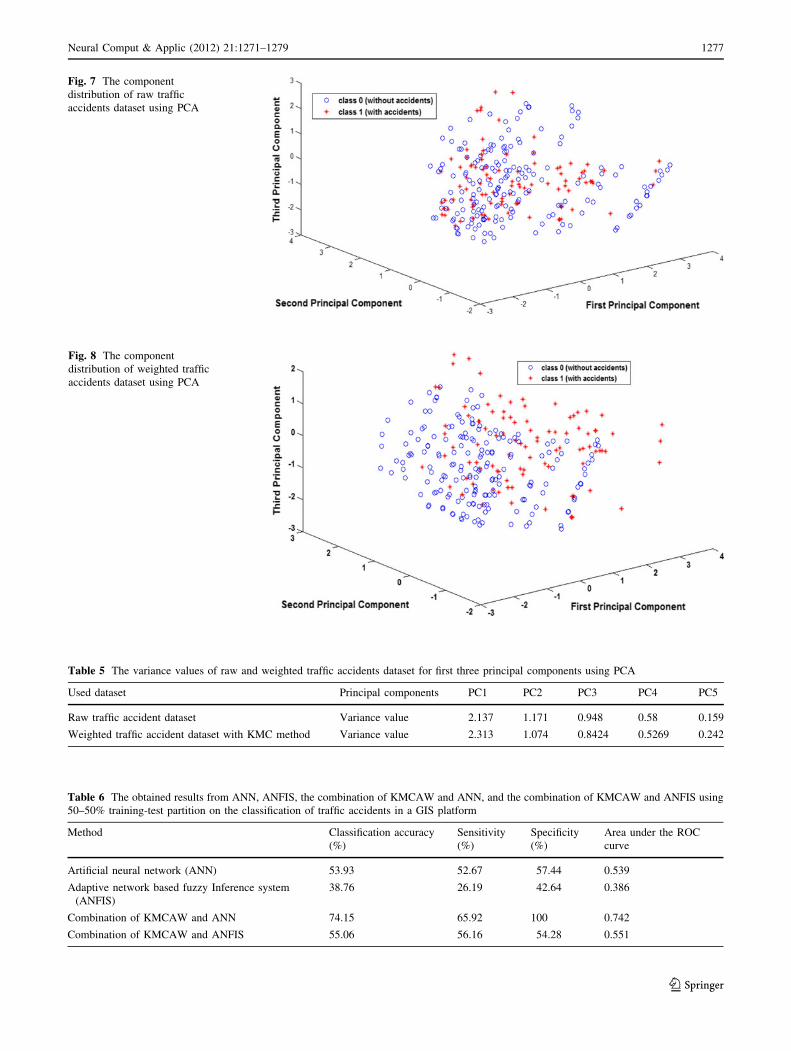
Fig. 8 The component
distribution of weighted traffic
accidents dataset using PCA
Fig. 7 The component
distribution of raw traffic
accidents dataset using PCA
Table 6 The obtained results from ANN, ANFIS, the combination of KMCAW and ANN, and the combination of KMCAW and ANFIS using
50–50% training-test partition on the classification of traffic accidents in a GIS platform
Method Classification accuracy
(%)
Sensitivity
(%)
Specificity
(%)
Area under the ROC
curve
Artificial neural network (ANN) 53.93 52.67 57.44 0.539
Adaptive network based fuzzy Inference system
(ANFIS)
38.76 26.19 42.64 0.386
Combination of KMCAW and ANN 74.15 65.92 100 0.742
Combination of KMCAW and ANFIS 55.06 56.16 54.28 0.551
Table 5 The variance values of raw and weighted traffic accidents dataset for first three principal components using PCA
Used dataset Principal components PC1 PC2 PC3 PC4 PC5
Raw traffic accident dataset Variance value 2.137 1.171 0.948 0.58 0.159
Weighted traffic accident dataset with KMC method Variance value 2.313 1.074 0.8424 0.5269 0.242
Neural Comput & Applic (2012) 21:1271–1279 1277
123
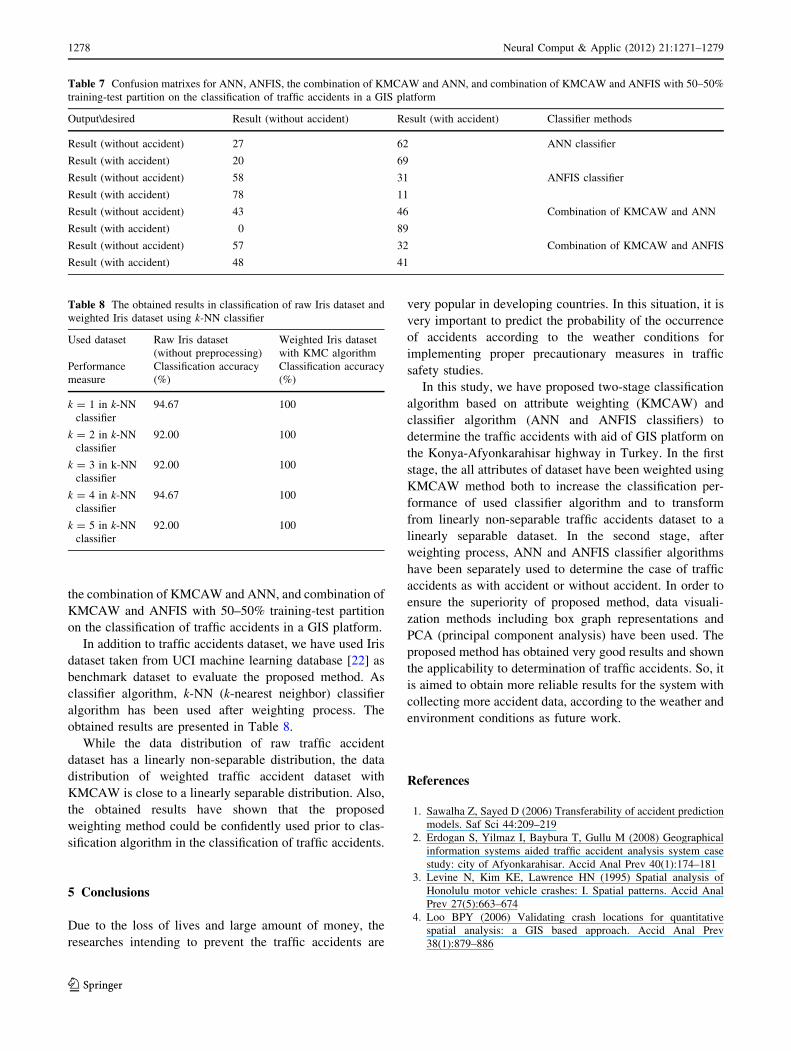
the combination of KMCAW and ANN, and combination of
KMCAW and ANFIS with 50–50% training-test partition
on the classification of traffic accidents in a GIS platform.
In addition to traffic accidents dataset, we have used Iris
dataset taken from UCI machine learning database [22] as
benchmark dataset to evaluate the proposed method. As
classifier algorithm, k-NN (k-nearest neighbor) classifier
algorithm has been used after weighting process. The
obtained results are presented in Table 8.
While the data distribution of raw traffic accident
dataset has a linearly non-separable distribution, the data
distribution of weighted traffic accident dataset with
KMCAW is close to a linearly separable distribution. Also,
the obtained results have shown that the proposed
weighting method could be confidently used prior to clas-
sification algorithm in the classification of traffic accidents.
5 Conclusions
Due to the loss of lives and large amount of money, the
researches intending to prevent the traffic accidents are
very popular in developing countries. In this situation, it is
very important to predict the probability of the occurrence
of accidents according to the weather conditions for
implementing proper precautionary measures in traffic
safety studies.
In this study, we have proposed two-stage classification
algorithm based on attribute weighting (KMCAW) and
classifier algorithm (ANN and ANFIS classifiers) to
determine the traffic accidents with aid of GIS platform on
the Konya-Afyonkarahisar highway in Turkey. In the first
stage, the all attributes of dataset have been weighted using
KMCAW method both to increase the classification per-
formance of used classifier algorithm and to transform
from linearly non-separable traffic accidents dataset to a
linearly separable dataset. In the second stage, after
weighting process, ANN and ANFIS classifier algorithms
have been separately used to determine the case of traffic
accidents as with accident or without accident. In order to
ensure the superiority of proposed method, data visuali-
zation methods including box graph representations and
PCA (principal component analysis) have been used. The
proposed method has obtained very good results and shown
the applicability to determination of traffic accidents. So, it
is aimed to obtain more reliable results for the system with
collecting more accident data, according to the weather and
environment conditions as future work.
References
1. Sawalha Z, Sayed D (2006) Transferability of accident prediction
models. Saf Sci 44:209–219
2. Erdogan S, Yilmaz I, Baybura T, Gullu M (2008) Geographical
information systems aided traffic accident analysis system case
study: city of Afyonkarahisar. Accid Anal Prev 40(1):174–181
3. Levine N, Kim KE, Lawrence HN (1995) Spatial analysis of
Honolulu motor vehicle crashes: I. Spatial patterns. Accid Anal
Prev 27(5):663–674
4. Loo BPY (2006) Validating crash locations for quantitative
spatial analysis: a GIS based approach. Accid Anal Prev
38(1):879–886
Table 7 Confusion matrixes for ANN, ANFIS, the combination of KMCAW and ANN, and combination of KMCAW and ANFIS with 50–50%
training-test partition on the classification of traffic accidents in a GIS platform
Output\desired Result (without accident) Result (with accident) Classifier methods
Result (without accident) 27 62 ANN classifier
Result (with accident) 20 69
Result (without accident) 58 31 ANFIS classifier
Result (with accident) 78 11
Result (without accident) 43 46 Combination of KMCAW and ANN
Result (with accident) 0 89
Result (without accident) 57 32 Combination of KMCAW and ANFIS
Result (with accident) 48 41
Table 8 The obtained results in classification of raw Iris dataset and
weighted Iris dataset using k-NN classifier
Used dataset Raw Iris dataset
(without preprocessing)
Weighted Iris dataset
with KMC algorithm
Performance
measure
Classification accuracy
(%)
Classification accuracy
(%)
k = 1 in k-NN
classifier
94.67 100
k = 2 in k-NN
classifier
92.00 100
k = 3 in k-NN
classifier
92.00 100
k = 4 in k-NN
classifier
94.67 100
k = 5 in k-NN
classifier
92.00 100
1278 Neural Comput & Applic (2012) 21:1271–1279
123
5. Andreescu MP, Frost DB (1998) Weather and traffic accidents in
Montreal, Canada. Clim Res 9:225–230
6. MacQueen B (1967) Some methods for classification and analysis
of multivariate observations. Proceedings of 5th Berkeley sym-
posium on mathematical statistics and probability, University of
California Press, Berkeley, 1:281–297
7. Bezdek JC (1981) Pattern recognition with fuzzy objective
function algorithms. Plenum Press, New York
8. Yager RR, Filev DP (1994) Generation of fuzzy rules by
mountain clustering. IEEE Trans Syst Man Cybern 24:209–219
9. Chiu SL (1994) Fuzzy model identification based on cluster
estimation, J Intell Fuzzy Syst 2
10. Rui Xu, Donald Wunsch II (2005) Survey of clustering algo-
rithms. IEEE Trans Neural Netw 16(3):645–678
11. Guldemır H, Sengur A (2006) Comparison of clustering algo-
rithms for analog modulation classification. Expert Syst Appl
30(4):642–649
12. Dirgenali F, Kara S (2006) Recognition of early phase of ath-
erosclerosis using principles component analysis and artificial
neural networks from carotid artery Doppler signals. Expert Syst
Appl 31(3):643–651
13. Jang JSR (1992) Self-learning fuzzy controllers based on
temporal backpropagation. IEEE Trans Neural Netw 3(5):
714–723
14. Jang JSR (1993) ANFIS: adaptive-network based fuzzy inference
systems. IEEE Trans Syst Man Cybern 23(03):665–685
15. Tsoukalas LH, Uhrıg RE (1996) Fuzzy and neural approaches in
engineering. Wiley, New York
16. Lewis D, Gale W (1994) A sequential algorithm for training text
classifiers. Annual ACM conference on research and develop-
ment in information retrieval, the 17th annual international ACM
SIGIR conference on research and development in information
retrieval, New York, 3–12
17. Ma Y, Guo L, Cukic B (2006) A statistical framework for the
prediction of fault-proneness, advances in machine learning
application in software engineering. Idea Group Inc
18. Fawcett F (2005) An introduction to ROC analysis. Pattern Re-
cogn Lett 27(8):861–874
19. Gunes S, Polat K, Yosunkaya S (2010) Efficient sleep stage
recognition system based on EEG signal using k-means clustering
based feature weighting. Expert Syst Appl 37(12):7922–7928
20. Durduran SS (2010) A decision making system to automatic
recognize of traffic accidents on the basis of a GIS platform.
Expert Syst Appl 37(12):7729–7736
21. Polat K, Durduran SS (2010) Ensemble of classifiers for intelli-
gent recognition of traffic accidents using a geographical infor-
mation systems platform, 1st international symposium on
computing in science and Engineering (ISCSE), June 3–5, 2010,
Kusadası, Turkiye
22. Frank A, Asuncion A (2011) UCI machine learning repository.
University of California, School of Information and Computer
Science, Irvine, CA. http://archive.ics.uci.edu/ml
23. Polat K, Gunes S (2006) A hybrid medical decision making
system based on principles component analysis, k-NN based
weighted pre-processing and adaptive neuro-fuzzy inference
system. Digital Signal Process 16(6):913–921
Neural Comput & Applic (2012) 21:1271–1279 1279
123
Top Related
Copyright © 2022 FDOKUMEN

