


Bahasa
Halaman
Hukum


Assignment 2: Database Systems & Database ModelsBrian Nance
CIS 515 Strategic Planning for Database SystemsStrayer University
Prof. (Dr.) Mark O AfolabiOctober 28, 2014

Assignment 2: Database Systems & Database Models 2
1. Query to determine the commission paid to specific employees
in the month of December
After information is gathered about the employee; most of what
was mentioned before, and input into the system a query can be
designed to pull that information from the tables. In order to
pull information from tables the SELECT function is used to
determine the information that is needed and the FROM function
tells from what tables to pull it (Coronel, Morris & Rob, 2012).
The coding that was used to find information on commissions paid
to employees was: SELECT Employee.*
FROM Employee, Invoice
WHERE (Department ID =2);
The asterisk next to employees indicates that all the information
under the employee table was used to generate the search. In this
query information was pulled from the employee and invoice

Assignment 2: Database Systems & Database Models 3
tables. The WHERE function more specifically states the
department which can be changed
and it would generate new information. The query currently only
shows employee commission information for employees who work in
department two.
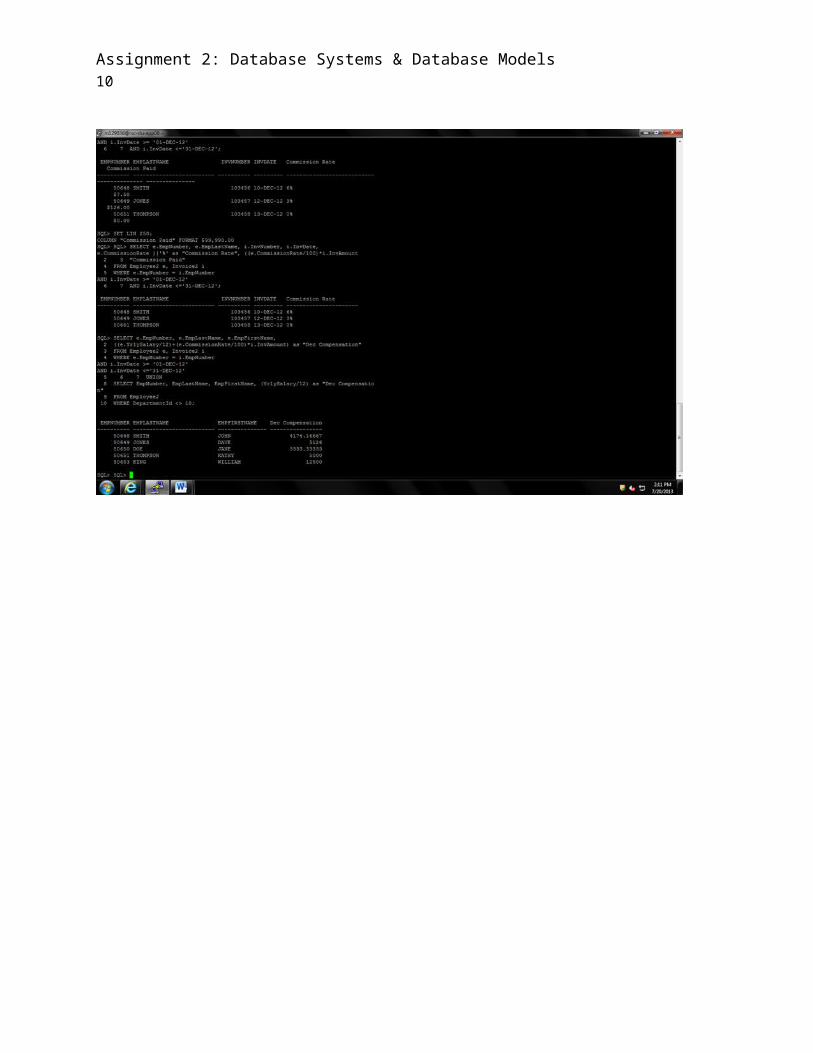
SET LIN 250;
COLUMN "Commission Paid" FORMAT $99,990.00
SELECT e.EmpNumber, e.EmpLastName, i.InvNumber, i.InvDate,
e.CommissionRate ||'%' as "Commission Rate",
((e.CommissionRate/100)*i.InvAmount) as
"Commission Paid"
FROM Employee2 e, Invoice2 i
WHERE e.EmpNumber = i.EmpNumber
AND i.InvDate >= '01-DEC-12'
AND i.InvDate <='31-DEC-12';
2. Query for total compensation paid to each employee for the
same month
If the finance department wanted to find the total compensation
paid to each employee in the same month as the first query a

Assignment 2: Database Systems & Database Models 4
slightly different query would be run to generate that
information. The first code simply pulled the information and did
not include and computation because the finance department only
requested to be able to determine as in pull up the record for
employee’s commission paid. The second code will include
computation which will divide the yearly salary by twelve months
then multiples the commission rate by the total amount of product
sold and lastly add those two numbers together to get the total
compensation for that month.
SELECT Employee.EmpNumber, Employee.EmpFirstName,
Employee.EmpLastName, Employee.YrlySalary, Invoice.InvAmount,
Invoice.InvDate, Employee.CommissionRate
FROM Employee INNER JOIN Invoice ON Employee.EmpNumber =
Invoice.EmpNumber
WHERE (Department ID=2);
SELECT e.EmpNumber, e.EmpLastName, e.EmpFirstName,
((e.YrlySalary/12) + (e.CommissionRate/100)*i.InvAmount) as "Dec
Compensation"
FROM Employee2 e, Invoice2 i

Assignment 2: Database Systems & Database Models 5
WHERE e.EmpNumber = i.EmpNumber
AND i.InvDate >= '01-DEC-12'
AND i.InvDate <='31-DEC-12'
UNION
SELECT EmpNumber, EmpLastName, EmpFirstName, (YrlySalary/14) as
"Dec Compensation"
FROM Employee2
WHERE DepartmentId <> 10;
3. Factors necessary to ensure Referential Integrity
Coronel, Morris, and Rob (2013) stated that, “foreign keys are
used to ensure referential integrity, the condition in which
every reference to an entity instance by another entity instance
is valid” (Coronel, Morris, & Rob, 2012). Factors necessary to
ensure referential integrity do describe a condition where a
foreign key value has a match in a corresponding table or in
which the foreign key value is null. The null foreign key value
makes it possible not to have a matching value, but the
corresponding condition on values that are not null makes it
impossible not to have a valid value. This means that, any

Assignment 2: Database Systems & Database Models 6
foreign key that contains a value ensures that the value refers
to an existing valid row in another relation. Furthermore,
referential integrity is a safeguard that makes it impossible to
assign a non-existing foreign key value to a table.
4. Entity Relationships
The Entity Relationship model, as stated by Coronel et al, (2013)
“represent the conceptual database as viewed by end user”
(Coronel et al, 2013). Entity Relationship Diagrams are a major
data modeling tool that helps organize data into entities and
define the relationships between the entities. This process
facilitates a good database structure that enables efficiency in
data storage, retrieval, and manipulation.
Relationship between entities is symbolized by lines that connect
the primary key in the parent entity to its resultant foreign key
in a child entity. Descriptors and types of the relationships are
also depicted with 1:1, 1: M or M: 1. Entity relationships in
this scenario are mostly 1:1 and two 1: M or M: 1 to denote which
connectivity describes the relationship classification.

Assignment 2: Database Systems & Database Models 7
6. Big Data in Productivity and Forecasting
Big Data could be used to assist in productivity and forecasting
of organizations product and resources because it takes “large
pools of data that can be brought together and analyzed to
discern patterns and make better decisions”. It “enhances
productivity and creates significant value for the world economy
by reducing waste and increasing the quality of products and
services (Mcguire, 2012). Additionally, Big Data adds “value by
making information transparent... “store more transactional data
in digital form”, and develop the next generation of products and
services” (Mcguire, 2012). That last aspect of Big Data allows
“manufacturers are using data obtained from sensors embedded in
products to create innovative after-sales service offerings such
as proactive maintenance to avoid failures in new products
(Mcguire, 2012).
Figure1. Shows the entity relationships between the objects and
highlights the types of relationship.

Assignment 2: Database Systems & Database Models 8
EM PLOYEE2
DEPARTM ENT2
JOB2
INVOICE2 PRODUCT2
INVOICELINE2
EM PNUM BERPK
DEPARTM ENTID FK
JOBID FK
DEPARTM ENTIDPK
JOBIDPK
INVNUM BERPK
EM PNUM BERFK
PRODUCTNUM BERPK
INVLINENUM BERPK
INVNUM BER FK
PRODUCTIDFK
Can Generate
Can Have
Belongs to
DEPARTM ENTDESCRIPTION
INVAM OUNT
PRODUCTCOST
JOBDESCRIPTION
EM PFIRSTNAM E
EM PLASTNAM E
COM M ISSIONRATE
YRLYSALARY
PRODUCTCOST
1:M
1:M
PRODUCTDESCRIPTION
1:1
1:1
1:1
1:1
Can Have
Can Generate
1:1
1:M
1:1
1:1
attribute name
attribute name
Figure 2. Data set created
Figure 3. December commission for the sale Department

Assignment 2: Database Systems & Database Models 9
Figure 4. Total compensation for December
Assignment 2: Database Systems & Database Models 10

Assignment 2: Database Systems & Database Models 11
References
Coronel, C., Morris, S., & Rob, P. (2013). Database Systems:
Design, Implementation, and Management. Mason, OH: Cengage
Learning.
Halper, F. (2012). Four Vendor Views on Big Data and Big Data
Analytics: IBM. Retrieved from:
http://fbhalper.wordpress.com/2012/01/30/four-vendor-views-
on-big-data-and-big-data-analytics-ibm/
Manyika, J., Chui, M., Brown, B., Bughin, J., Dobbs, R.,
Roxburgh, C., Byers A. (2011). Big data: The next frontier
for innovation, competition, and productivity.
http://www.mckinsey.com/insights/business_technology/big_data
_the_next_frontier_for_innovation
Mcguire, T. (2012, July). Why big data is the new competitive
advantage. Retrieved from
http://www.iveybusinessjournal.com/topics/strategy/why-big-
data-is-the-new-competitive-advantage

Assignment 2: Database Systems & Database Models 12
Copyright © 2022 FDOKUMEN

