


Bahasa
Halaman
Hukum

An Experimental Study of High-Performance
Concrete Using Metakaolin Additive and Polymer
Admixture
By: Adel Ahmed Al Menhosh
Supervised by:
Dr. Yu Wang (Supervisor)
Dr. Jinyan Wang (Co-supervisor)
Directorate of Civil Engineering
School of Computing, Science and Engineering,
University of Salford
UK
Submitted in partial fulfilment of the requirements of Degree of
Doctor of Philosophy, December 2017
I
Abstract
In recent years, there has been a growing interest in the use of supplementary cementing
materials and polymers to produce high-performance concrete. Utilizing a mineral substance
as cement replacement in concrete has less environmental pollution and greatly increases
the service life of the concrete structures due to improve the most of concrete properties in
compared with conventional concrete. The aim of this project is an experimental study of
high-performance concrete using metakaolin (MK) additive as partial replacement of
cement and addition of the Styrene-Butadiene rubber (SBR) and Polyvinyl acetate (PVA),
to conduct a novel research to investigate the effectiveness of the additives materials on the
performance of concrete. It also investigates the effect of additional recycled plastic and
glass fibre as reinforcements used in the modified concrete.
Firstly, trial mixes of 460 cubes, 24 cylinders and 30 prisms were made to study the setting
time, workability, mechanical properties and water absorption of the concrete to find the
optimum metakaolin to cement ratio (MK/C), polymer to cement ratio (P/C), water to
cement ratio (W/C), and the best curing method among the wet, dry and moist, respectively.
The designed concrete mixes have a certain cement/sand/gravel proportion of 1:1.5:3. The
trial mixtures were tested for setting time, slump of fresh concrete mix, mechanical
properties, including compressive, splitting and flexural strength, and water absorption
capacity at age up to 28 days. Three polymers to cement ratios, which are 2.5, 5 and 7.5%,
and five metakaolin replacement ratio for the cement, which are 10, 15, 20, 30 and 40%,
were studied, respectively. For these mixtures, five W/C ratios, which are 0.35, 0.38, 0.40,
0.45, and 0.50, respectively, were compared. The use of recycled plastic and glass fibre
reinforcements took 5% of the total cement weight and tested for splitting and flexural
strength testes. The first phase work has shown clear improvement of the performance of
concrete modified by partial replacement of cement by metakaolin and adding polymers
admixture together. The optimised mix was identified to be that of 5% added polymers
included 80% SBR and 20% PVA, 15% metakaolin replacement for cement, 0.45 W/C ratio,
and using limestone aggregate as a coarse aggregates and using moist curing method as a
curing condition for the concrete.
Secondly, the optimum mixture identified in the trial study was further investigated for its
mechanical including compressive, flexural, and deformable proprieties at prolonged ages
up to 545 days. In addition, a specific durability properties of concrete including water and
gas permeability, carbonation penetration, chloride penetration, chemical attack resistance,
II
water absorption, rate of water absorption and the corrosion rate of the steel reinforcement
in the concrete. The results show that significant improvement in mechanical properties
including compressive, splitting, flexural strength and deformation properties. Also, the
results show improvement in durability properties including chemical resistance, water
absorption, rate of water absorption, carbonation depth of penetration, chloride ion
penetration, water penetration under pressure, water permeability, gas penetration and steel
corrosion resistance. The optimum mix of 15% partial replacement of cement by metakaolin,
5% polymer, 0.45 W/C ratio and moist curing condition of the modified concrete produced
high-performance concrete more environmental friendly due to improved overall of the
mechanical and durability properties of the concrete.
Finally, microscopic composition of the hydration products and the corresponding pores
structure have been investigated for the optimised mixes based on the material composition
analysis and microscopic images obtained using scanning electronic microscope (SEM) and
the computed tomography scanner (CT) technologies. Correlation between the mechanical,
durability properties and the microscopic phases has been investigated and discussed for a
deep understanding of the mechanism of the optimum mixture. SEM and CT scanner
technologies provide qualitative and quantitative description of the concrete properties. It’s
also, proved that the concrete modified by both of metakaolin and two types of polymers
have a significant change in the pores structure of concrete compared with other mixes.
Scanning electron microscopy and computed tomography scanner results show that the
approach can be effectively applied in high-performance concrete related studies and
provide further evidence on mechanical and durability properties of concrete.
III
List of Contents
Abstract .................................................................................................................................. I
List of Contents ................................................................................................................... III
List of Figures ...................................................................................................................... IX
List of Tables ................................................................................................................. XVIII
List of Abbreviations ........................................................................................................ XIX
List of Publications ............................................................................................................ XX
Acknowledgements .......................................................................................................... XXI
Dedication ....................................................................................................................... XXII
Declaration..................................................................................................................... XXIII
CHAPTER 1 ......................................................................................................................... 1
INTRODUCTION ................................................................................................................ 1
1.1 Background and problem ................................................................................................ 1
1.2 Aim and Objectives ......................................................................................................... 3
1.3. Contributions to Knowledge ........................................................................................... 4
1.4 Content Organisation ....................................................................................................... 5
CHAPTER 2 ......................................................................................................................... 6
LITERATURE REVIEW ..................................................................................................... 6
2.1 Introduction ..................................................................................................................... 6
2.2 Supplementary cementing materials (SCMs) .................................................................. 8
2.3 Metakaolin ..................................................................................................................... 15
2.4 Metakaolin in concrete .................................................................................................. 17
2.5 Uses of metakaolin in concrete ...................................................................................... 25
2.6 Advantages of metakaolin in concrete........................................................................... 26
2.7 Disadvantages of metakaolin in concrete ...................................................................... 26
2.8 Polymer .......................................................................................................................... 27
2.9 Classification of polymers ............................................................................................. 27
2.10 Polymer in concrete ..................................................................................................... 28

IV
2.10.1 Polymer-impregnated concrete (PIC): .................................................................. 29
2.10.2 Polymer concrete (PC): ........................................................................................ 29
2.10.3 Polymer Portland cement concrete (PPCC): ........................................................ 29
2.11 Styrene-butadiene rubber (SBR) ................................................................................. 37
2.12 Polyvinyl acetate in concrete (PVA) ........................................................................... 42
2.13 Advantages of polymers in concrete ........................................................................... 44
2.14 Application of polymer in mortar and concrete........................................................... 45
2.15 Combined polymer modified concrete and SCMs materials ....................................... 46
2.16 Durability of modified concrete .................................................................................. 49
2.16.1 Concrete permeability........................................................................................... 51
2.16.2 Corrosion of steel embedded in concrete ............................................................. 54
2.17 Limestone cement and aggregate ................................................................................ 56
2.18 Fibre in concrete .......................................................................................................... 58
2.19 Microstructure of concrete........................................................................................... 60
2.20 Summary of the available literature review ................................................................. 66
CHAPTER THREE ............................................................................................................ 70
RESEARCH METHODOLOGY....................................................................................... 70
3.1 Introduction ................................................................................................................... 70
3.2 Raw Materials ................................................................................................................ 70
3.2.1. Cement: .................................................................................................................. 70
3.2.2. Aggregate .............................................................................................................. 70
3.2.2.1. Fine aggregate: ............................................................................................... 70
3.2.2.2. Course aggregate: ........................................................................................... 70
3.2.3. Metakaolin: ............................................................................................................ 72
3.2.4. Polymers ................................................................................................................ 72
3.2.4.1. Styrene butadiene rubber (SBR): .................................................................... 72
3.2.4.2. Polyvinyl acetate (PVA): ................................................................................ 72
3.2.5. Fibre reinforcements: ............................................................................................. 72
V
3.3 Mixture Design for the trial mixtures ............................................................................ 75
3.3.1. Preparation of materials and mixing proportions .................................................. 75
3.3.2. Mixing procedures ................................................................................................. 76
3.3.3. Moulding and curing condition ............................................................................. 76
3.4. Experimental tests for the trial mixes of study ............................................................. 78
3.4.1. Setting time test ..................................................................................................... 78
3.4.2. Slump test .............................................................................................................. 79
3.4.3. Mechanical properties............................................................................................ 79
3.4.3.1. Compressive strength test ............................................................................... 79
3.4.3.2. Splitting tensile strength test .......................................................................... 80
3.4.3.3. Flexural strength test ...................................................................................... 80
3.4.4 Water absorption test .............................................................................................. 82
3.5 Mixture proportions for the mechanical and durability properties ................................ 82
3.6 Experimental tests of the mechanical and durability properties .................................... 83
3.6.1. Mechanical properties............................................................................................ 83
3.6.2. Deformation properties .......................................................................................... 83
3.6.2.1. Stress-strain curve, static modulus of elasticity tests ..................................... 83
3.6.2.2. Drying shrinkage test ...................................................................................... 83
3.6.3. Durability test ........................................................................................................ 85
3.6.3.1. Chemical resistance test ................................................................................. 85
3.6.3.2. Water absorption test ...................................................................................... 86
3.6.3.3. Rate of water absorption ................................................................................. 86
3.6.3.4. Carbonation test .............................................................................................. 87
3.6.4.5. Chloride ion penetration test........................................................................... 88
3.6.4. Water permeability tests ........................................................................................ 89
3.6.4.1. Water permeability using core laboratory instruments (PERL-200) .............. 89
3.6.4.2. Depth of penetration of water under pressure ................................................ 90
3.6.5. Gas penetration of concrete under pressure tests................................................... 92
VI
3.6.6. Corrosion rate of steel embedded in concrete ....................................................... 93
CHAPTER 4 ....................................................................................................................... 95
RESULTS OF TRAIL MIXTURES AND MECHANICAL PROPERTIES ................. 95
4.1 Trail mixtures results ..................................................................................................... 95
4.1.1 Setting of cement paste ........................................................................................... 95
4.1.2 Slump of fresh concrete .......................................................................................... 98
4.1.3 Mechanical properties for short term.................................................................... 102
4.1.3.1 Compressive strength .................................................................................... 102
4.1.3.2 Splitting tensile strength ................................................................................ 108
4.1.3.3 Flexural strength ............................................................................................ 109
4.1.4 Water absorption test ............................................................................................ 112
4.2 Mechanical Properties of concrete .............................................................................. 114
4.2.1 Compressive strength ........................................................................................... 114
4.2.2 Splitting tensile strength ....................................................................................... 115
4.2.3 Flexural strength ................................................................................................... 116
4.2.4 Deformation properties ......................................................................................... 118
4.2.4.1 Stress-strain curve and Modulus of elasticity ................................................ 118
4.2.4.2 Drying shrinkage of concrete ........................................................................ 119
4.3 Summary of the results ................................................................................................ 121
4.3.1 Results of trial mixes ............................................................................................ 121
4.3.2 Results of mechanical strength ............................................................................. 122
CHAPTER 5 ..................................................................................................................... 123
RESULTS OF DURABILITY PROPERTIES ............................................................... 123
5.1 Chemical resistance ..................................................................................................... 123
5.2 Water absorption and rate of water absorption properties ........................................... 131
5.3 Depth of carbonation of concrete ................................................................................ 134
5.4 Depth of Chloride ion penetration ............................................................................... 137
5.5 Permeability property .................................................................................................. 138
VII
5.5.1 Water permeability test using (PERL-200) device ............................................... 138
5.5.2 Depth of water of penetration on concrete under pressure ................................... 140
5.5.3 Gas penetration of concrete under pressure .......................................................... 141
5.6 Steel reinforcement corrosion on concrete .................................................................. 143
5.7 Summary of the results of durability properties .......................................................... 147
CHAPTER 6 ..................................................................................................................... 148
CONCRETE MICROSTRUCTURE ............................................................................... 148
6.1 Introduction ................................................................................................................. 148
6.2 Scanning Electronic Microscope (SEM) ..................................................................... 149
6.3 Computed tomography (CT) scan technology............................................................. 151
6.4 Results and discussions of microstructure properties .................................................. 152
6.4.1 Scanning Electronic Microscope (SEM) .............................................................. 152
6.4.2 SEM image Processing ......................................................................................... 168
6.4.3 Energy Dispersive X-Rays (EDX) ....................................................................... 175
6.4.4 CT scanner ............................................................................................................ 203
6.5 Summary of the microstructure properties .................................................................. 219
CHAPTER SEVEN .......................................................................................................... 220
DISCUSSION THE RESULTS ....................................................................................... 220
7.1 General......................................................................................................................... 220
7.2 Results of the mechanical and durability Properties ................................................... 222
7.3 Results of the microstructure properties ...................................................................... 223
7.4 Discussion the results .................................................................................................. 224
CHAPTER EIGHT ........................................................................................................... 227
CONCLUSION AND RECOMMENDATIONS ............................................................ 227
8.1 Conclusion ................................................................................................................... 227
8.2 Recommendations and future works ........................................................................... 231
8.3 Industry applications ................................................................................................... 232
References ......................................................................................................................... 233

VIII
Appendix A .......................................................................................................................... A
Appendix B ........................................................................................................................... D
Appendix C ............................................................................................................................ F
Appendix D .......................................................................................................................... L
Appendix E ........................................................................................................................... N
IX
List of Figures
Figure 2.1: Calcium hydroxide content as a function of time (Moiseas and Joseph, 2000) 21
Figure 2.2: Compressive strength of mortars containing varying amounts of metakaolin at
28 days of curing Khatib et al. (2012) ................................................................................. 26
Figure 2.3: Steps from 1 to 4 of development of the relationship between the cement
hydration and polymer film formation (Beeldens et al., 2005) ........................................... 34
Figure 2.4: Chemical structure of styrene-butadiene rubber (Ohama, 1995) ...................... 37
Figure 2.5: Compressive strength of polymer-modified mortars with different P/C ratios
(Wang et al. 2005) ............................................................................................................... 38
Figure 2.6: Fracture surface of 28-day wet-cured polymer-modified mortars at p/c ratio of
(a) 0%, (b) 1%, (c) 5%, (d) 8%, (e) 10%, (f) 15% and (g) 20 % (Wang et al. 2005) .......... 39
Figure 2.7: Chemical structure of the polyvinyl acetate (Ohama, 1995) ............................ 43
Figure 2.8: Measure of carbonation for a split concrete cylinder specimen, Chang and Chen
(2006) .................................................................................................................................. 53
Figure 2.9: Weight loss measurement for concrete specimens with metakaolin (Parande et
al., 2008) .............................................................................................................................. 55
Figure 2.10: Comparisons of 28 days old Portland cement concrete and matching binary
image with a different w/c ratio (Sahu et al., 2004). ........................................................... 65
Figure 3.1: Sieve analyses for fine aggregate ...................................................................... 71
Figure 3.2: Sieve analysis for crushed granite coarse aggregate ......................................... 71
Figure 3.3: Sieve analysis for coarse limestone coarse aggregate ....................................... 71
Figure 3.4: Moulds used in study ........................................................................................ 76
Figure 3.5: Manual Vicat apparatus used for setting time test ............................................ 79
Figure 3.6: Splitting tensile strength of the cylinder specimen ........................................... 80
Figure 3.7: Typical cross-section of the prism under flexural strength test ........................ 81
Figure 3.8: Concrete prism under flexural strength test ...................................................... 81
Figure 3.9: Cylinder 150 mm x 300 mm under compressive stress .................................... 84
Figure 3.10: Prisms used for drying shrinkage test ............................................................. 84
Figure 3.11: Drying shrinkage test ...................................................................................... 85
Figure 3.12: Standard test method for measurement of rate of absorption of water by
hydraulic-cement concretes (ASTM C1585 – 04) ............................................................... 87
Figure 3.13: Typical longitudinal cross section of specimen after carbonation or chloride ion
penetration test ..................................................................................................................... 88
X
Figure 3.14: PERL-200 device to measure water permeability for concrete and mortar .... 90
Figure 3.15: Device used to measure depth of penetration of water under pressure ........... 91
Figure 3.16: Measurement the depth penetration of water under pressure test arrangement
(BS EN 12390-8:2009) ........................................................................................................ 91
Figure 3.17: Gas penetration (carbonation) under pressure test device. ............................. 92
Figure 3.18: Typical section for concrete cube shows the CO2 penetration into concrete
under 4 bars pressure ........................................................................................................... 93
Figure 4.1: Setting time of SBR modified cement paste ..................................................... 96
Figure 4.2: Setting time of PVA modified cement paste ..................................................... 96
Figure 4.3: Setting time of polymer modified cement paste ............................................... 97
Figure 4.4: Setting time of 15% metakaolin cement paste .................................................. 97
Figure 4.5: Setting time of 100% SBR and 15% Metakaolin cement paste ........................ 97
Figure 4.6: Setting time of 100% PVA and 15% Metakaolin cement paste ....................... 98
Figure 4.7: Setting time of (80%SBR and 20%PVA) and 15% Metakaolin cement paste . 98
Figure 4.8: Slump values for SBR modified fresh concrete ................................................ 99
Figure 4.9: Slump values for PVA modified fresh concrete ............................................. 100
Figure 4.10: Slump values for 80% SBR & 20% PVA modified fresh concrete .............. 100
Figure 4.11: Slump values for metakaolin modified fresh concrete ................................. 100
Figure 4.12: Slump values for fresh concrete modified by polymers and 15% metakaolin
........................................................................................................................................... 101
Figure 4.13: Slump values with different w/c ratio for the modified fresh concrete ........ 101
Figure 4.14: Compressive strength of the concrete modified by SBR% at 28 days ......... 103
Figure 4.15: Compressive strength of the concrete modified by PVA at 28 days ............ 104
Figure 4.16: Compressive strength for modified concrete with different polymer percents
and 0.45 W/C at 28 days .................................................................................................... 104
Figure 4.17: Compressive strength for concrete with different polymer percents using
0.45W/C at 28 days ........................................................................................................... 104
Figure 4.18: Compressive strength of different Metakaolin percent without polymers using
0.45 W/C ............................................................................................................................ 105
Figure 4.19: compressive strength for the modified concrete with different W/C ratio at 28
days .................................................................................................................................... 105
Figure 4.20: Effect of curing method on ompressive strength of polymer modified concrete
at 7 days ............................................................................................................................. 105

XI
Figure 4.21: Effect of curing methods on compressive strength of polymer modified concrete
at 28 days using 0.45 W/C ratio without metakaolin ....................................................... 106
Figure 4. 22: Effect of curing methods on compressive strength of modified concrete at 28
days using 0.45 W/C ratio and 15 % metakaolin .............................................................. 106
Figure 4.23: Effect of polymer on concrete using crushed limestone and granite coarse
aggregate ............................................................................................................................ 106
Figure 4.24: Compressive strength with different Metakaolin ratio using limestone aggregate
and granite coarse aggregate and 0.45 W/C ratio .............................................................. 107
Figure 4.25: Effect of polymer on concrete using limestone aggregate and granite coarse
aggregate with 15% metakaolin ........................................................................................ 107
Figure 4.26: Compressive strength of different modified concrete mixes compared with
conventional concrete w/c=0.45 at age 7 and 28 days ...................................................... 108
Figure 4.27: Splitting tensile strength for different modified concrete at age 28 days ..... 109
Figure 4.28: Splitting tensile strength for different modified concrete reinforced by glass
fibre (GF) and plastic fibre (PF) at age 28 days. ............................................................... 109
Figure 4.29: Flexural strength of modified concrete at age 28, days ................................ 110
Figure 4.30: Flexural strength of modified concrete at age 28 days ................................. 110
Figure 4.31: Effect of plastic fibre reinforcement on crack zone ...................................... 111
Figure 4.32: Comparison between the effect of Glass fibre and Plastic fibre reinforcement
on crack type ...................................................................................................................... 111
Figure 4.33: Water absorption for polymer modified concrete at age 28 days ................. 112
Figure 4.34: Effect of Metakaolin replacement on concrete water absorption ................. 113
Figure 4.35: Water absorption of modified concrete at age 28 ......................................... 113
Figure 4.36: compressive strength of modified concrete with different w/c ratio at age 28
and 90 days. ....................................................................................................................... 115
Figure 4.37: Relationships between compressive strength and period of curing of modified
concrete .............................................................................................................................. 115
Figure 4.38: Relationships between splitting tensile strength and curing time for different
modified concrete reinforced by glass fibre(GF) and plastic fibre (PF) .......................... 116
Figure 4.39: Relationships between flexural strength and ages for modified concrete without
fibres up to 180 days .......................................................................................................... 117
Figure 4.40: Relationships between flexural strength and ages for modified concrete
reinforced by fibers ............................................................................................................ 117
Figure 4.41: Stress-strain curve for conventional and modified concrete at age 28 days . 118
Figure 4.42: Modulus of elasticity for modified concrete at age 28 days ......................... 119
XII
Figure 4.43: Relationships between drying shrinkage and age of modified concrete ....... 120
Figure 4.44: Relationships between mass loss percent and age for for modified concrete
mixes .................................................................................................................................. 120
Figure 5.1: Chemical resistance of modified concrete immersed in 5% NaCl solution .... 124
Figure 5.2: Chemical resistance of modified concrete immersed in 20% NaOH solution 125
Figure 5.3: Compressive strength of the modified concrete immersied in 5% NaCL and 20%
NaOH solution at age 90 days ........................................................................................... 125
Figure 5.4: Effect of 5% NaCl solution on the surface of concrete specimens after 180 days
(A before dry, B after dry) ................................................................................................. 126
Figure 5.5: Effect of 20% NaOH solution on the surface of concrete specimens after 180
days (A before dry, B after dry) ........................................................................................ 126
Figure 5.6: Chemical resistance of concrete immerssed in 5% H2SO4 solution acid after age
28 days of moist curing ..................................................................................................... 128
Figure 5.7: Chemical resistance of concrete immerssed in 5% HCl solution after age 28 days
of curing ............................................................................................................................. 128
Figure 5.8: Chemical resistance of concrete immersed in 5% H2SO4 solution after age 365
days of curing .................................................................................................................... 129
Figure 5.9: Chemical resistance of concrete immerssed in 5% HCL solution after age 365
days of curing .................................................................................................................... 129
Figure 5.10: Surface deterioration of concrete specimens after 180 days of immersed in 5%
H2SO4 acid after 28 days of curing .................................................................................... 130
Figure 5.11: Surface deterioration of concrete specimens after 180 days of immersed in 5%
HCl acid after 28 days of curing ........................................................................................ 130
Figure 5.12: Surface deterioration after 90 days of immersion in 5% H2SO4 and 5% HCL
........................................................................................................................................... 130
Figure 5.13: Water absorption of modified concrete at age 28 and 56 days ..................... 132
Figure 5.14: The absorption plotted against square root of time, for modified concrete
specimens at age 28 days . ................................................................................................. 132
Figure 5.15: Rate of the absorption ( I) plotted against square root of time, for modified
concrete specimens at age 56 days ................................................................................... 133
Figure 5.16: Comparison of the absorption plotted against square root of time, for modified
concrete specimens at age 28 and 56 days ........................................................................ 133
Figure 5.17: The top surface area of conventional concrete and modified concrete ......... 134
XIII
Figure 5.18: Cross-sections of a split concrete cylinder specimens after carbonation for
modified concrete mixes .................................................................................................... 135
Figure 5.19: Measuring depth of carbonation of modified concrete by 15% partial
replacement of metakaolin and 5% polymer ..................................................................... 135
Figure 5.20: Relationships between carbonation depth and exposure time to CO2 for
modified concrete. ............................................................................................................. 136
Figure 5.21: Comparison depth of carbonation between the experimental results of modified
concrete and theoretical equation D= K (t) ½ .................................................................. 136
Figure 5.22: Mesuring depth of chloride ion penetration for modified concrete ............. 137
Figure 5.23: Relationship between chloride ion pentration and exposure time to CL of
concrete .............................................................................................................................. 138
Figure 5.24: Relationships between permeability and time of curing for different modified
cement mortar using PERL -200 device ............................................................................ 139
Figure 5.25: Relationships between permeability and time of curing for different modified
concrete using PERL -200 device ..................................................................................... 139
Figure 5.26: Penetration of water for modified concrete under 5 bar pressure after splitting
of the concrete specimens .................................................................................................. 140
Figure 5.27: Section of modified concrete specimen shows depth of water penetration under
5 bar pressure ..................................................................................................................... 141
Figure 5.28: Relationships between depth of water penetration and curing time for modified
concrete .............................................................................................................................. 141
Figure 5.29: Relationships between gas penetration depth and time of curing of concrete
specimens .......................................................................................................................... 142
Figure 5.30: Section in the specimen shows the depth of gas penetration for the modified
concrete at age 90 days (uncoloured area)......................................................................... 142
Figure 5.31: Corrosion rate of steel reinforcement of specimens after 180 days of exposure
........................................................................................................................................... 143
Figure 5.32: The weight loss of the reinforcements of the specimens after 180 days exposure
........................................................................................................................................... 144
Figure 5.33: Corrosion rate of steel reinforcement of specimens after 270 days exposure
........................................................................................................................................... 144
Figure 5.34: The weight loss of the reinforcements of the specimens after 270 days exposure
........................................................................................................................................... 145
Figure 5.35: Corrosion rate of steel reinforcement of specimens after 365 days exposure
........................................................................................................................................... 145
XIV
Figure 5.36: The weight loss of the reinforcements of the specimens after 365 days exposure
........................................................................................................................................... 146
Figure 5.37: Corrosion rate of steel reinforcement of specimens after 180, 270 and 365 days
exposure to three curing condition .................................................................................... 146
Figure 5.38: The weight loss of the steel reinforcements of the specimens after 180, 270 and
365 days of exposure to three curing conditions ............................................................... 147
Figure 6.1: The FEG Quanta 250 ESEM ........................................................................... 150
Figure 6.2: Phoenix V/Tome/X computed tomography (CT) scanner device ................... 151
Figure 6.3: SEM for concrete at age 7 days 100x magnifications ..................................... 153
Figure 6.4: SEM for conrete at age 7 days 1000x of magnifications ................................ 154
Figure 6.5: SEM for concrete at age 7 days 5000x magnifications ................................... 155
Figure 6.6: SEM for conrete at age 7 days 10000x magnifications .................................. 156
Figure 6.7: SEM for concrete at age 28 days 100x magnifications ................................... 157
Figure 6.8: SEM for conrete at age 28 days 1000x magnification .................................... 158
Figure 6.9: SEM for conrete at age 28 days 5000x magnifications .................................. 159
Figure 6.10: SEM for mix 1 and mix 3 at age 56 days for 100x, 1000x and 5000x
magnifications ................................................................................................................... 162
Figure 6.11: SEM for conrete at age 270 days 100x magnifications ................................ 163
Figure 6.12: SEM for conrete at agre 270 days 1000x magnifications ............................. 164
Figure 6.13: SEM for conrete at agre 270 days 5000x magnifications ............................. 165
Figure 6.14: SEM for conrete at agre 270 days 20000x magnifications ........................... 166
Figure 6.15: SEM for Mix 1 and mix 3 at ages 7, 28, 56 and 270 days 5000x magnification
........................................................................................................................................... 167
Figure 6.16: BW image processing for concrete at age 7 days at 100x of magnification 169
Figure 6.17: Pores area for concrete at age7 days at 100x of magnifications ................... 169
Figure 6.18: BW image processing for concrete at age 7 days at 1000x of magnification
........................................................................................................................................... 170
Figure 6.19: Pores area for concrete at age 7 days at 1000x of magnifications ................ 170
Figure 6.20: BW image processing for concrete at age 7 days at 5000x magnifications .. 171
Figure 6.21: Pores area for concrete at age 7 days at 5000x of magnification .................. 171
Figure 6. 22: BW image processing for concrete at age 28 days at 100x of magnifications
........................................................................................................................................... 172
Figure 6. 23: Pores area for concrete at age 28 days at 100x of magnifications ............... 172
Figure 6.24: BW image processing concrete at age 28 days at 1000x of magnifications . 173
XV
Figure 6.25: Pores area for concrete at age 28 days at 1000x of magnifications .............. 173
Figure 6.26: BW image processing for concrete at age 28 days at 5000x of magnifications
........................................................................................................................................... 174
Figure 6.27: Pores area for concrete at age 28 days at 5000x of magnifications .............. 174
Figure 6.28: The EDX results for the mix1 at age 7days, area a, b and c at 10000x
magnification ..................................................................................................................... 176
Figure 6.29: The EDX results for the mix 2 at age 7days, area A and B for 10000x of
magnification ..................................................................................................................... 177
Figure 6.30: The EDX results for the mix 2 at age 7days, area A, B and C for 10000x of
magnification ..................................................................................................................... 178
Figure 6.31: The EDX results for the mix3 at age 7days, area A, B, C and D for 10000x of
magnification ..................................................................................................................... 179
Figure 6.32: The EDX results for the mix4 at age 7days, area A, B and C for 10000x of
magnifications ................................................................................................................... 180
Figure 6.33: The EDX results for the mix1 at age 28 days, area A, B, C and D for 2000x of
magnifications ................................................................................................................... 182
Figure 6.34: The EDX results for the mix1 at age 28days, area A, B and C for 1000x of
magnifications ................................................................................................................... 183
Figure 6.35: The EDX results for the mix2 at age 28days, area A, B and C for 10000x of
magnifications ................................................................................................................... 184
Figure 6.36: The EDX results for the mix2 at age 28days, area A, B, C and D for 5000x of
magnifications ................................................................................................................... 185
Figure 6.37: The EDX results for the mix3 at age 28days, area A, B and C for 10000x of
magnifications ................................................................................................................... 186
Figure 6.38: The EDX results for the mix 3 at age 28 days, area A and B at 5000x
magnifications ................................................................................................................... 187
Figure 6.39: The EDX results for the mix4 at age 28days, area A, B and C for 5000x of
magnifications ................................................................................................................... 188
Figure 6.40: The EDX results for the mix4 at age 28 days, area A, B and C for 5000x of
magnifications ................................................................................................................... 189
Figure 6.41: The EDX results for the mix1 at age 56 days, area A, B and C for 20000x of
magnifications ................................................................................................................... 191
Figure 6.42: The EDX results for the mix1 at age 56 days, area A, B and C for 20000x of
magnifications ................................................................................................................... 192
XVI
Figure 6.43: The EDX results for the mix3 at age 56 days, area A, B and C for 5000x of
magnification ..................................................................................................................... 193
Figure 6.44: The EDX results for the mix1 at age 270 days, area A, B and C for 1000x of
magnification ..................................................................................................................... 194
Figure 6.45: The EDX results for the mix1 at age 270 days, area A and B for 4000x of
magnification ..................................................................................................................... 195
Figure 6.46: The EDX results for the mix1 at age 270 days, area A, B, C and D for 10000x
of magnification ................................................................................................................. 196
Figure 6.47: The EDX results for the mix2 at age 270 days, area A and B for 1000x of
magnifications ................................................................................................................... 198
Figure 6.48: The EDX results for the mix2 at age 270 days, area A, B and C for 4000x of
magnification ..................................................................................................................... 199
Figure 6.49: The EDX results for the mix3 at age 270 days, area A, B and C for 1000x of
magnification ..................................................................................................................... 200
Figure 6.50: The EDX results for the mix3 at age 270 days, area A and B for 5000x of
magnification ..................................................................................................................... 201
Figure 6.51: The EDX results for the mix4 at age 270 days, area A and B for 20000x of
magnification ..................................................................................................................... 202
Figure 6.52: Scan of concrete cubes with 3D visualization of porosity in yellow colour for
voids volume ..................................................................................................................... 204
Figure 6.53: Concrete porosity at age 56 days by CT scanner device............................... 205
Figure 6.54: Total voids volume and total voids number at age 56 days ........................ 205
Figure 6.55: Total voids surface area and total voids number at age 56 days ................... 205
Figure 6.56: Void volume and sphericity for four concrete samples ................................ 206
Figure 6.57: Relationship between surface area and the voids volume............................ 207
Figure 6.58: Percentage of voids of the total volume of the concrete specimens for the
different range of volume .................................................................................................. 208
Figure 6.59: Relationship between frequency and voids volume at age 56 days .............. 208
Figure 6.60: Relationship between the voids volume, surface area and the porosity for
different size of voids from (0-75) mm3 ............................................................................ 209
Figure 6.61: Relationship between the voids volume, surface area and the porosity for
different size of voids from (75-150) mm3 ........................................................................ 210
Figure 6.62: 3 D view of concrete voids for the voids volume from 0 to 25 mm3 ........... 211
Figure 6.63: 3 D view of concrete voids for the voids volume from 25 to 50 mm3 ......... 212
Figure 6.64: 3 D view of concrete voids for the voids volume from 50 to 75 mm3 ......... 212
XVII
Figure 6.65: 3 D view of concrete voids for the voids volume from 75 to 100 mm3 ....... 213
Figure 6.66: 3 D view of concrete voids for the voids volume from 100 to 125 mm3 ..... 213
Figure 6.67: 3 D view of concrete voids for the voids volume from 125 to 150 mm3 ..... 214
Figure 6.68: Sections of the mix 1 show voids section with yellow colour ..................... 215
Figure 6.69: Sections of the mix 2 show voids section with yellow colour ..................... 216
Figure 6.70: Sections of the mix 3 show voids section with yellow colour ..................... 217
Figure 6.71: Sections of the mix 4 show voids section with yellow colour ..................... 218
Figure 7.1: Comparison between the effect of the both of metakaolin and polymer of this
study and the effect of metakaolin alone on the concrete pores system at age 7 days. (A):
mixes of this study, (B) mixes done by Gopalakrishnan and Govindarajan (2011) .......... 225
Figure 7.2: Comparison between the effect of the both of metakaolin and polymer of this
study (A) and the effect of polymer alone done by Yang et al., (2009) (B) on the concrete
pores system at age 28days. ............................................................................................... 226
XVIII
List of Tables
Table 2.1: The chemical composition of some typical SCMs Thomas (2013) ..................... 9
Table 2.2: Requirements of metakaolin (ASTM C 618) (Siddique, 2007) ......................... 16
Table 2.3: Physical properties of metakaolin (Siddique and Khan, 2011) .......................... 16
Table 2.4: Typical chemical composition of the metakaolin............................................... 16
Table 2.5: Workability of the concrete modified by metakaolin (Wild et al., 1996) .......... 20
Table 2.6: Compressive strength of modified concrete utilising water/cement ratio of 0.45
(Parande et al., 2008) ........................................................................................................... 55
Table 2.7: Summary of literature of the mortar and concrete modified by Metakaolin ...... 68
Table 2.8: Summary of literature of the mortar and concrete modified by polymer ........... 69
Table 3.1: Physical properties of the cement used (EN: BS 197-1: 2011) .......................... 73
Table 3. 2: Chemical composition of the cement (BS EN: 197-1: 2011) ............................ 73
Table 3. 3: Properties of metakaolin .................................................................................... 74
Table 3. 4: Properties of styrene butadiene rubber .............................................................. 74
Table 3. 5: Properties of polyvinyl acetate .......................................................................... 74
Table 3. 6: The proportions of the trial mixtures ................................................................. 75
Table 3.7: Numbers, dimensions and quantity of specimens used in trial mixtures ........... 77
Table 3.8: Numbers, dimensions and quantity of specimens used after trial mixes............ 77
Table 3.9: Mixes proportion by mass for the standard consistency, initial setting and final
setting time .......................................................................................................................... 78
Table 3.10: Mixes proportions of mechanical and durability tests for age up to 545 days . 82
Table 6.1: Mixes proportions of concrete used for SEM and CT scanner ........................ 149
XIX
List of Abbreviations
Symbols Definitions
ASR Alkali-Silica Reactions
ASTM American Society For Testing And Materials
BS British Standard
CASH Calcium Aluminate Silicate Hydrates
C2ASH8 Stratlingite
CH Calcium Hydroxide Ca(OH)2
CSH Calcium Silicate Hydrate
CT Scan Computed Tomography Scan
FA Fly Ash
GF Glass Fiber
GGBS Ground Granulated Blast Furnace Slag
LOI Loss Of Ignition
MK Metakaolin
MK/C Metakaolin / Cement
NMR Nuclear Magnetic Resonance
OPC Ordinary Portland cement
PC Polymer Concrete
PF Plastic Fiber
PIC Polymer Impregnated Concrete
PLC Portland Limestone Cement
PMC Polymer Modified Concrete
POFA Palm Oil Fuel Ash
PPCC Polymer Portland Cement Concrete
PVA Poly Vinyl Acetate
RHA Rice Husk Ash
SBR Styrene Butadiene Rubber
SCMs Supplementary Cementing Materials
SF Silica Fume
W/C Water To Cement Ratio
XRD X-Ray Diffraction
XX
List of Publications
Al Menhosh, A., Wang, Y., and Wang, Y. (2016). An experimental study of the
concrete using polymer and metakaolin as additives. Paper presented at
the International Conference on Sustainable Construction Materials &
Technologies (SCMT4), Nevada university, Las Vegas, USA.
Al Menhosh, A., Wang, Y., and Wang, Y. (2016). The mechanical properties of the
concrete using metakaolin additive and polymer admixture. Journal of
Engineering.
XXI
Acknowledgements
I would like to thank the following people and organisations for supporting me in numerous
ways throughout my PhD. First and foremost, I am indebted to my supervisor Dr.Yu Wang
for his continuous support and guidance throughout the PhD process. Wang, I am so lucky
to have you as my supervisor and I would have never completed my PhD without your
knowledge, advice and most importantly your encouragement! I would also like to extend
my gratitude to Dr Levi Augusthus for his guidance during the PhD. Levi , I am really
appreciated your help and support throughout all the difficult times that I faced before
finishing my PhD. Deep thanks from my heart.
I would like to take this opportunity to thank the Iraqi ministry of higher education
and scientific research, their representative Iraqi cultural attaché and the
University of Basra/ Collage of engineering for offer me this opportunity to finish
my PhD here in the UK. In addition, I would like to thank the School of Computing, Science
and Engineering for their help and support during my PhD journey. I am grateful to the
academic and support staff from the School of Computing, Science and Engineering for their
efficient service and support.
Special thanks to the civil engineering laboratory staff, Philip Letham, Antony Burrage,
Mark Avis, Stuart Peniceth & Alan Mappin Without their support, I would not have
completed the PhD as expected. I would also like to thank all my Iraqi friends for their help
and support, Hyder, Ammar, Jawad, Ihsan, Osama, Wessam, Suhail, Khaldown, Abbas &
Zaid.
My gratitude goes to my wife Bushra for her continuous support and the strength she has
given to me throughout my personal life and especially during the final stage of my PhD
when I needed her the most. Without her support, I would have never completed the PhD as
planned. My family and brothers are also thanked for their love and support.

XXII
Dedication
I dedicate this piece of research to my Father,
mother, brothers, sisters, wife and my lovely
kids Ahmed, Sarah, Ali and Marwa.
XXIII
Declaration
This thesis is submitted to the University of Salford rules and regulations for the award of a
PhD degree by research. While the research was in progress, some research findings were
published in refereed journals and conference papers prior to this submission (refer to List
of Publications).
The researcher declares that no portion of the work referred to in this thesis has been
submitted in support of an application for another degree of qualification of this, or any other
university or institution of learning.
------------------------------
Adel Ahmed Almenhosh

CHAPTER ONE
INTRODUCTION
Chapter One Introduction
1
CHAPTER 1
INTRODUCTION
1.1 Background and problem
Concrete plays a vital role in building construction and industry. The preeminent properties of
strength, durability, workability and the ability of concrete to be formed in various structural
shapes make it the material of choice for various uses in the construction industry. It is used
more than all other construction materials put together and attractive in many applications,
including buildings, roads, concrete bridges, tunnels, tanks, infrastructures and sewerage
systems (Neville and Brooks, 1987). Nevertheless, the premature deterioration of concrete
structures in aggressive environments has led to the development of high-performance concrete.
The production of high performance concrete involves appropriate selection and proportioning
of the constituents to produce a composite mainly characterised by its developed strength, low
porosity and fine pore structure. According to Buyukozturk and Lau (2004). In order to improve
the concrete performance, the following three aspects are considered: (a) the hydrated cement
paste should be strengthened, (b) the porosity in concrete should be lowered, and (c) the
interfacial transition zone should be toughened. Therefore, the expression ‘high-performance
concrete’ became more and more widely used to describe the overall improvement in the
properties of this new family of concretes modified by partial replacement of one or more of
the supplementary cementing materials and addition of polymers (Aitcin, 2011). For that, high-
performance concrete is defined as a concrete has been designed to be more durable and
stronger than conventional concrete according to Nawy (2001).
However, practices for manufacturing concrete play a significant role in all aspects of modern
environmental life, as they bring about increased atmospheric concentrations of carbon dioxide.
Consequently, cement production is responsible for 5% of global ambient carbon dioxide (CO2)
emissions and 7% of industrial energy resources consumption (Habert, 2013; Nicholas, 2012).
The environmental concerns, stemming from the high-energy expense and CO2 emission
associated with cement manufacture have brought about pressures to decrease cement
production according to John et al. (2012). One of the significant strategies for reduction of
environmental impacts during the cement fabrication process is principally to reduce the high-
Chapter One Introduction
2
energy consumption in order to provide greater sustainability in the construction industry by
Guneyisi et al. (2012). Therefore, if the using of fossil fuel energy sources is reduced by using
alternative environmentally friendly materials such as SCMs, this will reduce the high
environmental destruction associated with the production process, with significantly reduced
CO2 emissions in addition to produce concrete with high performance (Suhendro, 2014).
Nevertheless, it is clear that by using less Portland cement, concrete can be more environment
friendly. In recent years, various efforts have been made by researchers to develop more
sustainable cementitious systems such as supplementary cementing materials (SCMs) in order
to address the negative environmental impacts and deterioration of concrete structures
associated with ordinary Portland cement (OPC) (Spliethoff, 2010; Proops et al., 2012; Hossain
et al., 2016). The utilisation of SCMs as partial replacement of cement in concrete, such as fly
ash (FA), silica fume (SF), rice husk ash (RHA), and metakaolin (MK), is considered effective,
as it allows for reduction of the cement consumption while improving the concrete strength and
durability characteristics to produce high performance concrete by Targana et al. (2002). Most
of the supplementary cementing materials have potential to improve the microstructure system
of the concrete, such as permeability and pore size distribution, as well as the mechanical
properties such as compressive, splitting, flexural strength, drying shrinkage, creep, and
modulus of elasticity (Siddique and Khan, 2011; Patil et al., 2013).
In addition, concrete deteriorates when exposed to aggressive conditions, which significantly
effects its service behaviour, design life and safety. However, high porosity, cracking of
concrete, low resistance to some aggressive chemical agents, low abrasion resistance,
inadequate cover of steel reinforcements, and the overall general quality of the structural
concrete are the major factors that encourage the transport mechanism of aggressive agents,
such as chlorides and sulphate, into concrete.
Partial replacement of cement by metakaolin as SCMs in concrete causes chemical combination
of the pozzolanic components of metakaolin with calcium hydroxide Ca (OH)2 one of the by-
products of the hydration reaction of cement in the presence of a high water demand. This
reaction produces stable calcium silicates hydrate (CSH) gel, which has cementitious properties
and results in enhanced concrete strength and durability properties. Moreover, according to
Zhang and Malhotra, (1995) in an experimental study observed that the metakaolin material is
highly poxzolanic and can be used as a supplementary cementing material to produce high-
Chapter One Introduction
3
performance concrete. However, incorporation of metakaolin in concrete demand more water
and reduce the workability. Therefore, to achieve adequate workability, as well as high strength,
the use of a water reducer, such as polymers, is required to improve the flow and workability
of the modified concrete mix (Neville, 2011; Aiswarya et al., 2013; Ravikumar et al., 2013).
However, Polymers, such as styrene-butadiene rubber (SBR) emulsion and polyvinyl acetate
(PVA) emulsion have been commonly used as admixtures in concrete practice (Atkins et al.,
1991; Konar et al., 2011). Polymer admixtures are recognised to modulate the physical
properties of cement pastes by reducing macro-voids and improving the bond strength of the
polymer cement mortars to aggregates and improve workability of the concrete mix due to
retard the setting and the hydration of Portland cement by the polymer film (Su et al., 1991)
The current research is designed to provide further understanding of the effect of the partial
replacement of cement using metakaolin as the supplementary cementing materials and addition
of polymers on the mechanical, durability and microstructure features of concrete, aiming to
preserve the environment by reducing CO2 emissions in addition to the improvement of the
concrete properties. It also investigates the effect of additional recycled plastic and glass fibre
as reinforcements used in the modified concrete.
1.2 Aim and Objectives
The main goal of the current study is to investigate sustainable approaches to enhance the
properties of concrete. This study aims to derive the optimum ratio of metakaolin to cement
percentage (MK/C), polymer to cement percentage (P/C), water to cement ratio (W/C) for the
concrete. It investigates the effect of the partial replacement of cement using different
proportions of metakaolin and addition of styrene-butadiene rubber (SBR) and polyvinyl
acetate (PVA) as a water reducer with different percent and proportions, and the use of 5% of
glass fibre (GF) and 5% of polypropylene fibre (PF) to improve the tension strength property
of the concrete. This project has been conducted in two stages:
(i) Made trail mixes to optimise concrete mix proportions, in terms of the workability,
mechanical and water absorption properties at age up to 28 days, (ii) to understand these
improvements in terms of mechanical and durability properties for age up to 545 days and
microscopic and hydrated product composition analysis using SEM, Energy Dispersive X-Rays
analyses (EDX) and CT scan technologies up to 270 days.
Chapter One Introduction
4
The planned experimental studies include:
Study the effect of curing conditions on compressive strength of the concrete, to find
the most suitable curing method for the modified concrete using different proportions
of the metakaolin and polymers and compared with control concrete.
Study the optimum ratio of metakaolin to cement percentage (MK/C), polymer to
cement percentage (P/C), water to cement ratio (W/C) for the concrete.
Study the setting time of the cement paste modified by partial replacement of cement
by metakaolin and addition of Styrene-Butadiene rubber (SBR) and Polyvinyl acetate
(PVA) together and compared with the setting time of the conventional cement paste by
using the Vicat apparatus.
Study the effect of different proportions of partial replacement of cement by metakaolin
an addition different proportions of Styrene-Butadiene rubber (SBR) and Polyvinyl
acetate (PVA) on the concrete workability by measure the slump values for the fresh
concrete.
Study the mechanical, durability and deformation characteristics of concrete and the
corrosion rate of the steel reinforcement in the modified concrete by using 15% partial
replacement of cement by metakaolin and addition of 5% of polymers.
Study the effect of addition of 5% of glass fibre (GF) and 5% of polypropylene fibre
(PF) on the flexural and splitting strength properties of the concrete.
Study the effect of partial replacement of cement by 15% of metakaolin and addition of
4% Styrene-Butadiene rubber (SBR) and 1% of Polyvinyl acetate (PVA) together on
the microscopic structure of the modified concrete using scanning electronic
microscope (SEM), EDX analyses and computed tomography scanner (CT scan) tests.
1.3. Contributions to Knowledge
So far, there has been little discussion about the performance of polymer cement concrete with
supplementary cementing materials SCMs such as metakaolin. However, there is a large
volume of published studies describing that the partial replacement of cement by weight of the
metakaolin without adding polymers showed an improvement in concrete properties. In
addition, it found that while the presence of metakaolin in the cement concrete mix improved
concrete properties, metakaolin reduced the workability of concrete and required more water
for the pozzolanic reactions. On the other hand, many studies have investigated polymer-
Chapter One Introduction
5
modified concrete without metakaolin and demonstrated clear improvements in workability and
durability properties of concrete.
To extend the investigation, this study aims to investigate experimentally properties of the
concrete modified by using both of partial replacement of cement by metakaolin and addition
of polymers together covering the most important characteristics of the concrete for long term.
In addition to, this study aiming to produce high-performance concrete appropriate for the
applications, which are subject to aggressive conditions, particularly in hydraulic concrete
structures such as dams and sewage treatment plants. Furthermore, produce concrete more
environmental friendly by reduce CO2 emissions.
1.4 Content Organisation
The thesis is organised into 8 chapters:
Chapter 1 presents a brief introduction on the necessity of producing modified and
sustainable concrete to be used as construction materials for concrete structures that are
directly exposed to aggressive conditions. It also outlines the problem statement, aims
and objectives, contributions to knowledge and organisation of the study.
Chapter 2 provides a review of the literature involving SCMs in concrete, metakaolin in
concrete, polymer in concrete, styrene-butadiene rubber (SBR) in concrete, polyvinyl
acetate in concrete (PVA), durability of concrete, steel reinforcement corrosion in
concrete, fibre in concrete, concrete microstructure properties and summary of the
literature.
Chapter 3 presents the proposed methodology of the research, including preparing the
materials, test procedures, and collecting data.
Chapter 4 concentrates on the results of the trail mixes and mechanical properties of
concrete of the study.
Chapter 5 concentrates on the results of durability properties tests of the study.
Chapter 6 presents the microstructure study including image processing of scanning
electronic microscopy images by the Mat lab programme, IBM-SPSS programme and
CT scanner test.
Chapter 7 presents the discussion the results of the study.
Chapter 8 display the conclusion of the present study and recommendation for the future
work.

CHAPTER TWO
LITERATURE REVIEW
Chapter Two Literature Review
6
CHAPTER 2
LITERATURE REVIEW
2.1 Introduction
Cement may be pure Portland cement, or it made from Portland cement mixed with other
materials that also have cementitious properties such as supplementary cementing materials.
SCMs are important and necessary components for modern concrete structures by produce
high-performance concrete (Aitcin, 2011). The mortar and concrete properties, both in fresh
and hardened cases, can be enhanced by cement composed of mixtures of Portland cement
with these other additives, which have been used in more and more concrete projects
(Zongjin, 2011). The outgrowth of such high-performance concrete has brought the
fundamental need for additives, both chemical and supplementary cementing materials, to
enhance the concrete properties. Concrete enhancement worldwide has been corroborated by
continuous improvement of these additives (Murthy et al., 2012). Hence, SCMs have become
a complementary part of high-performance concrete mix design. It is including natural
materials, by-products, and industrial wastes from other manufacturing processes. Several
attempts have been made to develop sustainable binders through the use of SCMs as partial
replacement of cement in concrete, such as slag, fly ash (FA), palm oil fuel ash (POFA), silica
fume (SF), rice husk ash (RHA), ground granulated blast furnace slag (GGBFS), metakaolin
(MK) etc. These SCMs have been utilised very commonly as pozzolanas materials in concrete
and have showed a considerable effect to improve the mechanical and durability properties of
concrete (Siddique and Klaus, 2009).
Metakaolin is one of the SCMs considered as an environmentally friendly material in contrast
to the environmental impact of cement. It is created from kaolinite clay that is calcined at
temperatures around 800±100˚C (Klimesch and Ray, 1998; Siddique, 2007), which is much
less than the temperature required to produce cement which is around 1450°C. Actually,
production of 1 kg of cement releases about 0.95 kg of CO2, while production of 1 kg of
metakaolin releases about 0.1 kg of CO2 (Nicholas, 2012; Habert, 2013; Torgal et al., 2011).
Kaolinite is the most common clay mineral, and entire clay deposits can be composed of this
Chapter Two Literature Review
7
mineral. There are many commercial Kaolinite mines where this mineral is mined in large
volumes for its various industrial uses. Hence, partial replacement of cement by metakaolin
contributes to reducing the CO2 emission in addition to improving concrete properties (Kumar
et al., 2012). According to Mehta (2010) pointed out that consumption of less cement in
concrete mixtures, consumption of less concrete for new structures, and the consumption of
less clinker in the cementing material are the main ways to reduce CO2 emission. Previous
work has found that while the presence of metakaolin in the cement concrete mix improved
concrete strength, concrete modified by metakaolin required a water reducer, such as a
superplasticiser or polymer, to offset the water demand by the reactions of the metakaolin
component with the cement hydration products. Reducing the cement to water ratio leads to
an improvement in strength as long as there is sufficient water available to fully hydration of
the cement phase present. The amount of water reducer added to the concrete mix is in direct
proportion to the amount of metakaolin replacement (Wild et al., 1996).
On the other hand, in practice, polymers have also been used as additive materials in concrete
to improve binding and adhesion of aggregates. The long-chain molecules of polymers raise
the long-range bonding network in the hardened concrete. As a result, polymer-modified
concrete usually displays improved concrete mix workability, compressive, flexural and
tensile strength, when compared to control concrete. Some of the polymers provide higher
tensile and flexural strength for concrete compared to compressive strength. In addition, they
provide good resistance to physical damage such as abrasion, erosion, and impact of chemical
substances attack by reducing the porosity (Islam et al., 2011). In particular, the commercial
polymer latexes widely used globally are SBR, chloroprene rubber (CR), polyacrylic ester
(PAE) and polyethylene-vinyl acetate) (EVA) copolymers. Most commercial polymer latexes
for polymer-based admixtures contain proper antifoaming agents and can be generally used
without the addition of antifoaming agents during mixing (Ohama, 1998). SBR and PVA are
two polymers commonly used in concrete with the effect of reducing the pore spaces and
connection.
Furthermore, the use of limestone Portland cement in concrete also contributes to
environmental conservation because the incorporation of limestone in cement manufacturing
contributes to reducing the emissions of CO2, in addition to its improvement in concrete
properties as compared with using ordinary Portland cement. The limestone cements indicate
Chapter Two Literature Review
8
appropriate strength but in general demand less water than the ordinary Portland cements. The
incorporation of limestone enhances the clinker reaction and the exploitation of its hydraulic
potential. The Portland limestone cements indicate competitive concrete properties and
improve the corrosion performance of the concrete as mentioned by Tsivilis et al. (2002).
Finally, incorporation of fibres into concrete improves the mechanical strength including
flexural strength, compressive strength, toughness, splitting tensile strength and improve the
long-term durability of concrete as compared to conventional concrete. Fibres contribute to
improve performance of concrete as fibres may perform its functions of networking, bridging
cracking and toughening to reinforce concrete.
This chapter presents fundamental information about using typical SCMs in concrete,
including metakaolin, polymers, PLC and fibres. Results of studies utilising metakaolin as
partial replacement of cement, polymers as additives substances, including information about
the steel reinforcement corrosion, are discussed. In addition, information regarding the
durability of concrete properties, including chemical attack and permeability and the
microstructure of concrete compositions, is presented.
2.2 Supplementary cementing materials (SCMs)
High-performance concrete (HPC) has long been a subject of great interest in a wide range of
concrete industry fields. In particular, reinforced concrete related contemporary construction
practices have generally been in need of high performance concrete. Enhancing strength with
improved durability of the concrete is the most important criteria sought for high performance
concrete. High performance concrete is defined as the concrete, which possesses superior
mechanical and durability properties (Guneyisi et al., 2012). The incorporation of different
types of SCMs either as ingredients in blended cement or as separately batched constituents
in mortar and concrete mixtures has been demonstrated worldwide by a significant number of
researchers, giving encouraging results regarding the mechanical and durability properties of
mortar and concrete (Papadakis et al., 2002). SCMs or mineral admixtures can lead to many
improvements in the fresh and hardened properties of mortar and concrete, including
improved workability, increased long-term strength and improved durability in an aggressive
environment, and controlled cracking and reduced heat generation to a certain degree
(Papadakis and Tsimas, 2005). The presence of SCMs can significantly enhance
microstructure and improve disconnected capillary pores in concrete according to Zhimin et
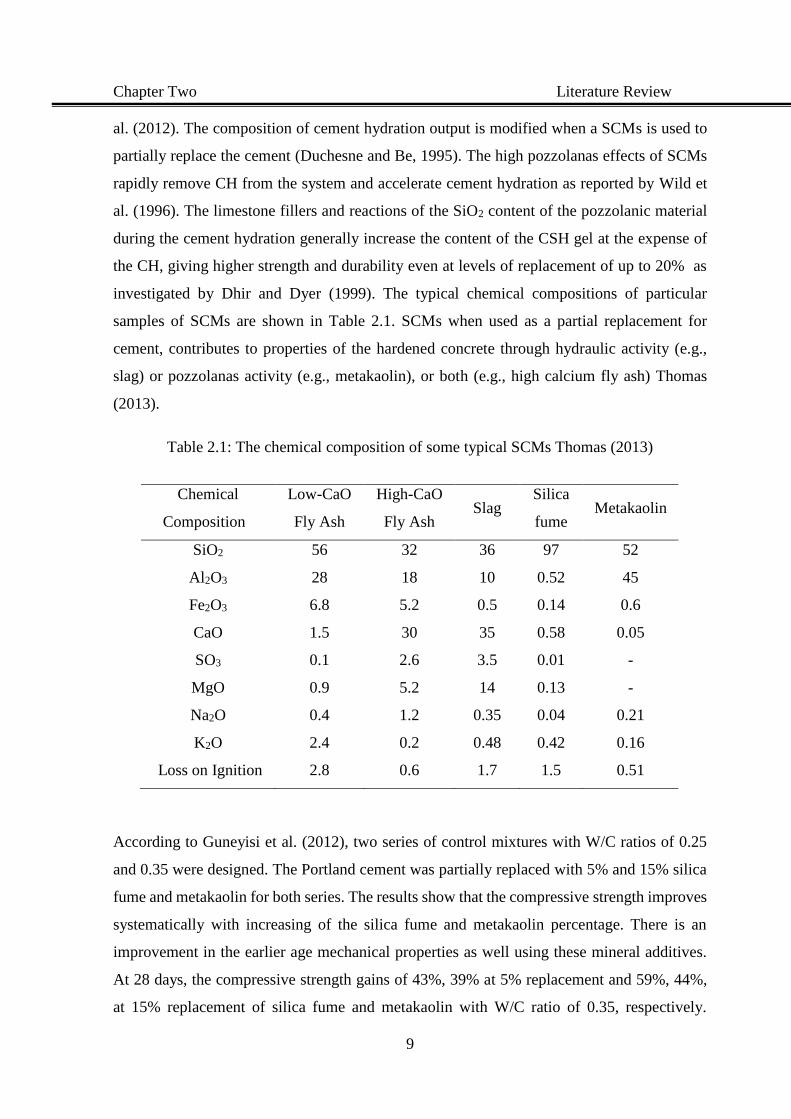
Chapter Two Literature Review
9
al. (2012). The composition of cement hydration output is modified when a SCMs is used to
partially replace the cement (Duchesne and Be, 1995). The high pozzolanas effects of SCMs
rapidly remove CH from the system and accelerate cement hydration as reported by Wild et
al. (1996). The limestone fillers and reactions of the SiO2 content of the pozzolanic material
during the cement hydration generally increase the content of the CSH gel at the expense of
the CH, giving higher strength and durability even at levels of replacement of up to 20% as
investigated by Dhir and Dyer (1999). The typical chemical compositions of particular
samples of SCMs are shown in Table 2.1. SCMs when used as a partial replacement for
cement, contributes to properties of the hardened concrete through hydraulic activity (e.g.,
slag) or pozzolanas activity (e.g., metakaolin), or both (e.g., high calcium fly ash) Thomas
(2013).
Table 2.1: The chemical composition of some typical SCMs Thomas (2013)
According to Guneyisi et al. (2012), two series of control mixtures with W/C ratios of 0.25
and 0.35 were designed. The Portland cement was partially replaced with 5% and 15% silica
fume and metakaolin for both series. The results show that the compressive strength improves
systematically with increasing of the silica fume and metakaolin percentage. There is an
improvement in the earlier age mechanical properties as well using these mineral additives.
At 28 days, the compressive strength gains of 43%, 39% at 5% replacement and 59%, 44%,
at 15% replacement of silica fume and metakaolin with W/C ratio of 0.35, respectively.
Chemical
Composition
Low-CaO
Fly Ash
High-CaO
Fly Ash Slag
Silica
fume Metakaolin
SiO2 56 32 36 97 52
Al2O3 28 18 10 0.52 45
Fe2O3 6.8 5.2 0.5 0.14 0.6
CaO 1.5 30 35 0.58 0.05
SO3 0.1 2.6 3.5 0.01 -
MgO 0.9 5.2 14 0.13 -
Na2O 0.4 1.2 0.35 0.04 0.21
K2O 2.4 0.2 0.48 0.42 0.16
Loss on Ignition 2.8 0.6 1.7 1.5 0.51
Chapter Two Literature Review
10
Whilst, 27%, 39%, 18%, and 29% compressive strength gains were observed for the concrete
group with W/C ratio of 0.25 in compared with first series. The bond between the cement
paste and aggregate particles is enhanced by the addition of metakaolin into the concrete mix.
The increase in the density of the modified cement paste remarkably improves the
compressive strength of the concrete. The shrinkage of the normal concrete samples developed
faster and was greater than the shrinkage strain in metakaolin or silica fume modified concrete.
Moreover, increasing the level of silica fume and metakaolin resulted in significant improved
the pores system leads to decreasing in permeability of concretes.
In addition, the pore system of concrete, which includes air voids, capillary pores and gel
pores, contributes significantly to the properties of concrete; the pore structure has an
important role affecting the mechanical, durability and transporting liquids agents properties
of concrete (Duan et al., 2013a). Utilisation of supplementary cementing materials such as
metakaolin, silica fume, and slag improves the microstructure of concrete as found by Duan
et al. (2013b).
Furthermore, Ding and Li (2002) studied the effects of metakaolin and silica fume on concrete
properties. Experimental comparison of seven concrete mixtures of 0, 5, 10, and 15% by
weight replacement of cement with metakaolin or silica, at a water-to-cement (W/C) ratio of
0.35 and the fine to coarse aggregate ratio of 40%. All mixtures contained 1% of a naphthalene
sulfonate-based high range water-reducing admixture by mass of binder and 0.25% of a
retarder by mass of binder. The findings of this study showed the effects of metakaolin or
silica on the workability, strength, shrinkage, and resistance to chloride penetration of
concrete. The use of both metakaolin and silica in concrete was found to increase the strength
of the modified concrete and reduce the free-drying shrinkage and restrained shrinkage
cracking width. The chloride penetration depth also decreased significantly.
Similarly, Justice et al. (2005) studied the effect of replacing 8% of cement with metakaolin
and silica fume by mass, as supplementary cementing materials, on the mortar and concrete
properties. The addition of metakaolin considerably improved strength and durability, and
exhibited improvements in shrinkage properties compared with the conventional and SF
mixtures. The average pozzolanic reaction and CH consumption in metakaolin systems have
been observed to be higher than in silica fume-modified systems. Corral et al. (2011), studied
partial replacement of Portland cement with two types of supplementary cementing materials
Chapter Two Literature Review
11
of fly ash and silica fume. They studied the effect of the curing and supplementary materials
on the deterioration of the concrete and reinforcement corrosion when the concrete exposed
to 3.5% Na2SO4 solution. The results indicate that the incorporation of fly ash or silica fume
in concrete contributed to the refinement of the pores system in the cementing matrix, which
reduces the easy penetration of sulphate ions into concrete. The other action of these SCMs in
decreasing the impact of sulphate attack is the CH consumption during the pozzolanic reaction
that means the amount of formed gypsum can be smaller in the mixes with SCMs compared
with the conventional Portland cement concrete. Nevertheless, pozzolanas materials, such as
metakaolin, are defined as siliceous or siliceous and aluminous materials. The pozzolanic
action depends on a number of significant factors, such as the chemical and mineralogical
composition of the additive, amorphous phase content, the degree of dihydroxylation, specific
surface area, content of CH in the cement paste, the mineral admixture percentage and W/C
ratio in the total mixture (Shvarzman et al., 2003). Pozzolanic material requires CH in order
to form strength products, whereas a cementitious material itself contains quantities of calcium
oxide (CaO) and can display a self-cementitious activity. Usually, the CaO content of the latter
material is insufficient to react with all the pozzolanic compounds. Thus, it also exhibits
pozzolanic activity.
Supplementary cementing materials components are often used in combination with Portland
cement, which contains, essential for their activation, CH which produce from its hydration,
as mentioned by Papadakis and Tsimas (2002). Pozzolanas materials in the presence of water
chemically react with CH at normal temperatures to form components with cementitious
properties, while it has a little or no cementitious content. It is also often used as a low-cost
replacement for more expensive sand for concrete production, as a fine aggregate in high-
performance lightweight concrete according to Targana et al. (2002). The properties of fresh
concrete and the strength development of hardened concrete are affected by physical
properties of natural pozzolanas, such as the fineness, specific surface area, the shape of
particles, and density (Ramezanianpour and Jovein, 2012). The pozzolanic activity of
metakaolinite is related to the crystallinity of the original kaolinite, and metakaolinite reacts
with CH and water to yield hydrated compounds of (Ca and Al ) silicate (Kakali et al., 2001;
Bich et al., 2009).
Chapter Two Literature Review
12
Kakali et al. (2001), studied the mineralogy of Greek kaolin and one commercial product. The
outcomes showed that the pozzolanic activity of metakaolinite is related strongly to the
crystallinity of the original kaolinite. Kaolinite is transformed into less reactive metakaolinite.
The crystallinity of kaolinite can be evaluated based on X-ray diffraction, differential thermal
analysis, and infrared spectroscopy studies of raw kaolin. The effect of bentonite, colemanite
waste, coal fly ash and coal bottom fly ash on the properties of cement and concrete was
investigated by Targana et al. (2002). They examined the setting time, bending strength,
volume expansion, and compressive strength and water consistency properties. The results
showed that setting time of the cement was accelerated generally when bentonite replaced a
part of the cement. Bentonite exhibited a significant retarding effect when used in combination
with colemanite waste in Portland cement at lower replacement levels and showed an
accelerating effect at higher replacement levels. Although the inclusion of bentonite at
replacement levels of 5% to 10% resulted in an increase in compressive strength at early ages,
it decreased the compressive strength when used in combination with other materials.
Wainwright and Rey (2000), conducted an experimental evaluation of the effect of ground
granulated blastfurnace slag on the bleeding of concrete. Their results suggested that the
addition of slag at both levels of 55% and 85% resulted in an increase in workability from 15
mm slump to between 20 and 40 mm for the slag mixes compared with control mix. The
partial replacement of cement with up to 55% ground granulated blastfurnace slag increased
the bleed capacity by 30% but had little effect on the bleed rate. Increasing the slag level to
85% had no further significant effect on bleeding compared to the OPC control.
In addition, the tests implemented by Kim et al. (2007) confirmed that metakaolin constitutes
a promising material as a substitute for the cost prohibitive silica fume. In 2010, Moser et al.,
published a paper in which they described the potential for binary and ternary blends of
metakaolin, with two differing particle size distributions, and class C fly ash to mitigate alkali-
silica reactions (ASR) with a highly reactive fine aggregate. The results showed that using
metakaolin decreased the CH content. The relative effectiveness of metakaolin primarily
results from the smaller particle size, higher degree of reactivity, and chemical composition.
The use of metakaolin in concrete was more effective than fly ash.
Using of SCMs, such as fly ash, silica fume and metakaolin, in addition to properties
improvement, adds sustainability to concrete and reduces the growing challenges in
Chapter Two Literature Review
13
conserving raw materials and power sources, as well as decreasing its CO2 emission, as
mentioned by Nath and Sarker (2011). Accordingly, the use of alternative materials has
already increased significantly in recent years. The use of such materials, as a partial
replacement for cement where reduction of the clinkering process is involved, leads to a
significant reduction in CO2 emissions per ton of cementitious materials and is also a means
to utilise by-products of industrial manufacturing processes, according to Lothenbach et al.
(2011). In addition, Muthupriya et al. (2011) found that adding both fly ash and metakaolin in
fresh concrete is more cohesive and less inclined to segregation. The utilisation of SCMs, such
as fly ash and metakaolin, enhances the concrete properties. It was also demonstrated to
decrease the rate of water absorption of the modified specimens compared to that of normal
concrete.
Research by Rajamma et al. (2012), also suggested that mixes containing metakaolin enhance
strength properties more than mixes containing biomass fly ash only. In a different study, by
Ravikumar et al. (2013), the influences of partial replacement of different pozzolanic materials
in mortar mixes were investigated. Different pozzolanic materials, such as fly ash, rice husk
ash, silica fume, calcined clay (Grog) and ground granulated blastfurnace slag replaced at 12%
of OPC, were experimentally investigated for the strength and durability properties, in the
modification of OPC mortar mix. The utilisation of 12% of pozzolanic material to cement
mortar mixes showed that pozzolanic materials have a potential, in addition to various mortars,
as cement replacement materials from the point of view of strength, durability and
sustainability aspects.
Generally, the SCMs improve concrete properties by enhancing concrete microstructure due
to the filler effect of additive materials by accelerating of cement hydration due to the
pozzolanic reaction with CH, and by refining pores system of the concrete. The effectiveness
of the supplementary materials on concrete properties is in the sequence: metakaolin > silica
fume > slag. metakaolin presents the most distinct improvement effects on the microstructure
of concrete compared to the other supplementary materials, such as silica fume and slag, due
to the higher pozzolanic activity of metakaolin (Duan et al., 2013b). Metakaolin could
effectively serve as an alternative to silica fume and ground granulated blast furnace slag in
the countries where these are either not available or economically inconvenient Vejmelkova
et al. (2010).
Chapter Two Literature Review
14
The last finding is consistent with the study by Ayub et al. (2014) which presented a
comprehensive review of the role of different mineral admixtures on the mechanical properties
of concrete, as the performance of concrete can be evaluated from mechanical properties. The
conclusion in this review emphasised that incorporation of mineral admixtures reduces pore
size with increasing pore size distribution and, consequently, reduces porosity, permeability,
shrinkage and creep. The porosity of concrete is inversely dependent on the cement
replacement content and age of the concrete. Incorporation of a mineral admixture develops
the compressive strength of concrete. However, fly ash and ground granulated blastfurnace
slag are those mineral admixtures that improve the later age compressive strength due to their
slow pozzolanic reactivity and/or lesser surface area instead of early age improvements, as in
metakaolin, due to high pozzolanic reactivity.
Recently, Hossain et al. (2016) gave a comprehensive review on the development of
sustainable binders through the use of pozzolanic materials, such as slag, fly ash, palm oil fuel
ash, metakaolin, silica fume, rice husk ash etc., as partial replacement in cement. SCMs have
an important role, when combined into a cement system in a certain proportion, in the mortar
and concrete properties. Based on the outcomes of the reviewed research, it is observed that
the partial replacement of SCMs improves mortar and concrete properties by refinement of
the pores system and the pozzolanic reaction. As consequence, concrete exhibited significant
enhanced reinforcement corrosion, and chemical and sulphate resistance, and reduced chloride
and carbon dioxide penetration.
A study by Palou et al. (2016) investigated the effects of four compound systems consisting
of Portland cement and three SCMs: silica fume, blast furnace slag, and metakaolin, on the
hydration progress. The pozzolanic activity of the SCMs increased the strength properties of
blended concrete and thus overcame the dilution action especially when cured for a long term.
The quadrilateral blended mixture showed formation of more thermal stable hydration
products in comparison with conventional Portland cement meaning the SCMs can be
considered as promising materials for the enhancement of special concrete and also, for
hydrothermal applications.
Recently, in vitro studies by Kuzielova et al. (2017) have investigated the correlation between
porosity and mechanical properties of Portland cement replacement of 25, 30 and 35% of
systems consisting of slag, silica fume and metakaolin. The development of the porous
Chapter Two Literature Review
15
structure and its effect on mechanical strength were investigated for an age of up to 365 days
of curing. The refinement of the pores structure is dependent on both the reaction of the used
SCMs and the level of Portland cement replacement. The components of the blended materials
affected the porosity in comparison with conventional Portland cement without replacement
during all the curing times. In contrast, partial replacement of SCMs increased the gel pores
percentage and the strength characteristics of the modified system increased as a result of the
total porosity decrease.
2.3 Metakaolin
Metakaolin (MK) has been commercially available since the mid-1990s. It has become one of
the new materials, which has been used recently as a SCM in the field of civil engineering
applications, that conforms to ASTM C 618, Class N Pozzolanas Specifications as shown in
Table 2.2 (Siddique, 2007; Ramezanianpour, 2014). The use of metakaolin in concrete is
relatively new, and it is being investigated because of its high pozzolanic properties, making
it possible to modify the concrete properties to suit the desired application, as analysed by
Moiseas and Joseph (2000).
Nevertheless, the ‘meta’ prefix in the term is used to denote change. In the case of metakaolin,
the change that is taking place is dehydroxylisation (Siddique, 2007; Ramezanianpour, 2014).
Kaolin clay is the raw material input in the production of metakaolin (Al2Si2O7). Kaolin is a
fine, white, clay mineral that has been used in the production of porcelain. Kaolinite is the
mineralogical term that is applicable to kaolin clays. Kaolinite is defined as a mineral, with
desilicated hydrated aluminium being its most common component. The average size of the
metakaolin particles is quite small, being around three µm. Its colour is off-white. Physical
properties of metakaolin are shown in Table 2.3. The main contents of metakaolin are silica
oxide (SiO2) and alumina oxide (Al2O3), in addition to ferric oxide, calcium oxide, magnesium
oxide, potassium oxide, etc. The chemical contents of metakaolin are shown in Table 2.4
(Siddique and Khan, 2011).
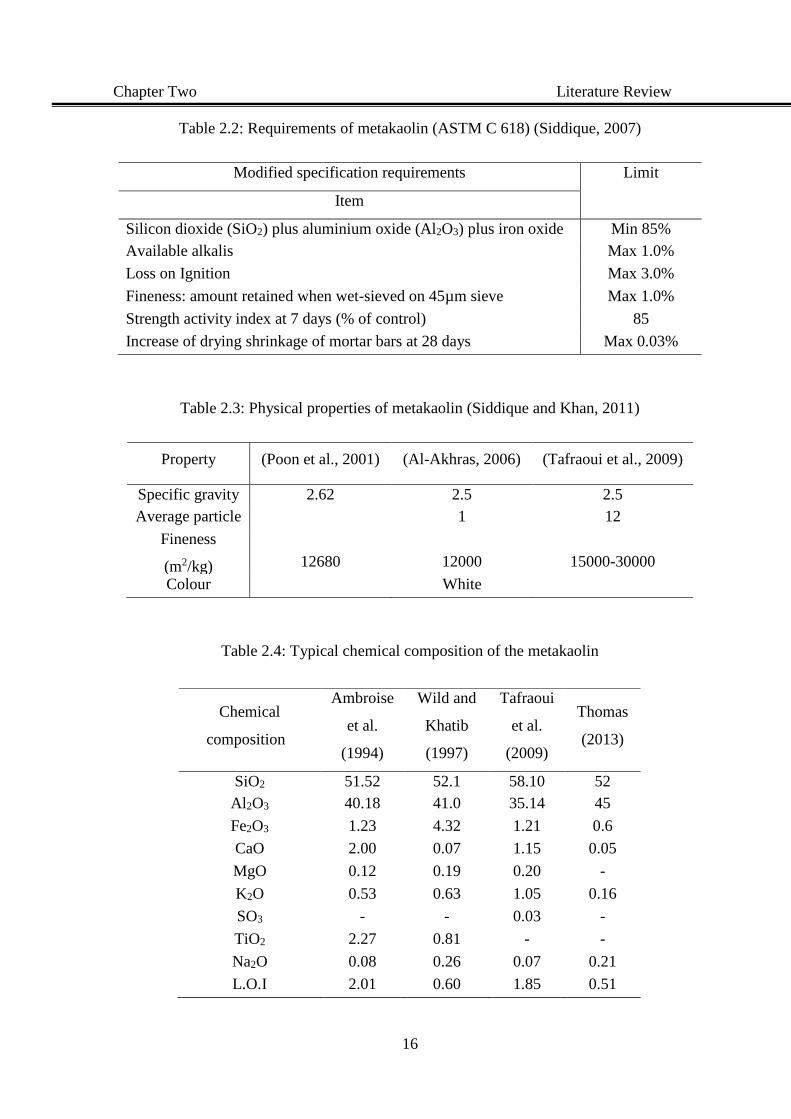
Chapter Two Literature Review
16
Table 2.2: Requirements of metakaolin (ASTM C 618) (Siddique, 2007)
Table 2.3: Physical properties of metakaolin (Siddique and Khan, 2011)
Property (Poon et al., 2001) (Al-Akhras, 2006) (Tafraoui et al., 2009)
Specific gravity 2.62 2.5 2.5
Average particle
size (µm)
1 12
Fineness
(m2/kg)
12680 12000 15000-30000
Colour White
Table 2.4: Typical chemical composition of the metakaolin
Modified specification requirements Limit
Item
Silicon dioxide (SiO2) plus aluminium oxide (Al2O3) plus iron oxide
(Fe2O3)
Min 85%
Available alkalis Max 1.0%
Loss on Ignition Max 3.0%
Fineness: amount retained when wet-sieved on 45µm sieve Max 1.0%
Strength activity index at 7 days (% of control) 85
Increase of drying shrinkage of mortar bars at 28 days Max 0.03%
Chemical
composition
Ambroise
et al.
(1994)
Wild and
Khatib
(1997)
Tafraoui
et al.
(2009)
Thomas
(2013)
SiO2 51.52 52.1 58.10 52
Al2O3 40.18 41.0 35.14 45
Fe2O3 1.23 4.32 1.21 0.6
CaO 2.00 0.07 1.15 0.05
MgO 0.12 0.19 0.20 -
K2O 0.53 0.63 1.05 0.16
SO3 - - 0.03 -
TiO2 2.27 0.81 - -
Na2O 0.08 0.26 0.07 0.21
L.O.I 2.01 0.60 1.85 0.51
Chapter Two Literature Review
17
In addition to the work of Gruber et al. (2001), previously, Zhang and Malhotra (1995)
indicated that metakaolin is a silica-based product that, when reacted with Ca(OH)2, produces
CSH gel. Metakaolin also contains alumina that reacts with CH to produce more alumina
phases, including C4AH13, C2ASH8, and C3AH6. He et al. (1995), also showed similar results.
The pozzolanic action of the additive is included in the concrete mixes for engineering and
economic reasons. The pozzolanic nature of metakaolin, when used with cement as a partial
replacement, means it is able to react with portlandite which is produced by the cement
hydration to shape supplementary calcium-silicate-hydrate gel, similar in components and
structure to the cement hydration productions, as highlighted by Terrence et al. (2000).
Metakaolinite is considered a good synthetic pozzolanas as it reacts, especially with lime, and
produces hydrate components of Ca and Al silicates in the presence of water. The quality and
abundance of clay minerals in the raw material, the calcination status and the final product
fineness affect the development of pozzolanic properties as indicated in a different study by
Kakali et al. (2001). The main reaction product of the activation of metakaolin with highly
alkaline solutions in the presence of calcium hydroxide is a sodium aluminosilicate, the same
as that produced when metakaolin is activated without calcium hydroxide. In addition, the
formation of CSH gel as a by-product is also observed (Alonso and Palomo, 2001). The by-
products of the metakaolin action with the cement hydration product reduce the cost of the
concrete due to decreasing the quantity of the cement used. In addition, the durability
properties of concrete improve, consequently, due to the refining of the pores system by the
secondary hydrates (Chadbourn, 1997). Another important advantage of the partial replacing
of cement by metakaolin in concrete is the contribution to significantly reducing the emissions
of CO2 and thus environmental pollution. Metakaolin has been used to replace some parts of
the cement of concrete to increase the strength properties and reduce the permeability of the
concrete in order to enhance the service life of concrete structures, as carried out by (Gruber
et al., 2001; Aiswarya et al., 2013a; Khatib et al., 2014).
2.4 Metakaolin in concrete
The reaction between cement particles and water is the main chemical and physical process
in the hydration of cement. The properties of fresh concrete and hardened concrete, such as
setting, hardening, and strength are the direct results of the process of hydration. The
mechanism of cement hydration is the reaction of the main two calcium silicate components
Chapter Two Literature Review
18
of the cement. These hydrations are similar in terms of the chemical reaction, differing only
in the amount of calcium hydroxide formed, the heat released and the reaction rate. Typical
reactions are shown in the following equations (Neville, 2011):
2C3S + 6H → C3S2H8 + 3CH …………………………….………………….……..….. (2.1)
2C2S + 4H → C3S2H8 + CH …………………………………….………….….……....(2.2)
The principal hydration product is C3S2H8. It is a widely held view that CSH is the major
strength provider for Portland cement concrete due to its amount and small size. Nevertheless,
the other product of the cement hydration is CH. This product is a good crystalline with a plate
shape in most cases. CH is formed in solution by crystallisation and occupies about 25% of
the structural component of cement paste. CH can bring the pH value to over 12 and it is good
for corrosion protection of steel. From a durability of the concrete point of view, CH may lead
to leaching due to its solubility, carbonation due to its reaction with carbon dioxide, alkali-
aggregate reaction due to its high pH value, or sulphate attack due to its reaction with sulphate.
Hence, in contemporary concrete technology concepts, there has been a trend to reduce the
amount of CH in concrete as much as possible. However, a minimum amount of CH is needed
to keep the high alkali environment in concrete as conducted by Zongjin (2011).
Supplementary cementing materials, such as metakaolin, when used as a partial replacement
substance for cement in concrete, has high pozzolanic properties which are similar in many
aspects to those of Portland or blended cement systems, as mentioned by De Silva and Glasser
(1993). It reacts with Ca(OH)2 and results in an additional CSH gel which results in increased
strength. Metakaolin also reduces the hardened cement permeability to liquids and gases,
resulting in an increase in the service life of buildings. The chemical reaction as shown below
becomes important within the interfacial transition zone located between the aggregate and
paste fractions (Justice et al., 2005; Aiswarya et al., 2013a)
Cement + Water = CSH gel + Ca(OH)2 ………………………………..……..……….….(2.3)
Ca(OH)2 + Metakaolin = CSH gel ……………………………………………….………..(2.4)
The experimental study of a partial replacement of cement by metakaolin showed that cement
hydration products represented by CH crystals are quickly consumed, and the microstructure
of the cement mortar appears with a high level of CSH and stratlingite (C2ASH8), the pore
Chapter Two Literature Review
19
size distribution tends towards a smaller size, and the CH content was considerably reduced
as mentioned by Ambroise et al. (1994). They investigated the effects of partial replacement
of metakaolin by cement. Four mortar mixtures were prepared at 0, 10, 20 and 30% metakaolin
replacement. It was found that after 7 days of curing the compressive strength of modified
pastes becomes higher than that of the conventional mix for 10% and 20% of metakaolin
replacement. However, utilisation of high contents of metakaolin increases the demand for
water needed to reach the same workability as in a plain cement mix due to high reactivity of
pozzolanic materials in metakaolin (Siddique and Khan, 2011). It essential to use
superplasticisers in conjunction with metakaolin in the cement paste to reduce the water
demand. The increase in metakaolin content leads to a displacement of pore diameters towards
smaller values. This explanation of properties improvement is also put forward by Wild et al.
(1996), in their study which showed that the filler effect, the acceleration of cement hydration,
and the pozzolanic action of metakaolin with CH are the factors which affect the contribution
made by metakaolin to improving the strength when it partially replaces some of the cement
in concrete.
A previous work by Wild et al. (1996) illustrated the effect of partial replacement of
metakaolin at 5, 10, 15, 20, 25, and 30% on the workability of the concrete mixture. The
modified concrete mix proportion was 1:2.3:3.4. The optimised mix is that of 20% cement
replacement by metakaolin, using 0.45 W/C ratios. The effect of metakaolin on the
workability is shown in Table 2.5. The effect of the superplasticiser on the workability can be
clearly seen, even though increasing the metakaolin level.
The research study by Zhang and Malhotra (1995) presented the results of the physical and
chemical properties of a thermally activated alumina-silicate material metakaolin and deals
with the properties of fresh and hardened concrete incorporating this material. The results of
this limited study show that the thermally activated aluminosilicate material is highly
pozzolanic and appears to have excellent potential as a supplementary cementing material for
improving concrete properties and produce high-performance concrete. The concrete
incorporating 10% metakaolin required more superplasticiser and air-entraining admixture
and improved the strength up to 180 days of curing compared with the conventional concrete.
Incorporation of metakaolin improved the resistance to chloride diffusion compared to
conventional concrete.
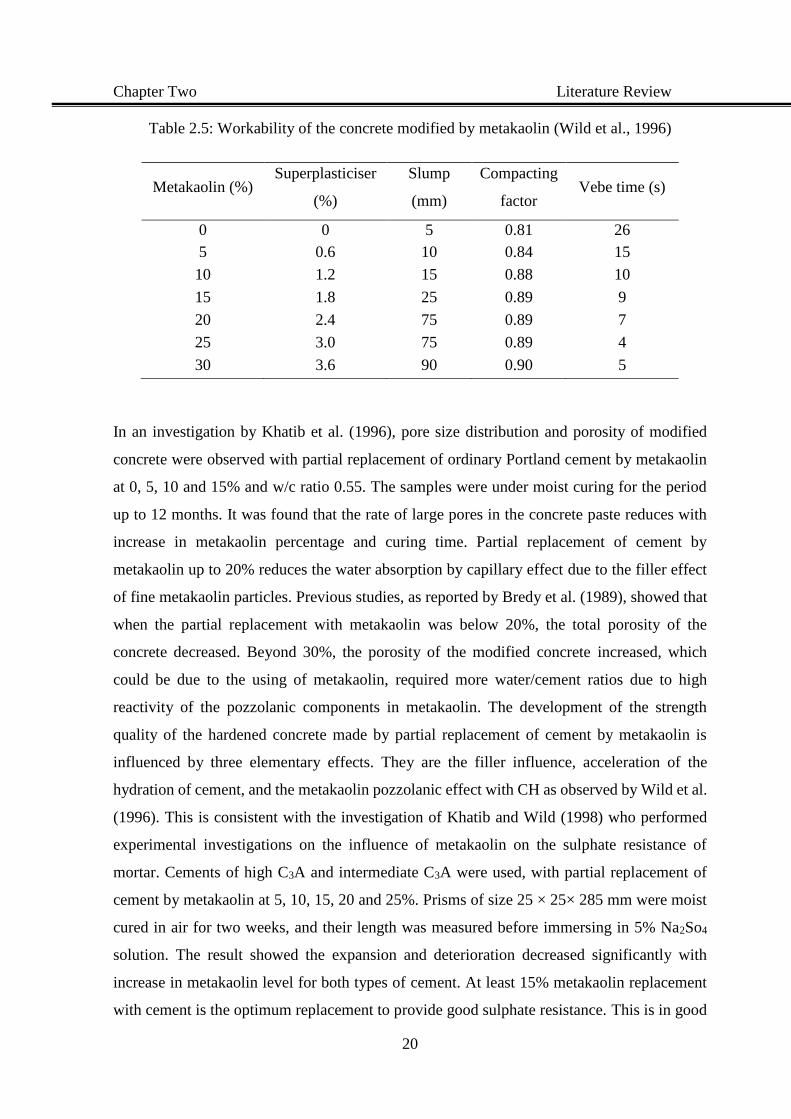
Chapter Two Literature Review
20
Table 2.5: Workability of the concrete modified by metakaolin (Wild et al., 1996)
Metakaolin (%) Superplasticiser
(%)
Slump
(mm)
Compacting
factor Vebe time (s)
0 0 5 0.81 26
5 0.6 10 0.84 15
10 1.2 15 0.88 10
15 1.8 25 0.89 9
20 2.4 75 0.89 7
25 3.0 75 0.89 4
30 3.6 90 0.90 5
In an investigation by Khatib et al. (1996), pore size distribution and porosity of modified
concrete were observed with partial replacement of ordinary Portland cement by metakaolin
at 0, 5, 10 and 15% and w/c ratio 0.55. The samples were under moist curing for the period
up to 12 months. It was found that the rate of large pores in the concrete paste reduces with
increase in metakaolin percentage and curing time. Partial replacement of cement by
metakaolin up to 20% reduces the water absorption by capillary effect due to the filler effect
of fine metakaolin particles. Previous studies, as reported by Bredy et al. (1989), showed that
when the partial replacement with metakaolin was below 20%, the total porosity of the
concrete decreased. Beyond 30%, the porosity of the modified concrete increased, which
could be due to the using of metakaolin, required more water/cement ratios due to high
reactivity of the pozzolanic components in metakaolin. The development of the strength
quality of the hardened concrete made by partial replacement of cement by metakaolin is
influenced by three elementary effects. They are the filler influence, acceleration of the
hydration of cement, and the metakaolin pozzolanic effect with CH as observed by Wild et al.
(1996). This is consistent with the investigation of Khatib and Wild (1998) who performed
experimental investigations on the influence of metakaolin on the sulphate resistance of
mortar. Cements of high C3A and intermediate C3A were used, with partial replacement of
cement by metakaolin at 5, 10, 15, 20 and 25%. Prisms of size 25 × 25× 285 mm were moist
cured in air for two weeks, and their length was measured before immersing in 5% Na2So4
solution. The result showed the expansion and deterioration decreased significantly with
increase in metakaolin level for both types of cement. At least 15% metakaolin replacement
with cement is the optimum replacement to provide good sulphate resistance. This is in good
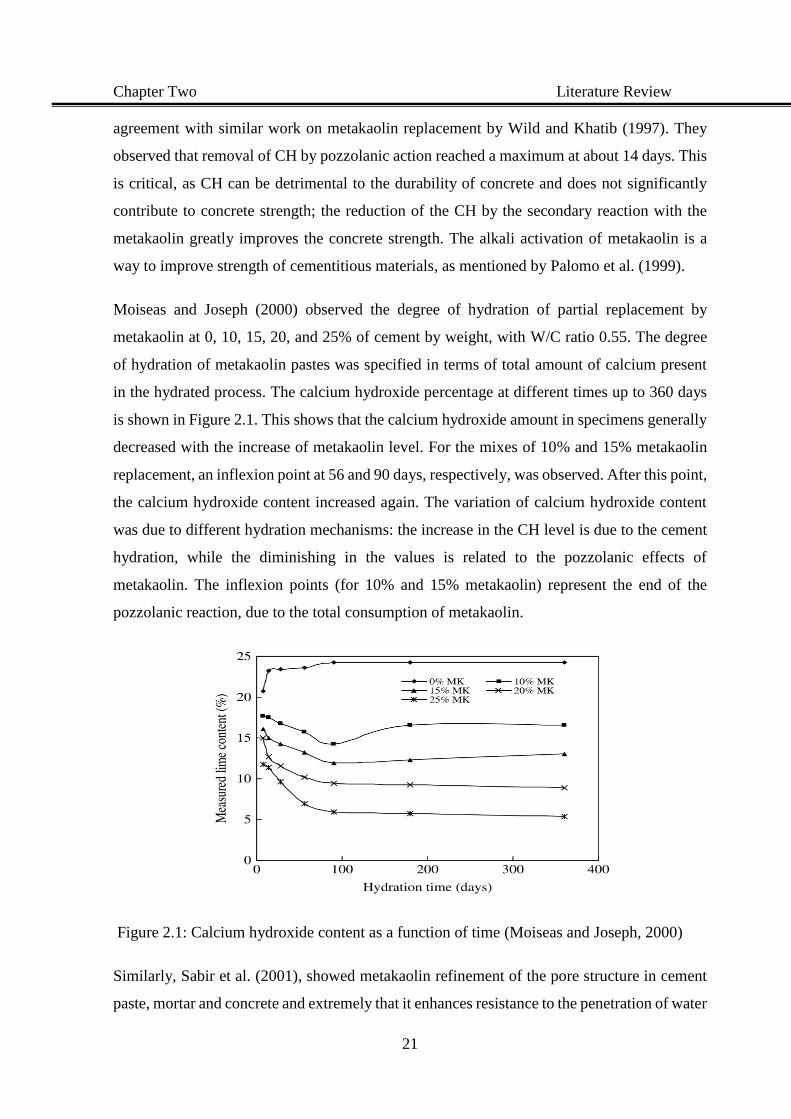
Chapter Two Literature Review
21
agreement with similar work on metakaolin replacement by Wild and Khatib (1997). They
observed that removal of CH by pozzolanic action reached a maximum at about 14 days. This
is critical, as CH can be detrimental to the durability of concrete and does not significantly
contribute to concrete strength; the reduction of the CH by the secondary reaction with the
metakaolin greatly improves the concrete strength. The alkali activation of metakaolin is a
way to improve strength of cementitious materials, as mentioned by Palomo et al. (1999).
Moiseas and Joseph (2000) observed the degree of hydration of partial replacement by
metakaolin at 0, 10, 15, 20, and 25% of cement by weight, with W/C ratio 0.55. The degree
of hydration of metakaolin pastes was specified in terms of total amount of calcium present
in the hydrated process. The calcium hydroxide percentage at different times up to 360 days
is shown in Figure 2.1. This shows that the calcium hydroxide amount in specimens generally
decreased with the increase of metakaolin level. For the mixes of 10% and 15% metakaolin
replacement, an inflexion point at 56 and 90 days, respectively, was observed. After this point,
the calcium hydroxide content increased again. The variation of calcium hydroxide content
was due to different hydration mechanisms: the increase in the CH level is due to the cement
hydration, while the diminishing in the values is related to the pozzolanic effects of
metakaolin. The inflexion points (for 10% and 15% metakaolin) represent the end of the
pozzolanic reaction, due to the total consumption of metakaolin.
Figure 2.1: Calcium hydroxide content as a function of time (Moiseas and Joseph, 2000)
Similarly, Sabir et al. (2001), showed metakaolin refinement of the pore structure in cement
paste, mortar and concrete and extremely that it enhances resistance to the penetration of water
Chapter Two Literature Review
22
and diffusion of harmful ions which lead to deterioration of the microstructure system of
cement concrete. However, other research by Qian and Li (2001), has also shown that
increasing replacement levels of metakaolin increases the tensile strength and peak strain.
There is a significant increase in compressive strength at early ages, and higher long-term
strength.
Courard et al. (2003), investigated the sulphate resistance of modified mortars by partial
replacement of cement by 0, 5, 10, 15 and 20% metakaolin. The specimens of mixtures were
cast with 1:3 cement/sand with w/c ratio 0.50. Regarding behaviours of modified mortar in
comparison with conventional mortar, an inhibition of sulphate attack was observed. The
optimum percentage of the metakaolin replacement seemed to be between 10 and 15%
regarding the low decrease of workability, the best mechanical performances about 19.9%
compared with control concrete at 15% metakaolin replacement. Increasing the metakaolin
level up to 20% contributed to a decrease in absorption by capillary action. There is a link
between the water absorption, modulus of elasticity, and strength and pore size distribution
according to Khatib and Clay (2004).
A study by Batis (2005), suggests there the increase of the partial cement replacement using
metakaolin results in a considerable increase in the required water for the hydration process.
The results show improvement in compressive strength about 19.5% with partial replacement
of metakaolin of 10% at age 28 days. Using metakaolin as a sand or cement replacement up
to 20% and 10% by weight respectively, enhances the corrosion resistance of mortar samples.
However, Justice (2005) studied the effect of using metakaolin as a supplementary
cementitious material on the concrete properties. With respect to workability and setting time,
the use of metakaolin generally required more superplasticiser to achieve adequate concrete
workability, because metakaolin caused the highest reductions in workability due to the filler
influence, acceleration of the hydration of cement, and the metakaolin pozzolanic effect.
Metakaolin also shortened setting time of cement paste by 35-50% as compared to the control
cement paste. In addition, compared to the control sample, the samples of metakaolin had the
improvement of 42%, 9.5% and 10% in compressive, splitting tensile, flexural strengths
respectively over controls for W/C of 0.40, respectively. This finding is consistent with
findings of past studies by Sadr et al. (2007), which found that metakaolin improves
compressive strength and reduces shrinkage compared with the conventional specimens, and
Chapter Two Literature Review
23
the optimum percentage of replacement is between 10 and 20%. Furthermore, in the same
vein, Khatib (2008) showed that the workability reduced with an increase of metakaolin level,
as reported before, as the results showed the slump reduce from 17 mm to 0 mm when the
metakaolin content increase from 0% to 20% respectively. The maximum contribution of
metakaolin to strength was at 14 days and the optimum percentage of metakaolin was 15%.
The increase in metakaolin content of up to at least 20% leads to a decrease in shrinkage and
an increase in expansion after 56 days of curing. This is supported by the Bai and Gailius
(2009) which revealed that partial replacement of cement by metakaolin significantly affects
consistency and early strength of cement paste. Due to high pozzolanic reactivity of the
metakaolin and specific surface, water demand increases with increased metakaolin content
in the concrete mixture. Meanwhile, Siddique and Klaus (2009) reviewed the available
literature on the effect of metakaolin on the mortar and concrete characteristics. Similar results
were found to those mentioned above. The literature reviewed clearly demonstrates that
metakaolin is an effective pozzolanas and concludes that metakaolin improves the early age
strength as well as the long-term properties, and reduces the permeability of the mortar and
concrete. Incorporation of metakaolin in a cement system causes a significant change in the
chemical composition of the cement hydration products and partial replacement of 10% and
15% metakaolin exhibited excellent durability properties, such as resistance to chemical
attack.
In addition, according to Vejmelkova et al. (2010) The durability properties of concrete
modified by metakaolin were improved. Its frost resistance was better as compared to Portland
cement high performance concrete. The chemical resistance of metakaolin concrete in distilled
water and HCl was better than for Portland cement in control concrete. In another study,
Anupama et al. (2011) studied the effect of partial replacement of cement by 0%, 10%, 15%
of metakaolin using different W/C ratios are 0.35, 0.4, 0.45 and 0.50 at ages 3, 7, 28, 56 and
90 days. The results showed that using metakaolin in concrete increase the rate of early age
strength of the concrete paste. Optimum partial replacement was found to be 15% metakaolin
at age 90 days. Compressive strength enhances with an increase of metakaolin level. The
maximum density of modified concrete was achieved at 0.45 w/c ratio and 10% metakaolin
replacement.
Chapter Two Literature Review
24
This is supported by the Beulah and Prahallada (2012) study which investigated the partial
replacement of cement by metakaolin at 0, 10, 20 and 30%. It was observed that the addition
of metakaolin increases the resistance of the concrete to acid attack. The results also, show
that the compressive strength improved by 11.6% at 10% replacement of cement by
metakaolin. This is consistent with a study by Murthy et al. (2012) which investigated the
influence of partial replacement of 7.5, 10, 12.5, 15 and 17.5% metakaolin by weight of
cement on the modulus of elasticity of concrete. Cylinders of size 150 mm diameter and 300
mm height at various percentages of metakaolin were used to determine the modulus of
elasticity after curing for 28 days. Variation of Young’s modulus at different percentages of
metakaolin was compared with conventional concrete. It was found that Young’s modulus of
elasticity increases with metakaolin replacement up to 10% then decreases with further
metakaolin increase. In addition, there was an improvement in compressive strength of the
concrete mix up to 8.6% at age 28 days for 10% metakaolin replacement by weight of cement.
Khatib et al. (2012) observed that the 20% replacement of cement with metakaolin resulted in
a substantial improvement in the compressive strength of mortar. The compressive strength
increased by approximately 50% compared to that of conventional concrete. When using over
30% metakaolin. However, the compressive strength started to decrease as shown in Figure
2.2. Furthermore, Shelorkar and Jadhao (2013) investigated the influence of metakaolin
replacement on strength properties and rapid chloride permeability of concrete. Specimens
with partial replacement of cement by metakaolin at 0, 4, 6 and 8% were prepared. It was
observed that there was a remarkable enhancement in compressive strength about 9%, 13.2%
and 21% for 4%, 6% and 8% cement replacement by metakaolin. The percentage reduction in
chloride permeability values in coulombs was 48.57 %, 51.88 % and 56.43% for metakaolin
content of 4%, 6% and 8% respectively. Nova (2013), also provided a study of the effects of
partial replacement of cement by metakaolin at 5, 10, 15 and 20% on concrete. The results
showed the partial replacement with metakaolin admixture effectively improved the
mechanical properties of the concrete. It was found that the mechanical properties increased
up to 15% metakaolin replacement and then decreased as metakaolin was increased further.
In contrast with conventional concrete, the percentages of the increase in the mechanical
strength were 39.2, 8.90 and 15.2 for compressive, splitting and flexural strength respectively.

Chapter Two Literature Review
25
In a different study, Srinivasu et al. (2014) discussed the significant relationship between the
metakaolin level and the concrete properties. It was emphasised that the inclusion of
metakaolin in the concrete led to a 25% increase in strength and enhanced durability.
Metakaolin increases the density of the concrete, which displays a low water permeability and
sorptivity. It is also improving the acid resistance of the concrete and decreases the chloride
penetration. In another study, Khatib et al. (2014) examined that the ‘the properties of the fly
ash paste activated by lime and metakaolin, are affected by the metakaolin level and curing
time, compared with the paste without metakaolin. Meanwhile, and with the same objective,
Kannan and Ganesan (2014) showed similar results. Results of experimental research by
Marinos et al. (2015) also point towards improvement in strength and durability of concrete
by the partial replacement of cement by metakaolin by mass. Partial replacement of 10% of
cement by metakaolin resulted in decreased chloride permeability and increased compressive
strength. At a higher level of replacement, chloride penetration further decreased, at the
expense of compressive strength. The higher the volume of pozzolanic materials, like
metakaolin, in the binder, the higher the carbonation of the micro concrete, due to the low
available amount of Ca(OH)2 in the matrix.
Recently, Narmatha and Felixkala (2017), have shown an increased interest in using
metakaolin in concrete structures due to its effect on improving concrete properties. The
increase in metakaolin content improves the compressive strength and splitting tensile
strength up to 15% cement replacement. The results encourage the use of metakaolin, as a
pozzolanic material for partial replacement in producing high performance concrete.
2.5 Uses of metakaolin in concrete
Metakaolin is used in the following concrete applications as mentioned by (Siddique and
Khan, 2011; Bapat, 2012):
• High performance concrete, high quality concrete, and lightweight concrete
• Precast concrete for architectural, civil, industrial, and structural purposes
• Fibre cement and Ferro cement products
• Glass fibre reinforced concrete
• Repair material, pool plasters
• Improved finish ability, colour and appearance.
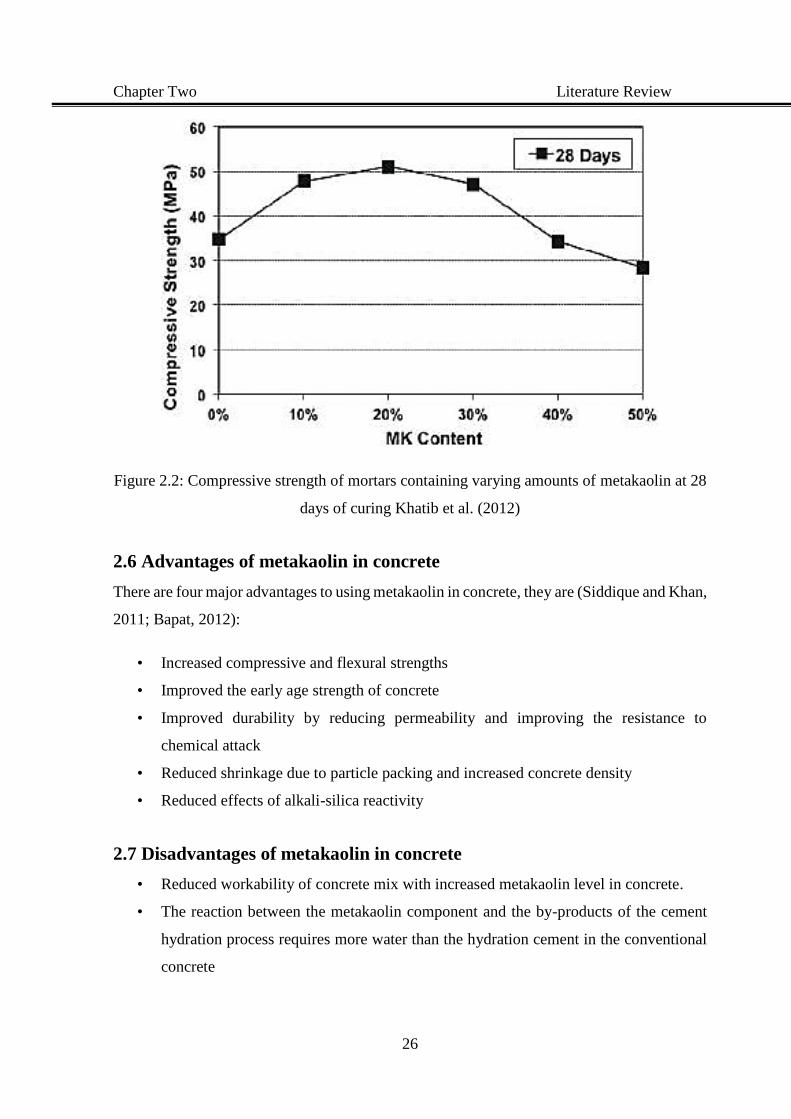
Chapter Two Literature Review
26
Figure 2.2: Compressive strength of mortars containing varying amounts of metakaolin at 28
days of curing Khatib et al. (2012)
2.6 Advantages of metakaolin in concrete
There are four major advantages to using metakaolin in concrete, they are (Siddique and Khan,
2011; Bapat, 2012):
• Increased compressive and flexural strengths
• Improved the early age strength of concrete
• Improved durability by reducing permeability and improving the resistance to
chemical attack
• Reduced shrinkage due to particle packing and increased concrete density
• Reduced effects of alkali-silica reactivity
2.7 Disadvantages of metakaolin in concrete
• Reduced workability of concrete mix with increased metakaolin level in concrete.
• The reaction between the metakaolin component and the by-products of the cement
hydration process requires more water than the hydration cement in the conventional
concrete
Chapter Two Literature Review
27
• Partial replacement of cement by metakaolin requires superplasticiser as a water
reducer to improve mix workability and amends the water cement ratio for cement
hydration progresses.
• Decreasing the strength properties with increasing the MK contents over 20%.
2.8 Polymer
The term of polymer is used to indicate the compounds consisting of many repeated structural
units. The prefix ῾poly᾿ means ῾many᾿ and ῾mer᾿ means ῾part ᾿. Each repeated structural unit
in the compound is called a monomer. A polymer consists of numerous monomers which are
linked together in a chain-link structure and the chemical process which causes this linkage is
called polymerisation. The number of repeating units in the chain linkage is called the degree
of polymerisation. If more than one kind of monomer is used, the process is called
copolymerisation and the resulting substance is a copolymer. The monomeric units may
combine with each other into a macromolecule to form polymers of linear, branched or cross-
linked (three-dimensional) structures. The term linear polymer is used for polymers in which
the carbon atoms are joined together as a continuous sequence in a chain polymer, and also
have cross-linked or space network structures and they have three-dimensional systems
(Bolton, 1998). However, there are two molecular factors that govern the mechanical
properties of the polymer, the first is the length of the molecule, which is proportional to the
degree of polymerisation and proportional to the molecule size, or relative molecular mass.
The second factor is the shape of the molecules. The chemical reactivity of a polymer is
dependent on the reactivity of its molecular components (McCrum et al., 1997).
In general, the properties of the polymer also depend upon the form and arrangement of its
macro-molecules. The critical factors are the molecular weight (which depends on the degree
of polymerisation), the extent of branching, crosslinking, or network structure and the degree
and crystallinity of the macro-molecules according to Dara and Umare (2010).
2.9 Classification of polymers
Polymers can be classified according to their response to thermal treatment as thermoplastics,
thermosets, and elastomers. The simple methods by which thermoplastics and thermosets can
be distinguished is when heat is applied. With thermoplastics, the material softens on heating
and become plastic so that it can be converted to any shape by moulding. On cooling, they
Chapter Two Literature Review
28
become hard and rigid. On reheating, they soften again and the material can be remoulded to
any desired shape. The chemical structure or the molecular weight of the thermoplastic resins
are not changed during the heating or moulding operations. Examples of thermoplastics are,
polyethylene, polystyrene, polyvinyl and acrylics. However, thermosetting resins are those,
which set upon heating and cannot be reformed once they are set. Thermosetting resins have
a three-dimensional network structure and have very high molecular weights. When these
materials are moulded, additional crosslinking is formed between the long chains leading to a
further increase in molecular weight. Examples of these materials include phenol
formaldehyde, urea and melamine formaldehyde, polyester, epoxy, and silicone, etc.
(Nicholson, 2006).
On the other hand, an elastomer is a class of polymers classified according to the application
and physical properties. Its structure allows reversible considerable extensions; elastomers
shows very large strain when subject to stress and return to their original dimensions when
the stress is removed. The elastomer structure is that of linear chain molecules with some
cross-linking between chains, examples include natural rubber and synthetic rubber, styrene-
butadiene rubber and polyurethane, etc. (Ghosh, 2002).
2.10 Polymer in concrete
Mortar and concrete made with Portland cement have been popular construction materials
globally for the past 170 years and more. However, some of the drawbacks of concrete
structures, are low tensile strength, large drying shrinkage, low chemical attack resistance and
delayed hardening. In order to minimise these drawbacks, several attempts have been made to
utilise polymers in mortar and concrete. Research and development of polymer-modified
concrete have become active in many countries, particularly in Japan, the USA, Germany and
the UK. The notion of a polymer-hydraulic cement work is not new, and in 1923 the first
patent of the system was issued by Cresson, as published by Ohama (1995). It has been found
that the properties of polymer-modified concrete significantly depend on the polymer to
cement percentage on concrete and mortar mixtures or polymer contents of ingredients
(Ohama, 1998). The incorporation of polymers into cementing concrete materials in order to
enhance the bond adhesion, flexibility and workability of the resultant composite first took
place in the 1930s where natural rubber was used. A wide variety of polymers has been
investigated to modify mortar and concrete, such as epoxy (EP), styrene-butadiene rubber
Chapter Two Literature Review
29
(SBR), polyvinyl acetate (PVA), Polyacrylicester (PAE), polypropylene (PP) and chloroprene
rubber (CR) etc. according to Miller (2005). According to American concrete institute (ACI)
committee (1986), polymer-modified concrete can be classified as follows:
2.10.1 Polymer-impregnated concrete (PIC):
To make PIC, conventional Portland cement concrete is dried and subsequently saturated with
a liquid monomer, which is subsequently polymerised in situ. In general, almost any shape,
size, configuration orientation and quality of hardened Portland cement concrete can be
impregnated with the monomer to some degree, provided the monomer has access to the void
space within the concrete.
2.10.2 Polymer concrete (PC):
PC is a composite material formed by a polymerised monomer and aggregate mixture. The
polymer acts as a binder for the aggregate. The composites do not contain a hydrated cement
case; however, Portland cement can be used as a filler.
2.10.3 Polymer Portland cement concrete (PPCC):
PPCC is a premixed material in which polymer and cement are added together to a fresh
concrete mix in the form of a liquid, powder or dispersed phase, and allowed to cure. The
mixing and handling of PPCC are similar to conventional Portland cement concrete.
Generally, polymer latexes used as concrete modifiers are not toxic, and are safe substances
to handle. Consequently, they require no special precautions (Fowler, 1983; Ohama, 1995).
Polymer-modified Portland cement concrete and mortar are widely incorporated in civil
applications because the production method is not difficult and costs are lower compared to
the other polymer concrete categories, such as PIC and PC according to Ramakrishnan
(1992). Previous studies have primarily concentrated on the effect of polymers on concrete
properties. Ohama (1982) mentioned the significant relationship between the pore structure
and polymer content in concrete. It has been shown that the pore structure of latex-modified
concrete is affected by the polymer to cement (P/C) ratio. The porosity or pore volume depend
upon the polymer content, which may reduce the permeability and durability of latex-modified
concrete. With the same objective, Larbi and Bijen (1990) indicated that there are two
suggested ideas for the action of polymer dispersions in concrete. The first theory explained
that there is no chemical reaction between the polymer particles and the cement hydration
Chapter Two Literature Review
30
compositions. During the cement hydration progress, the polymer particles build up together
to form a film and gradually form a three-dimensional network that contributes together with
cement hydration products to improve the strength of the concrete. The second theory suggests
that there is a chemical interaction between the polymer particles and the cement hydration
products. These interactions result in the formation of complexes, which often retard or
accelerate the hydration of the cement system and affect the concrete properties. Meanwhile,
in a different study, Lewis and Lewis (1990) noted that the final distribution of the polymer
into the concrete matrix could be considered as being between the two extremes of: i) a
completely homogeneous co-matrix, in which both polymer and cement gel are continuous,
and ii) a matrix including only cement hydration gel, with coalescence of polymer as a
disperse phase within that matrix, either randomly distributed within the gel, or localised, for
example, in pores or at aggregate matrix interfaces.
The above finding is consistent with the study by Atkins et al. (1991) whose results proposed
that there is a different level of chemical interaction between some types of polymers and
Portland cement hydration components. SBR and Polyvinyl alcohol (PVA1) appear to have
very little chemical interaction while Polyvinyl acetate shows full interaction. Acrylic-based
polymers are observed to partially interact with Portland cement. Regarding the rate of cement
hydration, calcium hydroxide directing in the interfacial zone, and micro-hardness of the
composites were investigated by Su et al. (1991). The results showed that there is a significant
retardation in setting time and the hydration of cement for the modified cement by polymer
due to an overlay of polymer film over the cement grains which restricts access of water to
the cement.
Furthermore, Ohama et al. (1993) concluded that polymer cement ratios of 5 to 10% are
considered optimum for the preparation of such polymer-modified cement (PMC) mortars
using epoxy resin without any hardener. Research findings by Sakai and Sugita (1995), also
point towards the observation of the microstructure and composite mechanism of PMC mixed
with polymers in two cases of emulsion and powder. The results showed an improvement in
the bending strength of PMC is attributed to the polymer particles reinforcement action when
distributed in the hardened cement matrix, and the formation of a film in the interface with
other materials increased the adhesiveness of PMC to other materials. All the above findings
are consistent with the study by Ramachandran (1996). It was found that most of the polymers
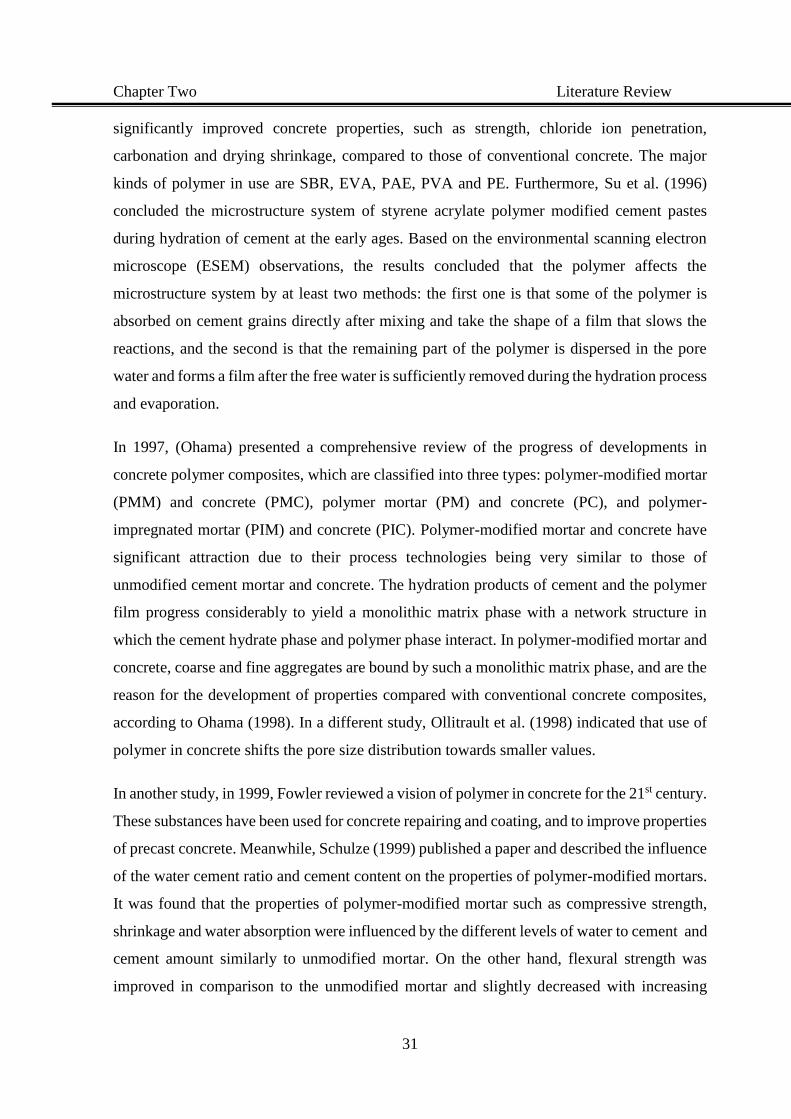
Chapter Two Literature Review
31
significantly improved concrete properties, such as strength, chloride ion penetration,
carbonation and drying shrinkage, compared to those of conventional concrete. The major
kinds of polymer in use are SBR, EVA, PAE, PVA and PE. Furthermore, Su et al. (1996)
concluded the microstructure system of styrene acrylate polymer modified cement pastes
during hydration of cement at the early ages. Based on the environmental scanning electron
microscope (ESEM) observations, the results concluded that the polymer affects the
microstructure system by at least two methods: the first one is that some of the polymer is
absorbed on cement grains directly after mixing and take the shape of a film that slows the
reactions, and the second is that the remaining part of the polymer is dispersed in the pore
water and forms a film after the free water is sufficiently removed during the hydration process
and evaporation.
In 1997, (Ohama) presented a comprehensive review of the progress of developments in
concrete polymer composites, which are classified into three types: polymer-modified mortar
(PMM) and concrete (PMC), polymer mortar (PM) and concrete (PC), and polymer-
impregnated mortar (PIM) and concrete (PIC). Polymer-modified mortar and concrete have
significant attraction due to their process technologies being very similar to those of
unmodified cement mortar and concrete. The hydration products of cement and the polymer
film progress considerably to yield a monolithic matrix phase with a network structure in
which the cement hydrate phase and polymer phase interact. In polymer-modified mortar and
concrete, coarse and fine aggregates are bound by such a monolithic matrix phase, and are the
reason for the development of properties compared with conventional concrete composites,
according to Ohama (1998). In a different study, Ollitrault et al. (1998) indicated that use of
polymer in concrete shifts the pore size distribution towards smaller values.
In another study, in 1999, Fowler reviewed a vision of polymer in concrete for the 21st century.
These substances have been used for concrete repairing and coating, and to improve properties
of precast concrete. Meanwhile, Schulze (1999) published a paper and described the influence
of the water cement ratio and cement content on the properties of polymer-modified mortars.
It was found that the properties of polymer-modified mortar such as compressive strength,
shrinkage and water absorption were influenced by the different levels of water to cement and
cement amount similarly to unmodified mortar. On the other hand, flexural strength was
improved in comparison to the unmodified mortar and slightly decreased with increasing
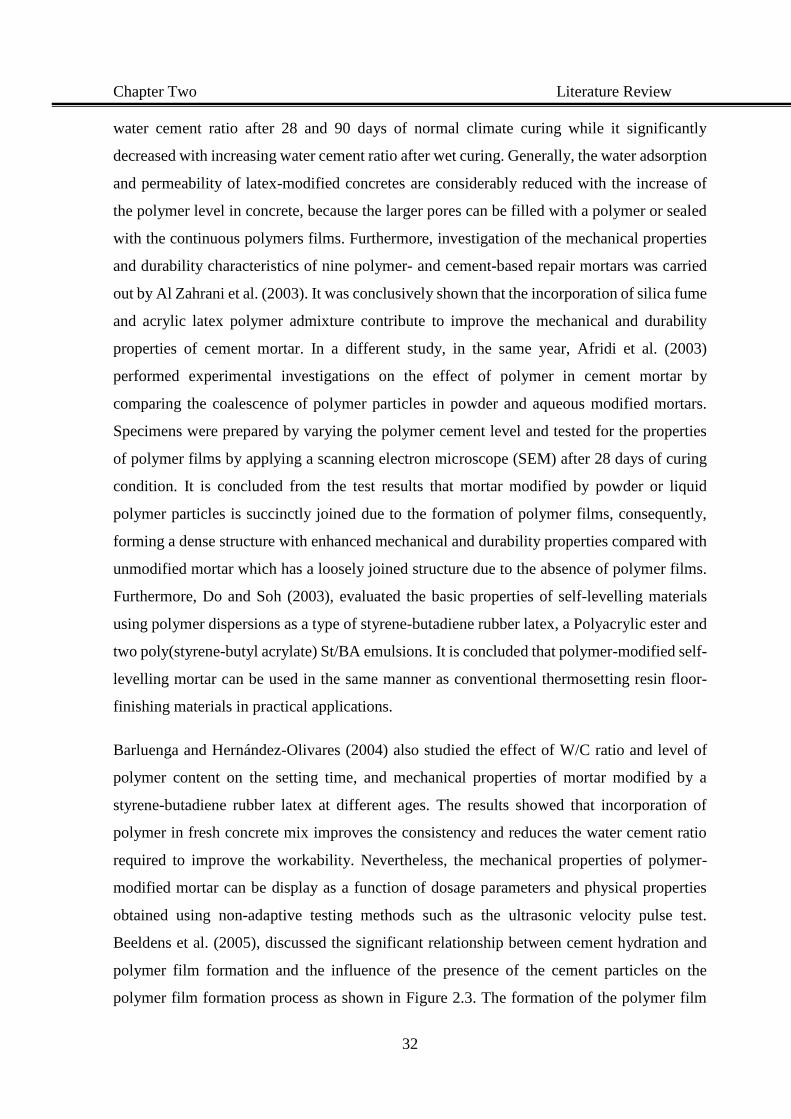
Chapter Two Literature Review
32
water cement ratio after 28 and 90 days of normal climate curing while it significantly
decreased with increasing water cement ratio after wet curing. Generally, the water adsorption
and permeability of latex-modified concretes are considerably reduced with the increase of
the polymer level in concrete, because the larger pores can be filled with a polymer or sealed
with the continuous polymers films. Furthermore, investigation of the mechanical properties
and durability characteristics of nine polymer- and cement-based repair mortars was carried
out by Al Zahrani et al. (2003). It was conclusively shown that the incorporation of silica fume
and acrylic latex polymer admixture contribute to improve the mechanical and durability
properties of cement mortar. In a different study, in the same year, Afridi et al. (2003)
performed experimental investigations on the effect of polymer in cement mortar by
comparing the coalescence of polymer particles in powder and aqueous modified mortars.
Specimens were prepared by varying the polymer cement level and tested for the properties
of polymer films by applying a scanning electron microscope (SEM) after 28 days of curing
condition. It is concluded from the test results that mortar modified by powder or liquid
polymer particles is succinctly joined due to the formation of polymer films, consequently,
forming a dense structure with enhanced mechanical and durability properties compared with
unmodified mortar which has a loosely joined structure due to the absence of polymer films.
Furthermore, Do and Soh (2003), evaluated the basic properties of self-levelling materials
using polymer dispersions as a type of styrene-butadiene rubber latex, a Polyacrylic ester and
two poly(styrene-butyl acrylate) St/BA emulsions. It is concluded that polymer-modified self-
levelling mortar can be used in the same manner as conventional thermosetting resin floor-
finishing materials in practical applications.
Barluenga and Hernández-Olivares (2004) also studied the effect of W/C ratio and level of
polymer content on the setting time, and mechanical properties of mortar modified by a
styrene-butadiene rubber latex at different ages. The results showed that incorporation of
polymer in fresh concrete mix improves the consistency and reduces the water cement ratio
required to improve the workability. Nevertheless, the mechanical properties of polymer-
modified mortar can be display as a function of dosage parameters and physical properties
obtained using non-adaptive testing methods such as the ultrasonic velocity pulse test.
Beeldens et al. (2005), discussed the significant relationship between cement hydration and
polymer film formation and the influence of the presence of the cement particles on the
polymer film formation process as shown in Figure 2.3. The formation of the polymer film
Chapter Two Literature Review
33
significantly influences the modification progress of cementitious mortar and concrete. The
relative humidity of the curing method has an important effect on film formation and
especially on the drying rate. The hydration of the cement is retarded when the
polymer/cement ratio is increased. Meanwhile, the compressive and flexural strengths after 7
days of dry curing, reduced and increased, respectively, in comparison to the unmodified
mortar strength.
Aggarwal et al. (2007), carried out an experimental study of the characteristics of cement
mortar modified by an epoxy emulsion compared with an acrylic-modified mortar. The results
showed that the polymer-modified mortars have significant improvement in strength
properties and enhanced resistance to carbonation and chloride ion penetration and improved
workability. Nevertheless, with the same level of polymers, epoxy emulsion showed better
improvement properties than the acrylic emulsion.
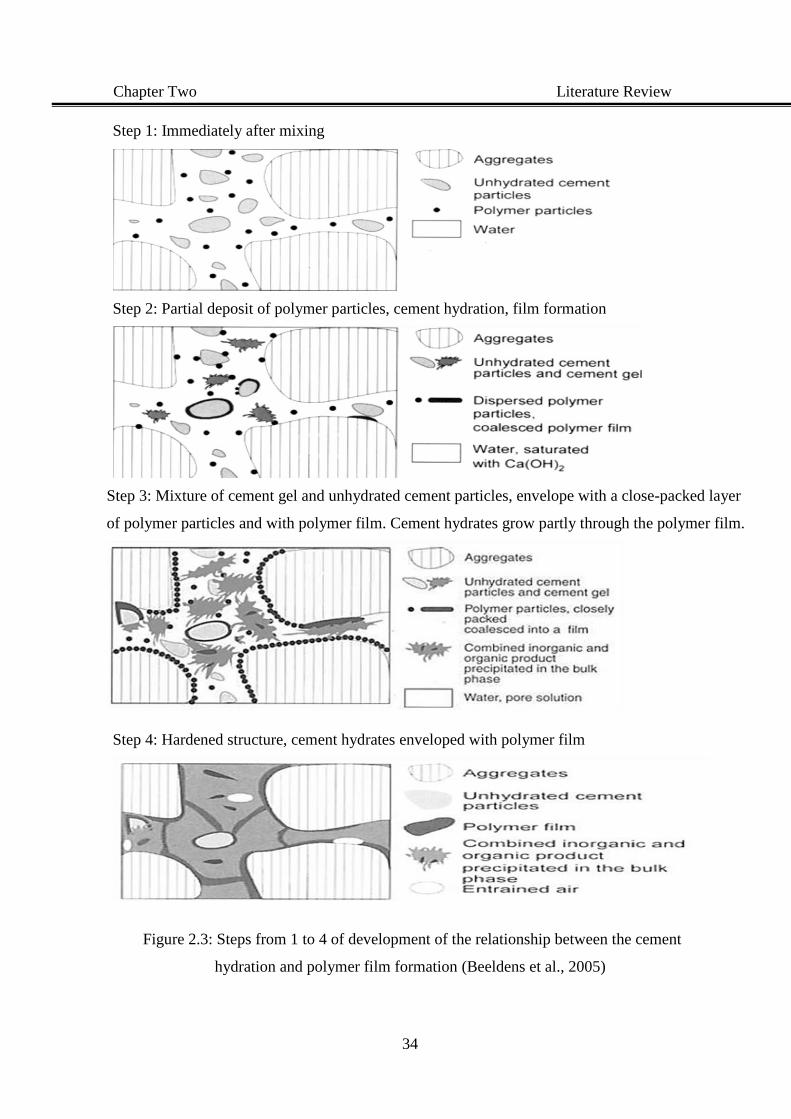
Chapter Two Literature Review
34
Figure 2.3: Steps from 1 to 4 of development of the relationship between the cement
hydration and polymer film formation (Beeldens et al., 2005)
Step 1: Immediately after mixing
Step 2: Partial deposit of polymer particles, cement hydration, film formation
Step 3: Mixture of cement gel and unhydrated cement particles, envelope with a close-packed layer
of polymer particles and with polymer film. Cement hydrates grow partly through the polymer film.
Step 4: Hardened structure, cement hydrates enveloped with polymer film
Chapter Two Literature Review
35
Zhao et al. (2009) reported that an experimental study of the incorporation of PVA emulsion
in lightweight concrete clearly improves the mechanical properties for long-term curing
beyond 180 days. The result shows that the compressive strength increased up to 20% aftre
180 days of curing. Flexural strength of modified lightweight concrete at 28 days was around
10% higher than that of the unmodified concrete, due to the development of the bond between
the cementing materials and the polymer film of polyvinyl acetate. To determine the effects
of incorporation of the polymer into the mixtures in order to improve the strength of pervious
concrete, Huang et al. (2010) evaluated the properties of pervious concrete through an air void
test, permeability test, compressive strength test, and splitting tensile strength test. Three types
of limestone aggregates were used, and SBR polymer was incorporated to modify the pervious
concrete properties. The polymer and sand decreased the porosity and permeability of
pervious concrete and increased the compressive strength of pervious concrete. However, only
the addition of polymer could increase the splitting tensile strength of pervious concrete.
In 2015, Bothra and Ghugal reviewed the use, application, classification and microstructure
of polymer in concrete. This review presented a better understanding of the mechanism of
coagulation of polymer in cement paste. Firstly, after adding polymer into fresh concrete mix,
polymer particles are suspended and dispersed throughout the cement paste, meanwhile,
cement components start to hydrolyse and form solution of CH, and generate ettringite and
CH crystals in the zone adjacent to aggregates and probably a calcium silicate layer on the
aggregate. Polymer particles sediment on the gel products and on the unhydrated clinker
particles. With the demand of water during the hydration process, and the increase of
hydration products, the polymer particles gradually concentrate in the capillary pores, and
forming a close packed layer on the gel product surfaces, on the unhydrated cement grains
and on the developing silicate layer over the aggregates. Further consumption of water by
hydration or drying leads to coalescing polymer particles on the gel products and in the voids
coalesce into continuous films or membranes, producing a co-matrix intermingled with the
hydrated cement paste and binding the hydrates to each other and to the aggregates. Some
polymers participate in chemical reactions with the cement hydration products to the detriment
of the composite. There is a considerable variation of polymer application in the construction
industry. Polymers in concrete are mostly used as overlays on roadways and bridges, both as
new construction and as repairs of existing deteriorated structures, and are used in floorings,
water tanks, swimming pools, septic tanks, silos, drains, pipes and ship decks. A relatively
Chapter Two Literature Review
36
new application, which is proving to be very promising, is its use in combination with fibre
reinforcing.
Momtazi et al. (2015), reviewed and emphasised the positive effect of polymer on concrete
properties, and displayed the three types of polymer in concrete: polymer-impregnated
concrete (PIC), polymer concrete (PC) and polymer-modified concrete (PMC). Polymers
enhance mechanical and durability properties of concrete including increased compressive
strength, flexural and tensile strength as well as excellent improvement in chemical resistance
and reduction of corrosion and permeability of concrete. Moreover, Nguyen et al. (2016)
carried out an experimental study on the influence of the chemical nature of polyvinyl alcohol
on early hydration of Portland cement. The result showed that polymer incorporation retarded
the hydration of C3S, and the heat measurement flow data for the first 24 hours showed that
the chemical nature of polyvinyl alcohol has significant influence on the hydration process of
Portland cement due to both the fully hydrolysed PVA and the released acetates. An increase
in the degree of polymerisation of the polymer reduces the dispersing effect of the polymer
and, therefore, increases the retardation of cement hydration. Meanwhile, Giustozzi (2016),
evaluated the use of different types of polymer to modify the functional and mechanical
properties of pervious concrete mixes. Four polymers with various chemical properties were
incorporated in the mixtures and several tests were carried out on cement grouts and mortars,
firstly, and on pervious concrete mixes, secondly. Results generally showed that some of the
polymers were beneficial to enhance the durability of the material. Specifically, it is concluded
that polymer-modified mixes showed enhanced ability to be denser by means of a lower
compaction energy to obtain a specific void level and polymers demonstrated to retard the
cement hydration process and thus developing strength for long-term curing. In addition, the
increase in flexural strength, stiffness, and durability properties was obviously observed.
However, it is seen that the addition of polymers in different forms can greatly enhance
concrete properties, reducing the drawback of unmodified concrete properties, along with the
increased adhesion to steel and/or old concrete, corrosion resistance, impermeability, etc. The
cement particles are better dispersed in the polymer modified cement mixture and a more
homogeneous material is formed. In most cases, a better fluidity of the fresh mix and a lower
mixing water demand is noticed by Prakash et al. (2016).
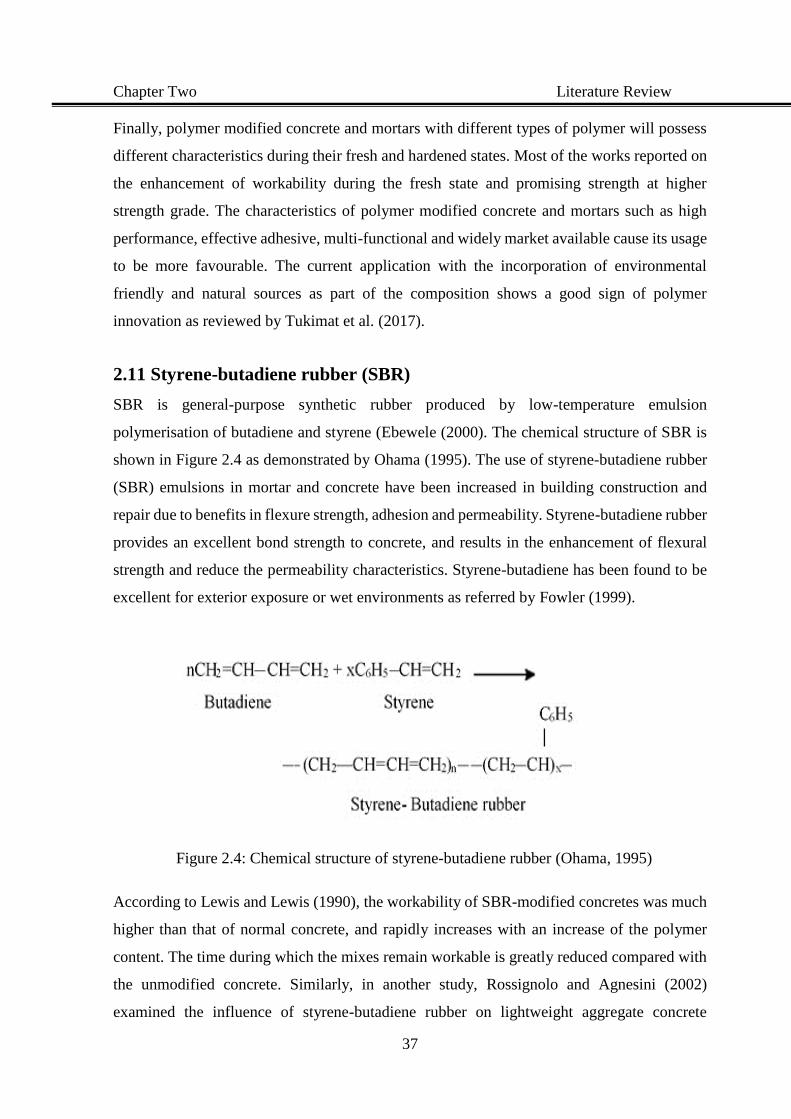
Chapter Two Literature Review
37
Finally, polymer modified concrete and mortars with different types of polymer will possess
different characteristics during their fresh and hardened states. Most of the works reported on
the enhancement of workability during the fresh state and promising strength at higher
strength grade. The characteristics of polymer modified concrete and mortars such as high
performance, effective adhesive, multi-functional and widely market available cause its usage
to be more favourable. The current application with the incorporation of environmental
friendly and natural sources as part of the composition shows a good sign of polymer
innovation as reviewed by Tukimat et al. (2017).
2.11 Styrene-butadiene rubber (SBR)
SBR is general-purpose synthetic rubber produced by low-temperature emulsion
polymerisation of butadiene and styrene (Ebewele (2000). The chemical structure of SBR is
shown in Figure 2.4 as demonstrated by Ohama (1995). The use of styrene-butadiene rubber
(SBR) emulsions in mortar and concrete have been increased in building construction and
repair due to benefits in flexure strength, adhesion and permeability. Styrene-butadiene rubber
provides an excellent bond strength to concrete, and results in the enhancement of flexural
strength and reduce the permeability characteristics. Styrene-butadiene has been found to be
excellent for exterior exposure or wet environments as referred by Fowler (1999).
Figure 2.4: Chemical structure of styrene-butadiene rubber (Ohama, 1995)
According to Lewis and Lewis (1990), the workability of SBR-modified concretes was much
higher than that of normal concrete, and rapidly increases with an increase of the polymer
content. The time during which the mixes remain workable is greatly reduced compared with
the unmodified concrete. Similarly, in another study, Rossignolo and Agnesini (2002)
examined the influence of styrene-butadiene rubber on lightweight aggregate concrete
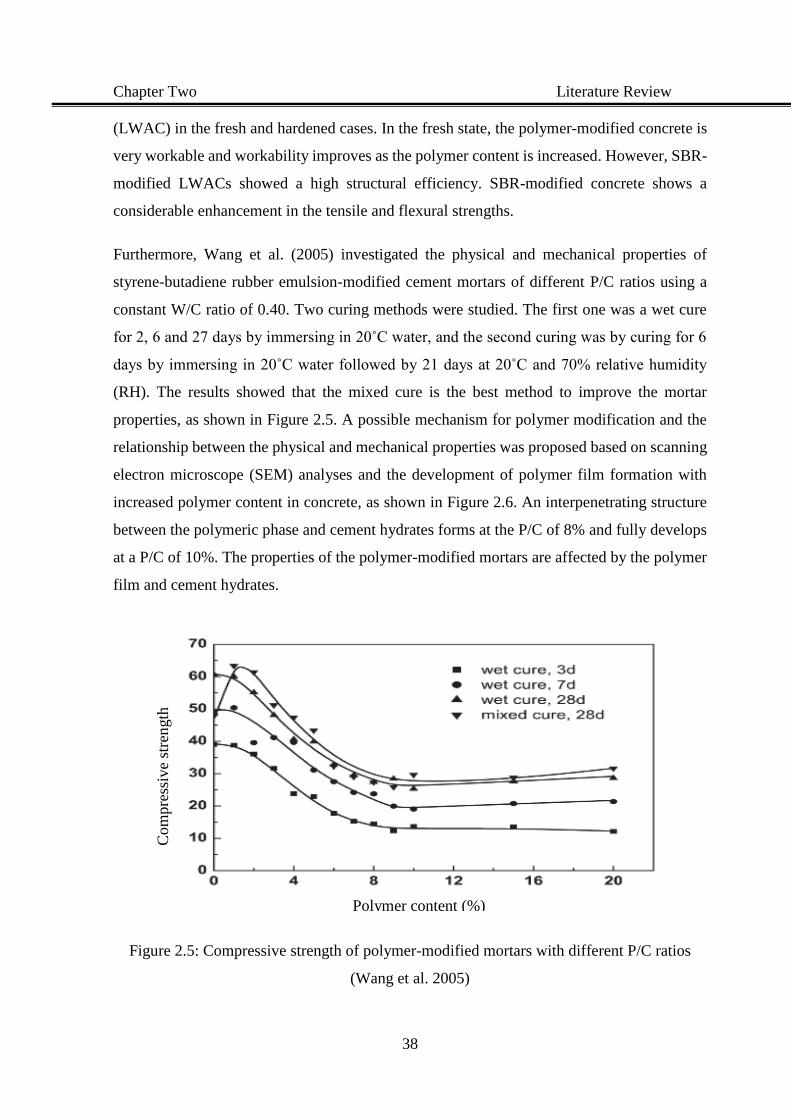
Chapter Two Literature Review
38
(LWAC) in the fresh and hardened cases. In the fresh state, the polymer-modified concrete is
very workable and workability improves as the polymer content is increased. However, SBR-
modified LWACs showed a high structural efficiency. SBR-modified concrete shows a
considerable enhancement in the tensile and flexural strengths.
Furthermore, Wang et al. (2005) investigated the physical and mechanical properties of
styrene-butadiene rubber emulsion-modified cement mortars of different P/C ratios using a
constant W/C ratio of 0.40. Two curing methods were studied. The first one was a wet cure
for 2, 6 and 27 days by immersing in 20˚C water, and the second curing was by curing for 6
days by immersing in 20˚C water followed by 21 days at 20˚C and 70% relative humidity
(RH). The results showed that the mixed cure is the best method to improve the mortar
properties, as shown in Figure 2.5. A possible mechanism for polymer modification and the
relationship between the physical and mechanical properties was proposed based on scanning
electron microscope (SEM) analyses and the development of polymer film formation with
increased polymer content in concrete, as shown in Figure 2.6. An interpenetrating structure
between the polymeric phase and cement hydrates forms at the P/C of 8% and fully develops
at a P/C of 10%. The properties of the polymer-modified mortars are affected by the polymer
film and cement hydrates.
Figure 2.5: Compressive strength of polymer-modified mortars with different P/C ratios
(Wang et al. 2005)
Com
pre
ssiv
e st
ren
gth
(MP
a)
Polymer content (%)
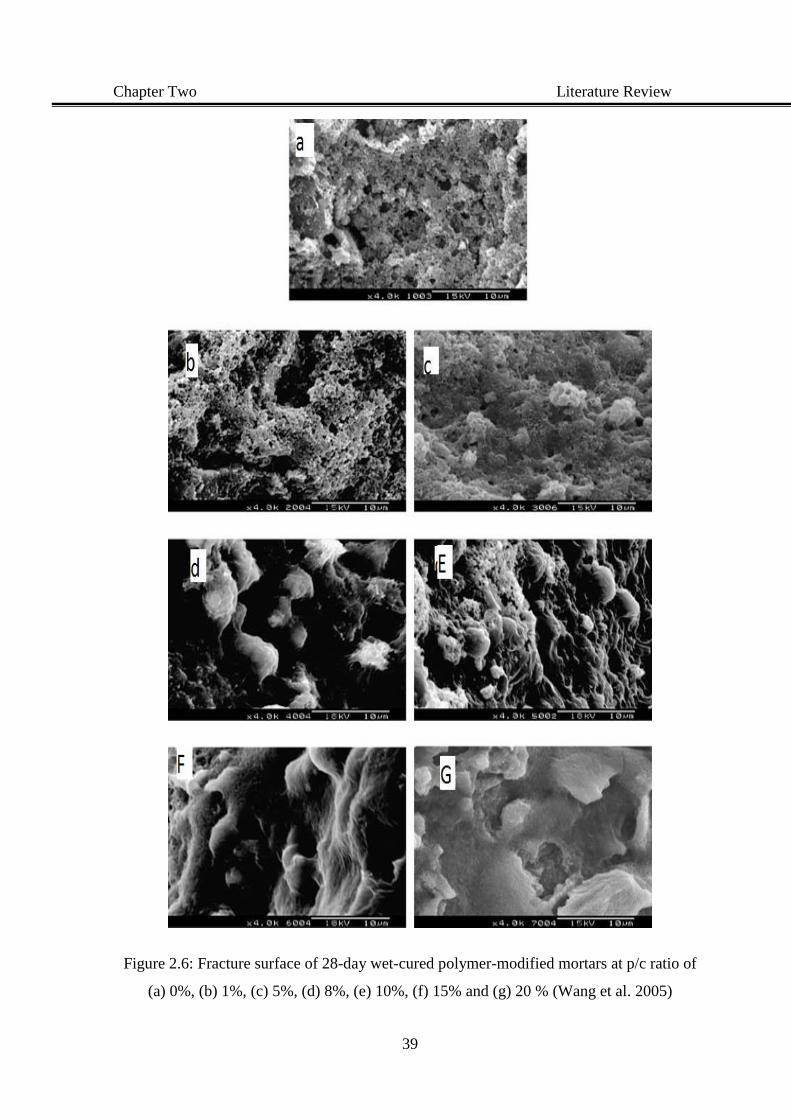
Chapter Two Literature Review
39
Figure 2.6: Fracture surface of 28-day wet-cured polymer-modified mortars at p/c ratio of
(a) 0%, (b) 1%, (c) 5%, (d) 8%, (e) 10%, (f) 15% and (g) 20 % (Wang et al. 2005)
Chapter Two Literature Review
40
Yang et al. (2009), conducted an experimental study to evaluate the chloride permeability and
microstructure of SBR-modified Portland cement mortars. They studied various
polymer/cement mass ratios under a constant water/cement ratio of 0.45 and a constant
sand/cement ratio of two. This work brought new insights into the interaction mechanisms
between cement hydration and SBR latex modifiers. It provided an improved understanding
of the effect of admixed SBR latex on the microstructure, chemistry, ionic permeability and
chloride binding behaviour of Portland cement mortar. Such knowledge is expected to
contribute to the effort of searching for effective measures to improve the durability of cement
mortar and concrete in a chloride-laden environment. In another study, Al-Nu'man and Al-
Hadithi (2009) investigated the behaviour of SBR-modified reinforced concrete beams. The
SBR-modified concrete showed a considerable enhancement in the tensile and flexural
strengths. The polymer modified concrete beams had a stiffer response in terms of flexural
strength, an increase of ductility. Cracks of beams made of polymer-modified concrete are
finer in distribution and shorter in length compared with references mix highlighting the
applicability of SBR polymer to enhance the properties of reinforced concrete beams.
Furthermore, Bhikshma et al. (2010) showed that polymer addition can improve the properties
of concrete such as increasing the strength and reducing water permeability. The polymer
levels used were 5%, 7.5%, and 10% of cement weight. It was found that styrene-butadiene
rubber could increase the workability of concrete when the SBR content increases. The slump
values increased from 45mm to 60mm with addition ratios 0% to 10% of Polymer. In addition,
the strength of concrete was improved with the increase of polymer content in the concrete.
There is an increase in compressive strength of concrete grade 20 (M20) concrete by 15.94,
29.61 and 33.33% for 5, 7.5 and 10% polymer addition respectively, compared to control
concrete without polymer.
However, from the mechanical point of view, hardened mortar or concrete products are porous
materials. Incorporation of SBR polymer into such pores obviously reduces micro-connection
of the voids. This is the basic concept of refinement voids structure. In addition, there is an
interaction between the SBR latex particles and the cementitious matrix of the cement
hydration compositions. These findings are consistent with a study by Konar et al. (2011),
which found that the formation of SBR film network provides excellent bonding between the
aggregate and the cement particles in comparison to the normal mortar. The increasing of
Chapter Two Literature Review
41
porosity due to the increase of the SBR latex content had a large influence on the compressive
strength and actually a low impact on the flexural strength, indicating the useful impact of
SBR latex on the interface properties, with the latter mainly controlling the flexural strength
of the considered types of mortar, as mentioned by Wang et al. (2011).
On the other hand, Radhakrishnan et al. (2012) examined experimentally the performance of
SBR as a concrete repair substance in tropical climatic conditions. SBR is a useful repair
substance in the case of spalled roof slabs with exposed steel reinforcement, as the SBR
modified cement mortar showed excellent reduction in the water penetration resistance.
Moreover, the results showed that SBR as a bonding agent has improved tensile strength
compared to cement paste. Consequently, SBR is an excellent choice in repairing and
resurfacing concrete in the tension zone of a flexural member. Meanwhile, Ahmed et al.
(2012) illustrated that the use of polymers in mortar and concrete as admixture can improve
the physical and mechanical properties, such as higher strength and lower permeability than
conventional concrete. The styrene-butadiene latex was specifically designed for use in
cement composites. Similarly, the study showed an improvement in the compressive and
flexural strengths of the cement mortar with 8% polymer content added. The compressive
strengths at 3, 7, and 28 days were increased by 13.5%, 8.35% and 9.12%, respectively,
compared with conventional mortar, while the maximum increase in flexural strength at 8%
polymer content was 11%. The incorporation of SBR emulsion in concrete construction and
repair work has been increasing as a result of its improving the flexural strength and adhesion,
and reducing the permeability as mentioned in an investigation by Yao and Ge (2012).
Essa et al. (2012), used SBR as a modified bonding layer between old and new concrete. An
increase was observed in the compressive and flexural strengths of the modified specimens
with a modified bonding (SBR), for the ages of 7, 28 and 60 days, compared with the new
concrete bond with the old concrete without using the polymer as a bonding.
According to Shafieyzadeh (2013), the effect of SBR increasing the workability of concrete,
and the compressive strength of modified mortar was equal to and even slightly higher than
that of the normal cement mortar at a P/C ratio of 5% due to the filling effect of the SBR. It
seems that at a P/C ratio of 5% the polymer film formation is shown through tiny bridges on
a limited number of spots. Although the structure between the polymer film and cement
hydrates is developed at a P/C ratio of 10%, the compressive strength of concrete is decreased
Chapter Two Literature Review
42
in comparison to normal concrete. In other words, incorporation of high percent of SBR latex
in concrete decreases the compressive strength, due to a lower mechanical capacity of polymer
film with respect to cement paste. Meanwhile, Ukrainczyk and Rogina (2013), mention the
significant relationship between the properties improvement and the polymer film formation
of the SBR modified calcium aluminate cement mortar. SBR latex significantly retarded the
cement hydration process and caused a slight decrease in the compressive strength and
remarkable increase in the flexural strength with polymer addition, as compared to
conventional mortar. Utilising SBR contributed to a reduction in the connected pores. This
can be attributed to the filling of pores by coalescence SBR polymer particles as well as to the
greater air stimulation by polymers and surfactants in the latex. The polymer film formation
due to the coalescence SBR particles and air bubbles contributes to disconnect of the pore
system.
However, Jamshidi et al. (2014) showed that the polymer admixtures caused a decrease in
water permeability of the concrete and improvement in barrier efficiency against water
absorption of a latex-modified concrete with an increment of latex percentage. The latex-
modified concrete specimens were cast using W/C ratio of 0.35 and 0.45. These samples were
left for 48 hours in moulds under wet conditions and cured in a humidity chamber (at 95±5%
relative humidity and 25˚C) for 5 days, followed by air curing for 21 days in laboratory air
conditions. Moreover, Khan and Deulkar (2016) found that SBR content percentage has a
significant effect on the concrete properties and required quantity of sand, gravels and water,
and unit cement content.
2.12 Polyvinyl acetate in concrete (PVA)
Polyvinyl acetate is a thermoplastic resin produced by the polymerisation of vinyl acetate
monomer [CH3COOCHCH2] in water producing an emulsion with a solids content of 50-55%
(Ebewele (2000). PVA, a synthetic organic chemical composite, when applied as an admixture
with Portland cement, has been noted to obtain excellent bonding of fresh mortar to old
concrete, and to improve several properties of concrete. The chemical structure of PVA is
shown in Figure 2.7 as referred by Ohama (1995).
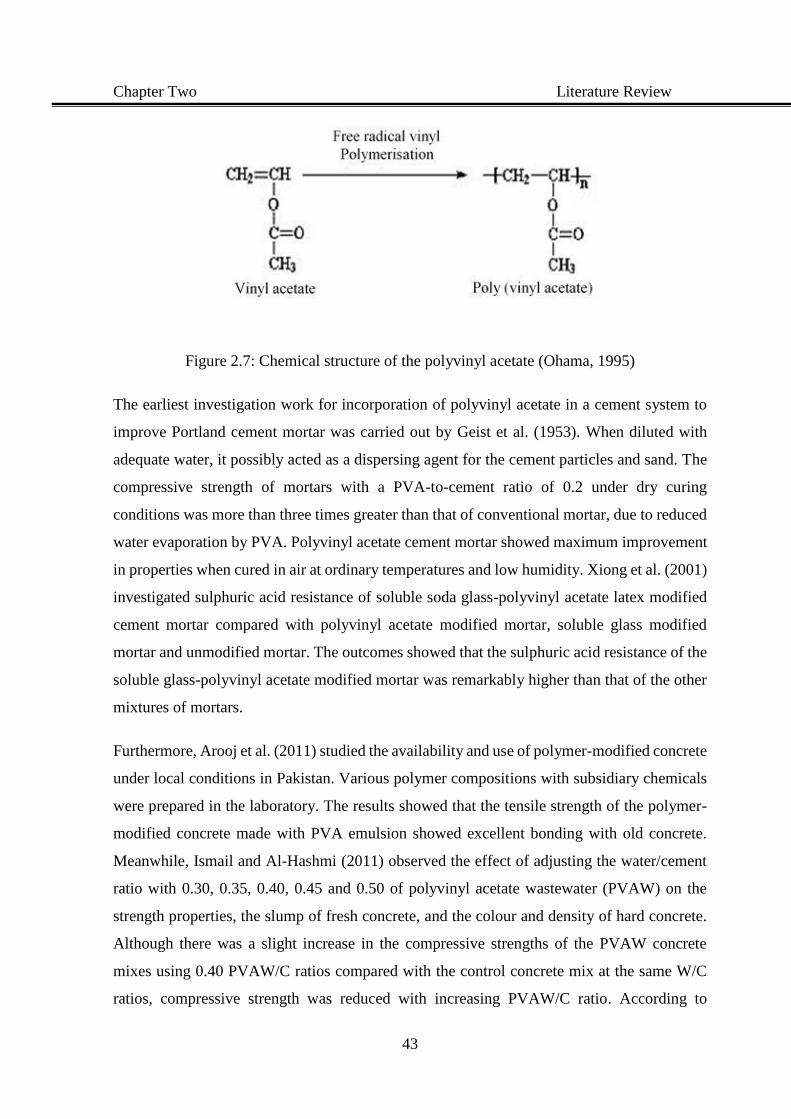
Chapter Two Literature Review
43
Figure 2.7: Chemical structure of the polyvinyl acetate (Ohama, 1995)
The earliest investigation work for incorporation of polyvinyl acetate in a cement system to
improve Portland cement mortar was carried out by Geist et al. (1953). When diluted with
adequate water, it possibly acted as a dispersing agent for the cement particles and sand. The
compressive strength of mortars with a PVA-to-cement ratio of 0.2 under dry curing
conditions was more than three times greater than that of conventional mortar, due to reduced
water evaporation by PVA. Polyvinyl acetate cement mortar showed maximum improvement
in properties when cured in air at ordinary temperatures and low humidity. Xiong et al. (2001)
investigated sulphuric acid resistance of soluble soda glass-polyvinyl acetate latex modified
cement mortar compared with polyvinyl acetate modified mortar, soluble glass modified
mortar and unmodified mortar. The outcomes showed that the sulphuric acid resistance of the
soluble glass-polyvinyl acetate modified mortar was remarkably higher than that of the other
mixtures of mortars.
Furthermore, Arooj et al. (2011) studied the availability and use of polymer-modified concrete
under local conditions in Pakistan. Various polymer compositions with subsidiary chemicals
were prepared in the laboratory. The results showed that the tensile strength of the polymer-
modified concrete made with PVA emulsion showed excellent bonding with old concrete.
Meanwhile, Ismail and Al-Hashmi (2011) observed the effect of adjusting the water/cement
ratio with 0.30, 0.35, 0.40, 0.45 and 0.50 of polyvinyl acetate wastewater (PVAW) on the
strength properties, the slump of fresh concrete, and the colour and density of hard concrete.
Although there was a slight increase in the compressive strengths of the PVAW concrete
mixes using 0.40 PVAW/C ratios compared with the control concrete mix at the same W/C
ratios, compressive strength was reduced with increasing PVAW/C ratio. According to
Chapter Two Literature Review
44
Edmonds and Majumdar (1989) the addition of a water-soluble polymer such as partially
hydrolysed polyvinyl acetate permits the formation of a workable paste containing very little
water; the polymer acts as a lubricant facilitating close packing of the cement grains, which
are then held tightly together as the polymer-water gel dehydrates. Flexural strength tended to
exhibit the same behaviour as compressive strength. The decrease of the strength values can
be attributed to the inhomogeneity and insufficiency of water content available for cement
hydration. Good adhesion of polymer and higher tensile strength of polymer-modified self-
compacting concrete caused increasing in the bond strength between steel reinforcement and
polymer concrete. The bond strength between steel and concrete, especially for deformed steel
bars, is significantly affected by concrete tensile strength. The bond strength increases with
increasing concrete tensile strength as conducted by Aliabdo and Abd_Elmoaty (2012).
Tomas (2013), also investigated the influence of polymer fibre on the strength of concrete.
The study was carried out by mixing dissolved polymer fibre (polyvinyl alcohol, polyvinyl
acetate) into concrete mixes. The compressive strength test was conducted for the hardened
concrete after 7, 14 and 28 days. The polymer-modified concrete of 2% P/C showed the
highest compressive strength and that of 6% P/C displayed a similar result to that of the
conventional concrete.
2.13 Advantages of polymers in concrete
In recent decades, the polymer in concrete has been one of the major interesting research
subjects due to its significant effect on the mortar and concrete properties including
improvement workability, retarding or accelerating setting time, and enhancement of strength
and durability properties. The main reason for incorporating polymer materials into concrete
and cement based compounds is to improve the mechanical properties of the mortar and
concrete materials. The addition of the polymer into the cementitious system enables its use
in more complex structures and applications. Cement hydration products together with film
formation of the polymer within the matrix must occur in harmony in order to achieve the
maximum benefits of polymer-modified cement improvements. A considerable amount of
literature has shown that mixing of polymer emulsions such as styrene-butadiene rubber,
acrylics, epoxy and polyvinyl acetate etc. with cementing materials generally, contributes to
improving the properties of mortar and concrete, in the following ways (Ohama, 1995;
Halliwell, 2002; Fowler, 2003; Miller, 2005):

Chapter Two Literature Review
45
1- Reduced appearance of cracking in the hardened structure due to structural movement
or as a consequence of expansion and contraction motivated by changes in surrounding
temperature;
2- Enhancement in the workability and bond adhesion along with improved flexural and
tensile strengths and excellent bonding to steel reinforcement and to old concrete;
3- Improved durability properties by reducing the permeability, improving resistance to
chemical attack and resistance to penetration by water and salt, and excellent durability
under freeze-thaw cycling;
4- Enhanced abrasion resistance when polymer-modified mortar is used in conjunction
with concrete.
2.14 Application of polymer in mortar and concrete
Nowadays, the use of polymers in mortar and concrete components is commonplace for a
wide range of applications. Polymer admixture can improve concrete properties. During the
hydration process, the products of hardened materials include a continuous, interconnected
matrix of coalition polymer particles which fill up pores in the cement structure and enhance
the formation of the chemical bond between the polymer and hardened cement and hence
improve the bonding between aggregates and the cement paste. Thus, due to polymer network
formation, polymer-modified mortars have low permeability, good freeze–thaw resistance,
relatively higher flexural strength and adhesion strength to old concrete substrate, which
makes these materials extremely suitable for use as repair materials for concrete buildings,
concrete bridges, highway covering materials and waterproof materials. There are many
potential applications for the future related to materials processing and applications, which
will ensure these materials will continue to be important in the construction field. In 1956, the
first polymer-modified bridge overlay was produced by blending an SBR into the concrete
mortar, which was subsequently applied to the Cheboygan Bridge in Michigan, USA.
Incorporation of polymers into cement materials is a way to overcome or combat the
disadvantages of Portland cement materials, such as rigidity when cured, and low tensile and
flexural strength. Analysis of polymer-modified cementitious materials has clearly shown an
improvement in flexural strength and impact resistance of the final product (Ohama, 1995;
Halliwell, 2002; Fowler, 2003; Miller, 2005). Some important applications of polymer in
concrete are:
Chapter Two Literature Review
46
1- Modified cementing material such as SBR used in applications such as the resurfacing
of roads, making the surface more hard-wearing and less likely to crack;
2- The polymer in concrete applied for bridge decking, dam outlets, offshore structures,
underwater oil storage vessels and ocean thermal energy plants;
3- Polymer cement concrete applied for maintenance in hydraulic structures surfaces
subjected to a high-velocity water flow;
4- Polymer-modified mortars widely incorporated as high-performance, low-cost
construction materials, particularly for finishing and repairing in cement mortar works.
2.15 Combined polymer modified concrete and SCMs materials
Although extensive research on the evaluation of the effect of polymer and partial replacement
by SCMs by cement on the mortar/concrete properties separately has been conducted, little
research data on their combined use in concrete/mortar are available in the literature.
Nevertheless, this section of the literature review attempts to provide more detailed
information on investigations regarding the effects of the combination of polymers and partial
replacement by SCMs on the mortar/concrete properties. Chakraborty et al. (2000), studied
the effect of silica fume modified polymer cement mortar incorporating two types of polymer
emulsions, an acrylic based copolymer and SBR latex. The results showed that silica fume
enhanced the compressive strength, capability of resisting acid attack and other fresh
properties of the polymer-modified cement mortar.
In 2002, Gao et al., investigated the influence of combined of Polyacrylic ester (PAE)
emulsion and partial replacement by silica fume (SF) on the mortar mechanical strength and
durability properties. The pozzolanic effect of SF and the water-reducing and filling effect of
the polymer decreased porosity and increased the density of cement mortars. Flexural and
compressive strength and resistance to chloride penetration improved which was attributed to
the high reduction in porosity, increasing the density and interfacial adhesion between
aggregates and the cement paste. In another study, Almeida and Sichieri (Mineralogical study
of polymer modified mortar with silica fume 2006) experimentally studied influences of a
combination of styrene acrylic polymer with silica fume on the mineralogical composition of
pastes of high-early-strength Portland cement cured to 28 days. The interaction between
polymers and cement hydration products, and the progress of the pozzolanic reaction of silica
fume in the cement paste was investigated. The results showed that the incorporation of silica
Chapter Two Literature Review
47
fume and polymer reduced the portlandite production and was attributed to the delay in
Portland cement hydration and pozzolanic interaction. Similarly, Almeida and Sichieri
(Thermogravimetric analyses and mineralogical study of polymer modified mortar with silica
fume 2006) confirmed findings consistent with findings of the previous study. Furthermore,
this is also supported by the Almeida and Sichieri (2007) study which revealed that the
combination of polymer and silica fume produced mortars resulted in developed properties.
The adhesion strength between the mortar and the porcelain tile was improved due to the
greater area of contact between tiles and cement paste and lower porosity that was attributed
to the reduction of the pore diameter due to the effect of the polymer film and pozzolanic
reactions of silica fume.
In the last decade, some researchers have presented results showing that the polymer
combined with the mineral additions can produce a considerable decrease in the thickness of
the matrix-aggregate interfacial transition zone (ITZ), in addition to the densification of this
region, leading to an enhancement of the mechanical strength and concrete durability
properties. Rossignolo (2007), investigated the effect of silica fume and SBR latex on the
microstructure of the ITZ between Portland cement paste and aggregates, using a scanning
electron microscope (SEM) equipped with energy dispersive x-ray analysis system (EDX).
The microstructural analyses of the concrete showed that the highest values of the thickness
reduction of the ITZ were for the concretes with incorporation of both silica fume and SBR
latex. The reduction was of 54% and 64% for concretes with P/C = 5% and (silica fume to
cement) SF/C 10%, and for P/C 10% and SF/C 10%, respectively, in comparison to
conventional concrete. The finding is consistent with findings of previous studies by
Rossignolo (2009) which, similarly, found that incorporation of both SF and SBR latex
obtained the highest values of the thickness reduction of the ITZ for the concretes.
Furthermore, Barbuta et al. (2009) studied the effect of combining FA and SF as a filler on
the mechanical properties of epoxy polymer concrete. The results showed that this
combination increased the compressive strength and splitting tensile strength, while the
flexural strength slowly decreased.
An investigation, by Ahmed (2011), studied the mechanical and durability properties of
mortars modified with combined polymer and SCMs. Findings suggested that the combination
of the polymer (SBR, PAE, and EVA) with slag and SF respectively, led to an enhancement
Chapter Two Literature Review
48
in the mechanical properties, such as compressive strength and flexural strength, and a
reduction in the water absorption, carbonation and chloride penetration values. The
improvement of the modified mortar/concrete properties was attributed to the developed bond
strength between cement hydrates and aggregates, reduction of the pores size and increasing
density, due to polymer film formation and the pozzolanas reaction of SCMs. In addition, the
finding is consistent with findings of previous studies by Lho et al. (2012), which investigated
the effects of polymer-binder ratio and slag content on the strength properties of autoclaved
SBR-modified concrete using GGBS and SBR latex.
However, in 2013, (Shafieyzadeh) investigated the influences of partial replacement by SF
combined with SBR on the compressive strength of concrete. The compressive strength of
concrete with 5% SBR and cement replacement up to 7.5% by SF improved, due to filling and
pozzolanas effects. In other research by Shafieyzadeh (2015), it was observed that the flexural
strength of concrete with 5% SBR increases remarkably similarly to the compressive strength,
as mentioned in the previous research, and cement replacement up to 7.5% with SF improves
the flexural strength to its maximum value. Kerur and Patil (2015), also studied the effect of
utilising SBR polymer in concrete combined with FLY ASH and SF. Similarly, as mentioned
in the previous studies, although the replacement with one or more mineral admixtures
improved the mechanical strength, the combination with the polymer showed greater
improvement in workability and mechanical strength.
More recently, (Al Menhosh et al., 2016a, 2016b), investigated the effect of different
proportions of a combination of two different polymers, metakaolin, and recycled fibre
reinforcement, on the setting time, water absorption and mechanical properties for an age up
to 28 days. The results showed that metakaolin will accelerate the setting time of cement
pastes and decrease the fluidity of concrete. However, the polymer has an inverse influence
on the two properties. The addition of 5% optimised polymer and 15% cement replacement
by metakaolin generates an optimised concrete mixture for both strength and durability.
Finally, Jiang et al. (2017) experimentally investigated the effects of different amounts of
polyacrylic ester and silica fumes on the compressive strength, splitting tensile strength,
bonding strength, and abrasion resistance of the cement mortar. The combination of
polyacrylic ester polymer and silica fumes led to remarkable improvement in the mechanical
strength of cement mortar compared with the normal cement mortar.
Chapter Two Literature Review
49
It should be noted from the above literature review, however, that limited studies are available
on the combination of polymer-modified concrete with partial replacement of cement by one
or more SCMs generally, and metakaolin especially, to modify concrete properties. This has
motivated the present study to investigate the effect of partial replacement of cement by
metakaolin combined with two types of polymer-modified concrete to produce high quality
concrete properties appropriate for applications in highly aggressive conditions.
2.16 Durability of modified concrete
Durability is the ability to last a long time without significant deterioration. A durable material
helps the environment by conserving resources and reducing wastes and the environmental
impact of repair and replacement. One of the main characteristics influencing the durability
of concrete is its permeability to the ingress of water, oxygen, carbon dioxide, chloride,
sulphate, and other potential deleterious substances. The durability of concrete depends
fundamentally on the degree of cement hydration progress, and the microstructure of the
hardened concrete (Newman and Choo, 2003; Neville, 2011).
A considerable amount of literature has been published to study the development of durability
properties of mortar and concrete by incorporation of chemical additives such as polymers or
SCMs as partial replacement of cement such as FLY ASH, SF, GGBS, RHA and MK.
However, they have argued that the utilisation of both SCMs and polymers contributes to
enhancing the mortar and concrete properties in addition to consumption of less energy, and
has a lower environmental impact because of the reduction in carbon dioxide released because
of the reduction in the manufacture of Portland cement. This part of the present study reviews
the effect of using supplementary cementitious materials and polymers on the durability
properties of concrete.
According to Andera et al. (2001), the durability characteristics, including permeability,
conductivity and chloride penetration, were improved with increased metakaolin content but
with decreased water cement ratio. This is consistent with the laboratory evaluation of Gruber
et al. (2001), which showed that the incorporation of metakaolin significantly reduced the
chloride ion penetration coefficient of concrete. Compared with the conventional concrete
diffusion the average reduction was 50% for 8% replacement and 60% for 12% replacement
of cement. This reduction has important influence on the service life of the concrete structures
Chapter Two Literature Review
50
in chloride conditions. The durability characteristics of the concrete materials can be evaluated
by measuring chloride permeability, electrical resistivity, depth of carbonation, water
absorption and chemical attack resistance, according to Al Zahrani et al. (2003). The latter
evaluated the mechanical properties and durability characteristics of nine polymer and
cement-based repair mortars. The results showed that there was a reduction in the elastic
modulus of the polymer-based repair mortars compared to that of the cement-based repair
mortars. This resulted in a reduced drying shrinkage cracking in the polymer-based repair
mortars compared to the cement-based repair mortars. The electrical resistivity of cement-
based repair mortars was less than that of polymer-based repair mortars. Such a trend was not
noted in the chloride permeability data. The chloride penetration in all the repair materials
was very low. Improvement in carbonation was noted in some of the polymer-based repair
mortars.
Furthermore, research by Batis et al. (2005) also found that the performance of concrete
depends on durability which generally can be reduced and influenced by the corrosion
resistance properties, and the former depends mainly on the environmental conditions,
microstructure and chemical composites of the concrete. The corrosion resistance can be
improved by incorporation of 10% or 20% of metakaolin as partial replacement of cement or
sand, respectively, due to the high pozzolanas reactivity and consumption of Ca(OH)2 and
reduction of the main pores size, leading to decreased porosity of the mortar.
Durability and transport properties of concrete are influenced by the permeability porosity
features. Durability is associated to considerable deterioration processes driven by the
transport characteristics of concrete according to Safiuddin and Hearn (2005). However,
incorporation of metakaolin as partial replacement of cement improves the durability of
concrete due to the influence of pozzolanas and chemistry action on the microstructure and
chemical composition of the concrete, causing reduced capillary porosity of the cementing
materials making the system less permeable to aggressive agents. This is supported by a
Shekarchi et al. (2010) study which investigated the transport properties and durability
characteristics of concrete containing different levels of metakaolin. Water penetration, gas
permeability, water absorption, electrical resistivity, chloride ingress, and alkali–silica
reaction potential were studied. Compressive strength increased by 20% and water penetration
improved by 50% with an MK level of 15%. Similarly, gas permeability, water absorption,
Chapter Two Literature Review
51
electrical resistivity and ionic diffusion had improvements of up to 37%, 28%, 45%, and 47%,
respectively. As far as the durability properties are concerned, the metakaolin used reduced
water permeability, absorption, and chloride permeability as the partial replacement
percentage of metakaolin increased. This is due to the filler effect of metakaolin particles
which basically decrease the permeability or porosity of the concrete, according to a study by
Dinakar et al. (2013). A more recent study has confirmed that the durability of concrete
represents the ability to prevent the ingress of aggressive chemical agents. Kameche et al.
(2014), presented an experimental study on relative gas and water permeability of ordinary
concrete with its saturation degree. The results showed the measurements of liquid water and
gas permeability of concrete specimens of different sizes as well as those of the degree of
saturated liquid water found by mass weighing. The outcomes showed the effect of the
saturation degree of concrete on the variation of water and gas permeability.
2.16.1 Concrete permeability
One of the most significant current discussion points in concrete technology, concerning the
main reason for concrete deterioration, is permeability. Generally, permeability is defined as
the property that governs the rate flow of a fluid into a porous solid material. Permeability can
also be defined as the ability of materials to bear environment action, chemical attack,
abrasion, or any process of deterioration.
The water or gas permeability of concrete can be obtained by means of a simple laboratory
test, but the results are fundamentally proportional. The side surfaces of a concrete sample are
sealed and water under pressure is applied to the top or bottom side surface only. When steady
state status is approached the quantity of water flowing through a given thickness of concrete
in a specific time and temperature is computed. The permeability is expressed as a coefficient
of permeability, K, given by Darcy’s equation. There is no unique relation between the gas
and water permeability for any concrete, although they are both generally dependent on the
W/C ratio and the curing time of the concrete as mentioned by Neville and Brooks (1987).
However, a considerable amount of literature has been published to evaluate and measure the
permeability of concrete for gas and water according to the Darcy equation for liquid flow.
The coefficient of permeability, K, of concrete for steady-state flow of fluid through a
specimen of concrete follows Darcy’s law as described by the following equations:
Chapter Two Literature Review
52
dq/dt = K 𝐴 × ∆ℎ
𝐿 ……………………………...………………………………………..…(2-5)
Where
dq/dt = rate of flow of fluid through the sample (Q)
A = cross-sectional area of the sample
∆h = drop in hydraulic pressure through the sample
L = Length or thickness of the sample.
K = Q × L
A × Δh …………………………………………………………………………….(2-6)
Concrete of high quality and low water permeability enhances durability by preventing
diffusion of an aggressive solution, such as chloride ions, from penetrating to the steel
reinforcement. Improvement of concrete properties requires combining the concrete with one
or more of the SCMs and utilising a low w/c ratio according to Gruber et al. (2001).
Meanwhile, in an experimental study by Costa and Appleton (2001), results showed that
chloride penetration and carbonation can play an important role in the deterioration process.
In a different study, Loosveldt et al. (2002) performed experimental investigations on the gas
and water permeability of mortar. The measure of permeability considered was in accordance
with the generalised Darcy’s law. The experimental outcomes showed that water permeability
was systematically lower than gas permeability. This is generally attributed to the chemical
activity of unhydrated cement particles with water during the period of water pressure
application. According to Tsivilis et al. (2003), utilising Portland limestone cement in concrete
results in lower gas permeability values than those of ordinary Portland cement concrete. The
water permeability and absorptivity of concrete are enhanced with limestone cement addition.
Furthermore, according to Chang and Chen (2006), Phenolphthalein indicator can be used to
obtain the carbonation penetration in concrete, as shown in Figure 2.8. Carbonation reduces
the hydroxide concentration in the pore solution, destroying the passivity of the embedded
reinforcement bars. The effective passivation due to OH- ions is adversely affected by
carbonation of the concrete and the presence of Cl- ions, which actually reduces the
concentration of OH- ions.
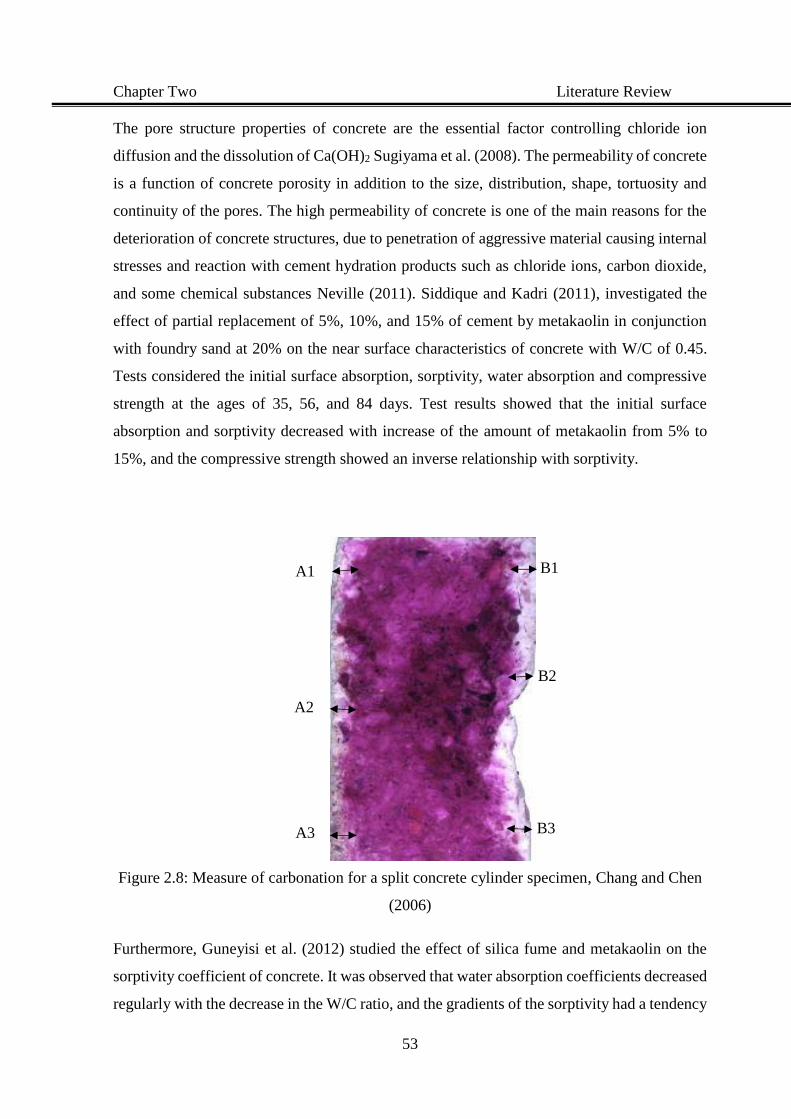
Chapter Two Literature Review
53
The pore structure properties of concrete are the essential factor controlling chloride ion
diffusion and the dissolution of Ca(OH)2 Sugiyama et al. (2008). The permeability of concrete
is a function of concrete porosity in addition to the size, distribution, shape, tortuosity and
continuity of the pores. The high permeability of concrete is one of the main reasons for the
deterioration of concrete structures, due to penetration of aggressive material causing internal
stresses and reaction with cement hydration products such as chloride ions, carbon dioxide,
and some chemical substances Neville (2011). Siddique and Kadri (2011), investigated the
effect of partial replacement of 5%, 10%, and 15% of cement by metakaolin in conjunction
with foundry sand at 20% on the near surface characteristics of concrete with W/C of 0.45.
Tests considered the initial surface absorption, sorptivity, water absorption and compressive
strength at the ages of 35, 56, and 84 days. Test results showed that the initial surface
absorption and sorptivity decreased with increase of the amount of metakaolin from 5% to
15%, and the compressive strength showed an inverse relationship with sorptivity.
Figure 2.8: Measure of carbonation for a split concrete cylinder specimen, Chang and Chen
(2006)
Furthermore, Guneyisi et al. (2012) studied the effect of silica fume and metakaolin on the
sorptivity coefficient of concrete. It was observed that water absorption coefficients decreased
regularly with the decrease in the W/C ratio, and the gradients of the sorptivity had a tendency
A1
A2
A3
B1
B2
B3
Chapter Two Literature Review
54
to decrease with increased replacement level of metakaolin and silica fume. Furthermore, it
was evident that there was an inverse proportionality between the sorptivity values and
mechanical properties. Permeation of chloride ions into the concrete structure is
fundamentally described in terms of the pore matrix of the concrete. Thus chloride
penetrability can be explained as being influenced by the W/C ratio of the concrete mix which
is influenced by the utilisation of SCMs, which may disconnect the pore structure, and the
degree of hydration, which may be accelerated or delayed by adding SCMs, consequently
affecting the chloride penetration Ahmad and Kumar (2013). Moreover, self-compacting
concrete (SCC) containing rice husk ash, metakaolin, and a combination of metakaolin and
rice husk ash showed significant improvement in durability properties compared to
conventional SCC, according to Kannan and Ganesan (2014).
Furthermore, Li et al. (2016) investigated water permeable performance in concrete using a
three-dimensional (3D) finite element (FE) algorithm. This FE model captured the three-
dimensional mesostructure consisting of coarse aggregates, mortar matrix, and the ITZ which
is in practice modelled by the zero-thickness interface element. It showed that the effects of
aggregates are prevalent for the overall water transform of concrete reduces with the combined
effect of aggregates and ITZ. Nevertheless, ITZ plays an important role in the permeability
properties of concrete due to its lower density and higher porosity, hence, the incorporation
of SCMs and polymers in concrete has a significant influence in the concrete permeability due
its effect on the ITZ.
2.16.2 Corrosion of steel embedded in concrete
The major economic losses in reinforced concrete structures are caused due to corrosion of
steel reinforcement in the concrete. However, a number of studies show significant effects of
the partial replacement by SCMs on the resistance of steel reinforcement, for example,
Cabrera (1996) used laboratory data to investigate the effects of corrosion rate on cracking
and bond strength loss. It was shown that there is an inverse relation between steel bar cover
and degree of corrosion. Crack intensity increases with increasing depth of cover and this can
be numerically related to the degree of corrosion expressed as weight loss per unit area. Chung
(2000), observed that the admixture enhances the corrosion resistance of steel reinforced
concrete. Silica fume as the admixture is particularly effective for improving the corrosion
resistance due to the decrease in permeability of the concrete.
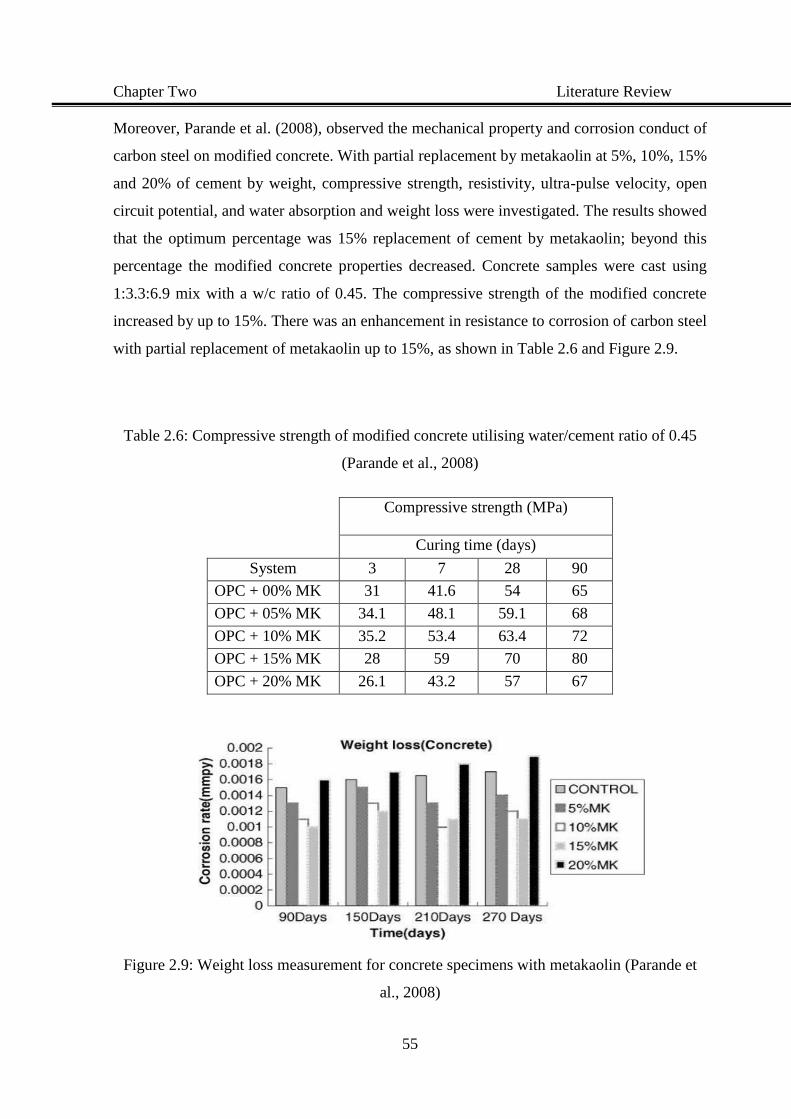
Chapter Two Literature Review
55
Moreover, Parande et al. (2008), observed the mechanical property and corrosion conduct of
carbon steel on modified concrete. With partial replacement by metakaolin at 5%, 10%, 15%
and 20% of cement by weight, compressive strength, resistivity, ultra-pulse velocity, open
circuit potential, and water absorption and weight loss were investigated. The results showed
that the optimum percentage was 15% replacement of cement by metakaolin; beyond this
percentage the modified concrete properties decreased. Concrete samples were cast using
1:3.3:6.9 mix with a w/c ratio of 0.45. The compressive strength of the modified concrete
increased by up to 15%. There was an enhancement in resistance to corrosion of carbon steel
with partial replacement of metakaolin up to 15%, as shown in Table 2.6 and Figure 2.9.
Table 2.6: Compressive strength of modified concrete utilising water/cement ratio of 0.45
(Parande et al., 2008)
Compressive strength (MPa)
Curing time (days)
System 3 7 28 90
OPC + 00% MK 31 41.6 54 65
OPC + 05% MK 34.1 48.1 59.1 68
OPC + 10% MK 35.2 53.4 63.4 72
OPC + 15% MK 28 59 70 80
OPC + 20% MK 26.1 43.2 57 67
Figure 2.9: Weight loss measurement for concrete specimens with metakaolin (Parande et
al., 2008)
Chapter Two Literature Review
56
Triana et al. (2013) conducted an experimental research to study the corrosion of steel
reinforcement in mortar using electrochemical impedance spectroscopy (EIS). In order to
accelerate the steel corrosion progress, all the specimens were cured in a 3% NaCl solution
with an applied constant anodic electrical potential. The EIS results showed that the partial
replacement of 20% of the ordinary Portland cement by metakaolin improved the corrosion
resistance of steel reinforcement in concrete especially at W/C ratio of 0.5 than samples
containing only ordinary Portland cement and modified samples by 20% metakaolin with a
W/C of 0.6. The result show that an increase in the matrix impedance occurred at higher and
intermediate frequencies, which was more noticeable in samples blended with a w/c of 0.5
and was a result of the cementitious material’s continuous hydration. However, while the bar
embedded in the OPC matrix with a w/c of 0.5 exhibited improved protection compared to the
corresponding sample with a w/c of 0.6, the bar embedded in the metakaolin sample at a w/c
of 0.5 exhibited greater instability of its passive film than that at a w/c of 0.6.
2.17 Limestone cement and aggregate
The use of Portland cements, particularly those including limestone, seems to have many
advantages, such as technical, economic and environmental. The British Standard EN 197-1
(2000) identifies two types of Portland limestone cement (PLC ) containing 6-20% limestone
(type II/A-L) and 21-35% limestone (type II/B-L), respectively. In general, the limestone
cements require a lower quantity of paste water than the ordinary cements and the water
demand reduction is mainly influenced by the clinker type and limestone characteristics. The
setting time and soundness of Portland limestone cements are satisfactory and similar to those
identified in ordinary Portland cements (Tsivilis et al., A study on the parameters affecting the
properties of Portland limestone cements, 1999). Tsivilis et al. (The effect of clinker and
limestone quality on the gas permeability, water absorption and pore structure of limestone
cement concrete 1999), examined the effect of clinker and limestone quality on the air
permeability, water absorption and pore structure of limestone cement concrete. It was found
that the limestone cement concrete achieves lower air permeability and water absorption on
average compared with Portland cement concrete. Using limestone cement in concretes
resulted in reduced resistance to freezing and thawing compared with the pure cement
concrete. Portland limestone cement, containing 20% limestone, was shown to provide the
optimum protection against reinforcement corrosion. Furthermore, the limestone additions
reduce the carbonation depth and the total porosity of the mortar Tsivilis et al. (2000). In
Chapter Two Literature Review
57
another study, Tsivilis et al. (2003) performed experimental investigations on the effect of
limestone incorporation on the gas permeability, water permeability, sorptivity, and porosity
of limestone cement concrete. It was observed that the PLC concrete exhibits properties
competitive with those of the OPC concrete. Moreover, the limestone addition has a positive
action on the water permeability and sorptivity of the concrete according to Puerta-Falla et al.
(2015).
Antoni et al. (2012) studied the incorporation of 30% metakaolin combined with 15%
limestone into Portland cement mortar improves the mechanical properties at 7 and 28 days
compared with the 100% Portland cement mortar. This improvement is due to the extra
alumina provided by the metakaolin which will interact with more limestone, resulting in the
improved properties. The reactions of metakaolin and limestone consume calcium hydroxide,
which may be completely absent in blends with high levels of substitution at later ages. The
metakaolin is shown to interact faster in the system with limestone than in the blend of
metakaolin and Portland cement alone. Also, the limestone is shown to react faster in the
system with metakaolin than in the blend of limestone and Portland cement. In a different
study, Nagrockiene et al. (2013) investigated the influence of cement type and plasticiser
addition on concrete properties. Research has shown that plasticiser type and dosage play a
significant role in successful cement application in concrete. The increase of polycarboxylate
ester (SP) level up to 1.2% in concrete with limestone cement after 7 and 28 days of hardening
increases the density, and subsequently the compression strength of the specimens, except for
samples containing maximal SP where the compression strength after 28 days of curing is
reduced. The density and compression strength of concrete with normal cement, in contrast to
concrete with limestone cement, after 7 and 28 days of curing, was seen to be slightly reduced.
Moreover, the emission of CO2 increases the pressure faced by the concrete industry which is
providing increased motivation to minimise the consumption of ordinary Portland cement.
There is interest in using limestone (CaCO3), an abundant mineral, to reduce the clinker
factors of OPC, and thus OPC use in concrete. Metakaolin is able to enhance the reaction of
limestone in cementitious systems leading to an increased consumption of Ca(OH)2 and more
CSH to be provided. PLC substitution for OPC is the most significant improvement to
concrete sustainability with current technology. When OPCs with up to 5% limestone are
replaced with PLCs containing 10% to 15% limestone, the resulting impact per million tons
of cement produced equates to 443,000 to 664,000 million BTU less clinkering energy used
Chapter Two Literature Review
58
and 189,000 to 283,000 tons reduction of CO2 emissions and it is seems to have superior
durability and environmental performance.
On the other hand, the concrete strength is mainly determined by the properties of the mortar,
coarse aggregate and the interface. For the same quality mortar, different types of coarse
aggregates with different shape, texture, mineralogy and strength may result in different
concrete strengths. The relationship between aggregate types and concrete mix components
has been widely investigated to studying the effect of the type of coarse aggregate on the
concrete properties. According to an investigation by Ozturan and Cecen (1997), the effect of
the type of coarse aggregate on the strength of concrete is more considerable in high
performance concretes. For the high strength concretes, about 10 to 20% higher compressive,
flexural and splitting tensile strengths are gained with basalt and limestone coarse aggregates
compared to normal gravel coarse aggregate. The relative higher strength of the concrete made
with limestone may be due to interfacial chemical reactivity between the cement paste and the
coarse aggregate particles. Furthermore, Yasar et al. (2004) investigated the effects of the W/C
ratio and coarse limestone aggregate type on the compressive strength of concrete. It was seen
that the compressive strength of concrete depends upon the W/C ratio and aggregate size.
However, using of limestone in the construction industry has been increased due to benefits
as aggregate. Some of these benefits include good strength, low possibility of alkali silica
reaction and the decrease in drying shrinkage of concrete. Aquino et al. (2010) studied the
effects of limestone aggregate on concrete properties and found that the coarse limestone
shrinks about 27% less than the normal gravel. In general, the shrinkage can be reduced mainly
by three components; admixtures, cement, and aggregate. Even though the aggregate makes
up about 80% of the concrete mix, it is still the cheaper raw material. Consequently, limestone
could be useful as a drying shrinkage reducer agent.
2.18 Fibre in concrete
Concrete is weak in tension and has a brittle character. The concept of incorporation of fibres
to improve the properties of construction materials is very old. Early applications include
addition of straw to mud bricks, horsehair to reinforce plaster and asbestos to reinforce pottery.
Use of reinforcement in concrete increases strength and ductility. Addition of fibres to
concrete makes it a homogeneous and isotropic material. When concrete cracks, the randomly
Chapter Two Literature Review
59
oriented fibres start functioning, arrest crack formation and propagation, and thus improve
strength and ductility (Wafa, 1990).
Research on the influence of fibres with various sizes and properties on the concrete properties
can still be a promising work as there is always a need to overcome the problem of brittleness
of concrete. Fibres have been widely used in concrete to improve its engineering properties
and performance. These fibres include metals, such as steel fibres, organic fibres, and
inorganic fibres. Polypropylene fibre (PF) and glass fibre (GF) are popular ones used in the
concrete industry. Investigations have been carried out into the mechanical properties of PF
and GF reinforced concrete. Studies have found that fibre can improve the flexural strength,
compressive strength, toughness, splitting tensile strength and long-term durability of
concrete. Additionally, it has been generally agreed that fibre may perform its functions of
networking, bridging cracking and toughening to reinforce concrete. Fibre significantly
improves the toughness of cementation matrices, performs as a bridge at the cracking section
and thus takes part or even all of the tensile stress to resist the spread of cracking as mentioned
by Sun and Xu (2009). Polypropylene fibres in particular have gained popularity in recent
years for use in concrete, mainly to enhance the shrinkage cracking resistance and toughness
of plain concrete (Alhozaimy et al., 1996).
Meanwhile, a reduction in bleeding is observed by the addition of glass fibres in the glass
fibre concrete mixes and this reduction enhances the surface integrity of concrete, develops
its homogeneity and decreases the probability of cracks, as mentioned by Chandramouli et al.
(2010). Glass fibre can control shrinkage cracks easily Shakor and Pimplikar (2011). Karahan
and Atis (2011) studied the drying shrinkage of 0%, 15% and 30% fly ash concrete samples
containing 0%, 0.05%, 0.10% and 0.20% polypropylene fibres. The result show that the
addition of polypropylene fibres in concrete or fly ash concrete reduces drying shrinkage of
1%, 4% and 11% when compared to fly ash concrete made without polypropylene fibre,
respectively. Moreover, according to Kene et al. (2012), incorporation of glass fibre into
concrete improves the mechanical strength as compared to conventional concrete without
fibre.
Zhang and Li (2013) conducted an experimental study to investigate the effect of
polypropylene fibre on the workability and durability of the concrete containing 15% fly ash
and 6% silica fume. Four different fibre level of 0.06%, 0.08%, 0.1% and 0.12% were
Chapter Two Literature Review
60
investigated. The decrease of the slump and slump flow were determined as 7.7% and 10.7%
for the concrete with 0.12% fibre volume respectively. As the fibre fraction of polypropylene
fibre is increased from 0% to 0.12%, the maximum dry shrinkage strain and carbonation depth
and the length of water permeability of 90 days’ age decreases 24%, 37.5% and 20%
respectively. The results of XRD test reveals that both Ca(CO)3 and Ca(OH)2 have not
changed significantly after adding PP fibres. This occurrence may prove that fibres could not
participate in any chemical reactions according to Ramezanianpour et al. (2013).
Furthermore, compressive strength, flexural strength and splitting tensile strength are
developed by adding fibre, as reviewed by Srinivasu et al. (2014). Using glass fibre in concrete
increases strength properties at age 28 days by 20 to 25% for compressive strength and 15 to
20% for flexural and splitting strength. However, according to Yin (2015), a methodology has
been developed to produce recycled polypropylene fibre with optimum mechanical properties
for reinforcing concrete. Afroughsabet and Ozbakkaloglu (2015) show that incorporation
0.15%, 0.3%, and 0.45% of polypropylene fibres, had a significant increased the splitting
tensile strength of the concrete by 13%, 16%, and 20% at 28 days respectively. There is great
potential for using these fibres in different concrete applications, such as footpaths and precast
concrete elements. This also provides an attractive avenue for recycling plastic waste.
The applications of fibres in concrete industries depend on the designer and builder in taking
advantage of the static and dynamic characteristics of this new material (Wafa, 1990). The
main area of fibres applications in concrete are: runway, aircraft parking, pavements, tunnel
lining, slope stabilization, thin shell, dams and hydraulic structure.
2.19 Microstructure of concrete
The microstructure of hardened concrete has the main effect on concrete properties such as
strength, shrinkage and permeability. Consequently, an understanding of the pore structure
would give an insight into the mechanisms of concrete properties improvement. Penetration
of harmful solutions into the concrete system is the major cause of deterioration of concrete
structures, which takes place through the porous microstructure. Therefore, the penetration of
aggressive agents depends on the pore structure, porosity and microstructure of the concrete
system. In addition to the pore geometry considerations, the reaction with penetrating
aggressive solutions such as chloride ions and carbon dioxide, influences physical and
Chapter Two Literature Review
61
chemical concrete properties. It is believed that porosity, and in particular capillary porosity,
influences concrete permeability. Factors such as interconnectivity, and volume and surface
area of the voids influence transport processes. A sensible target in the production of high
durability concrete materials would be lower permeability and pore sizes, to effect lower
penetrating flow. A detailed description of the pore size distribution of a paste is unlikely to
be sufficient for properties prediction. Some measure of pore volume, surface area,
distribution and connectivity will be required for prediction of permeability, while mechanical
properties of the solid phases and their bonds may be needed for prediction of strength and
deformation. The wide range of microscopic techniques available have much to contribute to
the study of cementitious materials the of cement and concrete, before and after hydration
such as, optical microscopy, Transmission electron microscopy (TEM), Scanning electron
microscopy (SEM), computing tomography scanner according to Scrivener, (1997).
Moreover, Edmonds and Majumdar (1989) investigated chemical reactions of polymer with
cement hydration products by using the techniques of conduction calorimetry, X-ray
diffraction, electron probe microanalysis and infrared spectroscopy to study in detail the
hydration of a calcium aluminate cement with various types of poly (vinyl alcohol-acetate)
added, and they found evidence for a chemical reaction between cement and polymer.
However, supplementary cementing materials such as metakaolin, as mentioned before, are
often used in concrete mixes to reduce cement contents, increase strength and enhance
durability through hydraulic or pozzolanic activity. Utilisation of such products in mortar and
concrete enhances the properties of concrete in the fresh and hardened states. The calcium
hydroxide produced from the cement hydration is consumed rapidly and effectively by partial
replacement by metakaolin and additional to CSH, phases like C2ASH8 (stratlingite), C4AH13
and C3ASH6 (hydrogarnet) produce a refinement to the pores due to their pozzolanic activity.
Badogiannis and Tsivilis (2009) observed a reduction in the diffusion rate of aggressive ions
therefore the penetration of water and other harmful chemicals is positively restricted.
Furthermore, Gopalakrishnan and Govindarajan (2011), by compressive strength and
scanning electron microscopy, investigated the cement hydration products, and microstructure
of paste with partial replacement of cement by metakaolin. The results showed that the partial
replacement of Portland cement by metakaolin decreased the level of CH, while the level of
CSH gel increased, causing increased density of the structure and improvement of the
Chapter Two Literature Review
62
microstructure, subsequently improving the strength and durability properties of the cement
paste.
It is fundamental that each concrete construction should continue to perform its design
functions, maintaining the required quality and serviceability, during the specified or
traditionally expected service life. It follows that concrete must be able to withstand the
processes of deterioration to which it can be expected to be exposed. Such concrete is said to
be durable as referred by Neville (2011). However, a number of studies show that there is a
significant relation between the metakaolin content in concrete, and the microstructure
durability properties of mortar and concrete, in addition to the mechanical strength.
Ramezanianpour and Jovein (2012) investigated the influence of incorporation of metakaolin
on the performance of concrete mixtures, in terms of compressive strength, water penetration,
sorptivity, salt ponding, Rapid Chloride Permeability Test (RCPT) and electrical resistivity,
at 7, 28, 90 and 180 days. The partial replacement of cement by metakaolin are 0%, 10%,
12.5% and 15% by mass. The W/C ratios are 0.35, 0.4 and 0.5. The microstructure of the
metakaolin cement pastes was observed by XRD and SEM tests. Scanning Electron
Micrographs (SEMs) of cement pastes reveal that the microstructure of the metakaolin cement
paste is more uniform and compact than that of the ordinary Portland cement paste. The results
showed that the strength properties improved with increasing metakaolin percentage. In
addition, the durability of concrete was enhanced and chloride diffusion reduced. There is an
exponential relationship between chloride permeability and compressive strength of modified
concrete and a significant linear relationship between chloride penetration and salt ponding
results.
SEM has been a fundamental tool in the examination of the complex internal structure of
mortar and concretes and hydrated cement pastes in recent decades. Concrete is a complex
engineering material. Its properties depend on its microstructure, and vary extremely. The
microstructure changes with time, but also varies with the cement type, mix proportions, heat
treatment or other special processing, curing or lack of it, use of supplementary cementing
materials, and many other variables. Furthermore, concretes in the application field are subject
to deterioration by different processes, all of which can affect their microstructure as well as
their end use characteristics according to Diamond (2004b).
Chapter Two Literature Review
63
SEM techniques have the feature of focusing a high-velocity electron beam on a highly fine
spot on the surface of a sample, and then causing the focused beam to execute a raster pattern
over the limited region of the sample surface to be imaged. However, Diamond (2004a)
attempted to provide a ‘visual primer’ explanation the significant characteristics of cement
hydration paste, both in separate preparations and in concrete, by backscatter scanning
electron microscopy (SEM). Backscatter-mode SEM is one of a number of different SEM
imaging techniques. In addition to SEM techniques, the energy- dispersive X-ray
spectroscopy (EDX) systems, which can almost promptly supply specific chemical
compositional information on any required spot or specific section in the image being tested
by SEM. This characteristic assist makes back-scatter SEM an extremely powerful and
informative technique in concrete studies. Feng et al. (2004), Estimated hydration of plain
Portland and blended cement pastes containing fly ash or slag by a scanning electron
microscope point-counting technique. The results referred to that the SEM point-counting
technique can be a reliable and effective analysis tool to estimate the degree of hydration of
the Portland cement and reaction of mineral admixtures in blended in Portland cement pastes.
Sahu et al. (2004) has advanced a methodology to determine the w/c ratio in hardened cement
concrete by a scanning electron microscope. The capillary porosity of the concrete quantified
by using image analysis program and setting an appropriate threshold of the grayscale. The
w/c ratio, which is directly related to the capillary porosity as shown in Figure 2.10. The image
on the left is the backscattered electron image at 800 times magnification, and the image to
the right is the matching binary image. The results showed that the w/c ratio of hardened
concrete could be determined by scanning electron microscopy with associated backscattered
electron imaging and image analysis software. Furthermore, Stutzman (2004) observed that
the backscattered electron SEM, combined with X-ray imaging provides the foundation for a
quantitative estimation of the phases in Portland cement.
On the other hand, computed tomography (CT) allows the analysis of the internal
microstructure in a non-destructive manner. Also the ambience of pores and cracks can be
taken into consideration with CT scanner. CT in combination with appropriate image
analysing software is a powerful tool to support the investigations on deterioration processes
in concrete specimens non-destructively. Compared with other investigation methods, often
describing only one feature, CT provides spatial information about the internal structure,
Chapter Two Literature Review
64
which plays a crucial role in this context. Kim et al. (2013) demonstrate the applicability of
3D X-ray CT imaging in studying the change in void microstructure system, and the initiation
and spatial configuration of fractures that develop in cement component. However, core
samples, which were often used in the field of building material testing, are mostly appropriate
for CT examination according to Meinel et al. (2014). Generally, computed tomography is a
well-known technique to measure porosity in concrete, however, this usually involves time
consuming scans and complex analysis procedures and mainly required software or
programming procedures (Du Plessis et al., 2016).
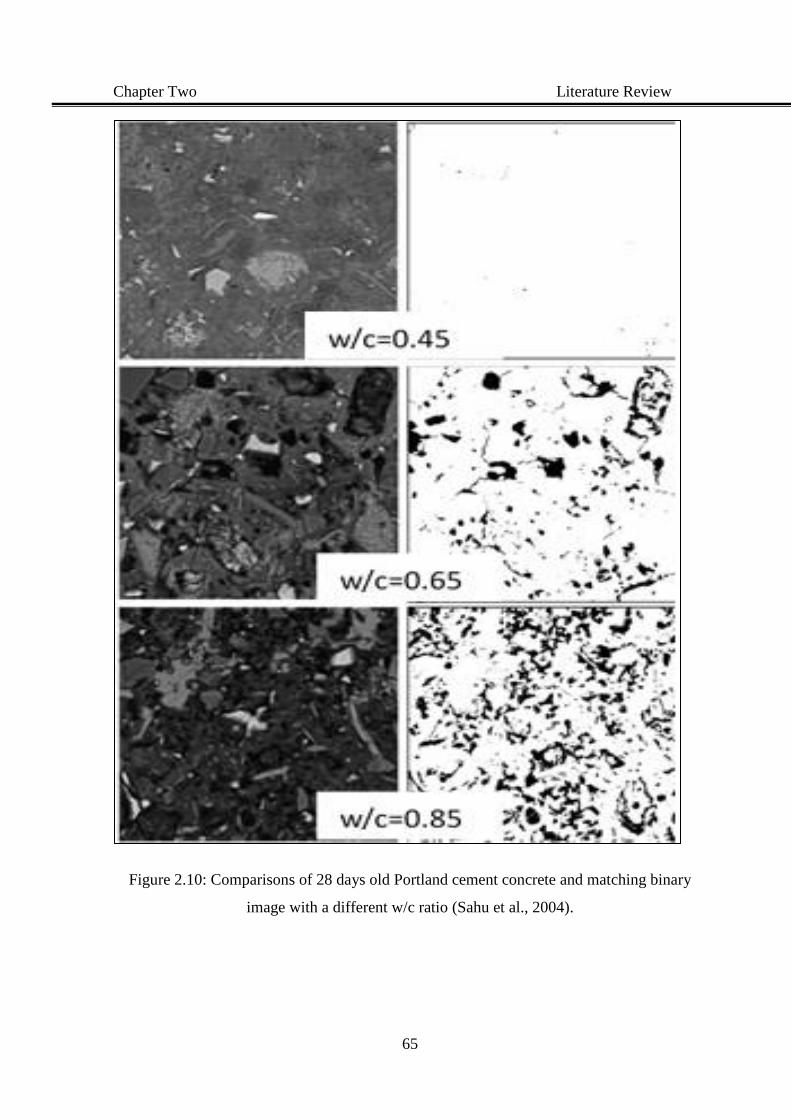
Chapter Two Literature Review
65
Figure 2.10: Comparisons of 28 days old Portland cement concrete and matching binary
image with a different w/c ratio (Sahu et al., 2004).
Chapter Two Literature Review
66
2.20 Summary of the available literature review
Generally, some of the available literatures identified that both SCMs as partial replacement
of cement and use of Portland limestone cement in the concrete significantly contribute to the
production of environmentally friendly concrete, by reducing the CO2 emission. Incorporation
of SCMs improves most of the mortar and concrete properties such as the microstructure of
the concrete, as well as improving the mechanical and durability properties. In particular, a
considerable amount of literature has been reviewed regarding the partial replacement of
cement by metakaolin weight. It has been shown to improve mechanical and durability
properties of concrete, such as compressive, flexural and splitting strength, reduce
permeability, increase resistance to chemical attack, and reduce alkali-silica reaction and
concrete shrinkage. Most improvements in the properties of concretes and mortars have been
attributed to the effect of fillers and the pozzolanic reactivity with the cement hydration
products in the presence of water. However, increasing the replacement of metakaolin content,
increases water demand due to its high chemical reactivity and high specific surface area.
Water reducers have been incorporated in combination with the SCMs to reduce the negative
impact of the high level of water on concrete strength and to improve the workability while
conserving the high strength of the concrete. Most of the studies suggest that the optimum
percentage of metakaolin replacement in concrete varies from 10% to 20%.
The effectiveness of the supplementary materials on concrete properties is in the sequence:
MK > SF > slag. Metakaolin presents the most distinct improvement effects on the
microstructure of concrete compared to the other supplementary cementing materials, such as
silica fume and slag, due to the higher pozzolanic activity of metakaolin. Utilisation of high
contents of metakaolin increases the demand for water needed to reach the same workability
as in a plain cement mix. It essential to use superplasticisers in conjunction with metakaolin
in the cement paste to reduce the water demand. Supplementary cementing materials, such as
metakaolin, when used as a partial replacement substance for cement in concrete, has high
pozzolanic properties which are similar in many aspects to those of Portland or blended
cement systems Table 2.7 summarizes the findings of previous research on the cement mortar
and concrete modified by metakaolin.
On the other hand, the polymer modified concrete showed clear improvements in the concrete
durability, and some of the mechanical properties (such as water absorption, chemical attack,
Chapter Two Literature Review
67
chloride penetration, carbonation, and flexural and splitting strength), in addition to increasing
concrete workability. Also, the using of admixture in concrete enhances the corrosion
resistance of steel reinforced concrete by improving the impermeability of the concrete.
Nevertheless, the general aims of adding the polymer admixture are to enhance workability
and reduce water demand to improve strength and durability of concrete properties, and to
enhance those properties that control the setting time and strength development rate of the
cement paste. The w/c ratio is a significant agent in cement hydration as it affects the concrete
porosity and permeability directly. Consequently, the w/c ratio affects the strength and
durability of concrete. Increasing the w/c ratio makes the concrete more porous. By using
polymer as a water reducer, the concrete paste becomes stronger due to decreased porosity
and the cement paste becomes impermeable because the pores are disconnected. Incorporation
of polymer in concrete increases bonding through the formation of a film at the concrete
component interface and leads to refinement of the pores matrix in the concrete structure. In
addition, the literature showed that using fibres such as polypropylene and glass fibre has a
positive effect on the mechanical properties of the concrete. Finally, concrete with limestone
Portland cement LPC is more sustainable, required less water for cement hydration and has
lower permeability with high properties compared with the ordinary Portland cement OPC.
Furthermore, using limestone aggregate increase the concrete strength compared with the
normal aggregate. Table 2.8 summarizes the findings of previous research on the cement
mortar and concrete modified by polymer.
However, far too little attention has been paid to using metakaolin combined with polymers
such as SBR and PVA to modify concrete properties. This has steered the current research to
study the influence of partial replacement of cement mix by metakaolin together with two
types of polymer-modified concrete to obtain high quality concrete properties appropriate for
applications in highly aggressive conditions.
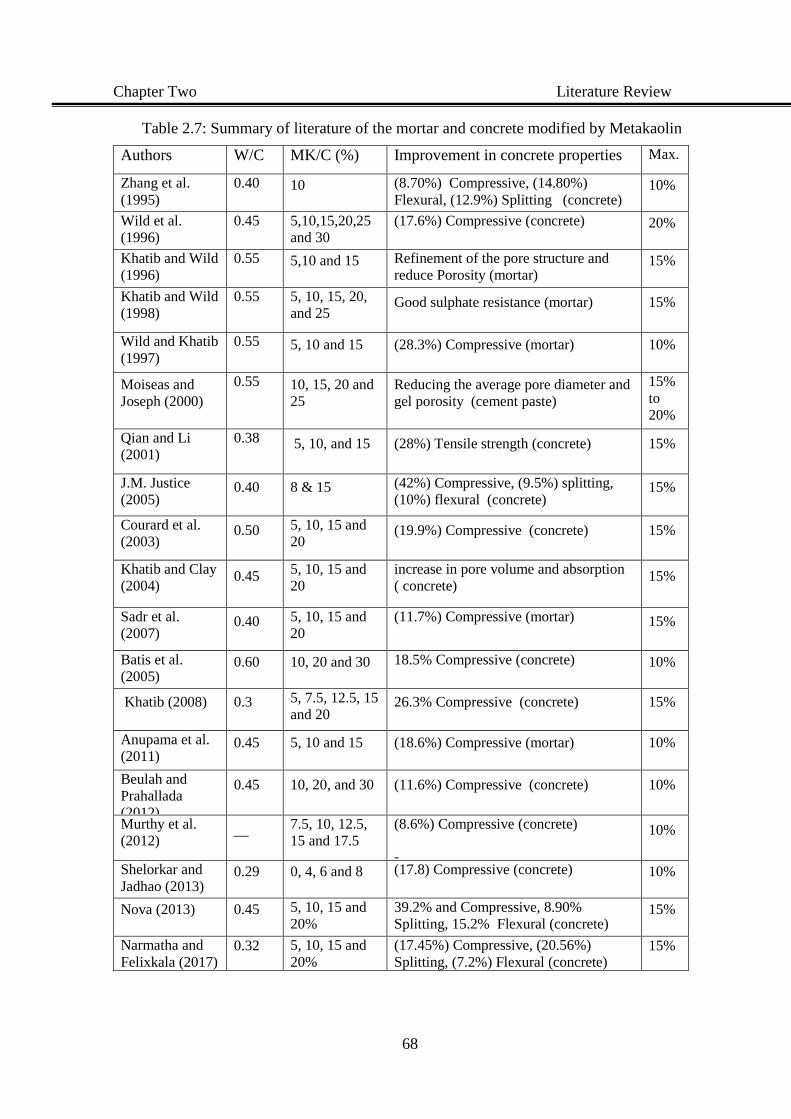
Chapter Two Literature Review
68
Table 2.7: Summary of literature of the mortar and concrete modified by Metakaolin
Authors W/C MK/C (%) Improvement in concrete properties Max.
Zhang et al.
(1995)
0.40 10 (8.70%) Compressive, (14.80%)
Flexural, (12.9%) Splitting (concrete) 10%
Wild et al.
(1996)
0.45 5,10,15,20,25
and 30
(17.6%) Compressive (concrete)
-
-
20%
Khatib and Wild
(1996)
0.55 5,10 and 15 Refinement of the pore structure and
reduce Porosity (mortar) 15%
Khatib and Wild
(1998)
0.55 5, 10, 15, 20,
and 25 Good sulphate resistance (mortar) 15%
Wild and Khatib
(1997)
0.55 5, 10 and 15 (28.3%) Compressive (mortar) 10%
Moiseas and
Joseph (2000)
0.55 10, 15, 20 and
25
Reducing the average pore diameter and
gel porosity (cement paste)
15%
to
20%
Qian and Li
(2001)
0.38 5, 10, and 15 (28%) Tensile strength (concrete) 15%
J.M. Justice
(2005)
0.40 8 & 15 (42%) Compressive, (9.5%) splitting,
(10%) flexural (concrete) 15%
Courard et al.
(2003) 0.50 5, 10, 15 and
20 (19.9%) Compressive (concrete) 15%
Khatib and Clay
(2004) 0.45
5, 10, 15 and
20
increase in pore volume and absorption
( concrete) 15%
Sadr et al.
(2007) 0.40 5, 10, 15 and
20
(11.7%) Compressive (mortar)
-
-
15%
Batis et al.
(2005)
0.60 10, 20 and 30 18.5% Compressive (concrete)
-
-
10%
Khatib (2008) 0.3 5, 7.5, 12.5, 15
and 20 26.3% Compressive (concrete) 15%
Anupama et al.
(2011) 0.45 5, 10 and 15 (18.6%) Compressive (mortar) 10%
Beulah and
Prahallada
(2012)
0.45 10, 20, and 30 (11.6%) Compressive (concrete) 10%
Murthy et al.
(2012)
__ 7.5, 10, 12.5,
15 and 17.5
(8.6%) Compressive (concrete)
-
-
10%
Shelorkar and
Jadhao (2013)
0.29 0, 4, 6 and 8 (17.8) Compressive (concrete)
-
10%
Nova (2013) 0.45 5, 10, 15 and
20%
39.2% and Compressive, 8.90%
Splitting, 15.2% Flexural (concrete) 15%
Narmatha and
Felixkala (2017) 0.32 5, 10, 15 and
20%
(17.45%) Compressive, (20.56%)
Splitting, (7.2%) Flexural (concrete) 15%
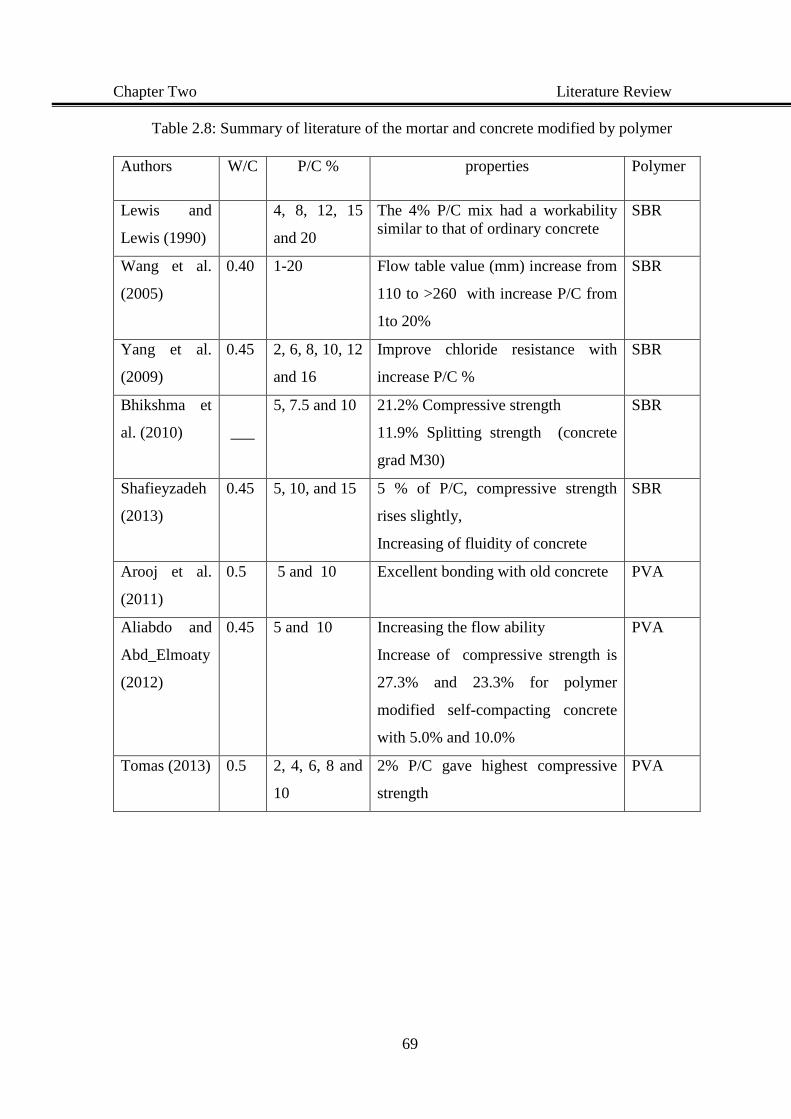
Chapter Two Literature Review
69
Table 2.8: Summary of literature of the mortar and concrete modified by polymer
Authors W/C P/C % properties Polymer
Lewis and
Lewis (1990)
4, 8, 12, 15
and 20
The 4% P/C mix had a workability
similar to that of ordinary concrete
SBR
Wang et al.
(2005)
0.40 1-20 Flow table value (mm) increase from
110 to >260 with increase P/C from
1to 20%
SBR
Yang et al.
(2009)
0.45 2, 6, 8, 10, 12
and 16
Improve chloride resistance with
increase P/C %
SBR
Bhikshma et
al. (2010) ___
5, 7.5 and 10 21.2% Compressive strength
11.9% Splitting strength (concrete
grad M30)
SBR
Shafieyzadeh
(2013)
0.45 5, 10, and 15 5 % of P/C, compressive strength
rises slightly,
Increasing of fluidity of concrete
SBR
Arooj et al.
(2011)
0.5 5 and 10 Excellent bonding with old concrete PVA
Aliabdo and
Abd_Elmoaty
(2012)
0.45 5 and 10 Increasing the flow ability
Increase of compressive strength is
27.3% and 23.3% for polymer
modified self-compacting concrete
with 5.0% and 10.0%
PVA
Tomas (2013) 0.5 2, 4, 6, 8 and
10
2% P/C gave highest compressive
strength
PVA
CHAPTER THREE
RESEARCH METHODOLOGY
Chapter Three Research Methodology
70
CHAPTER THREE
RESEARCH METHODOLOGY
3.1 Introduction
In order to achieve the aim and objectives of the research firstly, trial mixes were tested for
setting time, workability, mechanical properties and water absorption at age 7 and 28 days to
find the optimum mix proportions and curing condition. Secondly, the identified optimum mix
proportions were tested again to study the mechanical, durability and the microstructure
properties at more ages up to 545 days. This chapter describes the details of the raw materials
used, the preparation of specimens and the standard experimental tests employed in this
investigation.
3.2 Raw Materials
3.2.1. Cement:
Portland limestone cement CEM II/A-LL, (OR LL) 32.5R was supplied by Lafarge cement UK
LTD, under the trade name of Mastercrete. It is a slightly modified version of Portland cement
conforming with the criteria in British Standard EN 197-1 (2011) used for this study. The
cement properties are shown in Tables 3.1 and 3.2.
3.2.2. Aggregate
3.2.2.1. Fine aggregate:
The fine aggregate used was of the maximum size of 4.75 mm with relative density of 2.47,
conformed with BS 882:1992. The sieve analysis of the sand used is shown in Figure 3.1.
3.2.2.2. Course aggregate:
The course aggregates used in this investigation were crushed granite coarse aggregate and
crushed limestone coarse aggregate with maximum size 14 mm with 2.21 and 2.49 specific
gravity, respectively. The properties were tested according to BS 882: 1992. The grading of the
normal and the limestone aggregate used is shown in Figures 3.2 and 3.3 respectively.
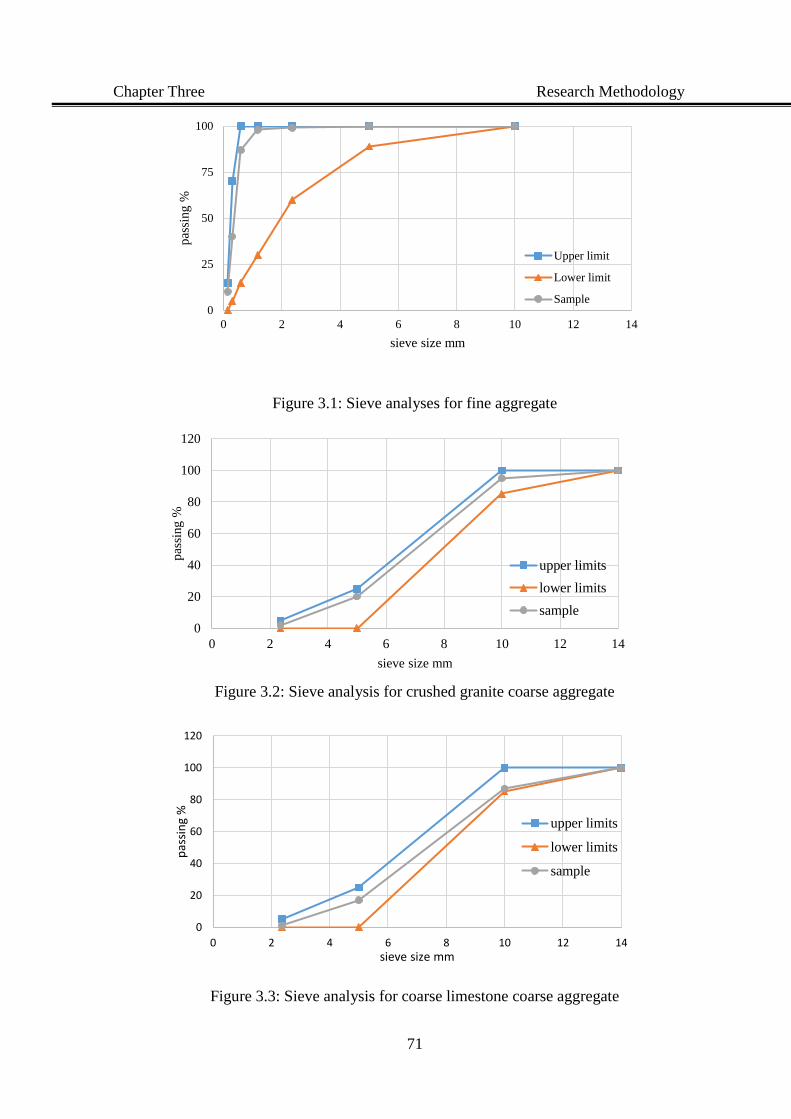
Chapter Three Research Methodology
71
Figure 3.1: Sieve analyses for fine aggregate
Figure 3.2: Sieve analysis for crushed granite coarse aggregate
Figure 3.3: Sieve analysis for coarse limestone coarse aggregate
0
25
50
75
100
0 2 4 6 8 10 12 14
pas
sing %
sieve size mm
Upper limit
Lower limit
Sample
0
20
40
60
80
100
120
0 2 4 6 8 10 12 14
pas
sing %
sieve size mm
upper limits
lower limits
sample
0
20
40
60
80
100
120
0 2 4 6 8 10 12 14
pas
sin
g %
sieve size mm
upper limits
lower limits
sample
Chapter Three Research Methodology
72
3.2.3. Metakaolin:
The metakaolin used in this project was supplied by IMERYS Performance Mineral, under the
trade name of MetaStar 501. It is a premium metakaolin produced by carefully controlled
calcinations. It is a high quality pozzolanic material which is blended with Portland cement in
order to improve the properties of concrete and mortars. Table 3.3 shows the properties of the
metakaolin used in this study.
3.2.4. Polymers
Two types of commercial polymer latexes were used to modify concrete properties in this
investigation:
3.2.4.1. Styrene butadiene rubber (SBR):
SBR is a specially modified Styrene Butadiene Copolymer Latex for the use of cement and
mortar. It improves toughness, waterproofs and chemical and abrasion resistance of renders,
screeds and other cement based mixes. The product name is cementone SBR, and supplied by
Bostik Limited. Table 3.4 shows the properties of SBR.
3.2.4.2. Polyvinyl acetate (PVA):
PVA is a synthetic organic chemical compound. It is supplied by Bostik Limited under the
name Evo-Stik or Evo-Bond Waterproof PVA, and these were used as polymer modifiers in
this study. Tables 3.5 shows the properties of PVA.
3.2.5. Fibre reinforcements:
Two types of fibres were used to reinforce the concrete in this study; they were recycled alkali
resistant glass fibre (GF) 10 to 13 mm in length with 0.05 mm diameter, and recycled
polypropylene fibre (PF) 0.80 to 0.95 mm diameter with different lengths between 15 mm and
30 mm.
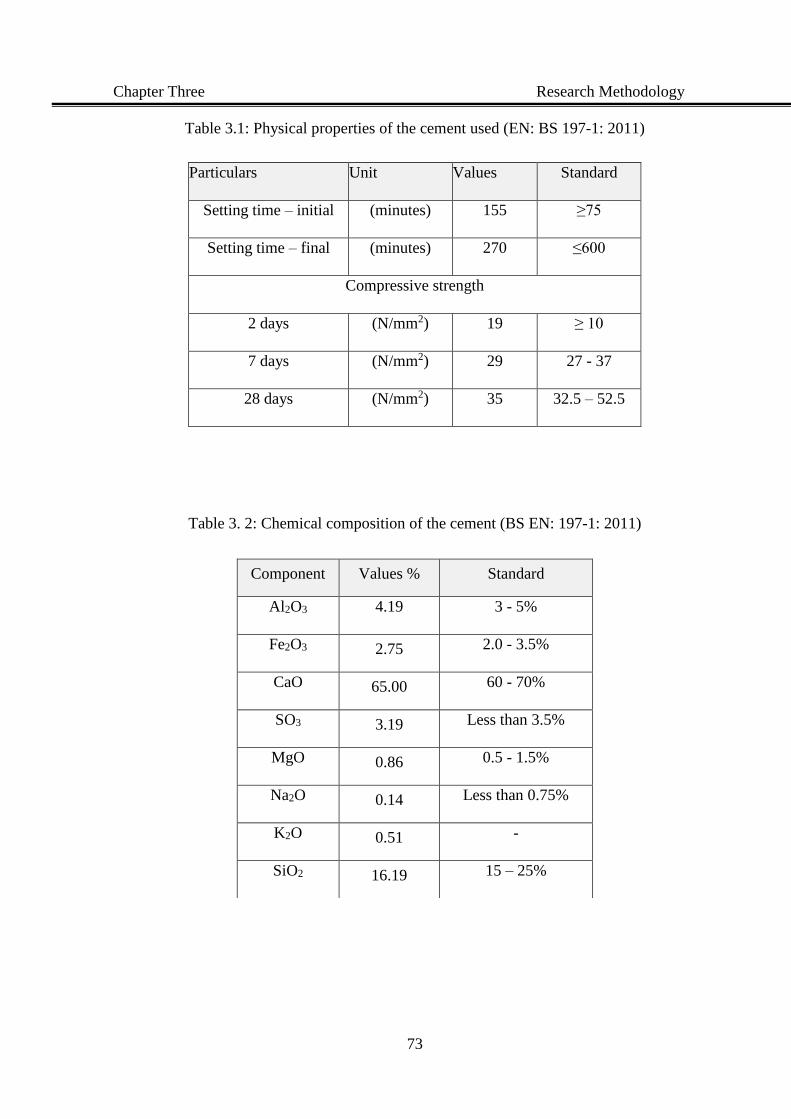
Chapter Three Research Methodology
73
Table 3.1: Physical properties of the cement used (EN: BS 197-1: 2011)
Particulars Unit Values Standard
Setting time – initial (minutes) 155 ≥75
Setting time – final (minutes) 270 ≤600
Compressive strength
2 days (N/mm2) 19 ≥ 10
7 days (N/mm2) 29 27 - 37
28 days (N/mm2) 35 32.5 – 52.5
Table 3. 2: Chemical composition of the cement (BS EN: 197-1: 2011)
Component Values % Standard
Al2O3 4.19 3 - 5%
Fe2O3 2.75 2.0 - 3.5%
CaO 65.00 60 - 70%
SO3 3.19 Less than 3.5%
MgO 0.86 0.5 - 1.5%
Na2O 0.14 Less than 0.75%
K2O 0.51 -
SiO2 16.19 15 – 25%
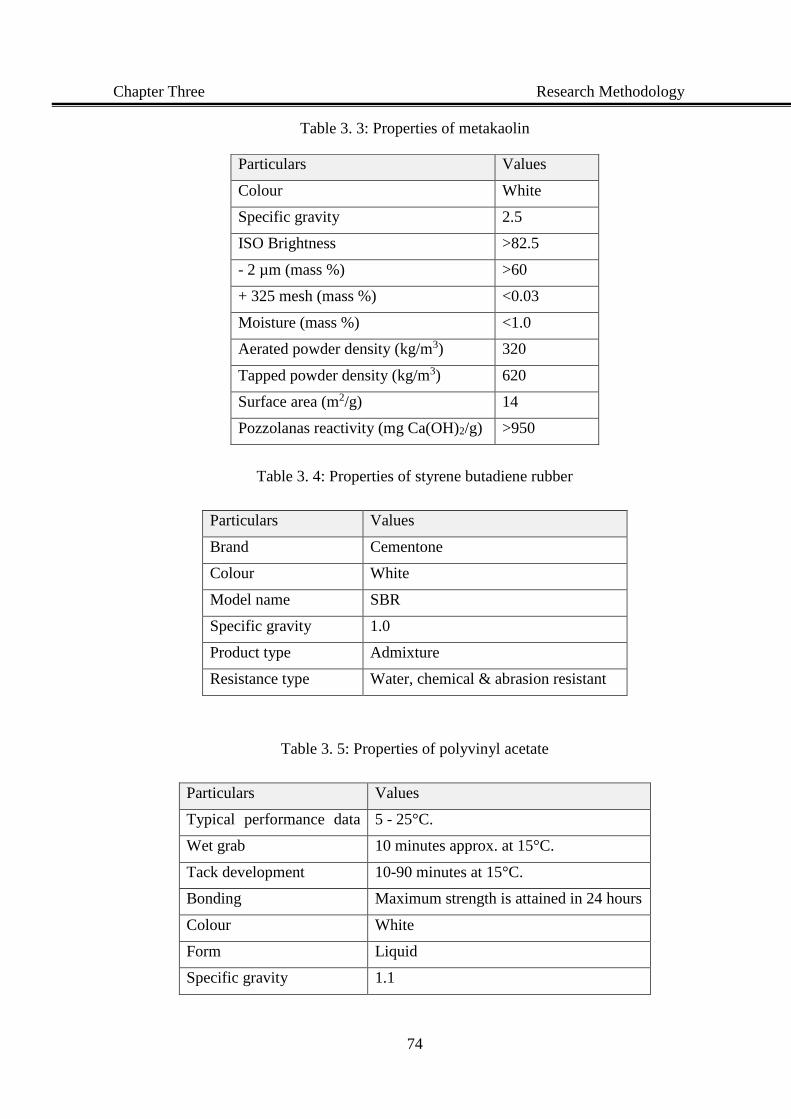
Chapter Three Research Methodology
74
Table 3. 3: Properties of metakaolin
Table 3. 4: Properties of styrene butadiene rubber
Particulars Values
Brand Cementone
Colour White
Model name SBR
Specific gravity 1.0
Product type Admixture
Resistance type Water, chemical & abrasion resistant
Table 3. 5: Properties of polyvinyl acetate
Particulars Values
Typical performance data
(approx.) application
temperature
5 - 25°C.
Wet grab 10 minutes approx. at 15°C.
Tack development 10-90 minutes at 15°C.
Bonding Maximum strength is attained in 24 hours
Colour White
Form Liquid
Specific gravity 1.1
Particulars Values
Colour White
Specific gravity 2.5
ISO Brightness >82.5
- 2 µm (mass %) >60
+ 325 mesh (mass %) <0.03
Moisture (mass %) <1.0
Aerated powder density (kg/m3) 320
Tapped powder density (kg/m3) 620
Surface area (m2/g) 14
Pozzolanas reactivity (mg Ca(OH)2/g) >950
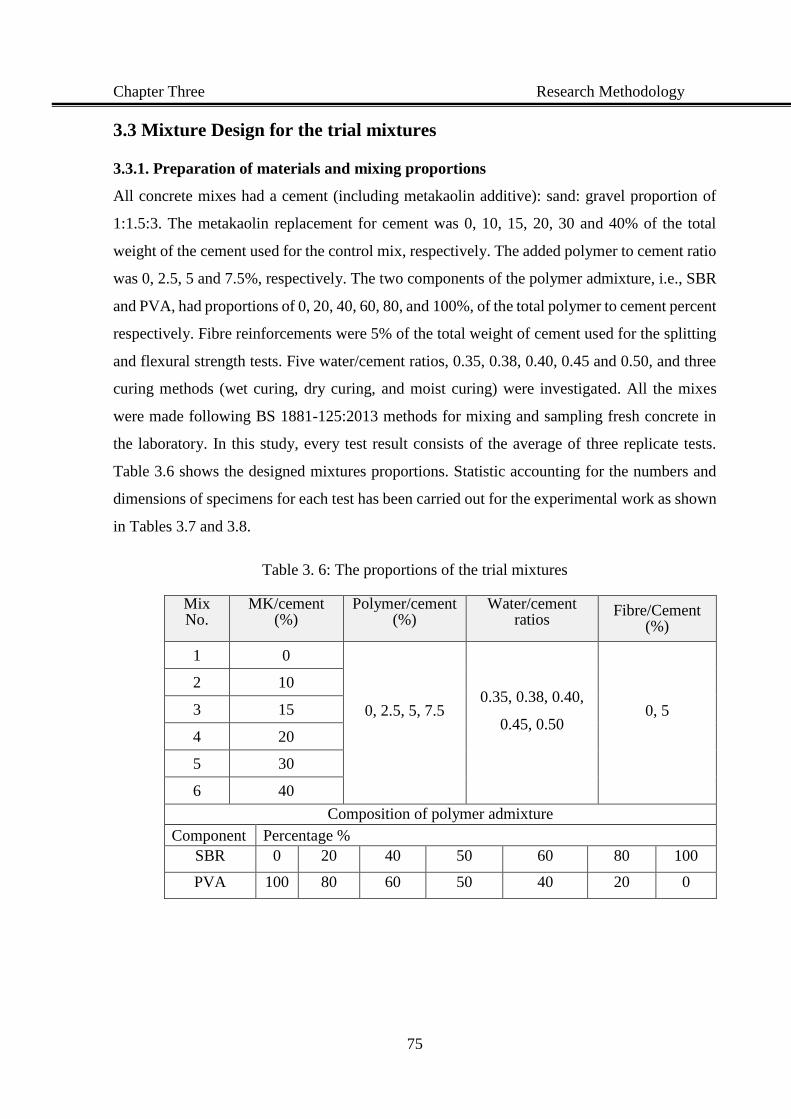
Chapter Three Research Methodology
75
3.3 Mixture Design for the trial mixtures
3.3.1. Preparation of materials and mixing proportions
All concrete mixes had a cement (including metakaolin additive): sand: gravel proportion of
1:1.5:3. The metakaolin replacement for cement was 0, 10, 15, 20, 30 and 40% of the total
weight of the cement used for the control mix, respectively. The added polymer to cement ratio
was 0, 2.5, 5 and 7.5%, respectively. The two components of the polymer admixture, i.e., SBR
and PVA, had proportions of 0, 20, 40, 60, 80, and 100%, of the total polymer to cement percent
respectively. Fibre reinforcements were 5% of the total weight of cement used for the splitting
and flexural strength tests. Five water/cement ratios, 0.35, 0.38, 0.40, 0.45 and 0.50, and three
curing methods (wet curing, dry curing, and moist curing) were investigated. All the mixes
were made following BS 1881-125:2013 methods for mixing and sampling fresh concrete in
the laboratory. In this study, every test result consists of the average of three replicate tests.
Table 3.6 shows the designed mixtures proportions. Statistic accounting for the numbers and
dimensions of specimens for each test has been carried out for the experimental work as shown
in Tables 3.7 and 3.8.
Table 3. 6: The proportions of the trial mixtures
Mix No.
MK/cement (%)
Polymer/cement (%)
Water/cement ratios
Fibre/Cement (%)
1 0
0, 2.5, 5, 7.5 0.35, 0.38, 0.40,
0.45, 0.50 0, 5
2 10
3 15
4 20
5 30
6 40
Composition of polymer admixture
Component Percentage %
SBR 0 20 40 50 60 80 100
PVA 100 80 60 50 40 20 0
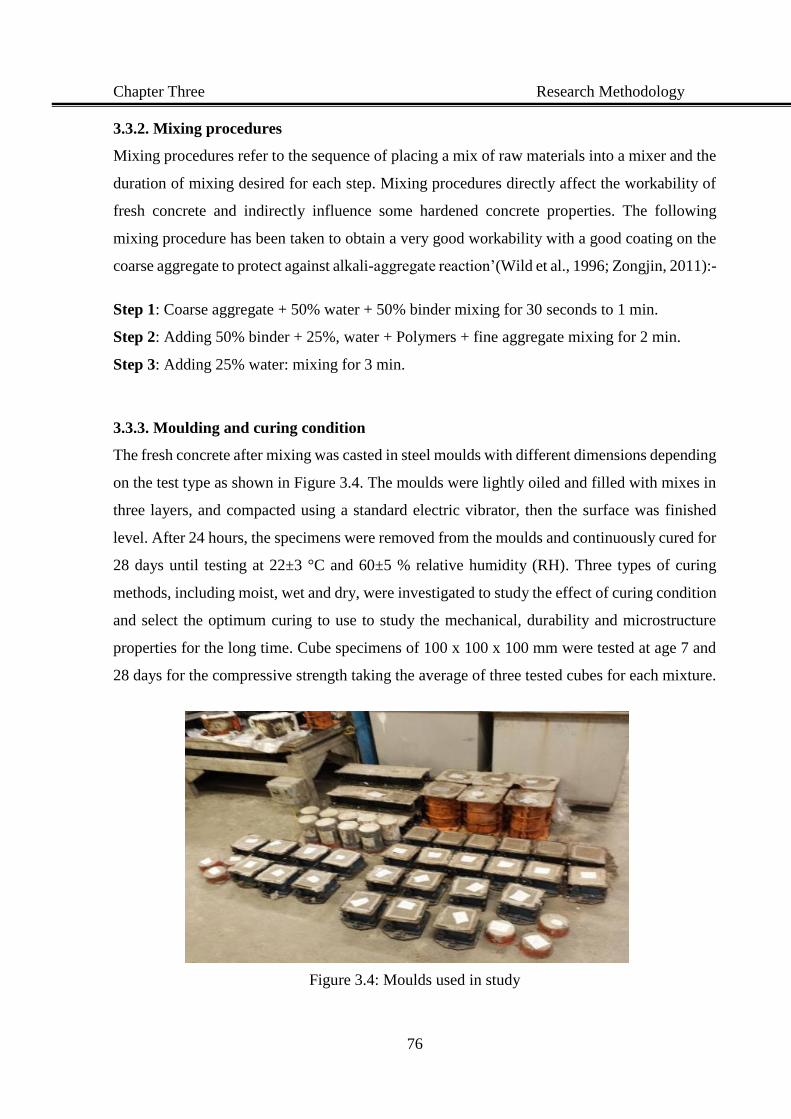
Chapter Three Research Methodology
76
3.3.2. Mixing procedures
Mixing procedures refer to the sequence of placing a mix of raw materials into a mixer and the
duration of mixing desired for each step. Mixing procedures directly affect the workability of
fresh concrete and indirectly influence some hardened concrete properties. The following
mixing procedure has been taken to obtain a very good workability with a good coating on the
coarse aggregate to protect against alkali-aggregate reaction’(Wild et al., 1996; Zongjin, 2011):-
Step 1: Coarse aggregate + 50% water + 50% binder mixing for 30 seconds to 1 min.
Step 2: Adding 50% binder + 25%, water + Polymers + fine aggregate mixing for 2 min.
Step 3: Adding 25% water: mixing for 3 min.
3.3.3. Moulding and curing condition
The fresh concrete after mixing was casted in steel moulds with different dimensions depending
on the test type as shown in Figure 3.4. The moulds were lightly oiled and filled with mixes in
three layers, and compacted using a standard electric vibrator, then the surface was finished
level. After 24 hours, the specimens were removed from the moulds and continuously cured for
28 days until testing at 22±3 °C and 60±5 % relative humidity (RH). Three types of curing
methods, including moist, wet and dry, were investigated to study the effect of curing condition
and select the optimum curing to use to study the mechanical, durability and microstructure
properties for the long time. Cube specimens of 100 x 100 x 100 mm were tested at age 7 and
28 days for the compressive strength taking the average of three tested cubes for each mixture.
Figure 3.4: Moulds used in study
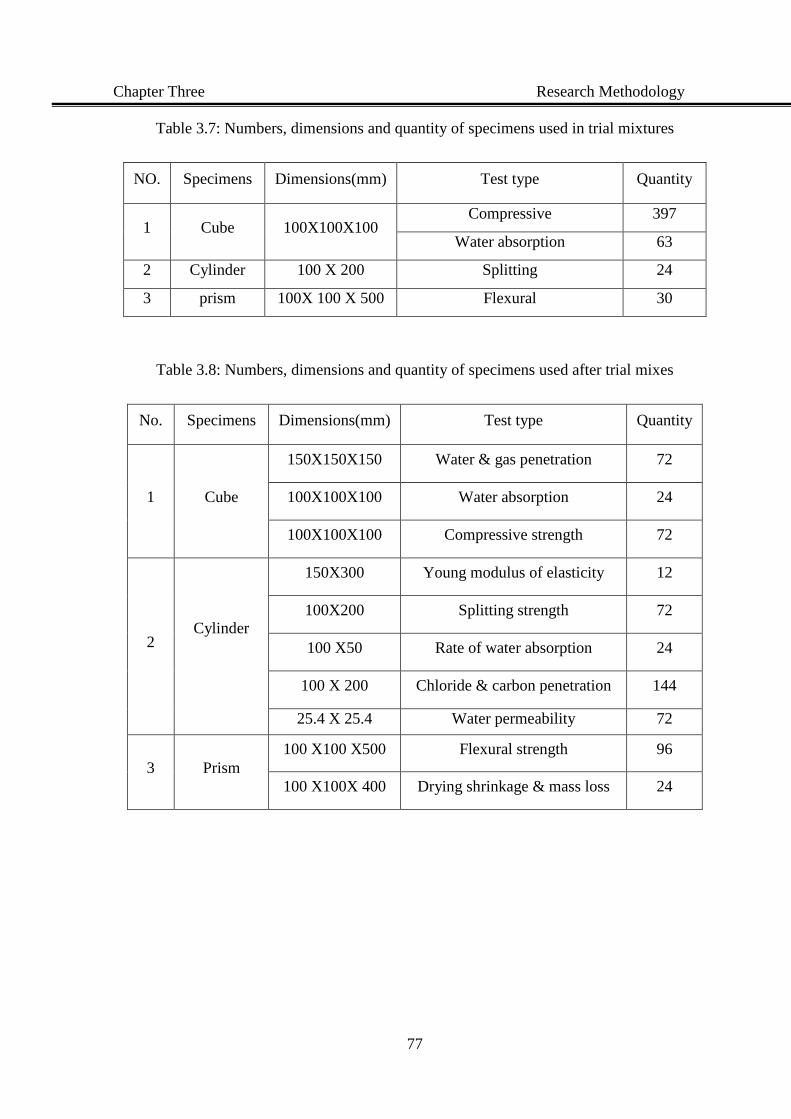
Chapter Three Research Methodology
77
Table 3.7: Numbers, dimensions and quantity of specimens used in trial mixtures
NO. Specimens Dimensions(mm) Test type Quantity
1 Cube 100X100X100 Compressive 397
Water absorption 63
2 Cylinder 100 X 200 Splitting 24
3 prism 100X 100 X 500 Flexural 30
Table 3.8: Numbers, dimensions and quantity of specimens used after trial mixes
No. Specimens Dimensions(mm) Test type Quantity
1 Cube
150X150X150 Water & gas penetration 72
100X100X100 Water absorption 24
100X100X100 Compressive strength 72
2 Cylinder
150X300 Young modulus of elasticity 12
100X200 Splitting strength 72
100 X50 Rate of water absorption 24
100 X 200 Chloride & carbon penetration 144
25.4 X 25.4 Water permeability 72
3 Prism
100 X100 X500 Flexural strength 96
100 X100X 400 Drying shrinkage & mass loss 24
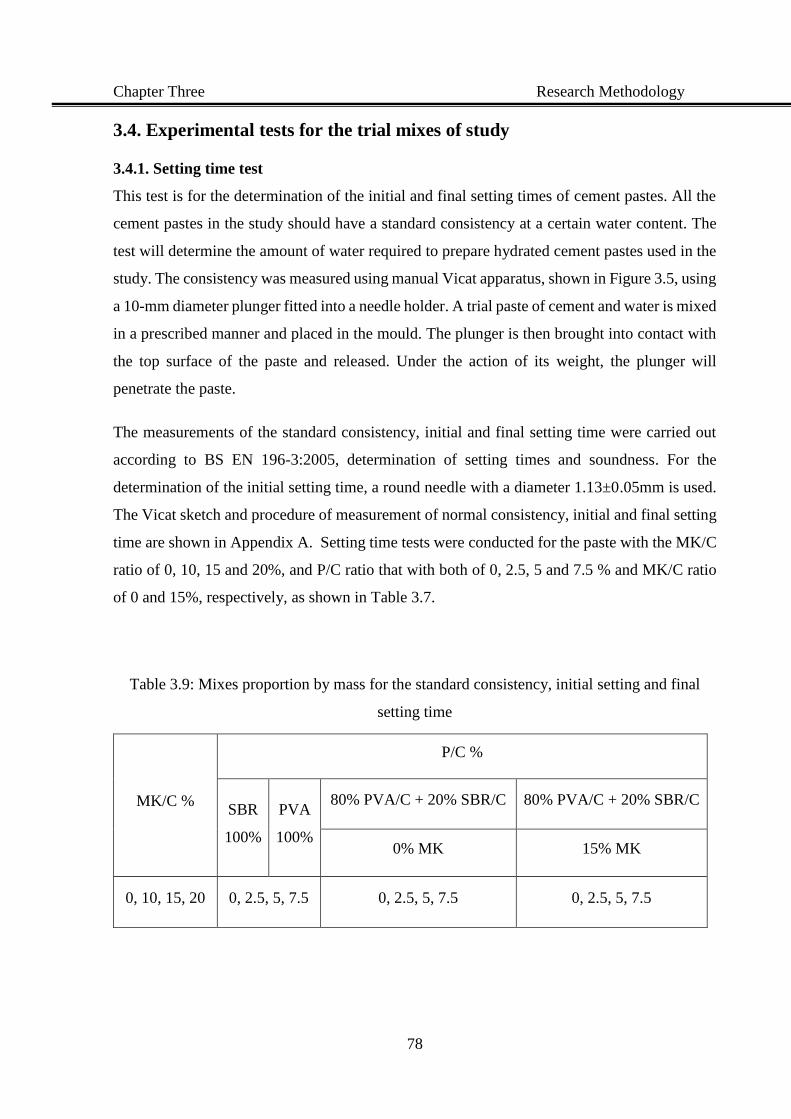
Chapter Three Research Methodology
78
3.4. Experimental tests for the trial mixes of study
3.4.1. Setting time test
This test is for the determination of the initial and final setting times of cement pastes. All the
cement pastes in the study should have a standard consistency at a certain water content. The
test will determine the amount of water required to prepare hydrated cement pastes used in the
study. The consistency was measured using manual Vicat apparatus, shown in Figure 3.5, using
a 10-mm diameter plunger fitted into a needle holder. A trial paste of cement and water is mixed
in a prescribed manner and placed in the mould. The plunger is then brought into contact with
the top surface of the paste and released. Under the action of its weight, the plunger will
penetrate the paste.
The measurements of the standard consistency, initial and final setting time were carried out
according to BS EN 196-3:2005, determination of setting times and soundness. For the
determination of the initial setting time, a round needle with a diameter 1.13±0.05mm is used.
The Vicat sketch and procedure of measurement of normal consistency, initial and final setting
time are shown in Appendix A. Setting time tests were conducted for the paste with the MK/C
ratio of 0, 10, 15 and 20%, and P/C ratio that with both of 0, 2.5, 5 and 7.5 % and MK/C ratio
of 0 and 15%, respectively, as shown in Table 3.7.
Table 3.9: Mixes proportion by mass for the standard consistency, initial setting and final
setting time
MK/C %
P/C %
SBR
100%
PVA
100%
80% PVA/C + 20% SBR/C 80% PVA/C + 20% SBR/C
0% MK 15% MK
0, 10, 15, 20 0, 2.5, 5, 7.5 0, 2.5, 5, 7.5 0, 2.5, 5, 7.5
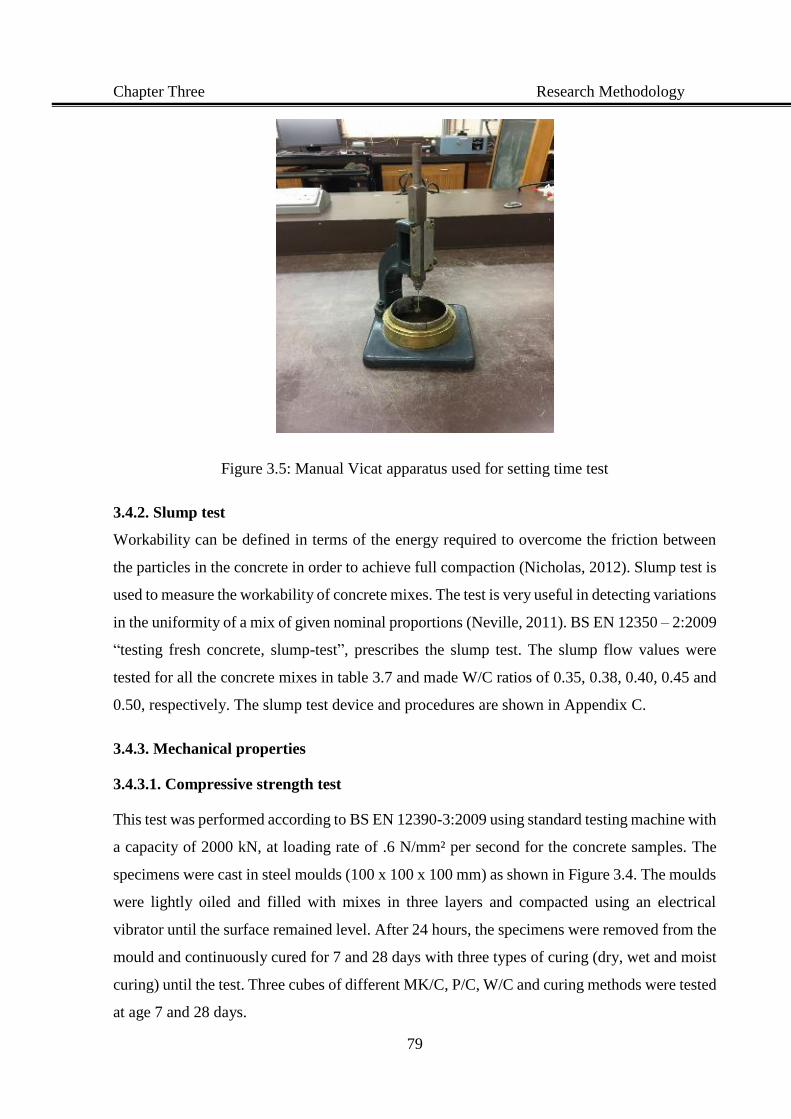
Chapter Three Research Methodology
79
Figure 3.5: Manual Vicat apparatus used for setting time test
3.4.2. Slump test
Workability can be defined in terms of the energy required to overcome the friction between
the particles in the concrete in order to achieve full compaction (Nicholas, 2012). Slump test is
used to measure the workability of concrete mixes. The test is very useful in detecting variations
in the uniformity of a mix of given nominal proportions (Neville, 2011). BS EN 12350 – 2:2009
“testing fresh concrete, slump-test”, prescribes the slump test. The slump flow values were
tested for all the concrete mixes in table 3.7 and made W/C ratios of 0.35, 0.38, 0.40, 0.45 and
0.50, respectively. The slump test device and procedures are shown in Appendix C.
3.4.3. Mechanical properties
3.4.3.1. Compressive strength test
This test was performed according to BS EN 12390-3:2009 using standard testing machine with
a capacity of 2000 kN, at loading rate of .6 N/mm² per second for the concrete samples. The
specimens were cast in steel moulds (100 x 100 x 100 mm) as shown in Figure 3.4. The moulds
were lightly oiled and filled with mixes in three layers and compacted using an electrical
vibrator until the surface remained level. After 24 hours, the specimens were removed from the
mould and continuously cured for 7 and 28 days with three types of curing (dry, wet and moist
curing) until the test. Three cubes of different MK/C, P/C, W/C and curing methods were tested
at age 7 and 28 days.
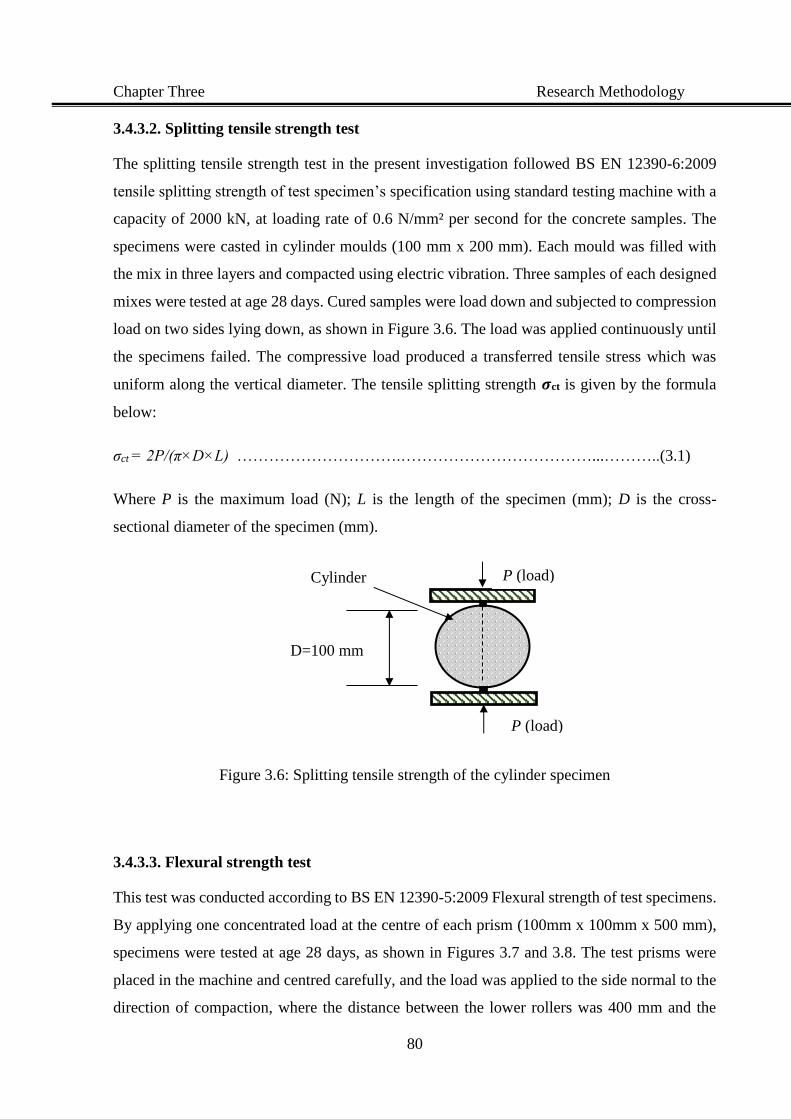
Chapter Three Research Methodology
80
3.4.3.2. Splitting tensile strength test
The splitting tensile strength test in the present investigation followed BS EN 12390-6:2009
tensile splitting strength of test specimen’s specification using standard testing machine with a
capacity of 2000 kN, at loading rate of 0.6 N/mm² per second for the concrete samples. The
specimens were casted in cylinder moulds (100 mm x 200 mm). Each mould was filled with
the mix in three layers and compacted using electric vibration. Three samples of each designed
mixes were tested at age 28 days. Cured samples were load down and subjected to compression
load on two sides lying down, as shown in Figure 3.6. The load was applied continuously until
the specimens failed. The compressive load produced a transferred tensile stress which was
uniform along the vertical diameter. The tensile splitting strength 𝝈ct is given by the formula
below:
σct = 2P/(π×D×L) ………………………….………………………………...………..(3.1)
Where P is the maximum load (N); L is the length of the specimen (mm); D is the cross-
sectional diameter of the specimen (mm).
Figure 3.6: Splitting tensile strength of the cylinder specimen
3.4.3.3. Flexural strength test
This test was conducted according to BS EN 12390-5:2009 Flexural strength of test specimens.
By applying one concentrated load at the centre of each prism (100mm x 100mm x 500 mm),
specimens were tested at age 28 days, as shown in Figures 3.7 and 3.8. The test prisms were
placed in the machine and centred carefully, and the load was applied to the side normal to the
direction of compaction, where the distance between the lower rollers was 400 mm and the
D=100 mm
P (load)
P (load)
Cylinder
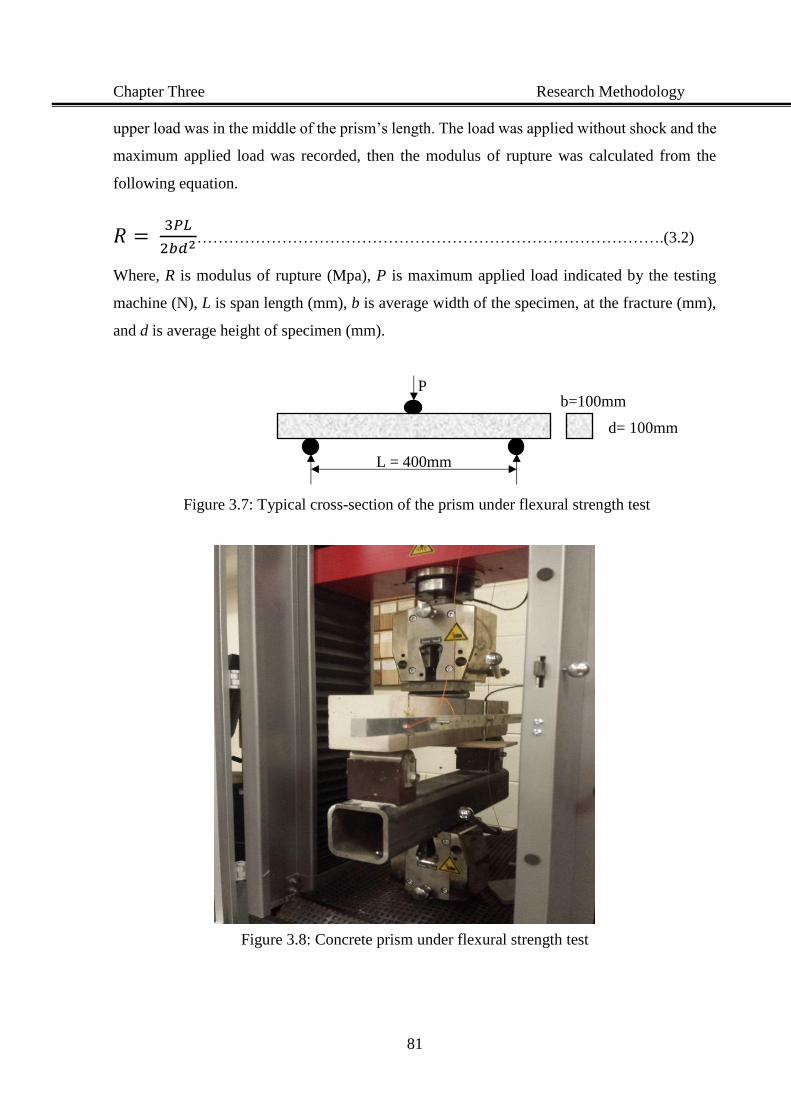
Chapter Three Research Methodology
81
upper load was in the middle of the prism’s length. The load was applied without shock and the
maximum applied load was recorded, then the modulus of rupture was calculated from the
following equation.
𝑅 = 3𝑃𝐿
2𝑏𝑑2…………………………………………………………………………….(3.2)
Where, R is modulus of rupture (Mpa), P is maximum applied load indicated by the testing
machine (N), L is span length (mm), b is average width of the specimen, at the fracture (mm),
and d is average height of specimen (mm).
Figure 3.7: Typical cross-section of the prism under flexural strength test
Figure 3.8: Concrete prism under flexural strength test
P
L = 400mm
d= 100mm
b=100mm
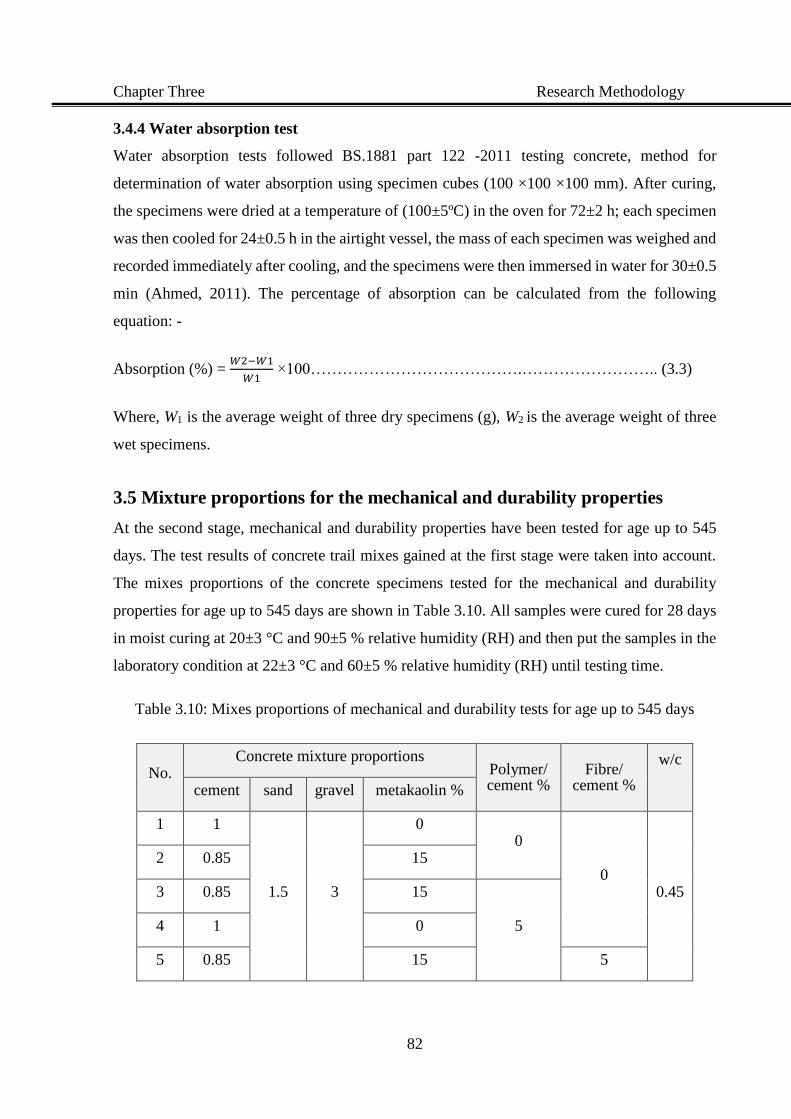
Chapter Three Research Methodology
82
3.4.4 Water absorption test
Water absorption tests followed BS.1881 part 122 -2011 testing concrete, method for
determination of water absorption using specimen cubes (100 ×100 ×100 mm). After curing,
the specimens were dried at a temperature of (100±5ºC) in the oven for 72±2 h; each specimen
was then cooled for 24±0.5 h in the airtight vessel, the mass of each specimen was weighed and
recorded immediately after cooling, and the specimens were then immersed in water for 30±0.5
min (Ahmed, 2011). The percentage of absorption can be calculated from the following
equation: -
Absorption (%) = 𝑊2−𝑊1
𝑊1 ×100………………………………….…………………….. (3.3)
Where, W1 is the average weight of three dry specimens (g), W2 is the average weight of three
wet specimens.
3.5 Mixture proportions for the mechanical and durability properties
At the second stage, mechanical and durability properties have been tested for age up to 545
days. The test results of concrete trail mixes gained at the first stage were taken into account.
The mixes proportions of the concrete specimens tested for the mechanical and durability
properties for age up to 545 days are shown in Table 3.10. All samples were cured for 28 days
in moist curing at 20±3 °C and 90±5 % relative humidity (RH) and then put the samples in the
laboratory condition at 22±3 °C and 60±5 % relative humidity (RH) until testing time.
Table 3.10: Mixes proportions of mechanical and durability tests for age up to 545 days
No. Concrete mixture proportions
Polymer/ cement %
Fibre/ cement %
w/c
cement sand gravel metakaolin %
1 1
1.5 3
0 0
0 0.45
2 0.85 15
3 0.85 15
5 4 1 0
5 0.85 15 5
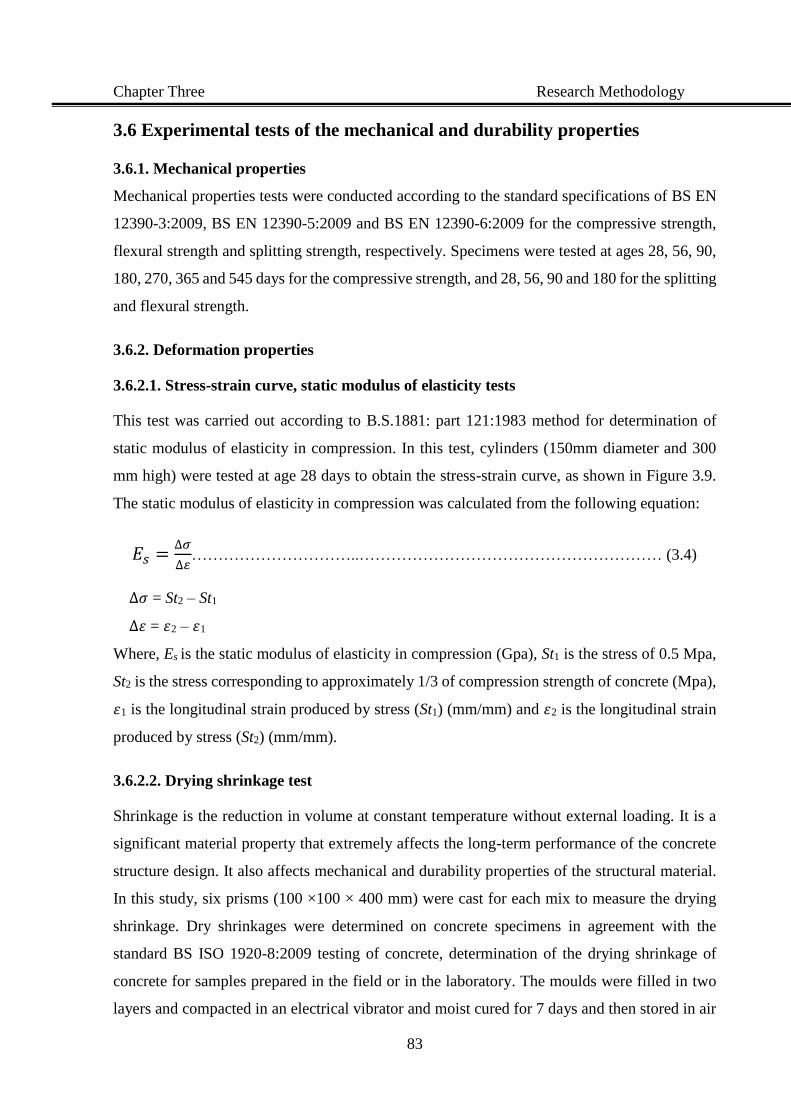
Chapter Three Research Methodology
83
3.6 Experimental tests of the mechanical and durability properties
3.6.1. Mechanical properties
Mechanical properties tests were conducted according to the standard specifications of BS EN
12390-3:2009, BS EN 12390-5:2009 and BS EN 12390-6:2009 for the compressive strength,
flexural strength and splitting strength, respectively. Specimens were tested at ages 28, 56, 90,
180, 270, 365 and 545 days for the compressive strength, and 28, 56, 90 and 180 for the splitting
and flexural strength.
3.6.2. Deformation properties
3.6.2.1. Stress-strain curve, static modulus of elasticity tests
This test was carried out according to B.S.1881: part 121:1983 method for determination of
static modulus of elasticity in compression. In this test, cylinders (150mm diameter and 300
mm high) were tested at age 28 days to obtain the stress-strain curve, as shown in Figure 3.9.
The static modulus of elasticity in compression was calculated from the following equation:
𝐸𝑠 =∆𝜎
∆𝜀…………………………..………………………………………………… (3.4)
∆𝜎 = St2 – St1
∆𝜀 = 𝜀2 – 𝜀1
Where, Es is the static modulus of elasticity in compression (Gpa), St1 is the stress of 0.5 Mpa,
St2 is the stress corresponding to approximately 1/3 of compression strength of concrete (Mpa),
𝜀1 is the longitudinal strain produced by stress (St1) (mm/mm) and 𝜀2 is the longitudinal strain
produced by stress (St2) (mm/mm).
3.6.2.2. Drying shrinkage test
Shrinkage is the reduction in volume at constant temperature without external loading. It is a
significant material property that extremely affects the long-term performance of the concrete
structure design. It also affects mechanical and durability properties of the structural material.
In this study, six prisms (100 ×100 × 400 mm) were cast for each mix to measure the drying
shrinkage. Dry shrinkages were determined on concrete specimens in agreement with the
standard BS ISO 1920-8:2009 testing of concrete, determination of the drying shrinkage of
concrete for samples prepared in the field or in the laboratory. The moulds were filled in two
layers and compacted in an electrical vibrator and moist cured for 7 days and then stored in air
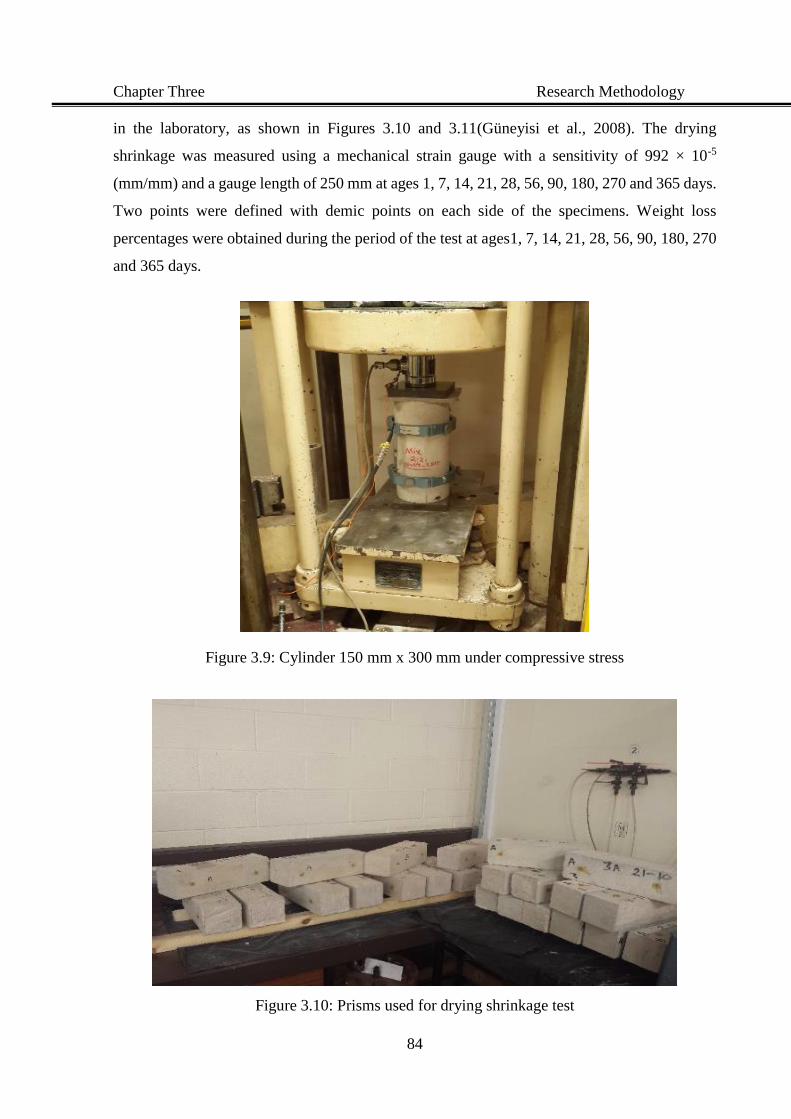
Chapter Three Research Methodology
84
in the laboratory, as shown in Figures 3.10 and 3.11(Güneyisi et al., 2008). The drying
shrinkage was measured using a mechanical strain gauge with a sensitivity of 992 × 10-5
(mm/mm) and a gauge length of 250 mm at ages 1, 7, 14, 21, 28, 56, 90, 180, 270 and 365 days.
Two points were defined with demic points on each side of the specimens. Weight loss
percentages were obtained during the period of the test at ages1, 7, 14, 21, 28, 56, 90, 180, 270
and 365 days.
Figure 3.9: Cylinder 150 mm x 300 mm under compressive stress
Figure 3.10: Prisms used for drying shrinkage test
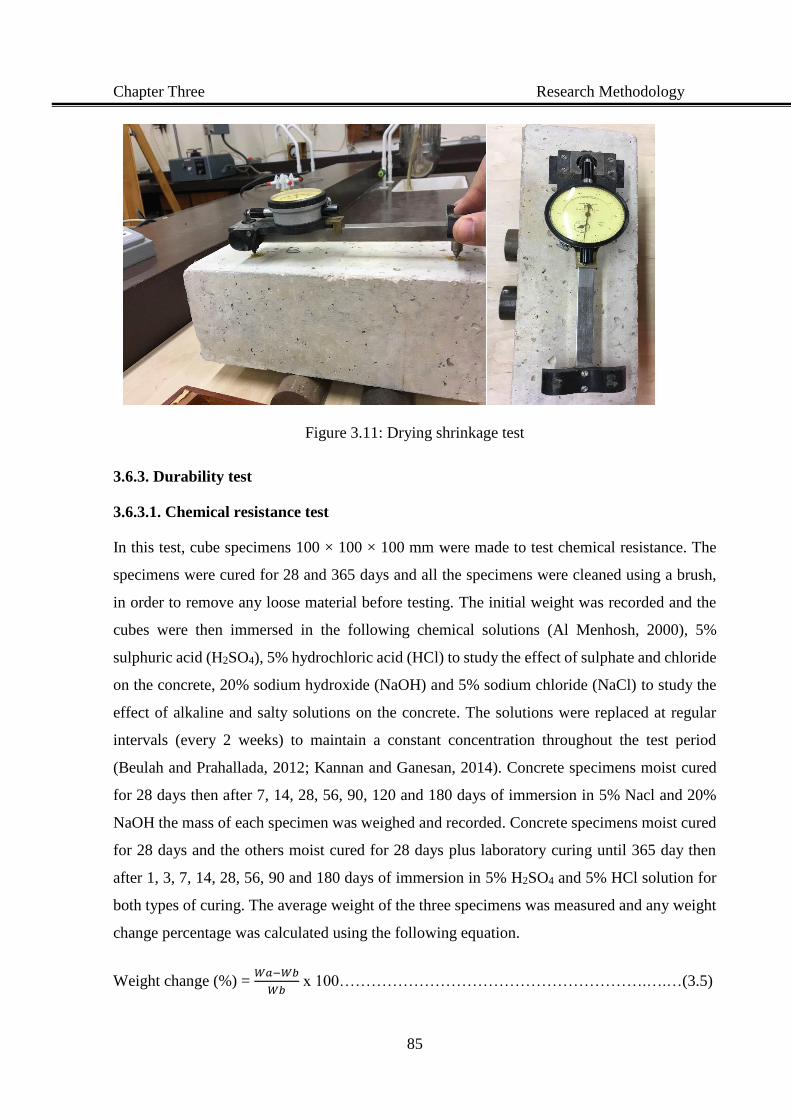
Chapter Three Research Methodology
85
Figure 3.11: Drying shrinkage test
3.6.3. Durability test
3.6.3.1. Chemical resistance test
In this test, cube specimens 100 × 100 × 100 mm were made to test chemical resistance. The
specimens were cured for 28 and 365 days and all the specimens were cleaned using a brush,
in order to remove any loose material before testing. The initial weight was recorded and the
cubes were then immersed in the following chemical solutions (Al Menhosh, 2000), 5%
sulphuric acid (H2SO4), 5% hydrochloric acid (HCl) to study the effect of sulphate and chloride
on the concrete, 20% sodium hydroxide (NaOH) and 5% sodium chloride (NaCl) to study the
effect of alkaline and salty solutions on the concrete. The solutions were replaced at regular
intervals (every 2 weeks) to maintain a constant concentration throughout the test period
(Beulah and Prahallada, 2012; Kannan and Ganesan, 2014). Concrete specimens moist cured
for 28 days then after 7, 14, 28, 56, 90, 120 and 180 days of immersion in 5% Nacl and 20%
NaOH the mass of each specimen was weighed and recorded. Concrete specimens moist cured
for 28 days and the others moist cured for 28 days plus laboratory curing until 365 day then
after 1, 3, 7, 14, 28, 56, 90 and 180 days of immersion in 5% H2SO4 and 5% HCl solution for
both types of curing. The average weight of the three specimens was measured and any weight
change percentage was calculated using the following equation.
Weight change (%) = 𝑊𝑎−𝑊𝑏
𝑊𝑏 x 100………………………………………………….….…(3.5)
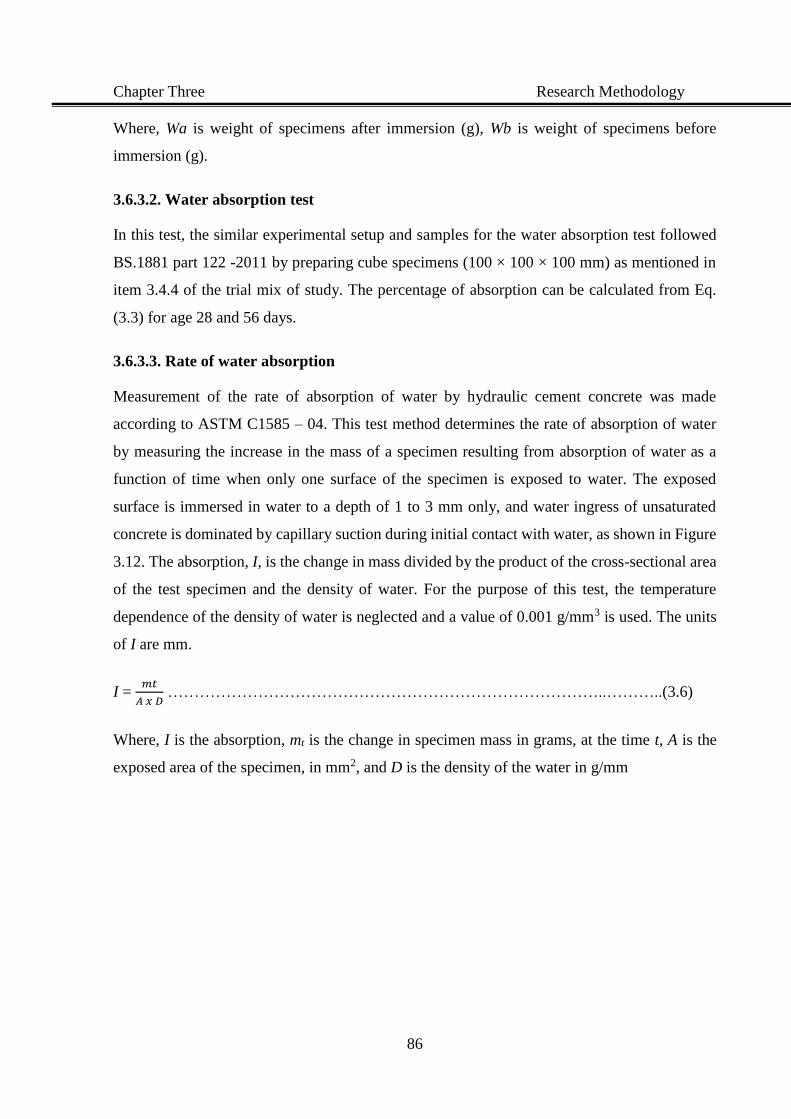
Chapter Three Research Methodology
86
Where, Wa is weight of specimens after immersion (g), Wb is weight of specimens before
immersion (g).
3.6.3.2. Water absorption test
In this test, the similar experimental setup and samples for the water absorption test followed
BS.1881 part 122 -2011 by preparing cube specimens (100 × 100 × 100 mm) as mentioned in
item 3.4.4 of the trial mix of study. The percentage of absorption can be calculated from Eq.
(3.3) for age 28 and 56 days.
3.6.3.3. Rate of water absorption
Measurement of the rate of absorption of water by hydraulic cement concrete was made
according to ASTM C1585 – 04. This test method determines the rate of absorption of water
by measuring the increase in the mass of a specimen resulting from absorption of water as a
function of time when only one surface of the specimen is exposed to water. The exposed
surface is immersed in water to a depth of 1 to 3 mm only, and water ingress of unsaturated
concrete is dominated by capillary suction during initial contact with water, as shown in Figure
3.12. The absorption, I, is the change in mass divided by the product of the cross-sectional area
of the test specimen and the density of water. For the purpose of this test, the temperature
dependence of the density of water is neglected and a value of 0.001 g/mm3 is used. The units
of I are mm.
I = 𝑚𝑡
𝐴 𝑥 𝐷 ………………………………………………………………………..………..(3.6)
Where, I is the absorption, mt is the change in specimen mass in grams, at the time t, A is the
exposed area of the specimen, in mm2, and D is the density of the water in g/mm
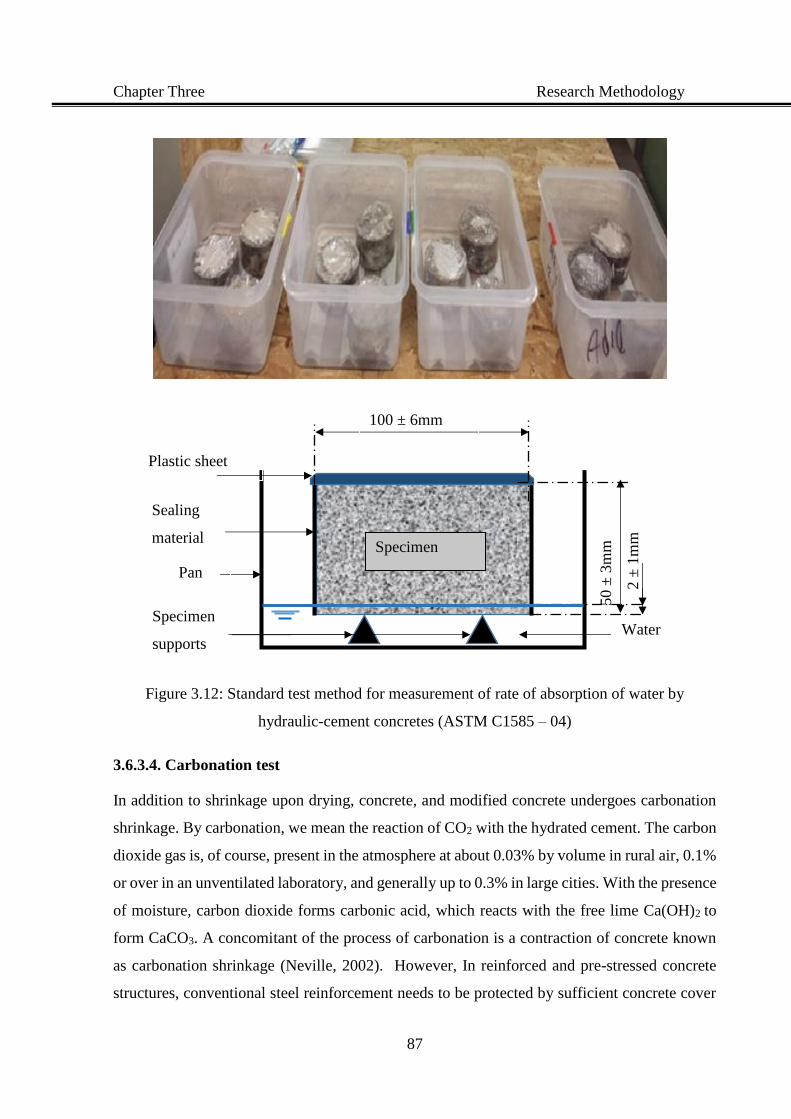
Chapter Three Research Methodology
87
Figure 3.12: Standard test method for measurement of rate of absorption of water by
hydraulic-cement concretes (ASTM C1585 – 04)
3.6.3.4. Carbonation test
In addition to shrinkage upon drying, concrete, and modified concrete undergoes carbonation
shrinkage. By carbonation, we mean the reaction of CO2 with the hydrated cement. The carbon
dioxide gas is, of course, present in the atmosphere at about 0.03% by volume in rural air, 0.1%
or over in an unventilated laboratory, and generally up to 0.3% in large cities. With the presence
of moisture, carbon dioxide forms carbonic acid, which reacts with the free lime Ca(OH)2 to
form CaCO3. A concomitant of the process of carbonation is a contraction of concrete known
as carbonation shrinkage (Neville, 2002). However, In reinforced and pre-stressed concrete
structures, conventional steel reinforcement needs to be protected by sufficient concrete cover
2 ±
1m
m
Specimen
Pan
Plastic sheet
Specimen
supports
Sealing
material
50 ±
3m
m
Water
100 ± 6mm
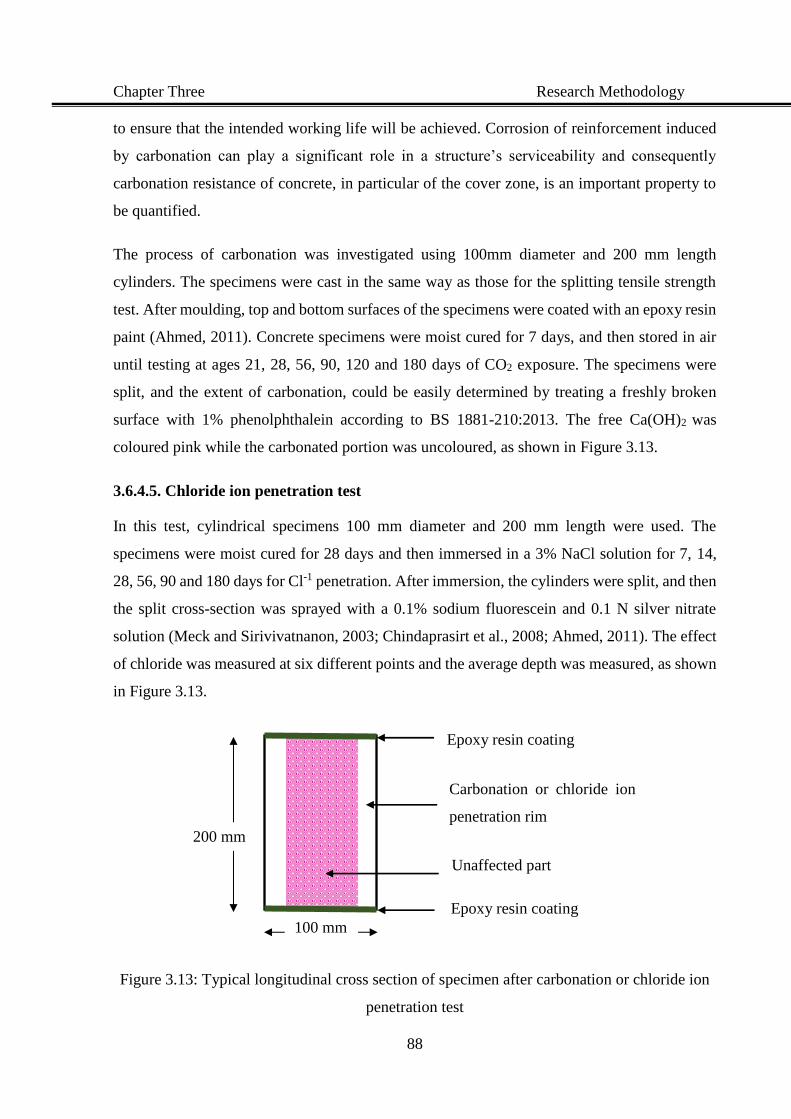
Chapter Three Research Methodology
88
to ensure that the intended working life will be achieved. Corrosion of reinforcement induced
by carbonation can play a significant role in a structure’s serviceability and consequently
carbonation resistance of concrete, in particular of the cover zone, is an important property to
be quantified.
The process of carbonation was investigated using 100mm diameter and 200 mm length
cylinders. The specimens were cast in the same way as those for the splitting tensile strength
test. After moulding, top and bottom surfaces of the specimens were coated with an epoxy resin
paint (Ahmed, 2011). Concrete specimens were moist cured for 7 days, and then stored in air
until testing at ages 21, 28, 56, 90, 120 and 180 days of CO2 exposure. The specimens were
split, and the extent of carbonation, could be easily determined by treating a freshly broken
surface with 1% phenolphthalein according to BS 1881-210:2013. The free Ca(OH)2 was
coloured pink while the carbonated portion was uncoloured, as shown in Figure 3.13.
3.6.4.5. Chloride ion penetration test
In this test, cylindrical specimens 100 mm diameter and 200 mm length were used. The
specimens were moist cured for 28 days and then immersed in a 3% NaCl solution for 7, 14,
28, 56, 90 and 180 days for Cl-1 penetration. After immersion, the cylinders were split, and then
the split cross-section was sprayed with a 0.1% sodium fluorescein and 0.1 N silver nitrate
solution (Meck and Sirivivatnanon, 2003; Chindaprasirt et al., 2008; Ahmed, 2011). The effect
of chloride was measured at six different points and the average depth was measured, as shown
in Figure 3.13.
Figure 3.13: Typical longitudinal cross section of specimen after carbonation or chloride ion
penetration test
200 mm
100 mm
Epoxy resin coating
Carbonation or chloride ion
penetration rim
Unaffected part
Epoxy resin coating
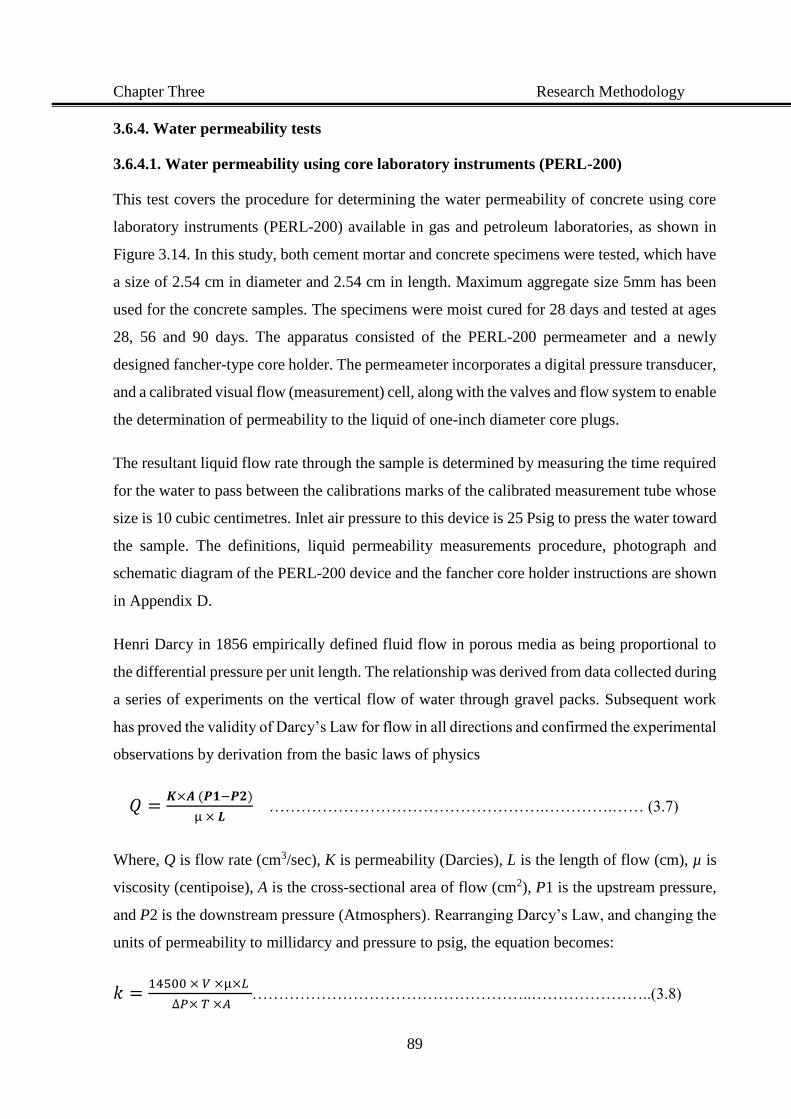
Chapter Three Research Methodology
89
3.6.4. Water permeability tests
3.6.4.1. Water permeability using core laboratory instruments (PERL-200)
This test covers the procedure for determining the water permeability of concrete using core
laboratory instruments (PERL-200) available in gas and petroleum laboratories, as shown in
Figure 3.14. In this study, both cement mortar and concrete specimens were tested, which have
a size of 2.54 cm in diameter and 2.54 cm in length. Maximum aggregate size 5mm has been
used for the concrete samples. The specimens were moist cured for 28 days and tested at ages
28, 56 and 90 days. The apparatus consisted of the PERL-200 permeameter and a newly
designed fancher-type core holder. The permeameter incorporates a digital pressure transducer,
and a calibrated visual flow (measurement) cell, along with the valves and flow system to enable
the determination of permeability to the liquid of one-inch diameter core plugs.
The resultant liquid flow rate through the sample is determined by measuring the time required
for the water to pass between the calibrations marks of the calibrated measurement tube whose
size is 10 cubic centimetres. Inlet air pressure to this device is 25 Psig to press the water toward
the sample. The definitions, liquid permeability measurements procedure, photograph and
schematic diagram of the PERL-200 device and the fancher core holder instructions are shown
in Appendix D.
Henri Darcy in 1856 empirically defined fluid flow in porous media as being proportional to
the differential pressure per unit length. The relationship was derived from data collected during
a series of experiments on the vertical flow of water through gravel packs. Subsequent work
has proved the validity of Darcy’s Law for flow in all directions and confirmed the experimental
observations by derivation from the basic laws of physics
𝑄 =𝑲×𝑨 (𝑷𝟏−𝑷𝟐)
µ × 𝑳 …………………………………………….………….…… (3.7)
Where, Q is flow rate (cm3/sec), K is permeability (Darcies), L is the length of flow (cm), µ is
viscosity (centipoise), A is the cross-sectional area of flow (cm2), P1 is the upstream pressure,
and P2 is the downstream pressure (Atmosphers). Rearranging Darcy’s Law, and changing the
units of permeability to millidarcy and pressure to psig, the equation becomes:
𝑘 =14500 × 𝑉 ×µ×𝐿
∆𝑃× 𝑇 ×𝐴……………………………………………..…………………..(3.8)
Chapter Three Research Methodology
90
Where, k is the permeability (millidarcies), V is the volume of fluid went through (millilitre), L
is the length of flow (cm), µ is viscosity of the liquid used in the test (centipoises), ∆P is the
pressure difference between inlet and outlet (psig), T is time in seconds and A is the cross-
sectional area of flow (cm2).
Figure 3.14: PERL-200 device to measure water permeability for concrete and mortar
3.6.4.2. Depth of penetration of water under pressure
The water penetration test, which is most commonly used to evaluate the permeability of
concrete, is the one specified by BS EN-12390-8:2009. In this test, water was applied on one
face of the 150 ×150 × 150 mm concrete cube specimens under a pressure of 72.5 psig (5 bars),
as shown in Figures 3.15 and 3.16. This pressure was maintained constant for a period of 72 h.
After the completion of the test, the specimens were taken out and split open into two halves.
The water penetration profile on the concrete surface was then marked and the maximum depth
of water penetration in specimens was recorded and considered as an indicator of the water
penetration. The specimens were tested at ages 28, 56 and 90 days.
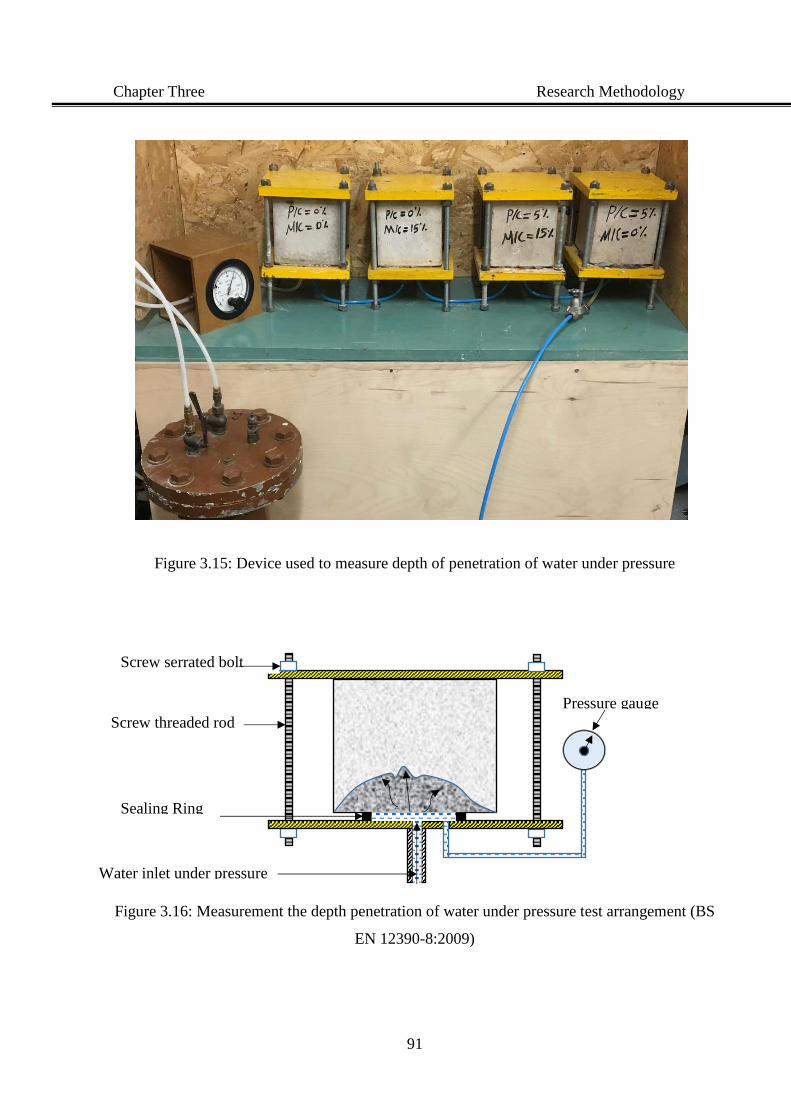
Chapter Three Research Methodology
91
Figure 3.15: Device used to measure depth of penetration of water under pressure
Figure 3.16: Measurement the depth penetration of water under pressure test arrangement (BS
EN 12390-8:2009)
Sealing Ring
Water inlet under pressure
Screw threaded rod
Screw serrated bolt
Pressure gauge
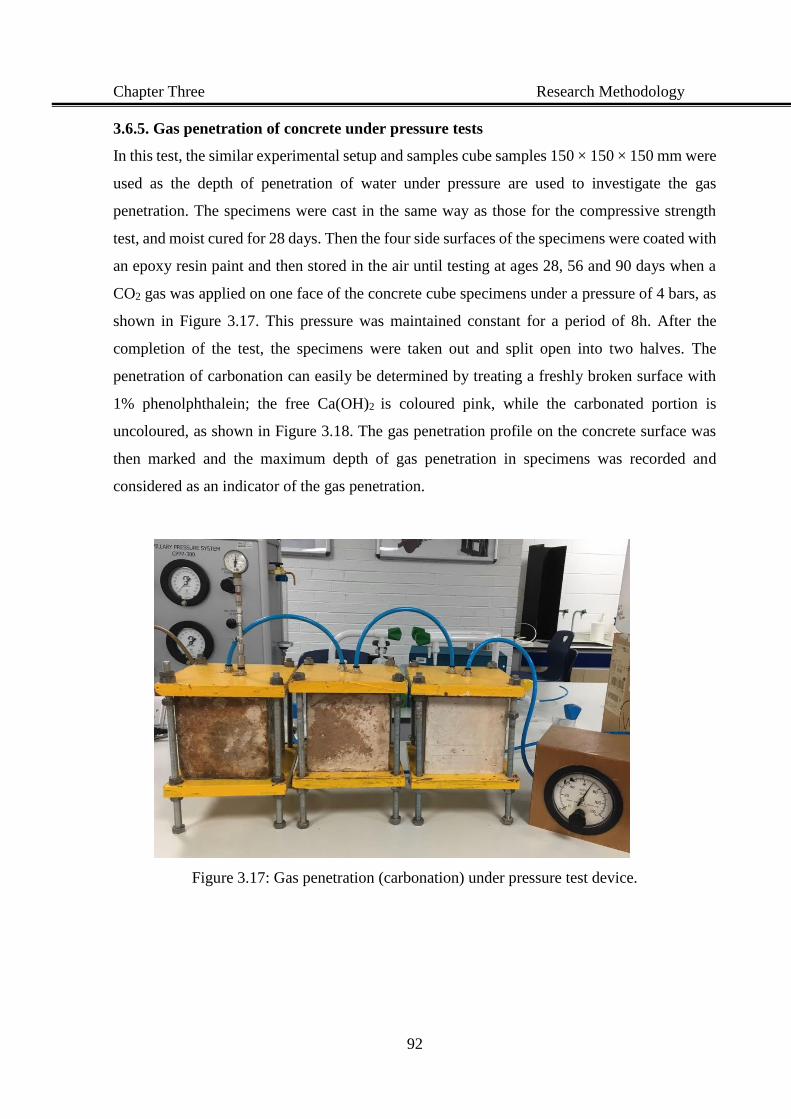
Chapter Three Research Methodology
92
3.6.5. Gas penetration of concrete under pressure tests
In this test, the similar experimental setup and samples cube samples 150 × 150 × 150 mm were
used as the depth of penetration of water under pressure are used to investigate the gas
penetration. The specimens were cast in the same way as those for the compressive strength
test, and moist cured for 28 days. Then the four side surfaces of the specimens were coated with
an epoxy resin paint and then stored in the air until testing at ages 28, 56 and 90 days when a
CO2 gas was applied on one face of the concrete cube specimens under a pressure of 4 bars, as
shown in Figure 3.17. This pressure was maintained constant for a period of 8h. After the
completion of the test, the specimens were taken out and split open into two halves. The
penetration of carbonation can easily be determined by treating a freshly broken surface with
1% phenolphthalein; the free Ca(OH)2 is coloured pink, while the carbonated portion is
uncoloured, as shown in Figure 3.18. The gas penetration profile on the concrete surface was
then marked and the maximum depth of gas penetration in specimens was recorded and
considered as an indicator of the gas penetration.
Figure 3.17: Gas penetration (carbonation) under pressure test device.
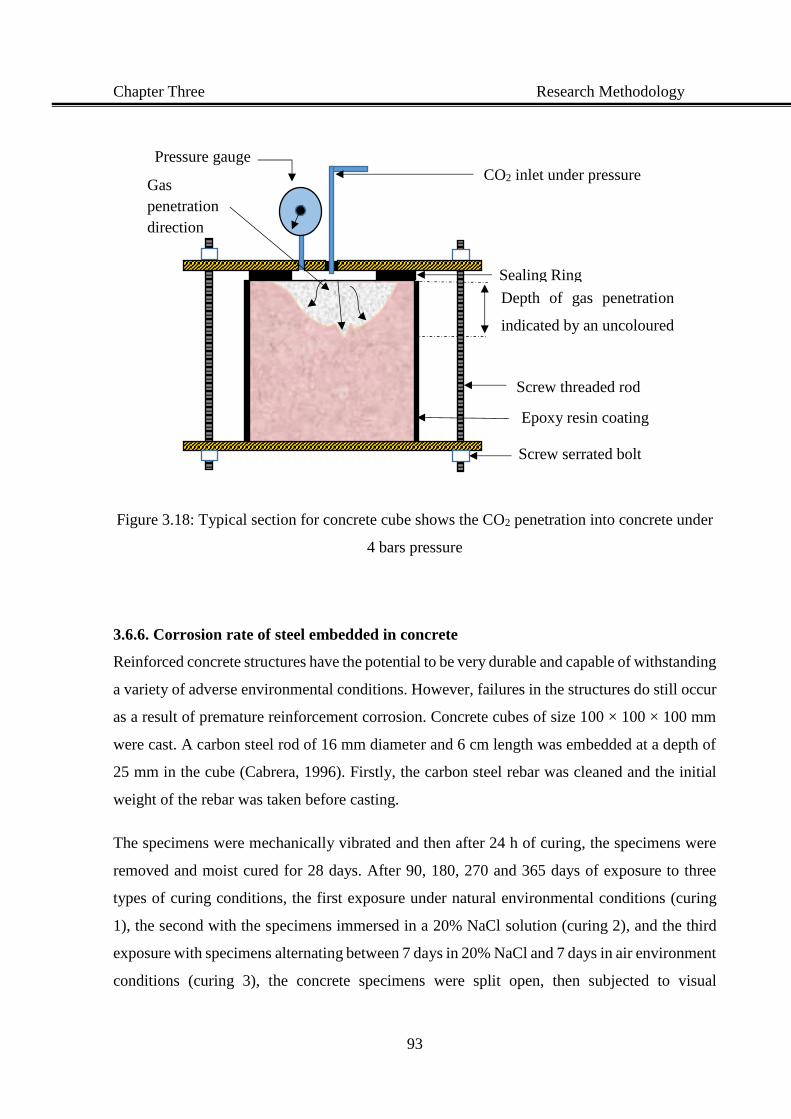
Chapter Three Research Methodology
93
Figure 3.18: Typical section for concrete cube shows the CO2 penetration into concrete under
4 bars pressure
3.6.6. Corrosion rate of steel embedded in concrete
Reinforced concrete structures have the potential to be very durable and capable of withstanding
a variety of adverse environmental conditions. However, failures in the structures do still occur
as a result of premature reinforcement corrosion. Concrete cubes of size 100 × 100 × 100 mm
were cast. A carbon steel rod of 16 mm diameter and 6 cm length was embedded at a depth of
25 mm in the cube (Cabrera, 1996). Firstly, the carbon steel rebar was cleaned and the initial
weight of the rebar was taken before casting.
The specimens were mechanically vibrated and then after 24 h of curing, the specimens were
removed and moist cured for 28 days. After 90, 180, 270 and 365 days of exposure to three
types of curing conditions, the first exposure under natural environmental conditions (curing
1), the second with the specimens immersed in a 20% NaCl solution (curing 2), and the third
exposure with specimens alternating between 7 days in 20% NaCl and 7 days in air environment
conditions (curing 3), the concrete specimens were split open, then subjected to visual
Gas
penetration
direction
Depth of gas penetration
indicated by an uncoloured
area
Sealing Ring
Screw threaded rod
Screw serrated bolt
CO2 inlet under pressure
Pressure gauge
Epoxy resin coating
Chapter Three Research Methodology
94
observation. The carbon steel was separated out from the concrete and the losses in weight were
determined. The corrosion rate is calculated using the following equation:
Corrosion rate = 87.6×𝑊 𝐷×𝐴 ×𝑇
…………………………………………….……...………. (3.9)
Weight loss W= W1 - Wo ………………………………………………………… (3.10)
Where, W is the weight loss in g, Wo is the weight of sample before the curing, W1 is the weight
of the sample after the curing, D is the density of the material used, A is the area of the specimen
(cm2), T is time duration in h.
Specimens with steel reinforcement were cast with both the conventional and modified concrete
to study the effect of additive material on the steel reinforcement corrosion in the concrete.
CHAPTER FOUR
EFFECT OF METAKAOLIN,
POLYMER AND FIBRE ON
WORKABILITY AND
STRENGTH OF CONCRETE
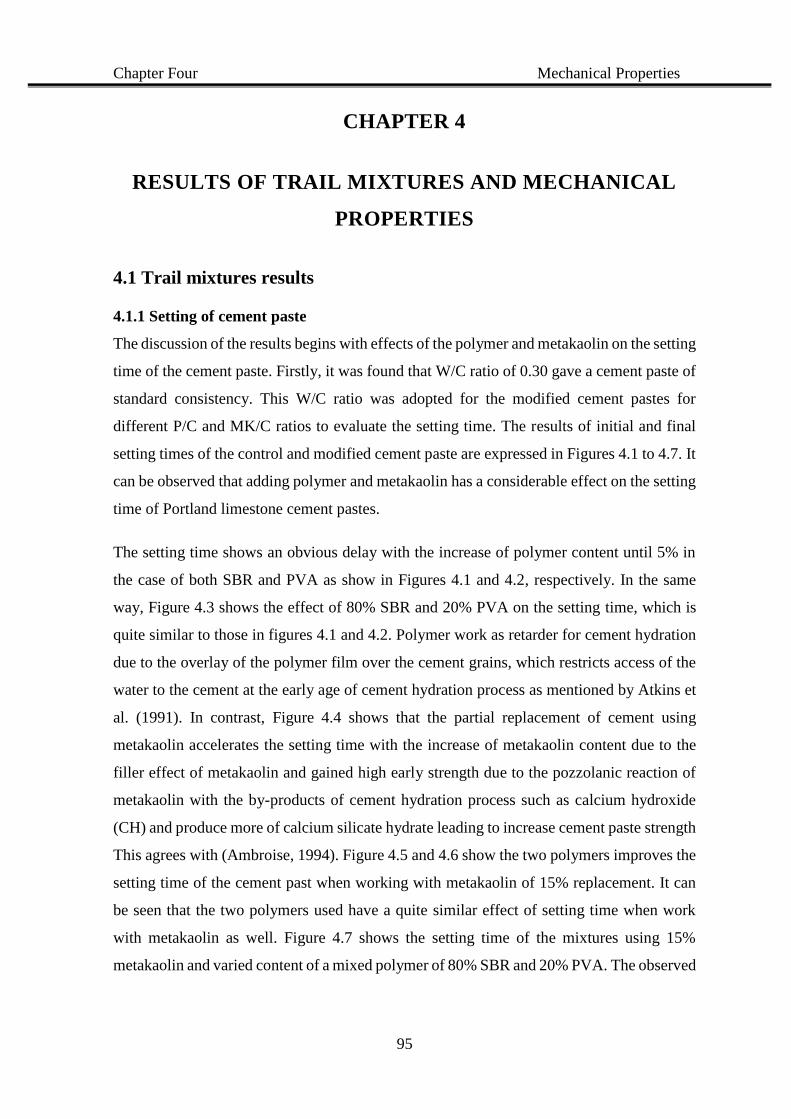
Chapter Four Mechanical Properties
95
CHAPTER 4
RESULTS OF TRAIL MIXTURES AND MECHANICAL
PROPERTIES
4.1 Trail mixtures results
4.1.1 Setting of cement paste
The discussion of the results begins with effects of the polymer and metakaolin on the setting
time of the cement paste. Firstly, it was found that W/C ratio of 0.30 gave a cement paste of
standard consistency. This W/C ratio was adopted for the modified cement pastes for
different P/C and MK/C ratios to evaluate the setting time. The results of initial and final
setting times of the control and modified cement paste are expressed in Figures 4.1 to 4.7. It
can be observed that adding polymer and metakaolin has a considerable effect on the setting
time of Portland limestone cement pastes.
The setting time shows an obvious delay with the increase of polymer content until 5% in
the case of both SBR and PVA as show in Figures 4.1 and 4.2, respectively. In the same
way, Figure 4.3 shows the effect of 80% SBR and 20% PVA on the setting time, which is
quite similar to those in figures 4.1 and 4.2. Polymer work as retarder for cement hydration
due to the overlay of the polymer film over the cement grains, which restricts access of the
water to the cement at the early age of cement hydration process as mentioned by Atkins et
al. (1991). In contrast, Figure 4.4 shows that the partial replacement of cement using
metakaolin accelerates the setting time with the increase of metakaolin content due to the
filler effect of metakaolin and gained high early strength due to the pozzolanic reaction of
metakaolin with the by-products of cement hydration process such as calcium hydroxide
(CH) and produce more of calcium silicate hydrate leading to increase cement paste strength
This agrees with (Ambroise, 1994). Figure 4.5 and 4.6 show the two polymers improves the
setting time of the cement past when working with metakaolin of 15% replacement. It can
be seen that the two polymers used have a quite similar effect of setting time when work
with metakaolin as well. Figure 4.7 shows the setting time of the mixtures using 15%
metakaolin and varied content of a mixed polymer of 80% SBR and 20% PVA. The observed
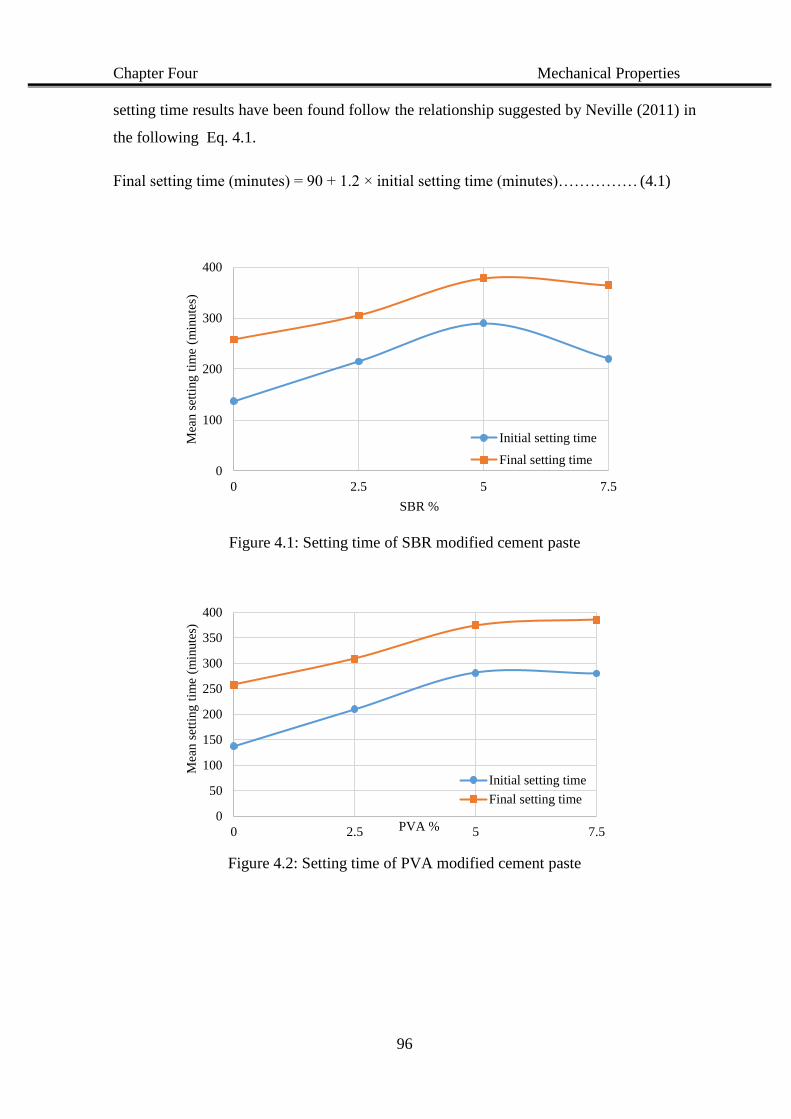
Chapter Four Mechanical Properties
96
setting time results have been found follow the relationship suggested by Neville (2011) in
the following Eq. 4.1.
Final setting time (minutes) = 90 + 1.2 × initial setting time (minutes)…………… (4.1)
Figure 4.1: Setting time of SBR modified cement paste
Figure 4.2: Setting time of PVA modified cement paste
0
100
200
300
400
0 2.5 5 7.5
Mea
n s
etti
ng t
ime
(min
ute
s)
SBR %
Initial setting time
Final setting time
0
50
100
150
200
250
300
350
400
0 2.5 5 7.5
Mea
n s
etti
ng t
ime
(min
ute
s)
PVA %
Initial setting time
Final setting time
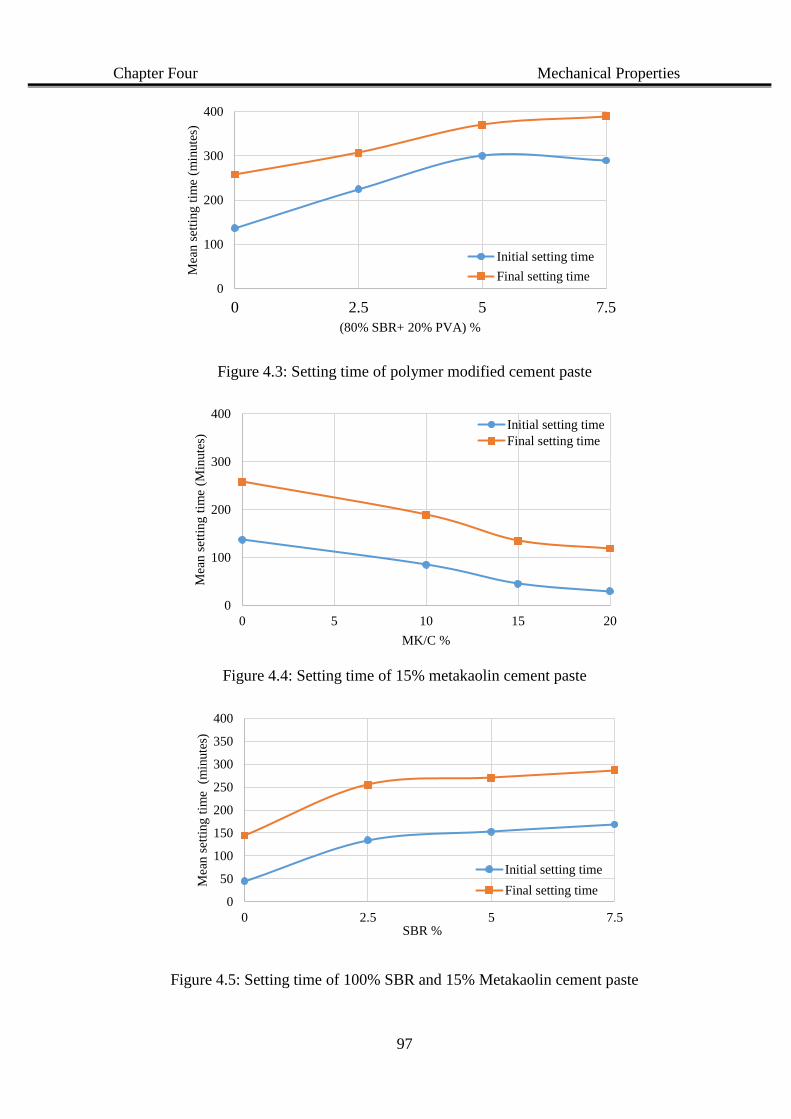
Chapter Four Mechanical Properties
97
Figure 4.3: Setting time of polymer modified cement paste
Figure 4.4: Setting time of 15% metakaolin cement paste
Figure 4.5: Setting time of 100% SBR and 15% Metakaolin cement paste
0
100
200
300
400
0 2.5 5 7.5
Mea
n s
etti
ng t
ime
(min
ute
s)
(80% SBR+ 20% PVA) %
Initial setting time
Final setting time
0
100
200
300
400
0 5 10 15 20
Mea
n s
etti
ng t
ime
(Min
ute
s)
MK/C %
Initial setting time
Final setting time
0
50
100
150
200
250
300
350
400
0 2.5 5 7.5
Mea
n s
etti
ng t
ime
(m
inute
s)
SBR %
Initial setting time
Final setting time
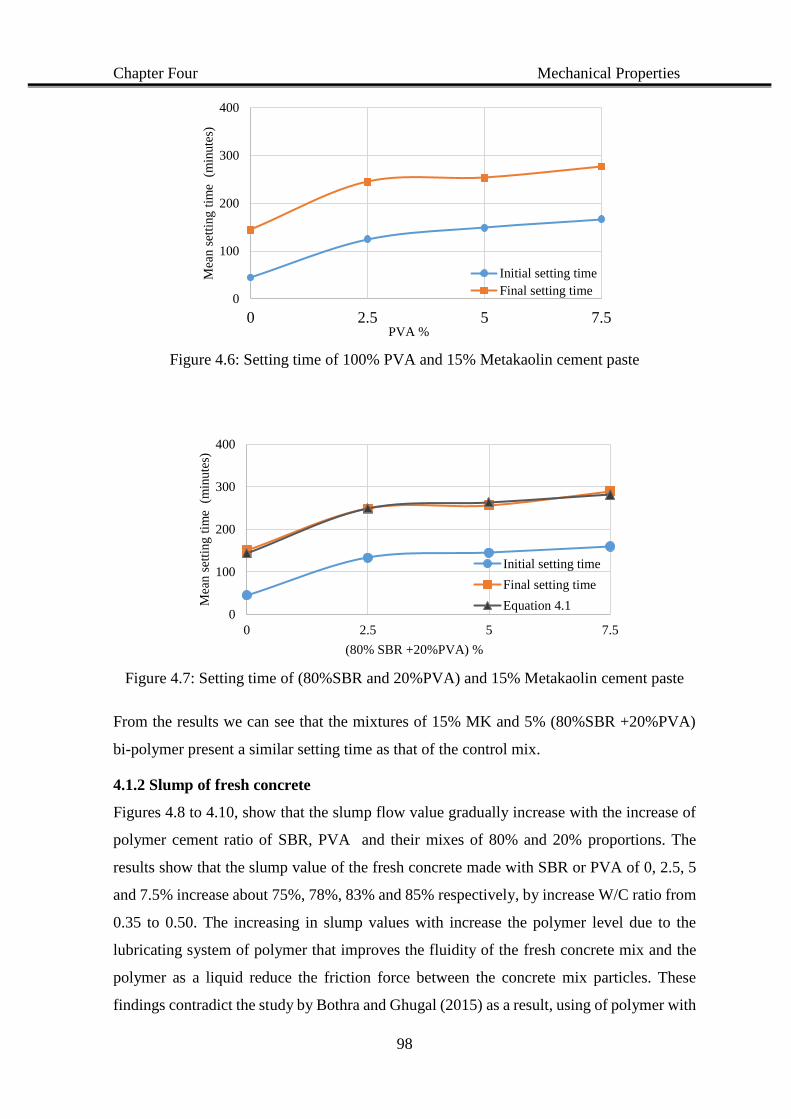
Chapter Four Mechanical Properties
98
Figure 4.6: Setting time of 100% PVA and 15% Metakaolin cement paste
Figure 4.7: Setting time of (80%SBR and 20%PVA) and 15% Metakaolin cement paste
From the results we can see that the mixtures of 15% MK and 5% (80%SBR +20%PVA)
bi-polymer present a similar setting time as that of the control mix.
4.1.2 Slump of fresh concrete
Figures 4.8 to 4.10, show that the slump flow value gradually increase with the increase of
polymer cement ratio of SBR, PVA and their mixes of 80% and 20% proportions. The
results show that the slump value of the fresh concrete made with SBR or PVA of 0, 2.5, 5
and 7.5% increase about 75%, 78%, 83% and 85% respectively, by increase W/C ratio from
0.35 to 0.50. The increasing in slump values with increase the polymer level due to the
lubricating system of polymer that improves the fluidity of the fresh concrete mix and the
polymer as a liquid reduce the friction force between the concrete mix particles. These
findings contradict the study by Bothra and Ghugal (2015) as a result, using of polymer with
0
100
200
300
400
0 2.5 5 7.5
Mea
n s
etti
ng t
ime
(m
inute
s)
PVA %
Initial setting time
Final setting time
0
100
200
300
400
0 2.5 5 7.5
Mea
n s
etti
ng t
ime
(m
inute
s)
(80% SBR +20%PVA) %
Initial setting time
Final setting time
Equation 4.1
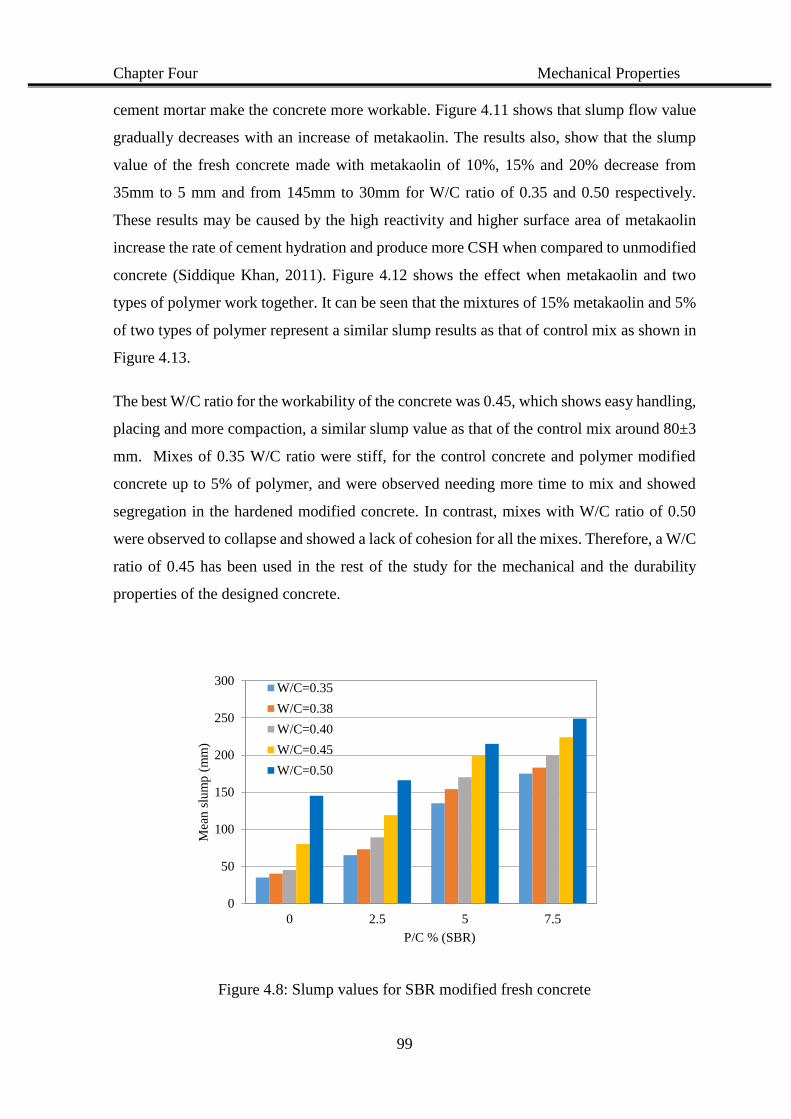
Chapter Four Mechanical Properties
99
cement mortar make the concrete more workable. Figure 4.11 shows that slump flow value
gradually decreases with an increase of metakaolin. The results also, show that the slump
value of the fresh concrete made with metakaolin of 10%, 15% and 20% decrease from
35mm to 5 mm and from 145mm to 30mm for W/C ratio of 0.35 and 0.50 respectively.
These results may be caused by the high reactivity and higher surface area of metakaolin
increase the rate of cement hydration and produce more CSH when compared to unmodified
concrete (Siddique Khan, 2011). Figure 4.12 shows the effect when metakaolin and two
types of polymer work together. It can be seen that the mixtures of 15% metakaolin and 5%
of two types of polymer represent a similar slump results as that of control mix as shown in
Figure 4.13.
The best W/C ratio for the workability of the concrete was 0.45, which shows easy handling,
placing and more compaction, a similar slump value as that of the control mix around 80±3
mm. Mixes of 0.35 W/C ratio were stiff, for the control concrete and polymer modified
concrete up to 5% of polymer, and were observed needing more time to mix and showed
segregation in the hardened modified concrete. In contrast, mixes with W/C ratio of 0.50
were observed to collapse and showed a lack of cohesion for all the mixes. Therefore, a W/C
ratio of 0.45 has been used in the rest of the study for the mechanical and the durability
properties of the designed concrete.
Figure 4.8: Slump values for SBR modified fresh concrete
0
50
100
150
200
250
300
0 2.5 5 7.5
Mea
n s
lum
p (
mm
)
P/C % (SBR)
W/C=0.35
W/C=0.38
W/C=0.40
W/C=0.45
W/C=0.50
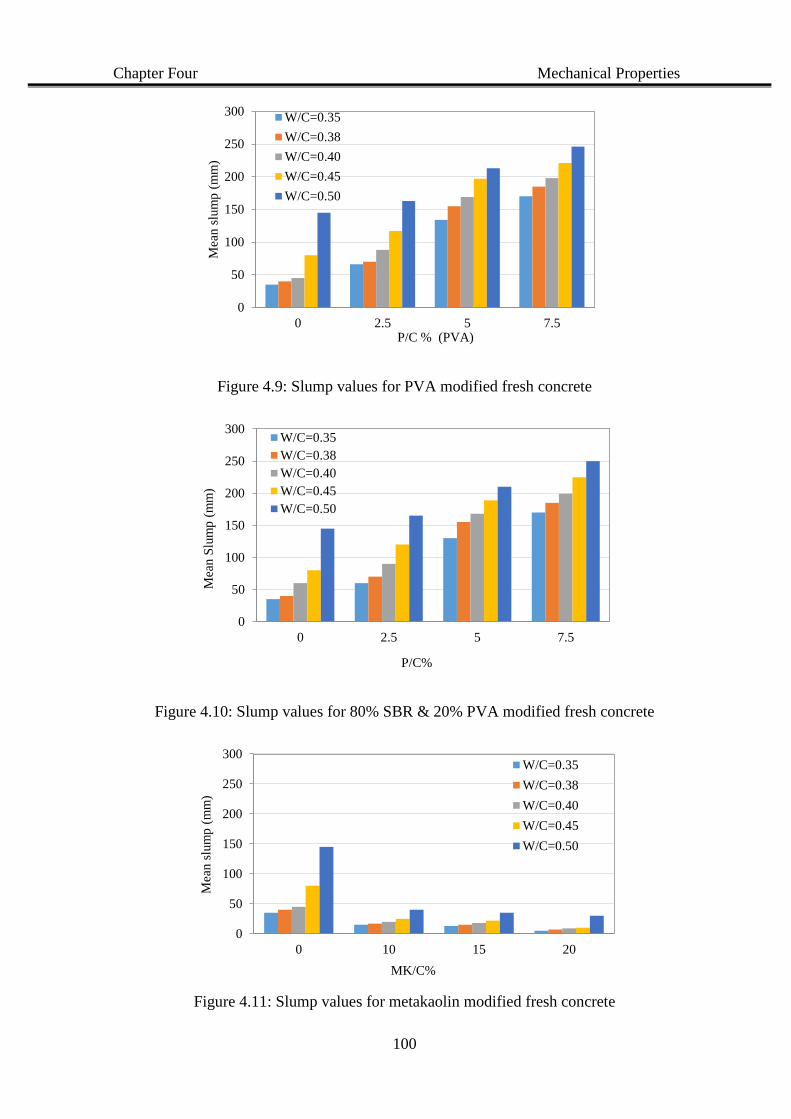
Chapter Four Mechanical Properties
100
Figure 4.9: Slump values for PVA modified fresh concrete
Figure 4.10: Slump values for 80% SBR & 20% PVA modified fresh concrete
Figure 4.11: Slump values for metakaolin modified fresh concrete
0
50
100
150
200
250
300
0 2.5 5 7.5
Mea
n s
lum
p (
mm
)
P/C % (PVA)
W/C=0.35
W/C=0.38
W/C=0.40
W/C=0.45
W/C=0.50
0
50
100
150
200
250
300
0 2.5 5 7.5
Mea
n S
lum
p (
mm
)
P/C%
W/C=0.35
W/C=0.38
W/C=0.40
W/C=0.45
W/C=0.50
0
50
100
150
200
250
300
0 10 15 20
Mea
n s
lum
p (
mm
)
MK/C%
W/C=0.35
W/C=0.38
W/C=0.40
W/C=0.45
W/C=0.50

Chapter Four Mechanical Properties
101
Figure 4.12: Slump values for fresh concrete modified by polymers and 15% metakaolin
Figure 4.13: Slump values with different w/c ratio for the modified fresh concrete
0
50
100
150
200
250
300
0 2.5 5 7.5
Mea
n s
lum
p (
mm
)
P/C %
80% SBR and 20% PVA
W/C=0.35
W/C=0.38
W/C=0.40
W/C=0.45
W/C=0.50
0
50
100
150
200
250
300
0 2.5 5 7.5
Mea
n s
lum
p (
mm
)
(80%SBR & 20% PVA) Polymer %
W/C=0.35
W/C=0.38
W/C=0.40
W/C=0.45
W/C=0.50
W/C=0.45+15% MK/C
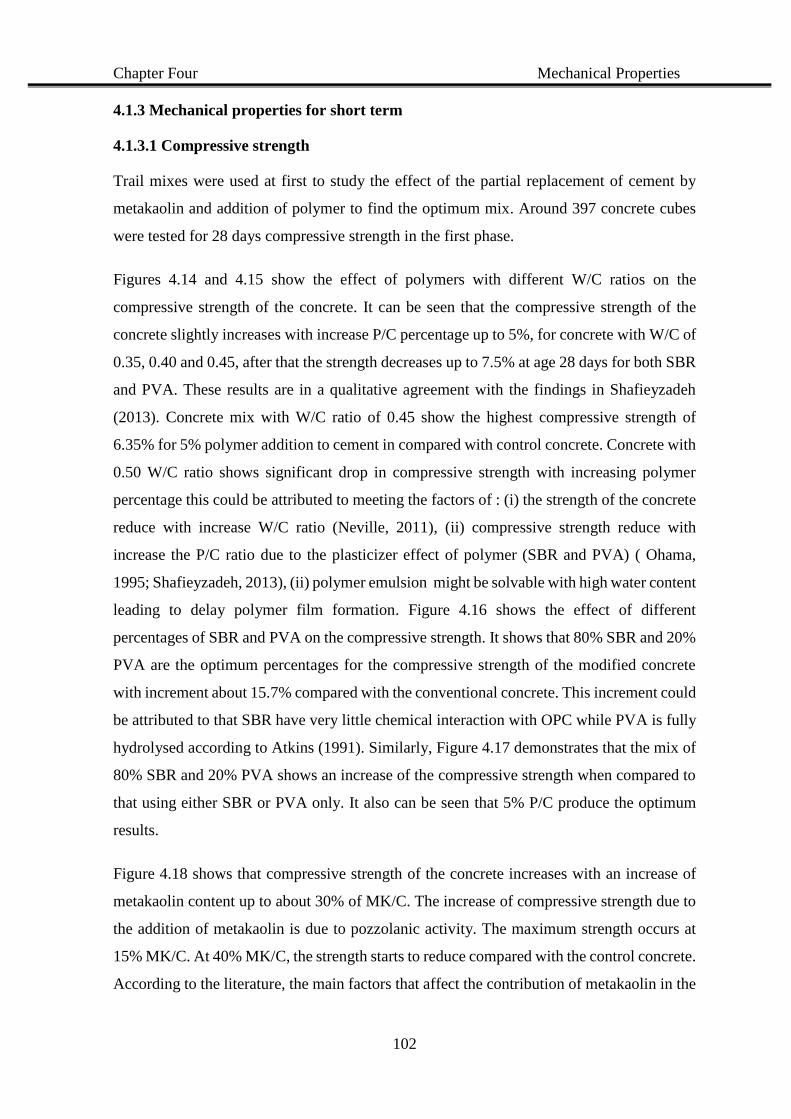
Chapter Four Mechanical Properties
102
4.1.3 Mechanical properties for short term
4.1.3.1 Compressive strength
Trail mixes were used at first to study the effect of the partial replacement of cement by
metakaolin and addition of polymer to find the optimum mix. Around 397 concrete cubes
were tested for 28 days compressive strength in the first phase.
Figures 4.14 and 4.15 show the effect of polymers with different W/C ratios on the
compressive strength of the concrete. It can be seen that the compressive strength of the
concrete slightly increases with increase P/C percentage up to 5%, for concrete with W/C of
0.35, 0.40 and 0.45, after that the strength decreases up to 7.5% at age 28 days for both SBR
and PVA. These results are in a qualitative agreement with the findings in Shafieyzadeh
(2013). Concrete mix with W/C ratio of 0.45 show the highest compressive strength of
6.35% for 5% polymer addition to cement in compared with control concrete. Concrete with
0.50 W/C ratio shows significant drop in compressive strength with increasing polymer
percentage this could be attributed to meeting the factors of : (i) the strength of the concrete
reduce with increase W/C ratio (Neville, 2011), (ii) compressive strength reduce with
increase the P/C ratio due to the plasticizer effect of polymer (SBR and PVA) ( Ohama,
1995; Shafieyzadeh, 2013), (ii) polymer emulsion might be solvable with high water content
leading to delay polymer film formation. Figure 4.16 shows the effect of different
percentages of SBR and PVA on the compressive strength. It shows that 80% SBR and 20%
PVA are the optimum percentages for the compressive strength of the modified concrete
with increment about 15.7% compared with the conventional concrete. This increment could
be attributed to that SBR have very little chemical interaction with OPC while PVA is fully
hydrolysed according to Atkins (1991). Similarly, Figure 4.17 demonstrates that the mix of
80% SBR and 20% PVA shows an increase of the compressive strength when compared to
that using either SBR or PVA only. It also can be seen that 5% P/C produce the optimum
results.
Figure 4.18 shows that compressive strength of the concrete increases with an increase of
metakaolin content up to about 30% of MK/C. The increase of compressive strength due to
the addition of metakaolin is due to pozzolanic activity. The maximum strength occurs at
15% MK/C. At 40% MK/C, the strength starts to reduce compared with the control concrete.
According to the literature, the main factors that affect the contribution of metakaolin in the
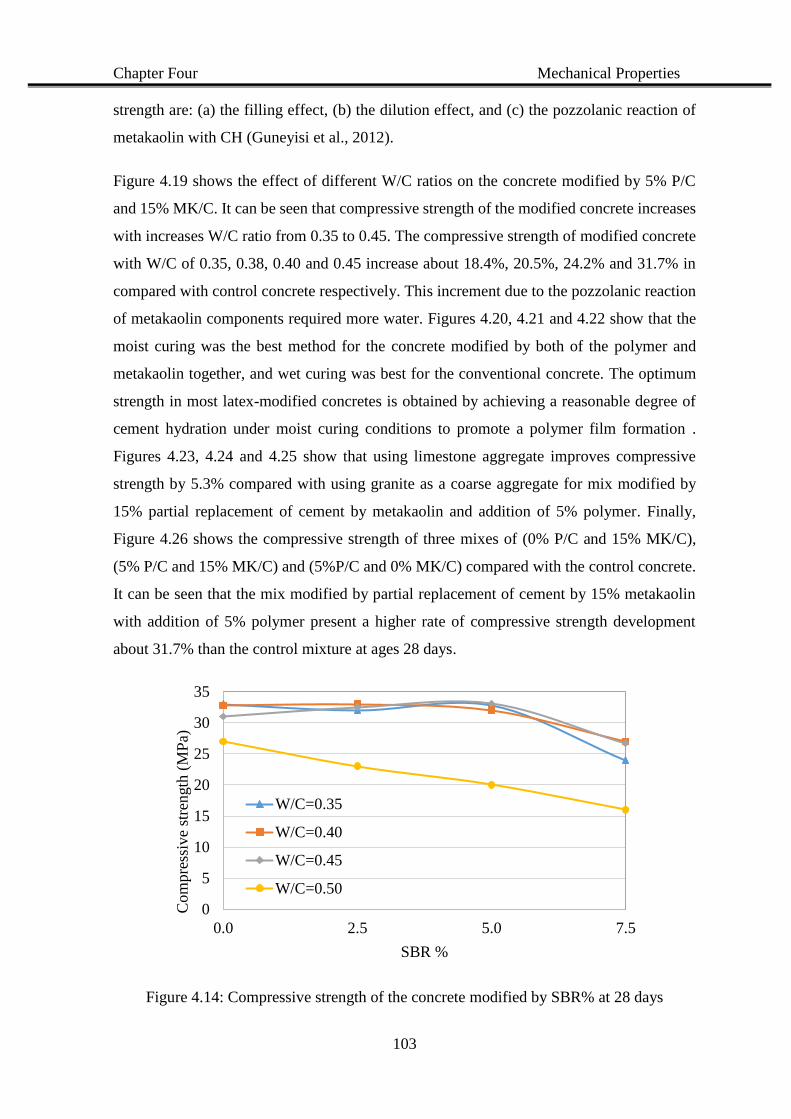
Chapter Four Mechanical Properties
103
strength are: (a) the filling effect, (b) the dilution effect, and (c) the pozzolanic reaction of
metakaolin with CH (Guneyisi et al., 2012).
Figure 4.19 shows the effect of different W/C ratios on the concrete modified by 5% P/C
and 15% MK/C. It can be seen that compressive strength of the modified concrete increases
with increases W/C ratio from 0.35 to 0.45. The compressive strength of modified concrete
with W/C of 0.35, 0.38, 0.40 and 0.45 increase about 18.4%, 20.5%, 24.2% and 31.7% in
compared with control concrete respectively. This increment due to the pozzolanic reaction
of metakaolin components required more water. Figures 4.20, 4.21 and 4.22 show that the
moist curing was the best method for the concrete modified by both of the polymer and
metakaolin together, and wet curing was best for the conventional concrete. The optimum
strength in most latex-modified concretes is obtained by achieving a reasonable degree of
cement hydration under moist curing conditions to promote a polymer film formation .
Figures 4.23, 4.24 and 4.25 show that using limestone aggregate improves compressive
strength by 5.3% compared with using granite as a coarse aggregate for mix modified by
15% partial replacement of cement by metakaolin and addition of 5% polymer. Finally,
Figure 4.26 shows the compressive strength of three mixes of (0% P/C and 15% MK/C),
(5% P/C and 15% MK/C) and (5%P/C and 0% MK/C) compared with the control concrete.
It can be seen that the mix modified by partial replacement of cement by 15% metakaolin
with addition of 5% polymer present a higher rate of compressive strength development
about 31.7% than the control mixture at ages 28 days.
Figure 4.14: Compressive strength of the concrete modified by SBR% at 28 days
0
5
10
15
20
25
30
35
0.0 2.5 5.0 7.5
Com
pre
ssiv
e st
rength
(M
Pa)
SBR %
W/C=0.35
W/C=0.40
W/C=0.45
W/C=0.50
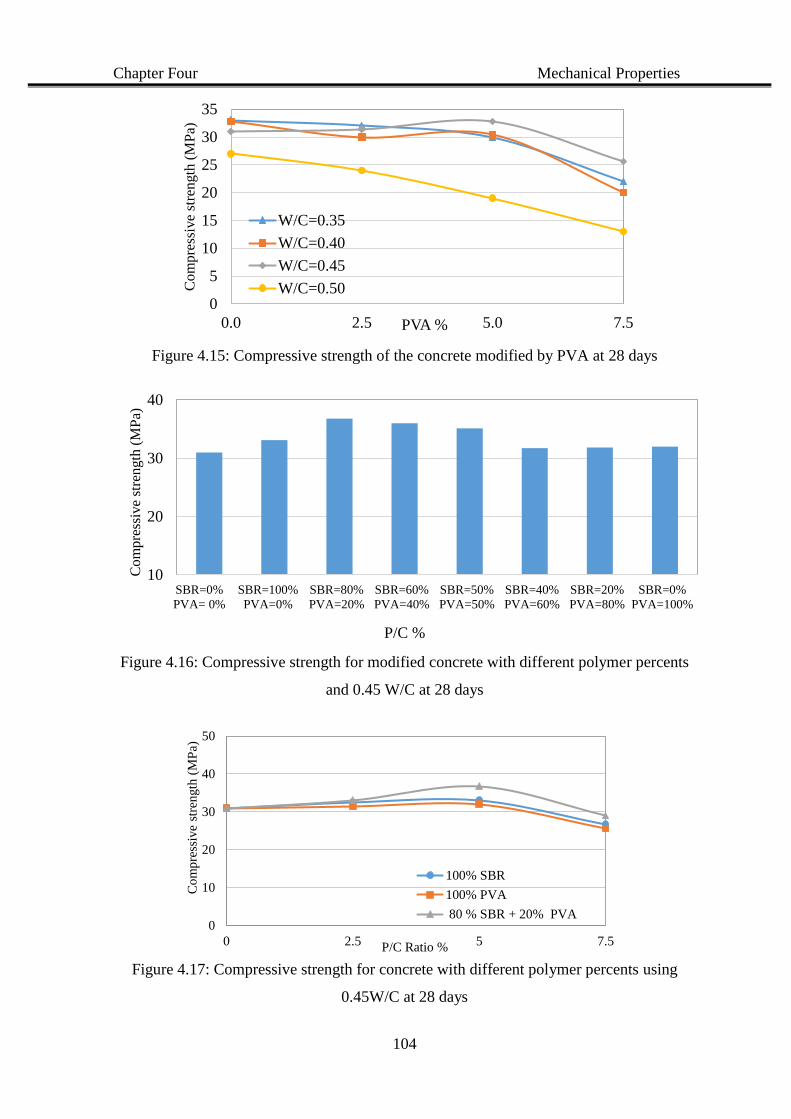
Chapter Four Mechanical Properties
104
Figure 4.15: Compressive strength of the concrete modified by PVA at 28 days
Figure 4.16: Compressive strength for modified concrete with different polymer percents
and 0.45 W/C at 28 days
Figure 4.17: Compressive strength for concrete with different polymer percents using
0.45W/C at 28 days
0
5
10
15
20
25
30
35
0.0 2.5 5.0 7.5
Co
mp
ress
ive
stre
ngth
(M
Pa)
PVA %
W/C=0.35
W/C=0.40
W/C=0.45
W/C=0.50
10
20
30
40
SBR=0%
PVA= 0%
SBR=100%
PVA=0%
SBR=80%
PVA=20%
SBR=60%
PVA=40%
SBR=50%
PVA=50%
SBR=40%
PVA=60%
SBR=20%
PVA=80%
SBR=0%
PVA=100%
Com
pre
ssiv
e st
rength
(M
Pa)
P/C %
0
10
20
30
40
50
0 2.5 5 7.5
Co
mp
ress
ive
stre
ngth
(M
Pa)
P/C Ratio %
100% SBR
100% PVA
80 % SBR + 20% PVA
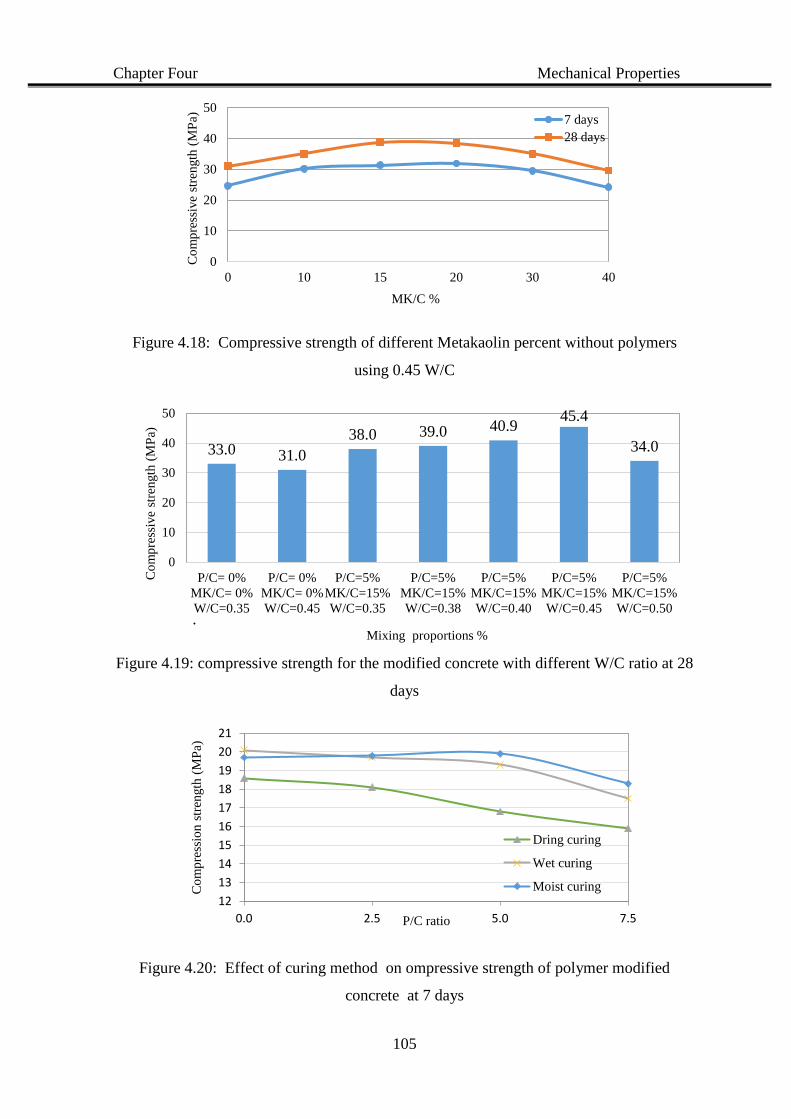
Chapter Four Mechanical Properties
105
Figure 4.18: Compressive strength of different Metakaolin percent without polymers
using 0.45 W/C
Figure 4.19: compressive strength for the modified concrete with different W/C ratio at 28
days
Figure 4.20: Effect of curing method on ompressive strength of polymer modified
concrete at 7 days
0
10
20
30
40
50
0 10 15 20 30 40
Co
mp
ress
ive
stre
ngth
(M
Pa)
MK/C %
7 days
28 days
33.0 31.0
38.0 39.0 40.945.4
34.0
0
10
20
30
40
50
P/C= 0%
MK/C= 0%
W/C=0.35
P/C= 0%
MK/C= 0%
W/C=0.45
P/C=5%
MK/C=15%
W/C=0.35
P/C=5%
MK/C=15%
W/C=0.38
P/C=5%
MK/C=15%
W/C=0.40
P/C=5%
MK/C=15%
W/C=0.45
P/C=5%
MK/C=15%
W/C=0.50
Co
mp
ress
ive
stre
ngth
(M
Pa)
Mixing proportions %
.
12
13
14
15
16
17
18
19
20
21
0.0 2.5 5.0 7.5
Co
mp
ress
ion s
tren
gth
(M
Pa)
P/C ratio
Dring curing
Wet curing
Moist curing
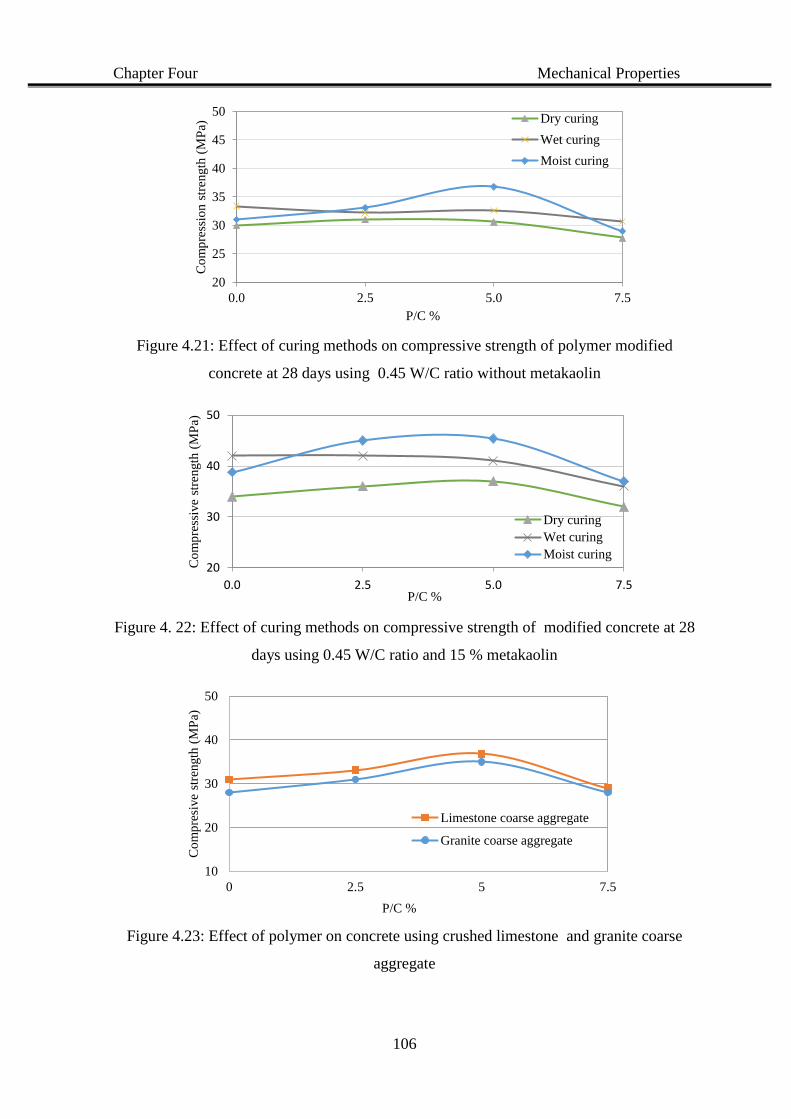
Chapter Four Mechanical Properties
106
Figure 4.21: Effect of curing methods on compressive strength of polymer modified
concrete at 28 days using 0.45 W/C ratio without metakaolin
Figure 4. 22: Effect of curing methods on compressive strength of modified concrete at 28
days using 0.45 W/C ratio and 15 % metakaolin
Figure 4.23: Effect of polymer on concrete using crushed limestone and granite coarse
aggregate
20
25
30
35
40
45
50
0.0 2.5 5.0 7.5
Co
mp
ress
ion s
tren
gth
(M
Pa)
P/C %
Dry curing
Wet curing
Moist curing
20
30
40
50
0.0 2.5 5.0 7.5
Co
mp
ress
ive
stre
ngth
(M
Pa)
P/C %
Dry curing
Wet curing
Moist curing
10
20
30
40
50
0 2.5 5 7.5
Co
mp
resi
ve
stre
ngth
(M
Pa)
P/C %
Limestone coarse aggregate
Granite coarse aggregate
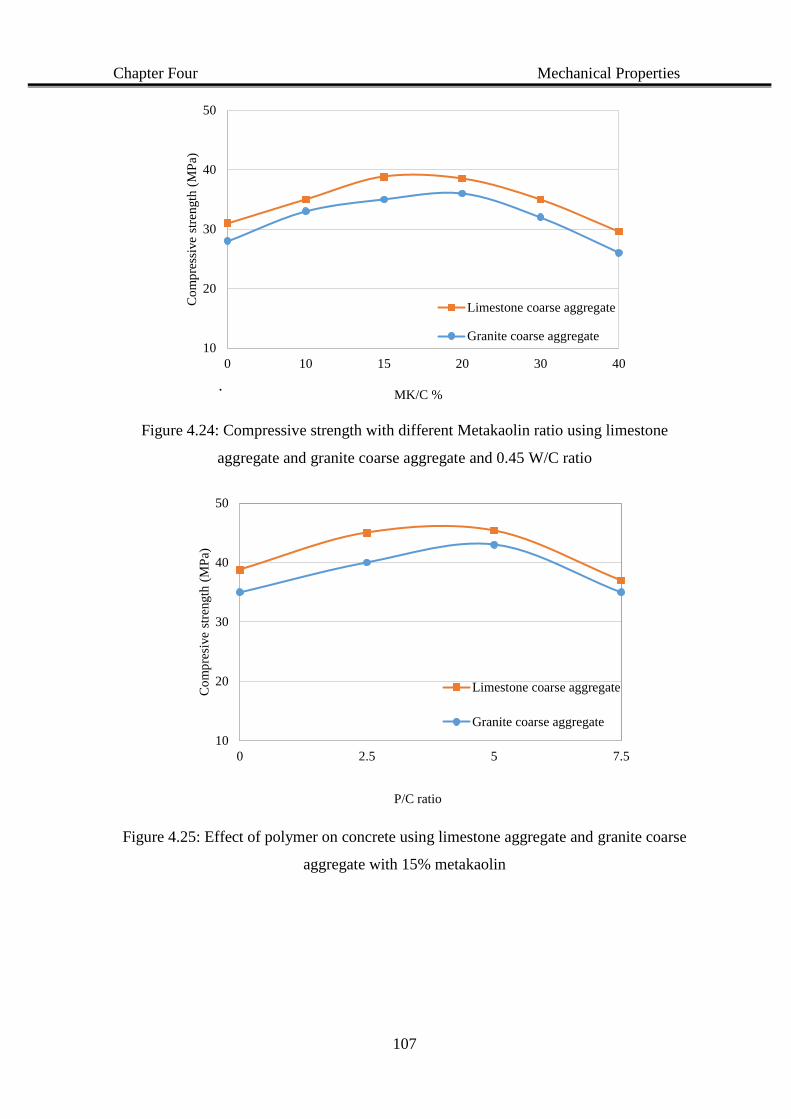
Chapter Four Mechanical Properties
107
Figure 4.24: Compressive strength with different Metakaolin ratio using limestone
aggregate and granite coarse aggregate and 0.45 W/C ratio
Figure 4.25: Effect of polymer on concrete using limestone aggregate and granite coarse
aggregate with 15% metakaolin
10
20
30
40
50
0 10 15 20 30 40
Co
mp
ress
ive
stre
ngth
(M
Pa)
MK/C %.
Limestone coarse aggregate
Granite coarse aggregate
10
20
30
40
50
0 2.5 5 7.5
Co
mp
resi
ve
stre
ngth
(M
Pa)
P/C ratio
Limestone coarse aggregate
Granite coarse aggregate
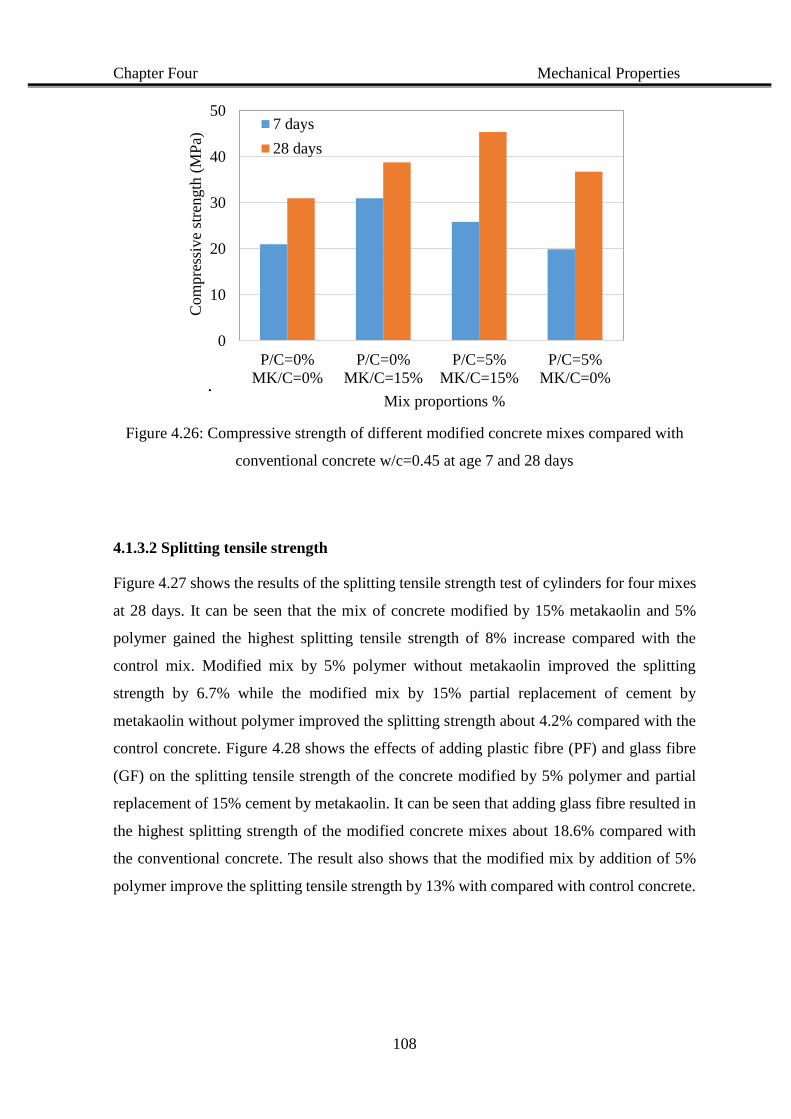
Chapter Four Mechanical Properties
108
Figure 4.26: Compressive strength of different modified concrete mixes compared with
conventional concrete w/c=0.45 at age 7 and 28 days
4.1.3.2 Splitting tensile strength
Figure 4.27 shows the results of the splitting tensile strength test of cylinders for four mixes
at 28 days. It can be seen that the mix of concrete modified by 15% metakaolin and 5%
polymer gained the highest splitting tensile strength of 8% increase compared with the
control mix. Modified mix by 5% polymer without metakaolin improved the splitting
strength by 6.7% while the modified mix by 15% partial replacement of cement by
metakaolin without polymer improved the splitting strength about 4.2% compared with the
control concrete. Figure 4.28 shows the effects of adding plastic fibre (PF) and glass fibre
(GF) on the splitting tensile strength of the concrete modified by 5% polymer and partial
replacement of 15% cement by metakaolin. It can be seen that adding glass fibre resulted in
the highest splitting strength of the modified concrete mixes about 18.6% compared with
the conventional concrete. The result also shows that the modified mix by addition of 5%
polymer improve the splitting tensile strength by 13% with compared with control concrete.
0
10
20
30
40
50
P/C=0%
MK/C=0%
P/C=0%
MK/C=15%
P/C=5%
MK/C=15%
P/C=5%
MK/C=0%
Com
pre
ssiv
e st
rength
(M
Pa)
Mix proportions %.
7 days
28 days
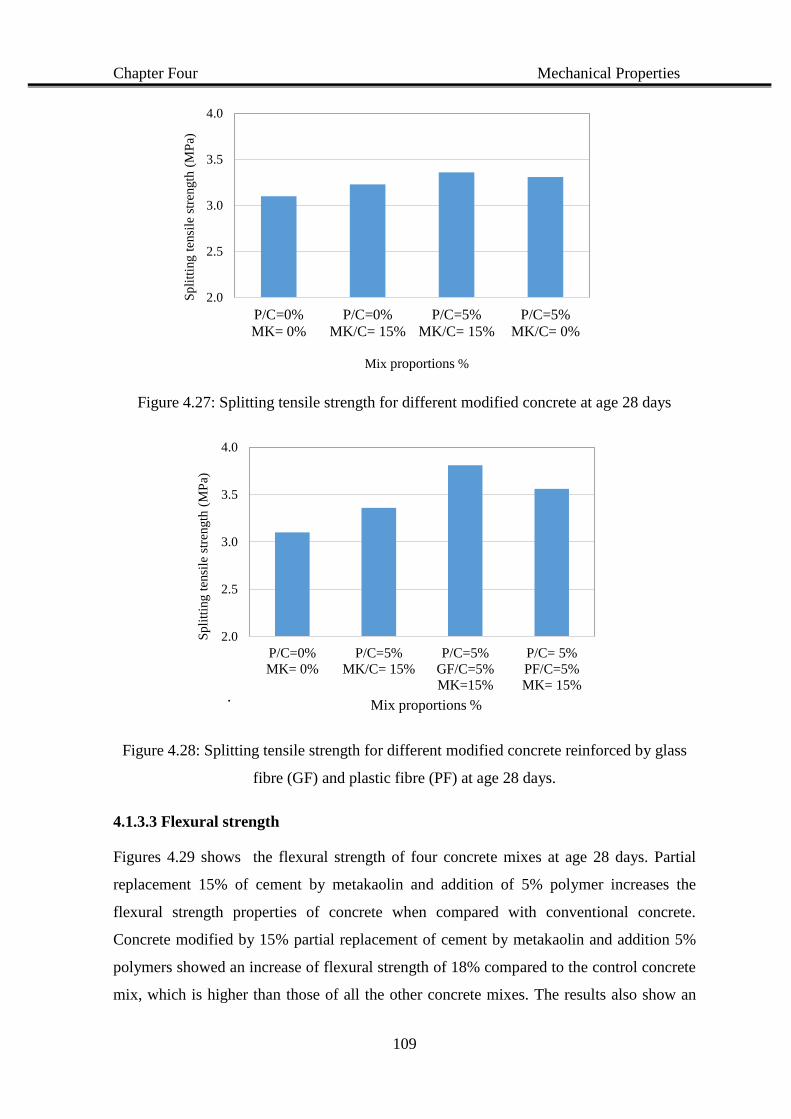
Chapter Four Mechanical Properties
109
Figure 4.27: Splitting tensile strength for different modified concrete at age 28 days
Figure 4.28: Splitting tensile strength for different modified concrete reinforced by glass
fibre (GF) and plastic fibre (PF) at age 28 days.
4.1.3.3 Flexural strength
Figures 4.29 shows the flexural strength of four concrete mixes at age 28 days. Partial
replacement 15% of cement by metakaolin and addition of 5% polymer increases the
flexural strength properties of concrete when compared with conventional concrete.
Concrete modified by 15% partial replacement of cement by metakaolin and addition 5%
polymers showed an increase of flexural strength of 18% compared to the control concrete
mix, which is higher than those of all the other concrete mixes. The results also show an
2.0
2.5
3.0
3.5
4.0
P/C=0%
MK= 0%
P/C=0%
MK/C= 15%
P/C=5%
MK/C= 15%
P/C=5%
MK/C= 0%
Sp
litt
ing t
ensi
le s
tren
gth
(M
Pa)
Mix proportions %
2.0
2.5
3.0
3.5
4.0
P/C=0%
MK= 0%
P/C=5%
MK/C= 15%
P/C=5%
GF/C=5%
MK=15%
P/C= 5%
PF/C=5%
MK= 15%
Sp
litt
ing t
ensi
le s
tren
gth
(M
Pa)
Mix proportions %.
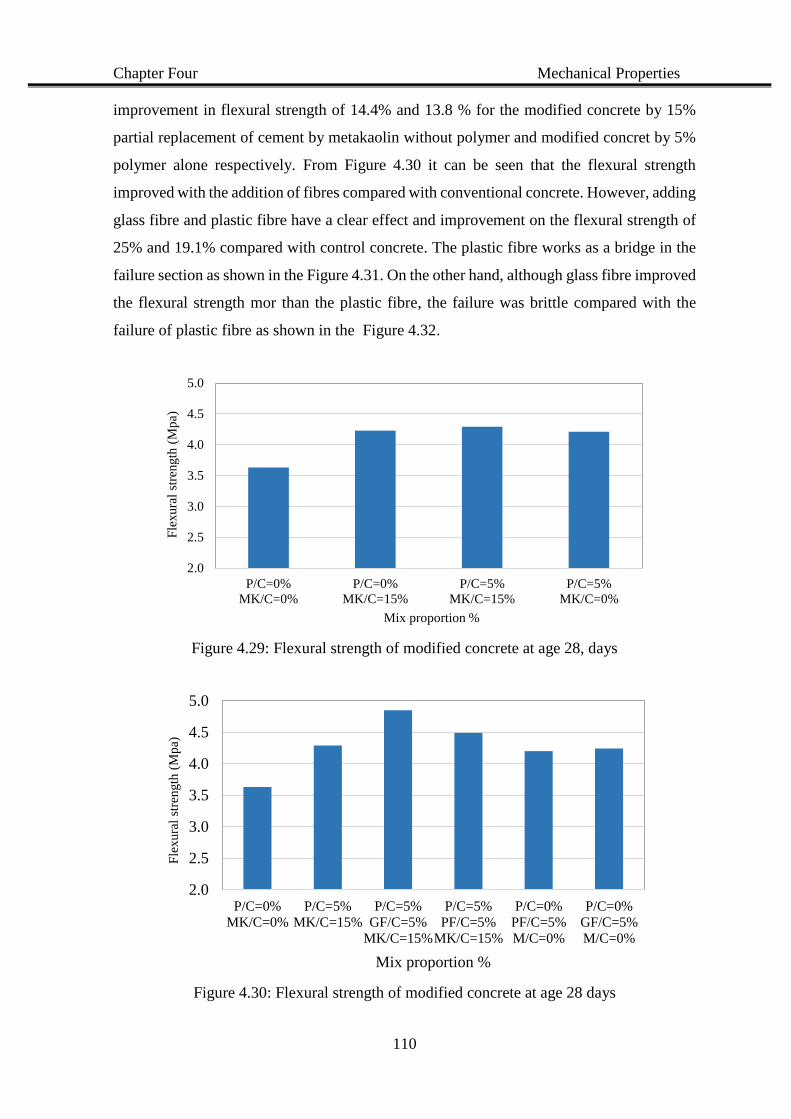
Chapter Four Mechanical Properties
110
improvement in flexural strength of 14.4% and 13.8 % for the modified concrete by 15%
partial replacement of cement by metakaolin without polymer and modified concret by 5%
polymer alone respectively. From Figure 4.30 it can be seen that the flexural strength
improved with the addition of fibres compared with conventional concrete. However, adding
glass fibre and plastic fibre have a clear effect and improvement on the flexural strength of
25% and 19.1% compared with control concrete. The plastic fibre works as a bridge in the
failure section as shown in the Figure 4.31. On the other hand, although glass fibre improved
the flexural strength mor than the plastic fibre, the failure was brittle compared with the
failure of plastic fibre as shown in the Figure 4.32.
Figure 4.29: Flexural strength of modified concrete at age 28, days
Figure 4.30: Flexural strength of modified concrete at age 28 days
2.0
2.5
3.0
3.5
4.0
4.5
5.0
P/C=0%
MK/C=0%
P/C=0%
MK/C=15%
P/C=5%
MK/C=15%
P/C=5%
MK/C=0%
Fle
xura
l st
rength
(M
pa)
Mix proportion %
2.0
2.5
3.0
3.5
4.0
4.5
5.0
P/C=0%
MK/C=0%
P/C=5%
MK/C=15%
P/C=5%
GF/C=5%
MK/C=15%
P/C=5%
PF/C=5%
MK/C=15%
P/C=0%
PF/C=5%
M/C=0%
P/C=0%
GF/C=5%
M/C=0%
Fle
xura
l st
rength
(M
pa)
Mix proportion %
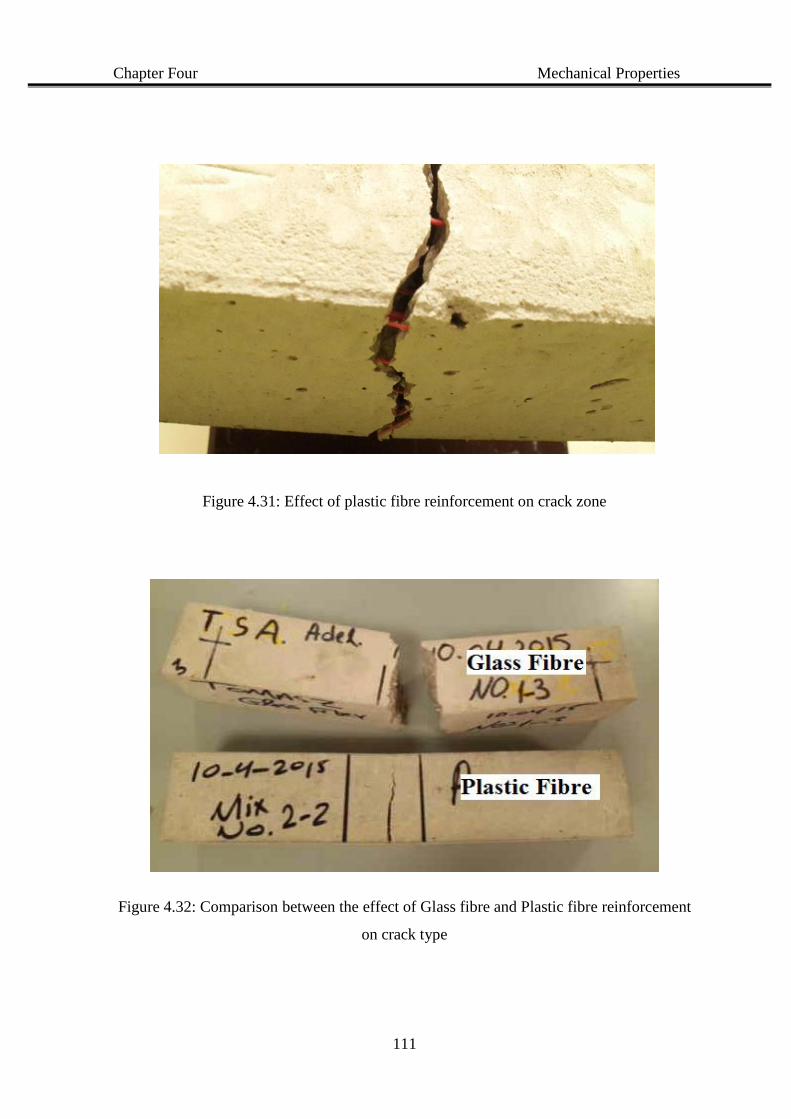
Chapter Four Mechanical Properties
111
Figure 4.31: Effect of plastic fibre reinforcement on crack zone
Figure 4.32: Comparison between the effect of Glass fibre and Plastic fibre reinforcement
on crack type
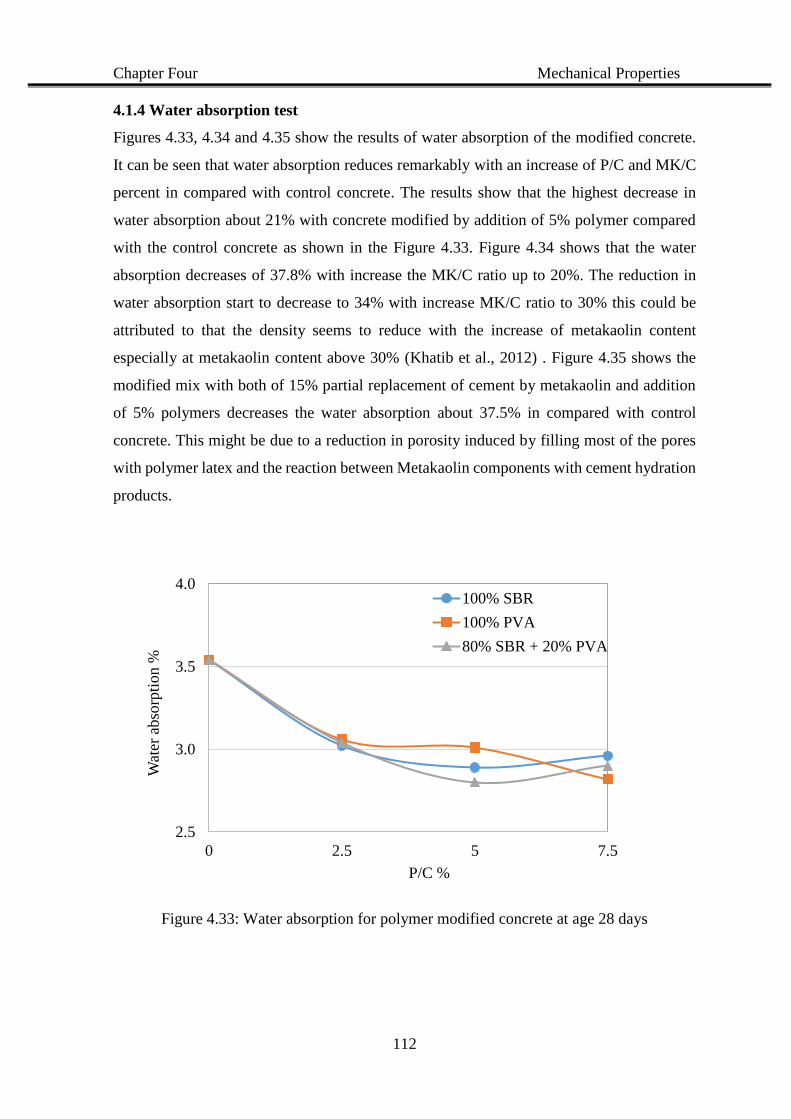
Chapter Four Mechanical Properties
112
4.1.4 Water absorption test
Figures 4.33, 4.34 and 4.35 show the results of water absorption of the modified concrete.
It can be seen that water absorption reduces remarkably with an increase of P/C and MK/C
percent in compared with control concrete. The results show that the highest decrease in
water absorption about 21% with concrete modified by addition of 5% polymer compared
with the control concrete as shown in the Figure 4.33. Figure 4.34 shows that the water
absorption decreases of 37.8% with increase the MK/C ratio up to 20%. The reduction in
water absorption start to decrease to 34% with increase MK/C ratio to 30% this could be
attributed to that the density seems to reduce with the increase of metakaolin content
especially at metakaolin content above 30% (Khatib et al., 2012) . Figure 4.35 shows the
modified mix with both of 15% partial replacement of cement by metakaolin and addition
of 5% polymers decreases the water absorption about 37.5% in compared with control
concrete. This might be due to a reduction in porosity induced by filling most of the pores
with polymer latex and the reaction between Metakaolin components with cement hydration
products.
Figure 4.33: Water absorption for polymer modified concrete at age 28 days
2.5
3.0
3.5
4.0
0 2.5 5 7.5
Wat
er a
bso
rpti
on %
P/C %
100% SBR
100% PVA
80% SBR + 20% PVA
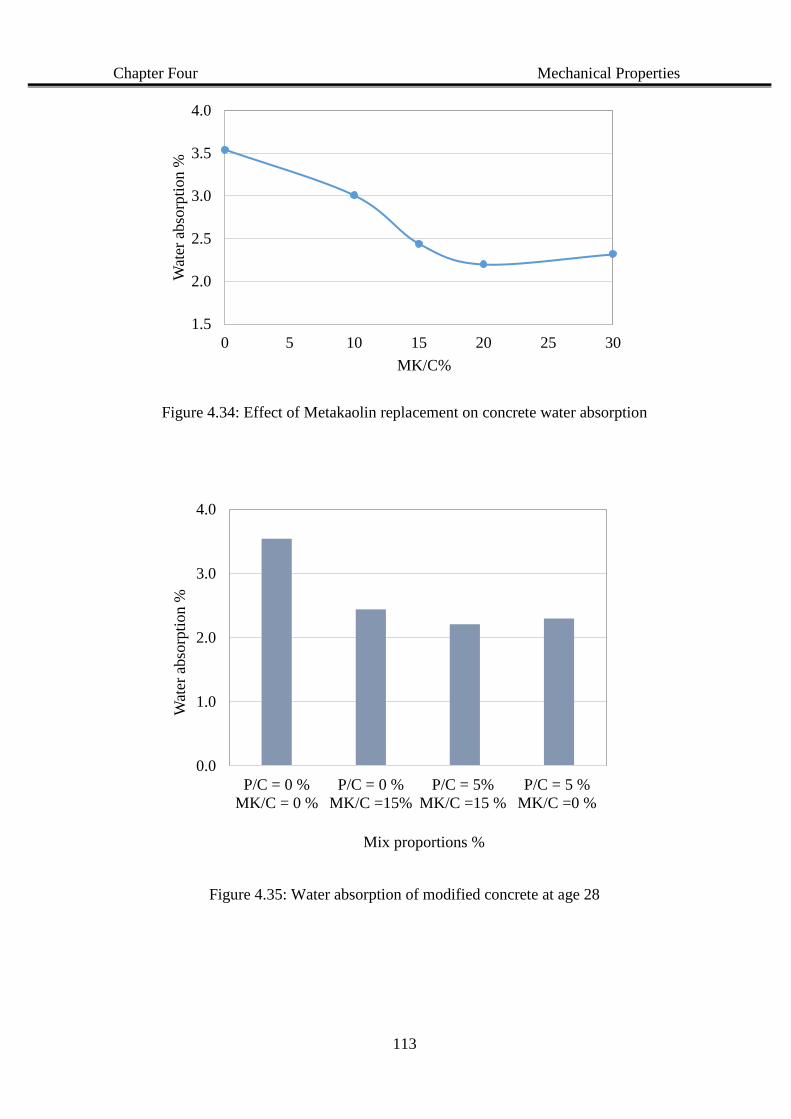
Chapter Four Mechanical Properties
113
Figure 4.34: Effect of Metakaolin replacement on concrete water absorption
Figure 4.35: Water absorption of modified concrete at age 28
1.5
2.0
2.5
3.0
3.5
4.0
0 5 10 15 20 25 30
Wat
er a
bso
rpti
on %
MK/C%
0.0
1.0
2.0
3.0
4.0
P/C = 0 %
MK/C = 0 %
P/C = 0 %
MK/C =15%
P/C = 5%
MK/C =15 %
P/C = 5 %
MK/C =0 %
Wat
er a
bso
rpti
on %
Mix proportions %
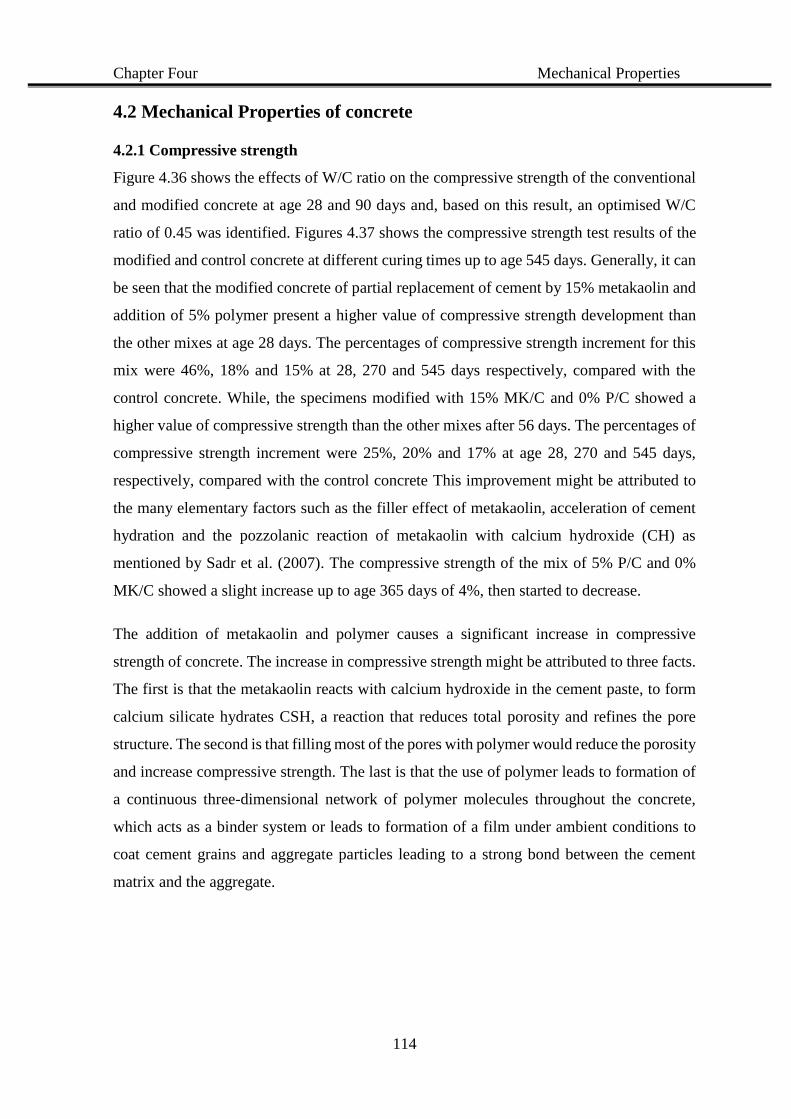
Chapter Four Mechanical Properties
114
4.2 Mechanical Properties of concrete
4.2.1 Compressive strength
Figure 4.36 shows the effects of W/C ratio on the compressive strength of the conventional
and modified concrete at age 28 and 90 days and, based on this result, an optimised W/C
ratio of 0.45 was identified. Figures 4.37 shows the compressive strength test results of the
modified and control concrete at different curing times up to age 545 days. Generally, it can
be seen that the modified concrete of partial replacement of cement by 15% metakaolin and
addition of 5% polymer present a higher value of compressive strength development than
the other mixes at age 28 days. The percentages of compressive strength increment for this
mix were 46%, 18% and 15% at 28, 270 and 545 days respectively, compared with the
control concrete. While, the specimens modified with 15% MK/C and 0% P/C showed a
higher value of compressive strength than the other mixes after 56 days. The percentages of
compressive strength increment were 25%, 20% and 17% at age 28, 270 and 545 days,
respectively, compared with the control concrete This improvement might be attributed to
the many elementary factors such as the filler effect of metakaolin, acceleration of cement
hydration and the pozzolanic reaction of metakaolin with calcium hydroxide (CH) as
mentioned by Sadr et al. (2007). The compressive strength of the mix of 5% P/C and 0%
MK/C showed a slight increase up to age 365 days of 4%, then started to decrease.
The addition of metakaolin and polymer causes a significant increase in compressive
strength of concrete. The increase in compressive strength might be attributed to three facts.
The first is that the metakaolin reacts with calcium hydroxide in the cement paste, to form
calcium silicate hydrates CSH, a reaction that reduces total porosity and refines the pore
structure. The second is that filling most of the pores with polymer would reduce the porosity
and increase compressive strength. The last is that the use of polymer leads to formation of
a continuous three-dimensional network of polymer molecules throughout the concrete,
which acts as a binder system or leads to formation of a film under ambient conditions to
coat cement grains and aggregate particles leading to a strong bond between the cement
matrix and the aggregate.
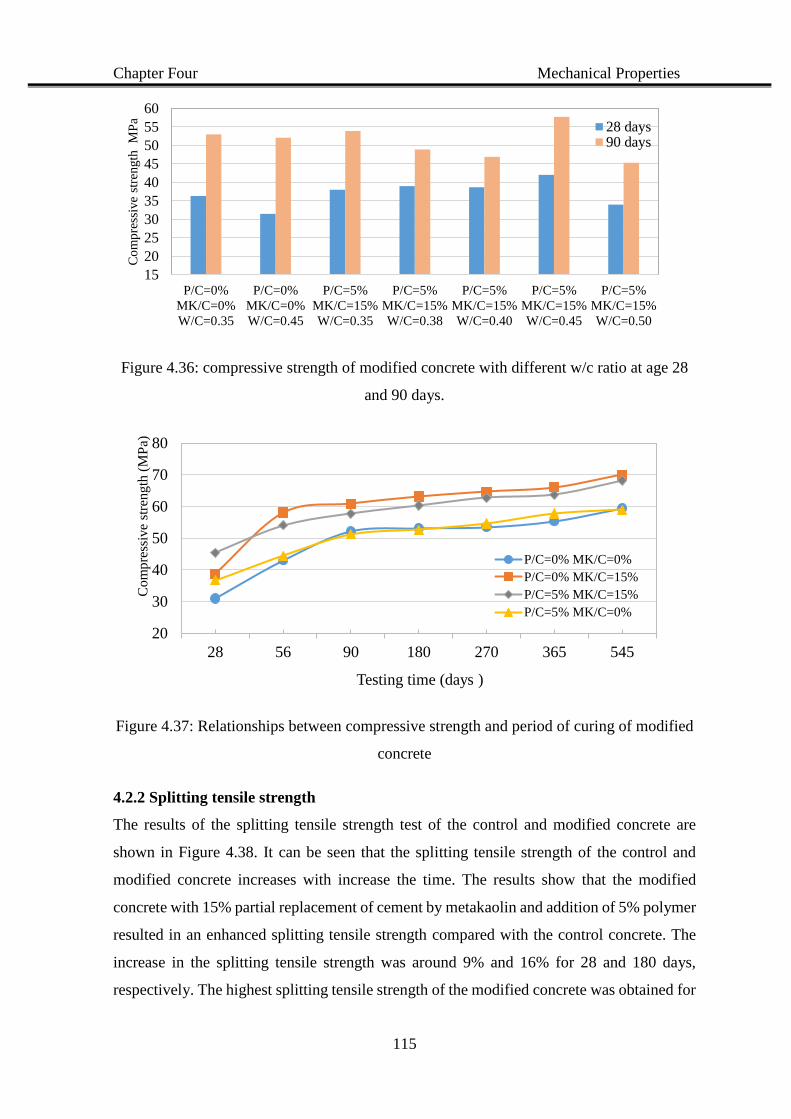
Chapter Four Mechanical Properties
115
Figure 4.36: compressive strength of modified concrete with different w/c ratio at age 28
and 90 days.
Figure 4.37: Relationships between compressive strength and period of curing of modified
concrete
4.2.2 Splitting tensile strength
The results of the splitting tensile strength test of the control and modified concrete are
shown in Figure 4.38. It can be seen that the splitting tensile strength of the control and
modified concrete increases with increase the time. The results show that the modified
concrete with 15% partial replacement of cement by metakaolin and addition of 5% polymer
resulted in an enhanced splitting tensile strength compared with the control concrete. The
increase in the splitting tensile strength was around 9% and 16% for 28 and 180 days,
respectively. The highest splitting tensile strength of the modified concrete was obtained for
15
20
25
30
35
40
45
50
55
60
P/C=0%
MK/C=0%
W/C=0.35
P/C=0%
MK/C=0%
W/C=0.45
P/C=5%
MK/C=15%
W/C=0.35
P/C=5%
MK/C=15%
W/C=0.38
P/C=5%
MK/C=15%
W/C=0.40
P/C=5%
MK/C=15%
W/C=0.45
P/C=5%
MK/C=15%
W/C=0.50
Co
mp
ress
ive
stre
ngth
M
Pa
28 days90 days
20
30
40
50
60
70
80
28 56 90 180 270 365 545
Com
pre
ssiv
e st
rength
(M
Pa)
Testing time (days )
P/C=0% MK/C=0%
P/C=0% MK/C=15%
P/C=5% MK/C=15%
P/C=5% MK/C=0%
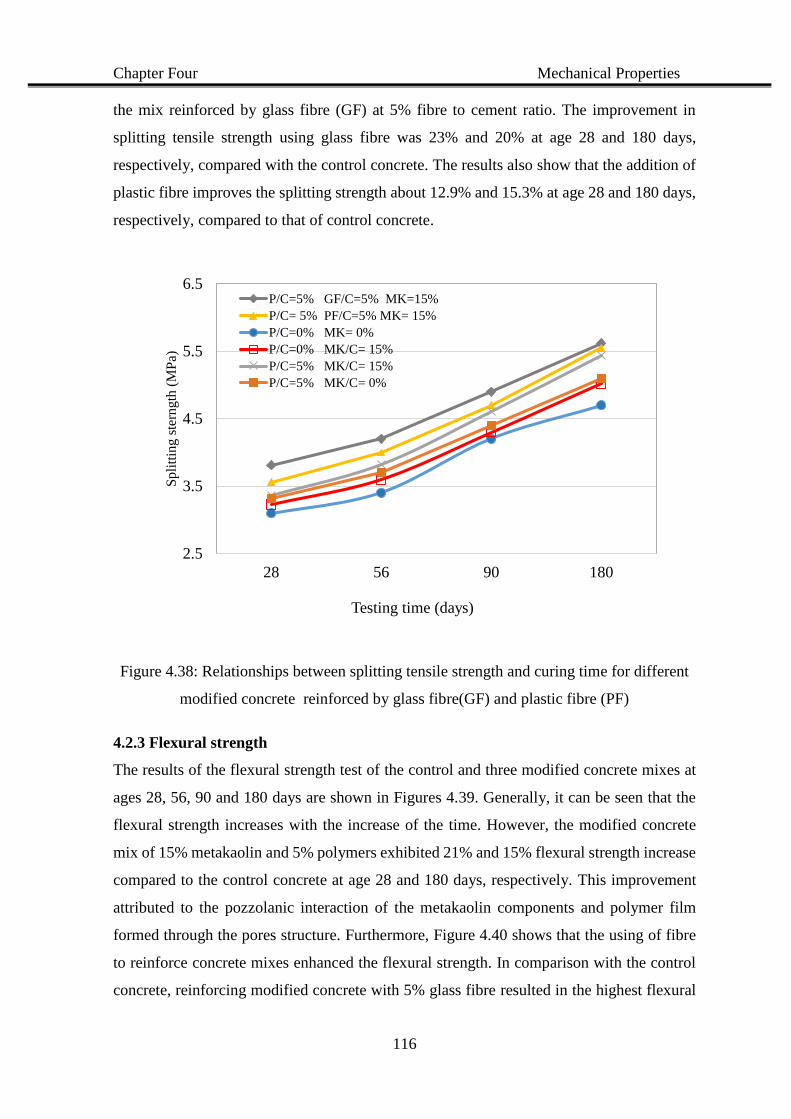
Chapter Four Mechanical Properties
116
the mix reinforced by glass fibre (GF) at 5% fibre to cement ratio. The improvement in
splitting tensile strength using glass fibre was 23% and 20% at age 28 and 180 days,
respectively, compared with the control concrete. The results also show that the addition of
plastic fibre improves the splitting strength about 12.9% and 15.3% at age 28 and 180 days,
respectively, compared to that of control concrete.
Figure 4.38: Relationships between splitting tensile strength and curing time for different
modified concrete reinforced by glass fibre(GF) and plastic fibre (PF)
4.2.3 Flexural strength
The results of the flexural strength test of the control and three modified concrete mixes at
ages 28, 56, 90 and 180 days are shown in Figures 4.39. Generally, it can be seen that the
flexural strength increases with the increase of the time. However, the modified concrete
mix of 15% metakaolin and 5% polymers exhibited 21% and 15% flexural strength increase
compared to the control concrete at age 28 and 180 days, respectively. This improvement
attributed to the pozzolanic interaction of the metakaolin components and polymer film
formed through the pores structure. Furthermore, Figure 4.40 shows that the using of fibre
to reinforce concrete mixes enhanced the flexural strength. In comparison with the control
concrete, reinforcing modified concrete with 5% glass fibre resulted in the highest flexural
2.5
3.5
4.5
5.5
6.5
28 56 90 180
Spli
ttin
g s
tern
gth
(M
Pa)
Testing time (days)
P/C=5% GF/C=5% MK=15%
P/C= 5% PF/C=5% MK= 15%
P/C=0% MK= 0%
P/C=0% MK/C= 15%
P/C=5% MK/C= 15%
P/C=5% MK/C= 0%
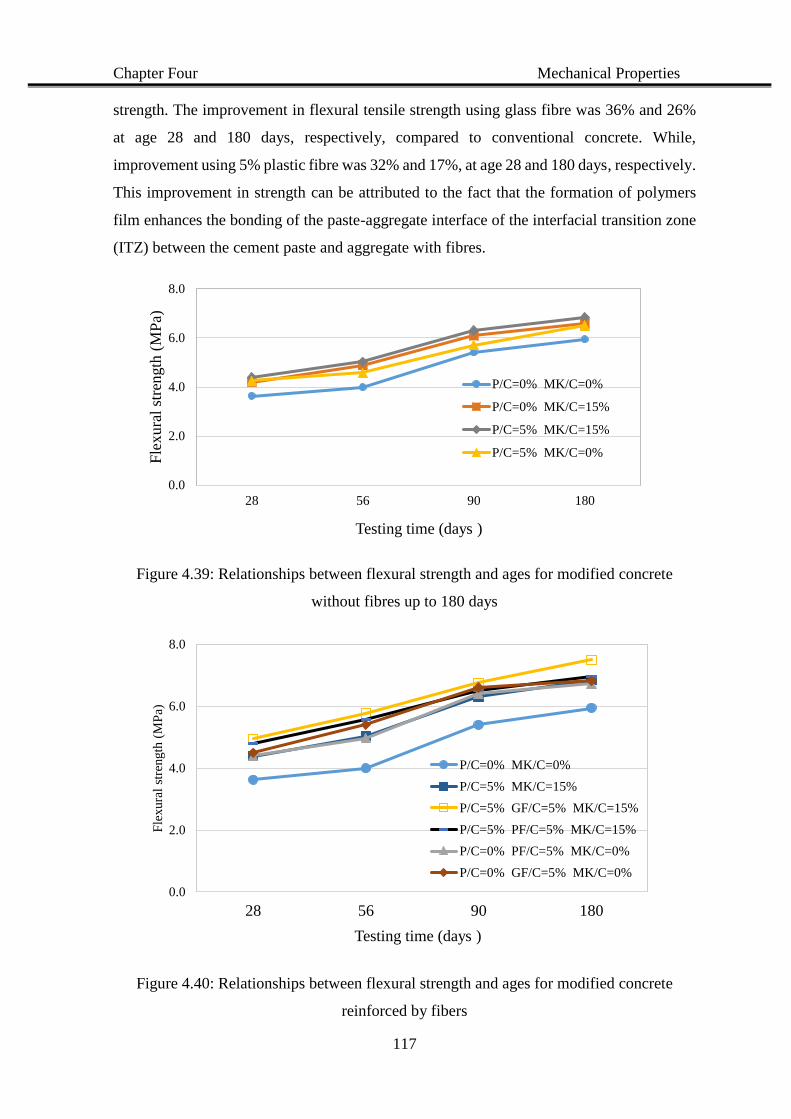
Chapter Four Mechanical Properties
117
strength. The improvement in flexural tensile strength using glass fibre was 36% and 26%
at age 28 and 180 days, respectively, compared to conventional concrete. While,
improvement using 5% plastic fibre was 32% and 17%, at age 28 and 180 days, respectively.
This improvement in strength can be attributed to the fact that the formation of polymers
film enhances the bonding of the paste-aggregate interface of the interfacial transition zone
(ITZ) between the cement paste and aggregate with fibres.
Figure 4.39: Relationships between flexural strength and ages for modified concrete
without fibres up to 180 days
Figure 4.40: Relationships between flexural strength and ages for modified concrete
reinforced by fibers
0.0
2.0
4.0
6.0
8.0
28 56 90 180
Fle
xura
l st
rength
(M
Pa)
Testing time (days )
P/C=0% MK/C=0%
P/C=0% MK/C=15%
P/C=5% MK/C=15%
P/C=5% MK/C=0%
0.0
2.0
4.0
6.0
8.0
28 56 90 180
Fle
xura
l st
rength
(M
Pa)
Testing time (days )
P/C=0% MK/C=0%
P/C=5% MK/C=15%
P/C=5% GF/C=5% MK/C=15%
P/C=5% PF/C=5% MK/C=15%
P/C=0% PF/C=5% MK/C=0%
P/C=0% GF/C=5% MK/C=0%
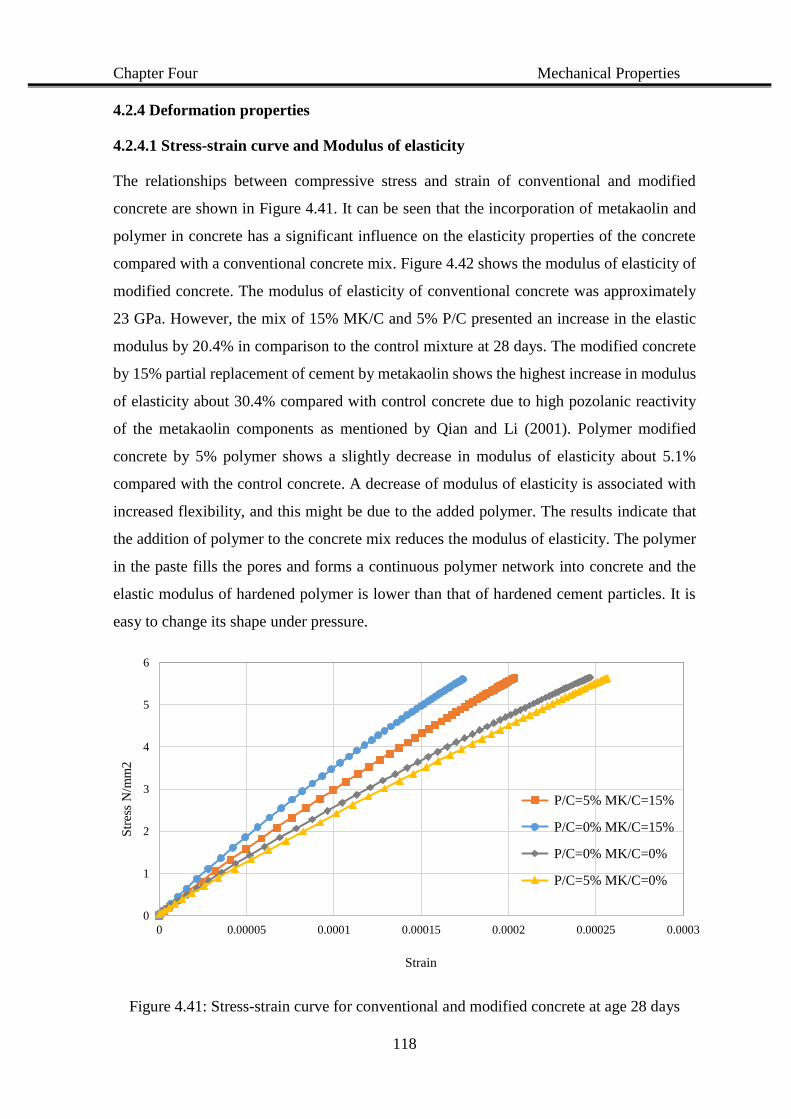
Chapter Four Mechanical Properties
118
4.2.4 Deformation properties
4.2.4.1 Stress-strain curve and Modulus of elasticity
The relationships between compressive stress and strain of conventional and modified
concrete are shown in Figure 4.41. It can be seen that the incorporation of metakaolin and
polymer in concrete has a significant influence on the elasticity properties of the concrete
compared with a conventional concrete mix. Figure 4.42 shows the modulus of elasticity of
modified concrete. The modulus of elasticity of conventional concrete was approximately
23 GPa. However, the mix of 15% MK/C and 5% P/C presented an increase in the elastic
modulus by 20.4% in comparison to the control mixture at 28 days. The modified concrete
by 15% partial replacement of cement by metakaolin shows the highest increase in modulus
of elasticity about 30.4% compared with control concrete due to high pozolanic reactivity
of the metakaolin components as mentioned by Qian and Li (2001). Polymer modified
concrete by 5% polymer shows a slightly decrease in modulus of elasticity about 5.1%
compared with the control concrete. A decrease of modulus of elasticity is associated with
increased flexibility, and this might be due to the added polymer. The results indicate that
the addition of polymer to the concrete mix reduces the modulus of elasticity. The polymer
in the paste fills the pores and forms a continuous polymer network into concrete and the
elastic modulus of hardened polymer is lower than that of hardened cement particles. It is
easy to change its shape under pressure.
Figure 4.41: Stress-strain curve for conventional and modified concrete at age 28 days
0
1
2
3
4
5
6
0 0.00005 0.0001 0.00015 0.0002 0.00025 0.0003
Str
ess
N/m
m2
Strain
P/C=5% MK/C=15%
P/C=0% MK/C=15%
P/C=0% MK/C=0%
P/C=5% MK/C=0%
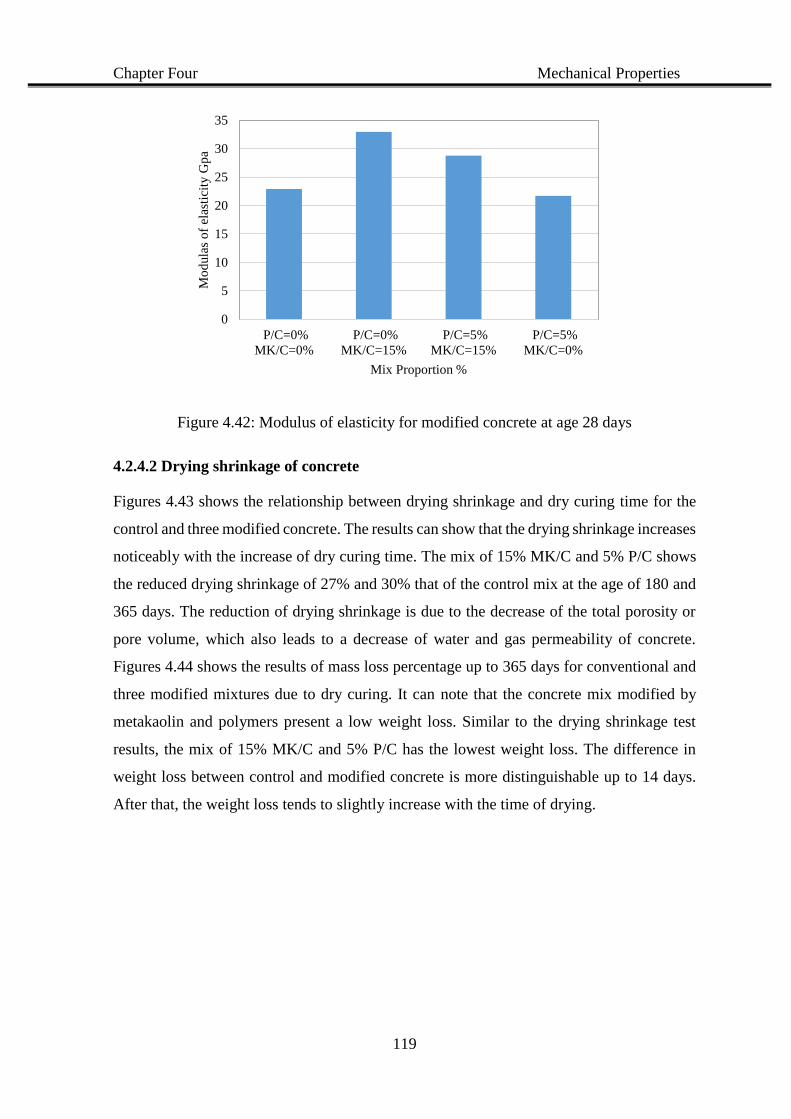
Chapter Four Mechanical Properties
119
Figure 4.42: Modulus of elasticity for modified concrete at age 28 days
4.2.4.2 Drying shrinkage of concrete
Figures 4.43 shows the relationship between drying shrinkage and dry curing time for the
control and three modified concrete. The results can show that the drying shrinkage increases
noticeably with the increase of dry curing time. The mix of 15% MK/C and 5% P/C shows
the reduced drying shrinkage of 27% and 30% that of the control mix at the age of 180 and
365 days. The reduction of drying shrinkage is due to the decrease of the total porosity or
pore volume, which also leads to a decrease of water and gas permeability of concrete.
Figures 4.44 shows the results of mass loss percentage up to 365 days for conventional and
three modified mixtures due to dry curing. It can note that the concrete mix modified by
metakaolin and polymers present a low weight loss. Similar to the drying shrinkage test
results, the mix of 15% MK/C and 5% P/C has the lowest weight loss. The difference in
weight loss between control and modified concrete is more distinguishable up to 14 days.
After that, the weight loss tends to slightly increase with the time of drying.
0
5
10
15
20
25
30
35
P/C=0%
MK/C=0%
P/C=0%
MK/C=15%
P/C=5%
MK/C=15%
P/C=5%
MK/C=0%
Mo
dula
s o
f el
asti
city
Gp
a
Mix Proportion %

Chapter Four Mechanical Properties
120
Figure 4.43: Relationships between drying shrinkage and age of modified concrete
Figure 4.44: Relationships between mass loss percent and age for for modified concrete
mixes
0.00000
0.00025
0.00050
0.00075
0.00100
0.00125
0.00150
0.00175
0.00200
0 1 7 14 21 28 56 90 180 270 365
Str
ain (
mm
/mm
)
Period of curing (days )
P/C =0 % MK/C =0 %
P/C =0 % MK/C=15%
P/C =5 % MK/C=15 %
P/C =5 % MK/C =0 %
0.00
0.25
0.50
0.75
1.00
1.25
1.50
1.75
2.00
1 7 14 21 28 56 90 180 270 365
Mas
s lo
ss %
Curing time (days )
P/C =0 % MK/C =0 %
P/C =0 % MK/C=15%
P/C =5 % MK/C=15 %
P/C =5 % MK/C =0 %
Chapter Four Mechanical Properties
121
4.3 Summary of the results
4.3.1 Results of trial mixes
The following summary can be drawn from the trial mixtures test results obtained up to 28
days: -
Metakaolin accelerates the initial and final setting time of cement paste. It is
decreased with increased metakaolin level. While, the polymer delays the setting
time.
Slump values of fresh concrete decrease with an increases of metakaolin content.
While the polymers improve the workability of the fresh concrete.
The level of metakaolin in concrete mixtures increases water demand to complete
cement hydration processes and decreases the workability of fresh concrete.
The amount of polymer added to each fresh concrete was in direct proportion to the
amount of replacement of metakaolin up to 5% in order to offset the increased water
demand. It improves concrete workability and enhances the effect of metakaolin on
the setting time of the cement paste, as the polymer acts as a retarder for the setting
time.
The optimum W/C ratio of the modified concrete is 0.45 and the moist curing is the
best curing method for the modified concrete.
The mechanical properties of the modified concrete by partial replacement of cement
by metakaolin and addition polymer increase with the time in compared with control
concrete.
The mechanical properties (compressive, splitting and flexural strength) of the
modified concrete made with 15% partial replacement of cement by metakaolin and
adding 5% of the polymer were higher than those of the control concrete.
Modified concrete by glass fibre and plastic fibre improve both of the splitting and
flexural strength. Concrete modified by glass fibre shows the highest splitting and
flexural strength in compared with the control concrete.
Water absorption reduces remarkably with increased P/C and MK/C percent when
compared with control concrete.
From the experimental trial results obtained can be sum up that the optimum mix
proportions of the modified concrete are 15% partial replacement of cement by
metakaolin, adding of 5% polymer (4% SBR and 1% PVA), 0.45 of W/C ratio and
Chapter Four Mechanical Properties
122
5% of fibre by weight of cement. These mixes used to study the mechanical
properties, durability properties and the microstructure of the pores system of
concrete for the long time up to 545 days in the second phase of the study.
4.3.2 Results of mechanical strength
Partial replacement of cement by 15% metakaolin show significant improvement in
the compressive strength after 28 days compared with control strength up to 545
days.
Partial replacement of cement by 15% metakaolin and adding of 5% (4 % SBR and
1% PVA) bi-polymer into concrete show significant improvement in splitting and
flexural strength compared with conventional strength up to 545 days.
Modified concrete by metakaolin and polymer show improvement in the
deformation properties by reduces the drying shrinkage with the time and increase
the modulus of elasticity.
Partial replacement of cement by 15% metakaolin and addition of 5% polymer shows
the highest reduction of drying shrinkage and mass loss with the time due to the
restriction of the drying shrinkage mitigates the surface cracks and reduce the mass
loss due to drying with the time.
Modified concrete can increase both the early and the latter concrete strength
compared with those of the control concrete. This enhancement in strength can be
attributed to the filler effect of metakaolin, and the pozzolanic reaction of metakaolin
with the by-products of cement hydration process such as calcium hydroxide (CH).
In addition, the formation of polymer film that could be, fill in most of the pores
system in concrete. These modified concrete mixtures have gained significant
importance because of the requirements of environmental protection and sustainable
construction in the future.
CHAPTER FIVE
EFFECT OF METAKAOLIN AND
POLYMER ON THE
DURABILITY PROPERTIES
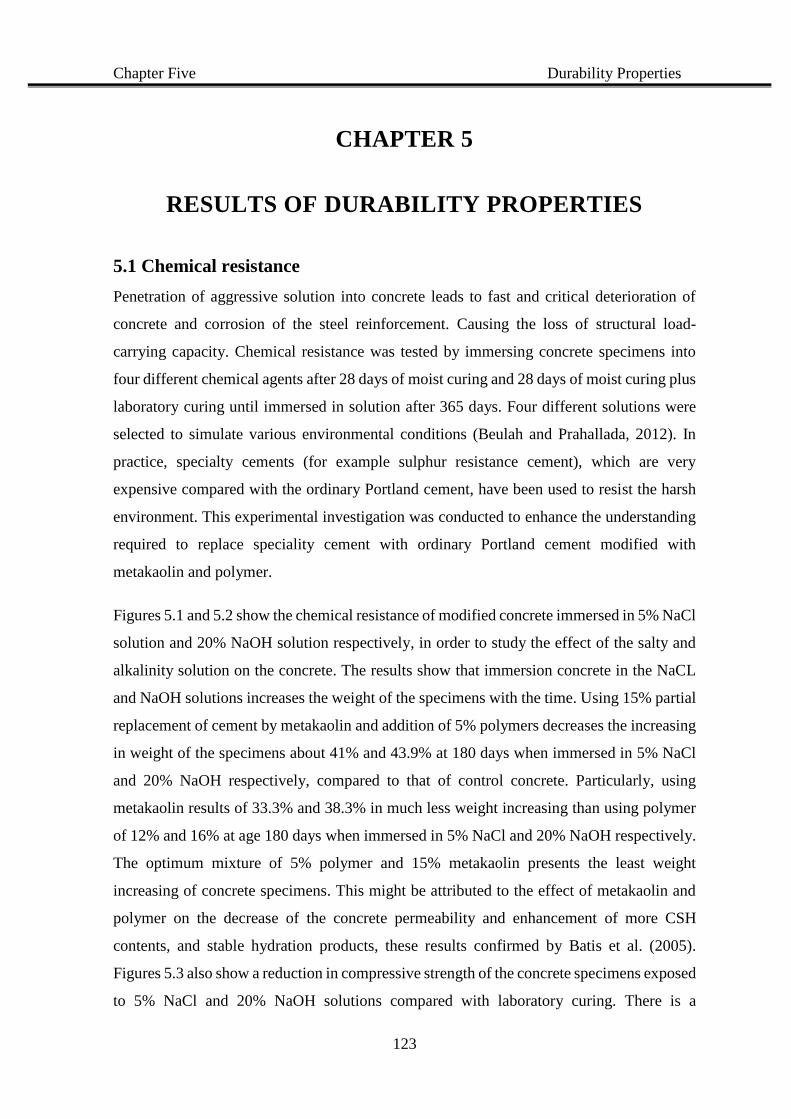
Chapter Five Durability Properties
123
CHAPTER 5
RESULTS OF DURABILITY PROPERTIES
5.1 Chemical resistance
Penetration of aggressive solution into concrete leads to fast and critical deterioration of
concrete and corrosion of the steel reinforcement. Causing the loss of structural load-
carrying capacity. Chemical resistance was tested by immersing concrete specimens into
four different chemical agents after 28 days of moist curing and 28 days of moist curing plus
laboratory curing until immersed in solution after 365 days. Four different solutions were
selected to simulate various environmental conditions (Beulah and Prahallada, 2012). In
practice, specialty cements (for example sulphur resistance cement), which are very
expensive compared with the ordinary Portland cement, have been used to resist the harsh
environment. This experimental investigation was conducted to enhance the understanding
required to replace speciality cement with ordinary Portland cement modified with
metakaolin and polymer.
Figures 5.1 and 5.2 show the chemical resistance of modified concrete immersed in 5% NaCl
solution and 20% NaOH solution respectively, in order to study the effect of the salty and
alkalinity solution on the concrete. The results show that immersion concrete in the NaCL
and NaOH solutions increases the weight of the specimens with the time. Using 15% partial
replacement of cement by metakaolin and addition of 5% polymers decreases the increasing
in weight of the specimens about 41% and 43.9% at 180 days when immersed in 5% NaCl
and 20% NaOH respectively, compared to that of control concrete. Particularly, using
metakaolin results of 33.3% and 38.3% in much less weight increasing than using polymer
of 12% and 16% at age 180 days when immersed in 5% NaCl and 20% NaOH respectively.
The optimum mixture of 5% polymer and 15% metakaolin presents the least weight
increasing of concrete specimens. This might be attributed to the effect of metakaolin and
polymer on the decrease of the concrete permeability and enhancement of more CSH
contents, and stable hydration products, these results confirmed by Batis et al. (2005).
Figures 5.3 also show a reduction in compressive strength of the concrete specimens exposed
to 5% NaCl and 20% NaOH solutions compared with laboratory curing. There is a

Chapter Five Durability Properties
124
significant reduction in compressive strength of the control concrete was found compared to
the concrete modified by partial replacement of cement by metakaolin and the addition of
polymer. The compressive strength of the specimens with 15% metakaolin and 5% polymer
cured in 5% NaCl and 20% NaOH solutions at age 90 days revealed a reduction ratio of
about 15.1% and 32.4%, respectively, compared to the modified concrete by 15%
metakaolin and 5% polymer those of cured in the laboratory environment. The compressive
strength of conventional concrete immersed in 5% NaCl and 20% NaOH solution was
observed to suffer a reduction of about 33% and 49%, respectively, compared with the
laboratory curing of control concrete. This result demonstrates that cured concrete may
undergo further chemical reactions with infiltrated salt and alkali ions in an early stage.
However, the use of polymer and metakaolin will reduce the potential chemical reactions
between the hydrated phases and the infiltrated salt or alkali ions, and this can be explained
due to enhanced CSH content in Portland cement and the formation of a polymer film
Similar results have also been observed by other researchers (Tukimat et al., 2017;
Narmatha, and Felixkala, 2017). The effect of the NaOH and NaCl solutions on the surface
of the concrete specimens is shown in Figures 5.4 and 5.5, respectively.
Figure 5.1: Chemical resistance of modified concrete immersed in 5% NaCl solution
0.0
0.5
1.0
1.5
2.0
2.5
3.0
3.5
4.0
4.5
7 14 28 56 90 120 180
Wei
ght
chan
ge
(%)
Immersion time (days)
P/C = 0 %, MK/C = 0 %
P/C = 0 %, MK/C = 15%
P/C = 5 %, MK/C = 15 %
P/C = 5 %, MK/C = 0 %
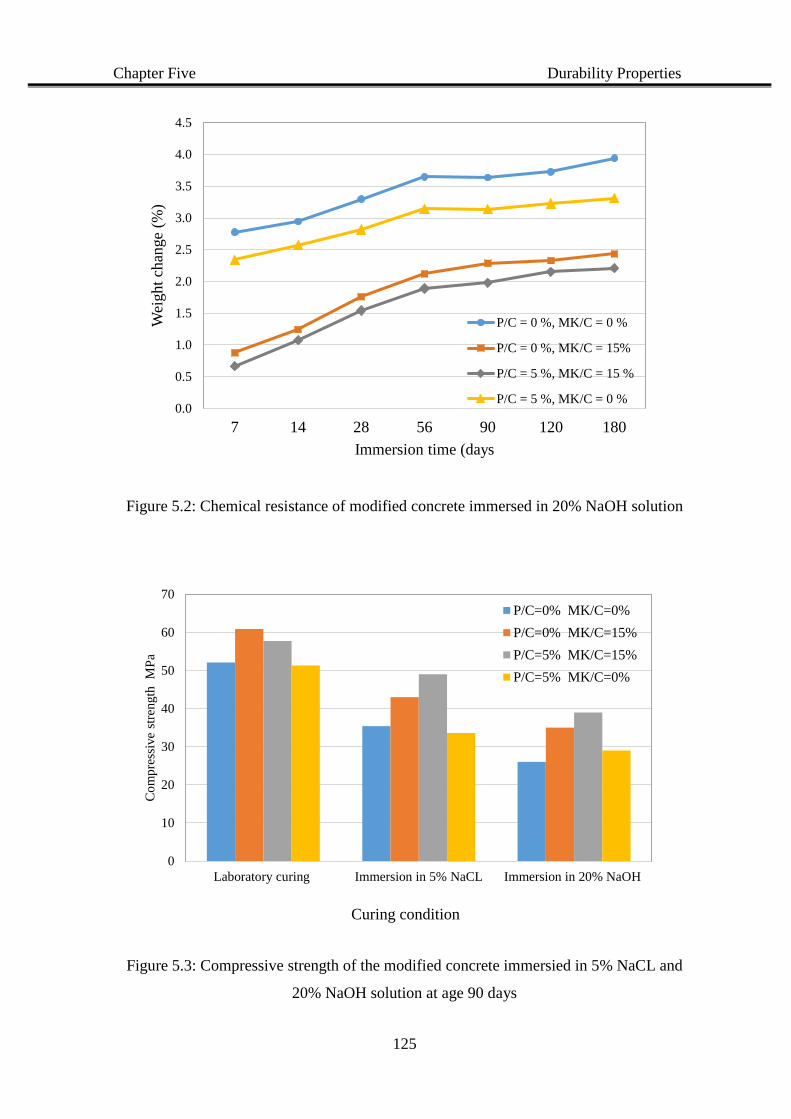
Chapter Five Durability Properties
125
Figure 5.2: Chemical resistance of modified concrete immersed in 20% NaOH solution
Figure 5.3: Compressive strength of the modified concrete immersied in 5% NaCL and
20% NaOH solution at age 90 days
0.0
0.5
1.0
1.5
2.0
2.5
3.0
3.5
4.0
4.5
7 14 28 56 90 120 180
Wei
ght
chan
ge
(%)
Immersion time (days
P/C = 0 %, MK/C = 0 %
P/C = 0 %, MK/C = 15%
P/C = 5 %, MK/C = 15 %
P/C = 5 %, MK/C = 0 %
0
10
20
30
40
50
60
70
Laboratory curing Immersion in 5% NaCL Immersion in 20% NaOH
Co
mp
ress
ive
stre
ngth
M
Pa
Curing condition
P/C=0% MK/C=0%
P/C=0% MK/C=15%
P/C=5% MK/C=15%
P/C=5% MK/C=0%
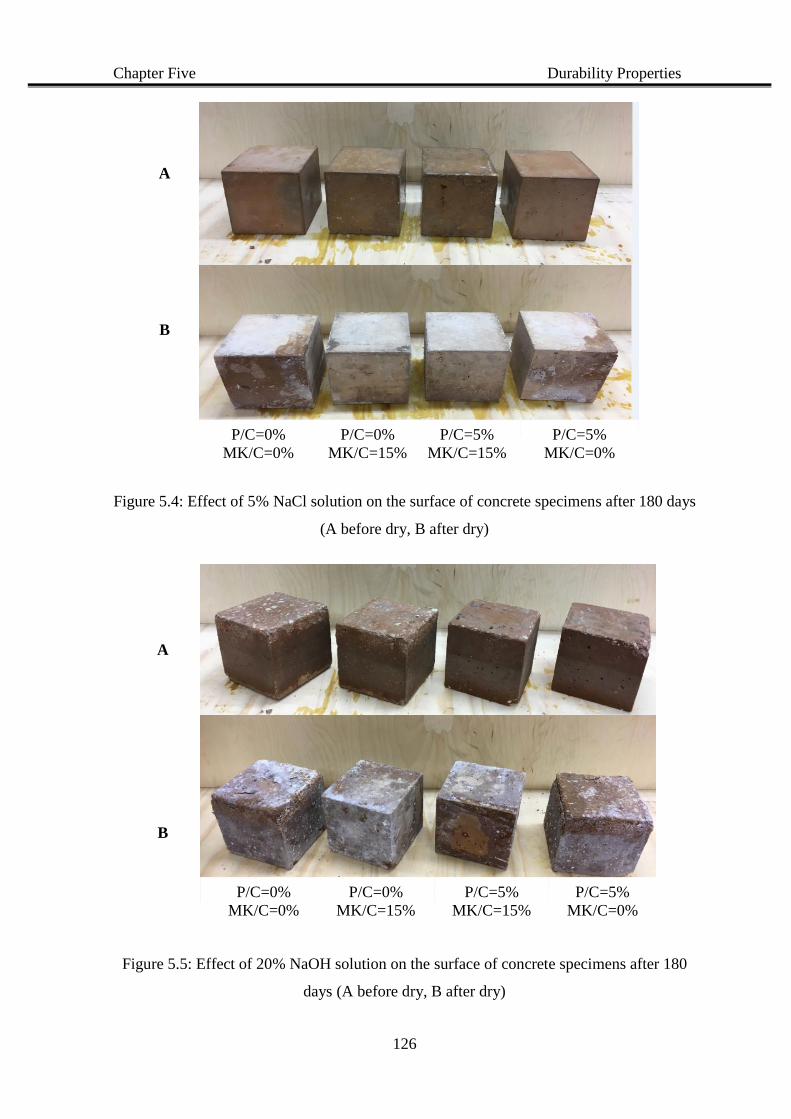
Chapter Five Durability Properties
126
Figure 5.4: Effect of 5% NaCl solution on the surface of concrete specimens after 180 days
(A before dry, B after dry)
Figure 5.5: Effect of 20% NaOH solution on the surface of concrete specimens after 180
days (A before dry, B after dry)
A
B
P/C=0%
MK/C=0%
P/C=0%
MK/C=15%
P/C=5%
MK/C=15%
P/C=5%
MK/C=0%
A
B
P/C=0%
MK/C=0%
P/C=0%
MK/C=15%
P/C=5%
MK/C=15%
P/C=5%
MK/C=0%
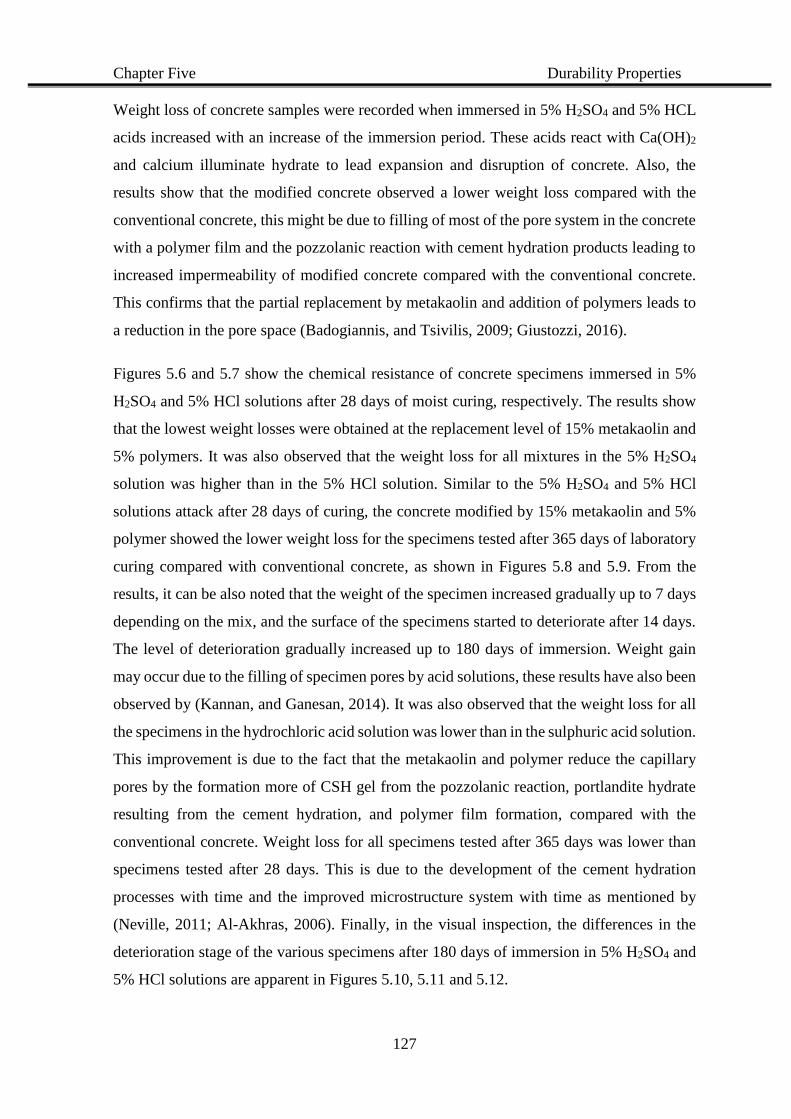
Chapter Five Durability Properties
127
Weight loss of concrete samples were recorded when immersed in 5% H2SO4 and 5% HCL
acids increased with an increase of the immersion period. These acids react with Ca(OH)2
and calcium illuminate hydrate to lead expansion and disruption of concrete. Also, the
results show that the modified concrete observed a lower weight loss compared with the
conventional concrete, this might be due to filling of most of the pore system in the concrete
with a polymer film and the pozzolanic reaction with cement hydration products leading to
increased impermeability of modified concrete compared with the conventional concrete.
This confirms that the partial replacement by metakaolin and addition of polymers leads to
a reduction in the pore space (Badogiannis, and Tsivilis, 2009; Giustozzi, 2016).
Figures 5.6 and 5.7 show the chemical resistance of concrete specimens immersed in 5%
H2SO4 and 5% HCl solutions after 28 days of moist curing, respectively. The results show
that the lowest weight losses were obtained at the replacement level of 15% metakaolin and
5% polymers. It was also observed that the weight loss for all mixtures in the 5% H2SO4
solution was higher than in the 5% HCl solution. Similar to the 5% H2SO4 and 5% HCl
solutions attack after 28 days of curing, the concrete modified by 15% metakaolin and 5%
polymer showed the lower weight loss for the specimens tested after 365 days of laboratory
curing compared with conventional concrete, as shown in Figures 5.8 and 5.9. From the
results, it can be also noted that the weight of the specimen increased gradually up to 7 days
depending on the mix, and the surface of the specimens started to deteriorate after 14 days.
The level of deterioration gradually increased up to 180 days of immersion. Weight gain
may occur due to the filling of specimen pores by acid solutions, these results have also been
observed by (Kannan, and Ganesan, 2014). It was also observed that the weight loss for all
the specimens in the hydrochloric acid solution was lower than in the sulphuric acid solution.
This improvement is due to the fact that the metakaolin and polymer reduce the capillary
pores by the formation more of CSH gel from the pozzolanic reaction, portlandite hydrate
resulting from the cement hydration, and polymer film formation, compared with the
conventional concrete. Weight loss for all specimens tested after 365 days was lower than
specimens tested after 28 days. This is due to the development of the cement hydration
processes with time and the improved microstructure system with time as mentioned by
(Neville, 2011; Al-Akhras, 2006). Finally, in the visual inspection, the differences in the
deterioration stage of the various specimens after 180 days of immersion in 5% H2SO4 and
5% HCl solutions are apparent in Figures 5.10, 5.11 and 5.12.
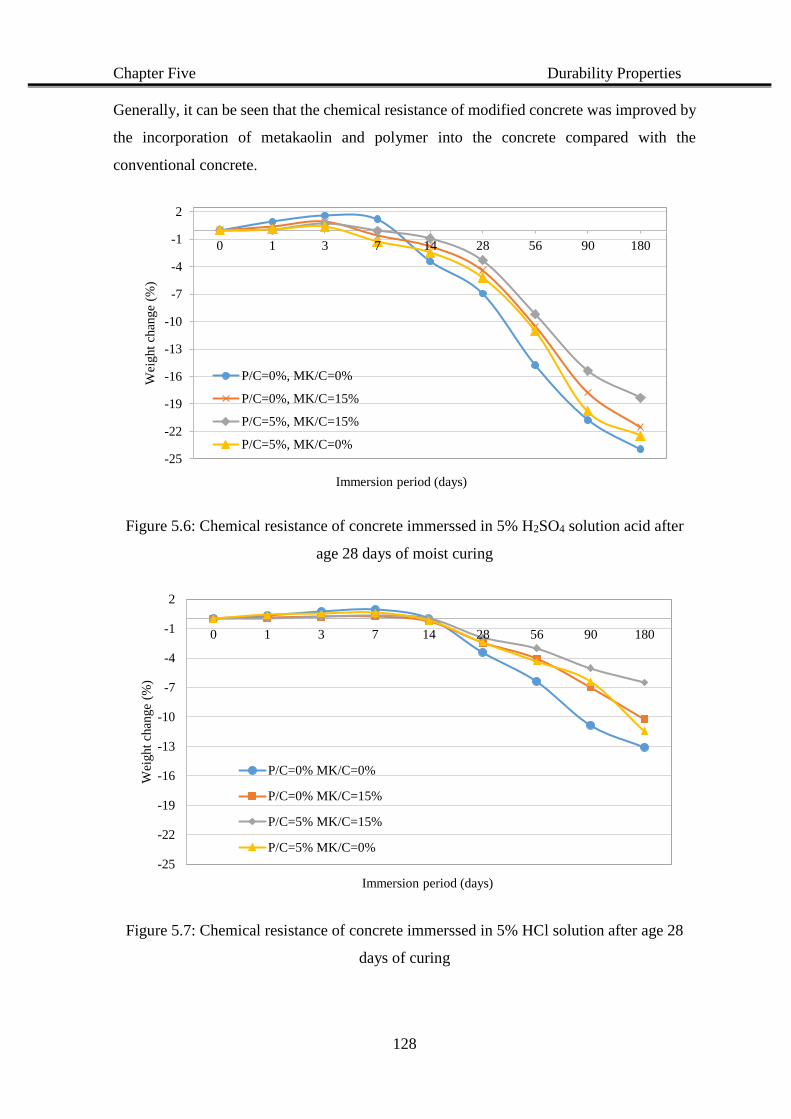
Chapter Five Durability Properties
128
Generally, it can be seen that the chemical resistance of modified concrete was improved by
the incorporation of metakaolin and polymer into the concrete compared with the
conventional concrete.
Figure 5.6: Chemical resistance of concrete immerssed in 5% H2SO4 solution acid after
age 28 days of moist curing
Figure 5.7: Chemical resistance of concrete immerssed in 5% HCl solution after age 28
days of curing
-25
-22
-19
-16
-13
-10
-7
-4
-1
2
0 1 3 7 14 28 56 90 180
Wei
ght
chan
ge
(%)
Immersion period (days)
P/C=0%, MK/C=0%
P/C=0%, MK/C=15%
P/C=5%, MK/C=15%
P/C=5%, MK/C=0%
-25
-22
-19
-16
-13
-10
-7
-4
-1
2
0 1 3 7 14 28 56 90 180
Wei
ght
chan
ge
(%)
Immersion period (days)
P/C=0% MK/C=0%
P/C=0% MK/C=15%
P/C=5% MK/C=15%
P/C=5% MK/C=0%
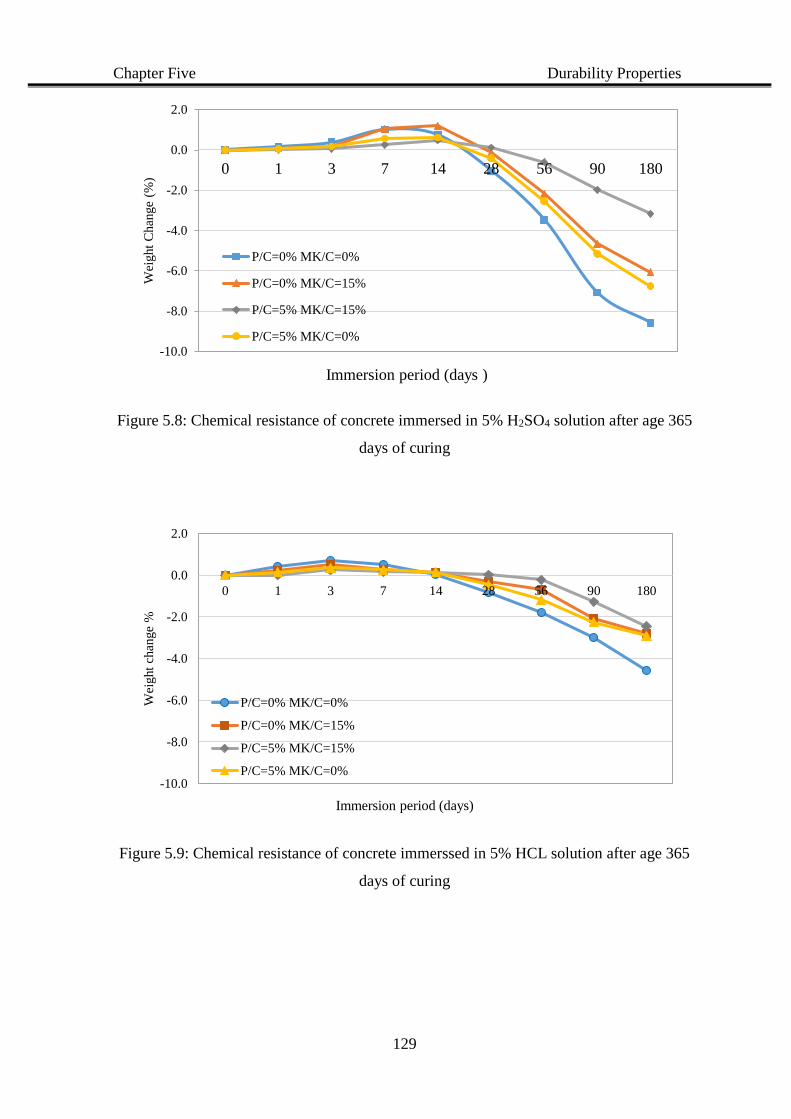
Chapter Five Durability Properties
129
Figure 5.8: Chemical resistance of concrete immersed in 5% H2SO4 solution after age 365
days of curing
Figure 5.9: Chemical resistance of concrete immerssed in 5% HCL solution after age 365
days of curing
-10.0
-8.0
-6.0
-4.0
-2.0
0.0
2.0
0 1 3 7 14 28 56 90 180
Wei
ght
Chan
ge
(%)
Immersion period (days )
P/C=0% MK/C=0%
P/C=0% MK/C=15%
P/C=5% MK/C=15%
P/C=5% MK/C=0%
-10.0
-8.0
-6.0
-4.0
-2.0
0.0
2.0
0 1 3 7 14 28 56 90 180
Wei
ght
chan
ge
%
Immersion period (days)
P/C=0% MK/C=0%
P/C=0% MK/C=15%
P/C=5% MK/C=15%
P/C=5% MK/C=0%
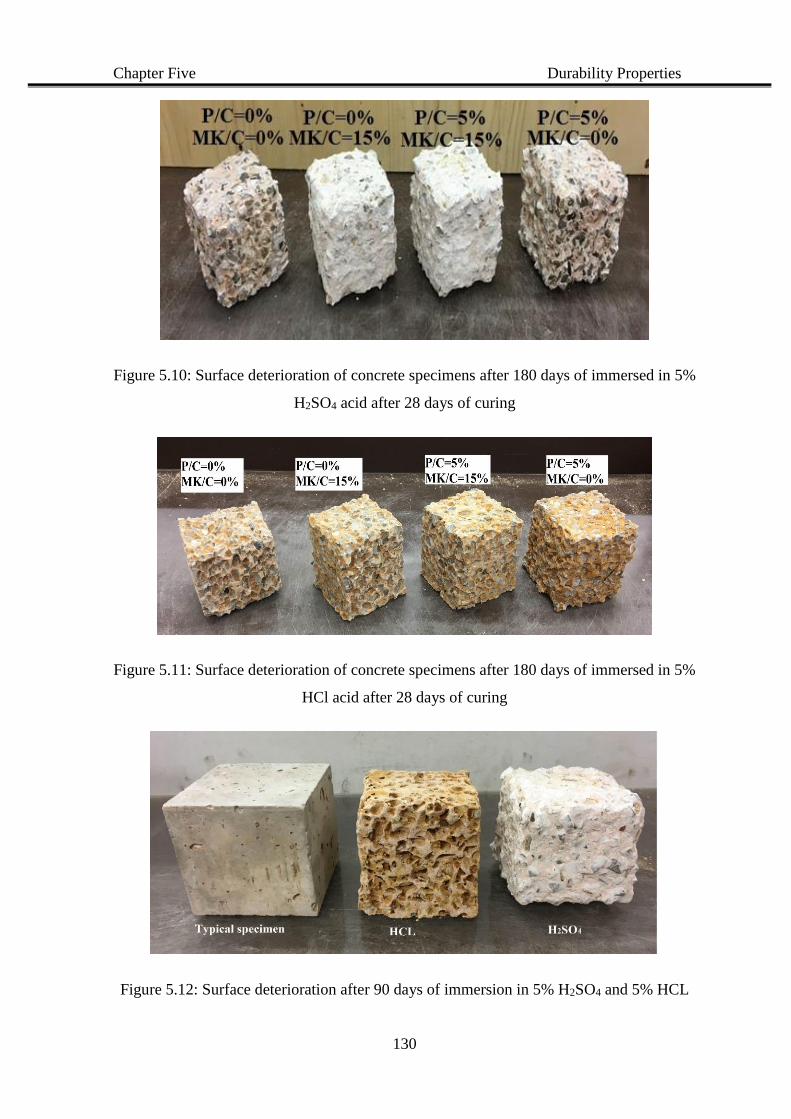
Chapter Five Durability Properties
130
Figure 5.10: Surface deterioration of concrete specimens after 180 days of immersed in 5%
H2SO4 acid after 28 days of curing
Figure 5.11: Surface deterioration of concrete specimens after 180 days of immersed in 5%
HCl acid after 28 days of curing
Figure 5.12: Surface deterioration after 90 days of immersion in 5% H2SO4 and 5% HCL
Chapter Five Durability Properties
131
5.2 Water absorption and rate of water absorption properties
Figure 5.13 shows the results of the water absorption test of control and modified concrete.
The results show that the water absorption of concrete decreases with the time due to the
development of cement hydration with the time for concrete according to Neville, (2011).
The results also show that the concrete modified by partial replacement of cement by 15%
metakaolin and addition of 5% polymer presents a lower water absorption than the
conventional concrete at ages 28 and 56 days. This is due to a reduction of porosity induced
by the added polymer (Afridi et al 2003) and enhanced production more of the CSH gel due
to the pozzolanic reaction of metakaolin according to (Khatib, and Clay (2004). The
modified concrete decreases the water absorption by about 37% and 29% at age 28 and 56
days, respectively, compared with conventional concrete.
Figures 5.14, 5.15 and 5.16 show the rate of water absorption of concrete variation with time
at age 28 and 56 days. It can be seen that the sorptivity progressively decreases with
incorporation of metakaolin and polymer because metakaolin particles are finer than cement
and produce an additional calcium silicate hydrate gel in addition to the fact that the
polymers might fill the pores with a three-dimensional polymeric film. This confirms that
the addition of metakaolin and polymers leads to a reduction in the pore size and connection.
The modified concrete by metakaolin and polymer presents a clear improvement in the
reduction of water absorption rate. The results showed a decrease in modified concrete water
absorption rate of 30% and 35% at age 28 and 56 days, respectively, compared with
conventional concrete. In comparison with the water absorption rate of 28 days, the
specimens at age 56 days showed lower sorptivity due to the early reaction and developed
cement hydration process in the presence of metakaolin as mentioned by Kannan and
Ganesan, (2014). Figure 5.17 show the top surface of conventional and modified concrete
by 15% metakaolin and 5% polymer after three days of the test. It can be seen that the top
surface area of conventional concrete is fully saturated compared with the modified
concrete.
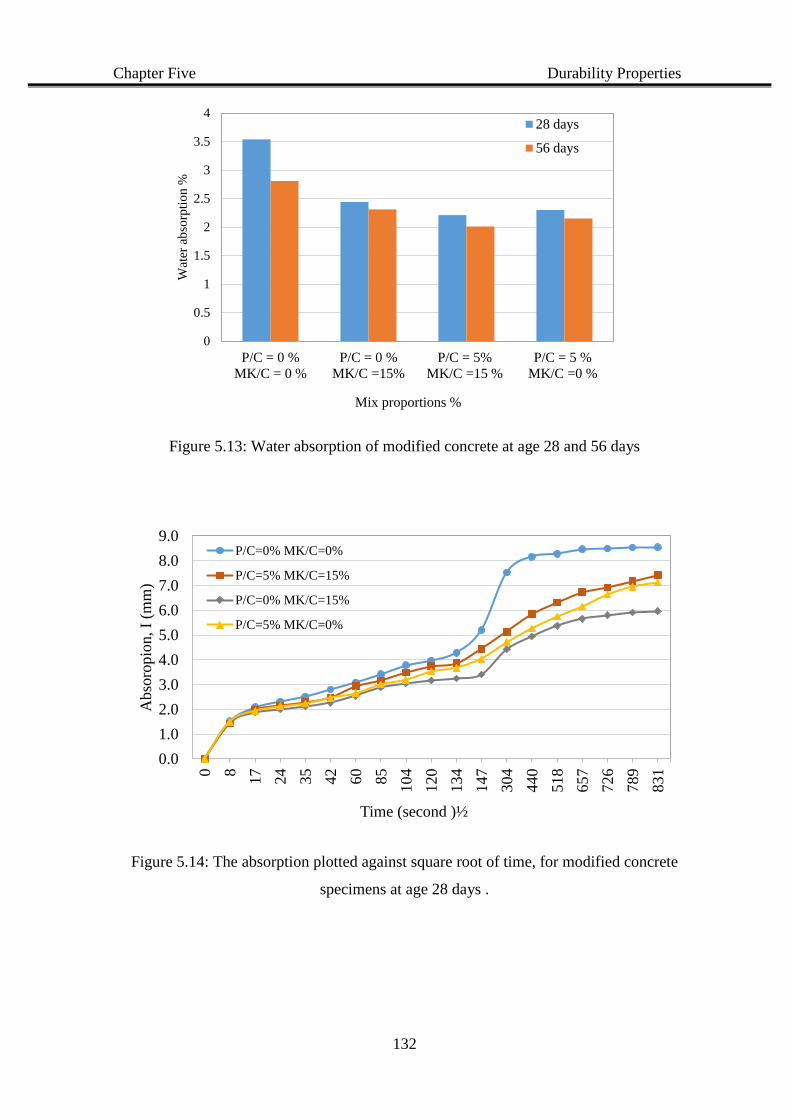
Chapter Five Durability Properties
132
Figure 5.13: Water absorption of modified concrete at age 28 and 56 days
Figure 5.14: The absorption plotted against square root of time, for modified concrete
specimens at age 28 days .
0
0.5
1
1.5
2
2.5
3
3.5
4
P/C = 0 %
MK/C = 0 %
P/C = 0 %
MK/C =15%
P/C = 5%
MK/C =15 %
P/C = 5 %
MK/C =0 %
Wat
er a
bso
rpti
on %
Mix proportions %
28 days
56 days
0.0
1.0
2.0
3.0
4.0
5.0
6.0
7.0
8.0
9.0
0 8
17
24
35
42
60
85
104
120
134
147
304
440
518
657
726
789
831
Abso
ropio
n, I
(mm
)
Time (second )½
P/C=0% MK/C=0%
P/C=5% MK/C=15%
P/C=0% MK/C=15%
P/C=5% MK/C=0%
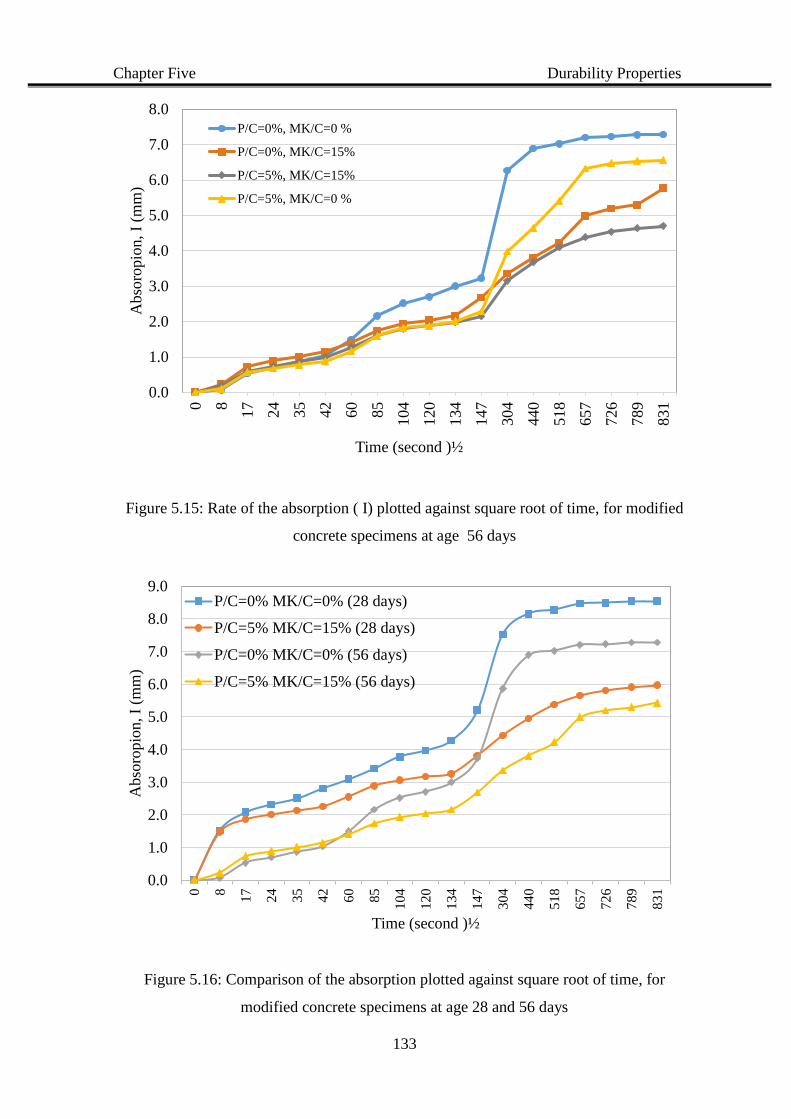
Chapter Five Durability Properties
133
Figure 5.15: Rate of the absorption ( I) plotted against square root of time, for modified
concrete specimens at age 56 days
Figure 5.16: Comparison of the absorption plotted against square root of time, for
modified concrete specimens at age 28 and 56 days
0.0
1.0
2.0
3.0
4.0
5.0
6.0
7.0
8.0
0 8
17
24
35
42
60
85
104
120
134
147
304
440
518
657
726
789
831
Abso
ropio
n, I
(mm
)
Time (second )½
P/C=0%, MK/C=0 %
P/C=0%, MK/C=15%
P/C=5%, MK/C=15%
P/C=5%, MK/C=0 %
0.0
1.0
2.0
3.0
4.0
5.0
6.0
7.0
8.0
9.0
0 8
17
24
35
42
60
85
104
120
134
147
304
440
518
657
726
789
831
Abso
ropio
n, I
(mm
)
Time (second )½
P/C=0% MK/C=0% (28 days)
P/C=5% MK/C=15% (28 days)
P/C=0% MK/C=0% (56 days)
P/C=5% MK/C=15% (56 days)
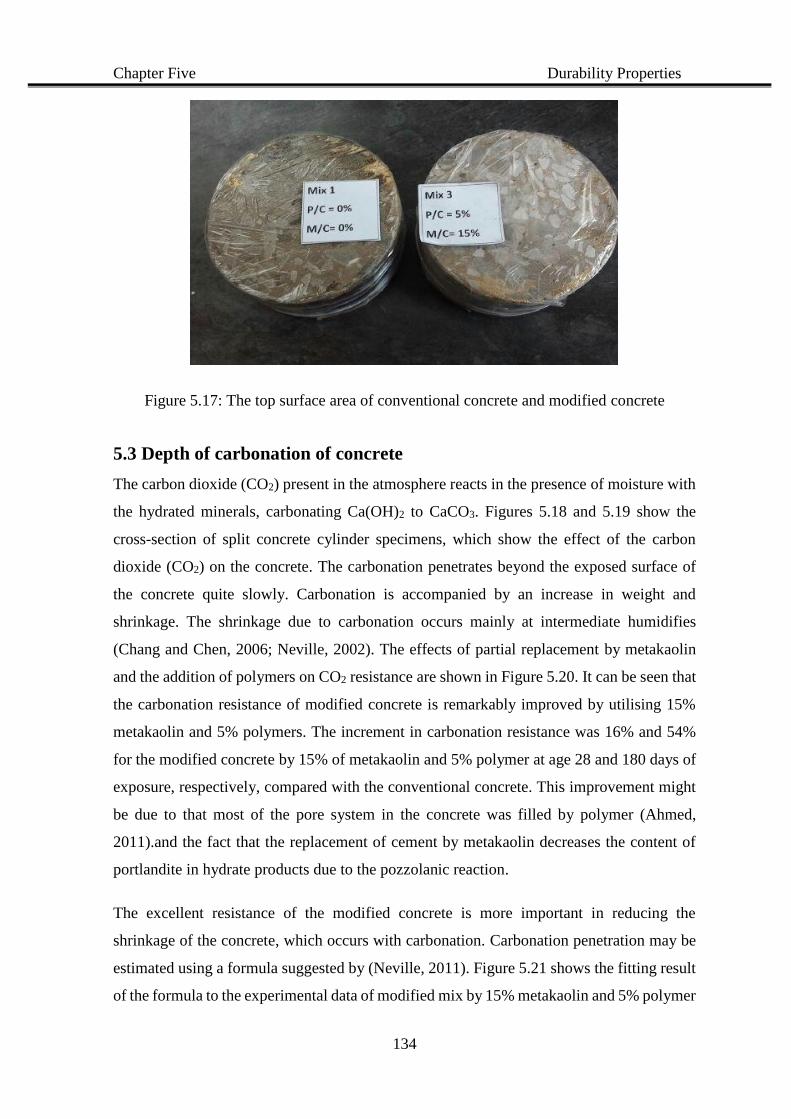
Chapter Five Durability Properties
134
Figure 5.17: The top surface area of conventional concrete and modified concrete
5.3 Depth of carbonation of concrete
The carbon dioxide (CO2) present in the atmosphere reacts in the presence of moisture with
the hydrated minerals, carbonating Ca(OH)2 to CaCO3. Figures 5.18 and 5.19 show the
cross-section of split concrete cylinder specimens, which show the effect of the carbon
dioxide (CO2) on the concrete. The carbonation penetrates beyond the exposed surface of
the concrete quite slowly. Carbonation is accompanied by an increase in weight and
shrinkage. The shrinkage due to carbonation occurs mainly at intermediate humidifies
(Chang and Chen, 2006; Neville, 2002). The effects of partial replacement by metakaolin
and the addition of polymers on CO2 resistance are shown in Figure 5.20. It can be seen that
the carbonation resistance of modified concrete is remarkably improved by utilising 15%
metakaolin and 5% polymers. The increment in carbonation resistance was 16% and 54%
for the modified concrete by 15% of metakaolin and 5% polymer at age 28 and 180 days of
exposure, respectively, compared with the conventional concrete. This improvement might
be due to that most of the pore system in the concrete was filled by polymer (Ahmed,
2011).and the fact that the replacement of cement by metakaolin decreases the content of
portlandite in hydrate products due to the pozzolanic reaction.
The excellent resistance of the modified concrete is more important in reducing the
shrinkage of the concrete, which occurs with carbonation. Carbonation penetration may be
estimated using a formula suggested by (Neville, 2011). Figure 5.21 shows the fitting result
of the formula to the experimental data of modified mix by 15% metakaolin and 5% polymer
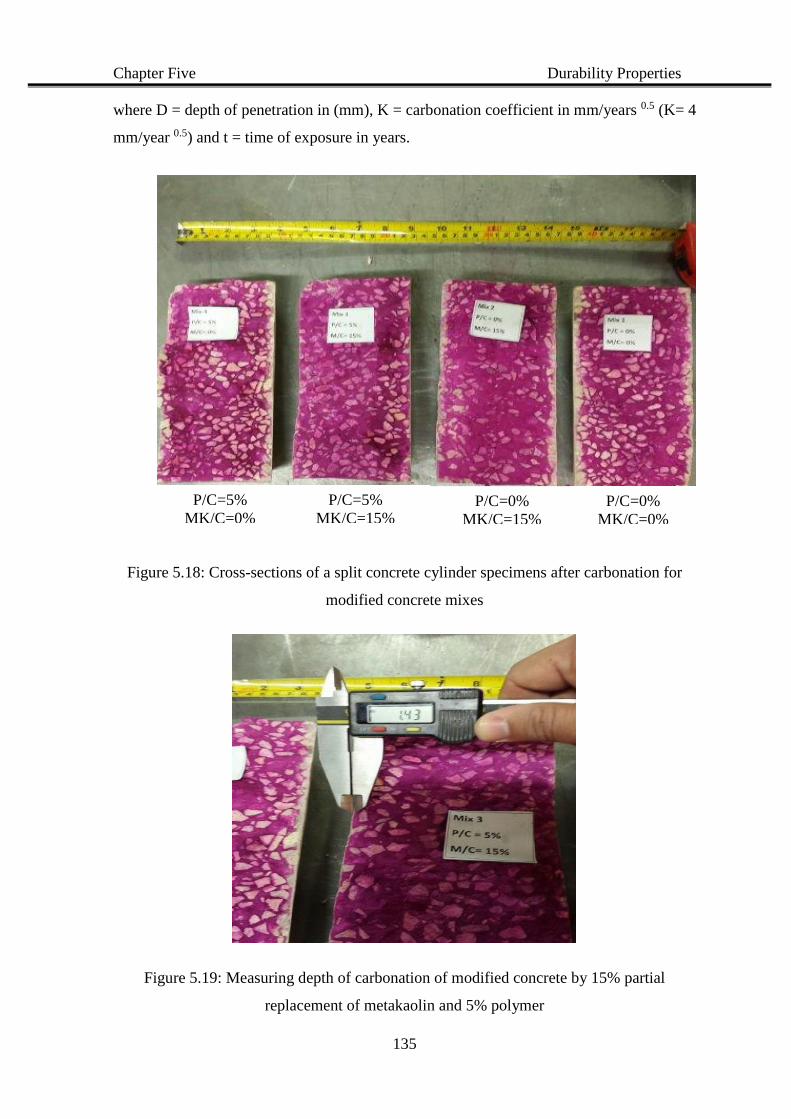
Chapter Five Durability Properties
135
where D = depth of penetration in (mm), K = carbonation coefficient in mm/years 0.5 (K= 4
mm/year 0.5) and t = time of exposure in years.
Figure 5.18: Cross-sections of a split concrete cylinder specimens after carbonation for
modified concrete mixes
Figure 5.19: Measuring depth of carbonation of modified concrete by 15% partial
replacement of metakaolin and 5% polymer
P/C=0%
MK/C=0%
P/C=0%
MK/C=15%
P/C=5%
MK/C=15%
P/C=5%
MK/C=0%
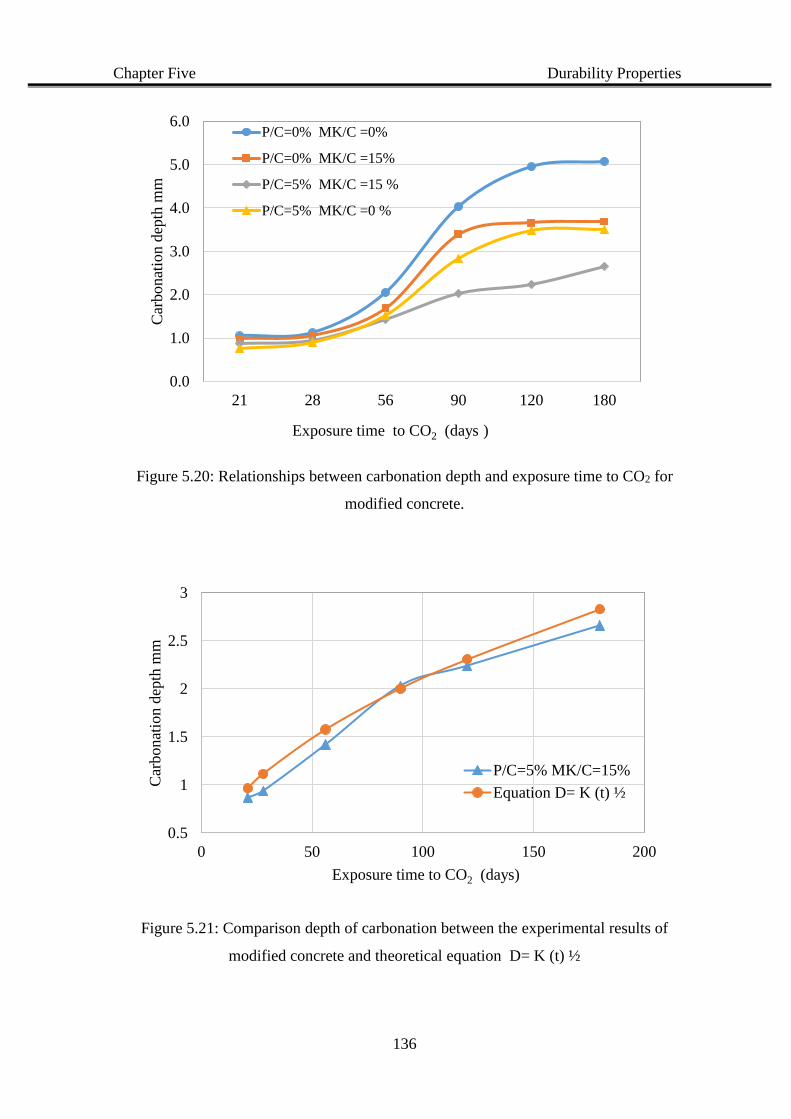
Chapter Five Durability Properties
136
Figure 5.20: Relationships between carbonation depth and exposure time to CO2 for
modified concrete.
Figure 5.21: Comparison depth of carbonation between the experimental results of
modified concrete and theoretical equation D= K (t) ½
0.0
1.0
2.0
3.0
4.0
5.0
6.0
21 28 56 90 120 180
Car
bonat
ion d
epth
mm
Exposure time to CO2 (days )
P/C=0% MK/C =0%
P/C=0% MK/C =15%
P/C=5% MK/C =15 %
P/C=5% MK/C =0 %
0.5
1
1.5
2
2.5
3
0 50 100 150 200
Car
bonat
ion d
epth
mm
Exposure time to CO2 (days)
P/C=5% MK/C=15%
Equation D= K (t) ½
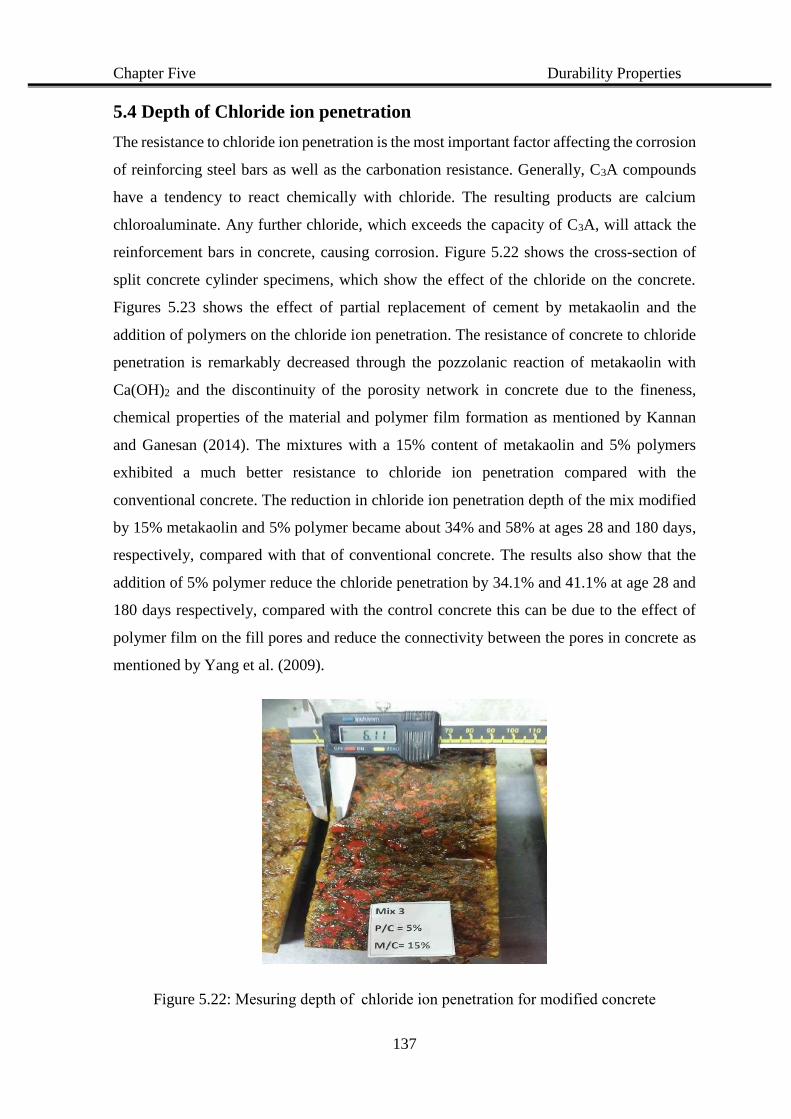
Chapter Five Durability Properties
137
5.4 Depth of Chloride ion penetration
The resistance to chloride ion penetration is the most important factor affecting the corrosion
of reinforcing steel bars as well as the carbonation resistance. Generally, C3A compounds
have a tendency to react chemically with chloride. The resulting products are calcium
chloroaluminate. Any further chloride, which exceeds the capacity of C3A, will attack the
reinforcement bars in concrete, causing corrosion. Figure 5.22 shows the cross-section of
split concrete cylinder specimens, which show the effect of the chloride on the concrete.
Figures 5.23 shows the effect of partial replacement of cement by metakaolin and the
addition of polymers on the chloride ion penetration. The resistance of concrete to chloride
penetration is remarkably decreased through the pozzolanic reaction of metakaolin with
Ca(OH)2 and the discontinuity of the porosity network in concrete due to the fineness,
chemical properties of the material and polymer film formation as mentioned by Kannan
and Ganesan (2014). The mixtures with a 15% content of metakaolin and 5% polymers
exhibited a much better resistance to chloride ion penetration compared with the
conventional concrete. The reduction in chloride ion penetration depth of the mix modified
by 15% metakaolin and 5% polymer became about 34% and 58% at ages 28 and 180 days,
respectively, compared with that of conventional concrete. The results also show that the
addition of 5% polymer reduce the chloride penetration by 34.1% and 41.1% at age 28 and
180 days respectively, compared with the control concrete this can be due to the effect of
polymer film on the fill pores and reduce the connectivity between the pores in concrete as
mentioned by Yang et al. (2009).
Figure 5.22: chloride ion penetration for modified concrete depth of Mesuring
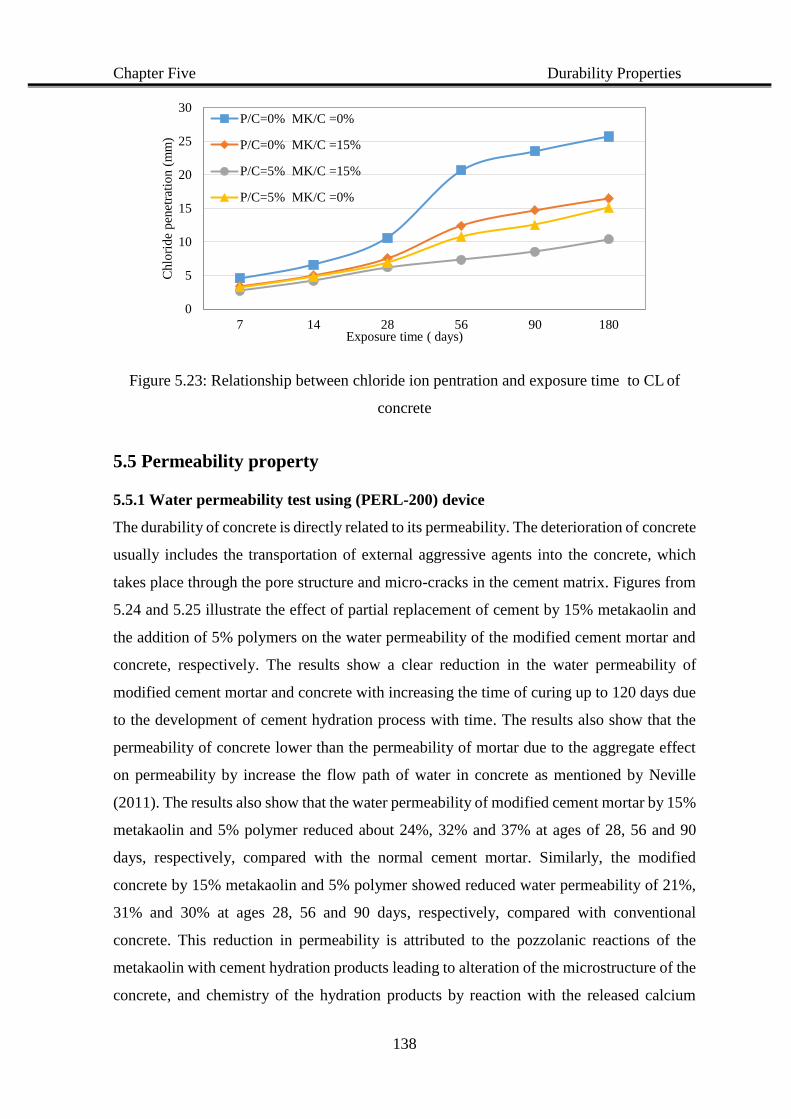
Chapter Five Durability Properties
138
Figure 5.23: Relationship between chloride ion pentration and exposure time to CL of
concrete
5.5 Permeability property
5.5.1 Water permeability test using (PERL-200) device
The durability of concrete is directly related to its permeability. The deterioration of concrete
usually includes the transportation of external aggressive agents into the concrete, which
takes place through the pore structure and micro-cracks in the cement matrix. Figures from
5.24 and 5.25 illustrate the effect of partial replacement of cement by 15% metakaolin and
the addition of 5% polymers on the water permeability of the modified cement mortar and
concrete, respectively. The results show a clear reduction in the water permeability of
modified cement mortar and concrete with increasing the time of curing up to 120 days due
to the development of cement hydration process with time. The results also show that the
permeability of concrete lower than the permeability of mortar due to the aggregate effect
on permeability by increase the flow path of water in concrete as mentioned by Neville
(2011). The results also show that the water permeability of modified cement mortar by 15%
metakaolin and 5% polymer reduced about 24%, 32% and 37% at ages of 28, 56 and 90
days, respectively, compared with the normal cement mortar. Similarly, the modified
concrete by 15% metakaolin and 5% polymer showed reduced water permeability of 21%,
31% and 30% at ages 28, 56 and 90 days, respectively, compared with conventional
concrete. This reduction in permeability is attributed to the pozzolanic reactions of the
metakaolin with cement hydration products leading to alteration of the microstructure of the
concrete, and chemistry of the hydration products by reaction with the released calcium
0
5
10
15
20
25
30
7 14 28 56 90 180
Chlo
rid
e p
enet
rati
on (
mm
)
Exposure time ( days)
P/C=0% MK/C =0%
P/C=0% MK/C =15%
P/C=5% MK/C =15%
P/C=5% MK/C =0%
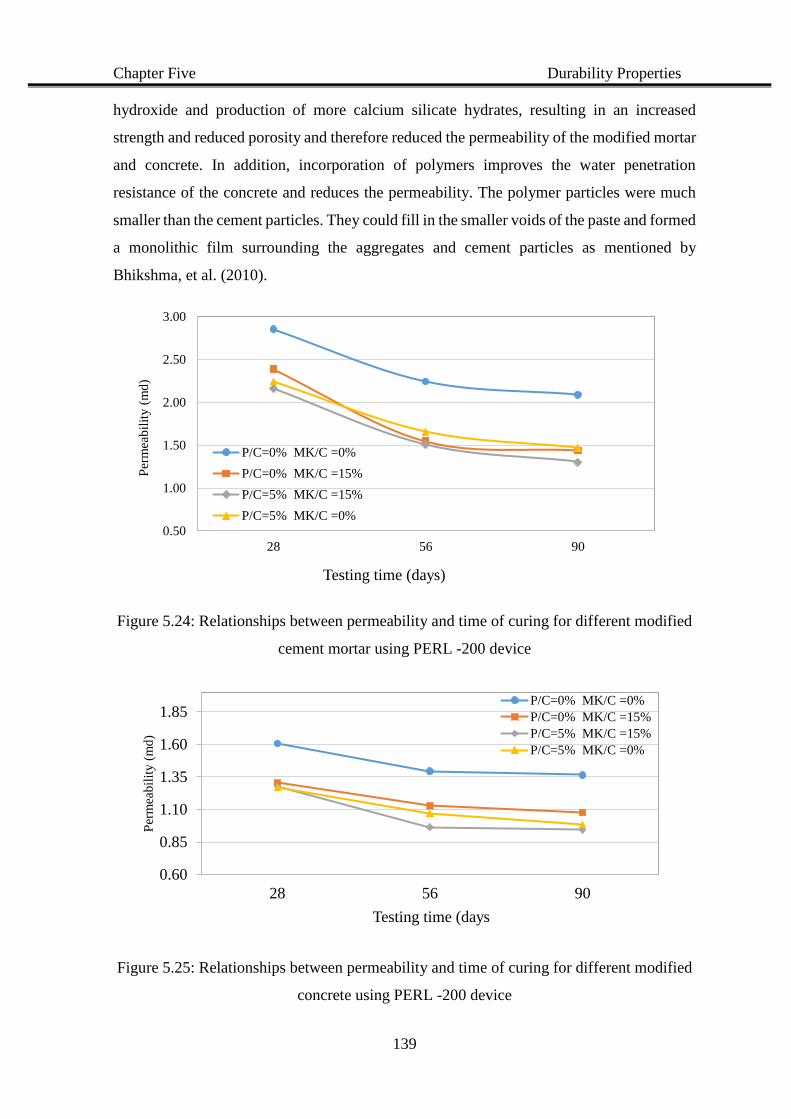
Chapter Five Durability Properties
139
hydroxide and production of more calcium silicate hydrates, resulting in an increased
strength and reduced porosity and therefore reduced the permeability of the modified mortar
and concrete. In addition, incorporation of polymers improves the water penetration
resistance of the concrete and reduces the permeability. The polymer particles were much
smaller than the cement particles. They could fill in the smaller voids of the paste and formed
a monolithic film surrounding the aggregates and cement particles as mentioned by
Bhikshma, et al. (2010).
Figure 5.24: Relationships between permeability and time of curing for different modified
cement mortar using PERL -200 device
Figure 5.25: Relationships between permeability and time of curing for different modified
concrete using PERL -200 device
0.50
1.00
1.50
2.00
2.50
3.00
28 56 90
Per
mea
bil
ity (
md
)
Testing time (days)
P/C=0% MK/C =0%
P/C=0% MK/C =15%
P/C=5% MK/C =15%
P/C=5% MK/C =0%
0.60
0.85
1.10
1.35
1.60
1.85
28 56 90
Per
mea
bil
ity (
md
)
Testing time (days
P/C=0% MK/C =0%
P/C=0% MK/C =15%
P/C=5% MK/C =15%
P/C=5% MK/C =0%
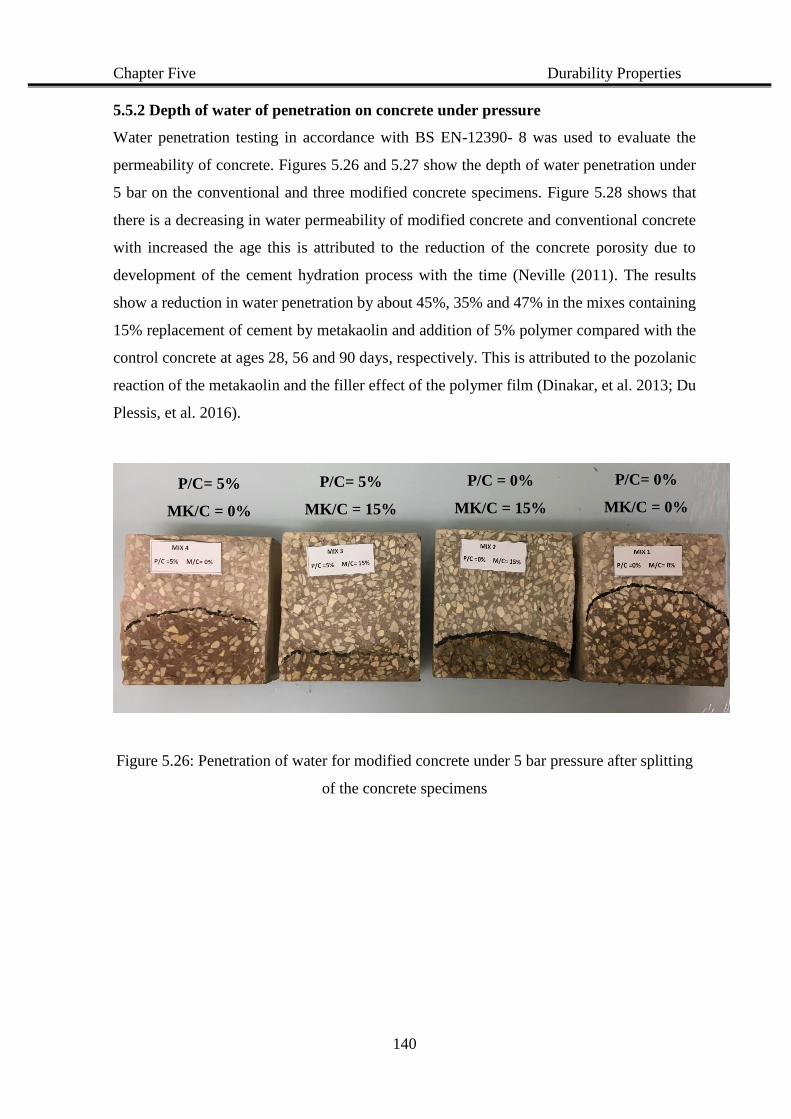
Chapter Five Durability Properties
140
5.5.2 Depth of water of penetration on concrete under pressure
Water penetration testing in accordance with BS EN-12390- 8 was used to evaluate the
permeability of concrete. Figures 5.26 and 5.27 show the depth of water penetration under
5 bar on the conventional and three modified concrete specimens. Figure 5.28 shows that
there is a decreasing in water permeability of modified concrete and conventional concrete
with increased the age this is attributed to the reduction of the concrete porosity due to
development of the cement hydration process with the time (Neville (2011). The results
show a reduction in water penetration by about 45%, 35% and 47% in the mixes containing
15% replacement of cement by metakaolin and addition of 5% polymer compared with the
control concrete at ages 28, 56 and 90 days, respectively. This is attributed to the pozolanic
reaction of the metakaolin and the filler effect of the polymer film (Dinakar, et al. 2013; Du
Plessis, et al. 2016).
Figure 5.26: Penetration of water for modified concrete under 5 bar pressure after splitting
of the concrete specimens
P/C= 5%
MK/C = 0%
P/C= 5%
MK/C = 15%
P/C = 0%
MK/C = 15%
P/C= 0%
MK/C = 0%
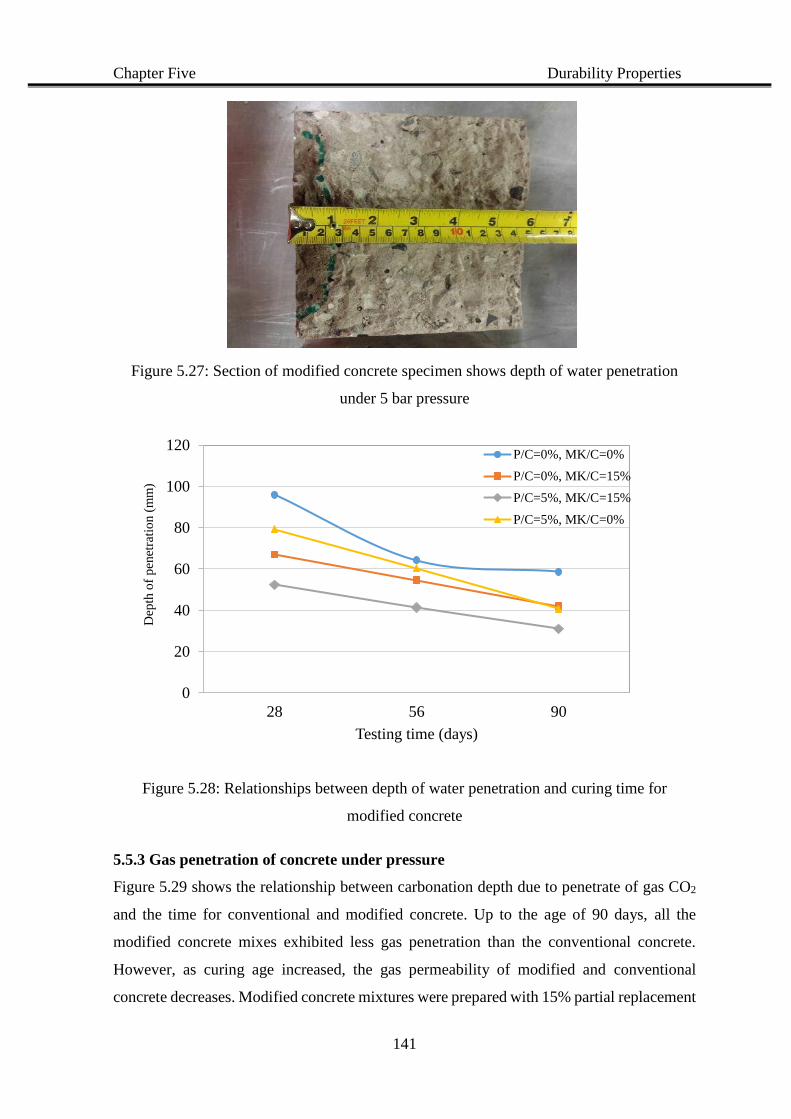
Chapter Five Durability Properties
141
Figure 5.27: Section of modified concrete specimen shows depth of water penetration
under 5 bar pressure
Figure 5.28: Relationships between depth of water penetration and curing time for
modified concrete
5.5.3 Gas penetration of concrete under pressure
Figure 5.29 shows the relationship between carbonation depth due to penetrate of gas CO2
and the time for conventional and modified concrete. Up to the age of 90 days, all the
modified concrete mixes exhibited less gas penetration than the conventional concrete.
However, as curing age increased, the gas permeability of modified and conventional
concrete decreases. Modified concrete mixtures were prepared with 15% partial replacement
0
20
40
60
80
100
120
28 56 90
Dep
th o
f p
enet
rati
on (
mm
)
Testing time (days)
P/C=0%, MK/C=0%
P/C=0%, MK/C=15%
P/C=5%, MK/C=15%
P/C=5%, MK/C=0%
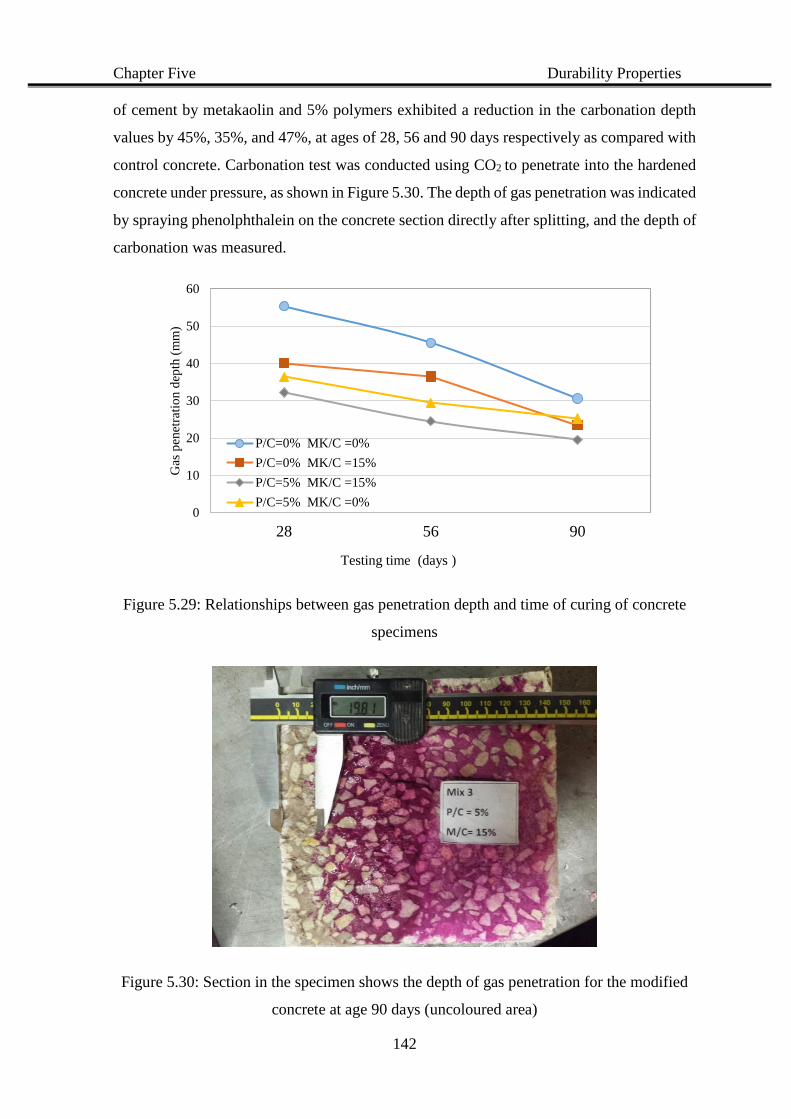
Chapter Five Durability Properties
142
of cement by metakaolin and 5% polymers exhibited a reduction in the carbonation depth
values by 45%, 35%, and 47%, at ages of 28, 56 and 90 days respectively as compared with
control concrete. Carbonation test was conducted using CO2 to penetrate into the hardened
concrete under pressure, as shown in Figure 5.30. The depth of gas penetration was indicated
by spraying phenolphthalein on the concrete section directly after splitting, and the depth of
carbonation was measured.
Figure 5.29: Relationships between gas penetration depth and time of curing of concrete
specimens
Figure 5.30: Section in the specimen shows the depth of gas penetration for the modified
concrete at age 90 days (uncoloured area)
0
10
20
30
40
50
60
28 56 90
Gas
pen
etra
tio
n d
epth
(m
m)
Testing time (days )
P/C=0% MK/C =0%
P/C=0% MK/C =15%
P/C=5% MK/C =15%
P/C=5% MK/C =0%
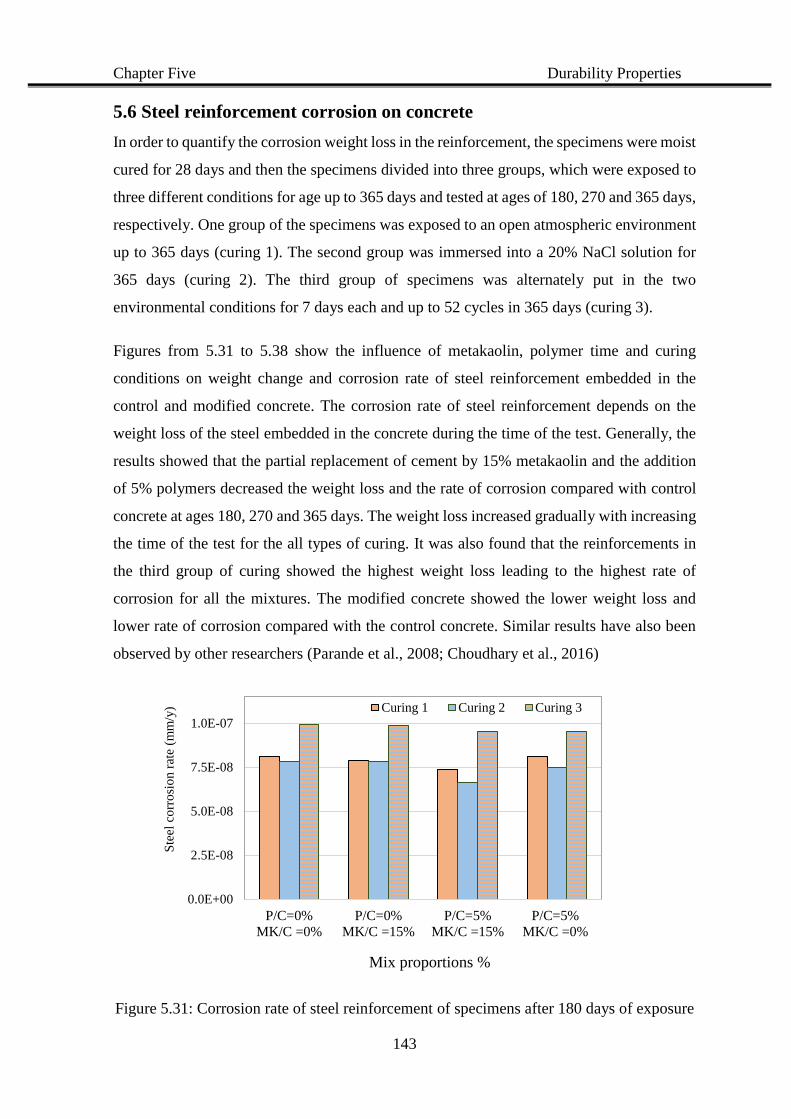
Chapter Five Durability Properties
143
5.6 Steel reinforcement corrosion on concrete
In order to quantify the corrosion weight loss in the reinforcement, the specimens were moist
cured for 28 days and then the specimens divided into three groups, which were exposed to
three different conditions for age up to 365 days and tested at ages of 180, 270 and 365 days,
respectively. One group of the specimens was exposed to an open atmospheric environment
up to 365 days (curing 1). The second group was immersed into a 20% NaCl solution for
365 days (curing 2). The third group of specimens was alternately put in the two
environmental conditions for 7 days each and up to 52 cycles in 365 days (curing 3).
Figures from 5.31 to 5.38 show the influence of metakaolin, polymer time and curing
conditions on weight change and corrosion rate of steel reinforcement embedded in the
control and modified concrete. The corrosion rate of steel reinforcement depends on the
weight loss of the steel embedded in the concrete during the time of the test. Generally, the
results showed that the partial replacement of cement by 15% metakaolin and the addition
of 5% polymers decreased the weight loss and the rate of corrosion compared with control
concrete at ages 180, 270 and 365 days. The weight loss increased gradually with increasing
the time of the test for the all types of curing. It was also found that the reinforcements in
the third group of curing showed the highest weight loss leading to the highest rate of
corrosion for all the mixtures. The modified concrete showed the lower weight loss and
lower rate of corrosion compared with the control concrete. Similar results have also been
observed by other researchers (Parande et al., 2008; Choudhary et al., 2016)
Figure 5.31: Corrosion rate of steel reinforcement of specimens after 180 days of exposure
0.0E+00
2.5E-08
5.0E-08
7.5E-08
1.0E-07
P/C=0%
MK/C =0%
P/C=0%
MK/C =15%
P/C=5%
MK/C =15%
P/C=5%
MK/C =0%
Ste
el c
orr
osi
on r
ate
(mm
/y)
Mix proportions %
Curing 1 Curing 2 Curing 3
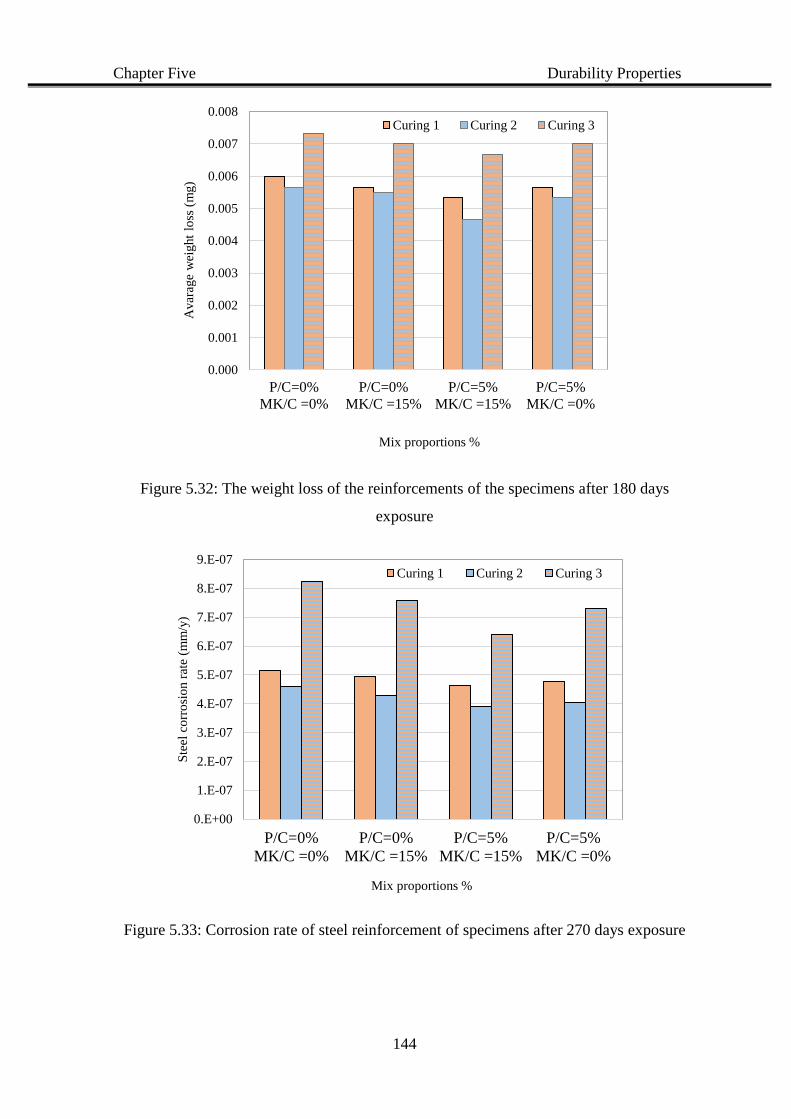
Chapter Five Durability Properties
144
Figure 5.32: The weight loss of the reinforcements of the specimens after 180 days
exposure
Figure 5.33: Corrosion rate of steel reinforcement of specimens after 270 days exposure
0.000
0.001
0.002
0.003
0.004
0.005
0.006
0.007
0.008
P/C=0%
MK/C =0%
P/C=0%
MK/C =15%
P/C=5%
MK/C =15%
P/C=5%
MK/C =0%
Avar
age
wei
ght
loss
(m
g)
Mix proportions %
Curing 1 Curing 2 Curing 3
0.E+00
1.E-07
2.E-07
3.E-07
4.E-07
5.E-07
6.E-07
7.E-07
8.E-07
9.E-07
P/C=0%
MK/C =0%
P/C=0%
MK/C =15%
P/C=5%
MK/C =15%
P/C=5%
MK/C =0%
Ste
el c
orr
osi
on r
ate
(mm
/y)
Mix proportions %
Curing 1 Curing 2 Curing 3
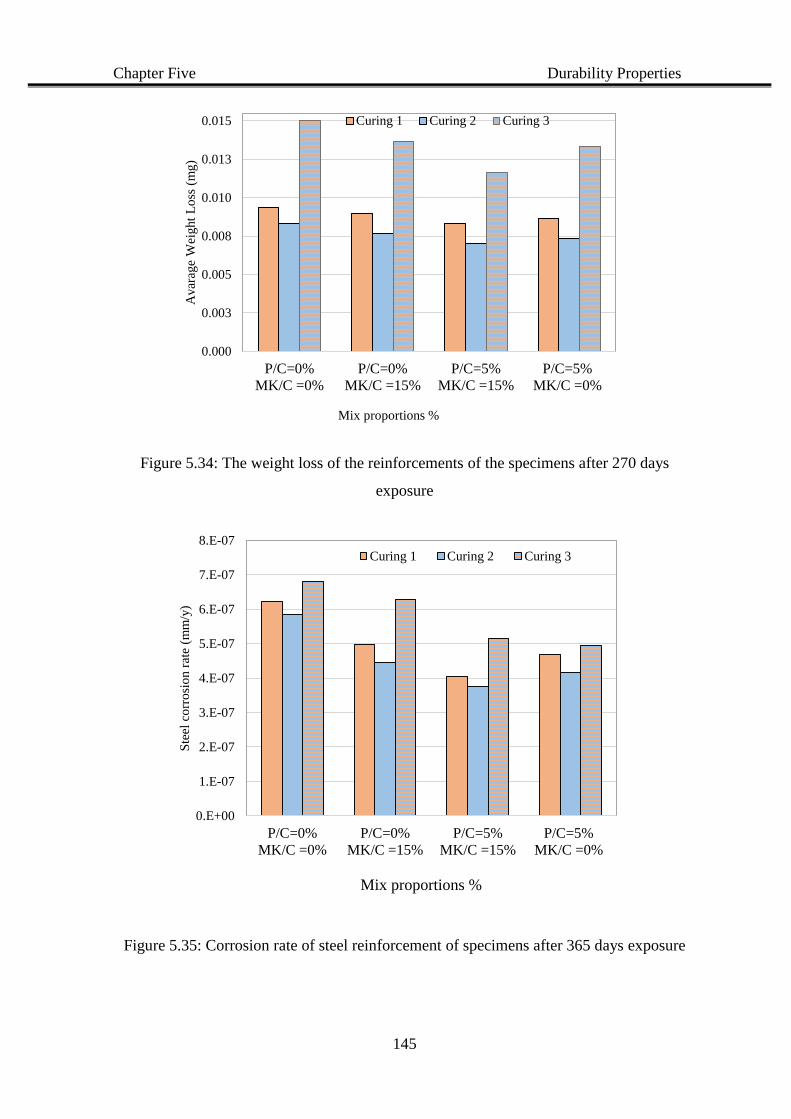
Chapter Five Durability Properties
145
Figure 5.34: The weight loss of the reinforcements of the specimens after 270 days
exposure
Figure 5.35: Corrosion rate of steel reinforcement of specimens after 365 days exposure
0.000
0.003
0.005
0.008
0.010
0.013
0.015
P/C=0%
MK/C =0%
P/C=0%
MK/C =15%
P/C=5%
MK/C =15%
P/C=5%
MK/C =0%
Avar
age
Wei
ght
Lo
ss (
mg)
Mix proportions %
Curing 1 Curing 2 Curing 3
0.E+00
1.E-07
2.E-07
3.E-07
4.E-07
5.E-07
6.E-07
7.E-07
8.E-07
P/C=0%
MK/C =0%
P/C=0%
MK/C =15%
P/C=5%
MK/C =15%
P/C=5%
MK/C =0%
Ste
el c
orr
osi
on r
ate
(mm
/y)
Mix proportions %
Curing 1 Curing 2 Curing 3
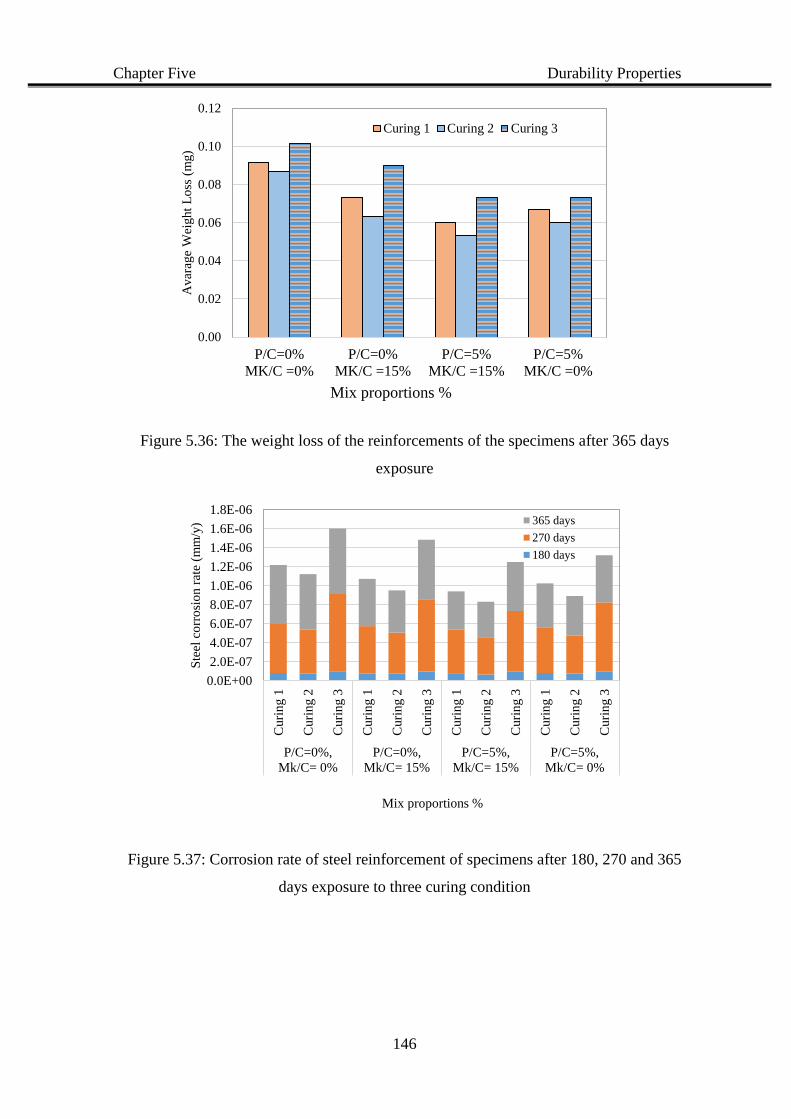
Chapter Five Durability Properties
146
Figure 5.36: The weight loss of the reinforcements of the specimens after 365 days
exposure
Figure 5.37: Corrosion rate of steel reinforcement of specimens after 180, 270 and 365
days exposure to three curing condition
0.00
0.02
0.04
0.06
0.08
0.10
0.12
P/C=0%
MK/C =0%
P/C=0%
MK/C =15%
P/C=5%
MK/C =15%
P/C=5%
MK/C =0%
Avar
age
Wei
ght
Lo
ss (
mg)
Mix proportions %
Curing 1 Curing 2 Curing 3
0.0E+00
2.0E-07
4.0E-07
6.0E-07
8.0E-07
1.0E-06
1.2E-06
1.4E-06
1.6E-06
1.8E-06
Curi
ng
1
Curi
ng
2
Curi
ng
3
Curi
ng
1
Curi
ng
2
Curi
ng
3
Curi
ng
1
Curi
ng
2
Curi
ng
3
Curi
ng
1
Curi
ng
2
Curi
ng
3
P/C=0%,
Mk/C= 0%
P/C=0%,
Mk/C= 15%
P/C=5%,
Mk/C= 15%
P/C=5%,
Mk/C= 0%
Ste
el c
orr
osi
on r
ate
(mm
/y)
Mix proportions %
365 days
270 days
180 days
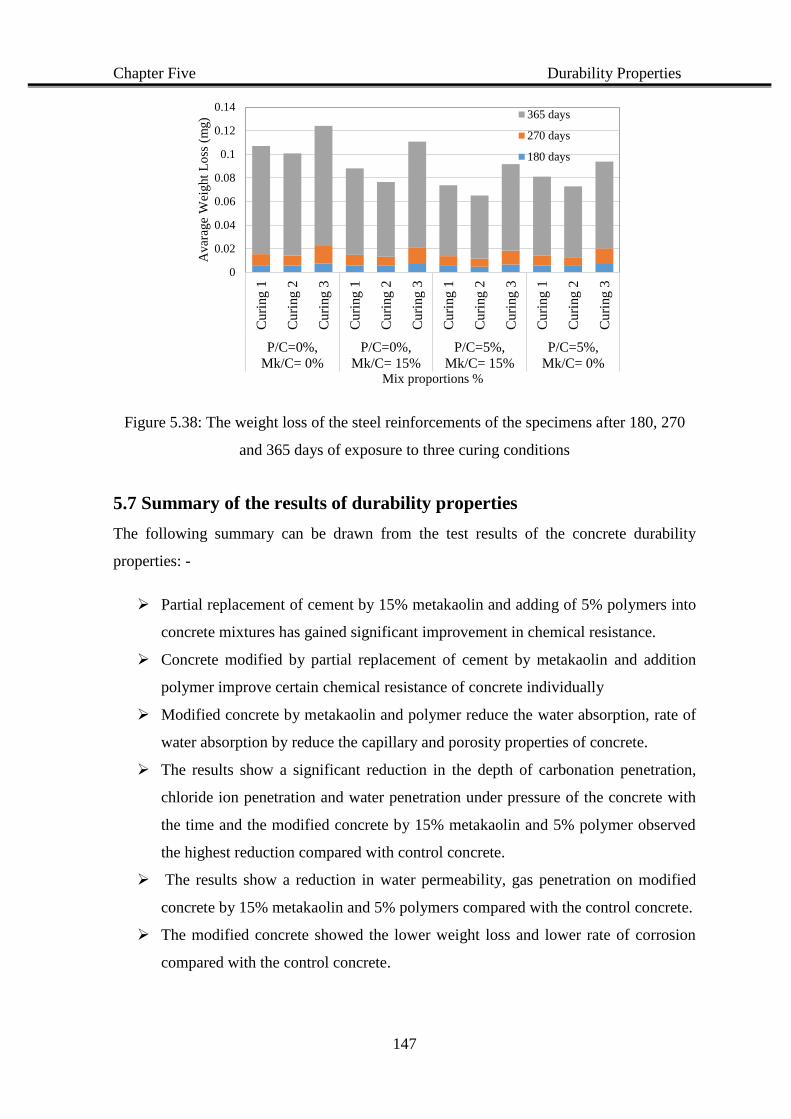
Chapter Five Durability Properties
147
Figure 5.38: The weight loss of the steel reinforcements of the specimens after 180, 270
and 365 days of exposure to three curing conditions
5.7 Summary of the results of durability properties
The following summary can be drawn from the test results of the concrete durability
properties: -
Partial replacement of cement by 15% metakaolin and adding of 5% polymers into
concrete mixtures has gained significant improvement in chemical resistance.
Concrete modified by partial replacement of cement by metakaolin and addition
polymer improve certain chemical resistance of concrete individually
Modified concrete by metakaolin and polymer reduce the water absorption, rate of
water absorption by reduce the capillary and porosity properties of concrete.
The results show a significant reduction in the depth of carbonation penetration,
chloride ion penetration and water penetration under pressure of the concrete with
the time and the modified concrete by 15% metakaolin and 5% polymer observed
the highest reduction compared with control concrete.
The results show a reduction in water permeability, gas penetration on modified
concrete by 15% metakaolin and 5% polymers compared with the control concrete.
The modified concrete showed the lower weight loss and lower rate of corrosion
compared with the control concrete.
0
0.02
0.04
0.06
0.08
0.1
0.12
0.14
Cu
ring
1
Cu
ring
2
Cu
ring
3
Cu
ring
1
Cu
ring
2
Cu
ring
3
Cu
ring
1
Cu
ring
2
Cu
ring
3
Curi
ng 1
Cu
ring
2
Cu
ring
3
P/C=0%,
Mk/C= 0%
P/C=0%,
Mk/C= 15%
P/C=5%,
Mk/C= 15%
P/C=5%,
Mk/C= 0%
Avar
age
Wei
ght
Lo
ss (
mg)
Mix proportions %
365 days
270 days
180 days
CHAPTER SIX
CONCRETE MICROSTRUCTURE
Chapter Six Concrete Microstructure
148
CHAPTER 6
CONCRETE MICROSTRUCTURE
6.1 Introduction
The microstructure of hardened concrete has the main effect on the concrete properties such as
strength, shrinkage and permeability. Consequently, an understanding of the pore structure
would give an insight into the mechanisms of concrete properties improvement. The pore
structure of concrete has long been recognised as the key to a wide range of different
mechanical, physical and chemical properties. The long-term performance and durability of
concrete are dictated significantly by the changes in the physical and chemical microstructure
of the material due to transport phenomena (Lu et al., 2006). Penetration of harmful solutions
into the concrete system is the major reason for deterioration of concrete structures, which takes
place through the porous microstructure. Therefore, the penetration of aggressive agents
depends on the pore structure and porosity of the concrete. In addition to the pore geometry
considerations, the reaction with penetrating aggressive solutions such as chloride ions and
carbon dioxide, influences physical and chemical concrete properties. It is believed that
porosity, and in particular capillary porosity, influences concrete permeability. Factors such as
interconnectivity, and volume and surface area of the voids influence transport processes. A
sensible aim in the production of high durability concrete materials would be a permeability
and small pore sizes so as to effect lower penetrating flow. A detailed description of the pore
size distribution of a paste is unlikely to be sufficient for property prediction. Extra measure of
pore volume, surface area, distribution and connectivity will be required for prediction of
permeability while mechanical properties of the solid phases and their bonds may be needed
for prediction of strength and deformation.
As mentioned in the literature review and the experimental results of the current study, the
improvement in concrete properties due to partial replacement of cement by metakaolin (MK)
and the addition of polymer is attributed to the chemical reactions and physical parameter
leading to alteration of the microscopic pores system of the concrete. The intention to
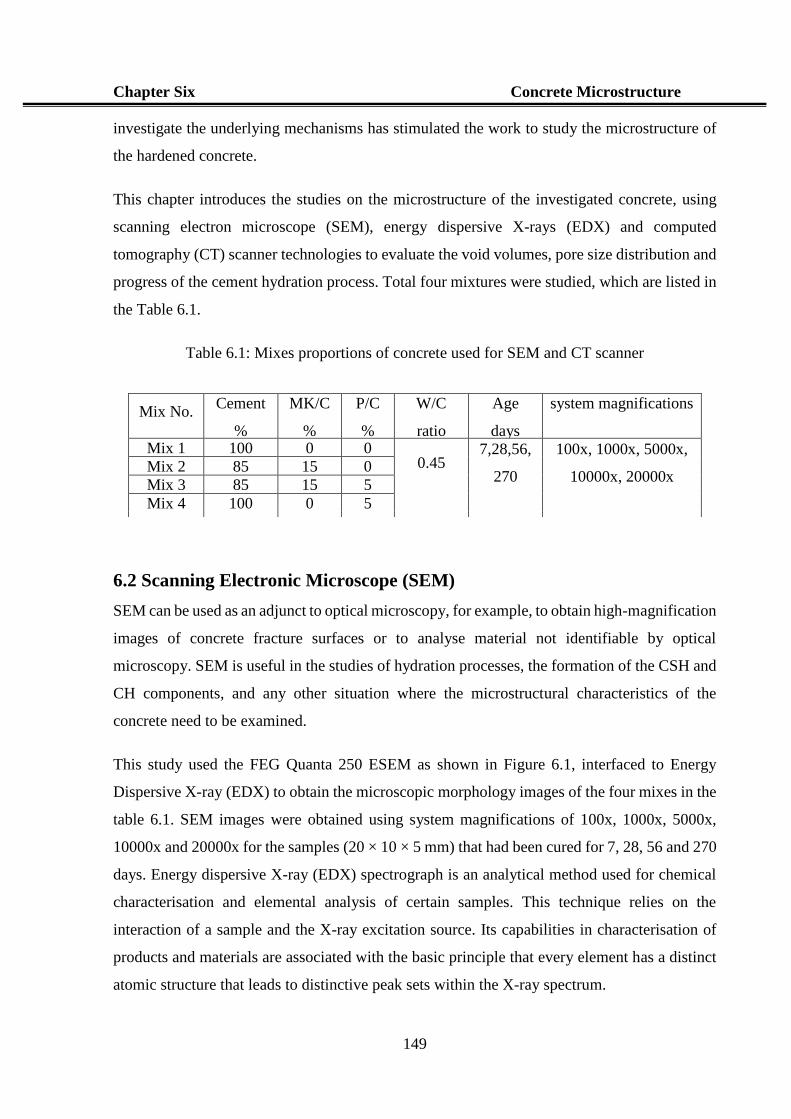
Chapter Six Concrete Microstructure
149
investigate the underlying mechanisms has stimulated the work to study the microstructure of
the hardened concrete.
This chapter introduces the studies on the microstructure of the investigated concrete, using
scanning electron microscope (SEM), energy dispersive X-rays (EDX) and computed
tomography (CT) scanner technologies to evaluate the void volumes, pore size distribution and
progress of the cement hydration process. Total four mixtures were studied, which are listed in
the Table 6.1.
Table 6.1: Mixes proportions of concrete used for SEM and CT scanner
6.2 Scanning Electronic Microscope (SEM)
SEM can be used as an adjunct to optical microscopy, for example, to obtain high-magnification
images of concrete fracture surfaces or to analyse material not identifiable by optical
microscopy. SEM is useful in the studies of hydration processes, the formation of the CSH and
CH components, and any other situation where the microstructural characteristics of the
concrete need to be examined.
This study used the FEG Quanta 250 ESEM as shown in Figure 6.1, interfaced to Energy
Dispersive X-ray (EDX) to obtain the microscopic morphology images of the four mixes in the
table 6.1. SEM images were obtained using system magnifications of 100x, 1000x, 5000x,
10000x and 20000x for the samples (20 × 10 × 5 mm) that had been cured for 7, 28, 56 and 270
days. Energy dispersive X-ray (EDX) spectrograph is an analytical method used for chemical
characterisation and elemental analysis of certain samples. This technique relies on the
interaction of a sample and the X-ray excitation source. Its capabilities in characterisation of
products and materials are associated with the basic principle that every element has a distinct
atomic structure that leads to distinctive peak sets within the X-ray spectrum.
Mix No. Cement
%
MK/C
%
P/C
%
W/C
ratio
Age
days
system magnifications
Mix 1 100 0 0 0.45
7,28,56,
270
100x, 1000x, 5000x,
10000x, 20000x Mix 2 85 15 0
Mix 3 85 15 5
Mix 4 100 0 5
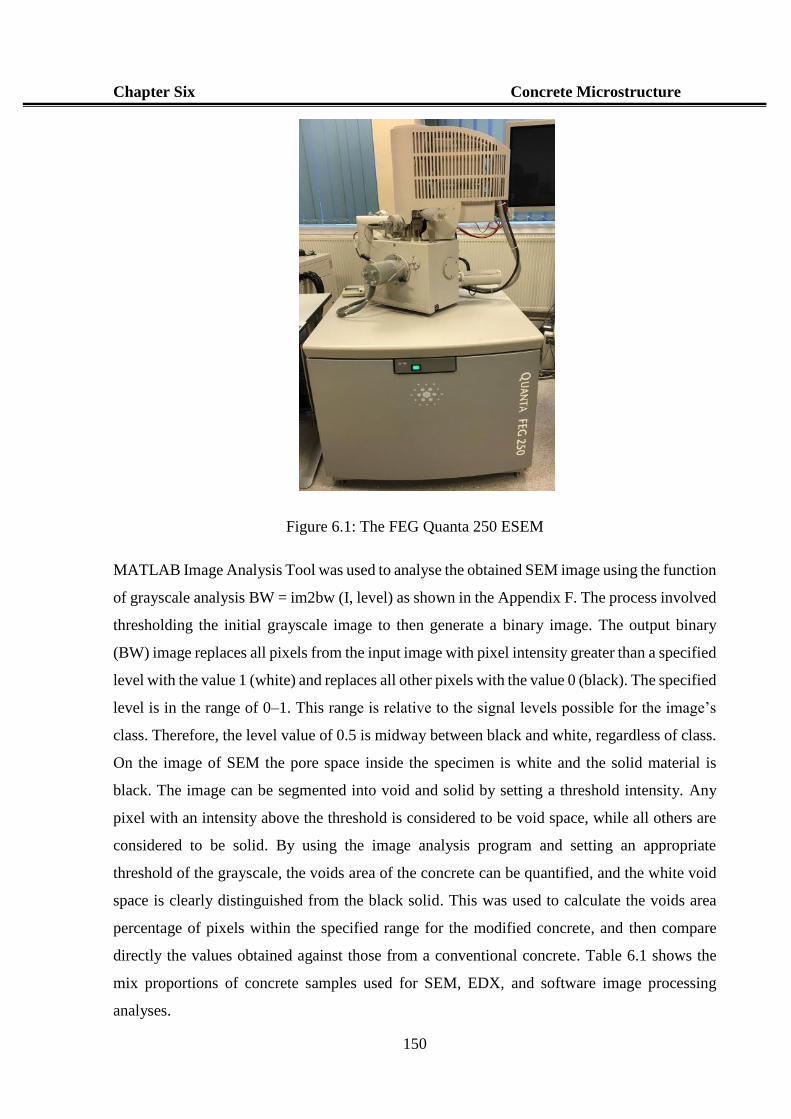
Chapter Six Concrete Microstructure
150
Figure 6.1: The FEG Quanta 250 ESEM
MATLAB Image Analysis Tool was used to analyse the obtained SEM image using the function
of grayscale analysis BW = im2bw (I, level) as shown in the Appendix F. The process involved
thresholding the initial grayscale image to then generate a binary image. The output binary
(BW) image replaces all pixels from the input image with pixel intensity greater than a specified
level with the value 1 (white) and replaces all other pixels with the value 0 (black). The specified
level is in the range of 0–1. This range is relative to the signal levels possible for the image’s
class. Therefore, the level value of 0.5 is midway between black and white, regardless of class.
On the image of SEM the pore space inside the specimen is white and the solid material is
black. The image can be segmented into void and solid by setting a threshold intensity. Any
pixel with an intensity above the threshold is considered to be void space, while all others are
considered to be solid. By using the image analysis program and setting an appropriate
threshold of the grayscale, the voids area of the concrete can be quantified, and the white void
space is clearly distinguished from the black solid. This was used to calculate the voids area
percentage of pixels within the specified range for the modified concrete, and then compare
directly the values obtained against those from a conventional concrete. Table 6.1 shows the
mix proportions of concrete samples used for SEM, EDX, and software image processing
analyses.
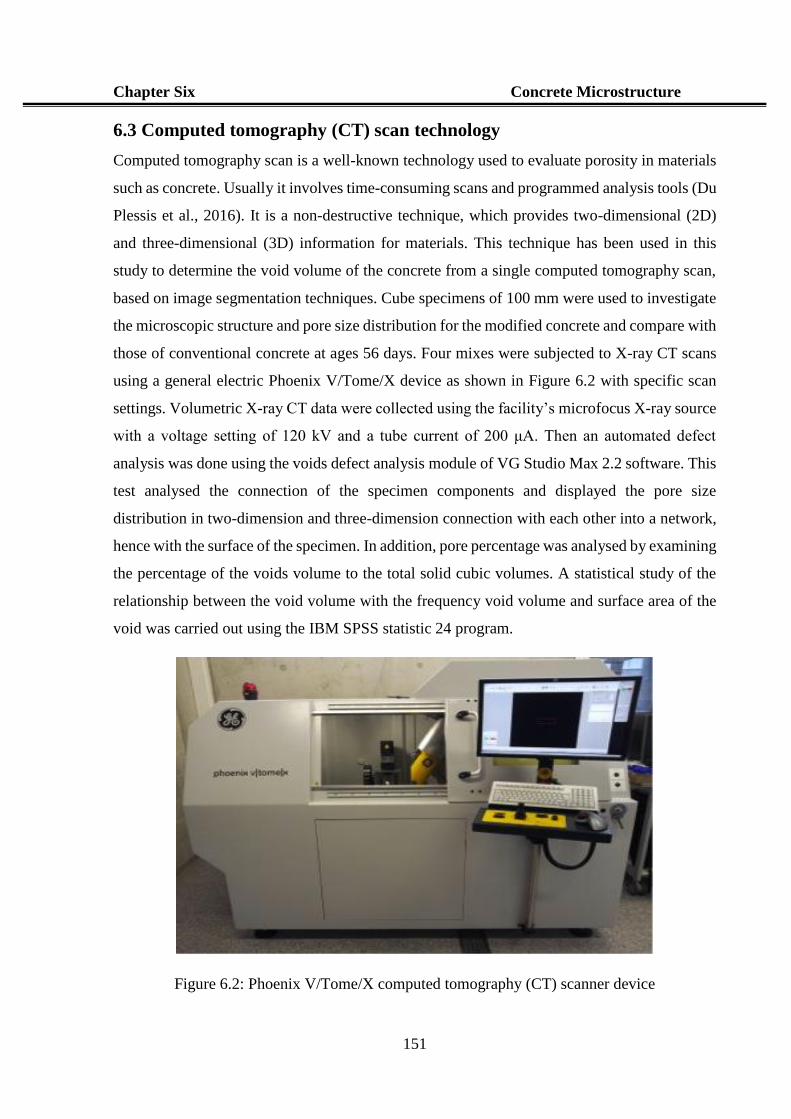
Chapter Six Concrete Microstructure
151
6.3 Computed tomography (CT) scan technology
Computed tomography scan is a well-known technology used to evaluate porosity in materials
such as concrete. Usually it involves time-consuming scans and programmed analysis tools (Du
Plessis et al., 2016). It is a non-destructive technique, which provides two-dimensional (2D)
and three-dimensional (3D) information for materials. This technique has been used in this
study to determine the void volume of the concrete from a single computed tomography scan,
based on image segmentation techniques. Cube specimens of 100 mm were used to investigate
the microscopic structure and pore size distribution for the modified concrete and compare with
those of conventional concrete at ages 56 days. Four mixes were subjected to X-ray CT scans
using a general electric Phoenix V/Tome/X device as shown in Figure 6.2 with specific scan
settings. Volumetric X-ray CT data were collected using the facility’s microfocus X-ray source
with a voltage setting of 120 kV and a tube current of 200 μA. Then an automated defect
analysis was done using the voids defect analysis module of VG Studio Max 2.2 software. This
test analysed the connection of the specimen components and displayed the pore size
distribution in two-dimension and three-dimension connection with each other into a network,
hence with the surface of the specimen. In addition, pore percentage was analysed by examining
the percentage of the voids volume to the total solid cubic volumes. A statistical study of the
relationship between the void volume with the frequency void volume and surface area of the
void was carried out using the IBM SPSS statistic 24 program.
Figure 6.2: Phoenix V/Tome/X computed tomography (CT) scanner device
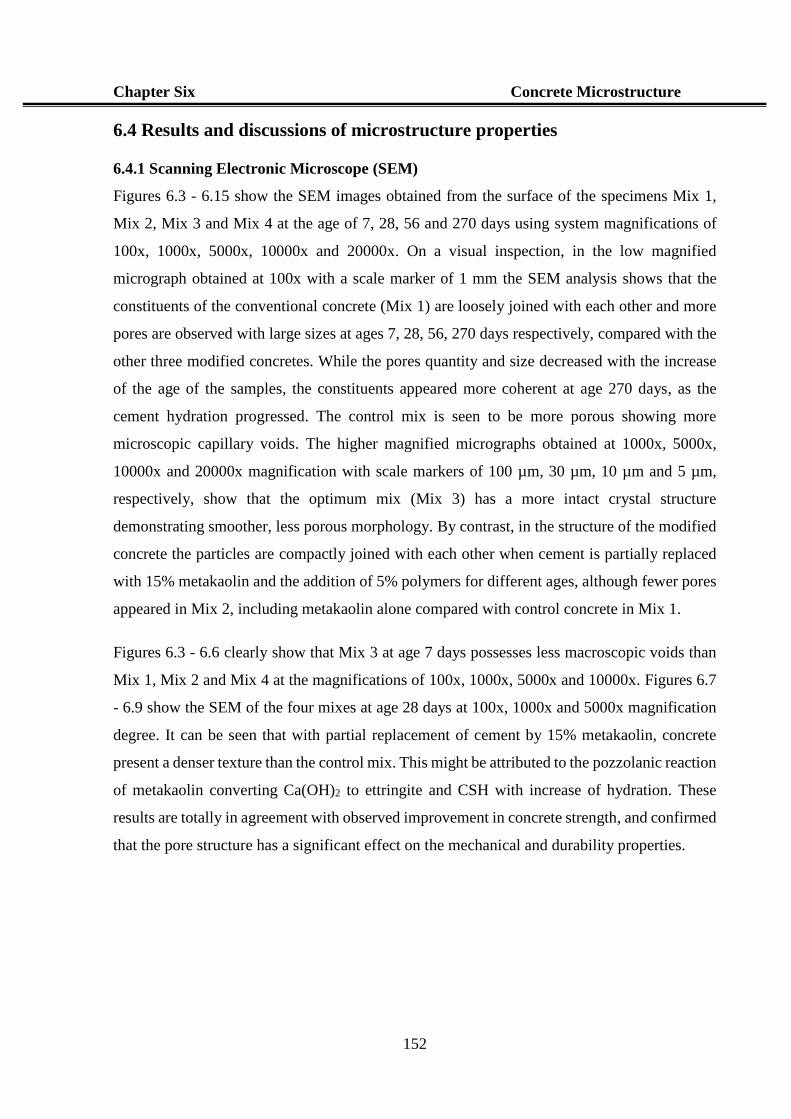
Chapter Six Concrete Microstructure
152
6.4 Results and discussions of microstructure properties
6.4.1 Scanning Electronic Microscope (SEM)
Figures 6.3 - 6.15 show the SEM images obtained from the surface of the specimens Mix 1,
Mix 2, Mix 3 and Mix 4 at the age of 7, 28, 56 and 270 days using system magnifications of
100x, 1000x, 5000x, 10000x and 20000x. On a visual inspection, in the low magnified
micrograph obtained at 100x with a scale marker of 1 mm the SEM analysis shows that the
constituents of the conventional concrete (Mix 1) are loosely joined with each other and more
pores are observed with large sizes at ages 7, 28, 56, 270 days respectively, compared with the
other three modified concretes. While the pores quantity and size decreased with the increase
of the age of the samples, the constituents appeared more coherent at age 270 days, as the
cement hydration progressed. The control mix is seen to be more porous showing more
microscopic capillary voids. The higher magnified micrographs obtained at 1000x, 5000x,
10000x and 20000x magnification with scale markers of 100 µm, 30 µm, 10 µm and 5 µm,
respectively, show that the optimum mix (Mix 3) has a more intact crystal structure
demonstrating smoother, less porous morphology. By contrast, in the structure of the modified
concrete the particles are compactly joined with each other when cement is partially replaced
with 15% metakaolin and the addition of 5% polymers for different ages, although fewer pores
appeared in Mix 2, including metakaolin alone compared with control concrete in Mix 1.
Figures 6.3 - 6.6 clearly show that Mix 3 at age 7 days possesses less macroscopic voids than
Mix 1, Mix 2 and Mix 4 at the magnifications of 100x, 1000x, 5000x and 10000x. Figures 6.7
- 6.9 show the SEM of the four mixes at age 28 days at 100x, 1000x and 5000x magnification
degree. It can be seen that with partial replacement of cement by 15% metakaolin, concrete
present a denser texture than the control mix. This might be attributed to the pozzolanic reaction
of metakaolin converting Ca(OH)2 to ettringite and CSH with increase of hydration. These
results are totally in agreement with observed improvement in concrete strength, and confirmed
that the pore structure has a significant effect on the mechanical and durability properties.
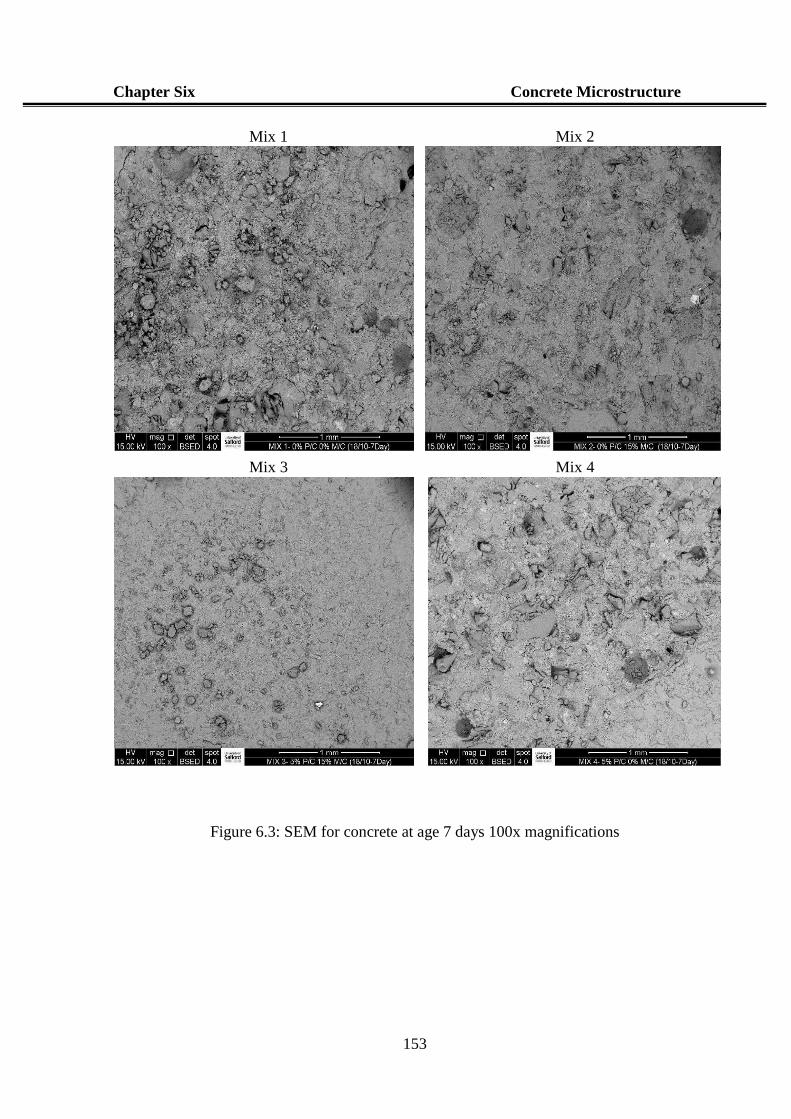
Chapter Six Concrete Microstructure
153
Figure 6.3: SEM for concrete at age 7 days 100x magnifications
Mix 1 Mix 2
Mix 3 Mix 4
Chapter Six Concrete Microstructure
154
Figure 6.4: SEM for conrete at age 7 days 1000x of magnifications
Mix 1 Mix 2
Mix 3 Mix 4
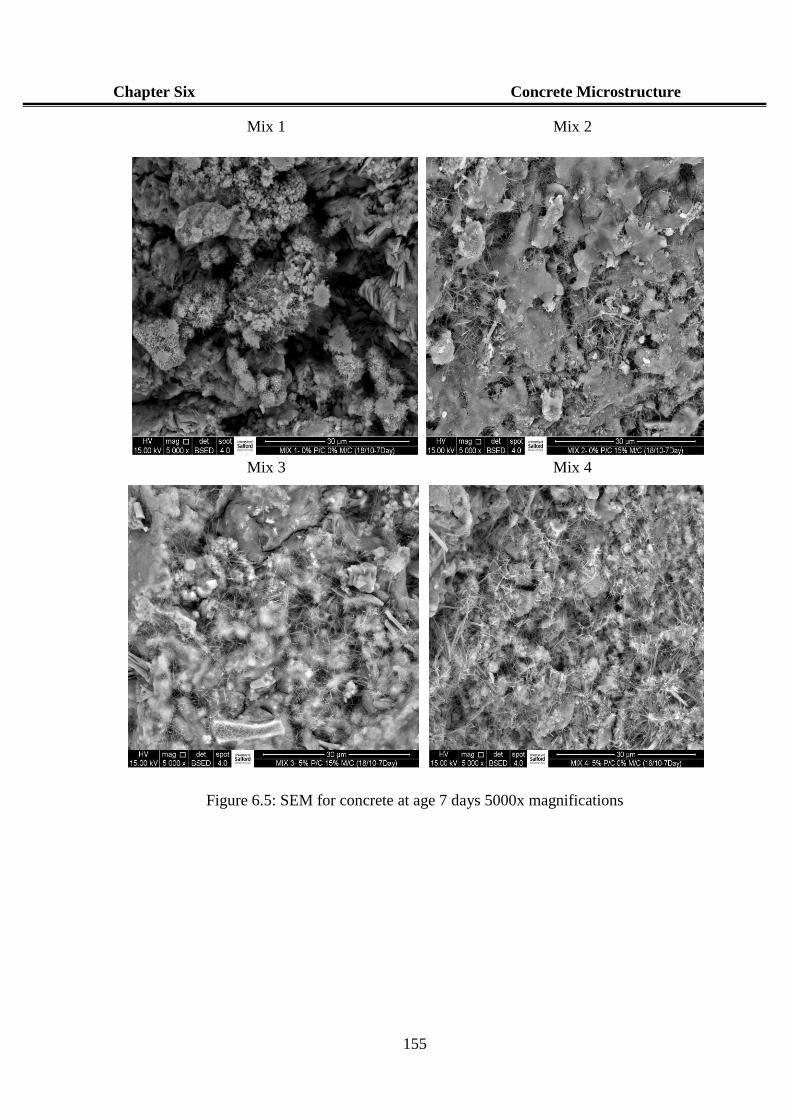
Chapter Six Concrete Microstructure
155
Figure 6.5: SEM for concrete at age 7 days 5000x magnifications
Mix 1 Mix 2
Mix 3 Mix 4

Chapter Six Concrete Microstructure
156
Figure 6.6: SEM for conrete at age 7 days 10000x magnifications
Mix 1 Mix 2
Mix 3 Mix 4
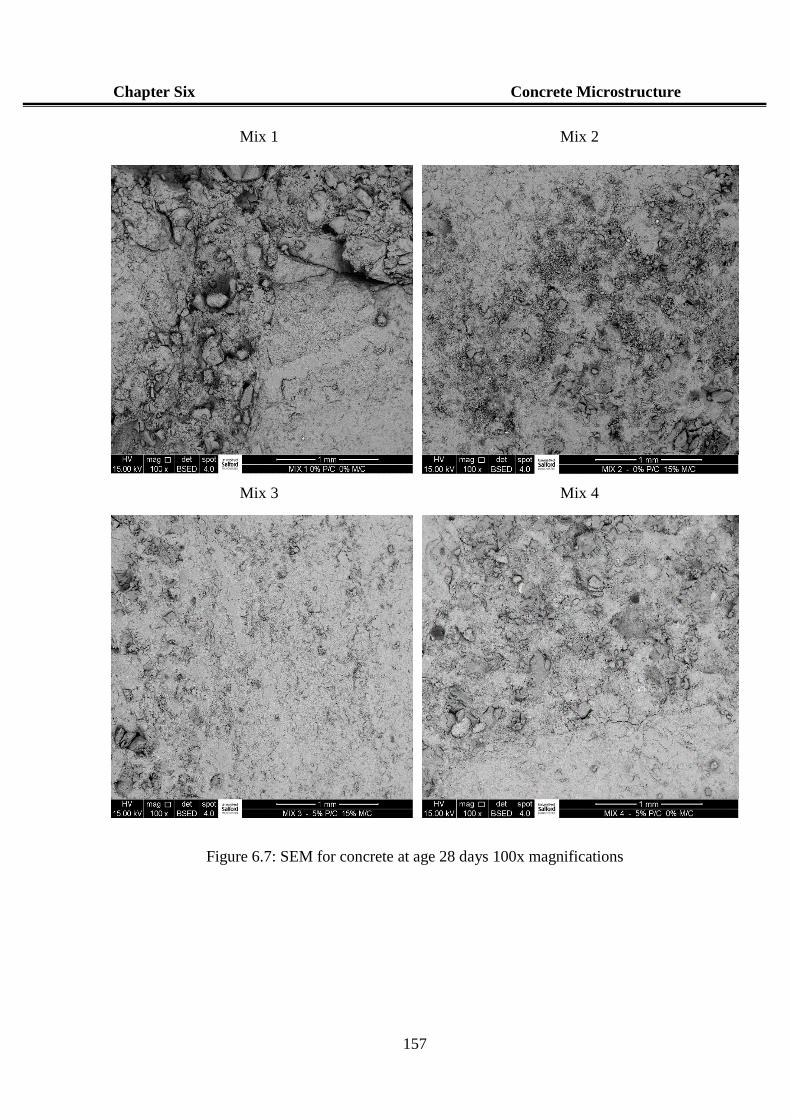
Chapter Six Concrete Microstructure
157
Figure 6.7: SEM for concrete at age 28 days 100x magnifications
Mix 1 Mix 2
Mix 3 Mix 4
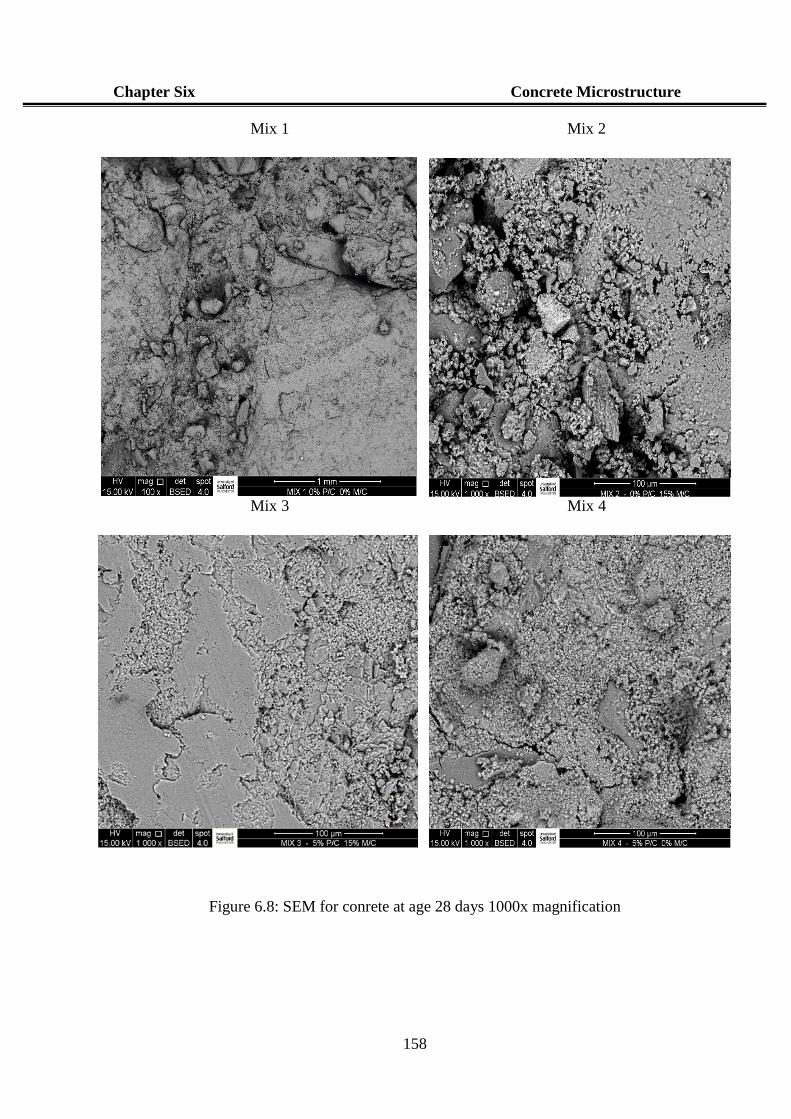
Chapter Six Concrete Microstructure
158
Figure 6.8: SEM for conrete at age 28 days 1000x magnification
Mix 1 Mix 2
Mix 3 Mix 4
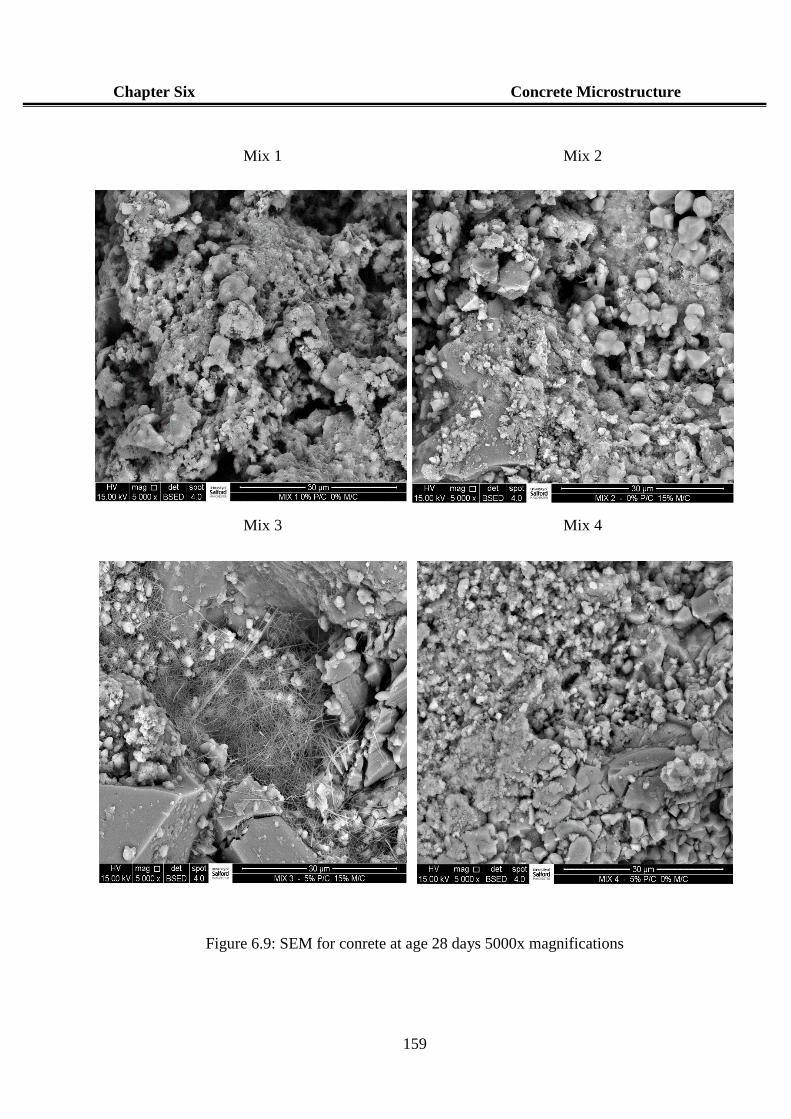
Chapter Six Concrete Microstructure
159
Figure 6.9: SEM for conrete at age 28 days 5000x magnifications
Mix 1 Mix 2
Mix 3 Mix 4
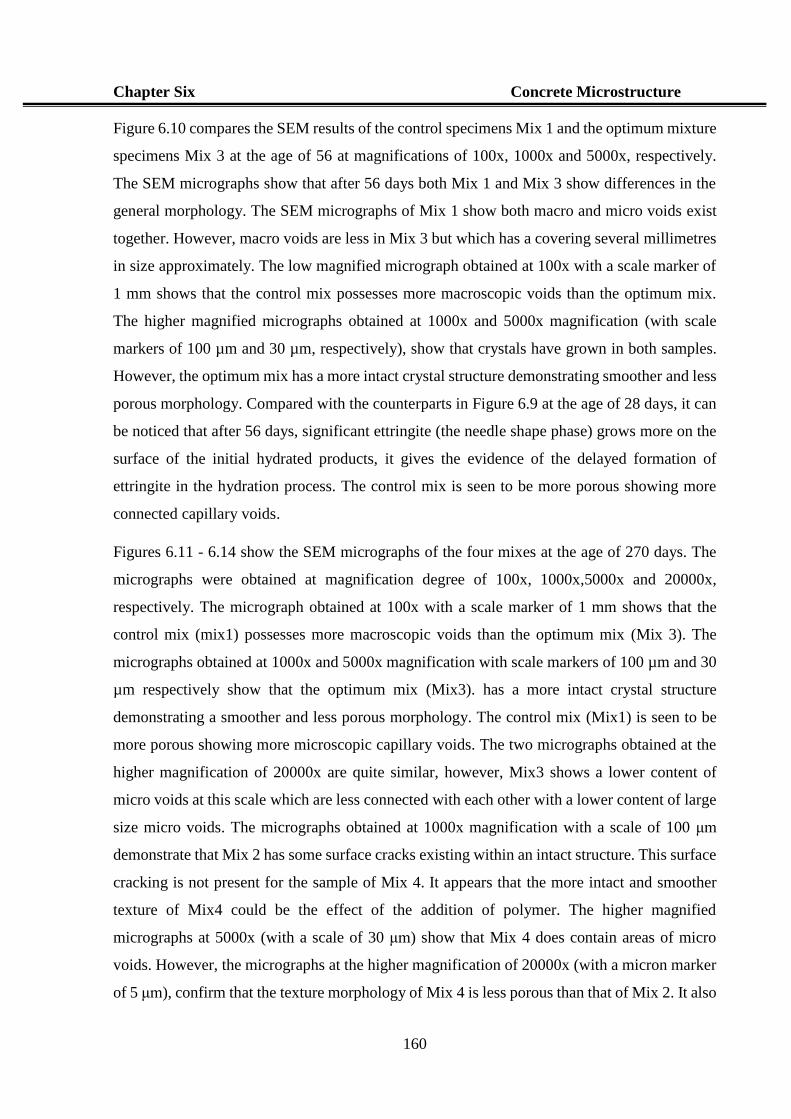
Chapter Six Concrete Microstructure
160
Figure 6.10 compares the SEM results of the control specimens Mix 1 and the optimum mixture
specimens Mix 3 at the age of 56 at magnifications of 100x, 1000x and 5000x, respectively.
The SEM micrographs show that after 56 days both Mix 1 and Mix 3 show differences in the
general morphology. The SEM micrographs of Mix 1 show both macro and micro voids exist
together. However, macro voids are less in Mix 3 but which has a covering several millimetres
in size approximately. The low magnified micrograph obtained at 100x with a scale marker of
1 mm shows that the control mix possesses more macroscopic voids than the optimum mix.
The higher magnified micrographs obtained at 1000x and 5000x magnification (with scale
markers of 100 µm and 30 µm, respectively), show that crystals have grown in both samples.
However, the optimum mix has a more intact crystal structure demonstrating smoother and less
porous morphology. Compared with the counterparts in Figure 6.9 at the age of 28 days, it can
be noticed that after 56 days, significant ettringite (the needle shape phase) grows more on the
surface of the initial hydrated products, it gives the evidence of the delayed formation of
ettringite in the hydration process. The control mix is seen to be more porous showing more
connected capillary voids.
Figures 6.11 - 6.14 show the SEM micrographs of the four mixes at the age of 270 days. The
micrographs were obtained at magnification degree of 100x, 1000x,5000x and 20000x,
respectively. The micrograph obtained at 100x with a scale marker of 1 mm shows that the
control mix (mix1) possesses more macroscopic voids than the optimum mix (Mix 3). The
micrographs obtained at 1000x and 5000x magnification with scale markers of 100 µm and 30
µm respectively show that the optimum mix (Mix3). has a more intact crystal structure
demonstrating a smoother and less porous morphology. The control mix (Mix1) is seen to be
more porous showing more microscopic capillary voids. The two micrographs obtained at the
higher magnification of 20000x are quite similar, however, Mix3 shows a lower content of
micro voids at this scale which are less connected with each other with a lower content of large
size micro voids. The micrographs obtained at 1000x magnification with a scale of 100 μm
demonstrate that Mix 2 has some surface cracks existing within an intact structure. This surface
cracking is not present for the sample of Mix 4. It appears that the more intact and smoother
texture of Mix4 could be the effect of the addition of polymer. The higher magnified
micrographs at 5000x (with a scale of 30 μm) show that Mix 4 does contain areas of micro
voids. However, the micrographs at the higher magnification of 20000x (with a micron marker
of 5 μm), confirm that the texture morphology of Mix 4 is less porous than that of Mix 2. It also
Chapter Six Concrete Microstructure
161
can be seen that Mix 2 contains areas of clusters of crystals appearing as needles in shape. This
phase is thought to be ettringite and/or AFm. These results support that using MK for SCM will
produce the CASH gel content, but the CASH gel has lower density than the CSH gel produced
by Portland cement, in which ettringite or AFm will develop at the internal gel surfaces. The
addition of polymer will help to reduce both the macro and micro voids. The result are in
agreement with that suggested by previous researches (Wang et al. 2005; Konar et al. 2011) as
reviewed. Finally, Figure 6.15 shows the stages of hydration process with time up to 270 days
for Mix 1 and Mix 3 at 5000x magnification. It can be seen that the void content decreased with
hydration time. Mix 3 shows a less voids connection than Mix 1. At last it should be pointed
out that high resolution electron microscopy can be extremely subjective at the higher
magnifications with complex porous materials such as cement. We are examining features
below 5 microns in size so the results can vary depending on the area chosen for examination.
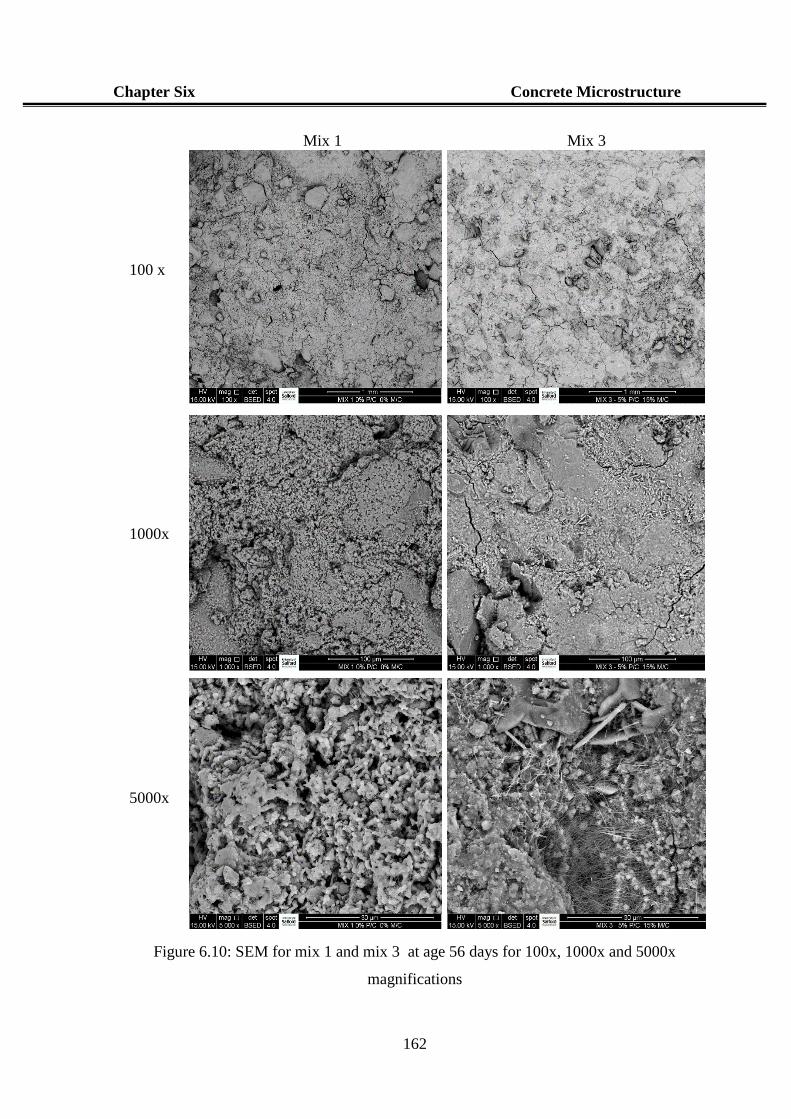
Chapter Six Concrete Microstructure
162
Figure 6.10: SEM for mix 1 and mix 3 at age 56 days for 100x, 1000x and 5000x
magnifications
Mix 1 Mix 3
100 x
1000x
5000x
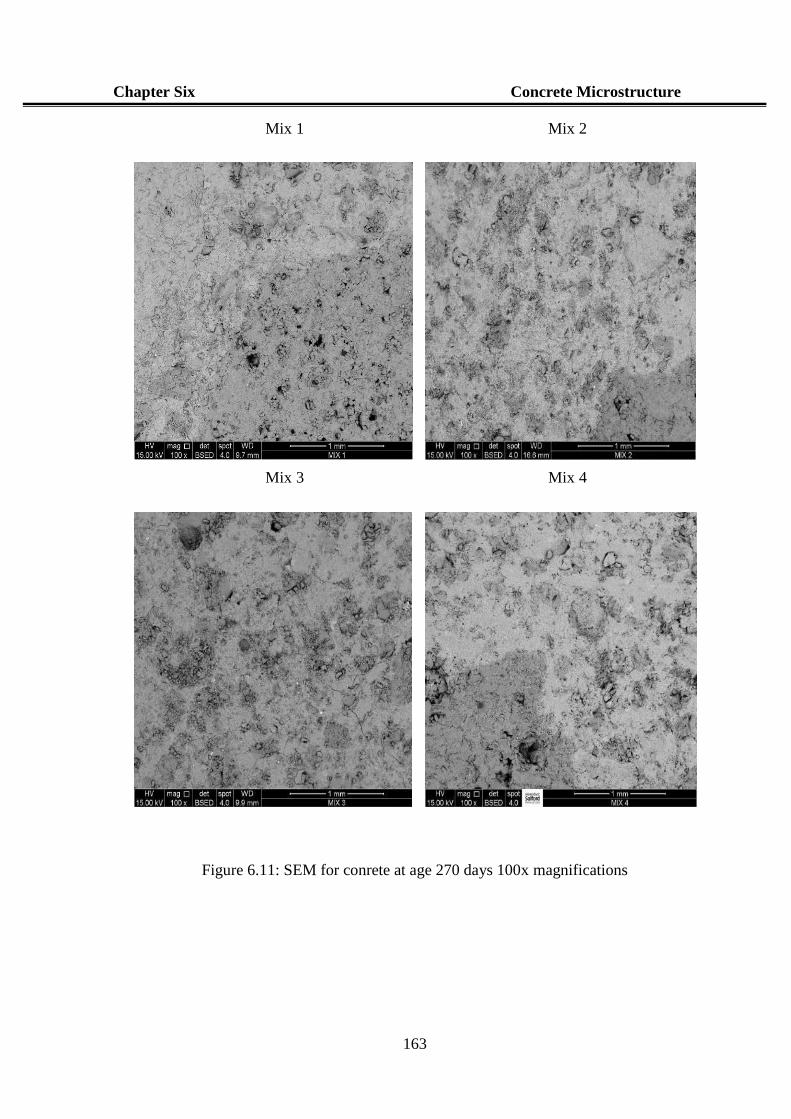
Chapter Six Concrete Microstructure
163
Figure 6.11: SEM for conrete at age 270 days 100x magnifications
Mix 1 Mix 2
Mix 3 Mix 4
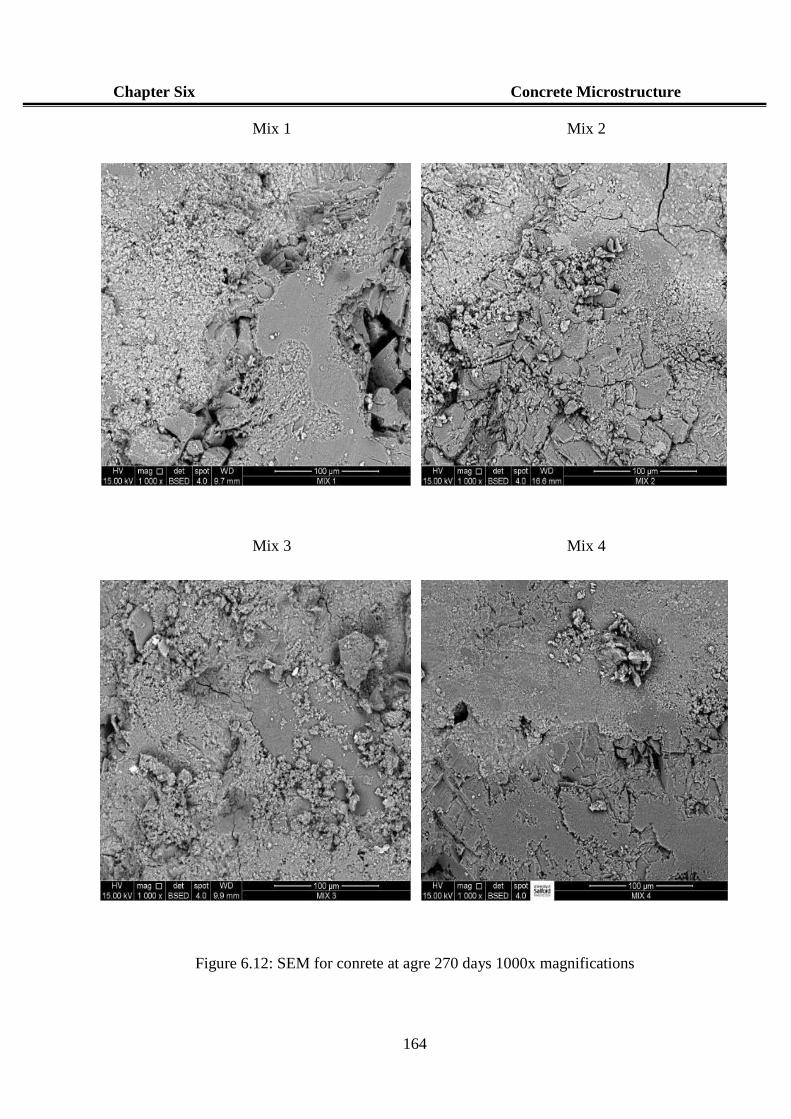
Chapter Six Concrete Microstructure
164
Figure 6.12: SEM for conrete at agre 270 days 1000x magnifications
Mix 1 Mix 2
Mix 3 Mix 4
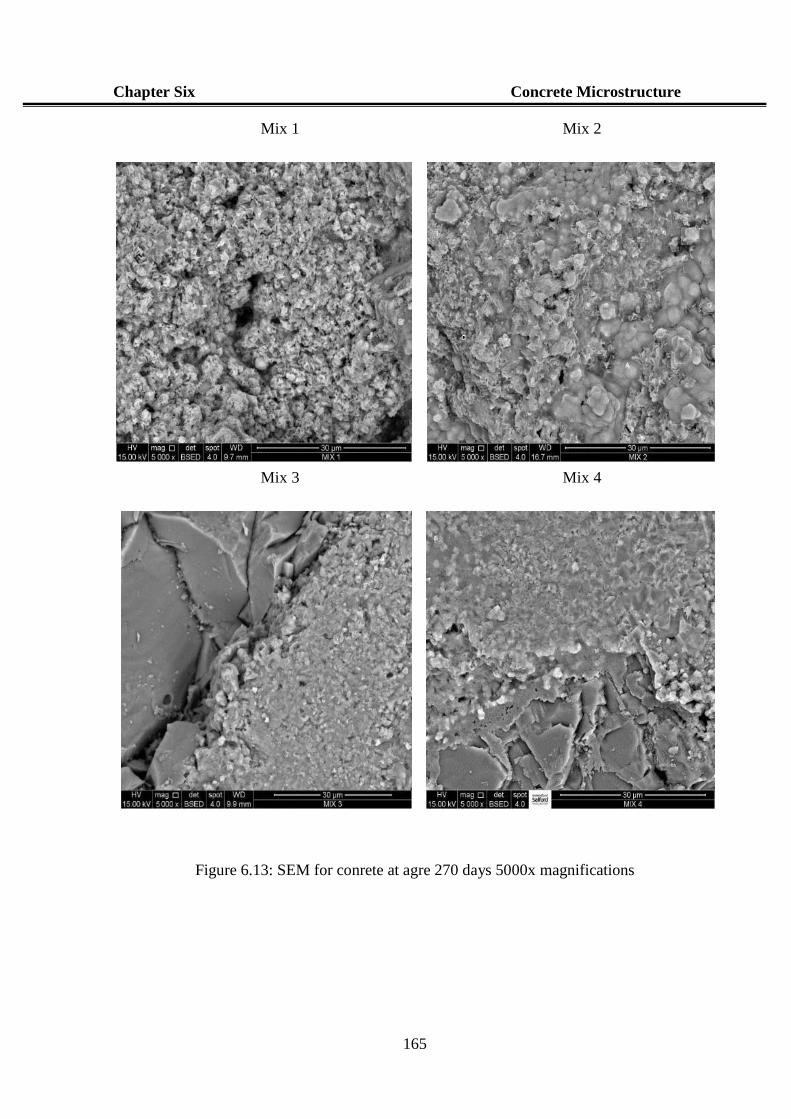
Chapter Six Concrete Microstructure
165
Figure 6.13: SEM for conrete at agre 270 days 5000x magnifications
Mix 1 Mix 2
Mix 3 Mix 4
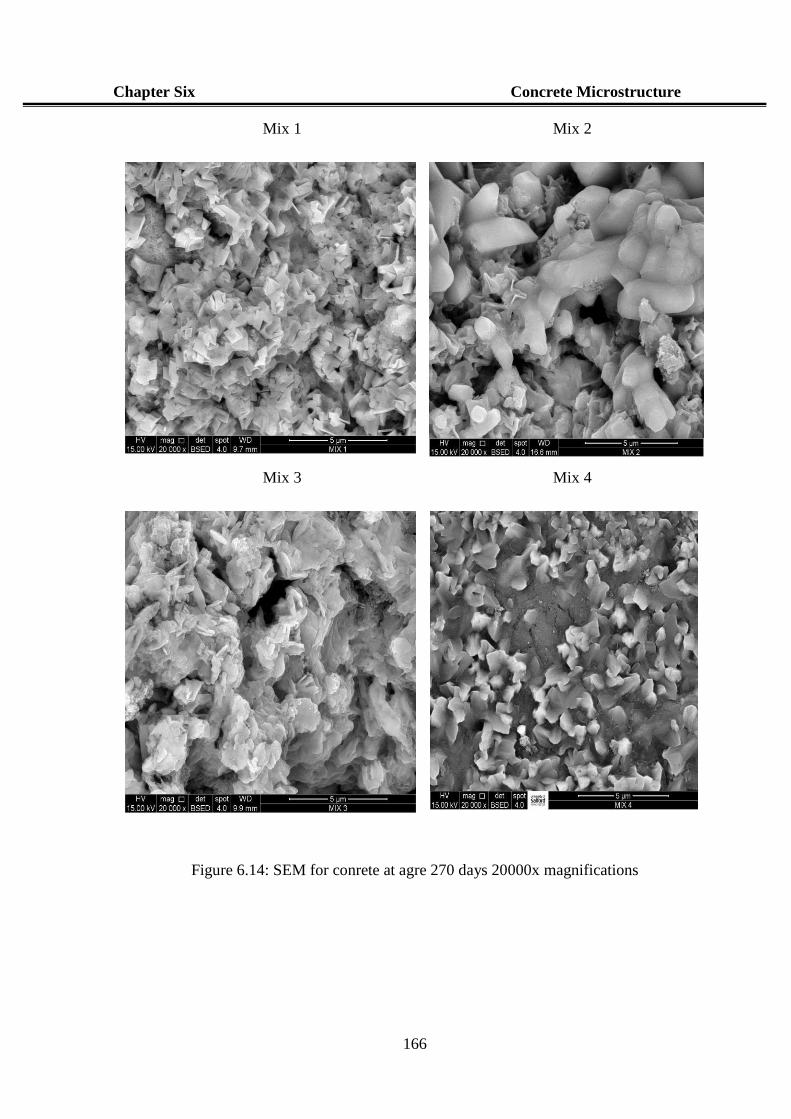
Chapter Six Concrete Microstructure
166
Figure 6.14: SEM for conrete at agre 270 days 20000x magnifications
Mix 1 Mix 2
Mix 3 Mix 4
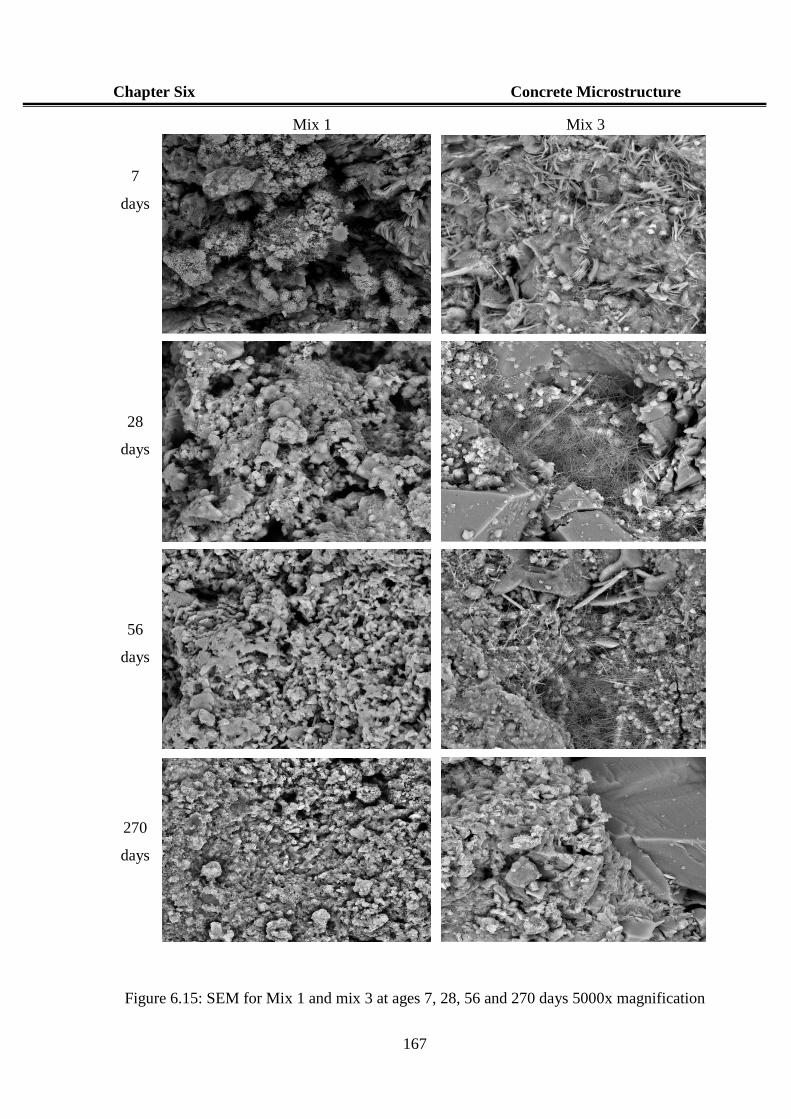
Chapter Six Concrete Microstructure
167
Figure 6.15: SEM for Mix 1 and mix 3 at ages 7, 28, 56 and 270 days 5000x magnification
Mix 1 Mix 3
7
days
28
days
56
days
270
days
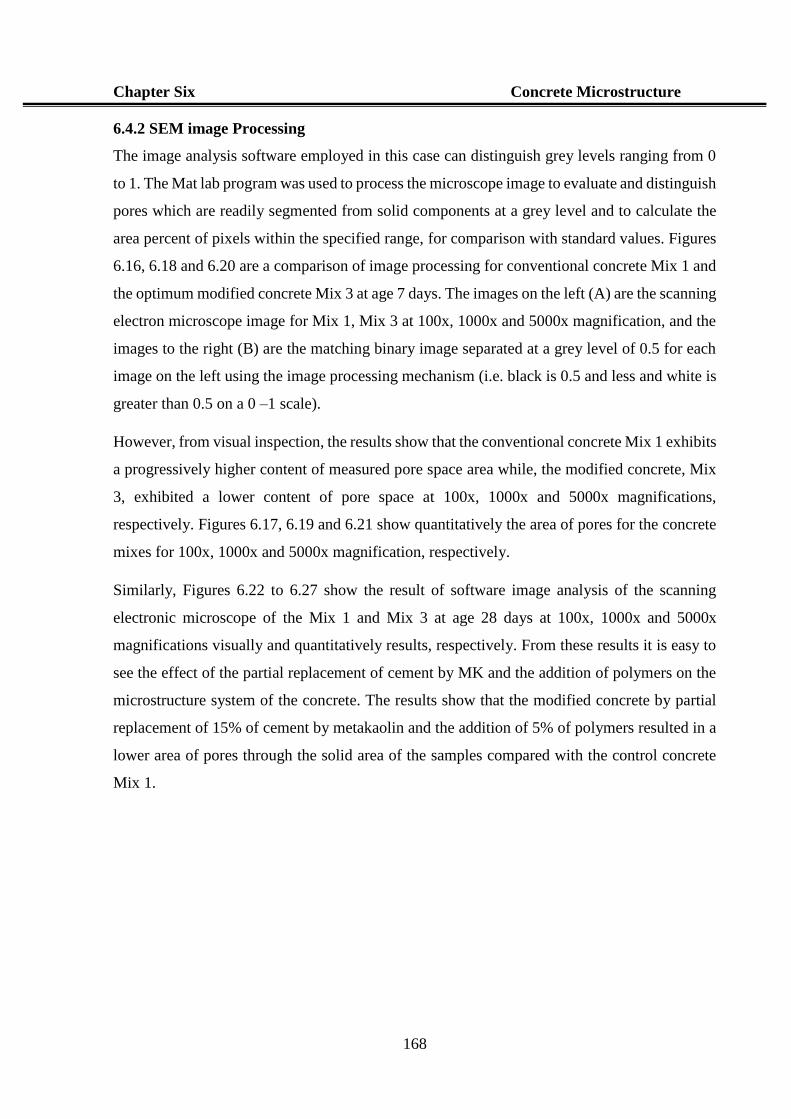
Chapter Six Concrete Microstructure
168
6.4.2 SEM image Processing
The image analysis software employed in this case can distinguish grey levels ranging from 0
to 1. The Mat lab program was used to process the microscope image to evaluate and distinguish
pores which are readily segmented from solid components at a grey level and to calculate the
area percent of pixels within the specified range, for comparison with standard values. Figures
6.16, 6.18 and 6.20 are a comparison of image processing for conventional concrete Mix 1 and
the optimum modified concrete Mix 3 at age 7 days. The images on the left (A) are the scanning
electron microscope image for Mix 1, Mix 3 at 100x, 1000x and 5000x magnification, and the
images to the right (B) are the matching binary image separated at a grey level of 0.5 for each
image on the left using the image processing mechanism (i.e. black is 0.5 and less and white is
greater than 0.5 on a 0 –1 scale).
However, from visual inspection, the results show that the conventional concrete Mix 1 exhibits
a progressively higher content of measured pore space area while, the modified concrete, Mix
3, exhibited a lower content of pore space at 100x, 1000x and 5000x magnifications,
respectively. Figures 6.17, 6.19 and 6.21 show quantitatively the area of pores for the concrete
mixes for 100x, 1000x and 5000x magnification, respectively.
Similarly, Figures 6.22 to 6.27 show the result of software image analysis of the scanning
electronic microscope of the Mix 1 and Mix 3 at age 28 days at 100x, 1000x and 5000x
magnifications visually and quantitatively results, respectively. From these results it is easy to
see the effect of the partial replacement of cement by MK and the addition of polymers on the
microstructure system of the concrete. The results show that the modified concrete by partial
replacement of 15% of cement by metakaolin and the addition of 5% of polymers resulted in a
lower area of pores through the solid area of the samples compared with the control concrete
Mix 1.
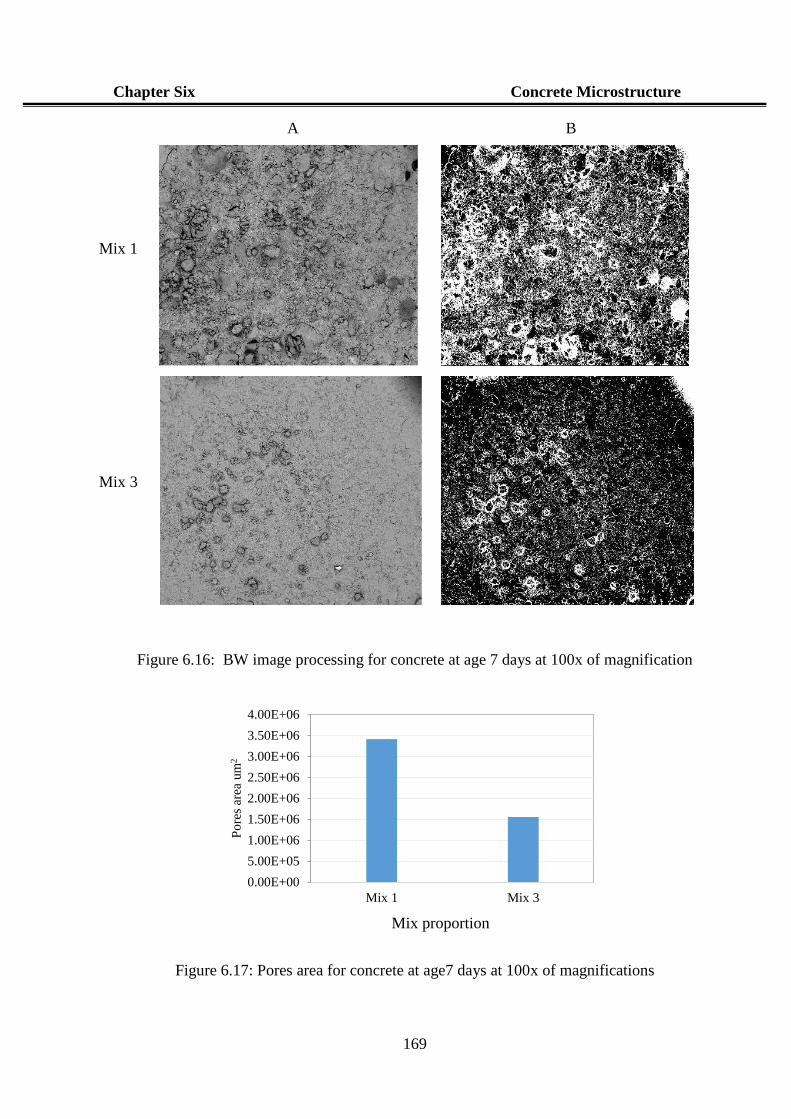
Chapter Six Concrete Microstructure
169
A B
Mix 1
Mix 3
Figure 6.16: BW image processing for concrete at age 7 days at 100x of magnification
Figure 6.17: Pores area for concrete at age7 days at 100x of magnifications
0.00E+00
5.00E+05
1.00E+06
1.50E+06
2.00E+06
2.50E+06
3.00E+06
3.50E+06
4.00E+06
Mix 1 Mix 3
Po
res
area
um
2
Mix proportion
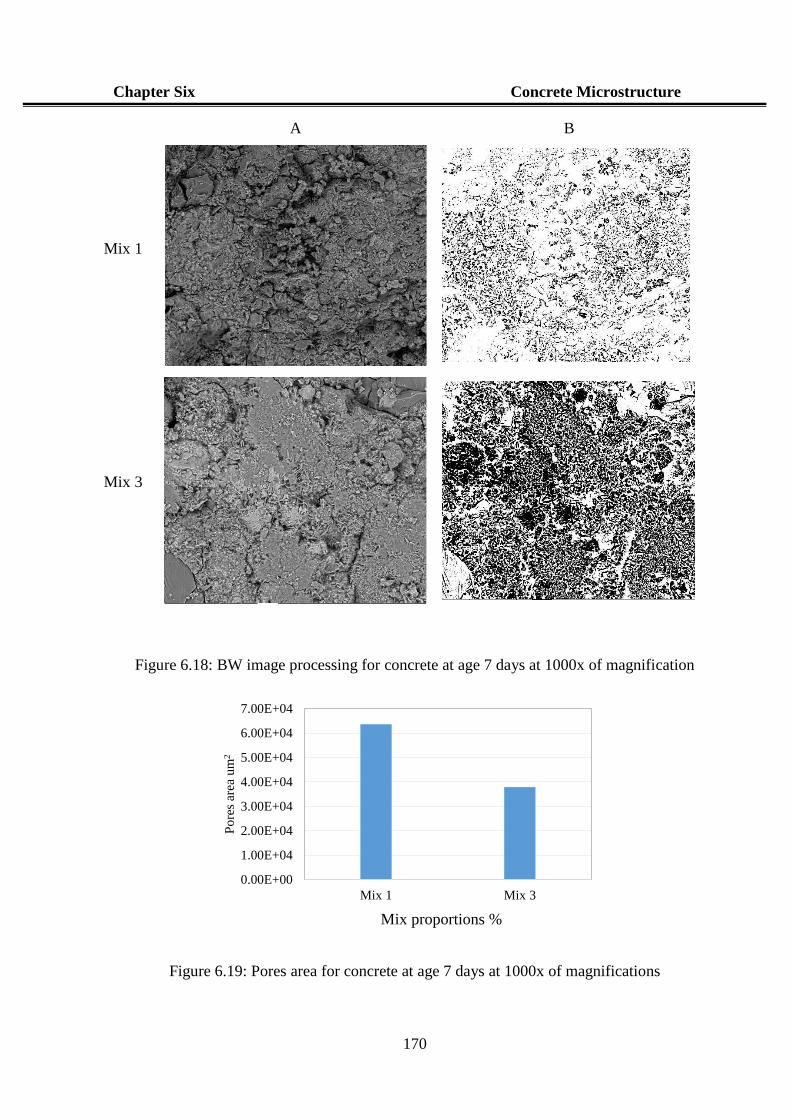
Chapter Six Concrete Microstructure
170
A B
Mix 1
Mix 3
Figure 6.18: BW image processing for concrete at age 7 days at 1000x of magnification
Figure 6.19: Pores area for concrete at age 7 days at 1000x of magnifications
0.00E+00
1.00E+04
2.00E+04
3.00E+04
4.00E+04
5.00E+04
6.00E+04
7.00E+04
Mix 1 Mix 3
Po
res
area
um
2
Mix proportions %
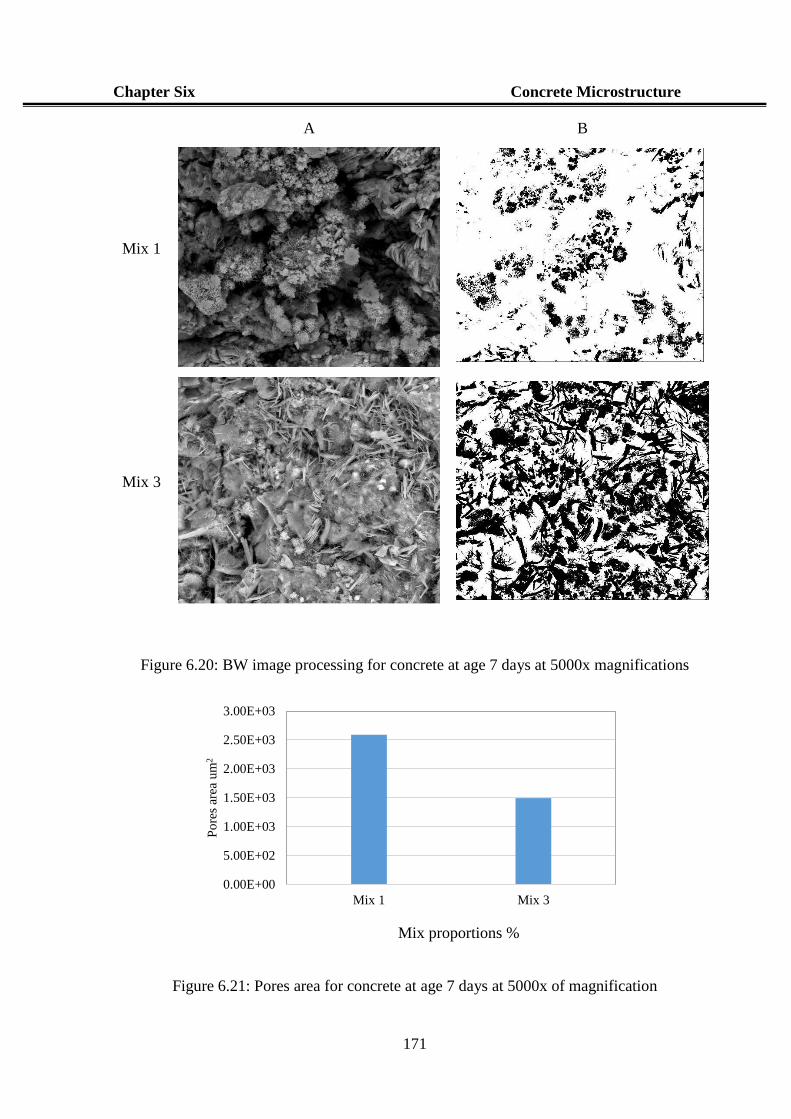
Chapter Six Concrete Microstructure
171
A B
Mix 1
Mix 3
Figure 6.20: BW image processing for concrete at age 7 days at 5000x magnifications
Figure 6.21: Pores area for concrete at age 7 days at 5000x of magnification
0.00E+00
5.00E+02
1.00E+03
1.50E+03
2.00E+03
2.50E+03
3.00E+03
Mix 1 Mix 3
Po
res
area
um
2
Mix proportions %
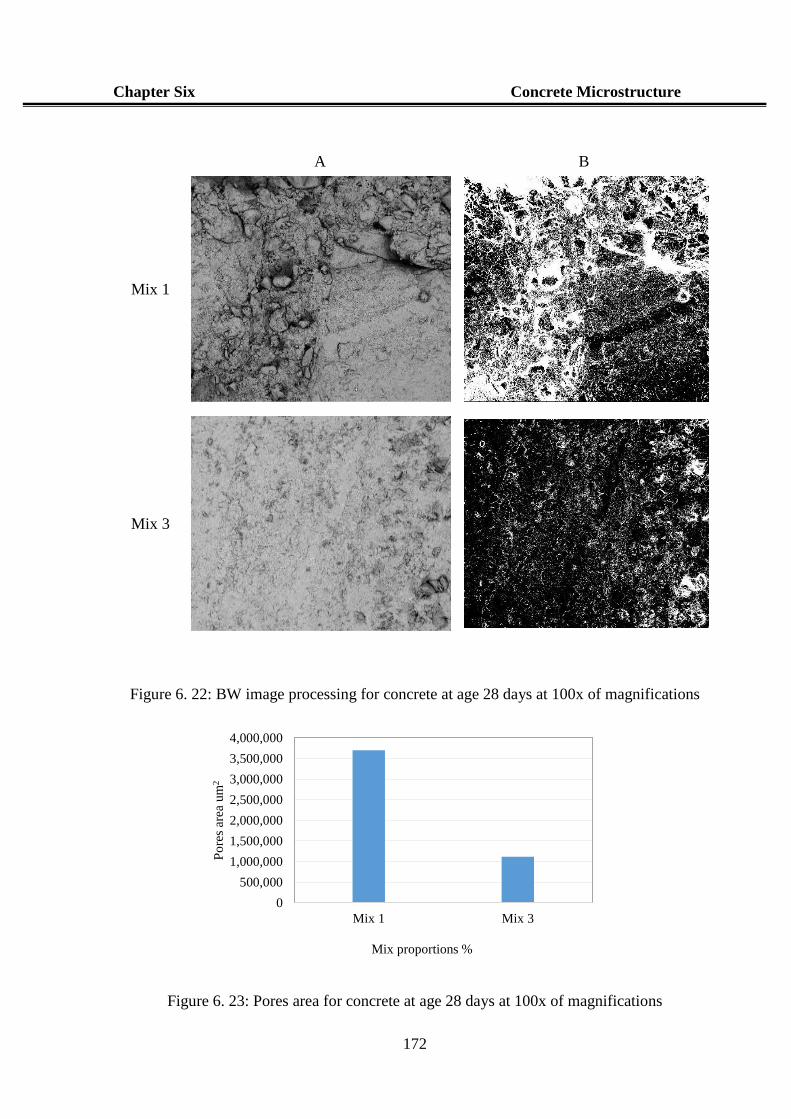
Chapter Six Concrete Microstructure
172
Figure 6. 22: BW image processing for concrete at age 28 days at 100x of magnifications
Figure 6. 23: Pores area for concrete at age 28 days at 100x of magnifications
0
500,000
1,000,000
1,500,000
2,000,000
2,500,000
3,000,000
3,500,000
4,000,000
Mix 1 Mix 3
Po
res
area
um
2
Mix proportions %
A B
Mix 1
Mix 3
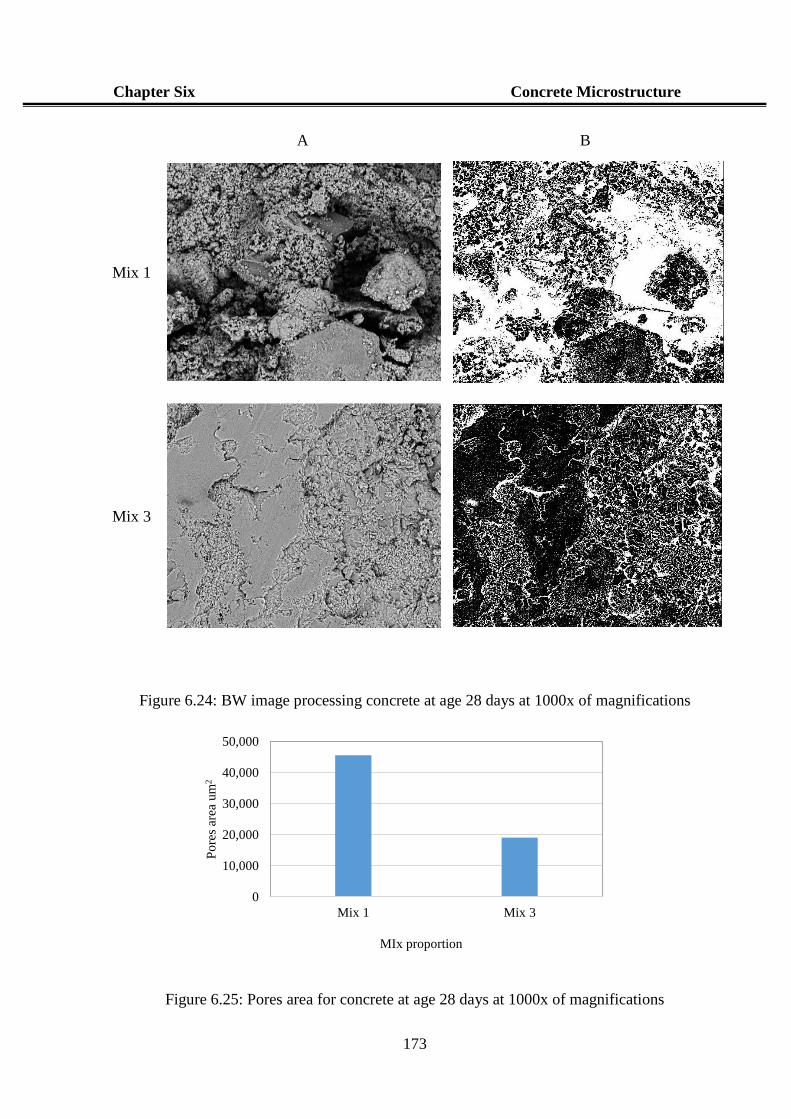
Chapter Six Concrete Microstructure
173
Figure 6.24: BW image processing concrete at age 28 days at 1000x of magnifications
Figure 6.25: Pores area for concrete at age 28 days at 1000x of magnifications
0
10,000
20,000
30,000
40,000
50,000
Mix 1 Mix 3
Po
res
area
um
2
MIx proportion
A B
Mix 1
Mix 3
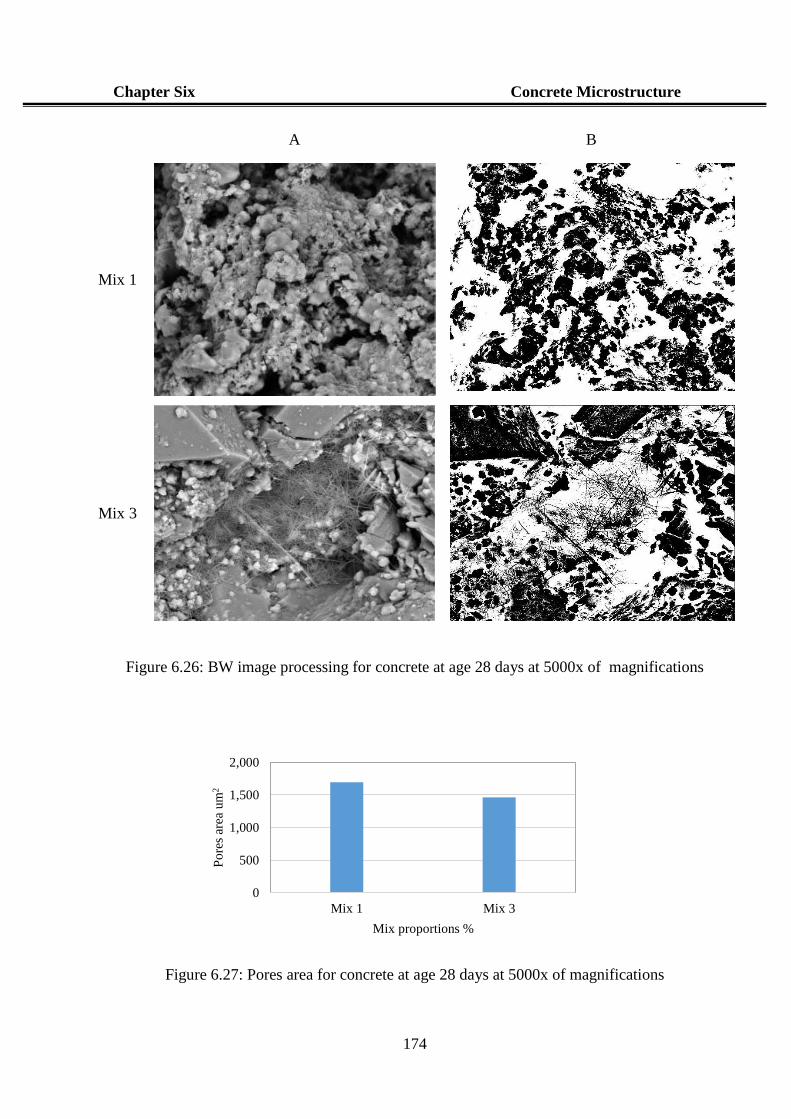
Chapter Six Concrete Microstructure
174
Figure 6.26: BW image processing for concrete at age 28 days at 5000x of magnifications
Figure 6.27: Pores area for concrete at age 28 days at 5000x of magnifications
0
500
1,000
1,500
2,000
Mix 1 Mix 3
Po
res
area
um
2
Mix proportions %
A B
Mix 1
Mix 3
Chapter Six Concrete Microstructure
175
6.4.3 Energy Dispersive X-Rays (EDX)
The EDX spectra are the result of examination of the different separate areas labelled as A-D
on the SEM micrograph obtained as shown in the figures below. The chosen areas were selected
because of noticeable difference in structure and or contrast variation. Figures 6.28to 6.32 show
the EDX analysis results of Mix 1, Mix 2, Mix 3 and Mix 4 at the age of 7 days at different
areas of the SEM micrograph at 10000x magnifications, respectively. Firstly, from Figure 6.28
location A shows a significant amount of cluster shaped portlandite of a high composition of
Ca and O and a small amount of Al, which grew on the top surface of a crystal gel of a
composition Si. The grown cluster shaped phase at location B also shows formed portlandite of
a high composition of Ca and O. The low composition of Si and a relatively low amount of Al,
Mg and Na and a little bit more of C indicate a primary product of CSH and a site for further
Portlandite development in later stages. location C shows the progress of portlandite and
production of CSH as the amount of Si and Al started to increase and the presence of a high
amount of Ca and O.
Figures 6.29 and 6.30 show the components of the cement hydration process for Mix 2. It can
be clearly seen that the amount and type of the components is different to that in Mix 1 with
increasing in the amount of Al and O indicating the phase of CASH and CSH, as shown in
locations A and B of Figure 6.29 and location C of Figure 6.30. This indicates that the addition
of the MK in Mix 2 has affected the chemical reactions of the cement hydration due to the
pozzolanic effect of MK. The EDX results for Mix 3 at age 7 days, area A, B, C and D for
10000x magnification, are shown in Figure 6.31. It shows that significate gel of ettringite with
high amount of Si and Ca with alternative amount of Al and O. as shown in locations A, C and
D. Area B shows an amount of shape plate of the portlandite with high amount of Ca. The
increasing of Si and Al in Mix 3 can be attributed to the effect of the MK and polymers in
cement hydration products.
Figure 6.32 shows the EDX results for Mix 4 at age 7 days, area A, B and C for 10000x
magnification. It can be clearly seen that the amount and type of the components is similar to
the components of Mix 1 with few differences in the amount of Si and Al. This indicates that
the addition of polymer in Mix 4 has a small effect in the chemical reactions of the cement
hydration compared with its effect on the filling of voids and reduction in porosity with the
refined microstructure of the pores system.
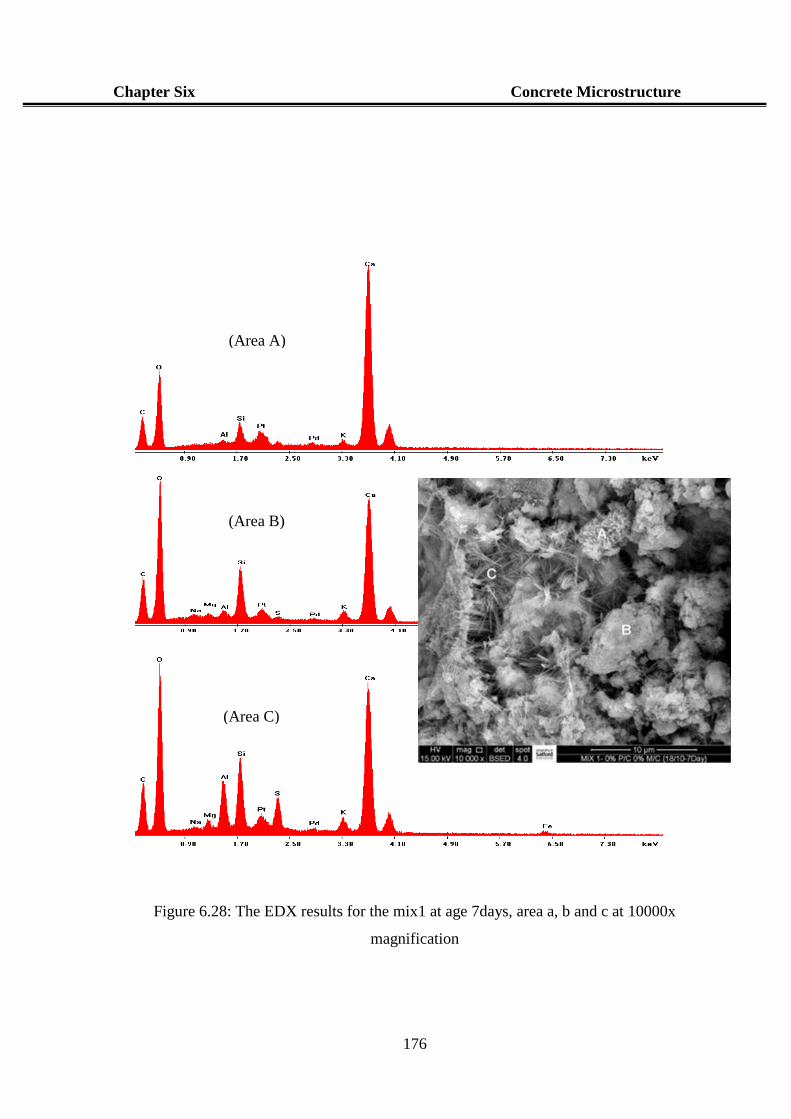
Chapter Six Concrete Microstructure
176
Figure 6.28: The EDX results for the mix1 at age 7days, area a, b and c at 10000x
magnification
(Area A)
(Area B)
(Area C)
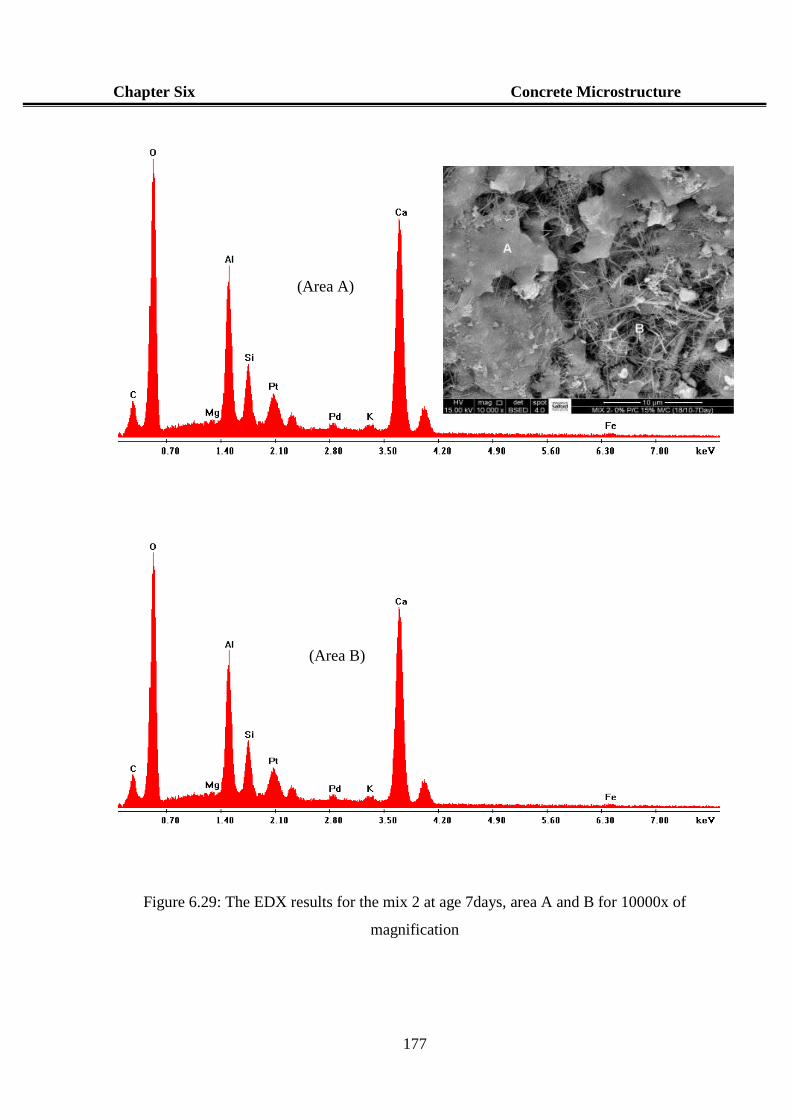
Chapter Six Concrete Microstructure
177
Figure 6.29: The EDX results for the mix 2 at age 7days, area A and B for 10000x of
magnification
(Area A)
(Area B)
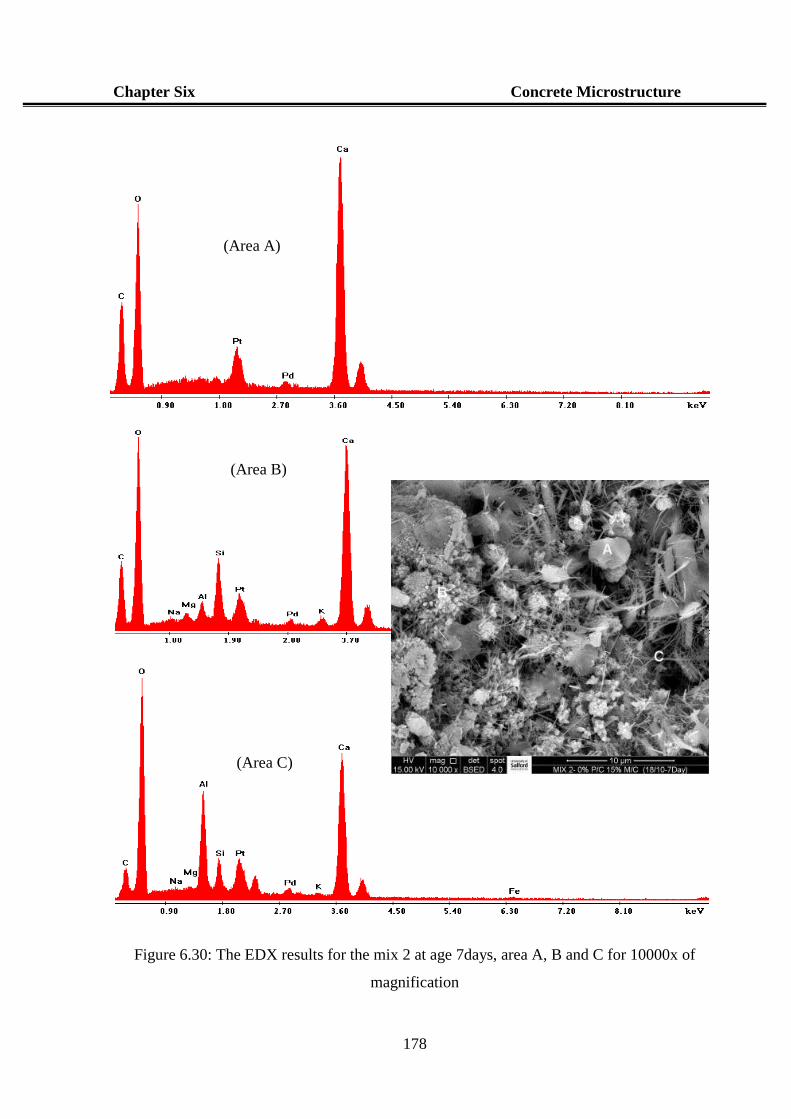
Chapter Six Concrete Microstructure
178
Figure 6.30: The EDX results for the mix 2 at age 7days, area A, B and C for 10000x of
magnification
(Area A)
(Area B)
(Area C)
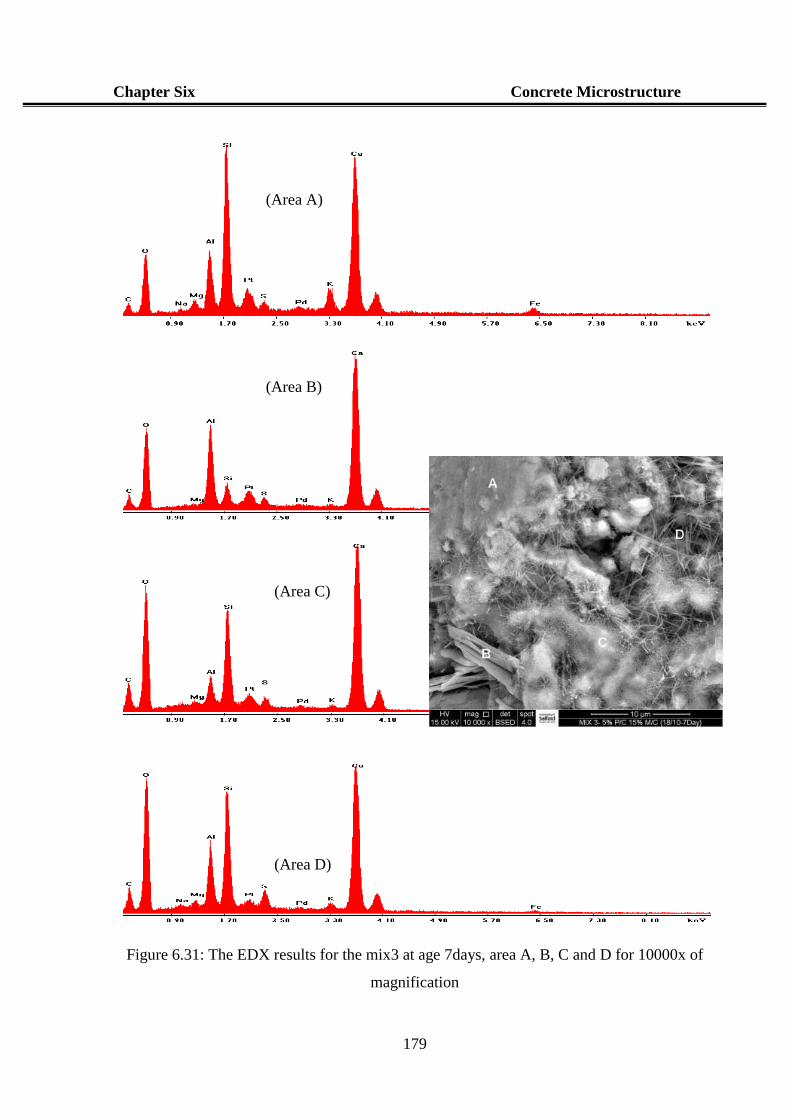
Chapter Six Concrete Microstructure
179
Figure 6.31: The EDX results for the mix3 at age 7days, area A, B, C and D for 10000x of
magnification
(Area D)
(Area A)
(Area B)
(Area C)
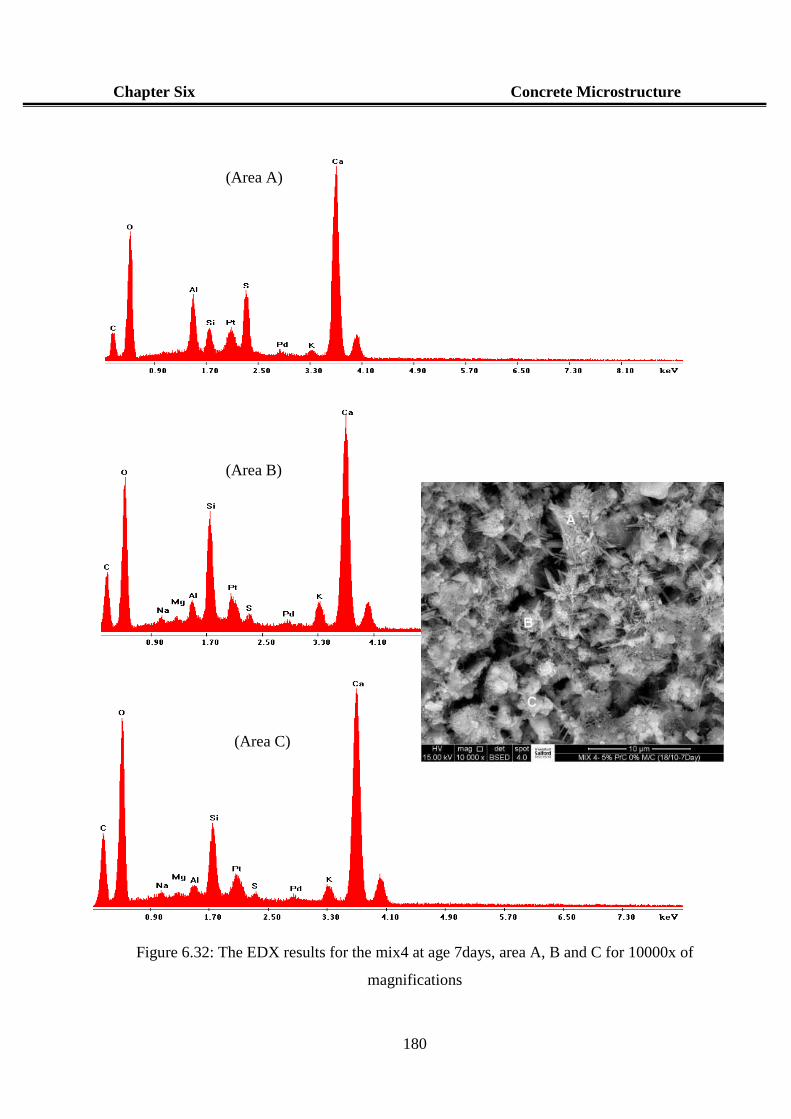
Chapter Six Concrete Microstructure
180
Figure 6.32: The EDX results for the mix4 at age 7days, area A, B and C for 10000x of
magnifications
(Area A)
(Area B)
(Area C)
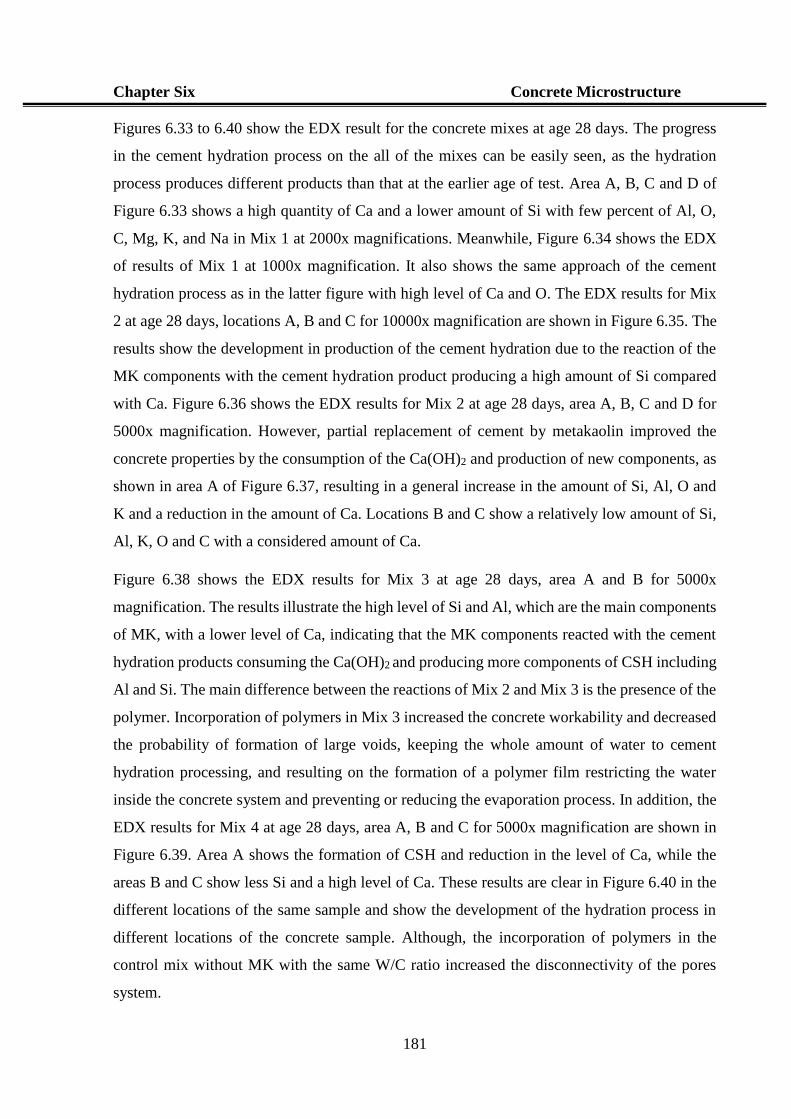
Chapter Six Concrete Microstructure
181
Figures 6.33 to 6.40 show the EDX result for the concrete mixes at age 28 days. The progress
in the cement hydration process on the all of the mixes can be easily seen, as the hydration
process produces different products than that at the earlier age of test. Area A, B, C and D of
Figure 6.33 shows a high quantity of Ca and a lower amount of Si with few percent of Al, O,
C, Mg, K, and Na in Mix 1 at 2000x magnifications. Meanwhile, Figure 6.34 shows the EDX
of results of Mix 1 at 1000x magnification. It also shows the same approach of the cement
hydration process as in the latter figure with high level of Ca and O. The EDX results for Mix
2 at age 28 days, locations A, B and C for 10000x magnification are shown in Figure 6.35. The
results show the development in production of the cement hydration due to the reaction of the
MK components with the cement hydration product producing a high amount of Si compared
with Ca. Figure 6.36 shows the EDX results for Mix 2 at age 28 days, area A, B, C and D for
5000x magnification. However, partial replacement of cement by metakaolin improved the
concrete properties by the consumption of the Ca(OH)2 and production of new components, as
shown in area A of Figure 6.37, resulting in a general increase in the amount of Si, Al, O and
K and a reduction in the amount of Ca. Locations B and C show a relatively low amount of Si,
Al, K, O and C with a considered amount of Ca.
Figure 6.38 shows the EDX results for Mix 3 at age 28 days, area A and B for 5000x
magnification. The results illustrate the high level of Si and Al, which are the main components
of MK, with a lower level of Ca, indicating that the MK components reacted with the cement
hydration products consuming the Ca(OH)2 and producing more components of CSH including
Al and Si. The main difference between the reactions of Mix 2 and Mix 3 is the presence of the
polymer. Incorporation of polymers in Mix 3 increased the concrete workability and decreased
the probability of formation of large voids, keeping the whole amount of water to cement
hydration processing, and resulting on the formation of a polymer film restricting the water
inside the concrete system and preventing or reducing the evaporation process. In addition, the
EDX results for Mix 4 at age 28 days, area A, B and C for 5000x magnification are shown in
Figure 6.39. Area A shows the formation of CSH and reduction in the level of Ca, while the
areas B and C show less Si and a high level of Ca. These results are clear in Figure 6.40 in the
different locations of the same sample and show the development of the hydration process in
different locations of the concrete sample. Although, the incorporation of polymers in the
control mix without MK with the same W/C ratio increased the disconnectivity of the pores
system.
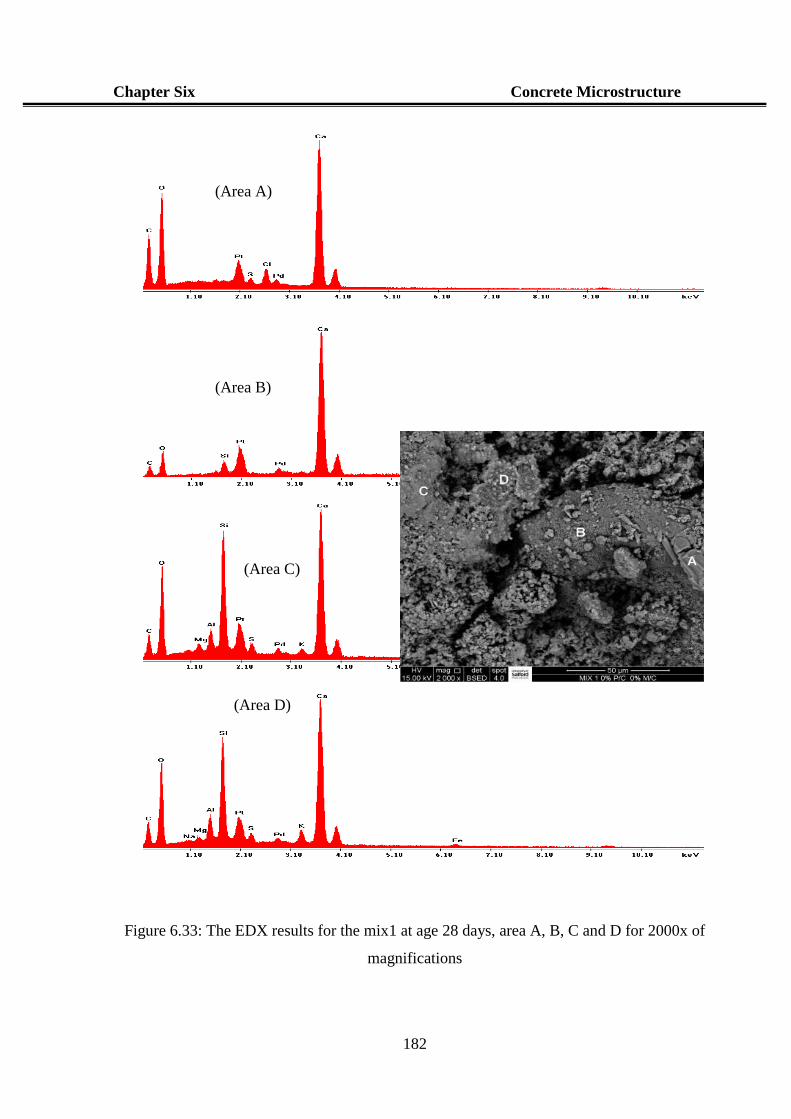
Chapter Six Concrete Microstructure
182
Figure 6.33: The EDX results for the mix1 at age 28 days, area A, B, C and D for 2000x of
magnifications
(Area A)
(Area B)
(Area C)
(Area D)
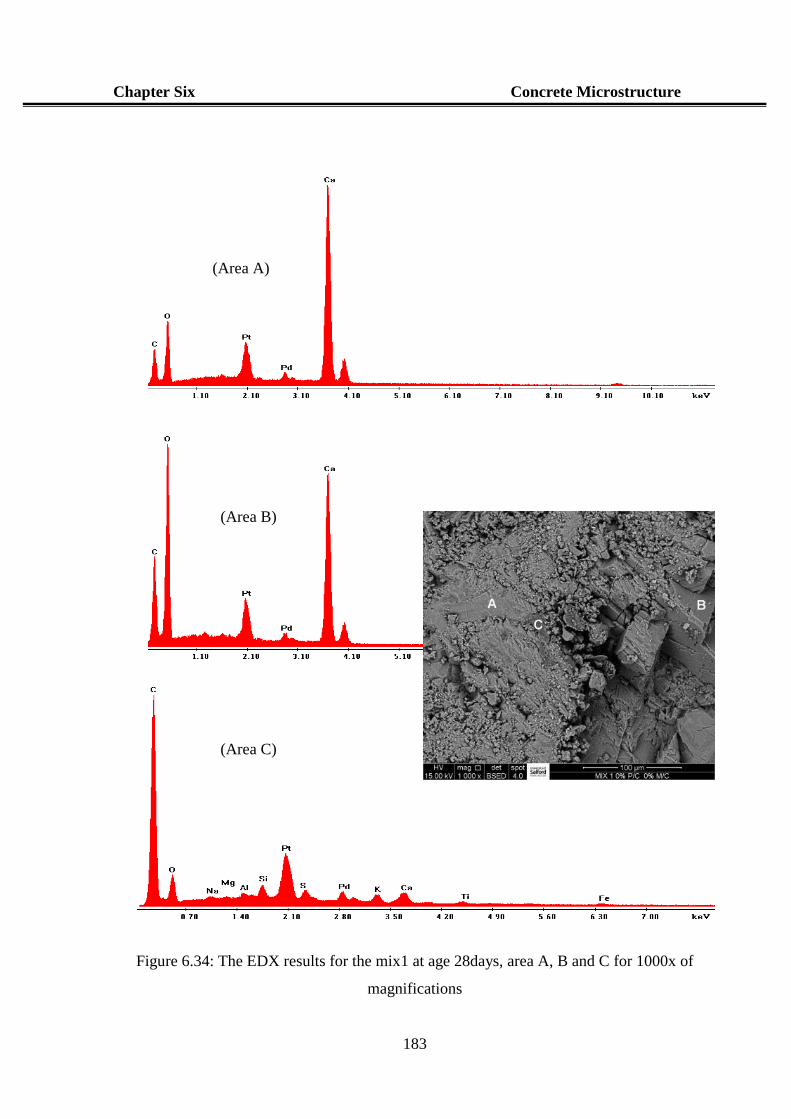
Chapter Six Concrete Microstructure
183
Figure 6.34: The EDX results for the mix1 at age 28days, area A, B and C for 1000x of
magnifications
(Area A)
(Area B)
(Area C)
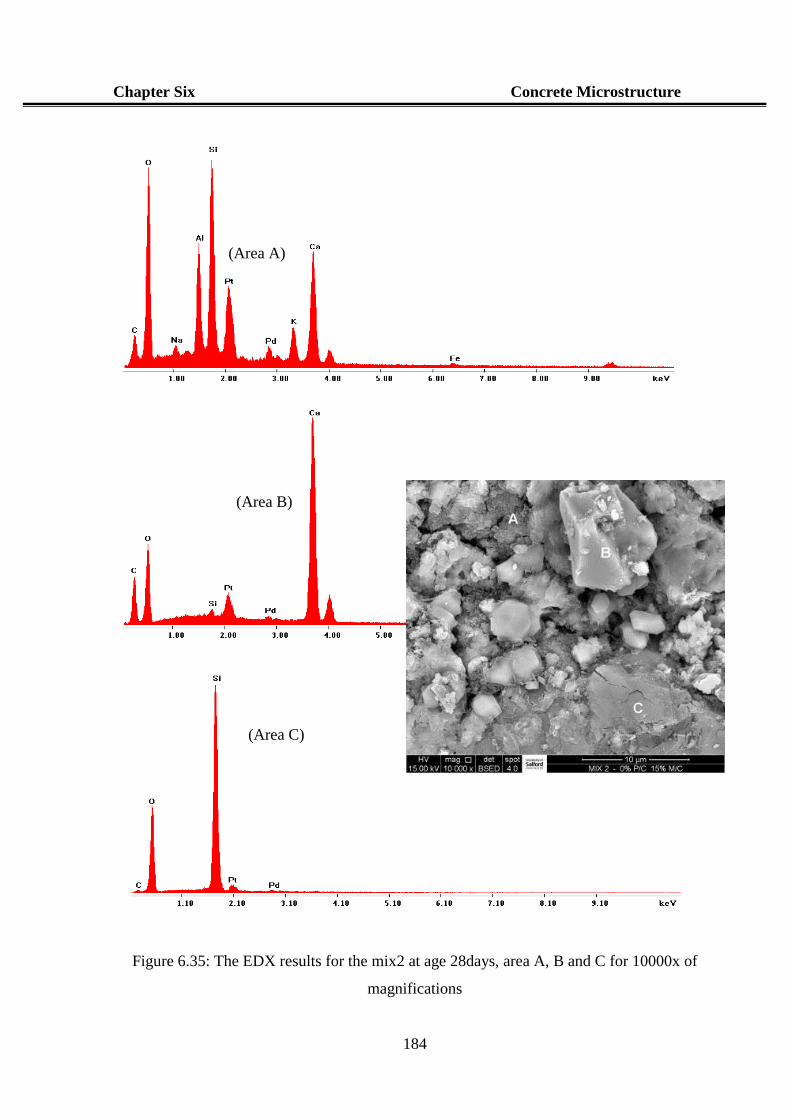
Chapter Six Concrete Microstructure
184
Figure 6.35: The EDX results for the mix2 at age 28days, area A, B and C for 10000x of
magnifications
(Area A)
(Area B)
(Area C)
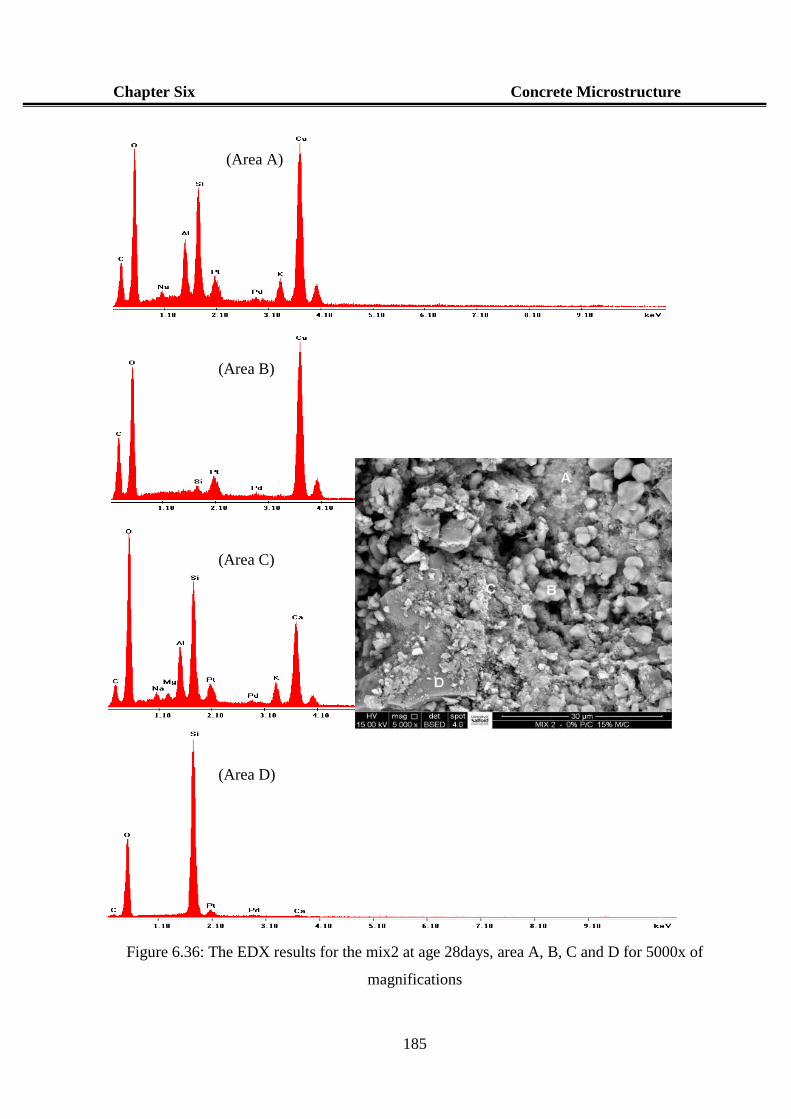
Chapter Six Concrete Microstructure
185
Figure 6.36: The EDX results for the mix2 at age 28days, area A, B, C and D for 5000x of
magnifications
(Area A)
(Area B)
(Area C)
(Area D)
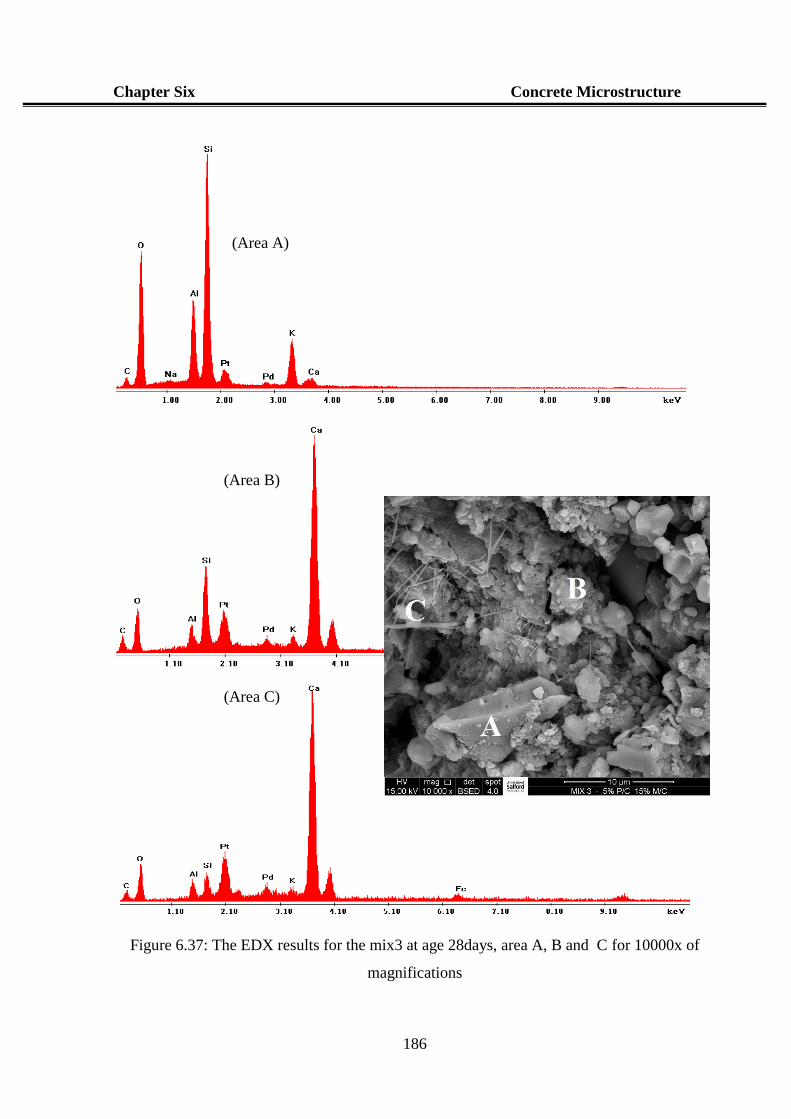
Chapter Six Concrete Microstructure
186
Figure 6.37: The EDX results for the mix3 at age 28days, area A, B and C for 10000x of
magnifications
(Area A)
(Area B)
(Area C)
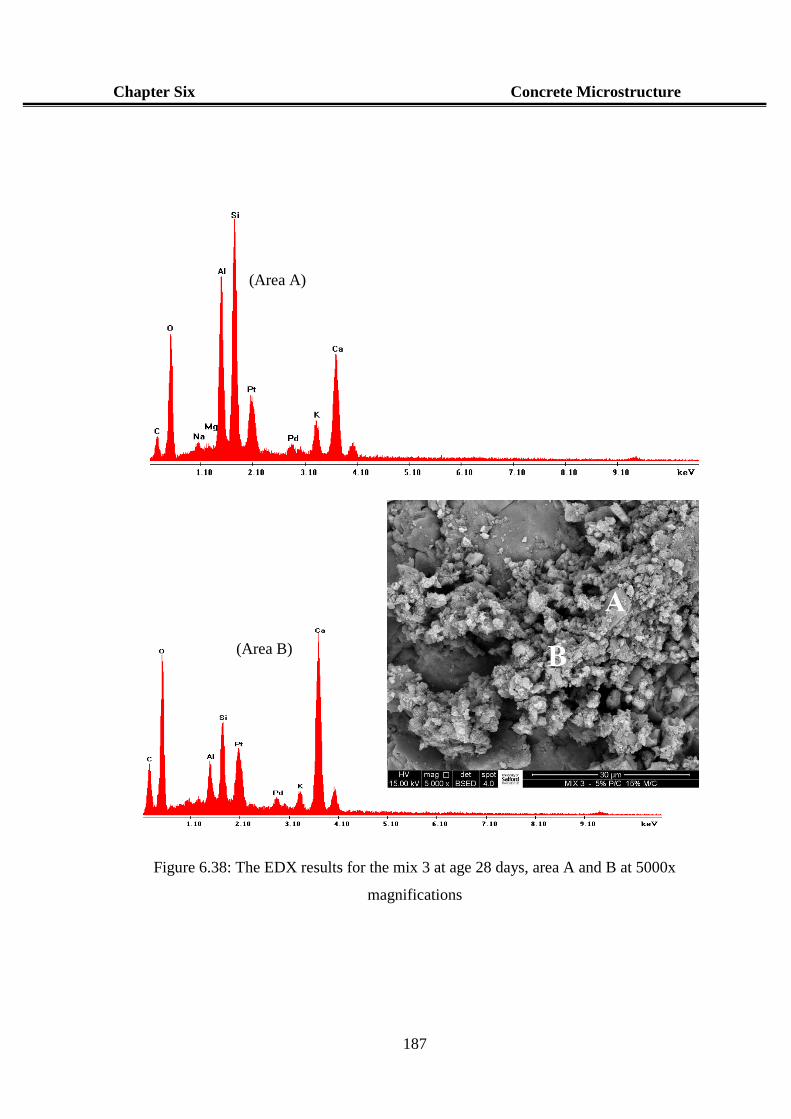
Chapter Six Concrete Microstructure
187
Figure 6.38: The EDX results for the mix 3 at age 28 days, area A and B at 5000x
magnifications
(Area A)
(Area B)
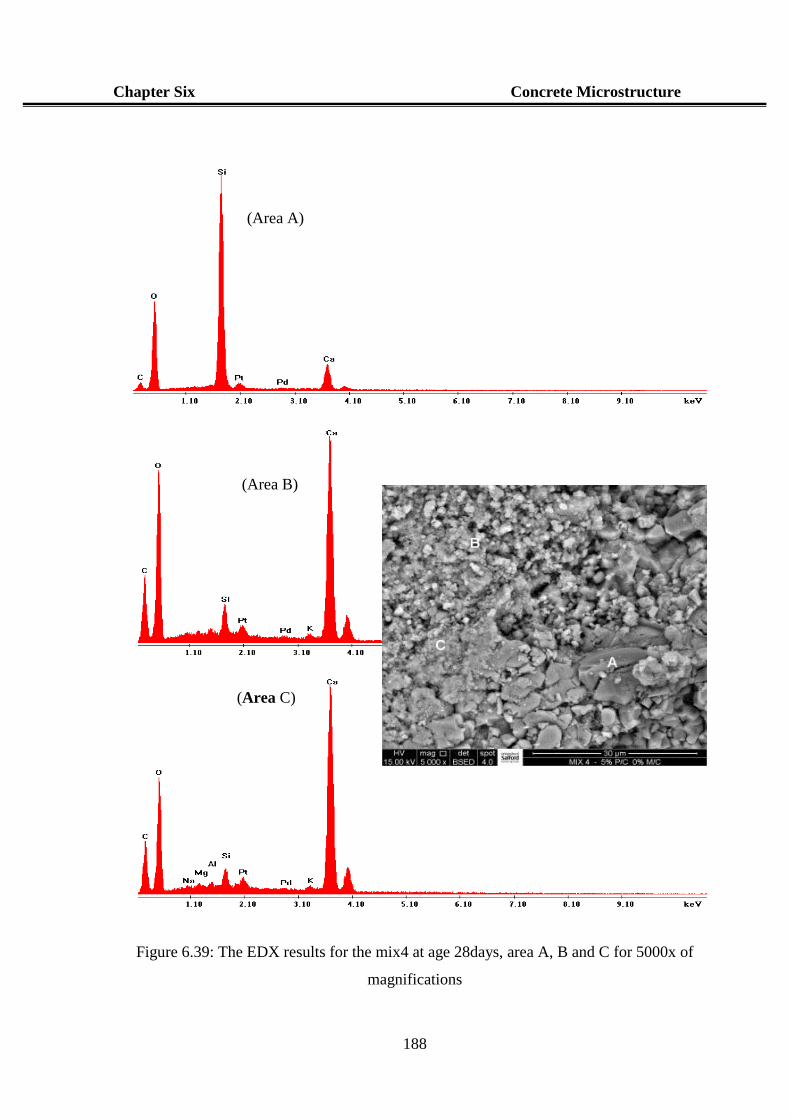
Chapter Six Concrete Microstructure
188
Figure 6.39: The EDX results for the mix4 at age 28days, area A, B and C for 5000x of
magnifications
(Area A)
(Area B)
(Area C)
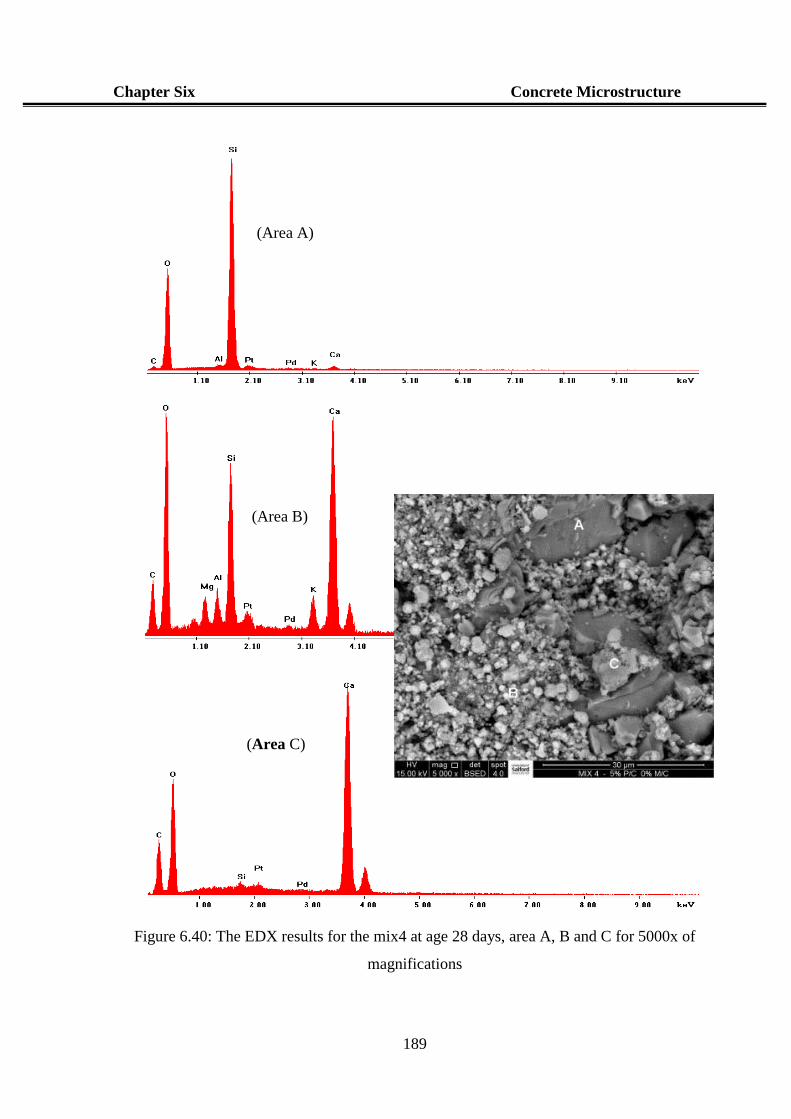
Chapter Six Concrete Microstructure
189
Figure 6.40: The EDX results for the mix4 at age 28 days, area A, B and C for 5000x of
magnifications
(Area A)
(Area B)
(Area C)
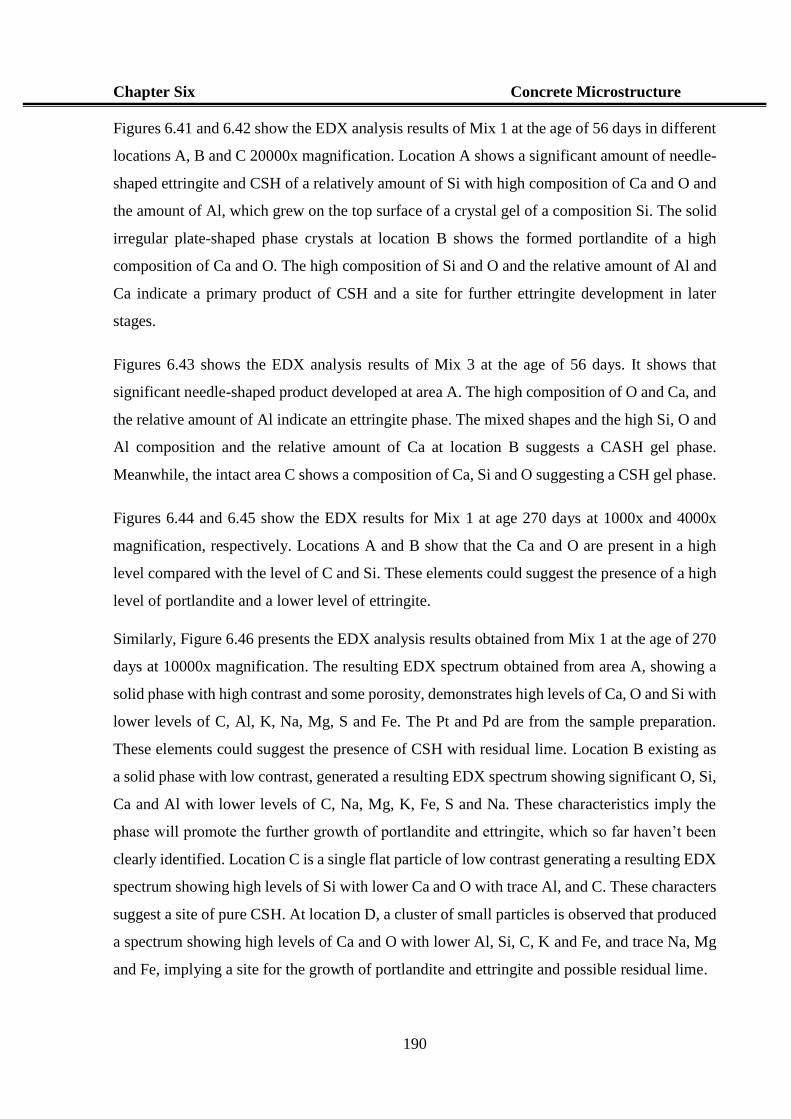
Chapter Six Concrete Microstructure
190
Figures 6.41 and 6.42 show the EDX analysis results of Mix 1 at the age of 56 days in different
locations A, B and C 20000x magnification. Location A shows a significant amount of needle-
shaped ettringite and CSH of a relatively amount of Si with high composition of Ca and O and
the amount of Al, which grew on the top surface of a crystal gel of a composition Si. The solid
irregular plate-shaped phase crystals at location B shows the formed portlandite of a high
composition of Ca and O. The high composition of Si and O and the relative amount of Al and
Ca indicate a primary product of CSH and a site for further ettringite development in later
stages.
Figures 6.43 shows the EDX analysis results of Mix 3 at the age of 56 days. It shows that
significant needle-shaped product developed at area A. The high composition of O and Ca, and
the relative amount of Al indicate an ettringite phase. The mixed shapes and the high Si, O and
Al composition and the relative amount of Ca at location B suggests a CASH gel phase.
Meanwhile, the intact area C shows a composition of Ca, Si and O suggesting a CSH gel phase.
Figures 6.44 and 6.45 show the EDX results for Mix 1 at age 270 days at 1000x and 4000x
magnification, respectively. Locations A and B show that the Ca and O are present in a high
level compared with the level of C and Si. These elements could suggest the presence of a high
level of portlandite and a lower level of ettringite.
Similarly, Figure 6.46 presents the EDX analysis results obtained from Mix 1 at the age of 270
days at 10000x magnification. The resulting EDX spectrum obtained from area A, showing a
solid phase with high contrast and some porosity, demonstrates high levels of Ca, O and Si with
lower levels of C, Al, K, Na, Mg, S and Fe. The Pt and Pd are from the sample preparation.
These elements could suggest the presence of CSH with residual lime. Location B existing as
a solid phase with low contrast, generated a resulting EDX spectrum showing significant O, Si,
Ca and Al with lower levels of C, Na, Mg, K, Fe, S and Na. These characteristics imply the
phase will promote the further growth of portlandite and ettringite, which so far haven’t been
clearly identified. Location C is a single flat particle of low contrast generating a resulting EDX
spectrum showing high levels of Si with lower Ca and O with trace Al, and C. These characters
suggest a site of pure CSH. At location D, a cluster of small particles is observed that produced
a spectrum showing high levels of Ca and O with lower Al, Si, C, K and Fe, and trace Na, Mg
and Fe, implying a site for the growth of portlandite and ettringite and possible residual lime.
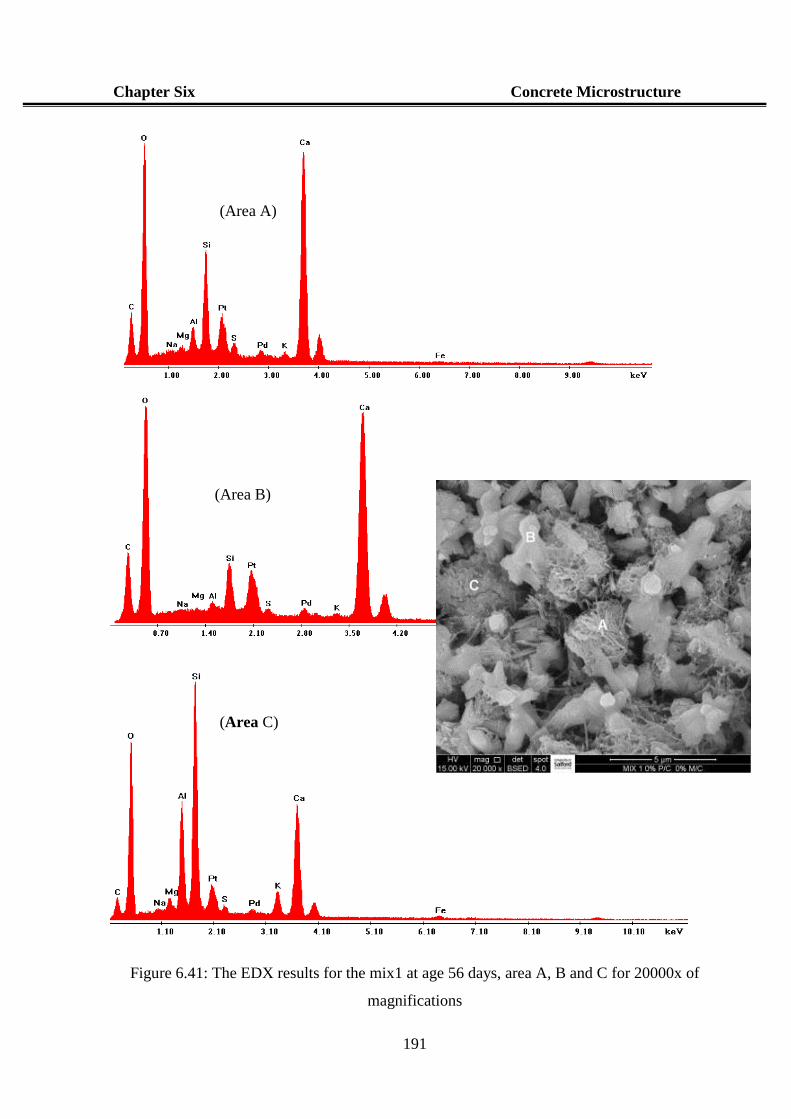
Chapter Six Concrete Microstructure
191
Figure 6.41: The EDX results for the mix1 at age 56 days, area A, B and C for 20000x of
magnifications
(Area A)
(Area B)
(Area C)
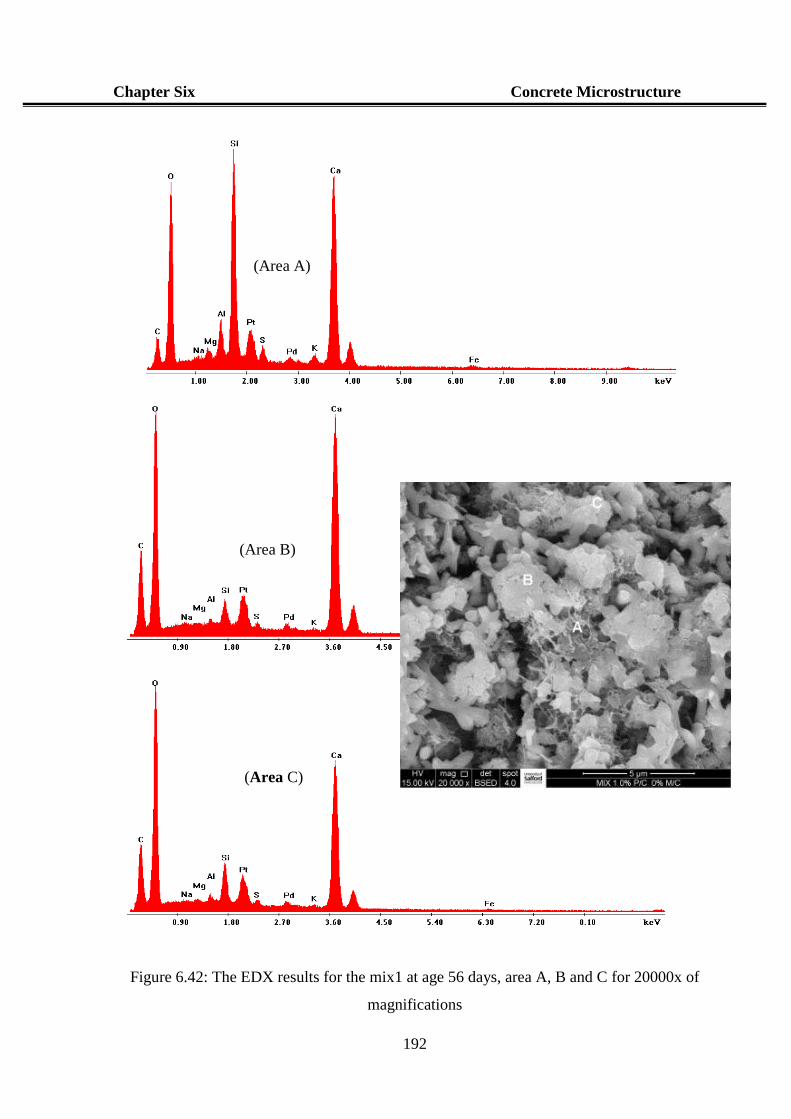
Chapter Six Concrete Microstructure
192
Figure 6.42: The EDX results for the mix1 at age 56 days, area A, B and C for 20000x of
magnifications
(Area A)
(Area B)
(Area C)
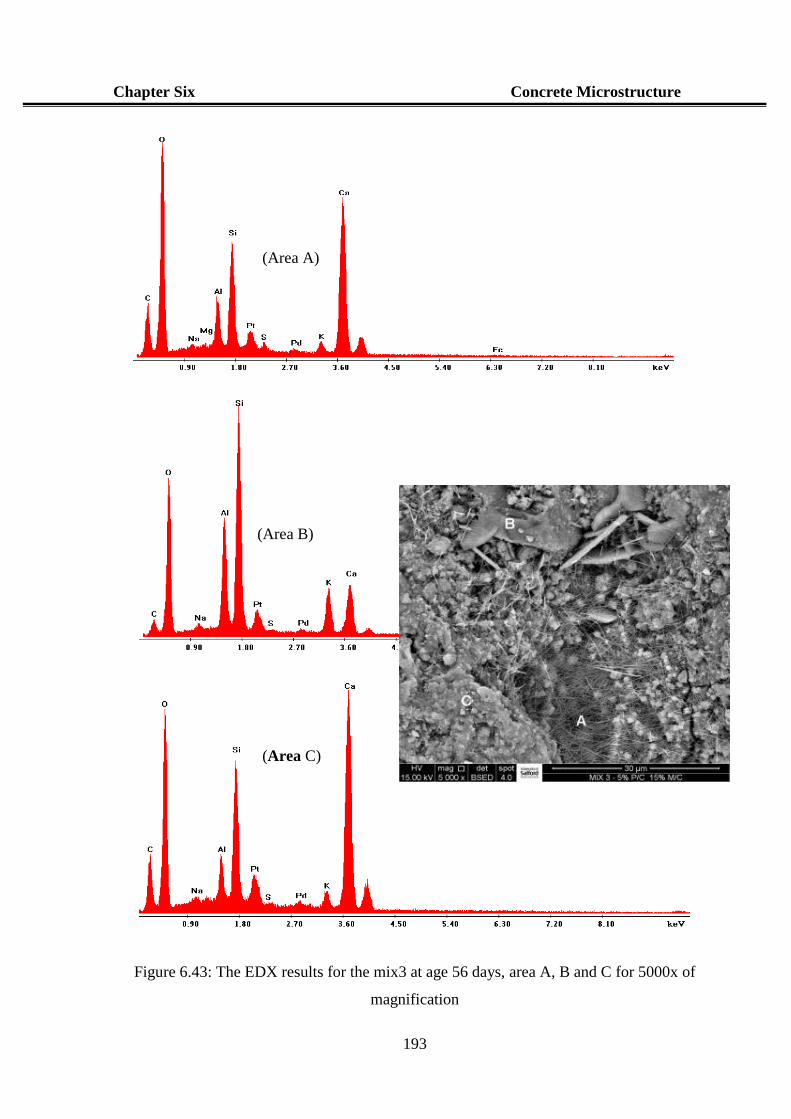
Chapter Six Concrete Microstructure
193
Figure 6.43: The EDX results for the mix3 at age 56 days, area A, B and C for 5000x of
magnification
(Area A)
(Area B)
(Area C)
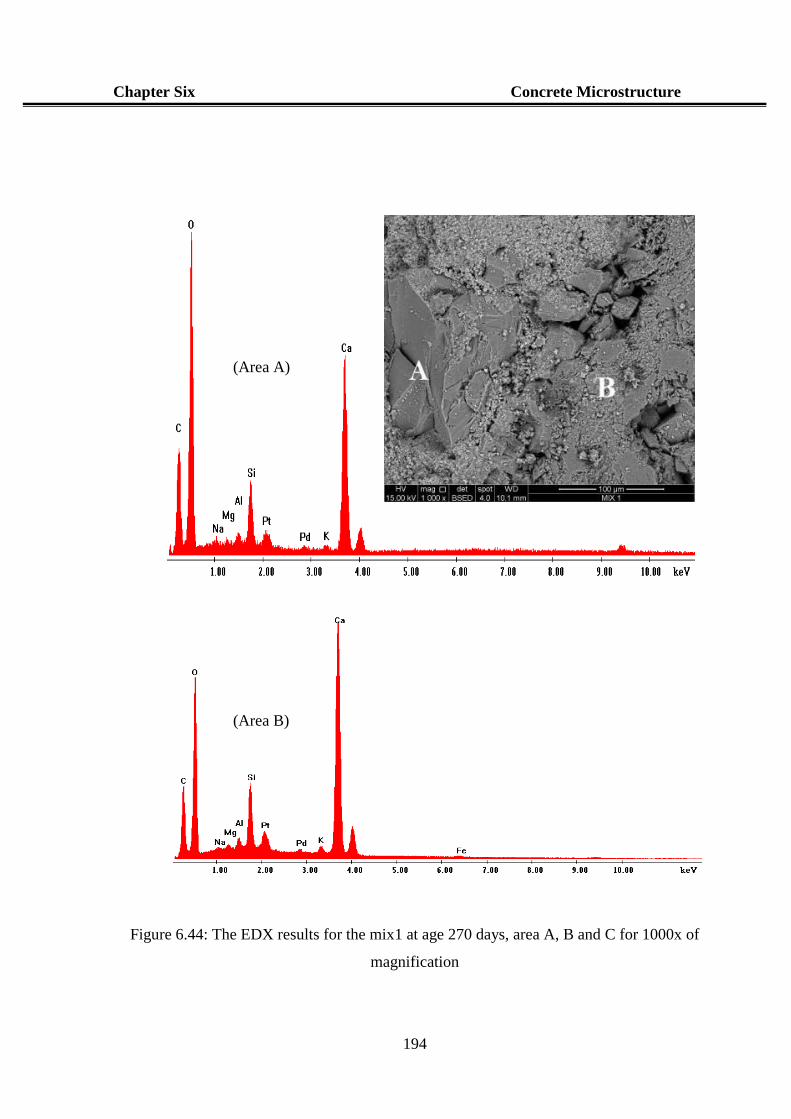
Chapter Six Concrete Microstructure
194
Figure 6.44: The EDX results for the mix1 at age 270 days, area A, B and C for 1000x of
magnification
(Area A)
(Area B)
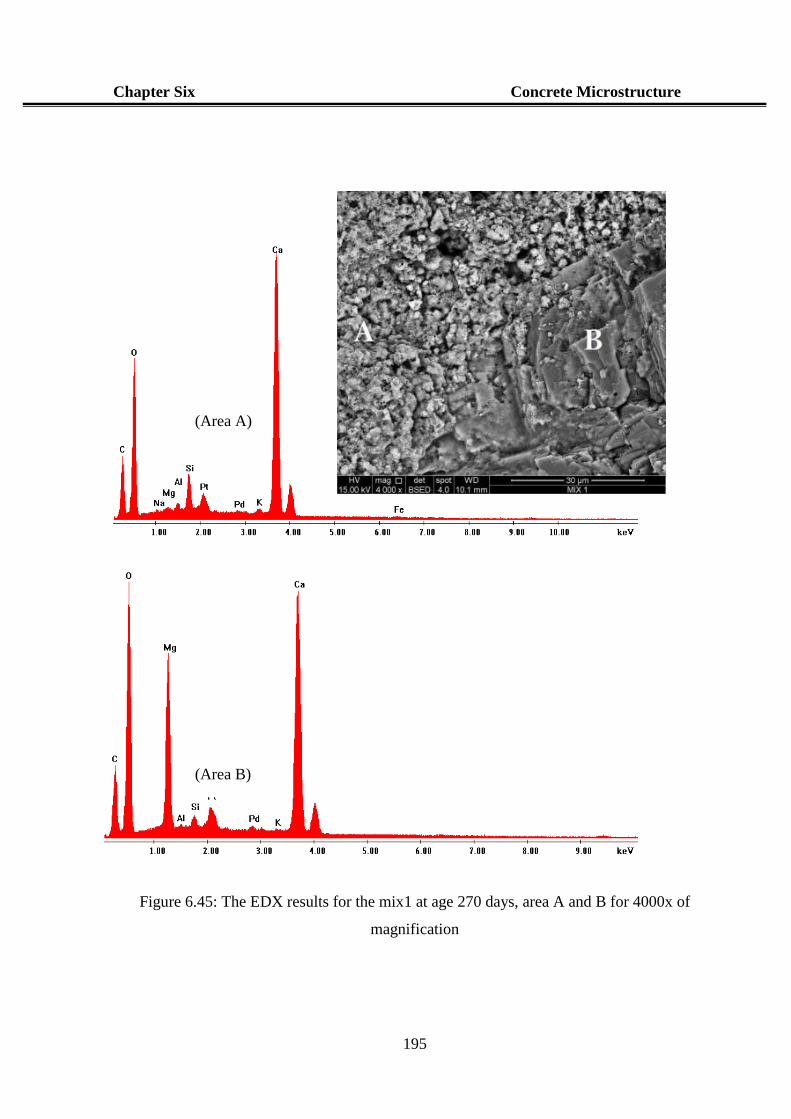
Chapter Six Concrete Microstructure
195
Figure 6.45: The EDX results for the mix1 at age 270 days, area A and B for 4000x of
magnification
(Area A)
(Area B)
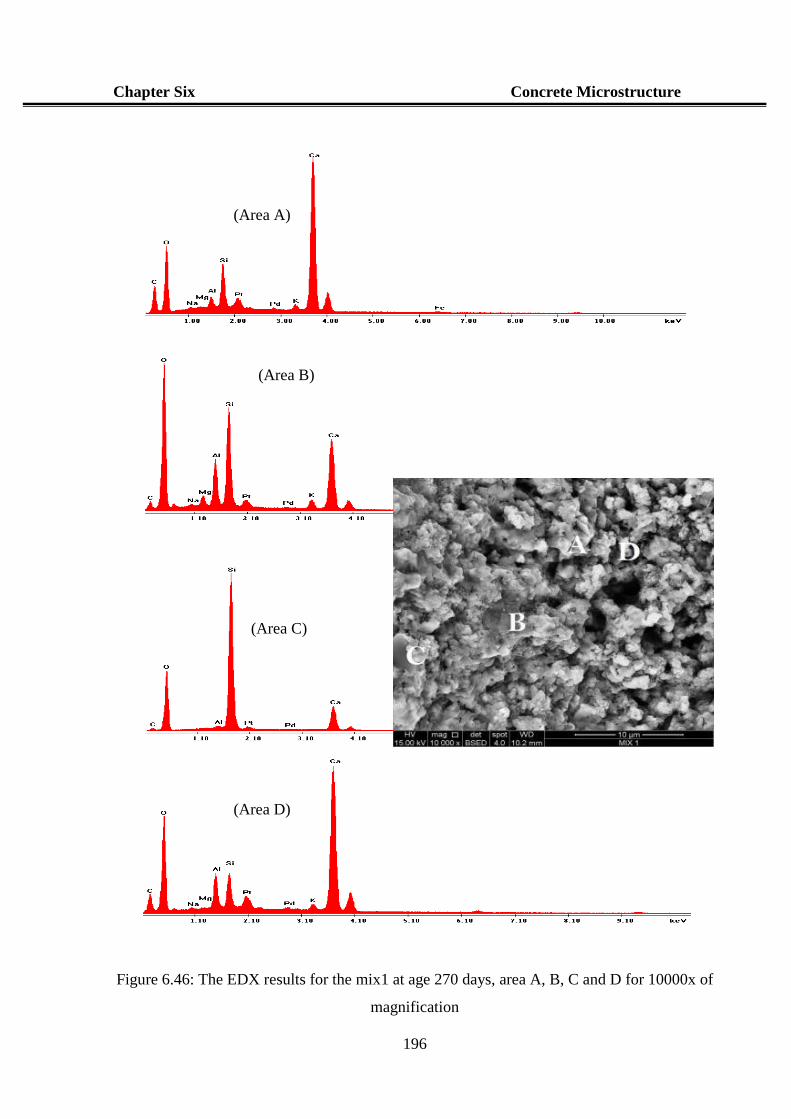
Chapter Six Concrete Microstructure
196
Figure 6.46: The EDX results for the mix1 at age 270 days, area A, B, C and D for 10000x of
magnification
(Area A)
(Area B)
(Area C)
(Area D)
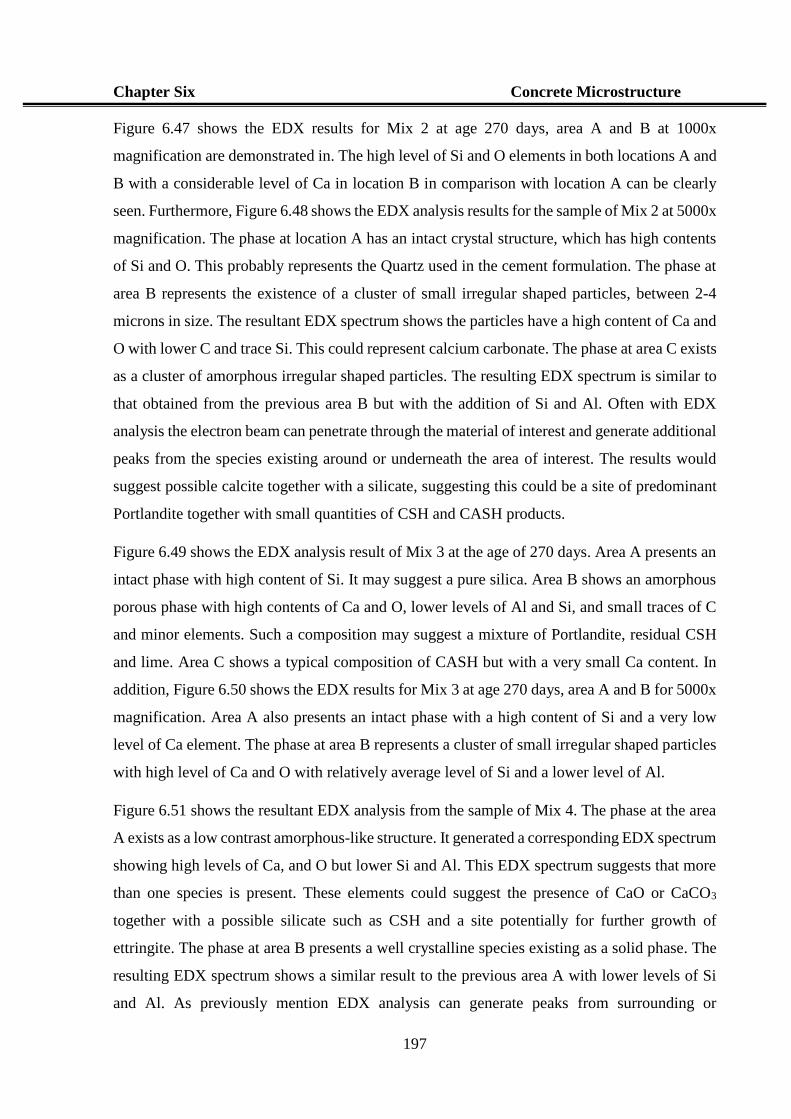
Chapter Six Concrete Microstructure
197
Figure 6.47 shows the EDX results for Mix 2 at age 270 days, area A and B at 1000x
magnification are demonstrated in. The high level of Si and O elements in both locations A and
B with a considerable level of Ca in location B in comparison with location A can be clearly
seen. Furthermore, Figure 6.48 shows the EDX analysis results for the sample of Mix 2 at 5000x
magnification. The phase at location A has an intact crystal structure, which has high contents
of Si and O. This probably represents the Quartz used in the cement formulation. The phase at
area B represents the existence of a cluster of small irregular shaped particles, between 2-4
microns in size. The resultant EDX spectrum shows the particles have a high content of Ca and
O with lower C and trace Si. This could represent calcium carbonate. The phase at area C exists
as a cluster of amorphous irregular shaped particles. The resulting EDX spectrum is similar to
that obtained from the previous area B but with the addition of Si and Al. Often with EDX
analysis the electron beam can penetrate through the material of interest and generate additional
peaks from the species existing around or underneath the area of interest. The results would
suggest possible calcite together with a silicate, suggesting this could be a site of predominant
Portlandite together with small quantities of CSH and CASH products.
Figure 6.49 shows the EDX analysis result of Mix 3 at the age of 270 days. Area A presents an
intact phase with high content of Si. It may suggest a pure silica. Area B shows an amorphous
porous phase with high contents of Ca and O, lower levels of Al and Si, and small traces of C
and minor elements. Such a composition may suggest a mixture of Portlandite, residual CSH
and lime. Area C shows a typical composition of CASH but with a very small Ca content. In
addition, Figure 6.50 shows the EDX results for Mix 3 at age 270 days, area A and B for 5000x
magnification. Area A also presents an intact phase with a high content of Si and a very low
level of Ca element. The phase at area B represents a cluster of small irregular shaped particles
with high level of Ca and O with relatively average level of Si and a lower level of Al.
Figure 6.51 shows the resultant EDX analysis from the sample of Mix 4. The phase at the area
A exists as a low contrast amorphous-like structure. It generated a corresponding EDX spectrum
showing high levels of Ca, and O but lower Si and Al. This EDX spectrum suggests that more
than one species is present. These elements could suggest the presence of CaO or CaCO3
together with a possible silicate such as CSH and a site potentially for further growth of
ettringite. The phase at area B presents a well crystalline species existing as a solid phase. The
resulting EDX spectrum shows a similar result to the previous area A with lower levels of Si
and Al. As previously mention EDX analysis can generate peaks from surrounding or
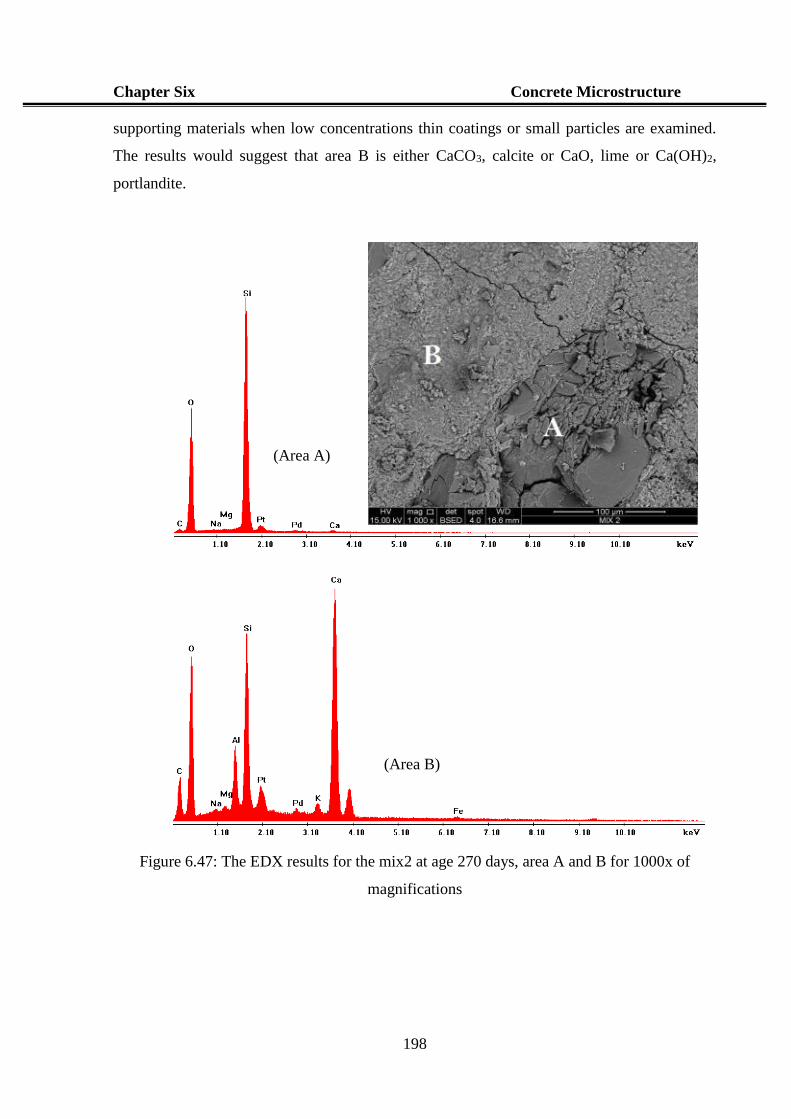
Chapter Six Concrete Microstructure
198
supporting materials when low concentrations thin coatings or small particles are examined.
The results would suggest that area B is either CaCO3, calcite or CaO, lime or Ca(OH)2,
portlandite.
Figure 6.47: The EDX results for the mix2 at age 270 days, area A and B for 1000x of
magnifications
(Area A)
(Area B)
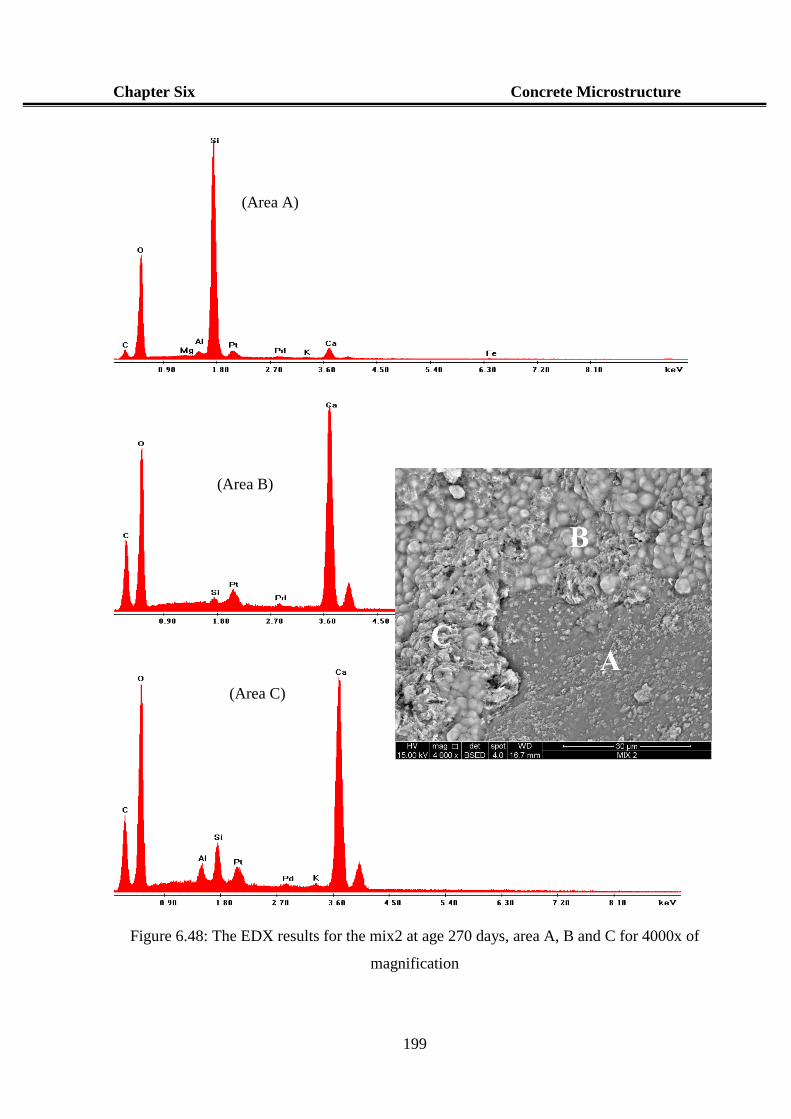
Chapter Six Concrete Microstructure
199
Figure 6.48: The EDX results for the mix2 at age 270 days, area A, B and C for 4000x of
magnification
(Area A)
(Area B)
(Area C)
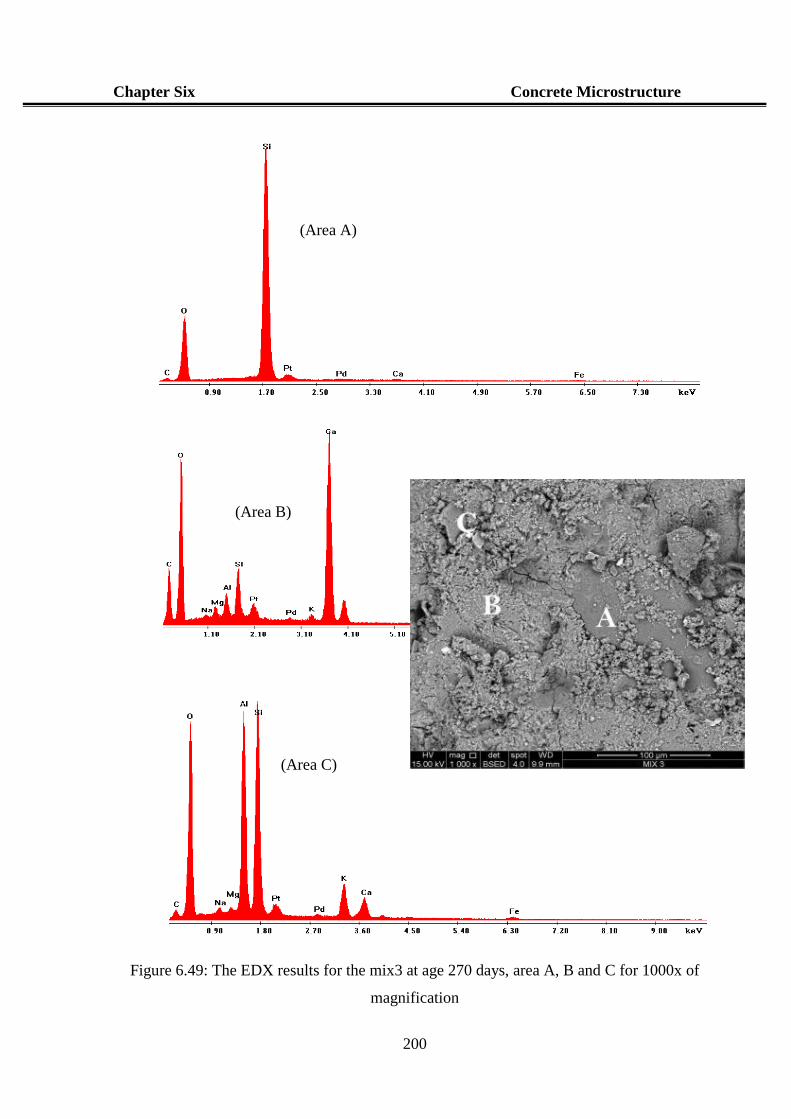
Chapter Six Concrete Microstructure
200
Figure 6.49: The EDX results for the mix3 at age 270 days, area A, B and C for 1000x of
magnification
(Area A)
(Area B)
(Area C)
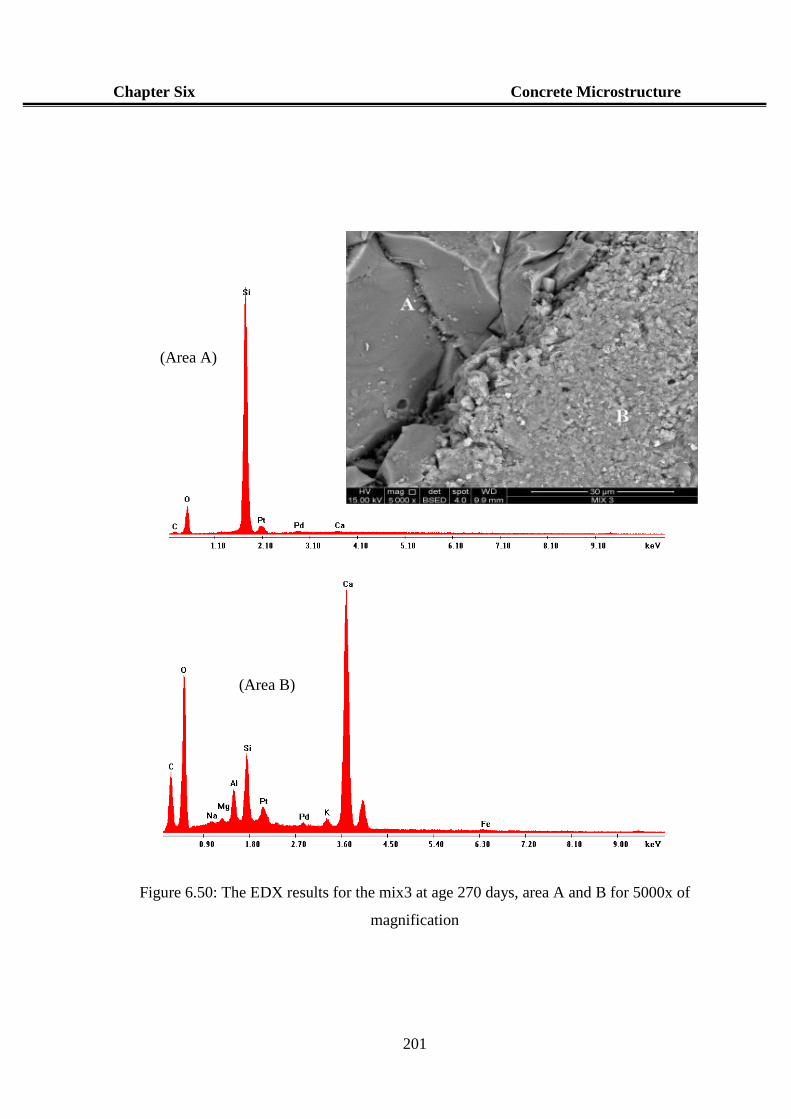
Chapter Six Concrete Microstructure
201
Figure 6.50: The EDX results for the mix3 at age 270 days, area A and B for 5000x of
magnification
(Area A)
(Area B)
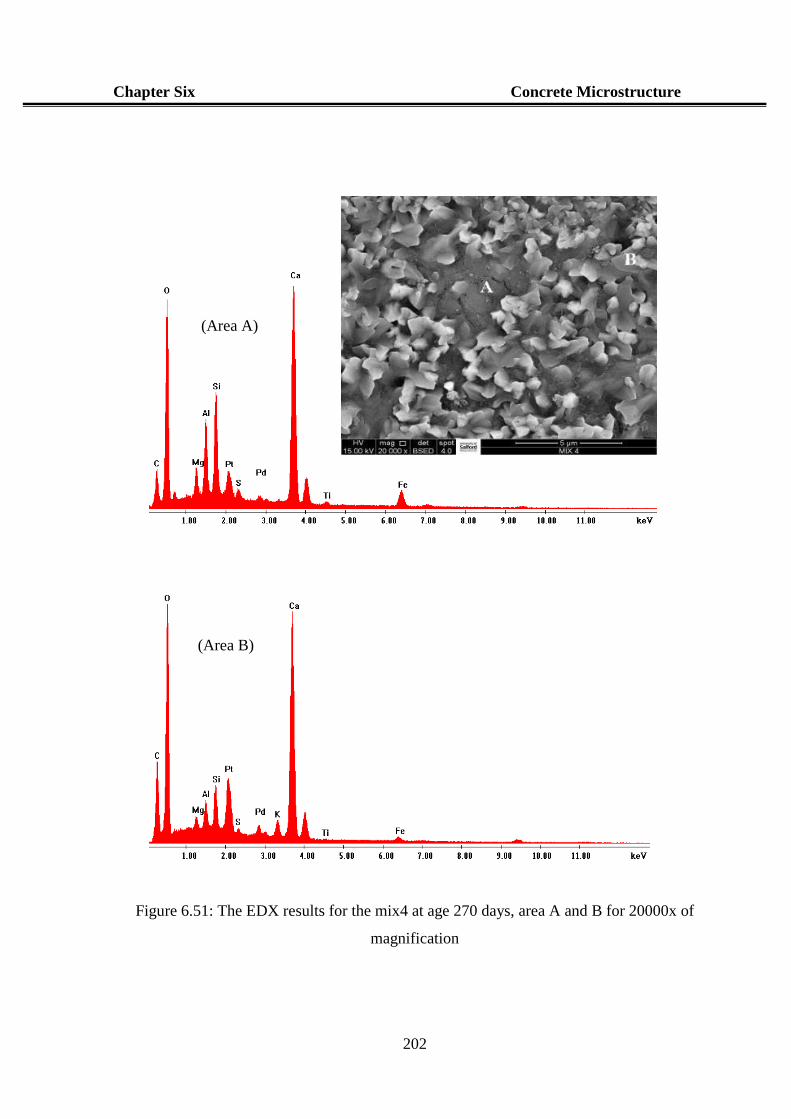
Chapter Six Concrete Microstructure
202
Figure 6.51: The EDX results for the mix4 at age 270 days, area A and B for 20000x of
magnification
(Area A)
(Area B)
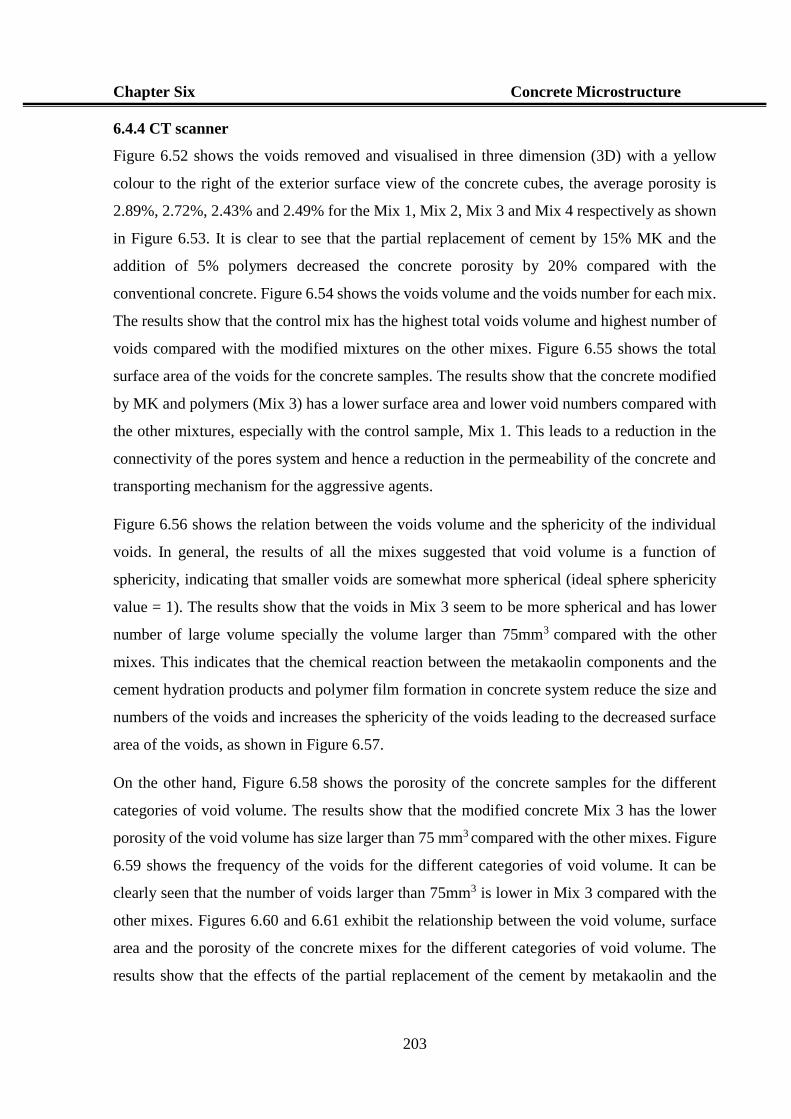
Chapter Six Concrete Microstructure
203
6.4.4 CT scanner
Figure 6.52 shows the voids removed and visualised in three dimension (3D) with a yellow
colour to the right of the exterior surface view of the concrete cubes, the average porosity is
2.89%, 2.72%, 2.43% and 2.49% for the Mix 1, Mix 2, Mix 3 and Mix 4 respectively as shown
in Figure 6.53. It is clear to see that the partial replacement of cement by 15% MK and the
addition of 5% polymers decreased the concrete porosity by 20% compared with the
conventional concrete. Figure 6.54 shows the voids volume and the voids number for each mix.
The results show that the control mix has the highest total voids volume and highest number of
voids compared with the modified mixtures on the other mixes. Figure 6.55 shows the total
surface area of the voids for the concrete samples. The results show that the concrete modified
by MK and polymers (Mix 3) has a lower surface area and lower void numbers compared with
the other mixtures, especially with the control sample, Mix 1. This leads to a reduction in the
connectivity of the pores system and hence a reduction in the permeability of the concrete and
transporting mechanism for the aggressive agents.
Figure 6.56 shows the relation between the voids volume and the sphericity of the individual
voids. In general, the results of all the mixes suggested that void volume is a function of
sphericity, indicating that smaller voids are somewhat more spherical (ideal sphere sphericity
value = 1). The results show that the voids in Mix 3 seem to be more spherical and has lower
number of large volume specially the volume larger than 75mm3 compared with the other
mixes. This indicates that the chemical reaction between the metakaolin components and the
cement hydration products and polymer film formation in concrete system reduce the size and
numbers of the voids and increases the sphericity of the voids leading to the decreased surface
area of the voids, as shown in Figure 6.57.
On the other hand, Figure 6.58 shows the porosity of the concrete samples for the different
categories of void volume. The results show that the modified concrete Mix 3 has the lower
porosity of the void volume has size larger than 75 mm3 compared with the other mixes. Figure
6.59 shows the frequency of the voids for the different categories of void volume. It can be
clearly seen that the number of voids larger than 75mm3 is lower in Mix 3 compared with the
other mixes. Figures 6.60 and 6.61 exhibit the relationship between the void volume, surface
area and the porosity of the concrete mixes for the different categories of void volume. The
results show that the effects of the partial replacement of the cement by metakaolin and the
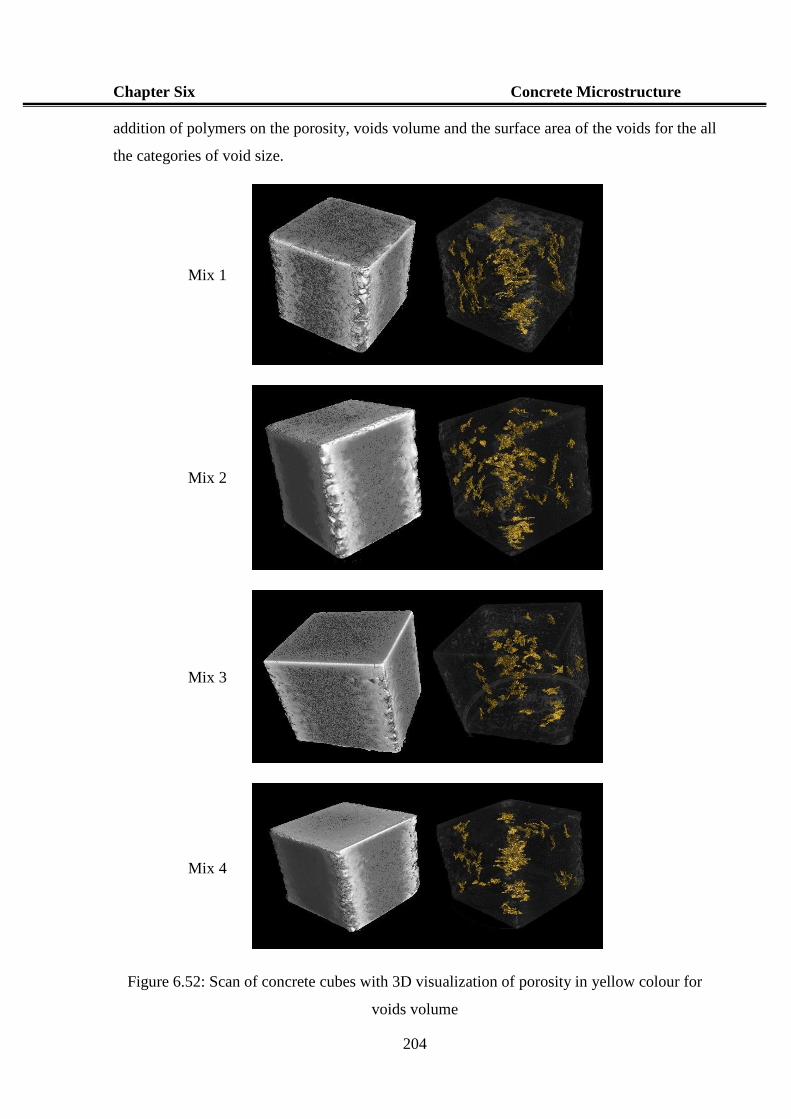
Chapter Six Concrete Microstructure
204
addition of polymers on the porosity, voids volume and the surface area of the voids for the all
the categories of void size.
Mix 1
Mix 2
Mix 3
Mix 4
Figure 6.52: Scan of concrete cubes with 3D visualization of porosity in yellow colour for
voids volume
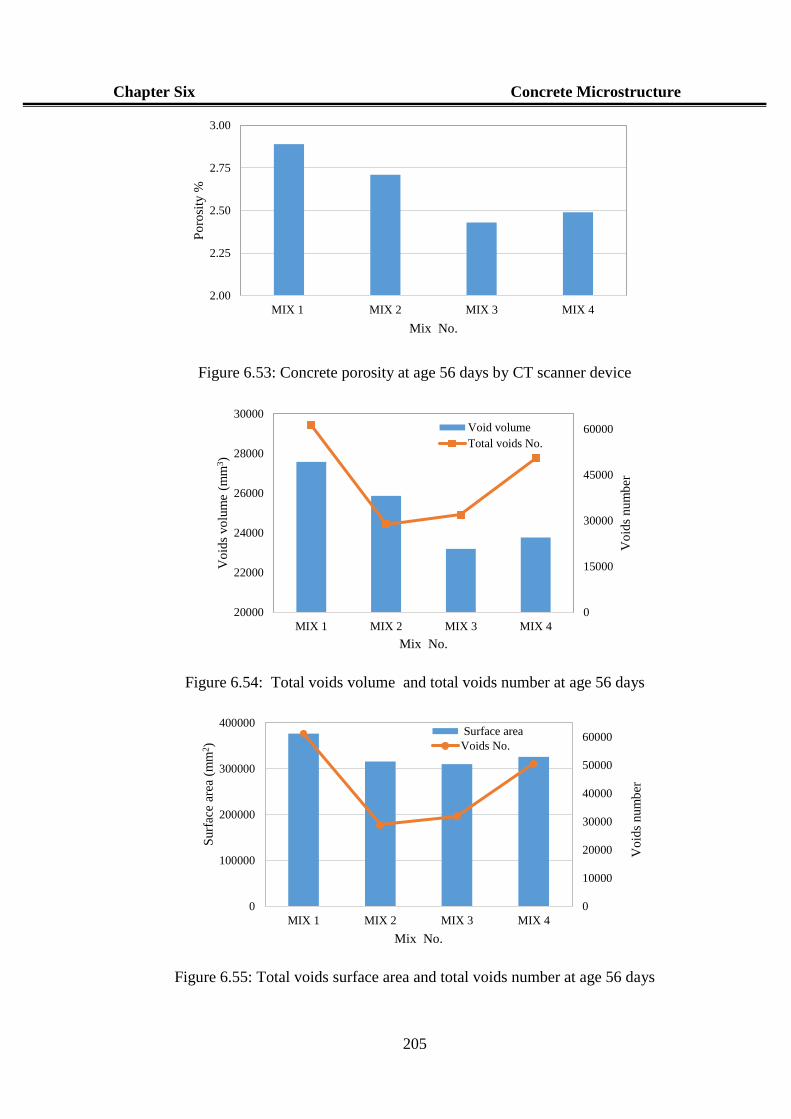
Chapter Six Concrete Microstructure
205
Figure 6.53: Concrete porosity at age 56 days by CT scanner device
Figure 6.54: Total voids volume and total voids number at age 56 days
Figure 6.55: Total voids surface area and total voids number at age 56 days
2.00
2.25
2.50
2.75
3.00
MIX 1 MIX 2 MIX 3 MIX 4
Po
rosi
ty %
Mix No.
0
15000
30000
45000
60000
20000
22000
24000
26000
28000
30000
MIX 1 MIX 2 MIX 3 MIX 4V
oid
s num
ber
Vo
ids
vo
lum
e (m
m3)
Mix No.
Void volume
Total voids No.
0
10000
20000
30000
40000
50000
60000
0
100000
200000
300000
400000
MIX 1 MIX 2 MIX 3 MIX 4
Vo
ids
num
ber
Surf
ace
area
(m
m2)
Mix No.
Surface area
Voids No.
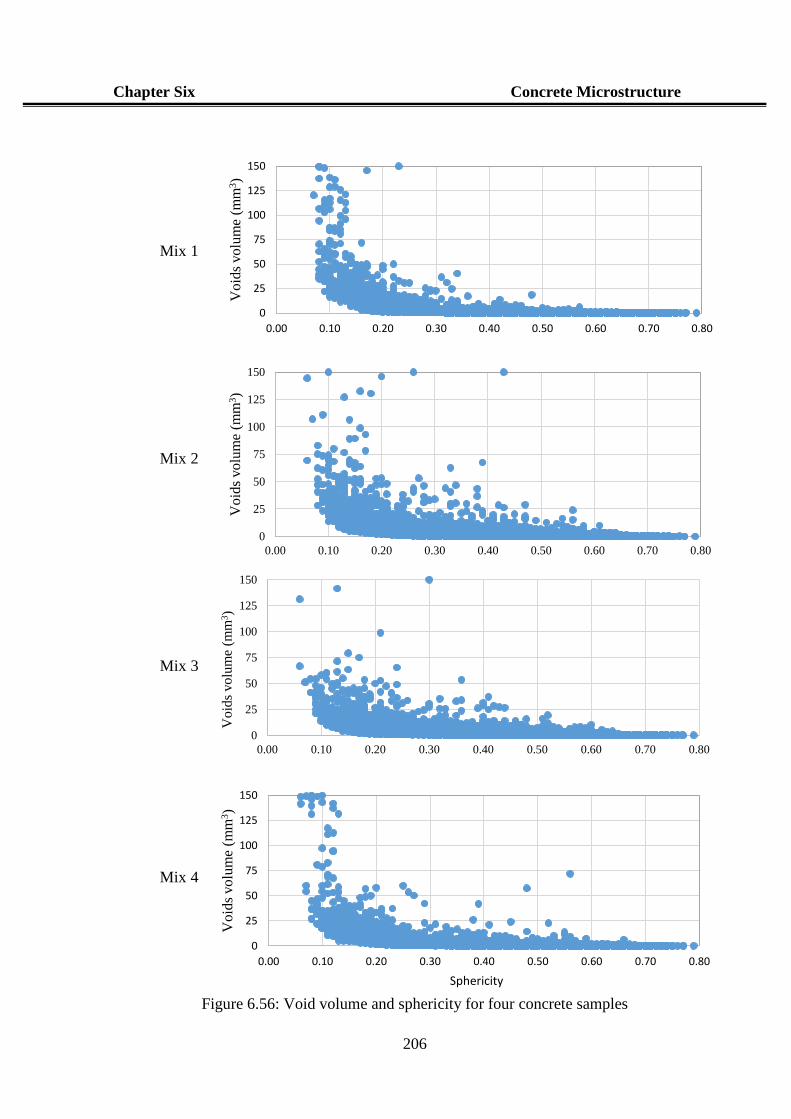
Chapter Six Concrete Microstructure
206
Mix 1
Mix 2
Mix 3
Mix 4
Figure 6.56: Void volume and sphericity for four concrete samples
0
25
50
75
100
125
150
0.00 0.10 0.20 0.30 0.40 0.50 0.60 0.70 0.80
Vo
ids
vo
lum
e (m
m3)
0
25
50
75
100
125
150
0.00 0.10 0.20 0.30 0.40 0.50 0.60 0.70 0.80
Void
s volu
me
(mm
3)
0
25
50
75
100
125
150
0.00 0.10 0.20 0.30 0.40 0.50 0.60 0.70 0.80
Void
s volu
me
(mm
3)
0
25
50
75
100
125
150
0.00 0.10 0.20 0.30 0.40 0.50 0.60 0.70 0.80
Vo
ids
vo
lum
e (m
m3)
Sphericity
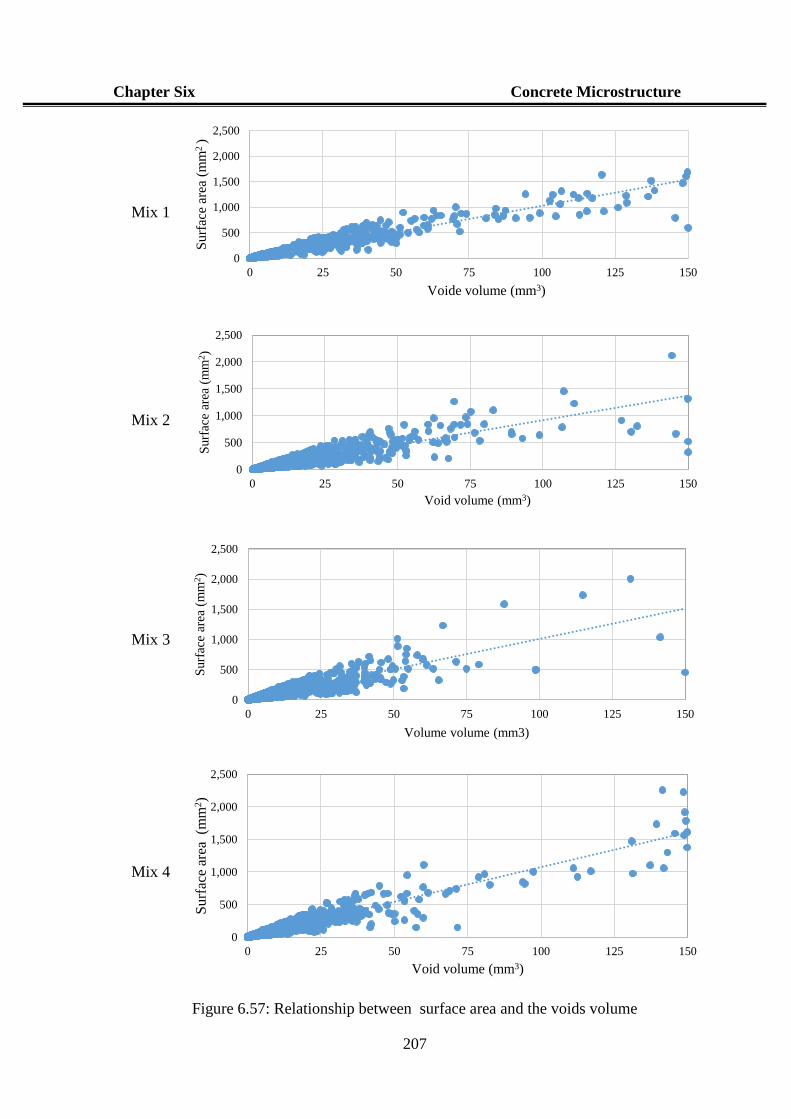
Chapter Six Concrete Microstructure
207
Mix 1
Mix 2
Mix 3
Mix 4
Figure 6.57: Relationship between surface area and the voids volume
0
500
1,000
1,500
2,000
2,500
0 25 50 75 100 125 150
Su
rfac
e ar
ea (
mm
2 )
Voide volume (mm3)
0
500
1,000
1,500
2,000
2,500
0 25 50 75 100 125 150
Surf
ace
area
(m
m2)
Void volume (mm3)
0
500
1,000
1,500
2,000
2,500
0 25 50 75 100 125 150
Surf
ace
area
(m
m2)
Volume volume (mm3)
0
500
1,000
1,500
2,000
2,500
0 25 50 75 100 125 150
Su
rfac
e ar
ea (m
m2)
Void volume (mm3)
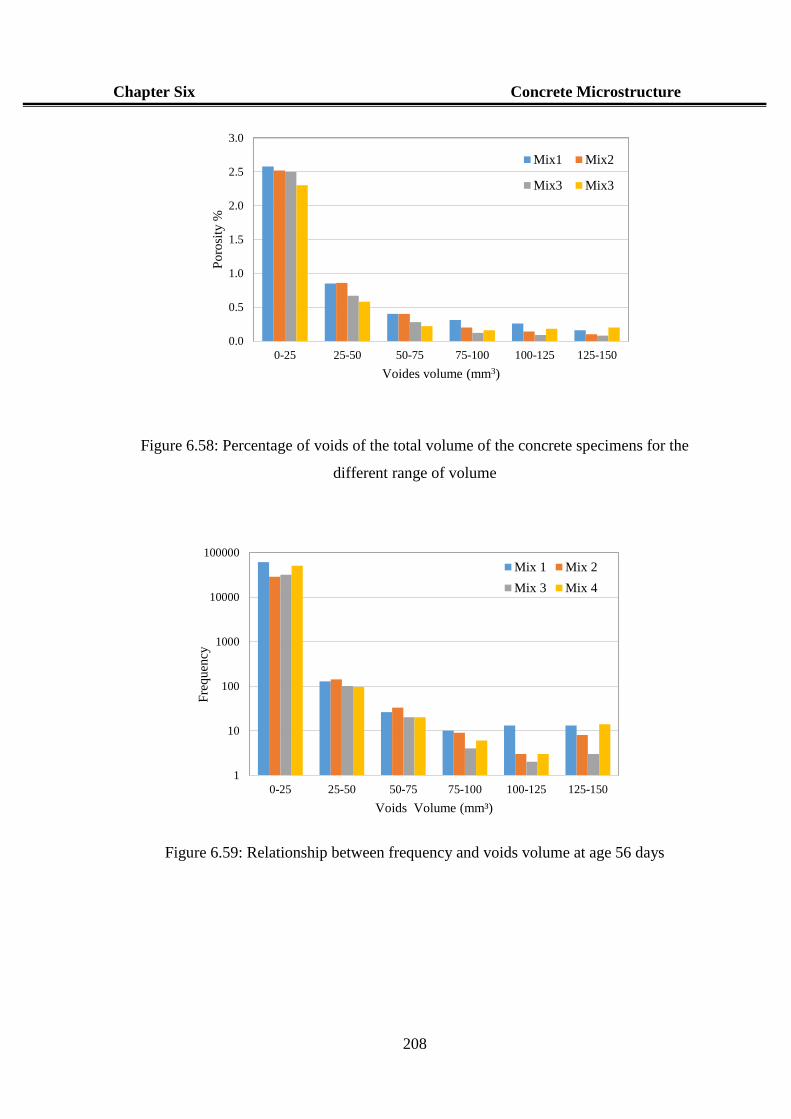
Chapter Six Concrete Microstructure
208
Figure 6.58: Percentage of voids of the total volume of the concrete specimens for the
different range of volume
Figure 6.59: Relationship between frequency and voids volume at age 56 days
0.0
0.5
1.0
1.5
2.0
2.5
3.0
0-25 25-50 50-75 75-100 100-125 125-150
Po
rosi
ty %
Voides volume (mm3)
Mix1 Mix2
Mix3 Mix3
1
10
100
1000
10000
100000
0-25 25-50 50-75 75-100 100-125 125-150
Fre
quen
cy
Voids Volume (mm³)
Mix 1 Mix 2
Mix 3 Mix 4
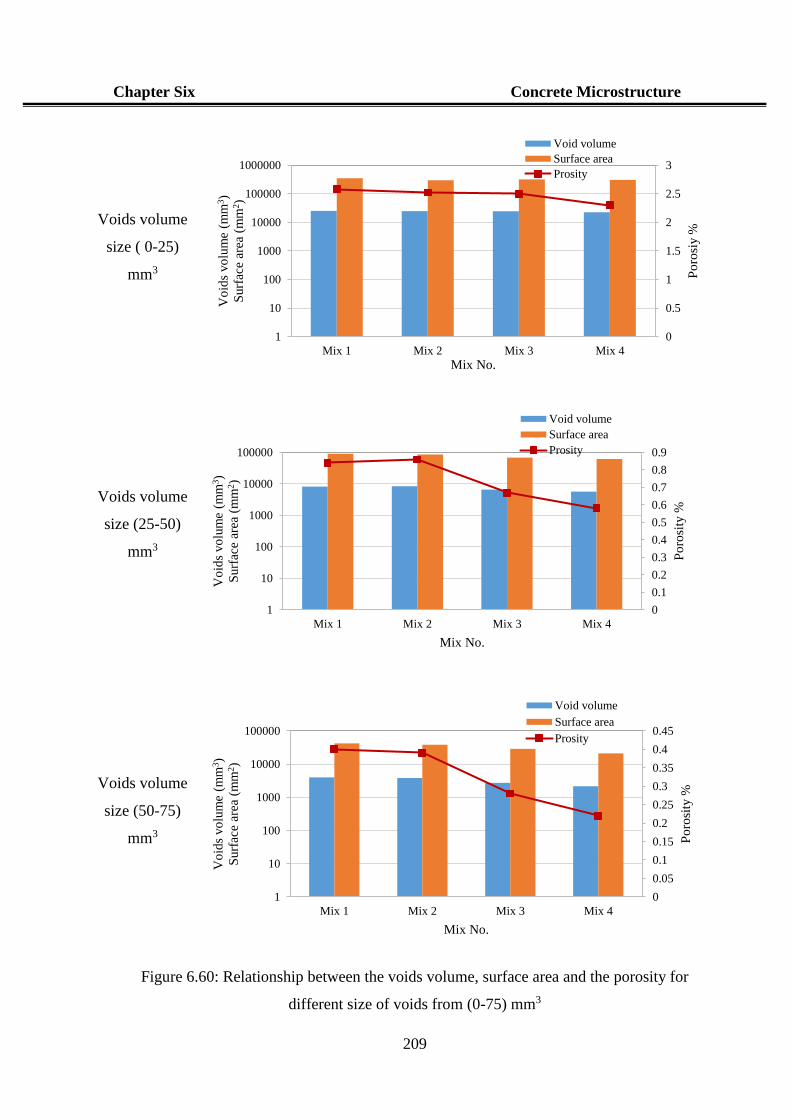
Chapter Six Concrete Microstructure
209
Voids volume
size ( 0-25)
mm3
Voids volume
size (25-50)
mm3
Voids volume
size (50-75)
mm3
Figure 6.60: Relationship between the voids volume, surface area and the porosity for
different size of voids from (0-75) mm3
0
0.5
1
1.5
2
2.5
3
1
10
100
1000
10000
100000
1000000
Mix 1 Mix 2 Mix 3 Mix 4
Po
rosi
y %
Vo
ids
vo
lum
e (m
m3)
Surf
ace
area
(m
m2)
Mix No.
Void volume
Surface area
Prosity
0
0.1
0.2
0.3
0.4
0.5
0.6
0.7
0.8
0.9
1
10
100
1000
10000
100000
Mix 1 Mix 2 Mix 3 Mix 4
Po
rosi
ty %
Vo
ids
vo
lum
e (m
m3)
Surf
ace
area
(m
m2)
Mix No.
Void volume
Surface area
Prosity
0
0.05
0.1
0.15
0.2
0.25
0.3
0.35
0.4
0.45
1
10
100
1000
10000
100000
Mix 1 Mix 2 Mix 3 Mix 4
Po
rosi
ty %
Vo
ids
vo
lum
e (m
m3)
Surf
ace
area
(m
m2)
Mix No.
Void volume
Surface area
Prosity
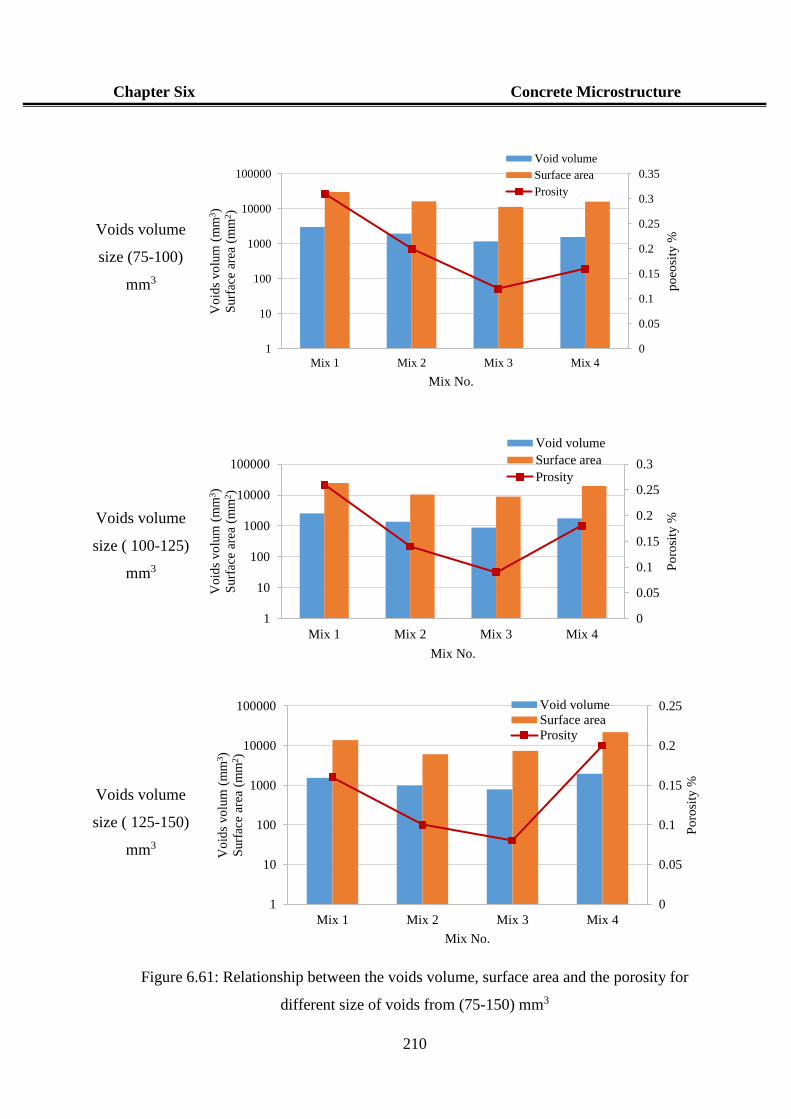
Chapter Six Concrete Microstructure
210
Voids volume
size (75-100)
mm3
Voids volume
size ( 100-125)
mm3
Voids volume
size ( 125-150)
mm3
Figure 6.61: Relationship between the voids volume, surface area and the porosity for
different size of voids from (75-150) mm3
0
0.05
0.1
0.15
0.2
0.25
0.3
0.35
1
10
100
1000
10000
100000
Mix 1 Mix 2 Mix 3 Mix 4
po
eosi
ty %
Vo
ids
vo
lum
(m
m3)
Surf
ace
area
(m
m2)
Mix No.
Void volume
Surface area
Prosity
0
0.05
0.1
0.15
0.2
0.25
0.3
1
10
100
1000
10000
100000
Mix 1 Mix 2 Mix 3 Mix 4
Po
rosi
ty %
Vo
ids
vo
lum
(m
m3)
Surf
ace
area
(m
m2)
Mix No.
Void volume
Surface area
Prosity
0
0.05
0.1
0.15
0.2
0.25
1
10
100
1000
10000
100000
Mix 1 Mix 2 Mix 3 Mix 4
Po
rosi
ty %
Vo
ids
vo
lum
(m
m3)
Surf
ace
area
(m
m2)
Mix No.
Void volume
Surface area
Prosity
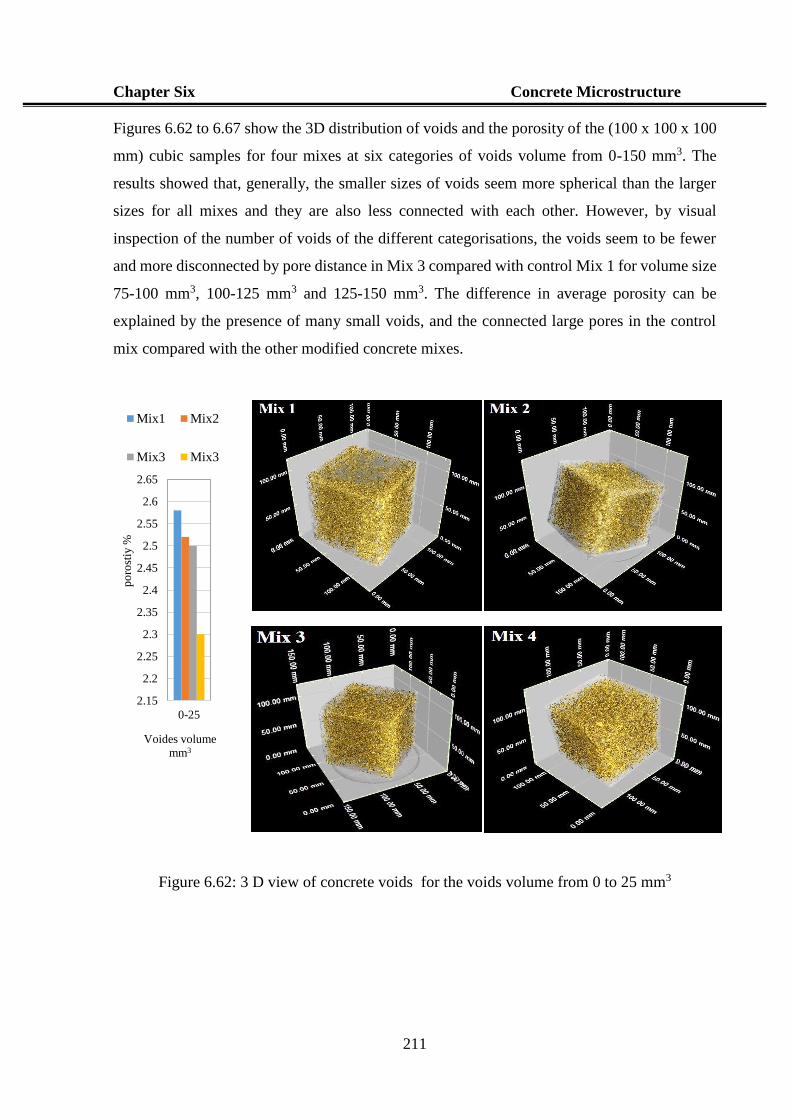
Chapter Six Concrete Microstructure
211
Figures 6.62 to 6.67 show the 3D distribution of voids and the porosity of the (100 x 100 x 100
mm) cubic samples for four mixes at six categories of voids volume from 0-150 mm3. The
results showed that, generally, the smaller sizes of voids seem more spherical than the larger
sizes for all mixes and they are also less connected with each other. However, by visual
inspection of the number of voids of the different categorisations, the voids seem to be fewer
and more disconnected by pore distance in Mix 3 compared with control Mix 1 for volume size
75-100 mm3, 100-125 mm3 and 125-150 mm3. The difference in average porosity can be
explained by the presence of many small voids, and the connected large pores in the control
mix compared with the other modified concrete mixes.
Figure 6.62: 3 D view of concrete voids for the voids volume from 0 to 25 mm3
2.15
2.2
2.25
2.3
2.35
2.4
2.45
2.5
2.55
2.6
2.65
0-25
po
rost
iy %
Voides volume
mm3
Mix1 Mix2
Mix3 Mix3
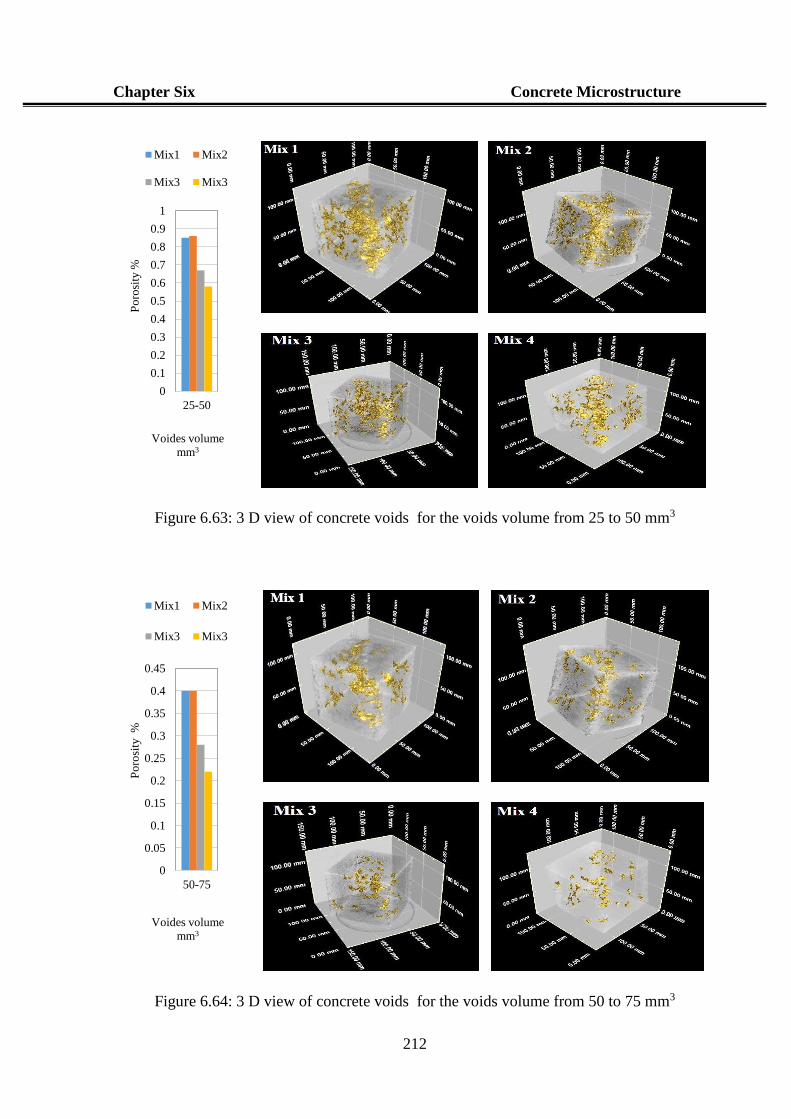
Chapter Six Concrete Microstructure
212
Figure 6.63: 3 D view of concrete voids for the voids volume from 25 to 50 mm3
Figure 6.64: 3 D view of concrete voids for the voids volume from 50 to 75 mm3
0
0.1
0.2
0.3
0.4
0.5
0.6
0.7
0.8
0.9
1
25-50
Po
rosi
ty %
Voides volume
mm3
Mix1 Mix2
Mix3 Mix3
0
0.05
0.1
0.15
0.2
0.25
0.3
0.35
0.4
0.45
50-75
Po
rosi
ty %
Voides volume
mm3
Mix1 Mix2
Mix3 Mix3
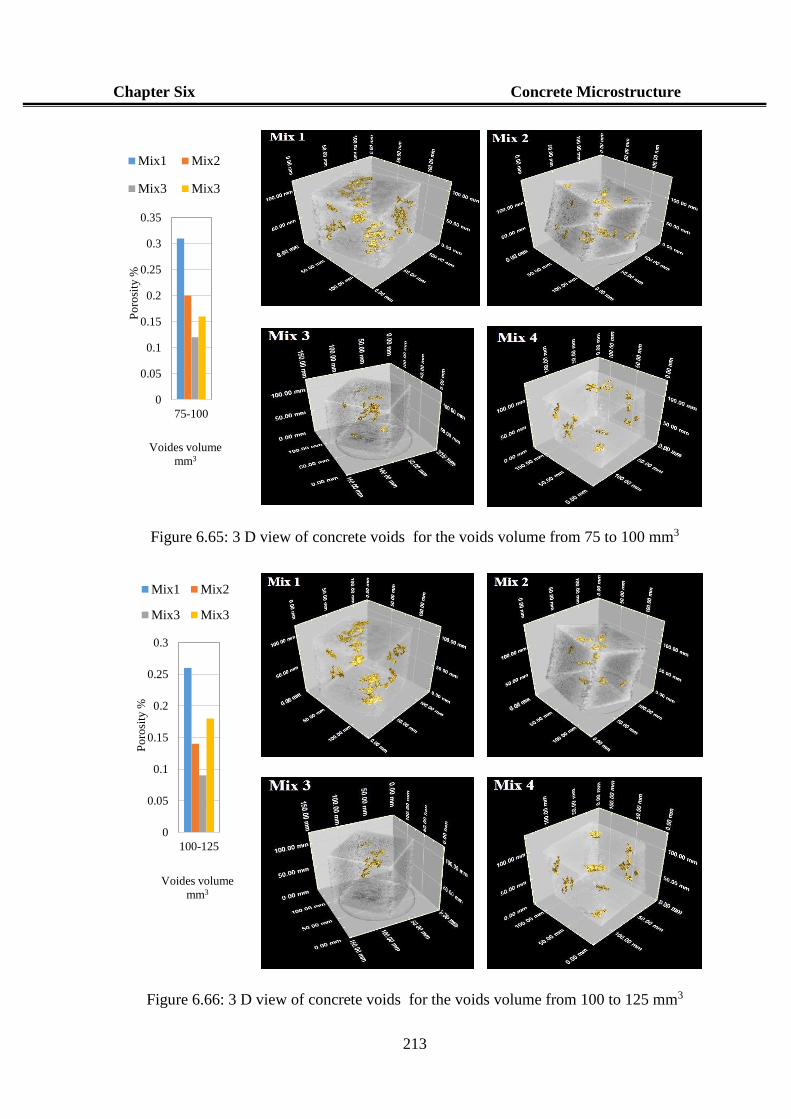
Chapter Six Concrete Microstructure
213
Figure 6.65: 3 D view of concrete voids for the voids volume from 75 to 100 mm3
Figure 6.66: 3 D view of concrete voids for the voids volume from 100 to 125 mm3
0
0.05
0.1
0.15
0.2
0.25
0.3
0.35
75-100
Po
rosi
ty %
Voides volume
mm3
Mix1 Mix2
Mix3 Mix3
0
0.05
0.1
0.15
0.2
0.25
0.3
100-125
Po
rosi
ty %
Voides volume
mm3
Mix1 Mix2
Mix3 Mix3
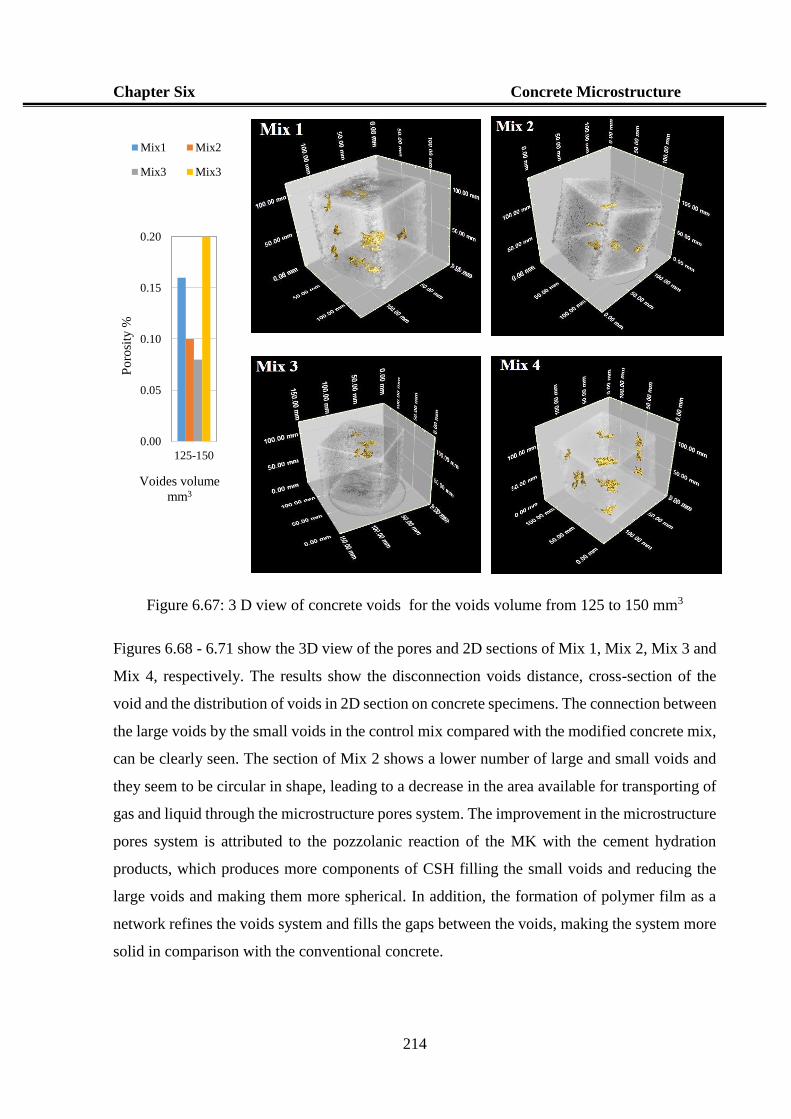
Chapter Six Concrete Microstructure
214
Figure 6.67: 3 D view of concrete voids for the voids volume from 125 to 150 mm3
Figures 6.68 - 6.71 show the 3D view of the pores and 2D sections of Mix 1, Mix 2, Mix 3 and
Mix 4, respectively. The results show the disconnection voids distance, cross-section of the
void and the distribution of voids in 2D section on concrete specimens. The connection between
the large voids by the small voids in the control mix compared with the modified concrete mix,
can be clearly seen. The section of Mix 2 shows a lower number of large and small voids and
they seem to be circular in shape, leading to a decrease in the area available for transporting of
gas and liquid through the microstructure pores system. The improvement in the microstructure
pores system is attributed to the pozzolanic reaction of the MK with the cement hydration
products, which produces more components of CSH filling the small voids and reducing the
large voids and making them more spherical. In addition, the formation of polymer film as a
network refines the voids system and fills the gaps between the voids, making the system more
solid in comparison with the conventional concrete.
0.00
0.05
0.10
0.15
0.20
125-150
Po
rosi
ty %
Voides volume
mm3
Mix1 Mix2
Mix3 Mix3
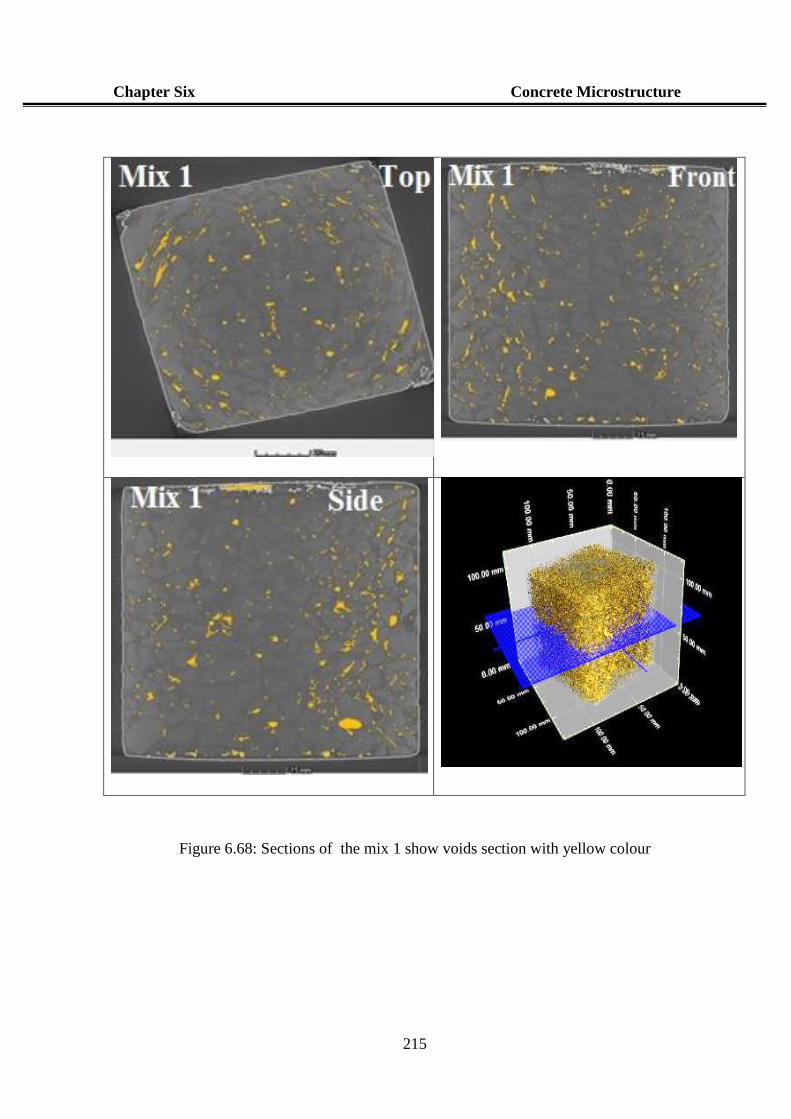
Chapter Six Concrete Microstructure
215
Figure 6.68: Sections of the mix 1 show voids section with yellow colour
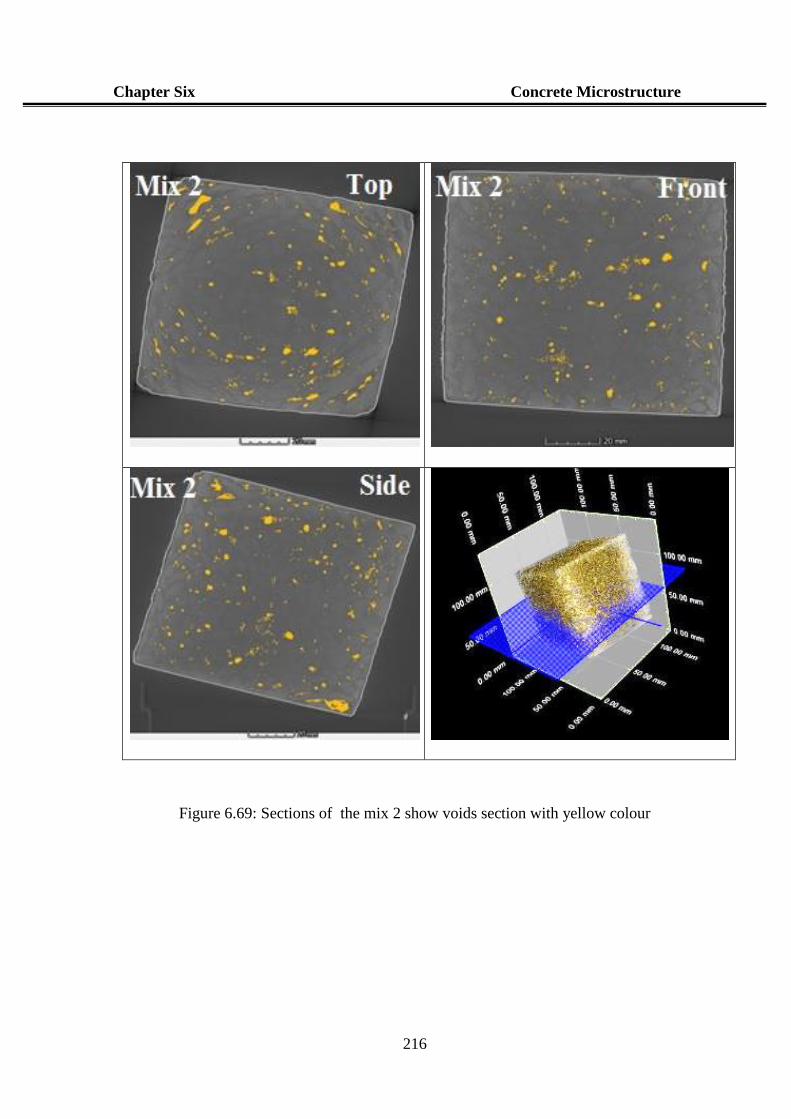
Chapter Six Concrete Microstructure
216
Figure 6.69: Sections of the mix 2 show voids section with yellow colour
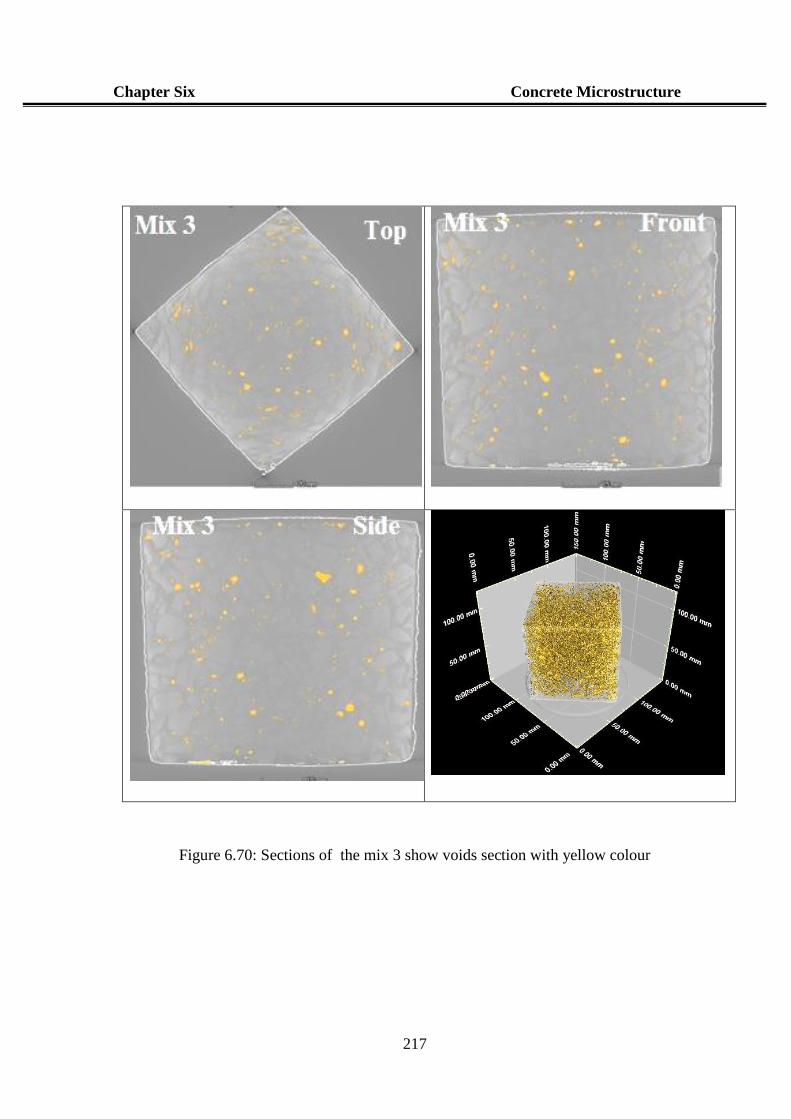
Chapter Six Concrete Microstructure
217
Figure 6.70: Sections of the mix 3 show voids section with yellow colour
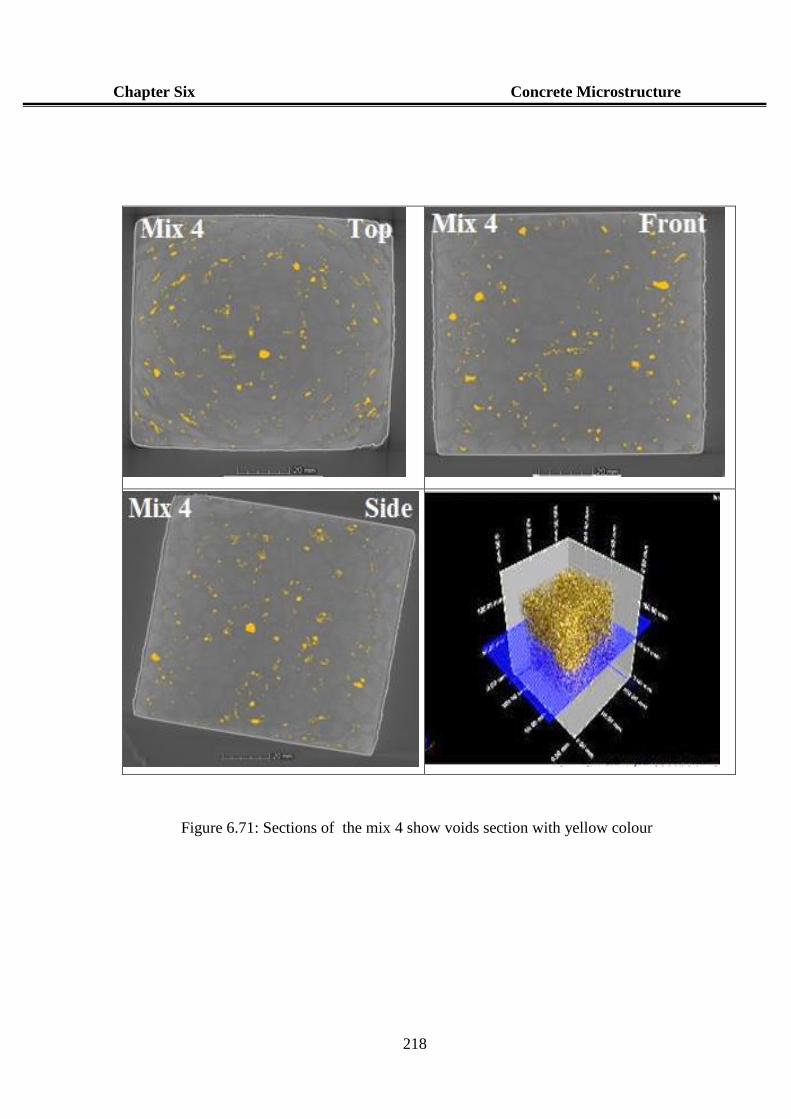
Chapter Six Concrete Microstructure
218
Figure 6.71: Sections of the mix 4 show voids section with yellow colour
Chapter Six Concrete Microstructure
219
6.5 Summary of the microstructure properties
The following summary can be drawn from the test results of the concrete microstructure
properties using SEM and CT scan techniques: -
SEM technologies provides qualitative and quantitative description of the concrete
properties. The visually analysis of presented SEM image proves that the concrete
modified by both of metakaolin and two types of polymers have a significant change in
the pores structure of concrete compared with other mixes.
The results of SEM observed that the amount of CSH gel is increased and the Ca(OH)2
content in the Mix 2 and Mix 3 is reduced as shown in the EDX analyse compared with
the Mix 4 and (control concrete) Mix 1. The results show that increase of the amount of
Si and Al in Mix 3, and increase amount of Ca and O in Mix 1.
The metakaolin replacing with some of cement is not only environmental benefits but
also beneficial for the improvement of microstructure and the increase of mechanical
strength and improves the durability properties of concrete compared with control
concrete.
The pozzolanic action of the metakaolin and film formed by polymers contributed to
refinement the voids size and distribution and reduced its connectivity as observed in
CT scan results as compared with the control concrete.
The results show that the voids in modified concrete by partial replacement of cement
by 15% metakaolin and addition of 4% SBR and 1% PVA are seem to be more circular
than irregular shape as shown in the other mixes (Mix 1, Mix 2 and Mix 4) leading to
reduce the surface area and reduce the opportunity to be more interconnected with each
other, leads to reduction in the porosity of the concrete. This improvement in the
concrete microstructure provides the enhancement in mechanical and durability
properties of concrete.
SEM and CT scanner results show that the approach can be effectively applied in
concrete related studies and provide further evidence on mechanical and durability
properties.

CHAPTER SEVEN
DISCUSSION THE RESULTS
Chapter Seven Discussion the Results
220
CHAPTER SEVEN
DISCUSSION THE RESULTS
7.1 General
Partial replacement of cement by metakaolin and addition of polymers produce concrete
with considerably higher strengths and improved durability properties. This improvement is
attributed to many factors which relating to the reaction of the metakaolin component and
the polymerization of polymer into pores network inside the concrete structure (Ohama,
1995). Properties of the modified concrete varies with use different additives materials and
mix proportions. For that, a trial mixes have been done to optimise the metakaolin, polymer,
W/C ratios and curing condition for the modified concrete. The following finding
summarized the main results of the first stage of the study: -
Metakaolin accelerated initial and final setting time of cement paste. It is decreased
with increased metakaolin level due to the finer particle size of the metakaolin, which
results in a much larger surface area available for reaction and thus a faster rate of
hydration and setting (Justice, 2005). While, the polymer delayed the setting time
due to the overlay of the polymer film over the cement grains, which restricts access
of the water to the cement at the early age of cement hydration process as mentioned
by Atkins et al. (1991).
Slump values of fresh concrete decrease with increased level of metakaolin content
due to the filler effect of metakaolin and the early hydration of cement with the
metakaolin components according to Siddique and Khan (2011). While the polymers
improved the workability of the fresh concrete mix due to the lubricating system of
polymer that improves the fluidity of the fresh concrete mix (Bothra and Ghugal,
2015).
Increase the level of metakaolin in concrete mixtures increased water demand to
complete cement hydration processes and decreased the workability of fresh
concrete mixes. For that, polymer was required for modified concrete by metakaolin
to achieve the target slump to make the fresh concrete workable and easy to mixing
and compacting.
Chapter Seven Discussion the Results
221
Modified concrete by partial replacement of cement by 15% metakaolin and addition
5% polymer with W/C of 0.45 show easy handling, placing and more compaction, a
similar and slump value as that of the control mix around 80±3 mm.
The amount of polymer added to each mix was in direct proportion to the amount of
replacement of metakaolin up to 5% in order to offset the increased water demand,
improved concrete workability and enhance the effect of metakaolin on the setting
time of the cement paste, as the polymer acts as a retarder for the setting time.
Optimum W/C ratio of the modified concrete is 0.45 and the moist curing is the best
curing method for the modified concrete by metakaolin and polymers.
Partial replacement of cement by metakaolin improves the concrete strength with
increase the metakaolin level up to 15% then decrease up to 40%, while the polymer
improves the concrete strength up to 5% the decrease up to 7.5%.
Polymer modified concrete by 4% styrene butadiene rubber (SBR): and 1%
Polyvinyl acetate (PVA) show the highest compressive strength compared with the
control concrete with W/C of 0.45.
The mechanical properties (compressive, splitting and flexural strength) of the
modified concrete made with 15% partial replacement of cement by metakaolin and
adding 5% of the polymer (80% styrene butadiene rubber and 20% Polyvinyl acetate)
were highest than those of the control concrete and the other mixes modified by
metakaolin and polymer separately.
Water absorption reduces remarkably with increased P/C and MK/C percent
compared with the control concrete.
From the experimental trial mixes results obtained can be sum up that the optimum mix
proportions of the modified concrete are 15% partial replacement of cement by metakaolin,
adding of 5% polymer (80% SBR and 20% PVA), 0.45 of W/C ratio and 5% of fibre by
weight of cement. These mixes used to study the mechanical properties, durability properties
and the microstructure of the pores system of concrete for the long time up to 545 days in
the second phase of the study.
Chapter Seven Discussion the Results
222
7.2 Results of the mechanical and durability Properties
At the second stage, mechanical, durability properties have been tested for age up to 545
days. The test results of concrete trail mixes gained at the first stage were taken into account.
The following summary can be drawn from the test results of the concrete durability
properties: -
Partial replacement of cement by 15% metakaolin show significant improvement in
the compressive strength after 28 days compared with control strength up to 545
days.
Partial replacement of cement by 15% metakaolin and adding of 5% (4 % SBR and
1% PVA) bi-polymer into concrete show significant improvement in splitting and
flexural strength compared with conventional strength up to 180 days.
Modified concrete by metakaolin and polymer show improvement in the
deformation properties by reduces the drying shrinkage with the time and increase
the modulus of elasticity compared with the control concrete.
Partial replacement of cement by 15% metakaolin and addition of 5% polymer shows
the highest reduction of drying shrinkage and mass loss with the time due to the
restriction of the drying shrinkage mitigates the surface cracks and reduce the mass
loss due to drying with the time compared with the control concrete.
Modified concrete can increase both the early and the latter concrete strength
compared with those of the control concrete. This enhancement in strength can be
attributed to the filler effect of metakaolin, and the pozzolanic reaction of metakaolin
with the by-products of cement hydration process such as calcium hydroxide (CH).
In addition, the formation of polymer film that could be, fill in most of the pores
system in concrete. These modified concrete mixtures have gained significant
importance because of the requirements of environmental protection and sustainable
construction in the future.
Partial replacement of cement by 15% metakaolin and adding of 5% polymers into
concrete mixtures has gained significant improvement in chemical resistance.
Concrete modified by partial replacement of cement by metakaolin and addition
polymer improve certain chemical resistance of concrete individually
Modified concrete by metakaolin and polymer reduce the water absorption, rate of
water absorption by reduce the capillary and porosity properties of concrete.
Chapter Seven Discussion the Results
223
The results show a significant reduction in the depth of carbonation penetration,
chloride ion penetration and water penetration under pressure of the concrete with
the time and the modified concrete by 15% metakaolin and 5% polymer observed
the highest reduction compared with control concrete.
The results show a reduction in water permeability, gas penetration on modified
concrete by 15% metakaolin and 5% polymers compared with the control concrete.
The modified concrete showed the lower weight loss and lower rate of corrosion
compared with the control concrete.
7.3 Results of the microstructure properties
The following summary can be drawn from the test results of the concrete microstructure
properties using SEM and CT scan techniques: -
SEM technologies provides qualitative and quantitative description of the concrete
properties. The visually analysis of presented SEM image proves that the concrete
modified by both of metakaolin and two types of polymers have a significant change
in the pores structure of concrete compared with other mixes.
The results of SEM observed that partial replacement of cement by 15% metakaolin
in the Mix 2 and Mix 3 increased the amount of CSH gel and reduced the Ca(OH)2
content as shown in the EDX analyse compared with the others mixes (Mix 1 and
Mix 4). The results show that increase of the amount of Si and Al in Mix 3, and
increase amount of Ca and O in Mix 1.
The partial replacement of cement by metakaolin is not only has an environmental
advantage but also beneficial for the improvement of microstructure and the increase
of mechanical strength and improves the durability properties of concrete.
The pozzolanic action of the metakaolin and film formed by polymers contributed to
refinement the voids size and distribution and reduced its connectivity as observed
in CT scan results in compared with the control concrete.
The results show that the voids in modified concrete by partial replacement of
cement by 15% metakaolin and addition of 4% SBR and 1% PVA are seem to be
more circular than irregular shape as shown in the other mixes leading to reduce the
surface area and reduce the opportunity to be more interconnected with each other,
leads to reduction in the porosity of the concrete. This improvement in the concrete
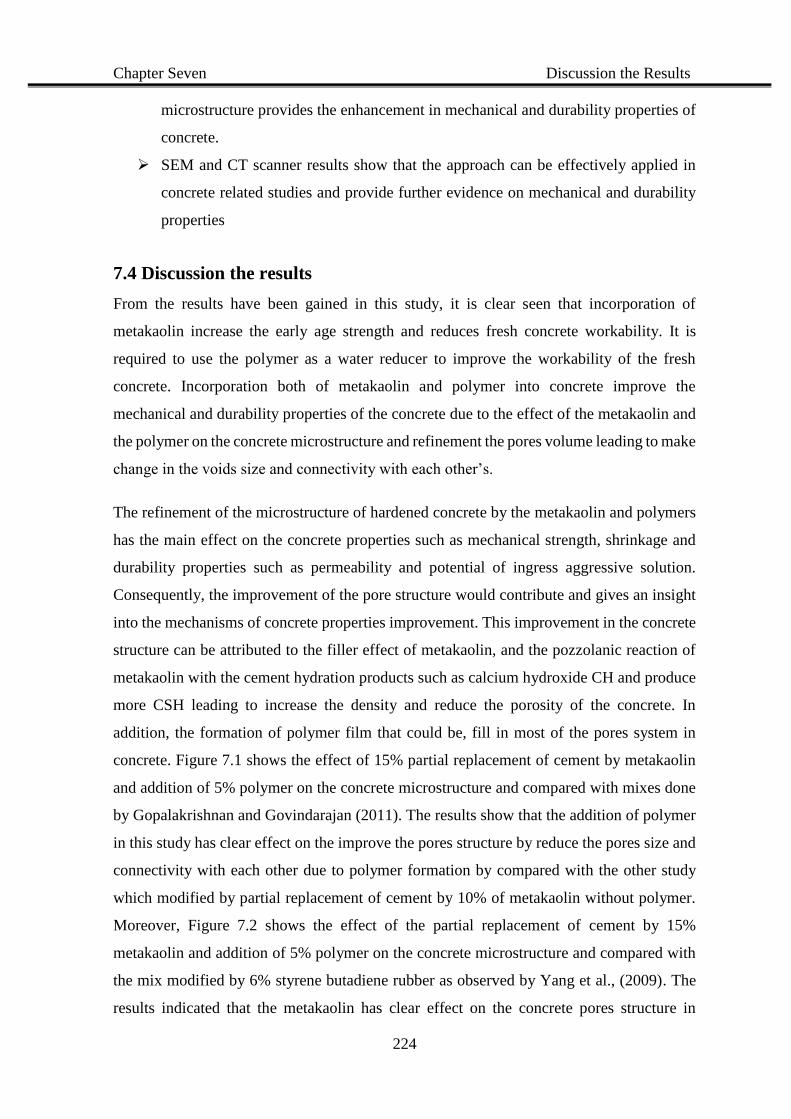
Chapter Seven Discussion the Results
224
microstructure provides the enhancement in mechanical and durability properties of
concrete.
SEM and CT scanner results show that the approach can be effectively applied in
concrete related studies and provide further evidence on mechanical and durability
properties
7.4 Discussion the results
From the results have been gained in this study, it is clear seen that incorporation of
metakaolin increase the early age strength and reduces fresh concrete workability. It is
required to use the polymer as a water reducer to improve the workability of the fresh
concrete. Incorporation both of metakaolin and polymer into concrete improve the
mechanical and durability properties of the concrete due to the effect of the metakaolin and
the polymer on the concrete microstructure and refinement the pores volume leading to make
change in the voids size and connectivity with each other’s.
The refinement of the microstructure of hardened concrete by the metakaolin and polymers
has the main effect on the concrete properties such as mechanical strength, shrinkage and
durability properties such as permeability and potential of ingress aggressive solution.
Consequently, the improvement of the pore structure would contribute and gives an insight
into the mechanisms of concrete properties improvement. This improvement in the concrete
structure can be attributed to the filler effect of metakaolin, and the pozzolanic reaction of
metakaolin with the cement hydration products such as calcium hydroxide CH and produce
more CSH leading to increase the density and reduce the porosity of the concrete. In
addition, the formation of polymer film that could be, fill in most of the pores system in
concrete. Figure 7.1 shows the effect of 15% partial replacement of cement by metakaolin
and addition of 5% polymer on the concrete microstructure and compared with mixes done
by Gopalakrishnan and Govindarajan (2011). The results show that the addition of polymer
in this study has clear effect on the improve the pores structure by reduce the pores size and
connectivity with each other due to polymer formation by compared with the other study
which modified by partial replacement of cement by 10% of metakaolin without polymer.
Moreover, Figure 7.2 shows the effect of the partial replacement of cement by 15%
metakaolin and addition of 5% polymer on the concrete microstructure and compared with
the mix modified by 6% styrene butadiene rubber as observed by Yang et al., (2009). The
results indicated that the metakaolin has clear effect on the concrete pores structure in
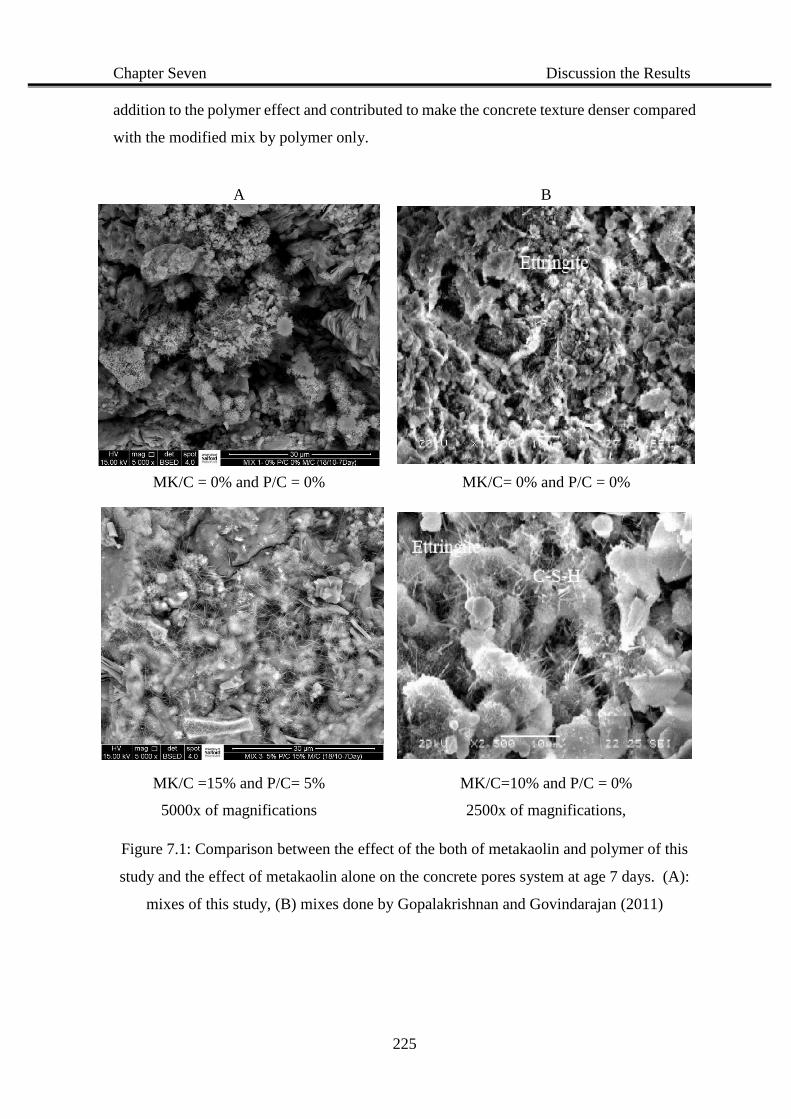
Chapter Seven Discussion the Results
225
addition to the polymer effect and contributed to make the concrete texture denser compared
with the modified mix by polymer only.
Figure 7.1: Comparison between the effect of the both of metakaolin and polymer of this
study and the effect of metakaolin alone on the concrete pores system at age 7 days. (A):
mixes of this study, (B) mixes done by Gopalakrishnan and Govindarajan (2011)
A B
MK/C = 0% and P/C = 0% MK/C= 0% and P/C = 0%
MK/C =15% and P/C= 5% MK/C=10% and P/C = 0%
5000x of magnifications 2500x of magnifications,
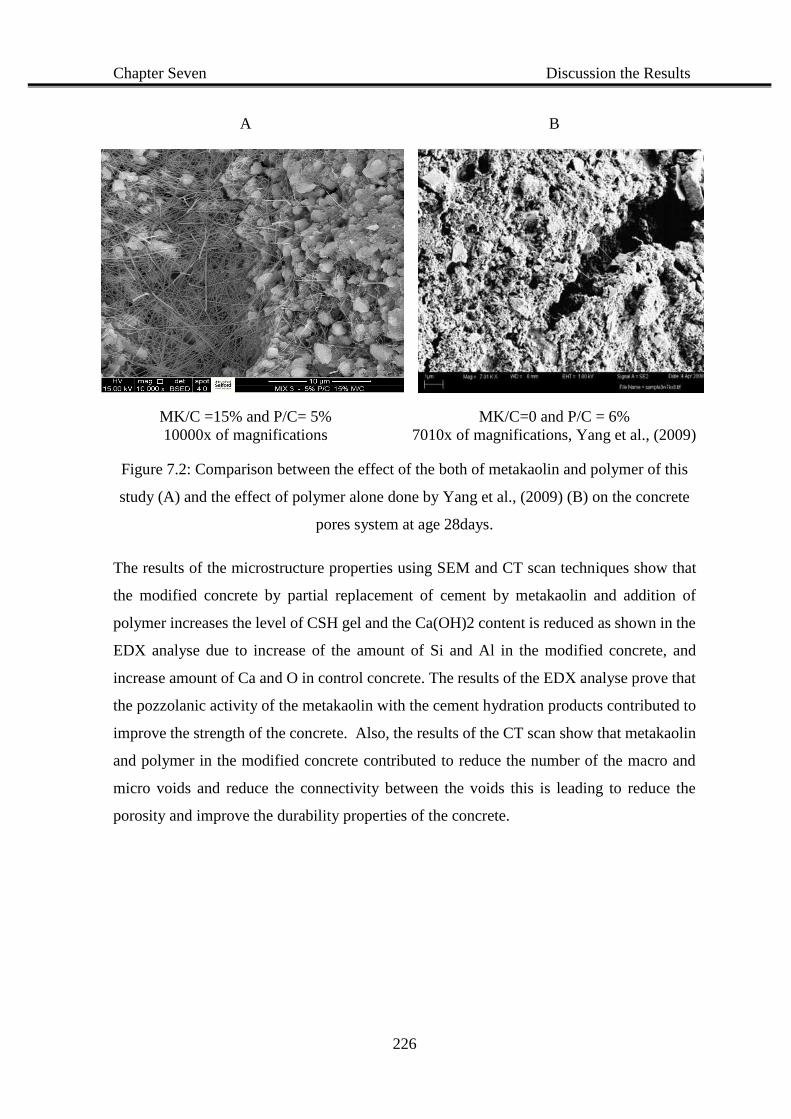
Chapter Seven Discussion the Results
226
Figure 7.2: Comparison between the effect of the both of metakaolin and polymer of this
study (A) and the effect of polymer alone done by Yang et al., (2009) (B) on the concrete
pores system at age 28days.
The results of the microstructure properties using SEM and CT scan techniques show that
the modified concrete by partial replacement of cement by metakaolin and addition of
polymer increases the level of CSH gel and the Ca(OH)2 content is reduced as shown in the
EDX analyse due to increase of the amount of Si and Al in the modified concrete, and
increase amount of Ca and O in control concrete. The results of the EDX analyse prove that
the pozzolanic activity of the metakaolin with the cement hydration products contributed to
improve the strength of the concrete. Also, the results of the CT scan show that metakaolin
and polymer in the modified concrete contributed to reduce the number of the macro and
micro voids and reduce the connectivity between the voids this is leading to reduce the
porosity and improve the durability properties of the concrete.
A B
MK/C =15% and P/C= 5% MK/C=0 and P/C = 6%
10000x of magnifications 7010x of magnifications, Yang et al., (2009)

CHAPTER EIGHT
CONCLUSION
AND RECOMMENDATIONS
Chapter Eight Conclusion and Recommendations
227
CHAPTER EIGHT
CONCLUSION AND RECOMMENDATIONS
8.1 Conclusion
This research has conducted an initial work to develop an environmental friendly concrete
mix for the expected strength and durability properties and produce high-performance
concrete, which are in high demand by concrete structures served in highly aggressive
conditions, such sewage treatment plants, and Marine ports. This type of applications
requires concrete of a very low permeability, and high mechanical strength. this study aims
to investigate experimentally properties of the concrete modified by using both of partial
replacement of cement by metakaolin and addition of polymers together covering the most
important characteristics of the concrete for long term. In addition, this study aiming to
produce high-performance concrete appropriate for the applications, which are subject to
aggressive conditions, particularly in hydraulic concrete structures such as dams and sewage
treatment plants. Furthermore, produce concrete more environmental friendly by reduce
CO2 emissions in the meantime of property improvement for concrete when using
metakaolin as the cement substitute in a modest quantity.
The main goal of the current study is to investigate sustainable approaches to enhance the
properties of concrete. It investigates the effect of the partial replacement of cement using
metakaolin and addition of styrene-butadiene rubber (SBR) and polyvinyl acetate (PVA) as
a water reducer, and the use of fibre to improve the tension strength on the performance of
concrete The research programme is investigated experimentally the mechanical properties
for short time by made trial mixtures to find the optimum proportions of the additives to
concrete, water to cement ratio and curing conditions. The planned experimental studies
included the following tests: -
1. Setting time test
2. Slump test
3. Mechanical proprieties tests
Chapter Eight Conclusion and Recommendations
228
a- Compressive strength
b- Splitting strength
c- Flexural strength
4. Water absorption test
The following are the main conclusions that can be drawn from the experimental trail mix
program: -
Metakaolin accelerates the initial and final setting time of cement paste. It is
decreased with increased metakaolin level.
Polymer delays the setting time. It is increased with increased polymer level for both
types of polymer styrene-butadiene rubber and polyvinyl acetate.
Slump values of the fresh concrete decrease with increased level of metakaolin
content. While the polymers decrease the slump values and improved the workability
of the concrete mix.
The increases the level of metakaolin in concrete mixtures increases water demand
to complete cement hydration processes and decreased the workability of concrete
mixes.
The amount of polymer added to each mix was in direct proportion to the amount of
replacement of metakaolin up to 5% in order to offset the increased water demand,
improved concrete workability and enhance the effect of metakaolin on the setting
time of the cement paste, as the polymer acts as a retarder for the setting time.
Optimum W/C ratio of the modified concrete is 0.45, moist curing is the best curing
method for the modified concrete.
The mechanical properties (compressive, splitting and flexural strength) of the
modified concrete made with 15% partial replacement of cement by metakaolin and
adding 5% of the polymer were higher than those of the control concrete at 28 days.
Water absorption reduces remarkably with increased polymer to cement ratio and
metakaolin to cement ratio.
The addition 5% of fibres such as glass fibre and plastic fibre improve both of the
splitting and flexural strength of the concrete.
The optimum mix proportions of the modified concrete are 15% partial replacement
of cement by metakaolin, adding of 5% polymer (4% SBR and 1% PVA), 0.45 of
W/C ratio and 5% of fibre by weight of cement. These mixes used to study the
Chapter Eight Conclusion and Recommendations
229
mechanical properties, durability properties and the microstructure of the pores
system of concrete for the long time up to 545 days in the second phase of the study.
In the second stage of the work, the optimum mixture identified in the trial study was further
investigated for its mechanical, deformable, durability and microstructure properties of the
concrete at prolonged ages up to 545 days, including the following tests: -
1. Mechanical properties including: -
a- Compressive strength up to 545 days
b- Splitting strength up to 180 days
c- Flexural strength up to 180 days
2. Deformation properties including: -
a- Stress-strain curve
b- Drying shrinkage
3. Durability properties including: -
a- Chemical resistance
b- Water absorption
c- Rate of water absorption
d- Depth of Carbonation
e- Depth of chloride penetration
f- Water permeability
g- Depth of water penetration
h- Depth of gas penetration
i- Rate of steel reinforcement corrosion
4. Microstructure properties including: -
a- Scanning electron microscopy (SEM)
b- Energy Dispersive X-Rays (EDX)
c- SEM image Processing
d- Computed tomography (CT) scan
Chapter Eight Conclusion and Recommendations
230
The major conclusions of the second stage can be summarised in the following: -
Partial replacement of cement by 15% metakaolin and adding of 5% (4% SBR and
1% PVA) bi-polymer into concrete show significant improvement the compressive
strength up to 545 days compared with the control concrete.
Partial replacement of 15% metakaolin by cement shows highest improvement in the
compressive after 28 days up to 545 days compared with the other mixes.
Mix with addition of 5% polymer improves the compressive strength at 28 days and
then it seems to be same as the compressive strength of the control concrete up to
545 days.
Partial replacement of metakaolin by cement and addition of polymers improve both
of the splitting and flexural strength for all the mixes compared with conventional
concrete up to 180 days.
Using both of metakaolin and polymer or separately in concrete reduce and restricted
the drying shrinkage of the concrete.
Significant improvement in durability properties of concrete including increases the
chemical resistance of concrete and steel reinforcement corrosion resistance with
incorporation of 5% polymers and partial replacement of 15% metakaolin by cement.
Significant reduction in water absorption, rate of water absorption, depth of
carbonation, depth of chloride ion penetration, water penetration under pressure,
water permeability, gas penetration with incorporation of 5% polymers and partial
replacement of 15% metakaolin by cement.
and was achieved by the optimum mix of 15% partial replacement of cement by
metakaolin and 5% polymer.
SEM and CT scan technologies provides qualitative and quantitative description of
the concrete properties. The visually analysis of presented SEM image and 3D
analyses of CT scan prove that the concrete modified by both of metakaolin and two
types of polymers have a significant change in the pores structure of concrete
compared with other mixes.
The results of SEM observed that the amount of CSH gel is increased and the
calcium hydroxide content is reduced as shown in the EDX analyse. The results show
that increase of the amount of Si and Al in Mix 3, and increase amount of Ca and O
in control mix.
Chapter Eight Conclusion and Recommendations
231
The pozzolanic action of the metakaolin and film formed by polymers contributed to
refinement the voids size and distribution and reduced its connectivity as observed
in CT scan results.
The results show that the voids in modified concrete by partial replacement of
cement by 15% metakaolin and addition of 4% SBR and 1% PVA are seem to be
more circular than irregular shape as shown in the other mixes leading to reduce the
surface area and reduce the opportunity to be more interconnected with each other
and reduce porosity.
This enhancement in mechanical strength, durability properties and refinement of
the pores structure can be attributed to the filler effect of metakaolin, gained high
early strength due to the pozzolanic reaction of metakaolin with the by-products of
cement hydration process such as calcium hydroxide (CH). In addition to, the
formation of polymer film that could be, fill of most of the pores system in concrete.
This modified concrete mixture has gained significant importance because of the
requirements of environmental protection and sustainable construction in the future.
In summary, this research conducted a novel work to investigate the combined effect of
metakaolin and polymer on high performance concrete properties. It has obtained the
expected results that planed at start.
8.2 Recommendations and future works
Further studies can be carried out on: -
Studying the effect of the optimum proportion of modified concrete (15% metakaolin
and 5% polymers) have used in this study on the lightweight concrete properties.
Studying the effect of using of 15% metakaolin and 5% polymer on the bending
deflection of the reinforced concrete members.
Studying the effect of another types of polymers as a water reducer for the concrete
modified by metakaolin such as epoxy, polyacrylic ester (PAE) and polvstyrene-
Acrylic ester (SAE) on the mechanical and durability properties of the concrete.
Studying the effect of the 15% partial replacement of metakaolin and 5% of polymers
on the crack width of the plain and reinforced concrete.
Chapter Eight Conclusion and Recommendations
232
8.3 Industry applications
Using both of metakaolin, polymer on the cement mortar as a binder material
between the new and the old concrete for repairing application such as to repair the
damaged concrete in the sewerage treatment plants.
Using 15% of the metakaolin and 5% of the polymer and 5% fibres to reduce the
crack width on the concrete surface for the applications such as water storage tanks,
dam, infrastructures, offshore structures and marine concrete structure.
Using the modified concrete and mortar by 15% partial replacement of cement by
metakaolin and addition of 5% polymers to repairing of the concrete bridge decks
and finishing and repairing the damaged concrete on the highway road.
Traditionally in the United Kingdom the construction industry uses the department
of environment method (DOE) for mix design (Teychenne, D, 1997). This method
facilitates cement replacement material into concrete mixes by weight. While, in the
United States of America uses the ACI code for mix design (ACI 318-2008). This
method facilitates cement replacement material into concrete mixes by volume. This
research investigates the replacement of material by weight of cement and integral
to the United Kingdom practices and DOE method. Therefore, any Engineer wishing
to use the United States method need to change the mix proportions of this study
from weight to volume in order to integrate the ACI code Method.
References
233
References
ACI Committee 548: (1986), Guide for use of polymer in concrete,. Vol. 83. No.5, pp.798-
829
ACI Committee, American Concrete Institute and International Organization for
Standardization, 2008. Building code requirements for structural concrete (ACI 318-
08) and commentary. American Concrete Institute.
Afridi, M., Ohama, Y., Demura, K., and Iqbal, M. (2003). Development of polymer films
by the coalescence of polymer particles in powdered and aqueous polymer-modified
mortars. Cement and Concrete Research, 33(11), 1715-1721.
Afroughsabet, V., and Ozbakkaloglu, T. (2015). Mechanical and durability properties of
high-strength concrete containing steel and polypropylene fibers. Construction and
Building Materials, 94, 73-82.
Aggarwal, L., Thapliyal, P., and Karade, S. (2007). Properties of polymer-modified mortars
using epoxy and acrylic emulsions. Construction and Building Materials, 21(2), 379-
383. doi: 10.1016/j.conbuildmat.2005.08.007
Ahmad, A., and Kumar, A. (2013). Chloride ion migration/diffusion through concrete and
test methods. International Journal of Advanced Scientific and Technical Research,
6(3), 151-180.
Ahmed, S. (2011). Mechanical and durability properties of mortars modified with combined
polymer and supplementary cementitious materials. Journal of Materials in Civil
Engineering, 23(9), 1311-1319.
Ahmed, S. A., Hawraa, S. J., and Inas, S. M. (2012). Improvement the Properties of Cement
Mortar by Using Styrene Butadiene Rubber Polymer. Journal of Engineering and
Aiswarya, S., Prince Arulraj, G., and Dilip, C. (2013). A review on use of metakaolin in
concrete. IRACST – Engineering Science and Technology, 3(3).
Aitcin, P. C. (2011). High performance concrete. CRC press.
Al-Akhras, N. M. (2006). Durability of metakaolin concrete to sulfate attack. Cement and
concrete research, 36(9), 1727-1734.
References
234
Alhozaimy, A. M., Soroushian, P., and Mirza, F., and Compos, C. C. (1996 ). Mechanical
properties of reinforced concrete and materials polypropylene fiber the effects of
pozzolanic. Cement and concrete composites, 18, 85-92.
Al-Nu'man, B. S., and Al-Hadithi, A. I. (2009). Flexural Behaviour of Polymer Modified
Reinforced Concrete Beams. Journal of Engineering and Development,, 13(1), 89-
110.
Al Menhosh, A. (2000). An experimental study on poroperties of polymermodified concrete
using (Epoxy -novolac)resin. (MSc), University of Basrah, Iraq.
Al Menhosh, A., Wang, Y., and Wang, Y. (2016). An experimental study of the concrete
using polymer and metakaolin as additives. Paper presented at the SCMT4, Las
Vegas, USA.
Al Menhosh, A., Wang, Y., and Wang, Y. (2016). The mechanical properties of the concrete
using metakaolin additive and polymer admixture. Journal of Engineering, 2016, 1-
6.
Al Zahrani, M. M., Maslehuddin, M., Al Dulaijan, S. U., and Ibrahim, M. (2003).
Mechanical properties and durability characteristics of polymer- and cement-based
repair materials. Cement and Concrete Composites, 25(4-5), 527-537. doi:
10.1016/s0958-9465(02)00092-6
Aliabdo, A. A., and Abd_Elmoaty, A. M. (2012). Experimental investigation on the
properties of polymer modified SCC. Construction and Building Materials, 34, 584-
592. doi: 10.1016/j.conbuildmat.2012.02.067
Almeida, A. E., and Sichieri, E. P. (2006). Mineralogical study of polymer modified mortar
with silica fume. Construction and Building Materials, 20(10), 882-887.
Almeida, A. E., and Sichieri, E. P. (2006). Thermogravimetric analyses and mineralogical
study of polymer modified mortar with silica fume. Materials research, 9(3), 321-
326.
Almeida, A. E., and Sichieri, E. P. (2007). Experimental study on polymer-modified mortars
with silica fume applied to fix porcelain tile. Building and environment,, 42(7), 2645-
2650.
References
235
Alonso, S., and Palomo, A. (2001). Alkaline activation of metakaolin and calcium hydroxide
mixtures: influence of temperature, activator concentration and solids ratio.
Materials Letters, 47(1), 55-62.
Ambroise, J., Maximilien, S., and Pera, J. (1994). Properties of metakaolin blended cements.
Advanced Cement Based Materials, 1(4), 161-168.
Andera, B., Hooton, R. D., and Gruber, K. A. (2001). Long-term testing of the chloride-
penetration resistance of concrete containing high-reactivity metakaolin. Cement
and concrete research, 31, 759-765.
Antoni, M., Rossen, J., Martirena, F., and Scrivener, K. (2012). Cement substitution by a
combination of metakaolin and limestone. Cement and Concrete Research, 42(12),
1579-1589. doi: 10.1016/j.cemconres.2012.09.006
Anupama, P. S., Nazeer, M., Nizad, A., and Suresh, S. (2011). Strength studies on
metakaolin modified cement mortar with quarry dust as fine aggregate. ACEE Int. J.
on Civil and Environmental Engineering, 1(1), 1-5.
Aquino, C., Inoue, M., Miura, H., Mizuta, M., and Okamoto, T. (2010). The effects of
limestone aggregate on concrete properties. Construction and Building Materials,
24(12), 2363-2368. doi: 10.1016/j.conbuildmat.2010.05.008
Arooj, M. F., Haydar, S., and Ahmad, K. (2011). Development of economical polymer-
modified concrete for repair of concrete structures in pakistan. Pakistan Journal of
Engineering and Applied Sciences., 8.
ASTM, C 618. (2003).Standard specification for fly ash and raw or calcined natural
pozzolan for use as a mineral Admixture in Portland Cement Concrete.
ASTM, C1585.(2004): Standard Test Method for Measurement of Rate of Absorption of
Water by Hydraulic Cement Concretes.
Atkins, K. M., Edmonds, R. N., and Majumdar, A. J. (1991). The hydration of portland and
aluminous cements with added polymer dispersions. JOURNAL OF MATERIALS
SCIENCE, 26, 2372-2378.
Ayub, T., Khan, S. U., and Memon, F. A. (2014). Mechanical characteristics of hardened
concrete with different mineral admixtures: a review. ScientificWorldJournal, 2014,
875082. doi: 10.1155/2014/875082
References
236
Badogiannis, E., and Tsivilis, S. (2009). Exploitation of poor Greek kaolins: Durability of
metakaolin concrete. Cement and Concrete Composites, 31(2), 128-133. doi:
10.1016/j.cemconcomp.2008.11.001
Bai, J., and Gailius, A. (2009). Consistency of fly ash and Metakaolin concrete. Journal of
Civil Engineering and Management, 15(2), 131-135. doi: 10.3846/1392-
3730.2009.15.131-135
Bapat, J. D. (2012). Mineral admixtures in cement and concrete.: CRC Press.
Barbuta, M., Harja, M., and Baran, I. (2009). Comparison of mechanical properties for
polymer concrete with different types of filler. Journal of Materials in Civil
Engineering, 22(7), 696-701.
Barluenga, G., and Hernández-Olivares, F. (2004). SBR latex modified mortar rheology and
mechanical behaviour. Cement and Concrete Research, 34(3), 527-535. doi:
10.1016/j.cemconres.2003.09.006
Batis, G., Pantazopoulou, P., Tsivilis, S., and Badogiannis, E. (2005). The effect of
metakaolin on the corrosion behavior of cement mortars. Cement and Concrete
Composites, 27(1), 125-130. doi: 10.1016/j.cemconcomp.2004.02.041
Beeldens, A., Van Gemert, D., Schorn, H., Ohama, Y., and Czarnecki, L. (2005). From
microstructure to macrostructure: an integrated model of structure formation in
polymer-modified concrete. Materials and structures, 38(6), 601-607.
Beulah, M. A., and Prahallada, M. C. (2012). Effect of replacement of cement by metakalion
on the properties of high performance concrete subjected to hydrochloric acid attack.
International Journal of Engineering Research and Applications, 2.
Bhikshma, V., Rao, K. J., and Balaji, B. (2010). An experimental study on behavior of
polymer cement concrete. Asian journal of civil engineering (building and housing),
11(5), 563-573.
Bich, C., Ambroise, J., and Pera, J. (2009). Influence of degree of dehydroxylation on the
pozzolanic activity of metakaolin. Applied Clay Science, 44(3), 194-200.
Bolton, W. (1998). Engineering materials technology (2 ed.). Great Britain: Oxford :
Butterworth-Heinemann Newnes.
References
237
Bothra, S. R., and Ghugal, Y. M. (2015). POLYMER-MODIFIED CONCRETE: REVIEW.
IJRET: International Journal of Research in Engineering and Technology, 4(4),
845-848.
Bredy, P., Chabannet, M., and Pera, J. (1989). Microstructural and porosity of metakaolin
blended cements. Paper presented at the In MRS Proceedings Cambridge University
Press.
BS EN 12350-2: (2009) : Testing fresh concrete. Slump-test, BSI: London
BS EN 12390–2: (2009) : Making and curing specimens for strength tests. BSI: London
BS EN 12390-3: (2009) : Compressive strength of test specimens. BSI: London
BS EN 12390-5: (2009): Testing hardened concrete: Flexural strength of test specimens,
BSI: London
BS EN 12390- 6:(2009):Testing hardened concrete: Tensile splitting strength of test
specimens, BSI: London
BS EN 12390 – 8: (2009) : Depth of penetration of water under pressure. BSI: London
BS EN 196-3: (2005): Determination of setting times and soundness. BSI: London
BS EN 197-1: (2000). Cement: composition, specifications and conformity criteria for
common cements. British Standards Institution, London.
BS ISO 1920-8:2009: Testing of concrete. Determination of the drying shrinkage of concrete
for samples prepared in the field or in the laboratory, BSI: London
BS 1881 Part -121: (1983): Method for determination of static modulus of elasticity in
compression, BSI: London
BS 1881 -122 : (2011): Testing concrete. Method for determination of water absorption,
BSI: London
BS 1881 – 125 : (2013): Testing concrete. Methods for mixing and sampling fresh concrete
in the laboratory View details, BSI: London
BS 1881 -210 : (2013) : Determination of the potential carbonation resistance ofconcrete –
Accelerated carbonation method. . BSI: London
BS 882: (1992): Specification for aggregates from natural sources for concrete, BSI:
London
British Standard EN 197-1. (2000). Cement: composition, specifications and conformity
criteria for common cements. British Standards Institution, London.
British Standard EN 197-1. (2011). Cement: composition, specifications and conformity
criteria for common cements. British Standards Institution, London.
References
238
Buyukozturk, O., and Lau, D. (2004). High Performance Concrete: Fundamentals and
Application. Department of Civil and Environmental Engineering, Massachusetts
Institute of Technology, Cambridge.
Cabrera, G. (1996). Deterioration of concrete due to reinforcement steel corrosion. Cement
and Concrete Composites, 18(1), 47-59.
Chadbourn, G. A. (1997). chloride resistance and durability of cement paste and concrete
containing metakaolin. (Doctor of philosophy), Aston.
Chakraborty, A. K., Dutta, S. C., Sen, P., and Ray, I. (2000). Improved performance of silica
fume modified mortar due to addition of polymer emulsions. Journal of Polymer
Materials, 17(1), 53-62.
Chandramouli, K., Srinivasa Rao, P., Pannirselvam, N., Seshadri Sekhar, T., and Sravana,
P. (2010). Strength properties of glass fiber concrete. ARPN journal of Engineering
and Applied sciences,, 5(4), 1-6.
Chang, C. F., and Chen, J. W. (2006). The experimental investigation of concrete
carbonation depth. Cement and Concrete Research, 36(9), 1760-1767. doi:
10.1016/j.cemconres.2004.07.025
Chindaprasirt, P., Rukzon, S., and Sirivivatnanon, V. (2008). Effect of carbon dioxide on
chloride penetration and chloride ion diffusion coefficient of blended Portland
cement mortar. Construction and Building Materials, 22(8), 1701-1707.
Chung, D. (2000). Corrosion control of steel-reinforced concrete. Journal of Materials
Engineering and Performance, 9(5), 585-588.
Corral, H. R., Arredondo Rea, S. P., Flores, N., Gómez Soberón, J. M. V., Almeraya
Calderón, F., Castorena González, J. H., et al. (2011). Sulfate attack and
reinforcement corrosion in concrete with recycled concrete aggregates and
supplementary cementing materials. International journal of electrochemical
science, 6, 613-621.
Costa, A., and Appleton, J. (2001). concrete carbonation and chloride penetretion in marine
environment. Concrete science and engineering, 3(12), 242-249.

References
239
Courard, L., Darimont, A., Schouterden, M., Ferauche, F., Willem, X., and Degeimbre, R.
(2003). Durability of mortars modified with metakaolin. Cement and Concrete
Research, 33(9), 1473-1479. doi: 10.1016/s0008-8846(03)00090-5
Dara, S., and Umare, S. (2010). Textbook Of Engineering Chemistry (2nd Ed.): S. Chand.
De Silva, P. S., and Glasser, F. P. (1993). Phase relations in the system CaO.Al2O3.SiO2H2O
relevant to metakaolin-calcium hydroxide hydration. Cement and concrete research,
23(3), 627-639.
Dhir, R. K., and Dyer, T. D. (1999). Modern concrete materials: Binders, additions and
admixtures. Paper presented at the proceedings of the international conference held
at the University of Dundee, Scotland, UK on 8-10 September 1999.
Diamond, S. (2004a). The microstructure of cement paste and concrete––a visual primer.
Cement and Concrete Composites, 26(8), 919-933. doi:
10.1016/j.cemconcomp.2004.02.028
Diamond, S. (2004b). Special issue on scanning electron microscopy of cements and
concretes. Cement and Concrete Composites, 26(8), 917-918. doi:
10.1016/j.cemconcomp.2004.02.027
Dinakar, P., Sahoo, P. K., and Sriram, G. (2013). Effect of Metakaolin Content on the
Properties of High Strength Concrete. International Journal of Concrete Structures
and Materials, 7(3), 215-223. doi: 10.1007/s40069-013-0045-0
Ding, J. T., and Li, Z. (2002). Effects of metakaolin and silica fume on properties of
concrete. ACI Materials Journal, 99(4), 393-398.
Do, J., and Soh, Y. (2003). Performance of polymer-modified self-leveling mortars with
high polymer–cement ratio for floor finishing. Cement and Concrete Research,
33(10), 1497-1505. doi: 10.1016/s0008-8846(02)01057-8
Du Plessis, A., Olawuyi, B. J., Boshoff, W. P., and Le Roux, S. G. (2016). Simple and fast
porosity analysis of concrete using X-ray computed tomography. Materials and
structures, 49(1-2), 553-562.
Duan, P., Shui, Z., Chen, W., and Shen, C. (2013). Effects of metakaolin, silica fume and
slag on pore structure, interfacial transition zone and compressive strength of
concrete. Construction and Building Materials, 44, 1-6.
References
240
Duan, P., Shui, Z., Chen, W., and Shen, C. (2013). Efficiency of mineral admixtures in
concrete: microstructure, compressive strength and stability of hydrate phases.
Applied Clay Science, 83(115-121).
Duchesne, J., and Be, M. A. (1995). Effect of supplementary cementing materials on the
composition of cement hydration products. Advanced Cement Based Materials, 2(2),
43-52.
Ebewele, R. O. (2000). Polymer science and technology (Vol. 1). Boca Raton, FL: CRC
press.
Edmonds, R. N., and Majumdar, A. J. (1989). The hydration of an aluminous cement with
added polyvinyl alcohol-acetate. Journal of materials science, 24(11), 3813-3818.
Essa, M. S., Abdul–Amir, A. M., and Hassan, N. F. (2012). Effect of Adding (SBR) on
Concrete Properties and Bond Between Old and New Concrete. Kufa journal of
Engineering, 4(1).
Feng, X., Garboczi, E. J., Bentz, D. P., Stutzman, P. E., and Mason, T. O. (2004). Estimation
of the degree of hydration of blended cement pastes by a scanning electron
microscope point-counting procedure. Cement and Concrete Research, 34(10),
1787-1793. doi: 10.1016/j.cemconres.2004.01.014
Fowler, D. W. (1983). Polymers in Concrete. Handbook of Structural Concrete. Evan
Cohen, USA, 1-30.
Fowler, D. W. (1999). Polymers in concrete: a vision for the 21st century. Cement and
concrete composites, 21(5), 449-452.
Fowler, D. W. (2003). Polymers in concrete: where have we been and where are we going?
Special Publication, 214, 111-118.
Gao, J. M., Qian, C. X., Wang, B., and Morino, K. (2002). Experimental study on properties
of polymer-modified cement mortars with silica fume. Cement and Concrete
Research, 32(1), 41-45.
Geist, J. M., Amagna, S. V., and Mellor, B. B. (1953). Improved portland cement mortars
with polyvinyl acetate emulsions. Industrial and engineering chemistry, 45(4), 759-
767.
References
241
Ghosh, P. (2002). Polymer science and technology Plastic, rubbers, Blends and Composites
(2nd ed.). NEWDELHI: Tata McGraw-HillPublishing company Limited.
Giustozzi, F. (2016). Polymer-modified pervious concrete for durable and sustainable
transportation infrastructures. Construction and Building Materials, 111, 502-512.
doi: 10.1016/j.conbuildmat.2016.02.136
Gopalakrishnan, R., and Govindarajan, D. (2011). Compressive strength and scanning
electron microscopy studies on metakaolin admixtured cement. Macromolecules An
Indian Journal, 7(1), 13-15.
Gruber, K. A., Ramlochan, T., Boddy, A., Hooton, R. D., and Thomas, M. D. A. (2001).
Increasing concrete durability with high-reactivity metakaolin. Cement and concrete
composites, 23(6), 479-484.
Guneyisi, E., Gesoglu, M., Karaoglu, S., and Mermerdas, K. (2012). Strength, permeability
and shrinkage cracking of silica fume and metakaolin concretes. Construction and
Building Materials, 34, 120-130.
Güneyisi, E., Gesoğlu, M., and Mermerdaş, K. (2008). Improving strength, drying
shrinkage, and pore structure of concrete using metakaolin. Materials and structures,
41(5), 937-949.
Habert, G. (2013). Environmental impact of Portland cement production Eco-efficient
concrete (pp. 3-25): Woodhead Publishing.
Halliwell, S. (2002). Polymers in building and construction (Vol. 154): iSmithers Rapra
Publishing.
He, C., Osbaeck, B., and Makovicky, E. (1995). Pozzolanic reactions of six principal clay
minerals: activation, reactivity assessments and technological effects. Cement and
Concrete Research, 25(8), 1691-1702.
Hossain, M. M., Karim, M. R., Hasan, M., Hossain, M. K., and Zain, M. F. M. (2016).
Durability of mortar and concrete made up of pozzolans as a partial replacement of
cement: A review. Construction and Building Materials, 116, 128-140. doi:
10.1016/j.conbuildmat.2016.04.147
References
242
Huang, B., Wu, H., Shu, X., and Burdette, E. G. (2010). Laboratory evaluation of
permeability and strength of polymer-modified pervious concrete. Construction and
Building Materials, 24(5), 818-823. doi: 10.1016/j.conbuildmat.2009.10.025
Islam, M. A., Rahman, M. M., and Ahmed, M. (2011). Polymer-modified concrete: world
experience and potential for Bangladesh. THE INDIAN CONCRETE JOURNAL, 1,
55-63.
Ismail, Z. Z., and Al-Hashmi, E. A. (2011). Assessing the recycling potential of industrial
wastewater to replace fresh water in concrete mixes: application of polyvinyl acetate
resin wastewater. Journal of Cleaner Production, 19(2), 197-203. doi:
10.1016/j.jclepro.2010.09.011
Jamshidi, M., Pakravan, H. R., and Pourkhorshidi, A. R. (2014). Application of polymer
admixtures to modify concrete properties: Effects of polymer type and content. Asian
journal of civil engineering (bhrc), 15(5), 779-787.
Jiang, C., Zhou, X., Huang, S., and Chen, D. (2017). Influence of polyacrylic ester and silica
fume on the mechanical properties of mortar for repair application. Advances in
Mechanical Engineering, 9(1), 1-10.
John, L. R., Proops, M. F., and Wagenhals, G. (2012). Reducing CO2 Emissions: A
Comparative Input-Output-Study for Germany and the UK: Springer Science &
Business Media.
Justice, J. M. (2005). Evaluation of metakaolins for use as supplementary cementitious
materials. (Master), Georgia Institute of Technology.
Justice, J. M., Kennison, L. H., Mohr, B. J., Beckwith, S. L., McCormick, L. E., Wiggins,
B., et al. (2005). Comparison of Two Metakaolins and a Silica Fume Used as
Supplementary Cementitious Materials. Paper presented at the Proc. Seventh
International Symposium on Utilization of High-Strength/High Performance
Concrete, Washington D.C.
Kakali, G., Perraki, T. H., Tsivilis, S., and Badogiannis, E. (2001). Thermal treatment of
kaolin: the effect of mineralogy on the pozzolanic activity. Applied Clay Science,
20(1), 73-80.

References
243
Kameche, Z. A., Ghomari, F., Choinska, M., and Khelidj, A. (2014). Assessment of liquid
water and gas permeabilities of partially saturated ordinary concrete. Construction
and Building Materials, 65, 551-565. doi: 10.1016/j.conbuildmat.2014.04.137
Kannan, V., and Ganesan, K. (2014). Chloride and chemical resistance of self compacting
concrete containing rice husk ash and metakaolin. Construction and Building
Materials, 51, 225-234. doi: 10.1016/j.conbuildmat.2013.10.050
Karahan, O., and Atiş, C. D. (2011). The durability properties of polypropylene fiber
reinforced fly ash concrete. Materials & Design, 32(2), 1044-1049.
Kene, K. S., Vairagade, V. S., and Sathawane, S. (2012). Experimental study on behavior
of steel and glass fiber reinforced concrete composites. Bonfring international
journal of industrial engineering and management science, 2(4), 125.
Kerur, V. S., and Patil, U. P. (2015). Effect of Styrene Butadiene Rubber Latex Polymer on
the Compressive and Tensile Strength of Concrete Containing one or two
Admixtures. International Research Journal of Engineering and Technology
(IRJET), 2(4), 1568-1572.
Khan, S., and Deulkar, V. (2016). Effect of polymer on modified concrete in rigid pavement
construction. International Journal of Latest Trends in Engineering and Technology,
7(4), 130-136.
Khatib, J. M. (2008). Metakaolin concrete at a low water to binder ratio. Construction and
Building Materials, 22(8), 1691-1700.
Khatib, J. M., and Clay, R. M. (2004). Absorption characteristics of metakaolin concrete.
Cement and Concrete Research, 34(1), 19-29. doi: 10.1016/s0008-8846(03)00188-
1
Khatib, J. M., Negim, E. M., and Gjonbalaj, E. (2012). High Volume Metakaolin as Cement
Replacement in Mortar. World journal of chemistry, 7(1), 7-10. doi:
10.5829/idosi.wjc.2012.7.1.251
Khatib, J. M., Negim, E. M., Yeligbayeva, G. Z., and Mun, G. A. (2014). Strength
characteristics of mortar containing high volume metakaolin as cement replacement.
Research and Reviews in Materials Science and Chemistry, 3(1), 85-95.
References
244
Khatib, J. M., and Wild, S. (1998). Sulphate resistance of metakaolin mortar. Cement and
concrete research, 28(1), 83-92.
Khatib, J. M., and Wild, S. (1996). Pore size distribution of metakaolin paste. Cement and
Concrete Research, 26(10), 1545-1553.
Kim, H. S., Lee, S. H., and Moon, H. Y. (2007). Strength properties and durability aspects
of high strength concrete using Korean metakaolin. Construction and Building
Materials, 21(6), 1229-1237. doi: 10.1016/j.conbuildmat.2006.05.007
Kim, K. Y., Yun, T. S., and Park, K. P. (2013). Evaluation of pore structures and cracking
in cement paste exposed to elevated temperatures by X-ray computed tomography.
Cement and Concrete Research, 50, 34-40.
Klimesch, D. S., and Ray, A. (1998). Autoclaved cement-quartz pastes with metakaolin
additions. Advanced Cement Based Materials, 7(3), 109-118.
Konar, B. B., Das, A., Gupta, P. K., and Saha, M. (2011). Physicochemical Characteristics
of Styrene-Butadiene Latex- modified Mortar Composite vis-à-vis Preferential
Interactions. Journal of Macromolecular Science, Part A, 48(9), 757-765. doi:
10.1080/10601325.2011.596072
Kumar, B. S. C., Varanasi, V. K., and Saha, P. (2012). Sustainable development using
supplementary cementitious materials and recycled aggregate. International Journal
of Modern Engineering Research (IJMER), 2(1), 165-171.
Kuzielova, E., Zemlicka, M., Bartonickova, E., and Palou, M. T. (2017). The correlation
between porosity and mechanical properties of multicomponent systems consisting
of Portland cement–slag–silica fume–metakaolin. Construction and Building
Materials, 135, 306-314. doi: 10.1016/j.conbuildmat.2016.12.105
Larbi, J. A., and Bijen, J. M. J. M. (1990). Interaction of polymers with Portland cement
during hydration: a study of the chemistry of the pore solution of polymer-modified
cement systems. cement and concrete research, 20(1), 139-147.
Lewis, W. J., and Lewis, G. (1990). The influence of polymer latex modifiers on the
properties of concrete. Composites, 21(6), 487-494.
References
245
Lho, B. C., Joo, M. K., Choi, K. H., and Choi, J. Y. (2012). Effects of polymer-binder ratio
and slag content on strength properties of autoclaved polymer-modified concrete.
KSCE Journal of Civil Engineering, 16(5), 803-808.
Li, X., Xu, Q., and Chen, S. (2016). An experimental and numerical study on water
permeability of concrete. Construction and Building Materials, 105, 503-510. doi:
10.1016/j.conbuildmat.2015.12.184
Loosveldt, H., Lafhaj, Z., and Skoczylas, F. (2002). Experimental study of gas and liquid
permeability of a mortar. cement and concrete research, 32(9), 1357-1363.
Lothenbach, B., Scrivener, K., and Hooton, R. D. (2011). Supplementary cementitious
materials. Cement and Concrete Research, 41(12), 1244-1256. doi:
10.1016/j.cemconres.2010.12.001
Lu, S., Landis, E. N., and Keane, D. T. (2006). X-ray microtomographic studies of pore
structure and permeability in Portland cement concrete. Materials and structures,
39(6), 611-620.
Malhotra, V. M. (2002). Introduction: Sustainable Development and Concrete Technology.
Concrete International, 24(7).
Marinos, A. S., Katsiotis, M. S., Alhassan, S. M., Gallias, J. L., and Beazi-Katsioti, M.
(2015). An investigation of the durability of air cured concretes containing
metakaolin. International Journal of Engineering and Technical Research (IJETR),
3(8).
McCrum, N. G., Buckley, C. P., and Bucknall, C. B. (1997). Principles of polymer
engineering: Oxford University Press, USA.
Meck, E., and Sirivivatnanon, V. (2003). Field indicator of chloride penetration depth.
Cement and Concrete Research, 33(8), 1113-1117.
Mehta, P. K. (2010). Sustainable cements and concrete for the climate change era–a review.
Paper presented at the In Second international conference on sustainable
construction materials and technologies.
Meinel, D., Ehrig, K., LHostis, V., Muzeau, B., and Paetsch, O. (2014). Examination of
Damage Processes in Concrete with CT.

References
246
Miller, M. (2005). Polymers in cementitious materials. Shawbury, Shrewsbury, Shropshire,
SY4 4NR, United Kingdom: iSmithers Rapra Publishing.
Moiseas, F., and Joseph, C. (2000). Pore size distribution and degree of hydration of
metakaolin-cement pastes. Cement and Concrete Research, 30, 561-569.
Momtazi, A. S., Khoshkbijari, R. K., and Mogharab, S. S. (2015). Polymers in Concrete:
Applications and Specifications. European Online Journal of Natural and Social
Sciences, 4(3), 62.
Moser, R. D., Jayapalan, A. R., Garas, V. Y., and Kurtis, K. E. (2010). Assessment of binary
and ternary blends of metakaolin and Class C fly ash for alkali-silica reaction
mitigation in concrete. cement and concrete research, 40(12), 1664-1672.
Murthy, N. K., Rao, A. N., Reddy, M. V. S., and Pamesh, P. (2012). The influence of
metakaolin on the modulus of elasticity of concrete. IOSR Journal of Engineering,
2(11), 18-23.
Muthupriya, P., Subramanian, K., and Vishnuram, B. G. (2011). Investigation on behavior
of high performance reinforced concrete columns with metakaolin and fly ash as
admixture. International Journal of Advanced Engineering Technology
Nagrockiene, D., Pundienė, I., and Kicaite, A. (2013). The effect of cement type and
plasticizer addition on concrete properties. Construction and Building Materials, 45,
324-331. doi: 10.1016/j.conbuildmat.2013.03.076
Narmatha, M., and Felixkala, T. (2017). Analyse the Mechanical Properties of Metakaolin
Using As a Partial Replacement of Cement in Concrete. International Journal of
Advance Research, Ideas and Innovations in Technology.
Nath, P., and Sarker, P. (2011). Effect of fly ash on the durability properties of high strength
concrete. Procedia Engineering, 14, 1149-1156.
Nawy, E.G., 2001. Fundamentals of high-performance concrete. John Wiley & Sons.
Neville, A. M. (2002). Properties of concrete (4th ed. ed.). Harlow: Harlow : England.
Neville, M. A. (2011). Properties of concrete (5th ed.). 90 Tottenham Court Road. London
WIT 4LP: Licensing Agency Ltd.
Neville, M. A., and Brooks, J. (1987). Concrete technology (2 ed.). England: Pearson
education limited.
References
247
Newman, J., and Choo, B. S. (2003). Advanced concrete technology 3.
Nguyen, D. D., Devlin, L. P., Koshy, P., and Sorrell, C. C. (2016). Effects of chemical nature
of polyvinyl alcohol on early hydration of Portland cement. Journal of Thermal
Analysis and Calorimetry, 123(2), 1439-1450. doi: 10.1007/s10973-015-5076-0
Nicholas, B. W. (2012). Understanding Cement. United Kingdom: WHD Microanalysis
Consultant Ltd.
Nicholson, J. W. (2006). the chemistry of polymers (3rd. ed.): RSC publishing.
Nova, J. (2013). Strength Properties of Metakaolin Admixed Concrete. International
Journal of Scientific and Research Publications,, 3(6), 1-7.
Ohama, Y. (1982). Durability performance of polymer-modified mortars. Cement, Concrete
and Aggregates, 4(2), 94-98.
Ohama, Y. (1995). Handbook of polymer-modified concrete and mortars properties and
process technology. Park ridpe, new jersey, U.S.A.: William Andrew.
Ohama, Y. (1997). Recent progress in concrete-polymer composites. Advanced Cement
Based Materials, 5(2), 31-40.
Ohama, Y. (1998). Polymer-based Admixtures. cement and Concrete composites, 20(2-3),
189-212.
Ohama, Y., Demura, K., and Endo, T. (1993). Properties of polymer-modified mortars using
epoxy resin without hardener. In . In L. A. Kuhlmann (Ed.), Polymer-Modified
Hydraulic-Cement Mixtures. Philadelphia, PA 19103: ASTM International.
Ollitrault, R., Gauthier, C., Clamen, G., and Boch, P. (1998). Microstructural aspects in a
polymer-modified cement. Cement and Concrete Research, 28(12), 1687-1693.
Osmani, M., and Pappu, A. (2010). An assessment of the compressive strength of glass
reinforced plastic waste filled concrete for potential applications in construction.
Concrete Research Letters, 1(1), 1-5.
Ozturan, T., and Cecen, C. (1997). Effect of coarse aggregate type on mechanical properties
of concretes with different strengths. cement and concrete research, 27(2), 165-170.
Palomo, A., Blanco-Varela, M. T., Granizo, M. L., Puertas, F., Vazquez, T., and Grutzeck,
M. W. (1999). Chemical stability of cementitious materials based on metakaolin.
cement and concrete research, 29(7), 997-1004.
References
248
Palou, M. T., Kuzielová, E., Novotný, R., Šoukal, F., and Žemlička, M. (2016). Blended
cements consisting of Portland cement–slag–silica fume–metakaolin system.
Journal of Thermal Analysis and Calorimetry, 125(3), 1025-1034.
Papadakis, V. G. (2000). Effect of supplementary cementing materials on concrete
resistance against carbonation and chloride ingress. Cement and concrete research,
30, 291–299.
Papadakis, V. G., Antiohos, S., and Tsimas, S. (2002). Supplementary cementing materials
in concrete Part II: A fundamental estimation of the efficiency factor. Cement and
concrete research, 32, 1533–1538.
Papadakis, V. G., and Tsimas, S. (2002). Supplementary cementing materials in concrete:
Part I: efficiency and design. Cement and concrete research, 32(10), 1525-1532.
Papadakis, V. G., and Tsimas, S. (2005). Greek supplementary cementing materials and their
incorporation in concrete. Cement and Concrete Composites, 27(2), 223-230. doi:
10.1016/j.cemconcomp.2004.02.011
Parande, A. K., Babu, B. R., Karthik, M. A., Kumaar, K. D., and Palaniswamy, N. (2008).
Study on strength and corrosion performance for steel embedded in metakaolin
blended concrete/mortar. Construction and Building Materials, 22(3), 127-134. doi:
10.1016/j.conbuildmat.2006.10.003
Patil, S. N., Gupta, A. K., and Deshpande, S. S. (2013). Metakaolinpozzolanic material for
cement in high strength concrete. Paper presented at the In Proceedings of the 2nd
International Conference on Emerging Trends in Engineering (SICETE’13).
Poon, C. S., Lam, L., Kou, S. C., Wong, Y. L., and Wong, R. (2001). Rate of pozzolanic
reaction of metakaolin in high-performance cement pastes. Cement and concrete
research, 31(9), 1301-1306.
Prakash, B., Titiksh, A., and Qureshi, A. A. (2016). Evaluating the Performance of Polymer
Modified Concrete in terms of Structural Properties. Journal of Structural
Technology, 1(1), 1-10.
Proops, J. L., Faber, M., and Wagenhals, G. (2012). Reducing CO2 Emissions: A
Comparative Input-output-study for Germany and the UK: Springer Science &
Business Media.

References
249
Puerta-Falla, G., Balonis, M., Le Saout, G., Neithalath, N., and Sant, G. (2015). The
Influence of Metakaolin on Limestone Reactivity in Cementitious Materials. Paper
presented at the In Calcined Clays for Sustainable Concrete.
Qian, X., and Li, Z. (2001). The relationships between stress and strain for high-performance
concrete with metakaolin. Cement and concrete research, 31(11), 1607-1611.
Radhakrishnan, R., Prakash, V. S., Thampan, C. K., and Varma, P. (2012). Performance-of-
Styrene-Butadiene-Rubber-as-a-Concrete-Repair-Material-in-tropical-climate.
International Journal of Advancements in Research & Technology
1(6).
Rajamma, R., Labrincha, J. A., and Ferreira, V. M. (2012). Alkali activation of biomass fly
ash–metakaolin blends. Fuel, 98, 265-271. doi: 10.1016/j.fuel.2012.04.006
Ramachandran, V. S. (1996). Concrete admixtures handbook: properties, science and
technology: William Andrew.
Ramakrishnan, V. (1992). Latex-modified concretes and mortars A synthesis of highway
practice (Vol. 179). Washington, D. C. : Transportation Research Board.
Ramezanianpour, A. A. (2014). Metakaolin: Springer Berlin Heidelberg.
Ramezanianpour, A. A., and Jovein, H. B. (2012). Influence of metakaolin as supplementary
cementing material on strength and durability of concretes. , 30, pp.470-479.
Construction and Building Materials, 30, 470-479.
Ramezanianpour, A. A., Esmaeili, M., Ghahari, S. A., and Najafi, M. H. (2013). Laboratory
study on the effect of polypropylene fiber on durability, and physical and mechanical
characteristic of concrete for application in sleepers. Construction and Building
Materials, 44, 411-418.
Ravikumar, C., Sreenivasa, M., Raheem, K. A., Prashanth, M., and Reddy, M. V. S. (2013).
Experimental studies on strength and durability of mortars containing pozzolonic
materials. International Journal of Advanced Structures and Geotechnical
Engineering, 2(2319-5347), 45-49.
Rossignolo, J. A. (2007). Effect of silica fume and SBR latex on the pasteaggregate
interfacial transition zone. Materials research, 10(1), 83-86.
References
250
Rossignolo, J. A. (2009). Interfacial interactions in concretes with silica fume and SBR latex.
Construction and Building Materials, 23(2), 817-821.
Rossignolo, J. A., and Agnesini, M. V. (2002). Mechanical properties of polymer-modified
lightweight aggregate concrete. Cement and Concrete Research, 32(3), 329–334.
Sabir, B. B., Wild, S., and Bai, J. (2001). Metakaolin and calcined clays as pozzolans for
concrete: a review. Cement and concrete composites, 23(6), 441-454.
Sadr, M. A., Ranjbar, M. M., Balalaei, F., and Nemati, R. (2007). The effect of Iran's
metakaolin in enhancing the concrete compressive strength. Paper presented at the
Int. Conf: Sustainable construction materials and technologies,.
Safiuddin, M., and Hearn, N. (2005). Comparison of ASTM saturation techniques for
measuring the permeable porosity of concrete. Cement and Concrete Research,
35(5), 1008-1013. doi: 10.1016/j.cemconres.2004.09.017
Sahu, S., Badger, S., Thaulow, N., and Lee, R. J. (2004). Determination of water–cement
ratio of hardened concrete by scanning electron microscopy. Cement and Concrete
Composites, 26(8), 987-992. doi: 10.1016/j.cemconcomp.2004.02.032
Sakai, E., and Sugita, J. (1995). Composite mechanism of polymer modified cement. Cement
and Concrete Research, 25(1), 127-135.
Schulze, J. (1999). Influence of water-cement ratio and cement content on the properties of
polymer-modified mortars. cement concrete research, 29(6), 909-915.
Scrivener, K. L. (1997). Microscopy methods in cement and concrete science. World Cement
Research and Development, 92-112.
Shafieyzadeh, M. (2013). Prediction of compressive strength of concretes containing silica
fume and styrene-butadiene rubber (SBR) with a mathematical model. International
Journal of Concrete Structures and Materials, 7(4), 295-301.
Shafieyzadeh, M. (2015). Prediction of Flexural Strength of Concretes Containing Silica
Fume and Styrene-Butadiene Rubber (SBR) with an Empirical Model. Journal of
The Institution of Engineers (India): Series A,, 96(4), 349-355.
Shakor, P. N., and Pimplikar, S. S. (2011). Glass fibre reinforced concrete use in
construction. International Journal of Technology and Engineering System, 2(2),
632-634.
References
251
Shekarchi, M., Bonakdar, A., Bakhshi, M., Mirdamadi, A., and Mobasher, B. (2010).
Transport properties in metakaolin blended concrete. Construction and Building
Materials, 24(11), 2217-2223.
Shelorkar, A. P., and Jadhao, P. D. (2013). Strength appraisal of high grade concrete by
using high reactive metakaolin. International Journal of Innovative Research in
Science, Engineering and Technology, 2(3), 657-663.
Shvarzman, A., Kovler, K., Grader, G. S., and Shter, G. E. (2003). The effect of
dehydroxylation/amorphization degree on pozzolanic activity of kaolinite. Cement
and concrete research, 33(3), 405-416.
Siddique, R. (2007). Waste materials and by-products in concrete: springer science and
business media.
Siddique, R., and Kadri, E. H. (2011). Effect of metakaolin and foundry sand on the near
surface characteristics of concrete. Construction and Building Materials, 25(8),
3257-3266.
Siddique, R., and Khan, M. I. (2011). Supplementary Cementing Materials (Engineering
Materials): springer.
Siddique, R., and Klaus, J. (2009). Influence of metakaolin on the properties of mortar and
concrete: A review. Applied Clay Science, 43(3-4), 392-400. doi:
10.1016/j.clay.2008.11.007
Spliethoff, H. (2010). Power generation from solid fuels: Springer Science & Business
Media.
Srinivasu, K., Krishna Sai, M. L. N., and Venkata Sairam Kumar, N. (2014). A review on
use of metakaolin in cement mortar and concrete. Paper presented at the
International Journal of Innovative Research in Science, Engineering and
Technology.
Stutzman, P. (2004). Scanning electron microscopy imaging of hydraulic cement
microstructure. Cement and Concrete Composites, 26(8), 957-966. doi:
10.1016/j.cemconcomp.2004.02.043
Su, Z., Bijen, J. M., and Larbi, J. A. (1991). Influence of polymer modification on the
hydration of portland cement. cement and concrete research, 21(4), 535-544.
References
252
Su, Z., Sujata, K., Bijen, J. M. J. M., Jennings, H. M., and Fraaij, A. L. A. (1996). The
evolution of the microstructure in styrene acrylate polymer-modified cement pastes
at the early stage of cement hydration. Advanced Cement Based Materials, 3(3-4),
87-93.
Sugiyama, T., Ritthichauy, W., and Tsuji, Y. (2008). Experimental investigation and
numerical modeling of chloride penetration and calcium dissolution in saturated
concrete. Cement and Concrete Research, 38(1), 49-67.
Suhendro, B. (2014). Toward green concrete for better sustainable environment. Procedia
Engineering, 95, 305-320.
Sun, Z., and Xu, Q. (2009). Microscopic, physical and mechanical analysis of polypropylene
fiber reinforced concrete. Materials Science and Engineering, 527(1), 198-204.
Tafraoui, A., Escadeillas, G., Lebaili, S., and Vidal, T. (2009). Metakaolin in the formulation
of UHPC. Construction and Building Materials, 23(2), 669-674.
Targana, S., Olgun, A., Erdoganb, Y., and Sevinc, V. (2002). Effects of supplementary
cementing materials on the properties of cement and concrete. Cement and concrete
research, 32, 1551–1558.
Terrence, R., Michael, T., and Karen, A. G. (2000). The effect of metakaolin on alkali-silica
reaction in concrete. cement Concrete researchers, 30, 339-344.
Teychenné, D.C., Franklin, R.E., Erntroy, H.C., Nicholls, J.C., Hobbs, D.W. and MARSH,
D., 1997. Design of normal concrete mixes.
Thomas, M. (2013). Supplementary Cementing Materials in Concrete: Tylor & Francis
Group.
Tomas, U. G. (2013). Influence of polymer fiber on strength of concrete. International
journal of advanced science and technology, 55.
Torgal, F., Jalali, S., 2011. Eco-efficient construction and building materials. Springer
Science & Business Media, London.
Triana, V., Lizarazo-Marriaga, J., and Flórez, J. O. (2013). Steel corrosion assessment by
electrochemical impedance on metakaolin blended mortars. Materials research,
16(6), 1457-1464. doi: 10.1590/s1516-14392013005000178
References
253
Tsivilis, S., Batis, G., Chaniotakis, E., Grigoriadis, G., and Theodossis, D. (2000). Properties
and behavior of limestone cement concrete and mortar. Cement and concrete
research, 30(10), 1679-1683.
Tsivilis, S., Chaniotakis, E., Badogiannis, E., Pahoulas, G., and Ilias, A. (1999). A study on
the parameters affecting the properties of Portland limestone cements. Cement and
Concrete Composites, 21(2), 107-116.
Tsivilis, S., Chaniotakis, E., Batis, G., Meletiou, C., Kasselouri, V., Kakali, G., et al. (1999).
The effect of clinker and limestone quality on the gas permeability, water absorption
and pore structure of limestone cement concrete. Cement and concrete composites,
21(2), 139-146.
Tsivilis, S., Chaniotakis, E., Kakali, G., and Batis, G. (2002). An analysis of the properties
of Portland limestone cements and concrete. Cement and concrete composites,
24(3), 371-378.
Tsivilis, S., Tsantilas, J., Kakali, G., Chaniotakis, E., and Sakellariou, A. (2003). The
permeability of Portland limestone cement concrete. Cement and Concrete
Research, 33(9), 1465-1471. doi: 10.1016/s0008-8846(03)00092-9
Tukimat, N. N. A., Sarbini, N. N., Ibrahim, I. S., Ma, C. K., and Mutusamy, K. (2017). Fresh
and Hardened State of Polymer Modified Concrete and Mortars–A Review. In
MATEC Web of Conferences, EDP Sciences., 103, 1025.
Ukrainczyk, N., and Rogina, A. (2013). Styrene–butadiene latex modified calcium
aluminate cement mortar. Cement and Concrete Composites, 41, 16-23. doi:
10.1016/j.cemconcomp.2013.04.012
Vejmelkova, E., Pavlíkova, M., Keppert, M., Keršner, Z., Rovnaníková, P., Ondráček, M.,
et al. (2010). High performance concrete with Czech metakaolin: Experimental
analysis of strength, toughness and durability characteristics. Construction and
Building Materials, 24(8), 1404-1411. doi: 10.1016/j.conbuildmat.2010.01.017
Wafa, F. F. (1990). Properties and applications of fiber reinforced concrete. Engineering
Sciences, 2(1).
Wainwright, P. J., and Rey, N. (2000). The influence of ground granulated blastfurnace slag
(GGBS) additions and time delay on the bleeding of concrete. Cement and concrete
composites, 22(4), 253-257.
References
254
Wang, R., Lackner, R., and Wang, P. M. (2011). Effect of Styrene-Butadiene Rubber Latex
on Mechanical Properties of Cementitious Materials Highlighted by Means of
Nanoindentation. Strain, 47(2), 117-126. doi: 10.1111/j.1475-1305.2008.00549.x
Wang, R., Wang, P.-M., and Li, X.-G. (2005). Physical and mechanical properties of
styrene–butadiene rubber emulsion modified cement mortars. Cement and Concrete
Research, 35(5), 900-906. doi: 10.1016/j.cemconres.2004.07.012
Wild, S., and Khatib, J. M. (1997). Portlandite consumption in metakaolin cement pastes
and mortars. Cement end Concrete Research,.
Wild, S., Khatib, J. M., and Jones, A. (1996). Relative strength, pozzolanic activity and
cement hydration in superplasticised metakaolin concrete. Cement and concrete
research, 26(10), 1537-1544.
Xiong, G., Chen, X., Li, G., and Chen, L. (2001). Sulphuric acid resistance of soluble soda
glass–polyvinyl acetate latex–modified cement mortar. cement and concrete
research, 31(1), 83-86.
Yang, Z., Shi, X., Creighton, A. T., and Peterson, M. M. (2009). Effect of styrene–butadiene
rubber latex on the chloride permeability and microstructure of Portland cement
mortar. Construction and Building Materials, 23(6), 2283-2290. doi:
10.1016/j.conbuildmat.2008.11.011
Yao, S. Y., and Ge, Y. (2012). Effect of Styrene Butadiene Rubber Latex on Mortar and
Concrete Properties. Advanced Engineering Forum, 5, 283-288. doi:
10.4028/www.scientific.net/AEF.5.283
Yasar, E., Erdogan, Y., and Kılıc, A. (2004). Effect of limestone aggregate type and water–
cement ratio on concrete strength. Materials Letters, 58(5), 772-777.
Yin, S. (2015). Development of recycled polypropylene plastic fibres to reinforce concrete.
(Doctoral), James Cook University.
Zhang, M. H., and Malhotra, V. M. (1995). Characteristics of a thermally activated alumino-
silicate pozzolanic material and its use in concrete. Cement and Concrete Research,
25(8), 1713-1725.
References
255
Zhang, P. and Li, Q.F., (2013). Effect of polypropylene fiber on durability of concrete
composite containing fly ash and silica fume. Composites Part B: Engineering,
45(1), pp.1587-1594.
Zhao, X., Tian, W., Jiang, X., and Zhang, X. (2009). Effects of vibration technology and
polyvinyl acetate emulsion on microstructure and properties of expanded
polystyrene lightweight concrete. Transactions of Tianjin University, 15(2), 145-
149. doi: 10.1007/s12209-009-0026-1
Zhimin, H., Junzhe, L., and Kangwu, Z. (2012). Influence of mineral admixtures on the short
and long-term performance of steam-cured concrete. Energy Procedia, 16(836-841).
Zongjin, L. (2011). Advanced Concrete Technology: John Wiley & Sons, Inc., Hoboken,
New Jersey, Canada.
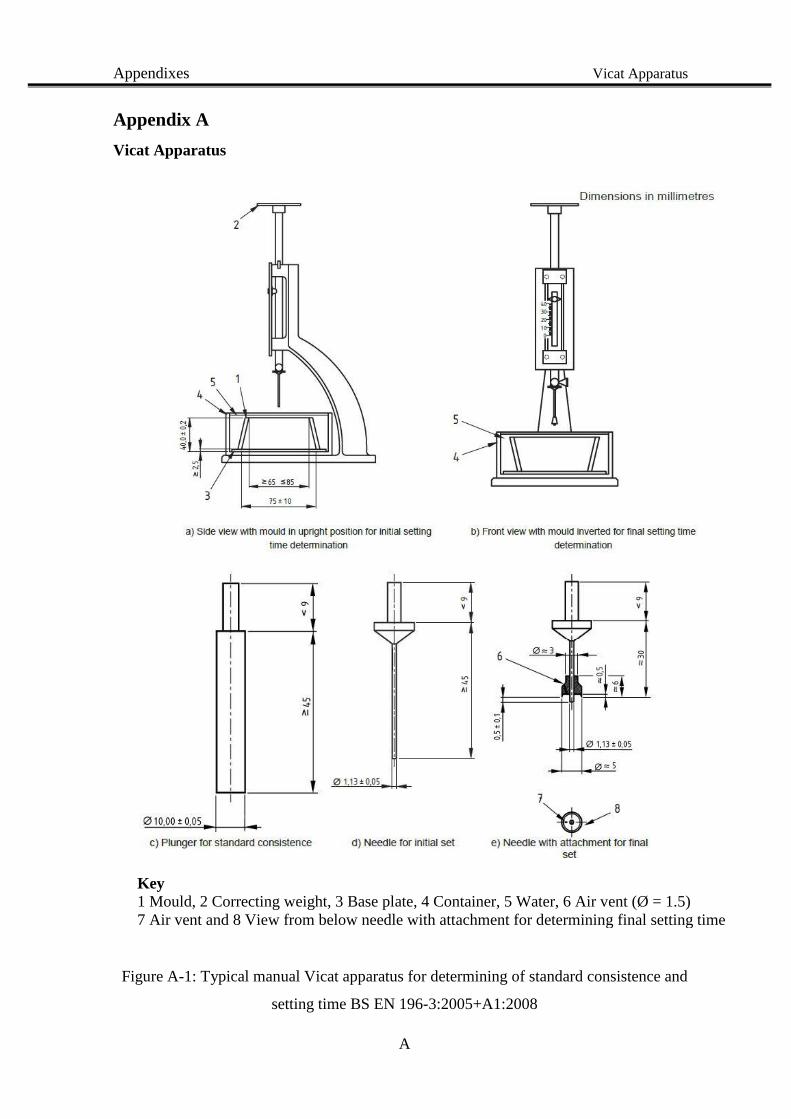
Appendixes Vicat Apparatus
A
Appendix A
Vicat Apparatus
Figure A-1: Typical manual Vicat apparatus for determining of standard consistence and
setting time BS EN 196-3:2005+A1:2008
Key
1 Mould, 2 Correcting weight, 3 Base plate, 4 Container, 5 Water, 6 Air vent (Ø = 1.5)
7 Air vent and 8 View from below needle with attachment for determining final setting time
Appendixes Vicat Apparatus
B
Determination of standard consistence:
Adjust the manual Vicat apparatus with the plunger (Figure B-1 c)), attached in advance of the test,
by lowering the plunger to rest on the base-plate to be used and adjusting the pointer or the scale to
read zero. Raise the plunger to the stand-by position. Immediately after levelling the paste, transfer
the mould and base-plate to the Vicat apparatus and position it centrally under the plunger. Lower
the plunger gently until it is in contact with the paste. Pause in that position for between 1 s and 2 s
in order to avoid initial velocity or forced acceleration of the moving parts. Then release the moving
parts quickly and allow the plunger to penetrate vertically into the centre of the paste. The release of
the plunger shall occur 4 min ± 10 s after zero time. Read the scale at least 5 s after penetration has
ceased or 30 s after the release of the plunger, whichever is the earlier.
Record the scale reading, which indicates the distance between the bottom face of the plunger and
the base-plate, together with the water content of the paste expressed as a percentage by mass of the
cement. Clean the plunger immediately after each penetration.
Repeat the test with pastes containing different water contents until one is found to produce a distance
between plunger and base-plate of (6 ± 2) mm. Record the water content of that paste to the nearest
0,5 % as the water for standard consistence.
Determination of initial setting time:
Remove the plunger and replace it by the needle (Figure B-1 d)) which shall be of steel and in the
form of a right cylinder of effective length of at least 45 mm and diameter (1,13 ± 0,05) mm. The
total mass of moving parts shall be (300 ± 1) g. Their movement shall be truly vertical and without
appreciable friction, and their axis shall coincide with that of the needle. Adjust the Vicat apparatus
with the needle (Figure B-1 d)), attached in advance of the test, by lowering the needle to rest on the
base-plate to be used, positioned inside the container, and adjusting the pointer or the scale to read
zero. Raise the needle to the stand-by position.
The time elapsed between zero time ( Time of start mix water with cement ) and the time at which
the distance between the needle and the base-plate is (6 ± 3) mm, measured to the nearest minute, is
the initial setting time of the cement.
Determination of final setting time:
Fit the needle with ring attachment of diameter approximately 5 mm (Figure B-1 e)) to facilitate
accurate observation of small penetrations. The total mass of moving parts shall be (300 ± 1) g. Their
movement shall be truly vertical and without appreciable friction, and their axis shall coincide with
that of the needle.
Appendixes Vicat Apparatus
C
Invert the filled mould used in determination of initial setting time on its base-plate so that the tests
for final set are made on the face of the specimen originally in contact with the base-plate. Immerse
the mould and base-plate in the container and store in the temperature controlled enclosure at (20,0
± 1,0) °C. After a suitable time, position the mould, base plate and container under the needle of the
Vicat apparatus. Lower the needle gently until it is in contact with the paste. Pause in that position
for between 1 s and 2 s in order to avoid initial velocity or forced acceleration of the moving parts.
Then release the moving parts quickly and allow the needle to penetrate vertically into the paste.
Read the scale when penetration has ceased, or 30 s after the release of the needle, whichever is the
earlier. Repeat the penetrations on the same specimen at conveniently spaced positions, not less than
8 mm from the rim of the mould or 5 mm from each other and at least 10 mm from the last penetration
position, at conveniently spaced intervals of time, e.g. at 30 min intervals. Between penetrations keep
the specimen in the container in the temperature controlled enclosure. Clean the Vicat needle
immediately after each penetration.
final setting time start from the elapsed time, measured from zero to that at which the needle
first penetrates only 0,5 mm into the specimen, as the final setting time of the cement, to the
nearest 15 min.
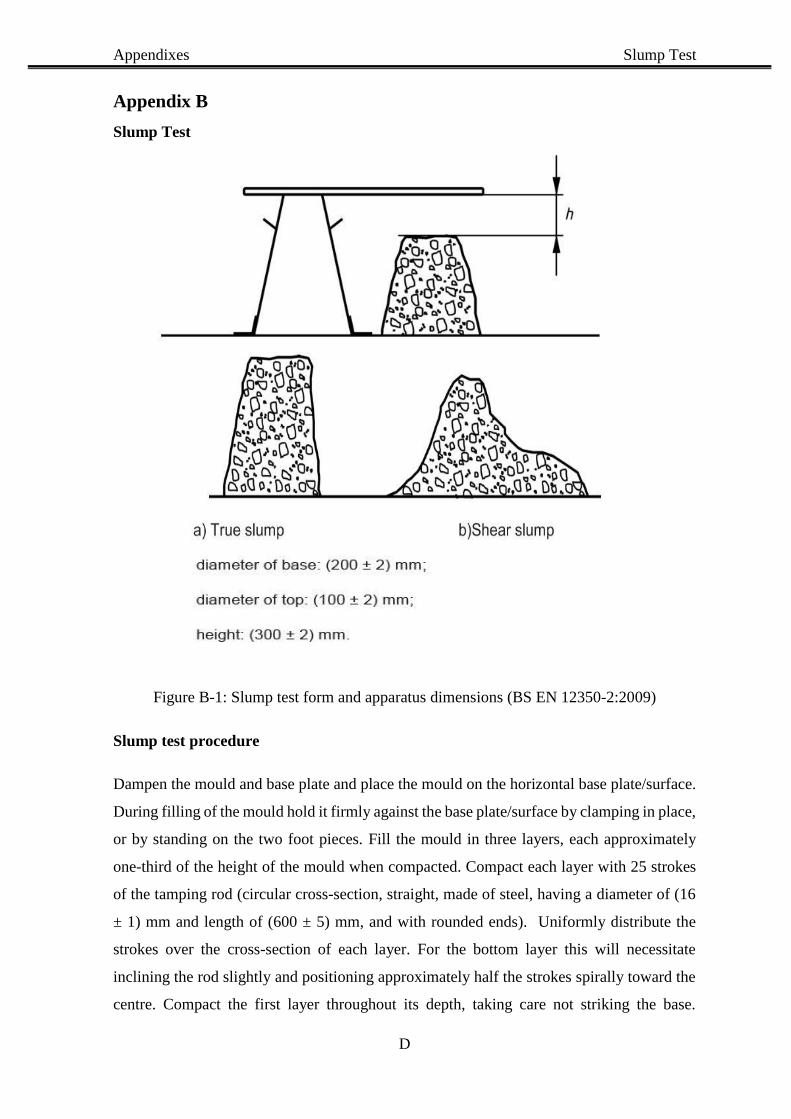
Appendixes Slump Test
D
Appendix B
Slump Test
Figure B-1: Slump test form and apparatus dimensions (BS EN 12350-2:2009)
Slump test procedure
Dampen the mould and base plate and place the mould on the horizontal base plate/surface.
During filling of the mould hold it firmly against the base plate/surface by clamping in place,
or by standing on the two foot pieces. Fill the mould in three layers, each approximately
one-third of the height of the mould when compacted. Compact each layer with 25 strokes
of the tamping rod (circular cross-section, straight, made of steel, having a diameter of (16
± 1) mm and length of (600 ± 5) mm, and with rounded ends). Uniformly distribute the
strokes over the cross-section of each layer. For the bottom layer this will necessitate
inclining the rod slightly and positioning approximately half the strokes spirally toward the
centre. Compact the first layer throughout its depth, taking care not striking the base.
Appendixes Slump Test
E
Compact the second layer and the top layer each throughout its depth, so that the strokes just
penetrate into the immediately underlying layer. In filling and compacting the top layer,
heap the concrete above the mould before tamping is started. If the tamping operation of the
top layer results in subsidence of the concrete below the top edge of the mould, add more
concrete to keep an excess above the top of the mould at all times. After the top layer has
been compacted, strike off the surface of the concrete by means of a sawing and rolling
motion of the compacting rod.
Remove spilled concrete from the base plate/surface. Remove the mould from the concrete
by raising it carefully in a vertical direction. Perform the operation of raising the mould in
2s to 5s, by a steady upward lift, with no lateral or torsional motion being imparted to the
concrete. Carry out the entire operation from the start of the filling to the removal of the
mould without interruption and complete it within 150s.
Immediately after removal of the mould, measure and record the slump h by determining
the difference between the height of the mould and that of the highest point of the slumped
test specimen as shown in Figure C-1.
Appendixes PERL-200 Device
F
Appendix C
PERL-200 Device
Definitions
1. Front Panel
Liquid Out Port
The liquid out port has a ¼ inch Prestolok fitting that allows connection of the PERL-200 to
the upstream (bottom) port of the Fancher core holder for permeability measurements.
Digital Pressure Display
Labelled upstream pressure, the display reads the sample inlet pressure in psig
Gas Regulator
The regulator allows fine-tuning of the inlet gas pressure. Maximum pressure from the
regulator is 25 psi.
Valve 1
V1 controls the flow of gas from the external regulator to the regulator of the instrument.
Recommended maximum pressure to the instrument regulator is 100 psi
Valve V2
V2 is a three-way valve that, in the flow position, directs gas pressure from the regulator to
the flow tube. In the vent position, air from the flow tube is vented during filling of the tube.
Valve V3
V3 is a three-way valve that, in the flow position, directs liquid from the flow tube to the
core sample. In the fill position, the flow of liquid is directed from the fill reservoir to the
flow tube.
Measurement Tube
The tube, located on the front of the instrument, is made of acrylic plastic. There are two
calibration marks, one at the top of the tube and one at the bottom. The tube volume between
the marks is 10 cc. When the liquid meniscus passes from the upper mark to the bottom
mark, 10 cc of liquid will have passed through the test sample (assuming that there is no air
in the system).
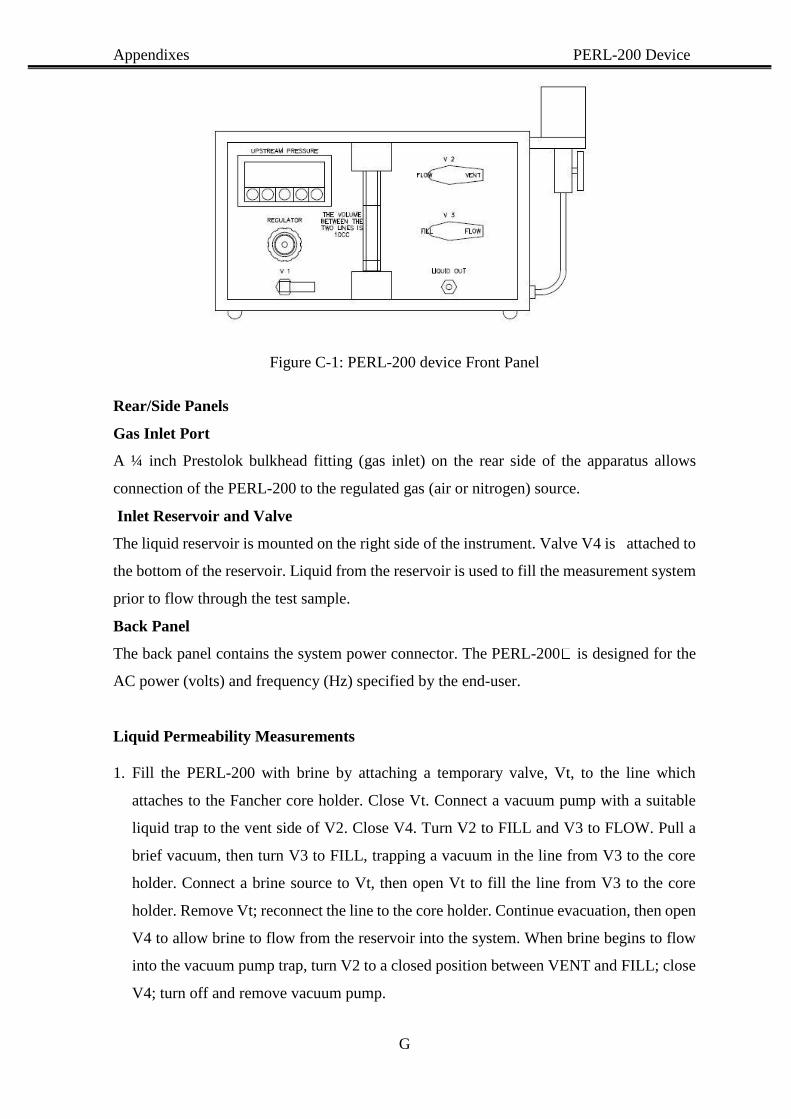
Appendixes PERL-200 Device
G
Figure C-1: PERL-200 device Front Panel
Rear/Side Panels
Gas Inlet Port
A ¼ inch Prestolok bulkhead fitting (gas inlet) on the rear side of the apparatus allows
connection of the PERL-200 to the regulated gas (air or nitrogen) source.
Inlet Reservoir and Valve
The liquid reservoir is mounted on the right side of the instrument. Valve V4 is attached to
the bottom of the reservoir. Liquid from the reservoir is used to fill the measurement system
prior to flow through the test sample.
Back Panel
The back panel contains the system power connector. The PERL-200 is designed for the
AC power (volts) and frequency (Hz) specified by the end-user.
Liquid Permeability Measurements
1. Fill the PERL-200 with brine by attaching a temporary valve, Vt, to the line which
attaches to the Fancher core holder. Close Vt. Connect a vacuum pump with a suitable
liquid trap to the vent side of V2. Close V4. Turn V2 to FILL and V3 to FLOW. Pull a
brief vacuum, then turn V3 to FILL, trapping a vacuum in the line from V3 to the core
holder. Connect a brine source to Vt, then open Vt to fill the line from V3 to the core
holder. Remove Vt; reconnect the line to the core holder. Continue evacuation, then open
V4 to allow brine to flow from the reservoir into the system. When brine begins to flow
into the vacuum pump trap, turn V2 to a closed position between VENT and FILL; close
V4; turn off and remove vacuum pump.
Appendixes PERL-200 Device
H
2. Place the saturated core plug to be evaluated in the Fancher core holder. Be sure that the
inlet port of the core holder and any space beneath the core plug are completely filled
with brine so that no air is injected into the sample.
3. The recommended sequence to prevent air in the space beneath the core plug is to fit the
plug into the stopper, then place the stopper into the receiving cylinder of the Fancher
core holder. Before placing the cylinder in the holder, invert the holder and cylinder, then
use the supplied syringe to inject brine into the gap at the end of the sample. (The fittings
must be plugged or liquid-filled lines attached.) Load the cylinder and sample into the
holder press, and tighten, then turn the press to its upright position.
4. Connect the regulated air supply to the instrument. Set the supply regulator to
approximately 25 psig. Open Valve V1 and adjust the flow pressure by rotating the handle
of the REGULATOR. (The flow pressure should be estimated from air permeability data,
if available, so that a flow rate between 1 and 6 cc/min is anticipated.) Allow the
UPSTREAM PRESSURE display to stabilize.
5. Place a suitable brine receptacle under the tubing from the core holder outlet.
6. Turn V3 and V2 to the FLOW positions.
7. Start a timer or stopwatch when the brine meniscus is at the upper calibration mark of the
measurement tube. Stop the timer when the meniscus reaches the lower calibration mark.
8. Turn V2 (and V3) to the FILL positions to stop flow through the sample.
9. Record the time required for the 10 cc of brine to pass through the sample. Record the
UPSTREAM PRESSURE during flow.
10. With V2 and V3 in the fill position, open V4 to allow the measurement tube to refill
to above the upper calibration mark to allow for pressure stabilization. Close V4. Turn
V3 to the flow position.
11. Adjust the upstream pressure, if needed, to obtain a convenient flow rate.
12. Turn V2 to the FLOW position, and repeat the measurement. (Steps 5 through 7).
13. Enter the recorded values in the spreadsheet to calculate the permeability to liquid for the
core sample.
14. Repeat the fill and flow sequence until repeatable permeability are obtained.
15. Turn V3 to the FILL position, and unload the test sample.
16. When loading subsequent samples, be sure that the inlet at the bottom of the core holder
is completely filled with brine in order to prevent injection of air into the sample.
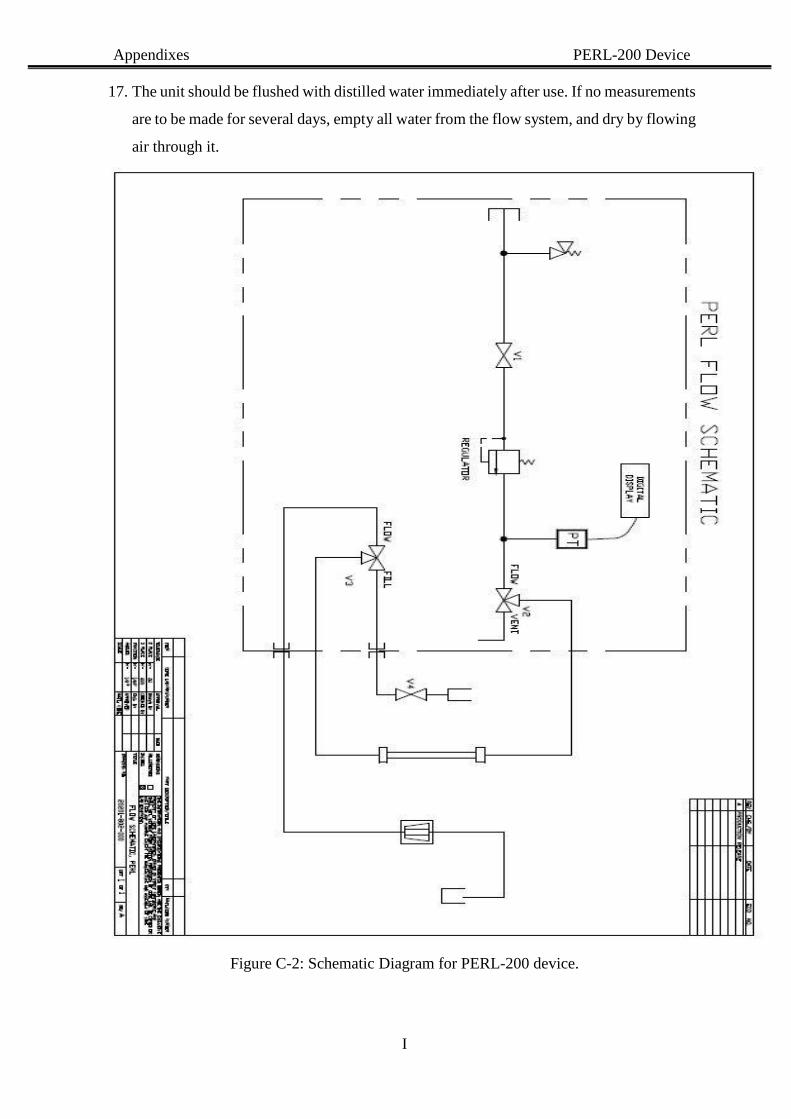
Appendixes PERL-200 Device
I
17. The unit should be flushed with distilled water immediately after use. If no measurements
are to be made for several days, empty all water from the flow system, and dry by flowing
air through it.
Figure C-2: Schematic Diagram for PERL-200 device.
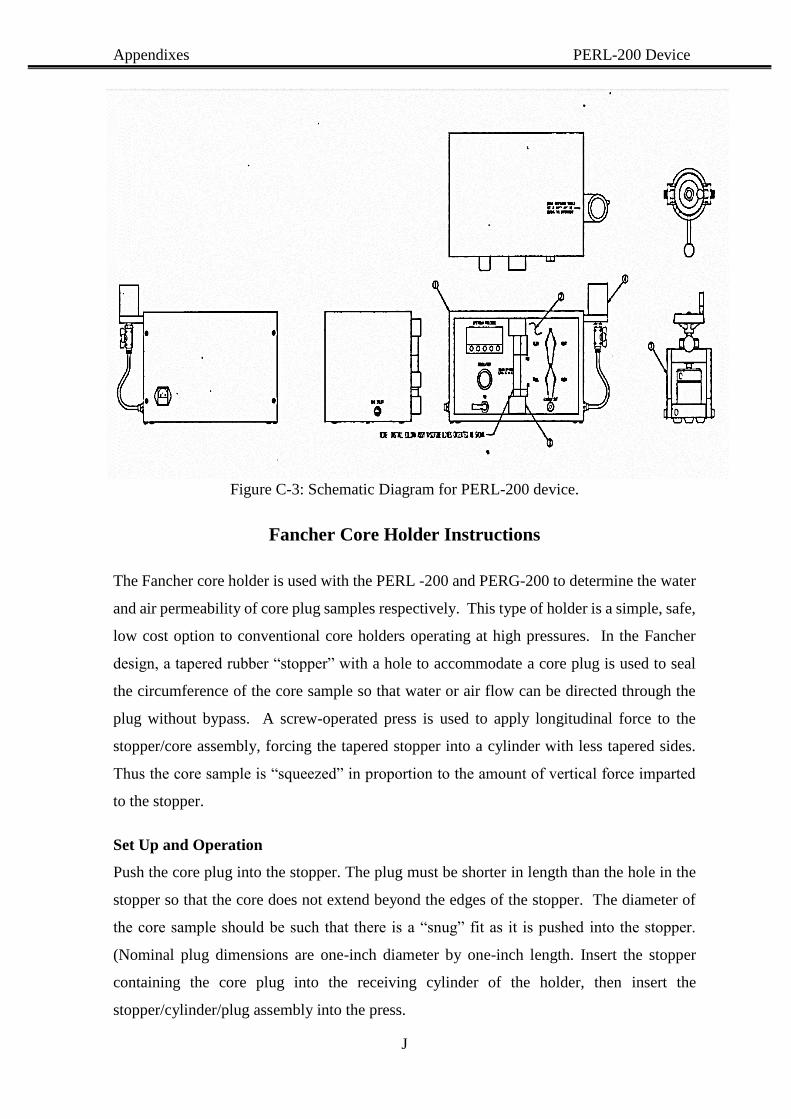
Appendixes PERL-200 Device
J
Figure C-3: Schematic Diagram for PERL-200 device.
Fancher Core Holder Instructions
The Fancher core holder is used with the PERL -200 and PERG-200 to determine the water
and air permeability of core plug samples respectively. This type of holder is a simple, safe,
low cost option to conventional core holders operating at high pressures. In the Fancher
design, a tapered rubber “stopper” with a hole to accommodate a core plug is used to seal
the circumference of the core sample so that water or air flow can be directed through the
plug without bypass. A screw-operated press is used to apply longitudinal force to the
stopper/core assembly, forcing the tapered stopper into a cylinder with less tapered sides.
Thus the core sample is “squeezed” in proportion to the amount of vertical force imparted
to the stopper.
Set Up and Operation
Push the core plug into the stopper. The plug must be shorter in length than the hole in the
stopper so that the core does not extend beyond the edges of the stopper. The diameter of
the core sample should be such that there is a “snug” fit as it is pushed into the stopper.
(Nominal plug dimensions are one-inch diameter by one-inch length. Insert the stopper
containing the core plug into the receiving cylinder of the holder, then insert the
stopper/cylinder/plug assembly into the press.
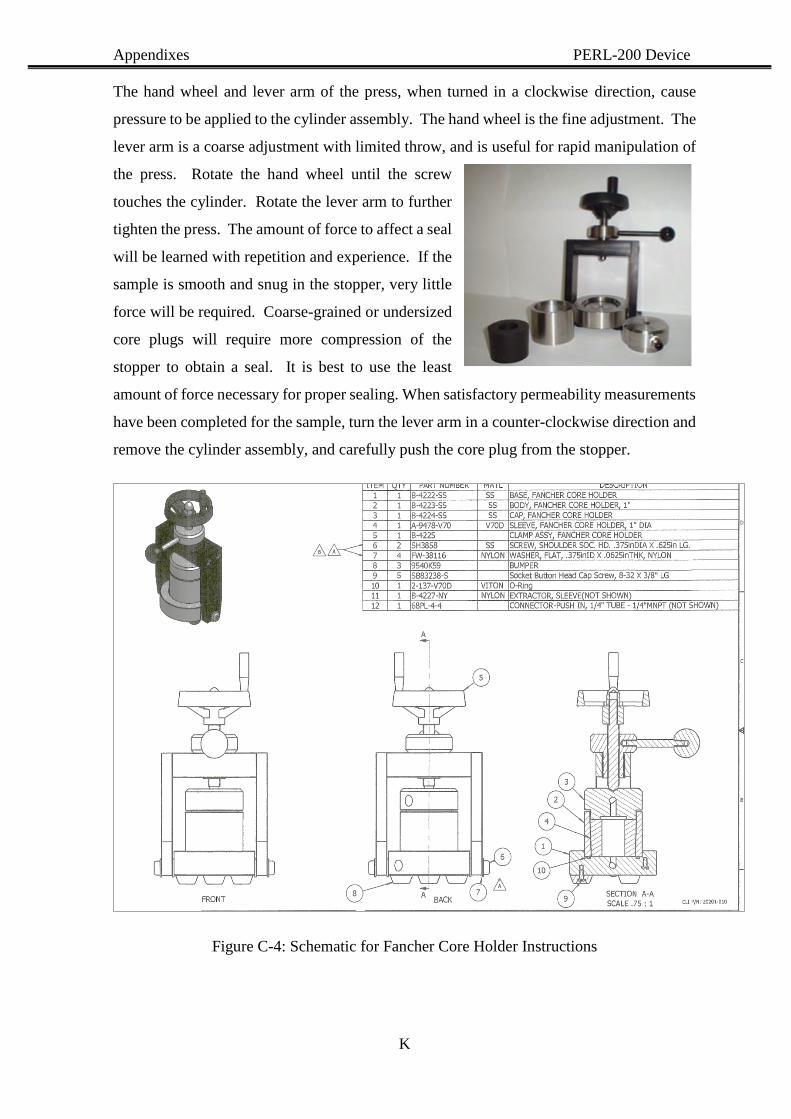
Appendixes PERL-200 Device
K
The hand wheel and lever arm of the press, when turned in a clockwise direction, cause
pressure to be applied to the cylinder assembly. The hand wheel is the fine adjustment. The
lever arm is a coarse adjustment with limited throw, and is useful for rapid manipulation of
the press. Rotate the hand wheel until the screw
touches the cylinder. Rotate the lever arm to further
tighten the press. The amount of force to affect a seal
will be learned with repetition and experience. If the
sample is smooth and snug in the stopper, very little
force will be required. Coarse-grained or undersized
core plugs will require more compression of the
stopper to obtain a seal. It is best to use the least
amount of force necessary for proper sealing. When satisfactory permeability measurements
have been completed for the sample, turn the lever arm in a counter-clockwise direction and
remove the cylinder assembly, and carefully push the core plug from the stopper.
Figure C-4: Schematic for Fancher Core Holder Instructions
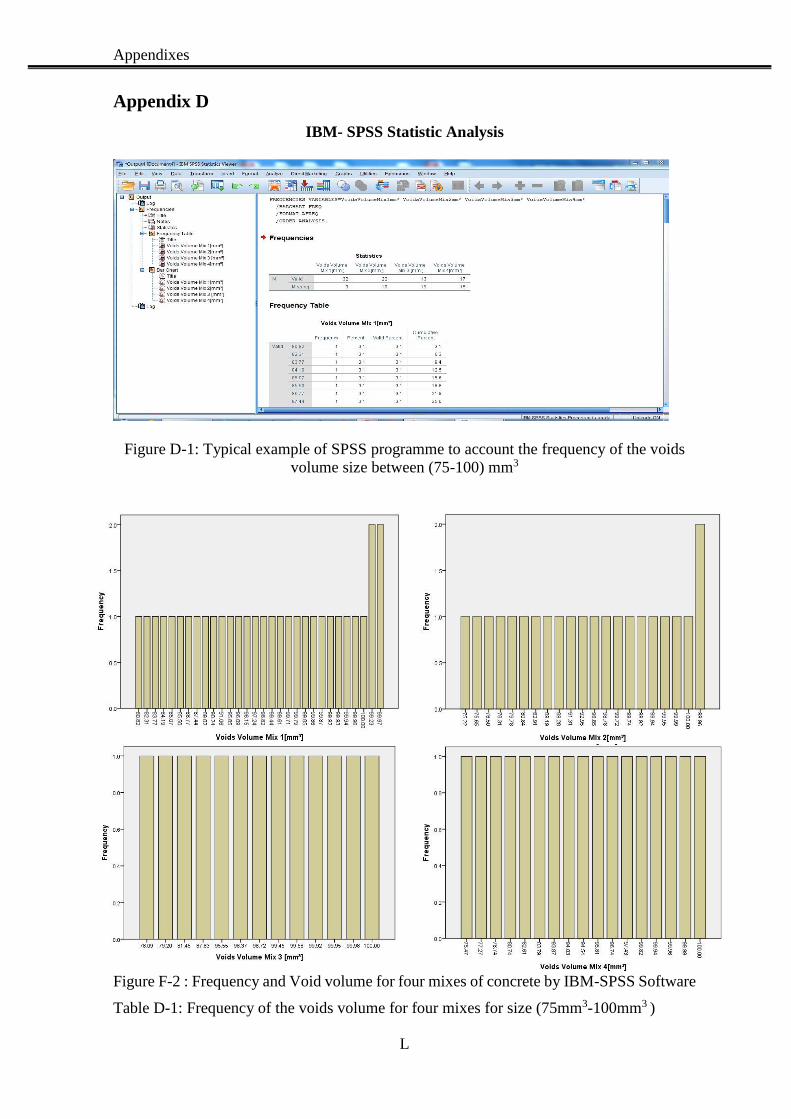
Appendixes
L
Appendix D
IBM- SPSS Statistic Analysis
Figure D-1: Typical example of SPSS programme to account the frequency of the voids
volume size between (75-100) mm3
Figure F-2 : Frequency and Void volume for four mixes of concrete by IBM-SPSS Software
Table D-1: Frequency of the voids volume for four mixes for size (75mm3-100mm3 )
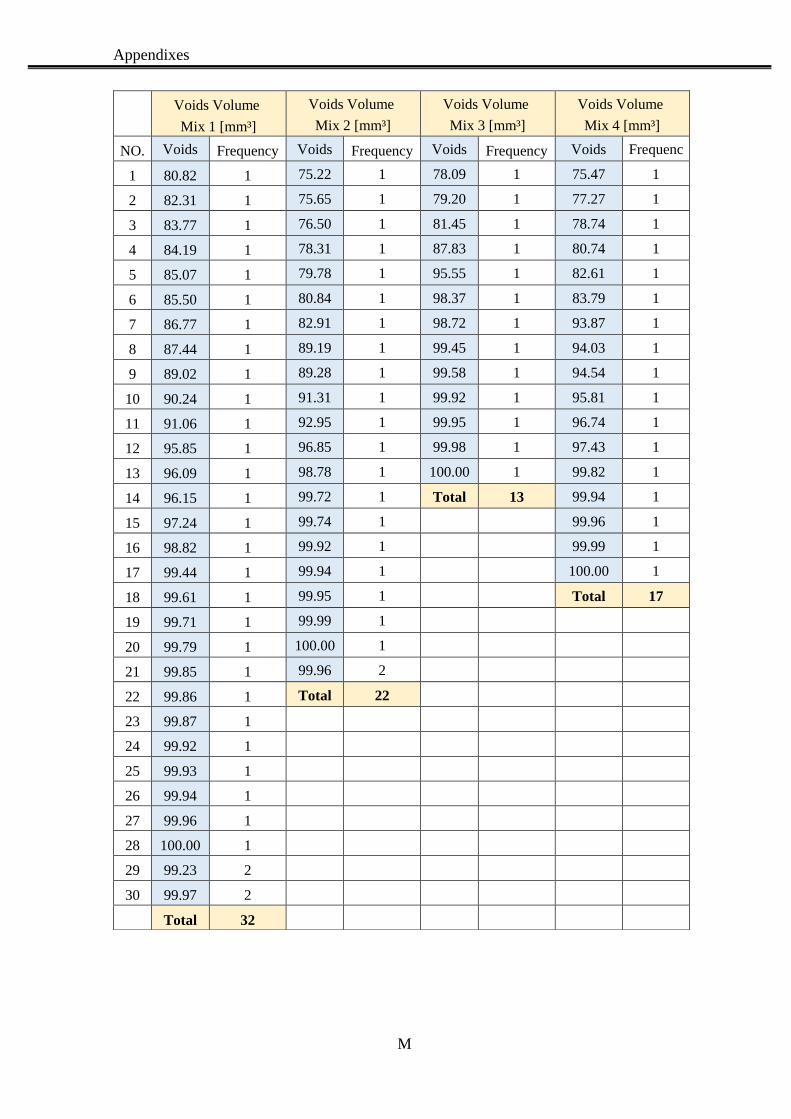
Appendixes
M
Voids Volume
Mix 1 [mm³]
Voids Volume
Mix 2 [mm³]
Voids Volume
Mix 3 [mm³]
Voids Volume
Mix 4 [mm³]
NO. Voids
volume
Frequency Voids
volume
Frequency Voids
volume
Frequency Voids
volume
Frequenc
y 1 80.82 1 75.22 1 78.09 1 75.47 1
2 82.31 1 75.65 1 79.20 1 77.27 1
3 83.77 1 76.50 1 81.45 1 78.74 1
4 84.19 1 78.31 1 87.83 1 80.74 1
5 85.07 1 79.78 1 95.55 1 82.61 1
6 85.50 1 80.84 1 98.37 1 83.79 1
7 86.77 1 82.91 1 98.72 1 93.87 1
8 87.44 1 89.19 1 99.45 1 94.03 1
9 89.02 1 89.28 1 99.58 1 94.54 1
10 90.24 1 91.31 1 99.92 1 95.81 1
11 91.06 1 92.95 1 99.95 1 96.74 1
12 95.85 1 96.85 1 99.98 1 97.43 1
13 96.09 1 98.78 1 100.00 1 99.82 1
14 96.15 1 99.72 1 Total 13 99.94 1
15 97.24 1 99.74 1 99.96 1
16 98.82 1 99.92 1 99.99 1
17 99.44 1 99.94 1 100.00 1
18 99.61 1 99.95 1 Total 17
19 99.71 1 99.99 1
20 99.79 1 100.00 1
21 99.85 1 99.96 2
22 99.86 1 Total 22
23 99.87 1
24 99.92 1
25 99.93 1
26 99.94 1
27 99.96 1
28 100.00 1
29 99.23 2
30 99.97 2
Total 32
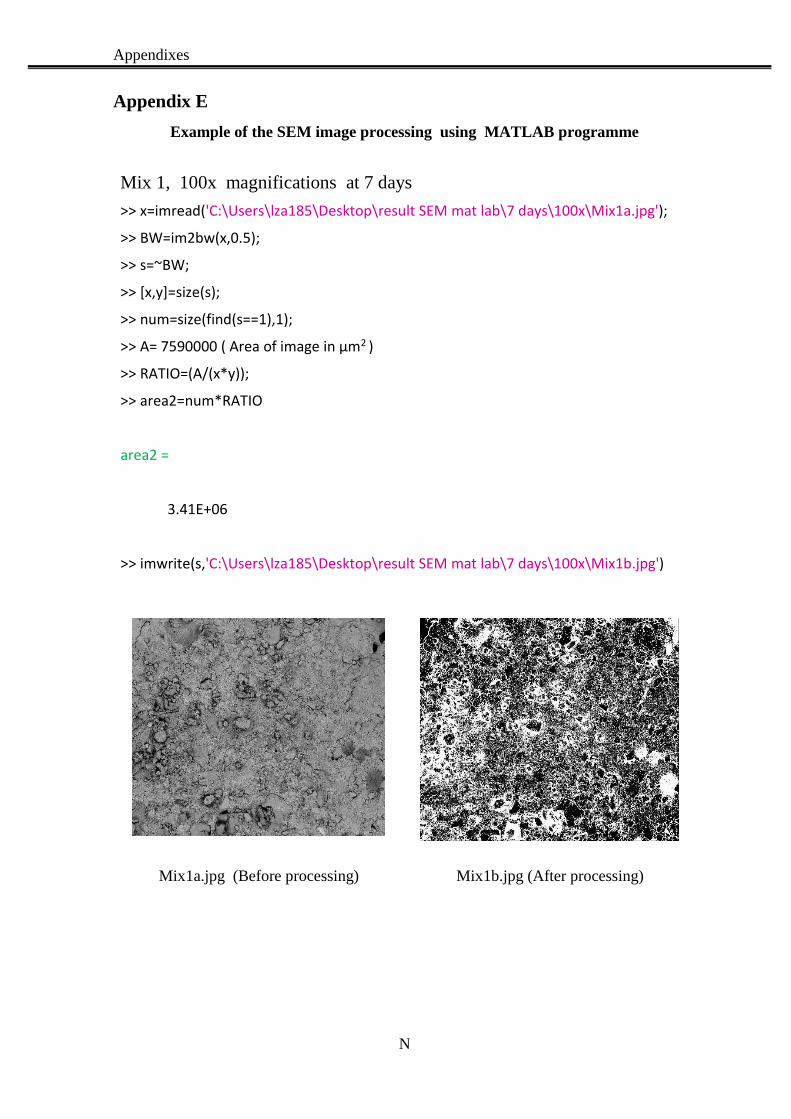
Appendixes
N
Appendix E
Example of the SEM image processing using MATLAB programme
Mix 1, 100x magnifications at 7 days
>> x=imread('C:\Users\lza185\Desktop\result SEM mat lab\7 days\100x\Mix1a.jpg');
>> BW=im2bw(x,0.5);
>> s=~BW;
>> [x,y]=size(s);
>> num=size(find(s==1),1);
>> A= 7590000 ( Area of image in µm2 )
>> RATIO=(A/(x*y));
>> area2=num*RATIO
area2 =
3.41E+06
>> imwrite(s,'C:\Users\lza185\Desktop\result SEM mat lab\7 days\100x\Mix1b.jpg')
Mix1a.jpg (Before processing) Mix1b.jpg (After processing)
Top Related
Copyright © 2022 FDOKUMEN

