
Vm Good Werken Ein christeleg skyr og liois Predikun, teken ...
Upload
khangminh22Category
view
0download
0
z/VM and Linux on z Performance Management GSE - UK
www.VelocitySoftware.com www.LinuxVM.com
“If you can’t Measure it, I am Just Not Interested ™”

Topics
• 2019 topics of interest
• Who is Velocity Software • Performance Management Overview
• Technology does not stand still – current topics
• What is Velocity Software doing now
• zOSMON
2

2019 Topics of Interest
• Applications • Splunk • MongoDB
• Docker • Secure container, • z/OS Container Extensions,
• Processor Performance • z/VM 7.1, z15 • SMT • LPAR Configuration, parking
• Enterprise Efficiencies • Cost of performance management in resources • Single pane of glass • Selling the mainframe to your users!!!
3

4
Who is Velocity Software
Founded 1988, Mission: Provide software to assist customers in optimizing the VM platform: First VM/XA performance product on market (XAMAP/XAMON) Continuous fully integrated enhancements over 30 years 200+ Installations (zVPS) (more than ½ IFLs world wide) 22 countries, 6 continents

Industries using Linux and Velocity Software
Banking, Financial: Government / Military: Health Care, Insurance, Retail Manufacturing: Automotive, computing, Oil Outsourcing

Velocity Software zVPS Provides:
• z/VM Performance Monitor (for 31 years) • NETWORK Monitoring (for 20 years) • Linux on “Z” Monitoring (for 18 years) • Oracle, Websphere Monitoring (for 10 years) • VSE Monitoring (for 5 years) • No charge features
• zOPERATOR for fully INTEGRATED operations management console • zALERT for supporting fully INTEGRATED operations • Distributed server monitoring (Linux, Microsoft)

zVPS 5.1
New Technologies • Docker (thousands of containers) • MongoDB (see Marriott presentations)
http://VelocitySoftware.com/MongoDB.html” • z/VM 7.1 (done, fcp, edev, diagnose, 80 threads) • SPLUNK (done) “http://VelocitySoftware.com/splunk.html” • z/OS…. (common request) • VSE CICS too • z/OS: Send link to your z/OS people….
http://demo.velocitysoftware.com/zview/zview.cgi?view=myzos&heading=no&menu=no
• See HTTP://VelocitySoftware.com/zOSMON.HTML”
Make it easy, low overhead, amazingly fast… • Z15: MFC data supported! (zVPS only consumer)
7

Performance Management Requirements
Performance Management User Requirements • Performance Analysis • Operational Alerts • Capacity Planning • Accounting/Charge back
Correct data (Virtual Linux CPU data wrong - SMT) Capture ratios (is the data valid?) Remember, 3 kinds of performance monitors
1. Products Used for performance Management 2. Products Used for Diagnostics 3. Products Turned off when there’s a cpu problem
Management can not be the problem….
8

Infrastructure Requirements: Performance Analysis
Why Performance Analysis: Service Level Mgmt • Diagnose problems real time • PLATFORM SPECIFIC…. • Analyze all z/VM Subsystems in detail, real time
• (DASD, Cache, Storage, Paging, Processor, TCPIP) • Analyze Linux
• (applications, processes, processor, storage, swap) • Historical view of same data important
• Why are things worse today than yesterday? • Did adding new workload affect overall throughput? • Know who/what is using resource and how to re-allocate • SEND IT FOR ANALYSIS…. WE LIKE DOING RESEARCH
9

Infrastructure Requirements: Capacity Planning
Why Capacity Planning: Future Service Levels • How many more servers can you support with existing z14? • What is capacity requirements for an application? (on x?) • Avoid crises in advance
Why Chargeback? • Distributed chargeback model is by server (does NOT port to Z!) • Shared chargeback model is by resource consumption • Encourages efficient/effective resource use • Align IT to your business model
Operational Requirements • Operations will manage 100’s (1000’s) of servers • Requires active performance management • Alerts for processes in loops, disks 90% full, missing processes • zALERT always needed • zOPERATOR, if no enterprise monitor, or do it anyway
10

zVPS does “End to End” Performance Management
• Management wants • “single pane of glass” - One tool that does all (and well)
• Complete performance management includes: • z/VM System Level: CEC, LPAR data, ALL SubSystems • Linux – Storage, CPU, file system, network • Process – applications, performance data • Network monitor • VSE: partitions, CPU, I/O, CICS • z/OS: CICS(110), BATCH (30), SYSTEM (70)
• Application subsystem analysis • Java, WAS, Oracle, MongoDB, Docker (MQ, DB2)
• Outside “Z” server platform analysis • Linux on “x”, VMWare, KVM, Secure Software Container • Microsoft servers • VPN, gateways, utilities
11

z/VM Performance monitor architecture
Traditional model (1989) ESAMON/zMON: Real time analysis
• Uses Standard CP Monitor • Real Time Analysis
ESAMAP/zMAP: Performance Reporting
• Post (midnight) Processing • Creates Long Term PDB • PDB or monwrite data input
PDB (Performance DataBase) • Complete data • By Minute, hour, day • Monthly/Yearly Archive
VM CP Monitor
zMON / zWRITE
PDB
Real-Time Displays
Reports zMAP
PDB
12
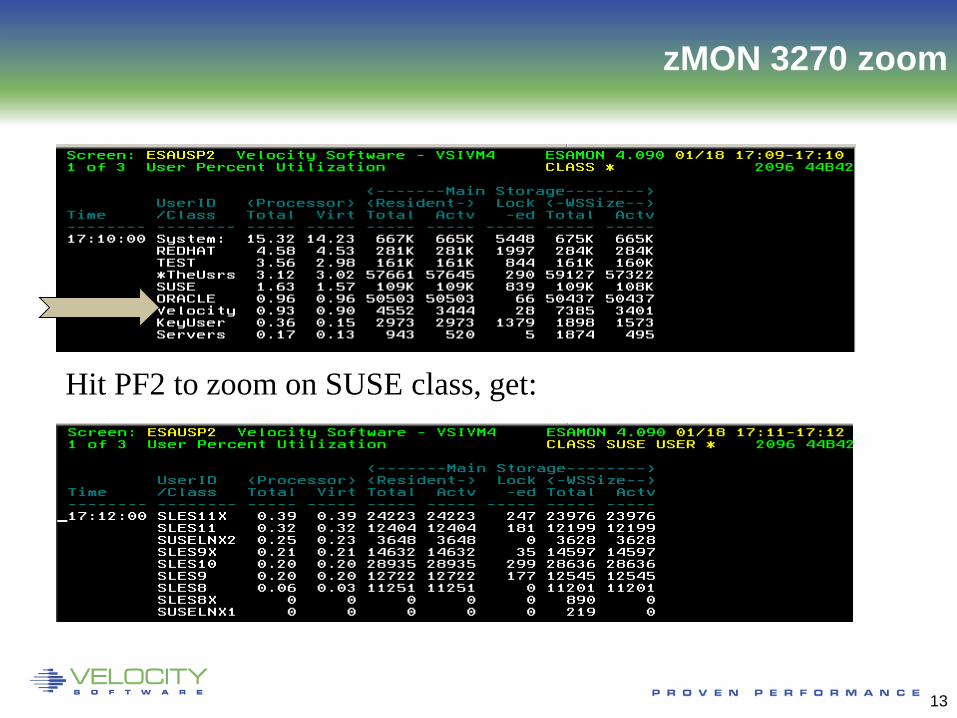
zMON 3270 zoom
Hit PF2 to zoom on SUSE class, get:
13

VM CP Monitor
zMON
PDB
zMAP
Chargeback: CA / MICS SPLUNK
Operations: Omnibus / Netcool (SNMP Alerts)
Capacity Planning MXG Mainview
PDB
Add “Enterprise” Support
Capacity Planning Chargeback Operations
14

Add “Network” Support – Pre Linux
VM CP Monitor
zMON
PDB
zMAP
Chargeback: CA / MICS SPLUNK
Operations: Omnibus / Netcool (SNMP Alerts)
Capacity Planning MXG Mainview
TCPIP SNMP/MIB II zTCP
15
PDB
SNMP collector All standard interface

Full Network Monitor
Report: ESATCP1 TCPIP Transport Layer Data Report ------------------------------------------------------------------------ Date/ <--------TCP Connections-----------> <-TCP Communications / sec Time/ Current <Opens/Second> <Closes/Sec> <----Segments Transmitted- Node Connects Active Passive Fails Resets Input Outpt ReTran InError -------- -------- ------ ------- ----- ------ ----- ----- ------ ------- 00:15:00 ***Node Groups*** KeyUser 1.1 0.0 0.0 0.0 0 0.04 0.06 0.07 0.00 *TheUsrs 21.9 1.3 1.6 0.2 0 48.74 48.75 0.00 0 VsLPARs 5.3 0.1 0.5 0.1 0.3 8.02 11.95 0.29 0.08 *** Nodes ******* oracle 16.9 0.5 1.0 0 0 24.51 24.52 0.00 0 RH5X161 0 0 0 0 0 0 0 0 0 S11R20RA 5.0 0.8 0.6 0.2 0 24.25 24.26 0 0 TCPIP 0 0.0 0.0 0.0 0 0.02 0.03 0.03 0.00 TCPIP2 0 0 0 0 0 0.01 0.01 0 0.00 TCPIP2 1.1 0.0 0.0 0.0 0 0.02 0.03 0.03 0.00 VSIVM1 2.0 0.0 0.0 0.0 0 0.49 0.59 0.10 0.01 VSIVM2 1.1 0.0 0.0 0.0 0 0.02 0.03 0.03 0.00 VSIVM4 2.2 0.0 0.4 0.0 0.3 7.51 11.33 0.15 0.07
MIB II: Transport layer, IP layer, hardware layer, icmp Transport layer data shows connections, TCP rates, UDP
rates
16

Full Network Monitor MIB II: Transport layer, IP layer, hardware layer, icmp
Transport layer data shows connections, TCP rates, UDP rates
17

Add snmp “host” Support
VM CP Monitor
zMON
PDB
zMAP
Chargeback: CA / MICS SPLUNK….
Operations: Omnibus / Netcool (SNMP Alerts)
Capacity Planning MXG Mainview
TCPIP SNMP/MIB II
LINUX/MS SNMP/Host MIBs
zTCP
18
PDB

“Host” support
19
• Snmp “host” mib • Process data (expensive, limited) • File system data • (no system data)
• ucd “linux” mib
• System data • Memory data • Disk data (expensive)
• Velocity mib
• Designed for efficiency • Designed for performance management • Process data improvements • Disk data improvements • VERY Extensible

Process Capture Ratio with Velocity mib
• High CPU capture ratio Report: ESALNXV LINUX Virtual Processor Analysis Report ----------------------------------------------------------------- Node/ VM <Linux Pct CPU> <Process Data> Capture Prorate Name ServerID Total Syst User Total Syst User Ratio Factor --------- -------- ----- ---- ---- ----- ---- ---- ------- ------ 10:03:00
NEALE1 LNEALE1 100.0 11.4 88.6 100.2 11.5 88.7 1.002 1.000 Report: ESALNXP LINUX HOST Process Statistics Report --------------------------------------------------------- node/ <-Process Ident-> Nice <------CPU Percents----> Name ID PPID GRP Valu Tot sys user syst usrt --------- ----- ----- ----- ---- ---- ---- ---- ---- ---- 10:03:00 NEALE1 0 0 0 0 100 0.43 3.35 11.0 85.4 kswapd0 100 1 1 0 0.12 0.12 0 0 0 snmpd 1013 1 1012 -10 0.13 0.03 0.10 0 0 sh 3653 3652 30124 0 52.7 0 0 9.37 43.3 gmake 9751 9750 30124 0 43.4 0.02 0.02 1.37 42.0 sh 10129 9751 30124 0 0.02 0.02 0 0 0 sh 10130 10129 30124 0 0.63 0.03 0.23 0.28 0.08 cc1 10307 10306 30124 0 3.12 0.18 2.93 0 0 rpmbuild 30124 16382 30124 0 0.07 0.03 0.03 0 0 sh 30125 30124 30124 0 0.02 0 0.02 0 0 gmake 30126 30125 30124 0 0.02 0 0.02 0 0
Report: ESALNXC LINUX Process Conf --------------------------------------- Node/ <-Process Ident-> <-----Pr Name ID PPID GRP Path ------------ ----- ----- ----- -------- NEALE1 init 1 0 0 init [3] migratio 2 1 0 migratio ksoftirq 3 1 0 ksoftirq events/0 4 1 0 events/0 khelper 5 4 0 khelper kblockd/ 6 4 0 kblockd/ cio 41 4 0 cio cio_noti 42 4 0 cio_noti kslowcrw 43 4 0 kslowcrw appldata 96 4 0 appldata aio/0 101 4 0 aio/0 pdflush 5266 4 0 pdflush pdflush 26647 4 0 pdflush kswapd0 100 1 1 kswapd0 kmcheck 158 1 1 kmcheck syslogd 976 1 976 /sbin/sy klogd 979 1 979 /sbin/kl snmpd 1013 1 1012 snmpd portmap 1030 1 1030 /sbin/po rpciod 1034 1 1 rpciod lockd 1035 1 1 lockd sshd 1072 1 1072 /usr/sbi sshd 16272 1072 16272 sshd: bu sshd 16288 1072 16288 sshd: bu sshd 16290 16288 16288 sshd: bu bash 16291 16290 16291 bash python 16312 16291 16291 python do-bui 16313 16312 16291 /bin/sh bb_do 16382 16313 16291 /usr/bin rpmb 16415 16382 16415 rpmbuild rpmb 30124 16382 30124 rpmbuild
20

“SNMP” collector 2018
zTCP: Network Monitor Standard SNMP collection Data added to PDB
VM CP Monitor
zMON
Reports
PDB
zMAP
Real-Time Displays
PDB
TCPIP SNMP/MIB II
LINUX SNMP/Host MIBs
zTCP SNMP
Snmp Collects data from: LINUX (netsnmp) NT/SUN/HP (native snmp) Printers/Routers…. THOUSANDS OF SERVERS?
WinNT SUN/HP/AIX Linux. Oracle (z/VSE!!!) (VMWare)
21
zVWS WWW
ZVWS Provides www access Written in assembler, VERY FAST Many web based applications….

“SNMP” collector 2019
zTCP: Network Monitor Standard SNMP collection Data added to PDB Now accepts SMF Records Now accepts DMF records Now accepts Collectd
TCPIP SNMP/MIB II
LINUX SNMP/Host MIBs
zTCP V5 SNMP
WinNT SUN/HP/AIX Linux. Oracle (z/VSE!!!) (VMWare)
22
z/OS SMF
zVSE DMF
Collectd (IBM Secure Container)

Modernize: Webserving, performance skills
zTUNE: Rules based analysis
TCPIP SNMP/MIB II
VM CP Monitor
LINUX SNMP/Host MIBs
zMON
Reports
PDB
zMAP
zTCP
Real-Time Displays
WWW
zTUNE
ZVWS Provides www access Written in assembler, VERY FAST Many customer applications….
23
PDB

Health Checker for z/VM, Linux: zTUNE
• Focus more now on simplifying problem resolution • User reports that applications complained about zLinux / WAS performance:
Report: ESATUNE Tuning Recommendation Report Monitor initialized: on 2084 serial 9ABED --------------------------------------------------------------- The following changes are suggestions by Velocity Software to enhance performance of this system. However, Velocity Software takes no responsibility - all tuning is the responsibility of the installations. Please call 650-964-8867 if you have any questions about these values, or suggestions on report enhancements.
USR2 User LINUX160 is paging excessively (75.0 per second) This user can be protected using SET RESERVED
SPL5 Spool utilization is 100% full. Perform Spool file analysis and purge large spool files, or force users currently writing excessively to spool.
*****zTUNE Evaluation ************* XAC1 User total PROCESSOR WAIT excessive at 33 percent. Current reporting threshold set to 20. This is percent of inqueue time waiting for specific (PROCESSOR)resources to become available. LPR3 LPAR share is too low, causing USER CPU Wait VM LPAR allocated share: 0.94 percent of total VM LPAR used 389 percent of allocated share
24

zVIEW V2
25
zVIEW V2 flexible, • Web based application • Supports enterprise data • Single pane of glass • VERY fast, (no java)…. • Front end for everything

Tailorable, expandable, zoomable
zVPS Enterprise View
26

Drill down Options – How fast is fast?
27

Did I say scalable? A lot of LPARS…. zVPS Enterprise View
28
“some installations”

Multiple System View (3 LPARs)
Data from multiple lpars visible on “Single pane of glass”
29

zALERT - Operational Support zAlert
• User tailorable • 3270 based, web based, and / or SNMP
• Linux alert examples: • Disk full • Missing processes (requires complete data) • Looping processes (requires correct data)
• z/VM alert examples • Page/spool space full (avoid abends), page rates • Looping servers • DASD service times
• Network alert examples • Transport errors, ICMP rates, Bandwidth thresholds
• z/OS (zVSE) • CPU, job utilization, cec (cpu type) utilization, • CICS max task, response times, etc
30

zALERT – Automate problem detection
3270 Style Alerts (50+ sample alerts provided) Or zVIEW based: Click Thru or SMS, email…
31

Operational Considerations
Issue with SNMP alerts (or other agents) • How many control points? (one per server?) • How many configuration files? (one plus per server?)
zVPS SNMP Alert Architecture • Centralized alert • One point of control (ZALERT)
SNMP alerts sent to any SNMP operations console • Create “SNMP TRAPDEST” file * this file is the list of snmp trap destinations * format is ip address, and community name 67.100.74.25 velocity
Sending SNMP alerts by other functions:
/* authorized user can send alerts */ parse arg msg ‘CP SMSG ZTCP ALERT’ msg
32

Copyright 2012 Velocity Software, Inc. All Rights Reserved. Other products and company names mentioned herein may be trademarks of their respective
Diagnostic vs Management Tools
• Diagnostic Tools • Turn on when there’s a problem (but not if too heavy….) • Significant overhead • Oracle and Java have many diagnostic tools
• z/VPS Objective is to provide “management tools” • Java metrics captured at low cost • Oracle metrics captured at low cost • Objective is still a .1% agent collecting data every minute
33

Splunk
Operations Tool (many installations!) Log analyzer Diagnostics tool
The Problem Agent is very high overhead Each Linux runs splunk agent, feeds central database One installation reports 2-4% of ONE IFL just for splunk agent
• (Using 20 IFLs just for splunk agent)
The (VERY efficient) solution All (almost all?) data captured by zVPS zVPS feeds splunk (no additional charge, big savings in cpu) Installation details on Velocity Software website

MongoDB (zVPS V5)
Fast DataBase Used for real time performance “read only” Benchmarked at 8,000 hits per second on ONE LPAR MongoDB engineers very impressed with “z” !!!
The Problem Black box?
The requirements: Management Marriott corporation offloading 5,000 transactions per second plus MongoDB on Linux on z architecture
The (VERY efficient) management solution MongoDB has snmp mib, fully supported by zVPS (real time, alerts…)

Docker and more (zVPS V5)
Docker container technology used for many implementations Docker/kubernetes collectd z/os container extensions
Docker Used extensively by a few large customers Snmp mib developed by Velocity Software
IBM Secure Container Black box as presented (no management capability if problems) Collectd implementation – one way mechanism, open source Supported by zvps
Z/OS container extensions Collectd implementation?

zOSMON
New Technologies • z/OS…. (common request) • VSE CICS too • z/OS: Send link to your z/OS people….
http://demo.velocitysoftware.com/zview/zview.cgi?view=myzos&heading=no&menu=no
Make it easy, low overhead, amazingly fast…
37

zOSMON fully integrated
Instant z/os system, cpu, jobs, configuration. (Tailorable)
38

zOSMON fully integrated
Instant z/os Graphs. (Tailorable) http://demo.velocitysoftware.com/zview/zview.cgi?view=zosgraph&heading=no&menu=no
39

CICS Configuration
Work in progress… z/OS, VSE, no limit… Monitor initialized: 10/01/19 at 13:15:00 on BC12 serial 0614C7 -------------------------------------------------------------------------------- SYSID <--CICS Program-> <-----Start-----> User Platform <----Location---> APPLID JobName Date Time IDentity O/S VRM LPARName VMID ---- -------- -------- -------- -------- -------- ---- ---- -------- -------- 13:16:00 VSI1 CICSZA1 CICSZA1 09/10/19 06:16:53 z/OS 0720 CICSZA2 CICSZA2 09/13/19 07:50:26 z/OS 0720 V61B CICSP1 CICSP1 09/18/19 10:46:00 PRODCICS VSE 0420 VSIVM5 ZVSE61B V62C CICSP1 CICSP1 09/14/19 06:13:22 PRODCICS VSE 0430 VSIVM5 ZVSE62C -------------------------------------------------------------------------------- 13:17:00 VSI1 CICSZA1 CICSZA1 09/10/19 06:16:53 z/OS 0720 CICSZA2 CICSZA2 09/13/19 07:50:26 z/OS 0720 V61B CICSP1 CICSP1 09/18/19 10:46:00 PRODCICS VSE 0420 VSIVM5 ZVSE61B V62C CICSP1 CICSP1 09/14/19 06:13:22 PRODCICS VSE 0430 VSIVM5 ZVSE62C

CICS by transaction id
Work in progress… Transaction data, waits by tran id Report: ZOSCIX4 z/OS CICS Tranaction ID Analysis Velocity So Monitor initialized: 09/30/19 at 00:00:00 on BC12 serial 0514C7 ------------------------------------------------------------------------------ Time/ Transacton <----Response Time (Seconds)----> total<----------I SYSID Tran Type Total Susp Disp CPU DISP ZIP CPU ID Count R T Resp Time Time Time Wait CPU Secs Term Jrn Str -------- ---- ----- - -- ----- ----- ----- ----- ----- --- ---- ---- --- --- 05:15:00 VSI1 CICSZA1 CHCK 9 F TO 100.0 6554K 0 0 0 0 0 0 0 0 CISR 9 F TO 100.0 6554K 0 0 0 0 0 0 0 0 CSHQ 9 F TO 100.0 6554K 0 0 0.176 0 0 0 0 0 CSNE 9 F TO 100.0 6554K 0 0 0 0 0 0 0 0 CSSY 18 F TO 100.0 6554K 0 0 0 0 0 0 0 0 CSSY 121 T TO 0.183 11977 0 0 1.714 0 0 0 0 0 CSTP 9 F TO 100.0 6102K 0 0 2745 0 0 0 0 0 STRH 37013 T TO 0.007 246.8 0 0 0 0 0 0 0 0 CICSZA2 CHCK 14 F S 68.57 4494K 0 0 0 0 0 0 0 0 CISE 13 F S 69.23 4537K 0 0 0 0 0 0 0 0 CSHQ 14 F S 68.57 4494K 0 0 0.395 0 0 0 0 0 CSNE 14 F S 68.57 4494K 0 0 0 0 0 0 0 0 CSOL 1 D S 1887 124M 0 0 26.62 0 0 0 0 0 CSSY 28 F S 68.57 4494K 0 0 0 0 0 0 0 0 CSSY 4 T S 0.196 12735 0 0 1.714 0 0 0 0 0 CSTP 14 F S 68.57 4493K 0 0 512.0 0 0 0 0 0 ZV61 CICSP1 CSNE 1 F TO 1800 1800 0 0 0 0 0 0 0 0 CSPQ 1 T TO 0.002 0.000 0.002 0.001 0 0 0.0 0 0 0 CSSY 5 F TO 1800 1800 0.000 0.000 0.000 0 0.0 0 0 0 CSTP 1 F TO 1800 1672 128.1 11.31 3.713 0 11.3 0 0 0 IESO 1 F TO 1800 1800 0 0 0 0 0 0 0 0 STRH 7328 T TO 0.053 0.033 0.020 0.003 0 0 21.3 0 0 0

CICS by Region
By minute, real time, wrapped up at night to 15 minute Report: ZOSCIX2 z/OS Region Transaction Analysis Monitor initialized: 09/30/19 at 00:00:00 on BC12 serial 0514C7 ------------------------------------------------------------------ Time/ Transacton <----Response Time (Seconds)----> total SYSID/ Name/ Type Total Susp Disp CPU DISP ZIP CPU Time ID Count R T Resp Time Time Time Wait CPU Secs ---- ------- ----- - -- ----- ----- ----- ----- ----- --- ---- 05:15:00 VSI1 CICSZA1 90 F S 100.0 6509K 0 0 274.9 0 0 121 T S 0.183 11977 0 0 1.714 0 0 37013 T TO 0.007 246.8 0 0 0 0 0 CICSZA2 1 D S 1887 124M 0 0 26.62 0 0 139 F S 68.63 4498K 0 0 52.16 0 0 4 T S 0.196 12735 0 0 1.714 0 0 ZV61 CICSP1 10 F S 1800 1787 12.81 1.131 0.371 0 11.3 1 T S 0.002 0.000 0.002 0.001 0 0 0.0 7328 T TO 0.053 0.033 0.020 0.003 0 0 21.3 ------------------------------------------------------------------ 05:30:00 VSI1 CICSZA1 1 D S 1887 124M 0 0 7091 0 0 90 F S 93.34 6076K 0 0 242.6 0 0 125 T S 0.205 13382 0 0 1.722 0 0 37312 T TO 0.006 190.5 0 0 0 0 0 CICSZA2 127 F S 69.44 4551K 0 0 57.48 0 0 1 T S 0.262 17060 0 0 1.588 0 0 ZV61 CICSP1 1 F S 1556 1556 0.000 0.000 0.000 0 0.0 9428 T TO 0.012 0.004 0.008 0.003 0 0 26.7 ------------------------------------------------------------------

Copyright 2008 Velocity Software, Inc. All Rights Reserved.
zOSMON Room for Thought….
• Processing requirements for 40 CICS transactions/sec • 140,000 transactions per hour • z/OS: .6-.7% GP for collector • zVPS: <1% of one IFL for everything, including web servers.
• z/OS processing time • 24 hours records 30/70: 24 cpu seconds on one IFL
• zOSMON Futures • DB2 (101,102) • MFC (113) • What customers want • Please send SMF data
43

Summary
Performance management is a business model Performance analysis and tuning Capacity planning Operational support Chargeback
Single pane of glass Efficiency critical, not just a diagnostic tool Flexibility important – architecture works….

Copyright 2008 Velocity Software, Inc. All Rights Reserved.
Velocity Software thanks you for running Linux on z…
• Please send data: • When you have a problem • When you have a new machine • When you would like to see zVPS reporting capability.
• Velocity Software in 2019 (V5) has added: • Collectd support for IBM Secure container, docker, z/OS Container Extensions • SMF support for z/OS (70, 30, 110, more to come) • DMF support for z/VSE • MongoDB support • Docker mib support
• zPRO: • IBM has failed to provide an on prem cloud solution • xcat, cma just did not work and have been withdrawn • zPRO does NOT use SMAPI, JAVA, guest Linux • zPRO is a native solution that many installations use for on prem cloud
45
Copyright © 2022 FDOKUMEN


![Á¯Y ÖfyZÀŒ¿YÁ cZ»|y Ä»Z¿€] {€] Z¯ ÖˆÀm ¾Ë ÁZnf» ½Z»](https://static.fdokumen.com/doc/165x107/631be1ecc2fddc481907bd33/aay-oefyzaoeya-czy-aez-z-oeam-e-aznf-z.jpg)