Zoom in - Baylor ECS
225
[ VOLUME 31 NUMBER 4 JULY 2014 ] Contents | Zoom in | Zoom out Search Issue | Next Page For navigation instructions please click here Contents | Zoom in | Zoom out Search Issue | Next Page For navigation instructions please click here
-
Upload
khangminh22 -
Category
Documents
-
view
0 -
download
0
Transcript of Zoom in - Baylor ECS

[VOLUME 31 NUMBER 4 JULY 2014]
Contents | Zoom in | Zoom out Search Issue | Next PageFor navigation instructions please click here
Contents | Zoom in | Zoom out Search Issue | Next PageFor navigation instructions please click here

PlasticCeramic
$199from ea.(qty. 1000)DC - 20 GHz2W ATTENUATORS
Ultra Small 2x2mm
RoHS compliant
Save PC board space with our new tiny 2W fixed value absorptive attenuators, available in molded plastic or high-rel hermetic nitrogen-filled ceramic packages. They are perfect building blocks, reducing effects of mismatches, harmonics, and intermodulation, improving isolation, and meeting other circuit level requirements. These units will deliver the precise attenuation you need, and are stocked in 1-dB steps from 0 to 10 dB, and 12, 15, 20 and 30 dB.
The ceramic hermetic RCAT family is built to deliver reliable, repeatable performance from DC-20GHz under the harshest conditions. With sample prices starting at
only $4.95 ea. (qty. 20), these units are qualified to meet MIL requirements including vibration, PIND, thermal shock, gross and fine leak and more, at up to 125°C!
The molded plastic YAT family uses an industry proven, high thermal conductivity case and has excellent electrical performance over the frequency range of DC to 18 GHz, for prices as low as $2.99 ea. (qty. 20).
For more details, just go to minicircuits.com – place your order today, and you can have these products in your hands
as soon as tomorrow!
http://www.modelithics.com/mvp/Mini-Circuits/
FREE Simulation Models!
515 rev D
Mini-Circuits®
www.minicircuits.com P.O. Box 35 166, Brooklyn, NY 11235-0003 (718) 934-4500 [email protected]
Previous Page | Contents | Zoom in | Zoom out | Front Cover | Search Issue | Next Page qqM
Mq
qM
MqM
THE WORLD’S NEWSSTAND®
Previous Page | Contents | Zoom in | Zoom out | Front Cover | Search Issue | Next Page qqM
Mq
qM
MqM
THE WORLD’S NEWSSTAND®
______________

IEEE SIGNAL PROCESSING MAGAZINE [1] JULY 2014
Digital Object Identifier 10.1109/MSP.2014.2311859
15 FROM THE GUEST EDITORSJoachim Ender, Moeness G. Amin, Gianfranco Fornaro,and Paul A. Rosen
16 WIDE-ANGLE SYNTHETIC APERTURE RADAR IMAGINGJoshua N. Ash, Emre Ertin,Lee C. Potter, and Edmund G. Zelnio
27 SPARSITY-DRIVEN SYNTHETIC APERTURE RADAR IMAGINGMüjdat Çetin, Ivana Stojanovic, N. Özben Önhon, Kush R. Varshney, Sadegh Samadi, W. Clem Karl, and Alan S. Willsky
41 TOMOGRAPHIC PROCESSING OF INTERFEROMETRIC SAR DATAGianfranco Fornaro, Fabrizio Lombardini, Antonio Pauciullo,Diego Reale, and Federico Viviani
51 SUPERRESOLVING SARTOMOGRAPHY FOR MULTIDIMENSIONAL IMAGING OF URBAN AREASXiao Xiang Zhu and Richard Bamler
59 CONTEXTUAL INFORMATION-BASED MULTICHANNEL SYNTHETIC APERTURE RADAR INTERFEROMETRYFabio Baselice, Giampaolo Ferraioli, Vito Pascazio, and Gilda Schirinzi
69 EXPLOITING PATCH SIMILARITY FOR SAR IMAGE PROCESSINGCharles-Alban Deledalle,Loïc Denis, Giovanni Poggi,Florence Tupin, and Luisa Verdoliva
79 MODELING AND INTERPRETATION OF SCATTERING MECHANISMS IN POLARIMETRIC SYNTHETIC APERTURE RADARSi-Wei Chen, Yong-Zhen Li, Xue-Song Wang, Shun-Ping Xiao, and Motoyuki Sato
90 SAR IMAGING ALGORITHMS AND SOME UNCONVENTIONAL APPLICATIONSRaffaele Solimene, Ilaria Catapano, Gianluca Gennarelli, Antonio Cuccaro, Angela Dell’Aversano, and Francesco Soldovieri
99 THE TIME-REVERSAL TECHNIQUE FOR SARFOCUSING OF BURIED TARGETSRobert Kedzierawski,Jean-Marc Le Caillec,and Witold Czarnecki
110 MULTIPATH EXPLOITATION AND SUPPRESSION FOR SAR IMAGING OF BUILDING INTERIORSMichael Leigsnering,Moeness G. Amin, Fauzia Ahmad,and Abdelhak M. Zoubir
[FEATURE]120 LONG-WAVE
INFRARED HYPERSPECTRAL REMOTE SENSING OF CHEMICAL CLOUDSDimitris G. Manolakis,Steven E. Golowich,and Robert S. DiPietro
[COLUMNS]4 FROM THE EDITOR
Signal Processing: Is it Time to Change the Society’s Name?Abdelhak Zoubir
6 PRESIDENT’S MESSAGEAt the Forefront in Technical PublicationsAlex Acero
8 READER’S CHOICETop Downloads in IEEE Xplore
10 SPECIAL REPORTSSignal Processing: On the Edge of Astronomy’s New FrontierJohn Edwards
Health Alliance Boosts Influence in Standards DevelopmentRon Schneiderman
142 LECTURE NOTESOptimal Multiuser Transmit Beamforming: A Difficult Problem with a Simple Solution StructureEmil Björnson, Mats Bengtsson,and Björn Ottersten
149 APPLICATIONS CORNEREffective Feature Extraction and Data Reduction in Remote Sensing Using Hyperspectral ImagingJinchang Ren, Jaime Zabalza,Stephen Marshall, and Jiangbin Zheng
155 LIFE SCIENCESSignal Processing in Visual OpticsD. Robert Iskander
[DEPARTMENT]159 DATES AHEAD
[CONTENTS] [VOLUME 31 NUMBER 4]
[ SPECIAL SECTION—SYNTHETIC APERTURERADAR IMAGING]
Previous Page | Contents | Zoom in | Zoom out | Front Cover | Search Issue | Next Page qqM
Mq
qM
MqM
THE WORLD’S NEWSSTAND®
Previous Page | Contents | Zoom in | Zoom out | Front Cover | Search Issue | Next Page qqM
Mq
qM
MqM
THE WORLD’S NEWSSTAND®

IEEE SIGNAL PROCESSING MAGAZINE [2] JULY 2014
Digital Object Identifier 10.1109/MSP.2014.2311860
SCOPE: IEEE Signal Processing Magazine publishes tutorial-style articles on signal processing research and applications, as well as columns and forums on issues of interest. Its coverage ranges from fundamental prin-ciples to practical implementation, reflecting the mul-tidimensional facets of interests and concerns of the community. Its mission is to bring up-to-date, emerg-ing and active technical developments, issues, and events to the research, educational, and professional communities. It is also the main Society communica-tion platform addressing important issues concerning all members.
IEEE SIGNAL PROCESSING MAGAZINEAbdelhak Zoubir—Editor-in-ChiefTechnische Universität Darmstadt, Germany
AREA EDITORSFeature ArticlesMarc Moonen—KU Leuven, BelgiumColumns and ForumAndrea Cavallaro—Queen Mary, University
of London, United Kingdom Andres Kwasinski—Rochester Institute
of Technology, United StatesSpecial IssuesFulvio Gini—University of Pisa, Italye-NewsletterChristian Debes—AGT International, Germany
EDITORIAL BOARDMoeness G. Amin—Villanova University,
United StatesSergio Barbarossa—University of Rome
“La Sapienza,” Italy Mauro Barni—Università di Siena, ItalyHelmut Bölcskei—ETH Zürich, SwitzerlandA. Enis Cetin—Bilkent University, Turkey Patrick Flandrin—CNRS chez ENS Lyon, FranceBastiaan Kleijn—Victoria University
of Wellington, New ZealandVisa Koivunen—Aalto University, FinlandHamid Krim—North Carolina State University,
United StatesYing-Chang Liang—Institute for Infocomm
Research, SingaporeV. John Mathews—University of Utah,
United StatesSatoshi Nakamura—Nara Institute
of Science and Technology, Japan Kuldip Paliwal—Griffith University, AustraliaBéatrice Pesquet-Popescu—Télécom ParisTech,
France Eli Saber—Rochester Institute of Technology,
United StatesAli Sayed—University of California, Los Angeles,
United StatesHing Cheung So—City University of Hong Kong,
Hong KongVictor Solo—University of New South Wales,
AustraliaSergios Theodoridis—University of Athens,
Greece
Isabel Trancoso—INESC-ID/Instituto Superior Técnico, Portugal
Michail K. Tsatsanis—Entropic CommunicationsMin Wu—University of MarylandPramod K. Varshney—Syracuse University,
United StatesZ. Jane Wang—The University of British Columbia,
Canada
ASSOCIATE EDITORS— COLUMNS AND FORUMRodrigo Capobianco Guido —
University of Sao Paulo, BrazilAleksandra Mojsilovic —
IBM T.J. Watson Research CenterDouglas O’Shaughnessy — INRS, CanadaGene Cheung — National Institute
of Informatics Alessandro Vinciarelli — IDIAP–EPFLMichael Gormish — Ricoh Innovations, Inc.Xiaodong He — Microsoft ResearchFatih Porikli — MERLStefan Winkler — UIUC/ADSC, SingaporeSaeid Sanei, — University of Surrey,
United KingdomAzadeh Vosoughi — University of Central FloridaDanilo Mandic — Imperial College,
United KingdomRoberto Togneri — The University of Western
AustraliaGail Rosen — Drexel University
ASSOCIATE EDITORS—E-NEWSLETTERGwenael Doerr—Technicolor, FranceVítor Nascimento—University of São Paulo, Brazil Shantanu Rane—MERLYan Lindsay Sun—University of Rhode Island
IEEE SIGNAL PROCESSING SOCIETYAlex Acero—PresidentRabab Ward—President-ElectKonstantinos (Kostas) N. Plataniotis—Vice
President, Awards and MembershipWan-Chi Siu—Vice President, ConferencesAlex Kot—Vice President, FinanceMari Ostendorf —Vice President, Publications Charles Bouman —Vice President,
Technical Directions
IEEE SIGNAL PROCESSING MAGAZINE (ISSN 1053-5888) (ISPREG) is published bimonthly by the Institute of Electrical andElectronics Engineers, Inc., 3 Park Avenue, 17th Floor, New York, NY 10016-5997 USA (+1 212 419 7900). Responsibility for the contents rests upon the authors and not the IEEE, the Society, or its members. Annual member subscriptions included in Society fee. Nonmember subscriptions available upon request. Individual copies: IEEE Members US$20.00 (first copy only), nonmembersUS$201.00 per copy. Copyright and Reprint Permissions: Abstracting is permitted with credit to the source. Libraries are permitted to photocopy beyond the limits of U.S. Copyright Law for private use of patrons: 1) those post-1977 articles that carry a code at the bottom of the first page, provided the per-copy fee indicated in the code is paid through the Copyright Clearance Center, 222 Rosewood Drive, Danvers, MA 01923 USA; 2) pre-1978 articles without fee. Instructors are permitted to photocopy isolated articles for noncommercial classroom use without fee. For all other copying, reprint, or republication permis-sion, write to IEEE Service Center, 445 Hoes Lane, Piscataway, NJ 08854 USA. Copyright ©2014 by the Institute of Electrical and Electronics Engineers, Inc. All rights reserved. Periodicals postage paid at New York, NY, and at additional mailing offices. Postmaster: Send address changes to IEEE Signal Processing Magazine, IEEE, 445 Hoes Lane, Piscataway, NJ 08854 USA. Canadian GST #125634188 Printed in the U.S.A.
[IEEE SIGNAL PROCESSING magazine]
IEEE PERIODICALSMAGAZINES DEPARTMENT
Jessica BarraguéManaging Editor
Geraldine Krolin-TaylorSenior Managing Editor
Susan SchneidermanBusiness Development Manager+1 732 562 3946 Fax: +1 732 981 1855
Felicia SpagnoliAdvertising Production Manager
Janet DudarSenior Art Director
Gail A. SchnitzerAssistant Art Director
Theresa L. SmithProduction Coordinator
Dawn M. Melley Editorial Director
Peter M. TuohyProduction Director
Fran ZappullaStaff Director, Publishing Operations
IEEE prohibits discrimination, harassment, and bullying. For more information, visit http://www.ieee.org/web/aboutus/whatis/policies/p9-26.html.
[COVER]IMAGE COURTESY OF CNR-IREA AND DLR-IMF
Previous Page | Contents | Zoom in | Zoom out | Front Cover | Search Issue | Next Page qqM
Mq
qM
MqM
THE WORLD’S NEWSSTAND®
Previous Page | Contents | Zoom in | Zoom out | Front Cover | Search Issue | Next Page qqM
Mq
qM
MqM
THE WORLD’S NEWSSTAND®
_____

IEEE Member Digital Library is an exclusive subscription available only to active IEEE members.
With two great options designed to meetthe needs—and budget—of every member, the IEEE Member Digital Library providesfull-text access to any IEEE journal articleor conference paper in the IEEE Xplore®
digital library.
Simply choose the subscription that’sright for you:
IEEE Member Digital LibraryDesigned for the power researcher who needs a more robust plan. Access all the IEEE content you need to explore ideasand develop better technology.
Get the latest technology research.
Try the IEEE Member Digital Library—FREE!www.ieee.org/go/trymdl
2 Ways to Access theIEEE Member Digital Library
Now...
IEEE Member Digital Library BasicCreated for members who want to stayup-to-date with current research. Access IEEE content and rollover unused downloads for
Previous Page | Contents | Zoom in | Zoom out | Front Cover | Search Issue | Next Page qqM
Mq
qM
MqM
THE WORLD’S NEWSSTAND®
Previous Page | Contents | Zoom in | Zoom out | Front Cover | Search Issue | Next Page qqM
Mq
qM
MqM
THE WORLD’S NEWSSTAND®

IEEE SIGNAL PROCESSING MAGAZINE [4] JULY 2014
[from the EDITOR]Abdelhak Zoubir
Editor-in-Chief [email protected]
http://signalprocessingsociety.org/publications/periodicals/spm
On 10 April 2014, I received an e-mail from Petar M. Djuric that was sent to all members of the IEEE Sig-nal Processing Society
(SPS), with the subject title, “The Power of a Name” [1]. The message provides a brief description of the evolution of the Society before suggesting that the time has come for another Society name change.
At the Board of Governors meeting in December 2013, a committee was formed (Philip Chou, Walter Kellermann, Antho-ny Kuh, Anna Scaglione, and Petar M. Djuric ´) to explore the possibility of chang-ing the Society’s name, an issue that has been a topic of discussion for quite a long time. But what is the motivation for such a change?
There has been a series of columns and editorials published in IEEE Signal Pro-cessing Magazine (SPM) over the last decade that have addressed the important issue of what signal processing conveys for a layperson [2], [3]. More recently, in the new SPM column, “Reflections,” José M.F. Moura et al. shared their “reflections” on this thought-provoking topic, i.e., signal processing inside [4].
There is no doubt in my mind that we must do something to increase awareness about our profession among the public at large. The fundamental question we should ask is whether a name change alone would achieve this goal. Clearly, a change of name would help, but to what? The e-mail Petar M. Djuric ´ sent on behalf of the committee can be found in [1]. It invites all SPS members to provide feed-
back on this topic and offers suggestions for some new names.
I took the time to read the many com-ments made by colleagues, and I found the exercise worthwhile. Some of the critics provide good arguments as to why the Society should stick with the name “Signal Processing.” One strong argument against a name change is that “The public (as a whole) has little awareness of what most professions really involve, or what they’re called. That is no reflection on the names or the crafts involved, and very clearly doesn’t matter…” The many in favor of a name change argue that they are “in favor of changing the name if the name chosen is broadening the domain of interest of SPS members in the sense of representing current (and eventually future) research and professional activities…”
The page is still available for com-ments, and we are interested in receiving feedback. So far, there seems to be interest in adding the word “Information” to “Sig-nal.” It is the committee’s responsibility to evaluate the many comments provided and to draw conclusions.
My personal view is that a name change would help, indeed. More importantly, however, is to raise awareness about our profession among the laypeople. In my editorial in the May 2013 issue of SPM [5], I wrote, “My personal view is that we have to be more active in disseminating success stories of signal processing, not only to the decision makers, but also to the public at large.” One of the commentators in [1] wrote, “When people ask ‘What is SP?’ I say it is everything that goes on inside a smart-phone and their eyes suddenly light up.”
Our mandate is to increase awareness to the point where the public no longer questions what signal processing is. If we
were to change the name, and the public still does not know what our profession involves, it would solidify what the observ-er before wrote, “The public (as a whole) has little awareness of what most profes-sions really involve.” This would not help the Society, and we would start the very same exercise years down the road. The real challenge is to actively promote our discipline so that just the mention of sig-nal processing without any explanation would cause the public’s eyes to light up.
SPM is an outstanding vehicle to raise awareness among professionals in signal processing and among professionals in cognate areas through columns, forum, and the eNewsletter. It gives me great pleasure to introduce the new area editor (eNewsletter), Dr.-Ing. Christian Debes, whose mandate is to reshape the eNews-letter in this new area of communication. He will replace Z. Jane Wang, whom I thank for her hard work as area editor and who will support SPM in her new role as a member of the Senior Editorial Board.
REFERENCES[1] P. M. Djuric . The Power of a Name. [Online]. Avail-able: http://www.signalprocessingsociety.org/uploads/email/power_of_a_name.html
[2] K. J. R. Liu, “Signal processing inside?” IEEE Sig-nal Processing Mag., vol. 21, no. 5, p. 2, Sept. 2004.
[3] J. M. F. Moura, “What is signal processing?” IEEE Signal Processing Mag., vol. 26, no. 6, p. 6, Nov. 2009.
[4] J. M. F. Moura, J. L. Flanagan, and N. S. Jayant, “The discipline of signal processing,” IEEE Signal Processing Mag., vol. 30, no. 6, pp. 174–176, Nov. 2013.
[5] A. M. Zoubir, “Dissemination of research findings: What role can we play?” IEEE Signal Processing Mag.,vol. 30, no. 3, p. 2, May 2013.
[SP]
Signal Processing: Is it Time to Change the Society’s Name?
Digital Object Identifier 10.1109/MSP.2014.2311862
Date of publication: 13 June 2014
Previous Page | Contents | Zoom in | Zoom out | Front Cover | Search Issue | Next Page qqM
Mq
qM
MqM
THE WORLD’S NEWSSTAND®
Previous Page | Contents | Zoom in | Zoom out | Front Cover | Search Issue | Next Page qqM
Mq
qM
MqM
THE WORLD’S NEWSSTAND®
___________________
___________________
______________

90°SPLITTERS
RoHS compliant
from
$199ea. qty. 10005 MHz to 8 GHz
With over 70 different models, our two-way 90° splitters make the perfect building blocks for many designs including balanced amplifiers, IQ modulator/demodulators, single sideband modulators, image rejection mixers, voltage variable attenuators, phase shifters, and more! Use them for signal processing designs requiring 90° phase offset or to insulate your circuit from reflective elements. The industry’s widest range of frequencies, extra low amplitude and phase unbalance, and packages as small as 0.08 x 0.05” make these hybrids essential tools for your RF design toolbox.
Tiny, robust, low-cost LTCC models are now available in small quantity reels,with standard counts of 20, 50, 100, 200, 500, 1000, or 2000 at no extra cost! For full performance details and product availability, visit minicircuits.com.
Order online today and have units in-hand as soon as tomorrow!
463 rev K
Mini-Circuits®
www.minicircuits.com P.O. Box 35 166, Brooklyn, NY 11235-0003 (718) 934-4500 [email protected]
Previous Page | Contents | Zoom in | Zoom out | Front Cover | Search Issue | Next Page qqM
Mq
qM
MqM
THE WORLD’S NEWSSTAND®
Previous Page | Contents | Zoom in | Zoom out | Front Cover | Search Issue | Next Page qqM
Mq
qM
MqM
THE WORLD’S NEWSSTAND®
______________

[president’s MESSAGE]
IEEE SIGNAL PROCESSING MAGAZINE [6] JULY 2014
Alex Acero 2014–2015 SPS President
At the Forefront in Technical Publications
The IEEE publishes nearly one third of the world’s technical literature in electrical engi-neering, computer science, and electronics. This includes
more than 154 transactions, journals, and magazines published annually. The IEEE Signal Processing Society (SPS) produces seven of those publications: IEEE Trans-actions on Signal Processing, IEEE Sig-nal Processing Magazine, IEEE Transac-tions on Image Processing, IEEE Signal Processing Letters, IEEE Transactions on Audio, Speech, and Language Processing, Journal on Selected Topics on Signal Pro-cessing and IEEE Transactions on Infor-mation Forensics and Security.
Included in the tier-2 Society mem-bership fee of US$35 a year, you receive electronic access to all seven of these publications. In 2013, these seven publica-tions produced 20,052 pages, a significant increase over the 14,419 pages published in 2008.
All of these IEEE journals are hybrid open access, meaning that authors of manuscripts accepted for publication are given the choice of paying to have their ar-ticles made freely available to all readers. These open access papers go through the identical peer-reviewed quality standards as conventional articles. This mechanism is valuable for authors whose research was funded by a government grant that re-quires open access publications.
The SPS is the fourth-largest Society by membership and second in publishing volume. This is a huge enterprise that requires many authors submitting manu-scripts, numerous volunteers reviewing them, and staff putting it all together. I would like to offer my most sincere “thank you” to all. For those of you who are
experts in one of our published fields, we welcome your assistance in helping us review qualified papers.
While quantity is an important metric, quality is even more important. Quality is a multidimensional assessment evaluated with metrics such as timeliness and impact factor. Timeliness is measured as average time from submission to publica-tion. The impact factor of a journal is the average number of citations received per paper published in that journal during the two preceding years. The IEEE is also using additional metrics to measure the stature of a journal in a field.
The IEEE Periodicals Review Commit-tee is tasked with ensuring quality, review-ing all IEEE journals and magazines every five years. In 2014, it was our turn. This process started with a thorough report prepared by the Society’s vice pres-ident of publications, publications board, and staff. In February, the Review Com-mittee reviewed the reports and spent about 45-min per publication asking questions of the Society leadership and the publications’ editors-in-chief. Their overall feedback was quite positive. Many of our publications have an impact factor over “3,” while IEEE Transactions on Sig-nal Processing ranks fifth in total cita-tions and IEEE Signal Processing Maga-zine has consistently been in the top five in impact factor. The average time from submission to publication across all our periodicals is under a year, with the fastest being about three months for IEEE Sig-nal Processing Letters. The Review Com-mittee was also complimentary of our publications processes, especially our recent policy of allowing papers in IEEE Signal Processing Letters to be presented at conferences.
In addition to our own publications, SPS manages IEEE Transactions on Multi-media, and we cosponsor other periodicals
covering topics such as cloud computing, big data, wireless communications, sen-sors, life sciences, the Internet of Things, and much more.
Reflecting the needs of our members in a fast-growing field, we have obtained approval for a new 2015 journal: IEEE Transactions on Computational Imaging.The IEEE Engineering in Medicine and Biology, IEEE Circuits and Systems, and IEEE Geoscience and Remote Sensing Societies are participating with us in this new journal, which we will manage. According to its approved scope, “The IEEE Transactions on Computational Imaging will publish articles where com-putation plays an integral role in the image formation process. Papers will cover all areas of computational imaging ranging from fundamental theoretical methods to the latest innovative computational imag-ing system designs. Topics of interest will include advanced algorithms and mathe-matical techniques, model-based data inversion, methods for image and signal recovery from sparse and incomplete data, techniques for nontraditional sensing of image data, methods for dynamic informa-tion acquisition and extraction from imag-ing sensors, software and hardware for efficient computation in imaging systems, and highly novel imaging system design.” I encourage all interested authors to submit high-quality papers to this journal.
Unwilling to rest on our laurels, I con-tinue to appreciate your suggestions for further improving our publications pro-cesses and content.
[SP]Digital Object Identifier 10.1109/MSP.2014.2311863
Date of publication: 13 June 2014
Previous Page | Contents | Zoom in | Zoom out | Front Cover | Search Issue | Next Page qqM
Mq
qM
MqM
THE WORLD’S NEWSSTAND®
Previous Page | Contents | Zoom in | Zoom out | Front Cover | Search Issue | Next Page qqM
Mq
qM
MqM
THE WORLD’S NEWSSTAND®
____________

Instant Access to IEEE Publications
Start today to maximize your research potential.
Contact: [email protected]/digitalsubscriptions
Enhance your IEEE print subscription with online access to the IEEE Xplore® digital library.
Download papers the day they are published
Discover related content in IEEE Xplore
Signifi cant savings over print with an onlineinstitutional subscription
“IEEE is the umbrella thatallows us all to stay currentwith technology trends.”
Dr. Mathukumalli VidyasagarHead, Bioengineering Dept. University of Texas, Dallas
Previous Page | Contents | Zoom in | Zoom out | Front Cover | Search Issue | Next Page qqM
Mq
qM
MqM
THE WORLD’S NEWSSTAND®
Previous Page | Contents | Zoom in | Zoom out | Front Cover | Search Issue | Next Page qqM
Mq
qM
MqM
THE WORLD’S NEWSSTAND®
________________

[reader’s CHOICE]
IEEE SIGNAL PROCESSING MAGAZINE [8] JULY 2014
Top Downloads in IEEE Xplore
This issue’s “Reader’s Choice” column contains a list of articles published by the IEEE Signal Processing Society (SPS) that ranked
among the top 100 most downloaded IEEE Xplore articles through December 2013. The table below contains the cita-tion information for each article and the rank obtained in IEEE Xplore. The
highest rank obtained by an article in this time frame is indicated in bold. Your suggestions and comments are welcome and should be sent to Associate Editor Michael Gormish ([email protected]).
Digital Object Identifier 10.1109/MSP.2014.2312184
Date of publication: 13 June 2014
TITLE, AUTHOR, PUBLICATION YEARIEEE SPS PUBLICATIONS ABSTRACT
RANK IN IEEE TOP 100 (2013)
N TIMESIN TOP
100 (SINCEJAN 2011)DEC NOV OCT SEP AUG JUL
A TUTORIAL ON PARTICLE FILTERSFOR ONLINE NONLINEAR/NON-GAUSSIAN–BAYESIAN TRACKINGArulampalam, M.S.; Maskell, S.;Gordon, N.; Clapp, T.;IEEE Transactions on Signal Processingvol. 50, no. 2, 2002, pp. 174–188
This paper reviews optimal and suboptimal Bayesian algorithms for nonlinear/non-Gaussian tracking problems, with a focus on particle filters. Variants of the particle filter are introduced within a framework of the sequential importance sampling (SIS) algorithm and compared with the standard EKF.
8 6 25 8 4 4 33
AN INTRODUCTION TOCOMPRESSIVE SAMPLINGCandes, E.J.; Wakin, M.B.IEEE Signal Processing Magazinevol. 25, no. 2, Mar. 2008, pp. 21–30
This article surveys the theory of compressive sampling, also known as compressed sensing or CS, a novel sensing/sampling paradigm that goes against the common wisdom in data acquisition.
10 11 10 15 13 19 35
IMAGE QUALITY ASSESSMENT:FROM ERROR VISIBILITY TOSTRUCTURAL SIMILARITYWang, Z.; Bovik, A.C.; Sheikh, H.R.; Simoncelli, E.P.IEEE Transactions on Image Processing vol.13, no. 4, 2004, pp. 600–612
This paper introduces a framework for quality assessment based on the degradation of structural information. Within this framework a structure similarity index is developed and evaluated. MATLAB code available.
28 24 33 37 38 30 15
IMAGE SUPER-RESOLUTION VIASPARSE REPRESENTATIONYang, J.; Wright, J.; Huang, T.S.; Ma, Y.IEEE Transactions on Image Processingvol. 19, no. 11, 2010, pp. 2861–2873
This paper presents an approach to single-image superresolution, based upon sparse signal representation of low- and high-resolution patches.
31 44 51 51 82 68 7
SUPER-RESOLUTION IMAGERECONSTRUCTION: A TECHNICALOVERVIEWCheol Park, S.; Kyu Park, M.; Gi Kang, M.IEEE Signal Processing Magazinevol. 20, no. 3, 2003, pp. 21–36
This article introduces the concept of super resolutions (SR) algorithms and presents a technical review of various existing SR methodologies and models the low-resolution image acquisition process.
34 45 90 16
Previous Page | Contents | Zoom in | Zoom out | Front Cover | Search Issue | Next Page qqM
Mq
qM
MqM
THE WORLD’S NEWSSTAND®
Previous Page | Contents | Zoom in | Zoom out | Front Cover | Search Issue | Next Page qqM
Mq
qM
MqM
THE WORLD’S NEWSSTAND®
___________

IEEE SIGNAL PROCESSING MAGAZINE [9] JULY 2014
TITLE, AUTHOR, PUBLICATION YEARIEEE SPS PUBLICATIONS
ABSTRACT RANK IN IEEE TOP 100 (2013)
N TIMESIN TOP
100 (SINCEJAN 2011)DEC NOV OCT SEP AUG JUL
COMPRESSIVE SENSING[LECTURE NOTES]Baraniuk, R.G.IEEE Signal Processing Magazine vol. 24, no. 4, 2007, pp. 118–121
This lecture note presents a new method to capture and represent compressible signals at a rate significantly below the Nyquist rate. This method, called compressive sensing, employs nonadaptive linear projections that preserve the structure of the signal; the signal is then reconstructed from these projections using an optimization process.
39 58 60 95 71 9
SCALING UP MIMO: OPPORTUNITIESAND CHALLENGES WITH VERY LARGEARRAYS Rusek, F.; Persson, D.; Buon Kiong L.; Larsson, E.G.; Marzetta, T.L.; Edfors, O.; Tufvesson, F.IEEE Signal Processing Magazine vol. 30, no. 1, 2013, pp. 40–60
The more antennas the transmitter/receiver is equipped with, and the more degrees of freedom that the propagation channel can provide, the better the performance in terms of data rate or link reliability. This article quantifies the relibality and acheivable rates.
43 75 73 10
THE DISCIPLINE OF SIGNAL PROCESSING: PART 2 [REFLECTIONS] Kwasinski, A; Kaveh, M.; Deng, L.IEEE Signal Processing Magazinevol. 31, no. 1, 2014, pp. 157–159
This article discusses the field of signal processing engineering and reports on applications and technologies supported by its use.
62 1
IMAGE PROCESSING USING SMOOTHORDERING OF ITS PATCHES Ram, I.; Elad, M.; Cohen, I.IEEE Transactions on Image Processingvol. 22, no. 7, 2013, pp. 2764–2774
This paper extracts overlapping image patches, orders these patches and applies one dimensional filtering to the reordered set of pixels. These techniques are applied to denoising and inpainting.
63 90 36 12 9 15 7
IMAGE INPAINTING: OVERVIEWAND RECENT ADVANCES Guillernot, C.; Le Meur, O.IEEE Signal Processing Magazinevol 31. no. 1, 2014, pp. 127–144
A survey of the processes of restoring missing or damaged areas in an image.
94 1
VECTOR-VALUED IMAGE PROCESSINGBY PARALLEL LEVEL SETS Ehrhardt, M.J.; Arridge, S.R.IEEE Transactions on Image Processingvol. 23, no. 1, pp. 9–18
This paper considers the components of an image as a vector. By minimizing large angles, parallel level sets are obtained and used for demosaicking.
98 1
ROBUST PART-BASED HAND GESTURERECOGNITION USING KINECT SENSOR Ren, Z.; Yuan, J.; Meng, J.; Zhang, Z.IEEE Transactions on Multimediavol. 15, no. 5, 2013, pp. 1110–1120
This paper focuses on building a robust part-based hand gesture recognition system using Kinect sensor. To handle the noisy hand shapes obtained from the Kinect sensor, we propose a novel distance metric, finger-Earth mover’s distance, to measure the dissimilarity between hand shapes.
93 1
A GENERALIZED MEMORYPOLYNOMIAL MODEL FOR DIGITALPREDISTORTION OF RF POWERAMPLIFIERSMorgan, D.R.; Ma, Z.; Kim, J.;Zierdt, M.G.; Pastalan, J.IEEE Transactions on Signal Processingvol. 54, no. 10, 2006, pp. 3852–3860
This paper reviews predistortion models based on memory polynomials and proposes a new generalized memory polynomial with results measured using a real 30-W, 2-GHz power amplifier.
1 1
[SP]
Previous Page | Contents | Zoom in | Zoom out | Front Cover | Search Issue | Next Page qqM
Mq
qM
MqM
THE WORLD’S NEWSSTAND®
Previous Page | Contents | Zoom in | Zoom out | Front Cover | Search Issue | Next Page qqM
Mq
qM
MqM
THE WORLD’S NEWSSTAND®

John Edwards[special REPORTS]
IEEE SIGNAL PROCESSING MAGAZINE [10] JULY 2014 1053-5888/14/$31.00©2014IEEE
Signal Processing: On the Edge of Astronomy’s New Frontier
Digital signal processing (DSP) plays several impor-tant roles in modern radio astronomy, such as pro-cessing data to create high-
resolution radio images, isolating weak emissions from celestial sources, and reducing distortions in incoming sig-nals. DSP can also manage beam-forming, a complex process that allows radio signals to be received from across the sky from any direction, and even multiple directions simultaneously.
Many astronomy projects are now relying on advanced signal processing techniques to probe the edges of the uni-verse to extend humanity’s understand-ing of its origins, scan the skies to image exoplanets—worlds outside our solar system—and investigate many of the major outstanding questions in astron-omy. Here’s a look at two of them.
MORE ANTENNAS, MORE RECEIVERSRadio astronomy is currently undergoing a fundamental change, perhaps its most important development since amateur radio operator and pioneer radio astrono-mer Grote Reber built the first parabolic dish radio telescope (measuring 9 m in diameter) in his Illinois backyard in 1937. In the years that followed, very large tele-scope dishes became icons of radio astronomy research.
Now, however, radio astronomy is moving toward antennas systems concen-trated among individual receivers. The 2010 Low Frequency Array (LOFAR) proj-ect, for example, uses approximately 50 stations, each consisting of at least 96 low band antennas and 768 high band anten-nas concentrated among approximately
48 receiving stations. Extending this approach even further is the Square Kilo-metre Array (SKA), planned for full oper-ation by 2030.
SKA’s designers anticipate deploying somewhere in the neighborhood of 50,000 networked receivers and perhaps as many as 2.5 million antennas. Many of the receivers will be located inside an inner core measuring approximately 100 km in length. Some receivers, however, will be arranged into a set of spiral arms measur-ing 1,500 km in length. With the help of interferometry signal processing, a collec-tion of relatively small radio telescopes will be able to operate as single, gigantic “virtual” instrument possessing a maxi-mum reception area equal to the com-bined area of the individual dishes (which for SKA, as its name indicates, is a square kilometer) (Figure 1). The system’s base-line—a measure of the telescope’s resolv-ing power—will be equal to the distance between the furthest individual compo-nents, roughly 200 km. “We have about 350 people involved in the current phase, the preconstruction phase, and we have a huge amount of interest from industry, from signal processing companies—com-panies that make field-programmable gate arrays (FPGAs), for example,” says Tim Cornwell, SKA’s architect.
SKA will be built in the southern hemisphere with cores in South Africa and Australia, locations where the view of the Milky Way Galaxy is best and radio interference is less of a problem. Upon completion, SKA promises to be approxi-mately 50 times as sensitive as existing radio telescopes and capable of surveying the sky about 10,000 times faster. The telescope is also expected to generate a torrent of data—up to 160 Gb/s second from each antenna. Much of that infor-mation will be used to help researchers
find answers to some of the biggest out-standing questions in astronomy. SKA is being designed, for example, to help astronomers search for gravitational waves, the ripples in the structure of space–time predicted by Albert Einstein’s general relativity. “If you have a large number of pulsars all over the sky, you can use them to look for gravitational waves,” Cornwell shares. “That’s one of the projects that will be done, a survey of the entire sky looking for pulsars.”
The system also promises to allow more astronomers to join the hunt for exoplanets, using an investigative tool with far greater resolving power than existing radio telescopes. Even more tan-talizing is the prospect of using SKA to look back in time to the universe’s so-called Dark Ages—a period extending up to some 400 million years after the Big Bang—an era of darkness that existed before the first stars and galaxies were formed and about which very little is directly known.
WHAT’S OLD IS NEWUtilizing interferometry as a technique to enhance a radio telescope’s resolving power isn’t a new idea. Many existing radio telescopes, including LOFAR, are integrated into such networks. SKA, however, takes the approach to a new level. Planners envision a Very Long Baseline Interferometry Network (VLN) that will combine telescopes separated by thousands of kilometers to form a radio interferometer with resolution comparable to a single dish measuring thousands of kilometers in diameter. “Digital signal processing will enable us to collect the very large amount of data that we need and to process it to get all the information out,” Cornwell notes. “Radio astronomy has always been at the
Digital Object Identifier 10.1109/MSP.2014.2312176
Date of publication: 13 June 2014
Previous Page | Contents | Zoom in | Zoom out | Front Cover | Search Issue | Next Page qqM
Mq
qM
MqM
THE WORLD’S NEWSSTAND®
Previous Page | Contents | Zoom in | Zoom out | Front Cover | Search Issue | Next Page qqM
Mq
qM
MqM
THE WORLD’S NEWSSTAND®

IEEE SIGNAL PROCESSING MAGAZINE [11] JULY 2014
forefront of digital signal processing because of this very factor.”
Interferometry is used to obtain high-resolution information about a particular radio source. “At its heart, interferometry is just a statistical technique,” Cornwell explains. “The noise signals at two or more antennas are correlated via one of a number of techniques (mostly digital/computer now).” If the signals are totally correlated then there must be a small source on the sky producing the same signal in different antennas. “The differ-ence in time between the signal landing at each telescope gives information about the location of the radio source on the sky,” Cornwell says. If the correlation shows more complex behavior then the source itself must be complicated. “A two-dimensional inverse Fourier transform (FT) will produce and image of the source,” Cornwell remarks.
Data from each SKA telescope will be transmitted to a system central correlator linked to high-speed computers that are designed to merge signals from multiple telescopes. The correlator will be situated near the array’s core, where the data will be combined and synchronized. Filters will then be used to separate the radio fre-quency signals required for astronomy from any interfering radio frequency sig-nal that would contaminate the data.
“Basically in radio, if you want to see objects at a very great distance, you have to deal with very faint signals and you have to collect a lot of those signals,” Cornwell says. “In modern processing, we find that to get high-accuracy infor-mation out, we have do DSP,” he adds.
Data from the correlator will be sent to another location for processing. “In South Africa one option would be in Cape Town,” Cornwell says. “In Cape Town there will be a supercomputer, and it will take all of this data and make an image from the information over the region you’re looking at.”
Images will also have to be stored inside a massive database, a system that has yet to be developed. “The astronomer will connect to the archive and download the image and look at it and do astrophys-ics,” Cornwell says “By the time we’re up and running on our network internally,
we’ll have something like an order of magnitude more data flowing than is on the entire global Internet today.”
SKA will also utilize beamforming, the critical signal processing technique used in radio astronomy to observe radio signals from specific regions of the sky. While radio dishes mechanically turn to observe an area of sky, SKA’s aperture array antennas will have no moving parts, so the beams must be electroni-cally steered to allow the observation of specific sky regions.
SKA will also use signal processing to automatically detect the repetitive pulsed signal of objects such as pulsars buried in the data. Besides pulsars, the SKA will be able to automatically detect transient astronomical events, including supernovae, gamma-ray bursts, and microlensing events, which can tempo-rarily brighten objects in the far reaches of the universe due to the gravity of a foreground object acting as a lens. Both methods of autodetection are time-frequency-based observations and require high time resolution data.
Cornwell notes that SKA will chal-lenge signal processing algorithm devel-opment in two key areas. Faster and better ways will have to be developed to make the high dynamic range images required for SKA science (a ratio of 10^6:1 to 10^7:1). Effective radio inter-ference mitigation algorithms will also be needed to enable observations across wide segments of the radio spectrum. The algorithms used will need to be as
efficient as possible to process the huge amounts of data expected to pour through the system.
SKA’s signal processing will require exceptionally high-speed computer sys-tems that must meet budget, processing, and thermal requirements. Four micro-processing platforms capable of support-ing signal processing are currently being developed and tested by the astronomy engineering community as potential solutions: general-purpose processors, a graphics processing unit, FPGAs, and an application-specific integrated circuit.
Cornwell says he spends a great deal of time thinking about the massive amounts of data that SKA will generate. “Processing that involves going from the data that’s emitted from the correlator through to images—that’s very complex processing, and for SKA 1 [the project’s first phase] it requires a supercomputer running at about 100 petaflops,” he says. “I think that’s going to be one of the real challenges of this project: to get our methods, our algorithms, and our soft-ware to work on that scale.”
EXOPLANET EXPLORATIONLast year, with the help of a basic signal processing technique, a team of Massa-chusetts Institute of Technology (MIT) researchers announced that they had dis-covered an Earth-sized exoplanet, Kepler 78b, a world that orbits around its host star in only 8.5 hours—one of the shortest orbital periods ever detected. The planet has an orbital radius only about
[FIG1] An artist’s rendition of the SKA dish arrays in operation at night. Using a technique known as interferometry, they will be able to combine their data to create an image that would be the same as one created by a much larger single aperture instrument. (Photo courtesy of the SKA Organisation.)
Previous Page | Contents | Zoom in | Zoom out | Front Cover | Search Issue | Next Page qqM
Mq
qM
MqM
THE WORLD’S NEWSSTAND®
Previous Page | Contents | Zoom in | Zoom out | Front Cover | Search Issue | Next Page qqM
Mq
qM
MqM
THE WORLD’S NEWSSTAND®

IEEE SIGNAL PROCESSING MAGAZINE [12] JULY 2014
[special REPORTS]continued
three times the radius of the star. Such close proximity to its host results in an estimated surface temperature as high as 3,000 °K, or more than 5,000 °F. “Some people have taken to calling these really, really close-in Earth-sized planets ‘lava worlds,’ even though we don’t know what they’re made of, or what their surfaces look like,” says Josh Winn, an associate professor of physics at MIT (Figure 2) and a member of the team led by physics pro-fessor emeritus Saul Rappaport.
To discover Kepler 78b, the team pored through more than 150,000 stars monitored by the Kepler Telescope, a space observatory launched by NASA in 2009 to discover Earth-like planets orbit-ing other stars. The goal for the MIT researchers was to look for Earth-sized planets with very short orbital periods. To find such worlds, the team scrutinized light data from thousands of stars, look-ing for dips indicating that a planet may be periodically passing in front of a star.
Yet other types of periodic stellar phe-nomena can also affect light emission, such as a star eclipsing another star. To detect only signals specifically associated with actual planets, physics graduate stu-dent Roberto Sanchis-Ojeda searched through the set of periodic light curves
looking for frequent smaller dips in the data midway between the planetary tran-sits. “We take kind of a shortcut,” Winn says. “We look for the planets that happen to be eclipsing their stars so that, as they go around, their orbit is lined up with the Earth just so, and as the exoplanet’s orbit takes it right in front of the star, it blocks a tiny amount of its light and we can reg-ister that dimming.”
Still, detecting tiny dips among tens of thousands of light curves is lengthy, painstaking work. To accelerate the pro-cess, the researchers turned to signal processing in the form of an FT search. “Signal processing is very much a part of what we do,” Winn says.
The standard algorithm for transit searching is the box least squares (BLS) algorithm, which generally offers the greatest efficiency for transits with a duration that is short in comparison to the orbital period. Yet BLS also presents some drawbacks. One critical problem is that the BLS spectrum includes peaks at multiples of the orbital period and at multiples of the orbital frequency, com-plicating attempts to determine the cor-rect period. Winn notes that BLS spectrum computation is basically a time-domain method. “It is essentially a matched filter for the transit signal (an inverse boxcar function),” he explains. “A detection statistic is computed after searching a range of candidate orbital periods, transit phases, and transit depths.” The researchers also found that the standard BLS algorithm generates spurious signals at periods that are inte-ger multiples of the Kepler sampling period of close to half an hour.
Winn credits Rappaport with suggest-ing the Fourier approach. “He was really the one who had the insight that we could get much further just by using the plain old FT as opposed to the very com-plicated wavelet-based matched filter,” Winn says. “He’s retired, but he’s spend-ing his retirement finding planets with Kepler data.”
The spurious peaks often lead to sig-nificant noise background in searches for planets with periods less than half a day.
While a method exists to partially sup-press the spurious peaks, the researchers felt that the introduction of an additional step would complicate the search. The team was also reluctant to follow in the footsteps of several other exoplanet re-search projects that scoured the Kepler database using a BLS algorithm.
Winn and his colleagues were able to take advantage of the fact that FTs can be computed so quickly that it was practical to repeat the search of the entire data-base many times while the code was being developed. Although the FT of a transit signal has power that is divided among several harmonics, the number of significant harmonics below the Nyquist limit declines as the orbital period is decreased. The FT is therefore quite sen-sitive to the shortest-period planets.
According to the researchers, the ratio of transit duration to period, or duty cycle, varies as P−2/3 (where P is the planet’s orbital period) and is as large as 20% for ultra-short-period planets, in which case the efficacy of the FT search is nearly equivalent to that of the BLS. Additionally, it’s rather simple to detect a peak in the FT and its equally spaced harmonics, either by means of an auto-mated algorithm or by eye. Meanwhile, the absence of any subharmonics is a useful and important property of a true planet transit as opposed to a back-ground blended binary.
In retrospect, Winn is pleased that taking a seemingly counterintuitive approach led the researchers to an important discovery. “The nice thing about the FT is that it’s as simple as any-thing that you learn in your first signal processing class in college, and we’re able to compute them extremely quickly,” he says. “Even though it’s not what the orthodox procedure would be, it turned out to work really well because it was so fast and so simple, and we could really tune it to the specific problem.”
AUTHORJohn Edwards ([email protected]) is a technology writer based in the Phoenix, Arizona area.
[FIG2] Josh Winn, associate professor of physics at MIT, discovered an exoplanet with the help of a basic signal processing technique. (Photo courtesy of MIT.)
Previous Page | Contents | Zoom in | Zoom out | Front Cover | Search Issue | Next Page qqM
Mq
qM
MqM
THE WORLD’S NEWSSTAND®
Previous Page | Contents | Zoom in | Zoom out | Front Cover | Search Issue | Next Page qqM
Mq
qM
MqM
THE WORLD’S NEWSSTAND®
_______________

1053-5888/14/$31.00©2014IEEE IEEE SIGNAL PROCESSING MAGAZINE [13] JULY 2014
Despite barriers relating to regulation, patient accep-tance, and privacy concerns, market researchers estimate the growth of the mobile
health-care market at US$9 billion in 2014. Looking ahead, analysts are project-ing growth in the mHealth sector at a compound annual growth rate of nearly 40% over the next six years. Equally impressive, mHealth has the potential to dramatically reduce the cost of health care.
But the sector has become a moving target, with rapid changes in mobile device technology and technical standards with design cycles that are longer than most wireless products, mainly due to regulatory approval requirements. Then there’s the market itself—it’s becoming more con-sumer centric, intensifying competition among the market’s incumbent players.
One of the most influential organiza-tions in the field is the Continua Health Alliance, an international nonprofit organi-zation enabling end-to-end, plug-and-play connectivity of personal health devices and services with more than 220 member com-panies, including medical device, telecom, health tech service, and health-care indus-try leaders, working to develop new stan-dards in medical electronics and take advantage of existing standards. While not formally a standards organization itself, Continua also works to identify and resolve gaps in standards to ensure that mHealth devices are interoperable.
The alliance has been a major contrib-utor to technical standards developed by the IEEE Standards Association (IEEE-SA), including the development of the IEEE 802.11 family of standards, and has
worked with the Wi-Fi Alliance to facilitate and promote the adoption of Wi-Fi tech-nology in connected health applications. Since its approval as a formal standard, 802.11 has become the dominant wireless area network technology, while Bluetooth, ZigBee, and near-field communications (NFCs) continue to gain market share in mHealth products.
For this second in a series of Q&A fea-tures for IEEE Signal Processing Maga-zine (SPM), we talked to Michael Kirwan (Figure 1), technical operations director of Continua, about its relationship with the IEEE-SA, its collaboration with other health organizations, and changes in its new design guidelines for mHealth origi-nal equipment manufacturers.
IEEE SPM: You recently signed an agree-ment to collaborate with other health industry organizations. What’s that about?
Michael Kirwan: Continua recently partnered with the newly formed Personal Connected Health Alliance (PCHA). This is a collaboration with Continua, the mHealth Summit, and Healthcare Infor-mation and Management System Society (HIMSS) to establish a global nonprofit al-liance representing the consumer voice in personal connected health. PCHA will pro-mote personal connected health solutions featuring interoperable, plug-and-play de-vices and systems, such as mhealth tools, remote monitoring devices, and sensors. Each member organization brings its own perspective to the collaboration, but this will strengthen Continua’s international expansion efforts. The Continua brand is unchanged. Our vision and mission re-main the same, with the same processes, events, and working groups. We will con-tinue to focus on standards.
We have also signed a strategic agree-ment with IEEE Standards to help
accelerate and broaden the adoption of globally relevant standards-based tech-nologies for the health-care arena. IEEE Standards developed the IEEE 11073 family of standards designed for the entire health-care continuum for per-sonal health device communications. The collaboration follows the U.S. Food and Drug Administration (FDA) announce-ment in November 2013 that it recog-nized the importance of interoperability in standards and published what it called its “final guidance” for developers of mobile medical devices last year in Sep-tember. The agency said it will oversee apps that function like medical devices, but it does not expect manufacturers to submit premarket review applications or to register and list their apps with the FDA. It also listed 25 standards that help support medical device interoperability, including 12 IEEE 11073 standards.
IEEE SPM: Will the PCHA have any influence on the development of IEEE 11073 standards updates?
Kirwan: Absolutely. Continua mem-bers are also members of the IEEE Stan-dards working groups that developing
Health Alliance Boosts Influence in Standards Development
Ron Schneiderman
Digital Object Identifier 10.1109/MSP.2014.2315332
Date of publication: 13 June 2014
[FIG1] Michael Kirwan is the technicaloperations director of the Continua Health Alliance. (Photo courtesy of the Continua Health Alliance.)
Previous Page | Contents | Zoom in | Zoom out | Front Cover | Search Issue | Next Page qqM
Mq
qM
MqM
THE WORLD’S NEWSSTAND®
Previous Page | Contents | Zoom in | Zoom out | Front Cover | Search Issue | Next Page qqM
Mq
qM
MqM
THE WORLD’S NEWSSTAND®

IEEE SIGNAL PROCESSING MAGAZINE [14] JULY 2014
[special REPORTS]continued
these standards. Of course, other organi-zations are involved with the IEEE-SA, such as universities, that are not mem-bers of Continua.
IEEE SPM: You publish Continua Design Guidelines every year to facili-tate the interoperability and efficient use of smartphones and tablets for con-nected health. What can we expect in the newest version of the guidelines?
Kirwan: Going forward, we’re now working on what we refer to internally as Genome. This will be our 2015 version, and it will add additional device special-ization from IEEE Standards, and addi-tional functionality, along with improvements to the existing guidelines as well. The guidelines also include new initiatives, such as NFCs in smartphones, the adoption of a RESTful (RESTful, or “representational state transfer,” is gener-ally described as the underlying architec-ture for the Web. Focusing on data elements in its construction, it has been used to develop Web services) style archi-tecture to better engage app developers, and SMS-based capability, which can wake up a device to receive data. Conti-nua requires that anything in our guide-lines matches up with IEEE standards.
The Continua Design Guidelines have been adopted by the International Tele-communications Union (ITU) and have been translated into six different lan-guages. The ITU has given final approval of a new standard, Recommendation ITU-T H.810, that is now part of the Continua Design Guidelines. As a next step, Conti-nua will submit testing specifications for ITU-T H.810 for approval by ITU-T’s Study Group 16. This will allow devices to be tested for conformance to the standard.
The guidelines specifically focus on plug-and-play connectivity across hubs (a common connection point for devices in a network), local area net-works, personal area networks, wide area network interfaces, and health records networks. Continua certifica-tion indicates that a mobile device can communicate simply and securely with any other Continua certified product across networks as well as with health records networks.
IEEE SPM: Other than the IEEE Stan-dards Association and ITU, do you work with any other organizations involved in standards development?
Kirwan: One is the Bluetooth Special Interest Group (SIG). I work with them almost daily. I also work with the ZigBee Alliance, the NFC Forum, the USB group on occasion, and others.
IEEE SPM: Who has access to the Con-tinua Design Guidelines?
Kirwan: It’s free from Continua. And it’s free to the ITU. All you have to do is tell us who you are and we’ll send you a copy through a link over the Internet.
IEEE SPM: Do you see any technology bottlenecks in the health-care industry?
Kirwan: Regulation is often an issue. We have a regulatory work group, and we weren’t getting enough guidance from the FDA, and then last year it came out with its “final guidance” for developers of mobile medical devices, giving IEEE stan-dards recognition that its 11,073 stan-dards are relevant to interoperability of medical devices, and how apps should be treated on mobile phones.
Another area we worked on for some time was the shift from an earlier version of Bluetooth that Continua had adopted, which was a health device profile standard by the Bluetooth SIG that was difficult for some companies to implement. The SIG has since switched from that to what is now Bluetooth Low Energy that Continua has adopted and included in its design guidelines. Everyone, including the IEEE, is now on board with the new [Bluetooth] standard, and companies are now design-ing their products to that standard. We’re also working with Google directly on Android to try to get them to support Con-tinua standards.
IEEE SPM: What’s the impact of “big data” technology on the health-care industry?
Kirwan: Our job is to get the data. Without Continua, you’re stuck in propri-etary channels. You’re not going to achieve big data that way. The way you achieve big data is by making your blood pressure cuff work with everything, and to go into every manufacturer’s back-end
system, or in the cloud. You have to do that as a standard, and you can do that with Continua. Then, you can have multi-ple blood pressure cuffs, produced by multiple manufacturers, located around the world, sending data to multiple mobile devices.
IEEE SPM: The Internet of Things and machine-to-machine (M2M) technologies are getting a lot of attention in the indus-try. Is sensor technology currently up to the task of meeting the requirements of mHealth, or so-called connected health, applications?
Kirwan: We’re working with the ITU on M2M. The ITU established a Focus Group on the M2M Service Layer early in January 2012 that would provide a cost-efficient platform, and could be easily deployed. Continua is also a member of oneM2M [a global organization launched in 2012 by seven international standards development organizations, the Associa-tion of Radio Industries and Business, the Telecommunications Technology Committee of Japan, the Alliance for Telecommunications Industry Solutions, the Telecommunications Industry Asso-ciation of the United States, the China Communications Standards Association, the European Telecommunications Stan-dards Institute, and the Telecommunica-tions Technology Association of Korea], which is doing similar work and is prob-ably a lot more interesting. oneM2M is expected to have its first [standards] release in July of this year. They’re devel-oping a new architecture to help every-one build their Internet of Things from apps to systems in a similar way. Conti-nua is helping them create a model of what they should be developing in the future, which would eventually be turned into a formal standard.
IEEE SPM: Is Continua focusing on any one area at the moment?
Kirwan: In terms of standard develop-ment activity, the clinical and personal health devices groups are the busiest right now. But most of our focus in the last year
(continued on page 148)
Previous Page | Contents | Zoom in | Zoom out | Front Cover | Search Issue | Next Page qqM
Mq
qM
MqM
THE WORLD’S NEWSSTAND®
Previous Page | Contents | Zoom in | Zoom out | Front Cover | Search Issue | Next Page qqM
Mq
qM
MqM
THE WORLD’S NEWSSTAND®

Joachim Ender, Moeness G. Amin, Gianfranco Fornaro, and Paul A. Rosen
[from the GUEST EDITORS]
IEEE SIGNAL PROCESSING MAGAZINE [15] JULY 2014
Recent Advances in Radar Imaging
Radar imaging reaches back to the patent on synthetic aper-ture radar (SAR) by John Wiley in the year 1954. From the early days of SAR when
imaging was performed using photo-graphic film technology, to modern times where enormous images can be formed on a single computer in practically no time with exquisite accuracy and resolu-tion, there have been tremendous advanc-es in the field. These advances have been, to some degree, motivated by the increas-ing availability of high-quality SAR data from the ever-expanding fleet of interna-tional airborne and spaceborne SAR sys-tems in both the civilian and military sector. In the civilian sector alone, the Na-tional Aeronautics and Space Administra-tion’s (NASA’s) SEASAT in 1978, followed by the NASA shuttle imaging radars SIR-A,SIR-B, and SIR-C, initiated a remarkable development of international radar mis-sions including Canada’s RADARSAT mis-sion, Japan’s Earth Resources Satellite (JERS) and Advanced Land Observing Sat-ellite (ALOS) missions, Europe’s European Remote Sensing (ERS) and Environmen-tal Satellite (ENVISAT), and NASA’s Shut-tle Radar Topography mission (SRTM), as well as Germany’s TerraSAR-X satellite. These, in turn, have led to a new generation of missions with even greater sophistication in modes and operational characteristics. Airborne SAR test beds that offer even greater resolution and mode diversity often support the satellite programs. The multidecade time series of data these missions provide have inspired research-ers to develop exciting new processing technologies for exploitation, which con-tinue to evolve.
SAR systems are now capable of pro-viding resolutions comparable to optical systems while operating in all weather and times, which are features of key impor-tance for many applications. SAR data pro-vide key information about the imaged area, unique and distinct from what opti-cal systems can provide in that the SAR is sensitive to the electrical and roughness characteristics of the scene rather than its chemical properties. The ability to control the illumination source gives a range of diversity in observations—polarization, phase-time, and frequency dependence—enabling broad applications including classification and change detection, for-estry, soil characterization, monitoring of areas subject to natural and anthropo-genic hazard, and many others.
Air- and space-based sensors that have been realized span frequencies extending from very high frequency to the upper mil-limeter wave region, offering deep explora-tion of scattering phenomenology and insights into the nature of targets and sur-faces. Extended SAR capabilities, such as the Shuttle Radar Topographic mission cross-track interferometer, the TanDEM-X satellite pair and the Constellation of Small Satellites for the Mediterranean Basin Observation (COSMO)/SKYMED constella-tion, have expanded applications of SAR in unique and important ways, including across/along track and repeat pass interfer-ometry techniques for topographic map-ping, velocity estimation of moving targets, and accurate deformation monitoring, as well as multiband operations and polari-metric exploitation: options that add to the almost incredible improvements in geolocating fine-resolution images through precision data processing. Today’s SAR technology offers a cost-effective alterna-tive to traditional techniques, capable of reaching accuracy and measurement
density that are starting to be comparable to lidar systems while retaining synoptic view and global coverage advantages.
This special issue of IEEE Signal Pro-cessing Magazine (SPM) provides an over-view of recent developments in SAR imaging and delineates potential research avenues for further progress in this area. It covers the relevant topics of high-resolu-tion and multistatic SAR imaging, SAR imaging of complex scenarios and buried targets, SAR interferometry, SAR tomogra-phy and polarimetric SAR, and multipath mitigation and exploitation in SAR. The intent is to provide readers with a breadth of topics in the theory and applications of SAR processing, capturing recent develop-ments and highlighting new frontiers.
The first article by Ash et al. addresses the issue of overcoming limitations of tra-ditional SAR imaging based on narrow-band/narrow angle acquisition. It provides an overview of the methods used for wide-angle SAR imaging and deals with prob-lems related to anisotropic scattering and the deviation from point scattering assump-tions and their effects on data interpretation and processing.
Çetin et al. provide an overview of recent research on SAR imaging for increased re-solvability of point scatterers, reduced speck-le, proper segmentation, and robustness to limitations in data quality and quantity.
The article by Fornaro et al. focuses on the developments of SAR interferometry, which has enabled the monitoring of ground deformations with applications to natural hazards as in revealing seismic and volca-nic risks and landslides and underground excavation/withdrawal. It also addresses the developments of SAR tomography that turns interferometric into multidimen-sional (space–time) imaging methods.
Digital Object Identifier 10.1109/MSP.2014.2312464
Date of publication: 13 June 2014 (continued on page 158)
Previous Page | Contents | Zoom in | Zoom out | Front Cover | Search Issue | Next Page qqM
Mq
qM
MqM
THE WORLD’S NEWSSTAND®
Previous Page | Contents | Zoom in | Zoom out | Front Cover | Search Issue | Next Page qqM
Mq
qM
MqM
THE WORLD’S NEWSSTAND®

IEEE SIGNAL PROCESSING MAGAZINE [16] JULY 2014 1053-5888/14/$31.00©2014IEEE
Digital Object Identifier 10.1109/MSP.2014.2311828
Date of publication: 13 June 2014
dvances in radar hardware have enabled the sensing of ever-wider synthesized apertures. In this article, radar video—a sequence of radar images indexed on sub-
aperture—is discussed as a natural, convenient, and revealing representation to cap-
ture wide-angle scattering behavior of com-plex objects. We review the inverse problem of recovering wide-angle scene reflectivity from synthetic aperture radar (SAR) mea-surements, survey signal processing approaches for its solution, and intro-duce a novel Bayesian es-timation method. Exam-ples from measured and simulated scattering data are presented to illustrate scattering behavior conve-niently revealed by the SAR video framework.
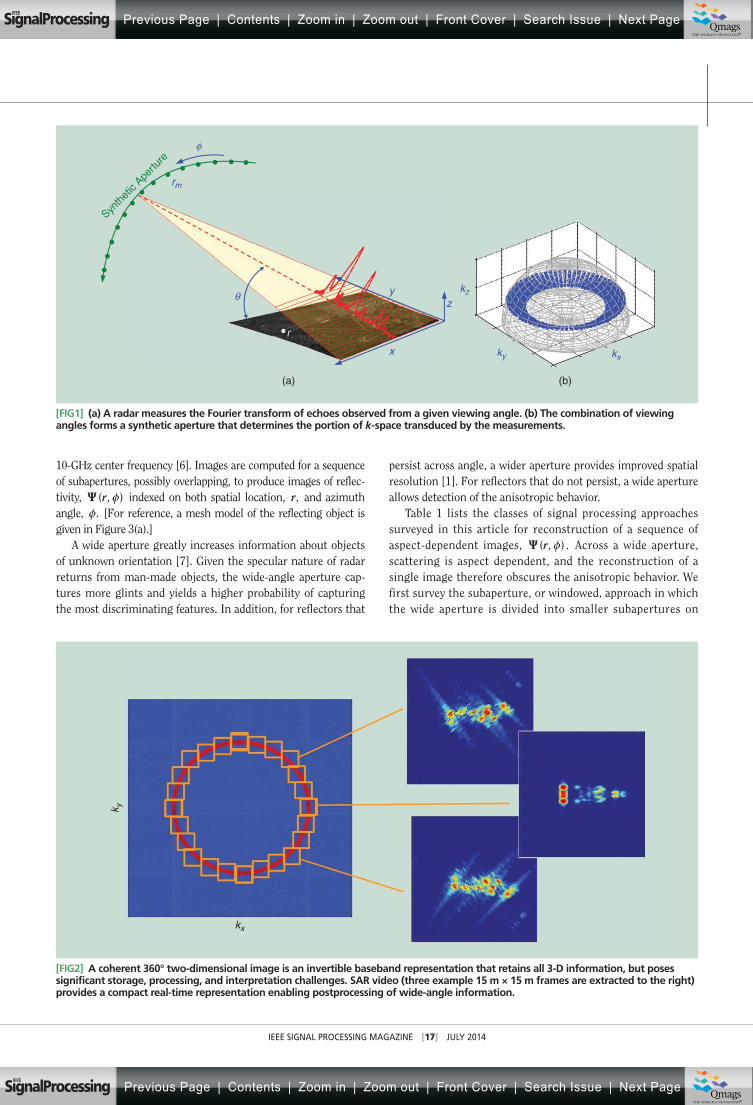
INTRODUCTIONRadar performs echo-location using a band-pass signal by measuring time delays due to reflecting objects. This is illustrated in Figure 1, where the red curve shows the envelope of the echo. The echo provides a one-dimensional projection of the three-dimensional (3-D) scene; points along concentric spheres collapse into a single position in the measurement. The radar bandwidth provides timing accuracy, and hence gives range resolution. To form a spatial map of scene reflectivity, the scene is viewed from a diversity of viewing angles; this is accomplished by moving the transmitter, here colocated with the receiver, to synthesize an aperture
much larger than the antenna’s physical size. Measurement positions along a notional synthetic aperture are depicted by dots in Figure 1. A small diversity of viewing angles can provide significant spatial resolution; for example, for a 3-cm wave-
length, approximately 3° of azimuth suffices to achieve 1-ft resolution [1].
Technological advances in digital hardware, radio frequency signal
generation, and navigation have facilitated the use of ever-
larger synthetic apertures in airborne radars [2]–[5]. Wide-angle SAR may be defined as employing any synthesized aperture whose azimuthal angular extent exceeds the sector
required for equal resolu-tion in range and cross-
range. That is, a wide-angle aperture has extent exceeding
/ ( )BWsin f2 2 c1- ^ h radians, where
BW and fc are the bandwidth and center frequency of the radar, in Hertz. However,
reflector geometry, shadowing, and coherent scintillation cause scattering behavior that can be strongly dependent on view-ing angle. With the scattering dependent not only on space, but also on viewing angle, measurement over a large aperture invites the question, “What is a wide-angle radar image?” In this tutorial article, the viewpoint is that SAR video, a map of reflectivity as a function of both space and viewing angle, is a natural signal pro-cessing choice. An image product from SAR video is illustrated in Figure 2. The red circle on the left graphically depicts frequency-domain radar measurements on a polar grid where radius corre-sponds temporal frequency and angle corresponds to the azimuthal viewing angle. Simulated far-field echoes here are col-lected for a 360° circular aperture, 640-MHz bandwidth and
[Joshua N. Ash, Emre Ertin, Lee C. Potter, and Edmund G. Zelnio]
A[Models and algorithms for anisotropic scattering]
Recent Advances in Synthetic Aperture Ra
darIma
ging
PH
OTO
CO
UR
TE
SY
OF
NA
SA
Previous Page | Contents | Zoom in | Zoom out | Front Cover | Search Issue | Next Page qqM
Mq
qM
MqM
THE WORLD’S NEWSSTAND®
Previous Page | Contents | Zoom in | Zoom out | Front Cover | Search Issue | Next Page qqM
Mq
qM
MqM
THE WORLD’S NEWSSTAND®
IEEE SIGNAL PROCESSING MAGAZINE [17] JULY 2014
10-GHz center frequency [6]. Images are computed for a sequence of subapertures, possibly overlapping, to produce images of reflec-tivity, ( , )r zW indexed on both spatial location, ,r and azimuth angle, .z [For reference, a mesh model of the reflecting object is given in Figure 3(a).]
A wide aperture greatly increases information about objects of unknown orientation [7]. Given the specular nature of radar returns from man-made objects, the wide-angle aperture cap-tures more glints and yields a higher probability of capturing the most discriminating features. In addition, for reflectors that
persist across angle, a wider aperture provides improved spatial resolution [1]. For reflectors that do not persist, a wide aperture allows detection of the anisotropic behavior.
Table 1 lists the classes of signal processing approaches surveyed in this article for reconstruction of a sequence of aspect-dependent images, ( , ) .r zW Across a wide aperture, scattering is aspect dependent, and the reconstruction of a single image therefore obscures the anisotropic behavior. We first survey the subaperture, or windowed, approach in which the wide aperture is divided into smaller subapertures on
[FIG1] (a) A radar measures the Fourier transform of echoes observed from a given viewing angle. (b) The combination of viewing angles forms a synthetic aperture that determines the portion of k-space transduced by the measurements.
[FIG2] A coherent 360° two-dimensional image is an invertible baseband representation that retains all 3-D information, but poses significant storage, processing, and interpretation challenges. SAR video (three example 15 m × 15 m frames are extracted to the right) provides a compact real-time representation enabling postprocessing of wide-angle information.
rm
zkz
ky kx
φ
θ
x
y
r
Synth
etic
Apertu
re
(a) (b)
k y
kx
Previous Page | Contents | Zoom in | Zoom out | Front Cover | Search Issue | Next Page qqM
Mq
qM
MqM
THE WORLD’S NEWSSTAND®
Previous Page | Contents | Zoom in | Zoom out | Front Cover | Search Issue | Next Page qqM
Mq
qM
MqM
THE WORLD’S NEWSSTAND®
IEEE SIGNAL PROCESSING MAGAZINE [18] JULY 2014
which scattering is more nearly homogeneous; on each sub-aperture, a single subimage is formed. For subaperture methods, we review a recursive linear imaging procedure and survey several nonlinear techniques that have been proposed for sharpening the resolution of the individual subimages. We next survey three inversion approaches that jointly pro-cess the wide-aperture data to explicitly reconstruct scatter-ing as a function of both space and viewing angle. Before proceeding to the survey, we provide an elementary state-ment of the image reconstruction problem. Following the survey, we discuss the benefits of SAR video and contrast the merits of the various approaches.
INVERSE SCATTERINGTraditional transmitters employ linear FM chirp waveforms for a constant envelope transmission; a receiver, after mixing and filtering, directly yields the in-phase and quadrature samples of the Fourier transform of the complex-baseband echo signal. Thus, far-field measurements can be indexed by the frequency and viewing angle, as illustrated in Figure 1.
For decades, airborne radar systems have typically operated with a small diversity of wavelengths and viewing angles. Two consequences result for imaging [1], [8]. First, the point scatter-ing assumption that reflectivity is constant across frequency and angle may be used with great success. Second, the small aperture allows for a plane-wave (far-field) assumption to hold across a large scene. Together, these approximations render the
[TABLE 1] A SURVEY OF ANISOTROPIC IMAGING PROCEDURES.
METHOD EXAMPLE REFERENCES
SUBAPERTURE METHODS
LINEAR: RECURSIVE BACKPROJECTION [11]
NONLINEAR: FILTER BANKS [12]–[15]
NONLINEAR: REGULARIZEDLEAST-SQUARES
[17]–[20]
FULL-APERTURE METHODS
PARAMETRIC MODELING [21]–[25]
REGULARIZED LEAST-SQUARES [26]–[27]
BAYESIAN [29]
BackhoeImpulse
Response
Range Cro
ss-R
ange
(a) (b) (c)
(d) (e) (f)
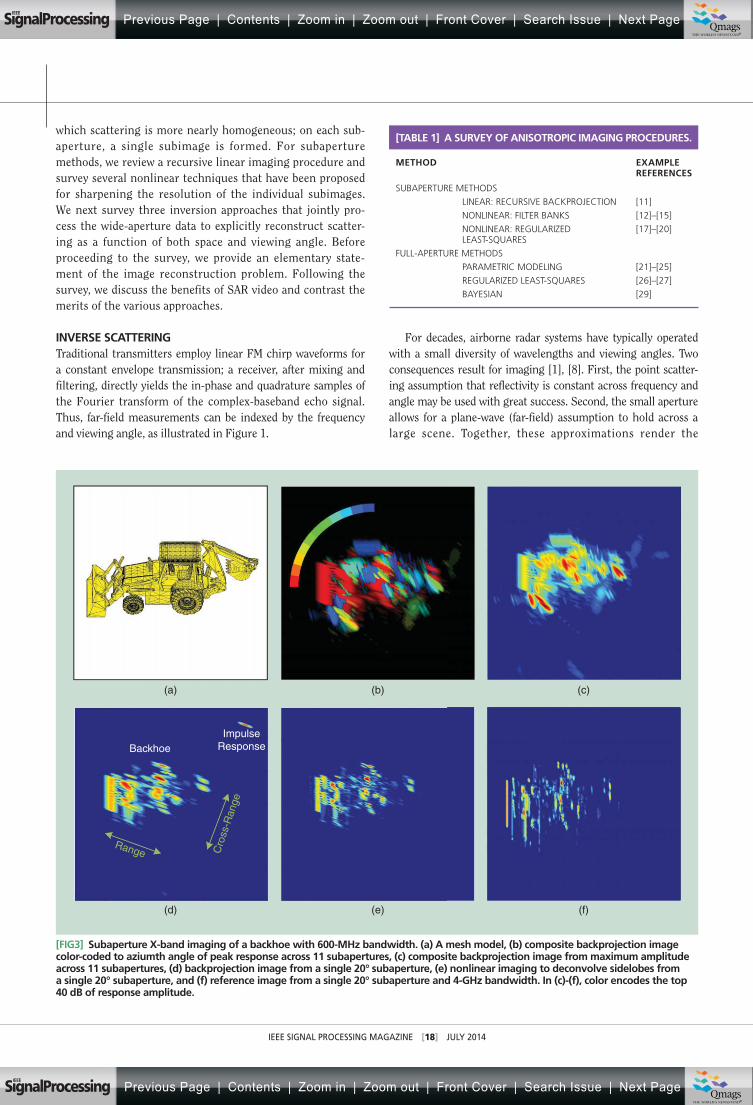
[FIG3] Subaperture X-band imaging of a backhoe with 600-MHz bandwidth. (a) A mesh model, (b) composite backprojection image color-coded to aziumth angle of peak response across 11 subapertures, (c) composite backprojection image from maximum amplitude across 11 subapertures, (d) backprojection image from a single 20° subaperture, (e) nonlinear imaging to deconvolve sidelobes from a single 20° subaperture, and (f) reference image from a single 20° subaperture and 4-GHz bandwidth. In (c)-(f), color encodes the top 40 dB of response amplitude.
Previous Page | Contents | Zoom in | Zoom out | Front Cover | Search Issue | Next Page qqM
Mq
qM
MqM
THE WORLD’S NEWSSTAND®
Previous Page | Contents | Zoom in | Zoom out | Front Cover | Search Issue | Next Page qqM
Mq
qM
MqM
THE WORLD’S NEWSSTAND®

IEEE SIGNAL PROCESSING MAGAZINE [19] JULY 2014
measurements to be simply samples of the Fourier transform of the scene reflectivity; the rectangular coordinates in Figure 1, ( , , ),k k kx y z are these spatial frequencies. Thus, imaging via Fou-rier transformation results in an image that is bandlimited in spa-tial frequency. Backprojection with convolution [8] yields the same result, and backprojection alone serves to approximate an inverse operator by the adjoint operator. This adjoint operator is the matched filter for ideal point scattering.
Taking a closer look, electromagnetic scattering from a scene may be fully described as a function of spatial location, viewing geometry, frequency, and polarization. For monostatic data collection, the scattered electric field from an object can be described by a 2 2# polarimetric scattering matrix,
, , ,r r fmW^ h (1)
where ( , , )r x y z= is the object location, r Rm3! is the mth
measurement location, and f is frequency. The measured fields are modeled by [1]
( , ) , ,
/ .exp
E r r r
Er r r
r
r rf f
j f c d
1
2 2
rm
mm
im m
4
# r
W=
- -
-^ h
' 1
#
(2)
The 2 1# complex-valued vector Ei is the incident field for a given polarization basis, and the two-way propagation time rela-tive to the scene center, ,r 0= is / .r r r c2 m m- -^ h In this linear (Born) model, only backscatter is modeled; any nonlinear interactions in actual scattering must be accounted for in the linear model by additional, spurious reflectors or “artifacts.”
Via traditional imaging, a two-dimensional or 3-D spatial rep-resentation is formed of the multivariable function .W Conse-quently, some behaviors may be obscured. A linear aperture leaves unresolvable any displacement orthogonal to the slant plane con-taining the aperture and the scene center. Thus, for a linear aper-ture the viewing position may be parametrized by one angle, and location by two variables. In addition, with a narrowband assump-tion, the frequency variable is eliminated to arrive at scattering as a function of three real variables, , , ,x y zW^ h where z is the azi-muth angle. Traditional imaging techniques further abandon the angle dependence [1], [8], yielding a function of two variables readily depicted as a two-dimensional map, , .x yW^ h Finally, a far-field plane-wave propagation assumption yields a linearization of the differential range, ,r rm - and
( , ) ,
/( )
.exp coscos sin
E
E
f x y
j f cx y
dx dy2 2
,x y
i#
.z
r iz z
W
+
^ h
' 1
#
(3)
The plane wave assumption yields the simplicity of Fourier pro-cessing for inversion of (3) but results in a predominantly qua-dratic phase error due to wavefront curvature; this error is limited by restricting the image scene size to be small relative to the standoff distance. For example, for a linear aperture sub-tending 30°, a 10-GHz center frequency, and a 15-km standoff
distance, the scene radius must be less than 28 m to limit qua-dratic phase error to /4r radians. Backprojection imaging, and its fast variations [5], apply with or without the far-field approxi-mation, while Fourier imaging requires the phase linearization provided by the approximation.
In contrast to a linear aperture, a curvilinear aperture can dis-ambiguate reflector locations in three spatial dimensions [1]. A spe-cial case is circular SAR (CSAR), in which the aperture positions lie on a circle of constant altitude, and a wide-beam antenna persis-tently illuminates a scene within the projection of the circle onto the ground below. Multiple circular orbits can further diversify viewing geometry and improve the 3-D resolution, e.g., using inter-ferometric approaches [9], [10]. Experimental demonstration of 3-D reconstructions, ( ),rW has been reported at X-band [2], VHF [4], and L-band [5]. For either linear or circular apertures, SAR video introduces an angle index, ,z to reconstruct ( , ) .r zW Exam-ples below consider both linear and circular apertures.
SUBAPERTURE METHODSWe first survey the subaperture, or windowed, approach: the wide aperture is divided into smaller subapertures on which scattering is more nearly homogeneous. On each subaperture, a single subimage is formed. Nonlinear techniques have been pro-posed for deconvolving the sidelobes, or “sharpening,” of the individual subimages.
RECURSIVE BACKPROJECTIONA sequence of subaperture images may be linearly constructed by recursive implementation of backprojection imaging. The recur-sive approach offers computational advantage in memory and peak-processing requirements, versus a block-processing strategy. In traditional block processing, a set of echoes across a contiguous set of aperture positions are filtered, weighted, and then backpro-jected to an imaging surface to form a complex-valued map of reflectivity. Fast backprojection algorithms reduce computational load (e.g., [5]). An aperture weighting provides suppression of the image point spread function sidelobes due to the finite aperture, but at the cost of a modest increase in the mainlobe width. Tradi-tional block-processing image formation computes an aperture-weighted backprojection image, ( ),r
( )tWX at slow-time azimuth
position .t The image is made using the synthetic aperture defined by the J most recent pulses and takes the form
( ) ( ),r w B( )t
jj
J
t j0
1
}W ==
-
-X / (4)
where t} is the echo at aperture position ,t B is the filter-and-backproject operator, and ,w j , , ,j J0 1f= - is an aperture weighting sequence, such as that provided by a Taylor or Hanning window. In SAR video applications requiring the pro-duction of a sequence of t-indexed images, the block-processing approach suffers from high memory and peak computation overhead, both proportional to the aperture size .J
In contrast, a recursive approach [11] to the computation (4) can offer nearly identical imagery with orders of magnitude reduction in memory and peak processing requirements,
Previous Page | Contents | Zoom in | Zoom out | Front Cover | Search Issue | Next Page qqM
Mq
qM
MqM
THE WORLD’S NEWSSTAND®
Previous Page | Contents | Zoom in | Zoom out | Front Cover | Search Issue | Next Page qqM
Mq
qM
MqM
THE WORLD’S NEWSSTAND®

IEEE SIGNAL PROCESSING MAGAZINE [20] JULY 2014
thereby enabling real-time SAR video imaging of large scenes. The recursion is given by
( ) ( ) ( ),r r B( ) ( )t
mm
M t mt
1a b }W W= +
=
-X X/ (5)
where M J11 is the recursion order, and { },ma b are con-stants controlling the effective weighting sequence. An example is provided in Figure 4 illustrating that a third-order recursion provides an excellent match to a Hanning window for aperture weighting. The recursive imaging provides SAR images at a frame rate equal to the pulse repetition frequency.
NONLINEAR RESOLUTION ENHANCEMENTThe processing of subapertures presents a tradeoff between spa-tial cross-range resolution and the blurring of scattering changes versus aspect angle. The same tradeoff is encountered, e.g., in the use of the short-time Fourier transform for time-series analysis. Nonlinear processing procedures have been applied in radar to enhance the resolution of a single subaperture image. The meth-ods implicitly assume nearly isotropic reflectivity across the small subaperture and result in a spatially varying point spread func-tion. We briefly survey two classes of such approaches: filter banks and regularized least-squares.
FILTER BANKSThe linear image formation techniques noted above can be viewed as fixed filter banks, where the image at location r is a linear com-bination of the vector y of data samples, ( ) .r w yr
HW =t Nonlinear sharpening techniques used in SAR are largely adapted from the rich literature of spectrum estimation; see [12] for an expansive survey. For adaptive filter bank methods, the weight vector itself is a function of the data. The data adaptive approaches reduce both
speckle and sidelobes at the expense of the processing gain in the target-to-clutter ratio (TCR). Let ar denote the ideal, noiseless modeled response from location ;r an isotropic point is the ubiqui-tous modeling choice. The minimum variance method (MVM) [12] seeks to minimize the expected energy, {| ( ) | },rE 2Wt subject to a unity gain constraint, .w a 1r r
H = The solution to the linearly con-strained quadratic optimization yields
.wa R a
R ar r
rr H 1
1= -
-
The covariance matrix, ,R is estimated as the sample covari-ance matrix computed from multiple overlapping data subaper-tures. Variations on the MVM approach include diagonal regularization of the covariance, ,R In+ and a rank-1 modifi-cation [13]. The high-definition imaging (HDI) approach [14] modifies MVM to constrain the angle between wr and .ar Each of these MVM variations have a computational complexity that is cubic in the number of pixels.
Adaptive sidelobe reduction (ASR) [12] provides a computa-tional complexity that is merely linear in the number of pixels; a single snapshot viewpoint is adopted, and, implicitly, a rank-1 cova-riance assumption. Data-adaptive weights are used to modify a matched-filter image via a spatially varying finite impulse response filter. The filter is constrained to be real valued, symmetric, have center tap equal to one, and to have all other taps yield sum of squares less than a prescribed constant. The constrained filter taps are then adapted to minimize the output energy. The approach is further simplified in spatially variant apodization (SVA), whereby the filtering is separable, uses only the two neighboring pixels in each direction, and imposes a coefficient positivity constraint. To suppress sidelobes, the SVA approach relies on the oscillatory struc-ture of a separable sinc point response.
Other spectrum estimation approaches have been proposed, as well, such as the use of a smoothed Wigner–Ville distribution, rather than short-time Fourier transform, in cross-range [15].
REGULARIZED INVERSIONTo enhance the resolution of a single subaperture image, side-lobes may be deconvolved via a regularized least-squares inver-sion of the linear, isotropic scattering model. Adopting W as a vectorized representation of the discrete pixels in ( ),rW the inversion may be expressed
,min A ysubject to0 22 # eW W W= -
WX (6)
where the 0, pseudo-norm · 0 counts nonzero entries in a vector and expresses the preference for an image dominated by a few strong reflectors (or, more generally, sparse in some basis). Greedy methods, such as CLEAN and orthogonal matched pursuit (e.g., references in [10] and [16]) have been widely used and can solve this NP-hard problem with suitable restrictions on both the correlation in columns of A and the sparsity of ;W likewise, the 0, pseudo-norm can be relaxed to an p, quasi-norm, .
/
np np p1
WW = $ ./ Authors have used
[FIG4] Recursive backprojection imaging enables orders of magnitude reduction in memory and peak computation for typical SAR video scenarios [11]. Here a third-order recursion well approximates a Hanning sequence for cross-range sidelobe control.
–150 –100 –50 0 50 100 150–100
–90
–80
–70
–60
–50
–40
–30
–20
–10
0
10
Crossrange (Samples)
Impu
lse
Res
pons
e (d
B)
Hanning Window AR(3) Approximation
Previous Page | Contents | Zoom in | Zoom out | Front Cover | Search Issue | Next Page qqM
Mq
qM
MqM
THE WORLD’S NEWSSTAND®
Previous Page | Contents | Zoom in | Zoom out | Front Cover | Search Issue | Next Page qqM
Mq
qM
MqM
THE WORLD’S NEWSSTAND®

IEEE SIGNAL PROCESSING MAGAZINE [21] JULY 2014
,p 1= resulting in a convex problem, and also p0 11 1 [17], [18] in the nonconvex formulation
.min A y pp
22 nW W W= - +
WX (7)
A fixed-point iteration has appeared in the literature as a solution technique (e.g., [19] and [20]) for (6); and, a conjugate gradient (CG) procedure has been applied to (7) with good success [17]. Moreover, in the CG framework, the objective can be generalized from pW to (| |)D pW with a differentiable function D pro-viding an edge-preserving region enhancement in the recovered imagery [17]. Lagrange multipliers, such as the n in (7), are tun-able algorithm parameters and may significantly impact resulting imagery. The use in radar imaging of greedy and optimization-based approaches for sparse linear inversion predates the theoret-ical underpinnings provided by compressive sensing [16]; however, the recent explosion of work in the area of compressive sensing has given rise to many good convex programming algo-rithms for numerical solution of (6) relaxed to pW for .p 1=
SUBAPERTURE PROCESSING EXAMPLESWe next illustrate the application of subaperture methods, provid-ing visualization of both aspect-dependent scattering and the ability of nonlinear processing to deconvolve sidelobes. For the examples, synthetic monostatic scattering data are generated for a backhoe model, illustrated in Figure 3(a), using a high-fre-quency computational electromagnetics code [6]. The center fre-quency is 10 GHz, and the bandwidth is 600 MHz unless otherwise noted. A linear aperture in the far field is used, with 45° depression angle at the center of the aperture.
In Figure 3(b) and (c), a 110° aperture is processed as a sequence of 11 overlapping subapertures, each of 20°. False color encodes the center azimuth angle of the subaperture at which the maximum amplitude occurs in (b), and in (c) encodes the maxi-mum amplitude across the subapertures. Note that the nonco-herent combination of subaperture images as in (c) can be interpreted as a generalized likelihood ratio test for a single reflector with 20° persistence and an unknown orientation aligned to one of the 11 subapertures.
Figure 3(d)–(f) illustrates nonlinear sidelobe deconvolution applied to a single 20° subaperture. The point spread function is displayed in the upper right-hand corner of (d) and reveals a finer resolution in cross-range than range, as expected. Also note that the orientation of the impulse response points towards the center of the 20° synthetic subaperture. Linear backprojection processing results in (d); at this orientation the glint due to the backhoe shovel appears prominently, seen at the far left. Deconvolution processing [17] of the coherent data, with .p 0 7= and .0 1n = in (7), results in (e), yielding many features that are more clearly delineated than in (d). For comparison, a reference image is shown in (f); the refer-ence is based on a large 4,000-MHz bandwidth, integration over the same 20° subaperture, and formed via backprojection as in (d), without deconvolution processing.
The choice of very large subapertures for nonlinear deconvo-lution of the point spread function (psf) offers no benefit; the
modeled psf implicit in the deconvolution algorithm can become increasingly mismatched to actual scattering as the subaperture is extended. Hence, the bias due to model mis-match can result in undesired imaging artifacts.
FULL-APERTURE METHODSIn contrast to the subaperture methods that presume nearly con-stant reflectivity versus azimuth angle across a small subaperture, the class of full-aperture methods models scattering as a function of both space and azimuth angle across the full aperture. By explic-itly adopting azimuth angle as an independent variable, the dimen-sionality of the image object, ( , )r zW grows, which therefore invites some form of regularization to recover the image from the sampled data. Here we survey three such approaches: parametric modeling, regularized linear inversion, and Bayesian estimation.
PARAMETRIC MODELINGParametric modeling approaches explicitly posit a parametric model for the scattering behavior and compute a nonconvex least-squares fit. These approaches are computationally expen-sive, especially considering the need to estimate a model order. Representative examples of this approach include sinc behavior in aspect [21]–[23], and Gaussian aspect dependence [24]. A larger family of canonical scattering objects has likewise been employed [25].
As an example of the parametric model fitting approaches, Figure 5 shows a 3-D reconstruction comprising even bounce (red) and odd bounce (blue) reflectors with a sinc response in azimuth, as predicted by physical optics approximation to high-frequency scattering [23], [25]. The reconstruction is computed via nonlinear least-squares estimation from the Gotcha X-band airborne measurements [2] using eight circular apertures and copolarized data measurements. The extent of a sinc response in azimuth is inversely related to the length of the reflector given in the visualization. In (a), a model of the Ford Taurus wagon vehicle is superimposed on the estimated reflectors, and the 3-D backprojection image is displayed in (b).
REGULARIZED INVERSIONThe regularized least-squares approach in (7) has been explicitly extended from ( )rW to the anisotropic model, ( , ) .r zW For example, in [26], a large dictionary of angle-dependent returns in the matrix A is managed by an iterative selection of a subset of columns. In [27], an angle-indexed image, ( , , )x y zWX is explicitly recovered using two regularization terms. The first is a total variation norm on the aspect dependence of pixel magni-tudes, to promote correlation in scattering behavior versus viewing angle. The second is a q-norm on the scattering strength at a given spatial location, to promote sparse reflectors
( , , )
( , , ) ( , , ) .
min A y x y
x y x y
( , , ) ,
,
x y ix yi
ip
ii
q
x y
22
1 1
22
m z
z z
W W
W Wm
- +
- +
zW+
|
|
) 3
//
// (8)
Previous Page | Contents | Zoom in | Zoom out | Front Cover | Search Issue | Next Page qqM
Mq
qM
MqM
THE WORLD’S NEWSSTAND®
Previous Page | Contents | Zoom in | Zoom out | Front Cover | Search Issue | Next Page qqM
Mq
qM
MqM
THE WORLD’S NEWSSTAND®

IEEE SIGNAL PROCESSING MAGAZINE [22] JULY 2014
BAYESIAN INVERSIONHere, we introduce an alternative wide-angle imaging technique that extends the regularized least-squares philosophy to a Bayes-ian estimator. The approach makes the modeling assumptions explicit, reports posterior confidence in inferred scattering behav-ior, and can provide automated tuning of algorithm parameters.
For wide-angle collections, the generation of azimuth-indexed SAR imagery has a natural interpretation as a state-space estimation problem within a dynamical system. In this context, a state vector C( )t N!W encodes the reflectivity at Nspatial points of interest within the scene and when viewed from a particular azimuth angle ,tz measured at time .t The state vector may be considered as a spatial image, and the collection { , , , }( ) ( ) ( )T1 2 fW W W comprises a time-series of images captur-ing the azimuth-dependent scattering behavior that we wish to recover from radar measurements,
.y F( ) ( ) ( ) ( )t t t teW= + (9)
Here, ,y C( )t M! , , ,t T1 f= denotes the k-space measure-ments obtained at time ,t and F( )t is the Fourier operator accounting for the radar bandwidth, sampling, and platform position at time .t It is assumed that the measurements are corrupted by additive noise, assumed to be zero-mean complex circular Gaussian, to be independent across time and space, and to have variance .2ve This is denoted ~ ( , ) .I0CN( )t 2ve e
When the state dynamics governing the evolution of ( )tW are known, we may employ classical methods to generate filtered estimates of ,( )tW based on linear measurements { , , },y y( ) ( )t1 f
or smoothed estimates, based on measurements { , , } .y y( ) ( )T1 f
A thorough review of classical state-space estimation may be found, e.g., in [28] and references therein. However, for the
anisotropic SAR problem, recent results in large-scale Bayesian inference of sparse time series are more appropriate. This field is generally referred to as dynamic compressive sensing (DCS) within the compressive sensing literature [29]. In wide-angle scenarios, sparsity is not only important because radar backscat-ter is often spatially sparse, but also because anisotropic behav-ior implies sparsity in the azimuth dimension as well.
The DCS problem considers the estimation of a sparse time series { }( )tW from linear measurements { }y( )t and exploits two forms of structure. First, the sparsity pattern of the signal is expected to change slowly over time (azimuth), and second, the nonzero coefficients (reflector amplitudes) vary slowly with time, as prescribed by an a priori model [29]. Incorporating the dynamics of amplitude and sparsity evolution enables DCS algo-rithms to outperform “snapshot” approaches based on solving a sequence of standard compressive sensing problems over a set of subapertures. Further, DCS problems may be considered in a completely Bayesian setting where both the time-varying ampli-tudes and the supports are estimated with posterior uncertainty. As such, the Bayesian DCS approach to wide-angle imaging is distinct in two respects from SAR video formed by independent processing of overlapping subapertures. First, the azimuth-indexed state estimates utilize all available data (in the case of smoothing), as opposed to a limited integration window with size selected by the user. In the Bayesian setting, an a priorimodel for reflector persistence implicitly controls the effective azimuth extent attributed to a scattering location. Second, the Bayesian DCS approach produces a measure of confidence to accompany the sequence of azimuth-indexed images. Specifi-cally, the approach generates an estimate of the posterior mar-ginal distribution of reflectivity as a function of scattering location and azimuth look angle. Knowledge of this uncertainty
[FIG5] (a) A 3-D parametric modeling of wide-angle scattering data [2] as a sum of dihedrals (red) and flat plates (blue). Lengths of estimated reflectors are inferred from the anisotropy of the azimuthal responses. A facet model of the Ford Taurus wagon is superimposed on the estimated reflectors for visual comparison. (b) The SAR image from same measurements processed by 3-Dbackprojection.
z z
x x
y
y
(a) (b)
Previous Page | Contents | Zoom in | Zoom out | Front Cover | Search Issue | Next Page qqM
Mq
qM
MqM
THE WORLD’S NEWSSTAND®
Previous Page | Contents | Zoom in | Zoom out | Front Cover | Search Issue | Next Page qqM
Mq
qM
MqM
THE WORLD’S NEWSSTAND®

IEEE SIGNAL PROCESSING MAGAZINE [23] JULY 2014
is useful for subsequent exploitation tasks, such as automated target recognition, that utilize the wide-angle measurements.
APPROXIMATE BELIEF PROPAGATIONIn the context of wide-angle SAR imaging, we review in this sec-tion a Bayesian approach to DCS based on approximate message passing [29]. An auxiliary time series { , , , }s s s( ) ( ) ( )T1 2 f is intro-duced, where { , }s 0 1( )t N! indicates the nonzero support at time .t That is, if the nthpixel of ,( )tW ,( )
ntW has nonzero ampli-
tude, then ,s 1( )nt = otherwise .s 0( )
nt = A second time-varying
random process ,a C( )t N! , , ,t T1 f= is introduced represent-ing the amplitudes of the nonzero elements of .( )tW Combined, the sparsity s( )t and amplitudes a( )t fully characterize the reflec-tivity of the nthpixel at time-t as
.s a( ) ( ) ( )nt
nt
ntW = (10)
The support and amplitudes are both hidden vector-valued ran-dom processes that we wish to estimate from radar measure-ments. To impose the notions of sparsity and smoothness described above onto the model, the { },s( )t and { };a( )t processes are imbued with certain a priori dynamical structures.
The support structure is modeled as a first-order Markov chain where the value of s( )
nt only depends on its temporal ancestor
.s( )nt 1- Independent Markov chains are used for , , ,n N1 f=
although spatial correlation across n is possible. The Markov chains are fully defined by the initial probability that the nth pixel is nonzero ( )s 1prob ( )
n11_m = and the transition probabilities
( | )s s1 0prob,( ) ( )nt
nt
1 01_m = =- and ( |s s0prob,
( ) ( )nt
nt
0 11_m = =-
) .1 The m-probabilities fully control the sparsity assumptions in the model. For example, small values of ,,1 0m and large values of ,,0 1m favor short sequences of nonzero support. This would be appropriate to model specular reflectors with limited persis-tence [3], [9].
Smooth structure in the amplitude parameters is captured using a first-order Gauss–Markov model
,a a( ) ( ) ( )nt
nt
nt1a g= +- (11)
where the scaling factor a and zero-mean Gaussian process noise ( , )0CN( )
nt 2
proc+g v control the temporal dynamics, with the initial state assumed to be Gaussian, ( , ) .a 0CN( )
n1 2
init+ v
Large values of | | ,a and small process variance ,2procv favor a
slowly varying radar cross section (RCS) across azimuth look angle. Conversely, small | |a and large 2
procv imply rapidly vary-ing RCS across azimuth with little correlation between adjacent look angles. As with the support variables, independent scalar processes are assumed for , , .n N1 f=
The models for azimuth-dependent scattering dynamics combine with the radar measurement model (9) to form a com-plete dynamical model describing the posterior distribution of the state space variables
({ }, { }, { } | { })s a yp ( ) ( ) ( ) ( )t t t t ?W
( | ) ( | , ) ( | ) ( | ),y s a s s a ap p p p( ) ( ) ( ) ( ) ( ) ( ) ( ) ( ) ( )
t
Tt t t t t t t t t
1
1 1W W=
- -% (12)
where ( | ) ( )s s sp p( ) ( ) ( )1 0 1_ and ( | ) ( )a a ap p( ) ( ) ( )1 0 1_ correspond to the initial prior distributions. The model (12) is illustrated graphically by the factor graph in Figure 6. In the graph, square nodes represent factors in the posterior distribution, and circles represent random variables, with shaded circles correspond-ing to observed random variables. From (9), the measurement factors are ( | ) ( ; , ),y y F Ip CN( ) ( ) ( ) ( ) ( )t t t t t
e2vW W= and from (10),
( | , ) ( ),s a s ap ( ) ( ) ( ) ( ) ( ) ( )t t t t t tdW W= - where d denotes the Dirac delta function applied element-wise.
Apparent in the factor graph is that the model describes a coupled dynamical system where the support variables form a hidden Markov model that is coupled to the linear dynamical system describing the amplitude process through the jointly dependent linear measurements { },y( )t governed by the radar system. Inference in coupled systems is generally difficult, and tackled, for example, by structured variational approximations. Alternatively, recent DCS work [29] leverages approximate mes-sage passing algorithms [30] and loopy belief propagation to efficiently generate approximate marginal state estimates for the exact system model, (12).
EXAMPLEFigure 7 illustrates the results of applying the approximate mes-sage passing approach to measured circular SAR data of a Ford Taurus wagon, similar in orientation to the model shown in Figure 5. The measured SAR data comes from the X-band Gotchadata set [2] with 640 MHz of bandwidth. In (a), a backprojection image is illustrated utilizing the entire 360° in the circular collec-tion. The vehicle is oriented such that its front corresponds to approximately 45° azimuth, and the passenger broadside is at approximately 315°. This wide-angle image displays scattering from all aspect angles, but does not reveal the anisotropic behav-ior of the constituent scatterers on the vehicle. In contrast, the two plots in (b) illustrate the azimuth-dependent posterior mean
s (1) s (2) s (3) s (T )
a (1) a (2) a (3) a (T )
y (1) y (2) y (3) y (T )
ψ (1) ψ (2) ψ (3) ψ (T )
. . .
. . .
[FIG6] The factor graph model representing the Bayesian state-space interpretation of wide-angle SAR imaging includes two coupled Markov chains: a hidden Markov model governing the sparsity dynamics { },s( )t and a linear dynamical system governing amplitude dynamics { };a( )t both are coupled through the radar measurements { } .y( )t
Previous Page | Contents | Zoom in | Zoom out | Front Cover | Search Issue | Next Page qqM
Mq
qM
MqM
THE WORLD’S NEWSSTAND®
Previous Page | Contents | Zoom in | Zoom out | Front Cover | Search Issue | Next Page qqM
Mq
qM
MqM
THE WORLD’S NEWSSTAND®

IEEE SIGNAL PROCESSING MAGAZINE [24] JULY 2014
state estimates for two particular points on the vehicle. The state-space includes a uniform grid of spatial points covering the vehi-cle, although the figure only presents results for two locations: the first, P1, is from the front of the vehicle, and the second, P2, is from the passenger broadside.
The state-space estimates exhibit sparsity and low noise as expected. Further, the posterior state estimates correctly iden-tify the dominant response directions: approximately 45° for the front of the vehicle (P1), and approximately 315° for the passen-ger broadside (P2). The P1 response also appears with lower amplitude, and broader, than P2. This is consistent with dihe-dral scattering approximations to vehicle sides [23], where the relatively longer broadside induces a larger RCS, but with shorter persistence, relative to the front of the vehicle.
DISCUSSION
WHY SAR VIDEO?For wide-angle radar imaging, SAR video can provide maximum TCR and is a revealing format for analysis of scattering signatures.
First, for a signal detection application, SAR video can pro-vide maximum TCR. Application of the radar range equation yields the TCR
,TTTCR
0 oc
ot
v dv= (13)
where v is the target’s radar cross section, 0v is the probabilis-tic clutter return power per unit area, and d is the pixel area, given by the product of range and cross-range resolutions. The
variables Tot and Toc are the time (equivalently, aperture extent) on target and clutter, respectively. All other radar range equa-tion terms, such as radiated power, antenna area, and energy spreading, cancel in the ratio. The TCR equation predicts the behavior shown in Figure 8 for a reflector with limited angular persistence. In the denominator of (13), an increase in the clut-ter integration time is offset by finer cross-range resolution; in the numerator, received power at a pixel increases with increas-ing integration aperture, until the reflector ceases to persist. For example, at 10 GHz a dihedral reflector 30 cm in length with base parallel to the xy plane has azimuth angular response that persists only 5°, as measured by the 6-dB beam width [25]. Thus, in SAR video, TCR is maximized for any subaperture inte-gration angle greater than .Tot Pixel amplitude histograms from measured Ku-band data illustrate the effect experimentally in Figure 8. Histograms are computed from clutter pixels and tar-get pixels for coarse-resolution (30 cm) and fine-resolu-tion (3.75 cm) images. The two histograms correspond to the two points highlighted on the TCR curve. The 8 × 8 reduction in pixel area results in 10 64 18log dB10 = shift in the clutter his-togram, as predicted by (13).
Second, for fine-scale analysis of target signatures, SAR video provides a revealing format for automated or human-aided interpretation of scattering physics, owing to several effects. For high-frequency radar, energy in a target signature is dominated by specular returns, which are highly directional. These dominant returns can obscure other scattering behaviors; a sequence of subaperture images serves to combat this dynamic range issue. Additionally, the number of strong
180°
90°
0°
270°
P1
P1
P2P2
0
–10
–20
–30
dB
0 45 90 135 180 225 270 315 360
0
–10
–20
–30dB
0 45 90 135 180 225 270 315 360
Azimuth (°)
Azimuth (°)(b)(a)
P2
[FIG7] Bayesian state-space processing for wide-angle measured X-band data. (a) A traditional 360° backprojection image of a Ford Taurus wagon. (b) Dynamic compressive sensing reveals dominant scattering on the front of the vehicle (P1) at an azimuth angle of ~45° and from the passenger broadside of the vehicle (P2) at ~315°.
Previous Page | Contents | Zoom in | Zoom out | Front Cover | Search Issue | Next Page qqM
Mq
qM
MqM
THE WORLD’S NEWSSTAND®
Previous Page | Contents | Zoom in | Zoom out | Front Cover | Search Issue | Next Page qqM
Mq
qM
MqM
THE WORLD’S NEWSSTAND®

IEEE SIGNAL PROCESSING MAGAZINE [25] JULY 2014
reflectors present in a single subaperture is less than across the full aperture, resulting in a more parsimonious, or more sparse, signature that is more amenable to nonlinear sharpening meth-ods which deconvolve sidelobes. Moreover, the aperture index provides a simple data structure for using the anisotropic behavior of the scattering to improve object classification [7]. Thus, several physical behaviors provide rationale for the use of SAR video format in the signature analysis context.
MERITSOf the imaging procedures outlined in Table 1, the recursive backprojection is simple, low complexity, linear, and robust to modeling assumptions. Further, pulse-by-pulse autofocus can be embedded using a closed-form procedure. The recursive backprojection procedure is well suited to wide-area coverage, and the analysis illustrated in Figure 8 informs proper choice of the subaperture extent. Several conclusions can be drawn for the subaperture nonlinear sharpening techniques. The model fitting and spectrum estimation techniques are computationally demanding, and therefore are only applicable for the processing of small regions of interest. In addition, the plane-wave assump-tion can limit the applicability of the spectrum estimation tech-niques. However, the nonlinear sharpening technique has been empirically demonstrated to provide a modest improvement in object classification due to resolution enhancement (e.g., see [10] and references therein).
The full-aperture procedures operate on the entire wide-aperture data record; consequently, they are inherently more computationally costly than the subaperture techniques and
offer less opportunity for efficient parallelization. The applicabil-ity of the full-aperture techniques is therefore limited to the processing of small regions of interest. The Bayesian approach avoids difficulties in both order selection for parametric tech-niques and Lagrange multiplier choice for regularized inversion.
CONCLUSIONSRadio frequency scattering varies not only with spatial location, but also with viewing angle, polarization, and frequency. Techno-logical advances have allowed for a more comprehensive mea-surement of this behavior. Interpretation of the measurements can be formulated as an inverse task to provide a rich character-ization of scattering behavior across dimensions beyond simply two or three spatial coordinates, as depicted in traditional imag-ery. The signal processing tools surveyed in this article provide aspect-dependent characterization of scene reflectivity.
ACKNOWLEDGMENTSThis work was supported in part by the Defense Advanced Research Projects Agency under grant N66001-10-1-4090, by the Army Research Office under grant W911NF-11-1-0391, and by the Air Force Research Laboratory under award FA8650-07-D-1220.
AUTHORSJoshua N. Ash ([email protected]) received B.S. degrees in phys-ics and electrical engineering in 1998 and the M.S.E.E. degree in 2003 from Washington University, St. Louis, Missouri. He received the Ph.D. degree in electrical and computer engineer-ing from The Ohio State University, Columbus, in 2007. From
TC
R
Integration Time/Angle(a)
(b)
ScattererPersists
Scatterer“Disappears”
60 70 80 90 100 110 120 1300
0.05
0.1
0.15
0.2
0
0.05
0.1
0.15
0.2
Pixel Magnitude (dB)60 70 80 90 100 110 120 130
Pixel Magnitude (dB)
Coarse Resolution Fine Resolution
Ret
urn
His
togr
ams
Imag
e
Ret
urn
His
togr
ams
Imag
e
Tot Toc
[FIG8] (a) Any subaperture integration angle exceeding the persistence of a reflector serves to maximize TCR. (b) Coarse- and fine-resolution images and corresponding return histograms display clutter (green) and target (red) distributions.
Previous Page | Contents | Zoom in | Zoom out | Front Cover | Search Issue | Next Page qqM
Mq
qM
MqM
THE WORLD’S NEWSSTAND®
Previous Page | Contents | Zoom in | Zoom out | Front Cover | Search Issue | Next Page qqM
Mq
qM
MqM
THE WORLD’S NEWSSTAND®
__________

IEEE SIGNAL PROCESSING MAGAZINE [26] JULY 2014
2000 to 2002, he was a technical staff member at Celox Net-works in St. Louis, Missouri. He is currently a research scientist with the Institute of Sensing Systems at The Ohio State Univer-sity. His research interests include statistical signal processing and machine learning, with applications in sensor networks, synthetic aperture radar, and hyperspectral imaging.
Emre Ertin ([email protected]) is a research assistant pro-fessor with the Department of Electrical and Computer Engi-neering at The Ohio State University. He received the B.S. degree in electrical engineering and physics from Bogazici University, Turkey, in 1992, the M.S. degree in telecommuni-cation and signal processing from Imperial College, United Kingdom, in 1993, and the Ph.D. degree in electrical engi-neering from The Ohio State University in 1999. From 1999 to 2002 he was with the Core Technology Group at Battelle Memorial Institute. His current research interests are statis-tical signal processing, wireless sensor networks, radar signal processing, and mobile health.
Lee C. Potter ([email protected]) received the B.E. degree from Vanderbilt University, Nashville, Tennessee, and the M.S. and Ph.D. degrees from the University of Illinois at Urbana-Champaign, all in electrical engineering. Since 1991, he has been with the Department of Electrical and Computer Engineering, The Ohio State University, Columbus, where he is also an investi-gator at the Davis Heart and Lung Research Institute. His research interests include statistical signal processing, inverse problems, detection, and estimation, with applications in radar and medical imaging. He received the Ohio State University Col-lege of Engineering MacQuigg Award for Outstanding Teaching.
Edmund G. Zelnio ([email protected]) graduated from Bradley University, Peoria, Illinois, in 1975 and has pur-sued doctoral studies at The Ohio State University in electro-magnetics and at Wright State University in signal processing. During his 37-year career with the Air Force Research Labora-tory (AFRL), Wright Patterson Air Force Base, Ohio, he has spent 35 years working in the area of automated exploitation of imaging sensors primarily addressing synthetic aperture radar. He is a former division chief and technical advisor of the Auto-matic Target Recognition Division of the Sensors Directorate in AFRL and serves in an advisory capacity to the Department of Defense and the intelligence community. He is currently the director of the Automatic Target Recognition Center in AFRL. He is the recipient of the 53rd Department of Defense Distin-guished Civilian Service Award and is a fellow of the AFRL.
REFERENCES[1] W. G. Carrara, R. S. Goodman, and R. M. Majewski, Spotlight Synthetic Aperture Radar Signal Processing Algorithms. Norwood, MA: Artech House, 1995.
[2] C. H. Casteel, Jr., L. A. Gorham, M. J. Minardi, S. M. Scarborough, K. D. Naidu,and U. K. Majumder, “A challenge problem for 2D/3D imaging of targets from a volumetric data set in an urban environment,” in Proc. SPIE, Algorithms for Synthetic Aperture Radar Imagery XIV, 2007, vol. 6568, pp. 65680D-1–65680D-7.
[3] H. Oriot and H. Cantalloube, “Circular SAR imagery for urban remote sens-ing,” in Proc. 7th Int. European Conf. Synthetic Aperture Radar (EUSAR 2008),June, pp. 1–4.
[4] P. Frolind, A. Gustavsson, M. Lundberg, and L. M. H. Ulander, “Circular-aperture VHF-band synthetic aperture radar for detection of vehicles in forest concealment,” IEEE Trans. Geosci. Remote Sensing, vol. 50, no. 4, pp. 1329–1339, Apr. 2012.
[5] O. Ponce, P. Prats-Iraola, M. Pinheiro, M. Rodriguez-Cassola, R. Scheiber, A.Reigber, and A. Moreira, “Fully polarimetric high-resolution 3-D imaging with circular SAR at L-band,” IEEE Trans. Geosci. Remote Sensing, vol. 52, no. 6, pp. 3074–3090, June 2014.
[6] K. Naidu and L. Lin, “Data dome: Full k-space sampling data for high frequency radar research,” in Proc. SPIE, Algorithms for Synthetic Aperture Radar Imagery XI, Orlando, FL, 2004, vol. 5427, pp. 200–207.
[7] K. E. Dungan and L. C. Potter, “Classifying vehicles in wide-angle radar using pyramid match hashing,” IEEE J. Select. Topics Signal Processing, vol. 5, no. 3,pp. 577–591, 2011.
[8] D. C. Munson, Jr., J. D. O’Brien, and W. K. Jenkins, “A tomographic formu-lation of spotlight-mode synthetic aperture radar,” Proc. IEEE, vol. 71, no. 8,pp. 917–925, 1983.
[9] Y. Lin, W. Hong, W. Tan, Y. Wang, and Y. Wu, “Interferometric circular SAR method for three-dimensional imaging,” IEEE Geosci. Remote Sensing Lett., vol. 8,no. 6, pp. 1026–1030, Nov. 2011.
[10] L. Potter, E. Ertin, J. Parker, and M. Cetin, “Sparsity and compressed sensing in radar imaging,” Proc. IEEE, vol. 98, no. 6, pp. 1006–1020, 2010.
[11] R. Moses and J. Ash, “An autoregressive formulation for SAR backprojection imaging,” IEEE Trans. Aerosp. Electron. Syst., vol. 47, no. 4, pp. 2860–2873,2011.
[12] S. R. DeGraaf, “SAR imaging via modern 2-D spectral estimation methods,” IEEE Trans. Image Processing, vol. 7, no. 5, pp. 729–761, 1998.
[13] P. Stoica, H. Li, and J. Li, “A new derivation of the APES filter,” IEEE Signal Processing Lett., vol. 6, no. 8, pp. 205–206, Aug. 1999.
[14] G. R. Benitz, “High-definition vector imaging,” Lincoln Lab. J., vol. 10, no. 2,pp. 147–170, 1997.
[15] Y. Wu and D. C. Munson, Jr., “Wide angle ISAR passive imaging using smoothed pseudo Wigner-Ville distribution,” in Proc. 2001 IEEE Radar Conf.,pp. 363–368.
[16] E. Candes and M. Wakin, “An introduction to compressive sampling,” IEEE Signal Processing Mag., vol. 25, no. 2, pp. 21–30, Mar. 2008.
[17] M. Çetin and W. C. Karl, “Feature-enhanced synthetic aperture radar image formation based on nonquadratic regularization,” IEEE Trans. Image Processing,vol. 10, no. 4, pp. 623–631, Apr. 2001.
[18] R. Chartrand and V. Staneva, “Restricted isometry properties and nonconvex compressive sensing,” Inverse Problems, vol. 24, no. 3, pp. 1–14, 2008.
[19] S. D. Cabrera and T. W. Parks, “Extrapolation and spectral estimation with iterative weighted norm modification,” IEEE Trans. Acoust., Speech, Signal Pro-cessing, vol. 39, no. 4, pp. 842–851, 1991.
[20] A. E. Brito, S. D. Cabrera, and C. Villalobos, “Optimal sparse representation algorithms for harmonic retrieval,” in Proc. 35th Asilomar Conf. Signals, Sys-tems and Computers, 2001, vol. 2, pp. 1407–1411.
[21] Z.-S. Liu and J. Li, “Feature extraction of SAR targets consisting of trihe-dral and dihedrals corner reflectors,” IEE Radar, Sonar Navig., vol. 145, no. 3, pp. 161–172, 1998.
[22] M. J. Gerry, L. C. Potter, I. J. Gupta, and A. van der Merwe, “A parametric mod-el for synthetic aperture radar measurements,” IEEE Trans. Antennas Propag.,vol. 47, no. 7, pp. 1179–1188, 1999.
[23] E. Ertin, C. D. Austin, S. Sharma, R. L. Moses, and L. C. Potter, “GOTCHAexperience report: Three-dimensional SAR imaging with complete circular aper-tures,” in Proc. SPIE, Algorithms for Synthetic Aperture Radar Imagery XIV,2007, vol. 6568, pp. 656802-1–656802-12.
[24] L. C. Trintinalia, R. Bhalla, and H. Ling, “Scattering center parameterization of wide-angle backscattered data using adaptive Gaussian representation,” IEEE Trans. Antennas Propag., vol. 45, no. 11, pp. 1664–1668, 1997.
[25] J. Jackson, B. Rigling, and R. Moses, “Canonical scattering feature models for 3D and bistatic SAR,” IEEE Trans. Aerosp. Electron. Syst., vol. 46, no. 2,pp. 525–541, 2010.
[26] K. R. Varshney, M. Çetin, J. W. Fisher III, and A. S. Willsky, “Sparse signal rep-resentation in structured dictionaries with application to synthetic aperture radar,” IEEE Trans. Signal Processing, vol. 56, no. 8, pp. 3548–3561, 2008.
[27] I. Stojanovic, M. Çetin, and W. C. Karl, “Joint space aspect reconstruction of wide-angle SAR exploiting sparsity,” in Proc. SPIE, Algorithms for Synthetic Aperture Radar Imagery XV, 2008, vol. 6970, pp. 697005-1–697005-12.
[28] M. S. Arulampalam, S. Maskell, N. Gordon, and T. Clapp, “A tutorial on par-ticle filters for online nonlinear/nonGaussian Bayesian tracking,” IEEE Trans. Sig-nal Processing, vol. 50, no. 2, pp. 174–188, 2002.
[29] J. Ziniel and P. Schniter, “Dynamic compressive sensing of time-varying signals via approximate message passing,” IEEE Trans. Signal Processing, vol. 61,no. 21, pp. 5270–5284, 2013.
[30] D. Donoho, A. Maleki, and A. Montanari, “Message passing algorithms for compressed sensing,” Proc. Natl. Acad. Sci., vol. 106, no. 45, pp. 18914–18919,2009.
[SP]
Previous Page | Contents | Zoom in | Zoom out | Front Cover | Search Issue | Next Page qqM
Mq
qM
MqM
THE WORLD’S NEWSSTAND®
Previous Page | Contents | Zoom in | Zoom out | Front Cover | Search Issue | Next Page qqM
Mq
qM
MqM
THE WORLD’S NEWSSTAND®
________________
___________
__________

1053-5888/14/$31.00©2014IEEE IEEE SIGNAL PROCESSING MAGAZINE [27] JULY 2014
Digital Object Identifier 10.1109/MSP.2014.2312834
Date of publication: 13 June 2014
This article presents a survey of recent research on sparsity-driven synthetic aperture radar (SAR) imag-ing. In particular, it reviews 1) the analysis and synthe-sis-based sparse signal representation formulations for SAR image for-
mation together with the associated im-aging results, 2) sparsity-based methods for wide-angle SAR im-aging and anisotropy charac-terization, 3) sparsity-based methods for joint imaging and autofocusing from data with phase errors, 4) techniques for exploit-ing sparsity for SAR imag-ing of scenes containing moving objects, and 5) re-cent work on compressed sensing (CS)-based analysis and design of SAR sensing missions.
INTRODUCTIONSAR imaging and sparse signal representation are well-established distinct lines of research. That said, spar-sity has been of interest for SAR imaging implicitly over many years, and more explicitly within the last 15 years or so. In fact, a considerable fraction of recent developments for SAR imagery have been driven by moving from a purely Fourier transform type pro-cessing paradigm to one that couples physics-motivated sensing models with some form of sparsity-based priors. Ideas based on sparse signal representation, proposed by a number of research groups, have recently led to advanced image formation
methods offering a number of benefits for SAR, including increased resolvability of point scatterers, reduced speckle, easier-to-segment regions, and robustness to limitations in data quality and quantity.
Furthermore, the sparse signal representation per-spective has provided inspiration for new ways
to think about and produce solutions for several important problems for
SAR, which are also motivated by a number of emerging SAR
data collection scenarios. These problems include autofocusing, wide-angle imaging, interferometry, SAR tomography (Tomo-SAR), through-the-wall radar imaging, multiple-in-
put, multiple-output (MIMO) radar imaging, passive radar
imaging, and moving target imaging, among others. Finally,
recent results on CS, built upon sparse signal representation, have generated con-
siderable interest in radar waveform design as well as analysis and design of radar sensing scenarios under
data collection constraints. Pursuing this overall new line of inqui-ry on SAR imaging leads to the discovery of a variety of technical problems that fall outside the standard domain of sparse signal representation, but that involve issues of critical concern for SAR imaging. The result is a rich, new area of research that has already shown its promise but that also motivates interesting lines of inquiry for the future. In this article, we present an over-view of the recent line of research pursued by several research groups on sparsity-driven SAR imaging. Our article shares some aspects of two recent survey papers [1], [2]. The first of these pa-pers [1] provides a broad introduction to the use of CS in radar,
[Müjdat Çetin, Ivana Stojanovic, N. Özben Önhon, Kush R. Varshney,
Sadegh Samadi, W. Clem Karl, and Alan S. Willsky]
[Reconstruction, autofocusing, moving targets,
and compressed sensing]
Recent Advances in Synthetic Aperture Ra
darIma
ging
PH
OTO
CO
UR
TE
SY
OF
NA
SA
Previous Page | Contents | Zoom in | Zoom out | Front Cover | Search Issue | Next Page qqM
Mq
qM
MqM
THE WORLD’S NEWSSTAND®
Previous Page | Contents | Zoom in | Zoom out | Front Cover | Search Issue | Next Page qqM
Mq
qM
MqM
THE WORLD’S NEWSSTAND®

IEEE SIGNAL PROCESSING MAGAZINE [28] JULY 2014
and considers three applications: pulse compression, radar imag-ing, and air space surveillance with antenna arrays. The second paper [2] provides an overview and examples of how central themes in sparsity and CS have been present in the array pro-cessing literature in general, and in radar imaging in particular, over many years. Our article complements these papers in sever-al ways and presents a focused and up-to-date picture of sparsity-driven radar imaging. In particular, we provide a comprehensive coverage of recent use of sparsity in a variety of radar imaging scenarios, with a signal processing focus and perspective. Appli-cations and connections covered include wide-angle imaging, autofocusing, moving target imaging, as well as CS.
ANALYSIS AND SYNTHESIS-BASED SPARSE RECONSTRUCTION FOR SARSAR imaging can be viewed as a linear inverse problem in which an unknown spatial reflectivity field is reconstructed from noisy measurements of waves backscattered from a scene. After cer-tain steps of preprocessing of the radar returns, the resulting data can be related to the underlying reflectivity field through a discretized model of the following form, which essentially involves a spatial Fourier transform:
( , ) ( , ) ( , ),r f s x y e n f( )cos sink l
m
M
m mj c
f x yk l
1
4 km l m li i= +
ri i
=
- +/ (1)
where c denotes the speed of light. We can stack the entire set of noisy phase history measurements ( , ),r fk li and the noise
( , )n fk li at all available frequencies ,fk , , ,k K1 f= and view-ing angles ,li , , ,l L1 f= as well as the reflectivity function or scattering response ( , )s x ym m at all spatial locations ( , ),x ym m
, ,m M1 f= (which include all the points containing the non-negligible scatterers), into vectors to obtain the following observation model:
,r Hs n= + (2)
where s denotes the underlying, complex-valued reflectivity image and H is the mathematical model of the observation pro-cess described by (1). While this model and the ideas described in this article can be used in the context of a variety of SAR operat-ing modes, for basic SAR imaging we will mostly assume spot-light-mode operation for concreteness. Given limitations in the bandwidth of the measured data and in the diversity of look angles, as well as the inherently noisy nature of the measurement process, the inverse problem in (2) is ill posed. To generate a solu-tion, implicit or explicit assumptions need to be made. Principled ways to incorporate such assumptions, in the form of constraints or prior information, include regularization and Bayesian estima-tion methods. Within this context, the information or constraint that the underlying reflectivity field admits a sparse representa-tion has proved to be a very useful asset for SAR imaging. The simplest form of sparsity (or compressibility) to exploit would be a scene consisting of a small number of dominant scatterers (e.g.,
man-made metallic objects). Exploitation of this type of sparsity has led to superresolution imaging in SAR (see Figure 1) [56]. More generally, the scene could be sparse in a different domain, as we discuss in more detail below. The remainder of this section provides an overview of analysis and synthesis-based sparse signal representation methods applied to SAR imaging.
In an analysis model, sparsity is imposed on some transfor-mation or features of the signal of interest, and, in this case, is often called cosparsity. Such an approach for SAR imaging was proposed in [3], where an estimate of s is obtained by minimiz-ing the following cost functional:
( ) .J s r Hs s spp
pp
22
1 2 dm m= - + + (3)
Here · p denotes the p, -norm, d is a discrete approximation to the two-dimensional (2-D) derivative operator (gradient), | |sdenotes the vector of magnitudes of the complex-valued vector ,sand 1m and 2m are scalar parameters. For p 21 we have promo-tion of sparsity, which gets weaker as we approach .p 2= The val-ues used for p in sparsity-driven SAR imaging are around 1, so the second and third terms enforce sparsity. The relative contribution of these two terms are determined through the choice of the hyperparameters 1m and .2m The second term indicates a prefer-ence for spatially sparse reflectivity fields. The third term enforces sparsity on the gradient of the reflectivity magnitudes, indicating a preference for piecewise smooth reflectivity magnitude fields. Such piecewise smoothness constraints have a long history in real-valued image restoration and reconstruction, under various names including edge-preserving regularization and total variation resto-ration. Within the context of SAR imaging, such smoothness is expected within homogenenous natural terrain types and within some man-made structures. Even in homogeneous regions, the phases of the reflectivities in spatially neighboring pixels however are generally uncorrelated, hence no such smoothness is expected in phase. As a consequence, we need to impose sparsity on | | ,sdand not on ,sd as the latter would lead to smoothing of the real and imaginary parts of the reflectivity field, which may not lead to the desired smoothing effect on the magnitudes.
Another perspective on sparsity-driven SAR imaging is that it can be used to preserve and enhance features that might be used in decision making based on SAR images, such as automatic tar-get recognition. With this perspective, the image formation approach of (3) was called feature-enhanced imaging in [3], with a dominant second term leading to point-enhanced imaging and a dominant third term leading to region-enhanced imaging.Point-enhanced imaging provides improved resolvability in sparse scenes, an example of which is provided in Figure 1. Region-enhanced imaging imposes sparsity on spatial gradients and leads to images with reduced speckle and easier to segment regions. Such improvements have partially been quantified in terms of feature extraction accuracy and object classification per-formance [4], [5].
Having to use a penalty on the magnitudes makes the optimi-zation problem in (3) more challenging than its counterparts in real-valued sparse signal recovery problems. Efficient algorithms
Previous Page | Contents | Zoom in | Zoom out | Front Cover | Search Issue | Next Page qqM
Mq
qM
MqM
THE WORLD’S NEWSSTAND®
Previous Page | Contents | Zoom in | Zoom out | Front Cover | Search Issue | Next Page qqM
Mq
qM
MqM
THE WORLD’S NEWSSTAND®

IEEE SIGNAL PROCESSING MAGAZINE [29] JULY 2014
matched to this problem structure have been developed [3]. These algorithms are based on half-quadratic regularization, and can be viewed as quasi-Newton methods with a specific Hessian update scheme. Another interpretation is that the overall nonquadratic problem is turned into a series of quadratic problems, each of which is efficiently solved in each iteration using conjugate gradi-ents. The special case of point-enhanced imaging can be solved by a variety of algorithms developed for sparse signal representation. In [6], a fast and adaptive sequential basis selection strategy is employed for point-enhanced imaging. Rather than solving a basis pursuit type optimization problem for point-enhanced SAR imag-ing, an alternative is to use a greedy matching pursuit algorithm, as in [7] and [8]. While the development of computationally effi-cient algorithms matched to the problem structure has been and continues to be an important line of research, at the fundamental level, the cost of solving the optimization problems involved in sparsity-driven SAR imaging is significantly higher than conven-tional processing. Hence there is certainly a price to be paid for potential improvements obtained in image quality. We should also note that many cost functionals considered in sparsity-driven SAR imaging are nonconvex. Throughout the work surveyed in this article, local optimization algorithms aiming to find the local min-ima of such cost functionals are used.
Now let us turn to synthesis-based models for sparse represen-tation. In a synthesis model, the formulation is based on repre-senting the signal of interest in terms of a dictionary and imposing sparsity on the dictionary coefficients. Let us just focus on one appealing feature of a synthesis model in the context of SAR imaging. We note that (3) uses two different regularization terms, one imposing the spatial sparsity of the field, and the other its piecewise smoothness. (One could combine the two terms into a single terms using a “tall” operator carrying out both analysis operations.) These two terms are used together to handle cases in which one of these terms does not serve as a good enough con-straint throughout the scene. However, (3) imposes these two potentially conflicting constraints jointly everywhere in the scene, leading to some degree of inconsistency with the stated objective. This issue may be handled in a more consistent manner
within a synthesis model. In particular, one can form an over-complete dictionary consisting of atoms corresponding to the dif-ferent types of features represented by the two constraints in (3). As the atoms can also exhibit spatial locality, one or the other type of feature can be “active” at a particular location in the scene, avoiding simultaneous use of potentially conflicting constraints. This could lead to a sparser representation for scenes exhibiting different types of features at different spatial locations. Based on these thoughts, a synthesis model for sparsity-driven SAR imag-ing has been proposed in [9]. As in (3), what admits sparse repre-sentation is the magnitude of the reflectivity field .s Hence we are interested in a representation of the form | | ,s Da= where Dis an overcomplete dictionary with the coefficient vector .a Let us also write | | ,s sU= where U is a diagonal matrix, the ithdiagonal element of which is ,e j ic with ic indicating the unknown phase of the ith scene element .si Based on this nota-tion, we can rewrite the observation model as
.r Hs n H D naU= + = + (4)
Letting z be a vector consisting of the diagonal elements of ,Uwe can write the following cost functional to be minimized for SAR imaging:
( , ) . . .J s t i1r H D pp
i22 6a a az m zU= - + = (5)
We note that the variables to be optimized involve the phase of the field, and the representation coefficients of its magnitude. This problem can be solved using the coordinate descent algo-rithm developed in [9]. Figure 2 contains a sample reconstruc-tion using a wavelet transform-based dictionary based on TerraSAR-X data [57]. For examples of other dictionaries used in this framework, including ones that are better matched to the task of representing reflectivity magnitudes, see [9]. This approach provides the capability to preserve and enhance multi-ple distinct features on different spatial regions of the scene uti-lizing combinations of a variety of standard and custom-made signal dictionaries including contourlets, combination of spikes
(a) (b) (c)
[FIG1] The reconstructions of the slicy target from the MSTAR data set [56]. (a) The reference image reconstructed from high-bandwidth data. (b) The conventional image reconstructed from limited-bandwidth data. (c) The sparsity-driven, point-enhanced image reconstructed from limited-bandwidth data.
Previous Page | Contents | Zoom in | Zoom out | Front Cover | Search Issue | Next Page qqM
Mq
qM
MqM
THE WORLD’S NEWSSTAND®
Previous Page | Contents | Zoom in | Zoom out | Front Cover | Search Issue | Next Page qqM
Mq
qM
MqM
THE WORLD’S NEWSSTAND®

IEEE SIGNAL PROCESSING MAGAZINE [30] JULY 2014
(the canonical basis to represent strong point scatterers) and edges, as well as dictionaries of various geometric shapes matched to the expected scene structure. Furthermore, the syn-thesis-based approach can be used to combine a standard dic-tionary with a learning-based dictionary. For example, [10] combines spikes with a learned dictionary. The reconstructed SAR scene would then be a composite image that can be decom-posed into multiple components represented by each dictionary, as illustrated in Figure 3.
While the sparsity-driven SAR imaging problem was formu-lated as a regularized optimization problem above, it could alter-natively be viewed as a maximum a posteriori (MAP) estimation problem with a Bayesian perspective, in which the sparsity con-straint turns into a heavy-tailed prior distribution for the features of interest. Continuing with the Bayesian perspective, one could also be interested in choosing other costs, leading to other esti-mators than MAP, or characterizing the posterior density rather than finding just a point estimate. There has been some explora-tion in this direction [11], [12]. There also exists some prelimi-nary work on automatic regularization parameter selection for sparsity-driven SAR imaging [13].
Sparsity-driven SAR imaging has been extended to and applied in emerging sensing scenarios in which the sensing aperture or the data are limited or sparse in some sense (see the section “Compressed Sensing-Based Analysis and Design of SAR Sensing Missions”), as well as in multistatic active and passive radar [14] including MIMO architectures [15]. The benefits pro-vided by sparsity-driven imaging are even greater in such non-conventional sensing scenarios. Sparsity-driven imaging has also been used for the problem of inverse SAR (ISAR) imaging of rotating targets [16], as well as for through-the-wall radar imaging [17]. It has also been extended to interferometric SAR [18] and SAR tomography (TomoSAR) [19] adding the elevation direction into the problem for 3-D imaging, as well as to four-dimensional (4-D) (differential, i.e., space-time) TomoSAR [20]. Sparsity-driven three-dimensional (3-D) image formation has also been used to initialize the process of geometric feature extraction from SAR data collected over arbitrary, monostatic or bistatic SAR apertures [21].
WIDE-ANGLE SAR IMAGING OF ANISOTROPIC SCATTERINGWide-angle SAR, a SAR modality in which radar returns are col-lected over a large azimuth extent or long aperture, has become possible due to advances in navigation and avionics that permit aircraft to follow precise routes for long distances. In theory, the wider the aspect angle covered by the synthetic aperture is, the finer the resolution of images in the cross-range direction can be. However, there are two main issues that arise in wide-angle SAR image formation. First, the sampling pattern of the collected radar returns in the frequency domain takes on an arch shape. However, the conventional Fourier transform-based polar format algorithm [22] is predicated on the polar frequency sampling pat-tern being a good approximation to a rectangular sampling pat-tern, which is violated with wide-angle apertures. Violation of this assumption leads to an irregular point spread function and to artifacts in imagery formed by conventional processing.
The second issue, and the main point of discussion in this sec-tion, is that when objects are viewed from diverse aspect angles, they have different scattering behaviors, i.e., the scattering response is a function of the azimuth angle. Imagine an upright flat metal plate; it will reflect radar signals back to the receiver strongly when viewed straight on but weakly when viewed obliquely. Angle-depen-dent scattering, termed angular anisotropy, is only prominent with wide-angle apertures, not narrow-angle apertures, in which case it is a reasonable assumption that scattering amplitude is constant over the aperture. The failure to model anisotropy in conventional image formation algorithms results in an averaging of scattering response over angle, leading to inaccurate scattering estimates in the formed imagery. Moreover, as anisotropy of scatterers is not characterized, one misses the opportunity of using it as a feature for automatic target recognition and scene understanding.
The problems of detecting, estimating, and modeling aspect-dependent scattering behavior have recently been studied. Anisot-ropy characterization methods may be broadly categorized into those employing parameterizations for angle-dependent scatter-ing in the phase history domain, multiaperture methods that operate in the image domain, and sparsity-driven nonparametric image formation and anisotropy characterization methods. Within the third category, techniques either apply sparse recon-struction methods described in the previous section indepen-dently on a set of (possibly overlapping) small subapertures [8], [23]–[25] or jointly process wide-aperture data by incorporating prior information on aspect-dependent scattering [26]–[28]. The independent processing methods have similarities with image domain multiaperture methods. In the remainder of this section, we describe one example formulation of a sparsity-driven subap-erture approach and two formulations of joint processing: one analysis based and one synthesis based.
Let us consider the following discrete version of the mea-surement model with anisotropy:
( , ) ( , ; ) ( , ),r f s x y e n f( )cos sink l
m
M
m m lj c
f x yk l
1
4 km l m li i i= +
ri i
=
- +/ (6)
(a) (b)
[FIG2] Reconstructions of a scene based on TerraSAR-X data [57]. (a) A conventional image. (b) A synthesis-based sparsity-driven image reconstructed using a multiresolution wavelet dictionary.
Previous Page | Contents | Zoom in | Zoom out | Front Cover | Search Issue | Next Page qqM
Mq
qM
MqM
THE WORLD’S NEWSSTAND®
Previous Page | Contents | Zoom in | Zoom out | Front Cover | Search Issue | Next Page qqM
Mq
qM
MqM
THE WORLD’S NEWSSTAND®
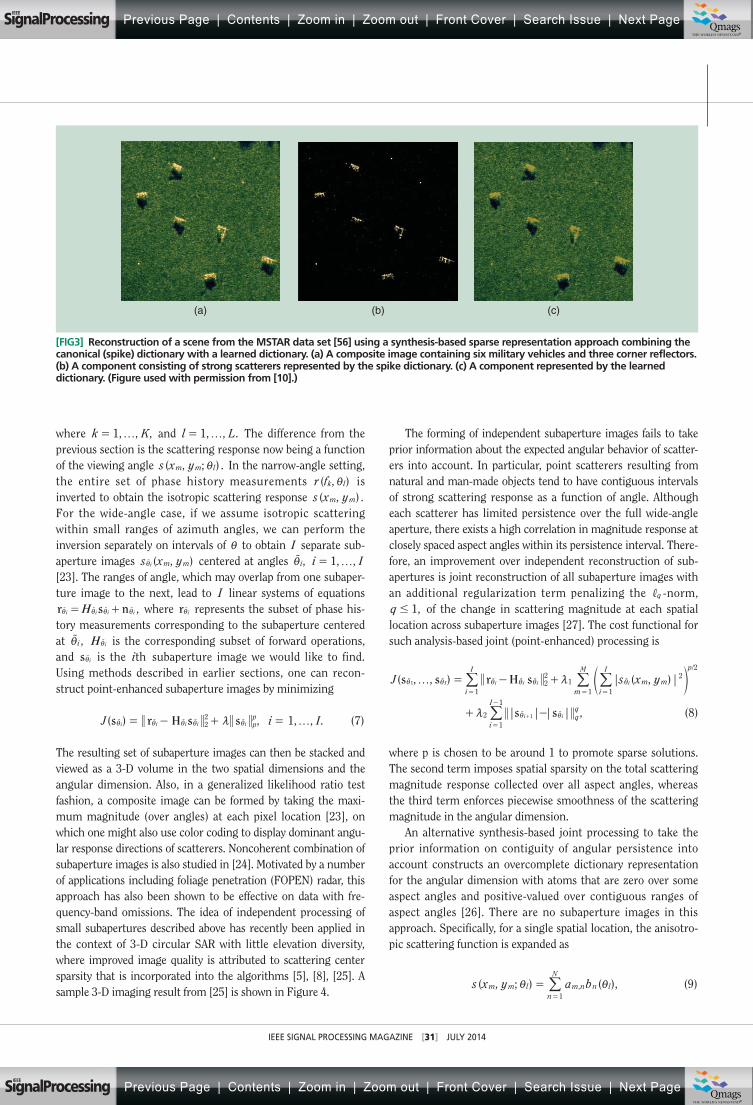
IEEE SIGNAL PROCESSING MAGAZINE [31] JULY 2014
where , , ,k K1 f= and , , .l L1 f= The difference from the previous section is the scattering response now being a function of the viewing angle ( , ; ) .s x ym m li In the narrow-angle setting, the entire set of phase history measurements ( , )r fk li is inverted to obtain the isotropic scattering response ( , ) .s x ym m
For the wide-angle case, if we assume isotropic scattering within small ranges of azimuth angles, we can perform the inversion separately on intervals of i to obtain I separate sub-aperture images ( , )s x ym miiu centered at angles ,iiu , ,i I1 f=
[23]. The ranges of angle, which may overlap from one subaper-ture image to the next, lead to I linear systems of equations
,Hr s ni i i i= +i i i iu u u u where r iiu represents the subset of phase his-tory measurements corresponding to the subaperture centered at ,iiu H iiu is the corresponding subset of forward operations, and s iiu is the ith subaperture image we would like to find. Using methods described in earlier sections, one can recon-struct point-enhanced subaperture images by minimizing
( ) , , , .J i I1s r H s s pp
22
i i i i i fm= - + =i i i i iu u u u u (7)
The resulting set of subaperture images can then be stacked and viewed as a 3-D volume in the two spatial dimensions and the angular dimension. Also, in a generalized likelihood ratio test fashion, a composite image can be formed by taking the maxi-mum magnitude (over angles) at each pixel location [23], on which one might also use color coding to display dominant angu-lar response directions of scatterers. Noncoherent combination of subaperture images is also studied in [24]. Motivated by a number of applications including foliage penetration (FOPEN) radar, this approach has also been shown to be effective on data with fre-quency-band omissions. The idea of independent processing of small subapertures described above has recently been applied in the context of 3-D circular SAR with little elevation diversity, where improved image quality is attributed to scattering center sparsity that is incorporated into the algorithms [5], [8], [25]. A sample 3-D imaging result from [25] is shown in Figure 4.
The forming of independent subaperture images fails to take prior information about the expected angular behavior of scatter-ers into account. In particular, point scatterers resulting from natural and man-made objects tend to have contiguous intervals of strong scattering response as a function of angle. Although each scatterer has limited persistence over the full wide-angle aperture, there exists a high correlation in magnitude response at closely spaced aspect angles within its persistence interval. There-fore, an improvement over independent reconstruction of sub-apertures is joint reconstruction of all subaperture images with an additional regularization term penalizing the q, -norm,
,q 1# of the change in scattering magnitude at each spatial location across subaperture images [27]. The cost functional for such analysis-based joint (point-enhanced) processing is
( , , ) | ( , ) |
| | | | ,
J s x ys s r H s
s s
/
i
I
m m
p
m
M
i
I
i
I
22
11
22
11
21
1
I i i i i
i i
1
1
f m
m
= - +
+ -
i i i i i i
i i
===
=
-
+
u u u u u u
u u
e o///
/ (8)
where p is chosen to be around 1 to promote sparse solutions. The second term imposes spatial sparsity on the total scattering magnitude response collected over all aspect angles, whereas the third term enforces piecewise smoothness of the scattering magnitude in the angular dimension.
An alternative synthesis-based joint processing to take the prior information on contiguity of angular persistence into account constructs an overcomplete dictionary representation for the angular dimension with atoms that are zero over some aspect angles and positive-valued over contiguous ranges of aspect angles [26]. There are no subaperture images in this approach. Specifically, for a single spatial location, the anisotro-pic scattering function is expanded as
( , ; ) ( ),s x y a b,m m l m nn
N
n l1
i i==
/ (9)
[FIG3] Reconstruction of a scene from the MSTAR data set [56] using a synthesis-based sparse representation approach combining the canonical (spike) dictionary with a learned dictionary. (a) A composite image containing six military vehicles and three corner reflectors. (b) A component consisting of strong scatterers represented by the spike dictionary. (c) A component represented by the learned dictionary. (Figure used with permission from [10].)
(a) (b) (c)
Previous Page | Contents | Zoom in | Zoom out | Front Cover | Search Issue | Next Page qqM
Mq
qM
MqM
THE WORLD’S NEWSSTAND®
Previous Page | Contents | Zoom in | Zoom out | Front Cover | Search Issue | Next Page qqM
Mq
qM
MqM
THE WORLD’S NEWSSTAND®

IEEE SIGNAL PROCESSING MAGAZINE [32] JULY 2014
where the a ,m n are coefficients and the ( )bn li are atoms. For each spatial location, there is one atom for each possible angular persis-tence width within the wide-angle aperture and each possible cen-ter angle. With such a dictionary construction, the number of atoms per spatial location is quadratic in ,L the number of aspect angles in the aperture. Substituting the dictionary expansion (9) into the anisotropic phase history expression (6), and stacking all data points into vector form yields an underdetermined system of linear equations of the form ,r aW= where a is a vector of all coefficients in the problem. The overcomplete dictionary at each spatial location can represent all contiguous angular scattering functions with a single atom. Hence in addition to spatial sparsity, the anisotropic scattering at each pixel can, in principle, be sparsely represented as well. So the problem is solved using spar-sity regularization by minimizing
( ) ,J a r a a pp
22W m= - + (10)
where p is chosen to be around 1. Because of the quadratic num-ber of atoms in the number of aspect angles, it is not tractable to optimize (10) directly, however the nesting structure of the dic-tionary allows the optimization to be approximated using a greedy graph search procedure [26]. Another challenge posed by a very large dictionary is that the problem becomes more underdeter-mined and it becomes harder to guarantee perfect recovery. The atomic decomposition allows for a direct interpretation of the coefficients in terms of the persistence and center angle of scatter-ing centers. This idea can be taken a step further by setting the dictionary atoms to be canonical scattering response magnitudes from typical object geometric configurations [28].
Image formation and anisotropy characterization from wide-aperture data collection using sparsity-driven approaches leads to improved results over conventional Fourier-based methods. We illustrate this point by showing results on a 110˚ aperture data set corresponding to a scene containing a backhoe loader [58]. Numerical quantifications of algorithm performance may be found in the respective papers [23], [26], and [27]. In this data set, the radar signals are generated using a high fidelity electromag-netic scattering code. Backhoe results from the conventional, independent point-enhanced subaperture, joint subaperture
reconstruction, and overcomplete dictionary algorithms are shown in Figure 5 (b)–(e), respectively. The image formed by con-ventional processing is quite unresolved and full of artifacts—it is difficult to even discern that the scene contains a backhoe. The backhoe is much more recognizable in the sparsity-driven results. Among the sparsity-driven approaches, joint processing gives finer resolution of the scattering behavior. The approaches we have described produce more than 2-D reflectivity images, in particular, these methods essentially reconstruct an angular scattering response at each pixel, leading to anisotropy characterization. This is demonstrated in Figure 6 for the analysis-based joint processing approach of [27]. The figure shows varying persistence of scat-tering as a function of angle in different parts of the backhoe. Such information could not be recovered by conventional image formation methods and could serve as an important fea-ture for automatic target recognition and scene understanding.
IMAGING AND AUTOFOCUSING IN THE PRESENCE OF PHASE ERRORSPhase errors in SAR phase history data arise due to errors in the esti-mation of the time required for the transmitted signal to propagate from the SAR platform to the scene and back. The most common causes of inaccuracies on the roundtrip propagation time are SAR platform position uncertainties and propagation induced errors due to atmospheric effects. The implication of such errors on conventional SAR imagery is the convolution of the image with a blurring kernel. Because of the defocusing effect of such errors, techniques developed for removing phase errors are called autofocus techniques. Existing well-known autofocus techniques commonly postprocess conventionally reconstructed defocused images to estimate the phase errors. One of these state-of-the-art techniques is mapdrift autofocus [29] which uses subaperture data to estimate the phase errors. Subaperture based techniques are suitable mostly for quadratic and slowly varying phase errors across the aperture. One of the most widely used autofocus tech-niques, phase gradient autofocus (PGA) [30], estimates phase errors using the data obtained by isolating several defocused tar-gets via center-shifting and windowing operations. Another well-known approach for autofocusing is based on the optimization of a sharpness metric. Commonly used metrics are entropy or square of the image intensity. A relatively new autofocus tech-nique, multichannel autofocus, is based on a noniterative algo-rithm that finds the focused image in terms of a basis formed from the defocused image, relying on a condition on the image support to obtain a unique solution.
The SAR autofocus problem has recently been handled in the context of sparsity-driven imaging as well. In [31], phase error estimation is performed by comparing and aligning sparsity-driven images produced from a sequence of smaller coherent processing intervals, for which motion errors can be assumed to be tolerable. For sparse aperture ISAR imaging, [32] proposes first to remove the phase errors by a weighted eigenvector-based phase correction method and then to form the image by spar-sity-driven imaging. The study in [33] demonstrates the effects of phase errors on sparsity-driven imaging and presents results
(a) (b) (c)
[FIG4] Sparsity-driven 3-D SAR imaging of a car. (a) Isometric view. (b) Side view. (c) Top view. (Figure used with permission from [25].)
Previous Page | Contents | Zoom in | Zoom out | Front Cover | Search Issue | Next Page qqM
Mq
qM
MqM
THE WORLD’S NEWSSTAND®
Previous Page | Contents | Zoom in | Zoom out | Front Cover | Search Issue | Next Page qqM
Mq
qM
MqM
THE WORLD’S NEWSSTAND®

IEEE SIGNAL PROCESSING MAGAZINE [33] JULY 2014
obtained by implementing PGA on sparsity-driven reconstruc-tions. In these pieces of work, the process of sparsity-driven imaging and that of autofocusing are rather isolated.
Going one step further, one can perform autofocusing and imaging simultaneously in a sparsity-driven framework, which has been shown to produce promising results [5], [34]–[37]. As an example of such an approach, the sparsity-driven autofocus (SDA) method [34] for an isotropic scattering scenario is based on the following observation model in which phase errors are considered as model errors:
( ) .r H s ne= + (11)
Here, ( )H e denotes the model matrix that takes the phase errors e into account. Assuming spatial sparsity of the reflectivity field, the following cost functional is minimized over both the field and the phase errors using a coordinate descent approach:
( , ) ( .)J S r H s s22
1e e m= - + (12)
Hence, SDA estimates the phase errors and performs sparsity-driven imaging jointly by solving this optimization problem. SDA has been used to compensate a variety of commonly encountered types of phase errors. A sample result on the backhoe data for a case involving randomly varying phase errors along the aperture
with a uniform distribution in [ , ],r r- is displayed in Figure 7. Note that this is a wide-angle imaging scenario and SDA is applied on subapertures within the framework of the wide-angle imaging method of [23]. Figure 7(a) and (b) show the reconstructions obtained by conventional imaging, and direct application of spar-sity-driven imaging without phase error compensation, respec-tively. The result of joint sparsity-driven imaging and phase error compensation through SDA is shown in Figure 7(c), which dem-onstrates the effectiveness of SDA in removing phase errors and reconstructing a high-quality image. The experimental analysis in [34] also shows how SDA provides improvements over existing autofocus methods.
More recently, [35] and [36] have used similar ideas to achieve autofocusing of undersampled SAR data. The method proposed in [35] is based on minimizing a constrained version of the cost functional in (12). Optimization is performed through a three-block relaxation approach by using an extra surrogate parameter for the field to guarantee convergence. In [36], motion compensation and image reconstruction are per-formed for SAR data obtained at a fraction of the Nyquist rate using reduced rate analog-to-digital converters. A total variation penalty on the field is incorporated into the optimization prob-lem as well. In [37], the idea of joint sparsity-driven imaging and autofocusing is used for 3-D imaging based on undersam-pled linear array SAR data.
(b)(a)
−35
−30
−25
−20
−15
−10
−5
−35
−30
−25
−20
−15
−10
−5
−24
−18
−12
−6
0
6
12
(c) (d) (e)
[FIG5] Wide-angle SAR imaging of a backhoe loader. (a) A CAD model. (b) Conventional reconstruction. (c) A composite independent subaperture image. (d) A composite joint subaperture image imposing piecewise smoothness in angular scattering. (e) A composite joint subaperture image based on an overcomplete dictionary for angular scattering. (Images used courtesy of [26] and [27].)
Previous Page | Contents | Zoom in | Zoom out | Front Cover | Search Issue | Next Page qqM
Mq
qM
MqM
THE WORLD’S NEWSSTAND®
Previous Page | Contents | Zoom in | Zoom out | Front Cover | Search Issue | Next Page qqM
Mq
qM
MqM
THE WORLD’S NEWSSTAND®

IEEE SIGNAL PROCESSING MAGAZINE [34] JULY 2014
MOVING TARGET IMAGINGJoint SAR imaging and ground moving target localization has proven to be an important but challenging task due to an inher-ent ambiguity in target geolocation and velocity. While the com-ponents of the received signal belonging to a particular stationary target have the same phase in successive radar returns, the phase of a moving target varies due to its varying range. Hence, to the conventional SAR imager working under the assumption that the scene is stationary during aperture synthesis, motion amounts to phase errors and results in defocusing and even displacement of moving target energy. On the other hand, if the SAR imager assumes a particular nonzero scene motion, the moving target with a matching velocity appears focused, while all stationary and velocity mismatched targets appear defocused.
A common approach for SAR moving target imaging is first to find the smeared imagery of moving targets in a conventionally formed image and then perform phase error estimation and com-pensation for the corresponding image parts. Space-time adaptive processing uses data obtained from multiple channels to suppress clutter and separate moving targets from the background. Velocity SAR exploits phase information from multiple receive antennas, whereas dual-speed SAR processes the data collected by a platform flying with two different speeds in the radar observation duration.
Sparsity-based methods have recently made their way into moving target SAR imaging. In [38]–[41], sparse representation techniques are used to search for a solution over an overcom-plete dictionary that consists of atoms for several velocity-posi-tion combinations. The overcomplete dictionary approach amounts to linearizing the nonlinear problem of target scatter-ing and motion estimation and subsequently to solving the prob-lem as a larger, unified regularized inversion problem involving sparsity constraints. A sample multistatic imaging result from [38] is illustrated in Figure 8. When a scene consisting of a
stationary, a slowly moving, and a fast-moving target [shown in Figure 8(a) at time zero] is conventionally imaged under a zero-velocity assumption, the slowly moving target is defocused, while the fast-moving target disappears [Figure 8(b)]. The conventional reconstruction over a set of hypothesized velocities accurately localizes the moving targets, albeit with residual blur. Finally, Figure 8(d) shows that target features can be recovered by the sparsity-enforcing overcomplete dictionary approach [38]. In [40], a similar optimization problem to the one in [38] is solved after a clutter cancellation procedure is applied to the data.
Based on the observation that radar returns from a scene with motion can be viewed as data from a stationary scene, but with phase errors due to motion, a recently proposed idea is to view moving target imaging as a generalized, spatially variant autofo-cusing problem. The work in [42] does just that and extends the SDA framework, described in the previous section, to the problem of moving target imaging. Due to the spatially variant nature of the defocusing (due to the possibility of targets with different velocities at different locations), the number of unknowns is much greater than a basic autofocusing problem, making this a very ill-posed problem, requiring effective constraints for a successful solution. Based on this observation, [42] not only exploits the sparsity of the reflectivity field, but also imposes a constraint on the spatial sparsity of the phase errors based on the assumption that motion in the scene will be limited to a small number of spa-tial locations. The phase errors corresponding to all points in the scene, for all aperture positions are incorporated into the problem using the vector ,b whose elements are in the form of .e sj \e The following cost functional is minimized jointly with respect to the field and the phase errors:
( , ) ( )
. . ( ) .
J
s t i i11s r H s s2
21 1
2 1 6
b b m
m b b
= - +
+ - = (13)
(b)(a)
[FIG6] Anisotropy characterization for a subset of pixels in the backhoe loader using joint subaperture reconstruction imposing piecewise smoothness in angular scattering. The individual small plots in (b) have subaperture angle iu as the abscissa and the scattering magnitude | ( ) |s iu as the ordinate. They are arranged to match the pixel locations in (a).
Previous Page | Contents | Zoom in | Zoom out | Front Cover | Search Issue | Next Page qqM
Mq
qM
MqM
THE WORLD’S NEWSSTAND®
Previous Page | Contents | Zoom in | Zoom out | Front Cover | Search Issue | Next Page qqM
Mq
qM
MqM
THE WORLD’S NEWSSTAND®

IEEE SIGNAL PROCESSING MAGAZINE [35] JULY 2014
Here, 1 is a vector of ones. Assuming that the number of mov-ing points constitutes a small percentage of the total number of points in the scene, most of the e values are zero, and subse-quently most of the elements in the vector b are one. There-fore, this sparsity on the phase errors is incorporated into the problem formulation by using the regularization term
.1 1b - Results of an experiment on a synthetic scene con-taining two moving targets are shown in Figure 9. The six pointlike targets are stationary. To simulate the SAR returns from the two large targets moving with constant cross-range velocities, quadratic phase errors with a center to edge ampli-tude of r radians and .2 5r radians have been added to the data of these particular targets. These phase errors correspond to velocities of 2 m/s and 5 m/s, respectively, for the SAR system used in this experiment. Figure 9(a) and (b) show the results of conventional imaging and sparsity-driven imaging without phase error compensation, respectively. The result of sparsity-driven moving target imaging [42], displayed in Figure 9(c), shows the effectiveness of the method in removing the phase errors due to motion, as well as in producing an image that exhibits the qualities of sparsity-driven SAR imaging.
There exist several other pieces of recent work exploiting sparsity for moving target SAR imaging. The work in [39] con-centrates on targets with micromotions that are mainly embod-ied with rotation and vibration. To enforce sparsity, generalized Gaussian and student-t prior models are considered, and the variational Bayes’ approximation estimator is applied to the hier-archical Bayesian models involved in the problem. The paper [41] considers the problem of motion parameter estimation of mov-ing targets with Doppler spectrum ambiguity and Doppler cen-troid frequency ambiguity encountered in SAR systems with low pulse repetition frequency, and presents a sparsity-based method that involves the use of the Radon transform to acquire unam-biguous across-track velocities and range positions in the range profile domain. The paper [43] proposes an adaptive CS-based SAR system for dynamic sparse target scenes. The proposed sys-tem uses the recovered target scene information to detect if the scene has changed and optimizes the transmission waveform and sensing matrix accordingly. Finally, the paper [44] presents an approach that combines sparsity-driven radar imaging and change detection for detecting and localizing moving humans behind walls and inside enclosed structures.
[FIG7] Imaging in the presence of phase errors uniformly distributed in [ , ] .r r- (a) Conventional imaging. (b) Sparsity-driven imaging without phase error compensation. (c) SDA.
[FIG8] Multistatic moving target imaging. (a) A simulated ground truth scene at time .t 0= The upper left target is stationary, the upper right target moves slowly, and the bottom target moves at a faster velocity. (b) Conventional reconstruction when motion is ignored. (c) Conventional reconstruction over a set of velocity hypotheses. (d) Sparsity-enforcing overcomplete dictionary reconstruction. (Images used courtesy of [38].)
(a) (b) (c)
5 10 15 20 25 30
20
406080
100120
00.10.20.30.40.50.60.70.80.91
5 10 15 20 25 30
20
406080
100120
00.10.20.30.40.50.60.70.80.91
5 10 15 20 25 30
20
406080
100120
00.10.20.30.40.50.60.70.80.91
5 10 15 20(a) (b) (c) (d)
25 30
20
406080
100120
00.10.20.30.40.50.60.70.80.91
Previous Page | Contents | Zoom in | Zoom out | Front Cover | Search Issue | Next Page qqM
Mq
qM
MqM
THE WORLD’S NEWSSTAND®
Previous Page | Contents | Zoom in | Zoom out | Front Cover | Search Issue | Next Page qqM
Mq
qM
MqM
THE WORLD’S NEWSSTAND®

IEEE SIGNAL PROCESSING MAGAZINE [36] JULY 2014
COMPRESSED SENSING-BASED ANALYSIS AND DESIGN OF SAR SENSING MISSIONSAs discussed in previous sections, ideas based on sparse signal rep-resentation have led to advanced image formation methods that offer a number of benefits for SAR such as increased resolvability of point scatterers and reduced speckle, as well as robustness to limitations in data quality and quantity. Robustness to missing or undersampled data has recently become a particularly critical con-cern due to new mission requirements and sensor geometries that result in nondense and irregular sampling patterns in the SAR measurement space. Current radar systems are capable of accom-modating multiple operational modes such as searching, tracking, and imaging on the same platform. Timeline constraints of a higher priority mode may require interrupts in SAR data collec-tion and lead to gaps in the synthetic aperture. Likewise, jamming and interference from nearby transmitters may lead to frequency gaps in SAR data collection. Furthermore, multiplatform and pas-sive sensing from transmitters of opportunity result in sparse sensing geometries and irregular sampling of the SAR measure-ment space. Such irregular and undersampled data scenarios motivate the application of CS [45] ideas and signal processing algorithms to SAR. Sparsity-driven methods described in previous sections serve as the main computational tool for inverting such limited data. In this section, we provide an overview of a subset of recent work on the use of CS theory and principles for analysis and design of monostatic and multistatic SAR sensing missions under various constraints on data collection.
CS seeks to acquire as few measurements as possible about an unknown signal, and given these measurements, reconstruct the signal either exactly or with provably small probability of error. Reconstruction methods used in CS involve sparsity-constrained, nonquadratic regularization ideas and algorithms similar to the ones discussed in previous sections. Based on CS theory, such methods can successfully recover the signal sampled well below the Nyquist rate provided that the signal has a sparse representation in some suitable domain and that its measurement process satisfies certain properties (such as incoherence [46]) with respect to the sig-nal’s sparsifying basis [45]. For example, signals sparse in the canon-ical basis (which is what we will assume in this section) can be
accurately reconstructed from measurements involving extremely few, but randomly chosen Fourier samples of a signal. Since both monostatic and multistatic SAR sensing can be viewed as obtain-ing samples of the spatial Fourier transform of the scattering field, these results open opportunities for reduced-data SAR sensing.
Random sampling of SAR data in 2-D Fourier space closely matches observation scenarios assumed in existing CS theory. While random subsampling can be primarily used to reduce on-board data storage requirements, it may not represent data limita-tions due to more structured interrupts and it may not enable reallocation of SAR sensing resources to other tasks. To enable such resource management and retasking, one could consider col-lecting returns of, e.g., a reduced number of transmitted wave-forms by imposing randomness into the synthetic aperture [47], [48]. It would then be of interest to analyze and design sensing mis-sions, i.e., practical data sampling configurations, based on the expected signal reconstruction quality and assess how well metrics appearing in CS theory (and that are defined by the measurement scenario) predict reconstruction performance from such limited data. Recent work on this question suggests CS principles may be used to analyze and guide the design of monostatic and multistatic SAR sensing missions under various constraints on data collection.
Here we provide highlights of such an analysis. One idea is to study sensitivity to data limitations and to the sampling pat-terns through mutual-coherence based metrics, which appear in CS theory. The mutual coherence of a measurement operator was proposed as a simple, but conservative measure of the abil-ity of sparsity-enforcing reconstruction to accurately recon-struct a signal [46]. The mutual coherence of a complex-valued matrix ,H which in our case becomes the mutual coherence of a sensing configuration, is defined as
( ) ,| , |
, ,max g g i jHh h
h hi j i j
i j
2 2ij ij !
G Hn = =
!(14)
where hi is the ith column of the matrix ,H and the inner prod-uct is defined as , .h h h hi j i
HjG H= The ith column vector hi can
be viewed as a range-aspect “steering vector” of a sensing
(a) (b) (c)
[FIG9] Imaging of a synthetic scene with moving targets. (a) Conventional imaging. (b) Sparsity-driven imaging assuming a stationary scene. (c) Joint sparsity-driven imaging and phase error correction.
Previous Page | Contents | Zoom in | Zoom out | Front Cover | Search Issue | Next Page qqM
Mq
qM
MqM
THE WORLD’S NEWSSTAND®
Previous Page | Contents | Zoom in | Zoom out | Front Cover | Search Issue | Next Page qqM
Mq
qM
MqM
THE WORLD’S NEWSSTAND®

IEEE SIGNAL PROCESSING MAGAZINE [37] JULY 2014
geometry or the contribution of a scatterer at a specific spatial location to the received phase history data. The mutual coherence measures the worst case correlation between responses of two distinct scatterers at different spatial locations. The t% -average mutual coherence, ,t%n has been proposed as a measure more closely related to the average reconstruction performance of spar-sity-driven SAR reconstruction [47]
( ) , ( ),, ,( )
( )
t
g tt
g10 otherwise
HI
II
%%
%t
i j
i j t
ij
ij ijij
ij%
%!n
f= =
!
! )//
(15)
where t%f denotes the set containing the largest %t column cross-correlations .gij Based on this definition, ( )Ht%n measures the average cross-correlation value within the set of the t% most simi-lar column pairs. A large value of ( )Ht%n indicates that there are many similar pairs of columns of H that can potentially confuse the reconstruction algorithm. This measure is more robust to outliers, which can unfairly dominate the mutual coherence. The %t-mutual coherence can be related to the cumulative coherence [49] that, in the CS literature, has been used to derive sparse signal recovery conditions with convex cost function relaxations. The cumulative coherence provides an upper bound on the %t -mutual coherence. Note that ( )Ht%n can be computed for a sensing config-uration before actual data collection. The question then is whether it can serve as a predictor of reconstruction quality of a sparse scene based on data to be collected through a particular configuration.
Figure 10 provides an example of the utility of t%-average mutual coherence on an urban scene from the publicly released Gotcha SAR data set [59]. Figure 10(a) shows the scatter plot of root-mean-square error (RMSE) of the reconstructions versus
. %0 5n when the number of randomly missing aperture positions increases linearly up to 50%. Just for visualization, Figure 10(b) and (c) shows sample conventional and sparsity-driven recon-structions of the scene with 24% of the synthetic aperture miss-ing. The result in Figure 10(a) indicates that configurations with sufficiently small values of the %t -average mutual coherence achieve high-quality reconstruction and that . %0 5n appears to be a good predictor of reconstruction quality. This is an easily com-puted parameter that can be utilized for real-time evaluation of sensing configurations and task planning of multimode radars. Although we have considered a simple monostatic scenario here for simplicity, the analysis in [47] suggests that such a CS-moti-vated metric can be useful in the analysis and design of multistatic sensing missions as well. In the multistatic case, CS and sparsity-driven reconstruction have the potential to allow for sensing with fewer transmitted probes and reduced acquisition time.
Another way CS theory has recently impacted SAR imaging is by motivating the design of new radar waveforms. New radar waveforms such as Alltop and pseudorandom sequences have been shown to lead to high-resolution imaging radar and reduced analog-to-digital conversion bandwidth [7], [50]. Com-pressive sensing through convolution using random noiselike transmitted waveforms followed by random time-domain sub-sampling and its application to SAR was discussed in [51]. These
waveforms result in incoherent radar sensing matrices and allow for accurate reconstruction of sparse target scenes. Multistatic and distributed radar waveform design for CS was discussed in [52]. CS for MIMO radars was addressed in scenarios involving uniform linear antenna array configurations [53], [54] and antennas randomly distributed over a small area [55].
SUMMARY AND DISCUSSIONWe have presented an overview of recent lines of inquiry that lie at the intersection of two domains: sparse signal representation and SAR image formation. For basic SAR imaging, we have described image formation methods founded upon analysis and synthesis-based sparse signal representation ideas, and discussed how the complex-valued and potentially random-phase nature of SAR reflectivities have led to interesting optimization formula-tions different from those encountered in basic sparse signal rep-resentation problems. Motivated by emerging applications, including those involving sensing by unmanned aerial vehicles, we have considered the problem of wide-angle SAR imaging and described how exploitation of the sparsity of the scene and that of the angular scattering response can lead to effective imaging and anisotropy characterization. Then we have turned to the issue of phase errors, and described how exploitation of sparsity enables autofocusing in challenging conditions. We have pointed to
(a)
(b) (c)
0.5
0.45
0.4
0.35
0.3
0.25
0.2
0.15
0.1
0.05
00
0.00
20.
004
0.00
60.
008
0.01
00.
012
0.01
40.
016
0.01
8
t%–Average Mutual Coherence, μ0.5%
RM
SE
[FIG10] A compressed sensing-based analysis of sensing con-figurations. (a) RMSE versus .. %0 5n (b) Conventional recon-struction, and (c) sparsity-driven reconstruction correspond-ing to the red point in (a) with 24% of missing data. (Images used courtesy of [47].)
Previous Page | Contents | Zoom in | Zoom out | Front Cover | Search Issue | Next Page qqM
Mq
qM
MqM
THE WORLD’S NEWSSTAND®
Previous Page | Contents | Zoom in | Zoom out | Front Cover | Search Issue | Next Page qqM
Mq
qM
MqM
THE WORLD’S NEWSSTAND®

IEEE SIGNAL PROCESSING MAGAZINE [38] JULY 2014
recent pieces of work that attempt to use sparsity for the chal-lenging problem of moving target SAR imaging. Finally, we have discussed how recent developments in CS theory have motivated not only the use of sparsity-driven methods for SAR imaging, but also the analysis and design of SAR sensing missions under physi-cal, geometric, or temporal constraints on data collection.
The body of work on sparsity-driven SAR imaging we have cov-ered here (and related pieces of work we were not able to cover due to space constraints), shows that sparsity can be a useful asset for SAR imaging especially in nonconventional data collection sce-narios (e.g., when the data are sparse, irregular, limited) leading to severely underconstrained, ill-posed problems for image forma-tion. Sparsity-driven imaging should not necessarily be viewed as a general-purpose approach that should replace more traditional SAR image formation methods completely. When used properly, it is a tool that can enable the radar engineer to extract interesting pieces of information from SAR data that is not possible through more conventional means. As any approach for solving an ill-posed problem, it relies on a certain type of assumption, which, in this particular case, is that the scene admits sparse representation in some domain. It performs very well on scenes that exhibit spar-sity or compressibility, and enhances aspects of a particular scene that exhibit these characteristics. If the important characteristics of the scene and the sparse structure imposed through a particu-lar dictionary are mismatched, we would obviously not expect the approach to produce improved imagery. This is why we expect “learning” to be an important theme in future work, as we describe below. Furthermore, when sparsity by itself is not suffi-cient to capture the rich information content of a scene, it might be possible to combine it with other types of priors each of which describes a component of a decomposed scene.
The research we have reviewed provides a principled basis and demonstrates how sparsity can be exploited in several contexts in SAR imaging. We believe we will witness wider utilization of spar-sity-based methods in real SAR imaging applications over the upcoming years if several challenges are addressed and further research is carried out with a broader perspective. These chal-lenges include reducing computational complexity, establishing stronger connections between imaging and decision-making, using effective machine-learning ideas to tune the notion of spar-sity to a particular context, and going beyond sparsity to capture other forms of simple structures present in the data. Based on this perspective, we briefly describe four lines of research that we believe will enrich this problem domain and widen its applicability.
1) Computational advances. The first issue is computational complexity. While we might never expect sparsity-driven imaging to be as fast as simple Fourier transform-based imag-ing methods, more work is needed to develop exact and approximate algorithms that exploit the problem structure to produce faster solutions. One can think of several related research thrusts under this theme. First, given recent develop-ments in convex optimization methods, it is of interest to adapt promising methods to particular SAR imaging problems to improve computational efficiency. As an example, aug-mented Lagrangian methods such as alternating direction
method of multipliers could be considered not only because of their fast convergence properties, but also due to their poten-tial for distributed implementation leading to parallelization. This brings us to our next point, which is whether one could exploit parallel processing on graphics processing units (GPUs) for sparsity-driven SAR imaging. While there exist GPU implementations of sparse signal representation ideas used as postprocessing despeckling methods, effective GPU implementations of the solution of the inverse problem for imaging is more challenging. Finally, for sparsity-driven SAR imaging problems involving large dictionaries, it is of interest to develop approximate algorithms that intelligently search the solution space exploiting the problem structure to achieve fast and reasonably accurate solutions. Advances in computa-tional tools would enable wider utilization of sparsity-driven SAR imaging methods especially in relatively large problems involving, e.g, 3-D imaging in the context of TomoSAR. 2) Decision-directed imaging. We envision two potential major lines of inquiry suggesting the establishment of closer connec-tions between SAR imaging and machine learning. The one we describe here involves the interplay between SAR imaging and further decision making. As discussed in the body of this arti-cle, one of the early motivations for sparsity-driven SAR imag-ing has been the preservation and enhancement of features important for tasks such as automatic target recognition. While this line of thinking has produced images with, e.g., bet-ter preservation of scatterer locations or easier to segment regions, accomplishments have been limited in at least to ways: first, only very low-level features have been used, and second, this has been an “open-loop” process. It would be interesting to bring in higher-level information, such as object shapes, into the problem formulation. It would also be inter-esting to take a decision-directed perspective and use informa-tion fed back from the inference engine, such as partial information on classes of objects in the scene, while solving the image formation problem. Whether one could formulate a sparse representation perspective to incorporate such high-level statistical information is a question worthy of exploration. 3) Closer connections to machine learning. Another major line of inquiry we foresee involves close integration of machine-learning methods into sparsity-driven SAR imaging. We have already mentioned that sparsity-driven imaging can be formulated using a Bayesian perspective that involves priors on the reflectivity field and the parameters, and in which the imaging problem involves characterizing a posterior density. While there exists some work with this perspective, using machine learning methods to demonstrate the benefits offered by such a statistical perspective is of interest for the future. Another aspect in which we expect learning methods to play a more prominent role is the construction of the dictionaries used in sparse representation. While there has been some pre-liminary work on dictionary learning in the context of SAR imaging, significant benefits are yet to be demonstrated. Con-necting this back to decision-directed processing, one might consider performing discriminative dictionary learning as well.
Previous Page | Contents | Zoom in | Zoom out | Front Cover | Search Issue | Next Page qqM
Mq
qM
MqM
THE WORLD’S NEWSSTAND®
Previous Page | Contents | Zoom in | Zoom out | Front Cover | Search Issue | Next Page qqM
Mq
qM
MqM
THE WORLD’S NEWSSTAND®

IEEE SIGNAL PROCESSING MAGAZINE [39] JULY 2014
4) Other forms of “simplicity.” The final area of research we anticipate is about exploiting other types of structures poten-tially exhibited by SAR data in addition to sparsity. In particular, a concrete potential line of work could involve the use of low-rank models. Recent theoretical work on low-rank models shares many aspects of earlier work on sparsity and CS: low-rank matrix recovery problems are posed as optimization problems, relaxed forms of which, involving nuclear norms of matrices, are solved efficiently. Temporal and spatial dependencies in SAR data may lead to successful use of low-rank models, in a variety of contexts including moving target imaging and wide-angle imag-ing, and could possibly involve decomposition of some of the sig-nals into sparse and low-rank components as well. Overall, sparsity-driven SAR imaging is an exciting topic of
study for both radar imaging experts and statistical signal pro-cessing researchers. Due to its connections to interesting ongo-ing theoretical work on signal representation and CS, as well as due to its potential for real impact on existing and emerging applications, we expect that it will continue to be an active area of academic and engineering development in the near future.
AUTHORSMüjdat Çetin ([email protected]) is an associate professor at Sabancı University, Istanbul, Turkey. He was the technical pro-gram cochair for the International Conference on Information Fusion in 2013 and for the International Conference on Pattern Recognition in 2010. He has received several awards including the 2013 IET Radar, Sonar, and Navigation Premium Award, the 2010 IEEE Signal Processing Society Best Paper Award, the 2007 Elsevier Signal Processing Journal Best Paper Award, and the 2008 Turkish Academy of Sciences Distinguished Young Scientist Award. He was an associate editor of IEEE Signal Processing Let-ters and IEEE Transactions on Cybernetics from 2012 to 2014. He is currently an associate editor of IEEE Transactions on Image Processing. His current research interests include image reconstruction and restoration, brain–computer interfaces, bio-medical information processing, and image analysis.
Ivana Stojanovic ([email protected]) received the Dipl.Ing. degree from the University of Belgrade, Serbia, in 1999 and the M.S. and Ph.D. degrees in electrical engineering from Bos-ton University in 2007 and 2012, respectively. At Boston University, she worked on sparse signal reconstruction and compressed sens-ing application to synthetic aperture radar imaging and biomedi-cal signal processing. She is currently a lead research engineer at HERE, a Nokia business developing 3-D maps. Previously, she held a senior research scientist position at Scientific Systems Company, where she worked on interrupted synthetic aperture radar. From 1999 to 2005, she held positions in Iospan Wireless and Intel working as a wireless systems engineer developing WiMax systems.
N. Özben Önhon ([email protected]) received the B.S. degree in electronics and telecommunication engineering and the M.S. degree in telecommunication engineering from Istanbul Technical University, in 2003 and 2006, respectively. She received the Ph.D. degree in electronics engineering from Sabancı University in 2012. She is currently a faculty member at
Turkish–German University, Istanbul, Turkey. Her research inter-ests are in the areas of signal and image processing.
Kush R. Varshney ([email protected]) received the B.S. degree in electrical and computer engineering with honors from Cornell University in 2004 and the S.M. and Ph.D. degrees, both in electrical engineering and computer science, from the Massachu-setts Institute of Technology in 2006 and 2010, respectively. He is a research staff member in the Mathematical Sciences and Analyt-ics Department at the IBM Thomas J. Watson Research Center. He received a Best Student Paper Travel Award at the 2009 Interna-tional Conference on Information Fusion; the Best Paper Award at the 2013 IEEE International Conference on Service Operations and Logistics, and Informatics; and several IBM awards for contri-butions to business analytics projects. He is on the editorial board of Digital Signal Processing and a member of the IEEE Signal Processing Society Machine Learning for Signal Processing Tech-nical Committee.
Sadegh Samadi (samadi@ sutech.ac.ir) is a faculty member at the Department of Electrical and Electronics Engineering, Shiraz University of Technology, Iran. He received the Ph.D. degree from Shiraz University, Iran, in 2010. He received the 2013 IET Radar, Sonar, and Navigation Premium Award. His research interests lie within the broad field of statistical signal and image processing.
W. Clem Karl ([email protected]) received the Ph.D. degree in electrical engineering and computer science from the Massachu-setts Institute of Technology. He is a professor of electrical and computer engineering and biomedical engineering at Boston Uni-versity. He is currently the editor-in-chief of IEEE Transactions on Image Processing and a member of the IEEE Signal Processing Society’s Conference Board. He is a past member of the Society’s Board of Governors and was the general chair of the 2009 IEEE International Symposium on Biomedical Imaging. His current research interests include statistical image processing, estimation, detection, and inverse problems, such as tomography.
Alan S. Willsky ([email protected]) is the E.S. Webster profes-sor of electrical engineering and computer science at the Massa-chusetts Institute of Technology and was a founder of Alphatech, Inc. Among his awards are the 1975 American Automatic Control Council Eckman Award, 1979 American Society of Civil Engineers Alfred Noble Prize, 1980 IEEE Browder Thompson Award, 2004 IEEE Donald Fink Prize Paper Award, Doctorat Honoris Causa from Université de Rennes, 2009 Technical Achievement and 2014 Society Awards from the IEEE Signal Processing Society. He is a member of the National Academy of Engineering and is a coau-thor of Signals and Systems. His research interests are in the development and application of methods of estimation, machine learning, and statistical signal and image processing.
REFERENCES[1] J. Ender, “On compressive sensing applied to radar,” Signal Process., vol. 90, no. 5, pp. 1402–1414, May 2010.
[2] L. C. Potter, E. Ertin, J. T. Parker, and M. Çetin, “Sparsity and compressed sensing in radar imaging,” Proc. IEEE, vol. 98, no. 6, pp. 1006–1020, June 2010.
[3] M. Çetin and W. C. Karl, “Feature-enhanced synthetic aperture radar image forma-tion based on nonquadratic regularization,” IEEE Trans. Image Processing, vol. 10,no. 4, pp. 623–631, Apr. 2001.
Previous Page | Contents | Zoom in | Zoom out | Front Cover | Search Issue | Next Page qqM
Mq
qM
MqM
THE WORLD’S NEWSSTAND®
Previous Page | Contents | Zoom in | Zoom out | Front Cover | Search Issue | Next Page qqM
Mq
qM
MqM
THE WORLD’S NEWSSTAND®
_______________
____________
_____________
_________
__________________
__________
______________

IEEE SIGNAL PROCESSING MAGAZINE [40] JULY 2014
[4] M. Çetin, W. C. Karl, and D. A. Castañón, “Feature enhancement and ATR perfor-mance using non-quadratic optimization-based SAR imaging,” IEEE Trans. Aerosp. Electron. Syst., vol. 39, no. 4, pp. 1375–1395, Oct. 2003.
[5] S. I. Kelly, C. Du, G. Rilling, and M. E. Davies, “Advanced image formation and processing of partial synthetic aperture radar data,” IET Signal Process., vol. 6, no. 5,pp. 511–520, July 2012.
[6] Z. Wang and W. Wang, “Fast and adaptive method for SAR superresolution imag-ing based on point scattering model and optimal basis selection,” IEEE Trans. Image Processing, vol. 18, no. 7, pp. 1477–1486, July 2009.
[7] R. Baraniuk and P. Steeghs, “Compressive radar imaging,” in Proc. IEEE Radar Conf., Waltham, MA, Apr. 2007, pp. 128–133.
[8] M. Ferrara, J. A. Jackson, and C. Austin, “Enhancement of multi-pass 3D circular SAR images using sparse reconstruction techniques,” in Algorithms for Synthetic Aperture Radar Imagery XVI, ser. Proc. SPIE, E. G. Zelnio and F. D. Garber, Eds., vol. 7337, Orlando, FL, Apr. 2009, p. 733702.
[9] S. Samadi, M. Çetin, and M. A. Masnadi-Shirazi, “Sparse representation-based synthetic aperture radar imaging,” IET Radar, Sonar Navigat., vol. 5, no. 2, pp. 182–193, Feb. 2011.
[10] I. Stojanovic, “Sparse reconstruction in monostatic and multistatic SAR,” Ph.D. dissertation, Dept. Electrical and Comput. Engin., Boston Univ., 2012.
[11] L. C. Potter, P. Schniter, and J. Ziniel, “Sparse reconstruction for radar,” in Algorithms for Synthetic Aperture Radar Imagery XV, ser. Proc. SPIE, E. G. Zelnioand F. D. Garber, Eds., vol. 6970, Orlando, FL, Mar. 2008, p. 697003.
[12] G. Xu, M. Xing, L. Zhang, Y. Liu, and Y. Li, “Bayesian inverse synthetic aperture radar imaging,” IEEE Geosci. Remote Sensing Lett., vol. 8, no. 6, pp. 1150–1154,Nov. 2011.
[13] O. Batu and M. Cetin, “Parameter selection in sparsity-driven SAR imaging,” IEEE Trans. Aerosp. Electron. Syst., vol. 47, no. 4, pp. 3040–3050, Oct. 2011.
[14] M. Çetin and A. Lanterman, “Region-enhanced passive radar imaging,” IEE Proc. Radar, Sonar Navigat., vol. 152, no. 3, pp. 185–194, June 2005.
[15] X. Tan, W. Roberts, J. Li, and P. Stoica, “Sparse learning via iterative minimiza-tion with application to MIMO radar imaging,” IEEE Trans. Signal Processing, vol. 59,no. 3, pp. 1088–1101, Mar. 2011.
[16] W. Rao, G. Li, X. Wang, and X.-G. Xia, “Adaptive sparse recovery by parametric weighted L1 minimization for ISAR imaging of uniformly rotating targets,” IEEE J. Select. Topics Appl. Earth Observ. Remote Sensing, vol. 6, no. 2, pp. 942–952, Apr. 2013.
[17] M. G. Amin and F. Ahmad, “Compressive sensing for through-the-wall radar im-aging,” J. Electron. Imag., vol. 22, no. 3, p. 030901, July 2013.
[18] N. Ramakrishnan, E. Ertin, and R. Moses, “Enhancement of coupled multichan-nel images using sparsity constraints,” IEEE Trans. Image Processing, vol. 19, no. 8,pp. 2115–2126, Aug. 2010.
[19] A. Budillon, A. Evangelista, and G. Schirinzi, “Three-dimensional SAR focusing from multipass signals using compressive sampling,” IEEE Trans. Geosci. Remote Sensing, vol. 49, no. 1, pp. 488–499, Jan. 2011.
[20] X. X. Zhu and R. Bamler, “Tomographic SAR inversion by L1-norm regulariza-tion—The compressive sensing approach,” IEEE Trans. Geosci. Remote Sensing,vol. 48, no. 10, pp. 3839–3846, Oct. 2010.
[21] J. Jackson and R. Moses, “Synthetic aperture radar 3D feature extraction for arbitrary flight paths,” IEEE Trans. Aerosp. Electron. Syst., vol. 48, no. 3,pp. 2065–2084, July 2012.
[22] W. G. Carrara, R. M. Majewski, and R. S. Goodman, Spotlight Synthetic Aperture Radar: Signal Processing Algorithms. Norwood, MA: Artech House, 1995.
[23] R. L. Moses, L. Potter, and M. Çetin, “Wide angle SAR imaging,” in Algorithms for Synthetic Aperture Radar Imagery XI, ser. Proc. SPIE, E. G. Zelnio and F. D.Garber, Eds., vol. 5427, Orlando, FL, Apr. 2004, pp. 164–175.
[24] A. Fasoula, H. Driessen, and P. van Genderen, “De-ghosting of tomographic images in a radar network with sparse angular sampling,” in Proc. European Radar Conf., Rome, Italy, Sept.–Oct. 2009, pp. 286–289.
[25] C. D. Austin, E. Ertin, and R. L. Moses, “Sparse signal methods for 3-D radar imag-ing,” IEEE J. Select. Topics Signal Processing., vol. 5, no. 3, pp. 408–423, June 2011.
[26] K. R. Varshney, M. Çetin, J. W. Fisher III, and A. S. Willsky, “Sparse represen-tation in structured dictionaries with application to synthetic aperture radar,” IEEE Trans. Signal Processing, vol. 56, no. 8, pp. 3548–3561, Aug. 2008.
[27] I. Stojanovic, M. Çetin, and W. C. Karl, “Joint space aspect reconstruction of wide-angle SAR exploiting sparsity,” in Algorithms for Synthetic Aperture Radar Imagery XV, ser. Proc. SPIE, E. G. Zelnio and F. D. Garber, Eds., vol. 6970, Orlando, FL, Mar. 2008, p. 697005.
[28] G. B. Hammond and J. A. Jackson, “SAR canonical feature extraction using mol-ecule dictionaries,” in Proc. IEEE Radar Conf., Ottawa, Canada, Apr.–May 2013.
[29] T. C. Calloway and G. Donohoe, “Subaperture autofocus for synthetic aperture radar,” IEEE Trans. Aerosp. Electron. Syst., vol. 30, no. 2, pp. 617–621, Apr. 1994.
[30] C. V. Jakowatz, D. E. Wahl, P. S. Eichel, D. C. Ghiglia, and P. A. Thompson,Spotlight-Mode Synthetic Aperture Radar: A Signal Processing Approach. Norwell, MA: Kluwer Academic, 1996.
[31] J. H. G. Ender, “Autofocusing ISAR images via sparse representation,” in Proc.European Conf. Synthetic Aperture Radar, Nuremberg, Germany, Apr. 2012, pp. 203–206.
[32] J. Duan, L. Zhang, and M. Xing, “A weighted eigenvector autofocus method for sparse-aperture ISAR imaging,” EURASIP J. Adv. Signal Process., vol. 2013, p. 92, Apr. 2013.
[33] T. Jihua and Z. Bingchen, “Motion compensation for compressive sensing SAR imaging with autofocus,” in Proc. IEEE Conf. Industrial Electronics and Applications (ICIEA), Beijing, China, June 2011, pp. 1564–1567.
[34] N. O. Önhon and M. Çetin, “A sparsity-driven approach for joint SAR imaging and phase error correction,” IEEE Trans. Image Processing, vol. 21, no. 4, pp. 2075–2088,Apr. 2012.
[35] S. I. Kelly, M. Yaghoobi, and M. E. Davies, “Auto-focus for under-sampled syn-thetic aperture radar,” in Proc. Sensor Signal Processing for Defence (SSPD), Lon-don, Sept. 2012.
[36] S. Ugur and O. Arikan, “SAR image reconstruction and autofocus by compressed sensing,” Digital Signal Process., vol. 22, no. 6, pp. 923–932, Dec. 2012.
[37] S.-J. Wei and X.-L. Zhang, “Sparse autofocus recovery for under-sampled linear array SAR 3-D imaging,” Prog. Electromagn. Res., vol. 140, pp. 43–62, 2013.
[38] I. Stojanovic and W. Karl, “Imaging of moving targets with multi-static SAR using an overcomplete dictionary,” IEEE J. Select. Topics Signal Processing, vol. 4, no. 1, pp. 164–176, Feb. 2010.
[39] S. Zhu, A. M. Djafari, H. Wang, B. Deng, X. Li, and J. Mao, “Parameter estimation for SAR micromotion target based on sparse signal representation,” EURASIP J. Adv. Signal Process., vol. 2012, p. 13, Jan. 2012.
[40] A. S. Khwaja and J. Ma, “Applications of compressed sensing for SAR moving-target velocity estimation and image compression,” IEEE Trans. Instrum. Meas.,vol. 60, no. 8, pp. 2848–2860, Aug. 2011.
[41] Q. Wu, M. Xing, C. Qiu, B. Liu, Z. Bao, and T.-S. Yeo, “Motion parameter estima-tion in the SAR system with low PRF sampling,” IEEE Geosci. Remote Sensing Lett.,vol. 7, no. 3, pp. 450–454, 2010.
[42] N. Ö. Önhon and M. Çetin, “SAR moving target imaging in a sparsity-driven framework,” in Proc. SPIE Optics+Photonics, Wavelets and Sparsity XIV, ser. Proc. SPIE, M. Papadakis, D. Van De Ville, and V. K. Goyal, Eds., 2011, vol. 8138, p. 813806.
[43] J. Zhang, D. Zhu, and G. Zhang, “Adaptive compressed sensing radar oriented toward cognitive detection in dynamic sparse target scene,” IEEE Trans. Signal Pro-cessing, vol. 60, no. 4, pp. 1718–1729, Apr. 2012.
[44] F. Ahmad and M. Amin, “Through-the-wall human motion indication using sparsity-driven change detection,” IEEE Trans. Geosci. Remote Sensing, vol. 51,no. 2, pp. 881–890, Feb. 2013.
[45] D. L. Donoho, “Compressed sensing,” IEEE Trans. Inform. Theory, vol. 52,no. 4, pp. 1289–1306, Apr. 2006.
[46] D. L. Donoho and M. Elad, “Optimally sparse representation in general (nonor-thogonal) dictionaries via 1, minimization,” Proc. Natl. Acad. Sci., vol. 100, no. 5, pp. 2197–2202, Mar. 2003.
[47] I. Stojanovic, M. Çetin, and W. C. Karl, “Compressed sensing of monos-tatic and multistatic SAR,” IEEE Geosci. Remote Sensing Lett., vol. 10, no. 6,pp. 1444–1448, June 2013.
[48] V. Patel, G. Easley, D. Healy, and R. Chellappa, “Compressed synthetic aperture radar,” IEEE J. Select. Topics Signal Processing, vol. 4, no. 2, pp. 244–254, Apr. 2010.
[49] J. Tropp, “Just relax: Convex programming methods for identifying sparse signals in noise,” IEEE Trans. Inform. Theory, vol. 52, no. 3, pp. 1030–1051, Mar. 2006.
[50] M. Herman and T. Strohmer, “High-resolution radar via compressed sensing,” IEEE Trans. Signal Processing, vol. 57, no. 6, pp. 2275–2284, June 2009.
[51] J. Romberg, “Compressive sensing by random convolution,” SIAM J. Imag. Sci.,vol. 2, no. 4, pp. 1098–1128, Oct. 2009.
[52] N. Subotic, B. Thelen, K. Cooper, W. Buller, J. Parker, J. Browning, and H. Beyer,“Distributed RADAR waveform design based on compressive sensing considerations,” in Proc. IEEE Radar Conf., Rome, Italy, May 2008.
[53] C. Chen and P. Vaidyanathan, “Compressed sensing in MIMO radar,” in Proc.Asilomar Conf. Signals, Systems and Computers, Pacific Grove, CA, Oct. 2008,pp. 41–44.
[54] T. Strohmer and B. Friedlander, “Compressed sensing for MIMO radar—Algo-rithms and performance,” in Proc. Asilomar Conf. Signals, Systems and Computers,Pacific Grove, CA, Nov. 2009, pp. 464–468.
[55] Y. Yu, A. Petropulu, and H. Poor, “MIMO radar using compressive sampling,” IEEE J. Select. Topics Signal Processing, vol. 4, no. 1, pp. 146–163, Feb. 2010.
[56] Air Force Research Laboratory, Sensor Data Management System, Moving and Stationary Target Acquisition and Recognition (MSTAR) data set. [Online]. Available: https://www.sdms.afrl.af.mil/index.php?collection=mstar
[57] Astrium TerraSAR-X sample imagery. [Online]. Available: http://www.astrium-geo.com/en/23-sample-imagery[58] Air Force Research Laboratory, Sensor Data Management System, Civil-ian Vehicle Radar Data Domes. [Online]. Available: https://www.sdms.afrl.af.mil/index.php?collection=cv_dome[59] Air Force Research Laboratory, Sensor Data Management System, Gotcha Volumetric SAR data set. [Online]. Available: https://www.sdms.afrl.af.mil/index.php?collection=gotcha
[SP]
Previous Page | Contents | Zoom in | Zoom out | Front Cover | Search Issue | Next Page qqM
Mq
qM
MqM
THE WORLD’S NEWSSTAND®
Previous Page | Contents | Zoom in | Zoom out | Front Cover | Search Issue | Next Page qqM
Mq
qM
MqM
THE WORLD’S NEWSSTAND®
__________________________
________________________
______________
___________
_____________
________________

1053-5888/14/$31.00©2014IEEE IEEE SIGNAL PROCESSING MAGAZINE [41] JULY 2014
Digital Object Identifier 10.1109/MSP.2014.2312073
Date of publication: 13 June 2014
Synthetic aperture radar (SAR) data processed with inter-ferometric techniques are widely used today for environ-mental risk monitoring and security. SAR tomography techniques are a recent advance that provide improved three-dimensional (3-D)
reconstruction and long-term deforma-tion monitoring capabilities. This ar-ticle is meant to discuss the main developments achieved in the last few years in the SAR to-mography framework, with particular reference to both urban and forest sce-narios. An insight on clas-sical multipass interfero-metric processing is also included to summarize the importance of the technology for natural hazards monitoring and to provide the basis for the de-scription of SAR tomography.
INTRODUCTIONSAR synthesizes a large antenna along the movement direction to provide images at microwaves with resolutions comparable with those achieved with optical sensors but with the advantage of day–night and all-weather acquisition capabil-ities [1]. Interferometric SAR (InSAR) techniques exploit angu-lar imaging diversity, offered by vertical spatial orbit, flight track, or antenna position offsets (spatial baselines), to recon-struct the scene topography: the technology is cost effective in terms of coverage/accuracy [2] and has been also used to map the Earth topography on a global scale [1]. The typical
satellite-enabled regular and systematic data acquisition plays a key role in applications to environmental risk monitoring and security. In particular, differential interferometry (DInSAR) can
reveal Earth displacements to a subcentimeter accu-racy and has been widely used for the analy-
sis of large deformations, for instance, associated with main earthquakes.
In the last decade, the develop-ment of algorithms [1], [3]–
[5] able to process large stacks of multipass inter-ferometric SAR images relevant to an area of in-terest has also allowed the monitoring of slow and long-term move-
ments, for instance, of landslides and subsidence,
e.g., due to mining and water/oil extraction. SAR tomography
techniques are a recent advance that “turn” interferometric methods into
(multidimensional) imaging [6]–[11]. By ex-ploiting acquisitions collected with multiple spatial base-
lines and temporal separation (temporal baselines), these techniques allow the implementation of a synthetic fine beam (radar) scanner along the vertical direction for full 3-D scene re-construction [6]–[8], as well as for slow, long-term deformation monitoring in complex areas [9]–[11], i.e., four-dimensional (4-D) (3-D+time) imaging.
The 3-D imaging (focusing) enables the investigation of the scene scattering structure along the vertical direction, which is not possible with neither conventional two-dimensional (2-D) SAR imaging nor with InSAR. This is an important feature for applications where the scattering is distributed along the height, for instance, for application to forests and glaciers
[Gianfranco Fornaro, Fabrizio Lombardini, Antonio Pauciullo,
Diego Reale, and Federico Viviani]
[Developments, applications, and future research perspectives]
Recent Advances in Synthetic Aperture Ra
darIma
ging
PH
OTO
CO
UR
TE
SY
OF
NA
SA
Previous Page | Contents | Zoom in | Zoom out | Front Cover | Search Issue | Next Page qqM
Mq
qM
MqM
THE WORLD’S NEWSSTAND®
Previous Page | Contents | Zoom in | Zoom out | Front Cover | Search Issue | Next Page qqM
Mq
qM
MqM
THE WORLD’S NEWSSTAND®

IEEE SIGNAL PROCESSING MAGAZINE [42] JULY 2014
(sensed by P- and L-band sensors [6]) which is of paramount importance in the climate change issues. With reference to for-est applications it is worth noting that the European Space Agency is developing a dedicated satellite (BIOMASS Earth Explorer mission) operating at P-band. Multidimensional (Mul-tiD) SAR imaging also benefits from the fine beam vertical scan-ning capabilities to investigate complex man-made scenes, such as urban areas and infrastructures, where perspective distortions
due to the radar imaging geometry frequently occur and lead to interference of the response of multiple scatterers relevant to different ground structures mapped in the same image pixel. This typical layover effect dramatically impairs urban areas and, in particular, data of high- and very high-resolution systems such as the recent X-band TerraSAR-X (TSX) and Cosmo-Skymed (CSK) missions, due to the spread of the effect over a large number of pixels.
INSIGHTS ON SAR INTERFEROMETRYSAR interferometry exploits at least two SAR images acquired with angular or time diversity to estimate the scene topogra-phy or the possible displacements of ground targets [2]. The key principle is the use of the phase difference between com-plex SAR images for the accurate measurement (to a subwave-length accuracy) of the radiation traveled path variation (path difference) in the two images. For images acquired simultane-ously from multiple sensors or from multiantenna platforms (single-pass interferometry) observing the scene with slightly different incidence angles (across-track interferometry), such a measurement allows, on one hand, estimating the scatterer elevation s, i.e., the scene topography. On the other hand, when images are acquired through different passes (repeat-pass acquisitions) the path difference is used to measure possi-ble displacements of the target even due to slow deformation with sub-cm accuracy (differential SAR interferometry, DInSAR).
We refer to (1), that in the hypothesis of high azimuth and range resolution, is the most general expression of the complex signal received at different antennas. Assuming the presence of a single scatterer at elevation s, the phase of the complex inter-ference between a pair of acquisitions g1 and g2 is
,arg g g rb s d4 4*
a w2 1{mr
mr { { {= = + + + +c6 @ (S1)
wherein b is the orthogonal baseline difference between the acquisitions and d is the scatterer displacement. All remaining terms are error sources: {c and a{ are the backscattering phase change and the atmospheric phase delay (APD) varia-tion between the two acquisitions, respectively, and w{ is the phase contribution of the thermal noise.
On one side, simultaneous or quasi-simultaneous acquisitions (in the absence of fast target movements) makes both a{ and d be zeroed: the system is able to measure, pixel by pixel, ,sand therefore to generate accurate digital elevation models. On the opposite side, for ,b 0. the systems is able to measure d provided that the associated component has a dynamic larger than a{ (for instance, displacements associated with earthquakes). In the case of large ,b an external digital eleva-tion model (DEM) must be used to subtract (DInSAR) the term related to the topography thus reducing the variation of s. The possibilities mentioned above are feasible when {c and w{ do not overwhelm the useful signal component.
Effects of w{ are “felt” generally in areas characterized by low backscattering; on the other hand, effects of {c are, as speckle, independent on the target backscattering magnitude and relate to decorrelation, which originates from imaging
angular variations (even associated with small variation of the target incidence or aspect angles) or from temporal backscat-tering changes. In the former case, the phenomenon is referred to as angular decorrelation, whereas in the latter case it is referred to as temporal decorrelation. The image cross cor-relation index, specifically its amplitude (coherence), evaluated on a pixel-by-pixel basis through a suitable complex multilook-ing, provides a way to quantify the decorrelation and is used to discriminate between reliable and unreliable regions for interferometric processing [1], [2].
The APD shows, unfortunately, spatial correlation and cannot be mitigated, as thermal noise, via spatial multilooking. The only possibility to separate it from the deformation signal is provided by the use of multiple observations at different times: in such a case the APD can be estimated via advanced DInSAR (A-DInSAR) techniques and compensated essentially by exploiting its differ-ent temporal statistics (typically uncorrelated over the epochs). A-DInSAR techniques, which allow APD removal and measure-ment of deformation time series (Figure S1), are essentially divided in two classes: the DInSAR stacking techniques and the PSI, which rely on different assumptions about the ground scat-tering. DInSAR stacking methods, such as the small baseline sub-set [4] and the coherent point targets [5], assume the scattering to be spatially distributed over the resolution cell and are based on the exploitation of both only small baseline interferograms (hard baseline thresholding) and spatial coherent multilook to limit the effects of decorrelation (8); see Figure S1. They are tai-lored to the monitoring of wide areas, including rural areas with slow temporal correlation losses. On the other hand PSI, such as the PSInSAR [3], [28] assumes the presence of dominant scatter-ers (8) and uses all (i.e., also large) baselines to achieve high accu-racy in the localization of targets for precise and accurate monitoring of man-made structures. Differently from SAR tomography, PSI methods are essentially phase model-based, i.e., do not use the amplitude information for estimating the target position and deformation parameters. Moreover, besides an early work on separation of double scatterers moving with the same velocity proposed in [29], precursor of the application of tomographic methods for layover solution over vertical build-ings, they assume the presence of a single persistent scatterer per resolution cell.
Recently a new approach, SqueeSar, has been introduced [23]: it relies on the use of the data covariance matrix, esti-mated by spatial adaptive averaging (Figure S1) to implement a soft and adaptive baseline threshold aimed at handling both the distributed and the dominant scatterers model. A principle
Previous Page | Contents | Zoom in | Zoom out | Front Cover | Search Issue | Next Page qqM
Mq
qM
MqM
THE WORLD’S NEWSSTAND®
Previous Page | Contents | Zoom in | Zoom out | Front Cover | Search Issue | Next Page qqM
Mq
qM
MqM
THE WORLD’S NEWSSTAND®

IEEE SIGNAL PROCESSING MAGAZINE [43] JULY 2014
By solving the layover problem, today SAR tomography tech-niques offer a unique tool [11]–[13] to carry out accurate 3-D reconstruction and long-term slow displacements monitoring of even single-built structures, which can be useful for security and long-term structural health-monitoring issues.
The article is meant to provide a concise overview of SAR interferometry and, together with the companion article [31focused on the use of compressive sensing (CS), of the devel-
opments of SAR tomography. The experiments’ results on real data are provided for both airborne and spaceborne SAR sensors to give a flavor of the application scenarios of the described techniques. Multiple polarization and polarimetric processing approaches have been also employed in the SAR tomography context, leading to polarimetric SAR tomogra-phy [14]–[16], however, this topic is outside the scope of this article.
of optimal coherent SAR data combination, for accurate multi-baseline interferometry exploiting also amplitude information for the reconstruction of the single scatterers heights and accounting for the distributed scattering, had been also first introduced; see modeling in [7] and introductory comments in [18], and references therein.
In all of the processing approaches, a critical step is the phase unwrapping (PhU) that must be handled to access the absolute phase measurements. The availability of a 2-D (typically sparse) spatial grid can be favorably exploited to perform PhU on spa-tially redundant networks. The latest-generation algorithms developed for multipass/multibaseline also exploits the redun-dancy of interferograms to improve the PhU step; see, e.g.,
[30] and other similar noncited (to limit the number of refer-ences in the article) recently published papers.
To show the importance of SAR interferometry for monitor-ing natural hazards, the images in the right part of Figure S1 are provided to shows a sample of the DInSAR stacking prod-uct in the region of L’Aquila (Italy) hit by the 2009 Mw 6.2 earthquake: the colors of the map are associated with the deformation mean velocity evaluated only on the postseismic acquisitions, and the plotted time series shows the possibility to identify and monitor also postseismic effects that typically lead to an exponential decrease of the deformation over time. Results were obtained by processing 33 CSK images between April and October 2009.
Processing forInterferogramGeneration
A-DInSARAnalysis
Multilook
Full Resolution(Fine Scale)
Low Resolution(Coarse Scale)
Atmospheric Propagation Delay
Deformation
–5.0 5.0(cm/y)
[FIGS1] The multipass DInSAR processing scheme. Deformation measurements are separated by the APD by analyzing stacks of interferograms generated by multiple SAR observations. The multilook operation, which can be carried out adaptively, is used to trade off the scale of analysis (fine and coarse scale) and the mitigation of noise. The images on the right (deformation map and deformation time series) show an example of application of the technique to postseismic monitoring typically associated with main earthquakes.
Previous Page | Contents | Zoom in | Zoom out | Front Cover | Search Issue | Next Page qqM
Mq
qM
MqM
THE WORLD’S NEWSSTAND®
Previous Page | Contents | Zoom in | Zoom out | Front Cover | Search Issue | Next Page qqM
Mq
qM
MqM
THE WORLD’S NEWSSTAND®

IEEE SIGNAL PROCESSING MAGAZINE [44] JULY 2014
SIGNAL MODELSThe multiacquisition SAR geometry is depicted in Figure 1 in the slant range r -slant height (elevation) s plane, which is defined with respect to a reference ground plane and is orthogo-nal to the azimuth direction ,x^ h this latter being coincident with the track of a reference master antenna. Assuming parallel antenna tracks (typically obtained by multiple passes with cur-rent satellite and airborne technologies), bn in Figure 1
, ,n N0 1f= -^ h is the orthogonal component of the baseline connecting the n th antenna to the master one.
For a generic n th acquisition (at time ),tn after the applica-tion of a standard azimuth-range (2-D) raw SAR focusing, the complex values gn of each ,x r^ h image pixel is the superposi-tion of multiple elementary backscattering contributions described by the distribution of the complex amplitude of the scattering snc ^ h along s (at )tn
,g e s e e ds w( , )n
j nn
j rb s j d s t
nI
4 4a
nn
s
c= +{mr
mr
^^ hh # (1)
where■ e j na{ ^ h is the term associated with the atmospheric phase delay variation caused by the propagation of the radiation in the atmosphere■ m is the radar wavelength ■ I s is the scene extension in the slant height direction ■ ( , )d s tn is the deformation signal at epoch tn (positive toward the sensor) affecting the generic scatterer at elevation s■ wn is the noise term in the focused pixel accounting for thermal noise, which has a strong impact in low backscat-ter areas.As anticipated in the introduction, the model we consider
refers to the single polarization case. In the following, we neglect the term a{ by assuming that
the atmospheric contribution is compensated through a pre-liminary standard multipass interferometric processing (data calibration) [10], as depicted in the left part of the tomo-graphic processing block diagram in Figure 2. In “Insights on SAR Interferometry,” details are provided on the data
calibration step and, in general, on the main issues related to InSAR and DInSAR for application to digital elevation model generation and monitoring of surface deformation, which have significantly pushed the development of the SAR technology. The double-framework, i.e., interferometric and tomographic, description is fundamental to clarify that the latter (SAR tomography) must be considered as a tool that enhances the former (SAR interferometry) with reference to specific applica-tions, e.g. urban areas, infrastructures, and forest.
With reference to (1), the particular case of simultaneous acquisitions implying the absence of temporal diversity, i.e., tn
fixed, or alternatively of the absence of any deformation (and temporal backscattering change), leads to the classical tomo-graphic (3-D) framework
.g s e ds wnj r
b sn
I
4 n
s
c= +mr+^ h# (2)
Equation (2) constitutes a Fourier transform (FT) operator. Two different equivalent visions can be considered depending on the choice of the transformation pairs:
, / , / .s b r b f s r2 2n n n sp m m=- =^ ^h h" ", , (3)
In a first vision, the sequence gn is a (sampled) spatial spec-trum, at frequencies ,np of the (tomographic) scene, with ( )scbeing the (spatial) signal; this is the so-called wavenumber domain frame. Dually, in a second vision, the data sequence gn
is the spatial (baseline) sampled signal, while ( )sc is a spatial spectrum (elevation scattering distribution) in the variable spa-tial frequencies :fs this frame can be termed spectral analysis,or SPECAN, vision and is also used in array signal processing [direction of arrival (DOA) estimation] [7]. For this reason it is also referred to as array processing-based vision.
In the more general and frequent case of acquisitions carried out with multiple passes at time ,tn the deformation term cannot be neglected. By introducing the conjugate variable v having the dimensions of a velocity (m/s), the second exponential term in (1), related to motion of the scatterer at elevation ,s can be expanded in Fourier harmonics with Fourier conjugate vari-ables , /v t2n nh m=-" , as follows:
, ,e h s v e dv( , ) /j d s t j v t
I
4 2 2n n
v
=mr
r m^ h# (4)
where ,h s v^ h plays in v the role of the spectrum of the motion-related signal for elevation .s Note that the decomposition in (4) is analogous to the quick-time Doppler spectrum used in surveillance radars, which can be expressed as a distribution of spectral velocities (“equivalent velocities”). This effect was exemplified for a jittered motion in [9]. It is also worth noting that, as happens for Doppler spectra, the spectral velocity vari-able v in the ,h s v^ h distribution is not an instantaneous (defor-mation) velocity; the difference between the two velocities is exactly that associated with spectral and instantaneous frequen-cies in the common signal theory and frequency modulation
nth Antenna
bn
Master Antenna
Orbit
s
r
[FIG1] Tomographic SAR and reference geometry.
Previous Page | Contents | Zoom in | Zoom out | Front Cover | Search Issue | Next Page qqM
Mq
qM
MqM
THE WORLD’S NEWSSTAND®
Previous Page | Contents | Zoom in | Zoom out | Front Cover | Search Issue | Next Page qqM
Mq
qM
MqM
THE WORLD’S NEWSSTAND®

IEEE SIGNAL PROCESSING MAGAZINE [45] JULY 2014
context. In particular, in the case of uniform deformation motion at a given ,s where the motion-related signal in (4) is a pure complex sinusoid, the spectral velocity turns to be a single one (i.e., h is d Dirac-shaped along )v and coincides with the constant velocity of the motion. On the other hand, the pres-ence of a peak at a given spectral velocity vr corresponds to a scatterer motion with a deformation mean velocity of .vr
The substitution of (4) in (1) leads to
, ,g s v e e dsdv wn nj r
b s j vtn
I I
4 4n n
s v
c= +mr
mr
^ h## (5)
where , ,s v s h s vn nc c=^ ^ ^h h h is the backscattering distribu-tion in the ,s v^ h plane.
Equation (5) describes what is known as differential-tomography (4-D) model [9]–[11]. It shows that a 2-D FT relation stands between the data ,gn which notably are typically irregu-larly sampled both in the baseline and temporal domains and the backscattering distribution. Similar to the 3-D case, a dual vision is possible by introducing, in addition to (3), the two fol-lowing FT variables pairs:
, / , / ,v t t f v2 2n n n th m m=- =" ", , (6)
wherein, the use of the left variable pair leads to the wavenum-ber vision, whereas the use of the right variable pairs refer to the array processing vision.
CoregisteredSLC Data Set
Phase-CalibratedSLC Data Set
Phase Calibration
MultidimensionalImaging
100
50
100
150
200
250
50
Hei
ght (
m)
–50200 400 600 800
Range Bin
Forest Urban and Infrastructures
1,000
0
100
150
200
+50 m +100 m
50
Hei
ght (
m)
–50
500 1,500 2,5000
5
10
15
20
25
Azimuth Bin
0
[FIG2] A scheme of the SAR tomography processing for forest and urban/infrastructures scenarios.
Previous Page | Contents | Zoom in | Zoom out | Front Cover | Search Issue | Next Page qqM
Mq
qM
MqM
THE WORLD’S NEWSSTAND®
Previous Page | Contents | Zoom in | Zoom out | Front Cover | Search Issue | Next Page qqM
Mq
qM
MqM
THE WORLD’S NEWSSTAND®

IEEE SIGNAL PROCESSING MAGAZINE [46] JULY 2014
Accordingly, (5), (3), and (6) show that, in the presence of deformations, the 3-D model in (2) is extended to the velocity domain and involves a 2-D FT in both elevation and velocity.
The (3-D/4-D) tomography problem consists of the estima-tion, in each image pixel, of the scene backscattering profile
,sc^ h or of the backscattering distribution ( , ),s vc starting from the N samples :gn it involves, in the most general case, the inversion of (5), that is a spectral analysis of the data.
Equation (5) represents the most general (4-D) imaging model. Nevertheless some important particularizations are use-ful to link to classical concepts, well known in the InSAR and DInSAR context, as well as for the developments of advanced 3-D/4-D imaging methods. In particular, to link to the classical persistent scatterers (PS) approach [3], a temporal invariant
nc c=^ h and concentrated nature of the scattering is assumed. With reference to the application to urban areas and particu-larly with high frequency systems (for instance, C-band and X-band sensors), due to frequent occurrence of the layover, the backscattering profile can be in fact assumed to be composed by a finite number K of d -Dirac functions in the ,s v^ h domain (line spectrum) centered in the different elevation/velocity scat-terers phase centers .,s vk k^ h Under this assumption ,s vc =^ h
,s s v vk k kk
K
0
1c d d- -
=
-^ ^h h/ where kc is the complex amplitude
of the k th scatterer, and the 4-D model in (5) (including the 3-D case) reduces to
,,g a wN s vk k kk
K
0
1c= +
=
-^ h/ (7)
where , ,g g gNT
0 1f= -6 @ is the vector collecting, for each pixel, the measured complex data, , ,w w wN
T0 1f= -6 @ collects the
noise contribution at each acquisition (T defines the transposition operator) and ,a s v^ h can be termed steering vector, as from the array processing area, and its elements are defined as
/, expa s v j s v N2n n nr p h= - +^ ^h h6 6@ @ for the generic eleva-tion/velocity pair .( , )s v We refer to (7) as the fully coherent (con-centrated, i.e., pointlike, and time invariant) scattering model.
In real cases, the scattering cannot be always assumed to be concentrated at discrete heights, thus leading to angular (spatial baseline) decorrelation; even more important, it cannot be consid-ered invariant over the time (temporal decorrelation) [1][2]. We refer therefore to (5) and restore the dependence of the backscat-tering over time and suppose the scattering to be distributed over “small” elevation intervals ,s kT (compact scatterers) centered in sk and moving with velocity .vk In this case we have [7], [17]
,,g a wN s vk k kk
K
0
19 c= +
=
-^ h/ (8)
where 9 denotes the Hadamard (element-by-element) product and ,, ,, ,k k k N
T0 1fc c c= -6 @ with
,s kTexps,k n nc c= ^ h#
,j s s ds2 n krp -^ h6 @ is a vector collecting the (angularly decor-relating and time-variant speckled) realizations of the k th scat-tering as seen at the N tracks. The decorrelation property of the scatterer, including compact time-invariant, concentrated time-variant, and more generally compact time-variant scatter-ing will be statistically described through the correlation
matrix defined as .R E k kH
k c c=c 6 @ The particular case in which ,R E 1 1k N N
T2k c=c 6 @ where 1N is the N -dimensional unity
vector and | |E k2c6 @ is the (possibly temporally averaged) scat-
terer powers, leads to the (statistical) equivalence between the speckled and time variant model in (8) and the pointlike model in (7) when kc are random variables. For this reason, we refer to the time-variant speckled model in (8) as the partially coher-ent scattering model.
MULTIDIMENSIONAL TOMOGRAPHY IMAGING METHODSThe 3-D and 4-D SAR imaging is achieved via inversion of (2) or (5), respectively. The acquisition geometry poses limitation on the imaging capabilities which can be overcome by the use of some specific techniques. The baseline distribution defines a reliable elevation span, i.e., the maximum extension in elevation direction to avoid heavy effects of aliasing. Assuming a uniform baseline distribution with an antenna separation of ,bT the unambiguous elevation interval is / :r b2sT Tm= ^ h in the nonuniform case bTis typically replaced by the average baseline separation. The Ray-leigh elevation resolution of the system is / ,r B2s md = ^ h with Bbeing the total baseline span. In the same way, an unambiguous velocity interval and a velocity resolution can be also defined as
/ t2vT Tm= ^ h and / ,T2v md = ^ h where tT and T are the average temporal separation and total temporal span, respectively.
Several techniques can be used to implement the inversion that leads to the estimation of the backscattering distribution along s or in the elevation/velocity plane , .s v^ h Each is charac-terized by a different tradeoff between simplicity, computational efficiency, sidelobes reductions, and super-resolution capability and may be well suited for specific applications. Nonparametric methods, i.e., beamforming (BF), singular value decomposition (SVD), and adaptive Capon BF, provide flexibility of application to scenarios with any elevation backscattering profile, in partic-ular with distributed (speckled) scatterers, and including also the pointlike scattering case. However, for 3-D imaging of forest volumes, linear methods such as SVD and nonparametric Capon BF can be well suited for handling the case of irregular baselines. On the contrary, for application to 3-D/4-D urban imaging and monitoring areas characterized by layover, super-resolution methods for compact scatterers like, e.g., multiple signal classification (MUSIC) may be better suited but require a prior determination of the scattering order for each pixel. In any case, as better specified in the following section dedicated to detection issues, with reference to this application even the sim-ple BF performs better than classical interferometric approaches, such as persistent scatterers interferometry (PSI).
BEAMFORMINGReferring to the 3-D model in (2), the backscattering profile
sc^ h can be estimated as follows:
[ ,] ( )a a gs g s s*nn
HnN
01
c = ==
-t^ ^h h/ (9)
where ( ) *: and H:^ h denotes the conjugation and Hermitian oper-ators, respectively. This technique is also usually referred to as
Previous Page | Contents | Zoom in | Zoom out | Front Cover | Search Issue | Next Page qqM
Mq
qM
MqM
THE WORLD’S NEWSSTAND®
Previous Page | Contents | Zoom in | Zoom out | Front Cover | Search Issue | Next Page qqM
Mq
qM
MqM
THE WORLD’S NEWSSTAND®

IEEE SIGNAL PROCESSING MAGAZINE [47] JULY 2014
(classical) BF in array processing or matched filter. Extension to the 4-D case of estimating ,s vc^ h is easily carried out by the use of the 2-D steering vectors .,a s v^ h Hereafter, we will refer to the generic 4-D inversion problem, assuming the 3-D focusing as a special case in which all dependences on v drop out .v 0=^ h
According to (9), BF corresponds to a rephase-and-sum array processing that forms a “beam” in the elevation/velocity direc-tions. In practical applications, as baselines are far from being uniformly distributed, BF may give poor reconstruction perfor-mances in terms of sidelobes and leakage of the point spread function. Strategies alternative to plain BF have been adopted to improve the resolution below the inherent Rayleigh limit (superresolution) and the sidelobes suppression.
SINGULAR VALUE DECOMPOSITIONThe discretization of the integral in (5) is now introduced with the assumption of a temporal invariant behavior, i.e., .nc c=
Letting , , , ,s v s vM MT
0 0 1 1fc c c= - -^ ^h h6 @ be the vector that collects the M M Ms v#= samples of ,s vc^ h at the discrete points, hereafter called bins, , ,s vm m^ h , , ,m M0 1f= -
belonging to the M Ms v# elevation/velocity grid, we have that the FT operator in (5) can be rewritten in the discrete case as
,g A wc= + (10)
where , ,A a aMT
0 1f= -6 @ is the N M# system matrix collect-ing the steering vectors associated with each discretization bin synthetically defined as , .a a s vm m m= ^ h
Particularly, with reference to the fully coherent model in (7), assuming the discretization grid to include the scatterer locations in the ,s v^ h-plane, the vector c will be characterized by only Knonzero elements at the bins corresponding to the scatterers phase centers. The case in which K M% leads to a sparsity nature of the unknown vector ,c which is of interest, as explained in [31], for the use of CS approaches.
The use of the SVD of the operator A in (10) allows regular-izing the inversion by restricting the solution space and benefit-ing of the inclusion of very limited a priori information on the expected scene elevation extent. The regularization, obtained through the so-called truncated SVD, allows the avoidance of noise amplification and inversion instabilities, and hence gener-ally provides a better sidelobe reduction as well as slight super-resolution than plain BF [8], [10].
CAPON SPECTRAL ESTIMATIONTo counteract the increase of sidelobes even more, 3-D and 4-D SAR focusing has been successfully set in the adaptive spectral estimation/array BF framework, in particular employing the Capon method [7], [13], [18]. As a result, (elevation) superresolu-tion adaptive tomography methods have been developed of non-parametric kind. The strong (elevation) spatial leakage associated with the irregular baselines is significantly reduced through the adaptive nulling, which interestingly results, jointly with a sensi-ble reduction of the anomalous sidelobes, in some elevation superresolution capabilities beyond the Rayleigh limit. This also
allows dealing with system problems of limited baseline span or of very detailed layover/volumetric analysis needs. In the general 4-D case, the data-dependent processing is based on the multi-baseline array spatial/temporal (“hybrid”) correlation matrix of the data R g [7], which requires operation with multilook data (multiple observations of the array data vector) for its estimation. The multilook operation is coherent, as in SAR interferometry, and the looks are typically obtained from multiple adjacent pixels (multilook cell). In this context, the tomographic output is the average squared modulus of , ,s vc^ h , | , | ,P s v E s v 2c=^ ^h h" ,
which is retrieved as follows:
, ., ( , )a R aP s v s v s vgH 11=
--t ^ ^^h h h (11)
In the tomographic application of the Capon beamformer, the integration of diagonal loading methods is necessary to handle problems related to the possible nonpositive-definiteness of the correlation matrix and to generally improve the inversion robustness [9]. Today, 3-D Capon tomography is a standard tool to get image enhancements beyond the above linear methods, in particular being very suitable for analyses of volumetric scat-terers and thus being commonly used for forest scenes [1], [14], [15], [19].
A typical result, which shows a demonstration of the Capon tomography [7] capability to well perform 3-D focusing on for-est scenarios [19], is reported in the lower left plot in Figure 2. The figure reports a tomographic slice obtained by processing nine tracks of P-band data (HV polarization) acquired with DLR E-SAR airborne platform over a boreal region in Sweden, where light temporal decorrelation effects occur.
MUSICModel-based beamformers matched to line spatial spectra have been applied to SAR tomography to get further performance improvements for the (urban) pointlike scatterers scenarios, revealing good capabilities even for distributed scatterers, depending on the compactness degree, despite the model approximation [7]. In particular, the spatial correlation matrix-based MUSIC method relying on the subspace decomposition [7] has been validated both for urban/infrastructure [16], [20] and forest scenarios 3-D imaging [15], [19]. In the case of com-pact or pointlike scatterers and nonfull yet sensible time coher-ence, a 2-D MUSIC estimator can be used for the 4-D case as follows [19], [21]:
, ,, ( , )a QQ aP s v s v s vH H 1=
-t ^ ^^h h h (12)
where Q is the noise eigenvector matrix and ,s vPt ^ h is a psedudospectrum.
As an example, the plot in the lower right part of Figure 2 shows an automatic-order MUSIC [7] tomogram obtained with the X-band airborne three-antenna (single-pass) system AER-II (FGAN) data [22] acquired over Weitingen, Germany. The result has been obtained by integrating an information theoretic crite-rion [21] order selection method exploiting the eigenvalues [7],
Previous Page | Contents | Zoom in | Zoom out | Front Cover | Search Issue | Next Page qqM
Mq
qM
MqM
THE WORLD’S NEWSSTAND®
Previous Page | Contents | Zoom in | Zoom out | Front Cover | Search Issue | Next Page qqM
Mq
qM
MqM
THE WORLD’S NEWSSTAND®
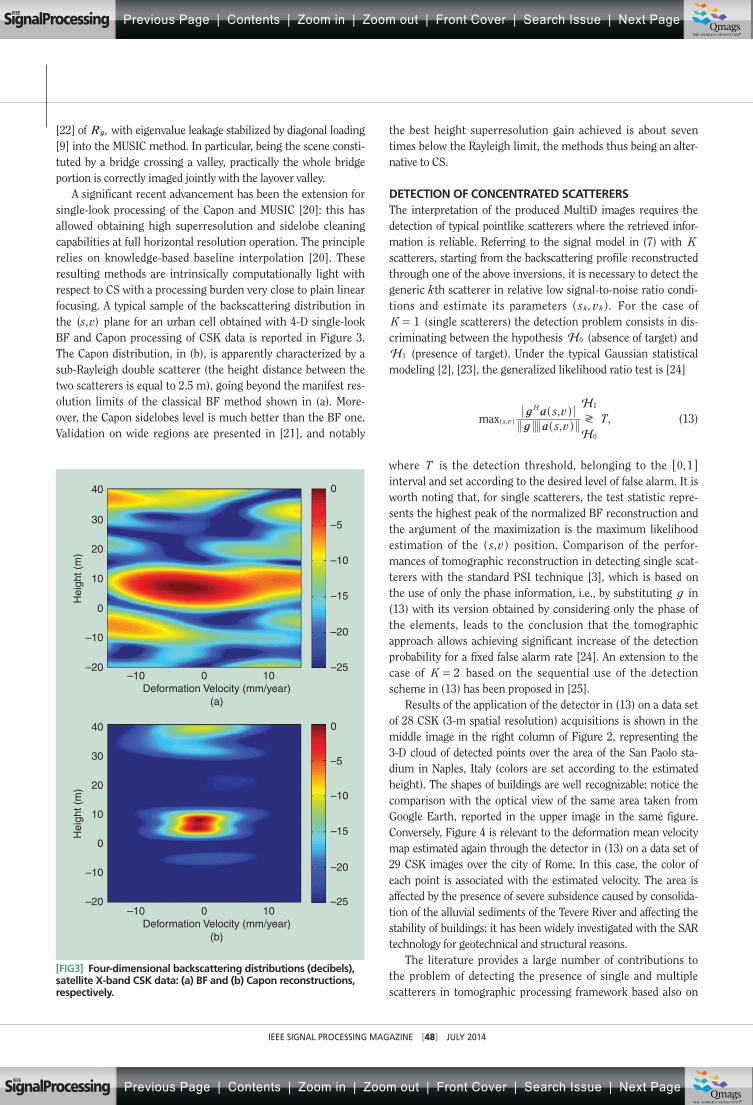
IEEE SIGNAL PROCESSING MAGAZINE [48] JULY 2014
[22] of ,Rg with eigenvalue leakage stabilized by diagonal loading [9] into the MUSIC method. In particular, being the scene consti-tuted by a bridge crossing a valley, practically the whole bridge portion is correctly imaged jointly with the layover valley.
A significant recent advancement has been the extension for single-look processing of the Capon and MUSIC [20]: this has allowed obtaining high superresolution and sidelobe cleaning capabilities at full horizontal resolution operation. The principle relies on knowledge-based baseline interpolation [20]. These resulting methods are intrinsically computationally light with respect to CS with a processing burden very close to plain linear focusing. A typical sample of the backscattering distribution in the ( , )s v plane for an urban cell obtained with 4-D single-look BF and Capon processing of CSK data is reported in Figure 3. The Capon distribution, in (b), is apparently characterized by a sub-Rayleigh double scatterer (the height distance between the two scatterers is equal to 2.5 m), going beyond the manifest res-olution limits of the classical BF method shown in (a). More-over, the Capon sidelobes level is much better than the BF one. Validation on wide regions are presented in [21], and notably
the best height superresolution gain achieved is about seven times below the Rayleigh limit, the methods thus being an alter-native to CS.
DETECTION OF CONCENTRATED SCATTERERSThe interpretation of the produced MultiD images requires the detection of typical pointlike scatterers where the retrieved infor-mation is reliable. Referring to the signal model in (7) with Kscatterers, starting from the backscattering profile reconstructed through one of the above inversions, it is necessary to detect the generic kth scatterer in relative low signal-to-noise ratio condi-tions and estimate its parameters , .s vk k^ h For the case of K 1= (single scatterers) the detection problem consists in dis-criminating between the hypothesis H0 (absence of target) and H1 (presence of target). Under the typical Gaussian statistical modeling [2], [23], the generalized likelihood ratio test is [24]
,,
,maxg ag a
s vs v
TH
H,s v
H
0
1
U^^
^hh
h (13)
where T is the detection threshold, belonging to the ,0 16 @interval and set according to the desired level of false alarm. It is worth noting that, for single scatterers, the test statistic repre-sents the highest peak of the normalized BF reconstruction and the argument of the maximization is the maximum likelihood estimation of the ,s v^ h position. Comparison of the perfor-mances of tomographic reconstruction in detecting single scat-terers with the standard PSI technique [3], which is based on the use of only the phase information, i.e., by substituting g in (13) with its version obtained by considering only the phase of the elements, leads to the conclusion that the tomographic approach allows achieving significant increase of the detection probability for a fixed false alarm rate [24]. An extension to the case of K 2= based on the sequential use of the detection scheme in (13) has been proposed in [25].
Results of the application of the detector in (13) on a data set of 28 CSK (3-m spatial resolution) acquisitions is shown in the middle image in the right column of Figure 2, representing the 3-D cloud of detected points over the area of the San Paolo sta-dium in Naples, Italy (colors are set according to the estimated height). The shapes of buildings are well recognizable: notice the comparison with the optical view of the same area taken from Google Earth, reported in the upper image in the same figure. Conversely, Figure 4 is relevant to the deformation mean velocity map estimated again through the detector in (13) on a data set of 29 CSK images over the city of Rome. In this case, the color of each point is associated with the estimated velocity. The area is affected by the presence of severe subsidence caused by consolida-tion of the alluvial sediments of the Tevere River and affecting the stability of buildings: it has been widely investigated with the SAR technology for geotechnical and structural reasons.
The literature provides a large number of contributions to the problem of detecting the presence of single and multiple scatterers in tomographic processing framework based also on
40
30
20
10
Hei
ght (
m)
–10
–10Deformation Velocity (mm/year)
0 10–25
–20
–15
–10
–5
0
–20
0
40
30
20
10
Hei
ght (
m)
–10
–10Deformation Velocity (mm/year)
(a)
(b)
0 10–25
–20
–15
–10
–5
0
–20
0
[FIG3] Four-dimensional backscattering distributions (decibels), satellite X-band CSK data: (a) BF and (b) Capon reconstructions, respectively.
Previous Page | Contents | Zoom in | Zoom out | Front Cover | Search Issue | Next Page qqM
Mq
qM
MqM
THE WORLD’S NEWSSTAND®
Previous Page | Contents | Zoom in | Zoom out | Front Cover | Search Issue | Next Page qqM
Mq
qM
MqM
THE WORLD’S NEWSSTAND®

IEEE SIGNAL PROCESSING MAGAZINE [49] JULY 2014
model order estimation strategies. As an example of application of the least square (LS) detector [13], [18], [20], 4-D single-look fitting fed by the Capon output in Figure 3(b) identifies a double scatterer, in agreement with the visual interpretation. Other 3-D/4-D extensive results of Capon-LS/MUSIC-LS detection are reported in [20] and [21] for CSK data.
CONCLUSIONS AND FUTURE RESEARCH This work has given an overview of the main advances achieved over the last decade in the SAR inter-ferometry/tomography areas. The basic concepts of multipass DInSAR and PSI have been summarized to provide indications about impor-tance of such techniques for surface height mapping and monitoring in the natural risk and security areas as well as to perform the calibration steps necessary for describing the advances achieved by adopting an imaging view, i.e., SAR tomography (3-D SAR imaging) and differential SAR tomography (4-D SAR imaging) with reference to application to forest, urban, and infra-structure imaging and monitoring.
A general formulation that starts from a model also address-ing the typical decorrelation problem has been introduced to provide the basis for future research accounting for target cor-relation properties [17], [19], and several imaging methods have been considered. Examples of results relevant to real cases for L- and P-band airborne data for application to forest imaging and latest-generation X-Band data for urban and infrastructure monitoring have been discussed, leaving to the existing litera-
ture validations that were also carried out on C-band medium-resolution data [8], [10], [13], [18], [20].
The existing SAR tomography literature also cover topics that have not been discussed due to article space limitations. This is the case of the extension of 4-D imaging to match specific nonuni-form deformation motion models, e.g., of thermal building dila-tions associated with temperature (baseline) distribution, to get five-dimensional (4-D+temperature) single-look analyses [26], and parametric superresolution [21]. Besides, fertilization of the Mul-
tiD imaging area with Cramer–Rao bounding tools has been also given for tomographic system and mission planning; see [7] and [24]. The exten-sion of 4-D SAR imaging for improved monitoring of thermal dilations has shown that a high cor-relation degree between (mainly temporal and temperature) baseline distributions may lead to detection ambiguity problems. In any case, an unnecessary increase in the dimen-
sionality of the imaging reduces the scatterer detection performances.
Emerging research topics are related to the extension of SAR tomography to unstructured SAR tomographic and scattering decomposition methods based on principal component analysis for urban and rural area monitoring [27]. With reference to for-est tomography, where nonconcentrated partially coherent scat-tering occurs, it is worth mentioning the possibility of exploiting 4-D imaging to obtain 3-D multipass volumetric tomographic imaging robustness to (long-term) temporal decorrelation, reducing the possible height blurring effects [19].
–1.0 (cm/y) 1.0
[FIG4] The deformation mean velocity of scatterers detected on the BF reconstruction on a data set of 29 CSK images over Rome. The subsidence due to consolidating alluvial-deposit close to the Tevere River is well recognizable. (Image courtesy of Google.)
EMERGING RESEARCHTOPICS ARE RELATED TOTHE EXTENSION OF SAR
TOMOGRAPHY TO UNSTRUCTUREDSAR TOMOGRAPHIC AND
SCATTERING DECOMPOSITIONMETHODS BASED ON PRINCIPAL
COMPONENT ANALYSIS.
Previous Page | Contents | Zoom in | Zoom out | Front Cover | Search Issue | Next Page qqM
Mq
qM
MqM
THE WORLD’S NEWSSTAND®
Previous Page | Contents | Zoom in | Zoom out | Front Cover | Search Issue | Next Page qqM
Mq
qM
MqM
THE WORLD’S NEWSSTAND®

IEEE SIGNAL PROCESSING MAGAZINE [50] JULY 2014
ACKNOWLEDGMENTSWe wish to thank the Italian Space Agency (ASI) for providing the CSK Rome and Naples data set under the ASI AO Project ID2246 and the L’Aquila CSK data set under the emergency plan with the Italian Department of Civil Protection. We are also thankful to the anonymous reviewers for their valuable comments.
AUTHORSGianfranco Fornaro ([email protected]) received the M.D. degree in 1992 and the Ph.D. degree in 1997. He is a senior researcher of IREA-CNR and has achieved the full professor habilitation in 2013. He is an associate editor of IEEE Geosci-ence and Remote Sensing Letters (GRSL) and received the IEE Mountbatten Premium Award in 1997, the IEEE GRSL Best Paper Award, and the 2012 IEEE Transactions on Geoscience and Remote Sensing Mention for Best Reviewer.
Fabrizio Lombardini ([email protected]) received the M.D. degree in 1993 and the Ph.D. degree in 1997. He is a senior assistant professor at the Department of Information Engineering at the University of Pisa, Italy, and achieved the associate professor habilitation in 2013. He originated the dif-ferential synthetic aperture radar tomography framework and received the Best Remote Sensing Paper Award on this topic at the annual GTTI Meeting in 2009.
Antonio Pauciullo ([email protected]) received the M.D. degree in 1998 and the Ph.D. degree in 2003. He is a researcher at IREA-CNR. His current research interests regard the field of sta-tistical signal processing with emphasis on synthetic aperture radar processing and code division multiple access systems.
Diego Reale ([email protected]) received the M.D. degree in 2007 and the Ph.D. degree in 2011. He is a researcher at IREA-CNR. In 2011, he received an award at the IEEE Joint Urban Remote Sensing Event 2011 Student Competition Contest. In 2012, he received the 2011 IEEE Geoscience and Remote Sens-ing Letters Best Paper Award.
Federico Viviani ([email protected]) received the M.D. degree in 2009. He was awarded the “Best Remote Sensing Thesis for the Year 2007” Prize from the IEEE Geoscience and Remote Sensing Society South Italy Chapter. He has been a research assistant and is now pursuing his Ph.D. degree at the University of Pisa/CNIT-RaSS, Italy, with attention to both urban and forest multidimensional synthetic aperture radar imaging.
REFERENCES[1] A. Moreira, P. Prats-Iraola, M. Younis, G. Krieger, I. Hajnsek, and K. P.Papathanassiou, “A tutorial on synthetic aperture radar,” IEEE Geosci. Remote Sens. Mag., vol. 1, no. 1, pp. 6–43, Mar. 2013.
[2] P. A. Rosen, S. Hensley, I. R. Joughin, F. K. Li, S. N. Madser, E. Rodriguez, and R. M. Goldstein, “Synthetic aperture radar interferometry,” Proc. IEEE, vol. 88,no. 3, pp. 333–382, 2000.
[3] A. Ferretti, C. Prati, and F. Rocca, “Permanent scatterers in SAR interferom-etry,” IEEE Trans. Geosci. Remote Sensing, vol. 39, no. 1, pp. 8–20, Jan. 2001.
[4] P. Berardino, G. Fornaro, R. Lanari, and E. Sansosti, “A new algorithm for surface deformation monitoring based on small baseline differential SAR in-terferograms,” IEEE Trans. Geosci. Remote Sensing, vol. 40, pp. 2375–2383,Nov. 2002.
[5] O. Mora, J. J. Mallorqui, and A. Broquetas, “Linear and nonlinear terrain de-formation maps from a reduced set of interferometric SAR images,” IEEE Trans. Geosci. Remote Sensing, vol. 41, no. 10, pp. 2243, 2253, 2003.
[6] A. Reigber and A. Moreira, “First demonstration of airborne SAR tomography using multibaseline L-band data,” IEEE Trans. Geosci. Remote Sensing, vol. 38,no. 5, pp. 2142–2152, 2000.
[7] F. Gini, F. Lombardini, and M. Montanari, “Layover solution in multibase-line SAR interferometry,” IEEE Trans. Aerosp. Electron. Syst., vol. 38, no. 4,pp. 1344–1356, Oct. 2002.
[8] G. Fornaro, F. Lombardini, and F. Serafino, “Three-dimensional multipass SAR focusing: Experiments with long-term spaceborne data,” IEEE Trans. Geosci. Re-mote Sensing, vol. 43, no. 4, pp. 702–714, 2005.
[9] F. Lombardini, “Differential tomography: A new framework for SAR Interfer-ometry,” IEEE Trans. Geosci. Remote Sensing, vol. 43, no. 1, pp. 37–44, 2005.
[10] G. Fornaro, D. Reale, and F. Serafino, “Four-dimensional SAR imaging for height estimation and monitoring of single and double scatterers,” IEEE Trans. Geosci. Remote Sensing, vol. 47, no. 1, pp. 224–237, Jan. 2009.
[11] X. Zhu and R. Bamler, “Very high resolution spaceborne SAR tomography in urban environment,“ IEEE Trans. Geosci. Remote Sensing, vol. 48, no. 12,pp. 4296–4308, Dec. 2010.
[12] D. Reale, G. Fornaro, A. Pauciullo, X. Zhu, and R. Bamler, “Tomographic imaging and monitoring of buildings with very high resolution SAR Data,” IEEE Geosci. Remote Sensing Lett., vol. 8, no. 4, pp. 661–665, July 2011.
[13] F. Lombardini and M. Pardini, “Superresolution differential tomography: Ex-periments on identification of multiple scatterers in spaceborne SAR data,” IEEE Trans. Geosci. Remote Sensing, vol. 50, no. 4, pp. 1117–1129, 2012.
[14] S. Tebaldini, “Single and multipolarimetric SAR tomography of forested ar-eas: A parametric approach,” IEEE Trans. Geosci. Remote Sensing, vol. 48, no. 5,pp. 2375–2387, 2010.
[15] M. Nannini, R. Scheiber, and A. Moreira, “First 3D reconstructions of targets hidden beneath foliage by means of polarimetric SAR tomography,” IEEE Geosci. Remote Sensing Lett., vol. 47, no. 2, pp. 531–543, Feb. 2009.
[16] S. Sauer, L. Ferro-Famil, A. Reigber, and E. Pottier, “Three-dimensional im-aging and scattering mechanism estimation over urban scenes using dual-baseline polarimetric InSAR observations at L-band,” IEEE Trans. Geosci. Remote Sensing,vol. 49, no. 11, pp. 4616–4629, Nov. 2011.
[17] A. Pauciullo, A. De Maio, S. Perna, D. Reale, and G. Fornaro, “Detection of partially coherent scatterers in multidimensional SAR tomography: A theoretical study,” IEEE Trans. Geosci. Remote Sensing, to be published.
[18] F. Lombardini, M. Pardini, G. Fornaro, F. Serafino, L. Verrazzani, and M. Costan-tini, “Linear and adaptive spaceborne three-dimensional SAR tomography: A compar-ison on real data,” IET Radar, Sonar Navigat., vol. 3, no. 4, pp. 424–436, 2009.
[19] F. Lombardini and F. Cai, “Temporal decorrelation-robust SAR tomography,” IEEE Trans. Geosci. Remote Sensing, vol. 52, no. 9, pp. 5412–5421, Sept. 2014.
[20] F. Lombardini, F. Cai, and D. Pasculli, “Spaceborne 3-D SAR tomography for analyzing garbled urban scenarios: Single-look superresolution advances and ex-periments,” IEEE J. Select. Topics Appl. Earth Observ. Remote Sensing (JSTARS),vol. 6, no. 2, pp. 960–968, 2013.
[21] F. Viviani, A. Pulella, and F. Lombardini, “Multidimensional tomography with new generation VHR SAR data for urban monitoring,” in Proc. 2013 IEEE Int. Geo-science Remote Sensing Symp. (IGARSS), 2013, pp. 81–84.
[22] L. Roessing and J. Ender, “Advanced SAR interferometry techniques with AER-II,” in Proc. Int. Radar Symp., 1998, pp. 1261–1269.
[23] A. Ferretti, A. Fumagalli, F. Novali, C. Prati, F. Rocca, and A. Rucci, “A new algorithm for processing interferometric data-stacks: SqueeSAR,” IEEE Trans. Geosci. Remote Sensing, vol. 49, no. 9, pp. 3460–3470, 2011.
[24] A. De Maio, G. Fornaro, and A. Pauciullo, “Detection of single scatterers in multi-dimensional SAR imaging,” IEEE Trans. Geosci. Remote Sensing, vol. 47,no. 7, pp. 2284–2297, July 2009.
[25] A. Pauciullo, D. Reale, A. De Maio, and G. Fornaro, “Detection of double scat-terers in SAR tomography,” IEEE Trans. Geosci. Remote Sensing, vol. 50, no. 9,pp. 3567–3586, Sept. 2012.
[26] X. Zhu and R. Bamler, “Let’s do the time warp: Multicomponent nonlinear motion estimation in differential SAR tomography,” IEEE Geosci. Remote Sens-ing Lett., vol. 8, no. 4, pp. 735–739, 2011.
[27] G. Fornaro, A. Pauciullo, D. Reale, and S. Verde, “SAR coherence tomogra-phy: A new approach for coherent analysis of urban areas,” in Proc. 2013 IEEE Int. Geoscience Remote Sensing Symp. (IGARSS), 2013, pp. 73–76.
[28] O. Monserrat, M. Crosetto, M. Cuevas, and B. Crippa, “The thermal expan-sion component of persistent scatterer interferometry observations,” IEEE Geosci. Remote Sensing Lett., vol. 8, no. 5, pp. 864–868, 2011.
[29] A. Ferretti, M. Bianchi, C. Prati, and F. Rocca, “Higher-order permanent scat-terers analysis,” EURASIP J. Adv. Signal Process., vol. 2005, no. 20, pp. 3231–3242, Jan. 2005.
[30] P. Agram and H. Zebker, “Edgelist phase unwrapping algorithm for time-series InSAR analysis,” J. Opt. Soc. Am. A, vol. 27, no. 3, pp. 605–612, Mar. 2010.
[31] X. Zhu and R. Bamler, “Superresolving SAR tomography for multidimensional imaging of urban areas,” IEEE Signal Process. Mag., vol. 31, no. 4, pp. 51–58,July 2014.
[SP]
Previous Page | Contents | Zoom in | Zoom out | Front Cover | Search Issue | Next Page qqM
Mq
qM
MqM
THE WORLD’S NEWSSTAND®
Previous Page | Contents | Zoom in | Zoom out | Front Cover | Search Issue | Next Page qqM
Mq
qM
MqM
THE WORLD’S NEWSSTAND®
_________________
___________
_____________
_____________
_______________

1053-5888/14/$31.00©2014IEEE IEEE SIGNAL PROCESSING MAGAZINE [51] JULY 2014
Digital Object Identifier 10.1109/MSP.2014.2312098
Date of publication: 13 June 2014
Synthetic aperture radar (SAR) is capable of assessing the deformation of the ground and buildings in the order of centimeters and millimeters due to its coherent nature and short wavelengths. Spaceborne SAR systems are particularly suited for
long-term monitoring of such dynamic processes. A single SAR image, however, only provides a two-di-mensional (2-D) projection of the objects, which is in many cases noninjective (i.e., suffers from layover). To retrieve the real three-dimensional (3-D) local-ization and motion of scattering objects, ad-vanced interferometric methods, like persistent scat-terer interferometry (PSI) or SAR tomography (TomoSAR), are required, which exploit stacks of com-plex-valued SAR images with diversity in space and time [1]–[6]. Modern spaceborne SAR sensors like TerraSAR-X, TanDEM-X, and COSMO-Skymed, pro-vide data with very high spatial resolution (VHR) in the order of 1 m, which matches well with the scale of building features (typical
floor height and window size and distance). This motivated the further development of existing TomoSAR techniques for explor-ing the potentials of VHR SAR data for urban infrastructure map-
ping [6]–[8]. In the last decade, conventional spec-tral estimation methods have been
implemented for tomographic SAR im-aging [3]–[6], [8]. However, for
VHR urban monitoring, the following requirements
should be met: ■ Maintaining the meter azimuth-range resolution, i.e., avoiding multilooking■ Improving the elevation resolution, i.e., providing superresolution (SR)■ Achieving high 3-D local-
ization accuracy even in the presence of unmodeled,
non-Gaussian noise■ Retrieving nonlinear motion, e.g.,
due to seasonal thermal dilation [9]. Driven by these requirements, new algorithms
have been invented in the last few years that take advantage of recent developments in signal processing such as sparse recon-struction and compressive sensing (CS) [10]–[12]. This article deals with CS-based TomoSAR inversion and is a follow-up to a companion TomoSAR article, also in this issue of IEEE Signal Processing Magazine [13].
[Xiao Xiang Zhu and Richard Bamler]
[Compressive sensing-based TomoSAR inversion]
Recent Advances in Synthetic Aperture Ra
darIma
ging
PH
OTO
CO
UR
TE
SY
OF
NA
SA
Previous Page | Contents | Zoom in | Zoom out | Front Cover | Search Issue | Next Page qqM
Mq
qM
MqM
THE WORLD’S NEWSSTAND®
Previous Page | Contents | Zoom in | Zoom out | Front Cover | Search Issue | Next Page qqM
Mq
qM
MqM
THE WORLD’S NEWSSTAND®

IEEE SIGNAL PROCESSING MAGAZINE [52] JULY 2014
TomoSAR SYSTEM MODEL Conventional SAR imaging provides a projection of the 3-D object reflectivity to the 2-D azimuth-range (x-r) plane. TomoSAR is a technique that allows resolving scatterer densities in the third native radar coordinate “elevation” (s), orthogonal to the azimuth-range plane. The term tomography is misleading since it suggests that a large range of angles is required like in computed axial tomography. TomoSAR uses only an extremely small angular diversity though. It rather extends the synthetic aperture princi-ple—as employed in the azimuth direction—to the elevation direction b s< by combining multiple passes of the radar at slightly different orbit positions to establish a virtual array of antennas, as depicted in Figure 1. Typically, the elevation extent
bT of the antenna array, i.e., the maximum orbit spread, is about 250 m for TerraSAR-X and the distance to the scene 700 km, lead-ing to an angular diversity as small as 0.02 degrees.
By stacking all the multiview coherent images and by per-forming the tomographic processing, s-profiles can be retrieved for every x-r pixel. These profiles can be continuous in the case of forest biomass imaging or may consist of only a few discrete responses, typically corresponding to scatterers located on the ground, façade, and roof, in the case of urban mapping. This arti-cle is devoted to the latter application, i.e., the result of tomo-graphic retrieval is a point cloud.
Since the elevation antenna array is in the Fraunhofer far-field of the imaged objects, the complex value gn of an azimuth-range pixel for the nth acquisition at aperture position , ,n Nb 1n f=^ h
is a sample of the Fourier transform of the reflectivity profile sc^ halong s
,expg s j s ds w2n nI
ns
c rp= - +^ ^h h# (1)
where geometric phase terms and atmospheric phase errors have been neglected, I s represents the range of possible eleva-tions, b r2n np m= - ^ h is the spatial (elevation) frequency depending on the (more or less random) elevation aperture posi-tion ,bn m stands for the wavelength, and wn is noise. There-fore, retrieval of the s-profile is a spectral estimation problem. The inherent (Rayleigh) elevation resolution st of the
tomographic arrangement is related to the elevation aperture extent bT
.br
2s Tt m= (2)
For the typical TerraSAR-X parameters given above,~ .30 50 mst =
EXTENSION TO MULTIMODAL DEFORMATIONFor the spaceborne case, the multipass acquisitions used in tomographic reconstruction are taken over a time span of sev-eral weeks to years. Hence, the long-term motion of a scattering object during this time period must be considered or is even the signal of interest. The additional motion term leads to an extended version of the system model from (1)
, ,expg s j s d s t ds w2 2n n nI
ns
c r p m= - + +^ ^^^h h hh# (3)
where ,d s tn^ h is the line of sight (LOS) displacement as a func-tion of elevation and time. The motion may be modeled as a lin-ear combination of M basis functions tm nx ^ h
, ,d s t p s tn m m nm
M
1x=
=
^ ^ ^h h h/ (4)
where p sm ^ h is the corresponding motion coefficient to be esti-mated. The choice of the basis functions depends on the under-lying physical motion processes. For example, long-term geodynamic processes may lead to a linear, accelerating, or decelerating motion; instantaneous geodynamic events, like earthquakes, result in a stepwise motion; thermal expansion causes a motion correlated to temperature, etc.
To convert (3) into a convenient Fourier transform, we warp the acquisition time axis for each motion basis function m $x ^ h
according to .t2,m n m nh x m= ^ h Then (3) can be rewritten as an M 1+^ h-dimensional Fourier transform of ( , ,s p p s1 1 fc d -^ ^h h
)p p sM M- ^ h which is an M-dimensional linear d-manifold (line, plane, or hyperplane) in the ( )M 1+ -dimensional elevation-motion parameter space [9]:
... , ...,
... ... ,
, ..., ,
exp
g s p p s p p s
j s p p dsdp dp
n N
2
1
w, ,
n
I
M M
II
n n M n M M n
1 1
1 1 1
pM sp1
$c d
r p h h
= - -
- + + + +
=
^ ^ ^^
^^
h h hh
hh
# ##
(5)
where Ipm stands for the maximum support of motion parame-ter .p sm ^ h The ideal d -manifold may broaden up a bit if the real motion does not follow our motion model. With this system model, the elevation profile and motion parameter retrieval boils down to an M 1+^ h-dimensional spectral estimation problem. In the following, for the sake of simplicity of the equations, we refer to one-dimensional (1-D) spectral estimation, i.e., the 3-D reconstruction case. Any motion term can be considered by add-ing another dimension. For the same reason we make no explicit distinction between “TomoSAR” and “differential TomoSAR.”
[FIG1] TomoSAR geometry and signal sparsity in the range-elevation (r–s) plane.
bΔb
ρ s≈ 30 ∼ 50 m ρr ≈ 0.6 m
s
r
Previous Page | Contents | Zoom in | Zoom out | Front Cover | Search Issue | Next Page qqM
Mq
qM
MqM
THE WORLD’S NEWSSTAND®
Previous Page | Contents | Zoom in | Zoom out | Front Cover | Search Issue | Next Page qqM
Mq
qM
MqM
THE WORLD’S NEWSSTAND®

IEEE SIGNAL PROCESSING MAGAZINE [53] JULY 2014
Discretizing the elevation profile in (1) [or the M-dimen-sional s p pM1- - -f space in (5)] leads to this standard linear system equation
,g A wc= + (6)
where g is the measurement vector of length ,N A is an N L#irregular Fourier matrix composed of the so-called steering vectors, c is the reflectivity profile uniformly sampled in eleva-tion at ( , ..., ),s l L1l = and w is noise. The profile c to be recon-structed is often sampled much more densely than suggested by the elevation resolution st to allow SR. As a consequence, L N& and (6) is severely underdetermined. An appropriate SR regularization is required for obtaining an unambiguous and robust estimate of .c
SPARSITY AND THE CITYThe tomographic imaging configuration for urban scenes of Figure 1 illustrates the following:
■ Short-wavelength microwaves are scattered at surfaces and to a limited extent in vegetation volumes. The vegetation responses tend to decorrelate over time and mostly contribute to noise rather than to the useful signal. Hence, our object to be retrieved is more or less a 2-D surface in 3-D space, or, for every azimuth position, a 1-D line in the 2-D range-elevation plane. The object is zero elsewhere in space; it is sparse.■ The tomographic 3-D resolution element (the blue-shaded elongated area in Figure 1) is highly anisotropic, if the eleva-tion aperture size, i.e., the maximum orbit spread ,bT is lim-ited as it is with modern satellite systems. For TerraSAR-X, the azimuth and range resolutions are in the range of 0.5~1 m, while ~ .30 50 mst = Therefore, SR in elevation is desir-able; otherwise layover cannot be resolved in the lower parts of buildings.As mentioned previously, SR, i.e., oversampling of ,c is equiv-
alent to setting up an underdetermined equation system that requires either regularization or parametric estimators. The stan-dard L2 norm regularizer leads to the conventional linear maxi-mum a posteriori (MAP) estimator
,A C A C A C g1 1 1 1T TMAP ww wwc = + cc
- - - -t ^ h (7)
where Cww and Ccc are the covariance matrices of noise and prior, respectively. The truncated SVD method described in [5] and [13] falls into the same class. These solutions are not able to achieve significant SR, however. Several nonlinear or parametric estima-tors known from spectral analysis are presented in the companion article [13] in this issue. Instead, we use the mentioned sparsity property and the CS framework.
Object sparsity could be exploited in several ways. A brute-force approach would attempt to reconstruct the line segments representing the surfaces, visible to the SAR (bold in Figure 1), in the 2-D range-elevation plane for every azimuth position. However, in the case of an anisotropic resolution element like the one in Figure 1, we only need SR in the elevation direction. The intersections of such an elongated resolution element with
the ground, the façade, and the roof of a building have an extent much smaller than .st Hence, the elevation profiles to be reconstructed for every azimuth-range pixel can be considered as consisting of a few d -functions, i.e., as sparse. The sparsity property can be used as a strong prior for regularizing the underdetermined inverse problem.
THE COMPRESSIVE SENSING-BASED SL1MMER ALGORITHMUsing the concept of CS for TomoSAR has been proposed by [10] and first demonstrated by the authors in [11]. We developed the SL1MMER algorithm (pronounced “slimmer”). The acronym stands for the three processing steps: 1) scale-down by L1 norm minimization, 2) model order selection, and 3) parameter estima-tion reconstruction. Considering that the elevation profile is sparse, we may assume that among the infinitely many solutions of the underdetermined system equation, the sparsest solution, i.e., the solution having the minimum L0 norm 0c (number of nonzero elements), is assumed to be the most probable one. The solution could be found by parametric nonlinear least squares (NLS) estimates of increasing number of scatterers combined with model order selection. However, this optimization task is NP-hard, it requires a combinatorial search of all possible scatterer posi-tions. CS theory [14], [15] tells us that under certain constraints, the L0 norm may be replaced by the by the (convex) L1 norm. Since the measurements are contaminated with noise, the L1
norm is preferably jointly minimized with the classical residual data term (log-likelihood)
.arg min g A K22
1c c cm= - +c
t " , (8)
Equation (8) gives the sparsest estimate of c if the mapping matrix A fulfills the restricted isometry (RIP) and incoherence properties [15]. However, for TomoSAR, RIP and incoherence are violated for several reasons. First, the mapping matrix A is predetermined by the measurement system (the elevation aper-ture sampling pattern) and may not be optimum. Second, oversampling the elevation profile c renders A overcomplete, reduces RIP, and increases coherence. Nevertheless, the L L2 1-norm minimization step shrinks A dramatically [16] and gives a first sparse estimate of .c This estimate, though, may still contain outliers and, hence, the sparsity K (i.e., the number of discrete scatterers, typically )K 0 3+= is often overestimated.
As the second algorithm step, model order selection is used to clean the c estimate of spurious, nonsignificant scatterers and to finally obtain the most likely number Kt of scatterers along eleva-tion. The model complexity can be described by the number of parameters that is proportional to the number of scatterers .K Let Ki^ h be the vector of the unknown amplitudes, phases, and ele-
vations for all the K scatterers. The goodness-of-model-fit can be described by the likelihood | , .p K Kg it ^^ h h A more complex model always fits the observations better, hence, for the purpose of selecting the most probable model, its complexity must be penal-ized to avoid overfitting of the data. The general form of penalized likelihood criteria is
Previous Page | Contents | Zoom in | Zoom out | Front Cover | Search Issue | Next Page qqM
Mq
qM
MqM
THE WORLD’S NEWSSTAND®
Previous Page | Contents | Zoom in | Zoom out | Front Cover | Search Issue | Next Page qqM
Mq
qM
MqM
THE WORLD’S NEWSSTAND®

IEEE SIGNAL PROCESSING MAGAZINE [54] JULY 2014
| , ,arg min lnK p K K C K2 2gK
i= - +t t ^^ ^h h h" , (9)
where C K^ h is a complexity penalty, e.g., the Bayesian informa-tion criterion (BIC) [17], the Akaike information criterion (AIC) [18], or the minimum description length (MDL) [19]. Note that those penalty terms are proportional to ,Ki.e., C K 0? c^ h and (9) is an L L2 0- norm minimization, but with known and few K candidate eleva-tion positions, and hence can be eas-ily solved.
As a last refinement, a much slimmer mapping matrix ,A st^ h i.e., the N K# t matrix with ,expA j s2s,n k n krp= -t t^ ^h h is built up, where skt is the estimated elevation value of the k th scatterer. The final complex-valued reflectivity sc t^ h for the Kt scatterers is obtained by solving the following overdetermined linear sys-tem equation:
,g A s s wc= + lt t^ ^h h (10)
where wl combines the measurement noise and the model error, i.e., the deviation from sparsity or unmodeled motion-induced phase terms. The complex amplitudes of the Kt discrete scatter-ers are finally found by the classical least-squares solution
.s A s A s A s gH H1c =
-t t t t t^ ^ ^^ ^h h hh h (11)
This last (debiasing) step is performed because (8) is known to slightly underestimate the magnitudes of c [20]. Although amplitude fidelity is not the main purpose of TomoSAR, (11) ren-ders SL1MMER a generic unbiased CS algorithm. Since the main step of SL1MMER is the L L2 1- norm minimization known from CS, the analysis and the results in the following sections apply similarly to other CS-based TomoSAR algorithms.
SUPERRESOLUTION FACTOR: THEORY, SIMULATIONS, AND REAL DATA EXAMPLESBy making use of object sparsity, the SL1MMER algorithm can achieve substantial SR in elevation while maintaining the full azi-
muth-range resolution. A simulation example may demonstrate SR with SL1MMER. Since multiple scatterers inside an azimuth-range pixel at dif-ferent elevation positions most likely occur in high-rise urban areas, we simulated a situation with two scat-terers inside a pixel: one point scat-ter at the building façade and another rough surface reflection
from the ground with an elevation distance of 0.4 of the Rayleigh resolution unit under an SNR of 10 dB and a number of acquisi-tions ,N 30= i.e., .SNRN 25 dB# . Figure 2 compares the reconstructed reflectivity profiles along the elevation direction using the linear MAP estimator and SL1MMER. The MAP estima-tor is subject to the Rayleigh resolution limit and is not able to separate the two closely spaced scatterers while SL1MMER easily separates them.
The example also shows that nonlinear (and semiparametric) spectral estimators like SL1MMER yield reconstructions with much sharper “point responses” than traditional nonparametric ones. However, the nice shape of the responses tells us neither their location accuracy nor the ability of the algorithm to resolve two close scatterers. To study the SR power of such algo-rithms, let us define the (elevation) resolution as the minimum distance PDt between two d -functions (point scatterers) that are separable at a prespecified probability of detection .PD Note that we investigate the detection rate in the SR regime, while in the companion article [13] the detection rates in the non-SR regime have been studied. PDt depends on the amplitude ratio of the scatterers, their phase difference, and (asymptotically) on
[FIG2] A demonstration of SR: reflectivity profiles along elevation direction reconstructed by the classical MAP estimator and by SL1MMER. The elevation distance between the layovered double scatterers is 0.4 of the Rayleigh resolution unit. In this example, N 30= and .10 dBSNR =
MAPSL1MM
ER
–20
0
20
40
60
S
0.4 ρ s
[FIG3] The fundamental bound of SR: SR factor of the SL1MMER algorithm averaged over {D as a function of N SNR# for different amplitude ratios a1/a2 of two close scatterers [21].
101
100
10 15 20 25N*SNR (dB)
SR
Fac
tor:κ 5
0% =
ρs/ρ
50%
30
a1/a2 = 1a1/a2 = 1.5a1/a2 = 2
a1/a2 = 3a1/a2 = 2.5
BY MAKING USE OF SPARSITY, THE SL1MMER ALGORITHM CAN ACHIEVE SUBSTANTIAL
SUPERRESOLUTION IN ELEVATION WHILE MAINTAINING THE FULL AZIMUTH-RANGE RESOLUTION.
Previous Page | Contents | Zoom in | Zoom out | Front Cover | Search Issue | Next Page qqM
Mq
qM
MqM
THE WORLD’S NEWSSTAND®
Previous Page | Contents | Zoom in | Zoom out | Front Cover | Search Issue | Next Page qqM
Mq
qM
MqM
THE WORLD’S NEWSSTAND®
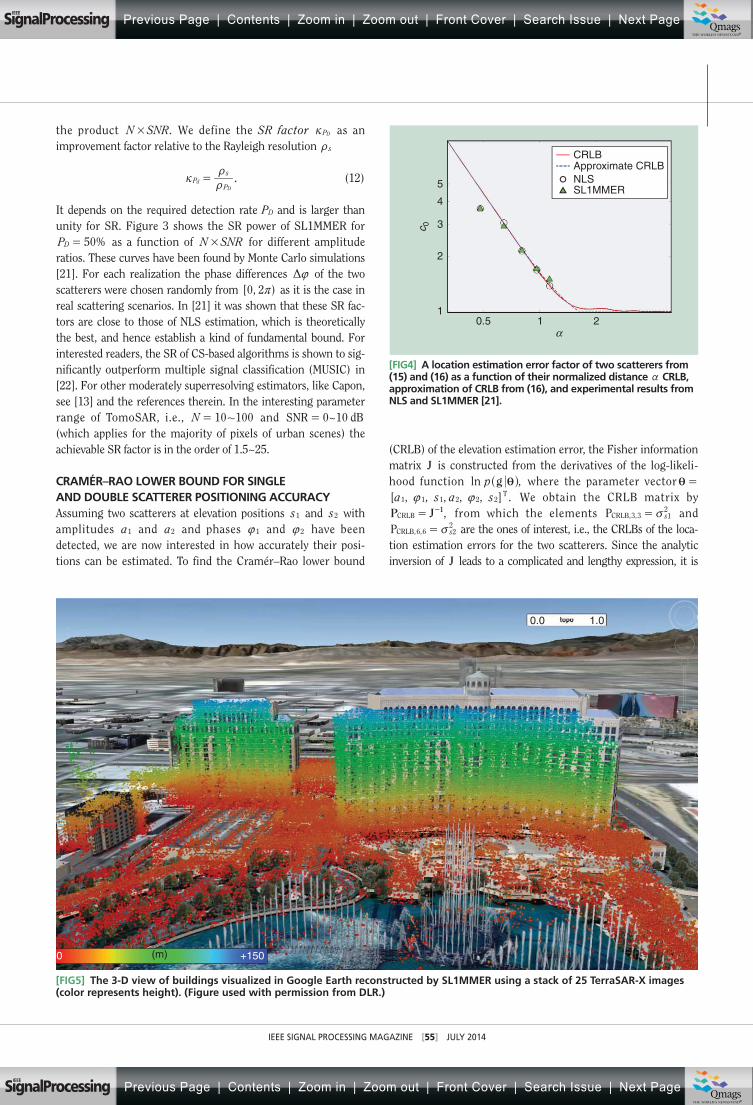
IEEE SIGNAL PROCESSING MAGAZINE [55] JULY 2014
the product .N SNR# We define the SR factor PDl as an improvement factor relative to the Rayleigh resolution st
.PP
sd
D
lt
t= (12)
It depends on the required detection rate PD and is larger than unity for SR. Figure 3 shows the SR power of SL1MMER for
%P 50D = as a function of N SNR# for different amplitude ratios. These curves have been found by Monte Carlo simulations [21]. For each realization the phase differences {D of the two scatterers were chosen randomly from [ , )0 2r as it is the case in real scattering scenarios. In [21] it was shown that these SR fac-tors are close to those of NLS estimation, which is theoretically the best, and hence establish a kind of fundamental bound. For interested readers, the SR of CS-based algorithms is shown to sig-nificantly outperform multiple signal classification (MUSIC) in [22]. For other moderately superresolving estimators, like Capon, see [13] and the references therein. In the interesting parameter range of TomoSAR, i.e., N 10 100+= and ~0 10SNR dB=
(which applies for the majority of pixels of urban scenes) the achievable SR factor is in the order of 1.5~25.
CRAMÉR–RAO LOWER BOUND FOR SINGLE AND DOUBLE SCATTERER POSITIONING ACCURACYAssuming two scatterers at elevation positions s1 and s2 with amplitudes a1 and a2 and phases 1{ and 2{ have been detected, we are now interested in how accurately their posi-tions can be estimated. To find the Cramér–Rao lower bound
(CRLB) of the elevation estimation error, the Fisher information matrix J is constructed from the derivatives of the log-likeli-hood function ,ln p g i^ h where the parameter vectori =[ , , , , , ] .a s a s1 1 1 2 2 2
T{ { We obtain the CRLB matrix by ,P J 1
CRLB = - from which the elements P , , s3 321CRLB v= and
P , , s2
6 6 2CRLB v= are the ones of interest, i.e., the CRLBs of the loca-tion estimation errors for the two scatterers. Since the analytic inversion of J leads to a complicated and lengthy expression, it is
[FIG4] A location estimation error factor of two scatterers from (15) and (16) as a function of their normalized distance a CRLB, approximation of CRLB from (16), and experimental results from NLS and SL1MMER [21].
5
4
3
2
10.5 1 2
α
c 0
CRLB
NLSSL1MMER
Approximate CRLB
[FIG5] The 3-D view of buildings visualized in Google Earth reconstructed by SL1MMER using a stack of 25 TerraSAR-X images (color represents height). (Figure used with permission from DLR.)
0.0 1.0
0 +150(m)
Previous Page | Contents | Zoom in | Zoom out | Front Cover | Search Issue | Next Page qqM
Mq
qM
MqM
THE WORLD’S NEWSSTAND®
Previous Page | Contents | Zoom in | Zoom out | Front Cover | Search Issue | Next Page qqM
Mq
qM
MqM
THE WORLD’S NEWSSTAND®

IEEE SIGNAL PROCESSING MAGAZINE [56] JULY 2014
more convenient to retrieve the relevant elements of PCRLB by solv-ing the inversion numerically. For the sequel, we split the elevation estimation error standard deviation into two contributions [21]
,c ,s s0 0q q$v v= (13)
where
Nr
4 2 SNR,s
q b0q
$ $ $v
r v
m= (14)
is the CRLB of the elevation estimates of the qth scatterer q 1 2or=^ h in the absence of the other one. bv is the standard
deviation of the elevation aperture antenna positions .bn For
uniformly distributed aperture sampling (randomly or equidis-tantly spaced) b 12bv D= and . .N0 39 SNR,s q s0q $ $.v t
In the parameter range of TomoSAR, ,s 0qv is in the order of 1/100 to 1/10 of the Rayleigh resolution unit .st The more inter-esting term is ,c0 the interference correction factor for closely spaced scatterers. It is asymptotically independent of SNR and Nand can be shown to be approximately (see [21] and the refer-ences therein)
/, ,max
cosc
9 6 3 2 2 3 240 1 3
10 2
2
a { a
a a
D=
- - + -
--
^ ^ ^
^
h h h
h) 3 (15)
where s sa d t= is the distance between the two scatterers, normalized to the Rayleigh resolution unit. Obviously, c0
depends strongly on the phase difference .{D Since for Tomo-SAR {D is totally random and depends on the unknown geo-metric configuration, we integrate c0
2 over .{D The resulting CRLB for the interference correction factor is plotted in Figure 4 as a function of the normalized distance a together with a convenient approximation [21]
. . . , .maxc 2 57 0 11 0 62 1,
.
s
s0
0
1 5 2
q
.vv
a= - +-^ h$ . (16)
The location estimation error is ,,s 0qv i.e., ,c 10 = as long as the two scatterers are far apart but increases at a rate of .1 5a- once the scat-terers are closer than about 1.6 times the Rayleigh resolution unit.
Figure 4 also compares the CRLB with the results from NLS (solution with the L0 norm prior) and SL1MMER. These have been obtained by simulations with randomly distributed phase differences. The elevation estimation accuracy of the CS-based algorithm SL1MMER approaches the CRLB and is almost iden-tical to NLS, i.e., both algorithms are efficient.
[FIG6] Histogram of the distance between the detected double scatterers using MAP (red) and SL1MMER (blue). (Figure used with permission from [23].)
[FIG7] The fusion of two point clouds generated from TerraSAR-X data stacks of ascending and descending orbits. The color represents height. Grey areas are temporally decorrelated objects, e.g., vegetation or water.
1,000
900
800
700
600
500
400
300
200
100
00 1 2
Normalized Elevation Difference α3 4 5 6
SuperresolvingRegime
Non-SuperresolvingRegime
MDSL1MMER
Previous Page | Contents | Zoom in | Zoom out | Front Cover | Search Issue | Next Page qqM
Mq
qM
MqM
THE WORLD’S NEWSSTAND®
Previous Page | Contents | Zoom in | Zoom out | Front Cover | Search Issue | Next Page qqM
Mq
qM
MqM
THE WORLD’S NEWSSTAND®

IEEE SIGNAL PROCESSING MAGAZINE [57] JULY 2014
EXAMPLES WITH VHR TerraSAR-X DATATomoSAR with VHR X-band data can achieve point densities in the order of 600,000~1,000,000/km2, which are much higher than with PSI (40,000~100,000 PS/km2) where only pixels con-taining single or dominant scatterer are considered. As a conse-quence, detailed monitoring of even single buildings and in general of infrastructure as well as cultural heritage is possible. In the following, we demonstrate practical use of TomoSAR with TerraSAR-X data.
Figure 5 presents a 3-D view of the Bellagio Hotel complex in downtown Las Vegas, Nevada visualized in Google Earth and recon-structed by SL1MMER using a stack of 25 TerraSAR-X images.
To demonstrate the effect of the SR power of SL1MMER on real data, Figure 6 shows the histogram of the elevation distance between detected double scatterers using MAP (red) and SL1MMER
(blue) over the Bellagio Hotel area. It is not surprising that the number of double scatterers detected by SL1MMER is much high-er than those detected by MAP and most of them lie in the SR re-gime 11a (green area). For an urban scene like this typically 30~40% of the scatterers detected by SL1MMER are double scat-terers compared to 10~20% detected by linear estimators.
Due to the side-looking geometry of SAR, a single stack of SAR images only provides information on one side of a building (see the bold surface segments in Figure 1). For comprehensive urban structure monitoring, a shadow-free point cloud is desirable. It requires fusion of the TomoSAR results of multiple stacks from opposite view angles. This is a nontrivial task, since all the scat-terer locations detected from TomoSAR are relative to a reference point and it is usually not possible to identify the same object as a reference for all the view angles [24]. Figure 7 presents the fusion result from two stacks, one from ascending orbit (94 acquisitions) and one from descending orbit (79 acquisitions), over the city of Berlin, Germany. The scene contains about 40 million detected scatterers each of which also contains its own deformation history. Small structures like the Victory Column, i.e., the statue at the center of the park can be easily identified.
Figure 8 shows an example of multicomponent motion esti-mation. Since July 2009, an area in the city of Las Vegas is undergoing a pronounced subsidence centered at the Conven-tion Center. Together with the thermal dilation-induced sea-sonal motion of the metallic building structure, the selected area is characterized by a two-component nonlinear motion as shown in the phase history. Here, we chose the motion basis functions as a sine-function with a period of one year for sea-sonal motion and a linear function for subsidence. The esti-mated linear deformation velocity in mm/year is shown in Figure 8(a), while (b) shows the LOS motion of one of the scat-terers on the roof of the Convention Center. The two-compo-nent motion is evident.
[FIG8] (a) TomoSAR deformation estimates of an area around the Las Vegas Convention Center: linear deformation velocity (unit: mm/y). (b) Phase (= deformation) history of one of the scatterers on the roof of the center building.
0 0.2 0.4 0.6 0.8 1 1.2 1.4–25
–20
–15
–10
–5
0
5
10
15
Dis
plac
emen
t (m
m)
Temporal Baseline (Year)(b)
–30 –25 –20 –15 –10 –5 0(a)
750
650
3.99823.9981
3.99813.9981
3.9983.9979
3.99793.9979
620 640 660 680 700 720 740
6.64456.645
6.6455
× 105
× 106
EN
700H
[FIG9] From TomoSAR point clouds to objects: reconstructed building façades of the Bellagio hotel complex in Las Vegas [25]. The point cloud is overlaid on the facade model, color corresponds to height.
Previous Page | Contents | Zoom in | Zoom out | Front Cover | Search Issue | Next Page qqM
Mq
qM
MqM
THE WORLD’S NEWSSTAND®
Previous Page | Contents | Zoom in | Zoom out | Front Cover | Search Issue | Next Page qqM
Mq
qM
MqM
THE WORLD’S NEWSSTAND®

IEEE SIGNAL PROCESSING MAGAZINE [58] JULY 2014
BUILDING RECONSTRUCTION FROM TomoSAR POINT CLOUDSThe point clouds from VHR TomoSAR can reach a density compa-rable to lidar. These tomographic point clouds can be potentially used for building facade reconstruction in urban environment from space with some special considerations such as the side-look-ing geometry, anisotropic estimation accuracy, and decorrelation. Yet to provide a high-quality spatiotemporal four-dimensional (4-D) city model, object reconstruction from these TomoSAR point clouds is an emergent topic. A 3-D view of the reconstructed facades over the Bellagio Hotel complex in Las Vegas (see Figure 5) using point clouds retrieved from stacks from both ascending and descending orbits, is exemplified in Figure 9.
CONCLUDING REMARKSWith reference to the current status of VHR spaceborne tomographic SAR inversion presented in this article, the fol-lowing conclusions can be drawn:
■ VHR tomographic SAR inversion is able to reconstruct the shape and motion of individual buildings and entire city areas.■ SR is crucial and possible, e.g., using CS, for VHR tomo-graphic SAR inversion for urban infrastructure.■ The motion or deformation of buildings is often nonlinear (periodic, accelerating, stepwise, etc.). Multicomponent non-linear motion of multiple scatterers can be separated.■ The 4-D point clouds retrieved by VHR TomoSAR has a point density comparable to LiDAR and can be potentially used for dynamic city model reconstruction.
AUTHORSXiao Xiang Zhu ([email protected]) is a scientist with the Remote Sensing Technology Institute at the German Aerospace Center (DLR), where she is the head of the synthetic aperture radar (SAR) Signal Analysis Team and with the Technische Universität München. Her main research interests are signal processing, including innovative algorithms such as compressive sensing, sparse reconstruction with applications in Earth observation, including SAR, and optical and hyperspectral remote sensing. She received the IEEE International Geoscience and Remote Sensing Symposium Best Paper Award in 2010, the Dimitri N. Chorofas Foundation Research Award in 2011, and the IEEE Geoscience and Remote Sensing Society Letters Best Paper Award in 2012.
Richard Bamler ([email protected]) is the director of the Remote Sensing Technology Institute at the German Aerospace Center. Since 2003 he has also held a full professorship at the Technische Universität München. His team and his institute work on synthetic aperture radar (SAR), optical remote sensing, com-puter vision, atmospheric sounding, and laboratory spectrometry. They develop and have developed operational processors for Earth observation missions such as SIR-C/X-SAR, SRTM, TerraSAR-X, TanDEM-X, ERS-2/GOME, ENVISAT/SCIAMACHY, MetOp/GOME-2, Sentinel 5p, and EnMAP. His research interests are in
algorithms for optimum information extraction from remote sensing data with emphasis on SAR.
REFERENCES[1] A. Reigber and A. Moreira, “First demonstration of airborne SAR tomography using multibaseline L-band data,” IEEE Trans. Geosci. Remote Sensing, vol. 38, no. 5, pp. 2142–2152, 2000.[2] F. Gini, F. Lombardini, and M. Montanari, “Layover solution in multibaseline SAR interferometry,” IEEE TAES, vol. 38, no. 4, pp. 1344–1356, 2002.[3] G. Fornaro, F. Lombardini, and F. Serafino, “Three-dimensional multipass SAR focusing: experiments with long-term spaceborne data,” IEEE Trans. Geosci. Re-mote Sensing, vol. 43, no. 4, pp. 702–714, 2005.[4] F. Lombardini, “Differential tomography: A new framework for SAR interferom-etry,” in Proc. IGARSS, Toulouse, France, 2003, pp. 1206–1208.[5] G. Fornaro, D. Reale, and F. Serafino, “Four-dimensional SAR imaging for height estimation and monitoring of single and double scatterers,” IEEE Trans. Geosci. Remote Sensing, vol. 47, no. 1, pp. 224–237, 2009.[6] X. Zhu and R. Bamler, “Very high resolution spaceborne SAR tomography in urban environment,” IEEE Trans. Geosci. Remote Sensing, vol. 48, no. 12,pp. 4296–4308, 2010.[7] R. Bamler, M. Eineder, N. Adam, X. Zhu, and S. Gernhardt, “Interferometric potential of high resolution spaceborne SAR,” Photogrammetrie Fernerkundung Geoinformation 5/2009, 2009, pp. 407–419.[8] D. Reale, G. Fornaro, A. Pauciullo, X. Zhu, and R. Bamler, “Tomographic imag-ing and monitoring of buildings with very high resolution SAR data,” IEEE Geosci. Remote Sensing Lett., vol. 8, no. 4, pp. 661–665, 2012.[9] X. Zhu and R. Bamler, “Let’s do the time warp: Multi-component nonlinear motion estimation in differential SAR tomography,” IEEE Geosci. Remote Sensing Lett., vol. 8, no. 4, pp. 735–739, 2012.[10] A. Budillon, A. Evangelista, and G. Schirinzi, “SAR tomography from sparse samples,” in Proc. IEEE Int. Geoscience Remote Sensing Symp. (IGARSS), Cape Town, Africa, 2009, pp. 865–868.[11] X. Zhu and R. Bamler, “Very high resolution SAR tomography via compressive sensing,” in Proc. FRINGE Workshop, Frascati, Italy, 2009, pp. 1–7.[12] X. Zhu and R. Bamler, “Tomographic SAR inversion by L1 norm regularization – The compressive sensing approach,” IEEE Trans. Geosci. Remote Sensing, vol. 48,no. 10, pp. 3839–3846, 2010.[13] G. Fornaro, F. Lombardini, A. Pauciullo, D. Reale, and F. Viviani, “Tomo-graphic processing of interferometric SAR data,” IEEE Signal Processing Mag.,vol. 31, no. 4, pp. 41–50, July 2014. [14] E. Candès, “Compressive sampling,” in Proc. Int. Congr. Mathematics,Madrid, 2006, vol. 3, pp. 1433–1452, 2006.[15] R. Baraniuk, “Compressive sensing,” IEEE Signal Processing Mag., vol. 24,no. 4, pp. 118–126, 2007.[16] X. Zhu, “Very high resolution tomographic SAR inversion for urban infra-structure monitoring—A sparse and nonlinear tour,” Ph.D. thesis, Deutsche Geodätische Kommission, Reihe C, Nr. 666, Verlag der Bayerischen Akademie der Wissenschaften, 2011.[17] K. P. Burnham and D. R. Anderson, “Multimodel inference: Understanding AIC and BIC in model selection,” Sociol. Methods Res., vol. 33, no. 2, pp. 261–304,2004.[18] G. Schwarz, “Estimating the dimension of a model,” Ann. Stat., vol. 6, no. 2,pp. 239–472, 1978.[19] J. Rissanen, “Modelling by shortest data description,” Automatica, vol. 14,no. 5, pp. 465–471, 1978.[20] S. J. Wright, R. D. Nowak, and M. At Figueiredo, “Sparse reconstruction by sepa-rable approximation,” IEEE Trans. Signal Processing, vol. 57, no. 7, pp. 2479–2493,2009.[21] X. Zhu and R. Bamler, “Super-resolution power and robustness of compressive sensing for spectral estimation with application to spaceborne tomographic SAR,” IEEE Trans. Geosci. Remote Sensing, vol. 50, no. 1, pp. 247–258, 2012.[22] P. Khomchuk, I. Bilik, and D. P. Kasilingam, “Compressive sensing-based SAR tomography,” in Proc. IEEE Radar Conf., Arlington, TX, 2010, pp. 354–358.[23] X. Zhu and R. Bamler, “Demonstration of super-resolution for tomographic SAR imaging in urban environment,” IEEE Trans. Geosci. Remote Sensing, vol. 50, no. 8, pp. 3150–3157, 2012.[24] Y. Wang, X. Zhu, Y. Shi, and R. Bamler, “Operational TomoSAR processing using multitrack TerraSAR-X high resolution spotlight data stacks,” in Proc. IEEE Int. Geoscience Remote Sensing Symp. (IGARSS), Munich, Germany, 2012, pp. 7047–7050.[25] X. Zhu and M. Shahzad, “Façade reconstruction using multi-view spaceborne TomoSAR point clouds,” IEEE Trans. Geosci. Remote Sensing, vol. 52, no. 6,pp. 3541–3552, 2014.
[SP]
Previous Page | Contents | Zoom in | Zoom out | Front Cover | Search Issue | Next Page qqM
Mq
qM
MqM
THE WORLD’S NEWSSTAND®
Previous Page | Contents | Zoom in | Zoom out | Front Cover | Search Issue | Next Page qqM
Mq
qM
MqM
THE WORLD’S NEWSSTAND®
_________
_____________

1053-5888/14/$31.00©2014IEEE IEEE SIGNAL PROCESSING MAGAZINE [59] JULY 2014
Digital Object Identifier 10.1109/MSP.2014.2312282
Date of publication: 13 June 2014
Interferometric synthetic aperture radar (InSAR) systems are capable of providing an estimate of the digital elevation model (DEM) of the imaged ground scene. This is usually done by means of a phase unwrapping (PU) operation. In the absence of additional regularity constraints, PU is an ill-
posed problem, because the solution is not unique. Multichannel (MCh) tech-niques, using stacks of images of the same scene, can be used for restoring the solution unique-ness and reducing the effect of phase noise. Moreover, statistical techniques ex-ploiting the contextual information contained in the data can provide satis-factory results. In this arti-cle, an overview of the main MCh statistical DEM recon-struction methods, developed both in the classical and in the Bayesian estimation framework, is presented. In particular, the effectiveness of the exploitation of contextual statistical models is shown by means of numerical experiments on simulated and real data sets.
INTRODUCTIONToday, InSAR systems are widely used and represent an effective tool for geoscience and topographic mapping of the earth’s surface. InSAR systems typically make use of two complex SAR images of
the same scene, acquired with slightly different view angles, from which it is possible to
generate the so-called phase interfero-gram, given by the wrapped differ-
ence of the two image phases. The phase interferogram is
linked through a known (nonlinear) relation to the height profile of the ob-served scene [1], [2], usu-ally also denoted as DEM.
Phase interferograms suffer from two main
problems: they are wrapped in the interval ] , ],r r- and
are corrupted by noise, which is related to the spatial and tem-
poral decorrelation between the two acquisitions and, in general, cannot be
neglected. The DEM reconstruction is, then, per-formed by means of a PU operation, which allows the phase reconstruction in the interval ] , [3 3- starting from the wrapped phase values [1]. Since there is an infinite number of height profiles that can be mapped in the same interferogram [2], PU is an ill-posed problem unless proper regularity constraints are imposed. This problem has been widely studied in many
[Fabio Baselice, Giampaolo Ferraioli, Vito Pascazio, and Gilda Schirinzi]
[Addressing DEM reconstruction using contextual information]
Recent Advances in Synthetic Aperture Ra
darIma
ging
PH
OTO
CO
UR
TE
SY
OF
NA
SA
Previous Page | Contents | Zoom in | Zoom out | Front Cover | Search Issue | Next Page qqM
Mq
qM
MqM
THE WORLD’S NEWSSTAND®
Previous Page | Contents | Zoom in | Zoom out | Front Cover | Search Issue | Next Page qqM
Mq
qM
MqM
THE WORLD’S NEWSSTAND®

IEEE SIGNAL PROCESSING MAGAZINE [60] JULY 2014
other application fields, such as radio astronomy [3] and mag-netic resonance imaging [4].
A constraint that is commonly adopted to regularize the PU problem, restoring the solution uniqueness, consists of impos-ing that the absolute values of the unwrapped phase jumps between adjacent pixels are less than .r This constraint is satis-fied in the case of height profiles without strong discontinuities and high slopes, and for small baseline values [2].
One of the first techniques proposed for InSAR dates back more than 25 years ago [5]. Since then, many other PU algo-rithms have been developed.
Most PU traditional techniques can be classified as either path-following methods or minimum norm methods. A good review is provided in [6]. A significant and more recent extension of the path-following methods is based on constrained optimization of network flows [7]. However, even the best PU method, based on a single interferogram, will fail for steep mountainous or urban areas due to the solution ambiguity and presence of noise.
The solution uniqueness can be recovered, without imposing any constraint on the height profile, by using MCh techniques [8]–[13], which exploit the availability of more than two images (i.e., more than one interferogram) obtained using multibaseline or multifrequency interferometric acquisitions. They have shown to be more robust compared to the ones based on a single interfer-ogram, and, besides solving the problem of the multiplicity of the solution, they provide improved accuracy and can be applied to a larger class of height profiles. The time series of SAR images are also useful for reducing noise in topographic applications or mea-suring time-varying surface deformations [2] in the differential interferometric configuration (DInSAR).
A boost to the development of MCh InSAR techniques has been also given by the recent launch of very high-resolution (VHR) SAR system constellations (e.g., TerraSAR-X, COSMO-SkyMed), provid-ing a huge amount of interferometric data acquired with small revisiting times.
Most of the MCh DEM reconstruction methods are based on statistical estimation techniques. Initially, methods based on maximum likelihood (ML) estimators have been proposed [11], [12], [14]. Such techniques, by exploiting the statistical distri-bution of the interferometric phase noise, are able to effectively combine the MCh data to estimate the height of a pixel inde-pendently from the ones surrounding. Achievable performances depend significantly on the number of images, the operating frequency, the baselines, and coherence values of each interfer-ogram [15]. Reliable and accurate reconstructions require a large number of channels, especially in the presence of low coherence areas.
To increase the performance of DEM reconstructions, espe-cially in the presence of a small number of channels, contextual information can be considered. Instead of working pixel-wise, this approach requires the simultaneous processing of pixel clusters by exploiting relationships existing between the nearby pixels (also called a neighborhood).
Contextual information methods can be grouped into two classes: methods imposing deterministic constraints between
the nearby pixel, and methods adopting statistical constraints between nearby pixels.
As far as deterministic constraints are concerned, pixels are jointly processed in clusters, in which some geometrical rela-tions are imposed [16]. In the case of statistical constraints based methods, instead, pixels are modeled considering their apriori joint statistical distribution [17]–[22].
The joint use of MCh data and contextual information noticeably improves DEM reconstruction accuracy. In particu-lar, MCh information allows solving the solution ambiguity problem, while the exploitation of neighboring pixel constraints allows reducing the reconstruction noise.
In [16], an MCh PU method using a deterministic constraint was proposed. The constraint imposes that a pixel and its neighbor-ing ones are belonging to the same local plane, whose parameters are estimated by a local cluster of data using an ML approach.
Later, statistical constraints have been explained. Bayesian approaches, such as the maximum a posteriori (MAP), taking into account the a priori statistical distributions for the two-dimensional (2-D) height profiles together with MCh data, have been introduced in [19].
The joint use of MCh data and contextual information can be particularly useful in the absence of coherent stable reflecting structures on the ground, as, for instance, permanent scatterers [2], and in the presence of high decorrelation. These techniques are particularly helpful when the fiducial points density is not sufficient to guarantee good results, even if algorithms properly developed to find networks of stable points are applied [23]. In this case, contex-tual MCh techniques can allow high-quality reconstructions also for distributed and progressively decorrelating targets.
A deep and quantitative analysis on the best reconstruction accuracy that can be achieved by both ML- and MAP-based approaches is reported in [15]. The obtained results are very inter-esting. It shows that while ML techniques exhibit an accuracy that weakly depends on the height slope and strongly depends on the baselines choice, the MAP technique exhibits an accuracy that strongly depends on the height slope and weakly depends on the baselines choice, thus relaxing the requirements on the baseline values, thus allowing a larger flexibility in their choice.
Within this article, an overview of the statistical methods, developed in both the classical and Bayesian estimation frame-work for solving the MCh InSAR PU problem for DEM genera-tion is presented, stressing the usefulness of the contextual information and drawing evolutions and new scenarios of PU approaches for the future.
MULTICHANNEL SYSTEMS AND CONTEXTUAL INFORMATIONAn InSAR MCh system exploitats different interferograms related to the same observed scene acquired with a diversity, i.e., by using different channels. Two typologies of diversity are commonly adopted: multifrequency and multibaseline configurations. In mul-tifrequency systems, multiple acquisition are obtained by observing the scene from the same position but using different working fre-quencies (or wavelengths ),m or by partitioning the SAR signal
Previous Page | Contents | Zoom in | Zoom out | Front Cover | Search Issue | Next Page qqM
Mq
qM
MqM
THE WORLD’S NEWSSTAND®
Previous Page | Contents | Zoom in | Zoom out | Front Cover | Search Issue | Next Page qqM
Mq
qM
MqM
THE WORLD’S NEWSSTAND®

IEEE SIGNAL PROCESSING MAGAZINE [61] JULY 2014
spectrum in subbands [16], [24]. Multibaseline systems consist of observing the scene with the same frequency from at least three slightly different positions (i.e., at least two different orthogonal baselines ) .B= The multibaseline geometry is shown in Figure 1 in the case of two baselines: B 1= and .B 2=
Considering K different channels, the acquired interfero-metric phase signal for the pixel s is related to the ground height via the following equation:
, , , , , , ,s h s w s k K s S1 1k k k 2 f fz a= + = =r^ ^ ^h h h
(1)
where S is the number of image pixels, k is the channel index, w is the interferometric phase noise, 2r$1 2 represents the “modulo-2 _r operation, and ka is a coefficient that takes into account the multifrequency or multibaseline diversity. In par-ticular, ka is given by
,sinRd4
kk
0a
ir= (2)
where dk is equal to B km= in case of multifrequency systems, or to B k m= in the case of multibaseline systems, i is the view angle, and R0 is the distance between the master antenna and the center of the scene. The DEM reconstruction problem, in an MCh framework, consists of estimating the height values ( )h s by prop-erly combining the K channels measured wrapped phases at posi-tion ,s i.e., the vector ( ) ( )( ) [ ( ) ] .s ss s K
T21 fz zzU =
As previously mentioned, MCh approaches are useful in removing the problem of solution multiplicity; however, they could not guarantee optimal performances in DEM estimation. To improve the reconstruction accuracy and regularize the solution, contextual information has proven to be helpful.
The choice of the quantity (how many?) and the quality (which one?) of the baselines affects the final performance of the DEM esti-mation: the larger the number of baselines, and the more different (from each other) the baseline values, the better the expected esti-mation performance. Unfortunately, it is often difficult to be able to collect SAR data relevant to several baselines of required length. In the repeat pass system configuration, this circumstance would imply several days or, worse, weeks of data acquisition. Such a situ-ation has a twofold undesired effect: very long acquisition time and lower coherence values due to the increasing of the temporal decorrelation (the positive effect due to the acquisition of several baselines can be thwarted for the presence of larger phase noise).
For this reason, it is very interesting and useful, from a practi-cal point of view, to use a limited number of baselines, without impairing the performance of the method. It can be realized with the application of an external regularization rule, i.e., the intro-duction of constraints on the height profile to be reconstructed through contextual information, as opposed to a pixel-based approach. Such an approach is closer to human perception and presents strong relations with computer vision, image analysis, and pattern recognition.
DEM reconstruction capabilities can dramatically be improved if contextual information is exploited. Contextual information exploits the connections between adjacent pixel behaviors across
the considered scene. It is likely that, especially in natural scenar-ios, the height relevant to a pixel is strictly related to its surround-ing pixels, particularly its neighborhood. The exploitation of the contextual information provides a regularization that derives from the natural properties of the imaged scene, instead from an exter-nal rule imposition. In our case, being the unknown image repre-sentative of the height of an observed scene, strong contextual pixel information is very likely to be.
Two main classes of contextual information can be identified: deterministic and stochastic. Within the first class, an interesting approach is the so-called local planes technique [16]. The method consists of estimating the profile values at a given position starting from the wrapped phase values in the same position and in a “clus-ter” of neighboring positions. The assumption is that the height of a pixel, and consequently its interferometric phase value, is linearly related to its neighborhood. The characteristic parameters of a plane, linearly approximating the height profile in correspondence of the position of the pixel of the cluster, are estimated. In practice, planes in a three-dimensional (3-D) space can approximate the DEM locally. As an example, considering a pixel ,s a squared neighboring system ,N s constituted by N 9= positions, has been considered in Figure 2. The height behavior of the pixels of the cluster can be approximated and modeled as a plane (the grey plane of Figure 2).
A second contextual information-based approach consists of modeling the interpixel dependencies of the neighboring system N s in a stochastic way, instead of a deterministic one, through an a priori joint probability density function (pdf). In such a way, the statistical distribution similarities of adjacent pixels can be taken into account, assigning different probabilities to different pixel configurations.
In this framework, the Markov random field (MRF) theory has proved to be a powerful and effective tool for modeling images, tak-ing into account the contextual pixel information [17]. In the MRF
B⊥2
SARFlight Track
B⊥1
R0
h (s )
B⊥222
SARFlight Track
BB⊥1
R0RR
hh (s )
[FIG1] Two-baselines (B 1= and )B 2= InSAR system geometry for the estimation of height ( ) .h s
Previous Page | Contents | Zoom in | Zoom out | Front Cover | Search Issue | Next Page qqM
Mq
qM
MqM
THE WORLD’S NEWSSTAND®
Previous Page | Contents | Zoom in | Zoom out | Front Cover | Search Issue | Next Page qqM
Mq
qM
MqM
THE WORLD’S NEWSSTAND®

IEEE SIGNAL PROCESSING MAGAZINE [62] JULY 2014
framework, the local Gaussian MRF (LGMRF) model described in [19] adapts well to describe natural scenarios. By properly tuning the locally defined model parameters related to the statistical corre-lation between neighboring pixels, an LGMRF can be adapted to any imaged scene, even in the presence of high slopes or strong height discontinuities. This peculiarity leads to a general model, well suited to represent a wide class of height profiles.
MULTICHANNEL PHASE UNWRAPPING FOR DIGITAL ELEVATION MODEL GENERATIONWithin this section, MCh PU techniques for DEM generation are presented. By exploiting the statistical distribution of data, such techniques are able to effectively combine the MCh-available data.
In the following, three techniques developed in the statisti-cal estimation framework will be presented and discussed: the ML approach, which does not exploit any constraints between neighboring pixels; ML with local planes (MLLP), which exploits deterministic constraints between neighboring pixels; and MAP approach, which exploits statistical constraints between neigh-boring pixels.
MAXIMUM LIKELIHOODLet us consider the height value ( )h s of an image as deterministic parameters. The ML solution consists of finding the unknown ( )h smaximizing the likelihood function ( ( )); ( )) .f s h sz Starting from the interferometric phase noise statistical distribution [25] and tak-ing into account the phase-height relation of (1), the likelihood
function in case of a single interferogram for the kth channel is shown in (3) at the box at the bottom of the page, where ( )skc is the coherence of the kth channel, i.e., the complex correlationcoefficient between the two SAR images that produce the kthinterferogram, at position s. Its value is related to different aspects, such as phase noise and ground scene changes that occurred dur-ing the temporal interval between the two acquisitions [1].
The likelihood function (3) is periodic with period / ,T 2k kr a=
and so it exhibits an infinite number of global maxima (see the dotted line of Figure 3), leading to ambiguous solutions.
The ambiguity can be solved considering additional MCh phase measures ( ), ( , , ) .s k K1k fz = Considering K indepen-dent phase measures, the MCh likelihood function can be defined as
; .;F s h s f s h skk
K
1MCh zU =
=
^ ^^ ^ ^^h hh h hh% (4)
The multiplication of K single channel likelihood functions withdifferent periods (effect of different baselines and/or working fre-quencies) avoids multiple global maxima that occur in single channel likelihood function, at least in the range of interest for
( ) .h s This effect is shown in Figure 3 (continuous line).The assumed independence between interferometric phases
is strictly related to the choice of the interferograms. In case of multifrequency systems, the independence can be easily sat-isfied by exploiting nonoverlapped bands [16]. This hypothesis is not always verified in case of multibaseline. An interesting study on the multibaseline configuration, in case the interfer-ograms are not statistically independent, can be found in [26] for the dual baseline case. In [26], it is shown that assuming the two interferograms to be independent, does not signifi-cantly affect the results, even if they are statistically depen-dent. The independence hypothesis can become more critical in the case of more than two baselines. In any case, it has to be pointed out that a closed-form expression of the joint pdf of the interferometric phases is not available for more than two baselines. Then, its approximate expression, obtained by using the independency assumption, is always adopted. The effect of this approximation on the DEM reconstruction accuracy is an important point that merits further investigations.
The MCh ML solution of the PU problem is
; .
;arg max
arg max
h s F s h s
f s h s
h
hk
k
K
1
ML MCh
z
U=
==
t ^ ^ ^^
^ ^^
h h hh
h hh% (5)
The position of the global maximum of FMCh represents the esti-mated height. Several global optimization procedures can be applied for solving the nonlinear maximization in (5). It must be pointed out that, for each fixed pixel, the maximization in (5) has to be performed respect to a scalar
h (s)
h (s)∧
Ns
S
h (h s)
h (h s)∧
NsN
S
[FIG2] The plane (grey) approximating the true profile for position s in the grid, for a neighboring system consisting of N 9= positions: [ represents the neighborhood Ns of pixel ,s : represents the true height values, and V represents the
height value approximated by the plane.
;( )
( )cos
cos
cos cos cos
f s h ss s h s
s
s s h s
s s h s s s h s
21
11
11
kk k k
k
k k k
k k k k k k
2 2
2
2 2 1 2
1
#
zr c z a
c
c z a
c z a c z a
=- -
-
+- -
- - --
^ ^^^ ^^
^ ^ ^^
^ ^ ^^ ^ ^ ^^
h hhh hh
h h hh
h h hh h h hh
66
@@
) 3 (3)
Previous Page | Contents | Zoom in | Zoom out | Front Cover | Search Issue | Next Page qqM
Mq
qM
MqM
THE WORLD’S NEWSSTAND®
Previous Page | Contents | Zoom in | Zoom out | Front Cover | Search Issue | Next Page qqM
Mq
qM
MqM
THE WORLD’S NEWSSTAND®

IEEE SIGNAL PROCESSING MAGAZINE [63] JULY 2014
unknown parameter, so that numerical complexity is not critical and parallel and efficient numerical techniques can be easily implemented.
MAXIMUM LIKELIHOOD WITH LOCAL PLANESAs described in the previous section, ML works pixel-wise, treat-ing the height estimation of each pixel independently from the surrounding ones. Better performance can surely be achieved if some constraints based on contextual information are intro-duced. In particular, within this section, the joint exploitation of the ML approach with the deterministic contextual information provided by local planes, reported in the section “Multichannel Systems and Contextual Information,” is presented.
Let us consider a “cluster” of neighbors of the pixel ,scalled ,N s formed by the pixel itself, and by N 1- neighbor-ing pixels. The considered contextual information consists of approximating the height surface in the cluster N s by a plane. The height ( )z n of each pixel belonging to N s can be approxi-mated by the equation [16]
, ,z n a s b s c s n N s!a bD D= + +^ ^ ^ ^h h h h (6)
where only the case of a perfect vertical plane is excluded. Note that Ta and Tb of (6) represent the ground range and the azimuth sampling steps, respectively.
In place of estimating the height values for each pixel inde-pendently from the others as performed by the ML method, the parameters ( ), ( ),a s b s and ( )c s of the plane best approxi-mating in the ML sense the true height profile of the pixel belonging to N s are sought. Thus, for each pixel, a vector of three unknown parameters [ ( ) ( ) ( )]x a s b s c ss
T= has to be estimated by exploiting N K# wrapped phase values
( ), ,n n NTs!U" , where ( )nU are the measured wrapped
phase K-element vectors defined in (4).The MLLP solution for the ( )h s reconstruction is achieved
via a two-step procedure. The first step consists of estimating the unknown parameter vector x s by computing
.
argmax
argmax
x x
x
F n
f n
sx
sn
xk s
k
K
n 1
MChN
N
s
s
z
U=
=
!
! =
t ^^
^^
h h
h h
%
%% (7)
The likelihood term xf nk sz ^^ h h is derived from (3) by consid-ering the neighborhood cluster n N s! instead of a single pixel
,s and instead of the height ( )h n the local plane ( )nz that depends on the unknown parameter vector .x s Once x st is esti-mated, the height of the pixel is assumed as the “central” point sof the estimated plane.
Considering Figure 2, the height of the central pixel (referred to as ): is approximated by the central point of the plane (referred to as ),9 computed by exploiting the ( )N K N 9# = wrapped phase measures. This led to an improvement of the ratio between the number of independent measures and the number of unknowns, compared to the ML.
In this case, the maximization in (7) has to be performed pixel-wise with respect to a vector of three unknown parameters, exploit-ing a number of data that depends on the neighborhood. Also in this case, the numerical complexity is not critical, and parallel and efficient numerical techniques can be easily implemented.
MAXIMUM A POSTERIORIThe contextual information can also be exploited in a statistical framework, i.e., modeling the behavior of a pixel to its neighbor-hood by considering the statistical distribution of the unknown image. This distribution is usually defined in such a way to assign high probability to particular pixel configurations. An effective tool to statistically describe and model the unknown height profile, able to take into account the contextual information between neighboring pixels, is provided by MRF theory.
According to the Hammersley–Clifford theorem [17], an MRF can be analytically expressed by a Gibbs distribution. The type of Gibbs distribution, or equivalently of the MRF, can be chosen according to the characteristics of the image. As already stated, a general model that well fits in case of a wide class of height pro-files is the local Gaussian MRF (LGMRF), whose expression is [19]
; ,exphgZ
h s h n12 ,
Hs nns
S
2
2
1 Ns
vv v
= --
!=
^^
^ ^^h
hh hh= G* 4// (8)
where ,s nv are the so-called hyperparameters, v is the hyperpa-rameter vector collecting all ,s nv values, and ( )Z v is the so-called partition function. In this framework, the unknown image
[ ( ) ( ) ( )]h h h h s1 2 Tf= is considered as a sample of a random vector H with an a priori Gibbs distribution.
The hyperparameter values, which are locally defined, are related to the height spatial variation between adjacent pixels. The hyperparameter ,,s nv in fact, can be seen as an indicator of the spatial correlation of the neighboring pixels. A high value of ,s nv
means that the probability that two neighboring pixels s and nhave different height values is high. On the contrary, a low value of
,s nv implies that the probability that ( )h s and ( )h n are different is small. By changing the hyperparameter values, the LGMRF model can be adapted to describe the image local nature.
0.8
0.6
0.4
0.2
00 100 200 300 400
Height (m)500 600
Like
lihoo
d F
unct
ion
Two ChannelsOne Channel
[FIG3] Single channel (dotted line) and multichannel (continuous line) likelihood functions.
Previous Page | Contents | Zoom in | Zoom out | Front Cover | Search Issue | Next Page qqM
Mq
qM
MqM
THE WORLD’S NEWSSTAND®
Previous Page | Contents | Zoom in | Zoom out | Front Cover | Search Issue | Next Page qqM
Mq
qM
MqM
THE WORLD’S NEWSSTAND®

IEEE SIGNAL PROCESSING MAGAZINE [64] JULY 2014
Exploiting the LGMRF model for the a priori statistical descrip-tion of the unknown ,h and following Bayes’ rule, the MAP solu-tion for the height reconstruction is provided by the value that maximizes the logarithm of the a posteriori distribution
.
,
arg min ln
arg max lnh hF s h s g
F s h s
h s h n2 ,
h
hH
n
s
N
s
S
s ns
S
1
2
2
1
1MAP MCh
MCh
Ns
v
v
U
U
-
+-
=
!
=
=
=
=
t
t t^ ^^ ^
^ ^^
^ ^^
h hh h
h hh
h hh
=
=
G
G*
*
4
4%
/
// (9)
The a posteriori distribution of (9) is obtained as the product of the MCh likelihood function of (4) and the a priori distribution of (8).
Clearly, the hyperparameters as they appear in (9) are not a pri-ori known and have to be estimated from the available data, the measured phase interferograms [ ( ) ( ) ( )]y S1 2T T T TgU UU=defined in (4).
An efficient and effective way to estimate the hyperparame-ters from the available noisy data is provided by the expecta-tion-maximization (EM) algorithm [17]. The expression of the hyperparameter estimation update at the ( )l 1 th+ step of the EM algorithm with respect to pixel s is
.,yl E h s h n l191
sn
s2 2
Ns
v v+ = -!
t t^ ^ ^ ^h h h h6= @ G/ (10)
The conditional expectation [.]E of the unknown h given the observed data y and the current estimation ( )lsvt is performed. To compute the expectation over h, samples of this random vector at the l th iteration are mandatory. The sampling is itera-tively performed starting from the a posteriori distribution of husing the Metropolis algorithm. The local estimation of hyper-parameters is very powerful, because it allows the localization of the flat regions and the discontinuities of the image.
Once the hyperparamters have been estimated for all the pix-els, ,s nv is set to be ( ) / .2,s n s nv v v= +t t t More details on hyperpa-rameter estimation can be found in [19].
The height samples generated during the hyperparameter estimation procedure can be used to initialize the search of the solution of (9). Therefore it is possible to carry out the optimiza-tion step using a semideterministic solution: the iterated condi-tional modes (ICM) algorithm is appropriate for this purpose. For a deeper analysis on the numerical implementation of the algo-rithms required by both hyperparameter estimation and optimi-zation steps (i.e., Metropolis algorithm and ICM) refer to [17].
The computational burden can be, differently from the previ-ous cases, critical for large size images. Anyway, alternative more efficient optimization schemes can be adopted (see the next section).
NEW TRENDSBesides the previously presented MCh algorithm, some new techniques developed in the contextual information framework have been recently proposed.
An improvement of the MAP approach, called multichannel phase unwrapping + total variation, has been presented in [27]. Such an algorithm is able to overcome some limitations of MAP approach regarding computational time and robustness to local optima in the optimization process. In particular, the new tech-nique is able to provide the global optimum for the considered energy function within a short time exploiting the graph-cut-based optimization tools. Its main drawback regards the mem-ory occupation, which is excessive in the case of large images.
Recently, an evolution of multichannel phase unwrapping + total variation, specifically thought for 3-D reconstruction of urban areas using VHR images, able to exploit the additional information provided by the amplitude of SAR data, has been introduced [28]. The amplitude data plays a double role: it helps both phase regularization and PU steps. In particular, amplitude data are useful for preserving height discontinuities and smooth-ing noise in homogeneous areas. The method is also able to cor-rectly handle MCh InSAR data corrupted by atmospheric artifacts and phase offsets, which is mandatory for a correct 3-D mapping.
Within the Bayesian estimation framework, interesting algo-rithms for PU that exploit the extended Kalman filter (EKF) have been proposed. The usefulness of the EKF for joint PU and noise reduction has been first demonstrated in [29] and recently adapted to work with MCh interferometric stacks, achieving interesting reconstruction improvements [30]. The EKF is a two-step technique for nonlinear fixed interval smoothing, per-forming simultaneously PU, noise reduction, and data fusion by a proper state space model design. Since it does not require an accurate numerical maximization of nonconvex objective func-tions, it can achieve high computational efficiency while main-taining the benefits of statistical Bayesian approaches. Its main drawback is related to the application of a monodimensional fil-ter to a 2-D domain problem, which implies that, at the present, some empirical coefficients have to be set.
EXPERIMENTSTo evaluate the performances of the described MCh PU algo-rithms, three case studies are considered. In particular, a simu-lated data set has been generated to quantitatively evaluate the unwrapping performances of the different approaches, and two real data sets (acquired by ENVISAT and COSMO-SkyMed sensors) have been considered to validate results on real images.
SIMULATED DATAA simulated data set has been generated using the profile shown in Figure 4(a). Five noisy interferograms with orthogonal baselines of [237.72 255.90 322.60 399.92 544.81] m have been simulated. The working frequency has been set to 5.3 GHz while ,R0 the distance between the sensor and the center of the scene, has been set to 700 km. The coherence for the whole scene has been simulated accord-ing to the rule ( ) / ( ) ,B B1 maxk k0c c= - = =` j where B max= is a constant related to the critical baseline, and set equal to 1,000 m.
The interferogram related to the smallest baseline is shown in Figure 4(b). The DEM has been estimated by applying ML, MLLP, and MAP, the results of which are reported in Figure 4(c)–(e),
Previous Page | Contents | Zoom in | Zoom out | Front Cover | Search Issue | Next Page qqM
Mq
qM
MqM
THE WORLD’S NEWSSTAND®
Previous Page | Contents | Zoom in | Zoom out | Front Cover | Search Issue | Next Page qqM
Mq
qM
MqM
THE WORLD’S NEWSSTAND®

IEEE SIGNAL PROCESSING MAGAZINE [65] JULY 2014
respectively. The reconstruction error progressively reduces from ML to MLLP solution (i.e., when deterministic contextual infor-mation is exploited) and from MLLP to MAP result (i.e., when sta-tistical contextual information is considered).
To quantitatively evaluate the performances of the consid-ered approaches with respect to stack characteristics, estima-tions have been performed varying both coherence value 0c and number of channels .K As an index of reconstruction accuracy, the normalized root mean square error defined as
,h
h hh 2
2
f =-t (11)
has been computed and reported in Figure 5. In (11) h is the vector collecting the true height values, ht is the vector collect-ing the estimated values, and 2$ is the quadratic norm. Results confirm what is expected: MAP overcomes MLLP and MLLP overcomes the ML solution. It is evident how the contex-tual information can greatly improve the accuracy of the esti-mated DEM, in particular in the case of stochastic relation between nearby pixels.
REAL DATA SETThe considered algorithms have been tested on two real data sets. The first image stack has been acquired by the ENVISAT
50
100
150
200
250
300
350
400
45050 100 150
0
20
40
60
80
100
120 50
100
150
200
250
300
350
400
45050 100
(a) (b)150
–2
–3
–1
0
2
1
3
50
100
150
200
250
300
350
400
45050 100 150
0
20
40
60
80
100
120 50
100
150
200
250
300
350
400
45050 100 150
0
20
40
60
80
100
120 50
100
150
200
250
300
350
400
45050 100
(c) (d) (e)150
0
20
40
60
80
100
120
[FIG4] A simulated data set. (a) The height profile and (b) smallest baseline interferogram. The coherence has been set to 0.85. (c) The DEM reconstruction with ML, (d) MLLP, and (e) MAP approaches. On the axes, the pixel indices are reported.
Previous Page | Contents | Zoom in | Zoom out | Front Cover | Search Issue | Next Page qqM
Mq
qM
MqM
THE WORLD’S NEWSSTAND®
Previous Page | Contents | Zoom in | Zoom out | Front Cover | Search Issue | Next Page qqM
Mq
qM
MqM
THE WORLD’S NEWSSTAND®

IEEE SIGNAL PROCESSING MAGAZINE [66] JULY 2014
sensor and refers to a natural scenario, a mountain in the region of Las Vegas, Nevada (United States). Acquisition parameters are the same of the simulated data set. Before applying MCh PU algorithms, the flat earth component has been removed, and phase offsets have been compensated. To better appreciate the accuracy of the obtained results, the SRTM DEM has been subtracted to the reconstructed profiles. These residual components—ML, MLLP, and MAP—are reported in Figure 6(a)–(c), respectively. The obtained results confirm the outcome of the simulated data. The MAP solution
outperforms MLLP and ML, both in terms of restoration and reconstructed details. It provides a reliable and realistic recon-struction, as it is evident in the 3-D projection of the com-puted DEM [Figure 6(d)].
The second data set is composed by 30 COSMO-SkyMED sensor images acquired in the urban area of Nola, Italy. This data set has been chosen to test the algorithms on a different scenario, compared to the Las Vegas one: data are acquired in X-band, instead of C-band, and are related to an urban area which, differently from a natural scenario, is characterized by
101
100
10–1
10–2
Nor
mal
ized
RM
SE
0.6 0.7 0.8 0.9Coherence
1
101
100
10–1
10–2
10–3
Nor
mal
ized
RM
SE
2 3 4Number of Channels
(a) (b)
5
MLML + Local PlanesMAP
MLML + Local PlanesMAP
[FIG5] The normalized root mean square error of considered MCh PU techniques with respect to (a) the coherence value 0c and (b) number of channels .K
100
200300
400500
600700
200 400 600 800 1,000 1,200 1,400
100 800
600
400
200
0
200300
400500
600700
200 400 600 800 1,000 1,200 1,400
20
10
0
–10
–20
100
200300
400500
600700
200 400 600 800(a) (b)
(c) (d)
1,000 1,200 1,400
20
10
0
–10
–20
20
10
0
–10
–20
[FIG6] The results on the Las Vegas site–ENVISAT data: (a) ML, (b) MLLP, and (c) MAP residual reconstructions, and (d) 3-D projection of MAP solution. On the axes, the pixel indices are reported.
Previous Page | Contents | Zoom in | Zoom out | Front Cover | Search Issue | Next Page qqM
Mq
qM
MqM
THE WORLD’S NEWSSTAND®
Previous Page | Contents | Zoom in | Zoom out | Front Cover | Search Issue | Next Page qqM
Mq
qM
MqM
THE WORLD’S NEWSSTAND®

IEEE SIGNAL PROCESSING MAGAZINE [67] JULY 2014
sharp discontinuities due to the presence of man-made structures. Results of the considered approaches are reported in Figure 7: (a) ML, (b) MLLP, and (c) MAP. Even in this sce-nario, contextual information, in particular the stochastic one (MAP solution) is able to sensibly improve the performances of the DEM generation. To appreciate the high accuracy and reliability of the MAP solution, its 3-D projection is presented in Figure 7(d).
CONCLUSIONSThe role of the contextual information in the MCh InSAR PU problem has been discussed. The exploitation of interdepen-dency between nearby pixels has been shown to be effective in regularizing the solution and in providing high-accuracy DEM. To assess the positive effect of contextual methods, three different MCh PU techniques have been investigated:
ML, MLLP, and MAP. The first methodology, the ML, makes no use of any contextual information, the second one, the MLLP describes the pixel neighborhood dependency using a deterministic model, while MAP exploits a stochastic relation between nearby pixels. The obtained results show that contex-tual information can substantially improve the DEM recon-struction performances, particularly in the case of stochastic models. This improvement has been quantitatively evaluated on a simulated data set and validated on two different real data scenarios.
ACKNOWLEDGMENTSThis work was supported in part by the Italian Space Agency within project ID2246 “Development of Imaging and Monitor-ing Methodologies Based on the Use of COSMO-SkyMed SAR Data” under contract I/065/09/0.
50
100
150
200
250
50 100 150 2000
1
2
3
4
5
6
7
8
50
100
150
200
250
50 100(c) (d)
150 2000
1
2
3
4
5
6
7
8
50
100
150
200
250
50 100(a) (b)
1500
1
2
3
4
5
6
7
8
[FIG7] The results on the Nola site–COSMO-SkyMED data: (a) ML, (b) MLLP, and (c) MAP solutions, and (d) the MAP 3-D projection. On the axes, the pixel indices are reported.
Previous Page | Contents | Zoom in | Zoom out | Front Cover | Search Issue | Next Page qqM
Mq
qM
MqM
THE WORLD’S NEWSSTAND®
Previous Page | Contents | Zoom in | Zoom out | Front Cover | Search Issue | Next Page qqM
Mq
qM
MqM
THE WORLD’S NEWSSTAND®

IEEE SIGNAL PROCESSING MAGAZINE [68] JULY 2014
AUTHORSFabio Baselice ([email protected]) received the B.S. and M.S. degrees in telecommunication engineering and the Ph.D. degree in information engineering from the Università di Napoli “Parthenope” in 2004, 2007, and 2010, respectively. He was a visiting student at Telecom ParisTech, France, and at the University of Antwerp, Belgium. He previously worked as a post-doctoral researcher with the Italian Consortium of Telecommuni-cations (CNIT) and the Università di Napoli “Parthenope.” He is the author of more than 35 scientific papers. His research inter-ests are in statistical signal processing, synthetic aperture radar interferometry, and magnetic resonance imaging.
Giampaolo Ferraioli ([email protected]) received the B.S. and M.S. degrees (summa cum laude) and Ph.D. degree in telecommunication engineering from the Uni-versità di Napoli “Parthenope” in 2003, 2005, and 2008, respec-tively. Currently, he is an assistant professor at the Università di Napoli “Parthenope.” He is the author of more than 40 scientific papers published in international journals and conference pro-ceedings. His main research interests are in statistical signal and image processing, synthetic aperture radar, and magnetic resonance imaging. He won the IEEE 2009 Best European Ph.D. Thesis in Remote Sensing Prize, sponsored by the IEEE Geoscience and Remote Sensing Society.
Vito Pascazio ([email protected]) graduated summa cum laude in 1986 from the Università di Bari with the M.S. degree in electronic engineering and received the Ph.D. degree in 1990 from the Università di Napoli Federico II. In 1990, he joined the Università di Napoli Parthenope, where he is a full professor of telecommunications and the chair of the Department of Engineering. He is the director of the National Laboratory of Multimedia Communications of the Italian Con-sortium of Telecommunications. He is the general cochair of the 2015 IEEE International Geoscience and Remote Sensing Symposium. His main scientific interests are in the fields of remote sensing, and statistical estimation, with emphasis on image processing and the reconstruction of microwave images. He has published more than 150 technical papers. He is a Senior Member of the IEEE.
Gilda Schirinzi ([email protected]) graduated with the M.S. degree in electronic engineering in 1983 from the Università di Napoli “Federico II” (Italy). In the same year she joined the Electronic Engineering Department as a research fellow. In 1988, she joined the Instituto di Ricerca per l’Elettromagnetismo e i Componenti Ellectronici of the Italian National Council of Researches. She became an associate professor of telecommunica-tions at the University of Cassino (Italy) in 1998, and, in 2005, she became a full professor. She has been with the Università di Napoli “Parthenope” since 2008. Her main scientific interests are in the field of image and signal processing, with particular reference to synthetic aperture radar systems and microwave remote sensing.
REFERENCES[1] R. Bamler and P. Hartl, “Synthetic aperture radar interferometry,” Inv. Probl., vol. 14, no. 4, pp. R1–R54, 1998.
[2] G. Fornaro and V. Pascazio, SAR Interferometry and Tomography: Theory and Applications (Vol. 2: Academic Press Library in Signal Processing).Amsterdam, the Netherlands: Elsevier, 2013.[3] A. R. Thompson, J. M. Moran, and G. W. Swenson, Interferometry and Synthesis in Radio Astronomy. New York: Wiley Interscience, 1986.[4] A. K. Funai, J. A. Fessler, D. T. B. Yeo, V. T. Olafsson, and D. C. Noll, “Reg-ularized field map estimation in MRI,” IEEE Trans. Med. Imag., vol. 27, no. 10, pp. 1484–1494, 2008.[5] R. M. Goldstein, H. A. Zebker, and C. L. Werner, “Satellite radar interferometry: Two-dimensional phase unwrapping,” Radio Sci., vol. 23, no. 4, pp. 713–720, 1988.[6] H. A. Zebker and Y. Lu, “Phase unwrapping algorithms for radar interferome-try: Residue-cut, least-squares, and synthesis algorithms,” J. Opt. Soc. Am., vol. 15,no. 3, pp. 586–598, 1998.[7] M. Costantini, “A novel phase unwrapping method based on network program-ming,” IEEE Trans. Geosci. Remote Sensing, vol. 36, no. 3, pp. 813–821, 1999.[8] F. Li and R. Goldstein, “Studies of multibaseline spaceborne interferometric synthetic aperture radars,” IEEE Trans. Geosci. Remote Sensing, vol. 28, no. 1,pp. 88–97, 1990.[9] F. Lombardini, “Optimum absolute phase retrieval in three-element SAR inter-ferometry,” Electron. Lett., vol. 34, no. 5, pp. 1522–1524, 1998.[10] A. Ferretti, C. Prati, and F. Rocca, “Multibaseline phase unwrapping for InSAR topography estimation,” Il Nuovo Cimento, vol. 24, no. 1, pp. 159–176, 2001.[11] M. Eineder and N. Adam, “A maximum-likelihood estimator to simultaneously unwrap, geocode, and fuse SAR interferograms from different viewing geometries into one digital elevation model,” Appl. Numer. Math., vol. 43, no. 4, pp. 359–373, 2002.[12] G. Fornaro, A. Monti Guarnieri, A. Pauciullo, and F. De-Zan, “Maximum likelihood multibaseline SAR interferometry,” IEEE Proc. Radar, Sonar Navig., vol. 153,no. 3, pp. 279–288, 2006.[13] F. Gini and F. Lombardini, “Multibaseline cross-track SAR interferometry: A signal processing perspective,” IEEE Aerosp. Electron. Syst. Mag., vol. 20, no. 8,pp. 71–93, Aug. 2005.[14] V. Pascazio and G. Schirinzi, “Estimation of terrain elevation by multifre-quency interferometric wide band SAR data,” IEEE Signal Processing Lett., vol. 8,no. 1, pp. 7–9, 2001.[15] G. Ferraiuolo, F. Meglio, V. Pascazio, and G. Schirinzi, “DEM reconstruction accuracy in multichannel SAR interferometry,” IEEE Trans. Geosci. Remote Sens-ing, vol. 47, no. 1, pp. 191–201, 2009.[16] V. Pascazio and G. Schirinzi, “Multifrequency InSAR height reconstruction through maximum likelihood estimation of local planes parameters,” IEEE Trans. Image Processing, vol. 11, no. 12, pp. 1478–1489, 2002.[17] S. Z. Li, Markov Random Field Modeling in Image Analysis. New York:Springer-Verlag, 2009.[18] J. Dias and J. Leitao, “The zπm algorithm: A method for interferometric image reconstruction in SAR/SAS,” IEEE Trans. Image Processing, vol. 11, no. 4, pp. 408–422, 2002.[19] G. Ferraiuolo, V. Pascazio, and G. Schirinzi, “Maximum a posteriori estimation of height profiles in InSAR imaging,” IEEE Geosci. Remote Sensing Lett., vol. 1,no. 2, pp. 66–70, 2004.[20] G. Nico, G. Palubinskas, and M. Datcu, “Bayesian approaches to phase unwrapping: Theoretical study,” IEEE Trans. Signal Processing, vol. 48, no. 9,pp. 2545–2556, 2000.[21] R. Chen, W. Yu, R. Wang, G. Liu, and Y. Shao, “Integrated denoising and un-wrapping of InSAR phase based on Markov random fields,” IEEE Trans. Geosci. Remote Sensing, vol. 51, no. 8, pp. 4473–4485, 2013.[22] G. Ferraiuolo and G. Poggi, “A Bayesian filtering technique for SAR interferomet-ric phase fields,” IEEE Trans. Image Processing, vol. 13, no. 10, pp. 1368–1378, 2004.[23] F. Rocca, “Modeling interferogram stacks,” IEEE Trans. Geosci. Remote Sens-ing, vol. 45, no. 10, pp. 3289–3299, 2007.[24] R. Bamler and M. Eineder, “Split band interferometry versus absolute rang-ing with wideband SAR systems,” in Proc. 2004 IEEE Int. Geoscience Remote Sensing Symp. (IGARSS), vol. 2, pp. 980–984.[25] D. Just and R. Bamler, “Phase statistics of interferograms with applications to synthetic aperture radar,” Appl. Opt., vol. 33, no. 20, pp. 4361–4367, 1994.[26] M. Lucido, F. Meglio, V. Pascazio, and G. Schirinzi, “Closed-form evaluation of the second-order statistical distribution of the interferometric phases in dual-baseline SAR systems,” IEEE Trans. Signal Processing, vol. 58, no. 3, pp. 1698–1707, 2010.[27] G. Ferraioli, A. Shabou, F. Tupin, and V. Pascazio, “Multichannel phase unwrapping with graph-cuts,” IEEE Geosci. Remote Sensing Lett., vol. 6, no. 3,pp. 562–566, 2009.[28] A. Shabou, F. Baselice, and G. Ferraioli, “Urban digital elevation model reconstruction using very high resolution multichannel InSAR data,” IEEE Trans. Geosci. Remote Sensing, vol. 50, no. 11, pp. 4748–4758, 2012.[29] O. Loffeld, H. Nies, S. Knedlik, and Y. Wang, “Phase unwrapping for SAR interferometry—A data fusion approach by Kalman filtering,” IEEE Trans. Geosci. Remote Sensing, vol. 46, no. 1, pp. 47–58, 2008.[30] D. Chirico and G. Schirinzi, “Multichannel interferometric SAR phase un-wrapping using extended Kalman smoother,” Int. J. Microwave Wireless Technol., vol. 5, no. 3, pp. 429–436, 2013.
[SP]
Previous Page | Contents | Zoom in | Zoom out | Front Cover | Search Issue | Next Page qqM
Mq
qM
MqM
THE WORLD’S NEWSSTAND®
Previous Page | Contents | Zoom in | Zoom out | Front Cover | Search Issue | Next Page qqM
Mq
qM
MqM
THE WORLD’S NEWSSTAND®
____________________
____________________
_______________________
____________________

1053-5888/14/$31.00©2014IEEE IEEE SIGNAL PROCESSING MAGAZINE [69] JULY 2014
Digital Object Identifier 10.1109/MSP.2014.2311305
Date of publication: 13 June 2014
Most current synthetic aperture radar (SAR) sys-tems offer high-resolution images featuring polarimetric, interferometric, multifrequency, multiangle, or multidate information. SAR images, however, suffer
from strong fluctuations due to the speckle phenomenon inherent to coherent imagery. Hence, all derived parameters display strong signal-dependent variance, preventing the full exploitation of such a wealth of information. Even with the abundance of despeckling techniques proposed over the last three decades, there is still a pressing need for new methods that can handle this variety of SAR products and effi-ciently eliminate speckle without sacrificing the spatial resolution. Recently, patch-based filtering has emerged as a highly successful concept in image processing. By exploiting the redundancy between similar patches, it succeeds in suppressing most of the noise with good preservation of texture and thin structures. Extensions of patch-based methods to speckle reduction and joint exploitation of multichannel SAR images (interferometric, polarimetric, or PolInSAR data) have led to the best denoising performance in radar imaging to date. We give a comprehensive survey of patch-based nonlocal filtering of SAR images, focusing on the two main ingredients of the methods: measuring patch similarity and estimating the parameters of interest from a collection of similar patches.
INTRODUCTIONCurrent SAR systems share two common characteristics: they provide a wealth of information thanks to polarimetric, wave-
length, or angle diversity, and they offer very high spatial resolutions that give access to the shape of man-
made structures. In radar images, how-ever, parameters of interest, like
interferometric phase, coherence, polarimetric properties, or
radiometry, are not directly accessible but must be esti-mated from unreliable data. It is essential that the estimation procedure be robust to the strong fluctuations in the mea-
surements due to speckle without trading off the spa-
tial resolution.The simplest way to reduce
speckle noise is to average pixels in a rectangular window around the
target pixel, so-called spatial multilooking.Although speckle is itself a signal of possible inter-
est, in the context of despeckling it is an undesired component, and hence customarily referred to as noise with a slight abuse of terminology [1]. This process, already present in the first European Remote Sensing (ERS) satellite images and still widely used for interferometric or polarimetric data, leads to a uniform reduction of speckle in homogeneous areas, with a residual variance inversely proportional to the number of pixels averaged. However, by potentially mixing different signals, it also impairs such important signal features as region edges, man-made structures, and fine textures. The point is that mul-tilooking is just a basic nonadaptive form of parameter estima-tion: to remove speckle without degrading fine features, local image content must be taken into account.
[Charles-Alban Deledalle, Loïc Denis, Giovanni Poggi, Florence Tupin, and Luisa Verdoliva]
[The nonlocal paradigm]
Recent Advances in Synthetic Aperture Ra
darIma
ging
PH
OTO
CO
UR
TE
SY
OF
NA
SA
Previous Page | Contents | Zoom in | Zoom out | Front Cover | Search Issue | Next Page qqM
Mq
qM
MqM
THE WORLD’S NEWSSTAND®
Previous Page | Contents | Zoom in | Zoom out | Front Cover | Search Issue | Next Page qqM
Mq
qM
MqM
THE WORLD’S NEWSSTAND®

IEEE SIGNAL PROCESSING MAGAZINE [70] JULY 2014
The design of efficient despeckling filters is a long-standing problem that has been the object of intense research since the advent of SAR technology [2], with the first contributions dating back to the 1980s [3]. However, research activity has accelerated significantly in recent years, reflecting both the success of SAR remote sensing in general and the lack of satisfactory methods for resolution-preserving speckle reduction. Some of the most successful methods proposed in the recent past for locally adaptive estimation are based on image models that enforce strong regularity constraints, either in the original domain (e.g., Markov random fields [4]), or in some trans-form domain (e.g., wavelet-based sparse representations [5]).
Very recently, patches, i.e., small rectangular image regions (typically squares of size between 3 × 3 and 11 × 11 pixels), have emerged as a powerful representation on which to build rich and flexible statistical models of natural images. Patches capture richer neighborhood configurations than first-order Markov random fields and are better localized than wavelets. Patch-based models do not enforce the solution to belong to a restricted class of signals, such as signals with bounded variations or with sparse
transform coefficients. They exploit the self-similarity, typical of natural scenes, and look for similar patches not just in the imme-
diate neighborhood of the target pixel but in an extended search area. Unlike a local method like [6] that considers only connected pixels, far apart pixels can be combined, thereby justifying the widespread nonlocal appellative. The evolution from explicit image models to the concept of patch redundancy corre-sponds to a true methodological
shift in image processing. In particular, recent denoising methods most often rely on the notion of a patch.
Interestingly, the concept of nonlocal filtering originally emerged in image processing after the pioneering work of Lee [7] for SAR despeckling. However, it was only with the development of patch-based methods, following the seminal work [8] in the 2000s, and the definition of highly discriminative patch-based similarity measures, that nonlocal filtering could be successfully applied to the low-SNR speckle-corrupted SAR images. The paradigm of patch-based nonlocal estimation is particularly interesting for SAR image processing given the poor fit of classical models to SAR scenes, characterized by many very strong punctual targets and high-contrast structures that are poorly modeled with piece-wise constants or wavelets.
The potential of this new paradigm for SAR imaging has quickly been recognized, with more than 30 papers published since 2009 that describe patch-based methods applied to SAR, including most state-of-the-art despeckling techniques [9]–[11]. In addition, nonlocal patch-based methods are very flexible and can readily be extended to different SAR modalities [12]–[14].
This article reviews the underlying ideas and principles of nonlocal estimation methods proposed in SAR imaging. We con-sider despeckling as a familiar and important case study, but we also address the more general point of view of parameter estima-tion, looking ahead at extensions to more challenging SAR modal-ities and estimation problems. Before diving into the core of patch-based methods, we begin by describing the classical speckle model in SAR imaging and the major families of estimation meth-ods that have emerged over the last three decades.
A SHORT OVERVIEW OF SAR DESPECKLINGDepending on the modality, SAR systems can record up to six channels of complex valued signals (see “SAR Imaging Modali-ties”). All of these signals present highly varying fluctuations because SAR is a coherent imaging system (see “Speckle Fluc-tuations in Radar Images”). The simplest way to reduce these fluctuations and estimate the values of the physical parame-ters is to average several independent samples from the data. This operation, called multilooking, was applied in various forms from the very beginning of the SAR era. However, such simple averaging that applies equally to every region of the image, regardless of the local heterogeneity, strongly degrades the spatial resolution.
SAR IMAGING MODALITIES SAR systems are based on the emission of an electromag-netic wave that is then backscattered by the ground level features and finally recorded by the receiving antenna. Several modalities are used in SAR imaging (see [15] for a comprehensive survey):
■ Amplitude: The simplest configuration provides, after SAR synthesis, an image of scattering coefficients k that are complex values with a magnitude (i.e., amplitude) that is representative of the radar cross-section. The square magnitude (i.e., intensity) is also often considered.
■ Polarimetric: The use of different polarizations at emission and reception of the radar wave provides a deeper insight into the backscattering mechanisms inside the resolution cell. The scattering vector k is formed by the complex values corresponding to each combination of emission/reception polarizations. Usually, horizontal (H) and vertical (V) polar-izations are used for emission and reception providing the scattering vector [ , , , ]z z z zk t
HH HV VH VV= (or, by reciprocity,[ , , ] ) .z z zk t
HH HV VV= This modality (PolSAR) is widely used to study vegetation growing or urban areas.
■ Interferometric: The combination of two backscat-tered signals, k1 and k2 , measured by two close config-urations of the acquisition systems can yield elevation information or ground displacement maps. In interfero-metric configurations, a composite signal k can be defined by the concatenation of the two received signals
[ , ] .k k kt t t1 2= These can be single (InSAR) or multipolar-
ization (PolInSAR) signals.
IT IS ESSENTIAL THAT THE ESTIMATION PROCEDURE BE ROBUST TO THE STRONG FLUCTUATIONS IN
THE MEASUREMENTS DUE TO SPECKLE WITHOUT TRADING OFF
THE SPATIAL RESOLUTION.
Previous Page | Contents | Zoom in | Zoom out | Front Cover | Search Issue | Next Page qqM
Mq
qM
MqM
THE WORLD’S NEWSSTAND®
Previous Page | Contents | Zoom in | Zoom out | Front Cover | Search Issue | Next Page qqM
Mq
qM
MqM
THE WORLD’S NEWSSTAND®

IEEE SIGNAL PROCESSING MAGAZINE [71] JULY 2014
Improved approaches have long been proposed to enhance this basic estimation method by better taking into account the image information. Many efforts have been devoted to the case of ampli-tude images, corresponding to the modulus of single polarization data. Most of these “filtering” methods are described in a review paper [2] and very recent tutorial [1]. The first attempts were derived according to estimation theory: Lee [3] proposed a min-imum mean square error (MMSE) estimator in the class of lin-ear filters, while Lopes et al. [16] considered the maximum aposteriori estimator. Both works used a statistical model limited to local distributions, and it is worth noting that these two filters were popular because of the clever analysis of the local context, using window splitting, or edge and target detection [16]. The idea of selecting the most relevant samples in the window has been fur-ther developed in [6] and is the main motivation of patch-based approaches. The following generation of filtering approaches introduced stronger priors to guide the solution.
The first family includes Markovian and variational approaches, which impose smoothness or regularity constraints on the solution through a suitable prior model. These approaches usually lead to minimizing an energy function com-posed of two terms. The first term reflects the data distribution and is related to statistical models of speckle (see “Speckle Fluc-tuations in Radar Images”). Due to the heavy tail of the distribu-tions of speckle-corrupted images, classical least-squares data fitting must be replaced by a more relevant criterion derived from speckle distributions. The second term relies on some prior on the solution. Although regularization models such as gradient sparsity have been investigated [4], they do not fit well SAR signal properties. The Markovian formalism can be easily extended to deal with different SAR modalities like interfero-metric data. However, the specific nature of SAR signals is poorly captured by simple models and more complex ones lead to very hard optimization problems.
SPECKLE FLUCTUATIONS IN RADAR IMAGES Coherent signals like SAR data present strong fluctuations. The waves backscattered by elementary scatterers inside each reso-lution cell are not “in phase” but arbitrarily “out-of-phase,” which results in constructive and destructive interferences. In a SAR inten-sity image, fluctuations due to speckle follow a heavy-tail distribu-tion (large deviations occur often) and are signal dependent (standard deviation is proportional to the radiometry), which departs from the usual additive Gaussian noise model (Figure S1).
Measured SAR intensity I 02 in untextured areas deviates from the radiometry R 02 according to an exponential distribution:
( | ) .expp I R R RI1= -c m (S1)
Multilook SAR images, obtained by averaging L intensity images, follow a gamma distribution (Figure S2):
( | ) ( ) .expp I R RL
LI
RLIL L 1
C= --
c cm m (S2)
In the more general case of a K-dimensional scattering vector as encountered in polarimetric and interferometric modalities
[ , , ] ,z zk Kt
1 f= the observed complex vector k follows a K-dimensional circular complex Gaussian distribution under Goodman’s fully developed speckle model (valid for untex-tured areas with physically homogeneous and rough surfaces)
( | )| |
( ),expp k k k1K
1
rR
RR= - @ - (S3)
where { }kkER = @ is a K K# complex covariance matrix char-acteristic of the imaged surface, E is the expectation, and @ the Hermitian transpose. Some radar images are not available in the form of scattering vectors, but rather as empirical covari-ance matrices
,LC k k1i
L
i i1
= @
=
/ (S4)
where the sum is carried over several scattering vectors for each pixel. In the case of amplitude images, k is a scalar and C corresponds to an L -looks intensity image. The empirical covariance C follows a Wishart distribution given by
( | , )( ) | || |
( ) ,expp LL
LLC
CCTr
KL
LK L K1
C RR R= -
--^ h (S5)
where Tr :^ h is the matrix trace. The equivalent number of looks L acts as the shape parameter of the Wishart distribution.
Noisy Image Noiseless Image Gaussian Noise
= += +
Noiseless Image Exponential NoiseNoisy Image
= ×= ×
(a)
(b)
[FIGS1] (a) Additive white Gaussian noise versus (b) multiplicative speckle noise.
p (I |R )L = 1
L = 20
L = 5
IR
[FIGS2] Gamma distributions for three different number looks L.
Previous Page | Contents | Zoom in | Zoom out | Front Cover | Search Issue | Next Page qqM
Mq
qM
MqM
THE WORLD’S NEWSSTAND®
Previous Page | Contents | Zoom in | Zoom out | Front Cover | Search Issue | Next Page qqM
Mq
qM
MqM
THE WORLD’S NEWSSTAND®

IEEE SIGNAL PROCESSING MAGAZINE [72] JULY 2014
The second large family of approaches is based on wavelet transforms. Thanks to their spatially localized and multiresolu-tion basis functions, wavelets yield sparse yet accurate represen-tations of natural images in the transform domain. Sharp discontinuities and pointlike features, so common in SAR images, are well described by a small number of basis functions, just like the large homogeneous regions between them. This compact representation was quickly recognized as a powerful tool for denoising. In fact, while the signal is projected on a rela-tively small number of large wavelet coefficients, the white noise remains white after the transform, and hence evenly distributed on all coefficients. Signal and noise can be, therefore, efficiently separated by means of an appropriate nonlinear processing, such as hard/soft thresholding or more sophisticated shrink-ages. The encouraging results provided by early SAR despeck-ling techniques spawned an intense research to overcome the shortfalls of soft/hard thresholding. A popular approach consid-ered wavelet shrinkage as a Bayesian estimation problem, possi-bly expressed after application of a homomorphic transform to reduce speckle to an independent additive perturbation. The major problem in this context becomes the modeling of signal and noise by suitable distributions, and a number of parametric models have indeed been proposed [5], [17]. Further improve-ments come from joint modeling of wavelet coefficients in and across subbands, like in [18]. Despite its potential, the wavelet transform cannot deal by itself with the high heterogeneity of SAR scenes. A number of spatially adaptive techniques were therefore proposed, based on some prior classification of the image, typically in homogeneous, heterogeneous (e.g., textures), and highly heterogeneous (e.g., point targets) regions, to tune filtering parameters or strategies to the different regions [19].
The approaches reviewed above generally try to estimate the signal at a certain pixel from the noisy observations at pixels close to it. However, with plenty of data to estimate the signal, i.e., the observations over the whole image, why restrict attention only to a small neighborhood of the target? The obvious answer is that not all image pixels carry valuable information on the target, and only close pixels are used because they are expected to be more similar to it, and hence, better estimators. The above consideration makes clear that the image denoising problem may be performed in two separate steps: 1) selecting good predictors, which carry useful information on the target, and then 2) using them to perform the actual estimate. Lacking any other hints, spatial closeness is taken
as a surrogate of signal similarity relying heavily on the fact that natural images are predominantly low-pass. Needless to say, sophisticated filters go much beyond a simple distance-based weighting of contributions, but this basic criterion remains a founding paradigm of local filters.
The patch-based nonlocal approach avoids the potentially dan-gerous identification between closeness and similarity and goes back to the original problem, trying to identify the pixels more similar to the target, irrespective (to a certain extent) of their spa-tial distance from it. In the next section, we explore in more depth the fundamental steps involved in nonlocal SAR despeckling and review the current state of the art.
NONLOCAL APPROACHES: EXPLOITING PATCH REDUNDANCYAt the core of the nonlocal approach stands the selection of suit-able predictors based on their similarity with the target. This idea began to gain some popularity with the bilateral filter, proposed for additive white Gaussian noise (AWGN) denoising, with predic-tor weights depending not only on their spatial distance from the target, but also on their similarity with it, measured by the differ-ence between observed values. Despite its simplicity, this filter gave a surprisingly good denoising performance, reducing the annoying edge-smearing phenomenon. However, the pixel-wise estimation of similarity was very rough and happened to reinforce observed values affected by strong noise, justifying the need for the spatial-distance term. The fundamental step toward nonlocal fil-tering was then the introduction, in nonlocal means (NL-means) [8], of a reliable patch-wise measure of similarity. When a rela-tively large patch is taken into account, it is very unlikely that pix-els characterized by a signal much different from the target be accepted as good predictors. Thanks to the improved reliability, predictors can be weighted based only on similarity, with no refer-ence to spatial information. Unlike local filters, nonlocal ones do not impose any specific structure (connectivity, shape) or smooth-ness, but only exploit that patches recur more or less frequently, a self-similarity property common to most images. Recurring patches are easily found in smooth regions, but just as well around region boundaries, textures, artificial structures, etc., as shown in Figure 1. Hence, for most patches, several other patches can be found with similar content. This form of stationarity in the space of patches is central to nonlocal approaches.
Nonlocal estimation methods generally follow a three-step scheme, summarized in Figure 2 with many possible variations at each step and, possibly, preprocessing steps and/or iterative refinement of results by repeated nonlocal estimations. The first step identifies similar patches (patch size is generally set from
to3 11 113 # # pixels). It must reliably find, within an extended search window (typically to21 21 39 39# # ), patches that are close to the reference central patch. Once several patches have been selected (from a few tens to all the hundreds of patches within the search window), they are assigned relative weights. The second step combines patches, according to their weights, to form an estimate of either the central pixel, the cen-tral patch, or all selected patches. The estimates computed from
[FIG1] Typical fragments of SAR images (51 × 51 pixels): (a) homo-geneous region, (b) line, (c) texture, and (d) structure. For each target patch (green) several similar 8 × 8 patches (red) are easily found in the same fragment.
(a) (b) (c) (d)
Previous Page | Contents | Zoom in | Zoom out | Front Cover | Search Issue | Next Page qqM
Mq
qM
MqM
THE WORLD’S NEWSSTAND®
Previous Page | Contents | Zoom in | Zoom out | Front Cover | Search Issue | Next Page qqM
Mq
qM
MqM
THE WORLD’S NEWSSTAND®

IEEE SIGNAL PROCESSING MAGAZINE [73] JULY 2014
all possible reference patches are then merged in a last step to produce the final image.
We now illustrate these steps for the special case of NL-means [8], indicating by ( )v x and ( ),v x respectively, the value at pixel x , and the image patch centered on x in the observed image. In NL-means, each pixel xl in a large search area around the target pixel x is considered and a similarity measure
( , )x xD l is computed by comparing the two patches centered on x and .xl Under AWGN, the sum of squared differences is a natural criterion to evaluate similarity
( , ) ( ) ( ) .v vx x x x 2D = -l l (1)
This measure is used to compute the weight for each predictor pixel ,xl with large weights associated with similar patches and negligible weights with dissimilar ones. An exponential kernel is used to this end
( , ) ( , ) / ,expw x x x x hD= -l l^ h (2)
with the bandwidth parameter h governing the weight distribu-tion. Finally, the target pixel x is estimated through the weighted average of all pixels within the search area
( )( , )
( , ) ( ),u
wx
w x x
x x v x
x
xNL =l
l l
l
lt //
(3)
where ut denotes an estimate of the unknown signal value .uIn the NL-means, therefore, only one estimate is obtained for
each pixel x, which corresponds to the top branch depicted in Figure 2. Generalizations provide several estimates for each pixel that must be properly combined in the last step.
The NL-means filter and its numerous variants are known to perform well under AWGN. However, the extension to SAR imag-ing, and in particular to speckle, is by no means trivial, and has been the object of several recent papers. One has to understand the foundation of such filters, and provide a flexible formulation suitable for different modalities and models of noise. In the follow-ing, we focus on the main concepts that have been proposed in SAR imaging, and try to provide some insight into the problems that emerge when noise departs from the Gaussian distribution,
and possible solutions to them. The key point of all these exten-sions is the consideration of the specific distributions of radar data.
STEP 1: DEFINING PATCH SIMILARITIESThe first step of nonlocal estimation methods is the identification of similar patches through a (dis)similarity criterion .( , )x xD l
This criterion quantifies, in a principled manner, by how much the unknown patches ( )u x and ( )u x differ. Based on the similar-ity to the reference patch at ,x predictor patches at xl can be either soft-assigned or hard-assigned to the set of similar patches. In the case of soft-assignment, a weight reflecting the level of similarity is associated to each patch within the search area, otherwise the most similar patches are included and used to perform the prediction.
Under AWGN, (1) is a natural criterion to evaluate similarity between two patches. Fluctuations created by speckle are multipli-cative and non-Gaussian; see “Speckle Fluctuations in Radar Images.” Specific criteria must be derived for the comparison of patches in SAR imaging.
The similarity between two patches is generally defined as the sum of the similarity d of each pair of corresponding pixels in the two noisy patches: ( , ) ( ( ), ( )) .x x v x v xd x xD = + +
xl l/ To
improve the discrimination power of the similarity criterion, sev-eral authors suggest using a pre-estimate uu computed either over the whole patch [20], obtained after a first iteration [11] or at the previous iteration [9] of the nonlocal method. The similarity then takes the form ( , )x xD =l ( ( ), ( )) .u x u xd x x+ +
xlu u/ Described
next are possible approaches to derive the pixel-wise similarity .d
DETECTION APPROACHDissimilarity can be defined based on the detection of the differ-ence between the underlying values u1 and u2 [21]. This detec-tion problem can be formulated as an hypothesis test where the null hypothesis corresponds to no difference :H u u u0 1 2 12= =^ h
and the alternative one to a difference : .H u u1 1 2!^ h Among several criteria considered in [21], the generalized likelihood ratio (GLR) is shown to perform best and fulfill several invari-ance properties
x ′ x ′
x ′
x ′x ′
x ′
x x
Image Space Image SpacePatch Space
Find SimilarPatches Stack of
SimilarPatches
EstimateRadar
Properties
Averaged CentralPixel Value
AveragedPatch
Stack of Denoised PatchesAfter Collaborative Filtering
Reprojection
or
or
1 23
[FIG2] Nonlocal estimation in action: processing at pixel x.
Previous Page | Contents | Zoom in | Zoom out | Front Cover | Search Issue | Next Page qqM
Mq
qM
MqM
THE WORLD’S NEWSSTAND®
Previous Page | Contents | Zoom in | Zoom out | Front Cover | Search Issue | Next Page qqM
Mq
qM
MqM
THE WORLD’S NEWSSTAND®

IEEE SIGNAL PROCESSING MAGAZINE [74] JULY 2014
( , ) [ ( | )] [ ( | )][ ( | ) ( | )]
.log sup supsup
v v p v u p v up v u p v u
u u
u1 2
1 1 2 2
1 12 2 12GLR
2
12
1
d =- (4)
Criteria specific to SAR imaging can be derived from (4) by using the statistical speckle models recalled in “Speckle Fluctuations in Radar Images.” Both single channel (intensity) and multichannel (polarimetric and/or interferometric) configurations lead to a cri-terion defined as the log of the ratio between arithmetic and geo-metric means [22]
( , )| | · | |
| |,logC C
C C
C CL2 2
1
1 21 2
1 2GLRd =
+(5)
where C may represent either the L-looks intensity (single-chan-nel images) or the L-looks empirical covariance matrices (multi-channel images). This is a natural criterion to compare patches corrupted by a multiplicative noise such as speckle since the cri-terion is invariant to a multiplicative change of contrast. It has been successfully used in nonlocal filtering of intensity, interfero-metric, and polarimetric SAR images [12], [14]. Detection-based criteria using similar expressions are also at the heart of [9], [13], [23], and [24].
INFORMATION APPROACHIn line with the detection approach, the authors of [9] and [20] consider a similar hypothesis test involving pre-estimates of the parameters. Good criteria to perform such a hypothesis test are provided by the h -z divergences where h and z refer to pre-defined functions. The h -z divergences measure the quantity of information shared by the distributions parametrized by u1u
and :u2u they evaluate the proportion of samples from one distri-bution that can be explained by the other. Specific choices of hand z lead for instance to the Hellinger divergence or the Kull-back–Leibler divergence. Again, taking into account specific SAR distributions provides well-founded criteria. The symmetri-cal version of Kullback–Leibler divergence (sKL) gives, in the case of Wishart-distributed empirical covariance matrices,
( , ) ( ) .,LTr const1 2 11
2 21
1sKLd R R R R R R= + +- -u u u u u u (6)
again involving ratios, as customary in SAR imagery.
GEOMETRIC APPROACHThe similarity can be defined by deriving a metric suitable to the specificities of SAR data. D’Hondt et al. [25] suggest using Hermi-tian semidefinite positive matrices and propose a metric con-nected to geodesic and Riemannian distances
( , ) ,( )log / /F1 2 2
1 21 2
1 2 2Geod R R R R R= - -u u u u u (7)
where log is the matrix logarithm and · F the Froebenius norm. This similarity offers some interesting invariance proper-ties. In the case of intensity images with pre-estimated
radiometry ,Ru this criterion boils down to ( ( ) ( )) ,log logR R2 12-u u
which is the square distance between observations after applying a homomorphic transform on the pre-estimates. It has been shown in the framework of detection theory that criteria based on variance-stabilization (such as the log transform in SAR) enjoy good properties [21]. It is interesting to see that such a criterion can be derived using different interpretations (a geometric found-ing or a statistical reasoning).
ESTIMATION APPROACHLee et al. [26] have shown that the estimation of radar properties may suffer from a systematic bias arising from the procedure that detects similar noisy values (hard-assignment). For SAR intensity images, they suggest using a preselection rule of the form
[ , ]I R R2 1 1! g gl —called sigma range—for which the prese-lected samples I2 do not introduce bias in the subsequent estima-tion when the radiometry is identical .R R1 2=^ h Values of g and gl are computed by an iterative method, while the unknown R1
is replaced by a pre-estimate R1u called a priori mean [10], [26]. By rather considering a preselection rule of the form
( , ) ,I I1 2 #d c numerical integrations over I1 and I2 show that the subsequent estimation is unbiased as soon as the rule can be rewritten as [ / , ] .I I I2 1 1! g g Detection rules such as GLR (5) verify this property.
Some of the estimators used in the second step of nonlocal estimation methods use the similarity ( , )x xD l to weight the importance of the patch ( )v xl (i.e., soft-assigment). The similar-ity ( , )x xD l is mapped into a weight ( , )w x xl using a function termed kernel. Many different kernels have been proposed in the literature, from simple thresholding ( , ) [ ( , ) ],1w x x x x h1D=l l
exponential kernels as in (2), to more sophisticated ones [14], [20], [24]. The shape of the kernel (e.g., smooth, discontinuous, or trapezoidal) changes the contributions of patches that may correspond to false detections and thus controls the bias/variance tradeoff. In [14] and [20], suitable kernels have been defined to guarantee the same bias/variance tradeoff, irrespective of the modality, the noise statistic, or the patch size.
STEP 2: ESTIMATION OF RADAR PROPERTIESAfter the selection of a stack of patches and/or computation of relative weights during the first step of the nonlocal estima-tion method, these patches are combined in a second step to form an estimate of the radar properties. This combination can be a simple (weighted) averaging as in the NL-means, or a more evolved estimator.
In SAR imaging, observations v may denote a collection of intensities I, amplitudes I or log-transformed values ( ),log I a vector of noisy coefficients in a transformed domain (discrete cosine transform, Fourier, wavelets, etc.), a collection of scatter-ing vectors k or of empirical covariance matrices .C The associ-ated collection of parameters of interest ,u are generally the radiometry R or covariance matrice .R The estimation step computes radar parameters from the collection of observations vand/or pre-estimations uu gathered during the first step. The most common estimators for patch-based denoising of SAR images are:
Previous Page | Contents | Zoom in | Zoom out | Front Cover | Search Issue | Next Page qqM
Mq
qM
MqM
THE WORLD’S NEWSSTAND®
Previous Page | Contents | Zoom in | Zoom out | Front Cover | Search Issue | Next Page qqM
Mq
qM
MqM
THE WORLD’S NEWSSTAND®

IEEE SIGNAL PROCESSING MAGAZINE [75] JULY 2014
■ SME/WSME: NL-means and many of its successors com-bine similar patches into a weighted average [weighted sample mean estimator (WSME)], where the weights are derived from the similarities; see (3). By using weights, the estimation relies more heavily on samples that are more similar (thus, more reliable), which reduces bias. Compared to an estima-tion based solely on a collection of patches detected as highly similar (i.e., by hard-assignment), the variance can also be reduced by considering a larger number of samples. The sam-ple mean estimator corresponds to the conditional expecta-tion [ | ] .v uE This expectation may not directly be equal to the parameter of interest ,u but require a debiasing step. A notable example is the case of (weighted) averaging of log-transformed SAR images. The estimation of covariance matri-ces from empirical ones can be performed by WSME [12], [14], [20], [24], [25]
( )( , )
( , ) ( )Cx
w x x
w x x x
x
xWSMER =l
l l
l
lt//
(8)
with ( , )w x xl the weight depending on the similarity ( , )x xD l
between patches extracted at pixel locations x and .xl■ MLE/WMLE: The sample mean is not a correct estimator of some parameters, e.g., the amplitude .I The sample mean should then be replaced by an estimator adjusted to the spe-cific noise distribution of the observations, such as the maxi-mum likelihood estimator. Similarly to the WSME, sample weights can be introduced in the estimation method. Maxi-mum likelihood can be generalized into the weighted maxi-mum likelihood estimator (WMLE) [9]:
, .arg max logu x w x x p v x uu x
WMLE = l ll
t ^ ^ ^h h h6 @/ (9)
WMLE leads to (8) for Wishart-distributed covariance matrices, but improvements are obtained for matrices with particular structures as in interferometric SAR imaging [13]. ■ MMSE: Kervrann et al. proposed a method called Bayesian NL-means [27] that estimates the parameters u as a linear combination of pre-estimated patches ,uu with weights defined by the likelihood of each pre-estimated patch with respect to the observation :v
( )[ ( ) | ( )]
[ ( ) | ( )] ( )u
v u
v u ux
p x x
p x x x
x
xMMSE .l l
l l
l
ltu
u u
//
. (10)
This estimator can be interpreted as an approximation of the MMSE error estimator, i.e., the posterior mean. Pre-estimates are usually obtained thanks to a two-step or iterative prefilter-ing [10]. Since the pre-estimation step provides only a coarse estimation uu of the patches ,u a smoothing parameter is introduced to reduce the selectivity of the likelihood function and thus avoid weighting too much patches that are very close to the observation [27]. ■ LMMSE: The linear MMSE (LMMSE) error estimator has long been used in SAR imaging [26]. This estimator restricts the form of the solution to linear transforms of ,vwhich is most efficient when noise and signal are well
separated. In SAR-BM3D [11], the LMMSE is computed after an undecimated discrete wavelet transform (UDWT) is applied to the stack of similar patches. Expectation and variance of observations and parameters can be obtained from band-wise statistics and later refined using prefiltered patches after a first restoration has been performed.The family of homomorphic approaches transform the mul-
tiplicative noise into an additive one by taking the logarithm of the observed intensity/amplitude. Several papers have derived nonlocal estimators in this sense, e.g., [28], where an “adjust mean” step is used to deal correctly with the bias arising from the Gaussian assumption (i.e., debiasing step described for SME). Note that estimators that process directly SAR data (i.e., without log-transforms) are often preferable since the debiasing step is then unnecessary.
STEP 3: REPROJECTION TO IMAGE SPACEThe second step of nonlocal methods provides estimates either for a single pixel (pixel-wise estimation), for a single patch (patch-wise estimation), or for the whole stack of patches (stack-wise estimation). The first option corresponds to basic NL means, already described above, so let us focus on the other two strategies.
The difference in patch-wise filtering is that all pixels in the patch, not just the central one, are estimated at once. Since each pixel is estimated several times, a suitable aggregation phase is necessary to combine all such estimates. In particular, we need to define a reprojection function, ,g $^ h to get an estimate in the pixel domain: ( ) ( ( ), , ( )).u uu x g x xK1 f=t t t What is more impor-tant, these estimates refer to different patches, with different reli-ability levels, an information that can be exploited to improve results. The reprojection can be performed through a weighted average of the K estimators:
( ) ( ).uu x xkk
K
k1a=
=
t t/ (11)
The simplest form of aggregation is to consider uniform weights ,ka as done in the block-wise NL-means [8]. Another strategy is to
set the weight associated with each estimate as inversely propor-tional to its variance [29].
To illustrate why patch-wise estimation improves perfor-mance, let us consider the special case of a pixel near the bound-ary between two homogeneous regions. Since the patch centered on it is strongly heterogeneous, most other patches of the search area, coming from homogeneous regions on either side of the boundary, are markedly dissimilar from it, and contribute very lit-tle to the average. The estimate, thus, involves only a small effec-tive number of predictors, those along the edge, which results in a high variance. As a result, a visible “halo” of residual noise is observed near the edges, a phenomenon well-known in NL-means, also referred to as the rare patch effect. The target pixel, however, belongs to a large number of patches, not just the patch centered on it, many of them drawn from the homogeneous region to which the pixel belongs. In patch-wise reprojection, all of these patches are included in the average reducing the
Previous Page | Contents | Zoom in | Zoom out | Front Cover | Search Issue | Next Page qqM
Mq
qM
MqM
THE WORLD’S NEWSSTAND®
Previous Page | Contents | Zoom in | Zoom out | Front Cover | Search Issue | Next Page qqM
Mq
qM
MqM
THE WORLD’S NEWSSTAND®

IEEE SIGNAL PROCESSING MAGAZINE [76] JULY 2014
estimate variance, especially if suitable weights are used to take into account the reliability of each contribution.
Let us now consider the third strategy, with stack-wise filtering. The first difference with regard to patch-wise filtering is that now all patches collected in the stack are collaboratively filtered before reprojecting them to their original position. The major improve-ment is that the stack is filtered in three dimensions, i.e, not only along the stack but also in the spatial domain. In BM3D [29] and, with necessary adjustments to the SAR domain, in SAR-BM3D [11], the whole stack, formed by just a limited number of similar patches, is wavelet transformed, Wiener filtered, and back trans-formed. By so doing, strong spatial structures are emphasized through filtering while random noise is efficiently suppressed. As a matter of fact, these techniques exhibit significant improvements especially in highly structured areas (edges, point reflectors,
textures). The efficiency of collaborative filtering comes from the full exploitation of the redundancy of information in a stack of sim-ilar patches.
In “Overview of Nonlocal Estimation Methods in SAR Imag-ing,” we compare nine recent patch-based techniques in rela-tion to each of the three steps previously described. Needless to say, performance depends on the setting of several parameters, like patch size and search area size, which should be related to image resolution, smoothing strength, and balance between original and pre-estimated data. In most of the nonlocal approaches these parameters are set by hand. Few works have considered semisupervised setting or automatic setting with spatial adaptation [14].
Some sample experimental results that confirm the potential of nonlocal methods are presented in Figure 3 for an amplitude
OVERVIEW OF NONLOCAL ESTIMATION METHODS IN SAR IMAGING Nonlocal estimation methods perform the three steps depicted in Figure 2. A great variety of methods dedicated to SAR images have been proposed over the last few years. These methods fol-low different paths to implement each of the three steps: 1) similar patches identification (choice of the similarity criterion)
2) estimation of radar properties (choice of the estimator) 3) reprojection of estimates onto the image space (choice of the domain).Table S1 is an overview of some of the main methods devoted to SAR imaging.
[TABLE S1] MAIN PATCH-BASED METHODS FOR SPECKLE REDUCTION IN SAR IMAGES.
METHOD (OLDEST FIRST)
DOMAIN ESTIMATOR SAR MODALITY SELF-SIMILARITY DOMAIN
SIMILARITY CRITERION
SCHEME
PPB/NL-INSAR PIXEL-WISE WMLE SAR (ANY L ) /INSAR (L 1= )
PATCH-WISE DETECTION + INFORMATION
ITERATIVE
[9], [13] ORIGINALITY: ITERATIVELY REFINES THE WEIGHTS BY COMPARING PATCHES OF PREVIOUS ESTIMATES AND PATCHESOF THE NOISY IMAGE.
PRETEST NLM PIXEL-WISE WSME POLSAR (L 3$ ) PATCH-WISE DETECTION ONE STEP
[12] ORIGINALITY: DIRECT EXTENSION OF [8] WITH A SELECTION BASED ON A GLR (REFERRED TO AS PRETEST STEP).
BAYESIAN NLM PIXEL-WISE MMSE SAR (ANY L ) PATCH-WISE ESTIMATION ONE STEP
[10] ORIGINALITY: PRIOR PATCHES ARE EXTRACTED IN A MULTILOOKED IMAGE. A SIGMA-RANGE PRESELECTION IS USEDAND DARKER PIXELS ARE DISCARDED.
SAR-BM3D STACKWISE LMMSE SAR (ANY L ) PATCH-WISE DETECTION + INFORMATION
TWO STEPS
[11] ORIGINALITY: WORKS ON THE UDWT OF STACKS: FIRST STEP USES STATISTICS OF EACH SUBBAND; SECOND ONE USESSTATISTICS PROVIDED BY THE FIRST ITERATION.
BILATERAL NLM PIXEL-WISE WSME POLSAR (ANY L ) PIXEL-WISE GEOMETRIC ITERATIVE
[25] ORIGINALITY: IMAGES ARE MULTILOOKED, THEN ITERATIVELY UPDATED BY NONLOCAL AVERAGING BASED ON GEOMETRI-CAL COMPARISON OF PIXEL VALUES (NO PATCH).
STOCHASTIC NLM PIXEL-WISE WSME POLSAR (NON-STATIONNARY L )
STATSWISE INFORMATION ONE STEP
[20] ORIGINALITY: LETS L VARY IN THE IMAGE. PATCH SIMILARITY IS BASED ON THE DIVERGENCE BETWEEN MLE ESTIMATESOF R AND L WITHIN THE PATCH.
DISCRIMINATIVE NLM PIXEL-WISE WSME POLSAR PATCH-WISE DETECTION ITERATIVE
[24] ORIGINALITY: ITERATIVELY REFINES WEIGHTS BASED ON THE RATIO OF DIAGONAL ELEMENTS OF EMPIRICAL COVARIANCEMATRICES AND THE SPAN OF THE PREVIOUS ITERATE.
NL-SAR PIXEL-WISE WMLE (POL)(IN)SAR(ANY L )
PATCH-WISE DETECTION ADAPTIVE
[14] ORIGINALITY: FULLY AUTOMATIC: PATCH SIZES, SEARCH WINDOWS AND PREFILTERING STRENGTHS ARE SPATIALLY TUNEDTO PROVIDE IMPROVED RESULTS.
Previous Page | Contents | Zoom in | Zoom out | Front Cover | Search Issue | Next Page qqM
Mq
qM
MqM
THE WORLD’S NEWSSTAND®
Previous Page | Contents | Zoom in | Zoom out | Front Cover | Search Issue | Next Page qqM
Mq
qM
MqM
THE WORLD’S NEWSSTAND®

IEEE SIGNAL PROCESSING MAGAZINE [77] JULY 2014
image with SAR-BM3D [11] and in Figure 4 for a polarimetric data with NL-SAR [14]. Visual inspection shows the perfor-mance of the approach in reducing strong fluctuations while preserving important features like targets and lines. Note that no systematic artefacts should be observed with these approaches unless the parameters are not set properly (e.g., no consideration of oversampled data). A rigorous performance evaluation of nonlocal despeckling techniques is beyond the scope of this article. Some frameworks for SAR despeckling evaluation and comparison are proposed in [1] and [30].
OPEN ISSUES AND FUTURE TRENDSPatch-based approaches provide the best performance to date for speckle reduction in SAR intensity images [30] and polari-metric or interferometric SAR images [14]. Beyond speckle sup-pression, they improve parameter estimation, drastically enhancing radar measures. Therefore, they can be expected to have a strong impact, in the near future, on major applications of radar imaging, improving the biomass estimation with polari-metric-interferometric data; increasing the spatial resolution in
urban monitoring with radar tomography; enabling more reliable phase unwrapping methods for interferometric SAR.
As a by-product of patch-based speckle reduction methods, sev-eral similar criteria especially suited for SAR imaging have been established. These criteria are central to many applications: for classification and indexing using patch clustering; for change detection; for movement monitoring by patch tracking.
Patch-based methods are at their beginning and many open issues have yet to be solved. The speckle model considered so far (simple complex Gaussian) is known to inaccurately describe very high-resolution images or textured areas. The introduction of more accurate models (e.g., Weibull, Fisher, or generalized gamma distributions for amplitude, and corresponding matrix-variate polarimetric distributions) raises questions about the increased complexity of estimators and the possible loss of robustness with the increase of degrees of freedom. Another limit is the geometric deformations appearing on SAR images with elevated objects. Such deformations should be considered to perform joint restoration of images taken from multiple inci-dence angles.
[FIG3] (a) The single-look TerraSAR-X image of Barcelona and (b) the radiometry estimated by the nonlocal method [11]. Images are 511 × 1,043 pixels with a spatial resolution of 2.5 m. (Images used with permission of Infoterra GmbH.)
[FIG4] (a) Two PolSAR images of the area of Kaufbeuren, Germany, sensed by F-SAR, single-look, X-band (top) and S-band (bottom) (image courtesy DLR). In (b) and (c), estimated polarimetric signatures using the nonlocal patch-based method (images used with permission from [14]). Images are 400 × 512 pixels with a spatial resolution of 0.5 m.
(a) (b)
(a) (b) (c)
Previous Page | Contents | Zoom in | Zoom out | Front Cover | Search Issue | Next Page qqM
Mq
qM
MqM
THE WORLD’S NEWSSTAND®
Previous Page | Contents | Zoom in | Zoom out | Front Cover | Search Issue | Next Page qqM
Mq
qM
MqM
THE WORLD’S NEWSSTAND®
IEEE SIGNAL PROCESSING MAGAZINE [78] JULY 2014
ACKNOWLEDGMENTSThis work has been supported in part by the following grants: ANR DEFI 09-EMER-008-01, ANR-11-IDEX-0007, ANR-11-LABX-0063, and project MIUR-PRIN 2012 “Very High Spatial and Spectral Resolution Remote Sensing: A Novel Integrated Data Analysis System.”
AUTHORSCharles-Alban Deledalle ([email protected]) received the Ph.D. degree from Telecom ParisTech, France, in 2011. In 2011–2012, he was a postoctoral fellow at the Université Paris Dauphine, France. He is currently a Centre National de la Recherche Scientifique researcher asso-ciate at the Institut de Mathématiques de Bordeaux, France. His research interests include image restoration, inverse problems, and parameter selection.
Loïc Denis ([email protected]) received the Ph.D. degree from the Université de Saint-Etienne in 2006. He is cur-rently an assistant professor at Telecom St. Etienne. His main research interests are in image restoration and reconstruction with applications in remote sensing, optical metrology, biomedical imaging, and astronomy.
Giovanni Poggi ([email protected]) received the laurea degree in electronic engineering from the University Federico II of Naples, Italy, in 1988. He is currently a professor of telecommunications with the same institution. His research in on statistical image pro-cessing, including compression, restoration, and segmentation of remote-sensing images, both optical and synthetic aperture radar, and digital forensics.
Florence Tupin ([email protected]) received the engineering and Ph.D. degrees in signal and image processing from Ecole Nationale Supérieure des Télécommunica-tions, Paris, France, in 1994 and 1997, respectively. Since 2009 she has been a professor of image processing at Telecom ParisTech. Her main research interests are image analysis and interpretation for remote sensing applications, in particular with synthetic aperture radar.
Luisa Verdoliva ([email protected]) received the laurea degree in telecommunication engineering and the Ph.D. degree in infor-mation engineering from the University Federico II of Naples, Italy, in 1998 and 2002, respectively. She is currently an assistant professor of telecommunications with the same institution. Her research is on image processing, in particular compression and restoration of remote-sensing images, both optical and synthetic aperture radar, and digital forensics.
REFERENCES[1] F. Argenti, A. Lapini, L. Alparone, and T. Bianchi, “A tutorial on speckle re-duction in synthetic aperture radar images,” IEEE Geosci. Remote Sens. Mag.,vol. 1, pp. 6–35, Sept. 2013.
[2] R. Touzi, “A review of speckle filtering in the context of estimation theory,” IEEE Trans. Geosci. Remote Sensing, vol. 40, no. 11, pp. 2392–2404, 2002.
[3] J. S. Lee, “Digital image enhancement and noise filtering by use of local statistics,” IEEE Trans. Pattern Anal. Mach. Intell., vol. 2, no. 2, pp. 165–168, 1980.
[4] L. Denis, F. Tupin, J. Darbon, and M. Sigelle, “Joint regularization of phase and am-plitude of In SAR data: Application to 3D reconstruction,” IEEE Trans. Geosci. Remote Sensing, vol. 47, no. 11, pp. 3774–3785, 2009.
[5] A. Achim, P. Tsakalides, and A. Bezerianos, “SAR image denoising via Bayesian wavelet shrinkage based on heavy-tailed modeling,” IEEE Trans. Geosci. Remote Sensing, vol. 41, no. 8, pp. 1773–1784, 2003.
[6] G. Vasile, E. Trouvé, and J. Lee, “Intensity-driven adaptive-neighborhood tech-nique for polarimetric and interferometric SAR parameters estimation,” IEEE Trans. Geosci. Remote Sensing, vol. 44, no. 6, pp. 1609–1621, 2006.
[7] J. S. Lee, “Digital image smoothing and the sigma filter,” Comput. Vis. Graph. Im-age Process., vol. 24, no. 2, pp. 255–269, 1983.
[8] A. Buades, B. Coll, and J. M. Morel, “A review of image denoising algorithms, with a new one,” Multiscale Modell. Simul., vol. 4, no. 2, pp. 490–530, 2005.
[9] C.-A. Deledalle, L. Denis, and F. Tupin, “Iterative weighted maximum likelihood denoising with probabilistic patch-based weights,” IEEE Trans. Image Processing,vol. 18, no. 12, pp. 2661–2672, 2009.
[10] H. Zhong, Y. Li, and L. Jiao, “SAR image despeckling using Bayesian nonlocal means filter with sigma preselection,” IEEE Geosci. Remote Sensing Lett., vol. 8,no. 4, pp. 809–813, 2011.
[11] S. Parrilli, M. Poderico, C. V. Angelino, and L. Verdoliva, “A nonlocal SAR im-age denoising algorithm based on LLMMSE wavelet shrinkage,” IEEE Trans. Geosci. Remote Sensing, vol. 50, no. 2, pp. 606–616, 2012.
[12] J. Chen, Y. Chen, W. An, Y. Cui, and J. Yang, “Nonlocal filtering for polarimet-ric SAR data: A pretest approach,” IEEE Trans. Geosci. Remote Sensing, vol. 49,no. 5, pp. 1744–1754, 2011.
[13] C.-A. Deledalle, L. Denis, and F. Tupin, “NL-InSAR: Nonlocal interferogram es-timation,” IEEE Trans. Geosci. Remote Sensing, vol. 49, no. 4, pp. 1441–1452, 2011.
[14] C.-A. Deledalle, L. Denis, F. Tupin, A. Reigbers, and M. Jäger, “NL-SAR: A uni-fied non-local framework for resolution-preserving (Pol)(In)SAR denoising,” Preprint HAL – hal-00844118, 2013. [Online]. Available: http://hal.archives-ouvertes.fr/hal-00844118
[15] A. Moreira, P. Prats-Iraola, M. Younis, G. Krieger, I. Hajnsek, and K. Papathanas-siou, “A tutorial on synthetic aperture radar,” IEEE Geosci. Remote Sens. Mag., vol. 1, no. 1, pp. 6–43, 2013.
[16] A. Lopes, R. Touzi, and E. Nezry, “Adaptative speckle filters and scene heterogene-ity,” IEEE Trans. Geosci. Remote Sensing, vol. 28, no. 6, pp. 992–1000, 1990.
[17] F. Argenti, T. Bianchi, and L. Alparone, “Multiresolution MAP despeckling of SAR images based on locally adaptive generalized Gaussian PDF modeling,” IEEE Trans. Image Processing, vol. 15, no. 11, pp. 3385–3399, 2006.
[18] H. Xie, L. E. Pierce, and F. T. Ulaby, “SAR speckle reduction using wavelet denois-ing and Markov random field modeling,” IEEE Trans. Geosci. Remote Sensing, vol. 40,no. 10, pp. 2196–2212, Jan. 2002.
[19] S. Foucher, G. B. Bénié, and J. M. Boucher, “Multiscale MAP filtering of SAR im-ages,” IEEE Trans. Image Processing, vol. 10, no. 1, pp. 49–60, Jan. 2001.
[20] L. Torres, S. J. S. Sant’Anna, C. da Costa Freitas, and A. C. Frery, “Speckle reduc-tion in polarimetric SAR imagery with stochastic distances and nonlocal means,” Pat-tern Recognit., vol. 47, no. 1, pp. 141–157, Jan. 2014. [Online]. Available: http://dx.doi.org/10.1016/j.patcog.2013.04.001
[21] C. Deledalle, L. Denis, and F. Tupin, “How to compare noisy patches? Patch simi-larity beyond Gaussian noise,” Int. J. Comput. Vis., vol. 99, no. 1, pp. 86–102, 2012.
[22] K. Conradsen, A. A. Nielsen, J. Schou, and H. Skriver, “A test statistic in the com-plex Wishart distribution and its application to change detection in polarimetric SAR data,” IEEE Trans. Geosci. Remote Sensing, vol. 41, no. 1, pp. 4–19, 2003.
[23] G. Poggi, F. Sica, L. Verdoliva, G. Fornaro, D. Reale, and S. Verde, “Non-local meth-ods for filtering interferometric SAR datasets,” in Proc. TyWRRS: From Earth Observa-tion to Homeland Security, 2012, pp. 136–139.
[24] G. Liu and H. Zhong, “Nonlocal means filter for polarimetric SAR data despeckling based on discriminative similarity measure,” IEEE Geosci. Remote Sensing Lett., vol. 11, no. 2, pp. 514–518, 2014.
[25] O. D’Hondt, S. Guillaso, and O. Hellwich, “Iterative bilateral filtering of polari-metric SAR data,” vol. 6, no. 3, pp. 1628–1639, 2013.
[26] J.-S. Lee, J.-H. Wen, T. L Ainsworth, K.-S. Chen, and A. J Chen, “Improved sigma filter for speckle filtering of SAR imagery,” IEEE Trans. Geosci. Remote Sensing, vol. 47, no. 1, pp. 202–213, 2009.
[27] C. Kervrann, J. Boulanger, and P. Coupé, “Bayesian non-local means filter, image redundancy and adaptive dictionaries for noise removal,” in Scale Space and Variational Methods in Computer Vision. New York: Springer, 2007,pp. 520–532.
[28] M. Makitalo, A. Foi, D. Fevralev, and V. Lukin, “Denoising of single-look SAR images based on variance stabilization and nonlocal filters,” in Int. Conf. Mathematical Methods in Electromagnetic Theory. Piscataway, NJ: IEEE, 2010.
[29] K. Dabov, A. Foi, V. Katkovnik, and K. Egiazarian, “Image denoising by sparse 3-D transform-domain collaborative filtering,” IEEE Trans. Image Processing,vol. 16, no. 8, 2007.
[30] G. Di Martino, M. Poderico, G. Poggi, D. Riccio, and L. Verdoliva, “Bench-marking framework for SAR despeckling,” IEEE Trans. Geosci. Remote Sensing,vol. 52, no. 3, 2014.
[SP]
Previous Page | Contents | Zoom in | Zoom out | Front Cover | Search Issue | Next Page qqM
Mq
qM
MqM
THE WORLD’S NEWSSTAND®
Previous Page | Contents | Zoom in | Zoom out | Front Cover | Search Issue | Next Page qqM
Mq
qM
MqM
THE WORLD’S NEWSSTAND®
__________
_________________________
_________
_____
_________________
_____________________
__________

1053-5888/14/$31.00©2014IEEE IEEE SIGNAL PROCESSING MAGAZINE [79] JULY 2014
Digital Object Identifier 10.1109/MSP.2014.2312099
Date of publication: 13 June 2014
Polarimetric target decomposition is a powerful tech-nique to interpret scattering mechanisms in polarimetric synthetic aperture radar (PolSAR) data. Eigenvalue-eigenvector-based and model-based methods are two main categories within the incoherent
decomposition techniques. Eigenvalue-ei-genvector-based decomposition be-comes relatively mature since it has a clearer mathematical background and has only one decomposition solution. In contrast, model-based de-compositions can obtain different decomposition solutions in terms of vari-ous scattering models. Meanwhile, conventional methods with models or as-sumptions that do not fit the observations may induce defi-ciencies. Thereby, the development of effective model-based decomposi-tions has received considerable attention and many advances have been reported. This article aims to provide a review for these notable advances, mainly in-cluding the incorporation of orientation compensation processing, nonnegative eigenvalue constraint, generalized scattering models, complete information utilization, full-parameter inversion schemes, and fusion of polarimetry and interferometry. Airborne
Pi-SAR data sets are used for demonstration. Besides, natural di-saster damage evaluation using model-based decomposition is car-ried out based on advanced land-observing satellite/phased array type L-band synthetic aperture radar (ALOS/PALSAR) data. Fi-
nally, further development perspectives are pre-sented and discussed.
INTRODUCTIONMicrowave remote sensing has
been rapidly developing over the past few decades with progresses in hardware systems, signal processing techniques, and interpre-tation theories. Micro-wave remote sensors, which can work day and
night and are nearly unaf-fected by weather and atmo-
spheric conditions, play an increasingly important role for
Earth and other planet monitoring in both global and regional scales. PolSAR is
one of the mainstream imaging systems in micro-wave remote sensing. It can obtain fully polarimetric information by transmitting and receiving microwaves with specific polariza-tion states [1]–[3]. Fully polarimetric information is sensitive to scattering mechanisms related to target responses during a back-scattering procedure. Full polarization acquisition can enhance the radar capability in scattering mechanism understanding and target parameters (e.g., material, shape, and orientation) retrieval. In this vein, many current airborne and spaceborne synthetic aperture
[Si-Wei Chen, Yong-Zhen Li, Xue-Song Wang, Shun-Ping Xiao, and Motoyuki Sato]
[Advances and perspectives]
Recent Advances in Synthetic Aperture Ra
darIma
ging
PH
OTO
CO
UR
TE
SY
OF
NA
SA
Previous Page | Contents | Zoom in | Zoom out | Front Cover | Search Issue | Next Page qqM
Mq
qM
MqM
THE WORLD’S NEWSSTAND®
Previous Page | Contents | Zoom in | Zoom out | Front Cover | Search Issue | Next Page qqM
Mq
qM
MqM
THE WORLD’S NEWSSTAND®

IEEE SIGNAL PROCESSING MAGAZINE [80] JULY 2014
radar (SAR) systems are equipped with a full-polarization mode. A number of PolSAR data sets have been acquired by these systems especially the routinely operated spaceborne systems such as on-orbit Radarsat-2 and TerraSAR, the retired ALOS/PALSAR, etc. [1]. These valuable data sets greatly stimulate the studies in both theory and appli-cation. Scattering mechanism under-standing is a bridge between the collected data and real applications. Generally, scattering mechanisms are determined by a set of factors such as radar frequency, radar bandwidth, illumination direction, and target dielectric/geometric properties. Although the basic the-ory of radar polarimetry has been well established [1]–[3], scatter-ing mechanism modeling and interpretation are still ongoing. How to effectively extract robust and useful information from collected data is still challenging.
In past decades, many scientists and researchers have been involved in this field to interpret the scattering mechanisms pres-ent in PolSAR data [1]–[4]. Polarimetric target decomposition theorems [5], originated from Huynen’s work in the 1970s [6], became one of the most powerful and the most popularly used techniques. With this technique, a measured polarimetric matrix can be decomposed into a summation of several canonical scat-tering mechanisms. Thereby, the dominant scattering mecha-nism can be determined and physical parameters can be retrieved. A number of successful applications, such as land-cover classification and target detection [1], [4], soil moisture estima-tion [2], [7], forest study [1], [3], ocean study [1], agriculture study [1], glacier study [8], and natural disaster study [9]. Since the measured scattering matrix is commonly affected by speckle phenomenon [1], incoherent analysis using the second-order sta-tistics such as the coherency/covariance matrix is mostly used. Incoherent decompositions can be divided into two categories: eigenvalue-eigenvector-based decomposition [1], [3], [5] and model-based decomposition [10], [11]. Eigenvalue-eigenvector-based decomposition becomes relatively mature since it has clearer mathematical background and has only one decomposi-tion solution. Polarimetric entropy, mean alpha angle ar , and polarimetric anisotropy are the most popular parameters derived from this technique and are widely used for scattering mecha-nism understanding [1], [3], [5]. In contrast, with various combi-nation of scattering models, model-based decompositions can obtain different decomposition solutions. Meanwhile, conven-tional model-based decompositions with models or assumptions that do not fit the observations may induce deficiencies, such as the appearances of negative powers for scattering mechanisms, overestimations of volume scattering, scattering mechanism ambiguities, etc. Thereby, the development of effective model-based decompositions has received considerable attention [12]. The Freeman–Durden decomposition [10] is the pioneer of inco-herent model-based decompositions. Thereafter, to enhance the scattering mechanism interpretation performance, many notable advances have been achieved, including orientation compensa-tion strategy [13]–[15]; nonnegative eigenvalue constraint
[16]–[18]; generalized scattering models [7], [19]–[26]; complete information utilization [18], [23], [26], [27]; full-parameter inver-sion technique [20], [21], [26]; and polarimetric-interferometric
decomposition [21], [24], [25]. In 1996, Cloude and Pottier
published an excellent review for target decomposition theorems [5]. Reference [12] also provides a short overview. Based on these papers, this article will investigate all these
recent advances, present a brief summary, and discuss the per-spectives for future developments.
BASICS OF SCATTERING MECHANISM MODELING
REPRESENTATION OF PolSAR DATAFor PolSAR, the acquired full polarimetric information can be expressed in the form of the scattering matrix, as
,SSS
SS
HH
VH
HV
VV= ; E (1)
where SHV is the backscattered return from vertical transmit-ting and horizontal receiving polarization.
Subject to the reciprocity condition ,S SHV VH=^ h the Pauli scattering vector is ( / ) .k S S S S S1 2 2P
THH VV HH VV HV= + -6 @
When rotated with angle i around the radar line of sight (LOS), it becomes [1]
.cossin
sincos
k R k k100
022
022
P P P3i i i
i
i
i
= =
-
^ ^h h > H (2)
The coherency matrix T without rotation is
,T k kTTT
TTT
TTT
P PH
11
21
31
12
22
32
13
23
33
= = > H (3)
where denotes the sample average, and kPH is the conjugate
transpose of .kP Tij is the ,i j^ h entry of .TThe coherency matrix T with rotation angle i is [1]
.T k k R TRP PH H
3 3i i i i i= =^ ^ ^ ^ ^h h h h h (4)
BASIC SCATTERING MODELS The general principle of incoherent model-based decomposi-tion is to decompose a polarimetric matrix into a summation of a set of basic scattering models. Using the coherency matrix as an example, basic scattering models include volume scatter-ing ,Tvol double-bounce scattering ,Tdbl odd-bounce scattering
,Todd and helix scattering .Thel In practice, volume scattering can represent the scattering mechanism from areas with a number of elemental scatterers inside, such as vegetation can-opy and ice. Double-bounce scattering indicates dihedral
PolSAR IS ONE OF THE MAINSTREAM IMAGING SYSTEMS IN
MICROWAVE REMOTE SENSING.
Previous Page | Contents | Zoom in | Zoom out | Front Cover | Search Issue | Next Page qqM
Mq
qM
MqM
THE WORLD’S NEWSSTAND®
Previous Page | Contents | Zoom in | Zoom out | Front Cover | Search Issue | Next Page qqM
Mq
qM
MqM
THE WORLD’S NEWSSTAND®

IEEE SIGNAL PROCESSING MAGAZINE [81] JULY 2014
corner reflection formed by ground-wall structures and ground-trunk interactions. Odd-bounce scattering can describe both single-bounce scattering from rough surfaces such as grass area and ocean, and triple-bounce scattering from ground-wall-ground and ground-trunk-ground struc-tures. Helix scattering fits the reflection asymmetry condition valid in heterogeneous areas, such as complicated shape tar-gets and built-up areas. Decomposition framework can be pre-sented as
,T f T f T f T f Tv d s cvol dbl odd hel g= + + + + (5)
where ,fv ,fd ,fs and fc are model coefficients.The number of model components is tunable for certain
decomposition. With the determination of the power of each component, scattering mechanisms can be understood and applications can be explored thereafter.
VOLUME SCATTERING MODELVolume scattering is usually modeled by a cloud of elemental scatterers with some orientation defined by an angle .i The coherency matrix for volume scattering is obtained by the inte-gration with a probability density function (PDF) ,p i^ h and can be generally expressed as
.T T p dade
dbf
efc
0
2vol i i i= = )
) )
r^ ^h h > H# (6)
For randomly oriented thin dipoles, if the PDF is assumed to be uniform )(p 1 2i r=^ h [10], the corresponding model is
.T 41
200
010
001
1vol = > H (7)
With another PDF ( )sinp 1 2i i=^ h proposed in [11], two models can be obtained using horizontal and vertical dipoles
T 301
1550
570
008
2vol = > H and .T 301
155
0
570
008
3vol = -
-> H (8)
DOUBLE-BOUNCE SCATTERING MODELThe double-bounce scattering is basically modeled by scattering from a dihedral corner reflector, such as ground-wall structures and ground-trunk interactions, where the reflector surfaces can be made of different dielectric materials. The corresponding coherency matrix [1] is
,T0
10
000
2
dbl
a
a
a
= )> H (9)
where a is complex valued and 11a [1].
ODD-BOUNCE SCATTERING MODELThe odd-bounce scattering is represented by a Bragg surface scat-tering model for slightly rough surfaces for which the depolariza-tion effect and the cross-polarization component is negligible. The corresponding coherency matrix [1] is
,T1
0 0
000
2odd b
b
b=
)
> H (10)
where 11b and b is real valued from most natural surfaces [1].
HELIX SCATTERING MODELThe roll-invariant helix scattering component was proposed in [11] to fit the reflection asymmetry condition, such as in built-up areas. The corresponding coherency matrix is
.Tj
j21
000
01
0
1hel
"
!= > H (11)
CONVENTIONAL THREE- ANDFOUR-COMPONENT DECOMPOSITIONSThe Freeman–Durden decomposition [10] is the first three-com-ponent incoherent model-based decomposition with the formu-lation as
.T f T f T f Tv d svol dbl odd= + + (12)
The Freeman–Durden decomposition assumes the reflection symmetry condition for which the cross-correlation between copolarization and cross-polarization are always zero (T 013 =
and ) .T 023 = In this way, there are five known observables ( ,T11 ,T22 ,T33 and complex valued )T12 with six unknown model parameters ,fv ,fd ,fs ,b and complex-valued )a to be determined. From the adopted models (7), (9), and (10), only the volume scattering contributes to the cross-polarization term .T33 Thereby, the volume model coefficient fv can be determined at first and its contribution is subtracted
.T T f T f T f Tv d sremainder vol dbl odd= - = + (13)
Based on the sign of ,Re S SHH VV)^ h the dominance of double-
or odd-bounce scattering in the remainder matrix Tremainder can be determined. If Re S SHH VV
)^ h is positive, parameter a of model (9) is fixed as –1, otherwise parameter b of model (10) is fixed as 1. In this vein, all the model parameters can be determined.
The Yamaguchi decomposition [11] includes helix scattering model to remove the reflection symmetry assumption since it is not always valid for various land covers
.T f T f T f T f Tv d s cvol dbl odd hel= + + + (14)
Another improvement is the extension of volume scattering modeling. For instance, a PDF for elemental scatterer orientation
Previous Page | Contents | Zoom in | Zoom out | Front Cover | Search Issue | Next Page qqM
Mq
qM
MqM
THE WORLD’S NEWSSTAND®
Previous Page | Contents | Zoom in | Zoom out | Front Cover | Search Issue | Next Page qqM
Mq
qM
MqM
THE WORLD’S NEWSSTAND®

IEEE SIGNAL PROCESSING MAGAZINE [82] JULY 2014
and another two volume scattering models are introduced, shown in (8). The most suitable volume model is determined by the ratio of copolarization terms. Since only helix scattering contrib-ute to ,Im T236 @ its model coefficient fc is determined and its contribution is subtracted with the highest prior-ity. The inversion strategy then follows the Freeman–Durden decomposition procedure.
EXISTING PROBLEMSFreeman–Durden and Yamaguchi decompositions are the pioneer model-based decomposition techniques. They are popularly used due to the easy physical interpretation of the scene they provide, together with their simplicity, computational efficiency, and rela-tively good performance. However, some issues exist too. The first is the occurrence of negative powers for double- or odd-bounce scattering after the subtraction of volume or helix scattering com-ponents. Although scattering powers can be forced to be zero or positive, these decomposition results are physically incorrect. Intrinsically, it means the scattering models do not fit the observa-tions. The second is that double- and odd-bounce scattering com-ponents are modeled with zero cross-polarization terms. In a real situation, the depolarization effect and polarization state rotation from terrain slopes and oriented buildings can induce significant cross-polarization power. Therefore, especially oriented man-made structures and hills are usually misjudged as volume scattering dominant, which produces serious scattering mechanism ambigu-ity. The volume scattering models ,T 1vol ,T 2vol and T 3vol from (7)–(8) all have constant model parameters. Therefore, using (6), the volume scattering contribution is fully determined by these con-stants and the cross-polarization term
.P a b c f ca b T F T1v v v33 33= + + = + + =^ eh o (15)
The dynamic range is limited and the volume scattering contribu-tion is easily overestimated. Moreover, for parameter inversion, the implicit assumption of model priority is included, since the obser-vations are used to satisfy helix and volume components first. In addition, conventional methods do not use the full information of a coherency matrix for modeling. For example, all models (7), (9), and (10) used in the Freeman–Durden decomposition [10] do not account for elements T13 and ,T23 while elements T13 and Re T236 @ are not utilized in the Yamaguchi decomposition [11].
RECENT ADVANCES IN MODEL-BASED DECOMPOSITIONThis section reviews recent advances in model-based decompo-sition and the key features are summarized in Table 1.
ORIENTATION COMPENSATION PROCESSINGPolarimetric responses of the same target with different orienta-tions can be quite different due to the rotation of polarization state. This phenomenon causes ambiguity for scattering mecha-nism discrimination. Orientation compensation [1], [14], also
named deorientation processing [6], can mitigate this orientation dependence effect by polarimetric matrix rotation around radar
LOS until the cross-polarization term is minimized.
Orientation compensation was incorporated into model-based decomposition [13]–[15]. The gen-eral orientation compensation effect is to minimize the cross-polarization term .T33 From (15), the decomposed volume scattering power is consistently reduced.
Therefore, orientation compensation can partially cure the overestimation of volume scattering power and the occurrence of negative powers. Besides, it is possible to compensate the tar-get orientation effect on the perpendicular plane to the radar LOS using this technique. However, since there is an intersec-tion angle between the rotation plane of oriented buildings or terrain slopes and the perpendicular plane, complete orienta-tion compensation cannot be achieved only using this tech-nique, which deserves further efforts.
NONNEGATIVE EIGENVALUE CONSTRAINTThe appearance of negative power due to the subtraction of the scattering component is an important issue of conventional methods. Van Zyl et al. [16] recognized this fact and proposed the nonnegative eigenvalue decomposition to theoretically avoid the occurrence of nonphysical negative power. Using three-component decomposition as an example, they intro-duced the nonnegative eigenvalue constraint (NNEC) during the subtraction of the volume scattering component. The core idea is to guarantee the eigenvalues of remainder matrix Tremainder are nonnegative. Then, the subtraction processing will not produce negative power. Using NNEC, the maximum vol-ume model coefficient can be determined
.T T f Tmaxvremainder vol= - (16)
Therefore, when f f maxv v# is satisfied, the negative power can be
avoided. With the reflection symmetry condition, the analytical expression of f max
v is derived in [16]. More recently, its analytical expression is extended to the nonreflection symmetry condition using the principle minor theory [17]. The optimal determination of fv is still open. In [3], a generalized Freeman–Durden decompo-sition is established and the appearance of negative powers is theo-retically avoided using both the eigenvalue technique and the orthogonality of double- and odd-bounce scattering models. Fur-thermore, with certain conditions, the idea of NNEC is generalized and volume model coefficient fv can be uniquely determined [18].
OTHER VOLUME SCATTERING MODELSTo better fit the elemental scatterer orientation and to extend the dynamic range of volume scattering model, other PDFs have been utilized [21]–[23]. The von Mises distribution has been used in [21] to characterize a vegetation canopy. The nth
THE GENERAL PRINCIPLE OF INCOHERENT MODEL-BASED
DECOMPOSITION IS TO DECOMPOSE A POLARIMETRIC MATRIX INTO A SUMMATION OF A SET OF BASIC
SCATTERING MODELS.
Previous Page | Contents | Zoom in | Zoom out | Front Cover | Search Issue | Next Page qqM
Mq
qM
MqM
THE WORLD’S NEWSSTAND®
Previous Page | Contents | Zoom in | Zoom out | Front Cover | Search Issue | Next Page qqM
Mq
qM
MqM
THE WORLD’S NEWSSTAND®

IEEE SIGNAL PROCESSING MAGAZINE [83] JULY 2014
power cosine-squared distribution, including two parameters of the mean orientation angle and the randomness indicator, was developed in [22]. Meanwhile, generalized volume scattering models generated from arbitrary-shaped elemental scatterers instead of the thin dipole assumption were also proposed [22]. Besides, a family of models based on the multilook phase differ-ence distributions, which are better suited to characterize ori-entation angle distributions, was proposed [23].
In addition, empirical volume scattering models have also been proposed as another alternative. An empirical model with shape parameter t was introduced to particularly fit randomly oriented prolate spheroidal and elliptical scatterers in [19] (notated as the Freeman II decomposition). Since polarimetric SAR interferometry (PolInSAR) coherence has a close relation-ship to forest structures [3], [28], volume scattering can be modeled from it and an adaptive volume scattering model was proposed [25] using PolInSAR coherence to be functioned as
the shape parameter. Identity matrix with the highest entropy was also proposed to fit volume scattering [13].
GENERALIZED DOUBLE- AND ODD-BOUNCE SCATTERING MODELSIn conventional methodologies, the double- and odd-bounce scat-tering mechanisms are assumed not to contribute to the cross-polarization term. However, in real situations, terrain slopes in the along-track direction and/or oriented buildings rotate the polar-ization basis of the scattering matrix, which will induce significant cross-polarization power [1], [2], [16]. Since the conventional models do not fit these situations, the scattering mechanism ambiguity is serious. Recently, several papers addressed this issue for more generalized double- and odd-bounce scattering modeling [7], [23], [26]. In [7], the Bragg surface model has been extended as the advanced X-Bragg model to fit the cross-polarization term induced by the depolarization effect. In [23], incoherent double- or
[TABLE 1] A SUMMARY OF TYPICAL MODEL-BASED DECOMPOSITIONS.
METHODS INFORMATION UTILIZATION
NEGATIVE POWER
MODEL INVERSION PRIORITY
COMPUTATION EFFICIENCY
NOTABLE REMARKS
FREEMAN–DURDENDECOMP. [10]
,T13 T23
UNACCOUNTEDYES VOLUME>DOUBLE-/
ODD-BOUNCEHIGH BASIC SCATTERING MODELS
FREEMAN IIDECOMP. [19]
,T13 T23
UNACCOUNTEDYES VOLUME>DOUBLE/
ODD-BOUNCEHIGH VOLUME SCATTERING MODEL IS
FITTED BY A SHAPE PARAMETER
YAMAGUCHIDECOMP. [11]
,T13 R TE 236 @UNACCOUNTED
YES HELIX>VOLUME>DOUBLE-/ODD-BOUNCE
HIGH INTRODUCE THE FOURTH HELIXCOMPONENT AND TWO MORE VOLUME SCATTERING MODELS
YAMAGUCHI (FREEMAN-DURDEN) DECOMP. + ORIENTATIONCOMPENSATION [13]–[15]
T13 ( ,T13 )TIM 236 @UNACCOUNTED
YES HELIX>VOLUME>DOUBLE-/ODD-BOUNCE
HIGH INCORPORATE THE ORIENTATIONCOMPENSATION TO MINIMIZE T33
AND ELIMINATE TRE 236 @GENERALIZED FREEMAN-DURDEN DECOMP. [3]
,T13 T23
UNACCOUNTEDNO VOLUME>DOUBLE-/
ODD-BOUNCEHIGH HYBRID FREEMAN–DURDEN/
EIGENVALUE TECHNIQUE
VAN ZYL ET AL.DECOMP. [16]
,T13 TIM 236 @UNACCOUNTED
NO VOLUME>DOUBLE-/ODD-BOUNCE
HIGH INCORPORATE THE NNEC TO THEORETICALLY AVOID THENEGATIVE POWER
GULAB ET AL.DECOMP. [27]
FULL POLARIMETRICINFORMATION
YES HELIX>VOLUME>DOUBLE-/ODD-BOUNCE
HIGH DOUBLE UNITARY ROTATIONPROCESSING
CUI ET AL.DECOMP. [18]
FULL POLARIMETRICINFORMATION
NO VOLUME>DOUBLE-/ODD-BOUNCE
HIGH HYBRID DECOMPOSITION USINGBOTH SCATTERING MODELSAND EIGENDECOMPOSITION
LEE ET AL.DECOMP [23]
T13 , TIM 236 @UNACCOUNTED
VERYLIMITED
VOLUME>DOUBLE-/ODD-BOUNCE
HIGH GENERALIZED DOUBLE- ANDODD-BOUNCE OR VOLUMESCATTERING MODELS
ARRI ET AL.DECOMP [20], [22]
T13 UNACCOUNTED OR FULL POLARIMETRICINFORMATION
NO PARTIAL PRIORITY,SIMULTANEOUSLYINVERSION
LOW GENERALIZED VOLUMESCATTERING MODELS, FULL-PARAMETER INVERSION
CHEN ET AL.DECOMP. [26]
FULL POLARIMETRICINFORMATION
NO NO PRIORITY,SIMULTANEOUSLYINVERSION
LOW GENERALIZED DOUBLE- ANDODD-BOUNCE MODELS, FULL-PARAMETER INVERSION
NEUMANN ET AL.DECOMP. [21]
POLARIMETRIC ANDINTERFEROMETRICINFORMATION
NO NO PRIORITY,SIMULTANEOUSLYINVERSION
LOW GENERALIZED MODELSESPECIALLY FOR VEGETATIONS,FULL-PARAMETER INVERSION
DAVID BALLESTER–BERMANET AL. DECOMP. [24]
POLARIMETRIC ANDINTERFEROMETRICINFORMATION
NO VOLUME>DOUBLE-/ODD-BOUNCE
LOW OBTAIN THE POWER ANDLOCATION OF EACH SCATTERINGMECHANISM AT THE VERTICALDIMENSION OF THE SCENE
POLARIMETRIC-INTERFEROMETRICDECOMP. [25]
POLARIMETRIC ANDINTERFEROMETRICINFORMATION
NO VOLUME>DOUBLE/ODD-BOUNCE
HIGH USING POLARIMETRIC ANDINTERFEROMETRIC INFORMATIONTO FIT VOLUME SCATTERING
Previous Page | Contents | Zoom in | Zoom out | Front Cover | Search Issue | Next Page qqM
Mq
qM
MqM
THE WORLD’S NEWSSTAND®
Previous Page | Contents | Zoom in | Zoom out | Front Cover | Search Issue | Next Page qqM
Mq
qM
MqM
THE WORLD’S NEWSSTAND®

IEEE SIGNAL PROCESSING MAGAZINE [84] JULY 2014
odd-bounce scattering models have been incorporated. Recently, in [26], double- and odd-bounce scattering models are generalized to fit the cross-polarization and off-diagonal terms, by separating their independent orientation angles dbli and .oddi
COMPLETE INFORMATION UTILIZATIONA coherency matrix contains nine real values (three real-valued quantities and three complex-valued quantities). Each of them has specific physical meaning. If scattering mechanisms are well mod-eled, each element of a coherency matrix should be fitted. The three-component Freeman–Durden decomposition [10] accounts for five of these parameters. The Yamaguchi decomposition [11] introduced the fourth component and accounts for six parame-ters. With the orientation compensation [14], Re T 023 =6 @ is achieved and nine elements are reduced to eight. Thereby, there remains three and two unaccounted parameters in Freeman–Dur-den and Yamaguchi decompositions, respectively. The details of many cur-rent model-based decompositions are summarized in Table 1.
How to model the scattering mechanisms using complete infor-mation is a major motivation, and three representative approaches were presented in [18], [26], and [27]. A further modified Yamaguchi decom-position was reported [27] and accounts for all parameters based on special double unitary transformations. In [26], a general decom-position framework was proposed to utilize all elements of a coher-ency matrix. All model parameters are optimally obtained using the full-parameter inversion technique. A hybrid decomposition using full information was established [18]. It generalized the van Zyl et al. decomposition [16] to uniquely determine volume scat-tering contribution from the scattering model while using the eigendecomposition to determine the double- and odd-bounce scattering contributions.
FULL-PARAMETER INVERSION STRATEGYModel parameters inversion is carried out at a certain order under some specific conditions for majority of the established model-based decompositions. For conventional Freeman–Durden and Yamaguchi decompositions, the volume scattering and helix scat-tering solely contributes to cross-polarization term T33 and
,Im T236 @ respectively. Therefore, their contributions are sub-tracted from the total measured data at first. Double- and odd-bounce scattering contributions are calculated in turn from the remainder matrix thereafter with a branch condition. This strategy is the main weakness and may overestimate volume scattering contribution, induce negative power, etc. In addition, it also implies that the volume and helix scattering components share the higher priority. Especially in mixed scenes, such a priority assump-tion seems unreasonable.
Generalized decomposition frameworks and full-parameter inversion techniques have been proposed [20], [26] to obtain all
the unknown parameters simultaneously using linear or non-linear optimization algorithms. Basically, the decomposition framework is generalized as
... .T f T f T f T f T f Tv d s c rvol dbl odd hel residual= + + + + + (17)
Suitable scattering models that guarantee parameter inversion as a determined problem can be included into (17). Tresidual is regarded as the residual induced by speckle, noise, and unmodeled contributions to the data. The residual matrix Tresidual can mea-sure how well those models fit the observations. Therefore, for model inversion, the optimization criterion is to minimize the residual. The optimization adopted in [20] and [26] is
: ,min T 2residual (18)
where T 2residual is the L2-norm of .Tresidual
Minimization (18) can be solved by a nonlinear least squares optimi-zation, as adopted in [26]. Full-parameter inversion can obtain all model parameters optimally and simultaneously while avoiding the model priority assumption and nega-tive power issue. Note that nonlinear optimization takes more computa-tion time and may obtain only local minimal of ,T 2residual which needs further studies.
POLARIMETRIC-INTERFEROMETRIC DECOMPOSITIONPolInSAR, which is a combination of PolSAR and interferometric SAR, has been well established [3], [28]. This combination allows understanding different scattering mechanisms located at differ-ent heights. The complementary information (e.g., PolInSAR coherence) between polarimetry and interferometry has been demonstrated to be very promising for many applications, such as forest characterization and land-cover classification [1], [3]. PolInSAR studies contain two main aspects. The first is the development of innovative imaging techniques especially for the vertical profile or the three-dimension reconstruction of targets using single- or multibaseline PolInSAR data. The second is the physical parameters (e.g., forest height, biomass) inversion, which also covers a wide scope. Each of these important topics and recent advances deserves separate papers to discuss in depth. In the second aspect, there is a small branch utilizing the con-cept of model-based decomposition and the framework of (5). Only this technique branch, mainly including three reported methods [21], [24], [25], will be introduced in this section. The main purpose of these methods is to incorporate interferometric information in scattering mechanism modeling. With extra information to conventional polarimetric decomposition frame-work, decomposition performance can be enhanced. In [21], scattering modeling especially in vegetation areas has been intensively studied and a set of volume scattering models using single- or multibaseline PolInSAR data has been established.
THE COMPLEMENTARY INFORMATION BETWEEN
POLARIMETRY AND INTERFEROMETRY HAS BEEN DEMONSTRATED TO BE
VERY PROMISING FOR MANY APPLICATIONS, SUCH AS FOREST CHARACTERIZATION AND LAND-
COVER CLASSIFICATION.
Previous Page | Contents | Zoom in | Zoom out | Front Cover | Search Issue | Next Page qqM
Mq
qM
MqM
THE WORLD’S NEWSSTAND®
Previous Page | Contents | Zoom in | Zoom out | Front Cover | Search Issue | Next Page qqM
Mq
qM
MqM
THE WORLD’S NEWSSTAND®

IEEE SIGNAL PROCESSING MAGAZINE [85] JULY 2014
Detailed geophysical parameters describing the vegetation layers can be derived. In [24], the concept of the Freeman–Durden decomposition has been extended to PolInSAR polarimetric-interferometric correlation matrix by adding the interferometric responses of each scattering mechanism. Thereby, both the power and location of each scattering mechanism can be deter-mined. In [25], an adaptive polarimetric-interferometric model-based decomposition has been developed using PolInSAR coherence. Demonstrations with real PolInSAR data validated its performance especially for oriented building characterization. These are the first attempts to fuse the polarimetric and interfer-ometric information for scattering mechanism modeling. More efforts are needed for further study.
EXPERIMENTAL DEMONSTRATION AND INVESTIGATION
DEMONSTRATION WITH AIRBORNE Pi-SAR DATAThis example demonstrates the effects of model priority issue, orientation compensation, generalized models, and full parame-ter inversion scheme. Airborne Pi-SAR X-band PolSAR data cov-ering an urban region from the downtown of Sendai, Japan, is used. The optical image and a photo for the tall building are shown in Figure 1(a). The representative three-component Freeman–Durden decomposition without and with orientation compensation [10], [14] and the recently developed Chen et al. decomposition [26] are used for comparison. The Chen et al. decomposition [26] uses the generalized double- and odd-bounce scattering models fitting the cross-polarization term and off-diagonal terms of a coherency matrix. To guarantee that the model inversion is a determined problem, a lookup table
including representative volume scattering models with con-stant parameters is formed. Suitable volume scattering model and optimal model parameters are determined using the full-parameter inversion technique (18). Decomposition results are shown in Figure 1(b)–(d), respectively. For Freeman–Durden decomposition, volume scattering contribution is first deter-mined and subtracted. This processing implies the model prior-ity assumption and volume scattering contribution always exist for any target. In Figure 1, without orientation compensation, the oriented tall building is obviously judged as dominant vol-ume scattering, which is usually exhibited by vegetated areas. Thereby, scattering mechanism ambiguity occurs. With orienta-tion compensation, the cross-polarization term is minimized and the volume scattering contribution is reduced. As can be seen in Figure 1(c), volume scattering contribution is greatly decreased. In reality, oriented buildings also induce significant cross-polarization term. Since conventional double- and odd-bounce models (9) and (10) do not account for it, and due to the model priority issue, the volume scattering contributions over these man-made targets are still overestimated. By that
[FIG1] A demonstration with Pi-SAR PolSAR data. (a) A Google Earth optical image and a photo for the tall building, (b) and (c) Freeman–Durden decomposition without and with orientation compensation [10], [14], (d) Chen et al. decomposition [26] without orientation compensation. The decomposition images are colored by Pd (red), Pv (green), and Ps (blue). (e) Decomposition performance comparison over oriented buildings.
Pd
Ps Pv
Color-Code
(a)
Volume
Double-Bounce + Odd-Bounce
Without Orientation Compensationand with Model Priority
Generalized Models andWithout Model Priority
With Orientation Compensationand with Model Priority
Volume +Double-Bounce
(e)(d)(c)(b)
Volume +Odd-Bounce
[TABLE 2] DOMINANT SCATTERING POWER CONTRIBUTION(%) FOR THE SELECTED BUILDING.
Pd Pv Ps
FREEMAN–DURDEN DECOMPOSITION [10] 2 94 4
FREEMAN–DURDEN DECOMPOSITION WITHORIENTATION COMPENSATION [14]
30 45 25
CHEN ET AL. DECOMPOSITION [26] 46 13 41
Previous Page | Contents | Zoom in | Zoom out | Front Cover | Search Issue | Next Page qqM
Mq
qM
MqM
THE WORLD’S NEWSSTAND®
Previous Page | Contents | Zoom in | Zoom out | Front Cover | Search Issue | Next Page qqM
Mq
qM
MqM
THE WORLD’S NEWSSTAND®

IEEE SIGNAL PROCESSING MAGAZINE [86] JULY 2014
means, comparable volume scattering and double- or odd-bounce scattering contributions coexist for these oriented buildings, which appear yellow or cyan in the RGB composite image in Figure 1(c). In comparison, the generalized models fit the cross-polarization terms while the full-parameter inversion technique avoids the negative power and model priority assumption. The general decomposition can successfully iden-tify these buildings as man-made structures. In Figure 1(d), these buildings show purple since both double- and odd-bounce scattering mechanisms are dominant. For the tall building shown in Figure 1(a), quantitative examination is also carried out and summarized in Table 2. Compared to the original Free-man–Durden decomposition [10], with orientation compensation, dominant volume scattering obvi-ously reduces from 94% to 45%, while the percentages of the domi-nant double- and odd-bounce scat-tering increase from 2% to 30% and 4% to 25%, respectively. Even still, volume scattering contribution is still overestimated and this building will be misjudged as dominant volume scattering. In comparison, dominant volume scattering further reduces to 13%, while dominant double- and odd-bounce scattering increase up to 46% and 41%. This building can be successfully discriminated as a man-made structure, which validates the efficiency of the advances.
APPLICATION FOR NATURAL DISASTER EVALUATIONThe occurrence of observed natural disasters, such as earthquakes and tsunamis, appears to have increased in recent decades [9]. With the advantages of a large imaging scene, revisiting capability,
and multitemporal data archives, spaceborne SAR sensors play an extremely important role for natural disaster evaluation. The fol-lowing demonstration uses the spaceborne ALOS data over the seriously damaged city of Ishinomaki, induced by the Eastern Japan great earthquake and tsunami that happened 11 March 2011. The after-tsunami optical and PolSAR data sets were acquired on 8 April 2011, while the latest before-tsunami data sets were acquired on 21 November 2010. Optical images are shown in Fig-ure 2(a) and (g). The Pacific Ocean is located to the right of the images. Buildings in the region, highlighted by the line, were almost completely flushed away leaving a relatively rough surface. Besides, the orientations of these buildings are inclined to the sen-
sor flight pass. From scattering interpretation
theory, this built-up area should response dominant double-bounce scattering induced by the ground-wall structures before the damage. However, after the tsunami, most of these buildings were swept away
and the ground-wall structures were dramatically decreased. Therefore, this seriously damaged area should be obviously changed into dominant odd-bounce (surface) scattering. As a comparison, the amplitudes of HH polarization are shown in Figure 2(b) and (h). Visually, single polarization is less sensitive to the changes of target structures, compared with fully polari-metric features. Meanwhile, mean alpha angle ar , which is the primary parameter for scattering mechanism indication in the Cloude–Pottier decomposition [1], [5], is derived and shown in Figure 2(c) and (i). For before-tsunami cases, 90"a cr and indi-cates double-bounce scattering, while 0"a cr and indicates sur-face scattering for after-tsunami cases. Therefore, the ar
N0° 90°
0° 90°
(a) (b) (c) (d) (e) (f)
(g) (h) (i) (j) (k) (l)
N
[FIG2] (a)–(f) Before- and (g)–(l) after-tsunami ALOS data and decomposition results. (a) and (g) show the ALOS optical image, (b) and (h) illustrate HH polarization amplitude data, (c) and (i) are the mean alpha angle parameter derived from Cloude–Pottier decomposition [1], [5], (d) and (j) show the Yamaguchi decomposition without orientation compensation [11], (e) and (k) show the Yamaguchi decomposition with orientation compensation [15], and (f)–(l) shows the Chen et al. decomposition [26] without orientation compensation. The decomposition images are colored by Pd (red), Pv (green), and Ps (blue).
SPACEBORNE SAR SENSORS PLAY AN EXTREMELY IMPORTANT
ROLE FOR NATURAL DISASTER EVALUATION.
Previous Page | Contents | Zoom in | Zoom out | Front Cover | Search Issue | Next Page qqM
Mq
qM
MqM
THE WORLD’S NEWSSTAND®
Previous Page | Contents | Zoom in | Zoom out | Front Cover | Search Issue | Next Page qqM
Mq
qM
MqM
THE WORLD’S NEWSSTAND®

IEEE SIGNAL PROCESSING MAGAZINE [87] JULY 2014
parameter can potentially discriminate damaged buildings. The Yamaguchi decomposition without and with orientation com-pensation [11], [15] and the Chen et al. decomposition [26] are also used for demonstration, shown in Figure 2(d)–(f) for before-tsu-nami cases and Figure 2(j)–(l) for after-tsunami cases, respectively. After the tsunami, the damaged area is correctly judged as dominant odd-bounce scattering (blue) indi-cating a rough surface from all three methods. However, for before-tsunami cases, the overestimation of volume scattering is significant without orientation compensation and this built-up area is falsely determined as dominant volume scattering (green), shown in Figure 2(d). In comparison, the other two approaches can successfully identify them as man-made structures that exhibit dominant double-bounce scattering (red). These polari-metric features are more stable during repeated data collects. The reduction of dominant double-bounce scattering amount has been verified to have a linear relationship with the amount of damaged ground-wall structures and has been utilized for quantitative evaluation of urban damage [9].
DISCUSSIONS AND PERSPECTIVES
PolSAR DATA PREPROCESSING ISSUEThere are two main aspects in PolSAR data preprocessing. The first is the data calibration. Generally, the acquired PolSAR data is affected by the channel imbalance and cross-talk effects that dis-tort the polarization purity [2], [3]. Polarimetric calibration should be implemented at first for further processing. The afore-mentioned polarimetric target decompositions are all based on well-calibrated data. For low-frequency band (e.g., P-, L-band) spaceborne systems, the Faraday rotation effect induced by the ionosphere should also be compensated beforehand. Propagation distortions including Faraday rotation effect in model-based decomposition have been investigated in [3].
The second aspect is speckle reduction. Speckle phenomenon is an intrinsic property for coherent imaging system of PolSAR [1]. The existence of speckle phenomenon makes information extraction more difficult. Speckle reduction is also a preprocess-ing step for PolSAR data utilization. Suitable speckle filter should significantly reduce speckle phenomenon while preserving image details [1].
RADAR FREQUENCY ISSUETarget backscattering properties usually vary with the illumi-nation frequency due to its physical characteristics, especially the geometric features (e.g., size, shape, and structure) with respect to the radar wavelength. Meanwhile, low frequencies such as P- and L-band usually have a penetration depth into forest/vegetation canopies, deserts, dry bare soil areas, etc. Intrinsically, incident microwaves with different wavelengths
interact with different parts of a complex target or medium and the polarimetric responses may differ accordingly. Thereby, scattering mechanisms of a same target strongly
depend on the observation fre-quency and so are the interpreta-tion results from model-based decomposition. For example, the scattering mechanism from vege-tations may totally differ at the P- and X-band. In addition, the scattering models presented in the sections “Basics of Scattering Mechanism Modeling” and “Recent Advances in Model-Based Decom-
position” have their theoretical assumptions that should be well satisfied before utilization.
HIGH SPATIAL RESOLUTION ISSUEWith the advances in SAR imaging systems, fine-resolution data in the order of decimeter and centimeter can be available. At such resolutions, scatterers may be very limited. Some of the current modeling schemes should be updated. For example, modeling volume scattering by a cloud of oriented elemental scatterers should be reconsidered. Besides, note that incoherent polarimetric decomposition with sample average of measured data may blur image detail, while coherent polarimetric decom-position with scattering matrix (1) have only five freedoms for modeling. Thereby, how to fit these fine-resolution data provides challenges to scattering mechanism modeling and interpreta-tion. In another aspect, more detailed information such as open-ing or closing a window may be sensed with high spatial resolution systems. Suitable decomposition techniques are highly expected for these situations.
PERFORMANCE EVALUATION ISSUEA number of advanced model-based decompositions have been reported. They raise urgent questions: how to judge whether one proposed scattering model is reasonable or superior and how to fairly evaluate the performance? Actually, there is no standard answer. From the literature and according to our studies, the used evaluation criterion are summarized and discussed:
1) Reflection symmetry assumption. This assumption is mainly satisfied in vegetated areas with relatively flat topogra-phy. More generalized decomposition should also account for the reflection asymmetry condition.2) Information utilization. The number of the used quantities of a polarimetric matrix is a good measure to evaluate a model-based decomposition proposal. Complete information utiliza-tion will be a mainstream concept for future development.3) Negative power occurrence. This is an important issue since the decomposition results are nonphysical. Intrinsically, it indi-cates that the scattering models do not fit the observations. 4) Scattering mechanism discrimination. This is one key cri-terion to evaluate the performance of model-based decomposi-tion. The majority of recent advances are also motivated to
SINCE THE SCATTERING MECHANISM CLOSELY RELATES
TO LOCAL INCIDENCE ANGLE AND TARGET ORIENTATION, USING
MULTILOOKINGDIRECTION DATA SETS IS ANOTHER PROMISING
TECHNIQUE.
Previous Page | Contents | Zoom in | Zoom out | Front Cover | Search Issue | Next Page qqM
Mq
qM
MqM
THE WORLD’S NEWSSTAND®
Previous Page | Contents | Zoom in | Zoom out | Front Cover | Search Issue | Next Page qqM
Mq
qM
MqM
THE WORLD’S NEWSSTAND®

IEEE SIGNAL PROCESSING MAGAZINE [88] JULY 2014
overcome the scattering mechanism ambiguity between for-ests and oriented buildings. 5) Model priority assumption. For mixed land covers, there is no proper reason to assign the model priority. If the volume scattering component is determined at first, each scatterer will have volume scattering contribution. For oriented build-ings, this contribution is not negligible. Generally, it is more reasonable to consider each scattering model share the equiv-alent priority. 6) Computation efficiency. Computation time and implemen-tation complexity are considered in real applications. Basically, computationally effective methods are preferred. These criteria can be the basics for model-based decomposi-
tion performance evaluation and comparison. Table 1 provides a summary of these criteria for typical model-based decomposi-tions. Note that it is not reasonable to claim one proposed decomposition is always superior to others. In practice, how to choose the most suitable decomposition is also data oriented and application oriented.
FURTHER GENERALIZED MODELINGOne difficulty in further development of model-based decompo-sition is how to balance model generalizations and model parameters inversion. A coherency matrix, providing nine inputs, allows at most nine unknown parameters for scattering mechanism modeling. There are several potential ways for future exploration. The first is still based on polarimetric data and segments the land cover beforehand. Specifically general-ized scattering models are established for different terrains using more freedom in the modeling. For example, for pure built-up areas with dominant double-bounce scattering, ocean and grass areas with dominant odd-bounce scattering, more generalized double- and odd-bounce models can be founded accordingly. The core idea is that it may not be necessary to keep three or four scattering components for known land covers, and more detailed information can be extracted thereafter. The second method is to develop more generalized scattering models that do not reduce the scattering components by fusing additional data sets. The polarimetric-interferometric decomposition [21], [24], [25] is one attempt. Since the scattering mechanism closely relates to local incidence angle and target orientation, using multilooking-direction data sets is another promising technique. Further-more, a combination of the aforementioned techniques may also be investigated in further studies.
CONCLUSIONSRecent advances in scattering modeling and model-based decomposition theorem were reviewed. The notable achieve-ments include orientation compensation processing, nonnega-tive eigenvalue constraint, generalized scattering models, complete information utilization, full-parameter inversion strategy, and the polarimetric-interferometric decomposition scheme. These advances contribute to make scattering models more adaptive, better fit observations and guarantee physically meaningful decomposition solutions. The key features of these
advances have been summarized. Performance evaluation and further development perspectives were also discussed. One promising way is to fuse multiple data to better model scatter-ing mechanisms, such as the polarimetric-interferometric modeling attempts. Besides, with the progress in PolSAR sen-sors, imaging modes (e.g., bistatic, hybrid-polarization and multi-incident-angle modes) and application requirements, the development of specific scattering mechanism interpreta-tion techniques, multiangular decomposition [29], and compact/hybrid decomposition [30] techniques are also highly preferred.
ACKNOWLEDGMENTSWe would like to thank the National Institute of Information and Communications Technology, Japan, and the Japan Aero-space Exploration Agency for providing the PolSAR data. We also deeply thank the editors and anonymous reviewers for their careful proofreading and constructive suggestions. This work was supported in part by the National Natural Science Founda-tion of China under grant 41301490.
AUTHORSSi-Wei Chen ([email protected]) received the Ph.D. degree (with honors) from the Graduate School of Environmental Studies, Tohoku University, Sendai, Japan, in 2012. He is an assistant professor at the State Key Laboratory of Complex Electromagnetic Environment Effects on Electronics and Infor-mation System, National University of Defense Technology. His research interests include radar polarimetry, polarimetric syn-thetic aperture radar, polarimetric synthetic aperture radar interferometry, and natural disaster study. He is a recipient of the 2011 Young Researcher Award from the IEEE Geoscience and Remote Sensing Society–Japan Chapter, the 2013 Dean Prize from the Graduate School of Environmental Studies, Tohoku University, and the Best Poster Award at the 2013 IET International Radar Conference. He was granted a Tohoku Uni-versity president fellowship (2011–2012). He is a coinvestigator of the European Space Agency Earth Observation Campaign and ALOS data.
Yong-Zhen Li ([email protected]) received the B.E. and Ph.D. degrees (with honors) from the School of Electronic Sci-ence and Engineering, National University of Defense Technol-ogy, Changsha, China, in 1999 and 2004, respectively. He is currently an associate professor at the National University of Defense Technology. His research interests include radar polarimetry, synthetic aperture radar, signal processing, and target recognition.
Xue-Song Wang ([email protected]) received the B.E. and Ph.D. degrees (with honors) from the School of Electronic Science and Engineering, National University of Defense Tech-nology, Changsha, China, in 1994 and 1999, respectively. He is currently a professor at the National University of Defense Technology, and he has been the dean of the College of Sci-ence, since 2013. His current research interests include radar polarimetry, synthetic aperture radar, signal processing, and
Previous Page | Contents | Zoom in | Zoom out | Front Cover | Search Issue | Next Page qqM
Mq
qM
MqM
THE WORLD’S NEWSSTAND®
Previous Page | Contents | Zoom in | Zoom out | Front Cover | Search Issue | Next Page qqM
Mq
qM
MqM
THE WORLD’S NEWSSTAND®
___________
______________
______________

IEEE SIGNAL PROCESSING MAGAZINE [89] JULY 2014
target recognition. He is a senior member of the Chinese Insti-tute of Electronics.
Shun-Ping Xiao ([email protected]) received the B.E. and Ph.D. degrees (with honors) in electronic engineering from the National University of Defense Technology, Hunan, China, in 1986 and 1995, respectively. He is currently a professor with the National University of Defense Technology, and he has been the director of the State Key Laboratory of Complex Electromag-netic Environment Effects on Electronics and Information Sys-tem, Changsha, China, since 2012. His current research interests include radar polarimetry, synthetic aperture radar, signal processing, and target recognition. He is a senior mem-ber of the Chinese Institute of Electronics.
Motoyuki Sato ([email protected]) has been a profes-sor at Tohoku University since 1997 and a distinguished profes-sor of Tohoku University since 2007. He was the director of the Center for Northeast Asian Studies, Tohoku University (2009–2013). His current interests include transient electromagnetics and antennas, radar polarimetry, ground penetrating radar (GPR), borehole radar, electromagnetic induction sensing, and interferometric and polarimetric synthetic aperture radar. He has conducted the development of the GPR sensor Advanced Landmine Indication System for humanitarian demining. He is a visiting professor at Jilin University, China, Delft University of Technology, The Netherlands, and the Mongolian University of Science and Technology. He is a member of the IEEE Geosci-ence and Remote Sensing Society (GRSS) Administrative Com-mittee (2006–present), where he is responsible for specialty symposia and Asian issues. He was the chair of the IEEE GRSS Japan Chapter (2006–2007). He served as the general chair of the 2011 IEEE International Geocsience and Remote Sensing Symposium. He is a Fellow of the IEEE.
REFERENCES[1] J. S. Lee and E. Pottier, Polarimetric Radar Imaging: From Basics to Applications. Boca Raton, FL: CRC Press, 2009.
[2] J. J. van Zyl and Y. Kim, Synthetic Aperture Radar Polarimetry. Hoboken, NJ:Wiley, 2011.
[3] S. R. Cloude, Polarisation Application in Remote Sensing. New York: Oxford Univ. Press, 2010.
[4] W. M. Boerner, “Recent advances in extra-wide-band polarimetry, interferom-etry and polarimetric interferometry in synthetic aperture remote sensing and its applications,” Proc. Inst. Elect. Eng.-Radar, Sonar Navig., vol. 150, no. 3,pp. 113–124, June 2003.
[5] S. R. Cloude and E. Pottier, “A review of target decomposition theorems in radar polarimetry,” IEEE Trans. Geosci. Remote Sensing, vol. 34, pp. 498–518,Mar. 1996.
[6] J. R. Huynen, “Phenomenological theory of radar targets,” Ph.D. thesis, Dept. Electr. Eng., Math. Comput. Sci., Technical Univ., Delft, The Nether-lands, 1970.
[7] I. Hajnsek, T. Jagdhuber, H. Schcon, and K. P. Papathanassiou, “Potential of estimating soil moisture under vegetation cover by means of PolSAR,” IEEE Trans. Geosci. Remote Sensing, vol. 47, pp. 442–454, Feb. 2009.
[8] J. J. Sharma, I. Hajnsek, K. P. Papathanassiou, and A. Moreira, “Polarimet-ric decomposition over glacier ice using long-wavelength airborne PolSAR,” IEEE Trans. Geosci. Remote Sensing, vol. 49, pp. 519–535, Jan. 2011.
[9] S. W. Chen and M. Sato, “Tsunami damage investigation of built-up areas us-ing multi-temporal spaceborne full polarimetric SAR images,” IEEE Trans. Geosci. Remote Sensing, vol. 51, no. 4, pp. 1985–1997, Apr. 2013.
[10] A. Freeman and S. L. Durden, “A three-component scattering model for po-larimetric SAR data,” IEEE Trans. Geosci. Remote Sensing, vol. 36, pp. 963–973,May 1998.
[11] Y. Yamaguchi, T. Moriyama, M. Ishido, and H. Yamada, “Four-component scattering model for polarimetric SAR image decomposition,” IEEE Trans. Geosci. Remote Sensing, vol. 43, pp. 1699–1706, Aug. 2005.
[12] J. S. Lee, T. L. Ainsworth, and Y. Wang, “Recent advances in scatter-ing model-based decompositions: An overview,” in Proc. IEEE Int. Geoscience Remote Sensing Symp., Vancouver, Canada, July 2011, pp. 9–12.
[13] W. T. An, Y. Cui, and J. Yang, “Three-component model-based decomposi-tion for polarimetric SAR data,” IEEE Trans. Geosci. Remote Sensing, vol. 48,pp. 2732–2739, June 2010.
[14] J. S. Lee and T. L. Ainsworth, “The effect of orientation angle compensation on coherency matrix and polarimetric target decompositions,” IEEE Trans. Geosci. Remote Sensing, vol. 49, pp. 53–64, Jan. 2011.
[15] Y. Yamaguchi, A. Sato, W. M. Boerner, R. Sato, and H. Yamada, “Four-com-ponent scattering power decomposition with rotation of coherency matrix,” IEEE Trans. Geosci. Remote Sensing, vol. 49, pp. 2251–2258, June 2011.
[16] J. J. Van Zyl, M. Arii, and Y. Kim, “Model-based decomposition of polarimetric SAR covariance matrices constrained for nonnegative eigenvalues,” IEEE Trans. Geosci. Remote Sensing, vol. 49, pp. 3452–3459, Sept. 2011.
[17] S. Kusano, K. Takahashi, and M. Sato, “Volume scattering power constraint based on the principal minors of the coherency matrix,” IEEE Geosci. Remote Sensing Lett., vol. 11, no. 1, pp. 361–365, Jan. 2014.
[18] Y. Cui, Y. Yamaguchi, J. Yang, H. Kobayashi, S. E. Park, and G. Singh, “On complete model-based decomposition of polarimetric SAR coherency matrix data,” IEEE Trans. Geosci. Remote Sensing, vol. 52, no. 4, pp. 1991–2001, Apr. 2014.
[19] A. Freeman, “Fitting a two-component scattering model to polarimetric SAR data from forests,” IEEE Trans. Geosci. Remote Sensing, vol. 45, pp. 2583–2592,Aug. 2007.
[20] M. Arii, J. J. van Zyl, and Y. Kim, “Adaptive model-based decomposition of polarimetric SAR covariance matrices,” IEEE Trans. Geosci. Remote Sensing,vol. 49, pp. 1104–1113, Mar. 2011.
[21] M. Neumann, L. Ferro-Famil, and A. Reigber, “Estimation of forest struc-ture, ground, and canopy layer characteristics from multibaseline polarimetric interferometric SAR data,” IEEE Trans. Geosci. Remote Sensing, vol. 48, no. 3,pp. 1086–1104, Mar. 2010.
[22] M. Arii, J. J. van Zyl, and Y. Kim, “A general characterization for polarimet-ric scattering from vegetation canopies,” IEEE Trans. Geosci. Remote Sensing,vol. 48, pp. 3349–3357, Sept. 2010.
[23] J. S. Lee, T. L. Ainsworth, and Y. Wang, “Generalized polarimetric model-based decompositions using incoherent scattering models,” IEEE Trans. Geosci. Remote Sensing, vol. 52, no. 5, pp 2474–2491, May 2014.
[24] J. D. Ballester-Berman and J. M. Lopez-Sanchez, “Applying the Freeman-Durden decomposition concept to polarimetric SAR interferometry,” IEEE Trans. Geosci. Remote Sensing, vol. 48, no. 1, pp. 466–479, Jan. 2010.
[25] S. W. Chen, X. S. Wang, Y. Z. Li, and M. Sato, “Adaptive model-based polari-metric decomposition using PolInSAR coherence,” IEEE Trans. Geosci. Remote Sensing, vol. 52, no. 3, pp. 1705–1718, Mar. 2014.
[26] S. W. Chen, X. S. Wang, S. P. Xiao, and M. Sato, “General polarimetric model-based decomposition for coherency matrix,” IEEE Trans. Geosci. Remote Sensing,vol. 52, no. 3, pp. 1843–1855, Mar. 2014.
[27] G. Singh, Y. Yamaguchi, and S.-E. Park, “General four-component scatter-ing power decomposition with unitary transformation of coherency matrix,” IEEE Trans. Geosci. Remote Sensing, vol. 51, no. 5, pp. 3014–3022, May 2013.
[28] S. R. Cloude and K. P. Papathanassiou, “Polarimetric SAR interferom-etry,” IEEE Trans. Geosci. Remote Sensing, vol. 36, no. 5, pp. 1551–1565,Sept. 1998.
[29] T. Jagdhuber, I. Hajnsek, A. Bronstert, and K. P. Papathanassiou, “Soil mois-ture estimation under low vegetation cover using a multi-angular polarimetric de-composition,” IEEE Trans. Geosci. Remote Sensing, vol. 36, no. 4, pp. 2201–2215,Apr. 2013.
[30] S. R. Cloude, D. G. Goodenough, and H. Chen, “Compact decomposition theory,” IEEE Geosci. Remote Sensing Lett., vol. 9, no. 1, pp. 28–32, Jan. 2012.
[SP]
Previous Page | Contents | Zoom in | Zoom out | Front Cover | Search Issue | Next Page qqM
Mq
qM
MqM
THE WORLD’S NEWSSTAND®
Previous Page | Contents | Zoom in | Zoom out | Front Cover | Search Issue | Next Page qqM
Mq
qM
MqM
THE WORLD’S NEWSSTAND®
_______________
____________

IEEE SIGNAL PROCESSING MAGAZINE [90] JULY 2014 1053-5888/14/$31.00©2014IEEE
Digital Object Identifier 10.1109/MSP.2014.2311271
Date of publication: 13 June 2014
This article deals with two significant aspects related to synthetic aperture radar imaging (SAR-I) of relevant theoretical and applicative interest. The first objective regards the analysis of the most-used SAR-I approaches under the
unified mathematical framework pro-vided by the Porter–Bojarski inte-gral equation. The second objective is to provide an updated overview on how SAR-I research is general-izing previous algorithms to deal with unconven-tional scenarios.
INTRODUCTIONSAR-I was originally intro-duced with regard to a sce-nario where the investigated scene is probed by a satellite plat-form-based synthetic aperture radar (SAR). Now, the corresponding imaging algorithms have crossed the boundaries of satel-lite imaging so that SAR-I refers to more general radar imaging contexts that encompass real (not synthetic) arrays, near-zone configurations, and layered (more in general lossy) scenarios. Therefore, SAR-I algorithms are relevant to many applicative sce-narios, ranging from monitoring and nondestructive diagnostics to border surveillance, security, and crisis management. Accord-ingly, a large body of methods has populated the specialized liter-ature; see, e.g., [1] and [2].
The need to link/compare these imaging methods arises quite naturally, and few works attempting to address such a compara-tive analysis have been presented in the literature [3]. In [4], the
classical matched filtered approach is reinterpreted as a particular case of some seismic migra-
tion; a similar analysis has been pre-sented in [5], where the version of
SAR-I given in [6] was com-pared to the frequency-wave-
number (F-K) migration. From a different point of view, Bamler showed in [7] that the wavenumber SAR focusing is related to the classical Range–Dop-pler method without
explicitly invoking the wave equation. The relationship
between the Kirchhoff migra-tion and the seismic method is
instead well known [2]. However, most of the aforementioned works com-
pared only a couple of methods and a more com-prehensive study is still missing.
Accordingly, the first objective of this article is to provide a unified and rigorous mathematical framework for several SAR-I approaches. To this end, we consider the traditional SAR-I scenario, i.e., the scattered field is collected under a mul-timonostatic measurement configuration (i.e., the transmitter and receiver are colocated) in a free-space scenario and the scattering phenomenon is assumed to be scalar. Despite SAR-I traditionally dealing with two-dimensional (2-D) scene approxi-mations (e.g., slant plane imaging or 2-D sliced approach), here the case of three-dimensional (3-D) scene is considered. This is
[Raffaele Solimene, Ilaria Catapano, Gianluca Gennarelli, Antonio Cuccaro,
Angela Dell’Aversano, and Francesco Soldovieri]
[A unified mathematical overview]
Recent Advances in Synthetic Aperture Ra
darIma
ging
PH
OTO
CO
UR
TE
SY
OF
NA
SA
Previous Page | Contents | Zoom in | Zoom out | Front Cover | Search Issue | Next Page qqM
Mq
qM
MqM
THE WORLD’S NEWSSTAND®
Previous Page | Contents | Zoom in | Zoom out | Front Cover | Search Issue | Next Page qqM
Mq
qM
MqM
THE WORLD’S NEWSSTAND®
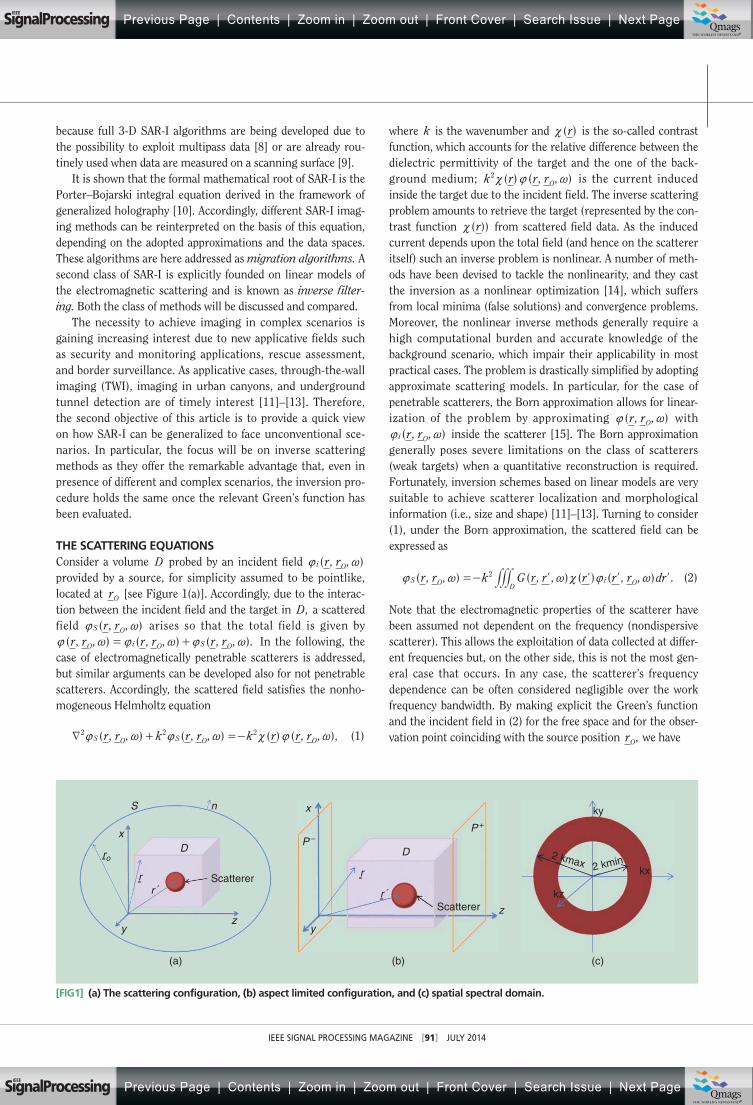
IEEE SIGNAL PROCESSING MAGAZINE [91] JULY 2014
because full 3-D SAR-I algorithms are being developed due to the possibility to exploit multipass data [8] or are already rou-tinely used when data are measured on a scanning surface [9].
It is shown that the formal mathematical root of SAR-I is the Porter–Bojarski integral equation derived in the framework of generalized holography [10]. Accordingly, different SAR-I imag-ing methods can be reinterpreted on the basis of this equation, depending on the adopted approximations and the data spaces. These algorithms are here addressed as migration algorithms. Asecond class of SAR-I is explicitly founded on linear models of the electromagnetic scattering and is known as inverse filter-ing. Both the class of methods will be discussed and compared.
The necessity to achieve imaging in complex scenarios is gaining increasing interest due to new applicative fields such as security and monitoring applications, rescue assessment, and border surveillance. As applicative cases, through-the-wall imaging (TWI), imaging in urban canyons, and underground tunnel detection are of timely interest [11]–[13]. Therefore,the second objective of this article is to provide a quick view on how SAR-I can be generalized to face unconventional sce-narios. In particular, the focus will be on inverse scattering methods as they offer the remarkable advantage that, even in presence of different and complex scenarios, the inversion pro-cedure holds the same once the relevant Green’s function has been evaluated.
THE SCATTERING EQUATIONSConsider a volume D probed by an incident field ( , , )r ri O{ ~
provided by a source, for simplicity assumed to be pointlike, located at rO [see Figure 1(a)]. Accordingly, due to the interac-tion between the incident field and the target in ,D a scattered field ( , , )r rS O{ ~ arises so that the total field is given by
.( , , ) ( , , ) ( , , )r r r r r rO i O S O{ ~ { ~ { ~= + In the following, the case of electromagnetically penetrable scatterers is addressed, but similar arguments can be developed also for not penetrable scatterers. Accordingly, the scattered field satisfies the nonho-mogeneous Helmholtz equation
( )( , , ) ( , , ) ( , , ),r r k r r k r r rS O S O O2 2 2d |{ ~ { ~ { ~+ =- (1)
where k is the wavenumber and ( )r| is the so-called contrast function, which accounts for the relative difference between the dielectric permittivity of the target and the one of the back-ground medium; ( ) ( , , )k r r rO
2| { ~ is the current induced inside the target due to the incident field. The inverse scattering problem amounts to retrieve the target (represented by the con-trast function ( ))r| from scattered field data. As the induced current depends upon the total field (and hence on the scatterer itself) such an inverse problem is nonlinear. A number of meth-ods have been devised to tackle the nonlinearity, and they cast the inversion as a nonlinear optimization [14], which suffers from local minima (false solutions) and convergence problems. Moreover, the nonlinear inverse methods generally require a high computational burden and accurate knowledge of the background scenario, which impair their applicability in most practical cases. The problem is drastically simplified by adopting approximate scattering models. In particular, for the case of penetrable scatterers, the Born approximation allows for linear-ization of the problem by approximating ( , , )r rO{ ~ with
( , , )r rOi{ ~ inside the scatterer [15]. The Born approximation generally poses severe limitations on the class of scatterers (weak targets) when a quantitative reconstruction is required. Fortunately, inversion schemes based on linear models are very suitable to achieve scatterer localization and morphological information (i.e., size and shape) [11]–[13]. Turning to consider (1), under the Born approximation, the scattered field can be expressed as
( , , ) .( , , ) ( , , ) ( ) r drr r k G r r r r OS O Di
2 ~{ ~ ~ | {=- ll l l### (2)
Note that the electromagnetic properties of the scatterer have been assumed not dependent on the frequency (nondispersive scatterer). This allows the exploitation of data collected at differ-ent frequencies but, on the other side, this is not the most gen-eral case that occurs. In any case, the scatterer’s frequency dependence can be often considered negligible over the work frequency bandwidth. By making explicit the Green’s function and the incident field in (2) for the free space and for the obser-vation point coinciding with the source position ,rO we have
S
x
zz
yy
ro
rr ′
D D
n
r
r ′Scatterer
Scatterer
x
P –P +
ky
kx
kz
2 kmin2 kmax
(a) (b) (c)
[FIG1] (a) The scattering configuration, (b) aspect limited configuration, and (c) spatial spectral domain.
Previous Page | Contents | Zoom in | Zoom out | Front Cover | Search Issue | Next Page qqM
Mq
qM
MqM
THE WORLD’S NEWSSTAND®
Previous Page | Contents | Zoom in | Zoom out | Front Cover | Search Issue | Next Page qqM
Mq
qM
MqM
THE WORLD’S NEWSSTAND®

IEEE SIGNAL PROCESSING MAGAZINE [92] JULY 2014
( , ) ( ) ( )( ) ,
expr
k Ir rjk r r
r dr4 42
S OO
O
D
2
2{ ~r~
r|=-
-
- -### (3)
where ( )I ~ is the transmitted signal Fourier spectrum. There-fore, ( )r| can be retrieved by inverting the linear integral equa-tion (3). The SAR-I based on the inversion of (3) are addressed as the inverse filtering methods.
Under ideal conditions (no noise and sampling effects), the scattering operator in (3) is injective and so, in principle, the contrast reconstruction can be obtained with “unlimited” reso-lution. However, the scattering operator in (3) is compact [16] and uncertainties are always present. Therefore, to obtain stable reconstructions, a tradeoff between resolution and stability must be always established.
As suggested in [15], starting from (3) and by considering ( , ) , ( )/ [ ( ) / ]r r k Ik j4S O OS
22 2{ ~ ~ ~r{=u as data, the following relationship can be established:
( , ) * ( ) * ( ) ( , )
( , ) ( ) ,
, , , ,r n G G n r S
G r r r r
r r r r
2
d
j d
S OSS O
D
O O
im
22
22{ ~ { ~
~ |
~ ~-
= l l l
u u
#####
(4)
where ( , , )r rG O ~ and ( , , ),G r r0im ~ are the Green’s function corresponding to real and imaginary parts of the quantity ,k2respectively; S is a closed measurement surface surrounding D ,and / n22 is the derivative along the outward normal. The obtained equation is the Porter–Bojarski equation, which repre-sents the foundation of generalized holography and establishes in a rigorous way the link between the backpropagated field and the scatterer. It is also interesting to outline that the time-domain ver-sion of (4) is equivalent to the widely used time-reversal imaging [17]. Differently from (3), (4) readily permits an estimate of ( )r|from the scattered field (and its normal derivative). However, for a finite frequency bandwidth, only a spatial band-limited version of
( )r| can be retrieved, with Fourier transform supported over the spherical shell ,k k k2 2min max min# #h and ,kmax being the wave-numbers corresponding the minimum and maximum work fre-quencies, respectively, and h is the radial coordinate in the Fourier k-space [see Figure 1(c)]. This can be explained by noting that the volume integral in (4) is a spatial convolution whose ker-nel, ,( , ),G r rOim ~ at a single frequency has a spatial Fourier transform supported on the Ewald’s sphere of radius .k2 It is interesting to note that the limit on the achievable resolution due to the aforementioned filtering [at variance of what happens while inverting (3)] is intrinsic of the method as no noise, uncertainties, and sampling effects have been considered in its derivation.
It must be stressed that full-view data (i.e., over a closed sur-face containing the scattering scene) have been considered while deriving (3) and (4). In most practical cases, data can be gathered only over a part of S and often under a reflection mode configuration. Therefore, it is necessary to address how (4) changes for aspect limited configurations. To this end, S can be deformed into two planes so that S P P,= - + (say P- and P+are orthogonal to the z-axis) and the scattering volume is now
the spatial region enclosed between these planes [see Figure 1(b)]. For a reflection mode configuration, data are collected only over P- (or .)P+ Accordingly, the surface integral in (4) particularizes as
( , ) * ( , , )
* ( , , ) ( , ) .
r z G r r dP
G r r z r P
2
2 d
S OP O
OPS O
22
22
{ ~ ~
~ { ~
-
=
-
-
-
-
u
u
##
## (5)
Some clarifications are in order. First, the surface integration restricted over a plane requires knowing only the field or its normal derivative [15]. Second, it can be shown that it is possi-ble to retrieve only the spatial spectrum of ( )r| belonging to the Ewald’s sphere part with .k 0z # Finally, when the mea-surement aperture R is a subset of ,P- the spatial filtering is even more severe and dictated by the aperture size [18].
SAR-IIn this section, most of the SAR-I approaches are reviewed and reinterpreted under a unified framework provided by (3) and (4).
MIGRATIONIn view of the assumed linearity for the scattering phenomenon, the reconstruction performances of the imaging algorithms can be provided by analysing the point spread function (i.e., the recon-struction of a pointlike scatterer). Accordingly, consider a pointlike scatterer located in the object space at ( , , ),r x y z= and denote as rO the observation point belonging to the measurement aperture R (a subset of the plane )z zO= and let ( )i t be the transmitted signal. The corresponding backscattered field is given by
( , )| |
,r t i t cr r
2S OO{ = --
c m (6)
where amplitude factor due to the propagation spreading has been neglected and ( )i t is a short duration pulse or the pulse after range compression has occurred. Actually, due to the finite directivity of the antennas, a point scatterer appears as a diffrac-tion hyperboloid whose apex is located at .( , , / )x y z c2 The aim of migration is to compensate such a spreading by refocusing each segment of the hyperbola to its apex.
The first method to accomplish such a task is a graphical method, which dates back to the work of Hogendoorn [19]. Basically, for each measurement point, a semisphere centered on the source-receiver position and of radius equal to the travel-time times half the wave speed is drawn; then, the scatterer’s location is identified as the point where all the semispheres intersect. This graphical method is known as wave interference migration [20]. A different way to implement the same imaging concept is through the so-called diffraction summation [20]. In this method, the object space is divided in pixels and for each of them a diffraction hyperboloid is constructed in the data space. Then, the reconstruction at each pixel is obtained by summing up contributions where the synthetic hyperboloid intersects data. Formally, the reconstruction is provided by ( )R r (corre-sponding to the migrated data)
Previous Page | Contents | Zoom in | Zoom out | Front Cover | Search Issue | Next Page qqM
Mq
qM
MqM
THE WORLD’S NEWSSTAND®
Previous Page | Contents | Zoom in | Zoom out | Front Cover | Search Issue | Next Page qqM
Mq
qM
MqM
THE WORLD’S NEWSSTAND®

IEEE SIGNAL PROCESSING MAGAZINE [93] JULY 2014
( ) ( , ) | | ,R r r t t c r r d dt2S O O
T
{ d R= - -R
c m## (7)
where T is the time interval during which data are collected. After Fourier transforming with respect to the time, (7) can be recast (apart an unessential factor) as
( ) ( , ) ( | |) ,expR r r k j k r r d dk2S O O
k
{ R= -XR
## (8)
kX being the frequency band in the k domain. Equation (8) points out the equivalence between the diffraction summation and the range migration technique [9] as well as to the SAR focusing technique [21]. The spatial convolution in (8) can be conveniently computed in the spatial Fourier domain so that
( ) ( , , ) ( , , ) [ ( )]
[ ( )] ,
exp
exp
R r f k k k k k k j k x k y
jk z z dk dk dk
x y S x y x y
z O x y
kk kx y
{= - +
-XX -
##(9)
where k kx yX - is the selected frequency band in the spatial spec-tral plane , ,k kx y^ h ;k k k k4z x y
2 2 2= - - ( , , )f k k kx y is a slowly varying amplitude factor arising by performing the Fourier transform of the exponential kernel ( )exp j k x z2 2 2+ thanks to the stationary phase method. Finally, (9) can be recast as a 3-D Fourier transform as
( )( , , )
( , , ) [ ( )]
[ ( )] .
exp
exp
R rk k k
k f k k kk k k j k x k y
jk z z dk dk dkx y z
z x y zS x y z x y
z O x y z
2 2 2{=
+ +- +
-X
#
(10)
Equation (10) has the computational advantage that it can be efficiently computed by FFT for each point in the object space but also requires data to be interpolated and resampled accord-ing to a rectangular grid in the k space [22]. It can be noted that, unless the amplitude factor, (10) is identical to the SAR-I algorithm presented in [6] and also very similar to the F-K migration as outlined in [5].
A more rigorous derivation follows the wave equation along with to the so-called exploding source model, which holds for both penetrable and nonpenetrable targets. Accordingly, the scattered field is thought as being radiated by a source at time t 0= embedded within a medium characterized by a half the wave speed. Therefore, by accounting for only up-traveling (i.e., toward the measurement aperture) waves and by enforcing the boundary condition over the measurement aperture at ,z zO=
the field can be backpropagated in the object space as
( ) ( , , ) [ ( )]
[ ( )] .
exp
exp
R r k k j k x k y
jk z z dk dk d
S x y x y
z O x y
kx ky
{ ~
~
= - +
-XX -
##
(11)
This is the so-called F-K migration and (11) can be readily recast in spatial domain as
( ) ( , ) ( , , ) .R r r z G r r d d*s O O2
2{ ~ ~ ~R=XR
## (12)
Migration in (12) is known as the Rayleigh–Sommerfeld holog-raphy and its time domain is the well-known Kirchhoff migra-tion [2]. Equation (12) has been obtained by requiring fewer approximations with respect to the previous methods; in fact, the amplitude spreading term has not been ignored and the sta-tionary phase method has not been employed. Therefore, it can be considered as the mathematical rationale supporting the intuitive discussion under which previous migration schemes have been developed. However, (12) suffers of an implicit con-tradiction: while the field is backpropagated as a solution of a homogeneous wave equation, the exploding source assumes it is being radiated by a localized source. Differently, these issues are completely avoided in (5), and therefore, the Porter–Bojarski equation can be considered as a rigorous mathematical founda-tion for the migration algorithms. Nonetheless, migration algo-rithms succeed in the localization of the discontinuities and the estimation of the geometry of the targets, since all previous methods led to a correct phase compensation. This is apparent by comparing the point spread function returned by (12)
( , ')
| ' |( | ' |)
| |( | |)
,exp exp
r r
kr r
jk r rz r r
jk r rd d
2 2psf
O
O
O
O22 2
2 ~R=-
- -
-
-
XR
= G##(13)
and (5)
.
( , ')
| ' |( | ' |)
| |( | |)exp exp
r r
r rjk r r
z r rjk r r
d d2 2
psf
O
O
O
O
22 ~R=
-
- -
-
-
XR
= G##(14)
The difference between (13) and (14) resides only in amplitude factors ,| ' |r rO - which become relevant only for near zone configuration, and in the k2 term that basically acts as a high-pass filter [5].
INVERSE FILTERINGInverse filtering algorithms aim at reconstructing ( )r| by solving (2). A simple way to address such a task is to Fourier transform the kernel function [20] and the resulting inversion scheme is referred to as diffraction tomography. More generally, the reconstruction problem can be cast as the inversion of the linear scalar operator (2). Rewriting such an equation in operator notation
: ,A S"| { (15)
where | and S{ are assumed to belong to suitable functional sets possibly according to a priori information about the unknown. To accommodate the effect of uncertainties and noise on data, usually the data space is assumed to be the Hilbert space of square integrable functions. This choice is also quite common for the unknown space, when no a priori information is available. The solution is then stated as
.{ }inf A S2| | {= -u (16)
Previous Page | Contents | Zoom in | Zoom out | Front Cover | Search Issue | Next Page qqM
Mq
qM
MqM
THE WORLD’S NEWSSTAND®
Previous Page | Contents | Zoom in | Zoom out | Front Cover | Search Issue | Next Page qqM
Mq
qM
MqM
THE WORLD’S NEWSSTAND®

IEEE SIGNAL PROCESSING MAGAZINE [94] JULY 2014
Since the operator A is compact, (16) cannot have a solution, or if the solution exists it does not depend continuously on data, so the inverse problem is ill posed [16]. The lack of stability of solu-tion can be restored by adopting a regularizing inversion scheme such as the Tikhonov method. This regularization scheme exploits a priori information about the unknown [16] and casts the inversion problem as a constrained optimization problem
.{ }inf A BS S2 2| | { a {= - +au (17)
Here B is a suitable constraint (smoothing) operator and a is the regularization parameter; a popular choice is ,B I= which con-strains the energy of solution. Important questions are the exis-tence of the solution and its convergence (to the generalized solution) as the regularization parameter and the noise tend to zero. On this topic, there is a large body of literature, and the reader can find an excellent basic review in [16]. It is clear that the key question is the choice of the regularization parameter, which actually establishes the tradeoff between stability and smoothing of the solution. Different methods exist to select the regularization parameter. These methods can explicitly exploit the knowledge of the noise level, as the Morozov discrepancy principle, or not such as the generalized cross validation [16]. Another very popular method is the so-called L-curve, which estimates the regularization parameter in correspondence of the knee exhibited by the trajec-tory described by the solution in the discrepancy-norm of the solu-tion plane as a varies [23]. However, the Tikhonov method as well as the regularization schemes based on (17) are particular cases of windowing regularization, i.e.,
,,W
vu,n
n
S n
nn
0|
v
{=
3
a a
=
u / (18)
where W ,n a filtering window and , ,v un n nv" , is the singular sys-tem of the scattering operator .A In inverse scattering problems, the relevant operator kernel is an analytic function of exponential type (far from its singularities) and this entails, for most situations, that the singular values have a nearly steplike behavior. Accord-ingly, the choice of W ,n a is simplified as it can be set equal to
{ : , : },W n N n N1 0,n T T2#=a where NT (the number of degrees of freedom) is the truncation index chosen around the knee exhib-ited by the singular values [24]. This regularization method is addressed as truncated singular value decomposition (TSVD) [16].
We end this section by making a comparison between the migration and inverse filtering methods. By looking at (8), it can be easily understood that migration basically performs the inver-sion by resorting to the adjoint of the scattering operator. This allows at obtaining a stable reconstruction, but even in absence of noise there is an intrinsic limitation on achievable resolution.
Finally, in the framework of inverse filtering, a new paradigm based on compressive sampling [25] has gained recent attention. The approach is of relevant interest when the scattering scene is sparse with respect to a suitable representation dictionary (roughly saying, if the target occupies a small fraction of the area to be imaged). In this case, the imaging problem is formulated as in (17), but the regularization term is based on the L1 norm.
Details on why such a kind of inverse filtering allows obtaining highly resolved reconstructions with sparse set of data is left to the pertinent literature. Here, we just mention the Baraniuk’s article [26] where an intuitive geometrical interpretation is pro-vided in terms of the “shape” of the hyperspheres in .L1 Of course, also for this scheme, the choice of the regularization parameter a is crucial, since it dictates the degree of sparsity at which the scene is reconstructed.
SOME UNCONVENTIONAL APPLICATIONS Many operational contexts require image scatterers embedded in complex obscuring and multipath environments (see Figure 2) [11]–[13], as in ground penetrating radar (GPR) and TWI surveys. In these cases, the first main difficulty regards the clutter arising from the obscuring medium, which can overwhelm the desired target response, especially for lossy background and/or when tar-gets are close to the air/soil interface or wall. In most cases, using classical preprocessing procedures, such as time-gating and back-ground removal solves the problem. The problem is more chal-lenging when the target response overlaps to the background returns. In this case, more sophisticated methods have to be employed [27].
The second difficulty regards the inaccurate knowledge of the electromagnetic properties of the embedding medium, which leads to defocused and delocalized reconstructions. Accordingly, a large body of research has been dedicated to the estimation of medium properties before/while imaging (e.g., see [27]).
Assuming that previous issues have been solved, we now focus on the reconstruction capabilities of model-based inversion meth-ods, particularly on the inverse filtering and the migration (inver-sion by using the adjoint of the operator). These imaging approaches are formulated by taking into account the Green’s function pertinent to the reference scenario under test. Accord-ingly, even though inverse filtering generally are computationally more challenging, they provide procedures more flexible and adaptable to a larger class of scenarios. The last consideration also includes measurement set-up where data are taken over a nonpla-nar aperture and possibly nonuniformly.
The first applicative example concerns the reconstruction of a dielectric target hidden in a dry soil, whose average dielectric permittivity has been estimated to be 4.5, while its electric con-ductivity has been fixed equal to 1 ms/m. The target is a sphere having diameter 6.5 cm and hidden 7.5 cm below the air–soil interface within a 100 cm × 70 cm × 45 cm wood tank; see Figure 3(a). The data have been collected on a 24 cm × 24 cm square grid with a 4-cm measurement step along both the x and y axis by means of a K2-RIS GPR system (produced by IDS Cor-poration) equipped with a single polarization 2-GHz antenna. The GPR traces have been gathered in a 16-ns time window. The measured data have been preprocessed by means of the back-ground removal filtering procedure to remove the direct antenna coupling and the backscattered field due to the air–soil interface. Then they have been transformed into the frequency domain and processed by means of Born approximation-based imaging approaches and the adjoint-based inversion procedure. A
Previous Page | Contents | Zoom in | Zoom out | Front Cover | Search Issue | Next Page qqM
Mq
qM
MqM
THE WORLD’S NEWSSTAND®
Previous Page | Contents | Zoom in | Zoom out | Front Cover | Search Issue | Next Page qqM
Mq
qM
MqM
THE WORLD’S NEWSSTAND®

IEEE SIGNAL PROCESSING MAGAZINE [95] JULY 2014
frequency range [1.1; 1.8] GHz has been selected and evenly sampled with a frequency step of 70 MHz (11 frequencies).
The obtained results are given in Figure 3(b)–(d), which show the constant depth slices of the reconstructed contrast function as normalized to its maximum value. These results have been obtained by assuming a half space as a reference scenario and assess the utility of a full 3-D wave propagation model. In particular, by comparing the results in Figure 3(b)–(d), we can state that the full 3-D Born approximation imaging approach provides cleaner images, from which the target’s shape and size can be estimated. Conversely, the migration-based reconstruction of Figure 3(c) is most sensitive to the soil inhomogeneity, and it is affected by sev-eral ghosts appearing in the upper part of the investigation domain. Finally, the most common pseudo-3-D algorithm, which produces 3-D images by interpolating 2-D reconstructions, does not allow for an accurate reconstruction of the geometrical features of the tar-get. The results in Figure 3(b) and (d) have been obtained by fixing the TSVD threshold in such a way to filter out all those singular values that are 30 dB below the maximum.
Inverse filtering approaches are suitable also for SAR-I in complex urban environments. In this framework, building walls obscuration and attenuation reduce the ability to detect targets, and most notably the electromagnetic signal propagation undergoes multipath effects. This usually produces artefacts (ghosts) so increasing the number of false alarms. A possible strategy to overcome this last problem is to mitigate multipath returns. In this frame, frequency dependence of scattering prop-erties of target and multipath structure cannot be ignored and a multipath separation requires large operational bandwidth.
However, when the target and the radar are not in the line of sight, the only possibility to retrieve information about its presence is thanks to multipath exploitation. Multipath exploitation is an emerging field of research in the framework of SAR-I for urban sensing applications [12], [28]. The main focus is on the develop-ment of multipath models leading to correct and easily interpreta-ble SAR images free from multipath ghosts. Furthermore, as shown in [12] and [28], a correct modeling and exploitation of the multipath provides additional information that may potentially improve imaging performance in terms of resolution limits.
We will discuss a novel and interesting application that helps us to elucidate these concepts [12]. Specifically, we are concerned with the problem of imaging strong scattering targets located in an urban canyon. In particular, we consider the 2-D scenario in Figure 4(a), which, though simple, accounts for all the relevant ingredients to highlight the necessity of a correct model-based approach for imaging targets in a complex multiscattering envi-ronment. The scene is probed by a ground-based SAR standing in close proximity of the canyon entrance. Due to the peculiar geometry, at each measurement point the received echo from the target is the superposition of various multipath contributions (e.g., direct path, single reflection path, diffraction path, etc.). It must be stressed that, depending on the system constraints in terms of operating bandwidth and/or aperture size, these mul-tipath returns may be or not well separated in time.
A linear scattering model is applicable under Kirchhoff’s approximation; however, as a noncanonical geometry is involved, no closed-form analytical expressions for the Green’s function are readily available. A possible answer may be to com-pute approximate expressions for instance by ray optics models. Alternatively, one must necessarily resort to numerical tech-niques which are quite flexible and therefore applicable in sev-eral contexts. In particular, the finite difference time domain (FDTD) method represents a good candidate.
Some representative results for a perfectly cylindrical target with radius 0.1 m and centered at the point (0, 1.3) m are reported in Figure 4, along with the scattering layout [Figure 4(a)]. A UWB electromagnetic pulse having the shape of a Ricker wavelet with central frequency of 1,600 MHz is radiated by each antenna, whereas the working frequency range is [1, 2] GHz discretized at a 50-MHz step. The SAR array is composed by 11 line sources with a spacing of 0.1 m placed in correspondence of the canyon entrance. The frequency domain scattered field data have been inverted by applying the TSVD inversion scheme with a truncation index selected in such a way to filter out the singular values lower than –20 dB with respect to the maximum one.
As can be seen in Figure 4(b), when the image is obtained by inverting the actual data by means of the free-space Green’s function, some artefacts, due to multipath, arise in the image
Ω
Ω
εb, σb
ε0 μ0
zz
y
y
xx
Γ
Γ
MeasurementLines
ObservationDomain
Σ
Scatterer
Investigation DomainD
TX/RX Positions in (–XM, XM)
xxM–xM
zmin
xmin
zmax
–xmin
Target
z
(a) (b) (c)
Incident Field
[FIG2] A schematic view for (a) GPR imaging, (b) TWI imaging, and (c) urban street canyon SAR-I.
Previous Page | Contents | Zoom in | Zoom out | Front Cover | Search Issue | Next Page qqM
Mq
qM
MqM
THE WORLD’S NEWSSTAND®
Previous Page | Contents | Zoom in | Zoom out | Front Cover | Search Issue | Next Page qqM
Mq
qM
MqM
THE WORLD’S NEWSSTAND®

IEEE SIGNAL PROCESSING MAGAZINE [96] JULY 2014
so to impair the localization of the real target. On the other hand, when the correct Green’s function (computed by FDTD) is adopted, the true target is well localized and the multipath ghosts are completely suppressed [see Figure 4(c)].
As a term of comparison, we report in Figure 4(d) the tomo-graphic reconstruction achievable with the adjoint inversion and the reconstruction performance are worse compared to the inverse filtering solution. Finally, by comparing the urban canyon recon-struction in Figure 4(c) to that attainable in a free-space scenario [see Figure 4(e)] with the same array configuration, it can be seen that the image relevant to the canyon scenario highlights a larger portion of the upper scatterer’s contour. This peculiar feature is a direct consequence of multipath exploitation that, in the specific example, is mainly related to the specular reflections from the building walls. From the physical perspective, this fact can be inter-preted by considering that the rays emitted by the source, reflected from the walls and reaching the target can be seen as originated by
“virtual sources” falling outside the array. In other words, the tar-get is “viewed” under a wider angle. As a result, once taken into account in the forward model, the multipath improves the image resolution in crossrange. Further details on the resolution enhancement due to multipath exploitation can be found in [12].
Finally, as further examples of unconventional measurement configurations, significant attention has been recently devoted to the development of hardware and data processing solutions for the multistatic SAR-I both for satellite imaging [29] and in [30] for high-resolution imaging for short-range applications.
CONCLUDING DISCUSSIONIn this article, a quick overview of several SAR-I algorithms has been presented. The discussion mainly focused on establishing the rigorous mathematical framework upon which such imaging algorithms are founded. It has been shown that SAR-I algorithms can be classified in inverse filtering and migration methods. The
x (cm)
y (c
m)
z = 5 cm
–0.1 0 0.1
–0.1
0
0.1
x (cm)
y (c
m)
z = 7 cm
–0.1 0 0.1
–0.1
0
0.1
x (cm)
y (c
m)
z = 9 cm
–0.1 0 0.1
–0.1
0
0.1
x (cm)
y (c
m)
z = 11 cm
–0.1 0 0.1
–0.1
0
0.1
x (cm)
y (c
m)
z = 13 cm
–0.1 0 0.1
–0.1
0
0.1
x (cm)
y (c
m)
z = 15 cm
–0.1 0 0.1
–0.1
0
0.1
0 0.1 0.2 0.3 0.4 0.5 0.6 0.7 0.8 0.9 1
x (cm)
y (c
m)
z = 5 cm
–0.1 0 0.1
–0.1
0
0.1
x (cm)y
(cm
)
z = 7 cm
–0.1 0 0.1
–0.1
0
0.1
x (cm)
y (c
m)
z = 9 cm
–0.1 0 0.1
–0.1
0
0.1
x (cm)
y (c
m)
z = 11 cm
–0.1 0 0.1
–0.1
0
0.1
x (cm)
y (c
m)
z = 13 cm
–0.1 0 0.1
–0.1
0
0.1
x (cm)
y (c
m)
z = 15 cm
–0.1 0 0.1
–0.1
0
0.1
0 0.1 0.2 0.3 0.4 0.5 0.6 0.7 0.8 0.9 1
x (cm)
y (c
m)
z = 5 cm
–0.1 0 0.1
–0.1
0
0.1
x (cm)
y (c
m)
z = 7 cm
–0.1 0 0.1
–0.1
0
0.1
x (cm)
y (c
m)
z = 9 cm
–0.1 0 0.1
–0.1
0
0.1
x (cm)
y (c
m)
z = 11 cm
–0.1 0 0.1
–0.1
0
0.1
x (cm)
y (c
m)
z = 13 cm
–0.1 0 0.1
–0.1
0
0.1
x (cm)
y (c
m)
z = 15 cm
–0.1 0 0.1
–0.1
0
0.1
0 0.1 0.2 0.3 0.4 0.5 0.6 0.7 0.8 0.9 1
(b)(a)
(d)(c)
[FIG3] A GPR imaging example. (a) An experimental setup, (b) depth slices of the full 3-D TSVD reconstruction, (c) depth slices of the full 3-D migration (reconstruction by the adjoint of the operator), and (d) depth slices of the pseudo-3-D TSVD reconstruction.
Previous Page | Contents | Zoom in | Zoom out | Front Cover | Search Issue | Next Page qqM
Mq
qM
MqM
THE WORLD’S NEWSSTAND®
Previous Page | Contents | Zoom in | Zoom out | Front Cover | Search Issue | Next Page qqM
Mq
qM
MqM
THE WORLD’S NEWSSTAND®

IEEE SIGNAL PROCESSING MAGAZINE [97] JULY 2014
first are methods that achieve imaging by inverting the linearized scattering operator. Migration, instead, basically achieves imaging by compensating the scattering phase by properly adopting a spa-tially varying filter. Interestingly, it has been shown that the gen-eralized holography coming from the Porter–Bojarski equation is the more rigorous migration scheme. In fact, the generalized holography provides an explicit relationship between the migrated field and the target and does not rely on the homoge-neous wave equation and the exploding source model. Nonethe-less, all migration schemes provide similar results because they compensate the scattering phase in the same way.
A comparison between migration and inverse filtering has been briefly addressed as well. Basically, as migration performs the inversion by approximating the inverse operator by the adjoint of the scattering operator, the achievable resolution is intrinsically limited. However, the inverse scattering problem is ill posed and noise and uncertainties are always present.
As shown by representative examples based on synthetic and experimental data, migration generally provides worse imaging performance compared to the inverse filtering; however, inverse filtering is usually more computationally demanding.
AUTHORSRaffaele Solimene ([email protected]) received the lau-rea degree (summa cum laude) in 1999 and the Ph.D. degree in 2003 in electronic engineering, both from the Seconda Università di Napoli (SUN), Aversa, Italy. In 2002, he became an assistant professor at the Faculty of Engineering of the University Mediter-ranea of Reggio Calabria, Italy. Since 2006, he has been with the Dipartimento di Ingegneria Industriale e dell’Informazione at SUN. His research activities focus on nondestructive subsurface investigations, through-the-wall imaging, and breast cancer detection. On these topics, he coauthored more than 150 scien-tific works.
z (m
)
z (m
)
x (m)x (m)−1 −0.5 0 0.5 1
−0.5
0
0.5
1
1.5
2
−0.4 −0.2 0 0.2 0.4
0.4
0.6
0.8
1
1.2
1.4
1.6
1.8
2
2.20.1
0.2
0.3
0.4
0.5
0.6
0.7
0.8
0.9
1
z (m
)
x (m)
(b)(a) (c)
−0.4 −0.2 0 0.2 0.4
0.4
0.6
0.8
1
1.2
1.4
1.6
1.8
2
2.20.1
0.2
0.3
0.4
0.5
0.6
0.7
0.8
0.9
1
y (m
)
x (m)−0.4 −0.2 0 0.2 0.4
0.4
0.6
0.8
1
1.2
1.4
1.6
1.8
2
2.20.1
0.2
0.3
0.4
0.5
0.6
0.7
0.8
0.9
1z
(m)
x (m)(d) (e)
−0.4 −0.2 0 0.2 0.4
0.4
0.6
0.8
1
1.2
1.4
1.6
1.8
2
2.20.1
0.2
0.3
0.4
0.5
0.6
0.7
0.8
0.9
1
[FIG4] Urban canyon SAR imaging: (a) scattering layout, (b) reconstruction with TSVD and free-space Green’s function, (c) reconstruction with TSVD and urban canyon Green’s function, (d) reconstruction with adjoint inversion and urban canyon Green’s function, and (e) reconstruction with TSVD obtained with the same array configuration in a free-space scenario.
Previous Page | Contents | Zoom in | Zoom out | Front Cover | Search Issue | Next Page qqM
Mq
qM
MqM
THE WORLD’S NEWSSTAND®
Previous Page | Contents | Zoom in | Zoom out | Front Cover | Search Issue | Next Page qqM
Mq
qM
MqM
THE WORLD’S NEWSSTAND®
_________________

IEEE SIGNAL PROCESSING MAGAZINE [98] JULY 2014
Ilaria Catapano ([email protected]) is a level-three research scientist at the Institute for Electromagnetic Sensing of the Environment, National Research Council of Italy (IREA-CNR). She received the Ph.D. degree in electric and information engineering from the University of Cassino, Italy, in 2006. In 2003, she started her research activity at IREA-CNR. Her scien-tific interest mainly concerns noninvasive electromagnetic diag-nostics, the development and performance assessment of microwave imaging approaches, and subsurface radar systems. She received the 2004 G. Barzilai Award by the Italian Electro-magnetic Society, was one of the Young Scientist Awardees at the 2008 XXIX Union Radio-Scientifique Internationale General Assembly, served as an adjunct professor at the Mediterranea University, Reggio Calabria, Italy (2010), and was an invited lec-turer at São Paulo University, Brazil (2013).
Gianluca Gennarelli ([email protected]) received the M.S. degree (summa cum laude) in electronic engineering and the Ph.D. degree in information engineering from the University of Salerno, Italy, in 2006 and 2010, respectively. He held a postdoc-toral fellowship at the University of Salerno from April 2010 to December 2011. Since January 2012, he has been a research fellow with IREA-CNR, Napoli, Italy. His interests cover theoretical and applied electromagnetic research topics such as microwave sen-sors, electromagnetic inverse scattering problems for nondestruc-tive subsurface investigations, through-the-wall imaging, diffraction problems, near-field far-field transformation tech-niques, and electromagnetic simulation.
Antonio Cuccaro ([email protected]) received the laurea degree (summa cum laude) in electronic engineering from the Seconda Università di Napoli, Aversa (SUN), Italy, in 2012. Since then he joined the research group in applied elec-tromagnetic fields of SUN as a Ph.D. student in electronic engi-neer. His main fields of interest are through-the-wall imaging applications and biomedical imaging.
Angela Dell’Aversano ([email protected]) received the laurea degree (summa cum laude) in electronic engineering from the Seconda Università di Napoli (SUN), Aversa, Italy, in 2012. Since then she joined the SUN research group in applied electromagnetic fields as a Ph.D. student in electronic engineering, and she is currently working on her Ph.D. thesis. Her main research interests include inverse scat-tering problems and microwave imaging.
Francesco Soldovieri ([email protected]) received the Ph.D. degree in electronic engineering from the University of Naples “Federico II,” Naples, Italy, in 1996. Since 2006, he has been a senior researcher at IREA-CNR. He was the general chair of the 2007 International Workshop on Advanced Ground Penetrat-ing Radar (GPR) and cochair of the 2010 International Conference on GPR. He is an associate editor of IEEE Geoscience and Remote Sensing Letters. He was awarded the 1999 Honorable Mention for the H.A. Wheeler Applications Prize Paper Award of the IEEE Antennas and Propagation Society. His main scientific interests include electromagnetic diagnostics, inverse scattering, GPR applications, antenna diagnostics and characterization, and secu-rity applications. He is a Member of the IEEE.
REFERENCES[1] D. C. Munson and R. L. Visentin, “A signal processing view of strip-mapping synthetic aperture radar,” IEEE Trans. Acoust., Speech, Signal Process., vol. 37,no. 12, pp. 2131–2147, 1989.[2] W. A. Schneider, “Integral formulation for migration in two and three dimen-sions,” Geophysics, vol. 43, no. 1, pp. 49–76, 1978.[3] J. van der Kruk, “Three-dimensional imaging of multicomponent ground-penetrating radar data” Ph.D. dissertation, Dept. Appl. Earth Sci., Delft Univ. Technology, The Netherlands, 2001.[4] C. Cafforio, C. Prati, and F. Rocca, “SAR data focusing using seismic migration techniques,” IEEE Trans. Aerosp. Electron. Syst., vol. 27, no. 2, pp. 194–207, 1991.[5] G. Gilmore, I. Jeffry, and J. Lo Vetri, “Derivation and comparison of SAR and frequency-wavenumber migration within a common inverse scalar wave problem formulation,” IEEE Trans. Geosci. Remote Sensing, vol. 44, no. 16, pp. 1454–1461, 2006.[6] M. Soumekh, Synthetic Aperture Radar Signal Processing with MATLAB Algorithms. New York: Wiley, 1999.[7] R. Bamler, “A comparison of range–Doppler and wavenumber domain SAR focusing algorithms,” IEEE Trans. Geosci. Remote Sensing, vol. 30, no. 4, pp. 706–713, 1992.[8] G. Fornaro, F. Lombardini, and F. Serafino, “Three-dimensional multipass SAR focusing: Experiments with long-term spacerborne data,” IEEE Trans. Geosci. Re-mote Sensing, vol. 43, no. 4, pp. 702–714, 2005.[9] J. M. Lopez-Sanchez and J. Fortuny-Guasch, “3-D radar imaging using range migration techniques,” IEEE Trans. Antennas Propag., vol. 48, no. 5, pp. 728–737,2000.[10] R. P. Porter and A. J. Devaney, “Holography and the inverse source problem,” J. Opt. Soc. Am., vol. 72, no. 3, pp. 327–330, 1982.[11] M. G. Amin, Through-the-Wall Radar Imaging. Boca Raton, FL: CRC Press,2011.[12] G. Gennarelli, and F. Soldovieri, “A linear inverse scattering algorithm for radar imaging in multipath environments,” IEEE Geosci. Remote Sensing Lett.,vol. 10, no. 5, pp. 1085–1089, 2013.[13] L. Lo Monte, D. Erricolo, F. Soldovieri, and M. C. Wicks, “Radio frequency tomography for tunnel detection,” IEEE Trans. Geosci. Remote Sensing, vol. 48,no. 3, pp. 1128–1137, 2010.[14] W. C. Chew, Waves and Fields in Inhomogeneous Media. Piscataway, NJ:IEEE, 1995.[15] K. J. Langenberg, “Applied inverse problems for acoustic, electromagnetic and elastic wave scattering,” in Basic Methods for Tomography and Inverse Problems, P. C. Sabatier, Ed. Bristol: Hilger, 1987, pp. 127–467.[16] M. Bertero, “Linear inverse and ill-posed problems,” Adv. Electron. Electron. Phys., vol. 45, pp. 1–120, 1989.[17] D. Cassereau and M. Fink, “Time-reversal of ultrasonic fields—Part III: Theory of the closed time-reversal cavity,” IEEE Trans. Ultrason. Ferroelectr., Freq. Con-trol, vol. 39, no. 5, pp. 579–592, 1992.[18] V. T. Vu, T. K. Sjogren, M. I. Pettersson, and H. Hellesten, “An impulse re-sponse function for evaluation of UWB SAR imaging,” IEEE Trans. Signal Process-ing, vol. 58, no. 7, pp. 3927–3932, 2010.[19] J. G. Hagedoorn, “A process of seismic reflection interpretation,” Geophys. Prosp., vol. 2, no. 2, pp. 85–127, 1954.[20] J. Gazdag and P. Sguazzero, “Migration of seismic data,” Proc. IEEE, vol. 72,no. 10, pp. 1302–1315, 1984.[21] R. Markelein, K. Mayer, R. Hannemann, T. Krylow, K. Balasubramanian,K. J. Langenberg, and V. Scmitz, “Linear and nonlinear algorithms applied in non-destructive evaluation,” Inv. Probl., vol. 18, pp. 1733–1757, Nov. 2002.[22] R. H. Stolt, “Migration by Fourier transform,” Geophysics, vol. 43, no. 1, pp. 23–48, 1978.[23] P. C. Hansen, J. Nagy, and D. P. O’Leary, Deblurring Images: Matrices, Spectra and Filtering. New York: SIAM, 2008.[24] R. Solimene, M. Maisto, and R. Pierri, “Role of diversity on the singular values of linear scattering operators: The case of strip objects,” J. Opt. Soc. Am. A, vol. 30,no. 11, pp. 2266–2272, 2013.[25] D. L. Donoho, “Compressed sensing,” IEEE Trans. Inform. Theory, vol. 52,no. 4, pp. 1289–1306, 2006.[26] R. G. Baraniuk, “Compressive sensing [Lecture Notes],” IEEE Signal Process-ing Mag., vol. 24, no. 4, pp. 118–121, 2007.[27] H. Jol, Ground Penetrating Radar Theory and Applications, 1st ed. Amsterdam, The Netherlands: Elsevier Science, 2008.[28] P. Setlur, M. Amin, and F. Ahmad, “Multipath model and exploitation in through-the-wall and urban radar sensing,” IEEE Trans. Geosci. Remote Sensing,vol. 49, no. 10, pp. 4021–4034, 2011.[29] D. Cerutti-Maori and J. Ender, “Performance analysis of multistatic configura-tions for spaceborne GMTI based on the auxiliary beam approach,” IEE Proc. Radar, Sonar Navigat., no. 2, pp. 96–103, 2006.[30] X. Zhuge, A. G. Yarovoy, T. Savelyev, and L. Ligthart, “Modified Kirchhoff mi-gration for UWB MIMO array-based radar imaging,” IEEE Trans. Geosci. Remote Sensing, vol. 48, no. 6, pp. 2692–2703, 2010.
[SP]
Previous Page | Contents | Zoom in | Zoom out | Front Cover | Search Issue | Next Page qqM
Mq
qM
MqM
THE WORLD’S NEWSSTAND®
Previous Page | Contents | Zoom in | Zoom out | Front Cover | Search Issue | Next Page qqM
Mq
qM
MqM
THE WORLD’S NEWSSTAND®
____________________
_________________
______________
_______________
______________

1053-5888/14/$31.00©2014IEEE IEEE SIGNAL PROCESSING MAGAZINE [99] JULY 2014
Digital Object Identifier 10.1109/MSP.2014.2311165
Date of publication: 13 June 2014
This tutorial-style article presents the novel concept of time-reversal-based airborne ground penetrating radar (TR-AGPR) and its application for soil imaging and gives a brief descrip-tion of the time-reversal
synthetic aperture radar SAR (TR-SAR) focusing algorithm. The intent of this article is to answer the question as to whether the time-reversal-based algorithm is a feasi-ble technique for SAR focusing of a buried tar-get (structure).
INTRODUCTIONSynthetic aperture radar (SAR) [1], [2] is one of the most important engineering inventions of the last century. High-resolution images are commonly used over a wide range of applications. With a var-ied number of modes and purposes, the SAR system pro-vides comprehensive imaging capabilities in microwave frequency range at different altitudes (airborne or spaceborne systems), on a large scale (depending on the footprint size), and in different frequency bands. Furthermore, electromagnetic (EM) waves have the ability to penetrate into the soil, be scattered on its inhomogeneities, and travel toward the initial source location in the form of backscattered waves. On the other hand, a radar system designed for nondestructive subsurface soil imaging,
referred to as ground penetrating radar (GPR) [3], more often uses the SAR technique for high-resolution imaging of the sub-
surface soil structure. A GPR system mostly operates as an ultra-wideband (UWB) [4] system in a low-
frequency range [very high frequency (VHF)/ultrahigh frequency (UHF),
and P-band and L-band of fre-quency] and has a limited
area of imaging, thus signif-icantly reducing the ability to image complex and vast buried structures to local-scale applications. The area of the GPR imaging process depends
on three factors: 1) the width of footprint over the
surface (antenna pattern, height, and incident angle), 2)
the effective penetration depth of soil, and 3) the antenna displacement.
SAR and GPR imaging processes exhibit simi-larities. For instance, both imaging processes have a
common feature, i.e., they are formed as a result of antenna movement above the surface at a constant height. Although hav-ing many differences, similarities between the two imaging pro-cesses led to the idea that it is possible to model and develop a concept of airborne GPR (AGPR), i.e., a radar system combining the advantages and essential features of the two well-known SAR/GPR techniques and operating over a large scale.
Some early attempts at this concept have been already per-formed in the Shuttle Imaging Radar-B mission: for instance, with the shuttle over a desert [5], [6] or glacier [7]. Due to natu-ral environmental conditions, the structures of a desert and
[Robert Kedzierawski, Jean-Marc Le Caillec, and Witold Czarnecki]
[Theoretical improvements and practical limitations]
Recent Advances in Synthetic Aperture Ra
darIma
ging
PH
OTO
CO
UR
TE
SY
OF
NA
SA
Previous Page | Contents | Zoom in | Zoom out | Front Cover | Search Issue | Next Page qqM
Mq
qM
MqM
THE WORLD’S NEWSSTAND®
Previous Page | Contents | Zoom in | Zoom out | Front Cover | Search Issue | Next Page qqM
Mq
qM
MqM
THE WORLD’S NEWSSTAND®

IEEE SIGNAL PROCESSING MAGAZINE [100] JULY 2014
glacier are strongly similar to a homogeneous structure (dry sand or ice) with almost constant EM parameters in the observed area. Hence, the propagation medium can be approximated as two homogeneous half-spaces, i.e., free space and a material medium. A similar homogeneous approach of the soil structure, with con-stant values of permittivity f and conductivity ,v was used in discussions, analysis, and numerical simulations [8]–[10]. Unfor-tunately, such a homogeneous approximation of the soil struc-ture does not correspond to the vast majority of lands, which are a mixture of different soil types, arranged in horizontal-layered structures with varied texture and parameters inside a single layer. Due to the inhomogeneous nature of the soil, the backscat-tered signal derived from multireflections of the EM waveform transmitted through the soil is disrupted by dispersion and loss effects. This leads to energy dissipation and pulse distortion strongly affecting the output of the matched filtering and signifi-cantly degrading the spatial resolution. Detailed analysis of the low-frequency SAR focusing problems was carried out in [11]. The most important problem is the strong defocusing of the backscattered signal in range (depth) dimension, which does not allow one to fully benefit from the SAR processing. The primary step to take advantage of the SAR processing should be the neu-tralization (or compression) of the defocusing effects in depth dimension. On the other hand, the time-reversal (TR) [12]–[15] technique is used to exploit multipath propagation in rich scat-tering media and to provide significant detection gain. For instance, experiments in the microwave frequency range 4–6 GHz with single antenna were described and performed in [15]. Overall, the TR is incorporated with the wide range of remote sensing applications to improve their imaging and detection effi-ciency [16]. Its applications in the SAR were described, e.g, for target focusing and removing ghost images [17], [18], as well as for change detection [19]. Furthermore, the TR were used for beamforming imaging [20] and source localization in changing media [21]. In addition, the TR were applied in the GPR for the focusing algorithm [22] and for TR-based range estimation [23].
The expansion of the functionality of the side-looking airborne radar (SLAR) with a new method of scanning along a modern sig-nal focusing algorithm, based on the TR approach, may result in novel and uncommon capabilities for high-resolution imaging of soil structure over a large scale and in many areas. A validation of the TR focusing algorithm would provide new broad-area imaging capabilities that would be usable in many fields, such as soil-resource mapping, environmental protection, and military sur-veillance and recognition. Before focusing on a general TR-AGPR concept, the modeling of the soil texture and the EM parameters are introduced to fully understand the complex nature of soil as a material medium, and TR principles are presented.
SOIL MODELING
PHYSICAL MODELIn general, modeling of the EM parameter of the soil is limited to estimating the permittivity f and the conductivity .v The permeability n is assumed to be free space. Estimation of the
relative complex dielectric constant rf is performed by a pedo-transfer function [24], [25] based on the soil texture and mois-ture profile. In [26], it is shown that the geological database is a valuable source of information about the soil texture, its inho-mogeneous and layered nature.
The soil typological unit (STU), from the geological database Soil Profile Analytical Database For Europe (SPADE)/2, contains averaged information about soil texture of the selected volume of ground, is organized as a column vector defined in depth dimen-sion, and presents information, e.g., about the percentage of clay
,cl percentage of silt ,st percentage of sand ,sd and bulk density .bt Relative amounts of clay, silt, and sand determine the soil
class. The fundamental method for classifying the soil types has been illustrated by the U.S. Department of Agriculture in the form of triangle, based on the relationships between percentages of dif-ferent sizes of particles. The 12 classes of unequal areas are distin-guishable, ranging from homogeneous (sand, silt, clay) to highly mixed (loam) [25].
The theory of pedotransfer function assumes the estimation of the immeasurable (or difficulty measurable) parameters from one or more measurable ones, i.e., estimation of rf based on soil texture , , ,c s sl t d bt^ h and soil moisture profile .mv The rf
of soil mixture can be expressed as
,jr r rf f f= -l m (1)
where the real part rfl is the dielectric constant of an equivalent lossless material, and the imaginary part rfm is the dielectric loss factor. Using the pedotransfer function proposed in [24], the real and imaginary part of (1) can be expressed as
. [ ( ) ] . ,m m1 15 1 1 0 68rs
bs v v
1f
t
tf f= + - + - -a b
~a
al ll (2)
,[ ]mr v1
f f= b~aam mm (3)
respectively. Variables in (2) and (3) mean mv is soil moisture profile; bt is bulk density of soil mixture; st = 2.66 g/cm3 is char-acteristic bulk density of soil mixture; sf is the dielectric con-stant of the soil solids and is given by ( . . )1 01 0 44s s
2f t= + -
. ;0 062 a= 0.65 is the empirical coefficient; bl and bm are empirical coefficients dependent on soil texture (i.e., cl and );sd
and f~l and f~m are mainly frequency-dependent parameters, and less texture-and-moisture dependent [24]–[26]. The fre-quency dependence of rf is one of the most important issues for UWB signals. According to (2) and (3), the soil mixture shows a dispersion nature and variations of both parts of rf are not monotonic [26]. Moreover, (2) and (3) indicate a strong depen-dence of permittivity from the soil moisture profile .mv Refer-ring to [26], the permittivity changes can be described as a process whose amplitude is similar to the soil moisture profile mv and is modulated by the soil texture, implying the influence of sd and cl into bl and bm [see [26, eqs. (13) and (14)]. Figure 1 shows an example of geological and EM modeling of the soil layered structure based on data from SPADE/2 and the pedotransfer function. Originally, soil typological unit (STU)
Previous Page | Contents | Zoom in | Zoom out | Front Cover | Search Issue | Next Page qqM
Mq
qM
MqM
THE WORLD’S NEWSSTAND®
Previous Page | Contents | Zoom in | Zoom out | Front Cover | Search Issue | Next Page qqM
Mq
qM
MqM
THE WORLD’S NEWSSTAND®

IEEE SIGNAL PROCESSING MAGAZINE [101] JULY 2014
HU360084 was composed of three classes of soil (horizons), starting from the top:
■ sandy clay loam (0, –0.96) m■ sand (–0.96, –1.38) m■ sandy clay (–1.38, –2.5) m.
Other classes of soil were artificially added in this STU profile to get more complex geological structures. Figure 1(a) presents the soil’s geological structure estimated on the basis of STU HU360084 to a depth of ZN = 2.5 m; the thickness of the each planar layer ln
equals dn= 5 mm. Thus, it results in structure of N 500= layers each with different geological structures and a planar interface between consecutive layers .,l ln n 1+^ h In realistic conditions, sev-eral man-made objects (or structures) can be buried at different depths, locations, and inclinations to the surface, e.g., pipelines, underground storage tanks, cables, rocks, archaeological remains,
mines, unexploded ordinances, and others. For the sake of simplic-ity, a bare and flat soil surface is assumed, thus avoiding taking into account the surface shape (roughness) and vegetation in the back-scattered signal simulation.
Referring to the modeling process presented in [26], the equivalent absolute value of the rf is presented in Figure 1(b), for single frequency f = 480 MHz. Although three main horizons of soil geological texture [see Figure 1(a)], due to the nonmono-tonic changes of the moisture profile ,mv the volume of | |rf pre-sented on Figure 1(b) consists of four ranges of similar dielectric constant values, from the top:
■ (0, –0.96) m ■ (–0.96, –1.38) m■ (–1.38, –1.59) m■ (–1.59, –2.5) m.
[FIG1] An example of a horizontal-layered soil structure: (a) geological and (b) relevant absolute value of complex relative dielectric constant rf .
–0.0
–0.5
–1.0
–1.5
–2.0
–2.5
1,00
090
080
070
060
050
040
030
020
010
0 00
500
1,000
1,500
2,000
2,500
Clay
Silty Clay
Sandy Clay
Silty Clay Loam
Clay Loam
Sandy Clay Loam
Silt
Silt Loam
Sandy Loam
Loamy Sand
Sand
Loam
(a)
–0.0
–0.5
–1.0
–1.5
–2.0
–2.5
1,00
090
080
070
060
050
040
030
020
010
0 00
500
1,000
1,500
2,000
2,500
30
28
26
24
22
20
18
16
14
12
10
(b)
Previous Page | Contents | Zoom in | Zoom out | Front Cover | Search Issue | Next Page qqM
Mq
qM
MqM
THE WORLD’S NEWSSTAND®
Previous Page | Contents | Zoom in | Zoom out | Front Cover | Search Issue | Next Page qqM
Mq
qM
MqM
THE WORLD’S NEWSSTAND®

IEEE SIGNAL PROCESSING MAGAZINE [102] JULY 2014
Inner range values differ slightly, the largest differences of the | |rf occur at the interfaces between ranges, due to the water exchange processes. Various hydrological properties of the indi-vidual soil layers cause the nonmonotonic progress of water percolation into and evaporation from soil structure. A complex nature of the mv (with respect to its shape and variation over time and spatial coordinates) forces to it numerical calculation [11], [26], for instance, based on the Richards’ equations [27] and the soil hydraulic parameters [25].
BACKSCATTERED SIGNALTheoretically, in a rich scattering medium, the target response of a point scatterer consists of a direct amplitude-scaled echo and multipath echoes from the surrounding scatterers. On the other hand, the target response ( )s tr in an AGPR consists of a strong backscattered echo derived from surface reflection and a weak cumulative echo from soil structure. The strong backscattered echo comes from the boundary between the sensor half-space and soil half-space. Furthermore, the weak echo from soil struc-ture contains direct amplitude-scaled and distorted echo from point scatterers, and superposition of every indirect multipath reflections from the point scatterers and an infinite number of multipath reflections from soil inhomogeneities. Therefore, the target response ( )s tr can be generally expressed as
,( ) ( ) ( ) * ( )s t s t h t s t tr r t di
i t d i1surface reflection
internal multireflections
v x x= - + - -3
=1 2 344 441 2 3444444 444444/ (4)
where rv is surface reflection coefficient, ( )s tt is transmitted radar signal, dx is the two-way time delay between radar and surface, ( )h ti is impulse response of ith propagation path inside the soil, ti is propagation time of ith path, and * denotes time convolution. The first term in (4), representing surface reflec-tion, strongly disturbs a weak cumulative echo derived from internal multireflections in the soil structure and should be pro-cessed as clutter. Furthermore, even a slight difference of EM parameters (e.g., rf ) between two consecutive layers ,l ln n 1+^ h
causes energy reflection proportionally to the reflection coeffi-cient [3]. Permittivity ,r nf affects the propagation time through the layer ,ln thus in consequence, the change of ,r nf affects the propagation time ti of the ith path (passing by the layer .)ln
Considering the downward and upward traveling of the UWB pulse only through a small number of dispersive layers L in the structure presented in Figure 1(b), where ,L N% with N of considered layers (see the section “Physical Model”), the back-scattered pulse distortion becomes nonnegligible. In addition, Ldecreases when the bandwidth of UWB pulse increases.
The main task of source separation methods is the extraction of weak cumulative echoes occurring on the strong surface reflection background. This operation is similar to the ground refection removal (GRR) used in the GPR imaging process and is aimed at the separation of strong terrain returns, which domi-nate in backscattered signal and shade weak echoes from the entire soil structure and not only from the upper shallow layers. In conventional GPR, the separation of surface reflection is
performed, for example, by the blind source separation [28], compressive sensing [29], or the simple averaging-and-subtrac-tion methods. The perpendicular location of the antenna directly above the ground surface reduces the footprint and allows one to process ground returns as point reflection assigned only to antenna coordinates, which simplifies processing. Unfortunately, there are a number of theoretical and practical issues related with the use of source separation methods in AGPR. First, the use of an airborne platform considerably increases the level of the ground returns caused by a significant expansion of the observed surface (a broader footprint on the surface in comparison to the vehicle-mounted GPR). Second, a nonperpendicular observation angle results in the spread of ground returns across time in the range from near slant range R sn to far slant range .R sf There-fore, a weak cumulative echo from soil structure derived from the slant range R ,s r occurs on the background of the superposi-tion of every ground return within the footprint. Additionally, the incident angle affects both the level of ground returns and the backscattered echo from buried targets, similarly as in conven-tional GPR. The complexity of source separation issues is only briefly highlighted in this article, however, the investigation of source separation techniques and their applicability is outside the scope of this article and will be addressed in future works.
TIME-REVERSAL
HYPOTHESISThe TR technique [12]–[16] exploits the reversibility (reciprocity) of the propagation medium, which means that a field and its time symmetric form can both propagate in this medium. Using the TR operator [ ]T [14], the “reversible” form of four vectorial fields describing EM waves , , , andE H D Br r r r are expressed as follows:
.
[ ( , )] ( , ),
[ ( , )] ( , ), [ ( , )] ( , )
[ ( , )] ( , ),E r t E r t D r t D r t
H r t H r t B r t B r t
T
T T
T = -
=- - =- -
= - r r r r
r r r r r r r r
r r r r
(5)
The TR invariance of the following wave equation in nondisper-sive and lossless media
( , ) ( ) ( ) ( , )E r t r rt
E r t 022
2d
22
n f- =r r r r r r (6)
indicates that vector electric field ( , )E r tr r and its time-reversed version [ ( , )]E r tT r r are solutions of the same wave equation (6). However, loss and dispersive media are naturally present in the environment, e.g., a soil mixture with all its natural belongings and man-made objects. The basic idea of the TR is to re-emit the received pulse to alleviate these loss effects. A nonzero value of the conductivity ( )rv r and dependence of medium permittivity from frequency ( , ) [ ( , )]r t rF 1 ~f f= -r r leads to the wave equation
.( , ) ( ) ( ( , ) * ( , )) ( ) ( ) ( , )E r t rt
r t E r t r r t E r t 022
2d
22
22n f n v- - =r r r r r r r r r r
(7)
The comparison of (6) and (7) shows the presence of the addi-tional term with first derivation of the ( , )E r tr r in our case. Thus, the conventional TR operator cannot be directly applied into
Previous Page | Contents | Zoom in | Zoom out | Front Cover | Search Issue | Next Page qqM
Mq
qM
MqM
THE WORLD’S NEWSSTAND®
Previous Page | Contents | Zoom in | Zoom out | Front Cover | Search Issue | Next Page qqM
Mq
qM
MqM
THE WORLD’S NEWSSTAND®

IEEE SIGNAL PROCESSING MAGAZINE [103] JULY 2014
loss media. In addition, the attenuation in dispersive media affecting each frequency component of ( , )E r tr r depends on the medium properties, for instance, the conductivity [compare (6) and (7)]. Without taking theoretical considerations into account [30], we describe the influence of dispersion and irregular atten-uation on the (ultra-)wideband signal, e.g., on the common radar linear frequency modulated (LFM) pulse.
■ Dispersion: In a dispersive medium, each wave component has a different phase velocity. Depending on the dispersion characteristic of the medium, when higher frequency compo-nents travel faster than the lower frequency components, then the duration time of up-chirp decreases while for down-chirp it increases, and reversely. Thus, the LFM pulse (whether up- or down-chirp) traveling through the dispersive medium does not maintain a constant value. Therefore, the once-changed shape can be retrieved with a fairly high accu-racy after retransmission through the same medium but with reversed internal frequency changes (down- or up-chirp). ■ Irregular attenuation: The frequency-dependent attenuation separately affects the amplitude of each frequency component of the LFM pulse. Depending on the attenuation properties of the medium, the amplitude of the LFM characteristic spectrum can change to any other shape. The attenuation characteristic in the frequency domain can be obtained based on the compari-son between the initial spectrum and the attenuated signal spectrum. Nevertheless, a priori knowledge about attenuation properties (for instance, based on the physical soil model, as shown in the section “Soil Modeling”) can be used to selectively amplify the attenuated frequency components to reach the desired shape. Thus, based on the attenuation characteristics obtained in a first transmission with initial LFM pulse, in retransmission each frequency component can be selectively overamplified to ensure the shape of the reattenuated spectrum similar to the characteristic spectrum of the LFM pulse. Taking both effects into account, it can be assumed that the
mirrored (time-reversed) retransmission of the once irregularly attenuated and dispersed signal through the same medium, with selective amplification of each frequency components, allows restoration of the initial pulse with very high precision. This hypothesis assumes a unchanging medium as well as the same location of the transmitter and receiver in the initial transmission and the secondary retransmission.
FOCUSING ALGORITHMAs shown in [12]–[16], TR measurement is organized as two successive and implicitly linked probings, where a single prob-ing is composed of its own signal transmission and registration. Thus, TR measurement can be simply represented as two pairs of signals: the first pair of [ ( ), ( )]s t s tt
frf representing the trans-
mitted ( )s ttf and recorded ( )s tr
f signal in forward probing, and the second pair of ( ), ( )s t s tt
trrtr6 @ representing the transmitted
( )s tttr and recorded ( )s tr
tr signals in TR probing. As follows from the TR assumptions, ( ),s tt
tr depends on ( ),s trf i .e. ,
( ) [ ( )],s t K SF *ttr
a rf1 ~= - where Ka is an energy normalization
factor, ( ) ,[ ( )]S s tFrf
rf~ = [ ]F is the Fourier transform, and *
denotes conjunction. This time-frequency dependence between ( )s tt
tr and ( )s trf results from the TR assumptions and is aimed
at retracing the signal propagation path and coherent energy refocusing phenomenon. Hence, the two remaining signals, i.e.,
( )s ttf and ( ),s tr
tr represent an input and an output of TR mea-surement. The first, ( )s tt
f , is a well-known radar waveform. The second, ( )s tr
tr , is supposed to represent the temporal and spatial refocused energy. While the signal is emitted with pulses cen-tered on the carrier frequency, the (re)focusing algorithm con-sists of matched filtering performed in the baseband frequency range on ( )s tr
tr and with ( )s ttf as a reference signal for providing
a high resolution and maximizing signal-to-noise ratio (SNR).
TR-BASED AGPR CONCEPTWithin the soil geological structure as well as the consequences on the backscattered signal presented in the section “Soil Model-ing” and the focusing hypothesis and algorithm described in the section “Time-Reversal,” we describe the TR-AGPR system designed for imaging of an optically invisible soil structure. From the geometrical point of view, the TR-AGPR configuration is identical to the SLAR configuration. The key difference lies in the different purposes of observation. Classical SAR systems are devoted to imaging the terrain surface, and a typical high-resolu-tion SAR image represents only a reflectivity of the terrain sur-face. On the contrary, TR-AGPR intends to image the optically invisible soil structure located under the surface and process typ-ical backscattered terrain returns as clutter. Figure 2 presents an adequate geometry of a TR-AGPR system (in SLAR, strip-mode SAR) with an example location of buried objects in the soil.
An AGPR mission, similar to SAR missions, is performed at a height H with the platform velocity .vp The antenna beam, with azimuth azi and elevation eli beamwidth, is oriented at an angle .ini TR-AGPR systems, during an acquisition along the synthetic aperture line ,Lsar observe swath about width WL
meters and length dependent on the duration of the TR-SAR acquisition. The near slant range to swath is Rsn and the far slant range is .Rsf The soil structure, presented in Figure 2, contains three types of usual objects located at typical depths for each. Antipersonnel mines are placed just below the surface, pipelines are usually located down to several meters, and stones (or rocks) may occur at every depth. Such objects have their own dielectric constants, defined by the material from which they are made (for instance, see [3, Table 2.1]).
TR-BASED METHOD OF SCANNINGAs shown in Figure 2, from the geometrical point of view, the conventional SLAR and TR-AGPR configurations are similar. The difference lies in the way of pulse transmission and signal processing. Unlike traditional SARs, as stated in the section “Focusing Algorithm,” TR-AGPR has two signal transmissions. First, a chirplike radar signal, of duration Ts and total energy
,Es is transmitted. Backscattered returns are recorded in time window .Tw Then, after source separation (see the section “Backscattered Signal”), TR operation and energy normaliza-tion, a new radar signal is transmitted and backscattered
Previous Page | Contents | Zoom in | Zoom out | Front Cover | Search Issue | Next Page qqM
Mq
qM
MqM
THE WORLD’S NEWSSTAND®
Previous Page | Contents | Zoom in | Zoom out | Front Cover | Search Issue | Next Page qqM
Mq
qM
MqM
THE WORLD’S NEWSSTAND®
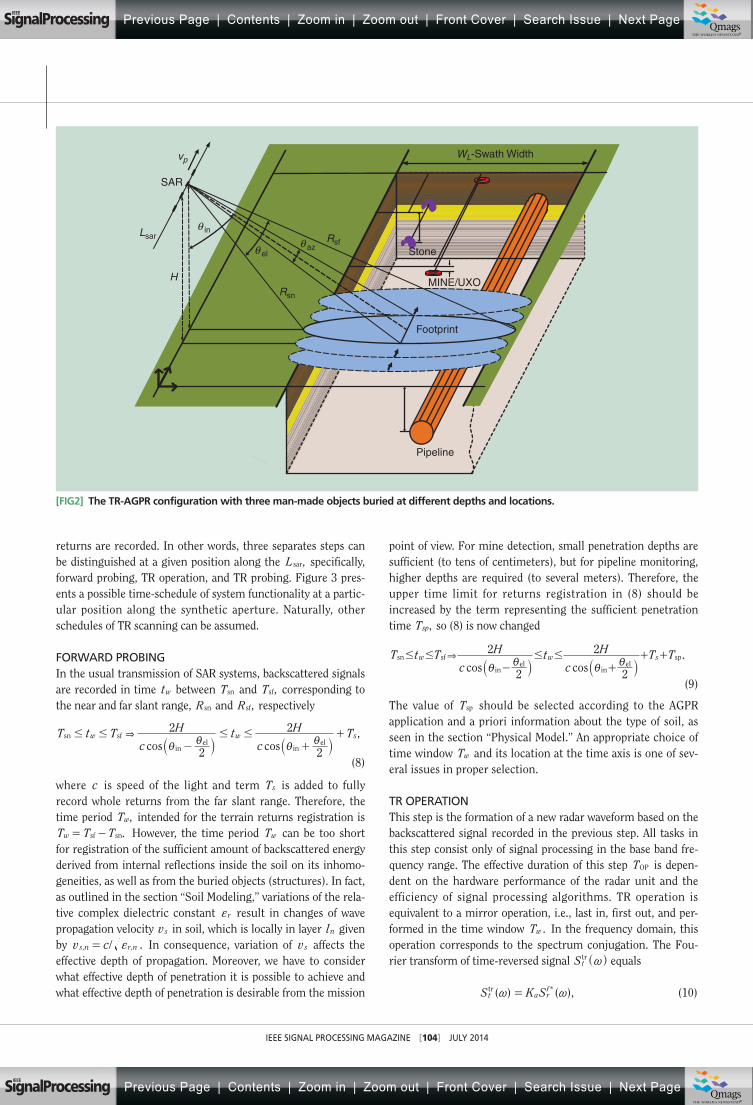
IEEE SIGNAL PROCESSING MAGAZINE [104] JULY 2014
returns are recorded. In other words, three separates steps can be distinguished at a given position along the ,Lsar specifically, forward probing, TR operation, and TR probing. Figure 3 pres-ents a possible time-schedule of system functionality at a partic-ular position along the synthetic aperture. Naturally, other schedules of TR scanning can be assumed.
FORWARD PROBINGIn the usual transmission of SAR systems, backscattered signals are recorded in time tw between Tsn and ,Tsf corresponding to the near and far slant range, Rsn and ,Rsf respectively
,cos cos
T t Tc
H tc
H T
2
2
2
2w w ssn sf
inel
inel
&# # # #i
ii
i- ++
` `j j(8)
where c is speed of the light and term Ts is added to fully record whole returns from the far slant range. Therefore, the time period ,Tw intended for the terrain returns registration is
.T T Tw sf sn= - However, the time period Tw can be too short for registration of the sufficient amount of backscattered energy derived from internal reflections inside the soil on its inhomo-geneities, as well as from the buried objects (structures). In fact, as outlined in the section “Soil Modeling,” variations of the rela-tive complex dielectric constant rf result in changes of wave propagation velocity vs in soil, which is locally in layer ln given by / .v c, ,s n r nf= In consequence, variation of vs affects the effective depth of propagation. Moreover, we have to consider what effective depth of penetration it is possible to achieve and what effective depth of penetration is desirable from the mission
point of view. For mine detection, small penetration depths are sufficient (to tens of centimeters), but for pipeline monitoring, higher depths are required (to several meters). Therefore, the upper time limit for returns registration in (8) should be increased by the term representing the sufficient penetration time ,Tsp so (8) is now changed
.cos cos
T t Tc
H tc
H T T
2
2
2
2w w ssn sf
inel
inel
sp&# # # #i
ii
i- ++ +
` `j j(9)
The value of Tsp should be selected according to the AGPR application and a priori information about the type of soil, as seen in the section “Physical Model.” An appropriate choice of time window Tw and its location at the time axis is one of sev-eral issues in proper selection.
TR OPERATIONThis step is the formation of a new radar waveform based on the backscattered signal recorded in the previous step. All tasks in this step consist only of signal processing in the base band fre-quency range. The effective duration of this step TOP is depen-dent on the hardware performance of the radar unit and the efficiency of signal processing algorithms. TR operation is equivalent to a mirror operation, i.e., last in, first out, and per-formed in the time window .Tw In the frequency domain, this operation corresponds to the spectrum conjugation. The Fou-rier transform of time-reversed signal St
tr ~^ h equals
( ) ( ),S K S *t a r
ftr ~ ~= (10)
H
WL-Swath Width
SAR
MINE/UXO
θ in
θ elθ az
Pipeline
Rsf
Rsn
vp
Footprint
Lsar
Stone
[FIG2] The TR-AGPR configuration with three man-made objects buried at different depths and locations.
Previous Page | Contents | Zoom in | Zoom out | Front Cover | Search Issue | Next Page qqM
Mq
qM
MqM
THE WORLD’S NEWSSTAND®
Previous Page | Contents | Zoom in | Zoom out | Front Cover | Search Issue | Next Page qqM
Mq
qM
MqM
THE WORLD’S NEWSSTAND®

IEEE SIGNAL PROCESSING MAGAZINE [105] JULY 2014
where ( ) [ ( )]S s tFtf
rf~ = and Ka is the energy normalization
factor (see the section “Focusing Algorithm”). Energy normal-ization EN^ h provides compensation for energy losses and keeps average energy at a constant level [15]. The normalization factor Ka is given by
,K EE
aw
s= (11)
where Es is the total energy of the transmitted radar signal and Ew is the total backscattered energy from soil structure. It should be noted that Es is calculated during Ts and Ew during
,Tw respectively, where .T Tw s& However, (11) expresses a nor-malization coefficient, which is valid only in the medium where the attenuation does not depend on the frequency, i.e., in a non-dispersive medium. In such a medium, EN can be performed as a compensation of average energy.
TR PROBINGThis key step starts at TTR (see Figure 3) and consists of retrans-mission and backscattered returns registration. The duration of the signal transmitted in TR probing is equal to .Tw Additionally, T Twsn & has to be satisfied to prevent signals overlapping and uncertainty of returns registration. Due to ,T Tw s& the radar blind zone for TR probing is greater than for forward probing. In this acquisition, the time period T ,wTR intended for backscattered returns registration is considerably longer than .Tw
DIFFERENCES, LIMITATIONS, AND EXCEPTIONSThe extended measurement times at individual positions along synthetic aperture, more than twice that of the conventional SAR, due to ( ),T T T ,wsf sn TR# + decrease the value of pulse repe-tition frequency (PRF). For the TR-AGPR, the mission value of PRF is considerably lower than PRF in conventional SAR mis-sions. A decreasing PRF value causes less precise reconstruction of the azimuth reference signal, and thus, deterioration of the azimuth resolution. Proper selection of PRF is the important issue in the TR-AGPR system, in particular, to perform the accurate synthesis of the antenna along the radar track.
The scheme of TR-AGPR acquisition with TR operation, pre-sented in the section “TR-Based Method of Scanning,” differs con-siderably from a typical scheme of TR measurements [15]–[16] in one field. Specifically, the conventional TR scheme assumes the
performance of additional (initial) probing of the clutter channel as a measure of clutter response only, i.e., when the target is absent. In the case of TR-AGPR, the presence of objects in the soil is difficult to identify due to their invisibility and buried nature. However, an additional flight and preacquisition over terrain, with the drawback of increasing the cost of the AGPR mission, may provide useful information about backscattered terrain returns, which are identified as clutter [see (4)]. Afterward, based on the properly developed source separation methods, the weak cumulative echoes derived form internal multireflection can be separated from clutter, time-reserved, and energy normalized, and used in TR probing. Unfortunately, as shown in the section “Backscattered Signal,” the use of source separation methods in AGPR requires additional and intensified investigations due to the complexity of this issue.
Moreover, the TR experiment, in the original form, specifies the location of the transmitter and receiver on opposite sides of the scattering environment. Such a configuration is not appropri-ate for GPR measurements due to natural impracticality. During the last few years, several configurations of the TR experiment (various transmitter–receiver configurations) were used: monos-tatic pulse-echo [18], [19] or bistatic pulse-echo [20], [23]. With regard to the AGPR mission configuration (i.e., one antenna for signal transmission and backscattered echo registration), the TR experiment with the use of an airborne platform can be carried out only in the monostatic pulse-echo configuration.
Further, as stated in the section “Focusing Algorithm,” the TR hypothesis assumes the invariant medium and the same position of the transmitter and receiver in the initial transmission and the secondary retransmission. The condition of invariant medium is valid since the TR-AGPR acquisition along Lsar takes up to several seconds, and thus, the geological and hydrological parameters impacting the value of complex relative dielectric constant [(1)–(3)] are constant. Unfortunately, since the radar is in motion, at the altitude ,H the second condition is not satis-fied. However, proper selection of PRF and consideration the fact that ,H h22 where h is the depth determined by the purpose of the mission, allow for presumption that radar motion at Hslightly affect the (re)focusing effect. Generally, since the refer-ence signal used in matched filtering is the pulse sent in the ini-tial probing, the (re)focusing effect depends only on “the quality of restoration” of the initial pulse in TR probing. As shown in
[FIG3] The schedule of TR acquisition at a given position along the synthetic aperture line.
0 Ts Tsn Tsf TTRTTR + Tw TTR + Tsn TTR + TTR, w
Tw Tw TTR, w
s (t ) s (t )
TOP
Forward Probing Time-Reversal Probing
PRI
t
Ts
st (t )tr
sr (t )trsr (t )fst (t )
f
Previous Page | Contents | Zoom in | Zoom out | Front Cover | Search Issue | Next Page qqM
Mq
qM
MqM
THE WORLD’S NEWSSTAND®
Previous Page | Contents | Zoom in | Zoom out | Front Cover | Search Issue | Next Page qqM
Mq
qM
MqM
THE WORLD’S NEWSSTAND®

IEEE SIGNAL PROCESSING MAGAZINE [106] JULY 2014
[21], minor perturbations in probing position, relative to the inhomogeneous medium, have few effects on TR focusing.
Beyond the lack of strict clutter probing, the main idea of the TR approach for AGPR remains the same (as presented in the section “Time-Reversal”). Due to complex scattering phe-nomena in soil structure, TR should coherently cover and exploit the original multipath propagation to provide a temporal and spatial energy refocusing effect.
TR-AGPR SIMULATION SETUPThe TR-AGPR simulations were performed on the basis of (rela-tively) a simple ray tracing method, with three point scatterers ,S1
,S2 S3 located in the soil structure, each at a different horizon [see Figure 1(a)]. The coordinates, i.e., (depth, along-track, across-track) m, are (0.625, 127, 1,746) m, (1.25, 255, 1844) m, and (1.875, 383, 1945) m for the first ,S1 second S2 , and third S3 scatterer, respec-tively. Soil structure and AGPR geometry configuration were chosen as depicted in Figure 2 in the section “Physical Model.” For the AGPR mission, the SLAR configuration with the following parame-ters were assumed: H = 3,500 m, vp= 100 ,ms 1- PRF 200= Hz,
ina = 35º, and TE polarization. As a radar signal, the up-chirp LFM pulse of fc= 430 MHz, B= 200 MHz, and x= 1.2 μs were used
,( ) ( )coss t f t t t2 2 2tf
c2 # #r rc x x= + - (12)
where c is the chirp rate. The SAR simulation was performed along 1,024 positions on the synthetic aperture line leading to a synthetic aperture length LS= 512 m.
To simplify the backscattered signal simulation and processing, the ground reflections are not included; only backscattered signals form buried targets are taken into account. As stated in the section “Physical Model,” the total number of distinguishable layers in the selected STU profile is equal ,N 500= each with a different value of the complex relative dielectric constant. The number of layers Lt taken into account in the simulation depends on the depth of the scatterer and is equal to 125, 250, and 375 for the first ,S1 sec-ond S2 , and third S3 scatterer, respectively. The different travel paths are modeled based on Snell’s law, starting from the radar location, through the entry point to the soil and relevant number of layers ,Lt to the scatterer location (refer to [11] for a detailed description of the simulation). Moreover, pulse instantaneous fre-quency lies in the range of 330–530 MHz, i.e., in a frequency range where the imaginary part of the relative complex dielectric con-stant rf varies the most; see (1)–(3) and refer to [26].
REFOCUSING PHENOMENONFigure 4 separately presents normalized output of the matched filtering for the three-point scatterers located inside the soil (see the section “TR-AGPR Simulation Setup”), for the scatterer S1 in (a), S2 in (b), and S3 in (c). On these plots, dashed (blue) lines represent the output of matched filtering after forward probing
( ),[s ttf ,( )]s t,r S
fi dotted (red) lines represent the output of
matched filtering after TR probing ( ),[s t,t Str
i ,( )]s t,r Str
i and solid (black) lines represent the output of cross-matched filtering
( ), ( ) ,s t s t,tf
r Str
i6 @ respectively.
■ Forward probing: For each point scatterer, the effective time duration of backscattered echo ( )s t,r S
fi is proportionally
shorter than the duration of radar (up-chirp) pulse ( ),s ttf as
seen in the section “Focusing Algorithm.” For up-chirp LFM, pulse dispersion caused a contraction of the backscattered echo. A cumulative nature of dispersion and attenuation makes echoes from deeper targets more deformed, the higher fre-quency components are more damped throughout the fre-quency band. Thus, the outputs of matched filtering are proportionally defocused, broader and (negatively) shifted from expected position at time axis; compare the dashed lines in Fig-ure 4(a)–(c). The ghost targets appear, comparing the side-lobe level (SLL), faintly visible for S1 in Figure 4(a), and clearly for S2 in Figure 4(b) and S3 in Figure 4(c). ■ TR probing: (As previously stated, this is a processing between input ( )s t,t S
tri and output ( )s t,r S
tri of TR probing treated
as a separate measurement in a dispersive and loss medium.) TR (mirrored or down-chirp) and energy normalized retrans-mission of the backscattered echo through the same loss medium resulted in reattenuation, due to the constant attenu-ation factor for each frequency component of the LFM pulse, regardless of the internal frequency change inside the pulse. The level of ghost targets (i.e., the increasing of side lobes) is higher than for forward probing; compare the SLL between dotted and dashed lines in Figure 4(a)–(c). Nevertheless, the reversed mode of internal frequency changes inside the pulse induces a lengthening of the backscattered echo (see the sec-tion “Focusing Algorithm”). For each point scatterer, the effec-tive time duration of backscattered echo ( )s t,r S
tri is longer than
the duration of the radar waveform ( )s t,t Str
i and is almost equal to the time duration of .( )s tt
f Furthermore, the energy nor-malization ensures an almost uniform level of .( )s t,r S
tri Thus,
outputs of matched filtering are still defocused and signifi-cantly broader. However, now they are reversely (positively) shifted, and moreover, centered at the expected location for each scatterer; compare the dotted plots in Figure 4(a)–(c). ■ Cross-matched filtering: Despite the strong frequency-dependent attenuation and dispersive characteristic of the soil, the results of cross-matched filtering are correctly focused. Retransmission of the time-reversed signal inversely restores the dispersion effects in backscattered echo and overstated energy normalization (selective overamplification) has neutral-ized attenuation in TR probing. Regardless of the scatterer location, the main lobes have the same width as the expected resolution. Furthermore, the value of (SLL) is slightly different between them, but oscillates around the theoretical value. Performed simulations are based on an assumption about
the time invariability of the rf (1) in individual layer .ln Such an assumption is correct, when taking into account that con-ventional TR-SAR acquisition along synthetic aperture Lsar can take approximately a few seconds.
TR-BASED SAR PROCESSINGFigure 4 presents the refocusing effects in the fast time domain (in range/depth dimension). Data collected along the synthetic
Previous Page | Contents | Zoom in | Zoom out | Front Cover | Search Issue | Next Page qqM
Mq
qM
MqM
THE WORLD’S NEWSSTAND®
Previous Page | Contents | Zoom in | Zoom out | Front Cover | Search Issue | Next Page qqM
Mq
qM
MqM
THE WORLD’S NEWSSTAND®

IEEE SIGNAL PROCESSING MAGAZINE [107] JULY 2014
aperture ,Lsar similarly to conventional SAR acquisition, have a migration effect resulting from changes in the relative distances between platform position and target location. Based on the range compression results, only compression in azimuth has to be additionally performed. The azimuthal compression factor Ka is given by /K v f R c2a p c s
2= [11], where vp is platform veloc-ity, fc is carrier frequency, R s is slant range to range cell, and cis the speed of the light. Azimuth reference function ( , ),a u rref
defined in slow time u and range ,r is expressed as
, ,expa u rR ru u
j 2c s
p2
02
refmr y=
-^
^
^eh
h
ho (13)
and is created based on TR-AGPR parameters. Using the fast convolution theory for azimuth compression,
the data presented in Figure 5 has been obtained. Correction of range migration (RMC) was intentionally skipped to focus only on azimuth compression. Hence, the scatterers have a curved glow. Both TR-SAR images obtained after forward probing [Figure 5(a)] and TR probing [Figure 5(b)] have low azimuth resolution decreasing with depth. Results of azimuth compression are strongly distorted and targets are unresolved. In addition, ghost targets caused by energy dissipation and pulse distortion appear in the both SAR images. Various object depths result in different amplitudes and levels of distortion in the backscattered echo. Thus, the results of SAR processing are proportionally deformed. For forward probing, [see Figure 5(a)], despite the absence of focal in depth and azimuth, S1 has the strongest echo of the three scatterers, S2 has slightly weaker echo and S3 is almost invisible. For TR probing, overstated energy normalization causes the opposite effect in SAR image; see Figure 5(b). Now, the
dominant echo from S3 significantly blurring the remaining weak echoes from S1 and ,S2 also the accumulation of ghost tar-gets is highly visible for .S3 The clearly visible width of the curved tail along synthetic aperture Lsar indicates the level of defocusing and distortion of backscattered echo. Figure 5(c) is much better focused, both in range and azimuth dimension. All targets are clearly resolved with nearly the same amplitude, despite the lack of the RMC (the curved tail along synthetic aper-ture Lsar is still present, but now is uniformly thin and identical for all scatterers). Due to the partial propagation in inhomoge-neous soil structure scatterers are shifted (delayed) in range domain, proportionally to depth location. The range shift (delay) results from smaller and irregular velocity of EM wave propaga-tion through the soil layered structure. The deeper targets have greater displacement than shallow targets.
CONCLUSIONS AND CHALLENGESConventional SAR systems, based on surface returns, process the backscattered energy as only reflected from terrain, and thus, omit the ability of the EM waves to penetrate through soil, scatter inside its inhomogeneous structure, and travel upward to the surface. Nevertheless, registration and processing of the backscattered waves derived from the internal multipath propa-gation and multireflection are a key aspect of remote sensing imaging of the ground. Thus, AGPR, unlike SAR, have to exploit the internal complex scattering phenomenon to provide range/depth focal of the backscattered energy and for high-resolution imaging of the soil structure.
As presented in this tutorial, configuration of the TR-AGPR acquisition involves a number of different nature issues and
[FIG4] The normalized output of matched filtering for three point scatterers , ,S S S31 2^ h after (a) forward probing (dashed lines), (b) TR probing (dotted lines), and (c) cross-matched filtering (solid lines).
–0.05 –0.03 –0.01 0 0.01 0.03 0.050
0.1
0.2
0.3
0.4
0.5
0.6
0.7
0.8
0.9
1.0
SLL
Time (μs)–0.05 –0.03 –0.01 0 0.01 0.03 0.050
0.1
0.2
0.3
0.4
0.5
0.6
0.7
0.8
0.9
1.0
Time (μs)–0.05 –0.03 –0.01 0 0.01 0.03 0.050
0.1
0.2
0.3
0.4
0.5
0.6
0.7
0.8
0.9
1.0
Time (μs)(a) Scatterer S1 at –0.625 m (b) Scatterer S2 at –1.25 m (c) Scatterer S3 at –1.875 m
F TR C F TR C F TR C
SLLSLL
Previous Page | Contents | Zoom in | Zoom out | Front Cover | Search Issue | Next Page qqM
Mq
qM
MqM
THE WORLD’S NEWSSTAND®
Previous Page | Contents | Zoom in | Zoom out | Front Cover | Search Issue | Next Page qqM
Mq
qM
MqM
THE WORLD’S NEWSSTAND®

IEEE SIGNAL PROCESSING MAGAZINE [108] JULY 2014
limitations. First, the inhomogeneous nature of the soil (see the section “Physical Model”) affects both the EM parameters, and consequently, the time-frequency form of an incident signal propagating through it, scattering on its inhomogeneities and traveling upward in the form of backscattered waves. Backscat-tered returns consist of many deformed, amplitude-scale, and phase-shifted replicas of the transmitted signal (see the section “Backscattered Signal”). Second, knowing that the effectiveness of wave penetration depends on the incident angle (Snell’s law), the parameters of the TR-AGPR acquisition along Lsar have to be well aligned to one another. The acquisition settings (e.g., altitude, platform velocity, incident angle, elevation and azi-muth beamwidth, and pulse repetition frequency) and radar configuration (e.g., frequency band, signal bandwidth, internal modulation, and signal power) affect the backscattered returns, for instance, by the implied impact of footprint dimensions, both on the surface clutter level and on the returns registration periods Tw and T ,wTR (see the section “TR-Based Method of
Scanning”). Moreover, as presented in the section “Differences, Limitations, and Exceptions,” decreases of PRF negatively affects the performance of image synthesis. Third, adaptation of the TR technique into measurement schedule, besides increas-ing the acquisition time at a given position along ,Lsar forces the creation of new signal processing algorithms aimed at source separation (see the section “Backscattered Signal”), at an estimation of selective attenuation characteristics of the soil as well as at TR-SAR processing.
Beyond these limitations, as shown in the section “Refocusing Phenomenon,” the TR approach for SAR focusing of buried tar-gets, under certain conditions, can provide an energy refocusing phenomenon, and thus, significantly improve range resolution (Figure 4) and increase detection gain over the conventional approach. Additionally, assuming that shape of the radar wave-form can have an important effect on the object detection in a dispersion and loss medium, the TR technique can provide a method for adaptation of the radar waveform to the medium. The
Azi
mut
h (m
) S1
S2
S3
1,700 1,750 1,800 1,850 1,900 1,950
−200
−100
0
100
200 −25
−20
−15
−10
−5
0
S1
S2
S3
Ground Range (m)(a)
Azi
mut
h (m
)
1,700 1,750 1,800 1,850 1,900 1,950
−200
−100
0
100
200 −25
−20
−15
−10
−5
0
Ground Range (m)(b)
Azi
mut
h (m
)
1,700 1,750 1,800 1,850 1,900 1,950
−200
−100
0
100
200 −25
−20
−15
−10
−5
0
Ground Range (m)(c)
S1
S2
S3
[FIG5] The result of SAR processing after (a) forward probing, (b) TR probing, and (c) cross-matched filtering (all in decibel scale).
Previous Page | Contents | Zoom in | Zoom out | Front Cover | Search Issue | Next Page qqM
Mq
qM
MqM
THE WORLD’S NEWSSTAND®
Previous Page | Contents | Zoom in | Zoom out | Front Cover | Search Issue | Next Page qqM
Mq
qM
MqM
THE WORLD’S NEWSSTAND®

IEEE SIGNAL PROCESSING MAGAZINE [109] JULY 2014
synthesis along Lsar results in a high-resolution TR-AGPR image of the soil subsurface structure (Figure 5), that similar to a con-ventional SAR image, represents only a reflectivity of buried objects located in the soil. Furthermore, properly devised and successfully validated algorithms for TR-AGPR are the basis for new challenges facing high-resolution and large-scale soil imag-ing. For example, application of the interferometry aimed at cre-ating a digital soil model, similar to the digital terrain model.
In summary, proper defining of all issues related to TR-AGPR open up many areas for high-resolution and large-scale imaging of optically invisible soil structure.
ACKNOWLEDGMENTSWe would like to acknowledge the anonymous reviewers for helpful remarks and suggestions, as well as thank the European Commissions Joint Research Center (The Institute for Environ-ment and Sustainability) for providing the SPADE/2v11: The Soil Profile Analytical Database for Europe Version 1.1.
AUTHORSRobert Kedzierawski ([email protected]) received the M.S. (Eng.) degree in electronics and telecommunications in 2010 from the vMilitary University of Technology (MUT), Warsaw, Poland. He began his Ph.D. study at MUT in cooperation with the École Nationale Supérieure des Télécommunications de Bretagne, Brest, France, in 2010. Currently, he is a research and teaching assistant at MUT. His research interests are in radar sig-nal processing, ground penetrating radar, and software-defined radar systems. He is a Student Member of the IEEE.
Jean-Marc Le Caillec ([email protected]) obtained the degree of engineer in telecommunications in 1992 from the École Nationale Supérieure des Télécommunications de Bretagne. He received the Ph.D. degree in mathematics and signal processing from the University of Rennes I in 1992. From 1997 to 1999, he worked for Thomson AirSys (now Thales AirSys) on unsu-pervised radar management. In 1999 he joined the ENST Bretagne, where he is currently a professor. His main research interests are statistics, nonlinear system modeling, mathematics, and signal processing for applications in remote sensing. He is a Senior Mem-ber of the IEEE.
Witold Czarnecki ([email protected]) received the M.S. and Ph.D. degrees in signal processing and telecommunica-tion from the Warsaw University of Technology (WUT) in 1967 and 1972, respectively, and the D.S. degree from the Military Univer-sity of Technology (MUT) in 2010. He was an assistant professor in the Institute of Telecommunications of the WUT and is currently a professor in the Institute of Radioelectronics at MUT. He special-izes in radar signal simulation and processing. Currently, his scientific interest is focused on synthetic aperture radar and ground penetrating radar techniques.
REFERENCES[1] K. Tomiyasu, “Tutorial review of synthetic-aperture radar (SAR) with applica-tions to imaging of the ocean surface,” Proc. IEEE, vol. 66, no. 5, pp. 563–583,May 1998.[2] J. C. Curlander and R. N. McDonough, Synthetic Aperture Radar: Systems and Signal Processing. New York: Wiley-Interscience, 1991.
[3] H. M. Jol, Ground Penetrating Radar: Theory and Applications. Amsterdam, The Netherlands: Elsevier Science, 2009.[4] J. Taylor, Ultrawideband Radar: Applications and Design. Boca Raton, FL:CRC Press, 2012.[5] G. L. Berlin, M. A. Tarabzouni, A. H. Al-Nazer, K. M. Sheikho, and R. W. Larson,“SIR-B subsurface imaging of a sand-buried landscape: Al Labbah Plateau, Saudi Arabia,” IEEE Trans. Geosci. Remote Sensing, vol. 24, no. 4, pp. 595–602, July 1986.[6] G. G. Schaber, J. F. McCauley, C. S. Breed, and G. R. Olhoeft, “Shuttle imag-ing radar: Physical controls on signal penetration and subsurface scattering in the Eastern Sahara,” IEEE Trans. Geosci. Remote Sensing, vol. 24, no. 4, pp. 603–623,July 1986.[7] J. J. Legarsky, S. P. Gogineni, and T. L. Akins, “Focused synthetic aperture radar processing of ice-sounder data collected over the Greenland ice sheet,” IEEE Trans. Geosci. Remote Sensing, vol. 39, no. 10, pp. 2109–2117, Oct. 2001.[8] W. Zhai, Y. Zhang, and X. Zhang, “SAR imaging simulation for subsurface target detection,” in Proc. 7th Int. Symp. Antennas, Propagation, EM Theory (ISAPE’97), Guilin, China, Oct. 2006, pp. 1–5.[9] S. Liu and Y. Feng, “Airborne GPR: Advances and numerical simulation,” in Proc. 2011 IEEE Int. Geoscience Remote Sensing Symp. (IGARSS), Vancouver, BC, Canada, July 2011, pp. 3390–3340.[10] L. Fu, S. Liu, and L. Liu, “Numerical simulations and analysis for airborne ground penetrating radar,” in Proc. 14th Int. Conf. Ground Penetrating Radar (GPR), Shanghai, China, June 2012, pp. 200–203.[11] J.-M. Le Caillec, S. Redadaa, C. Sintes, B. Solaiman, and M. Benslama, “Fo-cusing problems of a buried point scatterer using a low frequency SAR,” IEEE Trans. Aerosp. Electron. Syst., vol. 47, no. 1, pp. 438–453, Jan. 2011.[12] M. Fink, “Time reversal of ultrasonic yields – Part I: Basic principles,” IEEE Trans. Ultrason. Ferroelectr. Freq. Control, vol. 39, no. 5, pp. 555–567, Sept. 1992.[13] F. Wu, J.-L. Thomas, and M. Fink, “Time reversal of ultrasonic yields—Part II: Experimental results,” IEEE Trans. Ultrason. Ferroelectr. Freq. Control, vol. 39,no. 5, pp. 567–578, Sept. 1992.[14] J. de Rosny, G. Lerosey, and M. Fink, “Theory of electromagnetic time-re-versal mirrors,” IEEE Trans. Antennas Propagat., vol. 58, no. 10, pp. 3139–3149,Oct. 2010.[15] J. F. M. Moura and Y. Jin, “Detection by time reversal: Single antenna,” IEEE Trans. Signal Processing, vol. 55, no. 1, pp. 187–201, Jan. 2007.[16] M. E. Yavuz and F. L. Teixeira, “Ultrawideband microwave sensing and imag-ing using time-reversal techniques: A review,” Remote Sens., vol. 9, pp. 466–495,Sept. 2009.[17] Y. Jin and J. F. M. Moura, “TR-SAR: Time reversal target focusing in spot-light SAR,” in Proc. 2007 IEEE Int. Conf. Acoustics, Speech, Signal Processing, (ICASSP), Honolulu, HI, Apr. 2007, pp. II–957–II–960.[18] Y. Jin, J. F. M. Moura, N. O’Donoughue, M. T. Mulford, and A. A. Samuel,“Time reversal synthetic aperture radar imaging in multipath,” in Proc. 41st Annu. Asilomar Conf. Signals, Systems, Computers (Asilomar ’07), Pacific Grove, CA, Nov. 2007, pp. 1812–1816.[19] N. O’Donoughue, J. F. M. Moura, and Y. Jin, “Signal-domain registration for change detection in time-reversal SAR,” in Proc. 42nd Annu. Asilomar Conf. Signals, Systems, Computers (Asilomar ’08), Pacific Grove, CA, Nov. 2008,pp. 505–509.[20] J. F. M. Moura and Y. Jin, “Time reversal imaging by adaptive interference canceling,” IEEE Trans. Signal Processing, vol. 56, no. 1, pp. 233–247, Jan. 2008.[21] D. Liu, S. Vasudevan, J. Krolik, G. Bal, and L. Carin, “Electromagnetic time-reversal source localization in changing media: Experiment and analysis,” IEEE Trans. Antennas Propagat., vol. 55, no. 2, pp. 344–354, Feb. 2007.[22] A. Cresp, I. Aliferis, M. J. Yedlin, C. Pichot, and J.-Y. Dauvignac, “Investi-gation of time-reversal processing for surface-penetrating radar detection in a multiple-target configuration,” in Proc. 5th European Radar Conf. (EuRAD),Amsterdam, The Netherlands, Oct. 2008, pp. 144–147.[23] F. Foroozan and A. Asif, “Time-reversal ground-penetrating radar: Range es-timation with Cramér–Rao lower bounds,” IEEE Trans. Geosci. Remote Sensing,vol. 48, no. 10, pp. 3698–3708, Oct. 2010.[24] N. R. Peplinski, F. T. Ulaby, and M. C. Dobson, “Dielectric properties of soils in the 0.3–1.3 GHz range,” IEEE Trans. Aerosp. Electron. Syst., vol. 33, no. 3,pp. 803–807, May 1995.[25] B. J. Cosby, G. M. Hornberger, R. B. Clapp, and T. R. Ginn, “A statistical explo-ration of the relationships of soil moisture characteristics to the physical properties of soil,” Water Resource Research, vol. 20, no. 6, pp. 682–690, June 1984.[26] R. Kedzierawski, J.-M. Le Caillec, W. Czarnecki, and M. Pasternak, “Subsur-face soil modeling based on geological database for simulation of electromagnetic wave propagation,” in Proc. 13th Int. Radar Symp. (IRS), Warsaw, Poland, May2012, pp. 441–445.[27] L. A. Richards, “Capillary conduction of liquids through porous medium,” J. Appl. Phys., vol. 1, no. 5, pp. 318–333, June 1931.[28] M. Tria, M. Benidir, and E. Chaumette, “Application of the time-frequency-based blind source separation to an instantaneous mixture of secondary radar source,” Int. J. Comput. Inform. Eng., vol. 2, no. 8, pp. 539–544, 2008.[29] M. A. C. Tuncer and A. C. Gurbus, “Ground reflection removal in compres-sive sensing ground penetrating radar,” IEEE Geosc. Remote Sensing Lett., vol. 9,no. 1, pp. 23–27, Jan. 2012.[30] K. Zhang and D. Li, Electromagnetic Theory for Microwaves and Optoelec-tronics. Berlin: Springer-Verlag, 2008.
[SP]
Previous Page | Contents | Zoom in | Zoom out | Front Cover | Search Issue | Next Page qqM
Mq
qM
MqM
THE WORLD’S NEWSSTAND®
Previous Page | Contents | Zoom in | Zoom out | Front Cover | Search Issue | Next Page qqM
Mq
qM
MqM
THE WORLD’S NEWSSTAND®
_____________________
_________________
___________________

IEEE SIGNAL PROCESSING MAGAZINE [110] JULY 2014 1053-5888/14/$31.00©2014IEEE
Digital Object Identifier 10.1109/MSP.2014.2312203
Date of publication: 13 June 2014
Multipath that involves target scattering is an important phenomenon in synthetic aperture radar (SAR). It is highly pronounced in imag-ing of building interiors due to the presence of walls, ceilings,
and floors surrounding the targets of interest. Multipath attributed to tar-gets is a special type of clutter, which can be either sup-pressed or exploited. The latter has been the subject of many recent works in the area of SAR imaging and has led to tangible improvements in target detection and localiza-tion. In this article, we consider state-of-the-art multipath suppression and exploitation approaches, present their corresponding analytical models, and highlight their respective requirements, assumptions, and offerings. Both conventional and compressive sensing-based approaches are discussed, where the latter assumes the presence of a few behind-the-wall targets.
INTRODUCTIONIn recent years, radar imaging of building interiors has gained much interest due to the rising and ubiquitous use in civilian, security, and defense applications [1]–[3]. Typically, there is no
visual access to the scene, and optical, ultrasound, or thermal imaging is not effective. In this case, sensing is performed by the electromagnetic (EM) modality and has allowed the emergence of
the area of through-the-wall radar imaging (TWRI). Indoor targets and interior building layout are
detected and characterized from a stand-off distance. The radar systems may
be ground based or airborne and assume different modes of
operations and system parameters. One mode, which is consistent with many sensing objectives, is SAR. TWRI using SAR is the only viable choice when two-dimensional
(2-D) physical apertures required to achieve the
desired resolution are logisti-cally difficult or impossible. We
restrict the discussions to SAR imaging of stationary targets. Moving
targets pose a whole set of different chal-lenges, exceeding the scope of this article.
SAR imaging could be impaired by the many scatterers pre-sent in a typical indoor scene. In addition to the shortest path to the target and back to the receiver, the transmitted wave may travel on indirect paths due to secondary reflections arising from interior walls, floor, and ceiling. This leads to rich multipath associated with the targets, which, depending on the scattering environment, can have different adverse effects on the image quality and interpretation. The energy in the multipath returns may accumulate at locations where no physical targets reside, thus creating “ghosts.” With increased specular and diffuse
[Michael Leigsnering, Moeness G. Amin, Fauzia Ahmad, and Abdelhak M. Zoubir]
[An overview of recent advances]
Recent Advances in Synthetic Aperture Ra
darIma
ging
PH
OTO
CO
UR
TE
SY
OF
NA
SA
Previous Page | Contents | Zoom in | Zoom out | Front Cover | Search Issue | Next Page qqM
Mq
qM
MqM
THE WORLD’S NEWSSTAND®
Previous Page | Contents | Zoom in | Zoom out | Front Cover | Search Issue | Next Page qqM
Mq
qM
MqM
THE WORLD’S NEWSSTAND®

IEEE SIGNAL PROCESSING MAGAZINE [111] JULY 2014
scatterings, the stationary scene can become very cluttered, masking the true targets and disabling their detection. The signif-icance of multipath and ghost targets in imaging of building inte-riors has been shown in various works. Dogaru and Le [3] showed the ghost phenomenon using extensive numerical EM simula-tions. Others examined the same, using measurements in a lab setup [4], [5]. The radar community also acknowledged multipath as a significant problem on a special industry day [6].
Since multipath exists and is often observed, it must be described and accounted for, using accurate analytical models, and properly addressed in imaging techniques. Broadly, there are two paradigms to deal with indirect propagation: multipath sup-pression and multipath exploitation. The key idea of the former is to characterize the multipath returns and mitigate their effects on image formation [7]–[16]. Different properties of direct and indirect radar returns can be used to distinguish between the two arrivals and attenuate, if not remove, the indirect returns. These methods are generally straightforward to apply. However, they do not make use of the energy and target information contained in the multipath returns. The second method, reminiscent of the RAKE receiver in wireless communications [17], aims at exploit-ing the multipath and using it for imaging enhancements [4], [5], [18]–[24]. By properly modeling the indirect propagation paths, whether they are resolvable or not, their energy can be captured and attributed to their respective targets, allowing an increase in target to clutter and noise ratios, and thus culminating in an enhanced image. Further, areas in the shadow region of highly attenuative targets, which cannot be illuminated by the radar directly, can be imaged by utilizing multipath. Although mul-tipath exploitation has potential and tangible benefits, it often requires prior information or is computationally demanding.
SIGNAL MODELA forward scattering model should be developed for multipath to be properly exploited or mitigated. This requires determining the scattered field from the targets inside the building. If the building layout and imaging geometry is known, this problem can be exactly solved by using Maxwell’s equations [25]. However, there are two issues that render this approach impractical. First, solving a full wave model is computationally demanding and may require vast resources. Second, inferring the positions of the scatterers from the scattered field requires solving an inverse problem. Since the forward problem is nonlinear due to the influence of the scatterers on the surrounding field, the inverse problem is even more challenging and, for practical purposes, impossible to solve. To overcome these difficulties, various linear approximations of the forward scattering model, such as the Born approximation, Kirchoff approximation, and geometric optics (GO), have been introduced, all of which yield tractable solutions to the inverse problem [1], [26], [27]. More specifically, the Born approximation makes the weak scatterer assumption, i.e., the electrical parame-ters of the scatterers do not differ much from that of the back-ground medium. As such, the total field inside the target is approximated by the incident field [26]. The Kirchhoff or physical optics (PO) approximation assumes perfectly conducting targets,
and the interaction with the incident field takes place only on the surface of the targets [27]. For both Born and PO approximations, the background medium, which is the building enclosure in the problem at hand, is described by the Green’s function that depicts the impulse response of the wave equation. The GO or ray-tracing approach uses local plane wave assumption or “ray of light” to model the propagation of the wave [1]. Since the latter is the sim-plest and most commonly used approximation in TWRI, we focus on ray tracing for describing the signal model.
BASIC SIGNAL MODELConsider an N-element monostatic linear array of transceivers. Either all of the array elements can be physically present or a single transceiver can be moved to different locations to synthe-size the intended aperture. For the synthetic aperture, we assume the stop-and-go approximation for the movement pat-tern, i.e., the transceiver remains stationary while it transmits and receives at a particular array position and then moves to the next location. The model may be extended to a bistatic or multi-ple-input, multiple-output (MIMO) SAR scenario, where the transmitter(s) and receiver(s) move along different trajectories. However, this is not treated here for the sake of simplicity.
The linear array is located along the x -axis parallel to an exterior wall of thickness ,d with its element locations denoted by , , , .u n N0 1n f= - . At the nth array element location, a modulated wideband pulse { ( ) ( )}exps t j f t2 c0 r is transmitted, where t is the fast time, ( )s t is the pulse in the complex base-band, and fc is the carrier frequency. For a scene of P station-ary point targets behind the wall at positions ( , ),x zp p the nth element receives the baseband signal ( ),y tn given by
( ) ( ),expy t s t j f v t2n pp
P
c n0
1
pn pnv x r x= - - +=
-
^ ^h h/ (1)
where pv is the deterministic complex reflectivity of the pth target, and pnx is the two-way propagation delay between the nth transceiver and the pth target. We consider additive receiver noise ( ),v tn which is typically assumed to be an inde-pendent and identically distributed complex circular Gaussian process. For through-the-wall propagation, pnx comprises the components corresponding to traveling distances before, through, and after the wall [1]. Note that the received signal is a superposition of the individual direct target returns only. Target interactions with other targets and the surrounding environ-ment are ignored in this model. However, in indoor scenarios, such interactions are both pronounced and measurable and give rise to multipath propagation.
MULTIPATH PROPAGATION MODELWe broadly categorize multipath returns as follows:
■ Interior wall/floor/ceiling multipath: These involve indi-rect paths with secondary specular reflections at a large smooth surface. ■ Wall ringing multipath: This type involves signals that undergo multiple reflections within the exterior wall in tran-sit to/from the targets.
Previous Page | Contents | Zoom in | Zoom out | Front Cover | Search Issue | Next Page qqM
Mq
qM
MqM
THE WORLD’S NEWSSTAND®
Previous Page | Contents | Zoom in | Zoom out | Front Cover | Search Issue | Next Page qqM
Mq
qM
MqM
THE WORLD’S NEWSSTAND®

IEEE SIGNAL PROCESSING MAGAZINE [112] JULY 2014
■ Target-to-target interaction: This includes paths where the wave interacts with more than one diffusely scattering targets.The interior wall/floor/ceiling multipath returns can be fur-
ther subdivided into the following classes: ■ First-order multipath: This involves one secondary reflec-tion either on the transmit or receive path. ■ Second-order multipath: This involves two secondary reflections during the round-trip path. ■ Higher-order multipath: This includes multipath returns involving three or more secondary reflections during the round-trip path.Figure 1 shows examples of various multipath propagation
cases. As the signal weakens at each secondary reflection, the higher-order multipath returns can usually be neglected.
Considering a maximum of R possible propagation paths for each target–transceiver combination, including the direct path and excluding target-to-target interactions, we can extend the n th received signal model in (1) as
( ) ( ),expy t s t j f v t2( ) ( ) ( )n p
r
p
P
r
Rr
cr
n0
1
0
1
pn pnv x r x= - - +=
-
=
-
^ ^h h// (2)
where ( )rpnx is the round-trip propagation delay between the n th
transceiver and the pth target along the rth path, and ( )prv is
the complex reflectivity of the pth target when observed through the rth path. Let r 0= correspond to the direct path and the remaining R 1- be the multipath returns. The various propagation delays can be readily calculated using GO consider-ations [5]. The number paths R is a deterministic parameter that depends on the number and type of scattering walls, which are assumed to be known a priori.
For illustration, Figure 2 depicts an example of an interior wall multipath. The associated propagation delay may be deter-mined by considering the equivalent two-way path to the corre-sponding virtual target. Target-to-target interactions can be included in the multipath model of (2) by assuming additional double bounce paths between pairs of diffusely scattering targets. Note that, in this case, the associated propagation delays not only depend on the distances between the transceivers and the targets, but also on the separation between the targets themselves.
IMAGE FORMATION AND THE EFFECTS OF MULTIPATHHaving developed the forward scattering model, we now proceed with the inverse problem of determining the locations of the Ppoint targets. The conventional approach is delay-and-sum beam-forming or backprojection, which does not account for multipath propagation. As the number of targets is usually unknown a pri-ori, the target space is discretized into a rectangular grid of Ppixels. Hence, P is the deterministic total number of possible tar-get positions, which is determined by the dimensions of the area being imaged and the system resolution. A nonexisting target is simply represented by a pixel with zero reflectivity. An estimate of the image is obtained as [1]
( ) ( ) ( ) , , , ,I p N y t s t p P1 0 1n tn
N
0
1( )0pn
) g= - = -x==
-
/ (3)
[FIG1] Various cases for multipath in indoor scenes. (a) Direct propagation, (b) one secondary reflection at an interior wall, (c) multiple reflections inside the front wall, (d) two secondary reflections at an interior wall, and (e) target-to-target multipath.
[FIG2] Multipath propagation via reflection at an interior wall. (Figure used with permission from [19].)
Interior Wall
Target
Targets
Front Wall
Antenna(a) (b) (c) (d) (e)
Virtual Target
Interior Wall
Antenna
z
xx = xw
Target
Previous Page | Contents | Zoom in | Zoom out | Front Cover | Search Issue | Next Page qqM
Mq
qM
MqM
THE WORLD’S NEWSSTAND®
Previous Page | Contents | Zoom in | Zoom out | Front Cover | Search Issue | Next Page qqM
Mq
qM
MqM
THE WORLD’S NEWSSTAND®

IEEE SIGNAL PROCESSING MAGAZINE [113] JULY 2014
which employs matched filtering of the nth received signal, fol-lowed by sampling the output at the delay corresponding to direct propagation to the current pixel, and finally, coherently summing the results corresponding to all N array locations.
If multipath returns are present in the received signals, the image formation process results in ghost targets, i.e., the energy in the multipath returns is focused at locations where no physi-cal targets exist. Figure 3 shows the image of a scene consisting of two point targets inside a room, which was obtained by apply-ing beamforming to data simulated using (2). In addition to the direct returns, only first-order interior wall multipath and two wall ringing multipath returns per target were assumed to be present in the measurements. We observe that the multipath via reflections at interior walls causes ghosts within the room, whereas the wall ringing multipath creates equally spaced
copies of the target response in the downrange direction. The ghosts cause the scene image to be highly cluttered, rendering interpretation difficult and challenging.
MULTIPATH SUPPRESSIONHaving described the multipath model and the cluttering effects of multipath propagation, we revert back to multipath suppres-sion and exploitation. The objective of multipath suppression is to mitigate the effects of indirect propagation on the quality of the reconstructed scene image. A variety of multipath suppres-sion methods have been devised [7]–[14], which can either act directly on the raw data measurements or are implemented as a postprocessing step for the SAR image. These methods require the targets and ghosts/multipath returns to be well resolved and can achieve ghost suppression without any prior knowledge of the scene.
A SUPPRESSION USING GHOST PROPERTIES IN SAR IMAGESWe first describe methods applicable to suppression of ghosts in SAR images resulting from target-to-target interactions. Con-sidering two targets separated by a distance ,2d the received signal at the n th transceiver location would consist of three components: the two direct returns with respective round-trip propagation delays ( )
n10x and ,( )
n20x and a double scattering return
involving the two targets with a round-trip propagation delay of ( ) / ( ) ( ) / ( ),c2 2( ) ( ) ( )
n n n1
10
20
x x x d= + + where c is the speed of light in free space. Since the conventional SAR image formation method, described in the section “Image Formation and the Effects of Multipath,” is based on direct returns of single target scatterings, the additional delay associated with the double scat-tering multipath results in a ghost located at a farther range than the two targets, as shown in Figure 4(a).
Ghosts in SAR images resulting from target-to-target interac-tions have very specific characteristics, which can be exploited to distinguish them from real targets. These characteristics stem
[FIG3] A beamformed image of a two-target scene showing five ghost targets associated with each target (R 6= propagation paths per target).
6
5
4
3
2
1–2 –1 0 1 2 (dB)
x
z
–35
–30
–25
–20
–15
–10
–5
0
x
z (dB)–40
–35
–30
–25
–20
–15
–10
–5
0Before
x
z
(a) (b)
(dB)–40
–35
–30
–25
–20
–15
–10
–5
0After
[FIG4] The multipath suppression using the HMM-based approach [8]. The ghost at the highlighted position in (a) has been suppressed in (b). (Figure adapted from [8] and used with permission.)
Previous Page | Contents | Zoom in | Zoom out | Front Cover | Search Issue | Next Page qqM
Mq
qM
MqM
THE WORLD’S NEWSSTAND®
Previous Page | Contents | Zoom in | Zoom out | Front Cover | Search Issue | Next Page qqM
Mq
qM
MqM
THE WORLD’S NEWSSTAND®

IEEE SIGNAL PROCESSING MAGAZINE [114] JULY 2014
from the changes in the associated double scattering geometry with aspect angle as viewed by the imaging system [7].
Most targets exhibit aspect dependent scattering. However, unlike the targets, the ghost intensity takes on high values only over a portion of the synthetic aperture (see Figure 5), implying a smaller effective aperture for imaging of ghosts. This causes a wider point spread function in crossrange for the ghosts as compared to a real target, and subsequently lower crossrange resolution. Second, the phase characteristics of the ghost differ across the SAR aperture, leading to changes in the ghost loca-tion when observed through different smaller subapertures. This same characteristic causes the ghosts to be defocused when employing the full aperture. To reveal the ghost charac-teristics in SAR images, the full aperture is typically split into small subapertures for separate imaging. The above ghost char-acteristics across the subaperture images are effectively used for its suppression.
A simple technique for using the variation of the ghost intensity across the subaperture images was proposed in [7]. For each “candidate” target, the variance of the intensity is cal-culated across the subaperture images. Candidates with high variance are identified as ghosts and are attenuated or sup-pressed to obtain a ghost-free image. A more sophisticated tech-nique models the intensity variations to distinguish between the targets and the ghosts based on their aspect dependency [8]. However, the target intensity is also a function of its orientation, which is typically unknown. As such, the intensity variation across the various subaperture images can be modeled by a hid-den Markov model (HMM), where the hidden states are the possi-ble target orientations. The output of the HMM is the intensity profile RM!t of a certain image pixel, where M is the number of subapertures. Training data from known targets is used to esti-mate the state-transition probabilities, the probability of observ-ing a certain intensity in a given state, and the initial state probabilities. Thus, a specific HMM can be built for each consid-ered target type. For notational brevity, we consider only one tar-get type, denoted by .T1
In the testing phase, subaperture images are created from the full aperture image using directional filters. The pth image pixel has a corresponding intensity profile ,pt which may or
may not be generated by the T1 target. The trained HMM is used to evaluate the likelihood that the observed intensity pro-file is generated by the given target. The likelihood is given by
| ) ( | , ) ( | ),q qT T TP P Pq
p p1 1 1all
t t=( / (4)
where ( | , )q TP p 1t is the probability that pt was generated by state sequence q given target T1 , ( | )q TP 1 is the probability that state sequence q occurs given target ,T1 and the summa-tion is carried out over all possible state sequences .q If the pixel corresponds to the target, the likelihood should be high, whereas the value should be low if it corresponds to a multipath ghost. The pixel in the ghost-mitigated image is obtained by multiplying the original full aperture image pixel with the obtained likelihood value
( ) | ) ( ) .I p T I pP p 1mitigated t= (
Hence, only targets that fit the considered model with a high likelihood are retained and the ghosts are suppressed. The per-formance of the approach is illustrated in Figure 4. The ghost is strongly visible in the original image. However, it has been sup-pressed by about 15 dB in the processed image.
A different class of algorithms exploits the differences in the phase history of the subaperture images [9]. As explained above, the ghost targets exhibit a different phase history when viewed from different aspect angles, which depends on the distance 2dbetween the two scattering centers. This is exploited for a SAR image reconstruction scheme that generates a separate image for each assumed .d The true scatterer positions are then contained in the direct path image with .0d = This approach can be com-bined with a scheme that exploits the drift of ghost targets with aspect angle [10]. Drifting and nondrifting target candidates are separated using the Fourier transform of a subaperture image pair. Nondrifting targets are retained, whereas drifting targets are suppressed. An issue with the described approach is that the phase changes have to be observed over a large number of aspect angles. Hence, a large aperture and antennas with a large azi-muth beamwidth are required. This may work against the power constraints of the transmit chain.
One way to overcome the large synthetic aperture constraint is to exploit the nonlinearity in the phase delays of the ghosts directly in the raw data [11]. Under far-field assumptions, real targets exhibit a linear phase shift when viewed from a shifted aperture. In contrast, the ghosts have an additional nonlinear term in the phase history, which can be exploited to cancel mul-tipath returns and obtain a ghost-free image.
All of the aforementioned methods have been mainly devel-oped under the assumption of far-field conditions, which are mostly applicable to airborne platforms. For ground-based sys-tems, the building resides usually in the near-field, and may be observed from different sides. This gives rise to another approach for ghost suppression in TWRI [12]. An image is gen-erated for each vantage point used to interrogate the building
[FIG5] The support angle of SAR echoes in the wavenumber domain. Compared to the real target in (a), the ghost target in (b) exhibits a narrower support. (Figure adapted from [7] and used with permission.)
kz kz
kx kx0
Real Target
0
Ghost Target(a) (b)
4π Bc
4π Bc
Previous Page | Contents | Zoom in | Zoom out | Front Cover | Search Issue | Next Page qqM
Mq
qM
MqM
THE WORLD’S NEWSSTAND®
Previous Page | Contents | Zoom in | Zoom out | Front Cover | Search Issue | Next Page qqM
Mq
qM
MqM
THE WORLD’S NEWSSTAND®

IEEE SIGNAL PROCESSING MAGAZINE [115] JULY 2014
interior. After image registration, the primary reflections, i.e., the true targets, stay at the same location in all images. How-ever, multipath returns place ghosts at different locations, since the multipath reflection geometry changes with the vantage point. Thus, multiplicative fusion of the registered images retains the overlapping true targets and mitigates the nonover-lapping ghosts. This approach is conceptually similar to [9] and [10]. However, the drifts are much larger as the vantage points have a large separation. We note that, as the secondary specular reflection geometry is a function of the vantage point or aspect angle, the drift-based methods described previously are also applicable to specular multipath cases.
OTHER METHODS FOR MULTIPATH SUPPRESSIONIn this section, we briefly discuss multipath suppression meth-ods that do not fit in the aforementioned class of algorithms. One possibility is a colocated MIMO-based approach [13]. In MIMO radar imaging, orthogonal waveforms are transmitted from a transmit array and the scene reflections are received, using a receive array. Exploiting the orthogonality of the trans-mitted waveforms, the returns can be associated with the respective transmitter. From the propagation model, we know that the angle of departure (AOD) equals the angle of arrival (AOA) for the direct path. However, in the multipath propaga-tion case, particularly so for specular multipath, the transmit and receive paths are different and, consequently, the AOA is dif-ferent from the AOD. This effect can be exploited by using spa-tial filtering on the transmit and receive signals. By retaining only the signal components with equal AOA and AOD, the mul-tipath returns can be filtered out. Polarimetric features of the secondary reflections have also been exploited for multipath suppression [14]. Double scattering of the wave may change the polarization characteristics, which can be used to differentiate between targets and ghosts. Finally, even an optimized imaging geometry may help reduce ghosting [15]. If the secondary scat-terer is known, the SAR trajectory can be adjusted such that very little energy is contained in the multipath returns.
For extended targets modeled by a number of scattering cen-ters, ghosts can appear on or in the vicinity of the back wall due to target obstructing incident waves from reaching the back walls. This presents a vacuum in the image along the back wall or, if change detection is applied, it creates ghosts, which could be stronger than targets. In this case, ghost mitigation can pro-ceed utilizing the respective interrelated geometry of target and ghosts. Extended targets tend, in general, to produce blurred ghosts beyond those created by point target model.
MULTIPATH EXPLOITATIONMultipath suppression discards the energy contained in the mul-tipath returns to reduce their adverse effects on the image. Since multipath returns ultimately originate from the target, it is pru-dent to utilize the energy and information contained in such indi-rect target returns. Proper exploitation of the multipath returns has been shown to lead to higher signal-to-clutter ratio (SCR), higher crossrange resolution, and extended imaging regions.
However, all these imaging enhancements usually come at a price. Multipath exploitation schemes either require prior knowl-edge of the scattering environment or incur higher computa-tional costs. In the sequel, we categorize multipath exploitation methods according to their multipath resolution requirements.
EXPLOITATION REQUIRING RESOLVED MULTIPATHFor resolved multipath, the radar returns are well separated in fast time and form the target images and their ghosts. This cate-gory includes shadow region imaging in indoor settings [18], where information of hidden areas of spatially extended targets, which are not in the line-of-sight of the radar, is obtained by exploiting target-to-target interactions. The proposed multipath exploitation is a two-step procedure. First, a conventional SAR image (·)I is obtained using the radar returns. The scattering centers observed in the conventional SAR image are treated as new sources for the double scattered multipath returns. That is, the scattering centers act as new transmitters that can illuminate the shadow region of the targets. Next, a modified SAR algorithm is employed that assumes double-scattering propagation to obtain an image ( )Idouble $ as
( ) ( ) ( ( ) ( ) ) ( , , ),
, , ,
I p I p y t s t F p p n p
P0 1n
N
p
P
n t0
1
0
1double
npp)
f
= -
= -
x=
-
=
-
=l ll//
(5)
where nppx l is the round-trip path between the transceiver, the first scattering center at ( , ),x zp pl l and the second scattering point at ( , ) .x zp p The weighting function ( , , )F p p nl discards an ellip-soidal region surrounding the line-of-sight between the nth antenna location and the plth first scattering center to reduce the introduction of ghosts at implausible locations [see Figure 6(a)]. Finally, the two images are normalized and superimposed to obtain a composite image, which depicts significantly enhanced visible regions of the targets. For illustration, Figure 6(b) and (c) also show the images ( )I $ and ( )Idouble $ for a scene containing three targets of circular and rectangular shapes. Clearly, the con-ventional SAR image has difficulty in imaging the sides of the rectangular target, whereas the modified SAR algorithm can reconstruct the rectangular sides of the target. The main advan-tage of this algorithm is an extension of the visible target region without the need of prior knowledge of the scene distribution or the surrounding environment.
Following a similar idea, the work in [5] proposed a ghost-mapping approach, wherein the ghosts in the conventional SAR image, resulting from interior wall multipath, are mapped back onto the respective targets to obtain a ghost-free image with improved SCR. Complete knowledge of the room geometry is assumed, especially the locations of the interior walls. Using this prior knowledge, for any target position, the location of the associated ghosts (one for each interior wall) can be predicted. The exploitation scheme works as follows. Using conventional image formation, an image of the scene containing both real targets and ghosts is obtained. Next, for every image pixel (and
Previous Page | Contents | Zoom in | Zoom out | Front Cover | Search Issue | Next Page qqM
Mq
qM
MqM
THE WORLD’S NEWSSTAND®
Previous Page | Contents | Zoom in | Zoom out | Front Cover | Search Issue | Next Page qqM
Mq
qM
MqM
THE WORLD’S NEWSSTAND®

IEEE SIGNAL PROCESSING MAGAZINE [116] JULY 2014
possible target location), the energy of the associated ghosts is mapped back onto the target’s site. This is achieved by a 2-D convolution with a space-varying kernel ( , )H p r that uses the information of the ghost locations
( ) | ( ) | ( , ) .I p I p H p rr
R
0
1mapping )=
=
-
/ (6)
The weighting and shape of the kernel ( , )H p r is chosen such that the full energy of the ghosts is utilized to boost the amplitude of the real target. At the same time, the ghosts are suppressed. Finally, a composite ghost-free image with improved SCR is obtained by a pixel-by-pixel multiplication of the two images. Figure 7 illustrates the result of the multipath exploitation scheme using real data from a scene consisting of a single reflec-tor located between front and back walls. The conventional SAR image in Figure 7(a) shows both the target and the ghost due to multipath, originating from the back wall. The ghost is clearly suppressed in the composite image in Figure 7(b) obtained using the exploitation scheme.
EXPLOITATION WITH UNRESOLVED MULTIPATHThe previously described exploitation methods fail if the mul-tipath returns are not resolvable because they would lead to overlapping targets and ghosts in the conventional SAR image. Such situations may arise when system constraints permit use of limited bandwidth and/or aperture, and in the presence of non-homogeneous front walls. However, using proper modeling of the multipath returns, the additional energy and information therein may still be exploited to obtain an improved scene reconstruction.
If prior knowledge of the surrounding environment is avail-able, i.e., the location and dielectric properties of the walls, a linear inverse scattering scheme based on the PO model may be employed for exploiting multipath from walls and other specu-lar reflectors [20]. Using Kirchhoff’s approximation, a linearized scattering equation can be obtained as
( , ) ( , , , ) ( , , , ) ( , ) ,E u k E u x z k G u x z k x z dxdzs n i n n0 0 0 v=X
## (7)
[FIG6] (a) Propagation paths of single- and double-scattered waves. (b) The conventional SAR image. (c) The double scattering image. (Figure adapted from [18] and used with permission.)
TrueTrue
z
3
2
1
0
z
3
2
1
0(X, 0) –1 0 1 2
x–1–2 0 1 2
x
z
3
2
1
0–1–2 0 1 2
x(a) (b) (c)
First Fresnel Zone
p′Target
pε0
Direct PathMultipath 0.3
0.4
0.6
0.8
0.5
0.7
0.91
Before After
–8
–2
–4
–6
–10
–12
–14
–16
4
6
5
7
2
3
2 3–2–4 10–1–3
z
x(dB)
–8
–2
0 0
–4
–6
–10
–12
–14
–16
4
6
5
7
2
3
2 3–2–4 10–1–3
z
x(a) (b)
(dB)
Target Target
[FIG7] A backprojected image using the (a) conventional- and (b) multipath exploitation-based image formation approaches. (Figure adapted from [5] and used with permission.)
Previous Page | Contents | Zoom in | Zoom out | Front Cover | Search Issue | Next Page qqM
Mq
qM
MqM
THE WORLD’S NEWSSTAND®
Previous Page | Contents | Zoom in | Zoom out | Front Cover | Search Issue | Next Page qqM
Mq
qM
MqM
THE WORLD’S NEWSSTAND®

IEEE SIGNAL PROCESSING MAGAZINE [117] JULY 2014
where ( , )E u ks n 0 is the scattered field measured at the nth antenna location, k0 is the wave number in free space, ( )Ei $ is the incident field, ( )G $ is Green’s function for the relevant back-ground medium, ( , )x zv is the unknown target distribution, and X describes the spatial region being interrogated. With prior knowledge of the background scattering environment, Green’s function can be calculated analytically or numerically. The incident field can be obtained by the known emitted field of the transmitter and the reflection/refraction properties of the front wall. Discretizing the region of interest ,X a finite-dimen-sional equivalent representation of (7) is obtained as
,E As linscat v= (8)
where E s is the vectorized measured scattered field, Alinscat rep-resents the discretized linear operator in (7), and v is the dis-cretized and vectorized scattering space. An estimate of v can be achieved by finding the singular value decomposition of Alinscat
and inverting only the dominant singular values [20], [27]. Other inversion methods may employ a sparsifying regularization, as in [21]. Sparse reconstruction-based multipath exploitation approaches are described in more detail in the section “Multipath Exploitation/Suppression in Sparse Reconstructions.”
A similar method has been proposed to deal with multipath resulting from periodically structured front walls, e.g., cinder-block walls [4]. The propagation through the front wall is mod-eled analytically and is exploited in the image formation step to utilize the additional beams that are directed toward the target by the Floquet modes of the front wall.
Time-reversal methods [22]–[24] may also be applied to exploit multipath propagation in indoor imaging. The efficiency of this approach was first demonstrated by Fink [28], using acoustic waves and first applied to multipath environments in SAR by Sarabandi et al. [22]. Time-reversal is a two-step proce-dure. In the first step, the pulse is transmitted into the back-ground scene and reflections are received by an array. This is done to obtain information of the scattering scenario without the target of interest. In the second step, a time reversed received sig-nal is transmitted at the receive array into the scene containing the target of interest. In this way, the transmitted energy is focused at the original transmitter location. By using this scheme, the information of the scattering environment can be used to improve the effective array aperture. It should be noted that if the scattering environment is known a priori, the first transmit receive cycle can be executed via a simulation, thereby overcoming the otherwise limiting constraint of background scene access.
MULTIPATH EXPLOITATION/SUPPRESSION IN SPARSE RECONSTRUCTIONSSparse signal representation has been used successfully for solv-ing SAR image formation problems in a variety of applications [29]. This framework is based on the observation that typical underlying scenes usually exhibit sparsity in terms of certain features, such as scene reflectivity.
Sparse representation was first employed for imaging of building interiors in [30]. As only a few targets usually reside in the room, the complex amplitude of the image can be sparsely represented. The measurement model, motivated by the ray-tracing formulation of (1), is given by
,y A v= (9)
where y is the stacked vector representing the measurements from all N array element locations, v is the sparse vectorized image of the scene, and the matrix A is the dictionary of the radar responses under the assumed single-scattering-based point-target model. The scene image can be reconstructed using the basis pursuit denoising (BPDN) as follows:
,A ymin 21
22
1v v m v= - +v
t (10)
where m is a regularization parameter which provides a tradeoff between fidelity to measurements and noise tolerance. BPDN is a regularized least-squares solution that favors sparse results. Other reconstruction methods use greedy approaches to build the solu-tion iteratively. Optionally, a downsampling of the measurements in (9) can be done to reduce the amount of data. However, special care has to be taken to ensure incoherence of the sampling matrix and the dictionary to guarantee reliable recovery.
The sparse reconstruction approach for indoor images has been extended to exploit both the interior wall and wall ringing mul-tipath returns in [19] under the assumption of prior knowledge of building layout. Using a discretized version of the ray-tracing signal model in (2) and assuming knowledge of the building layout, the measurement vector y can be expressed as a superposition of indi-vidual linear models for each of the R propagation paths
,y A A A( ) ( ) ( ) ( ) ( ) ( )R R0 0 1 1 1 1fv v v= + + + - - (11)
where ( )rv is the vectorized image of the scene corresponding to the rth path and A( )r is the dictionary that embodies the GO propagation model for the rth path. Next, a stacked signal model is formed
,y Av= u u (12)
[FIG8] The group sparse structure for the subimages.
σ (0)
σ (1)
σ (2)
σ (R – 1)
Previous Page | Contents | Zoom in | Zoom out | Front Cover | Search Issue | Next Page qqM
Mq
qM
MqM
THE WORLD’S NEWSSTAND®
Previous Page | Contents | Zoom in | Zoom out | Front Cover | Search Issue | Next Page qqM
Mq
qM
MqM
THE WORLD’S NEWSSTAND®

IEEE SIGNAL PROCESSING MAGAZINE [118] JULY 2014
with a combined dictionary [ ]A A A A( ) ( ) ( )R0 1 1g= -u and stacked image vectors .( ) ( ) ( )T T R T T0 1 1gv v v v= -u ^ ^ ^h h h6 @
The vector vu can be estimated by exploiting the common support property of the R sparse images. This property stems from the fact that the images , ,( ) ( )R0 1fv v - describe the same underlying scene. That is, if a certain element in, e.g., ( )0v has a nonzero value, the corresponding elements in the other images should be also nonzero.
This means that corresponding pixels in the image vectors should be grouped, as shown in Figure 8, necessitating a group sparse reconstruction approach
,y Aarg min 21
,2 122
- mv v v= +v
ut u u uu
(13)
where
.
: , , ,
( ) ( ) *
,( ) ( ) ( )p p p
R T
p
P
pr
r
R
pr
p
P
0
1
0
1
2 10 1 1
20
1
fv
v v
v v v
=
=
=
-
=
-
-
=
-
u
^ h
6 @//
/
(14)
The mixed-norm term in the regularizer ensures the group structure in the sparse reconstruction result. Finally, the reconstruction results for the individual paths are combined noncoherently to obtain an overall image with suppressed ghost targets and improved SCR; see Figure 9. Data unders-ampling can precede the sparse reconstruction in this approach as well.
An alternate approach for sparsity-based scene reconstruc-tion in the presence of multipath has been proposed in [16]. The authors assume a convolutive model for multipath, wherein the echo waveform at each receiver is modeled as the superposition of the direct impulse response and the multipath impulse response for P targets convolved with the transmitted pulse waveform s
.( )y s g d gpp
P
p p p0
1
) )= +=
-
/ (15)
The direct impulse response g p is assumed to be a single spike and stronger than the indirect returns. The multipath impulse response is the convolution of the direct impulse response g p with a sparse delay vector .d p The multipath delays for a particular tar-get are assumed constant across the receivers. Using the above model, an iterative greedy sparse reconstruction approach is pro-posed by the authors to estimate the unknown impulse responses g p and delay vectors .d p The estimated direct impulse responses are then used to form a ghost-free image. The method performs well, especially in the case of wall ringing multipath. The advantage of this approach lies in the fact that no prior knowledge is needed. However, the additional energy in the multipath returns is sup-pressed rather than exploited for image formation.
CONCLUSIONSWe have considered the problem of imaging building interiors using SAR. The emerging TWRI technology has experienced a rising interest over the last decade due to its numerous civil and military applications. We have presented an overview of different approaches to deal with multipath in indoor radar imaging sce-narios. Multipath mitigation and exploitation are key to obtain-ing reliable information when many and/or strong secondary scatterers are present in the scene of interest. We have provided a balanced and complete account of existing methods and dis-cussed their respective advantages and disadvantages. Both con-ventional beamforming and compressive sensing-based methods have been presented, where the latter assume the underlying scene to be sparse. We bridged analysis with supporting simula-tion and experimental examples.
AUTHORSMichael Leigsnering ([email protected]) received the Dipl.-Ing. degree in electrical engineering and information technology (summa cum laude) from Technische Universität Darm-stadt in 2010. He is currently working toward his Ph.D. degree in the Signal Processing Group, Institute of Telecommunications, Technische Universität Darmstadt. His research interest lies in array
6
5
4
3
2
1–2 –1 0
x
z
1 2
6
5
4
3
2
1–2 –1 0
x
z
1 2
6
5
4
3
2
1–2 –1 0
x(a) (b) (c)
z
1 2
0
–5
–10
–15
–20
–25
–30
–35
–40(dB)
[FIG9] Backprojected image using the (a) full data, along with (b) conventional- and (c) multipath exploitation-based sparse reconstruction results. The sparse reconstruction used undersampled data, specifically, one-fourth of the array elements and one-eighth of the frequencies. (Figure adapted and used with permission from [31].)
Previous Page | Contents | Zoom in | Zoom out | Front Cover | Search Issue | Next Page qqM
Mq
qM
MqM
THE WORLD’S NEWSSTAND®
Previous Page | Contents | Zoom in | Zoom out | Front Cover | Search Issue | Next Page qqM
Mq
qM
MqM
THE WORLD’S NEWSSTAND®
___________________

IEEE SIGNAL PROCESSING MAGAZINE [119] JULY 2014
signal processing with a focus on through-the-wall radar imaging, compressive sensing, and multipath phenomena. He was a visiting research associate at the Center for Advanced Communications, Vil-lanova University, Pennsylvania, in 2012 and 2013.
Moeness G. Amin ([email protected]) received the Ph.D. degree in 1984 from the University of Colorado, Boul-der. He has been on the faculty of the Department of Electrical and Computer Engineering at Villanova University since 1985, where he is now a professor and the director of the Center for Advanced Communications. He is a Fellow of the IEEE, the International Society for Optical Engineering, and the Institute of Engineering and Technology. He received the IEEE Third Millennium Medal and the EURASIP Individual Technical Achievement Award. He was a Distinguished Lecturer of the IEEE Signal Processing Society. He has over 600 publications in the field of signal and array processing, including radar imag-ing. He is a recipient of eight Best Paper Awards. He serves on the editorial boards of IEEE Signal Processing Magazine and EURASIP’s journal, Signal Processing.
Fauzia Ahmad ([email protected]) received the M.S. and Ph.D. degrees in electrical engineering, both from the University of Pennsylvania, Philadelphia, in 1996 and 1997, respec-tively. Since 2002, she has been with the Center for Advanced Communications, Villanova University, Pennsylvania, where she is a research professor and the director of the Radar Imaging Lab. She has over 130 publications in the areas of radar imaging, radar signal processing, compressive sensing, array signal processing, waveform design and diversity, ultrasound imaging, and over-the-horizon radar. She is a Senior Member of the IEEE and the Inter-national Society for Optical Engineering (SPIE). She serves on the editorial boards of IET Radar, Sonar, & Navigation and the SPIE/IS&T Journal of Electronic Imaging.
Abdelhak M. Zoubir ([email protected]) received his Dr.-Ing. degree from Ruhr-Universität Bochum, Germany. He was with Queensland University of Technology, Australia, from 1992 to 1998. He then joined Curtin University of Technology, Australia, as a professor of telecommunications and was interim head of the School of Electrical and Computer Engineering from 2001 to 2003. Since 2003, he has been a professor of signal processing at Tech-nische Universität Darmstadt, Germany. He is an IEEE Distin-guished Lecturer (Class of 2010–2011), past chair of the IEEE Signal Processing Society’s Signal Processing Theory and Methods Technical Committee, and the current editor-in-chief of IEEE Sig-nal Processing Magazine. His research interest lies in statistical methods for signal processing applied to telecommunications, radar, sonar, car engine monitoring, and biomedicine. He has pub-lished over 300 papers in these areas. He is a Fellow of the IEEE.
REFERENCES[1] M. Amin and F. Ahmad, “Wideband synthetic aperture beamforming for through-the-wall imaging [lecture notes],” IEEE Signal Processing Mag., vol. 25,no. 4, pp. 110–113, July 2008.
[2] M. Amin, Ed., Through-the-Wall Radar Imaging. Boca Raton, FL: CRC Press,2010.
[3] T. Dogaru and C. Le, “SAR images of rooms and buildings based on FDTD com-puter models,” IEEE Trans. Geosci. Remote Sensing, vol. 47, no. 5, pp. 1388–1401,May 2009.
[4] R. Burkholder, “Electromagnetic models for exploiting multi-path propaga-tion in through-wall radar imaging,” in Proc. Int. Conf. Electromagnetics in Advanced Applications, Torino, Italy, Sept. 2009, pp. 572–575.[5] P. Setlur, M. Amin, and F. Ahmad, “Multipath model and exploitation in through-the-wall and urban radar sensing,” IEEE Trans. Geosci. Remote Sensing,vol. 49, no. 10, pp. 4021–4034, Oct. 2011.[6] E. J. Baranoski, Multipath Exploitation Radar Industry Day. Herndon, VA:DARPA, 2007.[7] W. Liang, H. Xiaotao, Z. Zhimin, and S. Qian, “Research on UWB SAR image formation with suppressing multipath ghosts,” in Proc. CIE Int. Conf. Radar,Shanghai, China, Oct. 2006, pp. 1–3.[8] Q. Tan and Y. Song, “A new method for multipath interference suppression in through-the-wall UWB radar imaging,” in Proc. Int. Conf. Advanced Computer Control (ICACC), Shenyang, China, Mar. 2010, vol. 5, pp. 535–540.[9] D. Garren, “SAR image formation uncorrupted by multiple-bounce artifacts,” in Proc. IEEE Radar Conf., Long Beach, USA, Apr. 2002, pp. 338–343.[10] D. Obuchon, D. Garren, J. S. Goldstein, R. Greene, and J. North, “Driftinversion estimation of multipath ghosts in SAR image reconstruction,” in Proc. IEEE Radar Conf., Philadelphia, PA, Apr. 2004, pp. 556–558.[11] J. DeLaurentis, “Multipath synthetic aperture radar imaging,” IET Radar, So-nar Navig., vol. 5, no. 5, pp. 561–572, June 2011.[12] F. Ahmad and M. Amin, “Multi-location wideband synthetic aperture imaging for urban sensing applications,” J. Franklin Inst., vol. 345, no. 6, pp. 618–639,Sept. 2008.[13] L. Li and J. Krolik, “Vehicular MIMO SAR imaging in multipath environ-ments,” in Proc. IEEE Radar Conf., Kansas City, USA, May 2011, pp. 989–994.[14] D. B. André, R. D. Hill, and C. P. Moate, “Multipath simulation and removal from SAR imagery,” in Proc. SPIE 6970, Algorithms for Synthetic Aperture Radar Imagery XV, Apr. 2008, p. 69700M.[15] A. O. Knapskog, “Moving targets and multipath in sar images of harbour scenes,” in Proc. European Conf. Synthetic Aperture Radar (EUSAR), Nurem-berg, Germany, Apr. 2012, pp. 547–550.[16] H. Mansour and D. Liu, “Blind multi-path elimination by sparse inversion in through-the-wall-imaging,” in Proc. IEEE Int. Workshop Computational Advances Multi-Sensor Adaptive Processing (CAMSAP), Saint Martin, Dec.2013, pp. 256–259.[17] R. Price and P. Green, “A communication technique for multipath channels,” Proc. IRE, vol. 46, no. 3, pp. 555–570, Mar. 1958.[18] S. Kidera, T. Sakamoto, and T. Sato, “Extended imaging algorithm based on aperture synthesis with double-scattered waves for UWB radars,” IEEE Trans. Geosci. Remote Sensing, vol. 49, no. 12, pp. 5128–5139, Dec. 2011.[19] M. Leigsnering, F. Ahmad, M. Amin, and A. Zoubir, “Multipath exploitation in through-the-wall radar imaging using sparse reconstruction,” IEEE Trans. Aerosp. Electron. Syst., to be published. [20] G. Gennarelli and F. Soldovieri, “A linear inverse scattering algorithm for radar imaging in multipath environments,” IEEE Geosci. Remote Sensing Lett.,vol. 10, no. 5, pp. 1085–1089, Sept. 2013.[21] G. Gennarelli, I. Catapano, and F. Soldovieri, “RF/microwave imaging of sparse targets in urban areas,” IEEE Antennas Wireless Propag. Lett., vol. 12,pp. 643–646, May 2013.[22] K. Sarabandi, I. Koh, and M. Casciato, “Demonstration of time reversal methods in a multi-path environment,” in Proc. IEEE Antennas Propagation Society Int. Symp., Monterey, USA, June 2004, Vol. 4, pp. 4436–4439.[23] J. M. F. Moura and Y. Jin, “Time reversal imaging by adaptive interference canceling,” IEEE Trans. Signal Processing, vol. 56, no. 1, pp. 233–247, Jan. 2008.[24] W. Zheng, Z. Zhao, and Z.-P. Nie, “Application of TRM in the UWB through wall radar,” Prog. Electromagn. Res., vol. 87, pp. 279–296, 2008.[25] K. J. Langenberg, M. Brandfaß, K. Mayer, T. Kreutter, A. Brüll, P. Fellinger,and D. Huo, “Principles of microwave imaging and inverse scattering,” EARSeL Adv. Remote Sens., vol. 2, no. 1, pp. 163–186, 1993.[26] F. Soldovieri and R. Solimene, “Through-wall imaging via a linear inverse scattering algorithm,” IEEE Geosci. Remote Sensing Lett., vol. 4, no. 4, pp. 513–517, 2007.[27] R. Solimene, F. Soldovieri, G. Prisco, and R. Pierri, “Three-dimensional through-wall imaging under ambiguous wall parameters,” IEEE Trans. Geosci. Remote Sensing, vol. 47, no. 5, pp. 1310–1317, Mar. 2009.[28] M. Fink, “Time-reversal mirrors,” J. Phys. D, vol. 26, no. 9, p. 1333, 1993.[29] L. Potter, E. Ertin, J. Parker, and M. Cetin, “Sparsity and compressed sensing in radar imaging,” Proc. IEEE, vol. 98, no. 6, pp. 1006–1020, June 2010.[30] Y.-S. Yoon and M. Amin, “Compressed sensing technique for high-resolution radar imaging,” in Proc. SPIE Signal Processing, Sensor Fusion, Target Recog-nition XVII, Orlando, FL, Mar. 2008, vol. 6968, no. 1, p. 69681A.[31] M. Leigsnering, F. Ahmad, M. Amin, and A. Zoubir, “Compressive sensing based specular multipath exploitation for through-the-wall radar imaging,” in Proc. IEEE Int. Conf. Acoustics, Speech, and Signal Processing (ICASSP), Van-couver, Canada, May 2013, pp. 6004–6008.
[SP]
Previous Page | Contents | Zoom in | Zoom out | Front Cover | Search Issue | Next Page qqM
Mq
qM
MqM
THE WORLD’S NEWSSTAND®
Previous Page | Contents | Zoom in | Zoom out | Front Cover | Search Issue | Next Page qqM
Mq
qM
MqM
THE WORLD’S NEWSSTAND®
_________________
__________________
__________________

IMAGE LICENSED BY INGRAM PUBLISHING
Long-Wave Infrared Hyperspectral
Remote Sensing of Chemical Clouds
IEEE SIGNAL PROCESSING MAGAZINE [120] JULY 2014 1053-5888/14/$31.00©2014IEEE
Digital Object Identifier 10.1109/MSP.2013.2294804
Date of publication: 13 June 2014
Many military and civilian applications depend on the ability to remotely sense chemical agent (CA) clouds, from detecting small but lethal con-centrations of chemical warfare agents (CWAs) to mapping plumes in the aftermath of natural disasters. Hyperspectral imaging sensors, in the long-wave infrared (IR) (LWIR) part of the spectrum, are particularly well
suited for these gas-sensing tasks. Their wide fields of view allow many square kilometers to be imaged almost simultaneously, and their high spectral resolutions often allow the detec-tion of chemical clouds even when they are optically thin (or nearly transparent).
In this review article, we focus on the signal processing approaches necessary to achieve the three main tasks of gas-phase remote sensing: detection of a plume, identification of its constituent gases, and quantification of the amounts present. We start with a tutorial intro-duction to the radiance phenomenology that drives the models on which exploitation algo-rithms are based. Next, we identify the fundamental aspects of the data-exploitation problem, develop algorithms that can successfully exploit data from many different sensors, and discuss the many challenges that remain open to the signal processing community. We present results using real hyperspectral data sets whenever possible.
INTRODUCTIONSpectroscopy, the study of the interaction between matter and radiated energy, originated with the study of visible light dispersed according to wavelength by a prism. IR spectroscopy is based on measurement of radiation, absorbed or emitted by a sample, as a function of the
[Dimitris G. Manolakis, Steven E. Golowich, and Robert S. DiPietro]
[A focus on signal processing approaches]
Previous Page | Contents | Zoom in | Zoom out | Front Cover | Search Issue | Next Page qqM
Mq
qM
MqM
THE WORLD’S NEWSSTAND®
Previous Page | Contents | Zoom in | Zoom out | Front Cover | Search Issue | Next Page qqM
Mq
qM
MqM
THE WORLD’S NEWSSTAND®

WIKIMEDIA COMMONS
IEEE SIGNAL PROCESSING MAGAZINE [121] JULY 2014
wavelength in the IR region of the electromagnetic spectrum (0.75–14 nm). Hyperspectral sensors are essentially spectrometers that measure the distribution of radiation in the IR region using a large number (typically more than 100) of contiguous narrow spectral bands [1].
Some sensors measure the spectrum of the entire scene in their field of view. Such single-pixel sensors can be used to collect multiple spectra by scanning a region to build an image or by staring at the same point to obtain a time-series of spectra. In contrast, hyperspectral imaging sensors divide the field of view into a rectangular grid of pixels and almost simultaneously meas-ure the spectrum of each pixel. As a result, they produce a data cube with two spatial dimensions and one spectral dimension. Hyperspectral sensors can be deployed on satellites, unmanned aerial vehicles, and ground-based platforms (see Figure 1). The choice of a specific platform, however, imposes crucial constraints on the design and performance of the sensor.
Standoff detection of chemical clouds is necessary when physical separation is required for convenience or to put people and assets outside the zone of severe risk. An important class of standoff sensors for chemical clouds is based on the principles of passive IR spectroscopy. Such sensors use passive imaging spectroscopy in the LWIR atmospheric window (8–14 nm). For passive IR detectors, sunlight and the earth’s thermal emission provide the illuminating source. In the LWIR region, thermal emission from the ground is far stronger than reflected sun-light. Thus, LWIR spectroscopy provides day and night capabil-ity for remote chemical detection applications. The LWIR region is also well suited for gas-sensing applications because:
■ A wide range of chemical compounds have unique identify-ing spectral signatures in the LWIR region. This is illustrated in Figure 2, which shows the spectral signature of ammonia.■ The atmosphere is relatively transparent within the LWIR window. This is also illustrated in Figure 2, which shows the atmospheric transmittance as a function of wavelength.The objective of a standoff sensor is to determine the pres-
ence of a chemical cloud in its field of view and provide infor-mation for its identification and quantification. From a signal processing point of view, the goal is to develop algorithms to detect, identify, and quantify chemical gases using mathemati-cal methodologies that address the physics of the problem, operational environment, characteristics of the sensor hard-ware, and user requirements.
[FIG1] Standoff hyperspectral sensors can be deployed on satellites, unmanned aerial vehicles, and ground-based platforms.
Previous Page | Contents | Zoom in | Zoom out | Front Cover | Search Issue | Next Page qqM
Mq
qM
MqM
THE WORLD’S NEWSSTAND®
Previous Page | Contents | Zoom in | Zoom out | Front Cover | Search Issue | Next Page qqM
Mq
qM
MqM
THE WORLD’S NEWSSTAND®

IEEE SIGNAL PROCESSING MAGAZINE [122] JULY 2014
When IR radiation passes through a chemical cloud, its spectral composition is modified by the transmittance of the cloud, which in turn depends on the spectral signature of the gas. All practical data exploitation algorithms exploit the differ-ences between radiation reaching the sensor directly or through the cloud.
When there is no plume in the sensor’s field of view, the observed signal consists of detector noise and the radiation from the surrounding background, which is called background clut-ter or simply clutter. The presence of unwanted detector noise and background clutter complicates the sensing of chemical clouds. Noise, which can usually be reduced by better sensor design, sets the limit for performance. Background clutter can often be reduced by appropriate signal processing to reach, at best, noise-limited performance.
The basic operational objectives of a chemical-cloud detection system are summarized in Table 1. Figure 3 shows the fundamen-tal signal processing operations required to address
the operational objectives in an automated fashion. Although many of these operations can be addressed by existing signal process-ing techniques, the complex interactions between the properties of the plume, atmosphere, and background pose chal-lenges that are unique to the LWIR prob-lem. In particular, the relative temperatures
of these three components, and variations thereof, can have a pro-found impact on the at-sensor radiance, while the nonlinear nature of the interactions can be both a help and a hindrance to inference algorithms. Understanding and appreciating such chal-lenges is necessary to properly apply existing tools and develop new algorithms that enable the next generation of applications, such as real-time operation, exploitation of a greater variety of sensor geometries, and tomographic plume reconstruction.
APPLICATIONSThe list of applications of standoff hyperspectral imaging for chem-ical gas sensing is long and growing. Here, we provide a sampling of some of the major ways in which this technology is employed.
ENVIRONMENTAL MONITORINGMany gaseous pollutants, as emitted by industrial and other sources, exhibit strong LWIR signatures that lend themselves well to passive monitoring [2]. This option has many advantages over in situ monitoring, most prominently the ability to survey wide areas rapidly and remotely, eliminating the need for site access. Such monitoring may be carried out either with a ground-based sensor with a horizontal viewing geometry or from an aircraft passing over the scene under study.
A comprehensive study of the down-looking airborne sce-nario was carried out in [3] and [4], in which effluent gases from industrial emission stacks were imaged with the Aero-space Spatially Enhanced Broadband Array Spectrograph Sys-tem (SEBASS) sensor [5]. A study [6] by the Environmental Protection Agency (EPA), using the University of Hawaii’s Air-borne Hyperspectral Imager (AHI) sensor [7], demonstrated the detection and identification of a number of hazardous emissions from petrochemical plants and other facilities. The side-looking geometry, with the ground-based Scanning IR Gas Imaging System (SIGIS) sensor [8], [9], was used in [10] to map the dispersion of a sulfur dioxide plume emitted from an oil-fired power plant under various atmospheric conditions. Similar side-looking geometries were employed in [11] and [12] using the Telops FIRST and Hyper-Cam sensors [13].
EMERGENCY RESPONSENatural and man-made disasters can result in the release of haz-ardous chemical vapors into the atmosphere. In such situations, the rapid assessment of the types and quantities of such plumes is crucial for the protection of both first responders and local res-idents. The EPA has been operating an always-on-call airborne system for this purpose for the past decade [14], [15]. The system employs two imagers that operate in the midwave IR (MWIR) and
[TABLE1] OPERATIONAL AND SIGNAL PROCESSING ALGORITHM OBJECTIVES OFAN AUTOMATED STANDOFF CHEMICAL GAS-DETECTION SYSTEM.
OPERATIONAL OBJECTIVES ALGORITHMIC OBJECTIVES IS AN AGENT CLOUD PRESENT? DETECT CHEMICAL CLOUDWHICH AGENT? IDENTIFY CHEMICAL FROM LIBRARYHOW MUCH MATERIAL WAS RELEASED? ESTIMATE CLOUD SHAPE AND STRENGTH OF CHEMICALWHERE IS THE CLOUD HEADED? TRACK CHEMICAL CLOUD
Detect IdentifyLWIRSensor
Quantify Track Cloud Report
[FIG3] The fundamental signal processing functions of an automated standoff chemical cloud detection system.
0 5 10 15
1
0
2
3
4
Wavelength (μm)
Abs
orba
nce
(NH
3)
× 10–3
LWIRRegion
Ammonia 100
80
60
40
20
0
Tran
smitt
ance
(%
)
[FIG2] A wide range of chemical compounds, such as ammonia, have unique identifying spectral signatures in the LWIR region (8–13 nm). The atmospheric transmittance function shows the presence of an atmospheric window in the LWIR from 8 to 13 nm.
Previous Page | Contents | Zoom in | Zoom out | Front Cover | Search Issue | Next Page qqM
Mq
qM
MqM
THE WORLD’S NEWSSTAND®
Previous Page | Contents | Zoom in | Zoom out | Front Cover | Search Issue | Next Page qqM
Mq
qM
MqM
THE WORLD’S NEWSSTAND®

IEEE SIGNAL PROCESSING MAGAZINE [123] JULY 2014
LWIR atmospheric windows; a multispectral scanner for plume detection over wide areas, and a cued hyperspectral spectrometer to measure high-spectral resolution radiances from specific plume locations. These latter spectra are used for gas identifica-tion and quantification. A special-purpose spectral library tai-lored for this application has been developed [16]. The system has been flown operationally on many missions in response to accidents, fires, and natural disasters, including Hurricanes Kat-rina and Rita [17]. A ground-based system has been developed for similar purposes by the Hamburg University of Technology [18].
CHEMICAL WARFARE THREAT MITIGATIONThe remote detection of CWAs and toxic industrial chemicals is of great importance for the protection of both civilian and mili-tary personnel and has been studied for more than 30 years. A great variety of deployment scenarios exist, including stationary ground-based sensors for the protection of fixed targets, ground vehicle deployments for mobile reconnaissance, and airborne missions to cover wide areas. The goals of such sensors are to detect possible threats, identify any constituent gases as belong-ing to a library of known agents, quantify the amount of gas present, and dynamically map the location of the plume, all with sufficiently low latency to allow responsive action to be taken. Wide-area sensors may be also be used to locate CWA production facilities by the detection of fugitive emissions. Some of the sensors that have been developed to address these threats are described in the section “Imaging Spectrometers.”
EARTH SCIENCEThe applications of remote imaging spectrometry in the earth and planetary sciences are vast in scope, and we mention just two direc-tions enabled by recent advances in LWIR imaging technology.
The monitoring of volcanic emissions is important for pub-lic health and environmental studies as they can have substan-tial effects on local and global atmospheric chemistry. The use of hyperspectral imagers for this purpose has been demon-strated with the AHI sensor flying over the Kilauea volcano [19] and by the SIGIS ground-based system viewing the Pop-ocatèpetl volcano [20].
Another promise of imaging spectrometry is the mapping of surface mineral composition. This area is most developed in the visible and near-IR/short-wave IR (VNIR/SWIR) window, in which the spectral signatures are dominated by electronic processes. The LWIR regime, by contrast, provides sensitivity to vibrational pro-cesses, and some minerals, mainly silicates and carbonates, have characteristic features in this range. Most work in this area has used multispectral radiometers, e.g., the orbital Advanced Space-borne Thermal Emission and Reflection Radiometer (ASTER) sen-sor [21], but increased spectral resolution offers the possibility of much finer mineral classification. The SEBASS sensor has been successfully used to explore these applications [22], [23].
IMAGING SPECTROMETERSThe fundamental function of a hyperspectral imaging sensor, also known as an imaging spectrometer, is to measure the spectrum
of each picture element in the field of view of the sensor. There-fore, at least in principle, hyperspectral sensors consist of an opti-cal system, an image scanning mechanism, and a spectrometer.
The optical system collects the radiation originating from some ground surface area and focuses the intercepted rays onto the surface of a detector element as shown in Figure 4. The area of the detector projected through the system’s optics onto the earth’s surface coincides with the ground resolution element.
The solid angle, through which radiation originating from the ground is accepted by the optical system and reaches the detector, is called the detector’s instantaneous field of view (IFOV). The IFOV is determined by the focal length of the optical system and the size of the detector. Because the IFOV subtends an area of the terrain equal to the ground resolution element, the combined detector–optics system functions as a spatial sampler with sampling area .x y#D D Typically, the ground resolution element is square and the quantity x yD D=is known as ground–sample distance.
At any instant of time, the sensor sees the energy within its IFOV. The sensor stares at a ground resolution element and col-lects photons for a time interval known as residence or dwell time. The energy measured within the IFOV is a weighted aver-age of the energy reflected or emitted from all materials within this circular area. Because averaging is done by integration, the dwell time is also known as integration time. The weighting function, which is known as the point spread function (PSF) of the sensor, extends beyond the area of a ground resolution element. In practical systems, the PSF accounts for optical, motion, and detector-size effects. Each ground resolution elem-ent is mapped onto one pixel of the image created by proper scanning of the surface by the sensor.
In a whisk broom system, the optical system, with the help of a rotating mirror and the forward motion of the sensor platform, scans the surface to collect a two-dimensional (2-D) grid of pixels. The angular field of view is that portion of the mirror sweep,
IFOV
AngularField
of View
Swath Path
Ground Resolution Element
[FIG4] An illustration of basic ideas for a whisk broom hyperspectral remote sensing system.
Previous Page | Contents | Zoom in | Zoom out | Front Cover | Search Issue | Next Page qqM
Mq
qM
MqM
THE WORLD’S NEWSSTAND®
Previous Page | Contents | Zoom in | Zoom out | Front Cover | Search Issue | Next Page qqM
Mq
qM
MqM
THE WORLD’S NEWSSTAND®

IEEE SIGNAL PROCESSING MAGAZINE [124] JULY 2014
measured in degrees, that is recorded as a scan line. The angular field of view and the altitude of the sensor determine the ground swath, which is the width of the terrain strip represented by the image. The radiance within the IFOV is passed onto a spectrometer that measures the spectrum of the pixel.
In a push broom system, there is a dedicated column of spectral detector elements for each cross-track pixel in the scene, which increases the dwell time (time-on-pixel) to the interval required to move one IFOV along the flight direction. The result is usually more accurate measurements because there is no moving mirror and the detector has more time to collect radiation from the ground resolution element. A step-stare Fourier-transform imaging spectrometer (FTIS) simultan-eously measures the spectra of each pixel in a 2-D array of pixels, which itself may or may not be scanned.
For aircraft or spaceborne instruments like the ones illus-trated in Figure 4, the motion of the platform usually provides
one of the scanning directions. Yet, for fixed site operation (such as tripod or mast-mounted instruments), either an FTIS must be employed or a scanning mechanism must be provided to build the required spatial dimensions. Measuring the spec-trum of each ground resolution element requires a spectrom-eter. There are three types of imaging spectrometers.
In prism spectrometers, the light passing through the prism is refracted over an area as a function of wavelength. Spectral sampling is achieved by detectors placed at proper locations to collect the components from a given spectral band and measure their radiance.
In grating spectrometers, the discontinuities on the grating surface redirect the incident radiation at an angle dependent on the wavelength. Because frequencies ( / )co m= of integer mul-tiple of each other are redirected in the same direction, it is necessary to use order-sorting filters to choose only the radi-ation of the frequency of interest.
Optics
Optics
Scan Line
Slit
DispersingElement
CollimatingOptics
FocusingOptics
FocusingOptics
Spe
ctra
l
Spatial
Spatial
Spatia
l
Spa
tial
Spectral
Spatial
2-D FPA
2-D FPA
Spa
tial
OPD
FFT
FTIS
(a)
(b)
[FIG5] Types of imaging spectrometers. (a) A “push broom type” imaging spectrometer using a dispersive element. The spectra of all pixels in the scan line are measured simultaneously. (b) “Step-stare” FTIS. The interferogram of all pixels in the field of view is computed simultaneously for each optical path difference (OPD). The image cube is the Fourier transform of the interferogram cube along the spectral dimension.
Previous Page | Contents | Zoom in | Zoom out | Front Cover | Search Issue | Next Page qqM
Mq
qM
MqM
THE WORLD’S NEWSSTAND®
Previous Page | Contents | Zoom in | Zoom out | Front Cover | Search Issue | Next Page qqM
Mq
qM
MqM
THE WORLD’S NEWSSTAND®

IEEE SIGNAL PROCESSING MAGAZINE [125] JULY 2014
In Fourier transform spectrometers, the incident radiation is split into two beams whose optical paths are varied differentially and recombined to allow interference. Fourier transform spec-troscopy consists of two processes: the first, experimental, is the measurement of an autocorrelation function called the inter-ferogram using a Michelson interferometer; the second, math-ematical, is the computation of the spectrum from the interferogram. Spectral resolution is determined by the length of the measured interferogram.
Prism and grating spectrometers [see Figure 5(a)] measure the spectrum directly in the frequency domain. In contrast, Fourier transform spectrometers [see Figure 5(b)] measure the spectrum indirectly by computing the Fourier transform of the physically measured interferogram. However, every spectrom-eter is characterized by its spectral resolution and the spanned spectral range. Spectral sampling is specified by the center wavelength and the width of each band (bandwidth or spectral resolution). The number of bands and their locations in the spectrum, expressed as wavelengths or frequencies specify the spectral response of the sensor.
The ground-based SEBASS (GBSS) [24] is a prism-based push broom imaging spectrometer with an IFOV of 1.1 mrad per pixel and spectral range of 7.8–13.4 nm. The focal plane array (FPA) is 128 # 128 and measures the spectrum of 128 pixels in 128 spectral bands. The entrance slit is aligned vertically and a large servo motor is used to do azimuth scanning.
The Telops FIRST imaging spectrometer [13] is a step-stare Michelson interferometer with spectral range of 8–12 nm, vari-able spectral resolution of 0.25–150 cm–1, and optimum resolu-tion 4 cm–1. The sensor uses a 320 # 256 pixel FPA with an IFOV of 0.35 mrad.
The Joint Services Lightweight Standoff Chemical Agent Detector (JSLSCAD) [25] uses a 2-D scanning Michelson inter-ferometer with a single detector element and a 1.5° IFOV. JSLSCAD, which has a spectral range of 7–14 nm, operates in a search mode with a spectral resolution of 16 cm–1 and an interrogation mode with a spectral resolution of 4 cm–1.
Imaging spectrometers take indirect measurements of phys-ical parameters in the sense that the output digital numbers are proportional to the incoming photon energy but they are not measured in any physically meaningful unit. The process of converting digital numbers into at-sensor spectral radiance is known as radiometric calibration. Conversion of at-sensor radiance to emissivity, which is a more complicated process, is discussed in the section “Signals, Distortions, and Clutter.”
AT-SENSOR RADIANCE SIGNAL MODELSIn this section, we explain the physical basis for gas detection with passive LWIR sensors. The radiance reaching the detector can often be modeled well using radiative transfer theory with three parallel atmospheric layers orthogonal to the line of sight of the sensor. The first layer extends from behind the plume to the background, the second layer is the plume itself, and the third layer is the atmosphere between the plume and the sensor. Each layer attenuates the radiation that passes through it and
emits radiation on the basis of its own content and temperature. This is illustrated in Figure 6 for a standoff sensor with a hori-zontal line of sight.
Several simplifying assumptions are made to arrive at expressions for the at-sensor radiance in the presence and absence of the chemical plume.
■ The atmosphere and plume are assumed free of aerosols and particulate matter so that scattering may be neglected throughout. ■ The plume and atmosphere are each assumed to be homoge-neous in both temperature and composition.
La, τa
Lp, τpLb
800 900 1,000 1,100 1,200 1,300
0.04
0.06
0.08
0.1
0.12
Wavenumber (cm−1)
800 900 1,000 1,100 1,200 1,300Wavenumber (cm−1)
(a)
(b)
Rad
ianc
e (W
/m2 /
sr/c
m−
1 )
−4
−2
0
2
× 10−3 × 10−3
Cha
nge
in R
adia
nce
0
1
2
3
4
5
Abs
orpt
ion
(ppm
−1 m
−1 )
Before
After
SpectralContrast
LibrarySpectrum
[FIG6] A pictorial representation of a three-layer side-looking radiative transfer radiance signal model for standoff CAdetection. ,La ,ax and ,Lp px are the path radiance and transmittance of the atmosphere and plume layers, respectively, and Lb is the background radiance.
[FIG7] (a) The radiance spectra of the same pixel before and after the appearance of a TEP plume. (b) Plots of radiance spectral contrast ( ) ( )L Lon offm m- and the absorption-coefficient library spectrum of TEP. (Notice the different units used for radiance and absorption.)
Previous Page | Contents | Zoom in | Zoom out | Front Cover | Search Issue | Next Page qqM
Mq
qM
MqM
THE WORLD’S NEWSSTAND®
Previous Page | Contents | Zoom in | Zoom out | Front Cover | Search Issue | Next Page qqM
Mq
qM
MqM
THE WORLD’S NEWSSTAND®

IEEE SIGNAL PROCESSING MAGAZINE [126] JULY 2014
■ The thickness of the plume layer and the distance between the plume and background are assumed to be small so that atmospheric transmittance can be neglected in those layers.■ Reflections off the background of both plume and down-welling atmospheric radiance are neglected.Under these assumptions, the at-sensor radiance in the
absence of plume, as a function of wavelength, is given by radia-tive transfer theory [26] to be
( ) ( ) ( ) ( ),L L La a boff m m x m m= + (1)
where ( )La m represents atmospheric path radiance and the sec-ond term is the contribution of background radiance ( )Lb m
modulated by the atmospheric transmittance ( ) .ax m
The presence of a plume has two effects: it absorbs part of the radiation emitted by the background, and it emits its own radiation. The resulting radiance is subsequently attenuated by transmission through the atmosphere and is given by
( ) ( ) ( ) ( ) ( )L L La a p bon m m x m x m m= +
( ) [ ( )] ( , ),B T1a p px m x m m+ - (2)
where ( )px m is the plume transmittance, Tp is its temperature, and ( , )B Tpm is the Planck function, which describes the radia-tion emitted by a black body at the plume’s temperature. Refer-ring to Figure 6, we have used Kirchhoff’s law [27] to write
( ) [ ( )] ( , ) .L B T1p p pm x m m= - In (2), the three terms represent the at-sensor radiance due to the atmosphere, the background radiance as modulated by the plume and atmosphere, and the plume radiance as modulated by the atmosphere.
The spectral transmittance function, ( ),px m of a plume with NG gas species can be modeled using Beer’s law [27]
( ) ( ) .expp mm
N
m1
G
x m c a m= -=
= G/ (3)
The function ( ),ma m which is known as the absorption coef-ficient spectrum, is unique for each gaseous chemical and can be used as a spectral fingerprint. The quantity ,mc which is called the concentration pathlength, is the product of two terms: the length along the sensor boresight that represents the depth of the cloud, and the average concentration along that path. Figure 7 shows examples of spectra with and without plume. The spectral contrast ( ) ( )L Lon offm m- is shown on the same plot with the absorption coefficient spectrum ( )ma m of triethyl phosphate (TEP), which is the released CA. Notice how the presence of the CA modifies the radiance spectrum of the background; this is precisely the information used by data exploitation algorithms to detect and identify CAs.
In preparation for the discussion of signal processing algorithms in the following sections, we present a mathem-atically equivalent form of the radiance equation that isolates the spectral contrast. Combining (1) with (2), we find after some algebra
( ) ( ) ( ( )) ( ( , ) ( )) ( ) .L B T L L1a p p bon offm x m x m m m m= - - + (4)
This form expresses the effect of a plume as a contrast between the on- and off-plume radiance. Also, it highlights the physical require-ments for plume detection: each of the terms in the product on the right-hand side of (4) must be nonzero. Because of their impor-tance, we enumerate these plume visibility conditions as
1) ( ) 0a 2x m (atmosphere not opaque)2) ( ) 1p 1x m (plume not transparent)3) ( , ) ( )B T L 0p b !m m- (nonzero contrast between plume black body and background radiance).In particular, plume detection is possible only if there is con-
trast between the plume black body and background radiance for at least some spectral channels.
The on-plume at-sensor radiance as a nonlinear function of parameters that characterize the plume, atmosphere, and back-ground is represented in (4). For some tasks, this equation is of direct utility. Still, there are many situations in which simplify-ing assumptions are both valid and advantageous in terms of algorithmic complexity and intuition. We describe three approx-imations that, under a wide range of situations, lead to a power-ful linear signal model.
Many applications call for maximum sensitivity to very weak plumes. In the optically thin plume approximation, Beer’s law (3) is linearized by using the first term of its Taylor expansion. The flat background emissivity approximation exploits the fact that many background emissivity functions
( )b me lack sharp spectral features, unlike most chemical plumes, leading to the approximation ( ) .1b -me When T T Tp bD = - is small in magnitude, typically less than 5 K,
the linear Planck function approximation holds, in which the Planck function is linearized in the thermal contrast term. Furthermore, the wavelength dependence of this difference is weak over the LWIR window.
Taking into consideration all three approximations, the at-sensor radiance signal model (4) becomes
( ) ( ) ( ) ( ) ( ),L C T Lm
N
B m a m1
on off
G
m c x m a m mD= +=
/ (5)
where CB is a constant independent of wavelength and temper-ature. This signal-plus-clutter model provides the basis for most detection, identification, and quantification algorithms used in practical applications.
The expression (5) represents the radiance present at the sensor input. The measurements of radiance that are output by the sensor contain the effects of the detector spectral response function ( ),RF m along with noise ( )n m introduced by the sen-sor. If ( )L mr denotes the measured radiance in a spectral chan-nel centered at m we have
( ) ( ) ( ) ( ),L L R non on Fm m m m= +*r (6)
where the convolution operator * is defined by
( ) ( ) ( ) ( ) .L R L R don F on F_m m o m o o-3
3
-* # (7)
Previous Page | Contents | Zoom in | Zoom out | Front Cover | Search Issue | Next Page qqM
Mq
qM
MqM
THE WORLD’S NEWSSTAND®
Previous Page | Contents | Zoom in | Zoom out | Front Cover | Search Issue | Next Page qqM
Mq
qM
MqM
THE WORLD’S NEWSSTAND®

IEEE SIGNAL PROCESSING MAGAZINE [127] JULY 2014
We stress that sensor measured radiances are always affected by sensor noise and other artifacts.
Suppose next that the sensor measures radiance at p spec-tral bands centered at wavelengths ,km .k p1 # # If we sample (6) at ,km m= we obtain
, , , , ,x g s v k p1 2k mm
N
mk k1
G
f= + ==
/ (8)
where
( ),x Lk kon_ mr (9a)
,g C Tm B m_ cD (9b)
{[ ( ) ( )] ( )} | ,s Rmk a m F k_ x m a m m m m=* (9c)
and
{ ( ) ( )} | ( )v L R nk koff F k_ m m m+m m=* (9d)
are, respectively, the measured radiance, chemical contrast, at-sensor gas signature, and background clutter plus noise. There-fore, the principal relationship for the analysis of radiance data can be written in a concise matrix form as
.x s v Sg vgmm
N
m1
G
_= + +=
/ (10)
According to this model, the radiance spectrum of a plume pixel is a linear mixture of the at-sensor gas signatures superimposed upon the radiance spectrum of the background. In practice, it is usually assumed that chemical mixtures are made up of three or fewer gas species: .N 3G #
SIGNALS, DISTORTIONS, AND CLUTTERThe at-sensor radiance model illustrates that the fundamental exploitation problem is to detect a known signal after modifica-tion by the surrounding environment and corruption by clutter and noise. This requires the mathematical representation of sig-nal and clutter and understanding the effects of atmospheric transmission and temperature upon the observed data.
GAS SPECTRAL LIBRARIESFor ground-level remote sensing of chemical plumes, the absorbance spectra of chemicals of interest are needed at atmos-pheric pressure and temperatures close to typical surface values. The preferred approach for obtaining these spectra is to use experimentally measured spectra from a quality-assured refer-ence database. Two such databases are publicly available, one maintained by the National Institute of Science and Technology (NIST) [28] and the other by the Pacific Northwest National Laboratory (PNNL) [29].
Both databases were developed with a view toward ground-level remote sensing applications and therefore use samples prepared at relevant pressure and temperatures. Both cover a spectral range that contains the LWIR atmospheric window, with similar spectral resolutions of about .0 1 cm 1oD = -
wavenumbers, consistent with the limiting values allowed by pressure broadening at one atmosphere. The gas species included differ in scope, although there is enough overlap to allow validating comparisons. The emphasis of the NIST data-base is greenhouse gases, the U.S. EPA hazardous air pollut-ants and freons, while that of the PNNL set is reactive compounds, industrial pollutants, and the Department of
2,150 2,200 2,250 2,300 2,3500
10
20
30
40
0
.2
.4
.6
.8
Wavenumber (cm−1)
Abs
orpt
ion
Coe
ffici
ent (
ppm
−1 m
−1 )
500 1,000 1,500 2,000 2,500 3,000 3,5000
2
4
6
8
10 × 10–3 50 × 10–6
50 × 10–6
× 200
× 10,000
3,20
03,
250
3,30
03,
350
3,40
03,
450
3,50
0
[FIG8] The library spectrum corresponding to freon-12 at 25 °C. The two insets contain the first and second overtones of the fundamental vibrational bands, appearing between 838–1,227 cm–1. Note the large dynamic range of the spectral data and, in this case, a signal-to-noise (root mean square) of over one million.
Previous Page | Contents | Zoom in | Zoom out | Front Cover | Search Issue | Next Page qqM
Mq
qM
MqM
THE WORLD’S NEWSSTAND®
Previous Page | Contents | Zoom in | Zoom out | Front Cover | Search Issue | Next Page qqM
Mq
qM
MqM
THE WORLD’S NEWSSTAND®

IEEE SIGNAL PROCESSING MAGAZINE [128] JULY 2014
Energy fossil and nuclear fuel remediation species. The two groups deliberately chose different methods of sample prepar-ation to allow meaningful cross-laboratory comparisons on common molecules. The interlaboratory comparison of 12 common species showed a root-mean-square deviation of less than 2% for integrated band densities, including small system-atic errors in measurement [30]. In practical applications, these errors are ignored; they are insignificant when com-pared to the overwhelming effects introduced by non-Gaussian and nonstationary background clutter. A typical PNNL library spectrum is shown in Figure 8.
ATMOSPHERIC COMPENSATION AND TEMPERATURE-EMISSIVITY SEPARATIONThe radiance signal due to the plume is modulated by those of the atmosphere and background before arriving at the sensor, as demonstrated by (2). To extract the plume signal, both of these effects must be suppressed, which is one of the central problems of the remote sensing of chemical plumes, as we discuss in the sections “Background Clutter” and “Detection Algorithms.” Atmospheric compensation techniques can sometimes be used to approximately remove the path radiance and the transmit-tance of the atmosphere from the signal.
Many assumptions are required to render the compensation task feasible. All existing algorithms depend on the atmospheric properties remaining constant over the entire image, which effectively limits applicability to the down-looking geometry. The in-scene atmospheric compensation (ISAC) algorithm [31] further assumes that many pixels in the scene are well approxi-mated as blackbodies and that there is temperature variability
within these pixels. In the LWIR regime, surface materials that radiate as blackbodies include water, vegetation, and very rough mineral surfaces in which many reflections occur. After such pixels are identified, the temperature variation may be exploited to recover the atmosphere parameters. The autonomous atmos-pheric compensation (AAC) algorithm [32] is a model-based alternative to ISAC. It assumes that the spatial variability of the atmospheric transmittance is primarily due to water vapor, with the other atmospheric constituents approximated by standard atmospheric profiles. A radiative transfer code is used to relate the atmospheric parameters to the observed radiances. There are several other approaches in the literature that refine and extend these two.
In gas-detection applications, the properties of the back-ground are treated as nuisance parameters, and the objective is suppression of the background signal to observe that of the plume. However, there are many applications, such as mineral studies and hard target detection, in which study of the back-ground properties is the goal. Radiance measured from the earth’s surface in the thermal IR region consists of emissivity and temperature information. Variations in emissivity relate to the chemistry and texture of materials at the surface. Temper-ature variations, which are an order of magnitude larger than emissivity variations, may obscure emissivity changes among pixels of the same or different clusters. Therefore, meaningful background modeling requires temperature-emissivity separ-ation (TES). A fundamental difficulty is that p spectral band measurements alone cannot be used to unambiguously deter-mine p spectral emissivities and a temperature [33]. This ambiguity is a serious problem for hard target detection appli-cations, where association of emissivity spectra to physical materials is crucial. TES algorithms use prior information or ancillary measurements to obtain unique parameter recovery. A highly developed optimization algorithm for this task is automatic retrieval of temperature and emissivity using spec-tral smoothness (ARTEMISS) [34], [35], which exploits the relative smoothness of the background emissivity as compared to the sharp spectral features commonly present in gas signa-tures. ARTEMISS is still under active validation.
BACKGROUND CLUTTERReal-world hyperspectral imaging scenes are made up of several spectrally distinct physical constituents. But, because of the lim-ited spatial resolution of the sensor, a given pixel in the scene may be composed of a single pure constituent (or end member) or it may contain a mixture of two or more constituents. Figure 9(a) shows the average radiance at every pixel for a LWIR hyperspec-tral data cube collected with the aerospace GBSS sensor. Figure 9(b) shows a density scatterplot (2-D histogram) in the first two principal components [36] accounting for 99% of the overall data variance. The four significant clusters correspond to pixels associated with sky, clouds, mountain, and ground sur-faces, respectively. These clusters comprise physically similar pix-els that exhibit a certain amount of random variation about a nominal mean value due to changes in physical composition,
Ground
Mountains
Sky Clouds
Mixed
(a)
Principal Component 1
Prin
cipa
l Com
pone
nt 2
Sky
CloudsMountains
Ground
Mixed
Low HighDensity
(b)
[FIG9] (a) The average spectral radiance for every pixel of a 128-spectral band LWIR data cube collected using the aerospace GBSS sensor. (b) A density scatterplot (a 2-D histogram) in the first two principal components of the LWIR cube shown in (a).
Previous Page | Contents | Zoom in | Zoom out | Front Cover | Search Issue | Next Page qqM
Mq
qM
MqM
THE WORLD’S NEWSSTAND®
Previous Page | Contents | Zoom in | Zoom out | Front Cover | Search Issue | Next Page qqM
Mq
qM
MqM
THE WORLD’S NEWSSTAND®

IEEE SIGNAL PROCESSING MAGAZINE [129] JULY 2014
temperature, atmospheric transmission, and sensor noise. There is a set of pixels between the sky and cloud clusters that corres-pond to the borderline between the sky and clouds. A plausible explanation is that the radiance spectra of these pixels are obtained from the mixing of sky and cloud spectra.
Two classes of hyperspectral background clutter models that are widely used in gas detection, identification, and quantifica-tion applications are density mixture models and linear sub-space models.
DENSITY MIXTURE MODELSInspection of several density scatterplots, like the one in Figure 9, suggests that LWIR radiance data cubes can be modeled as a mixture of unimodal densities, i.e.,
( ) ( ), , ,x xf f 0 1kk
N
k k kk
N
1 1
C C
$r r r= == =
/ / (11)
where x is the spectral vector, ( )xf is the probability density function (pdf) describing the entire data cube, kr is the a priori probability of the kth class, ( )xfk the pdf of the kth class, and NC is the number of classes. This model is used to develop per-formance-prediction models [37].
In most applications, we model each class by a multivariate normal distribution
( )( ) | |
( ) ( ) ,expxC
x m C x mf2
121
pT
2 21
1
r= - - --; E (12)
where m is a p 1# vector with entries ( )m E xi i= and C is a p p# covariance matrix with entries ( , ) .c x xCovij i j= The expression ~ ( , )x m CNp denotes a random vector x with pdf given by (12).
In practice, the mean vector and covariance matrix are determined using the maximum likelihood estimators
,m xN1
ii
N
1=
=
t / (13)
( ) ( ) .C x m x mN1
i
N
i iT
1= - -
=
t t t/ (14)
C is typically nonsingular in practice because noise is present and the number of pixels greatly exceeds the number of bands. The random vector
( ),z C x m/1 2= -- (15)
where C /1 2- is the square root of ,C 1- has the spherical distri-bution ( , ) .IN 0p The Mahalanobis square distance
( ) ( ) ~x m C x m z zT Tp
2 1 2|D = - - =- (16)
follows a central chi-square distribution. This distribution is used to assess deviations from normality in hyperspectral imaging data. The pdf of x has elliptical contours centered at m, whereas the pdf of z has spherical contours centered at the origin. For this reason, the operation (15) is called whitening or spherizing.
Normal distribution models provide mathematical tractabil-ity but often are inconsistent with empirical hyperspectral imaging data [38]. This is demonstrated in Figure 10, which shows probability of exceedance distributions of Mahalanobis square distance for the GBSS data in Figure 9(a) and the theor-etical multivariate normal distribution. These results clearly indicate that LWIR backgrounds exhibit tails heavier than those predicted by a multivariate normal distribution.
The class of elliptically contoured distributions [39] has been an attractive generalization of the multivariate normal distribu-tion. It contains many distributions, which, in general, have heav-ier tails than the normal and provide a better model for the tails of hyperspectral data. One important application of elliptical distri-butions with heavy tails is in investigating the robustness of deci-sion and estimation procedures based on the normal distribution.
A random vector x has an elliptical distribution with location vector m and scale positive-definite matrix ,C0 if its density takes the form
( ) | | ( ) ( ) ,x C x m C x mf c g/p
T0
1 20
1= - -- -6 @ (17)
where the function g is typically known as the density genera-tor. For a vector x distributed according to (17), we use the notation ( , ; )m CEC gp 0 or simply ( , ) .m CEC p 0 When m 0=and ,C I0 = we obtain the spherical family of densities. For the multivariate normal distribution ( , ),m CNp we have
( ) ( / ),expg u u 2= - ( ) ,c 2 /p
p 2r= - and .C C0 = This class of symmetric distributions includes the normal, Student’s ,tCauchy, and logistic distributions, among others [39].
Many natural hyperspectral backgrounds in the reflective spectral region (400–2,500 nm) can be accurately modeled using mixtures of elliptically contoured multivariate t -distribu-tions [40]. The development of models for LWIR hyperspectral backgrounds is more challenging because of complications resulting from temperature-emissivity coupling. In practice, modeling LWIR backgrounds as multivariate t mixtures often leads to underestimated false-alarm rates [41].
0 200 400 600 80010−6
10−4
10−2
100
Mahalanobis Distance
Pro
babi
lity
of E
xcee
danc
e
Mountain Pixels
All PixelsGaussian
[FIG10] The empirical probability of exceedance for a GBSS data cube. The dashed line represents a theoretical exceedance curve for a Gaussian distribution, which underestimates tail heaviness even for individual classes (e.g., the mountain class).
Previous Page | Contents | Zoom in | Zoom out | Front Cover | Search Issue | Next Page qqM
Mq
qM
MqM
THE WORLD’S NEWSSTAND®
Previous Page | Contents | Zoom in | Zoom out | Front Cover | Search Issue | Next Page qqM
Mq
qM
MqM
THE WORLD’S NEWSSTAND®

IEEE SIGNAL PROCESSING MAGAZINE [130] JULY 2014
LINEAR SUBSPACE MODELSThese models assume that each spectrum can be expressed as
x b e Bc ec ,kk
N
k1
B
_= + +=
/ (18)
where { , , },b bN1 Bf ,N pB # is a fixed set of linearly independ-ent vectors (which are not necessarily orthogonal), e is an approximation error, and the values of the coefficients ck vary from pixel to pixel.
The most practical ways to determine the basis vectors bk
from the radiance data cube are automated clustering techniques and end member extraction algorithms. Nevertheless, the appli-cation of both approaches to thermal hyperspectral data can be quite challenging [3], [42]. The difficulties are due to the radiance fluctuations that are induced by those of the background temper-ature, which varies over the scene, and possibly within individual pixels. This source of variability is absent in the VNIR/SWIR band, in which radiance is almost completely due to reflected light.
For gas-detection applications, it is sufficient to represent the background subspace using any basis equivalent to { , , } .b bN1 Bf For convenience, we use the orthogonal basis obtained from the singular value decomposition (SVD) of the p N# data matrix XT with columns the spectra , , ,x xN1 f i.e.,
X U W u wT Tk
k
r
k kT
1vR= =
=
u/ , (19)
where r is the rank of X and kvu its singular values. We note that uk are the eigenvectors of the unscaled correlation matrix X X.T If we retain only the first N rB 1 dominant terms of (19), we obtain an approximation Xt of X, which is optimum in the sense of least squares error. The resulting total squared error is given by the sum of squares of the dropped singular values.
The subspace matrix B is constructed from the NB most significant left singular vectors .uk We point out that the col-umns of B do not have any physical meaning. Yet, this is not a problem for detection applications as long as the subspace model provides a good approximation of the background.
An affine representation can be obtained by centering the spectra xi about their mean vector and computing the SVD of
the centered data matrix. This is equivalent to forming B using the dominant eigenvectors of the estimated covariance matrix. This subspace is centered at the mean background spectrum. When the approximations of the linear signal model (5) hold with high accuracy, the spectral mean plays no essential role and the affine representation is appropriate. When higher-order corrections to the radiance model are taken into account, the subspace representation may be preferred [43], [44].
APPLICATION REQUIREMENTS AND PERFORMANCE METRICSAlthough different applications often have different specific needs, they share some key tasks and associated performance metrics. Figure 11 illustrates the use of a hyperspectral imaging sensor in a typical standoff chemical sensing applica-tion. From a user’s perspective, the performance of a sensor system (sensor and exploitation algorithms) is specified by metrics that are specific to the application. Yet, many chemi-cal sensor systems are characterized by four key parameters: sensitivity, probability of detection, false-alarm rate, and response time [45]. The performance of a sensor system depends upon the sensor, environmental conditions, and sig-nal exploitation algorithms.
Sensitivity, which is also known as detection limit, is defined by the lowest concentration of a CA that can be detected with high confidence and is typically specified in units of particles per million [ppm] or mass per unit air vol-ume (particles/liter or mg/m3). Sensitivity may also be a meas-ure of a system’s ability to discriminate between small differences in the concentration of an agent. Hence, a sensitive detector gives a large change in signal intensity for a small change in concentration. A meaningful quantitative definition of detection limit depends upon a quantitative definition of confidence. Furthermore, sensitivity is not directly applicable to LWIR monitoring systems because a minimum concentra-tion does not exist; the optical path length of the cloud must be taken into account. These issues are further discussed in the section “Quantification Algorithms.”
The sensor response time is defined as the time interval between the arrival of the target agent concentration and the sensor detection declaration [45]. Clearly, in detect-to-warn applications, the response time must be less than the time nec-essary to take protective actions.
An alarm or hit from a detection algorithm does not neces-sarily mean that a CA is present. If the hit is the correct response to the presence of a CA, we have a detection (true positive). False alarms occur if a detector responds when a CA is not present (false positive). When a detector fails to respond to a CA that is present, we have a missed detection (false nega-tive). For some applications, missed detections are more prob-lematic than false alarms because the failure to produce an alarm may lead to dangerous situations. There is typically a tradeoff between probability of detection and probability of false alarm (or false-alarm rate). This tradeoff is captured by the receiver operating characteristic (ROC) curves, which
SensorInterferent
False Alarm
Agent ofInterest
False Alarm
False Alarm
Background Clutter:Pixel-to-PixelSpectral Variability
[FIG11] Detection, identification, and quantification are significantly hindered by environmental conditions, benign particulates, and background variability.
Previous Page | Contents | Zoom in | Zoom out | Front Cover | Search Issue | Next Page qqM
Mq
qM
MqM
THE WORLD’S NEWSSTAND®
Previous Page | Contents | Zoom in | Zoom out | Front Cover | Search Issue | Next Page qqM
Mq
qM
MqM
THE WORLD’S NEWSSTAND®
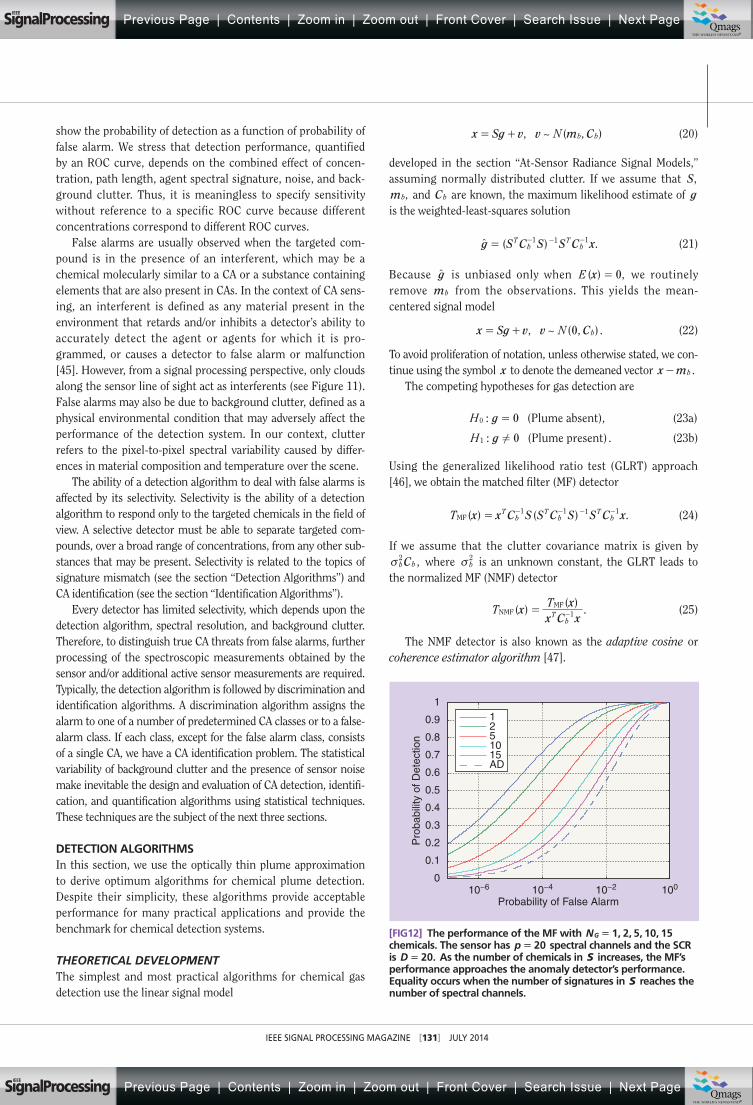
IEEE SIGNAL PROCESSING MAGAZINE [131] JULY 2014
show the probability of detection as a function of probability of false alarm. We stress that detection performance, quantified by an ROC curve, depends on the combined effect of concen-tration, path length, agent spectral signature, noise, and back-ground clutter. Thus, it is meaningless to specify sensitivity without reference to a specific ROC curve because different concentrations correspond to different ROC curves.
False alarms are usually observed when the targeted com-pound is in the presence of an interferent, which may be a chemical molecularly similar to a CA or a substance containing elements that are also present in CAs. In the context of CA sens-ing, an interferent is defined as any material present in the environment that retards and/or inhibits a detector’s ability to accurately detect the agent or agents for which it is pro-grammed, or causes a detector to false alarm or malfunction [45]. However, from a signal processing perspective, only clouds along the sensor line of sight act as interferents (see Figure 11). False alarms may also be due to background clutter, defined as a physical environmental condition that may adversely affect the performance of the detection system. In our context, clutter refers to the pixel-to-pixel spectral variability caused by differ-ences in material composition and temperature over the scene.
The ability of a detection algorithm to deal with false alarms is affected by its selectivity. Selectivity is the ability of a detection algorithm to respond only to the targeted chemicals in the field of view. A selective detector must be able to separate targeted com-pounds, over a broad range of concentrations, from any other sub-stances that may be present. Selectivity is related to the topics of signature mismatch (see the section “Detection Algorithms”) and CA identification (see the section “Identification Algorithms”).
Every detector has limited selectivity, which depends upon the detection algorithm, spectral resolution, and background clutter. Therefore, to distinguish true CA threats from false alarms, further processing of the spectroscopic measurements obtained by the sensor and/or additional active sensor measurements are required. Typically, the detection algorithm is followed by discrimination and identification algorithms. A discrimination algorithm assigns the alarm to one of a number of predetermined CA classes or to a false-alarm class. If each class, except for the false alarm class, consists of a single CA, we have a CA identification problem. The statistical variability of background clutter and the presence of sensor noise make inevitable the design and evaluation of CA detection, identifi-cation, and quantification algorithms using statistical techniques. These techniques are the subject of the next three sections.
DETECTION ALGORITHMSIn this section, we use the optically thin plume approximation to derive optimum algorithms for chemical plume detection. Despite their simplicity, these algorithms provide acceptable performance for many practical applications and provide the benchmark for chemical detection systems.
THEORETICAL DEVELOPMENTThe simplest and most practical algorithms for chemical gas detection use the linear signal model
, ~ ( , )x Sg v v m CN b b= + (20)
developed in the section “At-Sensor Radiance Signal Models,” assuming normally distributed clutter. If we assume that ,S
,mb and Cb are known, the maximum likelihood estimate of gis the weighted-least-squares solution
( )g S C S S C x.Tb
Tb
1 1 1= - - -t (21)
Because gt is unbiased only when ( ) ,xE 0= we routinely remove mb from the observations. This yields the mean-centered signal model
, ~ ( , ) .x Sg v v CN 0 b= + (22)
To avoid proliferation of notation, unless otherwise stated, we con-tinue using the symbol x to denote the demeaned vector .x mb-
The competing hypotheses for gas detection are
: ( ),gH 0 Plume absent0 = (23a)
: ( ) .gH 0 Plume present1 ! (23b)
Using the generalized likelihood ratio test (GLRT) approach [46], we obtain the matched filter (MF) detector
( ) ( )x x C S S C S S C xT .Tb
Tb
Tb
1 1 1 1MF = - - - - (24)
If we assume that the clutter covariance matrix is given by ,Cb b
2v where b2v is an unknown constant, the GLRT leads to
the normalized MF (NMF) detector
( ) ( ) .xx C x
xT
TT
b1NMF
MF= - (25)
The NMF detector is also known as the adaptive cosine or coherence estimator algorithm [47].
10−6 10−4 10−2 1000
0.1
0.2
0.3
0.4
0.5
0.6
0.7
0.8
0.9
11251015AD
Probability of False Alarm
Pro
babi
lity
of D
etec
tion
[FIG12] The performance of the MF with , , , ,N 1 2 5 10 15G =chemicals. The sensor has p 20= spectral channels and the SCRis .D 20= As the number of chemicals in S increases, the MF’s performance approaches the anomaly detector’s performance. Equality occurs when the number of signatures in S reaches the number of spectral channels.
Previous Page | Contents | Zoom in | Zoom out | Front Cover | Search Issue | Next Page qqM
Mq
qM
MqM
THE WORLD’S NEWSSTAND®
Previous Page | Contents | Zoom in | Zoom out | Front Cover | Search Issue | Next Page qqM
Mq
qM
MqM
THE WORLD’S NEWSSTAND®

IEEE SIGNAL PROCESSING MAGAZINE [132] JULY 2014
The MF and NMF for N 1G = are given by
( ) ( ) ,xs C s
x C sT T
b
Tb
1
1 2
MF = -
-
(26)
( )( ) ( )
( ) ,xs C s x C x
s C xT T
bT
b
Tb
1 1
1 2
NMF = - -
-
(27)
because the matrix S is reduced to a single vector .sIf the number of gases is equal to the number of spectral
bands ( )N pG = and S has full rank, we have
( ) ,x x C xT Tb
1AD = - (28)
i.e., the MF becomes an anomaly detector (AD) algorithm. The detector distributions under each hypothesis are
( )~ ( ),xT Dp2
AD | n (29a)
( )~ ( ),xT Db N2 2
MF Gv | n (29b)
( )~ ( ),xT D/ ,( )/N p N2 2NMF G Gb n- (29c)
where 0n = under ,H0 1n = under ,H1 and
( ) ( ) ( )Sg C SgD Tb b2 1v= - (30)
is the signal-to-clutter ratio (SCR). Using these distributions, we can determine detection performance using ROC curves. Inspection of the ROC curves in Figure 12 shows that the per-formance of the MF deteriorates with increasing NG and reaches the performance of AD for .N pG = Thus, in practice, it is preferable to use a separate detector for each chemical than to use one subspace detector that includes all chemicals.
To understand the meaning of single-gas AD, MF, and NMF, we use the whitening transformation
x C x s C sand/ /b b
1 2 1 2= =- -u u (31)
to express these detectors in the whitened space
( ) ,x x x xT T 2AD = =u u u (32)
( ) ( ) ( ) ( ),xs s
s xs s
s x xT TMFT
T
T
T2 22
MF = = =uu u
u u
u u
u u= G (33)
( )( ) ( )
( ) .cosxs s x x
s xT T T
T 22
NMF i= =uu u u u
u u(34)
Inspection of the whitened space in Figure 13 shows that for each whitened observation vector: 1) the AD uses only its length (the AD is omnidirectional because it does not use the target signature); 2) the MF uses the length of its projection along the whitened signature; and 3) the NMF uses its angle with the whitened signature. The effectiveness of the whitening opera-tion is further illustrated in Figure 14.
The MF maximizes the output SCR, i.e., it provides the max-imum separation between the output distributions. The NMF is scale invariant and it is robust to clutter distributions with heavy tails.
The application of MF and NMF detectors requires estima-tion and inversion of the background covariance matrix .Cb
But, in practice, Cb is often ill conditioned and its small eigen-values and corresponding eigenvectors are difficult to estimate and hard to compute accurately. There are many ways to deal with this problem. We produce numerically stable and more robust detectors by eliminating the smaller eigenvalues through averaging and loading. Thus, we approximate Cb by
C q q q q I,b kk
d
k kT
kk d
p
kT
1 1m a d= + +
= = +
u / / (35)
where ( ) / ( )p dd p1 ga m m= + + -+ and .0$d The inverse covariance matrix can be shown to be [48], [49]
.C I q q1b
k
k
k
d
k kT1
1a d m dm a=
+-
+--
=
u e o/ (36)
This expression shows that the inverse covariance matrix is built from the first d dominant eigenvectors.
TMF (Projection)
x
0
gs
gs
mb
0 x1
x2
x2
x1
x
|| ||x
(Hypercone)
(Hypersphere)
x = C −1/2(x − mb)b
s = C −1/2sb
θ
~
~
~
~
~
~
~
[FIG13] A geometric interpretation of the MF, NMF, and ADalgorithms in whitened space.
Rad
ianc
e
Whi
tene
dC
ontr
ast
800 1,000 1,200Wavenumber (cm−1)
800 1,000 1,200Wavenumber (cm−1)
Libr
ary
Spe
ctru
m
Whi
tene
dS
pect
rum
TEP Present
TEP Absent
TEPAbsorption
[FIG14] An illustration of background-clutter-based whitening operation on at-sensor radiance and a library spectrum.
Previous Page | Contents | Zoom in | Zoom out | Front Cover | Search Issue | Next Page qqM
Mq
qM
MqM
THE WORLD’S NEWSSTAND®
Previous Page | Contents | Zoom in | Zoom out | Front Cover | Search Issue | Next Page qqM
Mq
qM
MqM
THE WORLD’S NEWSSTAND®

IEEE SIGNAL PROCESSING MAGAZINE [133] JULY 2014
Another approach to chemical detection assumes that back-ground clutter can be represented by the subspace model (18), where ~ ( , ) .e IN 0 b
2v Then, the signal model (22) becomes
, ~ ( , ) .x Sg Bc e e IN 0 b2v= + + (37)
The GLRT approach for (2) with known b2v gives [50]
( )x x P x x P xT ,Tb
Ttb1 = -= = (38)
where Pb= and Ptb
= are orthogonal projection matrices
( ) ,P I B B B BbT T1= -= - (39)
( ) , [ ] .P I A A A A A S BtbT T1= - == - (40)
If b2v is unknown, the GLRT yields
( ) .xx P xx P x
P xP xT T
tb
Tb
tb
b2 2
2
= ==
=
=
=
(41)
We note that P xb= and P xtb
= are distances from the background and target-background subspaces, respectively. Note that (38) and (41) use the difference or ratio of lengths of the same vectors (see Figure 15). The performance of subspace detectors depends upon the SCR given by
( ) ( ) / .Sg P SgD Tb b0
2v= = (42)
Finally, we note that if km are much larger than a and ,d(36) yields C Pb b
1 ? =- because bk and qk span the same space. Therefore, ,s P xy T
bMF ?= which reveals a relationship between
full-covariance and subspace detectors [49].
PRACTICAL CONSIDERATIONSThe most relevant metric by which to judge a detector is the ROC curve, as discussed in the section “Application Requirements and Performance Metrics,” but we can gain a great deal of insight by also considering the SCR, defined in (30). While the SCR, as a sin-gle summary statistic, cannot encode all of the information in the ROC curve in any but the simplest of models, it generally does correctly track the trends in the area-under-ROC (AUROC) statis-tic for optically thin gases, and it is far more amenable to analysis [51], [52]. The SCR can give misleading results for optically thick plumes, due to the importance of nonlinear effects in this case. We note that most of the analytic results for SCR apply directly only to the MF (26), but similar conclusions are generally found to hold experimentally for the NMF (27).
The detectors that we have discussed require estimates of the at-sensor gas signature matrix S along with the background mean and covariance mb and .Cb Recalling (9c), the first of these requires knowledge of the atmospheric transmittance as well as the gas spectral signature; the other two must be obtained from background training data. Estimation error in any of these quantities will adversely affect the detector, in some cases, substantially.
There will always be some degree of signature mismatchbetween the estimated at-sensor gas signature and that
present in the scene. A small part of this discrepancy is due to minor differences in sample composition and conditions (pres-sure and temperature) of the gas signature measured in the lab as compared to that in the field, and sensor calibration error. More significantly, the observed signature varies with concentration path length according to Beer’s law (3), a minor effect for optically thin gases but a major effect for thick gases. Still more importantly, the atmospheric transmittance modu-lates the gas signature in (9c), and must be estimated, either from ancillary measurements, substitution of a standard pro-file, or though an in-scene compensation algorithm as dis-cussed in the section “Atmospheric Compensation and Temperature-Emissivity Separation.” If the gas spectral fea-tures overlap those of the local atmosphere, substantial uncer-tainties in the at-sensor signatures will exist. Also, for slant-path imaging geometries ( )ax m will vary throughout the scene, further complicating matters.
The most serious issue involving the estimation of mb and Cb is the possibility that some of the pixels used as background training data contain the plume signal, which we refer to as contamination of the background estimates. Contamination is primarily an issue through its effect on the covariance. It is well known that such contamination does not affect the MF detector statistic in the absence of signature mismatch, but we have seen that some amount of mismatch is inevitable. The MF SCR can be computed analytically in the case that the plume is uncorre-lated with the background and the gas signature is constant over the plume and is given by [53]
( , )
( , ) ,sin
cos
s s
s s
a a1 2
SCRSCR SCR
SCR
C
C
o o
o
a a2
2
2
22
0
20
b
b
v v=+ +c cm m
(43)
where SCRo is the SCR under optimal conditions, a2v is the
variance of the plume strength over all training pixels, a is the plume strength in the pixel under test, and the trigono-metric functions are defined according to the Mahalanobis inner product [see (34)]. This expression makes apparent the facts that covariance contamination does not cause SCR loss
x
P⊥b x
P⊥tbx
Spectral Vector
BackgroundSubspace
TargetSubspace
Target-BackgroundSubspace
[FIG15] A geometric interpretation of subspace detectors.
Previous Page | Contents | Zoom in | Zoom out | Front Cover | Search Issue | Next Page qqM
Mq
qM
MqM
THE WORLD’S NEWSSTAND®
Previous Page | Contents | Zoom in | Zoom out | Front Cover | Search Issue | Next Page qqM
Mq
qM
MqM
THE WORLD’S NEWSSTAND®

IEEE SIGNAL PROCESSING MAGAZINE [134] JULY 2014
without signature mismatch (i.e., ),s s0= and that without covariance corruption ( ),0av = a small amount of signature mismatch causes only minor SCR loss. However, the combin-ation of the two can cause substantial loss due to the quadratic dependence on SCRo in the denominator. In Figure 16, we illus-trate this phenomenon with a data cube collected by the aero-space GBSS sensor containing a plume detection. The detection result is substantially improved when the plume is removed from the training data used for covariance estimation.
Another view of the contamination problem may be obtained by decomposing the SCR as a sum of projections onto the back-ground’s principal components. When only a single gas is pre-sent, (30) can be written as
,q sg
SCRb k
kT
k2
2 2
v m=
^ h/ (44)
where km and qk are the eigenvectors and eigenvalues of .Cb
Figure 17 shows this decomposition for a GBSS cube containing a plume. The vast majority of the variation in the image is con-tained in the first few eigenvectors (blue line, computed using plume-free training data), illustrating that principal-component-based dimensionality reduction using only a few components would preserve the background pixels of this cube almost per-fectly. Nonetheless, the SCR in these components (green line) is very small, showing that such a dimensionality reduction would retain almost no information about the plume. By contrast, very high SCR values are seen at many principal components corre-sponding to much higher index eigenvalues. These are the plume signal components that are visible to detection algorithms. The inset images show projections of the cube onto individual princi-pal components. The first (largest) component shows the back-ground clearly but not the plume; the plume becomes visible in many of the higher-order components. The red line shows the SCR decomposition on the principal components of the plume-contaminated covariance matrix. Very little of the signal remains, which demonstrates that the amount of signature mismatch pre-sent was sufficient to almost completely obliterate the signal. This result underlines the necessity of mitigating plume contamina-tion of background training data during detection processing.
There are two main strategies for dealing with the contami-nation problem. The first, plume-free background estimation, is to remove as much of the plume as possible from the covariance training data with a two-pass detection process [3]. The second is to introduce robust detectors [52], [54], [55]. The intuition behind this approach is that nearby signatures may be rendered effectively identical by sacrificing some of the discriminating ability of the detector. As it is the combination of mismatch and plume contamination that causes loss, small differences between the observed and assumed gas signatures are thus ren-dered benign. A robust MF h xy T= may be defined as the solu-tion to the optimization problem
min h C h h s 1subject toh
Tb
T $ (45)
for all signatures s in the hypersphere .s s02 2# e- The
value of e determines the selectivity of the detector. Several solutions to (45) have been proposed in the literature [56]; they all lead to some kind of diagonal loading. An interesting solu-tion in [55] provides a direct link between e and the diagonal loading factor g in .C Ib
2g+ The resulting MFs are robust to signal mismatch and covariance contamination in exchange for a higher false-alarm rate. An alternate form of regularization is provided by dominant mode rejection [57]; both forms are included in the expression (36) for the inverse covariance.
There are many additional factors that affect the perform-ance of practical detectors. The sample size of the covariance training set may be an issue with low-spatial-resolution (usually scanning) spectrometers, although it is not generally a problem with imaging spectrometers containing tens of thousands of pixels or more. Chemical plumes may be widely distributed spatially over a scene, with variations in plume strength,
(a)
(b)
(d)
(e)
(f)
(c)
10−6 10−4 10−2 1000
0.2
0.4
0.6
0.8
1
PFA
PD
ContaminatedBackgroundEstimates
UncontaminedBackgroundEstimates
Random-GuessDetector
[FIG16] Detection images and receiver operator characteristics for a gas plume imaged by the aerospace GBSS sensor illustrating the necessity of computing background statistics using plume-free training data. Each detection image is normalized by background response (0–30 dB color scale). The solid ROC curves correspond to the NMF, the dashed ROC curves to the MF. (a) Broadband image, (b) NMF map (contaminated background estimate), (c) NMF map (uncontaminated background estimate), (d) MF map (uncontaminated background estimate), (e) MF map (contaminated background estimate), and (f) ROC curves derived from (b)–(e).
Previous Page | Contents | Zoom in | Zoom out | Front Cover | Search Issue | Next Page qqM
Mq
qM
MqM
THE WORLD’S NEWSSTAND®
Previous Page | Contents | Zoom in | Zoom out | Front Cover | Search Issue | Next Page qqM
Mq
qM
MqM
THE WORLD’S NEWSSTAND®

IEEE SIGNAL PROCESSING MAGAZINE [135] JULY 2014
temperature, and background characteristics over the spatial envelope of the plume. A spatially extended plume may be cor-related with the background when the statistics of the latter are spatially nonstationary. This plume-background correlation, in conjunction with signature mismatch and covariance contam-ination, can cause additional performance loss [51], [58].
The detectors we have discussed operate on a pixel-by-pixel basis, but often detection of the entire plume is desired. In this case, spatial processing can be performed to integrate the deci-sions of nearby pixels, for example via binary integration [59], and segment the scene into plume-present and plume-absent regions. When false alarms are spatially unstructured, this pro-cedure boosts the probability of detection and drives down the probability of false alarm. Further ROC gains can be obtained by integrating across frames of a time series of hyperspectral images, resulting in an event detector.
IDENTIFICATION ALGORITHMSThe task of determining the constituent gases of a detected plume is known as identification. Mathematically, this problem can be formulated as one of selecting variables in a linear model with correlated predictors, or model selection. There is an abundance of classical and recent statistical techniques dealing with this problem. Before delving into this subject, we will discuss the necessity of an identification step following the detector in a sig-nal processing chain.
DETECTION VERSUS IDENTIFICATIONWe observed in Figure 12 that ROC performance drops when multiple gases are included in a single detector, implying that a bank of detectors, with a separate detector for each kind of gas, should be employed instead. The question immediately arises as to how best to process the results of such a filter bank. An example that illustrates the problem is given in Figure 18, which shows the detection statistics at the output of a NMF fil-ter bank for a TEP release observed by the aerospace GBSS
hyperspectral imaging sensor. We note that the TEP-tuned NMF shows the maximum response; on the other hand, the diethyl ethyl phosphonate (DEEP)-tuned filter shows a significant response, and some response is visible with the tributyl phos-phate (TBP)-tuned filter. Another view of these results is afforded in Figure 19 by plotting the fraction of pixels that exceed a given threshold, for each detector, for sequences of cubes taken before and after the plume release. From the pre-release exceedance plots, we observe that an optimal detection threshold is approximately 0.4; however, using this threshold, DEEP would incorrectly be declared as present in the scene.
Ideally, our signal processing chain would not only detect this TEP release but also reliably inform us if TEP is the only gas pre-sent and, if not, what combination of gases is present. The detec-tion algorithms that we discussed in the section “Detection Algorithms” do not address this latter task—they do not give any information as to whether simultaneous TEP and DEEP detections means that both gases are present or only one of them. They also do not indicate, in the latter case, whether the stronger NMF filter score corresponds to the gas that is present. It is also possible for false alarms to occur in pixels in which no gas from the detector bank is present at all; this can happen for a variety of reasons. Iden-tification algorithms are designed to address all of these issues.
MODEL SELECTIONWe recall from (22) that under the linear signal model, the observed radiance may be written as
,x Sg v S g S g v1 1 2 2= + = + + (46)
where we have decomposed the gas signatures in the matrix Sinto two subsets. The goal of model selection algorithms is to determine the subset of gases S1 that are present in the scene along with their amounts ,g1 with the amounts of the remain-ing library gases set to .g 02 =
The most straightforward way to choose a subset of gases is to try every combination of gases in the CA library, and to
10−2
10−4
10−6
10−8
10−10
100
Eig
enva
lue
0 20 40 60 80 100 1200
150
300
450
600
Principal Component
SC
R
ContaminatedBackgroundEstimate
UncontaminatedBackgroundEstimate
[FIG17] A signal-to-clutter illustration. As shown by the green and red curves, the SCR is significantly reduced when background estimates are contaminated with signal. We can also see that significant signal-to-clutter contributions come from seemingly insignificant principal components. Principal-component-based dimensionality reduction retains energy but reduces detectability.
Previous Page | Contents | Zoom in | Zoom out | Front Cover | Search Issue | Next Page qqM
Mq
qM
MqM
THE WORLD’S NEWSSTAND®
Previous Page | Contents | Zoom in | Zoom out | Front Cover | Search Issue | Next Page qqM
Mq
qM
MqM
THE WORLD’S NEWSSTAND®

IEEE SIGNAL PROCESSING MAGAZINE [136] JULY 2014
compare the results according to some criterion. This approach is known as all possible regressions (APRs) and is feasible when the library is small, and/or there is a prior belief that the number of gases present is small. When neither of these conditions hold, the combinatorics become prohibitive and other approaches must be used. A popular technique in this latter case is stepwise regression, in which individual gases are added and deleted in a stepwise fashion. There are also Bayesian approaches to this problem.
The primary difficulty in model selection is in comparing models of different complexity, i.e., different numbers of gases present. Even in the special case of searching for a single library gas, as may happen in a CWA detection system, we still must compare the single-gas models with the background-only model, to eliminate the possibility of a false alarm from the detector. A model that is a strict superset of another will always exhibit a superior fit to the data, because of its additional flexi-bility. Therefore, any useful measure of goodness of fit must account for this flexibility. The partial F -test is one solution [46], [50], [60]. It tests whether the benefit in goodness of fit of added term(s) is greater than that due to chance alone. Refer-ring to (46), this approach tests the hypotheses
: ,gH 00 2 = (47): .gH 01 2 ! (48)
If ( )gS t and ( )gS 1t are the sum of squared errors for the full model (under )H1 and the reduced model (under ),H0 the H0
hypothesis can be tested using the F -test
( ) ( )( ) ( )
~ ( ),x gg g
F p qq
SS S
F ,q p q2 1
2 d=-
--t
t t(49)
where ( )F ,q p q2 d- is a noncentral F -distribution with a noncen-trality parameter
( ) ( ) .S g P S g1S
v
T2 2 2 2 21dv
= = (50)
Under ,H0 ( )xF follows a central F -distribution .F ,q p q2 - There-fore, if ( ) ,xF F ,q p q22 a
- we reject H0 with ( )100 1 a- percent confidence. The test (49) measures the contribution of gases ,S2
given that the other gases S1 are already in the model. The deriva-tion of the distribution of the F -test can be found in [46] and [60].
The partial F -test applies to nested models and is therefore auseful criterion for the stepwise regression approach. In this strategy, we begin with the background-only model. At each stage of the algorithm, we test for the addition of each gas in the library that is not already present, choosing that with the largest F statistic above a threshold (forward selection). We then test whether the elimination of any single gas in the model is significant (backward elimination). The procedure is repeated until no further variables are added.
While it may appear that the thresholds employed for the F -test are directly related to the probability of choosing thecorrect model, the situation is actually more complicated. The use of multiple tests, all based on the same data, to arrive
(a)
(b)
(c)
(d)
(e)
Broadband
AACID
TEP
TBP
DEEP
[FIG18] NMF images for various chemical signatures (0–1 color scale). TEP was released and imaged using the aerospace GBSS sensor; the other three chemicals are not present in the scene. (a) Broadband image, (b) acetic acid (AACID) signature, (c) TEP signature, (d) TBP signature, and (e) DEEP signature.
0 0.2 0.4 0.6 0.8 1
100
10–2
10–4
10–6
Threshold
Pro
babi
lity
of E
xcee
danc
e
0 0.2 0.4 0.6 0.8 1
100
10–2
10–4
10–6
Threshold
(a)
(b)
Pro
babi
lity
of E
xcee
danc
e
AACIDTEPTBPDEEP
[FIG19] The probability of exceedance curves for a sequence of data cubes from the TEP release of Figure 18: (a) before and (b) after TEP’s release. The color of each curve corresponds to the signature used by the NMF algorithm; different curves of the same color correspond to different cubes.
Previous Page | Contents | Zoom in | Zoom out | Front Cover | Search Issue | Next Page qqM
Mq
qM
MqM
THE WORLD’S NEWSSTAND®
Previous Page | Contents | Zoom in | Zoom out | Front Cover | Search Issue | Next Page qqM
Mq
qM
MqM
THE WORLD’S NEWSSTAND®

IEEE SIGNAL PROCESSING MAGAZINE [137] JULY 2014
at a final model results in correlations that change the distri-bution of the outcome. Therefore, thresholds must be chosen empirically. For the same reason, the naive use of standard inferences based on the result of the test, such as confidence intervals, is generally incorrect.
Other model selection criteria may be applied to the gas identification problem, including the adjusted ,R2 Mallow’s
,C p the Akaike information criterion, and the Bayesian infor-mation criterion (BIC). Instead of selecting a single model, as is done in APR and stepwise regression, Bayesian methods assign a posterior probability to each model, given the observed radi-ance. In general, the calculation of the posteriors requires time-consuming numerical methods such as Monte Carlo Markov chain [61], but approximate forms of BIC greatly sim-plify the computation [62]. Existing comparisons do not iden-tify any one technique as clearly superior to the others [63]. More development of these methods will be necessary to explore the wide variety of deployment scenarios, as well as to study the many sources of model mismatch, as discussed in the section “Practical Considerations.”
FALSE-ALARM MITIGATIONIn most applications, the goal of a CA detection system is to flag the presence of one or more of a list of agents in a signature library. The output of the variable selection step of the section “Model Selection” is a subset of gases that were selected to best represent the observed radiance, along with estimates of their strengths. The gases that are chosen are those that are most sig-nificant by the criteria of the variable selection algorithm, but it is not necessarily the case that the selected gases are present in the scene. A false alarm is defined as a gas that is identified as present in the scene, when in fact it is not. False alarms can be due to a number of factors, such as a gas or other interferent present in the scene but not included in the CA library, atypical background radiance or other phenomenological fluctuation in the data, or excessive sensor noise, due either to random variation or sensor malfunction. In the first case, the interferent may have signature indistinguishable from that of the real gas at the resolution of the sensor. There is little that can be done in this case, but other sources of false alarms can potentially be eliminated by false-alarm mitigation (FAM) algorithms.
The root cause of a false alarm is that the observed radiance fits the class of models spanned by the CA library well enough that the presence of one or more gases is considered significant by the detection and identification algorithms, when the gas is not present. Nevertheless, this determination does not imply that the fit is good on an absolute scale. The goal of FAM algo-rithms is to test the absolute goodness-of-fit of a selected model to decide between an actual detection and a false alarm. There are many ways in which a lack of fit may manifest itself; hence, it is useful to have several measures of lack of fit, which may be combined to arrive at a final determination. Most such tests are based on various decompositions of the residuals; a variety of methods are discussed in [64] and similar texts. An additional degree of freedom that is available with imaging spectrometers
is the use of spatial information to pool the information con-tained in nearby pixels.
The application of FAM techniques based on goodness-of-fit statistics in practice can be challenging. A major reason is that many sources of potential model mismatch exist even when the scene contains only library gases. As we have seen in the sections “At-Sensor Radiance Signal Models” and “Detection Algorithms,” the linear model (10) is only an approximate representation of the observed radiance. Many effects can influence the goodness of fit, including the presence of uncompensated atmospheric modula-tion, the nonlinear dependence of the gas signature on both the gas concentration and background radiance, and sensor calibra-tion. These effects may interact in complicated ways. Some may be ameliorated with additional algorithms; e.g., when the scene and deployment geometry support atmospheric compensation (see the section “Atmospheric Compensation and Temperature-Emissivity Separation”), most of the atmospheric modulation may be removed. Nonlinear models (see the section “Quantification Algorithms”) may be employed to correct for these sources of mis-match, but the additional complexity of these algorithms may con-flict with other system requirements, such as real-time operation. In any case, some residual model mismatch will always be present, and the challenge in FAM is to distinguish between mismatch due to false alarms and that due to other sources. It is apparent that this area is in need of significant further development.
QUANTIFICATION ALGORITHMSAfter a chemical plume has been detected, and its identity estab-lished, it is often necessary to establish the amount of gas present, which is known as quantification. The central parameter in chemical plume quantification is the mean concentration–path length (CL) product. When combined with information about the sensor and scene geometry, such as field of view and distance to the plume, estimates of CL may be used to obtain estimates of absolute gas quantity in each pixel of a scene. For some applica-tions, this ancillary information may be available for single scenes from an individual sensor. Alternatively, when the plume is viewed
Tp (K)
CL
(ppm
− m
) (ppm −
m)
285 290 295 300 305
0
50
100
150 100
101
102
103
[FIG20] Cramer–Rao lower bounds on ( )Var ct for SF6 with a black body background at 295 K.
Previous Page | Contents | Zoom in | Zoom out | Front Cover | Search Issue | Next Page qqM
Mq
qM
MqM
THE WORLD’S NEWSSTAND®
Previous Page | Contents | Zoom in | Zoom out | Front Cover | Search Issue | Next Page qqM
Mq
qM
MqM
THE WORLD’S NEWSSTAND®

IEEE SIGNAL PROCESSING MAGAZINE [138] JULY 2014
from more than one aspect with multiple sensors, tomographic reconstruction algorithms may enable unique plume quantifica-tion from CL estimates. Additionally, CL plays a large role as the key nonlinear parameter in the radiance signal model, through Beer’s law. This nonlinear dependence is important when optically thick plumes are observed, and indeed in these cases CL estima-tion can play a role in identification as well as quantification.
PHYSICAL MECHANISMSBefore reviewing specific CL estimation algorithms, we describe the challenges posed by plume phenomenology and the various physical mechanisms that enable the algorithms to arrive at estimates. We begin by framing the task as a non-linear optimization problem. In a scene containing a plume, we observe on-plume and off-plume pixels, with radiances modeled by (2) and (1), and we hope to recover estimates of
the CL parameters { }i iN
1Gc = in Beer’s law (3), with nuisance
parameters ,Tp ,La ( ),Lb m and ( ) .ax m The observed radi-ances are corrupted by measurement noise. To isolate the fundamental drivers of the problem, we note that, as described in the section “Atmospheric Compensation and Temperature-Emissivity Separation,” the atmospheric radi-ance ( )La m and transmittance ( )ax m may in principle be estimated from the off-plume pixels ( ),Loff m reducing the number of nuisance parameters. We see that the primary challenge of CL estimation is to separate the contributions of the plume from those of the background.
To illustrate some of the difficulties of and prospects for CL estimation, it is helpful to compute the Cramer–Rao (CR) bounds for unbiased estimates of CL. Such bounds allow us to probe the limits of performance that are imposed by various physical mechanisms, without being tied to any particular algo-rithm. In [65], these bounds were computed under a variety of assumptions. Here, we will focus on a single example that illus-trates a number of key points about the problem. We assume a single gas, sulfur hexafluoride, is present, and the atmospheric parameters are known exactly. The noise is taken to be Gauss-ian, independent across pixels, with a typical covariance from an experimentally measured cube. We work with the limiting case of the flat background approximation, so the background radi-ance is completely characterized by its temperature.
In Figure 20, the CR lower bound on the standard deviation of the estimator ct for the CL parameter is plotted against the plume temperature and CL, with fixed background temperature. Several important points can be inferred from this figure. First, the bounds diverge in two limits, those of a thin plume, and zero plume-background temperature contrast. This behavior is a result of nonidentifiability of the model. In the case of the thin plume, an explanation is given by (5), in which we observe that the CL parameter appears as a term in the product .C TB cDTherefore, c cannot be estimated independently from ,TD so the only way that c may be independently estimated is with extrinsic knowledge of .Tp The case of zero plume-background tempera-ture contrast violates one of the plume visibility conditions given after (4). When this condition is violated the plume is completely invisible to the sensor. We note that the nonidentifiability is only strictly true for pure black body backgrounds, but when the flat background approximation is reasonable, the CR bounds will still be very large when the temperature contrast is small.
At a fixed value of plume temperature, distinct from that of the background, we observe that the CR bound for ct drops sharply as CL increases from zero. This behavior suggests that the non-linear dependence on c resulting from an optically thick plume can be exploited, as we will see below. However, when the plume starts to become opaque, little background radiance reaches the sensor, the plume spectral signature is washed out into that of a black body at the plume tempera-ture, and differences in plume strength are no longer visible. The CR bound therefore increases at very large values of CL.
In addition to exploiting the nonlinearity of Beer’s law, there are other ways to determine the plume CL. If the plume is in
ExplosiveRelease
FugitiveEmissions
StackEmissions
DisasterRelease
Plume-AirEquilibrium
PlumeThickness
SpatiallyVarying
Background
SpectrallyStructured
Background
PreferredAlgorithms SB GLSF
SB, OLS(Adapted toGeometry)
SB, OLS
Dispersion Mechanism
Ena
blin
g P
heno
men
olog
y
Favorable Mixed Unfavorable
[FIG21] The availability of enabling phenomenological effects (rows) for a variety of plume dispersion mechanisms (columns).
[TABLE2] A SUMMARY OF EXISTING CL ESTIMATION ALGORITHMS.
ALGORITHM
RADIANCE APPROXIMATIONPLUME TRANSMITTANCE
BACKGROUNDCONTRAST
ELS, GLS [43] LINEAR LINEARELSI, GLSI, GLSF [43] LINEAR ITERATIVEOLS [3] LINEAR CONSTANTSPATIAL OLS [3] LINEAR CONSTANTOBS [66] LINEAR LINEAROBS [67] TAYLOR SERIES LINEARNLS [9] EXPONENTIAL ITERATIVENLS [12] EXPONENTIAL CONSTANTSB [68] EXPONENTIAL ITERATIVEBAYESIAN MAP [61], [69] EXPONENTIAL ITERATIVEBAYESIAN MCMC [61] EXPONENTIAL ITERATIVE
Previous Page | Contents | Zoom in | Zoom out | Front Cover | Search Issue | Next Page qqM
Mq
qM
MqM
THE WORLD’S NEWSSTAND®
Previous Page | Contents | Zoom in | Zoom out | Front Cover | Search Issue | Next Page qqM
Mq
qM
MqM
THE WORLD’S NEWSSTAND®

IEEE SIGNAL PROCESSING MAGAZINE [139] JULY 2014
thermal equilibrium with the surrounding atmosphere, its tem-perature may be recovered from an atmospheric compensation algorithm [31]. If the background temperature or spectrum var-ies spatially across the image, some spatial resolution may be sacrificed in favor of estimating CL [3]. Finally, spectral struc-ture in the background that overlaps that of the plume can ren-der the model identifiable [65].
The physical mechanisms that enable CL estimation may each be present to a greater or lesser degree in a given scene, depending on the source of the gaseous plume. In Figure 21, we tabulate which phenomena may be available for exploita-tion for a number of common plume sources, including: explosive, referring to a sudden release caused by an explosive device; fugitive, meaning a slow, inadvertent release; stack, emissions from an industrial stack, and disaster, correspond-ing to a release caused by a man-made or natural disaster, such as a hurricane. For example, an explosive release would, at least initially, entail a large temperature differential between the plume and surrounding atmosphere. Such would not be the case for slow, fugitive emissions leaking from a chemical production facility. Therefore, algorithms that assume that the plume and ambient atmosphere share the same tem-perature would not be applicable in the former case, but would in the latter. The algorithms referred to in Figure 21 are described in the section “Algorithms.”
ALGORITHMSExisting algorithms for gas quantification may be broadly classi-fied according to the approximations made in the plume trans-mittance and plume-background thermal contrast terms in (4), as summarized in Table 2. Those that depend on a linearization of Beer’s law are appropriate for optically thin plumes, while those that exploit the full nonlinear form can accommodate thick plumes. Each of these classes can be further subdivided by the treatment of the background radiance in the thermal con-trast term, which may be approximated by a constant vector, a linear expansion in some basis, or an iteratively updated linear model. A variety of statistical techniques have been employed, many of which were compared in [44].
A class of algorithms was proposed in [43] for the case of a thin plume assumed to be in thermal equilibrium with the atmosphere. The temperature, mean transmittance, and upwelling radiance of the atmosphere are assumed known, as would be estimated from an atmospheric compensation algo-rithm or ancillary measurements. The algorithms are based on different variants of statistical linear models, including extended least squares (ELS) and generalized least squares (GLS), and iterative versions (ELSI, GLSI, and GLSF). Related techniques that allow the plume temperature to differ from that of the atmosphere were proposed in [3] and [66], based on ordinary least squares (OLS) and orthogonal background suppression (OBS), respectively.
A number of authors employ algorithms that exploit the nonlinearity in Beer’s law to estimate CL, which in principle avoids the need for ancillary temperature estimates. The
approach taken in [67] is to expand Beer’s law (3) in a series expansion, retaining terms beyond the linear one. The coeffi-cients of the powers of the gas signature are obtained via a bank of projection filters. The CL parameter is obtained as a ratio of such coefficients.
The series expansion of Beer’s law may be avoided by the use of nonlinear least-squares (NLS) techniques, as is done in [9] and [12]. This approach is in principle quite general, as it can be applied to the full radiance model (2). Still, special cases can lead to simplifications and improved performance of the algorithms. The algorithms in [9] are specific to the case of plume and atmos-phere in thermal equilibrium, with their common temperature known from some ancillary measurement. By contrast, [12] treats the case of stack plumes, in which the gas and atmosphere are generally not in thermal equilibrium. The side-looking geom-etry particular to the case of stack emissions may be exploited by the choice of pixels on the chimney and in the clear sky close to, but outside of, the plume. The chimney pixels, which are assumed to have gray body emissivity, may be used to estimate the atmospheric transmittance between the plume and sensor. The clear sky pixels are used to directly estimate the background radiance, obviating the need for a statistical treatment. With knowledge of these parameters, the plume CL may be recovered.
An alternate approach for optically thick plumes is given by the selected band (SB) algorithm [68], which exploits the fact that the off-plume radiance in an on-plume pixel may be estimated from the bands in which the gas absorption is nearly zero. It is then possible to directly compute the difference between the on- and off-plume radiances and solve for the plume strength from Beer’s law, assuming the atmospheric parameters are known. The CL retrieval may be performed in a single spectral band, which leads to efficiency improvements. This procedure works well for gases with narrow spectral features that are nearly transparent in many spectral bands, and has been generalized to an iterative ver-sion that accommodates a wide variety of gas signatures.
Bayesian approaches are taken by [69] and [61], which both start with the full nonlinear radiance model (2) and a low-dimensional subspace model for background emissivity. Both place Bayesian priors on the parameters, and compute the max-imum a posteriori parameter values. In addition, [61] explores the full posterior distribution obtained by Markov chain Monte Carlo (MCMC). They present an example, with simulated data, to argue that estimates of the posterior distribution are particu-larly useful to handle the case of multiple gas species.
The previous algorithms for CL estimation all operate on a single pixel. An approach introduced in [3], which we refer to as Spatial OLS, exploits the spatial as well as spectral structure of a scene and enables CL estimation even in the flat background, thin plume limit with no extrinsic knowledge of the plume tem-perature. The crucial ingredient that must be present in the image is spatial variation of the background radiance, which is manifested as spatial variation of background temperature in the flat background limit. An essential assumption of this approach is that the spatial structure of the plume varies slowly compared to that of the background.
Previous Page | Contents | Zoom in | Zoom out | Front Cover | Search Issue | Next Page qqM
Mq
qM
MqM
THE WORLD’S NEWSSTAND®
Previous Page | Contents | Zoom in | Zoom out | Front Cover | Search Issue | Next Page qqM
Mq
qM
MqM
THE WORLD’S NEWSSTAND®

IEEE SIGNAL PROCESSING MAGAZINE [140] JULY 2014
SUMMARY AND CHALLENGESRapid advancements in sensor and computer technology have led to a growing list of standoff LWIR hyperspectral gas-detection applications for different deployment scenarios. The effective sensing of chemical clouds requires the joint exploitation of sig-nal processing algorithms, imaging-spectrometer characteristics, and thermal-radiance phenomenology. The underlying signal models serve as an indispensable guide to both the development of practical detection, identification, and quantification algo-rithms and the evaluation of their performance limits.
Detection algorithms based on MF theory are effective for optically thin plumes when the covariance matrix used for their implementation is not contaminated by the plume, i.e., it is plume-free. The development of effective algorithms for plume-free background estimation is a major practical challenge. Exper-imental results show that the NMF performs better than the MF detector. However, the performance of both algorithms deterio-rates as plumes become optically thick. Although the detection of optically thick plumes is not a major obstacle, the identification of such plumes is still a challenge.
The gas identification problem may be framed as the statis-tical problem of selecting an optimal subset of a large number of variables in a linear or nonlinear model. Variable selection has deep connections to classical and modern variable selection tech-niques in regression models, Bayesian model averaging, and com-pressive sensing. The related problem of mitigating the effects of false alarms due to interferents or background anomalies involves assessing the goodness of fit of the resulting models. Both of these problems become dramatically more demanding as the number of gases in the library, and those potentially present in the plume, increase. Furthermore, these algorithms are sensitive to subtle nonlinear interactions in the plume radiance, rendering application of standard techniques challenging. New ideas will be needed for further progress in these areas.
Quantifying the amount of chemical vapor that is present is a poorly conditioned problem and quantification algorithms must therefore rely on application-specific physical effects. Some existing algorithms exploit nonlinearity among the radi-ance parameters, while others use spatial degrees of freedom or specific assumptions about elements of the scene. Important aspects of this area are in need of further development, e.g., the quantification of plumes not in thermal equilibrium with the surrounding atmosphere.
Although remote chemical plume sensing is already a widely deployed and successful technology, we are still some distance from the goal of fully autonomous, reliable, real-time systems. New developments in signal processing algorithms, properly informed by radiance phenomenology and statistical theory, will be needed to fully exploit this rapidly developing technology.
ACKNOWLEDGMENTSThis work was sponsored by the Defense Threat Reduction Agency under Air Force Contract FA8721-05-C-0002. Opinions, interpreta-tions, conclusions, and recommendations are those of the authors and not necessarily endorsed by the United States Government.
AUTHORSDimitris G. Manolakis ([email protected]) received his B.S. degree in physics and his Ph.D. degree in electrical engin-eering from the University of Athens, Greece. He is currently a senior staff member at the Massachusetts Institute of Technol-ogy (MIT) Lincoln Laboratory in Lexington. Previously, he was a principal member of the research staff at Riverside Research Institute. He taught at the University of Athens, Northeastern University, Boston College, and Worcester Polytechnic Institute, and he is a coauthor of the textbooks Digital Signal Processing: Principles, Algorithms, and Applications (Prentice Hall, 2006, 4th ed.), Statistical and Adaptive Signal Processing (Artech House, 2005), and Applied Digital Signal Processing (Cam-bridge University Press, 2011). His research experience and interests include digital signal processing, adaptive filtering, array processing, pattern recognition, remote sensing, and radar systems.
Steven E. Golowich ([email protected]) received his Ph.D. degree in physics from Harvard University and his A.B. degree in physics and mathematics from Cornell University. He is a techni-cal staff member at the MIT Lincoln Laboratory, where his research interests include statistical signal processing, hyperspec-tral imaging, synthetic aperture radar, and structured light. Previ-ously, he was a member of technical staff at the Bell Labs Mathematical Sciences Research Center and taught at Princeton University. He received the American Statistical Association Out-standing Application Award and the Wilcoxon Prize.
Robert S. DiPietro ([email protected]) received his B.S. degree in applied physics and his M.S. degree in electrical engineering from Northeastern University, and he is currently pursuing a Ph.D. degree in computer science at Johns Hopkins University. He was an associate staff member at the MIT Lincoln Laboratory working on the detection of materials and CWAs in hyperspectral imagery. His research interests include detection theory, computer vision, and machine learning.
REFERENCES[1] R. A. Schowengerdt, Remote Sensing: Models and Methods for Image Process-ing. San Diego, CA: Elsevier, 2007.[2] T. Visser, “Infrared spectroscopy in environmental analysis,” Encyclopedia of Analytical Chemistry, pp. 1–22, 2000.[3] S. J. Young, “Detection and quantification of gases in industrial-stack plumes using thermal-infrared hyperspectral imaging,” Aerosp. Rep. ATR-2002 (8407), vol. 1, 2002.[4] S. J. Young, “Remote sensing of CO2 in industrial-stack plumes using thermal infrared hyperspectral imaging,” Aerosp. Rep. ATR-2003 (8407)-3, vol. 1, 2003.[5] J. A. Hackwell, “LWIR/MWIR imaging hyperspectral sensor for airborne and ground-based remote sensing,” in Proc. SPIE, Denver, CO, 1996, pp. 102–107.[6] D. J. Williams, B. L. Feldman, T. J. Williams, D. Pilant, P. G. Lucey, L. D. Wor-thy, A. M. Larar, M. Suzuki, and Q. Tong, “Detection and identification of toxic air pollutants using airborne LWIR hyperspectral imaging,” in Proc. SPIE Multi-spectral and Hyperspectral Remote Sensing Instruments and Applications II,vol. 5655. Honolulu, HI, Jan. 2005, pp. 134–141.[7] P. G. Lucey, “Three years of operation of AHI: The University of Hawaii’s air-borne hyperspectral imager,” in Proc. SPIE, Orlando, FL, 2001, pp. 112–120.[8] R. Harig and G. Matz, “Toxic cloud imaging by infrared spectrometry: A scan-ning FTIR system for identification and visualization,” Field Anal. Chem. Technol., vol. 5, no. 1–2, pp. 75–90, 2001.[9] R. Harig, G. Matz, and P. Rusch, “Scanning infrared remote sensing system for identification, visualization, and quantification of airborne pollutants,” in Proc. SPIE, vol. 4574, 2002, pp. 83–94.[10] M. Grutter, R. Basaldud, E. Flores, and R. Harig, “Optical remote sensing for characterizing the spatial distribution of stack emissions,” in Proc. Advanced Environmental Monitoring, 2008, pp. 107–118.
Previous Page | Contents | Zoom in | Zoom out | Front Cover | Search Issue | Next Page qqM
Mq
qM
MqM
THE WORLD’S NEWSSTAND®
Previous Page | Contents | Zoom in | Zoom out | Front Cover | Search Issue | Next Page qqM
Mq
qM
MqM
THE WORLD’S NEWSSTAND®
____________
____________
_______________

IEEE SIGNAL PROCESSING MAGAZINE [141] JULY 2014
[11] L. Sagiv, S. Rotman, and D. Blumberg, “Detection and identification of efflu-ent gases by long wave infrared (LWIR) hyperspectral images,” in Proc. IEEE 25th Convention of Electrical and Electronics Engineers in Israel, 2008, pp. 413–417.[12] P. Tremblay, S. Savary, M. Rolland, A. Villemaire, M. Chamberland, V. Farley, L.Brault, J. Giroux, J.-L. Allard, E. Dupuis, and T. Padia, “Standoff gas identification and quantification from turbulent stack plumes with an imaging Fourier-transform spectrometer,” in Proc. SPIE Advanced Environmental, Chemical, and Biologi-cal Sensing Technologies VII, T. Vo-Dinh, R. A. Lieberman, and G. Gauglitz, Eds., vol. 7673. Orlando, FL, Apr. 2010, pp. 76 730H–12.[13] V. Farley, A. Vallieres, M. Chamberland, A. Villemaire, and J.-F. Legault,“Performance of the FIRST: A long-wave infrared hyperspectral imaging sensor,” in Proc. SPIE, Stockholm, Sweden, 2006, pp. 63 980T–63 980T–11.[14] M. J. Thomas, P. E. Lewis, R. T. Kroutil, R. J. Combs, G. W. Small, R. W. Zywicki,D. L. Stageberg, C. T. Chaffin, Jr., and T. L. Marshall, “Infrared detection and analysis of vapor plumes using an airborne sensor,” in Proc. SPIE, vol. 4725, 2002, p. 47.[15] R. Kroutil, P. Lewis, M. Thomas, T. Curry, D. Miller, R. Combs, and A. Cummings, “Emergency response chemical detection using passive infrared spectroscopy,” in SPIE Newsroom, pp. 1–3, 2006. [16] M. J. Thomas, “Rationale and methodology for generating an airborne emer-gency response spectral reference library,” in Proc. SPIE, San Diego, CA, 2003,pp. 222–229.[17] P. Lewis, M. Thomas, R. Kroutil, R. Combs, A. Cummings, D. Miller, T. Curry,and S. Shen, “Airborne mapping of chemical plumes in the aftermath of hurricanes Katrina and Rita,” in Proc. SPIE, vol. 6233, pp. 62331X–I–II, 2006.[18] R. Harig, G. Matz, P. Rusch, H. H. Gerhard, J. H. Gerhard, and V. Schlabs, “New scanning infrared gas imaging system (SIGIS 2) for emergency response forces,” in Proc. SPIE, vol. 5995, 2005, pp. 174–181.[19] A. G. Mares, “LWIR spectral measurements of volcanic sulfur dioxide plumes,” in Proc. SPIE, Orlando, FL, 2004, pp. 266–272.[20] M. Grutter, R. Basaldud, C. Rivera, R. Harig, W. Junkerman, E. Caetano, and H. Delgado-Granados, “SO2 emissions from popocatépetl volcano: Emission rates and plume imaging using optical remote sensing techniques,” Atmos. Chem. Phys., vol. 8, no. 22, pp. 6655–6663, Nov. 2008.[21] Y. Yamaguchi, A. B. Kahle, H. Tsu, T. Kawakami, and M. Pniel, “Overview of advanced spaceborne thermal emission and reflection radiometer (ASTER),” IEEE Trans. Geosci. Remote Sens., vol. 36, no. 4, pp. 1062–1071, 2002.[22] L. Kirkland, K. Herr, E. Keim, P. Adams, J. Salisbury, J. Hackwell, and A. Trei-man, “First use of an airborne thermal infrared hyperspectral scanner for compo-sitional mapping,” Remote Sens. Environ., vol. 80, no. 3, pp. 447–459, June 2002.[23] R. G. Vaughan, W. M. Calvin, and J. V. Taranik, “SEBASS hyperspectral ther-mal infrared data: Surface emissivity measurement and mineral mapping,” Remote Sens. Environ., vol. 85, no. 1, pp. 48–63, 2003.[24] J. A. Hackwell, D. W. Warren, R. P. Bongiovi, S. J. Hansel, T. L. Hayhurst, D. J.Mabry, M. G. Sivjee, and J. W. Skinner, “LWIR/MWIR imaging hyperspectral sensor for airborne and ground-based remote sensing,” in Proc. SPIE, 1996, pp. 102–107.[25] B. Hammond and M. Popa, “Overview of the joint services lightweight standoff chemical agent detector (JSLSCAD),” in Proc. SPIE, 2005, pp. 86–95.[26] R. M. Goody and Y. L. Yung, Atmospheric Radiation: Theoretical Basis. New York: Oxford Univ. Press, 1995.[27] G. E. Thomas and K. Stamnes, Radiative Transfer in the Atmosphere and Ocean. Cambridge, U.K.: Cambridge Univ. Press, 2002.[28] P. M. Chu, F. R. Guenther, G. C. Rhoderick, and W. J. Lafferty, “The NIST quantitative infrared database,” J. Res. Natl. Inst. Standards Technol., vol. 104, no. 1, pp. 59–81, 1999.[29] S. W. Sharpe, T. J. Johnson, R. L. Sams, P. M. Chu, G. C. Rhoderick, and P. A.Johnson, “Gas-phase databases for quantitative infrared spectroscopy,” Appl. Spec-trosc., vol. 58, no. 12, pp. 1452–1461, 2004.[30] S. W. Sharpe, T. J. Johnson, R. L. Sams, P. M. Chu, G. C. Rhoderick, and P. A.Johnson, “Gas-phase databases for quantitative infrared spectroscopy,” Appl. Spec-trosc., vol. 58, no. 12, pp. 1452–1461, Dec. 2004.[31] S. J. Young, B. R. Johnson, and J. A. Hackwell, “An in-scene method for atmospheric compensation of thermal hyperspectral data,” J. Geophys. Res. Atmos., vol. 107, no. D24, p. 4774, 2002.[32] D. Gu, A. R. Gillespie, A. B. Kahle, and F. D. Palluconi, “Autonomous atmospheric compensation (AAC) of high resolution hyperspectral thermal infra-red remote-sensing imagery,” IEEE Trans. Geosci. Remote Sens., vol. 38, no. 6, pp. 2557–2570, 2000.[33] V. J. Realmuto, “Separating the effects of temperature and emissivity: Emis-sivity spectrum normalization,” in Proc. 2nd TIMS Workshop, 1990, pp. 90–55.[34] C. Borel, “Surface emissivity and temperature retrieval for a hyperspec-tral sensor,” in Geoscience and Remote Sensing Symp. Proc., vol. 1, July 1998, pp. 546–549.[35] C. Borel, “Error analysis for a temperature and emissivity retrieval algorithm forhyperspectral imaging data,” Int. J. Remote Sens., vol. 29, no. 17, pp. 5029–5045, 2008.[36] R. A. Johnson and D. W. Wichern, Applied Multivariate Statistical Analysis,6th ed. Englewood Cliffs, New Jersey: Prentice Hall, 2007.[37] E. Truslow, D. Manolakis, M. Pieper, T. Cooley, M. Brueggeman, and S. Lipson,“Performance prediction of matched filter and ACE hyperspectral target detectors,” IEEE J. Select. Topics Signal Processing, to be published.[38] D. Marden and D. Manolakis, “Modeling hyperspectral imaging data using elliptically contoured distributions,” in Proc. SPIE Algorithms and Technologies for Multispectral, Hyperspectral, and Ultraspectral Imagery IX, S. S. Shen and P. E. Lewis, Eds. Orlando, FL, 2003.
[39] K. T. Fang, S. Kotz, and K. W. Ng, Symmetric Multivariate and Related Dis-tributions. New York: Chapman & Hall, 1990.[40] D. Manolakis, M. Rossacci, D. Zhang, J. Cipar, R. Lockwood, T. Cooley, and J.Jacobson, “Statistical characterization of hyperspectral background clutter in the reflective spectral region,” Appl. Opt., vol. 47, no. 28, pp. F96–F106, 2008.[41] R. S. DiPietro, E. Truslow, D. G. Manolakis, S. E. Golowich, and R. B. Lockwood,“False-alarm characterization in hyperspectral gas-detection applications,” in Proc. SPIE, 2012, pp. 85 150I–85 150I–11.[42] A. R. Gillespie, “Spectral mixture analysis of multispectral thermal infrared images,” Remote Sens. Environ., vol. 42, no. 2, pp. 137–145, 1992.[43] N. B. Gallagher, B. M. Wise, and D. M. Sheen, “Estimation of trace vapor concentration-pathlength in plumes for remote sensing applications from hyper-spectral images,” Anal. Chim. Acta, vol. 490, no. 1–2, pp. 139–152, 2003.[44] S. Niu, S. E. Golowich, and D. G. Manolakis, “Algorithms for remote quanti-fication of chemical plumes: A comparative study,” in Proc. SPIE, vol. 8390, 2012,p. 83902I.[45] J. Carrano, “Chemical and biological sensor standards study,” Defence Ad-vanced Research Projects Agency, Washington, DC, Tech. Rep., ADA458370, 2004. [46] S. M. Kay, Fundamentals of Statistical Signal Processing. Englewood Cliffs, New Jersey: Prentice Hall, 1998.[47] S. Kraut, L. Scharf, and L. T. McWhorter, “Adaptive subspace detectors,” IEEE Trans. Signal Processing, vol. 49, no. 1, pp. 1–16, Jan. 2001.[48] H. Cox and R. Pitre, “Robust DMR and multi-rate adaptive beamforming,” in Proc. Signals, Systems & Computers, vol. 1, Nov. 1997, pp. 920–924.[49] D. Manolakis, R. Lockwood, T. Cooley, and J. Jacobson, “Hyperspectral de-tection algorithms: Use covariances or subspaces?” in Proc. SPIE vol. 7457, 2009, pp. 745702–1–8.[50] D. Manolakis, C. Siracusa, and G. Shaw, “Hyperspectral subpixel target detec-tion using the linear mixing model,” IEEE Trans. Geosci. Remote Sens., vol. 39,no. 7, pp. 1392–1409, July 2001.[51] J. Theiler and B. Foy, “Effect of signal contamination in matched-filter detec-tion of the signal on a cluttered background,” IEEE Geosci. Remote Sens. Lett., vol. 3, no. 1, pp. 98–102, 2006.[52] S. Niu, S. E. Golowich, V. K. Ingle, and D. G. Manolakis, “Implications and mitigation of model mismatch and covariance contamination for hyperspectral chemical agent detection,” Opt. Eng., vol. 52, no. 2, pp. 026 202–026 202, Feb. 2013.[53] H. Cox, “Resolving power and sensitivity to mismatch of optimum array pro-cessors,” J. Acoust. Soc. Am., vol. 54, no. 3, pp. 771–785, 1973.[54] H. Cox, R. Zeskind, and M. Owen, “Robust adaptive beamforming,” IEEE Trans. Acoust., Speech Signal Processing, vol. 35, no. 10, pp. 1365–1376, 1987.[55] J. Li, P. Stoica, and Z. Wang, “On robust Capon beamforming and diagonal loading,” IEEE Trans. Signal Processing, vol. 51, no. 7, pp. 1702–1715, July 2003.[56] R. Lorenz and S. Boyd, “Robust minimum variance beamforming,” IEEE Trans. Signal Processing, vol. 53, no. 5, pp. 1684–1696, May 2005.[57] D. Manolakis, R. Lockwood, T. Cooley, and J. Jacobson, “Is there a best hy-perspectral detection algorithm?” in Proc. SPIE Defense, Security, and Sensing, vol. 7334, no. 1, 2009, p. 733402.[58] J. Theiler, B. R. Foy, and A. M. Fraser, “Nonlinear signal contamination effects for gaseous plume detection in hyperspectral imagery,” in Proc. SPIE, vol. 6233,2006, pp. 623310–1–12.[59] M. A. Richards, Fundamentals of Radar Signal Processing, 1st ed. New York:McGraw-Hill, June 2005.[60] R. R. Hocking, Methods and Applications of Linear Models. New York: Wiley, 1996.[61] P. Heasler, C. Posse, J. Hylden, and K. Anderson, “Nonlinear Bayesian algo-rithms for gas plume detection and estimation from hyper-spectral thermal image data,” Sensors, vol. 7, no. 6, pp. 905–920, 2007.[62] A. E. Raftery, D. Madigan, and J. A. Hoeting, “Bayesian model averaging for linear regression models,” J. Am. Stat. Assoc., vol. 92, no. 437, pp. 179–191, Mar. 1997.[63] T. Burr, H. Fry, B. Mcvey, E. Sander, J. Cavanaugh, and A. Neath, “Performance of variable selection methods in regression using variations of the bayesian information criterion,” Commun. Stat. Simul. Computat., vol. 37, no. 3, pp. 507–520, 2008.[64] G. A. F. Seber and A. J. Lee, Linear Regression Analysis. Hoboken, NJ: Wiley,Jan. 2012.[65] S. E. Golowich and D. G. Manolakis, “Cramer-Rao bounds for long-wave infrared gaseous plume quantification,” Opt. Eng., vol. 53, no. 2, p. 021109, 2014.[66] A. Hayden, E. Niple, and B. Boyce, “Determination of trace-gas amounts in plumes by the use of orthogonal digital filtering of thermal-emission spectra,” Appl. Opt., vol. 35, no. 16, pp. 2802–2809, 1996.[67] A. Hayden and R. Noll, “Remote trace gas quantification using thermal IR spectroscopy and digital filtering based on principal components of background scene clutter,” in Proc. SPIE, vol. 3071, 1997, pp. 158–168.[68] S. Niu, S. E. Golowich, V. K. Ingle, and D. G. Manolakis, “Hyperspectral chemical plume quantification via background radiance estimation,” in Proc. SPIE, vol. 8743, May 2013, p. 874,316.[69] C. M. Gittins, “Detection and characterization of chemical vapor fugitive emis-sions by nonlinear optimal estimation: Theory and simulation,” Appl. Opt., vol. 48,no. 23, pp. 4545–4561, 2009.
[SP]
Previous Page | Contents | Zoom in | Zoom out | Front Cover | Search Issue | Next Page qqM
Mq
qM
MqM
THE WORLD’S NEWSSTAND®
Previous Page | Contents | Zoom in | Zoom out | Front Cover | Search Issue | Next Page qqM
Mq
qM
MqM
THE WORLD’S NEWSSTAND®

IEEE SIGNAL PROCESSING MAGAZINE [142] JULY 2014 1053-5888/14/$31.00©2014IEEE
Optimal Multiuser Transmit Beamforming: A Difficult Problem with a Simple Solution Structure
Transmit beamforming is a versatile technique for signal transmission from an array of N antennas to one or multi-ple users [1]. In wireless com-
munications, the goal is to increase the signal power at the intended user and reduce interference to nonintended users. A high signal power is achieved by trans-mitting the same data signal from all antennas but with different amplitudes and phases, such that the signal compo-nents add coherently at the user. Low interference is accomplished by making the signal components add destructivelyat nonintended users. This corresponds mathematically to designing beamform-ing vectors (that describe the amplitudes and phases) to have large inner products with the vectors describing the intended channels and small inner products with nonintended user channels.
If there is line-of-sight (LoS) between the transmitter and receiver, beamform-ing can be seen as forming a signal beam towards the receiver; see Figure 1. Beam-forming can also be applied in non-LoS scenarios, if the multipath channel is known, by making the multipath compo-nents add coherently or destructively.
Since transmit beamforming focuses the signal energy at certain places, less energy arrives to other places. This allows for so-called space-division multiple access (SDMA), where K spatially separated users are served simultaneously. One beamform-ing vector is assigned to each user and can be matched to its channel. Unfortunately, the finite number of transmit antennas only provides a limited amount of spatial directivity, which means that there are
energy leakages between the users that act as interference.
While it is fairly easy to design a beam-forming vector that maximizes the signal power at the intended user, it is difficult to strike a perfect balance between maximiz-ing the signal power and minimizing the interference leakage. In fact, the optimiza-tion of multiuser transmit beamforming is generally a nondeterministic polynomial-time (NP)-hard problem [2]. Nevertheless, this lecture note shows that the optimal transmit beamforming has a simple struc-ture with very intuitive properties and interpretations. This structure provides a theoretical foundation for practical low-complexity beamforming schemes.
RELEVANCEAdaptive transmit beamforming is key to increased spectral and energy efficiency in next-generation wireless networks, which are expected to include very large antenna arrays [3]. In light of the difficulty to compute the optimal multiuser transmit beamforming, there is a plethora of
heuristic schemes. Although each scheme might be optimal in some special case and can be tweaked to fit other cases, these heuristic schemes generally do not provide sufficient degrees of freedom to ever achieve the optimal performance. The main purpose of this lecture note is to provide a structure of optimal linear transmit beamforming, with a sufficient number of design parameters to not lose optimality. This simple structure provides many insights and is easily extended to take various design constraints of practi-cal cellular networks into account.
PREREQUISITESThe readers require basic knowledge in linear algebra, communication theory, and convex optimization.
PROBLEM (P1): POWERMINIMIZATION WITH SINR CONSTRAINTSWe consider a downlink channel where a base station (BS) equipped with N anten-nas communicates with K single-antenna
Digital Object Identifier 10.1109/MSP.2014.2312183
Date of publication: 13 June 2014
[FIG1] A visualization of transmit beamforming in an LoS scenario. The beamforming is adapted to the location of the intended user, such that a main-lobe with a strong signal power is achieved towards this user while the sidelobes that cause interference to other nonintended users are weak.
Transmitter
Beam 1
Beam 2
User 1
User 2
[lecture NOTES]Emil Björnson, Mats Bengtsson,
and Björn Ottersten
Previous Page | Contents | Zoom in | Zoom out | Front Cover | Search Issue | Next Page qqM
Mq
qM
MqM
THE WORLD’S NEWSSTAND®
Previous Page | Contents | Zoom in | Zoom out | Front Cover | Search Issue | Next Page qqM
Mq
qM
MqM
THE WORLD’S NEWSSTAND®

IEEE SIGNAL PROCESSING MAGAZINE [143] JULY 2014
users using SDMA. The data signal to user k is denoted s Ck ! and is normalized to unit power, while the vector h Ck
N 1! #
describes the corresponding channel. The K different data signals are separated spa-tially using the linear beamforming vectors
, , ,w w CKN
11f ! # where wk is associ-
ated with user .k The normalized version /w wk k^ h is called the beamforming
direction and points out a direction in the N-dimensional vector space—note that it only corresponds to a physical direction in LoS scenarios. The squared norm wk
2 is the power allocated for transmission to user .k We model the received signal r Ck ! at user k as
,r s nh wk kH
ii
K
i k1
= +=
e o/ (1)
where nk is additive receiver noise with zero mean and variance .2v Conse-quently, the signal-to-interference-and-noise ratio (SINR) at user k is
i k!
i k!
| || |
| |
| |.
1 1
1
SINRh wh w
h w
h w
kkH
i
kH
k
kH
i
kH
k
2 2
2
22
22
v
v
v
=+
=+
/
/(2)
We use the latter, noise-normalized expression in this lecture note since it emphasizes the impact of the noise.
The transmit beamforming can be optimized to maximize some perfor-mance utility metric, which is generally a function of the SINRs. The main goal of this lecture note is to analyze a gen-eral formulation of such a problem, defined later as Problem (P2), and to derive the structure of the optimal beamforming. As a preparation toward this goal, we first solve the relatively simple power minimization problem
.
minimize
subject to SINR
w, , k
k
K
k k
1
2w wK1
$ c
f=
/(P1)
The parameters , , K1 fc c are the SINRs that each user shall achieve at the opti-mum of (P1), using as little transmit power as possible. The c-parameters can, for example, describe the SINRs required for achieving certain data rates.
The values of the c-parameters are con-stant in (P1) and clearly impact the opti-mal beamforming solution, but we will see later that the solution structure is always the same.
SOLUTION TO PROBLEM (P1)The first step toward solving (P1) is to reformulate it as a convex problem. The cost function wkk
K1
2=
/ is clearly a convex function of the beamforming vec-tors. To extract the hidden convexity of the SINR constraints, ,SINRk k$ c we make use of a trick from [4]. We note that the absolute values in the SINRs in (2) make wk and ke wj
ki completely equiva-
lent for any common phase rotation .Rk !i Without loss of optimality, we
exploit this phase ambiguity to rotate the phase such that the inner product h wk
Hk
is real valued and positive. This implies that | | .0h w h wk
Hk k
Hk
2 $= By letting ( )R $ denoting the real part, the con-
straint SINRk k$ c can be rewritten as
| | | |
( )
| | .
1 1 1
1
1 1
h w h w
h w
h w
kkH
k kH
ii k
kkH
k
kH
ii k
22
22
2
22
+ 0
$
$
c v v
c v
v
+
+
!
!
/
/ (3)
The reformulated SINR constraint in (3) is a second-order cone constraint, which is a convex type of constraint [4]–[6], and it is easy to show that Slater’s constraint qualification is fulfilled [7]. Hence, opti-mization theory provides many important properties for the reformulated convex problem; in particular, strong duality and that the Karush–Kuhn–Tucker (KKT) conditions are necessary and sufficient for the optimal solution. It is shown in [6, Appendix A] (by a simple parameter change) that these properties also hold for the original problem (P1), although (P1) is not convex. The strong duality and KKT conditions for (P1) play a key role in this lecture note. To show this, we define the Lagrangian function of (P1) as
( , , , , , )
| |
| | ,
1
1 1
w w
w h w
h w
L K K
kk
K
kk
K
kH
ii k
kkH
k
1 1
2
1 12
2
22
f fm m
mv
c v
= +
+ -
!= =c
m
// /
(4)
where 0k $m is the Lagrange multiplier associated with the kth SINR constraint. The dual function is min L, ,w wK1 =f
kk
K
1m
=/ and the strong duality implies that it equals the total power wkk
K 21=/
at the optimal solution, which we utilize later. To solve (P1), we now exploit the sta-tionarity KKT conditions, which say that
/ ,0wL k2 2 = for , ,k 1 f= ,K at the opti-mal solution. This implies
0w h h w h h wki
i iH
ki k k
kk k
Hk2 2v
m
c v
m+ - =!
/(5)
1 1
I h h w
h h w
Ni
i
K
i iH
k
k
kk k
Hk
21
2
+v
m
v
mc
+
= +
=
e
c
o
m
/
(6)
,1 1
w I h h h
h w
k Ni
i
K
i iH
k
k
kkH
k
21
1
2
scalar
+
#
v
m
v
mc
= +
+
=
-
=
e
c
o
m1 2 34444 4444
/
(7)
where IN denotes the N N# identity matrix. The expression (6) is achieved from (5) by adding the term ( / )k
2 #m v
h h wk kH
k to both sides and (7) is obtained by multiplying with an inverse. Since ( / ) ( / )1 1 h wk k k
Hk
2v cm + is a scalar, (7) shows that the optimal wk must be paral-lel to .( ( / ) )I h h hN ii
Ki i
Hk
21
1vm+=
-/ In other words, the optimal beamforming vectors , ,w w**
K1 f are
, , ,
p
k K1for
wI h h h
I h h h*
i
K
i
K
k k
Ni
i iH
k
Ni
i iH
k
21
1
21
1
beamformingpower
beamforming directionw*k
f
v
m
v
m
=
+
+
=
=
=
-
=
-
= =u
e
e
o
o
1 2 3444444 444444
9 /
/
(8)
where pk denotes the beamforming power and w*
ku denotes the unit-norm beamforming direction for user .k The K unknown beamforming powers are computed by noting that the SINR constraints (3) hold with equality at the optimal solution. This implies /1 k #c^ h
| | | |p ph w h w**k k
Hk ii k k
Hi
2 2 2v- =!
u u/ for , , .k K1 f= Since we know the beam-
forming directions, we have K linear equations and obtain the K powers as
Previous Page | Contents | Zoom in | Zoom out | Front Cover | Search Issue | Next Page qqM
Mq
qM
MqM
THE WORLD’S NEWSSTAND®
Previous Page | Contents | Zoom in | Zoom out | Front Cover | Search Issue | Next Page qqM
Mq
qM
MqM
THE WORLD’S NEWSSTAND®

[lecture NOTES]continued
IEEE SIGNAL PROCESSING MAGAZINE [144] JULY 2014
,p
pM
K
11
2
2h h
v
v
= -> >H Hwhere
[ ]| | ,
| | ,
,
,
i j
i j
1M
h w
h w*
*
ij iiH
i
iH
j
2
2 !
c=-
=u
u* (9)
and [ ]M ij denotes the ( , )i j th element of the matrix .M RK K! #
By combining (8) and (9), we obtain the structure of optimal beamforming as a function of the Lagrange multipliers
., , K1 fm m Finding these multipliers is outside the scope of this lecture note, for reasons that will be clear in the next sec-tion. However, we note that the Lagrange multipliers can be computed by convex optimization [4] or from the fixed-point equations / ( ( / )) (1 1 h INk k k
H2m v c= + +`
( / ) )h h hi i iH
kiK 2 1
1m v -
=j/ for all k [5], [6].
PROBLEM (P2): GENERAL TRANSMITBEAMFORMING OPTIMIZATIONThe main goal of this lecture note is to analyze a very general transmit beamform-ing optimization problem. We want to maximize some arbitrary utility function
( , , )f SINR SINRK1 f that is strictly in-creasing in the SINR of each user, while the total transmit power is limited by .PThis is stated mathematically as
( , , )
.
f
P
maximize
subject to
SINR SINR
w
, , K
kk
K
1
1
w wK1f
#
f
=
2/ (P2)
Despite the conciseness of (P2), it is generally very hard to solve [7]. Indeed, [2] proves that it is NP-hard for many common utility functions; for example, the sum rate ( , , )f SINR SINRK1 f =
.( )log 1 SINRkk
K21+
=/ Nevertheless, we will show that the structure of the optimal solution to (P2) is easily obtained.
SOLUTION STRUCTURE TO PROBLEM (P2)Suppose for the moment that we know the SINR values , ,SINR SINR**
K1 f that are achieved by the optimal solution to (P2). What would happen if we set ,SINR*
k kc =
for , , ,k K1 f= and solve (P1) for these particular c-parameters? The answer is that the beamforming vectors that solve
(P1) will now also solve (P2) [7]. This is understood as follows: (P1) finds beam-forming vectors that achieve the SINR val-ues ., ,SINR SINR**
K1 f The solution to (P1) must satisfy the total power con-straint in (P2), because (P1) gives the beamforming that achieves the given SINRs using the minimal amount of power. Since the beamforming vectors from (P1) are feasible for (P2) and achieves the optimal SINR values, they are an opti-mal solution to (P2) as well.
We can, of course, not know , ,SINR*1 f
SINR*K unless we actually solve (P2). In
fact, the difference between the relatively easy (P1) and the difficult (P2) is that the SINRs are predefined in (P1) while we need to find the optimal SINR values (along with the beamforming vectors) in (P2). The connection between the two problem implies, however, that the opti-mal beamforming for (P2) is
, ,
p
k K1for
wI h h
I h h h
h
*
i
K
i
K
k k
Ni
i iH
k
Ni
i iH
k
21
21
1
1
f
v
m
v
m
=
+
+
==
=
-
-
e
e
o
o
/
/
(10)
for some positive parameters ., , K1 fm m
The strong duality property of (P1) implies ,Pii
K
1m =
=/ since P is the
optimal cost function in (P1) and ii
K
1m
=/ is the dual function. Finding the optimal parameter values in this range is equivalent to solving (P2), thus it is as hard as solving the original prob-lem. However, the importance of (10) is that it provides a simple structure for the optimal beamforming.
Since the matrix inverse in (10) is the same for all users, the matrix
[ ]W w w C* **K
N K1f != # with the opti-
mal beamforming vectors can be written in a compact form. To this end, we note that ( / ) ( / )1h h H Hi i i
H HiK 2 2
1v v Km =
=/
where [ ]H h h CKN K
1f != # contains the channels and ( , , )diag K1 fK m m=
is a diagonal matrix with the m -parame-ters. By gathering the power allocation in a matrix ,P we obtain
,1W I H H HP*N
H2
121
vK= +
-
c m (11)
where ( / ( / )p 1diagP I H HNH
12 1#v K= + -^ h
, , / ( / ) )p 1h I H H hK NH
K2
12 1 2
f v K+ -^ h
and ( ) /1 2$ denotes the matrix square root. In the next section we study the structure of (10) and (11) and gain some insights.
INTUITION BEHIND THE OPTIMAL STRUCTUREThe optimal beamforming direction in (10) consists of two main parts: 1) the channel vector hk between the BS and the intended user ;k and 2) the matrix
/ .I h hN iiK
i iH2
1
1m v+
=
-^` h j/ Beamform-
ing in the same direction as the channel (i.e., / )w h h( )
k k kMRT=u is known as maxi-
mum ratio transmission (MRT) or matched filtering [8]. This selection maximizes the received signal power | |p h wk k
Hk
2u at the intended user, because
| |argmax h whh
:kH
kk
k2
1w wk k2
==
uu u
(12)
due to the Cauchy–Schwarz inequality. This is the optimal beamforming direction for ,K 1= but not when there are multi-ple users because the interuser interfer-ence is unaccounted for in MRT. This is basically what the multiplication of hk
with /I h hN iiK
i iH2
1
1m v+
=
-^` h j/ (before
normalization) takes care of; it rotates MRT to reduce the interference that is caused in the co-user directions
, , , , , .h h h hk k K1 1 1f f- + This interpreta-tion is illustrated in Figure 2, where the optimal beamforming lies somewhere in between MRT and the vector that is orthog-onal to all co-user channels. The optimal beamforming direction depends ultimately on the utility function ( , , ) .f $ $f However, the parameter 0i $m can be seen as the priority of user ,i where a larger value means that other users’ beamforming vec-tors will be more orthogonal to .hi
ASYMPTOTIC PROPERTIESNext, we study the asymptotic beamform-ing properties. In the low signal-to-noise ratio (SNR) case, represented by ,2 " 3v
the system is noise-limited and the beam-forming matrix in (11) converges to
( ) ,0W I HP HP*N
1 21
21
22 2= + =" " "3 3 3vv v
-
(13)
where the matrix inverse vanishes and P 2"3v denotes the asymptotic power allocation. This implies that w*
k is a
Previous Page | Contents | Zoom in | Zoom out | Front Cover | Search Issue | Next Page qqM
Mq
qM
MqM
THE WORLD’S NEWSSTAND®
Previous Page | Contents | Zoom in | Zoom out | Front Cover | Search Issue | Next Page qqM
Mq
qM
MqM
THE WORLD’S NEWSSTAND®

IEEE SIGNAL PROCESSING MAGAZINE [145] JULY 2014
scaled version of the channel vector ,hk
which is equivalent to MRT. At high SNRs, given by ,02 "v the
system is interference-limited. We focus on the case N K$ with at least one spatial degree-of-freedom per user—this is the meaningful operating regime for SDMA. To avoid singularity in the inverse when 2v
is small, we use the identity ( )I AB A1+ -
( )A I BA 1= + - and rewrite (11) as W H I H H P /*
KH2 1 1 2v K= +
- u^ h , where ( / ( ) , ,pdiagP I H H hK
H1
2 11
2fv K= + -u
/ ( ) )p I H H hK KH
K2 1 2v K+ - denotes
the corresponding rewritten power alloca-tion matrix. It now follows that
,
0W H I H H P
H H H P
*K
H
H
01
0
1 10
2 2
2
K
K
= +
=
" "
"
v v
v
-
- -
u
u
^
^
h
h (14)
where the term IK2v vanishes when 02 "v and P 02"v
u denotes the asymptotic power allocation. This solution is known as channel inversion or zero-forcing beamforming (ZFBF) [9], because it con-tains the pseudoinverse H H HH 1-^ h of the channel matrix .HH Hence, H W*H
02 ="v
P102K "v
- u is a diagonal matrix. Since the off-diagonal elements are of the form
0h w*iH
k = for ,i k! this beamforming causes zero interuser interference by pro-jecting hk onto the subspace that is orthogonal to the co-user channels.
The asymptotic properties are intuitive if we look at the SINR in (2). The noise dominates over the interference at low SNRs, thus we should use MRT to maxi-mize the signal power without caring about interference. On the contrary, the interference dominates over the noise at high SNRs, thus we should use ZFBF to remove it. We recall from Figure 2 that MRT and ZFBF are also the two extremes from a geometric perspective and the opti-mal beamforming at arbitrary SNR balance between these extremes.
Another asymptotic regime has received much attention: the use of very large arrays where the number of anten-nas, ,N goes to infinity in the perfor-mance analysis [3]. A key motivation is that the squared channel norms hk
2^ h
are proportional to ,N while the cross-products (| |h hi
Hk for )i k! increase
more slowly with N (the exact scaling depends on the channel models). Hence,
the user channels become orthogonal as ,N " 3 which reduces interference and
allows for less transmit power. Observe that I H H H HK
H H2 .v K K+ for large ,N since only the elements of H HH grow
with .N Similar to (14), one can then prove that ZFBF is asymptotically optimal. MRT performs relatively well in this regime due to the asymptotic channel orthogonality, but will not reach the same performance as ZFBF [3, Table 1].
RELATIONSHIP TO RECEIVE BEAMFORMINGThere are striking similarities between transmit beamforming in the downlink and receive beamforming in the uplink, but also fundamental differences. To describe these, we consider the uplink sce-nario where the same K users are trans-mitting to the same BS. The received signal r CN 1! # at the BS is ,sr h ni ii
K
1= +
=/
where user k transmits the data signal sk
using the uplink transmit power .qk The receiver noise n has zero mean and the covariance matrix .IN
2v The uplink SINR for the signal from user k is
| |
| |,
q
q
SINRh v v I v
h vk
iiH
k kH
N ki k
kkH
k
22
22
uplink
v
v=
+!
/(15)
where v CkN 1! # is the unit-norm receive
beamforming vector used by the BS to spa-tially discriminate the signal sent by user kfrom the interfering signals. The uplink SINR in (15) is similar to the downlink SINR in (2), but the noise term is scaled by
vk2 and the indices are swapped in the
interference term: | |h wkH
i2 in the down-
link is replaced by | |q h vi iH
k2 in the
uplink. The latter is because downlink interference originates from the beam-forming vectors of other users, while uplink interference arrives through the channels from other users. This tiny differ-ence has a fundamental impact on the opti-mization, because the uplink SINR of user k only contains its own receive beamform-ing vector .vk We can therefore optimize the beamforming separately for each k:
| |
| |
.
argmax q
q
q
q
h v v I v
h v
I h h h
I h h h
:
i
Ki
K
iiH
k kH
N ki k
kkH
k
Ni
i iH
k
Ni
i iH
k
22
22
21
1
21
1
1
v vk k2
v
v
v
v
+
=
+
+
!
=
-=
=
-
c
c
m
m
/
/
/
(16)
The solution follows since this is the maxi-mization of a generalized Rayleigh quo-tient [7]. Note that the same receive beamforming is optimal irrespective of which function of the uplink SINRs we want to optimize. In fact, (16) also mini-mizes the mean squared error (MSE) between the transmitted signal and the processed received signal, thus it is known as the Wiener filter and minimum MSE (MMSE) filter [9].
The optimal transmit and receive beamforming have the same structure; the Wiener filter is obtained from (10) by set-ting km equal to the uplink transmit power
.qk This parameter choice is only optimal
Subspace ofCo-User Channels
h1, ..., hk − 1, hk + 1, ..., hK
Zero InteruserInterference
(ZFBF)
MaximizeSignal Power
(MRT)
hk wk
OptimalBeamforming
ChannelDirection
[FIG2] The optimal beamforming w*k is based on the channel direction hk but rotated
to balance between high signal power and being orthogonal to the co-user channels.
Previous Page | Contents | Zoom in | Zoom out | Front Cover | Search Issue | Next Page qqM
Mq
qM
MqM
THE WORLD’S NEWSSTAND®
Previous Page | Contents | Zoom in | Zoom out | Front Cover | Search Issue | Next Page qqM
Mq
qM
MqM
THE WORLD’S NEWSSTAND®

[lecture NOTES]continued
IEEE SIGNAL PROCESSING MAGAZINE [146] JULY 2014
for the downlink in symmetric scenarios, as discussed later. In general, the parame-ters are different because the uplink sig-nals pass through different channels (thus, the uplink is affected by variations in the channel norms), while everything that reaches a user in the downlink has passed through a single channel [4].
HEURISTIC TRANSMIT BEAMFORMINGIt is generally hard to find the optimal m-parameters, but the beamforming structure in (10) and (11) serves as a foundation for heuristic beamforming; that is, we can select the parameters judiciously and hope for close-to-optimal beamforming. If we make all the param-eters equal, km m= for all ,k we obtain
.
W I HH HP
H I H H P
NH
KH
2
121
2
121
vm
vm
= +
= +
-
-
c
c
m
m (17)
The heuristic beamforming in (17) is known as regularized ZFBF [10] since the identity matrix acts as a regularization of the ZFBF in (14). Regularization is a com-mon way to achieve numerical stability and robustness to channel uncertainty. Since there is only a single parameter m
in regularized ZFBF, it can be optimized for a certain transmission scenario by con-ventional line search.
The sum property Pii
K
1m =
=/ sug-
gests that we set the parameter in regular-ized ZFBF equal to the average transmit power: / .P Km = This parameter choice has a simple interpretation, because the corresponding beamforming directions
/P KI h h hN iK
i iH
k2
1
1v+
=
-`` j j/ are the
ones that maximize the ratio of the desired signal power to the noise power plus the interference power caused to other users; in other words,
| |
| |
.
argmax
KP
KP
KP
KP
1h w
h w
I h h h
I h h h
:
i
K
i
K
iH
ki k
kH
k
N i iH
k
N i iH
k
22
22
21
1
21
1
1w wk k2
v
v
v
v
+
=
+
+
!
=
-
=
-
= u
u
u u
e
e
o
o
/
/
/
(18)
This heuristic performance metric is identical to maximization of the uplink SINR in (15) for equal uplink powers
/ .P Kqi = Hence, (18) is solved, similar to (16), as a generalized Rayleigh quotient. The idea of maximizing the metric in (18)
has been proposed independently by many authors and the resulting beam-forming has received many different names. The earliest work might be [11] from 1995, where the authors suggested beamforming “such that the quotient of the mean power of the desired contribu-tion to the undesired contributions is maximized.” Due to the relationship to receive beamforming, this scheme is also known as transmit Wiener filter [9], sig-nal-to-leakage-and-noise ratio beam-forming [12], transmit MMSE beamform-ing, and virtual SINR beamforming; see [7, Remark 3.2] for a further historical background.
The heuristic beamforming direction in (18) is truly optimal only in special cases. For example, consider a symmet-ric scenario where the channels are equally strong and have well-separated directivity, while the utility function in (P2) is symmetric with respect to
, , .SINR SINRK1 f It then makes sense to let the m-parameters be symmetric as well, which implies /P Kkm = for all ksince .Pii
K
1m =
=/ In other words, the
reason that the transmit MMSE beam-forming performs well is that it satisfies the optimal beamforming structure—at least in symmetric scenarios. In general,
−10 −5 0 5 10 15 20 25 300
5
10
15
20
25
30
Average SNR (dB)
Ave
rage
Sum
Rat
e (b
it/C
hann
el U
se)
0
5
10
15
20
25
30
Ave
rage
Sum
Rat
e (b
it/C
hann
el U
se)
Optimal BeamformingTransmit MMSE/Regularized ZFBFZFBFMRT
Optimal BeamformingTransmit MMSE/Regularized ZFBFZFBFMRT
Low SNR:Maximize
Signal Power
High SNR:SuppressInteruser
Interference
−10 −5 0 5 10 15 20 25 30Average SNR (dB)
(a) (b)
[FIG3] The average sum rate for K 4= users as a function of the average SNR. Heuristic beamforming can perform closely to the optimal beamforming, particularly when there are many more antennas than users. Transmit MMSE/regularized ZFBF always performs better, or equally well, as MRT and ZFBF. (a) N 4= antennas. (b) N 12= antennas.
Previous Page | Contents | Zoom in | Zoom out | Front Cover | Search Issue | Next Page qqM
Mq
qM
MqM
THE WORLD’S NEWSSTAND®
Previous Page | Contents | Zoom in | Zoom out | Front Cover | Search Issue | Next Page qqM
Mq
qM
MqM
THE WORLD’S NEWSSTAND®

IEEE SIGNAL PROCESSING MAGAZINE [147] JULY 2014
we need all the K degrees of freedom provided by , , K1 fm m to find the opti-mal beamforming, because the single parameter in regularized ZFBF does not provide enough degrees of freedom to manage asymmetric user channel condi-tions and utility functions.
The properties of MRT, ZFBF, and transmit MMSE beamforming are illus-trated by simulation in Figure 3. We consider K 4= users and (P2) with the sum rate as utility function: ( , ,f SINR1 f
) ( ) .log 1SINR SINRkk4 21
4= +
=/ The
simulation results are averaged over ran-dom circularly symmetric complex Gauss-ian channel realizations, ~ ( , ),0h ICNk N
and the SNR is measured as / .P 2v The optimal beamforming is computed by the branch-reduce-and-bound algorithm in [7] whose computational complexity grows exponentially with .K This huge complex-ity stands in contrast to the closed-form heuristic beamforming directions that are combined with a closed-form power alloca-tion scheme from [7, Theorem 3.16].
Figure 3 shows the simulation results for (a) N 4= and (b) N 12= transmit antennas. In the former case, we observe that MRT is near optimal at low SNRs, while ZFBF is asymptotically optimal at high SNRs. Transmit MMSE beamform-ing is a more versatile scheme that com-bines the respective asymptotic properties of MRT and ZFBF with good perfor-mance at intermediate SNRs. However, there is still a significant gap to the opti-mal solution, which is only bridged by fine-tuning the K 4= parameters
, ,1 4fm m (with an exponential complex-ity in ) .K In the case of ,N 12= there are many more antennas than users, which makes the need for fine-tuning much smaller; transmit MMSE beam-forming is near optimal in the entire SNR range, which is an important obser-vation for systems with very large antenna arrays [3] (these systems are often referred to as massive MIMO). Fig-ure 3 was generated using MATLAB; the code is available for download in [13].
EXTENSIONSNext, we briefly describe extensions to scenarios with multiple BSs and practi-cal power constraints.
MULTIPLE COOPERATING BASE STATIONSSuppose the N transmit antennas are dis-tributed over multiple cooperating BSs. A key difference from (P2) is that only a sub-set of the BSs transmits to each user, which has the advantage of not having to distribute all users’ data to all BSs. This is equivalent to letting only a subset of the antennas transmit to each user. We describe the association by a diagonal matrix ( , , ),d ddiagD , ,k k k N1 f= where d 1,k n = if antenna n transmits to user kand d 0,k n = otherwise [7]. The effective beamforming vector of user k is D wk k
instead of .wk By plugging this into the derivations, the optimal beamforming in (10) becomes
, ,
p
k K1for
D w
I D h h D D h
I D h h D D h
*
K
K
k k
k
Ni
kH
i iH
ki
kH
k
Ni
kH
i iH
ki
kH
k
21
1
21
1
f
v
m
v
m
=
+
+
==
-
=
-
e
e
o
o
/
/
(19)
for some positive parameters , , .K1 fm m
The balancing between high signal power and low interference leakage now takes place only among the antennas that actu-ally transmit to the particular user.
GENERAL POWER AND SHAPING CONSTRAINTSPractical systems are constrained not only in terms of the total transmit power, as in (P1) and (P2), but also in other respects; for example, maximal per-antenna power, limited power per BS, regulatory limits on the equivalent iso-tropic radiated power, and interference suppression toward other systems. Such constraints can be well described by hav-ing L quadratic constraints of the form
, , ,P L1forw Q w,kH
k
K
k k1
f,# =, ,
=
/ (20)
where the positive semidefinite weighting matrix Q C,k
N N! #, describes a subspace
where the power is limited by a constant .P 0$, The total power constraint in (P2)
is given by L 1= and Q I,k N1 = for all ,kwhile per-antenna constraints are given by L N= and Q ,k, being nonzero only at
the th, diagonal element. The weighting matrices are user specific and can be used for precise interference shaping; for example, the interference leakage at user i is limited to P, if we set Q h h,k i i
H=, for k i! and .0Q ,i =,
If the power constraints are plugged into (P2), it is proved in [6] and [7] that the optimal beamforming is
,1W Q H H HP,*
L
kH
12
1
21
nvK= +,
,
,
=
-
e o/(21)
where the L new parameters , ,1 fn
0L $n describe the importance of shap-ing the beamforming to each power con-straint; if n, is large, very little power is transmitted into the subspace of .Q ,k,
On the contrary, inactive power con-straints have 0n =, and, thus, have no impact on the optimal beamforming. One can show that the parameters satisfy
Pmaxii
K
1m =
=/ and P Pmax
L
1n =, ,,=
/where maxP Pmax = , , [7].
LESSONS LEARNEDAND FUTURE AVENUESIt is difficult to compute the optimal multiuser transmit beamforming, but the solution has a simple and intuitive structure with only one design parame-ter per user. This fundamental property has enabled many researchers to propose heuristic beamforming schemes—there are many names for essentially the same simple scheme. The optimal beamform-ing maximizes the received signal powers at low SNRs, minimizes the interference leakage at high SNRs, and balances between these conflicting goals at inter-mediate SNRs.
The optimal beamforming structure can be extended to practical multicell scenarios, as briefly described in this lec-ture note. Alternative beamforming parameterizations based on local chan-nel state information (CSI) or trans-ceiver hardware impairments can be found in [7]. Some open problems in this field are the robustness to imperfect CSI, multistream beamforming to multian-tenna users, multicasting where each signal is intended for a group of users, and adaptive m-parameter selection based on the utility function.
Previous Page | Contents | Zoom in | Zoom out | Front Cover | Search Issue | Next Page qqM
Mq
qM
MqM
THE WORLD’S NEWSSTAND®
Previous Page | Contents | Zoom in | Zoom out | Front Cover | Search Issue | Next Page qqM
Mq
qM
MqM
THE WORLD’S NEWSSTAND®

[lecture NOTES]continued
IEEE SIGNAL PROCESSING MAGAZINE [148] JULY 2014
ACKNOWLEDGMENTSThis work was supported by the Interna-tional Postdoc Grant 2012-228 from the Swedish Research Council and by the European Research Council (ERC) under the European Community’s Seventh Framework Programme (FP7/20072013)/ERC grant 228044.
AUTHORSEmil Björnson ([email protected]) is an assistant professor in the Department of Electrical Engineering, Linköping Univer-sity, Sweden. He is also a joint postdoctoral researcher at Supélec, France, and at the KTH Royal Institute of Technology, Sweden.
Mats Bengtsson ([email protected]) is an associate professor in the Department of Signal Processing, KTH Royal Institute of Technology, Sweden.
Björn Ottersten ([email protected]) is a professor in the Depart-ment of Signal Processing, KTH Royal Institute of Technology, Sweden, and also the director for the Interdisciplinary
Centre for Security, Reliability and Trust, University of Luxembourg.
REPRODUCIBLE RESEARCHThis lecture note has supplementary, downloadable material available in [13], provided by the authors. The material includes MATLAB code that can repro-duce all the simulation results. Contact Emil Björnson for further questions about this work.
REFERENCES[1] A. Gershman, N. Sidiropoulos, S. Shahbazpanahi,M. Bengtsson, and B. Ottersten, “Convex optimiza-tion-based beamforming,” IEEE Signal Processing Mag., vol. 27, no. 3, pp. 62–75, 2010.
[2] Y.-F. Liu, Y.-H. Dai, and Z.-Q. Luo, “Coordinated beamforming for MISO interference channel: Com-plexity analysis and efficient algorithms,” IEEE Trans. Signal Processing, vol. 59, no. 3, pp. 1142–1157, 2011.
[3] F. Rusek, D. Persson, B. Lau, E. Larsson, T.Marzetta, O. Edfors, and F. Tufvesson, “Scaling up MIMO: Opportunities and challenges with very large arrays,” IEEE Signal Processing Mag., vol. 30, no. 1,pp. 40–60, 2013.
[4] M. Bengtsson and B. Ottersten, “Optimal and suboptimal transmit beamforming,” in Handbookof Antennas in Wireless Communications, L. C.Godara, Ed. Boca Raton, FL: CRC Press, pp. 18-1–18-33, 2001.
[5] A. Wiesel, Y. Eldar, and S. Shamai, “Linear pre-coding via conic optimization for fixed MIMO receiv-ers,” IEEE Trans. Signal Processing, vol. 54, no. 1,pp. 161–176, 2006.
[6] W. Yu and T. Lan, “Transmitter optimization for the multi-antenna downlink with per-antenna power constraints,” IEEE Trans. Signal Processing, vol. 55,no. 6, pp. 2646–2660, 2007.
[7] E. Björnson and E. Jorswieck, “Optimal resource allocation in coordinated multi-cell systems,” Found. Trends Commun. Inform. Theory, vol. 9, no. 2–3,pp. 113–381, 2013.
[8] T. Lo, “Maximum ratio transmission,” IEEE Trans. Commun., vol. 47, no. 10, pp. 1458–1461, 1999.
[9] M. Joham, W. Utschick, and J. Nossek, “Linear transmit processing in MIMO communications sys-tems,” IEEE Trans. Signal Processing, vol. 53, no. 8,pp. 2700–2712, 2005.
[10] C. Peel, B. Hochwald, and A. Swindlehurst,“A vector-perturbation technique for near-capacity multiantenna multiuser communication—Part I: Channel inversion and regularization,” IEEE Trans. Commun., vol. 53, no. 1, pp. 195–202, 2005.
[11] P. Zetterberg and B. Ottersten, “The spectrum efficiency of a base station antenna array system for spatially selective transmission,” IEEE Trans. Veh. Technol., vol. 44, no. 3, pp. 651–660, 1995.
[12] M. Sadek, A. Tarighat, and A. Sayed, “A leakage-based precoding scheme for downlink multi-user MIMO channels,” IEEE Trans. Wireless Commun., vol. 6, no. 5, pp. 1711–1721, 2007.
[13] E. Björnson, M. Bengtsson, and B. Ottersten. MATLAB code [Online]. Available: https://github.com/emilbjornson/optimal-beamforming
[SP]
[special REPORTS] (continued from page 14)
has been on diabetes. A glucose meter has been out on the market for many years, and we have gone through at least one revision in that standard and we’re work-ing on a second revision right now. We’re also working with an eHealth group at the University of Toronto that is developing a glucose monitor and insulin pump.
IEEE SPM: Batteries are always an issue, but probably more so with porta-ble, or wearable, medical devices. Is this being addressed from a technical and/or standards development perspective?
Kirwan: Batteries are always an issue. As consumers, we turn off Wi-Fi and Blue-tooth because we know it’s draining our battery. We need a better standard. But there are a lot of things happening now, and oneM2M is a good example of what we can do to help mobile devices in the future. Just looking at Continua; most of
our certified devices have the Bluetooth transport in them; I would say 60–70%. So, as I already indicated, we’re seeing manufacturers moving away from the clas-sic Bluetooth to Bluetooth Low Energy devices. But let’s say I get out of the hospi-tal and I have a blood pressure monitor and maybe some other medical device, my phone is going to be dead before long. The difference between the technologies between classic Bluetooth and Bluetooth Low Energy is that the radio is always on versus the radio is always off. If the radio is always off, it comes on at a timed inter-val. It comes on when it has to. It’s sup-posedly more efficient. That’s the difference with medical devices. With more of these [Bluetooth Low Energy-based] products going through the certifi-cation process, it’s only a matter of time before we see more of them on the market as real consumer products.
IEEE SPM: Any special events we should watch out for that focus on mHealth this year and into 2015?
Kirwan: Continua will be back on track with our mHealth summits this year, holding three events with Plugfests over the remainder of 2014. Two of the events will be held in conjunction with mHealth Summit conferences, bringing new opportunities to increase Continua’s visibility as an immediate benefit of our new collaboration under the PCHA umbrella. We will also colocate the Con-tinua Summer Summit with the Open Mobile Alliance.
The Plugfest dates will be announced shortly. Due to the timing of the currently scheduled events, we will move Conti-nua’s AsiaPac Summit to spring 2015.
Editor’s Note: This interview was conducted by Ron Schneiderman, a reg-ular contributor to SPM. [SP]
Previous Page | Contents | Zoom in | Zoom out | Front Cover | Search Issue | Next Page qqM
Mq
qM
MqM
THE WORLD’S NEWSSTAND®
Previous Page | Contents | Zoom in | Zoom out | Front Cover | Search Issue | Next Page qqM
Mq
qM
MqM
THE WORLD’S NEWSSTAND®
_______
_____
___________
____________
___________
_____

[applications CORNER]
1053-5888/14/$31.00©2014IEEE IEEE SIGNAL PROCESSING MAGAZINE [149] JULY 2014
Digital Object Identifier 10.1109/MSP.2014.2312071
Date of publication: 13 June 2014
Jinchang Ren, Jaime Zabalza, Stephen Marshall, and Jiangbin Zheng
Effective Feature Extraction and Data Reduction in Remote Sensing Using Hyperspectral Imaging
ith numerous and contiguous spectral
bands acquired from visible light (400–
1,000 nm) to (near) infrared (1,000–1,700 nm and over), hyperspectral imaging (HSI) can poten-tially identify different objects by detecting minor changes in temperature, moisture, and chemical content. As a result, HSI has been widely applied in a number of appli-cation areas, including remote sensing [1]. HSI data contains two-dimensional (2-D) spatial and one-dimensional spectral information, and naturally forms a three-dimensional (3-D) hypercube with a high spectral resolution in nanometers that enables robust discrimination of ground features. However, new challenges arise in dealing with extremely large data sets. For a hypercube with relatively small spatial dimension of 600 × 400 pixels at 16 bits-per-band-per-pixel, the data volume becomes 120 MB for 250 spectral bands. In some cases, this large data volume can be linearly increased when multiple hyper-cubes are acquired across time to monitor system dynamics in consecutive time instants. When the ratio between the fea-ture dimension (spectral bands) and the number of data samples (in vector-based pixels) is vastly different, high-dimen-sional data suffers from the well-known curse of dimensionality. For feature extraction and dimensionality reduction, principal components analysis (PCA) is widely used in HSI [2], where the number of extracted components is significantly reduced compared to the original feature dimension, i.e., the number of spectral bands. For effective analysis of large-scale
data in HSI, conventional PCA faces three main challenges:
■ obtain the covariance matrix in extremely large spatial dimension, which can lead to software tools such as MATLAB running out of memory■ cope with the high computational cost required for analysis of large data sets■ retain locally structured elements that only appear in a small number of bands (mainly local structures) for improved discriminating ability when feature bands are globally extracted as principal components.
This article discusses several variations and extensions of conventional PCA to address the aforementioned challenges. These variations and extensions include slicing the HSI data for efficient computa-tion of the covariance matrix similarly done in 2-D-PCA analysis [3] and group-ing the spectral data to preserve the local structures and further speedup the pro-cess to determine the covariance matrix [4]. In addition, we also discuss some non-PCA-based approaches for feature extraction and data reduction, based on techniques such as band selection, ran-dom projection, singular value decompo-sition, and machine-learning approaches such as the support vector machine (SVM) [2], [5], [6].
FEATURE EXTRACTION USING PCA AND ITS VARIATIONSPCA has been widely used for unsupervised feature extraction and data reduction [2], [7]. Through orthogonal projection and truncation of the transformed feature data, PCA can successfully remove correlation inherent in the data.
For a hypercube with F spectral bands and a spatial size of R C# (Figure 1),
where R and C are the number of rows and columns, respectively, conventional PCA first converts the data into an F S#matrix (I), where .S RC= Then, the covariance matrix of , ,I K is obtained as follows: eigendecomposition is followed by data projection to determine the prin-cipal components. Due to the extremely large size of ,S which can be over 100 kB, practical difficulties arise when directly determining K from .I To solve these problems, 2-D-PCA inspired data slicingPCA (SPCA) [3] along with segmented PCA (Seg-PCA) [4] are used.
DATA SLICING PCARather than taking all spectral vectors in Itogether, SPCA (Figure 1) treats each spectral vector In separately when deter-mining the corresponding covariance matrix ,K where .[ , ]n S1! For each
,InF 10! # its associated partial covari-
ance matrix is obtained as ,I In nF FT 0! #
and the overall covariance matrix K is determined as the sum of all partial cova-riance matrices by
.I IS1
n nn
S RC
1
TK ==
=
/ (1)
SPCA is equivalent to PCA in determin-ing the covariance matrix. The funda-mental difference is that the calculation of K is implemented by a series of S independent partial covariance matrices. As such, the memory requirement is reduced from F S# to .F 1# In addi-tion to this, these partial covariance matrices can be separately calculated in parallel to improve efficiency.
SEGMENTED PCAAlthough the spectral data in HSI natu-rally form long vectors, the input spec-tral data can be grouped to produce a
W
Previous Page | Contents | Zoom in | Zoom out | Front Cover | Search Issue | Next Page qqM
Mq
qM
MqM
THE WORLD’S NEWSSTAND®
Previous Page | Contents | Zoom in | Zoom out | Front Cover | Search Issue | Next Page qqM
Mq
qM
MqM
THE WORLD’S NEWSSTAND®

IEEE SIGNAL PROCESSING MAGAZINE [150] JULY 2014
[applications CORNER]continued
series of small vectors for fast calculation of PCA in each group while enabling extraction of local structures from each group. As shown in Figure 1, in Seg-PCA each of the S spectral vectors is grouped to form k subvectors. For each sub-vector, the size of its covariance matrix is reduced to .n nk k#
For a particular group [ , ],b k1! let [ ... ]i i i imb m m n m b1 2
Tb= denote the cor-
responding small spectral vector formed from the original F bands, where
[ , ],m S1! and bK is the covariance matrix. Then, bK can be determined as
,S1 i ib mb mbm
S1
TK ==
/ (2)
where again S denotes the spatial size of the hypercube. Also note that i imb mb
T is the partial covariance matrix obtained from the grouped spectral vector .imb
For a g iven spectra l vector ,in
F 10! # conventional PCA extracts all the principal components from the F bands. In contrast, Seg-PCA divides in into H groups and ensures that vari-able numbers of components are extracted from each group. As a result, Seg-PCA has the potential to preserve some local spectral structures, which are nondominant and thus are discarded
in conventional PCA. Such local struc-tures provide additional values to Seg-PCA for superior discrimination ability as explained below.
In Seg-PCA, as illustrated in Figure 1, each spectral vector of F bands is grouped into H groups or K groups as shown in Figure 1. When ,H 1= Seg-PCA defaults to SPCA, which is equivalent to the conventional PCA. In fact, the per-formance of the Seg-PCA is strongly dependent on how the bands are grouped, as it affects how much additional infor-mation can be extracted to improve the conventional PCA.
In one particular case where all groups contain the same number of Wbands, ,HW F= the covariance matrices from different groups share the same dimension. As a result, they can be summed to form one covariance matrix
.Seg PCAK - This can further simplify the eigendecomposition procedure for better efficiency, as only one matrix rather than k must be processed
.bb
k
1Seg PCAK K=- =/ (3)
In conventional PCA, using SPCA for example, the covariance matrix in (1) can be rewritten as follows, where
T[ , , ..., ] :i a a an n n Hn1 2=
.
S
S
1
1
i i
a aa a
a a
a aa a
a a
a aa a
a a
nn
Sn
n nT
n nT
Hn nT
n nT
n nT
nT
n HnT
n HnT
HnT
nS
1
1 1
2 1
1
1 2
2 2
2
1
2
1
TSPCA
Hn Hn
h h
g
g
j
g
h
K =
=
=
=
R
T
SSSSS
V
X
WWWWW
/
/
(4)
For the particular case in Seg-PCAwhere all groups have the same number of bands, the covariance matrix can be further derived as
.S1 a a a a a a
b
k
n nT
n nT
Hn HnT
nS
b1
1 1 2 21
Seg PCA
g
K K=
= + + +
- =
=^ h
//
(5)
From (4) and (5), it is straightforward to demonstrate that Seg PCAK - is formed by accumulating the W W# sections in the main diagonal of ,SPCAK the original covariance matrix. This is also illustrated in Figure 1 for comparison. Note that in a real hypercube, uneven band group-ings are used to allow variable numbers of bands to be contained in different groups. However, this leads to the chal-lenging problem of grouping bands for feature characterization, which is dis-cussed in the following sections.
W
W
HW
F = HW
Conventional PCA
RC
F
F
l1 l2 l3 ln
ln
lc
. . . . . . . . . .
c ∈ [1] n ∈ [1, RC ]
n1
n2
nk
n1
n2
nk
Original Bands Subgroups PCA ResultsExtractedFeatures
N ∗
Coding andCompressionClassificationVisualisationand Display
Applications...
Segmented PCA
FeatureSelection
PCABandGrouping
....
....
....
....
....
Bands (F )
Rows(R )
Columns (C )
Hypercube
Pixel-BasedSPCA
F
1
. . .
[FIG1] Diagrams of conventional PCA in comparison with the SPCA and Seg-PCA.
Previous Page | Contents | Zoom in | Zoom out | Front Cover | Search Issue | Next Page qqM
Mq
qM
MqM
THE WORLD’S NEWSSTAND®
Previous Page | Contents | Zoom in | Zoom out | Front Cover | Search Issue | Next Page qqM
Mq
qM
MqM
THE WORLD’S NEWSSTAND®

IEEE SIGNAL PROCESSING MAGAZINE [151] JULY 2014
FEATURE EXTRACTION USING NON-PCA-BASED APPROACHESFor non-PCA-based feature extraction and dimensionality reduction, the most com-monly used approaches are based on band selection [5], machine learning [6], and steepest ascent search [7]. As adjacent spectral bands in HSI usually contain a large degree of redundant information, these approaches tend to select individual spectral bands rather than PCA compo-nents for data classification.
In these approaches, bands that contain less discriminatory information are dis-carded, which results in a much reduced number of remaining bands. Usually, the discriminatory information is reflected by how different a band is in comparison to adjacent bands. To determine the degree of similarity between two (band) images, a number of approaches can be used includ-ing distance measurement, mutual infor-mation, and the structural similarity measurement (SSIM) [2], [5].
For any two band images Am and ,An the simplest distance-based similar-
ity is given below to measure an average distance/similarity over all pixels
( , )
[ ( ( , ), ( , ))]
| ( , ) ( , ) |,
max
S A A
A i j A i j
A i j A i j1
d m n
m ni
Y
i
X
m ni
Y
i
X
11
11= -
-
m
m
==
==
//
//
(6)
where 02m and ( , )i j are the spatial coordinate indices of the two images sat-isfying [ , ]i X1! and [ , ];j Y1! X Y#denotes the spatial dimension of the band images.
In contrast, mutual information-based similarity is determined by the image histograms [2], [5]. By treating the spectral images as random variables, their associated mutual information can be determined as follows:
( , ),H A A-( , ) ( ) ( )I A A H A H Am n m n m n= +
(7)
where ( )H Am and ( )H An are the entropy of Am and ,An and ( , )H A Am n is their joint entropy.
( ) ( ) ( )logH A p a p ama Am
=-!
/ . (8)
The SSIM [8] contains three factors,including consistency in terms of lumi-nance ( , ),l A Am n contrast ( , )c A Am n , and structure ( , )s A Am n defined as follows:
( , )l A ACC2
m nm n
m n2 2
1
1
n n
n n=
+ +
+
( , )c A ACC2
m nm n
m n2 2
2
2
v v
v v=+ ++
( , )s A A CC
m nm n
mn
3
3
v vv=
++ (9)
( , )
( , ) ( , ) ( , ),
A A
l A A c A A s A A
SSIM m n
m n m n m n
=a b c
(10)
where , nmn n^ h and ,m nv v^ h are the mean intensity and the standard deviation of the band images Am and ,An respec-tively; CC1 3- are constants; and , ,a b c
are nonnegative weights. In the particular case where 1a b c= = = and ,C C22 3=
SSIM can be further simplified as
( , )
( ) ( )( ) ( )
.
A A
C CC C2 2
SSIM m n
m n m n
m n2 2
12 2
2
1 2mn
n n v v
n n v=
+ + + +
+ +
(11)
Due to the inclusion of a consistencymeasurement in terms of luminance, contrast, and structural similarity, SSIM is found to produce more consistent sim-ilarity measurements than distance and mutual information-based approaches
[9]. For the 92AV3C data set as described in detail in the next section, SSIM-based band similarity maps are shown in Figure 2. As can be seen, bands are natu-rally divided into similar groups, with exceptions to bands just over 100 and 150 where adjacent bands show low sim-ilarity to each other. These are noisy bands that contain very little useful information, hence the low correlation with adjacent bands.
Based on the similarity maps men-tioned earlier, band groups and the key bands can be easily determined by thresholding [3] or the Jeffries–Matusita interclass distance [7] with the steepest ascent search strategy [2], [7]. For machine-learning-based approaches, ground truth information is usually used to determine the discriminatory ability of bands in any classification-based tests.
PERFORMANCE EVALUATION AND ANALYSISWe compare the performance of SPCA and Seg-PCA with conventional PCA using the publicly available hyperspectral data set 92AV3C from the original Indian Pines [10]. The 92AV3C data set was col-lected by the AVIRIS instrument over an agricultural study site in Northwest Indi-ana [10] for land cover classification in remote sensing applications. The hyper-spectral data set contains 220 spectral reflectance bands in the wavelength range of 400–2,500 nm, and the spatial size is
[FIG2] The correlation matrix among the band images of the 92AV3C data set.
50 100 150 200
20
40
60
80
100
120
140
160
180
200
2200
0.1
0.2
0.3
0.4
0.5
0.6
0.7
0.8
0.9
1
Previous Page | Contents | Zoom in | Zoom out | Front Cover | Search Issue | Next Page qqM
Mq
qM
MqM
THE WORLD’S NEWSSTAND®
Previous Page | Contents | Zoom in | Zoom out | Front Cover | Search Issue | Next Page qqM
Mq
qM
MqM
THE WORLD’S NEWSSTAND®

IEEE SIGNAL PROCESSING MAGAZINE [152] JULY 2014
[applications CORNER]continued
21,025 (145 × 145) pixels. The data set contains different land cover classes corre-sponding to agriculture, forest, vegetation, and buildings. One sample band and the ground truth of the 16 land cover classes are illustrated in Figure 3. Disregarding the white regions that are unclassified background, the other colored regions in the ground truth refer to alfalfa, corn (three types), wheat, grass (three types), oats, woods, soybeans (three types), hay, and two others.
FEATURE EXTRACTIONAND DATA CLASSIFICATIONSVM has been widely used for hyperspec-tral image classification [6], [7]. The implementation using the bSVM library [11] is employed for performance assess-ment. As a supervised classifier, SVM relies on training data for model optimization. In the experiments, the principal compo-nents extracted from the original spectral data using the conventional PCA, SPCA and Seg-PCA approaches are used as fea-tures for the SVM. For the labeled pixels in the data set, 30% of them are used for training the SVM and the remaining 70%
for testing. The kernel function used for SVM is the radial basis function, whose parameters, the penalty c^ h, and the gamma ,c^ h were optimized in the train-ing process through a grid search of possi-ble combinations of these parameters.
As suggested in the literature [5], [7], the noisy bands covering the region of water absorption (104–108, 150–163, 220) are removed from the spectral vec-tors before applying PCA for feature extraction. To this end, the effective num-ber of spectral bands for the data sets is reduced from 220 to 200. In total, four groups of features are used for compari-son. The first is referred to as the whole spectral band (WSB), in which the total 200 spectral bands are used directly as features. This is taken as a baseline approach for benchmarking. The remain-ing three groups use principal compo-nents as features, extracted from the conventional PCA, SPCA, and Seg-PCA approaches, respectively.
For each group of features as samples, ten experiments were carried out with data samples randomly selected for train-ing and testing. No data sample overlap
was allowed in the training set and testing set. The average testing result over these tests and the corresponding standard deviation of classification accuracy were obtained and reported below for evalua-tion and assessment.
PERFORMANCE ASSESSMENTWe assess performance in terms of reduc-tion of computation cost, memory requirement, and improvement of classifi-cation accuracy.
The computation costs of the SPCA and Seg-PCA are compared against those of the conventional PCA in Table 1, for the three stages involved, where S and Krefer, respectively, to the number of sam-ples (pixels) and the number of principal components extracted. Since the compu-tational cost for PCA and SPCA is the same, they are put together to be com-pared with Seg-PCA. The saving factor of computational cost for Seg-PCA is H or H3 in comparison to conventional PCA and SPCA. With H 10= and ,K 30= the number of multiply-accumulates required in PCA/SPCA is 9.75e8, where in Seg-PCA it is reduced to 9.67e7. In effect, the com-putational cost has reduced to 9.92%. In other words, Seg-PCA has achieved a sav-ing factor of ten, i.e., an order of magni-tude for the hyperspectral remote sensing data set used.
In Table 2, memory requirements for PCA, SPCA, and Seg-PCA over different stages are compared. SPCA only reduces memory requirement in the first stage when the covariance matrix is obtained. The other two stages require the same amount of memory as the conventional PCA. Seg-PCA has significantly lower memory requirements, and the mini-mum saving factor achieved is .H2
When H 10= Seg-PCA only requires 1% of the memory compared to the con-ventional PCA.
With local structures extracted over the spectral domain, Seg-PCA has great potential to improve the efficacy in fea-ture extraction resulting in higher dis-crimination power and better classifi-cation. With ,H 10= ,W 20=^ h the classification results using various num-bers of principal components are plotted in Figure 4, where K covers a large
(a) (b)
[FIG3] (a) One sample band image and (b) the ground truth of land cover of the 92AV3C data set. (Images used courtesy of [10].)
[TABLE 1] COMPARISONS OF COMPUTATIONAL COST.
STAGES/APPROACHES COVARIANCE MATRIX EIGENPROBLEM DATA PROJECTION
PCA/SPCA O S H W2 2^ h O H W3 3^ h O S HWK^ h
Seg-PCA O S H W2^ h O HW3^ h O S WK^ h
SAVING FACTOR H H2 H
Previous Page | Contents | Zoom in | Zoom out | Front Cover | Search Issue | Next Page qqM
Mq
qM
MqM
THE WORLD’S NEWSSTAND®
Previous Page | Contents | Zoom in | Zoom out | Front Cover | Search Issue | Next Page qqM
Mq
qM
MqM
THE WORLD’S NEWSSTAND®

IEEE SIGNAL PROCESSING MAGAZINE [153] JULY 2014
range from ten to 110. First, Seg-PCA is found to consistently outperform con-ventional PCA (and also SPCA). As can be seen, Seg-PCA significantly improves on the conventional PCA when the number of components is less than 110, i.e., 50% of the dimensionality of original fea-tures. When K is ten and over, Seg-PCA achieves comparable or even slightly bet-ter results in comparison to WSB for classification, a significant advantage for feature extraction as the dimensionality of features used in WSB is 200.
NON-PCA-BASED APPROACHESThe mutual information-based band selection approach [5], SVM-based approach [6], and the steepest ascent search-based approach [7] are compared in this group of experiments, along with the PCA-based methods. Again SVM is used as the preferred classifier yet under 60% training ratio. The results are sum-marized in Table 3 for comparison. As one can see, PCA-based approaches have gen-erated reasonably good results, where Seg-PCA is found to be the best among the five approaches evaluated. The SVM-based approach outperforms conventional PCA and the steepest ascent search-based approach, and the mutual information-based approach is found to be the poorest performing in this group of tests.
EFFECT OF NOISEDue to atmospheric water absorption and other effects, the hyperspectral images obtained may contain severe noise, where the corresponding band image is effectively useless as it has no correlation to any adjacent bands (see Figure 2). As a result, noise removal becomes a very important issue. Without
noisy band removal, the classification accuracy achieved for the 92AV3C data set by PCA with ten components is only around 70%, in comparison to nearly 87% obtained in Table 3. Furthermore, some researchers also apply noise removal in the spatial domain, using the known wavelet shrinkage approach [12]. After removal of the noisy bands, it is found that this pre-processing can fur-ther improve the overall classificationaccuracy by 2–3% [12].
CONCLUSIONSAlthough PCA has been widely used forfeature extraction and data reduction, it suffers from three main drawbacks: high computational cost, large memory re-quirement, and low efficacy in processing large data sets such as HSI. This article analyzed two variations of PCA, specifical-ly SPCA and Seg-PCA. Seg-PCA can fur-ther improve classification accuracy while significantly reducing the computational cost and memory requirement, without
[TABLE 2] A COMPARISON OF MEMORY REQUIREMENTS IN PCA, SPCA, AND SEG-PCA AT DIFFERENT STAGES.
STAGES/APPROACHES
COVARIANCECOMPUTATION
COVARIANCEMATRIX SIZE
PROJECTIONMATRIX SIZE
PROJECTIONMULTIPLICATION
PCA S HW# HW HW# HW K# SHW HWK#
SPCA 1HW# HW HW# HW K# SHW HW#
SAVING FACTOR S 1 1 1
Seg-PCA W#S WW# W K/H# HW WK/H#
SAVING FACTOR H H2 H2 SH2
10 20 30 40 50 60 70 80 90 100 11080
81
82
83
84
85
86
87
88
89
90
Number of Components
Suc
cess
Rat
e (%
)
WSBPCA/SPCASeg-PCA
[TABLE 3] A COMPARISON OF THE OVERALL ACCURACY OF DIFFERENT APPROACHESUNDER A VARIOUS NUMBER OF FEATURES USED FOR CLASSIFICATION.
METHODS PCA Seg-PCA [4] MUTUALINFORMATION [5]
SVM-BASEDBANDSELECTION [6]
STEEPESTASCENT SEARCHMETHOD [7]
10 86.76 91.40 73.06 87.55 85.79
20 89.56 92.49 73.95 90.68 87.92
30 89.17 92.61 76.58 91.03 89.45
[FIG4] The classification results for the 92AV3C data set from PCA/SPCA and Seg-PCA in benchmarking with WSB approach under various numbers of principal components used, where the training ratio is 30%.
Previous Page | Contents | Zoom in | Zoom out | Front Cover | Search Issue | Next Page qqM
Mq
qM
MqM
THE WORLD’S NEWSSTAND®
Previous Page | Contents | Zoom in | Zoom out | Front Cover | Search Issue | Next Page qqM
Mq
qM
MqM
THE WORLD’S NEWSSTAND®

IEEE SIGNAL PROCESSING MAGAZINE [154] JULY 2014
[applications CORNER]continued
requiring prior knowledge. There is po-tential to apply similar feature extraction and data reduction techniques in applica-tion areas beyond HSI when the analysis of large-dimensional data sets is required, such as magnetic resonance imaging and digital video processing.
RESOURCESFor hyperspectral remote sensing, a series of sensors have been applied in the world, which include AVIRIS [10], ROSIS [13], and HYDICE [10] as well as many others such as TRWIS, CASI, OKSI AVS, MERIS, Hyperio, HICO, CHRIS, NEON, and TERN. Detailed specifications in terms of the spectral range and spectral/spatial resolution etc. for these sensors are summarized in [14] and [15].
For the AVIRIS sensor, the data were acquired since the early 1990s, and they can be obtained from NASA by accessing the link http://aviris.jpl.nasa.gov/data/get_aviris_data.html. Alternatively, some asso-ciated data sets such as 92AV3C, Salinas, and Cuprite can be downloaded online from [10] and/or [13]. For the ROSIS sen-sor, the Pavia Center and Pavia University data sets can be obtained from [13]. In addition, the DC Mall data set from the HYDICE sensor is also available online [10]. Note that for 92AV3C, Salinas, the Pavia Center, and the Pavia University data sets, there are available ground truth to facilitate objective assessment in data clas-sification-based applications.
AUTHORS Jinchang Ren ([email protected]) is the deputy director of the Hyperspectral Imaging Centre in the University of Strathclyde, Glasgow, United Kingdom.
Jaime Zabalza ([email protected]) is currently working toward his Ph.D. degree in the Department of Elec-tronic and Electrical Engineering, Uni-versity of Strathclyde, United Kingdom.
Stephen Marshall ([email protected]) is a professor with the Department of Electronic and Elec-trical Engineering at the University of Strathclyde, United Kingdom. He is a fel-low of the Institute of Engineering and Technology.
Jiangbin Zheng ([email protected]) is currently a professor with the School of Software and Microelectronics, Northwest-ern Polytechnical University, Xi’an, China.
REFERENCES[1] R. Dianat and S. Kasaei, “Dimension reduction of optical remote sensing images via minimum change rate deviation method,” IEEE Trans. Geos-ci. Remote Sensing, vol. 48, no. 1, pp. 198–206,Jan. 2010.
[2] X. Jia, B.-C. Kuo, and M. Crawford, “Feature mining for hyperspectral image classification,” Proc. IEEE, vol. 101, no. 3, pp. 676–697, Mar. 2013.
[3] J. Yang, D. Zhang, A. F. Frangi, and J.-Y. Yang, “Two-dimensional PCA: A new approach to appearance-based face representation and recognition,” IEEE Trans. Pat-tern Anal. Mach. Intell., vol. 26, no. 1, pp. 131–137, Jan. 2004.
[4] X. Jia, and J. A. Richards, “Segmented principal components transformation for efficient hyperspec-tral remote sensing image display and classification,” IEEE Trans. Geosci. Remote Sensing, vol. 37, no. 1, pp. 538–542, 1999.
[5] B. Guo, S. Gunn, R. Damper, and J. Nelson, “Band selection for hyperspectral image classification using mutual information,” IEEE Geosci. Remote Sensing Lett., vol. 3, no. 4, pp. 522–526, 2006.
[6] M. Pal and G. M. Foody, “Feature selection for classification of hyperspectral data by SVM,” IEEE Trans. Geosci. Remote Sensing, vol. 48, no. 5, pp. 2297–2307, 2010.
[7] F. Melgani and L. Bruzzone, “Classification of hyperspectral remote sensing images with SVMs,” IEEE Trans. Geosci. Remote Sensing, vol. 42, no. 8, pp. 1778–1790, Aug. 2004.
[8] Z. Wang, A. C. Bovik, H. R. Sheikh, and E. P.Somoncelli, “Image quality assessment: From error visibility to structural similarity,” IEEE Trans. Image Processing, vol. 13, no. 4, pp. 600–612, 2004.
[9] D. P. Widemann, “Dimensionality reduction for hyperspectral data,” Ph.D. dissertation, Dept. Math., University of Maryland, 2008.
[10] (1992, June 12). Pursue’s University multispec site: Aviris image north-south flightline, Indiana. [Online]. Available: https://engineering.purdue.edu/~biehl/MultiSpec/hyperspectral.html
[11] C.-W. Hsu and C. -J. Lin. (2012, June 18). bSVM multiclass classifier 2.08. [Online]. Available: http://www.csie.ntu.edu.tw/~cjlin/bsvm/
[12] B. Demir, S. Erturk, and M. K. Gullu, “Hy-perspectral image classification using denoising of intrinsic mode functions,” IEEE Geosci. Remote Sensing Lett., vol. 8, no. 2, pp. 220–224, 2011.
[13] Comput. Intell. Group, Univ. Basque Coun-try. Hyperspectral remote sensing scenes. Online datasets. [Online]. Available: http://www.ehu.es/ccwintco/index.php/Hyperspectral_Remote_Sensing_Scenes
[14] (2013, Aug. 14). GISResources. Fundamentals of hyperspectral remote sensing. [Online]. Available: http://www.gisresources.com/fundamemtals-of-hyper-spectral-remote-sensing_2/
[15] (2013, Aug. 23). HySpeed Computing. Remote sensing data access, A review of online resources for hyperspectral imagery. [Online]. Available: http://hyspeedblog.wordpress.com/2013/04/23/remote-sensing-data-access-a-review-of-online- resources-for-hyperspectral-imagery/
[SP]
Previous Page | Contents | Zoom in | Zoom out | Front Cover | Search Issue | Next Page qqM
Mq
qM
MqM
THE WORLD’S NEWSSTAND®
Previous Page | Contents | Zoom in | Zoom out | Front Cover | Search Issue | Next Page qqM
Mq
qM
MqM
THE WORLD’S NEWSSTAND®
_____________
____________
___________
____
______________
___
_________
___
_____________________________________________________________
___
_________________________________
_____________________________________
_____________________
____________
___________________
__________
_________________________________

D. Robert Iskander[life SCIENCES]
1053-5888/14/$31.00©2014IEEE IEEE SIGNAL PROCESSING MAGAZINE [155] JULY 2014
Digital Object Identifier 10.1109/MSP.2014.2312072
Date of publication: 13 June 2014
Signal Processing in Visual Optics
Ioften finish my digital signal process-ing lecture on Fourier transformation asking students to think of a Fourier transform application that is close to them. The answers I usually get are
“it’s in my cell phone” or “in my laptop.” “It is much close to your skin,” I probe further. Rarely, I get the expected answer that the eye is essentially a Fourier trans-form operator. Hence, the human eye is an excellent object to study for a signal processing practitioner.
The eye, despite being extraordinarily well developed through evolution, is not an ideal optical system and produces retinal images of moderate quality. On the other hand, a simple textbook comparison of the eye to a man-made optical instrument, such as a camera, for example, is totally unjust. The eye is a complicated, dynamic, and robust optical system [1]. The image of a distant object needs to travel through a thin, few micrometers thick layer of tear film, cornea, aqueous humour, pupil, crys-talline lens with a gradient refractive index, before it falls on the photosensitive retina at the back of the eye. All of the eye ele-ments, which the rays that form the image of a distant object pass, are dynamic in nature and are not fully synchronized with each other. Figure 1 depicts the considered eye elements and the major signals that affect their performance.
First, the eye globe, as a whole, per-forms complicated micromovements in lateral as well as longitudinal directions. Tear film dynamically changes the optical characteristics of the eye from a blink to another [2]. The cornea, despite its name being derived from a horn, is not a rigid body and is suggested to undergo slow dynamic changes in central curvature,
possibly due to eye’s accommodation (i.e., changes in its focal point). The shape and size of the pupil are not fixed; they vary with light intensity and level of accommo-dation. Pupil size undergoes small micro-fluctuations called hippus (pupillary athetosis). Additionally, the center of the pupil is not concentric with the geometri-cal center of the cornea. Hence, with changes in size its relevant position to cor-nea also changes. This is an important fac-tor when relating optical characteristics of the cornea to those of the whole eye.
The crystalline lens is a flexible eye ele-ment that allows changing the eye’s focal point. In a young eye, those changes can reach over a dozen diopters. The accom-modative status of the crystalline lens is additionally modulated by the signals from the cardiopulmonary system [3]. At the end of their paths, the rays forming the image of an object fall on a dynamic retina, connected with the cardiopulmonary sys-tem, which may also undergo slow diurnal structural changes in its choroid [4].
All of the eye’s elements, described above, together with signals associated with accommodation, pupillary response, and those of cardiopulmonary system lead to a static retinal image that is far from ideal at a given point of time. However, due to the dynamic nature of all those ele-ments, the human eye is able to resolve images with high acuity of about 1 min of arc mainly because of the match between moderate optical image quality and the resolution of the retinal mosaic [1]. The actual image that a human being can resolve also depends on neural processes occurring in the retina and the brain. Those could involve elements of stochastic resonance where the naturally occurring eye vibrations may result in an improved visual quality [5], [6].
Some aspects of the dynamics in opti-cal characteristics of the eye, particularly those related to changes in the tear film structure and microfluctuations of the steady-state accommodation, have been considered. The latter can be associated
InputImage
IntraocularPressure
TearFilm Cornea
Pupil
CrystallineLens
Retina
EyeMovements
Cardio-PulmonarySystem
IlluminationLevel
Accommodation
ECG, Pulse, and Respiration
OutputImage
[FIG1] The human eye as a dynamic system.
Previous Page | Contents | Zoom in | Zoom out | Front Cover | Search Issue | Next Page qqM
Mq
qM
MqM
THE WORLD’S NEWSSTAND®
Previous Page | Contents | Zoom in | Zoom out | Front Cover | Search Issue | Next Page qqM
Mq
qM
MqM
THE WORLD’S NEWSSTAND®

[life SCIENCES]continued
IEEE SIGNAL PROCESSING MAGAZINE [156] JULY 2014
with the refractive status of the eye from which emmetropization mechanisms (i.e., processes that optimize the eye’s optics) could be learned. However, the wealth of information available when examining the dynamic nature of optical characteristics of the eye has not been fully exploited. Challenges exist to develop analytic meth-odologies that would adequately account for all such variations and their interde-pendencies with the major physiological signals of the human body. To achieve this goal, an overall system of the eye’s optics that takes into account the aberration dynamics needs to be considered. This col-umn summarizes the recent endeavors undertaken in search of adequate charac-terization of the human eye’s optics that involves application of various levels of signal processing tools. In particular, we focus on temporal changes in tear film and natural microfluctuations in a steady-state accommodation—the two factors that have the greatest influence on optical quality of the human eye.
DATA ACQUISITION Some progress in the development of instrumentation for acquisition of the sig-nals shown in Figure 1 has already been made. For example, the movements associ-ated with the eye/head interface can be measured with high-speed cameras, optical distance sensors, or ultrasonic sensors. The kinetics of tear film can be assessed with high-speed videokeratoscopy, interferome-try, wavefront sensing, or retroillumination techniques [2], [7]. Videokeratoscopy is the current standard for measuring corneal topography but reflective-based systems such as the Placido disk videokeratoscope are being utilized for assessing tear film surface quality. Interferometric techniques are used to measure the thickness of the tear film lipid layer or the quality of its sur-face as is the case with lateral shearing interferometry [2]. Wavefront sensing, usu-ally based on the Shack–Hartmann princi-ple, is the current standard for measuring the eye’s optical aberrations. It can also be utilized to assess tear film quality within the pupil area [3]. Similar assessment area can be obtained with the retroillumination technique in which an external light source is used to illuminate the retina that,
subsequently, retroilluminates the cornea and the tear film [7].
The dynamics of the anterior cornea can be currently assessed with high-speed videokeratoscopy. In the future, the ante-rior and posterior corneal surfaces could be evaluated with dynamic Scheimpflug imaging or dynamic spectral optical coherence tomography—techniques cur-rently well developed for static acquisition of those surfaces.
Scheimpflug imaging is a well-estab-lished technique in which the lens plane is not parallel to the image plane. This allows achieving a well-focused image of a wide cross-section of the cornea extending to the corneoscleral region. Optical coher-ence tomography, particularly the spectral domain based, became the standard for imaging both anterior and posterior seg-ments of the eye.
The effect of the intraocular pressure (IOP) on corneal surface can be assessed by measuring temporal variations in IOP using dynamic contour tonometry [8]. Further, the changes in pupil size and shape and their relation to the geometric center of the cornea can be simply assessed with high-speed pupillometry and appropriate image processing routines for estimating the corneal limbus. The dynamics of the crystalline lens, those associated with accommodation, and those related to the cardiopulmonary sys-tem can be assessed using a combined sys-tem of a wavefront sensor and a bioamplifier with sensors for measuring pulse, respiration, and the electric heart activity [9]. Finally, the dynamics related to the retina can be assessed by measuring fundus pulsation [10].
Although there are no instruments currently available that would acquire a complete dynamic “picture” of the eye’s optical and physiological characteristics, some progress has been made in this direction. For example, a combined topog-rapher/wavefront sensors instrument has been recently commercially realized. Sev-eral ophthalmic instruments include dynamic measurement of the pupil size and its position with respect to the cornea. There is also a growing body of laboratory settings where researchers try to combine several devices to assess correlation
(coherence) between the parameters (sig-nals) estimated from each of the consid-ered instruments [7], [9].
Problems associated with acquisition of dynamic data range from prosaic stor-age shortages and limits in computing power, as in the case of the three-dimen-sional optical coherence tomography, to more complex associated with limits in optical technology and lack of robust algo-rithms for data processing. The latest is of interest to signal processing community.
TEAR FILMThe tear film is the first optical element of the eye that the rays forming the image of an object in the field of view encounter. The tear film broadly comprises three dis-tinct layers, an outer lipid layer, a middle aqueous layer, and an inner mucin layer. It renews with every blink and will eventu-ally rupture/evaporate if blinking does not occur. At the air/tear film interface the rays undergo the strongest refraction (from about n 1= to about .. )n 1 336=
Hence, the stability of tear film surface smoothness is essential for the retinal image to have good quality.
Currently accepted assessment of tear film includes a range of clinical diagnostic methods that are time-consuming and unreliable. They are also inadequate to study the kinetics of tear film and their influence on visual performance of the eye [2]. Recently, more attention has been given to the developments of noninvasive methods for tear film surface analysis such as repeated measure videokeratog-raphy, high-speed videokeratoscopy, dynamic wavefront sensing, and interfer-ometry. There are also attempts of comb-ing several techniques as in the case of wavefront sensing and retroillumination [7]. A recent study comparing several non-invasive measurement technologies indi-cated that high-speed videokeratoscopy appears to be the most precise method for measuring tear film surface quality while lateral shearing interferometry appears to be the most sensitive method for analyz-ing tear film kinetics [2].
One of the important parameters char-acterizing tear film quality, particularly in the diagnosis of dry eye syndrome, is the tear film break-up time. In clinical
Previous Page | Contents | Zoom in | Zoom out | Front Cover | Search Issue | Next Page qqM
Mq
qM
MqM
THE WORLD’S NEWSSTAND®
Previous Page | Contents | Zoom in | Zoom out | Front Cover | Search Issue | Next Page qqM
Mq
qM
MqM
THE WORLD’S NEWSSTAND®

IEEE SIGNAL PROCESSING MAGAZINE [157] JULY 2014
practice, it is measured with a stop watch by observing postblink tear film thinning patterns in a slit-lamp biomicroscope after instillation of fluorescein into the eye. The method is both invasive (i.e., instillation of small amount of fluorescein to the eye is required) and nonphysiological as it requires the patient to keep their eyes open for a period of time significantly exceeding that of an average interblink interval. Noninvasive methods of tear film assessment resolve the first problem while robust estimation techniques applied to the acquired dynamic measurements help resolve the other [11]. Noninvasive mea-surement techniques that acquire dynamic data in natural blinking conditions bring several other parameters such as the tear film build-up time, tear film thinning rate, and the predicted tear film break-up time. For those, methods of data fitting involv-ing iterative orthogonal least square proce-dures and information criteria had to be developed [12].
Measurement and modeling of tear film surface kinetics is important for studying the loss of retinal image quality associated with poor term film, but their main purposes are to help diagnosing dry eye syndrome, and study the efficacy of tear film substitutes and biocompatibility of contact lens material.
MICROFLUCTUATIONS IN STEADY-STATE ACCOMMODATION The eye displays small movements even in a steady viewing condition. This particular phenomenon is not limited to the eye globe but also occurs in individual compo-nents of the eye such as the pupil, crystal-line lens, and retina (choroid). This results in the optical characteristics of the eye to exhibit some temporal variations, the mag-nitude of which is not large. Such varia-tions are referred to as microfluctuations in steady-state accommodation [3]. The first works on the character of measured dynamics of the eye’s monochromatic aberrations revealed their nonstationary character and possible correlation with the signals of the cardiopulmonary system [3]. Utilizing a set of metrics derived from a time-frequency coherence estimator, it was later confirmed that there exist periods of time during which the coherence between
aberration dynamics and signals of cardio-pulmonary systems is very high and peri-ods when quite opposite occurs [9]. This finding suggests that the microfluctuations in a steady-state accommodation are the result of not only the dynamics associated with crystalline lens—an idea well estab-lished earlier—but also to those related to choroidal pulsation. It has been hypothe-sized that the observed high coherence lev-els may be associated with the crystalline lens micromovements being in phase with those of choroid.
There were also attempts to model the individual aberration components, now standardly expressed as time-varying coef-ficients of a Zernike polynomial expansion to the dynamically measured wavefront aberrations [3], [13], [14]. Those models ranged from simple parametric autore-gressive (AR) and AR moving-average (ARMA) processes, to amplitude modula-tion-frequency modulation (AM-FM) sig-nals, to more intricate approaches involving wavelet-based multifractal anal-ysis and chaos theory. For example, Hampson and Mallen [13] have found that the aberration dynamics cannot be char-acterized by a single fractal dimension. They showed that the most frequently found Hölder exponent for the root mean square (RMS) wavefront error averaged across subjects was 0.31, indicating that the aberration dynamics are antipersistant ( / ) .H 1 21 In their latest developments [14], they showed that aberrations
dynamics can be well modeled as a chaotic process with the attractor embedding dimension equal to three and the average Lyapunov exponent of the RMS wavefronterror of 0.44 μm/s. These recent develop-ments are very interesting and indicate how intricate the problem of adequate modeling of eye’s visual optics is.
A VIBRATING EYE?The more we study the dynamics of the human eye’s optical system, the more questions arise. Taking into account all individual elements of the eye and the range of unsynchronized physiological signals of mechanical and electrical nature that affect their performance, how is it possible to achieve good retinal image quality? Are the elements of stochastic res-onance truly involved in the eye’s opera-tion? Is the only reason that we see so well because of the properly selected resolution of our photoreceptors? How then does the eye cope with both transversal and longi-tudinal changes in the retinal image?
One previously unconsidered aspect of human visual system can be related to an old study of Lohmann and Paris [15] who have shown that, under certain condi-tions, the transfer function of a defocused lens can be considerably improved by introducing to a system a certain amount of longitudinal vibrations. Contrarily, such improvement could not be demonstrated in the case of transverse vibrations. A sim-ple simulation demonstrates that using a
∑t
A
A′
O LongitudinalVibrations
[FIG2] Longitudinal vibrations at a point away from focus improve the overall image quality.
Previous Page | Contents | Zoom in | Zoom out | Front Cover | Search Issue | Next Page qqM
Mq
qM
MqM
THE WORLD’S NEWSSTAND®
Previous Page | Contents | Zoom in | Zoom out | Front Cover | Search Issue | Next Page qqM
Mq
qM
MqM
THE WORLD’S NEWSSTAND®

[life SCIENCES]continued
IEEE SIGNAL PROCESSING MAGAZINE [158] JULY 2014
low level of defocus, say about ±0.25 of a diopter and allowing for longitudinal vibrations of a similar order can result in a threefold increase in the eye’s visual Strehl ratio—a popular metric of retinal image quality [16]. Such levels of defocus are typically encountered in emmetropic sub-jects (i.e., those exhibiting good vision without any corrective implements). Figure 2 depicts the concept of improving integrated image quality with longitudinal vibrations, provided that the retinal image plane is not at the focal point. Whether the temporal summation of longitudinal vibra-tions truly occurs in the human eye is yet to be proved. For this, wavefront sensors equipped with high speed (exceeding the Nyquist frequency of 120 Hz) and sensitive enough cameras need to be employed.
The optical system of the human eye presents challenges for future generations of signal processing professionals. Current approaches to study its dynamics are often reduced to an application of the off-the-shelf signal processing tools to a limited aspect of the system. However, a more comprehensive approach that integrates all available information in some form of data fusion is needed to fully understand all its intricacies. Gaining such knowledge
would benefit not only the visual optic community but also those interested in computer and machine vision.
AUTHORD. Robert Iskander ([email protected]) is a professor of biomedical signal processing at the Institute of Biomedical Engineering and Instrumentation, Wroclaw University of Technology, Poland.
REFERENCES[1] P. Artal, A. Benito, and J. Tabernero, “The human eye is an example of robust optical design,” J. Vis.,vol. 10, no. 6, pt. 1, pp. 1–7, 2006.
[2] D. H. Szczesna, D. Alonso-Caneiro, D. R. Iskander,S. A. Read, and M. J. Collins, “Lateral shearing in-terferometry, dynamic wavefront sensing, and high-speed videokeratoscopy for non-invasive assessment of tear film surface characteristics: A comparative study,” J. Biomed. Opt., vol. 15, no. 3, p. 037005,2010.
[3] D. R. Iskander, M. J. Collins, M. R. Morelande,and M. Zhu, “Analyzing the dynamic wavefront aber-rations in human eye,” IEEE Trans. Biomed. Eng., vol. 51, no. 11, pp. 1969–1980, 2004.
[4] S. A. Read, M. J. Collins, and D. R. Iskander, “Di-urnal variation of axial length, intraocular pressure and anterior eye biometrics,” Invest. Ophthalmol. Vis. Sci., vol. 49, no. 7, pp. 2911–2918, 2008.
[5] M. H. Hennig, N. J. Kerscher, K. Funke, and F.Wörgötter, “Stochastic resonance in visual cor-tical neurons: Does the eye-tremor actually im-prove visual acuity?” Neurocomputing, vol. 44–46,pp. 115–120, 2002.
[6] M.-O. Hongler, Y. L. de Meneses, A. Beyeler, and J. Jacot, “The resonant retina: Exploiting vibration noise to optimally detect edges in an image,” IEEE
Trans. Pattern Anal. Mach. Intel., vol. 25, no. 9,pp. 1051–1062, 2003.
[7] N. L. Himebaugh, J. Nam, A. Bradley, H. Liu,L. N. Thibos, and C. G. Begley, “Scale and spatial distribution of aberrations associated with tear break-up,” Optom. Vis. Sci., vol. 89, no. 11, pp. 1590–1600,2012.
[8] E. M. Hoffmann, F. H. Grus, and N. Pfeiffer, “In-traocular pressure and ocular pulse amplitude using dynamic contour tonometry and contact lens tonom-etry,” BMC Ophthalmol., vol. 4, no. 4, pp. 1–7, 2004.
[9] M. Muma, D. R. Iskander, and M. J. Collins, “The role of cardiopulmonary signals in the dynamics of eye’s wavefront aberrations,” IEEE Trans. Biomed. Eng., vol. 57, no. 2, pp. 373–383, 2010.
[10] L. F. Schmetterer, F. Lexer, C. J. Unfried, H.Sattmann, and A. F. Fercher, “Topical measure-ment of fundus pulsations,” Opt. Eng., vol. 34, no. 3,pp. 711–716, 1995.
[11] D. H. Szczesna and D. R. Iskander, “Robust es-timation of tear film surface quality in lateral shear-ing interferometry,” J. Biomed. Opt., vol. 14, no. 6,p. 064039, 2009.
[12] D. H. Szczesna and D. R. Iskander, “Lateral shearing interferometry: A technique for complete temporal analysis of tear film surface kinetics,” Op-tom. Vis. Sci., vol. 87, no. 7, pp. 513517, 2010.
[13] K. M. Hampson and E. A. H. Mallen, “Mul-tifractal nature of ocular aberration dynamics of the human eye,” Biomed. Opt. Exp., vol. 2, no. 3,pp. 464–477, 2011.
[14] K. M. Hampson and E. A. H. Mallen, “Chaos in ocular aberration dynamics of the human eye,” Biomed. Opt. Exp., vol. 3, no. 5, pp. 863–877, 2012.
[15] A. W. Lohmann and D. P. Paris, “Influence of longitudinal vibrations on image quality,” Appl. Opt.,vol. 4, no. 4, pp. 393–397, 1965.
[16] D. R. Iskander, “Computational aspects of the visual Strehl ratio,” Optom. Vis. Sci., vol. 83, no. 1,pp. 57–59, 2006.
[SP]
[from the GUEST EDITORS] (continued from page 15)
Zhu and Bamler provide a further insight into SAR tomography, and their article demonstrates the ability of com-pressive sensing to achieve vertical super-resolution with data acquired by SAR systems operating in very high horizontal resolutions modes.
Still in the context of SAR interferome-try, the article by Baselice et al. investigates methods based on the use of contextual information and addresses statistical meth-ods to solve the multichannel interfero-metric SAR phase unwrapping problem for digital elevation model generation.
The article by Deledalle et al. covers the methods of filtering multichannel SAR data, represented by interferometric, polarimet-ric, or interferometric/polarimetric, to pro-vide preservation of texture and structures.
SAR polarimetry, the topic of the arti-cle by Chen et al., provides insights in
polarimetric target decomposition tech-niques for the interpretation of scattering mechanisms, including extension and fusion with interferometry.
Solimene et al.’s contribution deals with a unified treatment from the mathematical viewpoint of SAR imaging algorithms and discusses their generalizations to handle unconventional scenarios, such as through-wall imaging, imaging of urban canyons, and underground tunnel detection.
A further contribution to the imaging of buried targets is provided by the article by Kedzierawski et al., which addresses the topic of airborne ground penetrating radar (GPR), a combination of SAR and GPR, based on the use of time-reversal data pro-cessing algorithms.
Finally, Leigsnering et al. deal with the problem of scatterings and multipath when using SAR for imaging of building
interiors. The article discusses both mul-tipath mitigation and exploitation tech-niques and shows how to perform the latter with compressed observations.
We would like to express our deep gratitude to the many individuals who made this special issue of SPM possible. We thank all authors who submitted pro-posals and all reviewers whose recommen-dations significantly helped in improving the selected articles. We are also grateful to Abdelhak Zoubir, SPM’s editor-in-chief, and we are indebted to Fulvio Gini, special issues area editor, for his constant support and guidance throughout the solicitation and reviewing process, as well as to Rebecca Wollman for her valuable admin-istrative assistance.
[SP]
Previous Page | Contents | Zoom in | Zoom out | Front Cover | Search Issue | Next Page qqM
Mq
qM
MqM
THE WORLD’S NEWSSTAND®
Previous Page | Contents | Zoom in | Zoom out | Front Cover | Search Issue | Next Page qqM
Mq
qM
MqM
THE WORLD’S NEWSSTAND®
____________
____

IEEE SIGNAL PROCESSING MAGAZINE [159] JULY 2014
[dates AHEAD]
Please send calendar submissions to: Dates Ahead, c/o Jessica Barragué IEEE Signal Processing Magazine 445 Hoes Lane Piscataway, NJ 08855 USA e-mail: [email protected](Colored conference title indicates SP-sponsored conference.)
2014
[JUNE]IEEE Sensor Array and Multichannel Signal Processing Workshop (SAM)22–25 June, A Caruña, Spain.URL: http://www.gtec.udc.es/sam2014/
15th IEEE International Workshop on Signal Processing Advances in Wireless Communications (SPAWC)22–25 June, Toronto, Canada.General Cochairs: Tim Davidson and Wei YuURL: http://www.spawc2014.info/joomla30/
IEEE Statistical Signal Processing Workshop (SSP)29 June–2 July, Gold Coast, Australia.General Cochairs: Rob Evans and Abd-Krim SeghouaneURL: http://www.ee.unimelb.edu.au/SSP2014/index.html
[JULY]2nd IEEE China Summit and International Conference on Signal and Information Processing (ChinaSIP)9–13 July, Xi’an, China. General Chairs: Mingyi He and Kung YaoURL: http://www.chinasip2014.org/CfP.htm
IEEE International Conference on Multimedia and Expo (ICME)14–18 July, Chengdu, China.General Cochairs: Touradj Ebrahimi, Shipeng Li, Houjun Wang, and Jie YangURL: http://www.icme2014.org/
[AUGUST]2014 International Conference on Digital Signal Processing (DSP)20–23 August, Hong Kong.General Chairs:Yong Ching Lim, Daniel P.K. Lun, A.N. Skodras, and Danilo MandicURL:http://www.dsp2014.org/
11th IEEE International Conference on Advanced Video and Signal-Based Surveillance (AVSS)26–29 August, Seoul, South Korea.General Chair: Hanseok Ko General Cochair: Jin Young Choi URL: http://www.avss2014.org/
[SEPTEMBER]22nd European Signal Processing Conference (EUSIPCO)1–5 September, Lisbon, Portugal. Honorary Chair: Carlos SalemaGeneral Chair: Leonel Sousa URL: http://www.eusipco2014.org/
2014 Sensor Signal Processing for Defence (SSPD)8–9 September, Edinburgh, United Kingdom. General Chairs: Mike Davies, Paul Thomas, and Jonathon ChambersURL: http://www.see.ed.ac.uk/drupal/udrc/sspd/
24th IEEE International Workshop on Machine Learning for Signal Processing (MLSP)21–24 September, Reims, France.General Chair: Mamadou Mboup URL: http://mlsp2014.conwiz.dk/home.htm
16th IEEE International Workshop on Multimedia Signal Processing (MMSP)22–24 September, Jakarta, Indonesia. General Chairs: Susanto Rahardja and Zhengyou Zhang URL: http://mmsp2014.ilearning.me/call-for-paper/
[OCTOBER]IEEE Workshop on Signal Processing Systems (SIPS)20–23 October, Belfast, Ireland.
[DECEMBER]IEEE Global Conference on Signal and Information Processing (GlobalSIP)3–5 December, Atlanta, Georgia.General Chairs: Geoffrey Li and Fred JuangURL: http://renyi.ece.iastate.edu/globalsip2014/
IEEE International Workshop on Information Forensics and Security (WIFS)3–5 December, Atlanta, Georgia. General Chairs: Yan (Lindsay) Sun and Vicky H. ZhaoURL: http://ieeewifs.org/
IEEE Spoken Language Technology Workshop (SLT)6–9 December, South Lake Tahoe, California.General Chairs: Murat Akbacak and John Hansen
2014 Asia-Pacific Signal and Information Processing Association Annual Summit and Conference (APSIPA)9–12 December, Chiang Mai, Thailand. Honorary Cochairs: Sadaoki Furui, K.J. Ray Liu, and Prayoot AkkaraekthalinGeneral Cochairs: Kosin Chamnongthai, C.-C. Jay Kuo, and Hitoshi KiyaURL: http://www.apsipa2014.org/home/
2015[APRIL]IEEE International Conference on Acoustics, Speech, andSignal Processing (ICASSP)19–24 April, Brisbane, Australia.General Cochairs: Vaughan Clarkson and Jonathan MantonURL: http://icassp2015.org/
[SEPTEMBER]IEEE International Conference on Image Processing (ICIP)28 September–1 October, Quebec City, Quebec, Canada.
Digital Object Identifier 10.1109/MSP.2014.2311180
Date of publication: 13 June 2014
Previous Page | Contents | Zoom in | Zoom out | Front Cover | Search Issue | Next Page qqM
Mq
qM
MqM
THE WORLD’S NEWSSTAND®
Previous Page | Contents | Zoom in | Zoom out | Front Cover | Search Issue | Next Page qqM
Mq
qM
MqM
THE WORLD’S NEWSSTAND®
___________
______
____
___

[advertisers INDEX]
IEEE SIGNAL PROCESSING MAGAZINE [160] JULY 2014
[advertising SALES OFFICES]James A. VickSr. Director, AdvertisingPhone: +1 212 419 7767; Fax: +1 212 419 7589 [email protected]
Marion DelaneyAdvertising Sales DirectorPhone: +1 415 863 4717; Fax: +1 415 863 [email protected]
Susan E. SchneidermanBusiness Development ManagerPhone: +1 732 562 3946; Fax: +1 732 981 [email protected]
Product AdvertisingMIDATLANTICLisa Rinaldo Phone: +1 732 772 0160; Fax: +1 732 772 [email protected], NJ, PA, DE, MD, DC, KY, WV
NEW ENGLAND/SOUTH CENTRAL/ EASTERN CANADA Jody EstabrookPhone: +1 774 283 4528; Fax: +1 774 283 [email protected], VT, NH, MA, RI, CT, AR, LA, OK, TXCanada: Quebec, Nova Scotia, Newfoundland, Prince Edward Island, New Brunswick
SOUTHEAST Thomas FlynnPhone: +1 770 645 2944; Fax: +1 770 993 [email protected], NC, SC, GA, FL, AL, MS, TN
MIDWEST/CENTRAL CANADADave JonesPhone: +1 708 442 5633; Fax: +1 708 442 [email protected] IL, IA, KS, MN, MO, NE, ND, SD, WI, OHCanada: Manitoba, Saskatchewan, Alberta
MIDWEST/ ONTARIO, CANADAWill HamiltonPhone: +1 269 381 2156; Fax: +1 269 381 [email protected], MI. Canada: Ontario
WEST COAST/MOUNTAIN STATES/WESTERN CANADA Marshall RubinPhone: +1 818 888 2407; Fax: +1 818 888 4907 [email protected], CO, HI, NM, NV, UT, AK, ID, MT, WY, OR, WA, CA. Canada: British Columbia
EUROPE/AFRICA/MIDDLE EAST ASIA/FAR EAST/PACIFIC RIMLouise SmithPhone: +44 1875 825 700; Fax: +44 1875 825 [email protected], Africa, Middle East Asia, Far East, Pacific Rim, Australia, New Zealand
Recruitment AdvertisingMIDATLANTICLisa RinaldoPhone: +1 732 772 0160; Fax: +1 732 772 [email protected], NJ, CT, PA, DE, MD, DC, KY, WV
NEW ENGLAND/EASTERN CANADALiza ReichPhone: +1 212 419 7578; Fax: +1 212 419 [email protected], VT, NH, MA, RI. Canada: Quebec, Nova Scotia, Prince Edward Island, Newfoundland, New Brunswick
SOUTHEASTCathy FlynnPhone: +1 770 645 2944; Fax: +1 770 993 [email protected], NC, SC, GA, FL, AL, MS, TN
MIDWEST/SOUTH CENTRAL/CENTRAL CANADADarcy GiovingoPhone: +224 616 3034; Fax: +1 847 729 [email protected]; AR, IL, IN, IA, KS, LA, MI, MN, MO, NE, ND, SD, OH, OK, TX, WI. Canada: Ontario, Manitoba, Saskatchewan, Alberta
WEST COAST/SOUTHWEST/MOUNTAIN STATES/ASIATim MattesonPhone: +1 310 836 4064; Fax: +1 310 836 [email protected], CO, HI, NV, NM, UT, CA, AK, ID, MT, WY, OR, WA. Canada: British Columbia
EUROPE/AFRICA/MIDDLE EASTLouise SmithPhone: +44 1875 825 700; Fax: +44 1875 825 [email protected], Africa, Middle East
Digital Object Identifier 10.1109/MSP.2013.2290963
The Advertisers Index contained in this issue is compiled as a service to our readers and advertisers: the publisher is not liable for errors or omissions although every effort is made to ensure its accuracy. Be sure to let our adver-tisers know you found them through IEEE Signal Processing Magazine.
ADVERTISER PAGE URL PHONE
IEEE Marketing Department 7 www.ieee.org/digitalsubscriptions
IEEE MDL/Marketing 3 www.ieee.org/go/trymdl
Mathworks CVR 4 www.mathworks.com/accelerate +1 508 647 7040
Mini-Circuits CVR 2, 5, CVR 3 www.minicircuits.com +1 718 934 4500
Previous Page | Contents | Zoom in | Zoom out | Front Cover | Search Issue | Next Page qqM
Mq
qM
MqM
THE WORLD’S NEWSSTAND®
Previous Page | Contents | Zoom in | Zoom out | Front Cover | Search Issue | Next Page qqM
Mq
qM
MqM
THE WORLD’S NEWSSTAND®
___________________________
____________
____________
_____________
_____________
_____________
_____________
_____________
_____________
____________
____________
_____________
_________________________________

photo courtesy of the U.S. Military & NASA
CERAMIC MMIC AMPLIFIERS®RUGGED ULTRA REL
MIL Qualifications (see website for complete list and details )
Gross and Fine Leak HTOL (1700 hours+ @ +105°C)Mechanical Shock Thermal ShockVibration Steam AgingAcceleration Solder Heat ResistancePIND Autoclave (and more)
Robust performance across wide bandwidths makes them ideal for instrumentation, or anywhere long-term reliability adds bottom-line value. Go to minicircuits.com for all the details today, and get them in your hands as soon as tomorrow!
Electrical Specifications (-55 to +105°C)
Model Freq. Gain POUT IP3 NF DC Price $ ea.(GHz) (dB) (dBm) (dBm) (dB) (V) (qty 20)
CMA-62+ 0.01-6 15 19 33 5 5 4.95CMA-63+ 0.01-6 20 18 32 4 5 4.95CMA-545+ 0.05-6 15 20 37 1 3 4.95CMA-5043+ 0.05-4 18 20 33 0.8 5 4.95CMA-54SG1+ 0.4-2.2 32 23 36 0.9 5 5.45CMA-162LN+ 0.7-1.6 23 19 30 0.5 4 4.95CMA-252LN+ 1.5-2.5 17 18 30 1 4 4.95
High IP3 up to 38 dBm Low DC current 65 mA ea. (qty 20)$495
10 MHz to 6GHz
RoHS compliant
When failure is not an option. Our new CMA MMIC amplifiers deliver outstanding performance in a rugged, nitrogen-fi l led, hermetic LTCC design, just 0.045” high. These models are so tough, they’ve qualif ied for use under MIL environmental conditions:
Low NF 0.5 dB
NEW
NEW
NEW
NEW
503 Rev E
Mini-Circuits®
www.minicircuits.com P.O. Box 35 166, Brooklyn, NY 11235-0003 (718) 934-4500 [email protected]
3 x 3 x 1.14 mm
Previous Page | Contents | Zoom in | Zoom out | Front Cover | Search Issue | Next Page qqM
Mq
qM
MqM
THE WORLD’S NEWSSTAND®
Previous Page | Contents | Zoom in | Zoom out | Front Cover | Search Issue | Next Page qqM
Mq
qM
MqM
THE WORLD’S NEWSSTAND®
_______________

GENERATEHDL CODEAUTOMATICALLY
MATLAB
Simulink
from
Find it at mathworks.com/acceleratedatasheetvideo exampletrial request
®
HDL CODER™ automaticallyconverts Simulink models andMATLAB algorithms directly into Verilog and VHDL code for FPGAs or ASIC designs. The code is bit-true, cycle-accurate and synthesizable.
©20
12 T
he M
athW
orks
, Inc
.
®
®
and
Previous Page | Contents | Zoom in | Zoom out | Front Cover | Search Issue | Next Page qqM
Mq
qM
MqM
THE WORLD’S NEWSSTAND®
Previous Page | Contents | Zoom in | Zoom out | Front Cover | Search Issue | Next Page qqM
Mq
qM
MqM
THE WORLD’S NEWSSTAND®

JULY 2014
CONTENT GAZETTEIEEE SIGNAL PROCESSING SOCIETY
[ISSN 2167-5023]
Previous Page | Contents | Zoom in | Zoom out | Front Cover | Search Issue | Next Page qqM
Mq
qM
MqM
THE WORLD’S NEWSSTAND®
Previous Page | Contents | Zoom in | Zoom out | Front Cover | Search Issue | Next Page qqM
Mq
qM
MqM
THE WORLD’S NEWSSTAND®

Previous Page | Contents | Zoom in | Zoom out | Front Cover | Search Issue | Next Page qqM
Mq
qM
MqM
THE WORLD’S NEWSSTAND®
Previous Page | Contents | Zoom in | Zoom out | Front Cover | Search Issue | Next Page qqM
Mq
qM
MqM
THE WORLD’S NEWSSTAND®
____________
_____________

www.signalprocessingsociety.org [1] JULY 2014
MAY 15, 2014 VOLUME 62 NUMBER 10 ITPRED (ISSN 1053-587X)
REGULAR PAPERS
A Flexible NISC-Based LDPC Decoder http://dx.doi.org/10.1109/TSP.2014.2311964 . . . . . . . . . . .. . . . . . . . . . . . B. Le Gal, C. Jego, and C. Leroux 2469
Accuracy vs. Resolution in Radio Tomography http://dx.doi.org/10.1109/TSP.2014.2311969 . . . . . . . . . R. K. Martin, A. Folkerts, and T. Heinl 2480
DFTs http://dx.doi.org/10.1109/TSP.2014.2310434 . . . . . . . . . . . . . .
. . . . . . . . . . . . . . . . . . . . . . . . . . . . . . . . . . . . . . . . . . . . . . . . . . . . . . . . . . . . . . . . . . . . . . . . . . . . . . . . . . . . . . . . . . . . . . . . . . . . . . . W. Zheng, K. Li, and K. Li 2492
An Hybrid Cramér-Rao Bound in Closed Form for Direction-of-Arrival Estimation by an “Acoustic Vector Sensor” With
Gain-Phase Uncertainties http://dx.doi.org/10.1109/TSP.2014.2310431 . . . . . . . . . . . . . . . . . . . . . . . . . . . . . . . . . . . P. K. Tam, K. T. Wong, and Y. Song 2504
Optimal Design of Cosine Modulated Nonuniform Linear Phase FIR Filter Bank via Both Stretching and Shifting
Frequency Response of Single Prototype Filter http://dx.doi.org/10.1109/TSP.2014.2312326 . . . . . . . . . . . . . . . . . . . . . . . . . . . . . . . . . . . . . . . . . . . . . . . . . . .
. . . . . . . . . . . . . . . . . . . . . . . . . . . . . . . . . . . . . . . . . . . . . . . . . . . . . . . . . B. W.-K. Ling, C. Y.-F. Ho, K.-L. Teo, W.-C. Siu, J. Cao, and Q. Dai 2517
Distributed Localization of Coverage Holes Using Topological Persistence http://dx.doi.org/10.1109/TSP.2014.2314063 . . . . . . . . . . . . . . . . . . . . . .
. . . . . . . . . . . . . . . . . . . . . . . . . . . . . . . . . . . . . . . . . . . . . . . . . . . . . . . . . . . . . . . . . . . . . . . . . . . . . . . . . . . . . . . . . . . . . . . . . . . . . H. Chintakunta and H. Krim 2531
IEEE TRANSACTIONS ON SIGNAL PROCESSING (ISSN 1053-587X) is published semimonthly by the Institute of Electrical and Electronics Engineers, Inc. Responsibility for the contents
rests upon the authors and not upon the IEEE, the Society/Council, or its members. 3 Park Avenue, 17th Floor, New York, NY 10016-5997. IEEE Oper-
445 Hoes Lane, Piscataway, NJ 08854-4141. +1 732 981 0060.
only), nonmembers $569.00 per copy. (Note: Postage and handling charge not included.) Member and nonmember subscription prices available upon request. Copyright and Reprint
Abstracting is permitted with credit to the source. Libraries are permitted to photocopy for private use of patrons, provided the per-copy fee of $31.00 is paid through the
Copyright Clearance Center, 222 Rosewood Drive, Danvers, MA 01923. For all other copying, reprint, or republication permission, write to Copyrights and Permissions Department, IEEE
Publications Administration, 445 Hoes Lane, Piscataway, NJ 08854-4141. Copyright © 2014 by the Institute of Electrical and Electronics Engineers, Inc. All rights reserved. Periodicals
Send address changes to IEEE TRANSACTIONS ON SIGNAL PROCESSING, IEEE, 445 Hoes Lane, Piscataway,
NJ 08854-4141. GST Registration No. 125634188. CPC Sales Agreement #40013087. Return undeliverable Canada addresses to: Pitney Bowes IMEX, P.O. Box 4332, Stanton Rd.,
Toronto, ON M5W 3J4, Canada. IEEE prohibits discrimination, harassment and bullying. For more information visit http://www.ieee.org/nondiscrimination. Printed in U.S.A.
Previous Page | Contents | Zoom in | Zoom out | Front Cover | Search Issue | Next Page qqM
Mq
qM
MqM
THE WORLD’S NEWSSTAND®
Previous Page | Contents | Zoom in | Zoom out | Front Cover | Search Issue | Next Page qqM
Mq
qM
MqM
THE WORLD’S NEWSSTAND®
_________________________

www.signalprocessingsociety.org [2] JULY 2014
Nested Vector-Sensor Array Processing via Tensor Modeling http://dx.doi.org/10.1109/TSP.2014.2314437 . . . . . . . . . . K. Han and A. Nehorai 2542
Analytical Construction and Fast Computation of Frequency Warping Operators and Dual Frame
http://dx.doi.org/10.1109/TSP.2014.2309552 . . . . . . . . . . . . . . . . . . . . . . . . . . . . . . . . . . . . . . . . . . . . . . . . . . . . . . . . . . . . . . . . . . . . . . . . S. Caporale and N. Speciale 2554
http://dx.doi.org/10.1109/TSP.2014.2311965 . .
. . . . . . . . . . . . . . . . . . . . . . . . . . . . . . . . . . . . . . . . . . . . . . . . . . . . . . . . . . . . . . . . . . . . . . . . . . . . . . . . . . . . . . . . . . . . . . . . . . . . . . . . . . . . . M. Hotz and C. Vogel 2566
http://dx.doi.org/10.1109/TSP.2014.2314064 . . . . . . . . . . . . . . . . . . . . . . . . . . . . . . . . . . . . . . . . . . . . . . . . . . . . . . . . . . . . . . H.-J. Shao, X.-P. Zhang, and Z. Wang 2580
A Phase-Reconstruction Technique for Low-Power Centimeter-Accurate Mobile Positioning http://dx.doi.org/10.1109/TSP.2014.2311967 . .
. . . . . . . . . . . . . . . . . . . . . . . . . . . . . . . . . . . . . . . . . . . . . . . . . . . . . . . . . . . . . K. M. Pesyna, Z. M. Kassas, R. W. Heath, and T. E. Humphreys 2595
Analytical Performance Assessment of Multi-Dimensional Matrix- and Tensor-Based ESPRIT-Type Algorithms
http://dx.doi.org/10.1109/TSP.2014.2313530 . . . . . . . . . . . . . . . . . . . . . . . . . . . . . . . . . . . . . . . . . . . . . . . . . . . . . . . . . . F. Roemer, M. Haardt, and G. Del Galdo 2611
Sequential Bayesian Estimation With Censored Data for Multi-Sensor Systems http://dx.doi.org/10.1109/TSP.2014.2315163 . . . . . . . . . . . . . . . . .
. . . . . . . . . . . . . . . . . . . . . . . . . . . . . . . . . . . . . . . . . . . . . . . . . . . . . . . . . . . . . . . . . . . . . . . . . . . . . . . . . . . . . . . . . . . . Y. Zheng, R. Niu, and P. K. Varshney 2626
A New Technique for INS/GNSS Attitude and Parameter Estimation Using Online Optimization
http://dx.doi.org/10.1109/TSP.2014.2312317 . . . . . . . . . . . . . . . . . . . . . . . . . . . . . . . . . . . . . . . . . . . . . . . . . . . . . . . . . . . . . . . . . . . . . . . . . . Y. Wu, J. Wang, and D. Hu 2642
Resource Allocation in MIMO Radar With Multiple Targets for Non-Coherent Localization http://dx.doi.org/10.1109/TSP.2014.2315169 . .
. . . . . . . . . . . . . . . . . . . . . . . . . . . . . . . . . . . . . . . . . . . . . . . . . . . . . . . . . . . . . . . . . . . . . . . . N. Garcia, A. M. Haimovich, M. Coulon, and M. Lops 2656
Electrocardiogram Signal Modeling With Adaptive Parameter Estimation Using Sequential Bayesian Methods
http://dx.doi.org/10.1109/TSP.2014.2312316 . . . . . . . . . . . . . . . . . . . . . . . . . . . . . . . . . . . . . . . . . . . . . S. Edla, N. Kovvali, and A. Papandreou-Suppappola 2667
Distributed Inference With M-Ary Quantized Data in the Presence of Byzantine Attacks http://dx.doi.org/10.1109/TSP.2014.2314072 . . . . . .
. . . . . . . . . . . . . . . . . . . . . . . . . . . . . . . . . . . . . . . . . . . . . . . . . . . . . . . . . . . . . . . . . . . . . . . . . . . . . . . V. S. S. Nadendla, Y. S. Han, and P. K. Varshney 2681
A Low Complexity-High Throughput QC-LDPC Encoder http://dx.doi.org/10.1109/TSP.2014.2314435 . . . . . . . . . . A. Mahdi and V. Paliouras 2696
Explicit Causal Recursive Estimators for Continuous-Time Bivariate Markov Chains http://dx.doi.org/10.1109/TSP.2014.2314434 . . . . . . . . . .
. . . . . . . . . . . . . . . . . . . . . . . . . . . . . . . . . . . . . . . . . . . . . . . . . . . . . . . . . . . . . . . . . . . . . . . . . . . . . . . . . . . . . . . . . . . . . . . . . . . . . . . B. L. Mark and Y. Ephraim 2709
MMSE-SLNR Precoding for Multi-Antenna Cognitive Radio http://dx.doi.org/10.1109/TSP.2014.2314442 . . . . . . . . . . Y. Richter and I. Bergel 2719
Statistical Framework for Optimization in the Multi-User MIMO Uplink With ZF-DFE http://dx.doi.org/10.1109/TSP.2014.2314067 . . . . . . .
. . . . . . . . . . . . . . . . . . . . . . . . . . . . . . . . . . . . . . . . . . . . . . . . . . . . . . . . . . . . . . . . . . . . . . . . . . . . . . . . . . . S. Järmyr, B. Ottersten, and E. A. Jorswieck 2730
Previous Page | Contents | Zoom in | Zoom out | Front Cover | Search Issue | Next Page qqM
Mq
qM
MqM
THE WORLD’S NEWSSTAND®
Previous Page | Contents | Zoom in | Zoom out | Front Cover | Search Issue | Next Page qqM
Mq
qM
MqM
THE WORLD’S NEWSSTAND®

www.signalprocessingsociety.org [3] JULY 2014
MAY 15, 2014 VOLUME 62 NUMBER 10 ITPRED (ISSN 1053-587X)
REGULAR PAPERS
Biomedical Signal Processing
Electrocardiogram Signal Modeling With Adaptive Parameter Estimation Using Sequential Bayesian Methods
http://dx.doi.org/10.1109/TSP.2014.2312316 . . . . . . . . . . . . . . . . . . . . . . . . . . . . . . . . . . . . . . . . . . . . . S. Edla, N. Kovvali, and A. Papandreou-Suppappola 2667
Design and Implementation of Signal Processing Systems
DFTs http://dx.doi.org/10.1109/TSP.2014.2310434 . . . . . . . . . . . . . .
. . . . . . . . . . . . . . . . . . . . . . . . . . . . . . . . . . . . . . . . . . . . . . . . . . . . . . . . . . . . . . . . . . . . . . . . . . . . . . . . . . . . . . . . . . . . . . . . . . . . . . . W. Zheng, K. Li, and K. Li 2492
A Low Complexity-High Throughput QC-LDPC Encoder http://dx.doi.org/10.1109/TSP.2014.2314435 . . . . . . . . . . A. Mahdi and V. Paliouras 2696
Digital and Multirate Signal Processing
Optimal Design of Cosine Modulated Nonuniform Linear Phase FIR Filter Bank via Both Stretching and Shifting
Frequency Response of Single Prototype Filter http://dx.doi.org/10.1109/TSP.2014.2312326 . . . . . . . . . . . . . . . . . . . . . . . . . . . . . . . . . . . . . . . . . . . . . . . . . . .
. . . . . . . . . . . . . . . . . . . . . . . . . . . . . . . . . . . . . . . . . . . . . . . . . . . . . . . . . B. W.-K. Ling, C. Y.-F. Ho, K.-L. Teo, W.-C. Siu, J. Cao, and Q. Dai 2517
Analytical Construction and Fast Computation of Frequency Warping Operators and Dual Frame
http://dx.doi.org/10.1109/TSP.2014.2309552 . . . . . . . . . . . . . . . . . . . . . . . . . . . . . . . . . . . . . . . . . . . . . . . . . . . . . . . . . . . . . . . . . . . . . . . . S. Caporale and N. Speciale 2554
IEEE TRANSACTIONS ON SIGNAL PROCESSING (ISSN 1053-587X) is published semimonthly by the Institute of Electrical and Electronics Engineers, Inc. Responsibility for the contents
rests upon the authors and not upon the IEEE, the Society/Council, or its members. 3 Park Avenue, 17th Floor, New York, NY 10016-5997. IEEE Oper-
445 Hoes Lane, Piscataway, NJ 08854-4141. +1 732 981 0060.
only), nonmembers $569.00 per copy. (Note: Postage and handling charge not included.) Member and nonmember subscription prices available upon request. Copyright and Reprint
Abstracting is permitted with credit to the source. Libraries are permitted to photocopy for private use of patrons, provided the per-copy fee of $31.00 is paid through the
Copyright Clearance Center, 222 Rosewood Drive, Danvers, MA 01923. For all other copying, reprint, or republication permission, write to Copyrights and Permissions Department, IEEE
Publications Administration, 445 Hoes Lane, Piscataway, NJ 08854-4141. Copyright © 2014 by the Institute of Electrical and Electronics Engineers, Inc. All rights reserved. Periodicals
Send address changes to IEEE TRANSACTIONS ON SIGNAL PROCESSING, IEEE, 445 Hoes Lane, Piscataway,
NJ 08854-4141. GST Registration No. 125634188. CPC Sales Agreement #40013087. Return undeliverable Canada addresses to: Pitney Bowes IMEX, P.O. Box 4332, Stanton Rd.,
Toronto, ON M5W 3J4, Canada. IEEE prohibits discrimination, harassment and bullying. For more information visit http://www.ieee.org/nondiscrimination. Printed in U.S.A.
Previous Page | Contents | Zoom in | Zoom out | Front Cover | Search Issue | Next Page qqM
Mq
qM
MqM
THE WORLD’S NEWSSTAND®
Previous Page | Contents | Zoom in | Zoom out | Front Cover | Search Issue | Next Page qqM
Mq
qM
MqM
THE WORLD’S NEWSSTAND®
_________________________

www.signalprocessingsociety.org [4] JULY 2014
Implementation of Signal Processing Systems
A Flexible NISC-Based LDPC Decoder http://dx.doi.org/10.1109/TSP.2014.2311964 . . . . . . . . . . .. . . . . . . . . . . . B. Le Gal, C. Jego, and C. Leroux 2469
Signal Processing for Networks
Distributed Localization of Coverage Holes Using Topological Persistence http://dx.doi.org/10.1109/TSP.2014.2314063 . . . . . . . . . . . . . . . . . . . . . .
. . . . . . . . . . . . . . . . . . . . . . . . . . . . . . . . . . . . . . . . . . . . . . . . . . . . . . . . . . . . . . . . . . . . . . . . . . . . . . . . . . . . . . . . . . . . . . . . . . . . . H. Chintakunta and H. Krim 2531
Statistical Framework for Optimization in the Multi-User MIMO Uplink With ZF-DFE http://dx.doi.org/10.1109/TSP.2014.2314067 . . . . . . .
. . . . . . . . . . . . . . . . . . . . . . . . . . . . . . . . . . . . . . . . . . . . . . . . . . . . . . . . . . . . . . . . . . . . . . . . . . . . . . . . . . . S. Järmyr, B. Ottersten, and E. A. Jorswieck 2730
Other Areas and Applications
http://dx.doi.org/10.1109/TSP.2014.2311965 . .
. . . . . . . . . . . . . . . . . . . . . . . . . . . . . . . . . . . . . . . . . . . . . . . . . . . . . . . . . . . . . . . . . . . . . . . . . . . . . . . . . . . . . . . . . . . . . . . . . . . . . . . . . . . . . M. Hotz and C. Vogel 2566
Radar and Sonar Signal Processing
Resource Allocation in MIMO Radar With Multiple Targets for Non-Coherent Localization http://dx.doi.org/10.1109/TSP.2014.2315169 . .
. . . . . . . . . . . . . . . . . . . . . . . . . . . . . . . . . . . . . . . . . . . . . . . . . . . . . . . . . . . . . . . . . . . . . . . . N. Garcia, A. M. Haimovich, M. Coulon, and M. Lops 2656
Sensor Array and Multichannel Processing
An Hybrid Cramér-Rao Bound in Closed Form for Direction-of-Arrival Estimation by an “Acoustic Vector Sensor” With
Gain-Phase Uncertainties http://dx.doi.org/10.1109/TSP.2014.2310431 . . . . . . . . . . . . . . . . . . . . . . . . . . . . . . . . . . . P. K. Tam, K. T. Wong, and Y. Song 2504
Nested Vector-Sensor Array Processing via Tensor Modeling http://dx.doi.org/10.1109/TSP.2014.2314437 . . . . . . . . . . K. Han and A. Nehorai 2542
Analytical Performance Assessment of Multi-Dimensional Matrix- and Tensor-Based ESPRIT-Type Algorithms
http://dx.doi.org/10.1109/TSP.2014.2313530 . . . . . . . . . . . . . . . . . . . . . . . . . . . . . . . . . . . . . . . . . . . . . . . . . . . . . . . . . . F. Roemer, M. Haardt, and G. Del Galdo 2611
Signal Processing for Sensor Networks
Distributed Inference With M-Ary Quantized Data in the Presence of Byzantine Attacks http://dx.doi.org/10.1109/TSP.2014.2314072 . . . . . .
. . . . . . . . . . . . . . . . . . . . . . . . . . . . . . . . . . . . . . . . . . . . . . . . . . . . . . . . . . . . . . . . . . . . . . . . . . . . . . . V. S. S. Nadendla, Y. S. Han, and P. K. Varshney 2681
Sequential Bayesian Estimation With Censored Data for Multi-Sensor Systems http://dx.doi.org/10.1109/TSP.2014.2315163 . . . . . . . . . . . . . . . . .
. . . . . . . . . . . . . . . . . . . . . . . . . . . . . . . . . . . . . . . . . . . . . . . . . . . . . . . . . . . . . . . . . . . . . . . . . . . . . . . . . . . . . . . . . . . . Y. Zheng, R. Niu, and P. K. Varshney 2626
Signal Processing for Communications
MMSE-SLNR Precoding for Multi-Antenna Cognitive Radio http://dx.doi.org/10.1109/TSP.2014.2314442 . . . . . . . . . . Y. Richter and I. Bergel 2719
Statistical Signal Processing
A Phase-Reconstruction Technique for Low-Power Centimeter-Accurate Mobile Positioning http://dx.doi.org/10.1109/TSP.2014.2311967 . .
. . . . . . . . . . . . . . . . . . . . . . . . . . . . . . . . . . . . . . . . . . . . . . . . . . . . . . . . . . . . . K. M. Pesyna, Z. M. Kassas, R. W. Heath, and T. E. Humphreys 2595
Explicit Causal Recursive Estimators for Continuous-Time Bivariate Markov Chains http://dx.doi.org/10.1109/TSP.2014.2314434 . . . . . . . . . .
. . . . . . . . . . . . . . . . . . . . . . . . . . . . . . . . . . . . . . . . . . . . . . . . . . . . . . . . . . . . . . . . . . . . . . . . . . . . . . . . . . . . . . . . . . . . . . . . . . . . . . . B. L. Mark and Y. Ephraim 2709
A New Technique for INS/GNSS Attitude and Parameter Estimation Using Online Optimization
http://dx.doi.org/10.1109/TSP.2014.2312317 . . . . . . . . . . . . . . . . . . . . . . . . . . . . . . . . . . . . . . . . . . . . . . . . . . . . . . . . . . . . . . . . . . . . . . . . . . Y. Wu, J. Wang, and D. Hu 2642
http://dx.doi.org/10.1109/TSP.2014.2314064 . . . . . . . . . . . . . . . . . . . . . . . . . . . . . . . . . . . . . . . . . . . . . . . . . . . . . . . . . . . . . . H.-J. Shao, X.-P. Zhang, and Z. Wang 2580
Accuracy vs. Resolution in Radio Tomography http://dx.doi.org/10.1109/TSP.2014.2311969 . . . . . . . . . R. K. Martin, A. Folkerts, and T. Heinl 2480
Previous Page | Contents | Zoom in | Zoom out | Front Cover | Search Issue | Next Page qqM
Mq
qM
MqM
THE WORLD’S NEWSSTAND®
Previous Page | Contents | Zoom in | Zoom out | Front Cover | Search Issue | Next Page qqM
Mq
qM
MqM
THE WORLD’S NEWSSTAND®

www.signalprocessingsociety.org [5] JULY 2014
JUNE 1, 2014 VOLUME 62 NUMBER 11 ITPRED (ISSN 1053-587X)
REGULAR PAPERS
General Parameterized Time-Frequency Transform http://dx.doi.org/10.1109/TSP.2014.2314061 . . . . . . . . . . . . . . . . . . . . . . . . . . . . . . . . . . . . . . . . . . . . . . . . .
. . . . . . . . . . . . . . . . . . . . . . . . . . . . . . . . . . . . . . . . . . . . . . . . . . . . . . . . . . . . . . . . . . Y. Yang, Z. K. Peng, X. J. Dong, W. M. Zhang, and G. Meng 2751
Online Dictionary Learning for Kernel LMS http://dx.doi.org/10.1109/TSP.2014.2318132 . . . . . . W. Gao, J. Chen, C. Richard, and J. Huang 2765
General Non-Orthogonal Constrained ICA http://dx.doi.org/10.1109/TSP.2014.2318136 . . . . . . . . . . . . . . . . . . . . . . . . . . . . . . . . . . . . . . . . . . . . . . . . . . . . . . . . . .
. . . . . . . . . . . . . . . . . . . . . . . . . . . . . . . . . . . . . . . . . . . . . . . . . . . . . . . . . . . . . . . . . . . . . . . . . . P. A. 2778
Quadrature Compressive Sampling for Radar Signals http://dx.doi.org/10.1109/TSP.2014.2315168 . . . . . . . . . . . . . . . . F. Xi, S. Chen, and Z. Liu 2787
Forest Sparsity for Multi-Channel Compressive Sensing http://dx.doi.org/10.1109/TSP.2014.2318138 . . . . . . . . . . C. Chen, Y. Li, and J. Huang 2803
An EM Algorithm for Multipath State Estimation in OTHR Target Tracking http://dx.doi.org/10.1109/TSP.2014.2318134 . . . . . . . . . . . . . . . . . . . .
. . . . . . . . . . . . . . . . . . . . . . . . . . . . . . . . . . . . . . . . . . . . . . . . . . . . . . . . . . . . . . . . . . . . . . . . . . . . . . . H. Lan, Y. Liang, Q. Pan, F. Yang, and C. Guan 2814
Recursive Algorithm for Sliding Walsh Hadamard Transform http://dx.doi.org/10.1109/TSP.2014.2316146 . . . . . . . . . . . . . . . . . . . . . . . . . C.-S. Park 2827
Cooperative Synchronization in Wireless Networks http://dx.doi.org/yes . . . . . . .. . . . . . . B. Etzlinger, H. Wymeersch, and A. Springer 2837
IEEE TRANSACTIONS ON SIGNAL PROCESSING (ISSN 1053-587X) is published semimonthly by the Institute of Electrical and Electronics Engineers, Inc. Responsibility for the contents
rests upon the authors and not upon the IEEE, the Society/Council, or its members. 3 Park Avenue, 17th Floor, New York, NY 10016-5997. IEEE Oper-
445 Hoes Lane, Piscataway, NJ 08854-4141. +1 732 981 0060.
only), nonmembers $569.00 per copy. (Note: Postage and handling charge not included.) Member and nonmember subscription prices available upon request. Copyright and Reprint
Abstracting is permitted with credit to the source. Libraries are permitted to photocopy for private use of patrons, provided the per-copy fee of $31.00 is paid through the
Copyright Clearance Center, 222 Rosewood Drive, Danvers, MA 01923. For all other copying, reprint, or republication permission, write to Copyrights and Permissions Department, IEEE
Publications Administration, 445 Hoes Lane, Piscataway, NJ 08854-4141. Copyright © 2014 by the Institute of Electrical and Electronics Engineers, Inc. All rights reserved. Periodicals
Send address changes to IEEE TRANSACTIONS ON SIGNAL PROCESSING, IEEE, 445 Hoes Lane, Piscataway,
NJ 08854-4141. GST Registration No. 125634188. CPC Sales Agreement #40013087. Return undeliverable Canada addresses to: Pitney Bowes IMEX, P.O. Box 4332, Stanton Rd.,
Toronto, ON M5W 3J4, Canada. IEEE prohibits discrimination, harassment and bullying. For more information visit http://www.ieee.org/nondiscrimination. Printed in U.S.A.
Previous Page | Contents | Zoom in | Zoom out | Front Cover | Search Issue | Next Page qqM
Mq
qM
MqM
THE WORLD’S NEWSSTAND®
Previous Page | Contents | Zoom in | Zoom out | Front Cover | Search Issue | Next Page qqM
Mq
qM
MqM
THE WORLD’S NEWSSTAND®
_________________________

www.signalprocessingsociety.org [6] JULY 2014
Deterministic Construction of Sparse Sensing Matrices via Finite Geometry http://dx.doi.org/10.1109/TSP.2014.2318140 . . . . . . . . . . . . . . . . . . . .
. . . . . . . . . . . . . . . . . . . . . . . . . . . . . . . . . . . . . . . . . . . . . . . . . . . . . . . . . . . . . . . . . . . . . . . . . . . . . . . . . . . . . . . . . . . . . . . . . . . . . . . . . . . . . . . . . . . . S. Li and G. Ge 2850
Scalar Quantization for Estimation: From An Asymptotic Design to a Practical Solution http://dx.doi.org/10.1109/TSP.2014.2313528 . . . . . . .
. . . . . . . . . . . . . . . . . . . . . . . . . . . . . . . . . . . . . . . . . . . . . . . . . . . . . . . . . . . . . . . . . . . . . . . . . . . . . . . . . . . . . . . . . . . . R. Cabral Farias and J.-M. Brossier 2860
Bayesian Spectral Analysis With Student-t Noise http://dx.doi.org/10.1109/TSP.2014.2315164 . . . . . . . . . . . . . . . . . . . . . . . . . . . . . . . . . . . . J. Christmas 2871
Structural Health Monitoring http://dx.doi.org/10.1109/TSP.2014.2319775 . . . . . . . . . . . . . . . . . . . . . . . . . . . . . . . . . . . . . . . . . . . . . . . . . . . . . . . . . . . . . . . . . . . . . . .
. . . . . . . . . . . . . . . . . . . . . . . . . . . . . . . . . . . . . . . . . . . . . . . . . . . . . . . S. Chen, F. Cerda, P. Rizzo, J. Bielak, J. H. Garrett, and J. Kovacevic 2879
Blind Separation of Multi-Dimensional Components via Subspace Decomposition: Performance Analysis
http://dx.doi.org/10.1109/TSP.2014.2319774 . . . . . . . . . . . . . . . . . . . . . . . . . . . . . .. . . . . . . . . . . . . . . . . . . . . . . . . . . . . . D. Lahat, J.-F. Cardoso, and H. Messer 2894
Bayesian Group-Sparse Modeling and Variational Inference http://dx.doi.org/10.1109/TSP.2014.2319772 . . . . . . . . . . . . . . . . . . . . . . . . . . . . . . . . . . . . . . .
. . . . . . . . . . . . . . . . . . . . . . . . . . . . . . . . . . . . . . . . . . . . . . . . . . . . . . . . . . . . . . . . . . . . . . . . . . . . . . . . . . . . S. D. Babacan, S. Nakajima, and M. N. Do 2906
Codebook-Based Opportunistic Interference Alignment http://dx.doi.org/10.1109/TSP.2014.2313525 . . . . . . . . . . . . . . . . . . . . . . . . . . . . . . . . . . . . . . . . . . . .
. . . . . . . . . . . . . . . . . . . . . . . . . . . . . . . . . . . . . . . . . . . . . . . . . . . . . . . . . . . . . . . . . . . . . . . . . . . . . H. J. Yang, B. C. Jung, W.-Y. Shin, and A. Paulraj 2922
Laplace Transform of Product of Generalized Marcum Q, Bessel I, and Power Functions With Applications
http://dx.doi.org/10.1109/TSP.2014.2316162 . . . . . . . . . . . . . . . . . . . . . . . . . . . . . . . . . . . . . . . . . . . . . . . . . . . . . . . . . . . . . . . . . . N. Y. Ermolova and O. Tirkkonen 2938
Ambiguity Function Analysis for UMTS-Based Passive Multistatic Radar http://dx.doi.org/10.1109/TSP.2014.2319776 . . . . . . . . . . . . . . . . . . . . . . .
. . . . . . . . . . . . . . . . . . . . . . . . . . . . . . . . . . . . . . . . . . . . . . . . . . . . . . . . . . . . . . . . S. Gogineni, M. Rangaswamy, B. D. Rigling, and A. Nehorai 2945
Reduced Mean-Square Error Quadratic Inverse Spectrum Estimator http://dx.doi.org/10.1109/TSP.2014.2320462 . . . . . . . . . . . . . . . . . . . . . . . . . . . . . .
. . . . . . . . . . . . . . . . . . . . . . . . . . . . . . . . . . . . . . . . . . . . . . . . . . . . . . . . . . . . . . . . . . . . . . . . . . . . . . . . . . . . . . . . . . . . . . . . K. Q. Lepage and D. J. Thomson 2958
Unbiased Recursive Least-Squares Estimation Utilizing Dichotomous Coordinate-Descent Iterations http://dx.doi.org/ . . . . . . . . . .
. . . . . . . . . . . . . . . . . . . . . . . . . . . . . . . . . . . . . . . . . . . . . . . . . . . . . . . . . . . . . . . . . . . . . . . . . . . . . . . . . . . . . . . R. Arablouei, K. Do 2973
A New Decomposition Method for Multiuser DC-Programming and Its Applications http://dx.doi.org/ . . . . . . . . . . . . . . . . . . . . . . . . . . . .
. . . . . . . . . . . . . . . . . . . . . . . . . . . . . . . . . . . . . . . . . . . . . . . . . . . . . . . . . . . . . . . . . . . . . . . . . . . . . . . . . . . . . . . . A. Alvarado, G. Scutari, and J.-S. Pang 2984
Detection in Passive MIMO Radar Networks http://dx.doi.org/ . . . . . .. . . . . . D. E. Hack, L. K. Patton, B. Himed, and M. A. Saville 2999
Centralized Passive MIMO Radar Detection Without Direct-Path Reference Signals http://dx.doi.org/ . . . . . . . . . . . . . . . . . . . . . . . . . . . . .
. . . . . . . . . . . . . . . . . . . . . . . . . . . . . . . . . . . . . . . . . . . . . . . . . . . . . . . . . . . . . . . . . . . . . . . . D. E. Hack, L. K. Patton, B. Himed, and M. A. Saville 3013
Previous Page | Contents | Zoom in | Zoom out | Front Cover | Search Issue | Next Page qqM
Mq
qM
MqM
THE WORLD’S NEWSSTAND®
Previous Page | Contents | Zoom in | Zoom out | Front Cover | Search Issue | Next Page qqM
Mq
qM
MqM
THE WORLD’S NEWSSTAND®

www.signalprocessingsociety.org [7] JULY 2014
JUNE 1, 2014 VOLUME 62 NUMBER 11 ITPRED (ISSN 1053-587X)
REGULAR PAPERS
Adaptive Signal Processing
Unbiased Recursive Least-Squares Estimation Utilizing Dichotomous Coordinate-Descent Iterations
http://dx.doi.org/10.1109/TSP.2014.2316162 . . . . . . . . . . . . . . . . . . . . . . . . . . . . . . . . . . . . . . . . . . . . . . . . . . . . . . . . . . R. Arablouei, K. Do 2973
Digital and Multirate Signal Processing
Forest Sparsity for Multi-Channel Compressive Sensing http://dx.doi.org/10.1109/TSP.2014.2318138 . . . . . . . . . . C. Chen, Y. Li, and J. Huang 2803
Quadrature Compressive Sampling for Radar Signals http://dx.doi.org/10.1109/TSP.2014.2315168 . . . . . . . . . . . . . . . . F. Xi, S. Chen, and Z. Liu 2787
General Parameterized Time-Frequency Transform http://dx.doi.org/10.1109/TSP.2014.2314061 . . . . . . . . . . . . . . . . . . . . . . . . . . . . . . . . . . . . . . . . . . . . . . . . .
. . . . . . . . . . . . . . . . . . . . . . . . . . . . . . . . . . . . . . . . . . . . . . . . . . . . . . . . . . . . . . . . . . Y. Yang, Z. K. Peng, X. J. Dong, W. M. Zhang, and G. Meng 2751
Structural Health Monitoring http://dx.doi.org/10.1109/TSP.2014.2313528 . . . . . . . . . . . . . . . . . . . . . . . . . . . . . . . . . . . . . . . . . . . . . . . . . . . . . . . . . . . . . . . . . . . . . . .
. . . . . . . . . . . . . . . . . . . . . . . . . . . . . . . . . . . . . . . . . . . . . . . . . . . . . . . S. Chen, F. Cerda, P. Rizzo, J. Bielak, J. H. Garrett, and J. Kovacevic 2879
Multidimensional Signal Processing
Recursive Algorithm for Sliding Walsh Hadamard Transform http://dx.doi.org/10.1109/TSP.2014.2316146 . . . . . . . . . . . . . . . . . . . . . . . . . C.-S. Park 2827
IEEE TRANSACTIONS ON SIGNAL PROCESSING (ISSN 1053-587X) is published semimonthly by the Institute of Electrical and Electronics Engineers, Inc. Responsibility for the contents
rests upon the authors and not upon the IEEE, the Society/Council, or its members. 3 Park Avenue, 17th Floor, New York, NY 10016-5997. IEEE Oper-
445 Hoes Lane, Piscataway, NJ 08854-4141. +1 732 981 0060.
only), nonmembers $569.00 per copy. (Note: Postage and handling charge not included.) Member and nonmember subscription prices available upon request. Copyright and Reprint
Abstracting is permitted with credit to the source. Libraries are permitted to photocopy for private use of patrons, provided the per-copy fee of $31.00 is paid through the
Copyright Clearance Center, 222 Rosewood Drive, Danvers, MA 01923. For all other copying, reprint, or republication permission, write to Copyrights and Permissions Department, IEEE
Publications Administration, 445 Hoes Lane, Piscataway, NJ 08854-4141. Copyright © 2014 by the Institute of Electrical and Electronics Engineers, Inc. All rights reserved. Periodicals
Send address changes to IEEE TRANSACTIONS ON SIGNAL PROCESSING, IEEE, 445 Hoes Lane, Piscataway,
NJ 08854-4141. GST Registration No. 125634188. CPC Sales Agreement #40013087. Return undeliverable Canada addresses to: Pitney Bowes IMEX, P.O. Box 4332, Stanton Rd.,
Toronto, ON M5W 3J4, Canada. IEEE prohibits discrimination, harassment and bullying. For more information visit http://www.ieee.org/nondiscrimination. Printed in U.S.A.
Previous Page | Contents | Zoom in | Zoom out | Front Cover | Search Issue | Next Page qqM
Mq
qM
MqM
THE WORLD’S NEWSSTAND®
Previous Page | Contents | Zoom in | Zoom out | Front Cover | Search Issue | Next Page qqM
Mq
qM
MqM
THE WORLD’S NEWSSTAND®
_________________________

www.signalprocessingsociety.org [8] JULY 2014
Machine Learning
Bayesian Spectral Analysis With Student-t Noise http://dx.doi.org/10.1109/TSP.2014.2316139 . . . . . . . . . . . . . . . . . . . . . . . . . . . . . . . . . . . . J. Christmas 2871
General Non-Orthogonal Constrained ICA http://dx.doi.org/10.1109/TSP.2014.2318136 . . . . . . . . . . . . . . . . . . . . . . . . . . . . . . . . . . . . . . . . . . . . . . . . . . . . . . . . . .
. . . . . . . . . . . . . . . . . . . . . . . . . . . . . . . . . . . . . . . . . . . . . . . . . . . . . . . . . . . . . . . . . . . . . . . . . . P. A. 2778
Signal Processing for Networks
Online Dictionary Learning for Kernel LMS http://dx.doi.org/10.1109/TSP.2014.2318132 . . . . . . W. Gao, J. Chen, C. Richard, and J. Huang 2765
Optimization Methods for Signal Processing
A New Decomposition Method for Multiuser DC-Programming and Its Applications http://dx.doi.org/10.1109/TSP.2014.2315167 . . . . . . . . . .
. . . . . . . . . . . . . . . . . . . . . . . . . . . . . . . . . . . . . . . . . . . . . . . . . . . . . . . . . . . . . . . . . . . . . . . . . . . . . . . . . . . . . . . . A. Alvarado, G. Scutari, and J.-S. Pang 2984
Radar and Sonar Signal Processing
Centralized Passive MIMO Radar Detection Without Direct-Path Reference Signals http://dx.doi.org/10.1109/TSP.2014.2320462 . . . . . . . . . . .
. . . . . . . . . . . . . . . . . . . . . . . . . . . . . . . . . . . . . . . . . . . . . . . . . . . . . . . . . . . . . . . . . . . . . . . . D. E. Hack, L. K. Patton, B. Himed, and M. A. Saville 3013
Sensor Array and Multichannel Processing
Deterministic Construction of Sparse Sensing Matrices via Finite Geometry http://dx.doi.org/10.1109/TSP.2014.2318139 . . . . . . . . . . . . . . . . . . . .
. . . . . . . . . . . . . . . . . . . . . . . . . . . . . . . . . . . . . . . . . . . . . . . . . . . . . . . . . . . . . . . . . . . . . . . . . . . . . . . . . . . . . . . . . . . . . . . . . . . . . . . . . . . . . . . . . . . . S. Li and G. Ge 2850
Ambiguity Function Analysis for UMTS-Based Passive Multistatic Radar http://dx.doi.org/10.1109/TSP.2014.2318135 . . . . . . . . . . . . . . . . . . . . . . .
. . . . . . . . . . . . . . . . . . . . . . . . . . . . . . . . . . . . . . . . . . . . . . . . . . . . . . . . . . . . . . . . S. Gogineni, M. Rangaswamy, B. D. Rigling, and A. Nehorai 2945
Detection in Passive MIMO Radar Networks http://dx.doi.org/10.1109/TSP.2014.2319776 . . . . . . . . . . . . . . . . . . . . . . . . . . . . . . . . . . . . . . . . . . . . . . . . . . . . . . . .
. . . . . . . . . . . . . . . . . . . . . . . . . . . . . . . . . . . . . . . . . . . . . . . . . . . . . . . . . . . . . . . . . . . . . . . . D. E. Hack, L. K. Patton, B. Himed, and M. A. Saville 2999
Signal Processing for Sensor Networks
Cooperative Synchronization in Wireless Networks http://dx.doi.org/10.1109/TSP.2014.2313531 . . . . . . . . . . . . . . . . . . . . . . . . . . . . . . . . . . . . . . . . . . . . . . . .
. . . . . . . . . . . . . . . . . . . . . . . . . . . . . . . . . . . . . . . . . . . . . . . . . . . . . . . . . . . . . . . . . . . . . . . . . . . . . . . . . . . B. Etzlinger, H. Wymeersch, and A. Springer 2837
Signal Processing for Communications
Codebook-Based Opportunistic Interference Alignment http://dx.doi.org/10.1109/TSP.2014.2319774 . . . . . . . . . . . . . . . . . . . . . . . . . . . . . . . . . . . . . . . . . . . .
. . . . . . . . . . . . . . . . . . . . . . . . . . . . . . . . . . . . . . . . . . . . . . . . . . . . . . . . . . . . . . . . . . . . . . . . . . . . . H. J. Yang, B. C. Jung, W.-Y. Shin, and A. Paulraj 2922
Laplace Transform of Product of Generalized Marcum Q, Bessel I, and Power Functions With Applications
http://dx.doi.org/10.1109/TSP.2014.2319772 . . . . . . . . . . . . . . . . . . . . . . . . . . . . . . . . . . . . . . . . . . . . . . . . . . . . . . . . . . . . . . . . . . N. Y. Ermolova and O. Tirkkonen 2938
Statistical Signal Processing
Scalar Quantization for Estimation: From An Asymptotic Design to a Practical Solution http://dx.doi.org/10.1109/TSP.2014.2318140 . . . . . . .
. . . . . . . . . . . . . . . . . . . . . . . . . . . . . . . . . . . . . . . . . . . . . . . . . . . . . . . . . . . . . . . . . . . . . . . . . . . . . . . . . . . . . . . . . . . . R. Cabral Farias and J.-M. Brossier 2860
Bayesian Group-Sparse Modeling and Variational Inference http://dx.doi.org/10.1109/TSP.2014.2319775 . . . . . . . . . . . . . . . . . . . . . . . . . . . . . . . . . . . . . . .
. . . . . . . . . . . . . . . . . . . . . . . . . . . . . . . . . . . . . . . . . . . . . . . . . . . . . . . . . . . . . . . . . . . . . . . . . . . . . . . . . . . . S. D. Babacan, S. Nakajima, and M. N. Do 2906
Reduced Mean-Square Error Quadratic Inverse Spectrum Estimator http://dx.doi.org/10.1109/TSP.2014.2313525 . . . . . . . . . . . . . . . . . . . . . . . . . . . . . .
. . . . . . . . . . . . . . . . . . . . . . . . . . . . . . . . . . . . . . . . . . . . . . . . . . . . . . . . . . . . . . . . . . . . . . . . . . . . . . . . . . . . . . . . . . . . . . . . K. Q. Lepage and D. J. Thomson 2958
Blind Separation of Multi-Dimensional Components via Subspace Decomposition: Performance Analysis
http://dx.doi.org/10.1109/TSP.2014.2315164 . . . . . . . . . . . . . . . . . . . . . . . . . . . . . .. . . . . . . . . . . . . . . . . . . . . . . . . . . . . . D. Lahat, J.-F. Cardoso, and H. Messer 2894
An EM Algorithm for Multipath State Estimation in OTHR Target Tracking http://dx.doi.org/10.1109/TSP.2014.2318134 . . . . . . . . . . . . . . . . . . . .
. . . . . . . . . . . . . . . . . . . . . . . . . . . . . . . . . . . . . . . . . . . . . . . . . . . . . . . . . . . . . . . . . . . . . . . . . . . . . . . H. Lan, Y. Liang, Q. Pan, F. Yang, and C. Guan 2814
Previous Page | Contents | Zoom in | Zoom out | Front Cover | Search Issue | Next Page qqM
Mq
qM
MqM
THE WORLD’S NEWSSTAND®
Previous Page | Contents | Zoom in | Zoom out | Front Cover | Search Issue | Next Page qqM
Mq
qM
MqM
THE WORLD’S NEWSSTAND®

www.signalprocessingsociety.org [9] JULY 2014
JUNE 15, 2014 VOLUME 62 NUMBER 12 ITPRED (ISSN 1053-587X)
REGULAR PAPERS
Consensus-based Distributed Particle Filtering With Distributed Proposal Adaptation http://dx.doi.org/10.1109/TSP.2014.2319777 . . . . . . . . . .
. . . . . . . . . . . . . . . . . . . . . . . . . . . . . . . . . . . . . . . . . . . . . . . . . . . . . . . . . . . . . . . . . . . . . . . . . . . . . . . . . . . . . O. Hlinka, F. Hlawatsch, and P. M. Djuric 3029
Discrete Signal Processing on Graphs: Frequency Analysis http://dx.doi.org/10.1109/TSP.2014.2321121 . . . . . . . . . . . . . . . . . . . . . . . . . . . . . . . . . . . . . . . .
. . . . . . . . . . . . . . . . . . . . . . . . . . . . . . . . . . . . . . . . . . . . . . . . . . . . . . . . . . . . . . . . . . . . . . . . . . . . . . . . . . . . . . . . . . . . . . A. Sandryhaila and J. M. F. Moura 3042
Optimal Periodic Sensor Scheduling in Networks of Dynamical Systems http://dx.doi.org/10.1109/TSP.2014.2320455 . . . . . . . . . . . . . . . . . . . . . . . .
. . . . . . . . . . . . . . . . . . . . . . . . . . . . . . . . . . . . . . . . . . . . . . . . . . . . . . . . . . . . . . . . . . . . . . . . . . S. Liu, M. Fardad, P. K. Varshney, and E. Masazade 3055
Collective Ratings for Online Communities With Strategic Users http://dx.doi.org/10.1109/TSP.2014.2320457 . . . . . . . . . . . . . . . . . . . . . . . . . . . . . . . . .
. . . . . . . . . . . . . . . . . . . . . . . . . . . . . . . . . . . . . . . . . . . . . . . . . . . . . . . . . . . . . . . . . . . . . . . . . . . . . . . . . . . . . . . . . . . . . . . . Y. Zhang and M. van der Schaar 3069
SUMIS: Near-Optimal Soft-In Soft-Out MIMO Detection With Low and Fixed Complexity http://dx.doi.org/10.1109/TSP.2014.2303945 . .
. . . . . . . . . . . . . . . . . . . . . . . . . . . . . . . . . . . . . . . . . . . . . . . . . . . . . . . . . . . . . . . . . . . . . . . . . . . . . . . . . . . . . . . . . . . . . . . . . . . . . M. Cirkic and E. G. Larsson 3084
IEEE TRANSACTIONS ON SIGNAL PROCESSING (ISSN 1053-587X) is published semimonthly by the Institute of Electrical and Electronics Engineers, Inc. Responsibility for the contents
rests upon the authors and not upon the IEEE, the Society/Council, or its members. 3 Park Avenue, 17th Floor, New York, NY 10016-5997. IEEE Oper-
445 Hoes Lane, Piscataway, NJ 08854-4141. +1 732 981 0060.
only), nonmembers $569.00 per copy. (Note: Postage and handling charge not included.) Member and nonmember subscription prices available upon request. Copyright and Reprint
Abstracting is permitted with credit to the source. Libraries are permitted to photocopy for private use of patrons, provided the per-copy fee of $31.00 is paid through the
Copyright Clearance Center, 222 Rosewood Drive, Danvers, MA 01923. For all other copying, reprint, or republication permission, write to Copyrights and Permissions Department, IEEE
Publications Administration, 445 Hoes Lane, Piscataway, NJ 08854-4141. Copyright © 2014 by the Institute of Electrical and Electronics Engineers, Inc. All rights reserved. Periodicals
Send address changes to IEEE TRANSACTIONS ON SIGNAL PROCESSING, IEEE, 445 Hoes Lane, Piscataway,
NJ 08854-4141. GST Registration No. 125634188. CPC Sales Agreement #40013087. Return undeliverable Canada addresses to: Pitney Bowes IMEX, P.O. Box 4332, Stanton Rd.,
Toronto, ON M5W 3J4, Canada. IEEE prohibits discrimination, harassment and bullying. For more information visit http://www.ieee.org/nondiscrimination. Printed in U.S.A.
Previous Page | Contents | Zoom in | Zoom out | Front Cover | Search Issue | Next Page qqM
Mq
qM
MqM
THE WORLD’S NEWSSTAND®
Previous Page | Contents | Zoom in | Zoom out | Front Cover | Search Issue | Next Page qqM
Mq
qM
MqM
THE WORLD’S NEWSSTAND®
_________________________

www.signalprocessingsociety.org [10] JULY 2014
Distributed State Estimation With Dimension Reduction Preprocessing http://dx.doi.org/10.1109/TSP.2014.2323021 . . . . . . . . . . . . . . . . . . . . . . . . . .
. . . . . . . . . . . . . . . . . . . . . . . . . . . . . . . . . . . . . . . . . . . . . . . . . . . . . . . . . . . . . . . . . . . . . . . . H. Ma, Y.-H. Yang, Y. Chen, K. J. R. Liu, and Q. Wang 3098
Data-Aided Channel Estimation in Large Antenna Systems http://dx.doi.org/10.1109/TSP.2014.2321120 . . . . . . . . . .. . . . . . . . . . J. Ma and L. Ping 3111
Direct Construction of Superoscillations http://dx.doi.org/10.1109/TSP.2014.2321119 . . . . . . . . . . . . . . . . . . . . . . D. G. Lee and P. J. S. G. Ferreira 3125
Geolocation by Direction of Arrival Using Arrays With Unknown Orientation http://dx.doi.org/10.1109/TSP.2014.2321109 . . . . . . . . . . . . . . . . . .
. . . . . . . . . . . . . . . . . . . . . . . . . . . . . . . . . . . . . . . . . . . . . . . . . . . . . . . . . . . . . . . . . . . . . . . . . . . . . . . . . . . . . . . . . . . . . . . . . . . . . . . . . . . O. Jean and A. J. Weiss 3135
Fixed-Lag Smoothing for Bayes Optimal Knowledge Exploitation in Target Tracking http://dx.doi.org/10.1109/TSP.2014.2321731 . . . . . . . . . .
. . . . . . . . . . . . . . . . . . . . . . . . . . . . . . . . . . . . . . . . . . . . . . . . . . . . . . . . . . . . . . . . . . . . . . . . . . . . . . . . . . . . . F. Papi, M. Bocquel, M. Podt, and Y. Boers 3143
On Optimal Gaussian Signaling in MIMORelay Channels With Partial Decode-and-Forward http://dx.doi.org/10.1109/TSP.2014.2321737 . .
. . . . . . . . . . . . . . . . . . . . . . . . . . . . . . . . . . . . . . . . . . . . . . . . . . . . . . . . . . . . . . . . . . . . . . . . . . C. Hellings, L. Gerdes, L. Weiland, and W. Utschick 3153
http://dx.doi.org/10.1109/TSP.2014.2319773 . . . . . . . . . . . . . . . . . . . . . . . . . . . . . . . . . . . . . . . . . . . . . . . . . . . . . . . . . . . . . . . . . . . . . . . . . . . . . . . . Y. Fan and C.-Y. Tsui 3165
Sequential Distributed Detection in Energy-Constrained Wireless Sensor Networks http://dx.doi.org/10.1109/TSP.2014.2320458 . . . . . . . . . . . .
. . . . . . . . . . . . . . . . . . . . . . . . . . . . . . . . . . . . . . . . . . . . . . . . . . . . . . . . . . . . . . . . . . . . . . . . . . . . . . . . . . . . . . . . . . . . . . . . . . . . . . . . . . . . Y. Yilmaz and X. Wang 3180
http://dx.doi.org/10.1109/TSP.2014.2323022 . . . . . . . . . . . . . . . . . . . . . . . . . . . . . . . . . . . . . . . . . . . . . . . . . . . . . . . . . . . . . . Y. Gu, N. A. Goodman, and A. Ashok 3194
Distributed Detection in Tree Topologies With Byzantines http://dx.doi.org/10.1109/TSP.2014.2321735 . . . . . . . . . . . . . . . . . . . . . . . . . . . . . . . . . . . . . . . . .
. . . . . . . . . . . . . . . . . . . . . . . . . . . . . . . . . . . . . . . . . . . . . . . . . . . . . . . . . . . . . . . . . . . . . . B. Kailkhura, S. Brahma, Y. S. Han, and P. K. Varshney 3208
Approximate Subspace-Based Iterative Adaptive Approach for Fast Two-Dimensional Spectral Estimation
http://dx.doi.org/10.1109/TSP.2014.2320460 . . . . . . . . . . . . . . . . . . . . . .. . . . . . . . . . . . . . . . . . . . . . W. Sun, H. C. So, Y. Chen, L.-T. Huang, and L. Huang 3220
Optimal Energy Allocation for Energy Harvesting Transmitters With Hybrid Energy Storage and Processing Cost
http://dx.doi.org/10.1109/TSP.2014.2321733 . . . . . . . . . . . . . . . . . . . . . . . . . . . . . . . . . . . . . . . . . . . . . . . . . . . . . . . . . . . . . . . . O. Ozel, K. Shahzad, and S. Ulukus 3232
The Labeled Multi-Bernoulli Filter http://dx.doi.org/10.1109/TSP.2014.2323064 . . . . . . .. . . . . . . S. Reuter, B.-T. Vo, B.-N. Vo, and K. Dietmayer 3246
Distributed Compressive CSIT Estimation and Feedback for FDD Multi-User Massive MIMO Systems
http://dx.doi.org/10.1109/TSP.2014.2324991 . . . . . . . . . . . . . . . . . . . . . . . . . . . . . . . . . . . . . . .. . . . . . . . . . . . . . . . . . . . . . . . . . . . . . . . . . . . . . . X. Rao and V. K. N. Lau 3261
http://dx.doi.org/10.1109/TSP.2014.2324994 . . . . . . . . . . . . . . . . . . . . . . . . . . . . . . . . . . . . . . . . . . . . . . M. Marsousi, K. Abhari, P. Babyn, and J. Alirezaie 3272
http://dx.doi.org/10.1109/TSP.2014.2326451 . . . . . . . . . . . . . . . . . . . . . . .. . . . . . . . . . . . . . . . . . . . . . . 3284
Information for Authors http://dx.doi.org/10.1109/TSP.2014.2326452 . . . . . . . . . . . . . . . . . . . . . . . . . . . . . . . . . . . . . . . . . . . . . . . . . . . . . . . . . . . . . . . . . . . . . . . . . . . . . . 3286
Previous Page | Contents | Zoom in | Zoom out | Front Cover | Search Issue | Next Page qqM
Mq
qM
MqM
THE WORLD’S NEWSSTAND®
Previous Page | Contents | Zoom in | Zoom out | Front Cover | Search Issue | Next Page qqM
Mq
qM
MqM
THE WORLD’S NEWSSTAND®

www.signalprocessingsociety.org [11] JULY 2014
JUNE 15, 2014 VOLUME 62 NUMBER 12 ITPRED (ISSN 1053-587X)
REGULAR PAPERS
Design and Implementation of Signal Processing Systems
http://dx.doi.org/10.1109/TSP.2014.2319773 . . . . . . . . . . . . . . . . . . . . . . . . . . . . . . . . . . . . . . . . . . . . . . . . . . . . . . . . . . . . . . . . . . . . . . . . . . . . . . . . Y. Fan and C.-Y. Tsui 3165
Digital and Multirate Signal ProcessingDirect Construction of Superoscillations http://dx.doi.org/10.1109/TSP.2014.2321119 . . . . . . . . . . . . . . . . . . . . . . D. G. Lee and P. J. S. G. Ferreira 3125
Machine Learning
http://dx.doi.org/10.1109/TSP.2014.2324994 . . . . . . . . . . . . . . . . . . . . . . . . . . . . . . . . . . . . . . . . . . . . . . M. Marsousi, K. Abhari, P. Babyn, and J. Alirezaie 3272
Signal Processing for NetworksConsensus-based Distributed Particle Filtering With Distributed Proposal Adaptation http://dx.doi.org/10.1109/TSP.2014.2319777 . . . . . . . . . .. . . . . . . . . . . . . . . . . . . . . . . . . . . . . . . . . . . . . . . . . . . . . . . . . . . . . . . . . . . . . . . . . . . . . . . . . . . . . . . . . . . . . O. Hlinka, F. Hlawatsch, and P. M. Djuric 3029
Distributed Detection in Tree Topologies With Byzantines http://dx.doi.org/10.1109/TSP.2014.2321735 . . . . . . . . . . . . . . . . . . . . . . . . . . . . . . . . . . . . . . . . .. . . . . . . . . . . . . . . . . . . . . . . . . . . . . . . . . . . . . . . . . . . . . . . . . . . . . . . . . . . . . . . . . . . . . . B. Kailkhura, S. Brahma, Y. S. Han, and P. K. Varshney 3208
Distributed State Estimation With Dimension Reduction Preprocessing http://dx.doi.org/10.1109/TSP.2014.2323021 . . . . . . . . . . . . . . . . . . . . . . . . . .. . . . . . . . . . . . . . . . . . . . . . . . . . . . . . . . . . . . . . . . . . . . . . . . . . . . . . . . . . . . . . . . . . . . . . . . H. Ma, Y.-H. Yang, Y. Chen, K. J. R. Liu, and Q. Wang 3098
Collective Ratings for Online Communities With Strategic Users http://dx.doi.org/10.1109/TSP.2014.2320457 . . . . . . . . . . . . . . . . . . . . . . . . . . . . . . . . .. . . . . . . . . . . . . . . . . . . . . . . . . . . . . . . . . . . . . . . . . . . . . . . . . . . . . . . . . . . . . . . . . . . . . . . . . . . . . . . . . . . . . . . . . . . . . . . . Y. Zhang and M. van der Schaar 3069
IEEE TRANSACTIONS ON SIGNAL PROCESSING (ISSN 1053-587X) is published semimonthly by the Institute of Electrical and Electronics Engineers, Inc. Responsibility for the contents
rests upon the authors and not upon the IEEE, the Society/Council, or its members. 3 Park Avenue, 17th Floor, New York, NY 10016-5997. IEEE Oper-
445 Hoes Lane, Piscataway, NJ 08854-4141. +1 732 981 0060.
only), nonmembers $569.00 per copy. (Note: Postage and handling charge not included.) Member and nonmember subscription prices available upon request. Copyright and Reprint
Abstracting is permitted with credit to the source. Libraries are permitted to photocopy for private use of patrons, provided the per-copy fee of $31.00 is paid through the
Copyright Clearance Center, 222 Rosewood Drive, Danvers, MA 01923. For all other copying, reprint, or republication permission, write to Copyrights and Permissions Department, IEEE
Publications Administration, 445 Hoes Lane, Piscataway, NJ 08854-4141. Copyright © 2014 by the Institute of Electrical and Electronics Engineers, Inc. All rights reserved. Periodicals
Send address changes to IEEE TRANSACTIONS ON SIGNAL PROCESSING, IEEE, 445 Hoes Lane, Piscataway,
NJ 08854-4141. GST Registration No. 125634188. CPC Sales Agreement #40013087. Return undeliverable Canada addresses to: Pitney Bowes IMEX, P.O. Box 4332, Stanton Rd.,
Toronto, ON M5W 3J4, Canada. IEEE prohibits discrimination, harassment and bullying. For more information visit http://www.ieee.org/nondiscrimination. Printed in U.S.A.
Previous Page | Contents | Zoom in | Zoom out | Front Cover | Search Issue | Next Page qqM
Mq
qM
MqM
THE WORLD’S NEWSSTAND®
Previous Page | Contents | Zoom in | Zoom out | Front Cover | Search Issue | Next Page qqM
Mq
qM
MqM
THE WORLD’S NEWSSTAND®
_________________________

www.signalprocessingsociety.org [12] JULY 2014
Other Areas and Applications
Discrete Signal Processing on Graphs: Frequency Analysis http://dx.doi.org/10.1109/TSP.2014.2321121 . . . . . . . . . . . . . . . . . . . . . . . . . . . . . . . . . . . . . . . .
. . . . . . . . . . . . . . . . . . . . . . . . . . . . . . . . . . . . . . . . . . . . . . . . . . . . . . . . . . . . . . . . . . . . . . . . . . . . . . . . . . . . . . . . . . . . . . A. Sandryhaila and J. M. F. Moura 3042
Radar and Sonar Signal Processing
http://dx.doi.org/10.1109/TSP.2014.2323022 . . . . . . . . . . . . . . . . . . . . . . . . . . . . . . . . . . . . . . . . . . . . . . . . . . . . . . . . . . . . . . Y. Gu, N. A. Goodman, and A. Ashok 3194
Sensor Array and Multichannel Processing
Approximate Subspace-Based Iterative Adaptive Approach for Fast Two-Dimensional Spectral Estimation
http://dx.doi.org/10.1109/TSP.2014.2320460 . . . . . . . . . . . . . . . . . . . . . .. . . . . . . . . . . . . . . . . . . . . . W. Sun, H. C. So, Y. Chen, L.-T. Huang, and L. Huang 3220
Signal Processing for Sensor Networks
SUMIS: Near-Optimal Soft-In Soft-Out MIMO Detection With Low and Fixed Complexity http://dx.doi.org/10.1109/TSP.2014.2303945 . .
. . . . . . . . . . . . . . . . . . . . . . . . . . . . . . . . . . . . . . . . . . . . . . . . . . . . . . . . . . . . . . . . . . . . . . . . . . . . . . . . . . . . . . . . . . . . . . . . . . . . . M. Cirkic and E. G. Larsson 3084
Optimal Periodic Sensor Scheduling in Networks of Dynamical Systems http://dx.doi.org/10.1109/TSP.2014.2320455 . . . . . . . . . . . . . . . . . . . . . . . .
. . . . . . . . . . . . . . . . . . . . . . . . . . . . . . . . . . . . . . . . . . . . . . . . . . . . . . . . . . . . . . . . . . . . . . . . . . S. Liu, M. Fardad, P. K. Varshney, and E. Masazade 3055
Signal Processing for Communications
Optimal Energy Allocation for Energy Harvesting Transmitters With Hybrid Energy Storage and Processing Cost
http://dx.doi.org/10.1109/TSP.2014.2321733 . . . . . . . . . . . . . . . . . . . . . . . . . . . . . . . . . . . . . . . . . . . . . . . . . . . . . . . . . . . . . . . . O. Ozel, K. Shahzad, and S. Ulukus 3232
Data-Aided Channel Estimation in Large Antenna Systems http://dx.doi.org/10.1109/TSP.2014.2321120 . . . . . . . . . .. . . . . . . . . . J. Ma and L. Ping 3111
Distributed Compressive CSIT Estimation and Feedback for FDD Multi-User Massive MIMO Systems
http://dx.doi.org/10.1109/TSP.2014.2324991 . . . . . . . . . . . . . . . . . . . . . . . . . . . . . . . . . . . . . . .. . . . . . . . . . . . . . . . . . . . . . . . . . . . . . . . . . . . . . . X. Rao and V. K. N. Lau 3261
On Optimal Gaussian Signaling in MIMORelay Channels With Partial Decode-and-Forward http://dx.doi.org/10.1109/TSP.2014.2321737 . .
. . . . . . . . . . . . . . . . . . . . . . . . . . . . . . . . . . . . . . . . . . . . . . . . . . . . . . . . . . . . . . . . . . . . . . . . . . C. Hellings, L. Gerdes, L. Weiland, and W. Utschick 3153
Statistical Signal Processing
Fixed-Lag Smoothing for Bayes Optimal Knowledge Exploitation in Target Tracking http://dx.doi.org/10.1109/TSP.2014.2321731 . . . . . . . . . .
. . . . . . . . . . . . . . . . . . . . . . . . . . . . . . . . . . . . . . . . . . . . . . . . . . . . . . . . . . . . . . . . . . . . . . . . . . . . . . . . . . . . . F. Papi, M. Bocquel, M. Podt, and Y. Boers 3143
Sequential Distributed Detection in Energy-Constrained Wireless Sensor Networks http://dx.doi.org/10.1109/TSP.2014.2320458 . . . . . . . . . . . .
. . . . . . . . . . . . . . . . . . . . . . . . . . . . . . . . . . . . . . . . . . . . . . . . . . . . . . . . . . . . . . . . . . . . . . . . . . . . . . . . . . . . . . . . . . . . . . . . . . . . . . . . . . . . Y. Yilmaz and X. Wang 3180
The Labeled Multi-Bernoulli Filter http://dx.doi.org/10.1109/TSP.2014.2323064 . . . . . . .. . . . . . . S. Reuter, B.-T. Vo, B.-N. Vo, and K. Dietmayer 3246
Geolocation by Direction of Arrival Using Arrays With Unknown Orientation http://dx.doi.org/10.1109/TSP.2014.2321109 . . . . . . . . . . . . . . . . . .
. . . . . . . . . . . . . . . . . . . . . . . . . . . . . . . . . . . . . . . . . . . . . . . . . . . . . . . . . . . . . . . . . . . . . . . . . . . . . . . . . . . . . . . . . . . . . . . . . . . . . . . . . . . O. Jean and A. J. Weiss 3135
http://dx.doi.org/10.1109/TSP.2014.2326451 . . . . . . . . . . . . . . . . . . . . . . .. . . . . . . . . . . . . . . . . . . . . . . 3284
Information for Authors http://dx.doi.org/10.1109/TSP.2014.2326452 . . . . . . . . . . . . . . . . . . . . . . . . . . . . . . . . . . . . . . . . . . . . . . . . . . . . . . . . . . . . . . . . . . . . . . . . . . . . . . 3285
Previous Page | Contents | Zoom in | Zoom out | Front Cover | Search Issue | Next Page qqM
Mq
qM
MqM
THE WORLD’S NEWSSTAND®
Previous Page | Contents | Zoom in | Zoom out | Front Cover | Search Issue | Next Page qqM
Mq
qM
MqM
THE WORLD’S NEWSSTAND®

www.signalprocessingsociety.org [13] JULY 2014
MAY 2014 VOLUME 22 NUMBER 5 ITASFA (ISSN 2329-9290)
REGULAR PAPERS
Discriminatively Trained Sparse Inverse Covariance Matrices for Speech Recognition http://dx.doi.org/10.1109/TASLP.2014.2312548 . . . . . . .. . . . . . . . . . . . . . . . . . . . . . . . . . . . . . . . . . . . . . . . . . . . . . . . . . . . . . . . . . . . . . . . . . . . . . . . . . . . . . . . . . . . . . . . . . . . . . . . . . . . . . . . . . . . W. Zhang and P. Fung 873
Spoken Knowledge Organization by Semantic Structuring and a Prototype Course Lecture System for PersonalizedLearning http://dx.doi.org/10.1109/TASLP.2014.2310993 . . . . . . . . . . . . . . . . . . . . . . . . . . . . . . . . . . . . . . . . . . . . . . . . . . . . . . . . . . . . . . . . . . . . . . . . . . . . . . . . . . . . . . . . . . . .. . . . . . . . . . . . . . . . . . . . . . . . . . . . . . . . . . . . . . . . . H.-y. Lee, S.-R. Shiang, C.-f. Yeh, Y.-N. Chen, Y. Huang, S.-Y. Kong, and L.-s. Lee 883
Speech Enhancement with EMD and Hurst-Based Mode Selection http://dx.doi.org/10.1109/TASLP.2014.2312541 . . . . . . . . . . . . . . . . . . . . . . . . . . . . .. . . . . . . . . . . . . . . . . . . . . . . . . . . . . . . . . . . . . . . . . . . . . . . . . . . . . . . . . . . . . . . . . . . . . . . . . . . . . . . . . . . . . . . . . . . . . . L. Zão, R. Coelho, and P. Flandrin 899
IEEE TRANSACTIONS ON AUDIO, SPEECH, AND LANGUAGE PROCESSING (ISSN 2329-9290) is published bimonthly in print and monthly online by the Institute of Electrical and Electronics
Engineers, Inc. Responsibility for the contents rests upon the authors and not upon the IEEE, the Society/Council, or its members. 3 Park Avenue, 17th Floor,
New York, NY 10016-5997. 445 Hoes Lane, Piscataway, NJ 08854-4141. +1 732 981 0060. Individual
upon request. Abstracting is permitted with credit to the source. Libraries are permitted to photocopy for private use of patrons, provided the
per-copy fee of $31.00 is paid through the Copyright Clearance Center, 222 Rosewood Drive, Danvers, MA 01923. For all other copying, reprint, or republication permission, write to
Copyrights and Permissions Department, IEEE Publications Administration, 445 Hoes Lane, Piscataway, NJ 08854-4141. Copyright © 2014 by the Institute of Electrical and Electronics
Send address changes to IEEE TRANSACTIONS ON AUDIO,
SPEECH, AND LANGUAGE PROCESSING, IEEE, 445 Hoes Lane, Piscataway, NJ 08854-4141. GST Registration No. 125634188. CPC Sales Agreement #40013087. Return undeliverable
Canada addresses to: Pitney Bowes IMEX, P.O. Box 4332, Stanton Rd., Toronto, ON M5W 3J4, Canada. IEEE prohibits discrimination, harassment and bullying. For more information
visit http://www.ieee.org/nondiscrimination. Printed in U.S.A.
Previous Page | Contents | Zoom in | Zoom out | Front Cover | Search Issue | Next Page qqM
Mq
qM
MqM
THE WORLD’S NEWSSTAND®
Previous Page | Contents | Zoom in | Zoom out | Front Cover | Search Issue | Next Page qqM
Mq
qM
MqM
THE WORLD’S NEWSSTAND®
_________________________

www.signalprocessingsociety.org [14] JULY 2014
Stable 1-Norm Error Minimization Based Linear Predictors for Speech Modeling http://dx.doi.org/10.1109/TASLP.2014.2311324 . . . . . . . . . . . .. . . . . . . . . . . . . . . . . . . . . . . . . . . . . . . . . . . . D. Giacobello, Christensen, T. L. Jensen, M. N. Murthi, S. H. Jensen, and M. Moonen 912
Multichannel Noise Reduction in the Karhunen-Loève Expansion Domain http://dx.doi.org/10.1109/TASLP.2014.2311299 . . . . . . . . . . . . . . . . . . . .. . . . . . . . . . . . . . . . . . . . . . . . . . . . . . . . . . . . . . . . . . . . . . . . . . . . . . . . . . . . . . . . Y. Lacouture-Parodi, E. A. P. Habets, J. Chen, and J. Benesty 923
http://dx.doi.org/10.1109/TASLP.2014.2311329 . .. . . . . . . . . . . . . . . . . . . . . . . . . . . . . . . . . . . . . . . . . . . . . . . . . . . . . . . . . . . . . . . . . . . . . . . . . . . . . . . . . . . . . . . . . . . . . . . . . . S. O. Sadjadi and J. H. Hansen 937
Query-by-Example Spoken Term Detection using Frequency Domain Linear Prediction and Non-Segmental DynamicTime Warping http://dx.doi.org/10.1109/TASLP.2014.2311322 . . . . . . . . . . . . . . . . . . .. . . . . . . . . . . . . . . . . . . G. Mantena, S. Achanta, and K. Prahallad 946
On Over-Determined Frequency Domain BSS http://dx.doi.org/10.1109/TASLP.2014.2307166 . . . . . . . . . . . . . . . . . . C. Osterwise and S. L. Grant 956Noise Reduction in the Spherical Harmonic Domain Using a Tradeoff Beamformer and Narrowband DOA Estimates
http://dx.doi.org/10.1109/TASLP.2014.2311925 . . . . . . . . . . . . . . . . . . . . . . . . . . . . . . . . . . . D. P. Jarrett, M. Taseska, E. A. P. Habets, and P. A. Naylor 967Natural Language Generation as Incremental Planning Under Uncertainty: Adaptive Information Presentation forStatistical Dialogue Systems http://dx.doi.org/10.1109/TASL.2014.2315271 . . . . . . . . . . . . . . . . . . . . . . . . . . . . . . V. Rieser, O. Lemon, and S. Keizer 979
CORRESPONDENCE
Comments on “Complete Parallel Narrowband Active Noise Control Systems” http://dx.doi.org/10.1109/TASLP.2014.2311319 . . . . . . . . . . . . . . .. . . . . . . . . . . . . . . . . . . . . . . . . . . . . . . . . . . . . . . . . . . . . . . . . . . . . . . . . . . . . . . . . . . . . . . . . . . . . . . . . . . . . . . . . . . . . . . . . . . . . . . . . J. Cheer and S. J. Elliott 995
Previous Page | Contents | Zoom in | Zoom out | Front Cover | Search Issue | Next Page qqM
Mq
qM
MqM
THE WORLD’S NEWSSTAND®
Previous Page | Contents | Zoom in | Zoom out | Front Cover | Search Issue | Next Page qqM
Mq
qM
MqM
THE WORLD’S NEWSSTAND®

www.signalprocessingsociety.org [15] JULY 2014
MAY 2014 VOLUME 22 NUMBER 5 ITASFA (ISSN 2329-9290)
REGULAR PAPERS
Audio Source Separation and Enhancement
On Over-Determined Frequency Domain BSS http://dx.doi.org/10.1109/TASLP.2014.2307166 . . . . . . . . . . . . . . . . . . C. Osterwise and S. L. Grant 956Noise Reduction in the Spherical Harmonic Domain Using a Tradeoff Beamformer and Narrowband DOA Estimates
http://dx.doi.org/10.1109/TASLP.2014.2311925 . . . . . . . . . . . . . . . . . . . . . . . . . . . . . . . . . . . D. P. Jarrett, M. Taseska, E. A. P. Habets, and P. A. Naylor 967
IEEE TRANSACTIONS ON AUDIO, SPEECH, AND LANGUAGE PROCESSING (ISSN 2329-9290) is published bimonthly in print and monthly online by the Institute of Electrical and Electronics
Engineers, Inc. Responsibility for the contents rests upon the authors and not upon the IEEE, the Society/Council, or its members. 3 Park Avenue, 17th Floor,
New York, NY 10016-5997. 445 Hoes Lane, Piscataway, NJ 08854-4141. +1 732 981 0060. Individual
upon request. Abstracting is permitted with credit to the source. Libraries are permitted to photocopy for private use of patrons, provided the
per-copy fee of $31.00 is paid through the Copyright Clearance Center, 222 Rosewood Drive, Danvers, MA 01923. For all other copying, reprint, or republication permission, write to
Copyrights and Permissions Department, IEEE Publications Administration, 445 Hoes Lane, Piscataway, NJ 08854-4141. Copyright © 2014 by the Institute of Electrical and Electronics
Send address changes to IEEE TRANSACTIONS ON AUDIO,
SPEECH, AND LANGUAGE PROCESSING, IEEE, 445 Hoes Lane, Piscataway, NJ 08854-4141. GST Registration No. 125634188. CPC Sales Agreement #40013087. Return undeliverable
Canada addresses to: Pitney Bowes IMEX, P.O. Box 4332, Stanton Rd., Toronto, ON M5W 3J4, Canada. IEEE prohibits discrimination, harassment and bullying. For more information
visit http://www.ieee.org/nondiscrimination. Printed in U.S.A.
Previous Page | Contents | Zoom in | Zoom out | Front Cover | Search Issue | Next Page qqM
Mq
qM
MqM
THE WORLD’S NEWSSTAND®
Previous Page | Contents | Zoom in | Zoom out | Front Cover | Search Issue | Next Page qqM
Mq
qM
MqM
THE WORLD’S NEWSSTAND®
_________________________

www.signalprocessingsociety.org [16] JULY 2014
Speech Analysis
Stable 1-Norm Error Minimization Based Linear Predictors for Speech Modeling http://dx.doi.org/10.1109/TASLP.2014.2311324 . . . . . . . . . . . .. . . . . . . . . . . . . . . . . . . . . . . . . . . . . . . . . . . . D. Giacobello, Christensen, T. L. Jensen, M. N. Murthi, S. H. Jensen, and M. Moonen 912
Speech Enhancement
Multichannel Noise Reduction in the Karhunen-Loève Expansion Domain http://dx.doi.org/10.1109/TASLP.2014.2311299 . . . . . . . . . . . . . . . . . . . .. . . . . . . . . . . . . . . . . . . . . . . . . . . . . . . . . . . . . . . . . . . . . . . . . . . . . . . . . . . . . . . . Y. Lacouture-Parodi, E. A. P. Habets, J. Chen, and J. Benesty 923
Speech Enhancement with EMD and Hurst-Based Mode Selection http://dx.doi.org/10.1109/TASLP.2014.2312541 . . . . . . . . . . . . . . . . . . . . . . . . . . . . .. . . . . . . . . . . . . . . . . . . . . . . . . . . . . . . . . . . . . . . . . . . . . . . . . . . . . . . . . . . . . . . . . . . . . . . . . . . . . . . . . . . . . . . . . . . . . . L. Zão, R. Coelho, and P. Flandrin 899
Acoustic Modeling for Automatic Speech Recognition
Discriminatively Trained Sparse Inverse Covariance Matrices for Speech Recognition http://dx.doi.org/10.1109/TASLP.2014.2312548 . . . . . . .. . . . . . . . . . . . . . . . . . . . . . . . . . . . . . . . . . . . . . . . . . . . . . . . . . . . . . . . . . . . . . . . . . . . . . . . . . . . . . . . . . . . . . . . . . . . . . . . . . . . . . . . . . . . W. Zhang and P. Fung 873
Speaker Recognition and Characterization
http://dx.doi.org/10.1109/TASLP.2014.2311329 . .. . . . . . . . . . . . . . . . . . . . . . . . . . . . . . . . . . . . . . . . . . . . . . . . . . . . . . . . . . . . . . . . . . . . . . . . . . . . . . . . . . . . . . . . . . . . . . . . . . S. O. Sadjadi and J. H. Hansen 937
Spoken Language Understanding and Computational Semantics
Spoken Knowledge Organization by Semantic Structuring and a Prototype Course Lecture System for PersonalizedLearning http://dx.doi.org/10.1109/TASLP.2014.2310993 . . . . . . . . . . . . . . . . . . . . . . . . . . . . . . . . . . . . . . . . . . . . . . . . . . . . . . . . . . . . . . . . . . . . . . . . . . . . . . . . . . . . . . . . . . . .. . . . . . . . . . . . . . . . . . . . . . . . . . . . . . . . . . . . . . . . . H.-y. Lee, S.-R. Shiang, C.-f. Yeh, Y.-N. Chen, Y. Huang, S.-Y. Kong, and L.-s. Lee 883
Discourse and Dialog
Natural Language Generation as Incremental Planning Under Uncertainty: Adaptive Information Presentation forStatistical Dialogue Systems http://dx.doi.org/10.1109/TASL.2014.2315271 . . . . . . . . . . . . . . . . . . . . . . . . . . . . . . V. Rieser, O. Lemon, and S. Keizer 979
Speech Data Mining and Document Retrieval
Query-by-Example Spoken Term Detection using Frequency Domain Linear Prediction and Non-Segmental DynamicTime Warping http://dx.doi.org/10.1109/TASLP.2014.2311322 . . . . . . . . . . . . . . . . . . .. . . . . . . . . . . . . . . . . . . G. Mantena, S. Achanta, and K. Prahallad 946
CORRESPONDENCE
Active Noise Control, Echo Reduction and Feedback Reduction
Comments on “Complete Parallel Narrowband Active Noise Control Systems” http://dx.doi.org/10.1109/TASLP.2014.2311319 . . . . . . . . . . . . . . .. . . . . . . . . . . . . . . . . . . . . . . . . . . . . . . . . . . . . . . . . . . . . . . . . . . . . . . . . . . . . . . . . . . . . . . . . . . . . . . . . . . . . . . . . . . . . . . . . . . . . . . . . J. Cheer and S. J. Elliott 995
Previous Page | Contents | Zoom in | Zoom out | Front Cover | Search Issue | Next Page qqM
Mq
qM
MqM
THE WORLD’S NEWSSTAND®
Previous Page | Contents | Zoom in | Zoom out | Front Cover | Search Issue | Next Page qqM
Mq
qM
MqM
THE WORLD’S NEWSSTAND®

www.signalprocessingsociety.org [17] JULY 2014
JUNE 2014 VOLUME 22 NUMBER 6 ITASFA (ISSN 2329-9290)
REGULAR PAPERS
http://dx.doi.org/10.1109/TASLP.2014.2313404 . . . . . . . . . . . . . . . . . . . . . . . . . . . . .. . . . . . . . . . . . . . . . . . . . . . . . . . . . . . . . . . . . . . . . . . . . . . . . . . . . . . . . . . . . . . . . . . . . . . . . . . . . . . . . . . . . . . . . . . . . . . . . . . . . . . . . . . . V. Arora and L. Behera 1003
Design of Minimax Broadband Beamformers that are Robust to Microphone Gain, Phase, and Position Errorshttp://dx.doi.org/10.1109/TASLP.2014.2315044 . . . . . . . . . . . . . . . . . . . . . . . . . . . . . . . . . . . . . . . . . . .. . . . . . . . . . . . . . . . . . . . . . . . . . . . . . . . . . . . . . . . . . . R. C. Nongpiur 1013
Binaural Signal Processing Motivated Generalized Analytic Signal Construction and AM-FM Demodulationhttp://dx.doi.org/10.1109/TASLP.2014.2316376 . . . . . . . . . . . . . . . . . . . . . . . . . . . . . . . . . . . . . . . . . . . . . . . . . . . . . . . . . A. Venkitaraman and C. S Seelamantula 1023
IEEE TRANSACTIONS ON AUDIO, SPEECH, AND LANGUAGE PROCESSING (ISSN 2329-9290) is published bimonthly in print and monthly online by the Institute of Electrical and Electronics
Engineers, Inc. Responsibility for the contents rests upon the authors and not upon the IEEE, the Society/Council, or its members. 3 Park Avenue, 17th Floor,
New York, NY 10016-5997. 445 Hoes Lane, Piscataway, NJ 08854-4141. +1 732 981 0060. Individual
upon request. Abstracting is permitted with credit to the source. Libraries are permitted to photocopy for private use of patrons, provided the
per-copy fee of $31.00 is paid through the Copyright Clearance Center, 222 Rosewood Drive, Danvers, MA 01923. For all other copying, reprint, or republication permission, write to
Copyrights and Permissions Department, IEEE Publications Administration, 445 Hoes Lane, Piscataway, NJ 08854-4141. Copyright © 2014 by the Institute of Electrical and Electronics
Send address changes to IEEE TRANSACTIONS ON AUDIO,
SPEECH, AND LANGUAGE PROCESSING, IEEE, 445 Hoes Lane, Piscataway, NJ 08854-4141. GST Registration No. 125634188. CPC Sales Agreement #40013087. Return undeliverable
Canada addresses to: Pitney Bowes IMEX, P.O. Box 4332, Stanton Rd., Toronto, ON M5W 3J4, Canada. IEEE prohibits discrimination, harassment and bullying. For more information
visit http://www.ieee.org/nondiscrimination. Printed in U.S.A.
Previous Page | Contents | Zoom in | Zoom out | Front Cover | Search Issue | Next Page qqM
Mq
qM
MqM
THE WORLD’S NEWSSTAND®
Previous Page | Contents | Zoom in | Zoom out | Front Cover | Search Issue | Next Page qqM
Mq
qM
MqM
THE WORLD’S NEWSSTAND®
_________________________

www.signalprocessingsociety.org [18] JULY 2014
Memory-Enhanced Neural Networks and NMF for Robust ASR http://dx.doi.org/10.1109/TASLP.2014.2318514 . . . . . . . . . . . . . . . . . . . . . . . . . . . . . . . .. . . . . . . . . . . . . . . . . . . . . . . . . . . . . . . . . . . . . . . . . . J. T. Geiger, F. Weninger, J. F. Gemmeke, M. Wöllmer, B. Schuller, and G. Rigoll 1037
Memory Proportionate APA with Individual Activation Factors for Acoustic Echo Cancellationhttp://dx.doi.org/10.1109/TASLP.2014.2318519 . . . . . . . . . . . . . . . . . . . . . . . . . . . . . . . . . . . . . . . . . . . . . . . . . . . . . . H. Zhao, Y. Yu, S. Gao, X. Zeng, and Z. He 1047
Multiview Supervised Dictionary Learning in Speech Emotion Recognition http://dx.doi.org/10.1109/TASLP.2014.2319157 . . . . . . . . . . . . . . . . . . .. . . . . . . . . . . . . . . . . . . . . . . . . . . . . . . . . . . . . . . . . . . . . . . . . . . . . . . . . . . . M. J. Gangeh, P. Fewzee, A. Ghodsi, M. S. Kamel, and F. Karray 1056
Dual-Microphone Voice Activity Detection Technique Based on Two-Step Power Level Difference Ratiohttp://dx.doi.org/10.1109/TASLP.2014.2313917 . . . . . . . . . . . . . . . . . . . . . . . . . . . . . . . . . . . .. . . . . . . . . . . . . . . . . . . . . . . . . . . . . . . . . . . . J.-H. Choi and J.-H. Chang 1069
A Geometric Approach to Sound Source Localization from Time-Delay Estimates http://dx.doi.org/10.1109/TASLP.2014.2317989 . . . . . . . . . . .. . . . . . . . . . . . . . . . . . . . . . . . . . . . . . . . . . . . . . . . . . . . . . . . . . . . . . . . . . . . . . . . . . . . . . . . . . . . . . . . . . . . . . . . . . . . . X. Alameda-Pineda and R. Horaud 1082
Minimum Mutual Information-Based Linearly Constrained Broadband Signal Extraction http://dx.doi.org/10.1109/TASLP.2014.2319155 . . . .. . . . . . . . . . . . . . . . . . . . . . . . . . . . . . . . . . . . . . . . . . . . . . . . . . . . . . . . . . . . . . . . . . . . . . . . . . . K. Reindl, S. Meier, H. Barfuss, and W. Kellermann 1096
http://dx.doi.org/10.1109/TASLP.2014.2325655 . . . . . . . . . . . . . . . . . . . . . . . . . . . . . . . . . . . . . . . 1109Information for Authors http://dx.doi.org/10.1109/TASLP.2014.2325656 . . . . . . . . . . . . . . . . . . . . . . . . . . . . . . . . . . . . . . . . . . . . . . . . . . . . . . . . . . . . . . . . . . . . . . . . . . . . . 1111
Previous Page | Contents | Zoom in | Zoom out | Front Cover | Search Issue | Next Page qqM
Mq
qM
MqM
THE WORLD’S NEWSSTAND®
Previous Page | Contents | Zoom in | Zoom out | Front Cover | Search Issue | Next Page qqM
Mq
qM
MqM
THE WORLD’S NEWSSTAND®

www.signalprocessingsociety.org [19] JULY 2014
Previous Page | Contents | Zoom in | Zoom out | Front Cover | Search Issue | Next Page qqM
Mq
qM
MqM
THE WORLD’S NEWSSTAND®
Previous Page | Contents | Zoom in | Zoom out | Front Cover | Search Issue | Next Page qqM
Mq
qM
MqM
THE WORLD’S NEWSSTAND®

www.signalprocessingsociety.org [20] JULY 2014
MAY 2014 VOLUME 23 NUMBER 5 IIPRE4 (ISSN 1057-7149)
PAPERS
Saliency Tree: A Novel Saliency Detection Framework http://dx.doi.org/10.1109/TIP.2014.2307434 . . . . . . . . Z. Liu, W. Zou, and O. L. Meur 1937LBP-Based Edge-Texture Features for Object Recognition http://dx.doi.org/10.1109/TIP.2014.2310123 . . . . . . . . . . . . . . . . . . . . . . . . . . . . . . . . . . . . . . . . .. . . . . . . . . . . . . . . . . . . . . . . . . . . . . . . . . . . . . . . . . . . . . . . . . . . . . . . . . . . . . . . . . . . . . . . . . . . . . . . . . . . . . . . . . . . . A. Satpathy, X. Jiang, and H.-L. Eng 1953
Fast Space-Varying Convolution Using Matrix Source Coding With Applications to Camera Stray Light Reductionhttp://dx.doi.org/10.1109/TIP.2014.2311657 . . . . . . . . . . . . . . . . . . . . . . . . . . . . . . . . . . . . . . . . . . . . . . . . . . . . . . . . . . J. Wei, C. A. Bouman, and J. P. Allebach 1965
http://dx.doi.org/10.1109/TIP.2014.2310126 . . . . . . . . . . . . . . . . . . . . . . . . . . . . . . . . . . . . . . . . . . . . . . . . . . . . . . . . . . T. H. Thai, R. Cogranne, and F. Retraint 1980http://dx.doi.org/10.1109/TIP.2014.2310117 . . . . . . . . . . . . . . . . . . . . . . . . . . . . . .
. . . . . . . . . . . . . . . . . . . . . . . . . . . . . . . . . . . . . . . . . . . . . . . . . . . . . . . . . . . . . . . . . . . . . . . . . . . . . . . . . . . . . . . . L. Xie, Q. Tian, M. Wang, and B. Zhang 1994http://dx.doi.org/10.1109/TIP.2014.2310992 . .
. . . . . . . . . . . . . . . . . . . . . . . . . . . . . . . . . . . . . . . . . . . . . . . . . . . . . . . . . . . . . . . . . . . . . . . . . . . . . . . . . . . . . Y.-R. Yeh, C.-H. Huang, and Y.-C. F. Wang 2009Click Prediction for Web Image Reranking Using Multimodal Sparse Coding http://dx.doi.org/10.1109/TIP.2014.2311377 . . . . . . . . . . . . . . . . . . .. . . . . . . . . . . . . . . . . . . . . . . . . . . . . . . . . . . . . . . . . . . . . . . . . . . . . . . . . . . . . . . . . . . . . . . . . . . . . . . . . . . . . . . . . . . . . . . . . . . . . . . . . . J. Yu, Y. Rui, and D. Tao 2019
Images as Occlusions of Textures: A Framework for Segmentation http://dx.doi.org/10.1109/TIP.2014.2307475 . . . . . . . . . . . . . . . . . . . . . . . . . . . . . . .. . . . . . . . . . . . . . . . . . . . . . . . . . . . . . . . . . M. T. McCann, D. G. Mixon, M. C. Fickus, C. A. Castro, J. A. Ozolek, and J. Kovacevic 2033
Cross-Indexing of Binary SIFT Codes for Large-Scale Image Search http://dx.doi.org/10.1109/TIP.2014.2312283 . . . . . . . . . . . . . . . . . . . . . . . . . . . . .. . . . . . . . . . . . . . . . . . . . . . . . . . . . . . . . . . . . . . . . . . . . . . . . . . . . . . . . . . . . . . . . . . . . . . . . . . . . . . . . . . Z. Liu, H. Li, L. Zhang, W. Zhou, and Q. Tian 2047
Image-Difference Prediction: From Color to Spectral http://dx.doi.org/10.1109/TIP.2014.2311373 . . . . . . . . . . . . . . . . . . S. L. Moan and P. Urban 2058Full-Reference Quality Estimation for Images With Different Spatial Resolutions http://dx.doi.org/10.1109/TIP.2014.2310991 . . . . . . . . . . . . . . .. . . . . . . . . . . . . . . . . . . . . . . . . . . . . . . . . . . . . . . . . . . . . . . . . . . . . . . . . . . . . . . . . . . . . . . . . . . . A. M. Demirtas, A. R. Reibman, and H. Jafarkhani 2069
Saliency-Based Selection of Gradient Vector Flow Paths for Content Aware Image Resizing http://dx.doi.org/10.1109/TIP.2014.2312649 . . .. . . . . . . . . . . . . . . . . . . . . . . . . . . . . . . . . . . . . . . . . . . . . . . . . . . . . . . . . . . . . . . . . . . . . . . . . . S. Battiato, G. M. Farinella, G. Puglisi, and D. Ravì 2081
Single-Image Superresolution of Natural Stochastic Textures Based on Fractional Brownian Motionhttp://dx.doi.org/10.1109/TIP.2014.2312284 . . . . . . . . . . . . . . . . . . . . . . . . . . . . . . . . .. . . . . . . . . . . . . . . . . . . . . . . . . . . . . . . . . I. Zachevsky and Y. Y. (Josh) Zeevi 2096
Previous Page | Contents | Zoom in | Zoom out | Front Cover | Search Issue | Next Page qqM
Mq
qM
MqM
THE WORLD’S NEWSSTAND®
Previous Page | Contents | Zoom in | Zoom out | Front Cover | Search Issue | Next Page qqM
Mq
qM
MqM
THE WORLD’S NEWSSTAND®
_________________________

www.signalprocessingsociety.org [21] JULY 2014
Online Glocal Transfer for Automatic Figure-Ground Segmentation http://dx.doi.org/10.1109/TIP.2014.2312287 . . . . . . . . . . . . . . . . . . . . . . . . . . . . . .. . . . . . . . . . . . . . . . . . . . . . . . . . . . . . . . . . . . . . . . . . . . . . . . . . . . . . . . . . . . . . . . . . . . . . . . . . . . . . . . . . . . . . W. Zou, C. Bai, K. Kpalma, and J. Ronsin 2109
Learning Joint Intensity-Depth Sparse Representations http://dx.doi.org/10.1109/TIP.2014.2312645 . . . . . . . . . . sic and S. Drewes 2122A Regularized Approach for Geodesic-Based Semisupervised Multimanifold Learning http://dx.doi.org/10.1109/TIP.2014.2312643 . . . . . . . .. . . . . . . . . . . . . . . . . . . . . . . . . . . . . . . . . . . . . . . . . . . . . . . . . . . . . . . . . . . . . . . . . . . . . . . . . . . . . . . M. Fan, X. Zhang, Z. Lin, Z. Zhang, and H. Bao 2133
Residual Component Analysis of Hyperspectral Images-Application to Joint Nonlinear Unmixing and NonlinearityDetection http://dx.doi.org/10.1109/TIP.2014.2312616 . . . . . . . . . . . . . . . . . . . . . . . Y. Altmann, N. Dobigeon, S. McLaughlin, and J.-Y. Tourneret 2148
http://dx.doi.org/10.1109/TIP.2014.2297027 . . . . . . . . . . . . . .. . . . . . . . . . . . . . . . . . . . . . . . . . . . . . . . . . . . . . . . . . . . . . . . . . . . . . . . . . . . . . . . . . . . . . . . . . . . . . . . . . . . . . X. Liu, Q. Xu, J. Ma, H. Jin, and Y. Zhang 2159
MIMO Radar 3D Imaging Based on Combined Amplitude and Total Variation Cost Function With Sequential Order OneNegative Exponential Form http://dx.doi.org/10.1109/TIP.2014.2311735 . . . . . . . . . . . . . . .. . . . . . . . . . . . . . . C. Ma, T. S. Yeo, Y. Zhao, and J. Feng 2168
Persistent Aerial Video Registration and Fast Multi-View Mosaicing http://dx.doi.org/10.1109/TIP.2014.2313183 . . . . E. Molina and Z. Zhu 2184FeatureMatch: A General ANNF Estimation Technique and Its Applications http://dx.doi.org/10.1109/TIP.2014.2309436 . . . . . . . . . . . . . . . . . . . .. . . . . . . . . . . . . . . . . . . . . . . . . . . . . . . . . . . . . . . . . . . . . . . . . . . . . . . . . . . . . . . . . . . . . . . . . . . . . . . . . . . . . . . . . . . . . . . . . S. A. Ramakanth and R. V. Babu 2193
Modeling the Time-Varying Subjective Quality of HTTP Video Streams With Rate Adaptationshttp://dx.doi.org/10.1109/TIP.2014.2312613 . . . . . . . . . . . . C. Chen, L. K. Choi, G. de Veciana, C. Caramanis, R. W. Heath, and A. C. Bovik 2206
Nonlinear Transform for Robust Dense Block-Based Motion Estimation http://dx.doi.org/10.1109/TIP.2014.2314023 . . . . . . . . . . . . . . . . . . . . . . . . .. . . . . . . . . . . . . . . . . . . . . . . . . . . . . . . . . . . . . . . . . . . . . . . . . . . . . . . . . . . . . . . . . . . . . . . . . . . . . . . . . . . . . . . . . . . R. Xu, D. Taubman, and A. T. Naman 2222
Actively Learning Human Gaze Shifting Paths for Semantics-Aware Photo Cropping http://dx.doi.org/10.1109/TIP.2014.2311658 . . . . . . . . . . .. . . . . . . . . . . . . . . . . . . . . . . . . . . . . . . . . . . . . . . . . . . . . . . . . . . . . . . . . . . . . . . . . . . . . . . . . . . . . . L. Zhang, Y. Gao, R. Ji, Y. Xia, Q. Dai, and X. Li 2235
Gaussian Copula Multivariate Modeling for Texture Image Retrieval Using Wavelet Transformshttp://dx.doi.org/10.1109/TIP.2014.2313232 . . . . . . . . . . . . . . . . . . . . . . . . . . . . . . . . . . . . . . . . . . . . . . . . . . . . . . . . . . . . . . . . . . N.-E. Lasmar and Y. Berthoumieu 2246
Coding Visual Features Extracted From Video Sequences http://dx.doi.org/10.1109/TIP.2014.2312617 . . . . . . . . . . . . . . . . . . . . . . . . . . . . . . . . . . . . . . . . . .Cesana, A. Redondi, M. Tagliasacchi, and S. Tubaro 2262
A Fuzzy-Rule-Based Approach for Single Frame Super Resolution http://dx.doi.org/10.1109/TIP.2014.2312289 . . . . . . . . . . . . . . . . . . . . . . . . . . . . . . .. . . . . . . . . . . . . . . . . . . . . . . . . . . . . . . . . . . . . . . . . . . . . . . . . . . . . . . . . . . . . . . . . . . . . . . . . . . . . . . . . . . . . . . . . . . . P. Purkait, N. R. Pal, and B. Chanda 2277
A Probabilistic Graph-Based Framework for Plug-and-Play Multi-Cue Visual Tracking http://dx.doi.org/10.1109/TIP.2014.2312286 . . . . . . . .. . . . . . . . . . . . . . . . . . . . . . . . . . . . . . . . . . . . . . . . . . . . . . . . . . . . . . . . . . . . . . . . . . . . . . . . . . . . . . . . . . . . . . . . . . . . . . . . . S. Feldman-Haber and Y. Keller 2291
http://dx.doi.org/10.1109/TIP.2014.2316377 . . . . . . . . . . . . . . . . . . . .. . . . . . . . . . . . . . . . . . . . . . . . . . . . . . . . . . . E. Ringaby, O. Friman, P.-E. Forssén, T. O. Opsahl, T. V. Haavardsholm, and I. Kåsen 2302
Model-Based Edge Detector for Spectral Imagery Using Sparse Spatiospectral Masks http://dx.doi.org/10.1109/TIP.2014.2315154 . . . . . . . . . .. . . . . . . . . . . . . . . . . . . . . . . . . . . . . . . . . . . . . B. S. Paskaleva, S. E. Godoy, W.-Y. Jang, S. C. Bender, S. Krishna, and M. M. Hayat 2315
Discriminability Limits in Spatio-Temporal Stereo Block Matching http://dx.doi.org/10.1109/TIP.2014.2316420 . . . . . . . . . . . . . . . . . . . . . . . . . . . . . .. . . . . . . . . . . . . . . . . . . . . . . . . . . . . . . . . . . . . . . . . . . . . . . . . . . . . . . . . . . . . . . . . . . . . . . . . . . . . . . . . . . . . . . . . . . . . . . . . . . . . A. K. Jain and T. Q. Nguyen 2328
A Compact Representation for Compressing Converted Stereo Videos http://dx.doi.org/10.1109/TIP.2014.2315958 . . . . . . . . . . . . . . . . . . . . . . . . . . . .. . . . . . . . . . . . . . . . . . . . . . . . . . . . . . . . . . . . . . . . . . . . . . . . . . . . . . . . . . . . . . . . . . . . . . . . . . . . Z. Zhang, C. Zhou, R. Wang, Y. Wang, and W. Gao 2343
Robust Object Tracking via Sparse Collaborative Appearance Model http://dx.doi.org/10.1109/TIP.2014.2313227 . . . . . . . . . . . . . . . . . . . . . . . . . . . . .. . . . . . . . . . . . . . . . . . . . . . . . . . . . . . . . . . . . . . . . . . . . . . . . . . . . . . . . . . . . . . . . . . . . . . . . . . . . . . . . . . . . . . . . . . . . . . . W. Zhong, H. Lu, and M.-H. Yang 2356
Comparison of Image Patches Using Local Moment Invariants http://dx.doi.org/10.1109/TIP.2014.2315923 . . . . . . . . . . . . A. Sit and D. Kihara 2369Derivative-Based Scale Invariant Image Feature Detector With Error Resilience http://dx.doi.org/10.1109/TIP.2014.2315959 . . . . . . . . . . . . . . . . .. . . . . . . . . . . . . . . . . . . . . . . . . . . . . . . . . . . . . . . . . . . . . . . . . . . . . . . . . . . . . . . P. Mainali, G. Lafruit, K. Tack, L. V. Gool, and R. Lauwereins 2380
Segmentation-Driven Image Registration-Application to 4D DCE-MRI Recordings of the Moving Kidneyshttp://dx.doi.org/10.1109/TIP.2014.2315155 . . . . . . . . . . . . . . . . . . . . . . . . . . . . . . . . . . . . . . . . . . . . . . . . . . . . . . . . . . . . . . . . . . . . . . . . . . . . . . . . . . . . . . . . . . . . . . . . . . . . . . . . .. . . . . . . . . . . . . . . . . . . . . . E. Hodneland, E. A. Hanson, A. Lundervold, J. Modersitzki, E. Eikefjord, and A. Z. Munthe-Kaas 2392
A Sequential Framework for Image Change Detection http://dx.doi.org/10.1109/TIP.2014.2309432 . . . . . . . . . . . . . . . . . . . . . . . . . . . . . . . . . . . . . . . . . . . . . .. . . . . . . . . . . . . . . . . . . . . . . . . . . . . . . . . . . . . . . . . . . . . . . . . . . . . . . . . . . . . . . . . . . . . . . . . . . A. J. Lingg, E. Zelnio, F. Garber, and B. D. Rigling 2405
Previous Page | Contents | Zoom in | Zoom out | Front Cover | Search Issue | Next Page qqM
Mq
qM
MqM
THE WORLD’S NEWSSTAND®
Previous Page | Contents | Zoom in | Zoom out | Front Cover | Search Issue | Next Page qqM
Mq
qM
MqM
THE WORLD’S NEWSSTAND®

www.signalprocessingsociety.org [22] JULY 2014
MAY 2014 VOLUME 23 NUMBER 5 IIPRE4 (ISSN 1057-7149)
PAPERS
Statistical-Model Based Methods
http://dx.doi.org/10.1109/TIP.2014.2310126 . . . . . . .. . . . . . . . . . . . . . . . . . . . . . . . . . . . . . . . . . . . . . . . . . . . . . . . . . . . . . . . . . . . . . . . . . . . . . . . . . . . . . . . . . . . . . . . . . . . . . . . . . . . . . . T. H. Thai, R. Cogranne, and F. Retraint 1980
A Regularized Approach for Geodesic-Based Semisupervised Multimanifold Learning http://dx.doi.org/10.1109/TIP.2014.2312643 . . . . . . . . . . . . . . . . . . . . . . .. . . . . . . . . . . . . . . . . . . . . . . . . . . . . . . . . . . . . . . . . . . . . . . . . . . . . . . . . . . . . . . . . . . . . . . . . . . . . . . . . . . . . . . . . . . . . . M. Fan, X. Zhang, Z. Lin, Z. Zhang, and H. Bao 2133
Gaussian Copula Multivariate Modeling for Texture Image Retrieval Using Wavelet Transforms http://dx.doi.org/10.1109/TIP.2014.2313232 . . . . . . . . . . . .. . . . . . . . . . . . . . . . . . . . . . . . . . . . . . . . . . . . . . . . . . . . . . . . . . . . . . . . . . . . . . . . . . . . . . . . . . . . . . . . . . . . . . . . . . . . . . . . . . . . . . . . . . . . . . N.-E. Lasmar and Y. Berthoumieu 2246
Structural-Model Based Methods
Saliency Tree: A Novel Saliency Detection Framework http://dx.doi.org/10.1109/TIP.2014.2307434 . . . . . . . . . . . .. . . . . . . . . . . . Z. Liu, W. Zou, and O. L. Meur 1937
Image and Video Representation
LBP-Based Edge-Texture Features for Object Recognition http://dx.doi.org/10.1109/TIP.2014.2310123 . . . . . . . . . . . . . A. Satpathy, X. Jiang, and H.-L. Eng 1953http://dx.doi.org/10.1109/TIP.2014.2310117 . . . . . . . . . . . . . . . . . . . . . . . . . . . . . . . . . . . . . . . . . . . .
. . . . . . . . . . . . . . . . . . . . . . . . . . . . . . . . . . . . . . . . . . . . . . . . . . . . . . . . . . . . . . . . . . . . . . . . . . . . . . . . . . . . . . . . . . . . . . . . . . . . . . . L. Xie, Q. Tian, M. Wang, and B. Zhang 1994Learning Joint Intensity-Depth Sparse Representations http://dx.doi.org/10.1109/TIP.2014.2312645 . . . . . . . . . . . . . . . . . . . . . . . . . . . . . . . . . I. Tosic and S. Drewes 2122
http://dx.doi.org/10.1109/TIP.2014.2297027 . . . . . . . . . . . . . . . . . . . . . . . . . . . .. . . . . . . . . . . . . . . . . . . . . . . . . . . . . . . . . . . . . . . . . . . . . . . . . . . . . . . . . . . . . . . . . . . . . . . . . . . . . . . . . . . . . . . . . . . . . . . . . . . . . X. Liu, Q. Xu, J. Ma, H. Jin, and Y. Zhang 2159
A Compact Representation for Compressing Converted Stereo Videos http://dx.doi.org/10.1109/TIP.2014.2315958 . . . . . . . . . . . . . . . . . . . . . . . . . . . . . . . . . . . . . . . . .. . . . . . . . . . . . . . . . . . . . . . . . . . . . . . . . . . . . . . . . . . . . . . . . . . . . . . . . . . . . . . . . . . . . . . . . . . . . . . . . . . . . . . . . . . . . Z. Zhang, C. Zhou, R. Wang, Y. Wang, and W. Gao 2343
Comparison of Image Patches Using Local Moment Invariants http://dx.doi.org/10.1109/TIP.2014.2315923 . . . . . . . . . . . . . . . . . . . . . . . . . . A. Sit and D. Kihara 2369
Perception and Quality Models for Images and Video
Image-Difference Prediction: From Color to Spectral http://dx.doi.org/10.1109/TIP.2014.2311373 . . . . . . . . . . . . . . . .. . . . . . . . . . . . . . . . S. L. Moan and P. Urban 2058Full-Reference Quality Estimation for Images With Different Spatial Resolutions http://dx.doi.org/10.1109/TIP.2014.2310991 . . . . . . . . . . . . . . . . . . . . . . . . . . . . .. . . . . . . . . . . . . . . . . . . . . . . . . . . . . . . . . . . . . . . . . . . . . . . . . . . . . . . . . . . . . . . . . . . . . . . . . . . . . . . . . . . . . . . . . . . A. M. Demirtas, A. R. Reibman, and H. Jafarkhani 2069
Modeling the Time-Varying Subjective Quality of HTTP Video Streams With Rate Adaptations http://dx.doi.org/10.1109/TIP.2014.2312613 . . . . . . . . . . . . .. . . . . . . . . . . . . . . . . . . . . . . . . . . . . . . . . . . . . . . . . . . . . . . . . . . . . . . . . . C. Chen, L. K. Choi, G. de Veciana, C. Caramanis, R. W. Heath, and A. C. Bovik 2206
Actively Learning Human Gaze Shifting Paths for Semantics-Aware Photo Cropping http://dx.doi.org/10.1109/TIP.2014.2311658 . . . . . . . . . . . . . . . . . . . . . . . . .. . . . . . . . . . . . . . . . . . . . . . . . . . . . . . . . . . . . . . . . . . . . . . . . . . . . . . . . . . . . . . . . . . . . . . . . . . . . . . . . . . . . . . . . . . . . . . L. Zhang, Y. Gao, R. Ji, Y. Xia, Q. Dai, and X. Li 2235
Previous Page | Contents | Zoom in | Zoom out | Front Cover | Search Issue | Next Page qqM
Mq
qM
MqM
THE WORLD’S NEWSSTAND®
Previous Page | Contents | Zoom in | Zoom out | Front Cover | Search Issue | Next Page qqM
Mq
qM
MqM
THE WORLD’S NEWSSTAND®
_________________________

www.signalprocessingsociety.org [23] JULY 2014
Restoration and Enhancement
Fast Space-Varying Convolution Using Matrix Source Coding With Applications to Camera Stray Light Reductionhttp://dx.doi.org/10.1109/TIP.2014.2311657 . . . . . . . . . . . . . . . . . . . . . . . . . . . . . . . . . . . . . . . . . . . . . . . . . . . . . . . . . . . . . . . . . . . . . . . J. Wei, C. A. Bouman, and J. P. Allebach 1965
Saliency-Based Selection of Gradient Vector Flow Paths for Content Aware Image Resizing http://dx.doi.org/10.1109/TIP.2014.2312649 . . . . . . . . . . . . . . . . .. . . . . . . . . . . . . . . . . . . . . . . . . . . . . . . . . . . . . . . . . . . . . . . . . . . . . . . . . . . . . . . . . . . . . . . . . . . . . . . . . . . . . . . . . . S. Battiato, G. M. Farinella, G. Puglisi, and D. Ravì 2081
Interpolation, Super-Resolution, and Mosaicing
Single-Image Superresolution of Natural Stochastic Textures Based on Fractional Brownian Motion http://dx.doi.org/10.1109/TIP.2014.2312284 . . . . . . . .. . . . . . . . . . . . . . . . . . . . . . . . . . . . . . . . . . . . . . . . . . . . . . . . . . . . . . . . . . . . . . . . . . . . . . . . . . . . . . . . . . . . . . . . . . . . . . . . . . . . . . . . . . . . . I. Zachevsky and Y. Y. (Josh) Zeevi 2096
A Fuzzy-Rule-Based Approach for Single Frame Super Resolution http://dx.doi.org/10.1109/TIP.2014.2312289 . . . . P. Purkait, N. R. Pal, and B. Chanda 2277
Image and Video Multimedia Communications
Nonlinear Transform for Robust Dense Block-Based Motion Estimation http://dx.doi.org/10.1109/TIP.2014.2314023 . . . . . . . . . . . . . . . . . . . . . . . . . . . . . . . . . . . . . .. . . . . . . . . . . . . . . . . . . . . . . . . . . . . . . . . . . . . . . . . . . . . . . . . . . . . . . . . . . . . . . . . . . . . . . . . . . . . . . . . . . . . . . . . . . . . . . . . . . . . . . . . . R. Xu, D. Taubman, and A. T. Naman 2222
Color and Multispectral Imaging
http://dx.doi.org/10.1109/TIP.2014.2316377 . . . . . . . . . . . . . . . . . . . . . . . . . . . . . . . . . .. . . . . . . . . . . . . . . . . . . . . . . . . . . . . . . . . . . . . . . . . . . . . . . . . . . . E. Ringaby, O. Friman, P.-E. Forssén, T. O. Opsahl, T. V. Haavardsholm, and I. Kåsen 2302
Derivative-Based Scale Invariant Image Feature Detector With Error Resilience http://dx.doi.org/10.1109/TIP.2014.2315959 . . . . . . . . . . . . . . . . . . . . . . . . . . . . . .. . . . . . . . . . . . . . . . . . . . . . . . . . . . . . . . . . . . . . . . . . . . . . . . . . . . . . . . . . . . . . . . . . . . . . . . . . . . . . . P. Mainali, G. Lafruit, K. Tack, L. V. Gool, and R. Lauwereins 2380
Stereoscopic and Multiview Processing and Display
Persistent Aerial Video Registration and Fast Multi-View Mosaicing http://dx.doi.org/10.1109/TIP.2014.2313183 . . . . . . . . . . . . . . . . . . . E. Molina and Z. Zhu 2184Discriminability Limits in Spatio-Temporal Stereo Block Matching http://dx.doi.org/10.1109/TIP.2014.2316420 . . . . . . .. . . . . . . A. K. Jain and T. Q. Nguyen 2328
Magnetic Resonance Imaging
Segmentation-Driven Image Registration-Application to 4D DCE-MRI Recordings of the Moving Kidneys http://dx.doi.org/10.1109/TIP.2014.2315155 . .. . . . . . . . . . . . . . . . . . . . . . . . . . . . . . . . . . . . . . . . E. Hodneland, E. A. Hanson, A. Lundervold, J. Modersitzki, E. Eikefjord, and A. Z. Munthe-Kaas 2392
Radar Imaging, Remote Sensing, and Geophysical Imaging
Residual Component Analysis of Hyperspectral Images-Application to Joint Nonlinear Unmixing and Nonlinearity Detectionhttp://dx.doi.org/10.1109/TIP.2014.2312616 . . . . . . . . . . . . . . . . . . . . . . . . .. . . . . . . . . . . . . . . . . . . . . . . . . Y. Altmann, N. Dobigeon, S. McLaughlin, and J.-Y. Tourneret 2148
MIMO Radar 3D Imaging Based on Combined Amplitude and Total Variation Cost Function With Sequential Order One NegativeExponential Form http://dx.doi.org/10.1109/TIP.2014.2311735 . . . . . . . . . . . . . . . . . . . . . . . . . . .. . . . . . . . . . . . . . . . . . . . . . . . . . . C. Ma, T. S. Yeo, Y. Zhao, and J. Feng 2168
Model-Based Edge Detector for Spectral Imagery Using Sparse Spatiospectral Masks http://dx.doi.org/10.1109/TIP.2014.2315154 . . . . . . . . . . . . . . . . . . . . . . . .. . . . . . . . . . . . . . . . . . . . . . . . . . . . . . . . . . . . . . . . . . . . . . . . . . . . . . . B. S. Paskaleva, S. E. Godoy, W.-Y. Jang, S. C. Bender, S. Krishna, and M. M. Hayat 2315
A Sequential Framework for Image Change Detection http://dx.doi.org/10.1109/TIP.2014.2309432 . . . . A. J. Lingg, E. Zelnio, F. Garber, and B. D. Rigling 2405
Region, Boundary, and Shape Analysis
Images as Occlusions of Textures: A Framework for Segmentation http://dx.doi.org/10.1109/TIP.2014.2307475 . . . . . . . . . . . . . . . . . . . . . . . . . . . . . . . . . . . . . . . . . . . . .. . . . . . . . . . . . . . . . . . . . . . . . . . . . . . . . . . . . . . . . . . . . . . . . . . . M. T. McCann, D. G. Mixon, M. C. Fickus, C. A. Castro, J. A. Ozolek, and J. Kovacevic 2033
Online Glocal Transfer for Automatic Figure-Ground Segmentation http://dx.doi.org/10.1109/TIP.2014.2312287 . . . . . . . . . . . . . . . . . . . . . . . . . . . . . . . . . . . . . . . . . . .. . . . . . . . . . . . . . . . . . . . . . . . . . . . . . . . . . . . . . . . . . . . . . . . . . . . . . . . . . . . . . . . . . . . . . . . . . . . . . . . . . . . . . . . . . . . . . . . . . . . . W. Zou, C. Bai, K. Kpalma, and J. Ronsin 2109
Image and Video Interpretation and Understanding
http://dx.doi.org/10.1109/TIP.2014.2310992 . . . . . . . . . . . . . . .. . . . . . . . . . . . . . . . . . . . . . . . . . . . . . . . . . . . . . . . . . . . . . . . . . . . . . . . . . . . . . . . . . . . . . . . . . . . . . . . . . . . . . . . . . . . . . . . . . . . Y.-R. Yeh, C.-H. Huang, and Y.-C. F. Wang 2009
A Probabilistic Graph-Based Framework for Plug-and-Play Multi-Cue Visual Tracking http://dx.doi.org/10.1109/TIP.2014.2312286 . . . . . . . . . . . . . . . . . . . . . .. . . . . . . . . . . . . . . . . . . . . . . . . . . . . . . . . . . . . . . . . . . . . . . . . . . . . . . . . . . . . . . . . . . . . . . . . . . . . . . . . . . . . . . . . . . . . . . . . . . . . . . . . . . . . . . . S. Feldman-Haber and Y. Keller 2291
Robust Object Tracking via Sparse Collaborative Appearance Model http://dx.doi.org/10.1109/TIP.2014.2313227 . . .. . . W. Zhong, H. Lu, and M.-H. Yang 2356
Image and Video Storage and Retrieval
Click Prediction for Web Image Reranking Using Multimodal Sparse Coding http://dx.doi.org/10.1109/TIP.2014.2311377 . . . . . . J. Yu, Y. Rui, and D. Tao 2019Cross-Indexing of Binary SIFT Codes for Large-Scale Image Search http://dx.doi.org/10.1109/TIP.2014.2312283 . . . . . . . . . . . . . . . . . . . . . . . . . . . . . . . . . . . . . . . . . .. . . . . . . . . . . . . . . . . . . . . . . . . . . . . . . . . . . . . . . . . . . . . . . . . . . . . . . . . . . . . . . . . . . . . . . . . . . . . . . . . . . . . . . . . . . . . . . . . Z. Liu, H. Li, L. Zhang, W. Zhou, and Q. Tian 2047
Coding Visual Features Extracted From Video Sequences http://dx.doi.org/10.1109/TIP.2014.2312617 . . . . . . . . . . . . . . . . . . . . . . . . . . . . . . . . . . . . . . . . . . . . . . . . . . . . . . .Cesana, A. Redondi, M. Tagliasacchi, and S. Tubaro 2262
Image and Video Synthesis, Rendering, and Visualization
FeatureMatch: A General ANNF Estimation Technique and Its Applications http://dx.doi.org/10.1109/TIP.2014.2309436 . . . . . . . . . . . . . . . . . . . . . . . . . . . . . . . . . .. . . . . . . . . . . . . . . . . . . . . . . . . . . . . . . . . . . . . . . . . . . . . . . . . . . . . . . . . . . . . . . . . . . . . . . . . . . . . . . . . . . . . . . . . . . . . . . . . . . . . . . . . . . . . . . . S. A. Ramakanth and R. V. Babu 2193
Previous Page | Contents | Zoom in | Zoom out | Front Cover | Search Issue | Next Page qqM
Mq
qM
MqM
THE WORLD’S NEWSSTAND®
Previous Page | Contents | Zoom in | Zoom out | Front Cover | Search Issue | Next Page qqM
Mq
qM
MqM
THE WORLD’S NEWSSTAND®

www.signalprocessingsociety.org [24] JULY 2014
JUNE 2014 VOLUME 23 NUMBER 6 IIPRE4 (ISSN 1057-7149)
PAPERS
Generalized Higher Degree Total Variation (HDTV) Regularization http://dx.doi.org/10.1109/TIP.2014.2315156 . . . . . . . . . . . . . . . . . . . . . . . . . . . . . .. . . . . . . . . . . . . . . . . . . . . . . . . . . . . . . . . . . . . . . . . . . . . . . . . . . . . . . . . . . . . . . . . . . . . . . . . . . . . . . . . . . . . Y. Hu, G. Ongie, S. Ramani, and M. Jacob 2423
Common Feature Discriminant Analysis for Matching Infrared Face Images to Optical Face Imageshttp://dx.doi.org/10.1109/TIP.2014.2315920 . . . . . . . . . . . . . . . . . . . . . . . . . . . . . . . . . . . . . . . . . . . . . . . . . . . . . . . . . . . . . . . . Z. Li, D. Gong, Y. Qiao, and D. Tao 2436
A Locally Adaptive System for the Fusion of Objective Quality Measures http://dx.doi.org/10.1109/TIP.2014.2316379 . . . . . . . . . . . . . . . . . . . . . . .. . . . . . . . . . . . . . . . . . . . . . . . . . . . . . . . . . . . . . . . . . . . . . . . . . . . . . . . . . . . . . . . . . . . . . . . . . . . . . A. Barri, A. Dooms, B. Jansen, and P. Schelkens 2446
Gradient Histogram Estimation and Preservation for Texture Enhanced Image Denoising http://dx.doi.org/10.1109/TIP.2014.2316423 . . . . . .. . . . . . . . . . . . . . . . . . . . . . . . . . . . . . . . . . . . . . . . . . . . . . . . . . . . . . . . . . . . . . . . . . . . . . . . . . . . W. Zuo, L. Zhang, C. Song, D. Zhang, and H. Gao 2459
Q-STAR: A Perceptual Video Quality Model Considering Impact of Spatial, Temporal, and Amplitude Resolutionshttp://dx.doi.org/10.1109/TIP.2014.2303636 . . . . . . . . . . . . . . . . . . . . . . . . . . . . . . . . . . . . . . . . . . . . . . . . . . . . . . . . . . . . . . . . . . . . . . . Y.-F. Ou, Y. Xue, and Y. Wang 2473
Passive Synthetic Aperture Hitchhiker Imaging of Ground Moving Targets-Part 1: Image Formation and VelocityEstimation http://dx.doi.org/10.1109/TIP.2014.2302682 . . . . . . . . . . . . . . . . . . . . . . . . . . . . . . . . . . . . . . . . . . . . . . . . . . . . . . . . . . . . . . . . . . S. Wacks and B. Y 2487
Image Reconstruction From Double Random Projection http://dx.doi.org/10.1109/TIP.2014.2316642 . . . . . . . . Q. Zhang and R. J. Plemmons 2501Cascade Category-Aware Visual Search http://dx.doi.org/10.1109/TIP.2014.2317986 . . . . . . S. Zhang, Q. Tian, Q. Huang, W. Gao, and Y. Rui 2514Distributed Dictionary Learning for Sparse Representation in Sensor Networks http://dx.doi.org/10.1109/TIP.2014.2316373 . . . . . . . . . . . . . . . . .. . . . . . . . . . . . . . . . . . . . . . . . . . . . . . . . . . . . . . . . . . . . . . . . . . . . . . . . . . . . . . . . . . . . . . . . . . . . . . . . . . . . . . . . . J. Liang, M. Zhang, X. Zeng, and G. Yu 2528
Local Learned Dictionaries Optimized to Edge Orientation for Inverse Halftoning http://dx.doi.org/10.1109/TIP.2014.2319732 . . . . . . . . . . . . . .. . . . . . . . . . . . . . . . . . . . . . . . . . . . . . . . . . . . . . . . . . . . . . . . . . . . . . . . . . . . . . . . . . . . . . . . . . . . . . . . . . . . . . . . . . . . . . . . . . . . . . . . . . . C.-H. Son and H. Choo 2542
Combining LBP Difference and Feature Correlation for Texture Description http://dx.doi.org/10.1109/TIP.2014.2316640 . . . . . . . . . . . . . . . . . . . .. . . . . . . . . . . . . . . . . . . . . . . . . . . . . . . . . . . . . . . . . . . . . . . . . . . . . . . . . . . . . . . . . . . . . . . . . . . . . . . X. Hong, G. Zhao, M. Pietikäinen, and X. Chen 2557
A Statistical Prediction Model Based on Sparse Representations for Single Image Super-Resolutionhttp://dx.doi.org/10.1109/TIP.2014.2305844 . . . . . . . . . . . . . . . . . . . . . . . . . . . . . . . . . . . . . . . . . . . . . . . . . . . . . . . . . . . . . . . . . . . . . . . . . . . . . . . . T. Peleg and M. Elad 2569
Receptive Fields Selection for Binary Feature Description http://dx.doi.org/10.1109/TIP.2014.2317981 . . . . . . . . . . . . . . . . . . . . . . . . . . . . . . . . . . . . . . . . .. . . . . . . . . . . . . . . . . . . . . . . . . . . . . . . . . . . . . . . . . . . . . . . . . . . . . . . . . . . . . . . . . . B. Fan, Q. Kong, T. Trzcinski, Z. Wang, C. Pan, and P. Fua 2583
Previous Page | Contents | Zoom in | Zoom out | Front Cover | Search Issue | Next Page qqM
Mq
qM
MqM
THE WORLD’S NEWSSTAND®
Previous Page | Contents | Zoom in | Zoom out | Front Cover | Search Issue | Next Page qqM
Mq
qM
MqM
THE WORLD’S NEWSSTAND®
_________________________

www.signalprocessingsociety.org [25] JULY 2014
A Regularized Model-Based Optimization Framework for Pan-Sharpening http://dx.doi.org/10.1109/TIP.2014.2316641 . . . . . . . . . . . . . . . . . . . . . .. . . . . . . . . . . . . . . . . . . . . . . . . . . . . . . . . . . . . . . . . . . . . . . . . . . . . . . . . . . . . . . . . . . . . . . . . . . . . . . . . . . . . . . . . . . . . . . . . . . . . . . . . H. A. Aly and G. Sharma 2596
Light Illumination and Detection Patterns for Fluorescence Diffuse Optical Tomography Based on Compressive Sensinghttp://dx.doi.org/10.1109/TIP.2014.2300756 . . . . . . . . . . . . . . . . . . . . . . . . . . . . . . . . . . . . . . . . . . . . . . . . . . . . . . . . . . . . . . A. 2609
Saliency Detection for Stereoscopic Images http://dx.doi.org/10.1109/TIP.2014.2305100 . . . . . . . . . . . . . . . . . . . . . . . . . . . . . . . . . . . . . . . . . . . . . . . . . . . . . . . . .. . . . . . . . . . . . . . . . . . . . . . . . . . . . . . . . . . . . . . . . . . . . . . . . . . . . . . . . . . . . . . . . . . . . . . Y. Fang, J. Wang, M. Narwaria, P. L. Callet, and W. Lin 2625
On Scanning Linear Barcodes From Out-of-Focus Blurred Images: A Spatial Domain Dynamic Template MatchingApproach http://dx.doi.org/10.1109/TIP.2014.2319579 . . . . . . . . . . . . . . . . . . . . . . . . . . . . . . . . . . . . . . . . . . . . . . . . . . . . . . . . . . . . L. Chen, H. Man, and H. Jia 2637
Mixed Noise Removal by Weighted Encoding With Sparse Nonlocal Regularization http://dx.doi.org/10.1109/TIP.2014.2317985 . . . . . . . . . . . .. . . . . . . . . . . . . . . . . . . . . . . . . . . . . . . . . . . . . . . . . . . . . . . . . . . . . . . . . . . . . . . . . . . . . . . . . . . . . . . . . . . . . . . . . . . . . . . . . . J. Jiang, L. Zhang, and J. Yang 2651
Unsupervised Post-Nonlinear Unmixing of Hyperspectral Images Using a Hamiltonian Monte Carlo Algorithmhttp://dx.doi.org/10.1109/TIP.2014.2314022 . . . . . . . . . . . . . . . . . . . . . . . . . . . . . . . . . . . . . . . . . . . . . . . . . . . . . Y. Altmann, N. Dobigeon, and J.-Y. Tourneret 2663
An Iterative Compensation Approach Without Linearization of Projector Responses for Multiple-Projector Systemhttp://dx.doi.org/10.1109/TIP.2014.2317979 . . . . . . . . . . . . . . . . . . . . . . . . . . . . . . . . . . . . . . . . . . . . . . I. Miyagawa, Y. Sugaya, H. Arai, and M. Morimoto 2676
High-Dimensional Camera Shake Removal With Given Depth Map http://dx.doi.org/10.1109/TIP.2014.2320368 . . . . . . . . . . . . . . . . . . . . . . . . . . . . . .. . . . . . . . . . . . . . . . . . . . . . . . . . . . . . . . . . . . . . . . . . . . . . . . . . . . . . . . . . . . . . . . . . . . . . . . . . . . . . . . . . . . . . . . . . . . . . . . . . . . . . . . T. Yue, J. Suo, and Q. Dai 2688
Heterogeneity Image Patch Index and Its Application to Consumer Video Summarization http://dx.doi.org/10.1109/TIP.2014.2320814 . . . . .. . . . . . . . . . . . . . . . . . . . . . . . . . . . . . . . . . . . . . . . . . . . . . . . . . . . . . . . . . . . . . . . . . . . . . . . . . . . . . . . . . . . . . . . . . . . . . . . . . . . . . . . C. T. Dang and H. Radha 2704
Sparse Spatial Coding: A Novel Approach to Visual Recognition http://dx.doi.org/10.1109/TIP.2014.2317988 . . . . . . . . . . . . . . . . . . . . . . . . . . . . . . . . .. . . . . . . . . . . . . . . . . . . . . . . . . . . . . . . . . . . . . . . . . . . . . . . . . . . . . . . G. L. Oliveira, E. R. Nascimento, A. W. Vieira, and M. F. M. Campos 2719
Weighted KPCA Degree of Homogeneity Amended Nonclassical Receptive Field Inhibition Model for Salient ContourExtraction in Low-Light-Level Image http://dx.doi.org/10.1109/TIP.2014.2317987 . . . . . . . . . . . . . . . . . . Y. Zhang, J. Han, J. Yue, and L.-F. Bai 2732
TECHNICAL CORRESPONDENCE
Reversible Symmetric Nonexpansive Convolution: An Effective Image Boundary Processing for M-ChannelLifting-Based Linear-Phase Filter Banks http://dx.doi.org/10.1109/TIP.2014.2312647 . . . . . . . . . . . . . . . . . . . . . . . . . . . . . T. Suzuki and M. Ikehara 2744
COMMENTS AND CORRECTIONS
Erratum to “An Unbiased Risk Estimator for Image Denoising in the Presence of Mixed Poisson-Gaussian Noise”http://dx.doi.org/10.1109/TIP.2014.2320453 . . . . . . . . . . . . . . . . . . . . . . . . . . . . . . . . . . . . . . . . . Y. Le Montagner, E. D. Angelini, and J.-C. Olivo-Marin 2750
http://dx.doi.org/10.1109/TIP.2014.2320452 . . . . . . . . . . . . . . . . . . . . . . . . . . . . . . . . . . . .. . . . . . . . . . . . . . . . . . . . . . . . . . . . . . . . . . . . L. Bao, Y. Song, and Q. Yang 2751http://dx.doi.org/10.1109/TIP.2014.2325638 . . . . . . . . . . . . . . . . . . . . . . . . .. . . . . . . . . . . . . . . . . . . . . . . . 2752
Information for Authors http://dx.doi.org/10.1109/TIP.2014.2325637 . . . . . . . . . . . . . . . . . . . . . . . . . . . . . . . . . . . . . . . . . . . . . . . . . . . . . . . . . . . . . . . . . . . . . . . . . . . . . . . 2753
Previous Page | Contents | Zoom in | Zoom out | Front Cover | Search Issue | Next Page qqM
Mq
qM
MqM
THE WORLD’S NEWSSTAND®
Previous Page | Contents | Zoom in | Zoom out | Front Cover | Search Issue | Next Page qqM
Mq
qM
MqM
THE WORLD’S NEWSSTAND®

www.signalprocessingsociety.org [26] JULY 2014
JUNE 2014 VOLUME 23 NUMBER 6 IIPRE4 (ISSN 1057-7149)
PAPERS
Image and Video Sensing and Acquisition
Weighted KPCA Degree of Homogeneity Amended Nonclassical Receptive Field Inhibition Model for Salient Contour Extractionin Low-Light-Level Image http://dx.doi.org/10.1109/TIP.2014.2317987 . . . . . . . . . . . . . . . . . . .. . . . . . . . . . . . . . . . . . . . Y. Zhang, J. Han, J. Yue, and L.-F. Bai 2732
Image and Video Representation
Distributed Dictionary Learning for Sparse Representation in Sensor Networks http://dx.doi.org/10.1109/TIP.2014.2316373 . . . . . . . . . . . . . . . . . . . . . . . . . .. . . . . . . . . . . . . . . . . . . . . . . . . . . . . . . . . . . . . . . . . . . . . . . . . . . . . . . . . . . . . . . . . . . . . . . . . . . . . . . . . . . . . . . . . . . . . . . . . J. Liang, M. Zhang, X. Zeng, and G. Yu 2528
Combining LBP Difference and Feature Correlation for Texture Description http://dx.doi.org/10.1109/TIP.2014.2316640 . . . . . . . . . . . . . . . . . . . . . . . . . . . . .. . . . . . . . . . . . . . . . . . . . . . . . . . . . . . . . . . . . . . . . . . . . . . . . . . . . . . . . . . . . . . . . . . . . . . . . . . . . . . . . . . . . . . . . X. Hong, G. Zhao, M. Pietikäinen, and X. Chen 2557
Receptive Fields Selection for Binary Feature Description http://dx.doi.org/10.1109/TIP.2014.2317981 . . . . . . . . . . . . . . . . . . . . . . . . . . . . . . . . . . . . . . . . . . . . . . . . .. . . . . . . . . . . . . . . . . . . . . . . . . . . . . . . . . . . . . . . . . . . . . . . . . . . . . . . . . . . . . . . . . . . . . . . . . . . . B. Fan, Q. Kong, T. Trzcinski, Z. Wang, C. Pan, and P. Fua 2583
Perception and Quality Models for Images and Video
A Locally Adaptive System for the Fusion of Objective Quality Measures http://dx.doi.org/10.1109/TIP.2014.2316379 . . . . . . . . . . . . . . . . . . . . . . . . . . . . . . . .. . . . . . . . . . . . . . . . . . . . . . . . . . . . . . . . . . . . . . . . . . . . . . . . . . . . . . . . . . . . . . . . . . . . . . . . . . . . . . . . . . . . . . . A. Barri, A. Dooms, B. Jansen, and P. Schelkens 2446
Q-STAR: A Perceptual Video Quality Model Considering Impact of Spatial, Temporal, and Amplitude Resolutionshttp://dx.doi.org/10.1109/TIP.2014.2303636 . . . . . . . . . . . . . . . . . . . . . . . . . . . . . . . . . . . . . . . .. . . . . . . . . . . . . . . . . . . . . . . . . . . . . . . . . . . . . . . Y.-F. Ou, Y. Xue, and Y. Wang 2473
Saliency Detection for Stereoscopic Images http://dx.doi.org/10.1109/TIP.2014.2305100 . .. . Y. Fang, J. Wang, M. Narwaria, P. L. Callet, and W. Lin 2625
Restoration and Enhancement
Gradient Histogram Estimation and Preservation for Texture Enhanced Image Denoising http://dx.doi.org/10.1109/TIP.2014.2316423 . . . . . . . . . . . . . . .. . . . . . . . . . . . . . . . . . . . . . . . . . . . . . . . . . . . . . . . . . . . . . . . . . . . . . . . . . . . . . . . . . . . . . . . . . . . . . . . . . . . . W. Zuo, L. Zhang, C. Song, D. Zhang, and H. Gao 2459
Mixed Noise Removal by Weighted Encoding With Sparse Nonlocal Regularization http://dx.doi.org/10.1109/TIP.2014.2317985 . . . . . . . . . . . . . . . . . . . .. . . . . . . . . . . . . . . . . . . . . . . . . . . . . . . . . . . . . . . . . . . . . . . . . . . . . . . . . . . . . . . . . . . . . . . . . . . . . . . . . . . . . . . . . . . . . . . . . . . . . . . . . . . J. Jiang, L. Zhang, and J. Yang 2651
High-Dimensional Camera Shake Removal With Given Depth Map http://dx.doi.org/10.1109/TIP.2014.2320368 . . . . . . . . . T. Yue, J. Suo, and Q. Dai 2688
Interpolation, Super-Resolution, and Mosaicing
A Statistical Prediction Model Based on Sparse Representations for Single Image Super-Resolution http://dx.doi.org/10.1109/TIP.2014.2305844 . . .. . . . . . . . . . . . . . . . . . . . . . . . . . . . . . . . . . . . . . . . . . . . . . . . . . . . . . . . . . . . . . . . . . . . . . . . . . . . . . . . . . . . . . . . . . . . . . . . . . . . . . . . . . . . . . . . . . . . . . T. Peleg and M. Elad 2569
Previous Page | Contents | Zoom in | Zoom out | Front Cover | Search Issue | Next Page qqM
Mq
qM
MqM
THE WORLD’S NEWSSTAND®
Previous Page | Contents | Zoom in | Zoom out | Front Cover | Search Issue | Next Page qqM
Mq
qM
MqM
THE WORLD’S NEWSSTAND®
_________________________

www.signalprocessingsociety.org [27] JULY 2014
Printing and Halftoning
Local Learned Dictionaries Optimized to Edge Orientation for Inverse Halftoning http://dx.doi.org/10.1109/TIP.2014.2319732 . . . . . . . . . . . . . . . . . . . . . . .. . . . . . . . . . . . . . . . . . . . . . . . . . . . . . . . . . . . . . . . . . . . . . . . . . . . . . . . . . . . . . . . . . . . . . . . . . . . . . . . . . . . . . . . . . . . . . . . . . . . . . . . . . . . . . . . . . . C.-H. Son and H. Choo 2542
Scanned Document Analysis, Processing, and Coding
On Scanning Linear Barcodes From Out-of-Focus Blurred Images: A Spatial Domain Dynamic Template Matching Approachhttp://dx.doi.org/10.1109/TIP.2014.2319579 . . . . . . . . . . . . . . . . . . . . . . . . . . . . . . . . . . . . . . . . . . . . . . . . . . . . . . . . . . . . . . . . . . . . . . . . . . . . . . . L. Chen, H. Man, and H. Jia 2637
Stereoscopic and Multiview Processing and Display
An Iterative Compensation Approach Without Linearization of Projector Responses for Multiple-Projector Systemhttp://dx.doi.org/10.1109/TIP.2014.2317979 . . . . . . . . . . . . . . . . . . . . . . . . . . . . . . . . . . . . . . . . . . . . . . . . . . . . . . I. Miyagawa, Y. Sugaya, H. Arai, and M. Morimoto 2676
Tomographic Imaging
Passive Synthetic Aperture Hitchhiker Imaging of Ground Moving Targets-Part 1: Image Formation and Velocity Estimationhttp://dx.doi.org/10.1109/TIP.2014.2302682 . . . . . . . . . . . . . . . . . . . . . . . . . . . . . . . . . . . . . . . . . . . . . . . . . . . . . . . . . . . . . . . . . . . . . . . . . . . . . . . . . . . . . . S. Wacks and B. Y 2487
Light Illumination and Detection Patterns for Fluorescence Diffuse Optical Tomography Based on Compressive Sensinghttp://dx.doi.org/10.1109/TIP.2014.2300756 . . . . . . . . . . . . . . . . . . . . . . . . . . . . . . . . . . . . . . . . . . . . . . . . . . . . . . . . . . . . . . . . . . . . . . A. 2609
Magnetic Resonance Imaging
Generalized Higher Degree Total Variation (HDTV) Regularization http://dx.doi.org/10.1109/TIP.2014.2315156 . . . . . . . . . . . . . . . . . . . . . . . . . . . . . . . . . . . . . .. . . . . . . . . . . . . . . . . . . . . . . . . . . . . . . . . . . . . . . . . . . . . . . . . . . . . . . . . . . . . . . . . . . . . . . . . . . . . . . . . . . . . . . . . . . . . . Y. Hu, G. Ongie, S. Ramani, and M. Jacob 2423
Radar Imaging, Remote Sensing, and Geophysical Imaging
Image Reconstruction From Double Random Projection http://dx.doi.org/10.1109/TIP.2014.2316642 . . . . . . . . . . . . . . . . . Q. Zhang and R. J. Plemmons 2501A Regularized Model-Based Optimization Framework for Pan-Sharpening http://dx.doi.org/10.1109/TIP.2014.2316641 . . . . . . . . . . . . . . . . . . . . . . . . . . . . . . .. . . . . . . . . . . . . . . . . . . . . . . . . . . . . . . . . . . . . . . . . . . . . . . . . . . . . . . . . . . . . . . . . . . . . . . . . . . . . . . . . . . . . . . . . . . . . . . . . . . . . . . . . . . . . . . . . H. A. Aly and G. Sharma 2596
Unsupervised Post-Nonlinear Unmixing of Hyperspectral Images Using a Hamiltonian Monte Carlo Algorithmhttp://dx.doi.org/10.1109/TIP.2014.2314022 . . . . . . . . . . . . . . . . . . . . . . . . . . . . . . .. . . . . . . . . . . . . . . . . . . . . . . . . . . . . . . Y. Altmann, N. Dobigeon, and J.-Y. Tourneret 2663
Image and Video Interpretation and Understanding
Heterogeneity Image Patch Index and Its Application to Consumer Video Summarization http://dx.doi.org/10.1109/TIP.2014.2320814 . . . . . . . . . . . . . .. . . . . . . . . . . . . . . . . . . . . . . . . . . . . . . . . . . . . . . . . . . . . . . . . . . . . . . . . . . . . . . . . . . . . . . . . . . . . . . . . . . . . . . . . . . . . . . . . . . . . . . . . . . . . . . . . C. T. Dang and H. Radha 2704
Sparse Spatial Coding: A Novel Approach to Visual Recognition http://dx.doi.org/10.1109/TIP.2014.2317988 . . . . . . . . . . . . . . . . . . . . . . . . . . . . . . . . . . . . . . . . .. . . . . . . . . . . . . . . . . . . . . . . . . . . . . . . . . . . . . . . . . . . . . . . . . . . . . . . . . . . . . . . . G. L. Oliveira, E. R. Nascimento, A. W. Vieira, and M. F. M. Campos 2719
Image and Video Biometric Analysis
Common Feature Discriminant Analysis for Matching Infrared Face Images to Optical Face Images http://dx.doi.org/10.1109/TIP.2014.2315920 . .. . . . . . . . . . . . . . . . . . . . . . . . . . . . . . . . . . . . . . . . . . . . . . . . . . . . . . . . . . . . . . . . . . . . . . . . . . . . . . . . . . . . . . . . . . . . . . . . . . . . . Z. Li, D. Gong, Y. Qiao, and D. Tao 2436
Image and Video Storage and Retrieval
Cascade Category-Aware Visual Search http://dx.doi.org/10.1109/TIP.2014.2317986 . . . . . . .. . . . . . . . S. Zhang, Q. Tian, Q. Huang, W. Gao, and Y. Rui 2514
TECHNICAL CORRESPONDENCE
Lossy Coding of Images and Video
Reversible Symmetric Nonexpansive Convolution: An Effective Image Boundary Processing for M-Channel Lifting-BasedLinear-Phase Filter Banks http://dx.doi.org/10.1109/TIP.2014.2312647 . . . . . . . . . . . . . . . . . . . . . . . . . . .. . . . . . . . . . . . . . . . . . . . . . . . . . . T. Suzuki and M. Ikehara 2744
COMMENTS AND CORRECTIONS
Erratum to “An Unbiased Risk Estimator for Image Denoising in the Presence of Mixed Poisson-Gaussian Noise”http://dx.doi.org/10.1109/TIP.2014.2320453 . . . . . . . . . . . . . . . . . . . . . . . . .. . . . . . . . . . . . . . . . . . . . . . . . . Y. Le Montagner, E. D. Angelini, and J.-C. Olivo-Marin 2750
http://dx.doi.org/10.1109/TIP.2014.2320452 . . . . . . . . . . . . . . . . . . . . . . . . . . . . . . . . . . . . . . . .. . . . . . . . . . . . . . . . . . . . . . . . . . . . . . . . . . . . . . . . L. Bao, Y. Song, and Q. Yang 2751http://dx.doi.org/10.1109/TIP.2014.2325638 . . . . . . . . . . . . . . . . . . . . . . . . . . . .. . . . . . . . . . . . . . . . . . . . . . . . . . . . 2752
Information for Authors http://dx.doi.org/10.1109/TIP.2014.2325637 . . . . . . . . . . . . . . . . . . . . . . . . . . . . . . . . . . . . . . . . . . . . . . . . . . . . . . . . . . . . . . . . . . . . . . . . . . . . . . . . . . . . . . 2753
Previous Page | Contents | Zoom in | Zoom out | Front Cover | Search Issue | Next Page qqM
Mq
qM
MqM
THE WORLD’S NEWSSTAND®
Previous Page | Contents | Zoom in | Zoom out | Front Cover | Search Issue | Next Page qqM
Mq
qM
MqM
THE WORLD’S NEWSSTAND®

www.signalprocessingsociety.org [28] JULY 2014
MAY 2014 VOLUME 9 NUMBER 5 ITIFA6 (ISSN 1556-6013)
OVERVIEW ARTICLE
Brain Waves for Automatic Biometric-Based User Recognition http://dx.doi.org/10.1109/TIFS.2014.2308640 . . . . . . . . . . . . . . . . . . . . . . . . . . . . . . . . . .. . . . . . . . . . . . . . . . . . . . . . . . . . . . . . . . . . . . . . . . . . . . . . . . . . . . . . . . . . . . . . . . . . . . . . . . . . . . . . . . . . . . . . . . . . . . . . . . . . . . . P. Campisi and D. La Rocca 782
REGULAR PAPERS
Video Steganalysis Against Motion Vector-Based Steganography by Adding or Subtracting One Motion Vector Valuehttp://dx.doi.org/10.1109/TIFS.2014.2308633 . . . . . . . . . . . . . . . . . . . . . . . . . . . . . . . . . . . . . . . . . . . . . . . . . . . . . . . . . . . . . . . . . . . K. Wang, H. Zhao, and H. Wang 741
Effect of Image Downsampling on Steganographic Security http://dx.doi.org/10.1109/TIFS.2014.2309054 . . . . . . J. Kodovský and J. Fridrich 752CP-ABE With Constant-Size Keys for Lightweight Devices http://dx.doi.org/10.1109/TIFS.2014.2309858 . . . . . . . . . . . . . . . . . . . . . . . . . . . . . . . . . . . . . .. . . . . . . . . . . . . . . . . . . . . . . . . . . . . . . . . . . . . . . . . . . . . . . . . . . . . . . . . . . . . . . . . . . F. Guo, Y. Mu, W. Susilo, D. S. Wong, and V. Varadharajan 763
Defense Against Primary User Emulation Attacks in Cognitive Radio Networks Using Advanced Encryption Standardhttp://dx.doi.org/10.1109/TIFS.2014.2310355 . . . . . . . . . . . . . . . . . . . . . . . . . . . . . . . . . . . . . . . . . . . . . . . . . . A. Alahmadi, M. Abdelhakim, J. Ren, and T. Li 772
Secure Transmission Using MIMO Precoding http://dx.doi.org/10.1109/TIFS.2014.2309211 . . . . . . . . . . . . . . C.-H. Lin, S.-H. Tsai, and Y.-P. Lin 801http://dx.doi.org/10.1109/TIFS.2014.2312817 . . . . . .. . . . . . L. Guo, J. Ni, and Y. Q. Shi 814
3D Assisted Face Recognition: Dealing With Expression Variations http://dx.doi.org/10.1109/TIFS.2014.2309851 . . . . . . . . . . . . . . . . . . . . . . . . . . . . .. . . . . . . . . . . . . . . . . . . . . . . . . . . . . . . . . . . . . . . . . . . . . . . . . . . . . . . . . . . . . . . . . . . . . . . . . . . . . . . . . . . . . . . . . . . . . . . . . N. Erdogmus and J.-L. Dugelay 826
Amplify-and-Forward Compressed Sensing as a Physical-Layer Secrecy Solution in Wireless Sensor Networkshttp://dx.doi.org/10.1109/TIFS.2014.2309855 . . . . . . . . . . . . . . . . . . . . .. . . . . . . . . . . . . . . . . . . . . J. E. Barceló-Lladó, A. Morell, and G. Seco-Granados 839
Unraveling the Effect of Textured Contact Lenses on Iris Recognition http://dx.doi.org/10.1109/TIFS.2014.2313025 . . . . . . . . . . . . . . . . . . . . . . . . . . .. . . . . . . . . . . . . . . . . . . . . . . . . . . . . . . . . . . . . . . . . . . . . . . . . . D. Yadav, N. Kohli, J. S. Doyle, Jr., R. Singh, M. Vatsa, and K. W. Bowyer 851
Adaptively Splitted GMM With Feedback Improvement for the Task of Background Subtractionhttp://dx.doi.org/10.1109/TIFS.2014.2313919 . . . . . . . . . . . . . . . . . . . . . . . . . . . . . . . . . . . . . . . . . . . . R. H. Evangelio, M. Pätzold, I. Keller, and T. Sikora 863
The Spammed Code Offset Method http://dx.doi.org/10.1109/TIFS.2014.2312851 . . . . . . . . . . . . . . . . . .. . . . . . . . . . . . . . . . . B. Skoric and N. de Vreede 875
Previous Page | Contents | Zoom in | Zoom out | Front Cover | Search Issue | Next Page qqM
Mq
qM
MqM
THE WORLD’S NEWSSTAND®
Previous Page | Contents | Zoom in | Zoom out | Front Cover | Search Issue | Next Page qqM
Mq
qM
MqM
THE WORLD’S NEWSSTAND®
_________________________

www.signalprocessingsociety.org [29] JULY 2014
MAY 2014 VOLUME 9 NUMBER 5 ITIFA6 (ISSN 1556-6013)
OVERVIEW ARTICLE
Brain Waves for Automatic Biometric-Based User Recognition http://dx.doi.org/10.1109/TIFS.2014.2308640 . . . . . . . . . . . . . . . . . . . . . . . . . . . . . . . . . .. . . . . . . . . . . . . . . . . . . . . . . . . . . . . . . . . . . . . . . . . . . . . . . . . . . . . . . . . . . . . . . . . . . . . . . . . . . . . . . . . . . . . . . . . . . . . . . . . . . . . P. Campisi and D. La Rocca 782
REGULAR PAPERS
Anonymization and Data Privacy
The Spammed Code Offset Method http://dx.doi.org/10.1109/TIFS.2014.2312851 . . . . . . . . . . . . . . . . . .. . . . . . . . . . . . . . . . . B. Skoric and N. de Vreede 875
Applied Cryptography
CP-ABE With Constant-Size Keys for Lightweight Devices http://dx.doi.org/10.1109/TIFS.2014.2309858 . . . . . . . . . . . . . . . . . . . . . . . . . . . . . . . . . . . . . .. . . . . . . . . . . . . . . . . . . . . . . . . . . . . . . . . . . . . . . . . . . . . . . . . . . . . . . . . . . . . . . . . . . F. Guo, Y. Mu, W. Susilo, D. S. Wong, and V. Varadharajan 763
Biometrics
3D Assisted Face Recognition: Dealing With Expression Variations http://dx.doi.org/10.1109/TIFS.2014.2309851 . . . . . . . . . . . . . . . . . . . . . . . . . . . . .. . . . . . . . . . . . . . . . . . . . . . . . . . . . . . . . . . . . . . . . . . . . . . . . . . . . . . . . . . . . . . . . . . . . . . . . . . . . . . . . . . . . . . . . . . . . . . . . . N. Erdogmus and J.-L. Dugelay 826
Unraveling the Effect of Textured Contact Lenses on Iris Recognition http://dx.doi.org/10.1109/TIFS.2014.2313025 . . . . . . . . . . . . . . . . . . . . . . . . . . .. . . . . . . . . . . . . . . . . . . . . . . . . . . . . . . . . . . . . . . . . . . . . . . . . . D. Yadav, N. Kohli, J. S. Doyle, Jr., R. Singh, M. Vatsa, and K. W. Bowyer 851
Communication and Physical-Layer Security
Secure Transmission Using MIMO Precoding http://dx.doi.org/10.1109/TIFS.2014.2309211 . . . . . . . . . . . . . . C.-H. Lin, S.-H. Tsai, and Y.-P. Lin 801Amplify-and-Forward Compressed Sensing as a Physical-Layer Secrecy Solution in Wireless Sensor Networks
http://dx.doi.org/10.1109/TIFS.2014.2309855 . . . . . . . . . . . . . . . . . . . . .. . . . . . . . . . . . . . . . . . . . . J. E. Barceló-Lladó, A. Morell, and G. Seco-Granados 839
Network Security
Defense Against Primary User Emulation Attacks in Cognitive Radio Networks Using Advanced Encryption Standardhttp://dx.doi.org/10.1109/TIFS.2014.2310355 . . . . . . . . . . . . . . . . . . . . . . . . . . . . . . . . . . . . . . . . . . . . . . . . . . A. Alahmadi, M. Abdelhakim, J. Ren, and T. Li 772
Previous Page | Contents | Zoom in | Zoom out | Front Cover | Search Issue | Next Page qqM
Mq
qM
MqM
THE WORLD’S NEWSSTAND®
Previous Page | Contents | Zoom in | Zoom out | Front Cover | Search Issue | Next Page qqM
Mq
qM
MqM
THE WORLD’S NEWSSTAND®
_________________________

www.signalprocessingsociety.org [30] JULY 2014
Steganography and Covert Communications
Video Steganalysis Against Motion Vector-Based Steganography by Adding or Subtracting One Motion Vector Valuehttp://dx.doi.org/10.1109/TIFS.2014.2308633 . . . . . . . . . . . . . . . . . . . . . . . . . . . . . . . . . . . . . . . . . . . . . . . . . . . . . . . . . . . . . . . . . . . K. Wang, H. Zhao, and H. Wang 741
Effect of Image Downsampling on Steganographic Security http://dx.doi.org/10.1109/TIFS.2014.2309054 . . . . . . J. Kodovský and J. Fridrich 752http://dx.doi.org/10.1109/TIFS.2014.2312817 . . . . . .. . . . . . L. Guo, J. Ni, and Y. Q. Shi 814
Surveillance
Adaptively Splitted GMM With Feedback Improvement for the Task of Background Subtractionhttp://dx.doi.org/10.1109/TIFS.2014.2313919 . . . . . . . . . . . . . . . . . . . . . . . . . . . . . . . . . . . . . . . . . . . . R. H. Evangelio, M. Pätzold, I. Keller, and T. Sikora 863
Previous Page | Contents | Zoom in | Zoom out | Front Cover | Search Issue | Next Page qqM
Mq
qM
MqM
THE WORLD’S NEWSSTAND®
Previous Page | Contents | Zoom in | Zoom out | Front Cover | Search Issue | Next Page qqM
Mq
qM
MqM
THE WORLD’S NEWSSTAND®

www.signalprocessingsociety.org [31] JULY 2014
JUNE 2014 VOLUME 9 NUMBER 6 ITIFA6 (ISSN 1556-6013)
PAPERS
Captcha as Graphical Passwords-A New Security Primitive Based on Hard AI Problems http://dx.doi.org/10.1109/TIFS.2014.2312547 . . . . . .. . . . . . . . . . . . . . . . . . . . . . . . . . . . . . . . . . . . . . . . . . . . . . . . . . . . . . . . . . . . . . . . . . . . . . . . . . . . . . . . . B. B. Zhu, J. Yan, G. Bao, M. Yang, and N. Xu 891
Active Content Fingerprinting http://dx.doi.org/10.1109/TIFS.2014.2315531 . . . . . . . . . . . . . . . . . . . . . . . . . . . . F. Farhadzadeh and S. Voloshynovskiy 905
Unclonable Functions http://dx.doi.org/10.1109/TIFS.2014.2315743 . . . . . . L. Zhang, Z. H. Kong, C.-H. Chang, A. Cabrini, and G. Torelli 921http://dx.doi.org/10.1109/TIFS.2014.2316472 . . . . . . . . . . . . . . . . . . . . N. Sae-Bae and N. Memon 933
A New Sketch Method for Measuring Host Connection Degree Distribution http://dx.doi.org/10.1109/TIFS.2014.2312544 . . . . . . . . . . . . . . . . . . . .. . . . . . . . . . . . . . . . . . . . . . . . . . . . . . . . . . . . . . . . . . . . . . . . . . . . . . . . . . . . . . . . . . . . . . . . . . . . . . . . . . P. Wang, X. Guan, J. Zhao, J. Tao, and T. Qin 948
A Robust Grouping Proof Protocol for RFID EPC C1G2 Tags http://dx.doi.org/10.1109/TIFS.2014.2316338 . . . . . . . . . . . . . . . . . . . . . . . . . . . . . . . . . . . .. . . . . . . . . . . . . . . . . . . . . . . . . . . . . . . . . . . . . . . . . . . . . . . . . . . . . . . . . . . . . . . . . . . . . . . . . . S. Sundaresan, R. Doss, S. Piramuthu, and W. Zhou 961
SybilBelief: A Semi-Supervised Learning Approach for Structure-Based Sybil Detection http://dx.doi.org/10.1109/TIFS.2014.2316975 . . . . .. . . . . . . . . . . . . . . . . . . . . . . . . . . . . . . . . . . . . . . . . . . . . . . . . . . . . . . . . . . . . . . . . . . . . . . . . . . . . . . . . . . . . . . . . . . . N. Z. Gong, M. Frank, and P. Mittal 976
Detection of Abnormal Visual Events via Global Optical Flow Orientation Histogram http://dx.doi.org/10.1109/TIFS.2014.2315971 . . . . . . . . .. . . . . . . . . . . . . . . . . . . . . . . . . . . . . . . . . . . . . . . . . . . . . . . . . . . . . . . . . . . . . . . . . . . . . . . . . . . . . . . . . . . . . . . . . . . . . . . . . . . . . . . . . . T. Wang and H. Snoussi 988
Exploiting the Incomplete Diffusion Feature: A Specialized Analytical Side-Channel Attack Against the AES and ItsApplication to Microcontroller Implementations http://dx.doi.org/10.1109/TIFS.2014.2315534 . . . . . . . . . . . . . . . . . . . . . . . . . . . . . . . . . . . . . . . . . . . . . . . .. . . . . . . . . . . . . . . . . . . . . . . . . . . . . . . . . . . . . . . . . . . . . . . . . . . . . S. Guo, X. Zhao, F. Zhang, T. Wang, Z. Shi, F.-X. Standaert, and C. Ma 999
Thermal Facial Analysis for Deception Detection http://dx.doi.org/10.1109/TIFS.2014.2317309 . . . . . . .. . . . . . . B. A. Rajoub and R. Zwiggelaar 1015Keyless Authentication in a Noisy Model http://dx.doi.org/10.1109/TIFS.2014.2320634 . . . . . . . . . . . . . . . . . . . . . . . . .. . . . . . . . . . . . . . . . . . . . . . . . . S. Jiang 1024
http://dx.doi.org/10.1109/TIFS.2014.10.1109/TIFS.2014.2323174 . . . . . . . . . . . . . . . . . . . . . . . . . . . . . . . . 1034Information for Authors http://dx.doi.org/10.1109/TIFS.2014.2323173 . . . . . . . . . . . . . . . . . . . . . . . . . . . . . . . . . . . . . . . . . . . . . . . . . . . . . . . . . . . . . . . . . . . . . . . . . . . . . . 1035
ANNOUNCEMENTS
Call for Papers—IEEE TRANSACTIONS ON INFORMATION FORENSICS AND SECURITY http://dx.doi.org/10.1109/TIFS.2014.2324431 . . . . . . . . . 1037Call for Papers—IEEE JOURNAL OF SELECTED TOPICS IN SIGNAL PROCESSING http://dx.doi.org/10.1109/TIFS.2014.2323156 . . . . . . . . .. . . . . . . . 1038Call for Papers—IEEE JOURNAL OF SELECTED TOPICS IN SIGNAL PROCESSING http://dx.doi.org/10.1109/TIFS.2014.2323157 . . . . . . . . .. . . . . . . . 1039IEEE Open Access Publishing http://dx.doi.org/10.1109/TIFS.2014.2323159 . . . . . . . . . . . . . . . . . . . . . . . . . . . . . . . . . . . . . . . . . . . . . . . . . . . . . . . . . . . . . . . . . . . . . . . 1040
Previous Page | Contents | Zoom in | Zoom out | Front Cover | Search Issue | Next Page qqM
Mq
qM
MqM
THE WORLD’S NEWSSTAND®
Previous Page | Contents | Zoom in | Zoom out | Front Cover | Search Issue | Next Page qqM
Mq
qM
MqM
THE WORLD’S NEWSSTAND®
_________________________

www.signalprocessingsociety.org [32] JULY 2014
JUNE 2014 VOLUME 9 NUMBER 6 ITIFA6 (ISSN 1556-6013)
PAPERS
Applied Cryptography
Exploiting the Incomplete Diffusion Feature: A Specialized Analytical Side-Channel Attack Against the AES and ItsApplication to Microcontroller Implementations http://dx.doi.org/10.1109/TIFS.2014.2315534 . . . . . . . . . . . . . . . . . . . . . . . . . . . . . . . . . . . . . . . . . . . . . . . .. . . . . . . . . . . . . . . . . . . . . . . . . . . . . . . . . . . . . . . . . . . . . . . . . . . . . S. Guo, X. Zhao, F. Zhang, T. Wang, Z. Shi, F.-X. Standaert, and C. Ma 999
Biometrics
http://dx.doi.org/10.1109/TIFS.2014.2316472 . . . . . . . . . . . . . . . . . . . . N. Sae-Bae and N. Memon 933
Forensics Analysis
Thermal Facial Analysis for Deception Detection http://dx.doi.org/10.1109/TIFS.2014.2317309 . . . . . . .. . . . . . . B. A. Rajoub and R. Zwiggelaar 1015
Hardware Security
Unclonable Functions http://dx.doi.org/10.1109/TIFS.2014.2315743 . . . . . . L. Zhang, Z. H. Kong, C.-H. Chang, A. Cabrini, and G. Torelli 921
Information Theoretic Security
Captcha as Graphical Passwords-A New Security Primitive Based on Hard AI Problems http://dx.doi.org/10.1109/TIFS.2014.2312547 . . . . . .. . . . . . . . . . . . . . . . . . . . . . . . . . . . . . . . . . . . . . . . . . . . . . . . . . . . . . . . . . . . . . . . . . . . . . . . . . . . . . . . . B. B. Zhu, J. Yan, G. Bao, M. Yang, and N. Xu 891
Keyless Authentication in a Noisy Model http://dx.doi.org/10.1109/TIFS.2014.2320634 . . . . . . . . . . . . . . . . . . . . . . . . .. . . . . . . . . . . . . . . . . . . . . . . . . S. Jiang 1024
Previous Page | Contents | Zoom in | Zoom out | Front Cover | Search Issue | Next Page qqM
Mq
qM
MqM
THE WORLD’S NEWSSTAND®
Previous Page | Contents | Zoom in | Zoom out | Front Cover | Search Issue | Next Page qqM
Mq
qM
MqM
THE WORLD’S NEWSSTAND®
_________________________

www.signalprocessingsociety.org [33] JULY 2014
Multimedia Content Hash
Active Content Fingerprinting http://dx.doi.org/10.1109/TIFS.2014.2315531 . . . . . . . . . . . . . . . . . . . . . . . . . . . . F. Farhadzadeh and S. Voloshynovskiy 905
Network Security
A New Sketch Method for Measuring Host Connection Degree Distribution http://dx.doi.org/10.1109/TIFS.2014.2312544 . . . . . . . . . . . . . . . . . . . .. . . . . . . . . . . . . . . . . . . . . . . . . . . . . . . . . . . . . . . . . . . . . . . . . . . . . . . . . . . . . . . . . . . . . . . . . . . . . . . . . . P. Wang, X. Guan, J. Zhao, J. Tao, and T. Qin 948
SybilBelief: A Semi-Supervised Learning Approach for Structure-Based Sybil Detection http://dx.doi.org/10.1109/TIFS.2014.2316975 . . . . .. . . . . . . . . . . . . . . . . . . . . . . . . . . . . . . . . . . . . . . . . . . . . . . . . . . . . . . . . . . . . . . . . . . . . . . . . . . . . . . . . . . . . . . . . . . . N. Z. Gong, M. Frank, and P. Mittal 976
Security of Large Networked Systems
A Robust Grouping Proof Protocol for RFID EPC C1G2 Tags http://dx.doi.org/10.1109/TIFS.2014.2316338 . . . . . . . . . . . . . . . . . . . . . . . . . . . . . . . . . . . .. . . . . . . . . . . . . . . . . . . . . . . . . . . . . . . . . . . . . . . . . . . . . . . . . . . . . . . . . . . . . . . . . . . . . . . . . . S. Sundaresan, R. Doss, S. Piramuthu, and W. Zhou 961
Surveillance
Detection of Abnormal Visual Events via Global Optical Flow Orientation Histogram http://dx.doi.org/10.1109/TIFS.2014.2315971 . . . . . . . . .. . . . . . . . . . . . . . . . . . . . . . . . . . . . . . . . . . . . . . . . . . . . . . . . . . . . . . . . . . . . . . . . . . . . . . . . . . . . . . . . . . . . . . . . . . . . . . . . . . . . . . . . . . T. Wang and H. Snoussi 988
http://dx.doi.org/10.1109/TIFS.2014.2323174 . . . . . . . . . . . . . . . . . . . . . . . . . . . . . . . . . . . . . . . . . . . . . 1034Information for Authors http://dx.doi.org/10.1109/TIFS.2014.2323173 . . . . . . . . . . . . . . . . . . . . . . . . . . . . . . . . . . . . . . . . . . . . . . . . . . . . . . . . . . . . . . . . . . . . . . . . . . . . . . 1035
ANNOUNCEMENTS
Call for Papers—IEEE TRANSACTIONS ON INFORMATION FORENSICS AND SECURITY http://dx.doi.org/10.1109/TIFS.2014.2324431 . . . . . . . . . 1037Call for Papers—IEEE JOURNAL OF SELECTED TOPICS IN SIGNAL PROCESSING http://dx.doi.org/10.1109/TIFS.2014.2323156 . . . . . . . . .. . . . . . . . 1038Call for Papers—IEEE JOURNAL OF SELECTED TOPICS IN SIGNAL PROCESSING http://dx.doi.org/10.1109/TIFS.2014.2323157 . . . . . . . . .. . . . . . . . 1039IEEE Open Access Publishing http://dx.doi.org/10.1109/TIFS.2014.2323159 . . . . . . . . . . . . . . . . . . . . . . . . . . . . . . . . . . . . . . . . . . . . . . . . . . . . . . . . . . . . . . . . . . . . . . . 1040
Previous Page | Contents | Zoom in | Zoom out | Front Cover | Search Issue | Next Page qqM
Mq
qM
MqM
THE WORLD’S NEWSSTAND®
Previous Page | Contents | Zoom in | Zoom out | Front Cover | Search Issue | Next Page qqM
Mq
qM
MqM
THE WORLD’S NEWSSTAND®

www.signalprocessingsociety.org [34] JULY 2014
CALL FOR PAPERSIEEE TRANSACTIONS ON INFORMATION FORENSICS AND SECURITY
Special Issue on Biometric Spoofing and CountermeasuresGuest EditorsNicholas Evans EURECOM, France ([email protected])Sébastien Marcel Idiap Research Institute, Switzerland ([email protected])Arun Ross Michigan State University, USA ([email protected])Stan Z. Li Chinese Academy of Sciences, China ([email protected])
While biometrics technology has revolutionized approaches to person authentication and has evolved to play a critical role in personal, national and global security, the potential for the technology to be fooled or ‘spoofed’ is widely acknowledged. Efforts to study such threats and to develop countermeasures are now well underway resulting in some promising solutions. While progress with respect to each biometric modality has attained varying degrees of maturity, there are some notable shortcomings in research methodologies. Current spoofing studies focus on specific, known attacks. Existing countermeasures designed to detect and deflect such attacks are often based on unrealistic a priori knowledge and typically learned using training data produced using exactly the same spoofing method that is to be detected. Current countermeasures thus have questionable application in practical scenarios where the nature of the attack can never be known. This special issue will focus on the latest research on the topic of biometric spoofing and countermeasures, with a particular emphasis on novel methodologies and generalized spoofing countermeasures that have the potential to protect biometric systems against varying or previously unseen attacks. The aim is to further the state-of-the-art in this field, to stimulate interactions between the biometrics and information forensic communities, to encourage the development of reliable methodologies in spoofing and countermeasure assessment and solutions, and to promote the development of generalized countermeasures. Papers on biometric obfuscation (e.g., fingerprint or face alteration) and relevant countermeasures will also be considered in the special issue. Novel contributions related to both traditional biometric modalities such as face, iris, fingerprint, and voice, and other modalities such as vasculature and electrophysiological signals will be considered. The focus includes, but is not limited to, the following topics related to spoofing and anti-spoofing countermeasures in biometrics:
vulnerability analysis with an emphasis on previously unconsidered spoofing attacks;theoretical models for attack vectors;advanced machine learning and pattern recognition algorithms for anti-spoofing;information theoretic approaches to quantify spoofing vulnerability;spoofing and anti-spoofing in mobile devices;generalized countermeasures;
challenge-response countermeasures;sensor-based solutions to spoof attacks;biometric obfuscation schemes;information forensic approaches to spoofing detection;new evaluation protocols, datasets, and performance metrics;reproducible research (public databases, open source software and experimental setups).
Submission Procedure: Manuscripts are to be submitted according to the Information for Authors at http://www.signalprocessingsociety.org/publications/periodicals/forensics/forensics-authors-info/ using the IEEE online manuscript system, Manuscript Central. Papers must not have appeared or be under review elsewhere.Manuscripts by the guest editors submitted to this SI will be handled by the EIC of IEEE-TIFS.
Schedule:Submission deadline: 1st July 2014First Review: 15th September 2014Revisions Due: 1st November 2014Final Decision: 15th December 2014Final manuscript due: 15th January 2015Tentative publication date: 1st April 2015
Previous Page | Contents | Zoom in | Zoom out | Front Cover | Search Issue | Next Page qqM
Mq
qM
MqM
THE WORLD’S NEWSSTAND®
Previous Page | Contents | Zoom in | Zoom out | Front Cover | Search Issue | Next Page qqM
Mq
qM
MqM
THE WORLD’S NEWSSTAND®
____________
___________
_______________
____________

www.signalprocessingsociety.org [35] JULY 2014
General ChairsVaughan Clarkson
University of QueenslandJonathan Manton
University of Melbourne
Technical Program ChairsDoug Cochran
Arizona State UniversityDoug Gray
University of Adelaide
Finance ChairLang White
University of Adelaide
Special Session ChairsRobert Calderbank
Duke UniversityStephen Howard
DSTO
Tutorials ChairDaniel Palomar
Hong Kong University of S&T
Local Arrangements ChairAndrew Bradley
University of Queensland
Registration ChairPaul Teal
Victoria University of Wellington
Publicity ChairMatt McKay
Hong Kong University of S&T
Publication ChairLeif Hanlen
NICTA
Exhibits ChairIain Collings
CSIRO
Student Paper Contest ChairNikos Sidiropoulos
University of Minnesota
Conference Managers
Registration & Program Enquiries:Conference Management Services, Inc3833 S Texas Ave, Ste 221,Bryan TX 77802, USA
General Enquiries:arinex pty limited S3, The Precinct, 12 Browning StBrisbane QLD 4101, AustraliaPh: +61 2 9265 0700Email: [email protected]
First Call for Papers
ICASSP 20152015 IEEE International Conference on Acoustics,
Speech, and Signal Processing (ICASSP)Brisbane Convention & Exhibition CentreApril 19 – 24, 2015 Brisbane, Australia
www.ICASSP2015.orgThe 40th International Conference on Acoustics, Speech, and Signal Processing (ICASSP) will be held in the Brisbane Convention & Exhibition Centre, Brisbane, Australia, between April 19th and 24th, 2015. ICASSP is the world’s largest and most comprehensive technical conference focused on signal processing and its applications. The conference will feature world-class speakers, tutorials, exhibits, and over 120 lecture and poster sessions. Topics include but are not limited to:
Audio and acoustic signal processing Multimedia signal processingBio- imaging and biomedical signal processing Sensor array & multichannel signal processingSignal processing education Design /implementation of signal processing systemsSpeech processing Signal processing for communications & networkingIndustry technology tracks Image, video & multidimensional signal processingInformation forensics and security Signal processing theory & methodsMachine learning for signal processing Spoken language processingLocalisation and tracking Remote sensing signal processing
Brisbane – Australia’s New World City: Brisbane provides a beautiful location for ICASSP 2015 with its picturesque winding river, attractive modern buildings, thriving retail centre, excellent restaurants and year-round pleasant weather. Brisbane is a city of alluring character, from its distinctive architecture (the charming “Queenslanders” and workers’ cottages that line inner-suburban streets) to its swimming beach right in the middle of the central business district. As the capital of Queensland, Australia’s “Sunshine State”, Brisbane is an ideal gateway to the world-famous beaches and theme parks of the Gold and Sunshine Coasts, the rainforests of the islands and hinterlands, and the Great Barrier Reef.
Submission of Papers: Prospective authors are invited to submit full-length papers, with up to four pages for technical content including figures and possible references, and with one additional optional 5th page containing only references. A selection of best papers will be made by the ICASSP 2015 committee upon recommendations from Technical Committees.
Notice: The IEEE Signal Processing Society enforces a “no-show” policy. Any accepted paper included in the final program is expected to have at least one author or qualified proxy attend and present the paper at the conference. Authors of the accepted papers included in the final program who do not attend the conference will be subscribed to a “No-Show List”, compiled by the Society. The “no-show” papers will not be published by IEEE on IEEEXplore or other public access forums, but these papers will be distributed as part of the on-site electronic proceedings and the copyright of these papers will belong to the IEEE.
Tutorial and Special Sessions Proposals: Tutorials will be held on April 19 and 20. Brief proposals should be submitted by August 17, 2014, to [email protected] and must include title, outline, contact information, biography and selected publications for the presenter(s), and a description of the tutorial and material to be distributed to participants. Special sessions proposals should be submitted by August 17, 2014, [email protected] and must include a topical title, rationale, session outline, contact information, and a list of invited papers. Refer to the ICASSP 2015 website for additional information.
Important Deadlines:
Special session & tutorial proposals due.................................Sunday, August 17th 2014Notification of special session & tutorial acceptance .......... Sunday, September 7th 2014Submission of regular papers.................................................. Sunday, October 5th 2014Early registration opens........................................................ Monday, January 12th 2015Notification of paper acceptance .................................... Wednesday, January 14th 2015Revised paper upload ............................................................Friday, February 13th 2015Author registration..................................................................Friday, February 13th 2015
Previous Page | Contents | Zoom in | Zoom out | Front Cover | Search Issue | Next Page qqM
Mq
qM
MqM
THE WORLD’S NEWSSTAND®
Previous Page | Contents | Zoom in | Zoom out | Front Cover | Search Issue | Next Page qqM
Mq
qM
MqM
THE WORLD’S NEWSSTAND®
_______________

www.signalprocessingsociety.org [36] JULY 2014
JUNE 2014 VOLUME 16 NUMBER 4 ITMUF8 (ISSN 1520-9210)
OVERVIEW PAPER
http://dx.doi.org/10.1109/TMM.2014.2315596 . . . . . . . . . . . . . . . . . . . . . . . . . . . . . . . . . . . . . . . . . . . . . . . . . . . . .. . . . . . . . . . . . . . . . . . . . . . . . . . . . . . . . . . . . . . . . . . . . . . . . . . . . . . . . . . . . . . . . . . . . . . . . . Y. Wen, X. Zhu, J. J. P. C. Rodrigues, and C. W. Chen 885
REGULAR PAPERS
Audio/Video Analysis and Synthesis
Video Object Co-Segmentation via Subspace Clustering and Quadratic Pseudo-Boolean Optimization in an MRFFramework http://dx.doi.org/10.1109/TMM.2014.2306393 . . . . . . . . . . . . . . . . . .. . . . . . . . . . . . . . . . . . C. Wang, Y. Guo, J. Zhu, L. Wang, and W. Wang 903
http://dx.doi.org/10.1109/TMM.2014.2307552 . . . . . . . . . . . . . . . . . . . . . . . . . . . . . . . . . . . . . . . . . . . . . . . . . . . . . . . .. . . . . . . . . . . . . . . . . . . . . . . . . . F. Cricri, M. J. Roininen, J. Leppänen, S. Mate, I. D. D. Curcio, S. Uhlmann, and M. Gabbouj 917
Compression and Coding
http://dx.doi.org/10.1109/TMM.2014.2305579 . . . . . . . . . . . . . . . . . . . . . . . . . . . . . . . . . . .. . . . . . . . . . . . . . . . . . . . . . . . . . . . . . . . . . . . . . . . . . . . . . . . . . . . . . . . . . . . . . . . . . . . . . . . . . . . . . . . . . . . . . . . . . . . . . . . M. Wang, K. N. Ngan, and L. Xu 933
Prediction Modes http://dx.doi.org/10.1109/TMM.2014.2306396 . . . . . . . . . . . . . . . . . . . . . . . . . . . . . . . . . . . . . . . . . C. E. Rhee, T. S. Kim, and H.-J. Lee 947Stationary Probability Model for Microscopic Parallelism in JPEG2000 http://dx.doi.org/10.1109/TMM.2014.2307553 . . . . . . . . . . . . . . . . . . . . . . . .. . . . . . . . . . . . . . . . . . . . . . . . . . . . . . . . . . . . . . . . . . . . . . . . . . . . . . . . . . . . . . . . . . . . . . . . . . . . . . . . . . . . . . . . . . . . . . F. Aulí-Llinàs and M. W. Marcellin 960
3-D Audio/Video Processing
Physical Metaphor for Streaming Media Retargeting http://dx.doi.org/10.1109/TMM.2014.2305917 . . . . . . . . . . . . . . . . . . . . . . . . . . . . . . . . . . . . . . . . . . . . . .. . . . . . . . . . . . . . . . . . . . . . . . . . . . . . . . . . . . . . . . . . . . . . . . . . . . . . . . . . . . . . . . . . . . . . . . . . . . . . . . . . . . . . . . R. Gallea, E. Ardizzone, and R. Pirrone 971
Sparse Signal Processing
Image Similarity Using Sparse Representation and Compression Distance http://dx.doi.org/10.1109/TMM.2014.2306175 . . . . . . . . . . . . . . . . . . . . . .. . . . . . . . . . . . . . . . . . . . . . . . . . . . . . . . . . . . . . . . . . . . . . . . . . . . . . . . . . . . . . . . . . . . . . . . . . . . . . . . . . . . . . . . . . . . . . . . . . . . . . . . . . T. Guha and R. K. Ward 980
Previous Page | Contents | Zoom in | Zoom out | Front Cover | Search Issue | Next Page qqM
Mq
qM
MqM
THE WORLD’S NEWSSTAND®
Previous Page | Contents | Zoom in | Zoom out | Front Cover | Search Issue | Next Page qqM
Mq
qM
MqM
THE WORLD’S NEWSSTAND®
_______________________________

www.signalprocessingsociety.org [37] JULY 2014
Display Technology for Multimedia
Corruptive Artifacts Suppression for Example-Based Color Transfer http://dx.doi.org/10.1109/TMM.2014.2305914 . . . . . . . . . . . . . . . . . . . . . . . . . . . .. . . . . . . . . . . . . . . . . . . . . . . . . . . . . . . . . . . . . . . . . . . . . . . . . . . . . . . . . . . . . . . . . . . . . . . . . . . . . . . . . . . . . . . . Z. Su, K. Zeng, L. Liu, B. Li, and X. Luo 988
System Software for Multimedia
Variational Bayesian Methods For Multimedia Problems http://dx.doi.org/10.1109/TMM.2014.2307692 . . . . . . . . . . . . . . . . . . . . . . . . . . . . . . . . . . . . . . . . .. . . . . . . . . . . . . . . . . . . . . . . . . . . . . . . . . . . . . . . . . . . . . . . . . . . . . . . . . . . . . . . . . . . Z. Chen, S. D. Babacan, R. Molina, and A. K. Katsaggelos 1000
Multimodal Human-Human and Human-Computer Dialog
Hire me: Computational Inference of Hirability in Employment Interviews Based on Nonverbal Behaviorhttp://dx.doi.org/10.1109/TMM.2014.2307169 . . . . . . . . . . . . . . . . . . . . . . . . . . . . . . L. S. Nguyen, D. Frauendorfer, M. S. Mast, and D. Gatica-Perez 1018
Multimodal Human-Machine Interfaces and Interaction
Simultaneous-Speaker Voice Activity Detection and Localization Using Mid-Fusion of SVM and HMMshttp://dx.doi.org/10.1109/TMM.2014.2305632 . . . . . . . . . . . . . . . . . . . . . . . . . . . . . . . . . . . . . . . . . . . . . . . . . . . . . . . . . . . . . . V. P. Minotto, C. R. Jung, and B. Lee 1032
Multimedia Interfaces and Interaction
http://dx.doi.org/10.1109/TMM.2014.2306183 . . . . . . . . . . . . . . . . . . . . . . . . . . . . . . . . . . . . . . .. . . . . . . . . . . . . . . . . . . . . . . . . . . . . . . . . . . . . . . G. Strong and M. Gong 1045
Knowledge and Semantics Modeling for Multimedia Databases
A Cross-Modal Approach for Extracting Semantic Relationships Between Concepts Using Tagged Imageshttp://dx.doi.org/10.1109/TMM.2014.2306655 . . . . . . . . . . . . . . . . . . . . . . . . . . . .. . . . . . . . . . . . . . . . . . . . . . . . . . . . M. Katsurai, T. Ogawa, and M. Haseyama 1059
Multimedia Search and Retrieval
Corpus Development for Affective Video Indexing http://dx.doi.org/10.1109/TMM.2014.2305573 . . . . . . . . . . . . . . . . . . . . . . . . . . . . . . . . . . . . . . . . . . . . . . . .. . . . . . . . . . . . . . . . . . . . . . . . . . . . . . . . . . . . . . . . . . . . . . . . . . . . . . . . . . . . . . . . . . . . . . . . . . . . M. Soleymani, M. Larson, T. Pun, and A. Hanjalic 1075
Discrete Cosine Transform Locality-Sensitive Hashes for Face Retrieval http://dx.doi.org/10.1109/TMM.2014.2305633 . . . . . . . . . . . . . . . . . . . . . . .. . . . . . . . . . . . . . . . . . . . . . . . . . . . . . . . . . . . . . . . . . . . . . . . . . . . . . . . . . . . . . . . . . . . . . . . . . . . . . . . . . . . . . . . . . . . . M. Kafai, K. Eshghi, and B. Bhanu 1090
Contextual Query Expansion for Image Retrieval http://dx.doi.org/10.1109/TMM.2014.2305909 . . . . . . . . . . . . . . . . . . . . . . . . . . . . . . . . . . . . . . . . . . . . . . . . . .. . . . . . . . . . . . . . . . . . . . . . . . . . . . . . . . . . . . . . . . . . . . . . . . . . . . . . . . . . . . . . . . . . . . . . . . . . . . . . . . . . . . . . H. Xie, Y. Zhang, J. Tan, L. Guo, and J. Li 1104
Image Attribute Adaptation http://dx.doi.org/10.1109/TMM.2014.2306092 . . . . . .. . . . . . . Y. Han, Y. Yang, Z. Ma, H. Shen, N. Sebe, and X. Zhou 1115A Prior-Free Weighting Scheme for Binary Code Ranking http://dx.doi.org/10.1109/TMM.2014.2306392 . . . . . . . . . . . . . . . . . . . . . . . . . . . . . . . . . . . . . . .. . . . . . . . . . . . . . . . . . . . . . . . . . . . . . . . . . . . . . . . . . . . . . . . . . . . . . . . . . . . . . . . . . . . . . . . . . . . . . . . . . . . . . . . . . . . . . . . . Y. Zhang, L. Zhang, and Q. Tian 1127
Wireless/Mobile Multimedia
An Adaptive Mechanism for Optimal Content Download in Wireless Networks http://dx.doi.org/10.1109/TMM.2014.2307155 . . . . . . . . . . . . . . .. . . . . . . . . . . . . . . . . . . . . . . . . . . . . . . . . . . . . . . . . . . . . . . . . . . . . . . . . . . . . . . . . . . . . . . . . . . . . . . . . . . . . . . . . . . . . . . . . . . . . . . . I. de Fez and J. C. Guerri 1140
Multimedia Algorithms, Systems, and Interfaces
PicWords: Render a Picture by Packing Keywords http://dx.doi.org/10.1109/TMM.2014.2305635 . . . . . . . . . . . . . . . . . . . . . . . . . . . . . . . . . . . . . . . . . . . . . . . . .. . . . . . . . . . . . . . . . . . . . . . . . . . . . . . . . . . . . . . . . . . . . . . . . . . . . . . . . . . . . . . . . . . . . . . . . Z. Hu, S. Liu, J. Jiang, R. Hong, M. Wang, and S. Yan 1156
Regularity Preserved Superpixels and Supervoxels http://dx.doi.org/10.1109/TMM.2014.2305571 . . . . . . . . . . . . . . . . . . . . . . . . . . . . . . . . . . . . . . . . . . . . . . . .. . . . . . . . . . . . . . . . . . . . . . . . . . . . . . . . . . . . . . . . . . . . . . . . . . . . . . . . . . . . . . . . . . . . . . . . . . . . . . . . . . . . . H. Fu, X. Cao, D. Tang, Y. Han, and D. Xu 1165
CORRESPONDENCE
Wireless/Mobile Multimedia
Interruption Probability of Wireless Video Streaming With Limited Video Lengths http://dx.doi.org/10.1109/TMM.2014.2306656 . . . . . . . . . . . .. . . . . . . . . . . . . . . . . . . . . . . . . . . . . . . . . . . . . . . . . . . . . . . . . . . . . . . . . . . . . . . . . . . . . . . . . . . . . . . . . . . . . . . . . . . . . . . . . . . . A. Anttonen and A. Mämmelä 1176
http://dx.doi.org/10.1109/TMM.2014.2322433 . . . . . . . . . . . . . . . . . . . . . . . . . . . . . .. . . . . . . . . . . . . . . . . . . . . . . . . . . . . . 1181Information for Authors http://dx.doi.org/10.1109/TMM.2014.2322434 . . . . . . . . . . . . . . . . . . . . . . . . . . . . . . . . . . . . . . .. . . . . . . . . . . . . . . . . . . . . . . . . . . . . . . . . . . . . . . 1182
Previous Page | Contents | Zoom in | Zoom out | Front Cover | Search Issue | Next Page qqM
Mq
qM
MqM
THE WORLD’S NEWSSTAND®
Previous Page | Contents | Zoom in | Zoom out | Front Cover | Search Issue | Next Page qqM
Mq
qM
MqM
THE WORLD’S NEWSSTAND®

www.signalprocessingsociety.org [38] JULY 2014
JUNE 2014 VOLUME 8 NUMBER 3 IJSTGY (ISSN 1932-4553)
EDITORIAL
Introduction to the Issue on Perception Inspired Video Processing http://dx.doi.org/10.1109/JSTSP.2014.2318078 . . . . . . . . . . . . . . . . . . . . . . . . . . . . . . .. . . . . . . . . . . . . . . . . . . . . . . . . . . . . . . . . . . . . . . . . . . . . . . . . . . . . . . . . . . . . . . . . . . . H. Kalva, A. Bovik, H. Chen, K. Egiazarian, and Z. Wang 355
PAPERS
Evoked Neural Responses to Events in Video http://dx.doi.org/10.1109/JSTSP.2014.2313022 . . . . . . . . . . . . . . . . . . . . . . . . . . . . . . . . . . . . . . . . . . . . . . . . . . . . . .. . . . . . . . . . . . . . . . . . . . . . . . . . . . . . . . . . . . . . . . . . . . . . . . . . . . . . . . . . . . . . . . . . . . . . . D. Rosenthal, P. DeGuzman, L. C. Parra, and P. Sajda 358
Using Electroencephalography to Measure Perceived Video Quality http://dx.doi.org/10.1109/JSTSP.2014.2313026 . . . . . . . . . . . . . . . . . . . . . . . . . . . .. . . . . . . . . . . . . . . . . . . . . . . . . . . . . . . . . . . . . . . . . . . . . . . . . . . . . . . . . . . . . . . . S. Arndt, J.-N. Antons, R. Schleicher, S. Möller, and G. Curio 366
Objective Quality Assessment for Image Retargeting Based on Perceptual Geometric Distortion and Information Losshttp://dx.doi.org/10.1109/JSTSP.2014.2311884 . . . . . . . . . . . . . . . . . . . . . . . . . . . . . . . . . . . . . . . . . . . . . . . . . . . . . . . C.-C. Hsu, C.-W. Lin, Y. Fang, and W. Lin 377
Mobile Video Perception: New Insights and Adaptation Strategies http://dx.doi.org/10.1109/JSTSP.2014.2313456 . . . . J. Xue and C. W. Chen 390Visual Attention Model Aided Non-Uniform Asymmetric Coding of Stereoscopic Video http://dx.doi.org/10.1109/JSTSP.2014.2313717 . . . . .. . . . . . . . . . . . . . . . . . . . . . . . . . . . . . . . . . . . . . . . . . . . . . . . . . . . . . . . . . . . . . . . . . . . . . E. Ekmekcioglu, V. De Silva, P. T. Pesch, and A. Kondoz 402
3D Visual Discomfort Prediction: Vergence, Foveation, and the Physiological Optics of Accommodationhttp://dx.doi.org/10.1109/JSTSP.2014.2311885 . . . . . . . . . . . . . . . . . . . . . . . . . . . . . . . . . . . . . . . . . . . . . . . . . . . . . . . . . . . . . . . . . . . J. Park, S. Lee, and A. C. Bovik 415
http://dx.doi.org/10.1109/JSTSP.2014.2315742 . . . . . . . . . . . . . . . . . . . . .. . . . . . . . . . . . . . . . . . . . . . . . . . . . . . . . . . . . . . . . . . . . . . . . . . . . . . . . . . . . . . . . . . . . . . . . . . . . . . . . C. Thériault, N. Thome, M. Cord, and P. Pérez 428
A Retina-Based Perceptually Lossless Limit and a Gaussian Foveation Scheme With Loss Controlhttp://dx.doi.org/10.1109/JSTSP.2014.2315716 . . . . . . . . . . . . . . . . . . . . . . . . . . . . . . . . . . . . . . . . . . . . . . . . . . . . . . . . . A. L. N. Targino da Costa and M. N. Do 438
Coherency Based Spatio-Temporal Saliency Detection for Video Object Segmentation http://dx.doi.org/10.1109/JSTSP.2014.2315874 . . . . . . .. . . . . . . . . . . . . . . . . . . . . . . . . . . . . . . . . . . . . . . . . . . . . . . . . . . . . . . . . . . . . . . . . . . . . . . . . . . . . . . . . . . D. Mahapatra, S. O. Gilani, and M. K. Saini 454
Perception-Oriented Methodology for Robust Motion Estimation Design http://dx.doi.org/10.1109/JSTSP.2014.2317289 . . . . . . . . . . . . . . . . . . . . . .. . . . . . . . . . . . . . . . . . . . . . . . . . . . . . . . . . . . . . . . . . . . . . . . . . . . . . . . . . . . . . . . . . . . . . . . . . . A. Heinrich, R. J. van der Vleuten, and G. de Haan 463
Region-of-Interest Based Conversational HEVC Coding with Hierarchical Perception Model of Facehttp://dx.doi.org/10.1109/JSTSP.2014.2314864 . . . . . . . . . . . . . . . . . . . . . . . . . . . . . . . . . . . . . . . . . . . . . . . . . . . . . . . . . . . . . . M. Xu, X. Deng, S. Li, and Z. Wang 475
http://dx.doi.org/10.1109/JSTSP.2014.2313182 . . . . .. . . . . . . . . . . . . . . . . . . . . . . . . . . . . . . . . . . . . . . . . . . . . . . . . . . . . . . . . . . . . . . . . . . . . . . . . . . . . S. W. Zamir, J. Vazquez-Corral, and M. Bertalmo 490
Previous Page | Contents | Zoom in | Zoom out | Front Cover | Search Issue | Next Page qqM
Mq
qM
MqM
THE WORLD’S NEWSSTAND®
Previous Page | Contents | Zoom in | Zoom out | Front Cover | Search Issue | Next Page qqM
Mq
qM
MqM
THE WORLD’S NEWSSTAND®
____________________

www.signalprocessingsociety.org [39] JULY 2014
Information for Authors http://dx.doi.org/10.1109/JSTSP.2014.2322300 . . . . . . . . . . . . . . . . . . . . . . . . . . . . . . . . . . . . . . . . . . . . . . . . . . . . . . . . . . . . . . . . . . . . . . . . . . . . . 504
ANNOUNCEMENTS
Call for Papers—Special Issue on Spatial Audio http://dx.doi.org/10.1109/JSTSP.2014.2322303 . . . . . . . . . . . . . . . . . . . . . . . . . .. . . . . . . . . . . . . . . . . . . . . . . . . 506Call for Papers—Special Issue on Signal Processing for Big Data http://dx.doi.org/10.1109/JSTSP.2014.2322304 . . . . . . . . . . . . . . . . . . . . . . . . . . . . . . 507Call for Papers—Special issue on Advances in Hyperspectral Data Processing and Analysis http://dx.doi.org/10.1109/JSTSP.2014.2322305 . .. . . . . . . . . . . . . . . . . . . . . . . . . . . . . . . . . . . . . . . . . . . . . . . . . . . . . . . . . . . . . . . . . . . . . . . . . . . . . . . . . . . . . . . . . . . . . . . . . . . . . . . . . . . . . . . . . . . . . . . . . . . . . . . . . . . . . 508
Previous Page | Contents | Zoom in | Zoom out | Front Cover | Search Issue | Next Page qqM
Mq
qM
MqM
THE WORLD’S NEWSSTAND®
Previous Page | Contents | Zoom in | Zoom out | Front Cover | Search Issue | Next Page qqM
Mq
qM
MqM
THE WORLD’S NEWSSTAND®

www.signalprocessingsociety.org [40] JULY 2014
JUNE 2014 VOLUME 21 NUMBER 6 ISPLEM (ISSN 1070-9908)
LETTERS
On the Complementarity of Phone Posterior Probabilities for Improved Speaker Recognition http://dx.doi.org/10.1109/LSP.2014.2312213 . .. . . . . . . . . . . . . . . . . . . . . . . . . . . . . . . . . . . . . . . . . . . . M. Diez, A. Varona, M. Penagarikano, L. J. Rodriguez-Fuentes, and G. Bordel 649
New Steady-State Analysis Results of Variable Step-Size LMS Algorithm With Different Noise Distributionshttp://dx.doi.org/10.1109/LSP.2013.2291404 . . . . . . . . . . . . . . . . . . . . . . . . . . . . . . . . . . . . . . . . . . . . . . . . . . . . . . . . . . . . . . . . . . . . . . . . . . . . . . . S. Zhang and J. Zhang 653
Tongue Contour Reconstruction from Optical and Electrical Palatography http://dx.doi.org/10.1109/LSP.2014.2312456 . . . . . . . . . . . . . . . . . . . . . . .. . . . . . . . . . . . . . . . . . . . . . . . . . . . . . . . . . . . . . . . . . . . . R. Mumtaz, S. Preuß, C. Neuschaefer-Rube, C. Hey, R. Sader, and P. Birkholz 658
Time-of-Flight Depth Camera Motion Blur Detection and Deblurring http://dx.doi.org/10.1109/LSP.2014.2312384 . . . . . . . . . . . . . . . . . . . . S. Lee 663Study of the Mainlobe Misorientation of the First-Order Steerable Differential Array in the Presence of Microphone Gainand Phase Errors http://dx.doi.org/10.1109/LSP.2014.2312729 . . . . . . . . . . . . . . . . . . . . . . . . . . . . . . . . . . . . . . . . . . X. Wu, H. Chen, J. Zhou, and T. Guo 667
Consensus Bernoulli Filter for Distributed Detection and Tracking using Multi-Static Doppler Shiftshttp://dx.doi.org/10.1109/LSP.2014.2313177 . . . . . . . . . . . . . . . . . . . . . . . . . . . . . . . . . . . . . . . . . . . . . . . . . . . . . . . . . . . . . . . . . . . . . . . . . . . . . . . . . . . . . . M. B. Guldogan 672
A Non-Parametric Motion Model for Foreground Detection in Camera Jitter Scenes http://dx.doi.org/10.1109/LSP.2014.2312371 . . . . . . . . . . .. . . . . . . . . . . . . . . . . . . . . . . . . . . . . . . . . . . . . . . . . . . . . . . . . . . . . . . . . . . . . . . . . . . . . . . . . . . . . . . . . . . . . . . . . . . . J. Liao, R. Dong, B. Li, and Q. Chen 677
Robust Digital Image Reconstruction via the Discrete Fourier Slice Theorem http://dx.doi.org/10.1109/LSP.2014.2313341 . . . . . . . . . . . . . . . . . . .. . . . . . . . . . . . . . . . . . . . . . . . . . . . . . . . . . . . . . . . . . . . . . . . . . . . . . . . . . S. S. Chandra, N. Normand, A. Kingston, J. Guédon, and I. Svalbe 682
Parameterized AdaBoost: Introducing a Parameter to Speed Up the Training of Real AdaBoosthttp://dx.doi.org/10.1109/LSP.2014.2313570 . . . . . . . . . . . . . . . . . . . . . . . . . . . . . . . . . . . . . . . . . . . . . . . . . . . . . . . . . . . . . . . . . . . . . . . . . . . . S. Wu and H. Nagahashi 687
Time-Varying Multicomponent Signal Modeling for Analysis of Surface EMG Data http://dx.doi.org/10.1109/LSP.2014.2313880 . . . . . . . . . . .. . . . . . . . . . . . . . . . . . . . . . . . . . . . . . . . . . . . . . . . . . . . . . . . . . . . . . . . . . . . . . . . . . . . . . . . . . . . . . . . . . . . . . . . . . . . . . . . . . . . . . . . . . . . . . . . . . . . . . M. Zivanovic 692
IEEE SIGNAL PROCESSING LETTERS (ISSN 1070–9908) is published quarterly in print and monthly online by the Institute of Electrical and Electronics Engineers, Inc. Responsibility for
the contents rests upon the authors and not upon the IEEE, the Society/Council, or its members. 3 Park Avenue, 17th Floor, New York, NY 10016-5997. IEEE
445 Hoes Lane, Piscataway, NJ 08854-4141. +1 732 981 0060.
Abstracting is permitted with credit to the source. Libraries are permitted to photocopy for private use of patrons, provided the
or republication permission, write to Copyrights and Permissions Department, IEEE Publications Administration, 445 Hoes Lane, Piscataway, NJ 08854-4141. Copyright © 2014 by
Send address changes
to IEEE SIGNAL PROCESSING LETTERS, IEEE, 445 Hoes Lane, Piscataway, NJ 08854-4141. GST Registration No. 125634188. CPC Sales Agreement #40013087. Return undeliverable
Canada addresses to: Pitney Bowes IMEX, P.O. Box 4332, Stanton Rd., Toronto, ON M5W 3J4, Canada. IEEE prohibits discrimination, harassment and bullying. For more information
visit http://www.ieee.org/nondiscrimination. Printed in U.S.A.
Previous Page | Contents | Zoom in | Zoom out | Front Cover | Search Issue | Next Page qqM
Mq
qM
MqM
THE WORLD’S NEWSSTAND®
Previous Page | Contents | Zoom in | Zoom out | Front Cover | Search Issue | Next Page qqM
Mq
qM
MqM
THE WORLD’S NEWSSTAND®
_____________________

www.signalprocessingsociety.org [41] JULY 2014
Scene-Adaptive Hierarchical Data Association for Multiple Objects Tracking http://dx.doi.org/10.1109/LSP.2014.2313853 . . . . . . . . . . . . . . . . . . .. . . . . . . . . . . . . . . . . . . . . . . . . . . . . . . . . . . . . . . . . . . . . . . . . . . . . . . . . . . . . . . . . . . . . . . . . . . . . . . . . . . . . . . . . . . . . . . . . . . . . C. Wang, H. Liu, and Y. Gao 697
Probabilistic Linear Discriminant Analysis for Acoustic Modeling http://dx.doi.org/10.1109/LSP.2014.2313410 . . . . . . . . L. Lu and S. Renals 702Bayesian Texture and Instrument Parameter Estimation From Blurred and Noisy Images Using MCMC
http://dx.doi.org/10.1109/LSP.2014.2313274 . . . . . . . . . . . . . . . . . . . . . . . . . . . . . . . . . . . . . . . . . . . . . . . . . . C. Vacar, J. F. Giovannelli, and Y. Berthoumieu 707
http://dx.doi.org/10.1109/LSP.2014.2313885 . . . . . . . . . . . . . . . . . . . . . . . . . . . . . . . . . . . . . . . . . . . . . . . . . . . . . . . . . . . . . . . . . . . . . . . . . . . . I. Singh and K. Giridhar 712Depth Motion Detection—A Novel RS-Trigger Temporal Logic based Method http://dx.doi.org/10.1109/LSP.2014.2313345 . . . . . . . . . . . . . . . . .. . . . . . . . . . . . . . . . . . . . . . . . . . . . . . . . . . . . . . . . . . . . . . . . . . . . . . . . . . . . . . . . . . . . . . . . . . . . . . . . . . . . . . . . . . . . . . . . . . . . . . C. Wang, H. Liu, and L. Ma 717
Optimal Viterbi Based Total Variation Sequence Detection (TVSD) For Robust Image/Video Decoding InWireless SensorNetworks http://dx.doi.org/10.1109/LSP.2014.2313887 . . . . . . . . . . . . . . . . . . . . . . . . . . . . . . . . . . . . . . . . . . . . . . . . . . . A. Kudeshia and A. K. Jagannatham 722
Bernoulli Forward-Backward Smoothing for Track-Before-Detect http://dx.doi.org/10.1109/LSP.2014.2310137 . . . . . . . . . . . . . . . . . . . . . . . . . . . . . . . .. . . . . . . . . . . . . . . . . . . . . . . . . . . . . . . . . . . . . . . . . . . . . . . . . . . . . . . . . . . . . . . . . . . . . . . . . . . . . . . . . . . . . . . . . . . . . . . . . . . S. Wong, B.-T. Vo, and F. Papi 727
Recursive Prediction for Joint Spatial and Temporal Prediction in Video Coding http://dx.doi.org/10.1109/LSP.2014.2314215 . . . . F. Kamisli 732A Grid-Less Approach to Underdetermined Direction of Arrival Estimation Via Low Rank Matrix Denoising
http://dx.doi.org/10.1109/LSP.2014.2314175 . . . . . . . . . . . . . . . . . . . . . . . . . . . . . . . . . . . .. . . . . . . . . . . . . . . . . . . . . . . . . . . . . . . . . . . . P. Pal and P. P. Vaidyanathan 737A Differentiable Approximation Approach to Contrast-Aware Image Fusion http://dx.doi.org/10.1109/LSP.2014.2314647 . . . . . . . . . . . . . . . . . . . .. . . . . . . . . . . . . . . . . . . . . . . . . . . . . . . . . . . . . . . . . . . . . . . . . . . . . . . . . . . . . . . . . . . . . . . . . . . . . . . . . . . . . . . . . . . . K. Hara, K. Inoue, and K. Urahama 742
On Localization of A Non-Cooperative Target with Non-Coherent Binary Detectors http://dx.doi.org/10.1109/LSP.2014.2314220 . . . . . . . . . . .. . . . . . . . . . . . . . . . . . . . . . . . . . . . . . . . . . . . . . . . . . . . . . . . . . . . . . . . . . . . . . . . . . . . . . . . . . . . . . . . . . . . . . . . . . . . . . . . . . . . . . . . . . A. Shoari and A. Seyedi 746
A Fast Approach for No-Reference Image Sharpness Assessment Based on Maximum Local Variationhttp://dx.doi.org/10.1109/LSP.2014.2314487 . . . . . . . . . . . . . . . . . . . . . . . . . . . . . . . . . . . . . .. . . . . . . . . . . . . . . . . . . . . . . . . . . . . . . . . . . . . . K. Bahrami and A. C. Kot 751
Modulation Discovery Over Arbitrary Additive Noise Channels Based on the Richardson-Lucy Algorithmhttp://dx.doi.org/10.1109/LSP.2014.2314695 . . . . . . . . . . . . . . . . . . . . . . . . . . . . . . . . . . . . . . . . . . . . . . . . . B. Dulek, O. Ozdemir, P. K. Varshney, and W. Su 756
Super-Resolution Compressed Sensing: An Iterative Reweighted Algorithm for Joint Parameter Learning and SparseSignal Recovery http://dx.doi.org/10.1109/LSP.2014.2316004 . . . . . . . . . . . . . . . . . . . . . . . . . . . . . . . . . . . . . . . . . J. Fang, J. Li, Y. Shen, H. Li, and S. Li 761
Random Parameter EM-Based Kalman Filter (REKF) for Joint Symbol Detection and Channel Estimation in Fast FadingSTTC MIMO Systems http://dx.doi.org/10.1109/LSP.2014.2316538 . . . . . . . . . . . . . . . . . . . . . . . A. Mishra, R. Gayathri, and A. K. Jagannatham 766
Information for Authors http://dx.doi.org/10.1109/LSP.2014.2319553 . . . . . . . . . . . . . . . . . . . . . . . . . . . . . . . . . . . . . . . . . . . . . . . . . . . . . . . . . . . . . . . . . . . . . . . . . . . . . . 771http://dx.doi.org/10.1109/LSP.2014.2319551 . . . . . . . . . . . . . . . . . . . . . . .. . . . . . . . . . . . . . . . . . . . . . . 773
ANNOUNCEMENTS
Call for Papers—IEEE JOURNAL OF SELECTED TOPICS IN SIGNAL PROCESSING Issue on Spatial Audiohttp://dx.doi.org/10.1109/LSP.2014.2320433 . . . . . . . . . . . . . . . . . . . . . . . . . . . . . . . . . . . . . . . . . . . . . . . . . . . . . . . . . . . . . . . . . . . . . . . . . . . . . . . . . . . . . . . . . . . . . . . . . . . . . . . . 774
Call for Papers—IEEE JOURNAL OF SELECTED TOPICS IN SIGNAL PROCESSING Issue on Signal Processing for Big Datahttp://dx.doi.org/10.1109/LSP.2014.2320434 . . . . . . . . . . . . . . . . . . . . . . . . . . . . . . . . . . . . . . . . . . . . . . . . . . . . . . . . . . . . . . . . . . . . . . . . . . . . . . . . . . . . . . . . . . . . . . . . . . . . . . . . 775
Call for Papers—IEEE JOURNAL OF SELECTED TOPICS IN SIGNAL PROCESSING Issue on Advances in Hyperspectral DataProcessing and Analysis http://dx.doi.org/10.1109/LSP.2014.2320432 . . . . . . . . . . . . . . . . . . . . . . . . . . . . . . . . . . . . . .. . . . . . . . . . . . . . . . . . . . . . . . . . . . . . . . . . . . . . 776
Previous Page | Contents | Zoom in | Zoom out | Front Cover | Search Issue | Next Page qqM
Mq
qM
MqM
THE WORLD’S NEWSSTAND®
Previous Page | Contents | Zoom in | Zoom out | Front Cover | Search Issue | Next Page qqM
Mq
qM
MqM
THE WORLD’S NEWSSTAND®

www.signalprocessingsociety.org [42] JULY 2014
JUNE 2014 VOLUME 21 NUMBER 6 ISPLEM (ISSN 1070-9908)
LETTERS
Audio and Acoustic Signal Processing
Study of the Mainlobe Misorientation of the First-Order Steerable Differential Array in the Presence of Microphone Gainand Phase Errors http://dx.doi.org/10.1109/LSP.2014.2312729 . . . . . . . . . . . . . . . . . . . . . . . . . . . . . . . . . . . . . . . . . . X. Wu, H. Chen, J. Zhou, and T. Guo 667
Biomedical Signal Processing
Tongue Contour Reconstruction from Optical and Electrical Palatography http://dx.doi.org/10.1109/LSP.2014.2312456 . . . . . . . . . . . . . . . . . . . . . . .. . . . . . . . . . . . . . . . . . . . . . . . . . . . . . . . . . . . . . . . . . . . . R. Mumtaz, S. Preuß, C. Neuschaefer-Rube, C. Hey, R. Sader, and P. Birkholz 658
Time-Varying Multicomponent Signal Modeling for Analysis of Surface EMG Data http://dx.doi.org/10.1109/LSP.2014.2313880 . . . . . . . . . . .. . . . . . . . . . . . . . . . . . . . . . . . . . . . . . . . . . . . . . . . . . . . . . . . . . . . . . . . . . . . . . . . . . . . . . . . . . . . . . . . . . . . . . . . . . . . . . . . . . . . . . . . . . . . . . . . . . . . . . M. Zivanovic 692
Image and Multidimensional Signal Processing
Time-of-Flight Depth Camera Motion Blur Detection and Deblurring http://dx.doi.org/10.1109/LSP.2014.2312384 . . . . . . . . . . . . . . . . . . . . S. Lee 663A Non-Parametric Motion Model for Foreground Detection in Camera Jitter Scenes http://dx.doi.org/10.1109/LSP.2014.2312371 . . . . . . . . . . .. . . . . . . . . . . . . . . . . . . . . . . . . . . . . . . . . . . . . . . . . . . . . . . . . . . . . . . . . . . . . . . . . . . . . . . . . . . . . . . . . . . . . . . . . . . . J. Liao, R. Dong, B. Li, and Q. Chen 677
Robust Digital Image Reconstruction via the Discrete Fourier Slice Theorem http://dx.doi.org/10.1109/LSP.2014.2313341 . . . . . . . . . . . . . . . . . . .. . . . . . . . . . . . . . . . . . . . . . . . . . . . . . . . . . . . . . . . . . . . . . . . . . . . . . . . . . S. S. Chandra, N. Normand, A. Kingston, J. Guédon, and I. Svalbe 682
Depth Motion Detection—A Novel RS-Trigger Temporal Logic based Method http://dx.doi.org/10.1109/LSP.2014.2313345 . . . . . . . . . . . . . . . . .. . . . . . . . . . . . . . . . . . . . . . . . . . . . . . . . . . . . . . . . . . . . . . . . . . . . . . . . . . . . . . . . . . . . . . . . . . . . . . . . . . . . . . . . . . . . . . . . . . . . . . C. Wang, H. Liu, and L. Ma 717
Optimal Viterbi Based Total Variation Sequence Detection (TVSD) For Robust Image/Video Decoding InWireless SensorNetworks http://dx.doi.org/10.1109/LSP.2014.2313887 . . . . . . . . . . . . . . . . . . . . . . . . . . . . . . . . . . . . . . . . . . . . . . . . . . . A. Kudeshia and A. K. Jagannatham 722
Recursive Prediction for Joint Spatial and Temporal Prediction in Video Coding http://dx.doi.org/10.1109/LSP.2014.2314215 . . . . F. Kamisli 732A Differentiable Approximation Approach to Contrast-Aware Image Fusion http://dx.doi.org/10.1109/LSP.2014.2314647 . . . . . . . . . . . . . . . . . . . .. . . . . . . . . . . . . . . . . . . . . . . . . . . . . . . . . . . . . . . . . . . . . . . . . . . . . . . . . . . . . . . . . . . . . . . . . . . . . . . . . . . . . . . . . . . . K. Hara, K. Inoue, and K. Urahama 742
A Fast Approach for No-Reference Image Sharpness Assessment Based on Maximum Local Variationhttp://dx.doi.org/10.1109/LSP.2014.2314487 . . . . . . . . . . . . . . . . . . . . . . . . . . . . . . . . . . . . . .. . . . . . . . . . . . . . . . . . . . . . . . . . . . . . . . . . . . . . K. Bahrami and A. C. Kot 751
Modulation Discovery Over Arbitrary Additive Noise Channels Based on the Richardson-Lucy Algorithmhttp://dx.doi.org/10.1109/LSP.2014.2314695 . . . . . . . . . . . . . . . . . . . . . . . . . . . . . . . . . . . . . . . . . . . . . . . . . B. Dulek, O. Ozdemir, P. K. Varshney, and W. Su 756
IEEE SIGNAL PROCESSING LETTERS (ISSN 1070–9908) is published quarterly in print and monthly online by the Institute of Electrical and Electronics Engineers, Inc. Responsibility for
the contents rests upon the authors and not upon the IEEE, the Society/Council, or its members. 3 Park Avenue, 17th Floor, New York, NY 10016-5997. IEEE
445 Hoes Lane, Piscataway, NJ 08854-4141. +1 732 981 0060.
Abstracting is permitted with credit to the source. Libraries are permitted to photocopy for private use of patrons, provided the
or republication permission, write to Copyrights and Permissions Department, IEEE Publications Administration, 445 Hoes Lane, Piscataway, NJ 08854-4141. Copyright © 2014 by
Send address changes
to IEEE SIGNAL PROCESSING LETTERS, IEEE, 445 Hoes Lane, Piscataway, NJ 08854-4141. GST Registration No. 125634188. CPC Sales Agreement #40013087. Return undeliverable
Canada addresses to: Pitney Bowes IMEX, P.O. Box 4332, Stanton Rd., Toronto, ON M5W 3J4, Canada. IEEE prohibits discrimination, harassment and bullying. For more information
visit http://www.ieee.org/nondiscrimination. Printed in U.S.A.
Previous Page | Contents | Zoom in | Zoom out | Front Cover | Search Issue | Next Page qqM
Mq
qM
MqM
THE WORLD’S NEWSSTAND®
Previous Page | Contents | Zoom in | Zoom out | Front Cover | Search Issue | Next Page qqM
Mq
qM
MqM
THE WORLD’S NEWSSTAND®
____________________

www.signalprocessingsociety.org [43] JULY 2014
Machine Learning and Statistical Signal Processing
Scene-Adaptive Hierarchical Data Association for Multiple Objects Tracking http://dx.doi.org/10.1109/LSP.2014.2313853 . . . . . . . . . . . . . . . . . . .. . . . . . . . . . . . . . . . . . . . . . . . . . . . . . . . . . . . . . . . . . . . . . . . . . . . . . . . . . . . . . . . . . . . . . . . . . . . . . . . . . . . . . . . . . . . . . . . . . . . . C. Wang, H. Liu, and Y. Gao 697
Super-Resolution Compressed Sensing: An Iterative Reweighted Algorithm for Joint Parameter Learning and SparseSignal Recovery http://dx.doi.org/10.1109/LSP.2014.2316004 . . . . . . . . . . . . . . . . . . . . . . . . . . . . . . . . . . . . . . . . . J. Fang, J. Li, Y. Shen, H. Li, and S. Li 761
Sensor Array and Multichannel Signal Processing
A Grid-Less Approach to Underdetermined Direction of Arrival Estimation Via Low Rank Matrix Denoisinghttp://dx.doi.org/10.1109/LSP.2014.2314175 . . . . . . . . . . . . . . . . . . . . . . . . . . . . . . . . . . . .. . . . . . . . . . . . . . . . . . . . . . . . . . . . . . . . . . . . P. Pal and P. P. Vaidyanathan 737
On Localization of A Non-Cooperative Target with Non-Coherent Binary Detectors http://dx.doi.org/10.1109/LSP.2014.2314220 . . . . . . . . . . .. . . . . . . . . . . . . . . . . . . . . . . . . . . . . . . . . . . . . . . . . . . . . . . . . . . . . . . . . . . . . . . . . . . . . . . . . . . . . . . . . . . . . . . . . . . . . . . . . . . . . . . . . . A. Shoari and A. Seyedi 746
Signal Processing for Communications
http://dx.doi.org/10.1109/LSP.2014.2313885 . . . . . . . . . . . . . . . . . . . . . . . . . . . . . . . . . . . . . . . . . . . . . . . . . . . . . . . . . . . . . . . . . . . . . . . . . . . . I. Singh and K. Giridhar 712Random Parameter EM-Based Kalman Filter (REKF) for Joint Symbol Detection and Channel Estimation in Fast FadingSTTC MIMO Systems http://dx.doi.org/10.1109/LSP.2014.2316538 . . . . . . . . . . . . . . . . . . . . . . . A. Mishra, R. Gayathri, and A. K. Jagannatham 766
Speech Processing
On the Complementarity of Phone Posterior Probabilities for Improved Speaker Recognition http://dx.doi.org/10.1109/LSP.2014.2312213 . .. . . . . . . . . . . . . . . . . . . . . . . . . . . . . . . . . . . . . . . . . . . . M. Diez, A. Varona, M. Penagarikano, L. J. Rodriguez-Fuentes, and G. Bordel 649
Probabilistic Linear Discriminant Analysis for Acoustic Modeling http://dx.doi.org/10.1109/LSP.2014.2313410 . . . . . . . . L. Lu and S. Renals 702
Statistical and Adaptive Signal Processing
New Steady-State Analysis Results of Variable Step-Size LMS Algorithm With Different Noise Distributionshttp://dx.doi.org/10.1109/LSP.2013.2291404 . . . . . . . . . . . . . . . . . . . . . . . . . . . . . . . . . . . . . . . . . . . . . . . . . . . . . . . . . . . . . . . . . . . . . . . . . . . . . . . S. Zhang and J. Zhang 653
Consensus Bernoulli Filter for Distributed Detection and Tracking using Multi-Static Doppler Shiftshttp://dx.doi.org/10.1109/LSP.2014.2313177 . . . . . . . . . . . . . . . . . . . . . . . . . . . . . . . . . . . . . . . . . . . . . . . . . . . . . . . . . . . . . . . . . . . . . . . . . . . . . . . . . . . . . . M. B. Guldogan 672
Parameterized AdaBoost: Introducing a Parameter to Speed Up the Training of Real AdaBoosthttp://dx.doi.org/10.1109/LSP.2014.2313570 . . . . . . . . . . . . . . . . . . . . . . . . . . . . . . . . . . . . . . . . . . . . . . . . . . . . . . . . . . . . . . . . . . . . . . . . . . . . S. Wu and H. Nagahashi 687
Bayesian Texture and Instrument Parameter Estimation From Blurred and Noisy Images Using MCMChttp://dx.doi.org/10.1109/LSP.2014.2313274 . . . . . . . . . . . . . . . . . . . . . . . . . . . . . . . . . . . . . . . . . . . . . . . . . . C. Vacar, J. F. Giovannelli, and Y. Berthoumieu 707
Bernoulli Forward-Backward Smoothing for Track-Before-Detect http://dx.doi.org/10.1109/LSP.2014.2310137 . . . . . . . . . . . . . . . . . . . . . . . . . . . . . . . .. . . . . . . . . . . . . . . . . . . . . . . . . . . . . . . . . . . . . . . . . . . . . . . . . . . . . . . . . . . . . . . . . . . . . . . . . . . . . . . . . . . . . . . . . . . . . . . . . . . S. Wong, B.-T. Vo, and F. Papi 727
Information for Authors http://dx.doi.org/10.1109/LSP.2014.2319553 . . . . . . . . . . . . . . . . . . . . . . . . . . . . . . . . . . . . . . . . . . . . . . . . . . . . . . . . . . . . . . . . . . . . . . . . . . . . . . 771http://dx.doi.org/10.1109/LSP.2014.2319551 . . . . . . . . . . . . . . . . . . . . . . .. . . . . . . . . . . . . . . . . . . . . . . 773
ANNOUNCEMENTS
Call for Papers—IEEE JOURNAL OF SELECTED TOPICS IN SIGNAL PROCESSING Issue on Spatial Audiohttp://dx.doi.org/10.1109/LSP.2014.2320433 . . . . . . . . . . . . . . . . . . . . . . . . . . . . . . . . . . . . . . . . . . . . . . . . . . . . . . . . . . . . . . . . . . . . . . . . . . . . . . . . . . . . . . . . . . . . . . . . . . . . . . . . 774
Call for Papers—IEEE JOURNAL OF SELECTED TOPICS IN SIGNAL PROCESSING Issue on Signal Processing for Big Datahttp://dx.doi.org/10.1109/LSP.2014.2320434 . . . . . . . . . . . . . . . . . . . . . . . . . . . . . . . . . . . . . . . . . . . . . . . . . . . . . . . . . . . . . . . . . . . . . . . . . . . . . . . . . . . . . . . . . . . . . . . . . . . . . . . . 775
Call for Papers—IEEE JOURNAL OF SELECTED TOPICS IN SIGNAL PROCESSING Issue on Advances in Hyperspectral DataProcessing and Analysis http://dx.doi.org/10.1109/LSP.2014.2320432 . . . . . . . . . . . . . . . . . . . . . . . . . . . . . . . . . . . . . .. . . . . . . . . . . . . . . . . . . . . . . . . . . . . . . . . . . . . . 776
Previous Page | Contents | Zoom in | Zoom out | Front Cover | Search Issue | Next Page qqM
Mq
qM
MqM
THE WORLD’S NEWSSTAND®
Previous Page | Contents | Zoom in | Zoom out | Front Cover | Search Issue | Next Page qqM
Mq
qM
MqM
THE WORLD’S NEWSSTAND®

www.signalprocessingsociety.org [44] JULY 2014
JULY 2014 VOLUME 21 NUMBER 7 ISPLEM (ISSN 1070-9908)
Editorial http://dx.doi.org/10.1109/LSP.2014.2318131 . . . . . . . . . . . . . . . . . . . . . . . . . . . . . . . . . . . . . . . . . . . . . . . . . . . . . . . . . . . . . . . . . . . . . . . . . . . . . . . . . . . . . . P. Willett 781
Digital and Multirate Signal Processing
Orthogonal Wavelet Filters with Minimum RMS Bandwidth http://dx.doi.org/10.1109/LSP.2014.2318691 . . . . . . . . . . . . . . . . . . . . . . . . . . . . . . . . . . . . . .. . . . . . . . . . . . . . . . . . . . . . . . . . . . . . . . . . . . . . . . . . . . . . . . . . . . . . . . . . . . . . . . . . . . . . . . . . . . . . . . . . . . . . . . . D. B. H. Tay, Z. Lin, and S. Murugesan 819
A Reed-Solomon Code Based Measurement Matrix with Small Coherence http://dx.doi.org/10.1109/LSP.2014.2314281 . . . . . . . . . . . . . . . . . . . . . .. . . . . . . . . . . . . . . . . . . . . . . . . . . . . . . . . . . . . . . . . . . . . . . . . . . . . . . . . . . . . . . . . . . . . . . . . . . . . . . . . M. M. Mohades, A. Mohades, and A. Tadaion 839
Dynamically-Sampled Bivariate Empirical Mode Decomposition http://dx.doi.org/10.1109/LSP.2014.2317773 . . . . . . . . . . . . . . . . . . . . . . . . . . . . . . . . .. . . . . . . . . . . . . . . . . . . . . . . . . . . . . . . . . . . . . . . . . . . . . . . . . . . . . . . . . . . . . . . . . . . . . N. Rehman, M. W. Safdar, U. Rehman, and D. P. Mandic 857
Image and Multidimensional Signal Processing
Exploring Facial Asymmetry Using Optical Flow http://dx.doi.org/10.1109/LSP.2014.2316918 . . . . . . . . . . . . . . . . . . . . . . . . . . . . . . . . . . . . . . . . . . . . . . . . . . .. . . . . . . . . . . . . . . . . . . . . . . . . . . . . . . . . . . . . . . . . . . . . . . . . . . . . . . . . . . . . . . . . . . . . . . . . . . . . . . J. Chen, C. Yang, Y. Deng, G. Zhang, and G. Su 792
A Parametric Model for Describing the Correlation Between Single Color Images and Depth Mapshttp://dx.doi.org/10.1109/LSP.2013.2283851 . . . . . . . . . . . . . . . . . . . . . . . . . . . . . . . . . . . . . . . . . . . . . . . . . . . . . . . . . . . . . . . . . . . . . . Y. Wang, R. Wang, and Q. Dai 800
Discrete Anamorphic Transform for Image Compression http://dx.doi.org/10.1109/LSP.2014.2319586 . . . . . . . . . . M. H. Asghari and B. Jalali 829Fast Synopsis for Moving Objects Using Compressed Video http://dx.doi.org/10.1109/LSP.2014.2317754 . . . . . . . . . . . . . . . . . . . . . . . . . . . . . . . . . . . . . .. . . . . . . . . . . . . . . . . . . . . . . . . . . . . . . . . . . . . . . . . . . . . . . . . . . . . . . . . . . . . . . . . . . . . . . . . . . . . . . . . . . . . . . . R. Zhong, R. Hu, Z. Wang, and S. Wang 834
Co-Learned Multi-View Spectral Clustering for Face Recognition Based on Image Sets http://dx.doi.org/10.1109/LSP.2014.2319817 . . . . . . .. . . . . . . . . . . . . . . . . . . . . . . . . . . . . . . . . . . . . . . . . . . . . . . . . . . . . . . . . . . . . . . . . . . . . . . . . . . . . . . . . . . . . . . . . . . . . . . . . . . L. Huang, J. Lu, and Y.-P. Tan 875
Exposure-Robust Alignment of Differently Exposed Images http://dx.doi.org/10.1109/LSP.2014.2318302 . . . . . . . . . . . . . . . . . . . . . . . . . . . . . . . . . . . . . .. . . . . . . . . . . . . . . . . . . . . . . . . . . . . . . . . . . . . . . . . . . . . . . . . . . . . . . . . . . . . . . . . . . . . . . . . . . . . . . . . . . . . . . . . . . . . . . S. Wu, Z. Li, J. Zheng, and Z. Zhu 885
Effective Estimation of Image Rotation Angle Using Spectral Method http://dx.doi.org/10.1109/LSP.2014.2320503 . . . . . . . . . . . . . . . . . . . . . . . . . . .. . . . . . . . . . . . . . . . . . . . . . . . . . . . . . . . . . . . . . . . . . . . . . . . . . . . . . . . . . . . . . . . . . . . . . . . . . . . . . . . . . . . . . . . . . . . . . . . . . . . . . C. Chen, J. Ni, and Z. Shen 890
IEEE SIGNAL PROCESSING LETTERS (ISSN 1070–9908) is published quarterly in print and monthly online by the Institute of Electrical and Electronics Engineers, Inc. Responsibility for
the contents rests upon the authors and not upon the IEEE, the Society/Council, or its members. 3 Park Avenue, 17th Floor, New York, NY 10016-5997. IEEE
445 Hoes Lane, Piscataway, NJ 08854-4141. +1 732 981 0060.
Abstracting is permitted with credit to the source. Libraries are permitted to photocopy for private use of patrons, provided the
or republication permission, write to Copyrights and Permissions Department, IEEE Publications Administration, 445 Hoes Lane, Piscataway, NJ 08854-4141. Copyright © 2014 by
Send address changes
to IEEE SIGNAL PROCESSING LETTERS, IEEE, 445 Hoes Lane, Piscataway, NJ 08854-4141. GST Registration No. 125634188. CPC Sales Agreement #40013087. Return undeliverable
Canada addresses to: Pitney Bowes IMEX, P.O. Box 4332, Stanton Rd., Toronto, ON M5W 3J4, Canada. IEEE prohibits discrimination, harassment and bullying. For more information
visit http://www.ieee.org/nondiscrimination. Printed in U.S.A.
Previous Page | Contents | Zoom in | Zoom out | Front Cover | Search Issue | Next Page qqM
Mq
qM
MqM
THE WORLD’S NEWSSTAND®
Previous Page | Contents | Zoom in | Zoom out | Front Cover | Search Issue | Next Page qqM
Mq
qM
MqM
THE WORLD’S NEWSSTAND®
_____________________

www.signalprocessingsociety.org [45] JULY 2014
Machine Learning and Statistical Signal Processing
A Lossless Tagged Visual Cryptography Scheme http://dx.doi.org/10.1109/LSP.2014.2317706 . . . . . . . . . . . . . . . . . . . . X. Wang, Q. Pei, and H. Li 853
Multimedia Signal Processing
An Asymmetric Matching Method for a Robust Binary Audio Fingerprinting http://dx.doi.org/10.1109/LSP.2014.2310237 . . . . . . . . . J. S. Seo 844
Sensor Array and Multichannel Signal Processing
Uncensored Indoor Positioning http://dx.doi.org/10.1109/LSP.2014.2317787 . . . . . . . . . . . . . . . . . . . . . . . . . . . . . . . . . M. F. Mansour and D. W. Waters 824Adaptive Detection of Point-Like Targets in the Presence of Homogeneous Clutter and Subspace Interference
http://dx.doi.org/10.1109/LSP.2014.2309434 . . . . . . . . . . . . . . . . . . . . . . . . . . . . . . . . . . . . . . . . . . . . . . . A. Aubry, A. De Maio, D. Orlando, and M. Piezzo 848http://dx.doi.org/10.1109/LSP.2014.2312848 . . .
. . . . . . . . . . . . . . . . . . . . . . . . . . . . . . . . . . . . . . . . . . . . . . . . . . . . . . . . . . . . . . . . . . . . . . . . . . . . . . . X. Zhang, Y. Li, X. Yang, T. Long, and L. Zheng 871New Results on Fractional QCQP with Applications to Radar Steering Direction Estimation http://dx.doi.org/10.1109/LSP.2014.2320300 . .. . . . . . . . . . . . . . . . . . . . . . . . . . . . . . . . . . . . . . . . . . . . . . . . . . . . . . . . . . . . . . . . . . . . . . . . . . . . . . . . . . . . . . . . . . . . . . . . . . . . . . . . A. De Maio and Y. Huang 895
Signal Processing for Communications
On Symbol-Wise Variational Bayesian CSI Estimation and Detection for Distributed Antenna Systems Subjected toMultiple Unknown Jammers http://dx.doi.org/10.1109/LSP.2014.2315529 . . . . . . . . . . . . . . . . . . . . . . . . . . . . . . . . . . . . . . . . . . . . . . . . . . K. Zhong and S. Li 782
Application of Full-Duplex Wireless Technique into Secure MIMO Communication: Achievable Secrecy Rate basedOptimization http://dx.doi.org/10.1109/LSP.2014.2316999 . . . . . . . . . . . . . . . . . . . . . .. . . . . . . . . . . . . . . . . . . . . . Y. Zhou, Z. Z. Xiang, Y. Zhu, and Z. Xue 804
Noise Interpolation for Unique Word OFDM http://dx.doi.org/10.1109/LSP.2014.2317512 . . . . . . . . . . . . . . . . . . . . . . . . . . . . A. Onic and M. Huemer 814Low Complexity Equalization of HCM Systems with DPFFT Demodulation over Doubly-Selective Channels
http://dx.doi.org/10.1109/LSP.2014.2311128 . . . . . . . . . . . . . . . . . . . . . . . . . . . . . . . . . . . . . . . . . . . . . . . . . . . . . . . . . . . Y. Li, X. Sha, F.-C. Zheng, and K. Wang 862
Statistical and Adaptive Signal Processing
Parallel Consensus on Likelihoods and Priors for Networked Nonlinear Filtering http://dx.doi.org/10.1109/LSP.2014.2316258 . . . . . . . . . . . . . . .. . . . . . . . . . . . . . . . . . . . . . . . . . . . . . . . . . . . . . . . . . . . . . . . . . . . . . . . . . . . . . . . . . . . . . . . . . . . . . . . . . . . . . . G. Battistelli, L. Chisci, and C. Fantacci 787
A Lower Bound for the Fisher Information Measure http://dx.doi.org/10.1109/LSP.2014.2316008 . . . . . . . . . . . . . . . . . . . . . . . . . . . . . . . . . . . . . . . . . . . . . . . .. . . . . . . . . . . . . . . . . . . . . . . . . . . . . . . . . . . . . . . . . . . . . . . . . . . . . . . . . . . . . . . . . . . . . . . . . . . . . . . . . . . . . . . . M. Stein, A. Mezghani, and J. A. Nossek 796
Variable Tap-Length LMS Algorithm Based on Adaptive Parameters for TDL Structure Adaptionhttp://dx.doi.org/10.1109/LSP.2014.2317752 . . . . . . . . . . . . . . . . . . . . . . . . . . . . . . . . . . . . . . . . . . . . . . . . . . . . . . . . . . . . . . . . D. Xu, B. Yin, W. Wang, and W. Zhu 809
Information-Preserving Transformations for Signal Parameter Estimation http://dx.doi.org/10.1109/LSP.2014.2315537 . . . . . . . . . . . . . . . . . . . . . . .. . . . . . . . . . . . . . . . . . . . . . . . . . . . . . . . . . . . . . . . . . . . . . . . . . . . . . . . . . . . . . . . . . . . . . M. Stein, M. Castañeda, A. Mezghani, and J. A. Nossek 870
Steady-State Mean-Square Error Analysis for Adaptive Filtering under the Maximum Correntropy Criterionhttp://dx.doi.org/10.1109/LSP.2014.2319308 . . . . . . . . . . . . . . . . . . . . . . . . . . . . . . . . . . . . . . . . . B. Chen, L. Xing, J. Liang, N. Zheng, and J. C. Príncipe 880
Modeling Dependencies in Multiple Parallel Data Streams with Hyperdimensional Computinghttp://dx.doi.org/10.1109/LSP.2014.2320573 . . . . . . . . . . . . . . . . . . . . . . . . . . . . . . . . . . . . . . . . . . . . . . . . . . . . . . . . . . . . . . . . . . . . . . . . O. Räsänen and S. Kakouros 899
Previous Page | Contents | Zoom in | Zoom out | Front Cover | Search Issue | Next Page qqM
Mq
qM
MqM
THE WORLD’S NEWSSTAND®
Previous Page | Contents | Zoom in | Zoom out | Front Cover | Search Issue | Next Page qqM
Mq
qM
MqM
THE WORLD’S NEWSSTAND®

www.signalprocessingsociety.org [46] JULY 2014
JULY 2014 VOLUME 21 NUMBER 7 ISPLEM (ISSN 1070-9908)
Editorial http://dx.doi.org/10.1109/LSP.2014.2318131 . . . . . . . . . . . . . . . . . . . . . . . . . . . . . . . . . . . . . . . . . . . . . . . . . . . . . . . . . . . . . . . . . . . . . . . . . . . . . . . . . . . . . . P. Willett 781
LETTERS
On Symbol-Wise Variational Bayesian CSI Estimation and Detection for Distributed Antenna Systems Subjected toMultiple Unknown Jammers http://dx.doi.org/10.1109/LSP.2014.2315529 . . . . . . . . . . . . . . . . . . . . . . . . . . . . . . . . . . . . . . . . . . . . . . . . . . K. Zhong and S. Li 782
Parallel Consensus on Likelihoods and Priors for Networked Nonlinear Filtering http://dx.doi.org/10.1109/LSP.2014.2316258 . . . . . . . . . . . . . . .. . . . . . . . . . . . . . . . . . . . . . . . . . . . . . . . . . . . . . . . . . . . . . . . . . . . . . . . . . . . . . . . . . . . . . . . . . . . . . . . . . . . . . . G. Battistelli, L. Chisci, and C. Fantacci 787
Exploring Facial Asymmetry Using Optical Flow http://dx.doi.org/10.1109/LSP.2014.2316918 . . . . . . . . . . . . . . . . . . . . . . . . . . . . . . . . . . . . . . . . . . . . . . . . . . .. . . . . . . . . . . . . . . . . . . . . . . . . . . . . . . . . . . . . . . . . . . . . . . . . . . . . . . . . . . . . . . . . . . . . . . . . . . . . . . J. Chen, C. Yang, Y. Deng, G. Zhang, and G. Su 792
A Lower Bound for the Fisher Information Measure http://dx.doi.org/10.1109/LSP.2014.2316008 . . . . . . . . . . . . . . . . . . . . . . . . . . . . . . . . . . . . . . . . . . . . . . . .. . . . . . . . . . . . . . . . . . . . . . . . . . . . . . . . . . . . . . . . . . . . . . . . . . . . . . . . . . . . . . . . . . . . . . . . . . . . . . . . . . . . . . . . M. Stein, A. Mezghani, and J. A. Nossek 796
A Parametric Model for Describing the Correlation Between Single Color Images and Depth Mapshttp://dx.doi.org/10.1109/LSP.2013.2283851 . . . . . . . . . . . . . . . . . . . . . . . . . . . . . . . . . . . . . . . . . . . . . . . . . . . . . . . . . . . . . . . . . . . . . . Y. Wang, R. Wang, and Q. Dai 800
Application of Full-Duplex Wireless Technique into Secure MIMO Communication: Achievable Secrecy Rate basedOptimization http://dx.doi.org/10.1109/LSP.2014.2316999 . . . . . . . . . . . . . . . . . . . . . .. . . . . . . . . . . . . . . . . . . . . . Y. Zhou, Z. Z. Xiang, Y. Zhu, and Z. Xue 804
Variable Tap-Length LMS Algorithm Based on Adaptive Parameters for TDL Structure Adaptionhttp://dx.doi.org/10.1109/LSP.2014.2317752 . . . . . . . . . . . . . . . . . . . . . . . . . . . . . . . . . . . . . . . . . . . . . . . . . . . . . . . . . . . . . . . . D. Xu, B. Yin, W. Wang, and W. Zhu 809
Noise Interpolation for Unique Word OFDM http://dx.doi.org/10.1109/LSP.2014.2317512 . . . . . . . . . . . . . . . . . . . . . . . . . . . . A. Onic and M. Huemer 814Orthogonal Wavelet Filters with Minimum RMS Bandwidth http://dx.doi.org/10.1109/LSP.2014.2318691 . . . . . . . . . . . . . . . . . . . . . . . . . . . . . . . . . . . . . .. . . . . . . . . . . . . . . . . . . . . . . . . . . . . . . . . . . . . . . . . . . . . . . . . . . . . . . . . . . . . . . . . . . . . . . . . . . . . . . . . . . . . . . . . D. B. H. Tay, Z. Lin, and S. Murugesan 819
Uncensored Indoor Positioning http://dx.doi.org/10.1109/LSP.2014.2317787 . . . . . . . . . . . . . . . . . . . . . . . . . . . . . . . . . M. F. Mansour and D. W. Waters 824
IEEE SIGNAL PROCESSING LETTERS (ISSN 1070–9908) is published quarterly in print and monthly online by the Institute of Electrical and Electronics Engineers, Inc. Responsibility for
the contents rests upon the authors and not upon the IEEE, the Society/Council, or its members. 3 Park Avenue, 17th Floor, New York, NY 10016-5997. IEEE
445 Hoes Lane, Piscataway, NJ 08854-4141. +1 732 981 0060.
Abstracting is permitted with credit to the source. Libraries are permitted to photocopy for private use of patrons, provided the
or republication permission, write to Copyrights and Permissions Department, IEEE Publications Administration, 445 Hoes Lane, Piscataway, NJ 08854-4141. Copyright © 2014 by
Send address changes
to IEEE SIGNAL PROCESSING LETTERS, IEEE, 445 Hoes Lane, Piscataway, NJ 08854-4141. GST Registration No. 125634188. CPC Sales Agreement #40013087. Return undeliverable
Canada addresses to: Pitney Bowes IMEX, P.O. Box 4332, Stanton Rd., Toronto, ON M5W 3J4, Canada. IEEE prohibits discrimination, harassment and bullying. For more information
visit http://www.ieee.org/nondiscrimination. Printed in U.S.A.
Previous Page | Contents | Zoom in | Zoom out | Front Cover | Search Issue | Next Page qqM
Mq
qM
MqM
THE WORLD’S NEWSSTAND®
Previous Page | Contents | Zoom in | Zoom out | Front Cover | Search Issue | Next Page qqM
Mq
qM
MqM
THE WORLD’S NEWSSTAND®
_____________________

www.signalprocessingsociety.org [47] JULY 2014
Discrete Anamorphic Transform for Image Compression http://dx.doi.org/10.1109/LSP.2014.2319586 . . . . . . . . . . M. H. Asghari and B. Jalali 829Fast Synopsis for Moving Objects Using Compressed Video http://dx.doi.org/10.1109/LSP.2014.2317754 . . . . . . . . . . . . . . . . . . . . . . . . . . . . . . . . . . . . . .. . . . . . . . . . . . . . . . . . . . . . . . . . . . . . . . . . . . . . . . . . . . . . . . . . . . . . . . . . . . . . . . . . . . . . . . . . . . . . . . . . . . . . . . R. Zhong, R. Hu, Z. Wang, and S. Wang 834
A Reed-Solomon Code Based Measurement Matrix with Small Coherence http://dx.doi.org/10.1109/LSP.2014.2314281 . . . . . . . . . . . . . . . . . . . . . .. . . . . . . . . . . . . . . . . . . . . . . . . . . . . . . . . . . . . . . . . . . . . . . . . . . . . . . . . . . . . . . . . . . . . . . . . . . . . . . . . M. M. Mohades, A. Mohades, and A. Tadaion 839
An Asymmetric Matching Method for a Robust Binary Audio Fingerprinting http://dx.doi.org/10.1109/LSP.2014.2310237 . . . . . . . . . J. S. Seo 844Adaptive Detection of Point-Like Targets in the Presence of Homogeneous Clutter and Subspace Interference
http://dx.doi.org/10.1109/LSP.2014.2309434 . . . . . . . . . . . . . . . . . . . . . . . . . . . . . . . . . . . . . . . . . . . . . . . A. Aubry, A. De Maio, D. Orlando, and M. Piezzo 848A Lossless Tagged Visual Cryptography Scheme http://dx.doi.org/10.1109/LSP.2014.2317706 . . . . . . . . . . . . . . . . . . . . X. Wang, Q. Pei, and H. Li 853Dynamically-Sampled Bivariate Empirical Mode Decomposition http://dx.doi.org/10.1109/LSP.2014.2317773 . . . . . . . . . . . . . . . . . . . . . . . . . . . . . . . . .. . . . . . . . . . . . . . . . . . . . . . . . . . . . . . . . . . . . . . . . . . . . . . . . . . . . . . . . . . . . . . . . . . . . . N. Rehman, M. W. Safdar, U. Rehman, and D. P. Mandic 857
Low Complexity Equalization of HCM Systems with DPFFT Demodulation over Doubly-Selective Channelshttp://dx.doi.org/10.1109/LSP.2014.2311128 . . . . . . . . . . . . . . . . . . . . . . . . . . . . . . . . . . . . . . . . . . . . . . . . . . . . . . . . . . . Y. Li, X. Sha, F.-C. Zheng, and K. Wang 862
Information-Preserving Transformations for Signal Parameter Estimation http://dx.doi.org/10.1109/LSP.2014.2315537 . . . . . . . . . . . . . . . . . . . . . . .. . . . . . . . . . . . . . . . . . . . . . . . . . . . . . . . . . . . . . . . . . . . . . . . . . . . . . . . . . . . . . . . . . . . . . M. Stein, M. Castañeda, A. Mezghani, and J. A. Nossek 866
http://dx.doi.org/10.1109/LSP.2014.2312848 . . .. . . . . . . . . . . . . . . . . . . . . . . . . . . . . . . . . . . . . . . . . . . . . . . . . . . . . . . . . . . . . . . . . . . . . . . . . . . . . . . X. Zhang, Y. Li, X. Yang, T. Long, and L. Zheng 871
Co-Learned Multi-View Spectral Clustering for Face Recognition Based on Image Sets http://dx.doi.org/10.1109/LSP.2014.2319817 . . . . . . .. . . . . . . . . . . . . . . . . . . . . . . . . . . . . . . . . . . . . . . . . . . . . . . . . . . . . . . . . . . . . . . . . . . . . . . . . . . . . . . . . . . . . . . . . . . . . . . . . . . L. Huang, J. Lu, and Y.-P. Tan 875
Steady-State Mean-Square Error Analysis for Adaptive Filtering under the Maximum Correntropy Criterionhttp://dx.doi.org/10.1109/LSP.2014.2319308 . . . . . . . . . . . . . . . . . . . . . . . . . . . . . . . . . . . . . . . . . B. Chen, L. Xing, J. Liang, N. Zheng, and J. C. Príncipe 880
Exposure-Robust Alignment of Differently Exposed Images http://dx.doi.org/10.1109/LSP.2014.2318302 . . . . . . . . . . . . . . . . . . . . . . . . . . . . . . . . . . . . . .. . . . . . . . . . . . . . . . . . . . . . . . . . . . . . . . . . . . . . . . . . . . . . . . . . . . . . . . . . . . . . . . . . . . . . . . . . . . . . . . . . . . . . . . . . . . . . . S. Wu, Z. Li, J. Zheng, and Z. Zhu 885
Effective Estimation of Image Rotation Angle Using Spectral Method http://dx.doi.org/10.1109/LSP.2014.2320503 . . . . . . . . . . . . . . . . . . . . . . . . . . .. . . . . . . . . . . . . . . . . . . . . . . . . . . . . . . . . . . . . . . . . . . . . . . . . . . . . . . . . . . . . . . . . . . . . . . . . . . . . . . . . . . . . . . . . . . . . . . . . . . . . . C. Chen, J. Ni, and Z. Shen 890
New Results on Fractional QCQP with Applications to Radar Steering Direction Estimation http://dx.doi.org/10.1109/LSP.2014.2320300 . .. . . . . . . . . . . . . . . . . . . . . . . . . . . . . . . . . . . . . . . . . . . . . . . . . . . . . . . . . . . . . . . . . . . . . . . . . . . . . . . . . . . . . . . . . . . . . . . . . . . . . . . . A. De Maio and Y. Huang 895
Modeling Dependencies in Multiple Parallel Data Streams with Hyperdimensional Computinghttp://dx.doi.org/10.1109/LSP.2014.2320573 . . . . . . . . . . . . . . . . . . . . . . . . . . . . . . . . . . . . . . . . . . . . . . . . . . . . . . . . . . . . . . . . . . . . . . . . O. Räsänen and S. Kakouros 899
Previous Page | Contents | Zoom in | Zoom out | Front Cover | Search Issue | Next Page qqM
Mq
qM
MqM
THE WORLD’S NEWSSTAND®
Previous Page | Contents | Zoom in | Zoom out | Front Cover | Search Issue | Next Page qqM
Mq
qM
MqM
THE WORLD’S NEWSSTAND®

www.signalprocessingsociety.org [48] JULY 2014
AUGUST 2014 VOLUME 21 NUMBER 8 ISPLEM (ISSN 1070-9908)
LETTERS
Object Tracking via Robust Multitask Sparse Representation http://dx.doi.org/10.1109/LSP.2014.2320291 . . . . . . . . . . . . . . . . Y. Bai and M. Tang 909Numerical Synthesis of an Optimal Low-Sidelobe Beam Pattern for a Microphone Array http://dx.doi.org/10.1109/LSP.2014.2320916 . . . . . .. . . . . . . . . . . . . . . . . . . . . . . . . . . . . . . . . . . . . . . . . . . . . . . . . . . . . . . . . . . . . . . . . . . . . . . . . . . . . . . . . . Y. Hur, Y.-C. Park, J. S. Abel, and D. H. Youn 914
Learning Structural Regularity for Evaluating Blocking Artifacts in JPEG Images http://dx.doi.org/10.1109/LSP.2014.2320743 . . . . . . . . . . . . . .. . . . . . . . . . . . . . . . . . . . . . . . . . . . . . . . . . . . . . . . . . . . . . . . . . . . . . . . . . . . . . . . . . . . . . . . . . . . . . . . . . . . . . . . . . . . . . . . . . . . . . . . . L. Li, W. Lin, and H. Zhu 918
Artifact Removal from Single-Trial ERPs using Non-Gaussian Stochastic Volatility Models and Particle Filterhttp://dx.doi.org/10.1109/LSP.2014.2321000 . . . . . . . . . . . . . . . . . . . . . . . . . . . . . . . . . . . . . . . . C.-M. Ting, S.-H. Salleh, Z. M. Zainuddin, and A. Bahar 923
Steady-State Performance of Non-Negative Least-Mean-Square Algorithm and Its Variants http://dx.doi.org/10.1109/LSP.2014.2320944 . . .. . . . . . . . . . . . . . . . . . . . . . . . . . . . . . . . . . . . . . . . . . . . . . . . . . . . . . . . . . . . . . . . . . . . . . . . . . . . . . . . . . . J. Chen, J. C. M. Bermudez, and C. Richard 928
A Time-Frequency Hybrid Downmixing Method for AC-3 Decoding http://dx.doi.org/10.1109/LSP.2014.2321061 . . . . . . . . . . . . . . . . . . . . . . . . . . . .. . . . . . . . . . . . . . . . . . . . . . . . . . . . . . . . . . . . . . . . . . . . . . . . . . . . . . . . . . . . . . . . . . . . . . . . . . . . . . . . . . . . . . . . . . . . . . . . . . . . . . . . . H. Li, Y. Wang, and P. Li 933
http://dx.doi.org/10.1109/LSP.2014.2320676 . . . . . . . . . . . . . . . . .. . . . . . . . . . . . . . . . . . . . . . . . . . . . . . . . . . . . . . . . . . . . . . . . . . . . . . . . . . . . . . . . . . . . . . . . . . . . . . . . . . . . . . . . . . . . . . . . . . . . . . . . . . . . . . . . J. Kim and D. Kim 937
A GMM Post-Filter for Residual Crosstalk Suppression in Blind Source Separation http://dx.doi.org/10.1109/LSP.2014.2317761 . . . . . . . . . . . .. . . . . . . . . . . . . . . . . . . . . . . . . . . . . . . . . . . . . . . . . . . . . . . . . . . . . . . . . . . . . . . . . . . . . . . . . . . B. Liu, V. G. Reju, A. W. H. Khong, and V. V. Reddy 942
Robust Transceiver for AF MIMO Relaying with Direct Link: A Globally Optimal Solution http://dx.doi.org/10.1109/LSP.2014.2321414 . .. . . . . . . . . . . . . . . . . . . . . . . . . . . . . . . . . . . . . . . . . . . . . . . . . . . . . . . . . . . . . . . . . . . . . . . . . . . . . . . . . . . . . . . . . . . . . . . . . . . . . H. Shen, W. Xu, and C. Zhao 947
Sparse Representation of Monogenic Signal: With Application to Target Recognition in SAR Imageshttp://dx.doi.org/10.1109/LSP.2014.2321565 . . . . . . . . . . . . . . . . . . . . . . . . . . . . . . . . . . . . . . . . . . . . . . . . . . . . . . . . . . . . . . . . . . G. Dong, N. Wang, and G. Kuang 952
IEEE SIGNAL PROCESSING LETTERS (ISSN 1070–9908) is published quarterly in print and monthly online by the Institute of Electrical and Electronics Engineers, Inc. Responsibility for
the contents rests upon the authors and not upon the IEEE, the Society/Council, or its members. 3 Park Avenue, 17th Floor, New York, NY 10016-5997. IEEE
445 Hoes Lane, Piscataway, NJ 08854-4141. +1 732 981 0060.
Abstracting is permitted with credit to the source. Libraries are permitted to photocopy for private use of patrons, provided the
or republication permission, write to Copyrights and Permissions Department, IEEE Publications Administration, 445 Hoes Lane, Piscataway, NJ 08854-4141. Copyright © 2014 by
Send address changes
to IEEE SIGNAL PROCESSING LETTERS, IEEE, 445 Hoes Lane, Piscataway, NJ 08854-4141. GST Registration No. 125634188. CPC Sales Agreement #40013087. Return undeliverable
Canada addresses to: Pitney Bowes IMEX, P.O. Box 4332, Stanton Rd., Toronto, ON M5W 3J4, Canada. IEEE prohibits discrimination, harassment and bullying. For more information
visit http://www.ieee.org/nondiscrimination. Printed in U.S.A.
Previous Page | Contents | Zoom in | Zoom out | Front Cover | Search Issue | Next Page qqM
Mq
qM
MqM
THE WORLD’S NEWSSTAND®
Previous Page | Contents | Zoom in | Zoom out | Front Cover | Search Issue | Next Page qqM
Mq
qM
MqM
THE WORLD’S NEWSSTAND®
_____________________

www.signalprocessingsociety.org [49] JULY 2014
AUGUST 2014 VOLUME 21 NUMBER 8 ISPLEM (ISSN 1070-9908)
LETTERS
Audio and Acoustic Signal Processing
Numerical Synthesis of an Optimal Low-Sidelobe Beam Pattern for a Microphone Array http://dx.doi.org/10.1109/LSP.2014.2320916 . . . . . .. . . . . . . . . . . . . . . . . . . . . . . . . . . . . . . . . . . . . . . . . . . . . . . . . . . . . . . . . . . . . . . . . . . . . . . . . . . . . . . . . . Y. Hur, Y.-C. Park, J. S. Abel, and D. H. Youn 914
A GMM Post-Filter for Residual Crosstalk Suppression in Blind Source Separation http://dx.doi.org/10.1109/LSP.2014.2317761 . . . . . . . . . . . .. . . . . . . . . . . . . . . . . . . . . . . . . . . . . . . . . . . . . . . . . . . . . . . . . . . . . . . . . . . . . . . . . . . . . . . . . . . B. Liu, V. G. Reju, A. W. H. Khong, and V. V. Reddy 942
Biomedical Signal Processing
Artifact Removal from Single-Trial ERPs using Non-Gaussian Stochastic Volatility Models and Particle Filterhttp://dx.doi.org/10.1109/LSP.2014.2321000 . . . . . . . . . . . . . . . . . . . . . . . . . . . . . . . . . . . . . . . . C.-M. Ting, S.-H. Salleh, Z. M. Zainuddin, and A. Bahar 923
Digital and Multirate Signal Processing
A Time-Frequency Hybrid Downmixing Method for AC-3 Decoding http://dx.doi.org/10.1109/LSP.2014.2321061 . . . . . . . . . . . . . . . . . . . . . . . . . . . .. . . . . . . . . . . . . . . . . . . . . . . . . . . . . . . . . . . . . . . . . . . . . . . . . . . . . . . . . . . . . . . . . . . . . . . . . . . . . . . . . . . . . . . . . . . . . . . . . . . . . . . . . H. Li, Y. Wang, and P. Li 933
http://dx.doi.org/10.1109/LSP.2014.2320927 . .. . . . . . . . . . . . . . . . . . . . . . . . . . . . . . . . . . . . . . . . . . . . . . . . . . . . . . . . . . . . . . . . . . . . . . . . . . . . . . . . . . . . . . . . . . . . . . . . . . . . . . . . . . E. Aboutanios and S. Ye 975
Automated Recovery of Compressedly Observed Sparse Signals From Smooth Background http://dx.doi.org/10.1109/LSP.2014.2321256 . .. . . . . . . . . . . . . . . . . . . . . . . . . . . . . . . . . . . . . . . . . . . . . . . . . . . . . . . . . . . . . . . . . . . . . . . . . . . . . . . . . . . . Z. Chen, R. Molina, and A. K. Katsaggelos 1012
Large Margin Dimensionality Reduction for Action Similarity Labeling http://dx.doi.org/10.1109/LSP.2014.2320530 . . . . . . . . . . . . . . . . . . . . . . . . .. . . . . . . . . . . . . . . . . . . . . . . . . . . . . . . . . . . . . . . . . . . . . . . . . . . . . . . . . . . . . . . . . . . . . . . . . . . . . . . . . . . . . . . . X. Peng, Y. Qiao, Q. Peng, and Q. Wang 1022
IEEE SIGNAL PROCESSING LETTERS (ISSN 1070–9908) is published quarterly in print and monthly online by the Institute of Electrical and Electronics Engineers, Inc. Responsibility for
the contents rests upon the authors and not upon the IEEE, the Society/Council, or its members. 3 Park Avenue, 17th Floor, New York, NY 10016-5997. IEEE
445 Hoes Lane, Piscataway, NJ 08854-4141. +1 732 981 0060.
Abstracting is permitted with credit to the source. Libraries are permitted to photocopy for private use of patrons, provided the
or republication permission, write to Copyrights and Permissions Department, IEEE Publications Administration, 445 Hoes Lane, Piscataway, NJ 08854-4141. Copyright © 2014 by
Send address changes
to IEEE SIGNAL PROCESSING LETTERS, IEEE, 445 Hoes Lane, Piscataway, NJ 08854-4141. GST Registration No. 125634188. CPC Sales Agreement #40013087. Return undeliverable
Canada addresses to: Pitney Bowes IMEX, P.O. Box 4332, Stanton Rd., Toronto, ON M5W 3J4, Canada. IEEE prohibits discrimination, harassment and bullying. For more information
visit http://www.ieee.org/nondiscrimination. Printed in U.S.A.
Previous Page | Contents | Zoom in | Zoom out | Front Cover | Search Issue | Next Page qqM
Mq
qM
MqM
THE WORLD’S NEWSSTAND®
Previous Page | Contents | Zoom in | Zoom out | Front Cover | Search Issue | Next Page qqM
Mq
qM
MqM
THE WORLD’S NEWSSTAND®
_____________________

www.signalprocessingsociety.org [50] JULY 2014
Image and Multidimensional Signal Processing
Object Tracking via Robust Multitask Sparse Representation http://dx.doi.org/10.1109/LSP.2014.2320291 . . . . . . . . . . . . . . . . Y. Bai and M. Tang 909Learning Structural Regularity for Evaluating Blocking Artifacts in JPEG Images http://dx.doi.org/10.1109/LSP.2014.2320743 . . . . . . . . . . . . . .. . . . . . . . . . . . . . . . . . . . . . . . . . . . . . . . . . . . . . . . . . . . . . . . . . . . . . . . . . . . . . . . . . . . . . . . . . . . . . . . . . . . . . . . . . . . . . . . . . . . . . . . . L. Li, W. Lin, and H. Zhu 918
http://dx.doi.org/10.1109/LSP.2014.2320676 . . . . . . . . . . . . . . . . .. . . . . . . . . . . . . . . . . . . . . . . . . . . . . . . . . . . . . . . . . . . . . . . . . . . . . . . . . . . . . . . . . . . . . . . . . . . . . . . . . . . . . . . . . . . . . . . . . . . . . . . . . . . . . . . . J. Kim and D. Kim 937
Sparse Representation of Monogenic Signal: With Application to Target Recognition in SAR Imageshttp://dx.doi.org/10.1109/LSP.2014.2321565 . . . . . . . . . . . . . . . . . . . . . . . . . . . . . . . . . . . . . . . . . . . . . . . . . . . . . . . . . . . . . . . . . . G. Dong, N. Wang, and G. Kuang 952
Robust Keypoint Detection Using Higher-Order Scale Space Derivatives: Application to Image Retrievalhttp://dx.doi.org/10.1109/LSP.2014.2321755 . . . . . . . . . . . . . . . . . . . . . . . . . . . . . . . . . . . . . . . . . . . . . . . . . . . . . . . . . . . . . . . . . . . . U. Park, J. Park, and A. K. Jain 962
Viewpoint-Aware Representation for Sketch-Based 3D Model Retrieval http://dx.doi.org/10.1109/LSP.2014.2321764 . . . . . . . . . . . . . . . . . . . . . . . . .. . . . . . . . . . . . . . . . . . . . . . . . . . . . . . . . . . . . . . . . . . . . . . . . . . . . . . . . . . . . . . . . . . . . . . . . . . . . . . . . . C. Zou, C. Wang, Y. Wen, L. Zhang, and J. Liu 966
A Generic Proximal Algorithm for Convex Optimization—Application to Total Variation Minimizationhttp://dx.doi.org/10.1109/LSP.2014.2322123 . . . . . . . . . . . . . . . . . . . . . . . . . . . . . . . . . . . . . . . . . . . . . . .. . . . . . . . . . . . . . . . . . . . . . . . . . . . . . . . . . . . . . . . . . . . . . . L. Condat 985
Machine Learning and Statistical Signal Processing
Reducing Basis Mismatch in Harmonic Signal Recovery via Alternating Convex Search http://dx.doi.org/10.1109/LSP.2014.2322444 . . . . . . .. . . . . . . . . . . . . . . . . . . . . . . . . . . . . . . . . . . . . . . . . . . . . . . . . . . . . . . . . . . . . . . . . . . . . . . . . . . . . . . . . . . . . . J. M. Nichols, A. K. Oh, and R. M. Willett 1007
Multimedia Signal Processing
PMFS: A Perceptual Modulated Feature Similarity Metric for Stereoscopic Image Quality Assessmenthttp://dx.doi.org/10.1109/LSP.2014.2320956 . . . . . . . . . . . . . . . . . . . . . . . . . .. . . . . . . . . . . . . . . . . . . . . . . . . . W. Zhou, G. Jiang, M. Yu, F. Shao, and Z. Peng 1003
Sensor Array and Multichannel Signal Processing
Orthogonal Space Projection (OSP) Processing for Adaptive Interference Cancellation http://dx.doi.org/10.1109/LSP.2014.2319317 . . . . . . . .. . . . . . . . . . . . . . . . . . . . . . . . . . . . . . . . . . . . . . . . . . . . . . . . . . . . . . . . . . . . . . . . . . . . . . . . . . . . . . . . . . . . . . . . . . . . . . . . . . . . . . . . . . . . . . . . . . . . . . . E. J. Holder 980
Signal Processing for Communications
Robust Transceiver for AF MIMO Relaying with Direct Link: A Globally Optimal Solution http://dx.doi.org/10.1109/LSP.2014.2321414 . .. . . . . . . . . . . . . . . . . . . . . . . . . . . . . . . . . . . . . . . . . . . . . . . . . . . . . . . . . . . . . . . . . . . . . . . . . . . . . . . . . . . . . . . . . . . . . . . . . . . . . H. Shen, W. Xu, and C. Zhao 947
Linearized Robust Beamforming for Two-Way Relay Systems http://dx.doi.org/10.1109/LSP.2014.2322118 . . . . . . . . . . . . . . . . . . . . . . . . . . . . . . . . . . . .. . . . . . . . . . . . . . . . . . . . . . . . . . . . . . . . . . . . . . . . . . . . . . . . . . . . . . . . . . . . . . . . . . . . . . . . . . . . . . . . . A. Aziz, C. Thron, S. Cui, and C. Georghiades 1017
Statistical and Adaptive Signal Processing
Steady-State Performance of Non-Negative Least-Mean-Square Algorithm and Its Variants http://dx.doi.org/10.1109/LSP.2014.2320944 . . .. . . . . . . . . . . . . . . . . . . . . . . . . . . . . . . . . . . . . . . . . . . . . . . . . . . . . . . . . . . . . . . . . . . . . . . . . . . . . . . . . . . J. Chen, J. C. M. Bermudez, and C. Richard 928
Determining the Existence of Objects in an Image and Its Application to Image Thumbnailing http://dx.doi.org/10.1109/LSP.2014.2321751 . .. . . . . . . . . . . . . . . . . . . . . . . . . . . . . . . . . . . . . . . . . . . . . . . . . . . . . . . . . . . . . . . . . . . . . . . . . . . . . . . . . . . . . . . . . . . . J. Choi, C. Jung, J. Lee, and C. Kim 957
http://dx.doi.org/10.1109/LSP.2014.2321791 . . . . . . . . . . . . . . . . . . . . . . . . . . . . . . . . . . . . . . . . . . . . . . . . . . . . . . . . . . . . . . . . . . . . . . . . . . . . . . . . . . N. Xi and L. Liping 971Condition Number-Constrained Matrix Approximation With Applications to Signal Estimation in CommunicationSystems http://dx.doi.org/10.1109/LSP.2014.2322113 . . . . . . . . . . . . . . . . . . . . . . . . . . . . . . . . . . . . . . . . . . . . . . . . J. Tong, Q. Guo, S. Tong, J. Xi, and Y. Yu 990
Asymptotic Performance of Categorical Decision Making with Random Thresholds http://dx.doi.org/10.1109/LSP.2014.2321474 . . . . . . . . . . .. . . . . . . . . . . . . . . . . . . . . . . . . . . . . . . . . . . . . . . . . . . . . . . . . . . . . . . . . . . . . . . . . . . . . . . . . . . . . . . . . . . . . . . . . . . . . T. Wimalajeewa and P. K. Varshney 994
Multichannel Detection of an Unknown Rank-N Signal Using Uncalibrated Receivers http://dx.doi.org/10.1109/LSP.2014.2322514 . . . . . . . . .. . . . . . . . . . . . . . . . . . . . . . . . . . . . . . . . . . . . . . . . . . . . . . . . . . . . . . . . . . . . . . . . . . . . . . . . . . . . . . . . . . . . D. E. Hack, C. W. Rossler, and L. K. Patton 998
Previous Page | Contents | Zoom in | Zoom out | Front Cover | Search Issue | Next Page qqM
Mq
qM
MqM
THE WORLD’S NEWSSTAND®
Previous Page | Contents | Zoom in | Zoom out | Front Cover | Search Issue | Next Page qqM
Mq
qM
MqM
THE WORLD’S NEWSSTAND®

www.signalprocessingsociety.org [51] JULY 2014
[VOLUME 31 NUMBER 4 JULY 2014]
Previous Page | Contents | Zoom in | Zoom out | Front Cover | Search Issue | Next Page qqM
Mq
qM
MqM
THE WORLD’S NEWSSTAND®
Previous Page | Contents | Zoom in | Zoom out | Front Cover | Search Issue | Next Page qqM
Mq
qM
MqM
THE WORLD’S NEWSSTAND®

www.signalprocessingsociety.org [52] JULY 2014
Digital Object Identifier 10.1109/MSP.2014.2311859
15 FROM THE GUEST EDITORSJoachim Ender, Moeness G. Amin, Gianfranco Fornaro, and Paul A. Rosen
16 WIDE-ANGLE SYNTHETIC APERTURE RADAR IMAGINGJoshua N. Ash, Emre Ertin, Lee C. Potter, and Edmund G. Zelnio
27 SPARSITY-DRIVEN SYNTHETIC APERTURE RADAR IMAGINGMüjdat Çetin, Ivana Stojanovic, N. Özben Önhon, Kush R. Varshney, Sadegh Samadi, W. Clem Karl, and Alan S. Willsky
41 TOMOGRAPHIC PROCESSING OF INTERFEROMETRIC SAR DATAGianfranco Fornaro, Fabrizio Lombardini, Antonio Pauciullo, Diego Reale, and Federico Viviani
51 SUPERRESOLVING SARTOMOGRAPHY FOR MULTIDIMENSIONAL IMAGING OF URBAN AREASXiao Xiang Zhu and Richard Bamler
59 CONTEXTUAL INFORMATION-BASED MULTICHANNEL SYNTHETIC APERTURE RADARINTERFEROMETRYFabio Baselice, Giampaolo Ferraioli, Vito Pascazio, and Gilda Schirinzi
69 EXPLOITING PATCH SIMILARITY FOR SAR IMAGE PROCESSINGCharles-Alban Deledalle, Loïc Denis, Giovanni Poggi, Florence Tupin, and Luisa Verdoliva
79 MODELING AND INTERPRETATION OF SCATTERING MECHANISMS IN POLARIMETRIC SYNTHETIC APERTURE RADARSi-Wei Chen, Yong-Zhen Li, Xue-Song Wang, Shun-Ping Xiao, and Motoyuki Sato
90 SAR IMAGING ALGORITHMS AND SOME UNCONVENTIONALAPPLICATIONSRaffaele Solimene, Ilaria Catapano, Gianluca Gennarelli, Antonio Cuccaro, Angela Dell’Aversano, and Francesco Soldovieri
99 THE TIME-REVERSALTECHNIQUE FOR SARFOCUSING OF BURIED TARGETSRobert Kedzierawski, Jean-Marc Le Caillec, and Witold Czarnecki
110 MULTIPATH EXPLOITATION AND SUPPRESSION FOR SAR IMAGING OF BUILDING INTERIORSMichael Leigsnering, Moeness G. Amin, Fauzia Ahmad, and Abdelhak M. Zoubir
[FEATURE]120 LONG-WAVE
INFRARED HYPERSPECTRALREMOTE SENSING OF CHEMICAL CLOUDSDimitris G. Manolakis, Steven E. Golowich, and Robert S. DiPietro
[COLUMNS]4 FROM THE EDITOR
Signal Processing: Is it Time to Change the Society’s Name?Abdelhak Zoubir
6 PRESIDENT’S MESSAGEAt the Forefront in Technical PublicationsAlex Acero
8 READER’S CHOICETop Downloads in IEEE Xplore
10 SPECIAL REPORTSSignal Processing: On the Edge of Astronomy’s New FrontierJohn Edwards
Health Alliance Boosts Influence in Standards DevelopmentRon Schneiderman
142 LECTURE NOTESOptimal Multiuser Transmit Beamforming: A Difficult Problem with a Simple Solution StructureEmil Björnson, Mats Bengtsson, and Björn Ottersten
149 APPLICATIONS CORNEREffective Feature Extraction and Data Reduction in Remote Sensing Using Hyperspectral ImagingJinchang Ren, Jaime Zabalza, Stephen Marshall, and Jiangbin Zheng
155 LIFE SCIENCESSignal Processing in Visual OpticsD. Robert Iskander
[DEPARTMENT]159 DATES AHEAD
[CONTENTS] [VOLUME 31 NUMBER 4]
[SPECIAL SECTION—SYNTHETIC APERTURERADAR IMAGING]
Previous Page | Contents | Zoom in | Zoom out | Front Cover | Search Issue | Next Page qqM
Mq
qM
MqM
THE WORLD’S NEWSSTAND®
Previous Page | Contents | Zoom in | Zoom out | Front Cover | Search Issue | Next Page qqM
Mq
qM
MqM
THE WORLD’S NEWSSTAND®

www.signalprocessingsociety.org [53] JULY 2014
■ 50 ■ 100 ■ 200 ■ 300 ■ 400 ■ 500 or _________ (in multiples of 50) reprints.■ YES ■ NO Self-covering/title page required. COVER PRICE: $74 per 100, $39 per 50.■ $58.00 Air Freight must be added for all orders being shipped outside the U.S.■ $18.50 must be added for all USA shipments to cover the cost of UPS shipping and handling.
...PLEASE SEND ME...
Number of Text Pages
1-4 5-8 9-12 13-16 17-20 21-24 25-28 29-32 33-36 37-40 41-44 45-4850 $126 $211 $243 $245 $285 $340 $371 $408 $440 $477 $510 $543100 $242 $423 $476 $492 $570 $680 $742 $817 $885 $953 $1021 $1088
...2011 REPRINT PRICES (without covers)..
■ Check enclosed. Payable on a bank in the USA.■ Charge my: ■ Visa ■ Mastercard ■ Amex ■ Diners Club
Account # ___________________________________________ Exp. date ____________________________________
Cardholder’s Name (please print): ____________________________________________________________________________________________________________________________________________________________________■ Bill me (you must attach a purchase order) Purchase Order Number ______________________________________
Send Reprints to: Bill to address, if different: _____________________________________ ____________________________________________________________________________________________ ____________________________________________________________________________________________ ____________________________________________________________________________________________ _______________________________________________________
Because information and papers are gathered from various sources, there may be a delay in receiving your reprint request. This is especially true with postconference publications. Please provide us with contact information if you would like notification of a delay of more than 12 weeks.
Telephone: _______________________ Fax: _________________________ Email Address: _____________________
...PAYMENT...
Tax Applies on shipments of regular reprints to CA, DC, FL, MI, NJ, NY, OH and Canada (GST Registration no. 12534188).
Prices are based on black & white printing. Please call us for full color price quote, if applicable.
Authorized Signature: ___________________________________________ Date:__________________
Author: ________________________________________
Publication Title: _________________________________
Paper Title: _____________________________________
_______________________________________________
RETURN THIS FORM TO:IEEE Publishing Services445 Hoes LaneBox 1331Piscataway, NJ 08855-1331Call Reprint Department at (732) 562-3941 for questions regarding this form(732) 981-8062 - FAX
...PLEASE FILL OUT THE FOLLOWING
ORDER FORM FOR REPRINTSPurchasing IEEE Papers in Print is easy, cost-effective and quick.
Complete this form, tear it out, and either fax it (24 hours a day) to 732-981-8062 or mail it back to us.
Larger quantities can be ordered. Email [email protected] with specific details.
Previous Page | Contents | Zoom in | Zoom out | Front Cover | Search Issue | Next Page qqM
Mq
qM
MqM
THE WORLD’S NEWSSTAND®
Previous Page | Contents | Zoom in | Zoom out | Front Cover | Search Issue | Next Page qqM
Mq
qM
MqM
THE WORLD’S NEWSSTAND®
__________

www.signalprocessingsociety.org [54] JULY 2014
Please PRINT your name as you want it to appear on your membership card and IEEE correspondence. As a key identifier for the IEEE database, circle your last/surname.
PERSONAL INFORMATION
To better serve our members and supplement member dues, your postal mailing address is made available to carefully selected organizations to provide you with information on technical services, continuing education, and conferences. Your e-mail address is not rented by IEEE. Please check box only if you do not want to receive these postal mailings to the selected address.
Start your membership immediately: Join online www.ieee.org/join
Name & Contact Information1
I have graduated from a three- to five-year academic program with a university-level degree. Yes No
This program is in one of the following fields of study:EngineeringComputer Sciences and Information TechnologiesPhysical SciencesBiological and Medical SciencesMathematicsTechnical Communications, Education, Management, Law and PolicyOther (please specify): _________________
This academic institution or program is accredited in the country where the institution is located. Yes No Do not know
I have ______ years of professional experience in teaching, creating, developing, practicing, or managing within the following field:
EngineeringComputer Sciences and Information TechnologiesPhysical SciencesBiological and Medical SciencesMathematicsTechnical Communications, Education, Management, Law and PolicyOther (please specify): _________________
Attestation2
I hereby apply for IEEE membership and agree to be governed by the IEEE Constitution, Bylaws, and Code of Ethics. I understand that IEEE will communicate with me regarding my individual membership and all related benefits. Application must be signed.
Signature Date
Please Sign Your Application4
3 Please Tell Us About Yourself
Male Female Date of birth (Day/Month/Year) / /
Please complete both sides of this form, typing or printing in capital letters.Use only English characters and abbreviate only if more than 40 characters and spaces per line. We regret that incomplete applications cannot be processed.
(students and graduate students must apply online)
A. Primary line of business1. Computers2. Computer peripheral equipment3. Software4. Office and business machines5. Test, measurement and instrumentation equipment6. Communications systems and equipment7. Navigation and guidance systems and equipment8. Consumer electronics/appliances9. Industrial equipment, controls and systems
10. ICs and microprocessors11. Semiconductors, components, sub-assemblies, materials and supplies12. Aircraft, missiles, space and ground support equipment13. Oceanography and support equipment14. Medical electronic equipment15. OEM incorporating electronics in their end product (not elsewhere classified)16. Independent and university research, test and design laboratories and
consultants (not connected with a mfg. co.)17. Government agencies and armed forces18. Companies using and/or incorporating any electronic products in their
manufacturing, processing, research or development activities19. Telecommunications services, telephone (including cellular)20. Broadcast services (TV, cable, radio)21. Transportation services (airline, railroad, etc.)22. Computer and communications and data processing services23. Power production, generation, transmission and distribution24. Other commercial users of electrical, electronic equipment and services
(not elsewhere classified)25. Distributor (reseller, wholesaler, retailer)26. University, college/other educational institutions, libraries27. Retired28. Other__________________________
Over Please
B. Principal job function9. Design/development
engineering—digital10. Hardware engineering11. Software design/development12. Computer science13. Science/physics/mathematics14. Engineering (not elsewhere
specified)15. Marketing/sales/purchasing16. Consulting17. Education/teaching18. Retired19. Other
1. General and corporate management2. Engineering management3. Project engineering management4. Research and development
management5. Design engineering management
—analog6. Design engineering management
—digital7. Research and development
engineering8. Design/development engineering
—analog
D. Title1. Chairman of the Board/President/CEO2. Owner/Partner3. General Manager4. VP Operations5. VP Engineering/Dir. Engineering6. Chief Engineer/Chief Scientist7. Engineering Management8. Scientific Management9. Member of Technical Staff
10. Design Engineering Manager11. Design Engineer12. Hardware Engineer13. Software Engineer14. Computer Scientist15. Dean/Professor/Instructor16. Consultant17. Retired18. Other
C. Principal responsibility 1. Engineering and scientific management2. Management other than engineering3. Engineering design4. Engineering5. Software: science/mngmnt/engineering
6. Education/teaching7. Consulting8. Retired9. Other
Are you now or were you ever a member of IEEE? Yes No If yes, provide, if known:
Membership Number Grade Year Expired
Select the numbered option that best describes yourself. This infor-mation is used by IEEE magazines to verify their annual circulation. Please enter numbered selections in the boxes provided.
2014 IEEE MEMBERSHIP APPLICATION
Title First/Given Name Middle Last/Family Surname
Primary Address
Street Address
City State/Province
Postal Code Country
Primary Phone
Primary E-mail
Secondary Address
Company Name Department/Division
Street Address City State/Province
Postal Code Country
Secondary Phone
Secondary E-mail
Home Business (All IEEE mail sent here)
Home Business
Previous Page | Contents | Zoom in | Zoom out | Front Cover | Search Issue | Next Page qqM
Mq
qM
MqM
THE WORLD’S NEWSSTAND®
Previous Page | Contents | Zoom in | Zoom out | Front Cover | Search Issue | Next Page qqM
Mq
qM
MqM
THE WORLD’S NEWSSTAND®

www.signalprocessingsociety.org [55] JULY 2014
(Updated March 2012)
The IEEE TRANSACTIONS are published monthly covering advances in the
the journal with the most appropriate scope for your submission.Authors are encouraged to submit manuscripts of Regular papers (papers
which provide a complete disclosure of a technical premise), or Correspon-dences (brief items that describe a use for or magnify the meaning of a singletechnical point, or provide comment on a paper previously published in theTRANSACTIONS). Submissions/resubmissions must be previously unpublishedand may not be under consideration elsewhere.
being addressed, (b) state why it is important to solve the problem, and (c) give
By submission/resubmission of your manuscript to this TRANSACTIONS, youare acknowledging that you accept the rules established for publication of man-uscripts, including agreement to pay all overlength page charges, color charges,and any other charges and fees associated with publication of the manuscript.Such charges are not negotiable and cannot be suspended.New and revised manuscripts should be prepared following the “New Manu-
script Submission” guidelines below, and submitted to the online manuscript
be prepared following the “FinalManuscript SubmissionGuidelines” below. Donot sendoriginal submissions or revisions directly to theEditor-in-Chief orAsso-ciate Editors; theywill access yourmanuscript electronically via the ScholarOneManuscripts system.
Please follow the next steps.1. Account in ScholarOne Manuscripts. If necessary, create an account in the
you already have an existing account which is based on your e-mail ad-dress and may have been created for you when you reviewed or authoreda previous paper.
2. Electronic Manuscriptdouble-spaced format (one full blank line between lines of type) using afont size of 11 points or larger, having a margin of at least 1 inch on allsides. For a regular paper, themanuscript may not exceed 30 double-spacedpages, including title; names of authors and their complete contact infor-
ures and equations are visible in your document before you “SUBMIT”your manuscript. Proofreading is critical; once you submit your manu-script, the manuscript cannot be changed in any way. You may also submit
issues prior to completing the submission process.3. Double-Column Version of Manuscript. You are required to also submita roughly formatted version of the manuscript in single-spaced, doublecolumn IEEE format (10 points for a regular submission or 9 points for
equations stick out). If accepted for publication, over length page chargesare levied beginning with the 11th published page of your manuscript.You are, therefore, advised to be conservative in your submission. This
proximate publication length of the manuscript and gives an additional
paid when billed upon publication.
ScholarOneManuscripts site.4. Additional Material for Review. Please upload pdf versions of all itemsin the reference list which are not publicly available, such as unpublished(submitted) papers. Other materials for review such as supplementary ta-
5. Submission.
sion will open on screen containing the manuscript tracking number and
contributing authors. Once you click “Submit,” your manuscript cannot bechanged in any way.
6. Copyright Form and Consent Form. By policy, IEEE owns the copyrightto the technical contributions it publishes on behalf of the interests of theIEEE, its authors, and their employers; and to facilitate the appropriatereuse of this material by others. To comply with the IEEE copyright poli-cies, authors are required to sign and submit a completed “IEEE Copyrightand Consent Form” prior to publication by the IEEE.The IEEE recommends authors to use an effective electronic copyright
form (eCF) tool within the ScholarOne Manuscripts system. You will beredirected to the “IEEE Electronic Copyright Form” wizard at the end ofyour original submission; please simply sign the eCF by typing your nameat the proper location and click on the “Submit” button.
Correspondence items are short disclosures with a
meaning of a single technical point, or provide brief comments on materialpreviously published in the TRANSACTIONS. These items may not exceed 12pages in double-spaced format (3 pages for Comments), using 11 point type,with margins of 1 inch minimum on all sides, and including: title, names andcontact information for authors, abstract, text, references, and an appropriatenumber of illustrations and/or tables. Correspondence items are submitted inthe same way as regular manuscripts (see “NewManuscript Submission” abovefor instructions).
Papers published on or after 1 January 2007 can nowbe up to 10 pages, and any paper in excess of 10 pages will be subject to overlength page charges. The IEEE Signal Processing Society has determinedthat the standard manuscript length shall be no more than 10 published pages(double-column format, 10 point type) for a regular submission, or 6 publishedpages (9 point type) for a Correspondence item, respectively. Manuscripts thatexceed these limits will incur mandatory over length page charges, as discussedbelow. Since changes recommended as a result of peer review may requireadditions to the manuscript, it is strongly recommended that you practiceeconomy in preparing original submissions.Exceptions to the 30-page (regular paper) or 12-page (Correspondences)
manuscript length may, under extraordinary circumstances, be granted by theEditor-in-Chief. However, such exception does not obviate your requirement topay any and all over length or additional charges that attach to the manuscript.
Authors of rejectedmanuscripts are allowed to resubmit their manuscripts only once. The SignalProcessing Society strongly discourages resubmission of rejected manuscriptsmore than once. At the time of submission, you will be asked whether you con-sider your manuscript to be a new submission or a resubmission of an earlierrejected manuscript. If you choose to submit a new version of your manuscript,you will be asked to submit supporting documents detailing how your new ver-sion addresses all of the reviewers’ comments.Full details of the resubmission process can be found in the Signal Processing
Society “Policy andProceduresManual” at http://www.signalprocessingsociety.org/about/governance/policy-procedure/. Also, please refer to the decision letterandyourAuthorCenter on theon-line submission system.
Author Misconduct Policy: Plagiarism includes copying someone else’s workwithout appropriate credit, using someone else’s work without clear delineationof citation, and the uncited reuse of an authors previously published work thatalso involves other authors. Plagiarism is unacceptable.Self-plagiarism involves the verbatim copying or reuse of an authors own
prior work without appropriate citation; it is also unacceptable. Self-plagiarismincludes duplicate submission of a single journal manuscript to two differentjournals, and submission of two different journal manuscripts which overlapsubstantially in language or technical contribution.Authors may only submit original work that has not appeared elsewhere in a
journal publication, nor is under review for another journal publication. Limitedoverlap with prior journal publications with a common author is allowed onlyif it is necessary for the readability of the paper. If authors have used their ownpreviously published work as a basis for a new submission, they are required
fers substantively novel contributions beyond those of the previously publishedwork.It is acceptable for conference papers to be used as the basis for a more fully
developed journal submission. Still, authors are required to cite related priorwork; the papers cannot be identical; and the journal publication must includenovel aspects.Author Misconduct Procedures: The procedures that will be used by the
Signal Processing Society in the investigation of author misconduct allegationsare described in the IEEE SPS Policies and Procedures Manual.
Previous Page | Contents | Zoom in | Zoom out | Front Cover | Search Issue | Next Page qqM
Mq
qM
MqM
THE WORLD’S NEWSSTAND®
Previous Page | Contents | Zoom in | Zoom out | Front Cover | Search Issue | Next Page qqM
Mq
qM
MqM
THE WORLD’S NEWSSTAND®

www.signalprocessingsociety.org [56] JULY 2014
Author Misconduct Sanctions: The IEEE Signal Processing Society willapply the following sanctions in any case of plagiarism, or in cases ofself-plagiarism that involve an overlap of more than 25% with another journalmanuscript:1) immediate rejection of the manuscript in question;2) immediate withdrawal of all other submitted manuscripts by any of theauthors, submitted to any of the Society’s publications (journals, con-ferences, workshops), except for manuscripts that also involve innocentco-authors; immediate withdrawal of all other submitted manuscripts byany of the authors, submitted to any of the Society’s publications (jour-nals, conferences, workshops), except for manuscripts that also involveinnocent co-authors;
3) prohibition against each of the authors for any new submissions, either in-dividually, in combination with the authors of the plagiarizing manuscript,or in combination with new co-authors, to all of the Society’s publications(journals, conferences, workshops). The prohibition shall continue for oneyear from notice of suspension.
Further, plagiarism and self-plagiarism may also be actionable by the IEEEunder the rules of Member Conduct.
Authors are encouraged to prepare manuscripts employing the on-line style
are available on the web at http://www.ieee.org/publications_standards/publi-cations/authors/authors_journals.html#sect2 under “Template for all Transac-tions.” (LaTeX and MS Word).Authors using LaTeX: the two PDF versions of the manuscript needed for
document is generated by including \documentclass[11pt,draftcls,onecolumn]
double-column document for estimating the publication page charges via\documentclass[10pt,twocolumn,twoside]{IEEEtran} for a regular submission,or \documentclass[9pt,twocolumn,twoside]{IEEEtran} for a Correspondenceitem.
Title page and abstract:title, names and contact information for all authors (full mailing address, in-
An asterisk * should be placed next to the name of the Corresponding Au-thor who will serve as the main point of contact for the manuscript duringthe review and publication processes.An abstract should have not more than 200 words for a regular paper,
or 50 words for a Correspondence item. The abstract should indicatethe scope of the paper or Correspondence, and summarize the author’sconclusions. This will make the abstract, by itself, a useful tool forinformation retrieval.EDICS:
EDICS published online at http://www.signalprocessingsociety.org/publi-cations/periodicals/tsp/TSP-EDICS/
mission of a newmanuscript, please choose the EDICS categories that bestsuit your manuscript. Failure to do so will likely result in a delay of the peerreview process.
abstract page—of the manuscript.Illustrations and tables:intelligible without requiring reference to the text. Illustrations/tables maybe worked into the text of a newly-submitted manuscript, or placed at the
tables must be submitted separately and not interwoven with the text.)
is understandable.In preparing your illustrations, note that in the printing process, most
illustrations are reduced to single-column width to conserve space. Thismay result in as much as a 4:1 reduction from the original. Therefore, makesure that all words are in a type size that will reduce to a minimum of9 points or 3/16 inch high in the printed version. Only the major grid lineson graphs should be indicated.Abbreviations: This TRANSACTIONS follows the practices of the IEEEon units and abbreviations, as outlined in the Institute’s publishedstandards. See http://www.ieee.org/portal/cms_docs_iportals/iportals/pub-lications/authors/transjnl/auinfo07.pdf for details.Mathematics: All mathematical expressions must be legible. Do not givederivations that are easily found in the literature; merely cite the reference.
Upon formal acceptance of a manuscript for publication, instructions for
sponding Author. Finalized manuscripts should be prepared in LaTeX or MS
http://www.ieee.org/publications_standards/publications/authors/authors_jour-nals.html#sect2.
setup.RANSACTIONS, the name of
the author, and the software used to format the manuscript.
(although this is acceptable for your initial submission). If submitting on
text, but include callouts like “(a),” “(b).”
Powerpoint, Excel or PDF.Not acceptable is GIF, JPEG,WMF, PNG,BMPor any other format (JPEG is accepted for author photographs only). Theprovided resolution needs to be at least 600 dpi (400 dpi for color).
note that this will be at the expense of the author. Without other indica-tions, color graphics will appear in color in the online version, but will beconverted to grayscale in the print version.
Additional instructions for preparing, verifying the quality, and submittinggraphics are available via http://www.ieee.org/publications_standards/publica-tions/ authors/authors_journals.html.
http://www.ieee.org/publications_standards/publications/authors/authors_jour-nals.html#sect6 under “Multimedia.” To make your work reproducible byothers, the TRANSACTIONS
Voluntary Page Charges. Upon acceptance of a manuscript for publication,the author(s) or his/her/their company or institution will be asked to pay a charge
that comprise the standard length (six pages, in the case of Correspondences).Mandatory Page Charges. The author(s) or his/her/their company or insti-
pages for regular papers and six published pages for correspondence items.These are mandatory page charges and the author(s) will be held responsible
ingness to pay these charges simply by submitting his/her/their manuscript tothe TRANSACTIONS. The Publisher holds the right to withhold publication underany circumstance, as well as publication of the current or future submissions ofauthors who have outstanding mandatory page charge debt.Color Charges.
in the hardcopy version in grayscale, and the author is responsible that the cor-
sive, and all charges for color are the responsibility of the author. The estimated
preparation charges which may be estimated as follows: color reproductionson four or fewer pages of the manuscript: a total of approximately $1045; color
color reproductions on nine through 12 pages: a total of approximately $3135,and so on. Payment of fees on color reproduction is not negotiable or voluntary,and the author’s agreement to publish the manuscript in the TRANSACTIONS isconsidered acceptance of this requirement.
Previous Page | Contents | Zoom in | Zoom out | Front Cover | Search Issue | Next Page qqM
Mq
qM
MqM
THE WORLD’S NEWSSTAND®
Previous Page | Contents | Zoom in | Zoom out | Front Cover | Search Issue | Next Page qqM
Mq
qM
MqM
THE WORLD’S NEWSSTAND®
______________________________________________
__________________
_____________________________________________
________________________________________________
_______________________________________
_____________________________________________
_________________

www.signalprocessingsociety.org [57] JULY 2014
Previous Page | Contents | Zoom in | Zoom out | Front Cover | Search Issue | Next Page qqM
Mq
qM
MqM
THE WORLD’S NEWSSTAND®
Previous Page | Contents | Zoom in | Zoom out | Front Cover | Search Issue | Next Page qqM
Mq
qM
MqM
THE WORLD’S NEWSSTAND®
______________

The 2014 Workshop on Genomic Signal Processing and Statistics (GENSIPS’14) will join the 2014 IEEE Global Conference on Signal and Information Processing (GlobalSIP’14) to be held in Atlanta on Dec. 3-5, 2014. GENSIPS’14 will continually provide a forum for researchers in signal processing, bioinformatics, computational biology, and biostatistics to share the state-of-art advances in the fast growing genomics, proteomics, metabolomics, lipidomics, and metagenomics areas and to tackle the challenges of high dimensionality, high heterogeneity, and high complexity.
Papers on unpublished original research are solicited. Topics of interest include, and not limited to:metabolomics, lipidomics, and metagenomics data
Prospective authors should submit to GENSISP 2014 by EDAS http://edas.info/newPaper.php?c=17341.Please use 2-column IEEE template available at http://www.ieeeglobalsip.org/formatting.html) for paper up to 4 pages. The key dates are:
Paper submission deadline July 25th, 2014 Notification of Acceptance Sept. 15th, 2014 Camera Ready paper due Oct.15th, 2014 GENSIPS’14 December 3-5, 2014
Selected papers will be invited to submit to IEEE Journal of Biomedical and Health Informatics, andother journal(s) for peer-review and publication.
Workshop Co-Chairs:Peng Qiu, Ph.D. Biomedical Engineering, Georgia Institute of Technology & Emory University May D. Wang, Ph.D. Biomedical Engineering and Electrical and Computer Engineering,
Georgia Institute of Technology & Emory University
Previous Page | Contents | Zoom in | Zoom out | Front Cover | Search Issue | Next Page qqM
Mq
qM
MqM
THE WORLD’S NEWSSTAND®
Previous Page | Contents | Zoom in | Zoom out | Front Cover | Search Issue | Next Page qqM
Mq
qM
MqM
THE WORLD’S NEWSSTAND®

Previous Page | Contents | Zoom in | Zoom out | Front Cover | Search Issue | Next Page qqM
Mq
qM
MqM
THE WORLD’S NEWSSTAND®
Previous Page | Contents | Zoom in | Zoom out | Front Cover | Search Issue | Next Page qqM
Mq
qM
MqM
THE WORLD’S NEWSSTAND®