Zinc Silicates with Complex Morphology by Reaction of ... - MDPI
Upload
khangminh22Category
view
0download
0
Agronomy 2020, 10, 1566; doi:10.3390/agronomy10101566 www.mdpi.com/journal/agronomy
Article
Zinc‐Induced Effects on Productivity, Zinc Use
Efficiency, and Grain Biofortification of Bread Wheat
under Different Tillage Permutations
Usman Zulfiqar 1, Saddam Hussain 1,*, Muhammad Ishfaq 1, Amar Matloob 2, Nauman Ali 3,
Muhammad Ahmad 1, Mohammed Nasser Alyemeni 4 and Parvaiz Ahmad 4,5,*
1 Department of Agronomy, Faculty of Agriculture, University of Agriculture, Faisalabad 38040, Pakistan;
[email protected] (U.Z.); [email protected] (M.I.); [email protected] (M.A.) 2 Department of Agronomy, Faculty of Agriculture & Environmental Sciences, Muhammad Nawaz Shareef
University of Agriculture, Multan 60000, Pakistan; [email protected] 3 Agronomic Research Institute, Ayub Agricultural Research Institute, Faisalabad 38000, Pakistan;
[email protected] 4 Botany and Microbiology Department, College of Science, King Saud University, Riyadh 11451, Saudi Arabia;
[email protected] 5 Department of Botany, S.P. College, Maulana Azad Road, Srinagar, Jammu and Kashmir, Pune 190001, India
* Correspondence: [email protected] or [email protected] (S.H.);
[email protected] or [email protected] or [email protected] (P.A.)
Received: 7 September 2020; Accepted: 2 October 2020; Published: 14 October 2020
Abstract: Zinc (Zn) deficiency is a global concern for human health and causes a decrease in crop
production and nutritional characteristics. A two‐year field study was planned to evaluate
comparative effects of various Zn application approaches in bread wheat under plough tillage (PT)
and zero tillage (ZT) system. Cultivation of wheat under ZT improved the soil organic carbon
(17%), total soil porosity (11%), soil microbial biomass nitrogen (5%), and carbon (5%) in
comparison to PT system averaged across the two years. Various efficiency indices were
significantly influenced by Zn application methods during both years of experimentation.
However, grain Zn contents were maximum with foliar‐applied Zn in PT (31%) and soil‐applied
Zn under the ZT system (29.85%). Moreover, Zn use also enhanced the bioavailable Zn as lower
phytate contents and phytate to Zn molar ratio were recorded. The highest bioavailable Zn was
calculated for foliar (30%) and soil application (28%). Under both tillage systems, the maximum net
benefits were obtained through Zn seed priming; nevertheless, ZT resulted in higher net benefits
than PT due to low associated costs. In conclusion, Zn nutrition through different methods
enhanced the productivity, profitability, and grain biofortification of wheat under PT and ZT
systems.
Keywords: agronomic biofortification; micronutrient application methods; seed enhancements; Zn
deficiency; Zinc enriched wheat
1. Introduction
Staple cereals (wheat, rice, and maize) are the principal source of food in developing countries
with low amounts of micronutrients including zinc (Zn), boron (B), and iron (Fe) [1]. Therefore, the
use of only staple food in daily diet is a major cause of widespread micronutrient deficiency in
under‐develop countries [2]. Wheat occupies a central position for the provision of micronutrients
and 70% daily calories in third world countries [3,4]. Among micronutrients, deficiency of Zn is most

Agronomy 2020, 10, 1566 2 of 21
common and widespread in wheat‐growing regions. Worldwide, about 50% of cultivated soils are
found deficient in bioavailable Zn [5]. The problem of Zn deficiency is associated with poor
availability and higher Zn adsorption on soil particles owing to the higher pH and calcareous nature
of soils [6]. Additionally, a considerable decline in yield due to insufficient Zn supply from the soil
also lowers the Zn concentration in grains [7]. For example, Zn contents of wheat grains were
reduced by 50% when it was cultivated on a Zn‐deficient soil in Turkey [5].
More than two billion people worldwide are suffering from several disorders due to deficiency
of micronutrients [8]. However, about 1.25 billion population is at the risk of Zn inadequacy [8,9]. In
Pakistan, 40% mothers and 33% children are under Zn malnutrition particularly in rural
communities [10]. About 49% of soils in the world [11] and 70% of soils across Pakistan are Zn
deficient [12]. Zn is an important micronutrient for biological systems in humans, animals, and
plants. In plants, it has a central role in the integrity of biological membranes, enzyme activation,
and protein synthesis [13,14].
Intensive and continuous wheat and rice cultivation has endangered the productivity and
sustainability of rice‐wheat cropping system (RWCS) owing to deteriorated soil heath, persistent
minerals mining [15], micronutrient inadequacy [1,16], and higher production costs [17–19]. Timely
sowing of wheat in conventional RWCS is delayed under plough tillage (PT). Moreover, continuous
soil disturbance along with the cultivation of high yielding cultivars (that demand high levels of
inputs) has caused a significant decline in system productivity owing to poor soil health and Zn
deficiency [20]. Additionally, tillage affects the transformation and availability of Zn predominately
in the top soil profile layers and plants [21]. Zero tillage (ZT) in this regard offers a practical solution
for sustaining the productivity of RWCS [22]. It ensures wheat sowing at proper time, saves energy
resources, and mends soil health as well as fertility [19,23]. Moreover, under ZT system, surface
stratification of Zn is different from conventional tillage system. The higher amount of Zn leads to
mount up in rhizosphere soil due to residues decay under ZT system as compared to the PT system
[24]. Residues retention on soil surface improves the moisture retention capability, regulates the soil
pH and temperature, and enhances the Zn availability to plants [25].
The Zn malnutrition can be minimized by various remedies like fortification of food,
supplementation, diversification in diet, and biofortification [26]. From these methods,
biofortification is a feasible and relatively inexpensive option, as it can be easily disseminated in
remote areas of under‐developed countries. It is a process of intentionally enhancing the nutritional
value of edible parts of plants via genetic engineering or agronomic interventions [27]. Genetic
biofortification is a less economical and time‐consuming approach [28]. Biofortification via
agronomic interventions (application of Zn fertilizer) is an easy and practical approach to produce
Zn enriched grains [29]. It can be applied as seed treatments and basal as well as foliar application
[30].
Role of Zn in enhancing the crop productivity and grain Zn concentration of bread wheat is
well reported [31–33]. However, information on the comparative efficacy of Zn application methods
in enhancing the productivity, profitability, grain biofortification, and bio‐availability of wheat sown
in traditional, as well as conservational tillage systems, is lacking. Therefore, the recent study was
carried out with the hypothesis that Zn application would enhance the productivity and grain Zn
concentration of bread wheat under different tillage systems. The objectives of this study were: (a) to
check the most appropriate and affordable approach of Zn application to increase wheat
productivity and grain Zn contents under PT and ZT, and (b) to examine the variations between PT
and ZT regarding Zn use efficiency and grain biofortification.
2. Materials and Methods
2.1. Experimental Site, Climate, and Soil
This experiment was executed at Student Research Farm, University of Agriculture, Faisalabad
(latitude 73.89° E, longitude 31.62° N, and altitude 183.8 m asl) for two consecutive growing seasons
(2017–2018 and 2018–2019). The climate of study site (Faisalabad) is sub‐tropical and has a dry

Agronomy 2020, 10, 1566 3 of 21
climate with temperatures varying from 26 °C to 38 °C in the summer and 7 °C to 20 °C in the winter
and the average rainfall is 350 mm (annually). For the entire period of experiment, the weather data
were obtained from the Meteorological Cell, University of Agriculture, Faisalabad (Table 1), which is
located very close to the experimental site. The experimental soil belonged to the Lyallpur soil series
and classified as Haplic Yermosol in the classification of Food and Agriculture Organization (FAO)
[34] and aridisol‐fine silty hyperthermic Ustalfic, Haplagrid under United State Department of
Agriculture (USDA) system of soil classification [35]. Pre‐sowing soil analysis depicted that texture
of experimental soil was sandy clay loam with pH 7.4, electrical conductivity (EC) 0.51 dS m−1, total
soil organic matter 0.66%, total nitrogen (N) 0.059%, available phosphorus (P) 7.3 mg kg−1,
extractable potassium (K) 92 mg kg−1, and diethylene triamine pentaacetic acid (DTPA) extractable Zn 0.67 mg kg−1.
Table 1. Weather data of experimental site for the wheat season of 2017–2018 and 2018–2019.
Months
Rainfall Relative
Humidity Temperature (°C)
Sunshine
(h)
(mm) (%) Monthly
Maximum
Monthly
Minimum Monthly Mean
2017
–
2018
201
8–
201
9
2017–
2018
2018–
2019
201
7–
201
8
2018–
2019
2017–
2018
2018–
2019
2017–
2018
2018–
2019
2017–
2018
2018
–
2019
Novemb
er
01.5
0 00.6 84.6 74.6 24.1 27.0 11.8 12.4 18.0 19.7 3.7 6.9
Decembe
r
04.2
0 00.7 69.3 81.7 22.0 21.7 6.7 6.5 14.4 14.1 6.0 6.9
January 00.0
0 18.0 75.9 81.0 21.5 19.2 5.5 7.0 13.5 13.2 6.4 5.4
February 09.5
0 73.2 73.3 79.0 24.0 20.3 9.5 9.1 16.7 14.7 6.5 6.7
March 12.5
0 55.7 61.6 68.8 31.2 26.0 16.4 13.8 23.8 19.9 8.6 8.9
April 07.9
0 31.2 47.3 57.4 36.8 35.0 20.8 20.6 28.8 27.8 9.1 9.0
Source: Meteorological Cell, University of Agriculture Faisalabad, Pakistan. All the values of
sunshine, relative humidity, and mean temperature are the monthly averages.
2.2. Plant Material
Seed of wheat cv. Anaaj‐2017 was acquired from Wheat Research Institute, Faisalabad.
Moisture contents and germination percentage of procured seeds was determined following ISTA,
2015 [36], and was 10.2% and 90%, respectively.
2.3. Experimentation
The study consisted of two variables, namely, tillage systems (plough tillage; PT and zero
tillage; ZT) and Zn application methods (No application, Zn seed coating, hydro‐priming, Zn seed
priming, Zn soil application, water foliar spray, and Zn foliar spray). In the PT system, the seedbed
was conventionally prepared with three cultivations followed by plankings. After that, seed was
sown with tractor‐mounted seed‐cum fertilizer drill. Wheat seeds were directly seeded into stubbles
of preceding rice crop with ZT drill and no preparatory tillage operations were practiced in ZT
system. During both study years, sowing of wheat was done in rows (22.5 cm spaced), while the
seeding rate was 125 kg ha−1 under both tillage systems. Wheat seed was sown on 19 November in
2017 and on 28 November in 2018. For all treatments, ZnSO4.7H2O was used as source of Zn and
applied using different methods. For seed coating, a sticking solution was prepared using Arabic
gum as a sticking agent, 1.25 g Zn kg−1 seed was added in sticky solution, and wheat seeds were
dipped in this solution for 45 min and allowed to adhere the Zn solution on wheat seeds. Wheat
seeds were soaked in distilled water (hydro‐priming) or 0.25 M aerated Zn solution (Zn priming) for

Agronomy 2020, 10, 1566 4 of 21
12 h with 1:5 seed weight to solution volume ratio for seed priming. Artificial aeration was given to
seeds with an aquarium pump during soaking. After removal of seeds from the priming solution,
their washing was done with distilled water and dried by forced air under shade until their initial
weight. Application of Zn was done as a basal dose at 10 kg ha−1 during seedbed preparation as soil
application. For foliar application, 0.5% Zn solution or water spray (distilled water) was applied
with manual sprayer at the booting stage (BBCH code 40) [37]. Hydro‐priming and water spray were
considered as a positive control for Zn priming and Zn foliar spray, respectively. Rice sowing was
done as a subsequent crop after wheat. For the last three years, the experimental patch had been
under a rice‐wheat rotation. For the study, a randomized complete block design under split plot
arrangement was used. In the main plots, tillage methods were assigned, while Zn application
approaches were placed in sub‐plots. All the treatments were replicated thrice. Based on soil
analysis, soil fertilization was carried out at N:P:K 100:85:65 kg ha−1 applying urea (46% N),
di‐ammonium phosphate (DAP) (46% P2O5), and sulfate of potash (SOP) (50% K2O). The whole
quantity of P and K and ½ of N was used during the time of sowing, whereas the remaining ½ of N
was top‐dressed in two halves at first and second irrigation. Pre‐sowing irrigation (soaking
irrigation) was applied before sowing of wheat during both years of experimentation, whereas
during the crop growth period, five irrigations (each 75 mm) were applied using canal water as a
source of irrigation. Wheat seeds were treated using Hombre® 37.25% FS (Imidacloprid 360 g L−1 and
Tebuconazole 12.5 g L−1) at a rate of 2 mL kg−1 seed to control seed‐borne and soil‐borne pathogens.
For weed control, Total® 80 WG (Sulfosulfuron + Metasulfuron 16 g a.i. ha−1) was sprayed at 30 days
after sowing. Wheat crop during the first and second season of experimentation was harvested on 14
April 2018, and 20 April 2019, respectively. The harvested wheat crop from each experimental unit
was tangled into bundles and sundried for seven days; then, it was threshed using a mini‐thresher.
2.4. Data Recording
2.4.1. Soil Properties
After wheat harvesting, random soil sampling (at 0–10 cm and 10–20 cm sampling depth) was
done at three test sites of each experimental unit during both years of experimentation. The physical
properties of soil were determined in the field including soil bulk density (SBD) using the core
method of Blake and Hartge [38], the total soil porosity (TSP) by following Vomocil [39] procedures,
and soil penetration resistance using the cone penetrometer. Total N, available P, and extractable K
were determined according to the methods suggested by Bremner and Mulvaney [40], Olsen [41],
and Richards [42], respectively. In addition, soil organic carbon (SOC) is estimated in accordance
with Walkley and Black [43]. For determination of soil microbial biomass carbon (SMBC) and
nitrogen (SMBN), samples of soil were collected at anthesis stage (BBCH code 69) [37] and
chloroform fumigation extraction procedure was followed to determine the SMBC and SMBN, as
per Brookes et al. [44] and Anderson and Ingram [45].
2.4.2. Yield Attributes
For calculating the number of productive tillers, data were recorded from three random spots (1
m × 1 m) from each experimental plot at the harvest maturity. To determine the grains per spike, 20
spikes from each experimental unit were clipped and threshed manually. Manually harvested crop
was tangled up in bundles and kept in the air for sun drying. Biological yield (Mg ha−1) was
determined by weighing the sundried and tied bundles of harvested crop after seven days of
harvesting. Each plot was threshed separately with the help of mini thresher. Grains were separated
from chaff and straw and grain yield (Mg ha−1) was noted for each plot. For the 1000‐grain weight
determination, three sub‐samples of 1000 grains for each experimental unit were drawn, counted,
and weighed with a digital weighing balance. Harvest index was computed as a ratio of grain yield
to biological yield and given in percentage.

Agronomy 2020, 10, 1566 5 of 21
2.4.3. Grain and Straw Zn Concentration
Samples of grain and straw were taken at the final harvest and prepared by the process of wet
ashing [46]. Samples were kept in an oven (UF1060plus Memmert, Germany) at 70 °C, and
oven‐dried samples were ground and weighed. Then, these samples were added in a di‐acid
(HClO4:HNO3 at 3:10 v/v ratio) mixture for the digestion process and placed on a digestion plate
(Heidolph, USA model, MR3003). Afterward, the atomic absorption spectrophotometer (Shimadzu,
UV‐1201, Kyoto, Japan) was used to determine Zn concentrations in grain and straw samples.
2.4.4. Estimation of Phytate Contents and Bioavailable Zn
For the determination of phytate in wheat grain, the procedure of Haug and Lantzsch [47] was
followed with minor modifications, as described in Rehman et al. [48,49]. For phytate determination,
ground seed samples (0.1 g) were placed in a tube along with Na2SO4 (10 mL) (10% solution
dissolved in 0.4 M HCl) and stirred for three h and centrifuged (Sigma GmbH, Germany model.
2‐16P) 4600 g for 20 min. Afterward, 1 mL from the centrifuged sample was collected and mixed in
ferric solution and heating was done at 95 °C for 30 min. Then, heated samples were instantly kept in
cold water to reduce the temperature. Samples were again centrifuged for 20 min and 1 mL
supernatant was added to fresh tube and mixed with 3 mL of 2,2′‐bi‐pyridine solution (C10H8N2) (5 g
dissolved in 500 mL water with 1% v/v thioglycollic acid (HSCH2COOH)). After the development of
pink color, measurement was taken at 519 nm with an atomic absorption spectrophotometer against
phytic acid standards. For calculation of [phytae]: [Zn], molar concentration of Zn and phytate in
wheat grain was used. Bioavailable Zn was estimated by employing the trivariate model of Zn
absorption [50]:
TAZ 0.5 . A TDZ K . 1TDPK
A TDZ K . 1TDPK
4 . A TDZ (1)
where TAZ is the total absorbed Zn per day (mg day−1), TDZ is total Zn in diet per day (mmol day−1),
and TDP is total phytate contents in diet per day (mmol day−1). Moreover, there are three constants
in the equation, i.e., maximum Zn absorption (AMAX = 0.091), dissociation constants of Zn‐receptor
binding reaction (KR = 0.680), and phytate‐Zn binding reaction (KP = 0.033) [51]. According to the
FAO [52], the average daily consumption of wheat is 300 g. Therefore, TAZ was measured for wheat
flour (300 g) and presented as estimated bioavailable Zn.
2.4.5. Estimation of Zn Use Efficiency
The estimated values of Zn use efficiencies were computed by following the formulas
suggested by Fageria [53] and Shivay and Prasad [54]:
Agronomic efficiency AgEGY GY
Zn (2)
Physiological efficiency PEY YU U
(3)
Agro physiological efficiency AgPEGY GY
U U (4)
Apparent recovery efficiency AREU U
Zn (5)
Utilization efficiency UE PE ARE (6)
Partial factor productivity PFPGYZn
(7)
where GYZn is the grain yield of Zn treated plots, GYC is the yield of untreated plots, Zna is the total
amount of Zn applied, YZn is the grain and straw yield of Zn treated plots, YC is the grain and straw

Agronomy 2020, 10, 1566 6 of 21
yield of untreated plots, UZn is the Zn uptake in grain and straw of Zn treated plots, and UC is the Zn
uptake in grain and straw of untreated plots.
2.4.6. Economic Analysis
For estimation of the economic viability of tillage systems as well as Zn application methods,
economic analyses were performed [55]. Actual grain and straw yield of wheat crop were reduced to
10% for adjusting grain and straw yield as per farmer’s level, as there are more precise management
practices in experimental research as compared to farmer fields. Seed, fertilizer, irrigation, plant
protection measures, harvesting, threshing, and labor costs were considered as fixed cost and
remained the same for all treatments. The cost incurred for tillage practices and Zn application was
included as a variable cost. Net benefit was calculated by deducting gross income from the total cost.
The benefit‐cost ratio (BCR) was computed as a ratio of gross income and total cost.
2.4.7. Statistical Analysis
Data on all parameters were analyzed statistically by performing analysis of variance (ANOVA)
technique through statistical software Statistix 10.1 (Analytical Software, Statistix; Tallahassee, FL,
USA, 1985–2003). Tukey’s HSD (honestly significant difference) at 5% probability level was used for
comparison of treatment’s means [56].
3. Results
3.1. Soil Properties
Tillage systems considerably affected the soil physical and biological properties (SBD, TSP, PR,
SMBC, SMBN, and SOC) and nutrient status (total N, available P, and extractable K), whereas soil
properties remained unaffected with Zn nutrition. Averaged across two years, SBD was 4.40%
higher at 0–10 cm, and 3.80% higher at 10–20 cm depth under PT as compared to ZT (Table 2).
However, ZT system recorded higher values for TSP (14.97% and 7.28%), PR (9.30% and 15.30%),
SMBC (5.15% and 4.39%), SMBN (4.6% and 5.11%), and SOC (16.56% and 16.55%) at 0–10 cm and 10–
20 cm depth, respectively, as compared to ZT (Table 2). Total N was 7.70% and 8.33% higher under
ZT during the first and second experimental year, respectively (Figure 1a; Table S1). Similarly, 3.73%
and 6.02% higher available P was observed under ZT than PT during 2017–2018 and 2018–2019,
respectively (Figure 1b; Table S1). Extractable K was statistically unaffected by the tillage systems
during the first year; however, the ZT system showed higher value (3.06%) for extractable K as
compared to PT system during 2018–2019 (Figure 1c; Table S1).
Table 2. Influence of tillage systems on soil health parameters recorded after wheat harvest.
Treatments 2017–2018 2018–2019
0–10 cm 10–20 cm 0–10 cm 10–20 cm
Soil bulk density (g cm−3)
Plough tillage 1.67 A 1.63 A 1.65 A 1.66 A
Zero tillage 1.60 B 1.57 B 1.58 B 1.59 B
HSD (p ≤ 0.05) 0.04 0.03 0.03 0.02
Total Soil Porosity (%)
Plough tillage 37.75 B 39.00 B 36.67 B 38.00 B
Zero tillage 43.57 A 41.85 A 42.00 A 40.76 A
HSD (p ≤ 0.05) 0.90 0.63 0.70 0.38
Penetration Resistance (kPa)
Plough tillage 513.1 A 580.1 B 520.4 B 575.4 B
Zero tillage 530.9 A 640.9 A 599.1 A 691.1 A
HSD (p ≤ 0.05) NS 13.61 19.51 11.63
Soil Microbial Biomass Carbon (μg g−1)
Plough tillage 160.8 B 163.4 B 168.4 B 164.9 B

Agronomy 2020, 10, 1566 7 of 21
Zero tillage 168.9 A 169.5 A 177.3 A 173.3 A
HSD (p ≤ 0.05) 1.41 2.92 3.41 1.68
Soil Microbial Biomass Nitrogen (μg g−1)
Plough tillage 574.9 B 562.0 B 578.0 B 561.1 B
Zero tillage 607.6 A 587.3 A 598.4 A 593.3 A
HSD (p ≤ 0.05) 11.96 2.21 8.69 5.32
Soil Organic Carbon (g kg−1)
Plough tillage 6.09 B 5.62 B 6.58 B 5.73 B
Zero tillage 7.21 A 6.55 A 7.55 A 6.68 A
HSD (p ≤ 0.05) 0.11 0.50 0.18 0.05
Means sharing the same uppercase letter during a year for a parameter do not differ significantly at p
≤ 0.05 honestly significant difference (HSD); NS = Non‐significant.
Figure 1. Influence of plough tillage and zero tillage system on (a) total nitrogen (g kg−1), (b) available
phosphorous (mg kg−1), and (c) extractable potassium (mg kg−1). Error bars above means indicate the
±S.E. of three replicates. Means sharing the same letter during an experimental year for a parameter
do not differ significantly at p ≤ 0.05.
3.2. Yield Attributes
Application of Zn significantly influenced the number of productive tillers during both years;
however, the effect of tillage systems was non‐significant for productive tillers. Averaged across
different wheat tillage systems (WTs), the number of productive tillers was 14.08% and 12.44%
higher with Zn priming during 2017–2018 and 2018–2019, respectively, compared with control.
Grains per spike were considerably influenced by tillage systems and Zn nutrition; ZT produced
higher number of grains per spike in comparison to PT and among Zn application methods, 38.2%
higher number of grains per spike were found with Zn priming in comparison to control treatment
during the first study year. For the second experimental year, the highest grains per spike (34.28%

Agronomy 2020, 10, 1566 8 of 21
over control) were found in response to Zn seed priming under ZT system. Tillage system had no
significant impact on 1000‐grain weight, whereas Zn application substantially influenced the grain
weight and Zn seed priming resulted in 26.46% and 23.45% increase in 1000‐grain weight relative to
control during 2017–2018 and 2018–2019, respectively. Foliar‐applied Zn during the second year
gave statistically similar results to seed Zn priming (Table 3). The highest biological yield (18.58%
relative to control) was documented through soil application of Zn that was statistically at par to Zn
seed priming during the first year. However, the interaction of WTs × Zn was significant during
second year and the highest biological yield (27.40%) was obtained with soil‐applied Zn in PT
system. Similarly, the highest grain yield (42.1% over control) was achieved with Zn seed priming in
the ZT system in first year that was statistically at par with Zn seed priming in the PT system.
However, the interaction of WTs × Zn was non‐significant during the second year and the highest
grain yield (32.8% over control) was obtained with Zn seed priming. For tillage systems, the higher
grain yield was recorded under ZT system in comparison to PT. The highest harvest index was
observed in response to Zn seed priming for both years (Table 4).
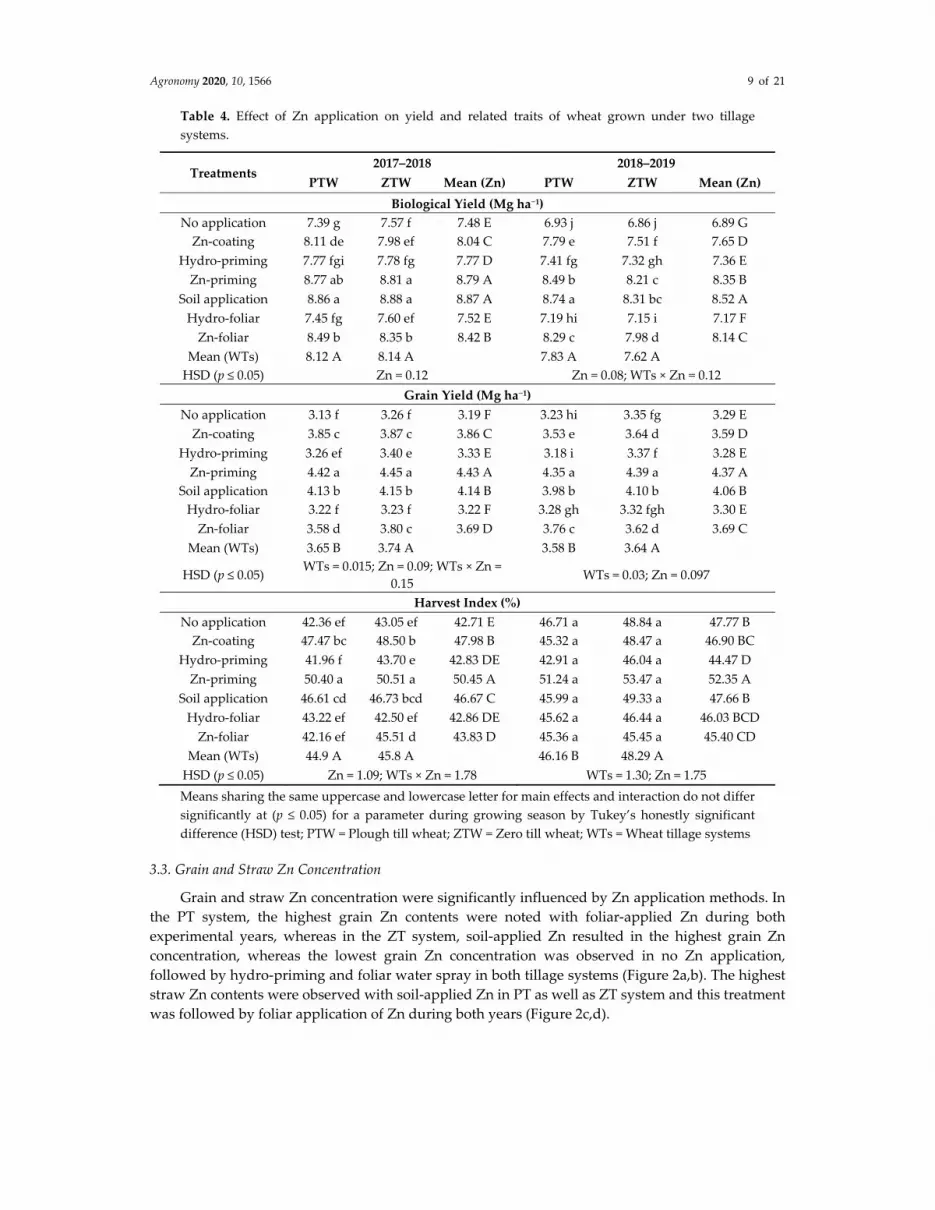
Table 3. Effect of Zn application on yield and related traits of wheat grown under two tillage
systems.
Table 2017–2018 2018–2019
PTW ZTW Mean (Zn) PTW ZTW Mean (Zn)
Productive Tillers (m−2)
No application 319 d 320 d 320 F 316 fg 319 efg 318 D
Zn‐coating 340 b 336 bc 338 C 335 cd 333 cd 334 BC
Hydro‐priming 325 cd 328 cd 327 DE 317 efg 313 g 315 D
Zn‐priming 365 a 364 a 365 A 354 ab 360 a 357 A
Soil application 355 a 354 a 355 B 344 bc 330 de 337 B
Hydro‐foliar 320 d 325 cd 323 EF 317 efg 315 fg 316 D
Zn‐foliar 327 cd 329 bcd 328 D 327 def 322 defg 325 CD
Mean (WTs) 336 A 337 A 330 A 327 A
HSD (p ≤ 0.05) Zn = 4.48 Zn = 9.68
Grains per Spike
No application 33 g 35 ef 34 F 35 e 36 e 36 C
Zn‐coating 41 d 41 d 41 D 41 d 41 d 41 C
Hydro‐priming 34 fg 35 ef 35 EF 36 e 36 e 36 C
Zn‐priming 47 a 47 a 47 A 45 b 47 a 46 A
Soil application 43 c 44 bc 44 C 43 c 43 c 43 B
Hydro‐foliar 35 ef 36 e 36 E 36 e 35 e 36 C
Zn‐foliar 45 b 45 b 45 B 47 a 45 b 46 A
Mean (WTs) 39.7 B 40.4 A 40.4 A 40.4 A
HSD (p ≤ 0.05) WTs = 0.7; Zn = 0.61 Zn = 0.93; WTs × Zn = 1.32
1000‐grain Weight (g)
No application 35.17 f 35.36 f 35.26 D 36.07 d 35.97 d 36.02 D
Zn‐coating 38.00 ef 38.92 de 38.46 C 38.37 c 38.35 c 38.36 C
Hydro‐priming 35.97 f 35.78 f 35.87 D 35.97 d 36.84 d 36.41 D
Zn‐priming 44.89 a 44.30 ab 44.59 A 43.98 a 44.97 a 44.47 A
Soil application 41.16 cd 41.83 bcd 41.49 B 41.16 b 42.36 b 41.76 B
Hydro‐foliar 35.15 f 36.32 ef 35.73 D 36.15 d 36.12 d 36.13 D
Zn‐foliar 42.70 abc 42.24 abc 42.47 B 44.04 a 44.41 a 44.22 A
Mean (WTs) 39.00 A 39.25 A 39.39 A 39.86 A
HSD (p ≤ 0.05) Zn = 1.68 Zn = 1.24
Means sharing the same uppercase and lowercase letter for main effects and interaction do not differ
significantly at (p ≤ 0.05) for a parameter during growing season by Tukey’s honestly significant
difference (HSD) test; PTW = Plough till wheat; ZTW = Zero till wheat; WTs = Wheat tillage systems.
Agronomy 2020, 10, 1566 9 of 21
Table 4. Effect of Zn application on yield and related traits of wheat grown under two tillage
systems.
Treatments 2017–2018 2018–2019
PTW ZTW Mean (Zn) PTW ZTW Mean (Zn)
Biological Yield (Mg ha−1)
No application 7.39 g 7.57 f 7.48 E 6.93 j 6.86 j 6.89 G
Zn‐coating 8.11 de 7.98 ef 8.04 C 7.79 e 7.51 f 7.65 D
Hydro‐priming 7.77 fgi 7.78 fg 7.77 D 7.41 fg 7.32 gh 7.36 E
Zn‐priming 8.77 ab 8.81 a 8.79 A 8.49 b 8.21 c 8.35 B
Soil application 8.86 a 8.88 a 8.87 A 8.74 a 8.31 bc 8.52 A
Hydro‐foliar 7.45 fg 7.60 ef 7.52 E 7.19 hi 7.15 i 7.17 F
Zn‐foliar 8.49 b 8.35 b 8.42 B 8.29 c 7.98 d 8.14 C
Mean (WTs) 8.12 A 8.14 A 7.83 A 7.62 A
HSD (p ≤ 0.05) Zn = 0.12 Zn = 0.08; WTs × Zn = 0.12
Grain Yield (Mg ha−1)
No application 3.13 f 3.26 f 3.19 F 3.23 hi 3.35 fg 3.29 E
Zn‐coating 3.85 c 3.87 c 3.86 C 3.53 e 3.64 d 3.59 D
Hydro‐priming 3.26 ef 3.40 e 3.33 E 3.18 i 3.37 f 3.28 E
Zn‐priming 4.42 a 4.45 a 4.43 A 4.35 a 4.39 a 4.37 A
Soil application 4.13 b 4.15 b 4.14 B 3.98 b 4.10 b 4.06 B
Hydro‐foliar 3.22 f 3.23 f 3.22 F 3.28 gh 3.32 fgh 3.30 E
Zn‐foliar 3.58 d 3.80 c 3.69 D 3.76 c 3.62 d 3.69 C
Mean (WTs) 3.65 B 3.74 A 3.58 B 3.64 A
HSD (p ≤ 0.05) WTs = 0.015; Zn = 0.09; WTs × Zn =
0.15 WTs = 0.03; Zn = 0.097
Harvest Index (%)
No application 42.36 ef 43.05 ef 42.71 E 46.71 a 48.84 a 47.77 B
Zn‐coating 47.47 bc 48.50 b 47.98 B 45.32 a 48.47 a 46.90 BC
Hydro‐priming 41.96 f 43.70 e 42.83 DE 42.91 a 46.04 a 44.47 D
Zn‐priming 50.40 a 50.51 a 50.45 A 51.24 a 53.47 a 52.35 A
Soil application 46.61 cd 46.73 bcd 46.67 C 45.99 a 49.33 a 47.66 B
Hydro‐foliar 43.22 ef 42.50 ef 42.86 DE 45.62 a 46.44 a 46.03 BCD
Zn‐foliar 42.16 ef 45.51 d 43.83 D 45.36 a 45.45 a 45.40 CD
Mean (WTs) 44.9 A 45.8 A 46.16 B 48.29 A
HSD (p ≤ 0.05) Zn = 1.09; WTs × Zn = 1.78 WTs = 1.30; Zn = 1.75
Means sharing the same uppercase and lowercase letter for main effects and interaction do not differ
significantly at (p ≤ 0.05) for a parameter during growing season by Tukey’s honestly significant
difference (HSD) test; PTW = Plough till wheat; ZTW = Zero till wheat; WTs = Wheat tillage systems
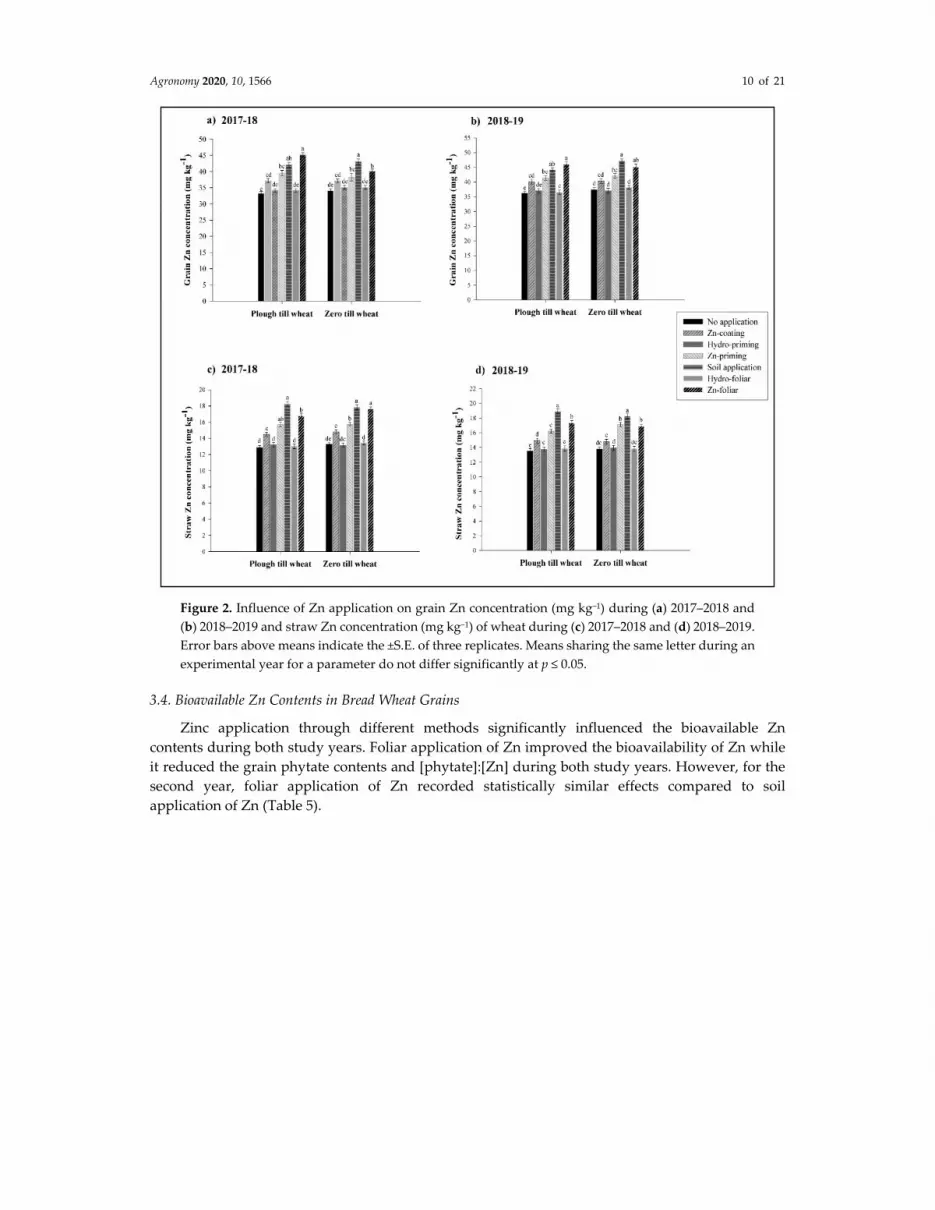
3.3. Grain and Straw Zn Concentration
Grain and straw Zn concentration were significantly influenced by Zn application methods. In
the PT system, the highest grain Zn contents were noted with foliar‐applied Zn during both
experimental years, whereas in the ZT system, soil‐applied Zn resulted in the highest grain Zn
concentration, whereas the lowest grain Zn concentration was observed in no Zn application,
followed by hydro‐priming and foliar water spray in both tillage systems (Figure 2a,b). The highest
straw Zn contents were observed with soil‐applied Zn in PT as well as ZT system and this treatment
was followed by foliar application of Zn during both years (Figure 2c,d).
Agronomy 2020, 10, 1566 10 of 21
Figure 2. Influence of Zn application on grain Zn concentration (mg kg−1) during (a) 2017–2018 and
(b) 2018–2019 and straw Zn concentration (mg kg−1) of wheat during (c) 2017–2018 and (d) 2018–2019.
Error bars above means indicate the ±S.E. of three replicates. Means sharing the same letter during an
experimental year for a parameter do not differ significantly at p ≤ 0.05.
3.4. Bioavailable Zn Contents in Bread Wheat Grains
Zinc application through different methods significantly influenced the bioavailable Zn
contents during both study years. Foliar application of Zn improved the bioavailability of Zn while
it reduced the grain phytate contents and [phytate]:[Zn] during both study years. However, for the
second year, foliar application of Zn recorded statistically similar effects compared to soil
application of Zn (Table 5).

Agronomy 2020, 10, 1566 11 of 21
Table 5. Effect of different Zn application methods on grain phytate, phytate into Zn molar ratio, and
bioavailable Zn content under two tillage systems.
Treatments 2017–2018 2018–2019
PTW ZTW Mean (Zn) PTW ZTW Mean (Zn)
Phytic Acid (mg g−1)
No application 12.46 a 12.39 a 12.42 A 13.05 ab 13.13 a 13.09 A
Zn‐coating 11.06 a 11.39 a 11.22 B 12.10 cd 12.48 bc 12.29 B
Hydro‐priming 12.49 a 12.53 a 12.51 A 13.08 ab 13.02 ab 13.05 A
Zn‐priming 10.71 a 10.85 a 10.78 C 11.60 de 11.74 de 11.67 C
Soil application 9.89 a 10.32 a 10.10 D 10.78 fg 11.21 ef 10.99 D
Hydro‐foliar 12.44 a 12.46 a 12.45 A 13.03 ab 13.13 a 13.08 A
Zn‐foliar 9.98 a 9.62 a 9.80 D 10.87 fg 10.51 g 10.69 D
Mean (WTs) 11.29 A 11.36 A 12.07 A 12.17 A
HSD (p ≤ 0.05) Zn = 0.32 Zn = 0.35; WTs × Zn = 0.56
[Phytate]:[Zn]
No application 37.13 a 35.99 ab 36.56 A 35.68 a 34.78 a 35.23 A
Zn‐coating 29.50 cd 30.40 c 29.95 B 29.92 a 30.66 a 30.29 B
Hydro‐priming 36.17 ab 35.37 ab 35.77 A 34.99 a 34.76 a 34.87 A
Zn‐priming 26.84 e 28.10 de 27.47 C 27.76 a 27.64 a 27.70 C
Soil application 23.28 f 23.68 f 23.48 D 24.21 a 23.57 a 23.89 D
Hydro‐foliar 36.03 ab 35.15 b 35.59 A 35.33 a 34.04 a 34.68 A
Zn‐foliar 21.89 f 23.78 f 22.83 D 23.34 a 23.05 a 23.19 D
Mean (WTs) 30.12 A 30.35 A 30.17 A 29.78 A
HSD (p ≤ 0.05) Zn = 1.49; WTs × Zn = 1.49 Zn = 1.25
Estimated Bioavailable Zinc (mg 300 g−1 flour)
No application 1.99 e 2.03 e 2.01 E 2.05 f 2.09 ef 2.07 D
Zn‐coating 2.30 c 2.26 cd 2.28 CD 2.29 cd 2.26 cde 2.27 C
Hydro‐priming 2.03 e 2.06 de 2.04 DE 2.08 ef 2.09 ef 2.08 D
Zn‐priming 2.43 bc 2.37 c 2.40 BC 2.39 c 2.40 bc 2.39 B
Soil application 2.63 ab 2.61 ab 2.62 AB 2.59 ab 2.63 a 2.61 A
Hydro‐foliar 2.03 e 2.07 de 2.05 DE 2.07 ef 2.12 def 2.09 D
Zn‐foliar 2.73 a 2.60 ab 2.66 A 2.64 a 2.66 a 2.65 A
Mean (WTs) 2.30 A 2.28 A 2.30 A 2.32 A
HSD (p ≤ 0.05) Zn = 0.23 Zn = 0.112
Means sharing the same uppercase and lowercase letter for main effects and interaction do not differ
significantly at (p ≤ 0.05) for a parameter during growing season by Tukey’s honestly significant
difference (HSD) test; PTW = Plough till wheat; ZTW = Zero till wheat; WTs = Wheat tillage systems
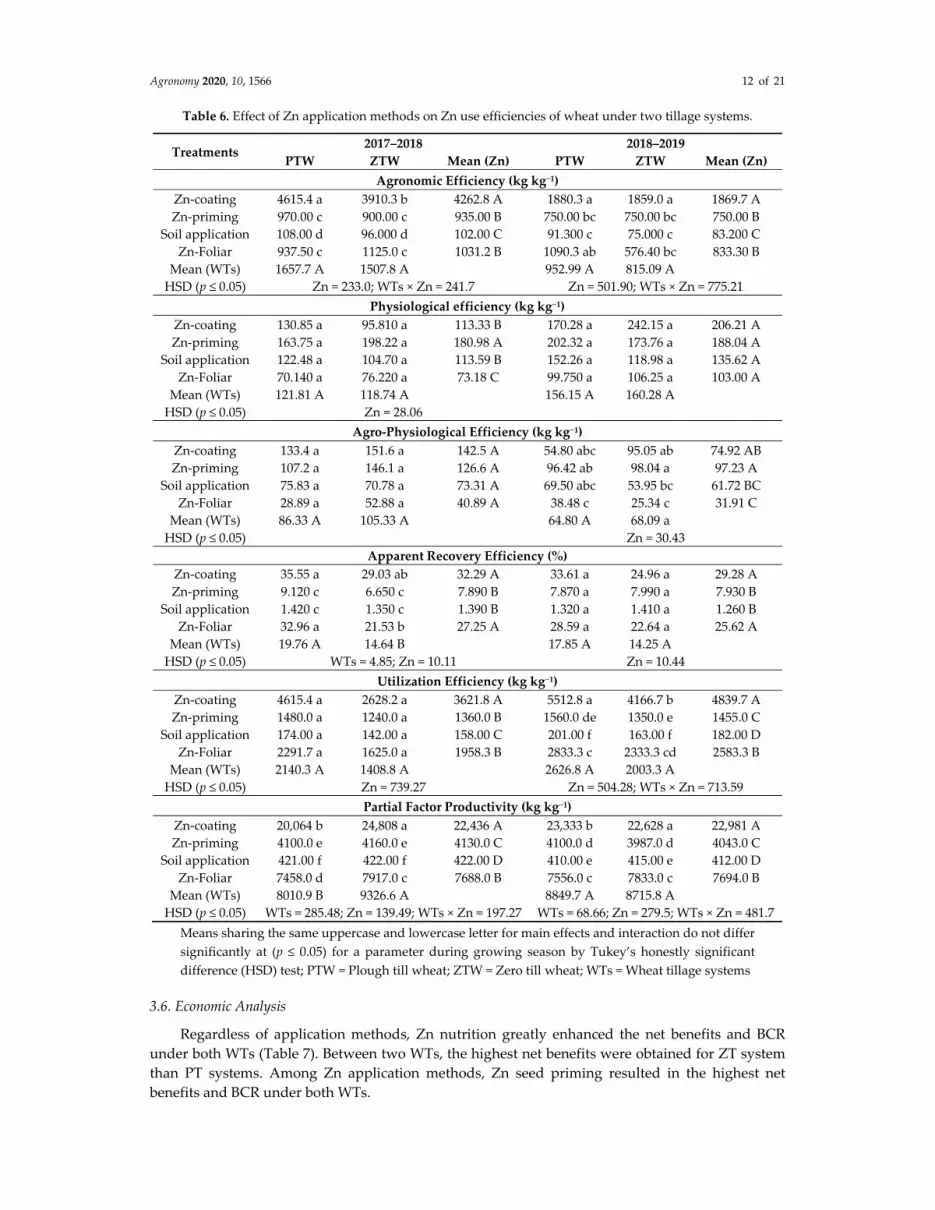
3.5. Zinc Use Efficiency Indices
Zinc application methods substantially affected the efficiency indices during the first and
second year (Table 6), whereas the ARE during the first year was considerably affected by WTs
(Table 6). Higher AgE was observed with Zn‐coating under PT during both the years. The highest PE
was noted with Zn seed priming for first year of study, whereas results were non‐significant during
the second year. Agro‐physiological efficiency (AgPE) was the highest with Zn seed priming during
the second year; however, the results of the AgPE for the first year were non‐significant. The ARE
was the highest with Zn seed coating during 2017–2018 and 2018–2019, and these results were
statistically similar with foliar‐applied Zn. Similarly, the highest UE was observed with Zn seed
coating during the first year. The interaction of WTs × Zn was significant during the second year and
the highest UE was observed when Zn coated wheat seeds were sown under PT system. The
interactive effect of WTs × Zn for PFP was significant and the highest PFP was noted with Zn seed
coating and ZT during both years (Table 6).
Agronomy 2020, 10, 1566 12 of 21
Table 6. Effect of Zn application methods on Zn use efficiencies of wheat under two tillage systems.
Treatments 2017–2018 2018–2019
PTW ZTW Mean (Zn) PTW ZTW Mean (Zn)
Agronomic Efficiency (kg kg−1)
Zn‐coating 4615.4 a 3910.3 b 4262.8 A 1880.3 a 1859.0 a 1869.7 A
Zn‐priming 970.00 c 900.00 c 935.00 B 750.00 bc 750.00 bc 750.00 B
Soil application 108.00 d 96.000 d 102.00 C 91.300 c 75.000 c 83.200 C
Zn‐Foliar 937.50 c 1125.0 c 1031.2 B 1090.3 ab 576.40 bc 833.30 B
Mean (WTs) 1657.7 A 1507.8 A 952.99 A 815.09 A
HSD (p ≤ 0.05) Zn = 233.0; WTs × Zn = 241.7 Zn = 501.90; WTs × Zn = 775.21
Physiological efficiency (kg kg−1)
Zn‐coating 130.85 a 95.810 a 113.33 B 170.28 a 242.15 a 206.21 A
Zn‐priming 163.75 a 198.22 a 180.98 A 202.32 a 173.76 a 188.04 A
Soil application 122.48 a 104.70 a 113.59 B 152.26 a 118.98 a 135.62 A
Zn‐Foliar 70.140 a 76.220 a 73.18 C 99.750 a 106.25 a 103.00 A
Mean (WTs) 121.81 A 118.74 A 156.15 A 160.28 A
HSD (p ≤ 0.05) Zn = 28.06
Agro‐Physiological Efficiency (kg kg−1)
Zn‐coating 133.4 a 151.6 a 142.5 A 54.80 abc 95.05 ab 74.92 AB
Zn‐priming 107.2 a 146.1 a 126.6 A 96.42 ab 98.04 a 97.23 A
Soil application 75.83 a 70.78 a 73.31 A 69.50 abc 53.95 bc 61.72 BC
Zn‐Foliar 28.89 a 52.88 a 40.89 A 38.48 c 25.34 c 31.91 C
Mean (WTs) 86.33 A 105.33 A 64.80 A 68.09 a
HSD (p ≤ 0.05) Zn = 30.43
Apparent Recovery Efficiency (%)
Zn‐coating 35.55 a 29.03 ab 32.29 A 33.61 a 24.96 a 29.28 A
Zn‐priming 9.120 c 6.650 c 7.890 B 7.870 a 7.990 a 7.930 B
Soil application 1.420 c 1.350 c 1.390 B 1.320 a 1.410 a 1.260 B
Zn‐Foliar 32.96 a 21.53 b 27.25 A 28.59 a 22.64 a 25.62 A
Mean (WTs) 19.76 A 14.64 B 17.85 A 14.25 A
HSD (p ≤ 0.05) WTs = 4.85; Zn = 10.11 Zn = 10.44
Utilization Efficiency (kg kg−1)
Zn‐coating 4615.4 a 2628.2 a 3621.8 A 5512.8 a 4166.7 b 4839.7 A
Zn‐priming 1480.0 a 1240.0 a 1360.0 B 1560.0 de 1350.0 e 1455.0 C
Soil application 174.00 a 142.00 a 158.00 C 201.00 f 163.00 f 182.00 D
Zn‐Foliar 2291.7 a 1625.0 a 1958.3 B 2833.3 c 2333.3 cd 2583.3 B
Mean (WTs) 2140.3 A 1408.8 A 2626.8 A 2003.3 A
HSD (p ≤ 0.05) Zn = 739.27 Zn = 504.28; WTs × Zn = 713.59
Partial Factor Productivity (kg kg−1)
Zn‐coating 20,064 b 24,808 a 22,436 A 23,333 b 22,628 a 22,981 A
Zn‐priming 4100.0 e 4160.0 e 4130.0 C 4100.0 d 3987.0 d 4043.0 C
Soil application 421.00 f 422.00 f 422.00 D 410.00 e 415.00 e 412.00 D
Zn‐Foliar 7458.0 d 7917.0 c 7688.0 B 7556.0 c 7833.0 c 7694.0 B
Mean (WTs) 8010.9 B 9326.6 A 8849.7 A 8715.8 A
HSD (p ≤ 0.05) WTs = 285.48; Zn = 139.49; WTs × Zn = 197.27 WTs = 68.66; Zn = 279.5; WTs × Zn = 481.7
Means sharing the same uppercase and lowercase letter for main effects and interaction do not differ
significantly at (p ≤ 0.05) for a parameter during growing season by Tukey’s honestly significant
difference (HSD) test; PTW = Plough till wheat; ZTW = Zero till wheat; WTs = Wheat tillage systems
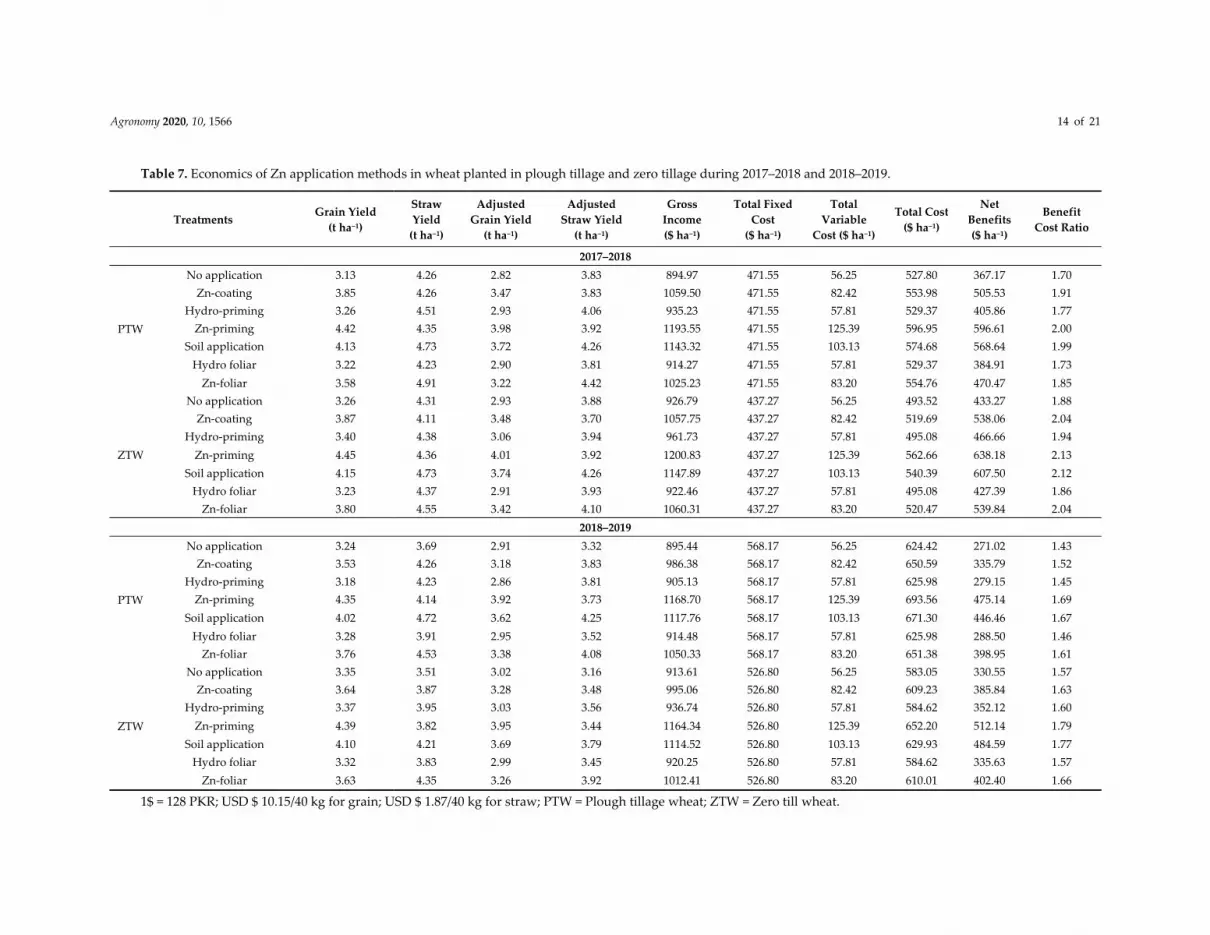
3.6. Economic Analysis
Regardless of application methods, Zn nutrition greatly enhanced the net benefits and BCR
under both WTs (Table 7). Between two WTs, the highest net benefits were obtained for ZT system
than PT systems. Among Zn application methods, Zn seed priming resulted in the highest net
benefits and BCR under both WTs.

Agronomy 2020, 10, 1566 13 of 21
4. Discussion
The experiment supported the hypothesis that the Zn application would enhance the wheat
productivity, profitability, and grain Zn biofortification cultivated under both tillage systems, and
the ZT would perform better as compared to the PT system for Zn nutrition. Zinc nutrition through
either method effectively improved the yield and related traits, grain Zn biofortification, and net
profitability under the PT and ZT systems. The Zn‐induced improvements in wheat yield were
related to increased number of productive tillers, grains per spike, and 1000‐grain weight (Table 3).
Tillage systems significantly influenced the soil properties and nutrient dynamics during both
years. Nevertheless, Zn nutrition did not have any considerable impact on SBD, TSP, PR, SMC,
SMBN, SOC, and nutrient dynamics (Table 2; Figure 1). Higher values of TSP, PR, SMBC, SMBN,
SOC, total N, available P, and extractable K and lower SBD were recorded in ZT than PT (Table 2;
Figure 1). Under ZT, the lower SBD and the higher TSP might be due to improvement in soil pores
continuity [57]. Residues retention on soil surface under ZT leads to the formation of stable
aggregates that leads to improvement in TSP and reduction in the infiltration capacity of the soil
[58,59]. Moreover, increase in stable aggregates is linked with higher soil porosity, as minimum
disturbance of soil increases the soil transmission and storage pores, thereby improving the soil
pores [60].
Agronomy 2020, 10, 1566 14 of 21
Table 7. Economics of Zn application methods in wheat planted in plough tillage and zero tillage during 2017–2018 and 2018–2019.
Treatments Grain Yield
(t ha−1)
Straw
Yield
(t ha−1)
Adjusted
Grain Yield
(t ha−1)
Adjusted
Straw Yield
(t ha−1)
Gross
Income
($ ha−1)
Total Fixed
Cost
($ ha−1)
Total
Variable
Cost ($ ha−1)
Total Cost
($ ha−1)
Net
Benefits
($ ha−1)
Benefit
Cost Ratio
2017–2018
PTW
No application 3.13 4.26 2.82 3.83 894.97 471.55 56.25 527.80 367.17 1.70
Zn‐coating 3.85 4.26 3.47 3.83 1059.50 471.55 82.42 553.98 505.53 1.91
Hydro‐priming 3.26 4.51 2.93 4.06 935.23 471.55 57.81 529.37 405.86 1.77
Zn‐priming 4.42 4.35 3.98 3.92 1193.55 471.55 125.39 596.95 596.61 2.00
Soil application 4.13 4.73 3.72 4.26 1143.32 471.55 103.13 574.68 568.64 1.99
Hydro foliar 3.22 4.23 2.90 3.81 914.27 471.55 57.81 529.37 384.91 1.73
Zn‐foliar 3.58 4.91 3.22 4.42 1025.23 471.55 83.20 554.76 470.47 1.85
ZTW
No application 3.26 4.31 2.93 3.88 926.79 437.27 56.25 493.52 433.27 1.88
Zn‐coating 3.87 4.11 3.48 3.70 1057.75 437.27 82.42 519.69 538.06 2.04
Hydro‐priming 3.40 4.38 3.06 3.94 961.73 437.27 57.81 495.08 466.66 1.94
Zn‐priming 4.45 4.36 4.01 3.92 1200.83 437.27 125.39 562.66 638.18 2.13
Soil application 4.15 4.73 3.74 4.26 1147.89 437.27 103.13 540.39 607.50 2.12
Hydro foliar 3.23 4.37 2.91 3.93 922.46 437.27 57.81 495.08 427.39 1.86
Zn‐foliar 3.80 4.55 3.42 4.10 1060.31 437.27 83.20 520.47 539.84 2.04
2018–2019
PTW
No application 3.24 3.69 2.91 3.32 895.44 568.17 56.25 624.42 271.02 1.43
Zn‐coating 3.53 4.26 3.18 3.83 986.38 568.17 82.42 650.59 335.79 1.52
Hydro‐priming 3.18 4.23 2.86 3.81 905.13 568.17 57.81 625.98 279.15 1.45
Zn‐priming 4.35 4.14 3.92 3.73 1168.70 568.17 125.39 693.56 475.14 1.69
Soil application 4.02 4.72 3.62 4.25 1117.76 568.17 103.13 671.30 446.46 1.67
Hydro foliar 3.28 3.91 2.95 3.52 914.48 568.17 57.81 625.98 288.50 1.46
Zn‐foliar 3.76 4.53 3.38 4.08 1050.33 568.17 83.20 651.38 398.95 1.61
ZTW
No application 3.35 3.51 3.02 3.16 913.61 526.80 56.25 583.05 330.55 1.57
Zn‐coating 3.64 3.87 3.28 3.48 995.06 526.80 82.42 609.23 385.84 1.63
Hydro‐priming 3.37 3.95 3.03 3.56 936.74 526.80 57.81 584.62 352.12 1.60
Zn‐priming 4.39 3.82 3.95 3.44 1164.34 526.80 125.39 652.20 512.14 1.79
Soil application 4.10 4.21 3.69 3.79 1114.52 526.80 103.13 629.93 484.59 1.77
Hydro foliar 3.32 3.83 2.99 3.45 920.25 526.80 57.81 584.62 335.63 1.57
Zn‐foliar 3.63 4.35 3.26 3.92 1012.41 526.80 83.20 610.01 402.40 1.66
1$ = 128 PKR; USD $ 10.15/40 kg for grain; USD $ 1.87/40 kg for straw; PTW = Plough tillage wheat; ZTW = Zero till wheat.

Agronomy 2020, 10, 1566 15 of 21
Reduced soil manipulation breaks the zone of soil compaction and provides a favorable
environment with significant improvement in biological properties of soil including SMBC, SOC,
and SMBN [19,61]. Crop residues present on soil surface improved the health of soil because of the
increased availability of C for decomposition as less soil disturbance provides organic carbon for soil
microbes on a continuous basis and enhances the activity of soil microbes, which thus results in the
highest SMBC in a ZT system [62]. Under ZT, improvement in SOC and SMBC were due to the
storage of mineralizable C from surface residues, ultimate improvement in soil biological activities,
and enhanced activities soil enzymes including phosphatase and urease [63]. Conversely, the lowest
SOC was recorded under PT primarily because of intensive tillage decline in microbial activity and
substantial organic carbon loss [64]. In addition, intensive tillage leads to the dispersion of soil
particles and exacerbation of carbon‐rich macropores and loss of the soil organic matter having
higher degradability and poor stability results loss of SOC [65]. Under ZT, the presence of crop
residues sustains organic matter in the soil after microbial decomposition; thus, higher SMBN, SOC
and SMBC leads to better the soil tilth and fertility on sustained basis. Furthermore, ZT reduces the
rate of soil organic matter decay, decreases losses of soil carbon and increases SOC, SMBC, and
SMBN [66]. Contrarily, intensive tillage under PT exposes organic C to the environment and
decreased diversity of soil biota, microbial biomass, and C and N mineralization, which leads to a
reduction in SOC, SMBC, and SMBN as witnessed in this study [67]. Total N concentration was
increased in ZT, which might be due to the release of nutrients, particularly N, after decomposition
of previous crop residues [68,69]. In contrast, under PT, the concentration of total N in the soil was
reduced, which might be attributed to nitrate leaching [70] and N volatilization [71]. An increase in
microbial activity accelerated the mineralization of nutrients, which enhanced the phosphorus
concentration [72] and extractable K [73]. Under PT, intensive ploughing and inversion of soil layer
shift less fertile layer to top of the soil [60].
Zinc seed priming was more effective treatment in enhancing the yield and profitability under
both WTs. Nonetheless, the yield was the highest under ZT in comparison to the PT system (Table
4). Zinc seed priming ensures early and uniform stand establishment due to the initiation of
pre‐germination metabolic mechanisms [74]. Primed seeds have readily available germination
metabolites at planting time [75]. Thus, better germination process results in uniform crop
establishment even under sub‐optimal conditions [76]. Seed germination requires sufficient quantity
of promptly available Zn to facilitate better root growth as Zn seed priming enhanced the ratio of
diving cells, which led to higher germination rate and improved tillering, and ultimately resulted in
higher wheat yields [77,78]. Moreover, seed priming with Zn enhances the stand establishment and
crop growth due to early radicle and coleoptile development [79]. Application of Zn considerably
improved the productive tillers, grains number per spike, and grain weight mainly due to the Zn
involvement in major metabolic activities including carbohydrate metabolism, chlorophyll
synthesis, and ribosomal functioning [80]. However, foliar application of Zn may not perform best
due to application at later stages and absence of Zn for plants during initial stage of development.
On the other hand, soil‐applied Zn may take more time owing to the slower movement towards
root. Additionally, Zn application in soil faces complex interactions that hinder the Zn uptake by
roots [81].
Foliar‐applied Zn in PT system and soil‐applied Zn in ZT system was superior in improving the
grain Zn accumulation during both years (Figure 2). As the Zn applied on foliage at the reproductive
stage is quickly transported to reproductive structures of plants, which is further accumulated in
developing seeds [82]. Foliar‐applied Zn is absorbed readily by the leaf epidermis, remobilized
further, and then translocated into the grain via phloem with the help of Zn‐regulating transporter
proteins [83]. Due to alkaline calcareous nature of experimental soil, Zn applied in soil under PT
system may get adsorbed [84]. In this study, under ZT system, the highest Zn accumulation in grains
was recorded with soil‐applied Zn. In some cases, foliar application of Zn leads to higher Zn levels
in the shoot that restricts better translocation towards grains than plants getting Zn through soil
application [85].
Agronomy 2020, 10, 1566 16 of 21
Foliar and soil applied Zn improved the Zn bioavailability (Table 5). Application of Zn as foliar
and basal treatment increased the bioavailable Zn by reducing the phytate content as phytate
decreases the Zn absorption by the human intestine [86]. In this study, the reduction in phytate
concentration was due to changes in P absorption from soil and translocation within plant [87].
Additionally, the improvements in bioavailable Zn were due to decrease in phytate to Zn molar ratio
owing to lower phytate and P contents in grain provided with higher Zn content. Moreover, Zn
biofortification and bioavailable Zn were improved by foliar‐applied Zn due to the reduced
anti‐nutrient content in grain and lower phytate to Zn molar ratio, which shows the bioavailability
of Zn in grains [88]. Furthermore, the increase in grain Zn content may enhance the Zn concentration
in starchy endosperm of wheat grains, which improves the Zn availability as endosperm has a lower
concentration of phytate [89].
The most significant factor for farming community is profit maximization and profitability is
principally associated with input cost and economic yield. The highest BCR was observed with Zn
seed priming under both tillage systems due to the maximum grain yield consequently ascertained
more beneficial on monetary basis. Among tillage systems, the ZT system had higher net benefits
because of no seedbed preparation in comparison with the PT system.
5. Conclusions
Zero tillage enhanced the soil physical and biological characteristics and nutrient availability as
indicated by higher TSP, PR, SMBC, SMBN, SOC, total N, available P, and extractable K, while we
recorded lower soil bulk density compared with PT. The application of Zn by either method (seed
coating, priming, soil or foliar application) enhanced the productivity, grain Zn concentration, Zn
use efficiencies, and bioavailability in bread wheat. Nevertheless, Zn seed priming was the most
cost‐effective method in enhancing the grain yield and net benefits under both tillage systems. The
interaction of Zn seed priming in the ZT system proved to be most efficient and economical in
enhancing the yield and related traits. The maximum grain Zn content and bioavailability were
found with foliar Zn application followed by soil application.
Supplementary Materials: The following are available online at
www.mdpi.com/2073‐4395/10/10/1566/s1. Table S1: comprising data as well as percentage difference
regarding Figure 1.
Author Contributions: conceptualization, data curation, investigation, methodology, and writing—original
draft, U.Z.; conceptualization, project administration, resources, supervision, validation, and writing—review
and editing, S.H.; data curation, investigation, methodology, and software, M.I.; formal analysis, software,
visualization, writing—review and editing, A.M.; data curation, methodology, software, and writing—original
draft, N.A.; data curation, formal analysis, software, and writing—original draft, M.A.; formal analysis, funding
acquisition, validation, and writing—review and editing, M.N.A.; funding acquisition, validation, visualization,
writing—original draft, and writing—review and editing, P.A. All authors have read and agreed to the
published version of the manuscript.
Funding: APC funded through RSP‐2020/180.
Acknowledgments: The authors acknowledge the University of Agriculture Faisalabad for the support during
research. Research in MNA and PA lab is supported by Researchers Supporting Project Number
(RSP‐2020/180), King Saud University, Riyadh, Saudi Arabia.
Conflicts of Interest: The authors declare no conflict of interest.
References
1 Nadeem, F.; Farooq, M. Application of micronutrients in rice‐wheat cropping systems of South Asia: A
review. Rice Sci. 2019, 26, 356–371.
2 Erdal, I.; Yilmaz, A.; Taban, S.; Eker, S.; Torun, B.; Cakmak, I. Phytic acid and phosphorus concentrations
in seeds of wheat cultivars grown with and without zinc fertilization. J. Plant Nutr. 2002, 25, 113‒127.
3 Cakmak, I. Enrichment of cereal grains with zinc: Agronomic or genetic biofortification? Plant Soil. 2008,
302, 1–17.

Agronomy 2020, 10, 1566 17 of 21
4 Shewry, P.R. Wheat. J. Exp. Bot. 2009, 60, 1537‒1553.
5 Cakmak, I. Zinc Plays Critical Role in Plant Growth. 2011. Available online:
http://www.zinc.org/crops/resourceserve/zinc_plays_critical_role_in_plant_ growth (accessed on 17 April
2011).
6 Hussain, S.; Maqsood, M.A.; Rahmatullah. Zinc release characteristics from calcareous soils using
di‐ethylenetri‐aminepentaacetic acid and other organic acids. Commun. Soil Sci. Plant Anal. 2011, 42, 1870‒
1881.
7 Alloway, B.J. Soil factors associated with zinc deficiency in crops and humans. Environ. Geochem. Health.
2009, 31, 537‒548.
8 Kumssa, D.B.; Joy, E.J.M.; Ander, E.L.; Watts, M.J.L.; Young, S.D.; Rosanoff, A.; White, P.J.; Walker, S.;
Broadley, M.R. Global magnesium supply in the food chain. Crop Pasture Sci. 2015, 66, 1278–1289.
9 Kumssa, D.B.; Joy, E.J.; Ander, E.L.; Watts, M.J.; Young, S.D.; Walker, S.; Broadley, M.R. Dietary calcium
and zinc deficiency risks are decreasing but remain prevalent. Sci. Rep. 2015, 5, 10974.
10 Ministry of Health. National health policy 2009. Stepping Towards Better Health; Ministry of Health:
Islamabad, Pakistan, 2009.
11 Sillanpaa, M. Micronutrient Assessment at Country Level: An International Study; Soils Bulletin No. 63; FAO:
Rome, Italy, 1990; p. 208.
12 Hussain, A.; Zahir, Z.A.; Asghar, H.N.; Ahmad, M.; Jamil, M.; Naveed, M.; Akhtar, M.F.U.Z. Zinc
solubilizing bacteria for zinc biofortification in cereals: A step toward sustainable nutritional security. In
Role of Rhizospheric Microbes in Soil; Springer: Singapore, 2018; pp. 203–227.
13 Lopez‐Millan, A.F.; Ellis, D.R.; Grusak, M.A. Effect of zinc and manganese supply on the activities of
superoxide dismutase and carbonic anhydrase in Medicago truncatula wild type and raz mutant plants.
Plant Sci. 2005, 168, 1015–1022.
14 Sinclair, S.A.; Krämer, U. The zinc homeostasis network of land plants. Biochim Biophys Acta (BBA) Mol. Cell
Res. 2012, 1823, 1553–1567.
15 Bhatt, R.; Kukal, S.S.; Busari, M.A.; Arora, S.; Yadav, M. Sustainability issues on rice–wheat cropping
system. Int. Soil Water Conserv. Res. 2016, 4, 64–74.
16 Jat, H.S.; Datta, A.; Sharma, P.C.; Kumar, V.; Yadav, A.K.; Choudhary, M.; Choudhary, V.; Gathala, M.K.;
Sharma, D.K.; Jat, M.L.; et al. Assessing soil properties and nutrient availability under conservation
agriculture practices in a reclaimed sodic soil in cereal‐based systems of North‐West India. Arch. Agron.
Soil Sci. 2018, 64, 531–545.
17 Nawaz, A.; Farooq, M.; Lal, R.; Rehman, A.; Rehman, H. Comparison of conventional and conservation
rice‐wheat systems in Punjab. Pakistan. Soil Tillage Res. 2017, 169, 35–43.
18 Nawaz, A.; Farooq, M.; Lal, R.; Rehman, A.; Hussain, T.; Nadeem, A. Influence of sesbania brown
manuring and rice residue mulch on soil health, weeds and system productivity of conservation rice–
wheat systems. Land Degrad. Develop. 2017, 28, 1078–1090.
19 Zulfiqar, U.; Maqsood, M.; Hussain, S.; Anwar‐ul‐Haq, M. Iron nutrition improves productivity,
profitability and biofortification of bread wheat under conventional and conservation tillage systems. J.
Soil Sci. Plant Nutr. 2020, doi:10.1007/s42729‐020‐00213‐1.
20 Kumar, D. Effect of Conservation Agriculture on Vertical Distribution of Organic Carbon and Zinc
Transformations under Alluvial Soil. Ph.D. Thesis, Department of Soil Science and Agricultural
Chemistry, BAU, Sabour, India, 2017.
21 Loke, P.F.; Kotzé, E.; Du Preez, C.C. Impact of long‐term wheat production management practices on soil
acidity, phosphorus and some micronutrients in a semi‐arid Plinthosol. Soil Res. 2013, 51, 415–426.
22 Nawaz, A.; Farooq, M.; Nadeem, F.; Siddique, K.H.M.; Lal, R. Rice–wheat cropping systems in South Asia:
Issues, options and opportunities. Crop Pasture Sci. 2019, 70, 395–427.
23 Dixit, A.K.; Agrawal, R.K.; Das, S.K.; Sahay, C.S.; Choudhary, M.; Rai, A.K.; Palsaniya, D.R. Soil properties,
crop productivity and energetics under different tillage practices in fodder sorghum + cowpea–wheat
cropping system. Arch. Agron. Soil Sci. 2019, 65, 492–506.
24 Naresh, R.K.; Timsina, J.; Bhaskar, S.; Gupta, R.K.; Singh, A.K.; Dhaliwal, S.S.; Rathore, R.S.; Kumar, V.;
Singh, P.; Singh, S.P.; et al. Effects of tillage, residue and nutrient management on soil organic carbon
dynamics and its fractions, soil aggregate stability and soil carbon sequestration: A review. EC Nutr. 2017,
12, 53–80.

Agronomy 2020, 10, 1566 18 of 21
25 Dasappagol, A.; Bellakki, M.A.; Ravi, M.V.; Kuchanur, P.H.; Jat, M.L. Distribution of zinc fractions in
surface alfisol after five years of conservation agriculture practices in rainfed Pigeonpea. Int. J. Chem. Stud.
2017, 5, 227–232.
26 Dubock, A. An overview of agriculture, nutrition and fortification, supplementation and biofortification:
Golden Rice as an example for enhancing micronutrient intake. Agric. Food Secur. 2017, 6, 1–20.
27 Zulfiqar, U.; Maqsood, M.; Hussain, S. Biofortification of Rice with Iron and Zinc: Progress and Prospects.
In Rice Research for Quality Improvement: Genomics and Genetic Engineering; Springer: Singapore, 2020; pp,
605–627.
28 Jaffe, G. Regulating transgenic crops: A comparative analysis of different regulatory processes. Transgenic
Res. 2004, 13, 5–19.
29 Saha, S.; Mandal, B.; Hazra, G.C.; Dey, A.; Chakraborty, M.; Adhikari, B.; Mukhopadhyay, S.K.;
Sadhukhan, R. Can agronomic biofortification of zinc be benign for iron in cereals? J. Cereal Sci. 2015, 65,
186–191.
30 Zulfiqar, U.; Hussain, S.; Ishfaq, M.; Ali, N.; Yasin, M.U.; Ali, M.A. Foliar manganese supply enhances crop
productivity, net benefits, and grain manganese accumulation in direct‐seeded and puddled transplanted
rice. J. Plant. Growth Regul. 2020, 1–18, doi:10.1007/s00344‐020‐10209‐x.
31 Chattha, M.U.; Hassan, M.U.; Khan, I.; Chattha, M.B.; Mahmood, A.; Nawaz, M.; Subhani, M.N.; Kharal,
M.; Khan, S. Biofortification of wheat cultivars to combat zinc deficiency. Front. Plant. Sci. 2017, 8, 281.
32 Dhaliwal, S.S.; Ram, H.; Shukla, A.K.; Mavi, G.S. Zinc biofortification of bread wheat, triticale, and durum
wheat cultivars by foliar zinc fertilization. J. Plant. Nutr. 2019, 42, 813–822.
33 Hassan, M.U.; Chattha, M.U.; Ullah, A.; Khan, I.; Qadeer, A.; Aamer, M.; Khan, A.U.; Nadeem, F.; Khan,
T.A. Agronomic biofortification to improve productivity and grain Zn concentration of bread wheat. Int. J.
Agric. Biol. 2019, 21, 615‒620.
34 FAO (Food and Agriculture Organization). World reference base for soil resources 2014. International Soil
Classification System for Naming Soils and Creating Legends for Soil Maps; FAO (Food and Agriculture
Organization): Rome, Italy, 2014.
35 USDA (United State Department of Agriculture). Keys to soil taxonomy. In Natural Resources Conservation
Service; 12th ed.; USDA (United State Department of Agriculture): Kansas City, MO, USA, 2014.
36 ISTA. International Rules for Seed Testing; International Seed Testing Association: Zürich, Switzerland, 2015.
37 Meier, U. Growth Stages of Mono‐And Dicotyledonous Plants; Federal Biological Research Centre for
Agriculture and Forestry: Berlin, Germany, 2001.
38 Blake, G.H.; Hartge, K.H. Bulk density. In Methods of Soil Analysis, 2nd ed.; Klute, A., Eds.; Agron. No. 9,
Part; American Society of Agronomy: Madison, USA, 1986; pp. 363–375.
39 Vomocil, J.A. Porosity. In Methods of Soil Analysis; Blake, C.A., Ed.; American Society of Agronomy:
Madison, WI, USA, 1965, pp. 299–314.
40 Bremner, J.M.; Mulvaney, C.S. Total nitrogen. In Methods of Soil Analysis; Page, A.L., Miller, R.H., Keeny,
D.R., Eds.; American Society of Agronomy and Soil Science; American Society of Agronomy: Madison,
WA, USA, 1982; pp. 1119–1123.
41 Olsen, S.R. Estimation of Available Phosphorus in Soils by Extraction with Sodium Bicarbonate (No. 939); US
Department of Agriculture: Madison, WI, USA, 1954.
42 Richards, L.A. Diagnosis and Improvement of Saline and Alkali Soils; LWW: New York, NW, USA, 1954; pp.
154.
43 Walkley, A.; Black, I.A. An examination of the Degtjareff method for determining soil organic matter, and
a proposed modification of the chromic acid titration method. Soil Sci. 1934, 37, 29–38.
44 Brookes, P.C.; Landman, A.; Pruden, G.; Jenkinson, D.S. Chloroform fumigation and the release of soil
nitrogen: A rapid direct extraction method to measure microbial biomass nitrogen in soil. Soil Biol.
Biochem. 1985, 17, 837–842.
45 Anderson, J.M.; Ingram, J.S.I. Tropical Soil Biology and Fertility. In A Handbook of Methods, 2nd ed.; CAB
International: Wallingford, UK, 1993.
46 Rashid, A. Mapping Zinc Fertility of Soils Using Indicator Plants and Soil Analyses. Ph.D. Thesis,
University of Hawaii at Manoa, Monoa, HI, USA, 1986.
47 Haug, W.; Lantzsch, H. Sensitive method for the rapid determination of phytate in cereals and cereal
products. J. Sci. Food Agric. 1983, 34, 1423–1424.

Agronomy 2020, 10, 1566 19 of 21
48 Rehman, A.; Farooq, M.; Naveed, M.; Nawaz, A.; Shahzad, B. Seed priming of Zn with endophytic bacteria
improves the productivity and grain biofortification of bread wheat. Eur. J. Agron. 2018, 94, 98–107.
49 Rehman, A.; Farooq, M.; Naveed, M.; Ozturk, L.; Nawaz, A. Pseudomonas‐aided zinc application
improves the productivity and biofortification of bread wheat. Crop. Pasture Sci. 2018, 69, 659–672.
50 Miller, L.V.; Krebs, N.F.; Hambidge, K.M. A mathematical model of zinc absorption in humans as a
function of dietary zinc and phytate. J. Nutr. 2007, 137, 135–141.
51 Hambidge, K.M.; Miller, L.V.; Westcott, J.E.; Sheng, X.; Krebs, N.F. Zinc bioavailability and homeostasis.
Amer. J. Clin. Nutr. 2010, 91, 1478–1483.
52 FAO (Food and Agriculture Organization). Food supply database 2007. Food and Agriculture Organization.
FAO (Food and Agriculture Organization): Rome, Italy, 2014. Available online:
http://faostat.fao.org/site/609/default.aspx# (accessed on 18 April 2018).
53 Fageria, N.K. The Use of Nutrients in Crop Plants; CRC Press: Boca Raton, FL, USA, 2009.
54 Shivay, Y.S.; Prasad, R. Zinc‐coated urea improves productivity and quality of basmati rice (Oryza sativa
L.) under zinc stress condition. J. Plant. Nutr. 2012, 35, 928–951.
55 CIMMYT Economics Program, International Maize, & Wheat Improvement Center. From Agronomic Data
to Farmer Recommendations: An Economics Training Manual (No. 27); CIMMYT: Texcoco, Mexico, 1988, pp.
31–33.
56 Steel, R.G.D.; Torrie, J.H.; Dickey, D.A. Principles and Procedures of Statistics a Biometrical Approach (No. 519.5
S8); McGraw‐Hill: New York, NY, USA, 1997.
57 Shah, A.N.; Tanveer, M.; Shahzad, B.; Yang, G.; Fahad, S.; Ali, S.; Bukhari, M.A.; Tung, S.A.; Hafeez, A.;
Souliyanonh, B. Soil compaction effects on soil health and crop productivity: An overview. Environ. Sci.
Pollut. Res. 2017, 24, 10056–10067.
58 Hobbs, P.R. Conservation agriculture: What is it and why is it important for future sustainable food
production? J. Agric. Sci. 2007, 145, 127–137.
59 Meena, J.R.; Behera, U.K.; Chakraborty, D.; Sharma, A.R. Tillage and residue management effect on soil
properties, crop performance and energy relations in green gram (Vigna radiata L.) under maize‐based
cropping systems. Int. Soil Water Cons. Res. 2015, 3, 261–272.
60 Busari, M.A.; Kukal, S.; Kaur, A.; Bhatt, R.; Dulazi, A.A. Conservation tillage impacts on soil, crop and the
environment. Int. Soil Water Cons. Res. 2015, 3, 199–129.
61 Nandan, R.; Singh, V.; Singh, S.S.; Kumar, V.; Hazra, K.K.; Nath, C.P.; Pooniad, S.; Malikd, R.K.;
Bhattacharyyae, R.; McDonald, A. Impact of conservation tillage in rice‐based cropping systems on soil
aggregation, carbon pools and nutrients. Geoderma 2019, 340, 104–114.
62 Chen, H.; Hou, R.; Gong, Y.; Li, H.; Fan, M.; Kuzyakov, Y. Effects of 11 years of conservation tillage on soil
organic matter fractions in wheat monoculture in Loess Plateau of China. Soil Tillage Res. 2009, 106, 85–94.
63 Lupwayi, N.; Hanson, K.; Harker, K.; Clayton, G.; Blackshaw, R.; O’Donovan, J.; Johnson, E.; Gan, Y.;
Irvine, R.; Monreal, M. Soil microbial biomass, functional diversity and enzyme activity in
glyphosate‐resistant wheat–canola rotations under low‐disturbance direct seeding and conventional
tillage. Soil Biol. Biochem. 2007, 39, 1418–1427.
64 Balota, E.L.; Colozzi‐Filho, A.; Andrade, D.S.; Dick, R.P. Microbial biomass in soils under different tillage
and crop rotation systems. Biol. Fert. Soils. 2003, 38, 15–20.
65 Haddaway, N.R.; Hedlund, K.; Jackson, L.E.; Kätterer, T.; Lugato, E.; Thomsen, I.K.; Jørgensen, H.B.;
Isberg, P.E. How does tillage intensity affect soil organic carbon? A systematic review. Environ. Evid. 2016,
6, 30.
66 Zikeli, S.; Gruber, S.; Teufel, C.F.; Hartung, K.; Claupein, W. Effects of reduced tillage on crop yield, plant
available nutrients and soil organic matter in a 12‐year long‐term trial under organic management.
Sustainability 2013, 5, 3876–3894.
67 Roscoe, R.; Burman, P. Tillage effects on soil organic matter in the density fractions of a Cerrado Oxisol.
Soil Tillage Res. 2003, 70, 107–119.
68 Paul, B.K.; Vanlauwe, B.; Ayuke, F.; Gassner, A.; Hoogmoed, M.; Hurisso, T.T.; Koala, S.; Lelei, D.;
Ndabamenye, T.; Six, J.; et al. Medium‐term impact of tillage and residue management on soil aggregate
stability, soil carbon, and crop productivity. Agric. Ecosyst. Environ. 2013, 164, 14–22.
69 Das, A.; Lyngdoh, D.; Ghosh, P.K.; Lal, R.; Layek, J.; Idapuganti, R.G. Tillage and cropping sequence effect
on physico‐chemical and biological properties of soil in Eastern Himalayas, India. Soil Tillage Res. 2018,
180, 182–193.

Agronomy 2020, 10, 1566 20 of 21
70 Meisinger, J.J.; Palmer, R.E.; Timlin, D.J. Effects of tillage practices on drainage and nitrate leaching from
winter wheat in the Northern Atlantic Coastal‐Plain USA. Soil Tillage Res. 2015, 151, 18–27.
71 Ali, M.A.; Ladha, J.K.; Rickman, J.; Lales, J.S. Comparison of different methods of rice establishment and
nitrogen management strategies for lowland rice. J. Crop. Improv. 2006, 16, 173–189.
72 Vincent, A.G.; Turner, B.L.; Tanner, E.V.J. Soil organic phosphorus dynamics following perturbation of
litter cycling in a tropical moist forest. Eur. J. Soil Sci. 2010, 61, 48–57.
73 Martin‐Rueda, I.; Munoz‐Guerra, L.M.; Yunta, F.; Esteban, E.; Tenorio, J.L.; Lucena, J.J. Tillage and crop
rotation effects on barley yield and soil nutrients on a Calciortidic Haploxeralf. Soil Tillage Res. 2007, 92, 1–
9.
74 Bam, R.K.; Kumaga, F.K.; Ori, K.; Asiedu, E.A. Germination, vigour and dehydrogenase activity of
naturally aged rice (Oryza sativa L.) seeds soaked in potassium and phosphorus. Asian J. Plant. Sci. 2006, 5,
948–955.
75 Singh, H.; Jassal, R.K.; Kang, J.S.; Sandhu, S.S.; Kang, H.; Grewal, K. Seed priming techniques in field
crops—A review. Agric. Rev. 2015, 36, 251–264.
76 Farooq, M.; Usman, M.; Nadeem, F.; Rehman, H.; Wahid, A.; Basra, S.M.A.; Siddique, K.H.M. Seed
priming in field crops: Potential benefits, adoption and challenges. Crop. Pasture Sci. 2019, 70, 731.
77 Rehman, A.; Farooq, M.; Ozturk, L.; Asif, M.; Siddique, K.H.M. Zinc nutrition in wheat‐based cropping
systems. Plant. Soil. 2018, 422, 283–315.
78 Reis, S.; Pavia, I.; Carvalho, A.; Moutinho‐Pereira, J.; Correia, C.; Lima‐Brito, J. Seed priming with iron and
zinc in bread wheat: Effects in germination, mitosis and grain yield. Protoplasma 2018, 255, 1179–1194.
79 Bityutskii, N.P.; Davydovskaya, E.N.; Malyuga, E.A.; Yakkonen, K.L. Mechanisms underlying iron and
zinc transport to axis organs in grain during early seedling development of maize. J. Plant. Nutr. 2004, 27,
1525–1541.
80 Cakmak, I.; Marschner, H. Effect of zinc nutritional status on activities of superoxide radical and hydrogen
peroxide scavenging enzymes in bean leaves. Plant. Soil. 1993, 155, 127–130.
81 Mabesa, R.L.; Impa, S.M.; Grewal, D.; Johnson‐Beebout, S.E. Contrasting grain‐Zn response of
biofortification rice (Oryza sativa L.) breeding lines to foliar Zn application. Field Crops Res. 2013, 149, 223–
233.
82 Wu, C.Y.; Lu, L.L.; Yang, X.E.; Feng, Y.; Wei, Y.Y.; Hao, H.L.; Stoffella, P.J.; He, Z.L. Uptake, translocation,
and remobilization of zinc absorbed at different growth stages by rice genotypes of different Zn densities.
J. Agric. Food Chem. 2010, 58, 6767–6773.
83 Li, M.; Yang, X.W.; Tian, X.H.; Wang, S.X.; Chen, Y.L. Effect of nitrogen fertilizer and foliar zinc
application at different growth stages on zinc translocation and utilization efficiency in winter wheat.
Cereal Res. Commun. 2014, 42, 81–90.
84 Farooq, M.; Ullah, A.; Rehman, A.; Nawaz, A.; Nadeem, A.; Wakeel, A.; Nadeem, F.; Siddique, K.H.M.
Application of zinc improves the productivity and biofortification of fine grain aromatic rice grown in dry
seeded and puddled transplanted production systems. Field Crops Res. 2018, 216, 53–62.
85 Dimkpa, C.O.; White, J.C.; Elmer, W.H.; Gardea‐Torresdey, J. Nanoparticle and ionic Zn promote nutrient
loading of sorghum grain under low NPK fertilization. J. Agric. Food Chem. 2017, 65, 8552–8559.
86 Gupta, R.K.; Gangoliya, S.S.; Singh, N.K. Reduction of phytic acid and enhancement of bioavailable
micronutrients in food grains. J. Food Sci. Technol. 2015, 52, 676–684.
87 Huang, C.; Barker, S.J.; Langridge, P.; Smith, F.W.; Graham, R.D. Zinc deficiency up‐regulates expression
of high‐affinity phosphate transporter genes in both phosphate‐ sufficient and—deficient barley roots.
Plant. Physiol. 2000, 124, 415–422.

Agronomy 2020, 10, 1566 21 of 21
88 Cakmak, I.; Pfeiffer, W.H.; McClafferty, B. Biofortification of durum wheat with zinc and iron. Cereal Chem.
2010, 87, 10–20.
89 Cakmak, I.; Kalayci, M.; Kaya, Y.; Torun, A.A.; Aydin, N.; Wang, Y.; Arisoy, Z.; Erdem, H.; Yazici, A.;
Gokmen, O.; et al. Biofortification and localization of zinc in wheat grain. J. Agric. Food Chem. 2010, 58,
9092–9102.
Publisher’s Note: MDPI stays neutral with regard to jurisdictional claims in published maps and institutional
affiliations.
© 2020 by the authors. Licensee MDPI, Basel, Switzerland. This article is an open access
article distributed under the terms and conditions of the Creative Commons Attribution
(CC BY) license (http://creativecommons.org/licenses/by/4.0/).
Copyright © 2022 FDOKUMEN