Yahel G., Zalogin T., Yahel R., and Genin A. (2005) Phytoplankton grazing by epi- and in-fauna...
11
REPORT Gitai Yahel Tania Zalogin Ruthy Yahel Amatzia Genin Phytoplankton grazing by epi- and infauna inhabiting exposed rocks in coral reefs Received: 20 February 2003 / Accepted: 11 August 2005 ȑ Springer-Verlag 2005 Abstract Exposed rocks with no visible macro-fauna are abundant in all coral reefs. Depletion of phytoplankton cells and pigments by the minute crypto fauna inhabiting the outer few centimeters of such rocks was experimen- tally studied over an annual cycle in the Gulf of Aqaba, Red Sea. Different substrata were introduced into small (3.6 L), well mixed, tanks that were fed by running sea- water pumped directly from the reef at a rate of 11±1 L h 1 . A steady-state reduction in phytoplankton abundance and chlorophyll a concentration of 38±26% (mean ± 1 SD) was found for untreated rocks but not for sand, gravel, or killed controls. Average areal clearance rate by untreated rocks was 17.3±8.0 ml cm 2 h 1 . Conservative extrapolation of this rate to the whole reef community suggests that the fauna inhabiting exposed rocks clears 2.1±0.9 m 3 m 2 d 1 at Eilat. Phytoplank- ton removal by untreated rocks varied from 1.5 ng chlorophyll a cm 2 h 1 during the oligotrophic summer conditions to 6 ng chlorophyll a cm 2 h 1 during the spring bloom. These values correspond to a potential nitrogen gain of 1.3 and 5.2 mmol Nm 2 day 1 , respectively. Cryptic reef-rock fauna can have a key role in the biogeochemical functioning of coral reef communities. Keywords Phytoplanktivory Community metabolism Nutrient flux Infauna Epifauna Suspension feeding Introduction Benthic grazing on phytoplankton is a principal trophic pathway in shallow, temperate coastal habitats (Riisga˚ rd et al. 2004 and references therein). The dominant grazers (phytoplanktivores) in those communities include biv- alves, ascidians, and polychaetes (Riisga˚rd 1998 and references therein). Studies of pelagic–benthic coupling in coral reefs, where the phytoplanktonic community is dominated by minute prokaryotic cells (Ferrier-Pages and Gattuso 1998), have focused on zooplankton, rather than phytoplankton, as the principal source of prey (reviewed by Yahel et al. 1998). However, following the advent of technologies that allow identification and counting of micron-size picoplankton in aquatic eco- systems, many recent studies demonstrated the signifi- cant role of phytoplanktivory and bacteriovory in the trophic dynamics of coral reefs (Ayukai 1995; Ferrier- Pages and Gattuso 1998; Gast et al. 1998; Yahel et al. 1998; Richter and Wunsch 1999; Fabricius and Dom- misse 2000; Richter et al. 2001; van Duyl and Gast 2001; van Duyl et al. 2002; Genin et al. 2002; Ribes et al. 2003, 2005). Nevertheless, unlike temperate and boreal coastal habitats, the identification of the key benthic phy- toplanktivores and the assessment of their feeding rates have, by and large, remained elusive. To our knowledge, phytoplanktivory has been investigated only in five coral reef dwellers: an Octocoral (Fabricius et al. 1998), two sponges (Pile 1997; Yahel et al. 2003) and commercially reared bivalves (Yukihira et al. 1999; Loret et al. 2000). Potential sinks for phytoplankton in coral reefs could be physical mechanisms such as entrainment and burial by high-pressure surge in the reef framework (Haber- stroh and Sansone 1999) and wave-driven filtration via sand ripples (Huettel and Rusch 2000). However, such Communicated by Environmental Editor B.G. Hatcher G. Yahel T. ZaloginR. Yahel A. Genin The Inter-university Institute for Marine Sciences of Eilat and Department of Evolution, Systematics and Ecology, The Hebrew University of Jerusalem, P.O. Box 469, 88103 Eilat, Israel G. Yahel (&) Department of Biology, University of Victoria, STN CSC, P.O. Box 3020, Victoria, BC, CanadaV8W 3N5 E-mail: [email protected] Tel.: +1-250-7218858 Fax: +1-250-7217120 Present address:R. Yahel VENUS Project, University of Victoria, STN CSC, P.O. Box 1700, Victoria, BC, CanadaV8W 2Y2 Coral Reefs (2005) DOI 10.1007/s00338-005-0075-4
Transcript of Yahel G., Zalogin T., Yahel R., and Genin A. (2005) Phytoplankton grazing by epi- and in-fauna...
REPORT
Gitai Yahel Æ Tania Zalogin Æ Ruthy Yahel
Amatzia Genin
Phytoplankton grazing by epi- and infauna inhabiting exposed rocksin coral reefs
Received: 20 February 2003 / Accepted: 11 August 2005� Springer-Verlag 2005
Abstract Exposed rocks with no visible macro-fauna areabundant in all coral reefs. Depletion of phytoplanktoncells and pigments by the minute crypto fauna inhabitingthe outer few centimeters of such rocks was experimen-tally studied over an annual cycle in the Gulf of Aqaba,Red Sea. Different substrata were introduced into small(3.6 L), well mixed, tanks that were fed by running sea-water pumped directly from the reef at a rate of11±1 L h�1. A steady-state reduction in phytoplanktonabundance and chlorophyll a concentration of 38±26%(mean± 1 SD) was found for untreated rocks but not forsand, gravel, or killed controls. Average areal clearancerate by untreated rocks was 17.3±8.0 ml cm�2 h�1.Conservative extrapolation of this rate to the whole reefcommunity suggests that the fauna inhabiting exposedrocks clears 2.1±0.9 m3 m�2 d�1 at Eilat. Phytoplank-ton removal by untreated rocks varied from 1.5 ngchlorophyll a cm�2 h�1 during the oligotrophic summerconditions to 6 ng chlorophyll a cm�2 h�1 during thespring bloom. These values correspond to a potentialnitrogen gain of 1.3 and 5.2 mmol N m�2 day�1,respectively. Cryptic reef-rock fauna can have a keyrole in the biogeochemical functioning of coral reefcommunities.
Keywords Phytoplanktivory Æ Communitymetabolism Æ Nutrient flux Æ Infauna ÆEpifauna Æ Suspension feeding
Introduction
Benthic grazing on phytoplankton is a principal trophicpathway in shallow, temperate coastal habitats (Riisgardet al. 2004 and references therein). The dominant grazers(phytoplanktivores) in those communities include biv-alves, ascidians, and polychaetes (Riisgard 1998 andreferences therein). Studies of pelagic–benthic couplingin coral reefs, where the phytoplanktonic community isdominated by minute prokaryotic cells (Ferrier-Pagesand Gattuso 1998), have focused on zooplankton, ratherthan phytoplankton, as the principal source of prey(reviewed by Yahel et al. 1998). However, following theadvent of technologies that allow identification andcounting of micron-size picoplankton in aquatic eco-systems, many recent studies demonstrated the signifi-cant role of phytoplanktivory and bacteriovory in thetrophic dynamics of coral reefs (Ayukai 1995; Ferrier-Pages and Gattuso 1998; Gast et al. 1998; Yahel et al.1998; Richter and Wunsch 1999; Fabricius and Dom-misse 2000; Richter et al. 2001; van Duyl and Gast 2001;van Duyl et al. 2002; Genin et al. 2002; Ribes et al. 2003,2005). Nevertheless, unlike temperate and boreal coastalhabitats, the identification of the key benthic phy-toplanktivores and the assessment of their feeding rateshave, by and large, remained elusive. To our knowledge,phytoplanktivory has been investigated only in five coralreef dwellers: an Octocoral (Fabricius et al. 1998), twosponges (Pile 1997; Yahel et al. 2003) and commerciallyreared bivalves (Yukihira et al. 1999; Loret et al. 2000).
Potential sinks for phytoplankton in coral reefs couldbe physical mechanisms such as entrainment and burialby high-pressure surge in the reef framework (Haber-stroh and Sansone 1999) and wave-driven filtration viasand ripples (Huettel and Rusch 2000). However, such
Communicated by Environmental Editor B.G. Hatcher
G. Yahel Æ T. ZaloginR. Yahel Æ A. GeninThe Inter-university Institute for Marine Sciences of Eilat andDepartment of Evolution, Systematics and Ecology, The HebrewUniversity of Jerusalem, P.O. Box 469, 88103 Eilat, Israel
G. Yahel (&)Department of Biology, University of Victoria, STN CSC,P.O. Box 3020, Victoria, BC, CanadaV8W 3N5E-mail: [email protected].: +1-250-7218858Fax: +1-250-7217120
Present address:R. YahelVENUS Project, University of Victoria, STN CSC,P.O. Box 1700, Victoria, BC, CanadaV8W 2Y2
Coral Reefs (2005)DOI 10.1007/s00338-005-0075-4
mechanisms pertain primarily to the surge zone andcannot account for the removal processes occurring inmoderate and low flow environments below the waveaction zone (Genin et al. 2002; Yahel et al. 2002). Severalbiotic guilds have been suggested by various authorsto be the dominant phytoplankton grazers in differentreefs. For instance, following the discovery of phy-toplanktivory in the octocoralDendronephthya hemprichi(Fabricius et al. 1995), phytoplankton depletion over softcoral-dominated reefs was attributed to the corals (Yahelet al. 1998; Fabricius and Dommisse 2000). Yahel et al.(1998) have speculated that epibenthic active suspension-feeders may be responsible for the phytoplanktondepletion over fringing reefs at the Gulf of Aqaba wheresoft corals are scarce. In follow-up studies, Richter andWunsch (1999) and Richter et al. (2001) suggested thatthe entire removal of phytoplankton could be accountedfor by cavity-dwelling fauna, primarily sponges. A simi-lar suggestion was recently made for epibenthic spongeand tunicates by Ribes et al. (2005). Yet, reef cavitieswere extremely rare at the experimental sites of Geninet al. (2002) in the Gulf of Aqaba where intense phyto-plankton grazing was documented. Moreover, up scalingcalculations of individual grazing rate measurementsmade at the same sites (G. Yahel et al. unpublished)suggest that visible active suspension feeders (includingsponges and boring sponges, Lithophaga and otherbivalves, and tunicates) account for only �15% of theobserved phytoplankton removal.
In a recent compilation of >1,000 surveys of differentcoral reefs, Hodgson and Liebeler (2002) reported that‘‘exposed’’ rocks, that is, hard substratum (excludingrecently killed corals) not occupied by live corals,sponges, fleshy algae, or other conspicuous macro-fau-na, comprise on average 26% of the Indo-Pacific and18% of the Atlantic reefs surface area, compared withmean live coral cover of 35% and 23%, respectively.Sand patches and coral rubble (0.5–15 cm) are the twoother predominant exposed substrata in coral reefs(Hodgson and Liebeler 2002). Aside from the role in-and epifauna have in reef bioerosion, their ecologicalfunctioning in the reef community is poorly understood(Hutchings 1978, 1983; Gischler 1997). Several reportsdescribing the community inhabiting exposed rocks incoral reefs indicated that populations of minute sus-pension feeders (such as polychaetes, foraminifers, tu-nicates, and boring sponges) are highly abundant in thismicro-habitat (e.g., Bonem 1977; Peyrot-Clausade 1977;Vasseur 1977; Hutchings 1978, 1983; Gischler 1997;Holmes et al. 2000 and references therein). In reefs understress, where the abundance of dead coral, rocks, andrubble is high (e.g., Edinger et al. 2000) and wheresometime anthropogenic eutrophication co-occurs,bioerosion becomes intense and the abundance of boringsponge increases (Holmes et al. 2000 and referencestherein).
The objective of this study was to experimentally testthe hypothesis that the cryptic fauna that inhabitsexposed rocks in coral reefs removes considerable
amounts of phytoplankton from the overlying waters,rendering significant its role in benthic–pelagic couplingin coral reefs.
Methods
Phytoplankton removal by the fauna inhabiting differentreef substrata (exposed rocks, gravel, and sand) wasstudied on the fringing coral reef in front of the SteinitzMarine Laboratory of Eilat, Gulf of Aqaba, Red Sea(29�30¢ N, 34�56¢ E). Reef substrata were brought to thelaboratory and placed in small tanks fed by runningwater pumped from the reef. Phytoplankton concen-tration was measured using either chlorophyll a or cellcounts with a flow cytometer. The sampling periodspanned the seasonal variation in the northern tip of theGulf of Aqaba (Lindell and Post 1995) starting duringsummer stratification (August 2001) and extendingthrough autumn (September 2001) and the winter mix-ing (October–December 2001), to the spring bloom(March 2002). See Yahel et al. (1998, 2002) and refer-ences therein for a description of the study site.
Experimental setup
The setup included ten polypropylene tanks (3.6 L,Fig. 1) into which different reef substrata (untreatedrock, gravel, sand, and controls, see below) were ran-domly allocated in each experiment (Table 1). Each tankwas supplied with running seawater via a 1 m long,6 mm diameter pipe from a common header tank (20 L)that supplied a constant flow of 11±1 L h�1
(mean ± SD). To ensure thorough mixing of the water
Fig. 1 An illustration (side view) of an experimental tank with 3rocks (r). Tank dimensions are 15.5·15.5·15 cm. The water inlet isvia a 6 mm hose from a common head tank, water outlet is fromnear the tank bottom via a 20 mm hose. An electric pump (p)ensured thorough mixing of the tank water. Each experimentconsisted of ten identical tanks attached to the common head tank
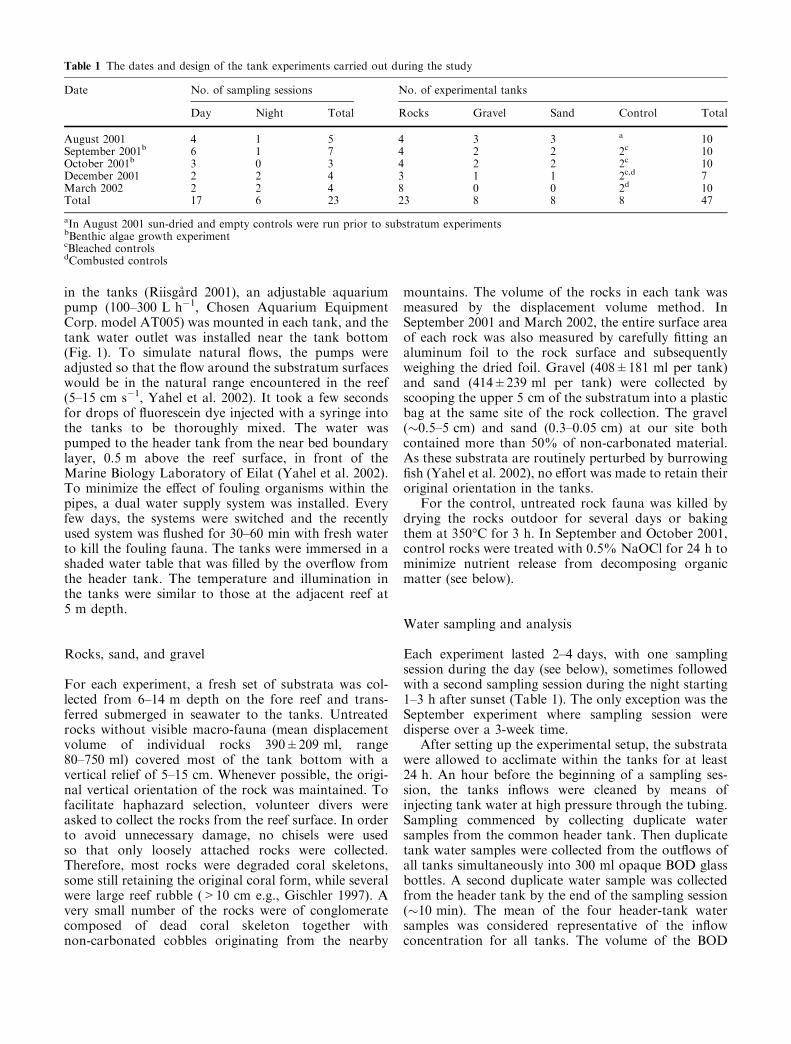
in the tanks (Riisgard 2001), an adjustable aquariumpump (100–300 L h�1, Chosen Aquarium EquipmentCorp. model AT005) was mounted in each tank, and thetank water outlet was installed near the tank bottom(Fig. 1). To simulate natural flows, the pumps wereadjusted so that the flow around the substratum surfaceswould be in the natural range encountered in the reef(5–15 cm s�1, Yahel et al. 2002). It took a few secondsfor drops of fluorescein dye injected with a syringe intothe tanks to be thoroughly mixed. The water waspumped to the header tank from the near bed boundarylayer, 0.5 m above the reef surface, in front of theMarine Biology Laboratory of Eilat (Yahel et al. 2002).To minimize the effect of fouling organisms within thepipes, a dual water supply system was installed. Everyfew days, the systems were switched and the recentlyused system was flushed for 30–60 min with fresh waterto kill the fouling fauna. The tanks were immersed in ashaded water table that was filled by the overflow fromthe header tank. The temperature and illumination inthe tanks were similar to those at the adjacent reef at5 m depth.
Rocks, sand, and gravel
For each experiment, a fresh set of substrata was col-lected from 6–14 m depth on the fore reef and trans-ferred submerged in seawater to the tanks. Untreatedrocks without visible macro-fauna (mean displacementvolume of individual rocks 390±209 ml, range80–750 ml) covered most of the tank bottom with avertical relief of 5–15 cm. Whenever possible, the origi-nal vertical orientation of the rock was maintained. Tofacilitate haphazard selection, volunteer divers wereasked to collect the rocks from the reef surface. In orderto avoid unnecessary damage, no chisels were usedso that only loosely attached rocks were collected.Therefore, most rocks were degraded coral skeletons,some still retaining the original coral form, while severalwere large reef rubble (>10 cm e.g., Gischler 1997). Avery small number of the rocks were of conglomeratecomposed of dead coral skeleton together withnon-carbonated cobbles originating from the nearby
mountains. The volume of the rocks in each tank wasmeasured by the displacement volume method. InSeptember 2001 and March 2002, the entire surface areaof each rock was also measured by carefully fitting analuminum foil to the rock surface and subsequentlyweighing the dried foil. Gravel (408±181 ml per tank)and sand (414±239 ml per tank) were collected byscooping the upper 5 cm of the substratum into a plasticbag at the same site of the rock collection. The gravel(�0.5–5 cm) and sand (0.3–0.05 cm) at our site bothcontained more than 50% of non-carbonated material.As these substrata are routinely perturbed by burrowingfish (Yahel et al. 2002), no effort was made to retain theiroriginal orientation in the tanks.
For the control, untreated rock fauna was killed bydrying the rocks outdoor for several days or bakingthem at 350�C for 3 h. In September and October 2001,control rocks were treated with 0.5% NaOCl for 24 h tominimize nutrient release from decomposing organicmatter (see below).
Water sampling and analysis
Each experiment lasted 2–4 days, with one samplingsession during the day (see below), sometimes followedwith a second sampling session during the night starting1–3 h after sunset (Table 1). The only exception was theSeptember experiment where sampling session weredisperse over a 3-week time.
After setting up the experimental setup, the substratawere allowed to acclimate within the tanks for at least24 h. An hour before the beginning of a sampling ses-sion, the tanks inflows were cleaned by means ofinjecting tank water at high pressure through the tubing.Sampling commenced by collecting duplicate watersamples from the common header tank. Then duplicatetank water samples were collected from the outflows ofall tanks simultaneously into 300 ml opaque BOD glassbottles. A second duplicate water sample was collectedfrom the header tank by the end of the sampling session(�10 min). The mean of the four header-tank watersamples was considered representative of the inflowconcentration for all tanks. The volume of the BOD
Table 1 The dates and design of the tank experiments carried out during the study
Date No. of sampling sessions No. of experimental tanks
Day Night Total Rocks Gravel Sand Control Total
August 2001 4 1 5 4 3 3 a 10September 2001b 6 1 7 4 2 2 2c 10October 2001b 3 0 3 4 2 2 2c 10December 2001 2 2 4 3 1 1 2c,d 7March 2002 2 2 4 8 0 0 2d 10Total 17 6 23 23 8 8 8 47
aIn August 2001 sun-dried and empty controls were run prior to substratum experimentsbBenthic algae growth experimentcBleached controlsdCombusted controls
bottles was individually measured to the nearest 10 ll.Water samples were immediately transferred to thelaboratory, pre-filtered using a 100 lm net to removelarge zooplankton and fragments of benthic algae, fil-tered on GF/F filters and analyzed for chlorophyll a bycold acetone extraction and fluorometric determinationon a TD-700 (Turner design) fluorometer as in Yahelet al. (1998). The precision of our method (measured asthe average deviation of duplicate chlorophyll mea-surements from their mean) was 5 ng chlorophyll L�1
(Coeffcient of variance, CV<2%, N=214).In early spring (March 2002), a flow cytometer
(FACScan, Becton Dickinson) was used to measure theconcentration of the two dominant autotrophic groups(Synechococcus and pico-eukaryotes) and the non-pho-tosynthetic bacteria as described by Marie et al. (1999).Taxonomic discrimination was made on the basis of cellside scatter, orange fluorescence of phycoerythrin, andred fluorescence of chlorophyll (Marie et al. 1999).
In order to detect possible remineralization processes,ammonium concentrations were measured during adaytime sampling session in September and October2001 using the fluorometric method (Holmes et al. 1999).Ammonium concentration was determined by a DyNAQuant 200 fluorometer (Hoffer) after 3 h dark incuba-tion with the reaction mixture in room temperature. Toimprove the method accuracy, an internal standardcurve was obtained for each sample by adding 0, 100,200, and 300 ll of a standard ammonium solution(2.5 lmol L�1) into 4 ml aliquots of the original watersample (David 2003).
Using a thoroughly mixed system, plankton concen-trations in the tanks outflow were equal to the concen-tration within the tank. Assuming steady-state conditionfor the duration of the sampling (Riisgard 2001), wecould calculate the substratum clearance rate (CR) ineach tank (a virtual volume of water filtered clear ofplankton per a time unit) as CR=Q·(Ci�Co)/Co (seeEq. 6 in Riisgard 2001) where Q [L h�1] is the flow ratethrough the system and Ci and Co are the planktonconcentrations in the inflow and outflow, respectively(measured either as nanogram chlorophyll L�1 or cellcounts with a flow cytometer). Following a standardengineering approach for calculating mass transfer rates(plankton or ammonium) between the rough rock sur-faces and the overlying water (Wildish and Kristmanson1997; Thomas and Atkinson 1997), we scaled the ob-served clearance rate to the planar area occupied by therocks in the tank (�240 cm2). Thus, unless statedotherwise, CR was normalized to the planar tank areaand is reported as ml seawater cleared per cm2 area perhour.
Algal growth experiments
The hypothesis that phytoplankton grazing and sub-sequent nutrient mineralization by the untreated rockfauna would facilitate the growth of benthic algae was
tested in September and October 2001 by incubatingfour small transparent plastic cylinders within eachexperimental tank. Cylinders were prepared from cutpieces of 1.5 ml Eppendorf microtubes which were thensuspended with small plastic-coated wires 5 cm belowthe water surface. After 14 or 6 days incubations (inSeptember and October, respectively), the cylinders wereremoved and the algae chlorophyll was extracted bysoaking the cylinder in 90% buffered acetone for 24 h at4�C in the dark. Chlorophyll was measured fluoromet-rically as above. Chlorophyll a accretion was used as aproxy for the benthic algae standing crop developed onthe cylinder during the incubation.
Rock fauna
Attaining a full quantitative taxonomic description ofthe in- and epifauna on the substrata was beyond thescope of this study. In order to quasi-quantitatively de-scribe the fauna, each rock was visually examined andphotographed and then a sub-sample (0.5–16 ml) wascarefully chiseled from the outer 3 cm of the rock sur-face and examined under a dissecting microscope. Sub-samples were carefully taken apart within a seawaterbath, using a small chisel, and the dismantled materialwas filtered (200 lm) and preserved in 4% bufferedformalin for later microscopical analysis. This procedurewas repeated for each tank in the first three experiments(August–October 2001). To examine the natural fau-nistic variability, three rock samples were taken andscreened in three cases. No attempt was made to quan-tify the numerous algae (endolithic, coralline, encrust-ing) found on the rocks. For sand and gravel, a 10 mlsample was preserved as above and the infauna inhab-iting 1 ml aliquot was microscopically counted.
The dismantled rocks were sorted under a dissectingmicroscope and identifiable organisms were photo-graphed and counted (Hutchings et al. 1992). The sep-aration and isolation of the organisms were difficult asmany animals were fractured or deformed during rockdismantling (Hutchings 1978, 1983). Since colonialorganisms could not be quantified (Kiene and Hutchings1994), only the presence/absence was noted for thesetaxa. The organisms were identified to the species levelwhenever possible; however, more often we were able tosort organisms only to order or family. Polychaetes withmouth parts indicating a suspension-feeding mode offeeding were counted separately.
Statistical analysis
Throughout the text, means are reported ±1 standarddeviation (SD) unless otherwise stated. Each experimentwas analyzed separately using a repeated-measuresANOVA with the sampling sessions as repeated mea-sures crossed with the substratum type. As ANOVAassumptions of homogeneity of variance and normality
were usually met, no transformation was used. We usedplanned comparisons to compare the clearance rates ofsand and gravel with the control, and of untreated rockswith all other substratum types pooled. Nighttimeclearance rates were compared with the preceding day-time results using Wilcoxon match paired test when thecomparison was carried only once (experiments 1 and 2)or a two-level repeated-measures ANOVA when thecomparison was repeated twice (experiments 4 and 5)with day/night as first repeated measure level and thesampling sessions as a second repeated measure. Theabundance of countable organisms in each tank wasestimated as the product of normalized abundances ofeach taxon in the corresponding sub-samples and therock volume in each tank. To examine possible rela-tionships between the fauna of each tank and the meantank clearance rate, we used a multiple backward step-wise linear regression analysis. A complete analysis ofresiduals was performed to validate the robustness of theresulting model. Statistical analysis was undertakenusing Statistica 6.0 (2002, Statsoft Inc.). The faunisticcomposition of the different substratum was comparedusing the ANOSIM (analysis of similarity) routine andthe Primer statistical package (Ver. 5.22, Primer-e Ltd.).
Results
Ambient condition
Typical oligotrophic conditions prevailed at our studysite during the summer stratification period (August–October 2001), with surface water temperature (SST)ranging from 25–26�C and chlorophyll concentrationranging from 150 to 220 ng L�1. Prokaryotes domi-nated the phytoplanktonic community. With the deep-ening of the winter mixing in the Gulf, eukaryotic algae
became more abundant and in December 2001 (SST,21�C) chlorophyll concentration rose above the annualmean (400 ng L�1). The spring bloom (>600 ng chlo-rophyll L�1) followed the initiation of water warming inMarch 2002 (SST, 21.9�C). Typical bloom conditionswere evident in March 2002 when the Prochlorococcusabundance was extremely low (Lindell and Post 1995;G. Yahel, unpublished data), Synechococcus (1.65·105cells ml�1) were 4 to 16-fold the non-bloom concentration(1–4·104 Synechococcus cells ml�1) and eukaryotic algae(1.1·104 cells ml�1) were 3–10 times above the non-bloom concentration (1–4·103 cells ml�1, G. Yahel,unpublished).
Phytoplankton removal
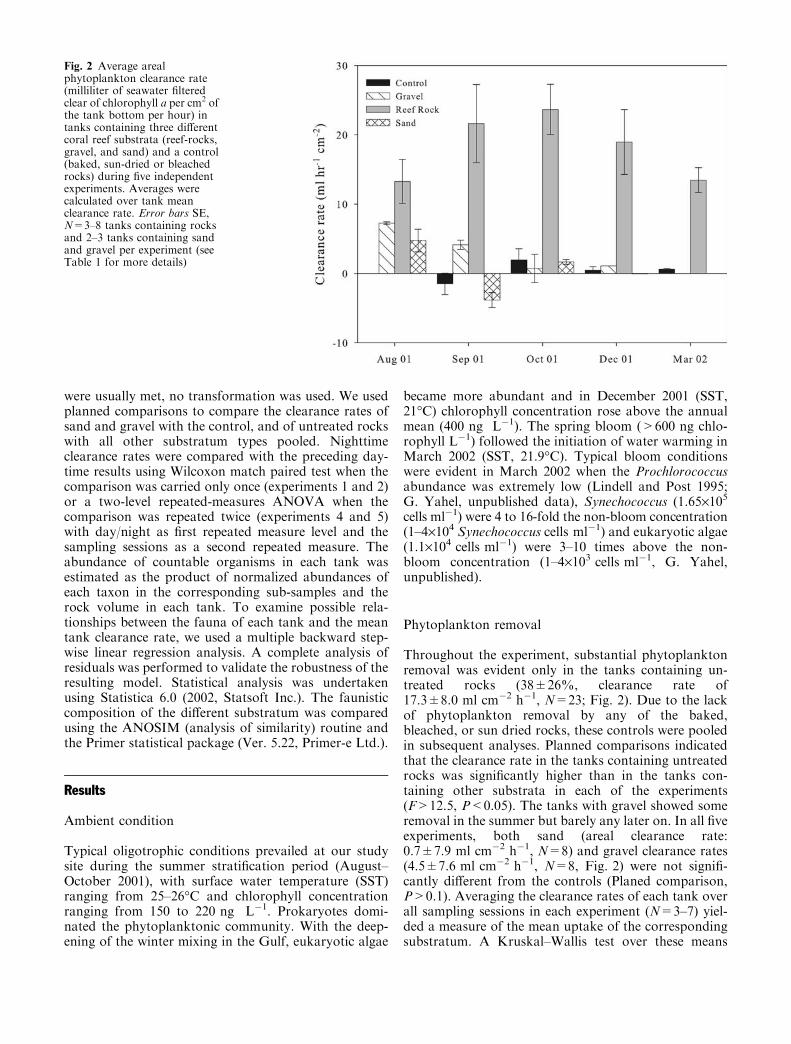
Throughout the experiment, substantial phytoplanktonremoval was evident only in the tanks containing un-treated rocks (38±26%, clearance rate of17.3±8.0 ml cm�2 h�1, N=23; Fig. 2). Due to the lackof phytoplankton removal by any of the baked,bleached, or sun dried rocks, these controls were pooledin subsequent analyses. Planned comparisons indicatedthat the clearance rate in the tanks containing untreatedrocks was significantly higher than in the tanks con-taining other substrata in each of the experiments(F>12.5, P<0.05). The tanks with gravel showed someremoval in the summer but barely any later on. In all fiveexperiments, both sand (areal clearance rate:0.7±7.9 ml cm�2 h�1, N=8) and gravel clearance rates(4.5±7.6 ml cm�2 h�1, N=8, Fig. 2) were not signifi-cantly different from the controls (Planed comparison,P>0.1). Averaging the clearance rates of each tank overall sampling sessions in each experiment (N=3–7) yiel-ded a measure of the mean uptake of the correspondingsubstratum. A Kruskal–Wallis test over these means
Fig. 2 Average arealphytoplankton clearance rate(milliliter of seawater filteredclear of chlorophyll a per cm2 ofthe tank bottom per hour) intanks containing three differentcoral reef substrata (reef-rocks,gravel, and sand) and a control(baked, sun-dried or bleachedrocks) during five independentexperiments. Averages werecalculated over tank meanclearance rate. Error bars SE,N=3–8 tanks containing rocksand 2–3 tanks containing sandand gravel per experiment (seeTable 1 for more details)
indicated a significant difference in the clearance rates ofthe different substratum types (H3,N=47=33.4,P <0.001). As in the parametric test, a post-hoc,non-parametric (pairwise) multiple comparison of the
medians indicated that the clearance in the tankscontaining untreated rock was significantly higher thanall other treatments (P<0.001) while the gravel and thesand were not significantly different from each other orfrom the control (P=1.0).
Differences in chlorophyll concentration greater thanthree times the precision of our method (i.e., >15 ngchlorophyll L�1) occurred in 97 of the total of 103 indi-vidual measurements carried with tanks containing un-treated rocks.Mean clearance rate in the tanks containinguntreated rocks ranged from 5.0±2.5 ml cm�2 h�1 to37.8±13.3 ml cm�2 h�1 and the average difference be-tween inflow and outflow (tankwater) concentrations was86±75 ng chlorophyll L�1 (38±26%). Gravel showeddetectable phytoplankton removals in 67% of the cases,but the average difference between inflow andoutflowwasonly 9±46 ng chlorophyll L�1.
In March 2002 the removal of Synechococcus sp. andeukaryotic algae was highly correlated (r=0.90,P<0.001, N=16). Phytoplankton clearance measuredas cell counts was significantly correlated with chloro-phyll clearance rate (r=0.57, P<0.01, N=16) andthe three measures were not significantly different (Two-level repeated measures ANOVA, F2,47=0.4, P=0.69).Mean clearance rates were 15±8, 13±7, and14±7 ml cm�2 h�1 for Synechococcus, eukaryotic algae,and chlorophyll, respectively. The grazing rates of non-photosynthetic bacteria was also considerable(8±6 ml cm�2 h�1), although significantly lower (Two-level repeated measures ANOVA, F1,7=8, P=0.02) incomparison to phytoplankton grazing. Clearance ratesof non-photosynthetic bacteria were well correlated withchlorophyll clearance (r=0.60, P=0.01, N=16) but lessso with phytoplankton cell counts (r=0.3, P>0.2,N=16).
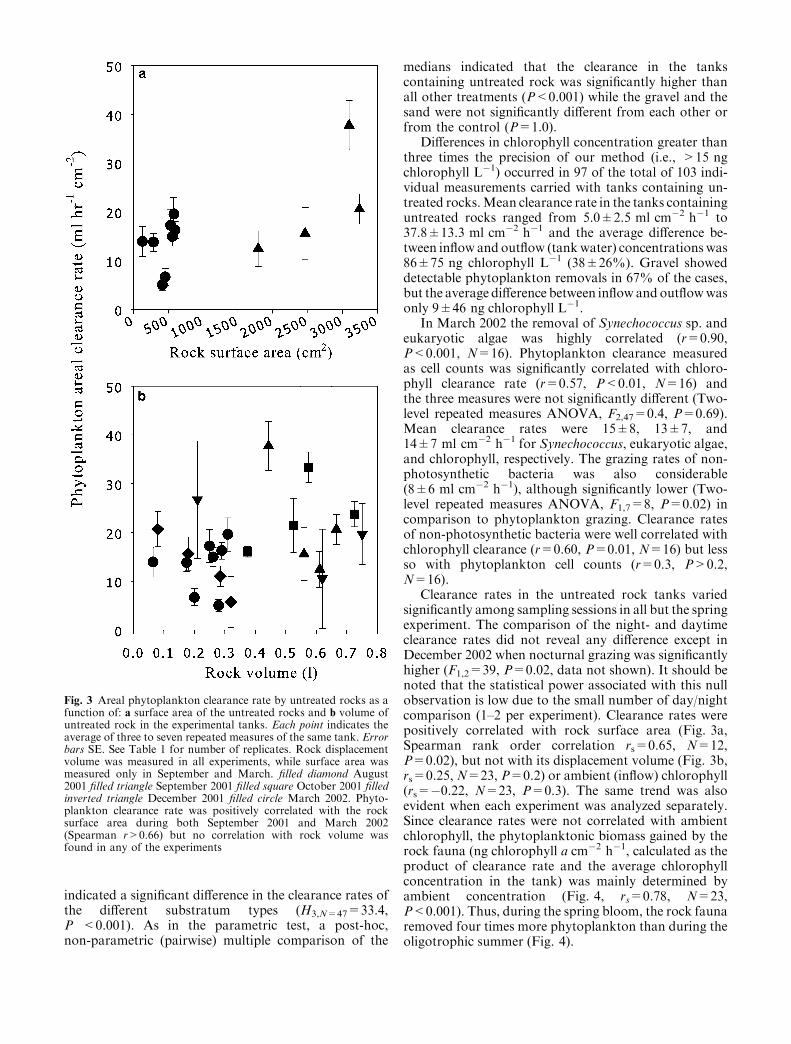
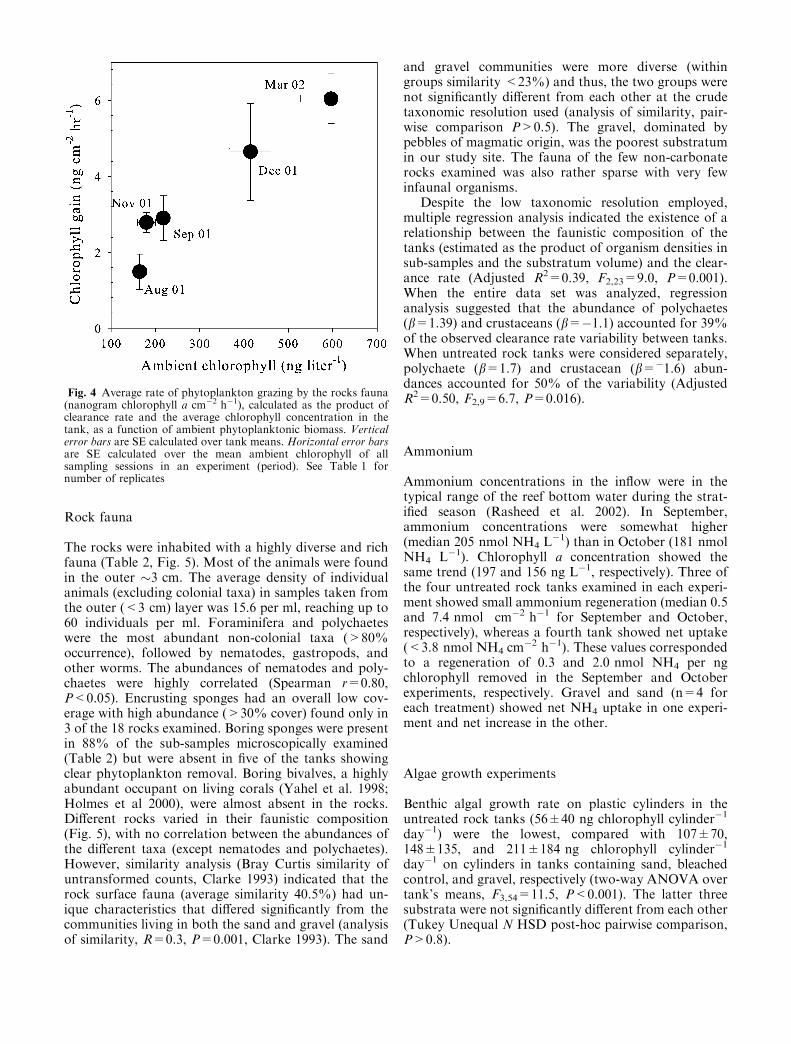
Clearance rates in the untreated rock tanks variedsignificantly among sampling sessions in all but the springexperiment. The comparison of the night- and daytimeclearance rates did not reveal any difference except inDecember 2002 when nocturnal grazing was significantlyhigher (F1,2=39, P=0.02, data not shown). It should benoted that the statistical power associated with this nullobservation is low due to the small number of day/nightcomparison (1–2 per experiment). Clearance rates werepositively correlated with rock surface area (Fig. 3a,Spearman rank order correlation rs=0.65, N=12,P=0.02), but not with its displacement volume (Fig. 3b,rs=0.25, N=23, P=0.2) or ambient (inflow) chlorophyll(rs=�0.22, N=23, P=0.3). The same trend was alsoevident when each experiment was analyzed separately.Since clearance rates were not correlated with ambientchlorophyll, the phytoplanktonic biomass gained by therock fauna (ng chlorophyll a cm�2 h�1, calculated as theproduct of clearance rate and the average chlorophyllconcentration in the tank) was mainly determined byambient concentration (Fig. 4, rs=0.78, N=23,P<0.001). Thus, during the spring bloom, the rock faunaremoved four times more phytoplankton than during theoligotrophic summer (Fig. 4).
Fig. 3 Areal phytoplankton clearance rate by untreated rocks as afunction of: a surface area of the untreated rocks and b volume ofuntreated rock in the experimental tanks. Each point indicates theaverage of three to seven repeated measures of the same tank. Errorbars SE. See Table 1 for number of replicates. Rock displacementvolume was measured in all experiments, while surface area wasmeasured only in September and March. filled diamond August2001 filled triangle September 2001 filled square October 2001 filledinverted triangle December 2001 filled circle March 2002. Phyto-plankton clearance rate was positively correlated with the rocksurface area during both September 2001 and March 2002(Spearman r>0.66) but no correlation with rock volume wasfound in any of the experiments
Rock fauna
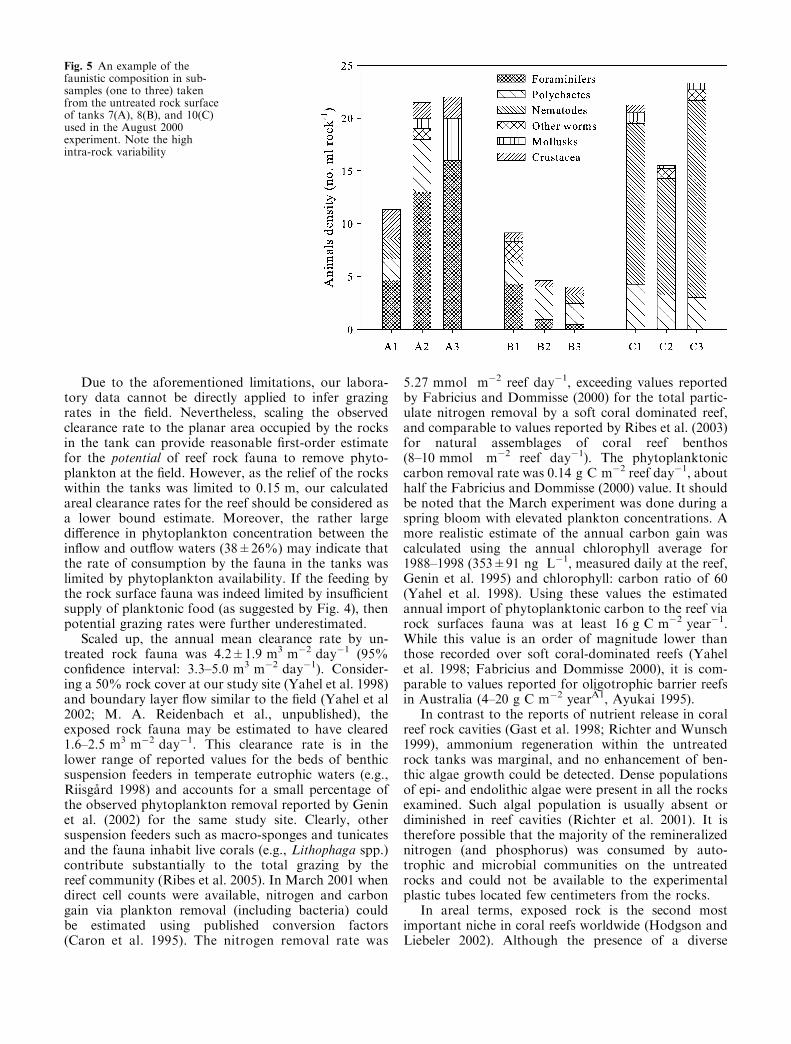
The rocks were inhabited with a highly diverse and richfauna (Table 2, Fig. 5). Most of the animals were foundin the outer �3 cm. The average density of individualanimals (excluding colonial taxa) in samples taken fromthe outer (<3 cm) layer was 15.6 per ml, reaching up to60 individuals per ml. Foraminifera and polychaeteswere the most abundant non-colonial taxa (>80%occurrence), followed by nematodes, gastropods, andother worms. The abundances of nematodes and poly-chaetes were highly correlated (Spearman r=0.80,P<0.05). Encrusting sponges had an overall low cov-erage with high abundance (>30% cover) found only in3 of the 18 rocks examined. Boring sponges were presentin 88% of the sub-samples microscopically examined(Table 2) but were absent in five of the tanks showingclear phytoplankton removal. Boring bivalves, a highlyabundant occupant on living corals (Yahel et al. 1998;Holmes et al 2000), were almost absent in the rocks.Different rocks varied in their faunistic composition(Fig. 5), with no correlation between the abundances ofthe different taxa (except nematodes and polychaetes).However, similarity analysis (Bray Curtis similarity ofuntransformed counts, Clarke 1993) indicated that therock surface fauna (average similarity 40.5%) had un-ique characteristics that differed significantly from thecommunities living in both the sand and gravel (analysisof similarity, R=0.3, P=0.001, Clarke 1993). The sand
and gravel communities were more diverse (withingroups similarity <23%) and thus, the two groups werenot significantly different from each other at the crudetaxonomic resolution used (analysis of similarity, pair-wise comparison P>0.5). The gravel, dominated bypebbles of magmatic origin, was the poorest substratumin our study site. The fauna of the few non-carbonaterocks examined was also rather sparse with very fewinfaunal organisms.
Despite the low taxonomic resolution employed,multiple regression analysis indicated the existence of arelationship between the faunistic composition of thetanks (estimated as the product of organism densities insub-samples and the substratum volume) and the clear-ance rate (Adjusted R2=0.39, F2,23=9.0, P=0.001).When the entire data set was analyzed, regressionanalysis suggested that the abundance of polychaetes(b=1.39) and crustaceans (b=�1.1) accounted for 39%of the observed clearance rate variability between tanks.When untreated rock tanks were considered separately,polychaete (b=1.7) and crustacean (b=�1.6) abun-dances accounted for 50% of the variability (AdjustedR2=0.50, F2,9=6.7, P=0.016).
Ammonium
Ammonium concentrations in the inflow were in thetypical range of the reef bottom water during the strat-ified season (Rasheed et al. 2002). In September,ammonium concentrations were somewhat higher(median 205 nmol NH4 L
�1) than in October (181 nmolNH4 L�1). Chlorophyll a concentration showed thesame trend (197 and 156 ng L�1, respectively). Three ofthe four untreated rock tanks examined in each experi-ment showed small ammonium regeneration (median 0.5and 7.4 nmol cm�2 h�1 for September and October,respectively), whereas a fourth tank showed net uptake(<3.8 nmol NH4 cm
�2 h�1). These values correspondedto a regeneration of 0.3 and 2.0 nmol NH4 per ngchlorophyll removed in the September and Octoberexperiments, respectively. Gravel and sand (n=4 foreach treatment) showed net NH4 uptake in one experi-ment and net increase in the other.
Algae growth experiments
Benthic algal growth rate on plastic cylinders in theuntreated rock tanks (56±40 ng chlorophyll cylinder�1
day�1) were the lowest, compared with 107±70,148±135, and 211±184 ng chlorophyll cylinder�1
day�1 on cylinders in tanks containing sand, bleachedcontrol, and gravel, respectively (two-way ANOVA overtank’s means, F3,54=11.5, P<0.001). The latter threesubstrata were not significantly different from each other(Tukey Unequal N HSD post-hoc pairwise comparison,P>0.8).
Fig. 4 Average rate of phytoplankton grazing by the rocks fauna(nanogram chlorophyll a cm�2 h�1), calculated as the product ofclearance rate and the average chlorophyll concentration in thetank, as a function of ambient phytoplanktonic biomass. Verticalerror bars are SE calculated over tank means. Horizontal error barsare SE calculated over the mean ambient chlorophyll of allsampling sessions in an experiment (period). See Table 1 fornumber of replicates
Discussion
The crypto fauna that inhabits exposed reef rocks re-moved up to 60% of the phytoplankton from the waterflowing above it in our laboratory tanks (Figs. 2, 3). The95% confidence interval for the annual mean clearancerate of untreated rock was 13.9–20.7 ml cm�2 h�1. Thelack of removal by the control (killed) rocks (Fig. 2)clearly ruled out hydraulic filtration or other abioticremoval mechanisms as a significant phytoplankton sinkunder the experimental conditions. Such mechanismsmay, however, have a significant role in situ, primarilywithin the wave action zone and in high flow environ-ments (Haberstroh and Sansone 1999; Huettel andRusch 2000). We therefore conclude that the observedplankton removal in the tanks was due to a biotic pro-cess, most likely grazing (phytoplanktivory) by minute,unidentified, phytoplanktivorous suspension-feedersthat inhabit the outer few centimeters of the rocks. Dueto the small sample size, the statistical power of ourexperimental design was insufficient to reject thehypothesis (H1) of significant plankton removal by thegravel or sand. However, the low to null removals re-corded for these substrata indicate that they are far lessimportant sinks for phytoplankton in comparison withexposed rock surfaces on the Eilat fringing reef.
The reef rocks we studied were selected by manyvolunteer divers when asked to choose rock sampleswith no visible macro-fauna cover (e.g., corals, sponges,tunicates, and fleshy algae). Thus it is most probablethat these rocks would have been classified as ‘rock’ inmost reef surveys (e.g., Reef Check, Hodgson and Lie-beler 2002). As in previous reports (e.g., Bonem 1977;Peyrot-Clausade 1977; Vasseur 1977; Hutchings 1978,1983; Gischler 1997; Holmes et al. 2000 and referencestherein), close examination of the surface of the rocksunder the dissecting microscope revealed a highlydiverse and rich fauna (Table 2, Fig. 5) with a mean
total density of 15.6 individuals per ml of rock surface(outer 3 cm, excluding colonial forms). However, thecryptic nature of many rock dwellers precluded accuratevisual counts of all the specimens present in a sample(Hutchings 1983). For example, serpulid polychaetescreate a maze of microscopic tubes within minute rockcrevices. It was sometimes impossible to separate indi-vidual tubes or to verify whether the tube contained aliving worm. Boring sponges (e.g., Cliona spp.) posedanother complication as there was no simple measure fortheir abundance (Kiene and Hutchings 1994). Moreover,due to methodological limitations (Wickham et al.2000), ciliates and flagellates were not enumerated.Thus, data reported here should be considered conser-vative. As indicated by the multivariate analysis, rocksurface fauna had unique characteristics and was bothricher and more diverse in comparison with the graveland sand communities. The regression analysis suggestsa dependence of removal rate on the substratum com-munity composition.
Robust inference from the experimental results to thefield should rely on a proper measure of the amount ofrock surface or phytoplanktivorous grazers in theexperimental tanks, establishing proper methodology formeasuring these parameters in the field, and goodreplication of field hydrodynamics in the laboratory.Unfortunately, none of the above can be easily estab-lished. Rock volume was clearly irrelevant as the vastmajority of the fauna was found within 5 cm from therock surface (see also Hutchings et al. 1992 and referencestherein). Indeed, rock volume and clearance rate were notcorrelated (Fig. 3b). Rock surface area is probably abetter predictor of the grazing rates as indicated by thesignificant, albeit not very high (rs=0.65), correlationwith clearance rates (Fig. 3a). This low correlation mayhave partly been a result of the inclusion of rocks basesand measurement inaccuracies; however, the most likelyexplanation is the high variability of the grazer’s abun-dance and community composition (Fig. 5).
Table 2 Average (SE) and maximum densities (# ml�1 of rock) of the fauna identified in sub-samples taken from the outer 3 cm of reefrocks surfaces used in the August, September, and October 2001 experiments. Percent values indicate the proportion of the sub-samples inwhich the taxon was present (sub-sample volume ranged 0.5–16 ml). Colonial organisms, such as sponges, ascidians, and bryozoans werenot quantified, thus only the presence/absence data are reported for these taxa. Endolithic, encrusting, and coralline algae were present inmost rocks but were not quantified. Visual observations of the rocks indicated the occurrence of additional taxa that were absent in thesub-samples, including: boring bivalves (Lithophaga spp.), holothurians, unidentified ophiuroids, nemerteans, small sea anemones, and afew coral polyps (new recruits)
Taxon Untreated rock (N=18) Gravel (N=7) Sand (N=7)
Density Max Percentage Density Max Percentage Density Max Percentage
Foraminifers 5.4 (1.7) 21 82 0.4 (0.2) 1 43 4.7 (2.2) 15 71Polychaetes 3.8 (1.0) 19 94 0 0 0 2.6 (1.1) 6 57Filter-feeding Polychaetes 0.8 (0.2) 3 59 0.3 (0.2) 1 29 0.3 (0.3) 2 14Nematodes 3.4 (1.4) 19 76 0.3 (0.2) 1 29 0.6 (0.3) 2 43Other worms 0.7 (0.2) 3 59 0.1 (0.1) 1 14 0.3 (0.2) 1 29Mollusks 0.8 (0.2) 4 71 0.1 (0.1) 1 14 1.7 (0.8) 5 43Crustaceans 1.1 (0.5) 8 76 0.1 (0.1) 1 14 0.6 (0.2) 1 57Sponges 88 29 0Tunicates 47 29 0Bryozoans 23 0 0
Due to the aforementioned limitations, our labora-tory data cannot be directly applied to infer grazingrates in the field. Nevertheless, scaling the observedclearance rate to the planar area occupied by the rocksin the tank can provide reasonable first-order estimatefor the potential of reef rock fauna to remove phyto-plankton at the field. However, as the relief of the rockswithin the tanks was limited to 0.15 m, our calculatedareal clearance rates for the reef should be considered asa lower bound estimate. Moreover, the rather largedifference in phytoplankton concentration between theinflow and outflow waters (38±26%) may indicate thatthe rate of consumption by the fauna in the tanks waslimited by phytoplankton availability. If the feeding bythe rock surface fauna was indeed limited by insufficientsupply of planktonic food (as suggested by Fig. 4), thenpotential grazing rates were further underestimated.
Scaled up, the annual mean clearance rate by un-treated rock fauna was 4.2±1.9 m3 m�2 day�1 (95%confidence interval: 3.3–5.0 m3 m�2 day�1). Consider-ing a 50% rock cover at our study site (Yahel et al. 1998)and boundary layer flow similar to the field (Yahel et al2002; M. A. Reidenbach et al., unpublished), theexposed rock fauna may be estimated to have cleared1.6–2.5 m3 m�2 day�1. This clearance rate is in thelower range of reported values for the beds of benthicsuspension feeders in temperate eutrophic waters (e.g.,Riisgard 1998) and accounts for a small percentage ofthe observed phytoplankton removal reported by Geninet al. (2002) for the same study site. Clearly, othersuspension feeders such as macro-sponges and tunicatesand the fauna inhabit live corals (e.g., Lithophaga spp.)contribute substantially to the total grazing by thereef community (Ribes et al. 2005). In March 2001 whendirect cell counts were available, nitrogen and carbongain via plankton removal (including bacteria) couldbe estimated using published conversion factors(Caron et al. 1995). The nitrogen removal rate was
5.27 mmol m�2 reef day�1, exceeding values reportedby Fabricius and Dommisse (2000) for the total partic-ulate nitrogen removal by a soft coral dominated reef,and comparable to values reported by Ribes et al. (2003)for natural assemblages of coral reef benthos(8–10 mmol m�2 reef day�1). The phytoplanktoniccarbon removal rate was 0.14 g C m�2 reef day�1, abouthalf the Fabricius and Dommisse (2000) value. It shouldbe noted that the March experiment was done during aspring bloom with elevated plankton concentrations. Amore realistic estimate of the annual carbon gain wascalculated using the annual chlorophyll average for1988–1998 (353±91 ng L�1, measured daily at the reef,Genin et al. 1995) and chlorophyll: carbon ratio of 60(Yahel et al. 1998). Using these values the estimatedannual import of phytoplanktonic carbon to the reef viarock surfaces fauna was at least 16 g C m�2 year�1.While this value is an order of magnitude lower thanthose recorded over soft coral-dominated reefs (Yahelet al. 1998; Fabricius and Dommisse 2000), it is com-parable to values reported for oligotrophic barrier reefsin Australia (4–20 g C m�2 yearA1, Ayukai 1995).
In contrast to the reports of nutrient release in coralreef rock cavities (Gast et al. 1998; Richter and Wunsch1999), ammonium regeneration within the untreatedrock tanks was marginal, and no enhancement of ben-thic algae growth could be detected. Dense populationsof epi- and endolithic algae were present in all the rocksexamined. Such algal population is usually absent ordiminished in reef cavities (Richter et al. 2001). It istherefore possible that the majority of the remineralizednitrogen (and phosphorus) was consumed by auto-trophic and microbial communities on the untreatedrocks and could not be available to the experimentalplastic tubes located few centimeters from the rocks.
In areal terms, exposed rock is the second mostimportant niche in coral reefs worldwide (Hodgson andLiebeler 2002). Although the presence of a diverse
Fig. 5 An example of thefaunistic composition in sub-samples (one to three) takenfrom the untreated rock surfaceof tanks 7(A), 8(B), and 10(C)used in the August 2000experiment. Note the highintra-rock variability
infauna in these rocks had been known for several dec-ades (reviewed by Hutchings 1983; Holmes et al. 2000),only little attention had been devoted to its ecologicalfunction. This study demonstrates the potential impor-tance of rock surface fauna in importing allochtoneousnutrients (as phytoplankton) into the reef. Furtherstudies are required to establish the role of different taxaand the overall contribution of reef rocks fauna to bio-geochemical fluxes in coral reefs.
Acknowledgements We thank M. Ohavia, R. Motro, S. Inbidner,D. Weil, S. Bitton, I. Handel, D. Fuchs, I. Linchevski, G. Niv, Y.Gesser, Y. Weiss, I. Ginzburg, E. Mahlab, M. Shitrit, I. Shub, andR. Schindler for their help in the field work; E. David, D. Golan,and A. Post for their help with the ammonia analysis; E. Avilev forEnglish proofing; and the IUI staff for logistic support. We aregrateful to Dr. N. Ben-Eliahu for the identification of polychaetesand to E. Halicz for the identification of foraminifera. This studywas founded by the US-Israel Binational Science Foundation(BSF).
References
Ayukai T (1995) Retention of phytoplankton and planktonic mi-crobes on coral-reefs within the Great-Barrier-Reef, Australia.Coral Reefs 14:141–147
Bonem RM (1977) Comparison of cavities and cryptic biota inmodern reefs with those developed in lower Pennsylvanian(Morrowan) Bioherms. In: Proceedings of Third InternationalCoral Reef Symposium, pp 75–80
Caron DA, Dam HG, Kremer P, Lessard EJ, Madin LP, MaloneTC, Napp JM, Peele ER, Roman MR, Youngbluth MJ (1995)The contribution of microorganisms to particulate carbon andnitrogen in surface waters of the Sargasso Sea near Bermuda.Deep-Sea Res I 42:943–972
Clarke KR (1993) Nonparametric multivariate analyses of changesin community structure. Aust J Ecol 18:117–143
David E (2003) Vertical distribution and fluxes of dissolved inor-ganic nitrogen and phytoplankton in the northern Gulf ofAqaba (Elat). MSc Thesis, The Hebrew University of Jerusalem
Edinger EN, Limmon GV, Jompa J, Widjatmoko W, Heikoop JM,Risk MJ (2000) Normal coral growth rates on dying reefs: arecoral growth rates good indicators of reef health? Mar PollutBull 40:404–425
Fabricius KE, Benayahu Y, Genin A (1995) Herbivory in asym-biotic soft corals. Science 268:90–92
Fabricius KE, Yahel G, Genin A (1998) In situ depletion of phy-toplankton by an azooxanthellate soft coral. Limnol Oceanogr43:354–356
Fabricius KE, Dommisse M (2000) Depletion of suspended par-ticulate matter over coastal reef communities dominated byzooxanthellate soft corals. Mar Ecol Prog Ser 196:157–167
Ferrier-Pages C, Gattuso JP (1998) Biomass, production andgrazing rates of pico- and nanoplankton in coral reef waters(Miyako Island, Japan). Microb Ecol 35:46–57
Gast GJ, Wiegman S, Wieringa E, van Duyl FC, Bak RPM (1998)Bacteria in coral reef water types: removal of cells, stimulationof growth and mineralization. Mar Ecol Prog Ser 167:37–45
Genin A, Lazar B, Brenner S (1995) Vertical mixing and coraldeath in the Red-Sea following the eruption of Mount-Pina-tubo. Nature 377:507–510
Genin A, Yahel G, Reidenbach MA, Monismith SG, Koseff JR(2002) Intense benthic grazing on phytoplankton in coral reefsrevealed using the control volume approach. Oceanography15:90–96
Gischler E (1997) Cavity dwellers (coelobites) beneath coral rubblein the Florida Reef Tract. Bull Mar Sci 61:467–484
Haberstroh PR, Sansone FJ (1999) Reef framework diagenesisacross wave flushed oxic-suboxic-anoxic transition zones. CoralReefs 18:229–240
Hodgson G, Liebeler L (2002) The global coral reef crisis: trendsand solutions, 1997–2001. Report No. 1, Reef Check Founda-tion, UCLA
Holmes RM, Aminot A, Kerouel R, Hooker BA, Peterson BJ(1999) A simple and precise method for measuring ammoniumin marine and freshwater ecosystemss. Can J Fish Aquat Sci56:1801–1808
Holmes KE, Edinger EN, Hariyadi, Limmon GV, Risk MJ (2000)Bioerosion of live massive corals and branching coral rubble onIndonesian coral reefs. Mar Pollut Bull 40:606–617
Huettel M, Rusch A (2000) Transport and degradation of phyto-plankton in permeable sediment. Limnol Oceanogr 45:534–549
Hutchings PA (1978) Non colonial cryptofauna. In: Stoddart DR,Johannes RE (eds) Coral reefs: research methods. UNESCO,Paris, pp 251–263
Hutchings PA (1983) Cryptofaunal communities of coral reefs. In:Barnes DJ (ed) Perspectives in coral reefs. AIMS, Townsville,pp 200–208
Hutchings PA, Kiene WE, Cunningham RB, Donnelly C (1992)Spatial and temporal patterns of non-colonial boring organisms(Polychaetes, Sipunculans and Bivalve Mollusks) in porites atLizard Island, Great-Barrier-Reef. Coral Reefs 11:23–31
Kiene WE, Hutchings PA (1994) Bioerosion experiments at Lizard-Island, Great-Barrier-Reef. Coral Reefs 13:91–98
Lindell D, Post AF (1995) Ultraphytoplankton succession is trig-gered by deep winter mixing in the Gulf-of-Aqaba (Eilat), Red-Sea. Limnol Oceanogr 40:1130–1141
Loret P, Le Gall S, Dupuy C, Blanchot J, Pastoureaud A, DelesalleB, Caisey X, Jonquieres G (2000) Heterotrophic protists as atrophic link between picocyanobacteria and the pearl oysterPinctada margaritifera in the Takapoto lagoon (TuamotuArchipelago, French Polynesia). Aqut Microb Ecol 22:215–226
Marie D, Brussaard CPD, Partensky F, Vaulot D (1999) Flowcytometric analysis of phytoplankton, bacteria and viruses. In:Robinson JP (ed) Current protocols in cytometry. Wiley, Inc.,New York, NY, p 11.11.11–11.11.15
Peyrot-Clausade M (1977) Settlement of an artificial biota by ancoral reef cryptofauna. In: Proceedings of Third InternationalCoral Reef Symposium, pp 101–103
Pile AJ (1997) Finding Reiswig’s missing carbon: quantification ofsponge feeding using dual-beam flow cytometry. In: Proceed-ings of Eighth International Coral Reef Symposium, pp 1403–1410
Rasheed M, Badran MI, Richter C, Huettel M (2002) Effect of reefframework and bottom sediment on nutrient enrichment in acoral reef of the Gulf of Aqaba, Red Sea. Mar Ecol Prog Ser239:277–285
Ribes M, Coma R, Atkinson MJ, Kinzie RA (2003) Particle re-moval by coral reef communities: picoplankton is a majorsource of nitrogen. Mar Ecol Prog Ser 257:13–23
Ribes M, Coma R, Atkinson MJ, Kinzie RA (2005) Sponges andascidians control removal of particulate organic nitrogen fromcoral reef water. Limnol Oceanogr 50:1480–1489
Richter C, Wunsch M (1999) Cavity-dwelling suspension feeders incoral reefs - a new link in reef trophodynamics. Mar Ecol ProgSer 188:105–116
Richter C, Wunsch M, Rasheed M, Kotter I, Badran MI (2001)Endoscopic exploration of Red Sea coral reefs reveals densepopulations of cavity-dwelling sponges. Nature 413:726–730
Riisgard HU (1998) Filter feeding and plankton dynamics in aDanish fjord: a review of the importance of flow, mixing anddensity-driven circulation. J Environ Manage 53:195–207
Riisgard HU (2001) On measurement of filtration rates in bival-ves—the stony road to reliable data: review and interpretation.Mar Ecol Prog Ser 211:275–291
Riisgard HU, Seerup DF, Jensen MH, Glob E, Larsen PS (2004)Grazing impact of filter-feeding zoobenthos in a Danish fjord. JExp Mar Biol Ecol 307:261–271
Thomas FIM, Atkinson MJ (1997) Ammonium uptake by coralreefs: Effects of water velocity and surface roughness on masstransfer. Limnol Oceanogr 42:81–88
van Duyl FC, Gast GJ (2001) Linkage of small-scale spatial varia-tions in DOC, inorganic nutrients and bacterioplankton growthwith different coral reefwater types.AquatMicrobEcol 24:17–26
van Duyl FC, Gast GJ, Steinhoff W, Kloff S, Veldhuis MJW, BakRPM (2002) Factors influencing the short-term variation inphytoplankton composition and biomass in coral reef waters.Coral Reefs 21:293–306
Vasseur P (1977) Cryptic sessile communities in various coral for-mation on reef flats in the vicinity of Tulear (Madagascar). In:Proceedings of Third International Coral Reef Symposium, pp95–100
Wickham S, Gieseke A, Berninger UG (2000) Benthic ciliateidentification and enumeration: an improved methodology andits application. Aquat Microb Ecol 22:79–91
Wildish DJ, Kristmanson D (1997) Benthic suspension feeders andflow Cambridge University Press, Cambridge
Yahel G, Post AF, Fabricius K, Marie D, Vaulot D, Genin A(1998) Phytoplankton distribution and grazing near coral reefs.Limnol Oceanogr 43:551–563
Yahel G, Sharp JH, Marie D, Hase C, Genin A (2003) In situfeeding and element removal in the symbiont-bearing spongeTheonella swinhoei: bulk DOC is the major source for carbon.Limnol Oceanogr 48:141–149
Yahel R, Yahel G, Genin A (2002) Daily cycles of suspended sandat coral reefs: a biological control. Limnol Oceanogr 47:1071–1083
Yukihira H, Klumpp DW, Lucas JS (1999) Feeding adaptations ofthe pearl oysters Pinctada margaritifera and P-maxima tovariations in natural particulates. Mar Ecol Prog Ser 182:161–173