Numerical Modelling of Hydrodynamics and Sedimentation in ...

ARTICLE
Received 24 Feb 2013 | Accepted 3 May 2013 | Published 4 Jun 2013
Human deforestation outweighs future climatechange impacts of sedimentation on coral reefsJoseph Maina1,2, Hans de Moel3, Jens Zinke4, Joshua Madin1, Tim McClanahan2 & Jan E. Vermaat5
Near-shore coral reef systems are experiencing increased sediment supply due to conversion
of forests to other land uses. Counteracting increased sediment loads requires an
understanding of the relationship between forest cover and sediment supply, and how this
relationship might change in the future. Here we study this relationship by simulating river
flow and sediment supply in four watersheds that are adjacent to Madagascar’s major coral
reef ecosystems for a range of future climate change projections and land-use change
scenarios. We show that by 2090, all four watersheds are predicted to experience
temperature increases and/or precipitation declines that, when combined, result in decreases
in river flow and sediment load. However, these climate change-driven declines are
outweighed by the impact of deforestation. Consequently, our analyses suggest that regional
land-use management is more important than mediating climate change for influencing
sedimentation of Malagasy coral reefs.
DOI: 10.1038/ncomms2986 OPEN
1 Department of Biological Sciences, Macquarie University, Sydney, New South Wales 2109, Australia. 2 Marine Programs, Wildlife Conservation Society,Bronx, New York 10460, USA. 3 Faculty of Earth and Life Sciences, Institute of Environmental Studies, VU University Amsterdam, Amsterdam, TheNetherlands. 4 School of Earth and Environment, Australian Institute of Marine Science, UWA Oceans Institute, University of Western Australia, Perth,Western Australia, Australia. 5 Faculty of Earth and Life Sciences, Section of Earth Sciences and Economics, VU University Amsterdam, Amsterdam,The Netherlands. Correspondence and requests for materials should be addressed to J.M. (email: [email protected]).
NATURE COMMUNICATIONS | 4:1986 | DOI: 10.1038/ncomms2986 | www.nature.com/naturecommunications 1
& 2013 Macmillan Publishers Limited. All rights reserved.

Madagascar is a global biodiversity hotspot and istherefore of high conservation priority1,2. Biologicallyrich forests have experienced landscape-level
conversion and deforestation primarily from anthropogenicagents, with B90% loss of original forest cover over the lastB2000 years since human arrival3,4. Despite attempts atprotection that date back two centuries and investment ofhundreds of millions of dollars, forest conservation goals appearto remain elusive, and forest destruction continues1,5. Changes invegetation cover and soil have caused disruption of water flowand soils in drainage basins’ hydrological cycles, potentiallyundermining the resilience of physically and biologically linkedecosystems5–7. Meanwhile, the conservation of coral reefs in ahigh-carbon dioxide world in Madagascar and in other tropicalcountries requires as one of the key strategy outcomes a reductionin the load of terrestrial sediment, nutrients and otherpollutants8–10. Therefore, quantifying hydrological changes ofthese coastal catchments under different climate and land use-land cover change (LULCC) scenarios will provide a basis forunderstanding and predicting the influence of land-use onsedimentation of near-shore marine areas, and subsequentlyhelp to identify land-use practices that will reduce the impacts11.
Pronounced climate change and LULCC represent the twoprimary challenges that most ecosystems will face this century12.These changes will directly affect the hydrology of the landsurface through changes in evapotranspiration and ground
water13,14 and the amount of sediment and fresh waterdischarged into marine coastal zones6. Predicting the impact ofclimate change and LULCC on the spatial and temporal fluvialdynamics in the tropics is complicated because of poor dataavailability, strong seasonality and high-intensity events such asEl Nino-Southern Oscillation15,16. Therefore, identifying andseparating the human impacts on fluvial dynamics relative tobackground processes and natural variability is challenging.
Using a hydrological and sedimentation modeling frameworkdeveloped for Madagascar6, we compare both the effects ofLULCC and projected climate change on river discharge andsediment supply from four Malagasy catchments (the south-west,west, north-west and north-east; Fig. 1). Malagasy watershedsrepresent socio-ecologically sensitive coastal catchments, andbecause latitudinal range and island aspect explain a large amountof environmental variability, they capture characteristicallydifferent climatic zones, and therefore represent a range ofenvironments found throughout the global tropics17. Thecatchments are adjacent to four main regions supportingMalagasy coral reefs, and the resource use in these watershedsalong with fishing are key components of the coral reef social-ecological system dynamics in Madagascar and throughout thetropics18,19. Using our integrated framework, we find that anincrease in air temperature and a decline in precipitation will leadto a general decline in river flow and sediment supply to coral reefareas. However, these climate change-driven declines are
45° 0'0" E
25°
0'0"
S20
° 0'
0" S
15° 0
'0"
S
50° 0'0" EN
D
A
BC
LegendNortheast
Northwest
West
Southwest
Coral reefs
500250
Km
1250
Figure 1 | Map of Madagascar showing coral reef areas and the four studied watersheds. Images showing (a and b) deforestation (images courtesy of X.
Vincke) and (c and d) reef sedimentation (panel c image courtesy of X. Vincke, panel d image courtesy of O. Raynaud). Images are shown with the
corresponding letters on the map indicating approximate location of image capture.
ARTICLE NATURE COMMUNICATIONS | DOI: 10.1038/ncomms2986
2 NATURE COMMUNICATIONS | 4:1986 | DOI: 10.1038/ncomms2986 | www.nature.com/naturecommunications
& 2013 Macmillan Publishers Limited. All rights reserved.
outweighed by the impact of deforestation. To date, removal ofnatural forest has increased sediment supply up to five-fold sincehuman settlement. Sediment supply is projected to increasefurther by 54–64% if 10–50% of natural forest is removed, butcould be reduced by 19–68% if 10–50% of natural forest isrestored. All in all, we demonstrate an integrated terrestrial–marine framework for informing decisions concerning sedimentsupply to coral reefs.
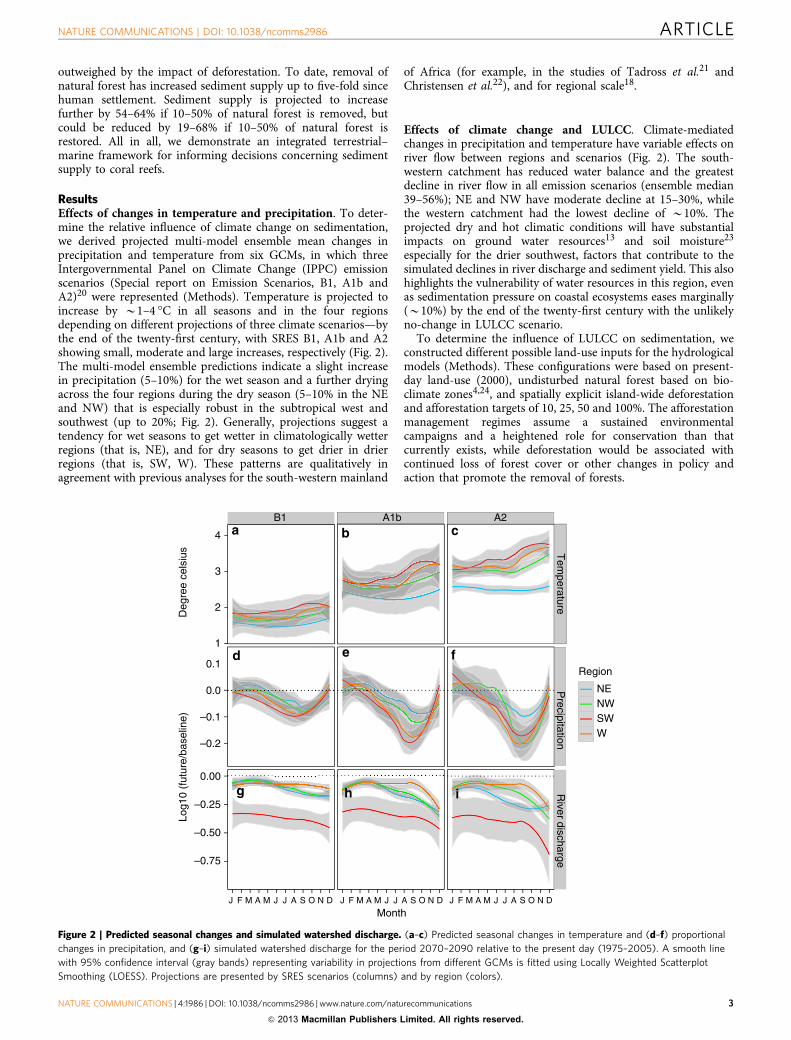
ResultsEffects of changes in temperature and precipitation. To deter-mine the relative influence of climate change on sedimentation,we derived projected multi-model ensemble mean changes inprecipitation and temperature from six GCMs, in which threeIntergovernmental Panel on Climate Change (IPPC) emissionscenarios (Special report on Emission Scenarios, B1, A1b andA2)20 were represented (Methods). Temperature is projected toincrease by B1–4 �C in all seasons and in the four regionsdepending on different projections of three climate scenarios—bythe end of the twenty-first century, with SRES B1, A1b and A2showing small, moderate and large increases, respectively (Fig. 2).The multi-model ensemble predictions indicate a slight increasein precipitation (5–10%) for the wet season and a further dryingacross the four regions during the dry season (5–10% in the NEand NW) that is especially robust in the subtropical west andsouthwest (up to 20%; Fig. 2). Generally, projections suggest atendency for wet seasons to get wetter in climatologically wetterregions (that is, NE), and for dry seasons to get drier in drierregions (that is, SW, W). These patterns are qualitatively inagreement with previous analyses for the south-western mainland
of Africa (for example, in the studies of Tadross et al.21 andChristensen et al.22), and for regional scale18.
Effects of climate change and LULCC. Climate-mediatedchanges in precipitation and temperature have variable effects onriver flow between regions and scenarios (Fig. 2). The south-western catchment has reduced water balance and the greatestdecline in river flow in all emission scenarios (ensemble median39–56%); NE and NW have moderate decline at 15–30%, whilethe western catchment had the lowest decline of B10%. Theprojected dry and hot climatic conditions will have substantialimpacts on ground water resources13 and soil moisture23
especially for the drier southwest, factors that contribute to thesimulated declines in river discharge and sediment yield. This alsohighlights the vulnerability of water resources in this region, evenas sedimentation pressure on coastal ecosystems eases marginally(B10%) by the end of the twenty-first century with the unlikelyno-change in LULCC scenario.
To determine the influence of LULCC on sedimentation, weconstructed different possible land-use inputs for the hydrologicalmodels (Methods). These configurations were based on present-day land-use (2000), undisturbed natural forest based on bio-climate zones4,24, and spatially explicit island-wide deforestationand afforestation targets of 10, 25, 50 and 100%. The afforestationmanagement regimes assume a sustained environmentalcampaigns and a heightened role for conservation than thatcurrently exists, while deforestation would be associated withcontinued loss of forest cover or other changes in policy andaction that promote the removal of forests.
B1 A1b
–0.75
–0.50
–0.25
0.00
–0.2
–0.1
0.0
0.1
Tem
peratureP
recipitationR
iver discharge
J F M A M J J A S O N D J F M A M J J A S O N D J F M A M J J A S O N D
Month
Region
NENWSWW
1
2
3
4
Deg
ree
cels
ius
Log1
0 (f
utur
e/ba
selin
e)
A2
Figure 2 | Predicted seasonal changes and simulated watershed discharge. (a–c) Predicted seasonal changes in temperature and (d–f) proportional
changes in precipitation, and (g–i) simulated watershed discharge for the period 2070–2090 relative to the present day (1975–2005). A smooth line
with 95% confidence interval (gray bands) representing variability in projections from different GCMs is fitted using Locally Weighted Scatterplot
Smoothing (LOESS). Projections are presented by SRES scenarios (columns) and by region (colors).
NATURE COMMUNICATIONS | DOI: 10.1038/ncomms2986 ARTICLE
NATURE COMMUNICATIONS | 4:1986 | DOI: 10.1038/ncomms2986 | www.nature.com/naturecommunications 3
& 2013 Macmillan Publishers Limited. All rights reserved.

The impacts of LULCC on sediment yields demonstrate theprofound influence of human actions on tropical hydrology16,and the potential of management measures to curb deforestationand to increase forest coverage. On one extreme, afforestation ofall areas to natural conditions would decrease sediment yield inall the four regions by 75–80% (Fig. 3; Table 1), while on theother extreme, forest conversion in all areas would increasesediment yield by up to five-fold in the NE and two-fold in theother regions (Fig. 3; Table 1).
Simulated changes in sediment yield when plotted againstchange in forest cover for each region indicates regionally specifictrajectories owing to the bio-climatic differences and thedisproportionate effects of forest manipulation policies on forestcover (Fig. 3). Sediment changes are not dependent on thedifferent predictions of the three climate scenarios. In the NE andNW regions, 25% island-wide afforestation scenario is estimatedto restore 11% and 25% forest cover respectively, while a 50%scenario would restore 41 and 56%, respectively. These afforesta-tion targets for NE and NW would lead to substantial declines(B60–80%) in the mean annual sediment yield.
The NE is one of the most hydrologically sensitive watersheds,where small changes in forest cover are projected to produce large
changes in sediment yield. The NE region is still covered byrelatively large areas of low-lying tropical forests, albeitfragmented, as a result of a low population density4. Therelatively high forest coverage in this region relative to otherregions is also consistent with our forest manipulation models(Fig. 3), which predict low susceptibility to deforestation due tothe steep terrain and less-developed infrastructure. Sediment yieldchanges along the forest cover gradient for the SW and W regionsdepict nearly identical response behavior patterns, perhaps owingto relatively similar climate and natural vegetation of mostly dryforest areas with less soil-binding vegetation25. In this region, 25%island-scale forest conversion (removes B44 and 46% of forestcover in SW and W respectively) leads to up to two-fold increasein sediment yield. It appears that at this level of deforestation,topsoils are completely depleted with sediment yield reaching asaturation point, which does not change with further decreases inforest cover. For the SW, 10 and 25% island-scale afforestationtargets would not have much impact on sediment yield, as thisincreases the forest cover in the watershed by only 4 and 12%,respectively. Significant sediment declines in the SW would beachieved with implementation of 50% island-scale afforestationtarget, which would add 29% of forested area and consequently
0.5
1.0
2.0
3.04.05.06.0
0.5
1.0
2.0
3.04.05.06.0
–100 –7
5–5
0–2
5 0 25 50 75 100
–100 –7
5–5
0–2
5 0 25 50 75 100
Change in forest cover (%)
Fut
ure/
base
line
ratio
(lo
g10
scal
e)
Climate scenatio
A1b
A2
B1
Present day
Land use scenario
Biome
50% Afforest
25% Afforest
10% Afforest
Baseline (2000 LU)
10% Deforest
25% Deforest
50% Deforest
100% Deforest
NE
W
NW
SWc d
a b
Figure 3 | Predicted changes in sediment yield as a function of forest cover change. The panels are divided by region: (a) North-east, (b) North-west,
(c) South-west, and (d) West. The mean predicted changes in sediment yields for each climate scenario (shapes) are presented for each region for
the period 2070–2090 relative to the present day (1975–2005), against varying forest cover changes based on the different LULCC scenarios
(color scale). A generalized linear model (GAM) smoother line for each climate scenario and the associated 95% confidence bands are displayed
as blue lines and gray shades respectively.
ARTICLE NATURE COMMUNICATIONS | DOI: 10.1038/ncomms2986
4 NATURE COMMUNICATIONS | 4:1986 | DOI: 10.1038/ncomms2986 | www.nature.com/naturecommunications
& 2013 Macmillan Publishers Limited. All rights reserved.

reduce sediment yield by B50%. Similarly in the west, anestimated 60% decline in sediment yield is achieved with anisland-scale afforestation target of 50%.
DiscussionModel results provide insights into the effects of forest conversionin the face of rising temperatures under climate change as well asafforestation policies and goals appropriate for the respectiveregions. Although climate change may be expected to exacerbatethese challenges through forest diebacks23,26,27, forest conversionremains the principal contributor to increased sedimentationof the near-shore marine environments. Future industrialdevelopment, such as dredging activities (currently not a
concern), could locally exacerbate the effects of forestconversion28,29. Increased sedimentation and poor water qualitycompromises resistance of corals to thermal stress and theirpotential to recover from bleaching events, resulting in a globaldeterioration of reef structure and ability of these ecosystems tosustain their characteristic complex ecological interactions30,31.As it is unlikely that rising global average temperature willstabilize at 2 �C above a pre-industrial levels32,33, it is foreseenthat unprecedented loss of species and widespread bleaching is alikely scenario32,34,35. Therefore local-scale mitigation throughcurbing sediment pollution has been promoted as particularlyrelevant for many tropical coastal communities who dependdirectly on marine resources for their livelihood. It is animportant realization that the management of land-use offers apractical solution to reducing sedimentation and contributing tothe resilience and adaptability of coral reefs facing both direct andindirect threats of rising CO2 (ref. 20).
The Malagasy and other governments are experiencingincreased interests from the broader donor, environmental andconservation communities to reverse deforestation and maintainthe hydrological and biological functions of forests5. However,forest conservation in Madagascar faces several challenges andcompeting interests that create a tension between resourceallocation and conservation, such as increasing population,demand for agricultural land, and mineral exploration andmining36. Further, there are technical challenges that includemonitoring forests dynamics and predicting how forests willrespond to future climate change16 in order to assess thesustainability and social equity of different managementregimes37. For instance, forest diebacks due to drought arelikely to hamper reforestation and lead to further losses ofagricultural productivity and forest cover23,26,38, especially in thedrier regions of W and SW. These challenges are monumental butare achievable with broader international support along with thegovernment and community’s good will and engagement. Finally,if afforestation were adopted and applied comprehensively andconsistently within a broader management policy and actionsframework, it offers promise for sustainable environmentaloutcomes in the face of climate change in one of the world’smost important biodiversity hotspots.
MethodsModels. We used two existing models (STREAM39 and N-SPECT40 that havebeen developed for Madagascar6 that utilize present-day climate and land-use data(1950–2006) to estimate 57-year time series of river discharge (m3 s� 1) andsediment yield (tonnes per year)6. In these calibrated and validated models, wesubstituted present-day climate and land-use data with future climate projectionsand LULCC scenarios, in order to simulate river discharge and sediment yield withnew climate and land-use data forcing.
We used the STREAM (Spatial Tools for River Basins, Environment andAnalysis of Management options)-distributed hydrological model to simulatemonthly river flow35. STREAM simulates the water balance for each grid using alimited number of parameters, including the spatial-temporal precipitation andtemperature trends, elevation, land-cover and soil water storage capacity. STREAMcan provide several outputs including, river flow maps for selected x–y points in thewatershed(s) being simulated, or as spatial maps of river flow per time step.N-SPECT36 (Non-Point Source Pollution and Erosion Comparison Tool),developed by National Oceanic and Atmospheric Administration (NOAA), wasused to calculate sediment yield per unit area. N-SPECT combines data onelevation, slope, soils, precipitation and land cover to derive estimates of runoff,erosion and pollutant sources (nitrogen, phosphorous and suspended solids),including estimates of sediment and pollutant accumulation in stream and rivernetworks. Erosion rates and sediment loads are calculated using the RevisedUniversal Soil Loss Equation (RUSLE) and Modified Universal Soil LossEquation (MUSLE).
Climate change scenarios. The STREAM model is calibrated6 using temperatureand precipitation monthly time series 55-km spatial resolution data (CRU version3.1) (ref. 41). To process the future climate data for the hydrological model’s input,first we extracted 31-year baseline period (1975–2005) from the present-day
Table 1 | Mean sediment change expressed as fractionalchange relative to the current estimates based on the 2000land-use and present-day climate.
LULCCClimatescenario NE NW SW W
Biome B1 0.27 0.21 0.18 0.27A1B 0.26 0.21 0.19 0.27A2 0.25 0.21 0.19 0.27Present day 0.27 0.22 0.20 0.28
50% Afforest B1 0.26 0.23 0.51 0.36A1B 0.27 0.23 0.53 0.39A2 0.26 0.22 0.53 0.37Present day 0.28 0.28 0.55 0.41
25% Afforest B1 0.32 0.36 0.83 0.68A1B 0.33 0.37 0.86 0.73A2 0.32 0.35 0.87 0.71Present day 0.34 0.38 0.90 0.72
10% Afforest B1 0.41 0.51 1.25 1.08A1B 0.41 0.49 1.23 1.07A2 0.43 0.54 1.32 1.17Present day 0.48 0.55 1.32 1.13
Baseline (2000 land use) B1 0.98 0.97 0.92 0.96A1B 0.95 0.93 0.93 0.97A2 0.91 0.94 0.93 0.97Present day 3.69 4.49 5.09 3.53
10% Deforest B1 1.10 1.30 1.73 1.77A1B 1.12 1.26 1.72 1.77A2 1.10 1.26 1.78 1.81Present day 1.16 1.36 1.89 1.86
25% Deforest B1 1.22 1.35 1.76 1.80A1B 1.17 1.30 1.79 1.81A2 1.14 1.31 1.79 1.82Present day 1.21 1.39 1.91 1.87
50% Deforest B1 1.36 1.42 1.81 1.83A1B 1.32 1.37 1.84 1.84A2 1.27 1.38 1.83 1.84Present day 1.38 1.47 1.95 1.88
100% Deforest B1 5.04 2.14 1.69 1.83A1B 4.91 2.05 1.71 1.84A2 4.68 2.07 1.71 1.85Present day 5.45 2.41 2.05 2.03
The s.d. associated with the means ranges between 0.00–0.07. Sediment load fractionalchanges for the current estimates (that is, 2000 land use and present-day climate) are relativeto the natural conditions, that is, the bio-climate map or biome.
NATURE COMMUNICATIONS | DOI: 10.1038/ncomms2986 ARTICLE
NATURE COMMUNICATIONS | 4:1986 | DOI: 10.1038/ncomms2986 | www.nature.com/naturecommunications 5
& 2013 Macmillan Publishers Limited. All rights reserved.

climate data and computed averages for each month (that is, monthly climatology)6.Second, future precipitation and temperature data based on six GCM’s with threeSRES scenarios represented (that is, A1b, A2 and B1, corresponding to 550, 700 and850 p.p.m. atmospheric carbon dioxide in 2100, respectively) were obtained fromWorld Climate Research Programme (WCRP) Coupled Model Inter-comparisonProject (CMIP3) multi-model data set’s archives (http://www-pcmdi.llnl.gov/projects/cmip/index.php). Finally, we applied a change-over-or time or delta-method42 to downscale the GCM projections to the present-day spatial resolution.In this method, from each of the individual time series (2000–2100), we selected afuture 31-year period (2065–2095) from which we calculated 31-year runningaverages for each month, for grid cells intersecting the four Malagasy watershedsadjacent important coral reef areas (that is, north-east, north-west, west and south-west) (Fig. 1). Using the temperature baseline and future monthly climatologies, wecomputed anomalies or change maps for each month in the time series, as theabsolute difference between future and present-day values. Similarly, we expressedprecipitation as fractional changes in monthly mean precipitation, by dividing thefuture monthly climatology by the baseline monthly climatology. These changes inclimate and precipitation were then applied to the present-day climate time series,to represent future climate at a relatively higher resolution.
Land-use scenarios. To investigate the relative influence of forest cover onhydrology, we constructed nine LULCC scenarios as follows: (i) present-day landuse, based on a land-use map for year 2000, which was developed from multi-temporal 1998–2001 satellite data4; (ii) completely forested or undisturbed,represented by the vegetation bio-climate map24; (iii–viii) incrementaldeforestation and afforestation targets (that is, 10, 25 and 50%), based on land-usechange simulation, and (ix) completely deforested. The present-day land-use mapis a combination of a vegetation distribution map distinguishing forested and non-forested areas4, and the Africover map for 2006 from the European Space Agencyto fill in the non-forest cells. To simulate land-use change, we defined spatiallyexplicit alternative futures that may result from future land management policiesand socioeconomic drivers. Using present-day land use as the baseline, land-usechanges for deforestation and afforestation targets at country level were simulatedbased on the slope and distance to roads.
For the afforestation and deforestation of cells, suitability for each scenario wascomputed for each cell, based on the slope and proximity to roads. For the 10%deforestation scenario, 10% of the forested cells with the highest suitability fordeforestation (low slope and short distance to roads) in the whole of Madagascarwere deforested. Note that this means that deforestation percentages in the fourcatchments considered in this study are therefore not necessarily the same asMadagascar as a whole. For afforestation, the reverse has been done. The 10% (or25 or 50%, depending on the scenario) of the non-forest cells with the highestsuitability to be forest (that is, high slope; far from roads) were transformed intoforest cells. Again, as the 10% afforestation scenario refers to 10% in the whole ofMadagascar, percentages in the individual catchments may differ. STREAM utilizescrop factors maps (that is, coefficients of evapotranspiration), for determiningpotential and actual evapotranspiration35. Crop factors based on land-covercharacteristics are therefore derived using land-cover information. The land-covermaps were re-classified to the crop factor maps for use in STREAM, using aweighted average crop factor of non-forest use for the deforested cells.
Rainfall erosivity. Rainfall erosivity is a measure for the erosive force of rainfall,and is a required input of RUSLE-based models including N-SPECT. Often, thelarge-scale mapping in data-poor regions is based on interpolation of erosivityvalues derived from rain-gauge data38. A few indices have been used to estimateerosivity, including the R-factor43, the Fournier Index (FI) and the modifiedFournier Index (MFI)38. MFI when used with the monthly satellite-basedprecipitation was found to provide good spatial estimates of annual erosivity44.Annual spatial maps of MFI were computed for 1961–2006 (ref. 6).
Soil data. Soil data was downloaded from Version 1.1 of the Harmonized soildatabase of the world (FAO/IIASA/ISRIC/ISSCAS/JRC 2009). STREAM utilizes thewater-holding capacity of the soil as one of the input variables. The soil databasewas used in a reclassification procedure to develop the water-holding capacity mapfor input in STREAM35. N-SPECT utilizes the two variables derived from soilsdata: (i) hydrologic soil group (HSG’s)—soils are classified into four hydrologic soilgroup (A, B, C and D) to indicate the minimum rate of infiltration obtained forbare soil after prolonged wetting45. Using the soil types in the soil database, a soilhydrologic group map for Madagascar was derived using reclassification procedure;(ii) soil erodibility factor (K-Factor) represents soil’s susceptibility to erosion byrainstorms. It is an integrated average parameter based on several different erosionand hydrologic processes. K-factor is expressed as a function of sand, silt, clay andorganic carbon concentration, which were derived using reclassification proceduresusing the soil database. A low K-factor (B0.05–0.2) indicates a high resistance toerosion and a high K-factor (BZ0.4) indicates easily eroded soil. K was computedas described in ref. 6.
Elevation data. STREAM utilizes the flow direction map and the digital elevationmodel (DEM) maps as inputs. Hydrologically corrected DEM at 500 m resolution
maps were downloaded from hydroSHEDS’s website46. N-SPECT utilizes DEM asan input factor where slope steepness (S) and slope length (L) that are derived fromDEM are RUSLE parameters that adjusts erosion rates based on topography,assigning higher rates to longer or steeper slopes and lower rates to shorter orflatter ones45. N-SPECT also utilizes the DEM to delineate watersheds.
Model calibration and runs. STREAM model was developed using present-dayclimate and land-use for the entire island6. The STREAM model was programmedto output the average monthly river flow in m3 s-1 for selected locations, whichincluded outlets points of rivers, which drain each of the four regions (Fig.1).Observed data for monthly average river flows were taken from the RivDISdatabase (available at http://daac.ornl.gov/RIVDIS/rivdis.shtml)42. The period ofrecord varies widely from station to station. We selected the station with thelongest time series, Bevoay on River Mangoky (Global Runoff Data Centre StationNumber 00059), and used it to calibrate the STREAM model6. The performance ofthe model was tested at every stage using the Nash and Sutcliffe model efficiencycoefficient (NSE)43, and by taking the ratio of modeled to observed values. Tosimulate river discharge under present day and future climate, and under theLULCC scenarios, the respective climate and land-use data were substituted in thecalibrated STREAM model6.
N-SPECT tool was run for each year from 1975–2006, with annual MFI,precipitation, land cover (crop factors), DEM and soil as the input variables. Thisprovided with among other outputs, annual sediment yield per unit area in metrictonnes per year. To estimate sediment under GCM scenarios, relationships betweenpresent-day river flow (STREAM output) and present-day sediment load wereestablished using bivariate regressions. River flow was summarized for each year(mean, maximum and minimum) and regressions performed between each of thesestatistics and present-day sediment output. Annual maximum average river flowwas found to have a better fit with annual sediment yield than with annual averagesand annual minimum. The relationships found were then applied to estimatecorresponding future sediment.
References1. Hannah, L. et al. Participatory planning, scientific priorities, and landscape
conservation in Madagascar. Environ. Conserv. 25, 30 (1998).2. Myers, N., Mittermeier, R. A., Mittermeier, C. G., da Fonseca, G. A. & Kent, J.
Biodiversity hotspots for conservation priorities. Nature 403, 853–858 (2000).3. Green, G. M. & Sussman, R. W. Deforestation history of the eastern rain forests
of madagascar from satellite images. Science 248, 212–215 (1990).4. Harper, G. J., Steininger, M. K., Tucker, C. J., Juhn, D. & Hawkins, F. Fifty years
of deforestation and forest fragmentation in Madagascar. Environ. Conserv. 34,325–333 (2007).
5. Hannah, L. et al. Climate change adaptation for conservation in Madagascar.Biol. Lett. 4, 590–594 (2008).
6. Maina, J. et al. Linking coral river runoff proxies with climate variability,hydrology and land-use in Madagascar catchments. Mar. Pollut. Bull. 64,2047–2059 (2012).
7. Andrefouet, S. et al. Fifty years of changes in reef flat habitats of the GrandRecif of Toliara (SW Madagascar) and the impact of gleaning. Coral Reefs1–12, doi:10.1007/s00338-013-1026-0 (2013).
8. Rau, G. H., McLeod, E. L. & Hoegh-Guldberg, O. The need for new oceanconservation strategies in a high-carbon dioxide world. Nat. Clim. Change 2,720–724 (2012).
9. Game, E. T., Lipsett-Moore, G., Saxon, E., Peterson, N. & Sheppard, S.Incorporating climate change adaptation into national conservationassessments. Global Change Biol. 17, 3150–3160 (2011).
10. Klein, C. J. et al. Forest conservation delivers highly variable coral reefconservation outcomes. Ecol. Appl. 22, 1246–1256 (2012).
11. Richmond, R. H. et al. Watersheds and coral reefs: Conservation science, policy,and implementation. BioScience 57, 598–607 (2007).
12. Brook, B. W. Synergies between climate change, extinctions and invasivevertebrates. Wildlife Res. 35, 249–252 (2008).
13. Ferguson, G. & Gleeson, T. Vulnerability of coastal aquifers to groundwater useand climate change. Nat. Clim. Change 2, 342–345 (2012).
14. Douville, H., Ribes, A., Decharme, B., Alkama, R. & Sheffield, J. Anthropogenicinfluence on multidecadal changes in reconstructed global evapotranspiration.Nat. Clim. Change 3, 59–62 (2013).
15. Krishnaswamy, J., Halpin, P. N. & Richter, D. D. Dynamics of sedimentdischarge in relation to land-use and hydro-climatology in a humid tropicalwatershed in Costa Rica. J. Hydrol. 253, 91–109 (2001).
16. Wohl, E. et al. The hydrology of the humid tropics. Nat. Clim. Change 2,655–662 (2012).
17. McClanahan, T. R., Ateweberhan, M., Omukoto, J. & Pearson, L. Recentseawater temperature histories, status, and predictions for Madagascar’s coralreefs. Mar. Ecol. Prog. Ser. 380, 117–128 (2009).
18. Chou, C. et al. Increase in the range between wet and dry season precipitation.Nat. Geosci. 6, 263–267 (2013).
ARTICLE NATURE COMMUNICATIONS | DOI: 10.1038/ncomms2986
6 NATURE COMMUNICATIONS | 4:1986 | DOI: 10.1038/ncomms2986 | www.nature.com/naturecommunications
& 2013 Macmillan Publishers Limited. All rights reserved.
19. Cinner, J. E. et al. Vulnerability of coastal communities to key impacts ofclimate change on coral reef fisheries. Global Environ. Change 22, 12–20 (2012).
20. Nakicenovic, N. Greenhouse gas emissions scenarios. Technol. Forecast Soc. 65,149–166 (2000).
21. Tadross, M., Jack, C. & Hewitson, B. On RCM-based projections of changein southern African summer climate. Geophys. Res. Lett. 32, doi:10.1029/2005gl024460 (2005).
22. Christensen, J. H. & Hewitson, B. Regional Climate Projections. ClimateChange 2007: The Physical Science Basis 847–940 (2007).
23. Dai, A. Increasing drought under global warming in observations and models.Nat. Clim. Change 3, 52–58 (2013).
24. Schatz, G. E. et al. Conspectus of the vascular plants of Madagascar: ataxonomic and conservation electronic database. Biodiversity of African Plants10–17. (Kluwer Academic Publishers, The Netherlands, 1996).
25. Myers, N. Threatened biotas: ‘hot spots’ in tropical forests. Environmentalist 8,187–208 (1988).
26. Choat, B. et al. Global convergence in the vulnerability of forests to drought.Nature 491, 752-þ (2012).
27. Christidis, N., Stott, P. A., Hegerl, G. C. & Betts, R. A. The role of land usechange in the recent warming of daily extreme temperatures. Geophys. Res. Lett.40, 589–594 (2013).
28. Burke, L., Reytar, K., Spalding, M. & Perry, A. Reefs at Risk Revisited (WorldResources Institute, Washington, DC, 2011).
29. Erftemeijer, P. L. A., Riegl, B., Hoeksema, B. W. & Todd, P. A. Environmentalimpacts of dredging and other sediment disturbances on corals: a review. Mar.Pollut. Bull. 64, 1737–1765 (2012).
30. Wiedenmann, J. et al. Nutrient enrichment can increase the susceptibility ofreef corals to bleaching. Nat. Clim. Change 3, 160–164 (2013).
31. Wooldridge, S. A. Water quality and coral bleaching thresholds: formalising thelinkage for the inshore reefs of the Great Barrier Reef, Australia. Mar. Pollut.Bull. 58, 745–751 (2009).
32. Frieler, K. et al. Limiting global warming to 2[thinsp][deg]C is unlikely to savemost coral reefs. Nature Clim. Change 3, 165–170 (2013).
33. UNFCC. Establishment of an Ad Hoc Working Group on the Durban Platformfor Enhanced Action (UNFCC, 2011).
34. van Hooidonk, R., Maynard, J. A. & Planes, S. Temporary refugia forcoral reefs in a warming world. Nature Climate Change 3, 508–511 (2013).
35. Carpenter, K. E. et al. One-third of reef-building corals face elevatedextinction risk from climate change and local impacts. Science. 321, 560–563(2008).
36. Watson, J. E. M., Joseph, L. N. & Fuller, R. A. Mining and conservation:implications for Madagascar’s littoral forests. Conserv. Lett. 3, 286–287(2010).
37. McConnell, W. J. & Sweeney, S. P. Challenges of forest governance inMadagascar. Geogr. J. 171, 223–238 (2005).
38. Anderegg, W. R. L., Anderegg, L. D. L., Sherman, C. & Karp, D. S. Effects ofwidespread drought-induced aspen mortality on understory plants. Conserv.Biol. 26, 1082–1090 (2012).
39. Aerts, J. C. J. H., Kriek, M. & Schepel, M. STREAM (Spatial Tools for RiverBasins and Environment and Analysis of Management Options): ‘Set up and
requirements’. Phys. Chem. Earth B Hydrol. Oceans Atmos. 24, 591–595(1999).
40. Eslinger, D. L. et al. The Nonpoint-Source Pollution and Erosion ComparisonTool (NOAA Coastal Services Center, Charleston, South Carolina, 2005).
41. Mitchell, T. D. & Jones, P. D. An improved method of constructing a databaseof monthly climate observations and associated high-resolution grids. Int. J.Climatol. 25, 693–712 (2005).
42. Diaz-Nieto, J. & Wilby, R. L. A comparison of statistical downscaling andclimate change factor methods: Impacts on low flows in the River Thames,United Kingdom. Clim. Change. 69, 245–268 (2005).
43. Renard, K. G. & Freimund, J. R. Using monthly precipitation data toestimate the R-Factor in the revised USLE. J. Hydrol. 157, 287–306(1994).
44. Vrieling, A., Sterk, G. & de Jong, S. M. Satellite-based estimation of rainfallerosivity for Africa. J. Hydrol. 395, 235–241 (2010).
45. Nam, K., Kim, J. Y. & Oh, D. I. Effect of soil aggregation on the biodegradationof phenanthrene aged in soil. Environ. Pollut. 121, 147–151 (2003).
46. Lehner, B., Verdin, K. & Jarvis, A. New global hydrograhy derived fromspaceborne elevation data. Eos Transactions AGU 89, 93–94 (2008).
AcknowledgementsThe Macquarie University’s Higher Degree Research program provided a PhDscholarship to J. Maina. We are grateful for financial support from the Western IndianOcean Marine Science Association, through a Marine Science for Management grant(MASMA/CC/2010/02) to J.M., J.Z. and J.V. J.Z. was supported by an IOMRC UWA/AIMS/CSIRO postdoctoral fellowship. We thank Dr Linda Beaumont for comments onthe manuscript.
Author contributionsJ.Z, J.M., H.dM. and J.V. designed the study. J.M., H.dM., J.S.M. and J.V. generatedmodel outputs and conceived data interpretation. J.S.M. and T.M. contributed to designof land-use scenarios and choice of key study areas. TRM was supported by the John D.and Catherine T. MacArthur Foundation. All co-authors contributed to manuscriptwriting, performed model interpretations and discussions of the model scenarioimplications.
Additional informationCompeting financial interests: The authors declare no competing financial interests.
Reprints and permission information is available online at http://www.nature.com/reprintsandpermissions
How to cite this article: Maina, J. et al. Human deforestation outweighs future climatechange impacts of sedimentation on coral reefs. Nat. Commun. 4:1986 doi: 10.1038/ncomms2986 (2013).
This article is licensed under a Creative Commons Attribution 3.0Unported Licence. To view a copy of this licence visit http://
creativecommons.org/licenses/by/3.0/.
NATURE COMMUNICATIONS | DOI: 10.1038/ncomms2986 ARTICLE
NATURE COMMUNICATIONS | 4:1986 | DOI: 10.1038/ncomms2986 | www.nature.com/naturecommunications 7
& 2013 Macmillan Publishers Limited. All rights reserved.
Copyright © 2022 FDOKUMEN