
x ri sg wi ryh y gyx yv ev wsx wy sws - Purdue University ...
799
-
Upload
khangminh22 -
Category
Documents
-
view
0 -
download
0
Transcript of x ri sg wi ryh y gyx yv ev wsx wy sws - Purdue University ...
SYNTHETIC METHODS TO CONTROL ALUMINUM PROXIMITY
IN CHABAZITE ZEOLITES AND CONSEQUENCES FOR
ACID AND REDOX CATALYSIS
A Dissertation
Submitted to the Faculty
of
Purdue University
by
John R. Di Iorio
In Partial Fulllment of the
Requirements for the Degree
of
Doctor of Philosophy
December 2018
Purdue University
West Lafayette, Indiana

ii
iii
THE PURDUE UNIVERSITY GRADUATE SCHOOL
STATEMENT OF DISSERTATION APPROVAL
Dr. Rajamani Gounder, Chair
Davidson School of Chemical Engineering
Dr. Fabio H. Ribeiro
Davidson School of Chemical Engineering
Dr. Jerey Greeley
Davidson School of Chemical Engineering
Dr. Jerey T. Miller
Davidson School of Chemical Engineering
Dr. Corey Thompson
Department of Chemistry
Approved by:
Dr. John Morgan
Head of the School Graduate Program

iv
To my family. Whose endless support, optimism, and sacrices have enabled this
opportunity and shaped who I am today.

v
ACKNOWLEDGMENTS
To Raj Gounder, whose mentorship, patience, and wisdom has been invaluable
and has given me the condence to push myself beyond what I once thought was
achievable. Your passion for research and learning has provided an exceptional ex-
ample and has inuenced the way that I think as a teacher, scientist, and mentor.
Thank you for all of the encouragement and feedback, especially when my writing is
less than acceptable, that you have given me over these 5 years. This has been an
experience that I will be forever grateful to have been a part of. Specic acknowledg-
ments for technical contributions are made within each chapter. Here, I would like
to acknowledge all those who have helped shape my experience at Purdue and in life.
Yury Zvinevich, whose advice and friendship has allowed me to learn at the hands of
a instrumentation wizard and taught me how irreplaceable hands-on experience can
be. Thank you for everything you have helped me with and for everything that you
do for the catalysis research groups. This place would not be the same without you.
To all the elder members of the Fabio research group, including Drs. Mike Detweiler,
Atish Parekh, Kaiwalya Sabnis, Paul Dietrich, John Degenstein, and Zhenglong Li.
Thank you for your mentorship and friendship. To Dr. Jamie Harris, Dr. Sydney
Hollingshead, Dr. Vishrut Garg, and soon-to-be-Dr. Michael Cordon. I will always
cherish your friendship and I am glad to have been able to cross paths with you.
To Austin Tackaberry, Daniel Gonzalez, Sawyer Morgan, Ricardo Cogua, and Chris
Ioeger who worked with me as undergrad researchers. Thank you for your hard work
and willingness to learn. To all of the members of the Gounder and Ribeiro Research
groups, thank you for all of your feedback and discussions. It has been a privilege
to work with such great people and researchers. I would like to acknowledge my
family, who this dissertation is dedicated to. Thank you for all of your support and
vi
encouragement over the past 27+ years. I owe everything that I have accomplished
to you. Finally, I want to thank Ana Steen for always reminding me that, whether
you were aware of it or not, this journey isn't about content or composition, but in
the pleasure of living. And that happiness isn't about freezing and clinging to each
momentary pleasure, but in ensuring that one's life produces many future moments
to anticipate. Thank you for everything.

vii
TABLE OF CONTENTS
Page
LIST OF TABLES . . . . . . . . . . . . . . . . . . . . . . . . . . . . . . . . . . xvi
LIST OF FIGURES . . . . . . . . . . . . . . . . . . . . . . . . . . . . . . . . xxiii
ABSTRACT . . . . . . . . . . . . . . . . . . . . . . . . . . . . . . . . . . . . . lvii
1 INTRODUCTION . . . . . . . . . . . . . . . . . . . . . . . . . . . . . . . . 1
2 THE DYNAMIC NATUREOF BRØNSTED ACID SITES IN CU-ZEOLITESDURING NOX SELECTIVE CATALYTIC REDUCTION: QUANTIFICA-TION BY GAS-PHASE AMMONIA TITRATION . . . . . . . . . . . . . . 112.1 Introduction . . . . . . . . . . . . . . . . . . . . . . . . . . . . . . . . . 112.2 Experimental Methods . . . . . . . . . . . . . . . . . . . . . . . . . . . 13
2.2.1 Catalyst Synthesis and Preparation . . . . . . . . . . . . . . . . 132.2.2 Characterization of Catalyst Structure and Composition . . . . 152.2.3 Titration of Brønsted Acid Sites using Amines . . . . . . . . . . 15
2.3 Results and Discussion . . . . . . . . . . . . . . . . . . . . . . . . . . . 182.3.1 NH3 Titration of Brønsted Acid Sites in H-Zeolites after Ox-
idative Treatments . . . . . . . . . . . . . . . . . . . . . . . . . 182.3.2 NH3 Titration of Brønsted Acid Sites in Cu-Zeolites after Ox-
idative Treatments . . . . . . . . . . . . . . . . . . . . . . . . . 222.3.3 NH3 Titration of Brønsted Acid Sites in Cu-Zeolites after Re-
ductive Treatments . . . . . . . . . . . . . . . . . . . . . . . . . 232.4 Conclusions . . . . . . . . . . . . . . . . . . . . . . . . . . . . . . . . . 262.5 Acknowledgements . . . . . . . . . . . . . . . . . . . . . . . . . . . . . 272.6 Figures and Tables . . . . . . . . . . . . . . . . . . . . . . . . . . . . . 282.7 Supporting Information . . . . . . . . . . . . . . . . . . . . . . . . . . . 29
2.7.1 Atomic Absorption Spectroscopy of Catalyst Samples. . . . . . . 292.7.2 X-Ray Diraction Characterization of Catalyst Samples. . . . . 302.7.3 N2 Adsorption Isotherms of Catalyst Samples. . . . . . . . . . . 322.7.4 27Al Magic Angle Spinning Nuclear Magnetic Resonance (27Al
MAS NMR) on H-ZSM-5 and H-SSZ-13 zeolites. . . . . . . . . . 352.7.5 Comparison of NH3 and n-propylamine titrations on ZSM-5 and
SSZ-13 . . . . . . . . . . . . . . . . . . . . . . . . . . . . . . . . 382.7.6 NH3 TPD proles after saturation at 323 K . . . . . . . . . . . 392.7.7 n-Propylamine titrations of ZSM-5 and SSZ-13 zeolites . . . . . 402.7.8 Ambient UV-Visible Spectroscopy of Cu-SSZ-13 . . . . . . . . . 42

viii
Page
3 CONTROLLING THE ISOLATION AND PAIRING OF ALUMINUM INCHABAZITE ZEOLITES USING MIXTURES OF ORGANIC AND IN-ORGANIC STRUCTURE-DIRECTING AGENTS . . . . . . . . . . . . . . 453.1 Introduction . . . . . . . . . . . . . . . . . . . . . . . . . . . . . . . . . 453.2 Experimental Methods . . . . . . . . . . . . . . . . . . . . . . . . . . . 49
3.2.1 Synthesis of SSZ-13 zeolites . . . . . . . . . . . . . . . . . . . . 493.2.2 Preparation of H-form and partially cation-exchanged zeolites . 503.2.3 Zeolite Characterization . . . . . . . . . . . . . . . . . . . . . . 52
3.3 Results and Discussion . . . . . . . . . . . . . . . . . . . . . . . . . . . 553.3.1 Quantication of isolated and paired Al in SSZ-13 zeolites . . . 553.3.2 Distribution of Al atoms in SSZ-13 zeolites synthesized using
only N,N,N-trimethyl-1-adamantylammonium cations . . . . . . 583.3.3 Eect of synthesis gel cationic charge density on the arrange-
ment of Al in SSZ-13 zeolites . . . . . . . . . . . . . . . . . . . 613.3.4 Proposed role of synthesis gel cationic charge density on frame-
work Al distribution in SSZ-13 zeolites . . . . . . . . . . . . . . 633.4 Conclusions . . . . . . . . . . . . . . . . . . . . . . . . . . . . . . . . . 643.5 Acknowledgements . . . . . . . . . . . . . . . . . . . . . . . . . . . . . 663.6 Figures and Tables . . . . . . . . . . . . . . . . . . . . . . . . . . . . . 673.7 Supporting Information . . . . . . . . . . . . . . . . . . . . . . . . . . . 78
3.7.1 Synthesis of SSZ-13(5) Zeolites . . . . . . . . . . . . . . . . . . 783.7.2 Synthesis of SSZ-13(15, 1) and SSZ-13(25, 1) Zeolites . . . . . . 783.7.3 Synthesis of Pure-silica Chabazite (Si-CHA). . . . . . . . . . . . 793.7.4 Synthesis and Characterization of SSZ-13 Zeolites without Na+ 803.7.5 Synthesis of SSZ-13 Zeolites at Constant Na+/TMAda+ and
Varied Si/Al Ratio . . . . . . . . . . . . . . . . . . . . . . . . . 803.7.6 Synthesis of SSZ-13 Zeolites at Si/Al = 15 and 25 at Constant
(Na++TMAda-+)/Al with Varying Na+/TMAda+ Ratio . . . . 813.7.7 Synthesis of SSZ-13 Zeolites at Si/Al = 15 with Varying (Na+
+ TMAda +) / Al and Varying Na+/TMAda+ . . . . . . . . . . 823.7.8 Powder X-Ray Diraction Patterns of SSZ-13 Zeolites . . . . . . 843.7.9 Ar Adsorption Isotherms of Catalyst Samples . . . . . . . . . . 913.7.10 Thermogravimetric Analysis (TGA) to Measure the Organic
Content of As-Synthesized Zeolites . . . . . . . . . . . . . . . . 953.7.11 27Al Magic Angle Spinning Nuclear Magnetic Resonance (27Al
MAS NMR) . . . . . . . . . . . . . . . . . . . . . . . . . . . . . 953.7.12 Copper Cation Speciation in SSZ-13 Zeolites . . . . . . . . . . . 983.7.13 Statistical Estimates of Paired Aluminum in CHA Zeolites . . 1003.7.14 Derivation of Cobalt Ion-Exchange Isotherm . . . . . . . . . . 1003.7.15 UV-Vis Spectroscopy of Co-SSZ-13(15, 1) . . . . . . . . . . . 1043.7.16 Sodium Cation Exchange Procedure and Derivation of Ion-
Exchange Isoth-erm . . . . . . . . . . . . . . . . . . . . . . . . 104
ix
Page3.7.17 Characterization Data for SSZ-13(15) with Varying (Na+ +
TMAda+) / Al (Total Charge) and Constant Na+/TMAda+
Ratios (Charge Density) . . . . . . . . . . . . . . . . . . . . . 1063.7.18 Characterization Data for SSZ-13(15) with Varying (Na+ +
TMAda+) / Al (Total Charge) and Varying Na+/TMAda+ Ra-tios (Charge Density) . . . . . . . . . . . . . . . . . . . . . . . 107
3.7.19 Characterization Data for SSZ-13(25) with Constant (Na+ +TMAda+) / Al (Total Charge) and Varying Na+/TMAda+ Ra-tios (Charge Density) . . . . . . . . . . . . . . . . . . . . . . . 109
4 COOPERATION AND COMPETITION BETWEEN ORGANIC AND IN-ORGANIC STRUCTURE DIRECTING AGENTS INFLUENCES THE ALU-MINUM ARRANGEMENT IN CHA ZEOLITES . . . . . . . . . . . . . . 1114.1 Introduction . . . . . . . . . . . . . . . . . . . . . . . . . . . . . . . . 1114.2 Results and Discussion . . . . . . . . . . . . . . . . . . . . . . . . . . 1134.3 Supporting Information . . . . . . . . . . . . . . . . . . . . . . . . . . 126
5 STRUCTURAL ANDKINETIC CHANGES TO SMALL-PORE CU-ZEOLITESAFTER HYDROTHERMAL AGING TREATMENTS AND SELECTIVECATALYTIC REDUCTION OF NOX WITH AMMONIA . . . . . . . . . 1395.1 Introduction . . . . . . . . . . . . . . . . . . . . . . . . . . . . . . . . 1395.2 Experimental Methods . . . . . . . . . . . . . . . . . . . . . . . . . . 142
5.2.1 Catalyst synthesis and treatment . . . . . . . . . . . . . . . . 1425.2.2 Catalyst structural characterization . . . . . . . . . . . . . . . 1445.2.3 Brønsted acid site quantication using NH3 titration methods 1455.2.4 Kinetic measurements of standard SCR turnover rates . . . . 146
5.3 Results and Discussion . . . . . . . . . . . . . . . . . . . . . . . . . . 1475.3.1 Structural features of CHA, AEI and RTH topologies . . . . . 1475.3.2 Synthesis and characterization of H-form and Cu-form zeolites
before hydrothermal aging . . . . . . . . . . . . . . . . . . . . 1485.3.3 Standard SCR kinetics of Cu-zeolites before hydrothermal aging 1495.3.4 Characterization of Cu-form zeolites before and after hydrother-
mal aging . . . . . . . . . . . . . . . . . . . . . . . . . . . . . 1515.3.5 Standard SCR kinetics of Cu-form zeolites before and after hy-
drothermal aging . . . . . . . . . . . . . . . . . . . . . . . . . 1535.3.6 Characterization of Cu-form zeolites before and after hydrother-
mal aging, and after exposure to NOx SCR . . . . . . . . . . . 1545.4 Conclusions . . . . . . . . . . . . . . . . . . . . . . . . . . . . . . . . 1555.5 Acknowledgements . . . . . . . . . . . . . . . . . . . . . . . . . . . . 1575.6 Figures and Tables . . . . . . . . . . . . . . . . . . . . . . . . . . . . 1585.7 Supporting Information . . . . . . . . . . . . . . . . . . . . . . . . . . 166
5.7.1 Powder X-ray diraction patterns on H- and Cu-zeolites . . . 1665.7.2 Argon adsorption isotherms on H- and Cu-zeolites . . . . . . . 167
x
Page5.7.3 27Al MAS NMR spectra on H- and Cu-zeolites . . . . . . . . . 1675.7.4 IR Spectra of H-RTH Before and After NH3 Exposure . . . . . 1725.7.5 NH3 TPD on Cu-zeolites . . . . . . . . . . . . . . . . . . . . . 172
6 CATALYSIS IN A CAGE: CONDITION-DEPENDENT SPECIATION ANDDYNAMICS OF EXCHANGED CU CATIONS IN SSZ-13 ZEOLITES . . 1776.1 Introduction . . . . . . . . . . . . . . . . . . . . . . . . . . . . . . . . 1776.2 Results and Discussion . . . . . . . . . . . . . . . . . . . . . . . . . . 181
6.2.1 Cu Cation Speciation in Cu-SSZ-13. . . . . . . . . . . . . . . . 1816.2.2 Copper Cation Structure under ex situ Conditions. . . . . . . 1886.2.3 Copper Speciation at SCR Conditions. . . . . . . . . . . . . . 1926.2.4 SCR Mechansim . . . . . . . . . . . . . . . . . . . . . . . . . 1986.2.5 SCR Rates on Other Cu-Zeolites. . . . . . . . . . . . . . . . . 200
6.3 Discussion . . . . . . . . . . . . . . . . . . . . . . . . . . . . . . . . . 2016.3.1 Al Distribution and Cu Speciation ex situ. . . . . . . . . . . . 2016.3.2 Cu Speciation in situ . . . . . . . . . . . . . . . . . . . . . . . 2026.3.3 Mechanistic Implications for SCR. . . . . . . . . . . . . . . . . 2046.3.4 Implications for Partial Methane Oxidation. . . . . . . . . . . 206
6.4 Conclusions . . . . . . . . . . . . . . . . . . . . . . . . . . . . . . . . 2066.5 Experimental Methods . . . . . . . . . . . . . . . . . . . . . . . . . . 208
6.5.1 DFT and AIMD Details . . . . . . . . . . . . . . . . . . . . . 2086.5.2 Ab Initio Free Energies . . . . . . . . . . . . . . . . . . . . . . 2096.5.3 Zeolite Synthesis and Characterization. . . . . . . . . . . . . . 2106.5.4 NH3 Temperature-Programmed Desorption. . . . . . . . . . . 2116.5.5 Kinetics . . . . . . . . . . . . . . . . . . . . . . . . . . . . . . 2126.5.6 Spectroscopic Methods (XAS, FTIR). . . . . . . . . . . . . . . 212
6.6 Acknowledgements . . . . . . . . . . . . . . . . . . . . . . . . . . . . 2136.7 Figures and Tables . . . . . . . . . . . . . . . . . . . . . . . . . . . . 2156.8 Supporting Information . . . . . . . . . . . . . . . . . . . . . . . . . . 232
6.8.1 HSE06-TSvdw Values for Phase Diagram Species . . . . . . . 2326.8.2 H2O Pressure Phase Diagrams . . . . . . . . . . . . . . . . . . 2326.8.3 Z2Cu vs ZCuOH Exchange Energetics . . . . . . . . . . . . . 2356.8.4 XRD Patterns . . . . . . . . . . . . . . . . . . . . . . . . . . . 2366.8.5 Atomic absorption spectroscopy . . . . . . . . . . . . . . . . . 2376.8.6 FTIR Details . . . . . . . . . . . . . . . . . . . . . . . . . . . 2376.8.7 Si:Al 5 repeat synthesis with H:Al ratios between 0.45-0.85 . . 2406.8.8 Si:Al=5 Cu:Al=0.02 Data . . . . . . . . . . . . . . . . . . . . 2416.8.9 XAS Details . . . . . . . . . . . . . . . . . . . . . . . . . . . . 2426.8.10 Mobility Calculation Details . . . . . . . . . . . . . . . . . . . 2436.8.11 XANES Fitting Details . . . . . . . . . . . . . . . . . . . . . . 2446.8.12 Z2Cu Modes . . . . . . . . . . . . . . . . . . . . . . . . . . . . 2446.8.13 RDF Calculations . . . . . . . . . . . . . . . . . . . . . . . . . 2466.8.14 XANES Reversibility Data . . . . . . . . . . . . . . . . . . . . 256
xi
Page6.8.15 Four site Adsorbate Binding Energies . . . . . . . . . . . . . . 2596.8.16 NH3 phase diagram results at experimental SCR conditions . . 2596.8.17 Cu diammine diusion CI-NEB . . . . . . . . . . . . . . . . . 2596.8.18 operando XAS . . . . . . . . . . . . . . . . . . . . . . . . . . . 2596.8.19 NO+NH3 NEBS . . . . . . . . . . . . . . . . . . . . . . . . . 2616.8.20 Disappearance of Proximal Sites Upon reoxidation . . . . . . . 2626.8.21 Mechanism energies . . . . . . . . . . . . . . . . . . . . . . . . 2656.8.22 Kinetic Data for BEA and ZSM-5 . . . . . . . . . . . . . . . . 2656.8.23 Z2Cu 200 C vs 400 C EXAFS comparison . . . . . . . . . . . 2656.8.24 200 C XANES, ZCuOH, NO only . . . . . . . . . . . . . . . . 2666.8.25 Synthesis details . . . . . . . . . . . . . . . . . . . . . . . . . 2666.8.26 Micropore volume . . . . . . . . . . . . . . . . . . . . . . . . . 2686.8.27 27Al NMR . . . . . . . . . . . . . . . . . . . . . . . . . . . . . 2706.8.28 NH3 TPD . . . . . . . . . . . . . . . . . . . . . . . . . . . . . 272
7 DYNAMIC MULTINUCLEAR SITES FORMED BY MOBILIZED COP-PER IONS IN NOX SELECTIVE CATALYTIC REDUCTION . . . . . . 2757.1 Introduction . . . . . . . . . . . . . . . . . . . . . . . . . . . . . . . . 2757.2 Turnover rates depend on the spatial density of single Cu sites . . . . 2767.3 CuI site density requirements dier for oxidation with O2 and NO2 . 2797.4 Solvation by ammonia confers mobility to single Cu ions . . . . . . . 2827.5 Outlook . . . . . . . . . . . . . . . . . . . . . . . . . . . . . . . . . . 2857.6 Acknowledgements . . . . . . . . . . . . . . . . . . . . . . . . . . . . 2867.7 Figures and Tables . . . . . . . . . . . . . . . . . . . . . . . . . . . . 2887.8 Supporting Information . . . . . . . . . . . . . . . . . . . . . . . . . . 294
7.8.1 Synthesis Methods and Characterization . . . . . . . . . . . . 2947.8.2 SCR Kinetics . . . . . . . . . . . . . . . . . . . . . . . . . . . 2987.8.3 X-Ray Absorption Spectroscopy . . . . . . . . . . . . . . . . . 3007.8.4 Kinetic models for the transient oxidation experiments . . . . 3047.8.5 DFT Methods . . . . . . . . . . . . . . . . . . . . . . . . . . . 3067.8.6 NO titrations to probe reaction stoichiometry . . . . . . . . . 3077.8.7 Random Distribution of Cu per Cage . . . . . . . . . . . . . . 3097.8.8 Metadynamics . . . . . . . . . . . . . . . . . . . . . . . . . . . 3097.8.9 Electrostatics . . . . . . . . . . . . . . . . . . . . . . . . . . . 3117.8.10 Stochastic Simulation . . . . . . . . . . . . . . . . . . . . . . . 312
8 INTRODUCING CATALYTIC DIVERSITY INTO SINGLE-SITE CHABAZITEZEOLITES OF FIXED COMPOSITION VIA SYNTHETIC CONTROLOF ACTIVE SITE PROXIMITY . . . . . . . . . . . . . . . . . . . . . . . 3418.1 Introduction . . . . . . . . . . . . . . . . . . . . . . . . . . . . . . . . 3418.2 Results and Discussion . . . . . . . . . . . . . . . . . . . . . . . . . . 343
8.2.1 Synthesis of CHA zeolites with dierent Al arrangements. . . . 343

xii
Page8.2.2 Methanol dehydration to dimethyl ether: a Brønsted acid probe
reaction. . . . . . . . . . . . . . . . . . . . . . . . . . . . . . . 3478.2.3 Methanol dehydration catalysis on CHA zeolites containing only
isolated H+ sites. . . . . . . . . . . . . . . . . . . . . . . . . . 3498.2.4 Methanol dehydration catalysis on H-CHA zeolites containing
paired protons. . . . . . . . . . . . . . . . . . . . . . . . . . . 3528.3 Conclusions . . . . . . . . . . . . . . . . . . . . . . . . . . . . . . . . 3548.4 Experimental Methods . . . . . . . . . . . . . . . . . . . . . . . . . . 356
8.4.1 Synthesis and preparation of MFI and CHA zeolites. . . . . . 3568.4.2 Characterization of CHA and MFI zeolites. . . . . . . . . . . . 3598.4.3 Measurement of methanol dehydration rates and titration of
Brønsted acid sites during catalysis. . . . . . . . . . . . . . . . 3608.4.4 Measurement of in situ IR spectra on CHA and MFI zeolites. 362
8.5 Acknowledgements . . . . . . . . . . . . . . . . . . . . . . . . . . . . 3638.6 Figures and Tables . . . . . . . . . . . . . . . . . . . . . . . . . . . . 3658.7 Supporting Information . . . . . . . . . . . . . . . . . . . . . . . . . . 375
8.7.1 Synthesis and ion-exchange of CHA and MFI zeolites . . . . . 3758.7.2 Characterization of CHA and MFI zeolites . . . . . . . . . . . 3768.7.3 Methanol dehydration catalysis . . . . . . . . . . . . . . . . . 4078.7.4 IR spectra under steady methanol dehydration . . . . . . . . . 4298.7.5 Evaluation of mass transfer in CHA zeolites . . . . . . . . . . 4318.7.6 Origin of kinetic inhibition in CHA zeolites . . . . . . . . . . . 445
REFERENCES . . . . . . . . . . . . . . . . . . . . . . . . . . . . . . . . . . . 451
A A BRIEF REVIEWOF THE LITERATURE PERTAINING TO THE ROLEOF PAIRED AL SITES IN CHA FOR VARIOUS APPLICATIONS . . . . 505A.1 Introduction . . . . . . . . . . . . . . . . . . . . . . . . . . . . . . . . 505A.2 Acid strength [477] . . . . . . . . . . . . . . . . . . . . . . . . . . . . 506A.3 Characterization of Al arrangement [480] . . . . . . . . . . . . . . . . 506A.4 CO2 Adsorption [217,481] . . . . . . . . . . . . . . . . . . . . . . . . 507A.5 MTO [216,484] . . . . . . . . . . . . . . . . . . . . . . . . . . . . . . 508A.6 Hydrothermal Stability and Sulfur Poisoning During NOx SCR [239,489]509A.7 Partial methane oxidation to methanol [219,490493] . . . . . . . . . 510
B CATALYSIS SCIENCE OF NOX SELECTIVE CATALYTIC REDUCTIONWITH AMMONIA OVER CU-SSZ-13 AND CU-SAPO-34 . . . . . . . . . 511
C EFFECTS OF ACID SITE PROXIMITY AND CONFINEMENT IN ZEO-LITES ON PREVALENT REACTIONMECHANISMS DURINGMETHANOLDEHYDRATION CATALYSIS . . . . . . . . . . . . . . . . . . . . . . . . 513C.1 Inhibition of methanol dehydration rates in CHA zeolites . . . . . . . 513
C.1.1 Estimation of methanol activity coecients . . . . . . . . . . 515C.1.2 Inhibition in small-pore zeolites . . . . . . . . . . . . . . . . . 521
xiii
PageC.1.3 Methanol dehydration rates at elevated temperatures . . . . . 522C.1.4 Methanol adsorption isotherms . . . . . . . . . . . . . . . . . 524C.1.5 Inhibition at low temperatures (323 K) . . . . . . . . . . . . . 526C.1.6 Steady-state isotopic transient kinetic analysis of methanol de-
hydration in CHA . . . . . . . . . . . . . . . . . . . . . . . . . 527C.2 Interpretation of methanol dehydration activation parameters . . . . 531
C.2.1 Comparison of isolated protons in CHA and MFI . . . . . . . 532C.2.2 Comparison of isolated and paired protons in CHA . . . . . . 535
C.3 Eect of paired protons in other zeolite frameworks . . . . . . . . . . 538
D SOLID-STATE NMR STRUCTURAL CHARACTERIZATION OF INOR-GANIC AND ORGANIC STRUCTURE DIRECTING AGENTS WITHFRAMEWORK AL ATOMS IN CHABAZITE ZEOLITES . . . . . . . . . 541D.1 Introduction . . . . . . . . . . . . . . . . . . . . . . . . . . . . . . . . 541D.2 Sample Preparation . . . . . . . . . . . . . . . . . . . . . . . . . . . . 542
D.2.1 Synthesis of CHA with dierent fractions of paired Al sites . . 542D.2.2 Synthesis of N,N,N-trimethyl-d9-1-adamantylammonium hydrox-
ide . . . . . . . . . . . . . . . . . . . . . . . . . . . . . . . . . 542D.2.3 Synthesis of CHA zeolites with TMAda-d9 . . . . . . . . . . . 543
D.3 Results and Discussion . . . . . . . . . . . . . . . . . . . . . . . . . . 544
E TITRATION AND QUANTIFICATION OF OPEN AND CLOSED LEWISACID SITES IN TIN-BETA ZEOLITES THAT CATALYZE GLUCOSEISOMERIZATION . . . . . . . . . . . . . . . . . . . . . . . . . . . . . . . 559E.1 Introduction . . . . . . . . . . . . . . . . . . . . . . . . . . . . . . . . 559E.2 Experimental Methods . . . . . . . . . . . . . . . . . . . . . . . . . . 563
E.2.1 Catalyst Synthesis . . . . . . . . . . . . . . . . . . . . . . . . 563E.2.2 Catalyst Characterization . . . . . . . . . . . . . . . . . . . . 565E.2.3 Temperature Programmed Desorption . . . . . . . . . . . . . 567E.2.4 Infrared Spectroscopy and Determination of Integrated Molar
Extinction Coecients . . . . . . . . . . . . . . . . . . . . . . 568E.2.5 Kinetic and Isotopic Tracer Studies of Glucose Reactions with
Sn-Beta . . . . . . . . . . . . . . . . . . . . . . . . . . . . . . 570E.3 Results and Discussion . . . . . . . . . . . . . . . . . . . . . . . . . . 572
E.3.1 Structural Characterization of Stannosilicates . . . . . . . . . 572E.3.2 Quantication of Lewis acid sites: IR studies with pyridine . 575E.3.3 Quantication of Lewis acid sites: TPD studies with n-propylamine
and ammonia . . . . . . . . . . . . . . . . . . . . . . . . . . . 576E.3.4 Quantication of open and closed Lewis acid sites: IR studies
with deuterated acetonitrile . . . . . . . . . . . . . . . . . . . 578E.3.5 Glucose isomerization rate constants on hydrophobic and hy-
drophilic Sn-Beta zeolites . . . . . . . . . . . . . . . . . . . . 581E.4 Conclusions . . . . . . . . . . . . . . . . . . . . . . . . . . . . . . . . 585

xiv
PageE.5 Acknowledgements . . . . . . . . . . . . . . . . . . . . . . . . . . . . 586E.6 Figures and Tables . . . . . . . . . . . . . . . . . . . . . . . . . . . . 588E.7 Supporting Information . . . . . . . . . . . . . . . . . . . . . . . . . . 603
E.7.1 X-ray diractograms of stannosilicate samples. . . . . . . . . . 603E.7.2 N2 and H2O adsorption isotherms of zeolite samples. . . . . . 604E.7.3 Diuse-reectance UV-Visible spectra of zeolite samples. . . . 607E.7.4 1H NMR spectra of sugars after reaction of glucose-D2 with
zeolite samples in water. . . . . . . . . . . . . . . . . . . . . . 614E.7.5 Determination of integrated molar extinction coecients for
pyridine on H-Y zeolite. . . . . . . . . . . . . . . . . . . . . . 617E.7.6 Pyridine titration and infrared spectroscopy of zeolite samples. 619E.7.7 n-Propylamine temperature programmed desorption (TPD) ex-
periments on zeolites. . . . . . . . . . . . . . . . . . . . . . . . 621E.7.8 Ammonia temperature programmed desorption experiments on
zeolite samples. . . . . . . . . . . . . . . . . . . . . . . . . . . 627E.7.9 Deuterated acetonitrile titration and infrared spectroscopy of
zeolites. . . . . . . . . . . . . . . . . . . . . . . . . . . . . . . 629E.7.10 Kinetic measurements of glucose isomerization on zeolite samples.647
F MOLECULAR STRUCTURE AND CONFINING ENVIRONMENT OFTIN SITES IN SINGLE-SITE ZEOLITES . . . . . . . . . . . . . . . . . . 659F.1 Introduction . . . . . . . . . . . . . . . . . . . . . . . . . . . . . . . . 659F.2 Results and Discussion . . . . . . . . . . . . . . . . . . . . . . . . . . 661
F.2.1 Synthesis of Sn-CHA and Bulk Structural Characterization ofStannosilicates . . . . . . . . . . . . . . . . . . . . . . . . . . 661
F.2.2 Quantifying Lewis acidic Sn sites using d3-acetonitrile and pyri-dine titration and IR spectroscopy . . . . . . . . . . . . . . . . 663
F.2.3 Catalytic interrogation of the conning environment around Snsites in Sn-CHA . . . . . . . . . . . . . . . . . . . . . . . . . . 666
F.2.4 Probing local Sn structure using 119Sn DNP NMR spectroscopy 669F.2.5 DFT calculations of 119Sn DNP NMR chemical shifts, spans,
and CSA parameters . . . . . . . . . . . . . . . . . . . . . . . 672F.3 Conclusions . . . . . . . . . . . . . . . . . . . . . . . . . . . . . . . . 674F.4 Acknowledgements . . . . . . . . . . . . . . . . . . . . . . . . . . . . 676F.5 Figures and Tables . . . . . . . . . . . . . . . . . . . . . . . . . . . . 677F.6 Supporting Information . . . . . . . . . . . . . . . . . . . . . . . . . . 687
F.6.1 Statement of author contributions . . . . . . . . . . . . . . . . 687F.6.2 Experimental and theoretical methods . . . . . . . . . . . . . 687F.6.3 X-ray diraction patterns . . . . . . . . . . . . . . . . . . . . 698F.6.4 Adsorption isotherms and pore size distributions . . . . . . . . 699F.6.5 Diuse reectance UV-visible spectra and Tauc plots . . . . . 702F.6.6 Thermogravimetric analysis . . . . . . . . . . . . . . . . . . . 705F.6.7 X-ray absorption spectroscopy . . . . . . . . . . . . . . . . . . 708
xv
PageF.6.8 Supplementary infrared spectra . . . . . . . . . . . . . . . . . 712F.6.9 Ammonia temperature programmed desorption . . . . . . . . 714F.6.10 Intermolecular MPVO reactions . . . . . . . . . . . . . . . . 715F.6.11 Additional details for 119Sn, and 29Si NMR spectra for Sn-CHA-F722F.6.12 2D 119Sn and 2D 15N CPMAT spectra of pyridine saturated Sn-
CHA-F-70 and 15N NMR spectra of pyridine saturated Si-CHA-F.729F.6.13 DFT Calculations . . . . . . . . . . . . . . . . . . . . . . . . . 733
VITA . . . . . . . . . . . . . . . . . . . . . . . . . . . . . . . . . . . . . . . . 735

xvi
LIST OF TABLES
Table Page
2.1 Number of H+ sites (per Altot) measured from NH3 titration of H-zeolitesand Cu-zeolites after oxidative treatments, including data originally re-ported by Bates et al. [78]. . . . . . . . . . . . . . . . . . . . . . . . . . . . 31
2.2 Number of H+ sites measured using gaseous NH3 titration of Cu-SSZ-13after oxidative treatments (H+
ox) and reductive treatments in owing NOand NH3 at 473 K for 2 hours (H+
red). Data adapted from Paolucci et al. [85].31
2.3 Elemental composition, and N2-derived BET surface areas and microporevolumes for all zeolite samples in this study [78]. . . . . . . . . . . . . . . . 36
2.4 27Al MAS NMR quantication results for H and NH4form of the ZSM-5(Si/Altot = 17, 30, 43, and 89) and SSZ-13 (Si/Altot = 4.5) samples [78]. . 39
2.5 Comparison of the H+/Altot ratios for zeolite samples measured by NH3
and n-propylamine (NPA). . . . . . . . . . . . . . . . . . . . . . . . . . . . 40
2.6 Number of H+ sites measured from the NH3 and C3H6 desorbed after n-propylamine decomposition on H- and Cu-form zeolites. Data originallyreported by Bates et al. [78]. . . . . . . . . . . . . . . . . . . . . . . . . . . 43
3.1 Characterization data for all Na+-free SSZ-13 samples at dierent Si/Alratios. . . . . . . . . . . . . . . . . . . . . . . . . . . . . . . . . . . . . . . 77
3.2 Characterization data for SSZ-13(15) and MOR samples synthesized withconstant synthesis solution Si/Al, constant hydroxide concentration, andvarying Na+/TMAda+. . . . . . . . . . . . . . . . . . . . . . . . . . . . . . 77
3.3 Calculation of the number of TMAda+ per cage for SSZ-13(X,0) and SSZ-13(15,X) with maintaining a constant (Na++TMAda+)/Al ratio. . . . . . . 95
3.4 Cu/Al, saturation Co/Al, predicted M2+/Al, and residual H+/Al on H-SSZ-13(5), H-SSZ-13(15, 1), and H-SSZ-13(25, 1). . . . . . . . . . . . . . . 98
3.5 Characterization for SSZ-13 samples synthesized at a constant Na+/TMA-da+ = 0.67 and varying Si/Al. . . . . . . . . . . . . . . . . . . . . . . . . 106
3.6 Characterization data for SSZ-13(15) and MOR samples synthesized withconstant synthesis solution Si/Al and varying total solution charge andNa+/TMAda+. . . . . . . . . . . . . . . . . . . . . . . . . . . . . . . . . 107
xvii
Table Page
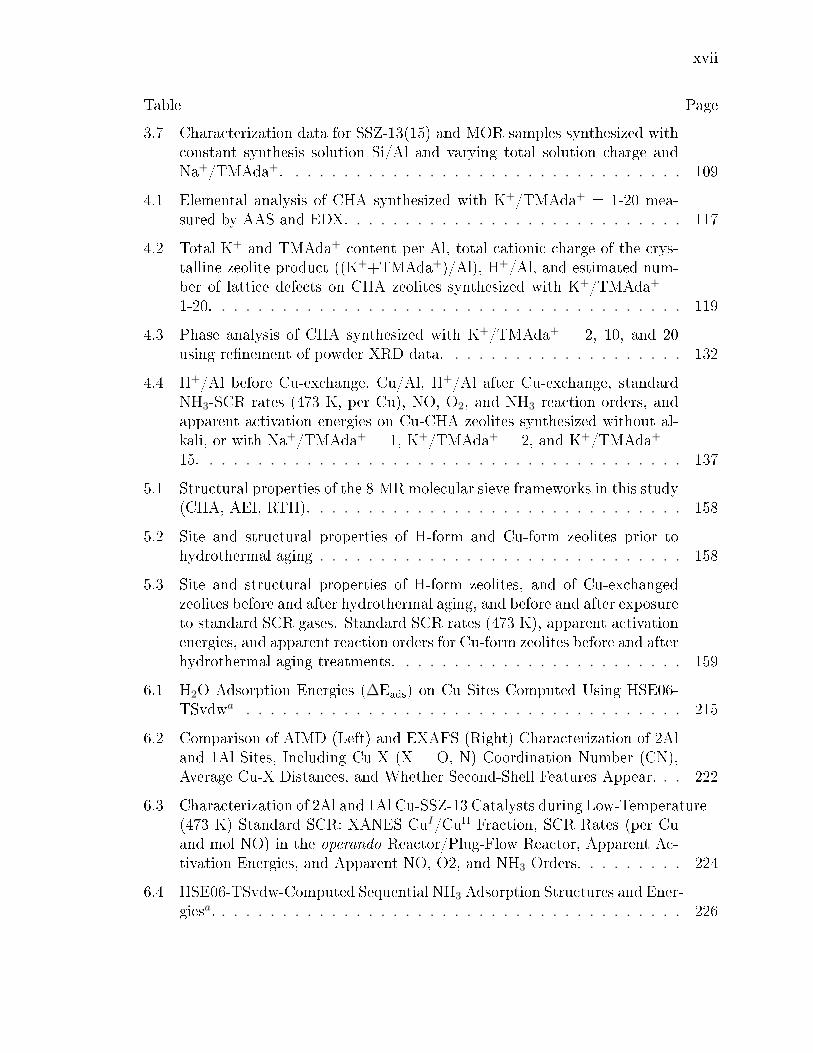
3.7 Characterization data for SSZ-13(15) and MOR samples synthesized withconstant synthesis solution Si/Al and varying total solution charge andNa+/TMAda+. . . . . . . . . . . . . . . . . . . . . . . . . . . . . . . . . 109
4.1 Elemental analysis of CHA synthesized with K+/TMAda+ = 1-20 mea-sured by AAS and EDX. . . . . . . . . . . . . . . . . . . . . . . . . . . . 117
4.2 Total K+ and TMAda+ content per Al, total cationic charge of the crys-talline zeolite product ((K++TMAda+)/Al), H+/Al, and estimated num-ber of lattice defects on CHA zeolites synthesized with K+/TMAda+ =1-20. . . . . . . . . . . . . . . . . . . . . . . . . . . . . . . . . . . . . . . 119
4.3 Phase analysis of CHA synthesized with K+/TMAda+ = 2, 10, and 20using renement of powder XRD data. . . . . . . . . . . . . . . . . . . . 132
4.4 H+/Al before Cu-exchange, Cu/Al, H+/Al after Cu-exchange, standardNH3-SCR rates (473 K, per Cu), NO, O2, and NH3 reaction orders, andapparent activation energies on Cu-CHA zeolites synthesized without al-kali, or with Na+/TMAda+ = 1, K+/TMAda+ = 2, and K+/TMAda+ =15. . . . . . . . . . . . . . . . . . . . . . . . . . . . . . . . . . . . . . . . 137
5.1 Structural properties of the 8-MR molecular sieve frameworks in this study(CHA, AEI, RTH). . . . . . . . . . . . . . . . . . . . . . . . . . . . . . . 158
5.2 Site and structural properties of H-form and Cu-form zeolites prior tohydrothermal aging . . . . . . . . . . . . . . . . . . . . . . . . . . . . . . 158
5.3 Site and structural properties of H-form zeolites, and of Cu-exchangedzeolites before and after hydrothermal aging, and before and after exposureto standard SCR gases. Standard SCR rates (473 K), apparent activationenergies, and apparent reaction orders for Cu-form zeolites before and afterhydrothermal aging treatments. . . . . . . . . . . . . . . . . . . . . . . . 159
6.1 H2O Adsorption Energies (∆Eads) on Cu Sites Computed Using HSE06-TSvdwa . . . . . . . . . . . . . . . . . . . . . . . . . . . . . . . . . . . . 215
6.2 Comparison of AIMD (Left) and EXAFS (Right) Characterization of 2Aland 1Al Sites, Including Cu-X (X = O, N) Coordination Number (CN),Average Cu-X Distances, and Whether Second-Shell Features Appear. . . 222
6.3 Characterization of 2Al and 1Al Cu-SSZ-13 Catalysts during Low-Temperature(473 K) Standard SCR: XANES CuI/CuII Fraction, SCR Rates (per Cuand mol NO) in the operando Reactor/Plug-Flow Reactor, Apparent Ac-tivation Energies, and Apparent NO, O2, and NH3 Orders. . . . . . . . . 224
6.4 HSE06-TSvdw-Computed Sequential NH3 Adsorption Structures and Ener-giesa. . . . . . . . . . . . . . . . . . . . . . . . . . . . . . . . . . . . . . . 226
xviii
Table Page
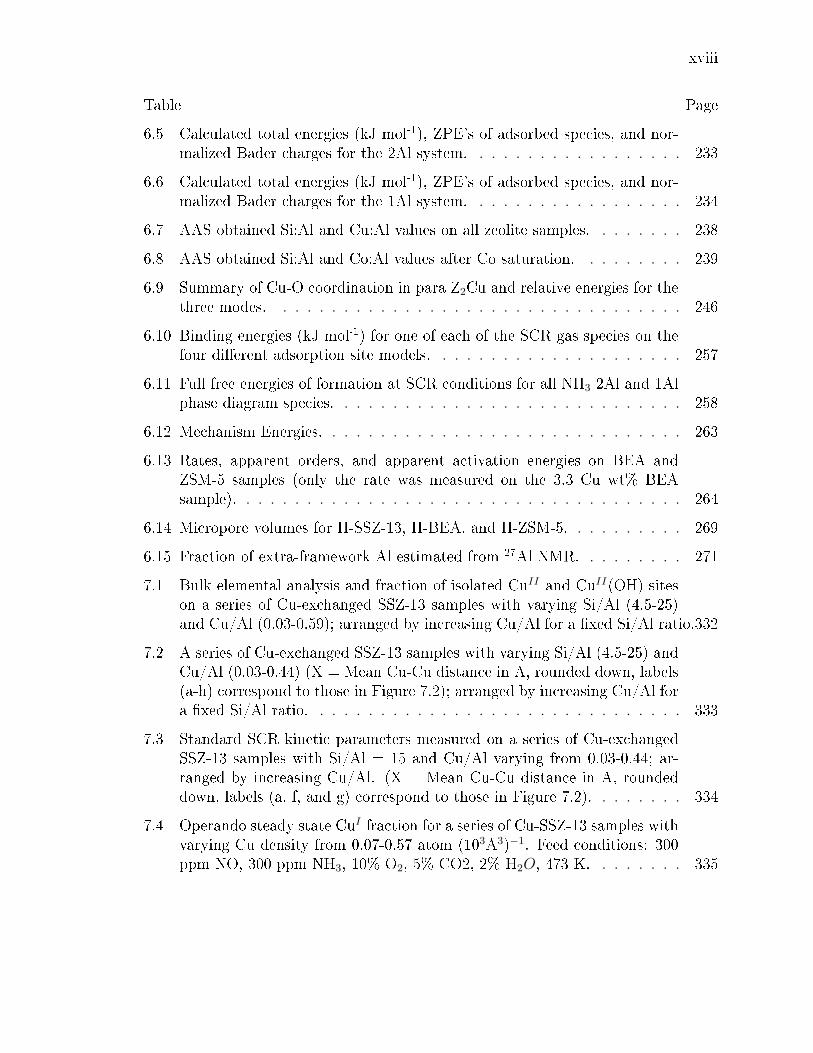
6.5 Calculated total energies (kJ mol-1), ZPE's of adsorbed species, and nor-malized Bader charges for the 2Al system. . . . . . . . . . . . . . . . . . 233
6.6 Calculated total energies (kJ mol-1), ZPE's of adsorbed species, and nor-malized Bader charges for the 1Al system. . . . . . . . . . . . . . . . . . 234
6.7 AAS obtained Si:Al and Cu:Al values on all zeolite samples. . . . . . . . 238
6.8 AAS obtained Si:Al and Co:Al values after Co saturation. . . . . . . . . 239
6.9 Summary of Cu-O coordination in para Z2Cu and relative energies for thethree modes. . . . . . . . . . . . . . . . . . . . . . . . . . . . . . . . . . 246
6.10 Binding energies (kJ mol-1) for one of each of the SCR gas species on thefour dierent adsorption site models. . . . . . . . . . . . . . . . . . . . . 257
6.11 Full free energies of formation at SCR conditions for all NH3 2Al and 1Alphase diagram species. . . . . . . . . . . . . . . . . . . . . . . . . . . . . 258
6.12 Mechanism Energies. . . . . . . . . . . . . . . . . . . . . . . . . . . . . . 263
6.13 Rates, apparent orders, and apparent activation energies on BEA andZSM-5 samples (only the rate was measured on the 3.3 Cu wt% BEAsample). . . . . . . . . . . . . . . . . . . . . . . . . . . . . . . . . . . . . 264
6.14 Micropore volumes for H-SSZ-13, H-BEA, and H-ZSM-5. . . . . . . . . . 269
6.15 Fraction of extra-framework Al estimated from 27Al NMR. . . . . . . . . 271
7.1 Bulk elemental analysis and fraction of isolated CuII and CuII(OH) siteson a series of Cu-exchanged SSZ-13 samples with varying Si/Al (4.5-25)and Cu/Al (0.03-0.59); arranged by increasing Cu/Al for a xed Si/Al ratio.332
7.2 A series of Cu-exchanged SSZ-13 samples with varying Si/Al (4.5-25) andCu/Al (0.03-0.44) (X = Mean Cu-Cu distance in A, rounded down, labels(a-h) correspond to those in Figure 7.2); arranged by increasing Cu/Al fora xed Si/Al ratio. . . . . . . . . . . . . . . . . . . . . . . . . . . . . . . 333
7.3 Standard SCR kinetic parameters measured on a series of Cu-exchangedSSZ-13 samples with Si/Al = 15 and Cu/Al varying from 0.03-0.44; ar-ranged by increasing Cu/Al. (X = Mean Cu-Cu distance in A, roundeddown, labels (a, f, and g) correspond to those in Figure 7.2). . . . . . . . 334
7.4 Operando steady state CuI fraction for a series of Cu-SSZ-13 samples withvarying Cu density from 0.07-0.57 atom (103A3)−1. Feed conditions: 300ppm NO, 300 ppm NH3, 10% O2, 5% CO2, 2% H2O, 473 K. . . . . . . . 335

xix
Table Page
7.5 Operando steady state CuI fraction for a series of Cu-SSZ-13 samples withvarying Cu density from 0.07-0.57 atom (103A3)−1. Feed conditions: 300ppm NO, 300 ppm NH3, 10% O2, 5% CO2, 2% H2O, 473 K. . . . . . . . 336
7.6 Fitted CuI fraction before and after oxidation with 10% O2 at 473 Kstarting from CuI(NH3)2 for Cu-CHA-20, Cu-CHA-15 and Cu-CHA-29. . 337
7.7 Fitted CuI fraction before and after repeated subsequent oxidation with10% O2 at 473 K starting from CuI(NH3)2 in each cycle for Cu-CHA-29. 337
7.8 Fitted CuI fraction before and after oxidation with 100 ppm NO2 at 473K starting from CuI(NH3)2 for Cu-CHA-20, Cu-CHA-15 and Cu-CHA-29. 338
7.9 PBE+D2 DFT computed reaction energies (column 2), total energy dif-ferences along the reaction coordinate (column 3), and normalized Badercharge [79] derived Cu oxidation states for the product in each step (col-umn 4) for all results reported in Figure 7.4. . . . . . . . . . . . . . . . . 338
7.10 Computed PBE+D2 and HSE06+TSvdw reaction energies for O2 and NO2
adsorption on a CuI(NH3)2 monomer. Rows 1 and 2 reference the twodierent (A, B) O2 adsorption congurations in Figure 7.21. Columns 3and 5 report the normalized Bader charge [79] derived Cu oxidation state. 339
7.11 Metadynamics parameters. . . . . . . . . . . . . . . . . . . . . . . . . . . 339
8.1 Characterization Data and Methanol Dehydration Rate Constants for CHAZeolites Synthesized at Dierent Compositions and with Dierent Frac-tions of Paired Al Sites in OH− and F− Media. . . . . . . . . . . . . . . 364
8.2 Weights (in grams) of synthesis reagents used in the crystallization of CHAzeolites with dierent Al precursors and equimolar amounts of Na+ andTMAda+ in OH− media. . . . . . . . . . . . . . . . . . . . . . . . . . . . 375
8.3 Characterization data of CHA zeolites synthesized using Al(OH)3 as thealuminum source, without Na+ in OH− and F− media. . . . . . . . . . . 377
8.4 Characterization of CHA zeolites synthesized with various Al precursorswith equimolar Na+ and TMAda+ in OH− media. . . . . . . . . . . . . . 378
8.5 Characterization of CHA zeolites synthesized using Al(OH)3 and equimo-lar Na+ and TMAda+ in OH− media. Also included is CHA-OH(16,6%)zeolite, which was synthesized using TMAda+ and hexyldecyltrimethylam-monium bromide (CTAB) in OH− media. . . . . . . . . . . . . . . . . . 378
8.6 Characterization of commercial MFI zeolites (Si/Al = 30-43). . . . . . . 379
xx
Table Page
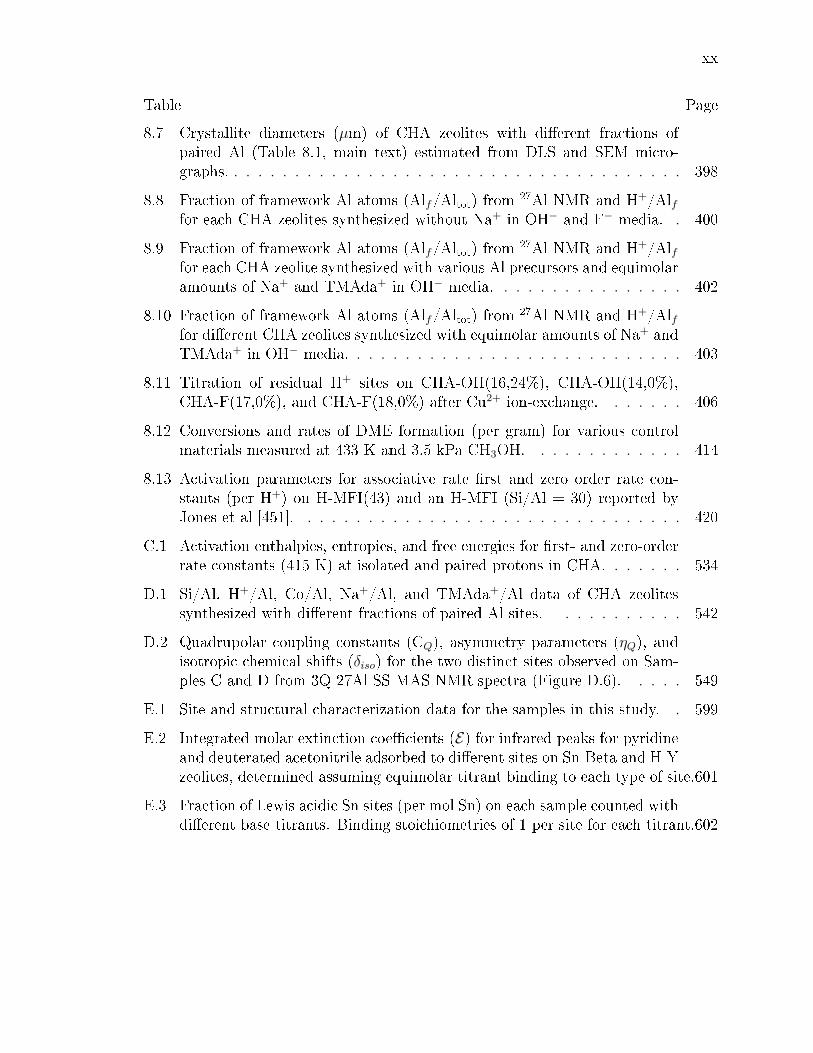
8.7 Crystallite diameters (µm) of CHA zeolites with dierent fractions ofpaired Al (Table 8.1, main text) estimated from DLS and SEM micro-graphs. . . . . . . . . . . . . . . . . . . . . . . . . . . . . . . . . . . . . . 398
8.8 Fraction of framework Al atoms (Alf/Altot) from 27Al NMR and H+/Alffor each CHA zeolites synthesized without Na+ in OH− and F− media. . 400
8.9 Fraction of framework Al atoms (Alf/Altot) from 27Al NMR and H+/Alffor each CHA zeolite synthesized with various Al precursors and equimolaramounts of Na+ and TMAda+ in OH− media. . . . . . . . . . . . . . . . 402
8.10 Fraction of framework Al atoms (Alf/Altot) from 27Al NMR and H+/Alffor dierent CHA zeolites synthesized with equimolar amounts of Na+ andTMAda+ in OH− media. . . . . . . . . . . . . . . . . . . . . . . . . . . . 403
8.11 Titration of residual H+ sites on CHA-OH(16,24%), CHA-OH(14,0%),CHA-F(17,0%), and CHA-F(18,0%) after Cu2+ ion-exchange. . . . . . . 406
8.12 Conversions and rates of DME formation (per gram) for various controlmaterials measured at 433 K and 3.5 kPa CH3OH. . . . . . . . . . . . . 414
8.13 Activation parameters for associative rate rst and zero order rate con-stants (per H+) on H-MFI(43) and an H-MFI (Si/Al = 30) reported byJones et al [451]. . . . . . . . . . . . . . . . . . . . . . . . . . . . . . . . 420
C.1 Activation enthalpies, entropies, and free energies for rst- and zero-orderrate constants (415 K) at isolated and paired protons in CHA. . . . . . . 534
D.1 Si/Al, H+/Al, Co/Al, Na+/Al, and TMAda+/Al data of CHA zeolitessynthesized with dierent fractions of paired Al sites. . . . . . . . . . . 542
D.2 Quadrupolar coupling constants (CQ), asymmetry parameters (ηQ), andisotropic chemical shifts (δiso) for the two distinct sites observed on Sam-ples C and D from 3Q 27Al SS MAS NMR spectra (Figure D.6). . . . . 549
E.1 Site and structural characterization data for the samples in this study. . 599
E.2 Integrated molar extinction coecients (E) for infrared peaks for pyridineand deuterated acetonitrile adsorbed to dierent sites on Sn-Beta and H-Yzeolites, determined assuming equimolar titrant binding to each type of site.601
E.3 Fraction of Lewis acidic Sn sites (per mol Sn) on each sample counted withdierent base titrants. Binding stoichiometries of 1 per site for each titrant.602

xxi
Table Page
E.4 Edge energies for all samples determined from x-intercepts of linear por-tions of Tauc plots (Figs. E.19 and E.20) DRUV band centers at maximumF(R) intensity are reported for spectra collected after dehydration treat-ments (Figs. E.17 and E.18), and parenthetical values are for second bandobserved in some DRUV spectra. . . . . . . . . . . . . . . . . . . . . . . 609
E.5 Molecules of NPA desorbed per Sn after saturation with 1000 ppm NPAfor 4 h at 323 K followed by purging for 4 h and 8 h. . . . . . . . . . . . 623
E.6 Moles of NPA desorbed per g zeolite after saturation with 1000 ppm NPAfor 4 h at 323 K followed by purging for 8 h. . . . . . . . . . . . . . . . . 624
E.7 Molecules of NH3 desorbed (per Sn) after saturation with 500 ppm NH3
for 5 h at 323 K, followed by purging for 8 h. . . . . . . . . . . . . . . . 628
E.8 Moles of NH3 desorbed (per g) after saturation with 500 ppm NH3 for 5h at 323 K followed by purging for 8 h. . . . . . . . . . . . . . . . . . . . 629
E.9 Peak areas at saturation for the 2316 cm−1, 2308 cm−1, 2287 cm−1, 2275cm−1 and 2265 cm−1 peaks for all Sn samples in this study. . . . . . . . 646
E.10 Site and structural characterization data for the samples in this study. . 657
F.1 Site and structural characterization data for the samples in this study. . 682
F.2 Lewis acid site and silanol group concentrations determined using pyridineand acetonitrile IR and ammonia TPD for the samples in this study.. . . 683
F.3 Intramolecular and intermolecular MPVO reaction rates measured on thesamples in this study. . . . . . . . . . . . . . . . . . . . . . . . . . . . . 684
F.4 Chemical shift anisotropy (CSA) parameters for the two dierent Sn sitesidentied in the hydrated and dehydrated states of Sn-CHA-F-70. . . . . 685
F.5 Chemical shift anisotropy (CSA) parameters for the two dierent Sn sitesidentied in the hydrated and dehydrated states of Sn-CHA-F-70. . . . . 686
F.6 Summary of XAS studies on stannosilicate materials. . . . . . . . . . . . 711
F.7 Reaction rates over Sn-CHA-F-60, Sn-Beta-F-116, Si-CHA-F, and Sn-xerogel, for the intermolecular MPVO reaction of ethanol and acetone. . 718
F.8 Control experiments performed using Sn-CHA-F-60, Sn-Beta, Si-CHA-F,and Sn-xerogel, as well as those performed in empty reactors. . . . . . . 719
F.9 Reaction rates over Sn-CHA-F-60, Sn-Beta-F-116, Si-CHA-F, and Sn-xerogel, for the intermolecular MPVO reaction of ethanol and acetone. . 723

xxii
Table Page
F.10 NMR CSA parameters calculated from DFT for hydrated (two watermolecules bound to each Sn site, two second shell waters, and implicitwater) and dehydrated Sn-CHA. . . . . . . . . . . . . . . . . . . . . . . 733
F.11 NMR CSA parameters calculated with DFT for pyridine saturated Sn-CHA-F and Si-CHA-F. . . . . . . . . . . . . . . . . . . . . . . . . . . . 733
F.12 DFT calculated pyridine adsorption free energies (calculated at 298 K)with respect to each site and the corresponding isolated pyridine molecules(∆G, kcal mol−1). The optimized structures were calculated at the lowerlevel of theory described in the computational details section (SectionF.6.2). The energies correspond to single-point calculations performedwith the M06, and Sn was described by the LanL2DZ eective core pseu-dopotential (ECP) augmented with a d polarization function; the rest ofatoms directly were described by a 6-311+G(d, p) basis set. The ther-mal correction terms were included and taken from the calculations atthe lower level of theory described in the computational details section(Section F.6.2). . . . . . . . . . . . . . . . . . . . . . . . . . . . . . . . 734

xxiii
LIST OF FIGURES
Figure Page
1.1 Dierent arrangements of Al atoms between (a) isolated and (b, c) pairedcongurations in a 6-MR. . . . . . . . . . . . . . . . . . . . . . . . . . . . 3
2.1 Isolated Cu2+ ions in SSZ-13 (Si/Altot = 4.5) that balance two frameworkAl atoms reduce in owing NO and NH3 (473 K) to form a proximal Cu+
and H+ site pair [85]. . . . . . . . . . . . . . . . . . . . . . . . . . . . . . . 28
2.2 NH3 desorption rates during TPD of H-ZSM-5 (Si/Altot = 12.5) after gas-phase NH3 adsorption at 433 K without purging or washing (light trace),and with purging in owing wet helium at 433 K (dark trace). . . . . . . . 28
2.3 (a) NH3 saturation at 433 K leads to adsorption on Brønsted and Lewisacid sites, and physisorption near pore walls, but (b) purging in wet heliumat 433 K (8 h) desorbs NH3 at non-protonic sites and enables quanticationof Brønsted acid sites via (c) TPD to 873 K [78]. . . . . . . . . . . . . . . 29
2.4 NH3 desorption rates during TPD of H-ZSM-5 with Si/Altot of (a) 17,(b) 30, (c) 43, and (d) 89 for gas-phase NH3 adsorption at 323 K withwater wash (light grey trace), gas-phase NH3 adsorption at 433 K withwet helium purge (black trace), and aqueous NH4NO3 ion exchange (greytrace) [78]. Quantication of the total number of H+ for each sample canbe found in Table 2.1. . . . . . . . . . . . . . . . . . . . . . . . . . . . . . 30
2.5 Number of H+ sites titrated by gas phase NH3 at 433 K followed by purgingin He and n-propylamine (NPA) for Cu (open) and H-form (solid) zeolites.The dashed line corresponds to the parity line. Data given Table 2.6 ofthe Supporting Information. . . . . . . . . . . . . . . . . . . . . . . . . . . 32
2.6 Number of residual H+ sites, relative to the number on the parent H-SSZ-13 (H+
parent), measured by NH3 titration on oxidized forms of Cu-SSZ-13samples of varying total Cu content (per H+
parent). The dashed lines withslopes (m) of -2, -1, and 0 represent Cu exchange stoichiometries of 2,1, or 0 H+ sites, respectively. Error bars correspond to 90% condenceintervals [78]. Tabulated data can be found in Table 2.2. . . . . . . . . . . 33
2.7 NH3 desorption rates during TPD of Cu-SSZ-13 (Si/Altot = 4.5) (a) Cu/Altot= 0.12 and (b) Cu/Altot = 0.20 before (dark trace) and after (light trace)reduction in owing NO and NH3 at 473 K (Figure 2.1) [85]. . . . . . . . . 34

xxiv
Figure Page
2.8 The number of extra H+ sites (H+red - H+
ox per Cutot) formed after reduc-tion of Cu-SSZ-13 (Si/Altot = 4.5, Cu/Altot = 0.12 and 0.20) in NO andNH3 at 473 K, as a function of Cu+ content (per Cutot). The dashed linerepresents the parity line, expected if one additional H+ site were formedper Cu+ (Scheme 1). Data adapted from Paolucci et al. [85]. . . . . . . . . 35
2.9 X-Ray diraction patterns for (a) H-SSZ-13 (Si/Altot = 4.5) and H-ZSM-5with Si/Altot of (b) 12.5, (c) 17, (d) 30, (e) 43, and (f) 89. . . . . . . . . . 37
2.10 27Al MAS NMR spectra for all H-ZSM-5 (dashed line) and NH4-ZSM-5(solid line) samples with Si/Altot = (a) 17, (b) 30, (c) 43, and (d) 89 [78]. . 38
2.11 27Al MAS NMR spectra for H-SSZ-13 (dashed line) and NH4-ZSM-5 (solidline) samples with Si/Altot = 4.5 [78]. . . . . . . . . . . . . . . . . . . . . . 39
2.12 NH3 desorption rates during TPD of (a) H-ZSM-5 (Si/Altot = 43) and (b)H-SSZ-13 (Si/Altot = 4.5) after gas phase saturation with NH3 at 323 K . 41
2.13 n-Propylamine decomposes only on Brønsted acid sites to form NH3 andC3H6 [117]. . . . . . . . . . . . . . . . . . . . . . . . . . . . . . . . . . . . 41
2.14 Desorption rates of reactive n-propylamine decomposition products NH3
(dark trace) and C3H6 (light trace) during TPD of H-ZSM-5 (Si/Altot =17) [78]. . . . . . . . . . . . . . . . . . . . . . . . . . . . . . . . . . . . . . 42
2.15 Integrated area of the hydrated Cu2+ d-d transition absorbance band (cen-tered at 12,500 cm-1) measured by UV-Vis spectroscopy as a function oftotal Cu content (Cu/Altot). The dashed line represents the best t for alinear trendline through the origin. . . . . . . . . . . . . . . . . . . . . . . 44
3.1 Dierent arrangements of Al atoms between (a) isolated and (b, c) pairedcongurations in a 6-MR. . . . . . . . . . . . . . . . . . . . . . . . . . . . 67
3.2 Proposed organization of Si and Al atoms in the CHA crystallizationmedium to form (a) isolated Al in the presence of TMAda+, or (b) pairedAl in the presence of TMAda+ and Na+. . . . . . . . . . . . . . . . . . . 67
3.3 (a) Co2+ and (b) Na+ ion-exchange isotherms measured on SSZ-13(15,0)(circles) and SSZ-13(15,1) (squares); solid lines represent least-squares re-gression of data to Langmuirian isotherms. . . . . . . . . . . . . . . . . . . 68
3.4 The number of residual H+ sites measured by NH3 titration on Co-SSZ-13(15, 1) samples of increasing Co content. The two dashed lines cor-respond to slopes of -2 and -1, reecting exchange of only divalent ormonovalent species, respectively. . . . . . . . . . . . . . . . . . . . . . . . . 69
xxv
Figure Page
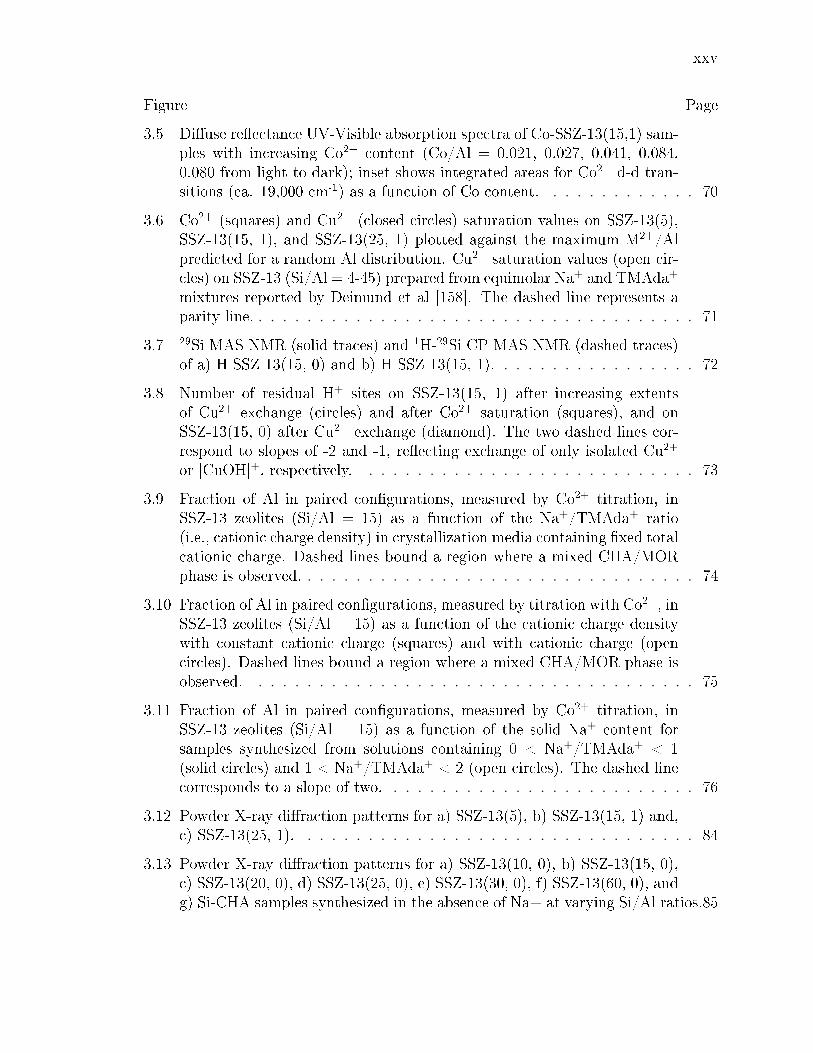
3.5 Diuse reectance UV-Visible absorption spectra of Co-SSZ-13(15,1) sam-ples with increasing Co2+ content (Co/Al = 0.021, 0.027, 0.041, 0.084,0.080 from light to dark); inset shows integrated areas for Co2+ d-d tran-sitions (ca. 19,000 cm-1) as a function of Co content. . . . . . . . . . . . . 70
3.6 Co2+ (squares) and Cu2+ (closed circles) saturation values on SSZ-13(5),SSZ-13(15, 1), and SSZ-13(25, 1) plotted against the maximum M2+/Alpredicted for a random Al distribution. Cu2+ saturation values (open cir-cles) on SSZ-13 (Si/Al = 4-45) prepared from equimolar Na+ and TMAda+
mixtures reported by Deimund et al [158]. The dashed line represents aparity line. . . . . . . . . . . . . . . . . . . . . . . . . . . . . . . . . . . . . 71
3.7 29Si MAS NMR (solid traces) and 1H-29Si CP MAS NMR (dashed traces)of a) H-SSZ-13(15, 0) and b) H-SSZ-13(15, 1). . . . . . . . . . . . . . . . . 72
3.8 Number of residual H+ sites on SSZ-13(15, 1) after increasing extentsof Cu2+ exchange (circles) and after Co2+ saturation (squares), and onSSZ-13(15, 0) after Cu2+ exchange (diamond). The two dashed lines cor-respond to slopes of -2 and -1, reecting exchange of only isolated Cu2+
or [CuOH]+, respectively. . . . . . . . . . . . . . . . . . . . . . . . . . . . 73
3.9 Fraction of Al in paired congurations, measured by Co2+ titration, inSSZ-13 zeolites (Si/Al = 15) as a function of the Na+/TMAda+ ratio(i.e., cationic charge density) in crystallization media containing xed totalcationic charge. Dashed lines bound a region where a mixed CHA/MORphase is observed. . . . . . . . . . . . . . . . . . . . . . . . . . . . . . . . . 74
3.10 Fraction of Al in paired congurations, measured by titration with Co2+, inSSZ-13 zeolites (Si/Al = 15) as a function of the cationic charge densitywith constant cationic charge (squares) and with cationic charge (opencircles). Dashed lines bound a region where a mixed CHA/MOR phase isobserved. . . . . . . . . . . . . . . . . . . . . . . . . . . . . . . . . . . . . 75
3.11 Fraction of Al in paired congurations, measured by Co2+ titration, inSSZ-13 zeolites (Si/Al = 15) as a function of the solid Na+ content forsamples synthesized from solutions containing 0 < Na+/TMAda+ < 1(solid circles) and 1 < Na+/TMAda+ < 2 (open circles). The dashed linecorresponds to a slope of two. . . . . . . . . . . . . . . . . . . . . . . . . . 76
3.12 Powder X-ray diraction patterns for a) SSZ-13(5), b) SSZ-13(15, 1) and,c) SSZ-13(25, 1). . . . . . . . . . . . . . . . . . . . . . . . . . . . . . . . . 84
3.13 Powder X-ray diraction patterns for a) SSZ-13(10, 0), b) SSZ-13(15, 0),c) SSZ-13(20, 0), d) SSZ-13(25, 0), e) SSZ-13(30, 0), f) SSZ-13(60, 0), andg) Si-CHA samples synthesized in the absence of Na+ at varying Si/Al ratios.85

xxvi
Figure Page
3.14 Powder X-ray diraction patterns for six independent syntheses of SSZ-13(15, 0). . . . . . . . . . . . . . . . . . . . . . . . . . . . . . . . . . . . . 86
3.15 Powder X-ray diraction patterns for a) SSZ-13(5, 0.67), b) SSZ-13(10,0.67), c) SSZ-13(15, 0.67), d) SSZ-13(25, 0.67), e) SSZ-13(50, 0.67), f) SSZ-13(100, 0.67), and g) SSZ-13(200, 0.67) samples synthesized with constantNa+/TMAda+ = 0.67 and varying Si/Al ratios. . . . . . . . . . . . . . . . 87
3.16 Powder X-ray diraction patterns for a) SSZ-13(15, 0), b) SSZ-13(15,0.25), c) SSZ-13(15, 0.50), d) SSZ-13(15, 0.67), e) SSZ-13(15, 1.00), f) SSZ-13(15, 1.50), g) SSZ-13(15, 2.00), h) MOR(15, 2.50), and i) MOR(15, 3.00)samples synthesized with constant solution Si/Al = 15, (Na++TMAda+)/Al(total charge), and varying Na+/TMAda+ ratios (charge density). . . . . . 88
3.17 Powder X-ray diraction patterns for a) SSZ-13(25, 0), b) SSZ-13(25,0.50), c) SSZ-13(25, 0.67), d) SSZ-13(25, 1.00), and e) SSZ-13(25, 2.00)samples synthesized with constant solution Si/Al = 25 and (Na+ +TMAda+)/ Al (total charge), and varying Na+/TMAda+ ratios (charge density). . . 89
3.18 Powder X-ray diraction patterns for a) SSZ-13(15, 0), b) SSZ-13(15,0.35), c) SSZ-13(15, 0.70), d) SSZ-13(15, 0.93), e) SSZ-13(15, 1.38), f)SSZ-13(15, 2.09), g) MOR(15, 3.45), h) MOR(15, 4.16, and i) MOR(15,5.55) samples synthesized with constant solution Si/Al = 15 and vary-ing (Na++TMAda+)/Al (total charge) and Na+/TMAda+ ratios (chargedensity). . . . . . . . . . . . . . . . . . . . . . . . . . . . . . . . . . . . . . 90
3.19 Ar adsorption isotherms at measured at 87 K on a) SSZ-13(5), b) SSZ-13(15, 1), and c) SSZ-13(25, 1). . . . . . . . . . . . . . . . . . . . . . . . . 91
3.20 Ar adsorption isotherms at measured at 87 K on a) SSZ-13(15, 0), b)SSZ-13(20, 0), c) SSZ-13(25, 0), d) SSZ-13(30, 0), and e) Si-CHA. . . . . . 92
3.21 Ar adsorption isotherms at measured at 87 K on a) H-SSZ-13(15, 0), b)H-SSZ-13(15, 0.25), c) H-SSZ-13(15, 0.50), d) H-SSZ-13(15, 0.67), e) H-SSZ-13(15, 1.00), f) H-SSZ-13(15, 1.50), and g) H-SSZ-13(15, 2.00). . . . . 93
3.22 Ar adsorption isotherms at measured at 87 K on a) H-SSZ-13(25, 0), b)H-SSZ-13(25, 0.25), c) H-SSZ-13(25, 0.50), d) H-SSZ-13(25, 1.00), and e)H-SSZ-13(25, 2.00). . . . . . . . . . . . . . . . . . . . . . . . . . . . . . . . 94
3.23 27Al MAS NMR spectra for a) H-SSZ-13(15, 0), b) H-SSZ-13(20, 0), c)H-SSZ-13(25, 0), and d) H-SSZ-13(30, 0). . . . . . . . . . . . . . . . . . . . 96
3.24 27Al MAS NMR spectra for a) H-SSZ-13(15, 0), b) H-SSZ-13(15, 0.25),c) H-SSZ-13(15, 0.50), d) H-SSZ-13(15, 0.67), e) H-SSZ-13(15, 1.00), f)H-SSZ-13(15, 1.50), and g) H-SSZ-13(15, 2.00). . . . . . . . . . . . . . . . 97
xxvii
Figure Page
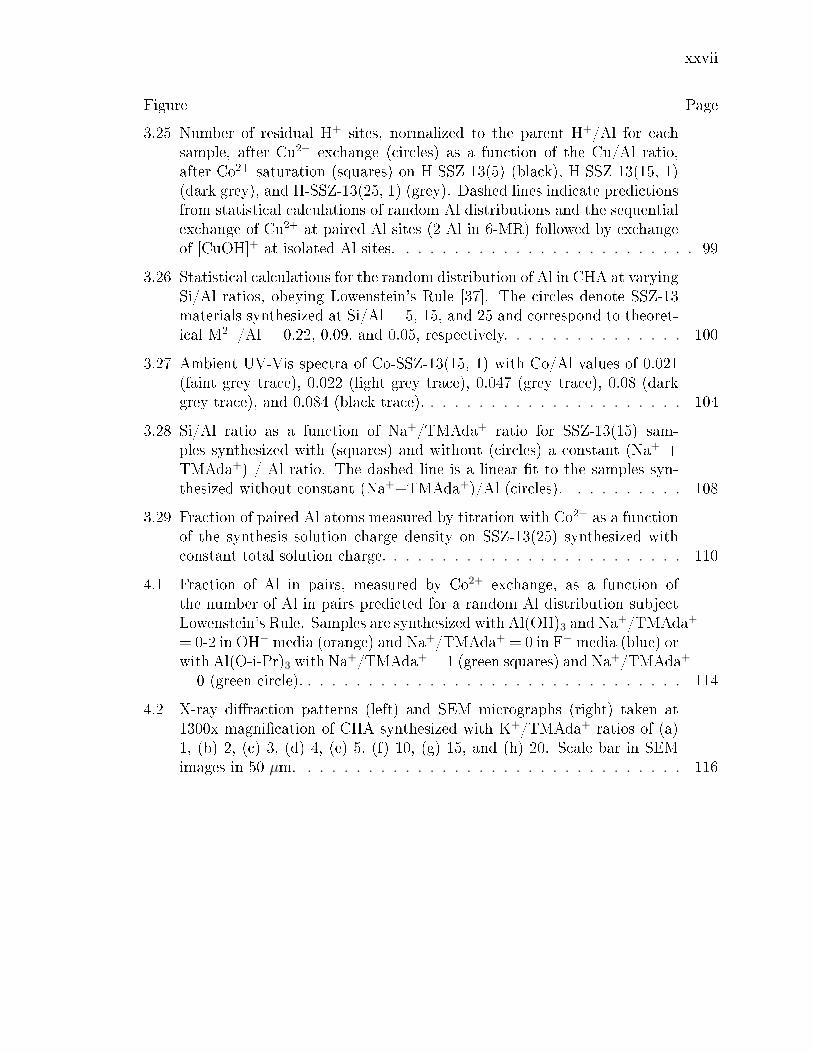
3.25 Number of residual H+ sites, normalized to the parent H+/Al for eachsample, after Cu2+ exchange (circles) as a function of the Cu/Al ratio,after Co2+ saturation (squares) on H-SSZ-13(5) (black), H-SSZ-13(15, 1)(dark grey), and H-SSZ-13(25, 1) (grey). Dashed lines indicate predictionsfrom statistical calculations of random Al distributions and the sequentialexchange of Cu2+ at paired Al sites (2 Al in 6-MR) followed by exchangeof [CuOH]+ at isolated Al sites. . . . . . . . . . . . . . . . . . . . . . . . . 99
3.26 Statistical calculations for the random distribution of Al in CHA at varyingSi/Al ratios, obeying Lowenstein's Rule [37]. The circles denote SSZ-13materials synthesized at Si/Al = 5, 15, and 25 and correspond to theoret-ical M2+/Al = 0.22, 0.09, and 0.05, respectively. . . . . . . . . . . . . . . 100
3.27 Ambient UV-Vis spectra of Co-SSZ-13(15, 1) with Co/Al values of 0.021(faint grey trace), 0.022 (light grey trace), 0.047 (grey trace), 0.08 (darkgrey trace), and 0.084 (black trace). . . . . . . . . . . . . . . . . . . . . . 104
3.28 Si/Al ratio as a function of Na+/TMAda+ ratio for SSZ-13(15) sam-ples synthesized with (squares) and without (circles) a constant (Na+ +TMAda+) / Al ratio. The dashed line is a linear t to the samples syn-thesized without constant (Na++TMAda+)/Al (circles). . . . . . . . . . 108
3.29 Fraction of paired Al atoms measured by titration with Co2+ as a functionof the synthesis solution charge density on SSZ-13(25) synthesized withconstant total solution charge. . . . . . . . . . . . . . . . . . . . . . . . . 110
4.1 Fraction of Al in pairs, measured by Co2+ exchange, as a function ofthe number of Al in pairs predicted for a random Al distribution subjectLowenstein's Rule. Samples are synthesized with Al(OH)3 and Na+/TMAda+
= 0-2 in OH− media (orange) and Na+/TMAda+ = 0 in F− media (blue) orwith Al(O-i-Pr)3 with Na+/TMAda+ = 1 (green squares) and Na+/TMAda+
= 0 (green circle). . . . . . . . . . . . . . . . . . . . . . . . . . . . . . . . 114
4.2 X-ray diraction patterns (left) and SEM micrographs (right) taken at1300x magnication of CHA synthesized with K+/TMAda+ ratios of (a)1, (b) 2, (c) 3, (d) 4, (e) 5, (f) 10, (g) 15, and (h) 20. Scale bar in SEMimages in 50 µm. . . . . . . . . . . . . . . . . . . . . . . . . . . . . . . . 116

xxviii
Figure Page
4.3 (a) Number of TMAda+ per CHA cage (squares), measured by TGA, andamount of Na+ retained per CHA cage (circles), measured by AAS, as afunction of the Na+/TMAda+ ratio in the synthesis media. (b) Number ofTMAda+ per CHA cage (squares and amount of K+ retained per CHA cage(circles) as a function of the K+/TMAda+ ratio in the synthesis media.(c) Number of TMAda+ per CHA cage as a function of the amount ofK+ (squares) or Na+ (circles) retained on the crystalline CHA product.Dashed (slope ca. 1/3) and dotted (slope ca. 0) lines are regressions toK+ (squares) and Na+ (circles) data sets, respectively. . . . . . . . . . . 118
4.4 (a) Snapshot of a single TMAda+ molecule (brown: C, blue: N, white: H)within the CHA cage. The numbers 1-6 correspond to the 6 unique Al sites,relative to the N atom of TMAda+, and the corresponding colors (1: green,2: grey, 3: orange, 4: light blue, 5: purple, 6: red) represent equivalentsites. (b) DFT energies, relative to Al position 1, of TMAda+ connedwith the CHA cage for the six dierent single Al sites in the 1x1x1 (black)and 1x1x2 (red) supercells. Inset snapshots show the relaxed structuresfor each Al position. . . . . . . . . . . . . . . . . . . . . . . . . . . . . . 121
4.5 DFT energies as a function of the Al-Al distance when two TMAda+
molecules are located in adjacent cages in CHA. Three unique TMAda-TMAda orientations were investigated at each Al-Al distance (Supp. Info.).122
4.6 (a) Snapshot of the most stable conguration of Na+ (black) in the pres-ence of a TMAda+ molecule in an adjacent cage with 2 framework Alatoms (green). Yellow: Si, green: Al, red: O, dark grey: C, blue: N,white: H, black: Na. (b) DFT energies as a function of the Al-Al distancewhen one Na+ and one TMAda+ molecule are located in adjacent cagesin CHA. . . . . . . . . . . . . . . . . . . . . . . . . . . . . . . . . . . . . 124
4.7 X-Ray diraction patterns of CHA synthesized using Al(O-i-Pr)3 at Si/Al= 15 and (a) Na+/TMAda+ = 0 and (b)-(d) Na+/TMAda+ = 1. . . . . 126
4.8 X-Ray diraction patterns of zeolites synthesized with K+/TMAda+ of(a) 30, (b) 50, (c) 100, and (d) ∞. A commercial MFI zeolite (Si/Al =43) is shown in (e). . . . . . . . . . . . . . . . . . . . . . . . . . . . . . . 127
4.9 SEM micrographs of CHA synthesized with K+/TMAda+ = 1 taken at(a) 1300x and (b) 5000x magnication. . . . . . . . . . . . . . . . . . . . 128
4.10 SEM micrographs of CHA synthesized with K+/TMAda+ = 2 taken at(a) 1250x and (b) 4800x magnication. . . . . . . . . . . . . . . . . . . . 128
4.11 SEM micrographs of CHA synthesized with K+/TMAda+ = 3 taken at(a) 1250x and (b) 5000x magnication. . . . . . . . . . . . . . . . . . . . 129
xxix
Figure Page
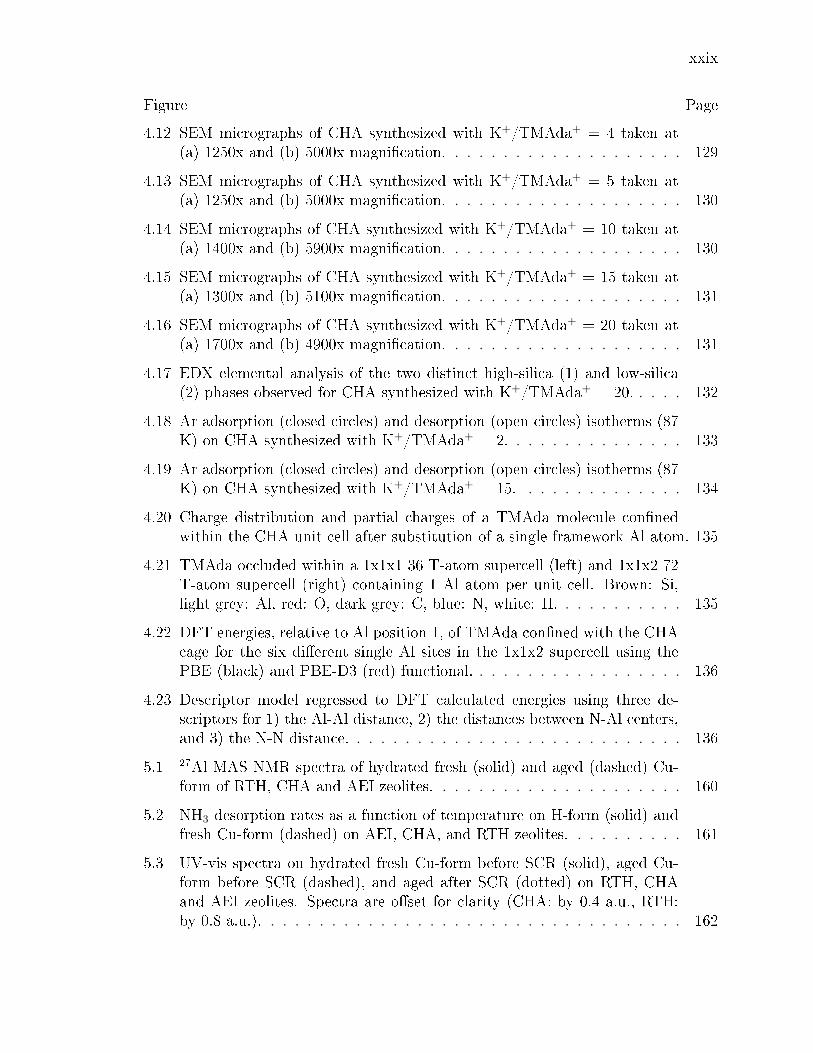
4.12 SEM micrographs of CHA synthesized with K+/TMAda+ = 4 taken at(a) 1250x and (b) 5000x magnication. . . . . . . . . . . . . . . . . . . . 129
4.13 SEM micrographs of CHA synthesized with K+/TMAda+ = 5 taken at(a) 1250x and (b) 5000x magnication. . . . . . . . . . . . . . . . . . . . 130
4.14 SEM micrographs of CHA synthesized with K+/TMAda+ = 10 taken at(a) 1400x and (b) 5900x magnication. . . . . . . . . . . . . . . . . . . . 130
4.15 SEM micrographs of CHA synthesized with K+/TMAda+ = 15 taken at(a) 1300x and (b) 5100x magnication. . . . . . . . . . . . . . . . . . . . 131
4.16 SEM micrographs of CHA synthesized with K+/TMAda+ = 20 taken at(a) 1700x and (b) 4900x magnication. . . . . . . . . . . . . . . . . . . . 131
4.17 EDX elemental analysis of the two distinct high-silica (1) and low-silica(2) phases observed for CHA synthesized with K+/TMAda+ = 20. . . . . 132
4.18 Ar adsorption (closed circles) and desorption (open circles) isotherms (87K) on CHA synthesized with K+/TMAda+ = 2. . . . . . . . . . . . . . . 133
4.19 Ar adsorption (closed circles) and desorption (open circles) isotherms (87K) on CHA synthesized with K+/TMAda+ = 15. . . . . . . . . . . . . . 134
4.20 Charge distribution and partial charges of a TMAda molecule connedwithin the CHA unit cell after substitution of a single framework Al atom. 135
4.21 TMAda occluded within a 1x1x1 36 T-atom supercell (left) and 1x1x2 72T-atom supercell (right) containing 1 Al atom per unit cell. Brown: Si,light grey: Al, red: O, dark grey: C, blue: N, white: H. . . . . . . . . . . 135
4.22 DFT energies, relative to Al position 1, of TMAda conned with the CHAcage for the six dierent single Al sites in the 1x1x2 supercell using thePBE (black) and PBE-D3 (red) functional. . . . . . . . . . . . . . . . . . 136
4.23 Descriptor model regressed to DFT calculated energies using three de-scriptors for 1) the Al-Al distance, 2) the distances between N-Al centers,and 3) the N-N distance. . . . . . . . . . . . . . . . . . . . . . . . . . . . 136
5.1 27Al MAS NMR spectra of hydrated fresh (solid) and aged (dashed) Cu-form of RTH, CHA and AEI zeolites. . . . . . . . . . . . . . . . . . . . . 160
5.2 NH3 desorption rates as a function of temperature on H-form (solid) andfresh Cu-form (dashed) on AEI, CHA, and RTH zeolites. . . . . . . . . . 161
5.3 UV-vis spectra on hydrated fresh Cu-form before SCR (solid), aged Cu-form before SCR (dashed), and aged after SCR (dotted) on RTH, CHAand AEI zeolites. Spectra are oset for clarity (CHA: by 0.4 a.u., RTH:by 0.8 a.u.). . . . . . . . . . . . . . . . . . . . . . . . . . . . . . . . . . . 162
xxx
Figure Page
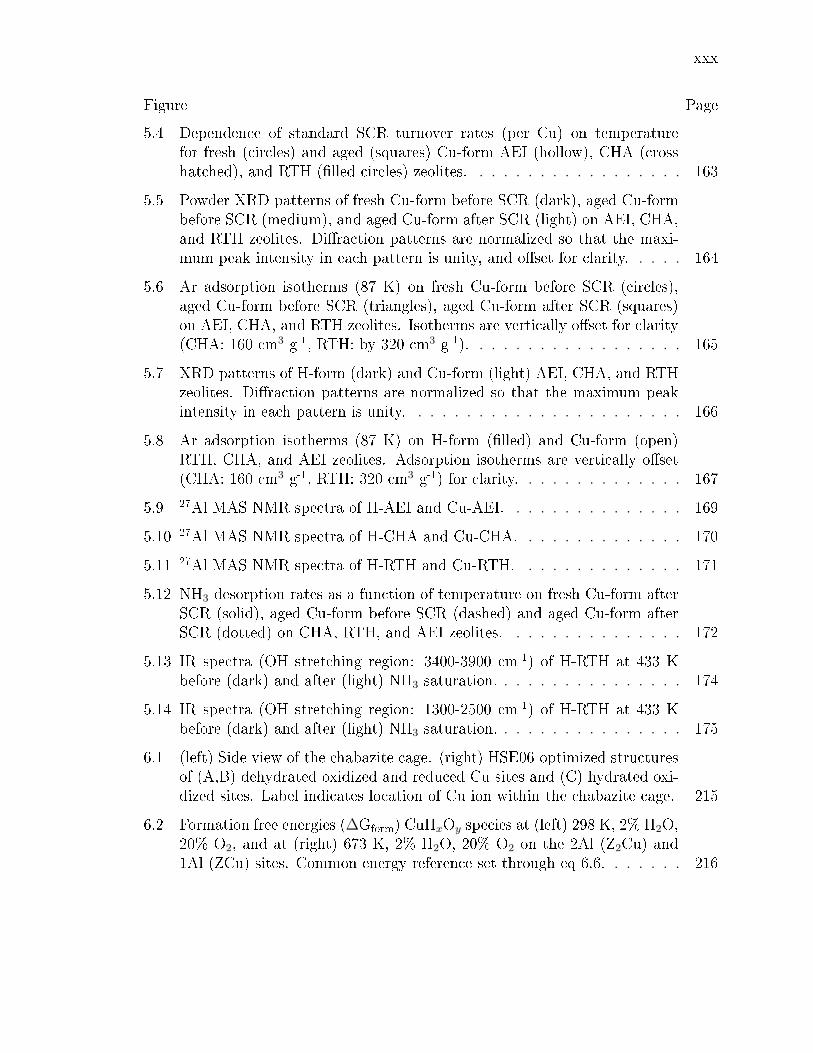
5.4 Dependence of standard SCR turnover rates (per Cu) on temperaturefor fresh (circles) and aged (squares) Cu-form AEI (hollow), CHA (crosshatched), and RTH (lled circles) zeolites. . . . . . . . . . . . . . . . . . 163
5.5 Powder XRD patterns of fresh Cu-form before SCR (dark), aged Cu-formbefore SCR (medium), and aged Cu-form after SCR (light) on AEI, CHA,and RTH zeolites. Diraction patterns are normalized so that the maxi-mum peak intensity in each pattern is unity, and oset for clarity. . . . . 164
5.6 Ar adsorption isotherms (87 K) on fresh Cu-form before SCR (circles),aged Cu-form before SCR (triangles), aged Cu-form after SCR (squares)on AEI, CHA, and RTH zeolites. Isotherms are vertically oset for clarity(CHA: 160 cm3 g-1, RTH: by 320 cm3 g-1). . . . . . . . . . . . . . . . . . 165
5.7 XRD patterns of H-form (dark) and Cu-form (light) AEI, CHA, and RTHzeolites. Diraction patterns are normalized so that the maximum peakintensity in each pattern is unity. . . . . . . . . . . . . . . . . . . . . . . 166
5.8 Ar adsorption isotherms (87 K) on H-form (lled) and Cu-form (open)RTH, CHA, and AEI zeolites. Adsorption isotherms are vertically oset(CHA: 160 cm3 g-1, RTH: 320 cm3 g-1) for clarity. . . . . . . . . . . . . . 167
5.9 27Al MAS NMR spectra of H-AEI and Cu-AEI. . . . . . . . . . . . . . . 169
5.10 27Al MAS NMR spectra of H-CHA and Cu-CHA. . . . . . . . . . . . . . 170
5.11 27Al MAS NMR spectra of H-RTH and Cu-RTH. . . . . . . . . . . . . . 171
5.12 NH3 desorption rates as a function of temperature on fresh Cu-form afterSCR (solid), aged Cu-form before SCR (dashed) and aged Cu-form afterSCR (dotted) on CHA, RTH, and AEI zeolites. . . . . . . . . . . . . . . 172
5.13 IR spectra (OH stretching region: 3400-3900 cm-1) of H-RTH at 433 Kbefore (dark) and after (light) NH3 saturation. . . . . . . . . . . . . . . . 174
5.14 IR spectra (OH stretching region: 1300-2500 cm-1) of H-RTH at 433 Kbefore (dark) and after (light) NH3 saturation. . . . . . . . . . . . . . . . 175
6.1 (left) Side view of the chabazite cage. (right) HSE06-optimized structuresof (A,B) dehydrated oxidized and reduced Cu sites and (C) hydrated oxi-dized sites. Label indicates location of Cu ion within the chabazite cage. 215
6.2 Formation free energies (∆Gform) CuHxOy species at (left) 298 K, 2% H2O,20% O2, and at (right) 673 K, 2% H2O, 20% O2 on the 2Al (Z2Cu) and1Al (ZCu) sites. Common energy reference set through eq 6.6. . . . . . . 216

xxxi
Figure Page
6.3 ex situ Cu speciation phase diagrams based on HSE06-TSvdw calculationson 1Al (left) and 2Al (right) Cu exchange sites. Regions indicate sitecomposition that minimizes free energy at 2% H2O and given T and PO2.Labeled on the phase diagram and illustrated below are minimum freeenergy species at (1) ambient (298 K, 20% O2), (2) oxidizing (673 K, 20%O2), and (3) inert (673 K, 10-6 atm O2 in He). . . . . . . . . . . . . . . . 217
6.4 Predicted Cu site compositional phase diagram versus Si:Al and Cu:Alratios. Color scale indicates predicted fraction of CuOH. White line de-marcates transition from [Z2Cu]-only region to mixed [Z2Cu]/[ZCuOH]region. White circles indicated compositions of synthesized Cu-SSZ-13samples. . . . . . . . . . . . . . . . . . . . . . . . . . . . . . . . . . . . . 218
6.5 Residual H+ sites per parent sample H+ from NH3 titrations on oxidizedM-SSZ-13 samples versus extent of M/Al exchange for Si:Al = 5 (blue),15 (green), and 25 (orange). Open and lled symbols denote Cu2+ andsaturated Co2+ exchange, respectively. Dashed lines are model predictions. 219
6.6 FTIR spectra of oxidized Cu-SSZ-13 samples (Cu:Al = 0-0.44, Si:Al =15). Inset: Integrated 3660 cm-1 CuO-H area as a function of Cu:Al ratio. 220
6.7 Left: XANES spectra collected on the 1Al (teal dashes) and 2Al (blacklines) Cu-SSZ-13 samples under treatment in 2% H2O, 20% O2 at 298 K.Middle: EXAFS spectra under the same conditions. Right: 298 K AIMDRDFs and integrated RDFs (inset). . . . . . . . . . . . . . . . . . . . . . 220
6.8 Cu positions (gray balls) visited during 90 ps of NVT AIMD at 298 K.Fixed zeolite framework shown for ease of visualization; framework wasunconstrained during dynamics. Inset illustrates discretization used tocompute relative Cu mobilities. . . . . . . . . . . . . . . . . . . . . . . . 221
6.9 Left: XANES spectra collected on the 1Al (top) and 2Al (bottom) samplesafter treatment in 20% O2 at 673 K (solid blue lines), He at 673 K (dashedteal lines), and in 3% H2 at 523 K (dot-dash red lines). Middle: Corre-sponding EXAFS spectra. Right: AIMD Cu-Si/O/Al RDFs for ZCuOHand ZCu (top) and Z2Cu (bottom). Insets show integrated RDFs. . . . . 223
6.10 Left: XANES spectra of the 1 Al (top) and 2Al (bottom) Cu-SSZ-13samples under treatment in 2% H2O, 10% O2, 300 ppm of NH3 at 473K (O2 + NH3, blue traces), 2% H2O and 300 ppm of NO/NH3 at 473 K(NO + NH3, red lines), and in 2% H2O, 10% O2, 300 ppm of NO/NH3 at473 K (black traces). Middle: EXAFS collected under same conditions.Right: AIMD Cu -Si/O/Al RDFs for the most stable CuI (red lines) andCuII (blue traces) species on the 1 and 2Al sites in the presence of NH3.Insets: Integrated RDFs. . . . . . . . . . . . . . . . . . . . . . . . . . . . 224
xxxii
Figure Page
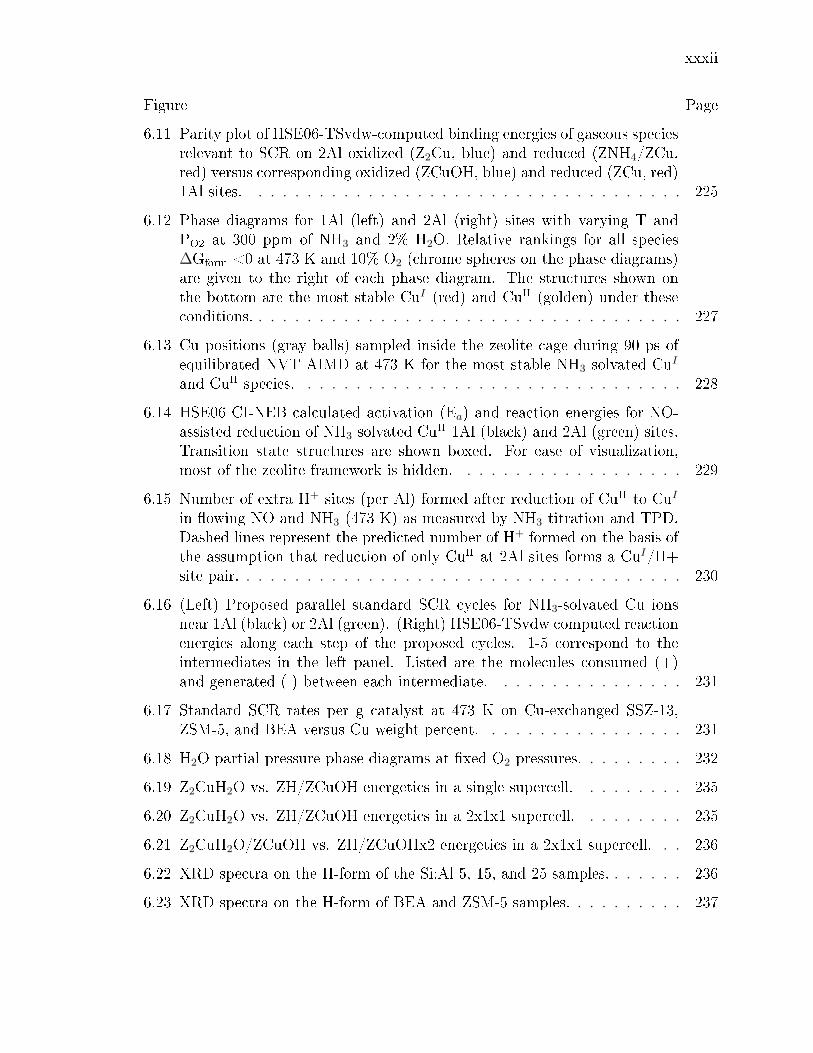
6.11 Parity plot of HSE06-TSvdw-computed binding energies of gaseous speciesrelevant to SCR on 2Al oxidized (Z2Cu, blue) and reduced (ZNH4/ZCu,red) versus corresponding oxidized (ZCuOH, blue) and reduced (ZCu, red)1Al sites. . . . . . . . . . . . . . . . . . . . . . . . . . . . . . . . . . . . 225
6.12 Phase diagrams for 1Al (left) and 2Al (right) sites with varying T andPO2 at 300 ppm of NH3 and 2% H2O. Relative rankings for all species∆Gform <0 at 473 K and 10% O2 (chrome spheres on the phase diagrams)are given to the right of each phase diagram. The structures shown onthe bottom are the most stable CuI (red) and CuII (golden) under theseconditions. . . . . . . . . . . . . . . . . . . . . . . . . . . . . . . . . . . . 227
6.13 Cu positions (gray balls) sampled inside the zeolite cage during 90 ps ofequilibrated NVT AIMD at 473 K for the most stable NH3 solvated CuI
and CuII species. . . . . . . . . . . . . . . . . . . . . . . . . . . . . . . . 228
6.14 HSE06 CI-NEB calculated activation (Ea) and reaction energies for NO-assisted reduction of NH3 solvated CuII 1Al (black) and 2Al (green) sites.Transition state structures are shown boxed. For ease of visualization,most of the zeolite framework is hidden. . . . . . . . . . . . . . . . . . . 229
6.15 Number of extra H+ sites (per Al) formed after reduction of CuII to CuI
in owing NO and NH3 (473 K) as measured by NH3 titration and TPD.Dashed lines represent the predicted number of H+ formed on the basis ofthe assumption that reduction of only CuII at 2Al sites forms a CuI/H+site pair. . . . . . . . . . . . . . . . . . . . . . . . . . . . . . . . . . . . . 230
6.16 (Left) Proposed parallel standard SCR cycles for NH3-solvated Cu ionsnear 1Al (black) or 2Al (green). (Right) HSE06-TSvdw computed reactionenergies along each step of the proposed cycles. 1-5 correspond to theintermediates in the left panel. Listed are the molecules consumed (+)and generated (-) between each intermediate. . . . . . . . . . . . . . . . 231
6.17 Standard SCR rates per g catalyst at 473 K on Cu-exchanged SSZ-13,ZSM-5, and BEA versus Cu weight percent. . . . . . . . . . . . . . . . . 231
6.18 H2O partial pressure phase diagrams at xed O2 pressures. . . . . . . . . 232
6.19 Z2CuH2O vs. ZH/ZCuOH energetics in a single supercell. . . . . . . . . 235
6.20 Z2CuH2O vs. ZH/ZCuOH energetics in a 2x1x1 supercell. . . . . . . . . 235
6.21 Z2CuH2O/ZCuOH vs. ZH/ZCuOHx2 energetics in a 2x1x1 supercell. . . 236
6.22 XRD spectra on the H-form of the Si:Al 5, 15, and 25 samples. . . . . . . 236
6.23 XRD spectra on the H-form of BEA and ZSM-5 samples. . . . . . . . . . 237

xxxiii
Figure Page
6.24 (left) XRD spectra for Si:Al 5 samples with H:Al ranging from 0.85(A)to 0.65(B) to 0.45(C) (right) NH3 TPDs following a purge of physisorbedNH3 to determine the number of H:Al. . . . . . . . . . . . . . . . . . . . 240
6.25 Residual H+ sites per parent sample H+ from NH3 titrations on oxidizedM-SSZ-13 samples vs. extent of M/Al exchange for Si:Al = 5 at a pH=5(black shapes) and no pH control (green shapes). Open and lled symbolsdenote Cu2+ and saturated Co2+ exchange, respectively. Dashed lines aremodel predictions. . . . . . . . . . . . . . . . . . . . . . . . . . . . . . . 241
6.26 Ring structures surrounding the 6MR, shown in perspective view for clar-ity. 4MR and 8MR alternates around the 6MR. . . . . . . . . . . . . . . 245
6.27 Pictures of Z2Cu modes. . . . . . . . . . . . . . . . . . . . . . . . . . . . 246
6.28 RDF of Cu-x (x=Si,Al,O) in [Z2CuII]. . . . . . . . . . . . . . . . . . . . . 247
6.29 RDF of Cu-x (x=Si,Al,O) in [ZCuI ]. . . . . . . . . . . . . . . . . . . . . 248
6.30 RDF of Cu-x (x=Si,Al,O) in [ZCuIIOH]. . . . . . . . . . . . . . . . . . . 249
6.31 RDF of Cu-x (x=Si,Al,O) in Z2[CuII(H2O)4](H2O)2. . . . . . . . . . . . . 250
6.32 RDF of Cu-x (x=Si,Al,O) in Z2[CuII(H2O)3](H2O)3. . . . . . . . . . . . . 251
6.33 RDF of Cu-x (x=Si,Al,O,N) in Z[CuI(NH3)2]. . . . . . . . . . . . . . . . 252
6.34 RDF of Cu-x (x=Si,Al,O,N) in Z[CuI(NH3)2]/[ZNH4]. . . . . . . . . . . . 253
6.35 RDF of Cu-x (x=Si,Al,O,N) in Z2[CuII(NH3)4]. . . . . . . . . . . . . . . 254
6.36 RDF of Cu-x (x=Si,Al,O,N) in Z[CuII(OH)(NH3)3]. . . . . . . . . . . . . 255
6.37 XANES spectra collected after exposing Si:Al 4.5 Cu:Al 0.08 (2Al) andSi:Al 15 Cu:Al 0.44 (1Al) to O2 balance He at 673 K following pretreatmentin He at 673 K. . . . . . . . . . . . . . . . . . . . . . . . . . . . . . . . . 256
6.38 CI-NEB for Cu diammine to transverse the 8MR. . . . . . . . . . . . . . 259
6.39 EXAFS spectrum collected at 473 K, 2% H2O, 300 ppm NH3, 10% O2, 300ppm NO, on a Cu:Al = 0.41, Si:Al = 25 sample. Rate per gram catalystis 81x10-8. . . . . . . . . . . . . . . . . . . . . . . . . . . . . . . . . . . . 260
6.40 XANES spectra collected after exposing Si:Al = 4.5, Cu:Al = 0.08 (2Al)and Si:Al = 15, Cu:Al = 0.44 (1Al) to O2 balance He at 673 K followingpretreatment in He at 673 K. . . . . . . . . . . . . . . . . . . . . . . . . 261
6.41 Titration of residual Brønsted sites on a Si:Al=5 Cu:Al=0.21 SSZ-13 sam-ple, before reduction in NO+NH3, after reduction, and after reductionfollowed by oxidation. . . . . . . . . . . . . . . . . . . . . . . . . . . . . 262

xxxiv
Figure Page
6.42 EXAFS spectra collected after exposing Si:Al 4.5 Cu:Al 0.08 (2Al) to eitherNO+NH3 (red) or O2+NH3 (orange), at (left) 200 C, and (right) 400 C. 265
6.43 XANES spectra collected after exposing Si:Al 15 Cu:Al 0.44 to 300 ppmNO and balance He at 200 C until steady-state. . . . . . . . . . . . . . . 266
6.44 Micropore Ar adsorption isotherms on H-SSZ-13 5, 15, and 25 samples. . 269
6.45 Micropore N2 adsorption isotherms on H-BEA and H-ZSM-5. . . . . . . 270
6.46 27Al NMR spectra for SSZ-13 at Si:Al 5, 15, 25. . . . . . . . . . . . . . . 272
7.1 Cu-density dependence of SCR rates. (A) The CHA cage [1] andschematic representation of the Cu ion densities per CHA cage in samples aand g. (B)Standard NOx SCR rates (per volume catalyst; 473 K; measuredin a dierential reactor by using a gas mixture representative of practicallow-temperature application, including 2.5% H2O; details in Supp. Info.section 7.8.2) and apparent O2 orders measured on Cu-CHA-X samples(Si/Al = 15, table 7.3) of increasing Cu ion density. Colored line is avisual guide; regression ts to the quadratic (R2 = 0.99) and linear (R2 =0.99) kinetic regimes are detailed in Supp. Info. section 7.8.2. . . . . . . 288
7.2 Cu-density dependence of operando Cu oxidation state. The de-pendence of CuI fraction on Cu ion volumetric density during steady-statestandard SCR at 473 K was measured by XANES (details in Supp. Info.section 7.8.3). Data points include samples a, f, and g shown in Fig. 7.1(Si/Al = 15, lled squares), samples at Si/Al = 4.5 and Si/Al = 25 (opensquares), and comparable literature data [open circle Ref [360], Si/Al =16; open triangle Ref [41], Si/Al = 4.5]. Inset shows NH3-solvated, isolatedCuI and CuII species previously observed and computed [79] to be presentduring standard SCR at 473 K. Gray, Cu; green, Al; yellow, Si; red, O;blue, N; and white, H. The colored arrow is a visual guide; error barsrepresent the absolute 5% uncertainty from linear combination XANEStting (details in Supp. Info. section 7.8.3). . . . . . . . . . . . . . . . . 289
xxxv
Figure Page
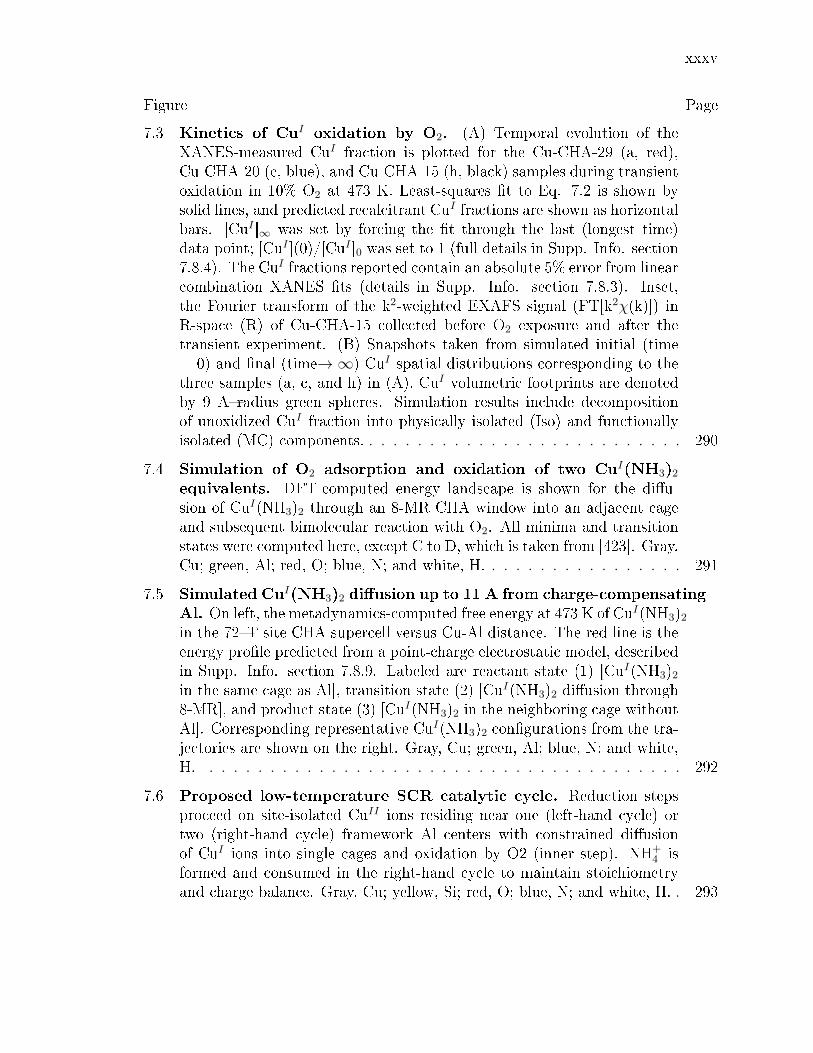
7.3 Kinetics of CuI oxidation by O2. (A) Temporal evolution of theXANES-measured CuI fraction is plotted for the Cu-CHA-29 (a, red),Cu-CHA-20 (c, blue), and Cu-CHA-15 (h, black) samples during transientoxidation in 10% O2 at 473 K. Least-squares t to Eq. 7.2 is shown bysolid lines, and predicted recalcitrant CuI fractions are shown as horizontalbars. [CuI ]∞ was set by forcing the t through the last (longest time)data point; [CuI ](0)/[CuI ]0 was set to 1 (full details in Supp. Info. section7.8.4). The CuI fractions reported contain an absolute 5% error from linearcombination XANES ts (details in Supp. Info. section 7.8.3). Inset,the Fourier transform of the k2-weighted EXAFS signal (FT[k2χ(k)]) inR-space (R) of Cu-CHA-15 collected before O2 exposure and after thetransient experiment. (B) Snapshots taken from simulated initial (time= 0) and nal (time→∞) CuI spatial distributions corresponding to thethree samples (a, c, and h) in (A). CuI volumetric footprints are denotedby 9 Aradius green spheres. Simulation results include decompositionof unoxidized CuI fraction into physically isolated (Iso) and functionallyisolated (MC) components. . . . . . . . . . . . . . . . . . . . . . . . . . . 290
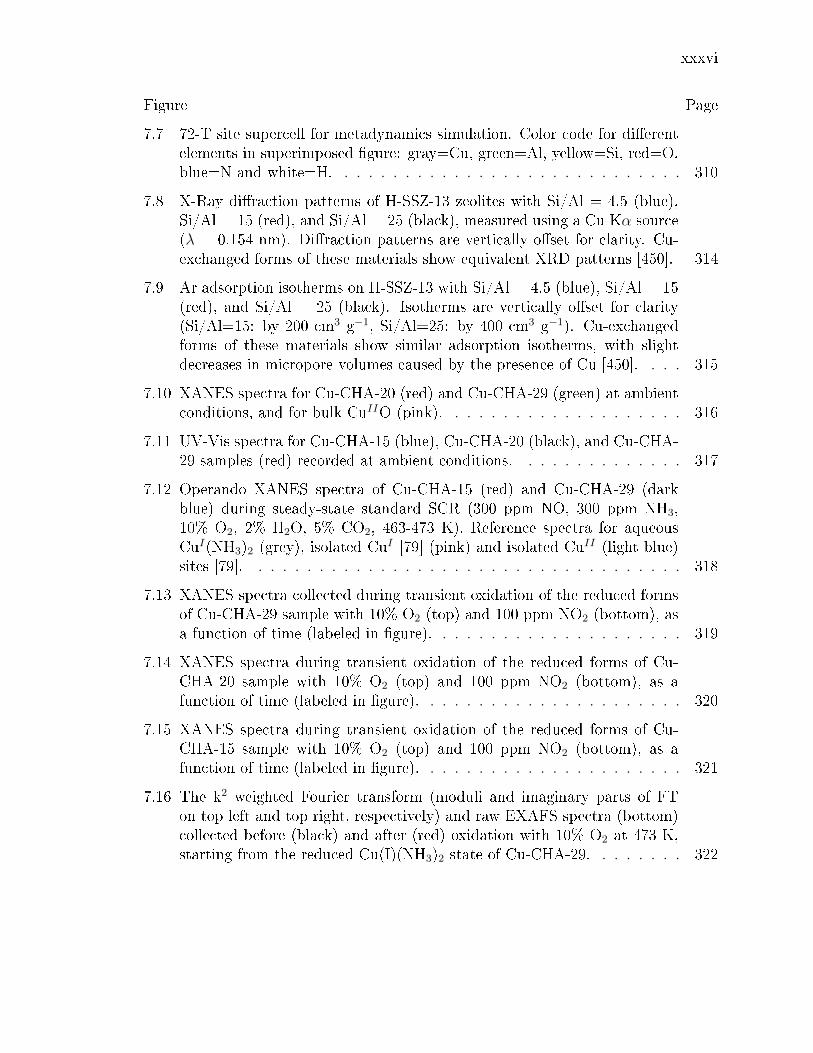
7.4 Simulation of O2 adsorption and oxidation of two CuI(NH3)2
equivalents. DFT-computed energy landscape is shown for the diu-sion of CuI(NH3)2 through an 8-MR CHA window into an adjacent cageand subsequent bimolecular reaction with O2. All minima and transitionstates were computed here, except C to D, which is taken from [423]. Gray,Cu; green, Al; red, O; blue, N; and white, H. . . . . . . . . . . . . . . . . 291
7.5 Simulated CuI(NH3)2 diusion up to 11 A from charge-compensatingAl. On left, the metadynamics-computed free energy at 473 K of CuI(NH3)2in the 72T site CHA supercell versus Cu-Al distance. The red line is theenergy prole predicted from a point-charge electrostatic model, describedin Supp. Info. section 7.8.9. Labeled are reactant state (1) [CuI(NH3)2in the same cage as Al], transition state (2) [CuI(NH3)2 diusion through8-MR], and product state (3) [CuI(NH3)2 in the neighboring cage withoutAl]. Corresponding representative CuI(NH3)2 congurations from the tra-jectories are shown on the right. Gray, Cu; green, Al; blue, N; and white,H. . . . . . . . . . . . . . . . . . . . . . . . . . . . . . . . . . . . . . . . 292
7.6 Proposed low-temperature SCR catalytic cycle. Reduction stepsproceed on site-isolated CuII ions residing near one (left-hand cycle) ortwo (right-hand cycle) framework Al centers with constrained diusionof CuI ions into single cages and oxidation by O2 (inner step). NH+
4 isformed and consumed in the right-hand cycle to maintain stoichiometryand charge balance. Gray, Cu; yellow, Si; red, O; blue, N; and white, H. . 293
xxxvi
Figure Page
7.7 72-T site supercell for metadynamics simulation. Color code for dierentelements in superimposed gure: gray=Cu, green=Al, yellow=Si, red=O,blue=N and white=H. . . . . . . . . . . . . . . . . . . . . . . . . . . . . 310
7.8 X-Ray diraction patterns of H-SSZ-13 zeolites with Si/Al = 4.5 (blue),Si/Al = 15 (red), and Si/Al = 25 (black), measured using a Cu Kα source(λ = 0.154 nm). Diraction patterns are vertically oset for clarity. Cu-exchanged forms of these materials show equivalent XRD patterns [450]. 314
7.9 Ar adsorption isotherms on H-SSZ-13 with Si/Al = 4.5 (blue), Si/Al = 15(red), and Si/Al = 25 (black). Isotherms are vertically oset for clarity(Si/Al=15: by 200 cm3 g−1, Si/Al=25: by 400 cm3 g−1). Cu-exchangedforms of these materials show similar adsorption isotherms, with slightdecreases in micropore volumes caused by the presence of Cu [450]. . . . 315
7.10 XANES spectra for Cu-CHA-20 (red) and Cu-CHA-29 (green) at ambientconditions, and for bulk CuIIO (pink). . . . . . . . . . . . . . . . . . . . 316
7.11 UV-Vis spectra for Cu-CHA-15 (blue), Cu-CHA-20 (black), and Cu-CHA-29 samples (red) recorded at ambient conditions. . . . . . . . . . . . . . 317
7.12 Operando XANES spectra of Cu-CHA-15 (red) and Cu-CHA-29 (darkblue) during steady-state standard SCR (300 ppm NO, 300 ppm NH3,10% O2, 2% H2O, 5% CO2, 463-473 K). Reference spectra for aqueousCuI(NH3)2 (grey), isolated CuI [79] (pink) and isolated CuII (light blue)sites [79]. . . . . . . . . . . . . . . . . . . . . . . . . . . . . . . . . . . . 318
7.13 XANES spectra collected during transient oxidation of the reduced formsof Cu-CHA-29 sample with 10% O2 (top) and 100 ppm NO2 (bottom), asa function of time (labeled in gure). . . . . . . . . . . . . . . . . . . . . 319
7.14 XANES spectra during transient oxidation of the reduced forms of Cu-CHA-20 sample with 10% O2 (top) and 100 ppm NO2 (bottom), as afunction of time (labeled in gure). . . . . . . . . . . . . . . . . . . . . . 320
7.15 XANES spectra during transient oxidation of the reduced forms of Cu-CHA-15 sample with 10% O2 (top) and 100 ppm NO2 (bottom), as afunction of time (labeled in gure). . . . . . . . . . . . . . . . . . . . . . 321
7.16 The k2 weighted Fourier transform (moduli and imaginary parts of FTon top left and top right, respectively) and raw EXAFS spectra (bottom)collected before (black) and after (red) oxidation with 10% O2 at 473 K,starting from the reduced Cu(I)(NH3)2 state of Cu-CHA-29. . . . . . . . 322
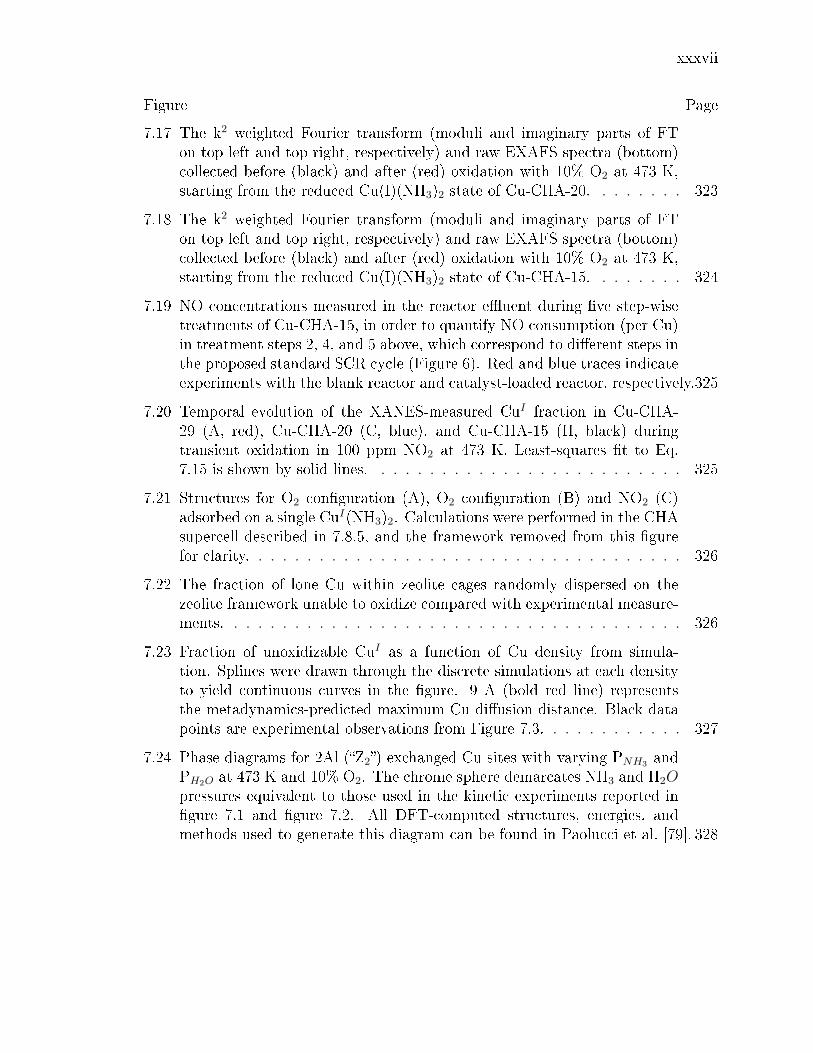
xxxvii
Figure Page
7.17 The k2 weighted Fourier transform (moduli and imaginary parts of FTon top left and top right, respectively) and raw EXAFS spectra (bottom)collected before (black) and after (red) oxidation with 10% O2 at 473 K,starting from the reduced Cu(I)(NH3)2 state of Cu-CHA-20. . . . . . . . 323
7.18 The k2 weighted Fourier transform (moduli and imaginary parts of FTon top left and top right, respectively) and raw EXAFS spectra (bottom)collected before (black) and after (red) oxidation with 10% O2 at 473 K,starting from the reduced Cu(I)(NH3)2 state of Cu-CHA-15. . . . . . . . 324
7.19 NO concentrations measured in the reactor euent during ve step-wisetreatments of Cu-CHA-15, in order to quantify NO consumption (per Cu)in treatment steps 2, 4, and 5 above, which correspond to dierent steps inthe proposed standard SCR cycle (Figure 6). Red and blue traces indicateexperiments with the blank reactor and catalyst-loaded reactor, respectively.325
7.20 Temporal evolution of the XANES-measured CuI fraction in Cu-CHA-29 (A, red), Cu-CHA-20 (C, blue), and Cu-CHA-15 (H, black) duringtransient oxidation in 100 ppm NO2 at 473 K. Least-squares t to Eq.7.15 is shown by solid lines. . . . . . . . . . . . . . . . . . . . . . . . . . 325
7.21 Structures for O2 conguration (A), O2 conguration (B) and NO2 (C)adsorbed on a single CuI(NH3)2. Calculations were performed in the CHAsupercell described in 7.8.5, and the framework removed from this gurefor clarity. . . . . . . . . . . . . . . . . . . . . . . . . . . . . . . . . . . . 326
7.22 The fraction of lone Cu within zeolite cages randomly dispersed on thezeolite framework unable to oxidize compared with experimental measure-ments. . . . . . . . . . . . . . . . . . . . . . . . . . . . . . . . . . . . . . 326
7.23 Fraction of unoxidizable CuI as a function of Cu density from simula-tion. Splines were drawn through the discrete simulations at each densityto yield continuous curves in the gure. 9 A (bold red line) representsthe metadynamics-predicted maximum Cu diusion distance. Black datapoints are experimental observations from Figure 7.3. . . . . . . . . . . . 327
7.24 Phase diagrams for 2Al (Z2) exchanged Cu sites with varying PNH3 andPH2O at 473 K and 10% O2. The chrome sphere demarcates NH3 and H2Opressures equivalent to those used in the kinetic experiments reported ingure 7.1 and gure 7.2. All DFT-computed structures, energies, andmethods used to generate this diagram can be found in Paolucci et al. [79]. 328
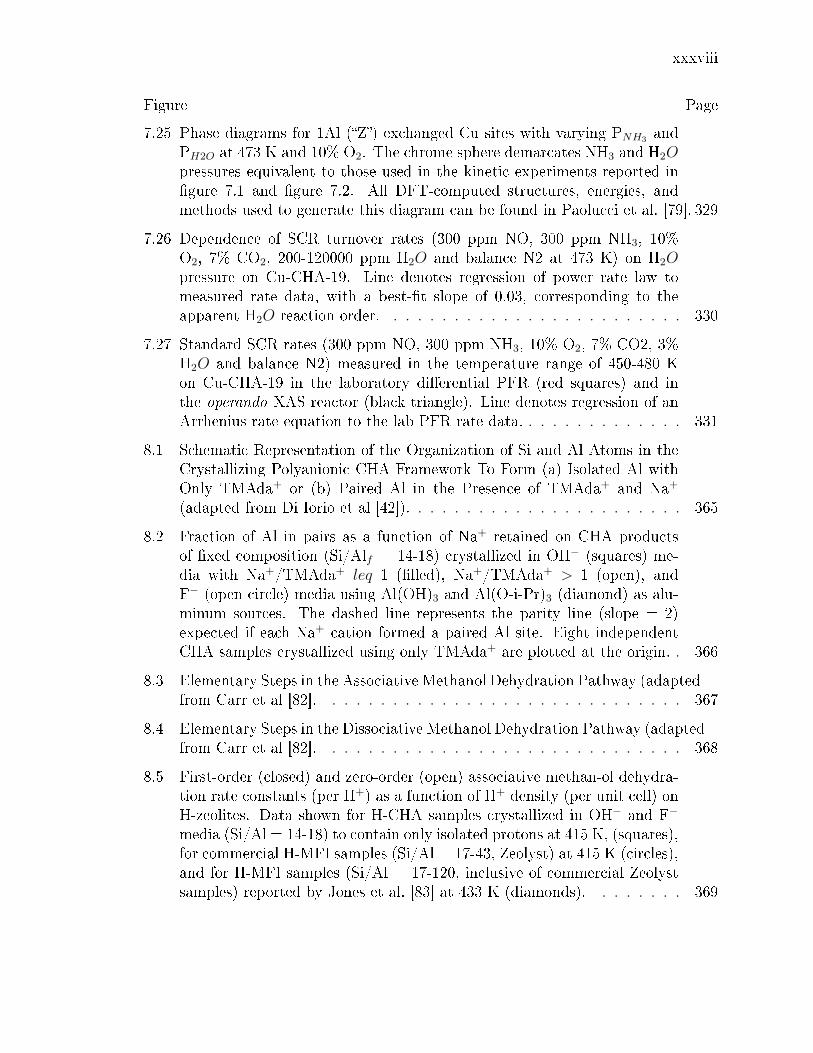
xxxviii
Figure Page
7.25 Phase diagrams for 1Al (Z) exchanged Cu sites with varying PNH3 andPH2O at 473 K and 10% O2. The chrome sphere demarcates NH3 and H2Opressures equivalent to those used in the kinetic experiments reported ingure 7.1 and gure 7.2. All DFT-computed structures, energies, andmethods used to generate this diagram can be found in Paolucci et al. [79]. 329
7.26 Dependence of SCR turnover rates (300 ppm NO, 300 ppm NH3, 10%O2, 7% CO2, 200-120000 ppm H2O and balance N2 at 473 K) on H2Opressure on Cu-CHA-19. Line denotes regression of power rate law tomeasured rate data, with a best-t slope of 0.03, corresponding to theapparent H2O reaction order. . . . . . . . . . . . . . . . . . . . . . . . . 330
7.27 Standard SCR rates (300 ppm NO, 300 ppm NH3, 10% O2, 7% CO2, 3%H2O and balance N2) measured in the temperature range of 450-480 Kon Cu-CHA-19 in the laboratory dierential PFR (red squares) and inthe operando XAS reactor (black triangle). Line denotes regression of anArrhenius rate equation to the lab PFR rate data. . . . . . . . . . . . . . 331
8.1 Schematic Representation of the Organization of Si and Al Atoms in theCrystallizing Polyanionic CHA Framework To Form (a) Isolated Al withOnly TMAda+ or (b) Paired Al in the Presence of TMAda+ and Na+
(adapted from Di Iorio et al [42]). . . . . . . . . . . . . . . . . . . . . . . 365
8.2 Fraction of Al in pairs as a function of Na+ retained on CHA productsof xed composition (Si/Alf = 14-18) crystallized in OH− (squares) me-dia with Na+/TMAda+ leq 1 (lled), Na+/TMAda+ > 1 (open), andF− (open circle) media using Al(OH)3 and Al(O-i-Pr)3 (diamond) as alu-minum sources. The dashed line represents the parity line (slope = 2)expected if each Na+ cation formed a paired Al site. Eight independentCHA samples crystallized using only TMAda+ are plotted at the origin. . 366
8.3 Elementary Steps in the Associative Methanol Dehydration Pathway (adaptedfrom Carr et al [82]. . . . . . . . . . . . . . . . . . . . . . . . . . . . . . 367
8.4 Elementary Steps in the Dissociative Methanol Dehydration Pathway (adaptedfrom Carr et al [82]. . . . . . . . . . . . . . . . . . . . . . . . . . . . . . 368
8.5 First-order (closed) and zero-order (open) associative methan-ol dehydra-tion rate constants (per H+) as a function of H+ density (per unit cell) onH-zeolites. Data shown for H-CHA samples crystallized in OH− and F−
media (Si/Al = 14-18) to contain only isolated protons at 415 K, (squares),for commercial H-MFI samples (Si/Al = 17-43, Zeolyst) at 415 K (circles),and for H-MFI samples (Si/Al = 17-120, inclusive of commercial Zeolystsamples) reported by Jones et al. [83] at 433 K (diamonds). . . . . . . . 369
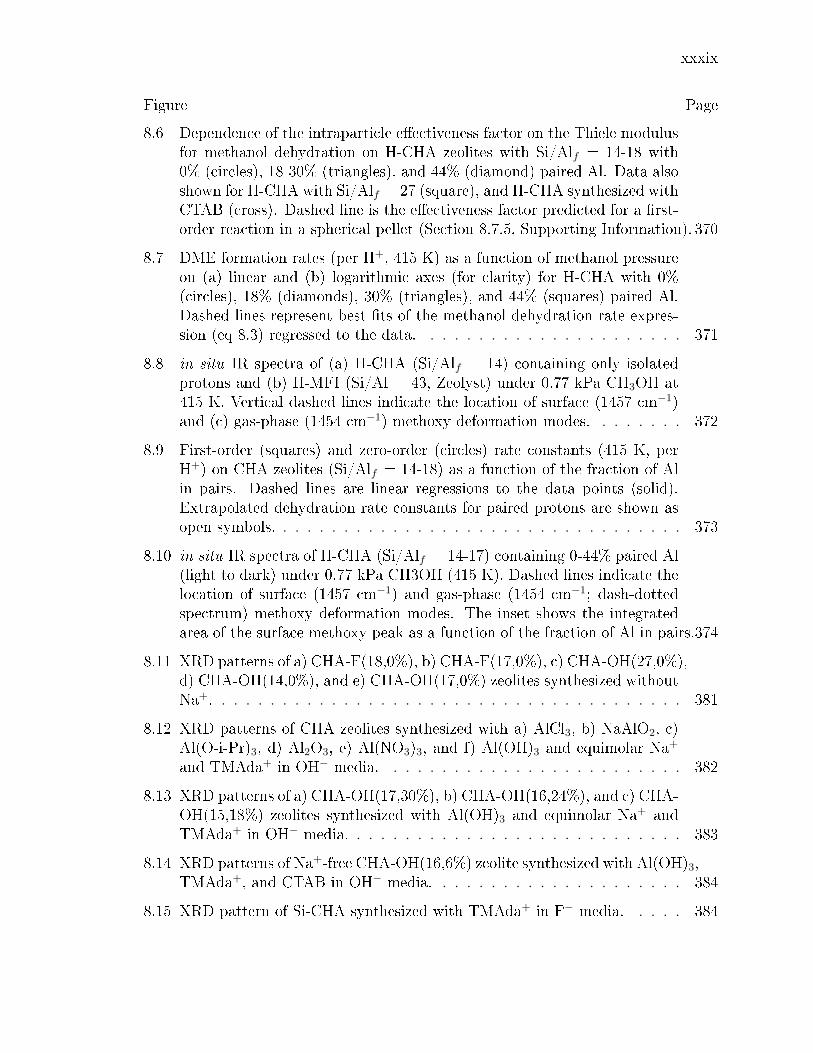
xxxix
Figure Page
8.6 Dependence of the intraparticle eectiveness factor on the Thiele modulusfor methanol dehydration on H-CHA zeolites with Si/Alf = 14-18 with0% (circles), 18-30% (triangles), and 44% (diamond) paired Al. Data alsoshown for H-CHA with Si/Alf = 27 (square), and H-CHA synthesized withCTAB (cross). Dashed line is the eectiveness factor predicted for a rst-order reaction in a spherical pellet (Section 8.7.5, Supporting Information). 370
8.7 DME formation rates (per H+, 415 K) as a function of methanol pressureon (a) linear and (b) logarithmic axes (for clarity) for H-CHA with 0%(circles), 18% (diamonds), 30% (triangles), and 44% (squares) paired Al.Dashed lines represent best ts of the methanol dehydration rate expres-sion (eq 8.3) regressed to the data. . . . . . . . . . . . . . . . . . . . . . 371
8.8 in situ IR spectra of (a) H-CHA (Si/Alf = 14) containing only isolatedprotons and (b) H-MFI (Si/Al = 43, Zeolyst) under 0.77 kPa CH3OH at415 K. Vertical dashed lines indicate the location of surface (1457 cm−1)and (c) gas-phase (1454 cm−1) methoxy deformation modes. . . . . . . . 372
8.9 First-order (squares) and zero-order (circles) rate constants (415 K, perH+) on CHA zeolites (Si/Alf = 14-18) as a function of the fraction of Alin pairs. Dashed lines are linear regressions to the data points (solid).Extrapolated dehydration rate constants for paired protons are shown asopen symbols. . . . . . . . . . . . . . . . . . . . . . . . . . . . . . . . . . 373
8.10 in situ IR spectra of H-CHA (Si/Alf = 14-17) containing 0-44% paired Al(light to dark) under 0.77 kPa CH3OH (415 K). Dashed lines indicate thelocation of surface (1457 cm−1) and gas-phase (1454 cm−1; dash-dottedspectrum) methoxy deformation modes. The inset shows the integratedarea of the surface methoxy peak as a function of the fraction of Al in pairs.374
8.11 XRD patterns of a) CHA-F(18,0%), b) CHA-F(17,0%), c) CHA-OH(27,0%),d) CHA-OH(14,0%), and e) CHA-OH(17,0%) zeolites synthesized withoutNa+. . . . . . . . . . . . . . . . . . . . . . . . . . . . . . . . . . . . . . . 381
8.12 XRD patterns of CHA zeolites synthesized with a) AlCl3, b) NaAlO2, c)Al(O-i-Pr)3, d) Al2O3, e) Al(NO3)3, and f) Al(OH)3 and equimolar Na+
and TMAda+ in OH− media. . . . . . . . . . . . . . . . . . . . . . . . . 382
8.13 XRD patterns of a) CHA-OH(17,30%), b) CHA-OH(16,24%), and c) CHA-OH(15,18%) zeolites synthesized with Al(OH)3 and equimolar Na+ andTMAda+ in OH− media. . . . . . . . . . . . . . . . . . . . . . . . . . . . 383
8.14 XRD patterns of Na+-free CHA-OH(16,6%) zeolite synthesized with Al(OH)3,TMAda+, and CTAB in OH− media. . . . . . . . . . . . . . . . . . . . . 384
8.15 XRD pattern of Si-CHA synthesized with TMAda+ in F− media. . . . . 384
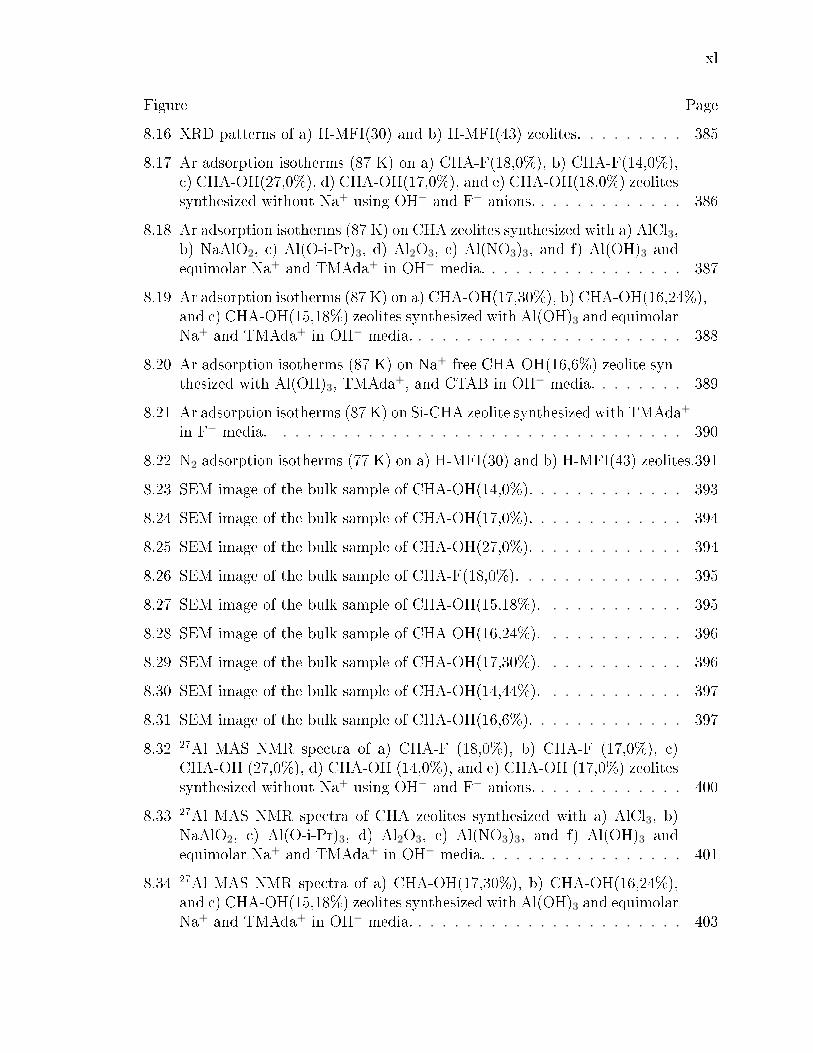
xl
Figure Page
8.16 XRD patterns of a) H-MFI(30) and b) H-MFI(43) zeolites. . . . . . . . . 385
8.17 Ar adsorption isotherms (87 K) on a) CHA-F(18,0%), b) CHA-F(14,0%),c) CHA-OH(27,0%), d) CHA-OH(17,0%), and e) CHA-OH(18,0%) zeolitessynthesized without Na+ using OH− and F− anions. . . . . . . . . . . . . 386
8.18 Ar adsorption isotherms (87 K) on CHA zeolites synthesized with a) AlCl3,b) NaAlO2, c) Al(O-i-Pr)3, d) Al2O3, e) Al(NO3)3, and f) Al(OH)3 andequimolar Na+ and TMAda+ in OH− media. . . . . . . . . . . . . . . . . 387
8.19 Ar adsorption isotherms (87 K) on a) CHA-OH(17,30%), b) CHA-OH(16,24%),and c) CHA-OH(15,18%) zeolites synthesized with Al(OH)3 and equimolarNa+ and TMAda+ in OH− media. . . . . . . . . . . . . . . . . . . . . . . 388
8.20 Ar adsorption isotherms (87 K) on Na+-free CHA-OH(16,6%) zeolite syn-thesized with Al(OH)3, TMAda+, and CTAB in OH− media. . . . . . . . 389
8.21 Ar adsorption isotherms (87 K) on Si-CHA zeolite synthesized with TMAda+
in F− media. . . . . . . . . . . . . . . . . . . . . . . . . . . . . . . . . . 390
8.22 N2 adsorption isotherms (77 K) on a) H-MFI(30) and b) H-MFI(43) zeolites.391
8.23 SEM image of the bulk sample of CHA-OH(14,0%). . . . . . . . . . . . . 393
8.24 SEM image of the bulk sample of CHA-OH(17,0%). . . . . . . . . . . . . 394
8.25 SEM image of the bulk sample of CHA-OH(27,0%). . . . . . . . . . . . . 394
8.26 SEM image of the bulk sample of CHA-F(18,0%). . . . . . . . . . . . . . 395
8.27 SEM image of the bulk sample of CHA-OH(15,18%). . . . . . . . . . . . 395
8.28 SEM image of the bulk sample of CHA-OH(16,24%). . . . . . . . . . . . 396
8.29 SEM image of the bulk sample of CHA-OH(17,30%). . . . . . . . . . . . 396
8.30 SEM image of the bulk sample of CHA-OH(14,44%). . . . . . . . . . . . 397
8.31 SEM image of the bulk sample of CHA-OH(16,6%). . . . . . . . . . . . . 397
8.32 27Al MAS NMR spectra of a) CHA-F (18,0%), b) CHA-F (17,0%), c)CHA-OH (27,0%), d) CHA-OH (14,0%), and e) CHA-OH (17,0%) zeolitessynthesized without Na+ using OH− and F− anions. . . . . . . . . . . . . 400
8.33 27Al MAS NMR spectra of CHA zeolites synthesized with a) AlCl3, b)NaAlO2, c) Al(O-i-Pr)3, d) Al2O3, e) Al(NO3)3, and f) Al(OH)3 andequimolar Na+ and TMAda+ in OH− media. . . . . . . . . . . . . . . . . 401
8.34 27Al MAS NMR spectra of a) CHA-OH(17,30%), b) CHA-OH(16,24%),and c) CHA-OH(15,18%) zeolites synthesized with Al(OH)3 and equimolarNa+ and TMAda+ in OH− media. . . . . . . . . . . . . . . . . . . . . . . 403

xli
Figure Page
8.35 Amount of exchanged Co2+ retained on H-CHA-F(18,0%) as a function ofthe Co2+ concentration in solution at equilibrium. . . . . . . . . . . . . . 405
8.36 Amount of Co2+ retained on H-CHA-F(18,0%) as a function of successiveCo2+ titrations with a 0.5M Co(NO3)2 solution. . . . . . . . . . . . . . . 406
8.37 The number of residual H+ sites (per H+ site on the H-form parent zeolite)as a function of the Cu-loading (per H+ site on the H-form parent zeolite)for CHA-OH(16,24%) (circle), CHA-OH(14,0%) (square), CHA-F(17,0%)(diamond), and CHA-F(18,0%) (triangle) zeolites. Dashed lines representthe expected exchange stoichiometry for exclusively Cu2+ (m = -2) or[CuOH]+ (m = -1). . . . . . . . . . . . . . . . . . . . . . . . . . . . . . . 407
8.38 Methanol dehydration rates (per H+, 415 K) on H-CHA-OH(14,0%) zeo-lites as a function of time-on-stream under 2.5 kPa CH3OH. . . . . . . . 415
8.39 Methanol dehydration rates (per H+) on H-MFI(30) (squares) and H-MFI(43) (circles) at 433 K and on H-MFI(30) (diamonds) and H-MFI(43)(crosses) at 415 K. Triangle data points are methanol dehydration rateson H-MFI (Si/Al = 30) at 433 K reported by Jones et al [83]. Dashedlines are regressions of the data to the associative pathway (Eq. 8.16). . . 417
8.40 Methanol dehydration rates (per gram, 433 K) on H-MFI(43) zeolites as afunction of cumulative moles of pyridine dosed. The dashed line is a linearregression to the data (last three points omitted). . . . . . . . . . . . . . 418
8.41 Associative rate rst (squares) and zero (circles) order rate constants (perH+) on H-MFI(43) measured as a function of temperature (405-433 K). . 420
8.42 Methanol dehydration rates (per H+, 415 K) on H-CHA-OH(16,0%) as afunction of methanol partial pressure. Dashed line is a regression to thegeneralized rate expression (Eq. 8.38). . . . . . . . . . . . . . . . . . . . 421
8.43 Methanol dehydration rates (per H+, 415 K) on H-CHA-OH(26,0%) as afunction of methanol partial pressure. Dashed line is a regression to thegeneralized rate expression (Eq. 8.38). . . . . . . . . . . . . . . . . . . . 422
8.44 Methanol dehydration rates (per H+, 415 K) on H-CHA-F(17,0%) as afunction of methanol partial pressure. Dashed line is a regression to thegeneralized rate expression (Eq. 8.38). . . . . . . . . . . . . . . . . . . . 423
8.45 Methanol dehydration rates (per H+, 415 K) on H-CHA-OH(16,6%) as afunction of methanol partial pressure. Dashed line is a regression to thegeneralized rate expression (Eq. 8.38). . . . . . . . . . . . . . . . . . . . 424

xlii
Figure Page
8.46 Methanol dehydration rates (per H+, 415 K) on H-MFI(17) as a functionof methanol partial pressure. Dashed line is a regression to the associativerate expression (Eq. 8.16). . . . . . . . . . . . . . . . . . . . . . . . . . . 425
8.47 Methanol dehydration rates (per H+, 415 K) on H-MFI(30) as a functionof methanol partial pressure. Dashed line is a regression to the associativerate expression (Eq. 8.16). . . . . . . . . . . . . . . . . . . . . . . . . . . 426
8.48 Methanol dehydration rates (per H+, 415 K) on H-MFI(43) as a functionof methanol partial pressure. Dashed line is a regression to the associativerate expression (Eq. 8.16). . . . . . . . . . . . . . . . . . . . . . . . . . . 427
8.49 Associative rst order rate constants (per H+, 433 K) as a function ofpore diameter in MFI, MTT, MTW, MOR, SFH, BEA, and FAU zeolites.Dashed line is an exponential regression to the data. All data is reproducedfrom Jones et al [22]. . . . . . . . . . . . . . . . . . . . . . . . . . . . . . 428
8.50 IR spectra of H-CHA-OH(14,0%) under 0 kPa CH3OH (bold) and 0.15,0.77, 1.5, 3.0, 5.9, 13.5, and 22 kPa CH3OH (thin) at 415 K. . . . . . . . 429
8.51 IR spectra of H-CHA-OH(14,44%) under 0 kPa CH3OH (bold) and 0.15,0.77, 1.5, 3.0, 5.9, 13.5, and 22 kPa CH3OH (thin) at 415 K. . . . . . . . 430
8.52 IR spectra of H-MFI(43) under 0 kPa CH3OH (bold) and 0.15, 0.77, 1.5,3.0, 5.9, 13.5, and 22 kPa CH3OH (thin) at 415 K. . . . . . . . . . . . . 430
8.53 Methanol dehydration rates (squares; per H+, 415 K, 1 kPa CH3OH) andconversion (circles) on H-CHA-OH(14,0%) as a function of residence time.Dashed lines represent a linear regression to conversion data and the av-erage rate of DME formation. . . . . . . . . . . . . . . . . . . . . . . . . 432
8.54 Methanol partial pressures in H-CHA-OH(14,0%) as a function of particleradius, where zero is the crystal center, for bulk CH3OH pressures of 0.05,0.1, 0.2, 0.4, 0.8, 1.6, 3.2, 6.4, 12.8, 25.6, and 51.2 kPa at 415 K. . . . . . 435
8.55 Methanol partial pressures in H-CHA-OH(17,0%) as a function of particleradius, where zero is the crystal center, for bulk CH3OH pressures of 0.05,0.1, 0.2, 0.4, 0.8, 1.6, 3.2, 6.4, 12.8, 25.6, and 51.2 kPa at 415 K. . . . . . 436
8.56 Methanol partial pressures in H-CHA-F(18,0%) as a function of particleradius, where zero is the crystal center, for bulk CH3OH pressures of 0.05,0.1, 0.2, 0.4, 0.8, 1.6, 3.2, 6.4, 12.8, 25.6, and 51.2 kPa at 415 K. . . . . . 437
8.57 Methanol partial pressures in H-CHA-OH(27,0%) as a function of particleradius, where zero is the crystal center, for bulk CH3OH pressures of 0.05,0.1, 0.2, 0.4, 0.8, 1.6, 3.2, 6.4, 12.8, 25.6, and 51.2 kPa at 415 K. . . . . . 438
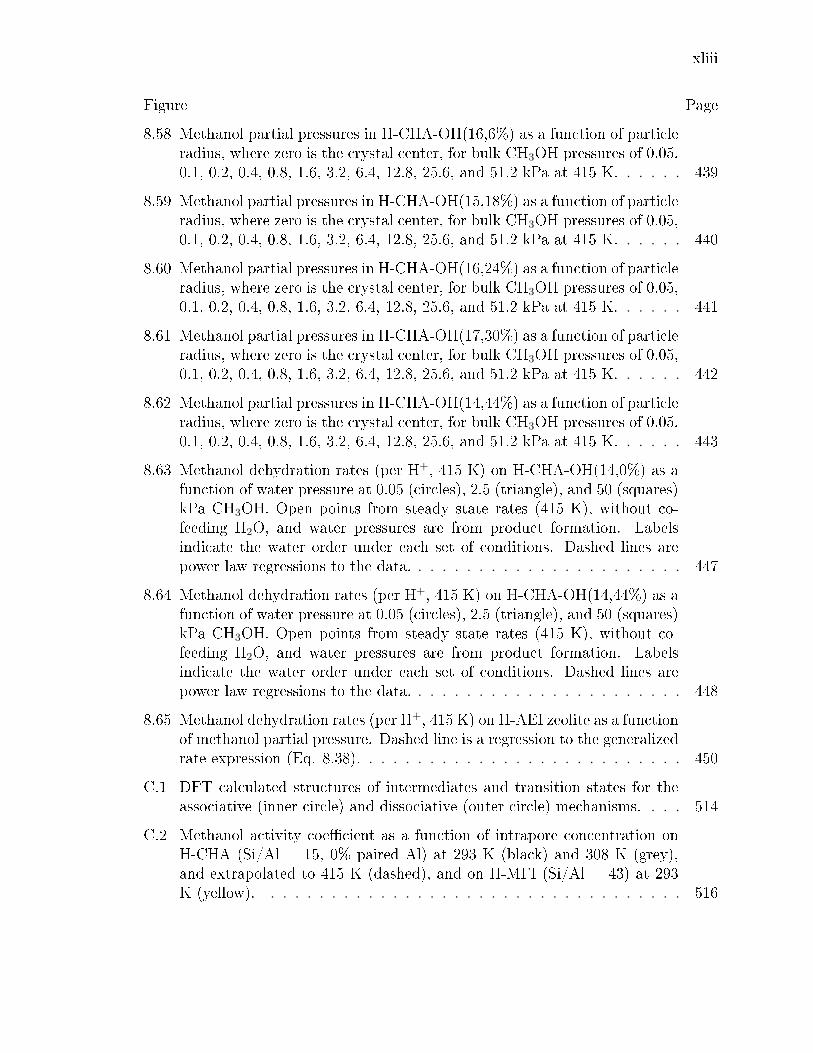
xliii
Figure Page
8.58 Methanol partial pressures in H-CHA-OH(16,6%) as a function of particleradius, where zero is the crystal center, for bulk CH3OH pressures of 0.05,0.1, 0.2, 0.4, 0.8, 1.6, 3.2, 6.4, 12.8, 25.6, and 51.2 kPa at 415 K. . . . . . 439
8.59 Methanol partial pressures in H-CHA-OH(15,18%) as a function of particleradius, where zero is the crystal center, for bulk CH3OH pressures of 0.05,0.1, 0.2, 0.4, 0.8, 1.6, 3.2, 6.4, 12.8, 25.6, and 51.2 kPa at 415 K. . . . . . 440
8.60 Methanol partial pressures in H-CHA-OH(16,24%) as a function of particleradius, where zero is the crystal center, for bulk CH3OH pressures of 0.05,0.1, 0.2, 0.4, 0.8, 1.6, 3.2, 6.4, 12.8, 25.6, and 51.2 kPa at 415 K. . . . . . 441
8.61 Methanol partial pressures in H-CHA-OH(17,30%) as a function of particleradius, where zero is the crystal center, for bulk CH3OH pressures of 0.05,0.1, 0.2, 0.4, 0.8, 1.6, 3.2, 6.4, 12.8, 25.6, and 51.2 kPa at 415 K. . . . . . 442
8.62 Methanol partial pressures in H-CHA-OH(14,44%) as a function of particleradius, where zero is the crystal center, for bulk CH3OH pressures of 0.05,0.1, 0.2, 0.4, 0.8, 1.6, 3.2, 6.4, 12.8, 25.6, and 51.2 kPa at 415 K. . . . . . 443
8.63 Methanol dehydration rates (per H+, 415 K) on H-CHA-OH(14,0%) as afunction of water pressure at 0.05 (circles), 2.5 (triangle), and 50 (squares)kPa CH3OH. Open points from steady state rates (415 K), without co-feeding H2O, and water pressures are from product formation. Labelsindicate the water order under each set of conditions. Dashed lines arepower law regressions to the data. . . . . . . . . . . . . . . . . . . . . . . 447
8.64 Methanol dehydration rates (per H+, 415 K) on H-CHA-OH(14,44%) as afunction of water pressure at 0.05 (circles), 2.5 (triangle), and 50 (squares)kPa CH3OH. Open points from steady state rates (415 K), without co-feeding H2O, and water pressures are from product formation. Labelsindicate the water order under each set of conditions. Dashed lines arepower law regressions to the data. . . . . . . . . . . . . . . . . . . . . . . 448
8.65 Methanol dehydration rates (per H+, 415 K) on H-AEI zeolite as a functionof methanol partial pressure. Dashed line is a regression to the generalizedrate expression (Eq. 8.38). . . . . . . . . . . . . . . . . . . . . . . . . . . 450
C.1 DFT calculated structures of intermediates and transition states for theassociative (inner circle) and dissociative (outer circle) mechanisms. . . . 514
C.2 Methanol activity coecient as a function of intrapore concentration onH-CHA (Si/Al = 15, 0% paired Al) at 293 K (black) and 308 K (grey),and extrapolated to 415 K (dashed), and on H-MFI (Si/Al = 43) at 293K (yellow). . . . . . . . . . . . . . . . . . . . . . . . . . . . . . . . . . . 516
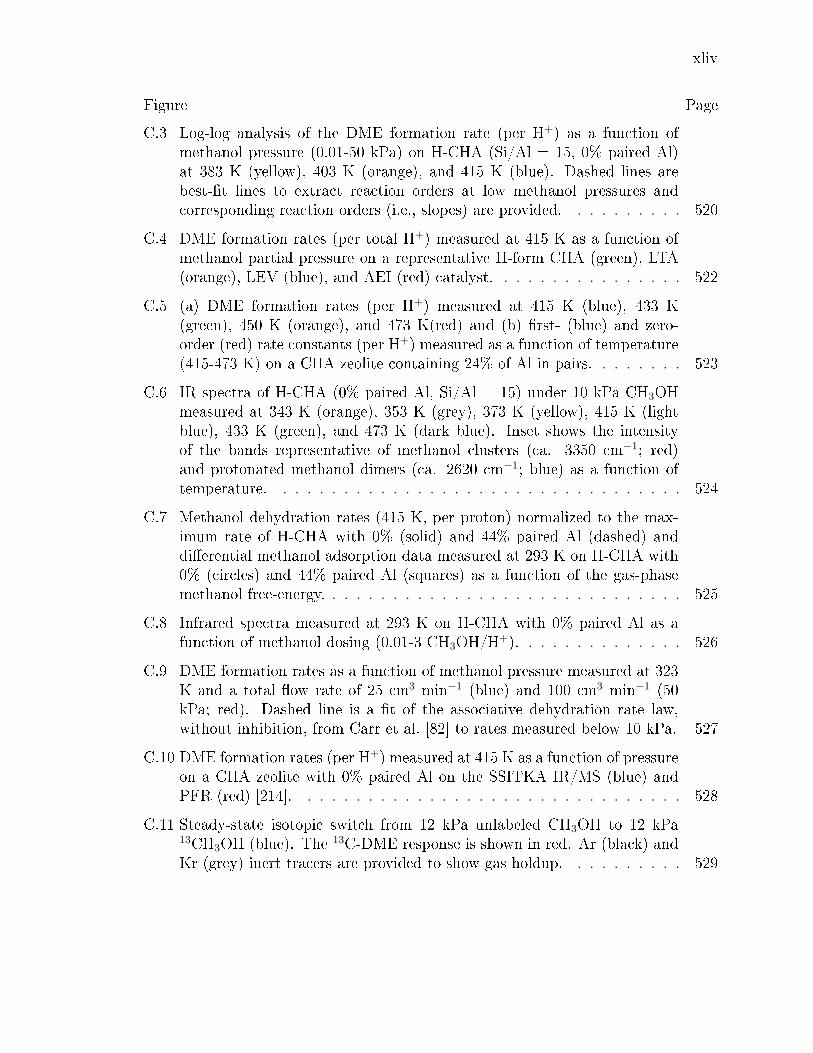
xliv
Figure Page
C.3 Log-log analysis of the DME formation rate (per H+) as a function ofmethanol pressure (0.01-50 kPa) on H-CHA (Si/Al = 15, 0% paired Al)at 383 K (yellow), 403 K (orange), and 415 K (blue). Dashed lines arebest-t lines to extract reaction orders at low methanol pressures andcorresponding reaction orders (i.e., slopes) are provided. . . . . . . . . . 520
C.4 DME formation rates (per total H+) measured at 415 K as a function ofmethanol partial pressure on a representative H-form CHA (green), LTA(orange), LEV (blue), and AEI (red) catalyst. . . . . . . . . . . . . . . . 522
C.5 (a) DME formation rates (per H+) measured at 415 K (blue), 433 K(green), 450 K (orange), and 473 K(red) and (b) rst- (blue) and zero-order (red) rate constants (per H+) measured as a function of temperature(415-473 K) on a CHA zeolite containing 24% of Al in pairs. . . . . . . . 523
C.6 IR spectra of H-CHA (0% paired Al, Si/Al = 15) under 10 kPa CH3OHmeasured at 343 K (orange), 353 K (grey), 373 K (yellow), 415 K (lightblue), 433 K (green), and 473 K (dark blue). Inset shows the intensityof the bands representative of methanol clusters (ca. 3350 cm−1; red)and protonated methanol dimers (ca. 2620 cm−1; blue) as a function oftemperature. . . . . . . . . . . . . . . . . . . . . . . . . . . . . . . . . . 524
C.7 Methanol dehydration rates (415 K, per proton) normalized to the max-imum rate of H-CHA with 0% (solid) and 44% paired Al (dashed) anddierential methanol adsorption data measured at 293 K on H-CHA with0% (circles) and 44% paired Al (squares) as a function of the gas-phasemethanol free-energy. . . . . . . . . . . . . . . . . . . . . . . . . . . . . . 525
C.8 Infrared spectra measured at 293 K on H-CHA with 0% paired Al as afunction of methanol dosing (0.01-3 CH3OH/H+). . . . . . . . . . . . . . 526
C.9 DME formation rates as a function of methanol pressure measured at 323K and a total ow rate of 25 cm3 min−1 (blue) and 100 cm3 min−1 (50kPa; red). Dashed line is a t of the associative dehydration rate law,without inhibition, from Carr et al. [82] to rates measured below 10 kPa. 527
C.10 DME formation rates (per H+) measured at 415 K as a function of pressureon a CHA zeolite with 0% paired Al on the SSITKA IR/MS (blue) andPFR (red) [214]. . . . . . . . . . . . . . . . . . . . . . . . . . . . . . . . 528
C.11 Steady-state isotopic switch from 12 kPa unlabeled CH3OH to 12 kPa13CH3OH (blue). The 13C-DME response is shown in red. Ar (black) andKr (grey) inert tracers are provided to show gas holdup. . . . . . . . . . 529
xlv
Figure Page
C.12 (a) NDME (per H+) and (b) the intrinsic turnover frequency (per H+)measured as a function of methanol pressure (0.1-25 kPa) at 415 K onCHA zeolites containing 0% (blue) and 30% (red) paired Al. . . . . . . . 530
C.13 DFT calculated free energies (433 K, 1 bar) for the associative (dashed)and dissociative (solid) methanol dehydration mechanisms on isolated pro-tons in CHA. . . . . . . . . . . . . . . . . . . . . . . . . . . . . . . . . . 533
C.14 Structure of the methoxy transition state at a paired proton in CHA.Values represent the distance between adjacent nuclei (green connectors)in pm. . . . . . . . . . . . . . . . . . . . . . . . . . . . . . . . . . . . . . 537
C.15 DFT calculated free energies (433 K, 1 bar) for the associative (dashed)and dissociative (solid) methanol dehydration mechanisms on isolated (black)and paired (blue) protons in CHA. . . . . . . . . . . . . . . . . . . . . . 538
C.16 IR spectra of CHA containing 0% (light green) and 44% (dark green)paired Al, LEV (blue; Si/Al = 17, 12% paired Al), AEI (red; Si/Al = 16,32% paired Al), AFX (yellow; Si/Al = 9, 34% paired Al), and RTH (grey;Si/Al = 15, 16% paired Al) under 0.77 kPa CH3OH at 415 K. . . . . . . 539
D.1 27Al SS MAS NMR spectra of Samples A (black), B (red), C (blue), and D(purple) over the whole range measured (a) and focused on the tetrahedralAl resonance (b). . . . . . . . . . . . . . . . . . . . . . . . . . . . . . . . 545
D.2 29Si SS MAS NMR spectra of Samples A (black), B (red), C (blue), andD (purple). . . . . . . . . . . . . . . . . . . . . . . . . . . . . . . . . . . 546
D.3 13C NMR spectra of TMAda+-d9 dissolved in D2O with an absent NMRline for methyl C (δ = 48 ppm). Inset shows the assignment of the dierentexpected chemical shifts for TMAda+. . . . . . . . . . . . . . . . . . . . 547
D.4 29Si (upper) and 27Al (lower) MAS DNP NMR spectra of Samples A (a)and C (b) without (black) and with (red) microwave-excitation. . . . . . 547
D.5 27Al29Si J-based INEPT MAS NMR spectrum of Sample A. . . . . . 548
D.6 3Q 27Al SS MAS NMR spectra of Samples C (a) and D (b) and twodistinct sites for Samples C ((i) and (ii)) and D ((iii) and (iv)). . . . . . 549
D.7 27Al-27Al SQ-DQMAS NMR cross-correlation peaks of Samples A (black),B (red), C (blue), and D (purple). Dashed lines represent the magnitudeof each cross-correlation peak for the corresponding samples (same coloridentities). . . . . . . . . . . . . . . . . . . . . . . . . . . . . . . . . . . . 550
D.8 13C SS MAS NMR spectra of as-synthesized CHA Samples A (black), B(red), C (blue), and D (purple). Inset shows the assignment of the ve13C NMR lines to the ve unique C atoms of the TMAda+ molecule. . . 551
xlvi
Figure Page
D.9 1H SS MAS NMR spectra of as-synthesized CHA Samples A (black), B(red), C (blue), and D (purple). Inset shows the assignment of the fourunique H atoms of the TMAda+ molecule. . . . . . . . . . . . . . . . . . 552
D.10 1H-13C HETCOR SS MAS NMR spectra of as-synthesized Sample B mea-sured at 100 K. . . . . . . . . . . . . . . . . . . . . . . . . . . . . . . . . 553
D.11 Variable-temperature 1H SS MAS NMR spectra of Sample measured at293 K (black) and 100 K (red). Black arrow is included to emphasizethe broadening of the methyl 1H NMR line. Inset shows the C3-axis ofrotation of the TMAda+ molecule. . . . . . . . . . . . . . . . . . . . . . 554
D.12 1H27Al REDOR MAS NMR spectra (a) without (S0) and with (S) 27Aldipolar dephasing of 1H spectra. (b) Shows the dierence in dipolar de-phasing of each unique proton in TMAda+ as a function of dephasingtime. . . . . . . . . . . . . . . . . . . . . . . . . . . . . . . . . . . . . . 555
D.13 23Na MAS NMR of Samples A (black), B (red), and C (blue) before (a)and after (b) removal of TMAda+. . . . . . . . . . . . . . . . . . . . . . 555
D.14 23Na 3Q MAS NMR of Samples A (a) and C (b). . . . . . . . . . . . . . 556
D.15 Variable-temperature 23Na MAS NMR spectra taken at 293 K (black) and100 K (red). . . . . . . . . . . . . . . . . . . . . . . . . . . . . . . . . . . 556
D.16 1H23Na REDOR MAS NMR spectra (a) without (S0, black) and with(S, red) 23Na dipolar dephasing of 1H spectra measured at 100 K. (b)Shows the dierence in dipolar dephasing of methyl protons in TMAda+with 23Na as a function of dephasing time. . . . . . . . . . . . . . . . . 557
E.1 Adsorption of CD3CN on dierent sites in stannosilicates and correspond-ing ν(C≡N) infrared vibrational frequencies. . . . . . . . . . . . . . . . . 588
E.2 Plausible reaction mechanism for glucose-fructose isomerization on openSn sites in Sn-Beta involving kinetically-relevant 1,2-intramolecular hy-dride shift (Step 2). For clarity, kinetically-irrelevant steps are lumped asquasi-equilibrated reactions (Steps 1, 3-5). . . . . . . . . . . . . . . . . . 588
E.3 Diuse reectance UV-Vis spectra in Kubelka-Munk units (normalizedto the maximum F(R) intensity within each series) for (a) Sn-Beta-F-170, (b) Sn-Beta-OH-200, and (c) SnO2/Si-Beta collected under ambientconditions (thin solid line), after dehydration at 523 K (thick solid line),and after rehydration at 303 K (dashed line). . . . . . . . . . . . . . . . 589
xlvii
Figure Page
E.4 IR spectra measured at low pyridine coverage (0.09-0.20 pyridine/Sn) andsaturated spectra (thick lines) for (a) Sn-Beta-F-100, (b) Sn-Beta-F-140,and (c) Sn-Beta-OH-170. Dashed reference lines shown for Lewis acidsites (1615 cm−1, 1450 cm−1), Lewis or Brønsted acid sites (1575 cm−1,1490 cm−1), Brønsted acid sites (1550 cm−1), and gas-phase pyridine (1595cm−1). . . . . . . . . . . . . . . . . . . . . . . . . . . . . . . . . . . . . 590
E.5 Determination of the integrated molar extinction coecient for pyridineadsorbed on Lewis acid sites (1450 cm−1) on Sn-Beta-OH-170 (black squares), Sn-Beta-F-140 (open triangles), Sn-Beta-F-100 (black circles), from IRpeak areas corresponding to pyridine/Sn coverages between 0.04-0.66. . 591
E.6 Titrant molar uptakes (per Sn) compared to pyridine molar uptakes (perSn) at saturation of Sn-Beta samples with (a) n-propylamine (NPA, blacksquares ), (b) ammonia (NH3, open triangles), and (c) CD3CN (blackcircles were included and were not included in tting of E values). Paritylines shown as dashed lines. NPA titration data not shown for samplesdenoted with an asterisk in Table 3E.3, for which TPD quanticationincludes binding to residual defect sites. . . . . . . . . . . . . . . . . . . 592
E.7 FTIR dierence spectra of Sn-Beta-F-105 (relative to the vacant surface)(a) with increasing CD3CN increasing coverage and (b) at a coverage of0.65 CD3CN/Sn with deconvolution into component peaks. Dashed ref-erence lines shown for open Sn sites (2316 cm−1), closed Sn sites (2308cm−1), (SiO)2Sn(OH)2 sites (speculative assignment, 2287 cm−1), silanolgroups (2275 cm−1), and gas-phase CD3CN (2265 cm−1). . . . . . . . . . 593
E.8 Evolution of IR peak areas for 2316 cm−1 (black triangles), 2308 cm−1
(diamonds), 2287 cm−1 ( black circles), and 2275 cm−1 () peaks withincreasing CD3CN coverage on Sn-Beta-F-105. . . . . . . . . . . . . . . . 594
E.9 Moles of CD3CN adsorbed on open Sn sites (diamonds) and closed Snsites (black triangles) on Sn-Beta-F-105, together with the ratio of open-to-closed Sn sites titrated (black circles), as a function of CD3CN coverage. 595
E.10 Dependence of initial glucose-fructose isomerization turnover rate (per to-tal Sn, 373 K) for Sn-Beta-F-220 on the initial aqueous-phase glucoseconcentration (1-10% (w/w)). . . . . . . . . . . . . . . . . . . . . . . . . 596
E.11 Dependence of initial glucose-fructose isomerization turnover rates (pertotal Sn, 373 K, 1% (w/w) glucose) on pyridine coverage from titrationbefore reaction on (a) Sn-Beta-F-110 and (b) Sn-Beta-F-170. The fractionof Sn open sites counted ex situ by CD3CN are shown as open diamondsalong the x-axes. . . . . . . . . . . . . . . . . . . . . . . . . . . . . . . . 597

xlviii
Figure Page
E.12 First-order glucose-fructose isomerization rate constant (per open Sn site,373 K) in water for hydrophobic Sn-Beta-F (black circles) and hydrophilicSn-Beta-OH () samples as a function of Sn/Si ratio. Dashed lines indicatethe averaged turnover rate within each series. . . . . . . . . . . . . . . . 598
E.13 Powder XRD patterns of the stannosilicate samples in this study. Pat-terns for Sn-Beta-OH-170 and Sn-Beta-OH-200 multiplied by 10×, andSn-xerogel multiplied by 5×, for clarity. . . . . . . . . . . . . . . . . . . . 603
E.14 N2 adsorption isotherms (77 K) for all samples used in this study. Isothermsoset by 200 cm3 g−1 for clarity. . . . . . . . . . . . . . . . . . . . . . . . 605
E.15 H2O adsorption isotherms (293 K) for Sn-Beta-F samples used in thisstudy. Isotherms oset by 100 cm3 g−1 for clarity. . . . . . . . . . . . . . 606
E.16 H2O adsorption isotherms (293 K) for Sn-Beta-OH samples, SnO2/Si-Beta-F, and Sn-xerogel used in this study. Isotherms oset by 300 cm3
g−1 for clarity. . . . . . . . . . . . . . . . . . . . . . . . . . . . . . . . . . 607
E.17 DRUV spectra for Sn-zeolite samples collected after dehydration treat-ments (523 K). Spectra normalized to F(R) at the peak maximum andarticially oset for clarity. . . . . . . . . . . . . . . . . . . . . . . . . . . 610
E.18 DRUV spectra for Sn-zeolite samples collected after dehydration treat-ments (523 K). Spectra normalized to F(R) at the peak maximum andarticially oset for clarity. . . . . . . . . . . . . . . . . . . . . . . . . . . 611
E.19 Tauc plots for Sn-zeolite samples from DRUV spectra collected after de-hydration treatments (523 K). . . . . . . . . . . . . . . . . . . . . . . . . 612
E.20 Tauc plots for Sn-zeolite samples from DRUV spectra collected after de-hydration treatments (523 K). Inset shows low-energy region for Sn-Beta-OH-200 that gives rise to the edge energy reported in Table E.1. . . . . 613
E.21 1H NMR spectra for glucose recovered after glucose isomerization catalysiswith the Sn-Beta samples tested in this study. The resonating multipletcentered around δ = 4.7 ppm corresponds to residual water present afterfreeze drying the monosaccharide products . . . . . . . . . . . . . . . . . 615
E.22 1H NMR spectra for the fructose recovered after glucose isomerizationcatalysis with the Sn-Beta samples tested in this study. A small resonanceat δ=3.47 ppm (denoted with an asterisk) is present in fructose productson Sn-Beta-OH-170 and Sn-Beta-OH-200, indicating a small contributionof the enolate mechanism by hydroxyl ions that becomes detectable at thelonger reaction times (>4 h) used to attain higher glucose conversion onthese samples. . . . . . . . . . . . . . . . . . . . . . . . . . . . . . . . . 616
xlix
Figure Page
E.23 IR spectra after progressive titration of pyridine on H-Y (Si/Al=2.6, Ze-olyst) at 423 K (pyridine/Al = 0.005-0.040). Dashed lines at 1630 cm−1
(protonated pyridine), 1545 cm−1 (protonated pyridine), and 1490 cm−1
(protonated pyridine or pyridine bound to Lewis acidic Al sites). . . . . 618
E.24 Integrated area of 1545 cm−1 IR peak multiplied by wafer cross-sectionalarea plotted against the amount of pyridine adsorbed on H-Y (Si/Al=2.6,Zeolyst) at 423 K. . . . . . . . . . . . . . . . . . . . . . . . . . . . . . . 619
E.25 IR spectra after progressive titration of pyridine on high temperature-treated H-Y (Si/Al=2.6, Zeolyst) at 423 K (pyridine/Al = 0.012-0.13).Dashed lines shown at 1630 cm−1 (protonated pyridine), 1615 cm−1 (pyri-dine bound to Lewis acidic Al sites), 1545 cm−1 (protonated pyridine),1490 cm−1 (protonated pyridine or pyridine bound to Lewis acidic Al sites),and 1455 cm−1 (pyridine bound to Lewis acidic Al sites). . . . . . . . . 620
E.26 IR dierence spectra for pyridine saturated Sn-Beta samples after evac-uation at 423 K for 900 s for (a) Sn-Beta-F-100, (b) Sn-Beta-F-105, (c)Sn-Beta-F-110, (d) Sn-Beta-F-140, (e) Sn-Beta-F-170, (f) Sn-Beta-F-220,(g) Sn-Beta-OH-170, (h) Sn-Beta-OH-200, (i) SnO2/Si-Beta, and (j) Sn-xerogel. All spectra normalized to the overtone and combination modes ofSi-O-Si stretches (1750-2100 cm−1) and to the maximum peak intensity forclarity. Dashed lines shown at 1610 cm−1 (pyridine bound to Lewis acidicSn sites), 1540 cm−1 (protonated pyridine), 1490 cm−1 (protonated pyri-dine or pyridine bound to Lewis acidic Sn sites), and 1450 cm−1 (pyridinebound to Lewis acidic Sn sites). . . . . . . . . . . . . . . . . . . . . . . . 622
E.27 IR spectra for pyridine-saturated Sn-Beta-F-100 during exposure to dy-namic vacuum at 423 K for 0 s, 300 s, and 900 s (thin to thick traces)after saturation with pyridine. Dashed lines shown at 1610 cm−1 (pyridinebound to Lewis acidic Sn sites), 1545 cm−1 (protonated pyridine), 1490cm−1 (protonated pyridine or pyridine bound to Lewis acidic Sn sites),and 1450 cm−1 (pyridine bound to Lewis acidic Sn sites). . . . . . . . . . 623
E.28 Integrated area of the IR peak at 1450 cm−1 as a function of time ex-posed to dynamic vacuum at 423 K for pyridine-saturated Sn-Beta-F-100.Dashed line at 900 seconds added for reference. . . . . . . . . . . . . . . 624
E.29 NPA (m/z = 59) response factor calibration curve of the mass spectrom-eter area ratio of NPA/Ar as a function of the molar ratio of NPA/Ar. . 625
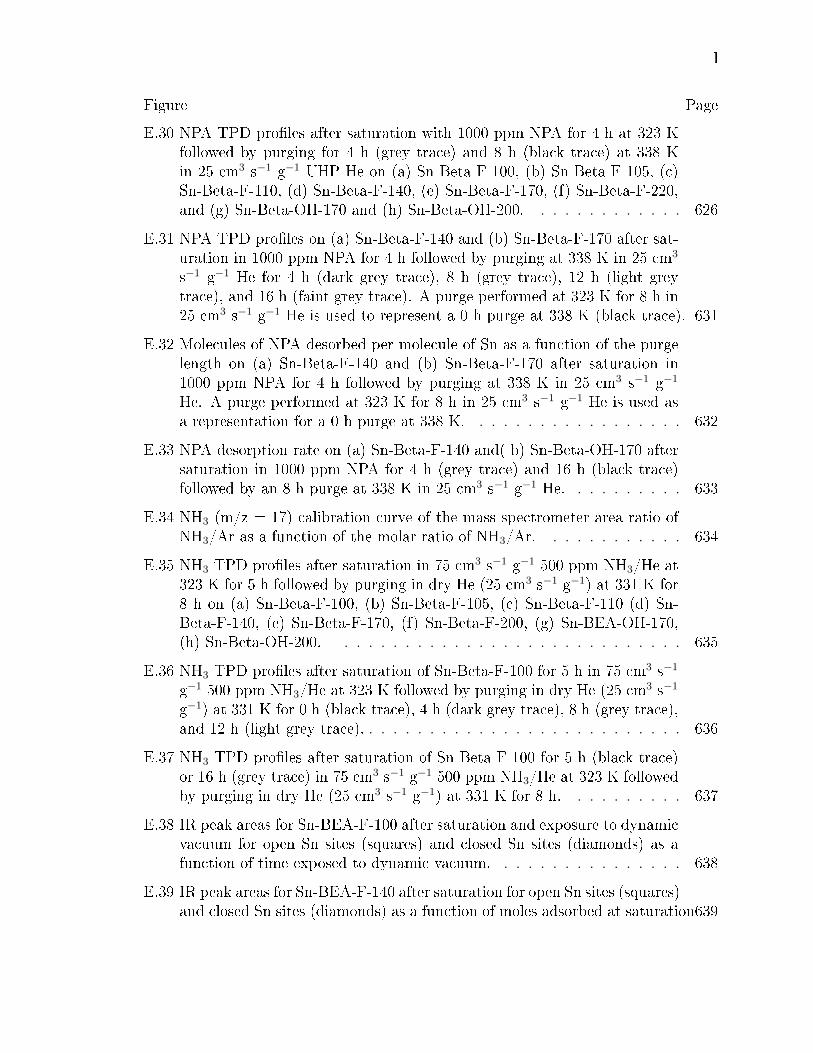
l
Figure Page
E.30 NPA TPD proles after saturation with 1000 ppm NPA for 4 h at 323 Kfollowed by purging for 4 h (grey trace) and 8 h (black trace) at 338 Kin 25 cm3 s−1 g−1 UHP He on (a) Sn-Beta-F-100, (b) Sn-Beta-F-105, (c)Sn-Beta-F-110, (d) Sn-Beta-F-140, (e) Sn-Beta-F-170, (f) Sn-Beta-F-220,and (g) Sn-Beta-OH-170 and (h) Sn-Beta-OH-200. . . . . . . . . . . . . 626
E.31 NPA TPD proles on (a) Sn-Beta-F-140 and (b) Sn-Beta-F-170 after sat-uration in 1000 ppm NPA for 4 h followed by purging at 338 K in 25 cm3
s−1 g−1 He for 4 h (dark grey trace), 8 h (grey trace), 12 h (light greytrace), and 16 h (faint grey trace). A purge performed at 323 K for 8 h in25 cm3 s−1 g−1 He is used to represent a 0 h purge at 338 K (black trace). 631
E.32 Molecules of NPA desorbed per molecule of Sn as a function of the purgelength on (a) Sn-Beta-F-140 and (b) Sn-Beta-F-170 after saturation in1000 ppm NPA for 4 h followed by purging at 338 K in 25 cm3 s−1 g−1
He. A purge performed at 323 K for 8 h in 25 cm3 s−1 g−1 He is used asa representation for a 0 h purge at 338 K. . . . . . . . . . . . . . . . . . 632
E.33 NPA desorption rate on (a) Sn-Beta-F-140 and( b) Sn-Beta-OH-170 aftersaturation in 1000 ppm NPA for 4 h (grey trace) and 16 h (black trace)followed by an 8 h purge at 338 K in 25 cm3 s−1 g−1 He. . . . . . . . . . 633
E.34 NH3 (m/z = 17) calibration curve of the mass spectrometer area ratio ofNH3/Ar as a function of the molar ratio of NH3/Ar. . . . . . . . . . . . 634
E.35 NH3 TPD proles after saturation in 75 cm3 s−1 g−1 500 ppm NH3/He at323 K for 5 h followed by purging in dry He (25 cm3 s−1 g−1) at 331 K for8 h on (a) Sn-Beta-F-100, (b) Sn-Beta-F-105, (c) Sn-Beta-F-110 (d) Sn-Beta-F-140, (e) Sn-Beta-F-170, (f) Sn-Beta-F-200, (g) Sn-BEA-OH-170,(h) Sn-Beta-OH-200. . . . . . . . . . . . . . . . . . . . . . . . . . . . . 635
E.36 NH3 TPD proles after saturation of Sn-Beta-F-100 for 5 h in 75 cm3 s−1
g−1 500 ppm NH3/He at 323 K followed by purging in dry He (25 cm3 s−1
g−1) at 331 K for 0 h (black trace), 4 h (dark grey trace), 8 h (grey trace),and 12 h (light grey trace). . . . . . . . . . . . . . . . . . . . . . . . . . . 636
E.37 NH3 TPD proles after saturation of Sn-Beta-F-100 for 5 h (black trace)or 16 h (grey trace) in 75 cm3 s−1 g−1 500 ppm NH3/He at 323 K followedby purging in dry He (25 cm3 s−1 g−1) at 331 K for 8 h. . . . . . . . . . 637
E.38 IR peak areas for Sn-BEA-F-100 after saturation and exposure to dynamicvacuum for open Sn sites (squares) and closed Sn sites (diamonds) as afunction of time exposed to dynamic vacuum. . . . . . . . . . . . . . . . 638
E.39 IR peak areas for Sn-BEA-F-140 after saturation for open Sn sites (squares)and closed Sn sites (diamonds) as a function of moles adsorbed at saturation639

li
Figure Page
E.40 2275 cm−1 peak area versus perturbed OH peak area (3000-3600 cm−1. . 642
E.41 2275 cm−1 band area versus negative SiOH band area (ca. 3740 cm−1). . 643
E.42 FTIR spectra of a dealuminated Beta zeolite after sequential doses ofCD3CN. Dashed lines shown at 2316 cm−1, 2308 cm−1, 2287 cm−1, 2275cm−1, and 2265 cm−1. . . . . . . . . . . . . . . . . . . . . . . . . . . . . 644
E.43 IR band area for the 2275 cm−1 peak on dealuminated Beta as a functionof moles CD3CN adsorbed. The slope of this line is the E value estimatedfor the 2275 cm−1 site. . . . . . . . . . . . . . . . . . . . . . . . . . . . . 645
E.44 IR spectra of CD3CN three sequential doses (0.05 mol CD3CN/Sn perdose) on Sn-xerogel. Dashed lines shown at 2316 cm−1, 2308 cm−1, 2287cm−1, and 2275 cm−1. . . . . . . . . . . . . . . . . . . . . . . . . . . . . 646
E.45 IR spectra of CD3CN dosed on Sn-xerogel to saturation. Dashed linesshown at 2316 cm−1, 2308 cm−1, 2287 cm−1, and 2275 cm−1. . . . . . . . 647
E.46 IR dierence spectra at CD3CN saturation coverages (relative to the CD3CN-free wafers and normalized to the maximum intensity of each spectra forclarity). (a) Spectra for (i) Sn-Beta-F-100, (ii) Sn-Beta-F-105, (iii) Sn-Beta-F-110, (iv) Sn-Beta-F-140, (v) Sn-Beta-F-170, (vi) Sn-Beta-F-220.(b) Spectra for (i) Sn-Beta-OH-170, (ii) Sn-Beta-OH-200, (iii) SnO2/Si-Beta, (iv) Sn-xerogel. Dashed lines shown at 2316 cm−1, 2308 cm−1, 2287cm−1, 2275 cm−1 and 2265 cm−1. . . . . . . . . . . . . . . . . . . . . . . 648
E.47 Initial glucose isomerization rates (373 K, normalized to untitrated sam-ples) as a function of pre-adsorbed pyridine (a) per gram, (b) per micro-pore volume, and (c) per external surface area for Sn-Beta-F-110 (closedcircles) and Sn-Beta-F-170 (open circles). . . . . . . . . . . . . . . . . . . 652
E.48 Scanning electron microscope images of Sn-Beta-F-110 and Sn-Beta-F-170. 653
E.49 Molar water uptake measured at P/P0=0.2, after subtracting the con-tribution from (a) total Sn (estimated by AAS) or (b) Lewis acidic Snassuming 2:1 H2O:Sn binding stoichiometry, plotted as a function of thesilanol content. . . . . . . . . . . . . . . . . . . . . . . . . . . . . . . . . 655
E.50 Rate constants per open Sn sites for all Sn-Beta-F samples as a functionof the silanol content measured using the E value for the peak for CD3CNbound to silanol sites centered at 2275 cm−1. Trendlines show correlationof rate constant with 1/(mol SiOH g−1) (dashed line) and 1/(mol SiOHg−1)2 (solid line) determined by linear regression. . . . . . . . . . . . . . 656

lii
Figure Page
F.1 Depictions of (a) framework Sn structures (closed, hydrolyzed-open, anddefect) that may be present in Sn zeolites, and (b) the proposed molecularstructures of Sn sites under dehydrated and hydrated conditions. . . . . . 677
F.2 (a) IR dierence spectra (relative to zero coverage) of Sn-CHA-F-70 uponsequential dosing of CD3CN to saturation coverages. Vertical dashed linesare shown for open (2316 cm−1) and closed (2308 cm−1) Sn sites. (b) IRspectra of CD3CN-saturated Sn-CHA-F-60, with thin dotted curve rep-resenting the sum of the component peaks, shown as thin solid lines forCD3CN bound to open (2316 cm−1) and closed Sn sites (2308 cm−1), Snsites within high defect surfaces (2287 cm−1), hydrogen bound to SiOHgroups (2275 cm−1), and gas phase or physisorbed CD3CN (2265 cm−1). 678
F.3 (a) 2D 119Sn CPMAT spectrum of hydrated Sn-CHA-F-70 and (b) ex-tracted 1D 119Sn NMR spectrum for Sn-CHA-F-70 (blue trace) t withtwo sets of CSA parameters (light blue and green traces) and their com-bination (red trace) resulting in better description of the experimentalspectrum. The spectrum was acquired on Bruker 600 MHz (14.1 T) DNPNMR spectrometer. MAS = 4 kHz; CP contact time = 1.5 ms; recyledelay = 3.5 s; 256 scans per t1 increment, and 85 t1 increments wereacquired. The CSA t was done using solid lineshape feature in Bruker'sTopspin program. . . . . . . . . . . . . . . . . . . . . . . . . . . . . . . . 679
F.4 (a) 2D 15N1H CPMAT NMR spectrum and (b) extracted 1D 15N NMRspectra and corresponding CSA t for pyridine-saturated Sn-CHA-F-70.The spectrum was acquired on Bruker 600 MHz (14.1 T) DNP NMRspectrometer. MAS= 4 kHz; CP contact time= 8.0 ms; recyle delay =4.5 s; 112 scans per t1 increment, and 112 t1 increments were acquired.The CSA t was performed using the solid lineshape feature in Bruker'sTopspin program. . . . . . . . . . . . . . . . . . . . . . . . . . . . . . . . 680
F.5 DFT optimized structures for (a) hydrated closed Sn sites, defect-open Snsites, and hydrolyzed-open Sn sites, for dehydrated closed Sn sites, defectSn sites, and hydrolyzed-open Sn sites, and (b) for pyridine saturatedclosed Sn, and defect Sn sites. Calculated isotropic chemical shifts (δiso),span (Ω), and skew (κ) are shown for each site. Details of DFT calculationsare in Section F.6.13. . . . . . . . . . . . . . . . . . . . . . . . . . . . . . 681
F.6 XRD patterns for (a) Si-CHA-F (b) Sn-CHA-F-60 (c) Sn-CHA-F-70 (d)Sn-Beta-F-116 and (e) Sn-xerogel. Patterns are normalized to their max-imum intensity and oset vertically for clarity. . . . . . . . . . . . . . . 698
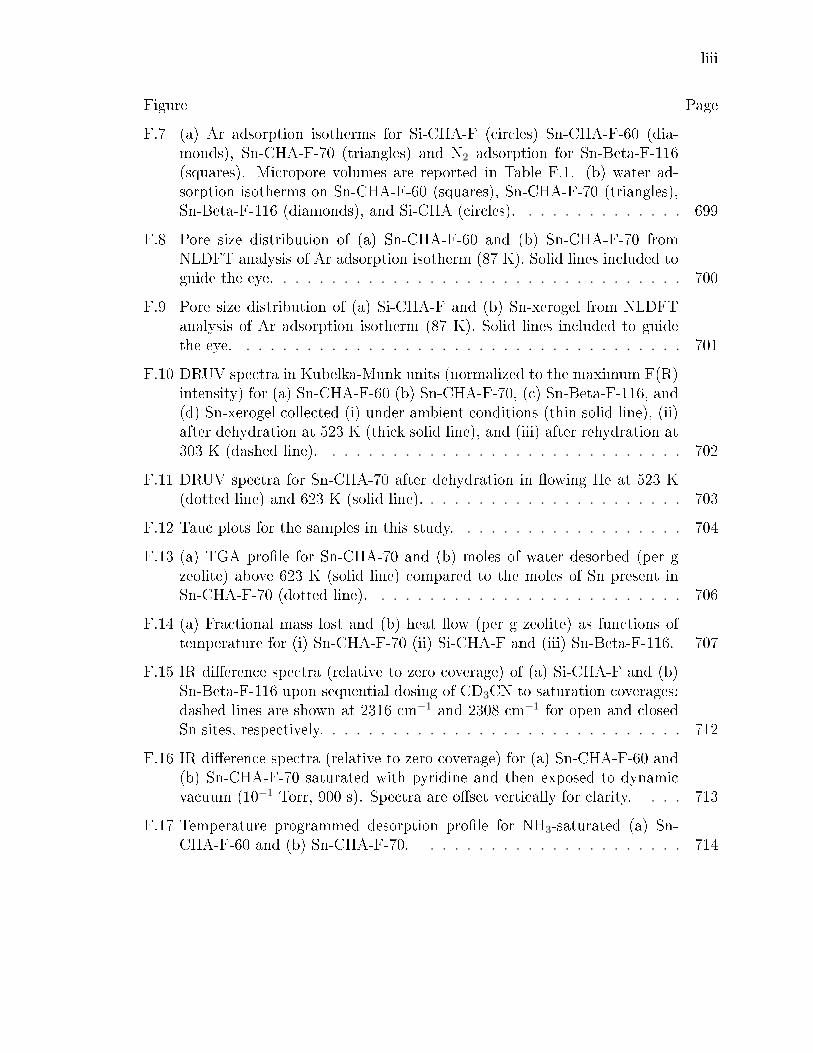
liii
Figure Page
F.7 (a) Ar adsorption isotherms for Si-CHA-F (circles) Sn-CHA-F-60 (dia-monds), Sn-CHA-F-70 (triangles) and N2 adsorption for Sn-Beta-F-116(squares). Micropore volumes are reported in Table F.1. (b) water ad-sorption isotherms on Sn-CHA-F-60 (squares), Sn-CHA-F-70 (triangles),Sn-Beta-F-116 (diamonds), and Si-CHA (circles). . . . . . . . . . . . . . 699
F.8 Pore size distribution of (a) Sn-CHA-F-60 and (b) Sn-CHA-F-70 fromNLDFT analysis of Ar adsorption isotherm (87 K). Solid lines included toguide the eye. . . . . . . . . . . . . . . . . . . . . . . . . . . . . . . . . . 700
F.9 Pore size distribution of (a) Si-CHA-F and (b) Sn-xerogel from NLDFTanalysis of Ar adsorption isotherm (87 K). Solid lines included to guidethe eye. . . . . . . . . . . . . . . . . . . . . . . . . . . . . . . . . . . . . 701
F.10 DRUV spectra in Kubelka-Munk units (normalized to the maximum F(R)intensity) for (a) Sn-CHA-F-60 (b) Sn-CHA-F-70, (c) Sn-Beta-F-116, and(d) Sn-xerogel collected (i) under ambient conditions (thin solid line), (ii)after dehydration at 523 K (thick solid line), and (iii) after rehydration at303 K (dashed line). . . . . . . . . . . . . . . . . . . . . . . . . . . . . . 702
F.11 DRUV spectra for Sn-CHA-70 after dehydration in owing He at 523 K(dotted line) and 623 K (solid line). . . . . . . . . . . . . . . . . . . . . . 703
F.12 Tauc plots for the samples in this study. . . . . . . . . . . . . . . . . . . 704
F.13 (a) TGA prole for Sn-CHA-70 and (b) moles of water desorbed (per gzeolite) above 623 K (solid line) compared to the moles of Sn present inSn-CHA-F-70 (dotted line). . . . . . . . . . . . . . . . . . . . . . . . . . 706
F.14 (a) Fractional mass lost and (b) heat ow (per g zeolite) as functions oftemperature for (i) Sn-CHA-F-70 (ii) Si-CHA-F and (iii) Sn-Beta-F-116. 707
F.15 IR dierence spectra (relative to zero coverage) of (a) Si-CHA-F and (b)Sn-Beta-F-116 upon sequential dosing of CD3CN to saturation coverages;dashed lines are shown at 2316 cm−1 and 2308 cm−1 for open and closedSn sites, respectively. . . . . . . . . . . . . . . . . . . . . . . . . . . . . . 712
F.16 IR dierence spectra (relative to zero coverage) for (a) Sn-CHA-F-60 and(b) Sn-CHA-F-70 saturated with pyridine and then exposed to dynamicvacuum (10−1 Torr, 900 s). Spectra are oset vertically for clarity. . . . 713
F.17 Temperature programmed desorption prole for NH3-saturated (a) Sn-CHA-F-60 and (b) Sn-CHA-F-70. . . . . . . . . . . . . . . . . . . . . . 714
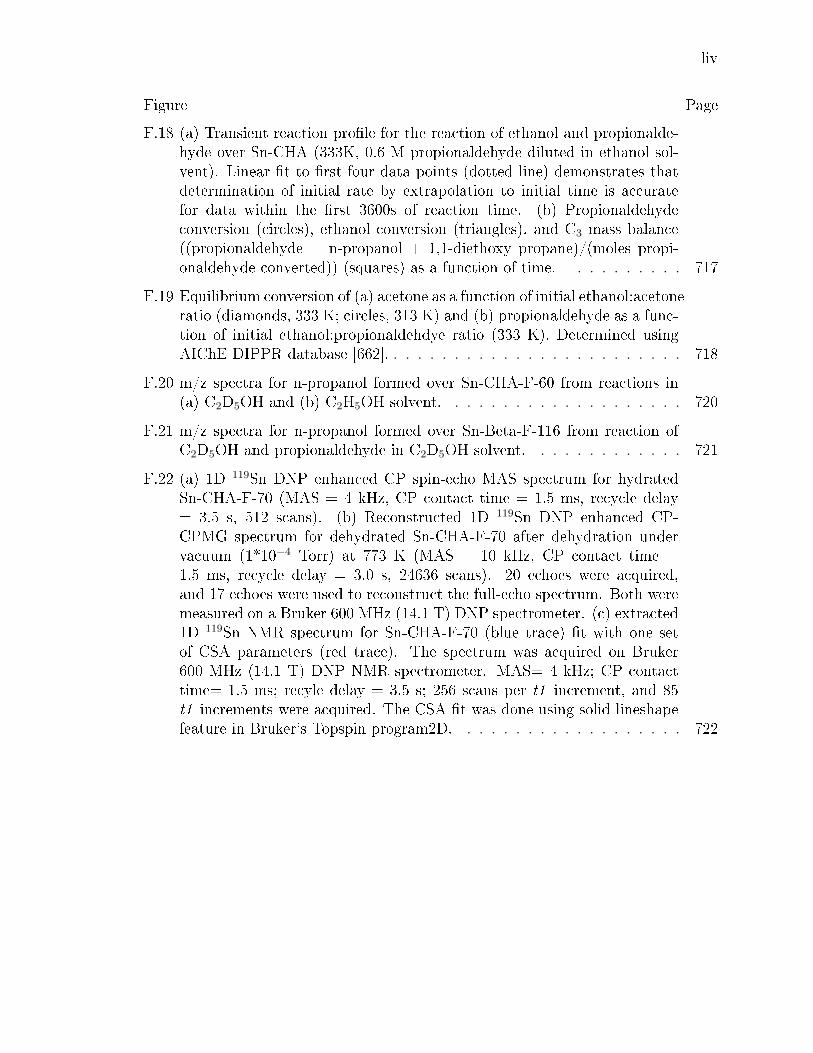
liv
Figure Page
F.18 (a) Transient reaction prole for the reaction of ethanol and propionalde-hyde over Sn-CHA (333K, 0.6 M propionaldehyde diluted in ethanol sol-vent). Linear t to rst four data points (dotted line) demonstrates thatdetermination of initial rate by extrapolation to initial time is accuratefor data within the rst 3600s of reaction time. (b) Propionaldehydeconversion (circles), ethanol conversion (triangles), and C3 mass balance((propionaldehyde + n-propanol + 1,1-diethoxy propane)/(moles propi-onaldehyde converted)) (squares) as a function of time. . . . . . . . . . 717
F.19 Equilibrium conversion of (a) acetone as a function of initial ethanol:acetoneratio (diamonds, 333 K; circles, 313 K) and (b) propionaldehyde as a func-tion of initial ethanol:propionaldehdye ratio (333 K). Determined usingAIChE DIPPR database [662]. . . . . . . . . . . . . . . . . . . . . . . . . 718
F.20 m/z spectra for n-propanol formed over Sn-CHA-F-60 from reactions in(a) C2D5OH and (b) C2H5OH solvent. . . . . . . . . . . . . . . . . . . . 720
F.21 m/z spectra for n-propanol formed over Sn-Beta-F-116 from reaction ofC2D5OH and propionaldehyde in C2D5OH solvent. . . . . . . . . . . . . 721
F.22 (a) 1D 119Sn DNP enhanced CP spin-echo MAS spectrum for hydratedSn-CHA-F-70 (MAS = 4 kHz, CP contact time = 1.5 ms, recycle delay= 3.5 s, 512 scans). (b) Reconstructed 1D 119Sn DNP enhanced CP-CPMG spectrum for dehydrated Sn-CHA-F-70 after dehydration undervacuum (1*10−4 Torr) at 773 K (MAS = 10 kHz, CP contact time =1.5 ms, recycle delay = 3.0 s, 24636 scans). 20 echoes were acquired,and 17 echoes were used to reconstruct the full-echo spectrum. Both weremeasured on a Bruker 600 MHz (14.1 T) DNP spectrometer. (c) extracted1D 119Sn NMR spectrum for Sn-CHA-F-70 (blue trace) t with one setof CSA parameters (red trace). The spectrum was acquired on Bruker600 MHz (14.1 T) DNP NMR spectrometer. MAS= 4 kHz; CP contacttime= 1.5 ms; recyle delay = 3.5 s; 256 scans per t1 increment, and 85t1 increments were acquired. The CSA t was done using solid lineshapefeature in Bruker's Topspin program2D. . . . . . . . . . . . . . . . . . . 722
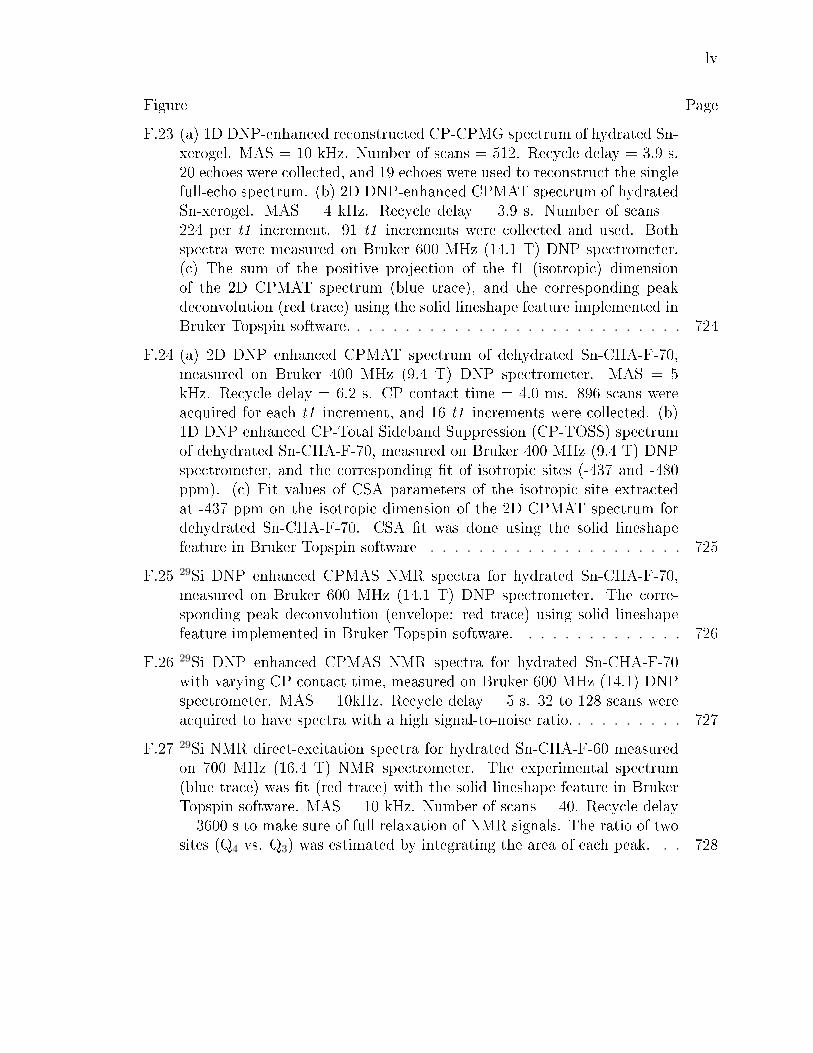
lv
Figure Page
F.23 (a) 1D DNP-enhanced reconstructed CP-CPMG spectrum of hydrated Sn-xerogel. MAS = 10 kHz. Number of scans = 512. Recycle delay = 3.9 s.20 echoes were collected, and 19 echoes were used to reconstruct the singlefull-echo spectrum. (b) 2D DNP-enhanced CPMAT spectrum of hydratedSn-xerogel. MAS = 4 kHz. Recycle delay = 3.9 s. Number of scans =224 per t1 increment. 91 t1 increments were collected and used. Bothspectra were measured on Bruker 600 MHz (14.1 T) DNP spectrometer.(c) The sum of the positive projection of the f1 (isotropic) dimensionof the 2D CPMAT spectrum (blue trace), and the corresponding peakdeconvolution (red trace) using the solid lineshape feature implemented inBruker Topspin software. . . . . . . . . . . . . . . . . . . . . . . . . . . . 724
F.24 (a) 2D DNP enhanced CPMAT spectrum of dehydrated Sn-CHA-F-70,measured on Bruker 400 MHz (9.4 T) DNP spectrometer. MAS = 5kHz. Recycle delay = 6.2 s. CP contact time = 4.0 ms. 896 scans wereacquired for each t1 increment, and 16 t1 increments were collected. (b)1D DNP enhanced CP-Total Sideband Suppression (CP-TOSS) spectrumof dehydrated Sn-CHA-F-70, measured on Bruker 400 MHz (9.4 T) DNPspectrometer, and the corresponding t of isotropic sites (-437 and -480ppm). (c) Fit values of CSA parameters of the isotropic site extractedat -437 ppm on the isotropic dimension of the 2D CPMAT spectrum fordehydrated Sn-CHA-F-70. CSA t was done using the solid lineshapefeature in Bruker Topspin software . . . . . . . . . . . . . . . . . . . . . 725
F.25 29Si DNP enhanced CPMAS NMR spectra for hydrated Sn-CHA-F-70,measured on Bruker 600 MHz (14.1 T) DNP spectrometer. The corre-sponding peak deconvolution (envelope: red trace) using solid lineshapefeature implemented in Bruker Topspin software. . . . . . . . . . . . . . 726
F.26 29Si DNP enhanced CPMAS NMR spectra for hydrated Sn-CHA-F-70with varying CP contact time, measured on Bruker 600 MHz (14.1) DNPspectrometer. MAS = 10kHz. Recycle delay = 5 s. 32 to 128 scans wereacquired to have spectra with a high signal-to-noise ratio. . . . . . . . . . 727
F.27 29Si NMR direct-excitation spectra for hydrated Sn-CHA-F-60 measuredon 700 MHz (16.4 T) NMR spectrometer. The experimental spectrum(blue trace) was t (red trace) with the solid lineshape feature in BrukerTopspin software. MAS = 10 kHz. Number of scans = 40. Recycle delay= 3600 s to make sure of full relaxation of NMR signals. The ratio of twosites (Q4 vs. Q3) was estimated by integrating the area of each peak. . . 728
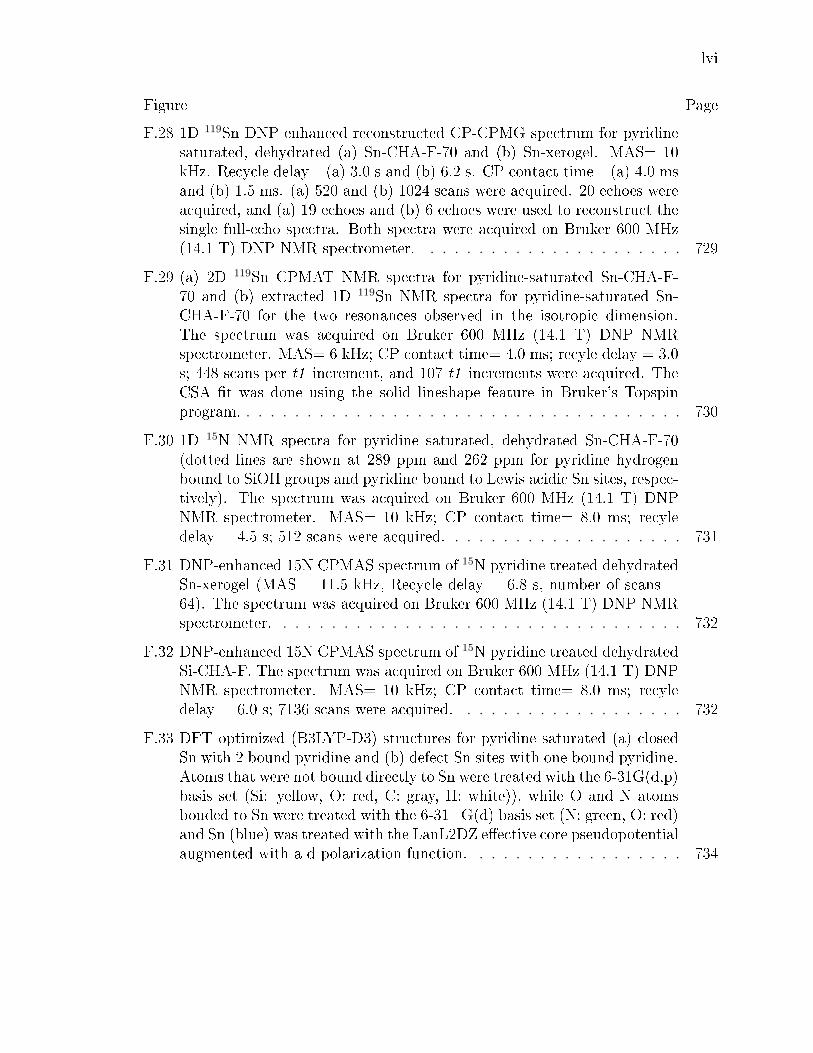
lvi
Figure Page
F.28 1D 119Sn DNP enhanced reconstructed CP-CPMG spectrum for pyridinesaturated, dehydrated (a) Sn-CHA-F-70 and (b) Sn-xerogel. MAS= 10kHz. Recycle delay= (a) 3.0 s and (b) 6.2 s. CP contact time= (a) 4.0 msand (b) 1.5 ms. (a) 520 and (b) 1024 scans were acquired. 20 echoes wereacquired, and (a) 19 echoes and (b) 6 echoes were used to reconstruct thesingle full-echo spectra. Both spectra were acquired on Bruker 600 MHz(14.1 T) DNP NMR spectrometer. . . . . . . . . . . . . . . . . . . . . . 729
F.29 (a) 2D 119Sn CPMAT NMR spectra for pyridine-saturated Sn-CHA-F-70 and (b) extracted 1D 119Sn NMR spectra for pyridine-saturated Sn-CHA-F-70 for the two resonances observed in the isotropic dimension.The spectrum was acquired on Bruker 600 MHz (14.1 T) DNP NMRspectrometer. MAS= 6 kHz; CP contact time= 4.0 ms; recyle delay = 3.0s; 448 scans per t1 increment, and 107 t1 increments were acquired. TheCSA t was done using the solid lineshape feature in Bruker's Topspinprogram. . . . . . . . . . . . . . . . . . . . . . . . . . . . . . . . . . . . . 730
F.30 1D 15N NMR spectra for pyridine saturated, dehydrated Sn-CHA-F-70(dotted lines are shown at 289 ppm and 262 ppm for pyridine hydrogenbound to SiOH groups and pyridine bound to Lewis acidic Sn sites, respec-tively). The spectrum was acquired on Bruker 600 MHz (14.1 T) DNPNMR spectrometer. MAS= 10 kHz; CP contact time= 8.0 ms; recyledelay = 4.5 s; 512 scans were acquired. . . . . . . . . . . . . . . . . . . . 731
F.31 DNP-enhanced 15N CPMAS spectrum of 15N pyridine treated dehydratedSn-xerogel (MAS = 11.5 kHz, Recycle delay = 6.8 s, number of scans =64). The spectrum was acquired on Bruker 600 MHz (14.1 T) DNP NMRspectrometer. . . . . . . . . . . . . . . . . . . . . . . . . . . . . . . . . . 732
F.32 DNP-enhanced 15N CPMAS spectrum of 15N pyridine treated dehydratedSi-CHA-F. The spectrum was acquired on Bruker 600 MHz (14.1 T) DNPNMR spectrometer. MAS= 10 kHz; CP contact time= 8.0 ms; recyledelay = 6.0 s; 7136 scans were acquired. . . . . . . . . . . . . . . . . . . 732
F.33 DFT optimized (B3LYP-D3) structures for pyridine saturated (a) closedSn with 2 bound pyridine and (b) defect Sn sites with one bound pyridine.Atoms that were not bound directly to Sn were treated with the 6-31G(d,p)basis set (Si: yellow, O: red, C: gray, H: white)), while O and N atomsbonded to Sn were treated with the 6-31+G(d) basis set (N: green, O: red)and Sn (blue) was treated with the LanL2DZ eective core pseudopotentialaugmented with a d polarization function. . . . . . . . . . . . . . . . . . 734

lvii
ABSTRACT
Di Iorio, John R. PhD, Purdue University, December 2018. Synthetic Methods toControl Aluminum Proximity in Chabazite Zeolites and Consequences for Acid andRedox Catalysis. Major Professor: Rajamani Gounder.
Zeolites contain distinct Brønsted acid site (H+) ensembles that arise from dier-
ences in the arrangement of framework Al atoms (Al-O(-Si-O)x-Al) between isolated
(x≥3) and paired (x=1,2) congurations, the latter dened by their ability to ex-
change certain divalent cations (e.g., Cu2+, Co2+). Manipulation of the synthesis
conditions used to prepare MFI zeolites has been proposed to inuence the proxim-
ity of framework Al atoms, but in a manner that is neither determined randomly
nor by any simple predictive rules. Moreover, the eects of proton proximity have
been studied for hydrocarbon catalysis in MFI zeolites, but interpretations of cat-
alytic phenomena are convoluted by eects of the distribution of framework Al atoms
among dierent crystallographic tetrahedral sites (T-sites) and diverse pore environ-
ments (i.e., conning environments) present in MFI. This work instead focuses on the
chabazite (CHA) framework, which contains a single crystallographically-distinct lat-
tice tetrahedral site (T-site) that allows clarifying how synthesis conditions inuence
Al proximity, and in turn, how H+ site proximity inuences catalysis independent of
T-site location.
Selective quantication of the number and type of H+ site ensembles present in a
given zeolite allows for more rigorous normalization of reaction rates by the number
of active sites, but also for probing the number and identity of active sites on bi-
functional catalysts that contain mixtures of Brønsted and Lewis acid sites. Gaseous
NH3 titrations can be used to count the total number of protons on small-pore CHA
zeolites, which are inaccessible to larger amine titrants (e.g., pyridine, alkylamines),
lviii
and can be used to quantify the exchange stoichiometry of extraframework metal
cations (e.g., Cu2+, [CuOH]+) that are stabilized at dierent framework Al arrange-
ments. Additionally, paired Al sites in CHA zeolites can be titrated selectively by
divalent Co2+ cations, whose sole presence is validated by measuring UV-Visible spec-
tra, counting residual protons after Co2+ exchange, and titration of paired Al with
other divalent cations (e.g., Cu2+). These dierent titration procedures enabled reli-
able and reproducible quantication of dierent Al arrangements, and recognition of
the eects of dierent synthetic methods on the resulting arrangement of framework
Al atoms in CHA zeolites.
Upon the advent of this suite of characterization and titration tools, dierent
synthetic methods were developed to crystallize CHA zeolites at constant composition
(e.g., Si/Al = 15) but with systematic variation in their paired Al content. The
substitution of N,N,N-trimethyl-1-adamantylammonium (TMAda+) cations for Na+
in the synthesis media (Na+/TMAda+ <2), while holding all other synthetic variables
constant, resulted in CHA zeolites of similar composition (Si/Al = 15) and organic
content (ca. 1 TMAda+ per cage), but with percentages of paired Al (0-44%) that
increased with the total amount of sodium retained on the zeolite product. This result
suggests that sodium atoms are occluded near the ammonium group of TMAda+
leading to the formation of a paired Al site. Replacement of Na+ by K+ in the
synthesis media allowed for the crystallization of CHA (Si/Al = 15) at much higher
ratios of alkali to TMAda+ (K+/TMAda+ <20), likely due to the suppression of
alternate crystalline phases by K+. Incorporation of K+ during crystallization of
CHA did not correlate with the formation of paired Al sites, but instead resulted in
the displacement of one TMAda+ molecule by two K+ cations, which likely assist in
the stabilization of the CHA framework at low TMAda+ concentrations. Ab initio
molecular dynamics simulations were used to assess the stability of various Al-Al
arrangements in the presence of dierent combinations of Na+, K+, and TMAda+
cations, and provide thermodynamic insight into electrostatic interactions between
Na+ and TMAda+ cations that stabilize paired Al sites in CHA.
lix
Using these synthetic procedures to prepare CHA zeolites of similar composi-
tion, but with varied arrangements of framework Al, the catalytic consequences of
framework Al arrangement were investigated using acid and redox catalysis. The low-
temperature (473 K) selective catalytic reduction of NOx with NH3 (NH3-SCR) was
investigated over Cu-exchanged CHA zeolites containing various Al arrangements.
Cu cations exchange as both divalent Cu2+ and monovalent [CuOH]+ complexes,
which exchange at paired and isolated Al sites, respectively, and turnover with sim-
ilar SCR rates (473 K). In situ and operando X-ray absorption spectroscopy (XAS)
were used to monitor the oxidation state and coordination environment of Cu as a
function of time and environmental conditions. Rationalization of these experimen-
tal observations by rst-principles thermodynamics and ab initio molecular dynamics
simulations revealed that both Cu2+ and [CuOH]+ complexes are solvated by NH3
and undergo reduction to Cu+ upon oxidation of NO with NH3. Cu+ cations become
mobilized by coordination with NH3 under reaction conditions (473 K, equimolar
NO and NH3 feed), and activate O2 through a dicopper complex formed dynamically
during reaction. These results implicate the spatial density of nominally site-isolated
Cu cations and, in turn, the arrangement of anionic framework Al atoms that anchor
such cationic Cu complexes, inuence the kinetics of O2 activation in selective oxi-
dation reactions, manifested as SCR rates (per 1000 A3) that depend quadratically
on Cu density (per 1000 A3) and become rate-limiting processes in practice at low
temperatures.
Furthermore, rst-order and zero-order rate constants (415 K, per H+) of methan-
ol dehydration, a probe reaction of acid strength and connement eects in solid
Brønsted acids, are nearly one order of magnitude larger on paired than on isolated
protons in CHA zeolites, reecting dierences in prevalent mechanisms and apparent
enthalpic and entropic barriers at these dierent active site ensembles. Yet, these
dierences in rate constants and activation parameters at isolated and paired protons
do not persist within larger pore zeolites (e.g., MFI). In situ IR spectra measured
during steady-state methanol dehydration catalysis (415 K, 0.05-22 kPa CH3OH)

lx
reveal that surface methoxy species are present in CHA zeolites containing paired
protons, but not in CHA zeolites containing only isolated protons or MFI zeolites,
providing evidence that sequential dehydration pathways via methoxy intermediates
become accessible on paired protons in CHA. Density functional theory is used to
provide atomistic detail of conned intermediates and transition states at isolated
and paired protons in CHA and MFI zeolites, indicating that paired protons in CHA
preferentially stabilize dehydration transition states that are partially-conned within
the 8-membered ring (8-MR) of CHA. These ndings provide evidence that catalytic
diversity for the same stoichiometric reaction among zeolites of xed structure and
composition, even for frameworks containing a single T-site, can be introduced delib-
erately through synthetic control of the atomic arrangement of matter.
1
1. INTRODUCTION
Zeolites are crystalline, microporous frameworks (pore diameter: <2 nm) constructed
from tetrahedrally-coordinated Si4+ heteroatoms (T-atom) connected by bridging O−2
atoms (chemical formula: SiO2). Dierences in the coordination environment around
a given T-atom yields a symmetry-distinct tetrahedral site (T-site), whose connectiv-
ity to adjacent T-sites (either of similar or distinct symmetry) allows for a diversity
of crystallographically-unique frameworks (>230 discovered structures [1]; >106 pre-
dicted frameworks [2, 3]). Isomorphous substitution of Al3+ for Si4+ results in the
formation of framework anionic charges (i.e., AlO−2 ) that require charge-balancing
by extraframework cations (e.g., Na+), whose identity can be tuned for various ap-
plications [47], and leads to the formation of Bronsted acid sites (H+) when ex-
traframework protons charge-balance lattice anionic charges. Aluminosilicate zeolites
are widely used as solid acid catalysts in the petrochemical industry [8,9], because of
the diverse structure of their microporous channels, which are of molecular dimension
(<2 nm) and can regulate reactivity and selectivity based on the size and structure
of reactants, products, or transition states [1013].
Early investigations of the identity of the active site in aluminosilicate zeolites
reported that hexane cracking rates (per g, 811 K) increased linearly with total Al
density (per g) in MFI zeolites [14]. These results suggested that all H+ sites are
catalytically-equivalent in MFI and that rates of hexane cracking (811 K) are inde-
pendent of composition (Si/Al = 10-10000) and topographic location, as would be
expected for a single-site catalyst [15]. More recently, catalytic turnover rates of
hydrocarbon reactions have been recognized to depend on the location of H+ sites
within MOR zeolites, despite equivalent acid strength as described rigorously by de-
protonation energy (DPE) [16], because the size and shape of microporous voids that
2
stabilize conned intermediates and transition states through van der Waals inter-
actions [1722]. Deconvolution of the catalytic behavior of zeolites containing active
sites located within voids of dierent size requires preferential titration of protons
in certain ring sizes or acquisition of zeolites of dierent provenance [21, 23]. These
observations suggest that the catalytic behavior of zeolite catalysts strongly depends
on the synthetic conditions used to prepare such frameworks.
Synthetic control of the location of Al atoms within a given zeolite is still an
emerging area of research, but has been demonstrated in ferrierite zeolites (FER)
synthesized in the presence of multiple organic structure directing agents (SDAs) of
dierent size [2428] and in MFI zeolites when synthesized using mixtures of organic
and inorganic SDAs [2932]. Turnover rates in zeolite catalysis, however, may still be
further convoluted by the proximity of H+ sites, which is regulated by the proximity
of framework Al atoms. Distinct Brønsted acid site congurations within a given
zeolite arise from dierent arrangements (Al-O(-Si-O)x-Al) of framework Al atoms
between isolated (x ≥ 3) or paired congurations (x = 1, 2; Figure 1.1), where the
latter are dened by their ability to ion-exchange divalent cations. One example,
is in Cu-exchanged zeolites utilized for the selective catalytic reduction (SCR) of
NOx with NH3 where Cu2+ cations exchange non-selectively as monovalent [CuOH]+
complexes at isolated Al and as divalent Cu2+ cations at paired Al in both MFI
[33] and chabazite (CHA) [3442] zeolites. Thus, synthetic methods to control the
proximity of framework Al atoms can open new opportunities to introduce structural
and catalytic diversity in a given zeolite with xed elemental composition, but require
methods for quantication of the distribution of Al atoms in the zeolite framework.
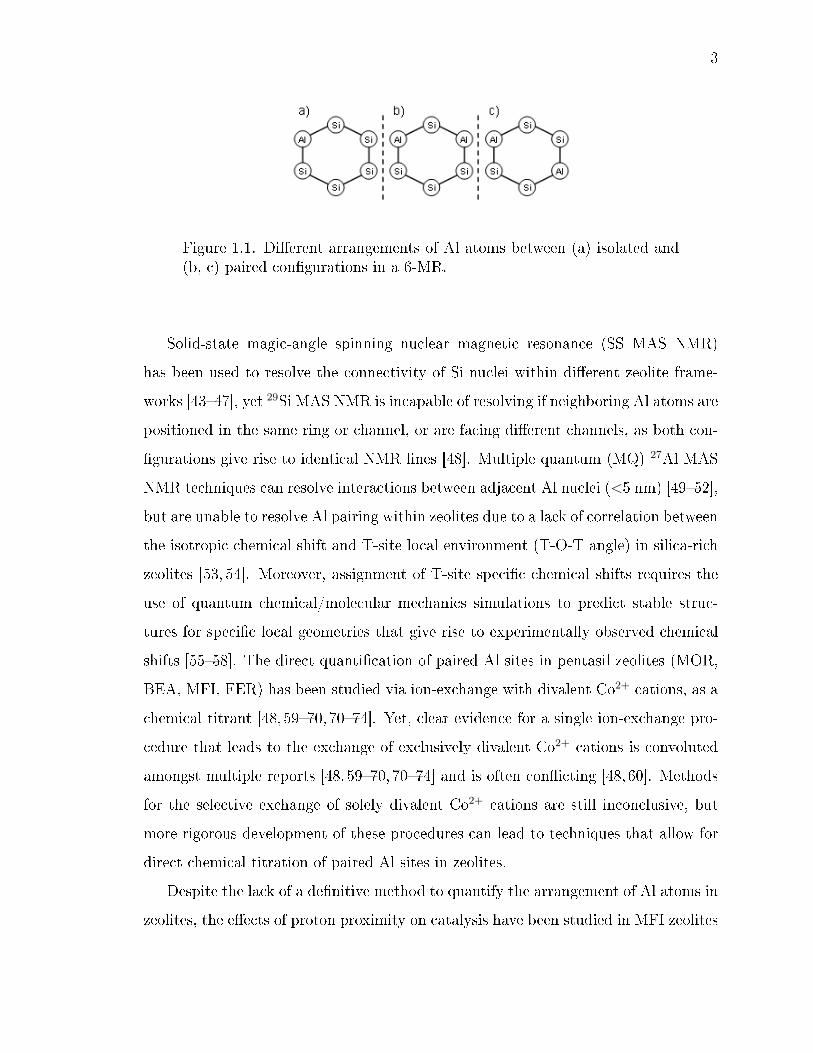
3
Figure 1.1. Dierent arrangements of Al atoms between (a) isolated and(b, c) paired congurations in a 6-MR.
Solid-state magic-angle spinning nuclear magnetic resonance (SS MAS NMR)
has been used to resolve the connectivity of Si nuclei within dierent zeolite frame-
works [4347], yet 29Si MAS NMR is incapable of resolving if neighboring Al atoms are
positioned in the same ring or channel, or are facing dierent channels, as both con-
gurations give rise to identical NMR lines [48]. Multiple quantum (MQ) 27Al MAS
NMR techniques can resolve interactions between adjacent Al nuclei (<5 nm) [4952],
but are unable to resolve Al pairing within zeolites due to a lack of correlation between
the isotropic chemical shift and T-site local environment (T-O-T angle) in silica-rich
zeolites [53, 54]. Moreover, assignment of T-site specic chemical shifts requires the
use of quantum chemical/molecular mechanics simulations to predict stable struc-
tures for specic local geometries that give rise to experimentally observed chemical
shifts [5558]. The direct quantication of paired Al sites in pentasil zeolites (MOR,
BEA, MFI, FER) has been studied via ion-exchange with divalent Co2+ cations, as a
chemical titrant [48, 5970, 7074]. Yet, clear evidence for a single ion-exchange pro-
cedure that leads to the exchange of exclusively divalent Co2+ cations is convoluted
amongst multiple reports [48, 5970, 7074] and is often conicting [48, 60]. Methods
for the selective exchange of solely divalent Co2+ cations are still inconclusive, but
more rigorous development of these procedures can lead to techniques that allow for
direct chemical titration of paired Al sites in zeolites.
Despite the lack of a denitive method to quantify the arrangement of Al atoms in
zeolites, the eects of proton proximity on catalysis have been studied in MFI zeolites
4
through variation in bulk Al concentration (Si/Al) [61, 75, 76]. Turnover rates (per
H+) of hydrocarbon cracking generally increased with total Al content [61, 75], but
changes in the bulk composition only inuence Al proximity on average. Recently,
modication of the Na+ cation concentration in the synthesis of MFI zeolites led to
changes in the number of paired Al sites [74], as measured by saturation with ion-
exchanged Co2+ cations [48,48,65,68,70,73,74], but the inuence of anionic charged
species (OH−, Cl−, NO−3 ) and dierent sources of Si and Al precursors, which was
not controlled for, were also shown to modify the Al isolation, but often with changes
in bulk Al concentration [48, 65, 74]. As a result, the routes used to synthesize MFI
zeolites can inuence the arrangement of framework Al atoms, but in a manner that
is neither random nor dened by any deterministic rules. Moreover, the structure of a
paired Al site in MFI, is ill-dened, as MFI contains three distinct 6-membered rings
that can exchanged divalent Co2+ cations. Thus, while paired H+ sites in MFI (Si/Al
= 13-140) have been proposed to increase alkene oligomerization [77] and alkane
cracking [75] turnover rates, concomitant changes in the distribution of Al among
dierent void environments (i.e., straight and sinusoidal channels, and intersections)
[61] have prevented unambiguous kinetic assessments of proton proximity eects in
zeolites.
In this work, we focus on the CHA framework, which is constructed from the
translation of double six-membered ring (6-MR) hexagonal prisms in a AABBCC
stacking sequence to form larger CHA cages (0.72 x 0.72 x 1.2 nm), whose access
is regulated by 8-MR windows (ca. 0.38 nm). As a result, the CHA framework
contains a single crystallographically-distinct T-site, which simplies interpretation
of structural characterization data and thus allows clarifying how dierent synthetic
procedures inuence Al pairing independent of T-site and, in turn, how Al arrange-
ment inuences redox catalysis at extraframework Lewis acid sites and Brønsted acid
catalysis. Moreover, the high-symmetry of the CHA framework acts as a well-dened
model system to facilitate the integration of theoretical and experimental assessments
of catalytic active sites and reaction mechanisms in zeolites.
5
The quantication of H+ sites in CHA zeolites requires judicious choices of the
titrants used because 8-MR windows (0.38 nm) limit transport through the frame-
work and prevent typically used bulky titrants (e.g., alkylamines, pyridine) from
accessing all H+ sites in CHA [49, 78]. Furthermore, titration of the number of H+
sites that remain after ion-exchange with redox-active metals (e.g., Cu2+) cannot be
performed using aqueous phase procedures involving small monovalent cations (e.g.,
Na+ or NH+4 ) because these titrants will also displace extraframework Cu2+ cations.
Chapter 2 discusses titration methods using gaseous NH3 that selectively titrate H+
sites in metal-exchanged zeolites when Lewis acid-bound and physisorbed NH3 are
removed after NH3 saturation steps, such as by ushing in wet helium at 433 K. IR
spectra indicate that these NH3 saturation and purging steps led to the complete
disappearance of Bronsted acidic OH stretching modes in small-pore CHA zeolites,
contrasting the inability of larger amine titrants (e.g., n-propylamine) to access the
same number of H+ sites in CHA (<0.25). NH3 titration of residual H+ sites remain-
ing after Cu2+ ion-exchange in low-silica CHA zeolites (Si/Al = 4.5, Cu/Al<0.20)
reveals that 2 H+ are removed per Cu after oxidative treatments, but only 1 H+ is
removed per Cu after reduction of Cu2+ by NO and NH3 (473 K), indicating that
a Cu+/H+ pair forms during the NO and NH3 assisted reduction of Cu2+ cations.
These titration procedures probe the dynamic role of Cu2+ active sites during the
selective catalytic reduction of NO with NH3 and can be used to elucidate exchange
stoichiometries of extraframework cations, which is sensitive to the underlying Al
arrangement in small-pore CHA zeolites.
CHA zeolites prepared with dierent amounts of framework Al (Si/Al = 5-25)
contain dierent fractions of paired Al sites because changes to the bulk Al content,
on average, change the total number of paired Al sites. Titration of residual H+ sites
remaining after Cu exchange of CHA zeolites (Si/Al = 5-25) indicated that Cu pref-
erentially exchanges rst as divalent Cu2+ at paired Al sites (2 H+ removed per Cu)
and then as monovalent [CuOH]+ at isolated Al sites, consistent with density func-
tional theory (DFT) calculations that predict larger adsorption energies for Cu2+ at
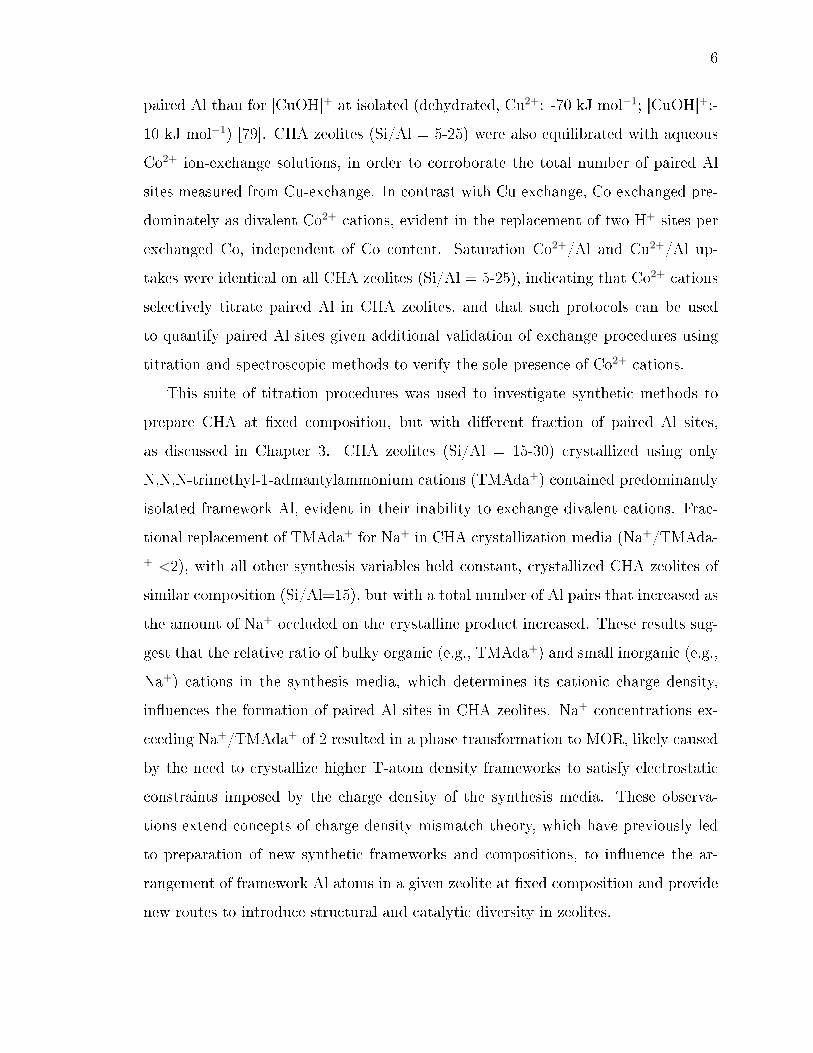
6
paired Al than for [CuOH]+ at isolated (dehydrated, Cu2+: -70 kJ mol−1; [CuOH]+:-
10 kJ mol−1) [79]. CHA zeolites (Si/Al = 5-25) were also equilibrated with aqueous
Co2+ ion-exchange solutions, in order to corroborate the total number of paired Al
sites measured from Cu-exchange. In contrast with Cu exchange, Co exchanged pre-
dominately as divalent Co2+ cations, evident in the replacement of two H+ sites per
exchanged Co, independent of Co content. Saturation Co2+/Al and Cu2+/Al up-
takes were identical on all CHA zeolites (Si/Al = 5-25), indicating that Co2+ cations
selectively titrate paired Al in CHA zeolites, and that such protocols can be used
to quantify paired Al sites given additional validation of exchange procedures using
titration and spectroscopic methods to verify the sole presence of Co2+ cations.
This suite of titration procedures was used to investigate synthetic methods to
prepare CHA at xed composition, but with dierent fraction of paired Al sites,
as discussed in Chapter 3. CHA zeolites (Si/Al = 15-30) crystallized using only
N,N,N-trimethyl-1-admantylammonium cations (TMAda+) contained predominantly
isolated framework Al, evident in their inability to exchange divalent cations. Frac-
tional replacement of TMAda+ for Na+ in CHA crystallization media (Na+/TMAda-+ <2), with all other synthesis variables held constant, crystallized CHA zeolites of
similar composition (Si/Al=15), but with a total number of Al pairs that increased as
the amount of Na+ occluded on the crystalline product increased. These results sug-
gest that the relative ratio of bulky organic (e.g., TMAda+) and small inorganic (e.g.,
Na+) cations in the synthesis media, which determines its cationic charge density,
inuences the formation of paired Al sites in CHA zeolites. Na+ concentrations ex-
ceeding Na+/TMAda+ of 2 resulted in a phase transformation to MOR, likely caused
by the need to crystallize higher T-atom density frameworks to satisfy electrostatic
constraints imposed by the charge density of the synthesis media. These observa-
tions extend concepts of charge density mismatch theory, which have previously led
to preparation of new synthetic frameworks and compositions, to inuence the ar-
rangement of framework Al atoms in a given zeolite at xed composition and provide
new routes to introduce structural and catalytic diversity in zeolites.

7
Interactions between organic and inorganic SDAs were further probed in Chapter
4 using K+ cations instead of Na+ during the synthesis of CHA zeolites with TMAda+.
CHA zeolites (Si/Al = 15) crystallized across a much wider range of K+/TMAda+ ra-
tios (<20) than when Na+ was used as the inorganic SDA (Na+/TMAda+ <2). These
results highlight the ability of dierent alkali cations to act as structure-directing
agents [80] and likely reect the limited role that K+ has as a structure-directing
agent, which instead aids in the crystallization of CHA by preventing the forma-
tion of other undesired phases, as has been previously suggested for the synthesis of
IFR zeolites [81]. SEM micrographs reveal the formation of a secondary phase at
K+/TMAda+ >10, which contains a higher concentration of both K+ and Al (from
EDS mapping) than the bulk average measured by atomic absorption spectroscopy,
suggesting the formation of a K-rich CHA phase, which appears to sequester excess
K+ at high K+/TMAda+ ratios. Unlike CHA synthesized using mixtures of Na+ and
TMAda+, the number of TMAda+ molecules per cage decreases as the amount of
occluded K+ increases, which is not accompanied by a subsequent increase in the
number of paired Al sites. These results suggest that the role of K+ during crystal-
lization of CHA zeolites is markedly dierent than that of Na+. Ab initio molecular
dynamics simulations reveal that electrostatic interactions between the quaternary
N-atom of TMAda+ and the anionic Al center favor the formation of isolated Al sites
(i.e., sites that are not exchangeable by Co2+), but that introduction of Na+ alters the
free energy landscape to favor the formation of paired Al. While these observations
do not directly describe the incorporation of Al during crystallization, which is often
a kinetically-controlled process, they do provide evidence that dierent alkali cations
can inuence the stability of dierent Al-Al arrangements in CHA zeolites during
crystallization, and that experimentally-guided calculations can be used to predict
material properties of dierent synthesis routes.
Predictable synthetic control of the arrangement of framework Al atoms in ze-
olites at xed composition enables routes to prepare zeolites with tunable catalytic
and structural properties, while maintaining a constant density of active sites. Cu-

8
exchanged zeolites are widely used for the selective catalytic reduction of NOx with
NH3, but suer from deactivation due to exposure to water vapor (up to 10 wt%) at
high-temperatures (up to 1073 K) in automotive applications. Chapter 5 investigates
the deactivation of three dierent small-pore cage-based zeolite frameworks (AEI,
CHA, RTH) after hydrothermal aging, in order to study the eect of zeolite topology
on the structural and kinetic changes that occur to Cu-zeolites used in NOx abate-
ment. Rates of NOx SCR (473 K, per Cu) on Cu-exchanged AEI and CHA zeolites,
which are constructed from double six-membered ring building units, decrease to a
similar extent after hydrothermal aging, suggesting a similar resistance to deactiva-
tion in both these frameworks. Cu-RTH, which is a small-pore pentasil framework
with a pseudo-1D connectivity, essentially deactivates completely after hydrother-
mal aging. These ndings highlight the benecial properties conferred by double
six-membered ring (D6R) composite building units and demonstrate that both ex-
posure to hydrothermal aging conditions and subsequent exposure to SCR reactants
at low temperatures are responsible for deleterious structural changes to Cu sites.
These results further indicate that the predictions of active site stability cannot be
inferred solely from assessments of framework structural integrity, but also require
detailed kinetic characterization of Cu active sites after hydrothermally aged zeolites
are exposed to low temperature SCR reaction conditions.
The nature of the Cu active sites formed in Cu-CHA zeolites and their involve-
ment in the NOx SCR mechanism are described in Chapter 6 and 7. The presence
of Cu2+ and [CuOH]+ cations is elucidated using ex situ IR and X-ray absorption
spectroscopies and titration with gas-phase NH3 after both oxidative and reductive
treatments. Cooperative use of in operando and in situ X-ray absorption spectroscopy
and ab initio calculations reveal that both Cu2+ and [CuOH]+ become solvated by
NH3 to form mobilized active sites that turnover with indistinguishable rates (473 K,
per Cu), which do not vary with Cu density at high Cu loadings. At low Cu con-
tent, however, SCR rates (473 K, per Cu; equimolar NO and NH3) increase linearly
with Cu content. This dependence on the Cu volumetric density is inconsistent with

9
the single-site kinetic behavior observed at high Cu densities because mobilized Cu
ions traverse zeolite pores to form transient Cu-dimers that mediate O2 activation,
a critical step in the low-temperature SCR mechanism. Electrostatic tethering of
cationic Cu complexes at anionic framework aluminum centers denes the space that
each Cu cation can sample and, thus, its capacity to activate O2. This dynamic and
reversible formation of multinuclear Cu sites from mobilized single atoms represents
a distinct phenomenon that falls outside the conventional boundaries of a heteroge-
neous or homogeneous catalyst. Moreover, these results underscore the necessity to
experimentally and computationally probe the active site under working conditions
that correspond to catalytic turnover.
Finally, Chapter 8 discusses the eect of the Al arrangement in CHA on acid catal-
ysis using the dehydration of methanol to dimethyl ether (DME), a reaction sensitive
to both dierences in acid strength and connement eects in zeolites [82,83]. DME
formation rates (415 K, per H+) on CHA zeolites increase linearly at low methanol
pressures, but decrease at high methanol pressures suggesting that DME formation
is inhibited by adsorbed methanol at high pressures. This behavior contrasts that
of larger pore zeolites (e.g., MFI) and unconned acid sites (e.g., polyoxometalates)
characterized by a kinetic regime that is zero-order at high CH3OH pressures. DME
formation rates (415 K, per H+) on CHA zeolites increased systematically with the
fraction of paired H+ sites and turnover rates were ca. 10x higher on paired than
on isolated H+ sites. Indicating that paired protons in CHA stabilize intermediates
and transition states more eectively than isolated protons or provide access to de-
hydration pathways inaccessible to isolated protons. In situ IR spectra collected in
the rst-order kinetic regime (415 K, <1.5 kPa CH3OH) provide evidence of surface
methoxy (1457 cm−1) formation on CHA containing paired Al sites, in amounts that
increased with paired acid site content in CHA. Methoxy species were not detected
at similar CH3OH pressures for CHA zeolites containing only isolated protons, or
in MFI zeolites. This suggests that paired protons in CHA form DME through a
dissociative pathway, in which CH3OH monomers dehydrate to form methoxy species
10
that react with a second methanol to form DME. This diers from the prevalent
pathway on supported Keggin polyoxometalate clusters and on larger pore zeolites,
which involves an associative pathway and direct DME elimination from co-adsorbed
CH3OH dimers at H+ sites. These ndings highlight the catalytic diversity of paired
and isolated Brønsted acid site ensembles for methanol conversion catalysis, even
within single T-site frameworks (e.g., CHA), caused by dierences in the stabilities
of reactive intermediates and transition states, which can alter the prevalent reaction
mechanism.

11
2. THE DYNAMIC NATURE OF BRØNSTED ACID SITES IN CU-ZEOLITES
DURING NOX SELECTIVE CATALYTIC REDUCTION: QUANTIFICATION
BY GAS-PHASE AMMONIA TITRATION
2.1 Introduction
Redox-active metal centers can be isolated in extraframework locations, via ion-
exchange of Brønsted acid sites (H+) present at oxygen atoms that bridge Si and Al
atoms in aluminosilicate (zeolite; Al3+ substituted for Si4+) and in silicoaluminophos-
phate (SAPO; Si4+ substituted for P5+) frameworks. This underlying concept de-
scribes the behavior of high aluminum (Si/Altot = 4.5) SSZ-13 zeolites containing iso-
lated extraframework Cu2+ cations [35,84], which undergo redox cycling (Cu2+/Cu+)
during the selective catalytic reduction (SCR) of NOx (x = 1, 2) compounds with
NH3 [8587].
Cu-exchanged SSZ-13 [88,89] and SAPO-34 [90] of the chabazite (CHA) topology,
as well as other redox-active metal-exchanged molecular sieves [9193], have been
investigated for NOx emission control strategies in mobile sources because they cat-
alyze SCR reactions, which under standard conditions (equimolar NO and NH3 feed)
occurs by the stoichiometric reaction:
4NH3 + 4NO +O2 → 4N2 + 6H2O (2.1)
Most mechanistic proposals for standard SCR on Cu-zeolites [37, 94, 95], Fe-
zeolites [96100], and VOx-TiO2 [101, 102] implicate a bifunctional mechanism with
steps involving reactions of NO with Lewis acid-bound NH3 intermediates, with
Brønsted acid-bound NH4+ intermediates, or with their derivatives, including our
most recent mechanistic proposal for low temperature (473 K) standard SCR on
high aluminum Cu-SSZ-13 zeolites [85]. We have used operando X-ray absorption
spectroscopy (XAS) and ambient UV-Visible spectroscopy to show that the initial
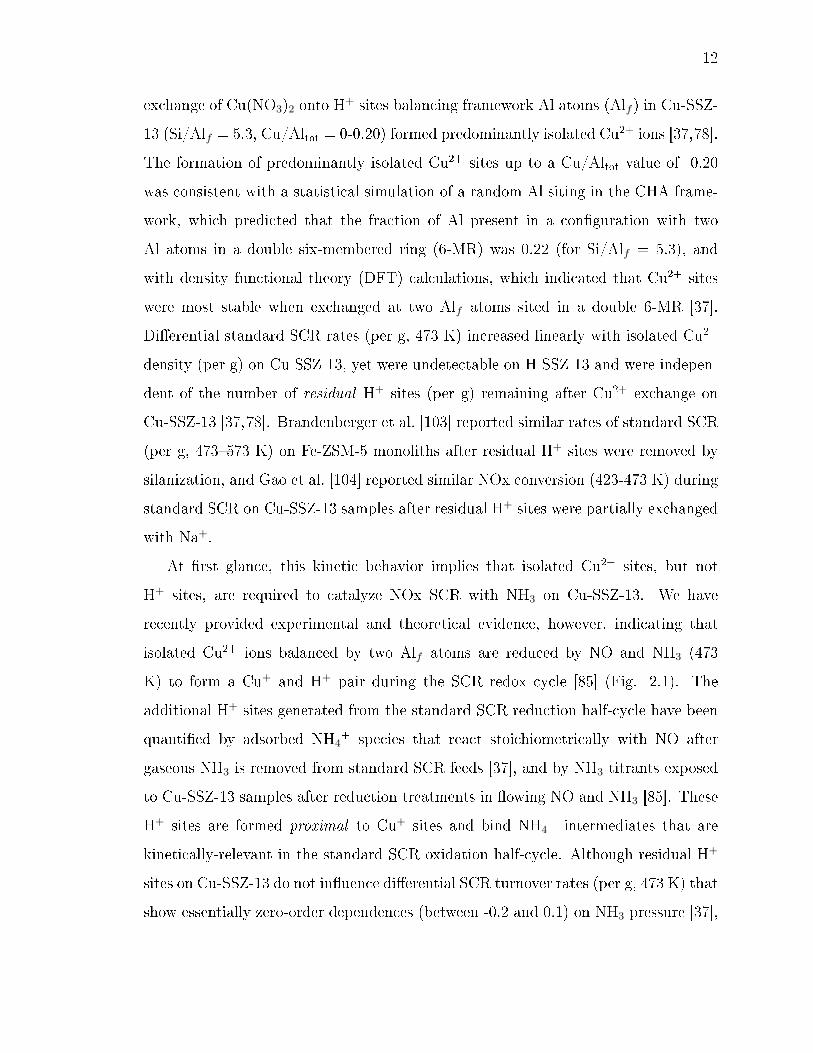
12
exchange of Cu(NO3)2 onto H+ sites balancing framework Al atoms (Alf ) in Cu-SSZ-
13 (Si/Alf = 5.3, Cu/Altot = 0-0.20) formed predominantly isolated Cu2+ ions [37,78].
The formation of predominantly isolated Cu2+ sites up to a Cu/Altot value of 0.20
was consistent with a statistical simulation of a random Al siting in the CHA frame-
work, which predicted that the fraction of Al present in a conguration with two
Al atoms in a double six-membered ring (6-MR) was 0.22 (for Si/Alf = 5.3), and
with density functional theory (DFT) calculations, which indicated that Cu2+ sites
were most stable when exchanged at two Alf atoms sited in a double 6-MR [37].
Dierential standard SCR rates (per g, 473 K) increased linearly with isolated Cu2+
density (per g) on Cu-SSZ-13, yet were undetectable on H-SSZ-13 and were indepen-
dent of the number of residual H+ sites (per g) remaining after Cu2+ exchange on
Cu-SSZ-13 [37,78]. Brandenberger et al. [103] reported similar rates of standard SCR
(per g, 473573 K) on Fe-ZSM-5 monoliths after residual H+ sites were removed by
silanization, and Gao et al. [104] reported similar NOx conversion (423-473 K) during
standard SCR on Cu-SSZ-13 samples after residual H+ sites were partially exchanged
with Na+.
At rst glance, this kinetic behavior implies that isolated Cu2+ sites, but not
H+ sites, are required to catalyze NOx SCR with NH3 on Cu-SSZ-13. We have
recently provided experimental and theoretical evidence, however, indicating that
isolated Cu2+ ions balanced by two Alf atoms are reduced by NO and NH3 (473
K) to form a Cu+ and H+ pair during the SCR redox cycle [85] (Fig. 2.1). The
additional H+ sites generated from the standard SCR reduction half-cycle have been
quantied by adsorbed NH4+ species that react stoichiometrically with NO after
gaseous NH3 is removed from standard SCR feeds [37], and by NH3 titrants exposed
to Cu-SSZ-13 samples after reduction treatments in owing NO and NH3 [85]. These
H+ sites are formed proximal to Cu+ sites and bind NH4+ intermediates that are
kinetically-relevant in the standard SCR oxidation half-cycle. Although residual H+
sites on Cu-SSZ-13 do not inuence dierential SCR turnover rates (per g, 473 K) that
show essentially zero-order dependences (between -0.2 and 0.1) on NH3 pressure [37],

13
such sites can bind and release NH3 during actual SCR operation and may become
kinetically-relevant in a regime where rates become limited by NH4+ surface coverages.
The dierential standard SCR turnover rates (per g, 473 K) measured previously on
Cu-SSZ-13, which show dierent dependences on the number of residual and proximal
H+ sites, provide insight into the dierent types and mechanistic roles of H+ sites
present on Cu-SSZ-13 during standard SCR redox cycles.
Here, we review methods we have developed recently to quantify, by direct chem-
ical titration, Brønsted acid sites present on small-pore Cu-SSZ-13 zeolites after ex-
posure to oxidation [78] and reduction [85] treatments that are representative of the
prevailing gaseous environments during standard SCR oxidation and reduction half-
cycles. These methods titrate H+ sites using gaseous ammonia, which can access all
void spaces in small-pore (8-MR) CHA zeolites [78] and which is the co-reductant in
standard SCR. Although gaseous NH3 binds non-selectively to Brønsted acid sites, to
Lewis acid sites (partial or extra-framework Al, extra-framework Cu2+ or Cu+), and
on siliceous pore walls [78,105,106], we demonstrate how NH3 bound at non-protonic
sites can be purged prior to temperature programmed-desorption (TPD) to enable
straightforward quantication of the number of H+ sites [78]. We also discuss how
gaseous NH3 titration of H+ sites provides an in situ method to probe structural
changes to active sites in Cu-SSZ-13 after standard SCR oxidation and reduction
half-cycles [85], which are reminiscent of previously reported structural changes to
active VOx-TiO2 oxide surfaces during SCR redox cycles [101,107,108].
2.2 Experimental Methods
2.2.1 Catalyst Synthesis and Preparation
NH4-ZSM-5 samples of varying Al content were obtained from Zeolyst, corre-
sponding to product numbers CBV2314 (Si/Altot = 12.5), CBV3024E (Si/Altot =
17.3), CBV5524G (Si/Altot = 30.6), CBV8014 (Si/Altot = 43) and CBV1502 (Si/Altot
= 89). NH4-form ZSM-5 catalysts were converted to their H-form by treatment in
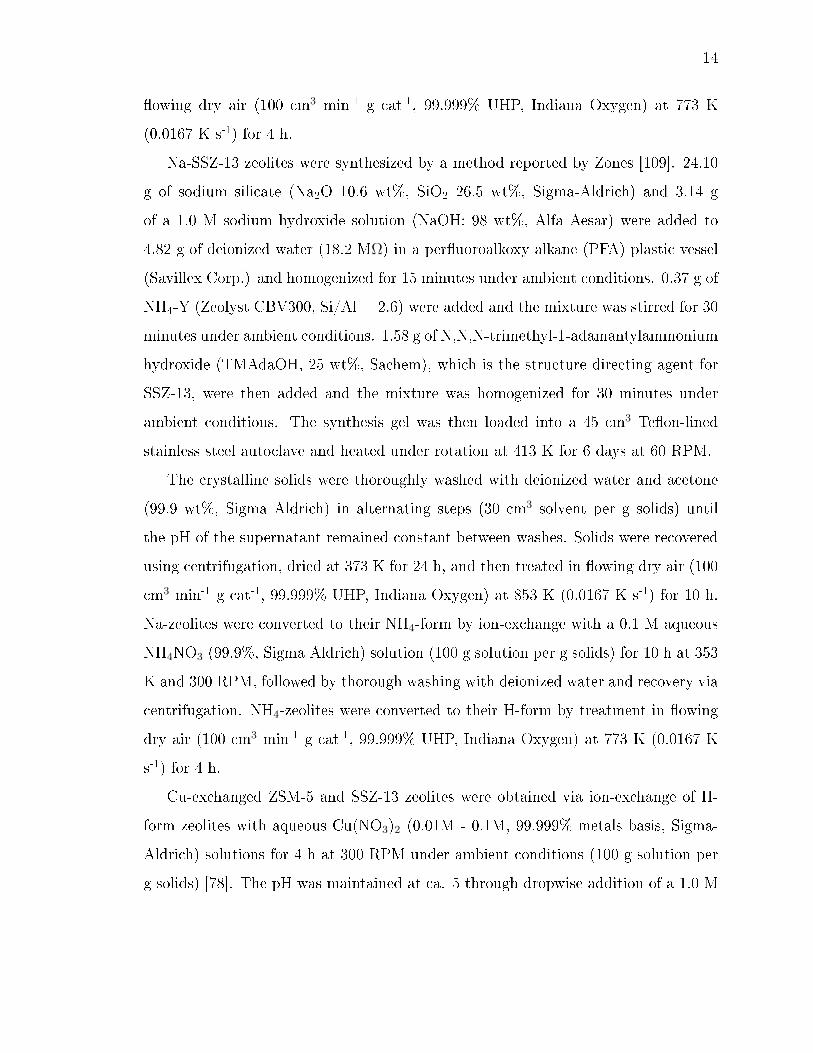
14
owing dry air (100 cm3 min-1 g cat-1, 99.999% UHP, Indiana Oxygen) at 773 K
(0.0167 K s-1) for 4 h.
Na-SSZ-13 zeolites were synthesized by a method reported by Zones [109]. 24.10
g of sodium silicate (Na2O 10.6 wt%, SiO2 26.5 wt%, Sigma-Aldrich) and 3.14 g
of a 1.0 M sodium hydroxide solution (NaOH: 98 wt%, Alfa Aesar) were added to
4.82 g of deionized water (18.2 MΩ) in a peruoroalkoxy alkane (PFA) plastic vessel
(Savillex Corp.) and homogenized for 15 minutes under ambient conditions. 0.37 g of
NH4-Y (Zeolyst CBV300, Si/Al = 2.6) were added and the mixture was stirred for 30
minutes under ambient conditions. 1.58 g of N,N,N-trimethyl-1-adamantylammonium
hydroxide (TMAdaOH, 25 wt%, Sachem), which is the structure directing agent for
SSZ-13, were then added and the mixture was homogenized for 30 minutes under
ambient conditions. The synthesis gel was then loaded into a 45 cm3 Teon-lined
stainless steel autoclave and heated under rotation at 413 K for 6 days at 60 RPM.
The crystalline solids were thoroughly washed with deionized water and acetone
(99.9 wt%, Sigma Aldrich) in alternating steps (30 cm3 solvent per g solids) until
the pH of the supernatant remained constant between washes. Solids were recovered
using centrifugation, dried at 373 K for 24 h, and then treated in owing dry air (100
cm3 min-1 g cat-1, 99.999% UHP, Indiana Oxygen) at 853 K (0.0167 K s-1) for 10 h.
Na-zeolites were converted to their NH4-form by ion-exchange with a 0.1 M aqueous
NH4NO3 (99.9%, Sigma Aldrich) solution (100 g solution per g solids) for 10 h at 353
K and 300 RPM, followed by thorough washing with deionized water and recovery via
centrifugation. NH4-zeolites were converted to their H-form by treatment in owing
dry air (100 cm3 min-1 g cat-1, 99.999% UHP, Indiana Oxygen) at 773 K (0.0167 K
s-1) for 4 h.
Cu-exchanged ZSM-5 and SSZ-13 zeolites were obtained via ion-exchange of H-
form zeolites with aqueous Cu(NO3)2 (0.01M - 0.1M, 99.999% metals basis, Sigma-
Aldrich) solutions for 4 h at 300 RPM under ambient conditions (100 g solution per
g solids) [78]. The pH was maintained at ca. 5 through dropwise addition of a 1.0 M
15
NH4OH (Sigma Aldrich) solution. The solids were thoroughly washed with deionized
water, until the pH was constant between washes, and recovered via centrifugation.
2.2.2 Characterization of Catalyst Structure and Composition
The total Si, Al, and Cu content of each sample were determined using atomic
absorption spectroscopy (AAS) on a Perkin Elmer AAnalyst 300 Atomic Absorption
Spectrometer (experimental details in Section 2.7.1, data in Table 2.3 of the Support-
ing Information). The MFI and CHA framework topologies of ZSM-5 and SSZ-13
zeolites, respectively, were conrmed using powder X-ray diraction (XRD) patterns
collected on a Rigaku SmartLab X-ray diractometer (experimental details in Sec-
tion 2.7.2, powder XRD patterns in Fig. 2.9 of the Supporting Information). The
micropore volumes of each sample were determined from N2 adsorption isotherms
measured at 77 K using a Micromeritics ASAP 2020 Surface Area and Porosity Ana-
lyzer, and were in reasonable agreement with the values expected for MFI and CHA
frameworks (experimental details and discussion in Section 2.7.3, data in Table 2.3
of the Supporting Information). 27Al magic angle spinning nuclear magnetic reso-
nance (MAS NMR) spectra of ZSM-5 samples were collected using a Bruker Avance
500 MHz spectrometer in a wide-bore 11.7 Tesla magnet (Caltech Solid-State NMR
Facility), and of SSZ-13 samples were collected using a Chemagnetics CMX400 400
MHz spectrometer in a wide-bore 9.4 Tesla magnet (Purdue Interdepartmental NMR
Facility), as described elsewhere [78]. The 27Al MAS NMR spectra of ZSM-5 and
SSZ-13 samples are shown respectively in Figures 2.10 and 2.11, and the fraction of
Al present in each sample is listed in Table 2.4 (additional details in Section 2.7.4 of
the Supporting Information).
2.2.3 Titration of Brønsted Acid Sites using Amines
The number of H+ sites on each H-form and Cu-exchanged ZSM-5 and SSZ-13
sample after oxidative treatments in owing air (773 K) was measured using a titration
16
procedure intended to saturate zeolite samples with gaseous NH3 prior to purging all
NH3 species bound to non-protonic sites. This procedure involved saturating zeolite
samples (0.03-0.05 g) in owing gaseous NH3 (3% NH3 in Ar, Praxair) diluted to
500 ppm with ultrahigh purity He (UHP, 99.999%, Indiana Oxygen) at 433 K for
2 h and a total ow rate of 350 cm3 min-1. Subsequently, NH3-saturated samples
were purged in owing UHP helium (350 cm3 min-1) containing moisture (up to 3%
H2O, hereafter referred to as wet helium) at 433 K for 8 h prior to temperature
programmed desorption (TPD) experiments. Deionized water was introduced into
the owing helium stream using a heated shell-type humidier (Perma Pure MH-
Series) in which the diusion of water across a Naon membrane was controlled by
temperature. NH3 titration experiments were also performed on an H-ZSM-5 and a
Cu-ZSM-5 sample in which the wet helium purge step at 433 K was not performed
prior to TPD, in order to demonstrate the eect of this purge step.
TPD experiments were performed using a Micromeritics Autochem II 2920 Chemi-
sorption analyzer equipped with an Agilent 5975C mass selective detector (MSD) to
identify the gaseous species evolved from the catalyst samples. Catalyst samples
were supported between two quartz wool plugs inside a U-shaped quartz cell held
within a clam-shell furnace, held in 50 cm3 min-1 owing UHP helium (99.999%,
Indiana Oxygen) at ambient temperature for 1 h, and heated to 873 K (0.167 K
s-1). The euent stream from the quartz cell was sent via heated transfer lines
held at 383 K to the MSD. The MSD m/z = 17 signal for NH3 was calibrated by
performing NH3 TPD experiments with four NH4-ZSM-5 zeolites of varying Si/Al
ratio (Si/Al = 17-89, Zeolyst), whose NH3 content was measured in independent
TPD experiments performed in a gas-phase plug-ow reactor connected to a MKS
Multigas 2030 gas-phase FT-IR spectrometer with on-board NH3 calibrations. After
each TPD experiment, a 0.5 cm3 sample loop was lled with argon (UHP, 99.999%,
Indiana Oxygen) and injected into 50 cm3 min-1 owing UHP helium that was sent
to the MSD as a reference standard to correct for instrument drift between TPD
experiments. The total NH3 desorbed was quantied from the m/z = 17 MSD signal
17
after subtraction of the contributing fragments of water (m/z = 17), which appears
in constant proportion to the m/z = 18 MSD signal for its parent ion.
Each H-form and Cu-form ZSM-5 and SSZ-13 sample was also titrated, after
oxidative treatments in owing air (773 K), with n-propylamine (NPA) at 323 K,
followed with a helium purge and subsequent TPD. On H-ZSM-5 zeolites, two other
independent NH3 titration methods were used to measure the number of H+ sites,
which involved either gaseous saturation with NH3 at 323 K followed with a helium
purge and washing in deionized water, or an aqueous-phase exchange using NH4NO3
followed by washing with deionized water. Detailed procedures on these NH3 and
NPA titration methods are reported elsewhere [78].
Titrations of H+ sites on Cu-SSZ-13 samples after oxidative treatment in owing
air (773 K), followed by reductive treatments that have been observed to cause Cu2+
to Cu+ reduction in independent operando XAS experiments, were performed as
originally described elsewhere [85]. After oxidative treatments, Cu-SSZ-13 samples
were held under owing NO (500 ppm) and NH3 (500 ppm) in balance UHP helium
(99.999%, Indiana Oxygen) at a total ow rate of 350 cm3 min-1 at 473 K for 2 h.
Operando XAS experiments indicated that these conditions were sucient to reduce
Cu2+ cations predominantly to the Cu+ oxidation state [85]. The temperature was
then lowered to 423 K in the same gaseous mixture, followed by replacement of the
500 ppm NO and 500 ppm NH3 mixture with a gaseous stream containing 500 ppm
of NH3 (balance He) at same total gas ow rate (350 cm3 min-1) for 2 h. Finally, NH3
was removed from the gaseous stream, the catalyst was held in owing wet helium
(350 cm3 min-1) for 8 h, and followed by a TPD in owing helium (350 cm3 min-1) to
823 K.

18
2.3 Results and Discussion
2.3.1 NH3 Titration of Brønsted Acid Sites in H-Zeolites after Oxidative Treatments
Ammonia adsorbs onto both Brønsted and Lewis acid sites in zeolites [105, 110,
111], but infrared (IR) spectra can be used to distinguish NH4+ species formed upon
protonation by H+ sites (ca. 1425 cm-1) from NH3 species bound to Lewis acid sites
(ca. 1625 cm-1), and to quantify their molar concentrations upon converting inte-
grated absorbances using molar extinction coecients (H-MOR: ε(NH4+, ca. 1450
cm1) = 0.147 cm2 µmol-1; ε(NH3, ca. 1620 cm-1) = 0.022 cm2 mumol-1 [112]). Ammo-
nia desorption from Brønsted acid sites tends to give rise to the highest temperature
desorption peaks ( 600-700 K) in temperature-programmed desorption (TPD) exper-
iments (Fig. 2.12, Supporting Information) [105, 106, 113], although desorption from
non-protonic binding sites can occur in this temperature range under certain exper-
imental conditions, complicating eorts to deconvolute TPD proles and determine
the contributions solely from NH4+ species [114]. The number of NH4
+ species can
be estimated unambiguously, however, by rst desorbing NH3 species bound to non-
protonic sites prior to performing TPD experiments. Woolery et al. showed that
saturation of H-ZSM-5 with gaseous NH3 followed by purging in owing dry helium
at 398 K evolved Lewis acid-bound NH3 at lower temperatures (ca. 500 K) than
NH4+ species (ca. 633 K) during a subsequent TPD, but that purging NH3-saturated
samples instead in owing wet helium at 398 K led only to the desorption of NH4+
species in the TPD experiment [105]. This and other studies show that NH3 has the
potential to titrate dierent types of acid sites on zeolites, but that renement of titra-
tion methods to selectively target Brønsted acid sites in the presence of Lewis acid
sites, present as partial- or fully-extraframework Al species [105] or as extraframework
metal cations (e.g., Cu2+) [78], would enable quantifying H+ sites from a straightfor-
ward TPD experiment, precluding eorts to deconvolute TPD proles with multiple
desorption features or to collect and interpret IR spectra.

19
The saturation of H-ZSM-5 (Si/Altot = 17) with gaseous NH3 at 323 K, followed
by TPD, evolved NH3 bound to Lewis acidic Al sites at lower temperatures (ca. 433
K, Figure 2.12, Supporting Information) than NH4+ bound to H+ sites (ca. 600
K, Figure 2.12) [78], consistent with previous reports [105]. We hypothesized that
removing NH3 from the owing gas stream after saturation, for long enough times
and at a temperature near the maximum desorption rate of the low temperature
desorption feature (433 K), would result in the desorption of all NH3 species bound to
non-protonic sites. The NH3 TPD proles measured after saturation of H-ZSM-5 with
gaseous NH3 at 433 K, with and without subsequent purging in owing helium that
contained traces of moisture, are shown in Figure 2.2. Both low and high temperature
NH3 desorption features are present in NH3-TPD proles measured when purging in
owing wet helium does not occur (Fig. 2.2, light trace), while purging in owing
wet helium (433 K, 8 h) results in the evolution of only the high temperature NH4+
desorption feature (Fig. 2.2, dark trace) [78]. The treatment of NH3-saturated zeolites
in owing wet helium at temperatures corresponding to detectable desorption rates
of NH3 bound Lewis acid sites (433 K) agrees with the previous reports by Woolery
et al. [105].
These ndings indicate that Brønsted acid sites on H-form zeolites can be selec-
tively titrated using gaseous NH3, as long as post-saturation purging procedures are
sucient to remove physically adsorbed and Lewis acid-bound NH3 species (Figure
2.3). The NH3 TPD proles of four H-ZSM-5 zeolites of dierent Al content, after
saturation with gaseous NH3 at 433 K and purging in owing wet helium (433 K, 8
h), are shown in Figure 2.4 (dark trace) together with NH3 TPD proles measured
after two independent NH3 saturation treatments intended to selectively retain NH4+
species [78]. One treatment involved aqueous-phase NH4+ ion-exchange of H-ZSM-5,
which occurs only at H+ sites and not at Lewis acidic Al sites [105], followed by wash-
ing in liquid water before measuring NH3 TPD proles (Fig. 2.4, grey traces). The
other treatment involved gas-phase NH3 saturation at 323 K, followed by washing
in liquid water to remove NH3 bound to Lewis acidic Al species [78], prior to mea-
20
surement of NH3 TPD proles (Fig. 2.4, light grey traces). The NH3 TPD proles
measured after each of the three NH3 titration methods are virtually indistinguish-
able (Fig. 2.4), and the amounts of NH3 quantied from these proles are similar
within experimental error (Table 2.1), providing further evidence that gaseous NH3
saturation (433 K) followed by purging in wet helium (433 K, 8 h) indeed selectively
titrated H+ sites on H-ZSM-5.
n-Propylamine (NPA) titrants, which adsorb onto both Brønsted and Lewis acid
sites but decomposes via Homan-type elimination reactions only on H+ sites to form
NH3 and C3H6 (Scheme 2.13, Section 2.7.6 of the Supporting Information) [114117],
also corroborate the ndings of NH3 titrations on H-ZSM-5. The NH3 and C3H6
TPD proles for a representative H-ZSM-5 sample are shown in Figure 2.14 of the
Supporting Information, with quantication provided in Table 2.6 of the Support-
ing Information. The numbers of H+ sites on H-ZSM-5 samples measured from NH3
titrations were equivalent, within experimental error, to the numbers measured by
reactive NPA decomposition (Table 2.1, Fig. 2.5). On H-ZSM-5 zeolites, H+/Altot
values ranged from 0.68-1.02, yet varied non-monotonically with Si/Altot ratio (Table
2.1), indicating that the number of H+ sites was not necessarily equal to the number
of total Al atoms on these samples [78]. The fraction of framework Al (Alf ) atoms
estimated from tetrahedral NMR line intensities in 27Al MAS NMR spectra (Fig.
2.10, Supporting Information), which are often treated as structural surrogates for
Brønsted acid sites in zeolites, ranged from 0.93-1.00 (Table 2.1) [78]. Thus, even af-
ter correcting for Alf content, NPA and NH3 titrations estimated sub-stoichiometric
H+/Alf ratios of 0.77 and 0.75 on H-ZSM-5 samples with Si/Altot ratios of 17 and 89,
respectively (Table 2.1). These data provide yet another demonstration that frame-
work Al atoms can overestimate the number of H+ sites in zeolites [118,119], especially
when measured under ex situ conditions and after hydration treatments intended to
sharpen 27Al MAS NMR lines, because exposure to water causes structural changes
to Al atoms that are partially-coordinated to aluminosilicate frameworks [120125]
and their detection as tetrahedral Al species. Yet, Al atoms partially-coordinated
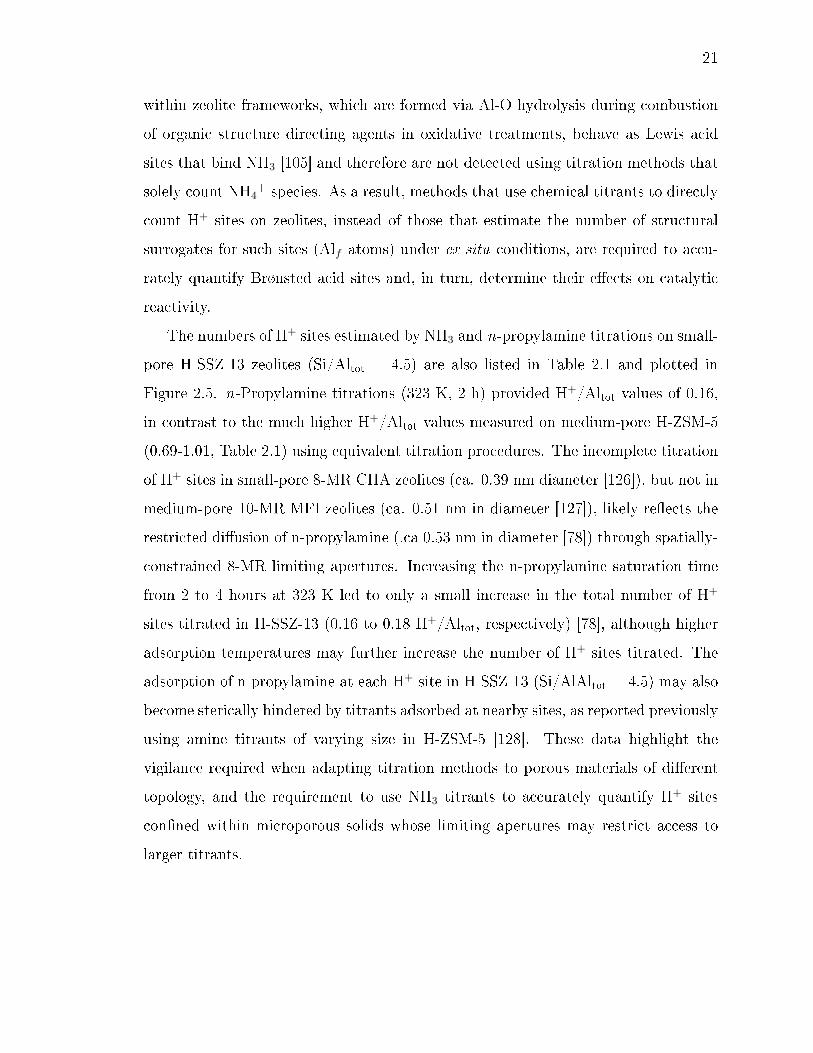
21
within zeolite frameworks, which are formed via Al-O hydrolysis during combustion
of organic structure directing agents in oxidative treatments, behave as Lewis acid
sites that bind NH3 [105] and therefore are not detected using titration methods that
solely count NH4+ species. As a result, methods that use chemical titrants to directly
count H+ sites on zeolites, instead of those that estimate the number of structural
surrogates for such sites (Alf atoms) under ex situ conditions, are required to accu-
rately quantify Brønsted acid sites and, in turn, determine their eects on catalytic
reactivity.
The numbers of H+ sites estimated by NH3 and n-propylamine titrations on small-
pore H-SSZ-13 zeolites (Si/Altot = 4.5) are also listed in Table 2.1 and plotted in
Figure 2.5. n-Propylamine titrations (323 K, 2 h) provided H+/Altot values of 0.16,
in contrast to the much higher H+/Altot values measured on medium-pore H-ZSM-5
(0.69-1.01, Table 2.1) using equivalent titration procedures. The incomplete titration
of H+ sites in small-pore 8-MR CHA zeolites (ca. 0.39 nm diameter [126]), but not in
medium-pore 10-MR MFI zeolites (ca. 0.51 nm in diameter [127]), likely reects the
restricted diusion of n-propylamine (.ca 0.53 nm in diameter [78]) through spatially-
constrained 8-MR limiting apertures. Increasing the n-propylamine saturation time
from 2 to 4 hours at 323 K led to only a small increase in the total number of H+
sites titrated in H-SSZ-13 (0.16 to 0.18 H+/Altot, respectively) [78], although higher
adsorption temperatures may further increase the number of H+ sites titrated. The
adsorption of n-propylamine at each H+ site in H-SSZ-13 (Si/AlAltot = 4.5) may also
become sterically hindered by titrants adsorbed at nearby sites, as reported previously
using amine titrants of varying size in H-ZSM-5 [128]. These data highlight the
vigilance required when adapting titration methods to porous materials of dierent
topology, and the requirement to use NH3 titrants to accurately quantify H+ sites
conned within microporous solids whose limiting apertures may restrict access to
larger titrants.

22
2.3.2 NH3 Titration of Brønsted Acid Sites in Cu-Zeolites after Oxidative Treat-ments
Among the methods reviewed in Section 2.3.1, gas-phase NH3 titration methods
are preferred to count H+ sites on partially metal-exchanged zeolites, because liquid-
phase washing or ion-exchange procedures may change the structure or distribution
of extraframework metal cations. The treatment of Cu-ZSM-5 zeolites in owing air
(773 K), followed by gaseous NH3 adsorption and subsequent purging in owing wet
helium (433 K), led to the evolution of similar amounts of NH3 in TPD experiments
as did reactive n-propylamine decomposition (Table 2.1, Fig. 2.5) [78]. As observed
for H-ZSM-5 (Fig. 2.2), the saturation of Cu-ZSM-5 with NH3 at 433 K retained NH3
bound at Lewis acidic Cu and Al species if purging in owing wet helium (433 K) was
not performed. These ndings, taken together, indicate that gaseous NH3 saturation
followed by steps that purge NH3 bound to non-protonic sites leads to the retention of
NH4+ species only at H+ sites in partially-Cu-exchanged zeolites. They demonstrate
how NH3 can be used to selectively titrate H+ sites in the presence of Lewis acidic
Cu cations on zeolites, extending the ndings of Woolery et al. for methods that
selectively adsorb NH3 onto H+ sites in the presence of Lewis acidic Al species in
H-ZSM-5 [105].
In a previous set of studies [37, 78, 129], we have discussed the preparation and
characterization of a series of Cu-SSZ-13 samples (Si/Altot = 4.5, Cu/Altot = 0-0.20)
containing predominantly isolated Cu2+ species after oxidation in owing air at 773 K
and cooling to ambient temperatures. These samples give rise to ambient UV-Visible
spectra that show absorption bands for d-d transitions in hydrated Cu2+ ions centered
at 12,500 cm-1, whose integrated areas increase linearly with Cu content (Fig. 2.15,
Supporting Information), and to ambient X-ray absorption spectra that are indis-
tinguishable from a hexacoordinated hydrated Cu2+ reference (aqueous Cu(NO3)2)
and that do not show detectable CuO or Cu+ signatures. The number of residual H+
sites counted by gaseous NH3 titration on these oxidized Cu-SSZ-13 samples decreased
with increasing Cu2+ content, with the stoichiometry expected from the replacement
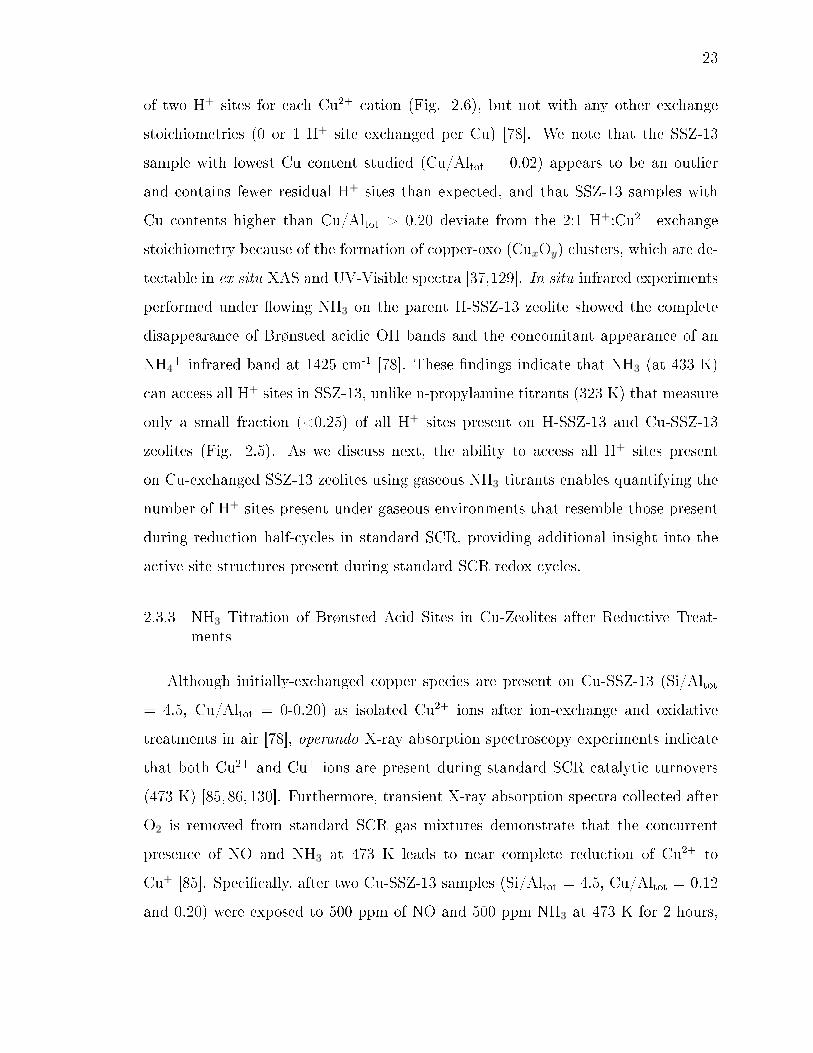
23
of two H+ sites for each Cu2+ cation (Fig. 2.6), but not with any other exchange
stoichiometries (0 or 1 H+ site exchanged per Cu) [78]. We note that the SSZ-13
sample with lowest Cu content studied (Cu/Altot = 0.02) appears to be an outlier
and contains fewer residual H+ sites than expected, and that SSZ-13 samples with
Cu contents higher than Cu/Altot > 0.20 deviate from the 2:1 H+:Cu2+ exchange
stoichiometry because of the formation of copper-oxo (CuxOy) clusters, which are de-
tectable in ex situ XAS and UV-Visible spectra [37,129]. In situ infrared experiments
performed under owing NH3 on the parent H-SSZ-13 zeolite showed the complete
disappearance of Brønsted acidic OH bands and the concomitant appearance of an
NH4+ infrared band at 1425 cm-1 [78]. These ndings indicate that NH3 (at 433 K)
can access all H+ sites in SSZ-13, unlike n-propylamine titrants (323 K) that measure
only a small fraction (<0.25) of all H+ sites present on H-SSZ-13 and Cu-SSZ-13
zeolites (Fig. 2.5). As we discuss next, the ability to access all H+ sites present
on Cu-exchanged SSZ-13 zeolites using gaseous NH3 titrants enables quantifying the
number of H+ sites present under gaseous environments that resemble those present
during reduction half-cycles in standard SCR, providing additional insight into the
active site structures present during standard SCR redox cycles.
2.3.3 NH3 Titration of Brønsted Acid Sites in Cu-Zeolites after Reductive Treat-ments
Although initially-exchanged copper species are present on Cu-SSZ-13 (Si/Altot
= 4.5, Cu/Altot = 0-0.20) as isolated Cu2+ ions after ion-exchange and oxidative
treatments in air [78], operando X-ray absorption spectroscopy experiments indicate
that both Cu2+ and Cu+ ions are present during standard SCR catalytic turnovers
(473 K) [85,86,130]. Furthermore, transient X-ray absorption spectra collected after
O2 is removed from standard SCR gas mixtures demonstrate that the concurrent
presence of NO and NH3 at 473 K leads to near complete reduction of Cu2+ to
Cu+ [85]. Specically, after two Cu-SSZ-13 samples (Si/Altot = 4.5, Cu/Altot = 0.12
and 0.20) were exposed to 500 ppm of NO and 500 ppm NH3 at 473 K for 2 hours,
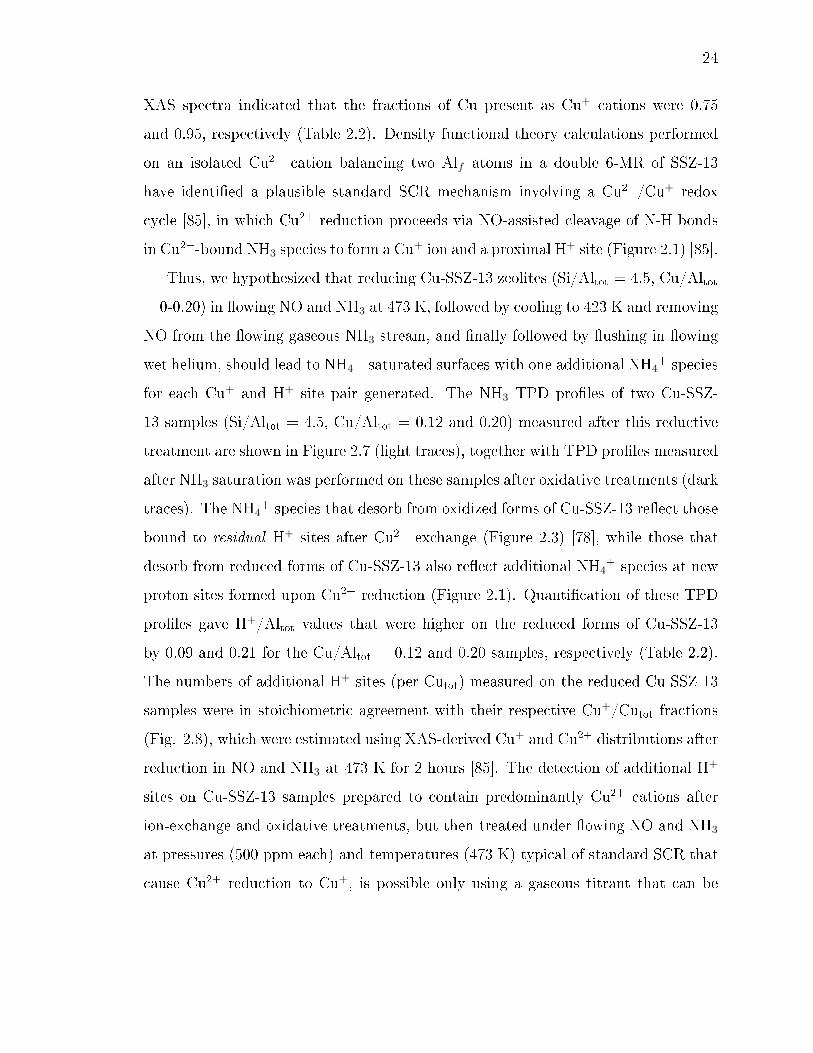
24
XAS spectra indicated that the fractions of Cu present as Cu+ cations were 0.75
and 0.95, respectively (Table 2.2). Density functional theory calculations performed
on an isolated Cu2+ cation balancing two Alf atoms in a double 6-MR of SSZ-13
have identied a plausible standard SCR mechanism involving a Cu2+/Cu+ redox
cycle [85], in which Cu2+ reduction proceeds via NO-assisted cleavage of N-H bonds
in Cu2+-bound NH3 species to form a Cu+ ion and a proximal H+ site (Figure 2.1) [85].
Thus, we hypothesized that reducing Cu-SSZ-13 zeolites (Si/Altot = 4.5, Cu/Altot
= 0-0.20) in owing NO and NH3 at 473 K, followed by cooling to 423 K and removing
NO from the owing gaseous NH3 stream, and nally followed by ushing in owing
wet helium, should lead to NH4+-saturated surfaces with one additional NH4
+ species
for each Cu+ and H+ site pair generated. The NH3 TPD proles of two Cu-SSZ-
13 samples (Si/Altot = 4.5, Cu/Altot = 0.12 and 0.20) measured after this reductive
treatment are shown in Figure 2.7 (light traces), together with TPD proles measured
after NH3 saturation was performed on these samples after oxidative treatments (dark
traces). The NH4+ species that desorb from oxidized forms of Cu-SSZ-13 reect those
bound to residual H+ sites after Cu2+ exchange (Figure 2.3) [78], while those that
desorb from reduced forms of Cu-SSZ-13 also reect additional NH4+ species at new
proton sites formed upon Cu2+ reduction (Figure 2.1). Quantication of these TPD
proles gave H+/Altot values that were higher on the reduced forms of Cu-SSZ-13
by 0.09 and 0.21 for the Cu/Altot = 0.12 and 0.20 samples, respectively (Table 2.2).
The numbers of additional H+ sites (per Cutot) measured on the reduced Cu-SSZ-13
samples were in stoichiometric agreement with their respective Cu+/Cutot fractions
(Fig. 2.8), which were estimated using XAS-derived Cu+ and Cu2+ distributions after
reduction in NO and NH3 at 473 K for 2 hours [85]. The detection of additional H+
sites on Cu-SSZ-13 samples prepared to contain predominantly Cu2+ cations after
ion-exchange and oxidative treatments, but then treated under owing NO and NH3
at pressures (500 ppm each) and temperatures (473 K) typical of standard SCR that
cause Cu2+ reduction to Cu+, is possible only using a gaseous titrant that can be
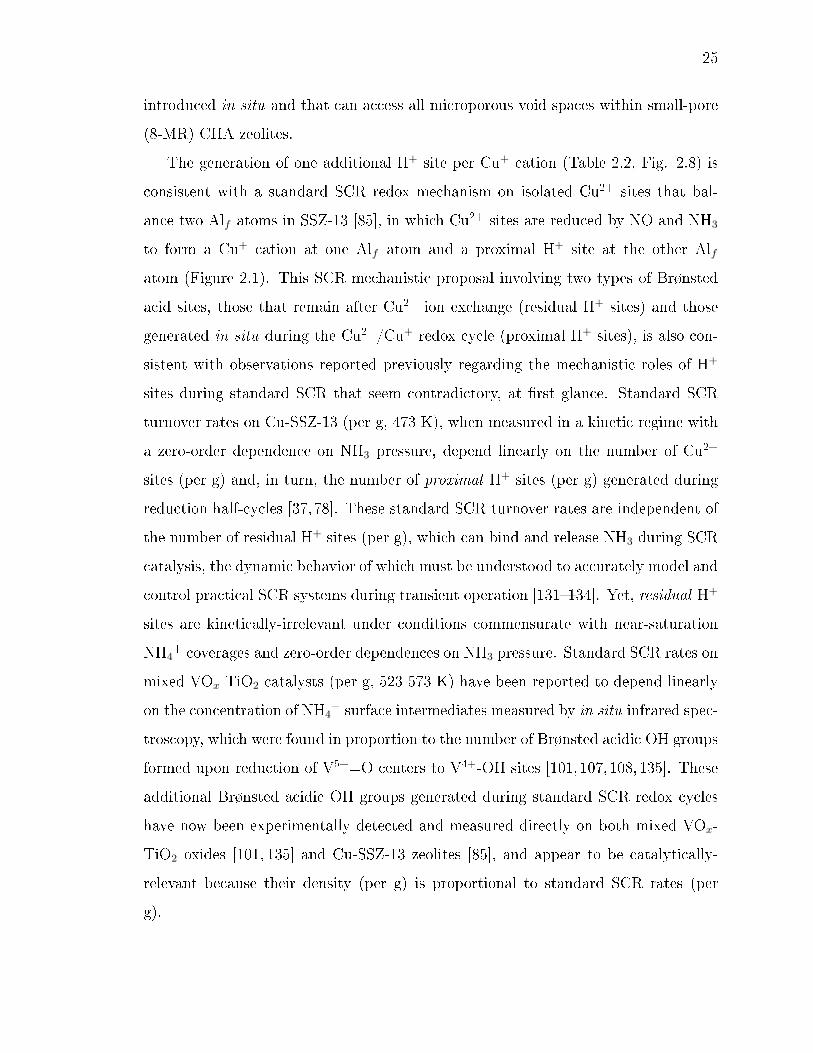
25
introduced in situ and that can access all microporous void spaces within small-pore
(8-MR) CHA zeolites.
The generation of one additional H+ site per Cu+ cation (Table 2.2, Fig. 2.8) is
consistent with a standard SCR redox mechanism on isolated Cu2+ sites that bal-
ance two Alf atoms in SSZ-13 [85], in which Cu2+ sites are reduced by NO and NH3
to form a Cu+ cation at one Alf atom and a proximal H+ site at the other Alf
atom (Figure 2.1). This SCR mechanistic proposal involving two types of Brønsted
acid sites, those that remain after Cu2+ ion exchange (residual H+ sites) and those
generated in situ during the Cu2+/Cu+ redox cycle (proximal H+ sites), is also con-
sistent with observations reported previously regarding the mechanistic roles of H+
sites during standard SCR that seem contradictory, at rst glance. Standard SCR
turnover rates on Cu-SSZ-13 (per g, 473 K), when measured in a kinetic regime with
a zero-order dependence on NH3 pressure, depend linearly on the number of Cu2+
sites (per g) and, in turn, the number of proximal H+ sites (per g) generated during
reduction half-cycles [37,78]. These standard SCR turnover rates are independent of
the number of residual H+ sites (per g), which can bind and release NH3 during SCR
catalysis, the dynamic behavior of which must be understood to accurately model and
control practical SCR systems during transient operation [131134]. Yet, residual H+
sites are kinetically-irrelevant under conditions commensurate with near-saturation
NH4+ coverages and zero-order dependences on NH3 pressure. Standard SCR rates on
mixed VOx-TiO2 catalysts (per g, 523-573 K) have been reported to depend linearly
on the concentration of NH4+ surface intermediates measured by in situ infrared spec-
troscopy, which were found in proportion to the number of Brønsted acidic OH groups
formed upon reduction of V5+=O centers to V4+-OH sites [101,107,108, 135]. These
additional Brønsted acidic OH groups generated during standard SCR redox cycles
have now been experimentally detected and measured directly on both mixed VOx-
TiO2 oxides [101, 135] and Cu-SSZ-13 zeolites [85], and appear to be catalytically-
relevant because their density (per g) is proportional to standard SCR rates (per
g).
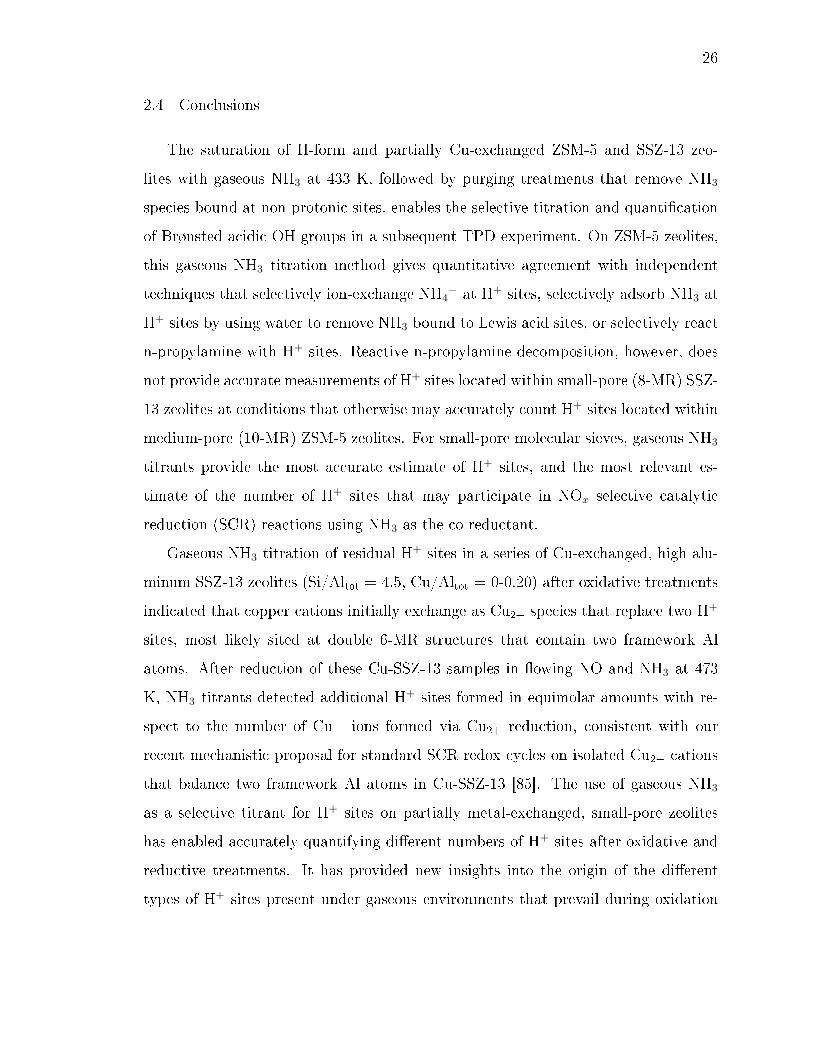
26
2.4 Conclusions
The saturation of H-form and partially Cu-exchanged ZSM-5 and SSZ-13 zeo-
lites with gaseous NH3 at 433 K, followed by purging treatments that remove NH3
species bound at non-protonic sites, enables the selective titration and quantication
of Brønsted acidic OH groups in a subsequent TPD experiment. On ZSM-5 zeolites,
this gaseous NH3 titration method gives quantitative agreement with independent
techniques that selectively ion-exchange NH4+ at H+ sites, selectively adsorb NH3 at
H+ sites by using water to remove NH3 bound to Lewis acid sites, or selectively react
n-propylamine with H+ sites. Reactive n-propylamine decomposition, however, does
not provide accurate measurements of H+ sites located within small-pore (8-MR) SSZ-
13 zeolites at conditions that otherwise may accurately count H+ sites located within
medium-pore (10-MR) ZSM-5 zeolites. For small-pore molecular sieves, gaseous NH3
titrants provide the most accurate estimate of H+ sites, and the most relevant es-
timate of the number of H+ sites that may participate in NOx selective catalytic
reduction (SCR) reactions using NH3 as the co-reductant.
Gaseous NH3 titration of residual H+ sites in a series of Cu-exchanged, high alu-
minum SSZ-13 zeolites (Si/Altot = 4.5, Cu/Altot = 0-0.20) after oxidative treatments
indicated that copper cations initially exchange as Cu2+ species that replace two H+
sites, most likely sited at double 6-MR structures that contain two framework Al
atoms. After reduction of these Cu-SSZ-13 samples in owing NO and NH3 at 473
K, NH3 titrants detected additional H+ sites formed in equimolar amounts with re-
spect to the number of Cu+ ions formed via Cu2+ reduction, consistent with our
recent mechanistic proposal for standard SCR redox cycles on isolated Cu2+ cations
that balance two framework Al atoms in Cu-SSZ-13 [85]. The use of gaseous NH3
as a selective titrant for H+ sites on partially metal-exchanged, small-pore zeolites
has enabled accurately quantifying dierent numbers of H+ sites after oxidative and
reductive treatments. It has provided new insights into the origin of the dierent
types of H+ sites present under gaseous environments that prevail during oxidation
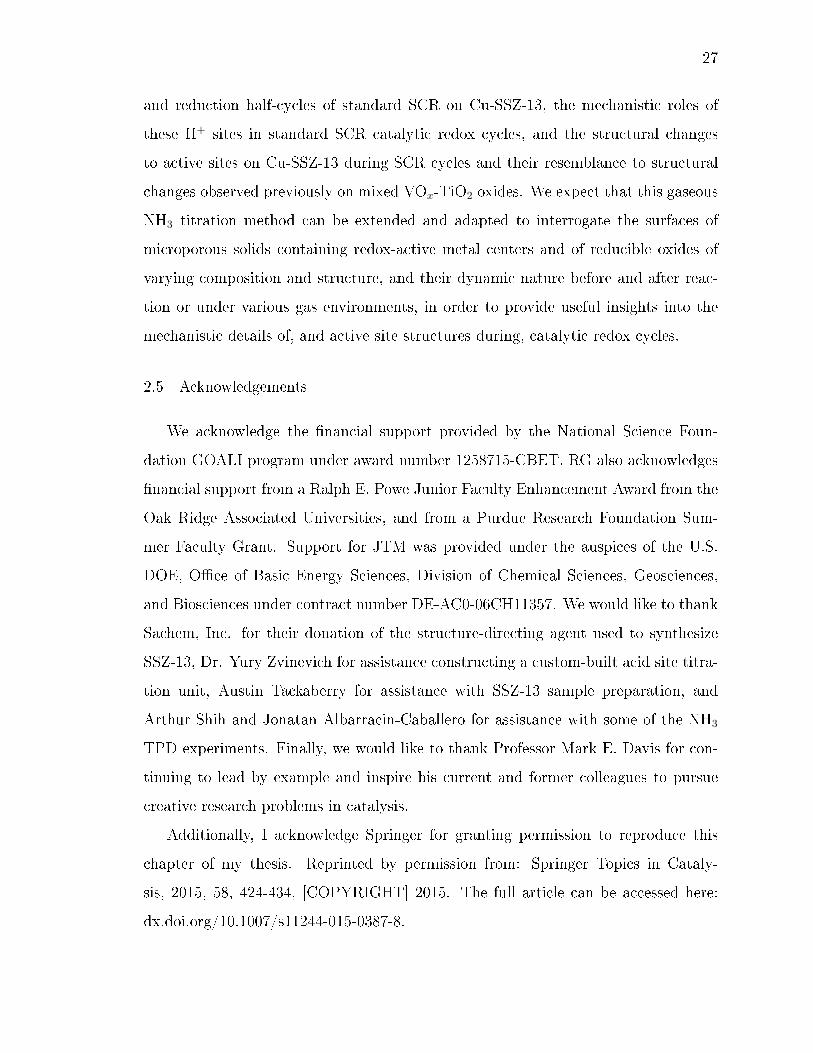
27
and reduction half-cycles of standard SCR on Cu-SSZ-13, the mechanistic roles of
these H+ sites in standard SCR catalytic redox cycles, and the structural changes
to active sites on Cu-SSZ-13 during SCR cycles and their resemblance to structural
changes observed previously on mixed VOx-TiO2 oxides. We expect that this gaseous
NH3 titration method can be extended and adapted to interrogate the surfaces of
microporous solids containing redox-active metal centers and of reducible oxides of
varying composition and structure, and their dynamic nature before and after reac-
tion or under various gas environments, in order to provide useful insights into the
mechanistic details of, and active site structures during, catalytic redox cycles.
2.5 Acknowledgements
We acknowledge the nancial support provided by the National Science Foun-
dation GOALI program under award number 1258715-CBET. RG also acknowledges
nancial support from a Ralph E. Powe Junior Faculty Enhancement Award from the
Oak Ridge Associated Universities, and from a Purdue Research Foundation Sum-
mer Faculty Grant. Support for JTM was provided under the auspices of the U.S.
DOE, Oce of Basic Energy Sciences, Division of Chemical Sciences, Geosciences,
and Biosciences under contract number DE-AC0-06CH11357. We would like to thank
Sachem, Inc. for their donation of the structure-directing agent used to synthesize
SSZ-13, Dr. Yury Zvinevich for assistance constructing a custom-built acid site titra-
tion unit, Austin Tackaberry for assistance with SSZ-13 sample preparation, and
Arthur Shih and Jonatan Albarracin-Caballero for assistance with some of the NH3
TPD experiments. Finally, we would like to thank Professor Mark E. Davis for con-
tinuing to lead by example and inspire his current and former colleagues to pursue
creative research problems in catalysis.
Additionally, I acknowledge Springer for granting permission to reproduce this
chapter of my thesis. Reprinted by permission from: Springer Topics in Cataly-
sis, 2015, 58, 424-434, [COPYRIGHT] 2015. The full article can be accessed here:
dx.doi.org/10.1007/s11244-015-0387-8.
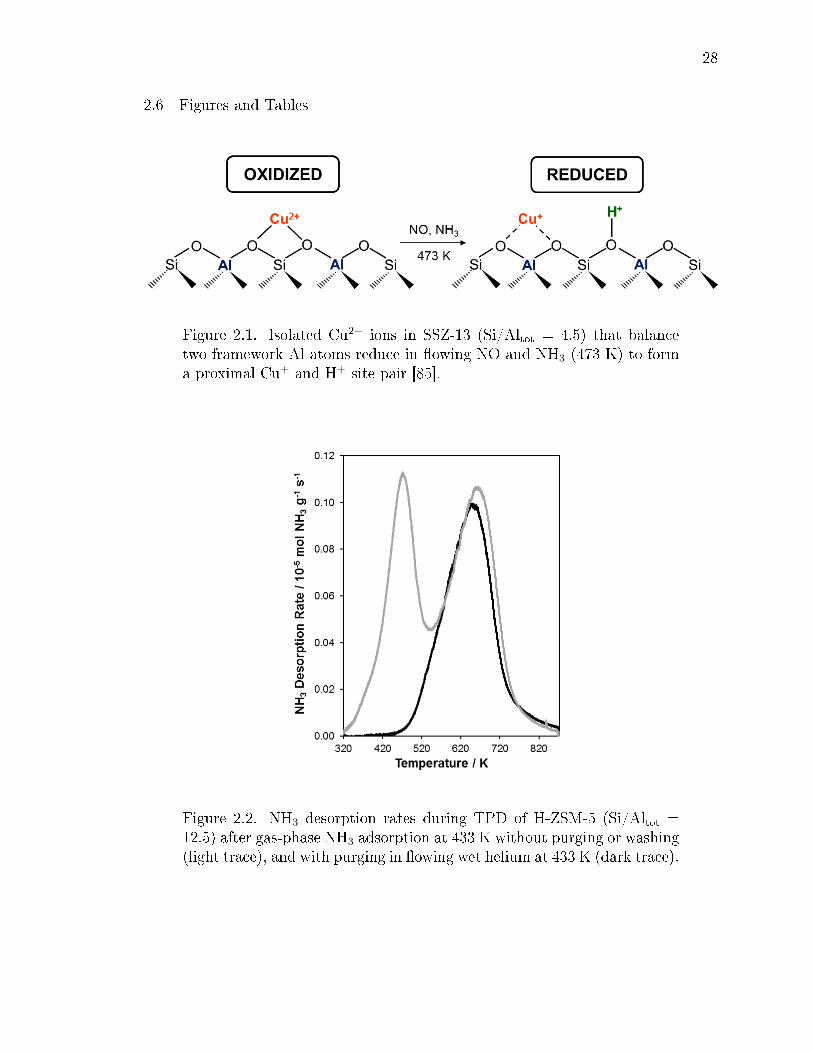
28
2.6 Figures and Tables
Figure 2.1. Isolated Cu2+ ions in SSZ-13 (Si/Altot = 4.5) that balancetwo framework Al atoms reduce in owing NO and NH3 (473 K) to forma proximal Cu+ and H+ site pair [85].
Figure 2.2. NH3 desorption rates during TPD of H-ZSM-5 (Si/Altot =12.5) after gas-phase NH3 adsorption at 433 K without purging or washing(light trace), and with purging in owing wet helium at 433 K (dark trace).

29
Figure 2.3. (a) NH3 saturation at 433 K leads to adsorption on Brønstedand Lewis acid sites, and physisorption near pore walls, but (b) purging inwet helium at 433 K (8 h) desorbs NH3 at non-protonic sites and enablesquantication of Brønsted acid sites via (c) TPD to 873 K [78].
2.7 Supporting Information
2.7.1 Atomic Absorption Spectroscopy of Catalyst Samples.
The total Si, Al, and Cu contents of each sample were determined using atomic
absorption spectroscopy (AAS) on a Perkin Elmer AAnalyst 300 Atomic Absorption
Spectrometer. Typically, 0.02 g of zeolite were dissolved in 2 g of hydrouoric acid
(48 wt%, Alfa Aesar) and the solution was allowed to sit overnight, prior to dilution
with 60 g of deionized water. Absorbances were measured using radiation sources at
wavelengths of 251.6 nm, 309.3 nm, and 324.8 nm for Si, Al, and Cu, respectively,
in an acetylene/nitrous oxide ame. Elemental compositions were determined from
30
Figure 2.4. NH3 desorption rates during TPD of H-ZSM-5 with Si/Altotof (a) 17, (b) 30, (c) 43, and (d) 89 for gas-phase NH3 adsorption at 323K with water wash (light grey trace), gas-phase NH3 adsorption at 433 Kwith wet helium purge (black trace), and aqueous NH4NO3 ion exchange(grey trace) [78]. Quantication of the total number of H+ for each samplecan be found in Table 2.1.
calibration curves derived from known standard solutions, and are listed for each
sample in Table 2.3.
2.7.2 X-Ray Diraction Characterization of Catalyst Samples.
Zeolite framework topologies were determined from powder X-ray diraction -
(XRD) patterns measured on a Rigaku SmartLab X-ray diractometer with a Cu Kα
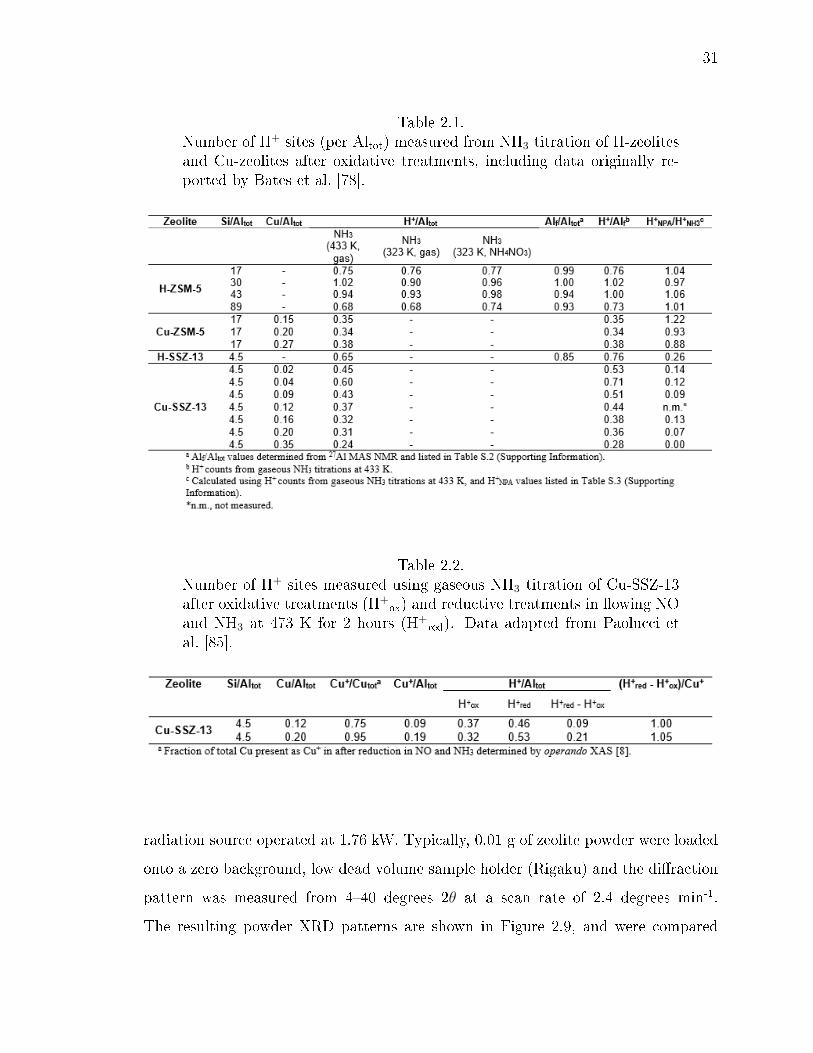
31
Table 2.1.Number of H+ sites (per Altot) measured from NH3 titration of H-zeolitesand Cu-zeolites after oxidative treatments, including data originally re-ported by Bates et al. [78].
Table 2.2.Number of H+ sites measured using gaseous NH3 titration of Cu-SSZ-13after oxidative treatments (H+
ox) and reductive treatments in owing NOand NH3 at 473 K for 2 hours (H+
red). Data adapted from Paolucci etal. [85].
radiation source operated at 1.76 kW. Typically, 0.01 g of zeolite powder were loaded
onto a zero background, low dead volume sample holder (Rigaku) and the diraction
pattern was measured from 440 degrees 2θ at a scan rate of 2.4 degrees min-1.
The resulting powder XRD patterns are shown in Figure 2.9, and were compared
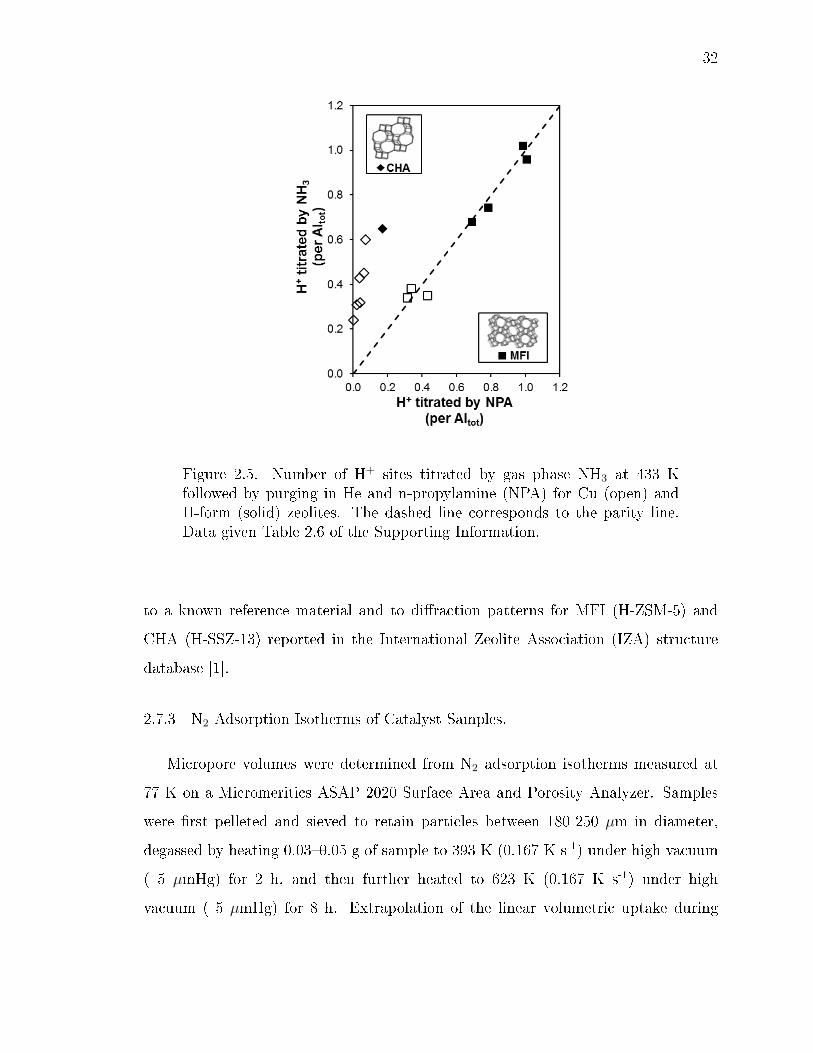
32
Figure 2.5. Number of H+ sites titrated by gas phase NH3 at 433 Kfollowed by purging in He and n-propylamine (NPA) for Cu (open) andH-form (solid) zeolites. The dashed line corresponds to the parity line.Data given Table 2.6 of the Supporting Information.
to a known reference material and to diraction patterns for MFI (H-ZSM-5) and
CHA (H-SSZ-13) reported in the International Zeolite Association (IZA) structure
database [1].
2.7.3 N2 Adsorption Isotherms of Catalyst Samples.
Micropore volumes were determined from N2 adsorption isotherms measured at
77 K on a Micromeritics ASAP 2020 Surface Area and Porosity Analyzer. Samples
were rst pelleted and sieved to retain particles between 180-250 µm in diameter,
degassed by heating 0.030.05 g of sample to 393 K (0.167 K s-1) under high vacuum
( 5 µmHg) for 2 h, and then further heated to 623 K (0.167 K s-1) under high
vacuum ( 5 µmHg) for 8 h. Extrapolation of the linear volumetric uptake during
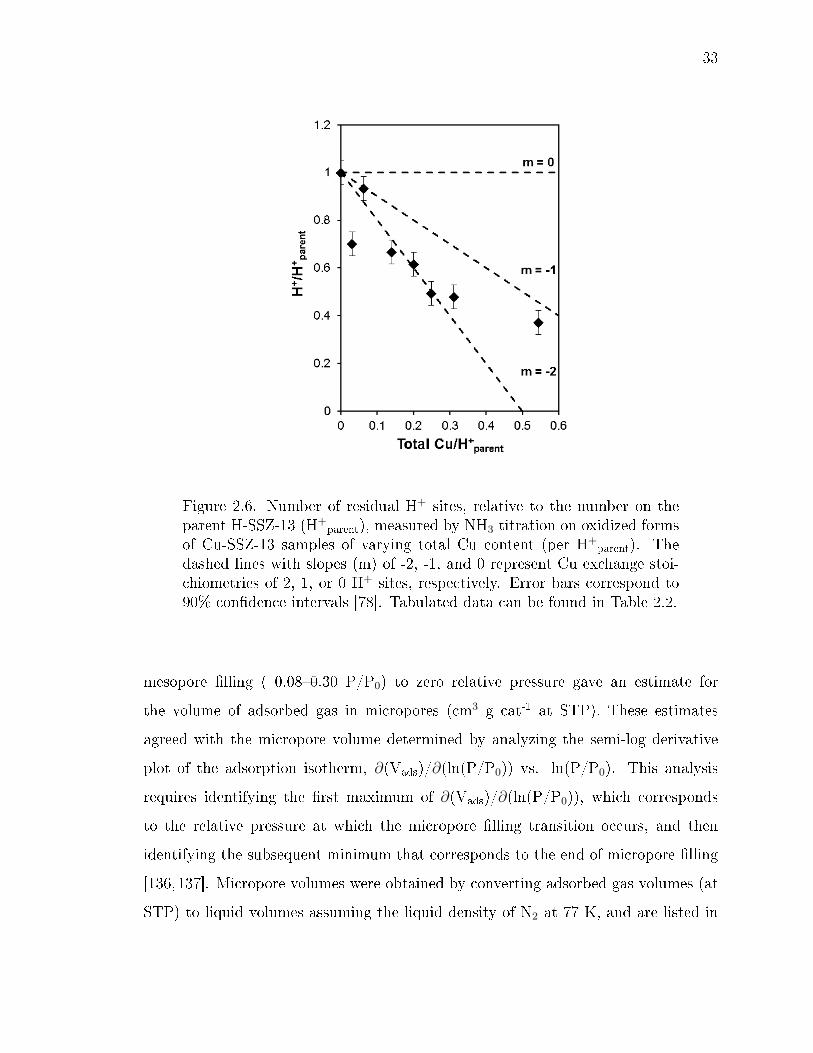
33
Figure 2.6. Number of residual H+ sites, relative to the number on theparent H-SSZ-13 (H+
parent), measured by NH3 titration on oxidized formsof Cu-SSZ-13 samples of varying total Cu content (per H+
parent). Thedashed lines with slopes (m) of -2, -1, and 0 represent Cu exchange stoi-chiometries of 2, 1, or 0 H+ sites, respectively. Error bars correspond to90% condence intervals [78]. Tabulated data can be found in Table 2.2.
mesopore lling ( 0.080.30 P/P0) to zero relative pressure gave an estimate for
the volume of adsorbed gas in micropores (cm3 g cat-1 at STP). These estimates
agreed with the micropore volume determined by analyzing the semi-log derivative
plot of the adsorption isotherm, ∂(Vads)/∂(ln(P/P0)) vs. ln(P/P0). This analysis
requires identifying the rst maximum of ∂(Vads)/∂(ln(P/P0)), which corresponds
to the relative pressure at which the micropore lling transition occurs, and then
identifying the subsequent minimum that corresponds to the end of micropore lling
[136,137]. Micropore volumes were obtained by converting adsorbed gas volumes (at
STP) to liquid volumes assuming the liquid density of N2 at 77 K, and are listed in
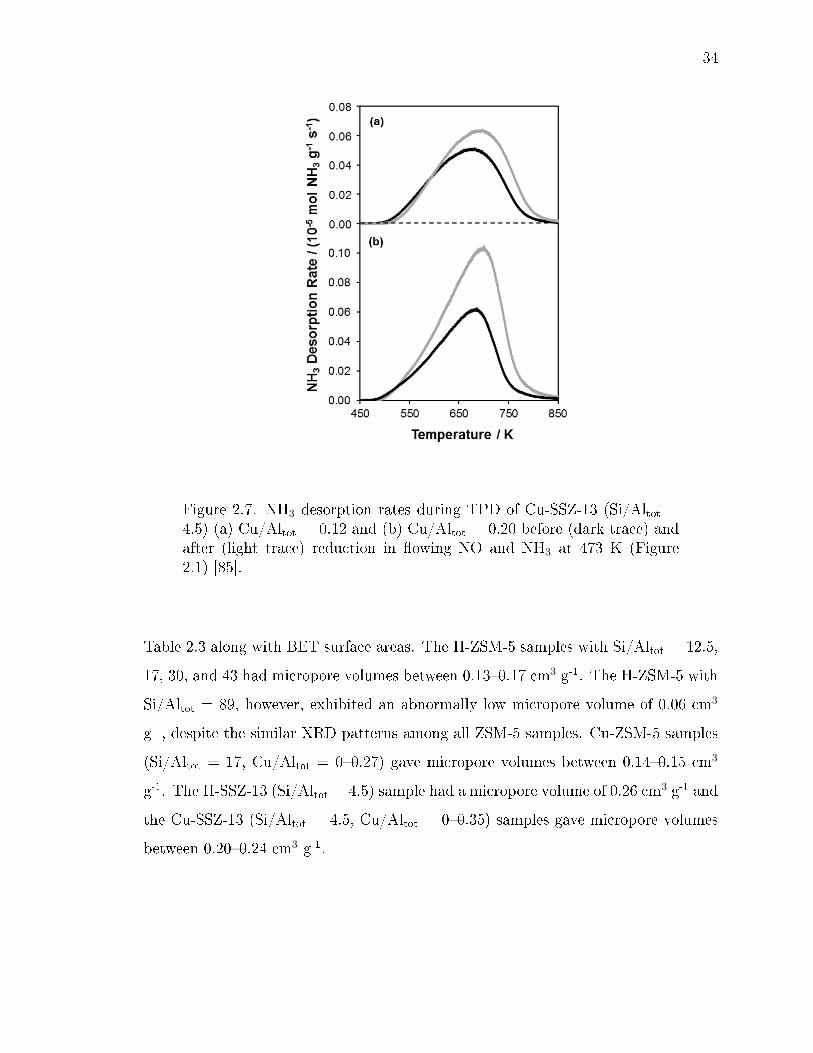
34
Figure 2.7. NH3 desorption rates during TPD of Cu-SSZ-13 (Si/Altot =4.5) (a) Cu/Altot = 0.12 and (b) Cu/Altot = 0.20 before (dark trace) andafter (light trace) reduction in owing NO and NH3 at 473 K (Figure2.1) [85].
Table 2.3 along with BET surface areas. The H-ZSM-5 samples with Si/Altot = 12.5,
17, 30, and 43 had micropore volumes between 0.130.17 cm3 g-1. The H-ZSM-5 with
Si/Altot = 89, however, exhibited an abnormally low micropore volume of 0.06 cm3
g-1, despite the similar XRD patterns among all ZSM-5 samples. Cu-ZSM-5 samples
(Si/Altot = 17, Cu/Altot = 00.27) gave micropore volumes between 0.140.15 cm3
g-1. The H-SSZ-13 (Si/Altot = 4.5) sample had a micropore volume of 0.26 cm3 g-1 and
the Cu-SSZ-13 (Si/Altot = 4.5, Cu/Altot = 00.35) samples gave micropore volumes
between 0.200.24 cm3 g-1.

35
Figure 2.8. The number of extra H+ sites (H+red - H+
ox per Cutot) formedafter reduction of Cu-SSZ-13 (Si/Altot = 4.5, Cu/Altot = 0.12 and 0.20)in NO and NH3 at 473 K, as a function of Cu+ content (per Cutot). Thedashed line represents the parity line, expected if one additional H+ sitewere formed per Cu+ (Scheme 1). Data adapted from Paolucci et al. [85].
2.7.4 27Al Magic Angle Spinning Nuclear Magnetic Resonance (27Al MAS NMR) onH-ZSM-5 and H-SSZ-13 zeolites.
27Al MAS NMR spectra were recorded on NH4-ZSM-5, H-ZSM-5, NH4-SSZ-13,
and H-SSZ-13 to estimate the fraction of framework (Alf ) and extraframework Al
(Alex) species present in each material. Spectra of H-ZSM-5 samples were collected
using a Bruker Avance 500 MHz spectrometer in a wide-bore 11.7 Tesla magnet (Cal-
tech Solid-State NMR Facility), and of H-SSZ-13 were collected using a Chemagnetics
CMX400 400 MHz spectrometer in a wide-bore 9.4 Tesla magnet (Purdue Interde-
partmental NMR Facility), as described elsewhere [78]. Briey, spectra were acquired
at ambient conditions from 456 scans with 12.5 µs pulses and a 2 s delay and were
measured at 104.24 MHz and a MAS rate of 5 kHz. Zeolite samples were hydrated

36
Table 2.3.Elemental composition, and N2-derived BET surface areas and microporevolumes for all zeolite samples in this study [78].
by holding for >48 h in a desiccator containing a saturated potassium chloride (KCl)
solution prior to packing in a 4mm ZrO2 rotor. All 27Al MAS NMR spectra are
referenced to an aqueous 1.0M Al(NO3)3 solution.
The 27Al MAS NMR spectra for the ZSM-5 samples are shown in Figure 2.10 and
the spectra for SSZ-13 are shown in Figure 2.11.
Tetrahedrally-coordinated Al atoms were characterized by a line centered around
55 ppm (52 ppm for ZSM-5 and 58 ppm for SSZ-13), with a small shoulder represen-
tative of pentacoordinated Al [118,138,139]. The relative intensity of the resonance at
52 ppm in H-ZSM-5 increased with increasing Al content (Fig. 2.10). Octahedrally-
coordinated Al atoms were characterized by a line centered at 0 ppm. The sum of

37
Figure 2.9. X-Ray diraction patterns for (a) H-SSZ-13 (Si/Altot = 4.5)and H-ZSM-5 with Si/Altot of (b) 12.5, (c) 17, (d) 30, (e) 43, and (f) 89.
the tertrahedral and pentacoordinated Al were taken to reect the total amount of
Alf species present, while the octahedrally-coordinated Al atoms were taken to reect
Alex species. The fraction of Al present in tetrahedral coordination was estimated
from the ratio of integrated areas for the 55 ppm line to the total Al area, and is
listed for each sample in Table 2.4.
Small amounts of Alex species were observed in NMR spectra for H-ZSM-5 with
Si/Altot = 43 and 89, 6% and 7%, respectively, and the H-ZSM-5 with Si/Altot =
17, and 30 showed Alex content of less than 2% (Fig. 2.10). The NMR spectra of
H-SSZ-13 showed a larger Alex contribution of 15% (Fig. 2.11). All NH4-ZSM-5 and
NH4-SSZ-13 showed Alex content of less than 2%. A small increase in the amount
of Alex was observed in the H-form relative to the NH4-form zeolite, which can be
attributed to either irreversible removal of Alf species from the lattice to form Alex or

38
Figure 2.10. 27Al MAS NMR spectra for all H-ZSM-5 (dashed line) andNH4-ZSM-5 (solid line) samples with Si/Altot = (a) 17, (b) 30, (c) 43, and(d) 89 [78].
to the reversible change between tetrahedral (Alf ) and octahedral (Alex) coordination
depending on the surrounding conditions [118,121,122].
2.7.5 Comparison of NH3 and n-propylamine titrations on ZSM-5 and SSZ-13
The number of H+ sites measured by NH3 titrations at 433 K, followed be purging
in owing helium, and measured by n-propylamine (Table 2.6, Section 2.7.7) are listed
in Table 2.5, and are plotted in Figure 2.5 of the main text.
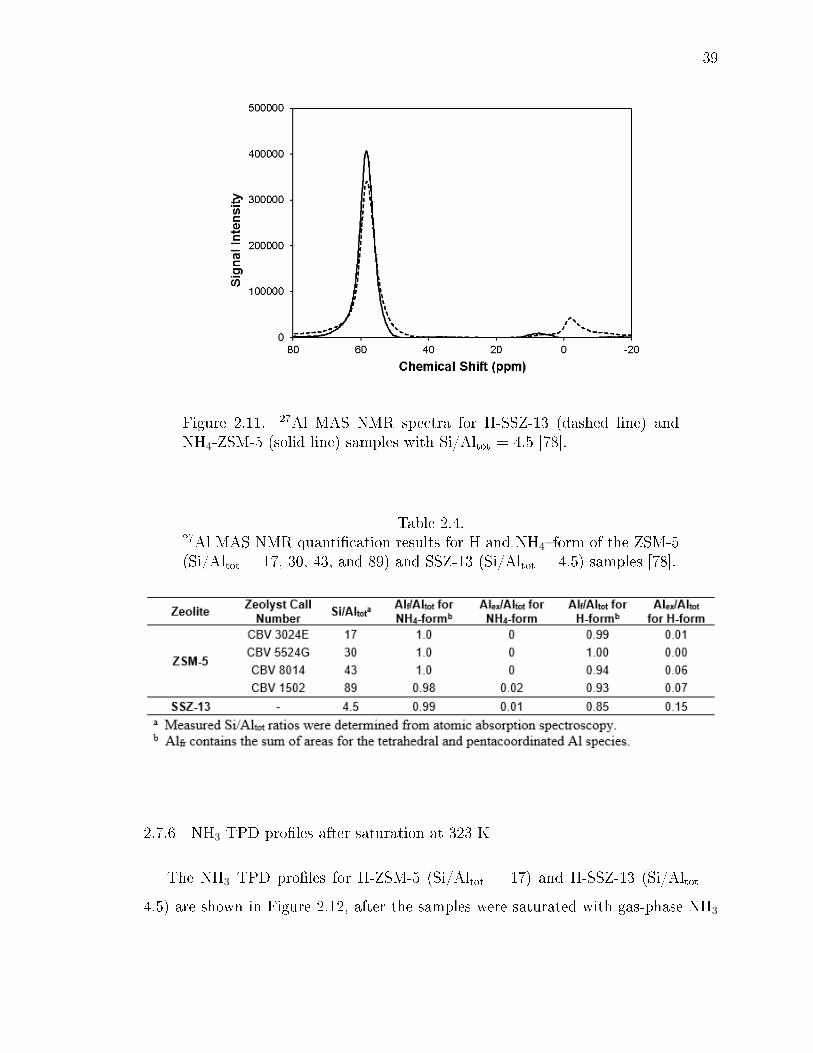
39
Figure 2.11. 27Al MAS NMR spectra for H-SSZ-13 (dashed line) andNH4-ZSM-5 (solid line) samples with Si/Altot = 4.5 [78].
Table 2.4.27Al MAS NMR quantication results for H and NH4form of the ZSM-5(Si/Altot = 17, 30, 43, and 89) and SSZ-13 (Si/Altot = 4.5) samples [78].
2.7.6 NH3 TPD proles after saturation at 323 K
The NH3 TPD proles for H-ZSM-5 (Si/Altot = 17) and H-SSZ-13 (Si/Altot =
4.5) are shown in Figure 2.12, after the samples were saturated with gas-phase NH3
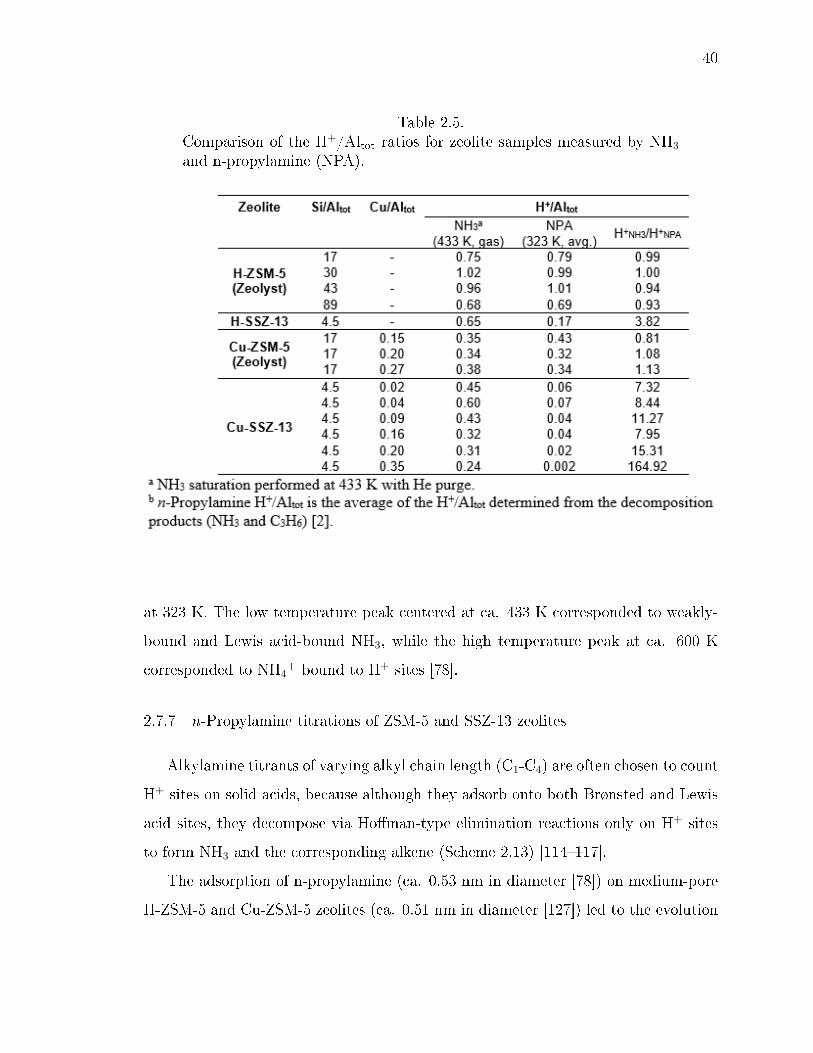
40
Table 2.5.Comparison of the H+/Altot ratios for zeolite samples measured by NH3
and n-propylamine (NPA).
at 323 K. The low temperature peak centered at ca. 433 K corresponded to weakly-
bound and Lewis acid-bound NH3, while the high temperature peak at ca. 600 K
corresponded to NH4+ bound to H+ sites [78].
2.7.7 n-Propylamine titrations of ZSM-5 and SSZ-13 zeolites
Alkylamine titrants of varying alkyl chain length (C1-C4) are often chosen to count
H+ sites on solid acids, because although they adsorb onto both Brønsted and Lewis
acid sites, they decompose via Homan-type elimination reactions only on H+ sites
to form NH3 and the corresponding alkene (Scheme 2.13) [114117].
The adsorption of n-propylamine (ca. 0.53 nm in diameter [78]) on medium-pore
H-ZSM-5 and Cu-ZSM-5 zeolites (ca. 0.51 nm in diameter [127]) led to the evolution
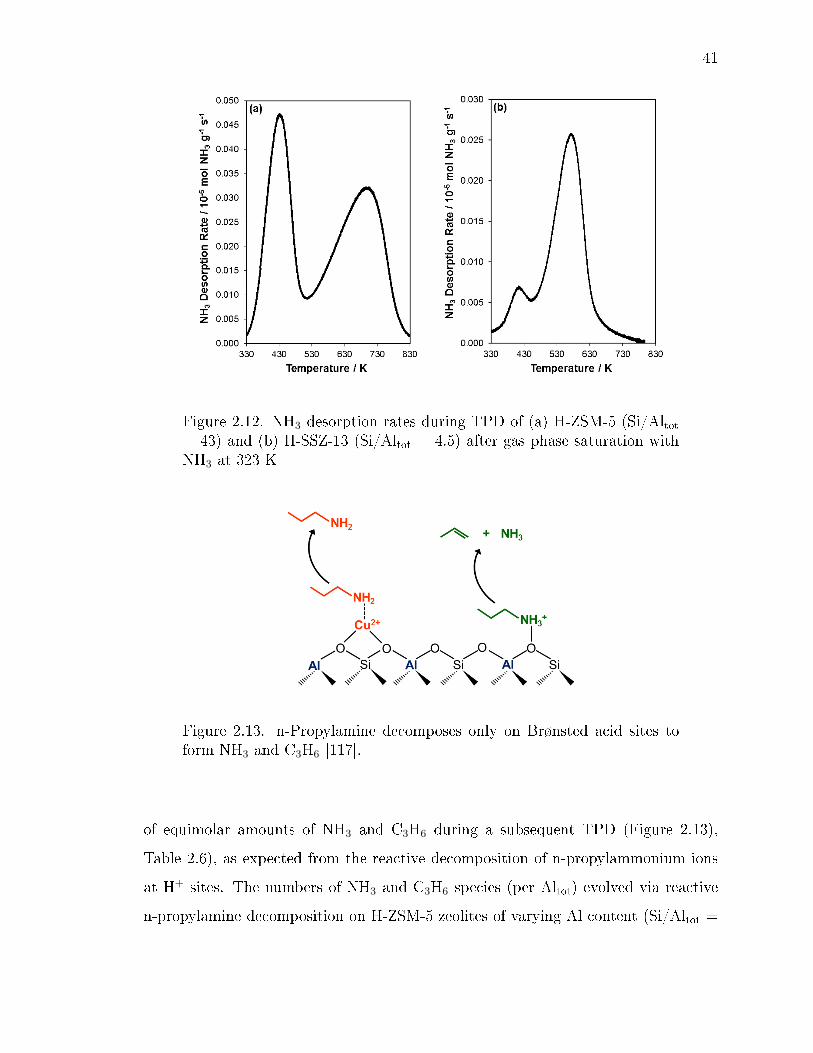
41
Figure 2.12. NH3 desorption rates during TPD of (a) H-ZSM-5 (Si/Altot= 43) and (b) H-SSZ-13 (Si/Altot = 4.5) after gas phase saturation withNH3 at 323 K
Figure 2.13. n-Propylamine decomposes only on Brønsted acid sites toform NH3 and C3H6 [117].
of equimolar amounts of NH3 and C3H6 during a subsequent TPD (Figure 2.13),
Table 2.6), as expected from the reactive decomposition of n-propylammonium ions
at H+ sites. The numbers of NH3 and C3H6 species (per Altot) evolved via reactive
n-propylamine decomposition on H-ZSM-5 zeolites of varying Al content (Si/Altot =
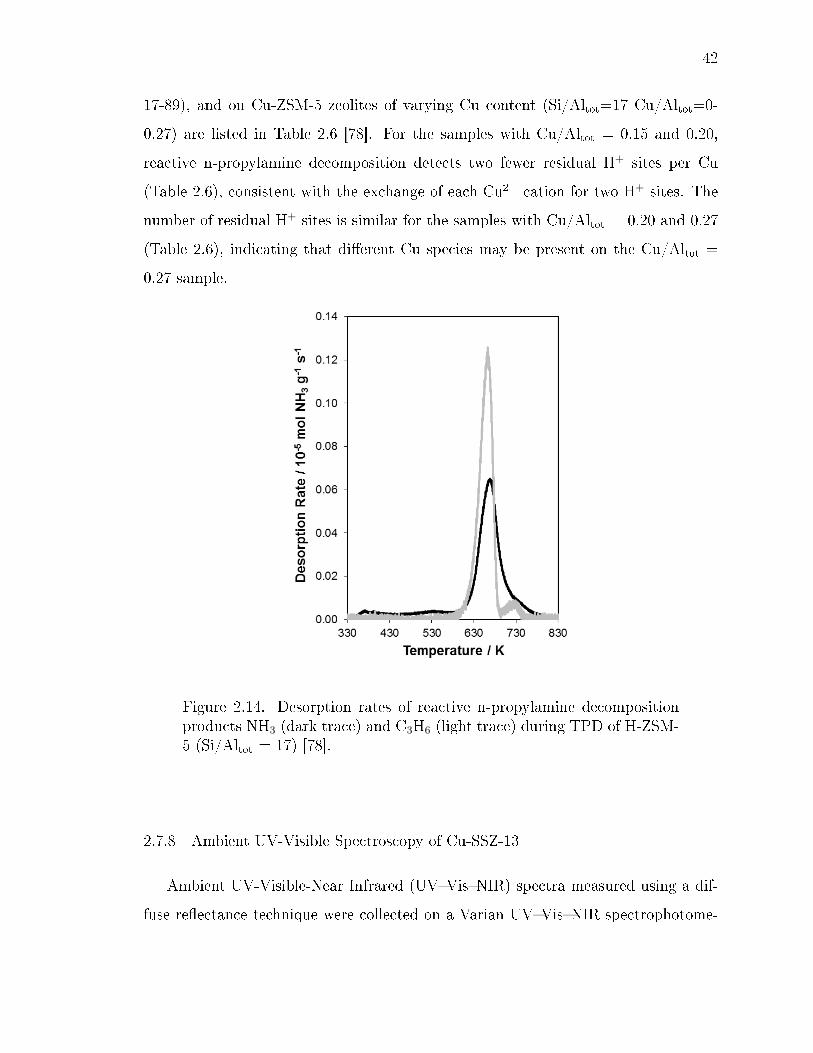
42
17-89), and on Cu-ZSM-5 zeolites of varying Cu content (Si/Altot=17 Cu/Altot=0-
0.27) are listed in Table 2.6 [78]. For the samples with Cu/Altot = 0.15 and 0.20,
reactive n-propylamine decomposition detects two fewer residual H+ sites per Cu
(Table 2.6), consistent with the exchange of each Cu2+ cation for two H+ sites. The
number of residual H+ sites is similar for the samples with Cu/Altot = 0.20 and 0.27
(Table 2.6), indicating that dierent Cu species may be present on the Cu/Altot =
0.27 sample.
Figure 2.14. Desorption rates of reactive n-propylamine decompositionproducts NH3 (dark trace) and C3H6 (light trace) during TPD of H-ZSM-5 (Si/Altot = 17) [78].
2.7.8 Ambient UV-Visible Spectroscopy of Cu-SSZ-13
Ambient UV-Visible-Near Infrared (UVVisNIR) spectra measured using a dif-
fuse reectance technique were collected on a Varian UVVisNIR spectrophotome-

43
Table 2.6.Number of H+ sites measured from the NH3 and C3H6 desorbed after n-propylamine decomposition on H- and Cu-form zeolites. Data originallyreported by Bates et al. [78].
ter (Cary 5000) equipped with a Harrick-Scientic Praying-Mantis diuse reectance
accessory (DRA). Barium sulfate (BaSO4, 98 wt%, Sigma Aldrich) was used as a
reference material when collecting background scans. This material was sieved to
a particle size of 125250 µm before taking the background scan. UV-Vis spectra
were collected from 7000-50,000 cm-1 at a scan speed of 2000 cm-1 min-1. Cu-SSZ-13
samples were pretreated in 10% O2/N2 at 798 K elsewhere and subsequently exposed
to ambient conditions. This was done to ensure that these samples were hydrated.
Approximately 0.1 g of each sample was placed in the sample cup and spectral mea-
surements were taken. The peak observed at 12,500 cm-1 is the contribution from the
dd transition of hydrated isolated Cu2+ ions [36, 129]. The peaks between 30,000-
50,000 cm-1 have been assigned to a convolution of dierent oxygen to Cu2+ charge
transfer and bare zeolite absorption edge [36,129]. The integrated spectra of the band
at 12,500 cm-1 can be found below in Figure 2.15. A linear increase in the integrated

44
absorbance band area centered around 12,500 cm-1 was observed for increasing total
Cu content (Cu/Altot) and is demonstrated by a best t trendline passing through
the origin.
Figure 2.15. Integrated area of the hydrated Cu2+ d-d transition ab-sorbance band (centered at 12,500 cm-1) measured by UV-Vis spec-troscopy as a function of total Cu content (Cu/Altot). The dashed linerepresents the best t for a linear trendline through the origin.

45
3. CONTROLLING THE ISOLATION AND PAIRING OF ALUMINUM IN
CHABAZITE ZEOLITES USING MIXTURES OF ORGANIC AND INORGANIC
STRUCTURE-DIRECTING AGENTS
3.1 Introduction
Brønsted acidic zeolites are silica-based molecular sieve frameworks that contain
a fraction of their silicon atoms substituted with aluminum atoms, which generate
anionic charges balanced by protons that dier in local micropore environment among
known zeolite topologies and in density with changes in bulk elemental composition
(Si/Al ratio). Even a given zeolite at xed composition, however, contains structural
and catalytic diversity conferred by the arrangement and distribution of its framework
Al atoms. One type of Al arrangement describes the location of Al atoms among dif-
ferent pores of a given zeolite, as in the case of ferrierite (FER) zeolites (Si/Al = 10-20)
that can be synthesized with mixtures of organic structure directing agents (SDAs)
that dier in size and direct the siting of framework Al atoms in either 8-membered
ring (8-MR) or 10-MR locations [140142]. Similarly, MFI zeolites synthesized in
the presence of only tetrapropylammonium (TPA+) cations contain higher fractions
of Al atoms located in 10-MR channel intersections, within which TPA+ cations re-
main occluded in crystalline products, than MFI zeolites synthesized with mixtures
of organic TPA+ and inorganic alkali (Na+) cations, which reside within straight and
sinusoidal 10-MR channels [32]. The distribution of Al among dierent voids of a
given zeolite inuences catalytic reactivity, in spite of the similar acid strength of
attendant protons [16], because reactive intermediates and transition states stabi-
lized at such protons interact with surrounding oxide cavities by van der Waals forces
whose strength depends on the geometry of the conning environment [21, 143, 144].
This Al distribution also inuences the structural stability of a given zeolite, as in
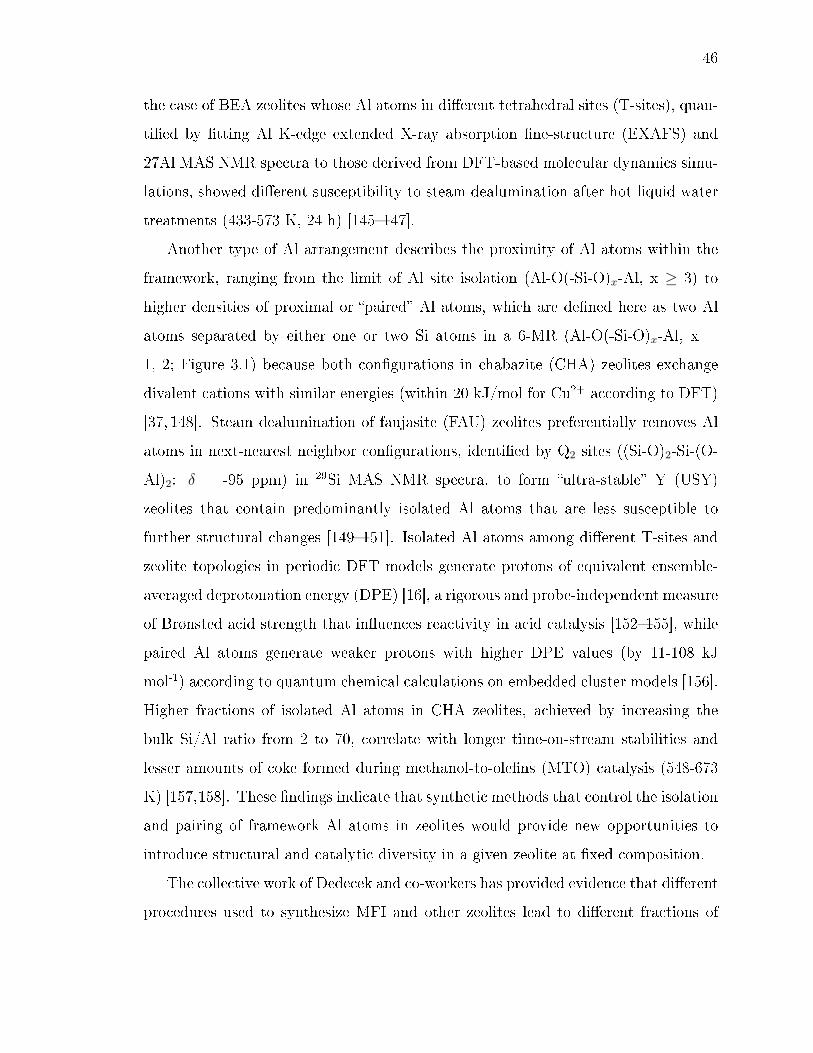
46
the case of BEA zeolites whose Al atoms in dierent tetrahedral sites (T-sites), quan-
tied by tting Al K-edge extended X-ray absorption ne-structure (EXAFS) and
27Al MAS NMR spectra to those derived from DFT-based molecular dynamics simu-
lations, showed dierent susceptibility to steam dealumination after hot liquid water
treatments (433-573 K, 24 h) [145147].
Another type of Al arrangement describes the proximity of Al atoms within the
framework, ranging from the limit of Al site isolation (Al-O(-Si-O)x-Al, x ≥ 3) to
higher densities of proximal or paired Al atoms, which are dened here as two Al
atoms separated by either one or two Si atoms in a 6-MR (Al-O(-Si-O)x-Al, x =
1, 2; Figure 3.1) because both congurations in chabazite (CHA) zeolites exchange
divalent cations with similar energies (within 20 kJ/mol for Cu2+ according to DFT)
[37, 148]. Steam dealumination of faujasite (FAU) zeolites preferentially removes Al
atoms in next-nearest neighbor congurations, identied by Q2 sites ((Si-O)2-Si-(O-
Al)2: δ = -95 ppm) in 29Si MAS NMR spectra, to form ultra-stable Y (USY)
zeolites that contain predominantly isolated Al atoms that are less susceptible to
further structural changes [149151]. Isolated Al atoms among dierent T-sites and
zeolite topologies in periodic DFT models generate protons of equivalent ensemble-
averaged deprotonation energy (DPE) [16], a rigorous and probe-independent measure
of Brønsted acid strength that inuences reactivity in acid catalysis [152155], while
paired Al atoms generate weaker protons with higher DPE values (by 11-108 kJ
mol-1) according to quantum chemical calculations on embedded cluster models [156].
Higher fractions of isolated Al atoms in CHA zeolites, achieved by increasing the
bulk Si/Al ratio from 2 to 70, correlate with longer time-on-stream stabilities and
lesser amounts of coke formed during methanol-to-olens (MTO) catalysis (548-673
K) [157,158]. These ndings indicate that synthetic methods that control the isolation
and pairing of framework Al atoms in zeolites would provide new opportunities to
introduce structural and catalytic diversity in a given zeolite at xed composition.
The collective work of Dedecek and co-workers has provided evidence that dierent
procedures used to synthesize MFI and other zeolites lead to dierent fractions of
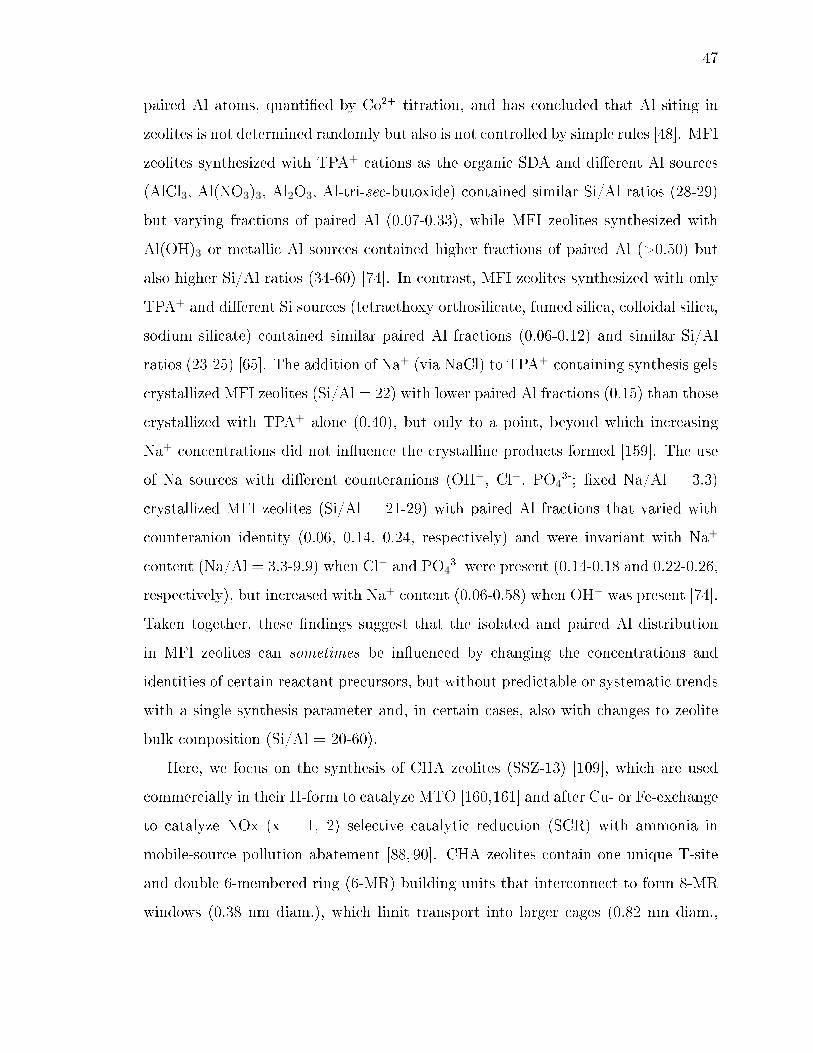
47
paired Al atoms, quantied by Co2+ titration, and has concluded that Al siting in
zeolites is not determined randomly but also is not controlled by simple rules [48]. MFI
zeolites synthesized with TPA+ cations as the organic SDA and dierent Al sources
(AlCl3, Al(NO3)3, Al2O3, Al-tri-sec-butoxide) contained similar Si/Al ratios (28-29)
but varying fractions of paired Al (0.07-0.33), while MFI zeolites synthesized with
Al(OH)3 or metallic Al sources contained higher fractions of paired Al (>0.50) but
also higher Si/Al ratios (34-60) [74]. In contrast, MFI zeolites synthesized with only
TPA+ and dierent Si sources (tetraethoxy orthosilicate, fumed silica, colloidal silica,
sodium silicate) contained similar paired Al fractions (0.06-0.12) and similar Si/Al
ratios (23-25) [65]. The addition of Na+ (via NaCl) to TPA+-containing synthesis gels
crystallized MFI zeolites (Si/Al = 22) with lower paired Al fractions (0.15) than those
crystallized with TPA+ alone (0.40), but only to a point, beyond which increasing
Na+ concentrations did not inuence the crystalline products formed [159]. The use
of Na sources with dierent counteranions (OH−, Cl−, PO43-; xed Na/Al = 3.3)
crystallized MFI zeolites (Si/Al = 21-29) with paired Al fractions that varied with
counteranion identity (0.06, 0.14, 0.24, respectively) and were invariant with Na+
content (Na/Al = 3.3-9.9) when Cl− and PO43- were present (0.14-0.18 and 0.22-0.26,
respectively), but increased with Na+ content (0.06-0.58) when OH− was present [74].
Taken together, these ndings suggest that the isolated and paired Al distribution
in MFI zeolites can sometimes be inuenced by changing the concentrations and
identities of certain reactant precursors, but without predictable or systematic trends
with a single synthesis parameter and, in certain cases, also with changes to zeolite
bulk composition (Si/Al = 20-60).
Here, we focus on the synthesis of CHA zeolites (SSZ-13) [109], which are used
commercially in their H-form to catalyze MTO [160,161] and after Cu- or Fe-exchange
to catalyze NOx (x = 1, 2) selective catalytic reduction (SCR) with ammonia in
mobile-source pollution abatement [88, 90]. CHA zeolites contain one unique T-site
and double 6-membered ring (6-MR) building units that interconnect to form 8-MR
windows (0.38 nm diam.), which limit transport into larger cages (0.82 nm diam.,
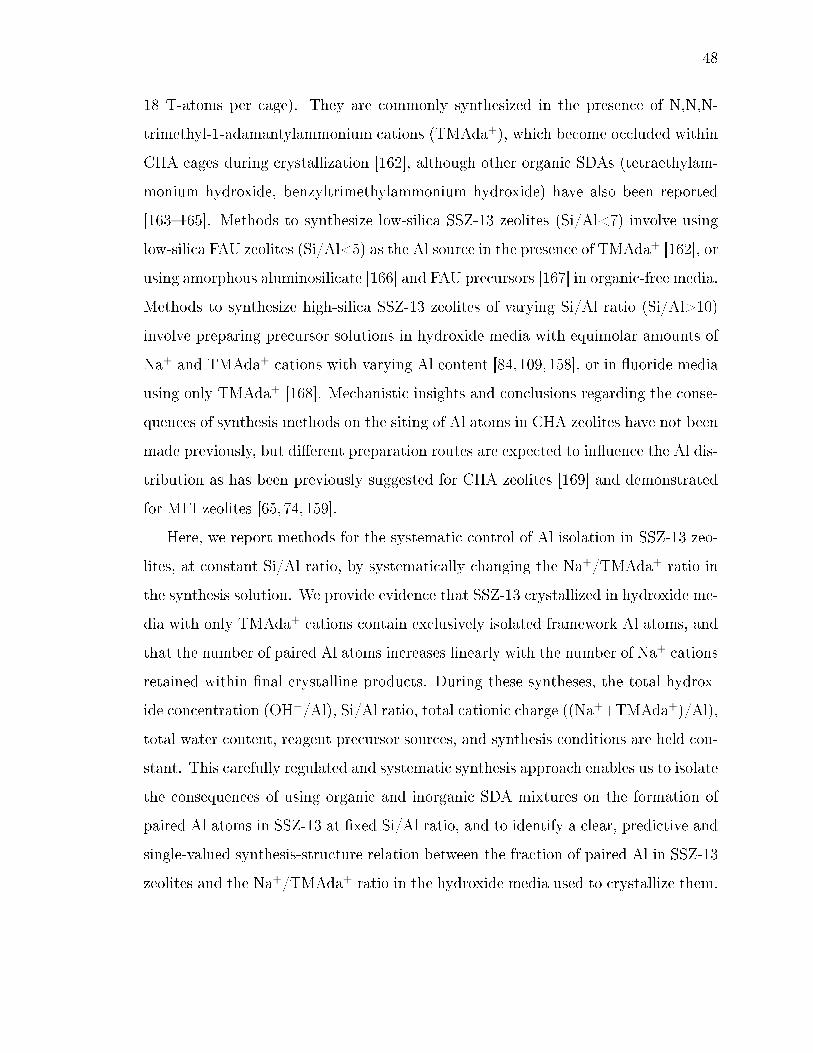
48
18 T-atoms per cage). They are commonly synthesized in the presence of N,N,N-
trimethyl-1-adamantylammonium cations (TMAda+), which become occluded within
CHA cages during crystallization [162], although other organic SDAs (tetraethylam-
monium hydroxide, benzyltrimethylammonium hydroxide) have also been reported
[163165]. Methods to synthesize low-silica SSZ-13 zeolites (Si/Al<7) involve using
low-silica FAU zeolites (Si/Al<5) as the Al source in the presence of TMAda+ [162], or
using amorphous aluminosilicate [166] and FAU precursors [167] in organic-free media.
Methods to synthesize high-silica SSZ-13 zeolites of varying Si/Al ratio (Si/Al>10)
involve preparing precursor solutions in hydroxide media with equimolar amounts of
Na+ and TMAda+ cations with varying Al content [84,109,158], or in uoride media
using only TMAda+ [168]. Mechanistic insights and conclusions regarding the conse-
quences of synthesis methods on the siting of Al atoms in CHA zeolites have not been
made previously, but dierent preparation routes are expected to inuence the Al dis-
tribution as has been previously suggested for CHA zeolites [169] and demonstrated
for MFI zeolites [65, 74,159].
Here, we report methods for the systematic control of Al isolation in SSZ-13 zeo-
lites, at constant Si/Al ratio, by systematically changing the Na+/TMAda+ ratio in
the synthesis solution. We provide evidence that SSZ-13 crystallized in hydroxide me-
dia with only TMAda+ cations contain exclusively isolated framework Al atoms, and
that the number of paired Al atoms increases linearly with the number of Na+ cations
retained within nal crystalline products. During these syntheses, the total hydrox-
ide concentration (OH−/Al), Si/Al ratio, total cationic charge ((Na++TMAda+)/Al),
total water content, reagent precursor sources, and synthesis conditions are held con-
stant. This carefully regulated and systematic synthesis approach enables us to isolate
the consequences of using organic and inorganic SDA mixtures on the formation of
paired Al atoms in SSZ-13 at xed Si/Al ratio, and to identify a clear, predictive and
single-valued synthesis-structure relation between the fraction of paired Al in SSZ-13
zeolites and the Na+/TMAda+ ratio in the hydroxide media used to crystallize them.
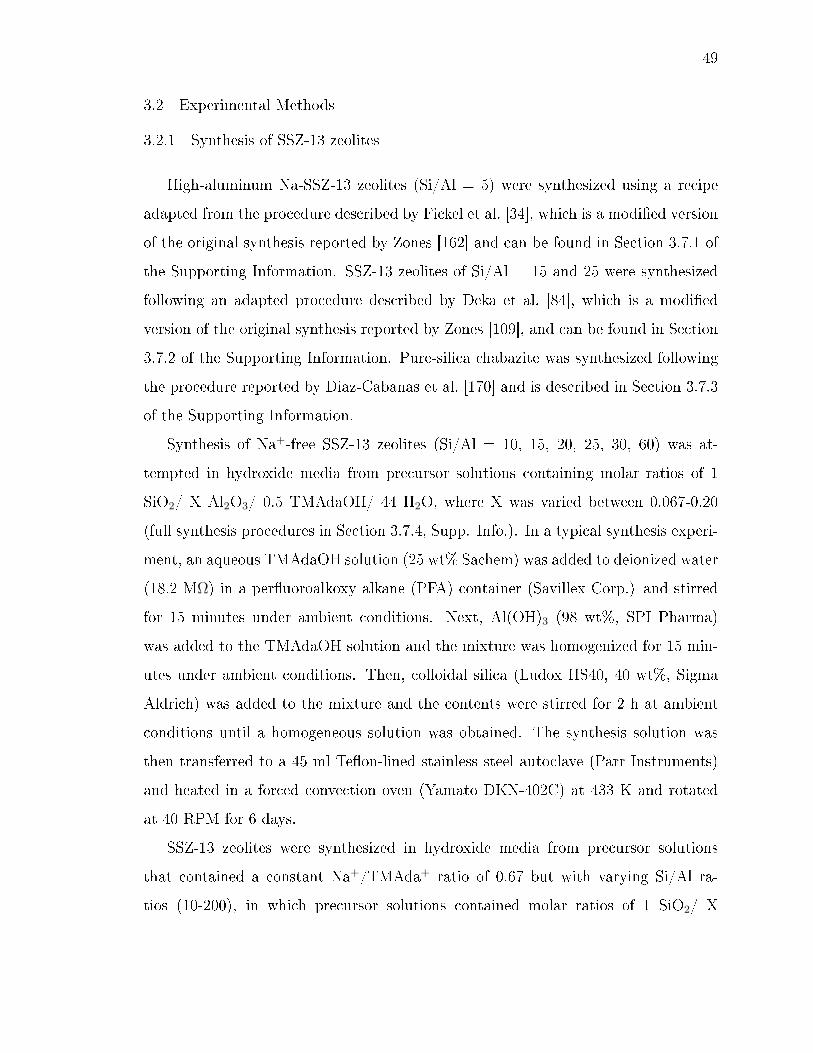
49
3.2 Experimental Methods
3.2.1 Synthesis of SSZ-13 zeolites
High-aluminum Na-SSZ-13 zeolites (Si/Al = 5) were synthesized using a recipe
adapted from the procedure described by Fickel et al. [34], which is a modied version
of the original synthesis reported by Zones [162] and can be found in Section 3.7.1 of
the Supporting Information. SSZ-13 zeolites of Si/Al = 15 and 25 were synthesized
following an adapted procedure described by Deka et al. [84], which is a modied
version of the original synthesis reported by Zones [109], and can be found in Section
3.7.2 of the Supporting Information. Pure-silica chabazite was synthesized following
the procedure reported by Diaz-Cabanas et al. [170] and is described in Section 3.7.3
of the Supporting Information.
Synthesis of Na+-free SSZ-13 zeolites (Si/Al = 10, 15, 20, 25, 30, 60) was at-
tempted in hydroxide media from precursor solutions containing molar ratios of 1
SiO2/ X Al2O3/ 0.5 TMAdaOH/ 44 H2O, where X was varied between 0.067-0.20
(full synthesis procedures in Section 3.7.4, Supp. Info.). In a typical synthesis experi-
ment, an aqueous TMAdaOH solution (25 wt% Sachem) was added to deionized water
(18.2 MΩ) in a peruoroalkoxy alkane (PFA) container (Savillex Corp.) and stirred
for 15 minutes under ambient conditions. Next, Al(OH)3 (98 wt%, SPI Pharma)
was added to the TMAdaOH solution and the mixture was homogenized for 15 min-
utes under ambient conditions. Then, colloidal silica (Ludox HS40, 40 wt%, Sigma
Aldrich) was added to the mixture and the contents were stirred for 2 h at ambient
conditions until a homogeneous solution was obtained. The synthesis solution was
then transferred to a 45 ml Teon-lined stainless steel autoclave (Parr Instruments)
and heated in a forced convection oven (Yamato DKN-402C) at 433 K and rotated
at 40 RPM for 6 days.
SSZ-13 zeolites were synthesized in hydroxide media from precursor solutions
that contained a constant Na+/TMAda+ ratio of 0.67 but with varying Si/Al ra-
tios (10-200), in which precursor solutions contained molar ratios of 1 SiO2/ X
50
Al2O3/ 0.3 TMAdaOH/ 0.2 NaOH/ 44 H2O (full synthesis procedures in Section
3.7.5, Supp. Info.). SSZ-13 zeolites were synthesized at Si/Al ratios of 15 and 25
with varying charge density (Na+/TMAda+ = 0-3), but with constant total charge
((Na++TMAda+)/Al = 7.5), in which precursor solutions contained molar ratios of 1
SiO2/ Y Al2O3/ X TMAdaOH/ (0.5 X) NaOH/ 44 H2O (full synthesis procedures in
Section 3.7.6, Supp. Info.). SSZ-13 zeolites were synthesized at a solution Si/Al ratio
of 15 with varying charge density (Na+/TMAda+ = 0-5.6) and varying total cationic
charge ((Na++TMAda+)/Al = 5.4-7.1) (full synthesis procedures in Section 3.7.7,
Supp. Info.). The preparation and crystallization procedures for Na+-containing
zeolites occurred as described for Na+-free zeolites, in which the Al addition and
homogenization step was followed by addition of Na+ via a 5M sodium hydroxide
solution (NaOH: 16.7 wt% NaOH in deionized water; NaOH 98 wt% Alfa Aesar) and
homogenization for 15 minutes under ambient conditions.
3.2.2 Preparation of H-form and partially cation-exchanged zeolites
Solids were recovered from autoclaves after their allotted crystallization time and
washed thoroughly with deionized water (18.2 MΩ) and acetone (99.9 wt%, Sigma
Aldrich) in alternating steps (70 cm3 solvent per g solids) until the pH of the super-
natant remained constant between washes, followed by a nal water wash to remove
residual acetone. Solids then were recovered via centrifugation, dried at 373 K under
stagnant air for 24 h, and then treated in owing dry air (1.67 cm3 s-1 gcat-1, 99.999
% UHP, Indiana Oxygen) at 853 K (0.0167 K s-1) for 10 h. The residual Na+ content
was removed by converting to the NH4-form via aqueous phase ion-exchange using
150 cm3 of a 1.0M NH4NO3 solution (8.0 wt% in H2O; 99.9 wt%, Sigma Aldrich)
per g solids for 24 h at ambient conditions, followed by washing the solids four times
with deionized water (70 cm3 per g solids). NH4-form zeolites were recovered using
centrifugation, dried at 373 K under stagnant air for 24 h, and then converted to their
H-form by treatment in owing dry air (1.67 cm3 s-1 gcat-1, 99.999% UHP, Indiana
Oxygen) at 773 K (0.0167 K s-1) for 4 h.
51
H-SSZ-13 zeolites were converted to their Cu2+ form by ion-exchange using aque-
ous Cu(NO3)2 solutions with molarities ranging between 0.001 M-0.25 M (0.02-3.75
wt% Cu(NO3)2; 99 wt%, Sigma Aldrich) for 4 h at ambient conditions under stirring.
The pH of the exchange solution was controlled to 5 through dropwise addition of
0.1 M NH4OH (ca. pH = 11; Sigma Aldrich). After Cu2+ exchange, samples were
washed four times with deionized water until the pH was constant between washes,
recovered via centrifugation, and then dried at 373 K under stagnant air for 24 h.
Cu-zeolites were then treated in owing dry air (1.67 cm3 s-1 gcat-1, 99.999% UHP,
Indiana Oxygen) at 773 K (0.0167 K s-1) for 4 h.
H-SSZ-13 zeolites were converted to their Co2+ form by an aqueous ion-exchange
using 150 cm3 of a 0.25 M Co(NO3)2 (4.6 wt% Co(NO3)2; 99 wt%, Sigma Aldrich)
solution per g zeolite for 4 h at ambient conditions under stirring. The pH of the
exchange solution was not controlled and reached a nal value of ca. 3.3 after 4 h.
After the exchange the samples were washed four times with deionized water (70 cm3
per g solids), recovered using centrifugation, and dried at 373 K under stagnant air
for 24 h. Co-SSZ-13 materials were then treated in owing dry air (1.67 cm3 s-1 gcat-1,
99.999% UHP, Indiana Oxygen) at 773 K (0.0167 K s-1) for 4 h. A subsequent Co2+
ion exchange was performed using a 0.5M Co(NO3)2 solution (9.2 wt% Co(NO3)2)
to verify that each sample was saturated with Co2+ after exchanges performed with
0.25 M solutions.
H-SSZ-13 zeolites were converted to their Na+ form using 150 cm3 of an aqueous
NaCl (99 wt%, Sigma Aldrich) solution per g zeolite with molarities ranging from
0.01-2.0 M (0.06-11.7 wt% NaCl in deionized water) for 24 h at ambient conditions.
The pH of the Na+ exchanges was not controlled and reached a nal value of ca. 3.2
after 24 h. Na+ exchanged samples were washed four times with deionized water (70
cm3 per g solids), recovered using centrifugation, and dried at 373 K under stagnant
air for 24 h. Na-SSZ-13 materials were then treated in owing dry air (1.67 cm3 s-1
gcat-1, 99.999% UHP, Indiana Oxygen) at 773 K (0.0167 K s-1) for 4 h.

52
3.2.3 Zeolite Characterization
Zeolite topologies were determined from powder X-ray diraction (XRD) patterns
measured on a Rigaku SmartLab X-ray diractometer with a Cu Kα radiation source
(|lambda=0.154 nm) operated at 1.76 kW. Typically, 0.50 g of zeolite powder were
loaded onto a high volume sample holder (Rigaku) and the diraction pattern was
measured from 440 2θ at a scan rate of 0.04 s-1. Powder XRD patterns for all
synthesized materials were compared to a known reference material and to diraction
patterns for CHA (SSZ-13) and MOR reported in the International Zeolite Associ-
ation (IZA) structure database [1]. All XRD patterns are normalized such that the
maximum peak intensity in each pattern is set to unity, and are shown in Section
3.7.8 of the Supporting Information.
Zeolite micropore volumes were determined from Ar adsorption isotherms mea-
sured on H-SSZ-13 samples held at 87 K in a liquid Ar bath using a Micromeritics
ASAP 2020 Surface Area and Porosity Analyzer. Micropore volumes were obtained
by converting adsorbed gas volumes (cm3 gcat-1 at STP) to liquid volumes using a
density conversion factor assuming the liquid density of Ar at 87 K. Samples were
pelleted and sieved to a nominal diameter between 180-250 µm before degassing by
heating 0.030.05 g of sieved sample to 393 K (0.167 K s-1) under high vacuum (ca.
5 µmHg) for 2 h, and then further heating to 623 K (0.167 K s-1) under high vac-
uum ( 5 µmHg) and holding for 9 h. Micropore volumes (cm3 gcat-1 at STP) were
estimated from extrapolation of the linear volumetric uptake during the beginning of
mesopore lling ( 0.080.30 P/P0) to zero relative pressure, which agreed with micro-
pore volumes estimated from analyzing the semi-log derivative plot of the adsorption
isotherm (∂(Vads)/∂(ln(P/P0)) vs. ln(P/P0)). All Ar adsorption isotherms are shown
in Section 3.7.9 of the Supporting Information.
Atomic absorption spectroscopy (AAS) was used to determine the total Si, Al,
Na, Cu, and Co content of each sample using a Perkin Elmer AAnalyst 300 Atomic
Absorption Spectrometer. Samples were prepared for AAS measurements by dissolv-
53
ing 0.02 g of zeolite in 3 g of hydrouoric acid (48 wt%, Sigma Aldrich), letting the
solution sit overnight, and then diluting with 60 g of deionized water (18.2 MΩ).
Caution: when working with HF acid, use appropriate personal protective equipment,
ventilation, and other safety measures. Absorbances were measured using radiation
sources at wavelengths of 251.6 nm and 309.3 nm for Si and Al, respectively, in a re-
ducing acetylene/nitrous oxide ame and at wavelengths of 589.0 nm, 324.8 nm, and
240.7 for Na, Cu, and Co, respectively, in an oxidizing acetylene/air ame. Elemental
compositions were determined from calibration curves derived from known standard
solutions.
Thermogravimetric analysis (TGA) experiments were performed on a TA Instru-
ments SDT Q600 thermogravimetric analyzer and dierential scanning calorimeter
(TGA-DSC) by heating 0.02 g of as-synthesized SSZ-13 in 83.3 cm3 s-1 gcat-1 dry air
(UHP, 99.999%, Indiana Oxygen) to 523 K (0.167 K s-1) and holding for 0.5 h to re-
move physisorbed water before further heating to 1073 K (0.167 K s-1). Combustion
of the organic structure directing agent was characterized by a sharp exothermic heat
ow centered around 773 K, which was accompanied by a sharp decrease in mass. All
SSZ-13 samples exhibited a weight loss of about 20 wt% associated with combustion
of TMAda+, corresponding to one TMAda+ molecule per CHA cage (Table 3.3, Sec-
tion 3.7.10 in Supp. Info.), consistent with reported organic weight loss of TMAda+
synthesized SSZ-13 [158,162].27Al magic angle spinning nuclear magnetic resonance (MAS NMR) spectra were
recorded on H-SSZ-13 zeolite samples to quantify their fraction of framework and
extraframework Al. NMR spectra of H-SSZ-13 were collected using a Chemagnetics
CMX-Innity 400 spectrometer in a wide-bore 9.4 Tesla magnet (Purdue Interdepart-
mental NMR Facility) and were acquired at ambient conditions using a 2.3 µs pulse
(equivalent to ca. 30 degrees), an acquisition time of 12.8ms and a relaxation delay
of 1s and were measured at 104.24 MHz and a MAS rate of 5 kHz. 1H decoupling
was used during acquisition, employing two-pulse phase modulation (TPPM) scheme.
Zeolite samples were hydrated by holding for >48 h in a desiccator containing a sat-

54
urated potassium chloride (KCl) solution prior to packing in a 4mm ZrO2 rotor. All27Al MAS NMR spectra are referenced to a static sample of AlCl3 dissolved in D2O
(0 ppm 27Al line) and are shown in Section 3.7.11 of the Supporting Information.29Si MAS NMR spectra were recorded on H-SSZ-13 samples to characterize their
coordination of Si atoms. Spectra of H-SSZ-13 were collected using a Chemagnetics
CMX-Innity 400 spectrometer in a wide-bore 9.4 Tesla magnet (Purdue Interde-
partmental NMR Facility) operated at 79.6 MHz and equipped with a 5mm H-X-Y
MAS probe. Zeolite samples were packed in 5mm ZrO2 rotors and spun with a MAS
rate of 5.6 kHz at room temperature. Single-pulse spectra were obtained using a 29Si
pulse of 5µs (ca. 90 degrees) and CP spectra used a 1H 90-degree pulse of 5µs and
a contact time of 2ms. Both types of spectra were collected with a relaxation delay
of 60s and an acquisition time of 20.5ms were used, along with 1H decoupling during
acquisition using the TPPM modulation scheme. Zeolite samples were hydrated by
holding for >48 h in a desiccator containing a saturated potassium chloride (KCl)
solution prior to packing in a 5mm ZrO2 rotor. All 29Si MAS NMR spectra are refer-
enced to a solid sodium salt of 4,4-dimethyl-4-silapentane-1-sulfonic acid (DSS) with
the 29Si line referenced to 0 ppm.
The number of H+ sites on H-form zeolites was quantied by temperature pro-
grammed desorption (TPD) of samples after liquid-phase ion-exchange with NH4+
cations, while the number of residual H+ sites on metal-exchanged zeolites (Cu- and
Co-SSZ-13) was quantied by TPD of samples saturated with gas-phase NH3 after
performing purging treatments that remove all non-Brønsted bound NH3 from the
samples, as reported in detail elsewhere [78, 171]. TPD experiments were performed
using a Micromeritics Autochem II 2920 Chemisorption analyzer connected to an
Agilent 5973N mass selective detector (MSD).
UV-Visible spectroscopy (UV-Vis) was used to determine the oxidation state of
Co2+ ions and to detect the presence of Co-oxides on Co-SSZ-13(15, 1) after exchange
with Co(NO3)2 solutions of varying molarity. Diuse reectance UV-Vis spectra were
recorded under ambient conditions using a Varian Cary 5000 UV-Vis-NIR Spectropho-
55
tometer attached with a Harrick Scientic Praying Mantis diuse reectance acces-
sory. Baseline spectra were recorded for every sample using barium sulfate (BaSO4;
98 wt%, Sigma Aldrich) as a 100% reectance reference material and also on H-
SSZ-13(15, 1), which is subtracted from the Co-SSZ-13(15, 1) spectra. Spectra were
recorded from 12,500-50,000 cm-1 at a scan rate of 167 cm-1 s-1. Typically, 0.10-0.15
g of Co-SSZ-13 samples were loaded into a sample cup and pressed with a clean
microscope slide until the surface was uniform.
3.3 Results and Discussion
3.3.1 Quantication of isolated and paired Al in SSZ-13 zeolites
Methods were rst developed to quantify the number of protons that compensate
isolated and paired Al sites in H-SSZ-13 zeolites of dierent elemental composition.
Each high-silica (Si/Al >10) sample is denoted as H-SSZ-13(X,Y), where X and Y
are the Si/Al ratio and the Na+/TMAda+ ratio in the synthesis gel. High-silica
SSZ-13 zeolites (Si/Al = 15, 25) were crystallized from precursor solutions containing
equimolar amounts of Na+ and TMAda+ cations but dierent Al contents [84, 109],
and one low-silica SSZ-13 zeolite (Si/Al = 5) was prepared using TMAda+ cations and
low-silica FAU zeolites as the Al source [34,162]. H-SSZ-13(5), H-SSZ-13(15, 1), and
H-SSZ-13(25, 1) showed XRD patterns consistent with phase-pure CHA (Fig. 3.12,
Supp. Info.). Micropore volumes were consistent with the CHA topology for H-SSZ-
13(15, 1) and H-SSZ-13(25, 1) zeolites (0.18-0.19 cm3 g-1, Ar adsorption isotherms in
Fig. 3.19, Supp. Info.), but slightly lower for H-SSZ-13(5) zeolites made via FAU-to-
CHA transformation (0.16 cm3 g-1) [158] that are also characterized by H+/Al ratios
(0.65 by NH3 TPD) and framework Al contents (Alf/Altot = 0.85 by 27Al MAS NMR)
lower than expected for phase-pure CHA [78].
H-SSZ-13(5), H-SSZ-13(15,1) and H-SSZ-13(25,1) samples were equilibrated with
aqueous Cu(NO3)2 solutions of increasing molarity to obtain partially Cu-exchanged
zeolites, with solid Cu/Al ratios measured by atomic absorption spectroscopy (AAS).

56
The numbers of residual H+ sites on H-form and Cu-exchanged zeolites were measured
by NH3 temperature-programmed desorption after NH3-saturated samples were held
in owing wet helium (3% H2O, 433 K) to remove Cu-bound NH3 and retain only
NH4+ species [78,171]. Cu exchanged predominantly as isolated Cu2+ cations for two
H+ sites until Cu/Al ratios of 0.21, 0.09 and 0.05 on H-SSZ-13(5), H-SSZ-13(15,1) and
H-SSZ-13(25,1), respectively, and then as isolated [CuOH]+ complexes for one H+ site
(Table 3.4, Fig. 3.25, Supp. Info.), consistent with DFT calculations and variable
temperature-programmed XRD analysis indicating that a Cu2+ cation exchanged at
2 Al atoms in a 6-MR is the most stable Cu exchange site in CHA zeolites [34,
37]. The transition from Cu2+ to [CuOH]+ agrees quantitatively with statistical
estimates of the number of paired Al atoms in a 6-MR of CHA based on a random Al
distribution obeying Löwenstein's rule (Fig. 3.26, Supp. Info.) [129]. These ndings
also agree with recent observations that SSZ-13 zeolites crystallized from synthesis
gels containing equimolar amounts of Na+ and TMAda+ (Si/Al = 4-55) exchanged
an equivalent number of Cu2+ cations as the number of paired Al predicted for a
random Al distribution [158]. Taken together, these data suggest that the Cu2+
saturation capacity provides a direct measurement of the number of paired Al, and
that synthesis gels containing equimolar amounts of Na+ and TMAda+ but varying
Al content crystallize SSZ-13(X,1) zeolites with their framework Al atoms distributed
randomly, subject to Löwenstein's rule.
H-SSZ-13 samples were also equilibrated with aqueous Co(NO3)2 solutions of in-
creasing molarity to obtain partially Co-exchanged zeolites and measure ion-exchange
isotherms (derivation in Section 3.7.14, Supp. Info.), in order to corroborate the nd-
ings from Cu-exchange, considering previous evidence for the non-random ordering
of Al atoms in certain CHA zeolites [172,173]. In contrast with Cu exchange, Co ex-
changed exclusively as isolated Co2+ cations with Langmuirian adsorption behavior
until saturation, as shown for H-SSZ-13(15,1) in Fig. 3.3, evident in the replacement of
two H+ sites per exchanged Co cation (Fig. 3.4). Diuse reectance UV-Vis (DRUV)
spectra recorded under ambient conditions on Co-SSZ-13(15, 1) zeolites with varying
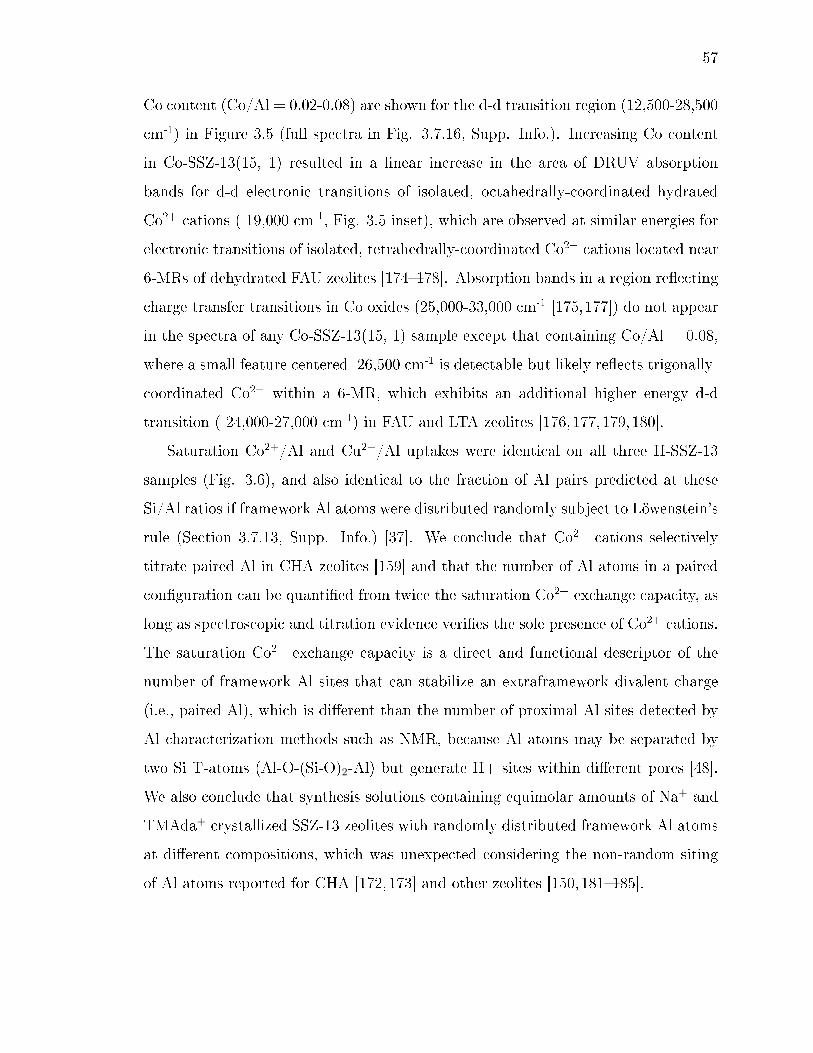
57
Co content (Co/Al = 0.02-0.08) are shown for the d-d transition region (12,500-28,500
cm-1) in Figure 3.5 (full spectra in Fig. 3.7.16, Supp. Info.). Increasing Co content
in Co-SSZ-13(15, 1) resulted in a linear increase in the area of DRUV absorption
bands for d-d electronic transitions of isolated, octahedrally-coordinated hydrated
Co2+ cations ( 19,000 cm-1, Fig. 3.5 inset), which are observed at similar energies for
electronic transitions of isolated, tetrahedrally-coordinated Co2+ cations located near
6-MRs of dehydrated FAU zeolites [174178]. Absorption bands in a region reecting
charge transfer transitions in Co oxides (25,000-33,000 cm-1 [175,177]) do not appear
in the spectra of any Co-SSZ-13(15, 1) sample except that containing Co/Al = 0.08,
where a small feature centered 26,500 cm-1 is detectable but likely reects trigonally-
coordinated Co2+ within a 6-MR, which exhibits an additional higher energy d-d
transition ( 24,000-27,000 cm-1) in FAU and LTA zeolites [176,177,179,180].
Saturation Co2+/Al and Cu2+/Al uptakes were identical on all three H-SSZ-13
samples (Fig. 3.6), and also identical to the fraction of Al pairs predicted at these
Si/Al ratios if framework Al atoms were distributed randomly subject to Löwenstein's
rule (Section 3.7.13, Supp. Info.) [37]. We conclude that Co2+ cations selectively
titrate paired Al in CHA zeolites [159] and that the number of Al atoms in a paired
conguration can be quantied from twice the saturation Co2+ exchange capacity, as
long as spectroscopic and titration evidence veries the sole presence of Co2+ cations.
The saturation Co2+ exchange capacity is a direct and functional descriptor of the
number of framework Al sites that can stabilize an extraframework divalent charge
(i.e., paired Al), which is dierent than the number of proximal Al sites detected by
Al characterization methods such as NMR, because Al atoms may be separated by
two Si T-atoms (Al-O-(Si-O)2-Al) but generate H+ sites within dierent pores [48].
We also conclude that synthesis solutions containing equimolar amounts of Na+ and
TMAda+ crystallized SSZ-13 zeolites with randomly distributed framework Al atoms
at dierent compositions, which was unexpected considering the non-random siting
of Al atoms reported for CHA [172,173] and other zeolites [150,181185].

58
3.3.2 Distribution of Al atoms in SSZ-13 zeolites synthesized using only N,N,N-trimethyl-1-adamantylammonium cations
High-silica SSZ-13 zeolites (Si/Al = 15, 25) crystallized from solutions comprising
equimolar amounts of Na+ and TMAda+ contained a detectable fraction of paired Al
atoms, as quantied by their saturation uptakes of divalent cations. The maximum
density of framework Al atoms beyond which the incorporation of additional Al causes
unavoidable formation of next-nearest-neighbor Al arrangements (Al-O-Si-O-Al) can
be calculated from the topological density of zeolite frameworks [186,187] and occurs
for CHA at a Si/Al ratio of 7 [186], suggesting that SSZ-13 with Si/Al >7 can be
prepared, in theory, to contain exclusively isolated Al atoms. Each TMAda+ cation
contains a large hydrophobic adamantyl moiety ( 0.7 nm diam.) covalently bound
to a singly-charged quaternary ammonium center and occupies the void space within
one CHA cage (12 T-atoms) [162]. Thus, we hypothesized that SSZ-13 crystallized
solely in the presence of TMAda+, based on steric constraints, should result in the
isolation of one Al atom per CHA cage (Si/Al = 11, defect-free).
The hydroxide-mediated crystallization of SSZ-13 using only TMAda+, in the ab-
sence of alkali, was attempted at dierent synthesis solution Si/Al ratios (10-60) with
all other synthesis parameters held constant. Precursor solutions containing Si/Al
ratios of 15 (repeated a total of 6x), 20, 25 and 30 were able to crystallize phase-pure
CHA zeolites (XRD patterns in Fig. 3.13, Ar adsorption isotherms in Fig. 3.20,
Supp. Info) with solid Si/Al ratios between 15-26. All crystalline samples contained
undetectable amounts of extraframework Al by 27Al NMR (spectra in Section 3.7.11,
Supp. Info.) and H+/Al ratios measured by NH3 titration between 0.94-0.98 (Table
3.1), reecting the nearly complete incorporation of Al atoms within the CHA frame-
work. The Co2+ exchange isotherm measured on SSZ-13 (15,1) shows Langmuirian
adsorption behavior to saturation at Co/Al = 0.09, while SSZ-13(15,0) showed neg-
ligible Co2+ exchange even at >10x higher aqueous-phase [Co2+]/[H+]2 ratios (Fig.
3.3). In sharp contrast, Na+ exchange isotherms (Fig. 3.3) on SSZ-13(15,0) and
SSZ-13(15,1) reached saturation at Na/Al = 0.91 and 1.02, respectively (isotherm

59
derivation in Section 3.7.16, Supp. Info.). These data suggest that all Al atoms are
completely isolated in SSZ-13 zeolites synthesized with only TMAda+ cations, con-
sistent with the occlusion of 1 TMAda+ molecule per CHA cage, as inferred from
thermogravimetric analysis (Table 3.1), that directs the siting of 1 Al atom per CHA
cage.29Si MAS NMR spectra (Fig. 3.7, solid traces) of SSZ-13(15,0) and SSZ-13(15,1)
appear indistinguishable and show high occupancies of both Q4 sites (Si-(O-Si)4:
δ = -111 ppm) and Q3 sites ((Si-O)3-Si-(O-Al): δ = -105 ppm), along with a third
feature ca. -101 ppm that reects either Q2 sites ((Si-O)2-Si-(O-Al)2) or silanol groups
(Si(OSi)3OH) [55, 168]. 1H-29Si CP MAS NMR spectra (Fig. 3.7, dashed traces)
showed a distinct resonance ca. -101 ppm, suggesting that silanol groups, but not
Q2 sites, are also present on these samples. These data suggest that Al-(O-Si)2-O-
Al linkages are formed preferentially over Al-O-Si-O-Al linkages (29Si Q2 sites) in
SSZ-13(15,1), as has also been observed in FAU zeolites [188,189], but that not even
Al-(O-Si)2-O-Al linkages are formed in SSZ-13(15,0) zeolites, which are unable to
exchange Co2+ cations (Fig. 3.3).
Attempts to crystallize SSZ-13 zeolites with Si/Al >30 in hydroxide media with
only TMAda+ resulted in amorphous phases, apparently because crystallization was
frustrated by the requirement to form anionic framework vacancy defects to balance
excess cationic charges in occluded TMAda+ cations that did not balance frame-
work Al (Table 3.3). These observations are consistent with the ability of SSZ-13 to
crystallize with low Al densities (Si/Al >60) and in a purely siliceous form (Si/Al
= ∞) in the presence of uoride anions (Section 3.7.3, Supp. Info.) [190], which
remain occluded within crystalline solids to balance excess cationic charges intro-
duced by TMAda+ cations. SSZ-13 synthesis solutions with Si/Al <15 also formed
amorphous phases when only TMAda+ was present, yet formed phase-pure SSZ-13
(Si/Al = 9) when additional Na+ cations were added to these solutions (Fig. 3.15,
Table 3.5, Supp. Info.), indicating that such high concentrations of AlO4- tetrahe-
dra led to anionic charge densities higher than TMAda+ cations alone were capable
60
of stabilizing. These observations are consistent with charge density mismatch the-
ory [191196], which proposes that the crystallization of aluminosilicate synthesis
solutions with a high density of anionic charge (i.e. low Si/Al ratios, high concen-
trations of AlO4- tetrahedra) becomes inhibited in the presence of SDAs with low
cationic charge density (e.g., bulky organics) [193, 194], and that the addition of
small amounts of cations with higher charge density (e.g. Na+) can help overcome
this barrier to crystallization [192]. Although previous work has shown that charge
density mismatch approaches can be used to crystallize zeolites of new topology (e.g.,
UFI [196]) or known zeolites at compositions that were previously inaccessible (e.g.,
BPH and LTA with Si/Al >1, and ERI with Si/Al >5 [195197]), the demonstration
herein illustrates that these approaches can control the arrangement of isolated and
paired Al atoms in a given zeolite at xed composition.
None of the SSZ-13(X,0) zeolites were able to exchange detectable amounts of
Co2+ (Table 3.1), demonstrating that SSZ-13 crystallized solely in the presence of
TMAda+ contains only isolated framework Al (1 Al per 6-MR). All SSZ-13(X,0)
samples contained one 1 TMAda+ molecule per CHA cage (Table 3.3), as expected
during the formation of CHA crystallites [158,162]. Furthermore, Cu exchanged onto
SSZ-13(15,0) solely as [CuOH]+ species (Cu/Al = 0.24, residual H+/Al = 0.76, Figure
3.8) as expected if every framework Al atom were isolated, in sharp contrast to the
sequential exchange of Cu2+ at paired Al and [CuOH]+ at isolated Al on SSZ-13(15,1)
(Fig. 3.8 and Fig. 3.25, Supp. Info). These ndings also agree with recent reports
of the predominance of monovalent [CuOH]+ species in high-silica Cu-SSZ-13 zeolites
(Si/Al = 14, Cu/Al = 0.44) [36, 38, 39, 41] synthesized using only TMAda+ cations
in uoride media [168], as would be expected from the incorporation of isolated Al
atoms by TMAda+ cations. The dierent Na+/TMAda+ ratios used to synthesize H-
SSZ-13(15,0) and H-SSZ-13(15,1) resulted in zeolites with identical bulk compositions
(Si/Al = 15, H+/Al =0.98), but dramatic dierences in their distributions of isolated
and paired framework Al sites, suggesting that the use of monovalent SDAs of dierent
size and cationic charge density directly inuenced the arrangement and distribution
61
of the framework Al atoms. These ndings extend the concepts of charge density
mismatch in zeolite crystallization and demonstrate that using organic and inorganic
SDA mixtures opens routes to systematically control the arrangement of matter in
zeolites at xed composition of matter.
3.3.3 Eect of synthesis gel cationic charge density on the arrangement of Al inSSZ-13 zeolites
The synthesis solutions used to crystallize SSZ-13(15,0) and SSZ-13(15,1) con-
tained constant total cationic charge ((Na++TMAda+)/Al) but dierent cationic
charge densities, as a result of dierent ratios of two monovalent cations (Na+/TMA-
da+) with dierent molecular volumes. Thus, we next focused on systematically
varying the molar ratio of Na+/TMAda+ (i.e., cationic charge density) between 0-3
at a xed synthesis solution composition (Si/Al = 15), xed total cationic charge
((Na++TMAda+)/Al = 7.5) and xed total hydroxide concentration (OH−/Al =
7.5). Precursor solutions with constant total cationic charge and Si/Al ratio (15)
crystallized phase-pure CHA zeolites with Si/Al = 15 (Table 3.2), whose occluded
TMAda+ content was measured by TGA (1 TMAda+ per cage, Table 3.3, Supp.
Info.) and Na+ content was measured by AAS. The (TMAda++Na+)/Al ratio on
each SSZ-13(15,X) sample was near unity (Table 3.2), indicating that every frame-
work Al atom was charge-balanced by either a TMAda+ or Na+ cation. Precursor
solutions with increasing Na+/TMAda+ ratio (0 to 1) crystallized SSZ-13(15,X) zeo-
lites that showed a linear increase in saturation Co2+ uptakes between Co/Al values
of 0 and 0.08 (Fig. 3.9), which range from the limit of Al isolation (Co/Al = 0) to
that predicted for a random Al distribution (Co/Al = 0.09) [37]. As Na+/TMAda+
ratios increased from 1 to 2, saturation Co2+ uptakes decreased toward zero (Fig.
3.9), while Na+/TMAda+ ratios >2 caused a phase transition toward formation of
mordenite (MOR) zeolites (XRD patterns in Fig. 3.16, Supp. Info.).
A second set of synthesis experiments with varying total cationic charge of the
precursor solution (i.e., (Na++TMAda+)/Al) at constant Si/Al = 15 (Table 3.6, Sec-
62
tion 3.7.18, Supp. Info.) was used to probe the inuence of total cationic charge on Al
siting. SSZ-13 crystallized with solid Si/Al ratios that systematically decreased from
18 to 12 with increasing total cationic charge (Fig. 3.28), yet the fraction of paired
Al depended only on the cationic charge density determined by the Na+/TMAda+
ratio in the precursor solution (Fig. 3.10). SSZ-13 zeolites crystallized from solutions
with varying total charge had varying compositions (Si/Al = 18-12), while SSZ-13
synthesized with constant total charge had similar compositions (Si/Al = 15) (Fig.
3.9). The decrease in the Si/Al ratio in the nal crystalline SSZ-13 product suggests
that the solid Al content is controlled by the total cationic charge in the synthesis
solution, independent of the charge density, and depends on the ratio of cations to
anionic AlO4- tetrahedra (i.e. (Na++TMAda+)/Al). Furthermore, both sets of SSZ-
13(15) zeolites undergo a phase transformation to MOR at the same Na+/TMAda+
ratio (>2), irrespective of the Si/Al ratio or total cationic charge (Fig. 3.10), suggest-
ing that this phase transformation is governed by thermodynamic driving forces in
order satisfy electrostatic constraints imposed by the charge density of the synthesis
solution.
An analogous set of experiments performed at a constant synthesis solution Si/Al
ratio of 25 and constant (Na++TMAda+)/Al ratio (Table 3.7, Section 3.7.19, Supp.
Info.), but with varying cationic charge density (Na+/TMAda+), were also performed.
The number of paired Al sites, measured by Co2+ titration, increased from the limit
of Al site isolation (Co/Al = 0) in SSZ-13(25, 0) to the value predicted (Co/Al =
0.04) for a random Al distribution in SSZ-13 (25, 1), and then decreases with as
the Na+/TMAda+ content increases beyond unity (Fig. 3.29). These ndings are
analogous to the dependence of paired Al content on cationic charge density for SSZ-
13(15, X) zeolites synthesized at constant total cationic charge. These data provide
further evidence that the cationic charge density in the crystallization medium, varied
here through the Na+/TMAda+ ratio, inuences the siting of Al in isolated or paired
framework locations in SSZ-13 zeolites.
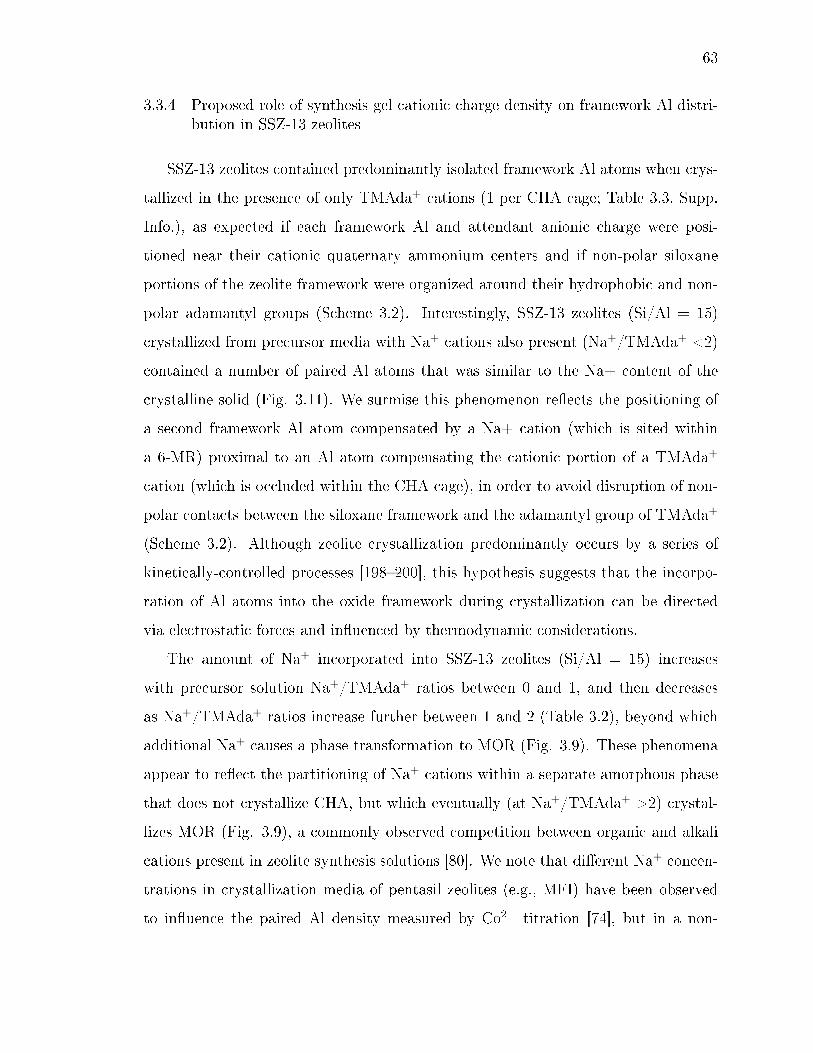
63
3.3.4 Proposed role of synthesis gel cationic charge density on framework Al distri-bution in SSZ-13 zeolites
SSZ-13 zeolites contained predominantly isolated framework Al atoms when crys-
tallized in the presence of only TMAda+ cations (1 per CHA cage; Table 3.3, Supp.
Info.), as expected if each framework Al and attendant anionic charge were posi-
tioned near their cationic quaternary ammonium centers and if non-polar siloxane
portions of the zeolite framework were organized around their hydrophobic and non-
polar adamantyl groups (Scheme 3.2). Interestingly, SSZ-13 zeolites (Si/Al = 15)
crystallized from precursor media with Na+ cations also present (Na+/TMAda+ <2)
contained a number of paired Al atoms that was similar to the Na+ content of the
crystalline solid (Fig. 3.11). We surmise this phenomenon reects the positioning of
a second framework Al atom compensated by a Na+ cation (which is sited within
a 6-MR) proximal to an Al atom compensating the cationic portion of a TMAda+
cation (which is occluded within the CHA cage), in order to avoid disruption of non-
polar contacts between the siloxane framework and the adamantyl group of TMAda+
(Scheme 3.2). Although zeolite crystallization predominantly occurs by a series of
kinetically-controlled processes [198200], this hypothesis suggests that the incorpo-
ration of Al atoms into the oxide framework during crystallization can be directed
via electrostatic forces and inuenced by thermodynamic considerations.
The amount of Na+ incorporated into SSZ-13 zeolites (Si/Al = 15) increases
with precursor solution Na+/TMAda+ ratios between 0 and 1, and then decreases
as Na+/TMAda+ ratios increase further between 1 and 2 (Table 3.2), beyond which
additional Na+ causes a phase transformation to MOR (Fig. 3.9). These phenomena
appear to reect the partitioning of Na+ cations within a separate amorphous phase
that does not crystallize CHA, but which eventually (at Na+/TMAda+ >2) crystal-
lizes MOR (Fig. 3.9), a commonly observed competition between organic and alkali
cations present in zeolite synthesis solutions [80]. We note that dierent Na+ concen-
trations in crystallization media of pentasil zeolites (e.g., MFI) have been observed
to inuence the paired Al density measured by Co2+ titration [74], but in a non-

64
systematic and uncontrolled manner, either because other synthesis parameters (e.g.,
counteranions, Si and Al precursors used) were not controlled for, or because Na+
and tetrapropylammonium (TPA+) mixtures used to crystallize MFI zeolites do not
function mechanistically as the Na+ and TMAda+ mixtures used here to crystallize
CHA zeolites.
3.4 Conclusions
Titration procedures to quantify the number of paired Al sites in SSZ-13 zeolites
(Si/Al = 5, 15, 25) using divalent Co2+ were developed by measurement of ion-
exchange isotherms on samples synthesized using an equimolar amount of Na+ and
TMAda+. The sole presence of isolated Co2+ cations on samples exposed to ambient
conditions was veried by diuse-reectance UV-Visible spectra, which showed bands
for d-d transition at 19,000 cm-1 characteristic of hydrated Co2+ cations and whose
integrated area increased linearly with increasing Co content. Furthermore, each
exchanged Co2+ cation replaced two H+ sites, quantied by selective titration of
residual H+ sites in Co-exchanged SSZ-13 zeolites using gaseous NH3 saturation and
purge procedures developed to retain only NH4+ species [171]. The number of paired
Al sites on SSZ-13 zeolites was also determined by counting residual H+ sites after
dierent extents of Cu cation exchange, which occurs sequentially as isolated Cu2+
cations at paired Al sites and then as [CuOH]+ species at isolated Al sites. On
SSZ-13 samples crystallized using equimolar ratios of Na+ and TMAda+, saturation
Cu2+ uptakes agreed quantitatively with saturation Co2+ uptakes and the predicted
number of Al pairs for a random Al distribution obeying Löwenstein's rule. These
spectroscopic and titration data provide the requisite evidence to conrm the sole
presence of Co2+ cations at coverages that saturate paired Al sites, which cannot
be assumed or asserted based solely on the adoption of Co2+ ion-exchange protocols
reported previously.
SSZ-13 zeolites (Si/Al = 15-30) synthesized solely in the presence of TMAda+
cations did not contain any paired Al sites, evident in their inability to exchange
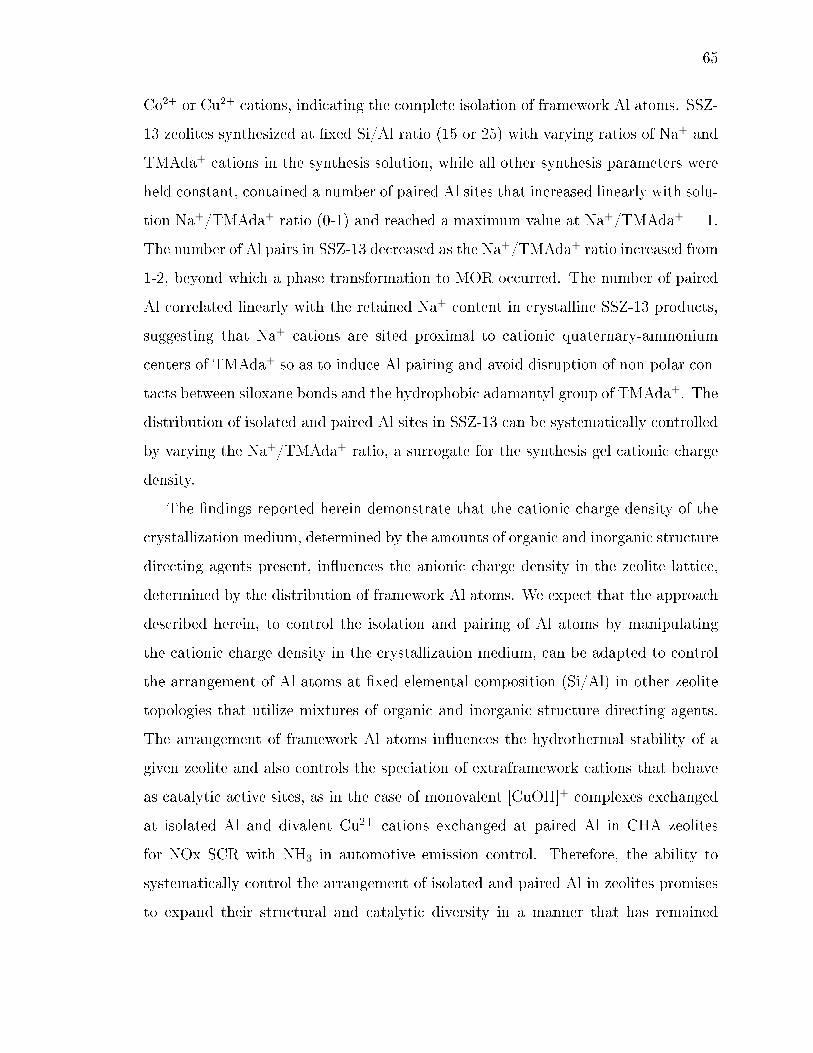
65
Co2+ or Cu2+ cations, indicating the complete isolation of framework Al atoms. SSZ-
13 zeolites synthesized at xed Si/Al ratio (15 or 25) with varying ratios of Na+ and
TMAda+ cations in the synthesis solution, while all other synthesis parameters were
held constant, contained a number of paired Al sites that increased linearly with solu-
tion Na+/TMAda+ ratio (0-1) and reached a maximum value at Na+/TMAda+ = 1.
The number of Al pairs in SSZ-13 decreased as the Na+/TMAda+ ratio increased from
1-2, beyond which a phase transformation to MOR occurred. The number of paired
Al correlated linearly with the retained Na+ content in crystalline SSZ-13 products,
suggesting that Na+ cations are sited proximal to cationic quaternary-ammonium
centers of TMAda+ so as to induce Al pairing and avoid disruption of non-polar con-
tacts between siloxane bonds and the hydrophobic adamantyl group of TMAda+. The
distribution of isolated and paired Al sites in SSZ-13 can be systematically controlled
by varying the Na+/TMAda+ ratio, a surrogate for the synthesis gel cationic charge
density.
The ndings reported herein demonstrate that the cationic charge density of the
crystallization medium, determined by the amounts of organic and inorganic structure
directing agents present, inuences the anionic charge density in the zeolite lattice,
determined by the distribution of framework Al atoms. We expect that the approach
described herein, to control the isolation and pairing of Al atoms by manipulating
the cationic charge density in the crystallization medium, can be adapted to control
the arrangement of Al atoms at xed elemental composition (Si/Al) in other zeolite
topologies that utilize mixtures of organic and inorganic structure directing agents.
The arrangement of framework Al atoms inuences the hydrothermal stability of a
given zeolite and also controls the speciation of extraframework cations that behave
as catalytic active sites, as in the case of monovalent [CuOH]+ complexes exchanged
at isolated Al and divalent Cu2+ cations exchanged at paired Al in CHA zeolites
for NOx SCR with NH3 in automotive emission control. Therefore, the ability to
systematically control the arrangement of isolated and paired Al in zeolites promises
to expand their structural and catalytic diversity in a manner that has remained
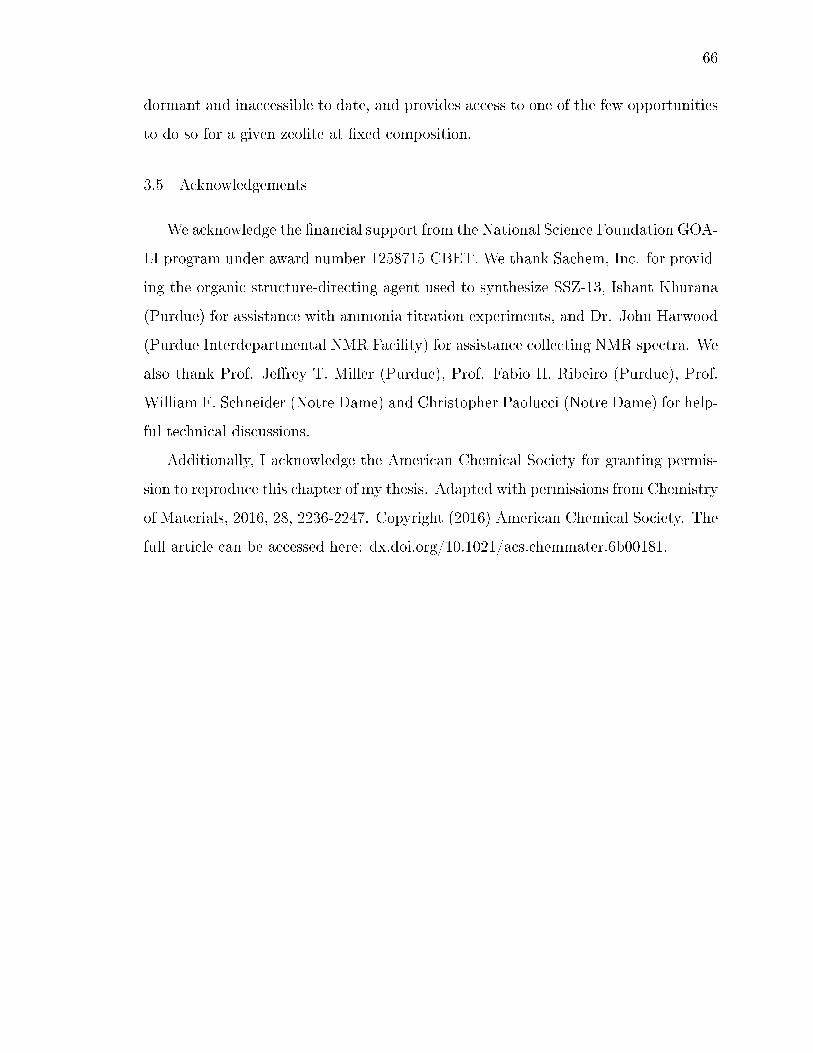
66
dormant and inaccessible to date, and provides access to one of the few opportunities
to do so for a given zeolite at xed composition.
3.5 Acknowledgements
We acknowledge the nancial support from the National Science Foundation GOA-
LI program under award number 1258715-CBET. We thank Sachem, Inc. for provid-
ing the organic structure-directing agent used to synthesize SSZ-13, Ishant Khurana
(Purdue) for assistance with ammonia titration experiments, and Dr. John Harwood
(Purdue Interdepartmental NMR Facility) for assistance collecting NMR spectra. We
also thank Prof. Jerey T. Miller (Purdue), Prof. Fabio H. Ribeiro (Purdue), Prof.
William F. Schneider (Notre Dame) and Christopher Paolucci (Notre Dame) for help-
ful technical discussions.
Additionally, I acknowledge the American Chemical Society for granting permis-
sion to reproduce this chapter of my thesis. Adapted with permissions from Chemistry
of Materials, 2016, 28, 2236-2247. Copyright (2016) American Chemical Society. The
full article can be accessed here: dx.doi.org/10.1021/acs.chemmater.6b00181.
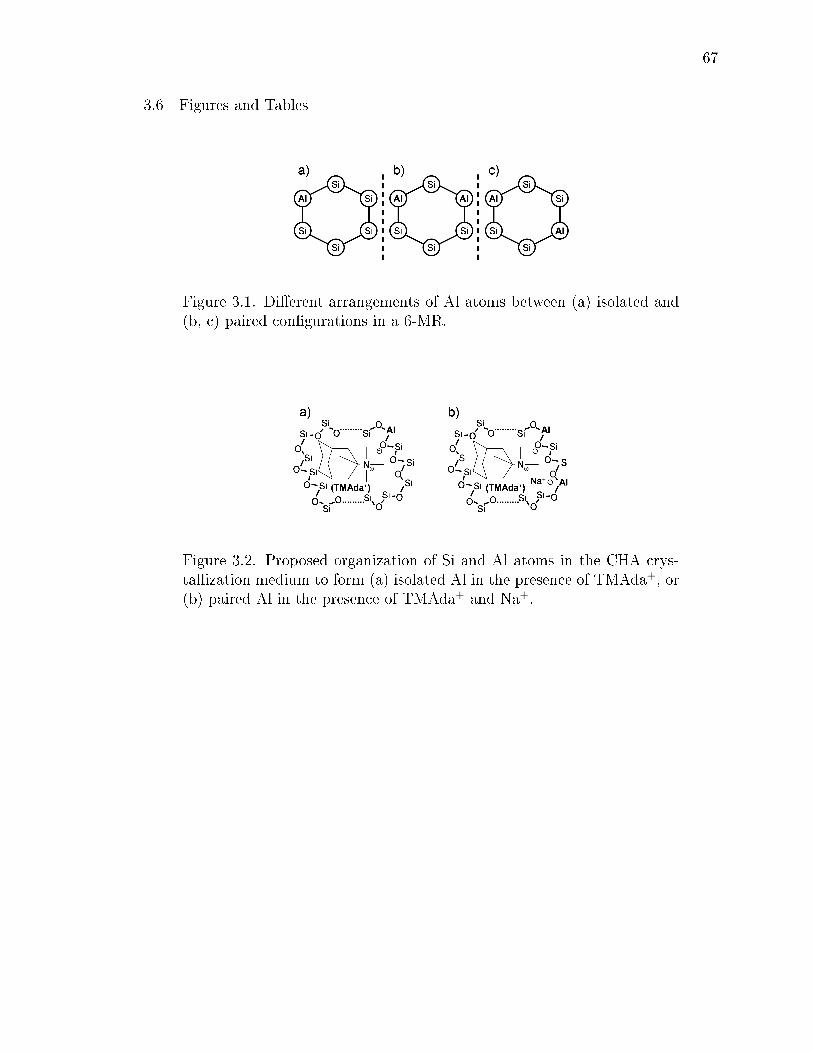
67
3.6 Figures and Tables
Figure 3.1. Dierent arrangements of Al atoms between (a) isolated and(b, c) paired congurations in a 6-MR.
Figure 3.2. Proposed organization of Si and Al atoms in the CHA crys-tallization medium to form (a) isolated Al in the presence of TMAda+, or(b) paired Al in the presence of TMAda+ and Na+.

68
Figure 3.3. (a) Co2+ and (b) Na+ ion-exchange isotherms measured onSSZ-13(15,0) (circles) and SSZ-13(15,1) (squares); solid lines representleast-squares regression of data to Langmuirian isotherms.
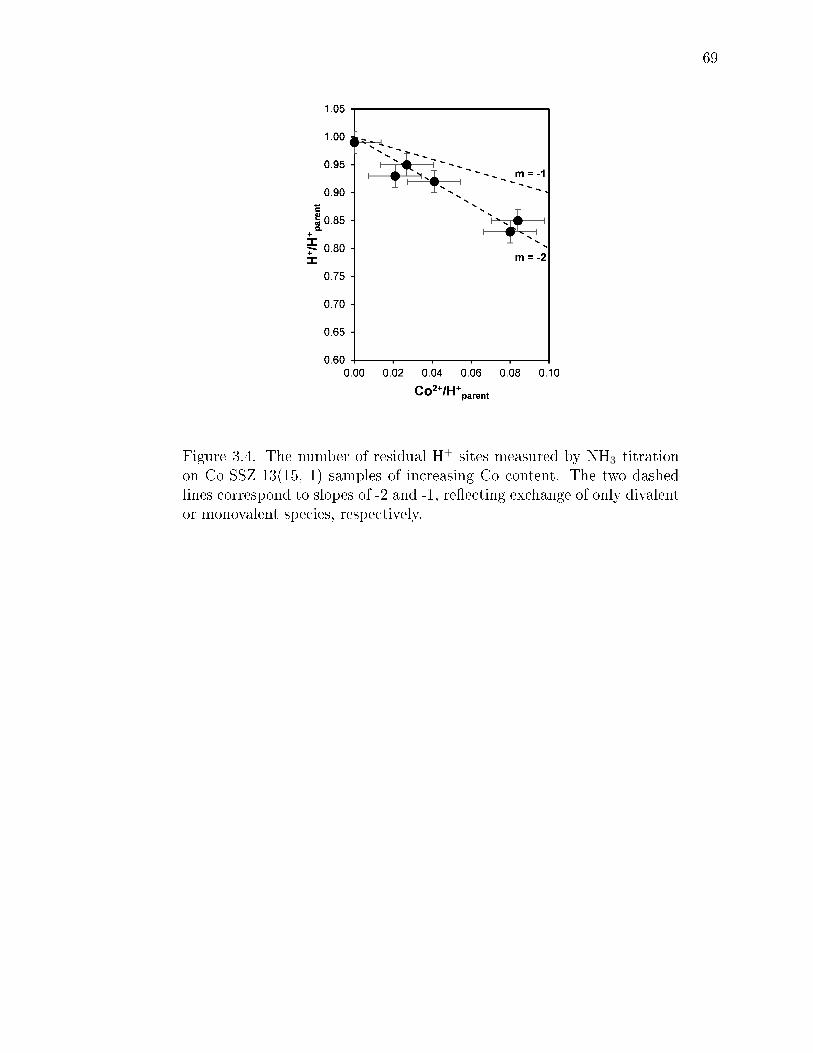
69
Figure 3.4. The number of residual H+ sites measured by NH3 titrationon Co-SSZ-13(15, 1) samples of increasing Co content. The two dashedlines correspond to slopes of -2 and -1, reecting exchange of only divalentor monovalent species, respectively.
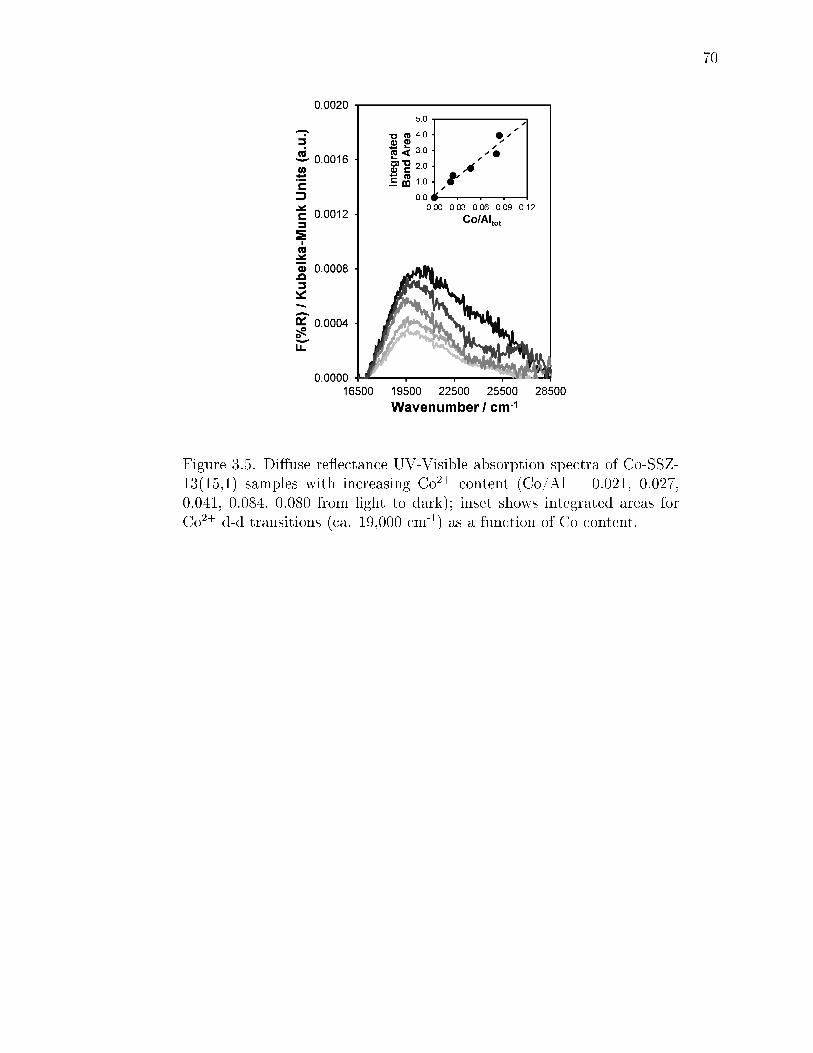
70
Figure 3.5. Diuse reectance UV-Visible absorption spectra of Co-SSZ-13(15,1) samples with increasing Co2+ content (Co/Al = 0.021, 0.027,0.041, 0.084, 0.080 from light to dark); inset shows integrated areas forCo2+ d-d transitions (ca. 19,000 cm-1) as a function of Co content.
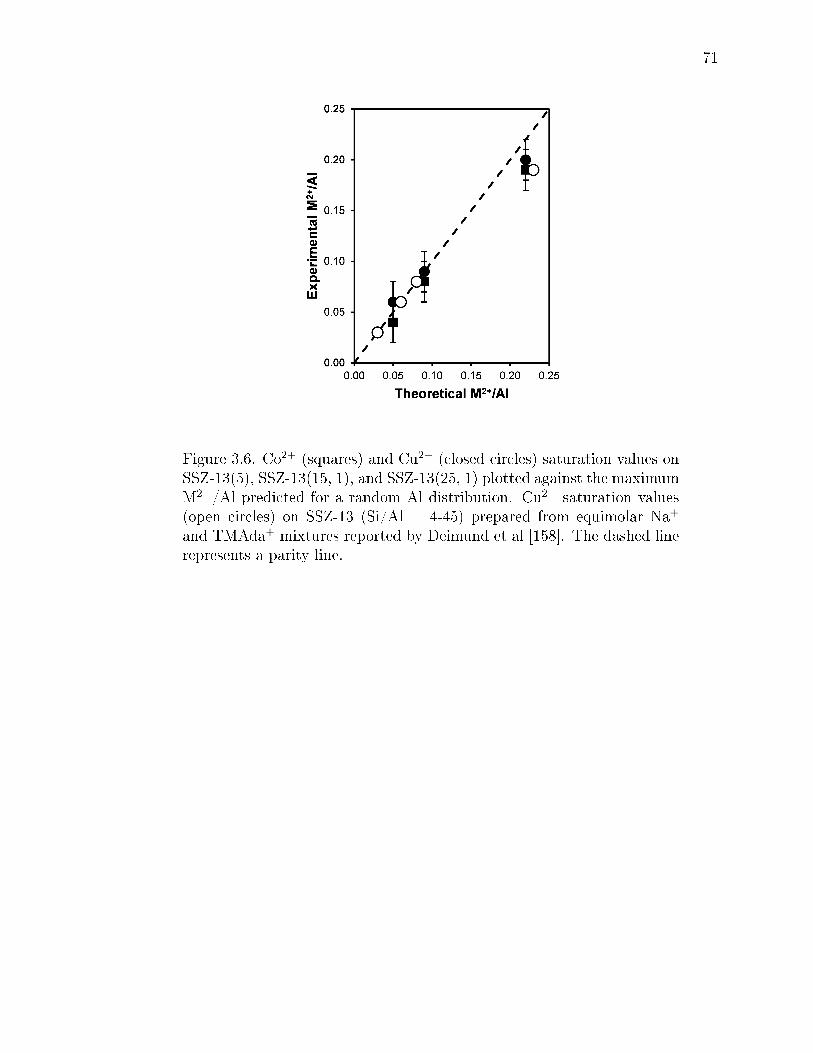
71
Figure 3.6. Co2+ (squares) and Cu2+ (closed circles) saturation values onSSZ-13(5), SSZ-13(15, 1), and SSZ-13(25, 1) plotted against the maximumM2+/Al predicted for a random Al distribution. Cu2+ saturation values(open circles) on SSZ-13 (Si/Al = 4-45) prepared from equimolar Na+
and TMAda+ mixtures reported by Deimund et al [158]. The dashed linerepresents a parity line.
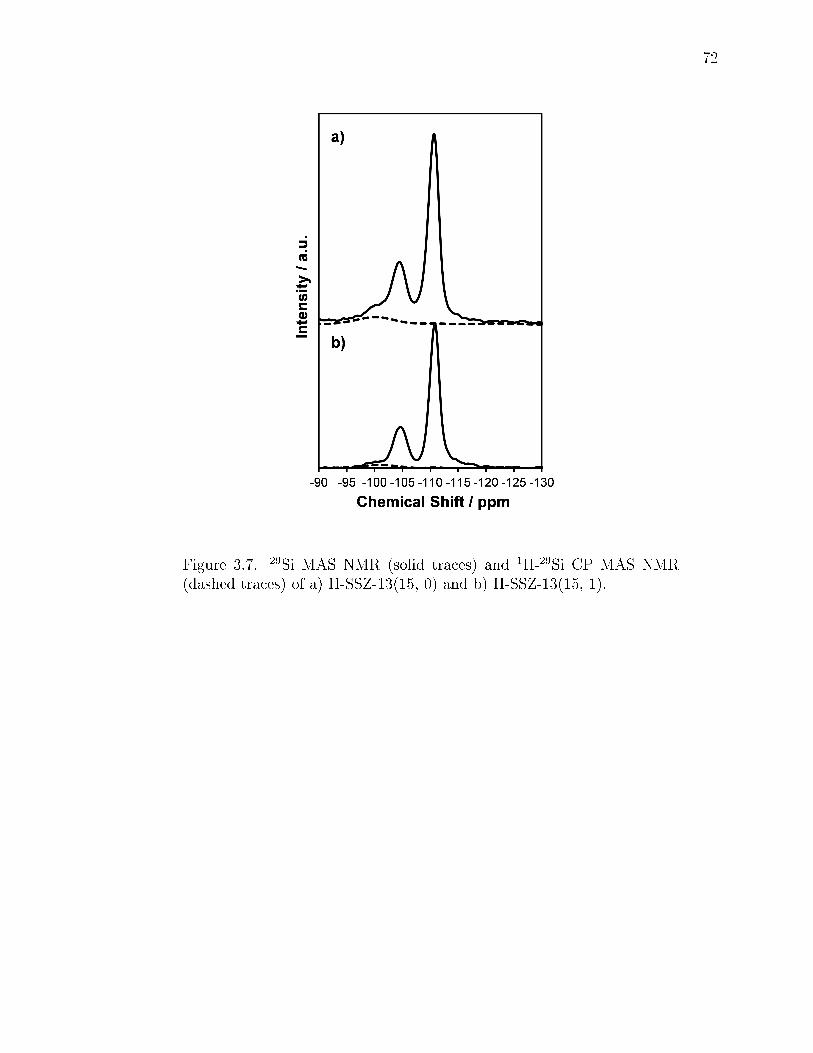
72
Figure 3.7. 29Si MAS NMR (solid traces) and 1H-29Si CP MAS NMR(dashed traces) of a) H-SSZ-13(15, 0) and b) H-SSZ-13(15, 1).

73
Figure 3.8. Number of residual H+ sites on SSZ-13(15, 1) after increasingextents of Cu2+ exchange (circles) and after Co2+ saturation (squares),and on SSZ-13(15, 0) after Cu2+ exchange (diamond). The two dashedlines correspond to slopes of -2 and -1, reecting exchange of only isolatedCu2+ or [CuOH]+, respectively.
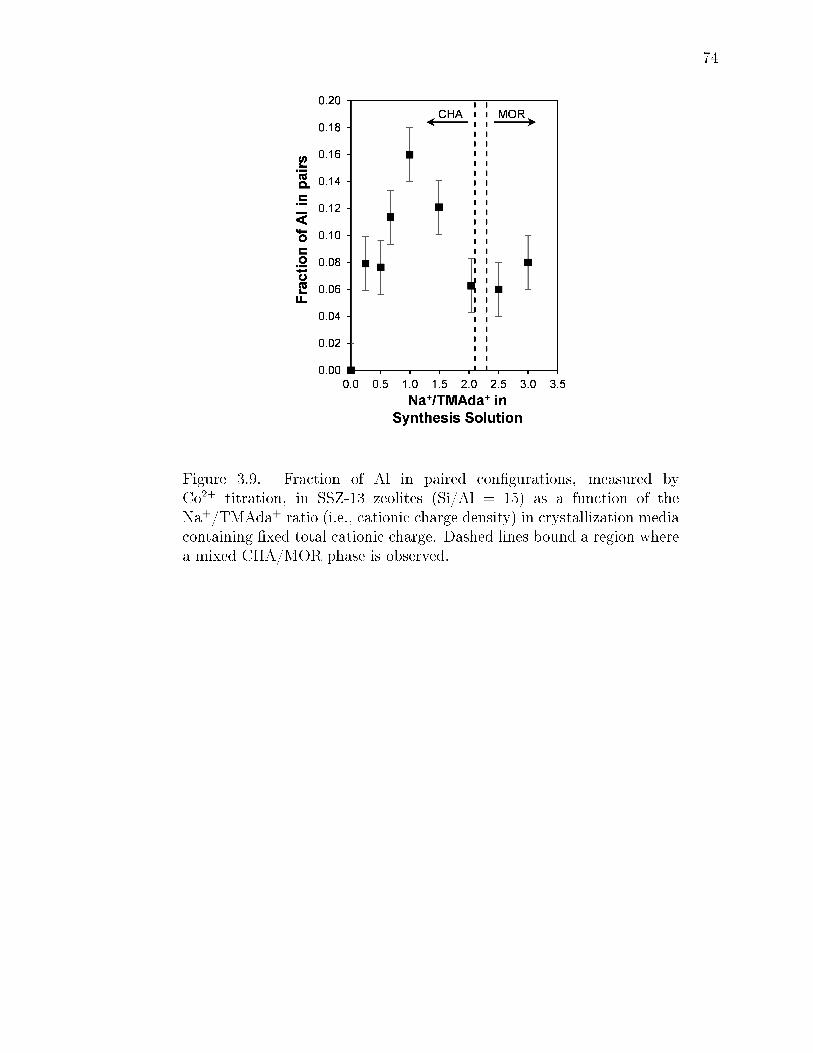
74
Figure 3.9. Fraction of Al in paired congurations, measured byCo2+ titration, in SSZ-13 zeolites (Si/Al = 15) as a function of theNa+/TMAda+ ratio (i.e., cationic charge density) in crystallization mediacontaining xed total cationic charge. Dashed lines bound a region wherea mixed CHA/MOR phase is observed.
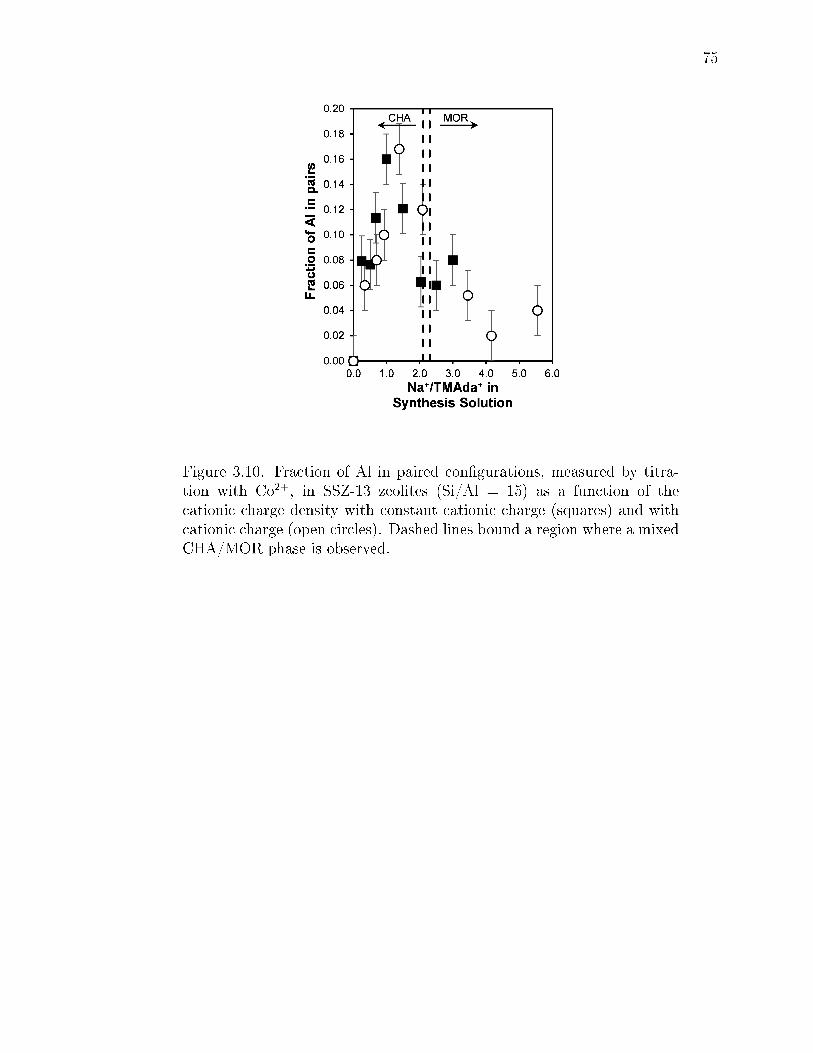
75
Figure 3.10. Fraction of Al in paired congurations, measured by titra-tion with Co2+, in SSZ-13 zeolites (Si/Al = 15) as a function of thecationic charge density with constant cationic charge (squares) and withcationic charge (open circles). Dashed lines bound a region where a mixedCHA/MOR phase is observed.

76
Figure 3.11. Fraction of Al in paired congurations, measured by Co2+
titration, in SSZ-13 zeolites (Si/Al = 15) as a function of the solidNa+ content for samples synthesized from solutions containing 0 <Na+/TMAda+ < 1 (solid circles) and 1 < Na+/TMAda+ < 2 (open cir-cles). The dashed line corresponds to a slope of two.
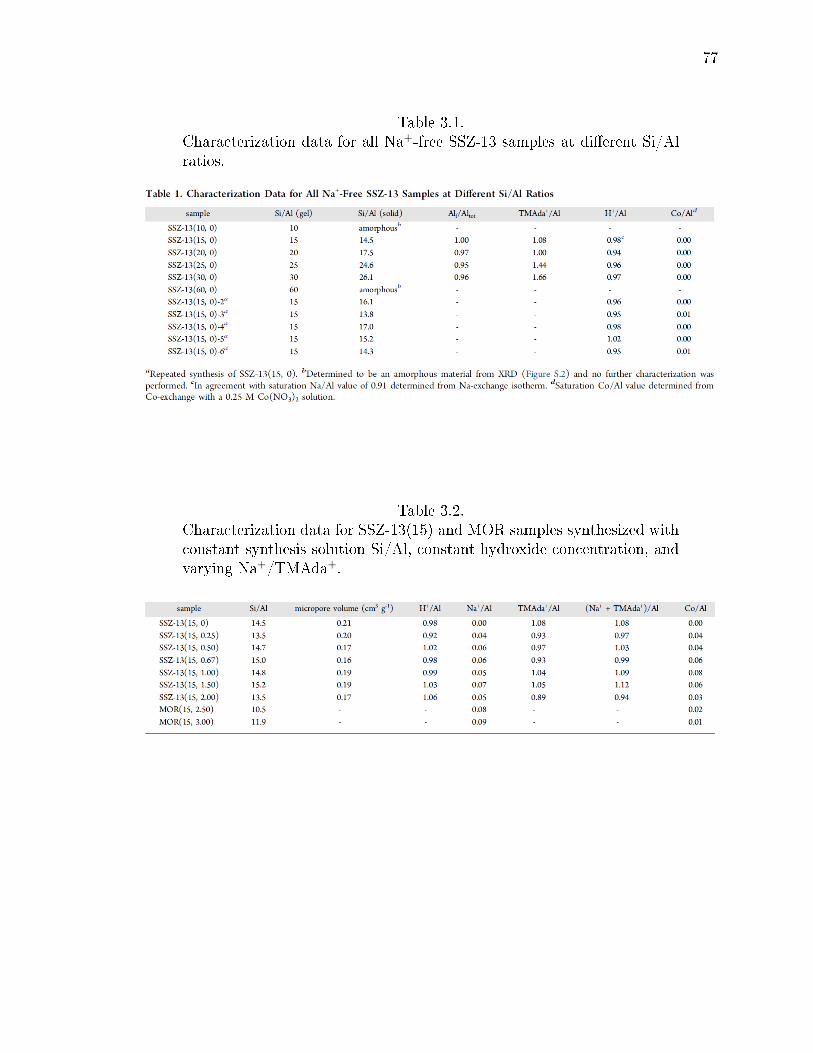
77
Table 3.1.Characterization data for all Na+-free SSZ-13 samples at dierent Si/Alratios.
Table 3.2.Characterization data for SSZ-13(15) and MOR samples synthesized withconstant synthesis solution Si/Al, constant hydroxide concentration, andvarying Na+/TMAda+.
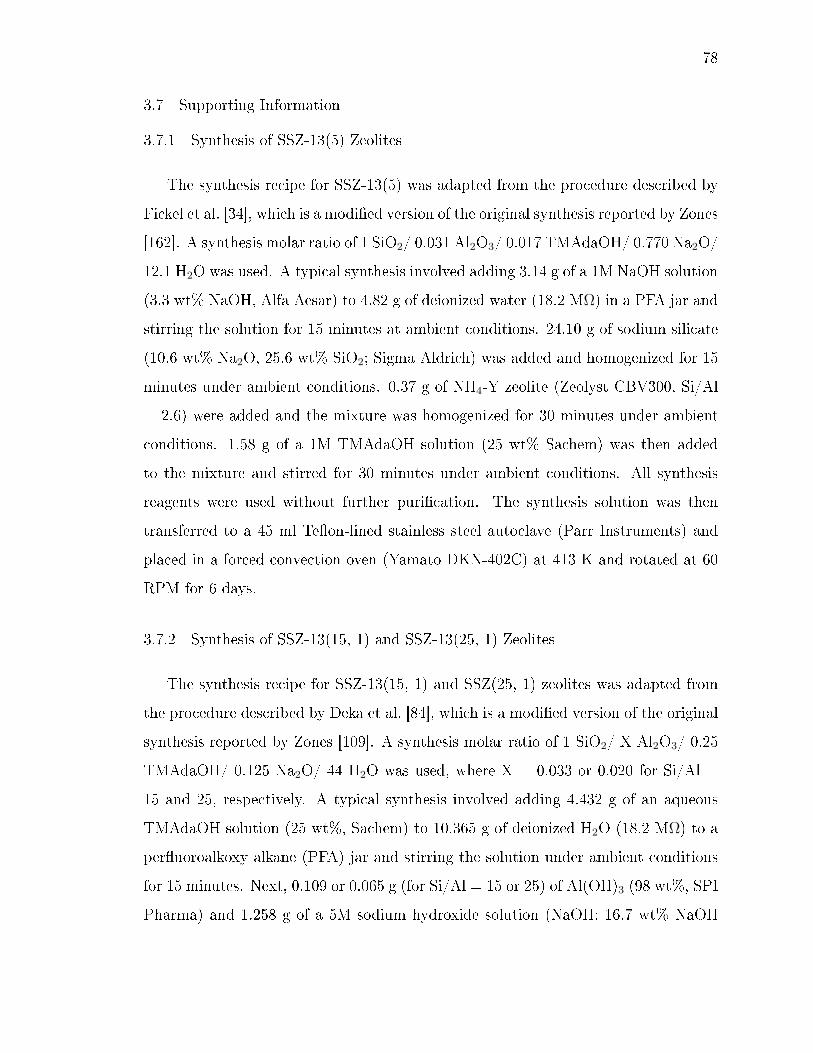
78
3.7 Supporting Information
3.7.1 Synthesis of SSZ-13(5) Zeolites
The synthesis recipe for SSZ-13(5) was adapted from the procedure described by
Fickel et al. [34], which is a modied version of the original synthesis reported by Zones
[162]. A synthesis molar ratio of 1 SiO2/ 0.031 Al2O3/ 0.017 TMAdaOH/ 0.770 Na2O/
12.1 H2O was used. A typical synthesis involved adding 3.14 g of a 1M NaOH solution
(3.3 wt% NaOH, Alfa Aesar) to 4.82 g of deionized water (18.2 MΩ) in a PFA jar and
stirring the solution for 15 minutes at ambient conditions. 24.10 g of sodium silicate
(10.6 wt% Na2O, 25.6 wt% SiO2; Sigma Aldrich) was added and homogenized for 15
minutes under ambient conditions. 0.37 g of NH4-Y zeolite (Zeolyst CBV300, Si/Al
= 2.6) were added and the mixture was homogenized for 30 minutes under ambient
conditions. 1.58 g of a 1M TMAdaOH solution (25 wt% Sachem) was then added
to the mixture and stirred for 30 minutes under ambient conditions. All synthesis
reagents were used without further purication. The synthesis solution was then
transferred to a 45 ml Teon-lined stainless steel autoclave (Parr Instruments) and
placed in a forced convection oven (Yamato DKN-402C) at 413 K and rotated at 60
RPM for 6 days.
3.7.2 Synthesis of SSZ-13(15, 1) and SSZ-13(25, 1) Zeolites
The synthesis recipe for SSZ-13(15, 1) and SSZ(25, 1) zeolites was adapted from
the procedure described by Deka et al. [84], which is a modied version of the original
synthesis reported by Zones [109]. A synthesis molar ratio of 1 SiO2/ X Al2O3/ 0.25
TMAdaOH/ 0.125 Na2O/ 44 H2O was used, where X = 0.033 or 0.020 for Si/Al =
15 and 25, respectively. A typical synthesis involved adding 4.432 g of an aqueous
TMAdaOH solution (25 wt%, Sachem) to 10.365 g of deionized H2O (18.2 MΩ) to a
peruoroalkoxy alkane (PFA) jar and stirring the solution under ambient conditions
for 15 minutes. Next, 0.109 or 0.065 g (for Si/Al = 15 or 25) of Al(OH)3 (98 wt%, SPI
Pharma) and 1.258 g of a 5M sodium hydroxide solution (NaOH: 16.7 wt% NaOH
79
in deionized water; NaOH pellets 98 wt%, Alfa Aesar) was added to the aqueous
TMAdaOH solution and the mixture was stirred under ambient conditions for 15
minutes to homogenize the contents. Finally, 3.150 g of colloidal silica (Ludox AS40,
40 wt% SiO2, Sigma Aldrich) was added to the mixture and stirred for 2 h under
ambient conditions. All synthesis reagents were used without further purication.
The synthesis solution was then transferred to a 45 ml Teon-lined stainless steel
autoclave (Parr Instruments) and placed in a forced convection oven (Yamato DKN-
402C) at 433 K and rotated at 40 RPM for 6 days.
3.7.3 Synthesis of Pure-silica Chabazite (Si-CHA).
Pure SiO2 chabazite was synthesized following the procedure reported by Díaz-
Cabañas et al. [170] using a synthesis solution molar ratio of 1 SiO2/ 0.5 TMAdaOH/
0.5 HF/ 3 H2O. In a typical synthesis 13 g of tetraethylorthosilicate (TEOS; 98 wt%,
Sigma Aldrich) were added to a PFA jar containing 25.849 g of a 1M TMAdaOH
solution (25 wt%, Sachem) and stirred under ambient conditions. Ethanol, formed
from the hydrolysis of TEOS, and excess water were then evaporated to reach the
target molar ratios by placing the TEOS and TMAdaOH solution under owing air
while stirring at ambient conditions. During the evaporation process, once the solu-
tion mass came within 5 g of the desired nal mass, an additional 10 g of water were
added to ensure complete hydrolysis of TEOS and to allow additional time to com-
pletely evaporate the ethanol. This rehydration process was performed twice during
the evaporation step. As the synthesis solution neared the desired H2O/SiO2 ratio of
3, the solution began to solidify and had to be stirred by hand for three additional
hours in order to complete the water evaporation process. Once the synthesis solution
had reached the desired H2O/SiO2 ratio, 1.275 g of concentrated hydrouoric acid
(HF; 48 wt%, Sigma Aldrich) was added dropwise to the synthesis and homogenized
for 15 minutes. Caution: when working with hydrouoric acid use appropri-
ate personal protective equipment, ventilation, and other safety measures.
Upon addition of HF to the solidied synthesis solution, the solution immediately
80
became a thick paste that became more solution-like under stirring. The solution
was then left to sit uncovered under ambient conditions for 30 minutes to allow for
any residual HF to evaporate before transferring the solution to a 45 ml Teon-lined
stainless steel autoclave (Parr Instruments) and heated in a forced convection oven
(Yamato DKN-402C) at 423 K under rotation at 40 RPM for 40 h. All synthesis
reagents were used without further purication.
3.7.4 Synthesis and Characterization of SSZ-13 Zeolites without Na+
For the synthesis of Na+-free SSZ-13 zeolites in hydroxide media, a molar ratio
of 1 SiO2/ X Al2O3/ 0.5 TMAdaOH/ 44 H2O was used, where X = 0.050, 0.033,
0.025, 0.02, 0.017, or 0.008 for Si/Al = 10, 15, 20, 25, 30 and 60, respectively. In
a typical synthesis 14.071 g of a TMAdaOH solution (25 wt% Sachem) were added
to 12.841 g of deionized water (18.2 MΩ) in a PFA jar and stirred for 15 minutes
under ambient conditions. Next 0.260, 0.173, 0.130, 0.104, 0.087, or 0.044 g (Si/Al
= 10, 15, 20, 25, 30, and 60, respectively) of Al(OH)3 (98 wt%, SPI Pharma) were
added to the TMAdaOH solution and the mixture was homogenized for 15 minutes
under ambient conditions. Then 5 g of colloidal silica (Ludox HS40, 40 wt%, Sigma
Aldrich) were added to the mixture and the contents were stirred for 2 h at ambient
conditions until a homogeneous solution was obtained. All synthesis reagents were
used without further purication. The synthesis solution was then transferred to a
45 ml Teon-lined stainless steel autoclave (Parr Instruments) and heated in a forced
convection oven (Yamato DKN-402C) at 433 K and rotated at 40 RPM for 6 days.
3.7.5 Synthesis of SSZ-13 Zeolites at Constant Na+/TMAda+ and Varied Si/Al Ra-tio
SSZ-13 zeolites were synthesized at a constant Na+/TMAda+ ratio of 2/3 and
with gel Si/Al ratios ranging from 10-200 in hydroxide media. A synthesis gel molar
ratio of 1 SiO2/ X Al2O3/ 0.3 TMAdaOH/ 0.2 NaOH/ 44 H2O was used, where X =
0.100, 0.050, 0.033, 0.020, 0.010, 0.005, and 0.0025, for Si/Al ratios of 5, 10, 15, 25,
81
50, 100, and 200, respectively. In a typical synthesis 8.443 g of a TMAdaOH solution
(25 wt% Sachem) were added to 15.698 g of deionized water (18.2 MΩ) in a PFA
jar and stirred for 15 minutes under ambient conditions. Next 0.519, 0.260, 0.173,
0.104, 0.052, 0.026, or 0.013 g (Si/Al = 5, 10, 15, 25, 50, 100, and 200, respectively)
of Al(OH)3 (98 wt%, SPI Pharma) were added to the TMAdaOH solution and the
mixture was homogenized for 15 minutes under ambient conditions. Then 5 g of
colloidal silica (Ludox HS40, 40 wt%, Sigma Aldrich) were added to the mixture and
the contents were stirred for 2 h at ambient conditions. All synthesis reagents were
used without further purication. The synthesis gel was then transferred to a 45
ml Teon-lined stainless steel autoclave (Parr Instruments) and heated in a forced
convection oven (Yamato DKN-402C) at 433 K and rotated at 40 RPM for 6 days.
3.7.6 Synthesis of SSZ-13 Zeolites at Si/Al = 15 and 25 at Constant (Na++TMAda-+)/Al with Varying Na+/TMAda+ Ratio
The synthesis of SSZ-13 zeolites in synthesis solutions with varying charge density,
but with constant total charge, was performed at a Si/Al = 15 and 25 at a constant
ratio of (Na++TMAda+)/Al = 7.5 while letting the Na+/TMAda+ ratio vary from 0
to 3. A synthesis solution molar ratio of 1 SiO2/ Y Al2O3/ X TMAdaOH/ (0.5 X)
NaOH/ 44 H2O was used, where X = 0.50, 0.40, 0.33, 0.30, 0.25, 0.20, 0.17, 0.14, and
0.125, for Na+/TMAda+ ratios of 0, 1/4, 1/2, 2/3, 1, 3/2, 2, 2.5, and 3, respectively,
and Y = 0.033 and 0.025 for Si/Al = 15 and 25, respectively. In a typical synthesis
14.071, 11.257, 9.381, 8.443, 7.036, 5.628, 4.690, 4.020, or 3.518 g (Na+/TMAda+ =
0, 1/4, 1/2, 2/3, 1, 3/2, 2, 2.5, and 3, respectively) of a TMAdaOH solution (25 wt%
Sachem) were added to 12.841, 14.269, 15.222, 15.698, 16.412, 17.127, 17.603, 17.943,
or 18.198 g (Na+/TMAda+ = 0, 1/4, 1/2, 2/3, 1, 3/2, 2, 2.5, and 3, respectively) of
deionized water (18.2 MΩ) in a PFA jar and stirred for 15 minutes under ambient
conditions. Next 0.173 or 0.104 g (Si/Al = 15 or 25, respectively) of Al(OH)3 (98
wt%, SPI Pharma) were added to the TMAdaOH solution and then 0, 0.815, 1.359,
1.630, 2.038, 2.446, 2.717, 2.911, or 3.057 g (Na+/TMAda+ = 0, 1/4, 1/2, 2/3, 1,

82
3/2, 2, 2.5, and 3, respectively) of a 5M sodium hydroxide solution (NaOH: 16.7 wt%
NaOH in deionized water; NaOH 98 wt% Alfa Aesar) were added and the mixture
was homogenized for 15 minutes under ambient conditions. Then 5 g of colloidal silica
(Ludox HS40, 40 wt%, Sigma Aldrich) were added to the mixture and the contents
were stirred for 2 h at ambient conditions. All synthesis reagents were used without
further purication. The synthesis solution was then transferred to a 45 ml Teon-
lined stainless steel autoclave (Parr Instruments) and heated in a forced convection
oven (Yamato DKN-402C) at 433 K and rotated at 40 RPM for 6 days.
3.7.7 Synthesis of SSZ-13 Zeolites at Si/Al = 15 with Varying (Na+ + TMAda +)/ Al and Varying Na+/TMAda+
Synthesis of SSZ-13 zeolites with varying total charge and charge density were
performed at a solution Si/Al ratio of 15 while varying the Na+/TMAda+ (charge
density) from 0 to 5.6 and (Na++TMAda+)/Al (total charge) from 5.4 to 7.1. A
synthesis solution molar ratio of 1 SiO2/ 0.033 Al2O3/ X TMAdaOH/ (0.5 X)
NaOH/ 44 H2O was used, where X = 0.50, 0.37, 0.29, 0.26, 0.21, 0.16, 0.11, 0.097,
and 0.076, for Na+/TMAda+ ratios of 0, 0.35, 0.70, 0.93, 1.38, 2.09, 3.45, 4.16, and
5.55, respectively. In a typical synthesis 8.443, 6.254, 4.966, 4.374, 3.547, 2.732, 1.897,
1.636, or 1.289 g (Na+/TMAda+ = 0, 0.35, 0.70, 0.93, 1.38, 2.09, 3.45, 4.16, and 5.55,
respectively) of a TMAdaOH solution (25 wt% Sachem) were added to 7.704, 8.816,
9.469, 9.770, 10.190, 10.603, 11.027, 11.160, or 11.336 g (Na+/TMAda+ = 0, 0.35,
0.70, 0.93, 1.38, 2.09, 3.45, 4.16, and 5.55, respectively) of deionized water (18.2 MΩ)
in a PFA jar and stirred for 15 minutes under ambient conditions. Next 0.104 g of
Al(OH)3 (98 wt%, SPI Pharma) were added to the TMAdaOH solution and then 0,
0.634, 1.007, 1.178, 1.418, 1.654, 1.896, 1.972, or 2.072 g (Na+/TMAda+ = 0, 0.35,
0.70, 0.93, 1.38, 2.09, 3.45, 4.16, and 5.55, respectively) of a 5M sodium hydroxide
solution (NaOH: 16.7 wt% NaOH in deionized water; NaOH 98 wt% Alfa Aesar) were
added and the mixture was homogenized for 15 minutes under ambient conditions.
Then 3 g of colloidal silica (Ludox HS40, 40 wt%, Sigma Aldrich) were added to the
83
mixture and the contents were stirred for 2 h at ambient conditions. All synthesis
reagents were used without further purication. The synthesis solution was then
transferred to a 23 ml Teon-lined stainless steel autoclave (Parr Instruments) and
heated in a forced convection oven (Yamato DKN-402C) at 433 K and rotated at 40
RPM for 6 days.
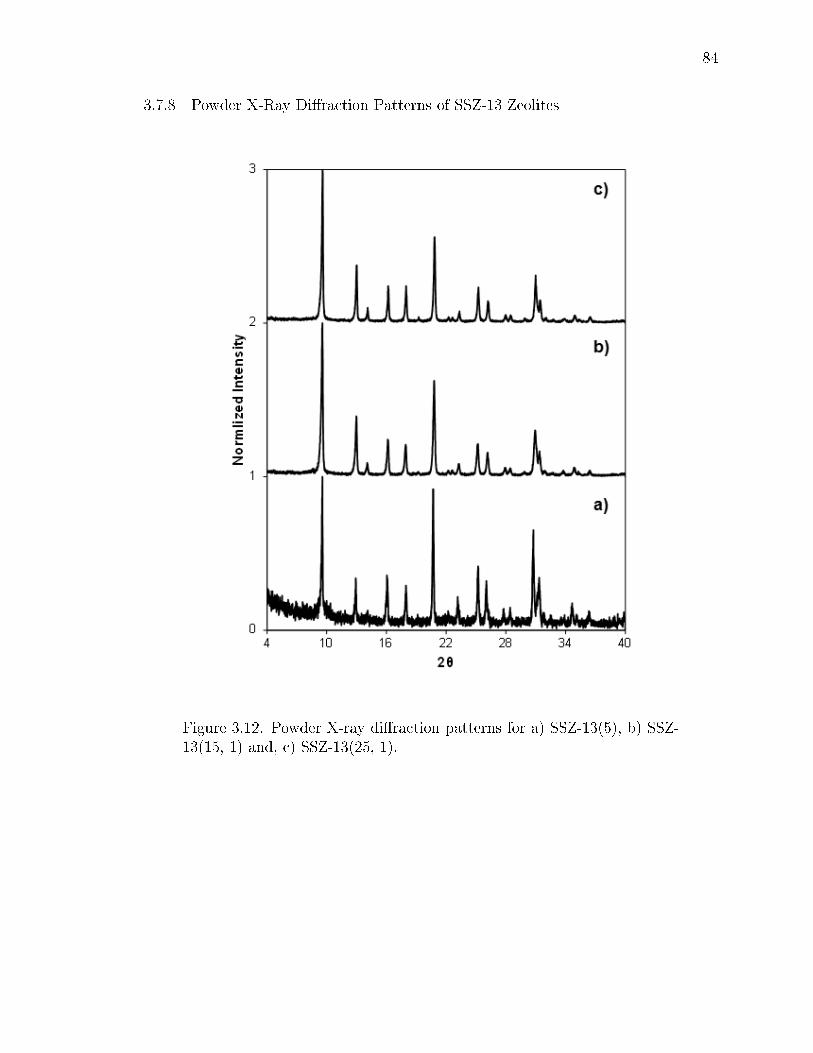
84
3.7.8 Powder X-Ray Diraction Patterns of SSZ-13 Zeolites
Figure 3.12. Powder X-ray diraction patterns for a) SSZ-13(5), b) SSZ-13(15, 1) and, c) SSZ-13(25, 1).
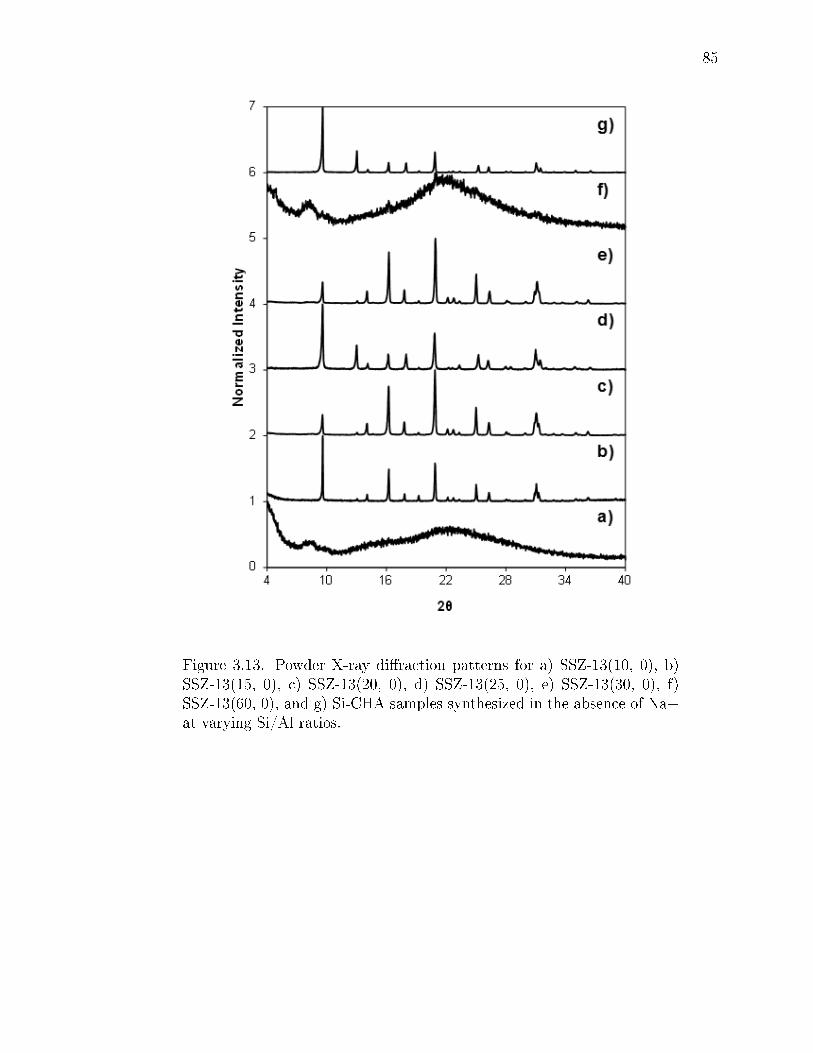
85
Figure 3.13. Powder X-ray diraction patterns for a) SSZ-13(10, 0), b)SSZ-13(15, 0), c) SSZ-13(20, 0), d) SSZ-13(25, 0), e) SSZ-13(30, 0), f)SSZ-13(60, 0), and g) Si-CHA samples synthesized in the absence of Na+at varying Si/Al ratios.
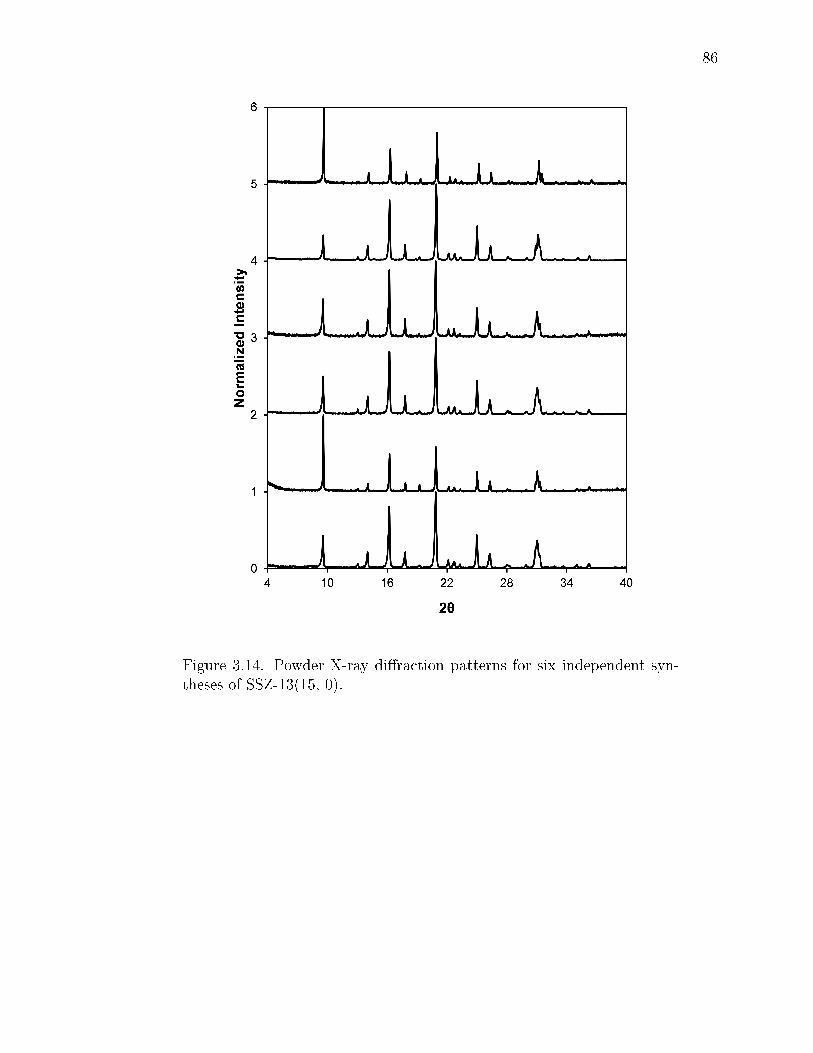
86
Figure 3.14. Powder X-ray diraction patterns for six independent syn-theses of SSZ-13(15, 0).
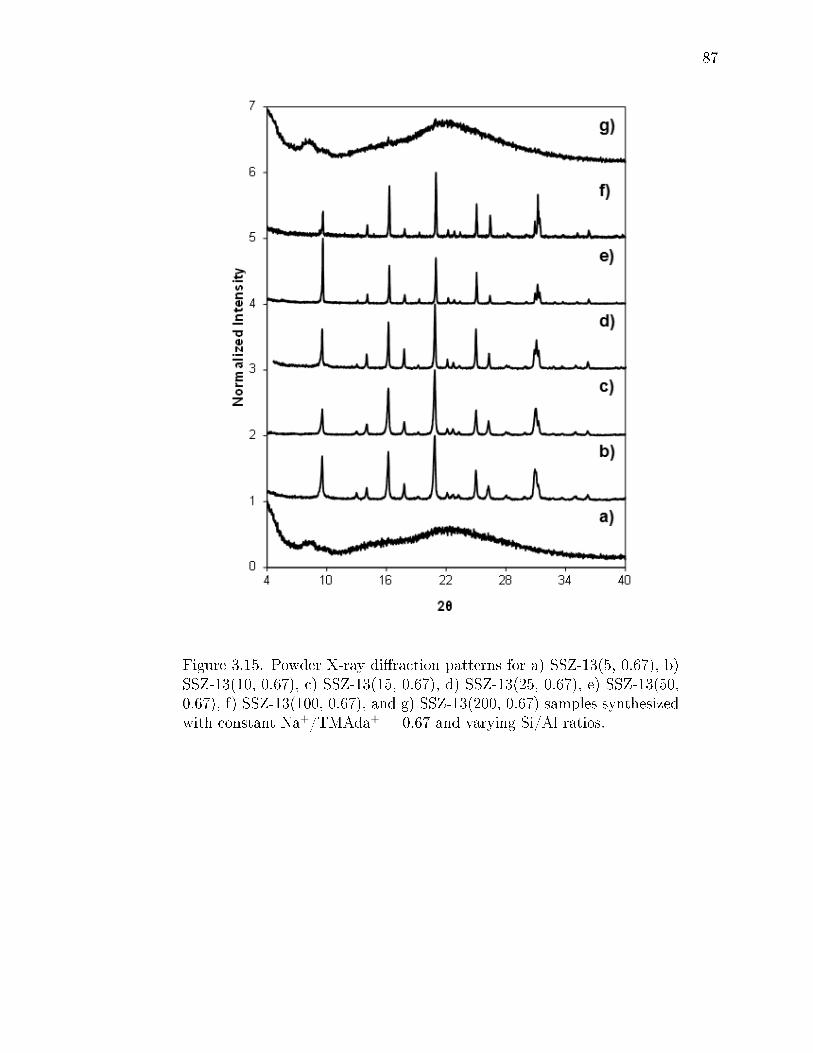
87
Figure 3.15. Powder X-ray diraction patterns for a) SSZ-13(5, 0.67), b)SSZ-13(10, 0.67), c) SSZ-13(15, 0.67), d) SSZ-13(25, 0.67), e) SSZ-13(50,0.67), f) SSZ-13(100, 0.67), and g) SSZ-13(200, 0.67) samples synthesizedwith constant Na+/TMAda+ = 0.67 and varying Si/Al ratios.
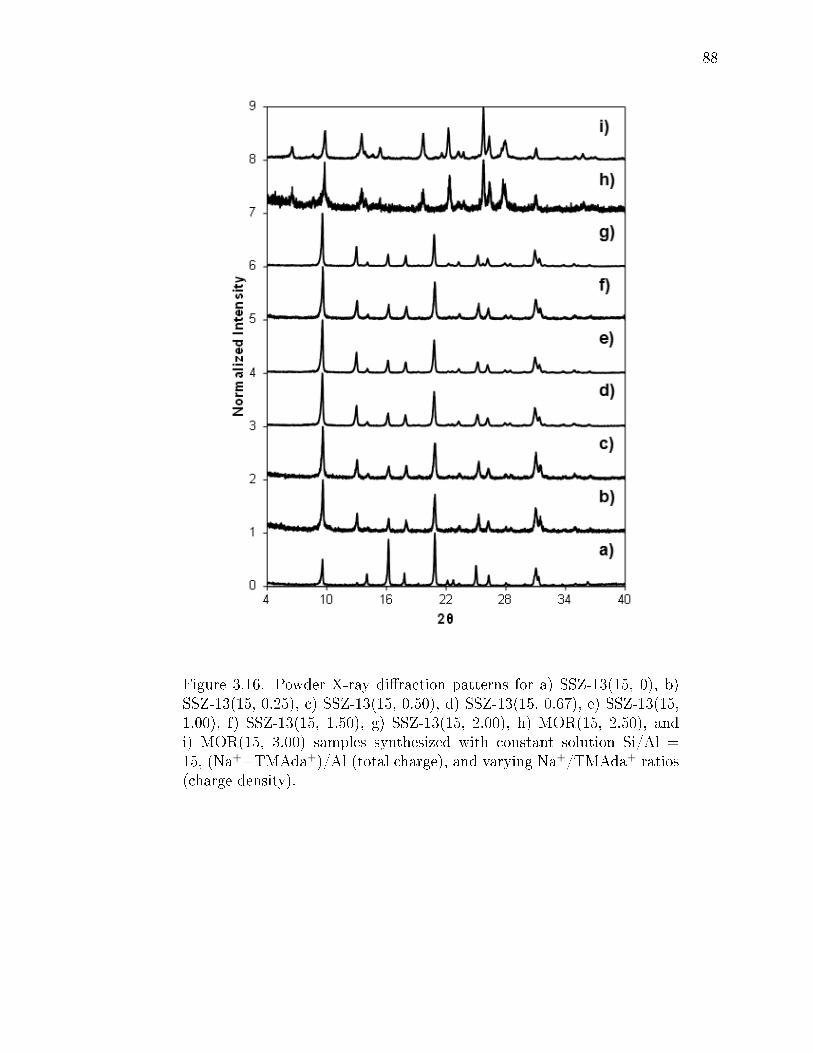
88
Figure 3.16. Powder X-ray diraction patterns for a) SSZ-13(15, 0), b)SSZ-13(15, 0.25), c) SSZ-13(15, 0.50), d) SSZ-13(15, 0.67), e) SSZ-13(15,1.00), f) SSZ-13(15, 1.50), g) SSZ-13(15, 2.00), h) MOR(15, 2.50), andi) MOR(15, 3.00) samples synthesized with constant solution Si/Al =15, (Na++TMAda+)/Al (total charge), and varying Na+/TMAda+ ratios(charge density).

89
Figure 3.17. Powder X-ray diraction patterns for a) SSZ-13(25, 0), b)SSZ-13(25, 0.50), c) SSZ-13(25, 0.67), d) SSZ-13(25, 1.00), and e) SSZ-13(25, 2.00) samples synthesized with constant solution Si/Al = 25 and(Na+ + TMAda+) / Al (total charge), and varying Na+/TMAda+ ratios(charge density).

90
Figure 3.18. Powder X-ray diraction patterns for a) SSZ-13(15, 0), b)SSZ-13(15, 0.35), c) SSZ-13(15, 0.70), d) SSZ-13(15, 0.93), e) SSZ-13(15,1.38), f) SSZ-13(15, 2.09), g) MOR(15, 3.45), h) MOR(15, 4.16, and i)MOR(15, 5.55) samples synthesized with constant solution Si/Al = 15and varying (Na++TMAda+)/Al (total charge) and Na+/TMAda+ ratios(charge density).
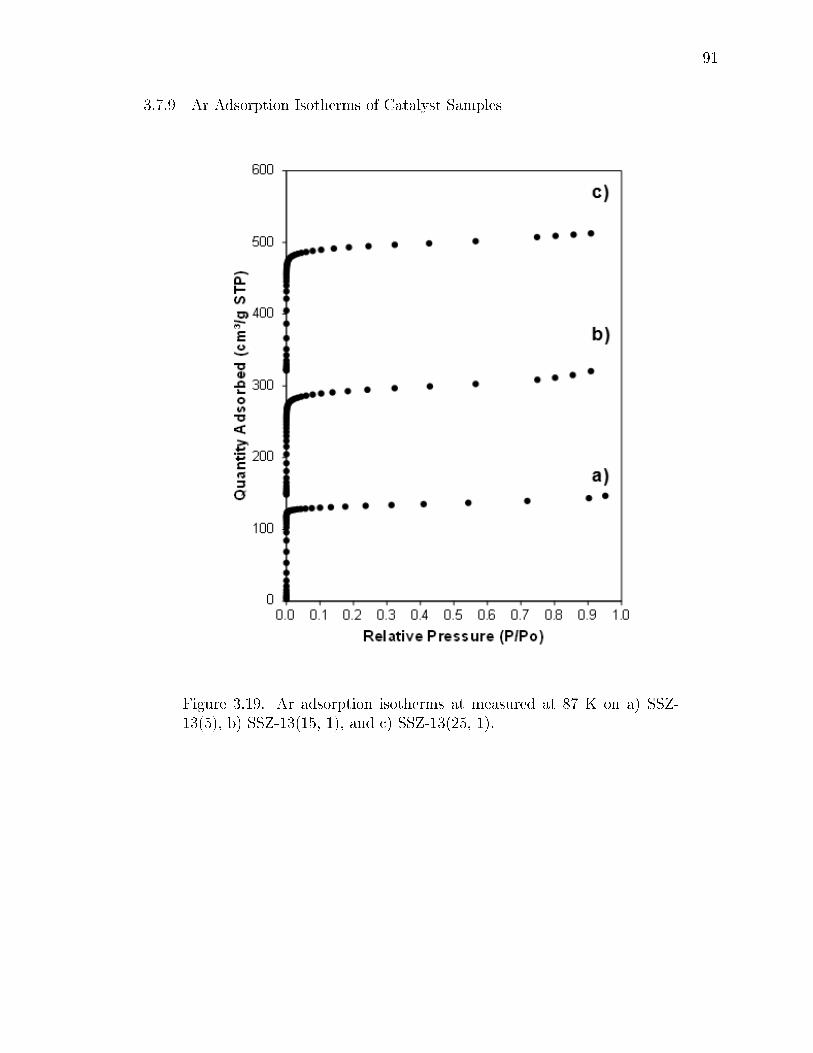
91
3.7.9 Ar Adsorption Isotherms of Catalyst Samples
Figure 3.19. Ar adsorption isotherms at measured at 87 K on a) SSZ-13(5), b) SSZ-13(15, 1), and c) SSZ-13(25, 1).

92
Figure 3.20. Ar adsorption isotherms at measured at 87 K on a) SSZ-13(15, 0), b) SSZ-13(20, 0), c) SSZ-13(25, 0), d) SSZ-13(30, 0), and e)Si-CHA.
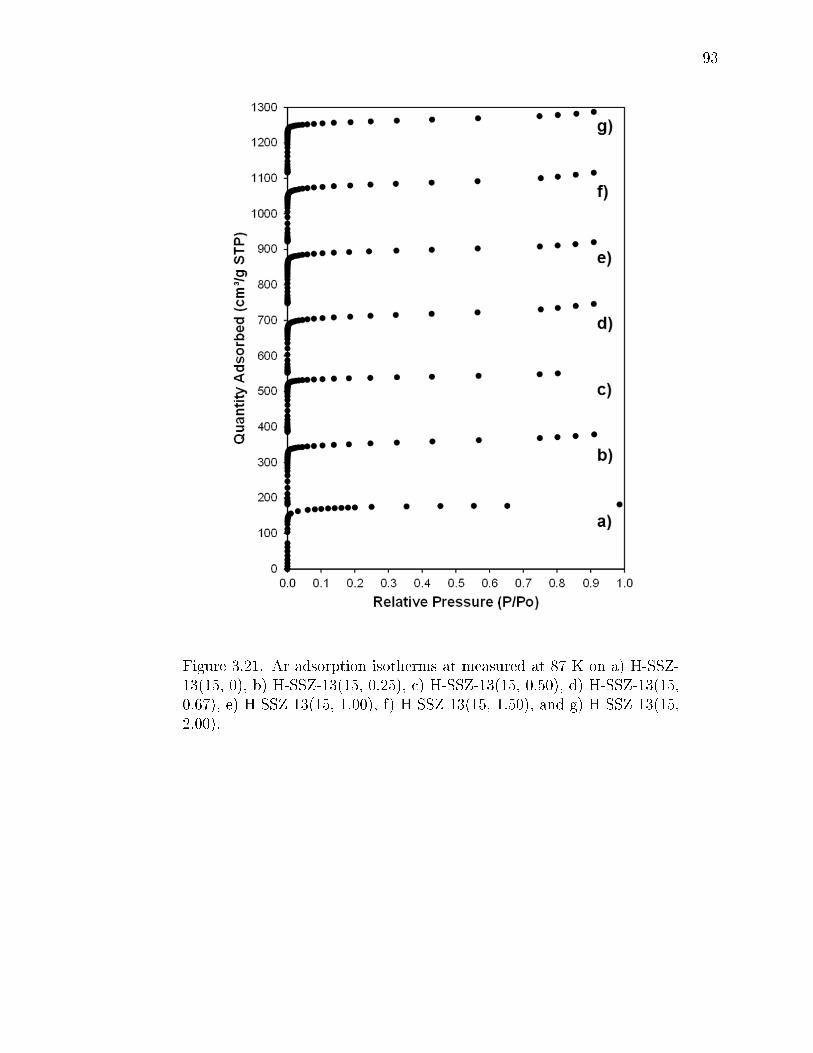
93
Figure 3.21. Ar adsorption isotherms at measured at 87 K on a) H-SSZ-13(15, 0), b) H-SSZ-13(15, 0.25), c) H-SSZ-13(15, 0.50), d) H-SSZ-13(15,0.67), e) H-SSZ-13(15, 1.00), f) H-SSZ-13(15, 1.50), and g) H-SSZ-13(15,2.00).
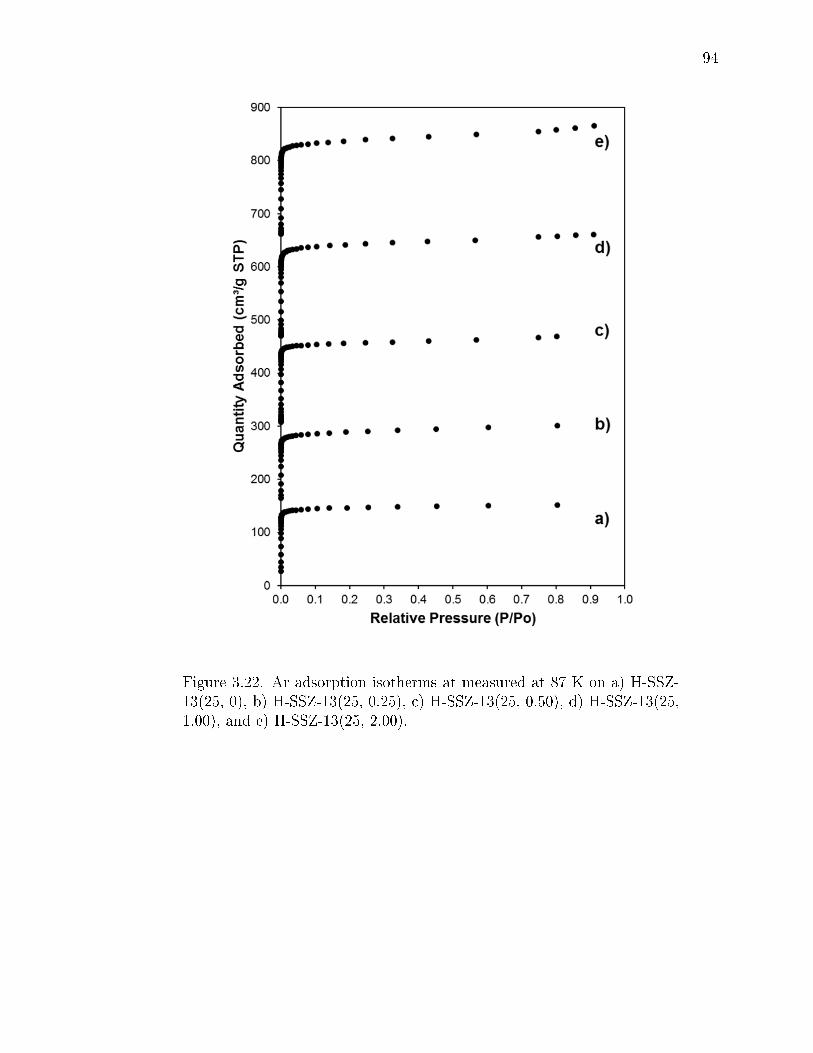
94
Figure 3.22. Ar adsorption isotherms at measured at 87 K on a) H-SSZ-13(25, 0), b) H-SSZ-13(25, 0.25), c) H-SSZ-13(25, 0.50), d) H-SSZ-13(25,1.00), and e) H-SSZ-13(25, 2.00).

95
3.7.10 Thermogravimetric Analysis (TGA) to Measure the Organic Content of As-Synthesized Zeolites
Table 3.3.Calculation of the number of TMAda+ per cage for SSZ-13(X,0) and SSZ-13(15,X) with maintaining a constant (Na++TMAda+)/Al ratio.
3.7.11 27Al Magic Angle Spinning Nuclear Magnetic Resonance (27Al MAS NMR)
The 27Al MAS NMR spectra for SSZ-13 samples synthesized without Na+ are
shown in Figure 3.23 and those synthesized at constant Si/Al = 15, (Na++TMAda+)-
/Al, and varying Na+/TMAda+ are shown in Figure 3.24. Tetrahedrally-coordinated
Al atoms were characterized by a resonance centered around 60 ppm. There was
no shoulder present at about 48 ppm, representative of pentacoordinated Al, and
a minimal (0-5%) amount of octahedral Al present at about 0 ppm [118, 138, 139].
Spectra were recorded with dierent sample masses so a quantitative comparison of
the line intensities between dierent samples is not possible because the intensity is
a function of the total Al content in the rotor, therefore the intensity of each H-SSZ-
13 spectra was normalized by the maximum intensity in each spectrum to allow for
qualitative comparison of the dierent H-SSZ-13 samples.

96
Figure 3.23. 27Al MAS NMR spectra for a) H-SSZ-13(15, 0), b) H-SSZ-13(20, 0), c) H-SSZ-13(25, 0), and d) H-SSZ-13(30, 0).
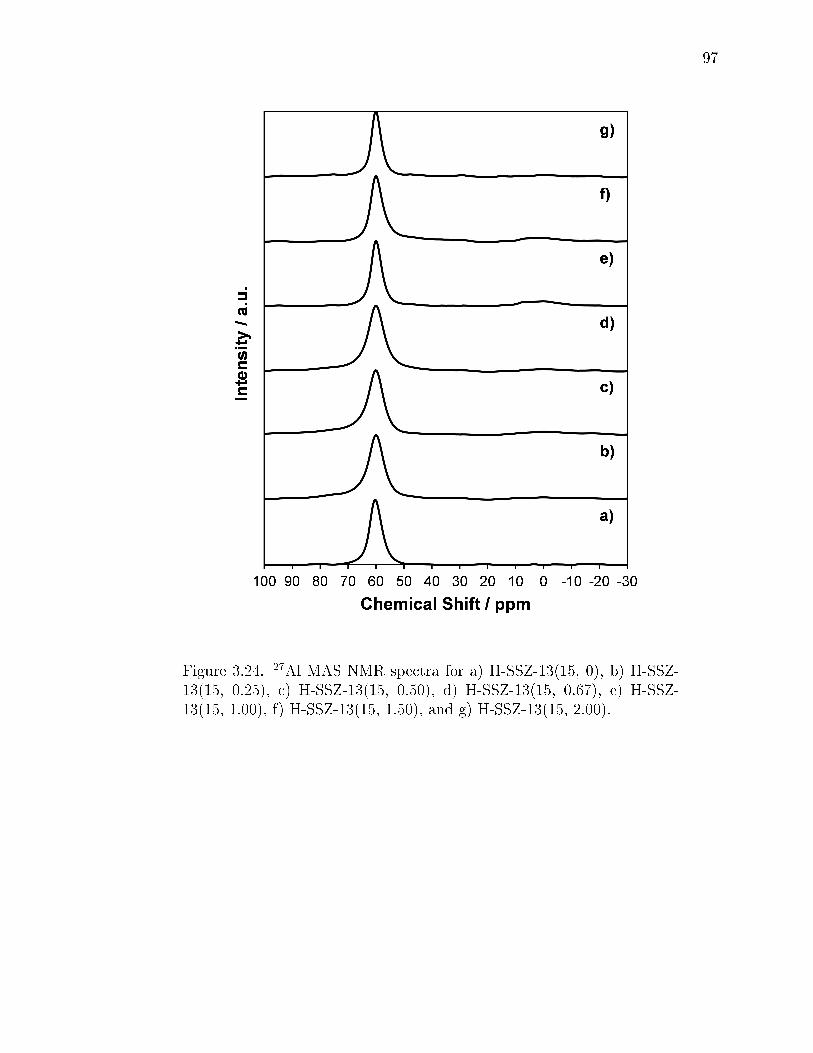
97
Figure 3.24. 27Al MAS NMR spectra for a) H-SSZ-13(15, 0), b) H-SSZ-13(15, 0.25), c) H-SSZ-13(15, 0.50), d) H-SSZ-13(15, 0.67), e) H-SSZ-13(15, 1.00), f) H-SSZ-13(15, 1.50), and g) H-SSZ-13(15, 2.00).
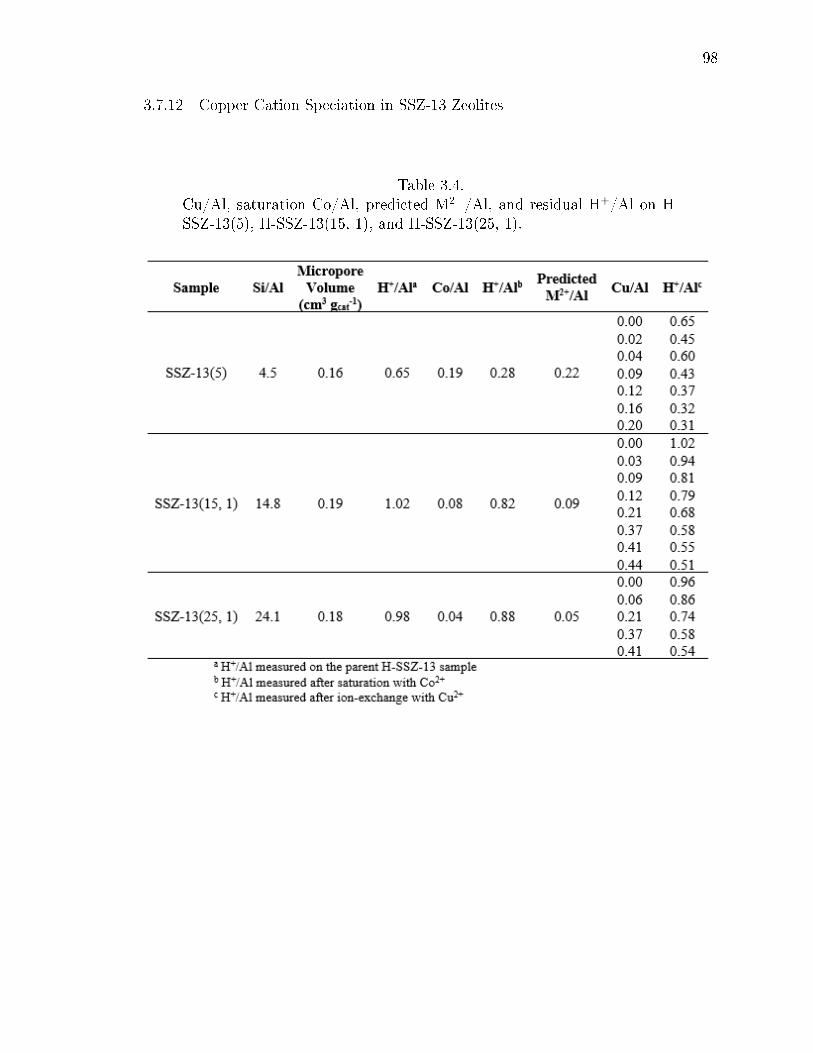
98
3.7.12 Copper Cation Speciation in SSZ-13 Zeolites
Table 3.4.Cu/Al, saturation Co/Al, predicted M2+/Al, and residual H+/Al on H-SSZ-13(5), H-SSZ-13(15, 1), and H-SSZ-13(25, 1).

99
Figure 3.25. Number of residual H+ sites, normalized to the parent H+/Alfor each sample, after Cu2+ exchange (circles) as a function of the Cu/Alratio, after Co2+ saturation (squares) on H-SSZ-13(5) (black), H-SSZ-13(15, 1) (dark grey), and H-SSZ-13(25, 1) (grey). Dashed lines indicatepredictions from statistical calculations of random Al distributions and thesequential exchange of Cu2+ at paired Al sites (2 Al in 6-MR) followed byexchange of [CuOH]+ at isolated Al sites.
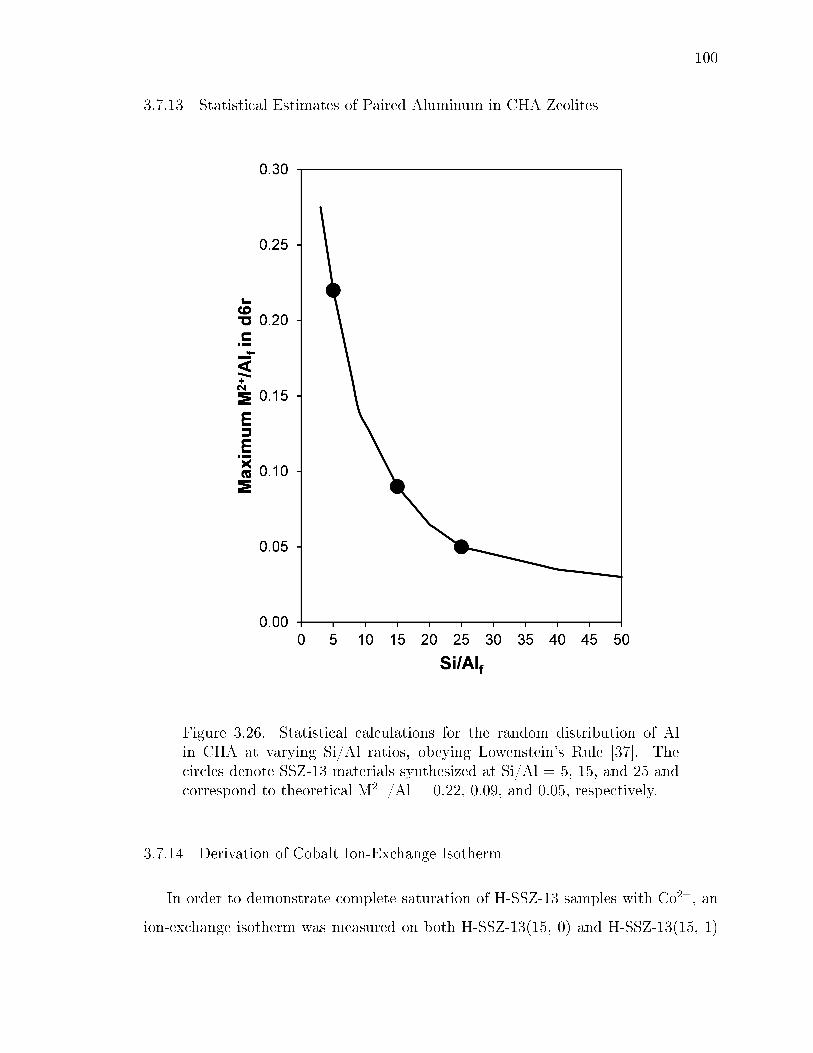
100
3.7.13 Statistical Estimates of Paired Aluminum in CHA Zeolites
Figure 3.26. Statistical calculations for the random distribution of Alin CHA at varying Si/Al ratios, obeying Lowenstein's Rule [37]. Thecircles denote SSZ-13 materials synthesized at Si/Al = 5, 15, and 25 andcorrespond to theoretical M2+/Al = 0.22, 0.09, and 0.05, respectively.
3.7.14 Derivation of Cobalt Ion-Exchange Isotherm
In order to demonstrate complete saturation of H-SSZ-13 samples with Co2+, an
ion-exchange isotherm was measured on both H-SSZ-13(15, 0) and H-SSZ-13(15, 1)

101
using Co(NO3)2 molarities ranging from 0.005-0.5 M and the procedure described
previously in the main text. The Langmuirian ion-exchange isotherm was derived
by rst assuming that the total Al atoms on a given sample (Altot) are equal to the
number of Al atoms that cannot exchange a cation (Alnon,exch) and the number of Al
atoms that can be ion-exchanged (Alexch):
Altot = Alnon,exch + Alexch (3.1)
The number of Alexch atoms is equal to the sum of the number of isolated Al sites,
which can exchange a monovalent cation (Alisotot), and twice the number of paired
Al sites, which can exchange a divalent cation (Alpairtot):
Alexch = Alisotot + 2Alpair
tot (3.2)
A mole balance on each of the Alisotot and Alpairtot terms describes the types of cations
they can exchange:
Alisotot = Aliso
H+
(3.3)
Alpairtot = Alpair
H+,H+
+ AlpairCo2+ (3.4)
where AlisoH+are isolated Al sites charge-balanced by a single H+, AlpairH
+,H+are
paired Al sites charge-balanced by two H+ sites, and AlpairCo2+
are paired Al sites
charge-balanced by a Co2+ ion. In this derivation, isolated Co2+ cations are assumed
to be the only Co species present and can only exchanged at a paired Al site, while
H+ are the only monovalent cations present and can exchange at both isolated and
paired Al sites. Substituting Eq. 3.2-3.4 into Eq. 3.1 results in a site balance equation
relating Altot to the number of Al sites occupied by dierent cations:
Altot = Alnon,exch + AlisoH+
+ 2(AlpairH+,H+
+ AlpairCo2+) (3.5)
The exchange of aqueous Co2+ ions Co(aq)2+ onto paired Al sites occupied by two
protons (AlpairH+,H+
) to form aqueous H+ (H(aq)+) and paired Al sites occupied by
Co2+ (AlpairCo2+
) is given by the following equilibrium reaction:
Co(aq)2+ + Alpair
H+,H+ K←→ 2H(aq)+ + Alpair
Co2+ (3.6)

102
where K is the equilibrium constant and is dened in terms of the following concen-
trations as:
K =[H(aq)
+]2[AlpairCo2+ ]
[Co(aq)2+][AlpairH+,H+
](
1
C0) (3.7)
where C0 is the standard state reference concentration of 1 M.
Dividing Eq. 3.5 by Altot yields a site balance equation expressed in terms of the
fractional coverages (θ) for each species:
1 =Alnon,exchAltot
+ θisoH+
+ 2(θpairH+,H+
+ θpairCo2+) (3.8)
where θisoH+is the coverage of AlisoH
+species, θpairH
+,H+is the coverage of AlpairH
+,H+
species, and θpairCo2+
is the coverage of AlpairCo2+
and each coverage term is dened
as follows:
θisoH+
=Aliso
H+
Altot(3.9)
θpairH+,H+
=Alpair
H+,H+
Altot(3.10)
θpairCo2+ =
AlpairCo2+
Altot(3.11)
Dividing Eq. 3.1 by Altot also results in an expression for the fraction of Alexch (AlexchAltot
)
in terms of the fraction of Alnon,exch (Alnon,exchAltot
):
AlexchAltot
= 1− Alnon,exchAltot
(3.12)
Substituting Eq. 3.12 into Eq. 3.8 results in the following equation that describes
the AlexchAltot
in terms of the fractional coverages of each species:
AlexchAltot
= θisoH+
+ 2(θpairH+,H+
+ θpairCo2+) (3.13)
where 2(θpairH+,H+
+ θpairCo2+) is equal to the fraction of Alpair present (
AlpairAltot
).
The equilibrium constant, K (Eq. 3.7), can be rewritten in terms of coverages to
derive an expression for θpairH+,H+
:
θpairH+,H+
=[H(aq)
+]2θpairCo2+
K[Co(aq)2+](3.14)
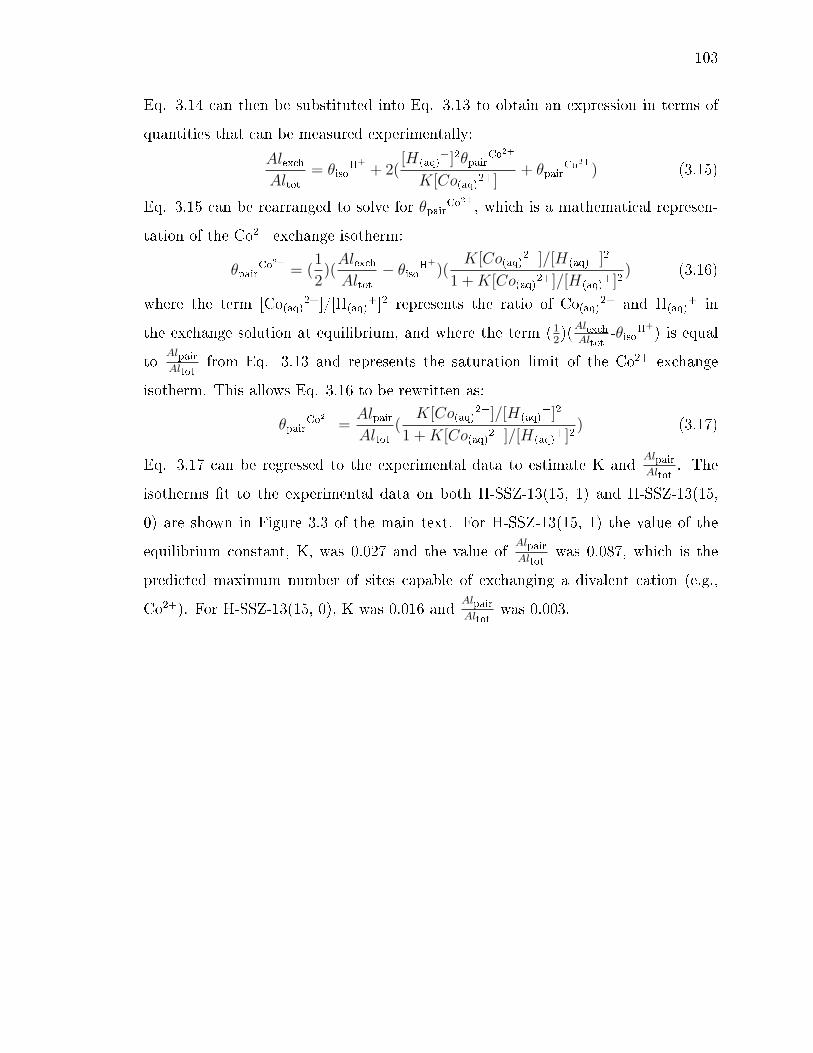
103
Eq. 3.14 can then be substituted into Eq. 3.13 to obtain an expression in terms of
quantities that can be measured experimentally:
AlexchAltot
= θisoH+
+ 2([H(aq)
+]2θpairCo2+
K[Co(aq)2+]+ θpair
Co2+) (3.15)
Eq. 3.15 can be rearranged to solve for θpairCo2+
, which is a mathematical represen-
tation of the Co2+ exchange isotherm:
θpairCo2+ = (
1
2)(AlexchAltot
− θisoH+
)(K[Co(aq)
2+]/[H(aq)+]2
1 +K[Co(aq)2+]/[H(aq)+]2
) (3.16)
where the term [Co(aq)2+]/[H(aq)+]2 represents the ratio of Co(aq)2+ and H(aq)
+ in
the exchange solution at equilibrium, and where the term (12)(Alexch
Altot-θisoH
+) is equal
toAlpairAltot
from Eq. 3.13 and represents the saturation limit of the Co2+ exchange
isotherm. This allows Eq. 3.16 to be rewritten as:
θpairCo2+ =
AlpairAltot
(K[Co(aq)
2+]/[H(aq)+]2
1 +K[Co(aq)2+]/[H(aq)+]2
) (3.17)
Eq. 3.17 can be regressed to the experimental data to estimate K andAlpairAltot
. The
isotherms t to the experimental data on both H-SSZ-13(15, 1) and H-SSZ-13(15,
0) are shown in Figure 3.3 of the main text. For H-SSZ-13(15, 1) the value of the
equilibrium constant, K, was 0.027 and the value ofAlpairAltot
was 0.087, which is the
predicted maximum number of sites capable of exchanging a divalent cation (e.g.,
Co2+). For H-SSZ-13(15, 0), K was 0.016 andAlpairAltot
was 0.003.

104
3.7.15 UV-Vis Spectroscopy of Co-SSZ-13(15, 1)
Figure 3.27. Ambient UV-Vis spectra of Co-SSZ-13(15, 1) with Co/Alvalues of 0.021 (faint grey trace), 0.022 (light grey trace), 0.047 (greytrace), 0.08 (dark grey trace), and 0.084 (black trace).
3.7.16 Sodium Cation Exchange Procedure and Derivation of Ion-Exchange Isoth-erm
A Langmuirian isotherm model for Na+ exchange was derived starting from Eq.
3.1, but using only a single adsorption site to describe the Alexch since a monovalent
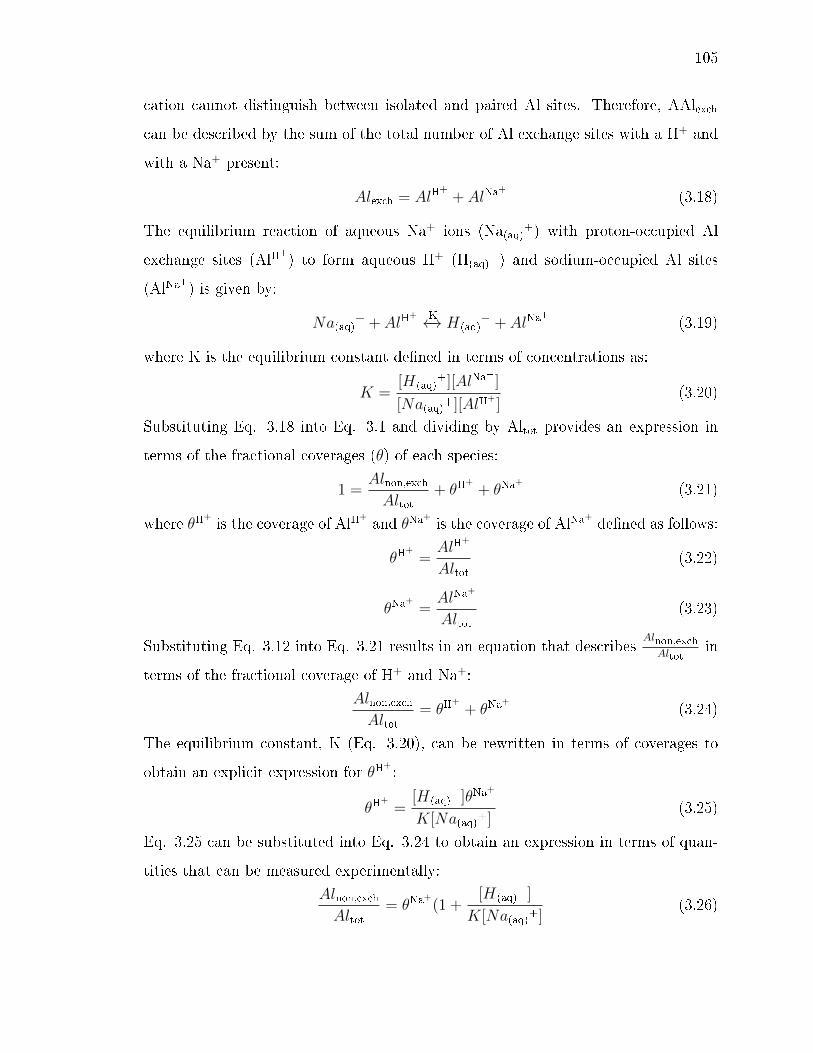
105
cation cannot distinguish between isolated and paired Al sites. Therefore, AAlexch
can be described by the sum of the total number of Al exchange sites with a H+ and
with a Na+ present:
Alexch = AlH+
+ AlNa+
(3.18)
The equilibrium reaction of aqueous Na+ ions (Na(aq)+) with proton-occupied Al
exchange sites (AlH+
) to form aqueous H+ (H(aq)+) and sodium-occupied Al sites
(AlNa+
) is given by:
Na(aq)+ + AlH
+ K←→ H(aq)+ + AlNa
+
(3.19)
where K is the equilibrium constant dened in terms of concentrations as:
K =[H(aq)
+][AlNa+
]
[Na(aq)+][AlH+
](3.20)
Substituting Eq. 3.18 into Eq. 3.1 and dividing by Altot provides an expression in
terms of the fractional coverages (θ) of each species:
1 =Alnon,exchAltot
+ θH+
+ θNa+
(3.21)
where θH+is the coverage of AlH
+and θNa
+is the coverage of AlNa
+dened as follows:
θH+
=AlH
+
Altot(3.22)
θNa+
=AlNa
+
Altot(3.23)
Substituting Eq. 3.12 into Eq. 3.21 results in an equation that describesAlnon,exchAltot
in
terms of the fractional coverage of H+ and Na+:
Alnon,exchAltot
= θH+
+ θNa+
(3.24)
The equilibrium constant, K (Eq. 3.20), can be rewritten in terms of coverages to
obtain an explicit expression for θH+:
θH+
=[H(aq)
+]θNa+
K[Na(aq)+](3.25)
Eq. 3.25 can be substituted into Eq. 3.24 to obtain an expression in terms of quan-
tities that can be measured experimentally:
Alnon,exchAltot
= θNa+
(1 +[H(aq)
+]
K[Na(aq)+](3.26)
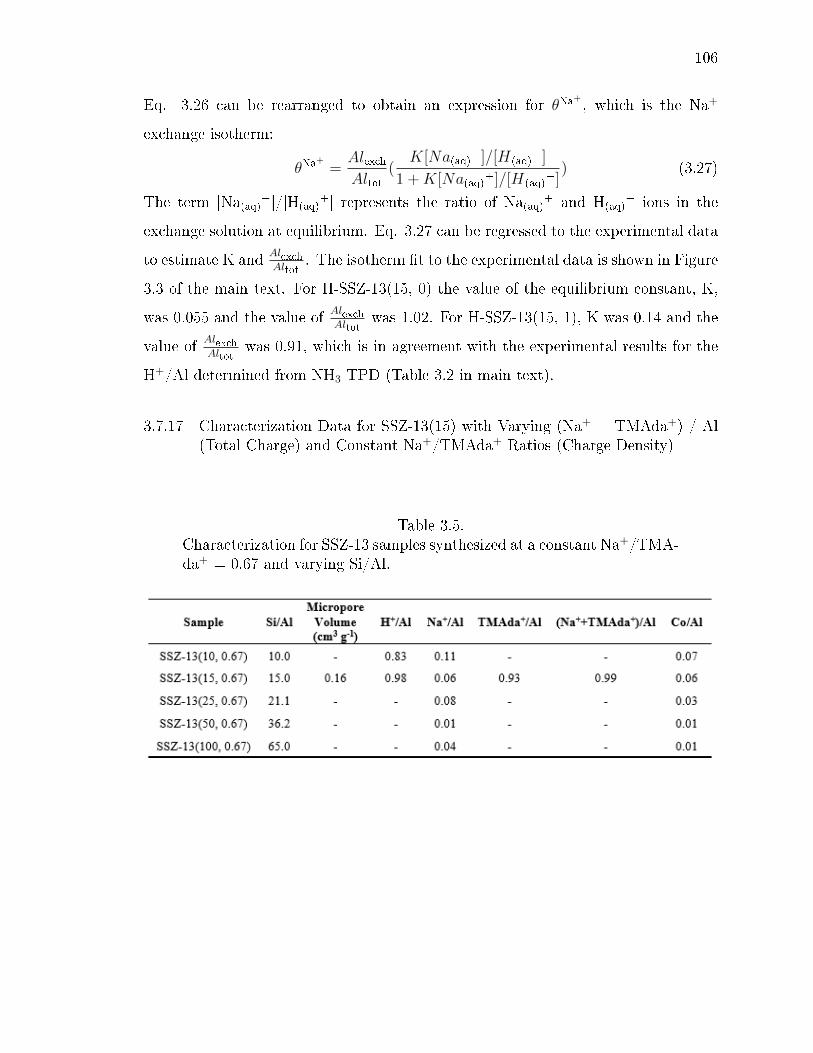
106
Eq. 3.26 can be rearranged to obtain an expression for θNa+, which is the Na+
exchange isotherm:
θNa+
=AlexchAltot
(K[Na(aq)
+]/[H(aq)+]
1 +K[Na(aq)+]/[H(aq)+]
) (3.27)
The term [Na(aq)+]/[H(aq)+] represents the ratio of Na(aq)+ and H(aq)
+ ions in the
exchange solution at equilibrium. Eq. 3.27 can be regressed to the experimental data
to estimate K and AlexchAltot
. The isotherm t to the experimental data is shown in Figure
3.3 of the main text. For H-SSZ-13(15, 0) the value of the equilibrium constant, K,
was 0.055 and the value of AlexchAltot
was 1.02. For H-SSZ-13(15, 1), K was 0.14 and the
value of AlexchAltot
was 0.91, which is in agreement with the experimental results for the
H+/Al determined from NH3 TPD (Table 3.2 in main text).
3.7.17 Characterization Data for SSZ-13(15) with Varying (Na+ + TMAda+) / Al(Total Charge) and Constant Na+/TMAda+ Ratios (Charge Density)
Table 3.5.Characterization for SSZ-13 samples synthesized at a constant Na+/TMA-da+ = 0.67 and varying Si/Al.
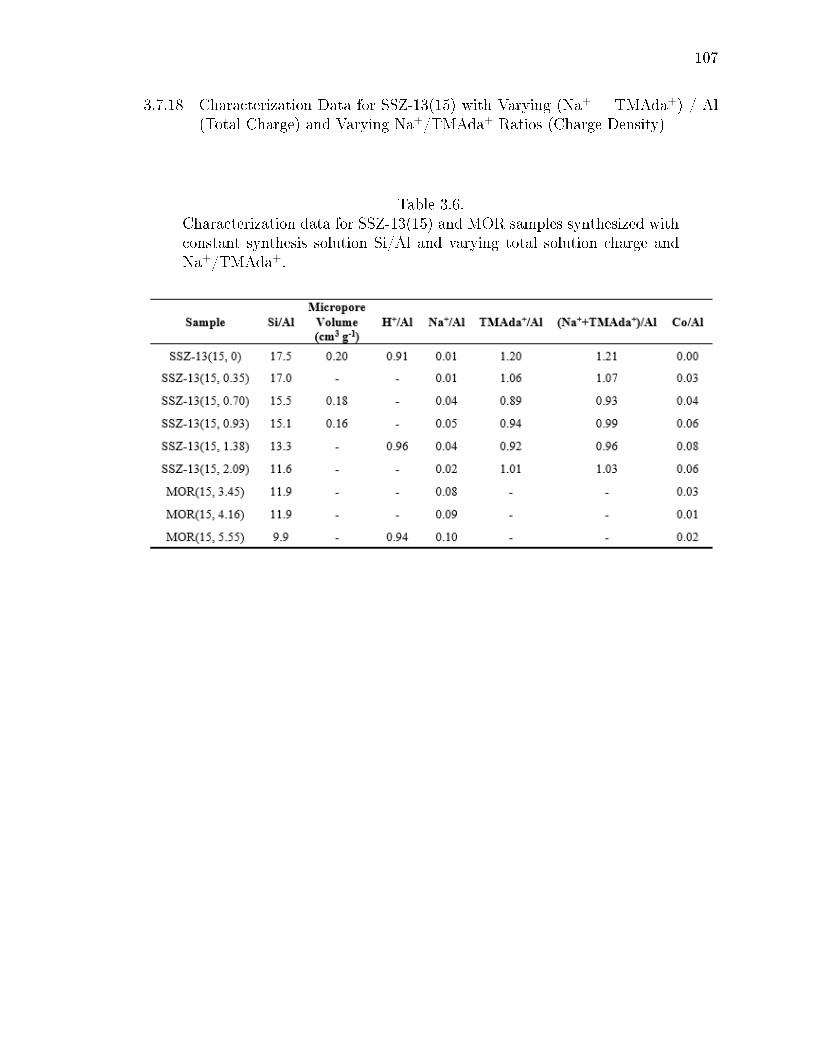
107
3.7.18 Characterization Data for SSZ-13(15) with Varying (Na+ + TMAda+) / Al(Total Charge) and Varying Na+/TMAda+ Ratios (Charge Density)
Table 3.6.Characterization data for SSZ-13(15) and MOR samples synthesized withconstant synthesis solution Si/Al and varying total solution charge andNa+/TMAda+.

108
Figure 3.28. Si/Al ratio as a function of Na+/TMAda+ ratio for SSZ-13(15) samples synthesized with (squares) and without (circles) a constant(Na+ + TMAda+) / Al ratio. The dashed line is a linear t to the samplessynthesized without constant (Na++TMAda+)/Al (circles).

109
3.7.19 Characterization Data for SSZ-13(25) with Constant (Na+ + TMAda+) / Al(Total Charge) and Varying Na+/TMAda+ Ratios (Charge Density)
Table 3.7.Characterization data for SSZ-13(15) and MOR samples synthesized withconstant synthesis solution Si/Al and varying total solution charge andNa+/TMAda+.

110
Figure 3.29. Fraction of paired Al atoms measured by titration with Co2+
as a function of the synthesis solution charge density on SSZ-13(25) syn-thesized with constant total solution charge.
111
4. COOPERATION AND COMPETITION BETWEEN ORGANIC AND
INORGANIC STRUCTURE DIRECTING AGENTS INFLUENCES THE
ALUMINUM ARRANGEMENT IN CHA ZEOLITES
4.1 Introduction
Zeolite materials provide a convenient platform for tailored materials design ef-
forts because of their well-dened crystalline frameworks, which facilitate connecting
data and insights from experimental and theoretical assessments of catalyst structure
and function [201]. Monte-Carlo simulations of silica polymerization have shown that
both the volume occupied by organic structure-directing agents (SDA) and the attrac-
tive forces between the SDA and lattice oxygen atoms are important for stabilizing
microporous voids during crystallization from monomeric silica precursors [202204].
In silico design of SDAs have generated libraries of dierent organic molecules that
could lead to more ecient synthesis routes to prepare known zeolites, or the dis-
covery of new synthetic zeolites that have only been predicted to be stable by the-
ory [205207]. Such theory-guided materials discovery approaches have recently been
used to synthesize new organic SDAs for the AEI [208], SFW [209], and STW [210]
zeolite frameworks, as well as to synthesize the rst chiral zeolite framework [207,211].
Computational methods can also be used to design organic SDAs that mimic tran-
sition state structures of a specic reaction, in order to guide synthesis of a zeolite
framework that may benet a desired chemical transformation [212].
The catalytic properties of zeolites are not only dened by their framework con-
nectivity, but also by the microscopic atomic arrangement of framework Al atoms that
generate catalytic active sites. In the case of chabazite (CHA) zeolites, which are high-
symmetry frameworks comprised of a single unique tetrahedral-site (T-site), distinct
arrangements of framework Al (i.e., Al-O(-Si-O)x-Al) between isolated (x ≥ 3) or

112
paired (x = 1, 2) congurations have been characterized, the latter by exchange of di-
valent Co2+ and Cu2+ cations [42,48,79,213]. These dierent framework Al ensembles
in CHA have been linked to dierences in turnover rates for methanol dehydration to
dimethyl ether (per total H+, 415 K) [214], time-on-stream stability for methanol-to-
olens catalysis (623 K) [158, 215, 216], CO2 adsorption equilibrium constants [217],
and the speciation of extraframework cationic Cu complexes [3436,3842,78,79,218]
that mediate partial methane oxidation (PMO) to methanol [219221] and selective
catalytic reduction (SCR) of NOx with NH3 [222]. Thus, synthetic protocols that pur-
posefully inuence the arrangement of heteroatoms substituted in zeolite frameworks,
and theoretical models of SDA-framework interactions that can aid in development
of such protocols, would provide avenues to prepare zeolites with tailored catalytic
and adsorption properties.
Cationic SDA molecules facilitate the substitution of solubilized anionic AlO−2 for
framework SiO2 species during crystallization [223, 224] and have been proposed to
inuence the siting of Al at specic T-site locations based on the proximity of the
charged portion of the SDA and the anionic lattice Al site [32, 56, 57, 141, 223, 225].
The eects of mixtures of cationic organic and inorganic SDAs on the energetics of Al
siting, however, are not as well understood. Crystallization of high-silica (Si/Al>7)
zeolites typically relies on the presence of organic SDA molecules in order to bal-
ance the anionic lattice charges via electrostatic interactions and to stabilize the
siliceous portions of the zeolite lattice via dispersive interactions [80, 198, 202, 226],
which can be tailored to selectively guide crystallization towards the desired crystal
phase [205]. Incorporation of alkali cations during zeolite crystallization has been
used to control crystal morphology of MFI [227], spatially bias Al incorporation in
FAU [228], and to inuence the arrangement of Al sites in MFI zeolites among dif-
ferently sized voids (straight and sinusoidal channels and their intersections) [2932]
and between isolated and paired congurations [48,74]. Previously, we have reported
that CHA zeolites (Si/Al = 15) crystallized from synthesis media containing only low
charge-density organic N,N,N-trimethyl-1-adamantylammonium cations (TMAda+)
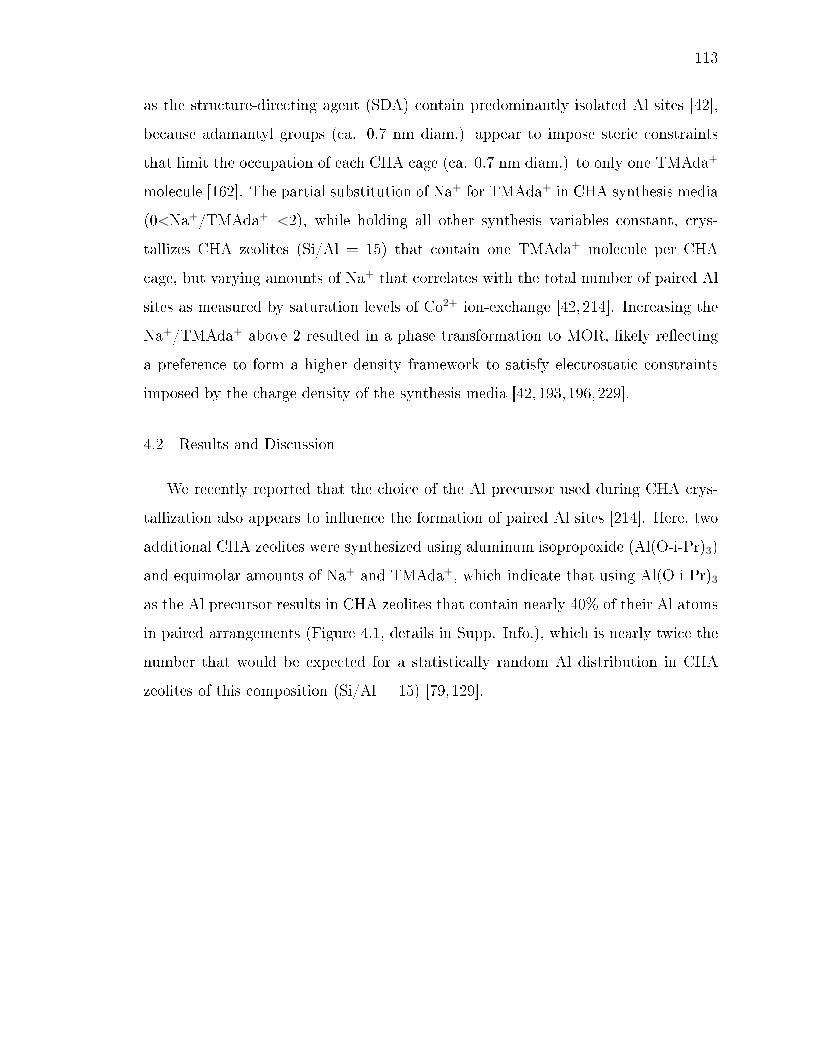
113
as the structure-directing agent (SDA) contain predominantly isolated Al sites [42],
because adamantyl groups (ca. 0.7 nm diam.) appear to impose steric constraints
that limit the occupation of each CHA cage (ca. 0.7 nm diam.) to only one TMAda+
molecule [162]. The partial substitution of Na+ for TMAda+ in CHA synthesis media
(0<Na+/TMAda+ <2), while holding all other synthesis variables constant, crys-
tallizes CHA zeolites (Si/Al = 15) that contain one TMAda+ molecule per CHA
cage, but varying amounts of Na+ that correlates with the total number of paired Al
sites as measured by saturation levels of Co2+ ion-exchange [42, 214]. Increasing the
Na+/TMAda+ above 2 resulted in a phase transformation to MOR, likely reecting
a preference to form a higher density framework to satisfy electrostatic constraints
imposed by the charge density of the synthesis media [42,193,196,229].
4.2 Results and Discussion
We recently reported that the choice of the Al precursor used during CHA crys-
tallization also appears to inuence the formation of paired Al sites [214]. Here, two
additional CHA zeolites were synthesized using aluminum isopropoxide (Al(O-i-Pr)3)
and equimolar amounts of Na+ and TMAda+, which indicate that using Al(O-i-Pr)3
as the Al precursor results in CHA zeolites that contain nearly 40% of their Al atoms
in paired arrangements (Figure 4.1, details in Supp. Info.), which is nearly twice the
number that would be expected for a statistically random Al distribution in CHA
zeolites of this composition (Si/Al = 15) [79,129].

114
Figure 4.1. Fraction of Al in pairs, measured by Co2+ exchange, as afunction of the number of Al in pairs predicted for a random Al distri-bution subject Lowenstein's Rule. Samples are synthesized with Al(OH)3and Na+/TMAda+ = 0-2 in OH− media (orange) and Na+/TMAda+ =0 in F− media (blue) or with Al(O-i-Pr)3 with Na+/TMAda+ = 1 (greensquares) and Na+/TMAda+ = 0 (green circle).
CHA zeolites crystallized in synthesis media containing only TMAda+ as the SDA,
but in the presence of Al(O-i-Pr)3, do not contain paired Al sites (Figure 4.1, details
in Supp. Info.), consistent with previous observations of CHA synthesized using only
TMAda+ and aluminum hydroxide (Al(OH)3) as the Al source [42]. Thus, the pres-
ence of Na+ in CHA synthesis media leads to the formation of paired Al sites regard-
less of Al precursor (Co/Al<0.01 when Na+/TMAda+=0 for Al(OH)3 or Al(O-i-Pr)3)
or mineralizing agent (e.g., OH− or F−) [214], suggesting that the structure of the
cations used to faciliate zeolite crystallization predominantly aects Al siting. Taken
together, these results suggest cooperative interactions between organic TMAda+

115
molecules and inorganic alkali cations (e.g., Na+) guide the formation of paired Al
sites during CHA crystallization.
Here, we further probe this hypothesis by utilizing K+, instead of Na+, as the
alkali SDA cation together with TMAda+ during CHA synthesis. K+ suppresses the
formation of certain crystal phases (e.g., BEA [81], MFI [230]), and also enables the
crystallization of low-silica CHA (Si/Al<5) from FAU precursors in the absence of
organic SDAs [231234], a transformation that is inaccessible using only Na+ with-
out using high concentrations of seed crystals (ca. 10 SiO2 wt% seed) [167]. These
observations suggest that K+ can guide crystallization towards the CHA framework,
with dierent consequences than Na+ regarding their role in directing Al incorpora-
tion. The inuence of K+ on the arrangement of Al in high-silica CHA (Si/Al = 15)
crystallized in the presence of TMAda+ was investigated using previously reported
synthesis procedures to prepare CHA with varying Na+/TMAda+ ratios [42], but by
substituting KOH for NaOH in the synthesis solution (details in Supp. Info.).
Synthesis media containing K+/TMAda+ ≥20 resulted in CHA zeolites without
detectable phase impurities from X-ray diraction data (Figure 4.2), but increasing
the K+/TMAda+ beyond 20 resulted in the formation of MFI (K+/TMAda+ up to∞;
Supp. Info.). This reects the role of TMAda+ to assist in directing toward the CHA
phase, and that K+ alone is unable to crystallize CHA under the synthesis conditions
reported here. The use of K+ enables CHA to crystallize from solutions containing
much higher alkali/TMAda+ ratios than when Na+ is used as the alkali source (MOR
was observed at Na/TMAda>2) [42]. These results highlight the capacity of dierent
alkali cations to act as co-SDAs [80] with TMAda+, and appear to reect the tendency
of K+ to suppress the formation of other undesired phases, as previously suggested for
the synthesis of IFR zeolites from mixtures of K+ and benzyl mono- and di-azabicyclo
complexes [81].
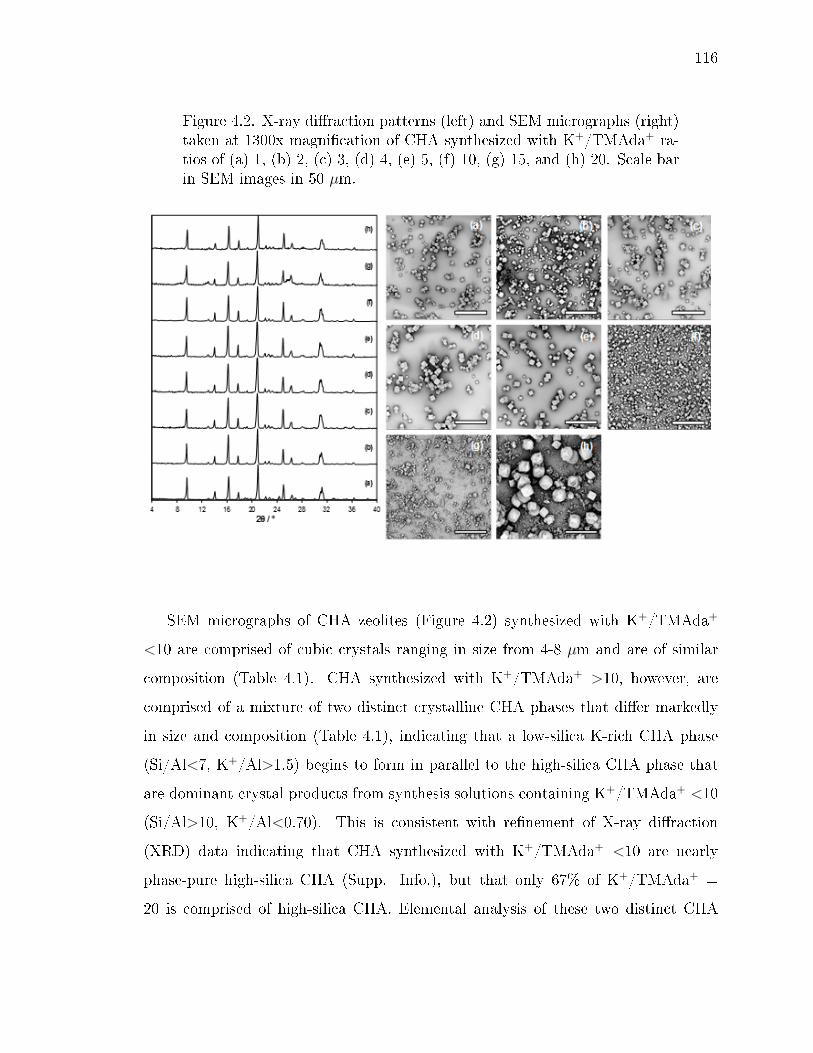
116
Figure 4.2. X-ray diraction patterns (left) and SEM micrographs (right)taken at 1300x magnication of CHA synthesized with K+/TMAda+ ra-tios of (a) 1, (b) 2, (c) 3, (d) 4, (e) 5, (f) 10, (g) 15, and (h) 20. Scale barin SEM images in 50 µm.
SEM micrographs of CHA zeolites (Figure 4.2) synthesized with K+/TMAda+
<10 are comprised of cubic crystals ranging in size from 4-8 µm and are of similar
composition (Table 4.1). CHA synthesized with K+/TMAda+ >10, however, are
comprised of a mixture of two distinct crystalline CHA phases that dier markedly
in size and composition (Table 4.1), indicating that a low-silica K-rich CHA phase
(Si/Al<7, K+/Al>1.5) begins to form in parallel to the high-silica CHA phase that
are dominant crystal products from synthesis solutions containing K+/TMAda+ <10
(Si/Al>10, K+/Al<0.70). This is consistent with renement of X-ray diraction
(XRD) data indicating that CHA synthesized with K+/TMAda+ <10 are nearly
phase-pure high-silica CHA (Supp. Info.), but that only 67% of K+/TMAda+ =
20 is comprised of high-silica CHA. Elemental analysis of these two distinct CHA

117
phases by EDX show that the high-silica CHA phase (Supp. Info.) has an elemental
composition similar to other CHA samples synthesized with K+/TMAda+ <10 (Table
4.1).
Table 4.1.Elemental analysis of CHA synthesized with K+/TMAda+ = 1-20 mea-sured by AAS and EDX.
CHA zeolites crystallized from mixtures of Na+ and TMAda+ contain one TMAd-
a+ per cage (ca. 20-22 wt% organic) [42,158,162], independent of the amount of resid-
ual Na+ retained within crystalline products (Figure 4.3) [42,214], yet those crystal-
lized from mixtures of K+ and TMAda+ showed that the occupancy of TMAda+ per
CHA cage systematically decreased as the amount of K+ retained on crystalline CHA
product increased (Figure 4.3, Table 4.1). The negative correlation observed between
TMAda+ and K+ in the crystalline CHA products suggests that three K+ cations dis-
place a single TMAda+ from the CHA cage and that K+ assists in the stabilization of
the CHA framework up to a limit of approximately 2 TMAda+ per unit cell (Figure
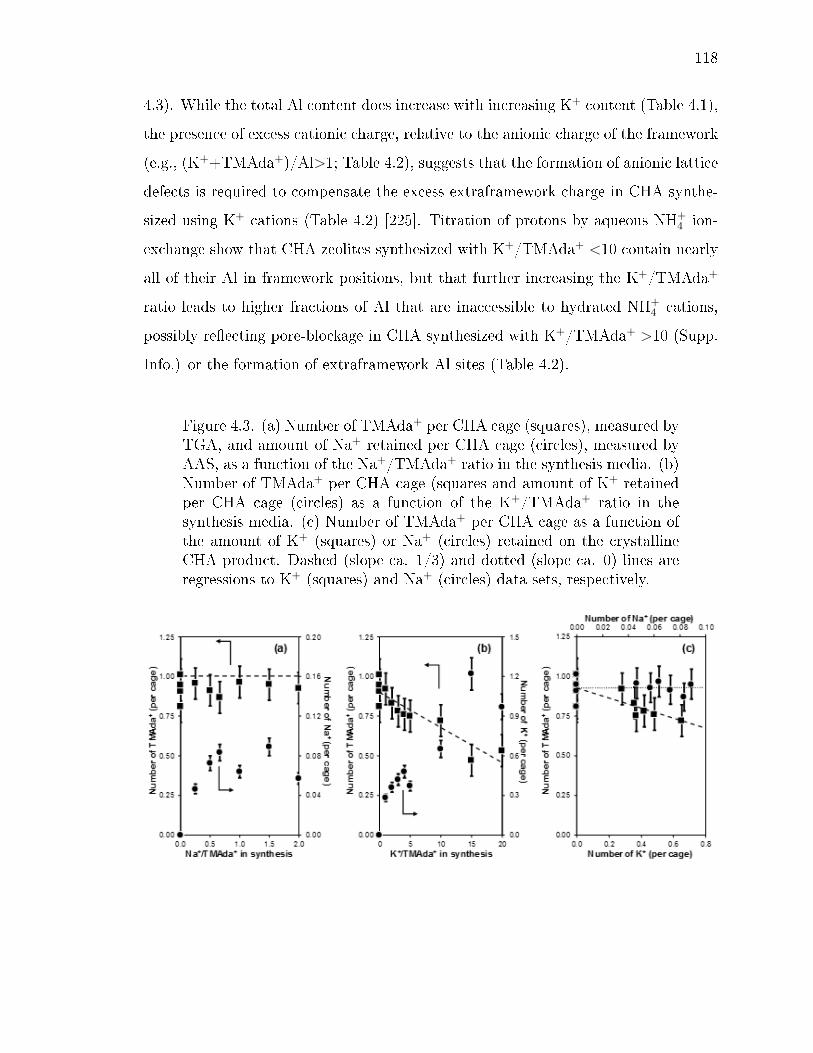
118
4.3). While the total Al content does increase with increasing K+ content (Table 4.1),
the presence of excess cationic charge, relative to the anionic charge of the framework
(e.g., (K++TMAda+)/Al>1; Table 4.2), suggests that the formation of anionic lattice
defects is required to compensate the excess extraframework charge in CHA synthe-
sized using K+ cations (Table 4.2) [225]. Titration of protons by aqueous NH+4 ion-
exchange show that CHA zeolites synthesized with K+/TMAda+ <10 contain nearly
all of their Al in framework positions, but that further increasing the K+/TMAda+
ratio leads to higher fractions of Al that are inaccessible to hydrated NH+4 cations,
possibly reecting pore-blockage in CHA synthesized with K+/TMAda+ >10 (Supp.
Info.) or the formation of extraframework Al sites (Table 4.2).
Figure 4.3. (a) Number of TMAda+ per CHA cage (squares), measured byTGA, and amount of Na+ retained per CHA cage (circles), measured byAAS, as a function of the Na+/TMAda+ ratio in the synthesis media. (b)Number of TMAda+ per CHA cage (squares and amount of K+ retainedper CHA cage (circles) as a function of the K+/TMAda+ ratio in thesynthesis media. (c) Number of TMAda+ per CHA cage as a function ofthe amount of K+ (squares) or Na+ (circles) retained on the crystallineCHA product. Dashed (slope ca. 1/3) and dotted (slope ca. 0) lines areregressions to K+ (squares) and Na+ (circles) data sets, respectively.
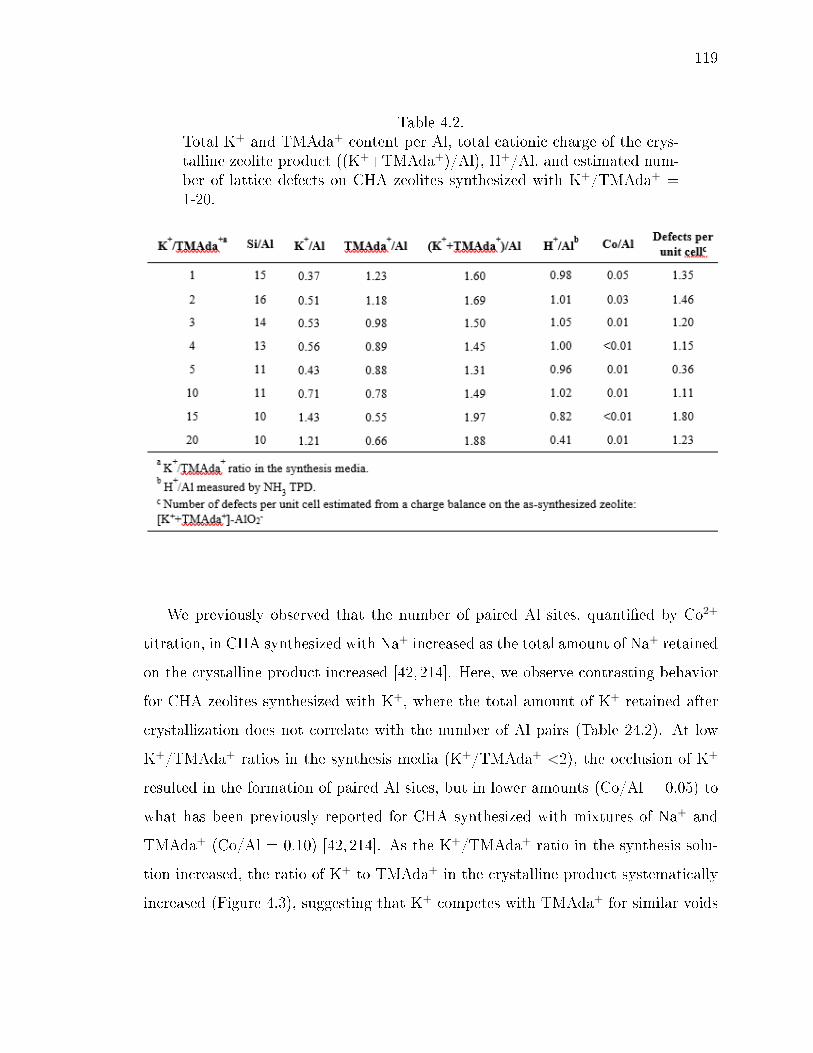
119
Table 4.2.Total K+ and TMAda+ content per Al, total cationic charge of the crys-talline zeolite product ((K++TMAda+)/Al), H+/Al, and estimated num-ber of lattice defects on CHA zeolites synthesized with K+/TMAda+ =1-20.
We previously observed that the number of paired Al sites, quantied by Co2+
titration, in CHA synthesized with Na+ increased as the total amount of Na+ retained
on the crystalline product increased [42, 214]. Here, we observe contrasting behavior
for CHA zeolites synthesized with K+, where the total amount of K+ retained after
crystallization does not correlate with the number of Al pairs (Table 24.2). At low
K+/TMAda+ ratios in the synthesis media (K+/TMAda+ <2), the occlusion of K+
resulted in the formation of paired Al sites, but in lower amounts (Co/Al = 0.05) to
what has been previously reported for CHA synthesized with mixtures of Na+ and
TMAda+ (Co/Al = 0.10) [42, 214]. As the K+/TMAda+ ratio in the synthesis solu-
tion increased, the ratio of K+ to TMAda+ in the crystalline product systematically
increased (Figure 4.3), suggesting that K+ competes with TMAda+ for similar voids
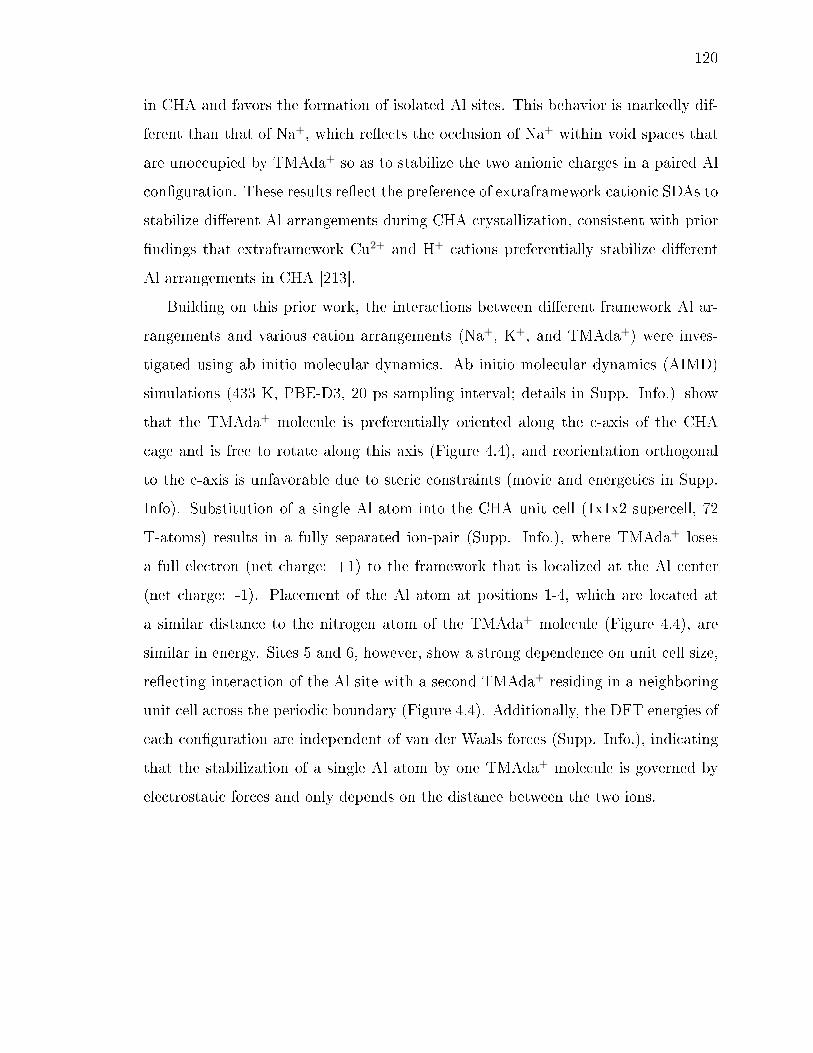
120
in CHA and favors the formation of isolated Al sites. This behavior is markedly dif-
ferent than that of Na+, which reects the occlusion of Na+ within void spaces that
are unoccupied by TMAda+ so as to stabilize the two anionic charges in a paired Al
conguration. These results reect the preference of extraframework cationic SDAs to
stabilize dierent Al arrangements during CHA crystallization, consistent with prior
ndings that extraframework Cu2+ and H+ cations preferentially stabilize dierent
Al arrangements in CHA [213].
Building on this prior work, the interactions between dierent framework Al ar-
rangements and various cation arrangements (Na+, K+, and TMAda+) were inves-
tigated using ab initio molecular dynamics. Ab initio molecular dynamics (AIMD)
simulations (433 K, PBE-D3, 20 ps sampling interval; details in Supp. Info.) show
that the TMAda+ molecule is preferentially oriented along the c-axis of the CHA
cage and is free to rotate along this axis (Figure 4.4), and reorientation orthogonal
to the c-axis is unfavorable due to steric constraints (movie and energetics in Supp.
Info). Substitution of a single Al atom into the CHA unit cell (1x1x2 supercell, 72
T-atoms) results in a fully separated ion-pair (Supp. Info.), where TMAda+ loses
a full electron (net charge: +1) to the framework that is localized at the Al center
(net charge: -1). Placement of the Al atom at positions 1-4, which are located at
a similar distance to the nitrogen atom of the TMAda+ molecule (Figure 4.4), are
similar in energy. Sites 5 and 6, however, show a strong dependence on unit cell size,
reecting interaction of the Al site with a second TMAda+ residing in a neighboring
unit cell across the periodic boundary (Figure 4.4). Additionally, the DFT energies of
each conguration are independent of van der Waals forces (Supp. Info.), indicating
that the stabilization of a single Al atom by one TMAda+ molecule is governed by
electrostatic forces and only depends on the distance between the two ions.
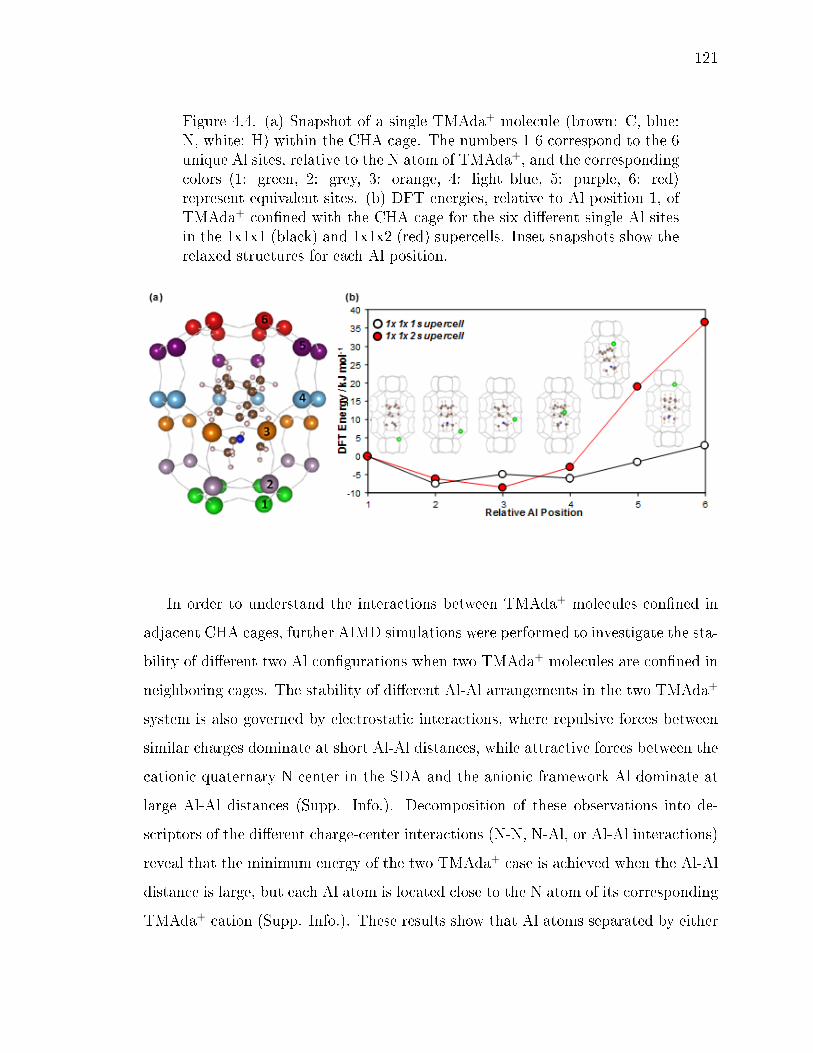
121
Figure 4.4. (a) Snapshot of a single TMAda+ molecule (brown: C, blue:N, white: H) within the CHA cage. The numbers 1-6 correspond to the 6unique Al sites, relative to the N atom of TMAda+, and the correspondingcolors (1: green, 2: grey, 3: orange, 4: light blue, 5: purple, 6: red)represent equivalent sites. (b) DFT energies, relative to Al position 1, ofTMAda+ conned with the CHA cage for the six dierent single Al sitesin the 1x1x1 (black) and 1x1x2 (red) supercells. Inset snapshots show therelaxed structures for each Al position.
In order to understand the interactions between TMAda+ molecules conned in
adjacent CHA cages, further AIMD simulations were performed to investigate the sta-
bility of dierent two Al congurations when two TMAda+ molecules are conned in
neighboring cages. The stability of dierent Al-Al arrangements in the two TMAda+
system is also governed by electrostatic interactions, where repulsive forces between
similar charges dominate at short Al-Al distances, while attractive forces between the
cationic quaternary N center in the SDA and the anionic framework Al dominate at
large Al-Al distances (Supp. Info.). Decomposition of these observations into de-
scriptors of the dierent charge-center interactions (N-N, N-Al, or Al-Al interactions)
reveal that the minimum energy of the two TMAda+ case is achieved when the Al-Al
distance is large, but each Al atom is located close to the N atom of its corresponding
TMAda+ cation (Supp. Info.). These results show that Al atoms separated by either
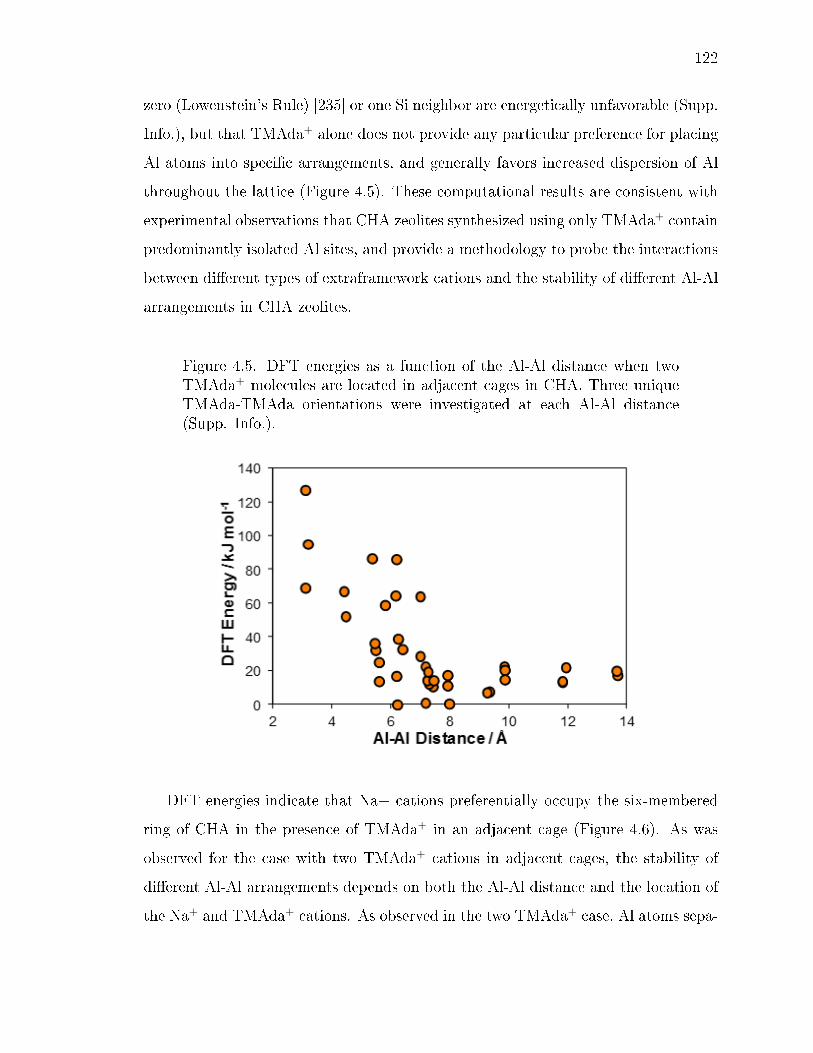
122
zero (Lowenstein's Rule) [235] or one Si neighbor are energetically unfavorable (Supp.
Info.), but that TMAda+ alone does not provide any particular preference for placing
Al atoms into specic arrangements, and generally favors increased dispersion of Al
throughout the lattice (Figure 4.5). These computational results are consistent with
experimental observations that CHA zeolites synthesized using only TMAda+ contain
predominantly isolated Al sites, and provide a methodology to probe the interactions
between dierent types of extraframework cations and the stability of dierent Al-Al
arrangements in CHA zeolites.
Figure 4.5. DFT energies as a function of the Al-Al distance when twoTMAda+ molecules are located in adjacent cages in CHA. Three uniqueTMAda-TMAda orientations were investigated at each Al-Al distance(Supp. Info.).
DFT energies indicate that Na+ cations preferentially occupy the six-membered
ring of CHA in the presence of TMAda+ in an adjacent cage (Figure 4.6). As was
observed for the case with two TMAda+ cations in adjacent cages, the stability of
dierent Al-Al arrangements depends on both the Al-Al distance and the location of
the Na+ and TMAda+ cations. As observed in the two TMAda+ case, Al atoms sepa-
123
rated by either one or two Si neighbors are the highest energy arrangements indicating
that Lowenstein's Rule is still obeyed in the presence of TMAda+ and Na+. These
observations complement previous reports that Al-Al nearest neighbors are the most
stable 2 Al arrangements when protons compensate lattice Al sites, and underscore
the necessity for models that reect realistic operating conditions [79, 213]. Unlike
the TMAda+-only case, which did not show a strong preference to any specic Al-Al
arrangement (Figure 4.5), Na+ cations appear to favor the incorporation of two Al
atoms in the same 6-MR when TMAda+ is located in an adjacent cage (Figure 4.6).
This preference for Na+ incorporation to form a paired Al site is consistent with ex-
perimental observations that Na+ occluded during CHA crystallizations promotes the
formation of paired Al sites [42]. While these observations do not directly describe the
incorporation of Al during crystallization, which is often kinetically-limited [198] and
sensitive to solvent eects [236] and signicant long-range electrostatic interactions
between extraframework cations residing in adjacent cages, they do provide evidence
that dierent cations can alter the stability of dierent Al-Al arrangements in CHA
zeolites.

124
Figure 4.6. (a) Snapshot of the most stable conguration of Na+ (black) inthe presence of a TMAda+ molecule in an adjacent cage with 2 frameworkAl atoms (green). Yellow: Si, green: Al, red: O, dark grey: C, blue: N,white: H, black: Na. (b) DFT energies as a function of the Al-Al distancewhen one Na+ and one TMAda+ molecule are located in adjacent cagesin CHA.
Finally, we compared the performance of Cu-exchanged CHA zeolites prepared
using mixtures of TMAda+ and Na+ or TMAda+ and K+ as co-SDAs (synthesis
and characterization details in SI) for the selective catalytic reduction (SCR) of NOx
with NH3. Turnover rates of NOx SCR (per Cu, 473 K) depend on the spatial
density of nominally site-isolated Cu cations (Cu per 1000 A3) and, in turn, the
arrangement of anionic framework Al atoms that anchor such cationic Cu complexes.
This reects O2 oxidation steps involving two [Cu(NH3)2]+ complexes, which are
electrostatically-tethered at anionic framework Al sites with localized mobility [237],
that becomes the rate-limiting process at low temperatures. The stability of Cu-CHA
zeolites also depends on the distribution of Cu2+ and [CuOH]+ complexes, which
respectively exchange at paired and isolated Al sites, because they show dierences
in their resistance to deactivation by sulfur poisoning [238, 239] and hydrothermal
aging [240]. Cu-exchanged CHA zeolites synthesized using TMAda+ with either Na+

125
or K+ as the alkali co-SDA (prior to hydrothermal aging) showed similar NOx SCR
rates (per Cu, 473 K), apparent reactant orders, and activation energies (Supp. Info.),
which are consistent with previously reported SCR rates (473 K, per Cu) on Cu-
CHA with similar Cu densities (Cu per 1000 A3) [237]. Cu-CHA synthesized using
Na+ or K+/TMAda+ <10 deactivate to similar extents after hydrothermal aging (10
vol% H2O, 1073 K, 16 h), suggesting that the stability of the CHA framework with
similar Al arrangements and total Al incorporation (H+/Al>0.90) is not inuenced by
the synthesis procedure. Cu-CHA synthesized with K+/TMAda+=15 exhibits more
severe deactivation after hydrothermal aging (Supp. Info.), likely reecting the highly
defective nature of CHA zeolites prepared with K+/TMAda+ >10, which contain
H+/Al counts lower than unity and micropore volumes that deviate signicantly from
CHA prepared with low alkali/TMAda+ ratios or in alkali-free crystallization media
(Supp. Info.).
These results highlight how CHA zeolites with similar microscopic arrangements
of framework Al atoms can be prepared from synthetic protocols that use dierent
alkali cations together with organic TMAda+, which modies the dominant SDA-
framework interactions that inuence Al siting. Na+ preferentially occupies 6-MR
voids in CHA and stabilizes paired Al sites in the presence of TMAda+, which are
occluded within larger CHA cages, suggesting cooperative interactions that stabi-
lize regions of locally higher anionic charge densities (i.e., paired Al) than can be
stabilized with TMAda+ alone. K+ cations compete with TMAda+ for occupancy
within CHA cages and eventually cause the displacement of TMAda+ at high K+
concentrations (K+/TMAda+ >2), which assists in stabilizing the CHA framework
at higher alkali concentrations in the synthesis media (K+/TMAda+ up to 20) than
possible with Na+ (MOR formed at Na+/TMAda+ >2). These observations likely
reect the dierent roles that cationic SDAs play in stabilizing zeolite frameworks
that contain high anionic charge densities [192, 229]. K+ cations favor the formation
of isolated Al sites, a consequence of their competition with TMAda+ for occupancy
within large CHA cages, in contrast to Na+ that does not compete with TMAda+ and

126
causes the formation of paired Al sites. The theoretical models used here describe
interactions of cationic SDAs with the anionic zeolite lattice and can be used to aid in
the design of experimental synthesis approaches to purposefully guide the incorpora-
tion of framework heteroatoms during zeolite crystallization. These ndings provide
a methodology to probe cooperative and competitive interactions of mixtures of or-
ganic and inorganic SDAs during zeolite crystallization, and provide opportunities to
design zeolitic materials with tailored adsorption and catalytic function.
4.3 Supporting Information
Figure 4.7. X-Ray diraction patterns of CHA synthesized using Al(O-i-Pr)3 at Si/Al = 15 and (a) Na+/TMAda+ = 0 and (b)-(d) Na+/TMAda+
= 1.
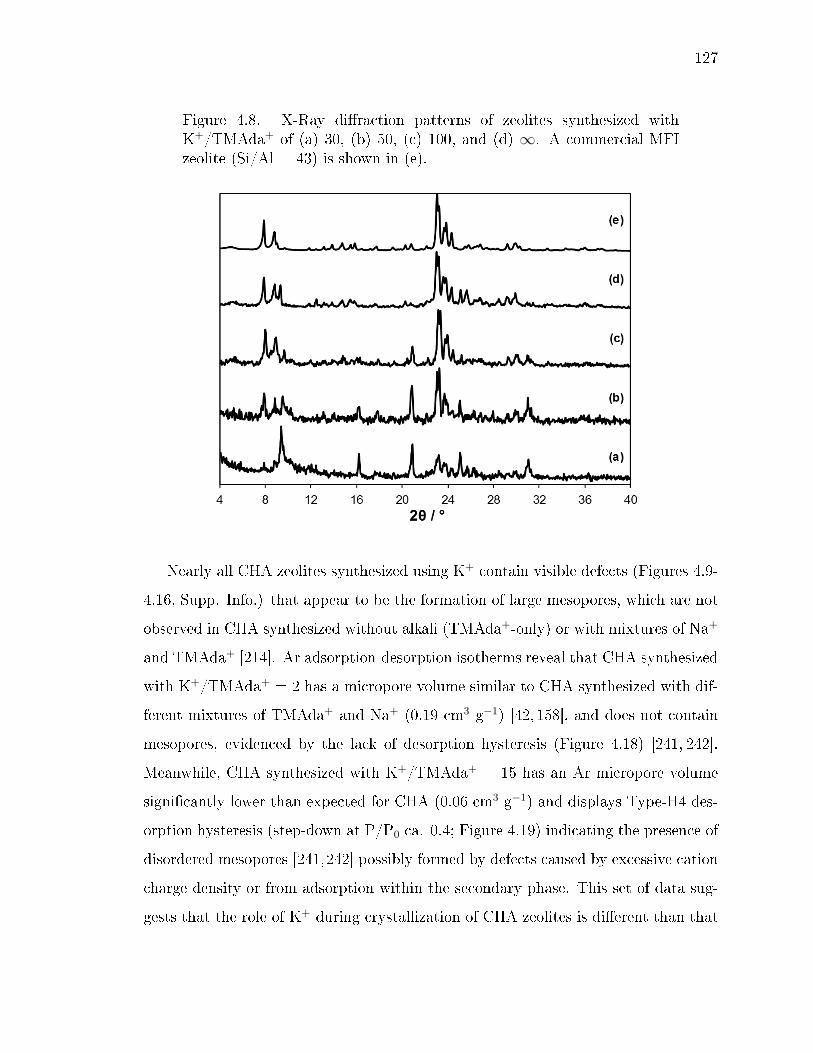
127
Figure 4.8. X-Ray diraction patterns of zeolites synthesized withK+/TMAda+ of (a) 30, (b) 50, (c) 100, and (d) ∞. A commercial MFIzeolite (Si/Al = 43) is shown in (e).
Nearly all CHA zeolites synthesized using K+ contain visible defects (Figures 4.9-
4.16, Supp. Info.) that appear to be the formation of large mesopores, which are not
observed in CHA synthesized without alkali (TMAda+-only) or with mixtures of Na+
and TMAda+ [214]. Ar adsorption-desorption isotherms reveal that CHA synthesized
with K+/TMAda+ = 2 has a micropore volume similar to CHA synthesized with dif-
ferent mixtures of TMAda+ and Na+ (0.19 cm3 g−1) [42, 158], and does not contain
mesopores, evidenced by the lack of desorption hysteresis (Figure 4.18) [241, 242].
Meanwhile, CHA synthesized with K+/TMAda+ = 15 has an Ar micropore volume
signicantly lower than expected for CHA (0.06 cm3 g−1) and displays Type-H4 des-
orption hysteresis (step-down at P/P0 ca. 0.4; Figure 4.19) indicating the presence of
disordered mesopores [241,242] possibly formed by defects caused by excessive cation
charge density or from adsorption within the secondary phase. This set of data sug-
gests that the role of K+ during crystallization of CHA zeolites is dierent than that
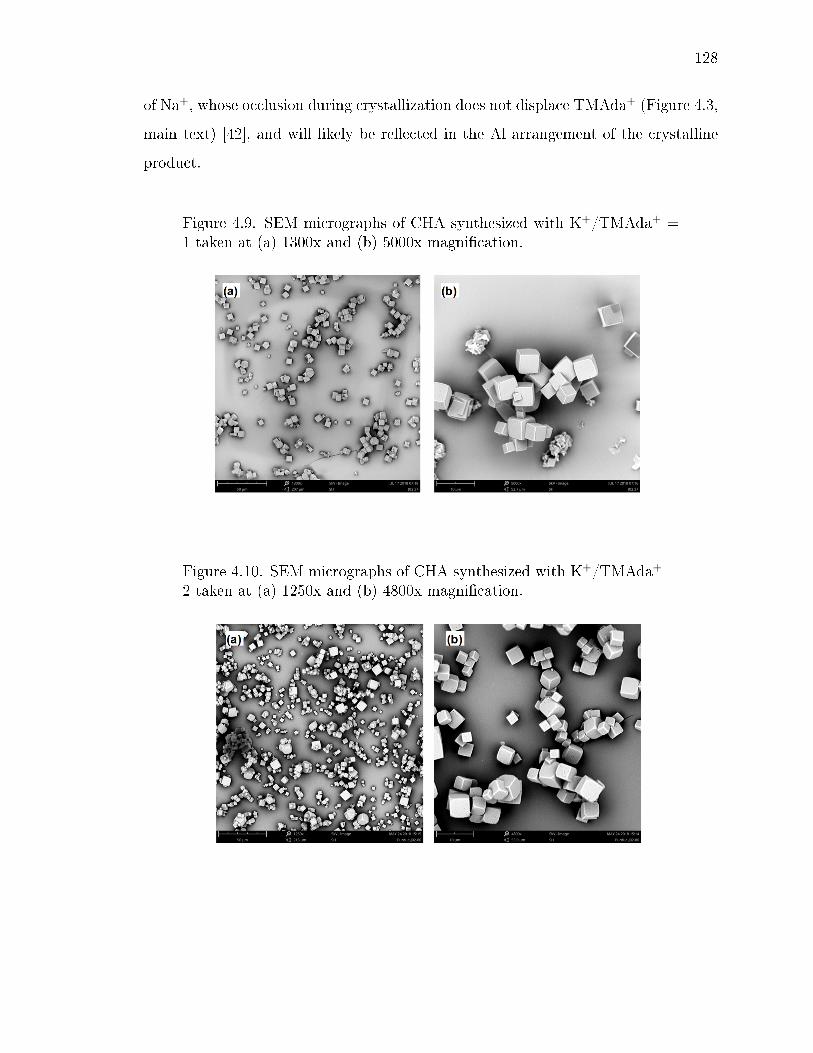
128
of Na+, whose occlusion during crystallization does not displace TMAda+ (Figure 4.3,
main text) [42], and will likely be reected in the Al arrangement of the crystalline
product.
Figure 4.9. SEM micrographs of CHA synthesized with K+/TMAda+ =1 taken at (a) 1300x and (b) 5000x magnication.
Figure 4.10. SEM micrographs of CHA synthesized with K+/TMAda+ =2 taken at (a) 1250x and (b) 4800x magnication.
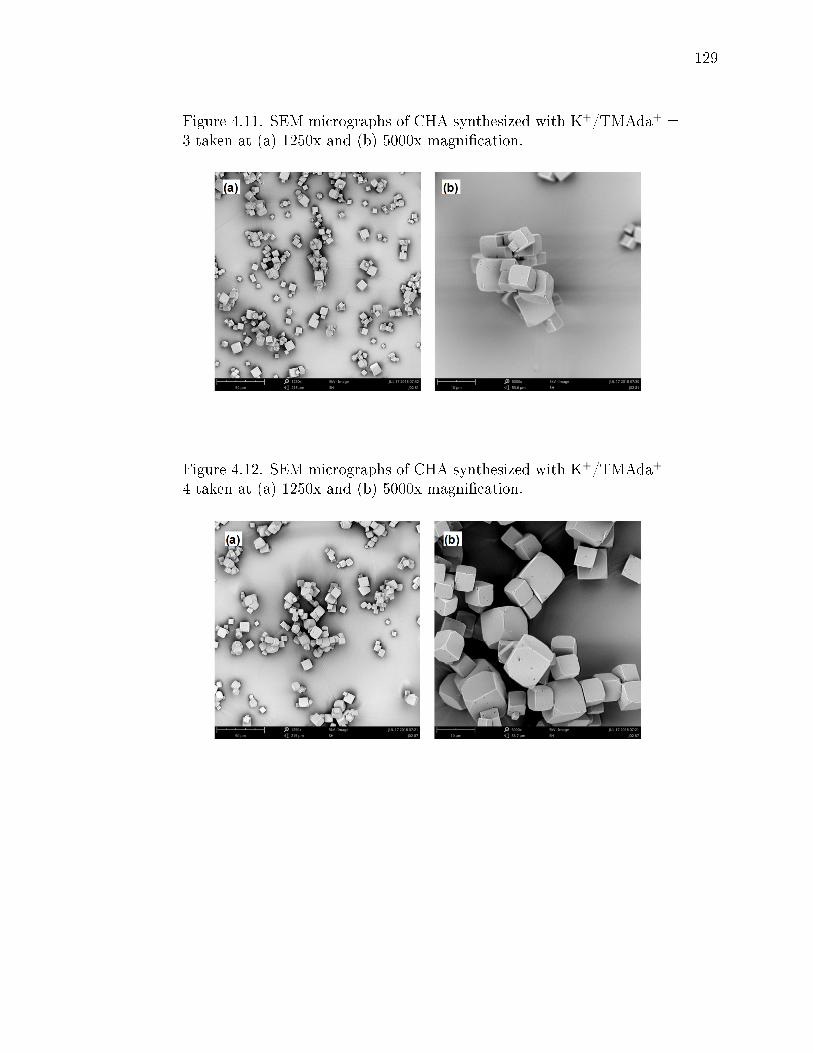
129
Figure 4.11. SEM micrographs of CHA synthesized with K+/TMAda+ =3 taken at (a) 1250x and (b) 5000x magnication.
Figure 4.12. SEM micrographs of CHA synthesized with K+/TMAda+ =4 taken at (a) 1250x and (b) 5000x magnication.
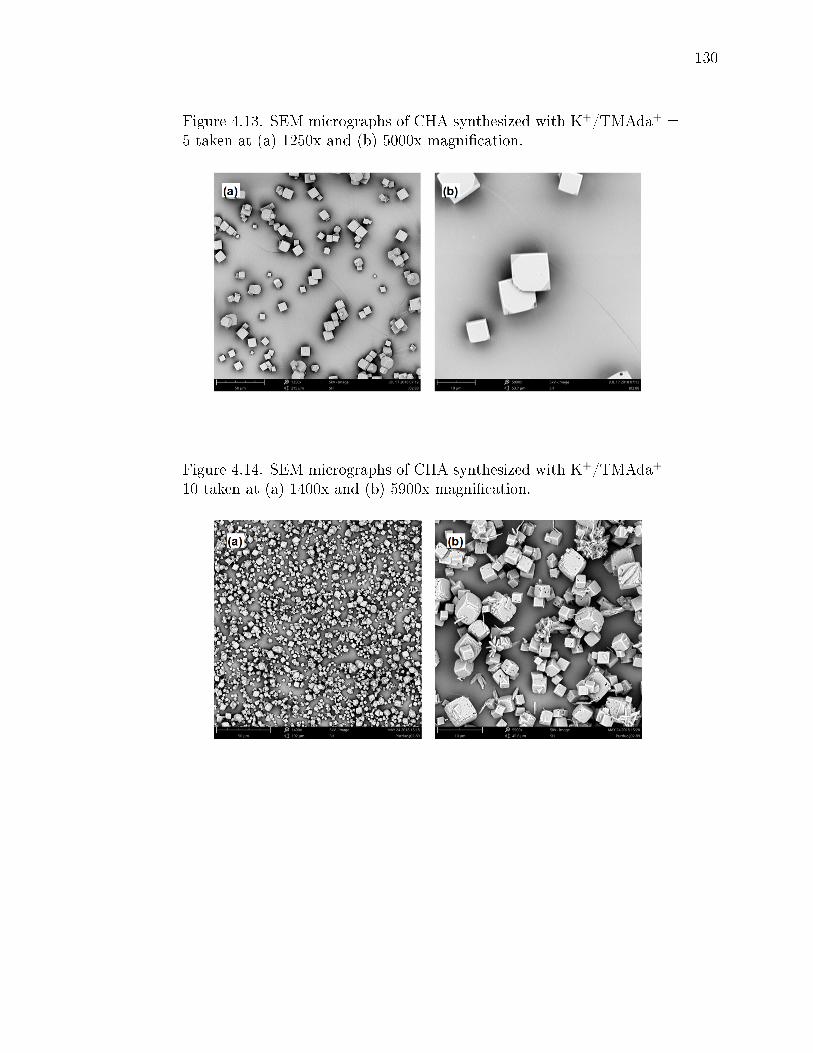
130
Figure 4.13. SEM micrographs of CHA synthesized with K+/TMAda+ =5 taken at (a) 1250x and (b) 5000x magnication.
Figure 4.14. SEM micrographs of CHA synthesized with K+/TMAda+ =10 taken at (a) 1400x and (b) 5900x magnication.
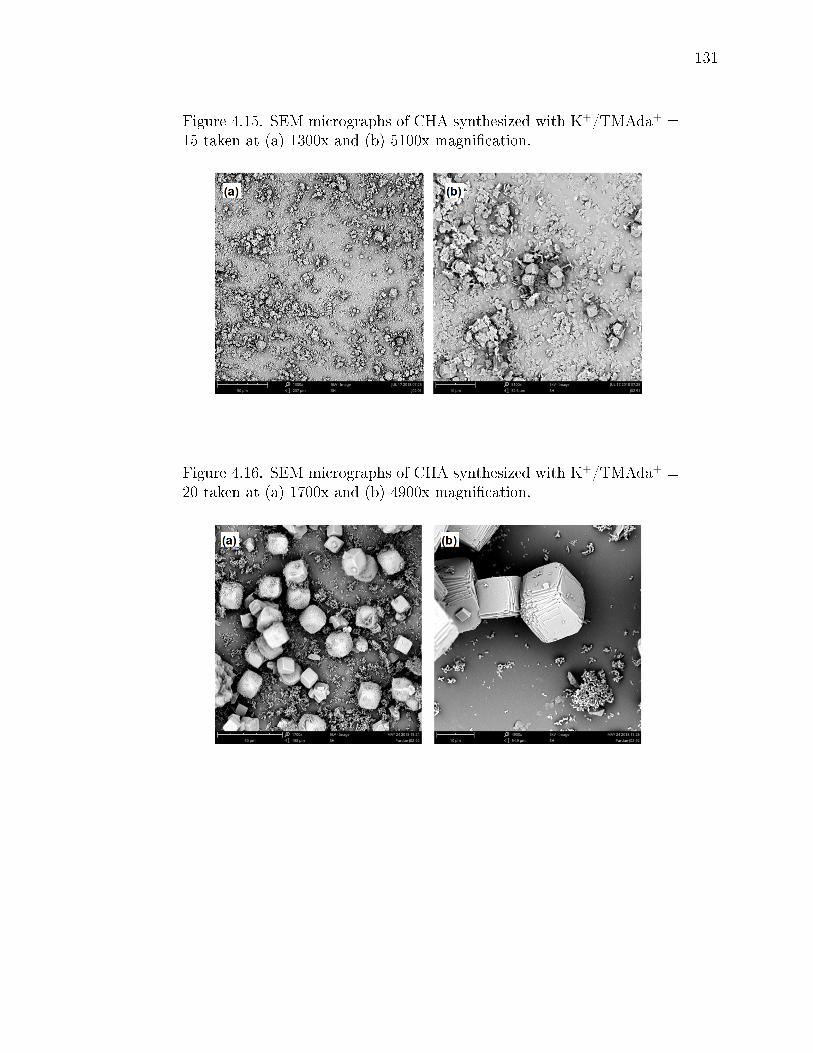
131
Figure 4.15. SEM micrographs of CHA synthesized with K+/TMAda+ =15 taken at (a) 1300x and (b) 5100x magnication.
Figure 4.16. SEM micrographs of CHA synthesized with K+/TMAda+ =20 taken at (a) 1700x and (b) 4900x magnication.
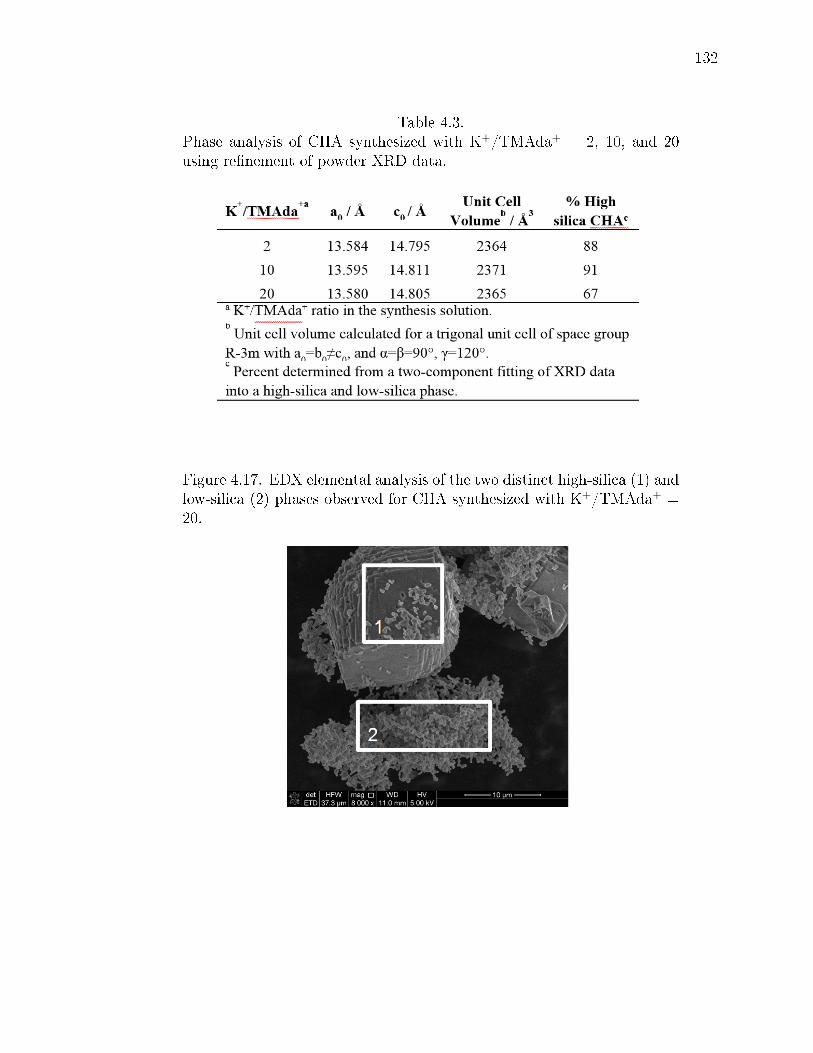
132
Table 4.3.Phase analysis of CHA synthesized with K+/TMAda+ = 2, 10, and 20using renement of powder XRD data.
Figure 4.17. EDX elemental analysis of the two distinct high-silica (1) andlow-silica (2) phases observed for CHA synthesized with K+/TMAda+ =20.
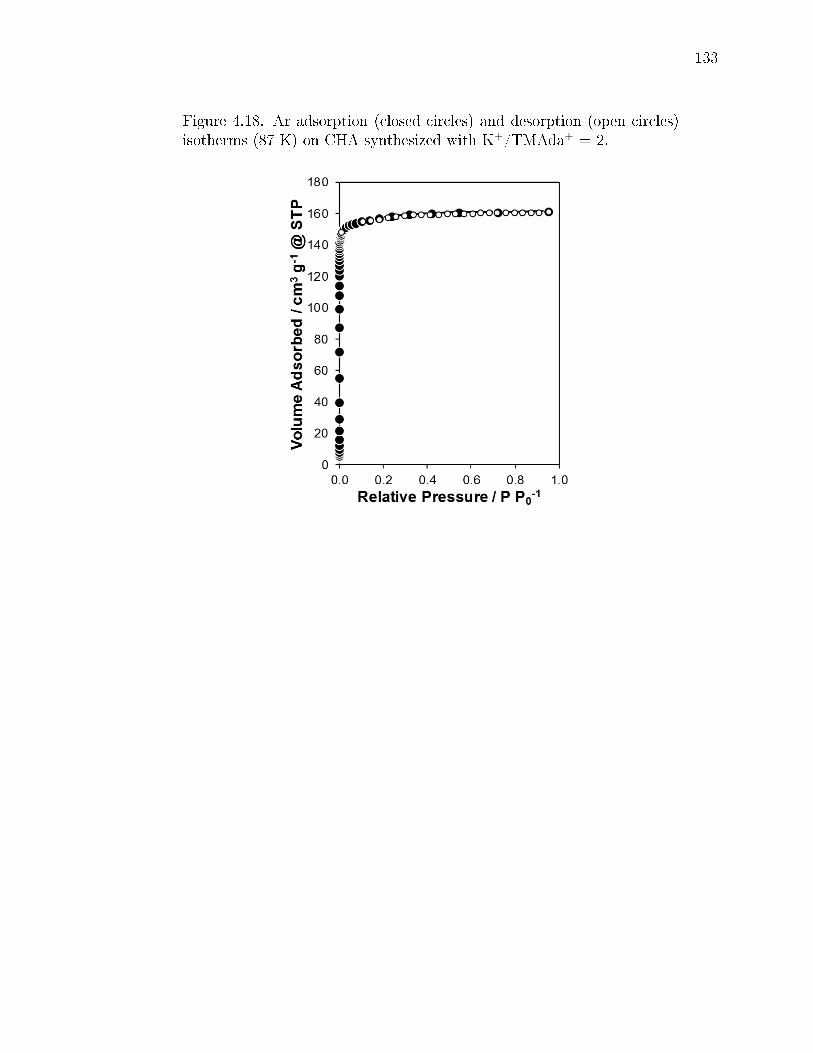
133
Figure 4.18. Ar adsorption (closed circles) and desorption (open circles)isotherms (87 K) on CHA synthesized with K+/TMAda+ = 2.

134
Figure 4.19. Ar adsorption (closed circles) and desorption (open circles)isotherms (87 K) on CHA synthesized with K+/TMAda+ = 15.
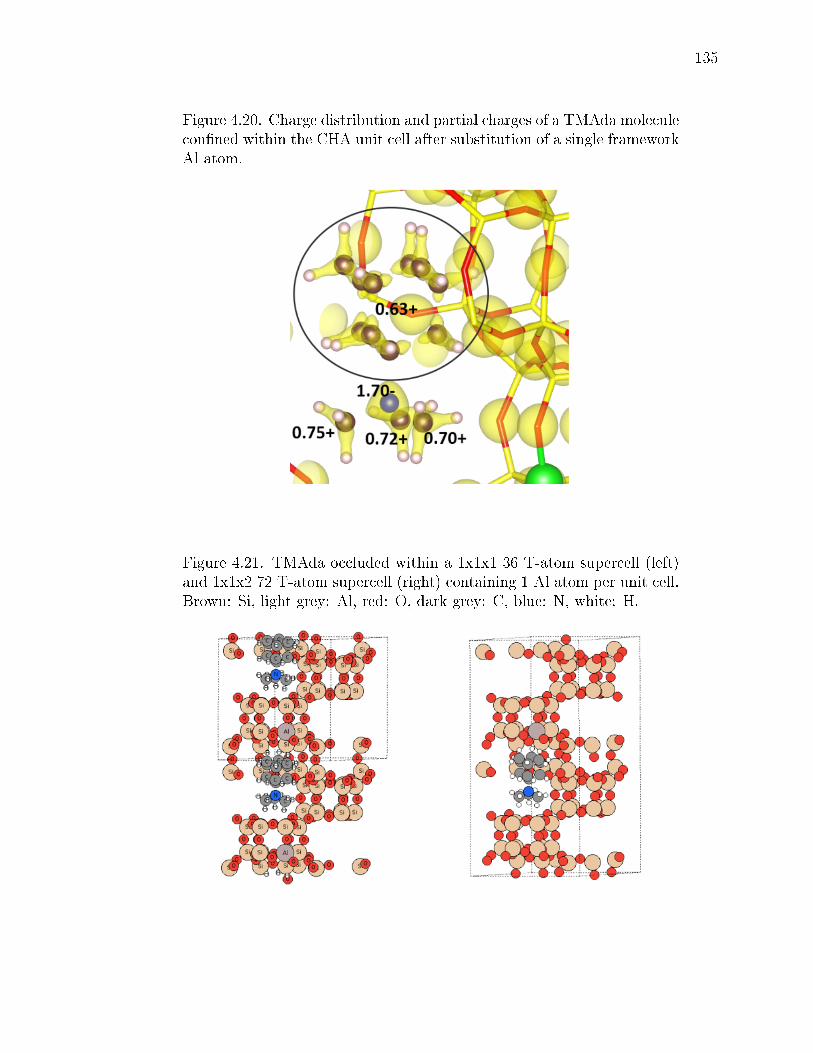
135
Figure 4.20. Charge distribution and partial charges of a TMAda moleculeconned within the CHA unit cell after substitution of a single frameworkAl atom.
Figure 4.21. TMAda occluded within a 1x1x1 36 T-atom supercell (left)and 1x1x2 72 T-atom supercell (right) containing 1 Al atom per unit cell.Brown: Si, light grey: Al, red: O, dark grey: C, blue: N, white: H.

136
Figure 4.22. DFT energies, relative to Al position 1, of TMAda connedwith the CHA cage for the six dierent single Al sites in the 1x1x2 super-cell using the PBE (black) and PBE-D3 (red) functional.
Figure 4.23. Descriptor model regressed to DFT calculated energies usingthree descriptors for 1) the Al-Al distance, 2) the distances between N-Alcenters, and 3) the N-N distance.
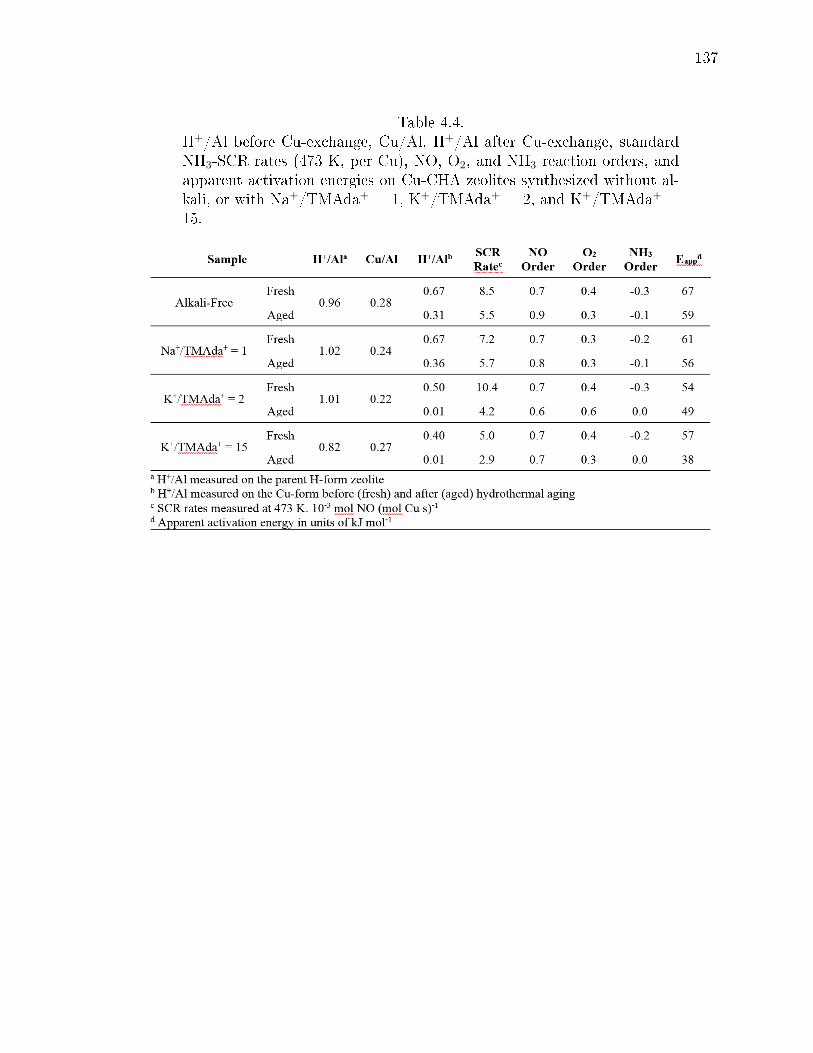
137
Table 4.4.H+/Al before Cu-exchange, Cu/Al, H+/Al after Cu-exchange, standardNH3-SCR rates (473 K, per Cu), NO, O2, and NH3 reaction orders, andapparent activation energies on Cu-CHA zeolites synthesized without al-kali, or with Na+/TMAda+ = 1, K+/TMAda+ = 2, and K+/TMAda+ =15.

138
139
5. STRUCTURAL AND KINETIC CHANGES TO SMALL-PORE CU-ZEOLITES
AFTER HYDROTHERMAL AGING TREATMENTS AND SELECTIVE
CATALYTIC REDUCTION OF NOX WITH AMMONIA
5.1 Introduction
Leading emissions control strategies for the abatement of hazardous nitrogen ox-
ide pollutants (NOx, x = 1, 2) in lean burn and diesel engine exhaust involve their
selective catalytic reduction (SCR) with ammonia, which is generated from the de-
composition of urea stored in an on-board tank. Cu- and Fe-exchanged molecular
sieves used to practice automotive SCR aftertreatment [92, 243247] are required to
retain sucient SCR performance after excursions to high temperatures (>923 K)
in the presence of steam (ca. 7% H2O (v/v)) [35, 89, 133, 248], conditions experi-
enced during regeneration of particulate lters. The structural integrity of molec-
ular sieve frameworks with medium pores (e.g., MFI [93, 97, 249252], FER [97];
ca.0.5 nm diam.) and large pores (e.g., BEA [93, 250, 253, 254], FAU [93]; >0.6 nm
diam.) becomes compromised during hydrothermal aging [93, 97, 249254]; more-
over, active sites within such frameworks can be poisoned chemically by residual
hydrocarbons in exhaust streams. These deactivation issues are mitigated within
small-pore, eight-membered ring (8-MR; <0.4 nm diam.) frameworks, which led to
the advent of the aluminosilicate (SSZ-13) and silicoaluminophosphate (SAPO-34)
compositions of the chabazite (CHA) topology [88, 93, 255], as commercially used
NOx SCR catalysts. Other small-pore molecular sieves with three-dimensional (e.g.,
AFX [250], AEI [256], KFI [250], SAV [257], SFW [209, 258]) and two-dimensional
(e.g., LEV [250], DDR [250], RTH [259]) pore connectivity have been considered as al-
ternatives to CHA molecular sieves, based on observations that small-pore frameworks
retain their structural integrity after exposure to hydrothermal aging conditions.
140
Hydrothermal aging of zeolites leads to the removal of aluminum atoms from
framework locations [250, 260262], which stabilize redox-active, extraframework Cu
cations and ammonium species during SCR catalysis. Framework dealumination gen-
erally leads to sintering of extraframework alumina and mixed oxide domains with
concomitant losses in microporous structure [263265] that may restrict molecular
trac to active sites. The eects of hydrothermal aging treatments on dealumination
have been assessed by changes in Al coordination using solid-state 27Al magic angle
spinning nuclear magnetic resonance (MAS NMR), and in long-range crystalline struc-
ture using X-ray diraction (XRD) and micropore volume measurements [93,266269].
Structural changes upon dealumination are more severe in Cu-exchanged medium
pore and large-pore zeolites (e.g., Cu-MFI, Cu-BEA) than in small-pore zeolites (e.g.,
Cu-CHA, Cu-AEI) [93, 253, 270], which are more recalcitrant to hydrothermal deac-
tivation. Aluminum hydroxide species (Al(OH)3; ca. 0.5 nm in diam.) formed upon
dealumination at high temperatures are thought to be unable to diuse through 8-MR
windows in CHA [250] and AEI [270] (ca. 0.38 nm in diam.), which prevents the for-
mation of larger extraframework alumina aggregates and allows for reincorporation
of monomeric Al species within framework vacancy positions at low temperatures.
Dealumination upon hydrothermal aging is also suppressed by the presence of ex-
traframework cations (e.g., Cu, Na, Li, Mg) [270272], which remove Brønsted acid
sites that are vulnerable locations for hydrolysis of framework bonds [273275]. Con-
sequently, the ability of a zeolite framework to resist dealumination and retain its
structural integrity upon hydrothermal aging has been used to identify promising
candidates for practical NOx SCR catalysis.
Deactivation caused by hydrothermal aging of molecular sieves may also reect
changes to the structure and location of extraframework Cu cations, such as their
aggregation into larger Cu oxide species (CuxOy), because the former isolated cations
have been implicated as active sites for low temperature (473 K) SCR catalysis
[40, 41, 79] while the latter oxide clusters are unreactive [78]. The disappearance of
isolated Cu2+ cations upon hydrothermal aging of Cu-SSZ-13 has been inferred from
141
the attenuation of absorption features characteristic of framework (TOT) vibra-
tions (900 and 940 cm-1) perturbed by ion-exchanged Cu species in diuse-reectance
infrared (DRIFTS) spectra, from decreases in the amount of NH3 desorbed from
Lewis acidic Cu cations (ca. 553 K) in TPD experiments, 32 and from decreases in
electron paramagnetic resonance (EPR) signals for isolated Cu2+ cations [267]. The
aggregation of isolated Cu2+ cations into larger CuxOy domains upon hydrothermal
aging has been detected by electron microscopy (TEM, SEM) and energy dispersive
X-ray spectroscopy (EDX) [266268]. Isolated Cu2+ cations have also been proposed
to interact with extraframework Al species, formed via dealumination, to generate
inactive copper-aluminate domains in hydrothermally aged Cu-SSZ-13, evident in ex-
tended X-ray absorption ne structure (EXAFS) spectra that show decreased CuCu
scattering distances and increased CuAl scattering distances, and in H2 tempera-
ture programmed reduction (TPR) proles that show decreased intensities of lower
temperature (500670 K) reduction features for isolated Cu cations with the concomi-
tant appearance of higher temperature (790880 K) reduction features attributed to
copper-aluminates [269]. Additionally, 27Al MAS NMR spectra show decreased in-
tensities for tetrahedral Al lines (δ ca. 60 ppm) without concomitant increases in
intensities for octahedral Al lines (δ ca. 0 ppm), suggesting that interactions of Al
with paramagnetic Cu render them invisible to NMR detection [93]. These results
provide evidence for one possible deactivation mechanism of Cu-SSZ-13 through loss
of isolated Cu2+ active sites during hydrothermal aging, but do not account for struc-
tural changes to active sites that may result from subsequent exposure to standard
SCR reactants. Thus, identifying new zeolite topologies that retain SCR reactivity
after hydrothermal aging treatments requires knowledge of how such treatments, and
subsequent exposure to SCR reaction conditions, aect the structures of both Cu
active sites and the zeolite framework.
Here, we investigate the eects of hydrothermal aging and subsequent exposure to
standard SCR reactants at low temperatures (473 K) on the structural and active site
changes experienced by three dierent small-pore Cu-exchanged zeolites (Cu-CHA,
142
Cu-AEI, Cu-RTH). Bulk characterization techniques, including XRD patterns and
micropore volumes, reveal only subtle dierences between Cu-zeolites before and after
hydrothermal aging, and after subsequent exposure to low temperature SCR reaction
conditions, and are unable to provide direct insight into the decreases in SCR reactiv-
ity measured on hydrothermally aged, small-pore Cu-zeolites. We provide evidence
that exposure of hydrothermally aged catalysts to SCR reaction conditions at low
temperatures causes further structural changes to active Cu sites that are detectable
by UV-visible spectroscopy, consistent with the formation of mixed copper-aluminate
domains via reaction with extraframework Al species formed upon dealumination dur-
ing hydrothermal aging. These ndings demonstrate that active site and structural
characterization of hydrothermally aged Cu-zeolites after exposure to SCR reactants
at low temperatures provide more accurate inferences about their catalytic behavior.
5.2 Experimental Methods
5.2.1 Catalyst synthesis and treatment
A sample of CHA (SSZ-13) zeolite with a Si/Al ratio of 15 was made as reported
elsewhere [109]. Briey, 28.4 g of N,N,Ntrimethyl-1-adamantylammonium hydroxide
(TMAdaOH, Sachem, 25 wt%) were mixed with 71.4 g of deionized water (18.2 MΩ),
0.87 g of aluminum hydroxide (SPI Pharma, 99.9 wt%, 0325 grade), and 34.6 g of
0.1 M sodium hydroxide (NaOH; Alfa Aesar), then stirred for 15 minutes at ambi-
ent conditions. 10 g of fumed silica (Cab-o-Sil M-5) were added to the mixture and
stirred for 2 hours at ambient conditions. The nal molar composition of the syn-
thesis solution was 1 SiO2/ 0.033 Al2O3/ 0.20 TMAdaOH/ 0.02 NaOH/ 23.8 H2O.
All reagents were used without further purication. The resulting solution was trans-
ferred to eight Teon-lined Parr autoclaves (45 mL each) and held at 433 K for 10
days under rotation.
A sample of AEI (SSZ-39) zeolite with a Si/Al ratio of 9.5 was synthesized
in a rotating oven at 413 K for 4 days as reported elsewhere [276], using cis-2,6-
143
dimethylpiperidinium hydroxide as the organic structure directing agent (OSDA). The
molar composition of the synthesis mixture was 1 SiO2/ 0.017 Al2O3/ 0.07 OSDA/
0.65 OH−/ 0.58 Na+/ 12.3 H2O, obtained by mixing (aqueous) OSDA, NaOH (1 M,
RT Baker), double distilled water, sodium silicate (N type, PQ Corporation) and
CBV500 (NH4-USY, Si/Al = 2.6, Zeolyst). A sample of RTH (SSZ-50) zeolite with
a Si/Al ratio of 15 was made using the CBV720 synthesis protocol reported else-
where [208,210,277].
As-synthesized zeolites were washed alternately with deionized water and acetone,
recovered via centrifugation, and dried at 323 K for 24 hours. The dried samples were
then treated to 873 K (0.0083 K s-1) in air (Commercial grade, Indiana Oxygen) for 6
hours before ion-exchanging in an aqueous 0.1 M NH4NO3 solution (Sigma Aldrich;
1000 mL per g zeolite) at 353 K for 10 hours. NH4-exchanged zeolites were washed
with deionized H2O, recovered via centrifugation, dried at 323 K for 24 hours, then
treated at 823 K (0.0083 K s-1) in air for 6 hours to obtain H-form zeolites. Cu-
exchanged CHA, AEI, and RTH zeolites were prepared via liquid phase ion-exchange
of H-form zeolites using an aqueous 0.2 M Cu(NO3)2 solution (99.999% trace metals
basis, Sigma-Aldrich; 150 mL per g zeolite) at ambient temperature for 4 hours. The
pH during the exchange was not controlled and the nal pH of the solution was ca.
3.6.
Hydrothermal aging experiments were performed on Cu-zeolites in a three-zone
horizontal tube furnace (Applied Test Systems Series 3210), in which each zone
was equipped with independent temperature control (Watlow EZ-Zone PM Express).
Once the furnace temperature reached 373 K, water was introduced via syringe pump
(KD Scientic Legato 100) into a stream of owing air (100 mL min-1, 99.999%, Indi-
ana Oxygen), which was transferred to the furnace through stainless steel lines held at
>373 K. Approximately 1 gram of catalyst was loaded into quartz boats held within
the tube furnace and treated to 1073 K (0.033 K s-1) for 16 hours in owing air (100
mL min-1, 99.999%, Indiana Oxygen) containing 10% (v/v) water. After treatment
144
for 16 hours at 1073 K, water was removed from the owing air stream while the
sample was cooled to ambient.
5.2.2 Catalyst structural characterization
Powder diraction patterns were collected using a Rigaku SmartLab diractome-
ter with a Cu Kα radiation source (1.76 kW), from 4 to 40 with a scan rate of 0.05
s-1 and a step size of 0.01. Diraction patterns are normalized so that the maximum
peak intensity in each pattern is unity. The diraction patterns were compared to
reference patterns to conrm the RTH, CHA and AEI topologies [1].
Ar adsorption isotherms were used to determine micropore volumes on zeolite
samples (87 K) using a Micromeritics ASAP 2020 Surface Area and Porosity Analyzer.
Micropore volumes were obtained by converting adsorbed gas volumes (cm3 gcat-1 at
STP) to liquid volumes assuming the liquid density of Ar at 87 K. Samples were
pelleted and sieved to retain particles between 125250 µm in diameter. Samples
(0.030.05 g) were degassed by heating to 393 K (0.167 K s-1) under high vacuum (ca.
5 µmHg) for 2 h, and then heating to 623 K (0.167 K s-1) under high vacuum (ca. 5 µm
Hg) and holding for 9 h. Micropore volumes (cm3 gcat-1 at STP) were estimated from
extrapolation of the linear volumetric uptake during the beginning of mesopore lling
(ca. 0.080.30 P/P0) to zero relative pressure, which agreed with micropore volumes
estimated from analyzing the semi-log derivative plot of the adsorption isotherm
(∂(Vads)/∂(ln(P/P0)) vs. ln(P/P0)).
In order to quantify the fractions of framework and extraframework Al, 27Al magic
angle spinning nuclear magnetic resonance (MAS NMR) spectra were recorded on H-
form and Cu-form CHA, AEI and RTH zeolite samples. NMR spectra were collected
using a Chemagnetics CMX-Innity 400 spectrometer in a wide-bore 9.4 Tesla magnet
(Purdue Interdepartmental NMR Facility) and were acquired at ambient conditions
using a 2.3 µs pulse (equivalent to ca. 30 degrees), an acquisition time of 12.8 ms
and a relaxation delay of 1 s, and were measured at 104.24 MHz and a MAS rate
of 5 kHz. 1H decoupling was used during acquisition, employing two-pulse phase
145
modulation (TPPM) scheme. Prior to packing in a 4 mm ZrO2 rotor, zeolite samples
were hydrated by holding for >48 h in a desiccator containing a saturated potassium
chloride (KCl) solution. All 27Al MAS NMR spectra are referenced to a static sample
of AlCl3 dissolved in D2O (0 ppm 27Al line).
Diuse reectance UV-visible spectra were recorded under ambient conditions
using a Varian UV-vis-NIR spectrophotometer (Cary 5000) with a diuse reectance
accessory consisting of two ellipsoidal mirrors (Harrick Scientic Praying Mantis).
Barium sulfate (BaSO4, 99.9%, Sigma-Aldrich) was used as the 100% reectance
standard. An ex situ sample holder was loaded with 0.1 g of sample, which was
pelleted and sieved to retain particles between 125250 µm in diameter. Spectra
were collected from 7000 to 50 000 cm-1 with a scan speed of 2000 cm-1 min-1, and
spectra of the H-form zeolite was subtracted from those for corresponding Cu-zeolites
to correct for contributions of absorption from the framework.
5.2.3 Brønsted acid site quantication using NH3 titration methods
The total number of Brønsted acid sites (H+) on H-form and Cu-exchanged zeolites
was quantied by temperature programmed desorption (TPD) of NH3 on a gas-phase
plug ow reactor, as described by Bates et al. [78], using a procedure described
elsewhere [171]. For H-form zeolites, NH3 saturation was performed via aqueous-
phase exchange with NH4+ cations, as reported elsewhere [78]. For Cu-exchanged
zeolites, samples were saturated with 500 ppm NH3 diluted with He (99.999%, UHP,
Indiana Oxygen) at 433 K for 2 h with a total ow rate of 350 mL min-1. Following
this NH3 saturation step, the sample was ushed with 2.53.0% water in UHP He
(wet purge) at 433 K for 8 h while maintaining the same total ow rate to desorb
NH3 bound to non-protonic sites. Following the wet purge step, samples were heated
to 820 K (0.167 K s-1) under owing He (UHP, 350 mL min-1). The total moles of
NH3 desorbed during the TPD experiment was measured using on-board calibrations
in an MKS Multigas 2030 gas-phase FT-IR spectrometer [78].
146
5.2.4 Kinetic measurements of standard SCR turnover rates
Standard selective catalytic reduction (SCR) kinetics were measured on a bench-
top tubular glass reactor described elsewhere [37]. All samples were sieved to a
nominal size of 125250 µm and diluted with silica gel to obtain a bed height of
ca. 2.5 cm. Steady-state kinetic data were collected at NO conversions below 20%
(dierential); thus, the entire catalyst bed was exposed to approximately the same gas
concentrations. Under standard SCR conditions, the reactant gas mixture comprised
300 ppm NO (3.6% NO/Ar, Praxair), 300 ppm NH3 (3.0% NH3/Ar, Praxair), 7% CO2
(liquid, Indiana Oxygen), 10% O2 (99.5%, Indiana Oxygen), 2.5% H2O (deionized,
18.2 MΩ, introduced through saturator), and balance N2 (99.999% UHP, Indiana
Oxygen). For all kinetic measurements, the total gas stream was maintained at a
ow rate of 1.5 L min-1 and at ambient pressure (ca. 101 kPa). Apparent reaction
orders were measured by independently varying partial pressures of NH3 (0.020.05
kPa), NO (0.020.05 kPa) or O2 (515 kPa) in the reactant gas stream, and adjusting
the balance N2 to maintain a constant total gas ow rate and pressure. Apparent
activation energies were measured under standard SCR conditions by varying the
temperature between 444476 K. Outlet gas concentrations were analyzed using on-
board gas calibrations on an MKS MultigasTM 2030 gas-phase Fourier transform
infrared (FTIR) spectrometer and NO, NO2, NH3, CO2, and H2O concentration data
was recorded every 0.95 s. Kinetic measurements were recorded after waiting for outlet
gas concentrations to reach steady-state, which typically occurred after 24 hours.
Reactant pressures and temperatures were then varied over the course of 18 hours,
and nally returned to initial conditions to verify that catalytic rates returned to their
initial steady-state values and that the catalyst had not undergone any deactivation.

147
5.3 Results and Discussion
5.3.1 Structural features of CHA, AEI and RTH topologies
The salient structural features of the three molecular sieve framework topologies
studied here are summarized in Figure 5.1. The CHA framework [126] has three-
dimensional micropore interconnectivity and is formed by the repetitive stacking of
a hexagonal array of planar 6-membered rings (6-MR) connected in an AABBCC-
type stacking scheme that form hexagonal prisms (double 6-MR). These double 6-MR
(D6R) units are ordered to form large chabazite cages that are ca .0.73 nm in diameter,
which are limited by symmetric 8-MR windows that are ca. 0.38 nm in diameter. The
CHA framework contains only one crystallographically unique T-site and its unit cell
contains 36 tetrahedrally-coordinated atoms (T-atoms) connected by 4-MR, 6-MR,
and 8-MR units that are shared between adjacent cages.
The AEI framework [278] also has three-dimensional micropore interconnectivity
and is constructed from a hexagonal array of 6-MR units similar to CHA, but neigh-
boring D6R units are rotated 180 with respect to each other (Figure 5.1). The D6R
units are ordered to form AEI cavities that are ca. 0.73 nm in diameter and are con-
tained within 4-MR, 6-MR, and 8-MR units, with access into AEI cavities limited by
symmetric 8-MR windows that are ca. 0.38 nm in diameter, as in the case of CHA.
In contrast to the CHA unit cell, the AEI unit cell contains 48 T-atoms and three
crystallographically-distinct T-sites.
The RTH framework [279] is unique among the three small-pore zeolites studied
here because it does not contain D6R building units, but instead is formed by two sets
of three 4-MR that are connected via 5-MR linkages. These chained 4-MR and 5-MR
periodic building units are repeated with simple translations to form RTH cavities
that are 0.81 nm in diameter, and are contained within 4-MR, 5-MR, 6-MR, and 8-MR
units. Consequently, the RTH unit cell (32 T-atoms) contains both symmetric (0.38
nm x 0.41 nm) and asymmetric (0.25 nm x 0.56 nm) 8-MR windows that result in
only two-dimensional pore interconnectivity. RTH contains four crystallographically-

148
distinct T-sites, three of which occupy positions accessible through either of the two
8-MR windows, and one that resides within the interconnected 4-MR chain and is
inaccessible from the RTH cavity.
5.3.2 Synthesis and characterization of H-form and Cu-form zeolites before hy-drothermal aging
Powder XRD patterns of H-form AEI, CHA, and RTH zeolites (Fig. 5.7, Supp.
Info.) were consistent with reported diraction patterns for these topologies [1] and
did not show diraction peaks for phase impurities. Ar adsorption isotherms (87
K) on H-form zeolites (Fig. 5.8, Supp. Info.) gave micropore volumes (Table 5.1)
consistent with the AEI [278], CHA [109], and RTH [279] topologies. 27Al MAS
NMR spectra of H-form zeolites (Fig. 5.9-5.11, Supp. Info.) show predominantly Al
incorporated into tetrahedral framework positions (Alf , δ ca. 60 ppm), with Alf/Altot
values quantied to be 0.85 for H-CHA, 0.85 for H-AEI, and 0.94 for H-RTH (Table
5.2). The number of protons per framework Al atom (H6+/Alf , Table 5.2) measured
by NH3 TPD (Fig. 5.2) on H-form zeolites was 0.95 and 0.85 for H-CHA and H-
AEI, respectively, indicating that nearly every framework Al generated a proton. In
contrast, the H+/Alf value was much lower on H-RTH (0.60, Table 5.2), suggesting
either that some framework Al atoms generate H+ sites that are inaccessible to NH3,
or that not all Al atoms are associated with a corresponding proton site. In the RTH
framework, it is plausible that some H+ sites are inaccessible to NH3, which has a
kinetic diameter (ca. 0.26 nm) [280] that is larger than one of the dimensions of the
distorted RTH window (0.56 nm x 0.25 nm), and because one of the four T-sites in
RTH is in a location that is inaccessible from the RTH cage. Infrared spectra collected
after H-RTH was exposed to NH3 (433 K), however, showed complete disappearance
of Brønsted acidic OH stretches (Fig. 5.13, Supp. Info.) indicating that all H+ sites
are accessible to NH3. Therefore, the H+/Alf value of 0.60 on H-RTH reects the
presence of distorted Al structures that do not generate H+ sites, but are otherwise
detected as Alf species in NMR spectra, as noted previously [78,118,281].
149
Powder XRD patterns of AEI, CHA, and RTH zeolites after Cu exchange do not
show signicant changes in structure compared to their respective H-form zeolites or
the presence of bulk CuxOy (Fig. 5.7, Supp. Info.). The micropore volume of each
Cu-exchanged zeolite decreased slightly (Table 5.2; Fig. 5.8, Supp. Info.) due to the
presence of extraframework Cu cations, which occupy a small, but detectable, fraction
of the void volume. Gaseous NH3 titration [78, 171] of residual H+ sites on Cu-CHA
(Cu/Al = 0.12) shows that H+ sites are replaced with an exchange stoichiometry of
two protons per Cu, reecting the presence of only divalent Cu2+ cations (Table 5.2,
Fig. 5.2). This result is consistent (within experimental error) with the sequential
exchange of isolated Cu2+ at paired Al sites until saturation followed by subsequent
exchange of monovalent [CuOH]+ at isolated Al sites [42,79,218]. Cu-RTH (Cu/Al =
0.11) shows an H+/Cu exchange stoichiometry of two that suggests only Cu2+ sites
are present, while Cu-AEI (Cu/Al = 0.17) shows an H+/Cu exchange stoichiometry
between 1 and 2 that suggests a mixture of Cu2+ and [CuOH]+ sites are present. UV-
visible spectra of hydrated Cu-AEI, Cu-CHA, and Cu-RTH zeolites (Fig. 5.3) show
absorption bands characteristic of dd transitions for hydrated Cu2+ complexes (ca.
12,500 cm-1) and broad bands for metalligand charge transfer (35,00047,000 cm-1),
which are convoluted by zeolitic framework metaloxygen charge transfer (36,750 and
43,500 cm-1) and CuO charge transfer (ca. 42,000 cm-1) [36,282,283]. An additional
feature is present at ca. 25 000 cm-1 in the UV-vis spectrum of Cu-RTH, but not in
spectra of either Cu-AEI or Cu-CHA, and appears in a region attributed to CuO
charge transfer in small Cu oxide clusters [36].
5.3.3 Standard SCR kinetics of Cu-zeolites before hydrothermal aging
Rates of NO consumption (473 K, per Cu) during standard SCR (equimolar NO
and NH3, with O2 as the oxidant) are shown in Table 5.3 and plotted in Fig. 5.4.
The measured NO consumption rate (per Cu) was similar on Cu-AEI and Cu-CHA
(within 1.3x), although direct quantitative comparison of these turnover rates is not
rigorously justied since they appear to be measured in dierent kinetic regimes,
150
reected in the dierent apparent NH3 reaction orders of -0.5 and -0.1 on Cu-CHA
and Cu-AEI (Table 5.3), respectively. The measured NO consumption rate was lower
(by 2.22.9x) on Cu-RTH than on either Cu-AEI or Cu-CHA (Table 5.3). At rst
glance, the similar turnover rates (per Cu) on Cu-CHA, Cu-AEI and Cu-RTH (within
3x, 473 K) seem reminiscent of standard SCR turnover rates (473 K) that have been
reported to be insensitive to the zeolite topology (CHA, BEA, MFI), as a consequence
of the solvation of Cu cations by NH3 during low temperature SCR conditions [79].
Apparent activation energies (Table 5.3) estimated from rate data collected be-
tween 444476 K (Fig. 5.4) were similar on Cu-AEI (46 ± 5 kJ mol-1) and Cu-CHA
(56 ± 5 kJ mol-1), and in a range previously reported for standard SCR activation
energies on Cu-CHA (Si/Al = 35, Cu/Al = 00.31) [37,40]. Apparent activation ener-
gies were much lower on Cu-RTH (28 ± 5 kJ mol-1), however, and approximately half
of the value measured on Cu-CHA, characteristic of severe intrazeolite mass transfer
limitations. Both the CHA and AEI frameworks contain three-dimensional pore sys-
tems interconnected by symmetric 8-MR windows (0.38 nm diameter), but the RTH
framework is a two-dimensional pore system with a limiting asymmetric 8-MR ring
of size (0.25 nm) similar to the kinetic diameter of the SCR reactants (ca. 0.3 nm).
In eect, the RTH framework appears to behave as a one-dimensional pore system
for this reaction, in which reactants preferentially diuse through the symmetric 8-
MR window. Internal diusion limitations have been proposed to account for the
lower NOx conversions (423573 K) in two-dimensional, small-pore LEV and DDR
zeolites, when compared to three-dimensional small-pore CHA zeolites [250]. Thus,
while small-pore zeolites show improved hydrothermal stability over medium and
large-pore zeolites [93,253], considerations of pore connectivity and limiting aperture
sizes are also critical in determining the reactivity of Cu sites located within them.
The number of residual H+ sites (per Altot) on Cu-CHA before and after exposure
to SCR gases was 0.72 and 0.70 ± 0.05, respectively. Similarly, the residual H+/Alf
value on Cu-AEI and Cu-RTH changed only from 0.54 to 0.50 ± 0.05 and from 0.38
to 0.39 ± 0.05, respectively (Table 5.3). Therefore, exposure to SCR gases did not
151
signicantly change the number of residual H+ sites on Cu-AEI, Cu-CHA and Cu-
RTH, indicating that framework Al remained largely intact on Cu-zeolites after NOx
SCR catalysis. Ar micropore and mesopore volume measurements (87 K) on Cu-
AEI, Cu-CHA and Cu-RTH before and after exposure to SCR gases were unchanged
(Table 5.3, Fig. 5.6), with micropore volumes for both Cu-CHA and Cu-RTH of 0.17
cm3 g-1 and for Cu-AEI of 0.180.19 cm3 g-1 before and after exposure to SCR gases,
respectively. Similarly, the mesopore volume for Cu-AEI, Cu-CHA and Cu-RTH
zeolites before and after exposure to SCR gases were the same, within experimental
error, between 0.030.05 cm3 g-1 (Table 5.3). Taken together, these characterization
data of Cu-zeolites that have not been exposed to hydrothermal aging treatments
indicate that minimal changes to H+ or Cu sites, or the zeolite framework, occur
after exposure to low temperature standard SCR reaction conditions (473 K).
5.3.4 Characterization of Cu-form zeolites before and after hydrothermal aging
Severe hydrothermal aging treatments of each Cu-exchanged zeolite, performed
to reproduce the eects experienced during a 135,000 mile lifetime (1073 K, 10%
(v/v) H2O, 16 h) [268], did not result in detectable loss of long-range structure as in-
ferred from powder XRD patterns (Fig. 5.5). After hydrothermal aging treatments,
the Ar micropore volumes decreased by only ca. 10% on Cu-AEI and Cu-CHA,
but remained constant on Cu-RTH (Table 5.3, Fig. 5.6). 27Al MAS NMR spec-
tra of Cu-zeolites after hydrothermal aging (Fig. 5.1) show decreased intensities for
tetrahedrally-coordinated Al lines (Alf, ca. 60 ppm; Table 5.3) and increased inten-
sities in octahedrally-coordinated Al lines (Alex, ca. 0 ppm; Fig. 5.1), indicating the
formation of extraframework Al species from framework dealumination. Framework
dealumination occurred to greater extents on Cu-RTH (ca. 25% loss in Alf) than
on either Cu-AEI or Cu-CHA (ca.7% loss in Alf), although we note that Al quan-
tication from NMR spectra of Cu-zeolites will be aected by species that are not
detected because of interactions with paramagnetic Cu [284]. Moreover, hydrother-
mal aging of Cu-RTH results in the appearance of a broad shoulder at ca. 4050 ppm
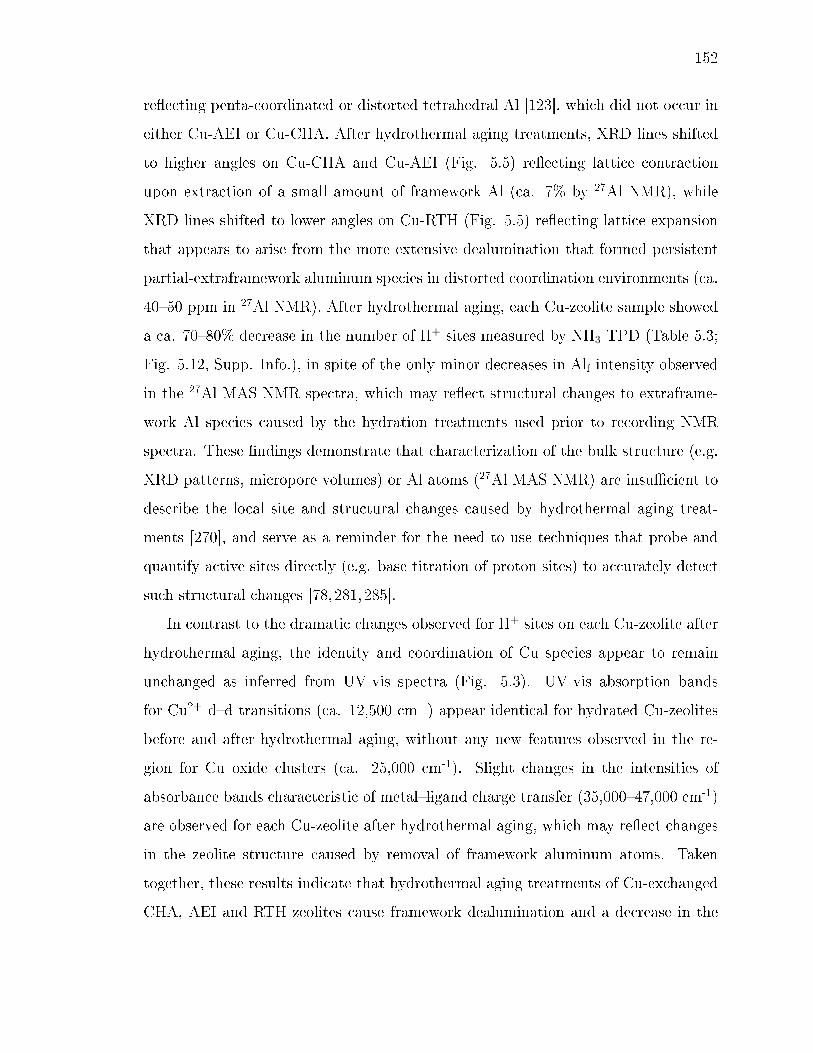
152
reecting penta-coordinated or distorted tetrahedral Al [123], which did not occur in
either Cu-AEI or Cu-CHA. After hydrothermal aging treatments, XRD lines shifted
to higher angles on Cu-CHA and Cu-AEI (Fig. 5.5) reecting lattice contraction
upon extraction of a small amount of framework Al (ca. 7% by 27Al NMR), while
XRD lines shifted to lower angles on Cu-RTH (Fig. 5.5) reecting lattice expansion
that appears to arise from the more extensive dealumination that formed persistent
partial-extraframework aluminum species in distorted coordination environments (ca.
4050 ppm in 27Al NMR). After hydrothermal aging, each Cu-zeolite sample showed
a ca. 7080% decrease in the number of H+ sites measured by NH3 TPD (Table 5.3;
Fig. 5.12, Supp. Info.), in spite of the only minor decreases in Alf intensity observed
in the 27Al MAS NMR spectra, which may reect structural changes to extraframe-
work Al species caused by the hydration treatments used prior to recording NMR
spectra. These ndings demonstrate that characterization of the bulk structure (e.g.
XRD patterns, micropore volumes) or Al atoms (27Al MAS NMR) are insucient to
describe the local site and structural changes caused by hydrothermal aging treat-
ments [270], and serve as a reminder for the need to use techniques that probe and
quantify active sites directly (e.g. base titration of proton sites) to accurately detect
such structural changes [78,281,285].
In contrast to the dramatic changes observed for H+ sites on each Cu-zeolite after
hydrothermal aging, the identity and coordination of Cu species appear to remain
unchanged as inferred from UV-vis spectra (Fig. 5.3). UV-vis absorption bands
for Cu2+ dd transitions (ca. 12,500 cm-1) appear identical for hydrated Cu-zeolites
before and after hydrothermal aging, without any new features observed in the re-
gion for Cu oxide clusters (ca. 25,000 cm-1). Slight changes in the intensities of
absorbance bands characteristic of metalligand charge transfer (35,00047,000 cm-1)
are observed for each Cu-zeolite after hydrothermal aging, which may reect changes
in the zeolite structure caused by removal of framework aluminum atoms. Taken
together, these results indicate that hydrothermal aging treatments of Cu-exchanged
CHA, AEI and RTH zeolites cause framework dealumination and a decrease in the
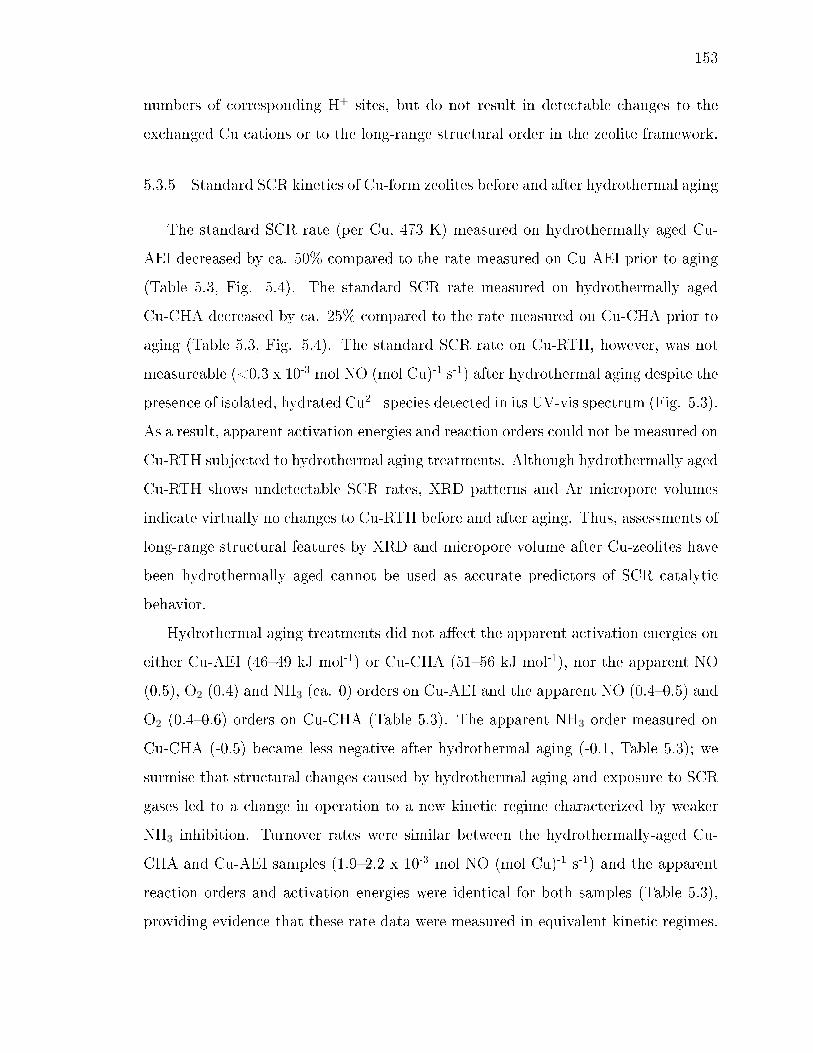
153
numbers of corresponding H+ sites, but do not result in detectable changes to the
exchanged Cu cations or to the long-range structural order in the zeolite framework.
5.3.5 Standard SCR kinetics of Cu-form zeolites before and after hydrothermal aging
The standard SCR rate (per Cu, 473 K) measured on hydrothermally aged Cu-
AEI decreased by ca. 50% compared to the rate measured on Cu-AEI prior to aging
(Table 5.3, Fig. 5.4). The standard SCR rate measured on hydrothermally aged
Cu-CHA decreased by ca. 25% compared to the rate measured on Cu-CHA prior to
aging (Table 5.3, Fig. 5.4). The standard SCR rate on Cu-RTH, however, was not
measureable (<0.3 x 10⁻³ mol NO (mol Cu)-1 s-1) after hydrothermal aging despite the
presence of isolated, hydrated Cu2+ species detected in its UV-vis spectrum (Fig. 5.3).
As a result, apparent activation energies and reaction orders could not be measured on
Cu-RTH subjected to hydrothermal aging treatments. Although hydrothermally aged
Cu-RTH shows undetectable SCR rates, XRD patterns and Ar micropore volumes
indicate virtually no changes to Cu-RTH before and after aging. Thus, assessments of
long-range structural features by XRD and micropore volume after Cu-zeolites have
been hydrothermally aged cannot be used as accurate predictors of SCR catalytic
behavior.
Hydrothermal aging treatments did not aect the apparent activation energies on
either Cu-AEI (4649 kJ mol-1) or Cu-CHA (5156 kJ mol-1), nor the apparent NO
(0.5), O2 (0.4) and NH3 (ca. 0) orders on Cu-AEI and the apparent NO (0.40.5) and
O2 (0.40.6) orders on Cu-CHA (Table 5.3). The apparent NH3 order measured on
Cu-CHA (-0.5) became less negative after hydrothermal aging (-0.1, Table 5.3); we
surmise that structural changes caused by hydrothermal aging and exposure to SCR
gases led to a change in operation to a new kinetic regime characterized by weaker
NH3 inhibition. Turnover rates were similar between the hydrothermally-aged Cu-
CHA and Cu-AEI samples (1.92.2 x 10-3 mol NO (mol Cu)-1 s-1) and the apparent
reaction orders and activation energies were identical for both samples (Table 5.3),
providing evidence that these rate data were measured in equivalent kinetic regimes.

154
These data indicate that the Cu species that remain active on both CHA and AEI
after hydrothermal aging behave catalytically similar, which may be linked to the
nature of the Cu2+ exchange sites at the 6-MR windows of D6R composite building
units that are found in both CHA and AEI.
5.3.6 Characterization of Cu-form zeolites before and after hydrothermal aging, andafter exposure to NOx SCR
Ar adsorption isotherms (87 K) and micropore volumes (Fig. 5.6, Table 5.3) of
Cu-zeolites after hydrothermal aging were indistinguishable before and after exposure
to low temperature standard SCR reaction conditions (473 K). XRD patterns were
also similar for hydrothermally-aged Cu-zeolites before and after exposure to standard
SCR gases (Fig. 5.5). These characterization data indicate that further structural
changes to the zeolite framework did not occur when aged Cu-zeolites were exposed
to standard SCR gas mixtures. The number of H+ sites on hydrothermally-aged Cu-
AEI and Cu-CHA zeolites were also similar before and after exposure to standard
SCR gas mixtures (Table 5.3), but H+ sites were no longer detectable (<0.03 H+/Al,
Table 5.3) on hydrothermally-aged Cu-RTH exposed to SCR gases. UV-vis spectra of
hydrothermally-aged Cu-CHA and Cu-RTH zeolites after exposure to standard SCR
reactants (Fig. 5.3) showed a reduction in Cu2+ dd transition intensity (ca. 12,500
cm-1) and concomitant increases in intensity for broad absorption bands between
20,00040,000 cm-1. The spectra of Cu-AEI, however, retained similar dd transition
intensity after aging and exposure to SCR reactants, with an increase in intensity in
the metalligand charge transfer region (35,00047,000 cm-1) that is also observed for
Cu-CHA, but not for Cu-RTH.
The Cu structure in Cu-CHA, Cu-AEI and Cu-RTH, characterized by UV-vis
spectra, showed hardly any changes after hydrothermal aging treatments, but showed
noticeable decreases in Cu2+ intensity upon subsequent exposure to low temperature
SCR reaction conditions. These ndings provide evidence that hydrothermal aging
causes removal of Al from framework to extraframework positions, and that further
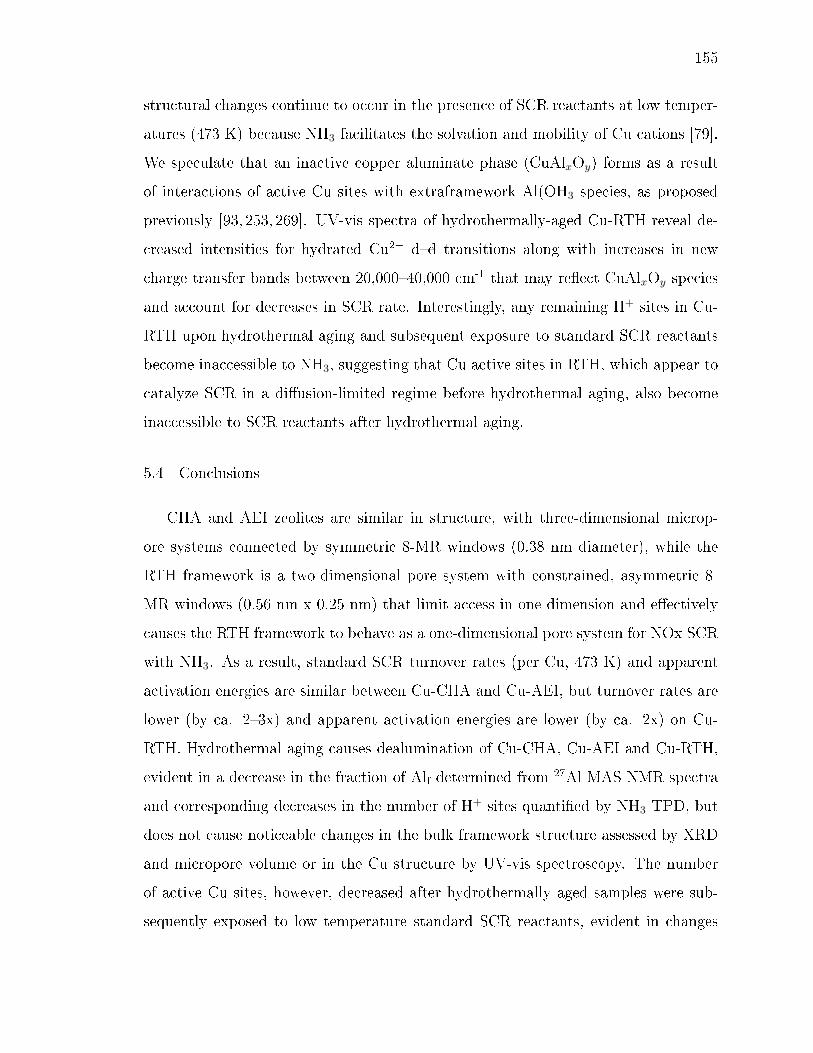
155
structural changes continue to occur in the presence of SCR reactants at low temper-
atures (473 K) because NH3 facilitates the solvation and mobility of Cu cations [79].
We speculate that an inactive copper aluminate phase (CuAlxOy) forms as a result
of interactions of active Cu sites with extraframework Al(OH3 species, as proposed
previously [93, 253, 269]. UV-vis spectra of hydrothermally-aged Cu-RTH reveal de-
creased intensities for hydrated Cu2+ dd transitions along with increases in new
charge transfer bands between 20,00040,000 cm-1 that may reect CuAlxOy species
and account for decreases in SCR rate. Interestingly, any remaining H+ sites in Cu-
RTH upon hydrothermal aging and subsequent exposure to standard SCR reactants
become inaccessible to NH3, suggesting that Cu active sites in RTH, which appear to
catalyze SCR in a diusion-limited regime before hydrothermal aging, also become
inaccessible to SCR reactants after hydrothermal aging.
5.4 Conclusions
CHA and AEI zeolites are similar in structure, with three-dimensional microp-
ore systems connected by symmetric 8-MR windows (0.38 nm diameter), while the
RTH framework is a two-dimensional pore system with constrained, asymmetric 8-
MR windows (0.56 nm x 0.25 nm) that limit access in one dimension and eectively
causes the RTH framework to behave as a one-dimensional pore system for NOx SCR
with NH3. As a result, standard SCR turnover rates (per Cu, 473 K) and apparent
activation energies are similar between Cu-CHA and Cu-AEI, but turnover rates are
lower (by ca. 23x) and apparent activation energies are lower (by ca. 2x) on Cu-
RTH. Hydrothermal aging causes dealumination of Cu-CHA, Cu-AEI and Cu-RTH,
evident in a decrease in the fraction of Alf determined from 27Al MAS NMR spectra
and corresponding decreases in the number of H+ sites quantied by NH3 TPD, but
does not cause noticeable changes in the bulk framework structure assessed by XRD
and micropore volume or in the Cu structure by UV-vis spectroscopy. The number
of active Cu sites, however, decreased after hydrothermally aged samples were sub-
sequently exposed to low temperature standard SCR reactants, evident in changes

156
to UV-vis spectra and concomitant decreases in standard SCR turnover rates. Hy-
drothermal aging causes removal of Al from framework to extraframework positions,
and further structural changes continue to occur in the presence of ammonia at low
temperatures (473 K), which solvate and mobilize extraframework cations to facili-
tate the formation of inactive copper-aluminate phases (CuAlxOy). These structural
changes appear to occur more readily in Cu-RTH than either Cu-AEI or Cu-CHA,
providing further evidence linking the presence of double six-membered rings (D6R)
in small-pore molecular sieve frameworks to increased resistance to active site and
framework structural changes upon hydrothermal aging.
Bulk structural characterization of small-pore zeolites after hydrothermal aging
treatments cannot be used to accurately infer catalytic behavior for low tempera-
ture NOx SCR with NH3. This is evident in the case of hydrothermally-aged Cu-
RTH, which deactivates completely upon exposure to standard SCR reactants but
is characterized by similar bulk properties (XRD, micropore volume) before and
after hydrothermal aging. Probes of Al structure (e.g., 27Al MAS NMR) reveal
that octahedrally-coordinated Al species are formed after hydrothermal aging of Cu-
zeolites, but in amounts that are unable to account for the much larger disappearance
in Brønsted acid sites titrated by NH3, providing another reminder that methods to
directly probe active sites are needed to assess their structural changes. We con-
clude that more accurate assessments of molecular sieve framework topologies that
are viable for practical NOx SCR catalysis require quantication and characterization
of Al and Cu site structures after hydrothermally aged samples are exposed to low
temperature SCR reaction conditions. We expect that holistic approaches to active
site characterization, especially of Al and Cu sites, in Cu-zeolites after hydrothermal
aging and subsequent exposure to low temperature SCR reaction conditions will be
able to provide more accurate guidance about molecular sieve topologies that are
viable candidates for practical SCR technologies.
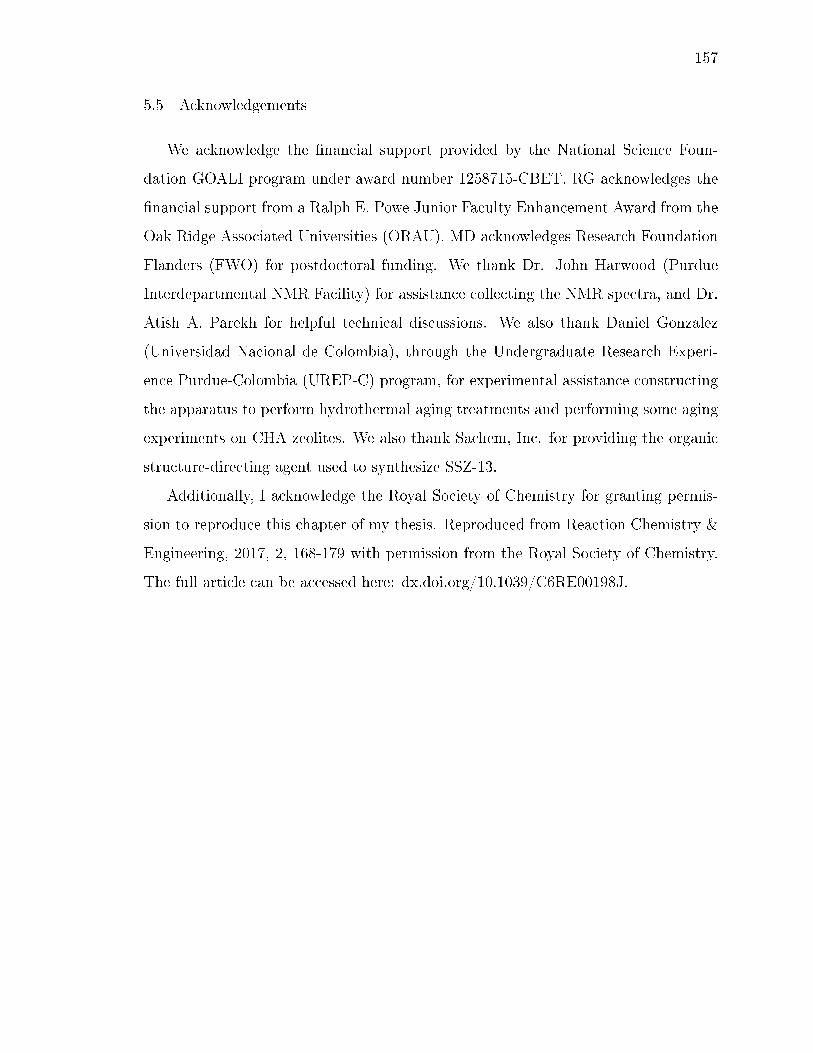
157
5.5 Acknowledgements
We acknowledge the nancial support provided by the National Science Foun-
dation GOALI program under award number 1258715-CBET. RG acknowledges the
nancial support from a Ralph E. Powe Junior Faculty Enhancement Award from the
Oak Ridge Associated Universities (ORAU). MD acknowledges Research Foundation
Flanders (FWO) for postdoctoral funding. We thank Dr. John Harwood (Purdue
Interdepartmental NMR Facility) for assistance collecting the NMR spectra, and Dr.
Atish A. Parekh for helpful technical discussions. We also thank Daniel Gonzalez
(Universidad Nacional de Colombia), through the Undergraduate Research Experi-
ence Purdue-Colombia (UREP-C) program, for experimental assistance constructing
the apparatus to perform hydrothermal aging treatments and performing some aging
experiments on CHA zeolites. We also thank Sachem, Inc. for providing the organic
structure-directing agent used to synthesize SSZ-13.
Additionally, I acknowledge the Royal Society of Chemistry for granting permis-
sion to reproduce this chapter of my thesis. Reproduced from Reaction Chemistry &
Engineering, 2017, 2, 168-179 with permission from the Royal Society of Chemistry.
The full article can be accessed here: dx.doi.org/10.1039/C6RE00198J.
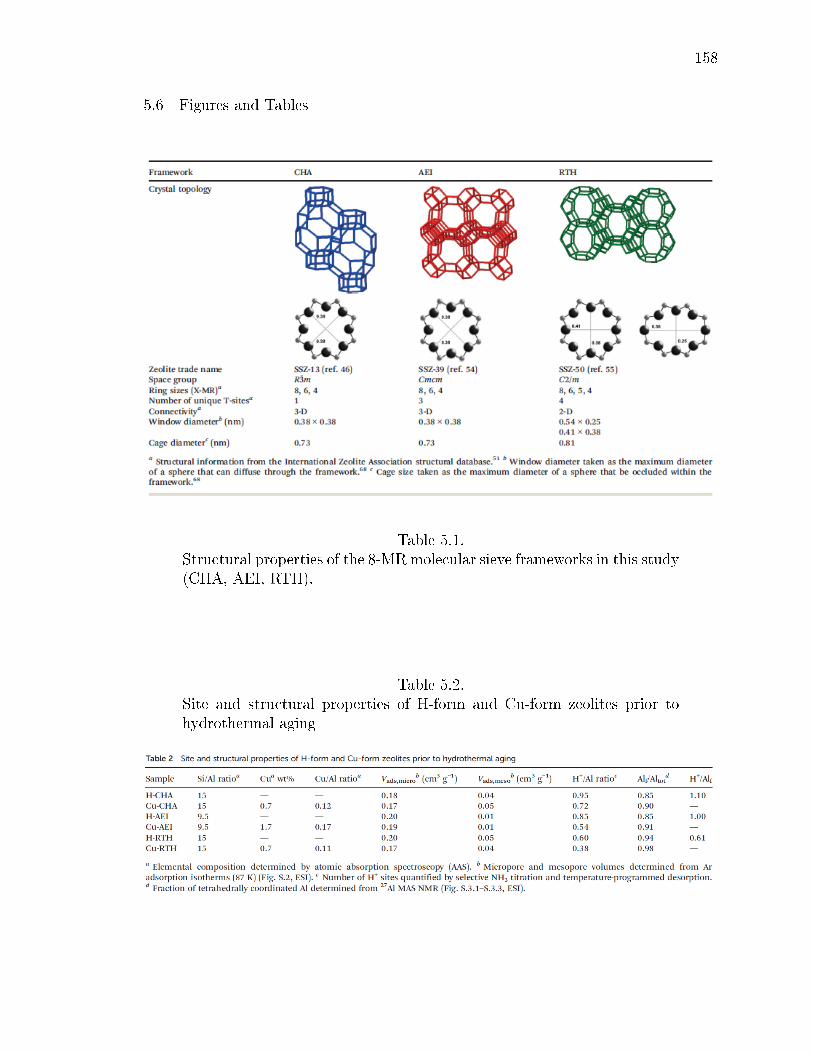
158
5.6 Figures and Tables
Table 5.1.Structural properties of the 8-MRmolecular sieve frameworks in this study(CHA, AEI, RTH).
Table 5.2.Site and structural properties of H-form and Cu-form zeolites prior tohydrothermal aging

159
Table 5.3.Site and structural properties of H-form zeolites, and of Cu-exchanged ze-olites before and after hydrothermal aging, and before and after exposureto standard SCR gases. Standard SCR rates (473 K), apparent activationenergies, and apparent reaction orders for Cu-form zeolites before andafter hydrothermal aging treatments.

160
Figure 5.1. 27Al MAS NMR spectra of hydrated fresh (solid) and aged(dashed) Cu-form of RTH, CHA and AEI zeolites.
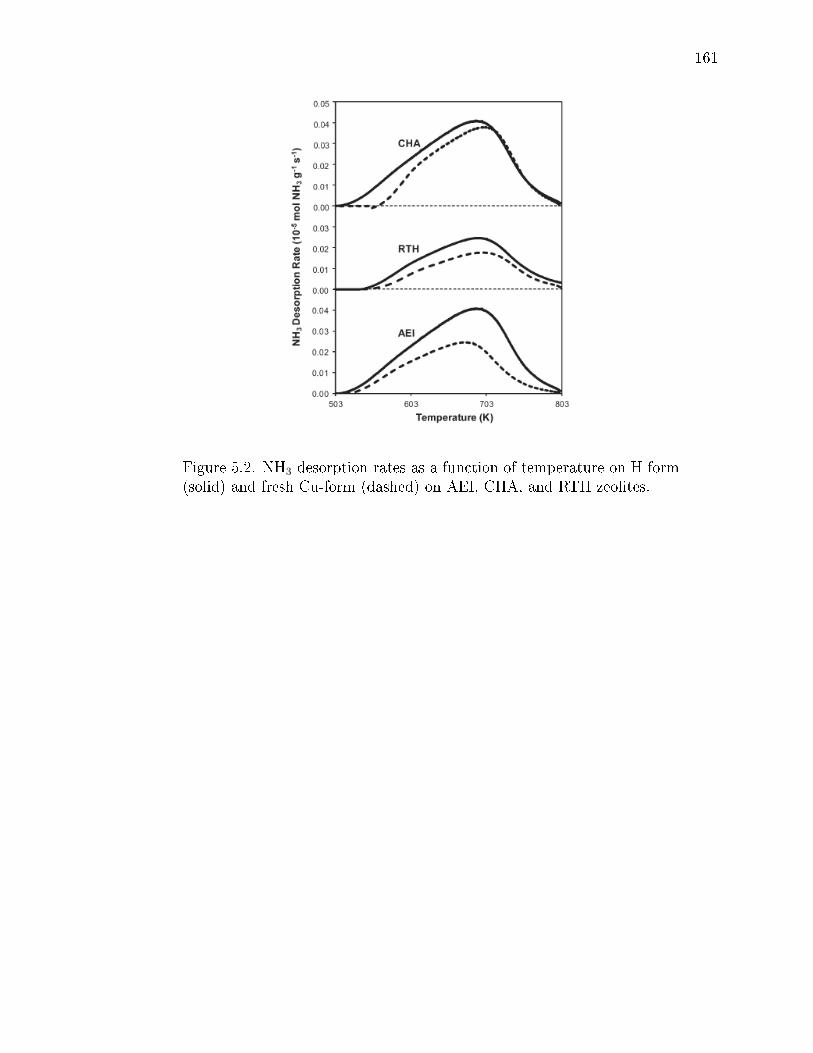
161
Figure 5.2. NH3 desorption rates as a function of temperature on H-form(solid) and fresh Cu-form (dashed) on AEI, CHA, and RTH zeolites.

162
Figure 5.3. UV-vis spectra on hydrated fresh Cu-form before SCR (solid),aged Cu-form before SCR (dashed), and aged after SCR (dotted) on RTH,CHA and AEI zeolites. Spectra are oset for clarity (CHA: by 0.4 a.u.,RTH: by 0.8 a.u.).
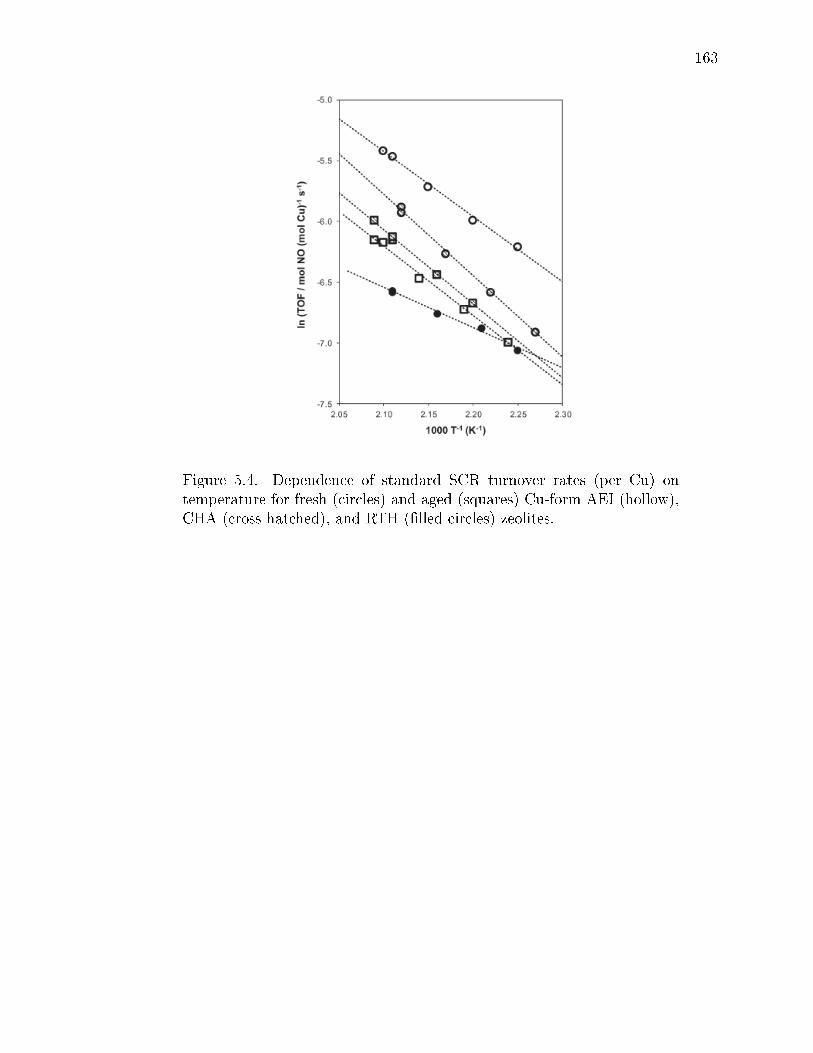
163
Figure 5.4. Dependence of standard SCR turnover rates (per Cu) ontemperature for fresh (circles) and aged (squares) Cu-form AEI (hollow),CHA (cross hatched), and RTH (lled circles) zeolites.

164
Figure 5.5. Powder XRD patterns of fresh Cu-form before SCR (dark),aged Cu-form before SCR (medium), and aged Cu-form after SCR (light)on AEI, CHA, and RTH zeolites. Diraction patterns are normalized sothat the maximum peak intensity in each pattern is unity, and oset forclarity.

165
Figure 5.6. Ar adsorption isotherms (87 K) on fresh Cu-form before SCR(circles), aged Cu-form before SCR (triangles), aged Cu-form after SCR(squares) on AEI, CHA, and RTH zeolites. Isotherms are vertically osetfor clarity (CHA: 160 cm3 g-1, RTH: by 320 cm3 g-1).
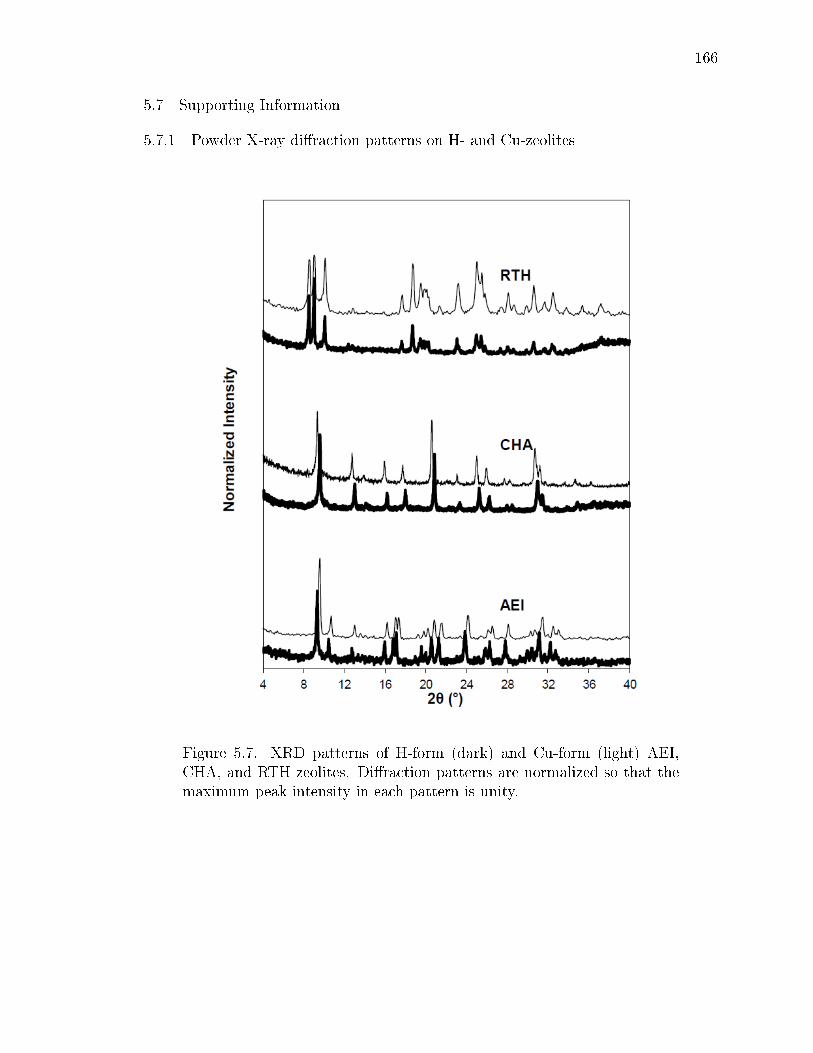
166
5.7 Supporting Information
5.7.1 Powder X-ray diraction patterns on H- and Cu-zeolites
Figure 5.7. XRD patterns of H-form (dark) and Cu-form (light) AEI,CHA, and RTH zeolites. Diraction patterns are normalized so that themaximum peak intensity in each pattern is unity.
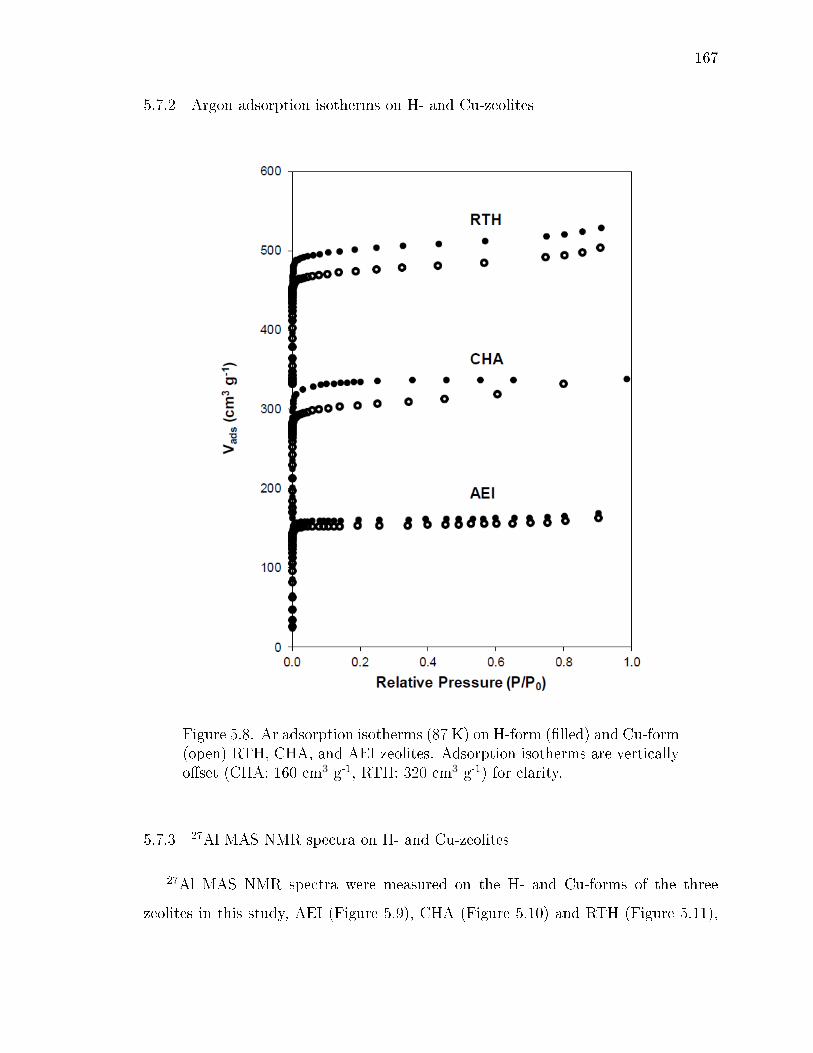
167
5.7.2 Argon adsorption isotherms on H- and Cu-zeolites
Figure 5.8. Ar adsorption isotherms (87 K) on H-form (lled) and Cu-form(open) RTH, CHA, and AEI zeolites. Adsorption isotherms are verticallyoset (CHA: 160 cm3 g-1, RTH: 320 cm3 g-1) for clarity.
5.7.3 27Al MAS NMR spectra on H- and Cu-zeolites
27Al MAS NMR spectra were measured on the H- and Cu-forms of the three
zeolites in this study, AEI (Figure 5.9), CHA (Figure 5.10) and RTH (Figure 5.11),
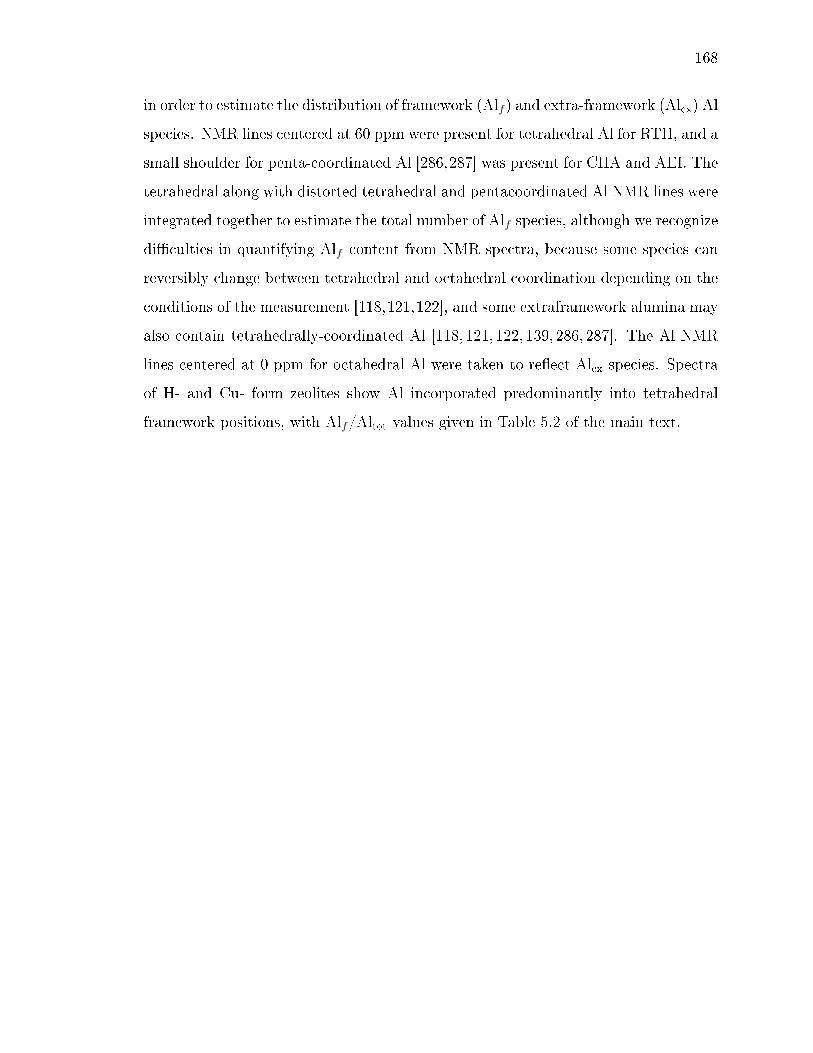
168
in order to estimate the distribution of framework (Alf ) and extra-framework (Alex) Al
species. NMR lines centered at 60 ppm were present for tetrahedral Al for RTH, and a
small shoulder for penta-coordinated Al [286,287] was present for CHA and AEI. The
tetrahedral along with distorted tetrahedral and pentacoordinated Al NMR lines were
integrated together to estimate the total number of Alf species, although we recognize
diculties in quantifying Alf content from NMR spectra, because some species can
reversibly change between tetrahedral and octahedral coordination depending on the
conditions of the measurement [118,121,122], and some extraframework alumina may
also contain tetrahedrally-coordinated Al [118, 121, 122, 139, 286, 287]. The Al NMR
lines centered at 0 ppm for octahedral Al were taken to reect Alex species. Spectra
of H- and Cu- form zeolites show Al incorporated predominantly into tetrahedral
framework positions, with Alf/Altot values given in Table 5.2 of the main text.
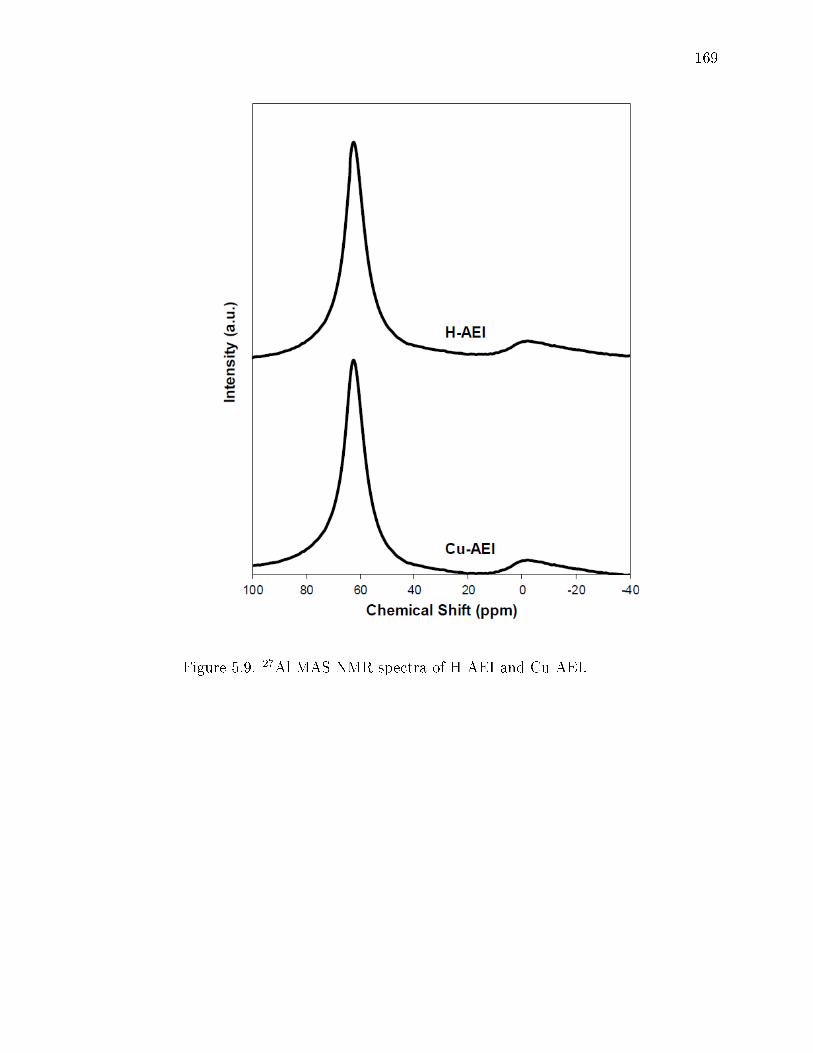
169
Figure 5.9. 27Al MAS NMR spectra of H-AEI and Cu-AEI.
170
Figure 5.10. 27Al MAS NMR spectra of H-CHA and Cu-CHA.
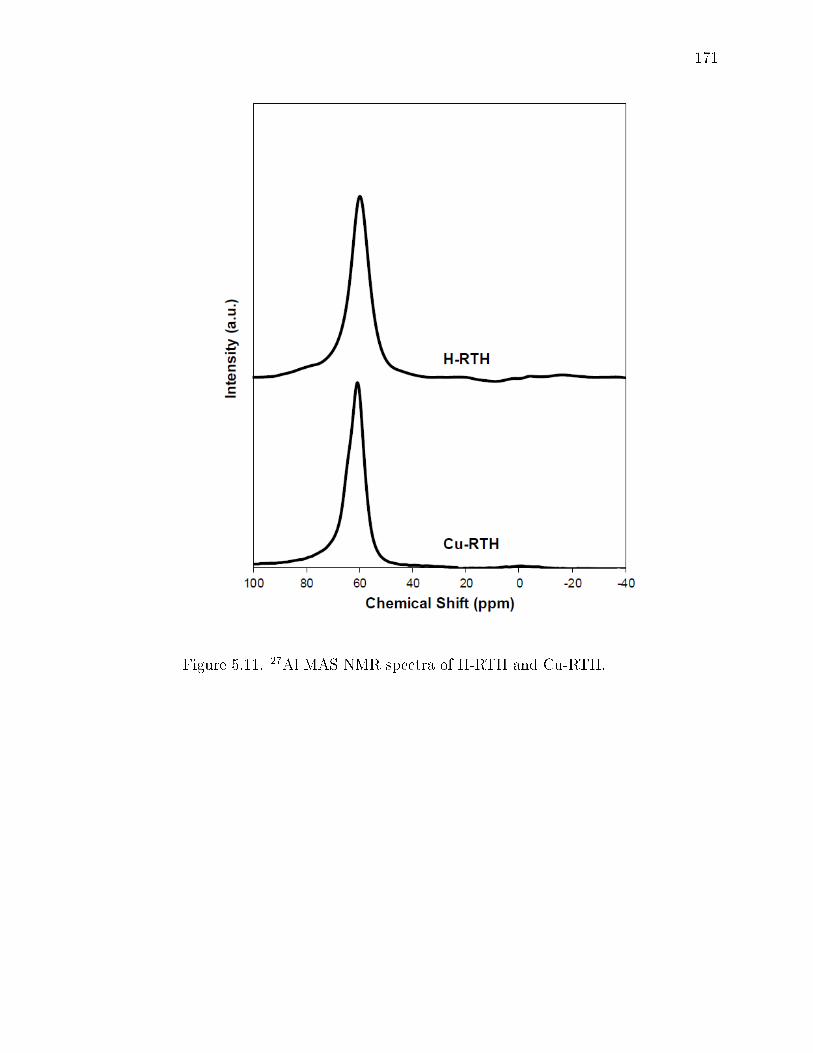
171
Figure 5.11. 27Al MAS NMR spectra of H-RTH and Cu-RTH.
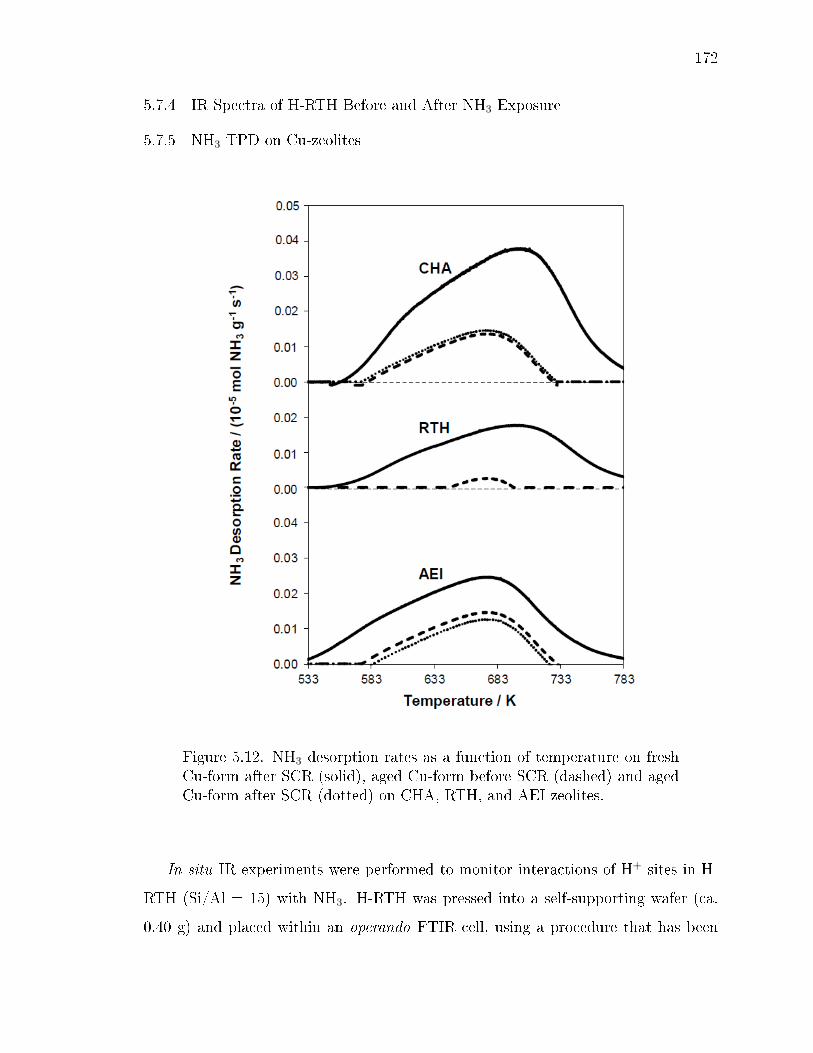
172
5.7.4 IR Spectra of H-RTH Before and After NH3 Exposure
5.7.5 NH3 TPD on Cu-zeolites
Figure 5.12. NH3 desorption rates as a function of temperature on freshCu-form after SCR (solid), aged Cu-form before SCR (dashed) and agedCu-form after SCR (dotted) on CHA, RTH, and AEI zeolites.
In situ IR experiments were performed to monitor interactions of H+ sites in H-
RTH (Si/Al = 15) with NH3. H-RTH was pressed into a self-supporting wafer (ca.
0.40 g) and placed within an operando FTIR cell, using a procedure that has been

173
described elsewhere [288]. The sample was heated to 723 K and held for 2 h under
50 cm3 min-1 of 10% O2 (99.5%, Indiana Oxygen) and balance N2 (99.999% UHP,
Indiana Oxygen), and then cooled to 433 K under ow (10% O2 and balance N2)
to give the spectra (dark traces) in Figure 5.13 and refg: Albarracin2016-SF7 (OH
stretching region shown in Fig. 5.13, NH bending region shown in Fig. 5.14). The
H-RTH wafer was then saturated in owing NH3 (350 ppm, 3 h, 433 K), to give
the spectra (light traces) in Figure 5.13. After NH3 saturation, Brønsted OH bands
disappeared completely, and new IR bands for NH4+ bending vibrations at 1425 cm-1
appeared concomitantly. These data indicate that all H+ sites in H-RTH were titrated
by NH3, and that the H+/Alf value of 0.61 measured in NH3 TPD experiments does
not reect a fraction of H+ sites that were inaccessible to NH3.
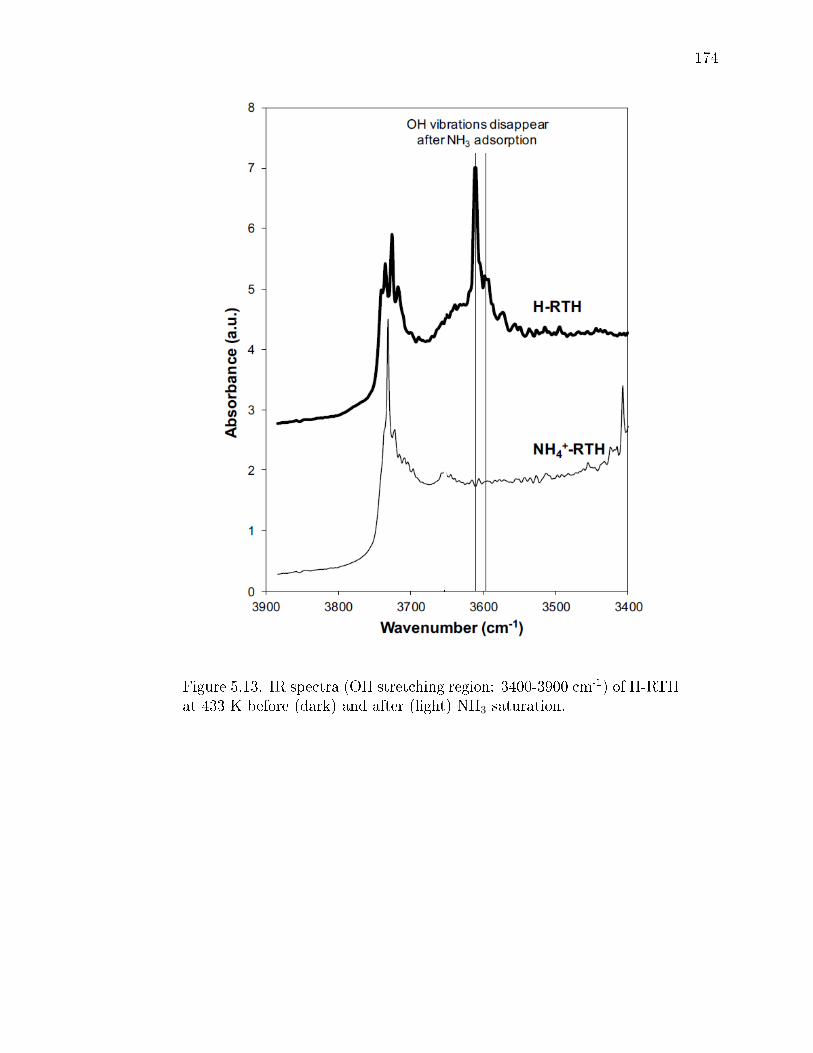
174
Figure 5.13. IR spectra (OH stretching region: 3400-3900 cm-1) of H-RTHat 433 K before (dark) and after (light) NH3 saturation.
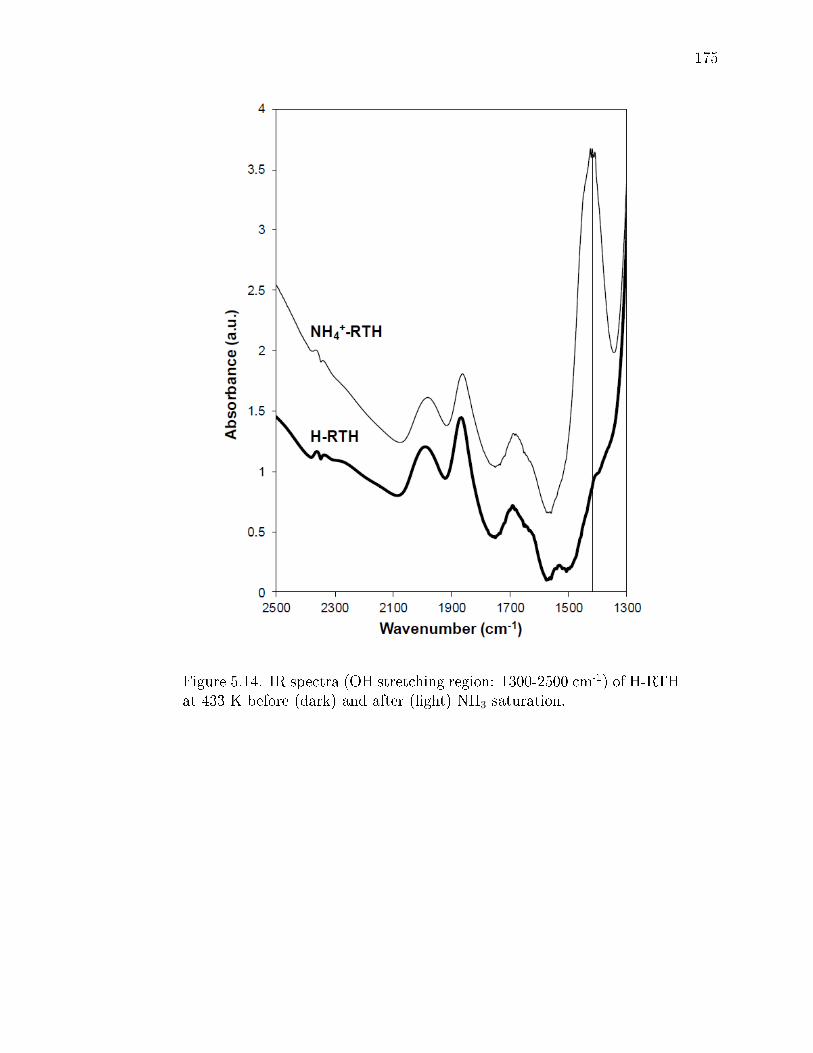
175
Figure 5.14. IR spectra (OH stretching region: 1300-2500 cm-1) of H-RTHat 433 K before (dark) and after (light) NH3 saturation.

176
177
6. CATALYSIS IN A CAGE: CONDITION-DEPENDENT SPECIATION AND
DYNAMICS OF EXCHANGED CU CATIONS IN SSZ-13 ZEOLITES
6.1 Introduction
In 1925 [289], Hugh Stott Taylor theorized that specic groups of atoms were
responsible for the rate-enhancing capacity of heterogeneous catalyst surfaces, from
which he coined the phrase active site. This concept has become ubiquitous in
modern catalysis science and has proven indispensable to the emergence of rational
catalyst design. Most catalytic solids, however, are structurally heterogeneous at
the molecular scale. They contain a distribution of active sites of dierent catalytic
reactivity [290292] reecting non-uniformities in active site coordination and local
environment [293, 294], response to external stimuli [295, 296], and interactions with
reacting molecules [297300]. The integration of density functional theory (DFT)
computational models and experimental spectroscopies measured in operando that
interrogate active sites during catalysis can provide powerful insights into the cou-
pling between active site composition, reaction environment, and reaction mecha-
nism [301, 302]. In this work, we demonstrate how this approach enables the iden-
tication, quantication, and characterization of distinctly dierent active sites in a
macro- and microscopically heterogeneous zeolite catalyst. We show through operando
characterization that the composition and structure of active sites change dynamically
during reaction, dier from their ex situ states, and that such reaction-environment-
induced modications are integral to observed catalytic performance.
We demonstrate this capability in the context of Cu-exchanged zeolite catalysts.
Zeolites are crystalline, nanoporous aluminosilicates constructed of corner-sharing
SiO4 and AlO4 tetrahedra, or T-sites. Framework substitution of Si4+ by Al3+ in-
troduces an anionic charge into the oxide lattice that must be charge-compensated
178
by extralattice cations. The Al sites are in general not ordered, so that at a given
Si:Al ratio a zeolite presents a distribution of local Al environments [33, 303306].
The common oxidation states of Cu are 1+ and 2+, and thus a single Cu ion can
in principle charge-compensate one or two Al T-sites [307314]. The exact form of
this exchange and charge compensation can depend on Cu oxidation state, overall
framework structure, and local Al siting. In addition, Cu is observed to form multi-
nuclear oxo-complexes and oxide clusters that further enrich its exchange chemistry
and catalysis [129,315319].
Cu-exchanged zeolites have been explored for a variety of hydrocarbon partial
oxidations [317,318,320330] and NOx reduction and decomposition chemistries [58,
331, 332]. Cu-zeolites have long been known to be active for the selective catalytic
reduction (SCR) of NOx with NH3 [92,130,133,301,333338]. SCR catalysts promote
the reduction of NOx by NH3:
4NH3 + 4NO +O2 → 6H2O + 4N2 (6.1)
over the competing and undesired oxidation of NH3:
4NH3 + 3O2 → 6H2O + 2N2 (6.2)
Small pore Cu-exchanged SSZ-13, in particular, is able to satisfy all of the practical
requirements of an SCR catalyst and is now in commercial use [89, 222, 249, 339].
However, the relationships between zeolite composition, reaction conditions, active
site(s), and mechanism remain to be elucidated.
SSZ-13 has the chabazite topology. The single symmetry-distinct T-site organizes
into four-, six-, and eight- membered rings (Figure 6.1, left) that form a cage ca.
0.8 nm in diameter [1]. SSZ-13 can be prepared in elemental compositions from
highly enriched (Si:Al = 2) to innitely dilute (Si:Al = ∞) in Al sites. The H-
form (i.e., Al charge-compensated by H+) can be exchanged to various Cu:Al ratios,
and the locations and forms of these exchanged Cu ions have received considerable
attention [34, 36, 37, 3941, 84, 91, 93, 129, 340349]. X-ray absorption (XAS), UV-
visible (UV-vis), and infrared spectra of zeolites [36, 37, 129, 328, 343, 349, 350] all
179
suggest exchanged Cu ions are present as hydrated and oxidized CuII(H2O)6 [351] at
ambient conditions regardless of zeolite composition and topology.
The homogeneity of Cu sites under ambient conditions gives way to a rich variety
of Cu species after high temperature and oxidative removal of H2O. X-ray diraction
(XRD) reveals monomeric Cu ions in SSZ-13 that occupy either 6MR (A) sites [34,84],
or both (A) and (B) sites [91, 346] (Figure 6.1). We have reported that high Al
content Cu-SSZ-13 zeolites (Si:Al = 5) contain exclusively CuII in the (A) site under
dry oxidizing conditions up to a Cu:Al = 0.20 [37, 85], as demonstrated through
the 4-fold coordination of Cu with zeolitic oxygen in extended X-ray absorption ne
structure spectra (EXAFS) and titrations of residual Brønsted acid sites that reveal
a 2:1 H+:Cu2+ exchange stoichiometry. In contrast, Borfecchia et al. report 3-fold
Cu coordination under similar conditions [39] on a Si:Al = 13, Cu:Al = 0.44 sample.
Giordanino et al. report IR features attributable to Cu hydroxyl ([CuIIOH]+) [36,39]
on Si:Al = 13, Cu:Al = 0.44, whereas Gao et al. only observe this band on a subset of
Si:Al = 6 samples [40]. DFT calculations generally indicate that isolated, unligated
CuI and CuII ions prefer the A site (Figure 6.1, left) regardless of the location of
Al [37, 39,85,86,148,342,352354].
H2 temperature-programmed reduction (TPR) [40,248] experiments are consistent
with the existence of at least two types of exchanged CuII with diering susceptibility
to reduction. Borfecchia et al. similarly observe only a fraction of CuII ions to reduce
in He at 673 K [39]. Chemical probes including NO, NO2, and CO [41,248,355359]
will thus see a dierent mixture of Cu sites depending on sample history. For instance,
NO adsorbs strongly on vacuum-reduced CuII → CuI sites [248,355] but more weakly
and dynamically on CuII sites [85, 340]. The relevance of these ex situ probes to
catalytic conditions has yet to be established.
Standard SCR is a redox reaction, as evidenced by the observation of both CuI
and CuII in operando experiments [41, 86, 360], and thus the ex situ reducibility of
catalysts might be expected to correlate with observed activity. However, catalysts
with dierent ex situ properties exhibit similar SCR characteristics. Reactant cuto
180
experiments demonstrate that both NO and NH3 are necessary for the CuII → CuI
reduction half-cycle across samples of various compositions [41,85]. Apparent activa-
tion energies are the same (ca. 70 kJ mol-1), and 473 K SCR turnover rates are linear
in Cu content (Cu:Al = 0.08-0.20) on Si:Al = 5 samples [37, 85, 361]. Samples with
compositions nearer to those studied by Borfecchia et al. present the same CuI/CuII
fractions in operando XAS [41] and apparent activation energies [40] similar to those
of the Si:Al = 5 samples but dierent susceptibilities to Cu reduction in H2 TPR [40].
Thus, while there is general agreement that various isolated, exchanged Cu ions
are present and contribute to the SCR catalysis, the precise nature, number, and reac-
tivity of dierent cationic species, their dependence on zeolite composition (Si:Al and
Cu:Al ratios) and framework topology, sample treatment history and environment,
and their spectroscopic signatures under ex situ versus in situ conditions remain un-
known. Here, we report a coordinated computational (stochastic simulation, ab initio
dynamics, and free energy) and experimental (synthetic, spectroscopic, and titrimet-
ric) analysis of Cu speciation under ex situ conditions and in situ and operando SCR
conditions as a function of catalyst composition over a wide range of zeolite chemical
composition space. We demonstrate that the types, numbers, and chemical character-
istics of Cu sites depend on bulk composition of the zeolite, can be predicted through
rst-principles- based models, can be distinguished in the laboratory, and depend
strongly on the environmental conditions. Environmental conditions have a profound
impact on Cu ion siting, coordination, and mobility, resulting in SCR turnover rates
(473 K) that are independent of the initial Cu cation site and the zeolite framework
type. The results rationalize a large body of literature, resolve contradictory ndings
regarding the active sites for NOx SCR, and consolidate the understanding of Cu
cation speciation in zeolites.

181
6.2 Results and Discussion
6.2.1 Cu Cation Speciation in Cu-SSZ-13.
First-Principles Speciation of Cationic Cu Complexes.
We rst created molecular models for isolated Cu exchange sites in SSZ-13 and
established their relative free energies under wet and oxidizing conditions relevant to
Cu exchange and catalyst treatment; computational details can be found in section
6.5.3. We used a 12 T-site supercell [37, 85, 86] with a single Al framework. Charge-
compensating CuI ions prefer to sit in the plane of the 6MR [37, 85, 86, 352], and we
label this structure as [ZCuI ] in Figure 6.1 to denote charge-compensation of a single
Al (Z) by Cu. This notation also emphasizes the formal 1+ oxidation state of Cu,
and this structure is used as the CuI reference in relating computed Bader charges
to eective Cu oxidation states. An oxidized form of the Cu site compensating a
single framework Al atom has been proposed [39, 41, 344] to be formed by addition
of an extra-lattice OH ligand, which redirects the Cu into the 8MR according to the
optimized [ZCuIIOH] structure shown in Figure 6.1.
Similarly, two proximal framework Al atoms (2Al sites) can be charge compensated
by a single CuII ion. The exchange energies of CuII at dierent potential 2Al sites
were previously computed using a 2 x 1 x 1 24 T-site supercell containing 4 Al atoms
distributed to place 2Al sites in each of the 4, 6, and 8MR [37]:
Z4H4 + CuIIaq → Z4H2CuII + 2H + aq (6.3)
CuII exchange at 2Al sites in the 6MR ring is 108 and 145 kJ mol-1 more exothermic
than exchange at 2Al sites in the 4MR and 8MR, respectively. We adopt a model
with 2Al at third nearest-neighbor (3NN) positions in a 6MR for Cu near 2Al. Cu
exchange at the 2NN Al 6MR is coordinatively similar and the exchange energy
more endothermic by 22 kJ mol-1. The 3NN Al 6MR structure is labeled [Z2CuII]
in Figure 6.1 and is taken as the Bader charge standard for the CuII oxidation state.
We previously found that this [Z2CuII] site can be reduced by addition of H to an
Al site proximal to Cu [85], which is the [ZH]/[ZCuI ] species shown in Figure 6.1.
182
The forward slash emphasizes that these two sites are proximal. Reduction to CuI
decreases Cu coordination to the lattice but preserves Cu location within the 6MR.
Motivated by XAS [37, 307, 343] and molecular dynamics [362] evidence that ex-
changed CuII ions are hydrated under ambient conditions, we rst explored H2O
coordination to the [Z2CuII] and [ZCuIIOH] ions by computing the structures and
successive adsorption energies of H2O ligands (x = 1-6):
1Al : ZCCuII(OH)(H2O)x-1 +H2O → ZCuII(OH)(H2O)x
2Al : Z2CuII(H2O)x-1 +H2O → Z2Cu
II(H2O)x
(6.4)
In each simulation, we started from the equilibrated (x - 1) H2O structure, added
another H2O molecule, annealed for 150 ps at 473 K using NVT ab initio molecu-
lar dynamics (AIMD) at the GGA level, then subsequently optimized the geometry
and evaluated the energy with the HSE06 functional including Tkatchenko Scheer
van der Waals (TSvdw) corrections (section E.2), and zero-point vibrational energies
(ZPE) (Supporting Information 6.8.1). Energy and Cu coordination number (CN)
results are summarized in Table 6.1, where CN is dened as the number of heavy
atoms within 2.3 A of Cu. H2O adsorption energies are on the order of -70 to -90 kJ
mol-1 and are generally more exothermic on [Z2CuII] than on [ZCuIIOH] sites. The
computed Cu oxidation state is insensitive to added H2O. On [Z2CuII], successive H2O
ligands generally displace framework oxygen (Of ) from the rst coordination sphere,
until at x = 4 the CuII ion is fully coordinated by H2O; additional H2O molecules
form a second coordination sphere through hydrogen bonds to rst shell H2O. With
hydration, the Cu ion moves from within the 6MR (site A, Figure 6.1) to the 8MR
(site B) to the cage center (site C). The nal optimized x = 6 structure is shown in
Figure 6.1. The [ZCuIIOH] site behaves similarly with added H2O; the fully hydrated
complex is shown in Figure 6.1.
Exchanged Cu may lose waters of hydration and acquire other ligands during
synthesis and after oxidation or reduction treatments. We computed the structures
and energies of various combinations of O, OH, H2O, and O2 ligands on both the 1Al
and the 2Al models in the nominally oxidized and reduced states. The list of candidate
183
structures was guided by chemical plausibility and includes proposed intermediate
species reported elsewhere (e.g., CuIIO, CuII(OH)2) [86, 363]. Optimized structures,
energies, and ZPEs of all 26 species are tabulated in Supporting Information 6.8.1.
We applied a rst-principles thermodynamic analysis to rank the stability of this
library of Cu-bound HxOy species as a function of temperature and hydrogen and
oxygen potentials. We take O2 and H2O as the oxygen and hydrogen references,
respect-ively:
Z∗Cu+x
2(H2O −
1
2O2) +
y
2O2 → Z∗CuHxOy (6.5)
used the HSE06-TSvdw energies, and applied previously developed correlations [85]
to estimate adsorbate entropies. The formation free energies (∆ Gform) are computed
according to section E.2 and the µH2O and µO2 related to T and P through the
ideal gas relation. Results for an ambient condition (condition 1, 298 K, 2% H2O,
and 20% O2) representative of an air-exposed catalyst and an elevated temperature
condition (condition 2, 673 K, 2% H2O, and 20% O2) representative of an oxidation
pretreatment are summarized in Figure 6.2. For clarity, species with ∆ Gform > +200
kJ mol-1 are not shown in condition 2. The relative energy alignment between Cu
near 1Al and 2Al is described in section 6.2.1.
At the high temperatures (673 K) and high oxygen potentials (20% O2) of condi-
tion 2, the lowest free energy structure near the 2Al site is the isolated [Z2CuII] ion.
At these conditions, adsorption of a single H2O ligand is endergonic by 15 kJ mol-1,
and the reduced form of the Cu site ([ZCuI ]/[ZH]) is endergonic by another 15 kJ
mol-1. Other adsorbates on Cu sites near 2Al lead to complexes much higher in free
energy, including adsorbed molecular O2. Similarly, on Cu sites near 1Al, the lowest
free energy structure is oxidized [ZCuIIOH] with normalized Bader charge (Support-
ing Information 6.8.1) of +1.8, slightly less than [Z2CuII]. The reduced form of the
site, [ZCuI ], and its hydrated form, [ZCuI(H2O)], are very close in free energy to the
oxidized [ZCuIIOH] state. Molecular O2 adsorption on the [ZCuI ] site is endergonic
by 50 kJ mol-1 relative to [ZCuIIOH], and even higher in free energy are other oxi-
dized forms, including [ZCuIIO] [363] and [ZCuII(OH)2] [85]. The primary eect of
184
decreasing temperatures to ambient (condition 1) is a signicant decrease in the free
energies of all hydrated Cu states, which causes the most stable species to become
the fully hydrated Z2[CuII(H2O)4](H2O)2 and Z[CuII(OH)(H2O)3](H2O)3 complexes
at 2Al and 1Al sites, respectively.
We generalize the analysis in Figure 6.2 to a range of temperatures and O2 pres-
sures at xed H2O partial pressure (2%) and plot the lowest free energy species at
each set of conditions in Figure 3 in the form of a phase diagram. For reference,
conditions 1 and 2 of Figure 6.2 are labeled with red boxes on Figure 6.3. The phase
diagrams are insensitive to the H2O pressure over the range of experimental interest.
For comparison, we report the corresponding T-PH2O diagram in Supporting Infor-
mation 6.8.2. As discussed below, these diagrams indicate that the stable Cu state
(CN, Of , and oxidation state) depends sensitively on the environmental conditions
over ranges of experimental interest and that the lowest free energy species dier for
Cu complexes that charge compensate 1Al or 2Al sites.
1Al and 2Al Cu Exchange Populations.
To this point, we have treated the 1Al and 2Al sites independently. To place these
two on a common energy scale, we computed the Cu exchange energy between the
two sites:
[Z2CuH2O] + [ZH]→ [ZH]/[ZH] + [ZCuOH],∆E = +66kJmol-1 (6.6)
We evaluated this energy in a large supercell containing separated Z2 and Z sites as
well as in separate supercells constructed to conserve atomic numbers; results are
in close agreement (+66 vs +69 kJ mol-1), and structures are given in Supporting
Information 6.8.3. We used the +66 kJ mol-1 result to oset the 0 K energies of
[Z2CuIIH2O] and [ZCuIIOH] and thus place the two site types on the same free energy
y-axis shown in Figure 6.2. The zero of energy is dened as [ZCuI ]. The free energy
associated with Cu near 2Al is substantially lower than that with Cu near 1Al at
185
both 298 K (-142 kJ mol-1) and 673 K (-55 kJ mol-1). These results indicate that Cu
ions prefer to segregate to 6MR 2Al exchange sites over a wide range of conditions.
The relative density of Cu ions in 6MR 2Al sites and in 8MR 1Al sites will depend
on the total Cu content and the number of such 2Al and 1Al sites present in a given
SSZ-13 sample. We determined the Al distribution as a function of Si:Al ratio by nu-
merical simulation [37,302] assuming random Al distribution subject to Lowenstein's
rule [235], which prohibits 1NN Al pairs. We then assume that exchanged Cu ions
populate all available 2NN and 3NN 2Al sites as [Z2CuII] before occupying 1Al sites
as [ZCuIIOH]. Figure 6.4 reports the computed fraction of Cu present as [ZCuIIOH]
as a function of Si:Al and Cu:Al ratios. The region below the white line corresponds
to a composition space containing exclusively Cu species near 2Al, while the region
above the white line contains gradually increasing [ZCuIIOH] fractions that become
the dominant species in the upper right red area. To ensure 2Al 6MR stays charge
compensated by a single Cu past the saturation point, we computed the energy of
two [ZCuIIOH] in a 6MR (Supporting Information 6.8.3):
[Z2CuH2O] + [ZCuOH]→ [ZCuOH]/[ZCuOH] + [ZH],∆E = +81kJmol-1 (6.7)
Thus, these 6MR 2Al sites will remain populated by [Z2CuII] as additional Cu is
exchanged in the form of [ZCuIIOH].
To test these model predictions, we prepared and analyzed a series of SSZ-13
catalysts of varying Si:Al and Cu:Al ratio (samples represented by white circles in
Figure 6.4). An Al-rich SSZ-13 sample (Si:Al = 5) was synthesized using high Al FAU
zeolite as the Al source [162] and characterized as reported previously [37,78,85,129,
171] while lower Al content SSZ-13 samples (Si:Al = 15, 25) were synthesized using
Al(OH)3 as the Al source [84]. Powder XRD patterns (Supporting Information 6.8.4)
and Ar adsorption isotherms (87 K, Supporting Information 6.8.26) were consistent
with the CHA topology on all H-form SSZ-13 samples. The number of H+ sites on
each H-SSZ-13 sample was quantied from the NH3 evolved during TPD of NH4-
form samples, and were 0.65, 1.02, and 0.98 H+:Al for the Si:Al ratios of 5, 15,
and 25, respectively. The high Al H-SSZ-13 sample (Si:Al = 5) contained fewer
186
H+ sites than its number of framework Al atoms (H+:Alf = 0.76),102 reecting the
imprecision with which ex situ methods such as 27Al MAS NMR spectroscopy may
characterize structural surrogates for H+ sites. It also reects the nonuniformity of
SSZ-13 samples prepared using FAU to CHA interconversion methods [162], for which
repeat synthesis experiments crystallized samples that contained H+:Al ratios that
varied between 0.45 and 0.85 (Supporting Information 6.8.7).
Increasing amounts of Cu were exchanged into these three (Si:Al = 5, 15, 25)
H-SSZ-13 samples from aqueous-phase CuII(NO3)2. The number of residual H+ sites
was quantied using NH3 TPD, which was performed after samples were saturated
with gaseous NH3 (433 K) and purged in wet helium (3% H2O, 433 K) to desorb
Lewis acid-bound NH3 and selectively retain NH4+ species [171], as illustrated by eq
6.8:
Z∗CuNH3 +H2O → Z∗CuH2O +NH3
ZNH4 +H2O → ZNH4 +H2O(6.8)
Figure 6.5 shows the number of residual H+ sites present on each Cu-SSZ-13 sample
after oxidative treatment in owing air (773 K), normalized by the number of H+
sites quantied on their respective H-SSZ-13 parent samples after the same oxidative
treatment, as a function of Cu:Al ratio. The dashed lines in Figure 6.5 represent the
number of residual H+ sites as a function of Cu:Al ratio predicted from the simulation
results in Figure 6.4. At a Si:Al ratio of 5, each exchanged Cu cation decreased the
number of residual H+ sites by two (on average) up to a Cu:Al ratio of 0.20 (Figure
6.5) [78, 171], consistent with the exchange stoichiometry:
Z2H2 + CuII → Z2CuII + 2H+ (6.9)
On samples with Si:Al ratios of 15 and 25, each exchanged Cu exchanged two H+
sites until Cu:Al ratios of 0.10 and 0.04, respectively, but only one additional H+ si-te
beyond this limit (Figure 6.5), consistent with the exchange reaction:
ZH + CuIIH2O → ZCuOH + 2H+ (6.10)

187
These Cu:H+ exchange stoichiometries provide experimental evidence that cation-
ic Cu species exchange sequentially as [Z2CuII] sites until saturation and then as
[ZCuII-OH] sites (Figure 6.2).
Figure 6.6 shows FTIR quantication of the disappearance of Brønsted ZH species
and the appearance of [ZCuIIOH] as a function of Cu density on the series of Cu-SSZ-
13 samples with Si:Al = 15. The H-SSZ-13 spectrum includes four features in the
O-H region, including modes at 3605 and 3580 cm−1 [364, 365] from Brønsted sites,
at 3732 cm-1 from isolated silanols, and at 3700 cm−1 from vicinal silanols [366]. The
integrated area of the Brønsted ZH peaks of the Cu:Al 0.12 sample, taking that of
the H-SSZ-13 sample as the baseline, decreased with a 2:1 H+:Cu ratio (Supporting
Information 6.8.6), consistent with eq 6.9. A new, fth feature appears at 3660 cm−1
in Cu:Al > 0.21 samples, at a location consistent with previous assignment to [39] and
the computed harmonic O-H stretch frequency of [ZCuIIOH]. The integrated area of
this 3660 cm-1 band increases linearly across the range Cu:Al = 0.21-0.44 (Figure 6.6,
inset), and the integrated areas of the Brønsted OH stretches decrease concurrently
in a 1:1 H+:Cu ratio, consistent with eq 6.10. These vibrational data provide strong
additional support for the sequential population of [Z2CuII] followed by [ZCuIIOH]
sites.
CoII exchange provides a third independent enumeration of the number of 2Al
6MR sites on each sample, because CoII does not exchange at single Al sites as
[ZCoIIOH] at the exchange pH used here (pH ca. 3.2) [367]. Samples with Si:Al ra-
tios 5, 15, and 25 were saturated with CoII, and the Co:Al contents were determined
by atomic absorption (Supporting Information 6.8.5) to be 0.19, 0.10, and 0.04, re-
spectively. These values agree quantitatively with the maximum number of 2Al 6MR
sites predicted for each Si:Al ratio in Figure 6.4 for a random Al distribution in SSZ-
13. Furthermore, the numbers of residual of H+ sites on Co-saturated SSZ-13 samples
were quantied by NH3 titration and are plotted on Figure 6.5 as lled symbols, and
agree quantitatively with the transition Cu:Al ratios between exchange of [Z2CuII]
and [ZCuIIOH] species. These results indicate that isolated CoII and CuII exhibit

188
identical preferences for 2Al 6MR sites and that both cations replace two Brønsted
sites via eq 6.9 when exchanged at these sites.
The Cu:Al values that demarcate the transition between formation of [Z2CuII]
sites and [ZCuIIOH] sites are 0.20, 0.10, and 0.04 for the H-SSZ-13 samples with
Si:Al ratios of 5, 15, and 25, respectively (Figure 6.5). These Cu:Al values are iden-
tical, within error, to the fraction of 2Al 6MR sites predicted from simulation of Al
distribution in CHA frameworks at these Si:Al ratios (Figure 6.4). Taken together,
these experimental and computational ndings indicate that under the conditions of
synthesis applied here [42], the concentration of 2Al 6MR sites is in agreement with
a random Al distribution in SSZ-13 subject to Lowenstein's rule, that 2Al 6MR are
the preferred sites for CuII exchange, and that these sites saturate before remaining
1Al sites are populated with [ZCuIIOH]. This quantication allows us to identify and
contrast the structures, properties, and catalytic performance under low-temperature
(473 K) standard SCR conditions of samples that contain predominantly [Z2CuII] or
[ZCuIIOH] sites. We choose a sample with Si:Al = 5 and Cu:Al = 0.08 to represent a
[Z2CuII] site and a sample with Si:Al = 15 and Cu:Al = 0.44, similar in composition
to that explored by others [36, 39, 41] to represent [ZCuIIOH]. We refer to these as
the 2Al and 1Al samples, respectively. While the 1Al sample contains ca. 20%
[Z2CuII] sites, they are in the minority, and the bulk spectroscopic techniques applied
here are primarily sensitive to the majority [ZCuIIOH] site.
6.2.2 Copper Cation Structure under ex situ Conditions.
We next combined XAS and AIMD simulations to explore the molecular and
electronic structures of both model 1Al and 2Al samples as a function of the conditions
represented in Figure 6.3. Results are summarized in Figures 6.7 and 6.8 and in Table
6.2. We expect the framework composition to be robust to the conditions studied here.
Signicant dealumination of SSZ-13 is observed only after several hours of exposure
to 10% H2O at ca. 1000 K [93,222,266,271].

189
Condition 1: Ambient Atmosphere (XAS/AIMD).
First, both 1Al and 2Al samples were subjected to high temperature oxidative
treatments and then exposed to ambient atmosphere at 298 K, corresponding to con-
dition 1 of Figure 6.3. The Cu K-edge X-ray absorption near edge spectra (XANES)
collected on both samples were indistinguishable, as shown in Figure 6.7, left. A single
edge at 8.988 keV corresponds to the 1s → 4p transitions of a CuII ion in a distorted
square-planar or octahedral coordination [351]. EXAFS spectra of both samples from
the same energy scan (Figure 6.7, middle) exhibited a high intensity rst coordina-
tion shell peak at ca. 1.5 A. The spectra were tted using a Cu2O(s) experimental
reference to estimate 4.0 Cu-O bonds (1.94 A average distance) and 4.2 Cu-O bonds
(1.93 A average distance), respectively, on the 2Al and 1Al samples, which are identi-
cal within the ±5% error of the t (details in Supporting Information 6.8.9). Higher
coordination shells beyond 2.0 A appear with low intensity on both samples and in-
dicate Cu-O bonds with extra-framework O species, as evidenced by the absence of
scattering from Si or Al atoms bound to Of . The XANES and EXAFS spectra are
indistinguishable from each other and that of aqueous CuII complexes [351], which
are also known to form a square-planar tetraaquo complex. These observations are
in agreement with the phase diagram condition 1 predictions shown in Figure 6.3.
The EXAFS provides an ensemble average of the Cu coordination environment.
To extract comparable information from simulation, we performed 298 K AIMD sim-
ulations (60 ps of equilibration followed by 90 ps of sampling) on the lowest free
energy hydrated forms of [Z2CuII] and [ZCuIIOH]. In both cases, Cu remained near
the center of the cage (Figure 6.1) and was dynamic. Figure 6.8 superimposes the
Cu positions relative to the zeolite cage during the 90 ps sampling. To quantify Cu
mobility, we discretized the supercell into 0.2 x 0.2 x 0.2 A cubes, counted the cubes
visited at least once during the simulation, scaled by the cube volume, and normalized
to the volume visited by Z2[CuII(H2O)4](H2O)2. Results are summarized in Table 6.2
and further detailed in Supporting Information 6.8.10. Z[CuIIOH(H2O)3](H2O)3 is
190
estimated to be 1.38 times as mobile as [Z2CuII(H2O)4](H2O)2, consistent with the
weaker electrostatic attraction to a single Al as compared to two proximal Al atoms.
Throughout the Z[CuIIOH(H2O)3](H2O)3 simulation, H atoms are observed to hop
between nonframework O with a barrier of ca. 20 kJ mol-1, causing O bound to Cu
to spend time as both OH and H2O.
The right panel of Figure 6.7 shows the computed radial distribution functions
(RDFs) between Cu and all heavy atoms. Both RDFs show a prominent peak near 2
A corresponding to the rst coordination shell with peak area corresponding to four O
atoms. These rst RDF peaks correspond with the rst EXAFS peak (the RDF and
EXAFS are oset due to the dierence between electron scattering and interatomic
distances). The 1Al RDF is broadened in comparison to the 2Al due to the presence
of both shorter Cu-OH and longer Cu-H2O bonds that are not resolvable by EXAFS.
The RDFs are near-zero between 2.2 and 3.0 A; structure appears beyond 3.0 A. The
results are consistent with the observation of only low intensity peaks beyond the rst
major one in the EXAFS and H2O solvated Cu complexes.
Condition 2: 20% O2, 673 K (XAS/AIMD).
Next, we collected XANES spectra at 298 K on both samples after 1 h treatment
at 673 K in O2, corresponding to condition 2 in Figure 6.3. The vessels were sealed
before cooling to prevent rehydration of Cu. Resultant XANES and EXAFS are
shown in Figure 6.9. In addition to the 8.988 keV CuII edge feature observed in
Figure 6.7, an additional feature appears at 8.987 keV that reects CuII present in a
lower than octahedral coordination environment [307]. Further, on the 1Al sample,
a low intensity peak appears at 8.983 keV that we assign to 5% CuI based on a t
using CuI and CuII references (Supporting Information 6.8.11).
The EXAFS (Figure 6.9, middle) exhibit high intensity peaks at ca. 1.5 A that
t to 3.0 Cu-O bonds at 1.91 A and to 3.8 Cu-O bonds at 1.94 A on the 1Al and 2Al
samples, respectively (Table 6.2). Consistent with the higher rst-shell coordination
and closer proximity to multiple Si/Al, the 2Al sample also exhibits a more distinct

191
second shell peak at ca. 2.4 A than that on the 1Al sample. To ensure reversibility, we
cycled samples between condition 1 and condition 2 and conrmed that XAS spectra
were identical to those shown in Figure 6.7.
These EXAFS features are consistent with those expected for the [Z2CuII] and
[ZCuIIOH] species predicted to predominate at condition 2. Cu remains bound to mul-
tiple Of for the duration of AIMD simulations on each, and each are computed to be
about 8 times less mobile than the Z2[CuII(H2O)4](H2O)2 reference. The [Z2CuII] site
oscillates between three nearly isoenergetic minima (Supporting Information 6.8.12)
that dier in the Of nearest-neighbor to Cu. The rst shell in the RDF (Figure 6.9,
bottom right) convolutes these three and integrates to a CN 3.9. By deconvolution
of the RDF, we assign the second feature at ca. 2.8 A to one Al and one Si atom
nearest Cu (Supporting Information 6.8.13). The AIMD CN is consistent with the
EXAFS t.
In contrast, [ZCuIIOH] only exhibits a wagging into and out of the 8MR plane
during AIMD. The Cu-Of and Cu-OH pairs appear as sharp features in the RDF
(Figure 6.9, top right). The integrated RDF and tted CN are identical. The slightly
broad second shell feature at ca. 2.75 A arises from the Al nearest Cu (Figure 6.1).
This second shell feature is at 0.25 A shorter distance and one-half the integrated area
of the [Z2CuII] second shell, consistent with both the location and the magnitude of
the EXAFS second shell features.
Condition 3: He, 673 K (XAS/AIMD).
As noted above, a small amount of CuI appears in the XANES of the calcined 1Al
sample. This autoreduction feature [36, 39] becomes more prominent after treating
the 1Al sample in owing helium at 673 K for 1 h following the calcining treatment
(Figure 6.9, left panel). From spectral deconvolution and EXAFS tting, we infer
55% of the Cu to be present as CuI and the mean Cu-O coordination number to
decrease to 2.4 (Table 6.2). In contrast, only 10% CuI is observed on the 2Al sam-
ple following the same He treatment, and the coordination number is unchanged.
192
The CuI feature becomes even more pronounced and the CuI fraction increases to
65% on the 1Al samples treated in 3% H2 at 523 K;76,77 the 2Al sample is changed
negligibly by H2 reduction. These observations of autoreduction in the 1Al but not
2Al samples are consistent with the predictions for condition 3 in Figure 6.3. That
reduction is not complete on the 1Al sample suggests some kinetic as well as ther-
modynamic contribution to the autoreduction process, possibly associated with the
mobility of the [ZCuIIOH]. Reoxidation of samples after the He purge or H2 treatment
returns the XANES and EXAFS spectra to their post-calcination forms (additional
details in Supporting Information 6.8.14), indicating that reduction and reoxidation
are reversible.
To interpret the observed EXAFS, we used 298 K AIMD to compute the dynamics
of the reduced [ZCuI ] site. The Cu ion stays within the 6MR and retains coordination
to the same two Of atoms; the computed RDF (Figure 6.9) is dominated by a Cu-Of
feature at 1.93 A that integrates to CN 2.1. The Cu mobility is enhanced by about
20% as compared to [ZCuIIOH] and [Z2CuII], but still roughly 8 times less than
hydrated [Z2CuII]. The second shell feature in EXAFS, spanning from roughly 2-3 A,
is echoed in the broad AIMD RDF past the rst coordination shell, a consequence of
[ZCuI ] mobility within the 6MR.
6.2.3 Copper Speciation at SCR Conditions.
The ex situ characterizations above show that Cu cations in the 1Al and 2Al sam-
ples are identical under ambient and hydrated conditions, exhibit dierent coordina-
tion after high-temperature oxidation, and respond dierently to high-temperature
reduction. We next explore the implications under catalytic conditions relevant to
low-temperature NOx SCR.

193
operando XAS Spectra and SCR Kinetics.
We used a custom-built reactor [87] designed to collect XAS spectra in operando
to determine the Cu oxidation states of the 2Al and 1Al samples during steady-
state SCR (300 ppm of NO, 300 ppm of NH3, 10% O2, 2% H2O) at 473 K under
dierential and plug-ow conditions (<20% NO conversion). Observed SCR turnover
rates (TOR, mol NO s-1 (mol Cu)-1), apparent NO, O2, and NH3 reaction orders,
and apparent activation energies (Eapp) (Table 6.3) were identical on the 2Al and
1Al samples, within experimental error, and identical to values measured on these
samples in a dierent plug-ow reactor (section 5.5). operando XANES spectra for
the two samples (Figure 6.10, left, black traces) indicate the presence of 50% and 55%
CuI (8.983 keV peak), respectively, that are identical within the tting error (5%).
Although the presence of both CuII and CuI species during standard SCR redox cycles
is not surprising [41,85,86,130,360], the identical CuI fractions and kinetic parameters
(Table 6.3) are unexpected given the dierent structures, dynamics, and reducibility of
[Z2CuII] and [ZCuIIOH] species in He and H2. These operando characterization results
suggest that cationic copper sites are functionally equivalent during low-temperature
standard SCR at 473 K.
SCR Gas Species Binding Energies.
To understand Cu coordination in the SCR gas mixture (H2O, N2, NH3, NO, O2),
we rst computed adsorption energies of these species as well as NO2, which is often
proposed as an SCR intermediate [41, 356359], on the oxidized and reduced forms
of the 1Al and 2Al Cu sites using the same AIMD and HSE06-TSvdw optimization
protocol. The computed NH3 binding energy to the [ZH]/[ZCuI ] Brønsted site is
-151 kJ mol-1, quantitatively consistent with NH3 dierential heats observed via
microcalorimetry on zeolitic H+ sites [368372]:
[ZH]/[ZCuI ] +NH3 → [ZNH4]/[ZCuI ] (6.11)
194
Thus, the NH4+ form of this site prevails under SCR conditions, and we used the
[ZNH4]/[ZCuI ] structure shown in Figure 6.11 as the model for a reduced 2Al site.
Computed 1Al site binding energies are plotted against 2Al sites in Figure 6.11.
Binding energies without the TSvdw correction are approximately 20 kJ mol-1 more
positive. Binding energies (Supporting Information 6.8.15) and structures on the
[Z2CuII] and [ZCuIIOH] sites are generally consistent with those for H2O, NO, and
NH3 reported elsewhere [41,341,352354], although the inclusion of hybrid exchange
signicantly decreases the NO binding relative to the GGA values [85, 341,352354].
The 1Al and 2Al binding energies are roughly linearly correlated, although deviations
as large as 50 kJ mol-1 are evident. O2 interacts weakly with all sites; H2O and
NO exhibit intermediate binding strengths. NH3 binds by -120 to -140 kJ mol-1 on
all four Cu adsorption sites and does not signicantly alter the Cu oxidation state.
NO2 binds strongly to reduced sites (oxidizing the Cu center to form a nitrite) but
interacts weakly with oxidized Cu. NO is a notable outlier from the linear correlation:
the HSE calculations predict NO to bind weakly to [Z2CuII] (-25 kJ mol-1) but with
intermediate strengths on [ZCuIIOH] (-75 kJ mol-1). NO locates near the OH ligand
rather than Cu, similar to structures for this species reported elsewhere [341], but
does not form a HONO-like structure. N2 more strongly adsorbs to [ZCuI ] than to
other sites.
Because NH3 out-binds all other species and is similar in its coordination behavior
to H2O, we explored the sequential binding of additional NH3 on all four sites:
∗(NH3)x-1 +NH3 → ∗(NH3)x (6.12)
using an AIMD anneal at 473 K followed by HSE06-TSvdw optimization. Results are
summarized in Table 6.4; structures and normalized Cu Bader charges are detailed in
Supporting Information 6.8.1. Binding energies are roughly constant as NH3 displaces
Of from the Cu coordination sphere. CuI and CuII retain 2-fold and 4-fold coordi-
nation, respectively; additional NH3 beyond these limits are more weakly bound and
not directly associated with Cu, instead forming hydrogen bonds with NH3 in the
rst coordination sphere. The only exception is ZCuIIOH(NH3)2; this species adopts
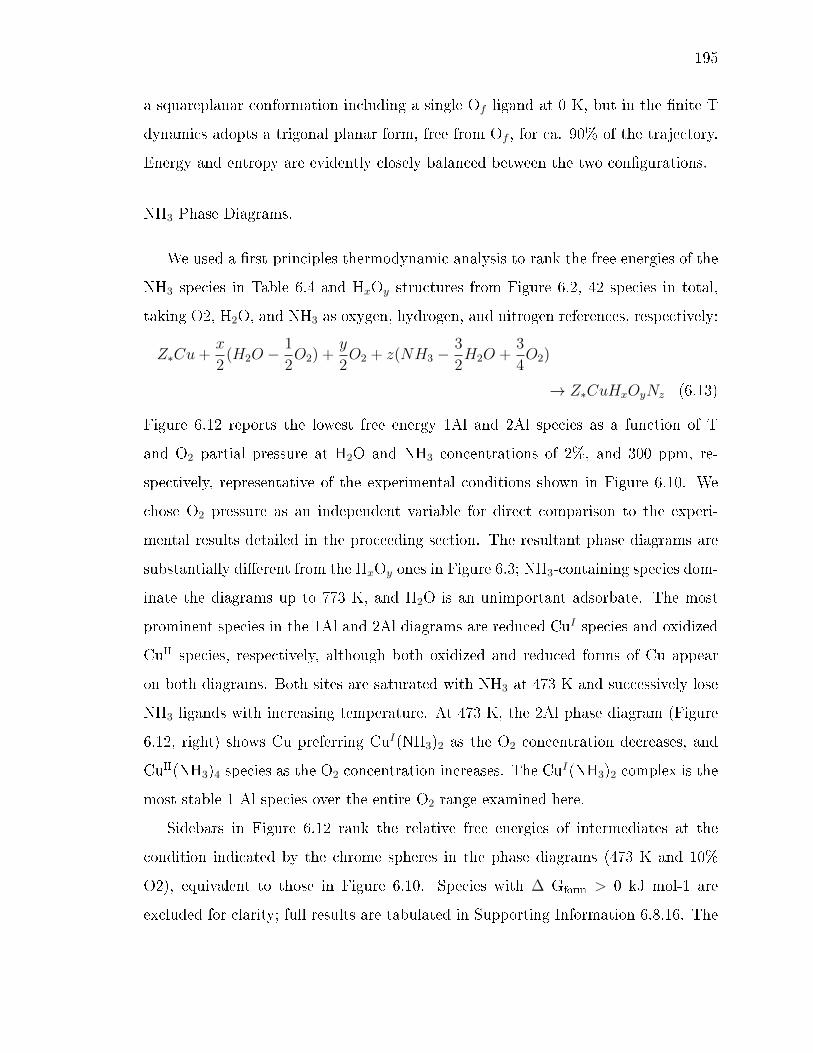
195
a squareplanar conformation including a single Of ligand at 0 K, but in the nite T
dynamics adopts a trigonal planar form, free from Of , for ca. 90% of the trajectory.
Energy and entropy are evidently closely balanced between the two congurations.
NH3 Phase Diagrams.
We used a rst-principles thermodynamic analysis to rank the free energies of the
NH3 species in Table 6.4 and HxOy structures from Figure 6.2, 42 species in total,
taking O2, H2O, and NH3 as oxygen, hydrogen, and nitrogen references, respectively:
Z∗Cu+x
2(H2O −
1
2O2) +
y
2O2 + z(NH3 −
3
2H2O +
3
4O2)
→ Z∗CuHxOyNz (6.13)
Figure 6.12 reports the lowest free energy 1Al and 2Al species as a function of T
and O2 partial pressure at H2O and NH3 concentrations of 2%, and 300 ppm, re-
spectively, representative of the experimental conditions shown in Figure 6.10. We
chose O2 pressure as an independent variable for direct comparison to the experi-
mental results detailed in the proceeding section. The resultant phase diagrams are
substantially dierent from the HxOy ones in Figure 6.3; NH3-containing species dom-
inate the diagrams up to 773 K, and H2O is an unimportant adsorbate. The most
prominent species in the 1Al and 2Al diagrams are reduced CuI species and oxidized
CuII species, respectively, although both oxidized and reduced forms of Cu appear
on both diagrams. Both sites are saturated with NH3 at 473 K and successively lose
NH3 ligands with increasing temperature. At 473 K, the 2Al phase diagram (Figure
6.12, right) shows Cu preferring CuI(NH3)2 as the O2 concentration decreases, and
CuII(NH3)4 species as the O2 concentration increases. The CuI(NH3)2 complex is the
most stable 1 Al species over the entire O2 range examined here.
Sidebars in Figure 6.12 rank the relative free energies of intermediates at the
condition indicated by the chrome spheres in the phase diagrams (473 K and 10%
O2), equivalent to those in Figure 6.10. Species with ∆ Gform > 0 kJ mol-1 are
excluded for clarity; full results are tabulated in Supporting Information 6.8.16. The
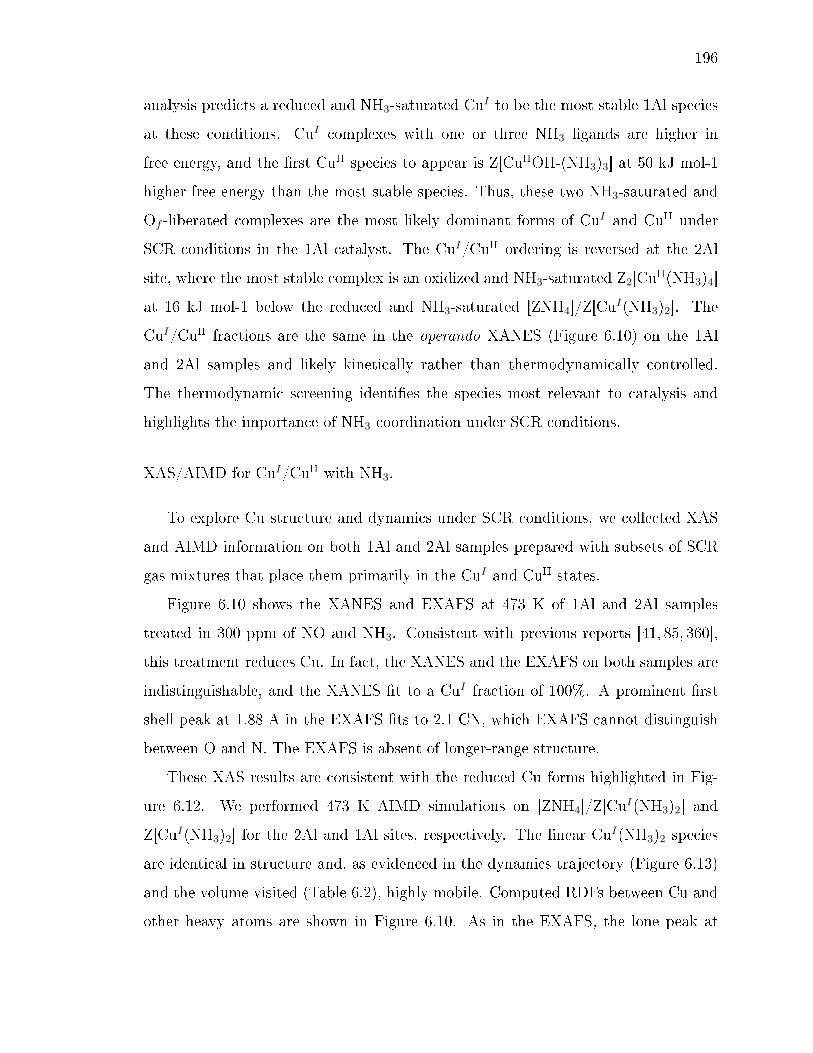
196
analysis predicts a reduced and NH3-saturated CuI to be the most stable 1Al species
at these conditions. CuI complexes with one or three NH3 ligands are higher in
free energy, and the rst CuII species to appear is Z[CuIIOH-(NH3)3] at 50 kJ mol-1
higher free energy than the most stable species. Thus, these two NH3-saturated and
Of -liberated complexes are the most likely dominant forms of CuI and CuII under
SCR conditions in the 1Al catalyst. The CuI/CuII ordering is reversed at the 2Al
site, where the most stable complex is an oxidized and NH3-saturated Z2[CuII(NH3)4]
at 16 kJ mol-1 below the reduced and NH3-saturated [ZNH4]/Z[CuI(NH3)2]. The
CuI/CuII fractions are the same in the operando XANES (Figure 6.10) on the 1Al
and 2Al samples and likely kinetically rather than thermodynamically controlled.
The thermodynamic screening identies the species most relevant to catalysis and
highlights the importance of NH3 coordination under SCR conditions.
XAS/AIMD for CuI/CuII with NH3.
To explore Cu structure and dynamics under SCR conditions, we collected XAS
and AIMD information on both 1Al and 2Al samples prepared with subsets of SCR
gas mixtures that place them primarily in the CuI and CuII states.
Figure 6.10 shows the XANES and EXAFS at 473 K of 1Al and 2Al samples
treated in 300 ppm of NO and NH3. Consistent with previous reports [41, 85, 360],
this treatment reduces Cu. In fact, the XANES and the EXAFS on both samples are
indistinguishable, and the XANES t to a CuI fraction of 100%. A prominent rst
shell peak at 1.88 A in the EXAFS ts to 2.1 CN, which EXAFS cannot distinguish
between O and N. The EXAFS is absent of longer-range structure.
These XAS results are consistent with the reduced Cu forms highlighted in Fig-
ure 6.12. We performed 473 K AIMD simulations on [ZNH4]/Z[CuI(NH3)2] and
Z[CuI(NH3)2] for the 2Al and 1Al sites, respectively. The linear CuI(NH3)2 species
are identical in structure and, as evidenced in the dynamics trajectory (Figure 6.13)
and the volume visited (Table 6.2), highly mobile. Computed RDFs between Cu and
other heavy atoms are shown in Figure 6.10. As in the EXAFS, the lone peak at
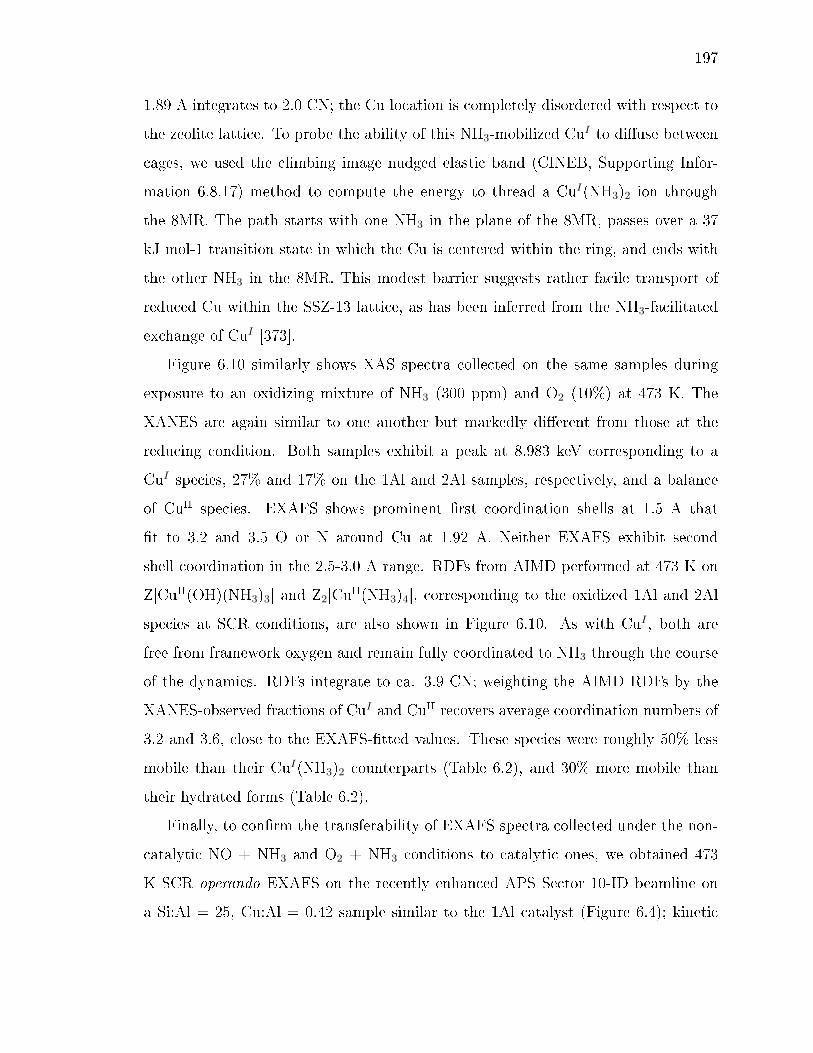
197
1.89 A integrates to 2.0 CN; the Cu location is completely disordered with respect to
the zeolite lattice. To probe the ability of this NH3-mobilized CuI to diuse between
cages, we used the climbing image nudged elastic band (CINEB, Supporting Infor-
mation 6.8.17) method to compute the energy to thread a CuI(NH3)2 ion through
the 8MR. The path starts with one NH3 in the plane of the 8MR, passes over a 37
kJ mol-1 transition state in which the Cu is centered within the ring, and ends with
the other NH3 in the 8MR. This modest barrier suggests rather facile transport of
reduced Cu within the SSZ-13 lattice, as has been inferred from the NH3-facilitated
exchange of CuI [373].
Figure 6.10 similarly shows XAS spectra collected on the same samples during
exposure to an oxidizing mixture of NH3 (300 ppm) and O2 (10%) at 473 K. The
XANES are again similar to one another but markedly dierent from those at the
reducing condition. Both samples exhibit a peak at 8.983 keV corresponding to a
CuI species, 27% and 17% on the 1Al and 2Al samples, respectively, and a balance
of CuII species. EXAFS shows prominent rst coordination shells at 1.5 A that
t to 3.2 and 3.5 O or N around Cu at 1.92 A. Neither EXAFS exhibit second
shell coordination in the 2.5-3.0 A range. RDFs from AIMD performed at 473 K on
Z[CuII(OH)(NH3)3] and Z2[CuII(NH3)4], corresponding to the oxidized 1Al and 2Al
species at SCR conditions, are also shown in Figure 6.10. As with CuI , both are
free from framework oxygen and remain fully coordinated to NH3 through the course
of the dynamics. RDFs integrate to ca. 3.9 CN; weighting the AIMD RDFs by the
XANES-observed fractions of CuI and CuII recovers average coordination numbers of
3.2 and 3.6, close to the EXAFS-tted values. These species were roughly 50% less
mobile than their CuI(NH3)2 counterparts (Table 6.2), and 30% more mobile than
their hydrated forms (Table 6.2).
Finally, to conrm the transferability of EXAFS spectra collected under the non-
catalytic NO + NH3 and O2 + NH3 conditions to catalytic ones, we obtained 473
K SCR operando EXAFS on the recently enhanced APS Sector 10-ID beamline on
a Si:Al = 25, Cu:Al = 0.42 sample similar to the 1Al catalyst (Figure 6.4); kinetic
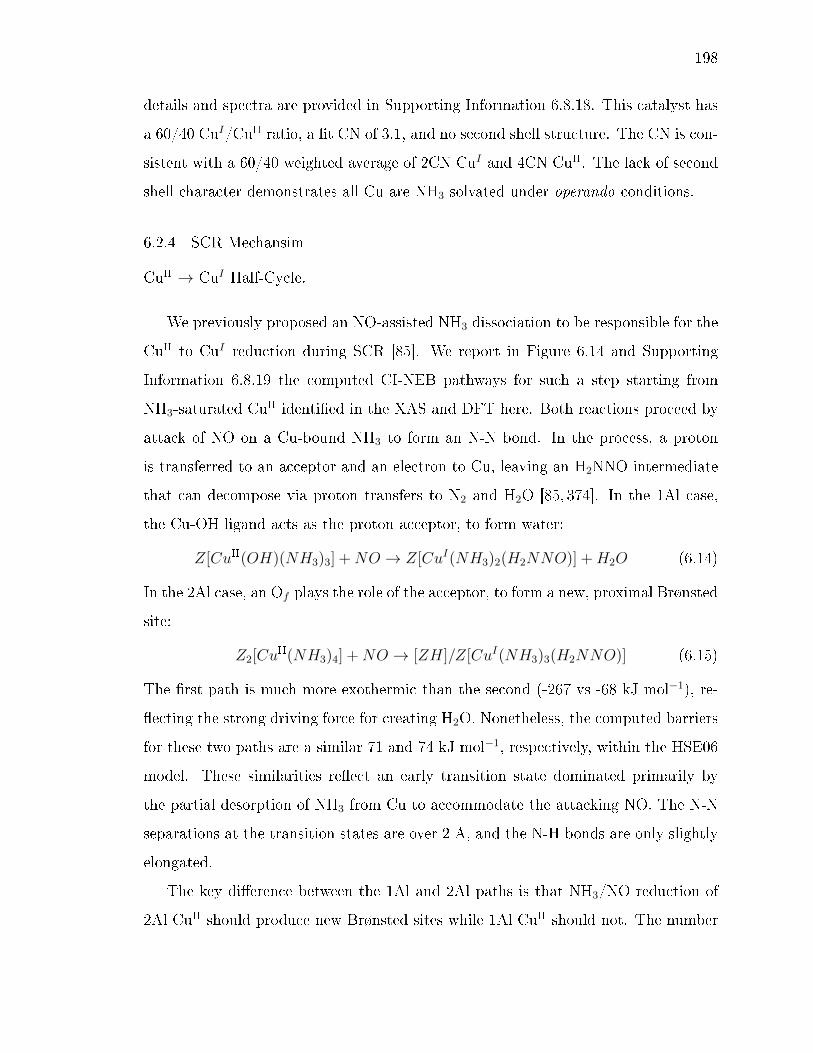
198
details and spectra are provided in Supporting Information 6.8.18. This catalyst has
a 60/40 CuI/CuII ratio, a t CN of 3.1, and no second shell structure. The CN is con-
sistent with a 60/40 weighted average of 2CN CuI and 4CN CuII. The lack of second
shell character demonstrates all Cu are NH3 solvated under operando conditions.
6.2.4 SCR Mechansim
CuII → CuI Half-Cycle.
We previously proposed an NO-assisted NH3 dissociation to be responsible for the
CuII to CuI reduction during SCR [85]. We report in Figure 6.14 and Supporting
Information 6.8.19 the computed CI-NEB pathways for such a step starting from
NH3-saturated CuII identied in the XAS and DFT here. Both reactions proceed by
attack of NO on a Cu-bound NH3 to form an N-N bond. In the process, a proton
is transferred to an acceptor and an electron to Cu, leaving an H2NNO intermediate
that can decompose via proton transfers to N2 and H2O [85, 374]. In the 1Al case,
the Cu-OH ligand acts as the proton acceptor, to form water:
Z[CuII(OH)(NH3)3] +NO → Z[CuI(NH3)2(H2NNO)] +H2O (6.14)
In the 2Al case, an Of plays the role of the acceptor, to form a new, proximal Brønsted
site:
Z2[CuII(NH3)4] +NO → [ZH]/Z[CuI(NH3)3(H2NNO)] (6.15)
The rst path is much more exothermic than the second (-267 vs -68 kJ mol−1), re-
ecting the strong driving force for creating H2O. Nonetheless, the computed barriers
for these two paths are a similar 71 and 74 kJ mol−1, respectively, within the HSE06
model. These similarities reect an early transition state dominated primarily by
the partial desorption of NH3 from Cu to accommodate the attacking NO. The N-N
separations at the transition states are over 2 A, and the N-H bonds are only slightly
elongated.
The key dierence between the 1Al and 2Al paths is that NH3/NO reduction of
2Al CuII should produce new Brønsted sites while 1Al CuII should not. The number
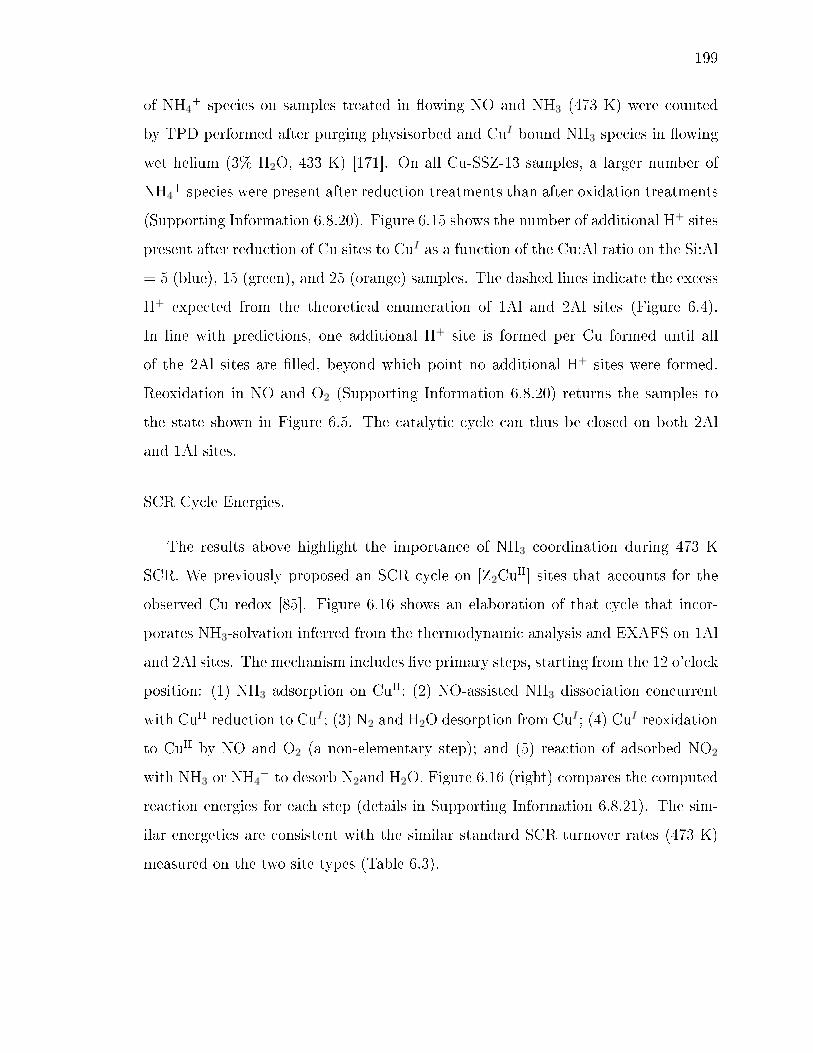
199
of NH4+ species on samples treated in owing NO and NH3 (473 K) were counted
by TPD performed after purging physisorbed and CuI bound NH3 species in owing
wet helium (3% H2O, 433 K) [171]. On all Cu-SSZ-13 samples, a larger number of
NH4+ species were present after reduction treatments than after oxidation treatments
(Supporting Information 6.8.20). Figure 6.15 shows the number of additional H+ sites
present after reduction of Cu sites to CuI as a function of the Cu:Al ratio on the Si:Al
= 5 (blue), 15 (green), and 25 (orange) samples. The dashed lines indicate the excess
H+ expected from the theoretical enumeration of 1Al and 2Al sites (Figure 6.4).
In line with predictions, one additional H+ site is formed per Cu formed until all
of the 2Al sites are lled, beyond which point no additional H+ sites were formed.
Reoxidation in NO and O2 (Supporting Information 6.8.20) returns the samples to
the state shown in Figure 6.5. The catalytic cycle can thus be closed on both 2Al
and 1Al sites.
SCR Cycle Energies.
The results above highlight the importance of NH3 coordination during 473 K
SCR. We previously proposed an SCR cycle on [Z2CuII] sites that accounts for the
observed Cu redox [85]. Figure 6.16 shows an elaboration of that cycle that incor-
porates NH3-solvation inferred from the thermodynamic analysis and EXAFS on 1Al
and 2Al sites. The mechanism includes ve primary steps, starting from the 12 o'clock
position: (1) NH3 adsorption on CuII; (2) NO-assisted NH3 dissociation concurrent
with CuII reduction to CuI ; (3) N2 and H2O desorption from CuI ; (4) CuI reoxidation
to CuII by NO and O2 (a non-elementary step); and (5) reaction of adsorbed NO2
with NH3 or NH4+ to desorb N2and H2O. Figure 6.16 (right) compares the computed
reaction energies for each step (details in Supporting Information 6.8.21). The sim-
ilar energetics are consistent with the similar standard SCR turnover rates (473 K)
measured on the two site types (Table 6.3).

200
6.2.5 SCR Rates on Other Cu-Zeolites.
All of the cationic Cu species in these cycles are NH3-solvated and thus not sen-
sitive to the location of charge-compensating framework Al. To test the generality of
this observation, standard SCR rates were measured on synthesized and commercial
Cu-ZSM-5 and Cu-BEA samples of compositions similar to the Si:Al = 15 SSZ-13
samples. Standard SCR rates (per g, 473 K) on Cu-exchanged MFI (Si:Al = 13),
BEA (Si:Al = 13) (sample preparation and characterization described in Supporting
Information 6.8.25, 6.8.26, and 6.8.4), and Cu-CHA (Si:Al = 5, 15) are shown in
Figure 6.17 as a function of the Cu density (per g). The error was calculated by
replicate experiments under the same conditions. These SCR rates were measured in
a regime uncorrupted by mass or heat transfer artifacts (Koros-Nowak test [361] and
in a kinetic regime characterized by similar apparent reaction orders and apparent
activation energies (Supporting Information 6.8.22). Standard SCR rates (per g, 473
K) increased linearly with Cu density (per g) on the Cu-CHA samples of dierent
Si:Al ratio (5, 15), as expected from the similar turnover rate measured for Cu at 1Al
and at 2Al sites (section 6.2.3). Turnover rates for Cu-ZSM-5 and Cu-BEA samples
are of the same magnitude and exhibit a similar dependence on Cu density. A linear
t to the entire data set has a correlation coecient R2 = 0.86. The Cu speciation
was not determined on the Cu-ZSM-5 and Cu-BEA samples, and thus the observed
scatter may have contributions from discrepancies between Cu wt% and isolated Cu
ion density on these samples. These data suggest that both turnover rates and SCR
mechanisms are independent of zeolite support at these conditions and in this kinetic
regime. We surmise that this insensitivity to zeolite framework arises from NH3 sol-
vation of both CuII and CuI species at 473 K, and that these NH3-covered ions are
responsible for observed SCR turnover.
201
6.3 Discussion
6.3.1 Al Distribution and Cu Speciation ex situ.
While the apparent macroscopic composition of a heterogeneous catalyst is typi-
cally simple to determine, relating that composition to the molecular-scale, functional
composition of an active site remains a major challenge. The relevant macroscopic
composition variables for the Cu-SSZ-13 materials are the Si:Al and Cu:Al ratios.
As reported in Figure 6.4 and the supporting experimental results, two types of Cu
sites are present over the composition ranges studied here, and the relative densi-
ties of each type of Cu site are a function of both composition variables. Figure
6.4 is based on two assumptions: rst, that framework Al atoms are randomly sited
during zeolite crystallization modulo Lowenstein's rule, and second, that 6MR 2Al
sites are populated by CuII cations to saturation before 1Al sites are populated with
CuIIOH. The close correspondence between these predictions and the experimental
characterizations supports the model.
Synthesis conditions are well-known to inuence Al siting in zeolites [32,42,48,56
58, 65, 70, 74, 147, 172, 173, 305, 306, 375] and specically in SSZ-13 [42], and thus the
conclusions drawn from the synthetic conditions here cannot be extended to all Cu-
zeolites or even to all Cu-SSZ-13 materials. We can, however, compare our ndings
to SSZ-13 zeolites prepared via procedures equivalent to those used here [34, 37, 109,
162,168,250,376,377]. Fickel et al. [34] concluded, on the basis of XRD and EXAFS,
that an SSZ-13 sample with Si:Al = 9 and Cu:Al = 0.18 contained predominantly Cu
in the 6MR, in agreement with the models here that predict 80% of [Z2CuII] in such
sites. Gao et al. compared the H2 TPR of SSZ-13 zeolites with Si:Al = 6 and 12 and
Cu:Al = 0.10-0.50 [40, 347, 348]. Samples we predict to contain [Z2CuII] show only a
653 K TPR feature, while samples in the range expected to contain [ZCuIIOH] also
exhibit a 503 K TPR feature, consistent with the readier reducibility of [ZCuIIOH]
sites demonstrated here (Figures 6.3 and 6.9). FTIR similarly shows only a 895 cm-
1 Cu-perturbed T-O-T vibration in the composition range dominated by [Z2CuII],

202
supplemented by a 940 cm-1 feature in the range containing [ZCuIIOH] [348]. Davis
and co-workers recently showed that these 2Al 6MR sites can be selectively protected
against dealumination and deactivated for methanol-to-olens (MTO) activity by
preferential exchange of CuII ions [158, 270, 271], and Gao et al. used an analogous
concept to exchange 2Al 6MR sites with alkaline earth cations [271].
While this partitioning and counting of [Z2CuII] and [ZCuIIOH] sites is successful,
these sites themselves are not monolithic. A 6MR ring can have 2Al in 2NN or 3NN
relative positions, and even for given positions, at nite temperature an exchanged
ion is quite dynamic within the site, as illustrated by the AIMD simulations. Coor-
dination numbers and bond distances from the HSE06 optimizations are similar to
those extracted from the AIMD trajectories, but only the latter captures the contri-
butions of dynamics to the EXAFS. For example, even for given Al positions within a
6MR, [Z2CuII] samples several local minima (Supporting Information 6.8.13) during
the AIMD, broadening the RDF (Figure 6.9) and reducing CN < 4. Thus, nite
temperatures and Cu dynamics are important considerations in DFT models of these
systems.
6.3.2 Cu Speciation in situ
Once microscopic sites are identied and enumerated, a second key challenge is
to determine how they respond to environmental, in situ conditions. We nd from
the rst-principles thermodynamics and spectroscopies that ambient conditions cause
both the [Z2CuII] and the [ZCuIIOH] species to exist as hydrated ions, liberated from
coordination to zeolite framework oxygens, diering in composition by only a single
proton, and diering only slightly in mobility (Figure 6.8). These observations are
consistent with a large body of literature on Cu-zeolites. XAS and UV-vis spectro-
scopies of CuII-exchanged SSZ-13 [36,87,129,350,378], ZSM-5, and BEA zeolites under
ambient conditions are identical to the corresponding spectra of aqueous CuII com-
plexes, demonstrating the insensitivity of zeolite topology to solvated ions [36, 351].
Similarly, the perturbed T-O-T vibrations in IR spectra due to framework-bound CuII
203
disappear upon hydration of CuII under ambient conditions [343]. Electron param-
agnetic resonance (EPR) spectra at ambient observed for predominantly [Z2CuII]
samples have been taken as evidence of hydrated and mobile CuII [347]; broadening
at 155 K is attributed to loss of that CuII ion mobility [272,311] and coalescence into
a single sharp signal at 523 K to loss of the hydration sphere [349].
The rst-principles thermodynamics and XAS spectroscopies are consistent with
the loss of water ligands at high temperature in O2. Similarly, Borfecchia et al. [39]
infer this loss from observed changes in EXAFS to a 3CN Cu species, the same be-
havior the Si:Al = 15, Cu:Al = 0.44 catalyst exhibits (Figure 6.9) after dehydration.
We and Borfecchia et al. also observe the appearance of CuI under more reducing
conditions. We assign this reduced fraction to [ZCuIIOH] species, based on the com-
parisons between the 1Al and 2Al samples. The autoreduction is not complete on
any sample, suggesting some kinetic in addition to thermodynamic control of the
reduction process. The nominal autoreduction stoichiometry:
4[ZCuOH]→ 4[ZCuI ] + 2H2O +O2 (6.16)
implies a complicated, multistep process likely involving Cu dimer or higher-order
intermediates [129, 344, 347] and thus a sensitivity to spatial Cu-Cu (and hence Al-
Al) separations. Consistent with this inference, Gao et al. [40] report that the fraction
of reducible [ZCuIIOH] at constant Cu:Al ratio decreases with increasing Si:Al ratio,
or, equivalently, increasing mean [ZCuIIOH] separation.
Under standard SCR conditions at 473 K, CuI and CuII ions near 1Al or 2Al are
all predicted and observed to be fully solvated by NH3, and further all Brønsted sites
are present as NH4+. Both NH4
+ and Cu-NH3 are observed in DRIFTS spectra at
similar conditions [38, 379, 380] on Cu-SSZ-13 samples. In fact, both vibrational and
XAS spectra of NH3 dosed to a number of Cu-exchanged zeolites are similar to those
of aqueous CuI(NH3)2 and CuII(NH3)4 [37, 41, 87, 379, 381385]. The standard SCR
active sites at 473 K are NH3-solvated Cu ions.
NH3 solvation inuences Cu mobility as well as structure, and this eect is in-
sensitive to zeolite topology. NH3 is observed to promote the exchange of CuII from
204
CuO(s) into a number of zeolite frameworks, and this process is further promoted by
in situ reduction of CuII to CuI by NH3 and NO mixtures [373].
6.3.3 Mechanistic Implications for SCR.
The SCR reaction is well established to involve CuI ↔ CuII redox cycles [41,
85, 130, 360]. There has been some controversy regarding the species responsible for
reduction [41, 85, 92, 355, 359]. Exposure to NO alone at 473 K does not reduce
either the 1Al [ZCuIIOH] (Supporting Information 6.8.24) or the 2Al ([Z2CuII]) [85]
samples, and the hybrid-exchange DFT results do not predict NO to strongly bind
to or reduce either CuII site. We thus nd no evidence to support the elementary
mechanistic steps:
[Z2Cu] +NO → [Z2CuINO+] (6.17)
or
[ZCuOH] +NO → [ZCuIHONO] (6.18)
Rather, NO and NH3 together are necessary to reduce either of these sites. The
reaction pathways and activation barriers for these reductions are computed to be
similar on the [ZCuIIOH] and [Z2CuII] sites in the presence of solvating NH3. These
barriers are also similar to the experimental apparent activation energies, although
direct comparison of the experiment and computations is only possible through a
kinetic model. The presence of both Cu oxidation states during standard SCR likely
indicates that neither oxidation nor reduction alone is rate-limiting [85], and thus a
satisfactory kinetic model would require kinetic details on both half-cycles. Reduction
rates on the [ZCuIIOH] and [Z2CuII] may dier at temperatures at which NH3 ligands
are lost.
While NO and NH3 are most eective at reducing CuII, we and others [360, 386]
also observe a partial reduction of CuII → CuI in owing NH3 and O2. DFT calcula-
tions identied an O2 assisted NH3 dissociation pathway that parallels but has a much

205
higher barrier than the NO-assisted NH3 dissociation reaction [85]. This pathway is
unlikely to be catalytically relevant but could be responsible for this reduction.
The results presented here provide indirect mechanistic information about the
SCR oxidation half-cycle. We nd adsorbed NO2 to oxidize CuI to CuII as Cu-bound
nitrite:
CuI +NO2 → CuIIO2N (6.19)
consistent with many proposals [41, 92, 356359]. The source of NO2 and even its
presence as a free intermediate during standard SCR is less clear. Janssens et al. [41]
proposed NO oxidation to nitrite to occur on a single, reduced Cu site through the
intermediacy of a nitrate with the initial step as rate-determining (RDS):
[ZCu(o2)(NO)]→ [ZCuNO3] +NO → [ZCuNO2] +NO2 +NH3
→ [ZCuOH] +H2O +N2 (6.20)
However, computed activation energies and the RDS assumption are inconsistent
with experimental activation energies and the observed 50/50 mixture of CuI/CuII
for SCR [37, 40, 85, 347]. Rather, as with autoreduction, NO oxidation may involve
participation of more than one Cu species, facilitated by the solvation and high mo-
bility of CuI(NH3)2 and its low diusion barrier between CHA cages. Solvated CuI
ions are well-known to participate in dimeric Cu oxidation chemistries [307,387389]
and a second-order dependence of SCR rate on Cu concentration has been observed
on an Si:Al = 6 Cu-SSZ-13 catalyst at Cu:Al ratios <0.03 [349]. At higher tempera-
tures, Cu is expected to desolvate (Figure 6.12), consistent with the FTIR ndings of
Giordanino et al. [38]. In sharp contrast to the 473 K spectra (Figure 6.10), EXAFS
collected at 673 K in NH3 and O2 demonstrate similar second-shell character (Sup-
porting Information 6.8.23) to the dry-oxidized framework bound Cu (Figure 6.9).
Concurrent with this desolvation, apparent activation energies increase from 70 kJ
mol-1 at 473 K to 140 kJ mol-1 [40] at 623 K, consistent with the dip in NO conver-
sion observed [248] in non-dierential measurements. Thus, NH3 (de)solvation likely
has a large impact on SCR oxidation half-cycle rates.
206
6.3.4 Implications for Partial Methane Oxidation.
The results and approach described here are useful for the interpretation of the re-
cently observed [329] noncatalytic, stoichiometric partial oxidation of methane (PMO)
on Cu-SSZ-13:
2CH4 +O2 → 2CH3OH (6.21)
PMO is carried out in a three-step sequence [324327,329] that can be understood in
part through reference to Figure 6.3. In a rst step, the Cu-SSZ-13 material is brought
to ca. 673 K in O2 (ca. 20%) and balance inert, corresponding to condition 2 in the
gure. O2 is then purged by inert, bringing the material to condition 3. We observe
a subset of sites to reduce under these conditions, consistent with the participation
of only a fraction of exchanged Cu in PMO [325]. Subsequent introduction of CH4
at 473 K results in the production of methanol, which is liberated by returning to
percent level H2O pressures, between conditions 1 and 2 of Figure 6.3.
Wulfers et al. demonstrated [329] PMO on Si:Al = 6 and 12, Cu:Al = 0.35 SSZ-13
materials. The Si:Al = 12 sample has roughly double (mol methanol per mol Cu) the
performance of the Si:Al = 6 sample, in precise correlation with the predicted increase
in [ZCuIIOH] sites (Figure 6.4). We conclude [ZCuIIOH] sites are likely precursors to
ZCuOCuZ sites proposed to be responsible for PMO activity [318,321,322,326,328]:
2ZCuOH → ZCuOCuZ +H2O (6.22)
and [Z2CuII] sites are inactive.
6.4 Conclusions
While the macroscopic composition of a solid catalyst is generally straightforward
to measure and control, the relationship between this apparent composition and the
number and type of catalytically relevant active sites is generally dicult to infer.
We illustrate here an example of a nontrivial catalytic system in which it is possible
to determine through theory and experiment both the speciation and the number

207
density of active sites as a function of the relevant synthetic compositional variables.
Further, we show that these distinct active sites can be tracked as they evolve un-
der dierent exposure conditions, from ambient characterization, to dry and inert
high temperature, to operando reaction conditions. This enumeration and tracking
is enabled by site-sensitive spectroscopies that are able to interrogate the catalyst
under working conditions and computational approaches that treat the catalyst in an
operando fashion, incorporating reaction conditions and eective estimates of free
energies avoiding the standard harmonic approximations into the predictions of site
structure and composition.
We show that exchanged, atomically dispersed, and isolated Cu ions within the
SSZ-13 cages populate two distinct types of sites, distinguished by the number of
charge-compensating Al T-sites, and that the structure and dynamics of these two
Cu types are strongly inuenced by the environment they experience. H2O solvates
both Cu types at ambient conditions, is lost at higher temperatures, and is replaced
by NH3 reactant at the 473 K SCR conditions. This NH3 liberates Cu from the
framework, greatly enhances Cu mobility, and masks some of the dierences between
the two site types. The sites remain distinct, however; while both Cu sites undergo
similar redox cycles at similar rates under the conditions studied here, the mechanisms
dier in detail, as illustrated by the intermediacy of transient Brønsted sites on one
but not the other Cu site type (Figure 6.15).
These ndings underscore the need for caution in extrapolating from ex situ
characterizations to catalytic conditions. Reaction conditions can and in this ex-
ample do have a substantial inuence on active site structure and properties. These
environment-induced modications need not be limited to reactants. Surrogate pro-
moters that modify active sites (e.g., by mobilizing at dierent conditions, or that
modify redox properties) could provide an alternative to traditional catalytic material
modications for tuning catalytic activity.
208
6.5 Experimental Methods
6.5.1 DFT and AIMD Details
Plane-wave, supercell DFT supercell calculations employed a triclinic SSZ-13
supercell containing 12 T-sites [86] and Si:Al ratios of either 11:1 or 10:2. The
rst Brillouin zone was sampled at the Γ point only, as appropriate for this insu-
lator. Many of the adsorbate structures considered here have multiple local min-
ima. To identify representative structures for subsequent optimizations, initial struc-
tures were rst annealed nonspin-polarized at 473 K in ve independent simula-
tions of 30 ps, each starting from dierent initial guess structures, for 150 ps to-
tal using the Car-Parrinello molecular dynamics software(CPMD; version 3.17.1)
[390], the Perdew-Becke-Erzenhof [391] generalized gradient approximation (GGA)
exchange-correlation functional, and ultrasoft pseudopotentials [392394]. These
Born-Oppenheimer molecular dynamics simulations were run in the NVT ensemble
using a Nose-Hoover thermostat with a time step of 0.6 fs. RDFs from the nal 90 of
150 ps simulations were constructed from the trajectories of a subset of these species
for comparison to EXAFS results.
Low energy structures visited during the AIMD simulations were subsequently
optimized using the Vienna Ab initio Simulation Package (VASP; version 5.3.5)
[395]. Calculations were performed spin-polarized using the projector augmented
wave (PAW) treatment of core-valence interactions [396,397] and a plane wave cuto
of 400 eV. For computational eciency, structures were rst relaxed within the GGA
of Perdew et al. [391] and subsequently relaxed using the hybrid screened-exchange
method of Heyd-Scuseria-Ernzerhof (HSE06) [398401] and the Tkatchenko Scheer
method for van der Waals interactions (TSvdW) [402]. We converged self-consistent-
eld (SCF) electronic energies to 10-6 eV and atomic forces to less than 0.03 eV/A.
Charge analysis was performed through the method of Bader [403407]. Cu charges
are reported normalized to CuII and CuI references ([Z2CuII] and [ZCuI ], respec-
tively), then rounded to I or II reported as a superscript on Cu. Harmonic vibra-

209
tional frequencies of adsorbed species were calculated at the HSE06-TSvdW level by
numerical dierentiation of atomic forces with 0.01 A displacements on the adsorbate
atoms and used to compute zero-point vibrational energies (ZPE).
6.5.2 Ab Initio Free Energies
To relate DFT-computed energies to reaction conditions, we write the formation
energies of adsorbed intermediates [408, 409] containing O and H relative to O2 and
H2O references:
∆Gformx,y(T,∆µO2,∆µH2O) =
∆Eformx,y − T∆EST
x,y(T )− x
2(∆µH2O −
1
2∆µO2)−
y
2∆µO2 (6.23)
∆Eformx,y = (EZCuHxOy − EZ*Cu)− x
2(EH2O −
1
2EO2)−
y
2EO2 (6.24)
The ∆ µ are free parameters corresponding to the dierence in chemical potential
between 0 K and the conditions of interest. They can be related to corresponding
temperatures and pressures through the ideal gas chemical potential relation. ∆SST
is the dierence in entropy between a free and adsorbate-covered site. We have previ-
ously found that the harmonic oscillator approximation signicantly underestimates
actual entropies [85], consistent with observations made by others [340,342,410]. Com-
parisons with dynamics simulations suggest a simple heuristic in which the dierence
is approximated from the Sackur-Tetrode expression:
∆SSTx,y = (SZ*CuHxOy − SZ*Cu) ≈ 2
3ln[(
2πMx,ykbT
h2)3/2
V e5/2
NA
] (6.25)
where Mx,y is the total mass of the adsorbed species and V is the supercell volume.
This model roughly treats adsorbed species as retaining 2/3 of their gas-phase trans-
lational entropy, similar to that discovered for adsorbates at surfaces [411].

210
It is straightforward to extend these expressions to ones appropriate in the pres-
ence of NH3, conditions that present nitrogen as well as hydrogen and oxygen to the
sites:
∆Gformx,y,z(T,∆µO2,∆µH2O,∆µNH3) =
∆Eformx,y,z − T∆EST
x,y,z(T )− x
2(∆µH2O −
1
2∆µO2)
− y
2∆µO2 − z(∆µNH3 −
3
2∆µH2O −
3
4∆µO2) (6.26)
6.5.3 Zeolite Synthesis and Characterization.
Synthesis methods for all zeolites (SSZ-13, BEA, ZSM-5) can be found in Sup-
porting Information 6.8.25. The crystal topologies of H-zeolites were conrmed from
powder X-ray diraction (XRD) patterns collected on a Rigaku SmartLab X-ray
diractometer equipped with a Cu Kα X-ray source (1.76 kW), and measured from
4 to 40 at a scan rate of 0.00833 s-1 with a step size of 0.01 (Supporting In-
formation 6.8.4). Micropore volumes of H-SSZ-13 zeolites were determined from Ar
adsorption isotherms (87 K), and for H-BEA and H-ZSM-5 zeolites were determined
from N2adsorption isotherms (77 K), using a Micromeritics ASAP 2020 Surface Area
and Porosity Analyzer, and were in reasonable agreement with the values expected
for the CHA, BEA, and MFI frameworks and can be found in Supporting Information
6.8.26. Solid-state 27Al magic angle spinning nuclear magnetic resonance (27Al MAS
NMR) spectroscopy was used to estimate the fraction of framework and extraframe-
work Al on H-form zeolites. SS NMR spectra were collected using a Chemagnetics
CMX400 400 MHz spectrometer in a wide-bore 9.4 T magnet at ambient conditions
from 456 scans with 12.5 µs pulses and a 2 s delay and were measured at 104.24 MHz
and MAS rate of 5 kHz. Prior to packing in a 4 mm ZrO2 rotor, zeolite samples
were hydrated by holding for >48 h in a desiccator containing a saturated potassium
chloride (KCl) solution. All 27Al MAS NMR spectra are referenced to an aqueous 1.0
M Al(NO3)3 solution. NMR spectra and quantication of extraframework Al for all
H-zeolite samples can be found in Supporting Information 6.8.27.

211
Cu-zeolites were prepared by aqueous-phase Cu ion exchange of H-form zeolites
with a CuII(NO3)2 solution (0.001-0.1 M, 100 cm3 g-1; 99.999 wt%, Sigma-Aldrich)
for 4 h and 300 rpm at ambient conditions, during which the pH was controlled to
4.9 ± 0.1 through dropwise addition of a 1.0 M NH4OH solution (Sigma-Aldrich).
Co-SSZ-13 zeolites were prepared by ion exchange of HSSZ-13 with an aqueous 0.25
M CoII(NO3)2 solution (150 cm3 g-1) for 4 h at ambient conditions, during which the
pH was not controlled (pH stabilized between 3.2 and 3.6 after 4 h). Metal-exchanged
zeolites were recovered by centrifugation and washed with deionized water six times
(70 cm3 g-1 per wash), dried at ambient temperature under owing air, and then
treated in owing dry air (100 cm3 g-1) to 773 K (0.0167 K s-1) for 4 h. Elemental
composition (Si, Al, Cu, Co) was determined using atomic absorption spectroscopy
(AAS) on a PerkinElmer Analyst 300.
6.5.4 NH3 Temperature-Programmed Desorption.
Residual H+ sites on H-zeolites, on Cu- and Co-exchanged zeolites after oxidation
treatments in air (20% O2, balance N2, 773 K, 4 h), and on Cu-zeolites after reduction
treatments (500 ppm of NO + 500 ppm of NH3, balance He, 473 K, 2 h) were titrated
using the procedure described by Di Iorio et al. [171]. This titration method involves
saturation of zeolites (ca. 0.03-0.05 g) with NH3 at 433 K (500 ppm, balance He, 2 h,
350 cm3 min-1), followed by removal of physisorbed and Cu-bound NH3 by treatment
in wet helium (2.5-3.0% H2O/He, 8 h, 350 cm3 min-1), to selectively retain surface
NH4+ species [78,105,171]. NH3 was then evolved in a subsequent TPD in owing He
(350 cm3 min-1) to 823 K (0.083 K s-1), and quantied using on-board calibrations in
a MKS MultiGas 2030 gas-phase FT-IR spectrometer. Further details can be found
in Supporting Information 6.8.28.
212
6.5.5 Kinetics
Standard selective catalytic reduction (SCR) kinetics were measured on a bench-
top tubular glass reactor described elsewhere [37]. All samples were sieved to a
nominal size of 125-250 µm and diluted with silica gel to obtain a bed height of ca.
2.5 cm. Steady-state kinetic data were collected at NO conversions below 20%, so
that the entire bed was exposed to approximately the same gas concentrations, using
a reactant gas mixture of 300 ppm of NO (3.6% NO/Ar, Praxair), 300 ppm of NH3
(3.0% NH3/Ar, Praxair), 5% CO2 (liquid, Indiana Oxygen), 10% O2 (99.5%, Indiana
Oxygen), 2.5% H2O (deionized, 18.2 MΩ, introduced through saturator), and bal-
ance N2 (99.999% UHP, Indiana Oxygen) at 473 K and 1 atm. The total gas ow
rate was maintained at 1.5 L min-1. Outlet gas concentrations were analyzed using
on-board gas calibrations on an MKS MultiGas 2030 gas-phase Fourier transform in-
frared (FTIR) spectrometer, and NO, NO2, NH3, CO2, and H2O concentration data
were recorded every 0.95 s.
6.5.6 Spectroscopic Methods (XAS, FTIR).
XAS experiments were carried out on the insertion device (ID) and bending mag-
net (BM) beamlines of the Materials Research Collaborative Access Team (MRCAT,
Sector 10) at the Advanced Photon Source (APS) at Argonne National Laboratory.
A cryogenically cooled double-crystal Si(111) monochromator was used with an un-
coated glass mirror to minimize the presence of harmonics. Spectra were recorded in
transmission mode with the ionization chambers optimized for the maximum current
with linear response (ca. 1010 photons s-1) using gas mixtures to give 10% absorption
in the incident X-ray detector and 70% absorption in the transmission X-ray detec-
tor. A Cu metal foil spectrum was simultaneously collected while measuring sample
spectra to calibrate the Cu K-edge to 8979 eV. operando experiments were performed
at the 10-ID line in a special glassy carbon tube reactor described by Kispersky et
al. [87], in which XAS spectra were collected simultaneously with steady-state stan-
213
dard SCR rate measurements to verify that rates were identical to those measured
in separate dierential plug-ow reactor experiments. XAS spectra were collected
in an energy range between 8700 and 9890 eV for samples held under dierent gas
conditions, and between 8700 and 9780 eV for operando experiments (additional de-
tails in Supporting Information 6.8.9). Multiple energy scans were taken to ensure
the absence of time-dependent change or beam damage to the sample. Spectra were
collected under isothermal conditions and normalized using a rst-order polynomial
in the pre-edge region and a third-order polynomial in the post-edge region. XANES
spectra were tted using a linear combination of CuI and CuII references [37, 85, 86]
to determine the fractions of CuI and CuII in certain gas environments and under
operando conditions. EXAFS data were t from k = 2.7 to ca. 11 A-1 (details of the
tting procedure in Supporting Information 6.8.9).
FTIR data were collected on zeolite samples using a Nicolet 6700 FTIR spec-
trometer equipped with a liquid nitrogen-cooled mercury cadmium telluride (MCT)
detector. Catalyst samples (ca. 35-40 mg) were pressed into a self-supporting wafer
(ca. 2 cm in diameter) and placed in a custom-built FTIR cell that has been described
elsewhere [288]. Wafers were treated in owing oxygen (10% O2, balance He) to 673
K for 30 min and then cooled to 473 K, prior to collecting spectra. Spectra were col-
lected with a resolution of 4 cm−1 and averaged over 1000 scans, baseline corrected,
and normalized to the framework Si-O-Si combination/overtone band between 2100
and 1750 cm−1. Additional details can be found in Supporting Information 6.8.6.
6.6 Acknowledgements
Financial support was provided by the National Science Foundation GOALI pro-
gram under award number 1258715-CBET (Purdue) and 1258690-CBET (Notre Dam-
e), and The Patrick and Jane Eilers Graduate Student Fellowship for Energy Related
Research. Use of the Advanced Photon Source is supported by the U.S. Department
of Energy, Oce of Science, and Oce of Basic Energy Sciences, under Contract no.
DEAC02-06CH11357. We would like to thank Victor J. Cybulskis (Purdue) for his
214
help in performing XAS experiments at the APS. We thank Sachem, Inc., for pro-
viding the organic structure-directing agent used to synthesize SSZ-13.We thank the
Center for Research Computing at Notre Dame, and EMSL, a DOE Oce of Sci-
ence User Facility sponsored by the Oce of Biological and Environmental Research
and located at Pacic Northwest National Laboratory, for support of computational
resources.
Additionally, I acknowledge the American Chemical Society for granting permis-
sion to reproduce this chapter of my thesis. Adapted with permissions from The
Journal of the American Chemical Society, 2016, 138, 6028-6048. Copyright (2016)
American Chemical Society.
The full article can be accessed here: dx.doi.org/10.1021/jacs.6b02651.

215
6.7 Figures and Tables
Figure 6.1. (left) Side view of the chabazite cage. (right) HSE06-optimizedstructures of (A,B) dehydrated oxidized and reduced Cu sites and (C)hydrated oxidized sites. Label indicates location of Cu ion within thechabazite cage.
Table 6.1.H2O Adsorption Energies (∆Eads) on Cu Sites Computed Using HSE06-TSvdwa
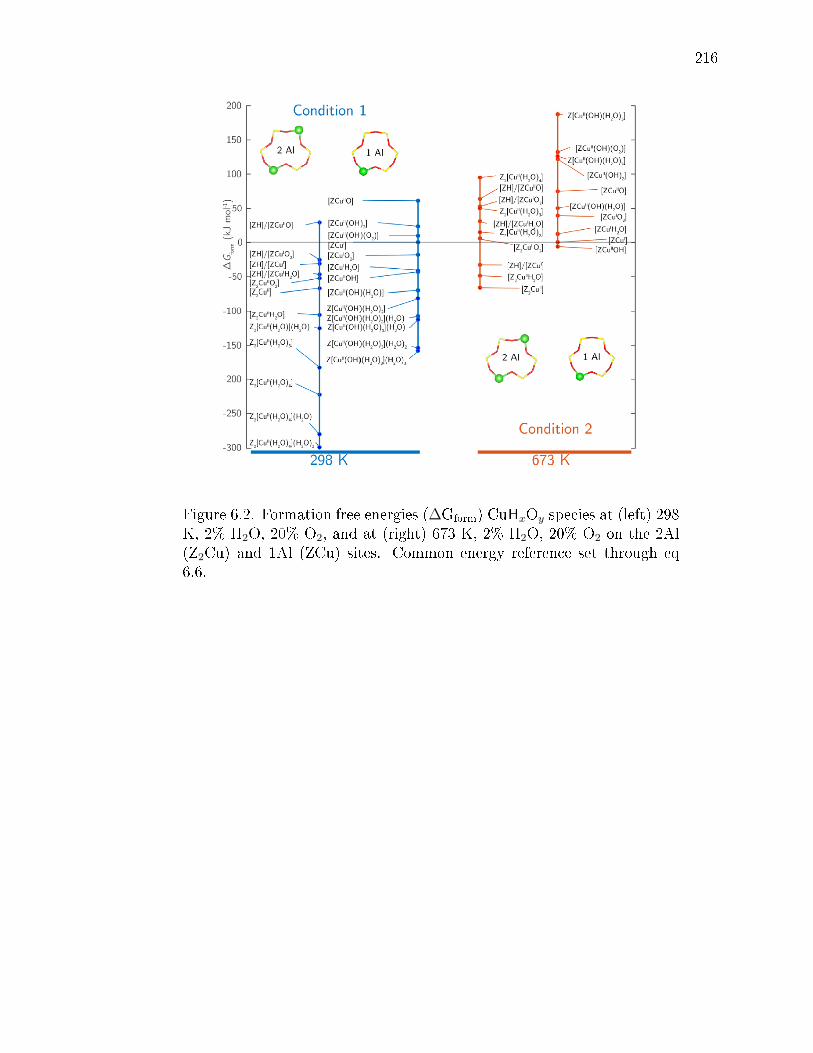
216
Figure 6.2. Formation free energies (∆Gform) CuHxOy species at (left) 298K, 2% H2O, 20% O2, and at (right) 673 K, 2% H2O, 20% O2 on the 2Al(Z2Cu) and 1Al (ZCu) sites. Common energy reference set through eq6.6.
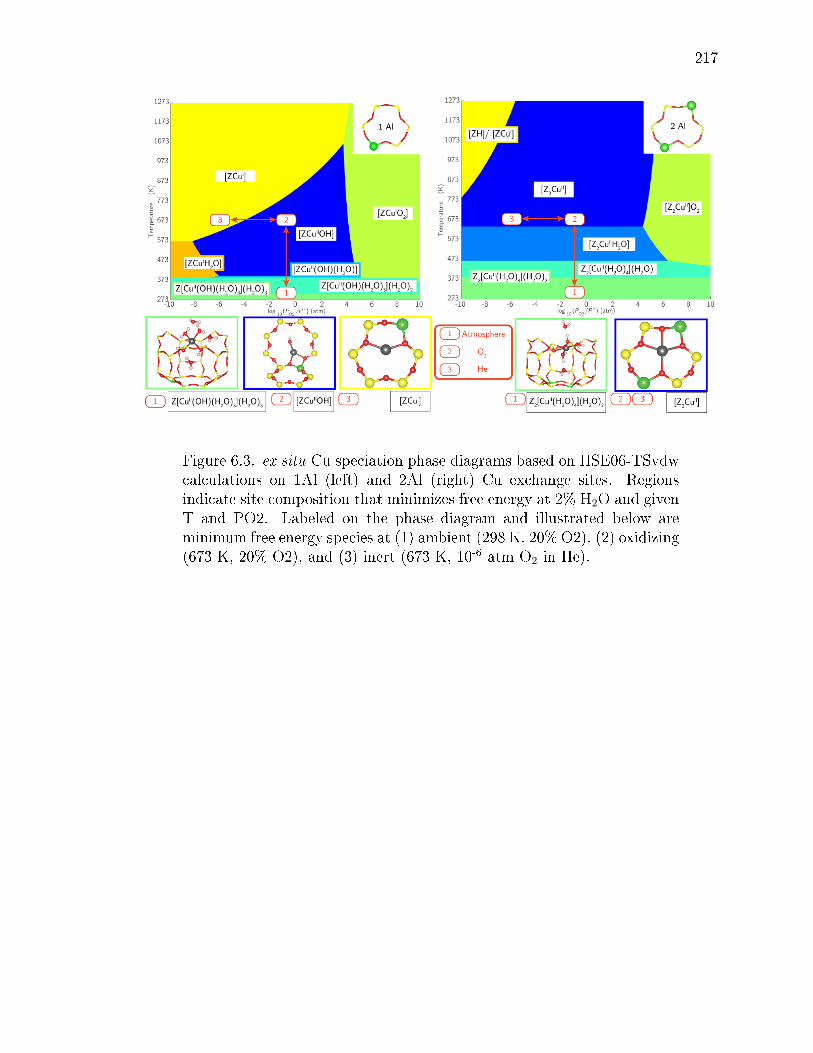
217
Figure 6.3. ex situ Cu speciation phase diagrams based on HSE06-TSvdwcalculations on 1Al (left) and 2Al (right) Cu exchange sites. Regionsindicate site composition that minimizes free energy at 2% H2O and givenT and PO2. Labeled on the phase diagram and illustrated below areminimum free energy species at (1) ambient (298 K, 20% O2), (2) oxidizing(673 K, 20% O2), and (3) inert (673 K, 10-6 atm O2 in He).
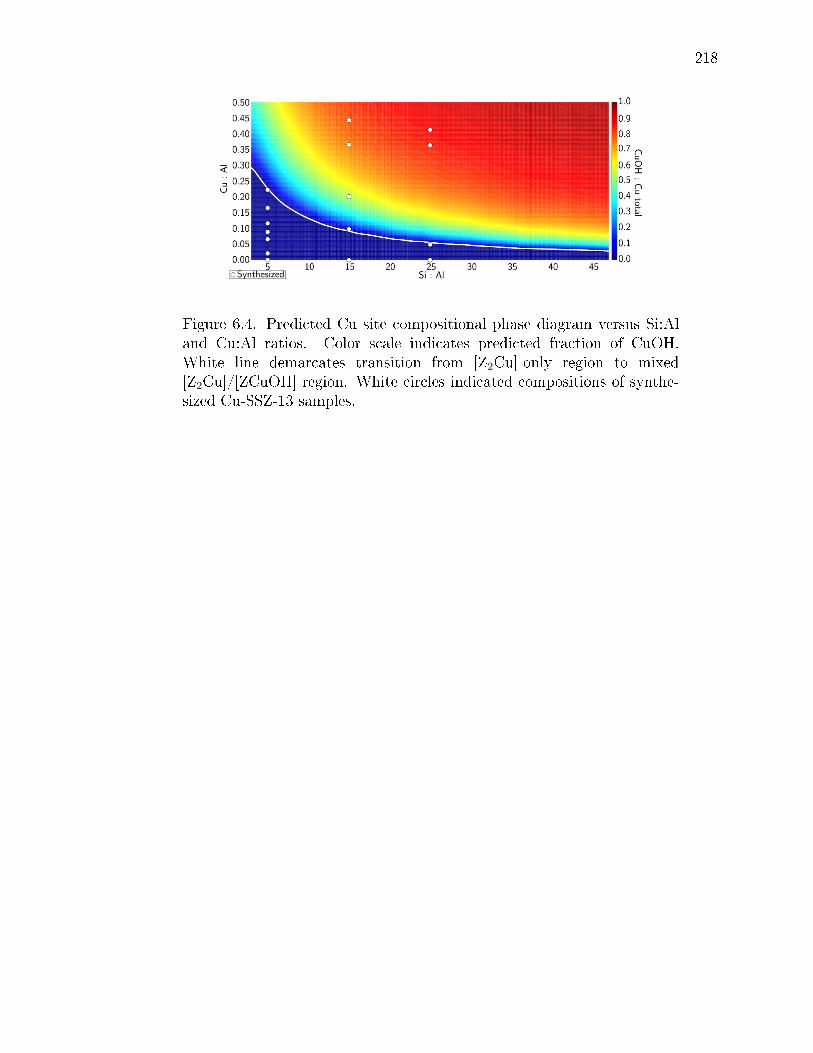
218
Figure 6.4. Predicted Cu site compositional phase diagram versus Si:Aland Cu:Al ratios. Color scale indicates predicted fraction of CuOH.White line demarcates transition from [Z2Cu]-only region to mixed[Z2Cu]/[ZCuOH] region. White circles indicated compositions of synthe-sized Cu-SSZ-13 samples.

219
Figure 6.5. Residual H+ sites per parent sample H+ from NH3 titrationson oxidized M-SSZ-13 samples versus extent of M/Al exchange for Si:Al= 5 (blue), 15 (green), and 25 (orange). Open and lled symbols denoteCu2+ and saturated Co2+ exchange, respectively. Dashed lines are modelpredictions.
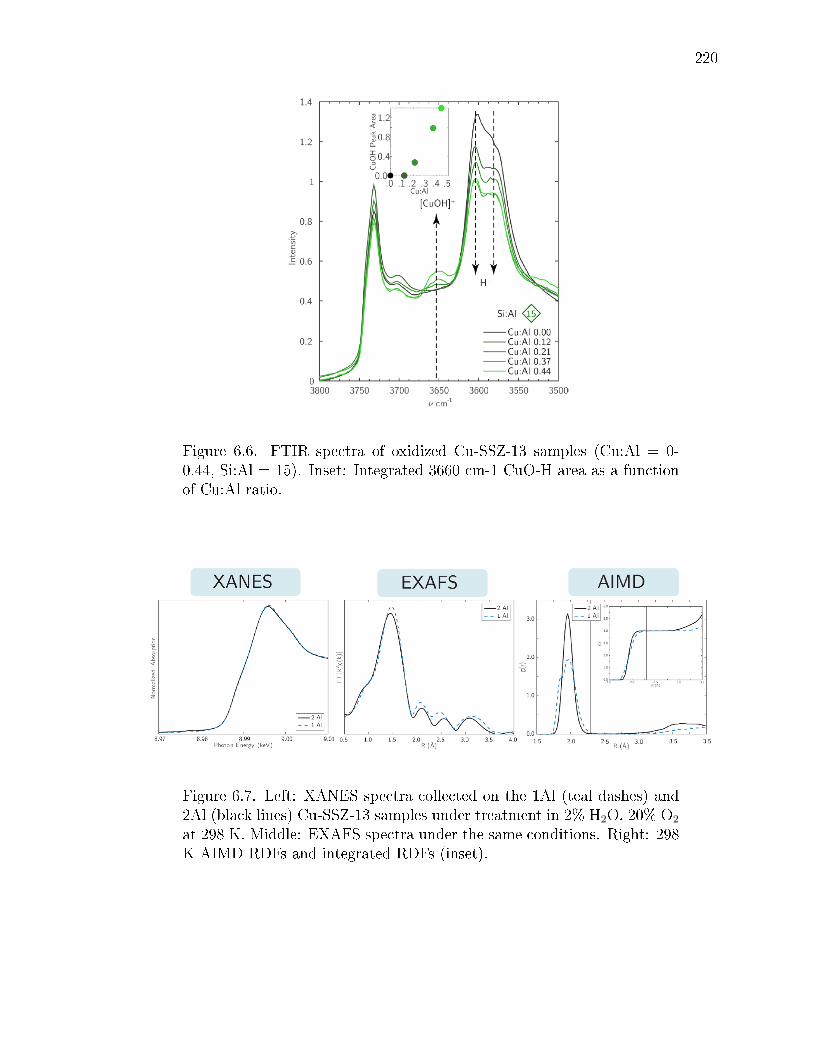
220
Figure 6.6. FTIR spectra of oxidized Cu-SSZ-13 samples (Cu:Al = 0-0.44, Si:Al = 15). Inset: Integrated 3660 cm-1 CuO-H area as a functionof Cu:Al ratio.
Figure 6.7. Left: XANES spectra collected on the 1Al (teal dashes) and2Al (black lines) Cu-SSZ-13 samples under treatment in 2% H2O, 20% O2
at 298 K. Middle: EXAFS spectra under the same conditions. Right: 298K AIMD RDFs and integrated RDFs (inset).
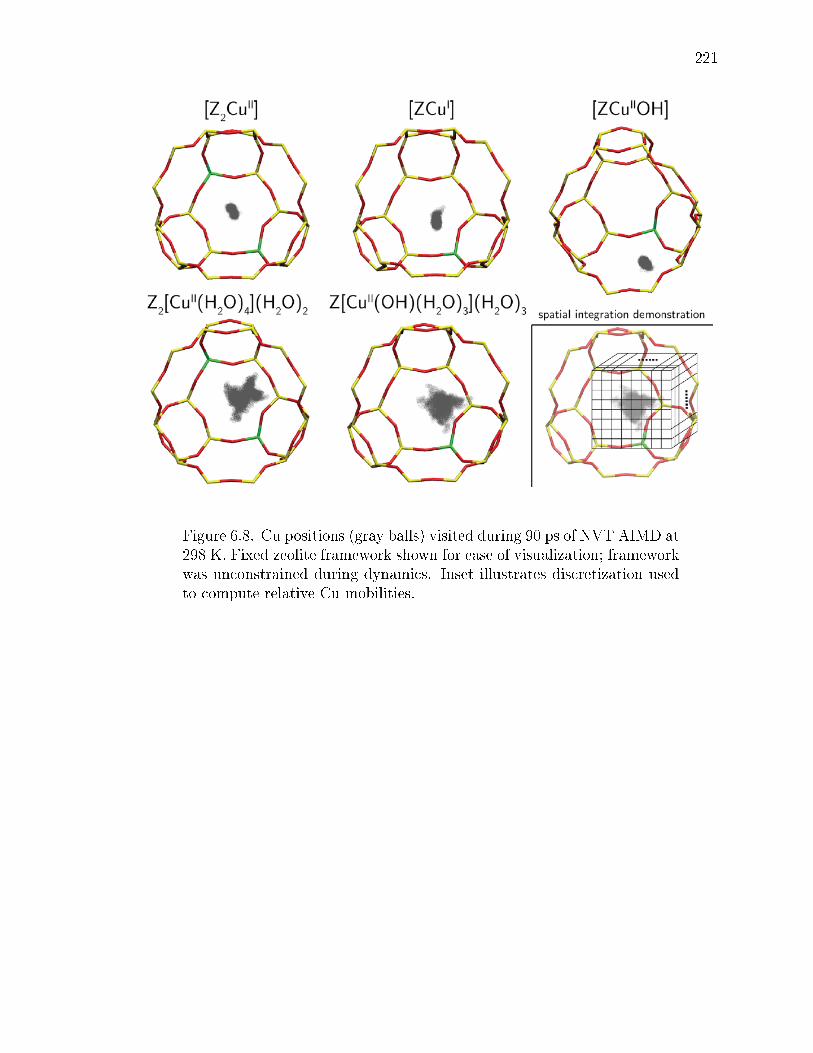
221
Figure 6.8. Cu positions (gray balls) visited during 90 ps of NVT AIMD at298 K. Fixed zeolite framework shown for ease of visualization; frameworkwas unconstrained during dynamics. Inset illustrates discretization usedto compute relative Cu mobilities.
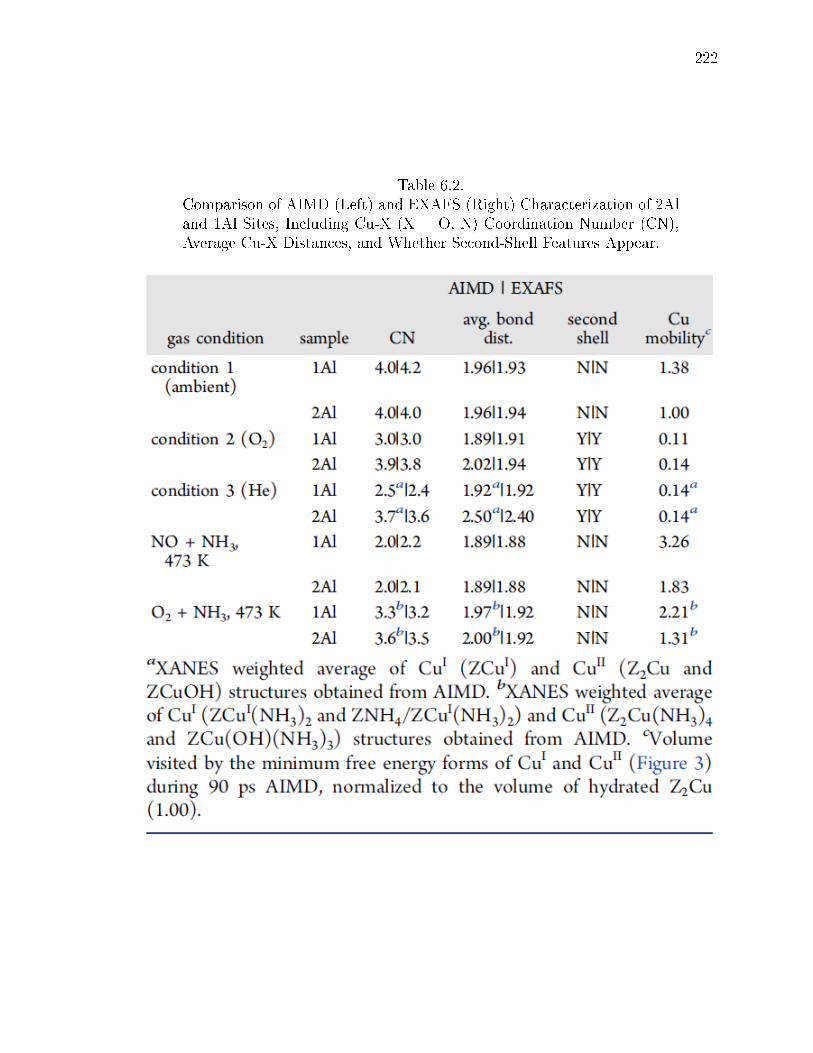
222
Table 6.2.Comparison of AIMD (Left) and EXAFS (Right) Characterization of 2Aland 1Al Sites, Including Cu-X (X = O, N) Coordination Number (CN),Average Cu-X Distances, and Whether Second-Shell Features Appear.
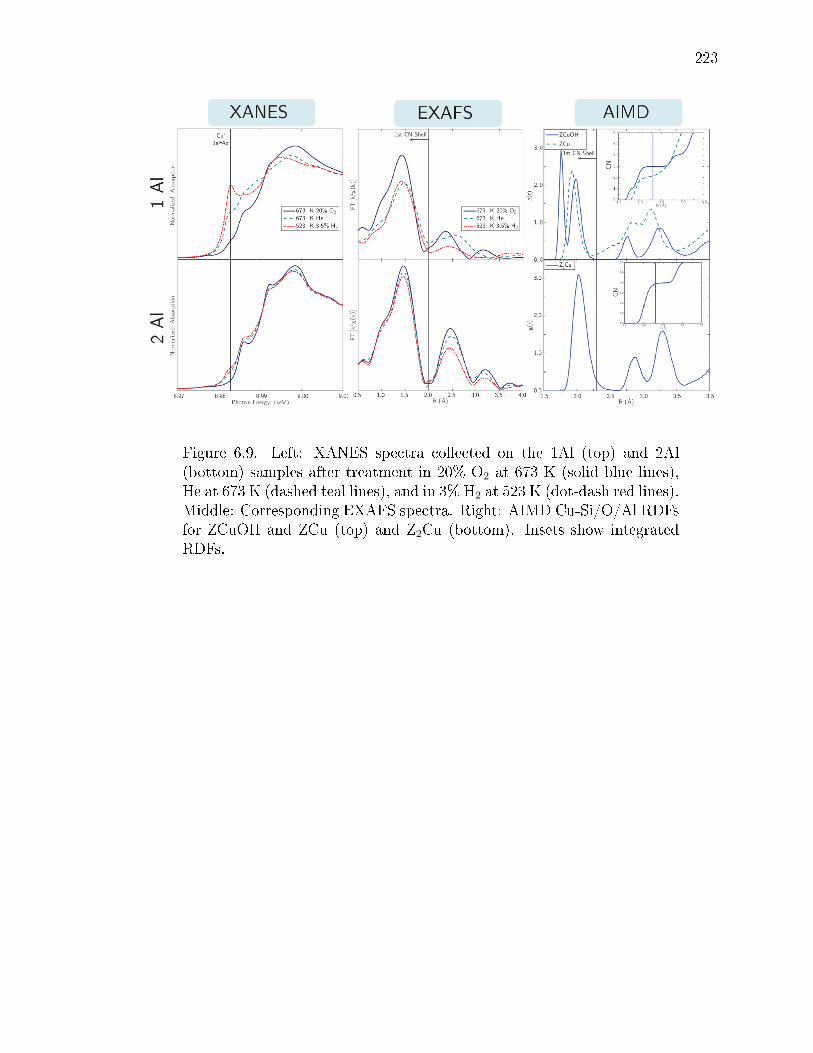
223
Figure 6.9. Left: XANES spectra collected on the 1Al (top) and 2Al(bottom) samples after treatment in 20% O2 at 673 K (solid blue lines),He at 673 K (dashed teal lines), and in 3% H2 at 523 K (dot-dash red lines).Middle: Corresponding EXAFS spectra. Right: AIMD Cu-Si/O/Al RDFsfor ZCuOH and ZCu (top) and Z2Cu (bottom). Insets show integratedRDFs.

224
Figure 6.10. Left: XANES spectra of the 1 Al (top) and 2Al (bottom) Cu-SSZ-13 samples under treatment in 2% H2O, 10% O2, 300 ppm of NH3 at473 K (O2 + NH3, blue traces), 2% H2O and 300 ppm of NO/NH3 at 473K (NO + NH3, red lines), and in 2% H2O, 10% O2, 300 ppm of NO/NH3
at 473 K (black traces). Middle: EXAFS collected under same conditions.Right: AIMD Cu -Si/O/Al RDFs for the most stable CuI (red lines) andCuII (blue traces) species on the 1 and 2Al sites in the presence of NH3.Insets: Integrated RDFs.
Table 6.3.Characterization of 2Al and 1Al Cu-SSZ-13 Catalysts during Low-Temperature (473 K) Standard SCR: XANES CuI/CuII Fraction, SCRRates (per Cu and mol NO) in the operando Reactor/Plug-Flow Reactor,Apparent Activation Energies, and Apparent NO, O2, and NH3 Orders.
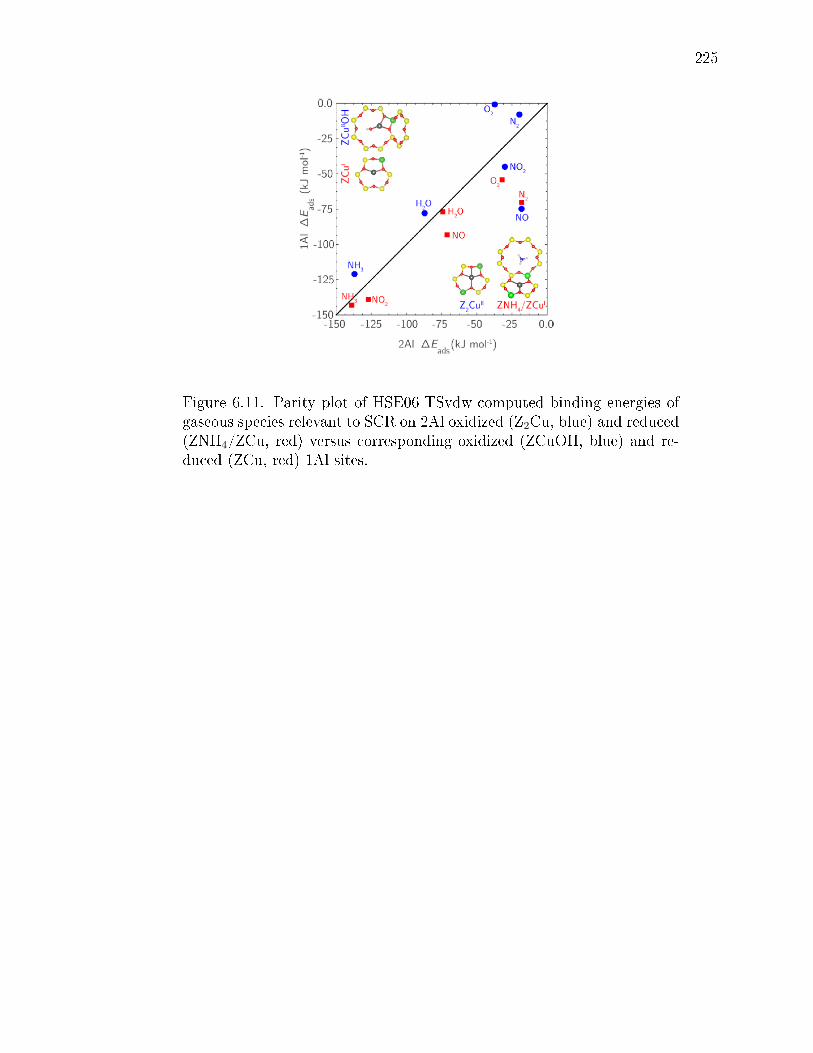
225
Figure 6.11. Parity plot of HSE06-TSvdw-computed binding energies ofgaseous species relevant to SCR on 2Al oxidized (Z2Cu, blue) and reduced(ZNH4/ZCu, red) versus corresponding oxidized (ZCuOH, blue) and re-duced (ZCu, red) 1Al sites.

226
Table 6.4.HSE06-TSvdw-Computed Sequential NH3 Adsorption Structures andEner-giesa.

227
Figure 6.12. Phase diagrams for 1Al (left) and 2Al (right) sites withvarying T and PO2 at 300 ppm of NH3 and 2% H2O. Relative rankings forall species ∆Gform <0 at 473 K and 10% O2 (chrome spheres on the phasediagrams) are given to the right of each phase diagram. The structuresshown on the bottom are the most stable CuI (red) and CuII (golden)under these conditions.

228
Figure 6.13. Cu positions (gray balls) sampled inside the zeolite cageduring 90 ps of equilibrated NVT AIMD at 473 K for the most stableNH3 solvated CuI and CuII species.
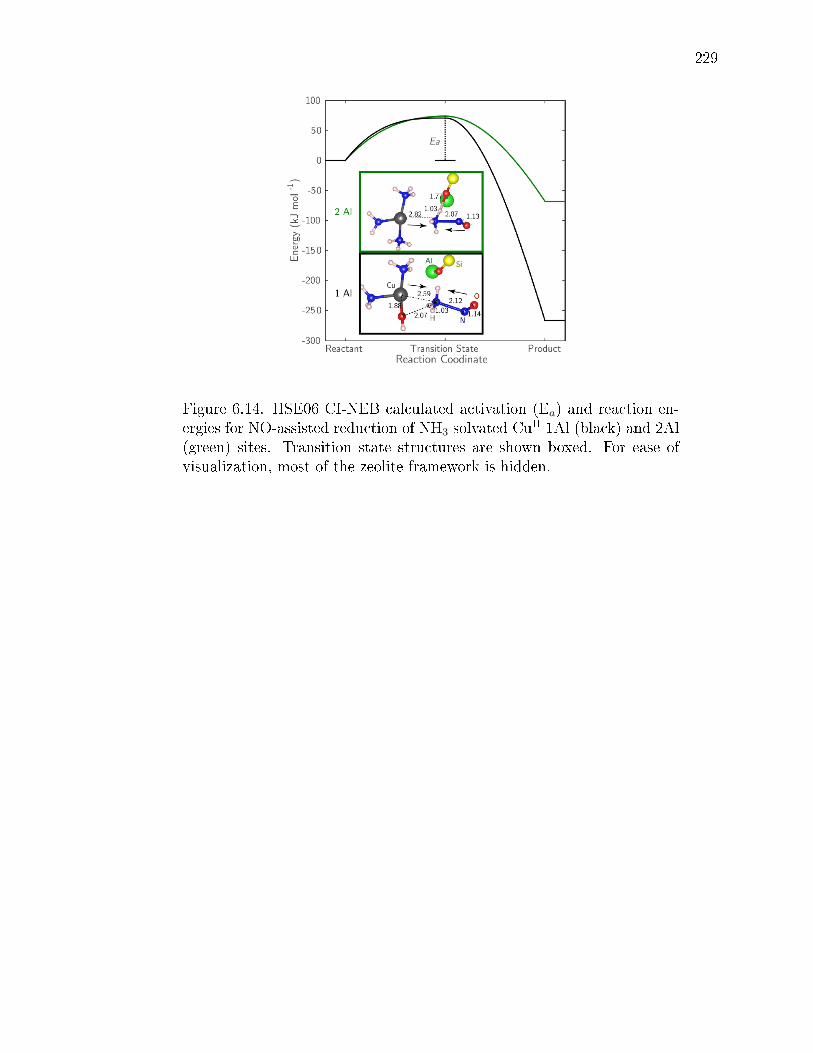
229
Figure 6.14. HSE06 CI-NEB calculated activation (Ea) and reaction en-ergies for NO-assisted reduction of NH3 solvated CuII 1Al (black) and 2Al(green) sites. Transition state structures are shown boxed. For ease ofvisualization, most of the zeolite framework is hidden.

230
Figure 6.15. Number of extra H+ sites (per Al) formed after reduction ofCuII to CuI in owing NO and NH3 (473 K) as measured by NH3 titrationand TPD. Dashed lines represent the predicted number of H+ formed onthe basis of the assumption that reduction of only CuII at 2Al sites formsa CuI/H+ site pair.
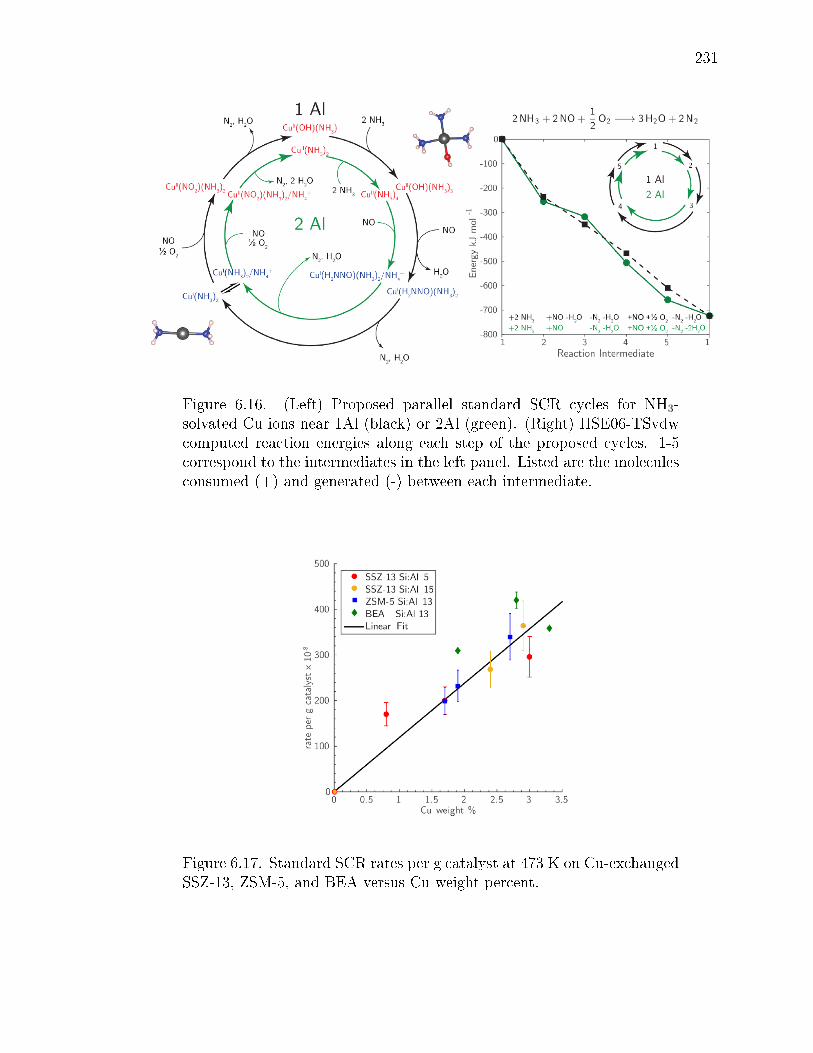
231
Figure 6.16. (Left) Proposed parallel standard SCR cycles for NH3-solvated Cu ions near 1Al (black) or 2Al (green). (Right) HSE06-TSvdwcomputed reaction energies along each step of the proposed cycles. 1-5correspond to the intermediates in the left panel. Listed are the moleculesconsumed (+) and generated (-) between each intermediate.
Figure 6.17. Standard SCR rates per g catalyst at 473 K on Cu-exchangedSSZ-13, ZSM-5, and BEA versus Cu weight percent.
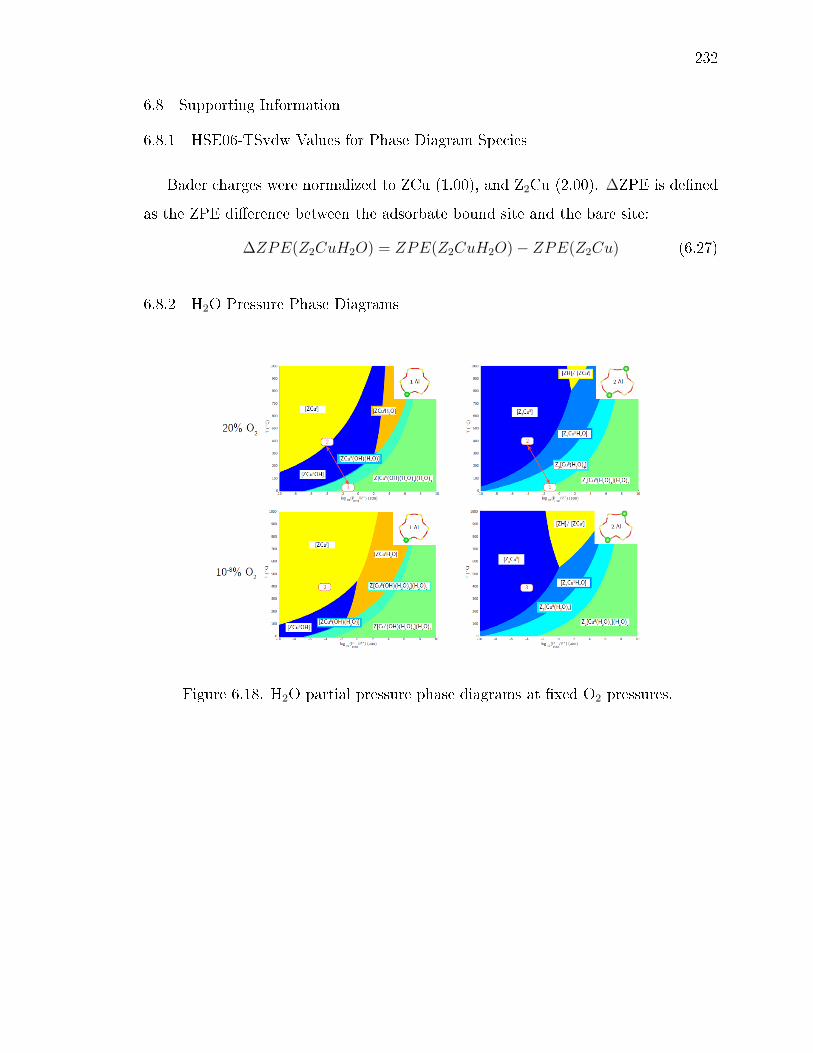
232
6.8 Supporting Information
6.8.1 HSE06-TSvdw Values for Phase Diagram Species
Bader charges were normalized to ZCu (1.00), and Z2Cu (2.00). ∆ZPE is dened
as the ZPE dierence between the adsorbate bound site and the bare site:
∆ZPE(Z2CuH2O) = ZPE(Z2CuH2O)− ZPE(Z2Cu) (6.27)
6.8.2 H2O Pressure Phase Diagrams
Figure 6.18. H2O partial pressure phase diagrams at xed O2 pressures.
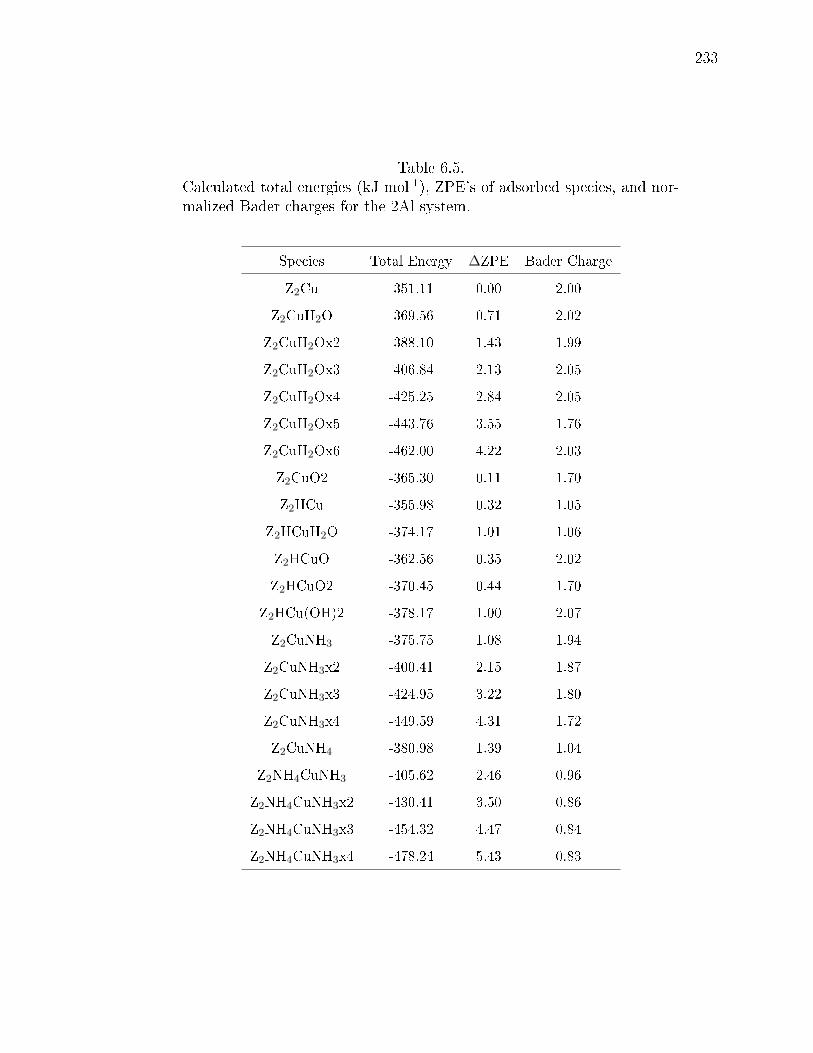
233
Table 6.5.Calculated total energies (kJ mol-1), ZPE's of adsorbed species, and nor-malized Bader charges for the 2Al system.
Species Total Energy ∆ZPE Bader Charge
Z2Cu -351.11 0.00 2.00
Z2CuH2O -369.56 0.71 2.02
Z2CuH2Ox2 -388.10 1.43 1.99
Z2CuH2Ox3 -406.84 2.13 2.05
Z2CuH2Ox4 -425.25 2.84 2.05
Z2CuH2Ox5 -443.76 3.55 1.76
Z2CuH2Ox6 -462.00 4.22 2.03
Z2CuO2 -365.30 0.11 1.70
Z2HCu -355.98 0.32 1.05
Z2HCuH2O -374.17 1.01 1.06
Z2HCuO -362.56 0.35 2.02
Z2HCuO2 -370.45 0.44 1.70
Z2HCu(OH)2 -378.17 1.00 2.07
Z2CuNH3 -375.75 1.08 1.94
Z2CuNH3x2 -400.41 2.15 1.87
Z2CuNH3x3 -424.95 3.22 1.80
Z2CuNH3x4 -449.59 4.31 1.72
Z2CuNH4 -380.98 1.39 1.04
Z2NH4CuNH3 -405.62 2.46 0.96
Z2NH4CuNH3x2 -430.41 3.50 0.86
Z2NH4CuNH3x3 -454.32 4.47 0.84
Z2NH4CuNH3x4 -478.24 5.43 0.83
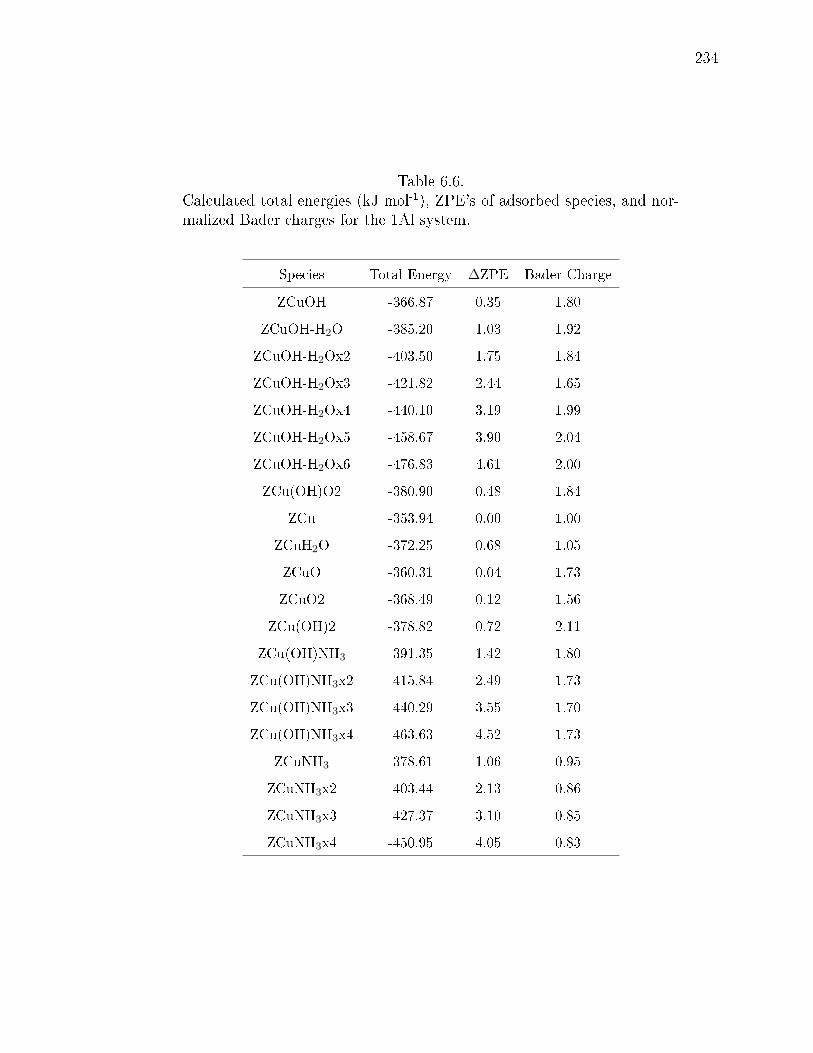
234
Table 6.6.Calculated total energies (kJ mol-1), ZPE's of adsorbed species, and nor-malized Bader charges for the 1Al system.
Species Total Energy ∆ZPE Bader Charge
ZCuOH -366.87 0.35 1.80
ZCuOH-H2O -385.20 1.03 1.92
ZCuOH-H2Ox2 -403.50 1.75 1.84
ZCuOH-H2Ox3 -421.82 2.44 1.65
ZCuOH-H2Ox4 -440.10 3.19 1.99
ZCuOH-H2Ox5 -458.67 3.90 2.04
ZCuOH-H2Ox6 -476.83 4.61 2.00
ZCu(OH)O2 -380.90 0.48 1.84
ZCu -353.94 0.00 1.00
ZCuH2O -372.25 0.68 1.05
ZCuO -360.31 0.04 1.73
ZCuO2 -368.49 0.12 1.56
ZCu(OH)2 -378.82 0.72 2.11
ZCu(OH)NH3 -391.35 1.42 1.80
ZCu(OH)NH3x2 -415.84 2.49 1.73
ZCu(OH)NH3x3 -440.29 3.55 1.70
ZCu(OH)NH3x4 -463.63 4.52 1.73
ZCuNH3 -378.61 1.06 0.95
ZCuNH3x2 -403.44 2.13 0.86
ZCuNH3x3 -427.37 3.10 0.85
ZCuNH3x4 -450.95 4.05 0.83

235
6.8.3 Z2Cu vs ZCuOH Exchange Energetics
Figure 6.19. Z2CuH2O vs. ZH/ZCuOH energetics in a single supercell.
Figure 6.20. Z2CuH2O vs. ZH/ZCuOH energetics in a 2x1x1 supercell.
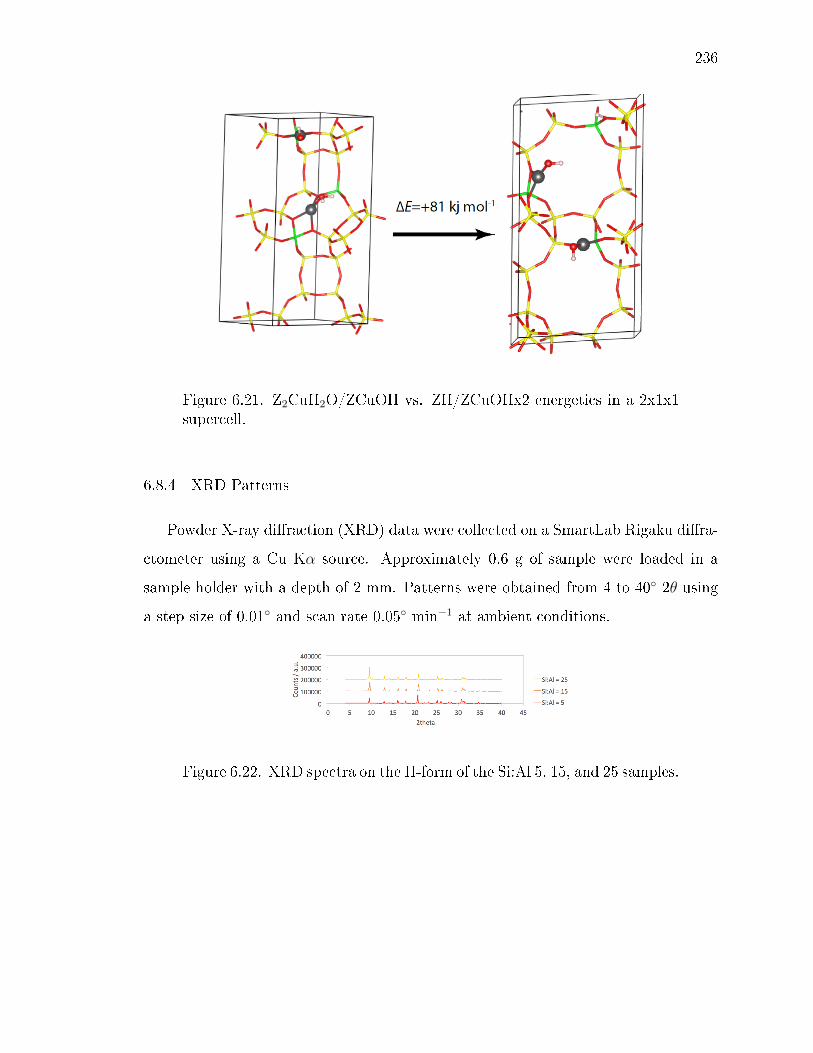
236
Figure 6.21. Z2CuH2O/ZCuOH vs. ZH/ZCuOHx2 energetics in a 2x1x1supercell.
6.8.4 XRD Patterns
Powder X-ray diraction (XRD) data were collected on a SmartLab Rigaku dira-
ctometer using a Cu Kα source. Approximately 0.6 g of sample were loaded in a
sample holder with a depth of 2 mm. Patterns were obtained from 4 to 40 2θ using
a step size of 0.01 and scan rate 0.05 min−1 at ambient conditions.
Figure 6.22. XRD spectra on the H-form of the Si:Al 5, 15, and 25 samples.
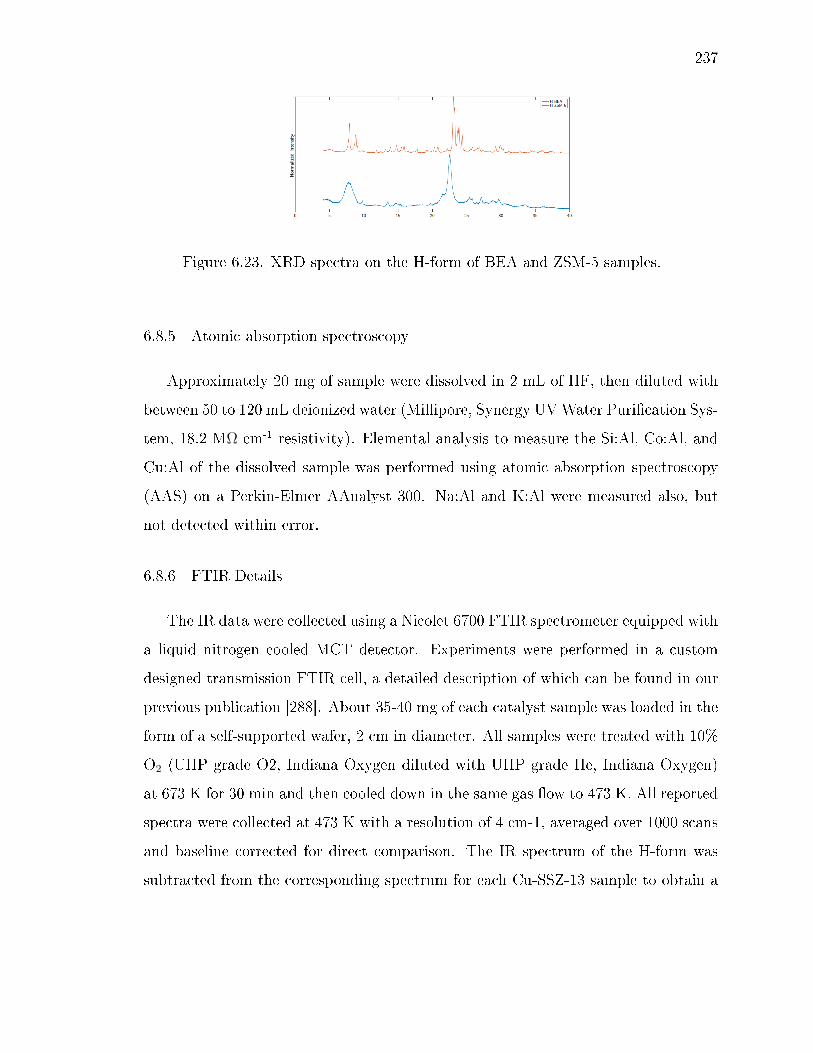
237
Figure 6.23. XRD spectra on the H-form of BEA and ZSM-5 samples.
6.8.5 Atomic absorption spectroscopy
Approximately 20 mg of sample were dissolved in 2 mL of HF, then diluted with
between 50 to 120 mL deionized water (Millipore, Synergy UVWater Purication Sys-
tem, 18.2 MΩ cm-1 resistivity). Elemental analysis to measure the Si:Al, Co:Al, and
Cu:Al of the dissolved sample was performed using atomic absorption spectroscopy
(AAS) on a Perkin-Elmer AAnalyst 300. Na:Al and K:Al were measured also, but
not detected within error.
6.8.6 FTIR Details
The IR data were collected using a Nicolet 6700 FTIR spectrometer equipped with
a liquid nitrogen cooled MCT detector. Experiments were performed in a custom
designed transmission FTIR cell, a detailed description of which can be found in our
previous publication [288]. About 35-40 mg of each catalyst sample was loaded in the
form of a self-supported wafer, 2 cm in diameter. All samples were treated with 10%
O2 (UHP grade O2, Indiana Oxygen diluted with UHP grade He, Indiana Oxygen)
at 673 K for 30 min and then cooled down in the same gas ow to 473 K. All reported
spectra were collected at 473 K with a resolution of 4 cm-1, averaged over 1000 scans
and baseline corrected for direct comparison. The IR spectrum of the H-form was
subtracted from the corresponding spectrum for each Cu-SSZ-13 sample to obtain a
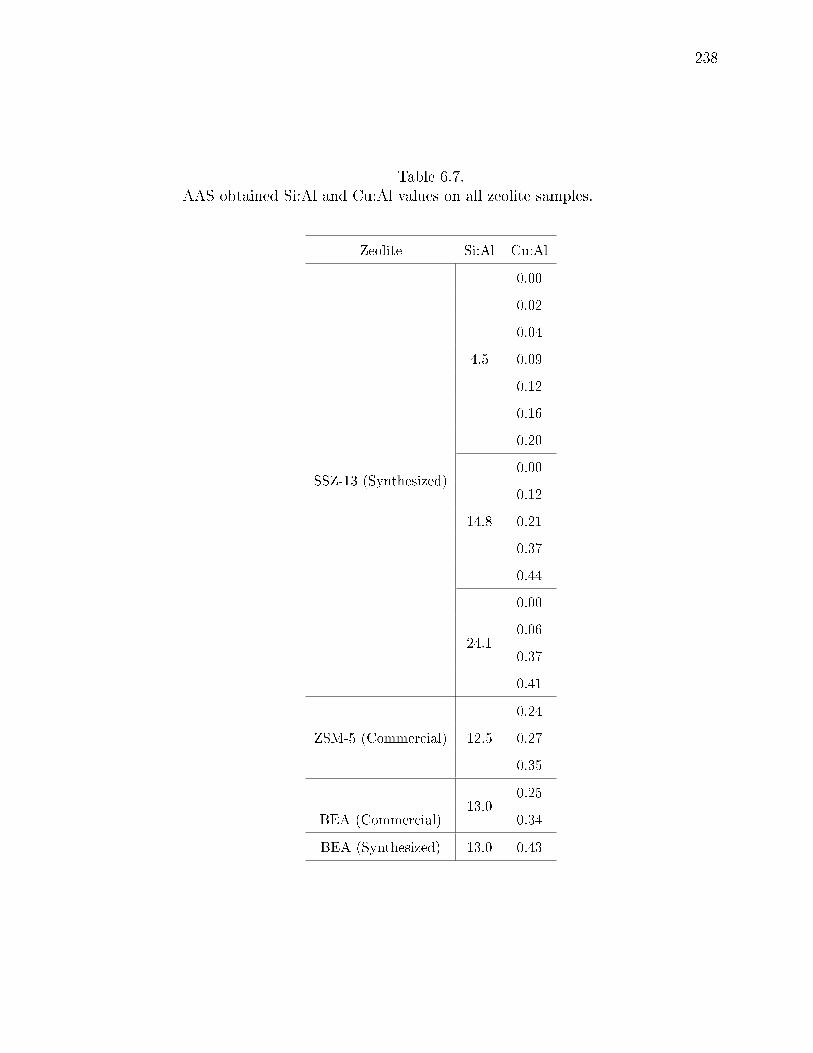
238
Table 6.7.AAS obtained Si:Al and Cu:Al values on all zeolite samples.
Zeolite Si:Al Cu:Al
SSZ-13 (Synthesized)
4.5
0.00
0.02
0.04
0.09
0.12
0.16
0.20
14.8
0.00
0.12
0.21
0.37
0.44
24.1
0.00
0.06
0.37
0.41
ZSM-5 (Commercial) 12.5
0.24
0.27
0.35
BEA (Commercial)13.0
0.25
0.34
BEA (Synthesized) 13.0 0.43
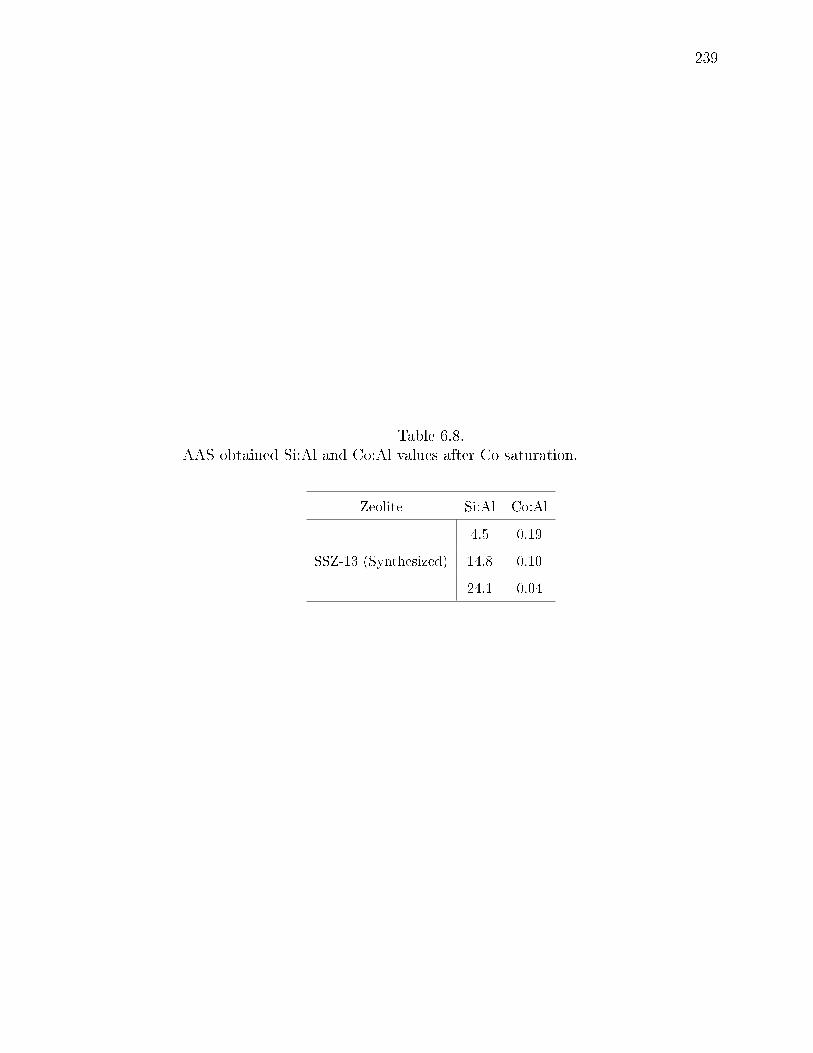
239
Table 6.8.AAS obtained Si:Al and Co:Al values after Co saturation.
Zeolite Si:Al Co:Al
SSZ-13 (Synthesized)
4.5 0.19
14.8 0.10
24.1 0.04
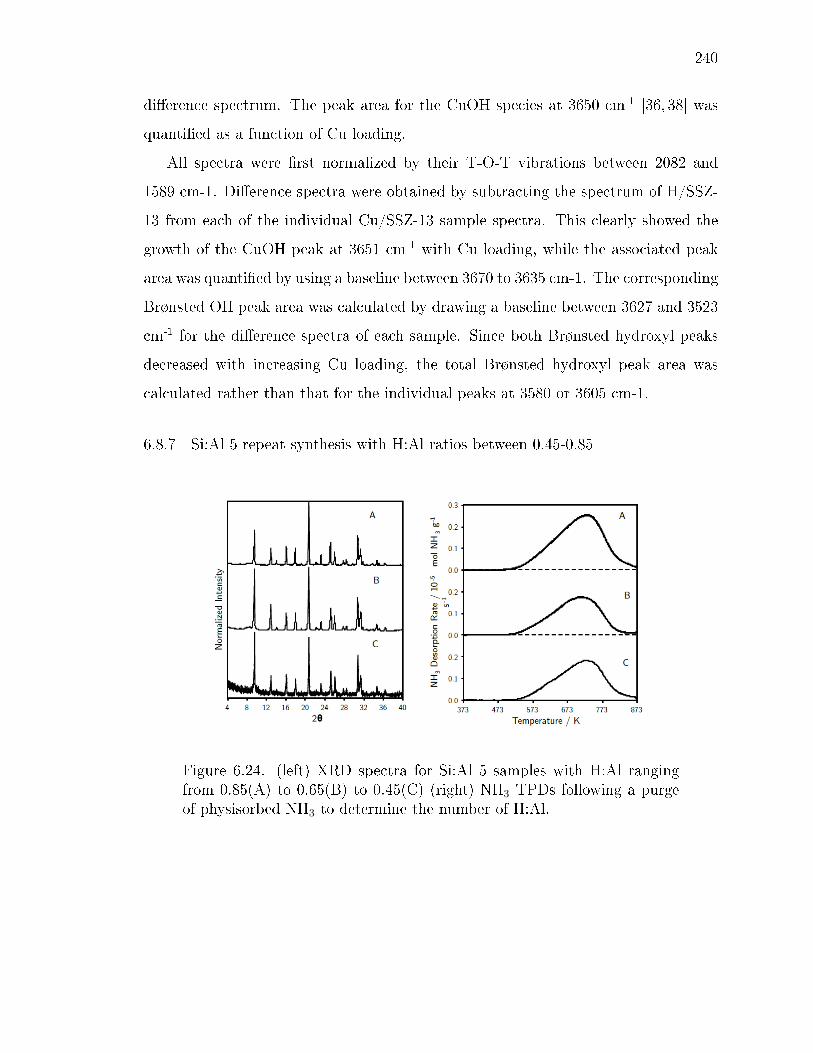
240
dierence spectrum. The peak area for the CuOH species at 3650 cm-1 [36, 38] was
quantied as a function of Cu loading.
All spectra were rst normalized by their T-O-T vibrations between 2082 and
1589 cm-1. Dierence spectra were obtained by subtracting the spectrum of H/SSZ-
13 from each of the individual Cu/SSZ-13 sample spectra. This clearly showed the
growth of the CuOH peak at 3651 cm-1 with Cu loading, while the associated peak
area was quantied by using a baseline between 3670 to 3635 cm-1. The corresponding
Brønsted OH peak area was calculated by drawing a baseline between 3627 and 3523
cm-1 for the dierence spectra of each sample. Since both Brønsted hydroxyl peaks
decreased with increasing Cu loading, the total Brønsted hydroxyl peak area was
calculated rather than that for the individual peaks at 3580 or 3605 cm-1.
6.8.7 Si:Al 5 repeat synthesis with H:Al ratios between 0.45-0.85
Figure 6.24. (left) XRD spectra for Si:Al 5 samples with H:Al rangingfrom 0.85(A) to 0.65(B) to 0.45(C) (right) NH3 TPDs following a purgeof physisorbed NH3 to determine the number of H:Al.
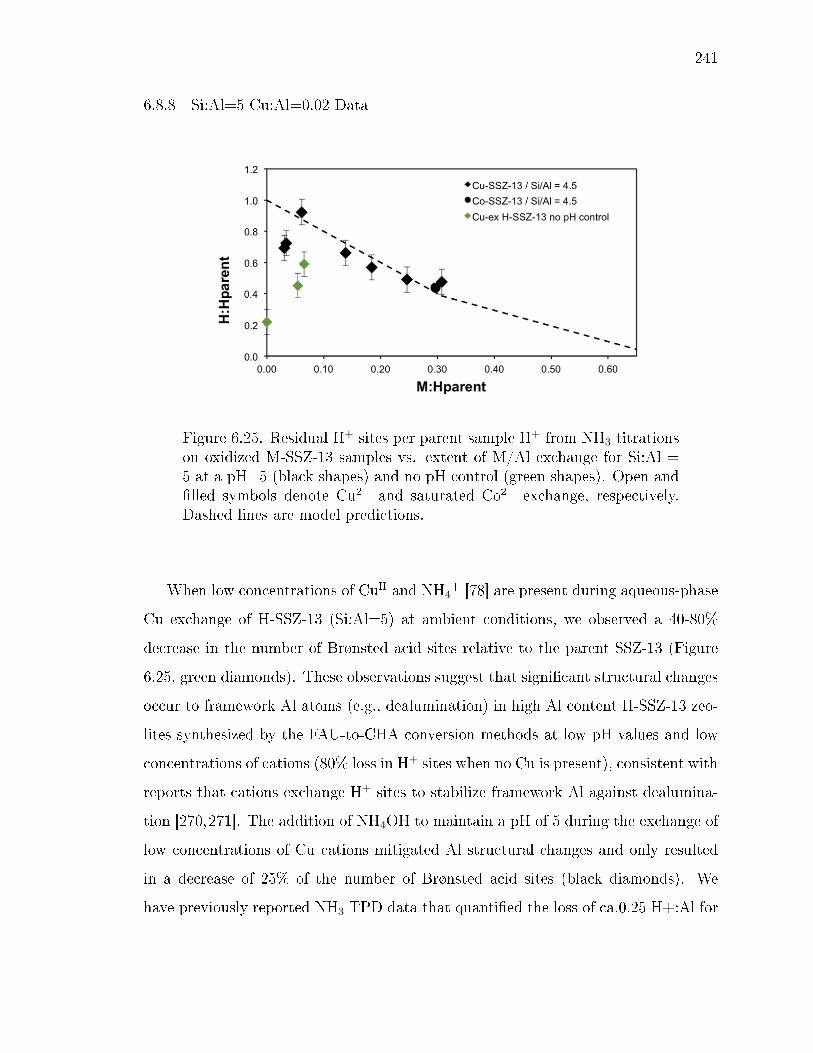
241
6.8.8 Si:Al=5 Cu:Al=0.02 Data
Figure 6.25. Residual H+ sites per parent sample H+ from NH3 titrationson oxidized M-SSZ-13 samples vs. extent of M/Al exchange for Si:Al =5 at a pH=5 (black shapes) and no pH control (green shapes). Open andlled symbols denote Cu2+ and saturated Co2+ exchange, respectively.Dashed lines are model predictions.
When low concentrations of CuII and NH4+ [78] are present during aqueous-phase
Cu exchange of H-SSZ-13 (Si:Al=5) at ambient conditions, we observed a 40-80%
decrease in the number of Brønsted acid sites relative to the parent SSZ-13 (Figure
6.25, green diamonds). These observations suggest that signicant structural changes
occur to framework Al atoms (e.g., dealumination) in high Al content H-SSZ-13 zeo-
lites synthesized by the FAU-to-CHA conversion methods at low pH values and low
concentrations of cations (80% loss in H+ sites when no Cu is present), consistent with
reports that cations exchange H+ sites to stabilize framework Al against dealumina-
tion [270,271]. The addition of NH4OH to maintain a pH of 5 during the exchange of
low concentrations of Cu cations mitigated Al structural changes and only resulted
in a decrease of 25% of the number of Brønsted acid sites (black diamonds). We
have previously reported NH3 TPD data that quantied the loss of ca.0.25 H+:Al for
242
this SSZ-13 sample (Si:Al=5, Cu:Al=0.02) [78], which is much larger than expected
from the CuII:H+ 2:1 exchange stoichiometry (0.04 H+:Al for a Cu:Al=0.02). In this
manuscript, we have removed this data point from the correlation in Figure 6.5, in
light of this new evidence for the simultaneous structural changes to zeolite exchange
sites (framework Al) that occur during Cu exchange procedure to prepare this sample.
6.8.9 XAS Details
XAS experiments were carried out at Sector 10 of the Advanced Photon Source
at Argonne National Laboratory. Spectra were collected at both beamlines, 10-ID
and 10-BM. The high photon ux at the ID line (approximately 100 times higher
than that at the BM line) was required to perform experiments in the operando
reactor to get enough transmitted X-ray intensity through the catalyst bed. Cu metal
foil spectrum was simultaneously collected while measuring sample spectra and its
energy was calibrated to 8979 eV for the Cu K-edge. All spectra were collected under
isothermal conditions and normalized using a 1st order polynomial in the pre-edge
region and a 3rd order polynomial in the post-edge region. EXAFS data was t from
k = 2.7 to 11 A. Linear combination XANES ts to determine the Cu(I) and Cu(II)
fractions under operando conditions were carried out using the appropriate references
as explained in our previous publications [37, 85, 87]. 10-15 mg of each sample was
loaded for in situ experiments. All spectra were collected in the step scan mode. Gas
treatments were performed in the lab and the samples were transferred to the beamline
and cooled down to room temperature before collecting spectra. The samples were
oxidized in a 20% O2/He (UHP grade, Airgas) ow, whereas the reducing treatments
used either UHP He (Airgas) at 673 K, 3.5% H2/He (UHP, Airgas) at 523 K or 1500
ppm NH3 (3% NH3/Ar, Praxair) + 1500 ppm NO (0.3% NO/N2, Airgas) at 673 K.
The total ow rate in each case was 100 ml min-1 and samples were exposed to the
corresponding gas conditions for 45 min. A wide range of catalysts with varying Si/Al
and Cu/Al ratios was used to sample the dierent Cu congurations and identify the
243
response of those species to the dierent gas treatments. The energy range for the
data collected at the 10-BM line was 8700 eV to 9890 eV.
operando experiments were performed at the 10-ID line in a special glassy carbon
tube reactor as described by Kispersky et al [87]. During these experiments XAS
spectra were simultaneously collected while measuring the reaction rates for each
sample to ensure that the standard SCR rate per mole Cu measured at APS matched
with that measured in the lab. Typical standard SCR conditions used were 300 ppm
NO, 300 ppm NH3, 10% O2, 2-2.5% H2O, 5% CO2 with a total ow rate of 500
ml min-1 at 458-463 K. 9-12 mg of each sample was loaded in the reactor to ensure
dierential conditions (< 20% conversion). Spectra under operando conditions were
collected in the quick scan mode and averaged over 3-5 scans. The in situ experiments
with 300 ppm NH3+10% O2 were performed at the 10-ID line with 2.5-3% H2O and
a total ow of 500 ml min-1 at 673 K. The energy range for the data collected at the
10-ID line was 8700 eV to 9780 eV.
EXAFS data was t from 2.7 to 10.5 A range with DWF's of 0.001 at room
temperature, 0.002 at 473 K and 0.0035 at 673 K. k2 weighting was used to convert
the data into R-space, and obtain the coordination numbers and bond distances under
the various gas conditions.
6.8.10 Mobility Calculation Details
Cu positions during the entire course of simulation are analyzed to nd out its
relative mobility when dierent ligands bind to Cu. Only Cu positions represented as
3D cartesian coordinates (x,y,z) after 60 ps of equilibration time are used for the study.
To calculate the volume of space Cu traveled, the 3D cartesian space is discretized
into 0.008 A3 cubes as illustrated in Figure 6.9. The number of cubes that Cu has
visited at least once is counted and summed up to be the nal volume. Absolute
volumes Cu visited for dierent binding ligands are going to change according to the
size of the cubes used, but relative ratio of this volume keeps the same for cube size
0.001 to 0.125 A3.
244
6.8.11 XANES Fitting Details
Since XAS is a bulk technique, each sample spectrum is a linear combination
of the corresponding oxidation states. A mixture of Cu(I) and Cu(II) are present
under standard SCR conditions and therefore, a linear combination XANES tting
of the Cu(I) and Cu(II) references was used to obtain the relative amounts of each
oxidation state under various conditions. Information about how the Cu(I) and Cu(II)
references were generated is provided in our previous publication [85]. EXAFS data
was t from 2.7 to 10.5 A-1 range with DWF's of 0.001 at room temperature, 0.002
at 473 K and 0.0035 at 673 K. k2 weighting was used to convert the data into R-
space, and obtain the coordination numbers and bond distances under the various
gas conditions.
6.8.12 Z2Cu Modes
The six oxygens in the 6MR are labeled from 1 through 6 clockwise to identify
Cu-O coordination. The ring structures just adjacent to the 6MR are shown in Figure
6.26, where 4MR and 8MR alternates around the 6MR. In principle any four oxygens
out of the six oxygens could be coordinated with Cu, however not all combinations
are energetically stable at 0K. We found that at least two out of the four Cu-O bonds
must come from the oxygen pair adjacent to the Al (i.e. O1/O6 pair, and O3/O4
pair). The rest of the two bonds must come from two other oxygens that's in the
neighboring 4MR. Alternatively the two oxygen pairs can all be coordinated with Cu.
This is because in a 6MR without Cu interaction, the TOT angle in the neighboring
4MR prefers to be <180, while the TOT angle in the neighboring 8MR prefers to be
>180. When Cu is introduced in the 6MR and bonding with four of the oxygens, it
is energetically more favorable to distort as less as TOT angles as possible. This can
be illustrated in the three stable local minima that we found as detailed below.
In Figure 6.27, dashed lines show Cu-O coordination and the numbering of oxygens
is consistent as in Figure 6.26. In modes 1 and 2 only one 8MR TOT angle is distorted
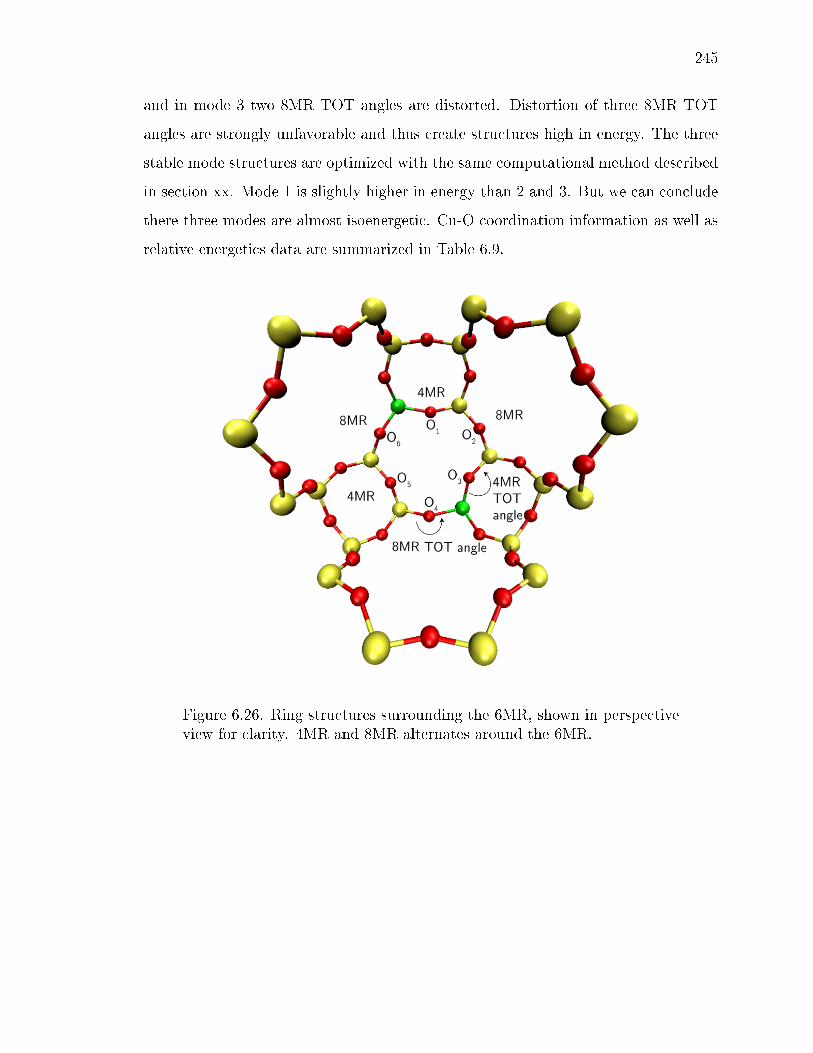
245
and in mode 3 two 8MR TOT angles are distorted. Distortion of three 8MR TOT
angles are strongly unfavorable and thus create structures high in energy. The three
stable mode structures are optimized with the same computational method described
in section xx. Mode 1 is slightly higher in energy than 2 and 3. But we can conclude
there three modes are almost isoenergetic. Cu-O coordination information as well as
relative energetics data are summarized in Table 6.9.
Figure 6.26. Ring structures surrounding the 6MR, shown in perspectiveview for clarity. 4MR and 8MR alternates around the 6MR.
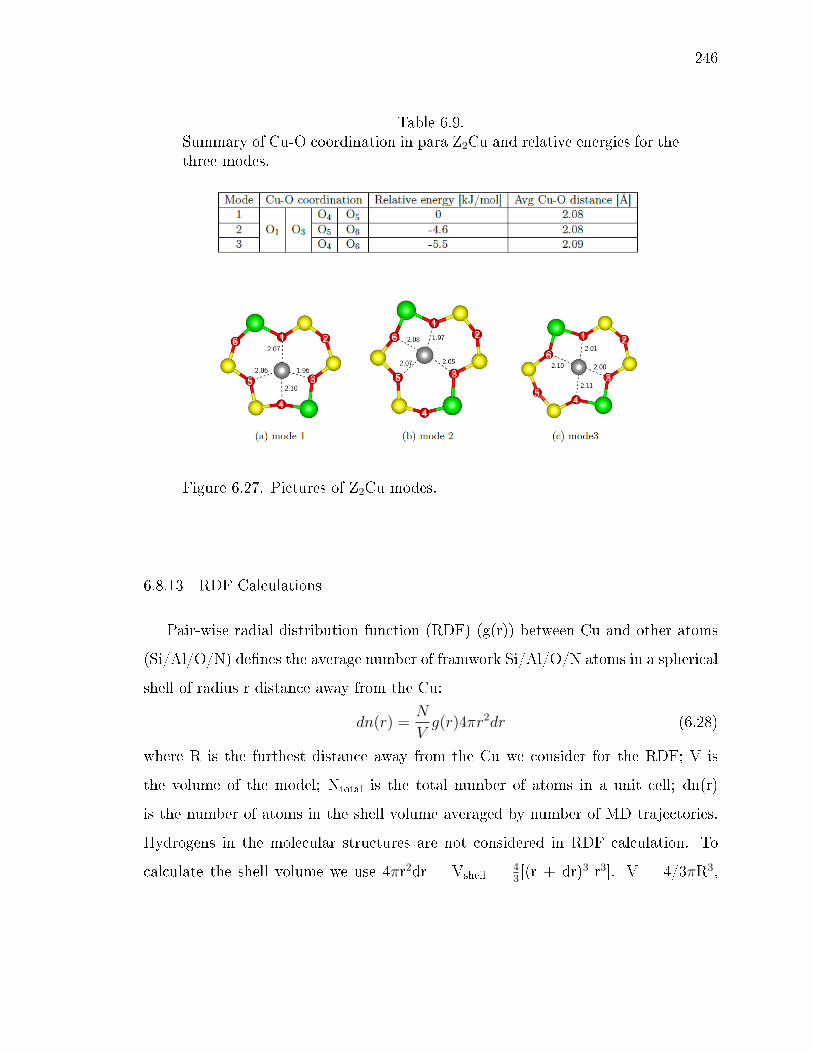
246
Table 6.9.Summary of Cu-O coordination in para Z2Cu and relative energies for thethree modes.
Figure 6.27. Pictures of Z2Cu modes.
6.8.13 RDF Calculations
Pair-wise radial distribution function (RDF) (g(r)) between Cu and other atoms
(Si/Al/O/N) denes the average number of framwork Si/Al/O/N atoms in a spherical
shell of radius r distance away from the Cu:
dn(r) =N
Vg(r)4πr2dr (6.28)
where R is the furthest distance away from the Cu we consider for the RDF; V is
the volume of the model; Ntotal is the total number of atoms in a unit cell; dn(r)
is the number of atoms in the shell volume averaged by number of MD trajectories.
Hydrogens in the molecular structures are not considered in RDF calculation. To
calculate the shell volume we use 4πr2dr = Vshell = 43[(r + dr)3-r3]. V = 4/3πR3,
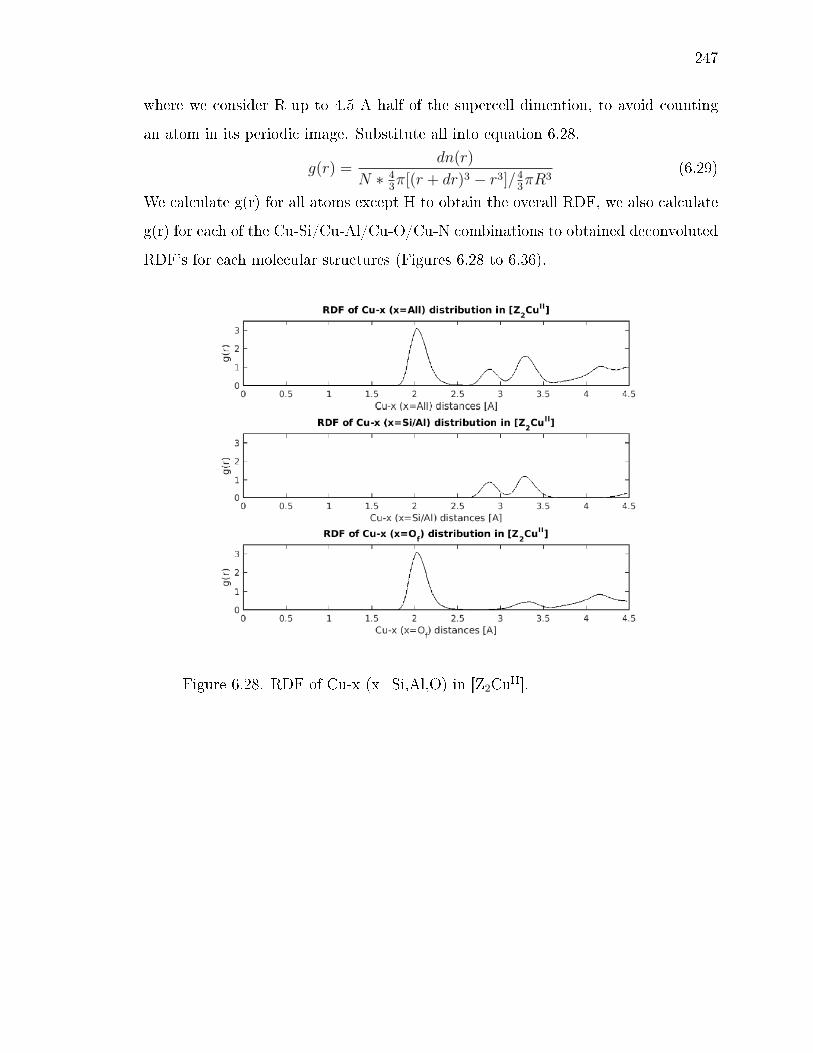
247
where we consider R up to 4.5 A half of the supercell dimention, to avoid counting
an atom in its periodic image. Substitute all into equation 6.28,
g(r) =dn(r)
N ∗ 43π[(r + dr)3 − r3]/4
3πR3
(6.29)
We calculate g(r) for all atoms except H to obtain the overall RDF, we also calculate
g(r) for each of the Cu-Si/Cu-Al/Cu-O/Cu-N combinations to obtained deconvoluted
RDF's for each molecular structures (Figures 6.28 to 6.36).
Figure 6.28. RDF of Cu-x (x=Si,Al,O) in [Z2CuII].

248
Figure 6.29. RDF of Cu-x (x=Si,Al,O) in [ZCuI ].
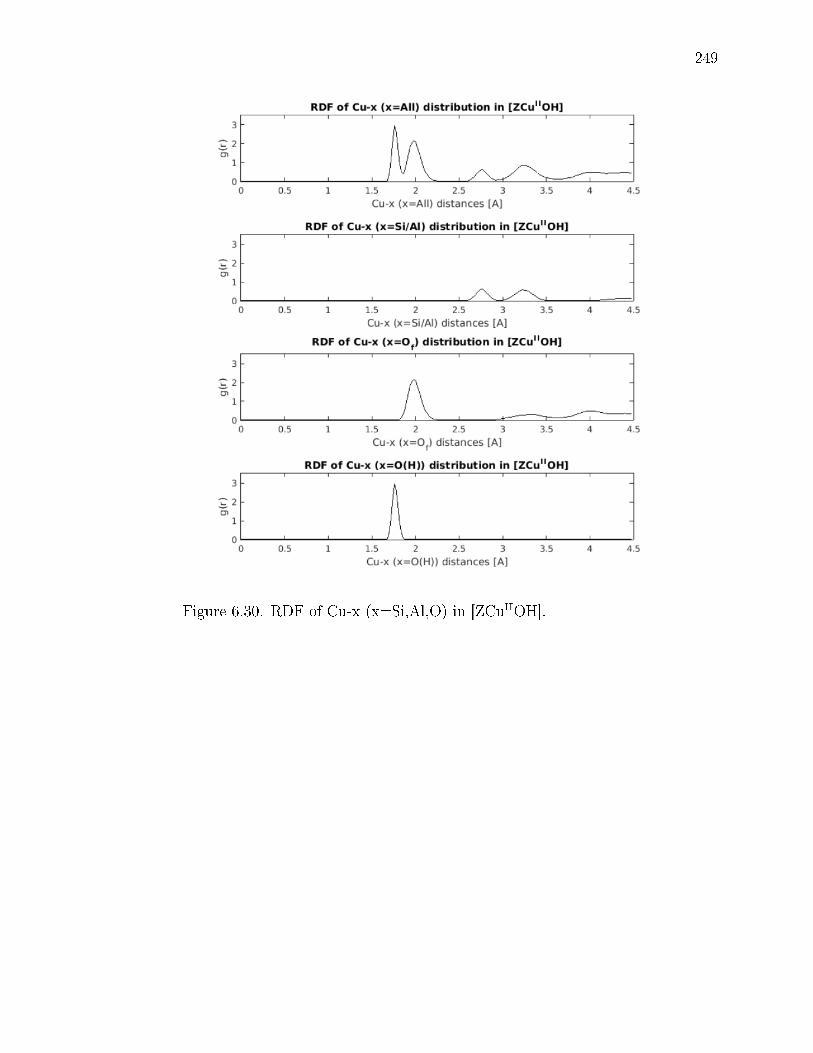
249
Figure 6.30. RDF of Cu-x (x=Si,Al,O) in [ZCuIIOH].

250
Figure 6.31. RDF of Cu-x (x=Si,Al,O) in Z2[CuII(H2O)4](H2O)2.
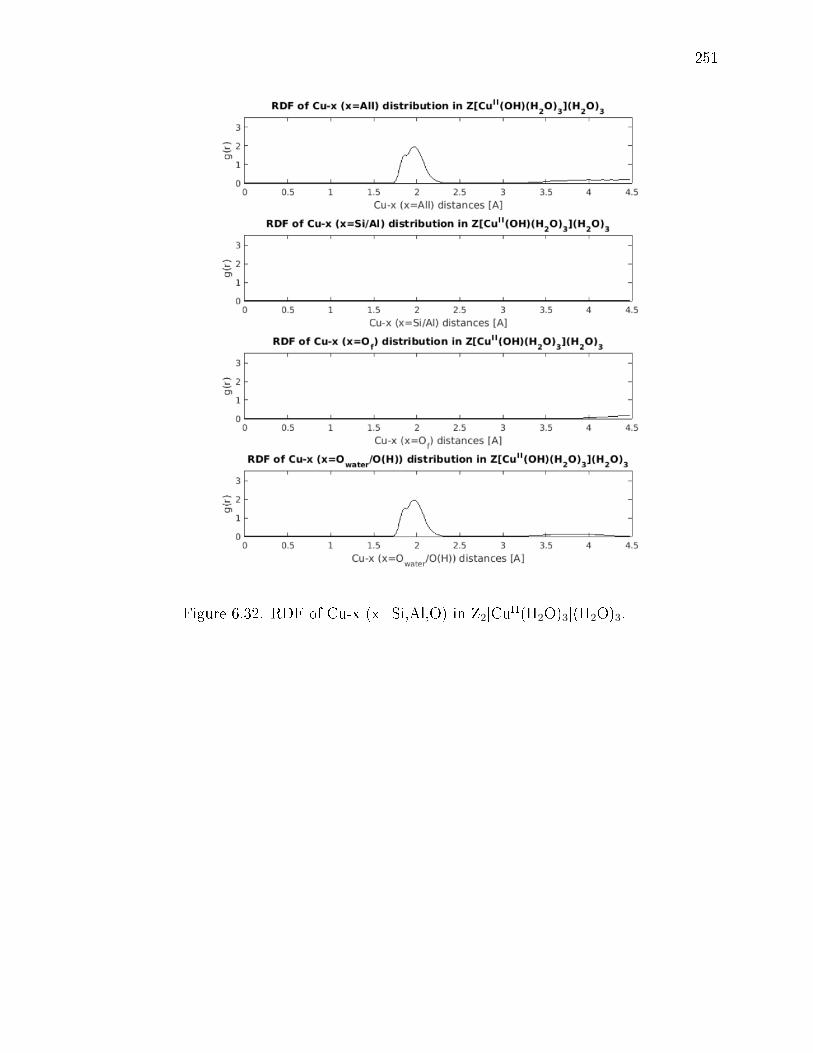
251
Figure 6.32. RDF of Cu-x (x=Si,Al,O) in Z2[CuII(H2O)3](H2O)3.
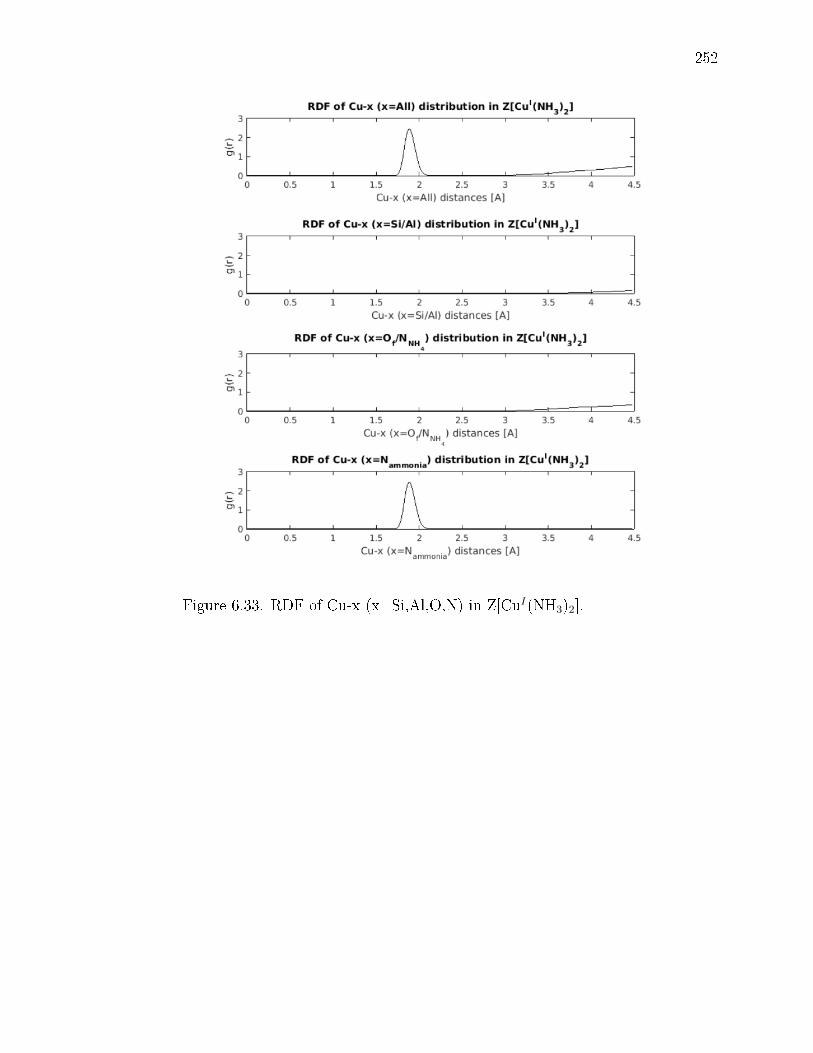
252
Figure 6.33. RDF of Cu-x (x=Si,Al,O,N) in Z[CuI(NH3)2].
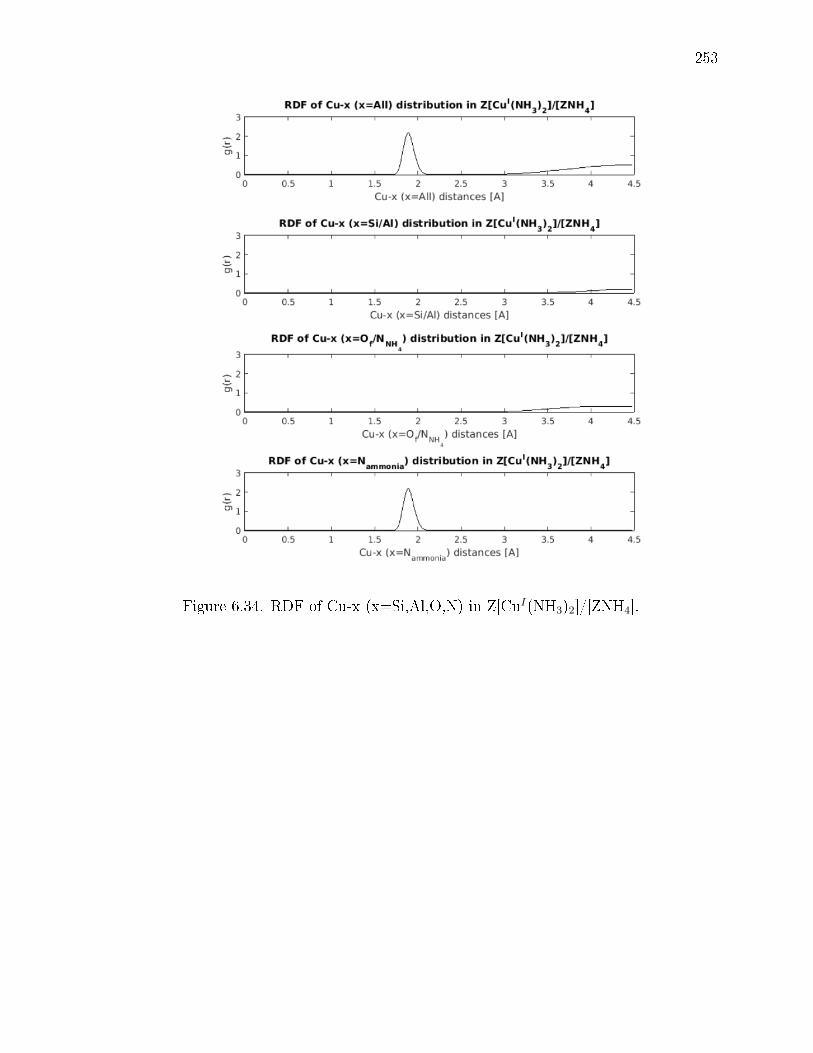
253
Figure 6.34. RDF of Cu-x (x=Si,Al,O,N) in Z[CuI(NH3)2]/[ZNH4].

254
Figure 6.35. RDF of Cu-x (x=Si,Al,O,N) in Z2[CuII(NH3)4].
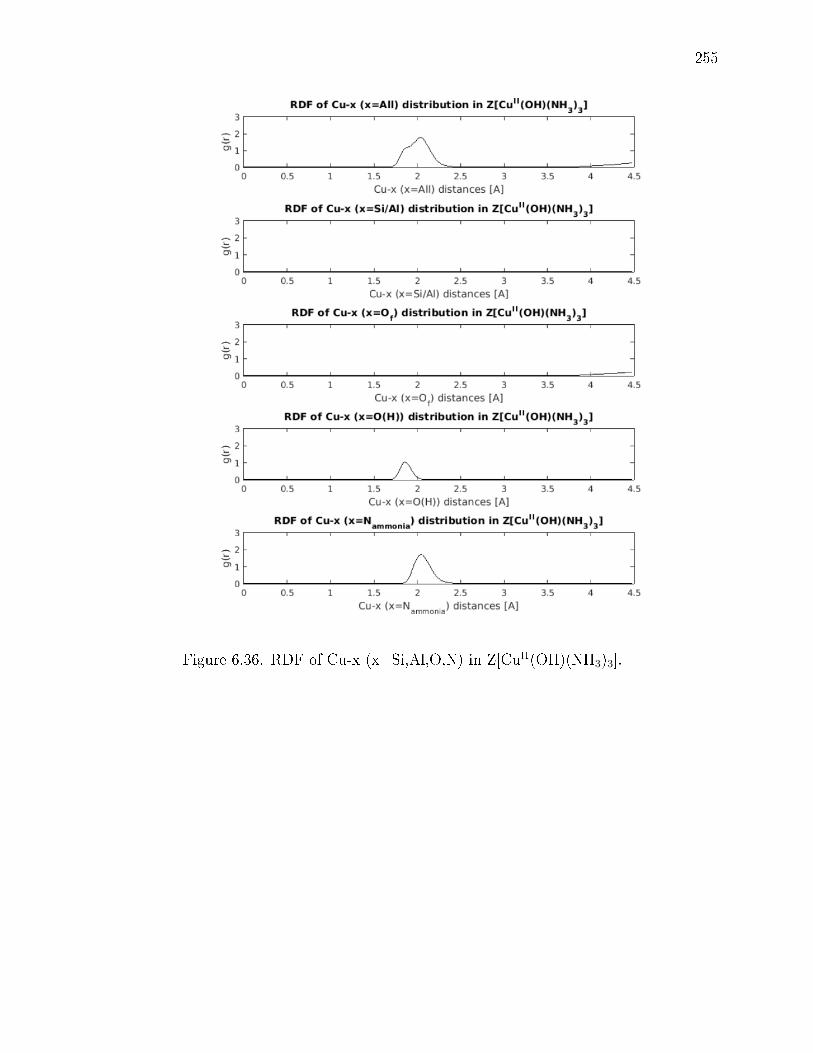
255
Figure 6.36. RDF of Cu-x (x=Si,Al,O,N) in Z[CuII(OH)(NH3)3].

256
6.8.14 XANES Reversibility Data
Figure 6.37. XANES spectra collected after exposing Si:Al 4.5 Cu:Al 0.08(2Al) and Si:Al 15 Cu:Al 0.44 (1Al) to O2 balance He at 673 K followingpretreatment in He at 673 K.
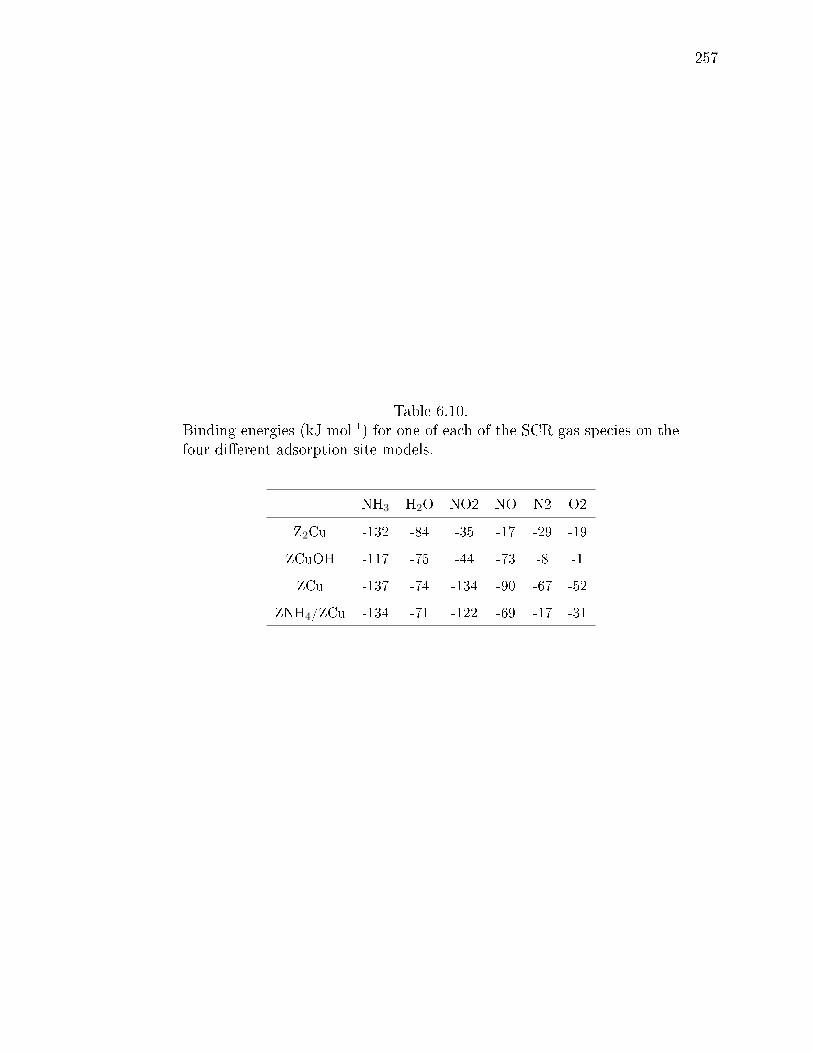
257
Table 6.10.Binding energies (kJ mol-1) for one of each of the SCR gas species on thefour dierent adsorption site models.
NH3 H2O NO2 NO N2 O2
Z2Cu -132 -84 -35 -17 -29 -19
ZCuOH -117 -75 -44 -73 -8 -1
ZCu -137 -74 -134 -90 -67 -52
ZNH4/ZCu -134 -71 -122 -69 -17 -31
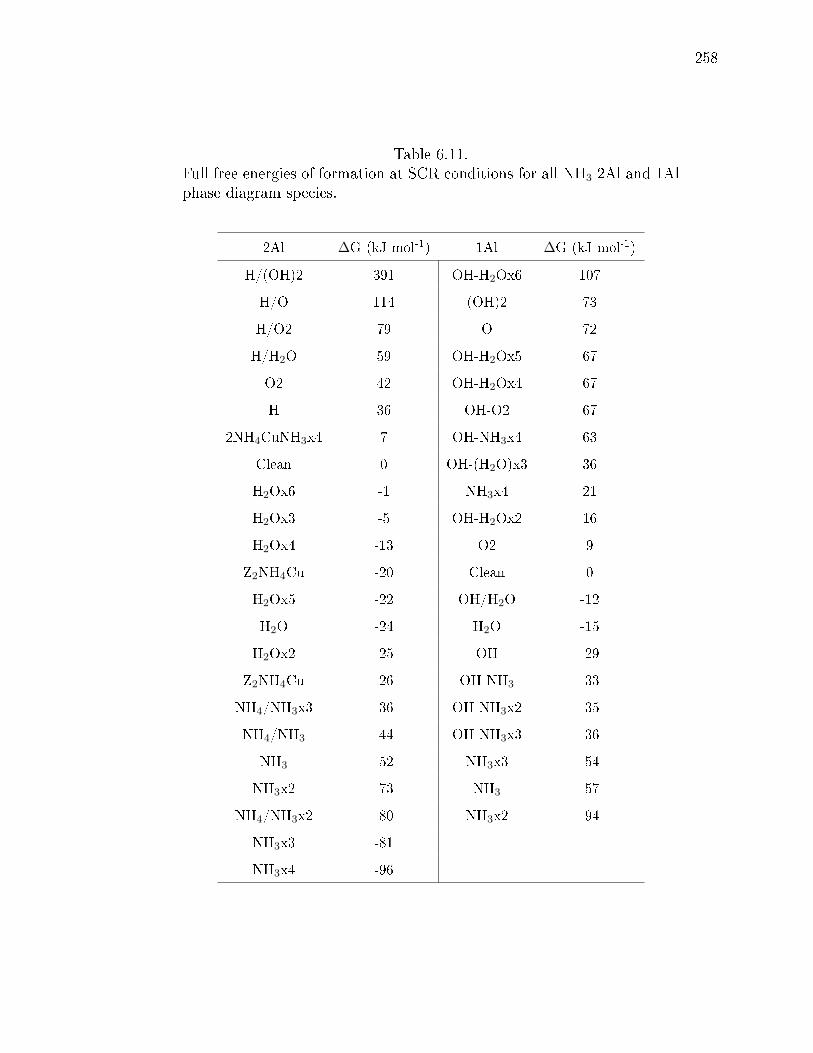
258
Table 6.11.Full free energies of formation at SCR conditions for all NH3 2Al and 1Alphase diagram species.
2Al ∆G (kJ mol-1) 1Al ∆G (kJ mol-1)
H/(OH)2 391 OH-H2Ox6 107
H/O 114 (OH)2 73
H/O2 79 O 72
H/H2O 59 OH-H2Ox5 67
O2 42 OH-H2Ox4 67
H 36 OH-O2 67
2NH4CuNH3x4 7 OH-NH3x4 63
Clean 0 OH-(H2O)x3 36
H2Ox6 -1 NH3x4 21
H2Ox3 -5 OH-H2Ox2 16
H2Ox4 -13 O2 9
Z2NH4Cu -20 Clean 0
H2Ox5 -22 OH/H2O -12
H2O -24 H2O -15
H2Ox2 -25 OH -29
Z2NH4Cu -26 OH-NH3 -33
NH4/NH3x3 -36 OH-NH3x2 -35
NH4/NH3 -44 OH-NH3x3 -36
NH3 -52 NH3x3 -54
NH3x2 -73 NH3 -57
NH4/NH3x2 -80 NH3x2 -94
NH3x3 -81
NH3x4 -96
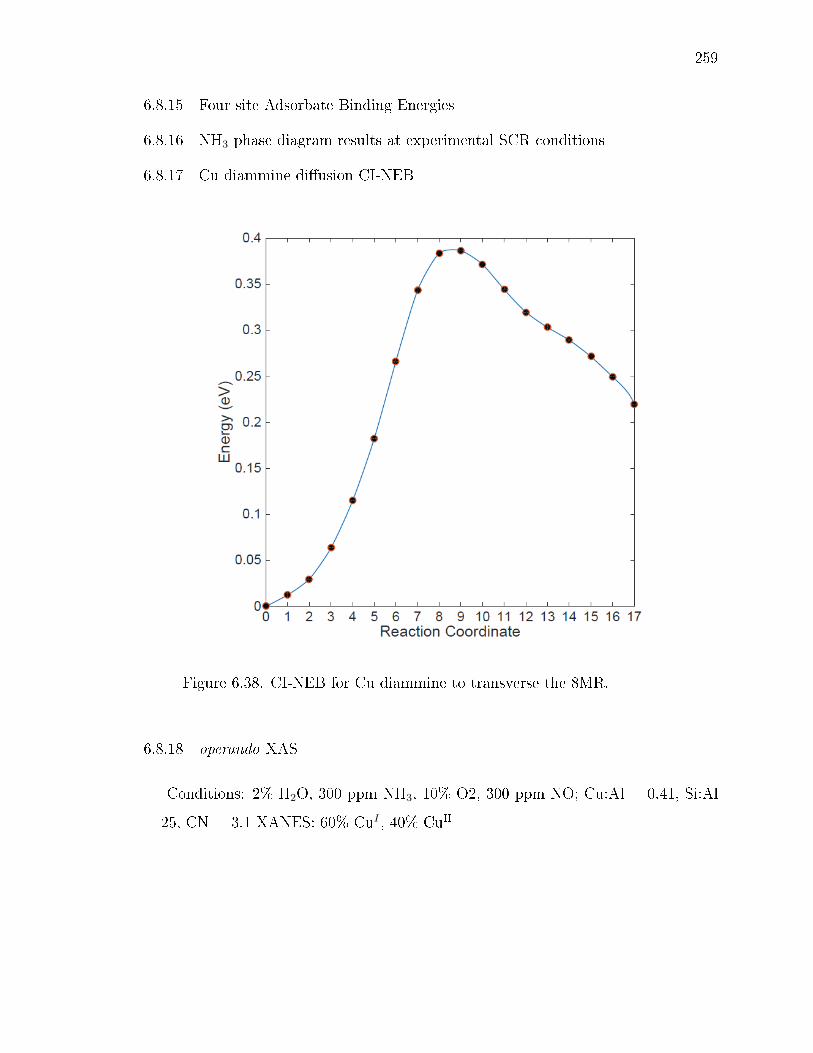
259
6.8.15 Four site Adsorbate Binding Energies
6.8.16 NH3 phase diagram results at experimental SCR conditions
6.8.17 Cu diammine diusion CI-NEB
Figure 6.38. CI-NEB for Cu diammine to transverse the 8MR.
6.8.18 operando XAS
Conditions: 2% H2O, 300 ppm NH3, 10% O2, 300 ppm NO; Cu:Al = 0.41, Si:Al
= 25, CN = 3.1 XANES: 60% CuI , 40% CuII
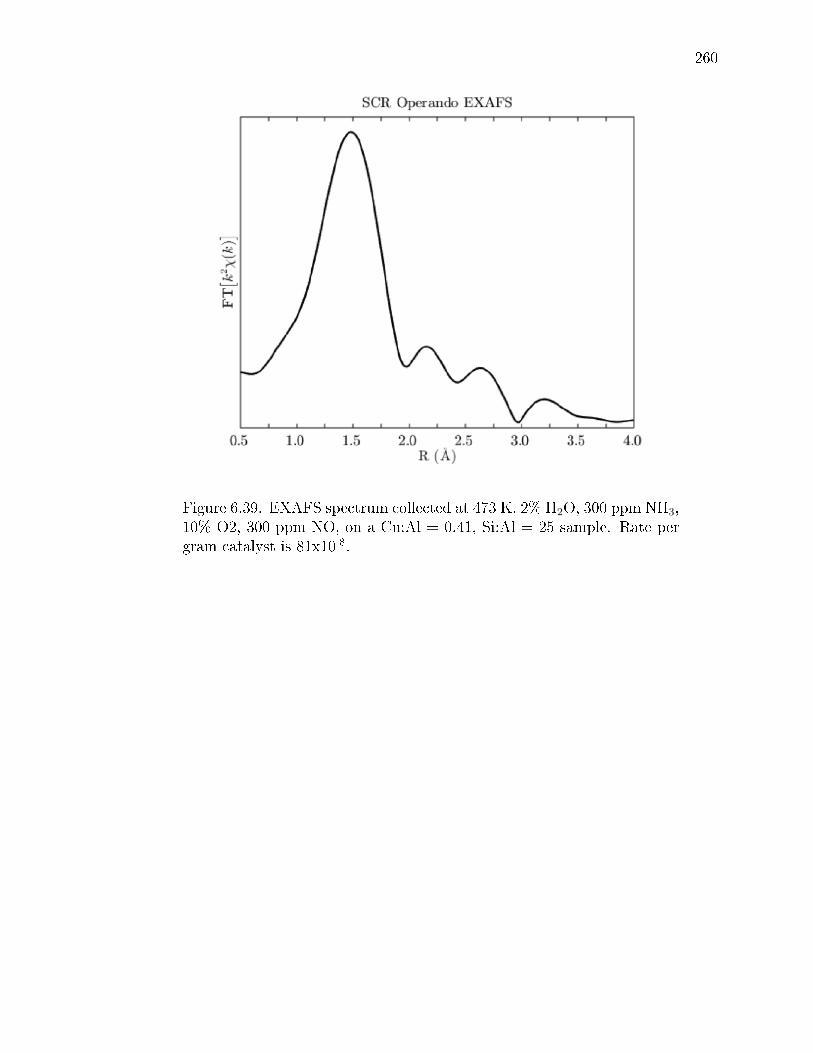
260
Figure 6.39. EXAFS spectrum collected at 473 K, 2% H2O, 300 ppm NH3,10% O2, 300 ppm NO, on a Cu:Al = 0.41, Si:Al = 25 sample. Rate pergram catalyst is 81x10-8.
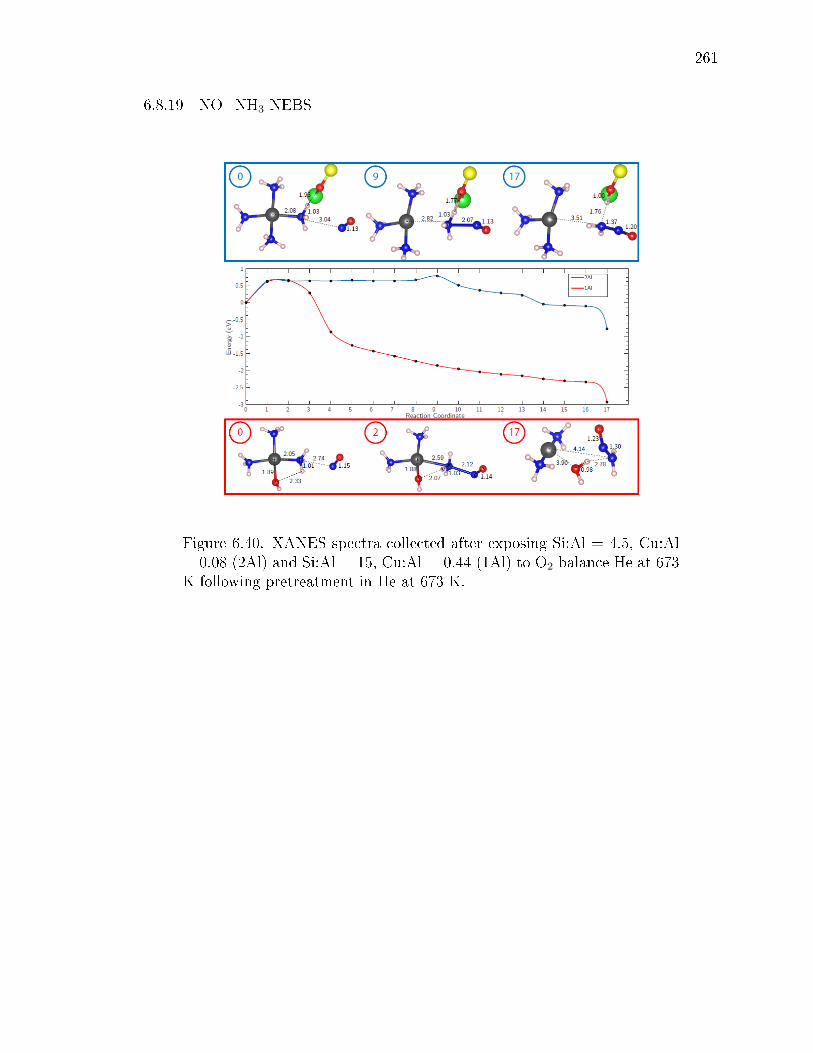
261
6.8.19 NO+NH3 NEBS
Figure 6.40. XANES spectra collected after exposing Si:Al = 4.5, Cu:Al= 0.08 (2Al) and Si:Al = 15, Cu:Al = 0.44 (1Al) to O2 balance He at 673K following pretreatment in He at 673 K.

262
6.8.20 Disappearance of Proximal Sites Upon reoxidation
Figure 6.41. Titration of residual Brønsted sites on a Si:Al=5 Cu:Al=0.21SSZ-13 sample, before reduction in NO+NH3, after reduction, and afterreduction followed by oxidation.
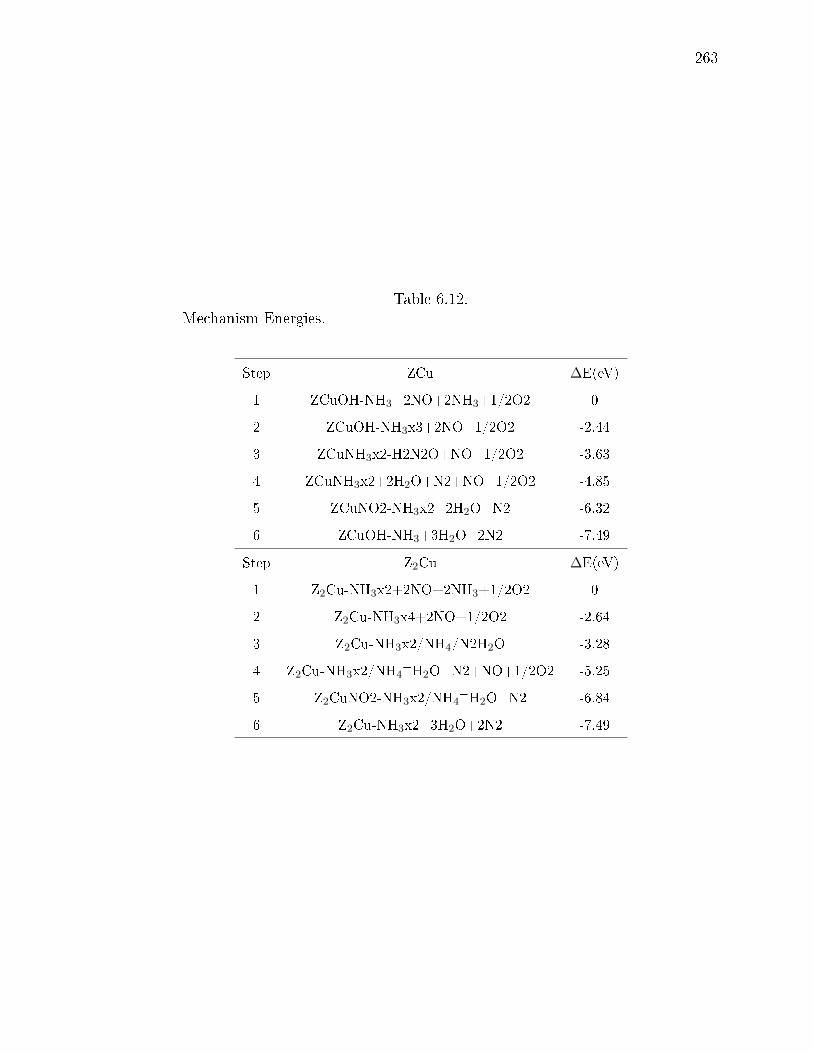
263
Table 6.12.Mechanism Energies.
Step ZCu ∆E(eV)
1 ZCuOH-NH3+2NO+2NH3+1/2O2 0
2 ZCuOH-NH3x3+2NO+1/2O2 -2.44
3 ZCuNH3x2-H2N2O+NO+1/2O2 -3.63
4 ZCuNH3x2+2H2O+N2+NO+1/2O2 -4.85
5 ZCuNO2-NH3x2+2H2O+N2 -6.32
6 ZCuOH-NH3+3H2O+2N2 -7.49
Step Z2Cu ∆E(eV)
1 Z2Cu-NH3x2+2NO+2NH3+1/2O2 0
2 Z2Cu-NH3x4+2NO+1/2O2 -2.64
3 Z2Cu-NH3x2/NH4/N2H2O -3.28
4 Z2Cu-NH3x2/NH4+H2O+N2+NO+1/2O2 -5.25
5 Z2CuNO2-NH3x2/NH4+H2O+N2 -6.84
6 Z2Cu-NH3x2+3H2O+2N2 -7.49

264
Table 6.13.Rates, apparent orders, and apparent activation energies on BEA andZSM-5 samples (only the rate was measured on the 3.3 Cu wt% BEAsample).
ZSM-5 (Si/Al = 13)
Cu wt% Cu:Al Ratea Eappb NO order NH3 order O2 order
1.7 0.24 199 61±10 0.6 -0.3 0.5
1.9 0.27 232 64±10 0.7 -0.4 0.4
2.7 0.36 340 77±10 0.6 -0.5 0.4
BEA (Si/Al = 13)
Cu wt% Cu:Al Ratea Eappb NO order NH3 order O2 order
1.9 0.25 314 48±15 0.6 0.0 0.3
2.6 0.34 438 58±15 0.7 -0.1 0.3
a Rate per gram x 10-1
b kJ mol-1
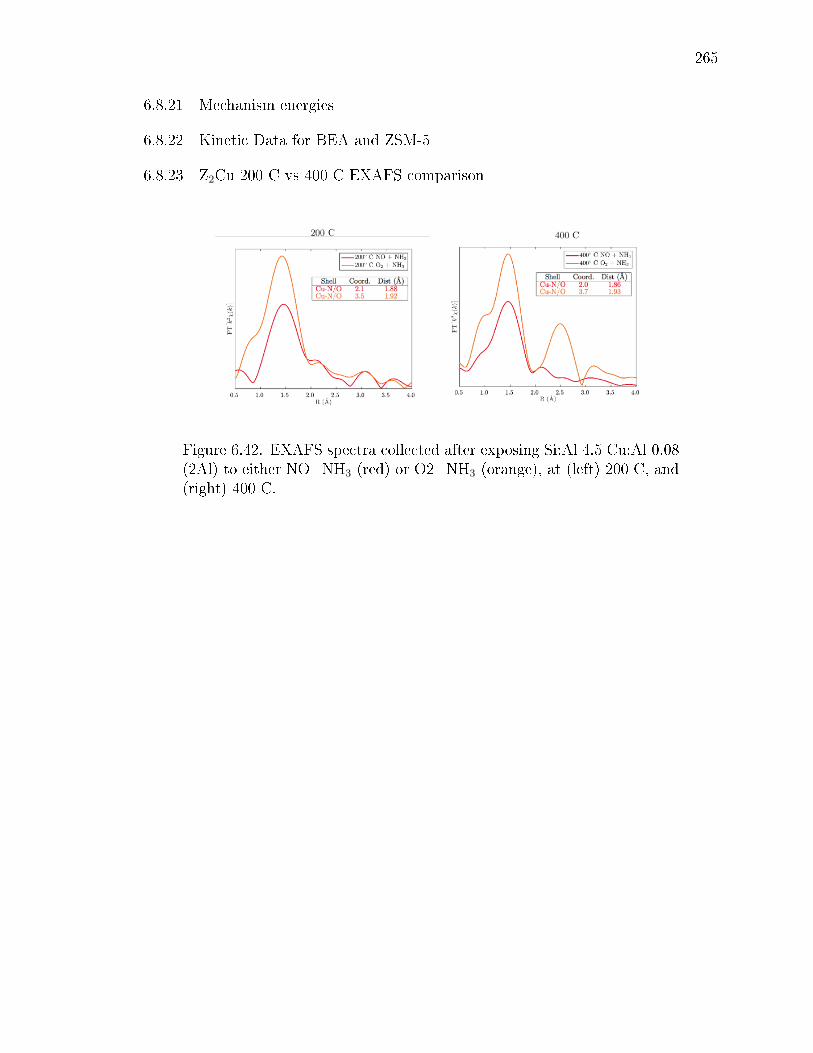
265
6.8.21 Mechanism energies
6.8.22 Kinetic Data for BEA and ZSM-5
6.8.23 Z2Cu 200 C vs 400 C EXAFS comparison
Figure 6.42. EXAFS spectra collected after exposing Si:Al 4.5 Cu:Al 0.08(2Al) to either NO+NH3 (red) or O2+NH3 (orange), at (left) 200 C, and(right) 400 C.

266
6.8.24 200 C XANES, ZCuOH, NO only
Figure 6.43. XANES spectra collected after exposing Si:Al 15 Cu:Al 0.44to 300 ppm NO and balance He at 200 C until steady-state.
6.8.25 Synthesis details
CHA (SSZ-13) zeolites with a Si:Al ratio of 5 were synthesized as reported else-
where [37,250], which was based on a method to convert FAU to CHA using N,N,N-
trimethyl-1-adamantylammonium hydroxide (TMAdaOH) developed by Zones [109,
162, 376] and modied by Fickel et al. [34, 250], with molar ratios of 1 SiO2 / 0.033
or 0.017 Al2O3 / 0.20 TMAdaOH / 0.17 Na2O / 26 H2O. A typical synthesis of
SSZ-13 with Si:Al = 15 or 25 was performed by preparing an aqueous mixture of
28.4 g TMAdaOH (25 wt%, Sachem) with 77.4 g H2O (deionized; 18.2 MΩ) in a
peruoroalkoxy alkane (PFA) plastic vessel and stirring the solution for 15 minutes
267
under ambient conditions. 0.87 or 0.43 g (Si:Al = 15 or 25, respectively) of aluminum
hydroxide (SPI Pharma) and 34.6 g of a 1M NaOH solution (Alfa Aesar) were added
and the mixture was stirred for 15 minutes at ambient conditions to homogenize the
contents. 10 g of fumed silica (Cab-o-Sil) were added and the mixture was stirred at
ambient conditions for 2h to homogenize the mixture. The synthesis gel was loaded
into four identical 45 cm3 Teon-lined stainless steel autoclaves (Parr Instruments)
and heated under rotation at 433 K for 6 days at 60 RPM.
BEA (Beta) zeolites were synthesized with a Si:Al ratio of 13 following a modied
procedure originally reported by Rubin [412]. A typical synthesis of BEA with Si:Al =
13 was prepared by dissolving 0.78 g of NaOH pellets (98%, Macron Fine Chemicals)
in 92.1 g of an aqueous tetraethylammonium hydroxide (TEAOH) solution (35 wt%,
Sachem) in a peruoroalkoxy alkane (PFA) plastic vessel and stirring the solution
for 15 minutes under ambient conditions. 139.0 g of colloidal silica (30 wt%, Ludox
HS30, Sigma Aldrich) and 11.6 g of aluminum isopropoxide (98 wt%, Sigma Aldrich)
were added to the mixture and stirred for 2h at ambient conditions to homogenize the
contents. The synthesis gel was loaded into two 45 cm3 and one 300 cm3 Teon-lined
stainless steel autoclaves (Parr Instruments) and heated at 413 K for 8 days.
After synthesis of CHA and BEA zeolites, crystalline solid products were washed
by alternating deionized water and acetone (99.9 wt%, Sigma Aldrich) rinses (50
cm3 g solid-1) until the pH was constant between washes. Solids were recovered by
centrifugation, dried under static air at 373 K for 24 h, and then treated in owing
dry air (100 cm3 min-1 g-1, 99.999% UHP, Indiana Oxygen) to 853 K (0.0167 K s-1)
for 10 h. All zeolite samples were converted to the NH4-form by ion-exchange with a
1.0M aqueous NH4NO3 (99.9 wt%, Sigma Aldrich) solution (100 cm3 solution g-1) for
10 h at 353 K, followed by washing the solids six times with deionized water (50 cm3
g-1), recovery via centrifugation, and drying the solids at 373 K for 24 h. NH4-form
zeolites were converted to their H-form by treating the solids in owing air (100 cm3
min-1 g-1, 99.999% UHP, Indiana Oxygen) at 773 K (0.0167 K s-1) for 4 h.
268
Cu-zeolites were prepared by aqueous-phase Cu ion exchange of H-form zeolites
with a CuII(NO3)2 solution (0.001M-0.1M, 100 cm3 g-1; 99.999 wt%, Sigma Aldrich)
for 4 h and 300 RPM at ambient conditions, during which the pH was controlled to
4.9 ± 0.1 through dropwise addition of a 1.0M NH4OH solution (Sigma Aldrich). Co-
SSZ-13 zeolites were prepared by ion exchange of H-SSZ-13 with an aqueous 0.25M
CoII(NO3)2 solution (150 cm3 g-1) for 4 h at ambient conditions, during which the pH
was not controlled (pH stabilized between 3.2-3.6 after 4 h). Metal-exchanged zeolites
were recovered by centrifugation and washed with deionized water six times (70 cm3
g-1 per wash), dried at ambient temperature under owing air, and then treated in
owing dry air (100 cm3 g-1) to 773 K (0.0167 K s-1) for 4h. Elemental composition
(Si, Al, Cu, Co) was determined using atomic absorption spectroscopy (AAS) on a
Perkin-Elmer AAnalyst 300.
Commercial BEA and ZSM-5 samples with Si:Al = 13 were purchased from Ze-
olyst.
6.8.26 Micropore volume
Zeolite samples were pelleted and sieved to obtain particles between 180-250 µm in
diameter, degassed by heating 0.02-0.05 g of zeolite to 393 K (0.167 K s-1) and holding
under high vacuum (ca. 5 µmHg) for 2 h, and then further heating to 623 K (0.167
K s-1) and holding high vacuum (ca. 5 µmHg) for 8 h. Micropore volumes (cm3 g-1
at STP) were measured by extrapolating the linear volumetric gas adsorption during
mesopore lling (ca. 0.08-0.30 P/P0) to zero relative pressure. These estimates were
in agreement with micropore volumes derived from analyzing the semi-log derivative
plot of the adsorption isotherm (∂Vads/∂ln(P¶0) vs. ln(P/P0)). This analysis requires
determining the rst maximum of ∂Vads/∂ln(P¶0), which corresponds to the relative
pressure when micropore lling occurs, and then identifying the subsequent minimum
that corresponds to the end of micropore lling [136, 137]. The micropore volumes
were determined by converting adsorbed gas volumes (at STP) to liquid volumes
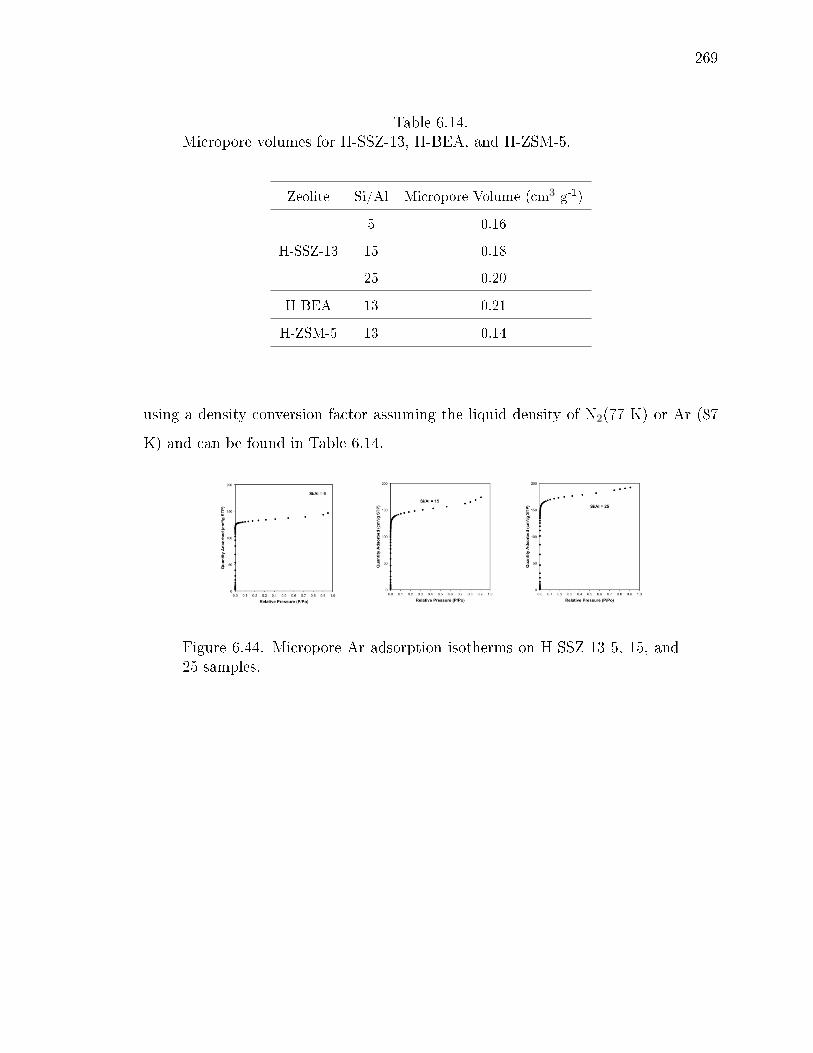
269
Table 6.14.Micropore volumes for H-SSZ-13, H-BEA, and H-ZSM-5.
Zeolite Si/Al Micropore Volume (cm3 g-1)
H-SSZ-13
5 0.16
15 0.18
25 0.20
H-BEA 13 0.21
H-ZSM-5 13 0.14
using a density conversion factor assuming the liquid density of N2(77 K) or Ar (87
K) and can be found in Table 6.14.
Figure 6.44. Micropore Ar adsorption isotherms on H-SSZ-13 5, 15, and25 samples.

270
Figure 6.45. Micropore N2 adsorption isotherms on H-BEA and H-ZSM-5.
6.8.27 27Al NMR
Solid-state 27Al magic angle spinning nuclear magnetic resonance (27Al MAS
NMR) spectroscopy was used to estimate the fraction of framework and extraframe-
work Al on H-form zeolites. SS NMR spectra were collected using a Chemagnetics
CMX400 400 MHz spectrometer in a wide-bore 9.4 Tesla magnet at ambient condi-
tions from 456 scans with 12.5 µs pulses and a 2 s delay and were measured at 104.24
MHz and MAS rate of 5 kHz. Prior to packing in a 4mm ZrO2 rotor, zeolite samples
were hydrated by holding for >48 h in a desiccator containing a saturated potassium
chloride (KCl) solution. All 27Al MAS NMR spectra are referenced to an aqueous
1.0M Al(NO3)3 solution. NMR spectra and quantication of extraframework Al for
all H-zeolite samples can be found in Table 6.15.
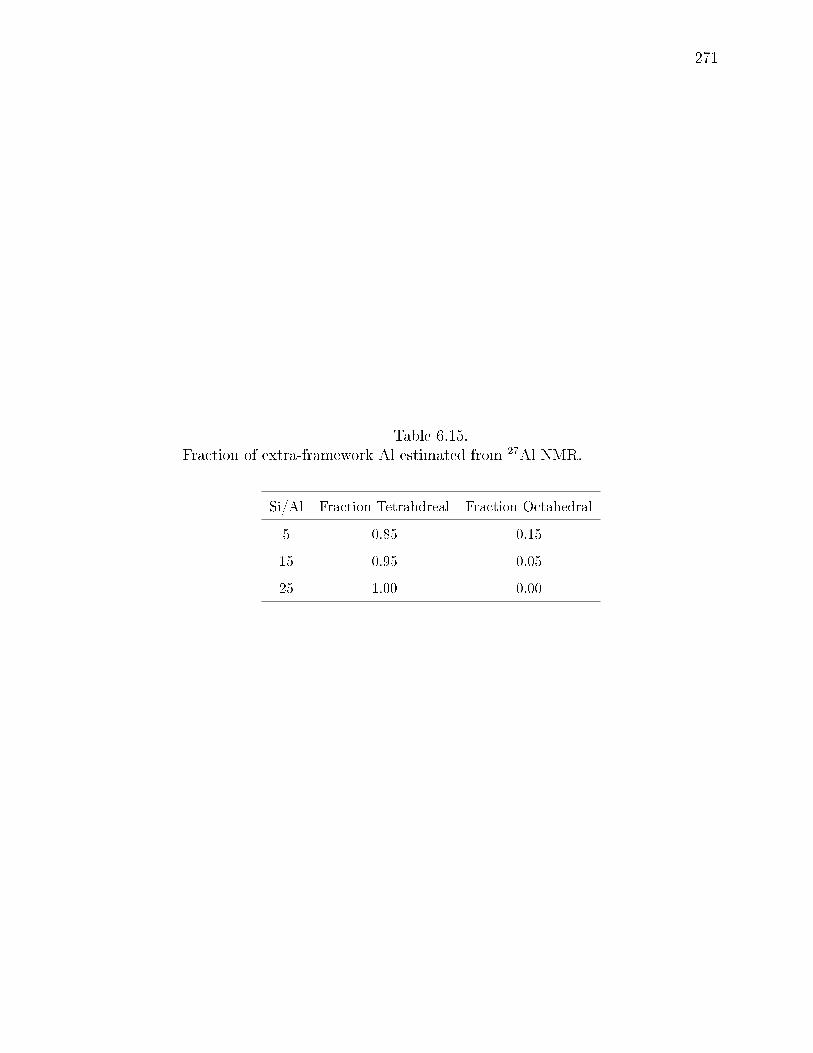
271
Table 6.15.Fraction of extra-framework Al estimated from 27Al NMR.
Si/Al Fraction Tetrahdreal Fraction Octahedral
5 0.85 0.15
15 0.95 0.05
25 1.00 0.00

272
Figure 6.46. 27Al NMR spectra for SSZ-13 at Si:Al 5, 15, 25.
6.8.28 NH3 TPD
H+ sites on H-SSZ-13, and oxidized and reduced forms of Cu-SSZ-13 samples
were measured using the NH3 titration procedure described by Di Iorio et al. [171].
Oxidizing pre-treatment involved heating in synthetic air (commercial grade, Indiana
Oxygen) at 773 K while the reducing pre-treatment involved owing 500 ppm NO
(from 3.6% NO/Ar, Praxair)+500 ppm NH3(from 3% NH3 in Ar, Praxair) at 473
K for 2 hr. 30-50 mg of each sample, in either its oxidized or reduced forms, was
saturated with 500 ppm NH3 diluted with UHP He (99.999% , Indiana Oxygen) at
433 K for 2 hr with a total ow rate of 350 cm3 min-1. Following this NH3 saturation
273
step, the sample was ushed with 2.5-3.0% water in UHP He (wet purge) for 8 hours
while still keeping the same total ow rate to desorb NH3 bound to non-protonic
sites [171]. Wet purge was followed by a temperature programmed desorption (TPD)
in UHP He from 433 K to 820 K at a ramp rate of 0.167 K s-1. NH3 titration on
the reduced form of Cu-SSZ-13 samples showed that Cu2+ sites balancing two Al
atoms formed a Cu+ cation and a proximal H+ site upon reduction, while [CuOH]+
sites formed a Cu+ cation and H2O without generating an additional H+ sites, as
proposed in the reaction scheme shown above. Thus, NH3 titrations can be used in
situ after oxidation and reduction treatments to distinguish between the Z2Cu and
[CuOH]+ sites by counting the total acid sites which are equal to the sum of residual
acid sites on the oxidized form of the sample and the excess acid sites generated after
reduction [85].
For Co-exchanged SSZ-13 samples, the number of H+ sites, after oxidative treat-
ments in owing air (773 K), were titrated in situ using a Micromeritics Autochem II
2920 Chemisorption analyzer and required the use of a lower gas ow rate than that
of the H- and Cuexchanged SSZ-13 samples. The NH3 titration procedure involved
saturating zeolite samples (30-50 mg) with 500 ppm NH3 (500 ppm NH3/He, Indiana
Oxygen) at 433 K for 5 h and a total ow rate of 150 cm3 min-1. Subsequently, NH3-
saturated samples were wet purged at 433 K for 8 h prior to temperature programmed
desorption (TPD) experiments. TPD experiments on H-SSZ-13 and Co-exchanged
SSZ-13 were performed using a Micromeritics Autochem II 2920 Chemisorption an-
alyzer equipped with an Agilent 5975C mass selective detector (MSD) to identify
the gaseous species desorbing from the catalyst samples. Catalyst samples were sup-
ported between two quartz wool plugs inside a U-shaped quartz cell held within a
clam-shell furnace, held in 50 cm3 min-1 owing UHP He at ambient temperature for
1 h, and heated to 873 K (0.167 K s-1). The euent stream from the quartz cell passed
through heated transfer lines held at 383 K to the MSD for analysis. The signal at
m/z = 17 was quantied by developing a calibration curve using four NH4-exchanged
ZSM-5 zeolites with varying Si/Al ratio (Si/Al = 17-89) [78]. The total NH3 des-
274
orbed per gram of these zeolites were determined by performing TPD experiments
on a gas-phase plug ow reactor, described in the subsequent paragraph. After each
TPD experiment, a 0.5 cm3 sample loop was lled with Ar (UHP, 99.999%, Indiana
Oxygen) and injected into 50 cm3 min-1 UHP He ow. The area of this Ar pulse
was used as an internal standard to correct for the instrumental drift between TPD
experiments. The total NH3 desorbed per gram of catalyst was quantied from the
area under the m/z = 17 signal, after subtracting the contribution from water at m/z
= 17 due to fragmentation.
TPD experiments on Cu-exchanged samples were performed on a gas-phase plug
ow reactor, as described by Bates et al [37]. The total moles of NH3 desorbed
during these TPD experiments were measured using on-board calibrations in a MKS
Multigas 2030 gas-phase FT-IR spectrometer [78].
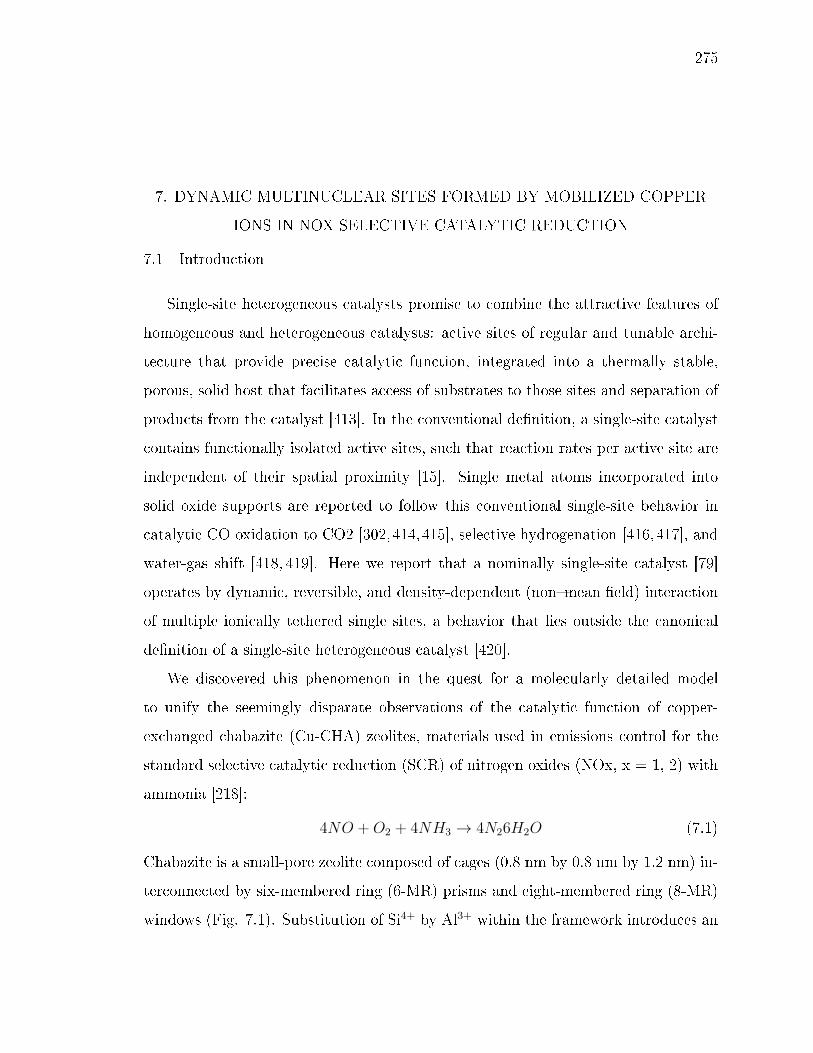
275
7. DYNAMIC MULTINUCLEAR SITES FORMED BY MOBILIZED COPPER
IONS IN NOX SELECTIVE CATALYTIC REDUCTION
7.1 Introduction
Single-site heterogeneous catalysts promise to combine the attractive features of
homogeneous and heterogeneous catalysts: active sites of regular and tunable archi-
tecture that provide precise catalytic function, integrated into a thermally stable,
porous, solid host that facilitates access of substrates to those sites and separation of
products from the catalyst [413]. In the conventional denition, a single-site catalyst
contains functionally isolated active sites, such that reaction rates per active site are
independent of their spatial proximity [15]. Single metal atoms incorporated into
solid oxide supports are reported to follow this conventional single-site behavior in
catalytic CO oxidation to CO2 [302,414,415], selective hydrogenation [416,417], and
water-gas shift [418, 419]. Here we report that a nominally single-site catalyst [79]
operates by dynamic, reversible, and density-dependent (nonmean eld) interaction
of multiple ionically tethered single sites, a behavior that lies outside the canonical
denition of a single-site heterogeneous catalyst [420].
We discovered this phenomenon in the quest for a molecularly detailed model
to unify the seemingly disparate observations of the catalytic function of copper-
exchanged chabazite (Cu-CHA) zeolites, materials used in emissions control for the
standard selective catalytic reduction (SCR) of nitrogen oxides (NOx, x = 1, 2) with
ammonia [218]:
4NO +O2 + 4NH3 → 4N26H2O (7.1)
Chabazite is a small-pore zeolite composed of cages (0.8 nm by 0.8 nm by 1.2 nm) in-
terconnected by six-membered ring (6-MR) prisms and eight-membered ring (8-MR)
windows (Fig. 7.1). Substitution of Si4+ by Al3+ within the framework introduces an

276
anionic charge that is balanced by extralattice cations. After Cu ion exchange and
high-temperature oxidation treatment, two isolated Cu site motifs are present: dis-
crete CuII ions that balance two proximal Al centers and [CuIIOH]+ ions that balance
single Al centers [35, 39, 79]. Under low-temperature (<523 K) standard SCR condi-
tions, ammonia coordinates to and liberates Cu ions from direct association with the
zeolite support, and these solvated Cu ions act as the redox-active catalytic sites [85].
At typical Cu ion volumetric densities, standard SCR rates increase linearly with Cu
density, as expected for a single-site catalyst. As shown here, however, experimental
observations in the lowCu density limit reveal a portion of the catalytic cycle in
which O2 activation by transiently formed Cu pairs becomes rate limiting. These Cu
pairs form from NH3-solvated Cu ions with mobilities restricted by electrostatic at-
traction to charge-compensating framework Al centers, leading to catalytic function
that is neither single site nor homogeneous.
Recognizing the intermediacy of this distinct catalytic state reconciles a number
of controversies in Cu-zeolite SCR catalysis, including the role of the zeolite support
in the catalytic mechanism, the sensitivity of SCR rates to Cu density under dierent
conditions of observation, the extent to which standard and the closely related fast
SCR cycles [41] are connected through common intermediates, the chemical processes
that limit low-temperature NOx SCR reactivity, and the origins of the apparent
change in mechanism at elevated temperatures. These observations provide insight
into the design of improved catalysts for SCR. More broadly, they reveal a distinct
class of catalytic materials characterized by partially mobile ions that dynamically
and reversibly form multinuclear active sites, a concept that may be exploited for a
wide variety of reactions.
7.2 Turnover rates depend on the spatial density of single Cu sites
To assess the catalytic consequences of Cu ion density, we prepared a series of Cu-
CHA samples with xed framework Al composition (Si/Al = 15) and Cu/Al content
ranging from 0.04 to 0.44 [for synthesis methods and characterization data, see Supp.
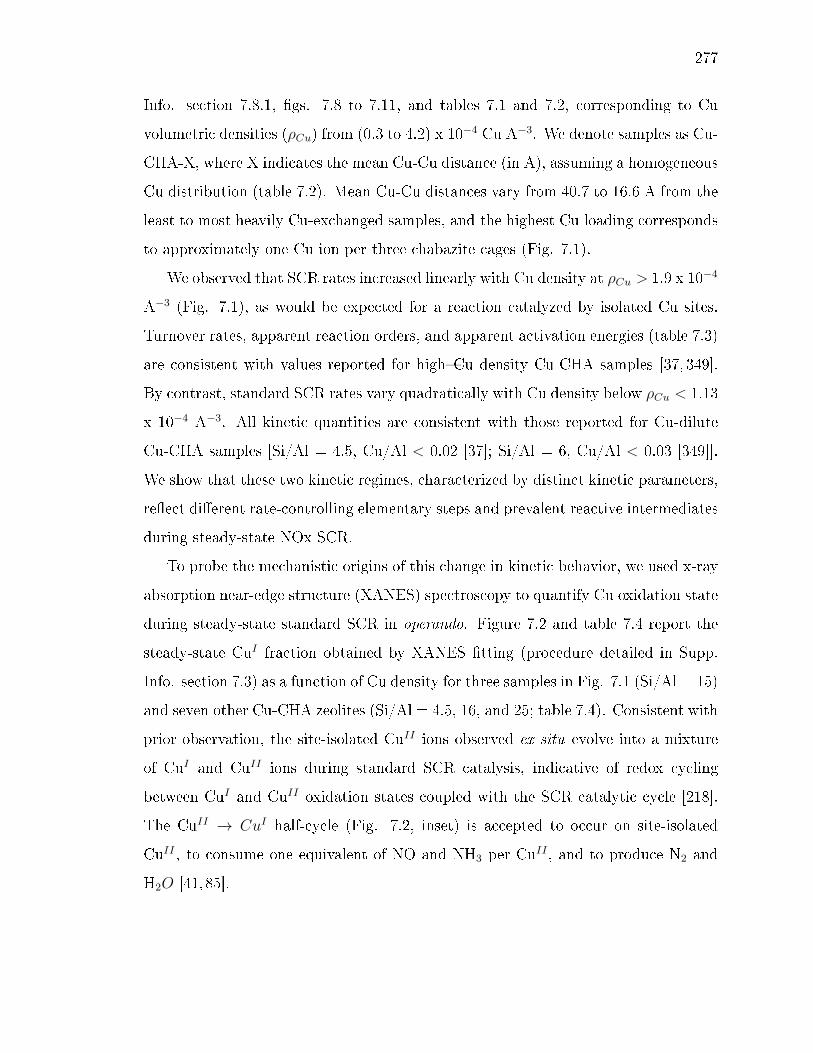
277
Info. section 7.8.1, gs. 7.8 to 7.11, and tables 7.1 and 7.2, corresponding to Cu
volumetric densities (ρCu) from (0.3 to 4.2) x 10−4 Cu A−3. We denote samples as Cu-
CHA-X, where X indicates the mean Cu-Cu distance (in A), assuming a homogeneous
Cu distribution (table 7.2). Mean Cu-Cu distances vary from 40.7 to 16.6 A from the
least to most heavily Cu-exchanged samples, and the highest Cu loading corresponds
to approximately one Cu ion per three chabazite cages (Fig. 7.1).
We observed that SCR rates increased linearly with Cu density at ρCu > 1.9 x 10⁻⁴
A−3 (Fig. 7.1), as would be expected for a reaction catalyzed by isolated Cu sites.
Turnover rates, apparent reaction orders, and apparent activation energies (table 7.3)
are consistent with values reported for highCu density Cu-CHA samples [37, 349].
By contrast, standard SCR rates vary quadratically with Cu density below ρCu < 1.13
x 10−4 A−3. All kinetic quantities are consistent with those reported for Cu-dilute
Cu-CHA samples [Si/Al = 4.5, Cu/Al < 0.02 [37]; Si/Al = 6, Cu/Al < 0.03 [349]].
We show that these two kinetic regimes, characterized by distinct kinetic parameters,
reect dierent rate-controlling elementary steps and prevalent reactive intermediates
during steady-state NOx SCR.
To probe the mechanistic origins of this change in kinetic behavior, we used x-ray
absorption near-edge structure (XANES) spectroscopy to quantify Cu oxidation state
during steady-state standard SCR in operando. Figure 7.2 and table 7.4 report the
steady-state CuI fraction obtained by XANES tting (procedure detailed in Supp.
Info. section 7.3) as a function of Cu density for three samples in Fig. 7.1 (Si/Al = 15)
and seven other Cu-CHA zeolites (Si/Al = 4.5, 16, and 25; table 7.4). Consistent with
prior observation, the site-isolated CuII ions observed ex situ evolve into a mixture
of CuI and CuII ions during standard SCR catalysis, indicative of redox cycling
between CuI and CuII oxidation states coupled with the SCR catalytic cycle [218].
The CuII → CuI half-cycle (Fig. 7.2, inset) is accepted to occur on site-isolated
CuII , to consume one equivalent of NO and NH3 per CuII , and to produce N2 and
H2O [41, 85].
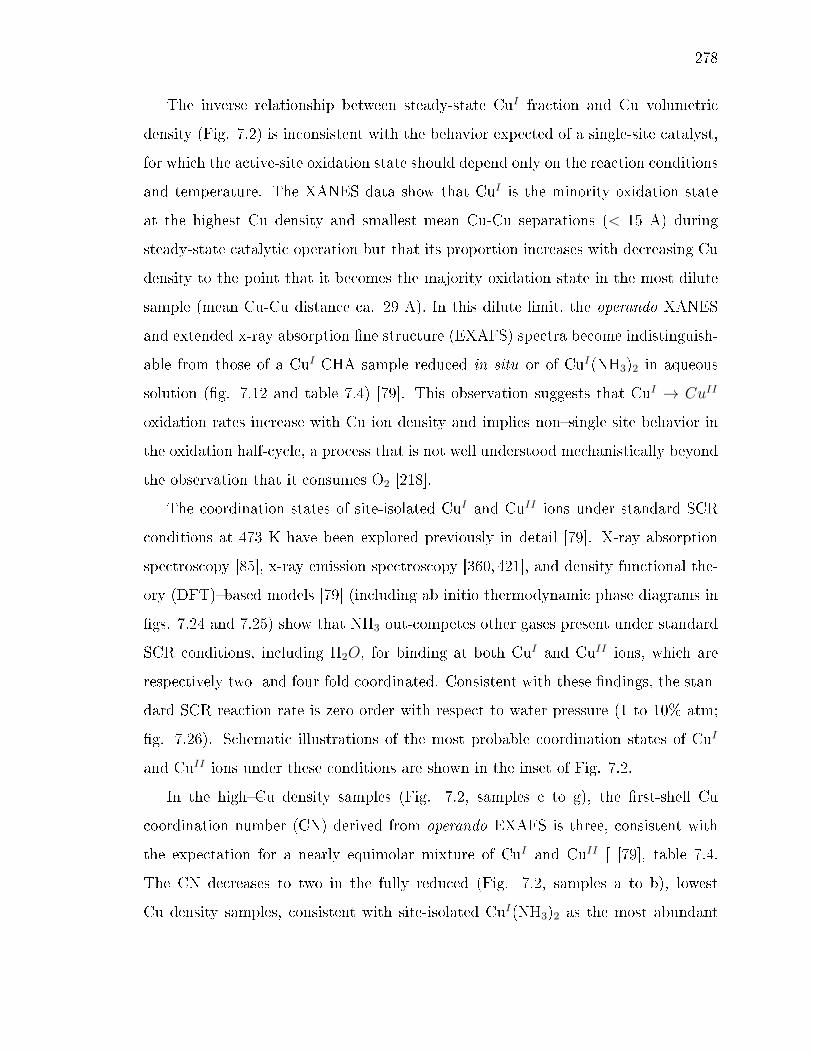
278
The inverse relationship between steady-state CuI fraction and Cu volumetric
density (Fig. 7.2) is inconsistent with the behavior expected of a single-site catalyst,
for which the active-site oxidation state should depend only on the reaction conditions
and temperature. The XANES data show that CuI is the minority oxidation state
at the highest Cu density and smallest mean Cu-Cu separations (< 15 A) during
steady-state catalytic operation but that its proportion increases with decreasing Cu
density to the point that it becomes the majority oxidation state in the most dilute
sample (mean Cu-Cu distance ca. 29 A). In this dilute limit, the operando XANES
and extended x-ray absorption ne structure (EXAFS) spectra become indistinguish-
able from those of a CuI-CHA sample reduced in situ or of CuI(NH3)2 in aqueous
solution (g. 7.12 and table 7.4) [79]. This observation suggests that CuI → CuII
oxidation rates increase with Cu ion density and implies nonsingle site behavior in
the oxidation half-cycle, a process that is not well understood mechanistically beyond
the observation that it consumes O2 [218].
The coordination states of site-isolated CuI and CuII ions under standard SCR
conditions at 473 K have been explored previously in detail [79]. X-ray absorption
spectroscopy [85], x-ray emission spectroscopy [360,421], and density functional the-
ory (DFT)based models [79] (including ab initio thermodynamic phase diagrams in
gs. 7.24 and 7.25) show that NH3 out-competes other gases present under standard
SCR conditions, including H2O, for binding at both CuI and CuII ions, which are
respectively two- and four-fold coordinated. Consistent with these ndings, the stan-
dard SCR reaction rate is zero order with respect to water pressure (1 to 10% atm;
g. 7.26). Schematic illustrations of the most probable coordination states of CuI
and CuII ions under these conditions are shown in the inset of Fig. 7.2.
In the highCu density samples (Fig. 7.2, samples c to g), the rst-shell Cu
coordination number (CN) derived from operando EXAFS is three, consistent with
the expectation for a nearly equimolar mixture of CuI and CuII [ [79], table 7.4.
The CN decreases to two in the fully reduced (Fig. 7.2, samples a to b), lowest
Cu density samples, consistent with site-isolated CuI(NH3)2 as the most abundant
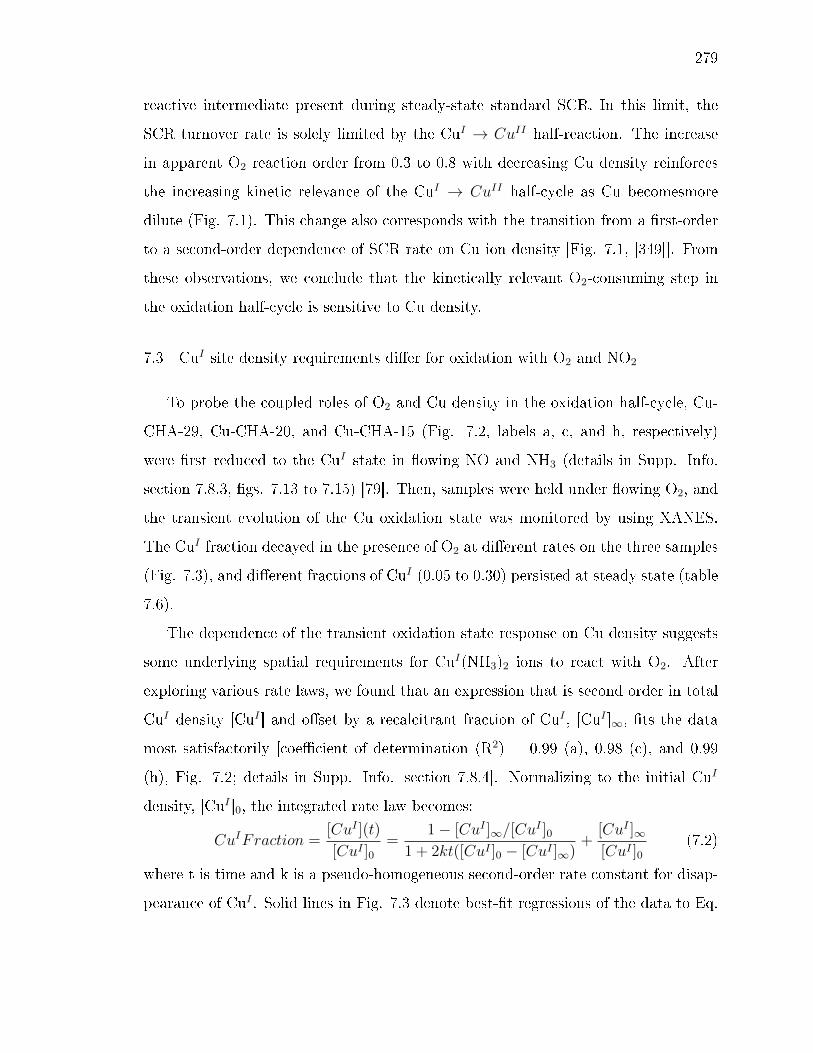
279
reactive intermediate present during steady-state standard SCR. In this limit, the
SCR turnover rate is solely limited by the CuI → CuII half-reaction. The increase
in apparent O2 reaction order from 0.3 to 0.8 with decreasing Cu density reinforces
the increasing kinetic relevance of the CuI → CuII half-cycle as Cu becomesmore
dilute (Fig. 7.1). This change also corresponds with the transition from a rst-order
to a second-order dependence of SCR rate on Cu ion density [Fig. 7.1, [349]]. From
these observations, we conclude that the kinetically relevant O2-consuming step in
the oxidation half-cycle is sensitive to Cu density.
7.3 CuI site density requirements dier for oxidation with O2 and NO2
To probe the coupled roles of O2 and Cu density in the oxidation half-cycle, Cu-
CHA-29, Cu-CHA-20, and Cu-CHA-15 (Fig. 7.2, labels a, c, and h, respectively)
were rst reduced to the CuI state in owing NO and NH3 (details in Supp. Info.
section 7.8.3, gs. 7.13 to 7.15) [79]. Then, samples were held under owing O2, and
the transient evolution of the Cu oxidation state was monitored by using XANES.
The CuI fraction decayed in the presence of O2 at dierent rates on the three samples
(Fig. 7.3), and dierent fractions of CuI (0.05 to 0.30) persisted at steady state (table
7.6).
The dependence of the transient oxidation state response on Cu density suggests
some underlying spatial requirements for CuI(NH3)2 ions to react with O2. After
exploring various rate laws, we found that an expression that is second order in total
CuI density [CuI ] and oset by a recalcitrant fraction of CuI , [CuI ]∞, ts the data
most satisfactorily [coecient of determination (R2) = 0.99 (a), 0.98 (c), and 0.99
(h), Fig. 7.2; details in Supp. Info. section 7.8.4]. Normalizing to the initial CuI
density, [CuI ]0, the integrated rate law becomes:
CuIFraction =[CuI ](t)
[CuI ]0=
1− [CuI ]∞/[CuI ]0
1 + 2kt([CuI ]0 − [CuI ]∞)+
[CuI ]∞[CuI ]0
(7.2)
where t is time and k is a pseudo-homogeneous second-order rate constant for disap-
pearance of CuI . Solid lines in Fig. 7.3 denote best-t regressions of the data to Eq.

280
7.2. Fitted k values of (1.0, 1.7, and 8.2) x 10−4 m3 mol Cu−1 s−1 for Cu-CHA-29,
Cu-CHA-20 and Cu-CHA-15, respectively, increased systematically with Cu density.
The variation in k demonstrates that all the reaction sites are not kinetically equiva-
lent. Further analysis below suggests that the oxidation kinetics cannot be faithfully
captured by a mean-eld model.
This second-order Cu dependence suggests a pseudo-bimolecular reaction between
two CuI(NH3)2 ions and O2 during the transient experiment:
2[CuI(NH3)2] +O2 → [(NH3)2CuII −O2 − CuII(NH3)2] (7.3)
Oxygen-bridged Cu dimers are well known in Cu-zeolite chemistry [317,318,422] and
nd analogies in the biological chemistry of Cu that prevails at lower temperatures
[316, 388, 423426]. These dimers can adopt various oxygen-bridging congurations
[389, 424]. To probe the plausibility of this reaction between two caged CuI(NH3)2
centers, we turned to DFT (computational details in Supp. Info. section 7.8.5).
We rst considered the energy landscape for two CuI(NH3)2 ions to occupy the
same CHA cage. Starting from two CuI(NH3)2 ions in adjacent cages that share an
Al T-site vertex (Fig. 7.4, structure A), the computed barrier for one CuI(NH3)2
to diuse through an 8-MR window into the adjacent CuI(NH3)2-containing cage
(structure B) is 35 kJ mol−1, consistent with prior estimates of CuI(NH3)2 diusion
barriers into an empty cage [79, 427]. The net pairing cost is 23 kJ mol−1. Thus,
transport between adjacent Al-sharing cages is expected to be facile at temperatures
of catalytic interest. Two CuI(NH3)2 ions bind O2 more eectively (59 kJ mol−1)
than does an isolated CuI(NH3)2 (26 kJ mol−1) (table 7.10 and g. 7.21), and the
O2 binding energy more than osets the energy cost for two CuI(NH3)2 to cohabit
the same cage. Initial reaction likely generates the end-on spin-triplet species shown
in Fig. 7.4 (structure C), and further rearrangement and dissociation of O2 across
two CuI centers ultimately leads to the di-oxo structure E, containing two four-fold
coordinated CuII centers. Conversion of structure C into D is spin forbidden; the
eective barrier in similar ligand environments is estimated to be 20 kJ mol−1 [423].
Subsequent conversion of structure D into E occurs with a modest barrier. The
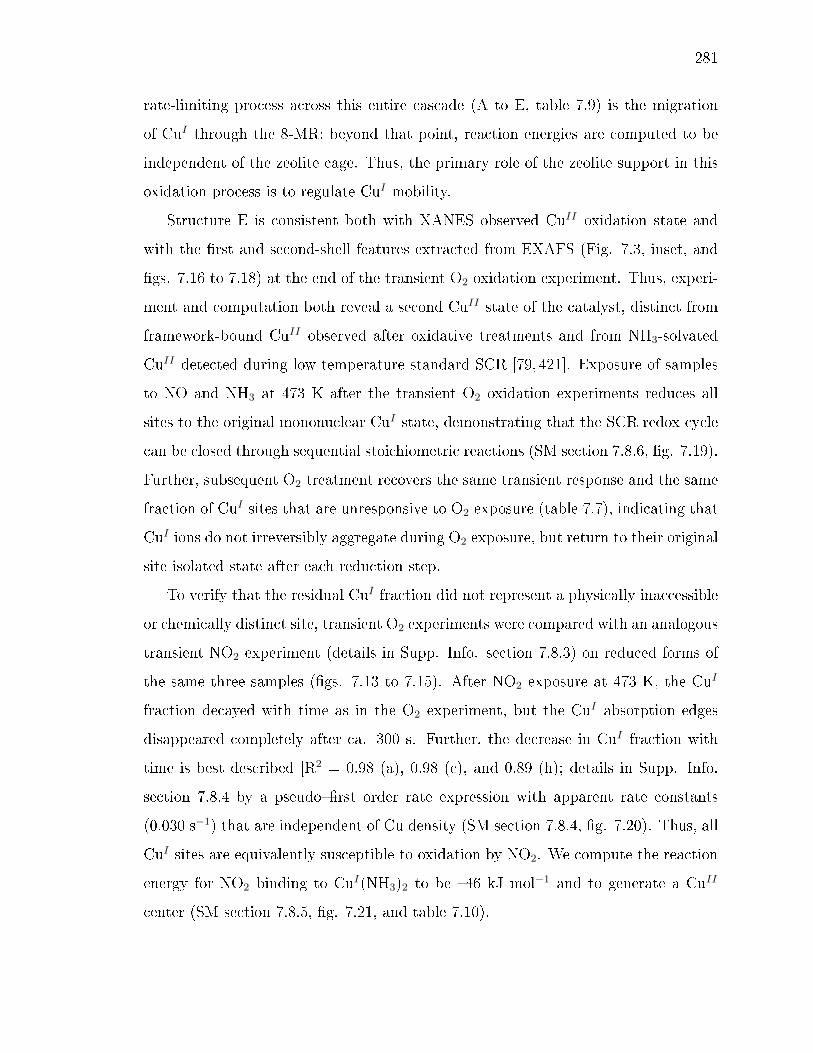
281
rate-limiting process across this entire cascade (A to E, table 7.9) is the migration
of CuI through the 8-MR; beyond that point, reaction energies are computed to be
independent of the zeolite cage. Thus, the primary role of the zeolite support in this
oxidation process is to regulate CuI mobility.
Structure E is consistent both with XANES observed CuII oxidation state and
with the rst and second-shell features extracted from EXAFS (Fig. 7.3, inset, and
gs. 7.16 to 7.18) at the end of the transient O2 oxidation experiment. Thus, experi-
ment and computation both reveal a second CuII state of the catalyst, distinct from
framework-bound CuII observed after oxidative treatments and from NH3-solvated
CuII detected during low-temperature standard SCR [79, 421]. Exposure of samples
to NO and NH3 at 473 K after the transient O2 oxidation experiments reduces all
sites to the original mononuclear CuI state, demonstrating that the SCR redox cycle
can be closed through sequential stoichiometric reactions (SM section 7.8.6, g. 7.19).
Further, subsequent O2 treatment recovers the same transient response and the same
fraction of CuI sites that are unresponsive to O2 exposure (table 7.7), indicating that
CuI ions do not irreversibly aggregate during O2 exposure, but return to their original
site isolated state after each reduction step.
To verify that the residual CuI fraction did not represent a physically inaccessible
or chemically distinct site, transient O2 experiments were compared with an analogous
transient NO2 experiment (details in Supp. Info. section 7.8.3) on reduced forms of
the same three samples (gs. 7.13 to 7.15). After NO2 exposure at 473 K, the CuI
fraction decayed with time as in the O2 experiment, but the CuI absorption edges
disappeared completely after ca. 300 s. Further, the decrease in CuI fraction with
time is best described [R2 = 0.98 (a), 0.98 (c), and 0.89 (h); details in Supp. Info.
section 7.8.4 by a pseudorst order rate expression with apparent rate constants
(0.030 s−1) that are independent of Cu density (SM section 7.8.4, g. 7.20). Thus, all
CuI sites are equivalently susceptible to oxidation by NO2. We compute the reaction
energy for NO2 binding to CuI(NH3)2 to be 46 kJ mol−1 and to generate a CuII
center (SM section 7.8.5, g. 7.21, and table 7.10).
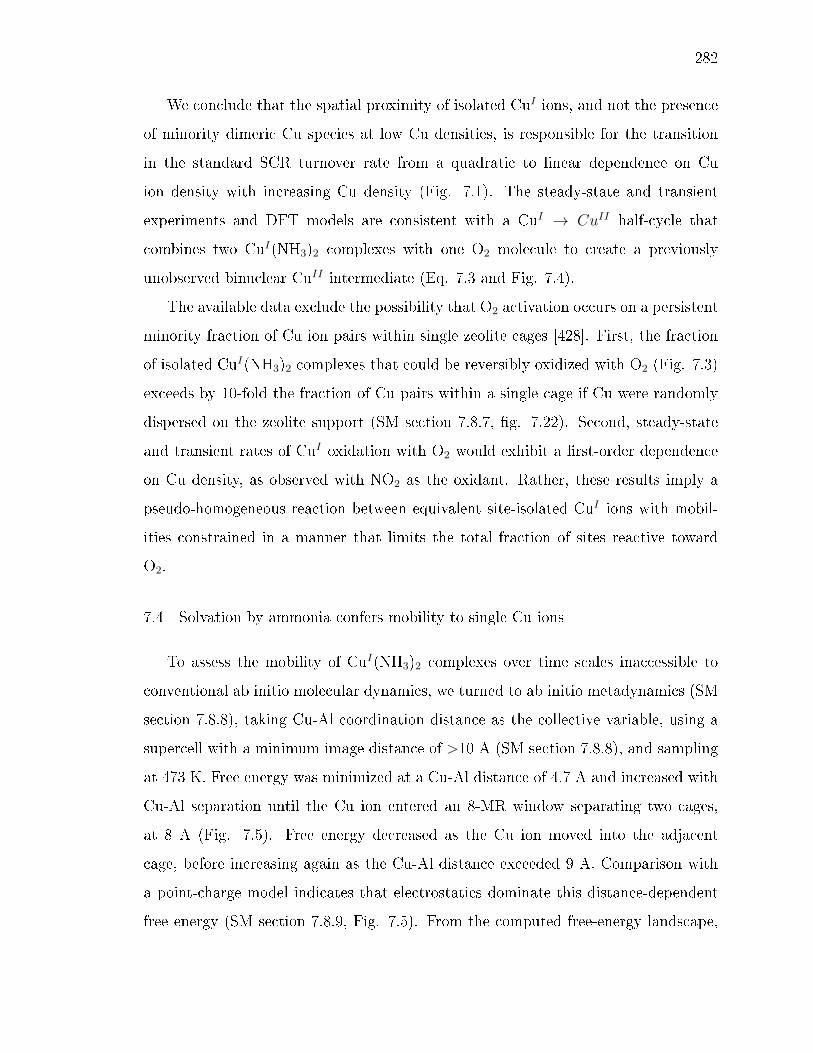
282
We conclude that the spatial proximity of isolated CuI ions, and not the presence
of minority dimeric Cu species at low Cu densities, is responsible for the transition
in the standard SCR turnover rate from a quadratic to linear dependence on Cu
ion density with increasing Cu density (Fig. 7.1). The steady-state and transient
experiments and DFT models are consistent with a CuI → CuII half-cycle that
combines two CuI(NH3)2 complexes with one O2 molecule to create a previously
unobserved binuclear CuII intermediate (Eq. 7.3 and Fig. 7.4).
The available data exclude the possibility that O2 activation occurs on a persistent
minority fraction of Cu ion pairs within single zeolite cages [428]. First, the fraction
of isolated CuI(NH3)2 complexes that could be reversibly oxidized with O2 (Fig. 7.3)
exceeds by 10-fold the fraction of Cu pairs within a single cage if Cu were randomly
dispersed on the zeolite support (SM section 7.8.7, g. 7.22). Second, steady-state
and transient rates of CuI oxidation with O2 would exhibit a rst-order dependence
on Cu density, as observed with NO2 as the oxidant. Rather, these results imply a
pseudo-homogeneous reaction between equivalent site-isolated CuI ions with mobil-
ities constrained in a manner that limits the total fraction of sites reactive toward
O2.
7.4 Solvation by ammonia confers mobility to single Cu ions
To assess the mobility of CuI(NH3)2 complexes over time scales inaccessible to
conventional ab initio molecular dynamics, we turned to ab initio metadynamics (SM
section 7.8.8), taking Cu-Al coordination distance as the collective variable, using a
supercell with a minimum image distance of >10 A (SM section 7.8.8), and sampling
at 473 K. Free energy was minimized at a Cu-Al distance of 4.7 A and increased with
Cu-Al separation until the Cu ion entered an 8-MR window separating two cages,
at 8 A (Fig. 7.5). Free energy decreased as the Cu ion moved into the adjacent
cage, before increasing again as the Cu-Al distance exceeded 9 A. Comparison with
a point-charge model indicates that electrostatics dominate this distance-dependent
free energy (SM section 7.8.9, Fig. 7.5). From the computed free-energy landscape,
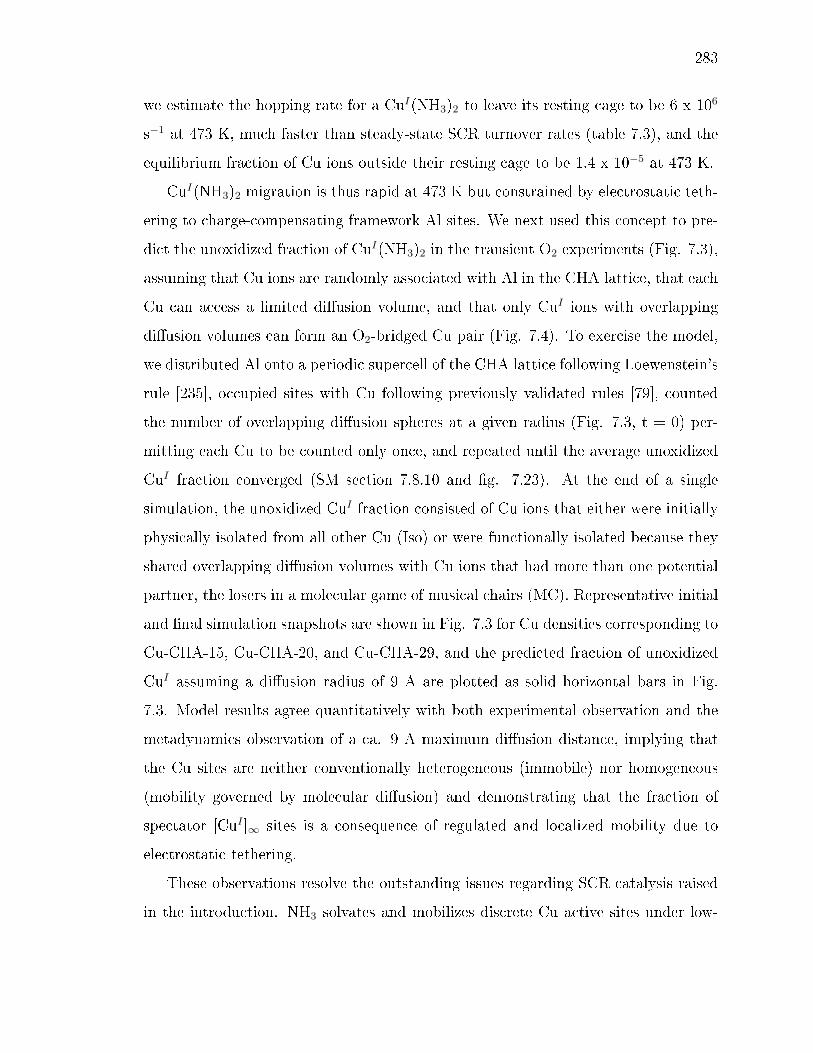
283
we estimate the hopping rate for a CuI(NH3)2 to leave its resting cage to be 6 x 10⁶
s−1 at 473 K, much faster than steady-state SCR turnover rates (table 7.3), and the
equilibrium fraction of Cu ions outside their resting cage to be 1.4 x 10⁻⁵ at 473 K.
CuI(NH3)2 migration is thus rapid at 473 K but constrained by electrostatic teth-
ering to charge-compensating framework Al sites. We next used this concept to pre-
dict the unoxidized fraction of CuI(NH3)2 in the transient O2 experiments (Fig. 7.3),
assuming that Cu ions are randomly associated with Al in the CHA lattice, that each
Cu can access a limited diusion volume, and that only CuI ions with overlapping
diusion volumes can form an O2-bridged Cu pair (Fig. 7.4). To exercise the model,
we distributed Al onto a periodic supercell of the CHA lattice following Loewenstein's
rule [235], occupied sites with Cu following previously validated rules [79], counted
the number of overlapping diusion spheres at a given radius (Fig. 7.3, t = 0) per-
mitting each Cu to be counted only once, and repeated until the average unoxidized
CuI fraction converged (SM section 7.8.10 and g. 7.23). At the end of a single
simulation, the unoxidized CuI fraction consisted of Cu ions that either were initially
physically isolated from all other Cu (Iso) or were functionally isolated because they
shared overlapping diusion volumes with Cu ions that had more than one potential
partner, the losers in a molecular game of musical chairs (MC). Representative initial
and nal simulation snapshots are shown in Fig. 7.3 for Cu densities corresponding to
Cu-CHA-15, Cu-CHA-20, and Cu-CHA-29, and the predicted fraction of unoxidized
CuI assuming a diusion radius of 9 A are plotted as solid horizontal bars in Fig.
7.3. Model results agree quantitatively with both experimental observation and the
metadynamics observation of a ca. 9 A maximum diusion distance, implying that
the Cu sites are neither conventionally heterogeneous (immobile) nor homogeneous
(mobility governed by molecular diusion) and demonstrating that the fraction of
spectator [CuI ]∞ sites is a consequence of regulated and localized mobility due to
electrostatic tethering.
These observations resolve the outstanding issues regarding SCR catalysis raised
in the introduction. NH3 solvates and mobilizes discrete Cu active sites under low-
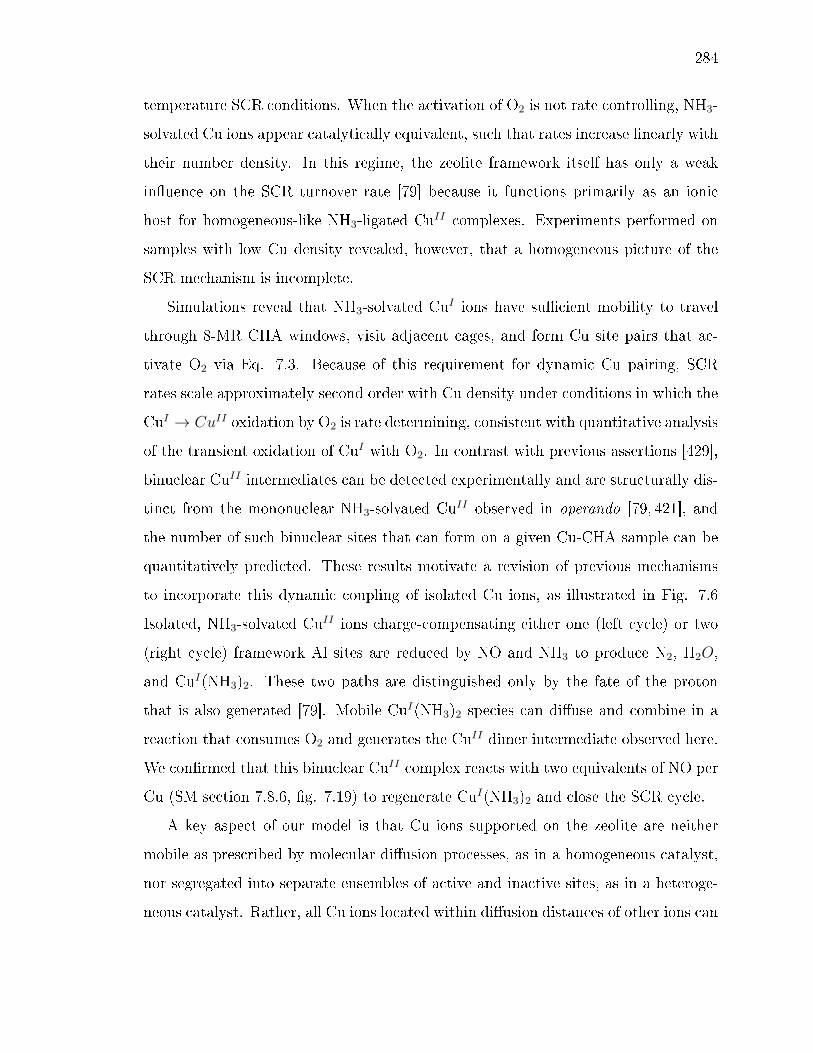
284
temperature SCR conditions. When the activation of O2 is not rate controlling, NH3-
solvated Cu ions appear catalytically equivalent, such that rates increase linearly with
their number density. In this regime, the zeolite framework itself has only a weak
inuence on the SCR turnover rate [79] because it functions primarily as an ionic
host for homogeneous-like NH3-ligated CuII complexes. Experiments performed on
samples with low Cu density revealed, however, that a homogeneous picture of the
SCR mechanism is incomplete.
Simulations reveal that NH3-solvated CuI ions have sucient mobility to travel
through 8-MR CHA windows, visit adjacent cages, and form Cu site pairs that ac-
tivate O2 via Eq. 7.3. Because of this requirement for dynamic Cu pairing, SCR
rates scale approximately second order with Cu density under conditions in which the
CuI → CuII oxidation by O2 is rate determining, consistent with quantitative analysis
of the transient oxidation of CuI with O2. In contrast with previous assertions [429],
binuclear CuII intermediates can be detected experimentally and are structurally dis-
tinct from the mononuclear NH3-solvated CuII observed in operando [79, 421], and
the number of such binuclear sites that can form on a given Cu-CHA sample can be
quantitatively predicted. These results motivate a revision of previous mechanisms
to incorporate this dynamic coupling of isolated Cu ions, as illustrated in Fig. 7.6
Isolated, NH3-solvated CuII ions charge-compensating either one (left cycle) or two
(right cycle) framework Al sites are reduced by NO and NH3 to produce N2, H2O,
and CuI(NH3)2. These two paths are distinguished only by the fate of the proton
that is also generated [79]. Mobile CuI(NH3)2 species can diuse and combine in a
reaction that consumes O2 and generates the CuII dimer intermediate observed here.
We conrmed that this binuclear CuII complex reacts with two equivalents of NO per
Cu (SM section 7.8.6, g. 7.19) to regenerate CuI(NH3)2 and close the SCR cycle.
A key aspect of our model is that Cu ions supported on the zeolite are neither
mobile as prescribed by molecular diusion processes, as in a homogeneous catalyst,
nor segregated into separate ensembles of active and inactive sites, as in a heteroge-
neous catalyst. Rather, all Cu ions located within diusion distances of other ions can
285
potentially form Cu pairs dynamically and reversibly during the SCR cycle, at rates
inuenced by the mobility and eective diusion distances of Cu ions. Thus, rates
of O2-assisted oxidations are sensitive to Cu proximity and could also be sensitive
to the zeolite support composition and topology. By contrast, all NH3-solvated CuI
sites are equivalently susceptible to rst-order oxidation by NO2, independent of Cu
spatial density, and are subsequently reducible by NO and NH3. These observations
demonstrate that fast SCR, in which oxidation capacity is provided by NO2 rather
than O2:
2NH3 +NO +NO2 → 2N2 + 3H2O (7.4)
is not linked through a common intermediate to standard SCR under conditions in
which Cu sites are solvated by NH3 [41]. NO2 oxidants accelerate SCR rates both by
accelerating CuI oxidation kinetics and by engaging a larger fraction of Cu sites in
the catalyst.
At higher temperatures (>523 K), standard SCR rates are independent of Cu
density [218,349], the apparent activation energy increases to 140 kJ mol−1 [349], and
Cu ions lose their NH3 solvation shell [218], implicating the involvement of dierent
O2 activation steps that do not occur at the Cu ion pairs formed dynamically at lower
temperatures (<523 K). Of greater practical importance to NOx emissions control
is to increase SCR rates at even lower temperatures (<473 K) [218]. The results
here imply that standard SCR onset ("light-o") temperatures, which are observed
to depend on zeolite composition, topology, and Cu distribution [89], are sensitive
to changes in rate-determining O2 activation steps. Thus, optimization of Cu spatial
distribution and promotion of Cu mobility are promising strategies for accelerating
CuI oxidation rates and improving low-temperature SCR catalysts.
7.5 Outlook
Our results point to a previously unrecognized catalytic mechanism that embod-
ies salient features of homogeneous and heterogeneous catalysts. This mechanism
286
encompasses solvent mobilization of discrete active site precursors (e.g., single metal
ions) and ionic bonds to the support that limit their mobility. The active site pre-
cursor has an eective diusion distance and occupies a volumetric footprint that
restricts its interactions only to other precursors within overlapping volumes; such
catalytic behavior cannot be described by mean-eld, Langmuir kinetics. The ionic
tethering motif provides opportunities to confer catalytic benets beyond immobi-
lization strategies based on covalent anchors or tethers. This motif enables the in
situ dynamic generation of multinuclear complexes implicated as active sites in O2
activation and therefore could also apply to other reactions, such as the partial oxi-
dation of methane to methanol on Cu-zeolites. We expect that design parameters to
regulate the mobility of active sites and their precursors would include the structure,
composition and electronic conductivity of the support, and the molecules that sol-
vate such sites to promote their mobility. Manipulating these variables could open
approaches to catalyst design for a wide variety of reactions by combining knowledge
from homogeneous and heterogeneous catalysis.
7.6 Acknowledgements
Full details of experiments and computational models are provided in the sup-
plementary information. Financial support was provided by the National Science
Foundation GOALI program under award numbers 1258715-CBET (Purdue) and
1258690-CBET (Notre Dame), the National Science Foundation Faculty Early Ca-
reer Development Program under award number 1552517-CBET (R.G.), Cummins,
Inc. (I.K., A.J.S., A.A.P., J.D.A.-C.). and The Patrick and Jane Eilers Graduate
Student Fellowship for Energy Related Research (C.P.). Use of the Advanced Photon
Source is supported by the U.S. Department of Energy, Oce of Science, and Oce
of Basic Energy Sciences, under Contract No. DE-AC02-06CH11357. We thank the
Center for Research Computing at Notre Dame, and EMSL, a DOE Oce of Science
User Facility sponsored by the Oce of Biological and Environmental Research and
located at Pacic Northwest National Laboratory, for computational resources.
287
Additionally, I acknowledge the AAAS for granting permission to reproduce this
chapter of my thesis. Adapted with permissions from Science, 2017, 357, 898-903.
Reprinted with permission from AAAS.
The full article can be accessed here: dx.doi.org/10.1126/science.aan5630.

288
7.7 Figures and Tables
Figure 7.1. Cu-density dependence of SCR rates. (A) The CHAcage [1] and schematic representation of the Cu ion densities per CHA cagein samples a and g. (B)Standard NOx SCR rates (per volume catalyst; 473K; measured in a dierential reactor by using a gas mixture representativeof practical low-temperature application, including 2.5% H2O; details inSupp. Info. section 7.8.2) and apparent O2 orders measured on Cu-CHA-X samples (Si/Al = 15, table 7.3) of increasing Cu ion density. Coloredline is a visual guide; regression ts to the quadratic (R2 = 0.99) and linear(R2 = 0.99) kinetic regimes are detailed in Supp. Info. section 7.8.2.

289
Figure 7.2. Cu-density dependence of operando Cu oxidationstate. The dependence of CuI fraction on Cu ion volumetric densityduring steady-state standard SCR at 473 K was measured by XANES(details in Supp. Info. section 7.8.3). Data points include samples a, f,and g shown in Fig. 7.1 (Si/Al = 15, lled squares), samples at Si/Al =4.5 and Si/Al = 25 (open squares), and comparable literature data [opencircle Ref [360], Si/Al = 16; open triangle Ref [41], Si/Al = 4.5]. Insetshows NH3-solvated, isolated CuI and CuII species previously observedand computed [79] to be present during standard SCR at 473 K. Gray,Cu; green, Al; yellow, Si; red, O; blue, N; and white, H. The colored arrowis a visual guide; error bars represent the absolute 5% uncertainty fromlinear combination XANES tting (details in Supp. Info. section 7.8.3).
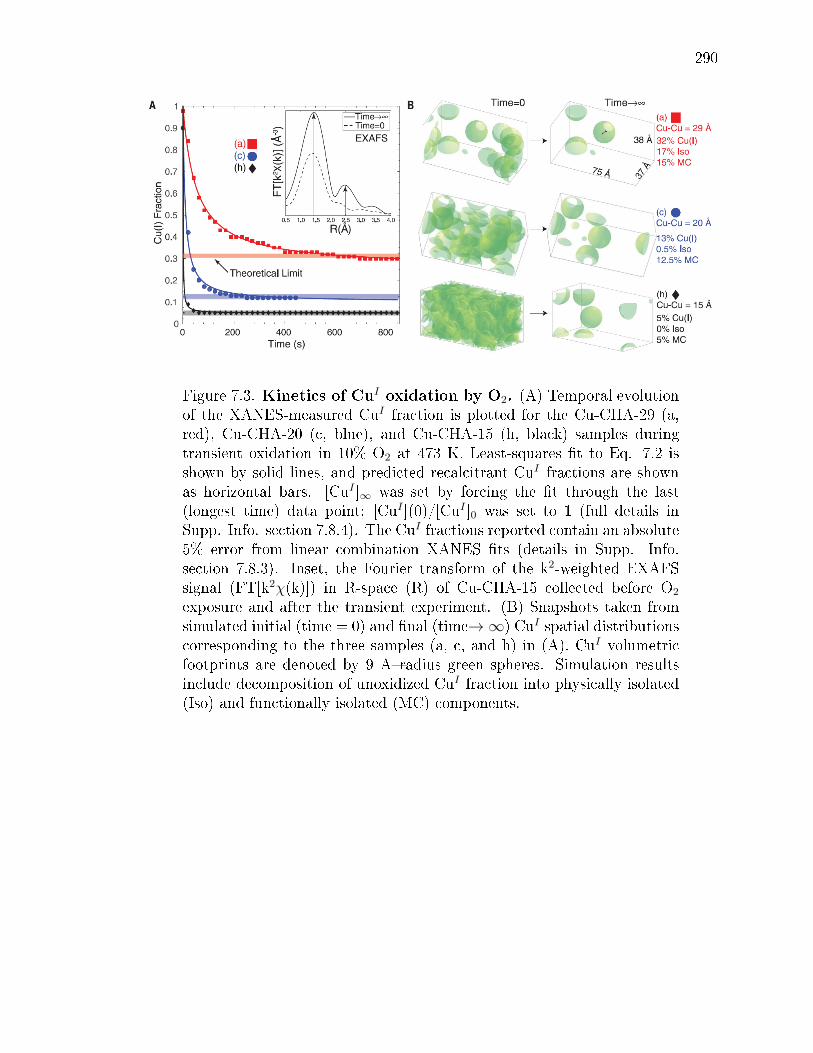
290
Figure 7.3. Kinetics of CuI oxidation by O2. (A) Temporal evolutionof the XANES-measured CuI fraction is plotted for the Cu-CHA-29 (a,red), Cu-CHA-20 (c, blue), and Cu-CHA-15 (h, black) samples duringtransient oxidation in 10% O2 at 473 K. Least-squares t to Eq. 7.2 isshown by solid lines, and predicted recalcitrant CuI fractions are shownas horizontal bars. [CuI ]∞ was set by forcing the t through the last(longest time) data point; [CuI ](0)/[CuI ]0 was set to 1 (full details inSupp. Info. section 7.8.4). The CuI fractions reported contain an absolute5% error from linear combination XANES ts (details in Supp. Info.section 7.8.3). Inset, the Fourier transform of the k2-weighted EXAFSsignal (FT[k2χ(k)]) in R-space (R) of Cu-CHA-15 collected before O2
exposure and after the transient experiment. (B) Snapshots taken fromsimulated initial (time = 0) and nal (time→∞) CuI spatial distributionscorresponding to the three samples (a, c, and h) in (A). CuI volumetricfootprints are denoted by 9 Aradius green spheres. Simulation resultsinclude decomposition of unoxidized CuI fraction into physically isolated(Iso) and functionally isolated (MC) components.

291
Figure 7.4. Simulation of O2 adsorption and oxidation of twoCuI(NH3)2 equivalents. DFT-computed energy landscape is shownfor the diusion of CuI(NH3)2 through an 8-MR CHA window into anadjacent cage and subsequent bimolecular reaction with O2. All minimaand transition states were computed here, except C to D, which is takenfrom [423]. Gray, Cu; green, Al; red, O; blue, N; and white, H.
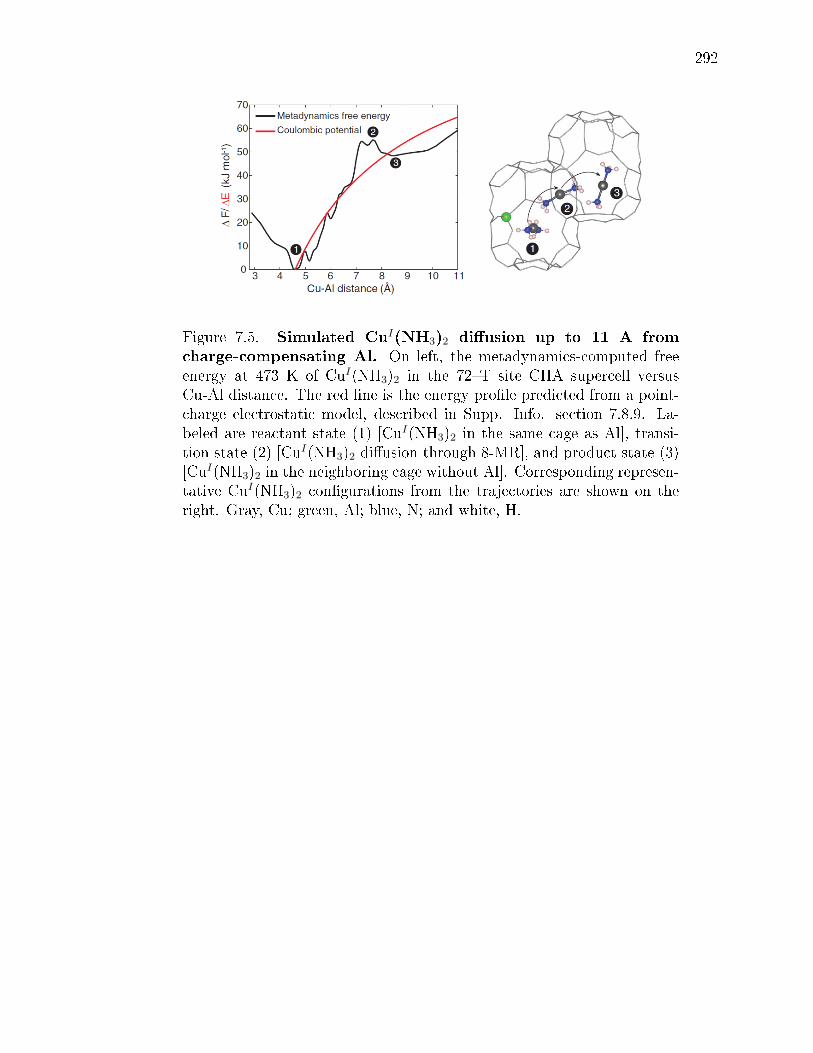
292
Figure 7.5. Simulated CuI(NH3)2 diusion up to 11 A fromcharge-compensating Al. On left, the metadynamics-computed freeenergy at 473 K of CuI(NH3)2 in the 72T site CHA supercell versusCu-Al distance. The red line is the energy prole predicted from a point-charge electrostatic model, described in Supp. Info. section 7.8.9. La-beled are reactant state (1) [CuI(NH3)2 in the same cage as Al], transi-tion state (2) [CuI(NH3)2 diusion through 8-MR], and product state (3)[CuI(NH3)2 in the neighboring cage without Al]. Corresponding represen-tative CuI(NH3)2 congurations from the trajectories are shown on theright. Gray, Cu; green, Al; blue, N; and white, H.
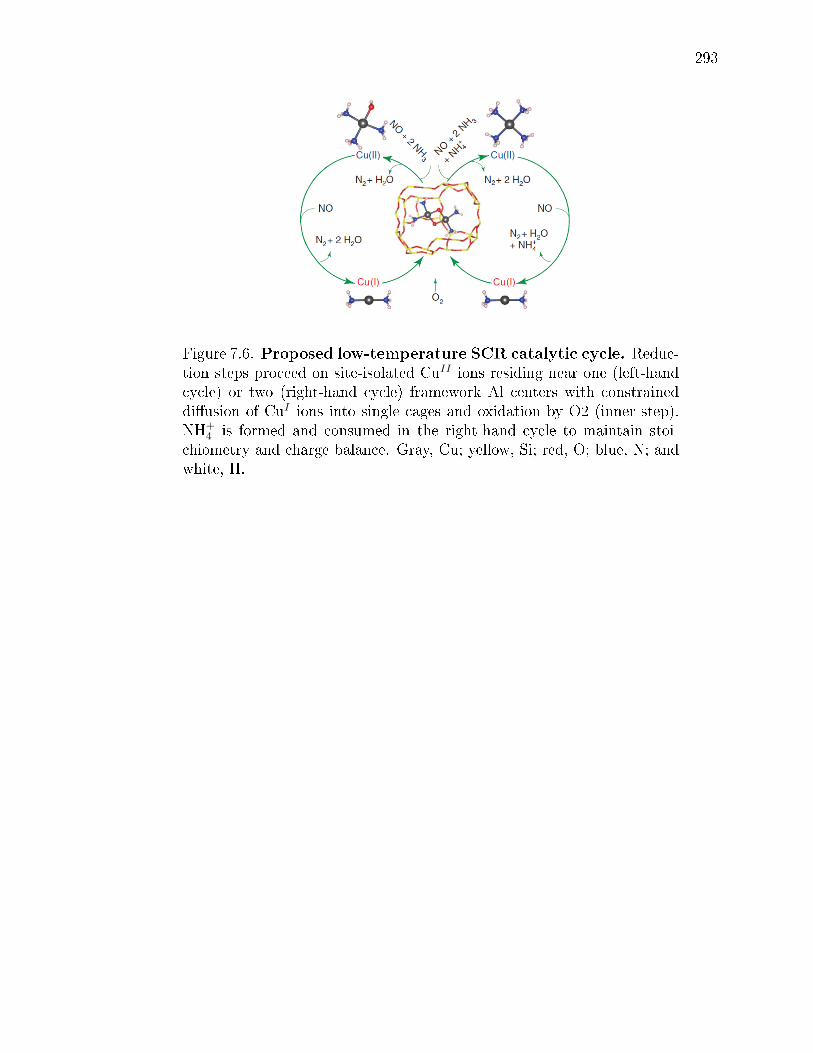
293
Figure 7.6. Proposed low-temperature SCR catalytic cycle. Reduc-tion steps proceed on site-isolated CuII ions residing near one (left-handcycle) or two (right-hand cycle) framework Al centers with constraineddiusion of CuI ions into single cages and oxidation by O2 (inner step).NH+
4 is formed and consumed in the right-hand cycle to maintain stoi-chiometry and charge balance. Gray, Cu; yellow, Si; red, O; blue, N; andwhite, H.
294
7.8 Supporting Information
7.8.1 Synthesis Methods and Characterization
Synthesis of SSZ-13 zeolites
Here, SSZ-13 is used to refer to materials of aluminosilicate composition and the
chabazite (CHA) framework. High-aluminum SSZ-13 zeolites (Si/Al = 4.5) were
synthesized as previously reported [79]. A molar ratio of 1 SiO2/ 0.031 Al2O3/ 0.017
TMAdaOH/ 0.770 Na2O/ 12.1 H2O was used in the synthesis solution. Briey, a 1M
NaOH solution (3.3 wt% NaOH, Alfa Aesar) was added to deionized water (18.2 MΩ)
in a peruoroalkoxy alkane (PFA) jar and stirred for 15 minutes at ambient conditions.
Next, sodium silicate (10.6 wt% Na2O, 25.6 wt% SiO2; Sigma Aldrich) was added
to the NaOH solution and stirred for 15 minutes under ambient conditions. Then,
NH4-Y zeolite (Zeolyst CBV300, Si/Al = 2.6) was added and the mixture was stirred
for 30 minutes under ambient conditions. Finally, an aqueous TMAdaOH solution
(25 wt%, Sachem) was added to the mixture and stirred for 30 minutes under ambient
conditions. The synthesis mixture was then transferred to 45 mL Teon-lined stainless
steel autoclaves (Parr Instruments) and placed in a forced convection oven (Yamato
DKN-402C) at 413 K and rotated at 60 RPM for 6 days.
Low aluminum SSZ-13 zeolites (Si/Al = 15-25) were synthesized in hydroxide me-
dia using a previously reported procedure [79]. A molar ratio of 1 SiO2/ 0.0167-0.033
Al2O3/ 0.25 TMAdaOH/ 0.125 Na2O/ 44 H2O was used to obtain Na+/TMAda+
= 1 and Si/Al = 15 or 25 in the synthesis solution. A typical synthesis involved
adding an aqueous TMAdaOH solution to deionized H2O in a PFA jar and stirring
the solution under ambient conditions for 15 minutes. Next, aluminum hydroxide was
added to the aqueous TMAdaOH solution. Then, a 5M NaOH solution (16.7 wt%
NaOH in deionized water; NaOH pellets 98 wt%, Alfa Aesar) was added dropwise to
the solution and stirred under ambient conditions for 15 minutes. Finally, colloidal
silica was added and the mixture was stirred for 2 h under ambient conditions. All
synthesis reagents were used without further purication. The synthesis solution was
295
then transferred to a 45 mL Teon-lined stainless steel autoclave and placed in a
forced convection oven at 433 K and rotated at 40 RPM for 6 days.
X-Ray diraction of CHA zeolites
The CHA crystal framework was determined from powder X-ray diraction (XRD)
patterns measured on a Rigaku SmartLab X-ray diractometer with a Cu Kα radia-
tion source (λ=0.154 nm) operated at 1.76 kW. 0.01 g of zeolite powder were loaded
onto a low-volume sample holder (Rigaku) and the diraction pattern was recorded
from 4-40 2θ at a scan rate of 0.04 s−1. Powder XRD patterns for all synthesized
materials were compared to diraction patterns for CHA reported in the Interna-
tional Zeolite Association (IZA) structure database [1]. All XRD patterns reported
here are normalized such that the maximum peak intensity in each pattern is unity.
Diraction patterns of CHA zeolites are shown in Fig. 7.8.
Adsorption isotherms to measure micropore volumes of CHA zeolites
Micropore volumes of CHA zeolites were determined from Ar adsorption isothe-
rms measured at 87 K on a Micromeritics ASAP 2020 Surface Area and Porosity
Analyzer. Typically, 0.030.05 g of pelleted and sieved sample (nominal diameter
between 180-250 µm) were degassed by heating to 393 K (0.167 K s-1) under vacuum
(<5 µmHg) for 2 h, and then further heating to 623 K (0.167 K s−1) under vacuum
(<5 µmHg) and holding for 9 h. Volumetric gas adsorption within micropores (cm3
g−1 at STP) was estimated from analysis of semi-log derivative plots of the adsorp-
tion isotherm (∂(Vads)/∂(ln(P/P0)) vs. ln(P/P0)) to identify the micropore lling
transition (rst maximum) and then the end of micropore lling (subsequent mini-
mum). Micropore volumes (cm3 g−1) were obtained on SSZ-13 zeolites by converting
standard gas adsorption volumes (cm3 g−1cat at STP) to liquid volumes using a density
conversion factor assuming the liquid density of Ar at 87 K. Micropore volumes of

296
CHA zeolites are shown in Fig. 7.9. In each gure, adsorption isotherms are oset in
increments of 200 cm3 g−1 for clarity.
Aqueous-phase Copper Ion-Exchange of H-SSZ-13
Cu-SSZ-13 zeolites were prepared by aqueous-phase Cu ion-exchange using Cu(N-
O3)2 as the precursor. A pH meter (Mettler Toledo SevenEasy pH Meter S20) cal-
ibrated at pH values of 1.0 (Sigma Aldrich FLUKA 31044 Buer solution pH 1.0
at 293 K), 4.0 (Hach Buer Solution pH 4.0±0.02 at 298 K), and 7.0 (Hach Buer
Solution pH 7.00±0.02 at 298 K) was used to monitor the pH throughout the Cu
ion-exchange process.
Typically, 1 to 2 g of H-SSZ-13 were added to 40 mL of deionized water (Millipore,
Synergy UV Water Purication System, 18.2 MΩ cm−1 resistivity at 298 K) in a 250
mL borosilicate Erlenmeyer ask and stirred at 300 rpm using a magnetic stir bar for
30 minutes at 313 K. Depending on the Cu exchange level targeted, 20 to 100 mL
of 0.001 M to 0.1M Cu(NO3)2 solution (Sigma Aldrich, 99.999% trace metals basis)
was added to the slurry. The pH was controlled to 4.9±0.1 by dropwise addition (ca.
2 drops per second) of 1.0 M NH4OH (Sigma Aldrich, 28.0% Ammonium hydrox-
ide solution, ACS reagent grade) immediately after addition of Cu(NO3)2 and was
maintained at 4.9±0.1 for 4 hours. Cu-exchanged SSZ-13 was recovered via centrifu-
gation, and then washed with deionized water six times (70 mL H2O g−1 per wash).
Cu-SSZ-13 catalysts were dried at 373 K in ambient air in a free convention oven for
12 hours, crushed with a mortar and pestle, then treated in owing dry air (100 mL
g−1, Indiana Oxygen, Zero grade air, < 1ppm THC) to 773 K at a rate of 1 K min−1.
Elemental Analysis using Atomic Absorption Spectroscopy
Typically, 0.02-0.05 g of dry sample (H-SSZ-13 or Cu-SSZ-13) were dissolved in
approximately 2 mL of hydrouoric acid (HF) (Mallinckrodt Baker, 48% HF, Baker
Analyzed A.C.S. Reagent) in a 60 mL high density polyethylene (HDPE) bottle (2

297
oz., 60 mL Nalgene Wide-Mouth Amber HDPE bottles). A polyethylene pipet was
used to transfer the HF. The sample was capped and left to dissolve for 12 hours then
diluted with approximately 50 mL of deionized water (Millipore, Synergy UV Water
Purication System, 18.2 MΩ cm−1 resistivity at 298 K).
Bulk elemental composition was determined using atomic absorption spectroscopy
(AAS) on a Perkin Elmer AAnalyst 300. Silicon AAS standards were created by
diluting a 1000 ppm silicon AAS standard solution (Sigma Aldrich, TraceCERT,
1000 mg/L Si in NaOH) to 15, 75, and 150 ppm. A linear calibration curve (ppm Si
versus Si absorbance at 251.6 nm) was determined by plotting the absorbance of each
silicon standard at 251.6 nm. Similar procedures were used for aluminum, copper and
sodium on all reported SSZ-13 catalysts.
Cu site characterization and quantication
Cu K-edge X-ray absorption near edge spectroscopy (XANES) of samples under
ambient conditions were indistinguishable from that of an aqueous CuII nitrate solu-
tion (Cu-CHA-20 and Cu-CHA-29 shown in Fig. 7.10) and did not show absorption
characteristic of CuI (edge at ca. 8983 eV [381, 430]) or of CuII within CuxOy clus-
ters [87,129]. Diuse reectance UV-Visible spectra collected on these samples under
ambient, hydrated conditions are shown in Fig. 7.11. The peak at 12500 cm−1 is
representative of hydrated isolated CuII ions. Peaks at ca. 22500 cm−1, reported to
be due to Cu-dimers in ZSM-5 [319], are not observed, indicating that predominantly
isolated CuII species are present. The broad absorption features between 30000 cm−1
and 50000 cm−1 are due to contributions from the zeolite framework.
The enumeration of isolated CuII and CuIIOH sites on each Cu-CHA zeolite was
determined after oxidative treatment (20% O2, 773 K) by quantifying the number
of residual protons that remained after Cu exchange, given that CuII sites exchange
two protons and CuIIOH sites exchange one proton. The quantication was per-
formed using methods that selectively titrate residual H+ sites in small-pore, metal-
exchanged zeolites [171], in which NH3-saturated samples are purged in owing wet

298
helium (3% H2O in He, 433 K) to desorb Lewis acid-bound NH3, prior to temper-
ature programmed desorption (Table 7.1). The CuII and CuIIOH site quantities
in the samples studied here are consistent with the thermodynamic preference for
CuII exchange at paired Al sites until saturation [79], followed by further exchange
of CuIIOH sites at isolated Al. Taken together, the ex situ characterization of Cu
sites by X-ray absorption, UV-Visible and quantication of residual H+ sites by NH3
titration, conrm that the Cu-CHA samples studied here contain only isolated CuII
cations, present either as CuII at paired framework Al sites or as CuIIOH at isolated
Al sites [79].
7.8.2 SCR Kinetics
Standard selective catalytic reduction (SCR) kinetic data were measured on a
down-ow 3/8" ID tubular quartz reactor. All samples were pelletized (Specac 13mm
Diameter Stainless Steel Evacuable Pellet Die) under 10,000 psi pressure (Carver
Laboratory Press), ground using a mortar and pestle, then sieved to retain 125 to
250 |umm particles (W.S. TYLER No. 60 and No. 120 all-stainless-steel). Typically,
0.015-0.050 g of sieved Cu-SSZ-13 catalyst were mixed with enough inert silica gel
(Fisher Chemical Silica Gel (Davisil) Sorbent, Grade 923) to obtain a bed height
of ca. 0.5 cm. Aluminum foil was wrapped around the quartz reactor to an outer
diameter of ca. 2.54 cm, in order to enhance heat conduction and minimize any
radial temperature gradients that may be present within the bed. The reactor was
then placed within a clam-shell furnace (Applied Test Systems) and pressure-tested
with helium (99.999%, Indiana Oxygen) at 5 psig for 20 minutes.
Steady state kinetic data were collected according to methods we have reported
previously [37]. Briey, rate data were measured at dierential NO conversion below
20% (total gas ow rate was varied between 0.8 to 1.5 L min-1), to ensure the entire
bed was exposed to approximately the same gas concentrations and temperatures
using a gas mixture of 300 ppm NO (3.5% NO in Ar, Praxair), 300 ppm NH3 (3.0%
NH3 in Ar, Praxair), 5% CO2 (liquid, Indiana Oxygen), 10% O2 (99.5%, Indiana Oxy-
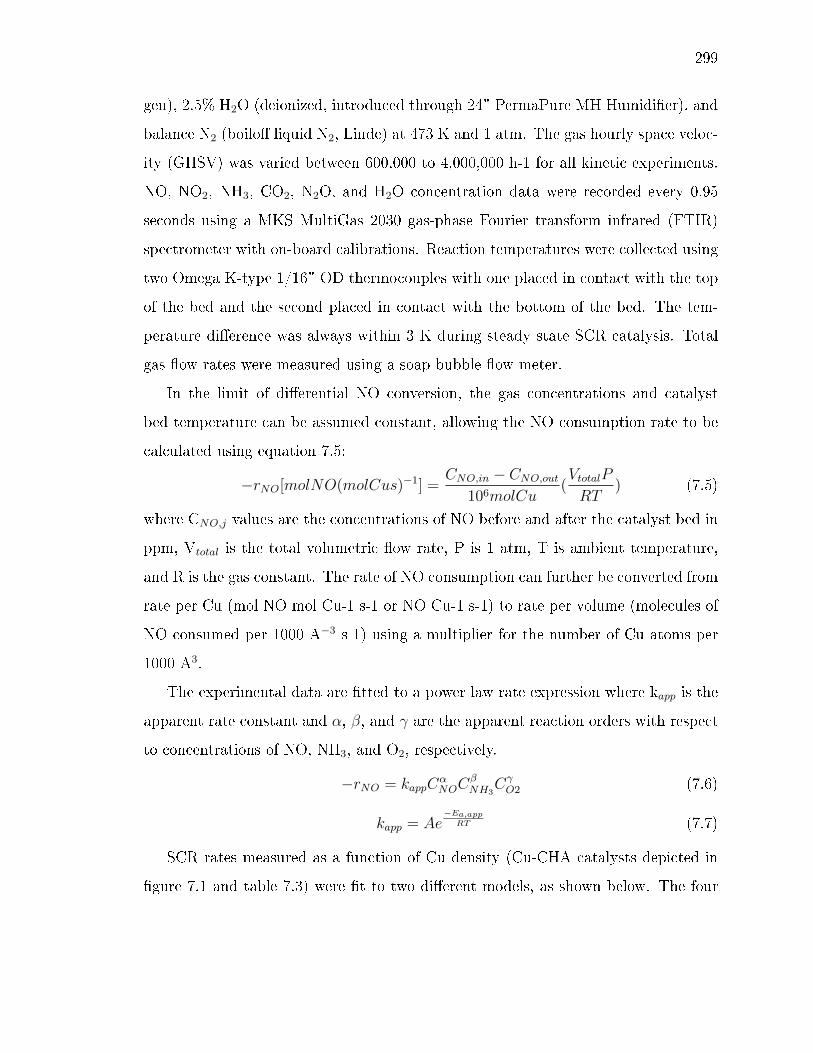
299
gen), 2.5% H2O (deionized, introduced through 24" PermaPure MH Humidier), and
balance N2 (boilo liquid N2, Linde) at 473 K and 1 atm. The gas hourly space veloc-
ity (GHSV) was varied between 600,000 to 4,000,000 h-1 for all kinetic experiments.
NO, NO2, NH3, CO2, N2O, and H2O concentration data were recorded every 0.95
seconds using a MKS MultiGas 2030 gas-phase Fourier transform infrared (FTIR)
spectrometer with on-board calibrations. Reaction temperatures were collected using
two Omega K-type 1/16" OD thermocouples with one placed in contact with the top
of the bed and the second placed in contact with the bottom of the bed. The tem-
perature dierence was always within 3 K during steady state SCR catalysis. Total
gas ow rates were measured using a soap bubble ow meter.
In the limit of dierential NO conversion, the gas concentrations and catalyst
bed temperature can be assumed constant, allowing the NO consumption rate to be
calculated using equation 7.5:
−rNO[molNO(molCus)−1] =CNO,in − CNO,out
106molCu(VtotalP
RT) (7.5)
where CNO,j values are the concentrations of NO before and after the catalyst bed in
ppm, Vtotal is the total volumetric ow rate, P is 1 atm, T is ambient temperature,
and R is the gas constant. The rate of NO consumption can further be converted from
rate per Cu (mol NO mol Cu-1 s-1 or NO Cu-1 s-1) to rate per volume (molecules of
NO consumed per 1000 A−3 s-1) using a multiplier for the number of Cu atoms per
1000 A3.
The experimental data are tted to a power law rate expression where kapp is the
apparent rate constant and α, β, and γ are the apparent reaction orders with respect
to concentrations of NO, NH3, and O2, respectively.
−rNO = kappCαNOC
βNH3
CγO2 (7.6)
kapp = Ae−Ea,app
RT (7.7)
SCR rates measured as a function of Cu density (Cu-CHA catalysts depicted in
gure 7.1 and table 7.3) were t to two dierent models, as shown below. The four
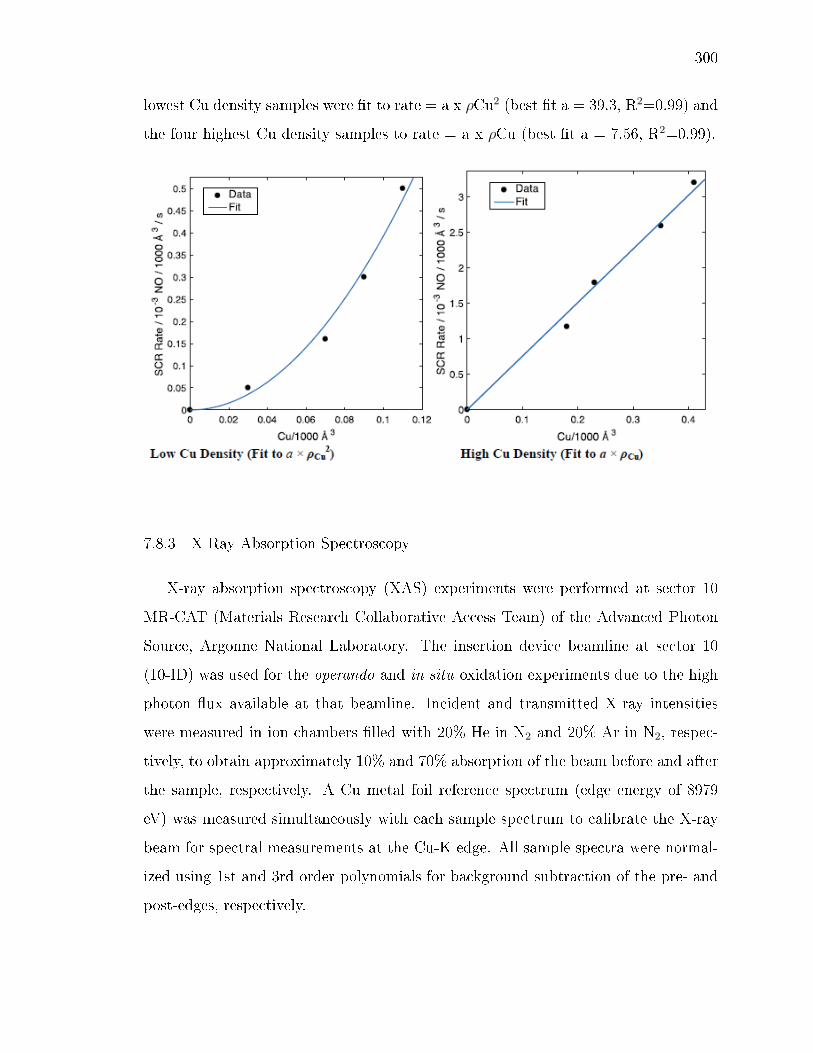
300
lowest Cu density samples were t to rate = a x ρCu2 (best t a = 39.3, R2=0.99) and
the four highest Cu density samples to rate = a x ρCu (best t a = 7.56, R2=0.99).
7.8.3 X-Ray Absorption Spectroscopy
X-ray absorption spectroscopy (XAS) experiments were performed at sector 10
MR-CAT (Materials Research Collaborative Access Team) of the Advanced Photon
Source, Argonne National Laboratory. The insertion device beamline at sector 10
(10-ID) was used for the operando and in situ oxidation experiments due to the high
photon ux available at that beamline. Incident and transmitted X-ray intensities
were measured in ion chambers lled with 20% He in N2 and 20% Ar in N2, respec-
tively, to obtain approximately 10% and 70% absorption of the beam before and after
the sample, respectively. A Cu metal foil reference spectrum (edge energy of 8979
eV) was measured simultaneously with each sample spectrum to calibrate the X-ray
beam for spectral measurements at the Cu-K edge. All sample spectra were normal-
ized using 1st and 3rd order polynomials for background subtraction of the pre- and
post-edges, respectively.

301
The Cu K-edge XANES spectra consists of several distinct features indicative of
the various electronic transitions for the CuI and CuII oxidation states [431, 432].
The peaks at 8977 eV and 8987 eV are representative of CuII . The peak centered at
8977 eV is due to the symmetry forbidden 1s→ 3d transition, which becomes allowed
due to mixing of the 3d and 4p orbitals and has been reported in several studies as
a low intensity, pre-edge feature [36, 433435]. The shoulder at 8987 eV is due to
the 1s → 4p electronic transition [38, 436]. The presence of the sharp peak centered
around 8983 eV is characteristic of the 1s → 4p transition for a two-coordinate CuI
complex. This peak has previously been reported in the literature under a variety of
environments including hydrocarbon SCR [437] and NO decomposition on Cu-ZSM-
5 [438], thermal reduction of Cu-mordenite [439], Cu-Y [440], and two-coordinate CuI
model compounds including copper(I) diamine complexes [381,441,442].
XAS is a bulk technique and each sample spectrum represents a mixture of oxi-
dation states. Therefore, a linear combination XANES tting of the CuI and CuII
references was used to obtain the relative amounts of Cu in each oxidation state in a
given spectrum. Information about how the CuI and CuII references were generated
is provided in our previous publication [79]. An absolute error of 5% was used as a
conservative estimate for the uncertainty in the linear combination XANES tting.
The largest source of uncertainty is the CuI reference used in the tting, as there is
no specic CuI reference spectrum, and the choice of reference may not exactly re-
produce the CuI amine structure present in the sample. If the CuI reference used in
the tting is assumed to be an accurate representation of the CuI structure present,
the uncertainty in the linear combination XANES tting would decrease to 2-3%.
The Debye-Waller factor (DWF) was determined to be 0.005 A2 for gas conditions
that included NH3, and was 0.003 A2 for all other gas conditions. All extended X-ray
absorption ne structure (EXAFS) tting was performed with the DWF xed at the
appropriate value, and EXAFS tting was only performed on the rst coordination
shell of Cu-O. The k2-weighted data in R-space was t by least-squares optimization
to provide coordination numbers (CN) and interatomic bond distances. The EXAFS
302
data was t over k = 2.7 to 8.5 A-1, incorporating as much data at high k values as
possible.
Operando XAS
Operando experiments were performed in a special glassy carbon tube reactor, and
the details of the custom operando XAS reactor setup were described by Kispersky
et al. [87]. During these experiments, XAS spectra were simultaneously collected
while measuring the reaction rates for each sample to ensure that the standard SCR
rate per mole Cu measured at APS were quantitatively the same, within error, to
that measured in laboratory dierential plug-ow reactors (PFR). Figure 7.27 shows
standard SCR reaction rates measured on a representative sample (Cu-CHA-19) in
the laboratory PFR and operando XAS reactor over a temperature range (450-480 K),
indicating that rates are reproduced in the two reactor setups to within 10%. Table
7.5 shows that standard SCR reaction rates for catalyst samples in the operando
reactor described above are within 10% of those measured in a separate plug ow
reactor, thus establishing kinetic equivalence of the two reactors.
In operando experiments, 7-13 mg of Cu-CHA-15, 30 mg of Cu-CHA-20, or 25
mg of Cu-CHA samples (sieved to 125-250 µm) were loaded in the operando reactor
to maintain dierential conditions (< 20% conversion). Gases were mixed and intro-
duced into the reactor in a precise manner to avoid any side reactions. De-ionized H2O
was introduced into the feed stream by owing He carrier gas through a heated shell
type humidier (Perma Pure MH-Series). All gas lines downstream of the humidier
were heated to above 373 K to prevent H2O condensation. After introducing H2O,
NO (300 ppm in N2, Matheson Tri-Gas) was introduced into the gas stream, followed
by the introduction of O2 (20% in He, Airgas, Inc.). The reaction mixture was then
preheated to 473 K. Ammonia (300 ppm in He, Airgas, Inc.) was introduced through
a 1/16" stainless steel line that was located immediately upstream of the catalyst
bed to minimize the possibility of gas-phase side reactions. Gas concentrations were
measured using a MKS Multi-Gas 2030 gas analyzer FTIR with a cell temperature
303
of 464 K and based on factory provided calibration les. Standard SCR conditions of
300 ppm NO, 300 ppm NH3, 10% O2, 2% H2O, 5% CO2, a total ow rate of 1000-1200
mL min-1 and a temperature of 463-473 K was used for all steady state experiments.
Steady state spectra were collected in the quick scan mode with an edge step of 0.5
eV, a dwell time of 0.05 s at each step and an energy range between 8700 and 9700
eV, with each spectrum taking 2-3 min to acquire. Steady state data were averaged
over 3-5 scans depending on the data quality obtained under dierent experimental
conditions. Linear combination XANES ts to determine the CuI and CuII frac-
tions under operando conditions were carried out using the appropriate references, as
explained in our previous publications [37,85,87].
Transient XAS
Transient O2 and NO2 oxidation experiments were carried out in the same ow
reactor setup as used for operando experiments. Reduction with 300 ppm NO and
300 ppm NH3 under a total ow of 1200 mL min-1 at approximately 447 K gave
90±5, 90±5 and 98±5 % CuI , for Cu-CHA-15, Cu-CHA-20, and Cu-CHA-29 samples,
respectively. Following the reduction to CuI , samples were exposed to either 10% O2
or 100 ppm NO2 at the same temperature in separate experiments. The CuI and
CuII fractions during these transient experiments were followed by collecting XANES
spectra (Figures 7.13-7.15) in quick scan mode from 8800 to 9400 eV. Each spectrum
took 21 s to acquire with a step size of 0.5 eV and a dwell time of 0.03 s. Higher
quality spectra were collected at the end of these transients by increasing the dwell
time from 0.03 s to 0.05 s. Linear combination XANES ts to determine the CuI and
CuII fractions from spectra collected during transient experiments were performed
using the same procedure to t spectra collected during operando XAS experiments.
The tted CuI fraction before and at the end of O2 and NO2 oxidation transients are
tabulated in Tables 7.6-7.8.
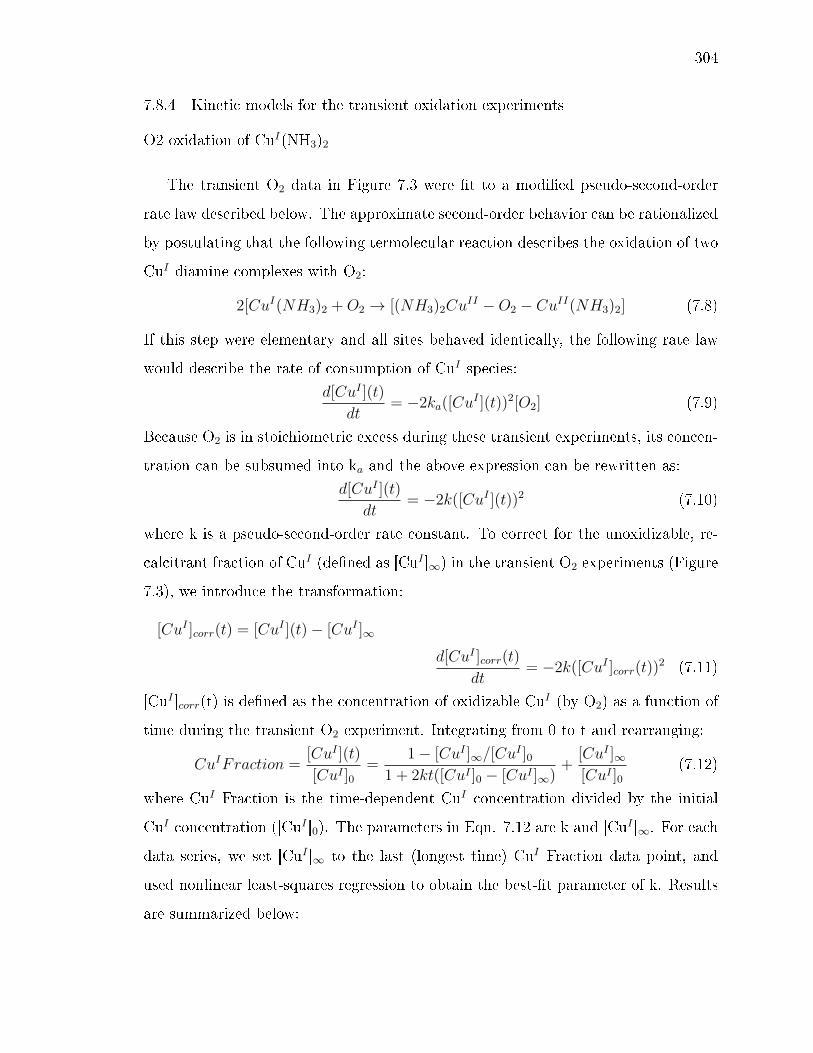
304
7.8.4 Kinetic models for the transient oxidation experiments
O2 oxidation of CuI(NH3)2
The transient O2 data in Figure 7.3 were t to a modied pseudo-second-order
rate law described below. The approximate second-order behavior can be rationalized
by postulating that the following termolecular reaction describes the oxidation of two
CuI diamine complexes with O2:
2[CuI(NH3)2 +O2 → [(NH3)2CuII −O2 − CuII(NH3)2] (7.8)
If this step were elementary and all sites behaved identically, the following rate law
would describe the rate of consumption of CuI species:
d[CuI ](t)
dt= −2ka([Cu
I ](t))2[O2] (7.9)
Because O2 is in stoichiometric excess during these transient experiments, its concen-
tration can be subsumed into ka and the above expression can be rewritten as:
d[CuI ](t)
dt= −2k([CuI ](t))2 (7.10)
where k is a pseudo-second-order rate constant. To correct for the unoxidizable, re-
calcitrant fraction of CuI (dened as [CuI ]∞) in the transient O2 experiments (Figure
7.3), we introduce the transformation:
[CuI ]corr(t) = [CuI ](t)− [CuI ]∞
d[CuI ]corr(t)
dt= −2k([CuI ]corr(t))
2 (7.11)
[CuI ]corr(t) is dened as the concentration of oxidizable CuI (by O2) as a function of
time during the transient O2 experiment. Integrating from 0 to t and rearranging:
CuIFraction =[CuI ](t)
[CuI ]0=
1− [CuI ]∞/[CuI ]0
1 + 2kt([CuI ]0 − [CuI ]∞)+
[CuI ]∞[CuI ]0
(7.12)
where CuI Fraction is the time-dependent CuI concentration divided by the initial
CuI concentration ([CuI ]0). The parameters in Eqn. 7.12 are k and [CuI ]∞. For each
data series, we set [CuI ]∞ to the last (longest time) CuI Fraction data point, and
used nonlinear least-squares regression to obtain the best-t parameter of k. Results
are summarized below:
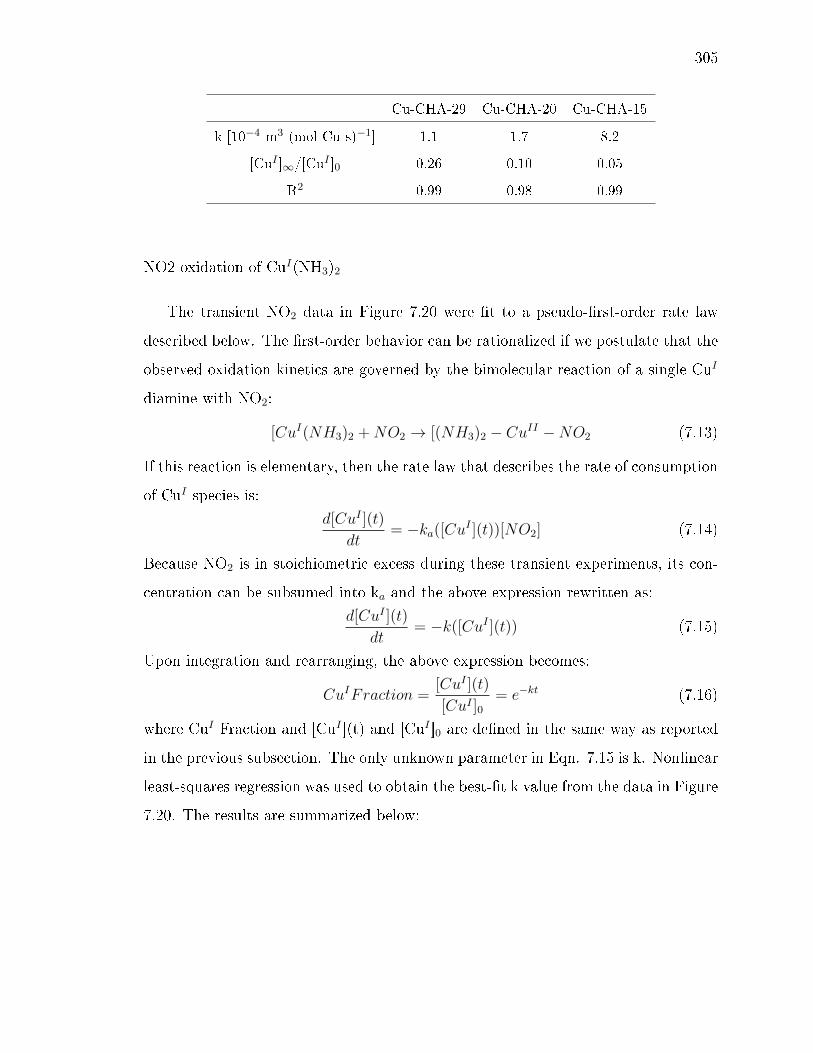
305
Cu-CHA-29 Cu-CHA-20 Cu-CHA-15
k [10−4 m3 (mol Cu s)−1] 1.1 1.7 8.2
[CuI ]∞/[CuI ]0 0.26 0.10 0.05
R2 0.99 0.98 0.99
NO2 oxidation of CuI(NH3)2
The transient NO2 data in Figure 7.20 were t to a pseudo-rst-order rate law
described below. The rst-order behavior can be rationalized if we postulate that the
observed oxidation kinetics are governed by the bimolecular reaction of a single CuI
diamine with NO2:
[CuI(NH3)2 +NO2 → [(NH3)2 − CuII −NO2 (7.13)
If this reaction is elementary, then the rate law that describes the rate of consumption
of CuI species is:
d[CuI ](t)
dt= −ka([CuI ](t))[NO2] (7.14)
Because NO2 is in stoichiometric excess during these transient experiments, its con-
centration can be subsumed into ka and the above expression rewritten as:
d[CuI ](t)
dt= −k([CuI ](t)) (7.15)
Upon integration and rearranging, the above expression becomes:
CuIFraction =[CuI ](t)
[CuI ]0= e−kt (7.16)
where CuI Fraction and [CuI ](t) and [CuI ]0 are dened in the same way as reported
in the previous subsection. The only unknown parameter in Eqn. 7.15 is k. Nonlinear
least-squares regression was used to obtain the best-t k value from the data in Figure
7.20. The results are summarized below:
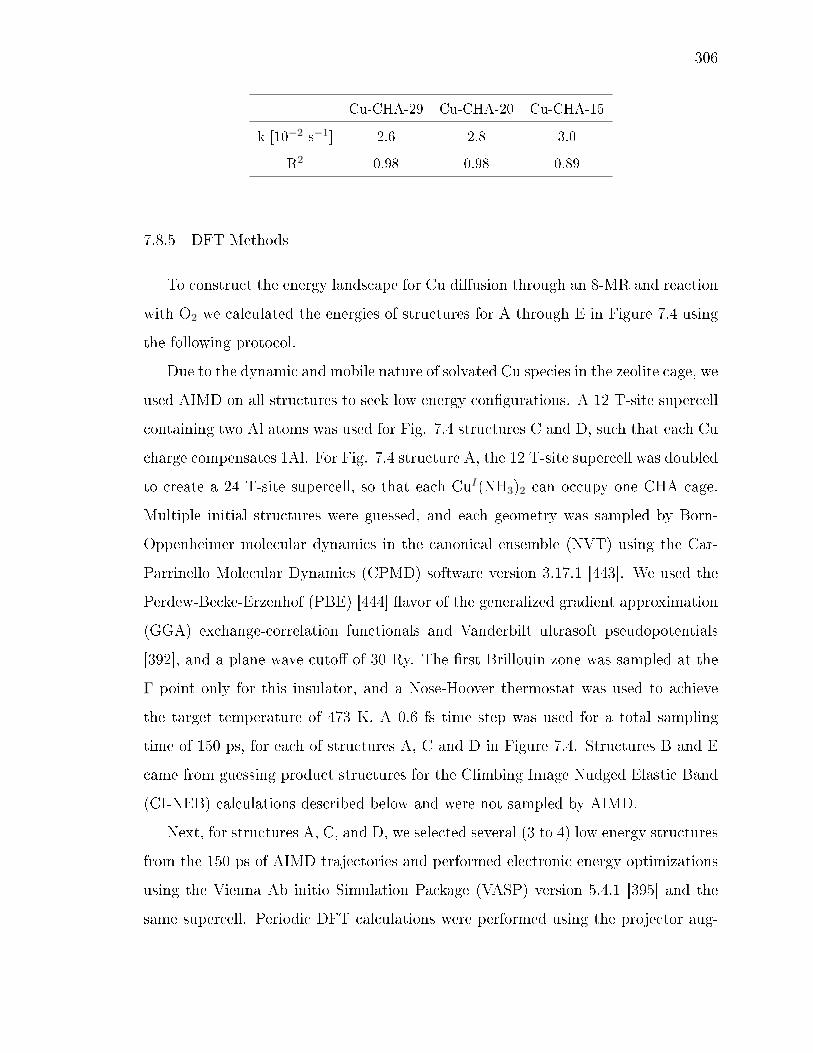
306
Cu-CHA-29 Cu-CHA-20 Cu-CHA-15
k [10−2 s−1] 2.6 2.8 3.0
R2 0.98 0.98 0.89
7.8.5 DFT Methods
To construct the energy landscape for Cu diusion through an 8-MR and reaction
with O2 we calculated the energies of structures for A through E in Figure 7.4 using
the following protocol.
Due to the dynamic and mobile nature of solvated Cu species in the zeolite cage, we
used AIMD on all structures to seek low energy congurations. A 12 T-site supercell
containing two Al atoms was used for Fig. 7.4 structures C and D, such that each Cu
charge compensates 1Al. For Fig. 7.4 structure A, the 12 T-site supercell was doubled
to create a 24 T-site supercell, so that each CuI(NH3)2 can occupy one CHA cage.
Multiple initial structures were guessed, and each geometry was sampled by Born-
Oppenheimer molecular dynamics in the canonical ensemble (NVT) using the Car-
Parrinello Molecular Dynamics (CPMD) software version 3.17.1 [443]. We used the
Perdew-Becke-Erzenhof (PBE) [444] avor of the generalized gradient approximation
(GGA) exchange-correlation functionals and Vanderbilt ultrasoft pseudopotentials
[392], and a plane wave cuto of 30 Ry. The rst Brillouin zone was sampled at the
Γ point only for this insulator, and a Nose-Hoover thermostat was used to achieve
the target temperature of 473 K. A 0.6 fs time step was used for a total sampling
time of 150 ps, for each of structures A, C and D in Figure 7.4. Structures B and E
came from guessing product structures for the Climbing Image Nudged Elastic Band
(CI-NEB) calculations described below and were not sampled by AIMD.
Next, for structures A, C, and D, we selected several (3 to 4) low energy structures
from the 150 ps of AIMD trajectories and performed electronic energy optimizations
using the Vienna Ab initio Simulation Package (VASP) version 5.4.1 [395] and the
same supercell. Periodic DFT calculations were performed using the projector aug-
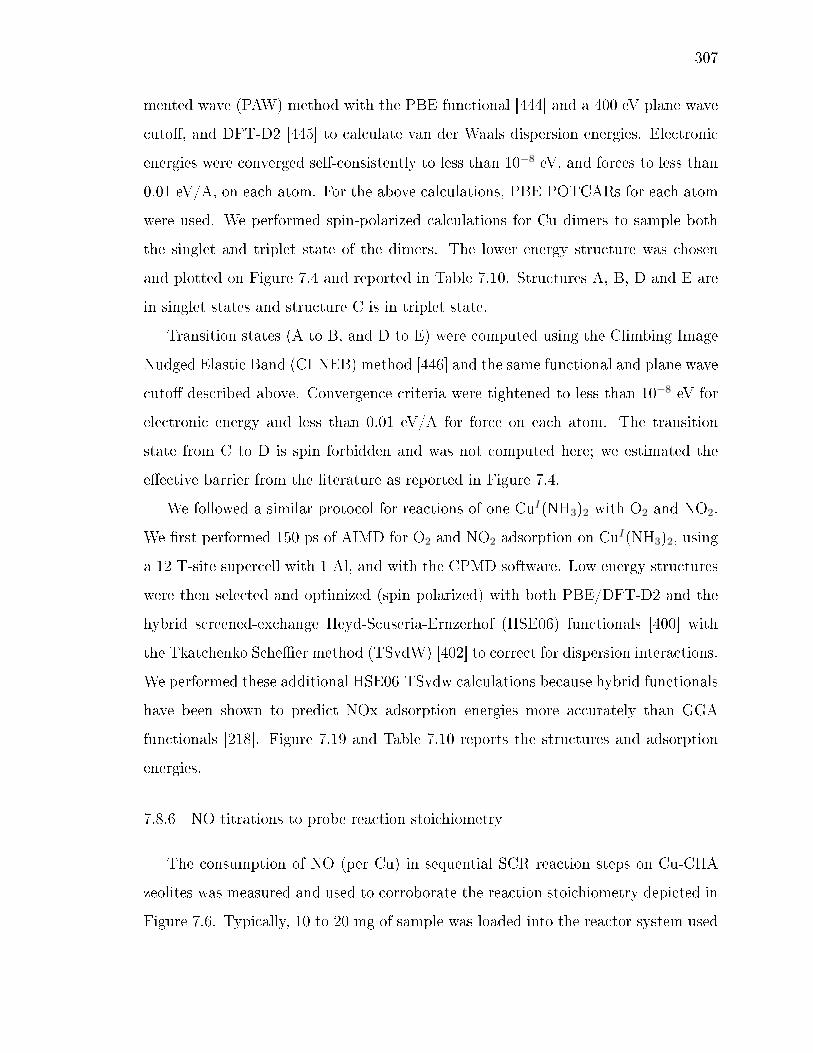
307
mented wave (PAW) method with the PBE functional [444] and a 400 eV plane wave
cuto, and DFT-D2 [445] to calculate van der Waals dispersion energies. Electronic
energies were converged self-consistently to less than 10−8 eV, and forces to less than
0.01 eV/A, on each atom. For the above calculations, PBE POTCARs for each atom
were used. We performed spin-polarized calculations for Cu dimers to sample both
the singlet and triplet state of the dimers. The lower energy structure was chosen
and plotted on Figure 7.4 and reported in Table 7.10. Structures A, B, D and E are
in singlet states and structure C is in triplet state.
Transition states (A to B, and D to E) were computed using the Climbing Image
Nudged Elastic Band (CI-NEB) method [446] and the same functional and plane wave
cuto described above. Convergence criteria were tightened to less than 10−8 eV for
electronic energy and less than 0.01 eV/A for force on each atom. The transition
state from C to D is spin forbidden and was not computed here; we estimated the
eective barrier from the literature as reported in Figure 7.4.
We followed a similar protocol for reactions of one CuI(NH3)2 with O2 and NO2.
We rst performed 150 ps of AIMD for O2 and NO2 adsorption on CuI(NH3)2, using
a 12 T-site supercell with 1 Al, and with the CPMD software. Low energy structures
were then selected and optimized (spin polarized) with both PBE/DFT-D2 and the
hybrid screened-exchange Heyd-Scuseria-Ernzerhof (HSE06) functionals [400] with
the Tkatchenko Scheer method (TSvdW) [402] to correct for dispersion interactions.
We performed these additional HSE06-TSvdw calculations because hybrid functionals
have been shown to predict NOx adsorption energies more accurately than GGA
functionals [218]. Figure 7.19 and Table 7.10 reports the structures and adsorption
energies.
7.8.6 NO titrations to probe reaction stoichiometry
The consumption of NO (per Cu) in sequential SCR reaction steps on Cu-CHA
zeolites was measured and used to corroborate the reaction stoichiometry depicted in
Figure 7.6. Typically, 10 to 20 mg of sample was loaded into the reactor system used

308
to measure steady-state SCR kinetics. The total gas ow rate used in the following
procedure was 600 mL min-1. The samples in Figure 7.3 were rst oxidized and
dehydrated to their CuII form [79] by treatment to 823 K (0.167 K s-1) in owing
20% O2 (99.5%, Indiana Oxygen) in balance He (99.999%, Indiana Oxygen), and
then cooling to 473 K. The sample was then held owing He for 30 minutes, and
then fully reduced in a mixture of 300 ppm NO (3.5% NO in Ar, Praxair) and 300
ppm NH3 (3.0% NH3 in Ar, Praxair) in balance He. Following reduction of Cu sites
to their CuI(NH3)2 states (corresponding to 6 o'clock positions in Figure 7.6), the
samples were exposed to owing 10% O2 in balance He until steady-state was achieved
(corresponding to the central position in Figure 7.6). The O2 oxidized sample was
then held in a owing stream of 300 ppm of NO in balance He, until steady-state was
achieved. Finally, 300 ppm NH3 was introduced to the ow of NO in balance He, to
reduce the sample back to CuI(NH3)2 (corresponding to 6 o'clock positions in Figure
7.6). Each of these sequential treatments was also performed in a blank reactor to
measure a baseline signal in the FTIR spectrometer (MKS Multigas TM 2030) used
to account for gas holdup and residence time in the reactor setup (NO conversion was
not detected in the blank reactor), in order to calculate the NO consumption from
the Cu-CHA catalyst during each treatment step (Figure 7.19).
Summarizing, after O2 oxidation of CuI(NH3)2 to form a NH3-solvated CuII dimer
(central position in Figure 7.6), the two-step procedure described above exposes the
catalyst to NO alone, and then to NO and NH3 together. Exposure of NO in the step
immediately following O2-assisted oxidation results in the consumption of one NO
equivalent (NO:Cu = 0.98 ± 0.10) per Cu site. Once steady-state is achieved, the
sequential addition of NH3 to the owing stream (already containing NO) consumes
another equivalent of NO per Cu site (NO:Cu = 1.07 ± 0.11) and fully reduces the
sample to CuI(NH3)2 (6 o'clock positions in Figure 7.6), which closes the catalytic
cycle. The 2:1 NO:Cu consumption ratio is consistent with Figure 7.6. Starting
from the Cu-oxo dimer in the center of the Figure 7.6, two NO molecules per Cu
309
are required to return to the 6 o'clock position in each cycle corresponding to the
formation of CuI(NH3)2 species.
7.8.7 Random Distribution of Cu per Cage
To eliminate the possibility that the oxidizable fraction of CuI corresponds to Cu
pairs or larger aggregates that, by random chance, are present in the same cage and
not from pairs formed from mobile CuI ions, we estimated the fraction of persistent
pairs that would be present assuming that Cu are randomly distributed among cages.
Results are compared with the observed fraction of oxidizable CuI in Figure 7.22. For
Cu densities corresponding to the zeolites studied in Figure 7.3, this immobile Cu
dimer model predicts values that are much smaller than the [CuI ]∞ values observed
experimentally and predicted from the non-mean-eld model described in 7.8.10:
Cu− CHA− 15 : OxidizableCuFraction = 0.072; [CuI ]∞/[CuI ]0 = 0.928
Cu− CHA− 20 : OxidizableCuFraction = 0.012; [CuI ]∞/[CuI ]0 = 0.988
Cu− CHA− 29 : OxidizableCuFraction = 0.002; [CuI ]∞/[CuI ]0 = 0.998 (7.17)
7.8.8 Metadynamics
We used metadynamics to compute the free energy landscape for a CuI(NH3)2 to
diuse away from a charge-compensating Al center into an adjacent cage. To avoid
interaction between periodic cells, a CHA supercell with 72 T-sites was adopted.
The 72-T-site supercell (pictured below) was generated by propagating the 36 T-site
CHA-silica supercell obtained from the database of zeolite structures [1] along one
direction. A T-site silicon is replaced by aluminum and a CuI(NH3)2 complex was
inserted into a cage near the Al to create the initial CuI(NH3)2 structure.
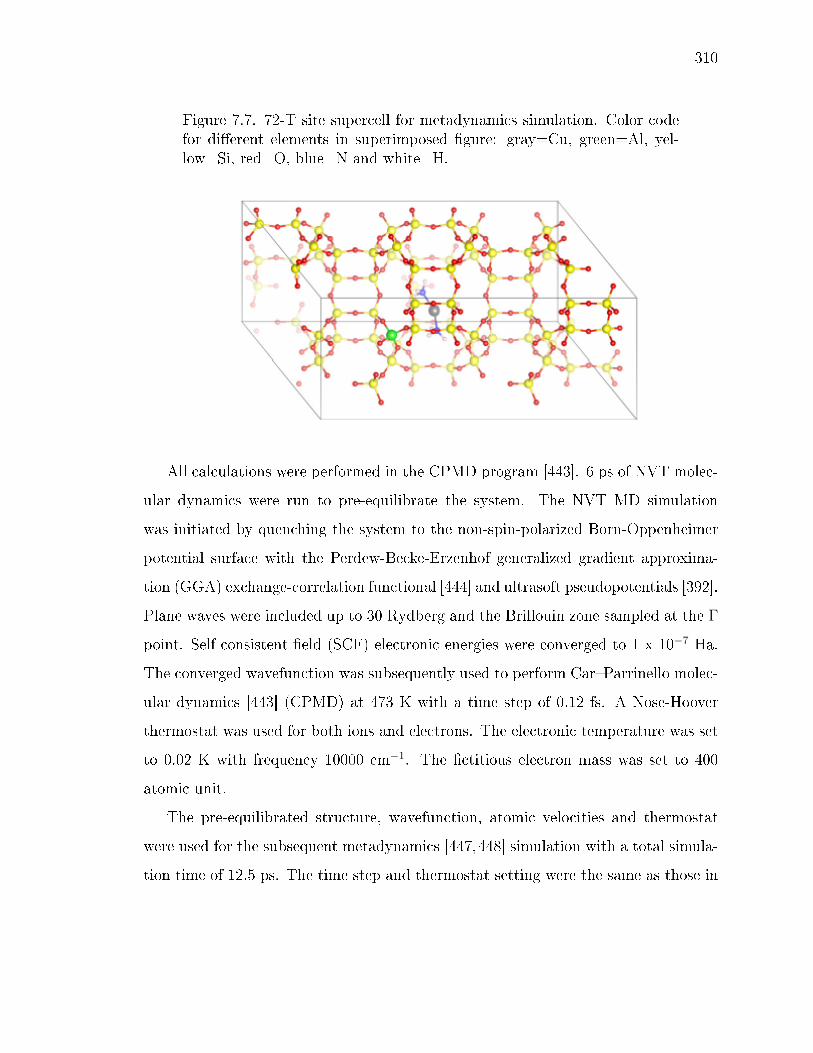
310
Figure 7.7. 72-T site supercell for metadynamics simulation. Color codefor dierent elements in superimposed gure: gray=Cu, green=Al, yel-low=Si, red=O, blue=N and white=H.
All calculations were performed in the CPMD program [443]. 6 ps of NVT molec-
ular dynamics were run to pre-equilibrate the system. The NVT MD simulation
was initiated by quenching the system to the non-spin-polarized Born-Oppenheimer
potential surface with the Perdew-Becke-Erzenhof generalized gradient approxima-
tion (GGA) exchange-correlation functional [444] and ultrasoft pseudopotentials [392].
Plane waves were included up to 30 Rydberg and the Brillouin zone sampled at the Γ
point. Self-consistent-eld (SCF) electronic energies were converged to 1 x 10⁻⁷ Ha.
The converged wavefunction was subsequently used to perform CarParrinello molec-
ular dynamics [443] (CPMD) at 473 K with a time step of 0.12 fs. A Nose-Hoover
thermostat was used for both ions and electrons. The electronic temperature was set
to 0.02 K with frequency 10000 cm−1. The ctitious electron mass was set to 400
atomic unit.
The pre-equilibrated structure, wavefunction, atomic velocities and thermostat
were used for the subsequent metadynamics [447,448] simulation with a total simula-
tion time of 12.5 ps. The time step and thermostat setting were the same as those in

311
the MD simulation. The collective variable was chosen to be the Cu-Al coordination
number (CN), dened as:
CN =1− (
dijd0
)p
1− (dijd0
)p+q(7.18)
where dij is dened as distance between Al and Cu and p and q are arbitrary scaling
constants. Values of other parameters are summarized in Table 7.11. d0 was chosen
as largest Cu-Al separation distance observed in the regular NVT MD simulation at
473 K. The k and µ were chosen such that the Lagrangian collective variable s and
the physical collective variable S stay close, and that S uctuates frequently at each
position in the conguration space.
7.8.9 Electrostatics
We estimated the electrostatic interaction between a CuI ion and its charge-
compensating Al center using Coulomb's Law. We assumed Cu and Al to be ele-
mentary positive and negative point charges, respectively, carrying the same electric
charge as a proton, 1.6 x 10⁻¹⁹ C, and we used the computed dielectric constant of
CHA-zeolite (εr), 2.7, reported by Rybicki and Sauer [449]. The equilibrium Cu-Al
distance of 4.6 A taken from the DFT-optimized CuI(NH3)2 structure was used as
the initial Cu-Al distance in the calculation. The energy of ionic separation of CuI
and framework Al from 4.6 A to r was calculated following Coulomb's law:
F =keqCuqAlεrr2
(7.19)
∆E = Na
∫ r
4.6A
Fdr∗ (7.20)
where ke is the electric force constant in vacuum, Na is the Avogadro constant, εr is
dielectric constant of CHA-zeolite, qCu and qAl are Cu and Al charges, and r is the
Cu-Al distance.
The computed Coulombic potential as a function of Cu-Al distance was plotted
and compared with the metadynamics-computed free energy prole in Figure 7.5. The
Coulombic potential and the computed free energy are similar up to 7 A, consistent
312
with electrostatics dominating the interaction. The computed free energy is slightly
more positive than the Coulombic potential for Cu-Al distance between 7 A and 8
A, highlighting the activation barrier for CuI(NH3)2 to travel through an 8-member-
ring window to a neighboring CHA cage, which is not captured by the Coulombic
model. The computed free energy falls after CuI(NH3)2 reaches the new cage and
stays relatively invariant thereafter. The Coulombic potential continues to increase
rapidly and surpasses the computed free energy above 8 A. Such dierence can be
rationalized by many-body long range Coulombic interaction between CuI(NH3)2 and
framework Al in periodic images in the metadynamics simulation, which intrinsically
lower the computed free energy compared to a two-point-charge Couloumbic model.
7.8.10 Stochastic Simulation
Here, we estimate the fraction of CuI able to form an oxo-bridged dimer (Figure
7.4), given a density of Cu and Al atoms in a CHA zeolite and a maximum distance
that each Cu can diuse from its charge compensating Al. Cu number densities
between 7x10⁻⁴ and 0.99 Cu/1000 A3 and Cu-Al diusion distances (represented by
the green spheres in Figure 7.3) from 5-12.5 A were modeled (Figure 7.23); procedural
details are described below.
We use a 1536 T-site CHA periodic supercell [1] with a total volume of 1.0172x10⁵
A3. The large cell size was used to avoid bias due to an even or odd number of
exchanged Cu present at smaller cell sizes and long Cu diusion distances. We per-
formed stochastic simulations as a function of Si/Al (spanning 2 to 511), Cu/Al
(0.0059 to 1), and a maximum Cu diusion distance of 12.5 A from the compensating
framework Al atom.
A 2D schematic representation of the simulation scheme is shown below; the
actual simulation was carried out on the 3D CHA lattice described above. In step
[1], CHA T-sites were randomly populated with Al avoiding any Al-Al rst-nearest-
neighbors (Loewenstein's rule) [235]. In step [2], we associated Cu ions with these
Al, obeying the previously validated rule [79] that 2Al 6MR sites rst exchange CuII
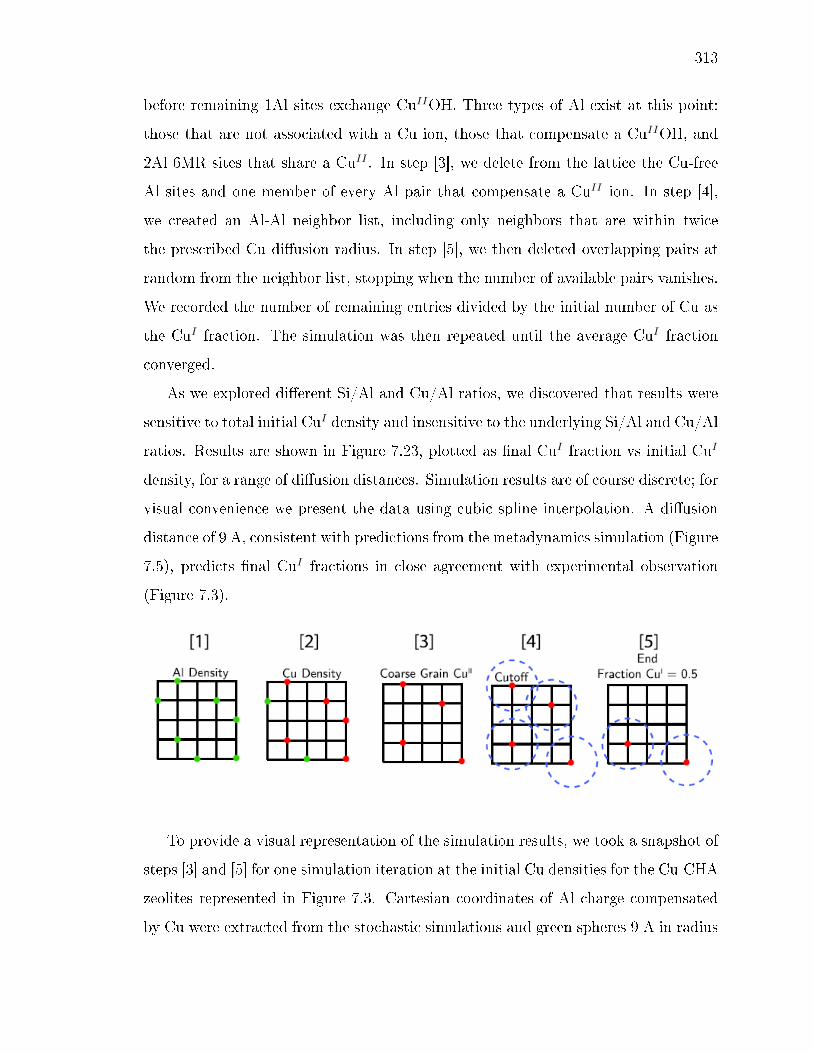
313
before remaining 1Al sites exchange CuIIOH. Three types of Al exist at this point:
those that are not associated with a Cu ion, those that compensate a CuIIOH, and
2Al 6MR sites that share a CuII . In step [3], we delete from the lattice the Cu-free
Al sites and one member of every Al pair that compensate a CuII ion. In step [4],
we created an Al-Al neighbor list, including only neighbors that are within twice
the prescribed Cu diusion radius. In step [5], we then deleted overlapping pairs at
random from the neighbor list, stopping when the number of available pairs vanishes.
We recorded the number of remaining entries divided by the initial number of Cu as
the CuI fraction. The simulation was then repeated until the average CuI fraction
converged.
As we explored dierent Si/Al and Cu/Al ratios, we discovered that results were
sensitive to total initial CuI density and insensitive to the underlying Si/Al and Cu/Al
ratios. Results are shown in Figure 7.23, plotted as nal CuI fraction vs initial CuI
density, for a range of diusion distances. Simulation results are of course discrete; for
visual convenience we present the data using cubic spline interpolation. A diusion
distance of 9 A, consistent with predictions from the metadynamics simulation (Figure
7.5), predicts nal CuI fractions in close agreement with experimental observation
(Figure 7.3).
To provide a visual representation of the simulation results, we took a snapshot of
steps [3] and [5] for one simulation iteration at the initial Cu densities for the Cu-CHA
zeolites represented in Figure 7.3. Cartesian coordinates of Al charge compensated
by Cu were extracted from the stochastic simulations and green spheres 9 A in radius
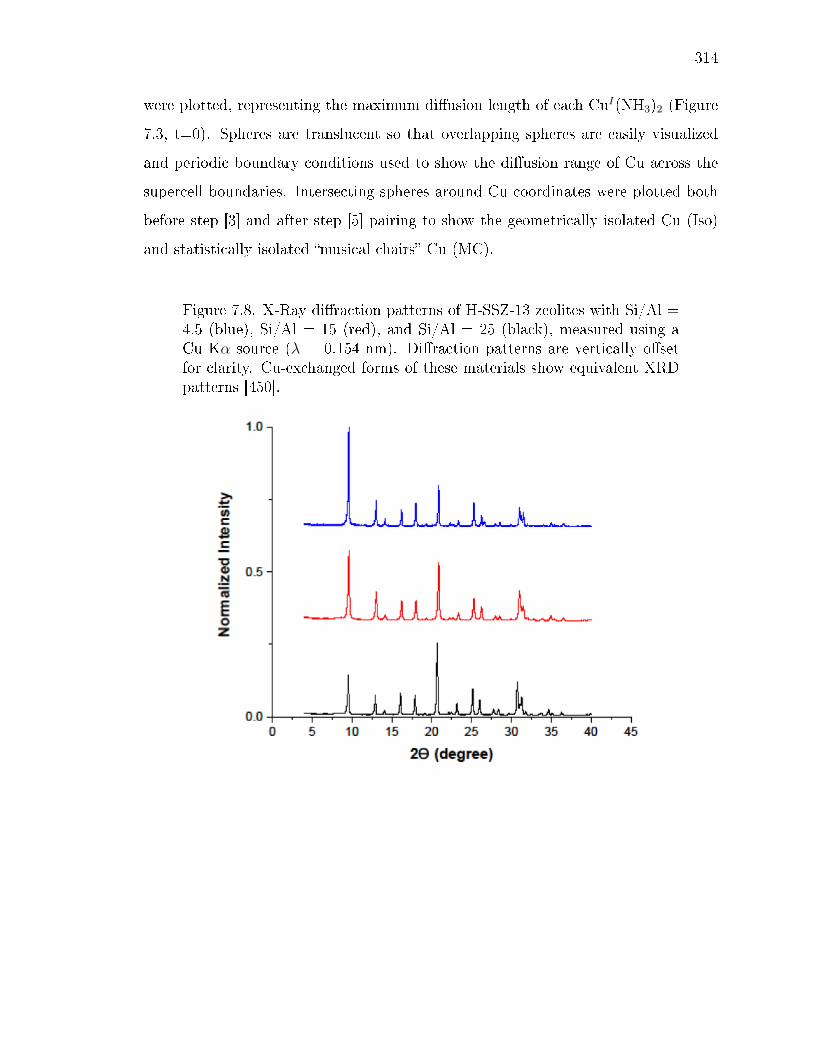
314
were plotted, representing the maximum diusion length of each CuI(NH3)2 (Figure
7.3, t=0). Spheres are translucent so that overlapping spheres are easily visualized
and periodic boundary conditions used to show the diusion range of Cu across the
supercell boundaries. Intersecting spheres around Cu coordinates were plotted both
before step [3] and after step [5] pairing to show the geometrically isolated Cu (Iso)
and statistically isolated musical chairs Cu (MC).
Figure 7.8. X-Ray diraction patterns of H-SSZ-13 zeolites with Si/Al =4.5 (blue), Si/Al = 15 (red), and Si/Al = 25 (black), measured using aCu Kα source (λ = 0.154 nm). Diraction patterns are vertically osetfor clarity. Cu-exchanged forms of these materials show equivalent XRDpatterns [450].
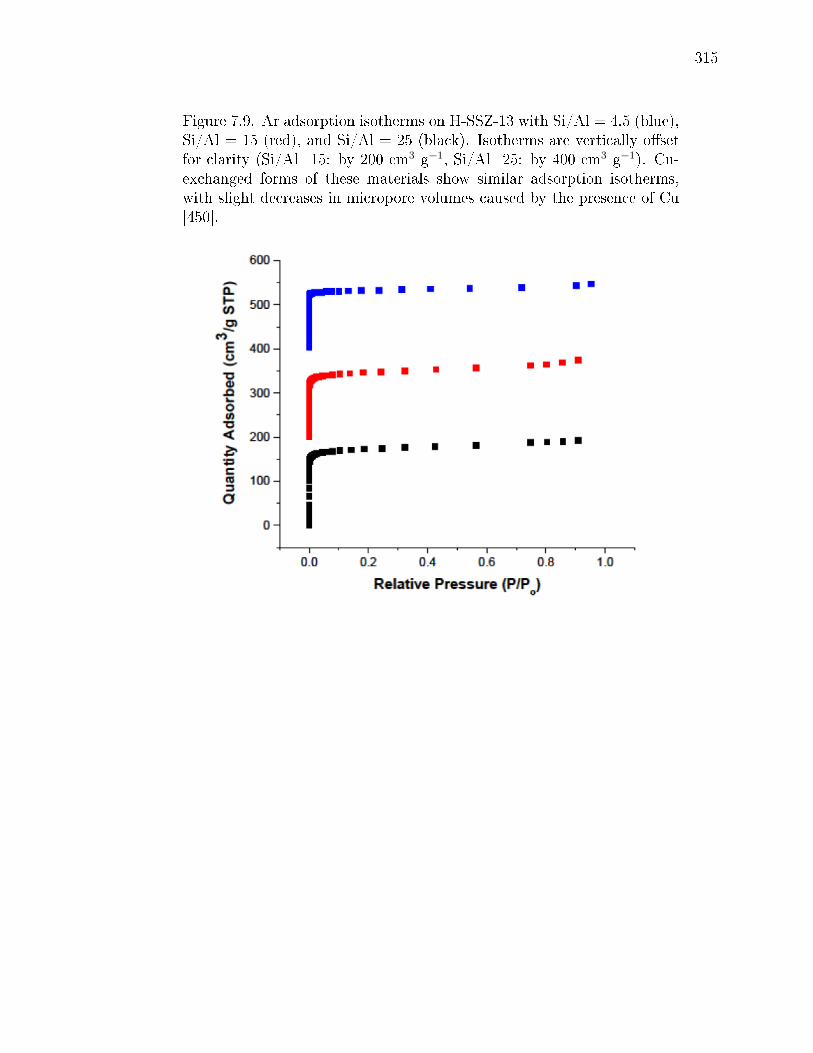
315
Figure 7.9. Ar adsorption isotherms on H-SSZ-13 with Si/Al = 4.5 (blue),Si/Al = 15 (red), and Si/Al = 25 (black). Isotherms are vertically osetfor clarity (Si/Al=15: by 200 cm3 g−1, Si/Al=25: by 400 cm3 g−1). Cu-exchanged forms of these materials show similar adsorption isotherms,with slight decreases in micropore volumes caused by the presence of Cu[450].

316
Figure 7.10. XANES spectra for Cu-CHA-20 (red) and Cu-CHA-29(green) at ambient conditions, and for bulk CuIIO (pink).

317
Figure 7.11. UV-Vis spectra for Cu-CHA-15 (blue), Cu-CHA-20 (black),and Cu-CHA-29 samples (red) recorded at ambient conditions.
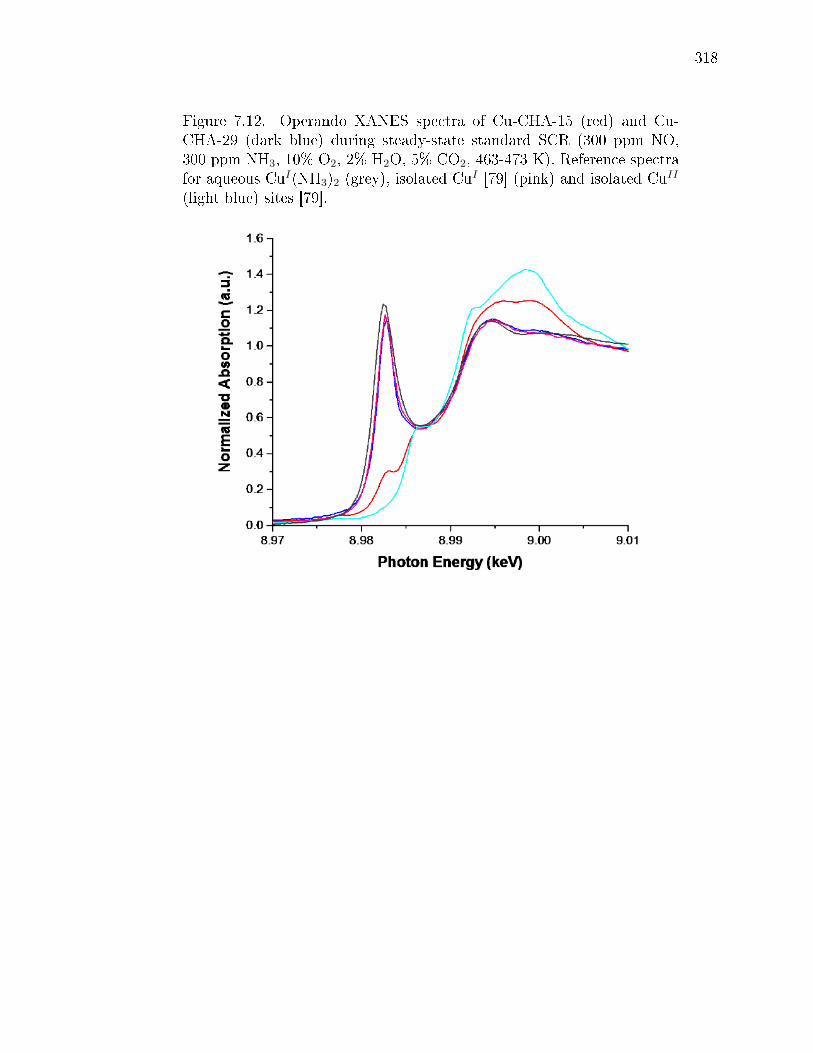
318
Figure 7.12. Operando XANES spectra of Cu-CHA-15 (red) and Cu-CHA-29 (dark blue) during steady-state standard SCR (300 ppm NO,300 ppm NH3, 10% O2, 2% H2O, 5% CO2, 463-473 K). Reference spectrafor aqueous CuI(NH3)2 (grey), isolated CuI [79] (pink) and isolated CuII
(light blue) sites [79].

319
Figure 7.13. XANES spectra collected during transient oxidation of thereduced forms of Cu-CHA-29 sample with 10% O2 (top) and 100 ppmNO2 (bottom), as a function of time (labeled in gure).
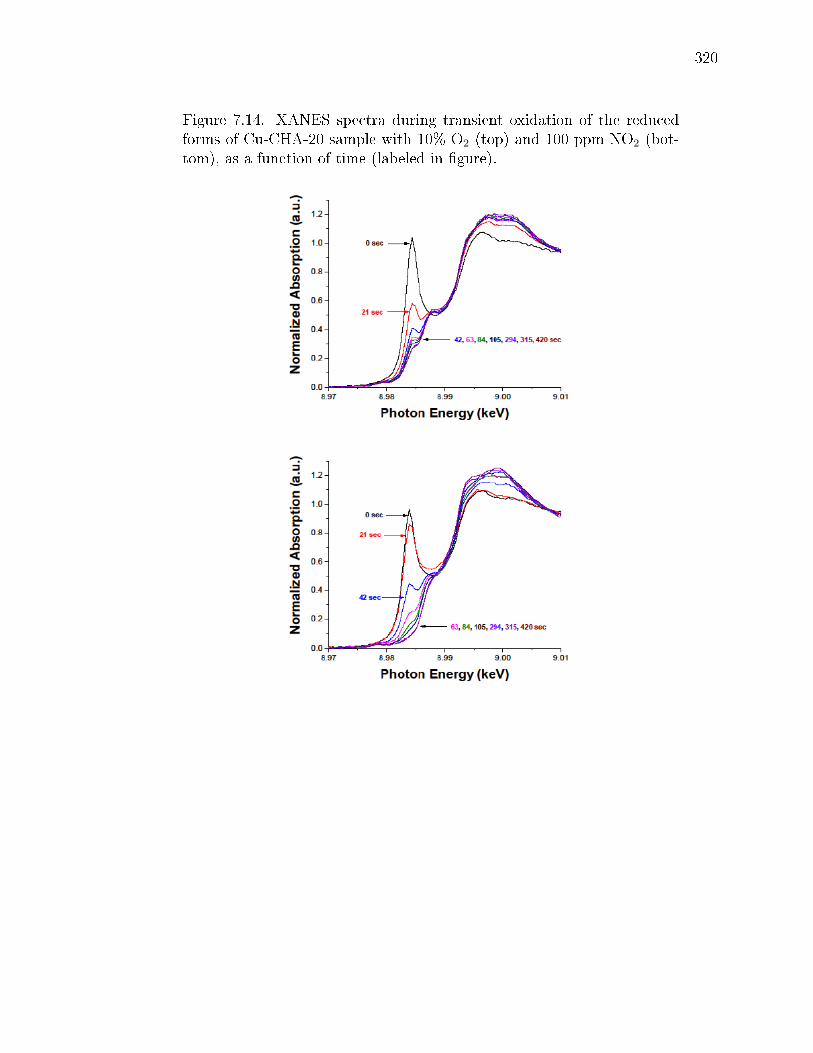
320
Figure 7.14. XANES spectra during transient oxidation of the reducedforms of Cu-CHA-20 sample with 10% O2 (top) and 100 ppm NO2 (bot-tom), as a function of time (labeled in gure).

321
Figure 7.15. XANES spectra during transient oxidation of the reducedforms of Cu-CHA-15 sample with 10% O2 (top) and 100 ppm NO2 (bot-tom), as a function of time (labeled in gure).
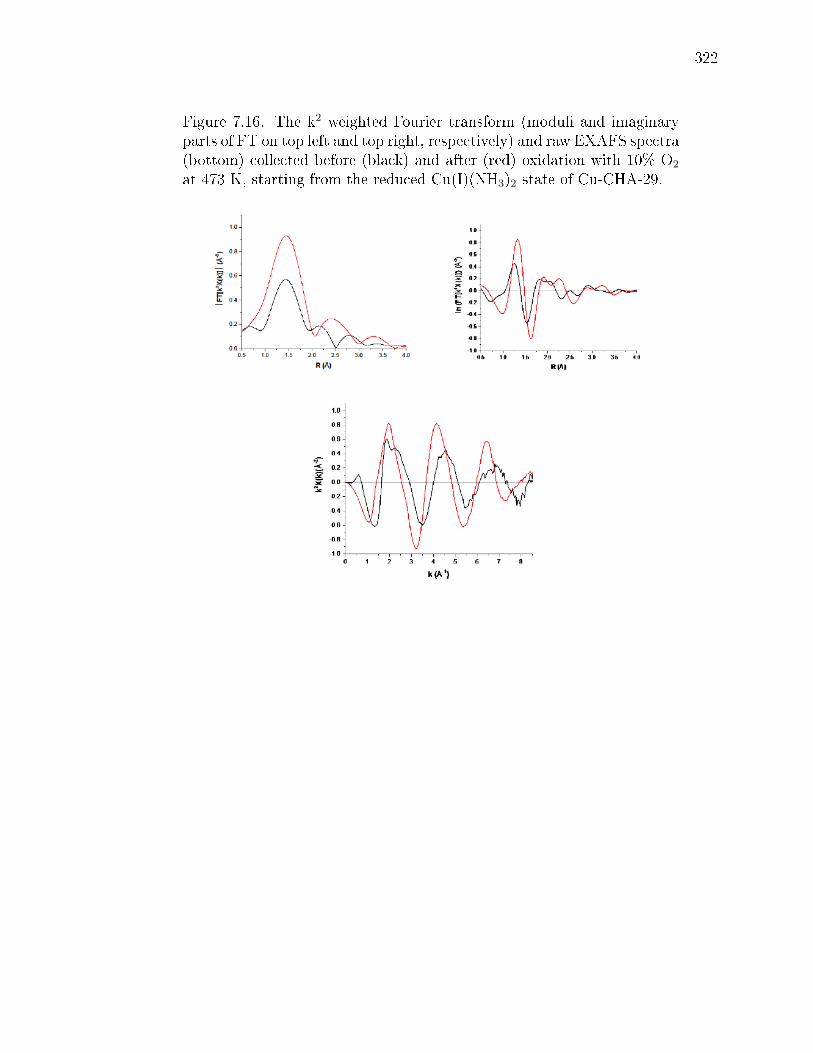
322
Figure 7.16. The k2 weighted Fourier transform (moduli and imaginaryparts of FT on top left and top right, respectively) and raw EXAFS spectra(bottom) collected before (black) and after (red) oxidation with 10% O2
at 473 K, starting from the reduced Cu(I)(NH3)2 state of Cu-CHA-29.
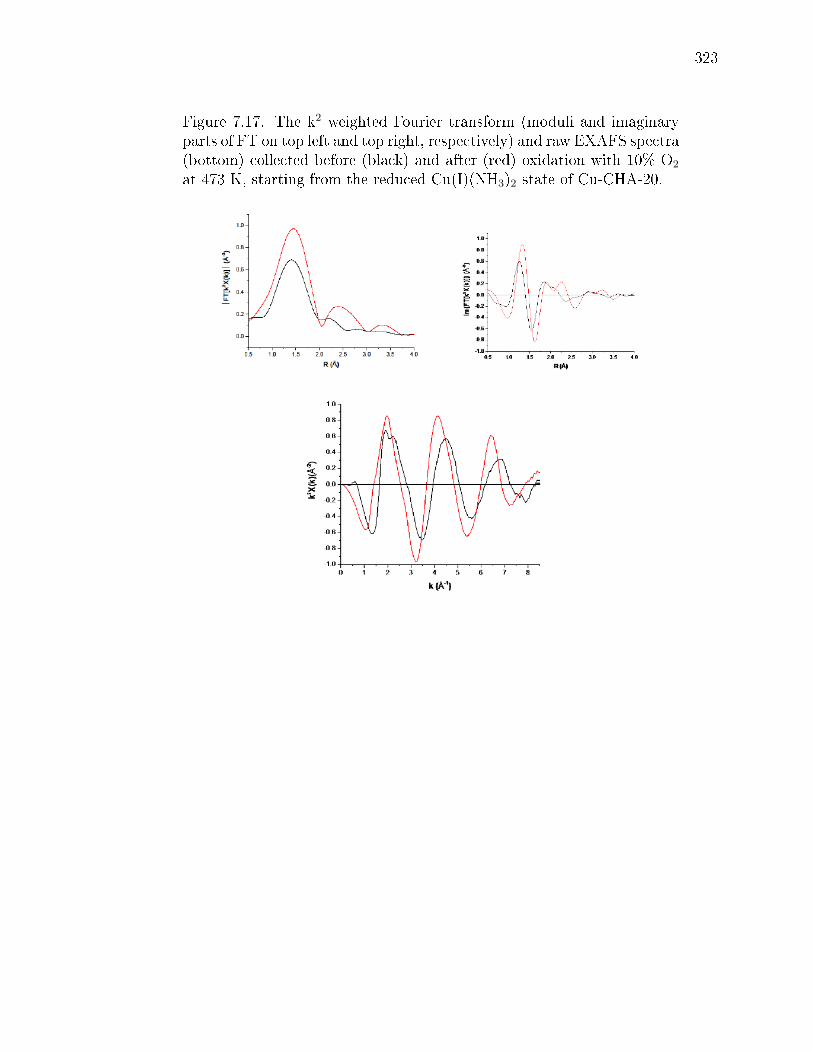
323
Figure 7.17. The k2 weighted Fourier transform (moduli and imaginaryparts of FT on top left and top right, respectively) and raw EXAFS spectra(bottom) collected before (black) and after (red) oxidation with 10% O2
at 473 K, starting from the reduced Cu(I)(NH3)2 state of Cu-CHA-20.

324
Figure 7.18. The k2 weighted Fourier transform (moduli and imaginaryparts of FT on top left and top right, respectively) and raw EXAFS spectra(bottom) collected before (black) and after (red) oxidation with 10% O2
at 473 K, starting from the reduced Cu(I)(NH3)2 state of Cu-CHA-15.
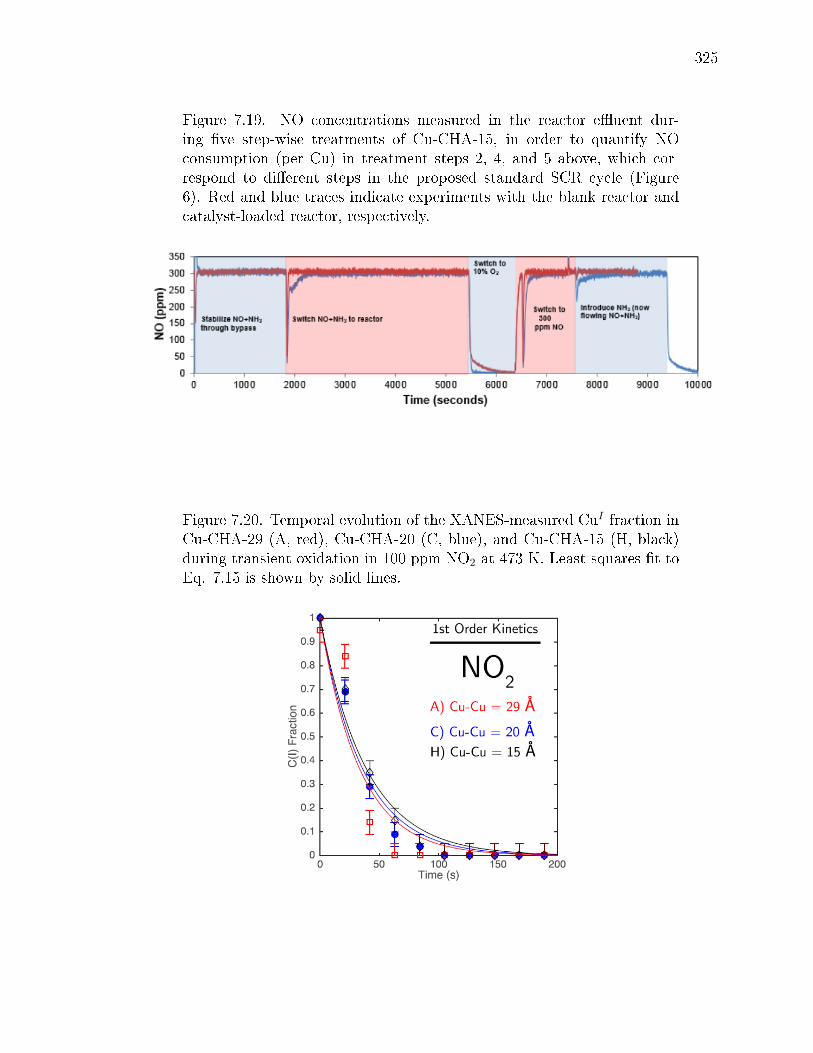
325
Figure 7.19. NO concentrations measured in the reactor euent dur-ing ve step-wise treatments of Cu-CHA-15, in order to quantify NOconsumption (per Cu) in treatment steps 2, 4, and 5 above, which cor-respond to dierent steps in the proposed standard SCR cycle (Figure6). Red and blue traces indicate experiments with the blank reactor andcatalyst-loaded reactor, respectively.
Figure 7.20. Temporal evolution of the XANES-measured CuI fraction inCu-CHA-29 (A, red), Cu-CHA-20 (C, blue), and Cu-CHA-15 (H, black)during transient oxidation in 100 ppm NO2 at 473 K. Least-squares t toEq. 7.15 is shown by solid lines.

326
Figure 7.21. Structures for O2 conguration (A), O2 conguration (B) andNO2 (C) adsorbed on a single CuI(NH3)2. Calculations were performedin the CHA supercell described in 7.8.5, and the framework removed fromthis gure for clarity.
Figure 7.22. The fraction of lone Cu within zeolite cages randomly dis-persed on the zeolite framework unable to oxidize compared with experi-mental measurements.

327
Figure 7.23. Fraction of unoxidizable CuI as a function of Cu densityfrom simulation. Splines were drawn through the discrete simulations ateach density to yield continuous curves in the gure. 9 A (bold red line)represents the metadynamics-predicted maximum Cu diusion distance.Black data points are experimental observations from Figure 7.3.
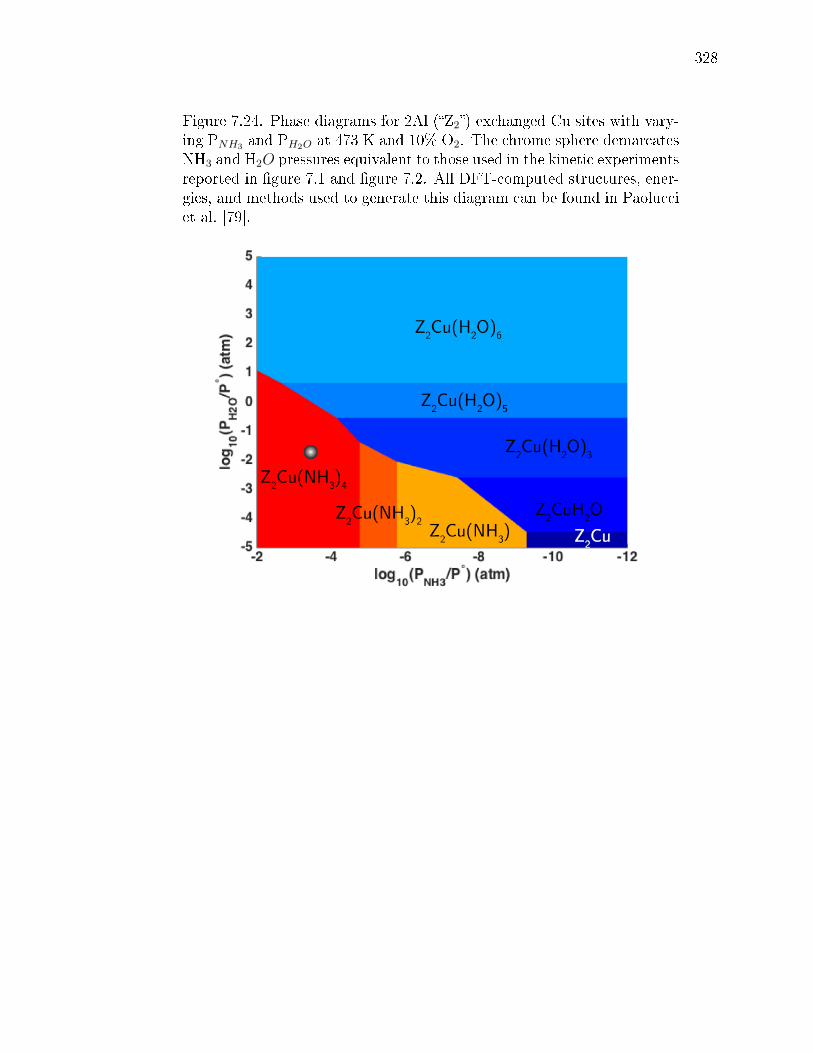
328
Figure 7.24. Phase diagrams for 2Al (Z2) exchanged Cu sites with vary-ing PNH3 and PH2O at 473 K and 10% O2. The chrome sphere demarcatesNH3 and H2O pressures equivalent to those used in the kinetic experimentsreported in gure 7.1 and gure 7.2. All DFT-computed structures, ener-gies, and methods used to generate this diagram can be found in Paolucciet al. [79].

329
Figure 7.25. Phase diagrams for 1Al (Z) exchanged Cu sites with vary-ing PNH3 and PH2O at 473 K and 10% O2. The chrome sphere demarcatesNH3 and H2O pressures equivalent to those used in the kinetic experimentsreported in gure 7.1 and gure 7.2. All DFT-computed structures, ener-gies, and methods used to generate this diagram can be found in Paolucciet al. [79].

330
Figure 7.26. Dependence of SCR turnover rates (300 ppm NO, 300 ppmNH3, 10% O2, 7% CO2, 200-120000 ppm H2O and balance N2 at 473 K)on H2O pressure on Cu-CHA-19. Line denotes regression of power ratelaw to measured rate data, with a best-t slope of 0.03, corresponding tothe apparent H2O reaction order.

331
Figure 7.27. Standard SCR rates (300 ppm NO, 300 ppm NH3, 10% O2,7% CO2, 3% H2O and balance N2) measured in the temperature range of450-480 K on Cu-CHA-19 in the laboratory dierential PFR (red squares)and in the operando XAS reactor (black triangle). Line denotes regressionof an Arrhenius rate equation to the lab PFR rate data.

332
Table 7.1.Bulk elemental analysis and fraction of isolated CuII and CuII(OH) siteson a series of Cu-exchanged SSZ-13 samples with varying Si/Al (4.5-25)and Cu/Al (0.03-0.59); arranged by increasing Cu/Al for a xed Si/Alratio.
Si/Al Cu/Al Cu wt% H+/Ala H+/Alb CuIIOHc/Al CuII/Alc
4.5 0.08 1.4 0.46 0.31 0 0.08
4.5 0.21 3.7 0.87 0.42 0 0.21
15 0.03 0.3 0.98 0.93 0 0.03
15 0.08 0.5 0.98 0.81 0 0.08
15 0.10 0.7 0.98 0.80 0.01 0.09
15 0.12 0.8 0.98 0.73 0.03 0.09
15 0.19 1.3 0.98 0.68 0.10 0.09
15 0.25 1.7 1.00 0.64 0.16 0.09
15 0.37 2.4 0.98 0.58 0.28 0.09
15 0.44 2.9 0.98 0.51 0.35 0.09
25 0.21 0.8 0.98 0.74 0.17 0.04
25 0.42 1.6 0.98 0.58 0.37 0.04
25 0.59 2.4 0.98 0.47 0.55 0.04
a H+/Al measured on the H-form zeolite.
b H+/Al measured on the Cu-exchanged zeolite.
c Determined from titration of residual H+ sites by NH3 and thermody-
namic preferences for CuII and CuIIOH siting [79].

333
Table7.2.
Aseries
ofCu-exchangedSS
Z-13samples
withvaryingSi/A
l(4.5-25)
andCu/Al(0.03-0.44)(X
=MeanCu-Cu
distance
inA,roun
deddown,
labels(a-h)correspond
tothosein
Figure7.2);arranged
byincreasing
Cu/Alfor
axed
Si/A
lratio.
CuCationDensity
MeanCu-CuDistance
Si/Al
Cu/A
l/mol
Cum−
3/Cuatom
s(103A
3)−
1Cuper
cage
/A
Cu-CHA-X
4.5
0.08
365
0.22
0.17
20.6
Cu-CHA-20(c)
4.5
0.21
958
0.57
0.44
15.0
Cu-CHA-15(h)
150.03
470.03
0.02
40.7
Cu-CHA-40
150.08
125
0.07
0.05
29.4
Cu-CHA-29(a)
150.10
157
0.09
0.07
27.2
Cu-CHA-27
150.12
188
0.11
0.08
25.6
Cu-CHA-25
150.19
298
0.18
0.14
22.0
Cu-CHA-22
150.25
395
0.23
0.18
20.1
Cu-CHA-20*
150.37
580
0.35
0.27
17.6
Cu-CHA-17(f)
150.44
689
0.41
0.31
16.6
Cu-CHA-16(g)
250.21
193
0.11
0.08
25.4
Cu-CHA-25(b)
250.42
395
0.24
0.18
19.8
Cu-CHA-19(d)
250.59
569
0.34
0.26
17.7
Cu-CHA-17*(e)
*Identies
thehigher
Si/Aldensity
sampleof
twosamplesthat
sharethesamemean(rounded
dow
n)Cu-Cudistance.

334
Table7.3.
Standard
SCR
kineticparametersmeasuredon
aseries
ofCu-exchangedSS
Z-13samples
withSi/A
l=
15and
Cu/Alvaryingfrom
0.03-0.44;
arranged
byincreasing
Cu/Al.(X
=MeanCu-Cudistance
inA,roun
deddown,
labels(a,f,andg)
correspond
tothosein
Figure7.2).
CuDensity
StandardSCRRate
Eapp
Cu-CHA-X
Cuatom
s(103A
3)−
1/10−
3mol
NO
(mol
Cus)−
1/10−
3mol
NO
(103A
3s)−
1O
2Ordera
kJmol−
1b
Cu-CHA-40(a)
0.03
1.8
0.05
0.8
47
Cu-CHA-29
0.07
2.3
0.16
0.7
50
Cu-CHA-27
0.09
3.3
0.30
0.7
56
Cu-CHA-25
0.11
4.5
0.50
0.7
56
Cu-CHA-22
0.18
6.5
1.17
0.5
60
Cu-CHA-20*
0.23
7.8
1.79
0.4
63
Cu-CHA-17(f)
0.35
7.4
2.59
0.4
66
Cu-CHA-16(g)
0.41
7.8
3.20
0.3
74
aErrorsin
theapparentO
2rate
order
are±
0.1.
bErrorsin
theapparentactivation
energy
(Eapp)are±7kJ/m
ol.Consistentwithprior
reports[37,349],Eappincreases
system
atically
withincreasingCudensity,reectingthegradualtransition
from
akineticregimein
whichO
2activation
israte-determining(low
Cudensity)to
onein
whichitisnot
(highCudensity).
*Identies
thehigher
Si/Aldensity
sampleof
twosamplesthat
sharethesamemean(rounded
dow
n)Cu-Cudistance.
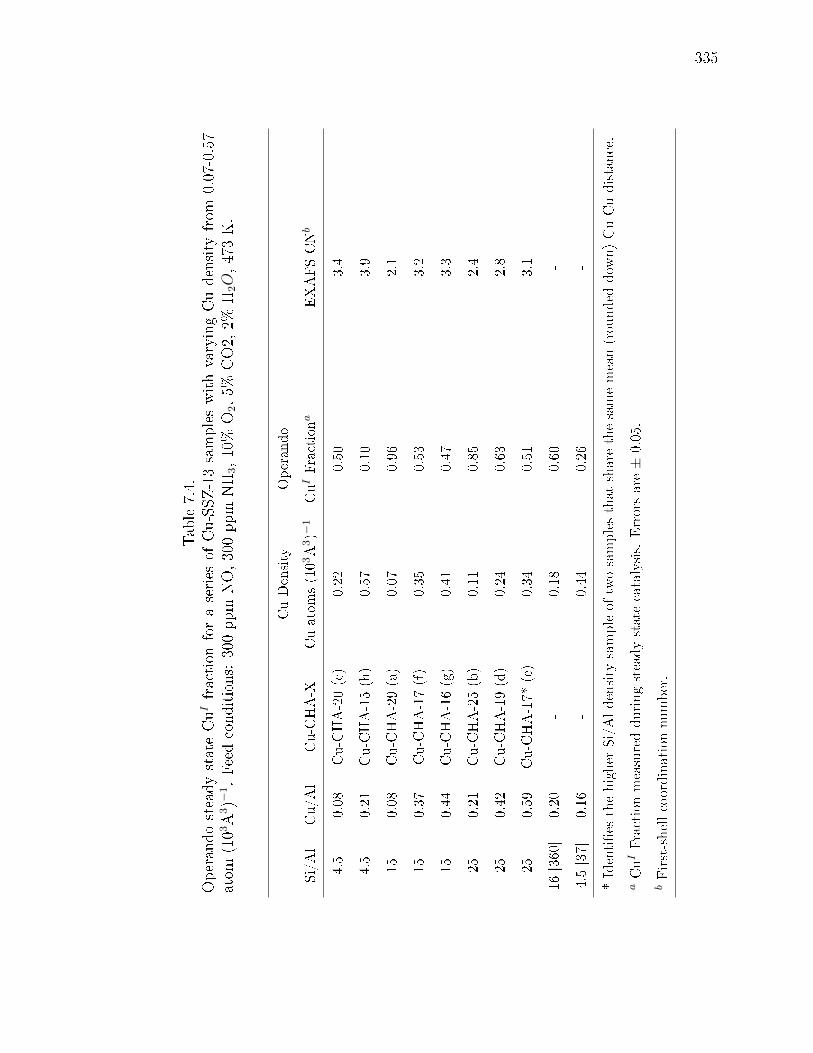
335
Table7.4.
Operand
osteady
stateCuI
fraction
foraseries
ofCu-SS
Z-13samples
withvaryingCudensityfrom
0.07-0.57
atom
(103A
3)−
1.Feed
cond
itions:300pp
mNO,300pp
mNH
3,10%
O2,5%
CO2,
2%H
2O,473K.
CuDensity
Operando
Si/Al
Cu/A
lCu-CHA-X
Cuatom
s(103A
3)−
1CuIFractiona
EXAFSCNb
4.5
0.08
Cu-CHA-20(c)
0.22
0.50
3.4
4.5
0.21
Cu-CHA-15(h)
0.57
0.10
3.9
150.08
Cu-CHA-29(a)
0.07
0.96
2.1
150.37
Cu-CHA-17(f)
0.35
0.53
3.2
150.44
Cu-CHA-16(g)
0.41
0.47
3.3
250.21
Cu-CHA-25(b)
0.11
0.85
2.4
250.42
Cu-CHA-19(d)
0.24
0.63
2.8
250.59
Cu-CHA-17*
(e)
0.34
0.51
3.1
16[360]
0.20
-0.18
0.60
-
4.5[37]
0.16
-0.44
0.26
-
*Identies
thehigher
Si/Aldensity
sampleof
twosamplesthat
sharethesamemean(rounded
dow
n)Cu-Cudistance.
aCuIFractionmeasuredduringsteadystatecatalysis.
Errorsare±
0.05.
bFirst-shellcoordinationnumber.
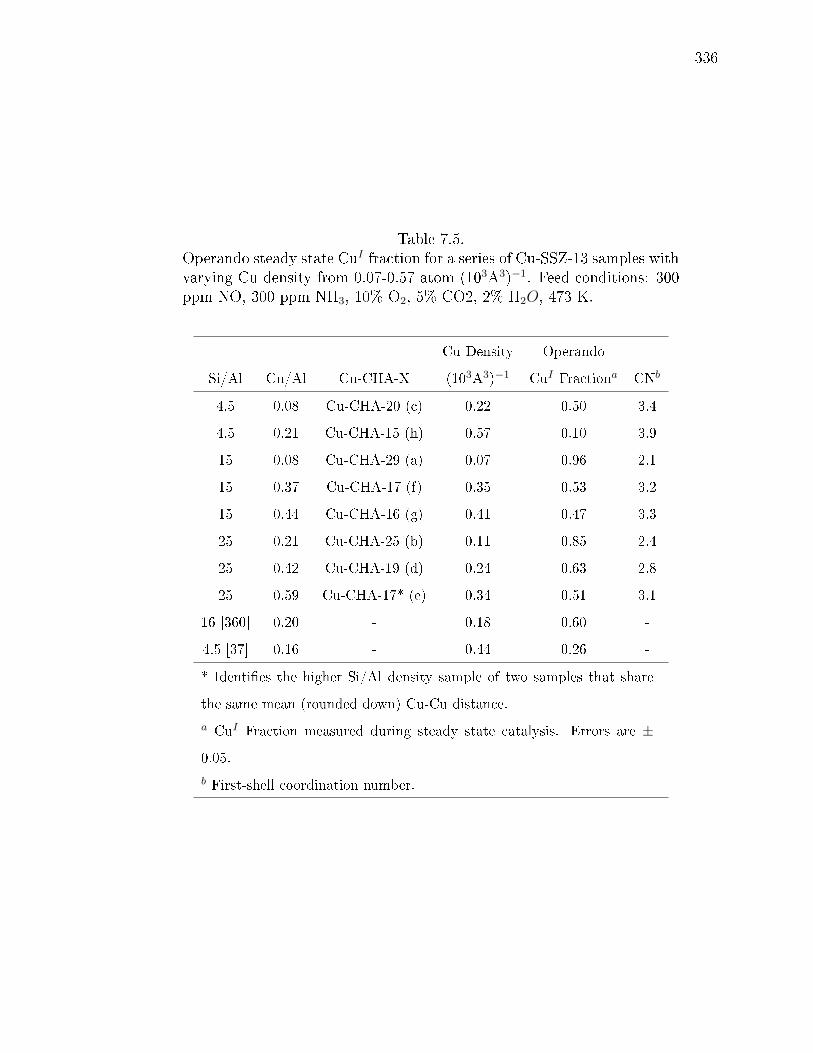
336
Table 7.5.Operando steady state CuI fraction for a series of Cu-SSZ-13 samples withvarying Cu density from 0.07-0.57 atom (103A3)−1. Feed conditions: 300ppm NO, 300 ppm NH3, 10% O2, 5% CO2, 2% H2O, 473 K.
Cu Density Operando
Si/Al Cu/Al Cu-CHA-X (103A3)−1 CuI Fractiona CNb
4.5 0.08 Cu-CHA-20 (c) 0.22 0.50 3.4
4.5 0.21 Cu-CHA-15 (h) 0.57 0.10 3.9
15 0.08 Cu-CHA-29 (a) 0.07 0.96 2.1
15 0.37 Cu-CHA-17 (f) 0.35 0.53 3.2
15 0.44 Cu-CHA-16 (g) 0.41 0.47 3.3
25 0.21 Cu-CHA-25 (b) 0.11 0.85 2.4
25 0.42 Cu-CHA-19 (d) 0.24 0.63 2.8
25 0.59 Cu-CHA-17* (e) 0.34 0.51 3.1
16 [360] 0.20 - 0.18 0.60 -
4.5 [37] 0.16 - 0.44 0.26 -
* Identies the higher Si/Al density sample of two samples that share
the same mean (rounded down) Cu-Cu distance.
a CuI Fraction measured during steady state catalysis. Errors are ±
0.05.
b First-shell coordination number.
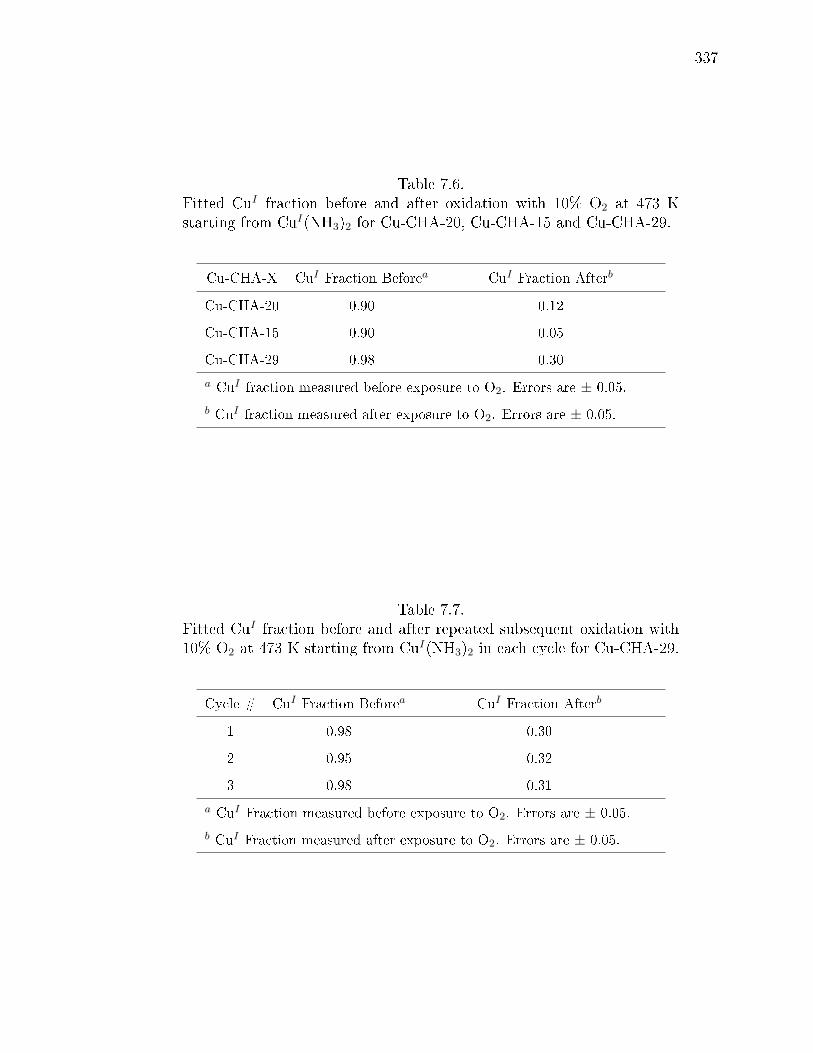
337
Table 7.6.Fitted CuI fraction before and after oxidation with 10% O2 at 473 Kstarting from CuI(NH3)2 for Cu-CHA-20, Cu-CHA-15 and Cu-CHA-29.
Cu-CHA-X CuI Fraction Beforea CuI Fraction Afterb
Cu-CHA-20 0.90 0.12
Cu-CHA-15 0.90 0.05
Cu-CHA-29 0.98 0.30
a CuI fraction measured before exposure to O2. Errors are ± 0.05.
b CuI fraction measured after exposure to O2. Errors are ± 0.05.
Table 7.7.Fitted CuI fraction before and after repeated subsequent oxidation with10% O2 at 473 K starting from CuI(NH3)2 in each cycle for Cu-CHA-29.
Cycle # CuI Fraction Beforea CuI Fraction Afterb
1 0.98 0.30
2 0.95 0.32
3 0.98 0.31
a CuI Fraction measured before exposure to O2. Errors are ± 0.05.
b CuI Fraction measured after exposure to O2. Errors are ± 0.05.

338
Table 7.8.Fitted CuI fraction before and after oxidation with 100 ppm NO2 at 473K starting from CuI(NH3)2 for Cu-CHA-20, Cu-CHA-15 and Cu-CHA-29.
Cu-CHA-X CuI Fraction Beforea CuI Fraction Afterb
Cu-CHA-20 0.90 0.00
Cu-CHA-15 0.90 0.00
Cu-CHA-29 0.98 0.00
a CuI Fraction measured before exposure to NO2. Errors are ± 0.05.
b CuI Fraction measured after exposure to NO2. Errors are ± 0.05.
Table 7.9.PBE+D2 DFT computed reaction energies (column 2), total energy dif-ferences along the reaction coordinate (column 3), and normalized Badercharge [79] derived Cu oxidation states for the product in each step (col-umn 4) for all results reported in Figure 7.4.
Reaction Energy Energy
Reaction / kJ mol−1 / kJ mol−1 Cu Oxidation State
A - 0 1.00
A → TS1 35 35
TS1 → B 23 23 1.00
B → C -59 -36 1.39
C → TS2 20 [423] -16
TS2 → D -26 -42 1.80
D → TS3 19 -23
TS3 → E -36 -60 2.10
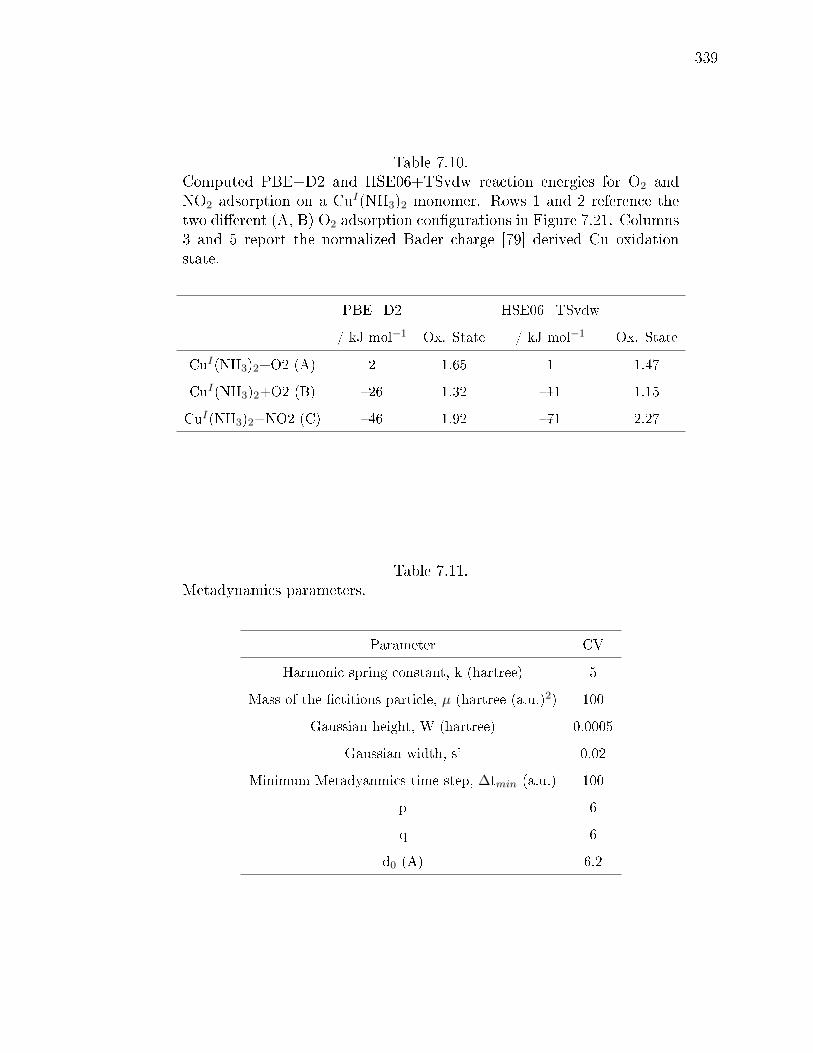
339
Table 7.10.Computed PBE+D2 and HSE06+TSvdw reaction energies for O2 andNO2 adsorption on a CuI(NH3)2 monomer. Rows 1 and 2 reference thetwo dierent (A, B) O2 adsorption congurations in Figure 7.21. Columns3 and 5 report the normalized Bader charge [79] derived Cu oxidationstate.
PBE+D2 HSE06+TSvdw
/ kJ mol−1 Ox. State / kJ mol−1 Ox. State
CuI(NH3)2+O2 (A) 2 1.65 1 1.47
CuI(NH3)2+O2 (B) 26 1.32 11 1.15
CuI(NH3)2+NO2 (C) 46 1.92 71 2.27
Table 7.11.Metadynamics parameters.
Parameter CV
Harmonic spring constant, k (hartree) 5
Mass of the ctitious particle, µ (hartree (a.u.)2) 100
Gaussian height, W (hartree) 0.0005
Gaussian width, s' 0.02
Minimum Metadyanmics time step, ∆tmin (a.u.) 100
p 6
q 6
d0 (A) 6.2

340
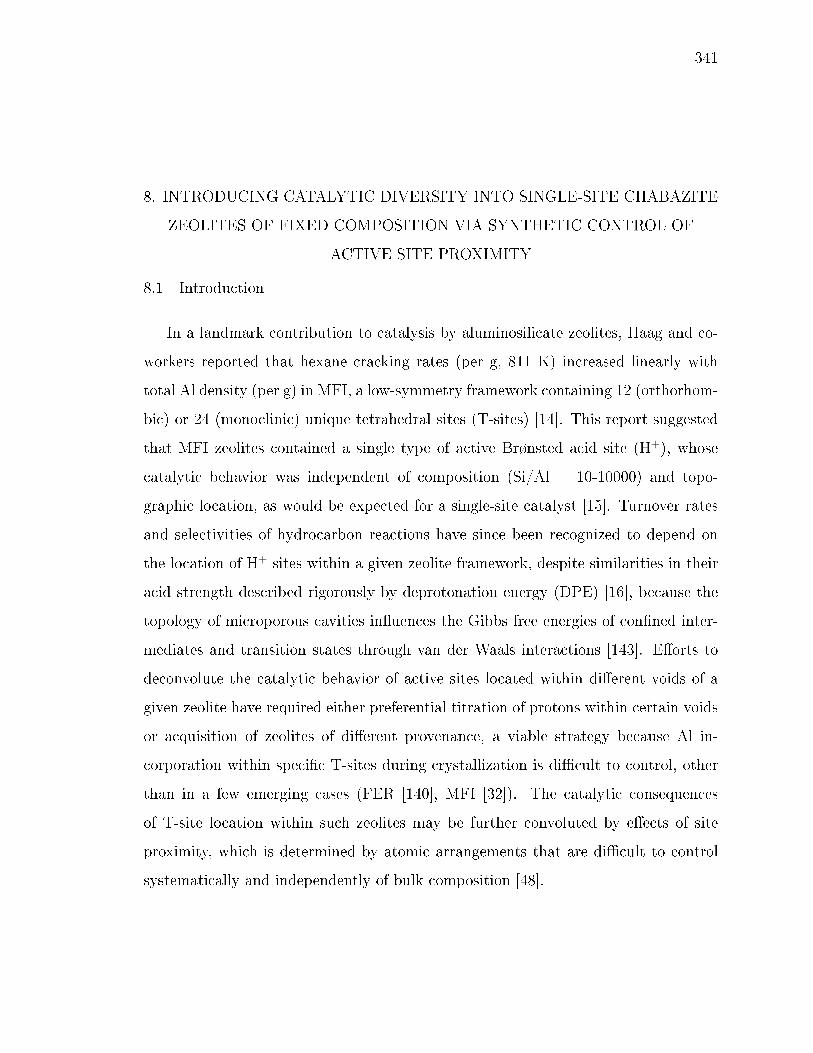
341
8. INTRODUCING CATALYTIC DIVERSITY INTO SINGLE-SITE CHABAZITE
ZEOLITES OF FIXED COMPOSITION VIA SYNTHETIC CONTROL OF
ACTIVE SITE PROXIMITY
8.1 Introduction
In a landmark contribution to catalysis by aluminosilicate zeolites, Haag and co-
workers reported that hexane cracking rates (per g, 811 K) increased linearly with
total Al density (per g) in MFI, a low-symmetry framework containing 12 (orthorhom-
bic) or 24 (monoclinic) unique tetrahedral sites (T-sites) [14]. This report suggested
that MFI zeolites contained a single type of active Brønsted acid site (H+), whose
catalytic behavior was independent of composition (Si/Al = 10-10000) and topo-
graphic location, as would be expected for a single-site catalyst [15]. Turnover rates
and selectivities of hydrocarbon reactions have since been recognized to depend on
the location of H+ sites within a given zeolite framework, despite similarities in their
acid strength described rigorously by deprotonation energy (DPE) [16], because the
topology of microporous cavities inuences the Gibbs free energies of conned inter-
mediates and transition states through van der Waals interactions [143]. Eorts to
deconvolute the catalytic behavior of active sites located within dierent voids of a
given zeolite have required either preferential titration of protons within certain voids
or acquisition of zeolites of dierent provenance, a viable strategy because Al in-
corporation within specic T-sites during crystallization is dicult to control, other
than in a few emerging cases (FER [140], MFI [32]). The catalytic consequences
of T-site location within such zeolites may be further convoluted by eects of site
proximity, which is determined by atomic arrangements that are dicult to control
systematically and independently of bulk composition [48].
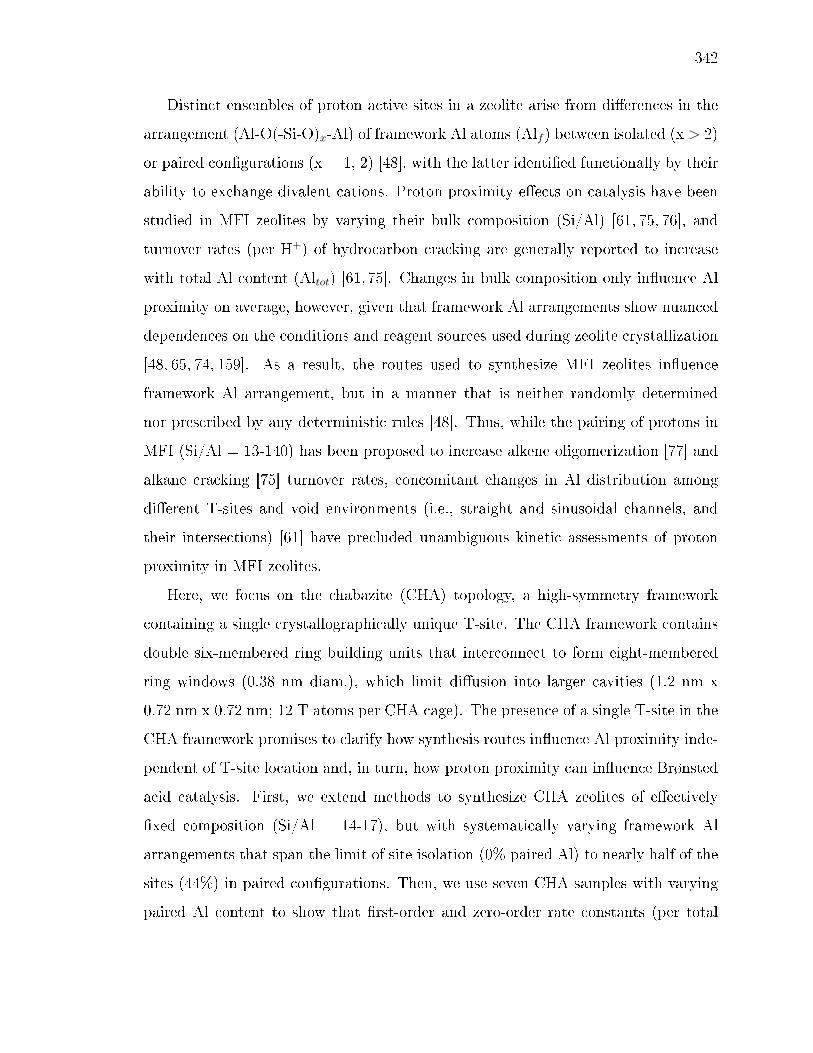
342
Distinct ensembles of proton active sites in a zeolite arise from dierences in the
arrangement (Al-O(-Si-O)x-Al) of framework Al atoms (Alf ) between isolated (x > 2)
or paired congurations (x = 1, 2) [48], with the latter identied functionally by their
ability to exchange divalent cations. Proton proximity eects on catalysis have been
studied in MFI zeolites by varying their bulk composition (Si/Al) [61, 75, 76], and
turnover rates (per H+) of hydrocarbon cracking are generally reported to increase
with total Al content (Altot) [61, 75]. Changes in bulk composition only inuence Al
proximity on average, however, given that framework Al arrangements show nuanced
dependences on the conditions and reagent sources used during zeolite crystallization
[48, 65, 74, 159]. As a result, the routes used to synthesize MFI zeolites inuence
framework Al arrangement, but in a manner that is neither randomly determined
nor prescribed by any deterministic rules [48]. Thus, while the pairing of protons in
MFI (Si/Al = 13-140) has been proposed to increase alkene oligomerization [77] and
alkane cracking [75] turnover rates, concomitant changes in Al distribution among
dierent T-sites and void environments (i.e., straight and sinusoidal channels, and
their intersections) [61] have precluded unambiguous kinetic assessments of proton
proximity in MFI zeolites.
Here, we focus on the chabazite (CHA) topology, a high-symmetry framework
containing a single crystallographically unique T-site. The CHA framework contains
double six-membered ring building units that interconnect to form eight-membered
ring windows (0.38 nm diam.), which limit diusion into larger cavities (1.2 nm x
0.72 nm x 0.72 nm; 12 T atoms per CHA cage). The presence of a single T-site in the
CHA framework promises to clarify how synthesis routes inuence Al proximity inde-
pendent of T-site location and, in turn, how proton proximity can inuence Brønsted
acid catalysis. First, we extend methods to synthesize CHA zeolites of eectively
xed composition (Si/Al = 14-17), but with systematically varying framework Al
arrangements that span the limit of site isolation (0% paired Al) to nearly half of the
sites (44%) in paired congurations. Then, we use seven CHA samples with varying
paired Al content to show that rst-order and zero-order rate constants (per total

343
H+, 415 K) for the Brønsted acid-catalyzed methanol dehydration to dimethyl ether
(DME) are nearly one order of magnitude larger on paired than on isolated protons.
IR spectra measured during steady-state dehydration catalysis enable direct observa-
tion of surface methoxy species (ca. 1457 cm−1) [451], providing evidence that paired
protons in CHA zeolites can access alternate methanol dehydration pathways that do
not propagate at isolated protons under these conditions. These results constitute
a synthesis-structure-function relation for proton proximity eects in CHA zeolites,
and they demonstrate that catalytic diversity can arise from dierences in the atomic
arrangement of active sites in single T-site zeolites of xed composition.
8.2 Results and Discussion
8.2.1 Synthesis of CHA zeolites with dierent Al arrangements.
We recently reported that structure-directing agents (SDAs) of dierent cationic
charge density can be used to systematically change the distribution of isolated and
paired framework Al atoms in CHA zeolites (SSZ-13) [42]. Proximal protons that
compensate paired Al sites were quantied by measuring Co2+ exchange isotherms,
which were validated by (i) collecting UV-visible spectra that showed Co2+ d-d tran-
sitions (ca. 19,500 cm−1) with undetectable cobalt oxide formation, (ii) quantifying
residual H+ sites after Co2+ exchange using NH3 titration methods (2 H+ replaced per
Co2+), and (iii) quantifying paired Al sites with another divalent cation (Cu2+) [42,79]
predicted by density functional theory to selectively titrate paired Al sites in CHA
frameworks (i.e., arrangements of 2 Al in a 6-MR) [79]. The use of chemical titrants
that directly probe the functional behavior of proximal protons, and directly quantify
such sites, avoids inaccuracies in assessing the proximity of their structural surrogates.
Although framework Al proximity in zeolites can be probed by NMR techniques, Al
separated by one or two Si atoms in certain frameworks (e.g., MFI) can lead to pro-
tons stabilized within dierent voids [48], which do not function as proximal protons
within the same void environment.

344
Here, we extend previously reported synthetic methods to prepare CHA zeolites of
eectively xed composition (Si/Alf = 14-17) with nearly half of their Al atoms (44%)
in paired congurations. Unless otherwise specied, each zeolite contained nearly
complete Al incorporation within framework locations (Alf/Altot > 0.95; 27Al MAS
NMR, Section 8.7.2, Supporting Information), and compensating H+ sites present in
similar amounts (H+/Alf > 0.95 by NH3 titration, Table 8.1). Relevant characteri-
zation data for CHA zeolites are summarized in Table 8.1, with all characterization
data and detailed methods provided in Section 8.7.2 of the Supporting Information.
CHA zeolites containing predominantly isolated Al atoms, which are unable to
exchange divalent cations (e.g., Co2+, Cu2+) but can quantitatively exchange mono-
valent cations (e.g., H+, Na+, NH+4 ), were crystallized at dierent compositions (Si/Al
= 15-30) in the presence of organic N,N,N-trimethyl-1-adamantylammonium cations
(TMAda+) as the sole SDA and hydroxide as the counteranion [42]. The ability
of TMAda+ cations to isolate framework Al atoms in CHA was veried by seven
replicate crystallization experiments [42]. The adamantyl group (ca. 0.7 nm diam.)
imposes steric constraints that limit occupation of each CHA cage (0.72 nm diam.) by
only one TMAda+ molecule (Table 8.1, TGA experiments detailed in Section 8.7.2,
Supporting Information) [162], while the single cationic charge at the quaternary am-
monium center imposes electrostatic constraints that direct placement of one anionic
framework Al center (Scheme 8.1) [200].
Despite the occlusion of a single TMAda+ molecule within each CHA cage, the
bulk compositions of the crystallized zeolites do not reect the incorporation of 1 Al
atom per cage (Si/Al = 11; 12 T atoms per cage), indicating that anionic lattice de-
fects (Si-O−) form to compensate cationic charges of some TMAda+ molecules. CHA
zeolites crystallized within a limited composition range (Si/Al = 15-30) in hydroxide
media, reecting crystallization barriers imposed by a disparity in Coulombic interac-
tions between occluded TMAda+ cations and the solid aluminosilicate polyanion [452].
TMAda+ alone is unable to stabilize CHA frameworks with high Al density (Si/Alf
< 11) because each cage (12 T atoms) contains one occluded TMAda+ cation [162].

345
TMAda+ is also ineective at stabilizing CHA frameworks with low Al density (Si/Alf
> 30) because anionic lattice defects are required to form in order to balance excess
cationic charges introduced by occluded cationic SDA molecules [225]. The electro-
static balance between occluded cations and anionic framework Al centers implies
that using dierent mineralizers (OH−, F−), which facilitate reversible formation of
Si-O and Al-O bonds during crystallization [453], should not inuence framework Al
arrangement within this composition range (Si/Al = 15-30). This hypothesis was
tested by preparing precursor solutions in uoride media containing TMAda+ as the
sole SDA. These solutions crystallized CHA zeolites (Si/Al = 18) that were also
unable to exchange Co2+ (details in Section 8.7.2, Supp. Info.), demonstrating the
ability of TMAda+ cations to direct the incorporation of isolated framework Al atoms
in CHA zeolites within this composition range (Si/Al = 15-30), irrespective of the
counteranion used as the mineralizer (OH−, F−).
CHA zeolites of xed composition, but with systematically varying fractions of
paired Al, were synthesized by varying the ratio of high (Na+) and low (TMAda+)
charge density cations in the precursor solution, at xed total cation content ((Na++-
TMAda+)/Al) [42]. Our previous synthesis experiments used the same aluminum
source (Al(OH)3) and resulted in CHA zeolites (Si/Al = 14-16) with varying per-
centages of paired Al (0-18%) that correlated linearly with the total amount of Na+
retained on the crystallized zeolite product (Figure 8.2).16 This correlation suggests
that a second anionic framework Al center, compensated by an extraframework Na+
cation, is incorporated proximal to a framework Al center compensating the ammo-
nium group in a TMAda+ cation occluded within a CHA cage, an assembly that pre-
serves dispersive contacts between nonpolar siloxane portions of the zeolite framework
and the hydrophobic adamantyl group of TMAda+ (Scheme 8.1) [42]. Al precursors
that dier in reactivity and dissolution rate [159] have been used to inuence Al pair-
ing in MFI zeolites crystallized from solutions containing TPA+ cations, although
without a discernible dependence on a single synthesis parameter and also often re-
sulting in changes to bulk composition (Si/Al = 25-60) [74]. Therefore, we attempted
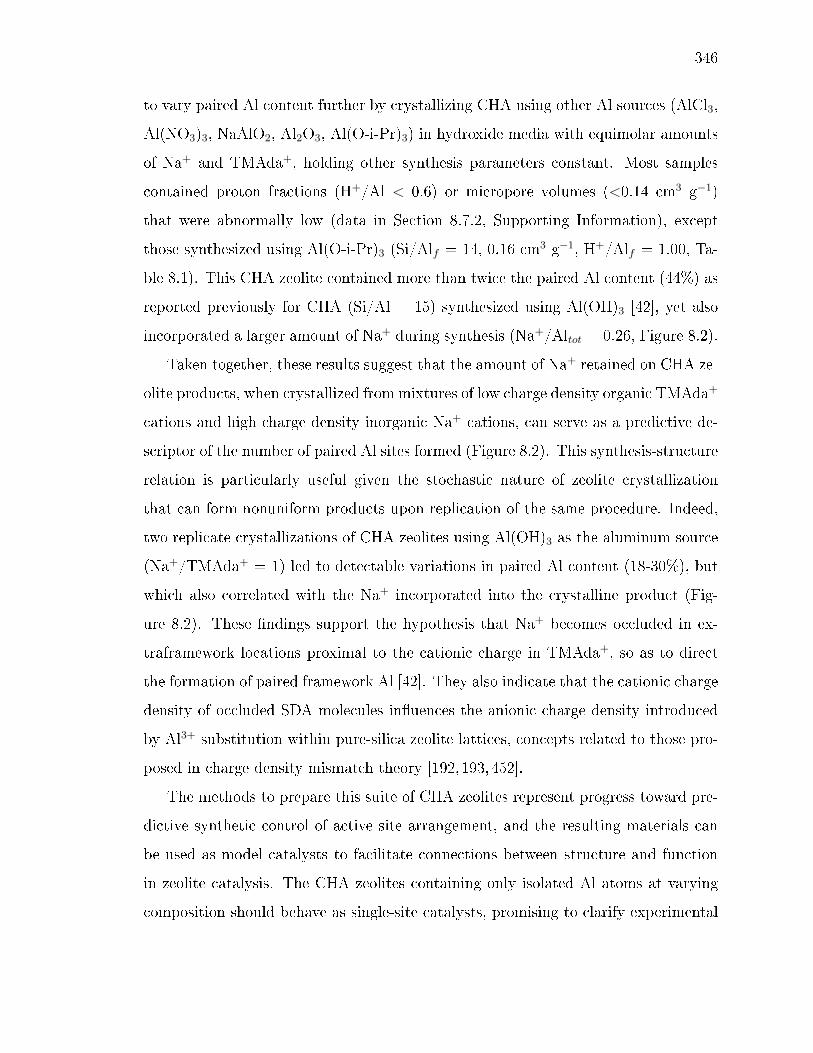
346
to vary paired Al content further by crystallizing CHA using other Al sources (AlCl3,
Al(NO3)3, NaAlO2, Al2O3, Al(O-i-Pr)3) in hydroxide media with equimolar amounts
of Na+ and TMAda+, holding other synthesis parameters constant. Most samples
contained proton fractions (H+/Al < 0.6) or micropore volumes (<0.14 cm3 g−1)
that were abnormally low (data in Section 8.7.2, Supporting Information), except
those synthesized using Al(O-i-Pr)3 (Si/Alf = 14, 0.16 cm3 g−1, H+/Alf = 1.00, Ta-
ble 8.1). This CHA zeolite contained more than twice the paired Al content (44%) as
reported previously for CHA (Si/Al = 15) synthesized using Al(OH)3 [42], yet also
incorporated a larger amount of Na+ during synthesis (Na+/Altot = 0.26, Figure 8.2).
Taken together, these results suggest that the amount of Na+ retained on CHA ze-
olite products, when crystallized from mixtures of low charge density organic TMAda+
cations and high charge density inorganic Na+ cations, can serve as a predictive de-
scriptor of the number of paired Al sites formed (Figure 8.2). This synthesis-structure
relation is particularly useful given the stochastic nature of zeolite crystallization
that can form nonuniform products upon replication of the same procedure. Indeed,
two replicate crystallizations of CHA zeolites using Al(OH)3 as the aluminum source
(Na+/TMAda+ = 1) led to detectable variations in paired Al content (18-30%), but
which also correlated with the Na+ incorporated into the crystalline product (Fig-
ure 8.2). These ndings support the hypothesis that Na+ becomes occluded in ex-
traframework locations proximal to the cationic charge in TMAda+, so as to direct
the formation of paired framework Al [42]. They also indicate that the cationic charge
density of occluded SDA molecules inuences the anionic charge density introduced
by Al3+ substitution within pure-silica zeolite lattices, concepts related to those pro-
posed in charge density mismatch theory [192,193,452].
The methods to prepare this suite of CHA zeolites represent progress toward pre-
dictive synthetic control of active site arrangement, and the resulting materials can
be used as model catalysts to facilitate connections between structure and function
in zeolite catalysis. The CHA zeolites containing only isolated Al atoms at varying
composition should behave as single-site catalysts, promising to clarify experimental
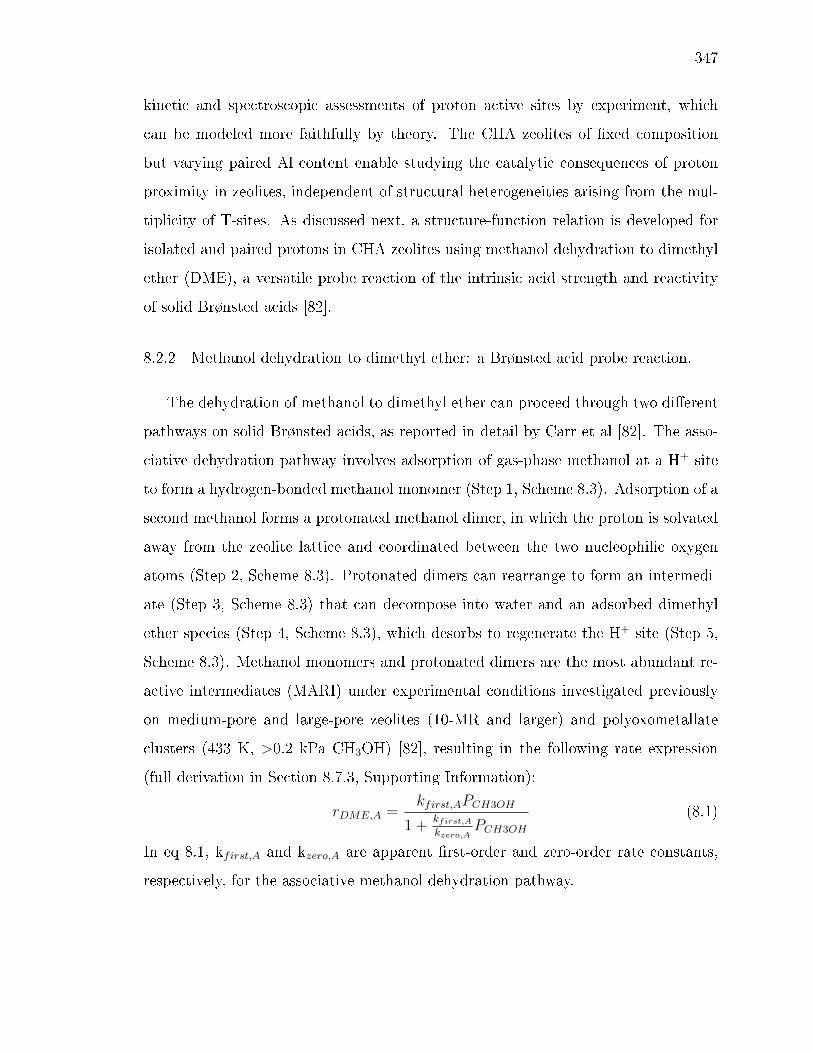
347
kinetic and spectroscopic assessments of proton active sites by experiment, which
can be modeled more faithfully by theory. The CHA zeolites of xed composition
but varying paired Al content enable studying the catalytic consequences of proton
proximity in zeolites, independent of structural heterogeneities arising from the mul-
tiplicity of T-sites. As discussed next, a structure-function relation is developed for
isolated and paired protons in CHA zeolites using methanol dehydration to dimethyl
ether (DME), a versatile probe reaction of the intrinsic acid strength and reactivity
of solid Brønsted acids [82].
8.2.2 Methanol dehydration to dimethyl ether: a Brønsted acid probe reaction.
The dehydration of methanol to dimethyl ether can proceed through two dierent
pathways on solid Brønsted acids, as reported in detail by Carr et al [82]. The asso-
ciative dehydration pathway involves adsorption of gas-phase methanol at a H+ site
to form a hydrogen-bonded methanol monomer (Step 1, Scheme 8.3). Adsorption of a
second methanol forms a protonated methanol dimer, in which the proton is solvated
away from the zeolite lattice and coordinated between the two nucleophilic oxygen
atoms (Step 2, Scheme 8.3). Protonated dimers can rearrange to form an intermedi-
ate (Step 3, Scheme 8.3) that can decompose into water and an adsorbed dimethyl
ether species (Step 4, Scheme 8.3), which desorbs to regenerate the H+ site (Step 5,
Scheme 8.3). Methanol monomers and protonated dimers are the most abundant re-
active intermediates (MARI) under experimental conditions investigated previously
on medium-pore and large-pore zeolites (10-MR and larger) and polyoxometallate
clusters (433 K, >0.2 kPa CH3OH) [82], resulting in the following rate expression
(full derivation in Section 8.7.3, Supporting Information):
rDME,A =kfirst,APCH3OH
1 +kfirst,Akzero,A
PCH3OH
(8.1)
In eq 8.1, kfirst,A and kzero,A are apparent rst-order and zero-order rate constants,
respectively, for the associative methanol dehydration pathway.

348
Alternatively, the dissociative dehydration pathway involves formation of metha-
nol monomers (Step 1, Scheme 8.4), which initially eliminate water to form a surface
methoxy group (Step 2, Scheme 8.4). Adsorption of a second methanol at an adja-
cent framework oxygen forms a surface methanol-methoxy pair (Step 3, Scheme 8.4).
Addition of the surface methoxy to the nucleophilic oxygen atom of the coadsorbed
methanol forms an adsorbed dimethyl ether species (Step 4, Scheme 8.4), which des-
orbs to regenerate the H+ site (Step 5, Scheme 8.4). An additional step involving
formation of methanol dimers (Step 2, Scheme 8.4) inhibits the formation of surface
methoxy groups that propagate the dissociative cycle.
The assumption of methanol monomers, protonated dimers, and surface methoxy-
methanol pairs as MARI leads to the following rate expression, which predicts that
rates become inhibited at high methanol pressures (full derivation in Section 8.7.3,
Supporting Information):
rDME,D =kfirst,DPCH3OH
1 +kfirst,Dkzero,D
PCH3OH +kfirst,Dkinhibit,D
P 2CH3OH
(8.2)
In eq 8.2, kfirst,D and kzero,D are rst-order and zero-order rate constants, respectively,
for the dissociative dehydration pathway, and kinhibit,D is an inhibition rate constant
that reects formation of an unreactive methanol dimer.
in situ IR spectra of H-MFI during steady-state methanol dehydration catalysis
(433 K, 0.2-16 kPa CH3OH) do not show deformation modes for surface methoxy
species (ca. 1457 cm−1) involved in the dissociative pathway, yet show hydrogen-
bonding modes for adsorbed CH3OH monomers (ca. 2380 cm−1) and protonated
CH3OH dimers (ca. 2620 cm−1) involved in the associative pathway [451]. Further,
periodic density functional theory (DFT) calculations indicate that DME formation
proceeds with lower free energy barriers via the associative pathway on isolated H+
sites in MFI zeolites (by ca. 50 kJ mol−1, vdW-DF functional) [454]. Kinetic mea-
surements were benchmarked in this study by comparing values for three commer-
cially sourced H-MFI samples (Zeolyst) to literature reports (details in Section 8.7.3,
Supporting Information) [83, 451]. Methanol dehydration rates on H-MFI (per H+,
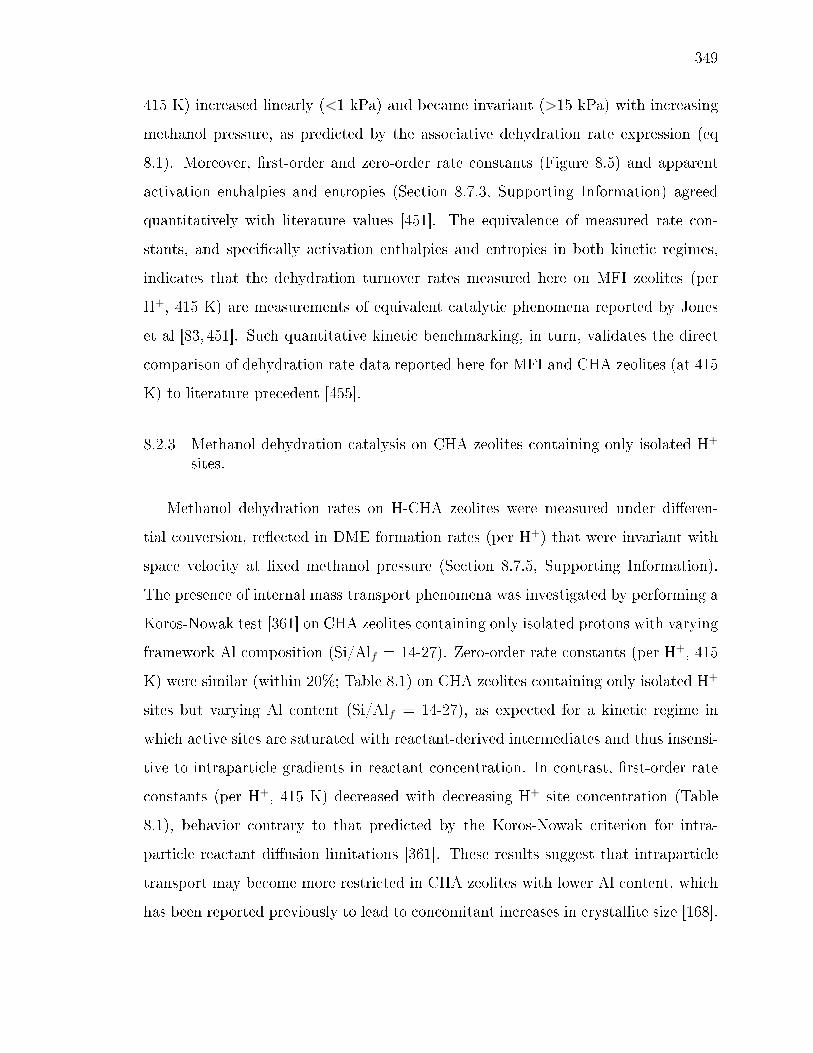
349
415 K) increased linearly (<1 kPa) and became invariant (>15 kPa) with increasing
methanol pressure, as predicted by the associative dehydration rate expression (eq
8.1). Moreover, rst-order and zero-order rate constants (Figure 8.5) and apparent
activation enthalpies and entropies (Section 8.7.3, Supporting Information) agreed
quantitatively with literature values [451]. The equivalence of measured rate con-
stants, and specically activation enthalpies and entropies in both kinetic regimes,
indicates that the dehydration turnover rates measured here on MFI zeolites (per
H+, 415 K) are measurements of equivalent catalytic phenomena reported by Jones
et al [83, 451]. Such quantitative kinetic benchmarking, in turn, validates the direct
comparison of dehydration rate data reported here for MFI and CHA zeolites (at 415
K) to literature precedent [455].
8.2.3 Methanol dehydration catalysis on CHA zeolites containing only isolated H+
sites.
Methanol dehydration rates on H-CHA zeolites were measured under dieren-
tial conversion, reected in DME formation rates (per H+) that were invariant with
space velocity at xed methanol pressure (Section 8.7.5, Supporting Information).
The presence of internal mass transport phenomena was investigated by performing a
Koros-Nowak test [361] on CHA zeolites containing only isolated protons with varying
framework Al composition (Si/Alf = 14-27). Zero-order rate constants (per H+, 415
K) were similar (within 20%; Table 8.1) on CHA zeolites containing only isolated H+
sites but varying Al content (Si/Alf = 14-27), as expected for a kinetic regime in
which active sites are saturated with reactant-derived intermediates and thus insensi-
tive to intraparticle gradients in reactant concentration. In contrast, rst-order rate
constants (per H+, 415 K) decreased with decreasing H+ site concentration (Table
8.1), behavior contrary to that predicted by the Koros-Nowak criterion for intra-
particle reactant diusion limitations [361]. These results suggest that intraparticle
transport may become more restricted in CHA zeolites with lower Al content, which
has been reported previously to lead to concomitant increases in crystallite size [168].

350
Indeed, SEM micrographs and dynamic light scattering measurements (Section 8.7.2,
Supporting Information) indicate that crystallite sizes increase from 1.5 to 6 µm (Ta-
ble 8.1) with decreasing Al content (Si/Alf = 14-27) among the samples studied here.
Figure 8.6 shows the intraparticle eectiveness factor (η) for a rst-order reaction in
a spherical pellet as a function of the Thiele modulus (φ), with values estimated for
these CHA zeolites (details and derivation of Thiele moduli and eectiveness factors
in Section 8.7.5, Supporting Information). CHA zeolites with Si/Alf = 14-18 (φ =
0.7-0.9) are characterized by eectiveness factors near unity (η = 0.9-1.1), indicat-
ing that intraparticle concentration gradients are absent and that rates measured on
these samples are kinetic in origin. CHA zeolites with Si/Alf = 27 (ψ = 3.5), how-
ever, are characterized by eectiveness factors below unity (η = 0.5), indicating that
intraparticle transport processes corrupt rates measured on this sample; thus, it was
not studied further.
Methanol dehydration rates on isolated protons in H-CHA (per H+, 415 K) in-
creased linearly (<1 kPa) before reaching a maximum and ultimately decreasing (>10
kPa) with increasing methanol pressure (Figure 8.7 and Section 8.7.3, Supporting In-
formation), in contrast with the behavior observed on HMFI. Reversible inhibition
observed at high pressures (>10 kPa) cannot be accounted for by the dissociative
pathway, as isolated protons in H-CHA zeolites do not stabilize surface methoxy
groups under these reaction conditions (415 K, 0.77 kPa; Figure 8.8) and thus catalyze
methanol dehydration via the associative pathway. Competitive adsorption of product
water with methanol at H+ sites is also unable to account for the apparent inhibi-
tion observed at high methanol pressures, both because measured dehydration rates
were invariant with reactant space velocity, and because the rate inhibition measured
from deliberate water cofeeding experiments is weaker than the observed inhibition
(details in Section 8.7.6, Supporting Information). The kinetic inhibition observed at
high methanol pressures occurs with the concomitant formation of methanol clusters
(ca. 3370 cm−1) [456] detected by in situ IR (Section 8.7.6, Supporting Information).
Physisorbed methanol molecules contributing to larger clusters appear to be occluded
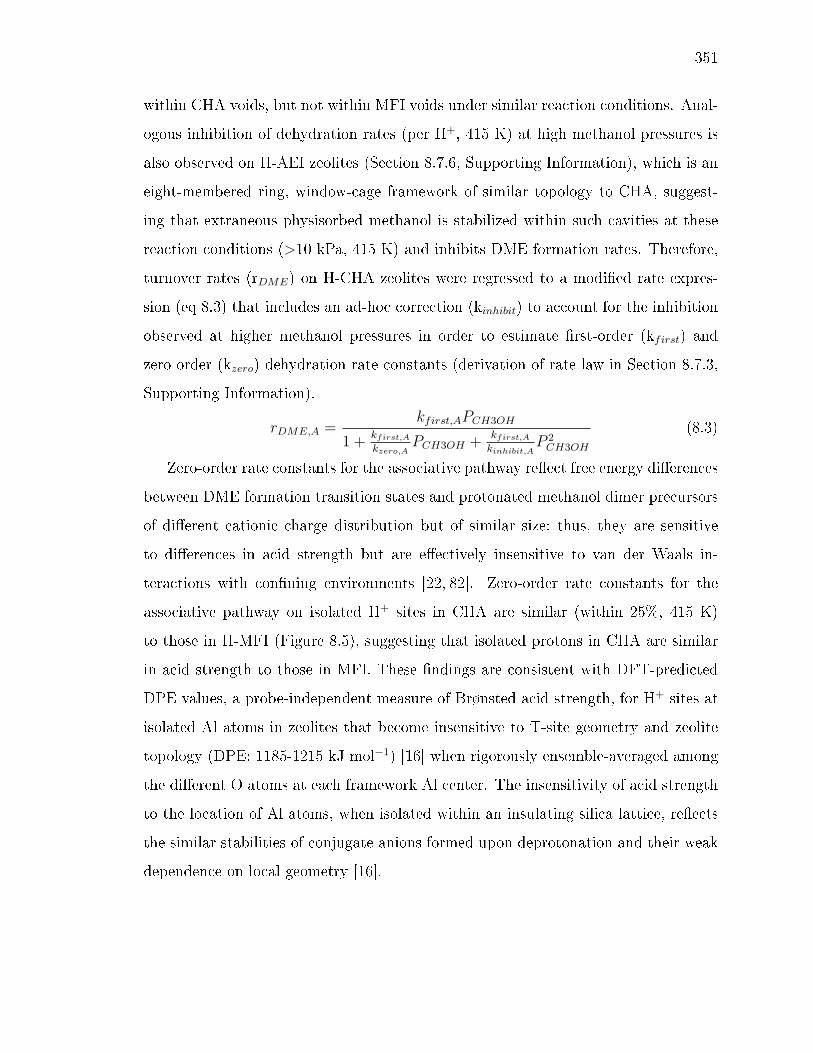
351
within CHA voids, but not within MFI voids under similar reaction conditions. Anal-
ogous inhibition of dehydration rates (per H+, 415 K) at high methanol pressures is
also observed on H-AEI zeolites (Section 8.7.6, Supporting Information), which is an
eight-membered ring, window-cage framework of similar topology to CHA, suggest-
ing that extraneous physisorbed methanol is stabilized within such cavities at these
reaction conditions (>10 kPa, 415 K) and inhibits DME formation rates. Therefore,
turnover rates (rDME) on H-CHA zeolites were regressed to a modied rate expres-
sion (eq 8.3) that includes an ad-hoc correction (kinhibit) to account for the inhibition
observed at higher methanol pressures in order to estimate rst-order (kfirst) and
zero-order (kzero) dehydration rate constants (derivation of rate law in Section 8.7.3,
Supporting Information).
rDME,A =kfirst,APCH3OH
1 +kfirst,Akzero,A
PCH3OH +kfirst,Akinhibit,A
P 2CH3OH
(8.3)
Zero-order rate constants for the associative pathway reect free energy dierences
between DME formation transition states and protonated methanol dimer precursors
of dierent cationic charge distribution but of similar size; thus, they are sensitive
to dierences in acid strength but are eectively insensitive to van der Waals in-
teractions with conning environments [22, 82]. Zero-order rate constants for the
associative pathway on isolated H+ sites in CHA are similar (within 25%, 415 K)
to those in H-MFI (Figure 8.5), suggesting that isolated protons in CHA are similar
in acid strength to those in MFI. These ndings are consistent with DFT-predicted
DPE values, a probe-independent measure of Brønsted acid strength, for H+ sites at
isolated Al atoms in zeolites that become insensitive to T-site geometry and zeolite
topology (DPE: 1185-1215 kJ mol−1) [16] when rigorously ensemble-averaged among
the dierent O atoms at each framework Al center. The insensitivity of acid strength
to the location of Al atoms, when isolated within an insulating silica lattice, reects
the similar stabilities of conjugate anions formed upon deprotonation and their weak
dependence on local geometry [16].

352
First-order rate constants for the associative pathway reect free energy dierences
between DME formation transition states and hydrogen-bonded methanol monomer
precursors of dierent cationic charge distribution and size; thus, they are sensitive
to dierences in both acid strength and connement [22, 82]. First-order rate con-
stants for the associative pathway were nearly an order of magnitude larger (415 K)
on isolated H+ sites in H-CHA than in H-MFI (Figure 8.5), reecting preferential
stabilization of larger transition states over smaller methanol monomers within the
more conning environments of CHA, given the similar acid strength of isolated pro-
tons in zeolitic frameworks. The dependence of methanol dehydration rst-order rate
constants reported for zeolites of widely varying pore size (0.5-1.2 nm free sphere
diameter) [22] allows estimating the eective reaction volume in H-CHA from its
rst-order rate constant and suggests that methanol dehydration in CHA zeolites oc-
curs within void sizes characteristic of 6-MR and 8-MR (Section 8.7.3, Supporting
Information). Additionally, rst-order and zero-order rate constants (per H+, 415
K) on isolated H+ sites in CHA zeolites synthesized in uoride media (Figure 8.5)
are equivalent to those on CHA zeolites synthesized in hydroxide media, providing
evidence that these samples contain only isolated framework Al atoms and protons
of indistinguishable acid strength.
8.2.4 Methanol dehydration catalysis on H-CHA zeolites containing paired protons.
Methanol dehydration rates are shown as a function of methanol pressure in Figure
8.7 for H-CHA zeolites of xed composition (Si/Alf = 14-17), but with systematically
increasing percentages of paired Al (0-44%). All rates were uncorrupted by intraparti-
cle transport artifacts (η > 0.95; Figure 8.6), and kinetic data for all samples can be
found in Section 8.7.3 of the Supporting Information. Methanol dehydration rates on
each H-CHA zeolite containing paired protons decreased at higher methanol pressures
(>10 kPa, Figure 8.7) concomitant with the formation of methanol clusters (ca. 3370
cm−1; Section 8.7.4, Supporting Information) at high methanol pressures, as observed
for H-CHA zeolites containing only isolated protons. Methanol dehydration turnover
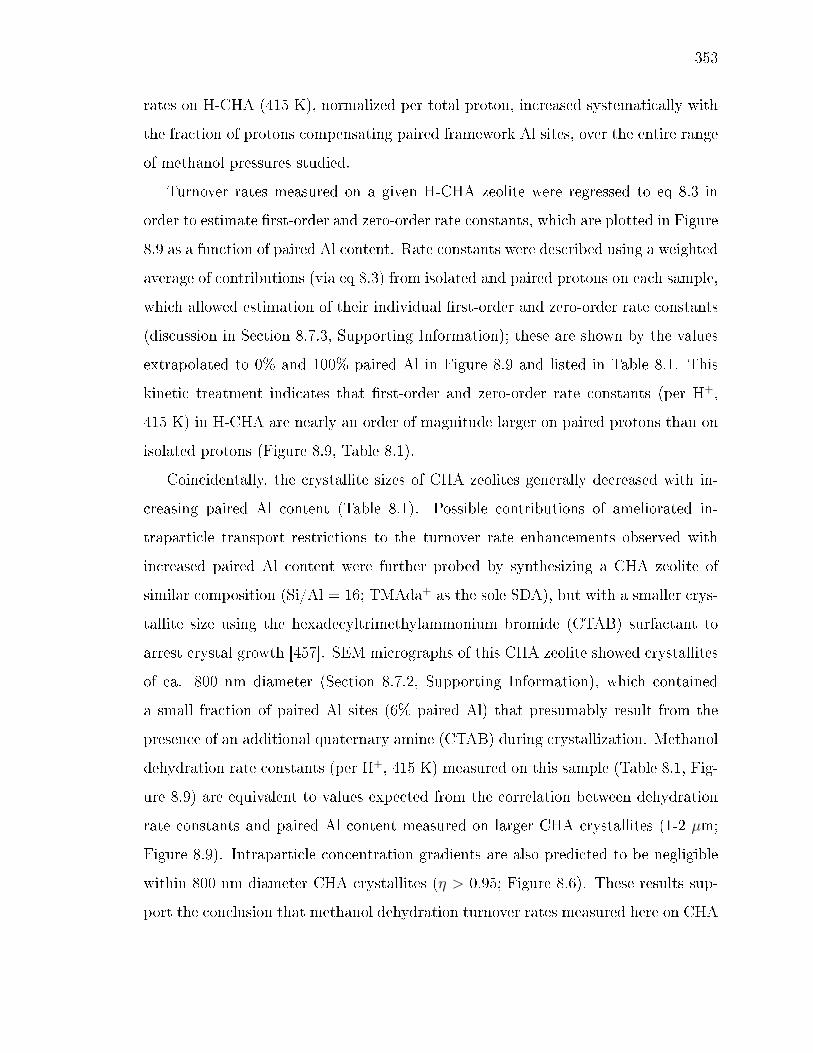
353
rates on H-CHA (415 K), normalized per total proton, increased systematically with
the fraction of protons compensating paired framework Al sites, over the entire range
of methanol pressures studied.
Turnover rates measured on a given H-CHA zeolite were regressed to eq 8.3 in
order to estimate rst-order and zero-order rate constants, which are plotted in Figure
8.9 as a function of paired Al content. Rate constants were described using a weighted
average of contributions (via eq 8.3) from isolated and paired protons on each sample,
which allowed estimation of their individual rst-order and zero-order rate constants
(discussion in Section 8.7.3, Supporting Information); these are shown by the values
extrapolated to 0% and 100% paired Al in Figure 8.9 and listed in Table 8.1. This
kinetic treatment indicates that rst-order and zero-order rate constants (per H+,
415 K) in H-CHA are nearly an order of magnitude larger on paired protons than on
isolated protons (Figure 8.9, Table 8.1).
Coincidentally, the crystallite sizes of CHA zeolites generally decreased with in-
creasing paired Al content (Table 8.1). Possible contributions of ameliorated in-
traparticle transport restrictions to the turnover rate enhancements observed with
increased paired Al content were further probed by synthesizing a CHA zeolite of
similar composition (Si/Al = 16; TMAda+ as the sole SDA), but with a smaller crys-
tallite size using the hexadecyltrimethylammonium bromide (CTAB) surfactant to
arrest crystal growth [457]. SEM micrographs of this CHA zeolite showed crystallites
of ca. 800 nm diameter (Section 8.7.2, Supporting Information), which contained
a small fraction of paired Al sites (6% paired Al) that presumably result from the
presence of an additional quaternary amine (CTAB) during crystallization. Methanol
dehydration rate constants (per H+, 415 K) measured on this sample (Table 8.1, Fig-
ure 8.9) are equivalent to values expected from the correlation between dehydration
rate constants and paired Al content measured on larger CHA crystallites (1-2 µm;
Figure 8.9). Intraparticle concentration gradients are also predicted to be negligible
within 800 nm diameter CHA crystallites (η > 0.95; Figure 8.6). These results sup-
port the conclusion that methanol dehydration turnover rates measured here on CHA
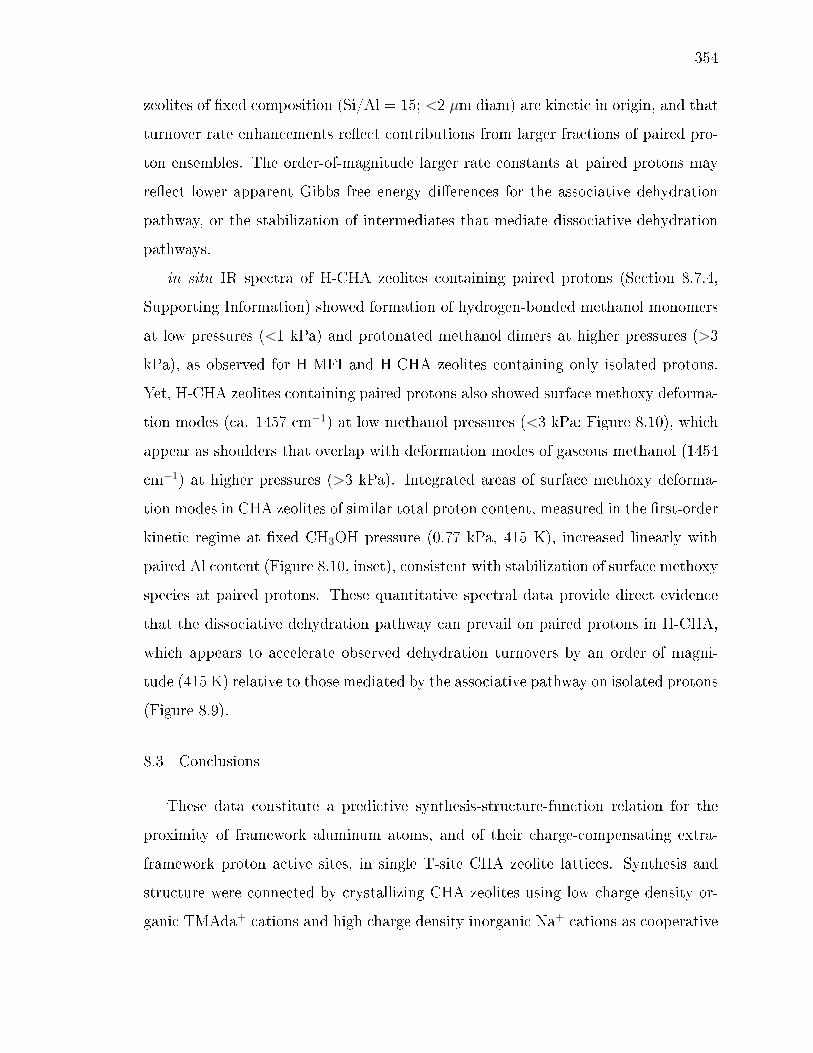
354
zeolites of xed composition (Si/Al = 15; <2 µm diam) are kinetic in origin, and that
turnover rate enhancements reect contributions from larger fractions of paired pro-
ton ensembles. The order-of-magnitude larger rate constants at paired protons may
reect lower apparent Gibbs free energy dierences for the associative dehydration
pathway, or the stabilization of intermediates that mediate dissociative dehydration
pathways.
in situ IR spectra of H-CHA zeolites containing paired protons (Section 8.7.4,
Supporting Information) showed formation of hydrogen-bonded methanol monomers
at low pressures (<1 kPa) and protonated methanol dimers at higher pressures (>3
kPa), as observed for H-MFI and H-CHA zeolites containing only isolated protons.
Yet, H-CHA zeolites containing paired protons also showed surface methoxy deforma-
tion modes (ca. 1457 cm−1) at low methanol pressures (<3 kPa; Figure 8.10), which
appear as shoulders that overlap with deformation modes of gaseous methanol (1454
cm−1) at higher pressures (>3 kPa). Integrated areas of surface methoxy deforma-
tion modes in CHA zeolites of similar total proton content, measured in the rst-order
kinetic regime at xed CH3OH pressure (0.77 kPa, 415 K), increased linearly with
paired Al content (Figure 8.10, inset), consistent with stabilization of surface methoxy
species at paired protons. These quantitative spectral data provide direct evidence
that the dissociative dehydration pathway can prevail on paired protons in H-CHA,
which appears to accelerate observed dehydration turnovers by an order of magni-
tude (415 K) relative to those mediated by the associative pathway on isolated protons
(Figure 8.9).
8.3 Conclusions
These data constitute a predictive synthesis-structure-function relation for the
proximity of framework aluminum atoms, and of their charge-compensating extra-
framework proton active sites, in single T-site CHA zeolite lattices. Synthesis and
structure were connected by crystallizing CHA zeolites using low charge density or-
ganic TMAda+ cations and high charge density inorganic Na+ cations as cooperative
355
SDAs, in which the amount of Na+ retained within crystallized products correlated
with the number of paired Al sites formed, which were quantied using validated
Co2+ titration methods. Structure and catalytic function were connected by measur-
ing kinetic rate constants of methanol dehydration to dimethyl ether on CHA zeolites
of similar composition but varying paired Al content. Paired protons accelerate dehy-
dration turnover rates by an order of magnitude (415 K) relative to isolated protons,
because paired protons appear to stabilize surface methoxy species involved in an
alternate dehydration mechanism. An order-of-magnitude dierence in methanol de-
hydration rate constants, here reecting the distinct catalytic behavior of isolated
and paired protons in CHA zeolites, is quantitatively reminiscent of the dierence in
rst-order dehydration rate constants conferred by the diverse conning voids of MFI
intersections (ca. 0.7 nm diam.) and FAU supercages (ca. 1.3 nm diam.) [22].
Predictive synthetic control of the arrangement of framework Al atoms in zeo-
lites of xed composition, especially for those containing a single crystallographically
unique T-site, provides opportunities to synthesize materials with tunable catalytic
and structural properties, while maintaining a constant bulk density of active sites,
if so desired. These synthetic protocols can be used to inuence the speciation of
extraframework Cu ions, which behave as active sites for the selective catalytic re-
duction (SCR) of nitrogen oxides with ammonia, because Cu2+ cations exchange
preferentially at paired Al sites while [CuOH]+ species exchange at isolated Al sites
in CHA zeolites [79]. Isolated framework Al atoms appear less susceptible to hy-
drothermal dealumination, according to 29Si NMR studies of steam-treated FAU
zeolites that show preferential removal of Al atoms in next-nearest neighbor con-
gurations ((Si-O)2-Si-(O-Al)2: δ = -95 ppm) [150].34 Moreover, the dierent C1
intermediates prevalent at distinct proton active site ensembles in CHA zeolites of
similar composition, under identical operating conditions, may have implications for
methanol conversion routes in small-pore zeolites, such as methanol-to-olens (MTO)
and methanol-to-hydrocarbons (MTH) catalysis. CHA molecular sieves (e.g., SAPO-
34, SSZ-13) convert methanol selectively to ethene and propene,35,36 but deactivate
356
upon formation of polycyclic aromatic species within CHA cages that hinder prod-
uct diusion [458, 459]. The proximity of H+ sites within CHA zeolites, varied by
changing bulk composition, has been proposed to inuence the time-on-stream sta-
bility during MTO catalysis [158]. Surface methoxy groups have also been implicated
as intermediates in hydride transfer reactions with adsorbed olens [460, 461] and
in the initiation of C-C bond formation via carbonylation with carbon monoxide or
formaldehyde present either as impurities in reactant feeds or formed in situ [462,463].
Within the context of aluminosilicate zeolites, these ndings represent progress
toward developing methods that may enable systematic and predictable control of
the arrangement of matter at the atomic scale. The consequent and marked eects of
active site proximity on methanol dehydration rate constants among high-symmetry
(1 T-site) CHA zeolites of eectively xed composition, at rst glance, contrast the al-
pha test results of Haag and co-workers [14], in which hexane cracking rates appeared
insensitive to the diverse active site ensembles likely present among low-symmetry
(12 T-site) MFI zeolites of widely varying composition. This apparent discord can be
reconciled by many possibilities, such as if the crystallization procedures of MFI sam-
ples studied led to similar Al arrangements, if the alpha test is insensitive to acid site
proximity, or if acid site ensembles dier in catalytic function among dierent zeolite
topologies. Nevertheless, the data reported here provide a provocative contrast to the
landmark demonstration of Haag and co-workers. They demonstrate that catalytic
diversity for the same reaction can be introduced into zeolites of xed structure and
composition, even for frameworks containing a single lattice T-site, through synthetic
control of the atomic arrangement of matter.
8.4 Experimental Methods
8.4.1 Synthesis and preparation of MFI and CHA zeolites.
MFI zeolites (CBV8014, Si/Al = 43; CBV5524G, Si/Al = 30) were obtained
from Zeolyst International in their NH4-form and converted to their H-form accord-

357
ing to the procedures described below. CHA zeolites synthesized without Na+ in
hydroxide media and Si-CHA were prepared by following previously reported proce-
dures [42, 190]. Full details of synthetic procedures can be found in Section 8.7.1 of
the Supporting Information.
CHA zeolites were prepared using dierent Al precursors by adapting procedures
described by Deka et al. [84], which is a modied version of the original synthe-
sis reported by Zones [109]. A synthesis molar ratio of 1 SiO2/ 0.033 Al2O3/ 0.25
TMAdaOH/0.125 Na2O/44 H2O was used to obtain a Si/Al = 15 and Na+/TMAda+
= 1 in the synthesis solution. A typical synthesis involved adding an aqueous solution
of TMAdaOH (25 wt%, Sachem) to deionized H2O (18.2 MΩ) in a peruoroalkoxy
alkane jar (PFA, Savillex Corp.) and stirring the solution under ambient conditions
for 15 min. Next, either aluminum hydroxide (Al(OH)3, grade 0325, SPI Pharma),
aluminum nitrate nonahydrate (Al(NO3)3, 98 wt%, Sigma-Aldrich), aluminum chlo-
ride (AlCl3, 99 wt%, Sigma-Aldrich), alumina (Al2O3, 99.5 wt%, Alfa Aesar), sodium
aluminate (NaAlO2, technical grade, Alfa Aesar), or aluminum isopropoxide (Al(O-i-
Pr)3, 98 wt%, Sigma-Aldrich) was added to the aqueous TMAdaOH solution. Then,
a 5 M sodium hydroxide solution (NaOH: 16.7 wt% NaOH in deionized water; NaOH
pellets 98 wt%, Alfa Aesar) was added dropwise to the synthesis mixture and stirred
under ambient conditions for 15 min. Finally, colloidal silica (Ludox HS40, 40 wt%,
Sigma-Aldrich) was added and the mixture was covered and stirred for 2 h under am-
bient conditions. All synthesis reagents were used without further purication. The
synthesis solution was then transferred to a 45 mL Teon-lined stainless steel auto-
clave (Parr Instruments) and placed in a forced convection oven (Yamato DKN-402C)
at 433 K and rotated at 40 rpm for 6 days.
CHA zeolites were also synthesized in uoride media using only TMAda+ as
the SDA and without Na+ present following the procedure reported by Eilertsen
et al. [168], using a molar ratio of 1 SiO2/ 0.0167 Al2O3/ 0.5 TMAdaOH/0.5 HF/3
H2O. In a typical synthesis, Al2O3 was added to an aqueous TMAdaOH solution in
a PFA jar and the mixture was stirred for 15 min under ambient conditions. Then,

358
tetraethylorthosilicate (TEOS, 98 wt%, Sigma-Aldrich) was added to the mixture,
and the contents were covered and stirred for 2 h at ambient conditions until a homo-
geneous solution was obtained. Next, ethanol (200 proof, Koptec) was added to the
synthesis solution and left uncovered to allow ethanol and excess water to evaporate
in order to reach the target molar ratios. Once the synthesis solution had reached the
desired H2O/SiO2 ratio, concentrated hydrouoric acid (HF; 48 wt%, Sigma-Aldrich)
was added dropwise to the synthesis and homogenized for 15 min by hand. Caution:
when working with hydrouoric acid use appropriate personal protective
equipment, ventilation, and other safety measures. Upon addition of HF, the
solution immediately became a thick paste. The mixture was then left to sit un-
covered under ambient conditions for 30 min to allow any residual HF to evaporate
before transferring the solution to a 45 mL Teon-lined stainless steel autoclave and
heated in a forced convection at 423 K under rotation at 40 rpm for 6 days.
CHA zeolites were synthesized with 800 nm crystallite diameters following the
procedure reported by Li et al. [457], but omitting the NaOH addition. First, a
Na+-free CHA synthesis solution was prepared (Section 8.7.1, Supporting Informa-
tion), placed in a 45 mL Teon-lined stainless steel autoclave and heated in a forced
convection oven at 433 K while rotating at 40 rpm for 1 day. The autoclave was
removed from the oven and quenched in a room temperature water bath for 4 h. Af-
ter cooling to ambient conditions, hexadecyltrimethylammonium bromide (CTAB, 99
wt%, Sigma-Aldrich) was added to the synthesis mixture to act as a crystal growth
inhibitor [457, 464]. The CTAB containing synthesis mixture was then returned to
the autoclave and heated at 433 K and rotated at 40 rpm for 9 additional days.
Zeolite crystallization products were isolated via centrifugation and washed thor-
oughly with deionized water (18.2 MΩ) and acetone (99.9 wt%, Sigma-Aldrich) in
alternating steps (70 cm3 solvent g−1 per wash) until the pH of the supernatant re-
mained constant between washes, followed by a nal water wash to remove residual
acetone. Solids were recovered via centrifugation, dried at 373 K under stagnant air
for 24 h, and then treated in owing dry air (1.67 cm3 s−1 g−1, 99.999% UHP, Indiana
359
Oxygen) at 853 K (0.0167 K s−1) for 10 h. Residual Na+ was removed by converting
to the NH4-form via ion-exchange using 150 cm3 of an aqueous 1 M NH4NO3 solution
(8.0 wt% in H2O; 99.9 wt%, Sigma-Aldrich) per gram zeolite, and stirring for 24 h
under ambient conditions. Solids were recovered via centrifugation and washed four
times with deionized water (70 cm3 g−1 per wash). Recovered NH4-form zeolites were
then dried at 373 K under stagnant air for 24 h, and converted to their H-form by
treatment in owing dry air (1.67 cm3 s−1 g−1, 99.999% UHP, Indiana Oxygen) at
773 K (0.0167 K s−1) for 4 h.
8.4.2 Characterization of CHA and MFI zeolites.
Detailed experimental procedures and characterization data for all samples can be
found in Section 8.7.2 of the Supporting Information. Error reported for elemental
analysis of Al, Na, and Co, and NH3 TPD was determined for each data point by
error propagation of experimentally measured variables to the calculated value.
CHA and MFI crystal topologies were measured using powder X-ray diraction
(XRD) and conrmed by comparison with an experimental reference and the CHA
and MFI diraction patterns reported in the International Zeolite Association (IZA)
structure database [1]. Argon (87 K) and nitrogen (77 K) adsorption isotherms were
used to estimate micropore volumes of CHA and MFI zeolites, respectively. Elemen-
tal composition (Al, Na, Co) of each zeolite was measured using atomic absorption
spectroscopy (AAS). Thermogravimetric analysis (TGA) was used to measure the
organic content of synthesized CHA zeolite products. The crystal sizes of all CHA
zeolites were estimated from scanning electron microscopy (SEM) micrographs and
averaged over a distribution of individual crystal sizes taken from dierent regions
of the SEM sample stage. The number of H+ sites on CHA and MFI zeolites was
quantied by temperature-programmed desorption (TPD) of samples after aqueous
ion-exchange with NH+4 cations, while the number of H+ sites remaining after Cu or
Co-exchange of CHA zeolites was quantied from TPD of samples using gas-phase
NH3 titrations with purging treatments to remove all non-Brønsted bound NH3 from
360
samples, as reported elsewhere [78,171]. 27Al magic angle spinning nuclear magnetic
resonance (MAS NMR) spectra were recorded under ambient conditions on H-CHA
zeolite samples to quantify their fraction of framework and extraframework Al.
Co2+ titrations were performed on H-CHA zeolites via ion-exchange with 150 cm3
of an aqueous 0.25 M Co(NO3)2 (4.6 wt% Co(NO3)2; 99 wt%, Sigma-Aldrich) solution
per gram of zeolite for 4 h at ambient conditions under stirring. The pH of the solution
was not controlled and reached a stable value of ca. 3.3 after 4 h. After ion-exchange,
the samples were recovered using centrifugation, washed four times with deionized
water (70 cm3 per g solids per wash), and dried at 373 K under stagnant air for 24 h.
Co-exchanged CHA zeolites were then treated in owing dry air (1.67 cm3 s−1 g−1,
99.999% UHP, Indiana Oxygen) at 773 K (0.0167 K s−1) for 4 h.
Samples in Table 8.1 are referred to according to the formula: [countercation]-
[zeolite framework]-[mineralizing agent] (Si/Alf , % paired Al). In this nomenclature,
the countercation is the extraframework titrant introduced by the ion-exchange step
immediately preceding analysis (e.g., NH+4 or Co2+) or after conversion to the H-
form (e.g., H+), while no countercation is used to describe zeolites in their directly
synthesized form. The zeolite framework is either CHA or MFI, the mineralizing agent
is either OH− or F−, the Si/Alf ratio is determined from elemental analysis (AAS) and27Al NMR, and the % paired Al is determined from Co2+ titration (100*2*Co/Al).
For example, an H-form CHA zeolite synthesized in hydroxide media with a bulk
composition of Si/Alf = 15 and 20% paired Al would have the sample name: H-
CHA-OH(15,20%).
8.4.3 Measurement of methanol dehydration rates and titration of Brønsted acidsites during catalysis.
Rates of methanol dehydration were measured at dierential conversion (<10%)
in a tubular packed-bed quartz reactor (7 mm inner diameter) with plug-ow hy-
drodynamics at 415 K. Catalyst samples were pelleted and sieved to retain particles
between 180 and 250 µm. The catalyst charged to the reactor was varied between

361
0.005 and 0.030 g to maintain dierential conversions, and were diluted with Si-CHA
(180-250 µm) to ensure a minimum of 0.025 g of total solids were charged to the re-
actor. The catalyst bed was supported in the reactor between two quartz wool plugs.
Reactor temperatures were controlled using a resistively heated three-zone furnace
(Series 3210, Applied Test Systems) and Watlow controllers (EZ-Zone Series). The
temperature of the catalyst bed was measured with a K-type thermocouple in direct
contact with the external surface of the quartz tube and positioned at the center of
the catalyst bed. Methanol (99.9 wt%, Sigma-Aldrich) partial pressures were con-
trolled using a syringe pump (Legato 100, KD Scientic) and injected into owing
He (UHP, Indiana Oxygen) and sent to the reactor through heated transfer lines
maintained at >373 K using resistive heating tape (BriskHeat Co.) and insulating
wrap. Prior to contact with methanol, samples were treated in a 5% O2/He ow
(50 cm3 g−1 s−1, 99.999%, Indiana Oxygen) by heating to 773 K (0.033 K s−1) and
holding for 4 h. After cooling to reaction temperature (415 K), the gas stream was
switched to He ow (150 cm3 g−1 s−1) while methanol, at a xed partial pressure,
was sent to a gas chromatograph (Agilent 6890GC) via heated transfer lines (>373
K) for bypass calibration. Concentrations of reactants and products were measured
using a gas chromatograph equipped with a ame ionization detector (HP Plot-Q KCl
column, 0.53 mm ID x 30 m x 40 µm lm, Agilent). Only dimethyl ether and water
were observed as products at all reaction conditions on all catalysts. Methane (25%
CH4/Ar, 99.999%, Indiana Oxygen) was introduced into the reactor euent stream
at a constant ow rate (0.083 cm3 s−1) and used as an internal standard.
The total number of Brønsted acid sites in H-MFI zeolites was measured dur-
ing steady state methanol dehydration catalysis using in situ titration with pyridine
on the same reactor unit described above. Steady-state dehydration rates (3.5 kPa
CH3OH, 415 K) were achieved prior to the introduction of pyridine titrants. Pyridine
(99.8 wt%, Sigma-Aldrich) was dissolved in methanol and evaporated into a owing
He stream (100 cm3 g−1 s−1) using a syringe pump to attain the desired concentra-
tion of reactant and titrant (3.5 kPa methanol, 0.5 Pa pyridine). The total number of
362
protons titrated was calculated by extrapolation of dehydration rates, measured as a
function of the cumulative pyridine dosed to the bed, to values of zero and assuming
a 1:1 pyridine:H+ stoichiometry (Section 8.7.3, Supporting Information).
The internal reproducibility error on methanol dehydration rates for each sample
and set of conditions was less than 10%. The uncertainties reported here for methanol
dehydration rates on CHA and MFI zeolites were determined for each data point by
propagation of error in each experimentally measured variable (e.g., temperature,
methanol partial pressure, catalyst mass, proton site content) to calculated rates, in
order to provide representative uncertainties for values that may be reproduced by an
independent researcher. The uncertainties in rst-order and zero-order rate constants
were determined from error analysis of a least-squares regression to the measured rate
data, accounting for uncertainties in rate measurements.
8.4.4 Measurement of in situ IR spectra on CHA and MFI zeolites.
in situ IR spectra were collected on a Nicolet 4700 spectrometer with a HgCdTe
detector (MCT, cooled to 77 K by liquid N2) by averaging 64 scans at a 2 cm−1
resolution collected between 4000 and 400 cm−1 range, taken relative to an empty
cell background reference collected under dry He ow (0.33 cm3 s−1, UHP, Indiana
Oxygen) at 415 K. CHA catalysts were pressed into self-supporting wafers (0.01-0.02 g
cm−2) and sealed within a custom-built quartz IR cell with CaF2 windows; a detailed
description of the IR cell design can be found elsewhere [465,466]. Wafer temperatures
were measured within 2 mm of each side of the wafer by K-type thermocouples (Omega
Engineering). The quartz IR cell was interfaced to a syringe pump (Legato 100, KD
Scientic) via a stainless-steel transfer line (0.25 in. diameter) that was maintained
>353 K using resistive heating tape (BriskHeat Co.) and insulating wrap, in order
to deliver liquid reactants to the IR cell. Prior to each IR experiment, the catalyst
wafer was treated in owing dry air (13.3 cm3 s−1 g−1) puried by an FTIR purge
gas generator (Parker Balston, < 1 ppm of CO2, 200 K H2O dew point) to 773 K
(0.083 K s−1) for 4 h, and then cooled under owing He (13.3 cm3 s−1 g−1) to 415
363
K. Methanol was introduced into the heated gas stream under steady-state ow, and
methanol partial pressures were varied non-systematically between 0.1 and 22 kPa. IR
spectra were recorded after equilibration of the surface was achieved (ca. 30 min) and
peak intensities remained constant for 15 min. All IR spectra were baseline-corrected
and normalized to combination and overtone zeolite T-O-T vibrational modes (1750-
2100 cm−1) only when comparing between dierent parent CHA samples, because
adsorption of methanol on the zeolite surface caused a systematic change to the T-
O-T band area with changing methanol pressure 8.50-8.52. An IR spectrum of an
empty IR cell under 2 kPa steady-state methanol pressure (13.3 cm3 s−1 g−1 He) was
used as a reference for gas-phase methanol vibrational modes observed in spectra of
catalyst wafers recorded under steady-state methanol pressure.
8.5 Acknowledgements
We acknowledge the nancial support from the National Science Foundation un-
der award number 1552517-CBET. We thank Sachem, Inc., for providing the organic
structure-directing agent used to synthesize CHA zeolites, and Mark Davis (Caltech)
and Michiel Dusselier (KU Leuven) for providing the AEI zeolite sample. We also
thank John Harwood (Purdue Interdepartmental NMR Facility) for assistance collect-
ing NMR spectra, Michael Cordon for assistance collecting SEM micrographs, and
Hyun Chang Kim and You-Yeon Won (Purdue) for DLS measurements. Finally, we
thank David Hibbitts (Florida), Juan Carlos Vega-Vila, and Jason Bates for technical
discussions and feedback on this manuscript.
Additionally, I acknowledge the American Chemical Society for granting permis-
sion to reproduce this chapter of my thesis. Adapted with permissions from ACS
Catalysis, 2017, 7, 6663-6674. Copyright (2017) American Chemical Society. The full
article can be accessed here: dx.doi.org/10.1021/acscatal.7b01273.

364
Table 8.1.Characterization Data and Methanol Dehydration Rate Constants forCHA Zeolites Synthesized at Dierent Compositions and with DierentFractions of Paired Al Sites in OH− and F− Media.
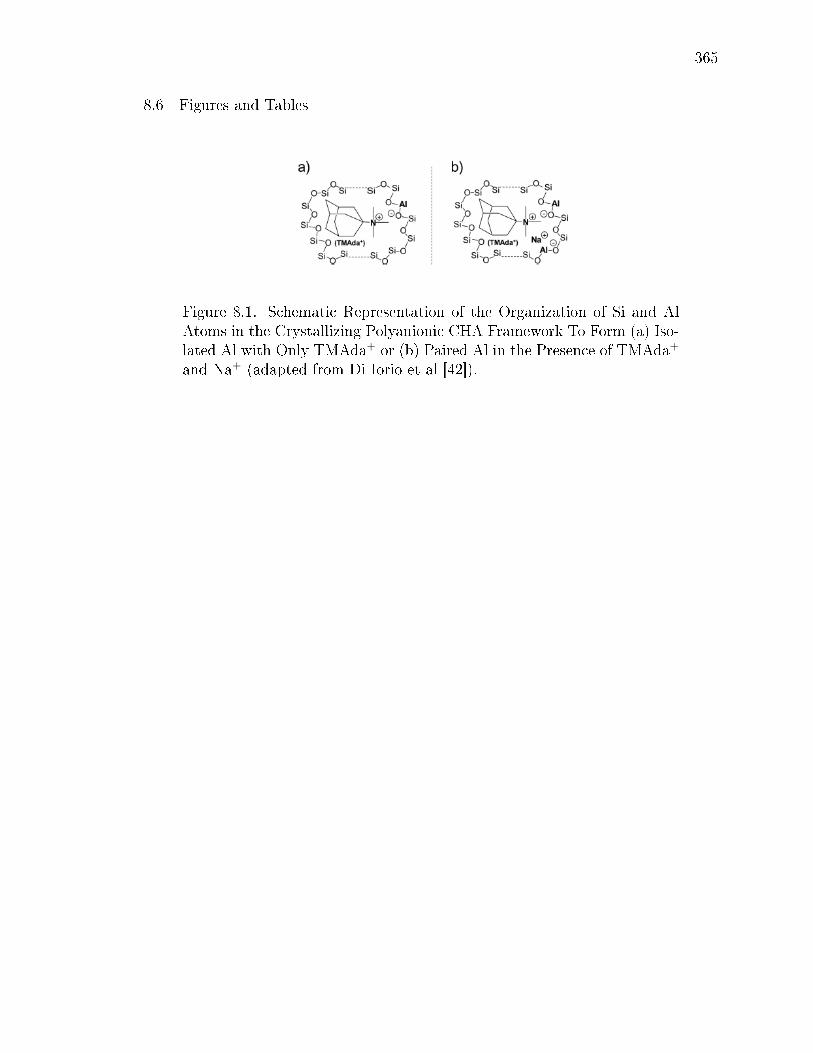
365
8.6 Figures and Tables
Figure 8.1. Schematic Representation of the Organization of Si and AlAtoms in the Crystallizing Polyanionic CHA Framework To Form (a) Iso-lated Al with Only TMAda+ or (b) Paired Al in the Presence of TMAda+
and Na+ (adapted from Di Iorio et al [42]).
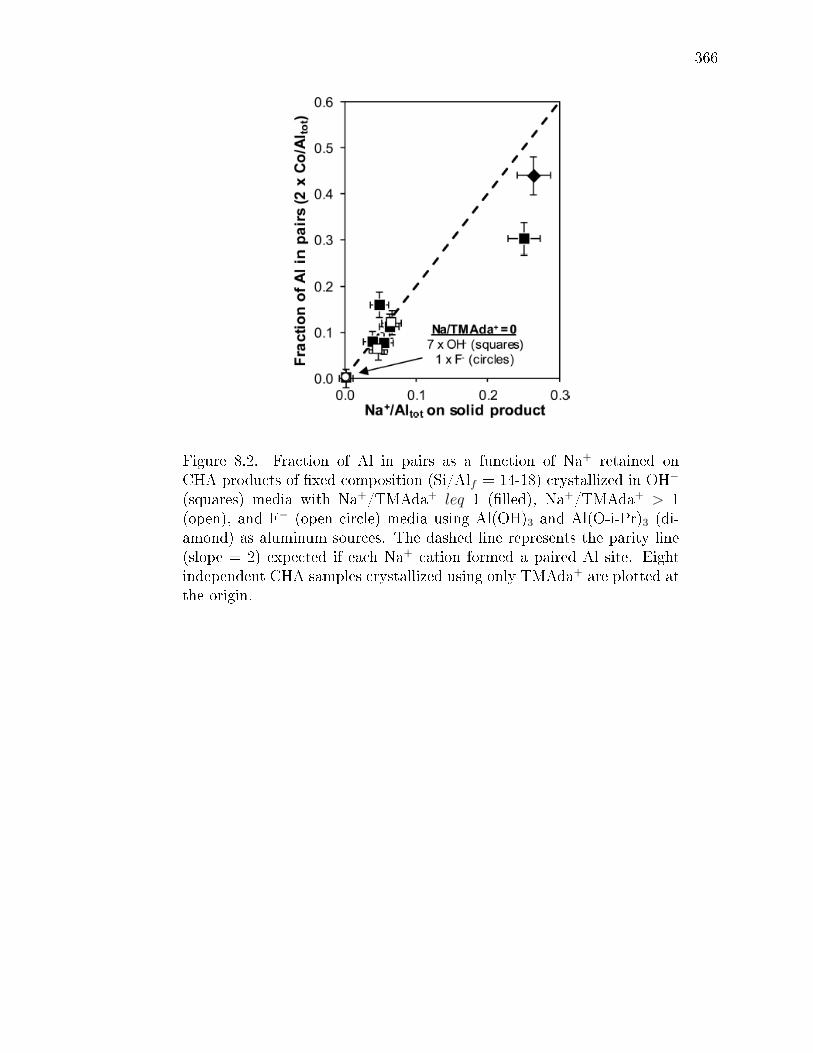
366
Figure 8.2. Fraction of Al in pairs as a function of Na+ retained onCHA products of xed composition (Si/Alf = 14-18) crystallized in OH−
(squares) media with Na+/TMAda+ leq 1 (lled), Na+/TMAda+ > 1(open), and F− (open circle) media using Al(OH)3 and Al(O-i-Pr)3 (di-amond) as aluminum sources. The dashed line represents the parity line(slope = 2) expected if each Na+ cation formed a paired Al site. Eightindependent CHA samples crystallized using only TMAda+ are plotted atthe origin.
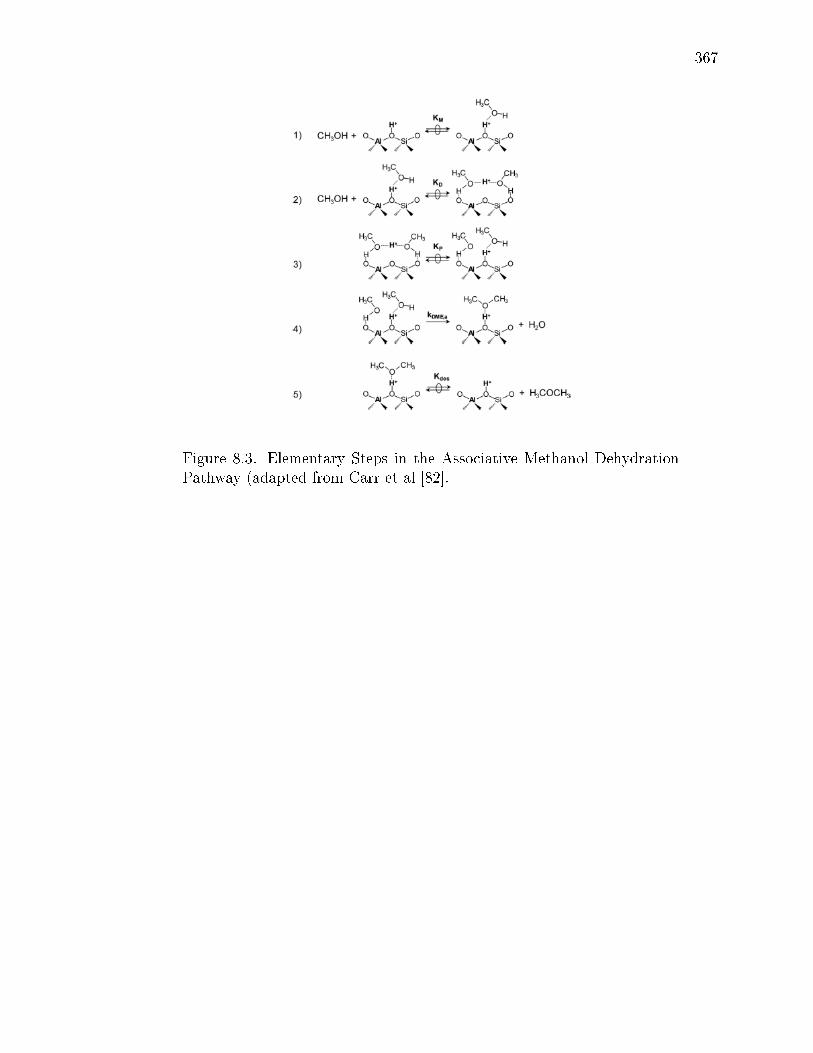
367
Figure 8.3. Elementary Steps in the Associative Methanol DehydrationPathway (adapted from Carr et al [82].
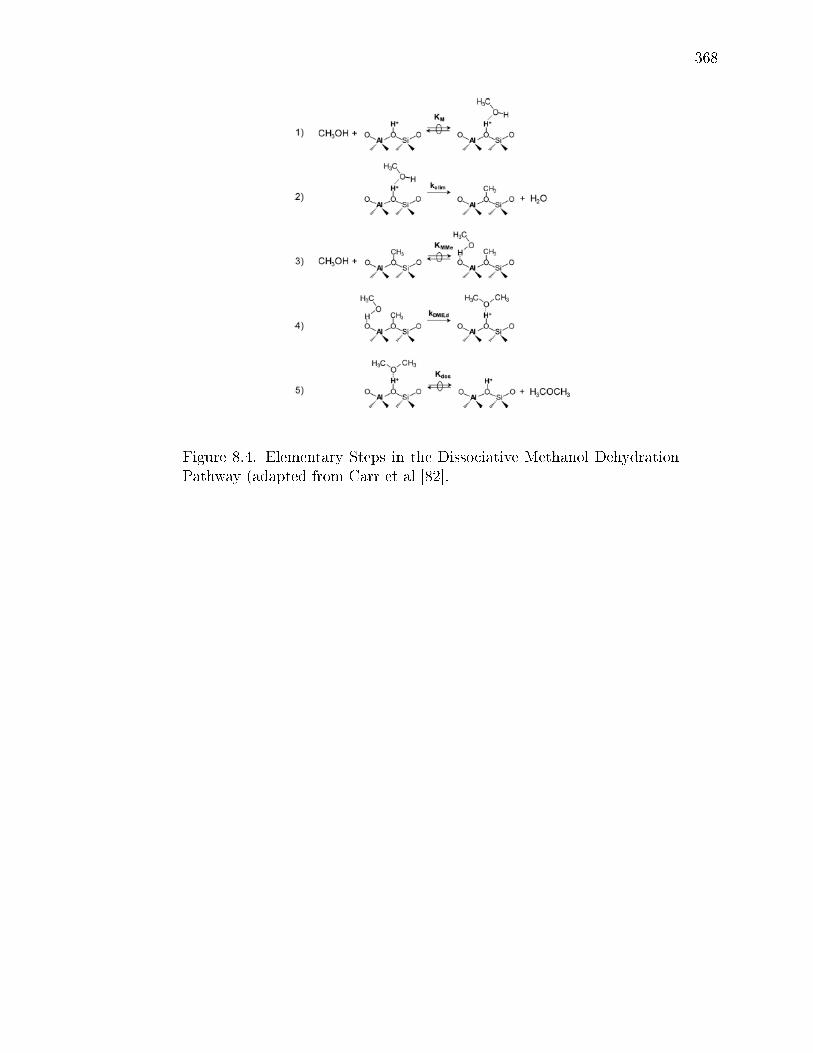
368
Figure 8.4. Elementary Steps in the Dissociative Methanol DehydrationPathway (adapted from Carr et al [82].
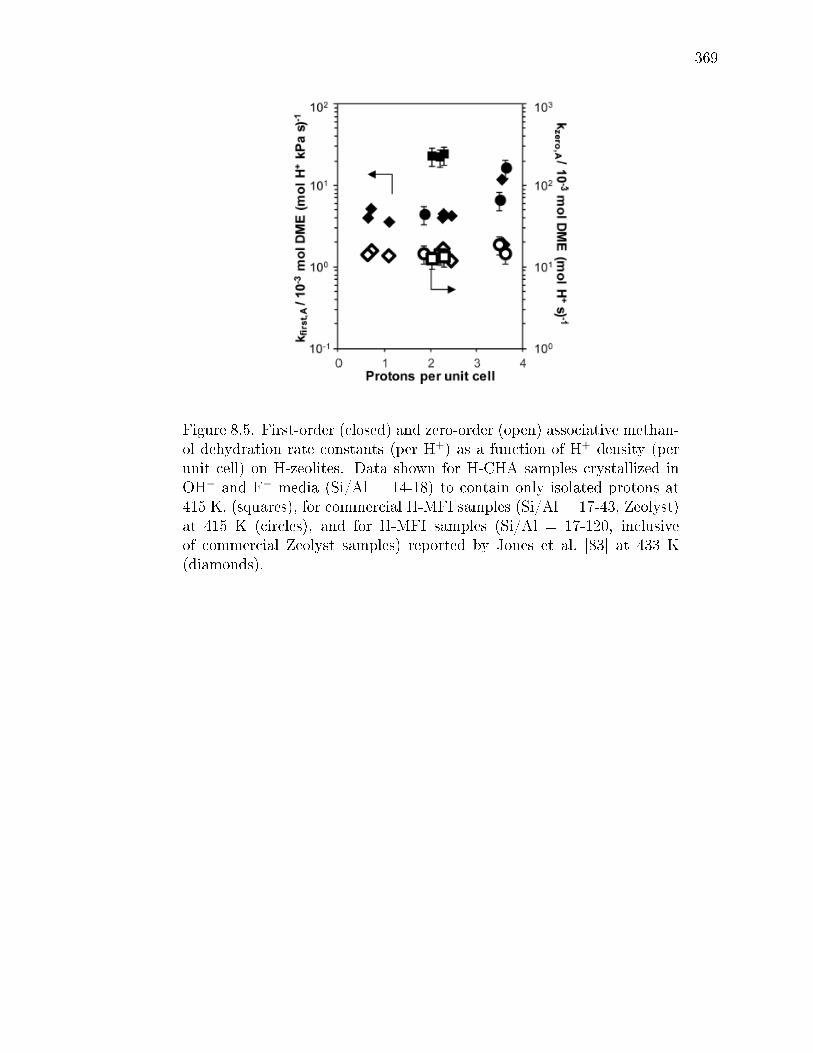
369
Figure 8.5. First-order (closed) and zero-order (open) associative methan-ol dehydration rate constants (per H+) as a function of H+ density (perunit cell) on H-zeolites. Data shown for H-CHA samples crystallized inOH− and F− media (Si/Al = 14-18) to contain only isolated protons at415 K, (squares), for commercial H-MFI samples (Si/Al = 17-43, Zeolyst)at 415 K (circles), and for H-MFI samples (Si/Al = 17-120, inclusiveof commercial Zeolyst samples) reported by Jones et al. [83] at 433 K(diamonds).

370
Figure 8.6. Dependence of the intraparticle eectiveness factor on theThiele modulus for methanol dehydration on H-CHA zeolites with Si/Alf= 14-18 with 0% (circles), 18-30% (triangles), and 44% (diamond) pairedAl. Data also shown for H-CHA with Si/Alf = 27 (square), and H-CHAsynthesized with CTAB (cross). Dashed line is the eectiveness factorpredicted for a rst-order reaction in a spherical pellet (Section 8.7.5,Supporting Information).
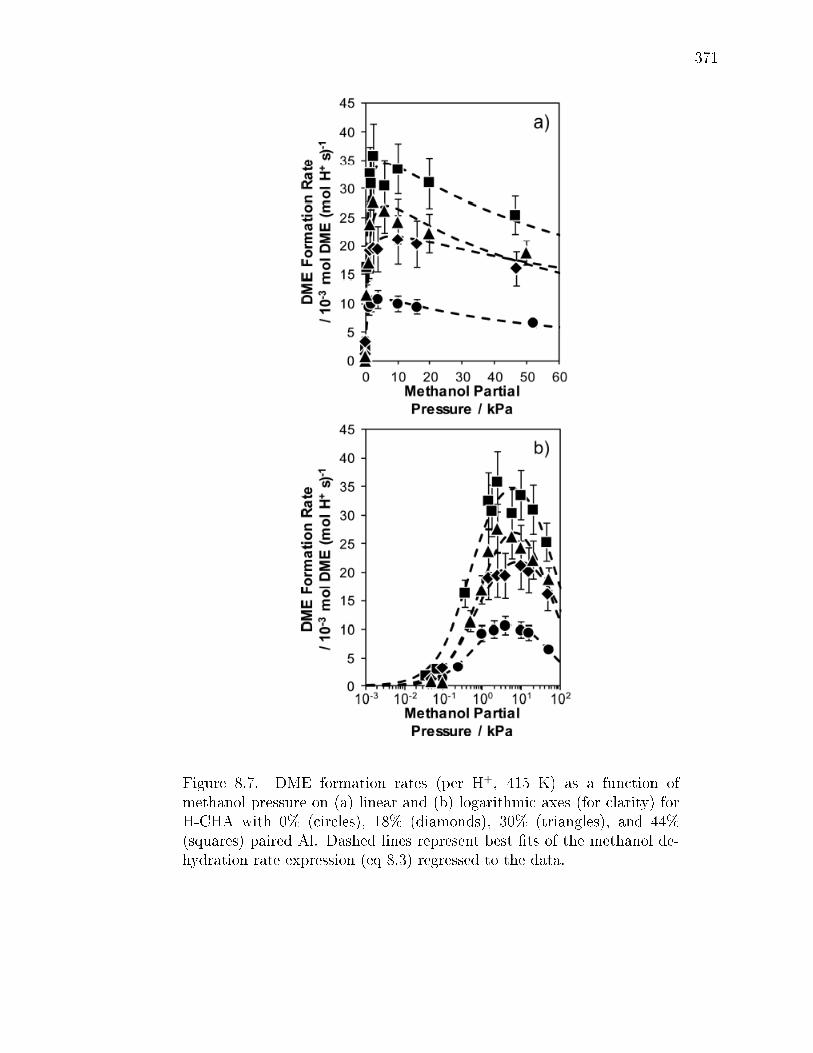
371
Figure 8.7. DME formation rates (per H+, 415 K) as a function ofmethanol pressure on (a) linear and (b) logarithmic axes (for clarity) forH-CHA with 0% (circles), 18% (diamonds), 30% (triangles), and 44%(squares) paired Al. Dashed lines represent best ts of the methanol de-hydration rate expression (eq 8.3) regressed to the data.
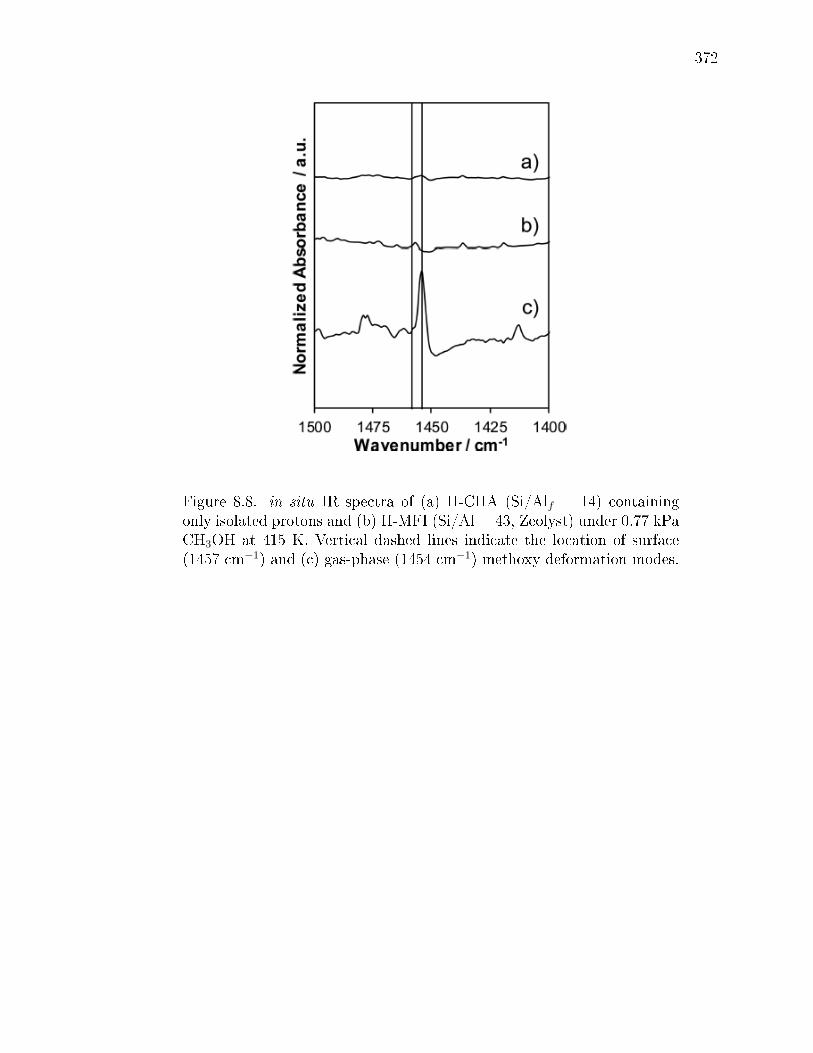
372
Figure 8.8. in situ IR spectra of (a) H-CHA (Si/Alf = 14) containingonly isolated protons and (b) H-MFI (Si/Al = 43, Zeolyst) under 0.77 kPaCH3OH at 415 K. Vertical dashed lines indicate the location of surface(1457 cm−1) and (c) gas-phase (1454 cm−1) methoxy deformation modes.
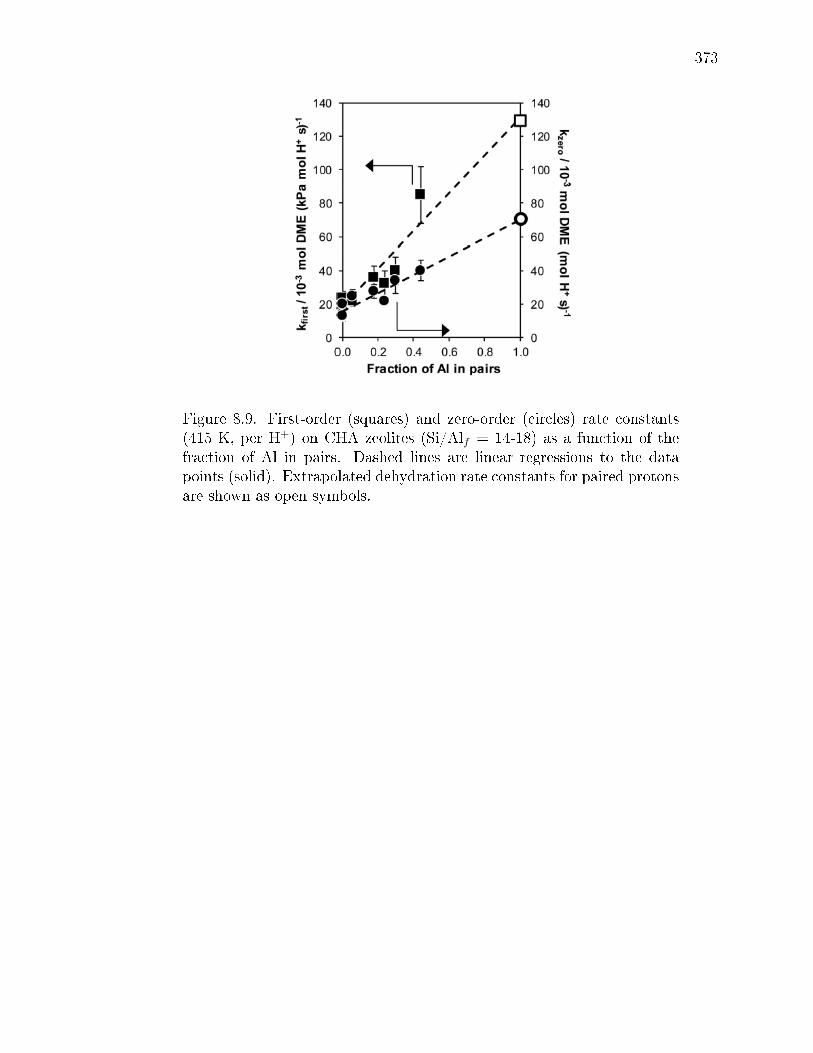
373
Figure 8.9. First-order (squares) and zero-order (circles) rate constants(415 K, per H+) on CHA zeolites (Si/Alf = 14-18) as a function of thefraction of Al in pairs. Dashed lines are linear regressions to the datapoints (solid). Extrapolated dehydration rate constants for paired protonsare shown as open symbols.
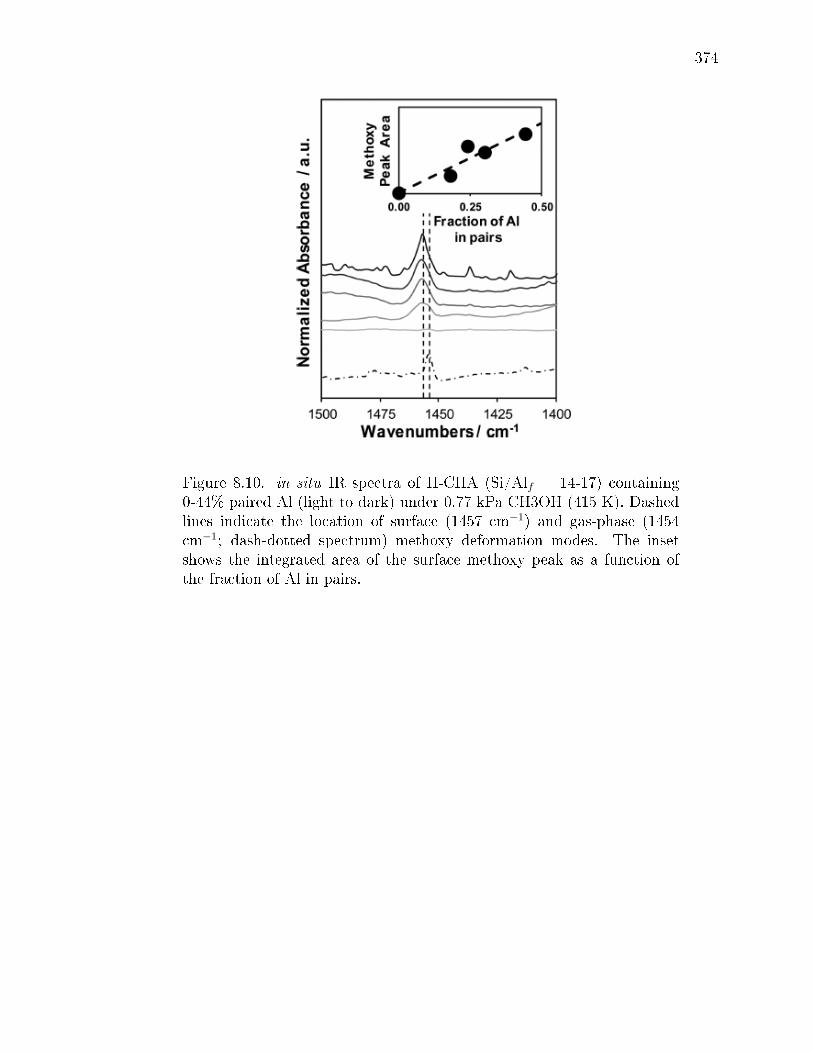
374
Figure 8.10. in situ IR spectra of H-CHA (Si/Alf = 14-17) containing0-44% paired Al (light to dark) under 0.77 kPa CH3OH (415 K). Dashedlines indicate the location of surface (1457 cm−1) and gas-phase (1454cm−1; dash-dotted spectrum) methoxy deformation modes. The insetshows the integrated area of the surface methoxy peak as a function ofthe fraction of Al in pairs.
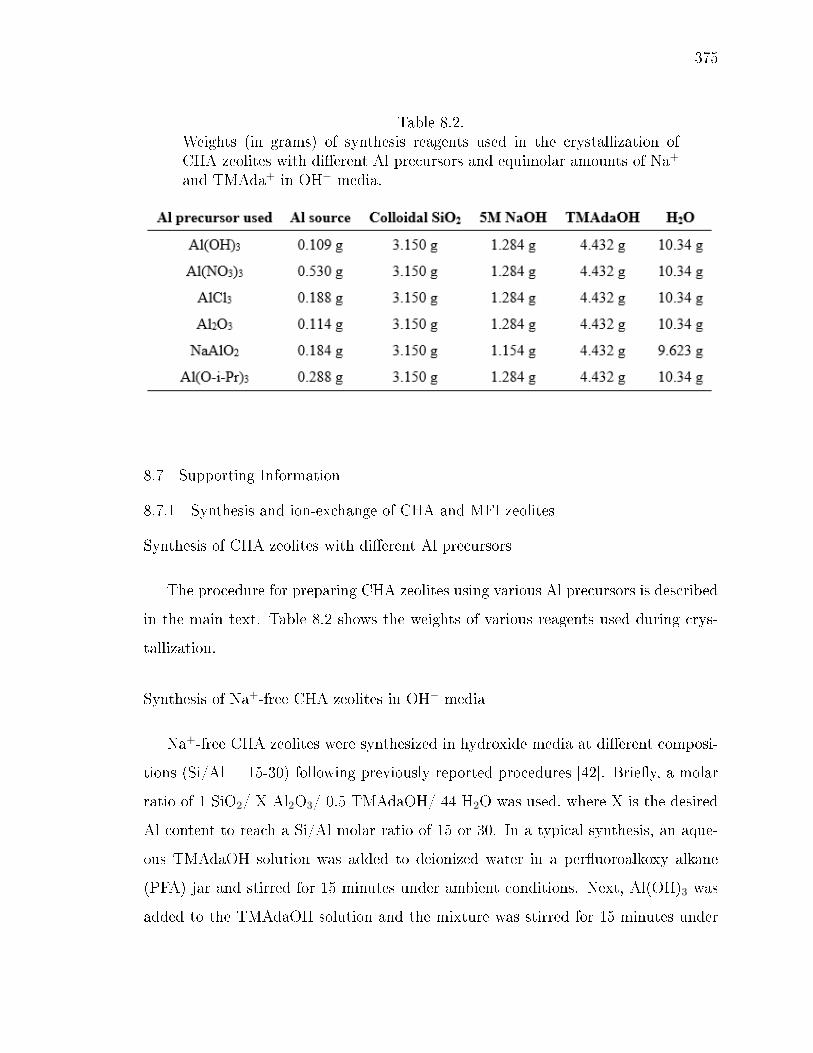
375
Table 8.2.Weights (in grams) of synthesis reagents used in the crystallization ofCHA zeolites with dierent Al precursors and equimolar amounts of Na+
and TMAda+ in OH− media.
8.7 Supporting Information
8.7.1 Synthesis and ion-exchange of CHA and MFI zeolites
Synthesis of CHA zeolites with dierent Al precursors
The procedure for preparing CHA zeolites using various Al precursors is described
in the main text. Table 8.2 shows the weights of various reagents used during crys-
tallization.
Synthesis of Na+-free CHA zeolites in OH− media
Na+-free CHA zeolites were synthesized in hydroxide media at dierent composi-
tions (Si/Al = 15-30) following previously reported procedures [42]. Briey, a molar
ratio of 1 SiO2/ X Al2O3/ 0.5 TMAdaOH/ 44 H2O was used, where X is the desired
Al content to reach a Si/Al molar ratio of 15 or 30. In a typical synthesis, an aque-
ous TMAdaOH solution was added to deionized water in a peruoroalkoxy alkane
(PFA) jar and stirred for 15 minutes under ambient conditions. Next, Al(OH)3 was
added to the TMAdaOH solution and the mixture was stirred for 15 minutes under
376
ambient conditions. Then, colloidal silica was added to the mixture and the contents
were stirred for 2 h at ambient conditions until a homogeneous solution was obtained.
All synthesis reagents were used without further purication. The synthesis solution
was then transferred to a 45 ml Teon-lined stainless steel autoclave and heated in a
forced convection oven at 433 K and rotated at 40 RPM for 6 days.
Synthesis of Si-CHA zeolites in F− media
Pure SiO2 chabazite was synthesized following a previously reported procedures
[42, 190] using a synthesis solution molar ratio of 1 SiO2/ 0.5 TMAdaOH/ 0.5 HF/
3 H2O. In a typical synthesis, TEOS was added to a PFA jar containing an aqueous
TMAdaOH solution and stirred under ambient conditions. Ethanol, formed from the
hydrolysis of TEOS, and excess water were then evaporated under ambient conditions
to reach target molar ratios. Once the synthesis solution had reached the desired
H2O/SiO2 ratio, hydrouoric acid (HF) was added dropwise to the synthesis and
homogenized for 15 minutes. Caution: when working with HF acid, use appropriate
personal protective equipment, ventilation, and other safety measures. The mixture
was then left to sit uncovered under ambient conditions for 30 minutes to allow for
any residual HF to evaporate before transferring the solution to a 45 ml Teon-
lined stainless steel autoclave and heated in a forced convection oven at 423 K under
rotation at 40 RPM for 40 h.
8.7.2 Characterization of CHA and MFI zeolites
Characterization data of all zeolites
Samples are labeled using the formula prescribed in the main text: [counter-
cation]-[zeolite framework]-[mineralizing agent](Si/Alf , % paired Al). Tables 8.3-8.6
contain characterization and kinetic data for CHA zeolites synthesized without Na+ in
OH− and F− media (Table 8.3), with various Al precursors using equimolar amounts
of Na+ and TMAda+ (Table 8.4), with Al(OH)3 and equimolar amounts of Na+ and

377
Table 8.3.Characterization data of CHA zeolites synthesized using Al(OH)3 as thealuminum source, without Na+ in OH− and F− media.
TMAda+ and inclusion of hexadecyltrimethylammonium bromide (CTAB; Table 8.5),
and for MFI zeolites (Table 8.6). Each table includes micropore volumes determined
from adsorption isotherms (Section 8.7.2, bulk Si/Al ratio from atomic absorption
spectroscopy (Section 8.7.2), organic content measured by thermogravimetric analysis
(Section 8.7.2), H+/Al values measured from NH3 temperature programmed desorp-
tion (Section 8.7.2), and the fraction of isolated (Aliso/Altot) and paired (Alpair/Altot)
Al measured from Co2+ titration (procedure in main text). Also presented are rst
and zero-order rate constants (per H+) for the dehydration of methanol to dimethyl
ether measured at 415 K (procedure in main text; Section 8.7.3).
X-Ray diraction of MFI and CHA zeolites
Crystal topologies of H-form zeolites were assessed from powder X-ray diraction
(XRD) patterns measured on a Rigaku SmartLab X-ray diractometer with a Cu
Kα radiation source (λ=0.154 nm) operated at 1.76 kW. Typically, 0.50 g of zeolite
powder were loaded onto a sample holder (Rigaku) and the diraction pattern was
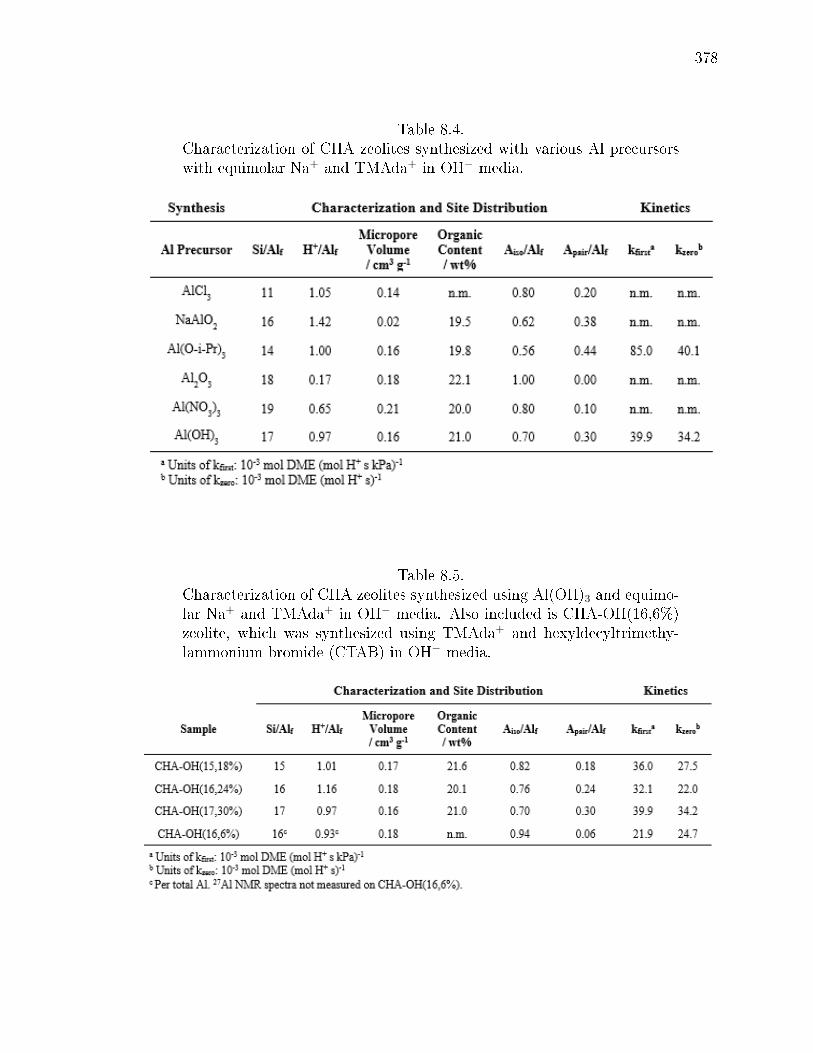
378
Table 8.4.Characterization of CHA zeolites synthesized with various Al precursorswith equimolar Na+ and TMAda+ in OH− media.
Table 8.5.Characterization of CHA zeolites synthesized using Al(OH)3 and equimo-lar Na+ and TMAda+ in OH− media. Also included is CHA-OH(16,6%)zeolite, which was synthesized using TMAda+ and hexyldecyltrimethy-lammonium bromide (CTAB) in OH− media.
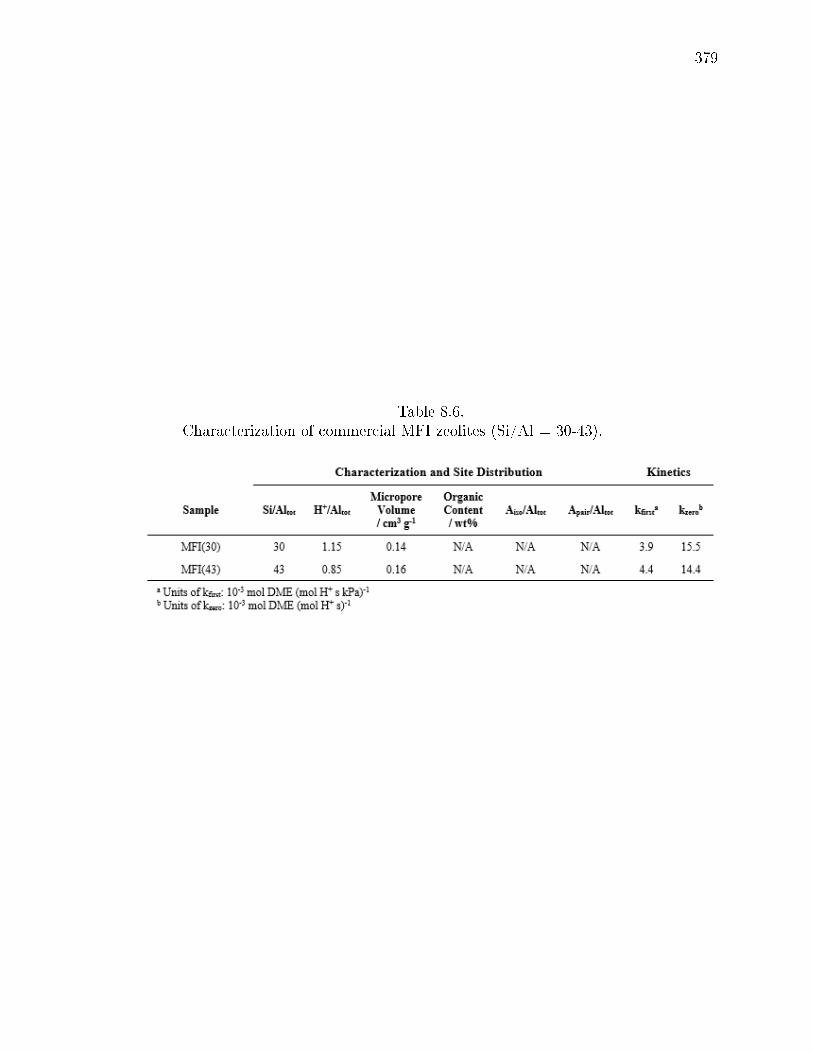
379
Table 8.6.Characterization of commercial MFI zeolites (Si/Al = 30-43).
380
recorded from 4-40 2θ at a scan rate of 0.04 s-1. Powder XRD patterns for all syn-
thesized materials were compared to diraction patterns for CHA (CHA) reported in
the International Zeolite Association (IZA) structure database [1]. All XRD patterns
reported here are normalized such that the maximum peak intensity in each pattern
is set to unity. Diraction patterns of CHA and MFI zeolites are shown in Figures
8.11-8.16.
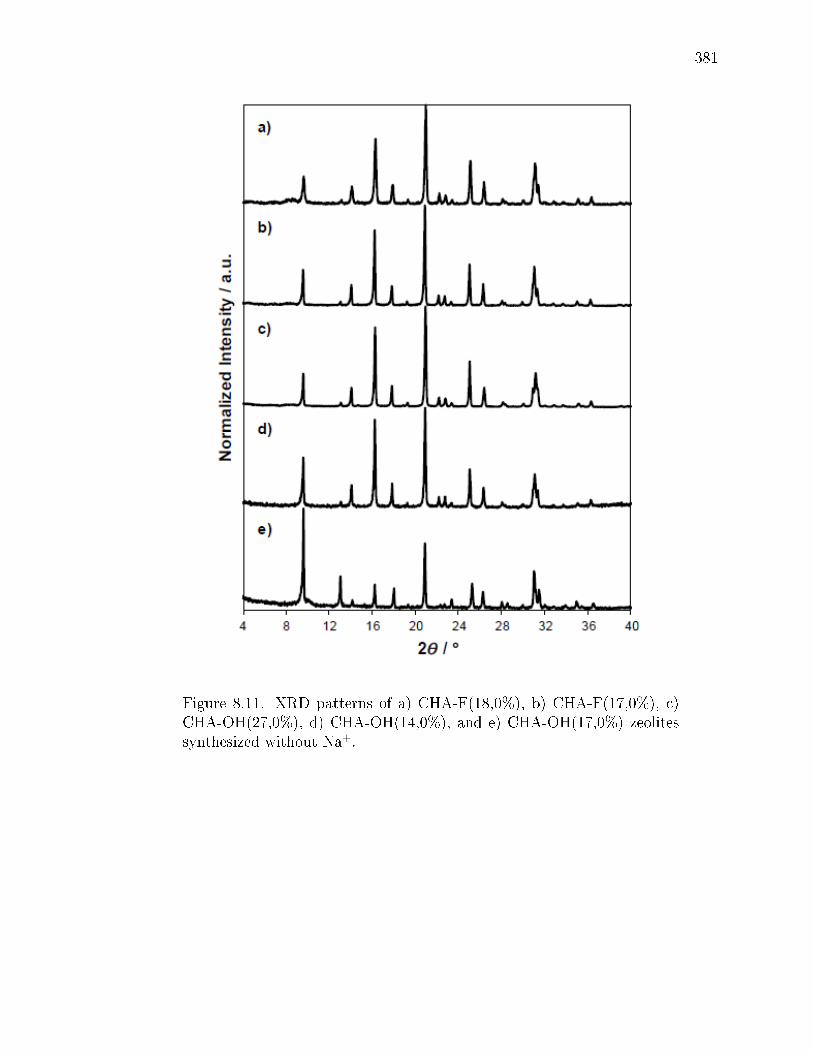
381
Figure 8.11. XRD patterns of a) CHA-F(18,0%), b) CHA-F(17,0%), c)CHA-OH(27,0%), d) CHA-OH(14,0%), and e) CHA-OH(17,0%) zeolitessynthesized without Na+.

382
Figure 8.12. XRD patterns of CHA zeolites synthesized with a) AlCl3,b) NaAlO2, c) Al(O-i-Pr)3, d) Al2O3, e) Al(NO3)3, and f) Al(OH)3 andequimolar Na+ and TMAda+ in OH− media.
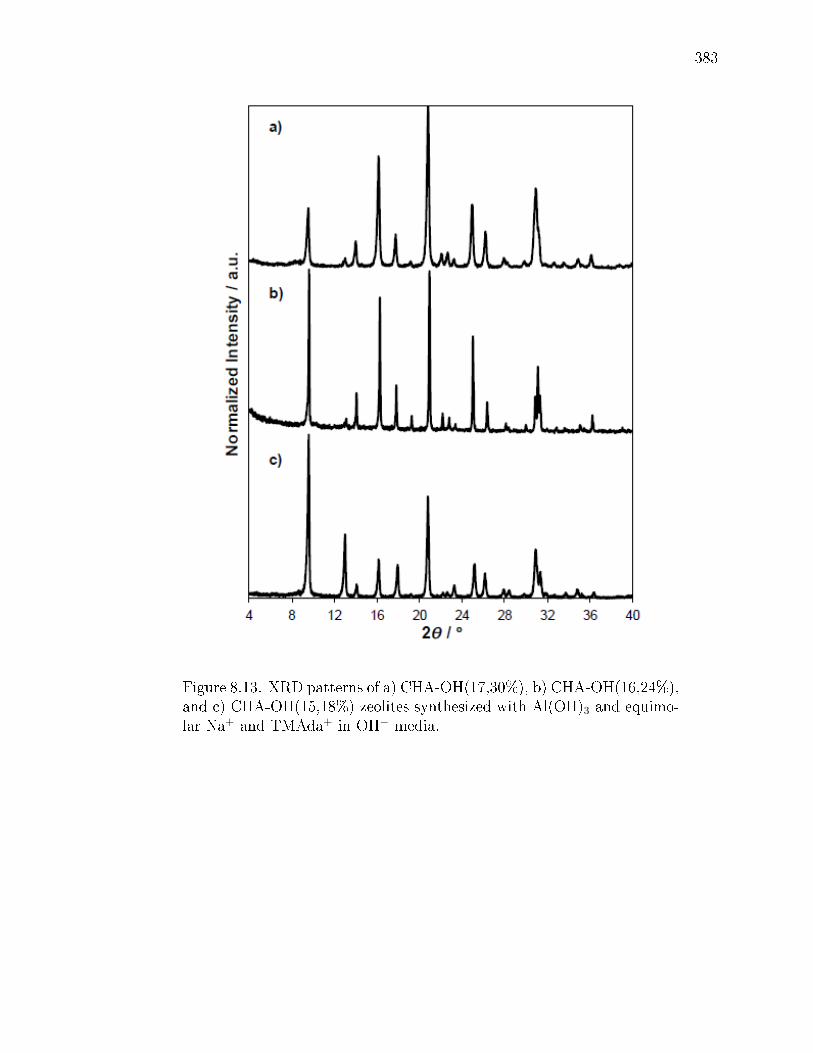
383
Figure 8.13. XRD patterns of a) CHA-OH(17,30%), b) CHA-OH(16,24%),and c) CHA-OH(15,18%) zeolites synthesized with Al(OH)3 and equimo-lar Na+ and TMAda+ in OH− media.
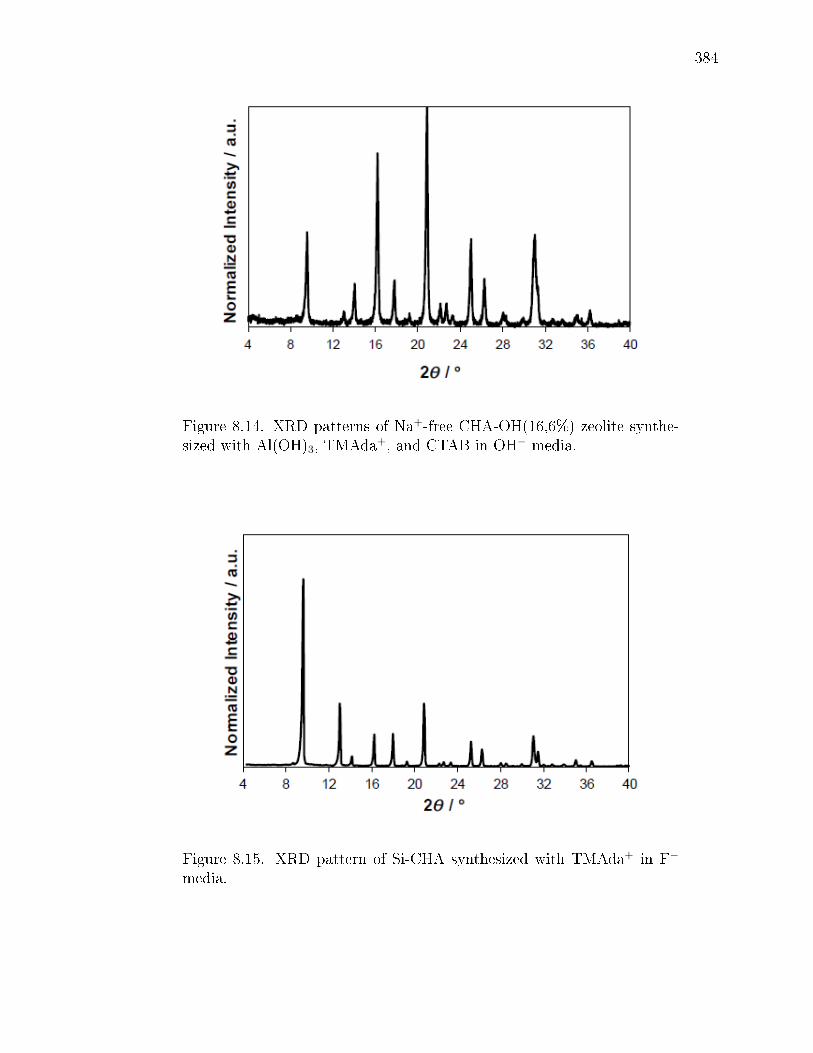
384
Figure 8.14. XRD patterns of Na+-free CHA-OH(16,6%) zeolite synthe-sized with Al(OH)3, TMAda+, and CTAB in OH− media.
Figure 8.15. XRD pattern of Si-CHA synthesized with TMAda+ in F−
media.
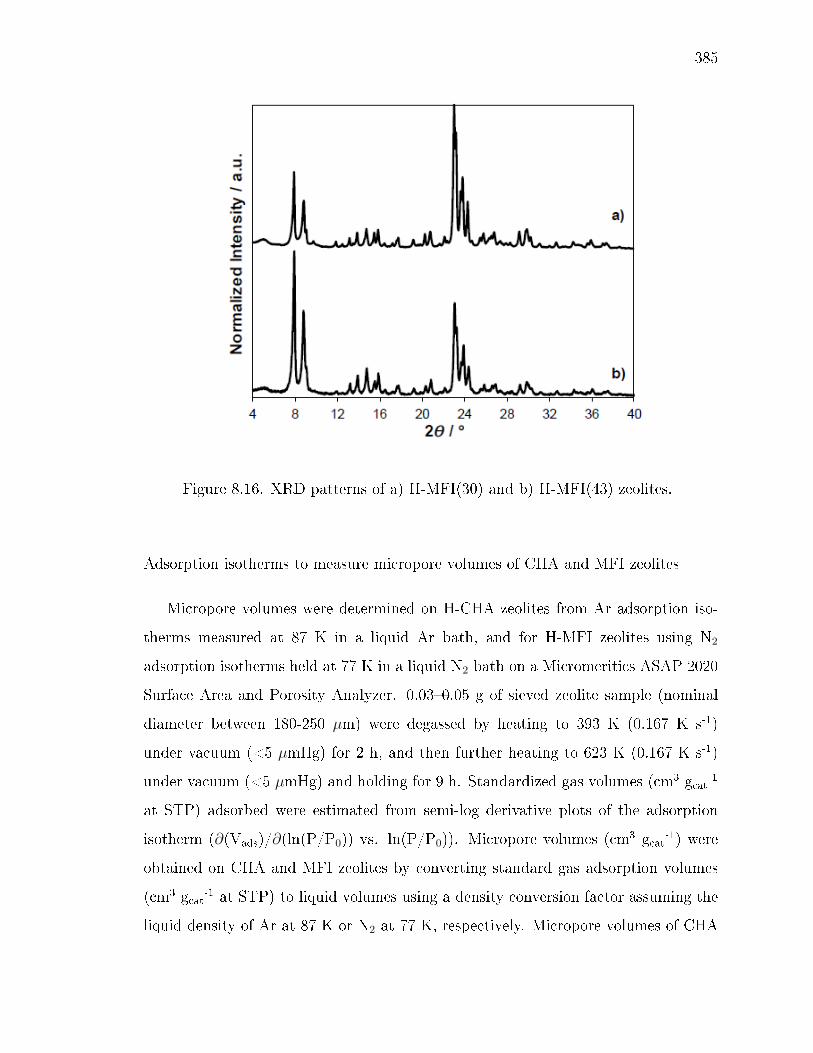
385
Figure 8.16. XRD patterns of a) H-MFI(30) and b) H-MFI(43) zeolites.
Adsorption isotherms to measure micropore volumes of CHA and MFI zeolites
Micropore volumes were determined on H-CHA zeolites from Ar adsorption iso-
therms measured at 87 K in a liquid Ar bath, and for H-MFI zeolites using N2
adsorption isotherms held at 77 K in a liquid N2 bath on a Micromeritics ASAP 2020
Surface Area and Porosity Analyzer. 0.030.05 g of sieved zeolite sample (nominal
diameter between 180-250 µm) were degassed by heating to 393 K (0.167 K s-1)
under vacuum (<5 µmHg) for 2 h, and then further heating to 623 K (0.167 K s-1)
under vacuum (<5 µmHg) and holding for 9 h. Standardized gas volumes (cm3 gcat-1
at STP) adsorbed were estimated from semi-log derivative plots of the adsorption
isotherm (∂(Vads)/∂(ln(P/P0)) vs. ln(P/P0)). Micropore volumes (cm3 gcat-1) were
obtained on CHA and MFI zeolites by converting standard gas adsorption volumes
(cm3 gcat-1 at STP) to liquid volumes using a density conversion factor assuming the
liquid density of Ar at 87 K or N2 at 77 K, respectively. Micropore volumes of CHA
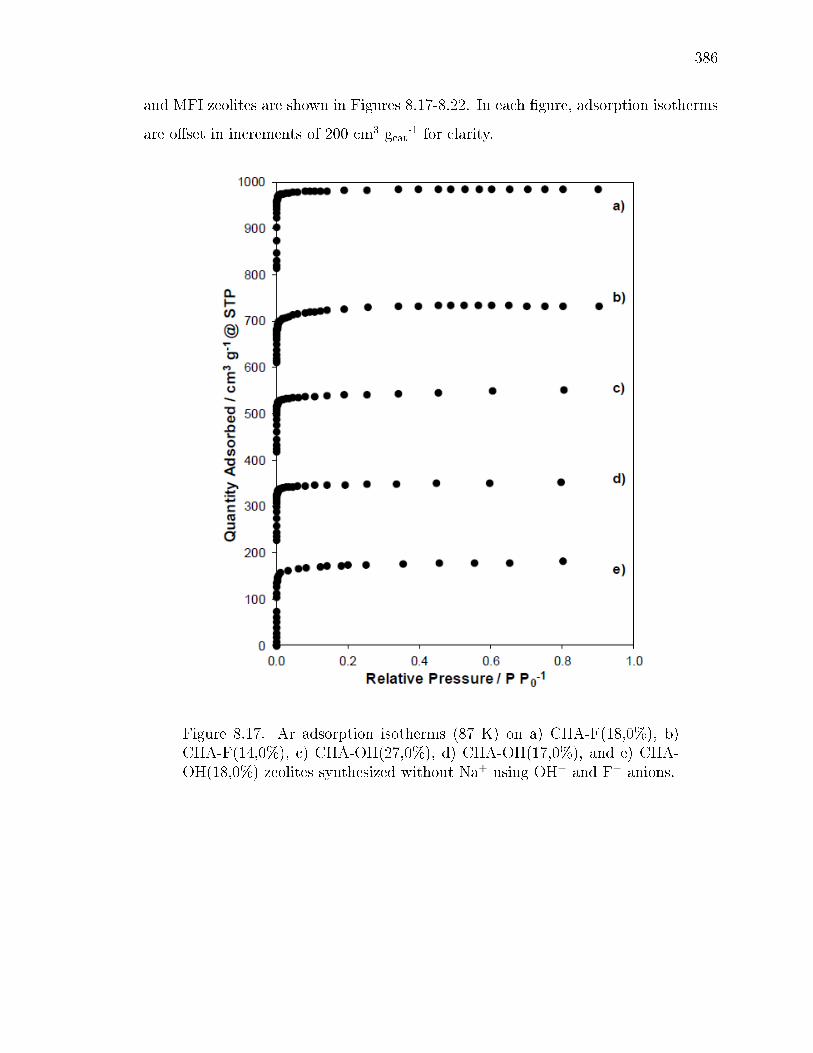
386
and MFI zeolites are shown in Figures 8.17-8.22. In each gure, adsorption isotherms
are oset in increments of 200 cm3 gcat-1 for clarity.
Figure 8.17. Ar adsorption isotherms (87 K) on a) CHA-F(18,0%), b)CHA-F(14,0%), c) CHA-OH(27,0%), d) CHA-OH(17,0%), and e) CHA-OH(18,0%) zeolites synthesized without Na+ using OH− and F− anions.
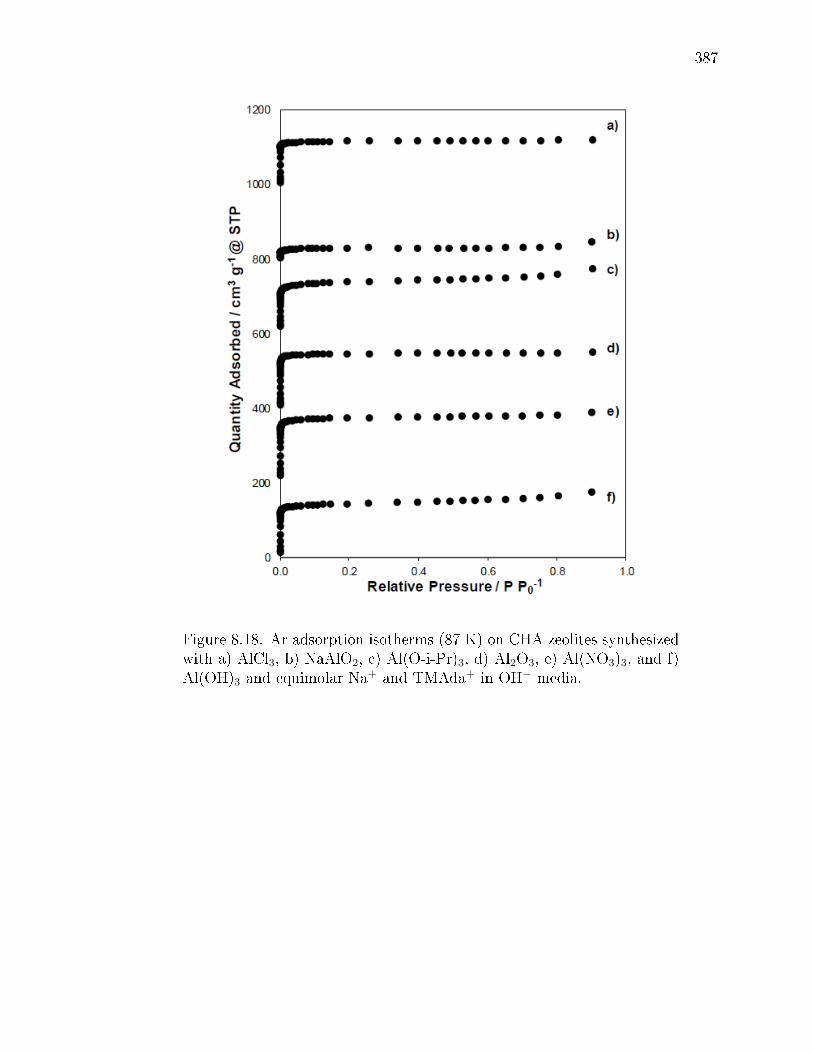
387
Figure 8.18. Ar adsorption isotherms (87 K) on CHA zeolites synthesizedwith a) AlCl3, b) NaAlO2, c) Al(O-i-Pr)3, d) Al2O3, e) Al(NO3)3, and f)Al(OH)3 and equimolar Na+ and TMAda+ in OH− media.
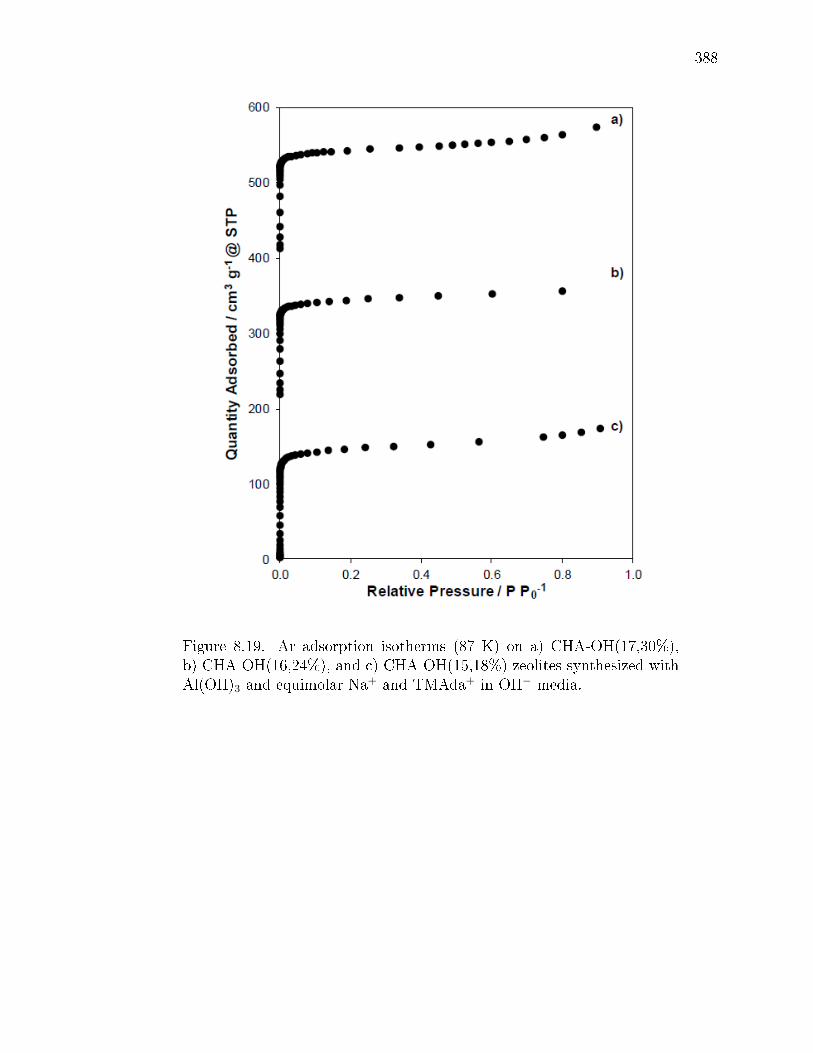
388
Figure 8.19. Ar adsorption isotherms (87 K) on a) CHA-OH(17,30%),b) CHA-OH(16,24%), and c) CHA-OH(15,18%) zeolites synthesized withAl(OH)3 and equimolar Na+ and TMAda+ in OH− media.

389
Figure 8.20. Ar adsorption isotherms (87 K) on Na+-free CHA-OH(16,6%)zeolite synthesized with Al(OH)3, TMAda+, and CTAB in OH− media.
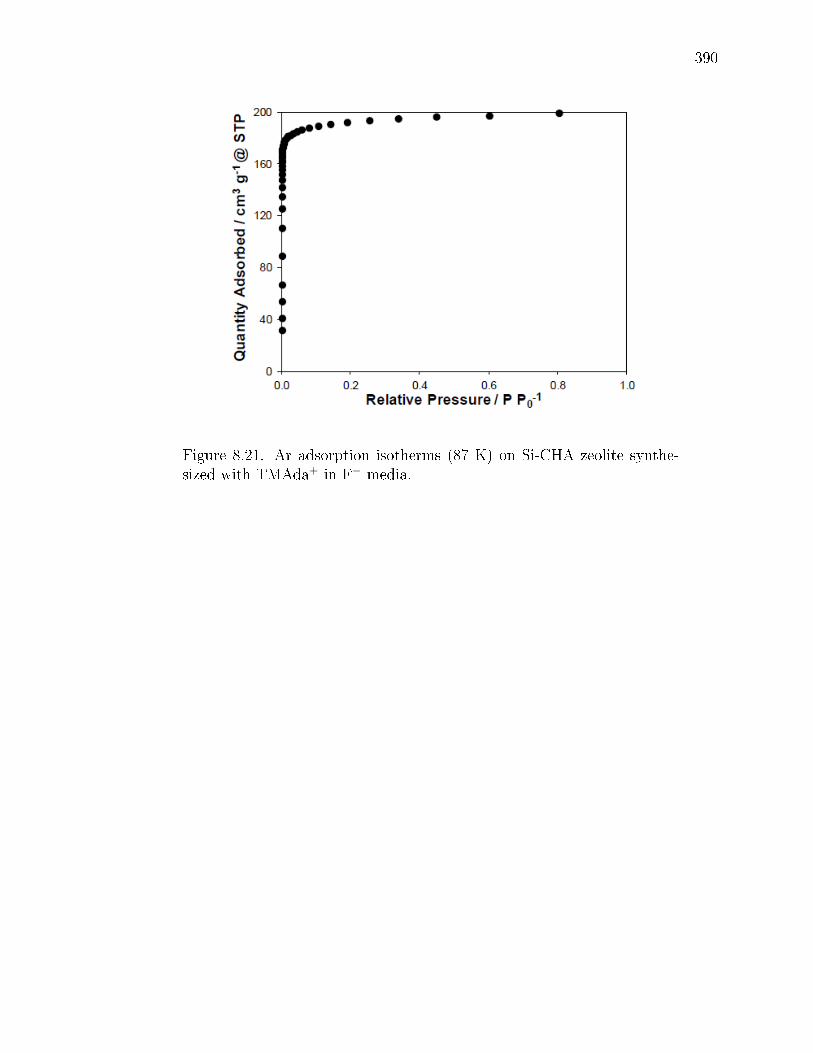
390
Figure 8.21. Ar adsorption isotherms (87 K) on Si-CHA zeolite synthe-sized with TMAda+ in F− media.
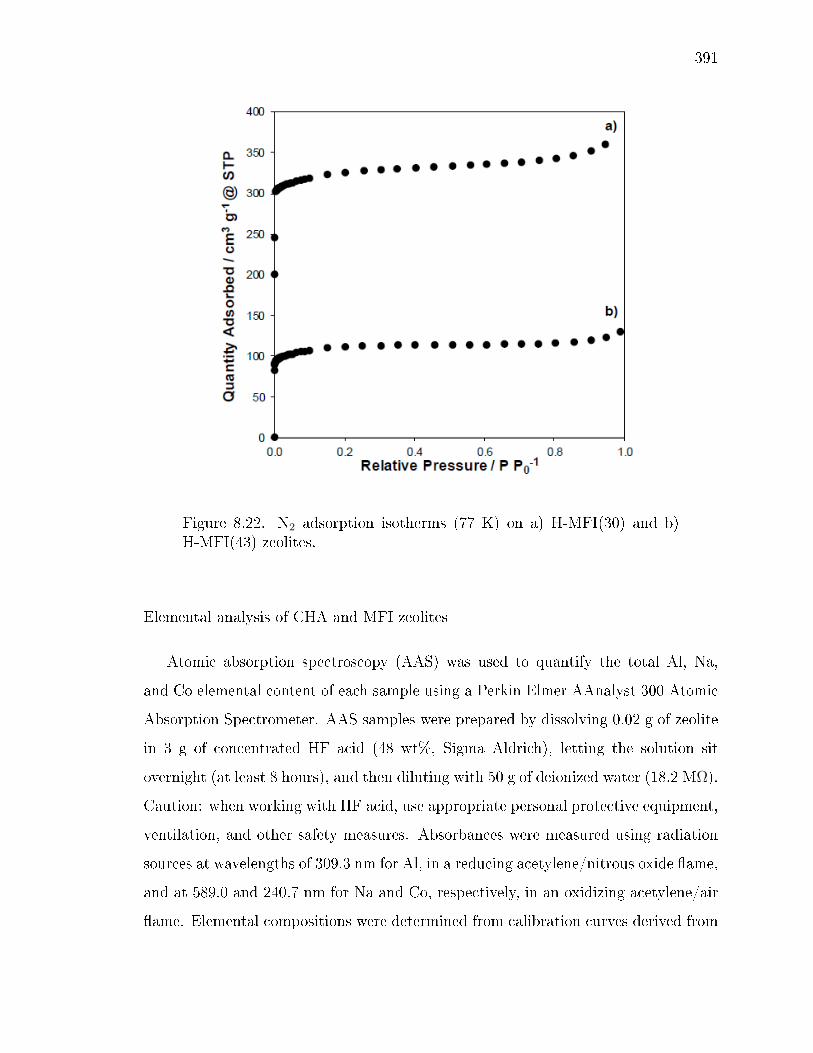
391
Figure 8.22. N2 adsorption isotherms (77 K) on a) H-MFI(30) and b)H-MFI(43) zeolites.
Elemental analysis of CHA and MFI zeolites
Atomic absorption spectroscopy (AAS) was used to quantify the total Al, Na,
and Co elemental content of each sample using a Perkin Elmer AAnalyst 300 Atomic
Absorption Spectrometer. AAS samples were prepared by dissolving 0.02 g of zeolite
in 3 g of concentrated HF acid (48 wt%, Sigma Aldrich), letting the solution sit
overnight (at least 8 hours), and then diluting with 50 g of deionized water (18.2 MΩ).
Caution: when working with HF acid, use appropriate personal protective equipment,
ventilation, and other safety measures. Absorbances were measured using radiation
sources at wavelengths of 309.3 nm for Al, in a reducing acetylene/nitrous oxide ame,
and at 589.0 and 240.7 nm for Na and Co, respectively, in an oxidizing acetylene/air
ame. Elemental compositions were determined from calibration curves derived from
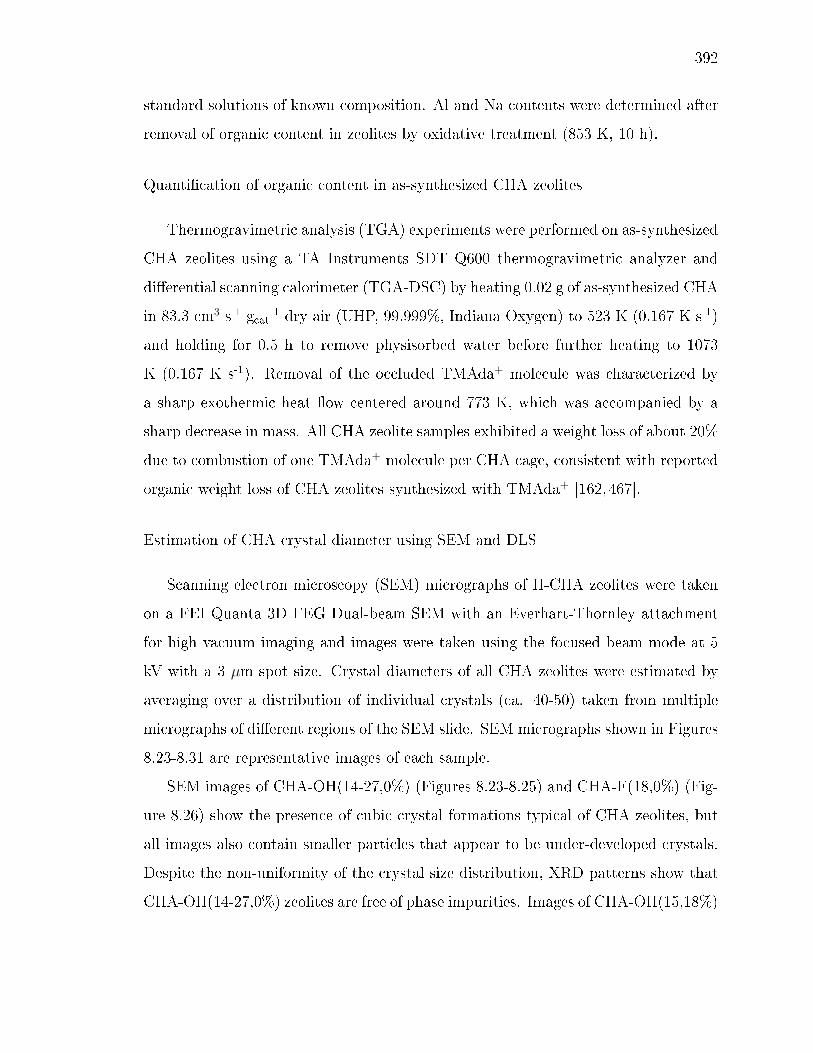
392
standard solutions of known composition. Al and Na contents were determined after
removal of organic content in zeolites by oxidative treatment (853 K, 10 h).
Quantication of organic content in as-synthesized CHA zeolites
Thermogravimetric analysis (TGA) experiments were performed on as-synthesized
CHA zeolites using a TA Instruments SDT Q600 thermogravimetric analyzer and
dierential scanning calorimeter (TGA-DSC) by heating 0.02 g of as-synthesized CHA
in 83.3 cm3 s-1 gcat-1 dry air (UHP, 99.999%, Indiana Oxygen) to 523 K (0.167 K s-1)
and holding for 0.5 h to remove physisorbed water before further heating to 1073
K (0.167 K s-1). Removal of the occluded TMAda+ molecule was characterized by
a sharp exothermic heat ow centered around 773 K, which was accompanied by a
sharp decrease in mass. All CHA zeolite samples exhibited a weight loss of about 20%
due to combustion of one TMAda+ molecule per CHA cage, consistent with reported
organic weight loss of CHA zeolites synthesized with TMAda+ [162,467].
Estimation of CHA crystal diameter using SEM and DLS
Scanning electron microscopy (SEM) micrographs of H-CHA zeolites were taken
on a FEI Quanta 3D FEG Dual-beam SEM with an Everhart-Thornley attachment
for high vacuum imaging and images were taken using the focused beam mode at 5
kV with a 3 µm spot size. Crystal diameters of all CHA zeolites were estimated by
averaging over a distribution of individual crystals (ca. 40-50) taken from multiple
micrographs of dierent regions of the SEM slide. SEM micrographs shown in Figures
8.23-8.31 are representative images of each sample.
SEM images of CHA-OH(14-27,0%) (Figures 8.23-8.25) and CHA-F(18,0%) (Fig-
ure 8.26) show the presence of cubic crystal formations typical of CHA zeolites, but
all images also contain smaller particles that appear to be under-developed crystals.
Despite the non-uniformity of the crystal size distribution, XRD patterns show that
CHA-OH(14-27,0%) zeolites are free of phase impurities. Images of CHA-OH(15,18%)
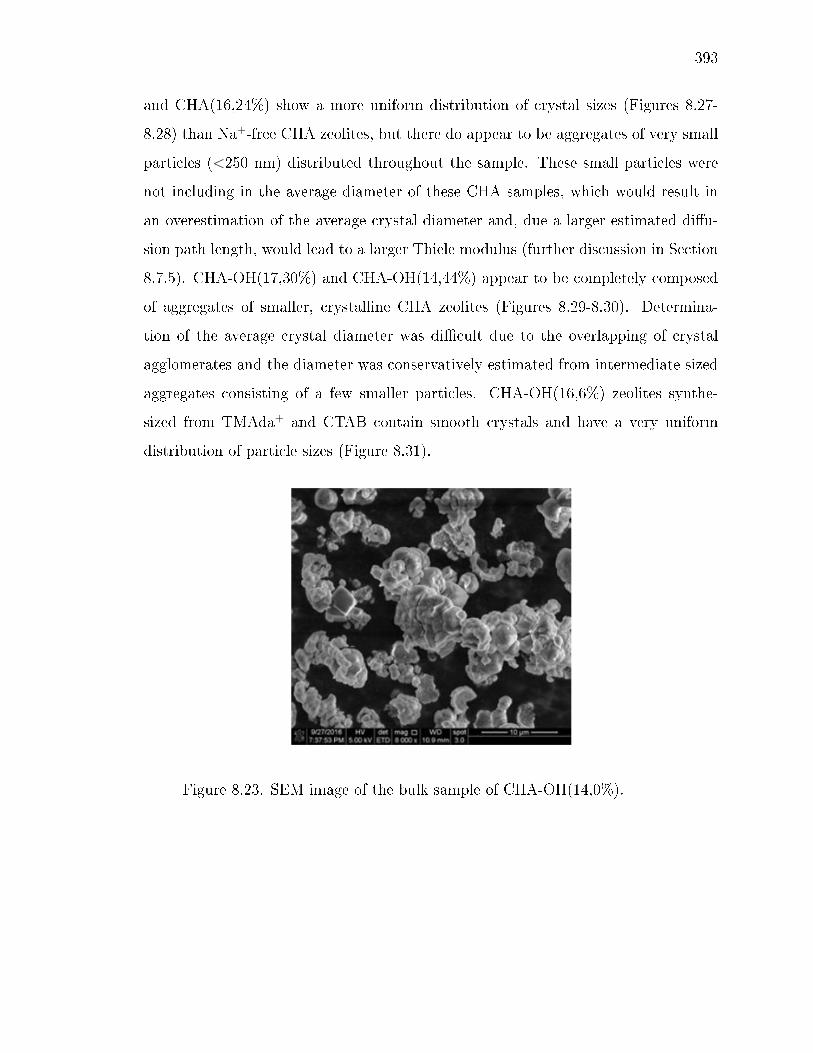
393
and CHA(16,24%) show a more uniform distribution of crystal sizes (Figures 8.27-
8.28) than Na+-free CHA zeolites, but there do appear to be aggregates of very small
particles (<250 nm) distributed throughout the sample. These small particles were
not including in the average diameter of these CHA samples, which would result in
an overestimation of the average crystal diameter and, due a larger estimated diu-
sion path length, would lead to a larger Thiele modulus (further discussion in Section
8.7.5). CHA-OH(17,30%) and CHA-OH(14,44%) appear to be completely composed
of aggregates of smaller, crystalline CHA zeolites (Figures 8.29-8.30). Determina-
tion of the average crystal diameter was dicult due to the overlapping of crystal
agglomerates and the diameter was conservatively estimated from intermediate sized
aggregates consisting of a few smaller particles. CHA-OH(16,6%) zeolites synthe-
sized from TMAda+ and CTAB contain smooth crystals and have a very uniform
distribution of particle sizes (Figure 8.31).
Figure 8.23. SEM image of the bulk sample of CHA-OH(14,0%).
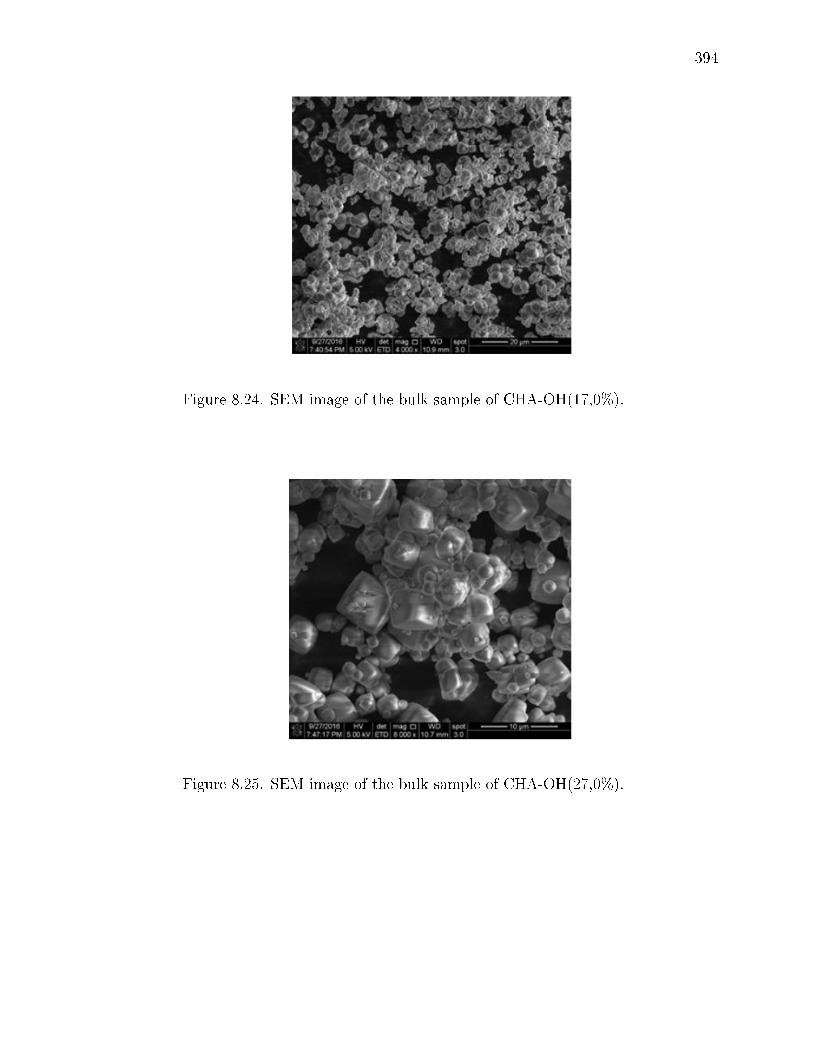
394
Figure 8.24. SEM image of the bulk sample of CHA-OH(17,0%).
Figure 8.25. SEM image of the bulk sample of CHA-OH(27,0%).
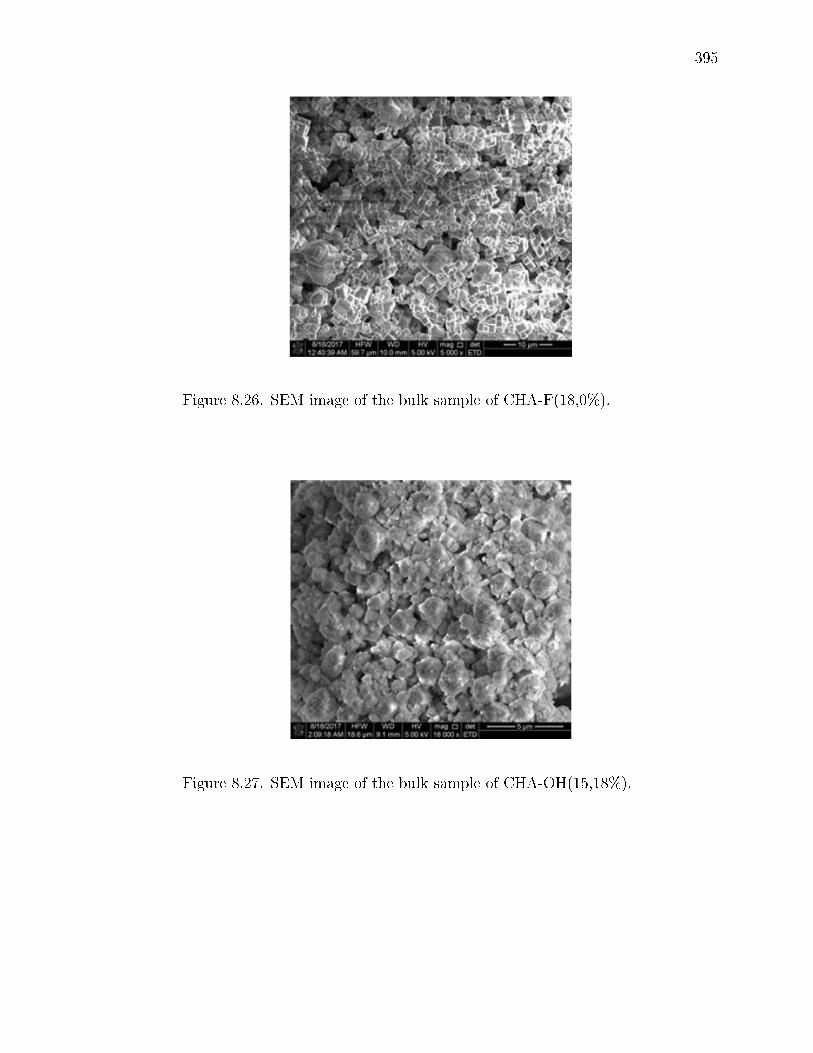
395
Figure 8.26. SEM image of the bulk sample of CHA-F(18,0%).
Figure 8.27. SEM image of the bulk sample of CHA-OH(15,18%).

396
Figure 8.28. SEM image of the bulk sample of CHA-OH(16,24%).
Figure 8.29. SEM image of the bulk sample of CHA-OH(17,30%).

397
Figure 8.30. SEM image of the bulk sample of CHA-OH(14,44%).
Figure 8.31. SEM image of the bulk sample of CHA-OH(16,6%).
Dynamic light scattering (DLS) was also used to estimate crystallite diameters
and to corroborate particle size estimates from SEMmicrographs. DLS measurements
were performed on a Brookhaven ZetaPALS instrument at a wavelength of 659 nm at
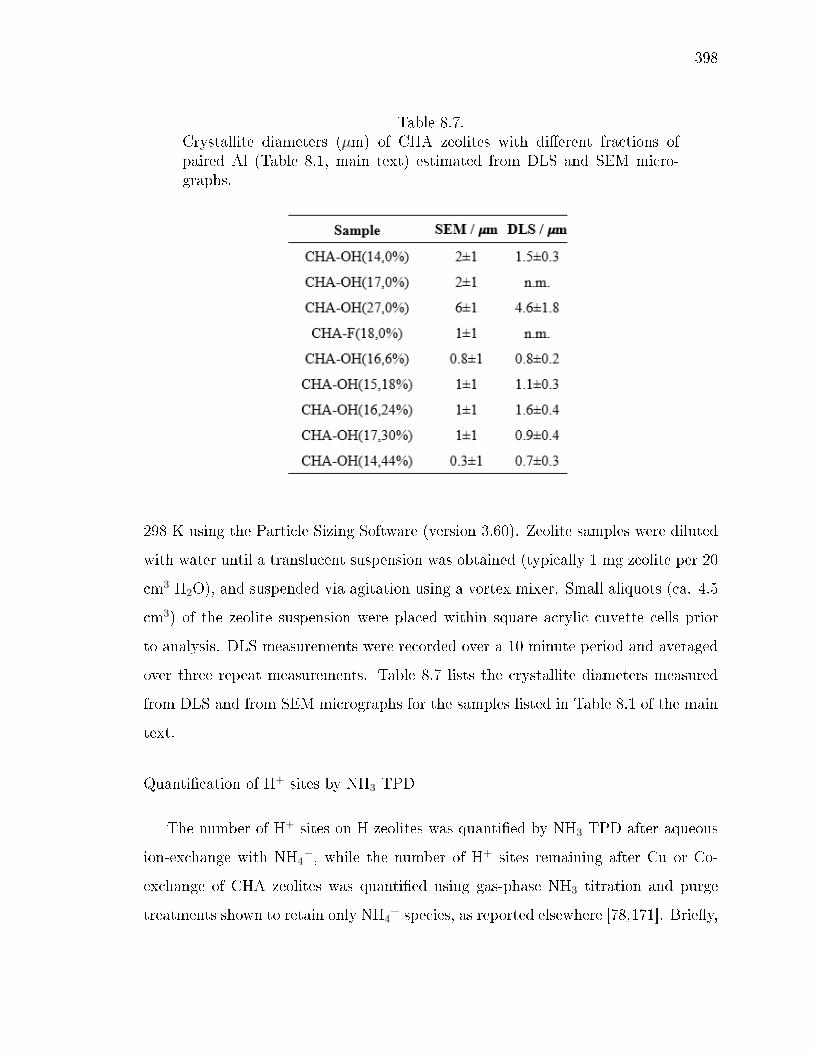
398
Table 8.7.Crystallite diameters (µm) of CHA zeolites with dierent fractions ofpaired Al (Table 8.1, main text) estimated from DLS and SEM micro-graphs.
298 K using the Particle Sizing Software (version 3.60). Zeolite samples were diluted
with water until a translucent suspension was obtained (typically 1 mg zeolite per 20
cm3 H2O), and suspended via agitation using a vortex mixer. Small aliquots (ca. 4.5
cm3) of the zeolite suspension were placed within square acrylic cuvette cells prior
to analysis. DLS measurements were recorded over a 10 minute period and averaged
over three repeat measurements. Table 8.7 lists the crystallite diameters measured
from DLS and from SEM micrographs for the samples listed in Table 8.1 of the main
text.
Quantication of H+ sites by NH3 TPD
The number of H+ sites on H-zeolites was quantied by NH3 TPD after aqueous
ion-exchange with NH4+, while the number of H+ sites remaining after Cu or Co-
exchange of CHA zeolites was quantied using gas-phase NH3 titration and purge
treatments shown to retain only NH4+ species, as reported elsewhere [78,171]. Briey,

399
gas-phase titrations were performed by saturating zeolite samples (0.03-0.05 g) in
owing gaseous NH3 (500 ppm NH3 in balance He, Matheson) at 433 K for 4 h and
a total ow rate of 20 cm3 s-1 g-1. NH3-saturated samples were then purged in wet,
owing He (ca. 3% H2O, 20 cm3 s-1 g-1) at 433 K for 8 h prior to TPD. Data for each
sample in Tables 8.3-8.6 (H+ per Alf ) and in Tables 8.8-8.10 (H+ per Altot).
27Al MAS NMR to characterization Al coordination environment
27Al magic angle spinning nuclear magnetic resonance (MAS NMR) spectra were
recorded under ambient conditions on H-CHA zeolites to quantify framework and
extraframework Al fractions. Spectra were recorded on a Chemagnetics CMX-Innity
400 spectrometer in a wide-bore 9.4 Tesla magnet (Purdue Interdepartmental NMR
Facility) and were acquired using a 2.3 µs pulse (ca. 30 degrees), an acquisition time
of 12.8ms and a relaxation delay of 1s, and were measured at 104.24 MHz and a MAS
rate of 5 kHz. 1H decoupling was used during acquisition, employing a two-pulse
phase modulation (TPPM) scheme. Samples were hydrated by storing for >48 h in
a hydrator containing a saturated potassium chloride (KCl) solution prior to packing
in a 4mm ZrO2 rotor. All 27Al MAS NMR spectra are referenced to a static sample
of AlCl3 dissolved in D2O (0 ppm 27Al line). Spectra are normalized so that the
maximum intensity in each spectrum is set to unity and are shown in Figures 8.32-
8.34. Fractions of framework (Alf ) and extraframework Al (Alex) per total Al are
listed in Tables 8.8-8.10 and the error associated with each is ±0.05.
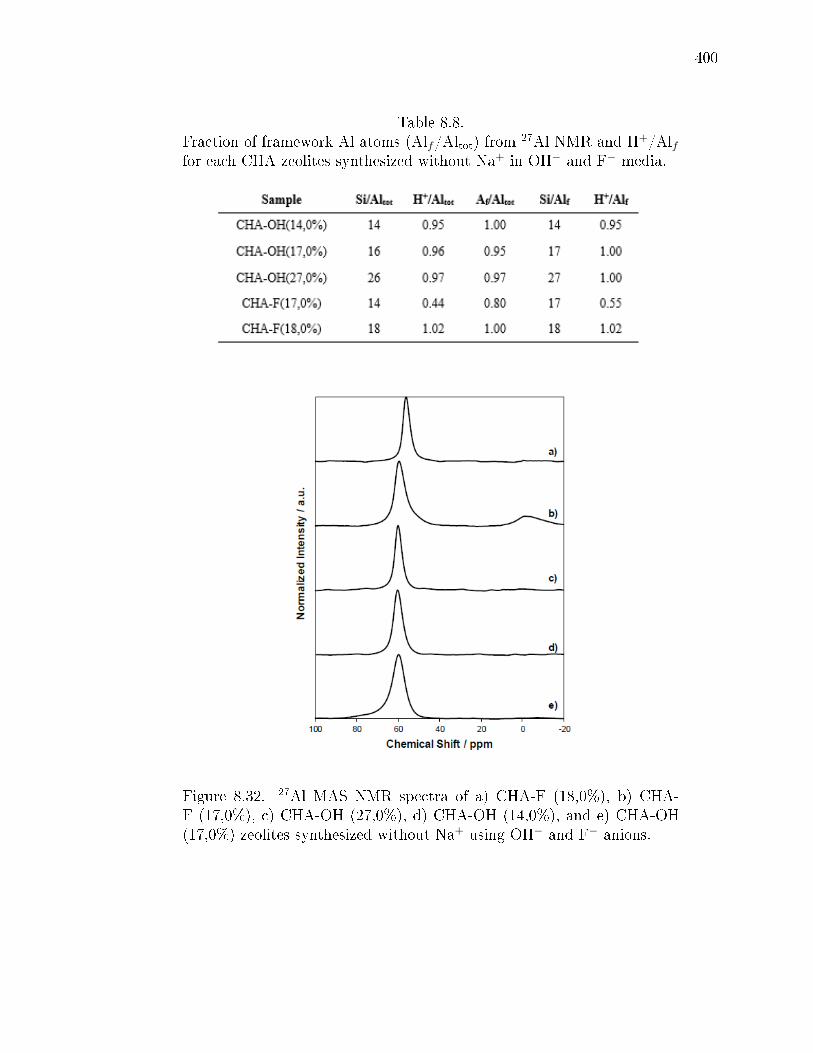
400
Table 8.8.Fraction of framework Al atoms (Alf/Altot) from 27Al NMR and H+/Alffor each CHA zeolites synthesized without Na+ in OH− and F− media.
Figure 8.32. 27Al MAS NMR spectra of a) CHA-F (18,0%), b) CHA-F (17,0%), c) CHA-OH (27,0%), d) CHA-OH (14,0%), and e) CHA-OH(17,0%) zeolites synthesized without Na+ using OH− and F− anions.
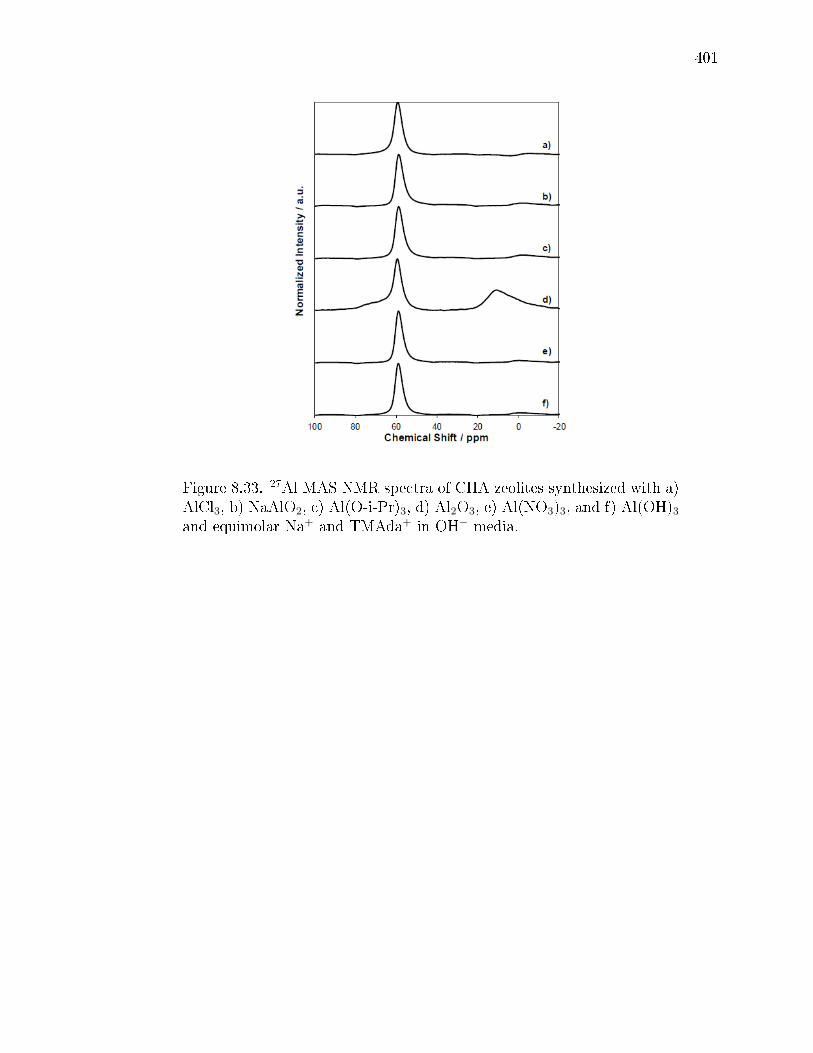
401
Figure 8.33. 27Al MAS NMR spectra of CHA zeolites synthesized with a)AlCl3, b) NaAlO2, c) Al(O-i-Pr)3, d) Al2O3, e) Al(NO3)3, and f) Al(OH)3and equimolar Na+ and TMAda+ in OH− media.
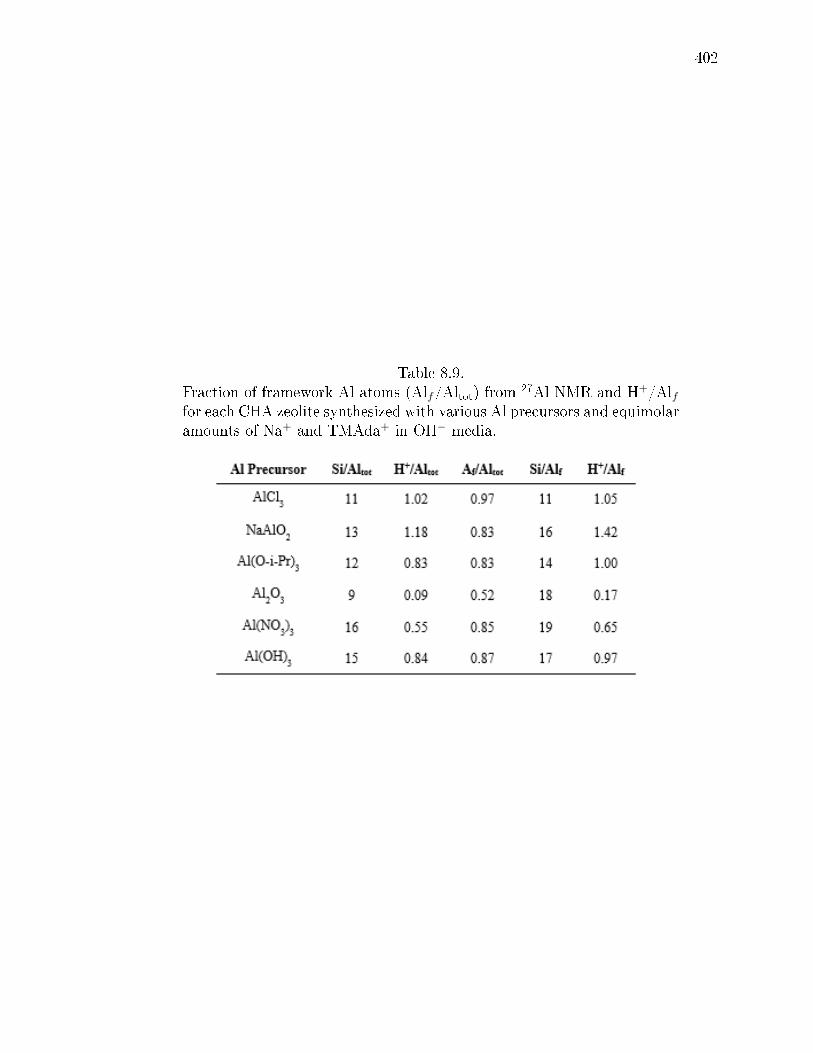
402
Table 8.9.Fraction of framework Al atoms (Alf/Altot) from 27Al NMR and H+/Alffor each CHA zeolite synthesized with various Al precursors and equimolaramounts of Na+ and TMAda+ in OH− media.
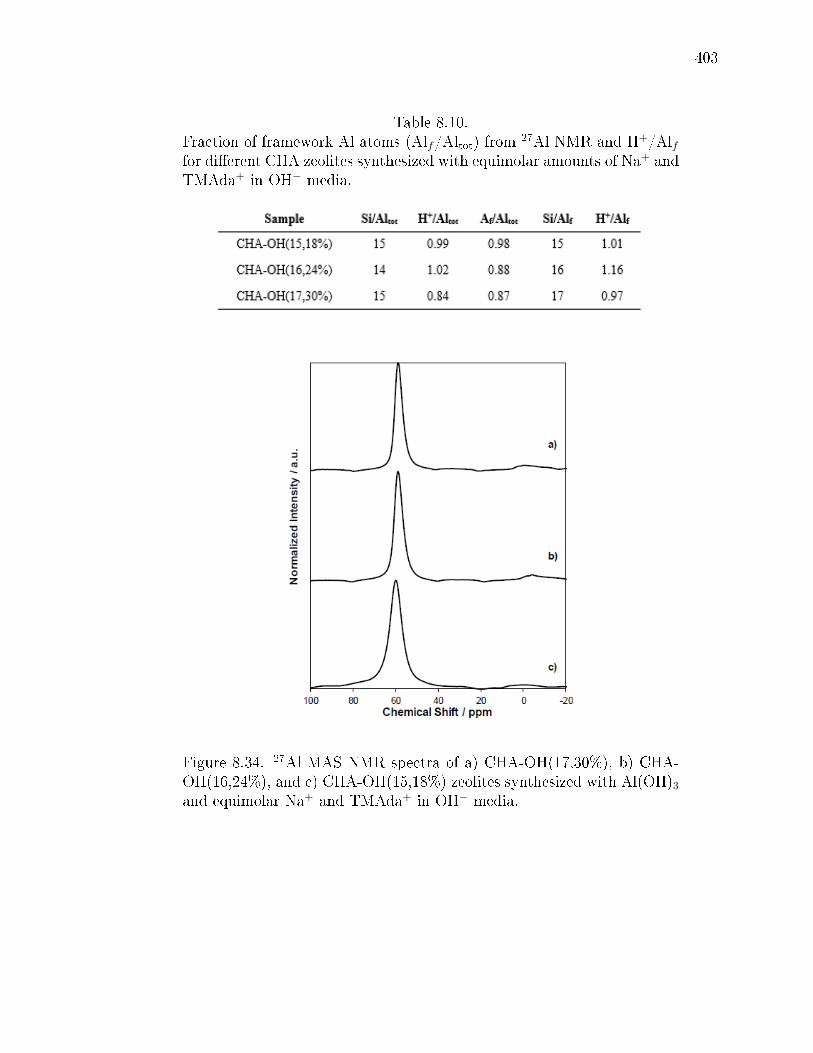
403
Table 8.10.Fraction of framework Al atoms (Alf/Altot) from 27Al NMR and H+/Alffor dierent CHA zeolites synthesized with equimolar amounts of Na+ andTMAda+ in OH− media.
Figure 8.34. 27Al MAS NMR spectra of a) CHA-OH(17,30%), b) CHA-OH(16,24%), and c) CHA-OH(15,18%) zeolites synthesized with Al(OH)3and equimolar Na+ and TMAda+ in OH− media.

404
Validation of Co2+ titration procedures on H-CHA-F zeolites
CHA zeolites crystallized with only TMAda+ cations in F− media at Si/Al<15
contained a large fraction of Al atoms unable to stabilize NH4+ cations (H+/Altot =
0.44), consistent with previous observations suggesting that TMAda+ cations alone
are unable to stabilize CHA zeolites with Si/Al<15 [42]. CHA-F zeolites with Si/Al
> 15 contained nearly all of their Al atoms in the framework (H+/Altot = 1.02 from
NH3 titrations; Table 8.3), yet were unable to exchange divalent Co2+ cations. Co2+
exchange isotherms (0.25-1M Co(NO3)2, 150 cm3 solution g-1, ambient temperature,
no pH adjustment) were measured at dierent conditions (Co2+ molarity, repeat ex-
changes) to assess whether Co2+ exchange behavior was inuenced by the hydrophobic
nature of the framework resulting from uoride-assisted crystallization [190]. Satura-
tion Co2+ exchange capacities of zero, within experimental error, were measured for
all H-CHA-F zeolites (Figure 8.35 and 8.36). To further demonstrate that H-CHA-F
zeolites contain only isolated Al atoms, Cu2+ ion-exchanges were performed and the
residual number of H+ sites, remaining after Cu2+-exchange, were quantied with
gas-phase NH3 titrations using previously reported procedures to determine the Cu-
exchange stoichiometry (Table 8.11) [42]. Cu-exchange and subsequent NH3 titration
data on CHA-OH(16,24%) [79] and CHA-OH(14,0%) [42] zeolites are included as
references for CHA zeolites containing exclusively Cu2+ and [CuOH]+, respectively.
Both CHA-F zeolites (Si/Al = 17-18) contain exclusively isolated [CuOH]+ cations,
consistent with the 1 H+ per Cu2+ exchange stoichiometry (Table 8.11, Figure 8.37),
indicating that all framework Al is present as isolated sites. The possibility that
[CuOH]+ preferentially exchanges before divalent Cu2+ cations is inconsistent with
experimentally-measured Cu2+-exchange isotherms (stoichiometry determined from
NH3 titration), and DFT-calculated adsorption energies show that Cu2+ preferen-
tially exchanges at paired Al sites before [CuOH]+ species exchange at isolated H+
sites [79].

405
Figure 8.35. Amount of exchanged Co2+ retained on H-CHA-F(18,0%) asa function of the Co2+ concentration in solution at equilibrium.
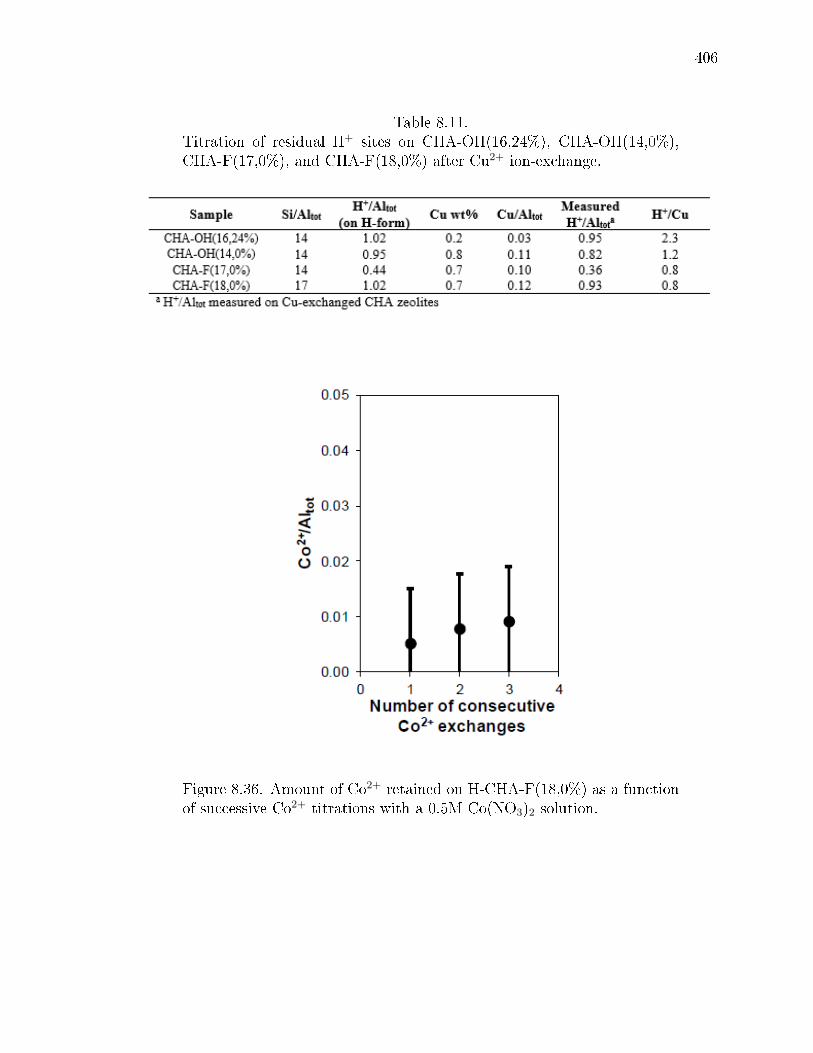
406
Table 8.11.Titration of residual H+ sites on CHA-OH(16,24%), CHA-OH(14,0%),CHA-F(17,0%), and CHA-F(18,0%) after Cu2+ ion-exchange.
Figure 8.36. Amount of Co2+ retained on H-CHA-F(18,0%) as a functionof successive Co2+ titrations with a 0.5M Co(NO3)2 solution.
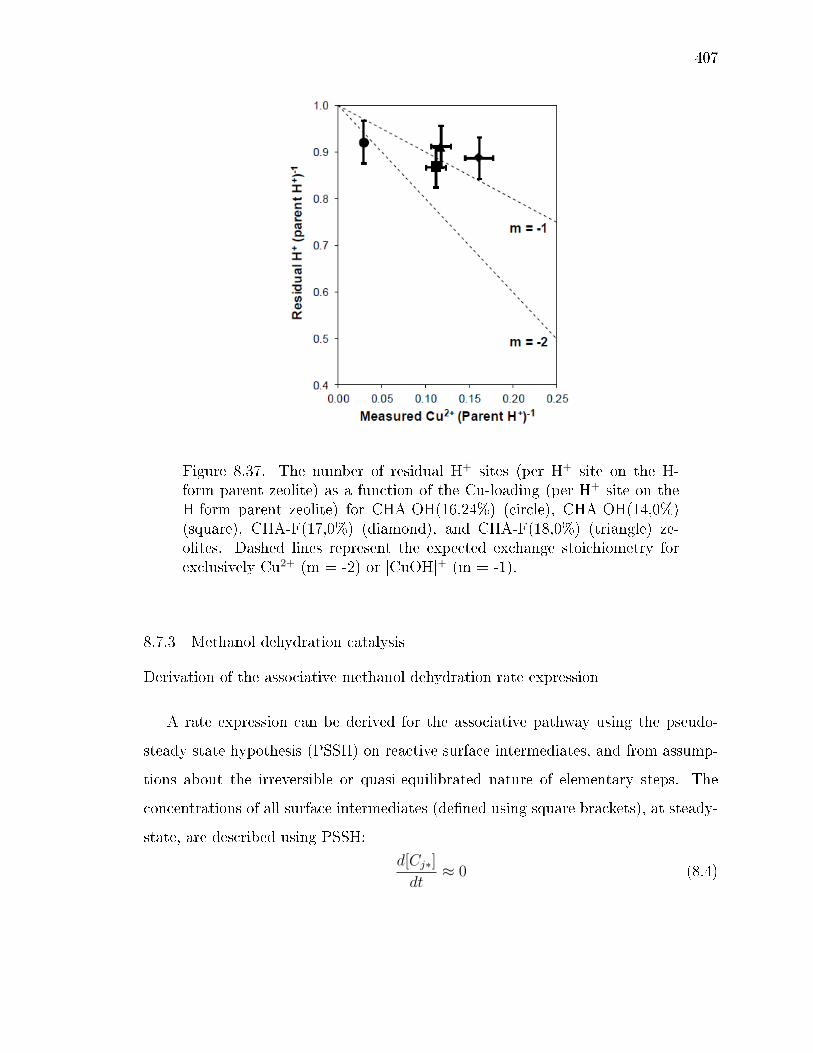
407
Figure 8.37. The number of residual H+ sites (per H+ site on the H-form parent zeolite) as a function of the Cu-loading (per H+ site on theH-form parent zeolite) for CHA-OH(16,24%) (circle), CHA-OH(14,0%)(square), CHA-F(17,0%) (diamond), and CHA-F(18,0%) (triangle) ze-olites. Dashed lines represent the expected exchange stoichiometry forexclusively Cu2+ (m = -2) or [CuOH]+ (m = -1).
8.7.3 Methanol dehydration catalysis
Derivation of the associative methanol dehydration rate expression
A rate expression can be derived for the associative pathway using the pseudo-
steady state hypothesis (PSSH) on reactive surface intermediates, and from assump-
tions about the irreversible or quasi-equilibrated nature of elementary steps. The
concentrations of all surface intermediates (dened using square brackets), at steady-
state, are described using PSSH:
d[Cj∗]
dt≈ 0 (8.4)

408
where [Cj∗] is the concentration of surface species j. Density functional theory calcula-
tions show that the formation of dimethyl ether from the methanol-pair intermediate
is irreversible and the rate-limiting elementary step for the associative dehydration
pathway [82] and, as a result, the net rate of dimethyl ether formation from the
associative pathway (rDME,A) can be expressed by the following expression:
rDME,A = kDME,A[P∗] (8.5)
Applying PSSH to the M*, D*, and P* intermediates, dened in the sequence of
elementary steps in Scheme 8.12 (main text), yields the following expressions:
d[M∗]dt
= kMPCH3OH [∗] + k−D[D∗]− k−M [M∗]− kDPCH3OH [M∗] ≈ 0 (8.6)
d[D∗]dt
= kDPCH3OH [M∗] + k−P [P∗]− k−D[D∗]− kP [D∗] ≈ 0 (8.7)
d[P∗]dt
= kP [D∗]− k−P [P∗]− kDME,A[P∗] ≈ 0 (8.8)
where kj and k−j are the forward and reverse rate constants for each elementary
step, respectively, and PCH3OH is the gas phase methanol partial pressure. Assuming
that methanol monomers and gas-phase methanol, methanol monomers and proto-
nated dimers, and the intermediate methanol pairs and protonated dimers are all in
quasi-equilibrium with each other, based on density functional theory calculations
performed on unconned, isolated H+ sites [82], steady-state surface concentrations
are given by the representative equilibrium constants (Kj):
[M∗] =kMk−M
PCH3OH [∗] = KMPCH3OH [∗] (8.9)
[D∗] =kDk−D
PCH3OH [M∗] = KDKMP2CH3OH [∗] (8.10)
[P∗] =kPk−P
[D∗] = KPKDKMP2CH3OH [∗] (8.11)
Substituting the expression for [P*] (Eq. 8.11) into Eq. 8.5, the rate expression
become second-order in methanol partial pressure:
rDME,A = kDME,AKPKDKMP2CH3OH [∗] (8.12)
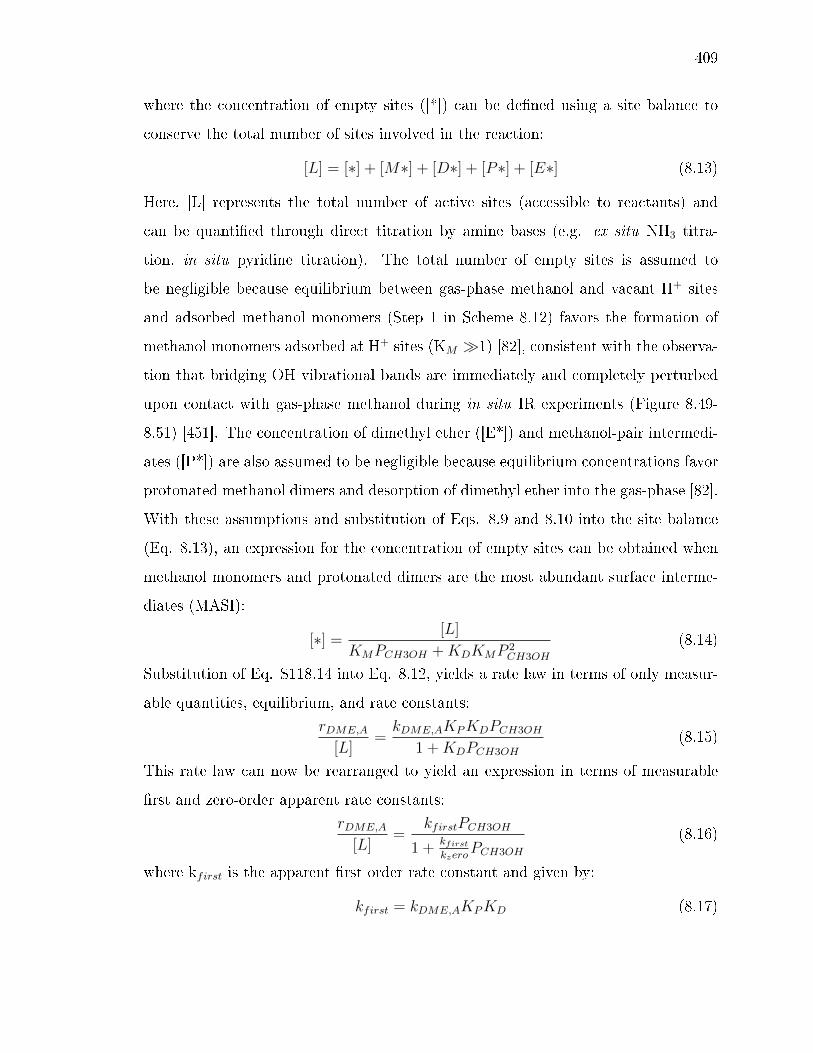
409
where the concentration of empty sites ([*]) can be dened using a site balance to
conserve the total number of sites involved in the reaction:
[L] = [∗] + [M∗] + [D∗] + [P∗] + [E∗] (8.13)
Here, [L] represents the total number of active sites (accessible to reactants) and
can be quantied through direct titration by amine bases (e.g. ex situ NH3 titra-
tion, in situ pyridine titration). The total number of empty sites is assumed to
be negligible because equilibrium between gas-phase methanol and vacant H+ sites
and adsorbed methanol monomers (Step 1 in Scheme 8.12) favors the formation of
methanol monomers adsorbed at H+ sites (KM 1) [82], consistent with the observa-
tion that bridging OH vibrational bands are immediately and completely perturbed
upon contact with gas-phase methanol during in situ IR experiments (Figure 8.49-
8.51) [451]. The concentration of dimethyl ether ([E*]) and methanol-pair intermedi-
ates ([P*]) are also assumed to be negligible because equilibrium concentrations favor
protonated methanol dimers and desorption of dimethyl ether into the gas-phase [82].
With these assumptions and substitution of Eqs. 8.9 and 8.10 into the site balance
(Eq. 8.13), an expression for the concentration of empty sites can be obtained when
methanol monomers and protonated dimers are the most abundant surface interme-
diates (MASI):
[∗] =[L]
KMPCH3OH +KDKMP 2CH3OH
(8.14)
Substitution of Eq. S118.14 into Eq. 8.12, yields a rate law in terms of only measur-
able quantities, equilibrium, and rate constants:
rDME,A
[L]=kDME,AKPKDPCH3OH
1 +KDPCH3OH
(8.15)
This rate law can now be rearranged to yield an expression in terms of measurable
rst and zero-order apparent rate constants:
rDME,A
[L]=
kfirstPCH3OH
1 +kfirstkzero
PCH3OH
(8.16)
where kfirst is the apparent rst order rate constant and given by:
kfirst = kDME,AKPKD (8.17)

410
and kzero is the apparent zero-order rate constant and given by:
kzero = kDME,AKP (8.18)
Derivation of the inhibited associative methanol dehydration rate expression
In order to account for the observed inhibition in the dimethyl ether formation
rate (415 K, per H+) at high methanol partial pressures, an additional term involv-
ing an inhibitory methanol species ([I*]) needs to be added to the associative rate
law. An additional methanol adsorption step involving methanol adsorbed at existing
methanol dimers to form an inhibitory methanol trimer can be added to the existing
set of elementary steps. The justication for including this step is described in detail
in Section 8.7.6. This new adsorption step to form methanol clusters can be assumed
to be in equilibrium with protonated methanol dimers and a gas-phase methanol
species and an equilibrium constant can be dened to describe the concentration of
these species on the surface:
[I∗] =kIk−I
[D∗]PCH3OH = KIKDKMP3CH3OH [∗] (8.19)
Including these methanol clusters as a MASI species, along with methanol monomers
and protonated dimers, a new site balance can be derived:
[∗] =[L]
KMPCH3OH +KDKMP 2CH3OH +KPKDKMP 3
CH3OH
(8.20)
Substitution of Eq. 8.20 into Eq. 8.12, yields a new rate law in terms of only
measurable quantities, and rate and equilibrium constants:
rDME,A
[L]=
kDME,AKPKDPCH3OH
1 +KDPCH3OH +KIKDP 2CH3OH
(8.21)
Derivation of the dissociative methanol dehydration rate expression
Rates of dimethyl ether formation via the dissociative pathway are governed by
the rate at which methanol/methoxy pairs form dimethyl ether and, assuming this
step to be irreversible, the rate expression becomes:
rDME,D = kDME,D[MMe∗] (8.22)
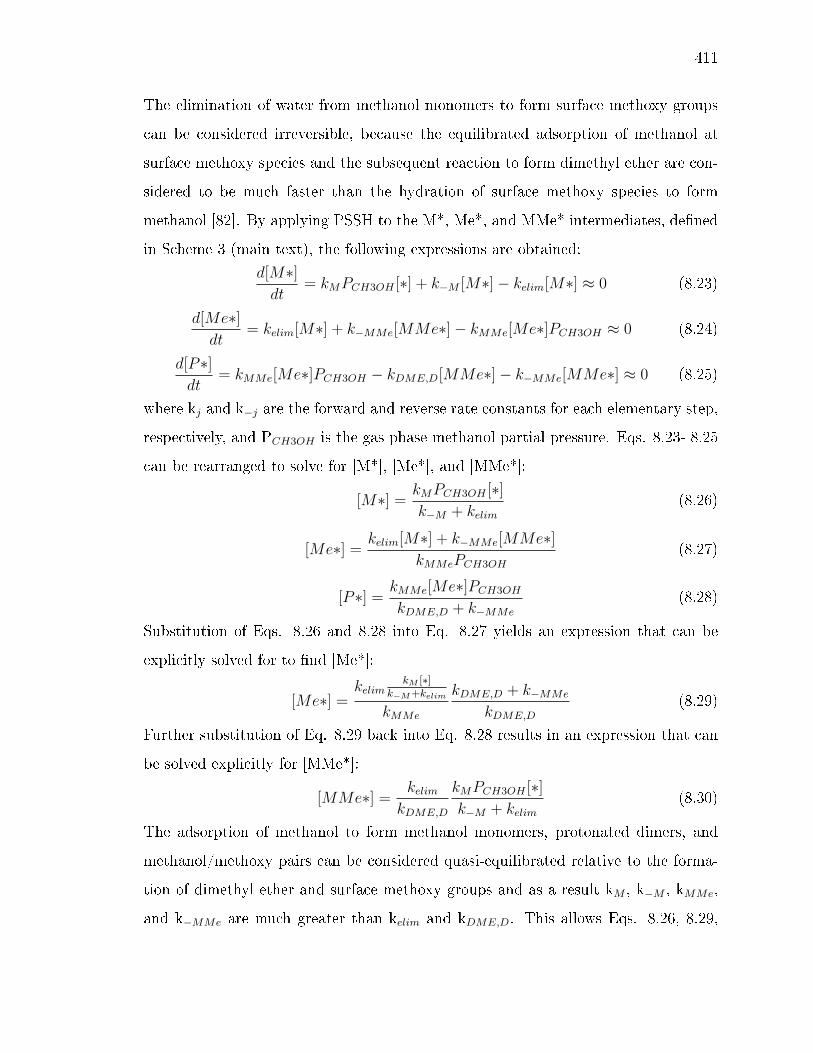
411
The elimination of water from methanol monomers to form surface methoxy groups
can be considered irreversible, because the equilibrated adsorption of methanol at
surface methoxy species and the subsequent reaction to form dimethyl ether are con-
sidered to be much faster than the hydration of surface methoxy species to form
methanol [82]. By applying PSSH to the M*, Me*, and MMe* intermediates, dened
in Scheme 3 (main text), the following expressions are obtained:
d[M∗]dt
= kMPCH3OH [∗] + k−M [M∗]− kelim[M∗] ≈ 0 (8.23)
d[Me∗]dt
= kelim[M∗] + k−MMe[MMe∗]− kMMe[Me∗]PCH3OH ≈ 0 (8.24)
d[P∗]dt
= kMMe[Me∗]PCH3OH − kDME,D[MMe∗]− k−MMe[MMe∗] ≈ 0 (8.25)
where kj and k−j are the forward and reverse rate constants for each elementary step,
respectively, and PCH3OH is the gas phase methanol partial pressure. Eqs. 8.23- 8.25
can be rearranged to solve for [M*], [Me*], and [MMe*]:
[M∗] =kMPCH3OH [∗]k−M + kelim
(8.26)
[Me∗] =kelim[M∗] + k−MMe[MMe∗]
kMMePCH3OH
(8.27)
[P∗] =kMMe[Me∗]PCH3OH
kDME,D + k−MMe
(8.28)
Substitution of Eqs. 8.26 and 8.28 into Eq. 8.27 yields an expression that can be
explicitly solved for to nd [Me*]:
[Me∗] =kelim
kM [∗]k−M+kelim
kMMe
kDME,D + k−MMe
kDME,D
(8.29)
Further substitution of Eq. 8.29 back into Eq. 8.28 results in an expression that can
be solved explicitly for [MMe*]:
[MMe∗] =kelim
kDME,D
kMPCH3OH [∗]k−M + kelim
(8.30)
The adsorption of methanol to form methanol monomers, protonated dimers, and
methanol/methoxy pairs can be considered quasi-equilibrated relative to the forma-
tion of dimethyl ether and surface methoxy groups and as a result kM , k−M , kMMe,
and k−MMe are much greater than kelim and kDME,D. This allows Eqs. 8.26, 8.29,

412
and 8.30 to be written directly in terms of only forward rate constants, equilibrium
constants, and measurable quantities:
[M∗] = KMPCH3OH [∗] (8.31)
[Me∗] =kelimKM
kDME,DKMMe
[∗] (8.32)
[MMe∗] =kelim
kDME,D
KMPCH3OH [∗] (8.33)
The formation of protonated dimers can also be considered to be quasi-equilibrated
and the surface concentration of such species can be expressed using Eq. 8.10. The
rate of dimethyl ether formation can now be expressed in terms of quantiable values
by substitution of Eq. 8.33 into Eq. 8.22:
rDME,D = kelimKMPCH3OH [∗] (8.34)
Considering methanol monomers, protonated dimers, and surface methoxy as MASI,
the site balance for the dissociative pathway can be expressed as:
[L] = [M∗] + [D∗] + [Me∗] (8.35)
and the number of vacant sites can be solved for by substitution of Eqs. 8.10, 8.31,
and 8.32 into Eq. 8.35:
[∗] =[L]
KMPCH3OH + kelimKM
kDME,DKMMe+KDKMP 2
CH3OH
(8.36)
Substitution of Eq. 8.36 into 8.34 and dividing through by kelimKM
kDME,DKMMeyields a new
rate expression in terms of only measurable quantities, rate constants, and equilibrium
constants:
rDME,D
[L]=
kDME,DKMMePCH3OH
1 +kDME,D
kelimKMMePCH3OH +
kDME,D
kelimKMMeKDP 2
CH3OH
(8.37)
Estimation of associative and dissociative rst and zero-order rate constants using ageneralized rate equation
Apparent rst and zero-order rate constants can be predicted for both the disso-
ciative and inhibited-associative dehydration pathways through a weighted-average
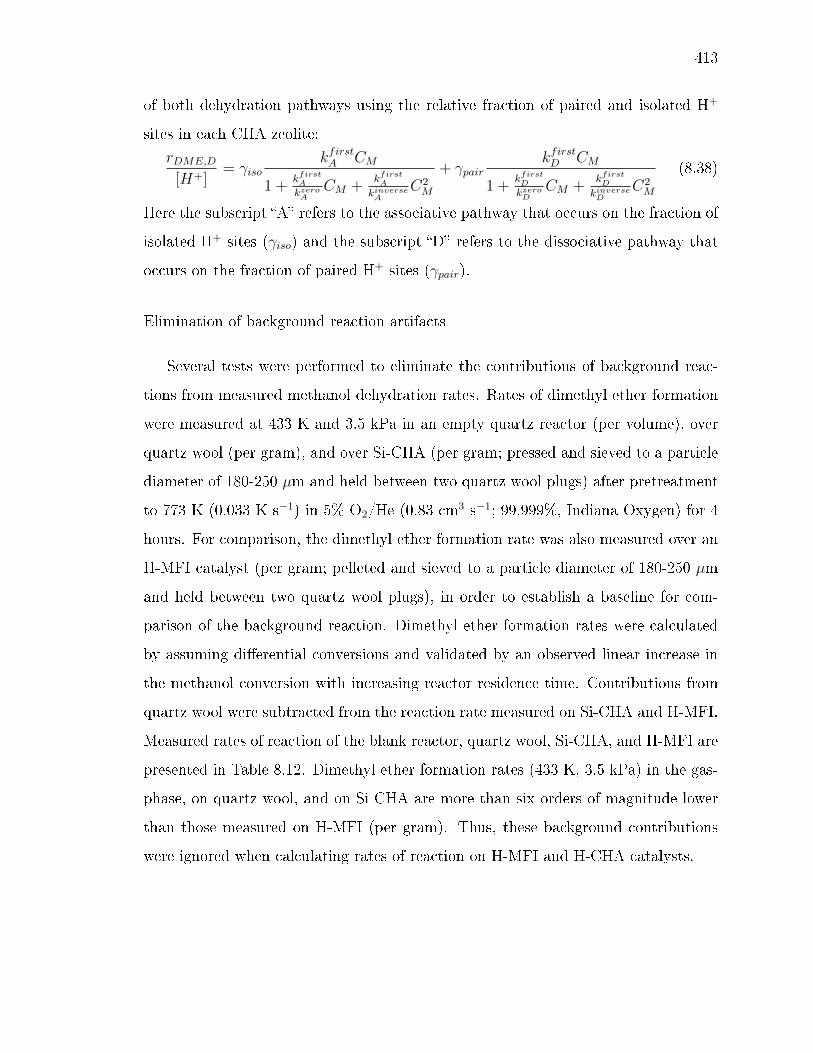
413
of both dehydration pathways using the relative fraction of paired and isolated H+
sites in each CHA zeolite:
rDME,D
[H+]= γiso
kfirstA CM
1 +kfirstA
kzeroACM +
kfirstA
kinverseA
C2M
+ γpairkfirstD CM
1 +kfirstD
kzeroDCM +
kfirstD
kinverseD
C2M
(8.38)
Here the subscript A refers to the associative pathway that occurs on the fraction of
isolated H+ sites (γiso) and the subscript D refers to the dissociative pathway that
occurs on the fraction of paired H+ sites (γpair).
Elimination of background reaction artifacts
Several tests were performed to eliminate the contributions of background reac-
tions from measured methanol dehydration rates. Rates of dimethyl ether formation
were measured at 433 K and 3.5 kPa in an empty quartz reactor (per volume), over
quartz wool (per gram), and over Si-CHA (per gram; pressed and sieved to a particle
diameter of 180-250 µm and held between two quartz wool plugs) after pretreatment
to 773 K (0.033 K s−1) in 5% O2/He (0.83 cm3 s−1; 99.999%, Indiana Oxygen) for 4
hours. For comparison, the dimethyl ether formation rate was also measured over an
H-MFI catalyst (per gram; pelleted and sieved to a particle diameter of 180-250 µm
and held between two quartz wool plugs), in order to establish a baseline for com-
parison of the background reaction. Dimethyl ether formation rates were calculated
by assuming dierential conversions and validated by an observed linear increase in
the methanol conversion with increasing reactor residence time. Contributions from
quartz wool were subtracted from the reaction rate measured on Si-CHA and H-MFI.
Measured rates of reaction of the blank reactor, quartz wool, Si-CHA, and H-MFI are
presented in Table 8.12. Dimethyl ether formation rates (433 K, 3.5 kPa) in the gas-
phase, on quartz wool, and on Si-CHA are more than six orders of magnitude lower
than those measured on H-MFI (per gram). Thus, these background contributions
were ignored when calculating rates of reaction on H-MFI and H-CHA catalysts.
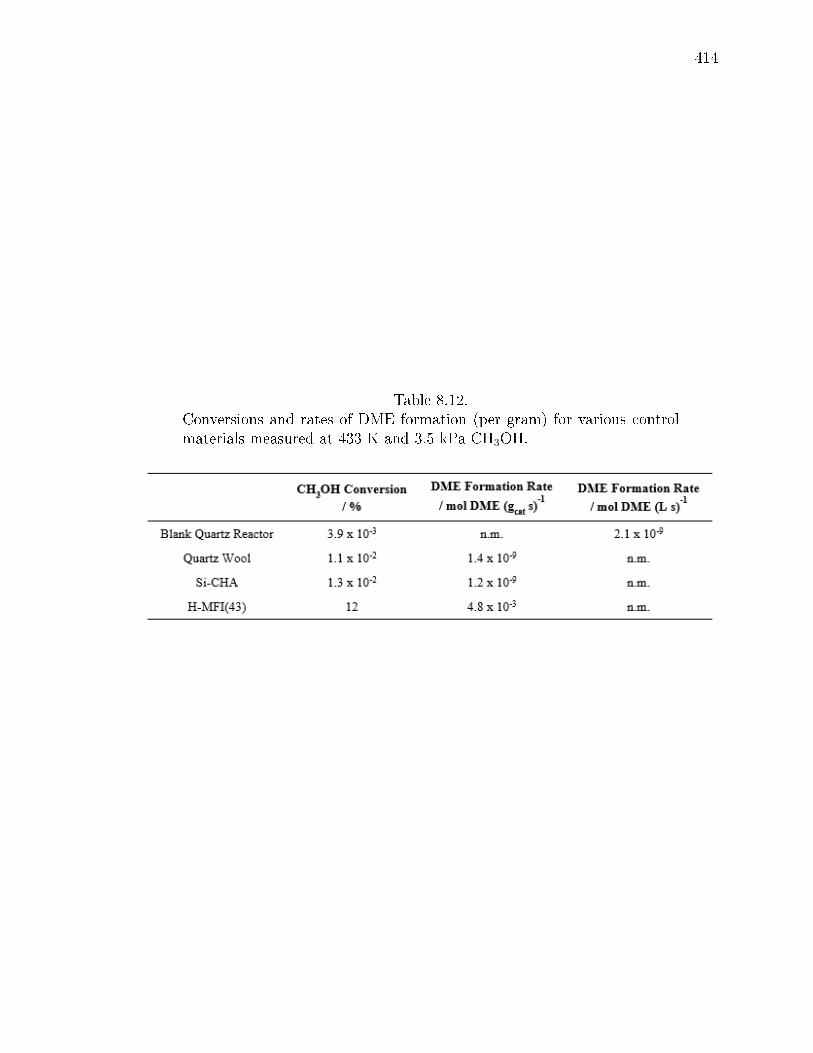
414
Table 8.12.Conversions and rates of DME formation (per gram) for various controlmaterials measured at 433 K and 3.5 kPa CH3OH.
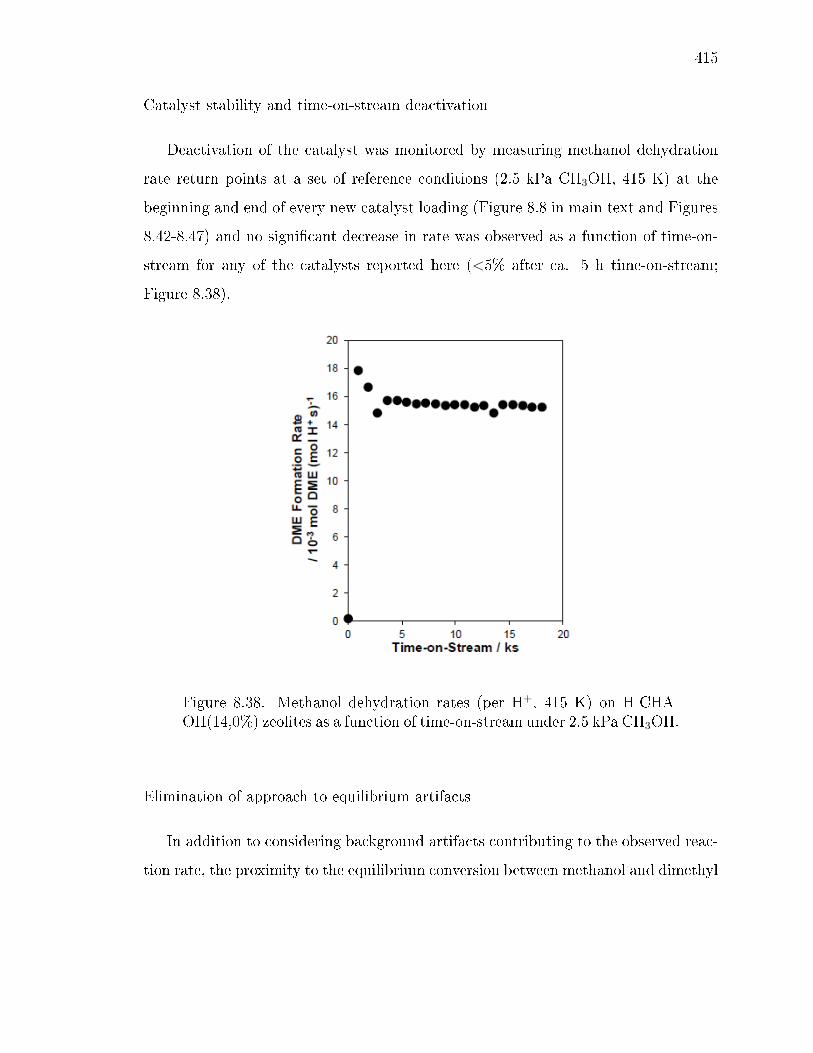
415
Catalyst stability and time-on-stream deactivation
Deactivation of the catalyst was monitored by measuring methanol dehydration
rate return points at a set of reference conditions (2.5 kPa CH3OH, 415 K) at the
beginning and end of every new catalyst loading (Figure 8.8 in main text and Figures
8.42-8.47) and no signicant decrease in rate was observed as a function of time-on-
stream for any of the catalysts reported here (<5% after ca. 5 h time-on-stream;
Figure 8.38).
Figure 8.38. Methanol dehydration rates (per H+, 415 K) on H-CHA-OH(14,0%) zeolites as a function of time-on-stream under 2.5 kPa CH3OH.
Elimination of approach to equilibrium artifacts
In addition to considering background artifacts contributing to the observed reac-
tion rate, the proximity to the equilibrium conversion between methanol and dimethyl
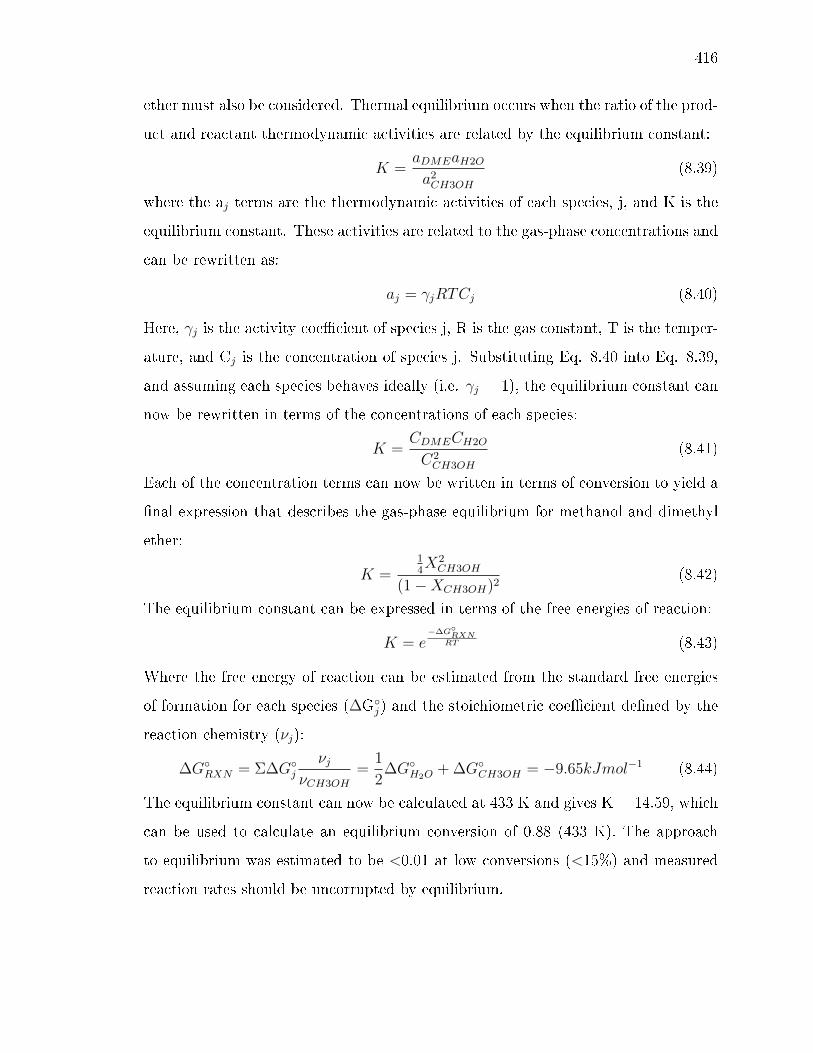
416
ether must also be considered. Thermal equilibrium occurs when the ratio of the prod-
uct and reactant thermodynamic activities are related by the equilibrium constant:
K =aDMEaH2O
a2CH3OH
(8.39)
where the aj terms are the thermodynamic activities of each species, j, and K is the
equilibrium constant. These activities are related to the gas-phase concentrations and
can be rewritten as:
aj = γjRTCj (8.40)
Here, γj is the activity coecient of species j, R is the gas constant, T is the temper-
ature, and Cj is the concentration of species j. Substituting Eq. 8.40 into Eq. 8.39,
and assuming each species behaves ideally (i.e. γj = 1), the equilibrium constant can
now be rewritten in terms of the concentrations of each species:
K =CDMECH2O
C2CH3OH
(8.41)
Each of the concentration terms can now be written in terms of conversion to yield a
nal expression that describes the gas-phase equilibrium for methanol and dimethyl
ether:
K =14X2CH3OH
(1−XCH3OH)2(8.42)
The equilibrium constant can be expressed in terms of the free energies of reaction:
K = e−∆GRXN
RT (8.43)
Where the free energy of reaction can be estimated from the standard free energies
of formation for each species (∆Gj) and the stoichiometric coecient dened by the
reaction chemistry (νj):
∆GRXN = Σ∆Gjνj
νCH3OH
=1
2∆GH2O
+ ∆GCH3OH = −9.65kJmol−1 (8.44)
The equilibrium constant can now be calculated at 433 K and gives K = 14.59, which
can be used to calculate an equilibrium conversion of 0.88 (433 K). The approach
to equilibrium was estimated to be <0.01 at low conversions (<15%) and measured
reaction rates should be uncorrupted by equilibrium.
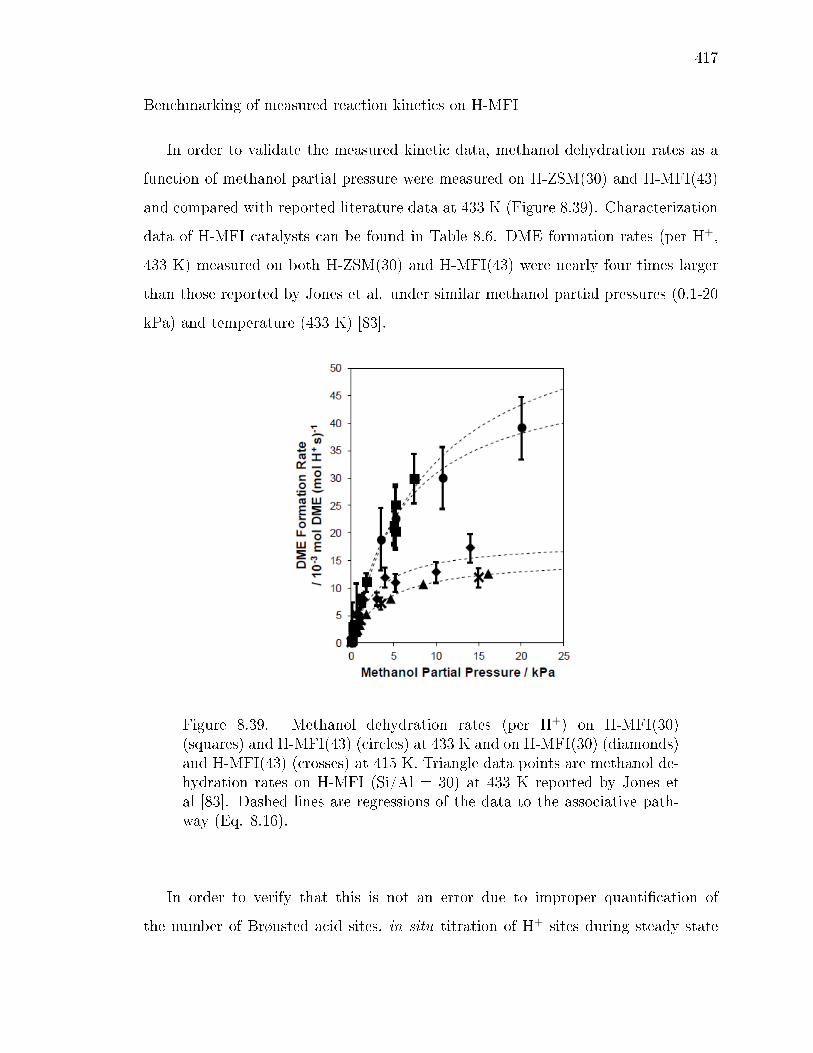
417
Benchmarking of measured reaction kinetics on H-MFI
In order to validate the measured kinetic data, methanol dehydration rates as a
function of methanol partial pressure were measured on H-ZSM(30) and H-MFI(43)
and compared with reported literature data at 433 K (Figure 8.39). Characterization
data of H-MFI catalysts can be found in Table 8.6. DME formation rates (per H+,
433 K) measured on both H-ZSM(30) and H-MFI(43) were nearly four times larger
than those reported by Jones et al. under similar methanol partial pressures (0.1-20
kPa) and temperature (433 K) [83].
Figure 8.39. Methanol dehydration rates (per H+) on H-MFI(30)(squares) and H-MFI(43) (circles) at 433 K and on H-MFI(30) (diamonds)and H-MFI(43) (crosses) at 415 K. Triangle data points are methanol de-hydration rates on H-MFI (Si/Al = 30) at 433 K reported by Jones etal [83]. Dashed lines are regressions of the data to the associative path-way (Eq. 8.16).
In order to verify that this is not an error due to improper quantication of
the number of Brønsted acid sites, in situ titration of H+ sites during steady state
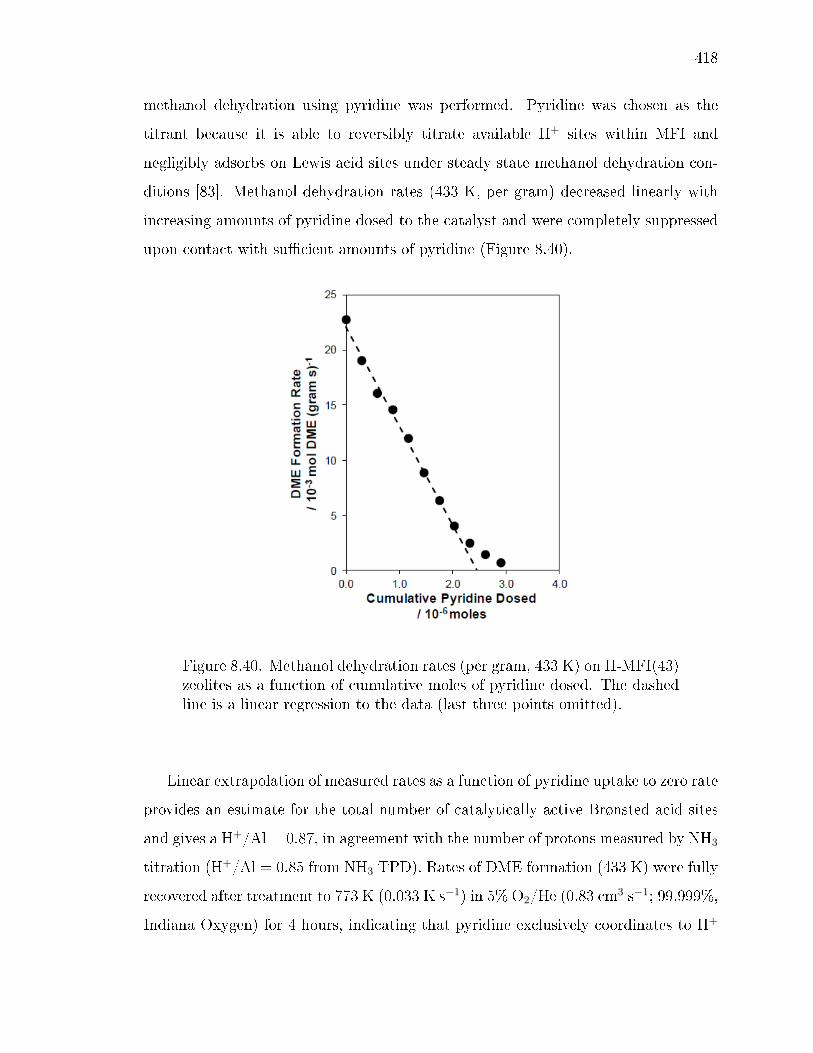
418
methanol dehydration using pyridine was performed. Pyridine was chosen as the
titrant because it is able to reversibly titrate available H+ sites within MFI and
negligibly adsorbs on Lewis acid sites under steady state methanol dehydration con-
ditions [83]. Methanol dehydration rates (433 K, per gram) decreased linearly with
increasing amounts of pyridine dosed to the catalyst and were completely suppressed
upon contact with sucient amounts of pyridine (Figure 8.40).
Figure 8.40. Methanol dehydration rates (per gram, 433 K) on H-MFI(43)zeolites as a function of cumulative moles of pyridine dosed. The dashedline is a linear regression to the data (last three points omitted).
Linear extrapolation of measured rates as a function of pyridine uptake to zero rate
provides an estimate for the total number of catalytically active Brønsted acid sites
and gives a H+/Al = 0.87, in agreement with the number of protons measured by NH3
titration (H+/Al = 0.85 from NH3 TPD). Rates of DME formation (433 K) were fully
recovered after treatment to 773 K (0.033 K s−1) in 5% O2/He (0.83 cm3 s−1; 99.999%,
Indiana Oxygen) for 4 hours, indicating that pyridine exclusively coordinates to H+

419
sites and that no structural changes occurred, leading to the observed decrease in the
dehydration rate. These results indicate that the ex situ NH3 titrations are capable of
quantifying H+ sites relevant for methanol dehydration chemistry in MFI zeolites and
represent an accurate count of the number of active sites. Despite the conrmation
that DME formation rates are properly normalized, the discrepancy between the
measured and reported methanol dehydration rates persisted.
DME formation rates (per H+ from pyridine) were next measured as a function of
temperature at various methanol pressures (0.1-20 kPa) until measured rates agreed
with reported values from Jones et al [83]. Both rst and zero-order rate constants
(per H+ site from pyridine) on H-MFI(30) and H-MFI(43) were reproduced within
15% of the values reported by Jones et al. [83] at a temperature of 415 K (Figure
8.39). Additionally, activation parameters (405-433 K) in both the rst and zero-
order kinetic regimes agreed within 20% of those reported for methanol dehydration
on MFI zeolites (Figure 8.41, Table 8.13), further indicating that rst and zero order
rate constants are being compared under the same catalytic conditions and that the
dierence in measured rates at 433 K is not due to a dierence in surface coverages or
apparent kinetic regimes. As both the rst and zero-order rate constants (per H+ from
pyridine) and apparent activation parameters were in agreement with those reported
for MFI zeolites, the temperature of 415 K was chosen for all catalysts studied and
the source of the discrepancy was not further investigated.
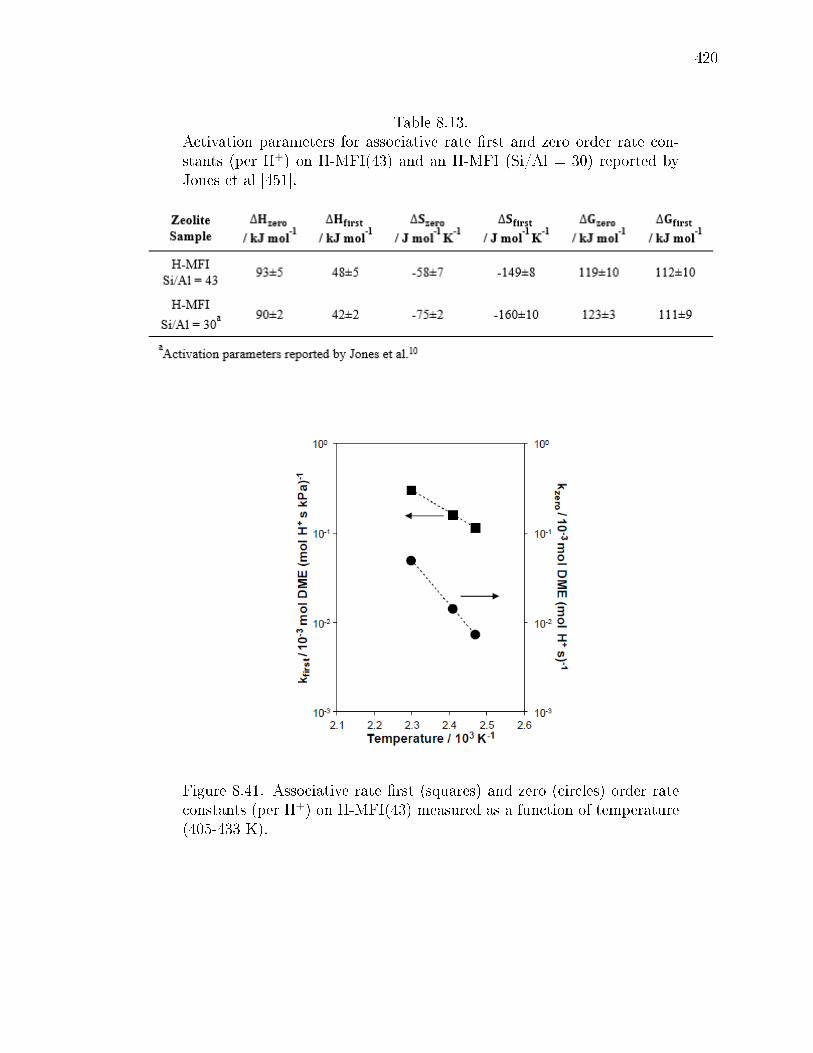
420
Table 8.13.Activation parameters for associative rate rst and zero order rate con-stants (per H+) on H-MFI(43) and an H-MFI (Si/Al = 30) reported byJones et al [451].
Figure 8.41. Associative rate rst (squares) and zero (circles) order rateconstants (per H+) on H-MFI(43) measured as a function of temperature(405-433 K).
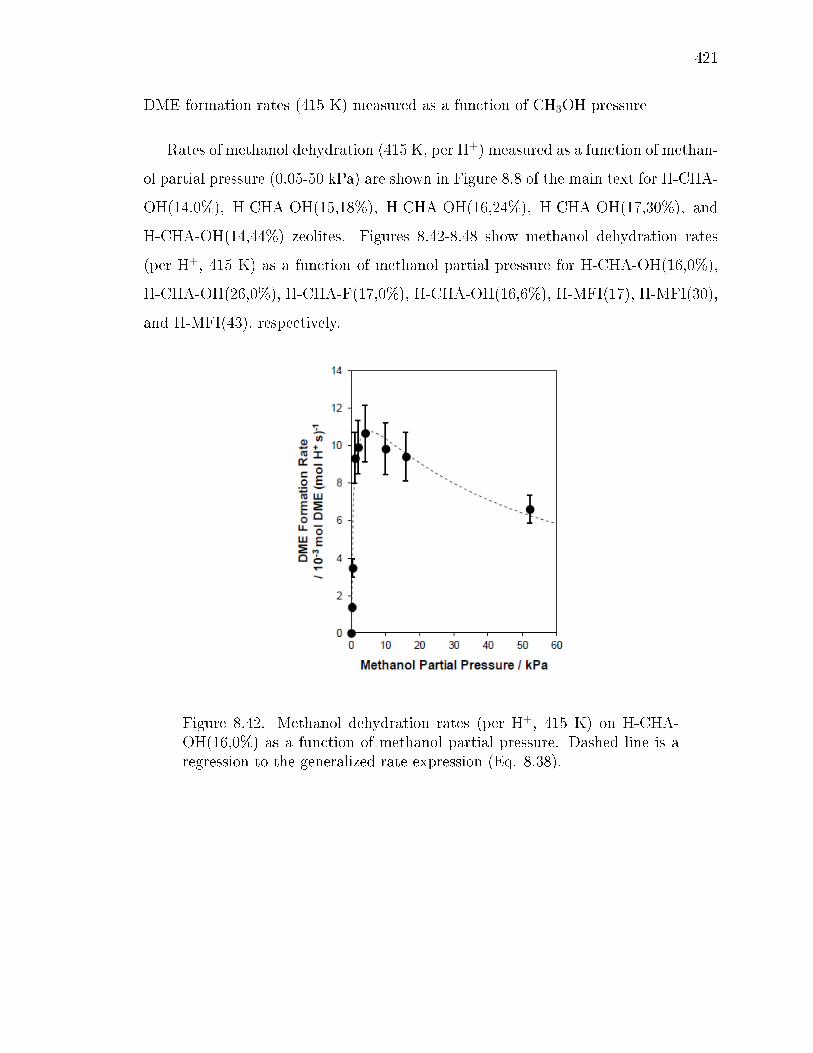
421
DME formation rates (415 K) measured as a function of CH3OH pressure
Rates of methanol dehydration (415 K, per H+) measured as a function of methan-
ol partial pressure (0.05-50 kPa) are shown in Figure 8.8 of the main text for H-CHA-
OH(14,0%), H-CHA-OH(15,18%), H-CHA-OH(16,24%), H-CHA-OH(17,30%), and
H-CHA-OH(14,44%) zeolites. Figures 8.42-8.48 show methanol dehydration rates
(per H+, 415 K) as a function of methanol partial pressure for H-CHA-OH(16,0%),
H-CHA-OH(26,0%), H-CHA-F(17,0%), H-CHA-OH(16,6%), H-MFI(17), H-MFI(30),
and H-MFI(43), respectively.
Figure 8.42. Methanol dehydration rates (per H+, 415 K) on H-CHA-OH(16,0%) as a function of methanol partial pressure. Dashed line is aregression to the generalized rate expression (Eq. 8.38).

422
Figure 8.43. Methanol dehydration rates (per H+, 415 K) on H-CHA-OH(26,0%) as a function of methanol partial pressure. Dashed line is aregression to the generalized rate expression (Eq. 8.38).

423
Figure 8.44. Methanol dehydration rates (per H+, 415 K) on H-CHA-F(17,0%) as a function of methanol partial pressure. Dashed line is aregression to the generalized rate expression (Eq. 8.38).
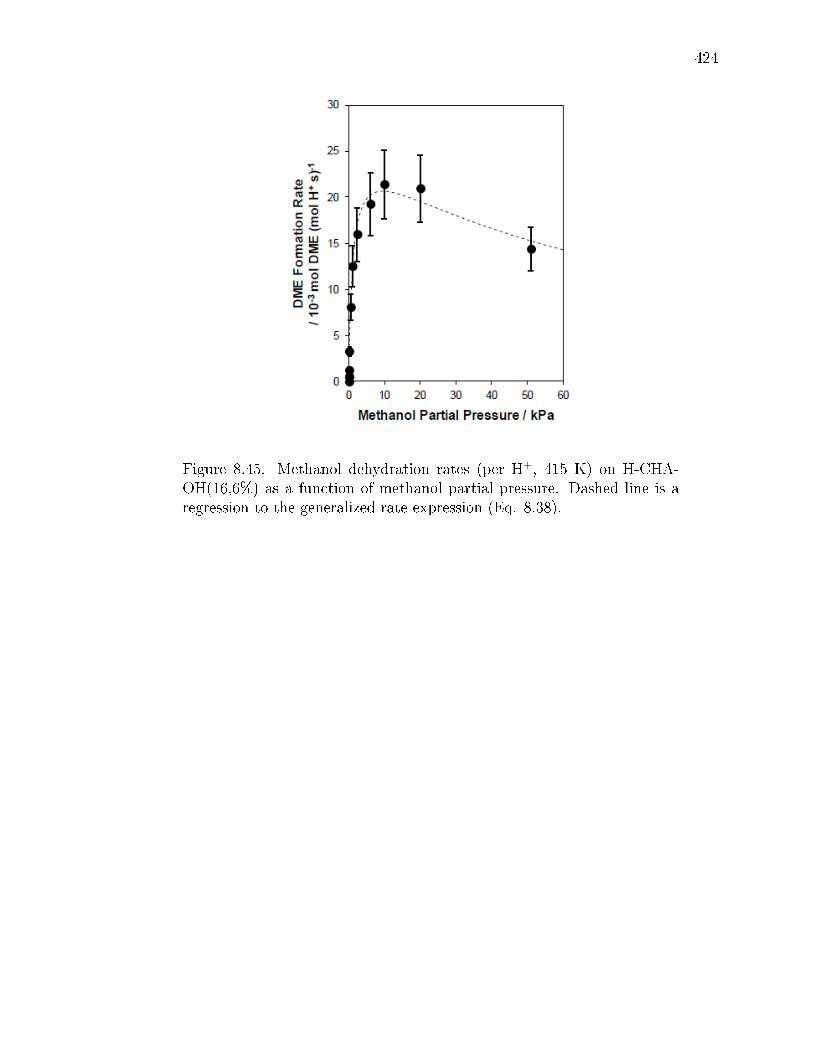
424
Figure 8.45. Methanol dehydration rates (per H+, 415 K) on H-CHA-OH(16,6%) as a function of methanol partial pressure. Dashed line is aregression to the generalized rate expression (Eq. 8.38).
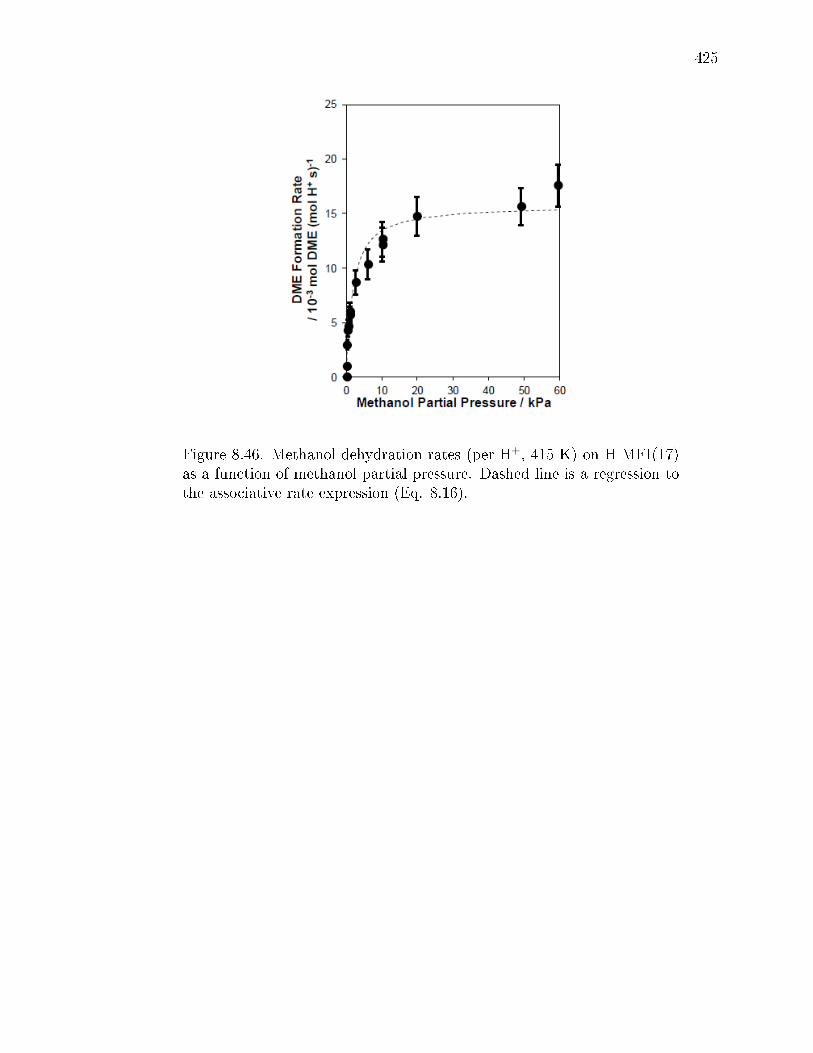
425
Figure 8.46. Methanol dehydration rates (per H+, 415 K) on H-MFI(17)as a function of methanol partial pressure. Dashed line is a regression tothe associative rate expression (Eq. 8.16).
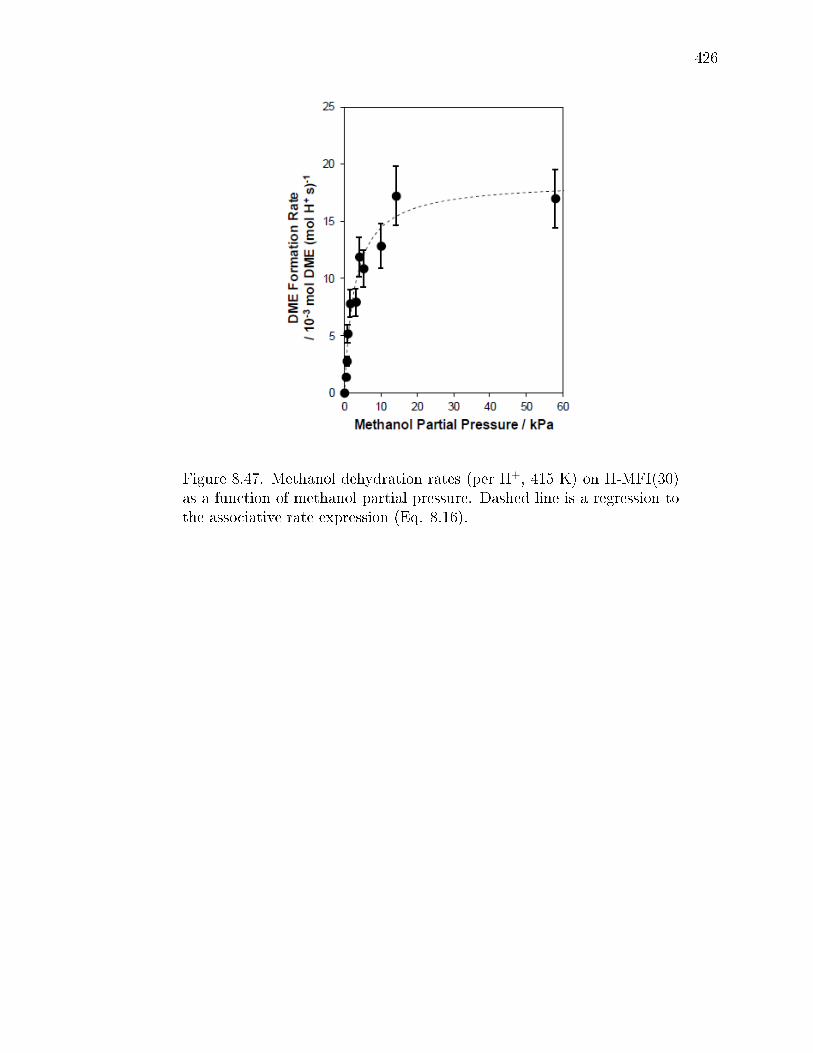
426
Figure 8.47. Methanol dehydration rates (per H+, 415 K) on H-MFI(30)as a function of methanol partial pressure. Dashed line is a regression tothe associative rate expression (Eq. 8.16).
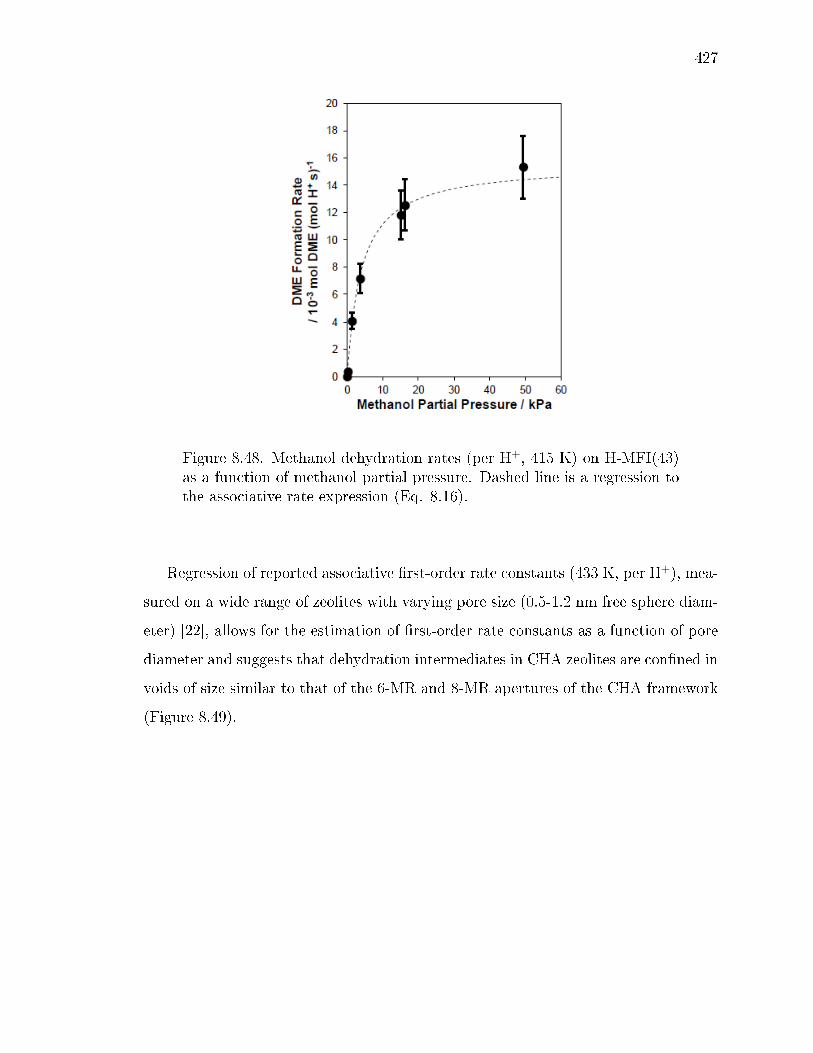
427
Figure 8.48. Methanol dehydration rates (per H+, 415 K) on H-MFI(43)as a function of methanol partial pressure. Dashed line is a regression tothe associative rate expression (Eq. 8.16).
Regression of reported associative rst-order rate constants (433 K, per H+), mea-
sured on a wide range of zeolites with varying pore size (0.5-1.2 nm free sphere diam-
eter) [22], allows for the estimation of rst-order rate constants as a function of pore
diameter and suggests that dehydration intermediates in CHA zeolites are conned in
voids of size similar to that of the 6-MR and 8-MR apertures of the CHA framework
(Figure 8.49).
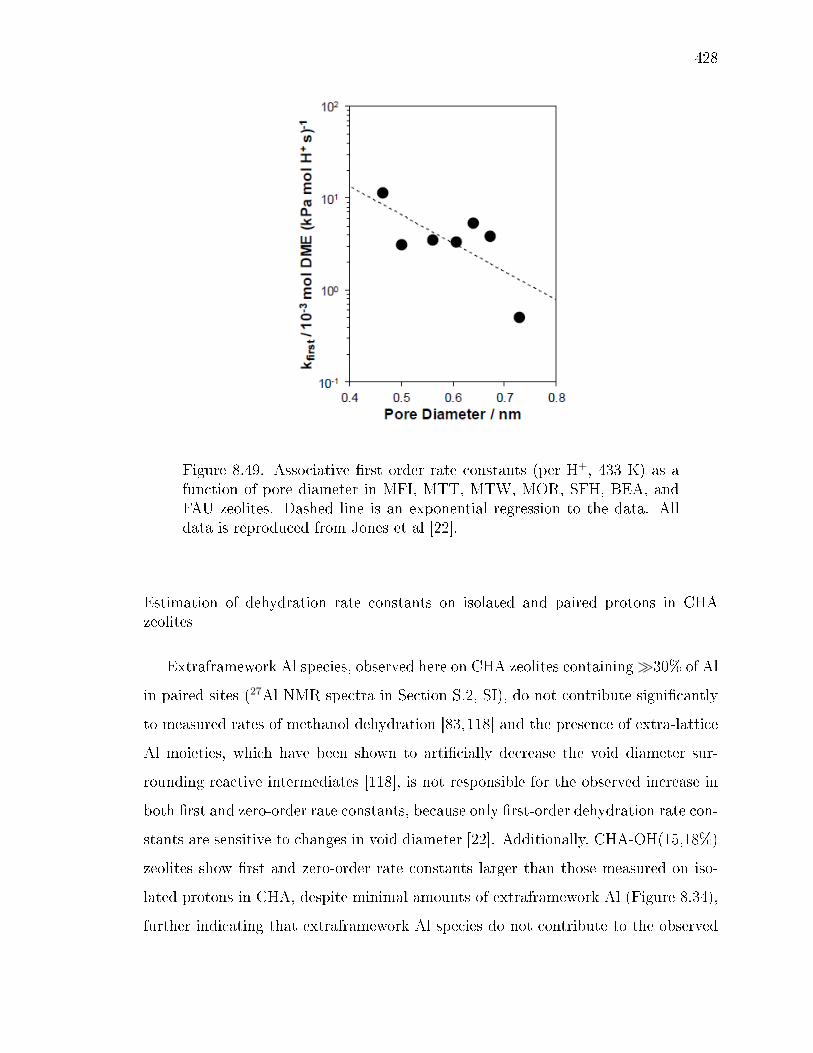
428
Figure 8.49. Associative rst order rate constants (per H+, 433 K) as afunction of pore diameter in MFI, MTT, MTW, MOR, SFH, BEA, andFAU zeolites. Dashed line is an exponential regression to the data. Alldata is reproduced from Jones et al [22].
Estimation of dehydration rate constants on isolated and paired protons in CHAzeolites
Extraframework Al species, observed here on CHA zeolites containing30% of Al
in paired sites (27Al NMR spectra in Section S.2, SI), do not contribute signicantly
to measured rates of methanol dehydration [83,118] and the presence of extra-lattice
Al moieties, which have been shown to articially decrease the void diameter sur-
rounding reactive intermediates [118], is not responsible for the observed increase in
both rst and zero-order rate constants, because only rst-order dehydration rate con-
stants are sensitive to changes in void diameter [22]. Additionally, CHA-OH(15,18%)
zeolites show rst and zero-order rate constants larger than those measured on iso-
lated protons in CHA, despite minimal amounts of extraframework Al (Figure 8.34),
further indicating that extraframework Al species do not contribute to the observed
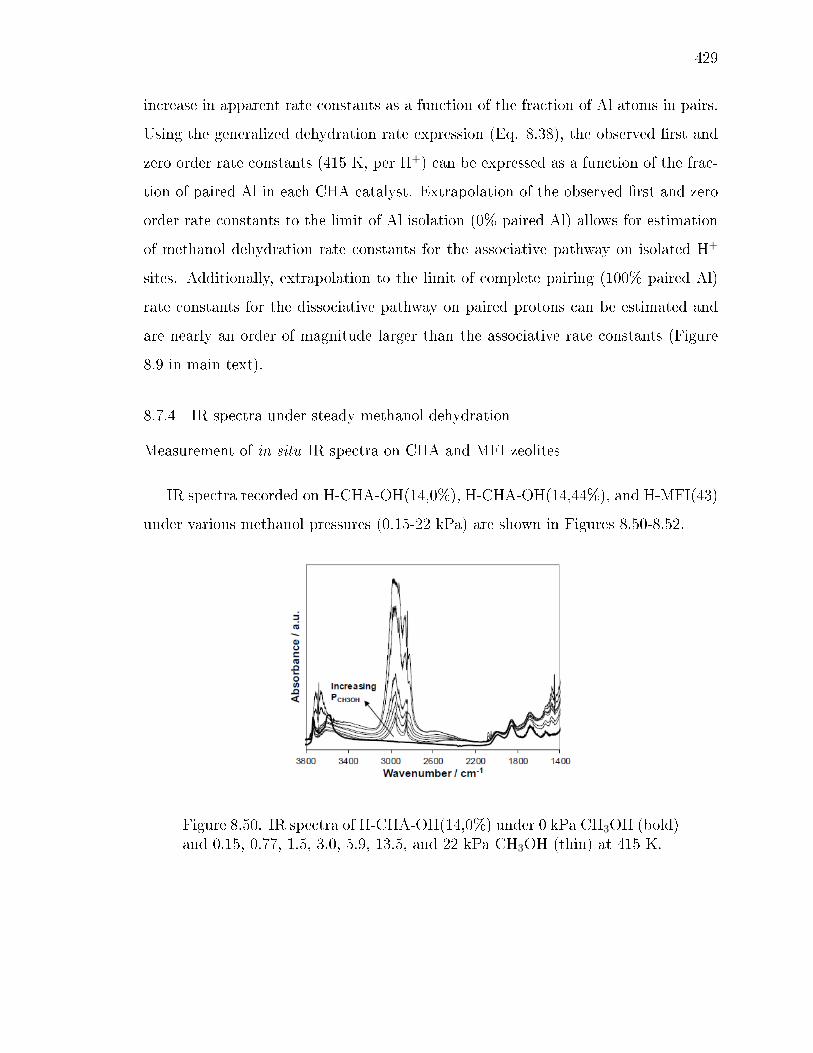
429
increase in apparent rate constants as a function of the fraction of Al atoms in pairs.
Using the generalized dehydration rate expression (Eq. 8.38), the observed rst and
zero order rate constants (415 K, per H+) can be expressed as a function of the frac-
tion of paired Al in each CHA catalyst. Extrapolation of the observed rst and zero
order rate constants to the limit of Al isolation (0% paired Al) allows for estimation
of methanol dehydration rate constants for the associative pathway on isolated H+
sites. Additionally, extrapolation to the limit of complete pairing (100% paired Al)
rate constants for the dissociative pathway on paired protons can be estimated and
are nearly an order of magnitude larger than the associative rate constants (Figure
8.9 in main text).
8.7.4 IR spectra under steady methanol dehydration
Measurement of in situ IR spectra on CHA and MFI zeolites
IR spectra recorded on H-CHA-OH(14,0%), H-CHA-OH(14,44%), and H-MFI(43)
under various methanol pressures (0.15-22 kPa) are shown in Figures 8.50-8.52.
Figure 8.50. IR spectra of H-CHA-OH(14,0%) under 0 kPa CH3OH (bold)and 0.15, 0.77, 1.5, 3.0, 5.9, 13.5, and 22 kPa CH3OH (thin) at 415 K.

430
Figure 8.51. IR spectra of H-CHA-OH(14,44%) under 0 kPa CH3OH(bold) and 0.15, 0.77, 1.5, 3.0, 5.9, 13.5, and 22 kPa CH3OH (thin) at 415K.
Figure 8.52. IR spectra of H-MFI(43) under 0 kPa CH3OH (bold) and0.15, 0.77, 1.5, 3.0, 5.9, 13.5, and 22 kPa CH3OH (thin) at 415 K.
In order to establish an experimental reference for surface methoxy deformation
modes, H-CHA-OH(14,0%), which was chosen because it contains a single type of
active site (i.e., only isolated protons), was equilibrated under steady-state methanol
pressure (0.15 kPa) and then purged in dry He (13.3 cm3 s−1 g−1) for 30 minutes
431
at 523 K until the spectra remained constant. Similar procedures have been used to
isolated surface methoxy species observed during IR [451, 468, 469], 13C NMR [470],
and neutron scattering [471] spectroscopic studies of methanol-to-olens chemistry.
8.7.5 Evaluation of mass transfer in CHA zeolites
Space velocity test to verify dierential operation
Dierential operation was conrmed by measuring the rate of methanol dehydra-
tion (per H+, 415 K) as a function of inverse space velocity (i.e. residence time) at
xed methanol partial pressures on each MFI and CHA zeolite prior to kinetic analy-
sis. Figure 8.53 shows a typical space velocity test performed at 1 kPa CH3OH. On all
catalysts tested, the CH3OH conversion increased linearly with increasing residence
time and DME formation rates (per H+, 415 K) were invariant with residence time at
xed CH3OH partial pressure. These results conrm that each catalyst is operating
under dierential conditions and rates are independent of reactor hydrodynamics.
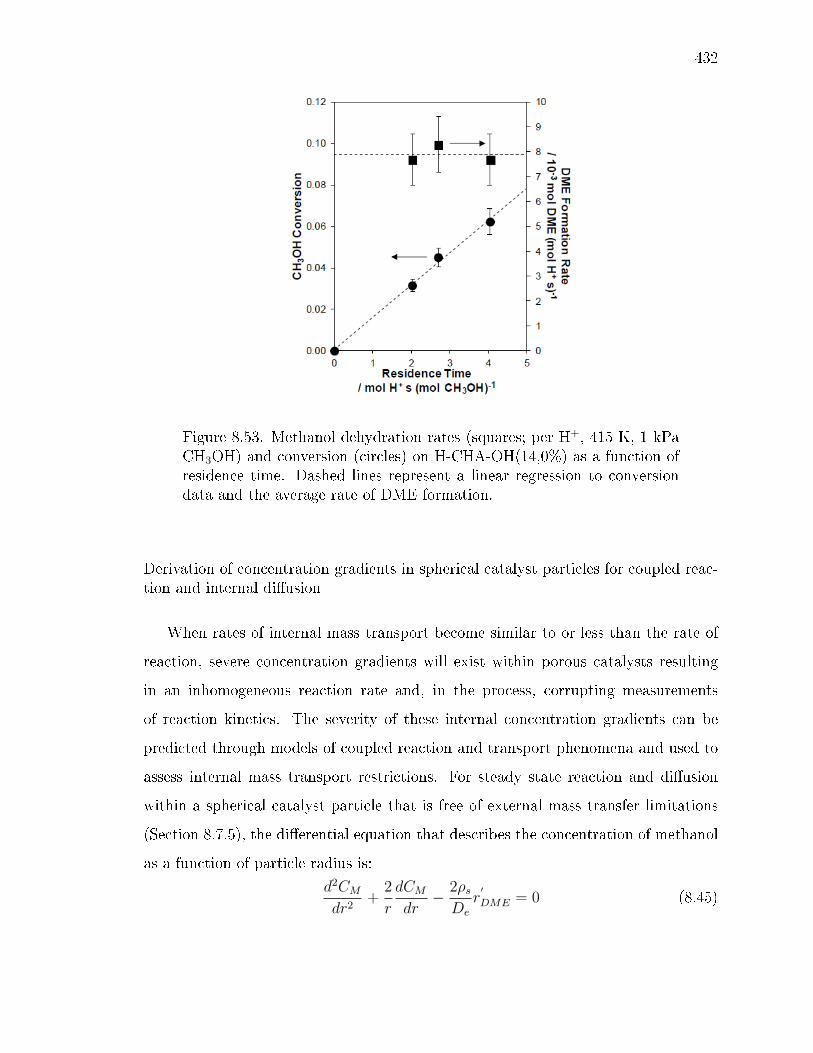
432
Figure 8.53. Methanol dehydration rates (squares; per H+, 415 K, 1 kPaCH3OH) and conversion (circles) on H-CHA-OH(14,0%) as a function ofresidence time. Dashed lines represent a linear regression to conversiondata and the average rate of DME formation.
Derivation of concentration gradients in spherical catalyst particles for coupled reac-tion and internal diusion
When rates of internal mass transport become similar to or less than the rate of
reaction, severe concentration gradients will exist within porous catalysts resulting
in an inhomogeneous reaction rate and, in the process, corrupting measurements
of reaction kinetics. The severity of these internal concentration gradients can be
predicted through models of coupled reaction and transport phenomena and used to
assess internal mass transport restrictions. For steady state reaction and diusion
within a spherical catalyst particle that is free of external mass transfer limitations
(Section 8.7.5), the dierential equation that describes the concentration of methanol
as a function of particle radius is:
d2CMdr2
+2
r
dCMdr− 2ρsDe
r′
DME = 0 (8.45)
433
Here, CM is the concentration of methanol (mol m−3), r is the distance from the
center of the pellet (m), ρs is the proton density per volume (mol H+ m−3), De is
the eective self-diusivity of methanol inside the pore (m2 s−1), and r'DME is the
rate of DME formation (mol DME (mol H+ s)−1). The factor of 2 accounts for the
dierence in stoichiometry between the product DME and methanol reactant (rM =
-2rDME). The self-diusivity of methanol within CHA was estimated from reported
molecular dynamics simulations of methanol diusion within DDR zeolites (De(360
K) = 7.5 x 10⁻¹¹ m2 s−1) [472], which is similar to CHA in both limiting pore diameter
(8-MR, 0.37 nm) and pore connectivity (window-cage structure), and extrapolated to
the relevant reaction temperature (De(415 K) = 9.3 x 10⁻¹¹ m2 s−1) using Chapman-
Enskog theory:
De(T2) = De(T1)(T2
T1
)3/2 (8.46)
The rate of DME formation (per H+) can be expressed using the generalized rate
expression (Eq. 8.38) that weights the contribution from both the associative and
dissociative pathways as a function of the relative population of isolated and paired
Al sites, respectively and allows for Eq. 8.45 to be rewritten as:
d2CMdr2
+2
r
dCMdr−
2ρsDe
[γisokfirstA CM
1 +kfirstA
kzeroACM +
kfirstA
kinverseA
C2M
+ γpairkfirstD CM
1 +kfirstD
kzeroDCM +
kfirstD
kinverseD
C2M
] = 0 (8.47)
Figures 8.14-8.62 show concentration proles as a function of particle radius and
concentration at 415 K for each CHA zeolite studied here. Bulk-phase methanol
concentrations were chosen to be similar to those used during methanol dehydration
catalysis (0.05-52 kPa CH3OH). It is apparent that the low-aluminum CHA catalyst
containing only isolated H+ sites (Si/Al = 30) exhibits severe concentration gradients
in the rst-order kinetic regime (<1 kPa), in agreement with lower observed rates of
DME formation (415 K, per H+) than on CHA with all isolated Al sites at higher
Al content (Si/Al = 15). These results are also in agreement with the measured
crystallite size, which increases nearly four-fold from a particle diameter of 1.5 µm
434
(Si/Al = 15) to 6 µm (Si/Al = 30). All other CHA zeolites examined at Si/Al =
15 (0-44% paired Al) contain crystallite sizes smaller than 1.5 µm and show minimal
internal concentration gradients despite rates of reaction that increased systematically
with the fraction of paired Al (Figure 8.8 in main text).
There was, however, a general decrease in the crystallite size as a function of paired
Al content and to eliminate this as a possible contributor to the increase in observed
DME formation rates (415 K, per H+), a nano-sized CHA zeolite was synthesized
using TMAda+ cations and the surfactant hexadecyl-trimethylammonium bromide
(CTAB) in the absence of Na+ [457]. SEM micrographs show that the nano-sized
CHA zeolite contains crystallites about 800 nm in diameter (Figure 8.31) and Co2+
titrations show that these zeolites contain a small fraction of paired Al sites (Co/Al =
0.03), introduced by including an additional quaternary amine (i.e. CTAB). Methanol
dehydration rates (415 K, per H+) on nano-sized CHA follow the same trend as seen
for CHA zeolites prepared through conventional synthesis protocols, where both the
rst and zero order rate constants increase as a function of paired Al content (Figure
8.9 in main text; Tables 8.3-8.5). Predicted internal concentration gradients are also
negligible on nano-sized CHA (Figure 8.58), in line with previous observations that
CHA zeolite with crystallite sizes <2 µm are free of internal concentration gradients.
These results further demonstrate that the increase in DME formation rate (per H+)
across CHA zeolites containing dierent amounts of paired Al (Si/Al = 15) is solely
a function of the number of paired Al sites and not a crystal size eect.
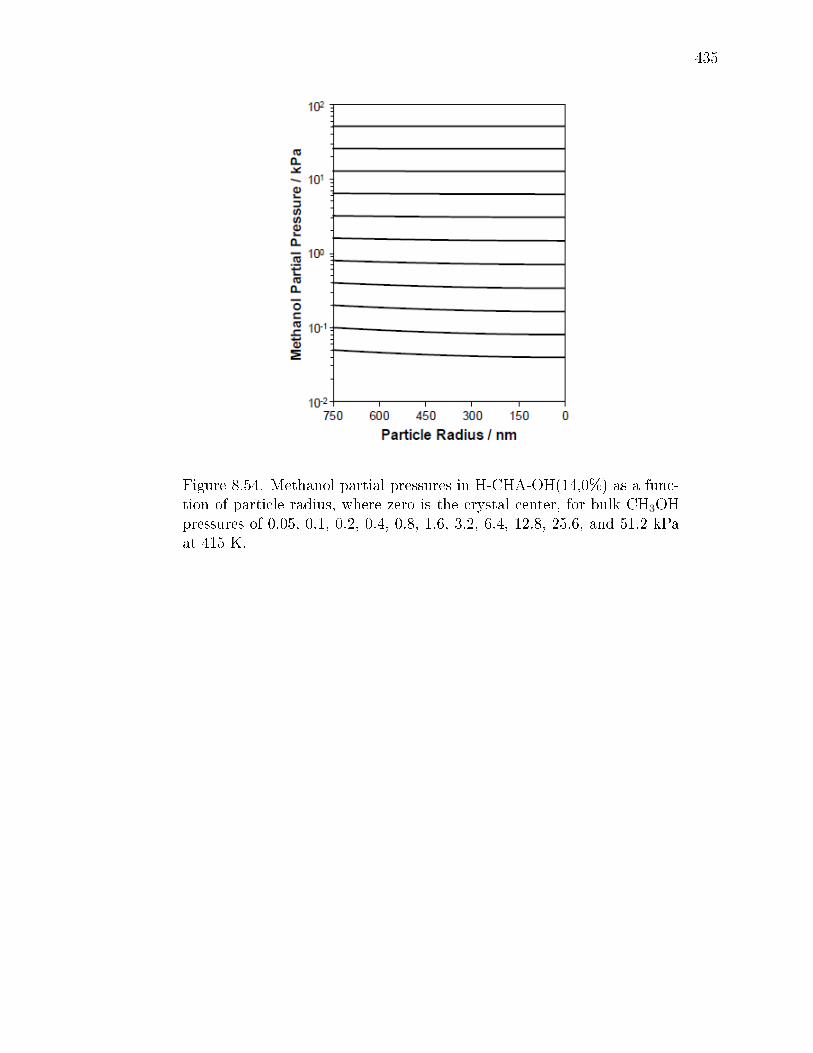
435
Figure 8.54. Methanol partial pressures in H-CHA-OH(14,0%) as a func-tion of particle radius, where zero is the crystal center, for bulk CH3OHpressures of 0.05, 0.1, 0.2, 0.4, 0.8, 1.6, 3.2, 6.4, 12.8, 25.6, and 51.2 kPaat 415 K.

436
Figure 8.55. Methanol partial pressures in H-CHA-OH(17,0%) as a func-tion of particle radius, where zero is the crystal center, for bulk CH3OHpressures of 0.05, 0.1, 0.2, 0.4, 0.8, 1.6, 3.2, 6.4, 12.8, 25.6, and 51.2 kPaat 415 K.
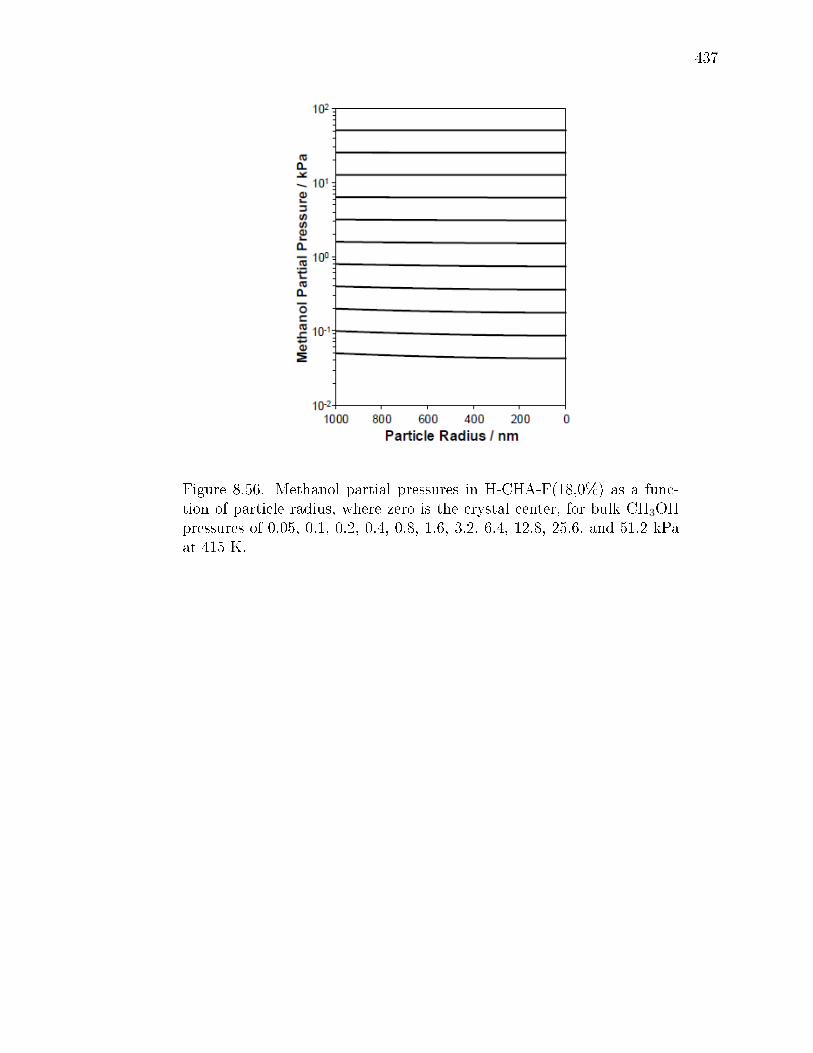
437
Figure 8.56. Methanol partial pressures in H-CHA-F(18,0%) as a func-tion of particle radius, where zero is the crystal center, for bulk CH3OHpressures of 0.05, 0.1, 0.2, 0.4, 0.8, 1.6, 3.2, 6.4, 12.8, 25.6, and 51.2 kPaat 415 K.
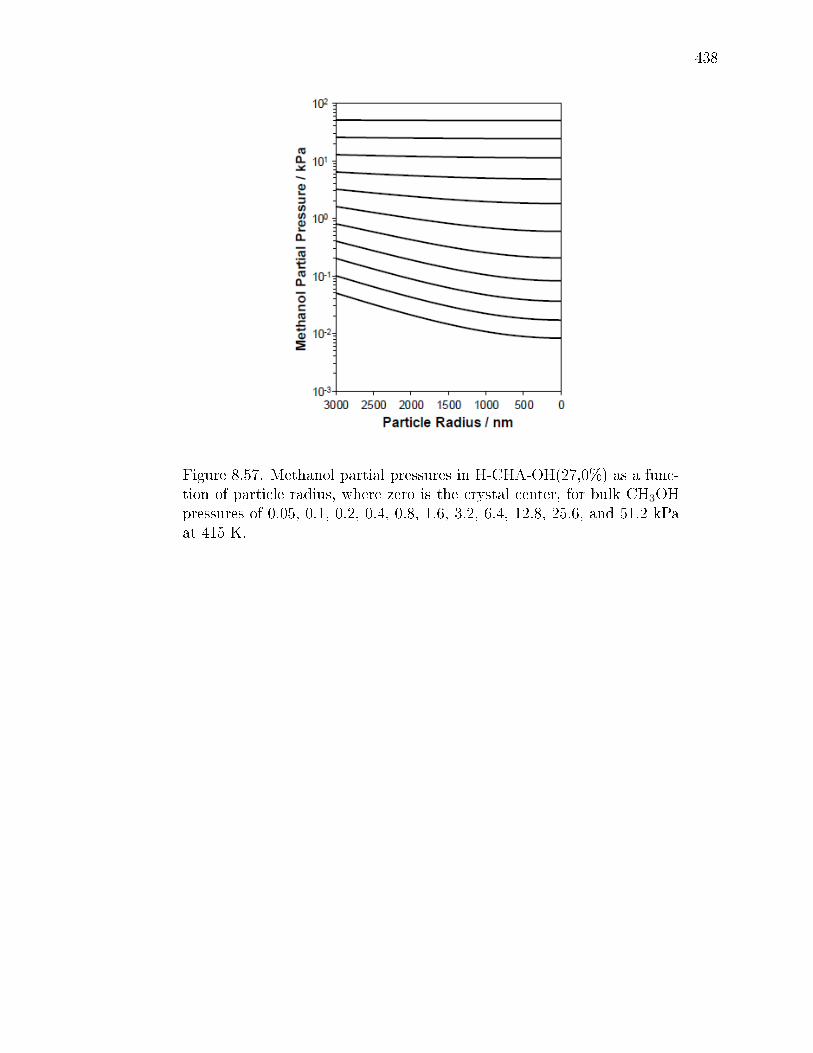
438
Figure 8.57. Methanol partial pressures in H-CHA-OH(27,0%) as a func-tion of particle radius, where zero is the crystal center, for bulk CH3OHpressures of 0.05, 0.1, 0.2, 0.4, 0.8, 1.6, 3.2, 6.4, 12.8, 25.6, and 51.2 kPaat 415 K.
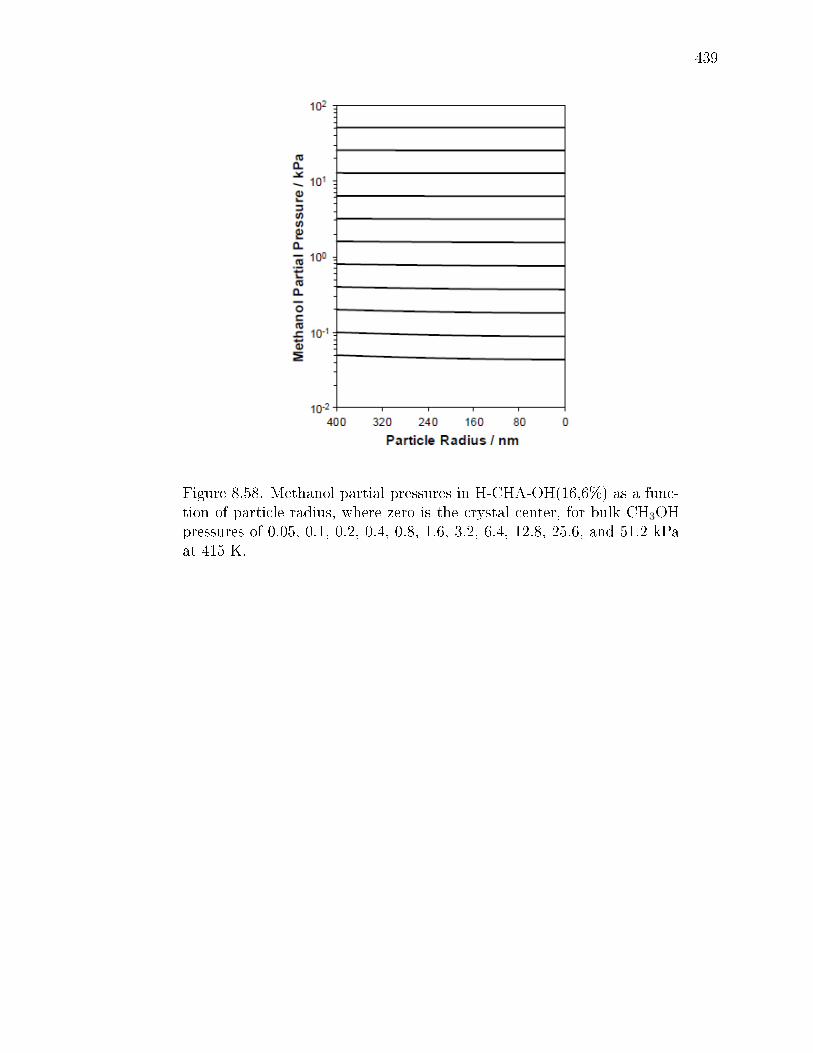
439
Figure 8.58. Methanol partial pressures in H-CHA-OH(16,6%) as a func-tion of particle radius, where zero is the crystal center, for bulk CH3OHpressures of 0.05, 0.1, 0.2, 0.4, 0.8, 1.6, 3.2, 6.4, 12.8, 25.6, and 51.2 kPaat 415 K.
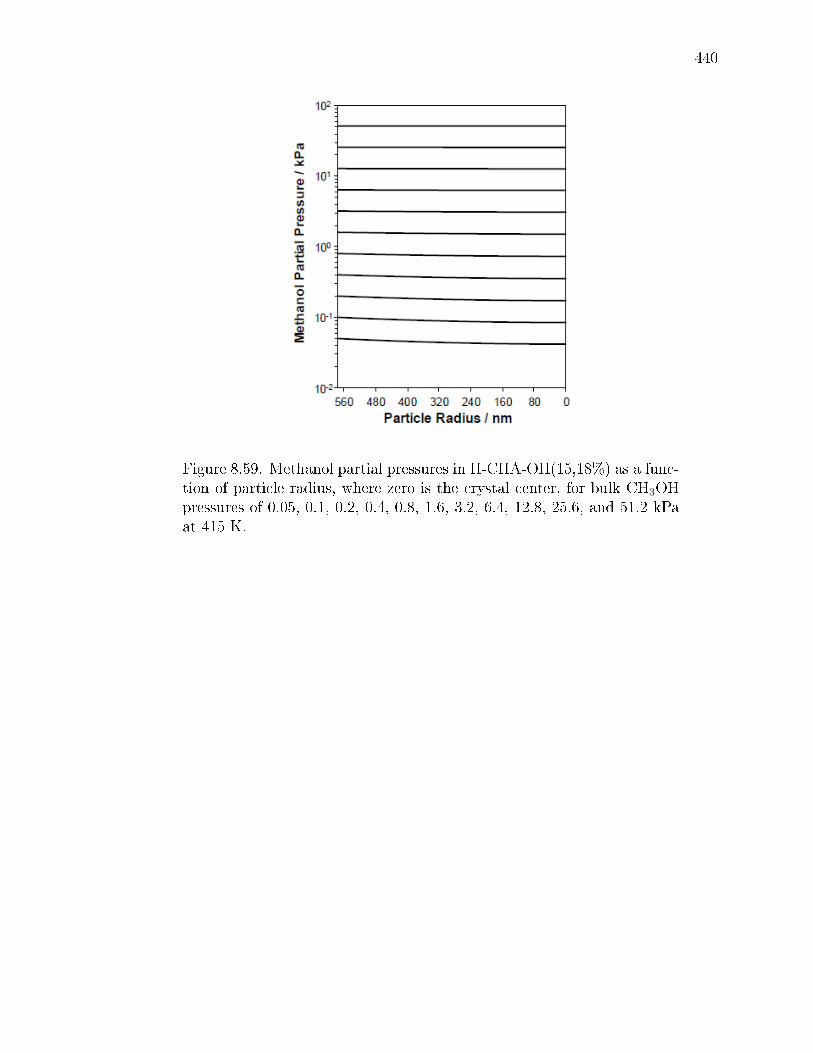
440
Figure 8.59. Methanol partial pressures in H-CHA-OH(15,18%) as a func-tion of particle radius, where zero is the crystal center, for bulk CH3OHpressures of 0.05, 0.1, 0.2, 0.4, 0.8, 1.6, 3.2, 6.4, 12.8, 25.6, and 51.2 kPaat 415 K.
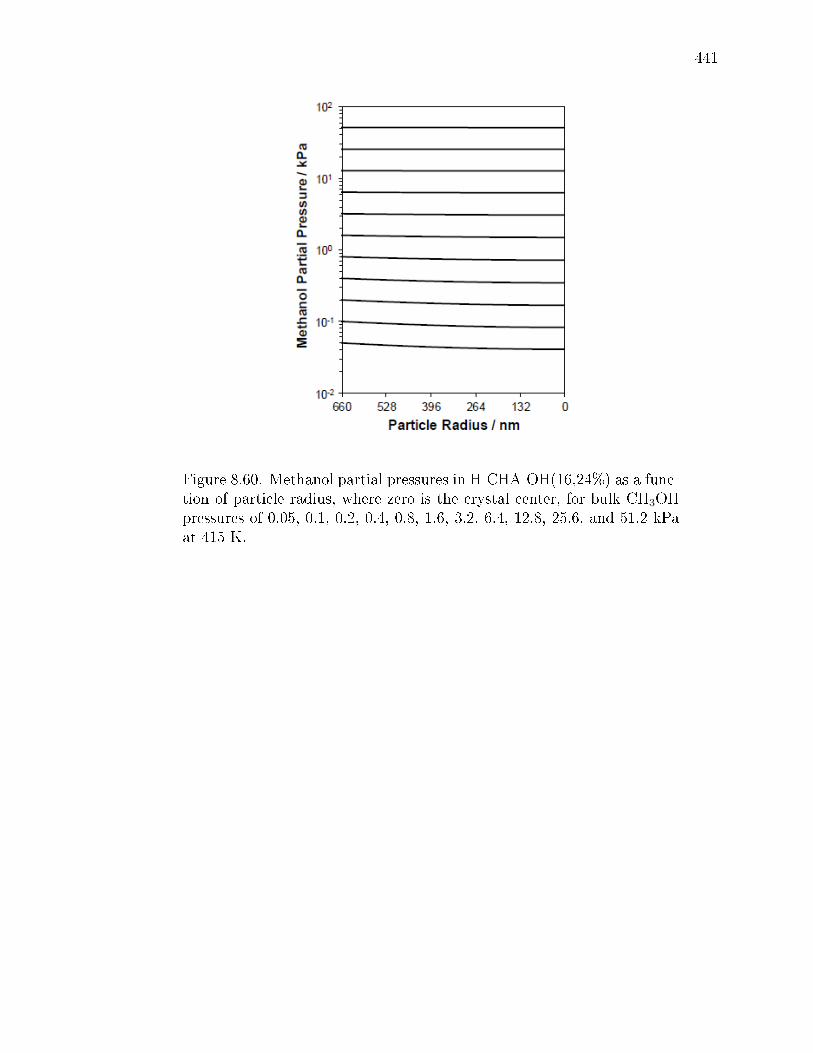
441
Figure 8.60. Methanol partial pressures in H-CHA-OH(16,24%) as a func-tion of particle radius, where zero is the crystal center, for bulk CH3OHpressures of 0.05, 0.1, 0.2, 0.4, 0.8, 1.6, 3.2, 6.4, 12.8, 25.6, and 51.2 kPaat 415 K.
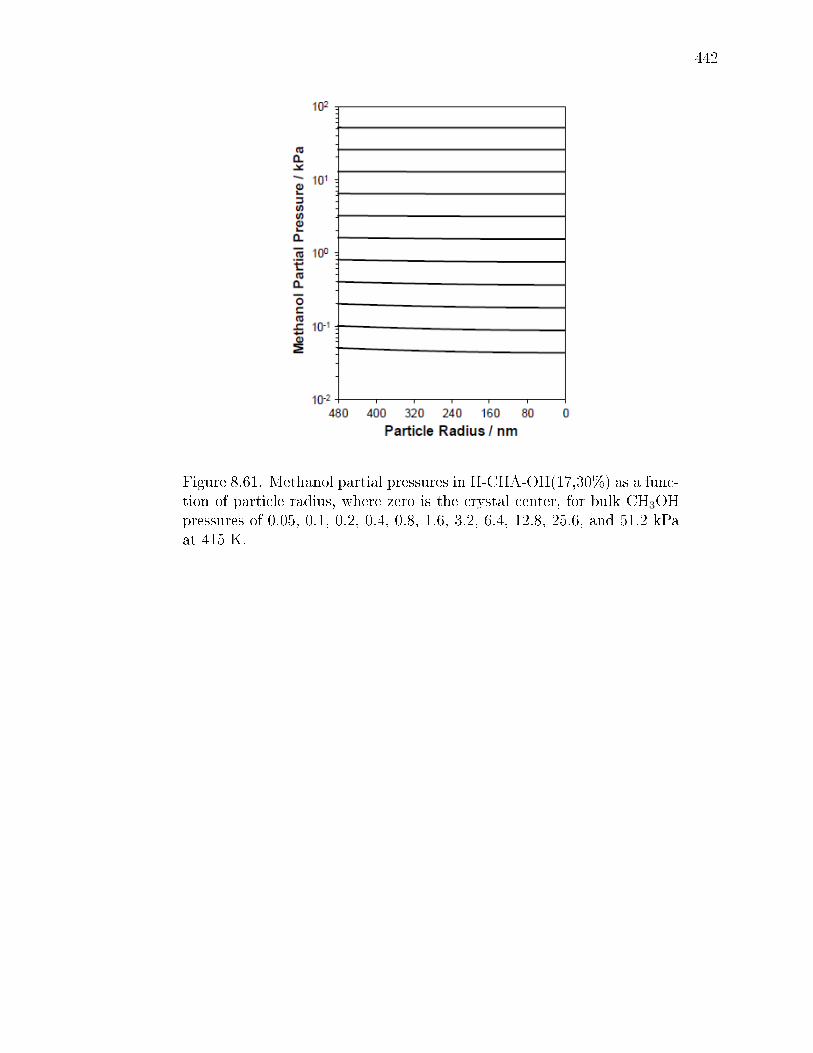
442
Figure 8.61. Methanol partial pressures in H-CHA-OH(17,30%) as a func-tion of particle radius, where zero is the crystal center, for bulk CH3OHpressures of 0.05, 0.1, 0.2, 0.4, 0.8, 1.6, 3.2, 6.4, 12.8, 25.6, and 51.2 kPaat 415 K.

443
Figure 8.62. Methanol partial pressures in H-CHA-OH(14,44%) as a func-tion of particle radius, where zero is the crystal center, for bulk CH3OHpressures of 0.05, 0.1, 0.2, 0.4, 0.8, 1.6, 3.2, 6.4, 12.8, 25.6, and 51.2 kPaat 415 K.
Derivation of rst and zero order eectiveness factors
A more quantitative evaluation of internal mass transfer can be evaluated by
calculating the internal eectiveness factor as a function of the Thiele modulus for
each CHA catalyst. For evaluation of the Thiele modulus, distinct rst and zero order
reaction rate laws were dened:
r′
first = (γisokfirstA + γpairk
firstD )CM (8.48)
r′
zero = γisokzeroA + γpairk
zeroD (8.49)
The rate of reaction for each kinetic regime will be evaluated using a generalize
rate expression (Eq. 8.38) that accounts for contributions from both relevant kinetic
pathways that occur uniquely at isolated (e.g. associative) and paired protons (e.g.
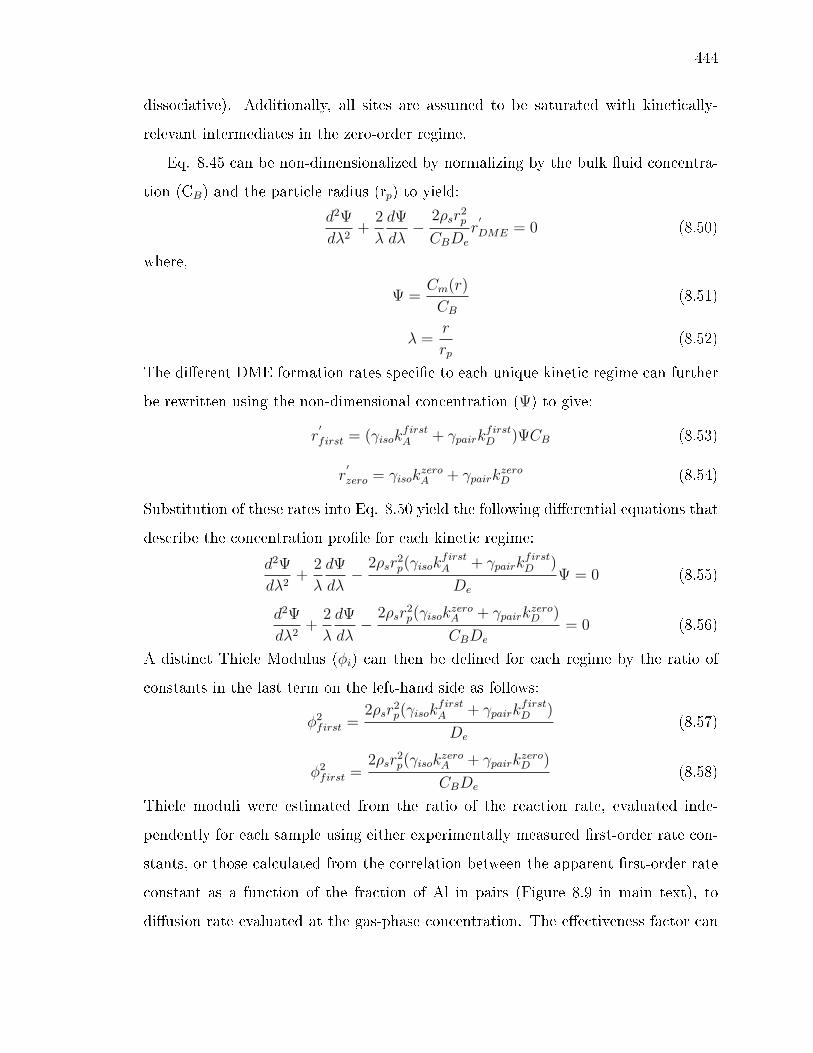
444
dissociative). Additionally, all sites are assumed to be saturated with kinetically-
relevant intermediates in the zero-order regime.
Eq. 8.45 can be non-dimensionalized by normalizing by the bulk uid concentra-
tion (CB) and the particle radius (rp) to yield:
d2Ψ
dλ2+
2
λ
dΨ
dλ−
2ρsr2p
CBDe
r′
DME = 0 (8.50)
where,
Ψ =Cm(r)
CB(8.51)
λ =r
rp(8.52)
The dierent DME formation rates specic to each unique kinetic regime can further
be rewritten using the non-dimensional concentration (Ψ) to give:
r′
first = (γisokfirstA + γpairk
firstD )ΨCB (8.53)
r′
zero = γisokzeroA + γpairk
zeroD (8.54)
Substitution of these rates into Eq. 8.50 yield the following dierential equations that
describe the concentration prole for each kinetic regime:
d2Ψ
dλ2+
2
λ
dΨ
dλ−
2ρsr2p(γisok
firstA + γpairk
firstD )
De
Ψ = 0 (8.55)
d2Ψ
dλ2+
2
λ
dΨ
dλ−
2ρsr2p(γisok
zeroA + γpairk
zeroD )
CBDe
= 0 (8.56)
A distinct Thiele Modulus (φi) can then be dened for each regime by the ratio of
constants in the last term on the left-hand side as follows:
φ2first =
2ρsr2p(γisok
firstA + γpairk
firstD )
De
(8.57)
φ2first =
2ρsr2p(γisok
zeroA + γpairk
zeroD )
CBDe
(8.58)
Thiele moduli were estimated from the ratio of the reaction rate, evaluated inde-
pendently for each sample using either experimentally measured rst-order rate con-
stants, or those calculated from the correlation between the apparent rst-order rate
constant as a function of the fraction of Al in pairs (Figure 8.9 in main text), to
diusion rate evaluated at the gas-phase concentration. The eectiveness factor can

445
then be expressed as the ratio of the observed reaction rate to the theoretical reaction
rate evaluated at the bulk concentration:
η =r′DME(Cm(r))
r′DME(CB)
(8.59)
Eectiveness factors were calculated from the ratio of the observed reaction rate,
using apparent rst-order rate constants, to the theoretical reaction rate evaluated
at the gas-phase concentration, using rst-order rate constants extracted from Figure
8.9 in the main text.
Equations 8.55 and 8.56 can be solved analytically for the concentration prole
inside the catalyst pellet and substituted into Eqs. 8.53 and 8.54 to derive an expres-
sion for the actual rate of reaction as a function of particle radius for each unique
kinetic regime. The eectiveness factor can then be evaluated as a function of the
Thiele modulus for the rst and zero order kinetic regimes:
ηfirst =3
φ2first
(φfirstcoth(φfirst)− 1) (8.60)
ηzero = 1 (8.61)
Figure 8.6 in main text shows the eectiveness factor for a rst order reaction as
a function of the Thiele modulus.
8.7.6 Origin of kinetic inhibition in CHA zeolites
Unlike MFI, and other medium and large pore zeolites, CHA zeolites, across all
composition and paired Al site concentrations, exhibit increasing inhibition of DME
formation rates as methanol partial pressures increase>10 kPa (415 K, per H+; Figure
8.8 in main text; Figures 8.42-8.45). One potential source of the observed inhibition
at high methanol pressures may be due to diusion limitations of DME leaving the
zeolite pores after desorption from the catalyst surface. Diusion coecients for DME
were conservatively estimated as being one order of magnitude smaller than CH3OH
diusion coecients in CHA zeolites (e.g. DME: De(T = 415 K) = 7.5 x 10⁻¹² m2
s−1). Experimentally measured DME self-diusion coecients (De(T = 293 K) = 1.2
x 10−9 m2 s−1) [473] in MFI zeolites are only twice as large as methanol self-diusion

446
coecients in MFI derived from molecular dynamic simulations (De(T = 300 K) =
2.5 x 10⁻⁹ m2 s−1) [472], suggesting that the estimate provided here for CHA zeolites
is reasonable and a conservative estimate for the CHA framework. The ratio of the
rate of DME formation (mol DME per unit time) and the transport rate of DME
through the catalyst (mol DME per unit time) can be evaluated as a function of the
internal concentration prole (Section 8.7.5) using Weisz-Prater criteria [474] to give
an order of magnitude estimate for the presence of product diusion and is expressed
by:
χ <r′DMEρsρBr
2p
DeCM(8.62)
Here, r′DME is the rate of DME formation per H+ site (415 K), ρs is the density of
H+ sites per gram, ρB is the bulk zeolite density (estimated to be 2.2 g cm−3), rp is
the particle radius, De is the eective diusivity of DME, and CM is the gas-phase
concentration of methanol. At all points within each CHA zeolite, the value of χ
is <10−2 indicating that the rate of DME formation is much slower than the rate
at which DME is transported out of the catalyst and that product diusion is not
responsible for the observed inhibition of DME formation rates at high methanol
pressures.
Alternatively, the presence of water formed through the dehydration process may
be responsible for the inhibition at high methanol pressures, as water is known to
inhibit alcohol dehydration reactions on solid acid catalysts [475]. The dependence of
methanol dehydration rates in CHA zeolites on water partial pressure was investigated
by co-feeding water during steady state catalysis (415 K) at various water to methanol
ratios (PH2O/PCH3OH = 0.02-3.6) and methanol pressures (0.05-50 kPa CH3OH) on
H-CHA-OH(14,0%) and H-CHA-OH(14,44%) catalysts and are shown in Figures 8.63
and 8.64, respectively.
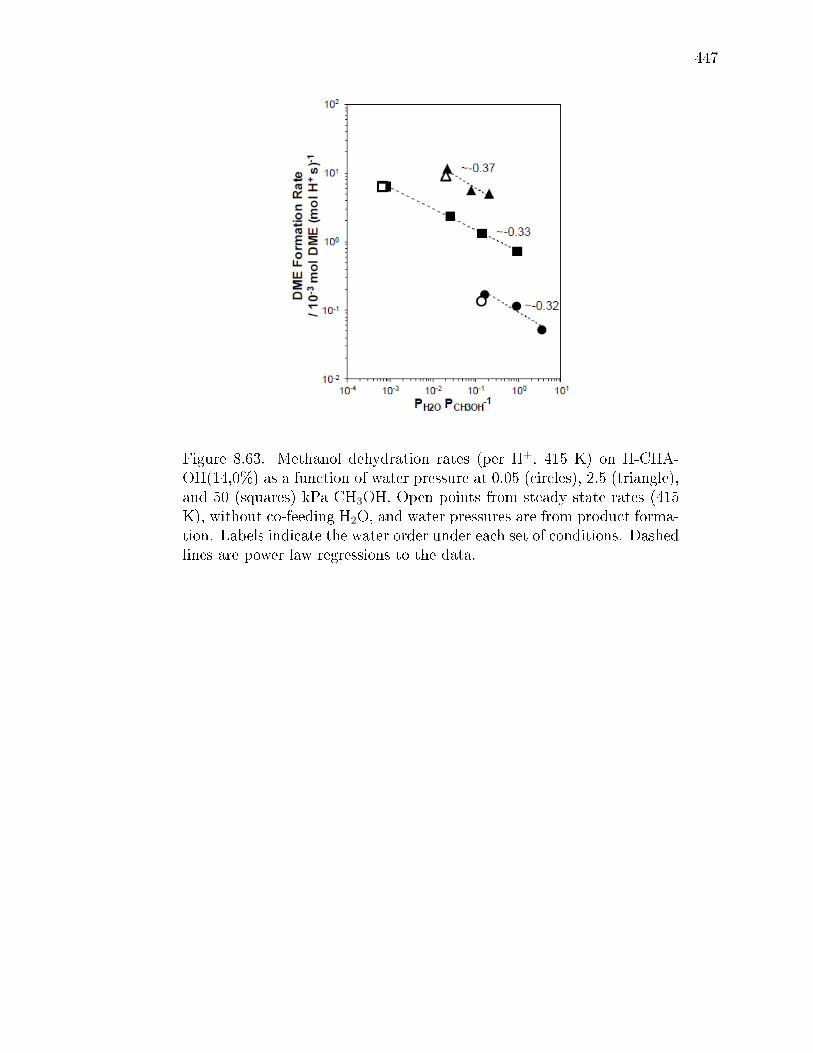
447
Figure 8.63. Methanol dehydration rates (per H+, 415 K) on H-CHA-OH(14,0%) as a function of water pressure at 0.05 (circles), 2.5 (triangle),and 50 (squares) kPa CH3OH. Open points from steady state rates (415K), without co-feeding H2O, and water pressures are from product forma-tion. Labels indicate the water order under each set of conditions. Dashedlines are power law regressions to the data.

448
Figure 8.64. Methanol dehydration rates (per H+, 415 K) on H-CHA-OH(14,44%) as a function of water pressure at 0.05 (circles), 2.5 (trian-gle), and 50 (squares) kPa CH3OH. Open points from steady state rates(415 K), without co-feeding H2O, and water pressures are from productformation. Labels indicate the water order under each set of conditions.Dashed lines are power law regressions to the data.
Figures 8.63 and 8.64 indicate that water inhibits the rate of DME formation at
415 K under all relevant methanol partial pressures (0.05-50 kPa) for both the asso-
ciative (isolated H+ sites) and dissociative (paired H+ sites) pathways. The amount
of water formed during methanol dehydration catalysis (415 K) when water is not
intentionally co-fed (open points in Figures 8.63 and 8.64), however, is not enough to
cause a measurable change in the rate of reaction, because of the low conversion in
the dierential regime. The origin of the approximately -1/3 water order measured
under every condition studied at 415 K likely reects a fractional coverage of water
on H+ sites and further analysis is beyond the scope of this work.
Another potential source of the inhibition observed in CHA zeolites at high metha-
nol pressures may be due to clustering of methanol around H+ sites, which solvate the

449
proton away from the zeolite lattice [456]. Under steady-state methanol dehydration
conditions (415 K, PCH3OH = 0.05-22 kPa), IR spectra of H-CHA (0-44% paired
Al) show a broad absorption band at ca. 3370 cm−1 that increases with increasing
CH3OH pressure, which has been attributed to the formation of methanol clusters
(Figures 8.50 and 8.51) [456]. Features for methanol clusters are also present in MFI
zeolites at high methanol partial pressures (>5 kPa CH3OH), but do not give rise
to inhibited dehydration rates at high methanol pressures (Figures 8.46-8.48) [83],
suggesting that certain structural features of the zeolite framework may stabilize the
formation of these extended reactant structures within the pores.
The CHA framework is unique when compared to other zeolite frameworks studied
for methanol dehydration (e.g. MFI, BEA, FAU, MOR, SFH, MTW, MTT) because
it is a small-pore, window-cage framework that does not contain quasi-cylindrical
pores. Instead, the CHA framework is comprised of 8-MR rings (0.38 nm in diameter)
that limit diusion of molecules into larger chab-cavities (0.73 x 1.2 nm), which may
stabilize the formation of extended methanol structures under the reaction conditions
studied. Methanol dehydration rates (per H+, 415 K) were measured on H-AEI
zeolites (AEI framework; synthesis and characterization reported elsewhere) [450],
which is another small-pore, window-cage framework that consists of 8-MR (0.38
nm) that limit diusion into aei -cavities (0.73 x 1.0 nm), to investigate if the zeolite
framework is responsible for this inhibition. DME formation rates (415 K, per H+)
measured on H-AEI zeolites (Figure 8.65) show similar inhibition at high methanol
partial pressures as observed for all CHA zeolites, indicating that such inhibition may
reect formation of methanol clusters inside the cavities of small-pore window-cage
frameworks (e.g. CHA, AEI).
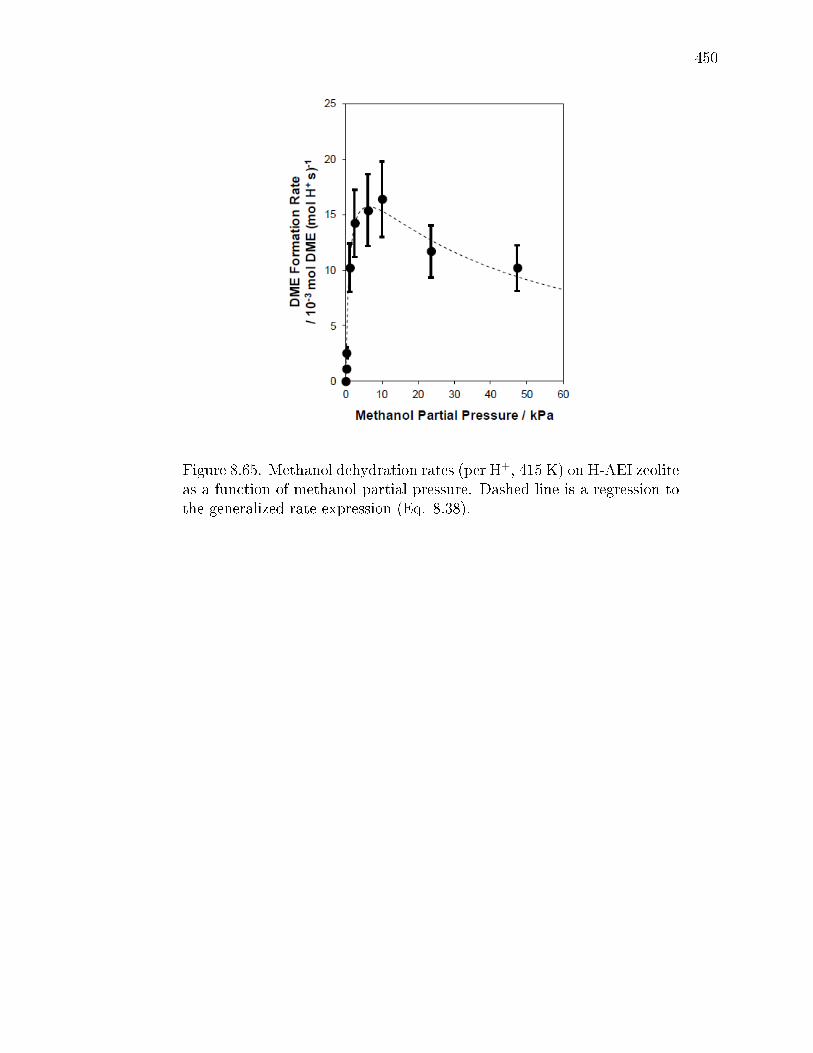
450
Figure 8.65. Methanol dehydration rates (per H+, 415 K) on H-AEI zeoliteas a function of methanol partial pressure. Dashed line is a regression tothe generalized rate expression (Eq. 8.38).

REFERENCES
451
REFERENCES
[1] C. Baerlocher and L. B. McCusker. Database of zeolite structures, 2017.
[2] Ramdas Pophale, Phillip A Cheeseman, and Michael W Deem. A database ofnew zeolite-like materials. Physical Chemistry Chemical Physics, 13(27):1240712412, 2011.
[3] Michael W Deem, Ramdas Pophale, Phillip A Cheeseman, and David J Earl.Computational discovery of new zeolite-like materials. The Journal of PhysicalChemistry C, 113(51):2135321360, 2009.
[4] P Bernardo, E Drioli, and G Golemme. Membrane gas separation: areview/state of the art. Industrial & Engineering Chemistry Research,48(10):46384663, 2009.
[5] Jens Weitkamp and Lothar Puppe. Catalysis and zeolites: fundamentals andapplications. Springer Science & Business Media, 2013.
[6] Bert M Weckhuysen and Jihong Yu. Recent advances in zeolite chemistry andcatalysis. Chemical Society Reviews, 44(20):70227024, 2015.
[7] M. E. Davis. Ordered porous materials for emerging applications. Nature,417(6891):813821, 2002.
[8] Thomas F Degnan. Applications of zeolites in petroleum rening. Topics inCatalysis, 13(4):349356, 2000.
[9] TF Degnan Jr. Recent progress in the development of zeolitic catalysts for thepetroleum rening and petrochemical manufacturing industries. In Studies inSurface Science and Catalysis, volume 170, pages 5465. Elsevier, 2007.
[10] Sigmund M Csicsery. Shape-selective catalysis in zeolites. Zeolites, 4(3):202213, 1984.
[11] Thomas F Degnan. The implications of the fundamentals of shape selectivityfor the development of catalysts for the petroleum and petrochemical industries.Journal of Catalysis, 216(1):3246, 2003.
[12] PB Weisz and VJ Frilette. Intracrystalline and molecular-shape-selective catal-ysis by zeolite salts. The Journal of Physical Chemistry, 64(3):382382, 1960.
[13] Po Bo Weisz, VJ Frilette, RW Maatman, and EB Mower. Catalysis by crys-talline aluminosilicates ii. molecular-shape selective reactions. Journal of Catal-ysis, 1(4):307312, 1962.
[14] WO Haag, RM Lago, and PB Weisz. The active site of acidic aluminosilicatecatalysts. Nature, 309:589591, 1984.
452
[15] M Boudart. Turnover rates in heterogeneous catalysis. Chemical reviews,95(3):661666, 1995.
[16] Andrew J Jones and Enrique Iglesia. The strength of brønsted acid sites inmicroporous aluminosilicates. ACS Catalysis, 5(10):57415755, 2015.
[17] Michele L Sarazen and Enrique Iglesia. Eects of charge, size, and shape of tran-sition states, bound intermediates, and conning voids in reactions of alkeneson solid acids. ChemCatChem, 2018.
[18] Gina Noh, Zhichen Shi, Stacey I Zones, and Enrique Iglesia. Isomerization andbeta-scission reactions of alkanes on bifunctional metal-acid catalysts: Conse-quences of connement and diusional constraints on reactivity and selectivity.Journal of Catalysis, 2018.
[19] Stanley Herrmann and Enrique Iglesia. Selective conversion of acetone toisobutene and acetic acid on aluminosilicates: Kinetic coupling between acid-catalyzed and radical-mediated pathways. Journal of Catalysis, 360:6680,2018.
[20] Rajamani Gounder, Andrew J Jones, Robert T Carr, and Enrique Iglesia. Sol-vation and acid strength eects on catalysis by faujasite zeolites. Journal ofcatalysis, 286:214223, 2012.
[21] Rajamani Gounder and Enrique Iglesia. Catalytic consequences of spatial con-straints and acid site location for monomolecular alkane activation on zeolites.Journal of the American Chemical Society, 131(5):19581971, 2009.
[22] Andrew J Jones, Stacey I Zones, and Enrique Iglesia. Implications of transitionstate connement within small voids for acid catalysis. The Journal of PhysicalChemistry C, 118(31):1778717800, 2014.
[23] Aditya Bhan, Ayman D Allian, Glenn J Sunley, David J Law, and EnriqueIglesia. Specicity of sites within eight-membered ring zeolite channels for car-bonylation of methyls to acetyls. Journal of the American Chemical Society,129(16):49194924, 2007.
[24] L. Gomez-Hortiguela, A. B. Pinar, F. Cora, and J. Perez-Pariente. Dopant-siting selectivity in nanoporous catalysts: control of proton accessibility in zeo-lite catalysts through the rational use of templates. Chemical Communications,46(12):20735, 2010.
[25] C. Marquez-Alvarez, A. B. Pinar, R. Garcia, M. Grande-Casas, and J. Perez-Pariente. Inuence of al distribution and defects concentration of ferrieritecatalysts synthesized from na-free gels in the skeletal isomerization of n-butene.Topics in Catalysis, 52(9):12811291, 2009.
[26] A. B. Pinar, C. Marquez-Alvarez, M. Grande-Casas, and J. Perez-Pariente.Template-controlled acidity and catalytic activity of ferrierite crystals. Journalof Catalysis, 263(2):258265, 2009.
[27] Ana B. Pinar, Paul A. Wright, Luis Gomez-Hortiguela, and Joaquin Perez-Pariente. Synthesis of ferrierite zeolite with pyrrolidine as structure directingagent: A combined x-ray diraction and computational study. Microporous andMesoporous Materials, 129(1-2):164172, 2010.
453
[28] Yuriy Román-Leshkov and Mark E Davis. Activation of carbonyl-containingmolecules with solid lewis acids in aqueous media. Acs Catalysis, 1(11):15661580, 2011.
[29] Sungsik Park, Turgren Biligetu, Yong Wang, Toshiki Nishitoba, Junko NKondo, and Toshiyuki Yokoi. Acidic and catalytic properties of zsm-5 zeoliteswith dierent al distributions. Catalysis Today, 303:6470, 2018.
[30] Turgen Biligetu, Yong Wang, Toshiki Nishitoba, Ryoichi Otomo, Sungsik Park,Hiroshi Mochizuki, Junko N Kondo, Takashi Tatsumi, and Toshiyuki Yokoi.Al distribution and catalytic performance of zsm-5 zeolites synthesized withvarious alcohols. Journal of Catalysis, 353:110, 2017.
[31] Toshiyuki Yokoi, Hiroshi Mochizuki, Turgen Biligetu, Yong Wang, and TakashiTatsumi. Unique al distribution in the m framework and its impact on catalyticproperties. Chemistry Letters, 46, 2017.
[32] Toshiyuki Yokoi, Hiroshi Mochizuki, Seitaro Namba, Junko N Kondo, andTakashi Tatsumi. Control of the al distribution in the framework of zsm-5zeolite and its evaluation by solid-state nmr technique and catalytic properties.The Journal of Physical Chemistry C, 119(27):1530315315, 2015.
[33] BR Goodman, KC Hass, WF Schneider, and JB Adams. Statistical analysis ofal distributions and metal ion pairing probabilities in zeolites. Catalysis letters,68(1-2):8593, 2000.
[34] D. W. Fickel, J. M. Fedeyko, and R. F. Lobo. Copper coordination in cu-ssz-13 and cu-ssz-16 investigated by variable-temperature xrd. Journal of PhysicalChemistry C, 114(3):16331640, 2010.
[35] S. T. Korhonen, D. W. Fickel, R. F. Lobo, B. M. Weckhuysen, and A. M. Beale.Isolated cu2+ ions: active sites for selective catalytic reduction of no. ChemicalCommunications, 47(2):800802, 2011.
[36] Filippo Giordanino, Peter NR Vennestrøm, Lars F Lundegaard, Frederick NStappen, Susanne Mossin, Pablo Beato, Silvia Bordiga, and Carlo Lamberti.Characterization of cu-exchanged ssz-13: a comparative ftir, uv-vis, and eprstudy with cu-zsm-5 and cu-β with similar si/al and cu/al ratios. Dalton Trans-actions, 42(35):1274112761, 2013.
[37] Shane A Bates, Anuj A Verma, Christopher Paolucci, Atish A Parekh,Trunojoyo Anggara, Aleksey Yezerets, William F Schneider, Jerey T Miller,W Nicholas Delgass, and Fabio H Ribeiro. Identication of the active cu site instandard selective catalytic reduction with ammonia on cu-ssz-13. Journal ofCatalysis, 312:8797, 2014.
[38] Filippo Giordanino, Elisa Borfecchia, Kirill A. Lomachenko, Andrea Lazzarini,Giovanni Agostini, Erik Gallo, Alexander V. Soldatov, Pablo Beato, Silvia Bor-diga, and Carlo Lamberti. Interaction of nh3 with cu-ssz-13 catalyst: A com-plementary ftir, xanes, and xes study. Journal of Physical Chemistry Letters,5(9):15521559, 2014.
[39] E Borfecchia, KA Lomachenko, F Giordanino, H Falsig, P Beato, AV Soldatov,S Bordiga, and C Lamberti. Revisiting the nature of cu sites in the activatedcu-ssz-13 catalyst for scr reaction. Chemical science, 6(1):548563, 2015.

454
[40] Feng Gao, Nancy M Washton, Yilin Wang, Marton Kollar, Janos Szanyi, andCharles HF Peden. Eects of si/al ratio on cu/ssz-13 nh 3-scr catalysts: Impli-cations for the active cu species and the roles of brønsted acidity. Journal ofCatalysis, 331:2538, 2015.
[41] Ton VW Janssens, Hanne Falsig, Lars F Lundegaard, Peter NR Vennestrøm,Søren B Rasmussen, Poul Georg Moses, Filippo Giordanino, Elisa Borfecchia,Kirill A Lomachenko, Carlo Lamberti, et al. A consistent reaction scheme for theselective catalytic reduction of nitrogen oxides with ammonia. ACS Catalysis,5(5):28322845, 2015.
[42] John R Di Iorio and Rajamani Gounder. Controlling the isolation and pair-ing of aluminum in chabazite zeolites using mixtures of organic and inorganicstructure-directing agents. Chemistry of Materials, 28(7):22362247, 2016.
[43] Hubert Koller and Mark Weisz. Solid state nmr of porous materials. Solid StateNMR, 306(123):189227, 2012.
[44] J. Klinowski. Recent advances in solid-state nmr of zeolites. Annual Review ofMaterials Science, 18:189218, 1988.
[45] MT Melchior, DEW Vaughan, and AJ Jacobson. Characterization of thesilicon-aluminum distribution in synthetic faujasites by high-resolution solid-state silicon-29 nmr. Journal of the American Chemical Society, 104(18):48594864, 1982.
[46] Gunter Engelhardt, Endel Lippmaa, and Mart Magi. Ordering of silicon andaluminium ions in the framework of nax zeolites. a solid-state high-resolution29 si nmr study. Chemical Communications, 14:712713, 1981.
[47] E Lippmaa, M Mägi, A Samoson, M Tarmak, and G Engelhardt. Investiga-tion of the structure of zeolites by solid-state high-resolution silicon-29 nmrspectroscopy. Journal of the American Chemical Society, 103(17):49924996,1981.
[48] Jiri Dedecek, Z. Sobalika, and B. Wichterlova. Siting and distribution of frame-work aluminium atoms in silicon-rich zeolites and impact on catalysis. CatalysisReviews-Science and Engineering, 54(2):135223, 2012.
[49] Zhiwu Yu, Anmin Zheng, Qiang Wang, Lei Chen, Jun Xu, Jean-PaulAmoureux, and Feng Deng. Insights into the dealumination of zeolite hyrevealed by sensitivity-enhanced 27al dq-mas nmr spectroscopy at high eld.Angewandte Chemie International Edition, 49(46):86578661, 2010.
[50] Melinda J Duer. Solid state NMR spectroscopy: principles and applications.John Wiley & Sons, 2008.
[51] Kenneth JD MacKenzie and Mark E Smith. Multinuclear solid-state nuclearmagnetic resonance of inorganic materials, volume 6. Elsevier, 2002.
[52] Ales Medek, John S Harwood, and Lucio Frydman. Multiple-quantum magic-angle spinning nmr: A new method for the study of quadrupolar nuclei in solids.Journal of the American Chemical Society, 117(51):1277912787, 1995.
455
[53] PJ Kunkeler, BJ Zuurdeeg, JC Van Der Waal, JA Van Bokhoven, DC Konings-berger, and H Van Bekkum. Zeolite beta: the relationship between calcinationprocedure, aluminum conguration, and lewis acidity. Journal of catalysis,180(2):234244, 1998.
[54] Jan Kucera and Petr Nachtigall. A simple correlation between average totangles and 27 al nmr chemical shifts does not hold in high-silica zeolites. Mi-croporous and mesoporous materials, 85(3):279283, 2005.
[55] Jiri Dedecek, Stepan Sklenak, Chengbin Li, Blanka Wichterlova, VendulaGábova, Jiri Brus, Marek Sierka, and Joachim Sauer. Eect of al- si- al andal- si- si- al pairs in the zsm-5 zeolite framework on the 27al nmr spectra. acombined high-resolution 27al nmr and dft/mm study. Journal of PhysicalChemistry C, 113(4):14471458, 2009.
[56] Stepan Sklenak, Jiri Dedecek, Chengbin Li, Blanka Wichterlova, VendulaGabova, Marek Sierka, and Joachim Sauer. Aluminium siting in the zsm-5framework by combination of high resolution 27al nmr and dft/mm calcula-tions. Physical Chemistry Chemical Physics, 11(8):12371247, 2009.
[57] Stepan Sklenak, Jiri Dedecek, Chengbin Li, Blanka Wichterlova, VendulaGabova, Marek Sierka, and Joachim Sauer. Aluminum siting in silicon-richzeolite frameworks: A combined high-resolution 27al nmr spectroscopy andquantum mechanics/molecular mechanics study of zsm-5. Angewandte ChemieInternational Edition, 46(38):72867289, 2007.
[58] J Dedecek, L Capek, P Sazama, Z Sobalik, and B Wichterlova. Control ofmetal ion species in zeolites by distribution of aluminium in the framework:From structural analysis to performance under real conditions of scr-nox andno, n2o decomposition. Applied Catalysis A: General, 391(1-2):244253, 2011.
[59] Petr Sazama, Edyta Tabor, Petr Klein, Blanka Wichterlova, Stepan Sklenak,Lukas Mokrzycki, Veronika Pashkkova, Masaru Ogura, and Jiri Dedecek. Al-rich beta zeolites. distribution of al atoms in the framework and related protonicand metal-ion species. Journal of Catalysis, 333:102114, 2016.
[60] Petr Sazama, Lukasz Mokrzycki, Blanka Wichterlova, Alena Vondrova, RadimPilar, Jiri Dedecek, Stepan Sklenak, and Edyta Tabor. Unprecedented propanescr-nox activity over template-free synthesized al-rich co-bea zeolite. Journal ofCatalysis, 332:201211, 2015.
[61] Amber Janda and Alexis T. Bell. Eects of si/al ratio on the distribution offramework al and on the rates of alkane monomolecular cracking and dehydro-genation in h-m. Journal of the American Chemical Society, 135(51):1919319207, 2013.
[62] P Sazama, J Dedecek, V Gabova, B Wichterlova, G Spoto, and S Bordiga.Eect of aluminium distribution in the framework of zsm-5 on hydrocarbontransformation. cracking of 1-butene. Journal of Catalysis, 254(2):180189,2008.
[63] Zdenek Sobalik, Jiri Dedecek, Dalibor Kaucky, Blanka Wichterlova, Lucie Droz-dova, and Roel Prins. Structure, distribution, and properties of co ions in ferrevealed by ftir, uvvis, and exafs. Journal of Catalysis, 194(2):330342, 2000.

456
[64] L Capek, J Dedecek, P Sazama, and B Wichterlova. The decisive role of thedistribution of al in the framework of beta zeolites on the structure and activityof co ion species in propanescrnox in the presence of water vapour. Journalof Catalysis, 272(1):4454, 2010.
[65] Vendula Gabova, Jiri Dedecek, and Jiri Cejka. Control of al distribution inzsm-5 by conditions of zeolite synthesis. Chemical Communications, 0(10):11961197, 2003.
[66] Lucie Drozdova, Roel Prins, Jiri Dedecek, Zdenek Sobalik, and Blanka Wichter-lova. Bonding of co ions in zsm-5, ferrierite, and mordenite: An x-ray absorp-tion, uv-vis, and ir study. Journal of Physical Chemistry B, 106(9):22402248,2002.
[67] Libor Capek, Jiri Dedecek, and Blanka Wichterlova. Co-beta zeolite highly ac-tive in propanescr-no x in the presence of water vapor: eect of zeolite prepara-tion and al distribution in the framework. Journal of Catalysis, 227(2):352366,2004.
[68] J. Dedecek, D. Kaucky, and B. Wichterlova. Al distribution in zsm-5 zeolites:an experimental study. Chemical Communications, 11:970971, 2001.
[69] Jiri Dedecek and Blanka Wichterlova. Co2+ ion siting in pentasil-containingzeolites. i. co2+ ion sites and their occupation in mordenite. a vis-nir dif-fuse reectance spectroscopy study. The Journal of Physical Chemistry B,103(9):14621476, 1999.
[70] Jiri Dedecek, Dalibor Kaucky, Blanka Wichterlova, and Olga Gonsiorova. Co2+ ions as probes of al distribution in the framework of zeolites. zsm-5 study.Physical Chemistry Chemical Physics, 4(21):54065413, 2002.
[71] Dalibor Kaucky, Jiri Dedecek, and Blanka Wichterlova. Co 2+ ion siting inpentasil-containing zeolites: Ii. co2+ ion sites and their occupation in ferrierite.a vis diuse reectance spectroscopy study. Microporous and mesoporous ma-terials, 31(1):7587, 1999.
[72] Dalibor Kaucky, Alena Vondrova, Jiri Dedecek, and Blanka Wichterlova. Ac-tivity of co ion sites in zsm-5, ferrierite, and mordenite in selective catalyticreduction of no with methane. Journal of Catalysis, 194(2):318329, 2000.
[73] J. Dedecek, D. Kaucky, and B. Wichterlova. Co2+ ion siting in pentasil-containing zeolites, part 3.: Co2+ ion sites and their occupation in zsm-5: a visdiuse reectance spectroscopy study. Microporous and Mesoporous Materials,3536(0):483494, 2000.
[74] Veronika Pashkova, Petr Klein, Jiri Dedecek, Venceslava Tokarova, and BlankaWichterlova. Incorporation of al at zsm-5 hydrothermal synthesis. tuning of alpairs in the framework. Microporous and Mesoporous Materials, 202:138146,2015.
[75] Chenhai Song, Yueying Chu, Meng Wang, Hui Shi, Li Zhao, Xuefeng Guo,Weimin Yang, Jianyi Shen, Nianhua Xue, Luming Peng, and Weiping Ding.Cooperativity of adjacent brønsted acid sites in m zeolite channel leads toenhanced polarization and cracking of alkanes. Journal of Catalysis, 349:163174, 2017.
457
[76] Anton N. Mlinar, Paul M. Zimmerman, Fuat E. Celik, Martin Head-Gordon,and Alexis T. Bell. Eects of brønsted-acid site proximity on the oligomerizationof propene in h-m. Journal of Catalysis, 288:6573, 2012.
[77] M Bernauer, E Tabor, V Pashkova, D Kaucky, Z Sobalík, B Wichterlová, andJ Dedecek. Proton proximitynew key parameter controlling adsorption, des-orption and activity in propene oligomerization over h-zsm-5 zeolites. Journalof Catalysis, 344:157172, 2016.
[78] Shane A. Bates, W. Nicholas Delgass, Fabio H. Ribeiro, Jerey T. Miller, andRajamani Gounder. Methods for nh3 titration of bronsted acid sites in cu-zeolites that catalyze the selective catalytic reduction of nox with nh3. Journalof Catalysis, 312:2636, 2014.
[79] Christopher Paolucci, Atish A Parekh, Ishant Khurana, John R Di Iorio,Hui Li, Jonatan D Albarracin Caballero, Arthur J Shih, Trunojoyo Anggara,W Nicholas Delgass, Jerey T Miller, Fabio H Ribeiro, Rajamani Gounder, andWilliam F Schneider. Catalysis in a cage: condition-dependent speciation anddynamics of exchanged cu cations in ssz-13 zeolites. Journal of the AmericanChemical Society, 138(18):60286048, 2016.
[80] R. F. Lobo, S. I. Zones, and M. E. Davis. Structure-direction in zeolite synthesis.Journal of Inclusion Phenomena and Molecular Recognition in Chemistry, 21(1-4):4778, 1995.
[81] Koki Muraoka, Watcharop Chaikittisilp, Yutaka Yanaba, Takeshi Yoshikawa,and Tatsuya Okubo. Directing aluminum atoms into energetically favorabletetrahedral sites in a zeolite framework by using organic structure-directingagents. Angewandte Chemie International Edition, 130(14):38043808, 2018.
[82] Robert T Carr, Matthew Neurock, and Enrique Iglesia. Catalytic consequencesof acid strength in the conversion of methanol to dimethyl ether. Journal ofCatalysis, 278(1):7893, 2011.
[83] Andrew J Jones, Robert T Carr, Stacey I Zones, and Enrique Iglesia. Acidstrength and solvation in catalysis by m zeolites and eects of the identity,concentration and location of framework heteroatoms. Journal of Catalysis,312:5868, 2014.
[84] Upakul Deka, Amelie Juhin, Einar A Eilertsen, Hermann Emerich, Mark AGreen, Satu T Korhonen, Bert M Weckhuysen, and Andrew M Beale. Con-rmation of isolated cu2+ ions in ssz-13 zeolite as active sites in nh3-selectivecatalytic reduction. The Journal of Physical Chemistry C, 116(7):48094818,2012.
[85] Christopher Paolucci, Anuj A Verma, Shane A Bates, Vincent F Kispersky,Jerey T Miller, Rajamani Gounder, W Nicholas Delgass, Fabio H Ribeiro,and William F Schneider. Isolation of the copper redox steps in the standardselective catalytic reduction on cu-ssz-13. Angewandte Chemie InternationalEdition, 53(44):1182811833, 2014.
[86] J. S. McEwen, T. Anggara, W. F. Schneider, V. F. Kispersky, J. T. Miller,W. N. Delgass, and F. H. Ribeiro. Integrated operando x-ray absorption anddft characterization of cu-ssz-13 exchange sites during the selective catalyticreduction of nox with nh3. Catalysis Today, 184(1):129144, 2012.
458
[87] Vincent F Kispersky, A Jeremy Kropf, Fabio H Ribeiro, and Jerey T Miller.Low absorption vitreous carbon reactors for operando xas: a case study oncu/zeolites for selective catalytic reduction of no x by nh 3. Physical ChemistryChemical Physics, 14(7):22292238, 2012.
[88] P.J. Andersen, J.E. Bailie, J.L. Casci, H.Y. Chen, J.M. Fedeyko, R.K.S. Foo,and R.R. Rajaram. Transition metal / zeolite scr catalysts, 2010.
[89] Ja Hun Kwak, Russell G Tonkyn, Do Heui Kim, Janos Szanyi, and Charles HFPeden. Excellent activity and selectivity of cu-ssz-13 in the selective catalyticreduction of nox with nh3. Journal of Catalysis, 275(2):187190, 2010.
[90] I. Bull, G.S. Koermer, A. Moini, and S. Unverricht. Catalysts, systems andmethods utilizing non-zeolitic metal-containing molecular sieves having the chacrystal structure, 2009.
[91] Upakul Deka, Ines Lezcano-Gonzalez, Stewart J Warrender, A Lorena Picone,Paul A Wright, Bert M Weckhuysen, and Andrew M Beale. Changing activesites in cucha catalysts: denox selectivity as a function of the preparationmethod. Microporous and Mesoporous Materials, 166:144152, 2013.
[92] Sandro Brandenberger, Oliver Krocher, Arno Tissler, and Roderik Altho. Thestate of the art in selective catalytic reduction of nox by ammonia using metal-exchanged zeolite catalysts. Catalysis Reviews, 50(4):492531, 2008.
[93] Ja Hun Kwak, Diana Tran, Sarah D Burton, Janos Szanyi, Jong H Lee, andCharles HF Peden. Eects of hydrothermal aging on nh3-scr reaction overcu/zeolites. Journal of Catalysis, 287:203209, 2012.
[94] H. Sjövall, L. Olsson, E. Fridell, and R. J. Blint. Selective catalytic reductionof nox with nh3 over cu-zsm-5the eect of changing the gas composition.Applied Catalysis B: Environmental, 64(34):180188, 2006.
[95] E.-Y. Choi, I.-S. Nam, and Y. G. Kim. Tpd study of mordenite-type zeolites forselective catalytic reduction of no by nh3. Journal of Catalysis, 161(2):597604,1996.
[96] H. Y. Huang, R. Q. Long, and R. T. Yang. Kinetics of selective catalyticreduction of no with nh3 on fe-zsm-5 catalyst. Applied Catalysis A: General,235(12):241251, 2002.
[97] K. Rahkamaa-Tolonen, T. Maunula, M. Lomma, M. Huuhtanen, and R. L.Keiski. The eect of no2 on the activity of fresh and aged zeolite catalysts inthe nh3-scr reaction. Catalysis Today, 100(34):217222, 2005.
[98] P. S. Metkar, N. Salazar, R. Muncrief, V. Balakotaiah, and M. P. Harold.Selective catalytic reduction of no with nh3 on iron zeolite monolithic cata-lysts: Steady-state and transient kinetics. Applied Catalysis B: Environmental,104(12):110126, 2011.
[99] R. Q. Long and R. T. Yang. Catalytic performance of fezsm-5 catalysts forselective catalytic reduction of nitric oxide by ammonia. Journal of Catalysis,188(2):332339, 1999.
459
[100] A. L. Kustov, T. W. Hansen, M. Kustova, and C. H. Christensen. Selectivecatalytic reduction of no by ammonia using mesoporous fe-containing hzsm-5and hzsm-12 zeolite catalysts: An option for automotive applications. AppliedCatalysis B: Environmental, 76(34):311319, 2007.
[101] J. A. Dumesic, N.Y. Topsøe, H. Topsøe, Y. Chen, and T. Slabiak. Kinetics ofselective catalytic reduction of nitric oxide by ammonia over vanadia/titania.Journal of Catalysis, 163(2):409417, 1996.
[102] H. Schneider, S. Tschudin, M. Schneider, A. Wokaun, and A. Baiker. In situdiuse reectance ftir study of the selective catalytic reduction of no by nh3over vanadia-titania aerogels. Journal of Catalysis, 147(1):514, 1994.
[103] S. Brandenberger, O. Krocher, A. Wokaun, A. Tissler, and R. Altho. The roleof bronsted acidity in the selective catalytic reduction of no with ammonia overfe-zsm-5. Journal of Catalysis, 268(2):297306, 2009.
[104] F. Gao, J. H. Kwak, J. Szanyi, and C. H F. Peden. Current understandingof cu-exchanged chabazite molecular sieves for use as commercial diesel enginedenox catalysts. Topics in Catalysis, 56(15-17):14411459, 2013.
[105] G. L. Woolery, G. H. Kuehl, H. C. Timken, A. W. Chester, and J. C. Vartuli.On the nature of framework bronsted and lewis acid sites in zsm-5. Zeolites,19(4):288296, 1997.
[106] G. Bagnasco. Improving the selectivity of nh3tpd measurements. Journal ofCatalysis, 159(1):249252, 1996.
[107] N. Y. Topsøe, H. Topsøe, and J. A. Dumesic. Vanadia-titania catalysts for selec-tive catalytic reduction (scr) of nitric-oxide by ammonia combined temperature-programmed in-situ ftir and on-line mass-spectroscopy studies. Journal ofCatalysis, 151:226240, 1995.
[108] N.Y. Topsøe, J. A. Dumesic, and H. Topsoe. Vanadia-titania catalysts forselective catalytic reduction of nitric-oxide by ammonia: I.i. studies of activesites and formulation of catalytic cycles. Journal of Catalysis, 151(1):241252,1995.
[109] S. I. Zones. Zeolite ssz-13 and its method of preparation, 1985.
[110] R. J. Gorte. What do we know about the acidity of solid acids? CatalysisLetters, 62:113, 1999.
[111] J. Wang, T. Yu, X. Q. Wang, G. S. Qi, J. J. Xue, M. Q. Shen, and W. Li. Theinuence of silicon on the catalytic properties of cu/sapo-34 for nox reductionby ammonia-scr. Applied Catalysis B-Environmental, 127:137147, 2012.
[112] J. Datka, B. Gil, and A. Kubacka. Acid properties of nah-mordenites: Infraredspectroscopic studies of ammonia sorption. Zeolites, 15(6):501506, 1995.
[113] N. Katada and M. Niwa. Analysis of acidic properties of zeolitic and non-zeolitic solid acid catalysts using temperature-programmed desorption of am-monia. Catalysis Surveys from Asia, 8(3):161170, 2004.
460
[114] W. E. Farneth and R. J. Gorte. Methods for characterizing zeolite acidity.Chemical Reviews, 95(3):615635, 1995.
[115] O. Kresnawahjuesa, R. J. Gorte, D. de Oliveira, and L. Y. Lau. A simple,inexpensive, and reliable method for measuring bronsted-acid site densities insolid acids. Catalysis Letters, 82(3-4):155160, 2002.
[116] O. Kresnawahjuesa, R. Heussner, C.-C. Lee, G. Kühl, and R.J. Gorte. Anexamination of acid sites in h-lta zeolites. Applied Catalysis A: General, 199:5360, 2000.
[117] D. J. Parrillo, A. T. Adamo, G. T. Kokotailo, and R. J. Gorte. Amine adsorptionin h-zsm-5. Applied Catalysis, 67(1):107118, 1990.
[118] R. Gounder, A. J. Jones, R. T. Carr, and E. Iglesia. Solvation and acid strengtheects on catalysis by faujasite zeolites. Journal of Catalysis, 286:214223, 2012.
[119] A. I. Baiglow, D. J. Parrillo, G. T. Kokotailo, and R. J. Gorte. A study ofdealuminated faujasites. Journal of Catalysis, 148:213223, 1994.
[120] B. Xu, F. Rotunno, S. Bordiga, R. Prins, and J. A. van Bokhoven. Reversibilityof structural collapse in zeolite y: Alkane cracking and characterization. Journalof Catalysis, 241(1):6673, 2006.
[121] A. Omegna, R. Prins, and J. A. van Bokhoven. Eect of temperature on alu-minum coordination in zeolites h-y and h-usy and amorphous silica-alumina: anin situ al k edge xanes study. Journal of Physical Chemistry B, 109(19):92809283, 2005.
[122] A. Omegna, J. A. van Bokhoven, and R. Prins. Flexible aluminum coordinationin alumino-silicates. structure of zeolite h-usy and amorphous silica-alumina.Journal of Physical Chemistry B, 107(34):88548860, 2003.
[123] J. A. van Bokhoven, A. L. Roest, D. C. Koningsberger, J. T. Miller, G. H.Nachtegaal, and A. P. M. Kentgens. Changes in structural and electronic prop-erties of the zeolite framework induced by extraframework al and la in h-usyand la(x)nay: a 29si and 27al mas nmr and 27al mq mas nmr study. Journalof Physical Chemistry B, 104(29):67436754, 2000.
[124] M. Hunger, G. Engelhardt, and J. Weitkamp. Solid-state 23na, 139la, 27al and29si nuclear magnetic resonance spectroscopic investigations of cation locationand migration in zeolites lanay. Microporous Materials, 3(45):497510, 1995.
[125] Zhenchao Zhao, Suochang Xu, Mary Y. Hu, Xinhe Bao, Charles H. F. Peden,and Jianzhi Hu. Investigation of aluminum site changes of dehydrated zeoliteh-beta during a rehydration process by high-eld solid-state nmr. Journal ofPhysical Chemistry C, 119(3):14101417, 2015.
[126] L. S. Dent and J. V. Smith. Crystal structure of chabazite, a molecular sieve.Nature, 181(4626):17941796, 1958.
[127] D. H. Olson, G. T. Kokotailo, S. L. Lawton, and W. M. Meier. Crystal struc-ture and structure-related properties of zsm-5. Journal of Physical Chemistry,85(15):22382243, 1981.

461
[128] C. G. Pope. Amine adsorption study of the acid sites in hzsm-5. Zeolites,10(1):2831, 1990.
[129] Anuj A Verma, Shane A Bates, Trunojoyo Anggara, Christopher Paolucci,Atish A Parekh, Krishna Kamasamudram, Aleksey Yezerets, Jerey T Miller,W Nicholas Delgass, William F Schneider, et al. No oxidation: A probe reactionon cu-ssz-13. Journal of Catalysis, 312:179190, 2014.
[130] Dmitry E Doronkin, Maria Casapu, Tobias Gunter, Oliver Muller, RonaldFrahm, and Jan-Dierk Grunwaldt. Operando spatially-and time-resolved xasstudy on zeolite catalysts for selective catalytic reduction of no x by nh3. TheJournal of Physical Chemistry C, 118(19):1020410212, 2014.
[131] B. Moden, J. M. Donohue, W. E. Cormier, and H.-X. Li. The uses and challengesof zeolites in automotive applications. Topics in Catalysis, 53(19-20):13671373,2010.
[132] O. Mihai, C. R. Widyastuti, S. Andonova, K. Kamasamudram, J. Li, S. Y.Joshi, N. W. Currier, A. Yezerets, and L. Olsson. The eect of cu-loadingon dierent reactions involved in nh3-scr over cu-bea catalysts. Journal ofCatalysis, 311(0):170181, 2014.
[133] Krishna Kamasamudram, Neal W Currier, Xu Chen, and Aleksey Yezerets.Overview of the practically important behaviors of zeolite-based urea-scr cata-lysts, using compact experimental protocol. Catalysis Today, 151(3-4):212222,2010.
[134] X. Auvray, W. P. Partridge, J.-S. Choi, J. A. Pihl, A. Yezerets, K. Kamasamu-dram, N. W. Currier, and L. Olsson. Local ammonia storage and ammoniainhibition in a monolithic copper-beta zeolite scr catalyst. Applied Catalysis B:Environmental, 126(0):144152, 2012.
[135] N. Y. Topsøe. Mechanism of the selective catalytic reduction of nitric oxide byammonia elucidated by in situ on-line fourier transform infrared spectroscopy.Science, 265:12171219, 1994.
[136] W. S. Borghard, P. T. Reischman, and E. W. Sheppard. Argon sorption inzsm-5. Journal of Catalysis, 139(1):1923, 1993.
[137] W. S. Borghard, E. W. Sheppard, and H. J. Schoennagel. An automated, highprecision unit for low-pressure physisorption. Review of Scientic Instruments,62(11):28012809, 1991.
[138] H. Kraus, M. Müller, R. Prins, and A. P. M. Kentgens. Comments on the 27alnmr visibility of aluminas. Journal of Physical Chemistry B, 102(20):38623865,1998.
[139] Zeev Luz and Alexander J. Vega. Interaction of h-rho zeolite with water andmethanol studied by multinuclear nmr spectroscopy. Journal of Physical Chem-istry, 91(2):374382, 1987.
[140] Ana Belen Pinar, Luis Gomez-Hortiguela, and Joaquin Perez-Pariente. Cooper-ative structure directing role of the cage-forming tetramethylammonium cationand the bulkier benzylmethylpyrrolidinium in the synthesis of zeolite ferrierite.Chemistry of Materials, 19(23):56175626, 2007.
462
[141] Ana B Pinar, Luis Gomez-Hortiguela, Lynne B McCusker, and Joaquin Perez-Pariente. Controlling the aluminum distribution in the zeolite ferrierite via theorganic structure directing agent. Chemistry of Materials, 25(18):36543661,2013.
[142] Yuriy Román-Leshkov, Manuel Moliner, and Mark E Davis. Impact of control-ling the site distribution of al atoms on catalytic properties in ferrierite-typezeolites. The Journal of Physical Chemistry C, 115(4):10961102, 2010.
[143] Rajamani Gounder and Enrique Iglesia. The catalytic diversity of zeolites: con-nement and solvation eects within voids of molecular dimensions. ChemicalCommunications, 49(34):34913509, 2013.
[144] Rajamani Gounder and Enrique Iglesia. The roles of entropy and enthalpy instabilizing ion-pairs at transition states in zeolite acid catalysis. Accounts ofChemical Research, 45(2):229238, 2012.
[145] Aleksei Vjunov, Miroslaw A. Derewinski, John L. Fulton, Donald M. Camaioni,and Johannes A. Lercher. Impact of zeolite aging in hot liquid water on activityfor acid-catalyzed dehydration of alcohols. Journal of the American ChemicalSociety, 137(32):1037410382, 2015.
[146] Aleksei Vjunov, John L. Fulton, Donald M. Camaioni, Jian Z. Hu, Sarah D.Burton, Like Arslan, and Johannes A. Lercher. Impact of aqueous medium onzeolite framework integrity. Chemistry of Materials, 27(9):35333545, 2015.
[147] Aleksei Vjunov, John L. Fulton, Thomas Huthwelker, Sonia Pin, Donghai Mei,Gregory K. Schenter, Niranjan Govind, Donald M. Camaioni, Jian Zhi Hu, andJohannes A. Lercher. Quantitatively probing the al distribution in zeolites.Journal of the American Chemical Society, 136(23):82968306, 2014.
[148] Florian Goltl, Rosa E. Bulo, Jurgen Hafner, and Philippe Sautet. What makescopper-exchanged ssz-13 zeolite ecient at cleaning car exhaust gases? Journalof Physical Chemistry Letters, 4(14):22442249, 2013.
[149] K. U. Gore, A. Abraham, S. G. Hegde, R. Kumar, J. P. Amoureux, and S. Gana-pathy. Si-29 and al-27 mas/3q-mas nmr studies of high silica usy zeolites. Jour-nal of Physical Chemistry B, 106(23):61156120, 2002.
[150] J Klinowski, JM Thomas, CA Fyfe, and GC Gobbi. Monitoring of structuralchanges accompanying ultrastabilization of faujasitic zeolite catalysts. Nature,296:533536, 1982.
[151] R. M. Lago, W. O. Haag, R. J. Mikovsky, D. H. Olson, S. D. Hellring, K. D.Schmitt, and G. T. Kerr. The nature of the catalytic sites in hzsm-5- activityenhancement. Studies in Surface Science and Catalysis, Volume 28:677684,1986.
[152] Josef Macht, Michael J Janik, Matthew Neurock, and Enrique Iglesia. Mecha-nistic consequences of composition in acid catalysis by polyoxometalate kegginclusters. Journal of the American Chemical Society, 130(31):1036910379, 2008.
[153] MT Aronson, RJ Gorte, and W Eo Farneth. The inuence of oxonium ionand carbenium ion stabilities on the alcohol/h-zsm-5 interaction. Journal ofCatalysis, 98(2):434443, 1986.

463
[154] RA Van Santen and GJ Kramer. Reactivity theory of zeolitic broensted acidicsites. Chemical Reviews, 95(3):637660, 1995.
[155] Avelino Corma. Inorganic solid acids and their use in acid-catalyzed hydrocar-bon reactions. Chemical Reviews, 95(3):559614, 1995.
[156] Marek Sierka, Uwe Eichler, Jerzy Datka, and Joachim Sauer. Heterogeneityof brønsted acidic sites in faujasite type zeolites due to aluminum content andframework structure. The Journal of Physical Chemistry B, 102(33):63976404,1998.
[157] Qingjun Zhu, Junko N. Kondo, Ryosuke Ohnuma, Yoshihiro Kubota, MasashiYamaguchi, and Takashi Tatsumi. The study of methanol-to-olen over pro-ton type aluminosilicate cha zeolites. Microporous and Mesoporous Materials,112(1-3):153161, 2008.
[158] Mark A. Deimund, Luke Harrison, Jonathan D. Lunn, Yu Liu, Andrzej Malek,Ramzy Shayib, and Mark E. Davis. Eect of heteroatom concentration in ssz-13on the methanol-to-olens reaction. ACS Catalysis, 6:542550, 2016.
[159] Jiri Dedecek, Vendula Balgova, Veronika Pashkova, Petr Klein, and BlankaWichterlova. Synthesis of zsm-5 zeolites with dened distribution of al atomsin the framework and multinuclear mas nmr analysis of the control of al distri-bution. Chemistry of Materials, 24(16):32313239, 2012.
[160] K.G. Strohmaier, S.C. Reyes, and D. Levin. High silica chabazite, its synthesisand its use in the conversion of oxygenates to olens, 2008.
[161] Yashodhan Bhawe, Manuel Moliner-Marin, Jonathan D. Lunn, Yu Liu, An-drzej Malek, and Mark Davis. Eect of cage size on the selective conversion ofmethanol to light olens. ACS Catalysis, 2(12):24902495, 2012.
[162] S. I. Zones. Conversion of faujasites to high-silica chabazite ssz-13 in the pres-ence of n,n,n-trimethyl-1-adamantammonium iodide. Journal of the ChemicalSociety, Faraday Transactions, 87(22):37093716, 1991.
[163] Nuria Martin, Manuel Moliner, and Avelino Corma. High yield synthesis ofhigh-silica chabazite by combining the role of zeolite precursors and tetraethy-lammonium: Scr of nox. Chemical Communications, 51(49):99659968, 2015.
[164] Masaya Itakura, Takayuki Inoue, Atsushi Takahashi, Tadahiro Fujitani, Ya-sunori Oumi, and Tsuneji Sano. Synthesis of high-silica cha zeolite from fauzeolite in the presence of benzyltrimethylammonium hydroxide. Chemistry Let-ters, 37(9):908909, 2008.
[165] Masaya Itakura, Ikuhiro Goto, Atsushi Takahashi, Tadahiro Fujitani, YusukeIde, Masahiro Sadakane, and Tsuneji Sano. Synthesis of high-silica cha typezeolite by interzeolite conversion of fau type zeolite in the presence of seedcrystals. Microporous and Mesoporous Materials, 144(13):9196, 2011.
[166] Hiroyuki Imai, Nozomu Hayashida, Toshiyuki Yokoi, and Takashi Tatsumi. Di-rect crystallization of cha-type zeolite from amorphous aluminosilicate gel byseed-assisted method in the absence of organic-structure-directing agents. Mi-croporous and Mesoporous Materials, 196:341348, 2014.
464
[167] Sarika Goel, Stacey I. Zones, and Enrique Iglesia. Synthesis of zeolites viainterzeolite transformations without organic structure-directing agents. Chem-istry of Materials, 27(6):20562066, 2015.
[168] Einar A. Eilertsen, Bjornar Arstad, Stian Svelle, and Karl P. Lillerud. Singleparameter synthesis of high silica cha zeolites from uoride media. Microporousand Mesoporous Materials, 153:9499, 2012.
[169] Raquel Martinez-Franco, Manuel Moliner, Joakim R. Thogersen, and AvelinoCorma. Ecient one-pot preparation of cu-ssz-13 materials using coopera-tive osdas for their catalytic application in the scr of nox. ChemCatChem,5(11):33163323, 2013.
[170] M. J. Díaz-Cabañas, P. A. Barrett, and M. A. Camblor. Synthesis and structureof pure sio2 chabazite: the sio2 polymorph with the lowest framework density.Chemical Communications, 0(17):18811882, 1998.
[171] John R Di Iorio, Shane A Bates, Anuj A Verma, W Nicholas Delgass, Fabio HRibeiro, Jerey T Miller, and Rajamani Gounder. The dynamic nature of brøn-sted acid sites in cuzeolites during no x selective catalytic reduction: quanti-cation by gas-phase ammonia titration. Topics in Catalysis, 58(7-9):424434,2015.
[172] Subramanian Prasad and Maria Petrov. Mixed domain models for the distri-bution of aluminum in high silica zeolite ssz-13. Solid State Nuclear MagneticResonance, 54:2631, 2013.
[173] D. E. Akporiaye, I. M. Dahl, H. B. Mostad, and R. Wendelbo. Aluminumdistribution in chabazite: An experimental and computational study. Journalof Physical Chemistry, 100(10):41484153, 1996.
[174] H. Praliaud and G. Coudurier. Optical spectroscopy of hydrated, dehydratedand ammoniated cobalt(ii) exchanged zeolites x and y. Journal of the ChemicalSociety, Faraday Transactions, 75:26012616, 1979.
[175] H. Hoser, S. Krzy»anowski, and F. Triró. Optical-spectra of co-zeolites. Jour-nal of the Chemical Society, Faraday Transactions, 71(3):665669, 1975.
[176] P. J. Hutta and J. H. Lunsford. Spectroscopic evidence for location of co-2+ ionsin zeolite-y upon dehydration. Journal of Chemical Physics, 66(10):47164717,1977.
[177] A. A. Verberckmoes, B. M. Weckhuysen, and R. A. Schoonheydt. Spectroscopyand coordination chemistry of cobalt in molecular sieves. Microporous andMesoporous Materials, 22(1-3):165178, 1998.
[178] K. Klier. Transition-metal ions in zeolites - the perfect surface sites. Langmuir,4(1):1325, 1988.
[179] K. Klier, .R Kellerman, and P. J. Hutta. Spectra of synthetic zeolites contain-ing transition-metal ions .5. pi-complexes of olens and acetylene with co(ii)amolecular-sieve. Journal of Chemical Physics, 61(10):42244234, 1974.
[180] K. Klier. Stereospecic adsorption of nitrous oxide, cyclopropane, water, andammonia on co(ii)a synthetic zeolite. Advances in Chemistry Series, 101:480489, 1971.
465
[181] Tamás I. Korányi and János B. Nagy. Distribution of aluminum and boronin the periodical building units of boron-containing beta zeolites. Journal ofPhysical Chemistry B, 110(30):1472814735, 2006.
[182] M. Kato and T. Hattori. Ordered distribution of aluminum atoms in analcime.Physics and Chemistry of Minerals, 25(8):556565, 1998.
[183] Tamás I. Korányi and János B. Nagy. Distribution of aluminum in the periodicalbuilding units of faujasites. Journal of Physical Chemistry C, 111(6):25202524,2007.
[184] Tamás I. Korányi and János B. Nagy. Distribution of aluminum in dierentperiodical building units of mor and bea zeolites. Journal of Physical ChemistryB, 109(33):1579115797, 2005.
[185] Tamás I. Korányi and János B. Nagy. Calculating the concentration of siohalspecies in ferrierites by si-29 and al-27 nmr spectroscopy. Journal of PhysicalChemistry C, 113(3):907913, 2009.
[186] D. Barthomeuf. Topology and maximum content of isolated species (al, ga, fe,b, si, ...) in a zeolitic framework - an approach to acid catalysis. Journal ofPhysical Chemistry, 97(39):1009210096, 1993.
[187] D. Barthomeuf. Zeolite acidity dependence on structure and chemical envi-ronment - correlations with catalysis. Materials Chemistry and Physics, 17(1-2):4971, 1987.
[188] S. Ramdas, J. M. Thomas, J. Klinowski, C. A. Fyfe, and J. S. Hartman. Order-ing of aluminum and silicon in synthetic faujasites. Nature, 292(5820):228230,1981.
[189] Edward Dempsey, G. H. Kühl, and David H. Olson. Variation of the latticeparameter with aluminum content in synthetic sodium faujasites. evidence forordering of the framework ions. Journal of Physical Chemistry, 73(2):387390,1969.
[190] M. A. Camblor, L. A. Villaescusa, and M. J. Díaz-Cabañas. Synthesis of all-silica and high-silica molecular sieves in uoride media. Topics in Catalysis,9(1-2):5976, 1999.
[191] Manuel Moliner. State of the art of lewis acid-containing zeolites: lessons fromne chemistry to new biomass transformation processes. Dalton Transactions,43(11):41974208, 2014.
[192] Min Bum Park, Yoorim Lee, Anmin Zheng, Feng-Shou Xiao, Christopher P.Nicholas, Gregory J. Lewis, and Suk Bong Hong. Formation pathway for ltazeolite crystals synthesized via a charge density mismatch approach. Journalof the American Chemical Society, 135(6):22482255, 2013.
[193] G. J. Lewis, M. A. Miller, J. G. Moscoso, B. A. Wilson, L. M. Knight, and S. T.Wilson. Experimental charge density matching approach to zeolite synthesis.Studies in Surface Science and Catalysis, 154:364372, 2004.
[194] Seok Han Kim, Min Bum Park, Hyung-Ki Min, and Suk Bong Hong. Zeolite syn-thesis in the tetraethylammoniumtetramethylammonium mixed-organic addi-tive system. Microporous and Mesoporous Materials, 123(1):160168, 2009.
466
[195] Mark A. Miller, Jaime G. Moscoso, Susan C. Koster, Michael G. Gatter, andGregory J. Lewis. Synthesis and characterization of the 12-ring zeolites uzm-4 (bph) and uzm-22 (mei) via the charge density mismatch approach in thecholine-li2o-sro-al2o3-sio2 system. Studies in Surface Science and Catalysis,Volume 170:347354, 2007.
[196] C. Scott Blackwell, Robert W. Broach, Michael G. Gatter, Jennifer S. Holm-gren, Deng-Yang Jan, Gregory J. Lewis, Beckay J. Mezza, Thomas M. Mezza,Mark A. Miller, Jaime G. Moscoso, R. Lyle Patton, Lisa M. Rohde, Michael W.Schoonover, Wharton Sinkler, Ben A. Wilson, and Stephen T. Wilson. Open-framework materials synthesized in the tma+/tea+ mixed-template system:The new low si/al ratio zeolites uzm-4 and uzm-5. Angewandte Chemie Inter-national Edition, 42(15):17371740, 2003.
[197] Joo Hyuck Lee, Min Bum Park, Jun Kyu Lee, Hyung-Ki Min, Mee Kyung Song,and Suk Bong Hong. Synthesis and characterization of eri-type uzm-12 zeolitesand their methanol-to-olen performance. Journal of the American ChemicalSociety, 132(37):1297112982, 2010.
[198] M. E. Davis and R. F. Lobo. Zeolite and molecular sieve synthesis. Chemistryof Materials, 4(4):756768, 1992.
[199] Avelino Corma, Fernando Rey, Jordi Rius, Maria J Sabater, and Susana Va-lencia. Supramolecular self-assembled molecules as organic directing agent forsynthesis of zeolites. Nature, 431(7006):287, 2004.
[200] Allen W Burton and Stacey I Zones. Organic molecules in zeolite synthesis:their preparation and structure-directing eects. Studies in Surface Scienceand Catalysis, 168:137179, 2007.
[201] Brandon C Knott, Claire T Nimlos, David J Robichaud, Mark R Nimlos, SeonahKim, and Rajamani Gounder. Consideration of the aluminum distributionin zeolites in theoretical and experimental catalysis research. ACS Catalysis,8(2):770784, 2017.
[202] Cecilia Bores, Scott M Auerbach, and Peter A Monson. Modeling the role ofexcluded volume in zeolite structure direction. The journal of physical chemistryletters, 2018.
[203] Szu-Chia Chien, Scott M. Auerbach, and Peter A. Monson. Modeling the self-assembly of silica-templated nanoparticles in the initial stages of zeolite forma-tion. Langmuir, 31(17):49404949, 2015.
[204] Mohammad Navaid Khan, Scott M. Auerbach, and Peter A. Monson. Lat-tice monte carlo simulations in search of zeolite analogues: Eects of structuredirecting agents. The Journal of Physical Chemistry C, 119(50):2804628054,2015.
[205] Ramdas Pophale, Frits Daeyaert, and Michael W Deem. Computational predic-tion of chemically synthesizable organic structure directing agents for zeolites.Journal of Materials Chemistry A, 1(23):67506760, 2013.
[206] Yi Li, Hongxiao Cao, and Jihong Yu. Toward a new era of designed synthesisof nanoporous zeolitic materials. ACS Nano, 12(5):40964104, 2018.
467
[207] Frits Daeyaert and Michael W. Deem. In silico design of chiral dimers to directthe synthesis of a chiral zeolite. Molecular Physics, 116(21-22):28362855, 2018.
[208] Joel E Schmidt, Mark A Deimund, Dan Xie, and Mark E Davis. Synthesis ofrth-type zeolites using a diverse library of imidazolium cations. Chemistry ofMaterials, 27(10):37563762, 2015.
[209] Tracy M Davis, Albert Tianxiang Liu, Christopher M Lew, Dan Xie, Annabelle IBenin, Saleh Elomari, Stacey I Zones, and Michael W Deem. Computationallyguided synthesis of ssz-52: a zeolite for engine exhaust clean-up. Chemistry ofMaterials, 28(3):708711, 2016.
[210] Joel E Schmidt, Michael W Deem, and Mark E Davis. Synthesis of a specied,silica molecular sieve by using computationally predicted organic structure-directing agents. Angewandte Chemie International Edition, 53(32):83728374,2014.
[211] Stephen K. Brand, Joel E. Schmidt, Michael W. Deem, Frits Daeyaert, YanhangMa, Osamu Terasaki, Marat Orazov, and Mark E. Davis. Enantiomericallyenriched, polycrystalline molecular sieves. Proceedings of the National Academyof Sciences, 2017.
[212] Eva Maria Gallego, M. Teresa Portilla, Cecilia Paris, Alejandro Leon-Escamilla,Mercedes Boronat, Manuel Moliner, and Avelino Corma. "ab initio" synthesisof zeolites for preestablished catalytic reactions. Science, 355(6329):1051, 2017.
[213] Sichi Li, Hui Li, Rajamani Gounder, Anthony D. DeBellis, Imke B. Müller,Subramanian Prasad, Ahmad Moini, and William F. Schneider. First-principlescomparison of proton and divalent copper cation exchange energy landscapesin ssz-13 zeolite. The Journal of Physical Chemistry C, 2018.
[214] John R Di Iorio, Claire T Nimlos, and Rajamani Gounder. Introducing catalyticdiversity into single-site chabazite zeolites of xed composition via syntheticcontrol of active site proximity. ACS Catalysis, 7(10):66636674, 2017.
[215] Avelino Corma, EVA M GALLEGO, CHENGENG LI, CECILIA PARIS,NURIA GARCIA, JOAQUIN MARTINEZ, MERCEDES BORONAT, andMANUEL MOLINER. Making nanosized cha zeolite with controlled al dis-tribution for optimizing mto performance. ChemistryA European Journal,2018.
[216] Toshiki Nishitoba, Naohiro Yoshida, Junko N Kondo, and Toshiyuki Yokoi.Control of al distribution in the cha-type aluminosilicate zeolites and its impacton the hydrothermal stability and catalytic properties. Industrial & EngineeringChemistry Research, 57(11):39143922, 2018.
[217] John M Findley, Peter I Ravikovitch, and David S Sholl. The eect of aluminumshort-range ordering on carbon dioxide adsorption in zeolites. The Journal ofPhysical Chemistry C, 2018.
[218] C Paolucci, JR Di Iorio, FH Ribeiro, R Gounder, and WF Schneider. Catalysisscience of nox selective catalytic reduction with ammonia over cu-ssz-13 andcu-sapo-34. Advances in Catalysis, 59:1107, 2016.
468
[219] Dimitrios K. Pappas, Elisa Borfecchia, Michael Dyballa, Ilia A. Pankin, Kir-ill A. Lomachenko, Andrea Martini, Matteo Signorile, Shewangizaw Teketel,Bjørnar Arstad, Gloria Berlier, Carlo Lamberti, Silvia Bordiga, Unni Olsbye,Karl Petter Lillerud, Stian Svelle, and Pablo Beato. Methane to methanol:Structureactivity relationships for cu-cha. Journal of the American ChemicalSociety, 139(42):1496114975, 2017.
[220] Mark A. Newton, Amy J. Knorpp, Ana B. Pinar, Vitaly L. Sushkevich, DennisPalagin, and Jeroen A. van Bokhoven. On the mechanism underlying the directconversion of methane to methanol by copper hosted in zeolites; braiding cuk-edge xanes and reactivity studies. Journal of the American Chemical Society,140(32):1009010093, 2018.
[221] Benjamin E. R. Snyder, Max L. Bols, Robert A. Schoonheydt, Bert F. Sels, andEdward I. Solomon. Iron and copper active sites in zeolites and their correlationto metalloenzymes. Chemical Reviews, 118(5):27182768, 2018.
[222] HY Chen. Urea-SCR technology for deNOx after treatment of diesel exhausts.Springer, 2014.
[223] Daniel F Shantz, Christian Fild, Hubert Koller, and Raul F Lobo. Guest-host interactions in as-made al-zsm-12: Implications for the synthesis of zeolitecatalysts. The Journal of Physical Chemistry B, 103(49):1085810865, 1999.
[224] Allen W. Burton, Stacey I. Zones, and Saleh Elomari. The chemistry of phaseselectivity in the synthesis of high-silica zeolites. Current Opinion in Colloid &Interface Science, 10(56):211219, 2005.
[225] Daniel F Shantz, Jörn Schmedt auf der Günne, Hubert Koller, and Raul FLobo. Multiple-quantum 1h mas nmr studies of defect sites in as-made all-silicazsm-12 zeolite. Journal of the American Chemical Society, 122(28):66596663,2000.
[226] Allen W Burton, Greg S Lee, and Stacey I Zones. Phase selectivity in thesyntheses of cage-based zeolite structures: An investigation of thermodynamicinteractions between zeolite hosts and structure directing agents by molecularmodeling. Microporous and mesoporous materials, 90(1-3):129144, 2006.
[227] Aseem Chawla, Rui Li, Rishabh Jain, R John Clark, James G Sutjianto,Jeremy C Palmer, and Jerey D Rimer. Cooperative eects of inorganic andorganic structure-directing agents in zsm-5 crystallization. Molecular SystemsDesign & Engineering, 3(1):159170, 2018.
[228] Matthew D Oleksiak, Koki Muraoka, Ming-Feng Hsieh, Marlon T Conato,Atsushi Shimojima, Tatsuya Okubo, Watcharop Chaikittisilp, and Jerey DRimer. Organic-free synthesis of a highly siliceous faujasite zeolite with spa-tially biased q4 (nal) si speciation. Angewandte Chemie International Edition,56(43):1336613371, 2017.
[229] Min Bum Park, Donghui Jo, Him Chan Jeon, Christopher P Nicholas, Gregory JLewis, and Suk Bong Hong. Zeolite synthesis from a charge density perspective:The charge density mismatch synthesis of uzm-5 and uzm-9. Chemistry ofMaterials, 26(23):66846694, 2014.
469
[230] Chunyan Liu, Wenying Gu, Dejia Kong, and Hongchen Guo. The signicanteects of the alkali-metal cations on zsm-5 zeolite synthesis: From mechanismto morphology. Microporous and Mesoporous Materials, 183:3036, 2014.
[231] Jin Shang, Gang Li, Ranjeet Singh, Penny Xiao, Jeerson Z Liu, and Paul AWebley. Potassium chabazite: a potential nanocontainer for gas encapsulation.The Journal of Physical Chemistry C, 114(50):2202522031, 2010.
[232] Yuewei Ji, Mark A Deimund, Yashodhan Bhawe, and Mark E Davis. Organic-free synthesis of cha-type zeolite catalysts for the methanol-to-olens reaction.ACS Catalysis, 5(7):44564465, 2015.
[233] Michel Bourgogne, Jean-Louis Guth, and Raymond Wey. Process for the prepa-ration of synthetic zeolites, and zeolites obtained by said process, 1985.
[234] Bo Liu, Yihong Zheng, Na Hu, Tian Gui, Yuqin Li, Fei Zhang, Rongfei Zhou,Xiangshu Chen, and Hidetoshi Kita. Synthesis of low-silica cha zeolite chabazitein uoride media without organic structural directing agents and zeolites. Mi-croporous and Mesoporous Materials, 196:270276, 2014.
[235] Walter Loewenstein. The distribution of aluminum in the tetrahedra of sili-cates and aluminates. American Mineralogist: Journal of Earth and PlanetaryMaterials, 39(1-2):9296, 1954.
[236] Colin S Cundy and Paul A Cox. The hydrothermal synthesis of zeolites: historyand development from the earliest days to the present time. Chemical Reviews,103(3):663702, 2003.
[237] Christopher Paolucci, Ishant Khurana, Atish A Parekh, Sichi Li, Arthur J Shih,Hui Li, John R Di Iorio, Jonatan D Albarracin-Caballero, Aleksey Yezerets, andJerey T Miller. Dynamic multinuclear sites formed by mobilized copper ionsin nox selective catalytic reduction. Science, 357(6354):898903, 2017.
[238] Peter S Hammershoi, Yasser Jangjou, William S Epling, Anker D Jensen, andTon VW Janssens. Reversible and irreversible deactivation of cu-cha nh3-scrcatalysts by so2 and so3. Applied Catalysis B: Environmental, 226:3845,2018.
[239] Yasser Jangjou, Quan Do, Yuntao Gu, Laura-Gaile Lim, Hong Sun, Di Wang,Ashok Kumar, Junhui Li, Lars C Grabow, and William S Epling. Nature of cuactive centers in cu-ssz-13 and their responses to so2 exposure. ACS Catalysis,8(2):13251337, 2018.
[240] Feng Gao and Janos Szanyi. On the hydrothermal stability of cu/ssz-13 scrcatalysts. Applied Catalysis A: General, 560:185194, 2018.
[241] Matthias Thommes. Physical adsorption characterization of nanoporous mate-rials. Chemie Ingenieur Technik, 82(7):10591073, 2010.
[242] Christopher GV Burgess, Douglas H Everett, and Stuart Nuttall. Adsorptionhysteresis in porous materials. Pure and Applied chemistry, 61(11):18451852,1989.

470
[243] Takayuki Komatsu, Makoto Nunokawa, Il Shik Moon, Toshiya Takahara,Seitaro Namba, and Tatsuaki Yashima. Kinetic studies of reduction of ni-tric oxide with ammonia on cu2+-exchanged zeolites. Journal of Catalysis,148(2):427437, 1994.
[244] Gérard Delahay, Stéphane Kieger, Nathalie Tanchoux, Philippe Trens, andBernard Coq. Kinetics of the selective catalytic reduction of no by nh3 on acu-faujasite catalyst. Applied Catalysis B: Environmental, 52(4):251257, 2004.
[245] Gérard Delahay, Enrique Ayala Villagomez, Jean-Marie Ducere, DorothéeBerthomieu, Annick Goursot, and Bernard Coq. Selective catalytic reductionof no by nh3 on cu-faujasite catalysts: an experimental and quantum chemicalapproach. ChemPhysChem, 3(8):686692, 2002.
[246] Joon Hyun Baik, Sung Dae Yim, In-Sik Nam, Young Sun Mok, Jong-Hwan Lee,Byong K Cho, and Se H Oh. Control of no x emissions from diesel engine byselective catalytic reduction (scr) with urea. Topics in catalysis, 30(1-4):3741,2004.
[247] Joo-Hyoung Park, Hye Jun Park, Joon Hyun Baik, In-Sik Nam, Chae-Ho Shin,Jong-Hwan Lee, Byong K Cho, and Se H Oh. Hydrothermal stability of cuzsm5catalyst in reducing no by nh3 for the urea selective catalytic reduction process.Journal of Catalysis, 240(1):4757, 2006.
[248] Andrew M Beale, Feng Gao, Ines Lezcano-Gonzalez, Charles HF Peden, andJanos Szanyi. Recent advances in automotive catalysis for no x emission controlby small-pore microporous materials. Chemical Society Reviews, 44(20):73717405, 2015.
[249] Qing Ye, Lifeng Wang, and Ralph T Yang. Activity, propene poisoning re-sistance and hydrothermal stability of copper exchanged chabazite-like zeolitecatalysts for scr of no with ammonia in comparison to cu/zsm-5. Applied Catal-ysis A: General, 427:2434, 2012.
[250] D. W. Fickel, E. D'Addio, J. A. Lauterbach, and R. F. Lobo. The ammoniaselective catalytic reduction activity of copper-exchanged small-pore zeolites.Applied Catalysis B: Environmental, 102(3-4):441448, 2011.
[251] K. C. C. Kharas, H. J. Robota, and D. J. Liu. Deactivation in cu-zsm-5 lean-burn catalysts. Applied Catalysis B: Environmental, 2(23):225237, 1993.
[252] SA Gomez, A Campero, A Martnez-Hernandez, and GA Fuentes. Changes incu2+ environment upon wet deactivation of cu-zsm-5 denox catalysts. AppliedCatalysis A: General, 197(1):157164, 2000.
[253] Philip G Blakeman, Eric M Burkholder, Hai-Ying Chen, Jillian E Collier,Joseph M Fedeyko, Hoi Jobson, and Raj R Rajaram. The role of pore sizeon the thermal stability of zeolite supported cu scr catalysts. Catalysis Today,231:5663, 2014.
[254] Soran Shwan, Radka Nedyalkova, Jonas Jansson, John Korsgren, Louise Olsson,and Magnus Skoglundh. Hydrothermal stability of febea as an nh3-scr catalyst.Industrial and Engineering Chemistry Research, 51(39):1276212772, 2012.

471
[255] I. Bull, R. S. Boorse, W. M. Jaglowski, G. S. Koermer, A. Moini, J. A. Patchett,W.-M. Xue, P. Burk, J. C. Dettling, and M. T. Caudle. Copper cha zeolitecataysts, 2008.
[256] Manuel Moliner, Cristina Franch, Eduardo Palomares, Marie Grill, and AvelinoCorma. Cussz-39, an active and hydrothermally stable catalyst for the selectivecatalytic reduction of no x. Chemical Communications, 48(66):82648266, 2012.
[257] A Lorena Picone, Stewart J Warrender, Alexandra MZ Slawin, Daniel MDawson, Sharon E Ashbrook, Paul A Wright, Stephen P Thompson, LuciaGaberova, Philip L Llewellyn, Beatrice Moulin, et al. A co-templating route tothe synthesis of cu sapo sta-7, giving an active catalyst for the selective catalyticreduction of no. Microporous and Mesoporous Materials, 146(1-3):3647, 2011.
[258] Dan Xie, Lynne B McCusker, Christian Baerlocher, Stacey I Zones, Wei Wan,and Xiaodong Zou. Ssz-52, a zeolite with an 18-layer aluminosilicate frame-work structure related to that of the denox catalyst cu-ssz-13. Journal of theAmerican Chemical Society, 135(28):1051910524, 2013.
[259] Donghui Jo, Jong Bin Lim, Taekyung Ryu, In-Sik Nam, Miguel A Camblor,and Suk Bong Hong. Unseeded hydroxide-mediated synthesis and co 2 adsorp-tion properties of an aluminosilicate zeolite with the rth topology. Journal ofMaterials Chemistry A, 3(38):1932219329, 2015.
[260] S Altwasser, J Jiao, S Steuernagel, J Weitkamp, and M Hunger. Elucidating thedealumination mechanism of zeolite hy by solid-state nmr spectroscopy. Studiesin Surface Science and Catalysis, 154:30983105, 2004.
[261] Malte Nielsen, Rasmus Yding Brogaard, Hanne Falsig, Pablo Beato, Ole Swang,and Stian Svelle. Kinetics of zeolite dealumination: insights from h-ssz-13. ACSCatalysis, 5(12):71317139, 2015.
[262] K Ehrhardt, M Suckow, and W Lutz. Hydrothermal decomposition of alumi-nosilicate zeolites and prediction of their long-term stability. Studies in SurfaceScience and Catalysis, 94:179186, 1995.
[263] Lei Ma, Yisun Cheng, Giovanni Cavataio, Robert W McCabe, Lixin Fu, andJunhua Li. In situ drifts and temperature-programmed technology study onnh3-scr of nox over cu-ssz-13 and cu-sapo-34 catalysts. Applied Catalysis B:Environmental, 156:428437, 2014.
[264] M Valdez Lancinha Pereira, A Nicolle, and D Berthout. Hydrothermal agingeects on cu-zeolite nh3-scr catalyst. Catalysis Today, 258:424431, 2015.
[265] Luis R Aramburo, Lukasz Karwacki, Pablo Cubillas, Shunsuke Asahina,Matthijs de Winter, Martyn R Drury, Inge LC Buurmans, Eli Stavitski, DavideMores, Marco Daturi, et al. The porosity, acidity, and reactivity of dealumi-nated zeolite zsm-5 at the single particle level: The inuence of the zeolitearchitecture. ChemistryA European Journal, 17(49):1377313781, 2011.
[266] Di Wang, Yasser Jangjou, Yong Liu, Munish K Sharma, Jinyong Luo, Junhui Li,Krishna Kamasamudram, and William S Epling. A comparison of hydrothermalaging eects on nh3-scr of nox over cu-ssz-13 and cu-sapo-34 catalysts. AppliedCatalysis B: Environmental, 165:438445, 2015.
472
[267] Jiancheng Wang, Zhaoliang Peng, Hui Qiao, Lina Han, Weiren Bao, LipingChang, Gang Feng, and Wei Liu. Inuence of aging on in situ hydrothermallysynthesized cu-ssz-13 catalyst for nh 3-scr reaction. Rsc Advances, 4(80):4240342411, 2014.
[268] Steven J Schmieg, Se H Oh, Chang H Kim, David B Brown, Jong H Lee,Charles HF Peden, and Do Heui Kim. Thermal durability of cu-cha nh3-scrcatalysts for diesel nox reduction. Catalysis Today, 184(1):252261, 2012.
[269] Wenkang Su, Zhenguo Li, Yue Peng, and Junhua Li. Correlation of the changesin the framework and active cu sites for typical cu/cha zeolites (ssz-13 andsapo-34) during hydrothermal aging. Physical Chemistry Chemical Physics,17(43):2914229149, 2015.
[270] Michiel Dusselier, Mark A Deimund, Joel E Schmidt, and Mark E Davis.Methanol-to-olens catalysis with hydrothermally treated zeolite ssz-39. ACSCatalysis, 5(10):60786085, 2015.
[271] Feng Gao, Yilin Wang, Nancy M. Washton, Marton Kollar, Janos Szanyi, andCharles H. F. Peden. Eects of alkali and alkaline earth cocations on the activ-ity and hydrothermal stability of cu/ssz-13 nh3-scr catalysts. ACS Catalysis,5(11):67806791, 2015.
[272] AV Kucherov and AA Slinkin. Introduction of transition metal ions in cationicpositions of high-silica zeolites by a solid state reaction. interaction of coppercompounds with h-mordenite or h-zsm-5. Zeolites, 6(3):175180, 1986.
[273] G. T. Kerr. Intracrystalline rearrangement of constitutive water in hydrogenzeolite y. Journal of Physical Chemistry, 71(12):41554156, 1967.
[274] G. T. Kerr. Chemistry of crystalline aluminosilicates. vii. thermal decompo-sition products of ammonium zeolite y. Journal of Catalysis, 15(2):200204,1969.
[275] Marius-Christian Silaghi, Celine Chizallet, Elena Petracovschi, Torsten Kerber,Joachim Sauer, and Pascal Raybaud. Regioselectivity of alo bond hydrolysisduring zeolites dealumination unied by brønstedevanspolanyi relationship.ACS Catalysis, 5(1):1115, 2014.
[276] Michiel Dusselier, Joel E Schmidt, Roger Moulton, Barry Haymore, Mark Hel-lums, and Mark E Davis. Inuence of organic structure directing agent isomerdistribution on the synthesis of ssz-39. Chemistry of Materials, 27(7):26952702,2015.
[277] Joel E Schmidt, Mark A Deimund, and Mark E Davis. Facile preparationof aluminosilicate rth across a wide composition range using a new organicstructure-directing agent. Chemistry of Materials, 26(24):70997105, 2014.
[278] Stacey I Zones, Yumi Nakagawa, Susan T Evans, and Gregory S Lee. Zeolitessz-39, 1999.
[279] Gregory S Lee and Stacey I Zones. Zeolite ssz-50, 2003.
[280] Gabriele Centi and Siglinda Perathoner. Nature of active species in copper-based catalysts and their chemistry of transformation of nitrogen oxides. AppliedCatalysis A: General, 132(2):179259, 1995.
473
[281] AI Biaglow, DJ Parrillo, GT Kokotailo, and RJ Gorte. A study of dealuminatedfaujasites. Journal of Catalysis, 148(1):213223, 1994.
[282] J Texter, DH Strome, RG Herman, and K Klier. Chemical and spectroscopicproperties of copper containing zeolites. The Journal of Physical Chemistry,81(4):333338, 1977.
[283] Kyle L Fujdala, Ian J Drake, Alexis T Bell, and T Don Tilley. Atomic levelcontrol over surface species via a molecular precursor approach: Isolated cu(i) sites and cu nanoparticles supported on mesoporous silica. Journal of theAmerican Chemical Society, 126(35):1086410866, 2004.
[284] Joseph Palamara, Karsten Seidel, Ahmad Moini, and Subramanian Prasad. Iondistribution in copper exchanged zeolites by using si-29 spin lattice relaxationanalysis. Journal of Magnetic Resonance, 267:914, 2016.
[285] Rajamani Gounder and Enrique Iglesia. The roles of entropy and enthalpy instabilizing ion-pairs at transition states in zeolite acid catalysis. Accounts ofchemical research, 45(2):229238, 2011.
[286] Jacek Klinowski. Nuclear magnetic resonance studies of zeolites. Progress innuclear magnetic resonance spectroscopy, 16:237309, 1984.
[287] Ja Hun Kwak, Jian Zhi Hu, Do Heui Kim, Janos Szanyi, and Charles HFPeden. Penta-coordinated al3+ ions as preferential nucleation sites for bao onγ-al2o3: An ultra-high-magnetic eld 27al mas nmr study. Journal of Catalysis,251(1):189194, 2007.
[288] Jun Wang, Vincent F Kispersky, W Nicholas Delgass, and Fabio H Ribeiro.Determination of the au active site and surface active species via operandotransmission ftir and isotopic transient experiments on 2.3 wt.% au/tio2 for thewgs reaction. Journal of catalysis, 289:171178, 2012.
[289] Hugh Stott Taylor. A theory of the catalytic surface. Proc. R. Soc. Lond. A,108(745):105111, 1925.
[290] Malte Behrens, Felix Studt, Igor Kasatkin, Stefanie Kühl, Michael Hävecker,Frank Abild-Pedersen, Stefan Zander, Frank Girgsdies, Patrick Kurr, andBenjamin-Louis Kniep. The active site of methanol synthesis over cu/zno/al2o3industrial catalysts. Science, 336(6083):893897, 2012.
[291] T Zambelli, J Wintterlin, J Trost, and G Ertl. Identication of the" activesites" of a surface-catalyzed reaction. Science, 273(5282):16881690, 1996.
[292] Thomas F Jaramillo, Kristina P Jørgensen, Jacob Bonde, Jane H Nielsen, Se-bastian Horch, and Ib Chorkendor. Identication of active edge sites for elec-trochemical h2 evolution from mos2 nanocatalysts. science, 317(5834):100102,2007.
[293] John Meurig Thomas. Design, synthesis, and in situ characterization of newsolid catalysts. Angewandte Chemie International Edition, 38(24):35883628,1999.
474
[294] Young Dok Kim, Ari P Seitsonen, Stefan Wendt, Jinhai Wang, C Fan, KarlJacobi, Herbert Over, and Gerhard Ertl. Characterization of various oxygenspecies on an oxide surface: Ruo2 (110). The Journal of Physical Chemistry B,105(18):37523758, 2001.
[295] Eric C Tyo, Chunrong Yin, Marcel Di Vece, Qiang Qian, Gihan Kwon, SungsikLee, Byeongdu Lee, Janae E DeBartolo, Sonke Seifert, Randall E Winans, et al.Oxidative dehydrogenation of cyclohexane on cobalt oxide (co3o4) nanoparti-cles: The eect of particle size on activity and selectivity. ACS Catalysis,2(11):24092423, 2012.
[296] Taeho Hwang, Bryan R Goldsmith, Baron Peters, and Susannah L Scott.Water-catalyzed activation of h2o2 by methyltrioxorhenium: A combinedcomputationalexperimental study. Inorganic chemistry, 52(24):1390413917,2013.
[297] Andrew M Beale, Ad MJ van der Eerden, Kaisa Kervinen, Mark A Newton, andBert M Weckhuysen. Adding a third dimension to operando spectroscopy: acombined uv-vis, raman and xafs setup to study heterogeneous catalysts underworking conditions. Chemical Communications, 0(24):30153017, 2005.
[298] Henrik Topsøe. Developments in operando studies and in situ characterizationof heterogeneous catalysts. Journal of Catalysis, 216(1-2):155164, 2003.
[299] Bert M Weckhuysen. Determining the active site in a catalytic process:Operando spectroscopy is more than a buzzword. Physical Chemistry ChemicalPhysics, 5(20):43514360, 2003.
[300] Isabel Xiaoye Green, Wenjie Tang, Matthew Neurock, and John T Yates. Spec-troscopic observation of dual catalytic sites during oxidation of co on a au/tio2catalyst. Science, 333(6043):736739, 2011.
[301] Alexey Boubnov, Hudson WP Carvalho, Dmitry E Doronkin, Tobias Gunter,Erik Gallo, Andrew J Atkins, Christoph R Jacob, and Jan-Dierk Grunwaldt. Se-lective catalytic reduction of no over fe-zsm-5: mechanistic insights by operandoherfd-xanes and valence-to- core x-ray emission spectroscopy. Journal of theAmerican Chemical Society, 136(37):1300613015, 2014.
[302] Eric J Peterson, Andrew T DeLaRiva, Sen Lin, Ryan S Johnson, Hua Guo,Jerey T Miller, Ja Hun Kwak, Charles HF Peden, Boris Kiefer, Lawrence FAllard, et al. Low-temperature carbon monoxide oxidation catalysed by re-generable atomically dispersed palladium on alumina. Nature communications,5:4885, 2014.
[303] Mark J Rice, Arup K Chakraborty, and Alexis T Bell. Site availability andcompetitive siting of divalent metal cations in zsm-5. Journal of Catalysis,194(2):278285, 2000.
[304] Mark J Rice, Arup K Chakraborty, and Alexis T Bell. Al next nearest neigh-bor, ring occupation, and proximity statistics in zsm-5. Journal of Catalysis,186(1):222227, 1999.
[305] Priit Sarv, Christian Fernandez, Jean-Paul Amoureux, and Kari Keskinen. Dis-tribution of tetrahedral aluminium sites in zsm-5 type zeolites: An 27al (multi-quantum) magic angle spinning nmr study. The Journal of Physical Chemistry,100(50):1922319226, 1996.
475
[306] Daniel E Perea, Ilke Arslan, Jia Liu, Zoran Ristanovi¢, Libor Kovarik, Bruce WArey, Johannes A Lercher, Simon R Bare, and Bert M Weckhuysen. Determin-ing the location and nearest neighbours of aluminium in zeolites with atomprobe tomography. Nature communications, 6:7589, 2015.
[307] Pieter Vanelderen, Julie Vancauwenbergh, Bert F Sels, and Robert A Schoon-heydt. Coordination chemistry and reactivity of copper in zeolites. CoordinationChemistry Reviews, 257(2):483494, 2013.
[308] Mark J Rice, Arup K Chakraborty, and Alexis T Bell. Theoretical studies of thecoordination and stability of divalent cations in zsm-5. The Journal of PhysicalChemistry B, 104(43):99879992, 2000.
[309] KC Hass andWF Schneider. Reliability of small cluster models for cu-exchangedzeolites. The Journal of Physical Chemistry, 100(22):92929301, 1996.
[310] Bernhardt L Trout, Arup K Chakraborty, and Alexis T Bell. Local spin densityfunctional theory study of copper ion-exchanged zsm-5. The Journal of PhysicalChemistry, 100(10):41734179, 1996.
[311] AV Kucherov, AA Slinkin, DA Kondrat'Ev, TN Bondarenko, AM Rubinstein,and Kh M Minachev. Cu2+-cation location and reactivity in mordenite andzsm-5: esr-study. Zeolites, 5(5):320324, 1985.
[312] G Spoto, A Zecchina, S Bordiga, G Ricchiardi, G Martra, G Leofanti, andG Petrini. Cu (i)-zsm-5 zeolites prepared by reaction of h-zsm-5 with gaseouscucl: spectroscopic characterization and reactivity towards carbon monoxideand nitric oxide. Applied Catalysis B: Environmental, 3(2-3):151172, 1994.
[313] Gemma Turnes Palomino, Paola Fisicaro, Silvia Bordiga, Adriano Zecchina,Elio Giamello, and Carlo Lamberti. Oxidation states of copper ions in zsm-5zeolites. a multitechnique investigation. The Journal of Physical Chemistry B,104(17):40644073, 2000.
[314] Dana Nachtigallová, Petr Nachtigall, Marek Sierka, and Joachim Sauer. Co-ordination and siting of cu+ ions in zsm-5: A combined quantum mechan-ics/interatomic potential function study. Physical Chemistry Chemical Physics,1(8):20192026, 1999.
[315] Patrick Da Costa, Björn Modén, George D Meitzner, Deuk Ki Lee, and EnriqueIglesia. Spectroscopic and chemical characterization of active and inactive cuspecies in no decomposition catalysts based on cu-zsm5. Physical ChemistryChemical Physics, 4(18):45904601, 2002.
[316] BR Goodman, KC Hass, WF Schneider, and JB Adams. Cluster model studiesof oxygen-bridged cu pairs in cu- zsm-5 catalysts. The Journal of PhysicalChemistry B, 103(47):1045210460, 1999.
[317] Pieter J Smeets, Ryan G Hadt, Julia S Woertink, Pieter Vanelderen, Robert ASchoonheydt, Bert F Sels, and Edward I Solomon. Oxygen precursor to the re-active intermediate in methanol synthesis by cu-zsm-5. Journal of the AmericanChemical Society, 132(42):1473614738, 2010.
476
[318] Julia S Woertink, Pieter J Smeets, Marijke H Groothaert, Michael A Vance,Bert F Sels, Robert A Schoonheydt, and Edward I Solomon. A [cu2o] 2+ core incu-zsm-5, the active site in the oxidation of methane to methanol. Proceedingsof the National Academy of Sciences, 106(45):1890818913, 2009.
[319] Marijke H Groothaert, Jeroen A van Bokhoven, Andrea A Battiston, Bert MWeckhuysen, and Robert A Schoonheydt. Bis (µ-oxo) dicopper in cu-zsm-5 andits role in the decomposition of no: a combined in situ xafs, uv- vis- near-ir, andkinetic study. Journal of the American Chemical Society, 125(25):76297640,2003.
[320] Ramakrishnan Balasubramanian, Stephen M Smith, Swati Rawat, Liliya A Yat-sunyk, Timothy L Stemmler, and Amy C Rosenzweig. Oxidation of methaneby a biological dicopper centre. Nature, 465(7294):115, 2010.
[321] Marijke H Groothaert, Pieter J Smeets, Bert F Sels, Pierre A Jacobs, andRobert A Schoonheydt. Selective oxidation of methane by the bis (µ-oxo) di-copper core stabilized on zsm-5 and mordenite zeolites. Journal of the AmericanChemical Society, 127(5):13941395, 2005.
[322] Pieter Vanelderen, Ryan G Hadt, Pieter J Smeets, Edward I Solomon, Robert ASchoonheydt, and Bert F Sels. Cu-zsm-5: A biomimetic inorganic model formethane oxidation. Journal of catalysis, 284(2):157164, 2011.
[323] Nadzeya V Beznis, Bert M Weckhuysen, and Johannes H Bitter. Cu-zsm-5zeolites for the formation of methanol from methane and oxygen: Probing theactive sites and spectator species. Catalysis letters, 138(1-2):1422, 2010.
[324] Evalyn Mae C Alayon, Maarten Nachtegaal, Andras Bodi, and Jeroen A vanBokhoven. Reaction conditions of methane-to-methanol conversion aect thestructure of active copper sites. ACS Catalysis, 4(1):1622, 2014.
[325] Evalyn Mae C Alayon, Maarten Nachtegaal, Evgeny Kleymenov, and Jeroen Avan Bokhoven. Determination of the electronic and geometric structure ofcu sites during methane conversion over cu-mor with x- ray absorption spec-troscopy. Microporous and Mesoporous Materials, 166:131136, 2013.
[326] Evalyn Mae C Alayon, Maarten Nachtegaal, Andras Bodi, Marco Ranocchiari,and Jeroen A van Bokhoven. Bis (µ-oxo) versus mono (µ-oxo) dicopper coresin a zeolite for converting methane to methanol: an in situ xas and dft investi-gation. Physical Chemistry Chemical Physics, 17(12):76817693, 2015.
[327] Sebastian Grundner, Monica AC Markovits, Guanna Li, Moniek Tromp,Evgeny A Pidko, Emiel JM Hensen, Andreas Jentys, Maricruz Sanchez-Sanchez,and Johannes A Lercher. Single-site trinuclear copper oxygen clusters in mor-denite for selective conversion of methane to methanol. Nature communications,6:7546, 2015.
[328] Pieter J Smeets, Marijke H Groothaert, and Robert A Schoonheydt. Cu basedzeolites: A uvvis study of the active site in the selective methane oxidation atlow temperatures. Catalysis today, 110(3-4):303309, 2005.
[329] Matthew J Wulfers, Shewangizaw Teketel, Bahar Ipek, and Raul F Lobo. Con-version of methane to methanol on copper-containing small-pore zeolites andzeotypes. Chemical Communications, 51(21):44474450, 2015.
477
[330] ST King. Reaction mechanism of oxidative carbonylation of methanol todimethyl carbonate in cuy zeolite. Journal of Catalysis, 161(2):530538, 1996.
[331] Pieter J Smeets, Bert F Sels, Robert M van Teeelen, Hugo Leeman, Emiel JMHensen, and Robert A Schoonheydt. The catalytic performance of cu-containingzeolites in n2o decomposition and the inuence of o2, no and h2o on recombi-nation of oxygen. Journal of Catalysis, 256(2):183191, 2008.
[332] Björn Modén, Patrick Da Costa, Benjamin Fonfé, Deuk Ki Lee, and EnriqueIglesia. Kinetics and mechanism of steady-state catalytic no decompositionreactions on cuzsm5. Journal of Catalysis, 209(1):7586, 2002.
[333] Masakazu Iwamoto, Hiroshi Furukawa, Yoshihiro Mine, Fumihide Uemura,Shin-ichi Mikuriya, and Shuichi Kagawa. Copper (ii) ion-exchanged zsm-5 ze-olites as highly active catalysts for direct and continuous decomposition of ni-trogen monoxide. Journal of the Chemical Society, Chemical Communications,0(16):12721273, 1986.
[334] Antonio Grossale, Isabella Nova, Enrico Tronconi, Daniel Chatterjee, andMichel Weibel. The chemistry of the no/no2nh3 fast scr reaction over fe-zsm5investigated by transient reaction analysis. Journal of Catalysis, 256(2):312322, 2008.
[335] Massimo Colombo, Isabella Nova, and Enrico Tronconi. A comparative studyof the nh3-scr reactions over a cu-zeolite and a fe-zeolite catalyst. CatalysisToday, 151(3-4):223230, 2010.
[336] Alexander Shishkin, Hannes Kannisto, Per-Anders Carlsson, Hanna Härelind,and Magnus Skoglundh. Synthesis and functionalization of ssz-13 as an nh 3-scrcatalyst. Catalysis Science & Technology, 4(11):39173926, 2014.
[337] Giovanni Cavataio, James Girard, Joseph Eli Patterson, Cliord Montreuil,Yisun Cheng, and Christine K Lambert. Laboratory testing of urea-scr formu-lations to meet tier 2 bin 5 emissions. Technical report, SAE Technical Paper,2007.
[338] Manfred Koebel, Martin Elsener, and Michael Kleemann. Urea-scr: a promisingtechnique to reduce nox emissions from automotive diesel engines. Catalysistoday, 59(3-4):335345, 2000.
[339] Jinyong Luo, Di Wang, Ashok Kumar, Junhui Li, Krishna Kamasamudram,Neal Currier, and Aleksey Yezerets. Identication of two types of cu sites incu/ssz-13 and their unique responses to hydrothermal aging and sulfur poison-ing. Catalysis Today, 267:39, 2016.
[340] Florian Goltl, Philippe Sautet, and Ive Hermans. Can dynamics be responsiblefor the complex multipeak infrared spectra of no adsorbed to copper (ii) sites inzeolites? Angewandte Chemie International Edition, 54(27):77997804, 2015.
[341] Renqin Zhang, Jean-Sabin McEwen, Marton Kollar, Feng Gao, Yilin Wang,Janos Szanyi, and Charles HF Peden. No chemisorption on cu/ssz-13: a com-parative study from infrared spectroscopy and dft calculations. Acs Catalysis,4(11):40934105, 2014.
478
[342] Florian Goltl, Philippe Sautet, and Ive Hermans. The impact of nite temper-ature on the coordination of cu cations in the zeolite ssz-13. Catalysis Today,267:4146, 2016.
[343] Ja Hun Kwak, Tamas Varga, Charles HF Peden, Feng Gao, Jonathan C Hanson,and Janos Szanyi. Following the movement of cu ions in a ssz-13 zeolite duringdehydration, reduction and adsorption: A combined in situ tp-xrd, xanes/driftsstudy. Journal of Catalysis, 314:8393, 2014.
[344] Anita Godiksen, Frederick N Stappen, Peter NR Vennestrøm, Filippo Gior-danino, S øren Birk Rasmussen, Lars F Lundegaard, and Susanne Mossin. Co-ordination environment of copper sites in cu-cha zeolite investigated by electronparamagnetic resonance. The Journal of Physical Chemistry C, 118(40):2312623138, 2014.
[345] Peter NR Vennestrøm, Anna Katerinopoulou, Ramchandra R Tiruvalam,Arkady Kustov, Poul G Moses, Patricia Concepcion, and Avelino Corma. Mi-gration of cu ions in sapo-34 and its impact on selective catalytic reduction ofno x with nh3. ACS Catalysis, 3(9):21582161, 2013.
[346] Casper Welzel Andersen, Martin Bremholm, Peter Nicolai Ravnborg Venne-strom, Anders Bank Blichfeld, Lars Fahl Lundegaard, and Bo BrummerstedtIversen. Location of cu2+ in cha zeolite investigated by x-ray diraction usingthe rietveld/maximum entropy method. IUCrJ, 1(6):382386, 2014.
[347] Feng Gao, Eric D Walter, Eric M Karp, Jinyong Luo, Russell G Tonkyn, Ja HunKwak, Janos Szanyi, and Charles HF Peden. Structureactivity relationships innh3-scr over cu-ssz-13 as probed by reaction kinetics and epr studies. Journalof catalysis, 300:2029, 2013.
[348] Ja Hun Kwak, Haiyang Zhu, Jong H Lee, Charles HF Peden, and Janos Szanyi.Two dierent cationic positions in cu-ssz-13? Chemical Communications,48(39):47584760, 2012.
[349] Feng Gao, Eric D Walter, Marton Kollar, Yilin Wang, Janos Szanyi, andCharles HF Peden. Understanding ammonia selective catalytic reduction kinet-ics over cu/ssz-13 from motion of the cu ions. Journal of Catalysis, 319:114,2014.
[350] jiri Dedecek and Blanka Wichterlova. Role of hydrated cu ion complexes andaluminum distribution in the framework on the cu ion siting in zsm-5. TheJournal of Physical Chemistry B, 101(49):1023310240, 1997.
[351] John L Fulton, Markus M Homann, John G Darab, Bruce J Palmer, andEdward A Stern. Copper (i) and copper (ii) coordination structure under hy-drothermal conditions at 325 c: an x-ray absorption ne structure and moleculardynamics study. The Journal of Physical Chemistry A, 104(49):1165111663,2000.
[352] Florian Goltl and Jurgen Hafner. Structure and properties of metal-exchangedzeolites studied using gradient-corrected and hybrid functionals. i. structure andenergetics. The Journal of chemical physics, 136(6):064501, 2012.

479
[353] Florian Goltl and Jurgen Hafner. Structure and properties of metal-exchangedzeolites studied using gradient-corrected and hybrid functionals. ii. electronicstructure and photoluminescence spectra. The Journal of chemical physics,136(6):064502, 2012.
[354] Florian Goltl and Jurgen Hafner. Structure and properties of metal-exchangedzeolites studied using gradient-corrected and hybrid functionals. iii. energeticsand vibrational spectroscopy of adsorbates. The Journal of chemical physics,136(6):064503, 2012.
[355] Ja Hun Kwak, Jong H Lee, Sarah D Burton, Andrew S Lipton, Charles HFPeden, and Janos Szanyi. A common intermediate for n2 formation in enzymesand zeolites: Side-on cunitrosyl complexes. Angewandte Chemie InternationalEdition, 52(38):99859989, 2013.
[356] Pio Forzatti, Luca Lietti, Isabella Nova, and Enrico Tronconi. Diesel nox af-tertreatment catalytic technologies: Analogies in lnt and scr catalytic chemistry.Catalysis Today, 151(3-4):202211, 2010.
[357] Massimo Colombo, Isabella Nova, and Enrico Tronconi. Detailed kinetic mod-eling of the nh3no/no2 scr reactions over a commercial cu-zeolite catalyst fordiesel exhausts after treatment. Catalysis Today, 197(1):243255, 2012.
[358] Maria Pia Ruggeri, Tommaso Selleri, Massimo Colombo, Isabella Nova, andEnrico Tronconi. Identication of nitrites/hono as primary products of no oxi-dation over fe-zsm-5 and their role in the standard scr mechanism: A chemicaltrapping study. Journal of Catalysis, 311:266270, 2014.
[359] Maria Pia Ruggeri, Isabella Nova, Enrico Tronconi, Josh A Pihl, Todd J Toops,and William P Partridge. In-situ drifts measurements for the mechanistic studyof no oxidation over a commercial cu-cha catalyst. Applied Catalysis B: Envi-ronmental, 166:181192, 2015.
[360] Tobias Gunter, Hudson WP Carvalho, Dmitry E Doronkin, Thomas Sheppard,Pieter Glatzel, Andrew J Atkins, Julian Rudolph, Christoph R Jacob, MariaCasapu, and Jan-Dierk Grunwaldt. Structural snapshots of the scr reactionmechanism on cu-ssz-13. Chemical Communications, 51(44):92279230, 2015.
[361] RM Koros and EJ Nowak. A diagnostic test of the kinetic regime in a packedbed reactor. Chemical Engineering Science, 22(3):470, 1967.
[362] George M Psofogiannakis, John F McCleerey, Eugenio Jaramillo, and Adri CTVan Duin. Reax reactive molecular dynamics simulation of the hydrationof cu-ssz-13 zeolite and the formation of cu dimers. The Journal of PhysicalChemistry C, 119(12):66786686, 2015.
[363] AKS Clemens, Alexander Shishkin, PA Carlsson, Magnus Skoglundh, MartinezCasado, Zdenek Matej, Olivier Balmes, and H Harelind. Reaction-driven ionexchange of copper into zeolite ssz-13. ACS Catalysis, 5(10):62096218, 2015.
[364] Marek Sierka and Joachim Sauer. Proton mobility in chabazite, faujasite, andzsm-5 zeolite catalysts. comparison based on ab initio calculations. The Journalof Physical Chemistry B, 105(8):16031613, 2001.
480
[365] Luis J Smith, Anne Davidson, and Anthony K Cheetham. A neutron diractionand infrared spectroscopy study of the acid form of the aluminosilicate zeolite,chabazite (h-ssz-13). Catalysis letters, 49(3-4):143146, 1997.
[366] Silvia Bordiga, Jenny G Vitillo, Gabriele Ricchiardi, Laura Regli, DonatoCocina, Adriano Zecchina, Bjørnar Arstad, Morten Bjørgen, Jasmina Hazovic,and Karl Petter Lillerud. Interaction of hydrogen with mof-5. The Journal ofPhysical Chemistry B, 109(39):1823718242, 2005.
[367] CF Baes and RE Mesmer. The hydrolysis of cations, 489 p, 1976.
[368] Aline Auroux, Vera Bolis, Piotr Wierzchowski, Pierre C Gravelle, and Jacques CVedrine. Study of the acidity of zsm-5 zeolite by microcalorimetry and infraredspectroscopy. Journal of the Chemical Society, Faraday Transactions 1: Phys-ical Chemistry in Condensed Phases, 75:25442555, 1979.
[369] Aline Auroux. Calorimetry and thermal methods in catalysis. Springer Seriesin Materials Science, 154, 2013.
[370] Sanjay B Sharma, Bernard L Meyers, Daniel T Chen, Jerey Miller, andJames A Dumesic. Characterization of catalyst acidity by microcalorime-try and temperature-programmed desorption. Applied Catalysis A: General,102(2):253265, 1993.
[371] C Lee, DJ Parrillo, RJ Gorte, and WE Farneth. Relationship between dieren-tial heats of adsorption and brønsted acid strengths of acidic zeolites: H-zsm-5and h-mordenite. Journal of the American Chemical Society, 118(13):32623268, 1996.
[372] Martin Brandle, Joachim Sauer, Roberto Dovesi, and Nicholas M Harrison.Comparison of a combined quantum mechanics/interatomic potential func-tion approach with its periodic quantum- mechanical limit: Proton siting andammonia adsorption in zeolite chabazite. The Journal of chemical physics,109(23):1037910389, 1998.
[373] Soran Shwan, Magnus Skoglundh, Lars F Lundegaard, Ramchandra R Tiru-valam, Ton VW Janssens, Anna Carlsson, and Peter NR Vennestrøm. Solid-state ion-exchange of copper into zeolites facilitated by ammonia at low tem-perature. ACS Catalysis, 5(1):1619, 2014.
[374] Donghai Sun, William F Schneider, James B Adams, and Debasis Sengupta.Molecular origins of selectivity in the reduction of no x by nh3. The Journal ofPhysical Chemistry A, 108(43):93659374, 2004.
[375] Oc Hee Han, Chang-Sam Kim, and Suk Bong Hong. Direct evidence for thenonrandom nature of al substitution in zeolite zsm-5: An investigation by 27almas and mq mas nmr. Angewandte Chemie International Edition, 41(3):469472, 2002.
[376] Stacey I Zones and Robert A Van Nordstrand. Novel zeolite transformations:the template-mediated conversion of cubic p zeolite to ssz-13. Zeolites, 8(3):166174, 1988.
481
[377] Chun-Chih Chang, Zhuopeng Wang, Paul Dornath, Hong Je Cho, and WeiFan. Rapid synthesis of sn-beta for the isomerization of cellulosic sugars. RscAdvances, 2(28):1047510477, 2012.
[378] MH Groothaert, K Lievens, Jeroen A van Bokhoven, AA Battiston, BM Weck-huysen, Kristine Pierloot, and RA Schoonheydt. Bis (µ-oxo) dicopper as in-termediate in the catalytic decomposition of no over cu-zsm-5. In Studies inSurface Science and Catalysis, volume 154, pages 24492457. Elsevier, 2004.
[379] Haiyang Zhu, Ja Hun Kwak, Charles HF Peden, and Janos Szanyi. In situ drifts-ms studies on the oxidation of adsorbed nh3 by nox over a cu-ssz-13 zeolite.Catalysis today, 205:1623, 2013.
[380] Janos Szanyi, Ja Hun Kwak, Haiyang Zhu, and Charles HF Peden. Character-ization of cu-ssz-13 nh3 scr catalysts: an in situ ftir study. Physical ChemistryChemical Physics, 15(7):23682380, 2013.
[381] Geraldine Lamble, Arild Moen, and David G Nicholson. Structure of the di-amminecopper (i) ion in solution. an x-ray absorption spectroscopic study. Jour-nal of the Chemical Society, Faraday Transactions, 90(15):22112213, 1994.
[382] Di Wang, Li Zhang, Krishna Kamasamudram, and William S Epling. In situ-drifts study of selective catalytic reduction of no x by nh3 over cu-exchangedsapo-34. Acs Catalysis, 3(5):871881, 2013.
[383] Hanna Sjovall, Erik Fridell, Richard J Blint, and Louise Olsson. Identicationof adsorbed species on cu-zsm-5 under nh3 scr conditions. Topics in Catalysis,42(1-4):113117, 2007.
[384] Ines Lezcano-Gonzalez, Upakul Deka, Bjornar Arstad, A Van Yperen-De Deyne,Karen Hemelsoet, Michel Waroquier, Veronique Van Speybroeck, Bert M Weck-huysen, and Andrew M Beale. Determining the storage, availability and reac-tivity of nh 3 within cu-chabazite-based ammonia selective catalytic reductionsystems. Physical Chemistry Chemical Physics, 16(4):16391650, 2014.
[385] B Gomez-Lor, M Iglesias, C Cascales, E Gutierrez-Puebla, and MA Monge. Adiamine copper (i) complex stabilized in situ within the ferrierite framework.catalytic properties. Chemistry of materials, 13(4):13641368, 2001.
[386] Marta Moreno-Gonzalez, Beatriz Hueso, Mercedes Boronat, Teresa Blasco, andAvelino Corma. Ammonia-containing species formed in cu-chabazite as per insitu epr, solid-state nmr, and dft calculations. The journal of physical chemistryletters, 6(6):10111017, 2015.
[387] Jessica M Hoover, Bradford L Ryland, and Shannon S Stahl. Mechanism ofcopper (i)/tempo-catalyzed aerobic alcohol oxidation. Journal of the AmericanChemical Society, 135(6):23572367, 2013.
[388] Peng Chen and Edward I Solomon. O2 activation by binuclear cu sites: noncou-pled versus exchange coupled reaction mechanisms. Proceedings of the NationalAcademy of Sciences, 101(36):1310513110, 2004.
[389] Edward I Solomon, David E Heppner, Esther M Johnston, Jake W Ginsbach,Jordi Cirera, Munzarin Qayyum, Matthew T Kieber-Emmons, Christian HKjaergaard, Ryan G Hadt, and Li Tian. Copper active sites in biology. Chemicalreviews, 114(7):36593853, 2014.
482
[390] J Hutter, P Ballone, M Bernasconi, P Focher, E Fois, St Goedecker, M Par-rinello, and M Tuckerman. Cpmd version 3.0. MPI für Festkörperforschung andIBM Zurich Research Laboratory, 1999, 1995.
[391] John P Perdew and Yue Wang. Accurate and simple analytic representation ofthe electron-gas correlation energy. Physical Review B, 45(23):13244, 1992.
[392] David Vanderbilt. Soft self-consistent pseudopotentials in a generalized eigen-value formalism. Physical Review B, 41(11):7892, 1990.
[393] Kari Laasonen, Roberto Car, Changyol Lee, and David Vanderbilt. Implemen-tation of ultrasoft pseudopotentials in ab initio molecular dynamics. PhysicalReview B, 43(8):6796, 1991.
[394] Kari Laasonen, Alfredo Pasquarello, Roberto Car, Changyol Lee, and DavidVanderbilt. Car-parrinello molecular dynamics with vanderbilt ultrasoft pseu-dopotentials. Physical Review B, 47(16):10142, 1993.
[395] Georg Kresse and Jürgen Furthmüller. Ecient iterative schemes for ab ini-tio total-energy calculations using a plane-wave basis set. Physical review B,54(16):11169, 1996.
[396] Peter E Blöchl. Projector augmented-wave method. Physical review B,50(24):17953, 1994.
[397] Georg Kresse and D Joubert. From ultrasoft pseudopotentials to the projectoraugmented-wave method. Physical Review B, 59(3):1758, 1999.
[398] Jochen Heyd, Gustavo E Scuseria, and Matthias Ernzerhof. Hybrid function-als based on a screened coulomb potential. The Journal of chemical physics,118(18):82078215, 2003.
[399] Jochen Heyd and Gustavo E Scuseria. Ecient hybrid density functional calcu-lations in solids: Assessment of the heydscuseriaernzerhof screened coulombhybrid functional. The Journal of chemical physics, 121(3):11871192, 2004.
[400] Jochen Heyd, Gustavo E Scuseria, and Matthias Ernzerhof. Hybrid functionalsbased on a screened coulomb potential. J. Chem. Phys., 124:219906, 2006.
[401] Aliaksandr V Krukau, Oleg A Vydrov, Artur F Izmaylov, and Gustavo EScuseria. Inuence of the exchange screening parameter on the performance ofscreened hybrid functionals. The Journal of chemical physics, 125(22):224106,2006.
[402] Alexandre Tkatchenko and Matthias Scheer. Accurate molecular van derwaals interactions from ground-state electron density and free-atom referencedata. Physical review letters, 102(7):073005, 2009.
[403] Richard FWBader. Atoms in molecules: a quantum theory, vol 22, internationalseries of monographs on chemistry, 1990.
[404] W Tang, E Sanville, and G Henkelman. A grid-based bader analysis algorithmwithout lattice bias. Journal of Physics: Condensed Matter, 21(8):084204, 2009.
483
[405] Edward Sanville, Steven D Kenny, Roger Smith, and Graeme Henkelman. Im-proved grid-based algorithm for bader charge allocation. Journal of computa-tional chemistry, 28(5):899908, 2007.
[406] Graeme Henkelman, Andri Arnaldsson, and Hannes Jónsson. A fast and robustalgorithm for bader decomposition of charge density. Computational MaterialsScience, 36(3):354360, 2006.
[407] Min Yu and Dallas R Trinkle. Accurate and ecient algorithm for bader chargeintegration. The Journal of chemical physics, 134(6):064111, 2011.
[408] JM Bray and WF Schneider. First-principles thermodynamic models in hetero-geneous catalysis. Computational Catalysis, 14:59, 2013.
[409] Michael W Penninger, Chang Hwan Kim, Levi T Thompson, and William FSchneider. Dft analysis of no oxidation intermediates on undoped and dopedlacoo3 perovskite. The Journal of Physical Chemistry C, 119(35):2048820494,2015.
[410] GiovanniMaria Piccini and Joachim Sauer. Eect of anharmonicity on adsorp-tion thermodynamics. Journal of chemical theory and computation, 10(6):24792487, 2014.
[411] Charles T Campbell and Jason RV Sellers. The entropies of adsorbed molecules.Journal of the American Chemical Society, 134(43):1810918115, 2012.
[412] Mae K Rubin. Synthesis of zeolite beta, 1992.
[413] John Meurig Thomas. The societal signicance of catalysis and the growingpractical importance of single-site heterogeneous catalysts, 2012.
[414] Kunlun Ding, Ahmet Gulec, Alexis M Johnson, Neil M Schweitzer, Galen DStucky, Laurence D Marks, and Peter C Stair. Identication of active sitesin co oxidation and water-gas shift over supported pt catalysts. Science,350(6257):189192, 2015.
[415] John Jones, Haifeng Xiong, Andrew T DeLaRiva, Eric J Peterson, Hien Pham,Sivakumar R Challa, Gongshin Qi, Se Oh, Michelle H Wiebenga, XavierIsidro Pereira Hernández, et al. Thermally stable single-atom platinum-on-ceriacatalysts via atom trapping. Science, 353(6295):150154, 2016.
[416] Georgios Kyriakou, Matthew B Boucher, April D Jewell, Emily A Lewis,Timothy J Lawton, Ashleigh E Baber, Heather L Tierney, Maria Flytzani-Stephanopoulos, and E Charles H Sykes. Isolated metal atom geometries as astrategy for selective heterogeneous hydrogenations. Science, 335(6073):12091212, 2012.
[417] Haisheng Wei, Xiaoyan Liu, Aiqin Wang, Leilei Zhang, Botao Qiao, XiaofengYang, Yanqiang Huang, Shu Miao, Jingyue Liu, and Tao Zhang. Feo x-supported platinum single-atom and pseudo-single-atom catalysts for chemos-elective hydrogenation of functionalized nitroarenes. Nature communications,5:ncomms6634, 2014.

484
[418] Ming Yang, Sha Li, Yuan Wang, Jerey A Herron, Ye Xu, Lawrence FAllard, Sungsik Lee, Jun Huang, Manos Mavrikakis, and Maria Flytzani-Stephanopoulos. Catalytically active au-o (oh) x-species stabilized by alkaliions on zeolites and mesoporous oxides. Science, 346(6216):14981501, 2014.
[419] Ming Yang, Jilei Liu, Sungsik Lee, Branko Zugic, Jun Huang, Lawrence FAllard, and Maria Flytzani-Stephanopoulos. A common single-site pt (ii)o (oh) xspecies stabilized by sodium on active and inert supports cat-alyzes the water-gas shift reaction. Journal of the American Chemical Society,137(10):34703473, 2015.
[420] John Meurig Thomas, Robert Raja, and Dewi W Lewis. Single-site heteroge-neous catalysts. Angewandte Chemie International Edition, 44(40):64566482,2005.
[421] Kirill A Lomachenko, Elisa Borfecchia, Chiara Negri, Gloria Berlier, Carlo Lam-berti, Pablo Beato, Hanne Falsig, and Silvia Bordiga. The cu-cha deno x cata-lyst in action: Temperature-dependent nh3-assisted selective catalytic reductionmonitored by operando xas and xes. Journal of the American Chemical Society,138(37):1202512028, 2016.
[422] Pieter Vanelderen, Benjamin ER Snyder, Ming-Li Tsai, Ryan G Hadt, JulieVancauwenbergh, Olivier Coussens, Robert A Schoonheydt, Bert F Sels, andEdward I Solomon. Spectroscopic denition of the copper active sites in mor-denite: Selective methane oxidation. Journal of the American Chemical Society,137(19):63836392, 2015.
[423] Markus Metz and Edward I Solomon. Dioxygen binding to deoxyhemocyanin:electronic structure and mechanism of the spin-forbidden two-electron reductionof o2. Journal of the American Chemical Society, 123(21):49384950, 2001.
[424] Liviu M Mirica, Xavier Ottenwaelder, and T Daniel P Stack. Structure andspectroscopy of copper- dioxygen complexes. Chemical Reviews, 104(2):10131046, 2004.
[425] Liviu M Mirica, Michael Vance, Deanne Jackson Rudd, Britt Hedman, Keith OHodgson, Edward I Solomon, and T Daniel P Stack. Tyrosinase reactiv-ity in a model complex: an alternative hydroxylation mechanism. Science,308(5730):18901892, 2005.
[426] Scott D McCann and Shannon S Stahl. Copper-catalyzed aerobic oxidationsof organic molecules: pathways for two-electron oxidation with a four-electronoxidant and a one-electron redox-active catalyst. Accounts of chemical research,48(6):17561766, 2015.
[427] Lin Chen, Jonas Jansson, Magnus Skoglundh, and Henrik Gronbeck. Mecha-nism for solid-state ion exchange of cu+ into zeolites. The Journal of PhysicalChemistry C, 120(51):2918229189, 2016.
[428] Hanne Falsig, Peter NR Vennestrøm, Poul Georg Moses, and Ton VW Janssens.Activation of oxygen and no in nh3-scr over cu-cha catalysts evaluated by den-sity functional theory. Topics in Catalysis, 59(10-12):861865, 2016.
485
[429] Feng Gao, Donghai Mei, Yilin Wang, Janos Szanyi, and Charles HF Peden.Selective catalytic reduction over cu/ssz-13: Linking homo-and heterogeneouscatalysis. Journal of the American Chemical Society, 139(13):49354942, 2017.
[430] Lung Shan Kau, Darlene J Spira-Solomon, James E Penner-Hahn, Keith OHodgson, and Edward I Solomon. X-ray absorption edge determination of theoxidation state and coordination number of copper. application to the type 3site in rhus vernicifera laccase and its reaction with oxygen. Journal of theAmerican Chemical Society, 109(21):64336442, 1987.
[431] Silvia Bordiga, Elena Groppo, Giovanni Agostini, Jeroen A van Bokhoven, andCarlo Lamberti. Reactivity of surface species in heterogeneous catalysts probedby in situ x-ray absorption techniques. Chemical reviews, 113(3):17361850,2013.
[432] Jeroen A Van Bokhoven and Carlo Lamberti. X-ray absorption and X-rayemission spectroscopy: theory and applications, volume 1. John Wiley & Sons,2016.
[433] C Lamberti, S Bordiga, F Bonino, C Prestipino, G Berlier, L Capello,F D'Acapito, FX Llabrés i Xamena, and A Zecchina. Determination of theoxidation and coordination state of copper on dierent cu-based catalysts byxanes spectroscopy in situ or in operando conditions. Physical Chemistry Chem-ical Physics, 5(20):45024509, 2003.
[434] GR Shulman, Y Yafet, P Eisenberger, and WE Blumberg. Observations andinterpretation of x-ray absorption edges in iron compounds and proteins. Pro-ceedings of the National Academy of Sciences, 73(5):13841388, 1976.
[435] James E Hahn, Robert A Scott, Keith O Hodgson, Sebastian Doniach, Sylvia RDesjardins, and Edward I Solomon. Observation of an electric quadrupole tran-sition in the x-ray absorption spectrum of a cu (ii) complex. Chemical PhysicsLetters, 88(6):595598, 1982.
[436] Peter NR Vennestrøm, Ton VW Janssens, Arkady Kustov, Marie Grill, AnnaPuig-Molina, Lars F Lundegaard, Ramchandra R Tiruvalam, Patricia Concep-ción, and Avelino Corma. Inuence of lattice stability on hydrothermal deacti-vation of cu-zsm-5 and cu-im-5 zeolites for selective catalytic reduction of noxby nh3. Journal of Catalysis, 309:477490, 2014.
[437] Di-Jia Liu and Heinz J Robota. On the mechanism of no selective catalyticreduction by hydrocarbons over cu-zsm-5 via x-ray absorption spectroscopicstudy. The Journal of Physical Chemistry B, 103(14):27552765, 1999.
[438] Di-Jia Liu and Heinz J Robota. In situ xanes characterization of the cu oxidationstate in cu-zsm-5 during no decomposition catalysis. Catalysis letters, 21(3-4):291301, 1993.
[439] Yasushige Kuroda, Yuzo Yoshikawa, Shin-ichi Konno, Hideaki Hamano, Hi-ronobu Maeda, Ryotaro Kumashiro, and Mahiko Nagao. Specic feature ofcopper ion-exchanged mordenite for dinitrogen adsorption at room tempera-ture. The Journal of Physical Chemistry, 99(26):1062110628, 1995.
486
[440] C Lamberti, G Spoto, D Scarano, C Pazé, M Salvalaggio, S Bordiga, A Zecchina,G Turnes Palomino, and F D'Acapito. Cui-y and cuii-y zeolites: a xanes, exafsand visible-nir study. Chemical physics letters, 269(5-6):500508, 1997.
[441] Karina Mathisen, Michael Stockenhuber, and David G Nicholson. In situxas and ir studies on cu: Sapo-5 and cu: Sapo-11: the contributory role ofmonomeric linear copper (i) species in the selective catalytic reduction of no xby propene. Physical Chemistry Chemical Physics, 11(26):54765488, 2009.
[442] Arild Moen, David G Nicholson, and Magnus Rønning. Studies on the pre-edge region of the x-ray absorption spectra of copper (i) oxide and the di-amminecopper (i) ion. Journal of the Chemical Society, Faraday Transactions,91(18):31893194, 1995.
[443] Richard Car and Mark Parrinello. Unied approach for molecular dynamicsand density-functional theory. Physical review letters, 55(22):2471, 1985.
[444] John P Perdew, Kieron Burke, and Matthias Ernzerhof. Generalized gradientapproximation made simple. Physical review letters, 77(18):3865, 1996.
[445] Stefan Grimme. Semiempirical gga-type density functional constructed with along-range dispersion correction. J. Comp. Chem., 27(15):17871799, 2006.
[446] Graeme Henkelman, Blas P Uberuaga, and Hannes Jónsson. A climbing imagenudged elastic band method for nding saddle points and minimum energypaths. The Journal of chemical physics, 113(22):99019904, 2000.
[447] M. Parrinello M. Iannuzzi, A. Laio. Ecient exploration of reactive potentialenergy surfaces using car-parrinello molecular dynamics. Physical review letters,90:238302, 2003.
[448] M. Parrinello A. Barducci, M. Bonomi. Metadynamics. Wiley Interdiscip. Rev.Comput. Mol. Sci., 1(5):826843, 2011.
[449] J. Sauer M. Rybicki. Acidity of two-dimensional zeolites. Phys. Chem. Chem.Phys., 17:2787327882, 2015.
[450] Jonatan D. Albarracin-Caballero, Ishant Khurana, John R. Di Iorio, Arthur J.Shih, Joel E. Schmidt, Michiel Dusselier, Mark E. Davis, Aleksey Yezerets,Jerey T. Miller, Fabio H. Ribeiro, and Rajamani Gounder. Structural andkinetic changes to small-pore cu-zeolites after hydrothermal aging treatmentsand selective catalytic reduction of nox with ammonia. Reaction Chemistry andEngineering, 2:168179, 2017.
[451] Andrew J Jones and Enrique Iglesia. Kinetic, spectroscopic, and theoretical as-sessment of associative and dissociative methanol dehydration routes in zeolites.Angewandte Chemie International Edition, 53(45):1217712181, 2014.
[452] Min Bum Park, Sang Hyun Ahn, Christopher P. Nicholas, Gregory J. Lewis,and Suk Bong Hong. Charge density mismatch synthesis of zeolite beta inthe presence of tetraethylammonium, tetramethylammonium, and sodium ions:Inuence of tetraethylammonium decomposition. Microporous and MesoporousMaterials, 240:159168, 2017.
487
[453] Colin S. Cundy and Paul A. Cox. The hydrothermal synthesis of zeolites: Pre-cursors, intermediates and reaction mechanism. Microporous and MesoporousMaterials, 82(12):178, 2005.
[454] Arian Ghorbanpour, Jerey D Rimer, and Lars C Grabow. Computational as-sessment of the dominant factors governing the mechanism of methanol dehy-dration over h-zsm-5 with heterogeneous aluminum distribution. ACS Catalysis,6(4):22872298, 2016.
[455] Thomas Bligaard, R. Morris Bullock, Charles T. Campbell, Jingguang G. Chen,Bruce C. Gates, Raymond J. Gorte, Christopher W. Jones, William D. Jones,John R. Kitchin, and Susannah L. Scott. Toward benchmarking in catalysis sci-ence: Best practices, challenges, and opportunities. ACS Catalysis, 6(4):25902602, 2016.
[456] Gabriele Mirth, Johannes A. Lercher, Michael W. Anderson, and Jacek Kli-nowski. Adsorption complexes of methanol on zeolite zsm-5. Journal of theChemical Society, Faraday Transactions, 86(17):30393044, 1990.
[457] Z. Li, M. T. Navarro, J. Martinez-Triguero, J. Yu, and A. Corma. Synthesis ofnano-ssz-13 and its application in the reaction of methanol to olens. CatalysisScience and Technology, 6(15):58565863, 2016.
[458] James F Haw, Weiguo Song, David M Marcus, and John B Nicholas. The mech-anism of methanol to hydrocarbon catalysis. Accounts of chemical research,36(5):317326, 2003.
[459] Xiaochun Zhu, Jan P Hofmann, Brahim Mezari, Nikolay Kosinov, Leilei Wu,Qingyun Qian, Bert M Weckhuysen, Shunsuke Asahina, Javier Ruiz-Martinez,and Emiel JM Hensen. Trimodal porous hierarchical ssz-13 zeolite with im-proved catalytic performance in the methanol-to-olens reaction. ACS catalysis,6(4):21632177, 2016.
[460] Andrew Hwang, Manjesh Kumar, Jerey D Rimer, and Aditya Bhan. Implica-tions of methanol disproportionation on catalyst lifetime for methanol-to-olensconversion by hssz-13. Journal of Catalysis, 346:154160, 2017.
[461] Sebastian Muller, Yue Liu, Felix M Kirchberger, Markus Tonigold, MaricruzSanchez-Sanchez, and Johannes A Lercher. Hydrogen transfer pathways duringzeolite catalyzed methanol conversion to hydrocarbons. Journal of the AmericanChemical Society, 138(49):1599416003, 2016.
[462] Yue Liu, Sebastian Muller, Daniel Berger, Jelena Jelic, Karsten Reuter, MarkusTonigold, Maricruz Sanchez-Sanchez, and Johannes A Lercher. Formationmechanism of the rst carboncarbon bond and the rst olen in the methanolconversion into hydrocarbons. Angewandte Chemie International Edition,128(19):58175820, 2016.
[463] Weiguo Song, David M Marcus, Hui Fu, Justin O Ehresmann, and James FHaw. An oft-studied reaction that may never have been: Direct catalytic con-version of methanol or dimethyl ether to hydrocarbons on the solid acids hzsm-5 or hsapo-34. Journal of the American Chemical Society, 124(15):38443845,2002.
488
[464] Yan Zhu, Zile Hua, Jian Zhou, Lijun Wang, Jinjin Zhao, Yun Gong, Wei Wu,Meiling Ruan, and Jianlin Shi. Hierarchical mesoporous zeolites: Direct self-assembly synthesis in a conventional surfactant solution by kinetic control overthe zeolite seed formation. Chemistry- A European Journal, 17(51):1461814627, 2011.
[465] Viktor J. Cybulskis, James W. Harris, Yury Zvinevich, Fabio H. Ribeiro,and Rajamani Gounder. A transmission infrared cell design for temperature-controlled adsorption and reactivity studies on heterogeneous catalysts. Reviewof Scientic Instruments, 87(10):103101, 2016.
[466] James W. Harris, Michael J. Cordon, John R. Di Iorio, Juan Carlos Vega-Vila,Fabio H. Ribeiro, and Rajamani Gounder. Titration and quantication of openand closed lewis acid sites in sn-beta zeolites that catalyze glucose isomerization.Journal of Catalysis, 335:141154, 2016.
[467] Mark A Deimund, Luke Harrison, Jonathan D Lunn, Yu Liu, Andrzej Malek,Ramzy Shayib, and Mark E Davis. Eect of heteroatom concentration in ssz-13on the methanol-to-olens reaction. ACS Catalysis, 6(2):542550, 2015.
[468] Pedro Salvador and W. Kladnig. Surface reactivity of zeolites type h-y andna-y with methanol. Journal of the Chemical Society, Faraday Transactions 1:Physical Chemistry in Condensed Phases, 73(0):11531168, 1977.
[469] Hiroshi Yamazaki, Hisashi Shima, Hiroyuki Imai, Toshiyuki Yokoi, Takashi Tat-sumi, and Junko N. Kondo. Evidence for a carbene-like intermediate duringthe reaction of methoxy species with light alkenes on h-zsm-5. AngewandteChemie International Edition, 50(8):18531856, 2011.
[470] Wei Wang, Andreas Buchholz, Michael Seiler, and Michael Hunger. Evidencefor an initiation of the methanol-to-olen process by reactive surface methoxygroups on acidic zeolite catalysts. Journal of the American Chemical Society,125(49):1526015267, 2003.
[471] Alexander J. O'Malley, Stewart F. Parker, Arunabhiram Chutia, Matthew R.Farrow, Ian P. Silverwood, Victoria Garcia-Sakai, and C. Richard A. Catlow.Room temperature methoxylation in zeolites: insight into a key step of themethanol-to-hydrocarbons process. Chemical Communications, 52(14):28972900, 2016.
[472] Rajamani Krishna and Jasper M van Baten. Hydrogen bonding eects in ad-sorption of water- alcohol mixtures in zeolites and the consequences for thecharacteristics of the maxwell- stefan diusivities. Langmuir, 26(13):1085410867, 2010.
[473] C Herrmann, J Haas, and F Fetting. Eect of the crystal size on the activityof zsm-5 catalysts in various reactions. Applied Catalysis, 35(2):299310, 1987.
[474] PB Weisz and CD Prater. Interpretation of measurements in experimentalcatalysis. Advances in Catalysis, 6:143196, 1954.
[475] Joseph F. DeWilde, Hsu Chiang, Daniel A. Hickman, Christopher R. Ho, andAditya Bhan. Kinetics and mechanism of ethanol dehydration on γ-al2o3: Thecritical role of dimer inhibition. ACS Catalysis, 3(4):798807, 2013.
489
[476] Jonatan D. Albarracin-Caballero, Ishant Khurana, John R. Di Iorio, Arthur J.Shih, Joel E. Schmidt, Michiel Dusselier, Mark E. Davis, Aleksey Yezerets,Jerey T. Miller, Fabio H. Ribeiro, and Rajamani Gounder. Structural andkinetic changes to small-pore cu-zeolites after hydrothermal aging treatmentsand selective catalytic reduction of nox with ammonia. Reaction Chemistry &Engineering, 2017.
[477] Steven Nystrom, Alexander Homan, and David Hibbitts. Tuning brønsted acidstrength by altering site proximity in cha framework zeolites. ACS Catalysis,8(9):78427860, 2018.
[478] Prashant Deshlahra, Robert T Carr, and Enrique Iglesia. Ionic and covalentstabilization of intermediates and transition states in catalysis by solid acids.Journal of the American Chemical Society, 136(43):1522915247, 2014.
[479] William Knaeble, Robert T Carr, and Enrique Iglesia. Mechanistic interpreta-tion of the eects of acid strength on alkane isomerization turnover rates andselectivity. Journal of Catalysis, 319:283296, 2014.
[480] Zhenchao Zhao, Youdong Xing, Shihan Li, Xiangju Meng, Feng-shou Xiao,Robert McGuire, Andrei-Nicolae Parvulescu, Ulrich Muller, and WeipingZhang. Mapping al distributions in ssz-13 zeolites from 23na solid-state nmrspectroscopy and dft calculations. The Journal of Physical Chemistry C,122(18):99739979, 2018.
[481] Ya Guo, Tianjun Sun, Yiming Gu, Xiaowei Liu, Quanli Ke, Xiaoli Wei, andShudong Wang. Rational synthesis of chabazite (cha) zeolites with controlledsi/al ratio and their co2/ch4/n2 adsorptive separation performances. Chemistry An Asian Journal, 2018.
[482] Angeles Pulido, Petr Nachtigall, Arnost Zukal, Irene Dominguez, and Jiri Cejka.Adsorption of co2 on sodium-exchanged ferrierites: The bridged co2 complexesformed between two extraframework cations. The Journal of Physical ChemistryC, 113(7):29282935, 2009.
[483] Chi-Ta Yang, Amber Janda, Alexis T. Bell, and Li-Chiang Lin. Atomistic in-vestigations of the eects of si/al ratio and al distribution on the adsorptionselectivity of n-alkanes in brønsted-acid zeolites. The Journal of Physical Chem-istry C, 122(17):93979410, 2018.
[484] Eva M. Gallego, Chengeng Li, Cecilia Paris, Nuria Martin, Joaquín Martinez-Triguero, Mercedes Boronat, Manuel Moliner, and Avelino Corma. Makingnanosized cha zeolites with controlled al distribution for optimizing methanol-to-olen performance. Chemistry A European Journal, 24(55):1463114635,2018.
[485] Unni Olsbye, Stian Svelle, Morten Bjorgen, Pablo Beato, Ton V. W. Janssens,Finn Joensen, Silvia Bordiga, and Karl Petter Lillerud. Conversion of methanolto hydrocarbons: How zeolite cavity and pore size controls product selectivity.Angewandte Chemie International Edition, 51(24):58105831, 2012.
[486] Ivar M Dahl and Stein Kolboe. On the reaction mechanism for hydrocarbonformation from methanol over sapo-34: I. isotopic labeling studies of the co-reaction of ethene and methanol. Journal of Catalysis, 149(2):458464, 1994.
490
[487] Ivar M Dahl and Stein Kolboe. On the reaction mechanism for hydrocarbonformation from methanol over sapo-34: 2. isotopic labeling studies of the co-reaction of propene and methanol. Journal of Catalysis, 161(1):304309, 1996.
[488] De Chen, Kjell Moljord, Terje Fuglerud, and Anders Holmen. The eect ofcrystal size of sapo-34 on the selectivity and deactivation of the mto reaction.Microporous and Mesoporous Materials, 29(1-2):191203, 1999.
[489] James Song, Yilin Wang, Eric D. Walter, Nancy M. Washton, Donghai Mei,Libor Kovarik, Mark H. Engelhard, Sebastian Prodinger, Yong Wang, CharlesH. F. Peden, and Feng Gao. Toward rational design of cu/ssz-13 selectivecatalytic reduction catalysts: Implications from atomic-level understanding ofhydrothermal stability. ACS Catalysis, 7(12):82148227, 2017.
[490] A. Martini, E. Borfecchia, K. A. Lomachenko, I. A. Pankin, C. Negri, G. Berlier,P. Beato, H. Falsig, S. Bordiga, and C. Lamberti. Composition-driven cu-speciation and reducibility in cu-cha zeolite catalysts: a multivariate xas/ftirapproach to complexity. Chemical Science, 8(10):68366851, 2017.
[491] Karthik Narsimhan, Kenta Iyoki, Kimberly Dinh, and Yuriy Roman-Leshkov.Catalytic oxidation of methane into methanol over copper-exchanged zeoliteswith oxygen at low temperature. ACS Central Science, 2(6):424429, 2016.
[492] Elisa Borfecchia, Dimitrios K. Pappas, Michael Dyballa, Kirill A. Lomachenko,Chiara Negri, Matteo Signorile, and Gloria Berlier. Evolution of active sites dur-ing selective oxidation of methane to methanol over cu-cha and cu-mor zeolitesas monitored by operando xas. Catalysis Today, 2018.
[493] Max L. Bols, Simon D. Hallaert, Benjamin E. R. Snyder, Julien Devos, Di-eter Plessers, Hannah M. Rhoda, Michiel Dusselier, Robert A. Schoonheydt,Kristine Pierloot, Edward I. Solomon, and Bert F. Sels. Spectroscopic iden-tication of the α-fe/α-o active site in fe-cha zeolite for the low-temperatureactivation of the methane ch bond. Journal of the American Chemical Soci-ety, 140(38):1202112032, 2018.
[494] Sichi Li, Yujia Wang, Tong Wu, and William F. Schneider. First-principlesanalysis of site- and condition-dependent fe speciation in ssz-13 and implicationsfor catalyst optimization. ACS Catalysis, pages 1011910130, 2018.
[495] R A Grieger and CA Eckert. Solvent eects on the activation volume of adiels-alder reaction. Transactions of the Faraday Society, 66:25792584, 1970.
[496] Merdith G Evans and Michael Polanyi. Some applications of the transitionstate method to the calculation of reaction velocities, especially in solution.Transactions of the Faraday Society, 31:875894, 1935.
[497] R Van Eldik, T Asano, and WJ Le Noble. Activation and reaction volumes insolution. 2. Chemical Reviews, 89(3):549688, 1989.
[498] Rostam J Madon and Enrique Iglesia. Catalytic reaction rates in thermodynam-ically non-ideal systems. Journal of Molecular Catalysis A: Chemical, 163(1-2):189204, 2000.

491
[499] Jianwei Liu, David Hibbitts, and Enrique Iglesia. Dense co adlayers as enablersof co hydrogenation turnovers on ru surfaces. Journal of the American ChemicalSociety, 139(34):1178911802, 2017.
[500] Terrell L. Hill. Theory of physical adsorption. Advances in Catalysis, 4:211258,1952.
[501] AL Myers and PA Monson. Adsorption in porous materials at high pressure:theory and experiment. Langmuir, 18(26):1026110273, 2002.
[502] PA Jacobs, Edith M Flanigen, JC Jansen, and Herman van Bekkum. Introduc-tion to zeolite science and practice, volume 137. Elsevier, 2001.
[503] Josiah Willard Gibbs. On the equilibrium of heterogeneous substances. Trans-actions of the Connecticut Academy of Arts and Sciences, 3:108524, 1879.
[504] Richard Maling Barrer and JA Davies. Sorption in decationated zeolites. i.gases in hydrogen-chabazite. Proc. R. Soc. Lond. A, 320(1542):289308, 1970.
[505] CA Eckert and M Boudart. On the use of fugacities in gas kinetics. Chem. Eng.Sci., 18(2):144147, 1963.
[506] JM Prausnitz. Fugacities in high-pressure equilibria and in rate processes.AIChE Journal, 5(1):39, 1959.
[507] Lovat V. C. Rees and Dongmin Shen. Adsorption of gases in zeolite molecularsieves. Studies in Surface Science and Catalysis, 137:579631, 2001.
[508] Ding-Yu Peng and Donald B Robinson. A new two-constant equation of state.Industrial & Engineering Chemistry Fundamentals, 15(1):5964, 1976.
[509] Schohn L Shannon and James G Goodwin Jr. Characterization of catalyticsurfaces by isotopic-transient kinetics during steady-state reaction. Chemicalreviews, 95(3):677695, 1995.
[510] Cristian Ledesma, Jia Yang, De Chen, and Anders Holmen. Recent approachesin mechanistic and kinetic studies of catalytic reactions using ssitka technique.ACS Catalysis, 4(12):45274547, 2014.
[511] Takayuki Inoue, Masaya Itakura, Hery Jon, Yasunori Oumi, Atsushi Takahashi,Tadahiro Fujitani, and Tsuneji Sano. Synthesis of lev zeolite by interzeoliteconversion method and its catalytic performance in ethanol to olens reaction.Microporous and Mesoporous Materials, 122(1):149154, 2009.
[512] A.B. Barnes, G. De Paëpe, P.C.A. van der Wel, K.-N. Hu, C.-G. Joo, V.S. Bajaj,M.L. Mak-Jurkauskas, J.R. Sirigiri, J. Herzfeld, R.J. Temkin, and R.G. Grif-n. High-Field Dynamic Nuclear Polarization for Solid and Solution BiologicalNMR. Applied magnetic resonance, 34(3-4):237263, 2008.
[513] Aaron J. Rossini, Alexandre Zagdoun, Moreno Lelli, Anne Lesage, ChristopheCopé ret, and Lyndon Emsley. Dynamic Nuclear Polarization Surface EnhancedNMR Spectroscopy. Accounts of Chemical Research, 46(9):19421951, 2013.
[514] T. V. Can, Q. Z. Ni, and R. G. Grin. Mechanisms of dynamic nuclear polar-ization in insulating solids. Journal of Magnetic Resonance, 253:2335, 2015.
492
[515] Takeshi Kobayashi, Olivier Lafon, Aany S. Lilly Thankamony, Igor I. Slowing,Kapil Kandel, Diego Carnevale, Veronika Vitzthum, Herve Vezin, Jean-PaulAmoureux, Georey Bodenhausen, and Marek Pruski. Analysis of sensitivityenhancement by dynamic nuclear polarization in solid-state NMR: a case studyof functionalized mesoporous materials. Physical Chemistry Chemical Physics,15(15):55535562, 2013.
[516] Olivier Lafon, Melanie Rosay, Fabien Aussenac, Xingyu Lu, Julien Trebosc,Odile Cristini, Christophe Kinowski, Nadia Touati, Herve Vezin, and Jean-PaulAmoureux. Beyond the Silica Surface by Direct Silicon-29 Dynamic Nuclear Po-larization. Angewandte Chemie International Edition, 50(36):83678370, 2011.
[517] C. A. Fyfe, K. C. Wong-Moon, Y. Huang, and H. Grondey. Inept experimentsin solid-state nmr. Journal of the American Chemical Society, 117(41):1039710398, 1995.
[518] J. P. Amoureux, J. Trebosc, J. Wiench, and M. Pruski. Hmqc and refocused-inept experiments involving half-integer quadrupolar nuclei in solids. Journalof Magnetic Resonance, 184(1):114, 2007.
[519] Lucio Frydman and John S. Harwood. Isotropic spectra of half-integerquadrupolar spins from bidimensional magic-angle spinning nmr. Journal ofthe American Chemical Society, 117(19):53675368, 1995.
[520] Hubert Koller, Soumya Senapati, Jinjun Ren, Tobias Uesbeck, Vassilios Siozios,Michael Hunger, and Raul F. Lobo. Post-synthesis conversion of borosilicate ze-olite beta to an aluminosilicate with isolated acid sites: A quantitative distanceanalysis by solid-state nmr. The Journal of Physical Chemistry C, 120(18):98119820, 2016.
[521] Marc Baldus, David Rovnyak, and Robert G. Grin. Radio-frequency-mediateddipolar recoupling among half-integer quadrupolar spins. The Journal of Chem-ical Physics, 112(13):59025909, 2000.
[522] Q. Wang, B. Hu, O. Lafon, J. Trebosc, F. Deng, and J. P. Amoureux. Double-quantum homonuclear nmr correlation spectroscopy of quadrupolar nuclei sub-jected to magic-angle spinning and high magnetic eld. Journal of MagneticResonance, 200(2):251260, 2009.
[523] Charlotte Martineau-Corcos, Jiri Dedecek, and Francis Taulelle. 27al-27aldouble-quantum single-quantum mas nmr: Applications to the structural char-acterization of microporous materials. Solid State Nuclear Magnetic Resonance,84:6572, 2017.
[524] S. I. Zones, R. A. Van Nordstrand, D. S. Santilli, D. M. Wilson, L. Yuen,and L. D. Scampavia. Sequence of high silica zeolites found during synthesisexperiments in the presence of a quaternary adamantammonium cation. Studiesin Surface Science and Catalysis, 49:299309, 1989.
[525] N. E. Jacobsen. Two-Dimensional NMR Spectroscopy: HETCOR, COSY, andTOCSY. NMR Spectroscopy Explained: Simplied Theory, Applications andExamples for Organic Chemistry and Structural Biology. John Wiley & Sons,Inc., 2007.
[526] Terry Gullion. Rotational-echo, double-resonance NMR. Springer, 2008.
493
[527] Terry Gullion. Measurement of dipolar interactions between spin-12 andquadrupolar nuclei by rotational-echo, adiabatic-passage, double-resonancenmr. Chemical Physics Letters, 246(3):325330, 1995.
[528] B Notari. Titanium silicalites. Catalysis Today, 18(2):163172, 1993.
[529] Avelino Corma, Laszlo T Nemeth, Michael Renz, and Susana Valencia. Sn-zeolite beta as a heterogeneous chemoselective catalyst for baeyervilliger oxi-dations. Nature, 412(6845):423, 2001.
[530] JC Van der Waal, PJ Kunkeler, K Tan, and H Van Bekkum. Zeolite titaniumbeta: a selective catalyst for the gas-phase meerweinponndorfverley, and op-penauer reactions. Journal of Catalysis, 173(1):7483, 1998.
[531] Avelino Corma and Hermenegildo Garcia. Lewis acids: from conventional homo-geneous to green homogeneous and heterogeneous catalysis. Chemical Reviews,103(11):43074366, 2003.
[532] Jan C van der Waal, Keqin Tan, and Herman van Bekkum. Zeolite titaniumbeta: a selective and water resistant catalyst in meerwein-ponndorf-verley-oppenauer reactions. Catalysis letters, 41(1-2):6367, 1996.
[533] Rajamani Gounder. Hydrophobic microporous and mesoporous oxides as brøn-sted and lewis acid catalysts for biomass conversion in liquid water. CatalysisScience & Technology, 4(9):28772886, 2014.
[534] Manuel Moliner, Yuriy Román-Leshkov, and Mark E Davis. Tin-containingzeolites are highly active catalysts for the isomerization of glucose in water.Proceedings of the National Academy of Sciences, 107(14):61646168, 2010.
[535] Stavros Caratzoulas, Mark E Davis, Raymond J Gorte, Rajamani Gounder,Raul F Lobo, Vladimiros Nikolakis, Stanley I Sandler, Mark A Snyder, MichaelTsapatsis, and Dionisios G Vlachos. Challenges of and insights into acid-catalyzed transformations of sugars. The Journal of Physical Chemistry C,118(40):2281522833, 2014.
[536] Jennifer D Lewis, Stijn Van de Vyver, Anthony J Crisci, William R Gunther,Vladimir K Michaelis, Robert G Grin, and Yuriy Román-Leshkov. A contin-uous ow strategy for the coupled transfer hydrogenation and etherication of5-(hydroxymethyl) furfural using lewis acid zeolites. ChemSusChem, 7(8):22552265, 2014.
[537] Silvia Bordiga, Francesca Bonino, Alessandro Damin, and Carlo Lamberti. Re-activity of ti (iv) species hosted in ts-1 towards h 2 o 2h 2 o solutions investi-gated by ab initio cluster and periodic approaches combined with experimentalxanes and exafs data: a review and new highlights. Physical Chemistry Chem-ical Physics, 9(35):48544878, 2007.
[538] Susana Valencia Valencia and Avelino Corma Canos. Stannosilicate molecularsieves, 1999.
[539] Chun-Chih Chang, Hong Je Cho, Zhuopeng Wang, Xuanting Wang, and WeiFan. Fluoride-free synthesis of a sn-bea catalyst by dry gel conversion. GreenChemistry, 17(5):29432951, 2015.

494
[540] Pierre Y Dapsens, Cecilia Mondelli, Jakub Jagielski, Roland Hauert, and JavierPérez-Ramírez. Hierarchical sn-m zeolites prepared by facile top-down meth-ods for sugar isomerisation. Catalysis science & technology, 4(8):23022311,2014.
[541] Pierre Y Dapsens, Cecilia Mondelli, and Javier Pérez-Ramírez. Design of lewis-acid centres in zeolitic matrices for the conversion of renewables. ChemicalSociety Reviews, 44(20):70257043, 2015.
[542] Pei Li, Guanqi Liu, Haihong Wu, Yueming Liu, Jin-gang Jiang, and Peng Wu.Postsynthesis and selective oxidation properties of nanosized sn-beta zeolite.The Journal of Physical Chemistry C, 115(9):36633670, 2011.
[543] Jan Dijkmans, Dries Gabriels, Michiel Dusselier, Filip de Clippel, PieterVanelderen, Kristof Houthoofd, Annelies Maliet, Yiannis Pontikes, and Bert FSels. Productive sugar isomerization with highly active sn in dealuminated βzeolites. Green Chemistry, 15(10):27772785, 2013.
[544] Xiaoying Ouyang, Son-Jong Hwang, Dan Xie, Thomas Rea, Stacey I Zones, andAlexander Katz. Heteroatom-substituted delaminated zeolites as solid lewis acidcatalysts. ACS Catalysis, 5(5):31083119, 2015.
[545] William NP van der Graa, Guanna Li, Brahim Mezari, Evgeny A Pidko, andEmiel JM Hensen. Synthesis of sn-beta with exclusive and high framework sncontent. ChemCatChem, 7(7):11521160, 2015.
[546] Jan Dijkmans, Jan Demol, Kristof Houthoofd, Shuigen Huang, Yiannis Pon-tikes, and Bert Sels. Post-synthesis snβ: an exploration of synthesis parametersand catalysis. Journal of Catalysis, 330:545557, 2015.
[547] Patrick Wolf, Ceri Hammond, Sabrina Conrad, and Ive Hermans. Post-syntheticpreparation of sn-, ti-and zr-beta: a facile route to water tolerant, highly activelewis acidic zeolites. Dalton Transactions, 43(11):45144519, 2014.
[548] Bo Tang, Weili Dai, Guangjun Wu, Naijia Guan, Landong Li, and MichaelHunger. Improved postsynthesis strategy to sn-beta zeolites as lewis acid cata-lysts for the ring-opening hydration of epoxides. ACS Catalysis, 4(8):28012810,2014.
[549] Ceri Hammond, Daniele Padovan, Abbas Al-Nayili, Peter P Wells, Emma KGibson, and Nikolaos Dimitratos. Identication of active and spectator snsites in sn-β following solid-state stannation, and consequences for lewis acidcatalysis. ChemCatChem, 7(20):33223331, 2015.
[550] Mercedes Boronat, Patricia Concepción, Avelino Corma, Michael Renz, andSusana Valencia. Determination of the catalytically active oxidation lewis acidsites in sn-beta zeolites, and their optimisation by the combination of theoreticaland experimental studies. Journal of Catalysis, 234(1):111118, 2005.
[551] Ricardo Bermejo-Deval, Marat Orazov, Rajamani Gounder, Son-Jong Hwang,and Mark E Davis. Active sites in sn-beta for glucose isomerization to fructoseand epimerization to mannose. ACS Catalysis, 4(7):22882297, 2014.
495
[552] Christian M Osmundsen, Martin Spangsberg Holm, Søren Dahl, and EsbenTaarning. Tin-containing silicates: structureactivity relations. Proc. R. Soc.A, 468(2143):20002016, 2012.
[553] Bhakti S Kulkarni, Sailaja Krishnamurty, and Sourav Pal. Probing lewis acidityand reactivity of sn-and ti-beta zeolite using industrially important moieties: Aperiodic density functional study. Journal of Molecular Catalysis A: Chemical,329(1-2):3643, 2010.
[554] Ricardo Bermejo-Deval, Rajeev S Assary, Eranda Nikolla, Manuel Moliner,Yuriy Román-Leshkov, Son-Jong Hwang, Arna Palsdottir, Dorothy Silverman,Raul F Lobo, Larry A Curtiss, et al. Metalloenzyme-like catalyzed isomeriza-tions of sugars by lewis acid zeolites. Proceedings of the National Academy ofSciences, 109(25):97279732, 2012.
[555] Neeraj Rai, Stavros Caratzoulas, and Dionisios G Vlachos. Role of silanol groupin sn-beta zeolite for glucose isomerization and epimerization reactions. ACScatalysis, 3(10):22942298, 2013.
[556] Yi-Pei Li, Martin Head-Gordon, and Alexis T Bell. Analysis of the reactionmechanism and catalytic activity of metal-substituted beta zeolite for the iso-merization of glucose to fructose. Acs Catalysis, 4(5):15371545, 2014.
[557] Li Li, Christophe Stroobants, Kaifeng Lin, Pierre A Jacobs, Bert F Sels, andPaolo P Pescarmona. Selective conversion of trioses to lactates over lewis acidheterogeneous catalysts. Green chemistry, 13(5):11751181, 2011.
[558] E Escalona Platero, M Peñarroya Mentruit, C Otero Areán, and A Zecchina.Ftir studies on the acidity of sulfated zirconia prepared by thermolysis of zir-conium sulfate. Journal of Catalysis, 162(2):268276, 1996.
[559] Gemma Turnes Palomino, Juan José Cuart Pascual, Montserrat Rodrguez Del-gado, José Bernardo Parra, and Carlos Otero Areán. Ft-ir studies on the acid-ity of gallium-substituted mesoporous mcm-41 silica. Materials chemistry andphysics, 85(1):145150, 2004.
[560] Michael R Basila, Theodore R Kantner, and Kee H Rhee. The nature of theacidic sites on a silica-alumina. characterization by infrared spectroscopic stud-ies of trimethylamine and pyridine chemisorption1. The Journal of PhysicalChemistry, 68(11):31973207, 1964.
[561] Hong Je Cho, Paul Dornath, and Wei Fan. Synthesis of hierarchical sn-mas lewis acid catalysts for isomerization of cellulosic sugars. Acs Catalysis,4(6):20292037, 2014.
[562] Simon R Bare, Shelly D Kelly, Wharton Sinkler, John J Low, Frank S Modica,Susana Valencia, Avelino Corma, and Laszlo T Nemeth. Uniform catalytic sitein sn-β-zeolite determined using x-ray absorption ne structure. Journal of theAmerican Chemical Society, 127(37):1292412932, 2005.
[563] Pierre Y Dapsens, Cecilia Mondelli, Bright T Kusema, René Verel, and JavierPérez-Ramírez. A continuous process for glyoxal valorisation using tailoredlewis-acid zeolite catalysts. Green Chemistry, 16(3):11761186, 2014.

496
[564] Jan Dijkmans, Michiel Dusselier, Dries Gabriels, Kristof Houthoofd,Pieter CMM Magusin, Shuigen Huang, Yiannis Pontikes, Maarten Trekels, An-dre Vantomme, Lars Giebeler, et al. Cooperative catalysis for multistep biomassconversion with sn/al beta zeolite. ACS Catalysis, 5(2):928940, 2015.
[565] Vitaly L Sushkevich, Alexandre Vimont, Arnaud Travert, and Irina I Ivanova.Spectroscopic evidence for open and closed lewis acid sites in zrbea zeolites.The Journal of Physical Chemistry C, 119(31):1763317639, 2015.
[566] Charles L Angell and Maria V Howell. Infrared spectroscopic investigationof zeolites and adsorbed molecules. iv. acetonitrile. The Journal of PhysicalChemistry, 73(8):25512554, 1969.
[567] Putcha Venkateswarlu. The rotation-vibration spectrum of methyl cyanide inthe region 1.6 µ20µ. The Journal of Chemical Physics, 19(3):293298, 1951.
[568] Sounak Roy, Kevin Bakhmutsky, Eyas Mahmoud, Raul F Lobo, and Raymond JGorte. Probing lewis acid sites in sn-beta zeolite. Acs Catalysis, 3(4):573580,2013.
[569] J Barthel and R Deser. Ftir study of ion solvation and ion-pair formationin alkaline and alkaline earth metal salt solutions in acetonitrile. Journal ofsolution chemistry, 23(10):11331146, 1994.
[570] Jochen Penzien, Anuji Abraham, Jeroen A van Bokhoven, Andreas Jentys,Thomas E Müller, Carsten Sievers, and Johannes A Lercher. Generation andcharacterization of well-dened zn2+ lewis acid sites in ion exchanged zeolitebea. The Journal of Physical Chemistry B, 108(13):41164126, 2004.
[571] B Wichterlova, Z Tvaruzkova, Z Sobalik, and P Sarv. Determination and prop-erties of acid sites in h-ferrierite: A comparison of ferrierite and m structures.Microporous and mesoporous materials, 24(4-6):223233, 1998.
[572] Rafael van Grieken, Carmen Martos, Manuel Sánchez-Sánchez, David P Ser-rano, Juan A Melero, José Iglesias, and Alvar G Cubero. Synthesis of snsilicalite from hydrothermal conversion of sio2sno2 xerogels. Microporous andMesoporous Materials, 119(1-3):176185, 2009.
[573] NY Chen. Hydrophobic properties of zeolites. The Journal of Physical Chem-istry, 80(1):6064, 1976.
[574] CA Emeis. Determination of integrated molar extinction coecients for in-frared absorption bands of pyridine adsorbed on solid acid catalysts. Journalof Catalysis, 141(2):347354, 1993.
[575] Rajamani Gounder and Mark E Davis. Monosaccharide and disaccharide iso-merization over lewis acid sites in hydrophobic and hydrophilic molecular sieves.Journal of catalysis, 308:176188, 2013.
[576] Rajamani Gounder and Mark E Davis. Beyond shape selective catalysis withzeolites: Hydrophobic void spaces in zeolites enable catalysis in liquid water.AIChE Journal, 59(9):33493358, 2013.
[577] Nawal Kishor Mal and Arumugamangalam V Ramaswamy. Hydroxylation ofphenol over sn-silicalite-1 molecular sieve: solvent eects. Journal of MolecularCatalysis A: Chemical, 105(3):149158, 1996.

497
[578] Ricardo Bermejo-Deval, Rajamani Gounder, and Mark E Davis. Framework andextraframework tin sites in zeolite beta react glucose dierently. ACS catalysis,2(12):27052713, 2012.
[579] Mahesh Bhagwat, Pallavi Shah, and Veda Ramaswamy. Synthesis of nanocrys-talline sno2 powder by amorphous citrate route. Materials Letters, 57(9-10):16041611, 2003.
[580] N Chiodini, A Paleari, D DiMartino, and G Spinolo. Sno 2 nanocrystals in sio 2:a wide-band-gap quantum-dot system. Applied physics letters, 81(9):17021704,2002.
[581] Feng Gu, Shu Fen Wang, Chun Feng Song, Meng Kai Lü, Yong Xin Qi,Guang Jun Zhou, Dong Xu, and Duo Rong Yuan. Synthesis and luminescenceproperties of sno2 nanoparticles. Chemical Physics Letters, 372(3-4):451454,2003.
[582] Guangsheng Pang, Siguang Chen, Yuri Koltypin, Arie Zaban, Shouhua Feng,and Aharon Gedanken. Controlling the particle size of calcined sno2 nanocrys-tals. Nano Letters, 1(12):723726, 2001.
[583] EP Parry. An infrared study of pyridine adsorbed on acidic solids. characteri-zation of surface acidity. Journal of Catalysis, 2(5):371379, 1963.
[584] E Selli and L Forni. Comparison between the surface acidity of solid catalystsdetermined by tpd and ftir analysis of pre-adsorbed pyridine. Microporous andmesoporous materials, 31(1-2):129140, 1999.
[585] NS Nesterenko, F Thibault-Starzyk, V Montouilliout, VV Yushchenko, C Fer-nandez, J-P Gilson, F Fajula, and II Ivanova. The use of the consecutiveadsorption of pyridine bases and carbon monoxide in the ir spectroscopic studyof the accessibility of acid sites in microporous/mesoporous materials. Kineticsand catalysis, 47(1):4048, 2006.
[586] AI Biaglow, DJ Parrillo, and RJ Gorte. Characterization of h, na-y using aminedesorption. Journal of Catalysis, 144(1):193201, 1993.
[587] Son-Jong Hwang, Rajamani Gounder, Yashodhan Bhawe, Marat Orazov, Ri-cardo Bermejo-Deval, and Mark E Davis. Solid state nmr characterization ofsn-beta zeolites that catalyze glucose isomerization and epimerization. Topicsin Catalysis, 58(7-9):435440, 2015.
[588] Sabrina Conrad, René Verel, Ceri Hammond, Patrick Wolf, Florian Göltl, andIve Hermans. Silica-grafted sniv catalysts in hydrogen-transfer reactions. Chem-CatChem, 7(20):32703278, 2015.
[589] Nan-Yu Topsøe, Karsten Pedersen, and Eric G Derouane. Infrared andtemperature-programmed desorption study of the acidic properties of zsm-5-type zeolites. Journal of Catalysis, 70(1):4152, 1981.
[590] Timothy D Courtney, Chun-Chih Chang, Raymond J Gorte, Raul F Lobo, WeiFan, and Vladimiros Nikolakis. Eect of water treatment on sn-bea zeolite:Origin of 960 cm- 1 ftir peak. Microporous and Mesoporous Materials, 210:6976, 2015.
498
[591] Naseh Rajabbeigi, Ana I Torres, Christopher M Lew, Bahman Elyassi, LiminRen, Zhuopeng Wang, Hong Je Cho, Wei Fan, Prodromos Daoutidis, andMichael Tsapatsis. On the kinetics of the isomerization of glucose to fructoseusing sn-beta. Chemical Engineering Science, 116:235242, 2014.
[592] T Blasco, MA Camblor, A Corma, P Esteve, JM Guil, A Martinez, JA Perdigon-Melon, and S Valencia. Direct synthesis and characterization of hydrophobicaluminum-free ti- beta zeolite. The Journal of Physical Chemistry B, 102(1):7588, 1998.
[593] Jerey R Christianson, Stavros Caratzoulas, and Dionisios G Vlachos. Com-putational insight into the eect of sn-beta na exchange and solvent on glucoseisomerization and epimerization. ACS Catalysis, 5(9):52565263, 2015.
[594] J Tauc, Radu Grigorovici, and Anina Vancu. Optical properties and electronicstructure of amorphous germanium. physica status solidi (b), 15(2):627637,1966.
[595] Jan Tauc. Optical properties and electronic structure of amorphous ge and si.Materials Research Bulletin, 3(1):3746, 1968.
[596] EA Davis and NFf Mott. Conduction in non-crystalline systems v. conduc-tivity, optical absorption and photoconductivity in amorphous semiconductors.Philosophical Magazine, 22(179):09030922, 1970.
[597] J Datka, AM Turek, JM Jehng, and IE Wachs. Acidic properties of supportedniobium oxide catalysts: an infrared spectroscopy investigation. Journal ofCatalysis, 135(1):186199, 1992.
[598] Thomas Robert Hughes and Harry M White. A study of the surface structureof decationized y zeolite by quantitative infrared spectroscopy. The Journal ofPhysical Chemistry, 71(7):21922201, 1967.
[599] Jérémie D. A. Pelletier and Jean-Marie Basset. Catalysis by Design: Well-Dened Single-Site Heterogeneous Catalysts. Accounts of Chemical Research,49(4):664677, 2016.
[600] Christophe Copéret, Aleix Comas-Vives, Matthew P. Conley, Deven P. Estes,Alexey Fedorov, Victor Mougel, Haruki Nagae, Francisco Núnez-Zarur, andPavel A. Zhizhko. Surface Organometallic and Coordination Chemistry towardSingle-Site Heterogeneous Catalysts: Strategies, Methods, Structures, and Ac-tivities. Chemical Reviews, 116(2):323421, 2016.
[601] Javier Guzman and Bruce C. Gates. Supported molecular catalysts: metalcomplexes and clusters on oxides and zeolites. Dalton Transactions, 0(17):33033318, 2003.
[602] Madelyn M. Stalzer, Massimiliano Delferro, and Tobin J. Marks. SupportedSingle-Site Organometallic Catalysts for the Synthesis of High-PerformancePolyolens. Catalysis Letters, 145(1):314, 2015.
[603] Justin M. Notestein, Enrique Iglesia, and Alexander Katz. Grafted Metal-localixarenes as Single-Site Surface Organometallic Catalysts. Journal of theAmerican Chemical Society, 126(50):1647816486, 2004.
499
[604] Staci L. Wegener, Tobin J. Marks, and Peter C. Stair. Design Strategies forthe Molecular Level Synthesis of Supported Catalysts. Accounts of ChemicalResearch, 45(2):206214, 2012.
[605] Margherita Pucino, Victor Mougel, Roman Schowner, Alexey Fedorov,Michael R. Buchmeiser, and Christophe Copéret. Cationic Silica-SupportedN-Heterocyclic Carbene Tungsten Oxo Alkylidene Sites: Highly Active and Sta-ble Catalysts for Olen Metathesis. Angewandte Chemie International Edition,55(13):43004302, 2016.
[606] Jelena Sepa, C. Lee, R. J. Gorte, David White, E. Kassab, E. M. Evleth,H. Jessri, and M. Allavena. Carbonyl 13c Shielding Tensors and Heats of Ad-sorption of Acetone Adsorbed in Silicalite and the 1:1 Stoichiometric Complexin H-ZSM-5. The Journal of Physical Chemistry, 100(47):1851518523, 1996.
[607] R. J Gorte and D White. Measuring sorption eects at zeolite acid sites: pursu-ing ideas from W.O. Haag. Microporous and Mesoporous Materials, 3536:447455, 2000.
[608] Mark E Davis. New vistas in zeolite and molecular sieve catalysis. Accounts ofchemical research, 26(3):111115, 1993.
[609] Avelino Corma, Marcelo E. Domine, Laszlo Nemeth, and Susana Valencia. Al-Free Sn-Beta Zeolite as a Catalyst for the Selective Reduction of CarbonylCompounds (Meerwein-Ponndorf-Verley Reaction). Journal of the AmericanChemical Society, 124(13):31943195, 2002.
[610] William R. Gunther, Vladimir K. Michaelis, Marc A. Caporini, Robert G. Grif-n, and Yuriy Roman-Leshkov. Dynamic Nuclear Polarization NMR Enablesthe Analysis of Sn-Beta Zeolite Prepared with Natural Abundance 119Sn Pre-cursors. Journal of the American Chemical Society, 136(17):62196222, 2014.
[611] Patrick Wolf, Maxence Valla, Francisco Nú ñ ez Zarur, Aleix Comas-Vives,Aaron J. Rossini, Connor Firth, Hana Kallas, Anne Lesage, Lyndon Emsley,Christophe Copé ret, and Ive Hermans. Correlating Synthetic Methods, Mor-phology, Atomic-Level Structure, and Catalytic Activity of Sn-β Catalysts. ACSCatalysis, pages 40474063, 2016.
[612] J. M. Newsam, M. M. J. Treacy, W. T. Koetsier, and C. B. De Gruyter. Struc-tural Characterization of Zeolite Beta. Proceedings of the Royal Society of Lon-don A: Mathematical, Physical and Engineering Sciences, 420(1859):375405,1988.
[613] S. Tolborg, A. Katerinopoulou, D. D. Falcone, I. Sá daba, C. M. Osmundsen,R. J. Davis, E. Taarning, P. Fristrup, and M. S. Holm. Incorporation of tinaects crystallization, morphology, and crystal composition of Sn-Beta. Journalof Materials Chemistry A, 2(47):2025220262, 2014.
[614] C. M. Zicovich-Wilson and R. Dovesi. Titanium-Containing Zeolites. A Periodicab Initio Hartree-Fock Characterization. The Journal of Physical Chemistry B,102(8):14111417, 1998.
[615] Alessandro Damin, Silvia Bordiga, Adriano Zecchina, Klaus Doll, and CarloLamberti. Ti-chabazite as a model system of Ti(IV) in Ti-zeolites: A periodicapproach. The Journal of Chemical Physics, 118(22):1018310194, 2003.
500
[616] Lina Han, Cui Wen, Zhiping Wu, Jiancheng Wang, Liping Chang, Gang Feng,Rongbin Zhang, Dejin Kong, and Jianwen Liu. Density functional theory inves-tigations into the structures and acidity properties of Ti-doped SSZ-13 zeolite.Microporous and Mesoporous Materials, 237:132139, 2017.
[617] C. M. Zicovich-Wilson, R. Dovesi, and A. Corma. Interaction of Ti-Zeoliteswith Water. A Periodic ab Initio Study. The Journal of Physical Chemistry B,103(6):988994, 1999.
[618] Cui Wen, Lu Geng, Lina Han, Jiancheng Wang, Liping Chang, Gang Feng,Dejin Kong, and Jianwen Liu. A comparative rst principles study on triva-lent ion incorporated SSZ-13 zeolites. Physical Chemistry Chemical Physics,17(44):2958629596, 2015.
[619] Brandon C. Bukowski and Jerey Greeley. Scaling Relationships for MolecularAdsorption and Dissociation in Lewis Acid Zeolites. The Journal of PhysicalChemistry C, 120(12):67146722, 2016.
[620] Einar Andre Eilertsen, Silvia Bordiga, Carlo Lamberti, Alessandro Damin,Francesca Bonino, Bjornar Arstad, Stian Svelle, Unni Olsbye, and Karl Pet-ter Lillerud. Synthesis of Titanium Chabazite: A New Shape Selective Oxida-tion Catalyst with Small Pore Openings and Application in the Production ofMethyl Formate from Methanol. ChemCatChem, 3(12):18691871, 2011.
[621] Ricardo Bermejo-Deval, Rajeev S. Assary, Eranda Nikolla, Manuel Moliner,Yuriy Romá n Leshkov, Son-Jong Hwang, Arna Palsdottir, Dorothy Silver-man, Raul F. Lobo, Larry A. Curtiss, and Mark E. Davis. Metalloenzyme-likecatalyzed isomerizations of sugars by Lewis acid zeolites. Proceedings of theNational Academy of Sciences, 109(25):97279732, 2012.
[622] Juan Carlos Vega-Vila, James W. Harris, and Rajamani Gounder. Controlledinsertion of tin atoms into zeolite framework vacancies and consequences forglucose isomerization catalysis. Journal of Catalysis, 344:108120, 2016.
[623] Vitaly L. Sushkevich, Irina I. Ivanova, and Alexander V. Yakimov. RevisitingAcidity of SnBEA Catalysts by Combined Application of FTIR Spectroscopyof Dierent Probe Molecules. The Journal of Physical Chemistry C, 121:1143711447, 2017.
[624] Tyler R. Josephson, Glen R. Jenness, Dionisios G. Vlachos, and Stavros Carat-zoulas. Distribution of open sites in Sn-Beta zeolite. Microporous and Meso-porous Materials, 245:4550, 2017.
[625] Alexander V. Yakimov, Yury G. Kolyagin, Søren Tolborg, Peter N. R.Vennestrøm, and Irina I. Ivanova. Accelerated synthesis of Sn-BEA in uoridemedia: eect of H2o content in the gel. New Journal of Chemistry, 40:43674374, 2016.
[626] Helen Y. Luo, Daniel F. Consoli, William R. Gunther, and Yuriy Román-Leshkov. Investigation of the reaction kinetics of isolated Lewis acid sites inBeta zeolites for the Meerwein-Ponndorf-Verley reduction of methyl levulinateto γ-valerolactone. Journal of Catalysis, 320:198207, 2014.
501
[627] Revital Cohen, Christopher R. Graves, SonBinh T. Nguyen, Jan M. L. Mar-tin, and Mark A. Ratner. The Mechanism of Aluminum-Catalyzed Meerwein-Schmidt-Ponndorf-Verley Reduction of Carbonyls to Alcohols. Journal of theAmerican Chemical Society, 126(45):1479614803, 2004.
[628] Rajeev S. Assary, Larry A. Curtiss, and James A. Dumesic. Exploring Meer-weinPonndorfVerley Reduction Chemistry for Biomass Catalysis Using aFirst-Principles Approach. ACS Catalysis, 3(12):26942704, 2013.
[629] Mercedes Boronat, Avelino Corma, and Michael Renz. Mechanism of theMeerwein-Ponndorf-Verley-Oppenauer (MPVO) Redox Equilibrium on Sn- andZr-Beta Zeolite Catalysts. The Journal of Physical Chemistry B, 110(42):2116821174, 2006.
[630] Makoto Shibagaki, Kyoko Takahashi, and Hajime Matsushita. The CatalyticReduction of Aldehydes and Ketones with 2-Propanol over Hydrous ZirconiumOxide. Bulletin of the Chemical Society of Japan, 61(9):32833288, 1988.
[631] V. V. Ordomsky, V. L. Sushkevich, and I. I. Ivanova. Study of acetaldehydecondensation chemistry over magnesia and zirconia supported on silica. Journalof Molecular Catalysis A: Chemical, 333(12):8593, 2010.
[632] V. A. Ivanov, J. Bachelier, F. Audry, and J. C. Lavalley. Study of the Meer-weinPondorVerley reaction between ethanol and acetone on various metaloxides. Journal of Molecular Catalysis, 91(1):4559, 1994.
[633] Dennis Palagin, Vitaly L. Sushkevich, and Irina Igorevna Ivanova. CC Cou-pling Catalyzed by Zeolites: is Enolization the Only Possible Pathway for AldolCondensation? The Journal of Physical Chemistry C, 120(41):2356623575,2016.
[634] Ivan Hung, Aaron J. Rossini, and Robert W. Schurko. Application of the Carr-Purcell Meiboom-Gill Pulse Sequence for the Acquisition of Solid-State NMRSpectra of Spin-1/2 Nuclei. The Journal of Physical Chemistry A, 108(34):71127120, 2004.
[635] J. Herzfeld and Alan E. Berger. Sideband intensities in NMR spectra of samplesspinning at the magic angle. The Journal of Chemical Physics, 73(12):60216030, 1980.
[636] William Robert Gunther, Vladimir K. Michaelis, Robert G. Grin, and YuriyRomán-Leshkov. Interrogating the Lewis Acidity of Metal Sites in Beta ZeolitesWith 15n Pyridine Adsorption Coupled With MAS NMR Spectroscopy. TheJournal of Physical Chemistry C, 120(50):2853328544, 2016.
[637] M. J. Díaz-Cabañas, P. A. Barrett, and M. A. Camblor. Synthesis and structureof pure sio2 chabazite: the sio2 polymorph with the lowest framework density.Chemical Communications, 17:18811882, 1998.
[638] Alexandre Zagdoun, Gilles Casano, Olivier Ouari, Martin Schwarzw'a lder,Aaron J. Rossini, Fabien Aussenac, Maxim Yulikov, Gunnar Jeschke,Christophe Copé ret, Anne Lesage, Paul Tordo, and Lyndon Emsley. LargeMolecular Weight Nitroxide Biradicals Providing Ecient Dynamic NuclearPolarization at Temperatures up to 200 K. Journal of the American ChemicalSociety, 135(34):1279012797, 2013.
502
[639] Alexandre Zagdoun, Aaron J. Rossini, David Gajan, Adrien Bourdolle, OlivierOuari, Melanie Rosay, Werner E. Maas, Paul Tordo, Moreno Lelli, LyndonEmsley, Anne Lesage, and Christophe Copé ret. Non-aqueous solvents for DNPsurface enhanced NMR spectroscopy. Chemical Communications, 48(5):654656, 2011.
[640] J. Z. Hu, D. W. Alderman, C. H. Ye, R. J. Pugmire, and D. M. Grant. AnIsotropic Chemical Shift-Chemical Shift Anisotropy Magic-Angle Slow-Spinning2d NMR Experiment. Journal of Magnetic Resonance, Series A, 105(1):8287,1993.
[641] S. H. Vosko, L. Wilk, and M. Nusair. Accurate spin-dependent electron liq-uid correlation energies for local spin density calculations: a critical analysis.Canadian Journal of Physics, 58(8):12001211, 1980.
[642] Chengteh Lee, Weitao Yang, and Robert G. Parr. Development of the Colle-Salvetti correlation-energy formula into a functional of the electron density.Physical Review B, 37(2):785789, 1988.
[643] Axel D. Becke. Density-functional thermochemistry. III. The role of exact ex-change. Journal of Chemical Physics, 98(7):5648, 1993.
[644] P. J. Stephens, F. J. Devlin, C. F. Chabalowski, and M. J. Frisch. Ab Initio Cal-culation of Vibrational Absorption and Circular Dichroism Spectra Using Den-sity Functional Force Fields. The Journal of Physical Chemistry, 98(45):1162311627, 1994.
[645] Stefan Grimme. A consistent and accurate ab initio parametrization of densityfunctional dispersion correction (DFT-D) for the 94 elements H-Pu. The Journalof Chemical Physics, 132(15):154104, 2010.
[646] Stefan Grimme, Stephan Ehrlich, and Lars Goerigk. Eect of the damping func-tion in dispersion corrected density functional theory. Journal of ComputationalChemistry, 32(7):14561465, 2011.
[647] M. J. Frisch, G. W. Trucks, H. B. Schlegel, G. E. Scuseria, M. A. Robb,J. R. Cheeseman, G. Scalmani, V. Barone, B. Mennucci, G. A. Petersson, andH. Nakatsuji. Gaussian 09. Gaussian Inc., 2009.
[648] E. Cancès, B. Mennucci, and J. Tomasi. A new integral equation formalismfor the polarizable continuum model: Theoretical background and applica-tions to isotropic and anisotropic dielectrics. The Journal of Chemical Physics,107(8):30323041, 1997.
[649] Maurizio Cossi, Vincenzo Barone, Benedetta Mennucci, and Jacopo Tomasi.Ab initio study of ionic solutions by a polarizable continuum dielectric model.Chemical Physics Letters, 286(34):253260, 1998.
[650] Benedetta Mennucci and Jacopo Tomasi. Continuum solvation models: A newapproach to the problem of solute's charge distribution and cavity boundaries.The Journal of Chemical Physics, 106(12):51515158, 1997.
[651] W. R. Wadt and P. J. Hay. Abinitio eective core potentials for molecularcalculations - potentials for main group elements Na to Bi. Journal of ChemicalPhysics, 82(1):284298, 1985.
503
[652] P. Jerey Hay. Ab initio eective core potentials for molecular calculations.Potentials for K to Au including the outermost core orbitals. The Journal ofChemical Physics, 82(1):299310, 1985.
[653] Hay. Ab initio eective core potentials for molecular calculations. Potentialsfor the transition metal atoms Sc to Hg. The Journal of Chemical Physics,82(1):270283, 1985.
[654] Georg Schreckenbach and Tom Ziegler. Calculation of NMR Shielding Ten-sors Using Gauge-Including Atomic Orbitals and Modern Density FunctionalTheory. The Journal of Physical Chemistry, 99(2):606611, 1995.
[655] Mykhaylo Krykunov, Tom Ziegler, and Erik van Lenthe. Hybrid density func-tional calculations of nuclear magnetic shieldings using Slater-type orbitals andthe zeroth-order regular approximation. International Journal of QuantumChemistry, 109(8):16761683, 2009.
[656] G. te Velde, F. M. Bickelhaupt, E. J. Baerends, C. Fonseca Guerra, S. J. A.van Gisbergen, J. G. Snijders, and T. Ziegler. Chemistry with ADF. Journalof Computational Chemistry, 22(9):931967, 2001.
[657] E. Van Lenthe and E. J. Baerends. Optimized Slater-type basis sets for theelements 1118. Journal of Computational Chemistry, 24(9):11421156, 2003.
[658] Wol. Calculation of DFT-GIAO NMR shifts with the inclusion of spin-orbitcoupling. The Journal of Chemical Physics, 109(3):895905, 1998.
[659] Wol. Density functional calculations of nuclear magnetic shieldings using thezeroth-order regular approximation (ZORA) for relativistic eects: ZORA nu-clear magnetic resonance. The Journal of Chemical Physics, 110(16):76897698,1999.
[660] Matthew P. Conley, Aaron J. Rossini, Aleix Comas-Vives, Maxence Valla,Gilles Casano, Olivier Ouari, Paul Tordo, Anne Lesage, Lyndon Emsley, andChristophe Copéret. Silica-surface reorganization during organotin grafting ev-idenced by 119sn DNP SENS: a tandem reaction of gem-silanols and strainedsiloxane bridges. Physical Chemistry Chemical Physics, 16(33):1782217827,2014.
[661] Jan Dijkmans, Michiel Dusselier, Wout Janssens, Maarten Trekels, André Van-tomme, Eric Breynaert, Christine Kirschhock, and Bert F. Sels. An Inner-/Outer-Sphere Stabilized Sn Active Site in bea-Zeolite: Spectroscopic Evidenceand Kinetic Consequences. ACS Catalysis, 6(1):3146, 2016.
[662] American Institute of Chemical Engineers. AICHe DIPPr Database, 2016.

APPENDICES

504

505
A. A BRIEF REVIEW OF THE LITERATURE PERTAINING TO THE ROLE
OF PAIRED AL SITES IN CHA FOR VARIOUS APPLICATIONS
A.1 Introduction
The synthesis and characterization of CHA zeolites containing dierent arrange-
ments of isolated and paired Al sites, at a xed elemental composition, has enabled
the preparation of model catalysts for investigating the role of active site structure
and arrangement on both acid and redox catalysis. Control of the Al arrangement
in CHA has enabled synthesis of Cu-containing zeolites with known distributions of
divalent Cu2+ and monovalent [CuOH]+ cations (Chapter 6) [79]. This set of model
Cu-CHA zeolites allowed us to assess the role of Cu2+ and [CuOH]+ site types and Cu
ion spatial density on the kinetics and mechanisms of NOx SCR using a combination
of kinetic, spectroscopic, and theoretical methods (Chapters 6 and 7) [79, 237], and
to rationalize the seemingly disparate proposals in the literature regarding the SCR
active site (Appendix B) [237, 476]. Moreover, this same set of model CHA zeolites,
in their H-form, allowed us to investigate the role of proton proximity on methanol
dehydration catalysis (Chapter 8 and Appendix C) [214]. Interrogating this set of
catalysts revealed that methanol dehydration rst- and zero-order rate constants (per
H+, 415 K) are nearly 10x larger at paired protons than at isolated protons, likely
due to the ability of paired protons to stabilize the methoxy transition-state of the
dissociative pathway. While our initial investigations have focused on two specic
applications, the eects of Al proximity on adsorption and catalysis has begun to
garner signicant attention in the scientic literature for other applications. Here,
some of the recent work investigating the role of framework Al arrangement in CHA
on a variety of applications is briey reviewed.
506
A.2 Acid strength [477]
The deprotonation energy (DPE), a probe independent description of acid streng-
th, of H+ sites has been shown to inuence the rate of acid-catalyzed reactions that
proceed through ion-pair intermediates and transition states [82,83,478,479]. In zeo-
lites, the acid strength of protons can be altered by substitution of dierent trivalent
heteroatoms (e.g., Al3+, Ga3+, Fe3+) into the framework [83]. Recently, the proxim-
ity of framework Al atoms was reported to inuence the acid strength of protons in
alumonisilicate CHA zeolites [477] The DPE of a proton when a second acid site is
located in the same 6-membered ring is lower than an isolated proton, because the
second acid site stabilizes the deprotonated lattice conjugate base across the 6-MR.
Other Al pairs in the 8-MR do not lead to dierences in DPE because residual pro-
tons do not orient within the 8-MR to stabilize the conjugate base. These eects are
reversed when the cation at the second site is replaced with an ammonium, indicat-
ing that the preference of dierent cations to become conned within specic rings of
CHA can alter the stability of the deprotonated site. These observations suggest that
enhancement of methanol dehydration rates at paired protons in CHA may reect an
acid strength eect, but this is dependent on the coverage of the second site, which
is still ongoing work.
A.3 Characterization of Al arrangement [480]
Multi-quantum 23Na magic-angle spinning nuclear magnetic resonance (23Na MQ
MAS NMR) spectroscopic techniques have been reported, which can assess the cor-
relation of Na+ nuclei in dierent coordination environments in CHA zeolites [480].23Na MAS NMR spectra measured on a series of Na-exchanged high-silica CHA zeo-
lites (Si/Al = 48) show single Na coordination environment in the 6-MR. Increasing
the total Al content leads to 23Na MQ NMR correlation between Na located in the
6-MR and an adjacent 8-MR, as observed from strong quadrupolar interactions be-
tween the two nuclei. These observations suggest that 23Na MQ NMR may be able to
507
distinguish dierent Al arrangements in CHA, but this technique may become limited
if CHA zeolites contain moderate to high Al concentrations (approaching 1 Al per
cage) with dierent arrangements.
A.4 CO2 Adsorption [217,481]
The eect of Al arrangement in CHA zeolites has also been investigated for CO2
adsorption. Kinetic Monte-Carlo CO2 adsorption models have been developed for a
series of CHA zeolites (and other zeolite frameworks) with dierent Si/Al ratios and
degrees of Al clustering (i.e., Al proximity). These models indicate that CO2 heats
of adsorption are larger in Na-exchanged CHA at a xed Si/Al = 11 with sparse Al
distributions (isolated Al) than at clustered Al sites (i.e., paired Al). CO2 adsorption,
however, is also more favorable in zeolites with lower Si/Al. These models indicate,
and support previous suggestions [482], that dual Na+ sites in the 8-MR are the most
favorable site for adsorbing CO2, which are formed in greater concentration in CHA
zeolites with high Al concentrations, but spares distributions [217]. These results are
in reasonable agreement with experimental CO2 gas-separation (from either CH4 or
N2) experiments performed on Na-CHA zeolites synthesized at various Si/Al ratios
(4-50) [481], which showed greater selectivity for CO2 at higher Al concentrations.
The work of Guo et al. [481] does not attempt to manipulate the Al distribution
at a xed Si/Al ratio, so direct correlation between their observations and those of
Findley et al. [217] are tentative. Moreover, proximal Al sites in MFI zeolites appear
be more selective for adsorbing linear alkanes at central C-C bonds than at terminal
C-C bonds [483]. These results present an interesting application for CHA, and other,
zeolites with tailored arrangements of framework Al atoms for gas separations, but
also an additional characterization technique to probe the arrangement of Al atoms
in CHA and other zeolites.
508
A.5 MTO [216,484]
Small-pore CHA zeolites are selective in their conversion of methanol to light
olens (e.g., ethene, propene) instead of aromatics [485]. CHA zeolites containing
dierent Al concentrations, and presumably dierent arrangements of Al, have pre-
viously been studied for MTO [158]. These previous results showed that low-silica
CHA zeolites (i.e., likely containing paired protons) had increased initial propane
selectivities, which is an indicator of hydrogen transfer events that facilitate deac-
tivation [486, 487], and shorter catalyst lifetimes (time to <85% conversion) [158].
Additionally, the eects of Al arrangement on MTO have also been studied on CHA
zeolites synthesized via FAU conversion with dierent arrangements of framework Al
atoms, as inferred from 29Si NMR, but similar total Al concentrations (Si/Al = 10-
13) [216]. Nishitoba et al. found that CHA zeolites that contained larger amounts of
Q2 sites (i.e., Si(OAl)2(OSi)2) had shorter MTO time-on-stream stability than CHA
containing more isolated Al sites [216], consistent with the previous conclusion from
Deimund et al [158]. Crystallite size and diusion within microporous voids play a
critical role in the time-on-stream stability of MTO catalysts [488]. Recently, Gallego
et al. reported the synthesis of nano-crystalline CHA zeolites (60-80 nm in diam-
eter) with dierent Al arrangements at similar bulk composition (Si/Al = 14) and
observed that nano-CHA containing higher amounts of isolated Al sites had longer
time-on-stream stabilities than CHA zeolites of similar size, with higher fractions of
paired Al [484]. Collectively, these results suggest that paired Al sites in CHA zeolites
lead to shorter time-on-stream stability for MTO than isolated Al sites possibly due
to their propensity to form propane at initial times. These results should be taken
with hesitation as all transient MTO deactivation studied here begins from 100%
conversion and does not provide a quantitative metric of catalyst lifetime or stability.
509
A.6 Hydrothermal Stability and Sulfur Poisoning During NOx SCR [239,489]
The speciation of Cu cations in CHA zeolites between divalent Cu2+ and mono-
valent [CuOH]+ complexes depends on the underlying arrangement of framework Al
atoms between isolated and paired sites [79]. Low-temperature NOx SCR rates (per
Cu, <523 K) are indistinguishable on Cu-CHA catalysts containing either predomi-
nantly Cu2+ or [CuOH]+, as long as catalysts operate in the reduction-limited regime
(> ca. 2 wt% Cu) [79, 237]. Cu-CHA catalysts do not show deactivation during
steady-state SCR, but frequent sojourns to elevated temperatures (>800 K) in the
presence of high water content (up to 10 wt%) during regeneration of up-stream par-
ticulate lters, and the presence of sulfur-containing compounds (e.g., SO2 and SO3)
in engine euent lead to deactivation of Cu active sites. Song et al. have investi-
gated the resistance of Cu-CHA zeolites to hydrothermal deactivation by preparing
a series of Cu-exchange CHA zeolites at dierent Si/Al ratios (Si/Al = 6-35) to
manipulate the Al arrangement, and, thus, the concentration of Cu2+ or [CuOH]+
active sites [489]. They conclude that Cu2+ sites are more resistant to deactivation
through Cu-oxide formation than [CuOH]+, and this formation of Cu-oxides clusters
ultimately leads to the loss in SCR performance after hydrothermal aging. These
results still leave lingering questions about the deactivating species (e.g., Cu-oxide
or Cu-aluminate) during hydrothermal aging because prior work has demonstrated
that Cu-oxide clusters are able to disperse into cationic Cu sites in the presence of
SCR reaction gas mixtures [363]. In a similar approach, Cu-CHA zeolites of dierent
Si/Al ratio (6 and 30) have been investigated for the resistance of dierent Cu sites to
sulfur poisoning [239]. Jangjou et al. conclude that Cu2+ cations are more resistant
to sulfur poisoning by SO2 than [CuOH]+ and provide evidence that the hydroxide
ligand promote the formation of highly stable bisulfate species [482]. Together, these
results indicate that Cu2+ is more resistant to both deactivation by hydrothermal
aging and sulfur poisoning than [CuOH]+, suggesting that CHA zeolites containing
high concentrations of Cu2+ would lead to SCR catalysts with greater lifetimes.
510
A.7 Partial methane oxidation to methanol [219,490493]
Cu-exchanged zeolites have garnered further interest due to their ability to active
the C-H bond in methane in selective oxidation reactions that produce methanol
[221]. Specically in CHA zeolites, [CuOH]+ complexes that exchanged at isolated
Al atoms have been proposed to be the precursor to the active site for partial methane
oxidation (PMO) [219,492]. Pappas et al. observed that the total amount of methanol
produced per Cu was lower on Cu-CHA zeolites that were expected to contain higher
concentrations of Cu2+ cations than on samples synthesized to contain predominantly
[CuOH]+ [219]. These reports do not systematically vary the Cu site identity at a
xed composition, however, which still leaves lingering questions about the role of
Cu site density and speciation. Fe-containing zeolites have also been utilized for
PMO [221] and recently paired Al sites in CHA were identied as the exchange
site for extraframework α-Fe active sites [493]. CHA zeolites synthesized through
dierent procedures (Si/Al = 9) were characterized by Co2+ titration to contain
dierent fractions of paired Al sites, whose content correlated with the content of the
proposed α-Fe active site [493]. These observations are consistent with calculated
phase-diagrams of Fe siting at dierent Al arrangements in CHA, which indicate that
α-Fe sites preferentially exchanged at paired Al in the 6-MR of CHA zeolites [494]. In
both Cu- and Fe-exchanged CHA zeolites, the formation of the proposed active site
(e.g., [CuOH]+ or α-Fe) depend directly on the underlying arrangement of framework
Al atoms, indicating that dierent synthetic procedures can be used to control the
formation of active sites for partial methane oxidation to methanol.

511
B. CATALYSIS SCIENCE OF NOX SELECTIVE CATALYTIC REDUCTION
WITH AMMONIA OVER CU-SSZ-13 AND CU-SAPO-34
Due to copyright restrictions, this manuscript cannot be reproduced in full. The full
text of Paolucci et al., Adv. Catal., 2016, 59, 1-107 can be found at:
dx.doi.org/10.1016/bs.acat.2016.10.002.

512
513
C. EFFECTS OF ACID SITE PROXIMITY AND CONFINEMENT IN
ZEOLITES ON PREVALENT REACTION MECHANISMS DURING
METHANOL DEHYDRATION CATALYSIS
C.1 Inhibition of methanol dehydration rates in CHA zeolites
Low-temperature (<453 K) dehydration of methanol to dimethyl ether (DME) is a
known probe of acid strength and connement eects in zeolite catalysts and proceeds
through two dierent mechanisms [21, 82]. The rst step in both mechanisms in the
quasi-equilibrated adsorption of gas-phase methanol at a proton. In the associative
dehydration mechanism, DME and water are formed through the kinetically-relevant
dehydration of protonated methanol dimers that form via quasi-equilibrated adsorp-
tion of a second methanol at a methanol monomer (Figure C.1, inner). While in the
dissociative dehydration mechanism (Figure C.1, outer), methanol monomers are de-
hydrated to eliminate water and form a surface methoxy species. DME is then formed
via a nucleophilic attack of a surface methoxy by a second methanol molecule that
is in quasi-equilibrium with the bare surface methoxy. The dissociative mechanism
is also inhibited by the formation of quasi-equilibrated methanol dimers that do not
participate in DME formation.

514
Figure C.1. DFT calculated structures of intermediates and transitionstates for the associative (inner circle) and dissociative (outer circle) mech-anisms.
Methanol dehydration proceeds via the associative dehydration mechanism on
acidic polyoxometalate clusters [82] located on mesoporous supports, and on acid
sites conned within medium- and large-pore zeolites [22], without inhibition at high
methanol pressures. Associative methanol dehydration rates (per H+, 415 K) on
small-pore CHA zeolites containing isolated protons, however, are inhibited at high
methanol pressures, which has been previously accounted for by introducing an in-
hibitory surface intermediate to the list of elementary steps [214]. Adsorption within
zeolites often deviates from ideality due to strong interactions between adsorbed
species and the zeolite framework, particularly at high surface coverages (or adsor-
bate pressures). In turn, this can lead to rates of reaction that deviate from ideal rate
laws due to adsorbate-adsorbate interactions and solvent crowding of the transition
state [495499]. These non-ideal interactions can be interpreted by deriving the asso-
ciative dehydration rate law using non-ideal transition state theory treatments, which
account for changes in rate due to dierences in the activity coecients of various
adsorbed species.
515
C.1.1 Estimation of methanol activity coecients
Activity coecients, which describe deviations from ideal solution behavior, of
adsorbed species solvated within zeolites can be estimated by treating intrazeolite
adsorption with solution thermodynamics [500503] and by modeling adsorption using
a Virial isotherm [504506]:
K =n
pγ (C.1)
γ = exp(2A1n+3
2A2n
2 +4
3A3n
3 + ... (C.2)
Ai = A0i (1 + aiT ) (C.3)
where K is the equilibrium constant, γ is the activity coecient, n is the concentration
(mole (Lcat)−1) of adsorbed species in equilibrium with gas-phase pressure, p (atm),
and the Ai terms are the ith virial coecients [504,507]. Virial coecients for various
gases adsorbed in H-CHA (e.g., O2, N2, Ar, Kr) have been observed to vary linearly
with temperature and depend on values of A0i and ai [504]. Methanol adsorption
isotherms measured on H-CHA zeolites (Si/Al = 15) as a function of temperature
(288-308 K) were t using Eq. C.1-C.3 to extract Virial coecients and estimate
activity coecients of adsorbed methanol at reaction temperatures and pressures
(415 K, <50 kPa).
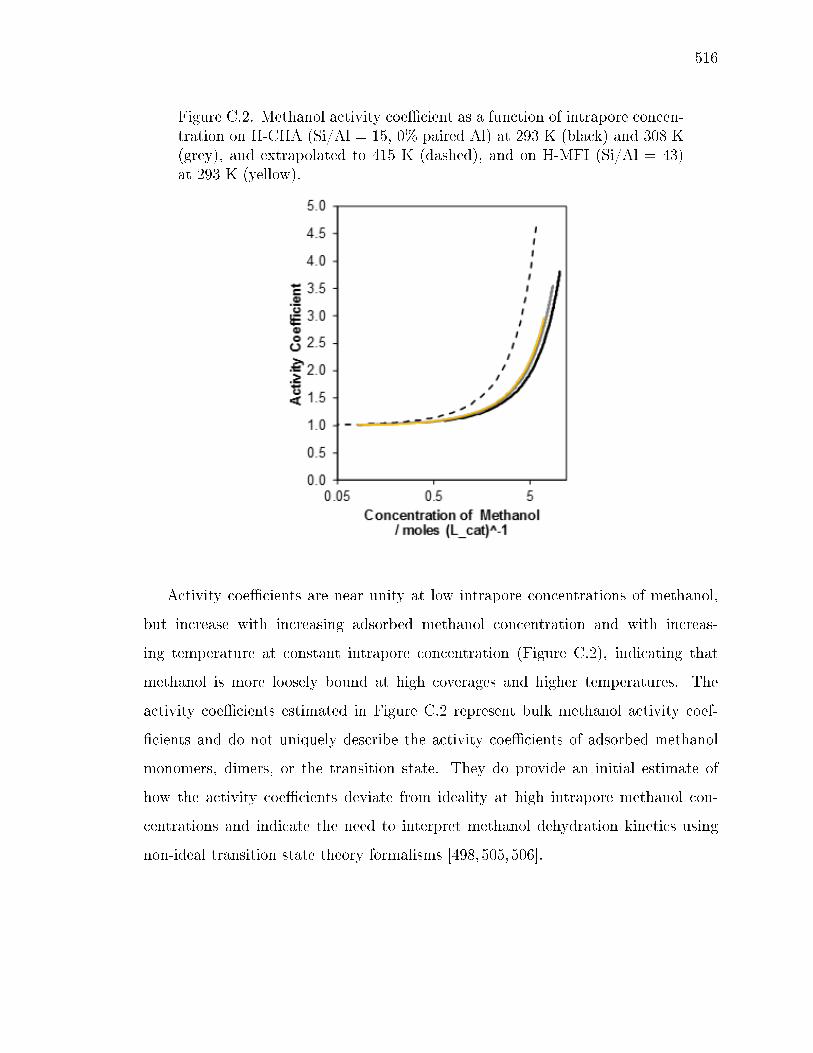
516
Figure C.2. Methanol activity coecient as a function of intrapore concen-tration on H-CHA (Si/Al = 15, 0% paired Al) at 293 K (black) and 308 K(grey), and extrapolated to 415 K (dashed), and on H-MFI (Si/Al = 43)at 293 K (yellow).
Activity coecients are near unity at low intrapore concentrations of methanol,
but increase with increasing adsorbed methanol concentration and with increas-
ing temperature at constant intrapore concentration (Figure C.2), indicating that
methanol is more loosely bound at high coverages and higher temperatures. The
activity coecients estimated in Figure C.2 represent bulk methanol activity coef-
cients and do not uniquely describe the activity coecients of adsorbed methanol
monomers, dimers, or the transition state. They do provide an initial estimate of
how the activity coecients deviate from ideality at high intrapore methanol con-
centrations and indicate the need to interpret methanol dehydration kinetics using
non-ideal transition state theory formalisms [498,505,506].

517
The rate limiting step of the associative dehydration mechanism involves the con-
certed rearrangement and dehydration of a co-adsorbed methanol dimer (C*) to form
the transition state (TS‡) [82]:
C∗ ↔ ‡ → DME ∗+H2O(g) (C.4)
where C* and TS‡ are quasi-equilibrated and the transition state irreversibly forms
the products. A rate law can now be dened that is related to the concentration of
the transition state and a barrier crossing coecient, νi:
rDME
[L]= νiθ‡ =
kbT
hθ‡ (C.5)
where, kb is the Boltzmann constant, T is the temperature, and h is the Planck
constant. Here, the dehydration rate is normalized by the total number of H+ sites
([L]), which allows writing the rate in terms of the coverage of various surface species
(θi). The coverage of the activated complex can then be written in terms of reactive
surface intermediates through quasi-equilibrium:
K‡ =a‡aC∗
=θ‡γ‡θC∗γC∗
(C.6)
where ai represents the thermodynamic activity of each species and γi are the activity
coecients. Substitution of Eq. C.6 into Eq. C.5 yields a rate law in terms of
adsorbed surface intermediates:
rDME
[L]=kbT
hK‡(
γCγ‡
)θC∗ (C.7)
The concentration of co-adsorbed methanol dimers which are dicult to experimen-
tally quantify, can then be related to the gas-phase methanol pressure via equilibrium
relations involving the dierent reactive intermediates (Scheme C.1):
KC∗ =aC∗aD∗
=θC∗γC∗θD∗γD∗
(C.8)
KD∗ =aD∗
aM∗aM=
θD∗γD∗θM∗γM∗γM
(P0
PM) (C.9)
KM∗ =aM∗a∗aM
=θM∗γM∗θ∗γ∗PMγM
(P0
PM) (C.10)
518
where KC∗, KD∗, and KM∗ are equilibrium constants for co-adsorbed methanol dimers,
protonated dimers, and methanol monomers, respectively, and P0 is a standard-state
pressure of 1 bar. Sequential substitution of KC∗, KD∗, and KM∗ into Eq. C.7 yields:
rDME
[L]=kbT
hK‡KC∗KD∗KM∗(
γ2Mγ∗γ‡
)(PMP0
)2θ∗ (C.11)
From Eq. C.11, the associative dehydration mechanism depends on the activity co-
ecients of two gas-phase methanol molecules, the transition state, an empty H+
site, methanol pressure, and the coverage of available H+ sites. During steady-state
methanol dehydration catalysis (415 K, >0.05 kPa CH3OH), H+ sites within CHA
zeolites are covered by methanol monomers, dimers, and methanol clusters [214]. The
latter will not be considered as an inhibiting species here, so that the role of the ac-
tivity coecients can be investigated independently of reactant inhibition. Treating
methanol monomers and protonated dimers as the most abundant reactive interme-
diates, results in the following site-balance:
1 = θM + θD (C.12)
Substitution of Eqs. C.9 and C.10 into Eq. C.12 gives:
θ∗ =1
[KM(γMγ∗γM∗
)(PM
P0)](1 +KD∗(
γMγM∗γD∗
)(PM
P0))
(C.13)
Eq. C.11 can now be rewritten using Eq. C.13 to give:
rDME
[L]=
kbThK‡KC∗KD∗(
γMγM∗γ‡
)(PM
P0)
1 +KD∗(γMγM∗γD∗
)(PM
P0)
(C.14)
In the ideal case (i.e., γi = 1), Eq. C.14 reduces to:
rDME
[L]=
kbThK‡KC∗KD∗(
PM
P0)
1 +KD∗(PM
P0)
(C.15)
Estimation of the fugacity of gas-phase methanol (γM) at 415 K using the Peng-
Robinson equation of state [508] gives activity coecients near unity (γM >0.98),
indicating that under the conditions studied here (415 K, 0.01-50 kPa CH3OH), gas-
phase methanol behaves as an ideal gas. This allows Eq. C.14 to be simplied to:
rDME
[L]=
kbThK‡KC∗KD∗(
γM∗γ‡
)(PM
P0)
1 +KD∗(γM∗γD∗
)(PM
P0)
(C.16)
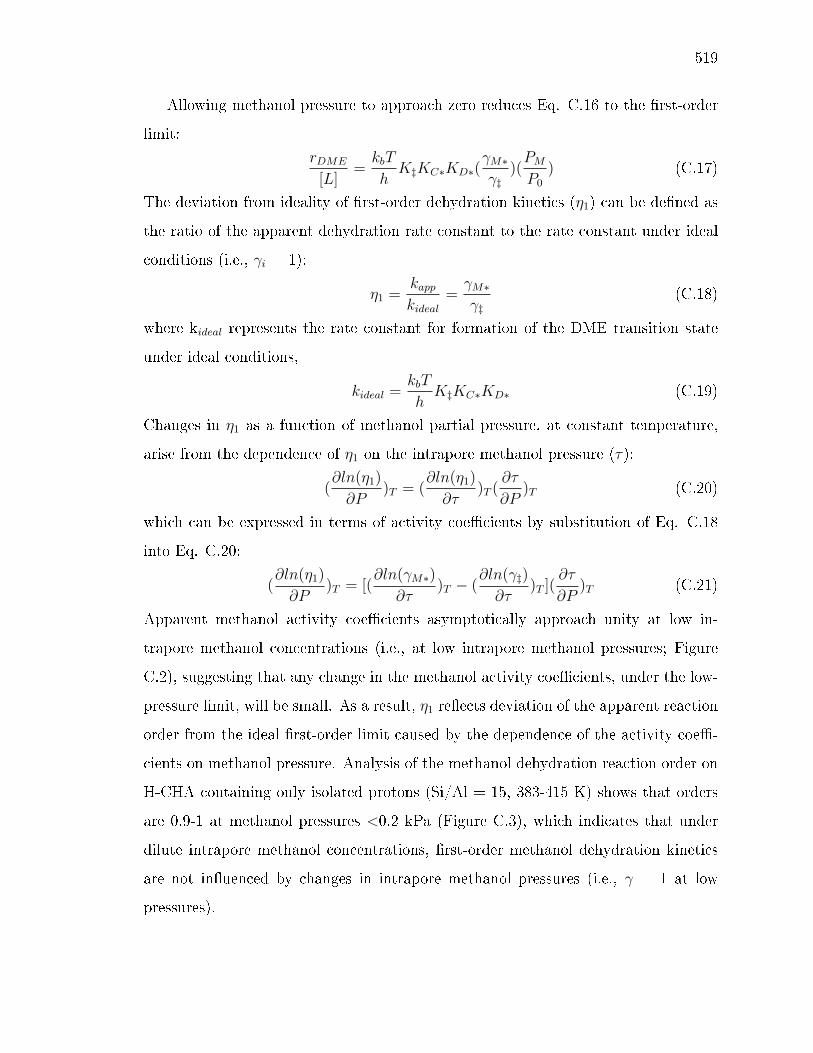
519
Allowing methanol pressure to approach zero reduces Eq. C.16 to the rst-order
limit:
rDME
[L]=kbT
hK‡KC∗KD∗(
γM∗γ‡
)(PMP0
) (C.17)
The deviation from ideality of rst-order dehydration kinetics (η1) can be dened as
the ratio of the apparent dehydration rate constant to the rate constant under ideal
conditions (i.e., γi = 1):
η1 =kappkideal
=γM∗γ‡
(C.18)
where kideal represents the rate constant for formation of the DME transition state
under ideal conditions,
kideal =kbT
hK‡KC∗KD∗ (C.19)
Changes in η1 as a function of methanol partial pressure, at constant temperature,
arise from the dependence of η1 on the intrapore methanol pressure (τ):
(∂ln(η1)
∂P)T = (
∂ln(η1)
∂τ)T (
∂τ
∂P)T (C.20)
which can be expressed in terms of activity coecients by substitution of Eq. C.18
into Eq. C.20:
(∂ln(η1)
∂P)T = [(
∂ln(γM∗)
∂τ)T − (
∂ln(γ‡)
∂τ)T ](
∂τ
∂P)T (C.21)
Apparent methanol activity coecients asymptotically approach unity at low in-
trapore methanol concentrations (i.e., at low intrapore methanol pressures; Figure
C.2), suggesting that any change in the methanol activity coecients, under the low-
pressure limit, will be small. As a result, η1 reects deviation of the apparent reaction
order from the ideal rst-order limit caused by the dependence of the activity coe-
cients on methanol pressure. Analysis of the methanol dehydration reaction order on
H-CHA containing only isolated protons (Si/Al = 15, 383-415 K) shows that orders
are 0.9-1 at methanol pressures <0.2 kPa (Figure C.3), which indicates that under
dilute intrapore methanol concentrations, rst-order methanol dehydration kinetics
are not inuenced by changes in intrapore methanol pressures (i.e., γ = 1 at low
pressures).
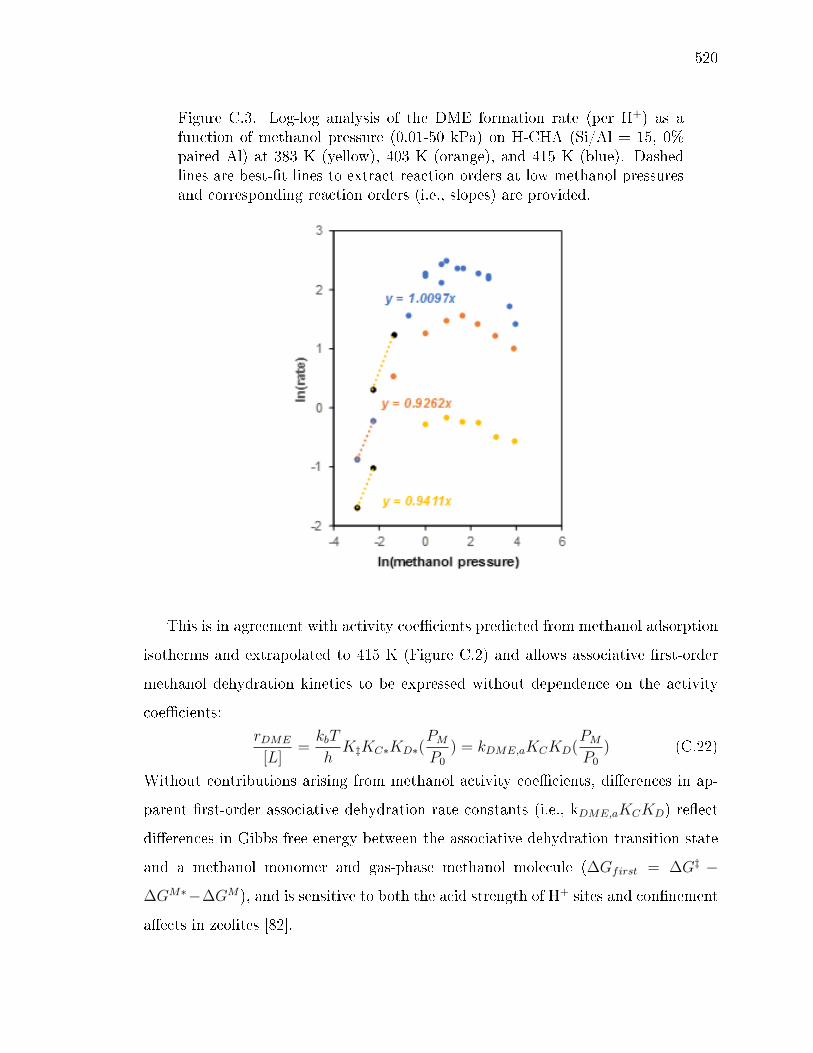
520
Figure C.3. Log-log analysis of the DME formation rate (per H+) as afunction of methanol pressure (0.01-50 kPa) on H-CHA (Si/Al = 15, 0%paired Al) at 383 K (yellow), 403 K (orange), and 415 K (blue). Dashedlines are best-t lines to extract reaction orders at low methanol pressuresand corresponding reaction orders (i.e., slopes) are provided.
This is in agreement with activity coecients predicted from methanol adsorption
isotherms and extrapolated to 415 K (Figure C.2) and allows associative rst-order
methanol dehydration kinetics to be expressed without dependence on the activity
coecients:
rDME
[L]=kbT
hK‡KC∗KD∗(
PMP0
) = kDME,aKCKD(PMP0
) (C.22)
Without contributions arising from methanol activity coecients, dierences in ap-
parent rst-order associative dehydration rate constants (i.e., kDME,aKCKD) reect
dierences in Gibbs free energy between the associative dehydration transition state
and a methanol monomer and gas-phase methanol molecule (∆Gfirst = ∆G‡ −
∆GM∗−∆GM), and is sensitive to both the acid strength of H+ sites and connement
aects in zeolites [82].
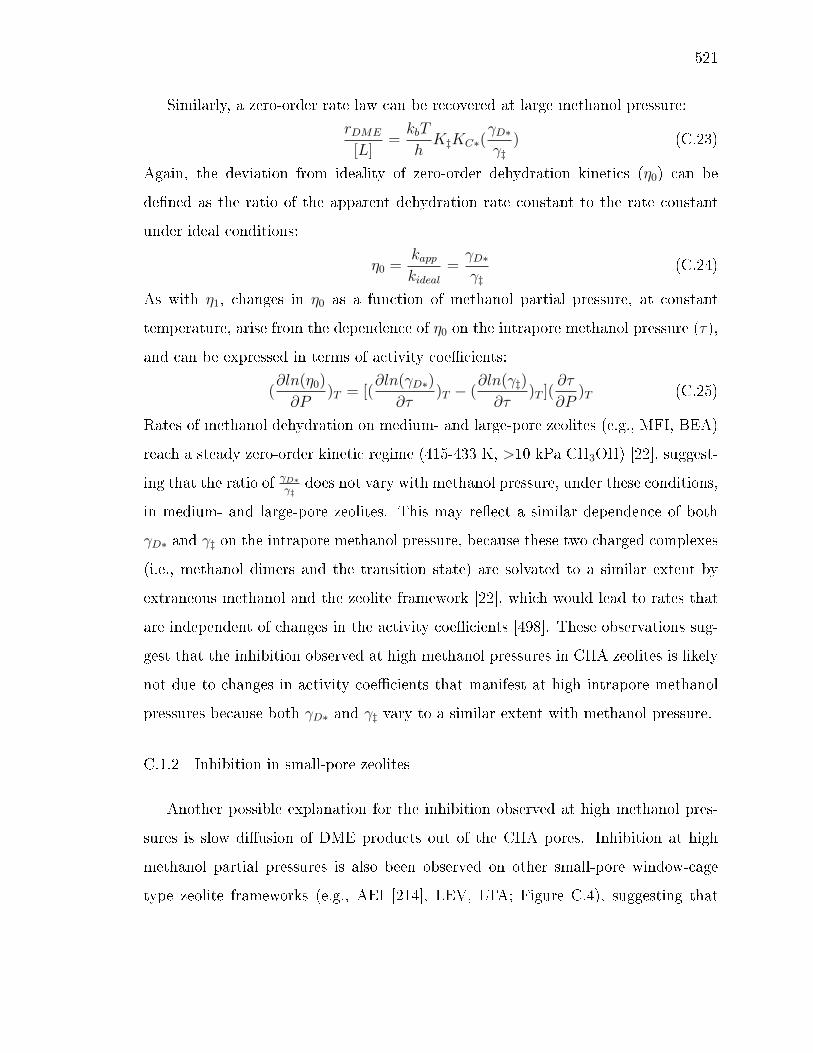
521
Similarly, a zero-order rate law can be recovered at large methanol pressure:
rDME
[L]=kbT
hK‡KC∗(
γD∗γ‡
) (C.23)
Again, the deviation from ideality of zero-order dehydration kinetics (η0) can be
dened as the ratio of the apparent dehydration rate constant to the rate constant
under ideal conditions:
η0 =kappkideal
=γD∗γ‡
(C.24)
As with η1, changes in η0 as a function of methanol partial pressure, at constant
temperature, arise from the dependence of η0 on the intrapore methanol pressure (τ),
and can be expressed in terms of activity coecients:
(∂ln(η0)
∂P)T = [(
∂ln(γD∗)
∂τ)T − (
∂ln(γ‡)
∂τ)T ](
∂τ
∂P)T (C.25)
Rates of methanol dehydration on medium- and large-pore zeolites (e.g., MFI, BEA)
reach a steady zero-order kinetic regime (415-433 K, >10 kPa CH3OH) [22], suggest-
ing that the ratio of γD∗γ‡
does not vary with methanol pressure, under these conditions,
in medium- and large-pore zeolites. This may reect a similar dependence of both
γD∗ and γ‡ on the intrapore methanol pressure, because these two charged complexes
(i.e., methanol dimers and the transition state) are solvated to a similar extent by
extraneous methanol and the zeolite framework [22], which would lead to rates that
are independent of changes in the activity coecients [498]. These observations sug-
gest that the inhibition observed at high methanol pressures in CHA zeolites is likely
not due to changes in activity coecients that manifest at high intrapore methanol
pressures because both γD∗ and γ‡ vary to a similar extent with methanol pressure.
C.1.2 Inhibition in small-pore zeolites
Another possible explanation for the inhibition observed at high methanol pres-
sures is slow diusion of DME products out of the CHA pores. Inhibition at high
methanol partial pressures is also been observed on other small-pore window-cage
type zeolite frameworks (e.g., AEI [214], LEV, LTA; Figure C.4), suggesting that

522
the specic framework topology may be responsible for limited DME egress from the
pores.
Figure C.4. DME formation rates (per total H+) measured at 415 K asa function of methanol partial pressure on a representative H-form CHA(green), LTA (orange), LEV (blue), and AEI (red) catalyst.
C.1.3 Methanol dehydration rates at elevated temperatures
Inhibition of methanol dehydration rates (per H+) measured on CHA zeolites at
high methanol partial pressures (>10 kPa) appears to diminish as the temperature
of reaction increases (415-473 K; Figure C.5). If the inhibition in CHA observed at
415 K were due to internal mass transport restrictions, then the observed inhibition
would be expected to become more severe as the temperature of reaction increased, a
behavior that is not observed here. Additionally, at elevated temperatures (>415 K)
the coverage of methanol would be expected to decrease with increasing temperature,
which may suggest that adsorption of additional methanol at a protonated dimer
may be responsible for inhibiting measured methanol dehydration rates in CHA at
415 K. At temperatures exceeding 450 K the formation of small olens (e.g., ethene
and propene) is observed at high methanol contact times (i.e., low methanol partial
pressures) and decrease in concentration with decreasing methanol contact time (i.e.,
high methanol partial pressures) [485]. First-order rate constants (per H+) do not fol-
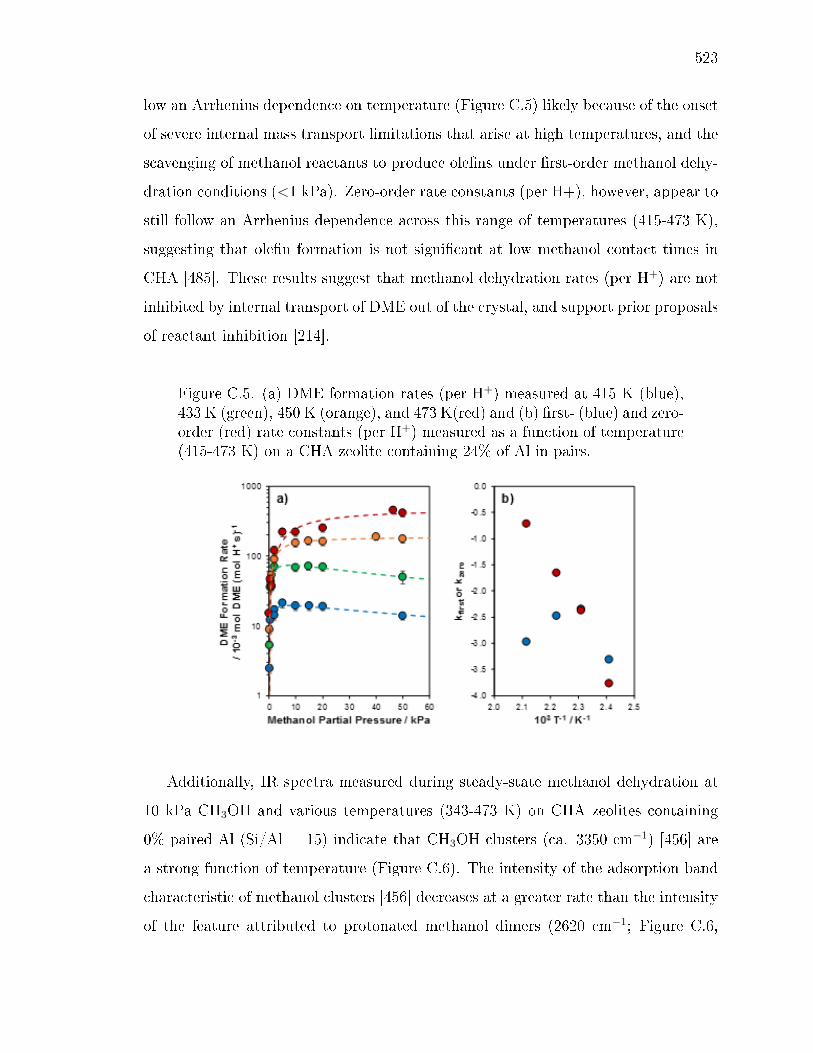
523
low an Arrhenius dependence on temperature (Figure C.5) likely because of the onset
of severe internal mass transport limitations that arise at high temperatures, and the
scavenging of methanol reactants to produce olens under rst-order methanol dehy-
dration conditions (<1 kPa). Zero-order rate constants (per H+), however, appear to
still follow an Arrhenius dependence across this range of temperatures (415-473 K),
suggesting that olen formation is not signicant at low methanol contact times in
CHA [485]. These results suggest that methanol dehydration rates (per H+) are not
inhibited by internal transport of DME out of the crystal, and support prior proposals
of reactant inhibition [214].
Figure C.5. (a) DME formation rates (per H+) measured at 415 K (blue),433 K (green), 450 K (orange), and 473 K(red) and (b) rst- (blue) and zero-order (red) rate constants (per H+) measured as a function of temperature(415-473 K) on a CHA zeolite containing 24% of Al in pairs.
Additionally, IR spectra measured during steady-state methanol dehydration at
10 kPa CH3OH and various temperatures (343-473 K) on CHA zeolites containing
0% paired Al (Si/Al = 15) indicate that CH3OH clusters (ca. 3350 cm−1) [456] are
a strong function of temperature (Figure C.6). The intensity of the adsorption band
characteristic of methanol clusters [456] decreases at a greater rate than the intensity
of the feature attributed to protonated methanol dimers (2620 cm−1; Figure C.6,
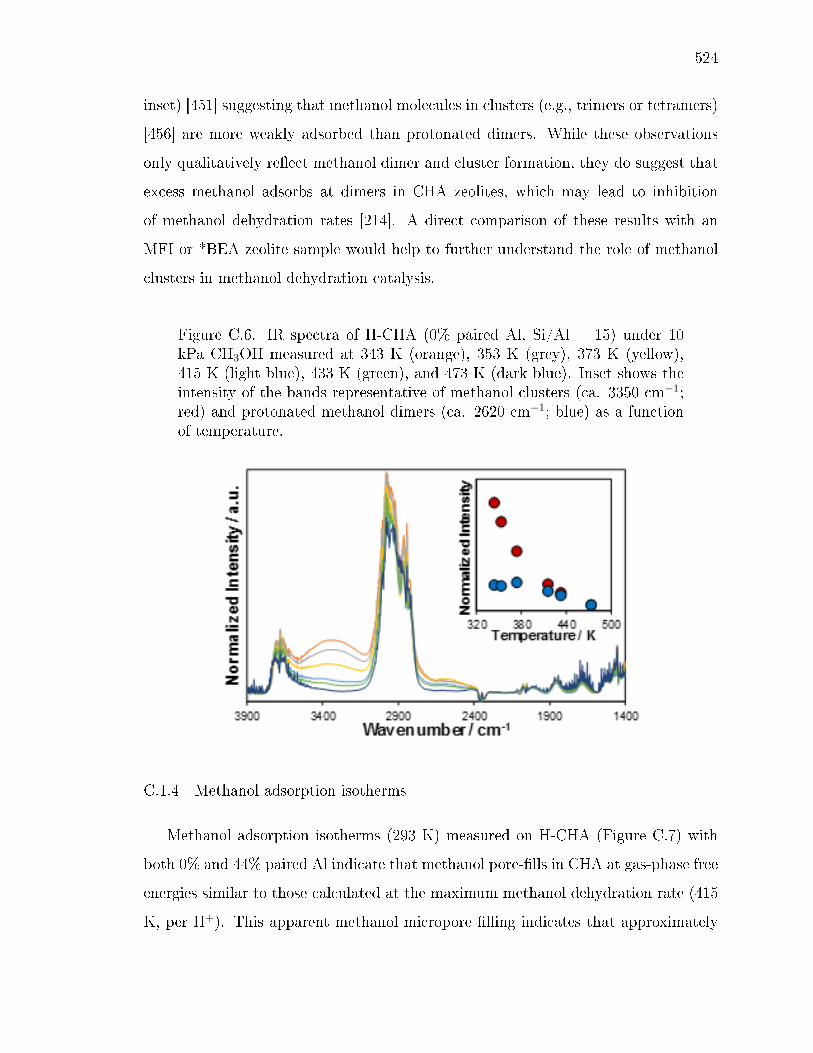
524
inset) [451] suggesting that methanol molecules in clusters (e.g., trimers or tetramers)
[456] are more weakly adsorbed than protonated dimers. While these observations
only qualitatively reect methanol dimer and cluster formation, they do suggest that
excess methanol adsorbs at dimers in CHA zeolites, which may lead to inhibition
of methanol dehydration rates [214]. A direct comparison of these results with an
MFI or *BEA zeolite sample would help to further understand the role of methanol
clusters in methanol dehydration catalysis.
Figure C.6. IR spectra of H-CHA (0% paired Al, Si/Al = 15) under 10kPa CH3OH measured at 343 K (orange), 353 K (grey), 373 K (yellow),415 K (light blue), 433 K (green), and 473 K (dark blue). Inset shows theintensity of the bands representative of methanol clusters (ca. 3350 cm−1;red) and protonated methanol dimers (ca. 2620 cm−1; blue) as a functionof temperature.
C.1.4 Methanol adsorption isotherms
Methanol adsorption isotherms (293 K) measured on H-CHA (Figure C.7) with
both 0% and 44% paired Al indicate that methanol pore-lls in CHA at gas-phase free
energies similar to those calculated at the maximum methanol dehydration rate (415
K, per H+). This apparent methanol micropore lling indicates that approximately
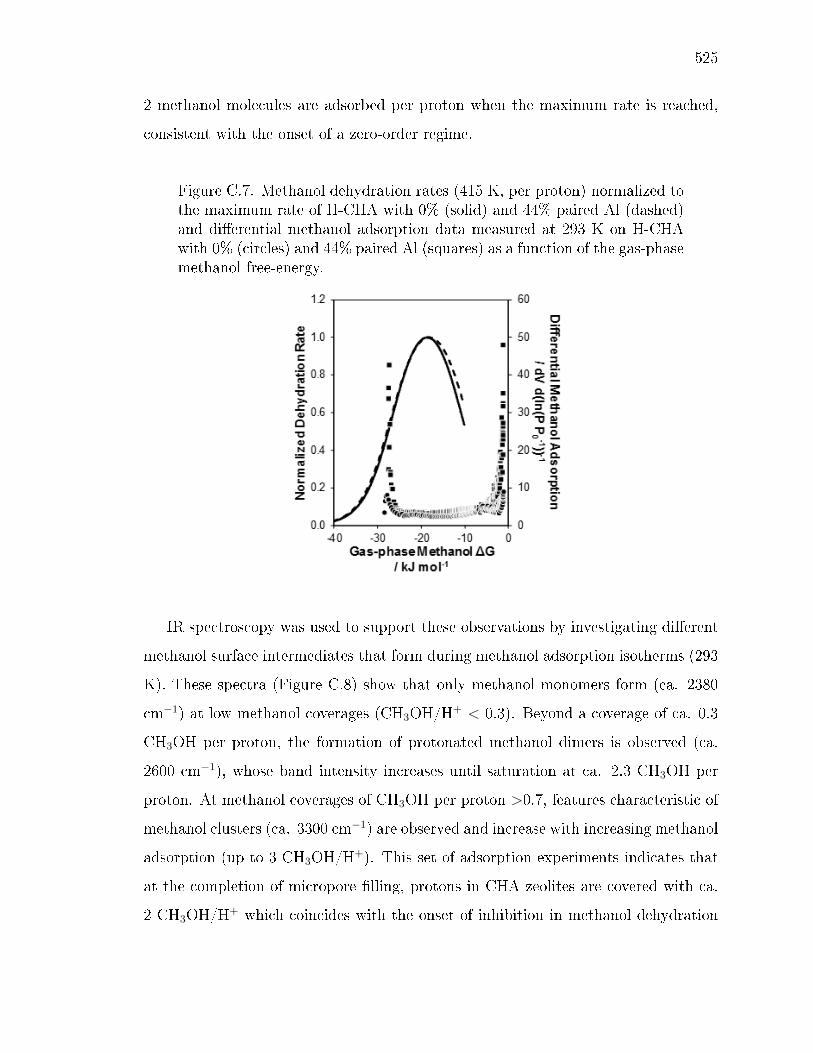
525
2 methanol molecules are adsorbed per proton when the maximum rate is reached,
consistent with the onset of a zero-order regime.
Figure C.7. Methanol dehydration rates (415 K, per proton) normalized tothe maximum rate of H-CHA with 0% (solid) and 44% paired Al (dashed)and dierential methanol adsorption data measured at 293 K on H-CHAwith 0% (circles) and 44% paired Al (squares) as a function of the gas-phasemethanol free-energy.
IR spectroscopy was used to support these observations by investigating dierent
methanol surface intermediates that form during methanol adsorption isotherms (293
K). These spectra (Figure C.8) show that only methanol monomers form (ca. 2380
cm−1) at low methanol coverages (CH3OH/H+ < 0.3). Beyond a coverage of ca. 0.3
CH3OH per proton, the formation of protonated methanol dimers is observed (ca.
2600 cm−1), whose band intensity increases until saturation at ca. 2.3 CH3OH per
proton. At methanol coverages of CH3OH per proton >0.7, features characteristic of
methanol clusters (ca. 3300 cm−1) are observed and increase with increasing methanol
adsorption (up to 3 CH3OH/H+). This set of adsorption experiments indicates that
at the completion of micropore lling, protons in CHA zeolites are covered with ca.
2 CH3OH/H+ which coincides with the onset of inhibition in methanol dehydration

526
rates at similar gas-phase methanol free-energies (415 K, per H+). These results are
also consistent with previous IR spectra measured during steady-state methanol dehy-
dration catalysis that show the formation of methanol clusters at methanol pressures
where rate inhibition begins to be observed (>5 kPa) [214].
Figure C.8. Infrared spectra measured at 293 K on H-CHA with 0% pairedAl as a function of methanol dosing (0.01-3 CH3OH/H+).
C.1.5 Inhibition at low temperatures (323 K)
Inhibition of methanol dehydration by adsorption of a single methanol at a pro-
tonated dimer should reach a -1 order regime at high enough methanol coverages.
Methanol dehydration rates (per H+) were measured at 323 K in an attempt to force
higher methanol coverages at high methanol pressures (Figure C.9). Under these
conditions, DME formation rates (323 K, per H+) increase at high methanol pres-
sures because the inlet reactant gas temperature is at a greater temperature than the
catalyst bed. Rates begin to show an exponential increase with increasing methanol
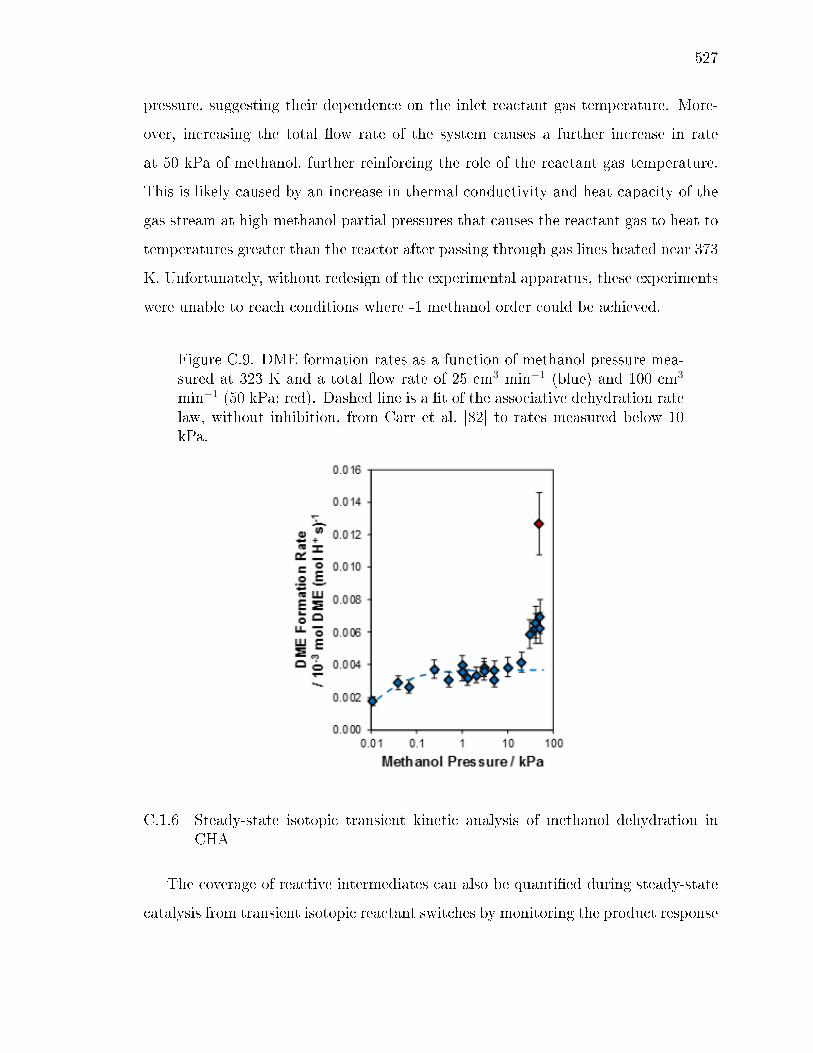
527
pressure, suggesting their dependence on the inlet reactant gas temperature. More-
over, increasing the total ow rate of the system causes a further increase in rate
at 50 kPa of methanol, further reinforcing the role of the reactant gas temperature.
This is likely caused by an increase in thermal conductivity and heat capacity of the
gas stream at high methanol partial pressures that causes the reactant gas to heat to
temperatures greater than the reactor after passing through gas lines heated near 373
K. Unfortunately, without redesign of the experimental apparatus, these experiments
were unable to reach conditions where -1 methanol order could be achieved.
Figure C.9. DME formation rates as a function of methanol pressure mea-sured at 323 K and a total ow rate of 25 cm3 min−1 (blue) and 100 cm3
min−1 (50 kPa; red). Dashed line is a t of the associative dehydration ratelaw, without inhibition, from Carr et al. [82] to rates measured below 10kPa.
C.1.6 Steady-state isotopic transient kinetic analysis of methanol dehydration inCHA
The coverage of reactive intermediates can also be quantied during steady-state
catalysis from transient isotopic reactant switches by monitoring the product response
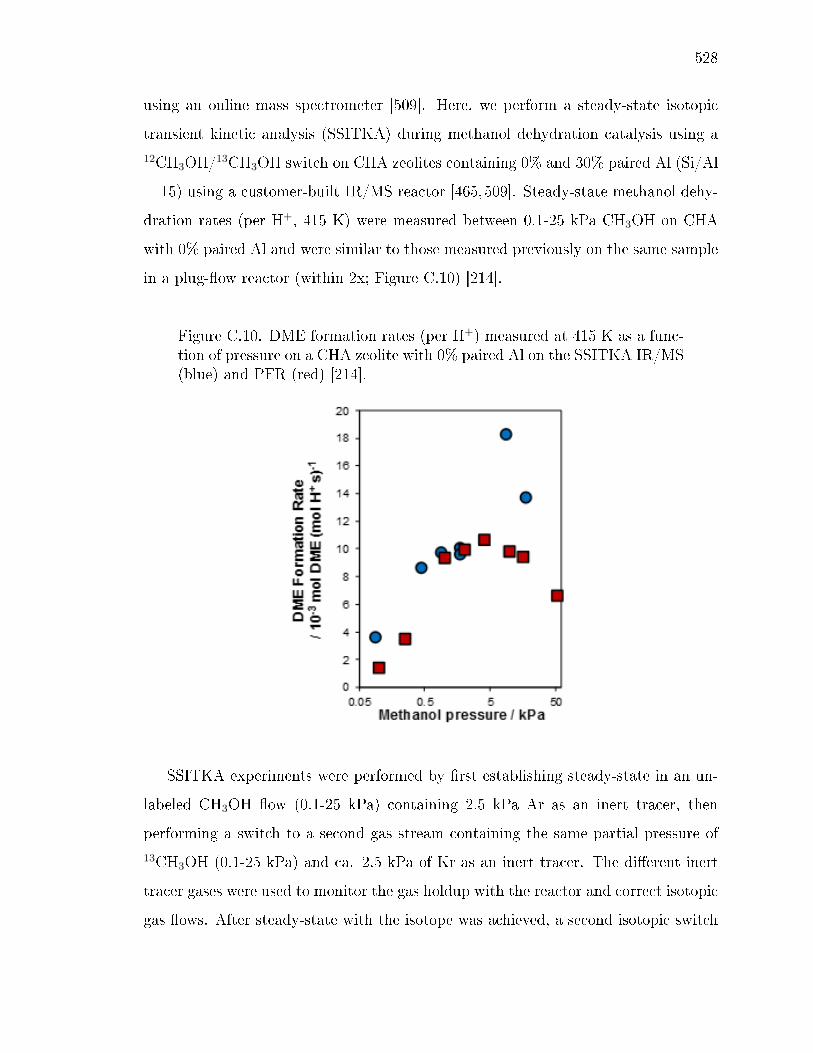
528
using an online mass spectrometer [509]. Here, we perform a steady-state isotopic
transient kinetic analysis (SSITKA) during methanol dehydration catalysis using a12CH3OH/13CH3OH switch on CHA zeolites containing 0% and 30% paired Al (Si/Al
= 15) using a customer-built IR/MS reactor [465,509]. Steady-state methanol dehy-
dration rates (per H+, 415 K) were measured between 0.1-25 kPa CH3OH on CHA
with 0% paired Al and were similar to those measured previously on the same sample
in a plug-ow reactor (within 2x; Figure C.10) [214].
Figure C.10. DME formation rates (per H+) measured at 415 K as a func-tion of pressure on a CHA zeolite with 0% paired Al on the SSITKA IR/MS(blue) and PFR (red) [214].
SSITKA experiments were performed by rst establishing steady-state in an un-
labeled CH3OH ow (0.1-25 kPa) containing 2.5 kPa Ar as an inert tracer, then
performing a switch to a second gas stream containing the same partial pressure of13CH3OH (0.1-25 kPa) and ca. 2.5 kPa of Kr as an inert tracer. The dierent inert
tracer gases were used to monitor the gas holdup with the reactor and correct isotopic
gas ows. After steady-state with the isotope was achieved, a second isotopic switch

529
was made back to the original unlabeled reactant stream. A representative isotopic
transience is shown in Figure C.11.
Figure C.11. Steady-state isotopic switch from 12 kPa unlabeled CH3OHto 12 kPa 13CH3OH (blue). The 13C-DME response is shown in red. Ar(black) and Kr (grey) inert tracers are provided to show gas holdup.
Quantication of the number of surface intermediates that form DME (NDME)
was done by integrating the dierence between the nal steady-state DME formation
rate (rDME) and the transient DME formation rate (rDME(t)) after switching [509]:
NDME =
∫ ∞0
(rDME − rDME(t))dt (C.26)
The intrinsic turnover frequency of the catalyst was calculated by taking the inverse
of the mean surface residence (τDME) from the integral of the dierence between the
normalized inert tracer response (I∗(t)) and the normalized transient DME formation
rate (r∗DME(t)) [509]:
τDME =
∫ ∞0
(I∗(t)− r∗DME(t))dt (C.27)
The calculated values of NDME and the intrinsic turnover frequency measured on CHA
zeolites containing 0% and 30% paired Al sites (Si/Al = 15) are shown in Figure C.12.
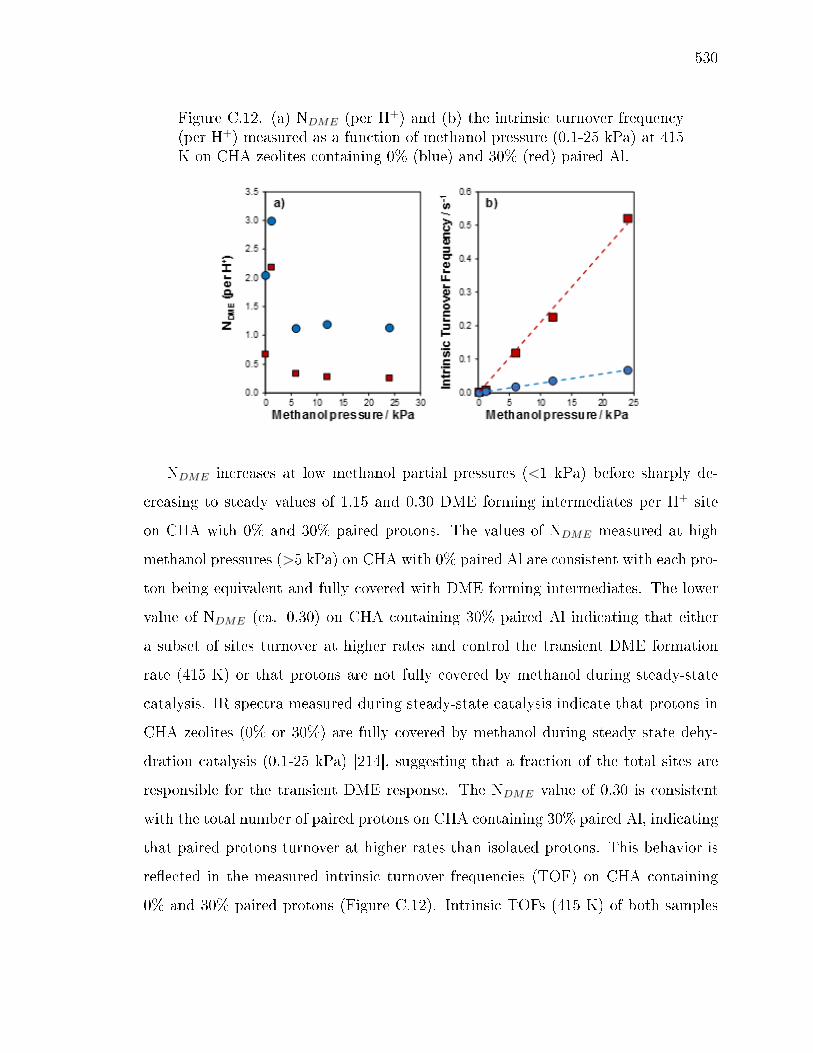
530
Figure C.12. (a) NDME (per H+) and (b) the intrinsic turnover frequency(per H+) measured as a function of methanol pressure (0.1-25 kPa) at 415K on CHA zeolites containing 0% (blue) and 30% (red) paired Al.
NDME increases at low methanol partial pressures (<1 kPa) before sharply de-
creasing to steady values of 1.15 and 0.30 DME forming intermediates per H+ site
on CHA with 0% and 30% paired protons. The values of NDME measured at high
methanol pressures (>5 kPa) on CHA with 0% paired Al are consistent with each pro-
ton being equivalent and fully covered with DME forming intermediates. The lower
value of NDME (ca. 0.30) on CHA containing 30% paired Al indicating that either
a subset of sites turnover at higher rates and control the transient DME formation
rate (415 K) or that protons are not fully covered by methanol during steady-state
catalysis. IR spectra measured during steady-state catalysis indicate that protons in
CHA zeolites (0% or 30%) are fully covered by methanol during steady state dehy-
dration catalysis (0.1-25 kPa) [214], suggesting that a fraction of the total sites are
responsible for the transient DME response. The NDME value of 0.30 is consistent
with the total number of paired protons on CHA containing 30% paired Al, indicating
that paired protons turnover at higher rates than isolated protons. This behavior is
reected in the measured intrinsic turnover frequencies (TOF) on CHA containing
0% and 30% paired protons (Figure C.12). Intrinsic TOFs (415 K) of both samples

531
increase linearly with methanol pressure (0.1-25 kPa), contrary to measured steady-
state dehydration rates that become zero-order and inhibited at methanol pressures
>5 kPa [214], but are nearly an order of magnitude larger on CHA containing paired
protons. These results are consistent with previous observations that both rst- and
zero-order methanol dehydration rate constants (per H+, 415 K) are an order of
magnitude larger at paired protons than at isolated protons in CHA zeolites [214].
The initial spike in coverage at low methanol pressures and the linear intrinsic
TOF through 25 kPa CH3OH on both CHA samples (Figure C.12), suggests that
the transient values presented are likely not measured under the expected methanol
pressures. Steady-state DME formation rates (per H+, 415 K) are consistent with
previously reported values (within 2x, Figure C.10) [214], but not with transiently
measured intrinsic TOF. Together this suggests that methanol transport to the IR
pellet surface is diusion limited and that transient rates are measured under lower
methanol pressures than expected of that chromatographic eects may be present
across the catalyst pellet [510]. These SSITKA experiments were not performed in
a true plug-ow reactor, so there is likely bypassing of the sample that also corrupts
measured data. Variation of the methanol site contact time during these exper-
iments could be performed to determine transient DME formation responses that
are uncorrupted by external gas transport [510]. While these SSITKA experiments
have produced exciting and encouraging data regarding the turnover of isolated and
paired sites in CHA, there is still a large amount of work required in order to ensure
that these experiments are performed under conditions that are free of concentration
gradients.
C.2 Interpretation of methanol dehydration activation parameters
Although more work is required to understand the mechanistic nature of the in-
hibition observed at high methanol pressures, these results collectively support prior
proposals implicating adsorption of an additional methanol molecule as the source of
inhibition in small-pore zeolites and we will use this assumption to model methanol
532
dehydration kinetics using a rate equation containing a trimeric inhibiting surface
species. This results in both the associative and dissociative dehydration rate laws
taking the same functional form and enables extraction of rst- and zero-order rate
constants for each pathway:
rDME,A =kfirst,APCH3OH
1 +kfirst,Akzero,A
PCH3OH +kfirst,Akinhibit,A
P 2CH3OH
(C.28)
rDME,D =kfirst,DPCH3OH
1 +kfirst,Dkzero,D
PCH3OH +kfirst,Dkinhibit,D
P 2CH3OH
(C.29)
C.2.1 Comparison of isolated protons in CHA and MFI
Methanol dehydration rates (415 K, per proton) measured on CHA zeolites (Chap-
ter 8) containing predominantly isolated protons increase linearly at low methanol
pressures, but approach a maximum and then decrease from inhibition at high methanol
pressures (>10 kPa) [214]. IR spectra measured on CHA zeolites containing predom-
inantly isolated protons under steady-state dehydration conditions (415 K, 0.1-22
kPa) do not show the formation of surface methoxy species, indicating that isolated
protons in CHA zeolites dehydrate methanol via the associative mechanism. Addi-
tionally, density functional theory predicts a lower free energy activation barrier for
DME formation via methanol monomers through protonated dimers (i.e., associative
pathway) than dehydration of a methanol monomer to form a surface methoxy (i.e.,
dissociative pathway) on isolated protons in CHA (118 vs 122 kJ mol−1; Figure C.13).
Associative dehydration zero-order rate constants (415 K, per H+) on CHA zeolites
containing isolated protons are similar to those in MFI zeolites, indicating that iso-
lated protons in CHA and protons in MFI are similar in acid strength [16, 83, 214].
First-order rate constants (415 K, per H+) on isolated protons in CHA are nearly
10x larger than in MFI, suggesting that this reaction occurs within a smaller void
in CHA than in MFI [22]. This dierence in rst-order rate constant is similar to
that expected from the dierence in connement between the 10-MR (ca. 0.56 nm)
in MFI an the 8-MR (ca. 0.38 nm) window in CHA [214].

533
Figure C.13. DFT calculated free energies (433 K, 1 bar) for the associa-tive (dashed) and dissociative (solid) methanol dehydration mechanisms onisolated protons in CHA.
First- and zero-order activation enthalpies (∆H), entropies (∆S), and Gibbs free
energies (∆G) were simultaneously estimated for isolated and paired protons in CHA
by tting DME formation rate data measured as a function of methanol pressure (0.05-
50 kPa), temperature (383-423 K), and paired Al site content (0-44%) to equation
C.30:
rDME
[H+]= γ
kpfirstPCH3OH
1 +kpfirstkpzero
PCH3OH +kpfirstkpinverse
P 2CH3OH
+ (1− γ)kifirstPCH3OH
1 +kifirstkizero
PCH3OH +kifirstkiinverse
P 2CH3OH
(C.30)
where γ is the fraction of protons in pairs, kij are rate constants of isolated protons,
and kpj are rate constants of paired protons. Apparent rst, zero, and inhibiting rate
constants were approximated using transition state theory:
k =kbT
he
∆SR e
−∆HRT (P0[
100kPa
bar])1−m (C.31)
where P0 is the standard state pressure of 1 bar to which the thermodynamic pa-
rameters are referred, m is the number of reactants that form the transition state, kb
is the Boltzmann constant, h is the Plank constant, and R is the ideal gas constant
(8.314 J mol−1 K−1). Apparent activation enthalpies and entropies for MFI were

534
obtained by tting equation C.28 to a DME formation rate data (per H+) measured
as a function of temperature (383-433 K) on two dierent MFI zeolites (Si/Al = 30,
43). Activation parameters for protons in MFI and for isolated and paired protons in
CHA are listed in Table C.1.
Table C.1.Activation enthalpies, entropies, and free energies for rst- and zero-orderrate constants (415 K) at isolated and paired protons in CHA.
First-order rate constants reect dierences in free energy between the same
associative dehydration transition state and a methanol monomer and gas-phase
methanol. ∆Gfirst(433 K) are lower at isolated protons in CHA than at protons
in MFI, consistent with larger rst-order rate constants at isolated protons in CHA.
As observed for associative zero-order rate constants, ∆Hfirst is larger and ∆Sfirst is
lower at isolated protons in CHA than at protons in MFI. The higher ∆Hfirst at iso-
lated protons in CHA likely reects the preferred stabilization of methanol monomers
relative to the TS, while the lower ∆Sfirst suggests that connement of a gas-phase
methanol to form the transition state is more entropically favorable in CHA than in
MFI.
535
C.2.2 Comparison of isolated and paired protons in CHA
First- and zero-order methanol dehydration rate constants (415 K, per proton)
are nearly 10x larger at paired protons than at isolated protons in CHA zeolites [214].
IR spectra measured under steady-state methanol dehydration conditions (415 K,
0.1-22 kPa) show the persistent presence of surface methoxy species on CHA zeolites
containing paired Al sites. These results indicate that paired protons in CHA may
allow methanol dehydration to proceed via the dissociative dehydration mechanism,
which is inaccessible under equivalent operating conditions on isolated protons in
CHA and protons in MFI zeolites (415 K, 0.1-22 kPa) [214]. Activation parameters
estimated for paired protons in CHA (Table C.1) reect those of the dissociative
dehydration mechanism, which is assumed to occur only and paired protons, while
those for isolated protons reect the associative mechanism, assumed to occur only
at isolated protons.
Dierences in zero-order rate constants reect dierences in the free energy be-
tween the associative transition state and a protonated methanol dimer, and the disso-
ciative transition state and a methoxy/methanol pair for isolated and paired protons,
respectively. ∆Hzero is similar for both the associative and dissociative pathways in
CHA (Table C.1) reecting similar stability between the two transition states and
their respective intermediates. ∆Szero, however, is more positive at paired protons
than at isolated protons. The small ∆Szero of the associative pathway likely reects
a transition state similar to the protonated dimer, but which loses some degrees of
freedom of one of the methyl groups (Scheme C.1). In the dissociative pathway, the
positive ∆Szero likely reects the liberation of the strongly-adsorbed methoxy to form
the transition state, assuming that both water and methanol have similar mobility
in the gas-phase. Dierences in rst-order rate constants reect dierences in the
free energy between the two dierent transition states and a methanol monomer and
gas-phase methanol. Smaller ∆Hfirst at paired protons reects the dierence in sta-
bility of the transition state and the methanol monomer, while gas-phase water and
536
methanol likely have similar gas-phase enthalpies. The larger ∆Hfirst at isolated pro-
tons likely arise from adsorption of the second methanol at a methanol monomer to
form the transition state (Scheme C.1). ∆Sfirst is more negative at paired protons
likely reecting the large entropic penalty required to form a surface methoxy from
a methanol monomer, despite the liberation of a gas-phase water molecule during
methoxy formation. Negative ∆Sfirst at isolated protons is likely reective of ad-
sorption and connement of a gas-phase methanol required to form the transition
state.
Experimentally derived activation parameters are able to provide some insight
into the mechanistic underpinnings of methanol dehydration at paired and isolated
sites, but are unable to rationalize this behavior with transition state structures or
stabilities. Here, we turned to a preliminary DFT investigation to help shed light on
why the dissociative pathway is favored at paired protons in CHA. The dissociative
pathway proceeds through two distinct transition states to form water and a surface
methoxy from a methanol monomer, and to form DME from a methoxy/methanol
pair. Calculations at isolated protons showed that the barrier to form a surface
methoxy is likely the rate-limiting barrier of the dissociative pathway (Figure C.13)
and provide a starting point for this investigation. The stability of the methoxy
transition state was probed by reorienting the bond angles between the four unique
CHA framework oxygen atoms, methoxy, and water, which comprise the methoxy
transition state, in order to determine the lowest energy structure. The methoxy
transition state is preferentially stabilized in the 8-MR window adjacent to a paired
proton (Figure C.14), because the size of the 8-MR (ca. 0.38 nm) allows the newly-
formed water molecule to hydrogen bond with the adjacent oxygen atoms.

537
Figure C.14. Structure of the methoxy transition state at a paired pro-ton in CHA. Values represent the distance between adjacent nuclei (greenconnectors) in pm.
Both the connement of this transition state within the 8-MR and the stabiliza-
tion of the conjugate anion by the second proton, result in a lower calculated free
energy barrier for the dissociative pathway at a paired proton than for the associa-
tive pathway at either an isolated or paired site (Figure C.15). These results provide
further evidence that methanol dehydration proceeds via the dissociative dehydra-
tion pathway at paired protons in CHA zeolites, and supports previous kinetic and
spectroscopic evidence of methoxy formation and lower free energy barriers at paired
protons in CHA.

538
Figure C.15. DFT calculated free energies (433 K, 1 bar) for the associa-tive (dashed) and dissociative (solid) methanol dehydration mechanisms onisolated (black) and paired (blue) protons in CHA.
C.3 Eect of paired protons in other zeolite frameworks
The observation made in CHA suggest that the presence of paired Al sites in a
6-MR adjacent to an 8-MR window are important for the stabilization of the methoxy
transition state. Many other zeolite frameworks contain similar building structures to
those found in CHA and provide a platform to further investigate methoxy formation
in small-pore zeolites. CHA, LEV, AEI, and AFX zeolites are part of the AABBCC
zeolite family and contain double 6-MR adjacent to an 8-MR window, while RTH
zeolites are built from chained 5-MR/4-MR building units and contain an 8-MR, but
no adjacent 6-MR. LEV [511], AEI [270], AFX [34], and RTH [208] zeolites were
synthesized according to reported procedures and all zeolites exchanged detectable
amounts of Co2+, indicating the presence of paired Al sites. IR spectra measured
on LEV, AEI, and AFX zeolites containing paired protons (12-34% paired Al) under
steady-state methanol dehydration conditions (415 K, 0.77 kPa) reveal that surface
methoxy species are present during methanol dehydration catalysis (Figure C.16).
RTH zeolites, which were able to exchange Co2+, did not show the formation of surface
methoxy under conditions where AEI, AFX, CHA, and LEV zeolites, which contained

539
paired protons, showed methoxy species (Figure C.16). These results further support
the role of paired protons in the formation of surface methoxy species, but only when
they are adjacent to an 8-MR window. This hypothesis still needs to be veried
by measuring IR spectra on zeolites that contain 6-MR, but not double 6-MR, next
to 8-MR (e.g., LTA) and on frameworks that contain paired Al in a double 6-MR,
but no adjacent 8-MR (e.g., FAU). Additional experiments should be performed by
synthesizing one of these alternative frameworks (e.g., AEI, AFX, LEV) with dierent
fractions of paired Al sites to see if methoxy formation and methanol dehydration rates
vary in the same way as observed in CHA [214].
Figure C.16. IR spectra of CHA containing 0% (light green) and 44% (darkgreen) paired Al, LEV (blue; Si/Al = 17, 12% paired Al), AEI (red; Si/Al= 16, 32% paired Al), AFX (yellow; Si/Al = 9, 34% paired Al), and RTH(grey; Si/Al = 15, 16% paired Al) under 0.77 kPa CH3OH at 415 K.

540
541
D. SOLID-STATE NMR STRUCTURAL CHARACTERIZATION OF
INORGANIC AND ORGANIC STRUCTURE DIRECTING AGENTS WITH
FRAMEWORK AL ATOMS IN CHABAZITE ZEOLITES
D.1 Introduction
Cationic structure-directing agents (SDA) direct the incorporation of Al into
framework positions during zeolite crystallization [223, 224], but the interactions be-
tween mixtures of organic and inorganic SDAs with anionic Al centers are less well
understood. Our initial investigation using a collaborative experimental and theo-
retical approach to probe dierent Al-Al arrangements in CHA zeolites synthesized
using N,N,N-trimethyl-1-adamantyl ammonium (TMAda+) and dierent alkali (e.g.,
Na+ or K+) cations is presented in Chapter 3. Ab initio molecular dynamics reveal
that Al incorporation is directed by cationic structure directing agents and that bulky
TMAda+ molecules isolated framework Al atoms due to electrostatic interactions that
prefer to separate like charges (e.g., anionic Al-Al in silica frameworks, or cationic
N-N in quaternized nitrogen centers in SDAs) and minimize the distance between op-
posite charges (e.g., Al-N). Incorporation of dierent inorganic Na+ cations disrupts
the long-range ordering of Al and TMAda+ and results in the stabilization of paired
Al sites, relative to other Al-Al arrangements, because Na+ cations prefer to locate
and direct the placement of a second Al atom in the face of a six-membered ring in
CHA. In this Appendix, we utilize solid-state magic angle spinning nuclear magnetic
resonance (SS MAS NMR) techniques to probe the local coordination environment
of TMAda+ and Na+ structure directing agents used in the crystallization of CHA
zeolites that contain dierent amounts of paired and isolated Al sites.
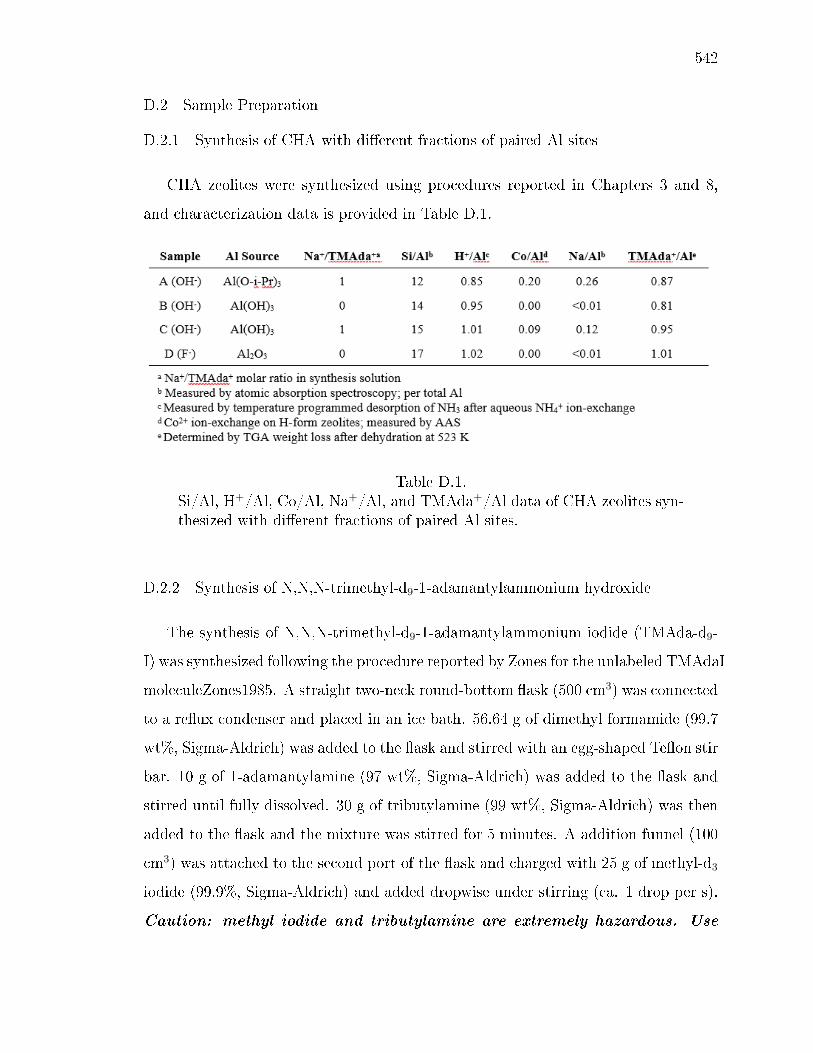
542
D.2 Sample Preparation
D.2.1 Synthesis of CHA with dierent fractions of paired Al sites
CHA zeolites were synthesized using procedures reported in Chapters 3 and 8,
and characterization data is provided in Table D.1.
Table D.1.Si/Al, H+/Al, Co/Al, Na+/Al, and TMAda+/Al data of CHA zeolites syn-thesized with dierent fractions of paired Al sites.
D.2.2 Synthesis of N,N,N-trimethyl-d9-1-adamantylammonium hydroxide
The synthesis of N,N,N-trimethyl-d9-1-adamantylammonium iodide (TMAda-d9-
I) was synthesized following the procedure reported by Zones for the unlabeled TMAdaI
moleculeZones1985. A straight two-neck round-bottom ask (500 cm3) was connected
to a reux condenser and placed in an ice bath. 56.64 g of dimethyl formamide (99.7
wt%, Sigma-Aldrich) was added to the ask and stirred with an egg-shaped Teon stir
bar. 10 g of 1-adamantylamine (97 wt%, Sigma-Aldrich) was added to the ask and
stirred until fully dissolved. 30 g of tributylamine (99 wt%, Sigma-Aldrich) was then
added to the ask and the mixture was stirred for 5 minutes. A addition funnel (100
cm3) was attached to the second port of the ask and charged with 25 g of methyl-d3
iodide (99.9%, Sigma-Aldrich) and added dropwise under stirring (ca. 1 drop per s).
Caution: methyl iodide and tributylamine are extremely hazardous. Use
543
proper personal protective equipment and engineering controls to limit ex-
posure. The reaction mixture was allowed to slowly warm to room temperature and
was stirred under an Ar purge for ve days. Approximately 200 cm3 of diethyl ether
(99.9 wt%, Sigma-Aldrich) was added to the resulting slurry and stirred for 30 minutes
to allow for further crystallization. The crystalline product was recovered through
vacuum ltration using a porous glass frit (2-8 µm pore size, Ace Glass) and resulted
in a bronze colored slurry. This was then washed with 100 cm3 of isopropyl alcohol
(99.9 wt%, Sigma-Aldrich), resulting in pure white crystals. Residual isopropyl alco-
hol was evaporated overnight at room temperature leaving behind the TMAda-d9-I
product (structure conrmed by 1H and 13C NMR in the results section).
TMAda-d9-I was converted to the OH- form via ion-exchange with Dowex Marathon
A OH exchange resin. Approximately 5 grams of TMAda-d9-I was dissolved in ca. 10
g of deionized water (18.2 MΩ cm−1) and added to a 100 cm3 burette packed with 50
cm3 of hydrated resin. The TMAda-d9 solution was allowed to pass through the resin
at a rate of ca. 1 drop per second until all the solution had entered the packed bed.
25 cm3 of deionized water was then added to the column and allowed to drain (ca. 1
drop per s) to ush the packed bed of any residual TMAda-d9-OH. The nal purity
and concentration was quantied by dropwise titration of the TMAda-d9-OH solution
with 0.1 M HCl (38 wt% HCl, Macron Fine Chemicals) using phenolphthalein (ACS
Reagent, Sigma-Aldrich) as an indicator. The nal purity was measured to be >90%
TMAda-d9-OH.
D.2.3 Synthesis of CHA zeolites with TMAda-d9
CHA zeolites were synthesized with NaOH/TMAda-d9-I = 1 and without Na+
using TMAda-d9-OH following previously reported procedures [42].
All samples were recovered from synthesis vessels via centrifugation and washed
repeated with water and acetone to remove any residual synthesis media. Samples
were then dried at 363 K for 24 hours and then the crystal structure was conrmed by
X-ray diraction (XRD). The total organic content was measured by thermal gravi-

544
metric analysis (TGA). Co-exchanged CHA zeolites were prepared following previ-
ously reported procedures [42]. Al, Na, and Co contents were measured by atomic
absorption spectroscopy (AAS). H+/Al values were measured using aqueous phase
NH3 titrations described elsewhere [78, 171].
D.3 Results and Discussion
27Al SS MAS NMR spectra measured on as-synthesized CHA zeolites (Samples A-
D) show predominantly tetrahedrally-coordinated Al atoms (δ = 58 ppm; Figure D.1)
with a minority of octahedrally-coordinated Al (δ = 0 ppm; Figure D.1) in Samples
A-C. Sample D showed an upeld shoulder (δ = 52 ppm) suggesting the presence of
a secondary tetrahedral Al environment.

545
Figure D.1. 27Al SS MAS NMR spectra of Samples A (black), B (red), C(blue), and D (purple) over the whole range measured (a) and focused onthe tetrahedral Al resonance (b).
19F SS MAS NMR did not show the presence of uoride in as-synthesized Sam-
ple D, indicating that this shoulder is likely not due to pentahedrally-coordinated
Al caused by coordination with uoride anions present in the synthesis media. 29Si
SS MAS NMR spectra revealed three dierent Si coordination environments (Fig-
ure D.2) with distinct chemical shifts corresponding to Si(OSi)4 (δ = -110 ppm),
Si(OAl)(OSi)3 (δ = -105 ppm), and either Si(OAl)2(OSi)2 or Si(OH)(OSi)3 (δ = -100
ppm) connectivities.
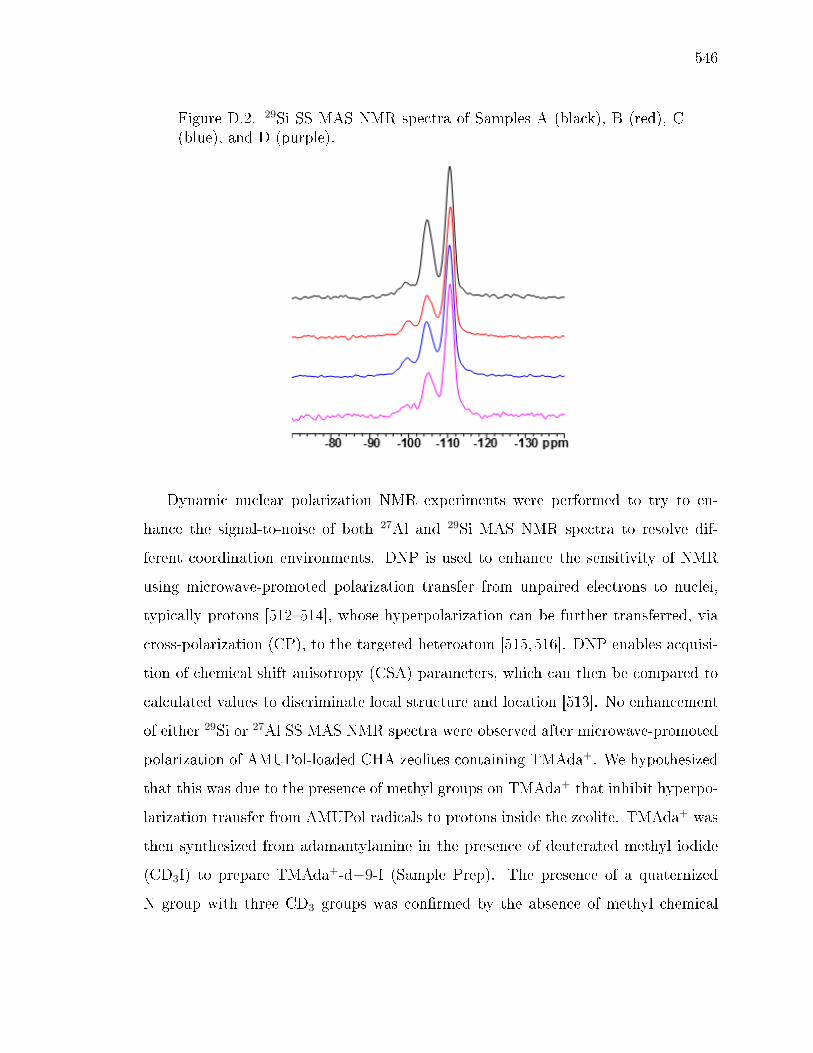
546
Figure D.2. 29Si SS MAS NMR spectra of Samples A (black), B (red), C(blue), and D (purple).
Dynamic nuclear polarization NMR experiments were performed to try to en-
hance the signal-to-noise of both 27Al and 29Si MAS NMR spectra to resolve dif-
ferent coordination environments. DNP is used to enhance the sensitivity of NMR
using microwave-promoted polarization transfer from unpaired electrons to nuclei,
typically protons [512514], whose hyperpolarization can be further transferred, via
cross-polarization (CP), to the targeted heteroatom [515,516]. DNP enables acquisi-
tion of chemical shift anisotropy (CSA) parameters, which can then be compared to
calculated values to discriminate local structure and location [513]. No enhancement
of either 29Si or 27Al SS MAS NMR spectra were observed after microwave-promoted
polarization of AMUPol-loaded CHA zeolites containing TMAda+. We hypothesized
that this was due to the presence of methyl groups on TMAda+ that inhibit hyperpo-
larization transfer from AMUPol radicals to protons inside the zeolite. TMAda+ was
then synthesized from adamantylamine in the presence of deuterated methyl iodide
(CD3I) to prepare TMAda+-d−9-I (Sample Prep). The presence of a quaternized
N group with three CD3 groups was conrmed by the absence of methyl chemical
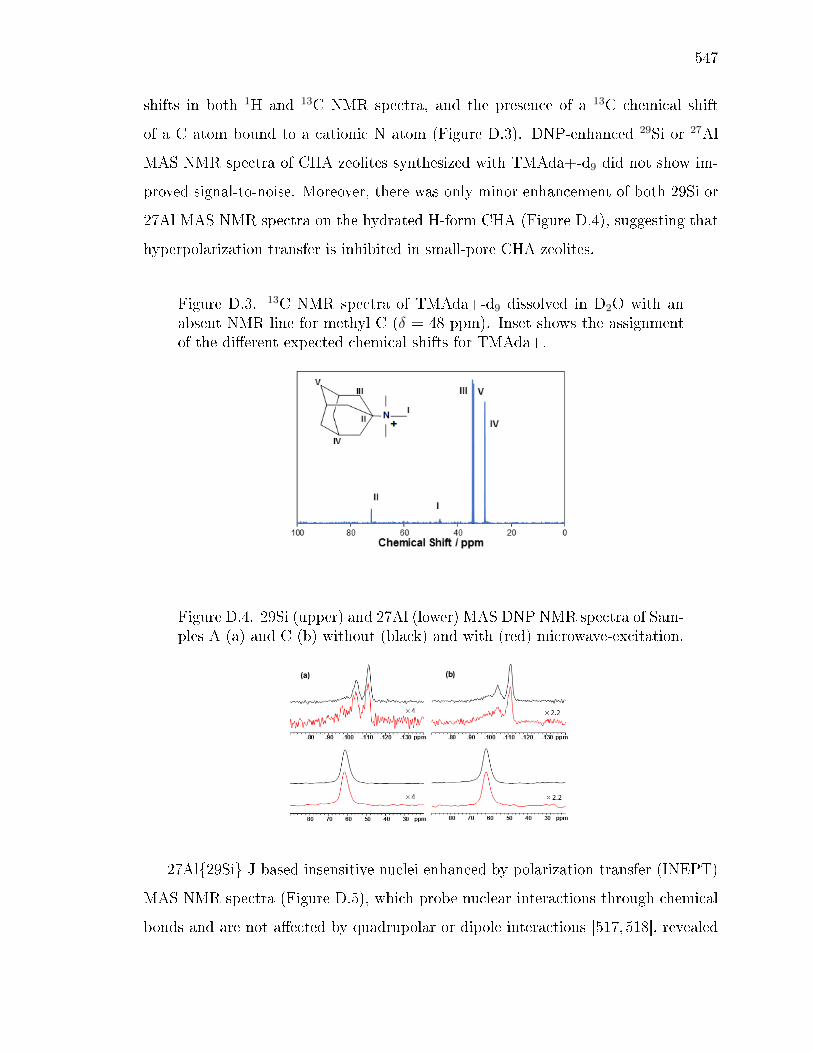
547
shifts in both 1H and 13C NMR spectra, and the presence of a 13C chemical shift
of a C atom bound to a cationic N atom (Figure D.3). DNP-enhanced 29Si or 27Al
MAS NMR spectra of CHA zeolites synthesized with TMAda+-d9 did not show im-
proved signal-to-noise. Moreover, there was only minor enhancement of both 29Si or
27Al MAS NMR spectra on the hydrated H-form CHA (Figure D.4), suggesting that
hyperpolarization transfer is inhibited in small-pore CHA zeolites.
Figure D.3. 13C NMR spectra of TMAda+-d9 dissolved in D2O with anabsent NMR line for methyl C (δ = 48 ppm). Inset shows the assignmentof the dierent expected chemical shifts for TMAda+.
Figure D.4. 29Si (upper) and 27Al (lower) MAS DNP NMR spectra of Sam-ples A (a) and C (b) without (black) and with (red) microwave-excitation.
27Al29Si J-based insensitive nuclei enhanced by polarization transfer (INEPT)
MAS NMR spectra (Figure D.5), which probe nuclear interactions through chemical
bonds and are not aected by quadrupolar or dipole interactions [517, 518], revealed

548
a single cross-correlation between tetrahedrally-coordinated Al (27Al, δ = 58 ppm)
and Si(OAl)(OSi)3 species (29Si, δ = -105 ppm), indicating that the 29Si feature at
-100 ppm is due to silanol groups and that Si(OAl)2(OSi)2 connectivities are absent
in all samples studied, consistent with previous proposals [42].
Figure D.5. 27Al29Si J-based INEPT MAS NMR spectrum of SampleA.
Triple quantum (3Q) 27Al SS MAS NMR experiments (Figure D.6), which mini-
mize higher-order quadrupolar eects to resolve inequivalent sites and enable extrac-
tion of isotropic quadrupolar shifts [52,519], reveal two distinct Al environments with
dierent quadrupolar coupling constants (CQ) and asymmetry parameters (ηQ), but
similar isotropic chemical shifts (δiso; Table D.2).
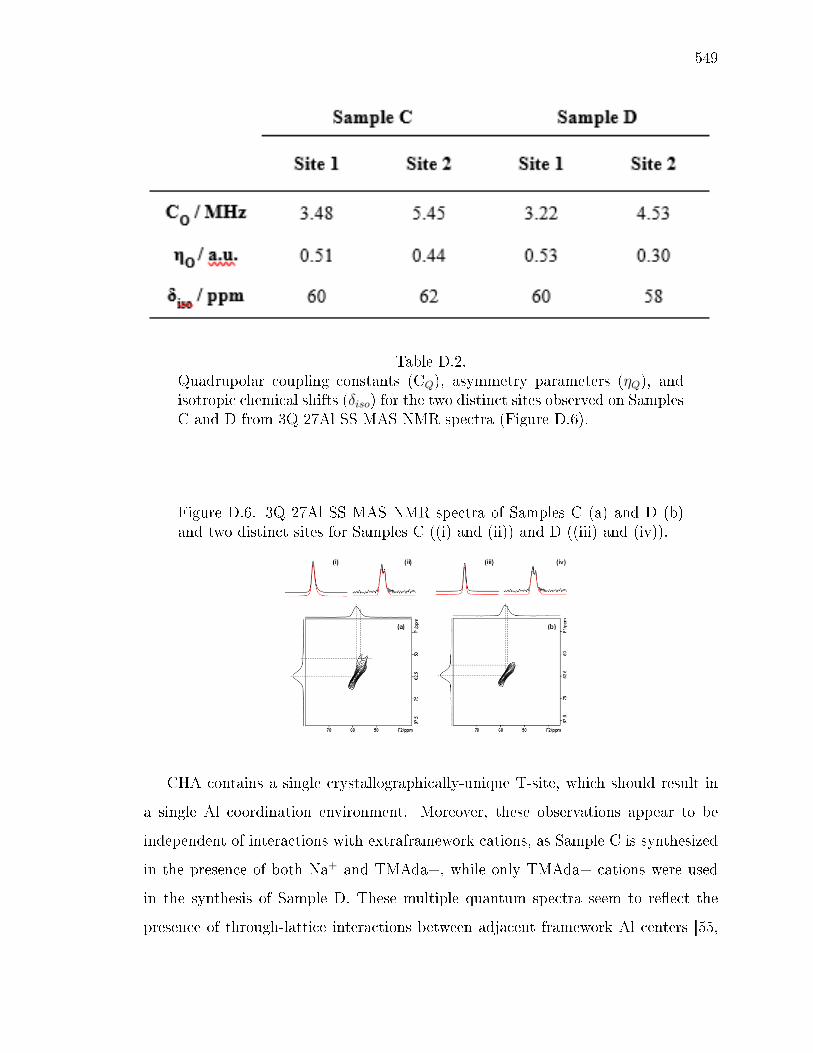
549
Table D.2.Quadrupolar coupling constants (CQ), asymmetry parameters (ηQ), andisotropic chemical shifts (δiso) for the two distinct sites observed on SamplesC and D from 3Q 27Al SS MAS NMR spectra (Figure D.6).
Figure D.6. 3Q 27Al SS MAS NMR spectra of Samples C (a) and D (b)and two distinct sites for Samples C ((i) and (ii)) and D ((iii) and (iv)).
CHA contains a single crystallographically-unique T-site, which should result in
a single Al coordination environment. Moreover, these observations appear to be
independent of interactions with extraframework cations, as Sample C is synthesized
in the presence of both Na+ and TMAda+, while only TMAda+ cations were used
in the synthesis of Sample D. These multiple quantum spectra seem to reect the
presence of through-lattice interactions between adjacent framework Al centers [55,

550
520]. Homonuclear dipolar interactions between adjacent framework Al atoms were
probed using 27Al-27Al single quantum-double quantum (SQ-DQ) MAS NMR [480,
521] and auto-correlation peaks between tetrahedrally-coordinated (27Al, δ = 58
ppm) framework Al atoms are shown in Figure D.7.
Figure D.7. 27Al-27Al SQ-DQ MAS NMR cross-correlation peaks of Sam-ples A (black), B (red), C (blue), and D (purple). Dashed lines representthe magnitude of each cross-correlation peak for the corresponding samples(same color identities).
Auto-correlation peaks (i.e., 27Al-27Al dipole interactions) were observed in each
sample, indicating the presence of two Al atoms separated by less than ca. 6 A [522].
Quantication of the distance between adjacent nuclei was not possible here, but could
be achieved through calibration of SQ-DQ MAS NMR experiments using frameworks
with precise Al-Al interatomic distances (e.g., AlPO frameworks). The magnitude of
the Al-Al cross-correlation peak (Figure D.7) does not correlate with the total number
of paired Al sites in Samples A-D, indicating that these samples contain additional Al-
Al arrangements not limited to 2 Al atoms within the same six-membered ring (6-MR)
of CHA. Furthermore, the presence of an auto-correlation peak in all samples indicates
that 8-MR Al pairs, which may be separated by either two or three Si neighbors and
are unable to exchange divalent Co2+ or Cu2+ cations [42,79], contribute signicantly
to 27Al-27Al MQ spectra and convolute interpretation of these data sets into singular
Al-Al arrangements, as has been previously suggested [523].
Next, we turn to probing the local environment of the extraframework SDA cations
and their relationship with Al pairing. 13C SS MAS NMR spectra are similar for all
as-synthesized CHA zeolites and are similar to 13C NMR spectra of TMAda+ in

551
solution [524], but do exhibit broadening of NMR lines consistent with connement
of the organic within CHA voids that limit free rotation (Figure D.8) [376,524].
Figure D.8. 13C SS MAS NMR spectra of as-synthesized CHA SamplesA (black), B (red), C (blue), and D (purple). Inset shows the assignmentof the ve 13C NMR lines to the ve unique C atoms of the TMAda+molecule.
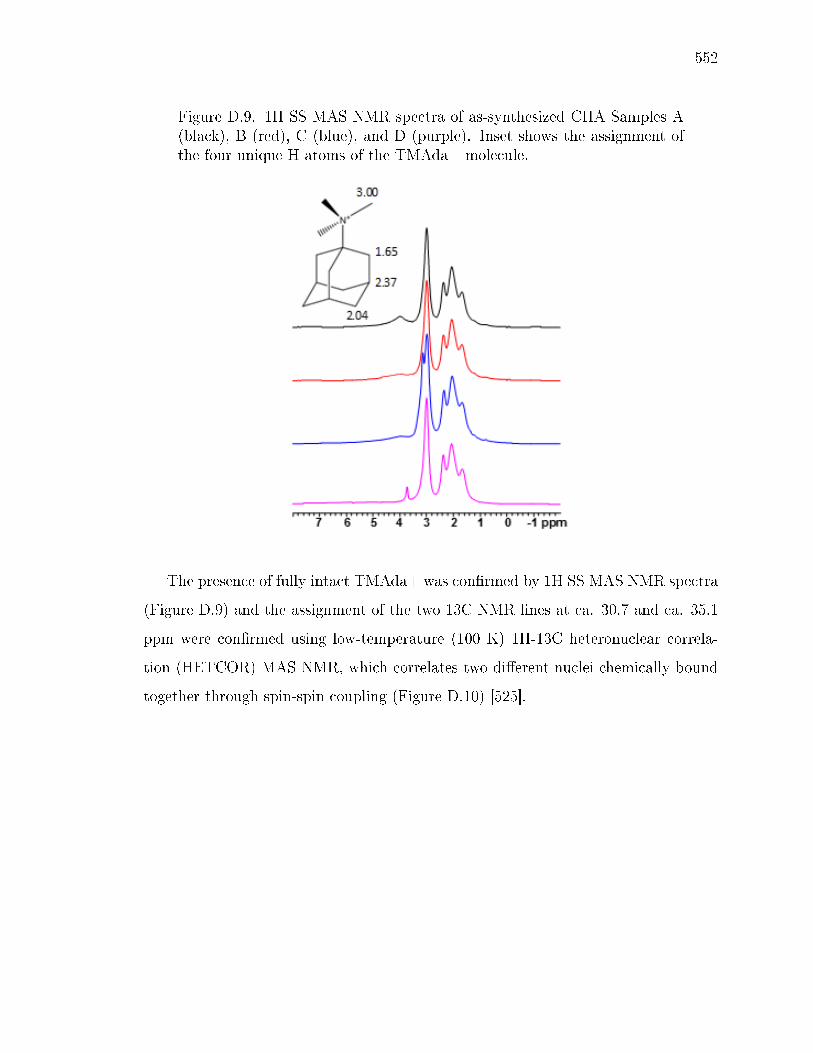
552
Figure D.9. 1H SS MAS NMR spectra of as-synthesized CHA Samples A(black), B (red), C (blue), and D (purple). Inset shows the assignment ofthe four unique H atoms of the TMAda+ molecule.
The presence of fully intact TMAda+ was conrmed by 1H SS MAS NMR spectra
(Figure D.9) and the assignment of the two 13C NMR lines at ca. 30.7 and ca. 35.1
ppm were conrmed using low-temperature (100 K) 1H-13C heteronuclear correla-
tion (HETCOR) MAS NMR, which correlates two dierent nuclei chemically-bound
together through spin-spin coupling (Figure D.10) [525].
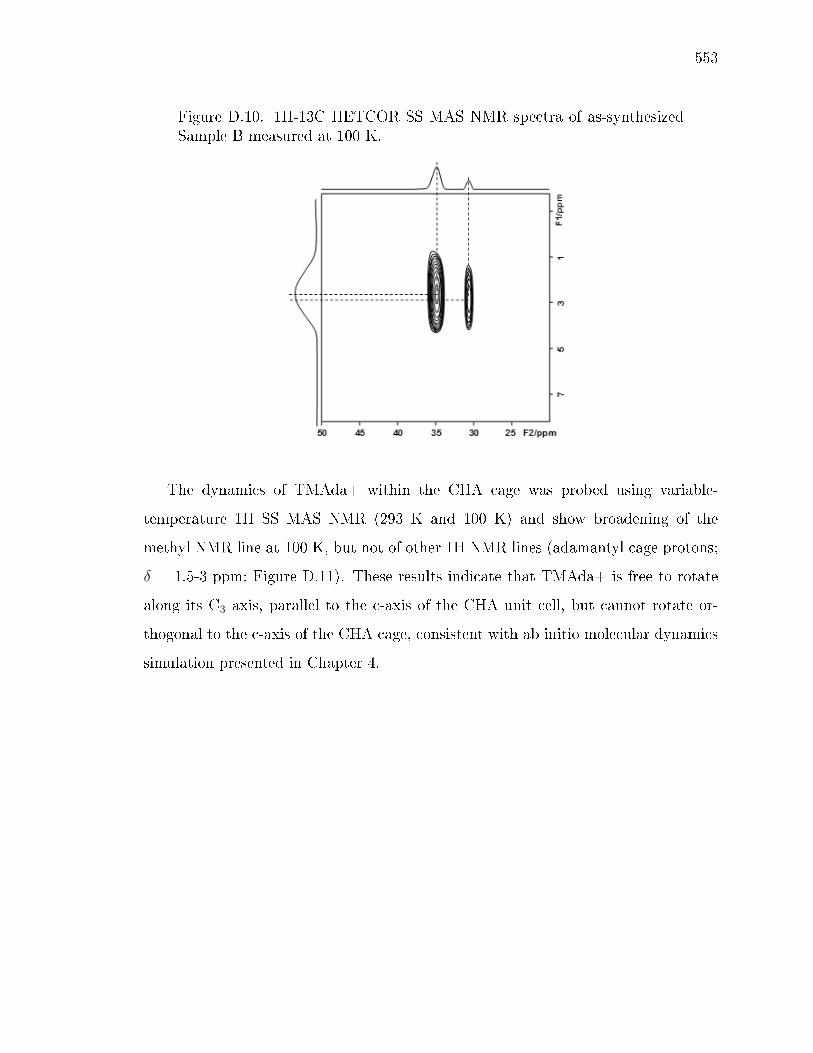
553
Figure D.10. 1H-13C HETCOR SS MAS NMR spectra of as-synthesizedSample B measured at 100 K.
The dynamics of TMAda+ within the CHA cage was probed using variable-
temperature 1H SS MAS NMR (293 K and 100 K) and show broadening of the
methyl NMR line at 100 K, but not of other 1H NMR lines (adamantyl cage protons;
δ = 1.5-3 ppm; Figure D.11). These results indicate that TMAda+ is free to rotate
along its C3 axis, parallel to the c-axis of the CHA unit cell, but cannot rotate or-
thogonal to the c-axis of the CHA cage, consistent with ab initio molecular dynamics
simulation presented in Chapter 4.

554
Figure D.11. Variable-temperature 1H SS MAS NMR spectra of Samplemeasured at 293 K (black) and 100 K (red). Black arrow is included toemphasize the broadening of the methyl 1H NMR line. Inset shows theC3-axis of rotation of the TMAda+ molecule.
Cationic SDAs direct the placement of Al atoms into positions proximal to the qua-
ternary N center during zeolite crystallization [80,200,223,224]. Rotational echo dou-
ble resonance (REDOR) MAS NMR was used to probe the orientation of TMAda+
with respect to framework Al atoms by measuring the dipolar coupling between two
heteronuclear nuclei (e.g., 1H and 27Al), which decays with distance (1/r3), and
can be used as a probe of the distance separating the two interrogated nuclei [526].
1H27Al REDOR MAS NMR was used to probe the distance between dierent H
atoms on TMAda+ with framework Al atoms (magnitude of ∆S/S0 reects distance
between nuclei; Figure 12) and indicated that Al atoms are located closest to methyl
protons attached to the cationic end of TMAda+. It also appears that Al atoms
are located near the back end of the adamantyl group, likely reecting interactions
of adamantyl protons with Al in an adjacent cage, and suggests that TMAda+ are
oriented opposite to each other in adjacent cages.
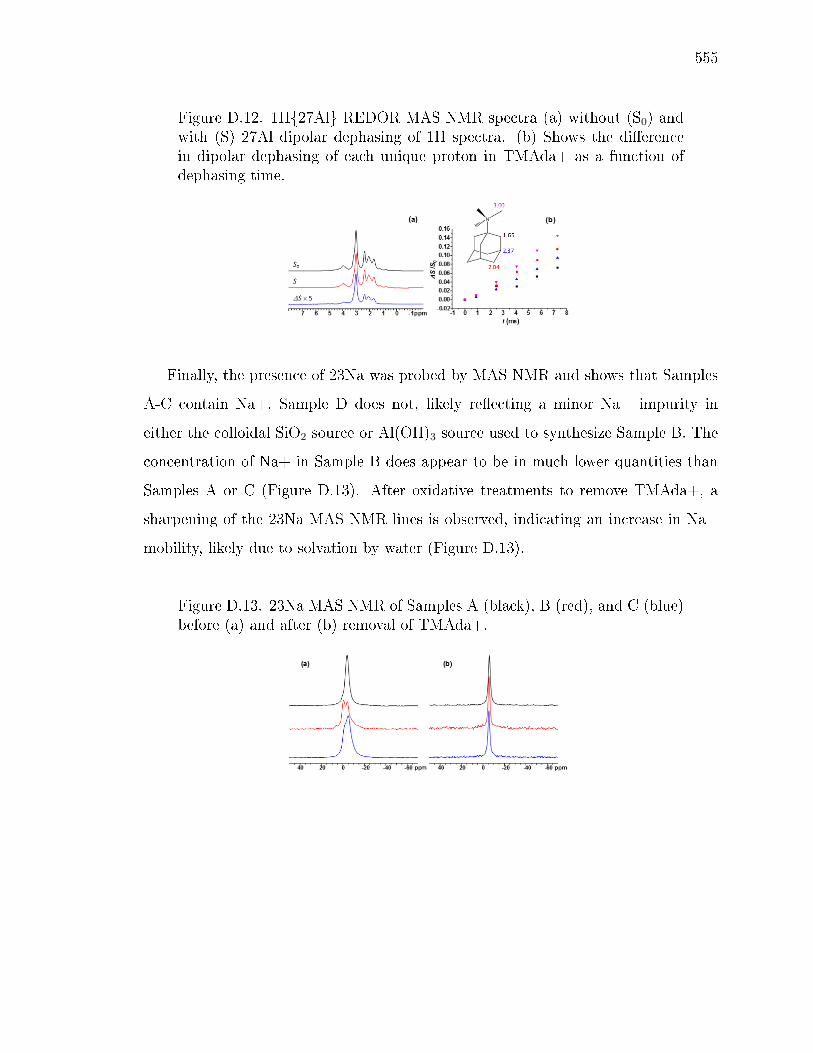
555
Figure D.12. 1H27Al REDOR MAS NMR spectra (a) without (S0) andwith (S) 27Al dipolar dephasing of 1H spectra. (b) Shows the dierencein dipolar dephasing of each unique proton in TMAda+ as a function ofdephasing time.
Finally, the presence of 23Na was probed by MAS NMR and shows that Samples
A-C contain Na+, Sample D does not, likely reecting a minor Na+ impurity in
either the colloidal SiO2 source or Al(OH)3 source used to synthesize Sample B. The
concentration of Na+ in Sample B does appear to be in much lower quantities than
Samples A or C (Figure D.13). After oxidative treatments to remove TMAda+, a
sharpening of the 23Na MAS NMR lines is observed, indicating an increase in Na+
mobility, likely due to solvation by water (Figure D.13).
Figure D.13. 23Na MAS NMR of Samples A (black), B (red), and C (blue)before (a) and after (b) removal of TMAda+.
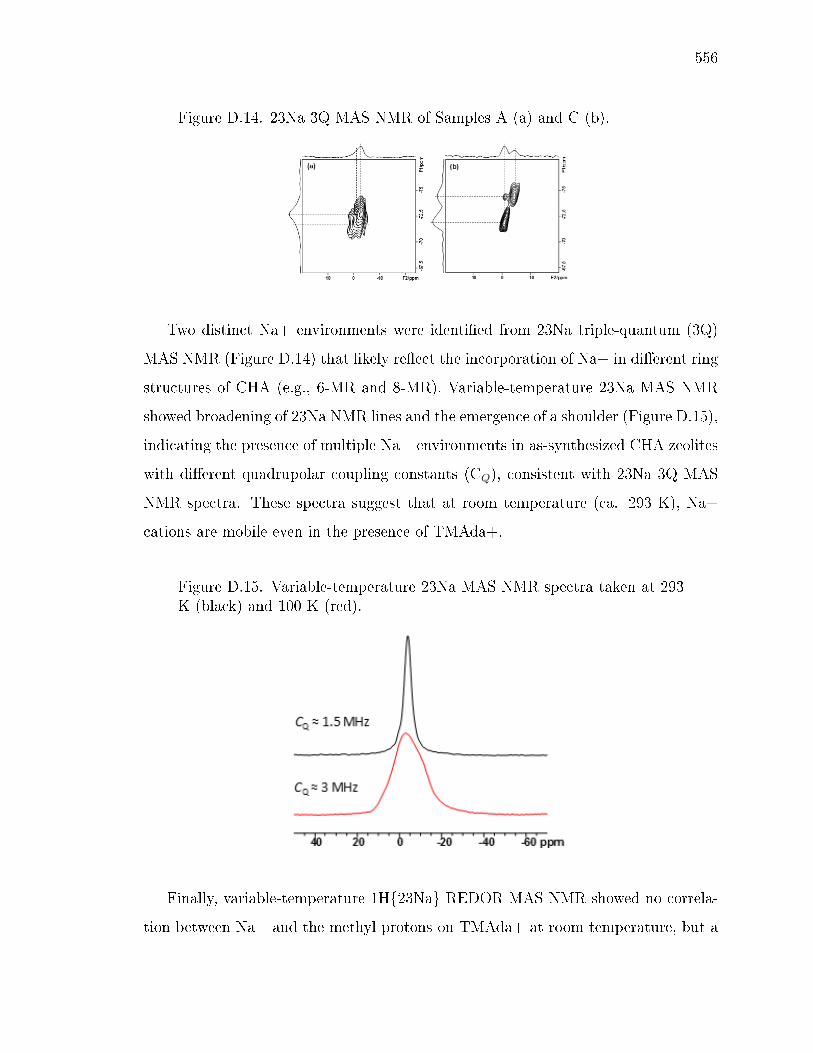
556
Figure D.14. 23Na 3Q MAS NMR of Samples A (a) and C (b).
Two distinct Na+ environments were identied from 23Na triple-quantum (3Q)
MAS NMR (Figure D.14) that likely reect the incorporation of Na+ in dierent ring
structures of CHA (e.g., 6-MR and 8-MR). Variable-temperature 23Na MAS NMR
showed broadening of 23Na NMR lines and the emergence of a shoulder (Figure D.15),
indicating the presence of multiple Na+ environments in as-synthesized CHA zeolites
with dierent quadrupolar coupling constants (CQ), consistent with 23Na 3Q MAS
NMR spectra. These spectra suggest that at room temperature (ca. 293 K), Na+
cations are mobile even in the presence of TMAda+.
Figure D.15. Variable-temperature 23Na MAS NMR spectra taken at 293K (black) and 100 K (red).
Finally, variable-temperature 1H23Na REDOR MAS NMR showed no correla-
tion between Na+ and the methyl protons on TMAda+ at room temperature, but a

557
strong correlation was observed at 100 K (Figure D.16), indicating that Na+ cations
are located near the quaternary N atom of TMAda+, but that Na+ is free to move
relative to TMAda+.
Figure D.16. 1H23Na REDORMAS NMR spectra (a) without (S0, black)and with (S, red) 23Na dipolar dephasing of 1H spectra measured at 100 K.(b) Shows the dierence in dipolar dephasing of methyl protons in TMAda+with 23Na as a function of dephasing time.
While this NMR analysis of the interactions of Na+ and TMAda+ with dierent
Al arrangements in CHA is still incomplete, it does provide evidence that Na+ atoms
are incorporated near the quaternary N atom of TMAda+ in CHA zeolites that con-
tain paired Al sites. These results are consistent with previous proposals of Al siting
in CHA [42] and DFT calculations of dierent Al-Al arrangements with Na+ and
TMAda+ in CHA (Chapter ??). Selective titrimetric probes of Al-Al pairs in the
8-MR of CHA would provide complimentary evidence to 27Al-27Al auto-correlation
in SQ-DQ MAS NMR spectra that indicate that even CHA zeolites that are un-
able to exchange Co2+ may still have two Al atoms located within the same ring
(e.g., 8-MR). Furthermore, 1H-1H SQ-DQ MAS NMR experiments could be used
to probe auto-correlation between Bronsted acid sites, which are not corrupted by
quadrupolar broadening, to look for the presence of Al-Al pairs in H-form zeolites with
higher sensitivity than 27Al-27Al SQ-DQ MAS NMR spectra. Resonant echo adia-
batic passage double resonance (REAPDOR) MAS NMR, which allows for correlat-
ing dipole moments between spin-1/2 (e.g., 29Si) and quadrupolar nuclei (e.g., 23Na,
27Al), something that is not possible in standard REDOR pulse-sequences [527], can
also be used to identify interactions between 23Na and 29Si (e.g., Si(OAl)(OSi)3),
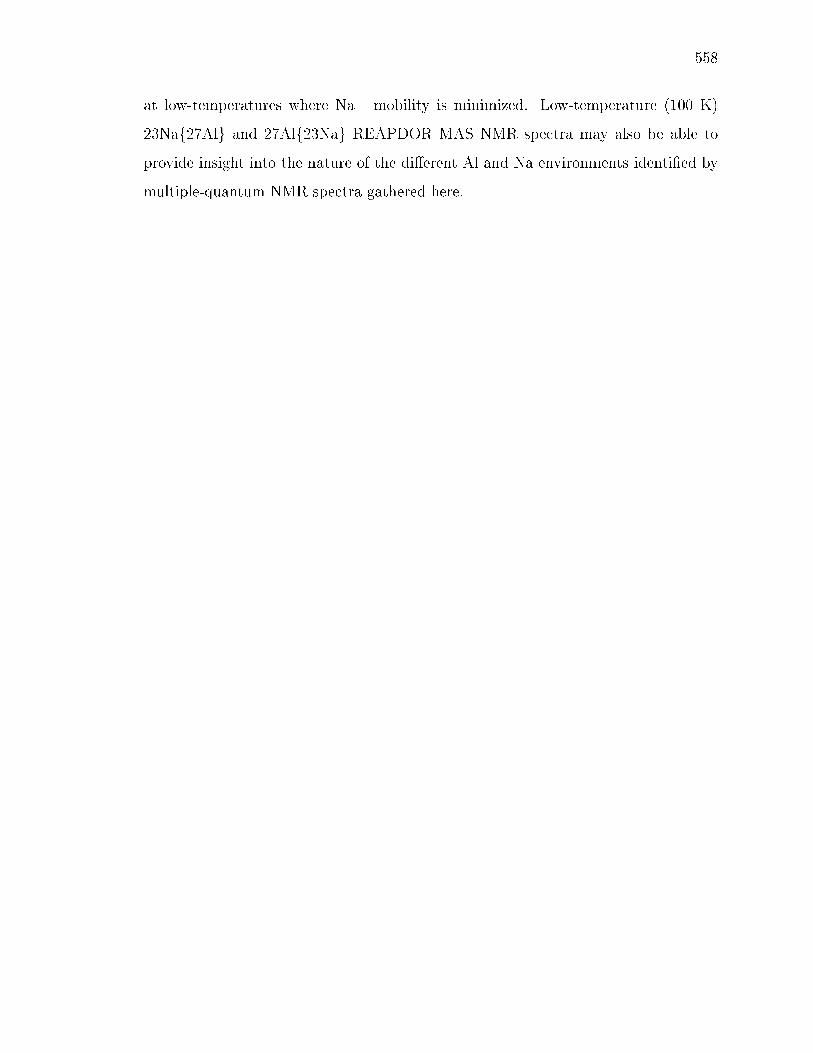
558
at low-temperatures where Na+ mobility is minimized. Low-temperature (100 K)
23Na27Al and 27Al23Na REAPDOR MAS NMR spectra may also be able to
provide insight into the nature of the dierent Al and Na environments identied by
multiple-quantum NMR spectra gathered here.

559
E. TITRATION AND QUANTIFICATION OF OPEN AND CLOSED LEWIS
ACID SITES IN TIN-BETA ZEOLITES THAT CATALYZE GLUCOSE
ISOMERIZATION
E.1 Introduction
Pure-silica molecular sieve frameworks containing Lewis acidic tetravalent het-
eroatoms (e.g., Sn4+, Ti4+) catalyze a range of oxidation reactions [528532], in-
cluding the concerted Meerwein-Ponndorf-Verley carbonyl reduction (aldehyde, ke-
tone) and Oppenauer alcohol oxidation via intramolecular or intermolecular cycles
(MPVO), with recent attention focused on MPVO reactions of biomass-derived oxy-
genates containing carbonyl moieties [28,191,533536]. Lewis acidic heteroatoms (M)
can be tetrahedrally coordinated (M-(OSi)4, closed site) or tri-coordinated ((HO)-
M-(OSi)3; open site) to the zeolite framework [537], each with its own strength and
reactivity. Lewis acidic Sn-Beta zeolites have been prepared by direct hydrothermal
crystallization (uoride-assisted [529, 538], hydroxide-assisted [539] and by several
indirect post-synthetic modications, which rst involve removing framework sili-
con atoms [540, 541] or heteroatoms (e.g., Zn, Al) [191] to form vacancy defects,
followed by insertion of Lewis acidic heteroatoms (e.g., Sn, Ti) via vapor-phase de-
position [542], via liquid-phase reux or exchange [543546], or via solid-state ion
exchange [547549]. Sn-Beta zeolites prepared by such diverse methods and treat-
ments dier in their distribution of open and closed sites [550] and their density of
other structures (e.g., Si-OH defects), requiring methods to quantify the number of
open and closed sites in order to interpret turnover rate dierences among samples
of varying origin or treatment history.
Experimental and theoretical assessments of the strength of Lewis acid sites, in-
ferred from their interactions with Lewis base probes, indicate that open sites are

560
stronger than closed sites in Sn-Beta. Deuterated acetonitrile (CD3CN) binding to
framework Sn sites involves donation of electron density from the HOMO of CD3CN
(localized at the nitrogen atom) to the LUMO of the Sn site (a combination of the
four antibonding σ*(Sn-O) orbitals) and concomitant lengthening of the four Sn-O
bonds, which occurs to a greater extent in open Sn sites than in less exible closed
Sn sites according to theory (ONIOM and DFT) [550]. These ndings are consis-
tent with experiment, which has noted that infrared ν(C≡N) stretches for gas-phase
CD3CN (2265 cm-1) are more strongly perturbed when bound to open (2316 cm-1)
than to closed Sn sites (2308 cm-1), and that IR peaks for CD3CN bound to closed
sites disappear preferentially upon evacuation of CD3CN-saturated surfaces (298-433
K) [550552]. Sn-Beta zeolites saturated with ammonia at 298 K and then evacu-
ated at 393 K give rise to 119Sn NMR resonances for tetrahedrally-coordinated closed
sites (ca. -443 ppm) but not for tetrahedrally-coordinated open sites (ca. -420 ppm),
which instead appear as broad resonances characteristic of penta-coordinated Sn (-
500 to -600 ppm; e.g., (NH3)(HO)-Sn-(OSi)3) [551], indicating that NH3 binds more
strongly at open Sn sites. Furthermore, NH3-saturated Sn-Beta zeolites that are
subsequently exposed to CD3CN (308 K) show IR peaks at 2308 cm-1 but not at
2316 cm-1 [551], indicating that NH3 binds more strongly than CD3CN to open Sn
sites, as also predicted by DFT [553]. Taken together, these spectroscopic data and
theoretical calculations provide evidence that open Sn sites bind Lewis bases more
strongly than closed Sn sites in Sn-Beta. Experimental and theoretical assessments of
catalytic oxidation reactivity also provide evidence that open sites are more reactive
Lewis acid sites than closed sites in Sn-zeolites. Boronat et al. varied the distribution
of open and closed sites in Sn-Beta by varying calcination conditions (e.g., humidity,
bed depth) and observed that the initial rate of Baeyer-Villiger oxidation of adaman-
tanone with aqueous H2O2 (per g, 363 K, dioxane solvent) correlated linearly with IR
peak areas for CD3CN bound to open Sn sites, but not for CD3CN bound to closed
Sn sites [550]. Bermejo-Deval et al. exchanged sodium cations onto silanol groups
proximal to open Sn sites in Sn-Beta and observed suppression of glucose-fructose

561
isomerization rates (per g, 353 K), concluding that open Sn sites were the dominant
active site for this intramolecular MPVO reaction [551]. These experimental ndings
are consistent with activation enthalpies for intramolecular 1,2-hydride shift steps in
glucose-fructose isomerization sequences that theory has predicted to be 5-10 kcal
mol-1 lower on open than on closed Sn sites [554556]. Both theory and experiment
indicate that open Sn sites are stronger Lewis acids and more reactive in oxidation
reactions than closed sites, but these two types of sites have yet to be quantied
precisely in Sn-zeolites, as required for rigorous normalization of catalytic turnover
rates.
Pyridine is used as a base titrant of Lewis acid sites because it gives rise to IR peaks
at 1455 cm-1 and 1623 cm-1 for perturbed gas-phase ring deformation modes (1439
cm-1 and 1580 cm-1, respectively) when present in Lewis-bound adducts [557560], but
it does not distinguish between open and closed Lewis acid sites. As a result, pyridine
titration of Sn-Beta zeolites has been used only to detect the presence of Lewis acidic
Sn [377, 561], to infer the density of Lewis acidic Sn sites from integrated IR peak
areas [542, 562], or to quantify the number of Lewis acidic Sn sites using integrated
molar extinction coecients (E) for Lewis acidic Al sites [545, 556, 563, 564]. Carbon
monoxide has also been used as a base titrant to identify open (2185 cm-1) and closed
(2176 cm-1) Lewis acidic Zr sites in Zr-Beta zeolites and to infer their density from
integrated IR peak areas [565]. Deuterated acetonitrile, which is used to avoid Fermi
resonance between the ν(C≡N) stretching mode and a combination of the symmetric
ν(C-C) and deformation ν(CH3) modes in CH3CN [566,567], can distinguish between
open (2316 cm-1) and closed (2308 cm-1) Lewis acid sites in Sn-Beta zeolites [547,
550552]. These dierent IR vibrational stretching frequencies have been proposed to
reect supra-stoichiometric CD3CN binding to Sn sites or the presence of additional
CD3CN within the immediate vicinity, based on temperature programmed desorption-
thermogravimetric analysis (TPD-TGA) of CD3CN-saturated Sn-Beta samples that
evolved 1.6 mol CD3CN per mol Sn [568] and reports of solvent-induced shifts in
CD3CN IR vibrations [569]. Yet, the distinct assignments of IR peaks to one CD3CN
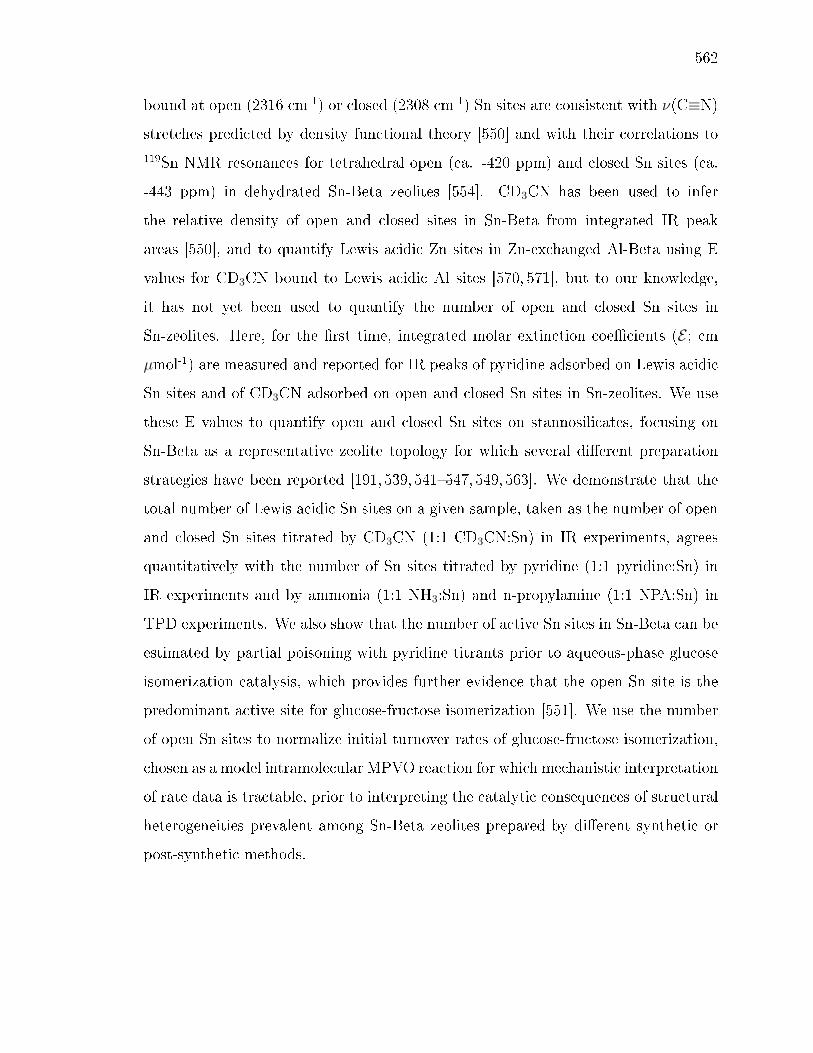
562
bound at open (2316 cm-1) or closed (2308 cm-1) Sn sites are consistent with ν(C≡N)
stretches predicted by density functional theory [550] and with their correlations to119Sn NMR resonances for tetrahedral open (ca. -420 ppm) and closed Sn sites (ca.
-443 ppm) in dehydrated Sn-Beta zeolites [554]. CD3CN has been used to infer
the relative density of open and closed sites in Sn-Beta from integrated IR peak
areas [550], and to quantify Lewis acidic Zn sites in Zn-exchanged Al-Beta using E
values for CD3CN bound to Lewis acidic Al sites [570, 571], but to our knowledge,
it has not yet been used to quantify the number of open and closed Sn sites in
Sn-zeolites. Here, for the rst time, integrated molar extinction coecients (E ; cm
µmol-1) are measured and reported for IR peaks of pyridine adsorbed on Lewis acidic
Sn sites and of CD3CN adsorbed on open and closed Sn sites in Sn-zeolites. We use
these E values to quantify open and closed Sn sites on stannosilicates, focusing on
Sn-Beta as a representative zeolite topology for which several dierent preparation
strategies have been reported [191, 539, 541547, 549, 563]. We demonstrate that the
total number of Lewis acidic Sn sites on a given sample, taken as the number of open
and closed Sn sites titrated by CD3CN (1:1 CD3CN:Sn) in IR experiments, agrees
quantitatively with the number of Sn sites titrated by pyridine (1:1 pyridine:Sn) in
IR experiments and by ammonia (1:1 NH3:Sn) and n-propylamine (1:1 NPA:Sn) in
TPD experiments. We also show that the number of active Sn sites in Sn-Beta can be
estimated by partial poisoning with pyridine titrants prior to aqueous-phase glucose
isomerization catalysis, which provides further evidence that the open Sn site is the
predominant active site for glucose-fructose isomerization [551]. We use the number
of open Sn sites to normalize initial turnover rates of glucose-fructose isomerization,
chosen as a model intramolecular MPVO reaction for which mechanistic interpretation
of rate data is tractable, prior to interpreting the catalytic consequences of structural
heterogeneities prevalent among Sn-Beta zeolites prepared by dierent synthetic or
post-synthetic methods.
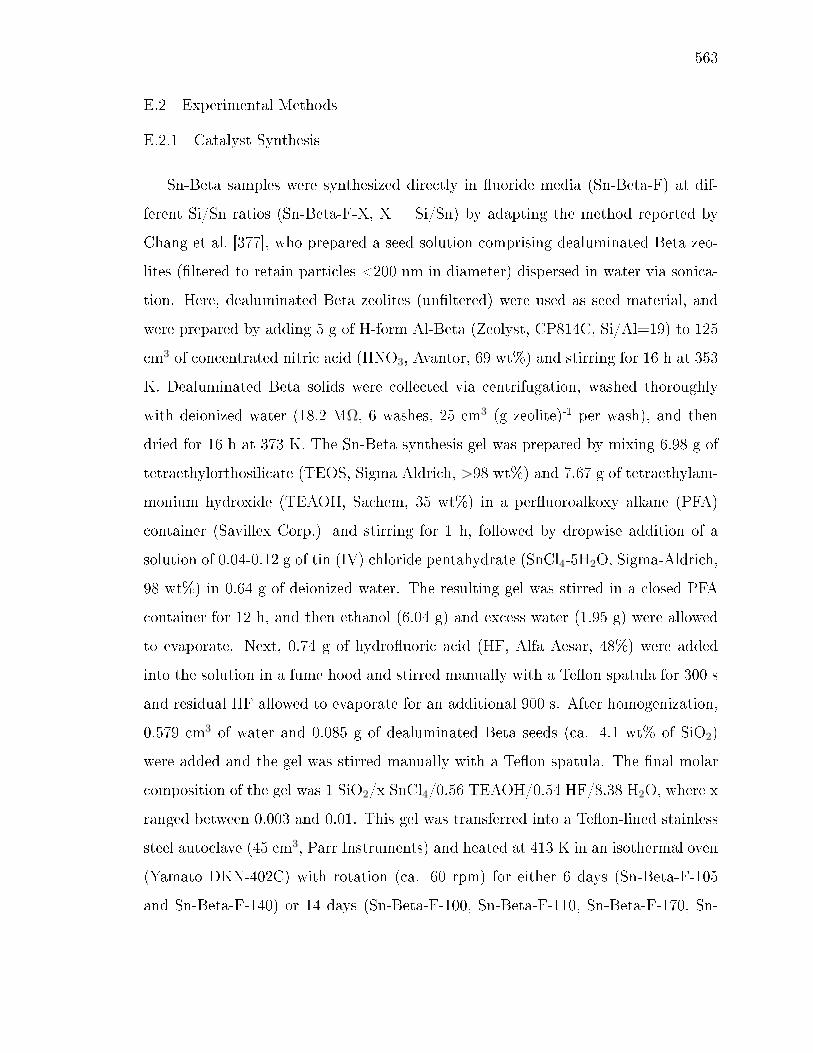
563
E.2 Experimental Methods
E.2.1 Catalyst Synthesis
Sn-Beta samples were synthesized directly in uoride media (Sn-Beta-F) at dif-
ferent Si/Sn ratios (Sn-Beta-F-X, X = Si/Sn) by adapting the method reported by
Chang et al. [377], who prepared a seed solution comprising dealuminated Beta zeo-
lites (ltered to retain particles <200 nm in diameter) dispersed in water via sonica-
tion. Here, dealuminated Beta zeolites (unltered) were used as seed material, and
were prepared by adding 5 g of H-form Al-Beta (Zeolyst, CP814C, Si/Al=19) to 125
cm3 of concentrated nitric acid (HNO3, Avantor, 69 wt%) and stirring for 16 h at 353
K. Dealuminated Beta solids were collected via centrifugation, washed thoroughly
with deionized water (18.2 MΩ, 6 washes, 25 cm3 (g zeolite)-1 per wash), and then
dried for 16 h at 373 K. The Sn-Beta synthesis gel was prepared by mixing 6.98 g of
tetraethylorthosilicate (TEOS, Sigma Aldrich, >98 wt%) and 7.67 g of tetraethylam-
monium hydroxide (TEAOH, Sachem, 35 wt%) in a peruoroalkoxy alkane (PFA)
container (Savillex Corp.) and stirring for 1 h, followed by dropwise addition of a
solution of 0.04-0.12 g of tin (IV) chloride pentahydrate (SnCl4-5H2O, Sigma-Aldrich,
98 wt%) in 0.64 g of deionized water. The resulting gel was stirred in a closed PFA
container for 12 h, and then ethanol (6.04 g) and excess water (1.95 g) were allowed
to evaporate. Next, 0.74 g of hydrouoric acid (HF, Alfa Aesar, 48%) were added
into the solution in a fume hood and stirred manually with a Teon spatula for 300 s
and residual HF allowed to evaporate for an additional 900 s. After homogenization,
0.579 cm3 of water and 0.085 g of dealuminated Beta seeds (ca. 4.1 wt% of SiO2)
were added and the gel was stirred manually with a Teon spatula. The nal molar
composition of the gel was 1 SiO2/x SnCl4/0.56 TEAOH/0.54 HF/8.38 H2O, where x
ranged between 0.003 and 0.01. This gel was transferred into a Teon-lined stainless
steel autoclave (45 cm3, Parr Instruments) and heated at 413 K in an isothermal oven
(Yamato DKN-402C) with rotation (ca. 60 rpm) for either 6 days (Sn-Beta-F-105
and Sn-Beta-F-140) or 14 days (Sn-Beta-F-100, Sn-Beta-F-110, Sn-Beta-F-170, Sn-
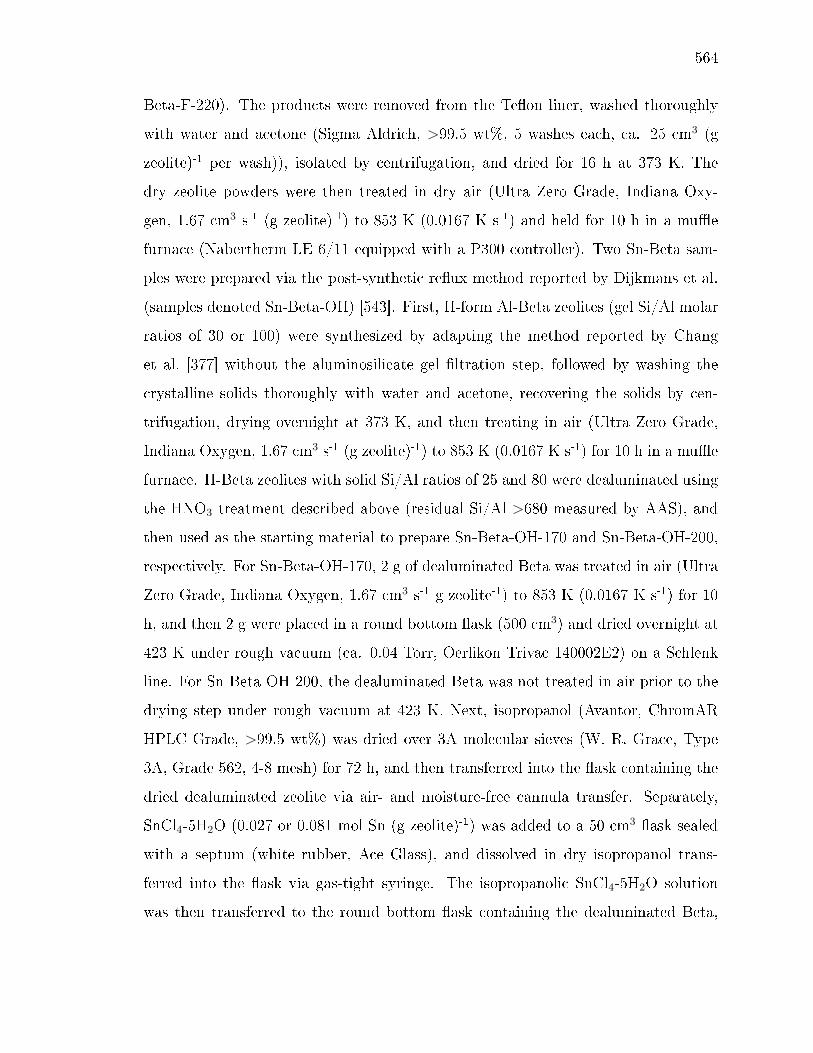
564
Beta-F-220). The products were removed from the Teon liner, washed thoroughly
with water and acetone (Sigma Aldrich, >99.5 wt%, 5 washes each, ca. 25 cm3 (g
zeolite)-1 per wash)), isolated by centrifugation, and dried for 16 h at 373 K. The
dry zeolite powders were then treated in dry air (Ultra Zero Grade, Indiana Oxy-
gen, 1.67 cm3 s-1 (g zeolite)-1) to 853 K (0.0167 K s-1) and held for 10 h in a mue
furnace (Nabertherm LE 6/11 equipped with a P300 controller). Two Sn-Beta sam-
ples were prepared via the post-synthetic reux method reported by Dijkmans et al.
(samples denoted Sn-Beta-OH) [543]. First, H-form Al-Beta zeolites (gel Si/Al molar
ratios of 30 or 100) were synthesized by adapting the method reported by Chang
et al. [377] without the aluminosilicate gel ltration step, followed by washing the
crystalline solids thoroughly with water and acetone, recovering the solids by cen-
trifugation, drying overnight at 373 K, and then treating in air (Ultra Zero Grade,
Indiana Oxygen, 1.67 cm3 s-1 (g zeolite)-1) to 853 K (0.0167 K s-1) for 10 h in a mue
furnace. H-Beta zeolites with solid Si/Al ratios of 25 and 80 were dealuminated using
the HNO3 treatment described above (residual Si/Al >680 measured by AAS), and
then used as the starting material to prepare Sn-Beta-OH-170 and Sn-Beta-OH-200,
respectively. For Sn-Beta-OH-170, 2 g of dealuminated Beta was treated in air (Ultra
Zero Grade, Indiana Oxygen, 1.67 cm3 s-1 g zeolite-1) to 853 K (0.0167 K s-1) for 10
h, and then 2 g were placed in a round bottom ask (500 cm3) and dried overnight at
423 K under rough vacuum (ca. 0.04 Torr, Oerlikon Trivac 140002E2) on a Schlenk
line. For Sn-Beta-OH-200, the dealuminated Beta was not treated in air prior to the
drying step under rough vacuum at 423 K. Next, isopropanol (Avantor, ChromAR
HPLC Grade, >99.5 wt%) was dried over 3A molecular sieves (W. R. Grace, Type
3A, Grade 562, 4-8 mesh) for 72 h, and then transferred into the ask containing the
dried dealuminated zeolite via air- and moisture-free cannula transfer. Separately,
SnCl4-5H2O (0.027 or 0.081 mol Sn (g zeolite)-1) was added to a 50 cm3 ask sealed
with a septum (white rubber, Ace Glass), and dissolved in dry isopropanol trans-
ferred into the ask via gas-tight syringe. The isopropanolic SnCl4-5H2O solution
was then transferred to the round bottom ask containing the dealuminated Beta,
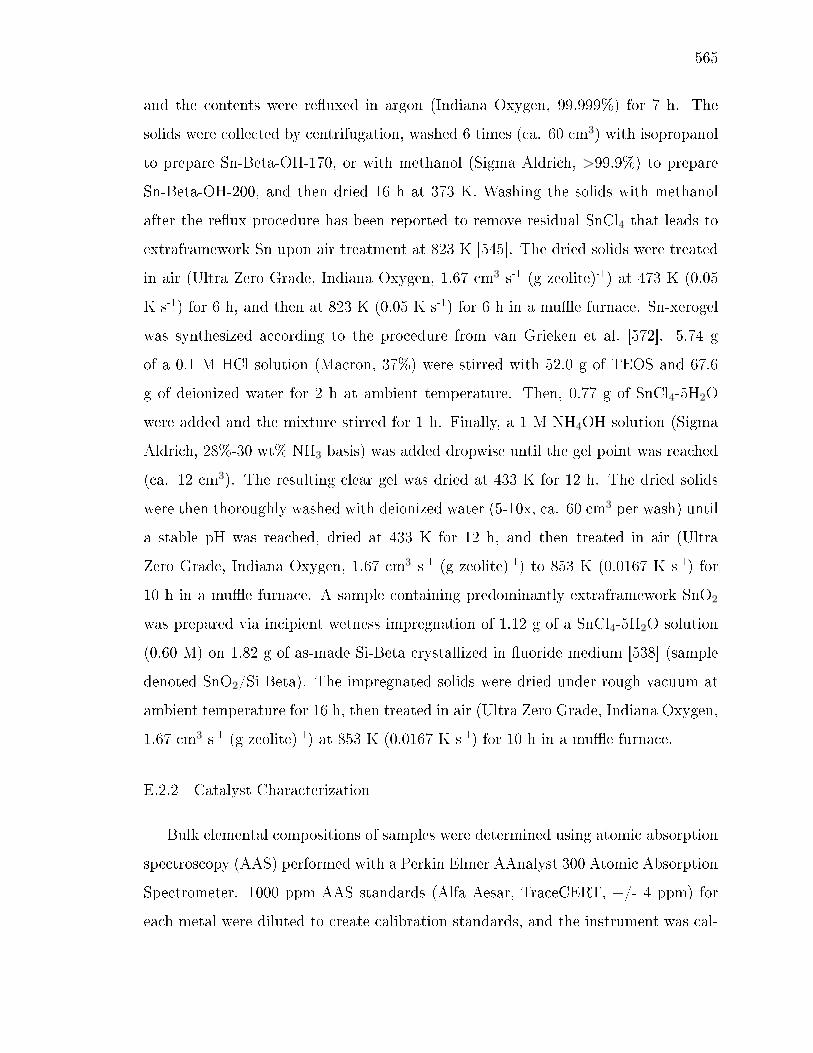
565
and the contents were reuxed in argon (Indiana Oxygen, 99.999%) for 7 h. The
solids were collected by centrifugation, washed 6 times (ca. 60 cm3) with isopropanol
to prepare Sn-Beta-OH-170, or with methanol (Sigma Aldrich, >99.9%) to prepare
Sn-Beta-OH-200, and then dried 16 h at 373 K. Washing the solids with methanol
after the reux procedure has been reported to remove residual SnCl4 that leads to
extraframework Sn upon air treatment at 823 K [545]. The dried solids were treated
in air (Ultra Zero Grade, Indiana Oxygen, 1.67 cm3 s-1 (g zeolite)-1) at 473 K (0.05
K s-1) for 6 h, and then at 823 K (0.05 K s-1) for 6 h in a mue furnace. Sn-xerogel
was synthesized according to the procedure from van Grieken et al. [572]. 5.74 g
of a 0.1 M HCl solution (Macron, 37%) were stirred with 52.0 g of TEOS and 67.6
g of deionized water for 2 h at ambient temperature. Then, 0.77 g of SnCl4-5H2O
were added and the mixture stirred for 1 h. Finally, a 1 M NH4OH solution (Sigma
Aldrich, 28%-30 wt% NH3 basis) was added dropwise until the gel point was reached
(ca. 12 cm3). The resulting clear gel was dried at 433 K for 12 h. The dried solids
were then thoroughly washed with deionized water (5-10x, ca. 60 cm3 per wash) until
a stable pH was reached, dried at 433 K for 12 h, and then treated in air (Ultra
Zero Grade, Indiana Oxygen, 1.67 cm3 s-1 (g zeolite)-1) to 853 K (0.0167 K s-1) for
10 h in a mue furnace. A sample containing predominantly extraframework SnO2
was prepared via incipient wetness impregnation of 1.12 g of a SnCl4-5H2O solution
(0.60 M) on 1.82 g of as-made Si-Beta crystallized in uoride medium [538] (sample
denoted SnO2/Si-Beta). The impregnated solids were dried under rough vacuum at
ambient temperature for 16 h, then treated in air (Ultra Zero Grade, Indiana Oxygen,
1.67 cm3 s-1 (g zeolite)-1) at 853 K (0.0167 K s-1) for 10 h in a mue furnace.
E.2.2 Catalyst Characterization
Bulk elemental compositions of samples were determined using atomic absorption
spectroscopy (AAS) performed with a Perkin Elmer AAnalyst 300 Atomic Absorption
Spectrometer. 1000 ppm AAS standards (Alfa Aesar, TraceCERT, +/- 4 ppm) for
each metal were diluted to create calibration standards, and the instrument was cal-
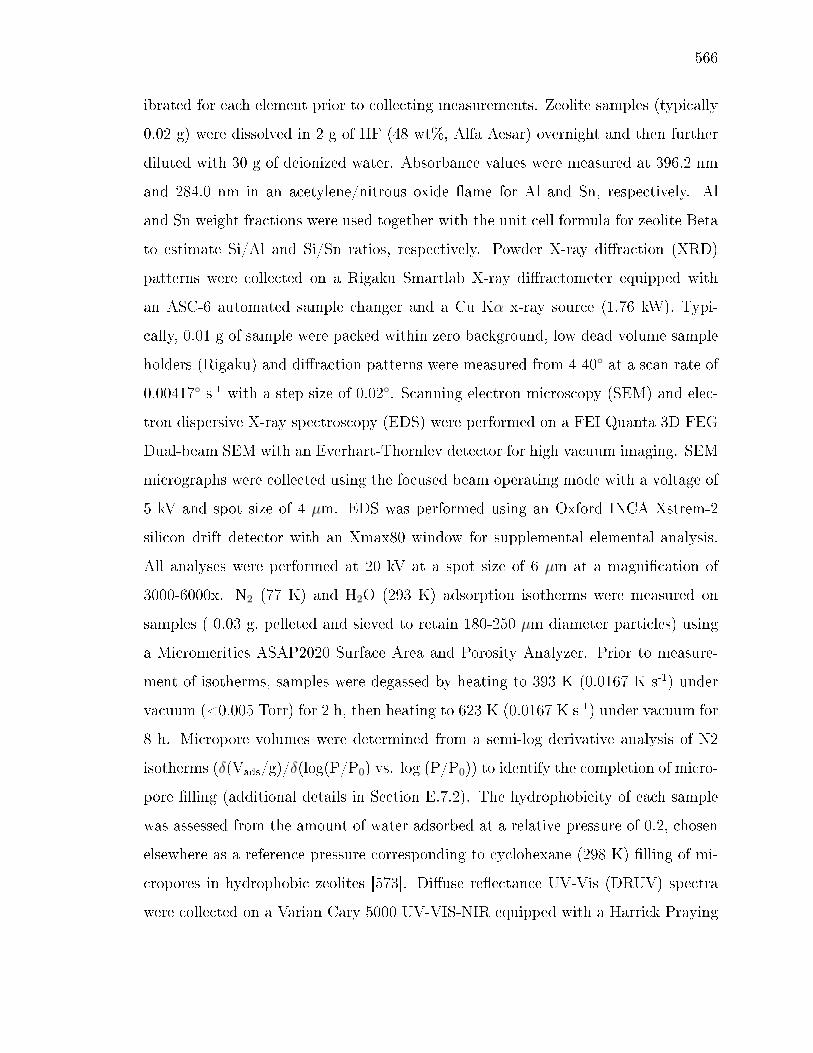
566
ibrated for each element prior to collecting measurements. Zeolite samples (typically
0.02 g) were dissolved in 2 g of HF (48 wt%, Alfa Aesar) overnight and then further
diluted with 30 g of deionized water. Absorbance values were measured at 396.2 nm
and 284.0 nm in an acetylene/nitrous oxide ame for Al and Sn, respectively. Al
and Sn weight fractions were used together with the unit cell formula for zeolite Beta
to estimate Si/Al and Si/Sn ratios, respectively. Powder X-ray diraction (XRD)
patterns were collected on a Rigaku Smartlab X-ray diractometer equipped with
an ASC-6 automated sample changer and a Cu Kα x-ray source (1.76 kW). Typi-
cally, 0.01 g of sample were packed within zero background, low dead volume sample
holders (Rigaku) and diraction patterns were measured from 4-40 at a scan rate of
0.00417 s-1 with a step size of 0.02. Scanning electron microscopy (SEM) and elec-
tron dispersive X-ray spectroscopy (EDS) were performed on a FEI Quanta 3D FEG
Dual-beam SEM with an Everhart-Thornlev detector for high vacuum imaging. SEM
micrographs were collected using the focused beam operating mode with a voltage of
5 kV and spot size of 4 µm. EDS was performed using an Oxford INCA Xstrem-2
silicon drift detector with an Xmax80 window for supplemental elemental analysis.
All analyses were performed at 20 kV at a spot size of 6 µm at a magnication of
3000-6000x. N2 (77 K) and H2O (293 K) adsorption isotherms were measured on
samples ( 0.03 g, pelleted and sieved to retain 180-250 µm diameter particles) using
a Micromeritics ASAP2020 Surface Area and Porosity Analyzer. Prior to measure-
ment of isotherms, samples were degassed by heating to 393 K (0.0167 K s-1) under
vacuum (<0.005 Torr) for 2 h, then heating to 623 K (0.0167 K s-1) under vacuum for
8 h. Micropore volumes were determined from a semi-log derivative analysis of N2
isotherms (δ(Vads/g)/δ(log(P/P0) vs. log (P/P0)) to identify the completion of micro-
pore lling (additional details in Section E.7.2). The hydrophobicity of each sample
was assessed from the amount of water adsorbed at a relative pressure of 0.2, chosen
elsewhere as a reference pressure corresponding to cyclohexane (298 K) lling of mi-
cropores in hydrophobic zeolites [573]. Diuse reectance UV-Vis (DRUV) spectra
were collected on a Varian Cary 5000 UV-VIS-NIR equipped with a Harrick Praying
567
Mantis in-situ diuse reectance cell. Spectra were collected on samples: (i) rst
exposed to ambient conditions and held in owing dry He (4.17 cm3 s-1 (g zeolite)-1)
(ambient treatment); (ii) after subsequent treatment to 523 K ( 0.5 K s-1) for 1800 s
in owing dry He (4.17 cm3 s-1 (g zeolite)-1) (dehydration treatment); and (iii) after
subsequent exposure to a owing wet He stream (4.17 cm3 s-1 (g zeolite)-1, ca. 3%
H2O, bubbled through a water saturator at ambient temperature) while cooling from
523 K to 303 K and holding for 300 s (rehydration treatment). Diuse reectance
spectra were collected at a rate of 10 nm s-1, using poly(tetraouroethylene) (PTFE, 1
µm powder, Sigma-Aldrich) as the 100% reectance standard, and then converted to
an absorption spectrum using the Kubelka-Munk (F(R)) function. Absorption edge
energies were calculated from Tauc plots of [F(R)hν]2 vs. hν (additional details in
Section E.7.3).
E.2.3 Temperature Programmed Desorption
Temperature programmed desorption (TPD) experiments were performed using a
Micromeritics Autochem II 2920 Chemisorption Analyzer interfaced with an Agilent
5793N mass selective detector (MSD) to quantify gaseous titrants evolved from the
catalysts. Zeolite samples (0.03-0.05 g, sieved to 180-250 µm) were supported in a
U-tube reactor between two quartz wool plugs inside of a clam-shell furnace. Zeolite
samples were treated in air (25 cm3 s-1 (g zeolite)-1, Indiana Oxygen, Ultra Zero
Grade) to 673 K (0.167 K s-1) for 4 h and then cooled to ambient temperature. For n-
propylamine (NPA) titration experiments, samples were saturated in a owing stream
comprising NPA (1000 ppm certied concentration), 1% Ar and balance He (75 cm3
s-1 (g zeolite)-1, Airgas, Certied Standard Grade) at 323 K for 4 h, and then purged
in owing He (25 cm3 s-1 (g zeolite)-1) at 338 K for 4 h to remove weakly-bound NPA
(additional details in Section E.7.7). For NH3 titration experiments, samples were
saturated in owing gaseous NH3 (456 ppm certied concentration) in balance N2 (25
cm3 s-1 (g zeolite)-1, Indiana Oxygen, Certied Standard Grade) for 12 h, and then
purged in owing He (25 cm3 s-1 (g zeolite)-1, Indiana Oxygen, 99.999%) for 8 h at 331
568
K to remove gaseous and physisorbed NH3 (additional details in Section E.7.8). After
titrant saturation and purge treatments, TPD was performed in owing He (25 cm3
s-1 (g zeolite)-1) to 873 K (at 0.167 K s-1), during which the U-tube reactor euent was
sent to the MSD via heated transfer lines held at 383 K. After each TPD experiment,
a 0.5 cm3 sample loop was lled with argon (99.999% Indiana Oxygen) and injected
by owing He (25 cm3 s-1) that was sent to the MSD in order to quantify the amount
of NH3 or NPA desorbed from the integrated MSD signals and a calibrated response
factor for NH3 or NPA relative to Ar.
E.2.4 Infrared Spectroscopy and Determination of Integrated Molar Extinction Co-ecients
IR spectra were collected on a Nicolet 4700 spectrometer with a Hg-Cd-Te (MCT,
cooled to 77 K by liquid N2) detector by averaging 64 scans at 2 cm-1 resolution
in the 4000 to 400 cm-1 range and were taken relative to an empty cell background
reference collected under dynamic vacuum (rotary vane rough pump, Alcatel 2008A,
<0.1 Torr) at either 303 K (CD3CN) or 423 K (pyridine). Self-supporting wafers
(0.01-0.03 g cm-1) were sealed within a custom-built quartz IR cell with CaF2 win-
dows, equipped with a mineral-insulated resistive heating coil (ARi Industries) and
encased in an alumina silicate ceramic chamber (Purdue Research Machining Ser-
vices). Wafer temperatures were measured within 2 mm of each side of the wafer by
K-type thermocouples (Omega). The quartz IR cell interfaced with a custom glass
vacuum manifold that was used for sample pretreatment and exposure to controlled
amounts of gaseous titrants. Prior to each IR experiment, wafers were treated in
owing dry air (6.66 cm3 s-1 (g zeolite)-1) puried by an FTIR purge gas generator
(Parker Balston, <1 ppm CO2, 200 K H2O dew point) to 823 K (0.083 K s-1) for 1 h,
and then held under dynamic vacuum (rotary vane rough pump, Alcatel 2008A, <0.1
Torr) at 823 K for 1 h. The wafer was then cooled under dynamic vacuum to 303
K for adsorption experiments with CD3CN, or to 423 K for adsorption experiments
with pyridine. Titrants were puried via freeze-pump-thaw (3 cycles) and admitted
569
to the cell in sequential doses (ca. 2.5 x 10⁻⁷ mol). Equilibration of the sample with
each dose was assumed when the nal pressure in the cell and transfer line did not
change for 180 s. For doses in which the nal pressure was recorded as 0.0 Torr, as
occurred during sub-saturation coverages, all of the titrant introduced to the cell was
assumed to adsorb on the sample wafer. After dosing was complete, which occurred
when samples reached equilibrium with a detectable gaseous titrant pressure (0.4-2.0
Torr), samples were exposed to dynamic vacuum (at 303 K for CD3CN or at 423 K
for pyridine) in order to remove gas-phase and weakly-bound species, which occurred
when the pressure was recorded as 0.0 Torr. IR peaks for bound titrants did not
change between spectra recorded after evacuation or after saturation, regardless of
the titrant pressure used for saturation (Fig. E.39). Each wafer was also heated to
523 K (0.167 K s-1) in dynamic vacuum to monitor the disappearance of IR peaks for
bound titrant species.
IR spectra reported here were baseline-corrected and normalized to combination
and overtone modes of zeolite Si-O-Si stretches (1750-2100 cm-1). Integrated molar
extinction coecients (E , cm µmol-1) for pyridine adsorbed onto Lewis acid sites on
three dierent Sn-Beta samples (Sn-Beta-F-100, Sn-Beta-F-140, and Sn-Beta-OH-
170) were determined from the increase in integrated area for the IR peak at 1450
cm-1 with sequential doses of pyridine to the wafer, and multiplying by the cross-
sectional area of the wafer (2.54 cm2). This analysis assumed that pyridine selectively
adsorbed on Lewis acid sites during titration, consistent with the absence of IR peaks
for pyridine adsorbed to non-Lewis acidic sites and with the method proposed by
Emeis [574] (details in Section E.7.6). IR peaks for CD3CN species bound to open
(2316 cm-1) and closed (2308 cm-1) Lewis acid sites, bound to Sn sites in highly-
defective oxide surfaces (2287 cm-1), hydrogen-bound to Si-OH sites (2275 cm-1), and
physisorbed or gas phase CD3CN (2265 cm-1) overlapped and required deconvolution
into individual components (details in Section E.7.9). Integrated molar extinction
coecients for CD3CN were determined for open Lewis acid sites (2316 cm-1) and
closed Lewis acid sites (2308 cm-1) on Sn-Beta by using a non-linear least squares
570
regression of saturation peak areas on three Sn-Beta samples (Sn-Beta-F-100, Sn-
Beta-F-105, Sn-Beta-OH-170), with the number of Lewis acid sites determined from
pyridine chemisorption IR experiments. The number of sites titrated by pyridine
or CD3CN on self-supporting sample wafers was estimated from integrated IR peak
areas and values using the following equation:
Site density (µmol g−1) =Integrated Peak Area (cm−1)
E(cmµmol−1)∗ aCS(cm2)
m(g)(E.1)
where aCS and m are the cross-sectional area and mass of the wafer, respectively.
E.2.5 Kinetic and Isotopic Tracer Studies of Glucose Reactions with Sn-Beta
Catalytic studies were performed in batch reactors using 1-10% (w/w) aqueous D-
glucose (Sigma Aldrich, >99.5%) solutions with Sn-Beta samples. Reactant solutions
were made with water (18.2 MΩ) adjusted to pH 5 (measured by Mettler Toledo Seven
Compact pH Ion S220 probe) by addition of hydrochloric acid (Macron, 37% (w/w))
prior to glucose addition and ltration through 0.2 µm PTFE lters (VWR). Catalytic
solids (ca. 0.01 g) were added to thick-walled glass reactors (10 cm3, VWR) sealed
with crimp tops (PTFE/silicone septum, Agilent). Reactors and reactant solutions
were heated separately for 600 s to 373 K atop a digital stirred hot plate (IKA RCT
basic) prior to injecting the reactant solution (ca. 1 cm3) into the capped reactors.
Reactors remained at 373 K while stirring at 750 rpm under autogenous pressure
for various time intervals (300-14440 s) prior to quenching in an ice bath. Resulting
product solutions were ltered through 0.2 µm PTFE lters, diluted to 1% (w/w)
sugar concentration if necessary, and mixed with a 1% (w/w) aqueous D-mannitol
(Sigma Aldrich, >98 wt%) solution as an internal standard. Component separation
was performed using an Agilent 1260 high performance liquid chromatograph (HPLC)
equipped with a Hi-Plex Ca column (7.7 x 300 mm, 8 µm particle size, Agilent) and
an aqueous mobile phase (0.01 cm3 s-1, 353 K), and quantication was performed
using an evaporative light scattering detector (Agilent 1260 Innity ELSD).
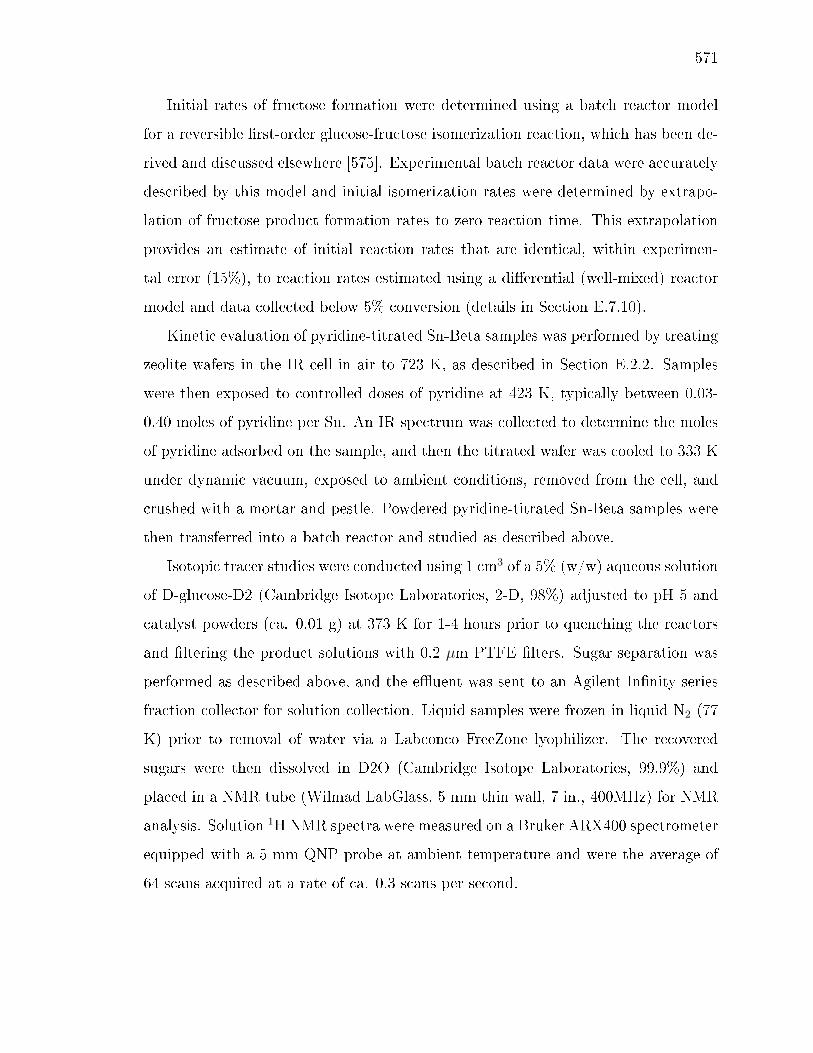
571
Initial rates of fructose formation were determined using a batch reactor model
for a reversible rst-order glucose-fructose isomerization reaction, which has been de-
rived and discussed elsewhere [575]. Experimental batch reactor data were accurately
described by this model and initial isomerization rates were determined by extrapo-
lation of fructose product formation rates to zero reaction time. This extrapolation
provides an estimate of initial reaction rates that are identical, within experimen-
tal error (15%), to reaction rates estimated using a dierential (well-mixed) reactor
model and data collected below 5% conversion (details in Section E.7.10).
Kinetic evaluation of pyridine-titrated Sn-Beta samples was performed by treating
zeolite wafers in the IR cell in air to 723 K, as described in Section E.2.2. Samples
were then exposed to controlled doses of pyridine at 423 K, typically between 0.03-
0.40 moles of pyridine per Sn. An IR spectrum was collected to determine the moles
of pyridine adsorbed on the sample, and then the titrated wafer was cooled to 333 K
under dynamic vacuum, exposed to ambient conditions, removed from the cell, and
crushed with a mortar and pestle. Powdered pyridine-titrated Sn-Beta samples were
then transferred into a batch reactor and studied as described above.
Isotopic tracer studies were conducted using 1 cm3 of a 5% (w/w) aqueous solution
of D-glucose-D2 (Cambridge Isotope Laboratories, 2-D, 98%) adjusted to pH 5 and
catalyst powders (ca. 0.01 g) at 373 K for 1-4 hours prior to quenching the reactors
and ltering the product solutions with 0.2 µm PTFE lters. Sugar separation was
performed as described above, and the euent was sent to an Agilent Innity series
fraction collector for solution collection. Liquid samples were frozen in liquid N2 (77
K) prior to removal of water via a Labconco FreeZone lyophilizer. The recovered
sugars were then dissolved in D2O (Cambridge Isotope Laboratories, 99.9%) and
placed in a NMR tube (Wilmad LabGlass, 5 mm thin wall, 7 in., 400MHz) for NMR
analysis. Solution 1H NMR spectra were measured on a Bruker ARX400 spectrometer
equipped with a 5 mm QNP probe at ambient temperature and were the average of
64 scans acquired at a rate of ca. 0.3 scans per second.
572
E.3 Results and Discussion
E.3.1 Structural Characterization of Stannosilicates
Characterization data for the Sn-Beta samples used in this study are shown in
Table E.1. Samples are denoted as Sn-Beta-X-Y, where X refers to the preparation
method used (F = uoride-assisted hydrothermal synthesis [377]; OH = post-synthetic
Sn insertion into dealuminated Beta [543]) and Y is the Si/Sn ratio determined by
atomic absorption spectroscopy. Powder XRD patterns for all zeolite samples(Fig.
E.13) were consistent with the Beta topology and did not show diraction peaks for
bulk SnO2 at 26.7 or 34 2θ. Diraction peaks for bulk SnO2 were also absent on
a control sample prepared to contain SnO2 supported on Si-Beta (SnO2/Si-Beta),
indicating that any SnO2 domains on this sample were small enough to be X-ray
amorphous (<3 nm in diam.) [290]. N2 adsorption isotherms measured at 77 K
(Fig. E.14) indicated that micropore volumes were 0.21-0.24 cm3 g-1 for all Sn-Beta-F
samples and 0.19-0.22 cm3 g-1 for all Sn-Beta-OH samples (Table E.1), also consistent
with the Beta topology. H2O adsorption isotherms measured at 293 K (Fig. E.15
and E.16) showed H2O uptakes (at P/P0 = 0.2) of 0.005-0.017 cm3 g-1 for Sn-Beta-F
samples (Table E.1), consistent with the hydrophobic nature of low-defect zeolites
crystallized in uoride media [576], but showed higher H2O uptakes of 0.036-0.092
cm3 g-1 for Sn-Beta-OH samples (Table E.1), reecting the more hydrophilic and
defective nature of samples prepared via Sn insertion into framework vacancy defects
of dealuminated zeolites.
Diuse reectance UV-visible (DRUV) spectroscopy has been used to probe Sn
coordination and detect tetrahedrally-coordinated framework Sn centers, which have
been assigned to bands centered at ca. 205 nm [534, 577], yet such sites can coordi-
nate water ligands to become penta- or hexa-coordinated [554] and give rise to bands
centered at ca. 220 nm and ca. 255 nm, respectively [577]. DRUV bands for hexa-
coordinated framework Sn centers at ca. 255 nm, however, also fall within a range
characteristic of small SnO2 domains, which give rise to DRUV bands centered at
573
lower wavelengths (ca. 240 nm) [568, 578] than for bulk SnO2 (ca. 280 nm) because
of quantum connement eects [579582], precluding unambiguous characterization
of Sn structure from DRUV spectra of Sn-zeolites exposed to ambient conditions.
Thus, DRUV spectra were collected on each sample under ambient conditions, after
dehydration treatments in owing dry helium at 523 K, and after rehydration treat-
ments while cooling to 303 K in owing wet (3% H2O) helium (dehydrated spectra in
Fig. E.17 and E.18). The positions of DRUV absorption (F(R)) bands of maximum
intensity, together with absorption edge energies (Tauc plots of [F(R)*hν]2 vs. hν
Fig. E.19 and E.20) are listed for each sample after dehydration treatments in Table
E.1.
DRUV spectra of Sn-Beta-F-170 (Fig. E.3a) exposed to ambient conditions showed
a broad band centered at ca. 250 nm, while spectra collected after dehydration
showed a new band centered at ca. 207 nm with a shoulder centered at ca. 250
nm, which reverted to a band centered at ca. 250 nm after rehydration treat-
ments. These spectral features are consistent with framework Sn centers that are
octahedrally-coordinated under ambient conditions or upon exposure to water, but
become tetrahedrally-coordinated in the absence of water [554]. DRUV spectra of
Sn-Beta-OH-200 (Fig. E.3b) exposed to ambient conditions showed a band centered
at ca. 230 nm, which shifted to ca. 190 nm upon dehydration and returned to ca. 230
nm after rehydration, similar to the spectral changes observed on Sn-Beta-F-170 (Fig.
E.3a) and as expected from the reversible coordination of water ligands to framework
Sn sites. These changes in DRUV spectra upon dehydration were observed to dif-
ferent extents among the dierent Sn-Beta samples in this study, for which bands
did not always shift completely to ca. 210 nm upon dehydration, but did revert to
a single band centered between ca. 230-250 nm upon rehydration. In sharp con-
trast, DRUV spectra of SnO2/Si-Beta (Fig. E.3c) did not change after dehydration
or rehydration treatments and remained centered at ca. 250 nm, indicating that Sn
atoms within SnO2 domains did not change coordination in the presence of water.
Absorption edge energies (Table E.1) on Sn-Beta-OH-170 (4.3 eV) and on Sn-xerogel
574
(4.4 eV) are characteristic of isolated Sn sites in silica [568] and higher than the edge
energy on SnO2/Si-Beta (4.1 eV), which is characteristic of SnO2 domains <3 nm
in diameter (details in Section E.7.3) [581]. Absorption edge energies for nearly all
Sn-Beta-F samples (4.2-4.3 eV; Table 1) fall within a range higher than reported for
SnO2 domains [579582] and reect the predominance of isolated framework Sn sites
in these samples, while the lower absorption edge energy of 4.1 eV on Sn-Beta-F-100
(Table E.1) appears to reect detectable amounts of small SnO2 domains (≤3 nm)
on this sample.
We conclude that DRUV spectra collected on stannosilicates exposed to ambi-
ent conditions cannot unambiguously discern penta- or hexa-coordinated Sn atoms
isolated within silica or stannic oxide domains [568,578] , but changes to spectral fea-
tures and absorption edge energies on dehydrated samples can distinguish between
them because Sn centers isolated in silica (but not in stannic oxide) surfaces become
tetrahedrally-coordinated [543,577]. The subtle, yet measurable, dierences in DRUV
absorption band maxima and edge energies among Sn-Beta-F and Sn-Beta-OH sam-
ples (Table E.1) may reect dierent densities of framework Sn and extraframework
SnO2 sites, which catalyze glucose-fructose isomerization by Lewis acid-mediated and
base-mediated mechanisms, respectively [578]. Isotopic tracer studies with glucose
reactants deuterated at the second carbon (glucose-D2), performed in the aqueous
phase under acidic conditions (pH=5) selectively formed fructose products that re-
tained the deuterium label at the rst carbon (fructose-D1) on all Sn-Beta samples in
this study (additional details and NMR spectra in Section E.7.4), as expected from
Lewis acid-mediated isomerization via intramolecular 1,2-hydride shift [142]. There-
fore, the aqueous-phase glucose isomerization rates measured here reect reactions
catalyzed solely by Lewis acid sites on Sn-Beta samples prepared by dierent routes
and that contain structural heterogeneities. Their eects on isomerization turnover
rates can be interpreted only after normalization by numbers of active Lewis acidic
sites, which require methods to quantify them.
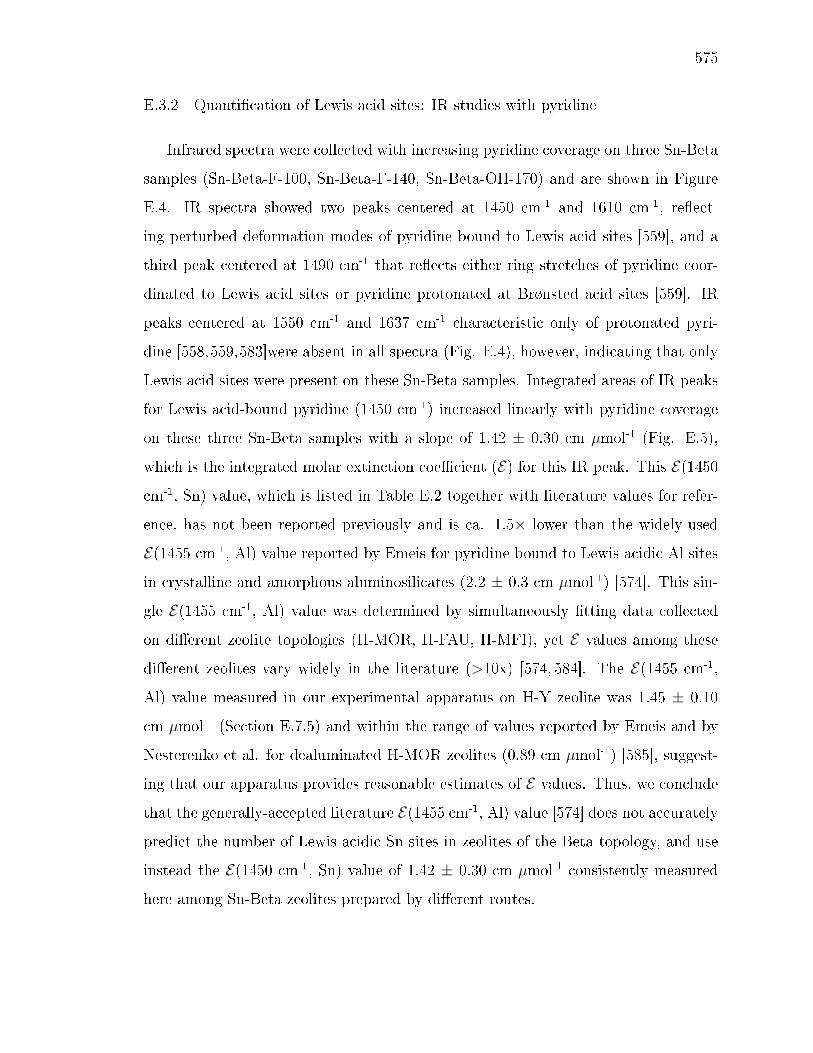
575
E.3.2 Quantication of Lewis acid sites: IR studies with pyridine
Infrared spectra were collected with increasing pyridine coverage on three Sn-Beta
samples (Sn-Beta-F-100, Sn-Beta-F-140, Sn-Beta-OH-170) and are shown in Figure
E.4. IR spectra showed two peaks centered at 1450 cm-1 and 1610 cm-1, reect-
ing perturbed deformation modes of pyridine bound to Lewis acid sites [559], and a
third peak centered at 1490 cm-1 that reects either ring stretches of pyridine coor-
dinated to Lewis acid sites or pyridine protonated at Brønsted acid sites [559]. IR
peaks centered at 1550 cm-1 and 1637 cm-1 characteristic only of protonated pyri-
dine [558,559,583]were absent in all spectra (Fig. E.4), however, indicating that only
Lewis acid sites were present on these Sn-Beta samples. Integrated areas of IR peaks
for Lewis acid-bound pyridine (1450 cm-1) increased linearly with pyridine coverage
on these three Sn-Beta samples with a slope of 1.42 ± 0.30 cm µmol-1 (Fig. E.5),
which is the integrated molar extinction coecient (E) for this IR peak. This E(1450
cm-1, Sn) value, which is listed in Table E.2 together with literature values for refer-
ence, has not been reported previously and is ca. 1.5× lower than the widely-used
E(1455 cm-1, Al) value reported by Emeis for pyridine bound to Lewis acidic Al sites
in crystalline and amorphous aluminosilicates (2.2 ± 0.3 cm µmol-1) [574]. This sin-
gle E(1455 cm-1, Al) value was determined by simultaneously tting data collected
on dierent zeolite topologies (H-MOR, H-FAU, H-MFI), yet E values among these
dierent zeolites vary widely in the literature (>10x) [574, 584]. The E(1455 cm-1,
Al) value measured in our experimental apparatus on H-Y zeolite was 1.45 ± 0.10
cm µmol-1 (Section E.7.5) and within the range of values reported by Emeis and by
Nesterenko et al. for dealuminated H-MOR zeolites (0.89 cm µmol-1) [585], suggest-
ing that our apparatus provides reasonable estimates of E values. Thus, we conclude
that the generally-accepted literature E(1455 cm-1, Al) value [574] does not accurately
predict the number of Lewis acidic Sn sites in zeolites of the Beta topology, and use
instead the E(1450 cm-1, Sn) value of 1.42 ± 0.30 cm µmol-1 consistently measured
here among Sn-Beta zeolites prepared by dierent routes.

576
Infrared spectra were collected after saturation of all Sn-Beta samples with pyri-
dine and subsequent evacuation at 423 K to remove gaseous and weakly-bound species
(additional details and spectra in Section E.7.6). Integrated IR peak (1450 cm-1) ar-
eas, together with the E(1450 cm-1, Sn) value (Table E.2) determined from spectra
collected at sub-saturation coverages (0.04-0.66 pyridine/Sn; Fig. E.5) that corre-
spond to equimolar pyridine binding to Sn, were used to quantify the number of
Lewis acidic Sn sites on each sample using Eq. E.1 and are reported in Table E.3.
The fraction of Lewis acidic Sn sites (per total Sn) varied between 0.73-0.90 on seven
of the eight Sn-Beta samples in this study (Table E.3), but was markedly lower on
Sn-Beta-F-100 (0.49, Table E.3) that contained SnO2 detectable in DRUV spectral
band centers and edge energies (Table E.1). The fraction of Lewis acidic Sn sites
(per total Sn) was much lower, but measurable, on the SnO2/Si-Beta control sam-
ple and Sn-xerogel (0.25 and 0.23, respectively Table E.3), suggesting that some
tetrahedrally-coordinated Sn atoms (analogous to open and closed Sn sites in Sn-
Beta) at their defective and undercoordinated surfaces are able to bind pyridine. On
every Sn-Beta sample, pyridine titrates only a fraction of Sn sites at saturation cov-
erages (Table E.3), either because of incomplete Sn incorporation within framework
locations or incomplete accessibility of pyridine to framework Sn sites. Therefore, we
next obtain independent estimates of the number of Lewis acid sites in these Sn-Beta
samples using smaller base titrants that coordinate with Lewis acid sites and that
can be quantied in temperature-programmed desorption (TPD) experiments.
E.3.3 Quantication of Lewis acid sites: TPD studies with n-propylamine and am-monia
Reactive alkylamine titrants (e.g. n-propylamine, NPA) can distinguish between
Lewis and Brønsted acid sites on a given surface because they coordinate to Lewis acid
sites and desorb intact, but become protonated by Brønsted acid sites and decom-
pose via Homan-type elimination reactions to form ammonia and the corresponding
alkene (e.g., propene) [114, 116, 117, 586]. The saturation of Sn-Beta samples with
577
NPA and subsequent purging in owing helium (338 K) led only to the desorption of
NPA (TPD proles in Section E.7.7) and not to any ammonia or propene, consistent
with the undetectable levels of Brønsted acid sites in infrared spectra collected after
pyridine saturation (Section E.3.2). The number of moles of NPA desorbed (per mol
Sn) on each sample is listed in Table E.3, and is plotted against the number of moles
of pyridine adsorbed at saturation in IR experiments (per mol Sn) in Figure E.6a for
four Sn-Beta-F samples with high Sn content (Si/Sn <150). On these Sn-Beta sam-
ples, a similar number of NPA and pyridine molecules (within 1.25×) were adsorbed
at saturation coverages (Table E.3, Fig. E.6a), suggesting that NPA also binds to Sn
with equimolar stoichiometry. On Sn-Beta samples with low Sn content (Sn-Beta-F-
170, Sn-Beta-F-220) or with high defect density (Sn-Beta-OH-170, Sn-Beta-OH-200),
however, a larger number (by 1.6-2.5x, Table E.3) of NPA desorbed during TPD than
the number of pyridine adsorbed at saturation (Table E.3), reecting the retention
of NPA at residual defect silanol sites under the conditions studied here (control
experiments performed on dealuminated Beta zeolites in Section E.7.7).
In contrast with reactive alkylamines, ammonia titrants desorb intact from both
Lewis and Brønsted acid sites present on a given surface. The treatment of NH3-
saturated samples in owing dry helium removes physisorbed NH3 species and enables
the concurrent measurement of NH3 bound to Lewis and Brønsted sites during a TPD
experiment, while treatment of NH3-saturated samples in owing wet helium has been
shown to also desorb NH3 bound to Lewis acid sites (Al [105]; Cu [78,171]) to enable
quantifying NH4+ species at Brønsted sites. The number of NH3 bound to Lewis
acid sites on solid acids can be estimated from the dierence between these two TPD
methods, but on Sn-Beta zeolites devoid of protons were estimated after purging
NH3-saturated samples only in dry helium at 331 K (NH3 TPD proles in Section
E.7.8). The number of moles of NH3 desorbed (per mol Sn) in a subsequent TPD is
listed in Table E.3 for each sample and was identical, within experimental error, to
the number of Lewis acidic Sn sites titrated by pyridine on all samples except for Sn-
Beta-F-105 and Sn-Beta-OH-170 (Table E.3, Fig. E.6b). These data suggest that NH3

578
binds to both open and closed Sn sites with equimolar stoichiometry, consistent with119Sn MAS NMR spectra of NH3 -saturated Sn-Beta samples that show resonances
attributed to penta-coordinated Sn (between -500 and -600 ppm) [551,587]. Control
experiments performed to saturate dealuminated Beta zeolites with NH3 and purge in
dry helium did not evolve any NHs3 in a subsequent TPD (details in Section E.7.8),
in contrast to analogous control experiments performed with NPA. Thus, we conclude
that the NPA and NH3 TPD techniques developed here can be used to accurately
quantify the number of Lewis acidic Sn sites on Sn-Beta-F samples with high Sn
contents (Si/Sn <150), but that NPA TPD overestimates the number of Lewis acid
sites on samples containing dilute amounts of Sn (Si/Sn >170) or high defect densities
(Sn-Beta-OH).
E.3.4 Quantication of open and closed Lewis acid sites: IR studies with deuteratedacetonitrile
Infrared spectra were collected with increasing CD3CN coverage (303 K) and are
shown for one representative Sn-Beta sample (Sn-Beta-F-105) in Figure E.7a. Each
IR spectrum was deconvoluted into principal component peaks (Fig. E.1, Fig. E.7b)
centered at 2316 cm−1, 2308 cm−1, 2287 cm−1, 2275 cm−1 and 2265 cm−1 (additional
details in Section E.7.9), and the evolution of IR peak areas with increasing CD3CN
coverage is shown in Figure E.8. Initial CD3CN doses led to the appearance of the
2316 cm−1 peak, with a shoulder at 2308 cm−1 and even smaller and broader peaks
at 2287 cm−1 and 2275 cm−1. Increasing CD3CN coverages caused the 2316 cm−1
peak to saturate, while the 2308 cm−1, 2287 cm−1, and 2275 cm−1 peaks continued
to increase in area. At a coverage corresponding to CD3CN/Sn = 1, the 2316 cm−1
and 2308 cm−1 peaks had already reached saturation, while the 2287 cm−1 and 2275
cm−1 peaks continued to increase in area. Finally, the 2265 cm−1 peak for gas-phase
CD3CN appeared after saturation of all adsorption sites on the sample [571].
The IR peaks at ca. 2316 cm−1 and ca. 2308 cm−1 reect CD3CN bound to open
and closed Lewis acidic Sn sites, respectively [550, 551], and have been correlated to

579
119Sn MAS NMR resonances at -423 ppm (open sites) and -443 ppm (closed sites)
in dehydrated Sn-Beta (vacuum, 393 K) [551]. The ratio of open-to-closed site peak
areas systematically decreases with increasing CD3CN coverage (Fig. E.9), indicating
that CD3CN binds preferentially to open Sn sites, as also reported previously [550
553]. Open and closed Sn sites become saturated at a sub-stoichiometric CD3CN/Sn
coverage of 0.80 (4.14*10−6 mol CD3CN, Fig. E.8), which is similar to the number
of total Sn sites titrated by pyridine (0.87, Table E.3) and provides evidence that
CD3CN also binds to Lewis acidic Sn sites with equimolar stoichiometry. We speculate
that the IR peak at ca. 2287 cm−1, which appears prominently in IR spectra of
Sn-xerogel samples at low CD3CN coverages but is not prominent at any CD3CN
coverage for Si-xerogel or SnO2/Si-Beta samples (spectra in Section E.7.9), reects
CD3CN interacting with Sn of highly-defective coordination (e.g., (SiO)2Sn(OH)2).
The existence of doubly-hydroxylated Sn sites has been proposed on Sn-Beta using119Sn CPMAS NMR [536], and on grafted Sn-SiO2 using in-situ DRIFTS [588]. The
IR peak centered at ca. 2275 cm−1 reects CD3CN bound to silanol groups [570,571],
and increases linearly in area with concomitant decreases in silanol OH stretching
peak areas (ca. 3740 cm−1) and concomitant increases in perturbed OH stretching
peak areas (ca. 3300-3600 cm−1) (Section E.7.9) [589].
Infrared spectra of Sn-Beta samples after saturation with CD3CN and subsequent
evacuation at 303 K retained four peaks in the C≡N stretching region (2316, 2308,
2287, 2275 cm−1, Fig. E.7b), whose areas were determined by deconvolution and were
present in dierent proportions for each sample (Table E.9).
Integrated molar extinction coecients were rst determined for the 2316 cm−1
and 2308 cm−1 IR peaks from spectra of three Sn-Beta samples (Sn-Beta-F-100, Sn-
Beta-F-105, Sn-Beta-OH-170), by non-linear least squares regression to minimize the
error between the total number of Lewis acid sites counted by CD3CN and pyridine
(additional details in Section E.7.9). These E(2316 cm−1, Sn) and E(2308 cm−1,
Sn) values were determined to be 1.04±0.22 and 2.04±0.43 cm µmol−1 (Table E.2),
respectively. Both CD3CN and pyridine estimated the same number of Lewis acid
580
sites (to within 1.25×) on ve other Sn-Beta samples that were not used in estimating
E values for CD3CN (Sn-Beta-F-110, Sn-Beta-F-140, Sn-Beta-F-170, Sn-Beta-F-220,
and Sn-Beta-OH-200), demonstrating that these E values can accurately quantify
Lewis acid sites on Sn-Beta zeolites. Next, E values for the 2287 cm−1 and 2275 cm−1
peaks were estimated from non-linear least squares regression of IR peak areas with
increasing CD3CN coverage on Sn-Beta-OH-170 (additional details in Section E.7.9),
which was chosen because it showed the largest 2275 cm−1 peak area of any Sn-Beta
sample. These E(2287 cm−1, Sn) and E(2275 cm−1) values were determined to be
2.13±0.45 and 0.74±0.16 cm µmol−1 (Table E.2), respectively. Increasing CD3CN
coverage on dealuminated Beta led only to the appearance the 2275 cm−1 peak,
whose integrated areas were used to independently estimate an E(2275 cm−1) value
of 0.89±0.09 cm µmol−1 (details in Section E.7.9), similar to the E(2275 cm−1) value
determined from least-squares regression of IR data collected on Sn-Beta-OH-170.
The numbers of open and closed Lewis acidic Sn sites on each Sn-Beta sample,
determined from IR spectra collected after CD3CN saturation (303 K) and integrated
molar extinction coecients (Table E.2), are listed in Table E.3 and were calculated
using Eq. E.1. The total number of Lewis acid sites quantied by CD3CN (per mol
Sn) is plotted against the number of sites quantied by pyridine (per mol Sn) in
Figure E.6c for each of the Sn-Beta-F and Sn-Beta-OH samples studied here. The
total number of Lewis acid sites (open and closed) counted by CD3CN was identical,
within experimental error, to the number of Lewis acid sites counted by pyridine
titration in IR experiments on each of the Sn-Beta samples (Table E.3, Fig. E.6c),
providing evidence that CD3CN also binds with equimolar stoichiometry to each Sn
site and that either pyridine or CD3CN can accurately quantify the total number of
Lewis acid sites in IR experiments. Among the Sn-Beta samples in this study, the
fraction of Sn present as Lewis acid sites was almost always below unity (0.49-1.00,
Table E.3), and the ratio of open-to-closed Lewis acid sites varied over a wide range
(0.29-1.64, Table E.3). The consistent estimates of Lewis acidic Sn sites determined
by mfore than one base titrant provides further evidence that the integrated molar

581
extinction coecients in Table 2 apply generally to Sn-Beta zeolites prepared via
dierent methods, in turn, enabling quantication of open (and closed) Sn sites to
normalize turnover rates for glucose-fructose isomerization, as we discuss next.
E.3.5 Glucose isomerization rate constants on hydrophobic and hydrophilic Sn-Betazeolites
Aqueous-phase glucose-fructose isomerization on Lewis acid sites proceeds via
quasi-equilibrated adsorption and ring-opening of glucose to form intermediates that
coordinate to Sn sites through oxygen atoms at the C1 (aldehyde) and C2 (deproto-
nated OH) positions [554], subsequent kinetically-relevant intramolecular 1,2-hydride
shift to form ring-opened fructose intermediates [142], and quasi-equilibrated ring-
closing and desorption of fructose (Fig. E.2). Initial isomerization turnover rates are
rst-order in glucose concentration (0-10% (w/w), 373 K, Figure E.10) with measured
H/D kinetic isotope values of 2.0-2.4 (373 K) for glucose deuterated at the second
carbon, as expected for kinetically-relevant intramolecular 1,2-hydride shift in the
absence of internal mass transfer limitations (details in Section E.7.10) [575]. The
rst-order dependence of isomerization rates on glucose concentration is consistent
with dilute glucose coverages and with two coordinated water molecules as the most
abundant surface intermediate (MASI) during reaction in liquid water, as expected
from the saturation of framework Sn sites with water even in ambient atmosphere to
give 119Sn MAS NMR resonances [554] and UV-Vis spectral features for octahedrally-
coordinated Sn (Section E.3.1). These quasi-equilibrated reactions, elementary steps
and mechanistic assumptions give a turnover rate equation that accurately describes
aqueous-phase glucose-fructose isomerization on Sn-Beta zeolites (mechanistic details
and derivation of rate expression in Section E.7.10) [575]:
risom = αK1k2
K4K5
CG = kisomCG (E.2)
In this turnover rate equation, K1 is the adsorption equilibrium constant relating
aqueous-phase glucose and ring-opened glucose intermediates bound to Sn sites, k2
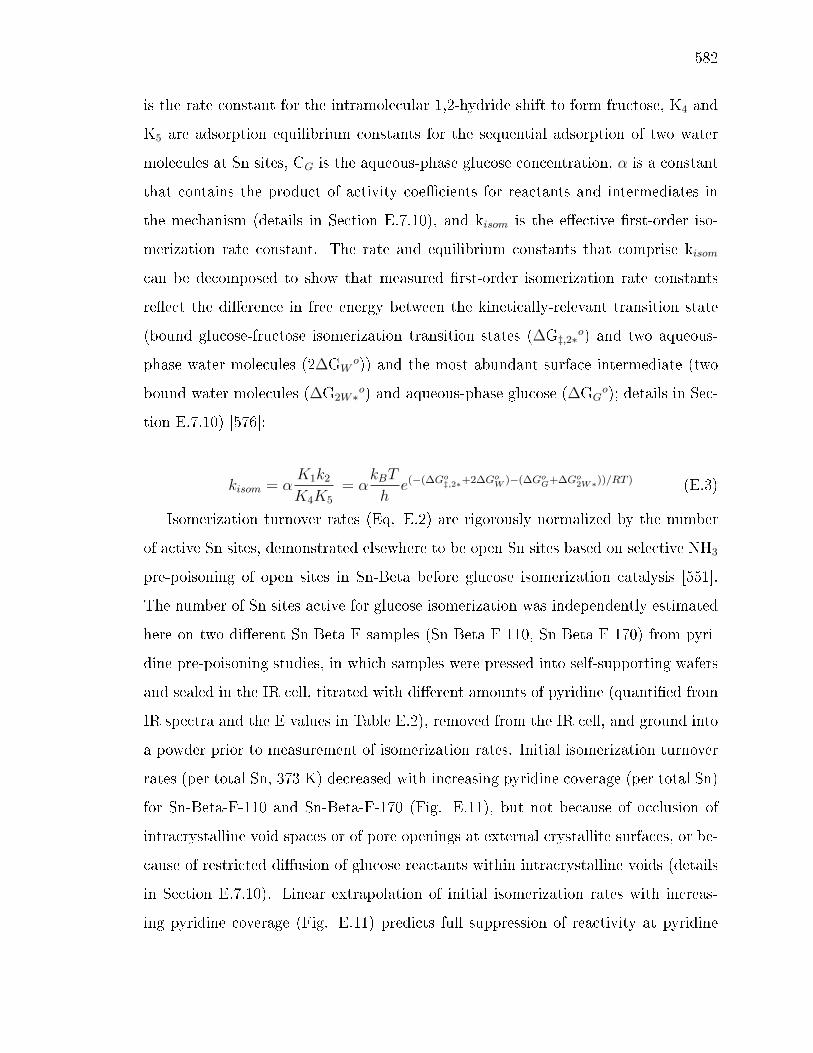
582
is the rate constant for the intramolecular 1,2-hydride shift to form fructose, K4 and
K5 are adsorption equilibrium constants for the sequential adsorption of two water
molecules at Sn sites, CG is the aqueous-phase glucose concentration, α is a constant
that contains the product of activity coecients for reactants and intermediates in
the mechanism (details in Section E.7.10), and kisom is the eective rst-order iso-
merization rate constant. The rate and equilibrium constants that comprise kisom
can be decomposed to show that measured rst-order isomerization rate constants
reect the dierence in free energy between the kinetically-relevant transition state
(bound glucose-fructose isomerization transition states (∆G‡,2∗o) and two aqueous-
phase water molecules (2∆GWo)) and the most abundant surface intermediate (two
bound water molecules (∆G2W∗o) and aqueous-phase glucose (∆GG
o); details in Sec-
tion E.7.10) [576]:
kisom = αK1k2
K4K5
= αkBT
he(−(∆Go
‡,2∗+2∆GoW )−(∆Go
G+∆Go2W∗))/RT ) (E.3)
Isomerization turnover rates (Eq. E.2) are rigorously normalized by the number
of active Sn sites, demonstrated elsewhere to be open Sn sites based on selective NH3
pre-poisoning of open sites in Sn-Beta before glucose isomerization catalysis [551].
The number of Sn sites active for glucose isomerization was independently estimated
here on two dierent Sn-Beta-F samples (Sn-Beta-F-110, Sn-Beta-F-170) from pyri-
dine pre-poisoning studies, in which samples were pressed into self-supporting wafers
and sealed in the IR cell, titrated with dierent amounts of pyridine (quantied from
IR spectra and the E values in Table E.2), removed from the IR cell, and ground into
a powder prior to measurement of isomerization rates. Initial isomerization turnover
rates (per total Sn, 373 K) decreased with increasing pyridine coverage (per total Sn)
for Sn-Beta-F-110 and Sn-Beta-F-170 (Fig. E.11), but not because of occlusion of
intracrystalline void spaces or of pore openings at external crystallite surfaces, or be-
cause of restricted diusion of glucose reactants within intracrystalline voids (details
in Section E.7.10). Linear extrapolation of initial isomerization rates with increas-
ing pyridine coverage (Fig. E.11) predicts full suppression of reactivity at pyridine
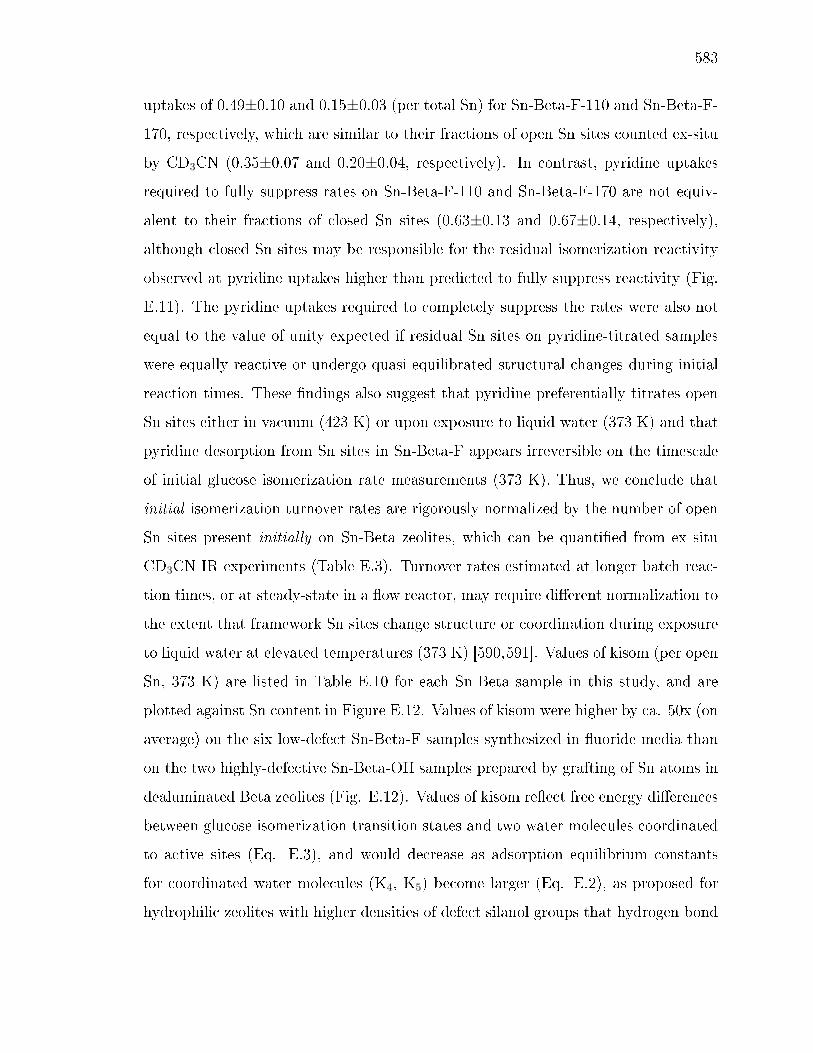
583
uptakes of 0.49±0.10 and 0.15±0.03 (per total Sn) for Sn-Beta-F-110 and Sn-Beta-F-
170, respectively, which are similar to their fractions of open Sn sites counted ex-situ
by CD3CN (0.35±0.07 and 0.20±0.04, respectively). In contrast, pyridine uptakes
required to fully suppress rates on Sn-Beta-F-110 and Sn-Beta-F-170 are not equiv-
alent to their fractions of closed Sn sites (0.63±0.13 and 0.67±0.14, respectively),
although closed Sn sites may be responsible for the residual isomerization reactivity
observed at pyridine uptakes higher than predicted to fully suppress reactivity (Fig.
E.11). The pyridine uptakes required to completely suppress the rates were also not
equal to the value of unity expected if residual Sn sites on pyridine-titrated samples
were equally reactive or undergo quasi-equilibrated structural changes during initial
reaction times. These ndings also suggest that pyridine preferentially titrates open
Sn sites either in vacuum (423 K) or upon exposure to liquid water (373 K) and that
pyridine desorption from Sn sites in Sn-Beta-F appears irreversible on the timescale
of initial glucose isomerization rate measurements (373 K). Thus, we conclude that
initial isomerization turnover rates are rigorously normalized by the number of open
Sn sites present initially on Sn-Beta zeolites, which can be quantied from ex situ
CD3CN IR experiments (Table E.3). Turnover rates estimated at longer batch reac-
tion times, or at steady-state in a ow reactor, may require dierent normalization to
the extent that framework Sn sites change structure or coordination during exposure
to liquid water at elevated temperatures (373 K) [590,591]. Values of kisom (per open
Sn, 373 K) are listed in Table E.10 for each Sn-Beta sample in this study, and are
plotted against Sn content in Figure E.12. Values of kisom were higher by ca. 50x (on
average) on the six low-defect Sn-Beta-F samples synthesized in uoride media than
on the two highly-defective Sn-Beta-OH samples prepared by grafting of Sn atoms in
dealuminated Beta zeolites (Fig. E.12). Values of kisom reect free energy dierences
between glucose isomerization transition states and two water molecules coordinated
to active sites (Eq. E.3), and would decrease as adsorption equilibrium constants
for coordinated water molecules (K4, K5) become larger (Eq. E.2), as proposed for
hydrophilic zeolites with higher densities of defect silanol groups that hydrogen bond
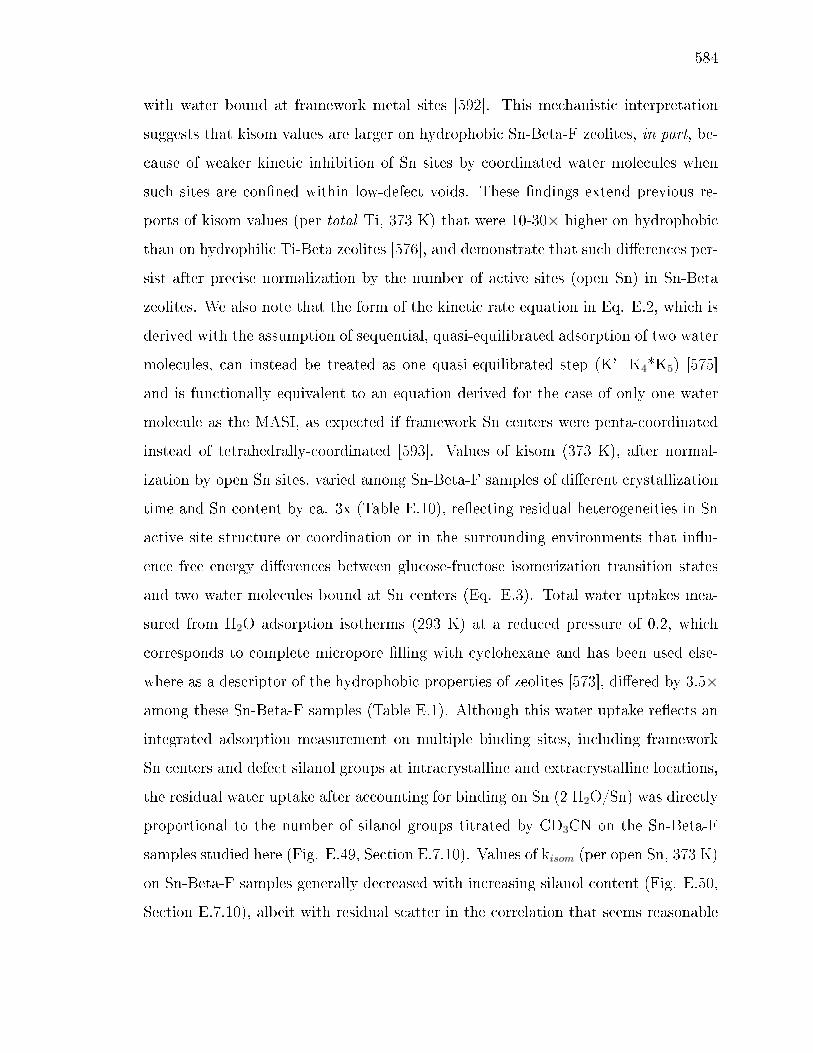
584
with water bound at framework metal sites [592]. This mechanistic interpretation
suggests that kisom values are larger on hydrophobic Sn-Beta-F zeolites, in part, be-
cause of weaker kinetic inhibition of Sn sites by coordinated water molecules when
such sites are conned within low-defect voids. These ndings extend previous re-
ports of kisom values (per total Ti, 373 K) that were 10-30× higher on hydrophobic
than on hydrophilic Ti-Beta zeolites [576], and demonstrate that such dierences per-
sist after precise normalization by the number of active sites (open Sn) in Sn-Beta
zeolites. We also note that the form of the kinetic rate equation in Eq. E.2, which is
derived with the assumption of sequential, quasi-equilibrated adsorption of two water
molecules, can instead be treated as one quasi-equilibrated step (K'=K4*K5) [575]
and is functionally equivalent to an equation derived for the case of only one water
molecule as the MASI, as expected if framework Sn centers were penta-coordinated
instead of tetrahedrally-coordinated [593]. Values of kisom (373 K), after normal-
ization by open Sn sites, varied among Sn-Beta-F samples of dierent crystallization
time and Sn content by ca. 3x (Table E.10), reecting residual heterogeneities in Sn
active site structure or coordination or in the surrounding environments that inu-
ence free energy dierences between glucose-fructose isomerization transition states
and two water molecules bound at Sn centers (Eq. E.3). Total water uptakes mea-
sured from H2O adsorption isotherms (293 K) at a reduced pressure of 0.2, which
corresponds to complete micropore lling with cyclohexane and has been used else-
where as a descriptor of the hydrophobic properties of zeolites [573], diered by 3.5×
among these Sn-Beta-F samples (Table E.1). Although this water uptake reects an
integrated adsorption measurement on multiple binding sites, including framework
Sn centers and defect silanol groups at intracrystalline and extracrystalline locations,
the residual water uptake after accounting for binding on Sn (2 H2O/Sn) was directly
proportional to the number of silanol groups titrated by CD3CN on the Sn-Beta-F
samples studied here (Fig. E.49, Section E.7.10). Values of kisom (per open Sn, 373 K)
on Sn-Beta-F samples generally decreased with increasing silanol content (Fig. E.50,
Section E.7.10), albeit with residual scatter in the correlation that seems reasonable

585
because kisom values may only sense dierences in the strength of water binding in
the vicinity of active Sn sites. These ndings and interpretations suggest that meth-
ods to insert Sn atoms into vacancy defects of Beta zeolites may benet from further
treatments to remove residual silanol defects to increase their hydrophobicity and, in
turn, turnover rates for aqueous-phase glucose isomerization.
E.4 Conclusions
Titration and quantication procedures were developed for four dierent Lewis
bases, two involving concurrent collection of infrared spectra (pyridine, deuterated
acetonitrile) and two involving subsequent temperature programmed desorption (am-
monia, n-propylamine), to quantify the number of Lewis acid sites in Sn-Beta zeolites
prepared by hydrothermal and post-synthetic routes. On crystalline zeolites, inte-
grated molar extinction coecients (E) for IR peaks reecting pyridine bound to
Lewis acidic Sn sites (1450 cm−1) and CD3CN bound to open (2316 cm−1) and closed
(2308 cm−1) Sn sites were dierent from E values for Lewis acidic Al sites. E values
for Al sites are available in the literature, but quantify Sn sites imprecisely from IR
spectra of Sn-Beta samples at saturation pyridine or CD3CN coverages, while the
E values on Sn sites reported here estimate similar numbers of Lewis acid sites on
the eight Sn-Beta samples in this study. Two additional TPD methods were also
developed to selectively titrate and quantify Lewis acid sites in Sn-Beta zeolites with
ammonia or n-propylamine, which are titrants used often to quantify Brønsted acid
sites but seldom to quantify Lewis acid sites in solid acids.
Open Sn sites, which are partially hydrolyzed framework Sn centers with an OH
ligand (Sn-OH) proximal to a silanol group (Si-OH), have been implicated as the dom-
inant active site in Sn-Beta for glucose-fructose isomerization via intramolecular 1,2-
hydride shift [551]. On two Sn-Beta samples, initial aqueous-phase glucose-fructose
isomerization turnover rates (per total Sn, 373 K) decreased linearly with the number
of pyridine titrants adsorbed prior to reaction, and become suppressed at pyridine
uptakes similar to the number of open Sn sites counted ex-situ by CD3CN (303 K).
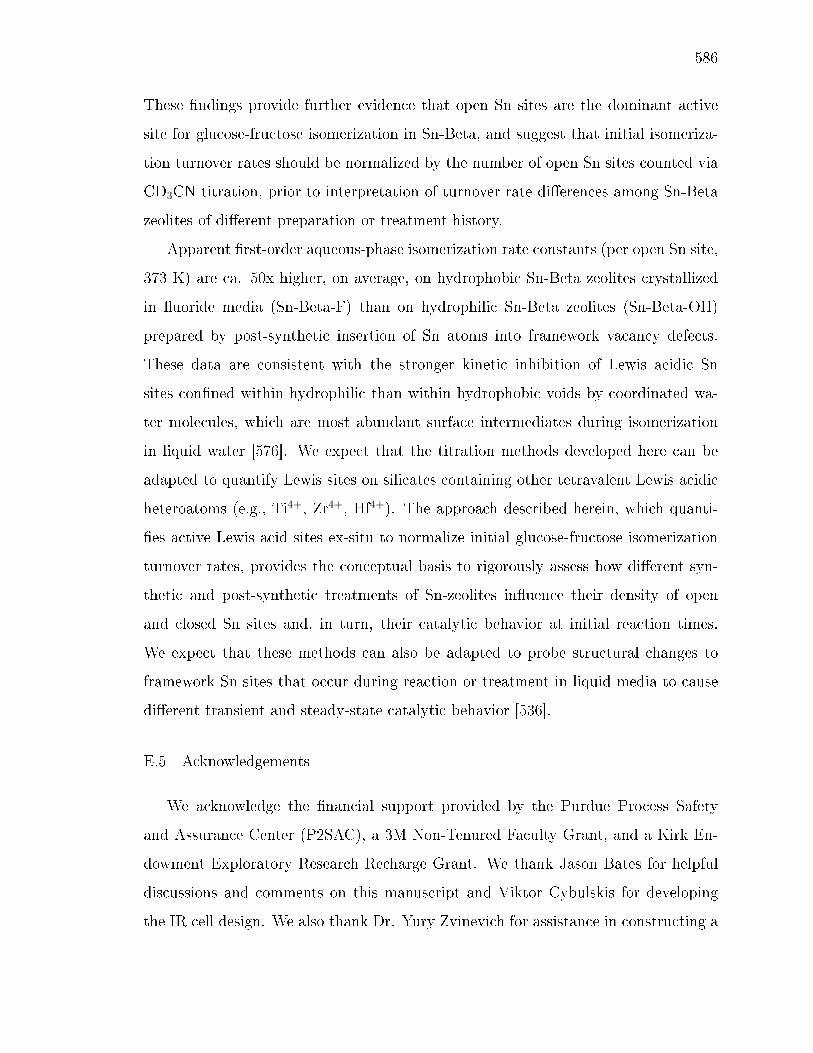
586
These ndings provide further evidence that open Sn sites are the dominant active
site for glucose-fructose isomerization in Sn-Beta, and suggest that initial isomeriza-
tion turnover rates should be normalized by the number of open Sn sites counted via
CD3CN titration, prior to interpretation of turnover rate dierences among Sn-Beta
zeolites of dierent preparation or treatment history.
Apparent rst-order aqueous-phase isomerization rate constants (per open Sn site,
373 K) are ca. 50x higher, on average, on hydrophobic Sn-Beta zeolites crystallized
in uoride media (Sn-Beta-F) than on hydrophilic Sn-Beta zeolites (Sn-Beta-OH)
prepared by post-synthetic insertion of Sn atoms into framework vacancy defects.
These data are consistent with the stronger kinetic inhibition of Lewis acidic Sn
sites conned within hydrophilic than within hydrophobic voids by coordinated wa-
ter molecules, which are most abundant surface intermediates during isomerization
in liquid water [576]. We expect that the titration methods developed here can be
adapted to quantify Lewis sites on silicates containing other tetravalent Lewis acidic
heteroatoms (e.g., Ti4+, Zr4+, Hf4+). The approach described herein, which quanti-
es active Lewis acid sites ex-situ to normalize initial glucose-fructose isomerization
turnover rates, provides the conceptual basis to rigorously assess how dierent syn-
thetic and post-synthetic treatments of Sn-zeolites inuence their density of open
and closed Sn sites and, in turn, their catalytic behavior at initial reaction times.
We expect that these methods can also be adapted to probe structural changes to
framework Sn sites that occur during reaction or treatment in liquid media to cause
dierent transient and steady-state catalytic behavior [536].
E.5 Acknowledgements
We acknowledge the nancial support provided by the Purdue Process Safety
and Assurance Center (P2SAC), a 3M Non-Tenured Faculty Grant, and a Kirk En-
dowment Exploratory Research Recharge Grant. We thank Jason Bates for helpful
discussions and comments on this manuscript and Viktor Cybulskis for developing
the IR cell design. We also thank Dr. Yury Zvinevich for assistance in constructing a
587
custom-built active site titration unit, Cindy Tavera for experimental assistance with
sample preparation, Jacklyn Hall for experimental assistance with isotopic tracer and
liquid NMR experiments, and John Degenstein and Dr. Mike Detwiler for assistance
with parameter estimation and spectral peak deconvolution. Finally, we thank Profs.
John Morgan and Julie Liu for access to the lyophilizer, and Dr. John Harwood
(Purdue Interdepartmental NMR Facility) for assistance with NMR.
Additionally, I acknowledge Elsevier for granting permission to reproduce this
chapter of my thesis. Adapted with permissions from Journal of Catalysis, 2016, 335,
141-154. Copyright Elsevier. The full article can be accessed here: dx.doi.org/10.1016/j.jcat.2015.12.024.

588
E.6 Figures and Tables
Figure E.1. Adsorption of CD3CN on dierent sites in stannosilicates andcorresponding ν(C≡N) infrared vibrational frequencies.
Figure E.2. Plausible reaction mechanism for glucose-fructose isomerizationon open Sn sites in Sn-Beta involving kinetically-relevant 1,2-intramolecularhydride shift (Step 2). For clarity, kinetically-irrelevant steps are lumpedas quasi-equilibrated reactions (Steps 1, 3-5).

589
Figure E.3. Diuse reectance UV-Vis spectra in Kubelka-Munk units(normalized to the maximum F(R) intensity within each series) for (a)Sn-Beta-F-170, (b) Sn-Beta-OH-200, and (c) SnO2/Si-Beta collected underambient conditions (thin solid line), after dehydration at 523 K (thick solidline), and after rehydration at 303 K (dashed line).
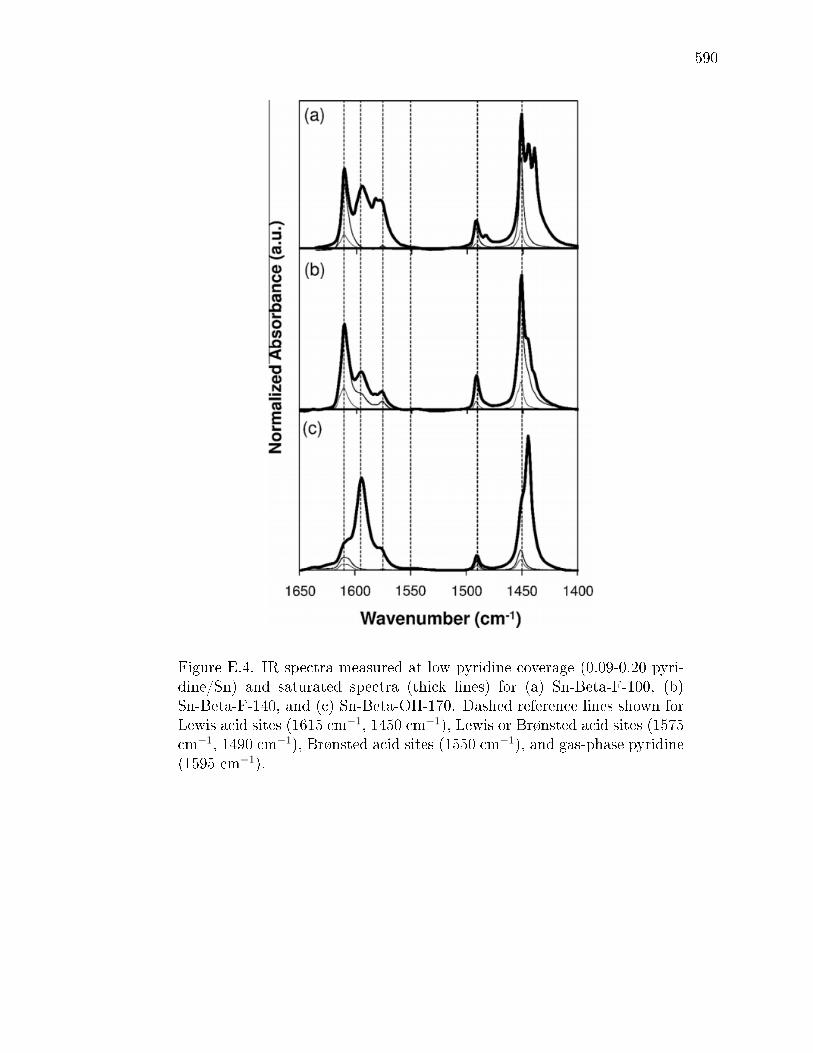
590
Figure E.4. IR spectra measured at low pyridine coverage (0.09-0.20 pyri-dine/Sn) and saturated spectra (thick lines) for (a) Sn-Beta-F-100, (b)Sn-Beta-F-140, and (c) Sn-Beta-OH-170. Dashed reference lines shown forLewis acid sites (1615 cm−1, 1450 cm−1), Lewis or Brønsted acid sites (1575cm−1, 1490 cm−1), Brønsted acid sites (1550 cm−1), and gas-phase pyridine(1595 cm−1).
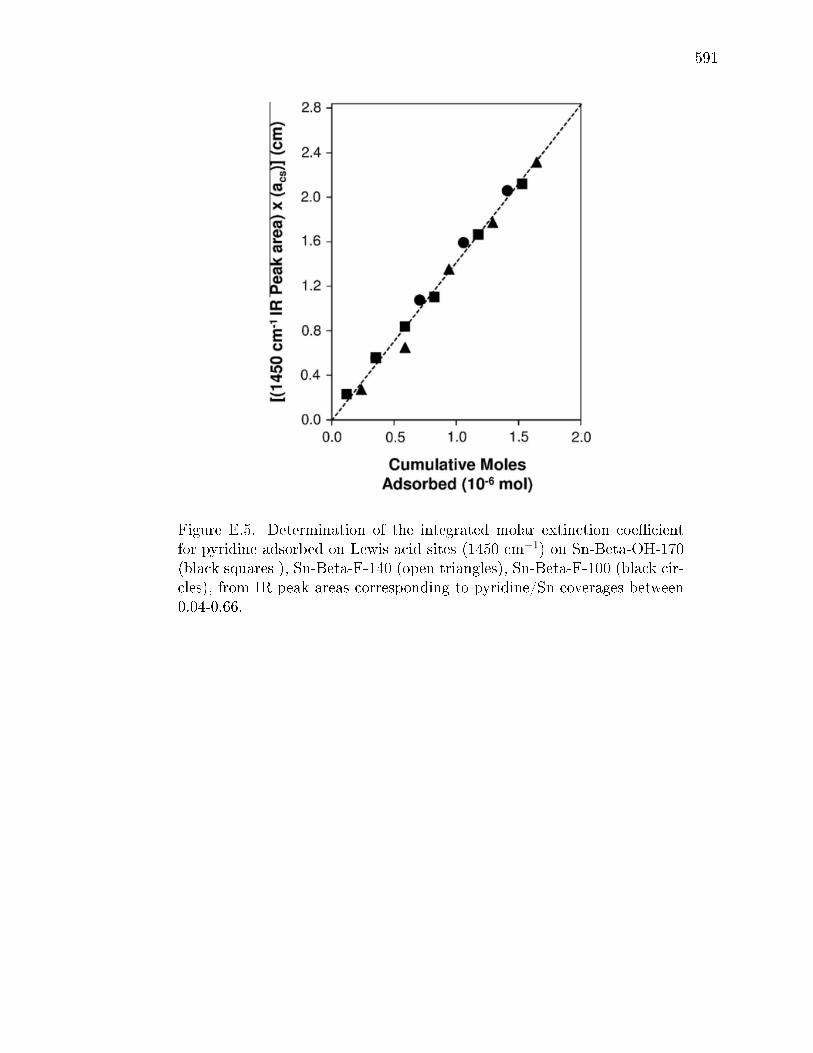
591
Figure E.5. Determination of the integrated molar extinction coecientfor pyridine adsorbed on Lewis acid sites (1450 cm−1) on Sn-Beta-OH-170(black squares ), Sn-Beta-F-140 (open triangles), Sn-Beta-F-100 (black cir-cles), from IR peak areas corresponding to pyridine/Sn coverages between0.04-0.66.
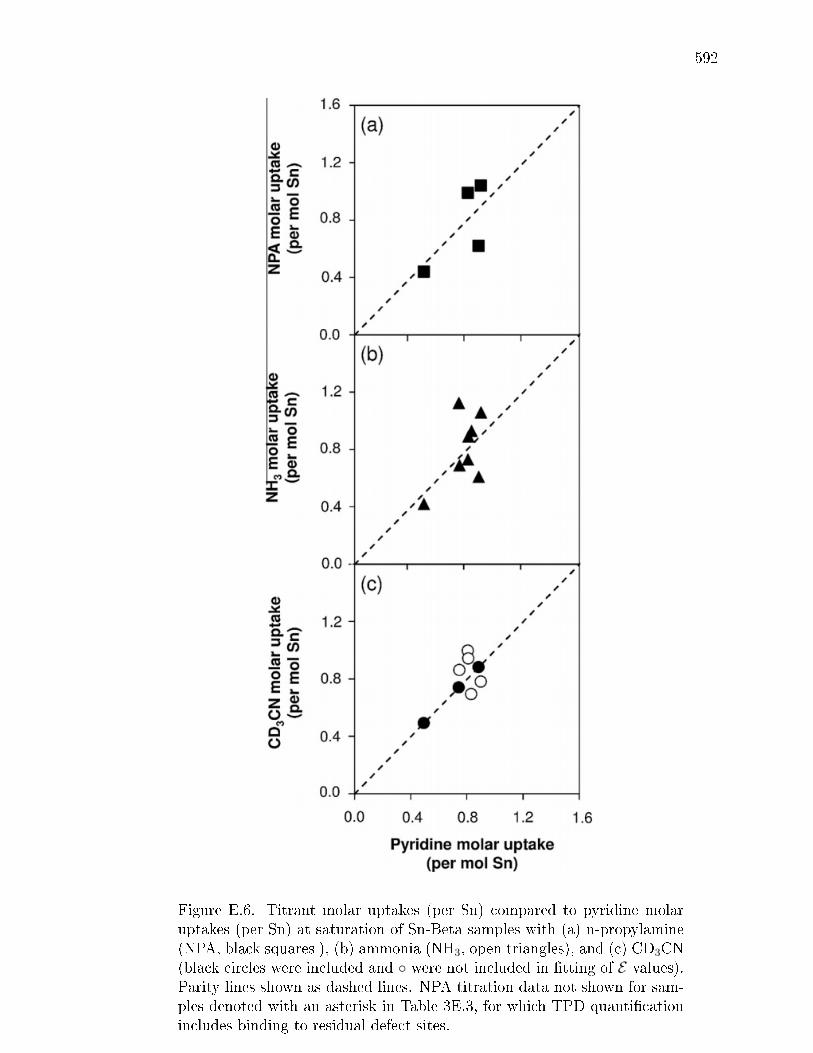
592
Figure E.6. Titrant molar uptakes (per Sn) compared to pyridine molaruptakes (per Sn) at saturation of Sn-Beta samples with (a) n-propylamine(NPA, black squares ), (b) ammonia (NH3, open triangles), and (c) CD3CN(black circles were included and were not included in tting of E values).Parity lines shown as dashed lines. NPA titration data not shown for sam-ples denoted with an asterisk in Table 3E.3, for which TPD quanticationincludes binding to residual defect sites.
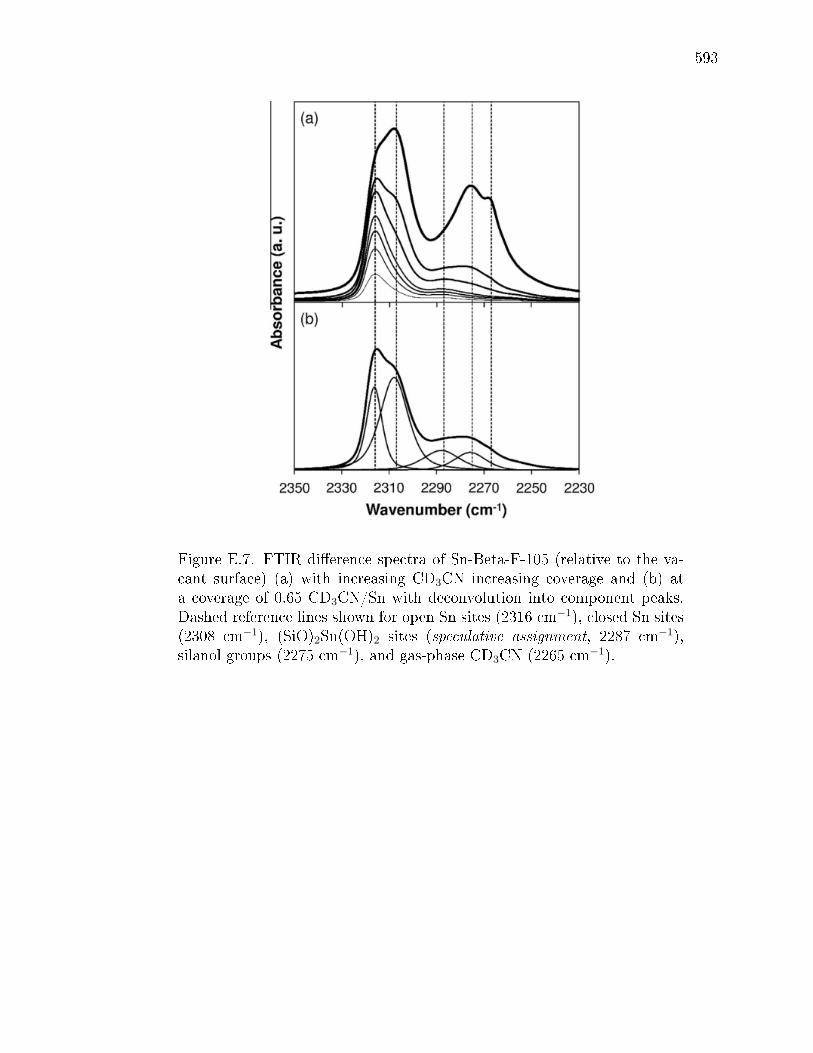
593
Figure E.7. FTIR dierence spectra of Sn-Beta-F-105 (relative to the va-cant surface) (a) with increasing CD3CN increasing coverage and (b) ata coverage of 0.65 CD3CN/Sn with deconvolution into component peaks.Dashed reference lines shown for open Sn sites (2316 cm−1), closed Sn sites(2308 cm−1), (SiO)2Sn(OH)2 sites (speculative assignment, 2287 cm−1),silanol groups (2275 cm−1), and gas-phase CD3CN (2265 cm−1).
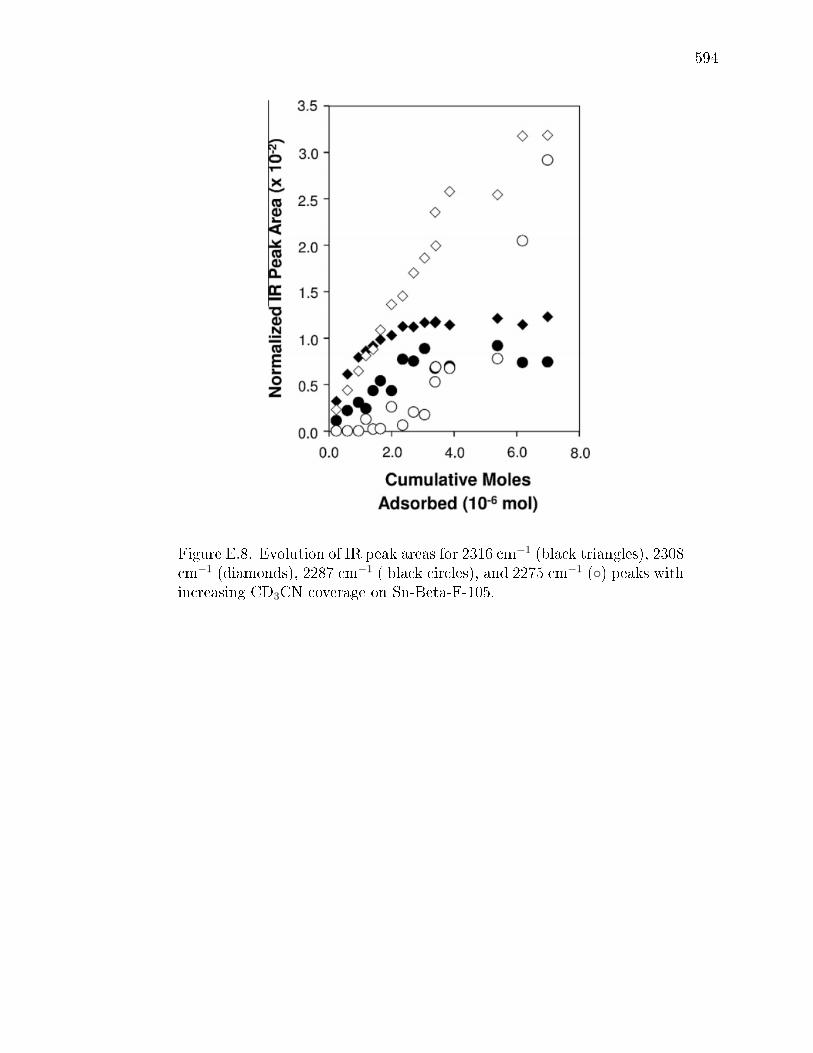
594
Figure E.8. Evolution of IR peak areas for 2316 cm−1 (black triangles), 2308cm−1 (diamonds), 2287 cm−1 ( black circles), and 2275 cm−1 () peaks withincreasing CD3CN coverage on Sn-Beta-F-105.
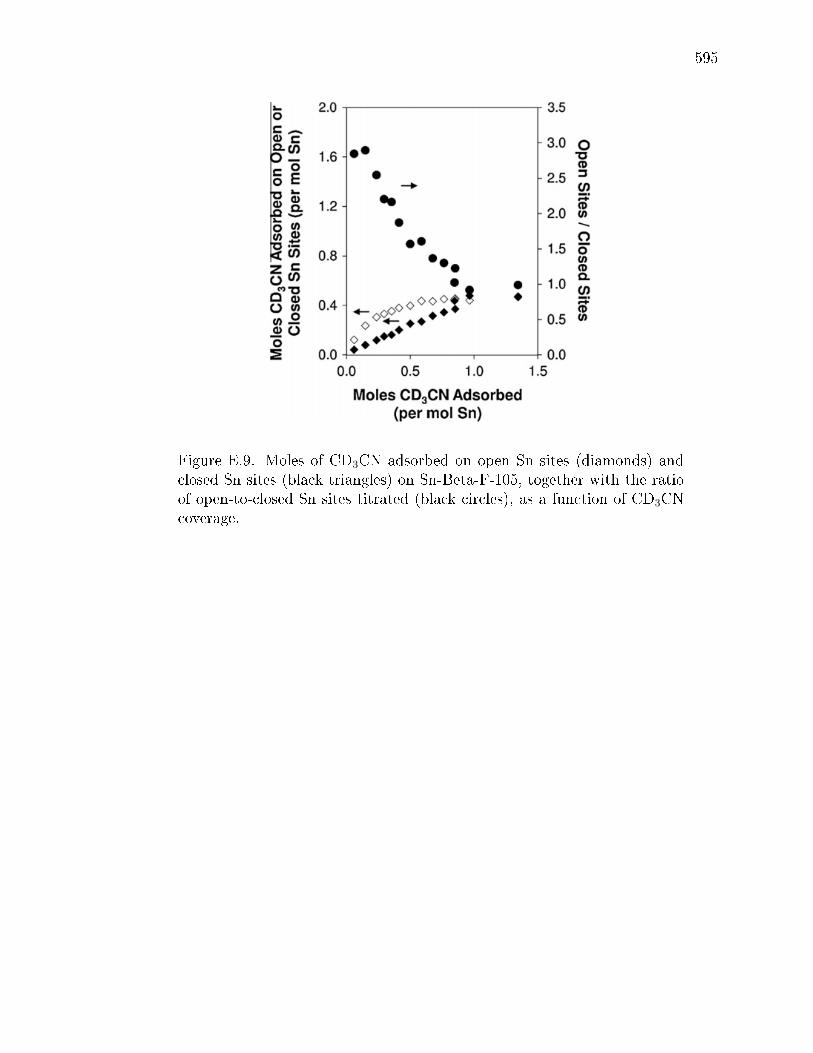
595
Figure E.9. Moles of CD3CN adsorbed on open Sn sites (diamonds) andclosed Sn sites (black triangles) on Sn-Beta-F-105, together with the ratioof open-to-closed Sn sites titrated (black circles), as a function of CD3CNcoverage.
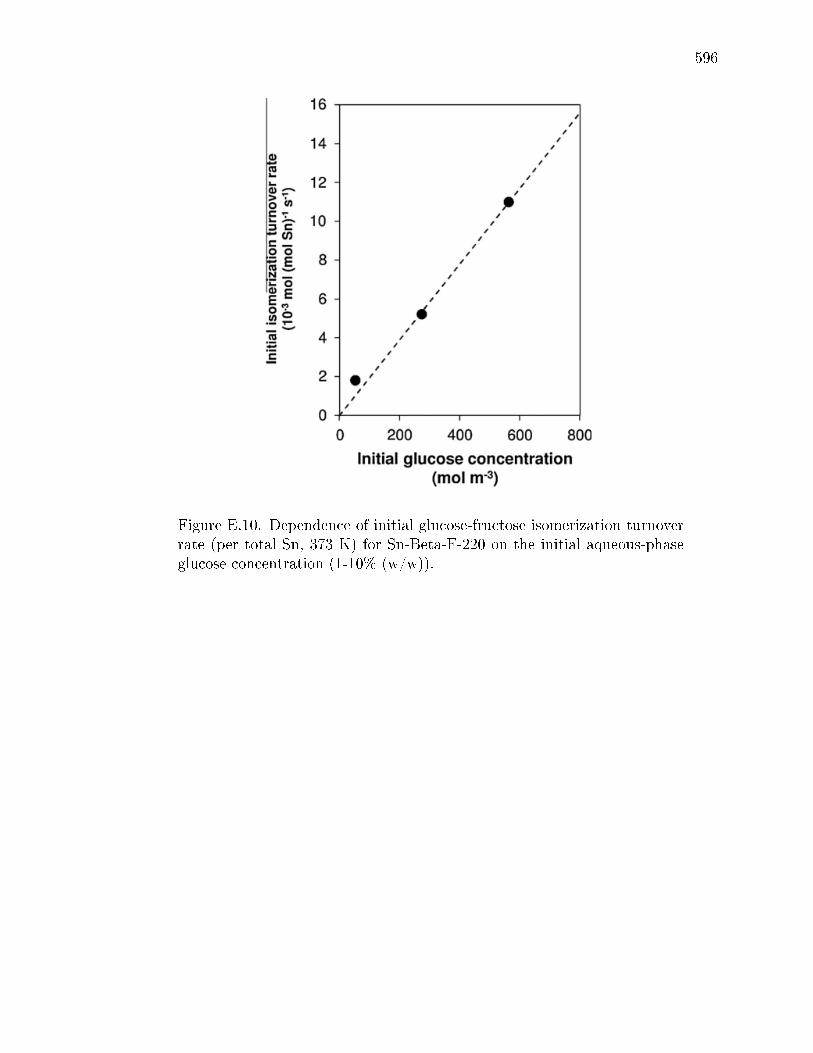
596
Figure E.10. Dependence of initial glucose-fructose isomerization turnoverrate (per total Sn, 373 K) for Sn-Beta-F-220 on the initial aqueous-phaseglucose concentration (1-10% (w/w)).
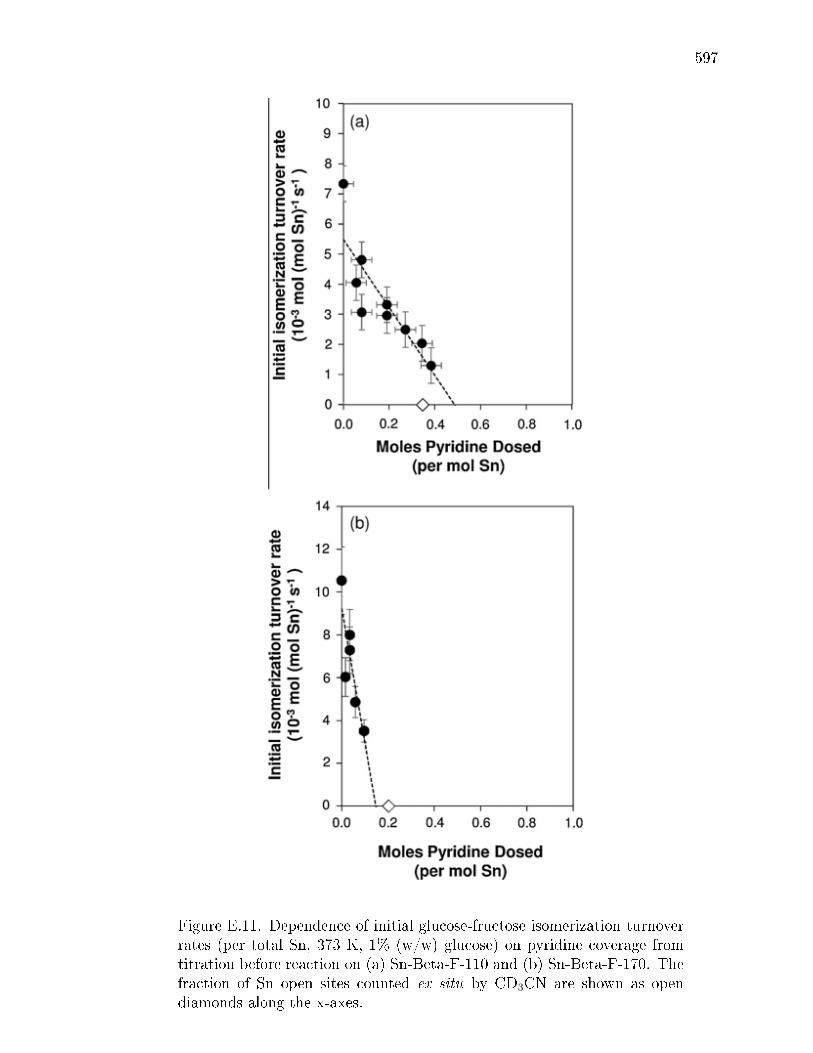
597
Figure E.11. Dependence of initial glucose-fructose isomerization turnoverrates (per total Sn, 373 K, 1% (w/w) glucose) on pyridine coverage fromtitration before reaction on (a) Sn-Beta-F-110 and (b) Sn-Beta-F-170. Thefraction of Sn open sites counted ex situ by CD3CN are shown as opendiamonds along the x-axes.
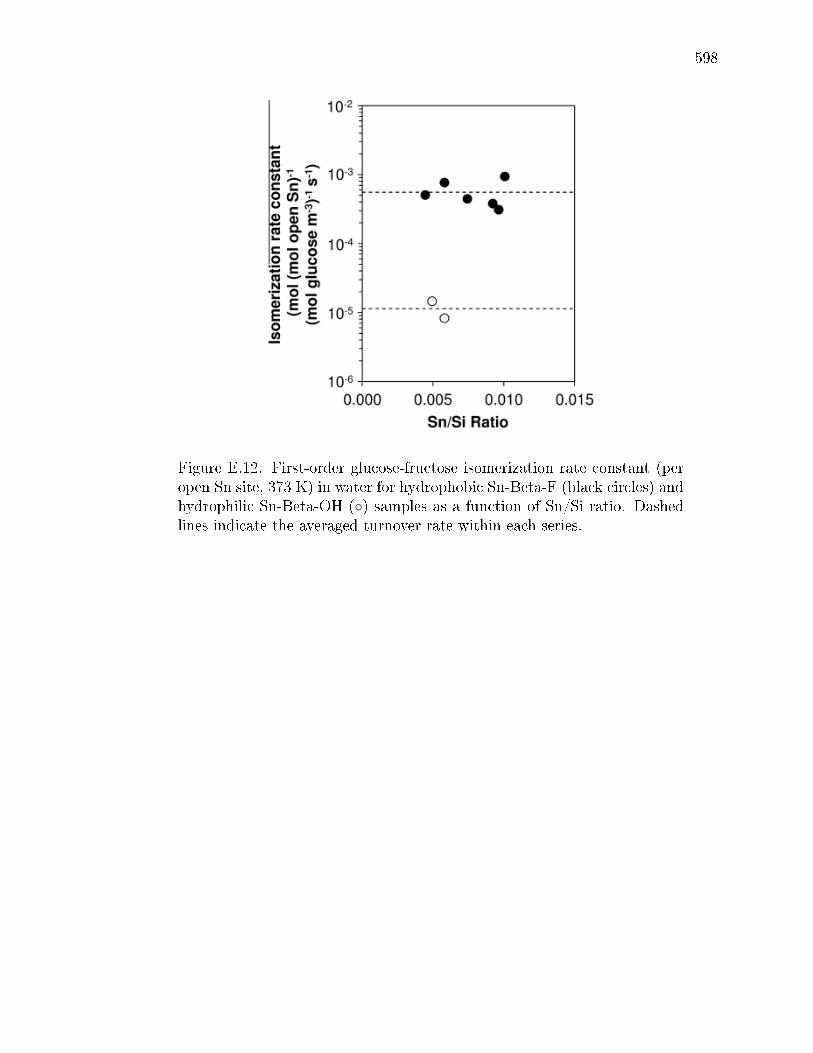
598
Figure E.12. First-order glucose-fructose isomerization rate constant (peropen Sn site, 373 K) in water for hydrophobic Sn-Beta-F (black circles) andhydrophilic Sn-Beta-OH () samples as a function of Sn/Si ratio. Dashedlines indicate the averaged turnover rate within each series.
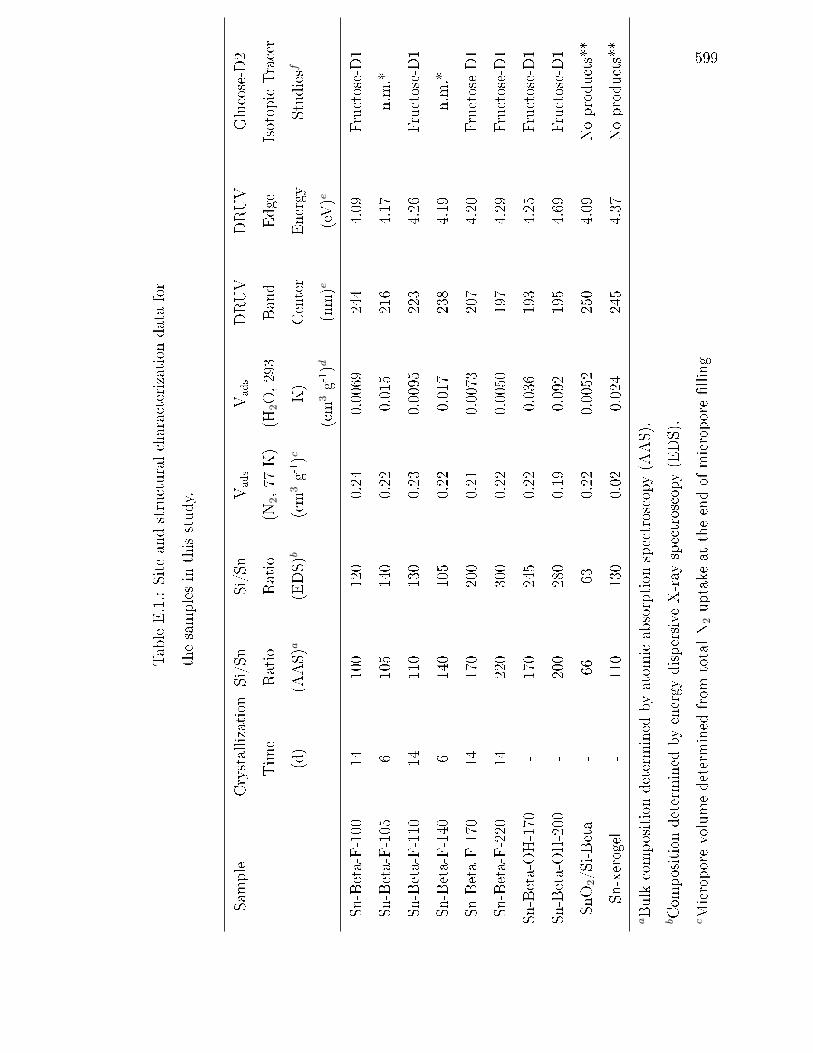
599
TableE.1.:Site
andstructural
characterization
data
for
thesamples
inthisstud
y.
Sample
Crystallization
Tim
e
(d)
Si/Sn
Ratio
(AAS)a
Si/Sn
Ratio
(EDS)b
Vads
(N2,77
K)
(cm
3g-1)c
Vads
(H2O,293
K)
(cm
3g-1)d
DRUV
Band
Center
(nm)e
DRUV
Edge
Energy
(eV)e
Glucose-D2
IsotopicTracer
Stud
iesf
Sn-Beta-F-100
14100
120
0.24
0.0069
244
4.09
Fructose-D1
Sn-Beta-F-105
6105
140
0.22
0.015
216
4.17
n.m.*
Sn-Beta-F-110
14110
130
0.23
0.0095
223
4.26
Fructose-D1
Sn-Beta-F-140
6140
105
0.22
0.017
238
4.19
n.m.*
Sn-Beta-F-170
14170
200
0.21
0.0073
207
4.20
Fructose-D1
Sn-Beta-F-220
14220
300
0.22
0.0050
197
4.29
Fructose-D1
Sn-Beta-OH-170
-170
245
0.22
0.036
193
4.25
Fructose-D1
Sn-Beta-OH-200
-200
280
0.19
0.092
195
4.69
Fructose-D1
SnO
2/Si-Beta
-66
630.22
0.0052
250
4.09
Noproducts**
Sn-xerogel
-110
130
0.02
0.024
245
4.37
Noproducts**
aBulkcomposition
determ
ined
byatom
icabsorption
spectroscopy
(AAS).
bCom
position
determ
ined
byenergy
dispersive
X-ray
spectroscopy
(EDS).
cMicropore
volumedeterm
ined
from
totalN
2up
take
attheendof
micropore
llin
g
600
inadsorption
isotherm
s(77K).
dH
2O
uptake
atP/P
0=
0.2(293
K)takenas
adescriptor
ofhydrophobicity
(P/P
0=0.2
correspond
sto
fullmicropore
llin
gwithcyclohexane[573]).
eDiusereectance
UV-Visspectra(bandcenter
atmaximum
F(R
)intensity)
andTaucplots
forsamples
afterdehydrationat
523K
(Section
E.7.3.
fFructose
productform
edfrom
glucose-D2reactantsin
water
(373
K),
1HNMRspectra
show
nin
Figures
E.21andE.22(Section
E.7.4).
*n.m.,notmeasured
**Noproducts
observed
forSn
O2/Si-Beta(0.01gcatalyst,4h)
andSn
-xerogel
(0.10gcatalyst,5h)
inaqueousglucose(1%
(w/w
),1cm
3solution,373K,pH
=5).

601
Table E.2.Integrated molar extinction coecients (E) for infrared peaks for pyridineand deuterated acetonitrile adsorbed to dierent sites on Sn-Beta and H-Y zeolites, determined assuming equimolar titrant binding to each type ofsite.
Type of
Site
Peak
Center
(cm−1
E ,
literature
(cm
µmol−1)
E , this
study
(cm
µmol−1)
Pyridine
Lewis acid, Al 1455 2.20 ± 0.30 [574] 1.45 ± 0.10
Brønsted acid, Al 1545 1.67 ± 0.25 [574] 1.95 ± 0.13
Lewis Acid, Sn 1450 n.a.* 1.42 ± 0.30
Deuterated acetonitrile
Open Lewis acid, Sn 2316 n.a.* 1.04 ± 0.22
Closed Lewis acid, Sn 2308 n.a.* 2.04 ± 0.43
Sn(OH)2 a 2287 n.a.* 2.13 ± 0.45
Silanol, SiOH 2275 n.a.* 0.74 ± 0.16
Lewis acid, Al 2325, 2310 3.6 ± 0.2 [571] n.m.**
Brønsted acid, Al 2297 2.5 ± 0.1 [571] n.m.**
a speculative assignment.
*n.a., not available
**n.m., not measured
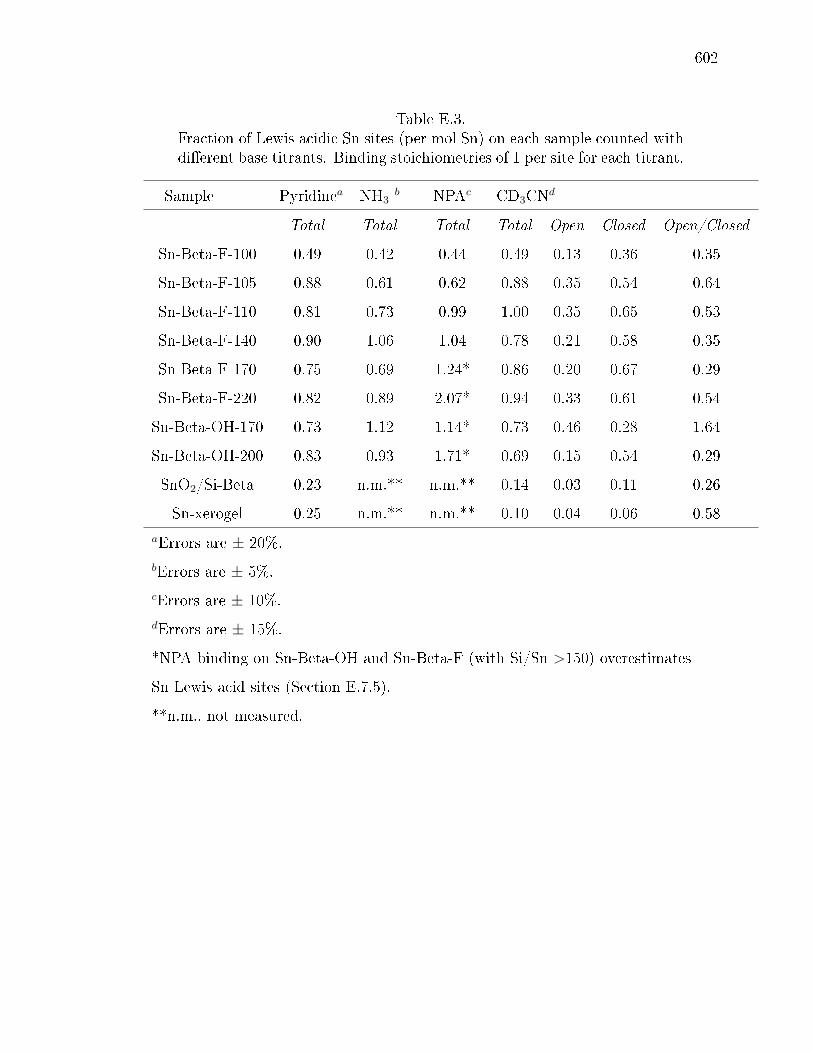
602
Table E.3.Fraction of Lewis acidic Sn sites (per mol Sn) on each sample counted withdierent base titrants. Binding stoichiometries of 1 per site for each titrant.
Sample Pyridinea NH3b NPAc CD3CNd
Total Total Total Total Open Closed Open/Closed
Sn-Beta-F-100 0.49 0.42 0.44 0.49 0.13 0.36 0.35
Sn-Beta-F-105 0.88 0.61 0.62 0.88 0.35 0.54 0.64
Sn-Beta-F-110 0.81 0.73 0.99 1.00 0.35 0.65 0.53
Sn-Beta-F-140 0.90 1.06 1.04 0.78 0.21 0.58 0.35
Sn-Beta-F-170 0.75 0.69 1.24* 0.86 0.20 0.67 0.29
Sn-Beta-F-220 0.82 0.89 2.07* 0.94 0.33 0.61 0.54
Sn-Beta-OH-170 0.73 1.12 1.14* 0.73 0.46 0.28 1.64
Sn-Beta-OH-200 0.83 0.93 1.71* 0.69 0.15 0.54 0.29
SnO2/Si-Beta 0.23 n.m.** n.m.** 0.14 0.03 0.11 0.26
Sn-xerogel 0.25 n.m.** n.m.** 0.10 0.04 0.06 0.58
aErrors are ± 20%.bErrors are ± 5%.cErrors are ± 10%.dErrors are ± 15%.
*NPA binding on Sn-Beta-OH and Sn-Beta-F (with Si/Sn >150) overestimates
Sn Lewis acid sites (Section E.7.5).
**n.m., not measured.
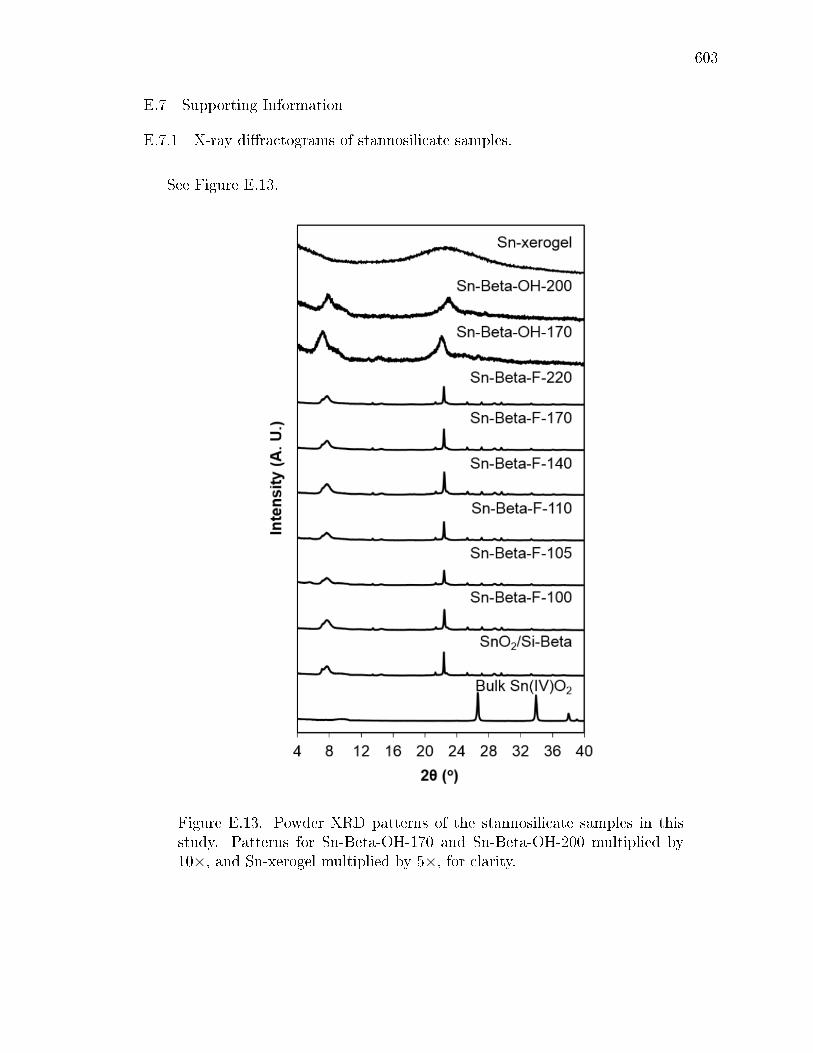
603
E.7 Supporting Information
E.7.1 X-ray diractograms of stannosilicate samples.
See Figure E.13.
Figure E.13. Powder XRD patterns of the stannosilicate samples in thisstudy. Patterns for Sn-Beta-OH-170 and Sn-Beta-OH-200 multiplied by10×, and Sn-xerogel multiplied by 5×, for clarity.
604
E.7.2 N2 and H2O adsorption isotherms of zeolite samples.
N2 adsorption isotherms (77 K) are shown for all Sn-Beta samples, SnO2/Si-Beta,
and Sn-xerogel in Figure S.2. On each sample, the micropore volume was deter-
mined from a semi-log derivative analysis of the N2 isotherms, by plotting δ(Vads/g)/
δ(log(P/P0) vs. log (P/P0) to identify the micropore lling transition (rst maxi-
mum) and then the end of micropore lling (subsequent minimum) [136, 137]. The
volume of adsorbed N2 (at STP) at the end of micropore lling was converted to the
volume of adsorbed liquid using the liquid N2 molar density (0.029 mol cm−3). This
method gave the micropore volumes listed in Table E.1.
H2O adsorption isotherms (293 K) are shown for Sn-Beta-F samples (Fig. E.15)
and for Sn-Beta-OH, SnO2/Si-Beta, and Sn-xerogel samples (Fig. E.16). On each
sample, the amount of water adsorbed at a relative pressure (P/P0) of 0.2 was used to
assess hydrophobicity, as chosen originally by Chen [573] because cyclohexane (298
K) lls the pores of hydrophobic zeolites at P/P0 = 0.2. The volume of adsorbed
H2O (at STP) at P/P0 = 0.2 was converted to the volume of adsorbed liquid using
the liquid H2O molar density (0.055 mol cm−3). This method gave the H2O uptake
values listed in Table E.1.

605
Figure E.14. N2 adsorption isotherms (77 K) for all samples used in thisstudy. Isotherms oset by 200 cm3 g−1 for clarity.

606
Figure E.15. H2O adsorption isotherms (293 K) for Sn-Beta-F samples usedin this study. Isotherms oset by 100 cm3 g−1 for clarity.

607
Figure E.16. H2O adsorption isotherms (293 K) for Sn-Beta-OH samples,SnO2/Si-Beta-F, and Sn-xerogel used in this study. Isotherms oset by 300cm3 g−1 for clarity.
E.7.3 Diuse-reectance UV-Visible spectra of zeolite samples.
DRUV spectra under ambient conditions, dehydrated conditions and rehydrated
conditions (see Section E.2.2) are shown for SnO2/Si-Beta, Sn-Beta-OH-200, and Sn-
Beta-F-170 in Fig. E.3. All samples contain DRUV bands with maxima at ca. 240 nm
under ambient conditions, characteristic of Sn in octahedral coordination [568, 578].
After dehydration treatments, DRUV bands for Sn-Beta-OH-200 and Sn-Beta-F-170
shift to ca. 210 nm characteristic of tetrahedral Sn [534,577], while DRUV bands for
the SnO2/Si-Beta do not change because octahedrally-coordinated Sn atoms in SnO2
do not change coordination upon heating. Although under-coordinated Sn atoms
near SnO2 surfaces may lose coordinated water upon dehydration, the fraction of such
608
Sn atoms appears small and noticeable changes to DRUV spectra after dehydration
ofSnO2/Si-Beta are not observed.
DRUV spectra of all Sn-Beta-F samples, and for Sn-Beta-OH, SnO2/Si-Beta, and
Sn-xerogel after dehydration treatments at 523 K are shown in Figures E.17 and
E.18, respectively. DRUV bands for Sn-Beta-F-100, Sn-Beta-F-105, and Sn-xerogel
were centered at ca. 240 nm upon dehydration. DRUV bands for Sn-Beta-F-110,
Sn-Beta-F-140, and Sn-Beta-F-170 were centered at ca. 210 nm, with a noticeable
shoulder at ca. 255 nm. For each of these samples, the lack of a complete shift
or remaining shoulder in DRUV spectra upon dehydration likely reects some non-
framework Sn species on these samples. DRUV bands for Sn-Beta-OH-170 at ca.
210 nm (ambient) may shift below 190 nm upon dehydration, while the shoulder
present at ca. 250 nm remains after the thermal treatment, likely reecting SnO2
nanoparticles larger than those that give rise to bands at ca. 230 nm due to quantum
connement eects [579582].
Tauc plots are shown for all Sn-Beta-F samples, and for Sn-Beta-OH, SnO2/Si-
Beta, and Sn-xerogel in Figures E.19 and E.20, respectively. Linear regions in the
low energy regime (<ca. 5 eV) of Tauc plots were extrapolated to determine the
x-intercept values, which correspond to the band gap energies for the Sn species
[594596], which can be correlated to SnO2 particle size [579582]. These values are
summarized in Table E.4.

609
Table E.4.Edge energies for all samples determined from x-intercepts of linear por-tions of Tauc plots (Figs. E.19 and E.20) DRUV band centers at maximumF(R) intensity are reported for spectra collected after dehydration treat-ments (Figs. E.17 and E.18), and parenthetical values are for second bandobserved in some DRUV spectra.
Sample Ambient
(eV)
Dehydrated
(eV)
Rehydrated
(eV)
Band
Maximum
(nm)
Sn-Beta-F-100 4.20 4.09 4.19 244
Sn-Beta-F-110 4.34 4.26 4.34 223
Sn-Beta-F-170 4.27 4.20 4.20 207
Sn-Beta-F-220 4.09 4.29 4.25 197 (260)
Sn-Beta-F-105 4.17 4.17 4.24 216
Sn-Beta-F-140 4.29 4.19 4.25 238
Sn-Beta-OH-170 4.02 4.25 4.10 267
Sn-Beta-OH-200 4.59 4.69 5.13 195
SnO2/Si-Beta 4.06 4.09 4.16 250
Sn-xerogel 4.45 4.37 4.46 245

610
Figure E.17. DRUV spectra for Sn-zeolite samples collected after dehydra-tion treatments (523 K). Spectra normalized to F(R) at the peak maximumand articially oset for clarity.
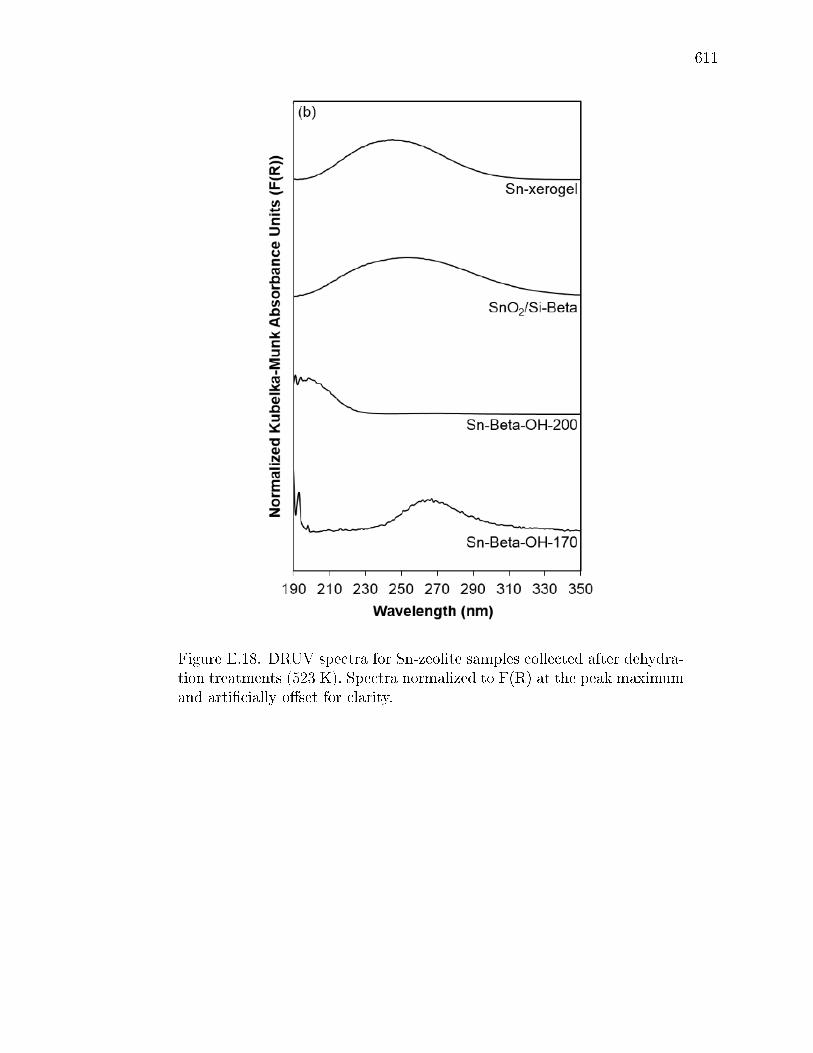
611
Figure E.18. DRUV spectra for Sn-zeolite samples collected after dehydra-tion treatments (523 K). Spectra normalized to F(R) at the peak maximumand articially oset for clarity.

612
Figure E.19. Tauc plots for Sn-zeolite samples from DRUV spectra collectedafter dehydration treatments (523 K).
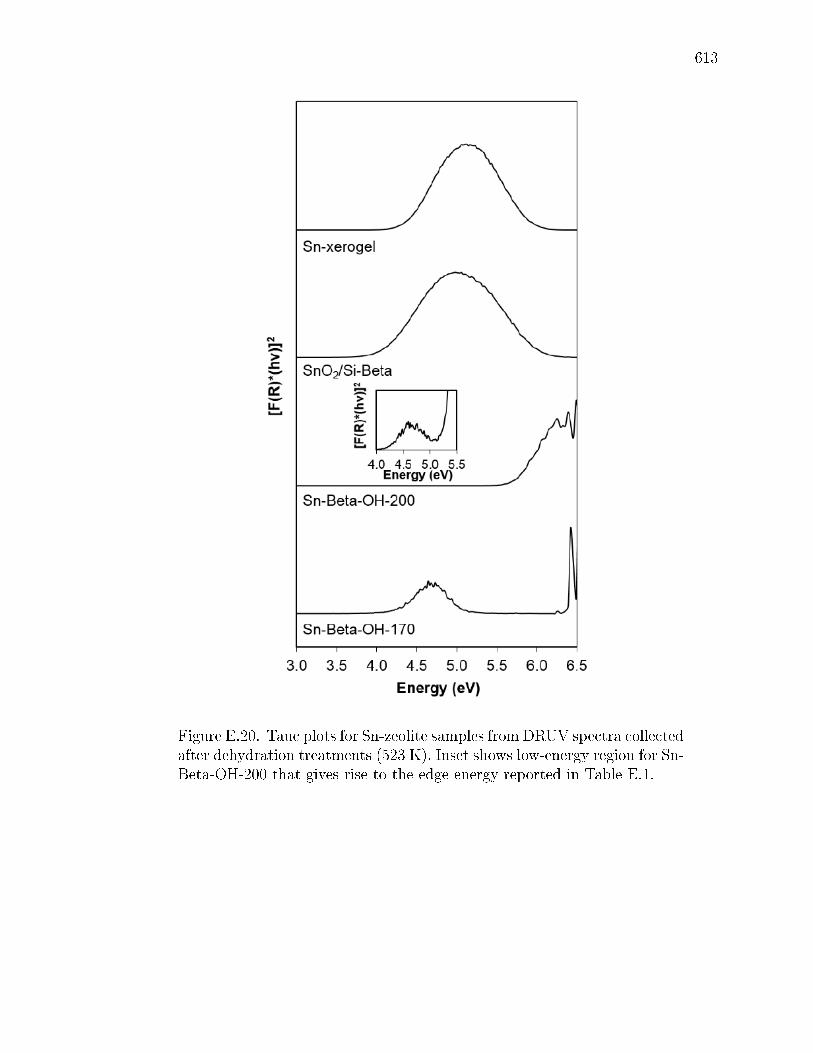
613
Figure E.20. Tauc plots for Sn-zeolite samples from DRUV spectra collectedafter dehydration treatments (523 K). Inset shows low-energy region for Sn-Beta-OH-200 that gives rise to the edge energy reported in Table E.1.

614
E.7.4 1H NMR spectra of sugars after reaction of glucose-D2 with zeolite samplesin water.
1H NMR spectra of glucose fractions recovered after reaction show no change when
compared to that of the labeled glucose-D2 reactant, which do not contain a resonance
at δ = 3.1 ppm (Fig. E.21. The absence of this resonance corresponds to a deuterium
atom bound to the α-carbonyl carbon (C2 position) of glucose and indicates negligible
H/D scrambling of glucose-D2 under the reaction conditions studied here [578]. 1H
NMR spectra of fructose fractions collected after reaction do not show a resonance
at δ = 3.45 ppm, which indicates that deuterium rather than hydrogen is present
at the fructose C1 position (Fig. E.22). This reects fructose formation only via
the Lewis acid-mediated intramolecular 1,2-hydride shift mechanism instead of the
enolate-mediated mechanism catalyzed by bases [142]. Fructose formation was not
observed with aqueous glucose solutions adjusted to pH=5 (with HCl) on SnO2/Si-
Beta or in reactors without catalyst present, further demonstrating that the fructose
products formed with Sn-Beta samples solely reect catalytic contributions of Lewis
acidic Sn sites.
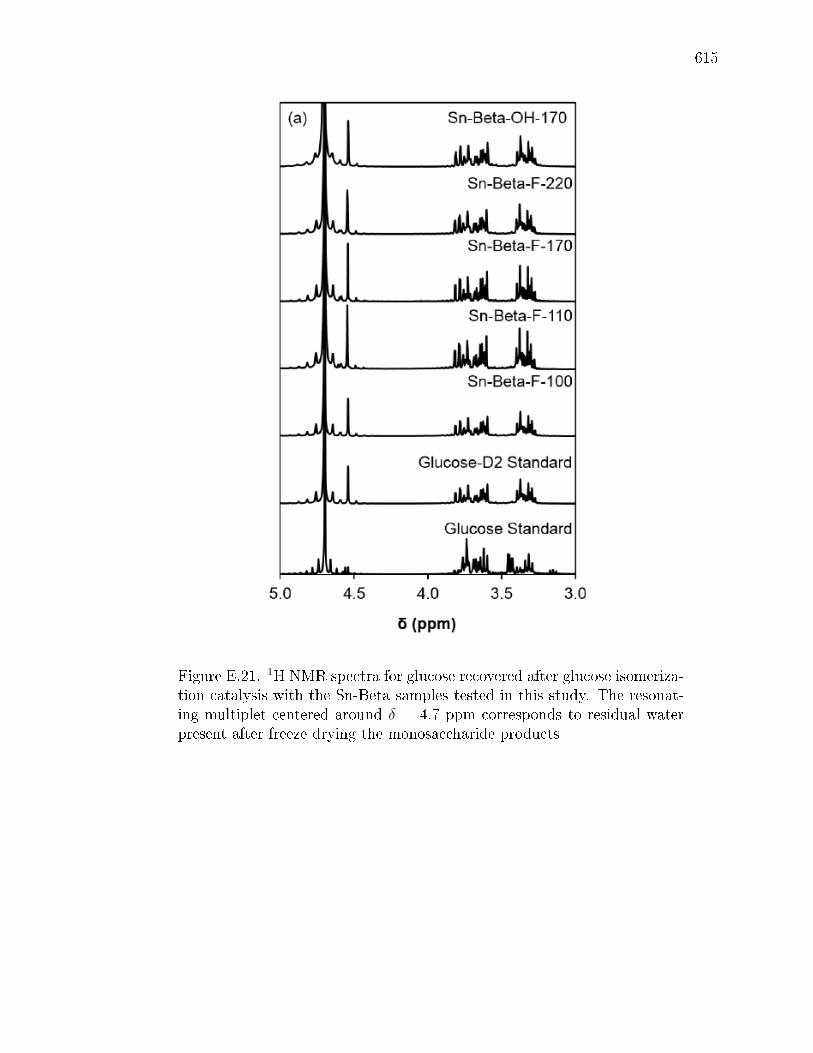
615
Figure E.21. 1H NMR spectra for glucose recovered after glucose isomeriza-tion catalysis with the Sn-Beta samples tested in this study. The resonat-ing multiplet centered around δ = 4.7 ppm corresponds to residual waterpresent after freeze drying the monosaccharide products

616
Figure E.22. 1H NMR spectra for the fructose recovered after glucose iso-merization catalysis with the Sn-Beta samples tested in this study. A smallresonance at δ=3.47 ppm (denoted with an asterisk) is present in fruc-tose products on Sn-Beta-OH-170 and Sn-Beta-OH-200, indicating a smallcontribution of the enolate mechanism by hydroxyl ions that becomes de-tectable at the longer reaction times (>4 h) used to attain higher glucoseconversion on these samples.

617
E.7.5 Determination of integrated molar extinction coecients for pyridine on H-Yzeolite.
NH4-Y (Zeolyst CBV300, Si/Al = 2.6) was treated at 823 K in owing dry air
(6.66 cm3 s−1 (g zeolite)−1) for 4 h to convert to the H-Y form. H-Y was pressed into
a self-supporting wafer and treated under vacuum at 823 K in the IR cell for 1 h,
before cooling to 423 K to perform pyridine titration experiments. As pyridine was
successively dosed onto the wafer, IR spectra (Fig. E.23) showed bands for protonated
pyridine (1630 cm−1, 1545 cm−1) and for either protonated pyridine or pyridine bound
to Lewis acidic Al sites (1490 cm−1). Yet, no bands for pyridine bound to Lewis
acidic Al sites (1610 cm−1, 1455 cm−1) were observed (Fig. E.23). Deconvolution
of IR spectra using the procedure described in Section S.9 was used to determine
areas of individual IR peaks after each pyridine dose of known quantity. The E value
for the IR band at 1540 cm−1 (protonated pyridine), which was determined from
the linear relationship between [integrated IR band area (cm−1)*wafer cross sectional
area (cm2)] and the total moles dosed (µmol, Fig. E.24), was 1.95 ± 0.13 cm µmol−1.
This value is similar, within error, to the value reported by Emeis (1.67 ± 0.25 cm
µmol−1) for pyridine adsorbed on Brønsted acid sites in Al-zeolites [574]. The error
in the E value was estimated by propagation of error in the moles of titrant adsorbed
within each dose (±0.05 Torr).
The H-Y wafer was then treated in owing air at 953 K for 4 h, in dynamic
vacuum (0.1 Torr) at 953 K for 1 h, and then cooled to 423 K for pyridine titration
experiments. As pyridine was successively dosed onto the wafer, new IR bands at
1610 cm−1 and 1455 cm−1 characteristic of pyridine bound to Lewis acidic Al sites
appeared (Fig E.23) [559]. Deconvolution of IR spectra using the same procedure as
above was used to determine IR peak areas for each dose of known quantity. The
E value for the IR band at 1455 cm−1 (pyridine bound to Lewis acidic Al sites) was
determined by rst calculating the squared error between the number of moles dosed
to the wafer and the estimated number of moles adsorbed for each dose, using the E
value of 1.95 cm ±mol−1 for protonated pyridine at 1540 cm−1 and an initial guess

618
for the E value for pyridine bound to Lewis acidic Al. The sum of squared errors
was minimized in order to determine the best t of E values for pyridine bound to
Lewis acidic Al sites, which was 1.45 ± 0.10 cm µmol−1. This value is outside of the
error of the E value for pyridine bound to Lewis acidic Al determined by Emeis on
H-MOR, H-Y, and H-ZSM-5 zeolites and amorphous silica-alumina (2.20 ± 0.33 cm
µmol−1 [574]), but falls within the range reported in the literature for pyridine bound
to Lewis acidic Al sites in aluminosilicates (0.89-3.9 cm µmol−1 [585,597,598]).
Figure E.23. IR spectra after progressive titration of pyridine on H-Y(Si/Al=2.6, Zeolyst) at 423 K (pyridine/Al = 0.005-0.040). Dashed linesat 1630 cm−1 (protonated pyridine), 1545 cm−1 (protonated pyridine), and1490 cm−1 (protonated pyridine or pyridine bound to Lewis acidic Al sites).

619
Figure E.24. Integrated area of 1545 cm−1 IR peak multiplied by wafercross-sectional area plotted against the amount of pyridine adsorbed onH-Y (Si/Al=2.6, Zeolyst) at 423 K.
E.7.6 Pyridine titration and infrared spectroscopy of zeolite samples.
IR spectra for each Sn-Beta sample after pyridine saturation and evacuation for
900 seconds under vacuum (0.1 Torr) at 423 K are shown in Figure E.26. This
evacuation procedure was sucient to remove gaseous pyridine and the majority of
the weakly-bound physisorbed pyridine that convolutes the peak at 1450 cm−1 (Fig
E.27). IR spectra were baseline-corrected between 1400 cm−1 to 1650 cm−1 and
deconvoluted in CasaXPS to determine the areas of IR peaks at 1610 cm−1 and 1450
cm−1, which reects pyridine bound to Lewis acidic Sn sites [559], using a combined
Gauss-Lorentzian (SGL) lineshape with an 80% Lorentzian contribution. Additional
bands at 1439 cm−1, 1445 cm−1, and 1490 cm−1 were included in the deconvolution
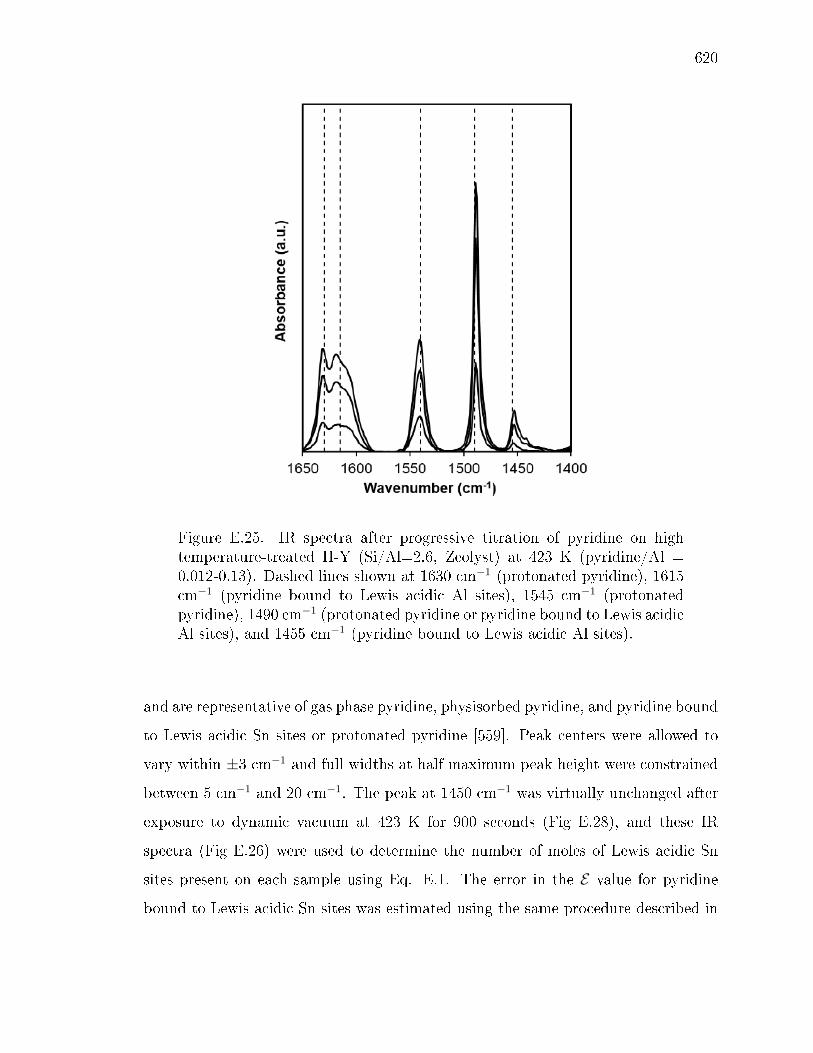
620
Figure E.25. IR spectra after progressive titration of pyridine on hightemperature-treated H-Y (Si/Al=2.6, Zeolyst) at 423 K (pyridine/Al =0.012-0.13). Dashed lines shown at 1630 cm−1 (protonated pyridine), 1615cm−1 (pyridine bound to Lewis acidic Al sites), 1545 cm−1 (protonatedpyridine), 1490 cm−1 (protonated pyridine or pyridine bound to Lewis acidicAl sites), and 1455 cm−1 (pyridine bound to Lewis acidic Al sites).
and are representative of gas phase pyridine, physisorbed pyridine, and pyridine bound
to Lewis acidic Sn sites or protonated pyridine [559]. Peak centers were allowed to
vary within ±3 cm−1 and full widths at half maximum peak height were constrained
between 5 cm−1 and 20 cm−1. The peak at 1450 cm−1 was virtually unchanged after
exposure to dynamic vacuum at 423 K for 900 seconds (Fig E.28), and these IR
spectra (Fig E.26) were used to determine the number of moles of Lewis acidic Sn
sites present on each sample using Eq. E.1. The error in the E value for pyridine
bound to Lewis acidic Sn sites was estimated using the same procedure described in

621
Section E.7.5 . For Sn-Beta-OH-200, the peak area at 1445 cm−1 was ca. 4× that
of the peak at 1450 cm-1 after saturation and exposure to dynamic vacuum for 900 s
(while this was ≤ ca. 1x on all other samples), leading to inaccurate deconvolution
of the 1450 and 1445 cm-1 peaks. In order to determine the saturation coverage of
pyridine on Lewis acid sites in Sn-Beta-OH-200, the integrated absorbance at 1450
cm-1 was estimated from the spectrum of a dose after the saturation of the peak for
pyridine to Sn Lewis acid sites, but before complete saturation of the surface defect
sites.
E.7.7 n-Propylamine temperature programmed desorption (TPD) experiments onzeolites.
A response factor for n-propylamine (NPA, m/z = 59) was developed by lling a
sample loop (1 or 5 cm3) with a mixture of 1000 ppm NPA and 1% Ar in balance
He (certied gas mixture, Airgas), and then injecting the loop contents into owing
He (1.66 cm3 s−1). This stream was transferred via heated gas lines (383 K) to
an expansion volume (150 cm3) and then into a mass selective detector (MSD). An
additional data point was collected by owing 20 cm3 min−1 of 1000 ppm NPA to the
MSD for 20 s. Afterwards, a 0.5 cm3 sample loop was lled with Ar (99.999%, Indiana
Oxygen) and injected into owing He (1.66 cm3 s−1) and sent to the MSD. Integrated
area ratios for NPA and Ar MSD traces and the molar ratios of each component are
plotted in Figure E.29 to obtain the response factor of NPA (relative to Ar), enabling
quantication of NPA MSD traces when using an Ar standard to account for signal
drift.
NPA TPD proles are shown for all Sn-Beta samples in Figure S.14. Each sample
was saturated with NPA for 4 h at 323 K (75 cm3 s−1 g−1), purged in owing dry He
for 4 or 8 h at 338 K (25 cm3 s−1 g−1), and then held in owing He (25 cm3 s−1 g−1)
from 338 to 773 K (0.167 K s−1). After each TPD experiment, a 0.5 cm3 sample loop
was lled with Ar and pulsed into owing He and sent to the MSD to quantify the
NPA evolved in the TPD (Tables E.5 and E.6).
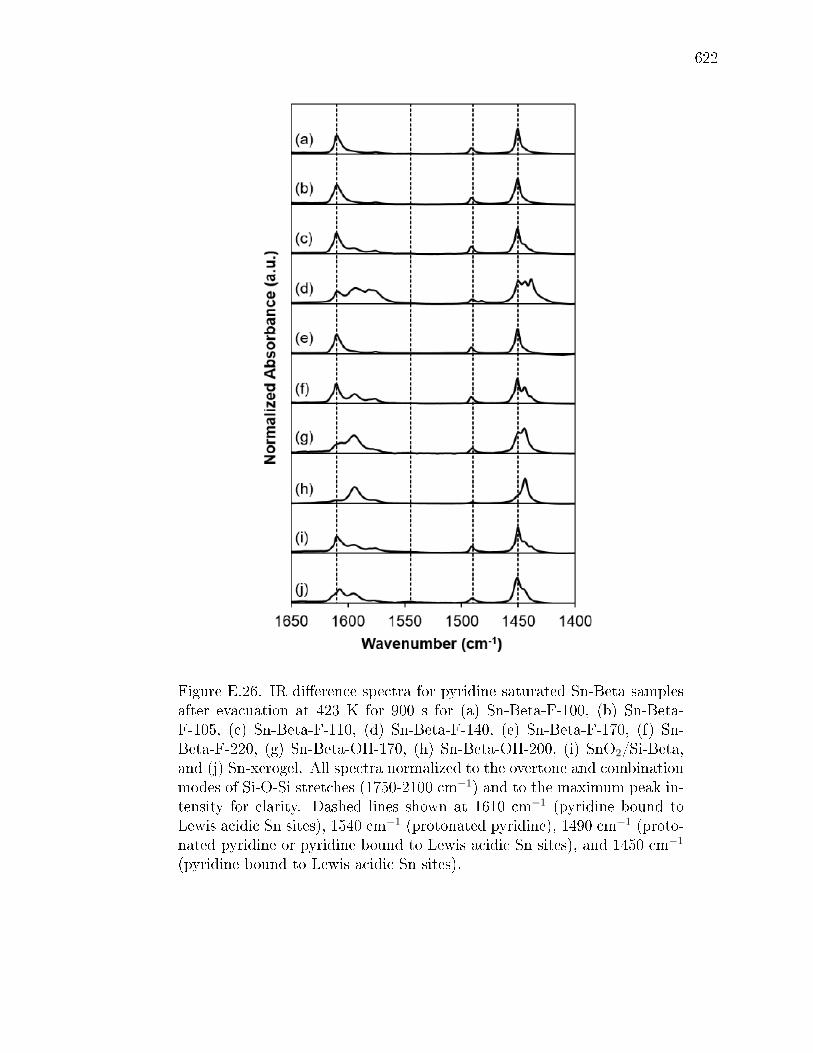
622
Figure E.26. IR dierence spectra for pyridine saturated Sn-Beta samplesafter evacuation at 423 K for 900 s for (a) Sn-Beta-F-100, (b) Sn-Beta-F-105, (c) Sn-Beta-F-110, (d) Sn-Beta-F-140, (e) Sn-Beta-F-170, (f) Sn-Beta-F-220, (g) Sn-Beta-OH-170, (h) Sn-Beta-OH-200, (i) SnO2/Si-Beta,and (j) Sn-xerogel. All spectra normalized to the overtone and combinationmodes of Si-O-Si stretches (1750-2100 cm−1) and to the maximum peak in-tensity for clarity. Dashed lines shown at 1610 cm−1 (pyridine bound toLewis acidic Sn sites), 1540 cm−1 (protonated pyridine), 1490 cm−1 (proto-nated pyridine or pyridine bound to Lewis acidic Sn sites), and 1450 cm−1
(pyridine bound to Lewis acidic Sn sites).
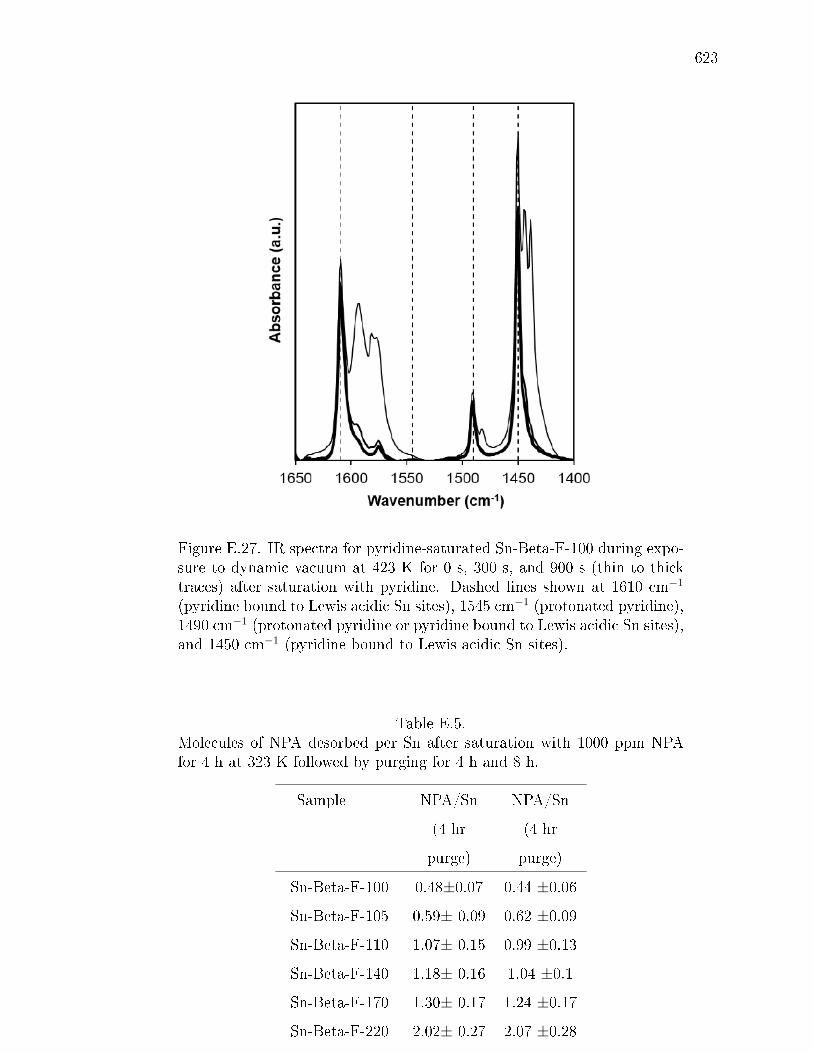
623
Figure E.27. IR spectra for pyridine-saturated Sn-Beta-F-100 during expo-sure to dynamic vacuum at 423 K for 0 s, 300 s, and 900 s (thin to thicktraces) after saturation with pyridine. Dashed lines shown at 1610 cm−1
(pyridine bound to Lewis acidic Sn sites), 1545 cm−1 (protonated pyridine),1490 cm−1 (protonated pyridine or pyridine bound to Lewis acidic Sn sites),and 1450 cm−1 (pyridine bound to Lewis acidic Sn sites).
Table E.5.Molecules of NPA desorbed per Sn after saturation with 1000 ppm NPAfor 4 h at 323 K followed by purging for 4 h and 8 h.
Sample NPA/Sn
(4 hr
purge)
NPA/Sn
(4 hr
purge)
Sn-Beta-F-100 0.48±0.07 0.44 ±0.06
Sn-Beta-F-105 0.59± 0.09 0.62 ±0.09
Sn-Beta-F-110 1.07± 0.15 0.99 ±0.13
Sn-Beta-F-140 1.18± 0.16 1.04 ±0.1
Sn-Beta-F-170 1.30± 0.17 1.24 ±0.17
Sn-Beta-F-220 2.02± 0.27 2.07 ±0.28
Sn-Beta-OH-170 1.37± 0.16 1.14 ±0.14
Sn-Beta-OH-200 n.d.* 1.71 ±0.21
*n.d.: data not collected
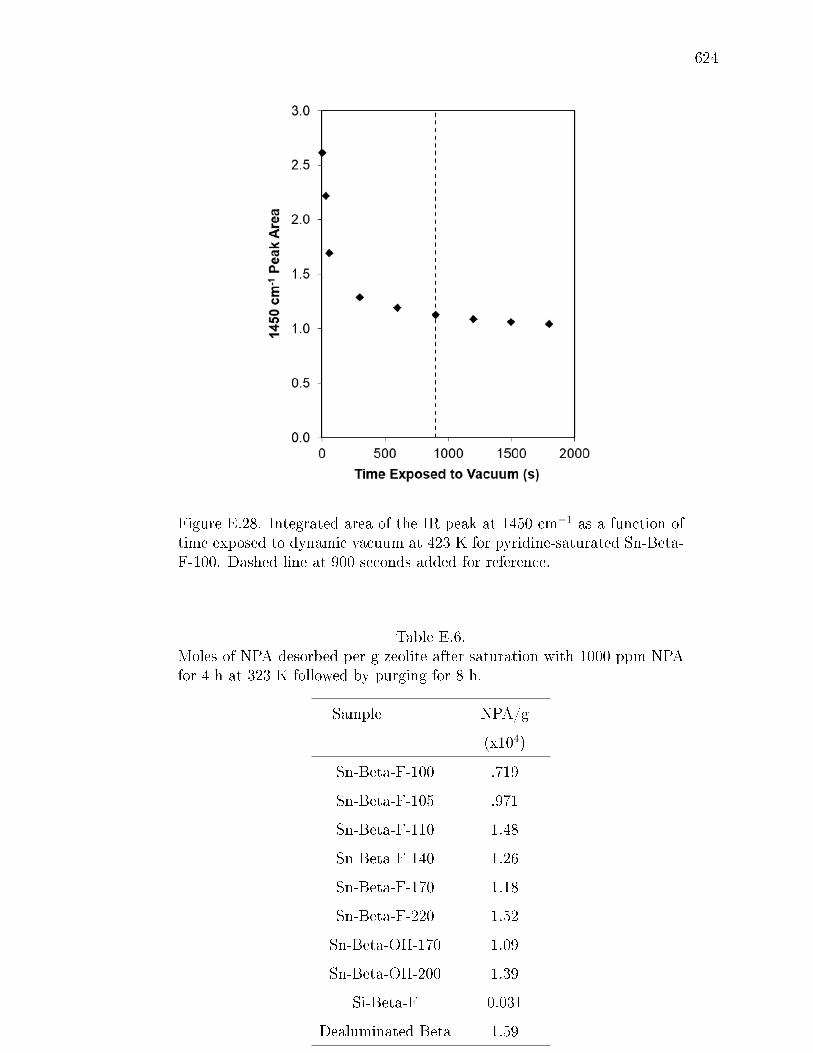
624
Figure E.28. Integrated area of the IR peak at 1450 cm−1 as a function oftime exposed to dynamic vacuum at 423 K for pyridine-saturated Sn-Beta-F-100. Dashed line at 900 seconds added for reference.
Table E.6.Moles of NPA desorbed per g zeolite after saturation with 1000 ppm NPAfor 4 h at 323 K followed by purging for 8 h.
Sample NPA/g
(x104)
Sn-Beta-F-100 .719
Sn-Beta-F-105 .971
Sn-Beta-F-110 1.48
Sn-Beta-F-140 1.26
Sn-Beta-F-170 1.18
Sn-Beta-F-220 1.52
Sn-Beta-OH-170 1.09
Sn-Beta-OH-200 1.39
Si-Beta-F 0.031
Dealuminated Beta 1.59
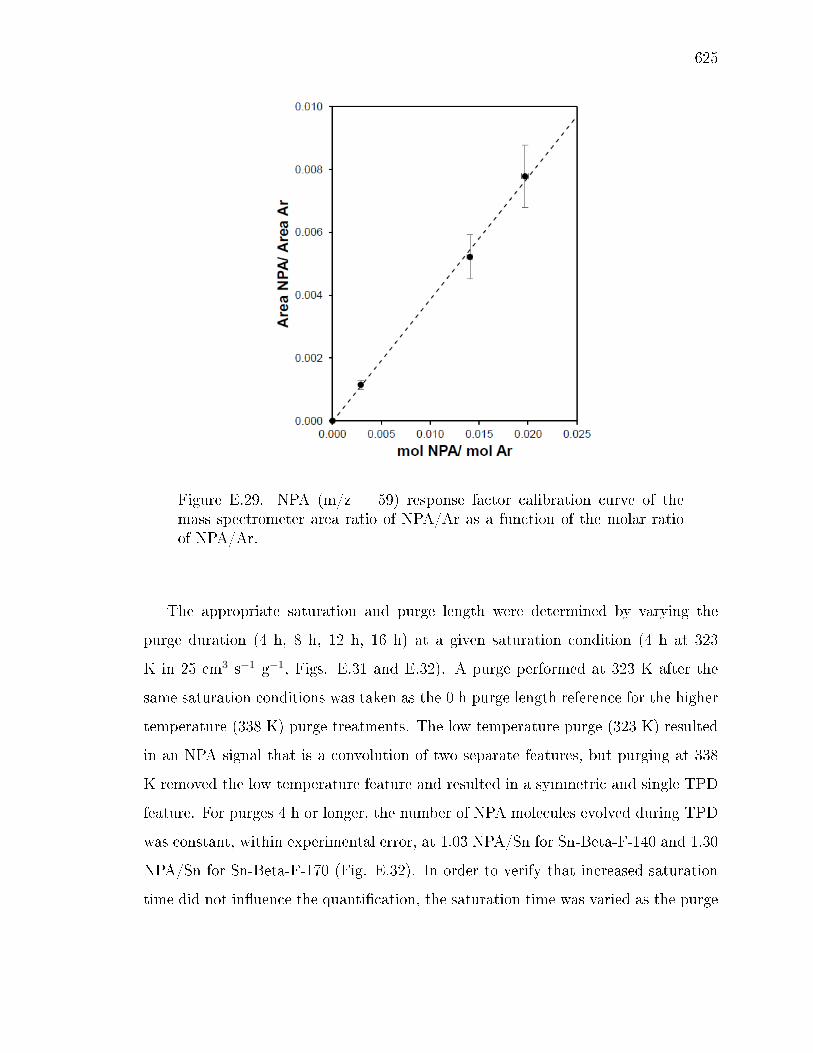
625
Figure E.29. NPA (m/z = 59) response factor calibration curve of themass spectrometer area ratio of NPA/Ar as a function of the molar ratioof NPA/Ar.
The appropriate saturation and purge length were determined by varying the
purge duration (4 h, 8 h, 12 h, 16 h) at a given saturation condition (4 h at 323
K in 25 cm3 s−1 g−1, Figs. E.31 and E.32). A purge performed at 323 K after the
same saturation conditions was taken as the 0 h purge length reference for the higher
temperature (338 K) purge treatments. The low temperature purge (323 K) resulted
in an NPA signal that is a convolution of two separate features, but purging at 338
K removed the low temperature feature and resulted in a symmetric and single TPD
feature. For purges 4 h or longer, the number of NPA molecules evolved during TPD
was constant, within experimental error, at 1.03 NPA/Sn for Sn-Beta-F-140 and 1.30
NPA/Sn for Sn-Beta-F-170 (Fig. E.32). In order to verify that increased saturation
time did not inuence the quantication, the saturation time was varied as the purge
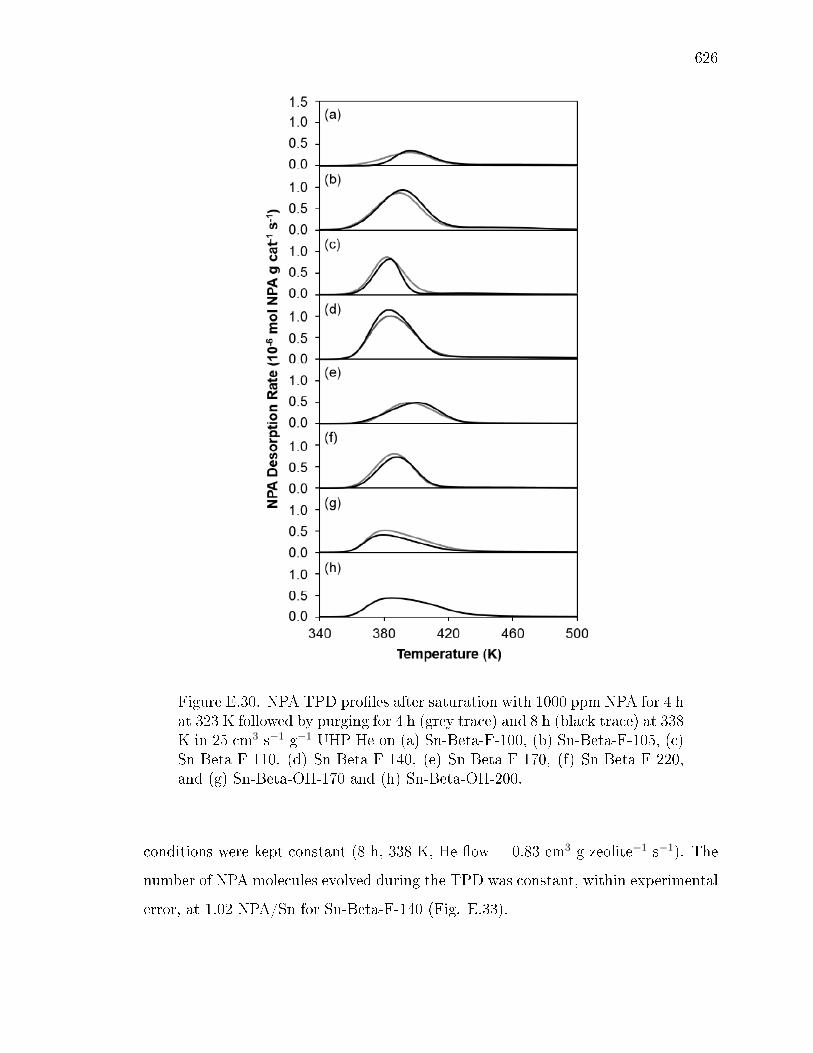
626
Figure E.30. NPA TPD proles after saturation with 1000 ppm NPA for 4 hat 323 K followed by purging for 4 h (grey trace) and 8 h (black trace) at 338K in 25 cm3 s−1 g−1 UHP He on (a) Sn-Beta-F-100, (b) Sn-Beta-F-105, (c)Sn-Beta-F-110, (d) Sn-Beta-F-140, (e) Sn-Beta-F-170, (f) Sn-Beta-F-220,and (g) Sn-Beta-OH-170 and (h) Sn-Beta-OH-200.
conditions were kept constant (8 h, 338 K, He ow = 0.83 cm3 g zeolite−1 s−1). The
number of NPA molecules evolved during the TPD was constant, within experimental
error, at 1.02 NPA/Sn for Sn-Beta-F-140 (Fig. E.33).

627
The number of NPA molecules (per Sn) evolved on Sn-Beta-F samples with low Sn
content (Sn-Beta-F-170, Sn-Beta-F-220) and on highly-defective Sn-Beta-OH samples
(Sn-Beta-OH-170, Sn-Beta-OH-200) were much larger than unity (Table E.5). These
ndings suggest that the saturation and purge treatments used here may not be suf-
cient to remove NPA at other binding sites on zeolite samples. Control experiments
performed on purely-siliceous Beta zeolites (Si-Beta-F) did not evolve a signicant
amount of NPA in TPD experiments (TableE.6), but those performed on dealumi-
nated Beta zeolites (parent Si/Al = 15) evolved as much or more NPA (per g) as the
low Sn content Sn-Beta-F and the highly-defective Sn-Beta-OH samples (Table E.6).
These ndings suggest that the saturation and purge conditions used in this study
causes NPA retention on residual defect sites in zeolite samples, which may lead to
inaccurate quantication of Lewis acidic Sn sites by NPA TPD for samples with low
Sn content and high defect densities.
E.7.8 Ammonia temperature programmed desorption experiments on zeolite sam-ples.
A response factor for ammonia (NH3, m/z = 17) was developed by performing NH3
TPD experiments on four NH4-ZSM-5 zeolites (Si/Al = 1789, Zeolyst). The moles
of NH3 desorbed from each material was measured in independent TPD experiments
performed in a gas-phase plug-ow reactor connected to a MKS Multigas 2030 gas-
phase FTIR spectrometer with an on-board NH3 calibration as described elsewhere
[78]. After each NH3 TPD experiment, a 0.5 cm3 loop was lled with Ar and injected
into owing He (0.83 cm3 s−1). The total NH3 desorbed was quantied from the m/z
= 17 MSD trace after subtracting the contributing fractionation products of water
(m/z = 17), which appears in constant proportion to the m/z = 18 signal for its
parent ion. The ratio of integrated areas for NH3 and Ar are plotted as a function
of their molar ratio (Figure E.34) to give a response factor of NH3 (relative to Ar)
in the MSD, which enables the quantication of NH3 MSD traces when using an Ar
standard to account for signal drift.

628
NH3 TPD proles are shown for all Sn-Beta samples in Fig. E.35. Each sample
was saturated with NH3 for 5 h at 323 K (75 cm3 s−1 g−1), purged in owing dry
He for 8 h at 331 K (25 cm3 s−1 g−1) to remove any physisorbed NH3, then kept in
owing He (25 cm3 s−1 g−1) as the temperature increased to 773 K (0.167 K s−1).
After each TPD experiment, a 0.5 cm3 loop (383 K) was lled with Ar and pulsed into
owing He sent to the MSD to correct for instrument drift. The number of molecules
of NH3 desorbed (per Sn) are given in Tables E.7 and E.7.
Table E.7.Molecules of NH3 desorbed (per Sn) after saturation with 500 ppm NH3 for5 h at 323 K, followed by purging for 8 h.
Sample NH3/Sn
(8 hr
purge)
Sn-Beta-F-100 0.42±0.02
Sn-Beta-F-105 0.61± 0.04
Sn-Beta-F-110 0.73± 0.04
Sn-Beta-F-140 1.06± 0.05
Sn-Beta-F-170 0.69± 0.03
Sn-Beta-F-220 0.89± 0.04
Sn-Beta-OH-170 1.12± 0.06
Sn-Beta-OH-200 0.93±0.05

629
Table E.8.Moles of NH3 desorbed (per g) after saturation with 500 ppm NH3 for 5 hat 323 K followed by purging for 8 h.
Sample NH3/g
(x104)
Sn-Beta-F-100 0.686
Sn-Beta-F-105 0.956
Sn-Beta-F-110 1.09
Sn-Beta-F-140 1.29
Sn-Beta-F-170 0.657
Sn-Beta-F-220 0.652
Sn-Beta-OH-170 1.08
Sn-Beta-OH-200 0.754
Si-Beta-F 0.003
Dealuminated Beta 0.157
Appropriate saturation and purge durations were determined by varying the purge
length (0, 4, 8, 12 h) at a xed saturation conditions (5 h, 323 K, owing 500 ppm NH3
at 75 cm3 s−1 g−1). For purges of 4 h and longer, the number of NH3 molecules evolved
per Sn during the TPD was constant, within experimental error, at 0.43 NH3/Sn for
Sn-Beta-F-100 (Fig. E.36). In order to verify that saturation times did not inuence
the quantication, the saturation time was varied at xed purge conditions (8 h, 331
K, owing He at 25 cm3 s−1 g−1) and the moles of NH3 evolved during TPD was
constant, within experimental error, at 0.44 NH3/Sn for Sn-Beta-F-100 (Fig. E.37).
E.7.9 Deuterated acetonitrile titration and infrared spectroscopy of zeolites.
Sn-Beta samples were saturated with CD3CN by exposure to a gaseous pressure
sucient to give rise to an IR peak at 2265 cm−1 for gaseous CD3CN. IR spectra corre-
sponding to samples saturated with CD3CN were collected after subsequent exposure
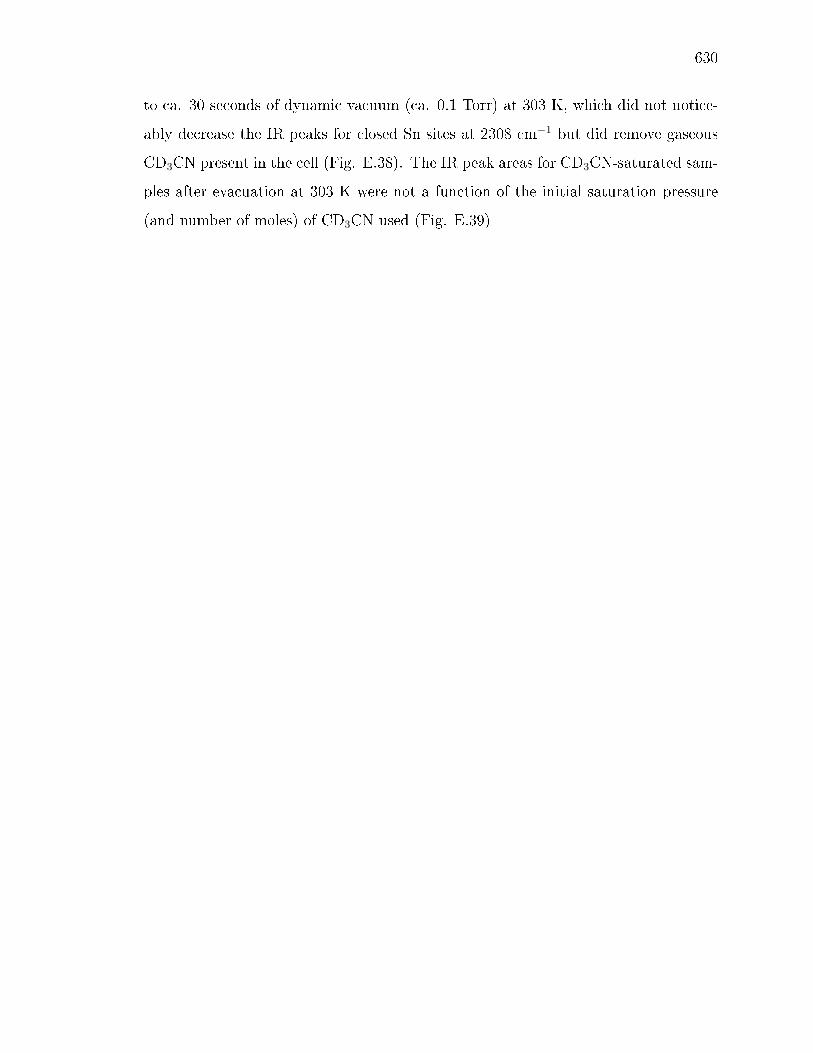
630
to ca. 30 seconds of dynamic vacuum (ca. 0.1 Torr) at 303 K, which did not notice-
ably decrease the IR peaks for closed Sn sites at 2308 cm−1 but did remove gaseous
CD3CN present in the cell (Fig. E.38). The IR peak areas for CD3CN-saturated sam-
ples after evacuation at 303 K were not a function of the initial saturation pressure
(and number of moles) of CD3CN used (Fig. E.39)
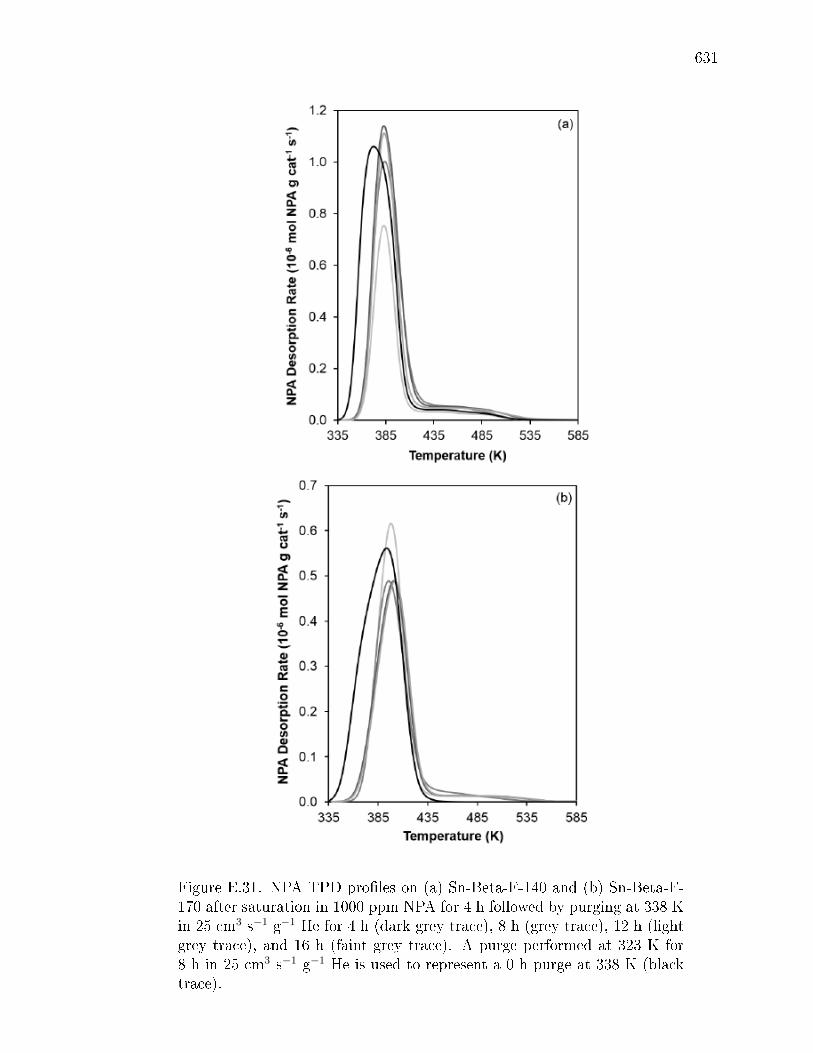
631
Figure E.31. NPA TPD proles on (a) Sn-Beta-F-140 and (b) Sn-Beta-F-170 after saturation in 1000 ppm NPA for 4 h followed by purging at 338 Kin 25 cm3 s−1 g−1 He for 4 h (dark grey trace), 8 h (grey trace), 12 h (lightgrey trace), and 16 h (faint grey trace). A purge performed at 323 K for8 h in 25 cm3 s−1 g−1 He is used to represent a 0 h purge at 338 K (blacktrace).
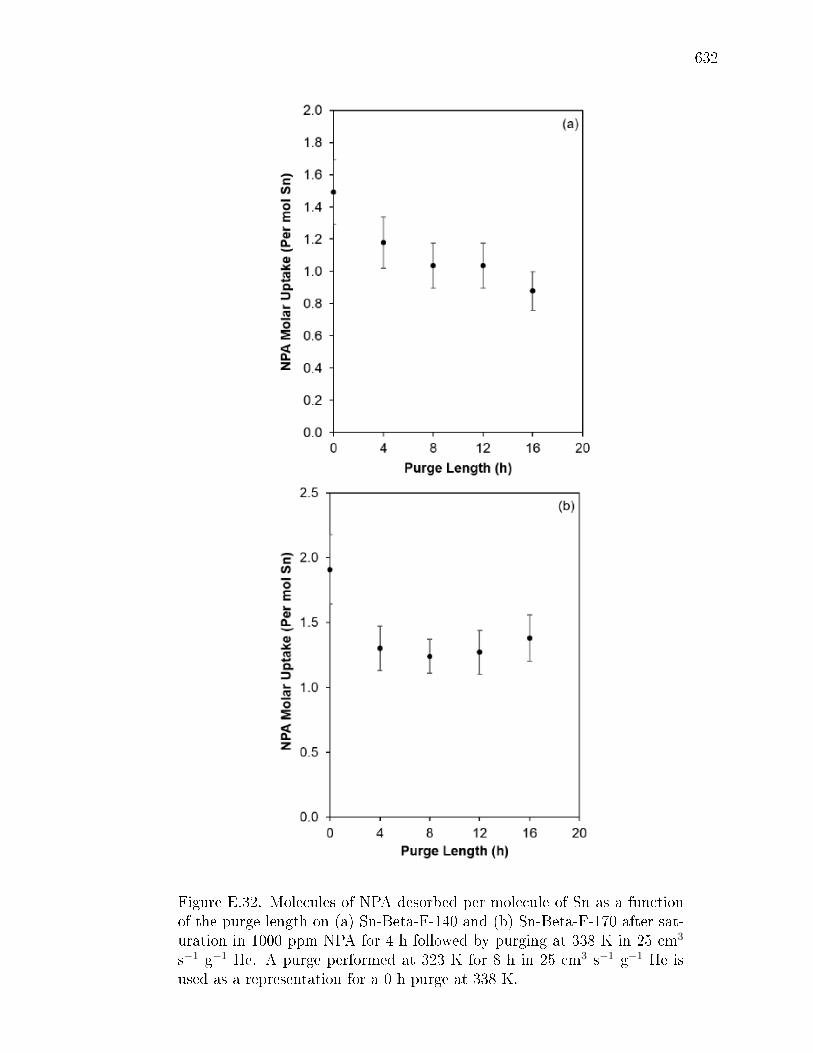
632
Figure E.32. Molecules of NPA desorbed per molecule of Sn as a functionof the purge length on (a) Sn-Beta-F-140 and (b) Sn-Beta-F-170 after sat-uration in 1000 ppm NPA for 4 h followed by purging at 338 K in 25 cm3
s−1 g−1 He. A purge performed at 323 K for 8 h in 25 cm3 s−1 g−1 He isused as a representation for a 0 h purge at 338 K.
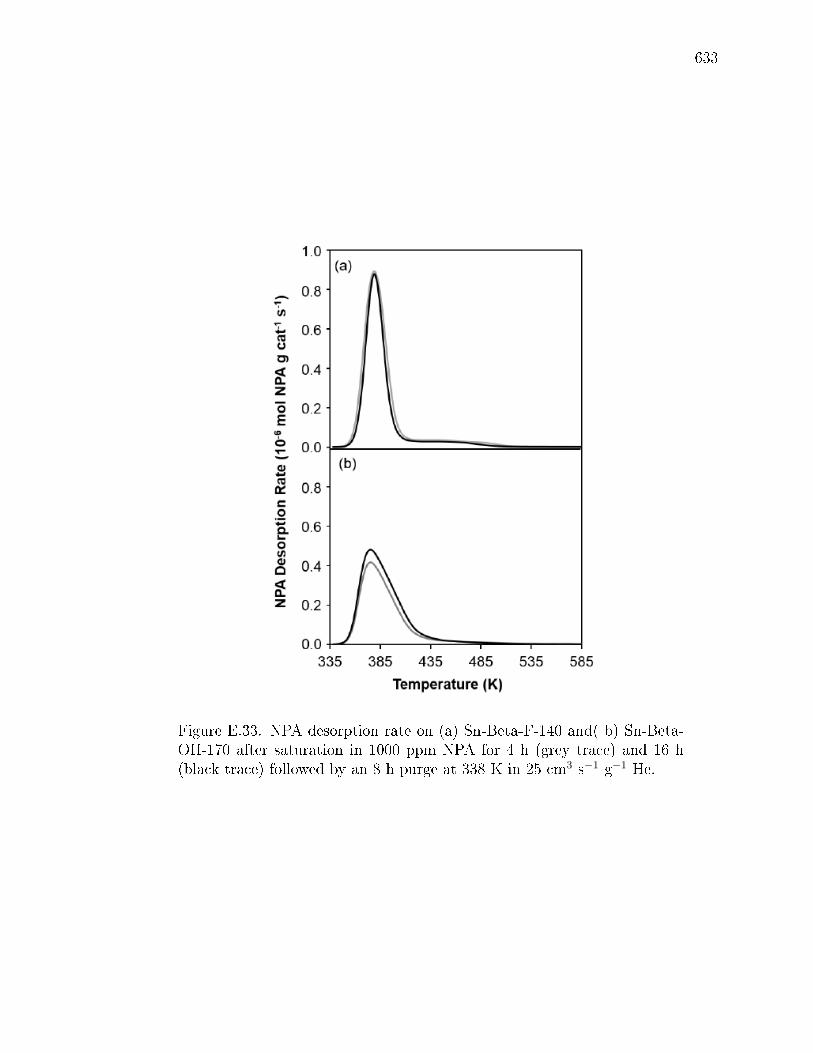
633
Figure E.33. NPA desorption rate on (a) Sn-Beta-F-140 and( b) Sn-Beta-OH-170 after saturation in 1000 ppm NPA for 4 h (grey trace) and 16 h(black trace) followed by an 8 h purge at 338 K in 25 cm3 s−1 g−1 He.
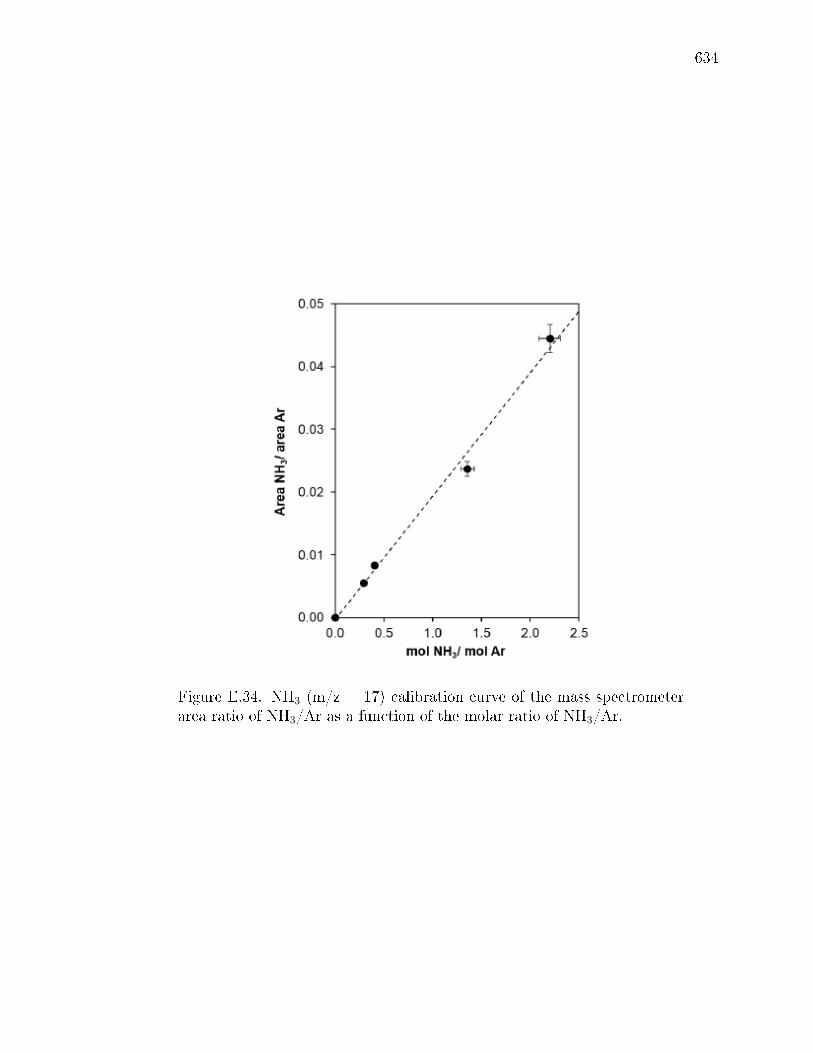
634
Figure E.34. NH3 (m/z = 17) calibration curve of the mass spectrometerarea ratio of NH3/Ar as a function of the molar ratio of NH3/Ar.

635
Figure E.35. NH3 TPD proles after saturation in 75 cm3 s−1 g−1 500ppm NH3/He at 323 K for 5 h followed by purging in dry He (25 cm3 s−1
g−1) at 331 K for 8 h on (a) Sn-Beta-F-100, (b) Sn-Beta-F-105, (c) Sn-Beta-F-110 (d) Sn-Beta-F-140, (e) Sn-Beta-F-170, (f) Sn-Beta-F-200, (g)Sn-BEA-OH-170, (h) Sn-Beta-OH-200.
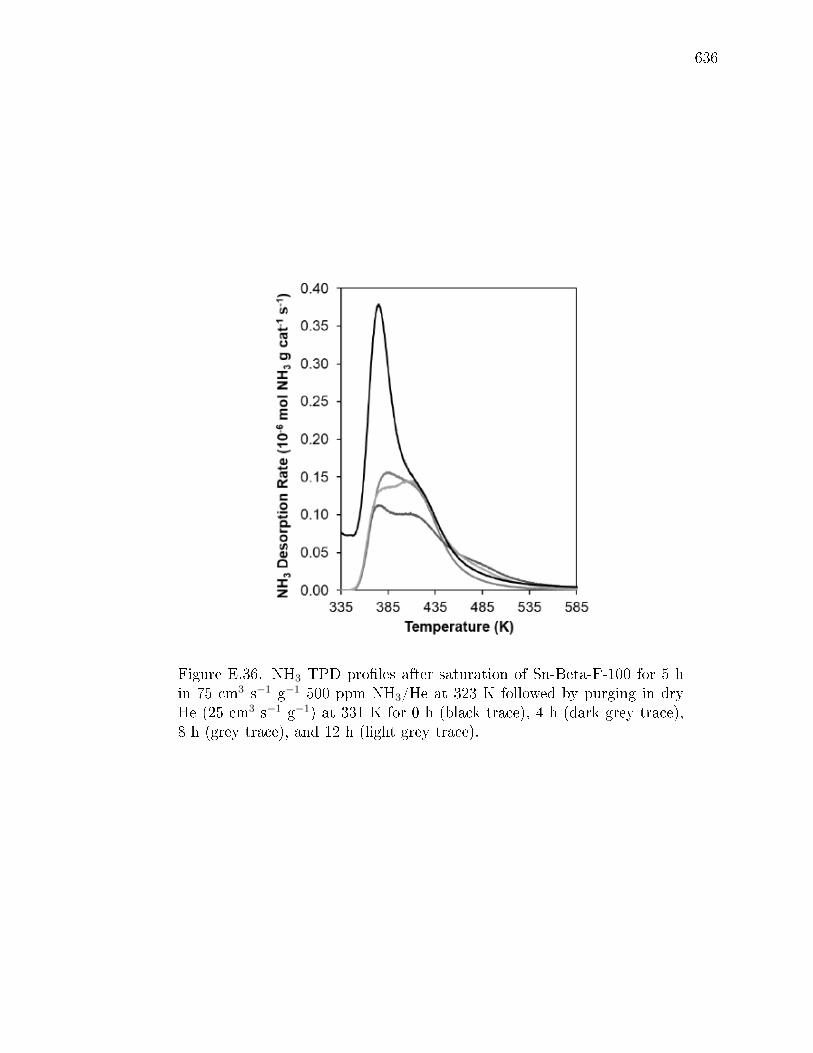
636
Figure E.36. NH3 TPD proles after saturation of Sn-Beta-F-100 for 5 hin 75 cm3 s−1 g−1 500 ppm NH3/He at 323 K followed by purging in dryHe (25 cm3 s−1 g−1) at 331 K for 0 h (black trace), 4 h (dark grey trace),8 h (grey trace), and 12 h (light grey trace).

637
Figure E.37. NH3 TPD proles after saturation of Sn-Beta-F-100 for 5 h(black trace) or 16 h (grey trace) in 75 cm3 s−1 g−1 500 ppm NH3/He at323 K followed by purging in dry He (25 cm3 s−1 g−1) at 331 K for 8 h.
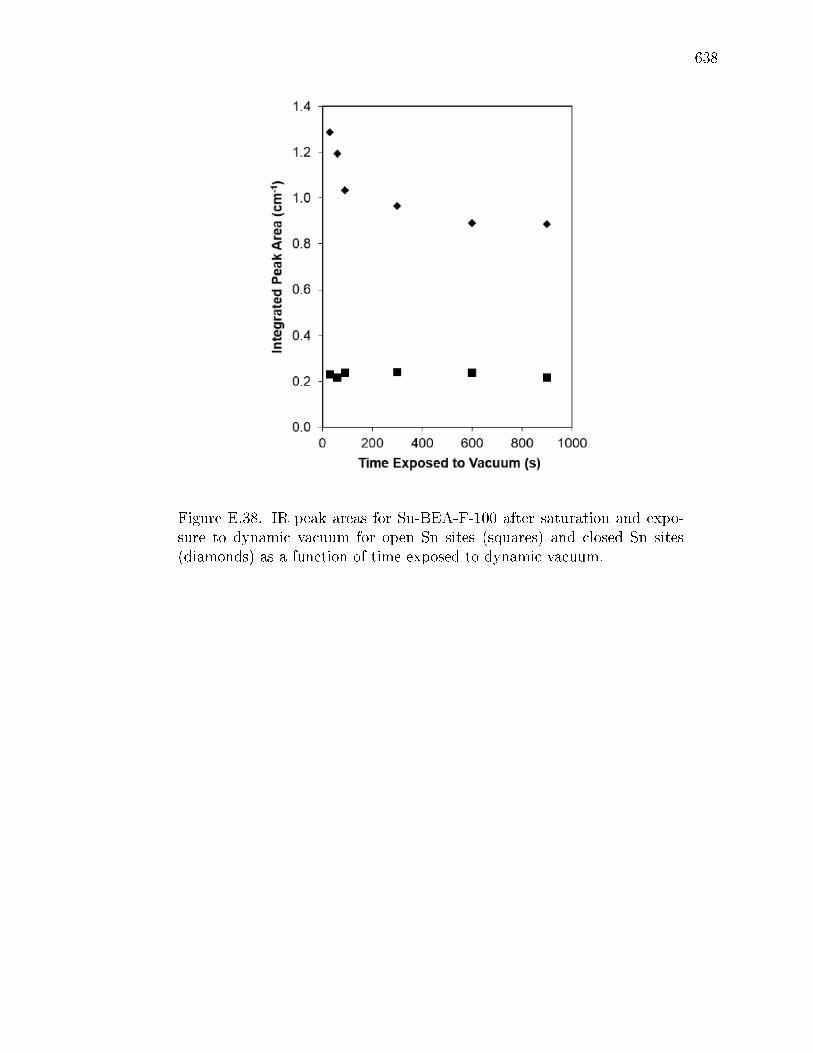
638
Figure E.38. IR peak areas for Sn-BEA-F-100 after saturation and expo-sure to dynamic vacuum for open Sn sites (squares) and closed Sn sites(diamonds) as a function of time exposed to dynamic vacuum.

639
Figure E.39. IR peak areas for Sn-BEA-F-140 after saturation for openSn sites (squares) and closed Sn sites (diamonds) as a function of molesadsorbed at saturation
Deconvolution of IR spectral features, after subtraction of IR spectra for CD3CN-
free wafers, was performed in CasaXPS. Individual components for IR peaks at 2316
cm−1, 2308 cm−1, 2287 cm−1, 2275 cm−1, and 2265 cm−1 were used to determine
areas within each CD3CN dose that correspond to open Sn sites, closed Sn sites,
(SiO)2Sn(SiOH)2 sites (speculative assignment), SiOH sites, and gas phase CD3CN,
respectively (Table E.9). IR peak centers were xed within ±5 cm−1, and the full
widths at half maxima were constrained to be between 5 cm−1 and 20 cm−1. The sum
of Gauss-Lorentzian (SGL) line shapes were used for each component, with a 50%
Lorentzian correction to a normally distributed Gaussian line shape (SGL(50)), as was
used previously for deconvolution of IR spectra obtained after CD3CN adsorption to
Zn exchanged Al-Beta [570].
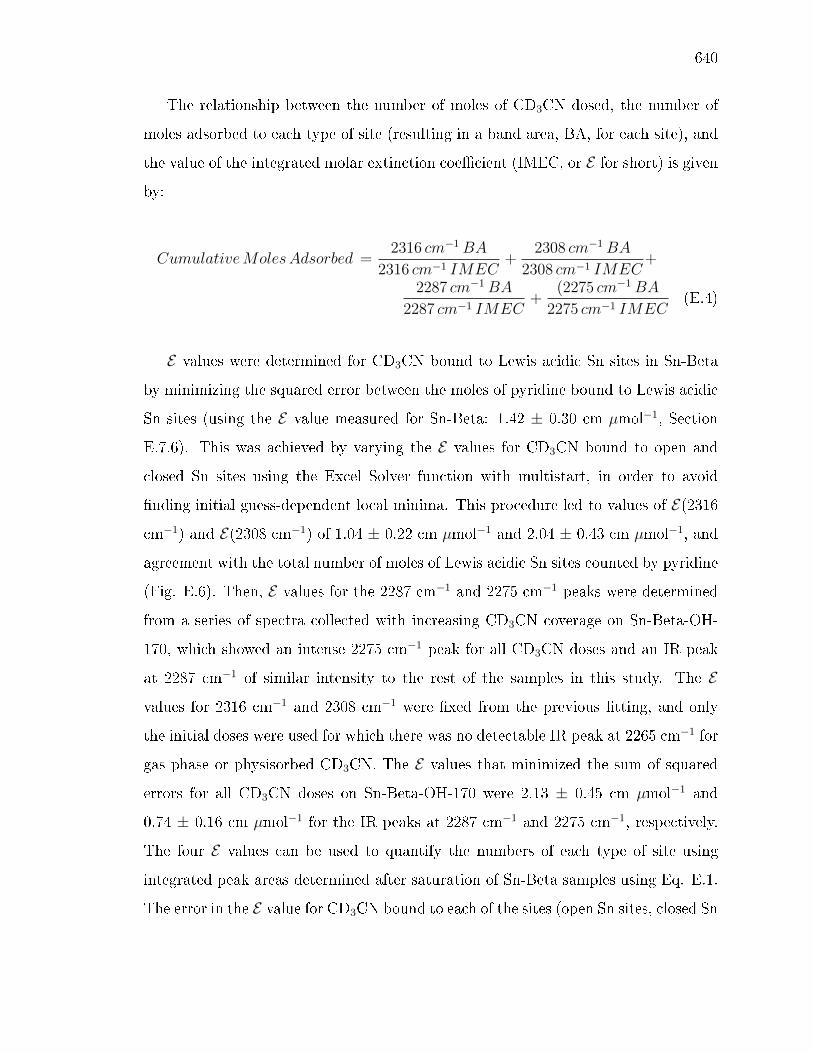
640
The relationship between the number of moles of CD3CN dosed, the number of
moles adsorbed to each type of site (resulting in a band area, BA, for each site), and
the value of the integrated molar extinction coecient (IMEC, or E for short) is given
by:
CumulativeMolesAdsorbed =2316 cm−1BA
2316 cm−1 IMEC+
2308 cm−1BA
2308 cm−1 IMEC+
2287 cm−1BA
2287 cm−1 IMEC+
(2275 cm−1BA
2275 cm−1 IMEC(E.4)
E values were determined for CD3CN bound to Lewis acidic Sn sites in Sn-Beta
by minimizing the squared error between the moles of pyridine bound to Lewis acidic
Sn sites (using the E value measured for Sn-Beta: 1.42 ± 0.30 cm µmol−1, Section
E.7.6). This was achieved by varying the E values for CD3CN bound to open and
closed Sn sites using the Excel Solver function with multistart, in order to avoid
nding initial guess-dependent local minima. This procedure led to values of E(2316
cm−1) and E(2308 cm−1) of 1.04 ± 0.22 cm µmol−1 and 2.04 ± 0.43 cm µmol−1, and
agreement with the total number of moles of Lewis acidic Sn sites counted by pyridine
(Fig. E.6). Then, E values for the 2287 cm−1 and 2275 cm−1 peaks were determined
from a series of spectra collected with increasing CD3CN coverage on Sn-Beta-OH-
170, which showed an intense 2275 cm−1 peak for all CD3CN doses and an IR peak
at 2287 cm−1 of similar intensity to the rest of the samples in this study. The E
values for 2316 cm−1 and 2308 cm−1 were xed from the previous tting, and only
the initial doses were used for which there was no detectable IR peak at 2265 cm−1 for
gas phase or physisorbed CD3CN. The E values that minimized the sum of squared
errors for all CD3CN doses on Sn-Beta-OH-170 were 2.13 ± 0.45 cm µmol−1 and
0.74 ± 0.16 cm µmol−1 for the IR peaks at 2287 cm−1 and 2275 cm−1, respectively.
The four E values can be used to quantify the numbers of each type of site using
integrated peak areas determined after saturation of Sn-Beta samples using Eq. E.1.
The error in the E value for CD3CN bound to each of the sites (open Sn sites, closed Sn
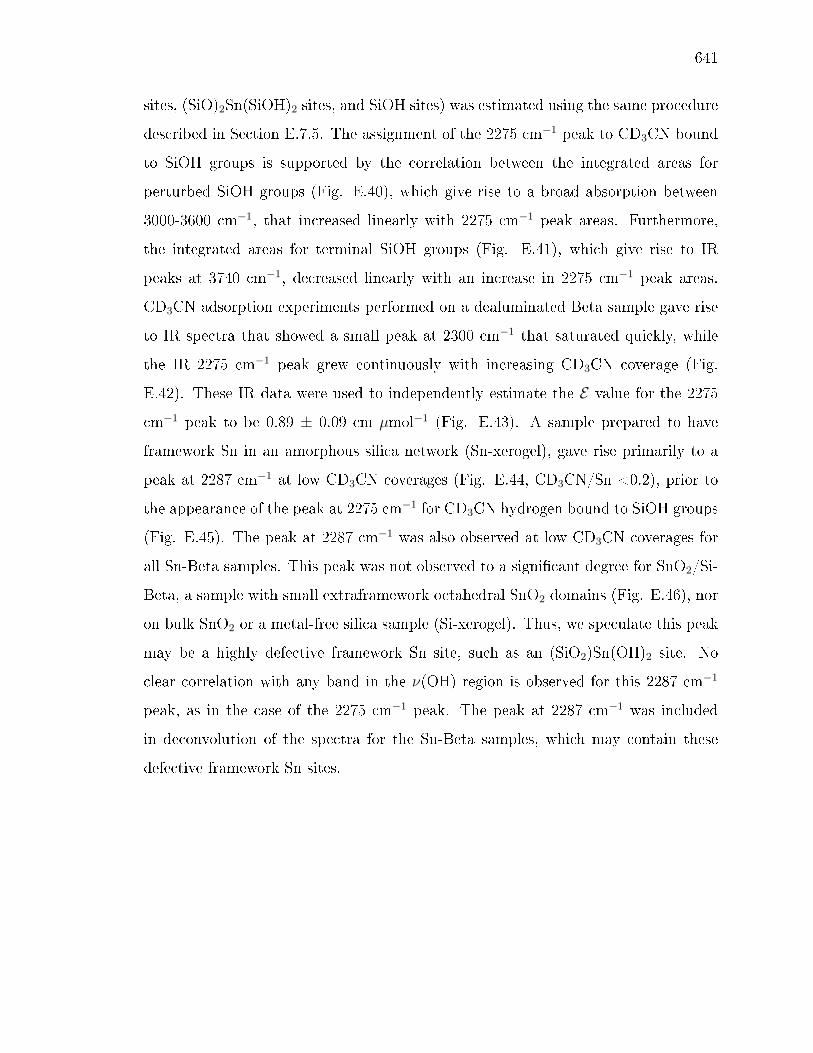
641
sites, (SiO)2Sn(SiOH)2 sites, and SiOH sites) was estimated using the same procedure
described in Section E.7.5. The assignment of the 2275 cm−1 peak to CD3CN bound
to SiOH groups is supported by the correlation between the integrated areas for
perturbed SiOH groups (Fig. E.40), which give rise to a broad absorption between
3000-3600 cm−1, that increased linearly with 2275 cm−1 peak areas. Furthermore,
the integrated areas for terminal SiOH groups (Fig. E.41), which give rise to IR
peaks at 3740 cm−1, decreased linearly with an increase in 2275 cm−1 peak areas.
CD3CN adsorption experiments performed on a dealuminated Beta sample gave rise
to IR spectra that showed a small peak at 2300 cm−1 that saturated quickly, while
the IR 2275 cm−1 peak grew continuously with increasing CD3CN coverage (Fig.
E.42). These IR data were used to independently estimate the E value for the 2275
cm−1 peak to be 0.89 ± 0.09 cm µmol−1 (Fig. E.43). A sample prepared to have
framework Sn in an amorphous silica network (Sn-xerogel), gave rise primarily to a
peak at 2287 cm−1 at low CD3CN coverages (Fig. E.44, CD3CN/Sn <0.2), prior to
the appearance of the peak at 2275 cm−1 for CD3CN hydrogen bound to SiOH groups
(Fig. E.45). The peak at 2287 cm−1 was also observed at low CD3CN coverages for
all Sn-Beta samples. This peak was not observed to a signicant degree for SnO2/Si-
Beta, a sample with small extraframework octahedral SnO2 domains (Fig. E.46), nor
on bulk SnO2 or a metal-free silica sample (Si-xerogel). Thus, we speculate this peak
may be a highly defective framework Sn site, such as an (SiO2)Sn(OH)2 site. No
clear correlation with any band in the ν(OH) region is observed for this 2287 cm−1
peak, as in the case of the 2275 cm−1 peak. The peak at 2287 cm−1 was included
in deconvolution of the spectra for the Sn-Beta samples, which may contain these
defective framework Sn sites.

642
Figure E.40. 2275 cm−1 peak area versus perturbed OH peak area (3000-3600 cm−1.
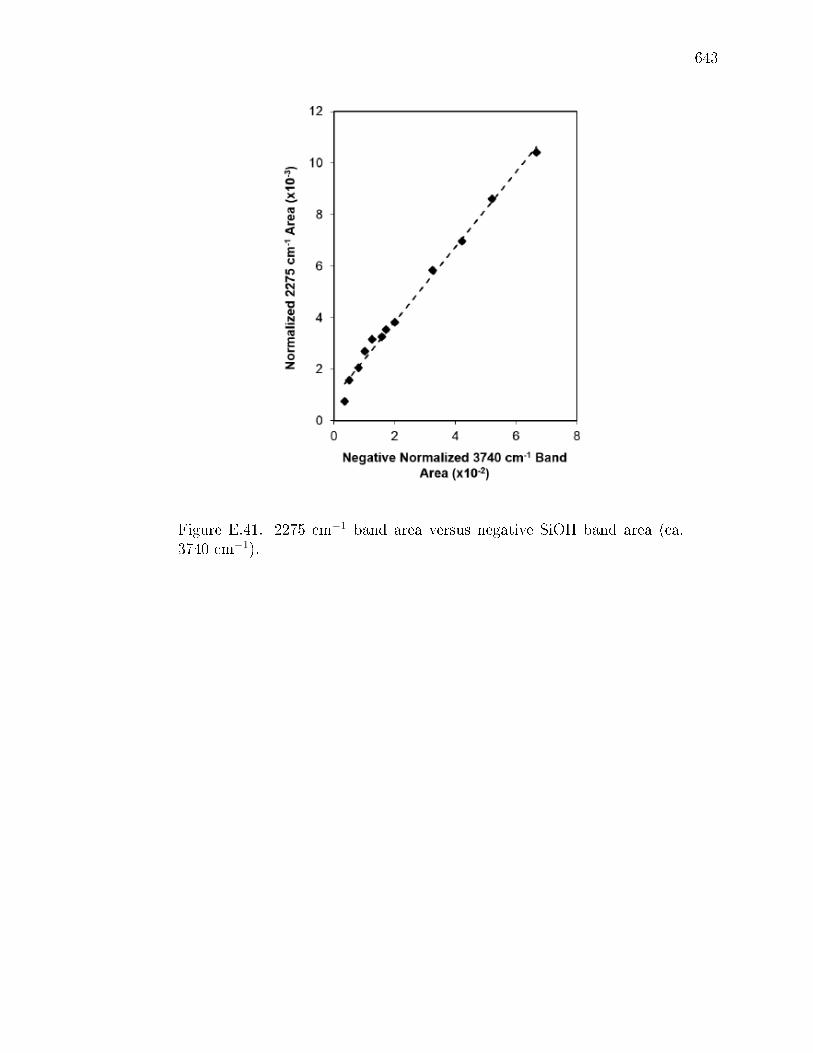
643
Figure E.41. 2275 cm−1 band area versus negative SiOH band area (ca.3740 cm−1).
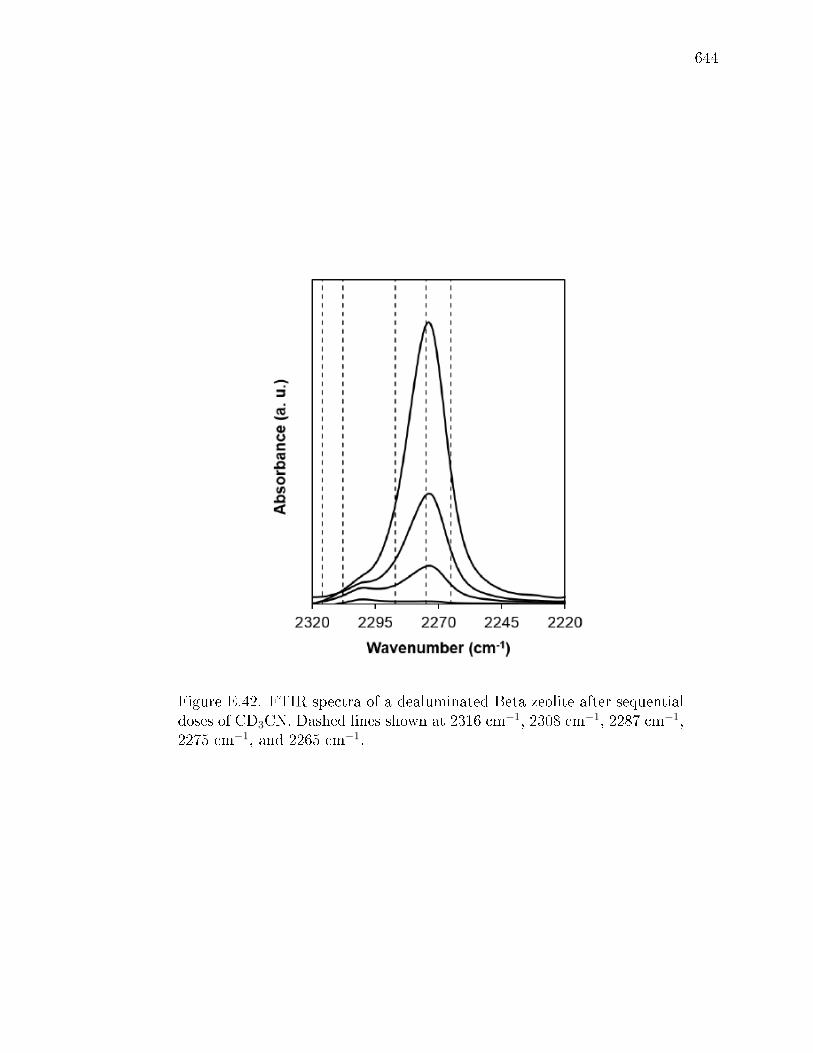
644
Figure E.42. FTIR spectra of a dealuminated Beta zeolite after sequentialdoses of CD3CN. Dashed lines shown at 2316 cm−1, 2308 cm−1, 2287 cm−1,2275 cm−1, and 2265 cm−1.
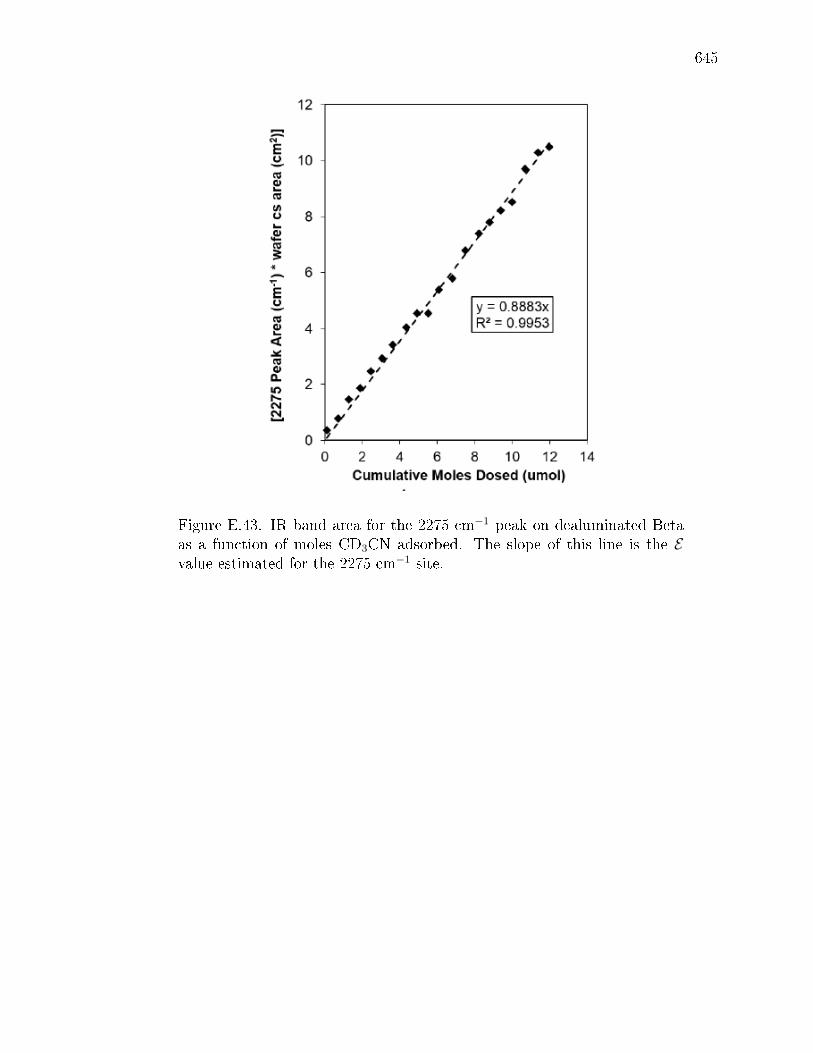
645
Figure E.43. IR band area for the 2275 cm−1 peak on dealuminated Betaas a function of moles CD3CN adsorbed. The slope of this line is the Evalue estimated for the 2275 cm−1 site.

646
Figure E.44. IR spectra of CD3CN three sequential doses (0.05 molCD3CN/Sn per dose) on Sn-xerogel. Dashed lines shown at 2316 cm−1,2308 cm−1, 2287 cm−1, and 2275 cm−1.
Table E.9.Peak areas at saturation for the 2316 cm−1, 2308 cm−1, 2287 cm−1, 2275cm−1 and 2265 cm−1 peaks for all Sn samples in this study.
Sample 2316
cm−1Area
cm−1
2308
cm−1Area
cm−1
2287
cm−1Area
cm−1
2275
cm−1Area
cm−1
Moles
2287 cm−1
sites (per
Sn)
Sn-Beta-F-100 0.22 1.19 0.27 043 0.078
Sn-Beta-F-105 0.36 1.96 0.33 2.24 0.079
Sn-Beta-F-110 0.92 3.36 1.26 1.17 0.23
Sn-Beta-F-140 0.73 2.22 0.34 3.24 0.094
Sn-Beta-F-170 0.37 2.47 0.37 1.39 0.096
Sn-Beta-F-220 0.50 1.81 1.26 1.17 0.41
Sn-Beta-OH-170 0.74 0.88 0.17 12.4 0.052
Sn-Beta-OH-200 0.30 2.03 0.07 24.5 0.019
SnO2/Si-Beta 0.20 1.49 0.08 1.95 0.0059
Sn-xerogel 0.066 0.223 1..66 4.12 0.42
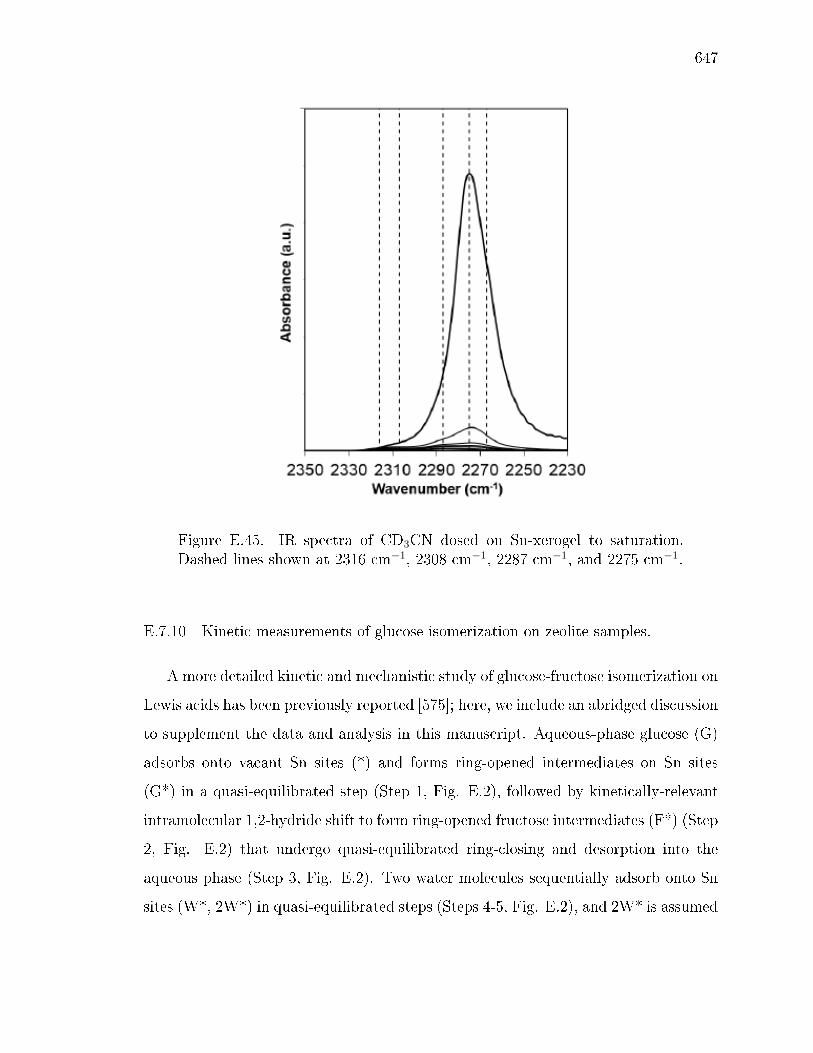
647
Figure E.45. IR spectra of CD3CN dosed on Sn-xerogel to saturation.Dashed lines shown at 2316 cm−1, 2308 cm−1, 2287 cm−1, and 2275 cm−1.
E.7.10 Kinetic measurements of glucose isomerization on zeolite samples.
A more detailed kinetic and mechanistic study of glucose-fructose isomerization on
Lewis acids has been previously reported [575]; here, we include an abridged discussion
to supplement the data and analysis in this manuscript. Aqueous-phase glucose (G)
adsorbs onto vacant Sn sites (*) and forms ring-opened intermediates on Sn sites
(G*) in a quasi-equilibrated step (Step 1, Fig. E.2), followed by kinetically-relevant
intramolecular 1,2-hydride shift to form ring-opened fructose intermediates (F*) (Step
2, Fig. E.2) that undergo quasi-equilibrated ring-closing and desorption into the
aqueous phase (Step 3, Fig. E.2). Two water molecules sequentially adsorb onto Sn
sites (W*, 2W*) in quasi-equilibrated steps (Steps 4-5, Fig. E.2), and 2W* is assumed
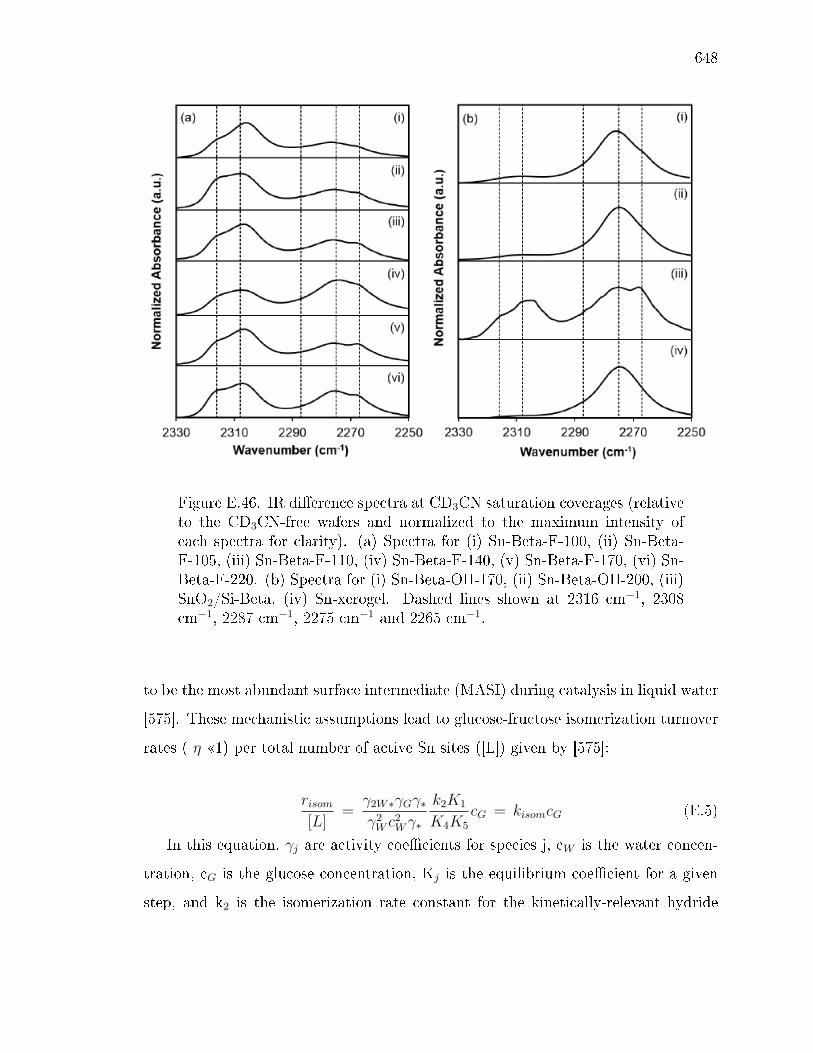
648
Figure E.46. IR dierence spectra at CD3CN saturation coverages (relativeto the CD3CN-free wafers and normalized to the maximum intensity ofeach spectra for clarity). (a) Spectra for (i) Sn-Beta-F-100, (ii) Sn-Beta-F-105, (iii) Sn-Beta-F-110, (iv) Sn-Beta-F-140, (v) Sn-Beta-F-170, (vi) Sn-Beta-F-220. (b) Spectra for (i) Sn-Beta-OH-170, (ii) Sn-Beta-OH-200, (iii)SnO2/Si-Beta, (iv) Sn-xerogel. Dashed lines shown at 2316 cm−1, 2308cm−1, 2287 cm−1, 2275 cm−1 and 2265 cm−1.
to be the most abundant surface intermediate (MASI) during catalysis in liquid water
[575]. These mechanistic assumptions lead to glucose-fructose isomerization turnover
rates ( η 1) per total number of active Sn sites ([L]) given by [575]:
risom[L]
=γ2W∗γGγ∗γ2W c
2Wγ∗
k2K1
K4K5
cG = kisomcG (E.5)
In this equation, γj are activity coecients for species j, cW is the water concen-
tration, cG is the glucose concentration, Kj is the equilibrium coecient for a given
step, and k2 is the isomerization rate constant for the kinetically-relevant hydride
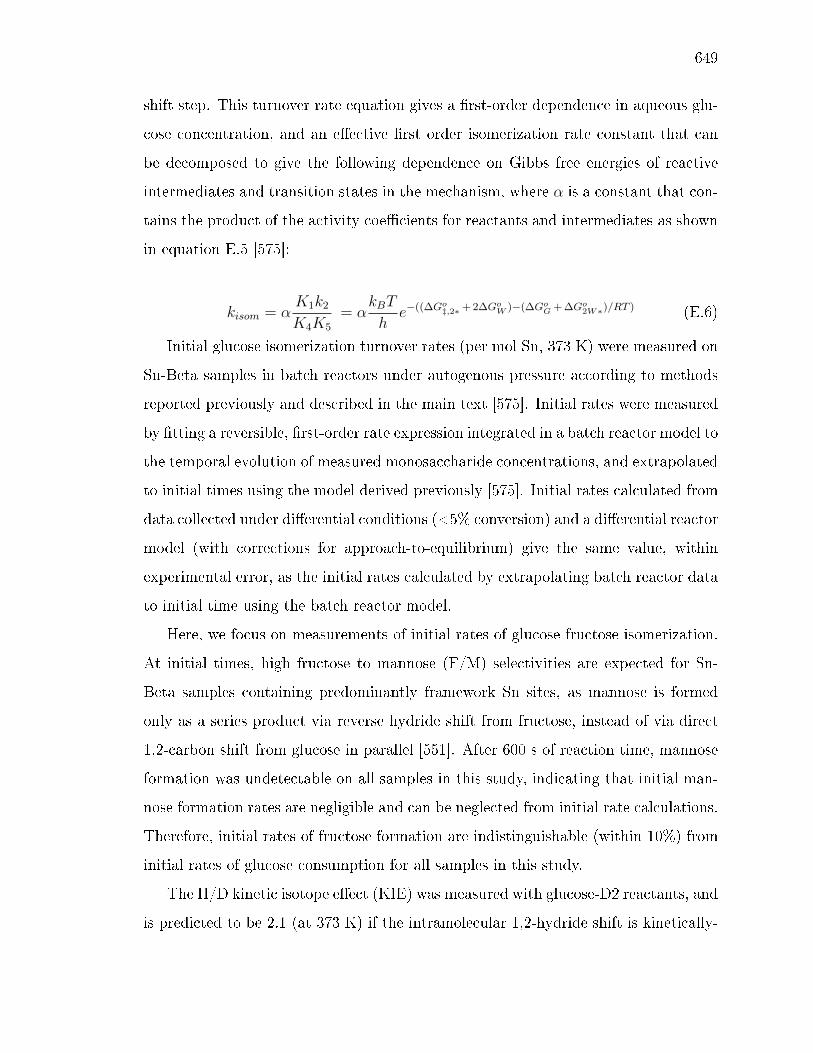
649
shift step. This turnover rate equation gives a rst-order dependence in aqueous glu-
cose concentration, and an eective rst order isomerization rate constant that can
be decomposed to give the following dependence on Gibbs free energies of reactive
intermediates and transition states in the mechanism, where α is a constant that con-
tains the product of the activity coecients for reactants and intermediates as shown
in equation E.5 [575]:
kisom = αK1k2
K4K5
= αkBT
he−((∆Go
‡,2∗+ 2∆GoW )−(∆Go
G + ∆Go2W∗)/RT ) (E.6)
Initial glucose isomerization turnover rates (per mol Sn, 373 K) were measured on
Sn-Beta samples in batch reactors under autogenous pressure according to methods
reported previously and described in the main text [575]. Initial rates were measured
by tting a reversible, rst-order rate expression integrated in a batch reactor model to
the temporal evolution of measured monosaccharide concentrations, and extrapolated
to initial times using the model derived previously [575]. Initial rates calculated from
data collected under dierential conditions (<5% conversion) and a dierential reactor
model (with corrections for approach-to-equilibrium) give the same value, within
experimental error, as the initial rates calculated by extrapolating batch reactor data
to initial time using the batch reactor model.
Here, we focus on measurements of initial rates of glucose-fructose isomerization.
At initial times, high fructose to mannose (F/M) selectivities are expected for Sn-
Beta samples containing predominantly framework Sn sites, as mannose is formed
only as a series product via reverse hydride shift from fructose, instead of via direct
1,2-carbon shift from glucose in parallel [551]. After 600 s of reaction time, mannose
formation was undetectable on all samples in this study, indicating that initial man-
nose formation rates are negligible and can be neglected from initial rate calculations.
Therefore, initial rates of fructose formation are indistinguishable (within 10%) from
initial rates of glucose consumption for all samples in this study.
The H/D kinetic isotope eect (KIE) was measured with glucose-D2 reactants, and
is predicted to be 2.1 (at 373 K) if the intramolecular 1,2-hydride shift is kinetically-
650
relevant (C-H scissoring frequency of 1500 cm-1) [578]. In the presence of strong
internal reactant mass transfer limitations, the observed H/D KIE value would be
equivalent to the square root of the kinetically-relevant value (ca. 1.4 at 373 K) [575].
Measured H/D KIE values were between 2.0-2.4 for all Sn-Beta samples tested in this
study, consistent with the absence of internal mass transfer limitations [575].
The H/D KIE value was also measured on a Sn-Beta-F-170 pre-poisoned with
pyridine to be 2.3 ± 0.2, as expected for kinetically-limited isomerization rates, sug-
gesting the decrease in observed isomerization rates with increasing amounts of pyri-
dine pre-titration (Fig. E.11) does not reect the introduction of diusion limitations
for glucose reactants. Initial isomerization turnover rates (373 K, normalized to rates
on untitrated samples) are plotted in Figure E.47 against the moles of pyridine ad-
sorbed per gram, per micropore volume, and per surface area of Sn-Beta-F-110 and
Sn-Beta-F-170. If occlusion of micropore volume were the mechanism by which pyri-
dine titration suppressed catalytic reactivity, then the amount of pyridine titrants
adsorbed onto Sn-Beta-F-110 and Sn-Beta-F-170 (nearly identical N2 micropore vol-
umes of 0.22 and 0.21 cm3 g−1, respectively) should be similar on a per gram or per
micropore volume basis. Analogously, if occlusion of pore mouths at external crystal-
lite surfaces by adsorbed pyridine were responsible for the decrease in isomerization
rates, then the amount of pyridine required to fully suppress rates would be similar on
an external surface area basis, which can be estimated from crystallite sizes (approx-
imating the Beta crystallites as spheres) derived from SEM images (Fig. E.48). The
amount of pyridine required to fully suppress rates on both Sn-Beta samples does not
agree with any of these properties, suggesting that occlusion of external pore mouths
or internal void spaces cannot account for the decrease in reactivity with increasing
pyridine coverage.

651
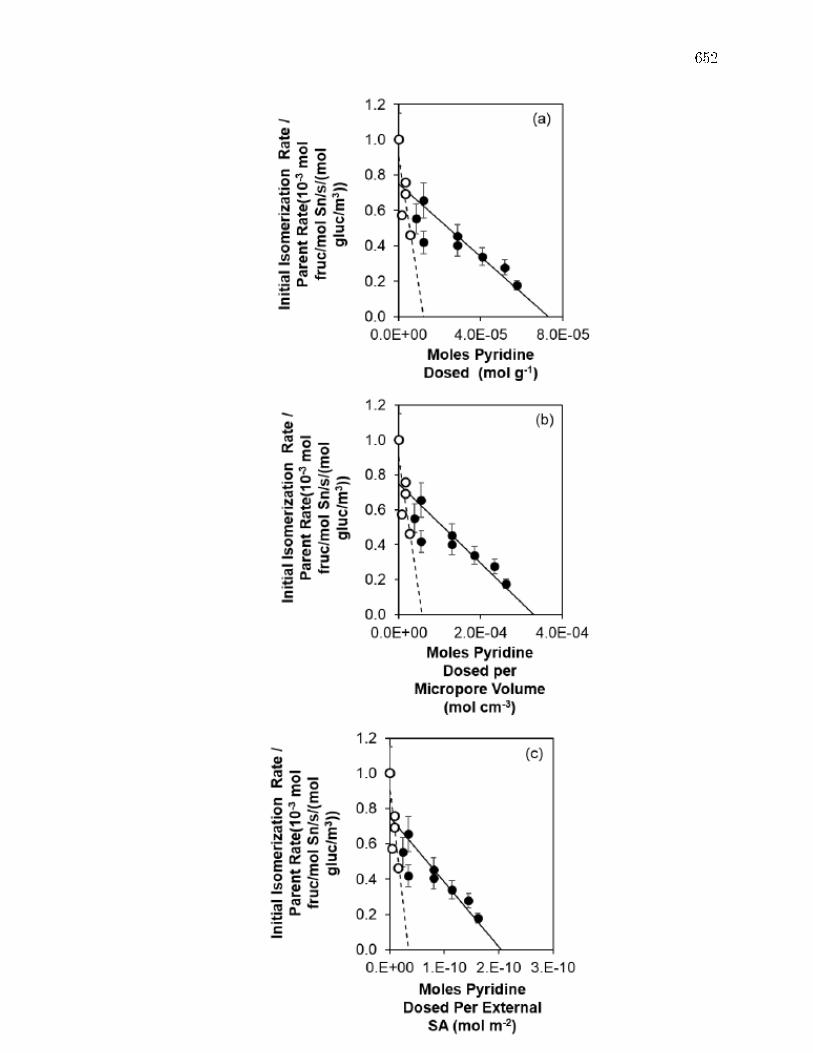
652
Figure E.47. Initial glucose isomerization rates (373 K, normalized to un-titrated samples) as a function of pre-adsorbed pyridine (a) per gram, (b)per micropore volume, and (c) per external surface area for Sn-Beta-F-110(closed circles) and Sn-Beta-F-170 (open circles).
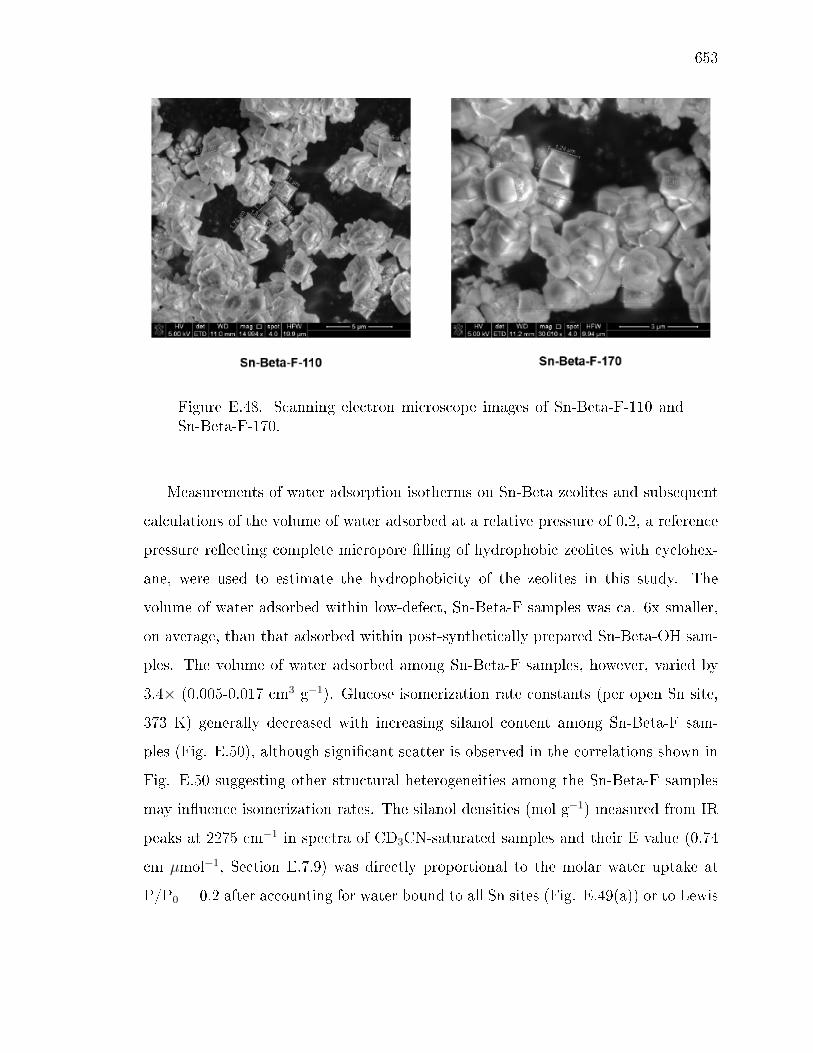
653
Figure E.48. Scanning electron microscope images of Sn-Beta-F-110 andSn-Beta-F-170.
Measurements of water adsorption isotherms on Sn-Beta zeolites and subsequent
calculations of the volume of water adsorbed at a relative pressure of 0.2, a reference
pressure reecting complete micropore lling of hydrophobic zeolites with cyclohex-
ane, were used to estimate the hydrophobicity of the zeolites in this study. The
volume of water adsorbed within low-defect, Sn-Beta-F samples was ca. 6x smaller,
on average, than that adsorbed within post-synthetically prepared Sn-Beta-OH sam-
ples. The volume of water adsorbed among Sn-Beta-F samples, however, varied by
3.4× (0.005-0.017 cm3 g−1). Glucose isomerization rate constants (per open Sn site,
373 K) generally decreased with increasing silanol content among Sn-Beta-F sam-
ples (Fig. E.50), although signicant scatter is observed in the correlations shown in
Fig. E.50 suggesting other structural heterogeneities among the Sn-Beta-F samples
may inuence isomerization rates. The silanol densities (mol g−1) measured from IR
peaks at 2275 cm−1 in spectra of CD3CN-saturated samples and their E value (0.74
cm µmol−1, Section E.7.9) was directly proportional to the molar water uptake at
P/P0 = 0.2 after accounting for water bound to all Sn sites (Fig. E.49(a)) or to Lewis
654
acidic Sn sites (Fig. E.49(b)), assuming 2:1 H2O:Sn binding stoichiometry (119Sn
NMR evidence [554]).

655
Figure E.49. Molar water uptake measured at P/P0=0.2, after subtractingthe contribution from (a) total Sn (estimated by AAS) or (b) Lewis acidicSn assuming 2:1 H2O:Sn binding stoichiometry, plotted as a function of thesilanol content.

656
Figure E.50. Rate constants per open Sn sites for all Sn-Beta-F samplesas a function of the silanol content measured using the E value for thepeak for CD3CN bound to silanol sites centered at 2275 cm−1. Trendlinesshow correlation of rate constant with 1/(mol SiOH g−1) (dashed line) and1/(mol SiOH g−1)2 (solid line) determined by linear regression.
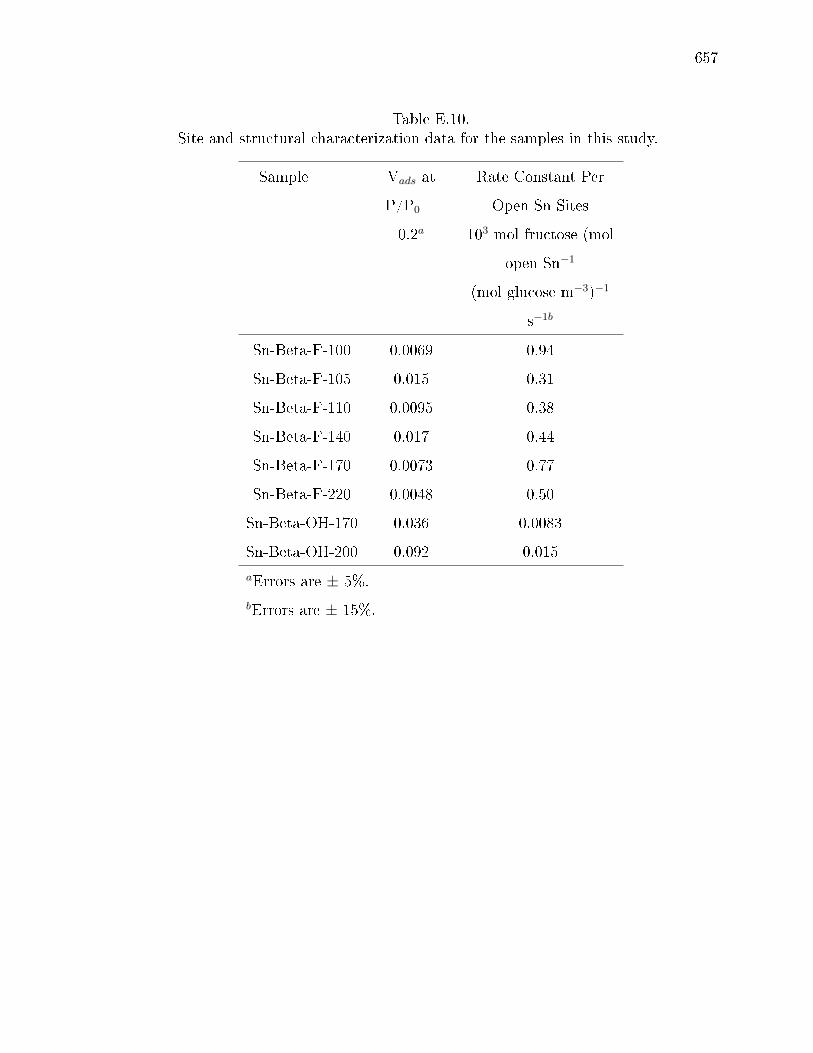
657
Table E.10.Site and structural characterization data for the samples in this study.
Sample Vads at
P/P0 =
0.2a
Rate Constant Per
Open Sn Sites
103 mol fructose (mol
open Sn−1
(mol glucose m−3)−1
s−1b
Sn-Beta-F-100 0.0069 0.94
Sn-Beta-F-105 0.015 0.31
Sn-Beta-F-110 0.0095 0.38
Sn-Beta-F-140 0.017 0.44
Sn-Beta-F-170 0.0073 0.77
Sn-Beta-F-220 0.0048 0.50
Sn-Beta-OH-170 0.036 0.0083
Sn-Beta-OH-200 0.092 0.015
aErrors are ± 5%.bErrors are ± 15%.

658
659
F. MOLECULAR STRUCTURE AND CONFINING ENVIRONMENT OF TIN
SITES IN SINGLE-SITE ZEOLITES
F.1 Introduction
Single-site heterogeneous catalysts contain active sites that behave uniformly as a
result of site isolation and well-dened structures. Their catalytic behavior depends
on their local coordination, dened by the bonding of sites to the support and to
ancillary ligands [413, 599602], which provides a primary envi-ronment that inu-
ences the electronic properties of the active sites [599, 600, 603605].Their catalytic
behavior also depends on their secondary environments, which can result from or-
ganic ligands [599, 600, 603605], or from connement of sites within an inorganic
cavity that provides enthalpic and entropic stabilization of bound reactive interme-
diates through van der Waals and electrostatic interactions [23, 143, 606, 607]. As
a result, accurate descriptions of catalytic active sites require precise denitions of
both the local structure and the secondary environments of the binding sites, in turn,
requiring spectroscopic and kinetic probes sensitive to both environments.
Zeolites belong to one of the most widely used and studied classes of heteroge-
neous catalysts [155, 608] for which primary and secondary environments inuence
catalytic reactivity. The substitution of some silicon atoms in the crystalline zeo-
lite lattice with heteroatoms provides a route to prepare single-site catalysts that
contain isolated metal atoms with well-dened local structures and conning en-
vironments. Among siliceous frameworks containing tetravalent heteroatoms (M4+
= Sn, Ti, Zr, Hf), Sn-Beta zeolites have received consid-erable attention because
of their ability to catalyze a broad range of reactions including the Baeyer-Villiger
oxidation of ketones [529], the intermolecular Meerwein-Ponndorf-Verley oxidation
of alcohols and Oppenauer reduction of aldehydes (MPVO) [609], and the related
660
intramolecular MPVO cycle of glucose-fructose isomerization [534]. Dierent four-
coordinate Sn local structures have been proposed, including closed sites with four
framework bonds [Sn-(OSi≡)4] and open sites with three framework bonds and
an OH ligand [(HO)-Sn-(OSi≡)3], which exist as either hydrolyzed-open (adjacent
≡Si-OH) or defect sites (adjacent to a framework Si vacancy) (Fig. F.1). Closed
and open Sn sites have been identied using IR and 119Sn solid-state NMR spec-
troscopy together with density functional theory (DFT) calculations [550, 551] and
their detailed local structures in Sn-Beta zeolites have been rened by the combined
use of dynamic nuclear polarization enhanced solid-state NMR (DNP NMR) and
DFT calculations. DNP is used to signicantly enhance the NMR sensitivity uti-
lizing microwave-promoted polarization transfer from unpaired electrons to nuclei,
typically protons [512514], whose hyperpolarization can be transferred to the tar-
geted heteroa-toms (e.g., 119Sn) [515, 516, 547, 610] through cross-polarization (CP).
DNP enables acquiring 119Sn chemical shift anisotropy (CSA) parameters at natural
abundance, which can be compared to values calculated from DFT to discriminate
local Sn structure and location [611]. In the case of Sn-Beta zeolites, however, precise
structural assignments are complicated by the pres-ence of dierent metal-framework
coordination modes, multiple tetrahedral-site (T-site) locations [562, 611] and crys-
tal polymorph [612], and the inhomogeneous spatial distribution of Sn throughout
crystallites [613]. In contrast to most molecular sieves, chabazite (CHA) is a high-
symmetry framework containing only one crystallo-graphically unique T-site, which
promises to clarify interpretations of experimental characterization data and to pro-
vide model structures that can be described more accurately by theory. Periodic
DFT studies of metal-substituted zeolites have estimated Ti heteroatom stability in
CHA [614], and compared adsorbate (water, ammonia, pyridine) binding energies at
various heteroatom sites in CHA [615618]. Such studies have also estimated am-
monia binding energies [267], and developed linear scaling relationships for O- and
S-containing compounds [619], bound at dierent heteroatoms in CHA. Theoretical

661
studies of metal-substituted CHA frameworks continue to proliferate, despite com-
mensurate experimental progress to prepare and characterize such model catalysts.
Here, we report the direct hydrothermal synthesis of Sn-CHA zeolites, their cat-
alytic function as solid Lewis acids for substrates of varying size, and the detailed
structural characterization of Sn active sites that distinguishes their primary and
secondary environments. The single T-site nature of Sn-CHA allows more accurate
theoretical modeling, and the use of CD3CN titrants enables quantifying dierent
Lewis acidic Sn structures detected by bulk spectroscopic techniques. We provide ev-
idence that Sn-CHA catalyzes the MPVO reaction of propionaldehyde and ethanol,
yet is essentially unreactive for glucose isomerization. The ability to complement DNP
NMR with DFT calculations enables identifying dierent local Sn structures (closed
vs. open vs. defect), while the combination of IR and DNP NMR with pyridine
titrants, unable to traverse eight-membered ring CHA micropore apertures, enables
probing dierent secondary conning environments in CHA (microporous vs. meso-
porous voids) and establishing a structure-reactivity relationship that highlights the
critical role of microporous conning environments around Sn sites for aqueous-phase
glucose-fructose isomerization.
F.2 Results and Discussion
F.2.1 Synthesis of Sn-CHA and Bulk Structural Characterization of Stannosilicates
Hydrothermal synthesis routes to prepare CHA molecular sieves containing frame-
work Sn heteroatoms have not been reported previously to our knowledge; therefore,
syntheses were performed by adapting reported procedures for the uoride-assisted
hydrothermal synthesis of Ti-CHA [620] (details in Section F.6.2). Generally, syn-
thetic routes for Sn-CHA involved rst homogenizing the silicon precursor (tetraethy-
lorthosilicate) and the tin precursor (an ethanolic solution of stannic chloride pen-
tahydrate) in an aqueous hydrogen peroxide solution, and then adding the organic
structure-directing agent (aqueous N,N,N-trimethyl-1-adamantylammonium hydrox-
662
ide). After a reaction and homogenization period (24 h), ethanol and excess wa-
ter were evaporated from this solution to obtain the low water con-tents typical of
uoride-assisted zeolite crystallization (H2O/SiO2 = 3), which required performing
one intermediate rehydration (H2O/SiO2 = 40) and dehydration cycle; attempts to
crystallize Sn-CHA without this rehydration cycle were unsuccessful (10 days, 423
K). Finally, aqueous hydrouoric acid was added as the mineralizing agent to form a
powder, which crystallized Sn-CHA (2 days, 423 K).
Structural characterization data are listed in Table F.1 for all samples in this study.
Stannosilicate molecular sieves are labeled Sn-X-Y-Z, where X is the framework type
(CHA or Beta), Y is the mineralizing agent used (-F: uoride, -OH: hydroxide), and
Z is the silicon-to-tin molar ratio determined from atomic absorption spectroscopy.
Powder XRD patterns were used to conrm the intended crystal topologies (Section
F.6.3, Fig. F.6) and that samples did not contain extracrystal-line SnO2 domains
larger than 3 nm in diameter [290]. Argon (CHA) and nitrogen (Beta, xerogel) ad-
sorption isotherms (Section F.6.4, Fig. F.7) were used to determine the micropore
volumes reported in Table F.1, which were consistent with previous reports for each
sample topology [42,467,621], except those measured for Sn-CHA-F-60 and Sn-CHA-
F-70, which were lower (0.15-0.16 cm3 g−1) than those measured for Si-CHA-F and
Al-CHA (0.20-0.23 cm3 g−1) [42,467]. Non-local density func-tional theory (NLDFT)
treatments of Ar adsorption isotherms used to determine pore size distributions (Sec-
tion F.6.4, Figs. F.8 and F.9) provide evidence for mesoporous voids (5-10 nm diam.)
in Sn-CHA-F samples, but not Si-CHA-F, evident in the ∼5x larger volumes of ad-
sorbed Ar at reduced pressures characteristic of mesopore lling (0.05-0.8 P/P0) for
Sn-CHA-F than for Si-CHA-F. Replicate synthesis of Sn-CHA resulted in samples
with dierent Sn content (Si/Sn = 60 and 70) but otherwise indistinguishable bulk
structural characteristics, while the Sn-Beta-F-116 sample studied here is representa-
tive of a larger suite of Sn-Beta-F samples (>20) we have studied previously [466,622].
Diuse-reectance UV-visible (DRUV) spectra of Sn-CHA-F-70, Sn-Beta-F-116,
and Sn-xerogel (Section F.6.5, Figure F.10) were collected after dehydration treat-
663
ments (523 K), in order to avoid the ambiguity of interpreting overlapping absorption
bands (220-250 nm) for hexacoordinate framework Sn centers with coordinated lig-
ands (e.g., water) [577] and for any Sn located within nanometer-sized non-framework
SnO2 domains [579582]. DRUV spectra showed dominant absorption bands for iso-
lated tetrahedral Sn in Sn-CHA-F-70 (ca. 220 nm) and Sn-Beta-F-116 (ca. 210
nm) [534,577], but also showed broad bands (ca. 250 nm) characteristic of hexacoor-
dinate Sn, reecting either the presence of minority SnO2 or incom-plete dehydration
at 623 K (Fig. F.11; TGA analysis in Section F.6.6). Absorption edge energies (F.1)
extracted from Tauc plots (Fig. F.12) were characteristic of isolated, tetrahedral
Sn in zeolitic frameworks (≥4.1 eV) [568, 581] for both Sn-CHA sam-ples (4.12-4.33
eV) and for Sn-Beta-F-116 (4.23 eV), and higher than for SnO2 domains (ca. 3 nm)
supported on Si-Beta (4.09 eV) [466]. Sn K-edge X-ray absorption spectra (XAS)
for Sn-CHA-F-70, Sn-Beta-F-116, and Sn-xerogel (Section F.6.7 indicated average
Sn coordination numbers of six (5.7-5.8 ± 0.6) under ambient conditions and four
(3.8-4.0 ± 0.4) after dehydration, the behavior expected of framework Sn centers.
The average Sn-O bond length in Sn-CHA-F-70 derived from EXAFS (1.96 ± 0.02
Å) was longer than expected from density functional theory (DFT) predictions for
closed and defect Sn sites (1.88 Å, Section F.2.5), perhaps indicating the presence
of residual water in Sn-CHA-F-70 at 523 K. These bulk characterization techniques
indicate that the Sn-CHA and Sn-Beta samples studied here contain predominantly
Sn atoms isolated within framework positions. We next use site-sensitive character-
ization techniques that provide increasing resolution into the molecular-level details
of local Sn coordination and geometry.
F.2.2 Quantifying Lewis acidic Sn sites using d3-acetonitrile and pyridine titrationand IR spectroscopy
Infrared (IR) spectra of Sn-CHA samples saturated with CD3CN are shown in
Figure F.2, and used to quantify their number of Lewis acidic Sn sites. Sn-Beta
zeolites show ν(C≡N) vibrations characteristic of CD3CN bound to open (2316 cm−1)
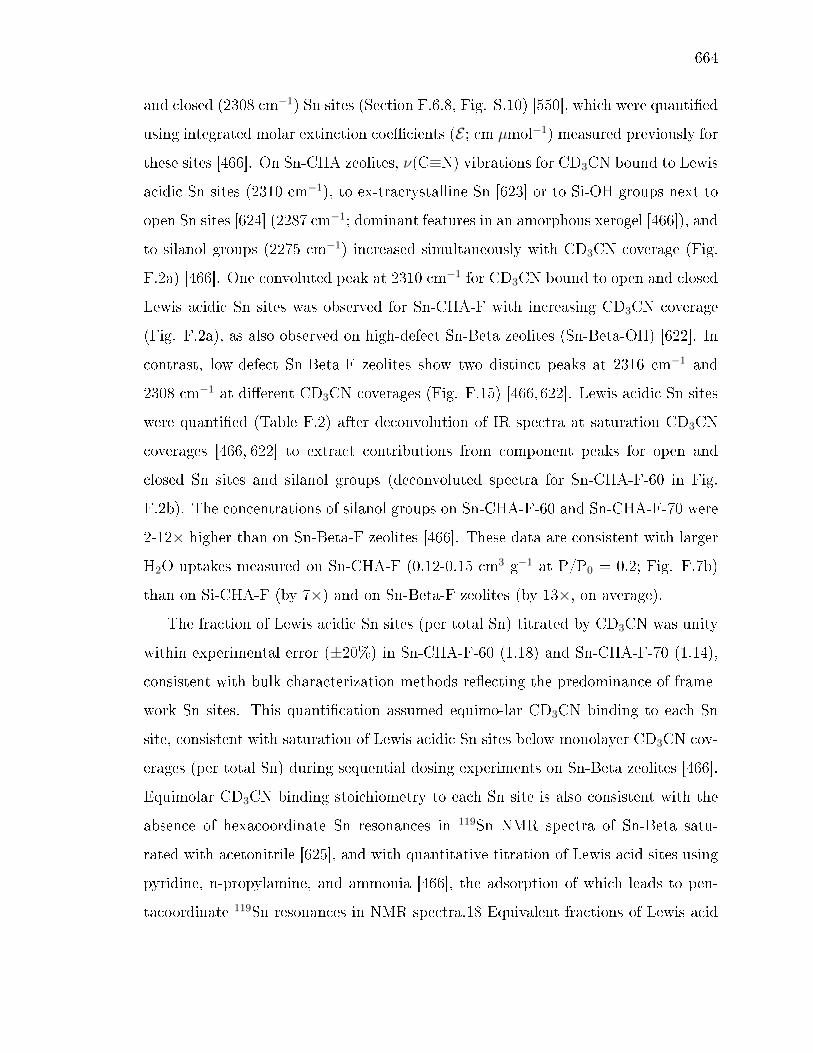
664
and closed (2308 cm−1) Sn sites (Section F.6.8, Fig. S.10) [550], which were quantied
using integrated molar extinction coecients (E ; cm µmol−1) measured previously for
these sites [466]. On Sn-CHA zeolites, ν(C≡N) vibrations for CD3CN bound to Lewis
acidic Sn sites (2310 cm−1), to ex-tracrystalline Sn [623] or to Si-OH groups next to
open Sn sites [624] (2287 cm−1; dominant features in an amorphous xerogel [466]), and
to silanol groups (2275 cm−1) increased simultaneously with CD3CN coverage (Fig.
F.2a) [466]. One convoluted peak at 2310 cm−1 for CD3CN bound to open and closed
Lewis acidic Sn sites was observed for Sn-CHA-F with increasing CD3CN coverage
(Fig. F.2a), as also observed on high-defect Sn-Beta zeolites (Sn-Beta-OH) [622]. In
contrast, low-defect Sn-Beta-F zeolites show two distinct peaks at 2316 cm−1 and
2308 cm−1 at dierent CD3CN coverages (Fig. F.15) [466,622]. Lewis acidic Sn sites
were quantied (Table F.2) after deconvolution of IR spectra at saturation CD3CN
coverages [466, 622] to extract contributions from component peaks for open and
closed Sn sites and silanol groups (deconvoluted spectra for Sn-CHA-F-60 in Fig.
F.2b). The concentrations of silanol groups on Sn-CHA-F-60 and Sn-CHA-F-70 were
2-12× higher than on Sn-Beta-F zeolites [466]. These data are consistent with larger
H2O uptakes measured on Sn-CHA-F (0.12-0.15 cm3 g−1 at P/P0 = 0.2; Fig. F.7b)
than on Si-CHA-F (by 7×) and on Sn-Beta-F zeolites (by 13×, on average).
The fraction of Lewis acidic Sn sites (per total Sn) titrated by CD3CN was unity
within experimental error (±20%) in Sn-CHA-F-60 (1.18) and Sn-CHA-F-70 (1.14),
consistent with bulk characterization methods reecting the predominance of frame-
work Sn sites. This quantication assumed equimo-lar CD3CN binding to each Sn
site, consistent with saturation of Lewis acidic Sn sites below monolayer CD3CN cov-
erages (per total Sn) during sequential dosing experiments on Sn-Beta zeolites [466].
Equimolar CD3CN binding stoichiometry to each Sn site is also consistent with the
absence of hexacoordinate Sn resonances in 119Sn NMR spectra of Sn-Beta satu-
rated with acetonitrile [625], and with quantitative titration of Lewis acid sites using
pyridine, n-propylamine, and ammonia [466], the adsorption of which leads to pen-
tacoordinate 119Sn resonances in NMR spectra.18 Equivalent fractions of Lewis acid

665
sites in Sn-CHA-F-60 (1.08, Table F.2) and Sn-CHA-F-70 (1.20, Table F.2) were also
quantied by ammonia titration and temperature programmed desorption methods
developed previously on Sn-Beta zeolites (Section F.6.9) [466]. These titration data
indicate that the Sn-CHA samples studied here contain predominantly Lewis acidic
Sn sites incorporated within framework locations, and that integrated molar extinc-
tion coecients for IR vibrations of CD3CN bound at Sn sites in Beta zeolites can
also be used to quantify Sn sites in CHA zeolites.
Framework Sn sites may be conned within either microporous or mesoporous
voids, both of which are detected in Ar adsorption isotherms, of Sn-CHA. The lo-
cation of Sn within dierent conning environments was probed using pyridine as a
probe molecule (ca. 0.6 nm), which cannot access microporous voids in CHA that
are limited by eight-membered ring window apertures (ca. 0.4 nm). Any vibra-tions
observed for pyridine bound to Lewis acidic Sn sites thus reect Sn atoms located at
external crystallite surfaces or within mesoporous voids, similar to previous reports
for H+ sites located in partially-mesoporous Al-CHA zeolites synthesized in uoride
media [459]. IR spectra measured after pyridine saturation (423 K) of Sn-CHA-F
(Section F.6.8, Fig. F.16) showed prominent peaks at 1450 cm−1 and 1610 cm−1
reecting deformation modes of pyridine coordinated to Lewis acid sites [559], and
a minor peak for protonated pyridine at 1545 cm−1 (20× smaller area than 1450
cm−1 peak) as observed previously for post-synthetically prepared Sn-Beta-OH zeo-
lites [622]. The fraction of Sn sites accessible to pyridine was 0.20 (per total Sn) for
both Sn-CHA-F-60 and Sn-CHA-F-70 (Table F.2, using E(1450 cm−1) values mea-
sured previously for Sn-Beta-F zeolites [466]. The accessibility of 20% of the Sn sites
in Sn-CHA to pyridine is consistent with a uniform distribution of Sn throughout Sn-
CHA crystallites, which show lower than expected micropore volumes (by 20-25%)
and the presence of mesoporous voids.
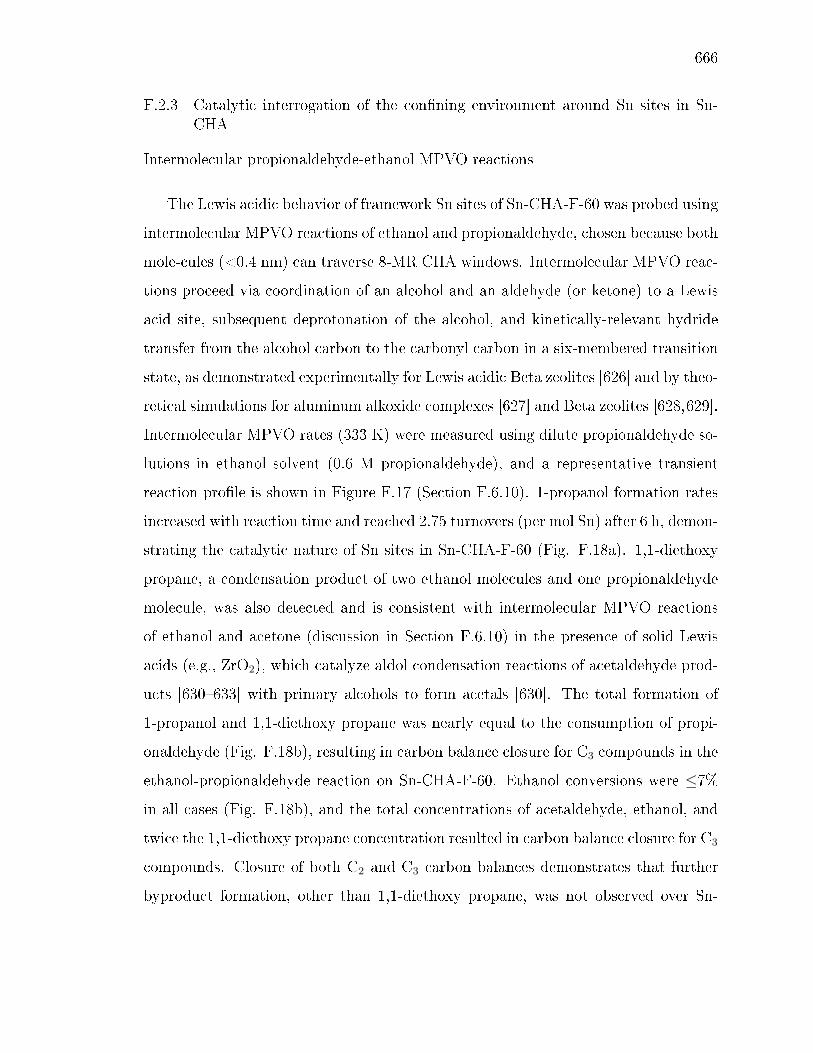
666
F.2.3 Catalytic interrogation of the conning environment around Sn sites in Sn-CHA
Intermolecular propionaldehyde-ethanol MPVO reactions
The Lewis acidic behavior of framework Sn sites of Sn-CHA-F-60 was probed using
intermolecular MPVO reactions of ethanol and propionaldehyde, chosen because both
mole-cules (<0.4 nm) can traverse 8-MR CHA windows. Intermolecular MPVO reac-
tions proceed via coordination of an alcohol and an aldehyde (or ketone) to a Lewis
acid site, subsequent deprotonation of the alcohol, and kinetically-relevant hydride
transfer from the alcohol carbon to the carbonyl carbon in a six-membered transition
state, as demonstrated experimentally for Lewis acidic Beta zeolites [626] and by theo-
retical simulations for aluminum alkoxide complexes [627] and Beta zeolites [628,629].
Intermolecular MPVO rates (333 K) were measured using dilute propionaldehyde so-
lutions in ethanol solvent (0.6 M propionaldehyde), and a representative transient
reaction prole is shown in Figure F.17 (Section F.6.10). 1-propanol formation rates
increased with reaction time and reached 2.75 turnovers (per mol Sn) after 6 h, demon-
strating the catalytic nature of Sn sites in Sn-CHA-F-60 (Fig. F.18a). 1,1-diethoxy
propane, a condensation product of two ethanol molecules and one propionaldehyde
molecule, was also detected and is consistent with intermolecular MPVO reactions
of ethanol and acetone (discussion in Section F.6.10) in the presence of solid Lewis
acids (e.g., ZrO2), which catalyze aldol condensation reactions of acetaldehyde prod-
ucts [630633] with primary alcohols to form acetals [630]. The total formation of
1-propanol and 1,1-diethoxy propane was nearly equal to the consumption of propi-
onaldehyde (Fig. F.18b), resulting in carbon balance closure for C3 compounds in the
ethanol-propionaldehyde reaction on Sn-CHA-F-60. Ethanol conversions were ≤7%
in all cases (Fig. F.18b), and the total concentrations of acetaldehyde, ethanol, and
twice the 1,1-diethoxy propane concentration resulted in carbon balance closure for C3
compounds. Closure of both C2 and C3 carbon balances demonstrates that further
byproduct formation, other than 1,1-diethoxy propane, was not observed over Sn-
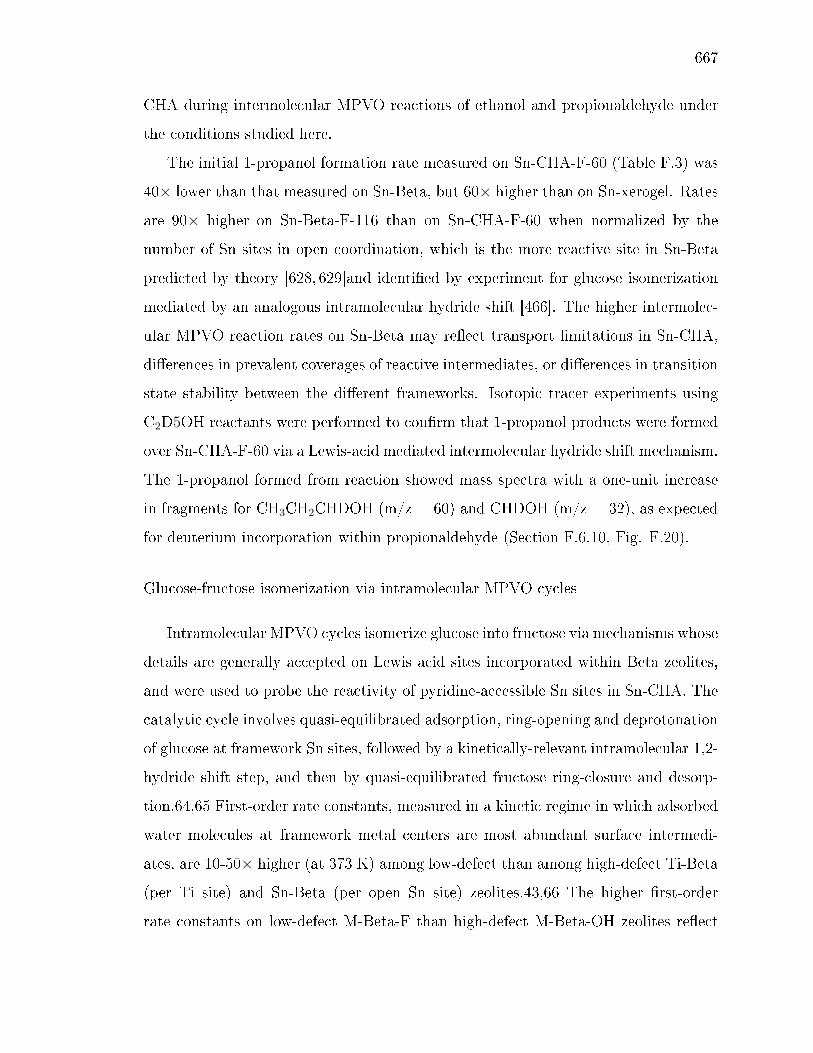
667
CHA during intermolecular MPVO reactions of ethanol and propionaldehyde under
the conditions studied here.
The initial 1-propanol formation rate measured on Sn-CHA-F-60 (Table F.3) was
40× lower than that measured on Sn-Beta, but 60× higher than on Sn-xerogel. Rates
are 90× higher on Sn-Beta-F-116 than on Sn-CHA-F-60 when normalized by the
number of Sn sites in open coordination, which is the more reactive site in Sn-Beta
predicted by theory [628, 629]and identied by experiment for glucose isomerization
mediated by an analogous intramolecular hydride shift [466]. The higher intermolec-
ular MPVO reaction rates on Sn-Beta may reect transport limitations in Sn-CHA,
dierences in prevalent coverages of reactive intermediates, or dierences in transition
state stability between the dierent frameworks. Isotopic tracer experiments using
C2D5OH reactants were performed to conrm that 1-propanol products were formed
over Sn-CHA-F-60 via a Lewis-acid mediated intermolecular hydride shift mechanism.
The 1-propanol formed from reaction showed mass spectra with a one-unit increase
in fragments for CH3CH2CHDOH (m/z = 60) and CHDOH (m/z = 32), as expected
for deuterium incorporation within propionaldehyde (Section F.6.10, Fig. F.20).
Glucose-fructose isomerization via intramolecular MPVO cycles
Intramolecular MPVO cycles isomerize glucose into fructose via mechanisms whose
details are generally accepted on Lewis acid sites incorporated within Beta zeolites,
and were used to probe the reactivity of pyridine-accessible Sn sites in Sn-CHA. The
catalytic cycle involves quasi-equilibrated adsorption, ring-opening and deprotonation
of glucose at framework Sn sites, followed by a kinetically-relevant intramolecular 1,2-
hydride shift step, and then by quasi-equilibrated fructose ring-closure and desorp-
tion.64,65 First-order rate constants, measured in a kinetic regime in which adsorbed
water molecules at framework metal centers are most abundant surface intermedi-
ates, are 10-50× higher (at 373 K) among low-defect than among high-defect Ti-Beta
(per Ti site) and Sn-Beta (per open Sn site) zeolites.43,66 The higher rst-order
rate constants on low-defect M-Beta-F than high-defect M-Beta-OH zeolites reect

668
lower apparent free energies of activation, which measure the dierence in stability
between kinetically-relevant isomerization transition states and two water molecules
bound at active metal sites.43,66 As a result, glucose isomerization turnover rates
and rate constants, measured in the rst-order kinetic regime, provide a quantitative
kinetic probe of the reactivity of Lewis acidic Sn sites, and can be used to assess the
catalytic consequences of their primary local environment and secondary conning
environment.
Glucose-fructose isomerization turnover rates (398 K, 1% (w/w) glucose; Table
F.3) on Sn-CHA-F-60, normalized by the number of pyridine-accessible Sn sites, were
four orders-of-magnitude lower than turnover rates on Sn-Beta-F-116. Isomerization
turnover rates were also four orders-of-magnitude lower on an amorphous Sn-xerogel,
which con-tains only unconned Sn sites, than on Sn-Beta-F-116 (Table F.3). Iso-
merization turnover rates measured on Sn-xerogel and on Sn-CHA-F-60 were sim-
ilar (within 2×), which is within the residual variation in turnover rates (within
2-3×) measured previously among Sn-Beta-F (>6 samples) or among Sn-Beta-OH
(>16 samples) of varying Sn content.43,44 The similar glucose-fructose isomerization
turnover rates measured on Sn-xerogel and Sn-CHA, upon normalization by the num-
ber of pyridine-accessible sites, provides quantitative kinetic evidence supporting the
presence of approximately 20% of the framework Sn sites located within mesoporous
voids of Sn-CHA. These data highlight the crucial role of conning microporous envi-
ronments in aqueous-phase glucose isomer-ization, and indicate that rates measured
on Sn-Beta zeolites reect reactions occurring at Sn sites conned within their 12-
MR microporous voids, and not at any unconned Sn sites that may be located at
external crystallite surfaces. We conclude from these catalytic intramolecular and
intermolecular MPVO probe reactions, together with the IR spectra collected after
CD3CN and pyridine titration, that Sn-CHA zeolites contain framework Sn sites that
function as Lewis acids and are located within both microporous and mesopo-rous
voids.

669
F.2.4 Probing local Sn structure using 119Sn DNP NMR spectroscopy
DNP enhanced 119Sn1H CPMAS NMR characterization of Sn-CHA-F-70 was
performed in its hydrated and dehydrated states. An asymmetric peak characteristic
of hexa-coordinated Sn (ca. -720 ppm) was detected in the hydrated state (Fig.
F.22a), while a broad peak characteristic of tetra-coordinated Sn (ca. -430 ppm) was
detected after dehydra-tion (Fig. F.22b), with asymmetric broadening and a wider
distribution of resonances reecting the greater inhomogenei-ty or asymmetry of Sn
sites after dehydration. The 119Sn1H CPMAS NMR sensitivity was considerably
higher on the hydrated sample (ca. 1800 s signal averaging time for a spectrum with a
signal-to-noise ratio = 35, Fig. F.22a), reecting the protonrich environment present
within microporous voids, than on the dehydrated sample (ca. 21 h signal averaging
time using Carr-Purcell Meiboom-Gill (CPMG) [634] echo trains for a spectrum with
a signal-to-noise ratio = 15, Fig. F.22b), suggesting inecient CP from 1H to 119Sn
resulting from the absence of water (and perhaps TCE molecules from the biradical
solution) within zeolitic pores. These changes in Sn coordination upon dehydration
are consistent with XAS data (Section F.2.1), and the behavior expected of framework
Sn sites.
The increased NMR sensitivity aorded by DNP enables performing 2D 119Sn1H
CP magic-angle turning (CPMAT) experiments, which can separate the chemical shift
anisotropy (CSA) for each isotropic 119Sn site that contributes to the broadened 119Sn
NMR resonance observed in the 1D spectra [611]. CSA is a second rank tensor dened
by three principal components (δ11, δ22, and δ33), and can also be described using the
Herzfeld-Berger convention [635] by the isotropic chemical shift (δiso), span (Ω), and
skew (κ) (Eqs. F.1-F.3):
δiso =δ11 + δ22 + δ33
3(F.1)
Ω = δ11 − δ33 (F.2)
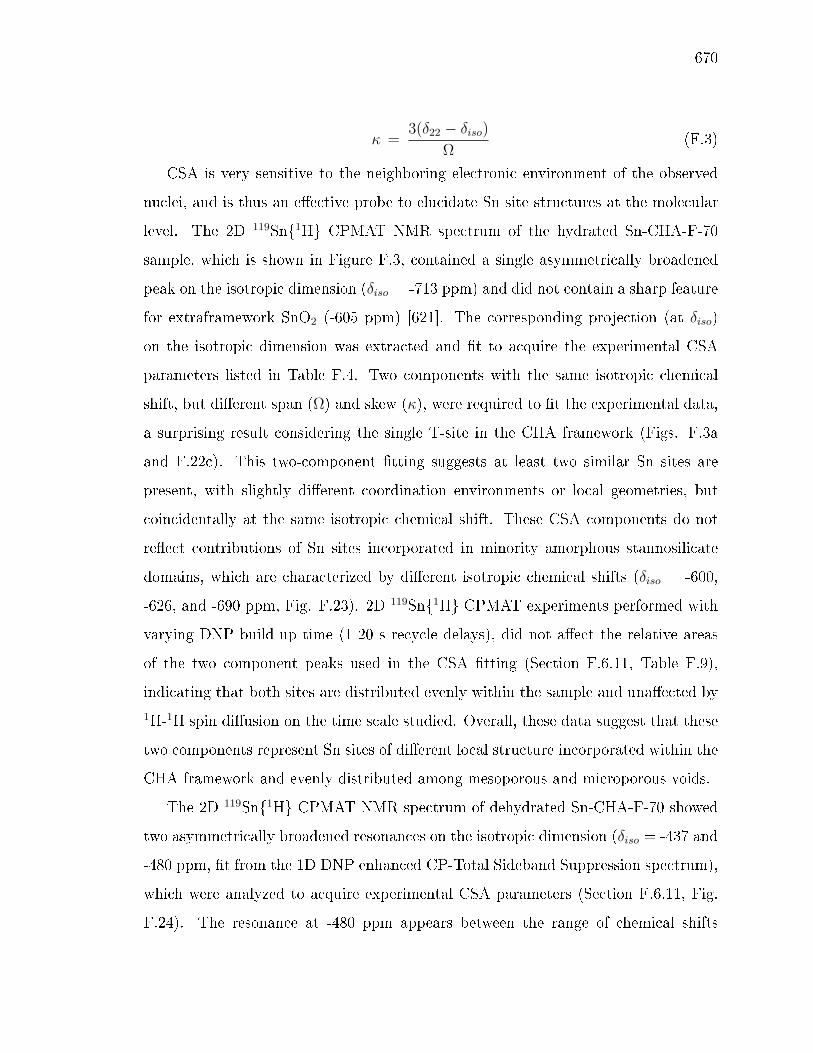
670
κ =3(δ22 − δiso)
Ω(F.3)
CSA is very sensitive to the neighboring electronic environment of the observed
nuclei, and is thus an eective probe to elucidate Sn site structures at the molecular
level. The 2D 119Sn1H CPMAT NMR spectrum of the hydrated Sn-CHA-F-70
sample, which is shown in Figure F.3, contained a single asymmetrically broadened
peak on the isotropic dimension (δiso = -713 ppm) and did not contain a sharp feature
for extraframework SnO2 (-605 ppm) [621]. The corresponding projection (at δiso)
on the isotropic dimension was extracted and t to acquire the experimental CSA
parameters listed in Table F.4. Two components with the same isotropic chemical
shift, but dierent span (Ω) and skew (κ), were required to t the experimental data,
a surprising result considering the single T-site in the CHA framework (Figs. F.3a
and F.22c). This two-component tting suggests at least two similar Sn sites are
present, with slightly dierent coordination environments or local geometries, but
coincidentally at the same isotropic chemical shift. These CSA components do not
reect contributions of Sn sites incorporated in minority amorphous stannosilicate
domains, which are characterized by dierent isotropic chemical shifts (δiso = -600,
-626, and -690 ppm, Fig. F.23). 2D 119Sn1H CPMAT experiments performed with
varying DNP build-up time (1-20 s recycle delays), did not aect the relative areas
of the two component peaks used in the CSA tting (Section F.6.11, Table F.9),
indicating that both sites are distributed evenly within the sample and unaected by1H-1H spin diusion on the time scale studied. Overall, these data suggest that these
two components represent Sn sites of dierent local structure incorporated within the
CHA framework and evenly distributed among mesoporous and microporous voids.
The 2D 119Sn1H CPMAT NMR spectrum of dehydrated Sn-CHA-F-70 showed
two asymmetrically broadened resonances on the isotropic dimension (δiso = -437 and
-480 ppm, t from the 1D DNP enhanced CP-Total Sideband Suppression spectrum),
which were analyzed to acquire experimental CSA parameters (Section F.6.11, Fig.
F.24). The resonance at -480 ppm appears between the range of chemical shifts
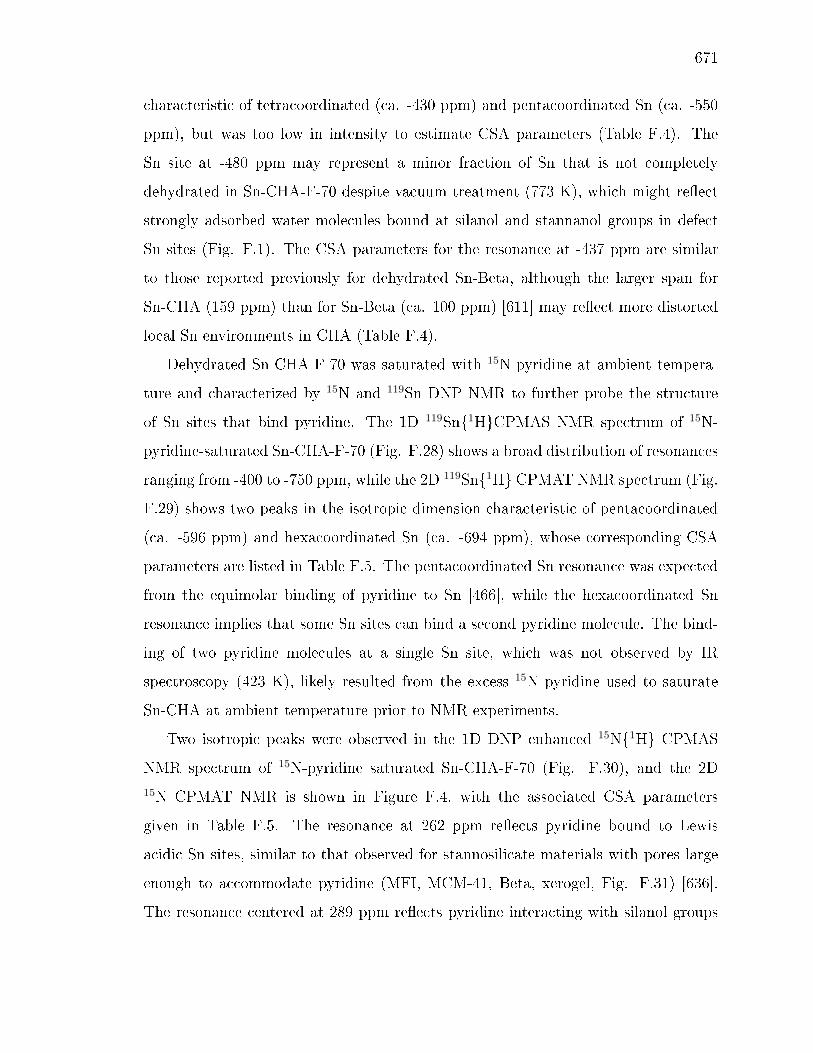
671
characteristic of tetracoordinated (ca. -430 ppm) and pentacoordinated Sn (ca. -550
ppm), but was too low in intensity to estimate CSA parameters (Table F.4). The
Sn site at -480 ppm may represent a minor fraction of Sn that is not completely
dehydrated in Sn-CHA-F-70 despite vacuum treatment (773 K), which might reect
strongly adsorbed water molecules bound at silanol and stannanol groups in defect
Sn sites (Fig. F.1). The CSA parameters for the resonance at -437 ppm are similar
to those reported previously for dehydrated Sn-Beta, although the larger span for
Sn-CHA (159 ppm) than for Sn-Beta (ca. 100 ppm) [611] may reect more distorted
local Sn environments in CHA (Table F.4).
Dehydrated Sn-CHA-F-70 was saturated with 15N-pyridine at ambient tempera-
ture and characterized by 15N and 119Sn DNP NMR to further probe the structure
of Sn sites that bind pyridine. The 1D 119Sn1HCPMAS NMR spectrum of 15N-
pyridine-saturated Sn-CHA-F-70 (Fig. F.28) shows a broad distribution of resonances
ranging from -400 to -750 ppm, while the 2D 119Sn1H CPMAT NMR spectrum (Fig.
F.29) shows two peaks in the isotropic dimension characteristic of pentacoordinated
(ca. -596 ppm) and hexacoordinated Sn (ca. -694 ppm), whose corresponding CSA
parameters are listed in Table F.5. The pentacoordinated Sn resonance was expected
from the equimolar binding of pyridine to Sn [466], while the hexacoordinated Sn
resonance implies that some Sn sites can bind a second pyridine molecule. The bind-
ing of two pyridine molecules at a single Sn site, which was not observed by IR
spectroscopy (423 K), likely resulted from the excess 15N pyridine used to saturate
Sn-CHA at ambient temperature prior to NMR experiments.
Two isotropic peaks were observed in the 1D DNP enhanced 15N1H CPMAS
NMR spectrum of 15N-pyridine saturated Sn-CHA-F-70 (Fig. F.30), and the 2D15N CPMAT NMR is shown in Figure F.4, with the associated CSA parameters
given in Table F.5. The resonance at 262 ppm reects pyridine bound to Lewis
acidic Sn sites, similar to that observed for stannosilicate materials with pores large
enough to accommodate pyridine (MFI, MCM-41, Beta, xerogel, Fig. F.31) [636].
The resonance centered at 289 ppm reects pyridine interacting with silanol groups
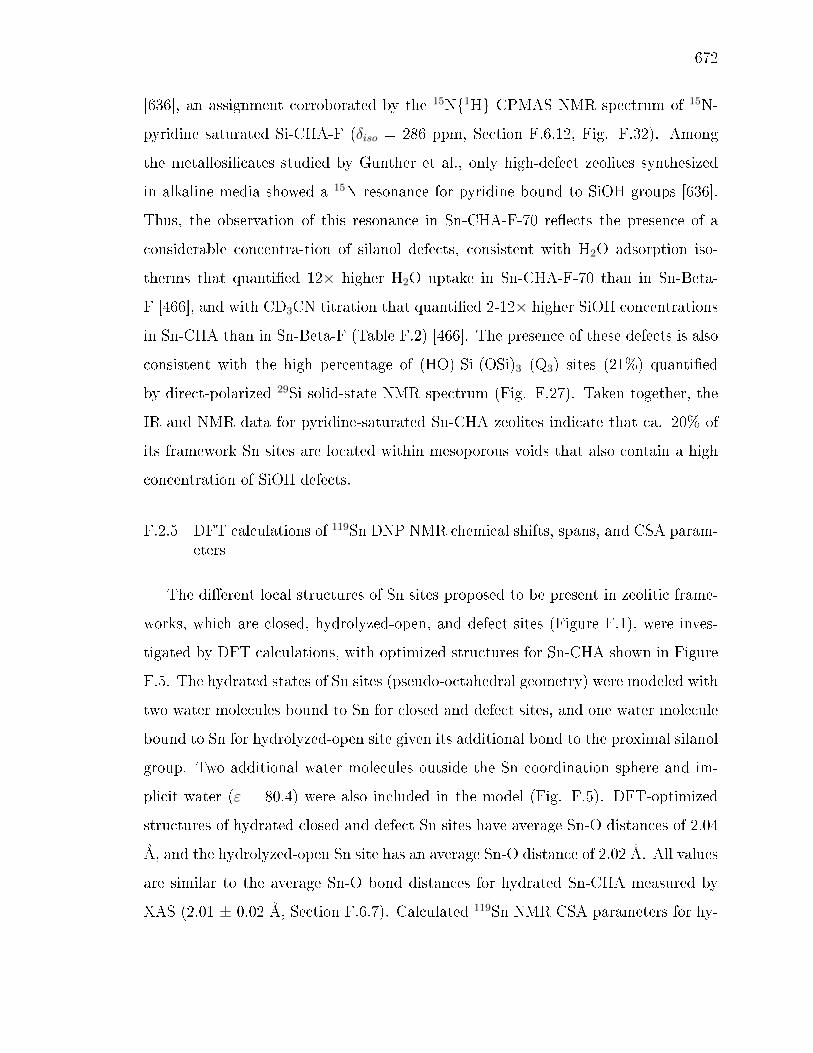
672
[636], an assignment corroborated by the 15N1H CPMAS NMR spectrum of 15N-
pyridine saturated Si-CHA-F (δiso = 286 ppm, Section F.6.12, Fig. F.32). Among
the metallosilicates studied by Gunther et al., only high-defect zeolites synthesized
in alkaline media showed a 15N resonance for pyridine bound to SiOH groups [636].
Thus, the observation of this resonance in Sn-CHA-F-70 reects the presence of a
considerable concentra-tion of silanol defects, consistent with H2O adsorption iso-
therms that quantied 12× higher H2O uptake in Sn-CHA-F-70 than in Sn-Beta-
F [466], and with CD3CN titration that quantied 2-12× higher SiOH concentrations
in Sn-CHA than in Sn-Beta-F (Table F.2) [466]. The presence of these defects is also
consistent with the high percentage of (HO)-Si-(OSi)3 (Q3) sites (21%) quantied
by direct-polarized 29Si solid-state NMR spectrum (Fig. F.27). Taken together, the
IR and NMR data for pyridine-saturated Sn-CHA zeolites indicate that ca. 20% of
its framework Sn sites are located within mesoporous voids that also contain a high
concentration of SiOH defects.
F.2.5 DFT calculations of 119Sn DNP NMR chemical shifts, spans, and CSA param-eters
The dierent local structures of Sn sites proposed to be present in zeolitic frame-
works, which are closed, hydrolyzed-open, and defect sites (Figure F.1), were inves-
tigated by DFT calculations, with optimized structures for Sn-CHA shown in Figure
F.5. The hydrated states of Sn sites (pseudo-octahedral geometry) were modeled with
two water molecules bound to Sn for closed and defect sites, and one water molecule
bound to Sn for hydrolyzed-open site given its additional bond to the proximal silanol
group. Two additional water molecules outside the Sn coordination sphere and im-
plicit water (ε = 80.4) were also included in the model (Fig. F.5). DFT-optimized
structures of hydrated closed and defect Sn sites have average Sn-O distances of 2.04
Å, and the hydrolyzed-open Sn site has an average Sn-O distance of 2.02 Å. All values
are similar to the average Sn-O bond distances for hydrated Sn-CHA measured by
XAS (2.01 ± 0.02 Å, Section F.6.7). Calculated 119Sn NMR CSA parameters for hy-
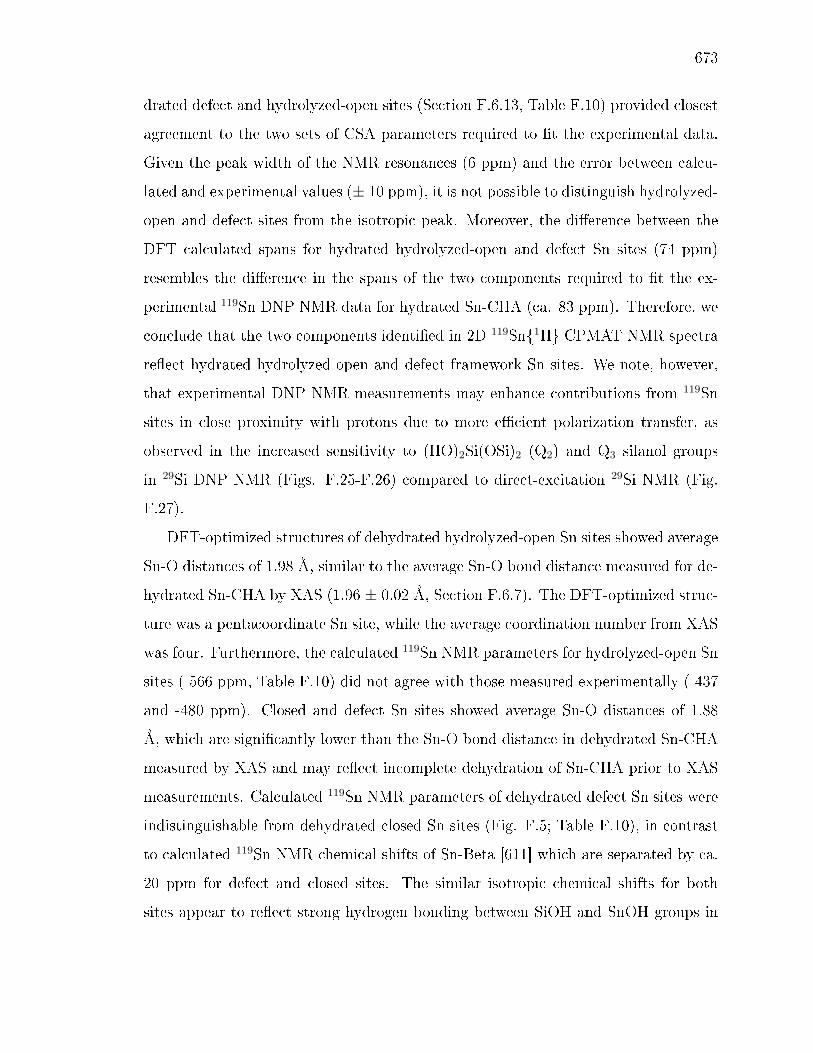
673
drated defect and hydrolyzed-open sites (Section F.6.13, Table F.10) provided closest
agreement to the two sets of CSA parameters required to t the experimental data.
Given the peak width of the NMR resonances (6 ppm) and the error between calcu-
lated and experimental values (± 10 ppm), it is not possible to distinguish hydrolyzed-
open and defect sites from the isotropic peak. Moreover, the dierence between the
DFT calculated spans for hydrated hydrolyzed-open and defect Sn sites (74 ppm)
resembles the dierence in the spans of the two components required to t the ex-
perimental 119Sn DNP NMR data for hydrated Sn-CHA (ca. 83 ppm). Therefore, we
conclude that the two components identied in 2D 119Sn1H CPMAT NMR spectra
reect hydrated hydrolyzed-open and defect framework Sn sites. We note, however,
that experimental DNP NMR measurements may enhance contributions from 119Sn
sites in close proximity with protons due to more ecient polarization transfer, as
observed in the increased sensitivity to (HO)2Si(OSi)2 (Q2) and Q3 silanol groups
in 29Si DNP NMR (Figs. F.25-F.26) compared to direct-excitation 29Si NMR (Fig.
F.27).
DFT-optimized structures of dehydrated hydrolyzed-open Sn sites showed average
Sn-O distances of 1.98 Å, similar to the average Sn-O bond distance measured for de-
hydrated Sn-CHA by XAS (1.96 ± 0.02 Å, Section F.6.7). The DFT-optimized struc-
ture was a pentacoordinate Sn site, while the average coordination number from XAS
was four. Furthermore, the calculated 119Sn NMR parameters for hydrolyzed-open Sn
sites (-566 ppm, Table F.10) did not agree with those measured experimentally (-437
and -480 ppm). Closed and defect Sn sites showed average Sn-O distances of 1.88
Å, which are signicantly lower than the Sn-O bond distance in dehydrated Sn-CHA
measured by XAS and may reect incomplete dehydration of Sn-CHA prior to XAS
measurements. Calculated 119Sn NMR parameters of dehydrated defect Sn sites were
indistinguishable from dehydrated closed Sn sites (Fig. F.5; Table F.10), in contrast
to calculated 119Sn NMR chemical shifts of Sn-Beta [611] which are separated by ca.
20 ppm for defect and closed sites. The similar isotropic chemical shifts for both
sites appear to reect strong hydrogen bonding between SiOH and SnOH groups in
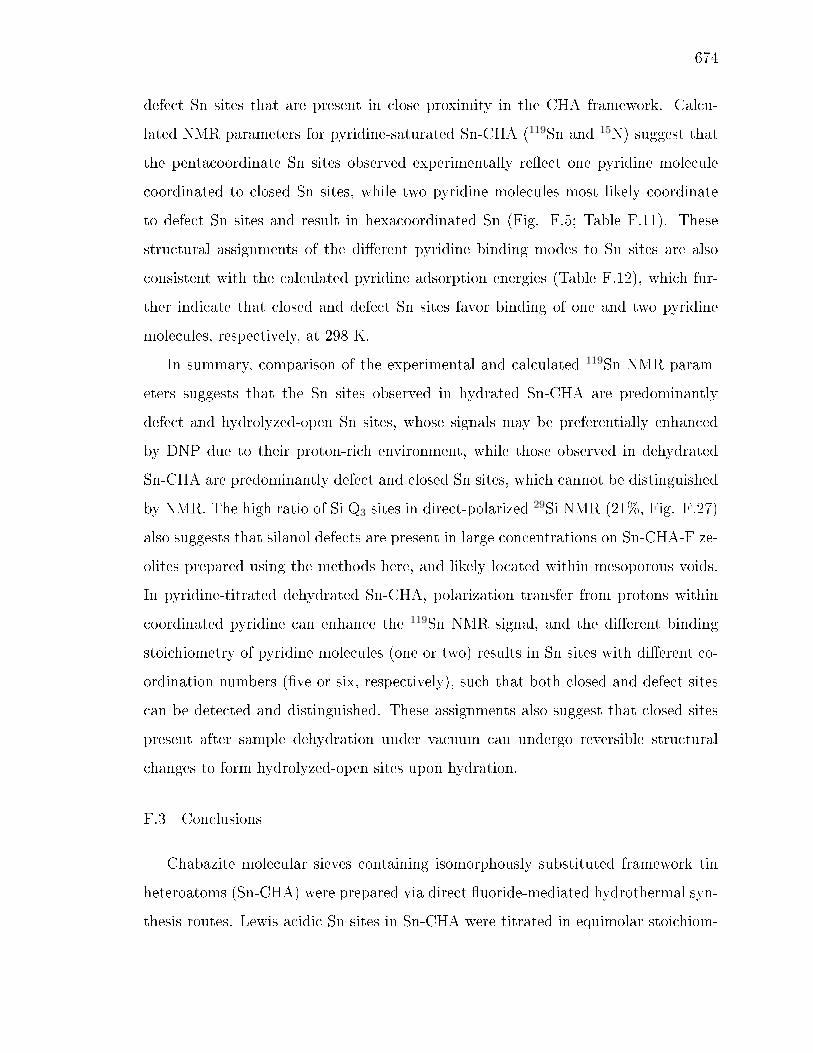
674
defect Sn sites that are present in close proximity in the CHA framework. Calcu-
lated NMR parameters for pyridine-saturated Sn-CHA (119Sn and 15N) suggest that
the pentacoordinate Sn sites observed experimentally reect one pyridine molecule
coordinated to closed Sn sites, while two pyridine molecules most likely coordinate
to defect Sn sites and result in hexacoordinated Sn (Fig. F.5; Table F.11). These
structural assignments of the dierent pyridine binding modes to Sn sites are also
consistent with the calculated pyridine adsorption energies (Table F.12), which fur-
ther indicate that closed and defect Sn sites favor binding of one and two pyridine
molecules, respectively, at 298 K.
In summary, comparison of the experimental and calculated 119Sn NMR param-
eters suggests that the Sn sites observed in hydrated Sn-CHA are predominantly
defect and hydrolyzed-open Sn sites, whose signals may be preferentially enhanced
by DNP due to their proton-rich environment, while those observed in dehydrated
Sn-CHA are predominantly defect and closed Sn sites, which cannot be distinguished
by NMR. The high ratio of Si Q3 sites in direct-polarized 29Si NMR (21%, Fig. F.27)
also suggests that silanol defects are present in large concentrations on Sn-CHA-F ze-
olites prepared using the methods here, and likely located within mesoporous voids.
In pyridine-titrated dehydrated Sn-CHA, polarization transfer from protons within
coordinated pyridine can enhance the 119Sn NMR signal, and the dierent binding
stoichiometry of pyridine molecules (one or two) results in Sn sites with dierent co-
ordination numbers (ve or six, respectively), such that both closed and defect sites
can be detected and distinguished. These assignments also suggest that closed sites
present after sample dehydration under vacuum can undergo reversible structural
changes to form hydrolyzed-open sites upon hydration.
F.3 Conclusions
Chabazite molecular sieves containing isomorphously substituted framework tin
heteroatoms (Sn-CHA) were prepared via direct uoride-mediated hydrothermal syn-
thesis routes. Lewis acidic Sn sites in Sn-CHA were titrated in equimolar stoichiom-
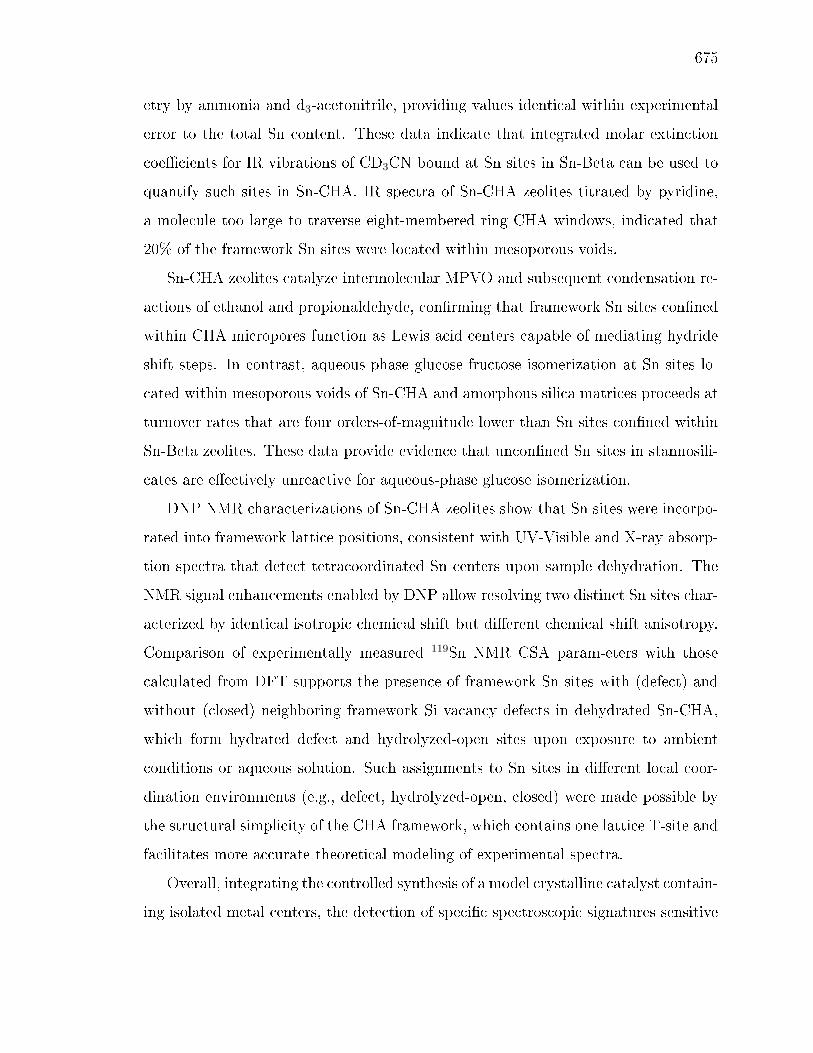
675
etry by ammonia and d3-acetonitrile, providing values identical within experimental
error to the total Sn content. These data indicate that integrated molar extinction
coecients for IR vibrations of CD3CN bound at Sn sites in Sn-Beta can be used to
quantify such sites in Sn-CHA. IR spectra of Sn-CHA zeolites titrated by pyridine,
a molecule too large to traverse eight-membered ring CHA windows, indicated that
20% of the framework Sn sites were located within mesoporous voids.
Sn-CHA zeolites catalyze intermolecular MPVO and subsequent condensation re-
actions of ethanol and propionaldehyde, conrming that framework Sn sites conned
within CHA micropores function as Lewis acid centers capable of mediating hydride
shift steps. In contrast, aqueous-phase glucose-fructose isomerization at Sn sites lo-
cated within mesoporous voids of Sn-CHA and amorphous silica matrices proceeds at
turnover rates that are four orders-of-magnitude lower than Sn sites conned within
Sn-Beta zeolites. These data provide evidence that unconned Sn sites in stannosili-
cates are eectively unreactive for aqueous-phase glucose isomerization.
DNP NMR characterizations of Sn-CHA zeolites show that Sn sites were incorpo-
rated into framework lattice positions, consistent with UV-Visible and X-ray absorp-
tion spectra that detect tetracoordinated Sn centers upon sample dehydration. The
NMR signal enhancements enabled by DNP allow resolving two distinct Sn sites char-
acterized by identical isotropic chemical shift but dierent chemical shift anisotropy.
Comparison of experimentally measured 119Sn NMR CSA param-eters with those
calculated from DFT supports the presence of framework Sn sites with (defect) and
without (closed) neighboring framework Si vacancy defects in dehydrated Sn-CHA,
which form hydrated defect and hydrolyzed-open sites upon exposure to ambient
conditions or aqueous solution. Such assignments to Sn sites in dierent local coor-
dination environments (e.g., defect, hydrolyzed-open, closed) were made possible by
the structural simplicity of the CHA framework, which contains one lattice T-site and
facilitates more accurate theoretical modeling of experimental spectra.
Overall, integrating the controlled synthesis of a model crystalline catalyst contain-
ing isolated metal centers, the detection of specic spectroscopic signatures sensitive
676
to their primary coordination and secondary conning environments, and the compu-
tation of plausible active site structures, was essential to resolve the local structure
of metal binding sites and to demonstrate the role of secondary conning voids in
catalysis.
F.4 Acknowledgements
Purdue researchers acknowledge the nancial support provided by the Purdue
Process Safety and Assurance Center (P2SAC) and a 3M Non-Tenured Faculty Grant.
At Purdue, we thank Juan Carlos Vega-Vila for assistance with glucose isomerization
reactions, Evan Wegener and Dr. Jerey T. Miller for XAS measurements and data
analysis, Jason Bates for measurement of H2O adsorption isotherms, and Michael
Cordon for assistance with SEM imaging. We also thank Sachem, Inc. for supplying
the organic structure directing agent used in synthesis of CHA molecular sieves. The
work of WCL and ACV is supported by Swiss National Foundation (200020-149704
and Ambizione project PZ00P2-148059, respectively). ACV also acknowledges the
Holcim Stiftung for nancial support. WCL thanks Mr. Erwin Lam for the help and
discussion about DFT calculations. We thank Dr. David Gajan and Dr. Anne Lesage
at CRMN Lyon for assisting with measurements on the 400 MHz DNP spectrometer
and for fruitful discussions. We thank Prof. Lyndon Emsley and the group members
at EPFL for fruitful discussions. We also thank ScopeM (ETH Z'urich) for use of their
electron microscopy facilities and Dr. Frank Krumeich for recording TEM images.
Additionally, I acknowledge the American Chemical Society for granting permis-
sion to reproduce this chapter of my thesis. Adapted with permissions from Chemistry
of Materials, 2017, 29, 8824-8837. Copyright (2017) American Chemical Society. The
full article can be accessed here: dx.doi.org/10.1021/acs.chemmater.7b03209.

677
F.5 Figures and Tables
Figure F.1. Depictions of (a) framework Sn structures (closed, hydrolyzed-open, and defect) that may be present in Sn zeolites, and (b) the proposedmolecular structures of Sn sites under dehydrated and hydrated conditions.
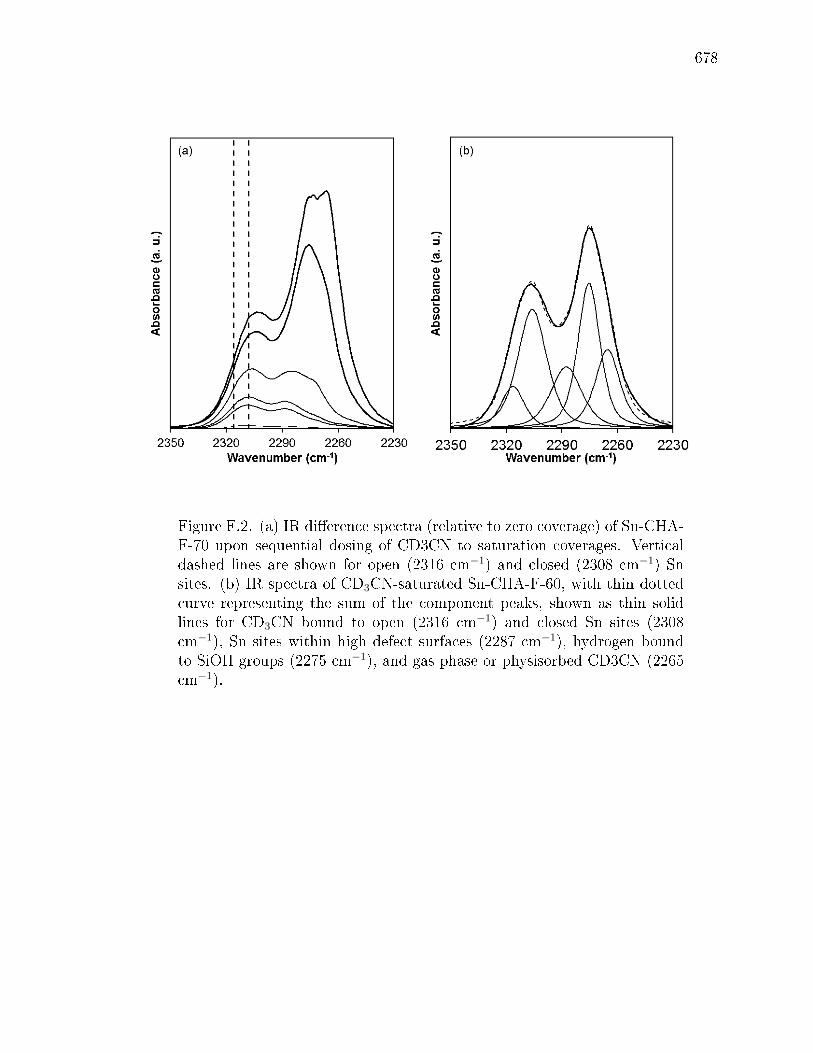
678
Figure F.2. (a) IR dierence spectra (relative to zero coverage) of Sn-CHA-F-70 upon sequential dosing of CD3CN to saturation coverages. Verticaldashed lines are shown for open (2316 cm−1) and closed (2308 cm−1) Snsites. (b) IR spectra of CD3CN-saturated Sn-CHA-F-60, with thin dottedcurve representing the sum of the component peaks, shown as thin solidlines for CD3CN bound to open (2316 cm−1) and closed Sn sites (2308cm−1), Sn sites within high defect surfaces (2287 cm−1), hydrogen boundto SiOH groups (2275 cm−1), and gas phase or physisorbed CD3CN (2265cm−1).
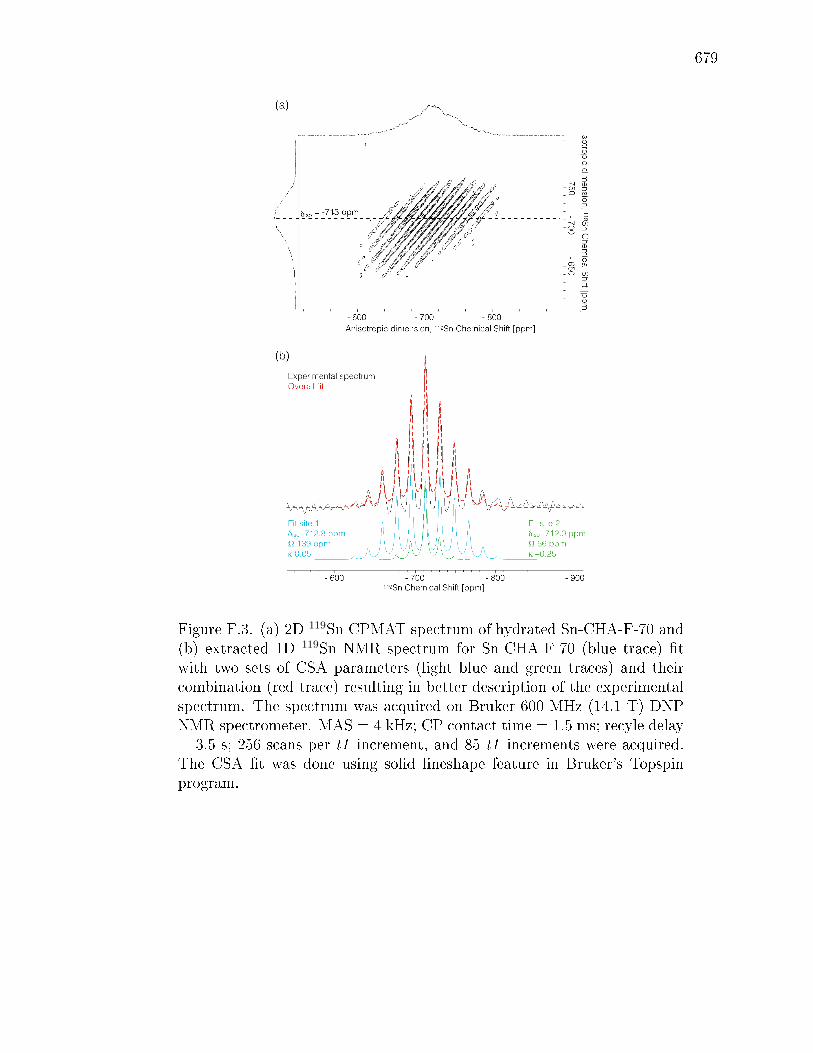
679
Figure F.3. (a) 2D 119Sn CPMAT spectrum of hydrated Sn-CHA-F-70 and(b) extracted 1D 119Sn NMR spectrum for Sn-CHA-F-70 (blue trace) twith two sets of CSA parameters (light blue and green traces) and theircombination (red trace) resulting in better description of the experimentalspectrum. The spectrum was acquired on Bruker 600 MHz (14.1 T) DNPNMR spectrometer. MAS = 4 kHz; CP contact time = 1.5 ms; recyle delay= 3.5 s; 256 scans per t1 increment, and 85 t1 increments were acquired.The CSA t was done using solid lineshape feature in Bruker's Topspinprogram.
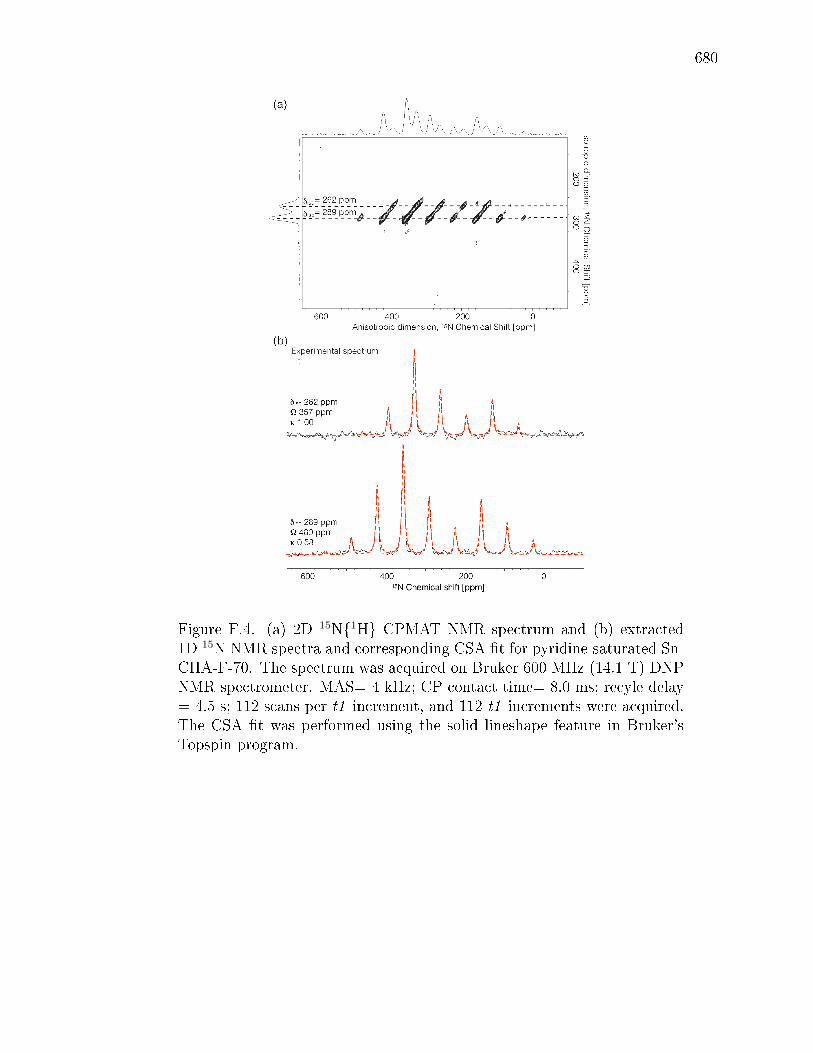
680
Figure F.4. (a) 2D 15N1H CPMAT NMR spectrum and (b) extracted1D 15N NMR spectra and corresponding CSA t for pyridine-saturated Sn-CHA-F-70. The spectrum was acquired on Bruker 600 MHz (14.1 T) DNPNMR spectrometer. MAS= 4 kHz; CP contact time= 8.0 ms; recyle delay= 4.5 s; 112 scans per t1 increment, and 112 t1 increments were acquired.The CSA t was performed using the solid lineshape feature in Bruker'sTopspin program.

681
Figure F.5. DFT optimized structures for (a) hydrated closed Sn sites,defect-open Sn sites, and hydrolyzed-open Sn sites, for dehydrated closedSn sites, defect Sn sites, and hydrolyzed-open Sn sites, and (b) for pyridinesaturated closed Sn, and defect Sn sites. Calculated isotropic chemicalshifts (δiso), span (Ω), and skew (κ) are shown for each site. Details ofDFT calculations are in Section F.6.13.

682
Table F.1.Site and structural characterization data for the samples in this study.
Sample Si/Sn
Ratio
(AAS)a
Si/Sn
Ratio
(EDS)b
Vads, micro
(cm3
g-1)
DRUV
Band
Center
(nm)e
DRUV
Edge
Energy
(eV)e
Sn-CHA-F-60 59 65 0.16c 219 4.33
Sn-CHA-F-70 70 65 0.15c 223 4.12
Sn-Beta-F-116 116 122 0.23d 222 4.23
Sn-xerogel 110 130 0.02c 245 4.37
Si-CHA-F n.m.* n.m.* 0.23c n.m.* n.m.*
aBulk composition determined by atomic absorption spectroscopy (AAS).bComposition determined by energy dispersive X-ray spectroscopy (EDS).cMicropore volume determined from Ar adsorption isotherms (87 K).dMicropore volume determined from N2 adsorption isotherms (77 K).eDiuse reectance UV-Vis spectra (band center at maximum F(R) intensity)
and Tauc plots for samples after dehydration at 523 K(Section F.6.5).).
*n. m., not measured.

683
Table F.2.Lewis acid site and silanol group concentrations determined using pyridineand acetonitrile IR and ammonia TPD for the samples in this study..
Sample Pyridinea CD3CNb NHc3
Total Total Open Closed SiOH Total
Sn-CHA-F-60 0.21 1.18 0.42 0.76 5.26*10−4 1.08
Sn-CHA-F-70 0.20 1.14 0.36 0.78 8.46*10−4 1.20
Sn-Beta-F-116 0.71 1.07 0.45 0.76 5.71*10−4 0.77
aErrors are ± 20%.bErrors are ± 20%.cErrors are ± 5%.
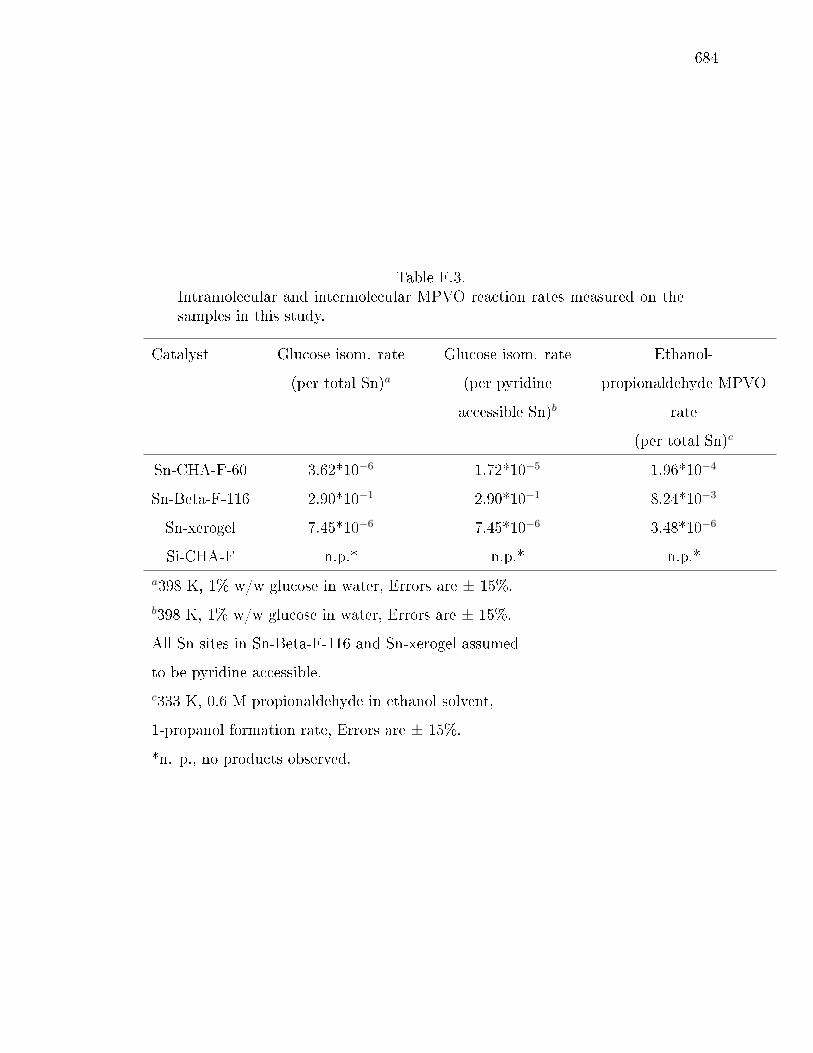
684
Table F.3.Intramolecular and intermolecular MPVO reaction rates measured on thesamples in this study.
Catalyst Glucose isom. rate
(per total Sn)aGlucose isom. rate
(per pyridine
accessible Sn)b
Ethanol-
propionaldehyde MPVO
rate
(per total Sn)c
Sn-CHA-F-60 3.62*10−6 1.72*10−5 1.96*10−4
Sn-Beta-F-116 2.90*10−1 2.90*10−1 8.24*10−3
Sn-xerogel 7.45*10−6 7.45*10−6 3.48*10−6
Si-CHA-F n.p.* n.p.* n.p.*
a398 K, 1% w/w glucose in water, Errors are ± 15%.b398 K, 1% w/w glucose in water, Errors are ± 15%.
All Sn sites in Sn-Beta-F-116 and Sn-xerogel assumed
to be pyridine accessible.c333 K, 0.6 M propionaldehyde in ethanol solvent,
1-propanol formation rate, Errors are ± 15%.
*n. p., no products observed.
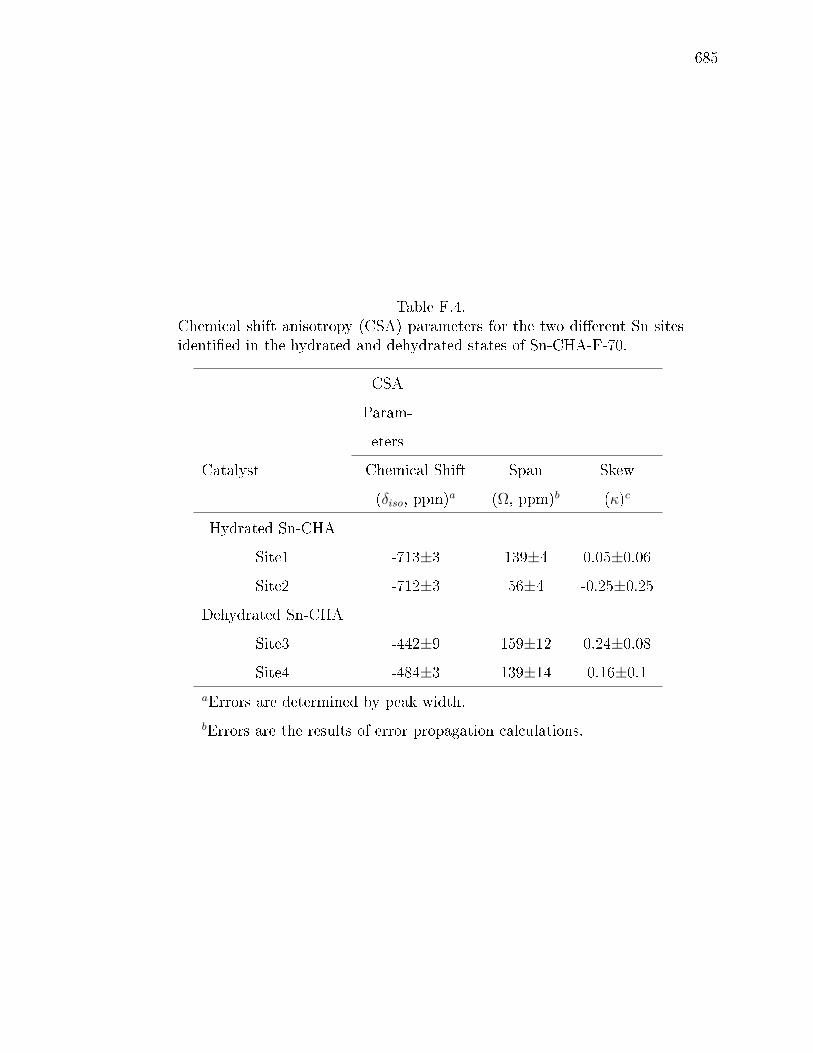
685
Table F.4.Chemical shift anisotropy (CSA) parameters for the two dierent Sn sitesidentied in the hydrated and dehydrated states of Sn-CHA-F-70.
CSA
Param-
eters
Catalyst Chemical Shift
(δiso, ppm)aSpan
(Ω, ppm)bSkew
(κ)c
Hydrated Sn-CHA
Site1 -713±3 139±4 0.05±0.06
Site2 -712±3 56±4 -0.25±0.25
Dehydrated Sn-CHA
Site3 -442±9 159±12 0.24±0.08
Site4 -484±3 139±14 0.16±0.1aErrors are determined by peak width.bErrors are the results of error propagation calculations.
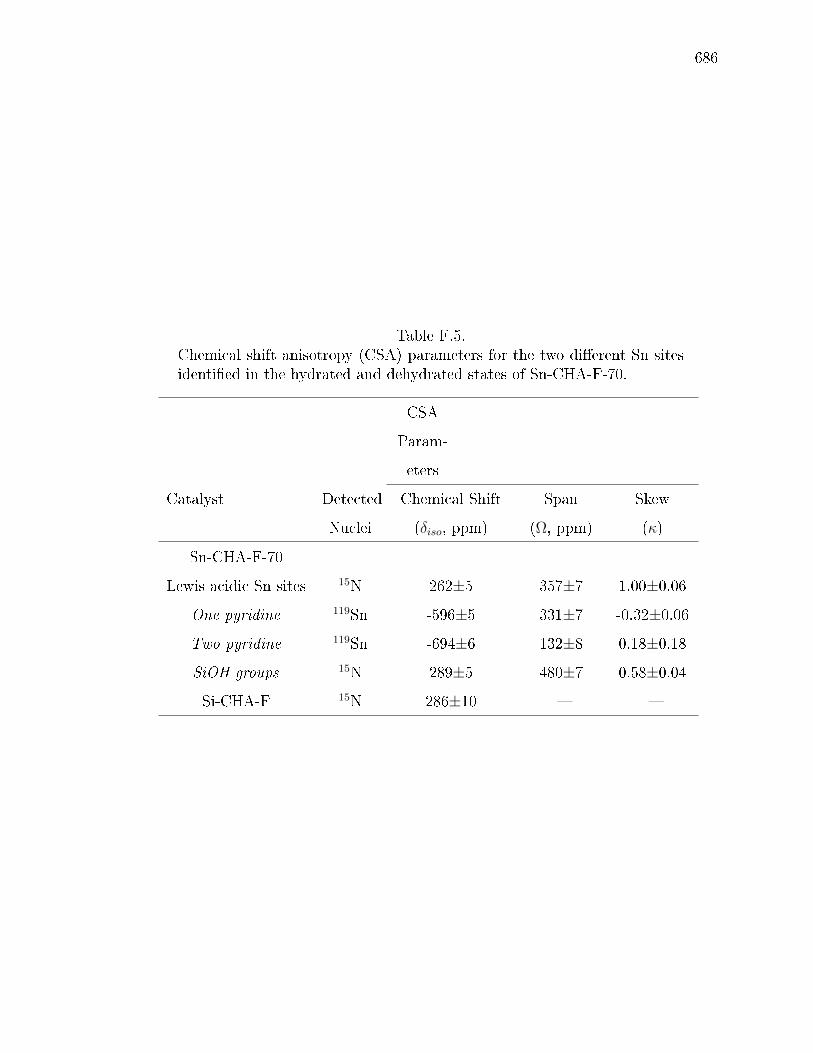
686
Table F.5.Chemical shift anisotropy (CSA) parameters for the two dierent Sn sitesidentied in the hydrated and dehydrated states of Sn-CHA-F-70.
CSA
Param-
eters
Catalyst Detected
Nuclei
Chemical Shift
(δiso, ppm)
Span
(Ω, ppm)
Skew
(κ)
Sn-CHA-F-70
Lewis acidic Sn sites 15N 262±5 357±7 1.00±0.06
One pyridine 119Sn -596±5 331±7 -0.32±0.06
Two pyridine 119Sn -694±6 132±8 0.18±0.18
SiOH groups 15N 289±5 480±7 0.58±0.04
Si-CHA-F 15N 286±10

687
F.6 Supporting Information
F.6.1 Statement of author contributions
JWH is a graduate student who wrote the manuscript, analyzed experimental
data, synthesized Sn-xerogel and Sn-Beta, and performed characterization and cat-
alytic reactivity experiments of all samples. JRD is a graduate student who synthe-
sized Si-CHA-F and Sn-CHA and assisted with characterization of Sn-CHA. AMH is
an undergraduate student who measured DRUV spectra and intermolecular MPVO
reactivity. WCL is a graduate student who performed all NMR measurements and
DFT calculations, and assisted with writing sections of the manuscript. TCO is a
research fellow who assisted with NMR measurements and DFT calculations. ACV
is a research fellow who guided and assisted the DFT calculations. CC and RG
are senior investigators who guided research eorts, assisted with data analysis and
interpretation, and manuscript writing.
F.6.2 Experimental and theoretical methods
Catalyst Synthesis
Sn-CHA molecular sieves were synthesized by adapting the procedure reported
for the synthesis of Ti-CHA by Eilertsen et al. [620]. In a typical synthesis, 40 g of
ethanol (200 proof, Koptec) were added to a peruoroalkoxy alkane (PFA, Savillex
Corp.) container, followed by addition of 25 g of tetraethylorthosilicate (TEOS, 98
wt%, Sigma Aldrich) and then stirring for 300 s under ambient conditions. Next, a
solution containing 0.601 g of Sn(IV)Cl4(H2O)5 (98 wt%, Sigma Aldrich) dissolved in
10 g of ethanol was added dropwise to the mixture comprised of TEOS and ethanol,
and then stirred for 300 s under ambient conditions. After this period of homogeniza-
tion, 0.577 g of hydrogen peroxide (H2O2, 30 wt%, Alfa Aesar) were added dropwise
and the solution was stirred for 900 s under ambient conditions. Next, 42.329 g of an
aqueous N,N,N-trimethyl-1-adamantylammonium hydroxide solution (TMAdaOH, 25
wt%, Sachem), the structure directing agent for CHA, were added dropwise to the
688
Sn-containing solution under constant stirring. The solution gelatinized after ap-
proximately 15-20 g of TMAdaOH were added, and was hydrated with 49.920 g of
deionized water (18.2 MΩ) and manually stirred with a Teon spatula until a uniform
solution was obtained. The remaining TMAdaOH was added dropwise and no further
gelatinization occurred. The resulting solution was covered and stirred at ambient
temperature for 24 h. In each of the synthesis procedures reported in this section,
reagents were used without further purication.
After this period of time, the solution was uncovered and ethanol (61.65 g, includ-
ing that generated by hydrolysis of TEOS) and excess water (77.78 g) were allowed
to evaporate to reach the target weight and desired H2O/SiO2 ratio of 3. This re-
sulted in a dry powder that was rehydrated with approximately 80 g of water (18.2
MΩ), stirred for 24 hours to obtain a homogeneous solution, and dehydrated again
to reach the desired H2O/SiO2 ratio of 3. Attempts to crystallize Sn-CHA without
this intermediate rehydration step resulted in amorphous products, even after ex-
tended periods of time in the synthesis oven (up to 10 days at 423 K). Next, 2.69 g of
hydrouoric acid (HF, 48 wt%, Alfa Aesar) were added dropwise to the synthesis pow-
der and stirred manually with a Teon spatula for 300 s and residual HF allowed to
evaporate for an additional 900 s. Caution: when working with hydrouoric acid use
appropriate personal protective equipment, ventilation, and other safety measures.
The nal molar composition of the synthesis powder was 1 SiO2/ 0.014 SnO2/ 0.43
TMAdaOH/ 0.38 HF/ 3 H2O. The powder was transferred to four Teon-lined stain-
less steel autoclaves (45 cm3, Parr Instruments) and heated at 423 K in an isothermal
oven (Yamato DKN-402C) with rotation (ca. 60 rpm) for 48 hours.
Pure silica chabazite was synthesized following the procedure reported by Dáz-
Cabañas et al. [637]. In a typical synthesis, 13 g of TEOS were added to a PFA
jar containing 25.849 g of an aqueous TMAdaOH solution and stirred under ambient
conditions for 300 s. The vessel was left uncovered and ethanol, formed from the
hydrolysis of TEOS, and excess water were evaporated to reach a target H2O/SiO2
ratio of 3. This resulted in a dry powder, at which point an additional 10 g of water
689
were added to ensure complete hydrolysis of TEOS and to allow additional time for
residual ethanol to completely evaporate. This rehydration procedure was performed
twice. Once the synthesis solution had reached the desired H2O/SiO2 ratio of 3,
1.28 g of HF (48 wt%, Sigma Aldrich) were added dropwise to the synthesis and
homogenized for 300 s using a Teon spatula. Upon addition of HF to the powdered
synthesis mixture, the powder immediately became a thick paste that liqueed slightly
under stirring. The solution was left uncovered under ambient conditions for 900 s to
allow for any residual HF to evaporate before transferring the solution to two Teon-
lined stainless steel autoclaves (45 cm3, Parr Instruments) and heating in a forced
convection oven (Yamato DKN-402C) at 423 K under rotation at 40 RPM for 48 h.
Sn-Beta was prepared in uoride media by modication of a previously reported
method [529] using Si-Beta zeolites as seed material. Sn-Beta zeolites were synthesized
using the same procedure as Si-Beta, except that dropwise addition of a solution of
0.30 g of tin (IV) chloride pentahydrate (SnCl4-5H2O, Sigma-Aldrich, 98 wt%) in 1.95
g of deionized water was performed prior to evaporation of ethanol and water, such
that the synthesis gel had a molar SiO2/SnO2 ratio of 130. After the HF addition
step and addition of the Sn-Beta synthesis gel to the Teon liner, 1.73 g of water and
0.254 g of as-made Si-Beta seeds (ca. 4.2 wt% of total SiO2) were added directly to
the liner and the mixture was stirred manually using a Teon spatula prior to heating
in an isothermal oven held at 413 K for 21 days with rotation at 60 RPM.
The solids obtained from all zeolite syntheses were removed from their Teon
liners, washed thoroughly with water and acetone (Sigma Aldrich, >99.5 wt%, 5
washes each, ca. 25 cm3 (g zeolite)−1 each wash)), isolated by centrifugation, and
dried at 373 K for 16 h. The dry zeolite powders were then treated in dry air (Ultra
Zero Grade, Indiana Oxygen, 1.67 cm3 s−1 (g zeolite)−1) to 853 K (0.0167 K s−1)
and held for 10 h in a mue furnace (Nabertherm LE 6/11 equipped with a P300
controller).
Amorphous Sn-xerogel was synthesized using the procedure reported by van Grieken
et al. [572]. 5.74 g of a 0.1 M HCl solution (Macron, 37%) were added to a mixture of

690
52.0 g of TEOS and 67.6 g of deionized water and stirred for 2 h at ambient temper-
ature. Then, 0.77 g of SnCl4-5H2O were added and the mixture stirred for 1 h. Next,
a 1 M NH4OH solution prepared from concentrated NH4OH (Sigma Aldrich, 28%-30
wt% NH3 basis) was added dropwise until the gel point was reached (ca. 12 cm3).
The resulting clear gel was dried for 12 h at 433 K. The dried solids were washed with
deionized water (5-10 washes, ca. 60 cm3 per wash) until a constant pH was reached,
dried for 12 h at 433 K, and then treated in air (Ultra Zero Grade, Indiana Oxygen,
1.67 cm3 s−1 (g zeolite)−1) to 853 K (0.0167 K s−1) for 10 h in a mue furnace.
Zeolite Structural Characterization
The bulk Sn content of each sample in this study was determined using atomic
absorption spectroscopy (AAS) performed with a Perkin Elmer AAnalyst 300 Atomic
Absorption Spectrometer. A 1000 ppm Sn standard (Alfa Aesar, TraceCERT, ±4
ppm) was diluted to create calibration standards, and the instrument was calibrated
each day before collecting measurements. Sn absorbance values were measured at
284.0 nm in an acetylene/nitrous oxide ame. Catalyst samples (ca. 0.02 g) were
dissolved in 2 g of HF (48 wt%, Alfa Aesar) overnight and then further diluted with
30 g of deionized water, prior to elemental analysis. The Sn weight fractions were
used together with the unit cell formula for Beta zeolite to estimate the Si/Sn ratio
in each sample.
Powder X-ray diraction (XRD) patterns were collected on a Rigaku Smartlab
X-ray diractometer with an ASC-6 automated sample changer and a Cu Kα x-ray
source (1.76 kW). Samples (ca. 0.01 g) were packed within zero background, low dead
volume sample holders (Rigaku) and diraction patterns were measured from 4-40
at a scan rate of 0.0417 s−1 with a step size of 0.02.
Scanning electron microscopy (SEM) and electron dispersive X-ray spectroscopy
(EDS) were performed on a FEI Quanta 3D FEG Dual-beam SEM with an Everhart-
Thornlev detector for high vacuum imaging. SEM micrographs were collected in the
focused beam operating mode with a voltage of 5 kV and spot size of 4 µm for samples
691
after high temperature oxidative treatment, but without additional preparation (e.g.,
sputtering with a metal coating to avoid charging of the metal oxide surface). EDS
was performed using an Oxford INCA Xstrem-2 silicon drift detector equipped with an
Xmax80 window for supplemental elemental analysis. EDS analyses were performed
at 20 kV with a 6 µm spot size at a magnication of 3000-6000×.
Ar (87 K) and N2 (77 K), and H2O (293 K) adsorption isotherms were measured
using a Micromeritics ASAP2020 Surface Area and Porosity Analyzer. Samples (ca.
0.03 g) were pelleted and sieved to retain 180-250 µm diameter particles prior to
analysis. Samples were degassed by heating to 393 K (0.0167 K s−1) under vacuum
(<0.005 Torr) for 2 h, then heating to 623 K (0.0167 K s−1) under vacuum for 8 h
prior to measurement of adsorption isotherms. Micropore volumes were determined
from a semi-log derivative analysis of Ar and N2 isotherms (δ(Vads/g)/δ(log(P/P0) vs.
log (P/P0)) to identify the completion of micropore lling. Reported pore volumes
were converted from volumes adsorbed at STP to the number of moles adsorbed and
then converted to liquid volumes using the liquid molar densities at their respective
adsorption temperatures (Ar: 87 K, 0.0350 mol cm−1, N2: 77 K, 0.0288 mol cm−3,
H2O: 293 K, 0.0554 mol cm−3).
Sn Active Site Characterization
Diuse Reectance UV-Visible Spectroscopy Diuse reectance UV-Visible
(DRUV) spectra were collected on a Varian Cary 5000 UV-VIS-NIR using a Harrick
Praying Mantis in-situ diuse reectance cell. The following spectra were collected on
each sample: (i) after exposure to ambient conditions and held in dry He ow (4.17
cm3 s−1 (g zeolite)−1) (ambient); (ii) after subsequent treatment to 523 K (ca. 0.5
K s−1) for 1.8 ks in dry He ow (4.17 cm3 s−1 (g zeolite)−1) (dehydrated); and (iii)
after subsequent exposure to a wet He stream (4.17 cm3 s−1 (g zeolite)−1, ca. 3% H2O,
bubbled through a glass saturator containing water at ambient temperature) while
cooling to 303 K and holding for 300 s (rehydrated). DRUV spectra were collected
at a resolution of 10 nm s−1, using poly(tetraouroethylene) (PTFE, 1 µm powder,
692
Sigma-Aldrich) as the 100% reectance standard, and were converted to an absorption
spectrum using the Kubelka-Munk (F(R)) function. Tauc plots of [F(R)hν]2 vs. hν
were used to calculate absorption edge energies (additional details in Section F.6.6).
Infrared Spectroscopy IR spectra were collected on a Nicolet 4700 spectrometer
equipped with a Hg-Cd-Te (MCT, cooled to 77 K by liquid N2) detector by averaging
64 scans at 2 cm−1 resolution in the 4000 to 400 cm−1 range, and were taken relative
to an empty cell background reference collected under dynamic vacuum (rotary vane
rough pump, Alcatel 2008A, <0.1 Torr) at either 423 K (pyridine) or 303 K (CD3CN).
Self-supporting wafers (0.01-0.03 g cm−2) were sealed within a custom-built quartz IR
cell with CaF2 windows, equipped with resistive heating cartridges (Chromalox) held
in a conductive brass block that is encased in an alumina silicate insulating chamber
(Purdue Research Machining Services), as described elsewhere. [465] Wafer tempera-
tures were measured within 2 mm of each side of the wafer by K-type thermocouples
(Omega). The quartz IR cell was connected to a custom glass vacuum manifold used
for sample pretreatment and exposure to controlled amounts of gaseous titrants.
Prior to each IR experiment, sample wafers were treated in owing dry air (6.66
cm3 s−1 (g zeolite)−1) puried by a purge gas generator (Parker Balston, <1 ppm
CO2, 200 K H2O dew point) to 823 K (0.083 K s−1) for 1 h, and then held under
dynamic vacuum (rotary vane rough pump, Alcatel 2008A, <0.1 Torr) at 823 K for 1
h. Next, the sample wafer was cooled under dynamic vacuum to 303 K for adsorption
experiments with CD3CN, or to 423 K for adsorption experiments with pyridine. Each
titrant was puried via freeze-pump-thaw (3 cycles) and introduced to the sample in
sequential doses (ca. 2.5 x 10⁻⁷ mol). Equilibration of the sample with each titrant
dose was assumed when the nal pressure in the cell remained constant for 180 s.
After samples reached equilibrium with a detectable gaseous titrant pressure (0.4-2.0
Torr) dosing was considered complete, and samples were exposed to dynamic vacuum
(60 s at 303 K for CD3CN or 900 s at 423 K for pyridine) to remove gas-phase and
weakly-bound species.
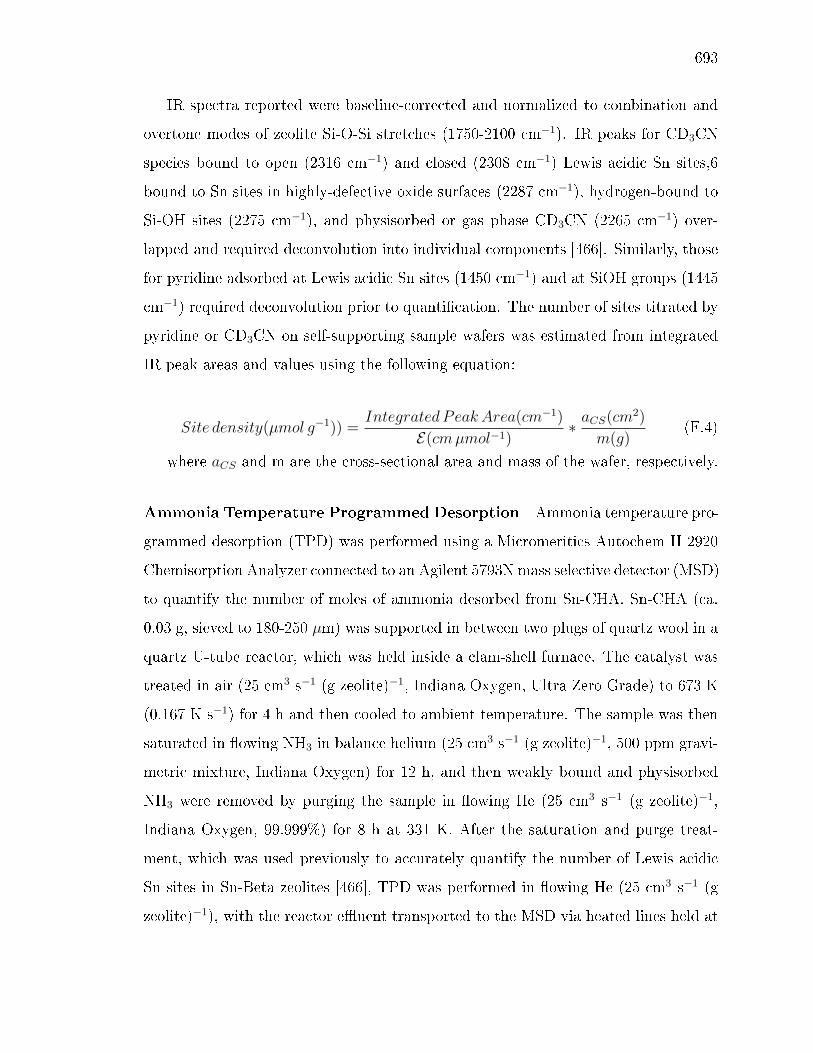
693
IR spectra reported were baseline-corrected and normalized to combination and
overtone modes of zeolite Si-O-Si stretches (1750-2100 cm−1). IR peaks for CD3CN
species bound to open (2316 cm−1) and closed (2308 cm−1) Lewis acidic Sn sites,6
bound to Sn sites in highly-defective oxide surfaces (2287 cm−1), hydrogen-bound to
Si-OH sites (2275 cm−1), and physisorbed or gas phase CD3CN (2265 cm−1) over-
lapped and required deconvolution into individual components [466]. Similarly, those
for pyridine adsorbed at Lewis acidic Sn sites (1450 cm−1) and at SiOH groups (1445
cm−1) required deconvolution prior to quantication. The number of sites titrated by
pyridine or CD3CN on self-supporting sample wafers was estimated from integrated
IR peak areas and values using the following equation:
Site density(µmol g−1)) =Integrated Peak Area(cm−1)
E(cmµmol−1)∗ aCS(cm2)
m(g)(F.4)
where aCS and m are the cross-sectional area and mass of the wafer, respectively.
Ammonia Temperature Programmed Desorption Ammonia temperature pro-
grammed desorption (TPD) was performed using a Micromeritics Autochem II 2920
Chemisorption Analyzer connected to an Agilent 5793N mass selective detector (MSD)
to quantify the number of moles of ammonia desorbed from Sn-CHA. Sn-CHA (ca.
0.03 g, sieved to 180-250 µm) was supported in between two plugs of quartz wool in a
quartz U-tube reactor, which was held inside a clam-shell furnace. The catalyst was
treated in air (25 cm3 s−1 (g zeolite)−1, Indiana Oxygen, Ultra Zero Grade) to 673 K
(0.167 K s−1) for 4 h and then cooled to ambient temperature. The sample was then
saturated in owing NH3 in balance helium (25 cm3 s−1 (g zeolite)−1, 500 ppm gravi-
metric mixture, Indiana Oxygen) for 12 h, and then weakly bound and physisorbed
NH3 were removed by purging the sample in owing He (25 cm3 s−1 (g zeolite)−1,
Indiana Oxygen, 99.999%) for 8 h at 331 K. After the saturation and purge treat-
ment, which was used previously to accurately quantify the number of Lewis acidic
Sn sites in Sn-Beta zeolites [466], TPD was performed in owing He (25 cm3 s−1 (g
zeolite)−1), with the reactor euent transported to the MSD via heated lines held at
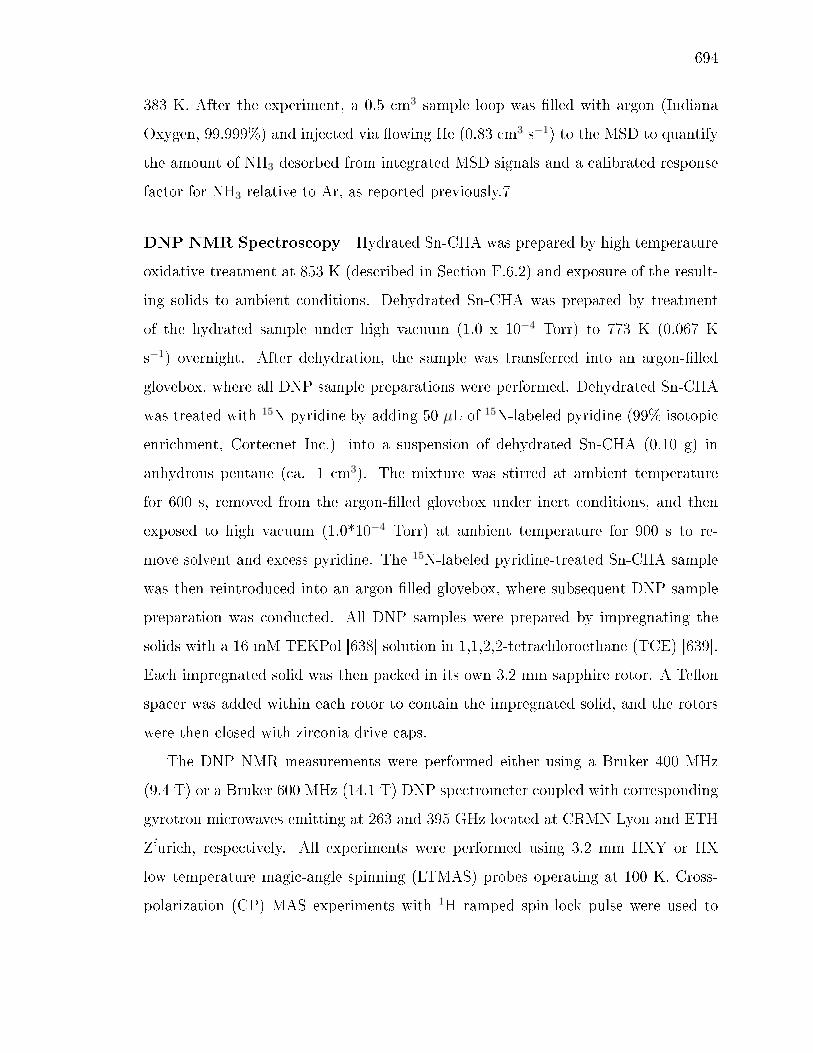
694
383 K. After the experiment, a 0.5 cm3 sample loop was lled with argon (Indiana
Oxygen, 99.999%) and injected via owing He (0.83 cm3 s−1) to the MSD to quantify
the amount of NH3 desorbed from integrated MSD signals and a calibrated response
factor for NH3 relative to Ar, as reported previously.7
DNP NMR Spectroscopy Hydrated Sn-CHA was prepared by high temperature
oxidative treatment at 853 K (described in Section F.6.2) and exposure of the result-
ing solids to ambient conditions. Dehydrated Sn-CHA was prepared by treatment
of the hydrated sample under high vacuum (1.0 x 10⁻⁴ Torr) to 773 K (0.067 K
s−1) overnight. After dehydration, the sample was transferred into an argon-lled
glovebox, where all DNP sample preparations were performed. Dehydrated Sn-CHA
was treated with 15N pyridine by adding 50 µL of 15N-labeled pyridine (99% isotopic
enrichment, Cortecnet Inc.) into a suspension of dehydrated Sn-CHA (0.10 g) in
anhydrous pentane (ca. 1 cm3). The mixture was stirred at ambient temperature
for 600 s, removed from the argon-lled glovebox under inert conditions, and then
exposed to high vacuum (1.0*10−4 Torr) at ambient temperature for 900 s to re-
move solvent and excess pyridine. The 15N-labeled pyridine-treated Sn-CHA sample
was then reintroduced into an argon-lled glovebox, where subsequent DNP sample
preparation was conducted. All DNP samples were prepared by impregnating the
solids with a 16 mM TEKPol [638] solution in 1,1,2,2-tetrachloroethane (TCE) [639].
Each impregnated solid was then packed in its own 3.2 mm sapphire rotor. A Teon
spacer was added within each rotor to contain the impregnated solid, and the rotors
were then closed with zirconia drive caps.
The DNP NMR measurements were performed either using a Bruker 400 MHz
(9.4 T) or a Bruker 600 MHz (14.1 T) DNP spectrometer coupled with corresponding
gyrotron microwaves emitting at 263 and 395 GHz located at CRMN Lyon and ETH
Z'urich, respectively. All experiments were performed using 3.2 mm HXY or HX
low temperature magic-angle spinning (LTMAS) probes operating at 100 K. Cross-
polarization (CP) MAS experiments with 1H ramped spin-lock pulse were used to
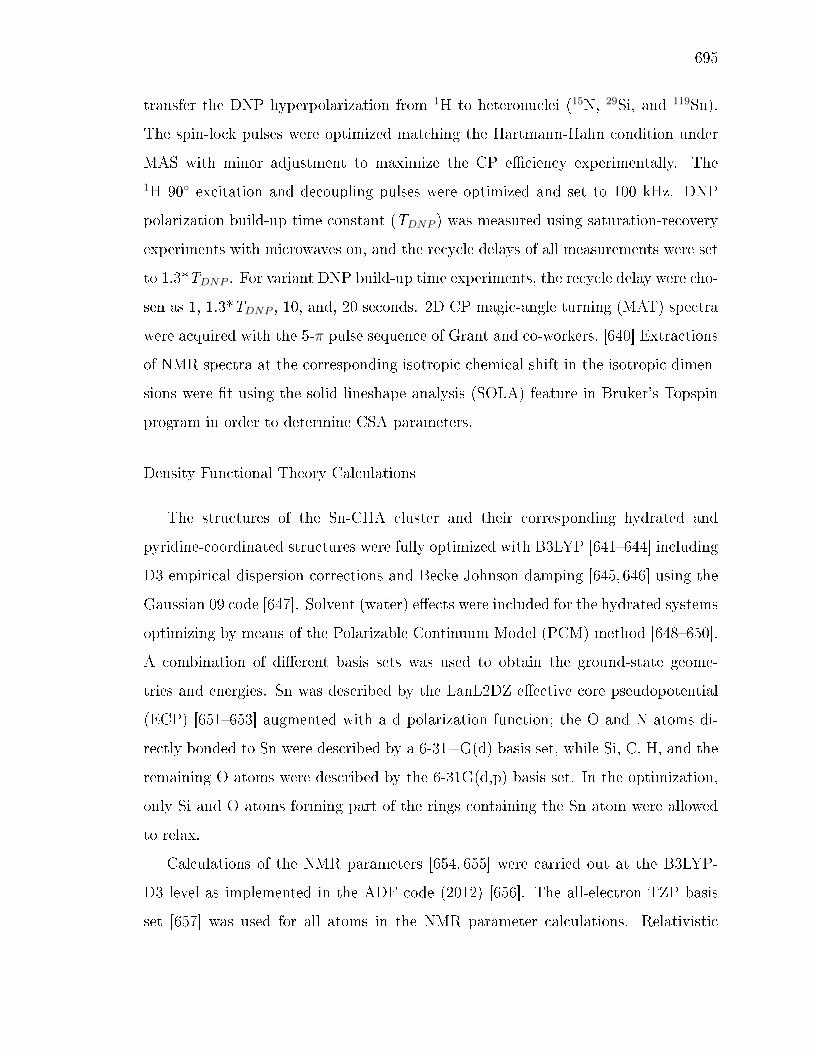
695
transfer the DNP hyperpolarization from 1H to heteronuclei (15N, 29Si, and 119Sn).
The spin-lock pulses were optimized matching the Hartmann-Hahn condition under
MAS with minor adjustment to maximize the CP eciency experimentally. The1H 90 excitation and decoupling pulses were optimized and set to 100 kHz. DNP
polarization build-up time constant (TDNP ) was measured using saturation-recovery
experiments with microwaves on, and the recycle delays of all measurements were set
to 1.3*TDNP . For variant DNP build-up time experiments, the recycle delay were cho-
sen as 1, 1.3*TDNP , 10, and, 20 seconds. 2D CP magic-angle turning (MAT) spectra
were acquired with the 5-π pulse sequence of Grant and co-workers. [640] Extractions
of NMR spectra at the corresponding isotropic chemical shift in the isotropic dimen-
sions were t using the solid lineshape analysis (SOLA) feature in Bruker's Topspin
program in order to determine CSA parameters.
Density Functional Theory Calculations
The structures of the Sn-CHA cluster and their corresponding hydrated and
pyridine-coordinated structures were fully optimized with B3LYP [641644] including
D3 empirical dispersion corrections and Becke-Johnson damping [645, 646] using the
Gaussian 09 code [647]. Solvent (water) eects were included for the hydrated systems
optimizing by means of the Polarizable Continuum Model (PCM) method [648650].
A combination of dierent basis sets was used to obtain the ground-state geome-
tries and energies. Sn was described by the LanL2DZ eective core pseudopotential
(ECP) [651653] augmented with a d polarization function; the O and N atoms di-
rectly bonded to Sn were described by a 6-31+G(d) basis set, while Si, C, H, and the
remaining O atoms were described by the 6-31G(d,p) basis set. In the optimization,
only Si and O atoms forming part of the rings containing the Sn atom were allowed
to relax.
Calculations of the NMR parameters [654, 655] were carried out at the B3LYP-
D3 level as implemented in the ADF code (2012) [656]. The all-electron TZP basis
set [657] was used for all atoms in the NMR parameter calculations. Relativistic

696
eects and spin-orbit couplings were taken into account through the ZORA method
[658, 659] for the calculations of the isotropic chemical shift (δiso) and the principal
components (δ11, δ22, and δ33) of all considered species. For the calculations of δiso, the
chemical shieldings of Sn(CH3)4 and CH3NO3 were used as references for 119Sn and15N, respectively. This methodology has been previously tested for molecular and
surface Sn species and showed excellent agreement with experiments within 10-15
ppm for 119Sn NMR [660].
Kinetic Studies of MPVO Reactions with Sn-CHA
Intramolecular MPVO with glucose Intramolecular MPVO reactions were per-
formed in batch reactors using 1% (w/w) D-glucose (Sigma Aldrich, ≥99.5%) solu-
tions prepared in Millipore water (18.2 MΩ) with the pH controlled to 2 with hy-
drochloric acid (Macron, 37% (w/w)) to suppress background reactions. Catalysts
(Sn-CHA and Sn-xerogel: ca. 0.1 g; Sn-Beta: 0.01 g, diluted 1:9 in Si-CHA-F) were
added to glass reactors (10 cm3, VWR) and sealed with crimp-tops (PTFE/silicone
septum, Agilent) before heating to 398 K atop a digital stirred hotplate (IKA RCT
basic). Reactant solutions (ca. 2 cm3) were pre-heated separately (600 s) and then
injected to the capped, preheated reactors, and stirred at 750 rpm under autogenous
pressure for either 600 s (Sn-Beta) or 6 h (Sn-CHA, Sn-xerogel) prior to quenching
in an ice bath. The obtained solutions were ltered with 0.2 µm PTFE lters and
mixed with a 1% (w/w) aqueous D-mannitol solution (Sigma-Aldrich ≥98%) used
as an internal standard. Product analysis was performed using an Agilent 1260 high
performance liquid chromatograph (HPLC) with a Hi-Plex Ca column (7.7 x 300 mm,
8 µm particle size, Agilent) an aqueous mobile phase (0.01 cm3 s−1, 353 K), and an
evaporative light scattering detector (Agilent 1260 Innity ELSD).
Intramolecular MPVO with glucose Intermolecular MPVO reactions were per-
formed in batch reactors using solutions of 0.05-0.2 M acetone (Sigma-Aldrich, ≥99.9%)
and propionaldehyde (Alfa Aesar, 97%) in ethanol (Sigma-Aldrich, ≥99.5%) as the
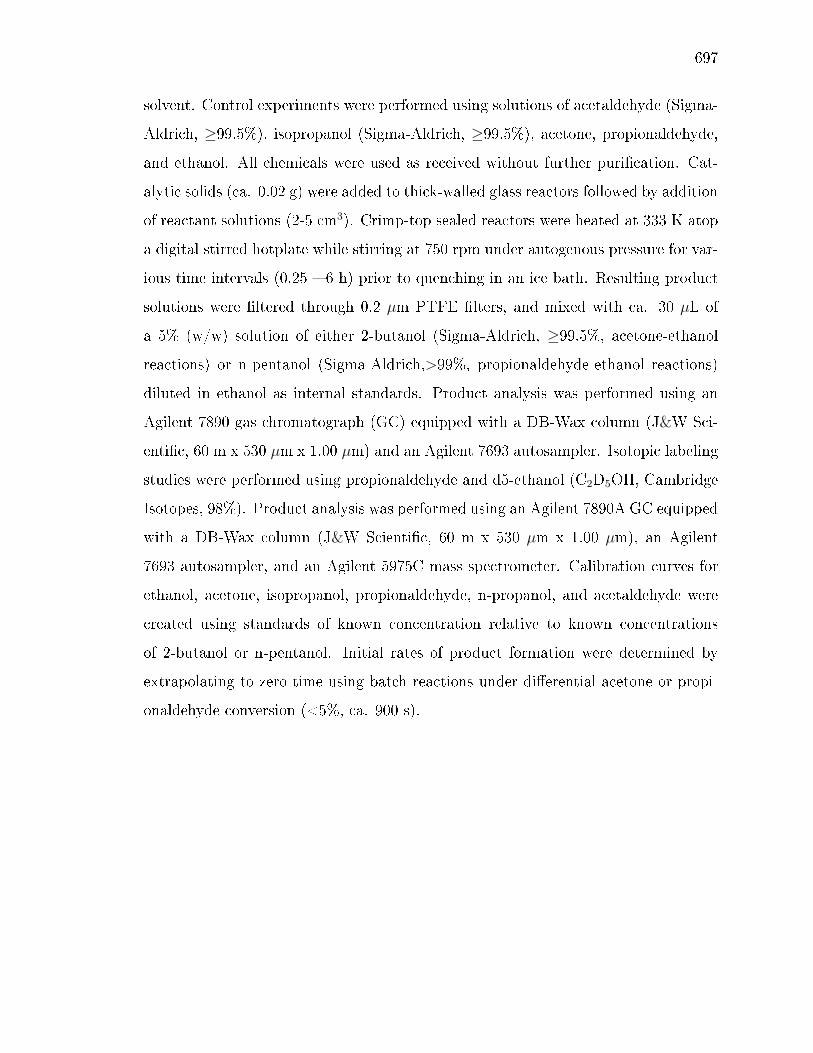
697
solvent. Control experiments were performed using solutions of acetaldehyde (Sigma-
Aldrich, ≥99.5%), isopropanol (Sigma-Aldrich, ≥99.5%), acetone, propionaldehyde,
and ethanol. All chemicals were used as received without further purication. Cat-
alytic solids (ca. 0.02 g) were added to thick-walled glass reactors followed by addition
of reactant solutions (2-5 cm3). Crimp-top sealed reactors were heated at 333 K atop
a digital stirred hotplate while stirring at 750 rpm under autogenous pressure for var-
ious time intervals (0.25 6 h) prior to quenching in an ice bath. Resulting product
solutions were ltered through 0.2 µm PTFE lters, and mixed with ca. 30 µL of
a 5% (w/w) solution of either 2-butanol (Sigma-Aldrich, ≥99.5%, acetone-ethanol
reactions) or n-pentanol (Sigma-Aldrich,>99%, propionaldehyde-ethanol reactions)
diluted in ethanol as internal standards. Product analysis was performed using an
Agilent 7890 gas chromatograph (GC) equipped with a DB-Wax column (J&W Sci-
entic, 60 m x 530 µm x 1.00 µm) and an Agilent 7693 autosampler. Isotopic labeling
studies were performed using propionaldehyde and d5-ethanol (C2D5OH, Cambridge
Isotopes, 98%). Product analysis was performed using an Agilent 7890A GC equipped
with a DB-Wax column (J&W Scientic, 60 m x 530 µm x 1.00 µm), an Agilent
7693 autosampler, and an Agilent 5975C mass spectrometer. Calibration curves for
ethanol, acetone, isopropanol, propionaldehyde, n-propanol, and acetaldehyde were
created using standards of known concentration relative to known concentrations
of 2-butanol or n-pentanol. Initial rates of product formation were determined by
extrapolating to zero time using batch reactions under dierential acetone or propi-
onaldehyde conversion (<5%, ca. 900 s).
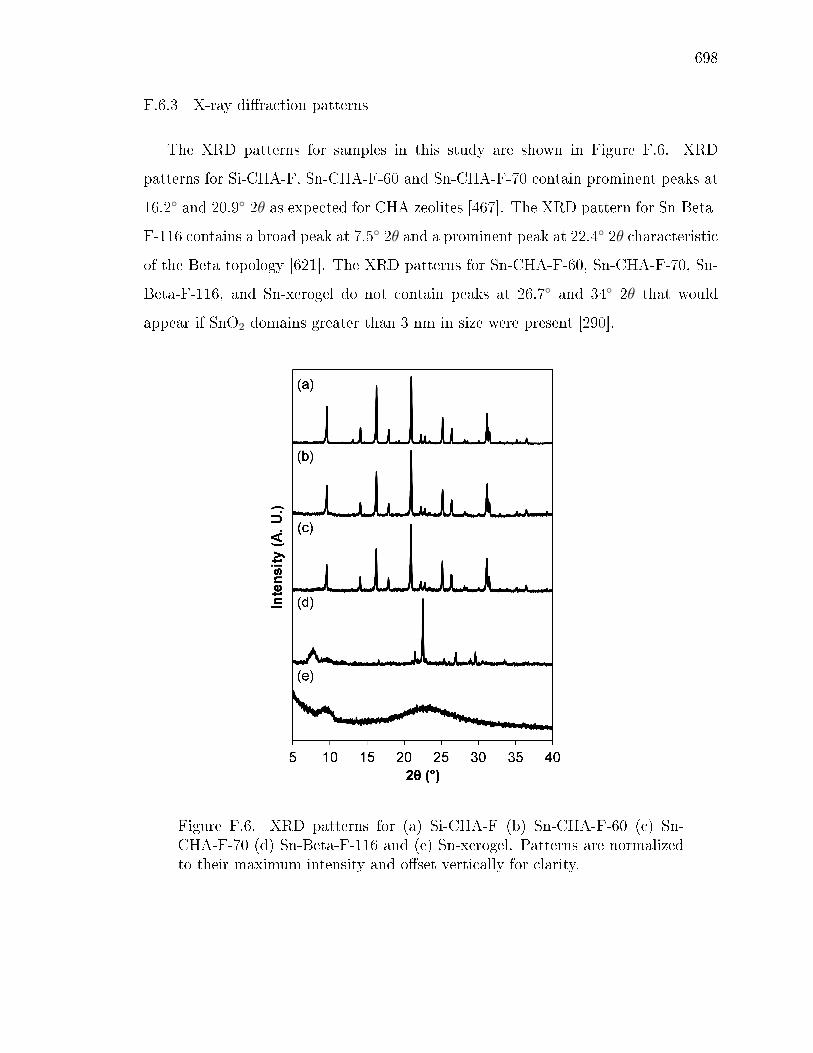
698
F.6.3 X-ray diraction patterns
The XRD patterns for samples in this study are shown in Figure F.6. XRD
patterns for Si-CHA-F, Sn-CHA-F-60 and Sn-CHA-F-70 contain prominent peaks at
16.2 and 20.9 2θ as expected for CHA zeolites [467]. The XRD pattern for Sn-Beta-
F-116 contains a broad peak at 7.5 2θ and a prominent peak at 22.4 2θ characteristic
of the Beta topology [621]. The XRD patterns for Sn-CHA-F-60, Sn-CHA-F-70, Sn-
Beta-F-116, and Sn-xerogel do not contain peaks at 26.7 and 34 2θ that would
appear if SnO2 domains greater than 3 nm in size were present [290].
Figure F.6. XRD patterns for (a) Si-CHA-F (b) Sn-CHA-F-60 (c) Sn-CHA-F-70 (d) Sn-Beta-F-116 and (e) Sn-xerogel. Patterns are normalizedto their maximum intensity and oset vertically for clarity.
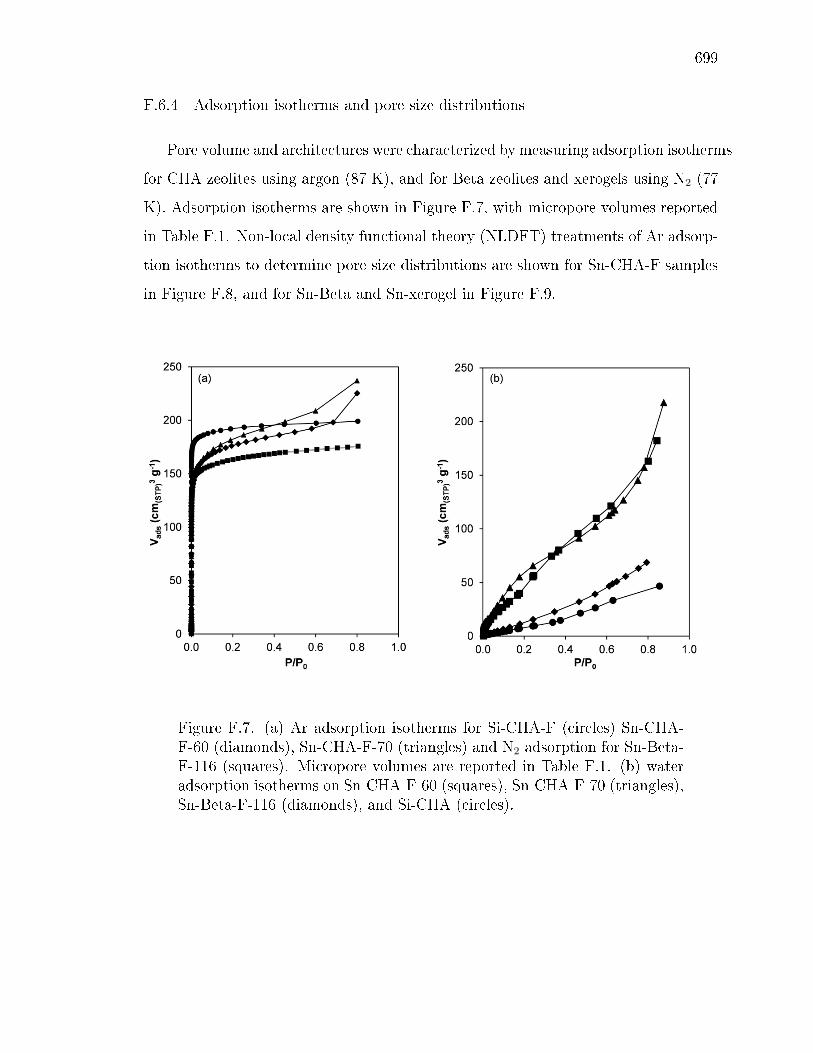
699
F.6.4 Adsorption isotherms and pore size distributions
Pore volume and architectures were characterized by measuring adsorption isotherms
for CHA zeolites using argon (87 K), and for Beta zeolites and xerogels using N2 (77
K). Adsorption isotherms are shown in Figure F.7, with micropore volumes reported
in Table F.1. Non-local density functional theory (NLDFT) treatments of Ar adsorp-
tion isotherms to determine pore size distributions are shown for Sn-CHA-F samples
in Figure F.8, and for Sn-Beta and Sn-xerogel in Figure F.9.
Figure F.7. (a) Ar adsorption isotherms for Si-CHA-F (circles) Sn-CHA-F-60 (diamonds), Sn-CHA-F-70 (triangles) and N2 adsorption for Sn-Beta-F-116 (squares). Micropore volumes are reported in Table F.1. (b) wateradsorption isotherms on Sn-CHA-F-60 (squares), Sn-CHA-F-70 (triangles),Sn-Beta-F-116 (diamonds), and Si-CHA (circles).
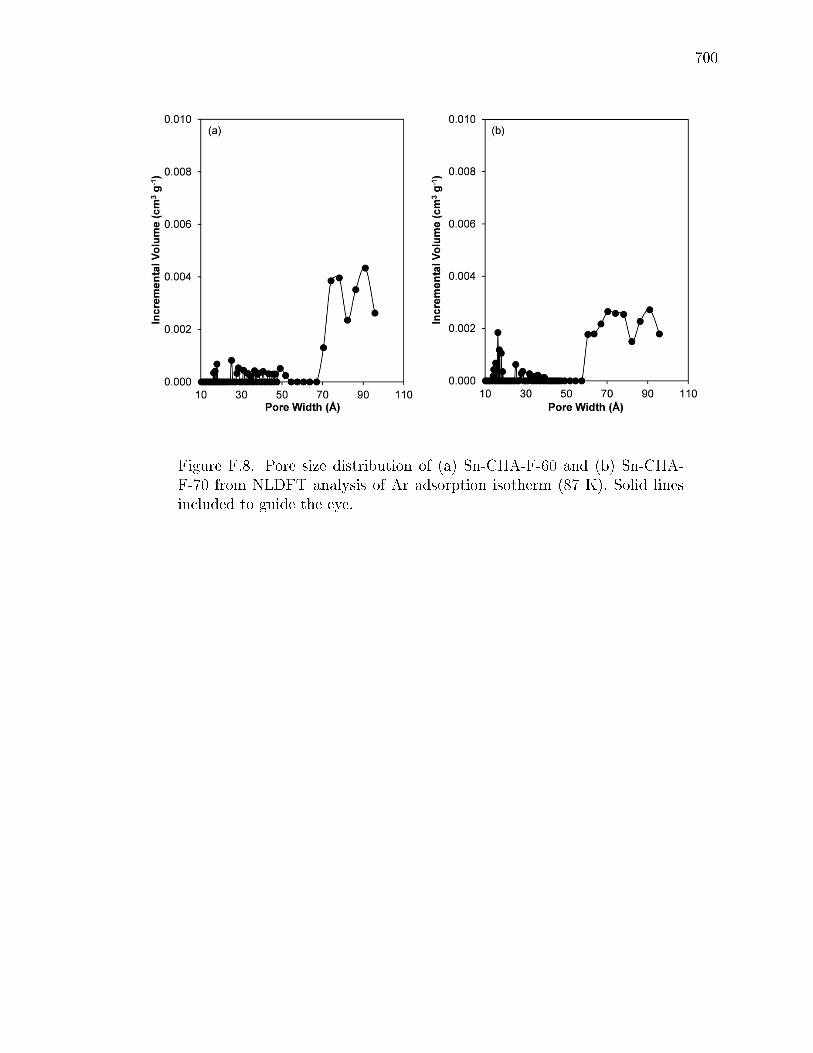
700
Figure F.8. Pore size distribution of (a) Sn-CHA-F-60 and (b) Sn-CHA-F-70 from NLDFT analysis of Ar adsorption isotherm (87 K). Solid linesincluded to guide the eye.
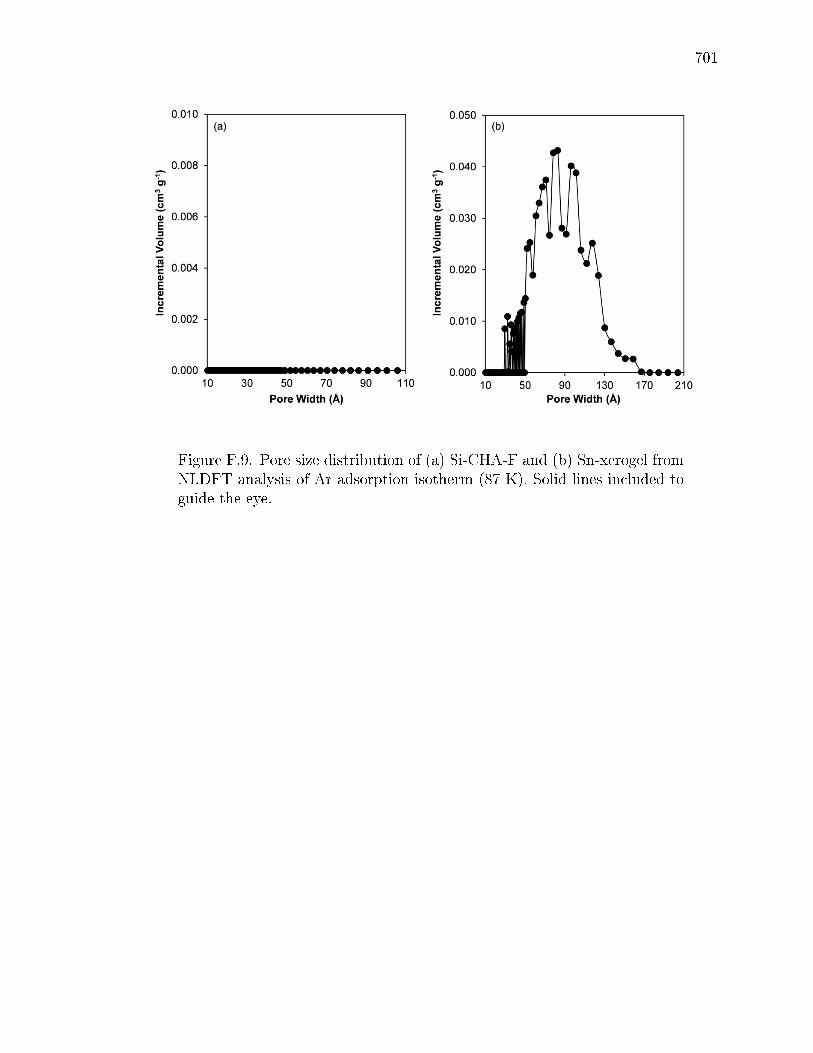
701
Figure F.9. Pore size distribution of (a) Si-CHA-F and (b) Sn-xerogel fromNLDFT analysis of Ar adsorption isotherm (87 K). Solid lines included toguide the eye.

702
F.6.5 Diuse reectance UV-visible spectra and Tauc plots
Figure F.10. DRUV spectra in Kubelka-Munk units (normalized to themaximum F(R) intensity) for (a) Sn-CHA-F-60 (b) Sn-CHA-F-70, (c) Sn-Beta-F-116, and (d) Sn-xerogel collected (i) under ambient conditions (thinsolid line), (ii) after dehydration at 523 K (thick solid line), and (iii) afterrehydration at 303 K (dashed line).
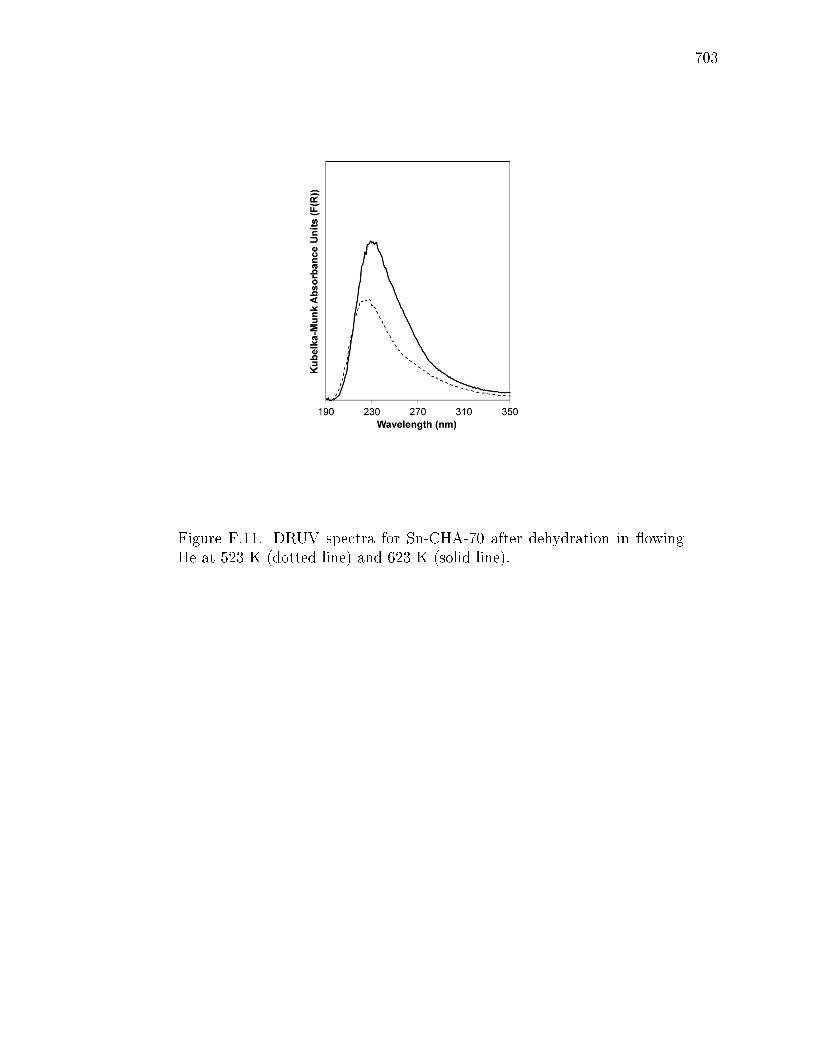
703
Figure F.11. DRUV spectra for Sn-CHA-70 after dehydration in owingHe at 523 K (dotted line) and 623 K (solid line).
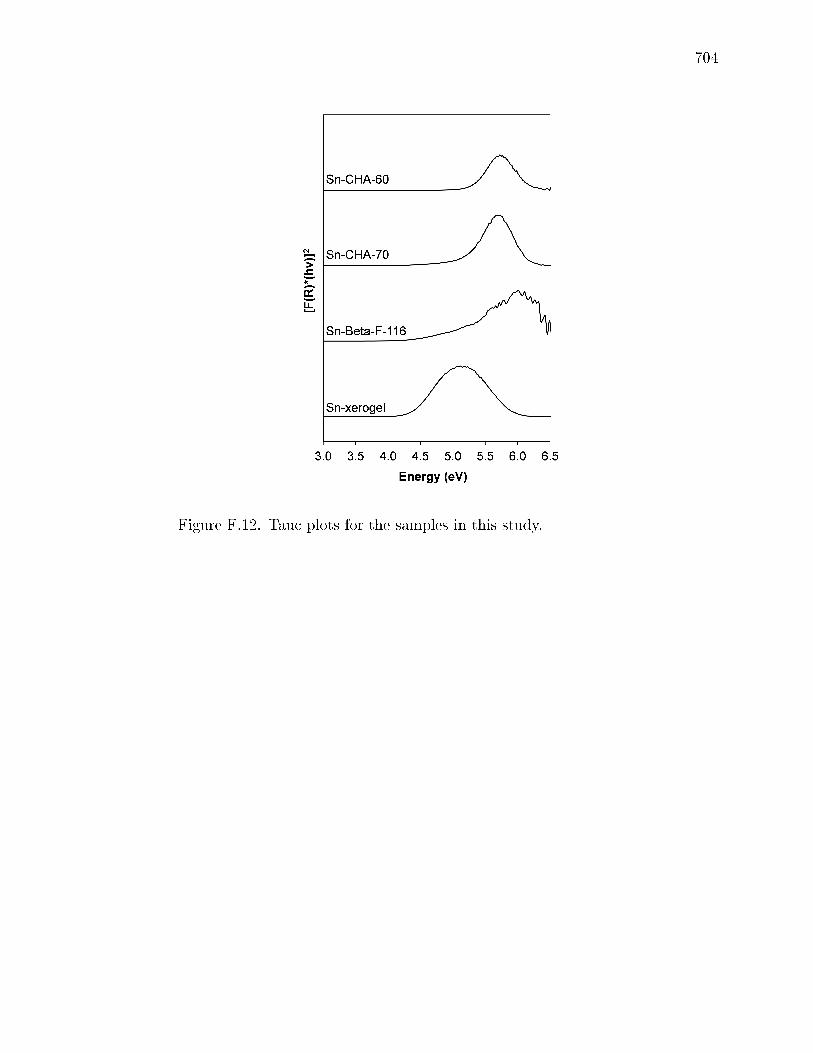
704
Figure F.12. Tauc plots for the samples in this study.

705
F.6.6 Thermogravimetric analysis
Thermogravimetric analysis was performed on Sn-CHA-F-70 using a 0.167 K s−1
temperature ramp to 523 K, followed by an 1800 s isothermal step at 523 K in order to
recreate the conditions used in DRUV and XAS measurements. After the isothermal
step, the temperature was increased to 873 K with an 0.167 K s−1 ramp rate. The
TGA prole for Sn-CHA-F-70 includes 0.8% weight loss above 623 K, which was the
maximum temperature tested for DRUV. The DRUV spectra for Sn-CHA-F-70 did
not change between 523 K and 623 K (Figure F.12), though the weight loss above
623 K amounts to more than one mole water per mol Sn (Figure F.14b). Assuming
all of the weight lost results from desorption of bound water ligands, the TGA prole
suggests Sn-CHA-F-70 may not be completely dehydrated at 623 K, in contrast to
Si-CHA-F and Sn-Beta-F-116, which do not change mass above 523 K (Figure F.15a).
This weight loss is endothermic based on the dierential scanning calorimetry (DSC)
prole, which presumably excludes condensation of silanols as a possible cause of the
high temperature water evolution on Sn-CHA-F-70 during TGA (Figure F.15b).

706
Figure F.13. (a) TGA prole for Sn-CHA-70 and (b) moles of water des-orbed (per g zeolite) above 623 K (solid line) compared to the moles of Snpresent in Sn-CHA-F-70 (dotted line).
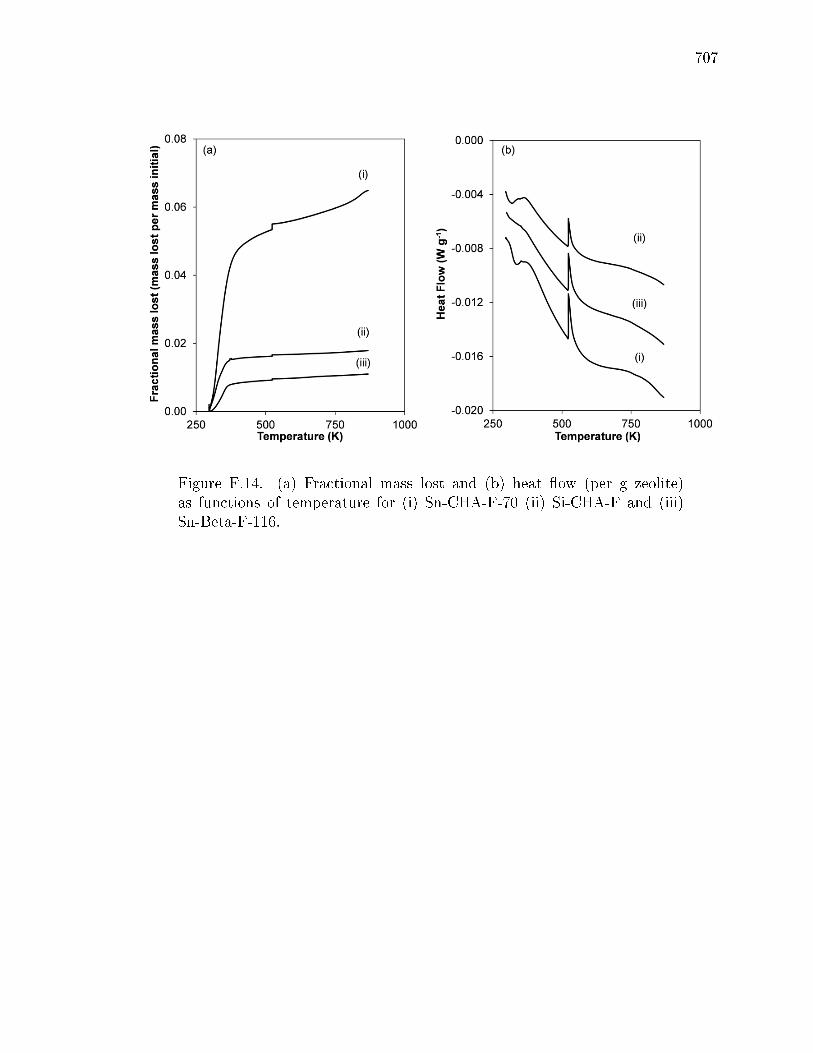
707
Figure F.14. (a) Fractional mass lost and (b) heat ow (per g zeolite)as functions of temperature for (i) Sn-CHA-F-70 (ii) Si-CHA-F and (iii)Sn-Beta-F-116.
708
F.6.7 X-ray absorption spectroscopy
XAS measurements were performed at the Sn K edge (29.200 keV) on the bending
magnet beamline of the Materials Research Collaborative Access Team (MRCAT) at
the Advanced Photon Source (APS), Argonne National Laboratory. The APS X-
ray ring has a current of 102 mA and the beamline has a ux of 5*1010 photons s−1.
Photon energies were selected using a water-cooled, double-crystal Si(111) monochro-
mator, which was detuned by approximately 50% to reduce harmonic reections.
Measurements were conducted in step-scan transmission mode and data points were
collected in three separate regions: a pre-edge region (-250 to -50 eV, step size = 10
eV, dwell time = 0.25 s), the XANES region (-50 to -30 eV, step size = 5 eV, dwell
time 0.25 s and -30 to 30 eV, step size 0.5 eV, dwell time = 0.5 s), and the EXAFS re-
gion (0 to 6 Å−1, step size = 0.05 Å−1, dwell time = 0.5 s and 6 to 15 Å−1, step size =
0.05 Å−1, dwell time 1 s). The ionization chambers were optimized for the maximum
current with linear response (ca.1010 photons detected s−1) with 10% absorption in
the incident ion chamber and 70% absorption in the transmission detector. During
each measurement, a third detector in series collected a Sn foil reference spectrum for
energy calibration.
Samples were pressed into self-supporting wafers in a cylindrical stainless-steel
holder containing six wells. The amount of sample was adjusted to obtain an ab-
sorbance (µx) approximately equal to 1.0. The sample holder was placed in a quartz
reactor tube (1 in. OD, 10 in. length) and sealed by two Ultra-Torr ttings with
Kapton windows through which gas could be owed. Measurements were performed
on samples under ambient conditions. Samples were then heated to 523 K (0.167 K
s−1) in owing He (1.67 cm3 s−1, Airgas, Built-In Purier Grade, 99.9997%) and held
for 1800 s to remove adsorbed water. The dehydrated samples were cooled to room
temperature in He and measurements performed at room temperature in He.
XAS spectra were analyzed using WinXAS 3.2 software. Data was normalized
with linear and cubic ts of the pre-edge and post-edge regions, respectively. The
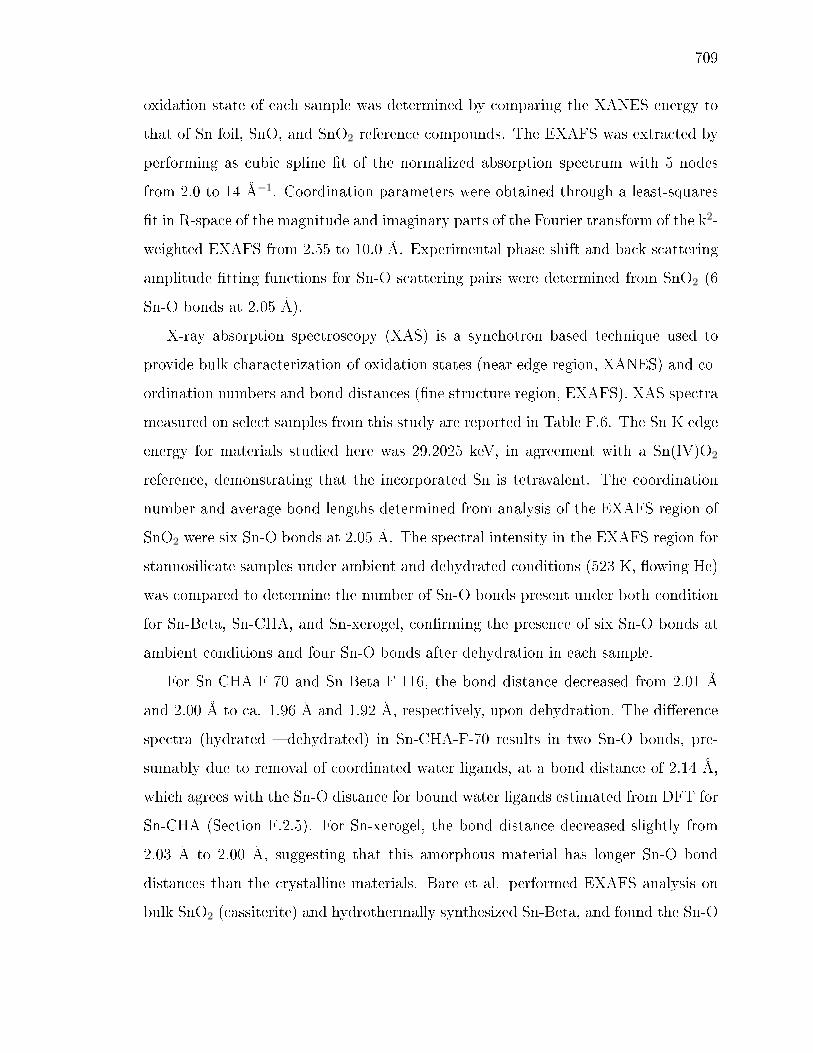
709
oxidation state of each sample was determined by comparing the XANES energy to
that of Sn foil, SnO, and SnO2 reference compounds. The EXAFS was extracted by
performing as cubic spline t of the normalized absorption spectrum with 5 nodes
from 2.0 to 14 Å−1. Coordination parameters were obtained through a least-squares
t in R-space of the magnitude and imaginary parts of the Fourier transform of the k2-
weighted EXAFS from 2.55 to 10.0 Å. Experimental phase shift and back scattering
amplitude tting functions for Sn-O scattering pairs were determined from SnO2 (6
Sn-O bonds at 2.05 Å).
X-ray absorption spectroscopy (XAS) is a synchotron based technique used to
provide bulk characterization of oxidation states (near edge region, XANES) and co-
ordination numbers and bond distances (ne structure region, EXAFS). XAS spectra
measured on select samples from this study are reported in Table F.6. The Sn K edge
energy for materials studied here was 29.2025 keV, in agreement with a Sn(IV)O2
reference, demonstrating that the incorporated Sn is tetravalent. The coordination
number and average bond lengths determined from analysis of the EXAFS region of
SnO2 were six Sn-O bonds at 2.05 Å. The spectral intensity in the EXAFS region for
stannosilicate samples under ambient and dehydrated conditions (523 K, owing He)
was compared to determine the number of Sn-O bonds present under both condition
for Sn-Beta, Sn-CHA, and Sn-xerogel, conrming the presence of six Sn-O bonds at
ambient conditions and four Sn-O bonds after dehydration in each sample.
For Sn-CHA-F-70 and Sn-Beta-F-116, the bond distance decreased from 2.01 Å
and 2.00 Å to ca. 1.96 Å and 1.92 Å, respectively, upon dehydration. The dierence
spectra (hydrated dehydrated) in Sn-CHA-F-70 results in two Sn-O bonds, pre-
sumably due to removal of coordinated water ligands, at a bond distance of 2.14 Å,
which agrees with the Sn-O distance for bound water ligands estimated from DFT for
Sn-CHA (Section F.2.5). For Sn-xerogel, the bond distance decreased slightly from
2.03 Å to 2.00 Å, suggesting that this amorphous material has longer Sn-O bond
distances than the crystalline materials. Bare et al. performed EXAFS analysis on
bulk SnO2 (cassiterite) and hydrothermally synthesized Sn-Beta, and found the Sn-O
710
distances to be 2.05 Å and 1.91 Å, respectively, after pre-treatment at 798 K in ow-
ing dry air and cooling to ambient temperature [562]. EXAFS analysis performed by
Dijkmans et al. found that dehydrated Sn-Beta (823 K, N2) had three Sn-O bonds
at 1.92 Å, with a fourth bond elongated to 2.13 Å, with 1.3 second-shell Si atoms
located at 2.96 Å and 2.7 Si atoms located at 3.17 Å [661]. Han et al. calculated Ti-O
bond lengths of ca.1.82 Å for Ti-CHA [616], bond distances similar to those found
in Ti-Beta dehydrated at 623 K for 1 h (1.80 Å) [592]. By extension, Sn-O bond
lengths in Sn-CHA may be expected to be similar to those found in Sn-Beta (ca. 1.92
Å). Considering the ca. 0.02 Å error in bond distances in EXAFS, the dehydrated
Sn-O distances measured for Sn-CHA and in literature for Sn-Beta are approximately
equivalent, though the dehydrated Sn-O distances measured for Sn-CHA are longer
than those expected from our calculations (ca. 1.89 Å), outside of the error of the
measurement.
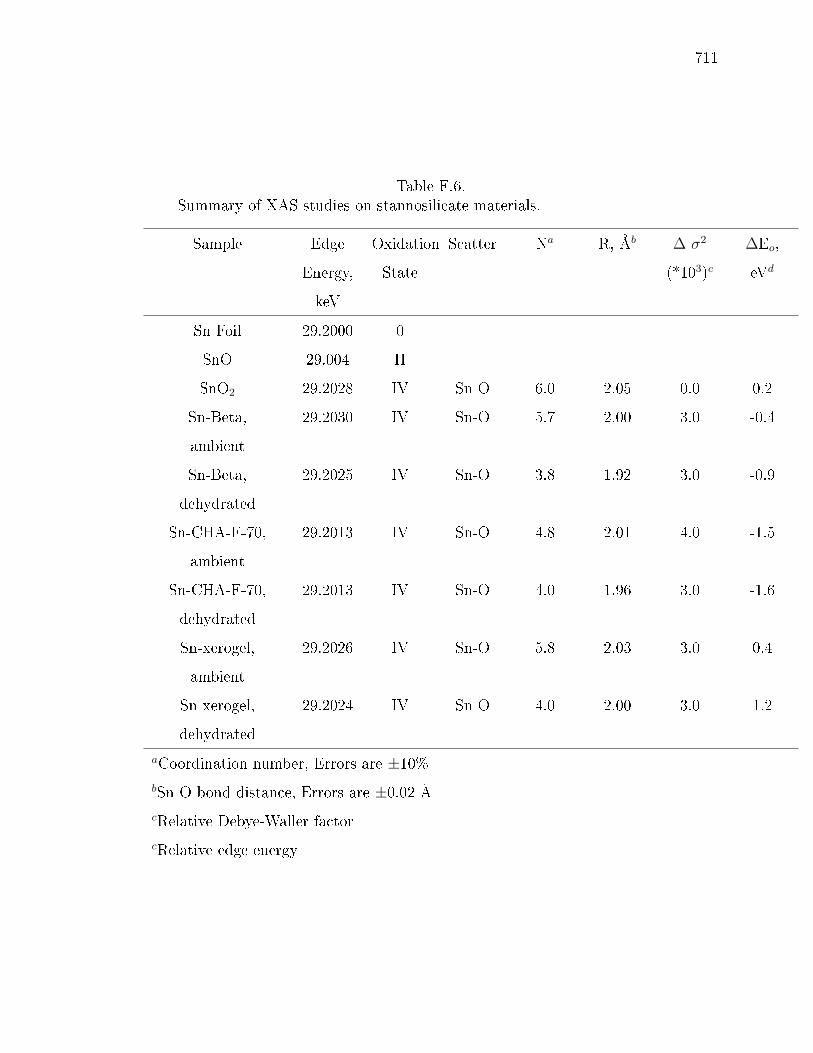
711
Table F.6.Summary of XAS studies on stannosilicate materials.
Sample Edge
Energy,
keV
Oxidation
State
Scatter Na R, Åb ∆ σ2
(*103)c∆Eo,
eVd
Sn Foil 29.2000 0
SnO 29.004 II
SnO2 29.2028 IV Sn-O 6.0 2.05 0.0 0.2
Sn-Beta,
ambient
29.2030 IV Sn-O 5.7 2.00 3.0 -0.4
Sn-Beta,
dehydrated
29.2025 IV Sn-O 3.8 1.92 3.0 -0.9
Sn-CHA-F-70,
ambient
29.2013 IV Sn-O 4.8 2.01 4.0 -1.5
Sn-CHA-F-70,
dehydrated
29.2013 IV Sn-O 4.0 1.96 3.0 -1.6
Sn-xerogel,
ambient
29.2026 IV Sn-O 5.8 2.03 3.0 0.4
Sn-xerogel,
dehydrated
29.2024 IV Sn-O 4.0 2.00 3.0 1.2
aCoordination number, Errors are ±10%bSn-O bond distance, Errors are ±0.02 ÅcRelative Debye-Waller factorcRelative edge energy
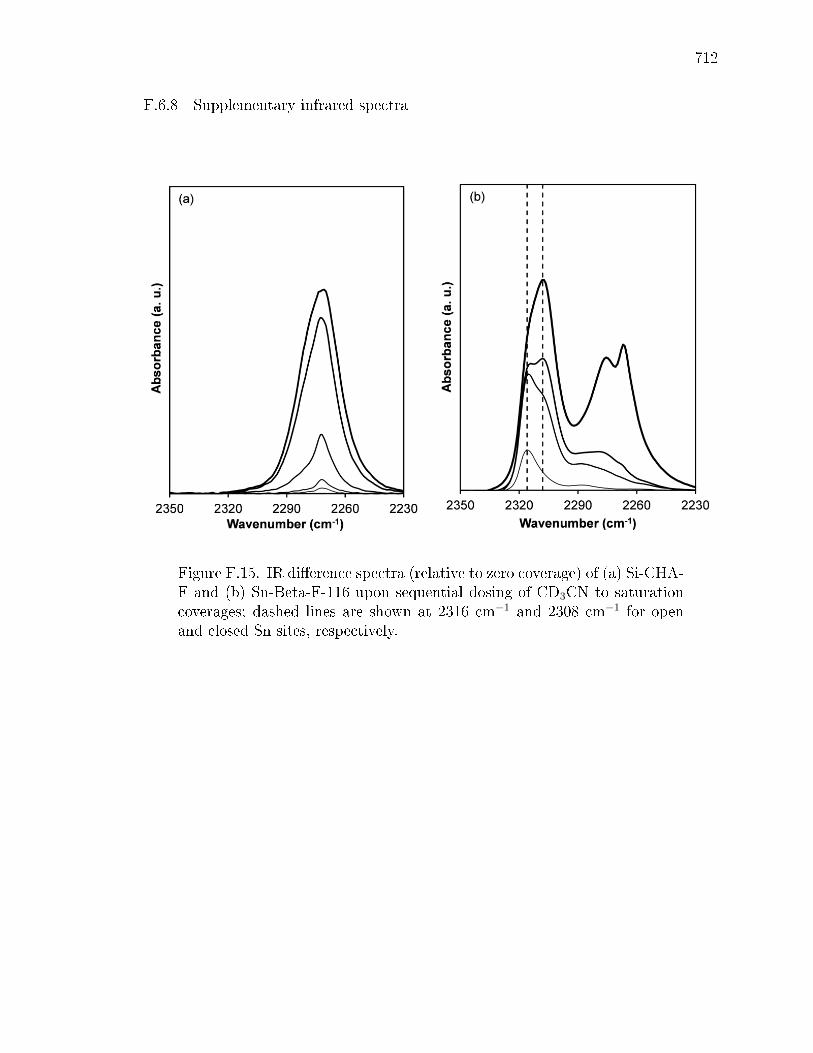
712
F.6.8 Supplementary infrared spectra
Figure F.15. IR dierence spectra (relative to zero coverage) of (a) Si-CHA-F and (b) Sn-Beta-F-116 upon sequential dosing of CD3CN to saturationcoverages; dashed lines are shown at 2316 cm−1 and 2308 cm−1 for openand closed Sn sites, respectively.

713
Figure F.16. IR dierence spectra (relative to zero coverage) for (a) Sn-CHA-F-60 and (b) Sn-CHA-F-70 saturated with pyridine and then exposedto dynamic vacuum (10−1 Torr, 900 s). Spectra are oset vertically forclarity.
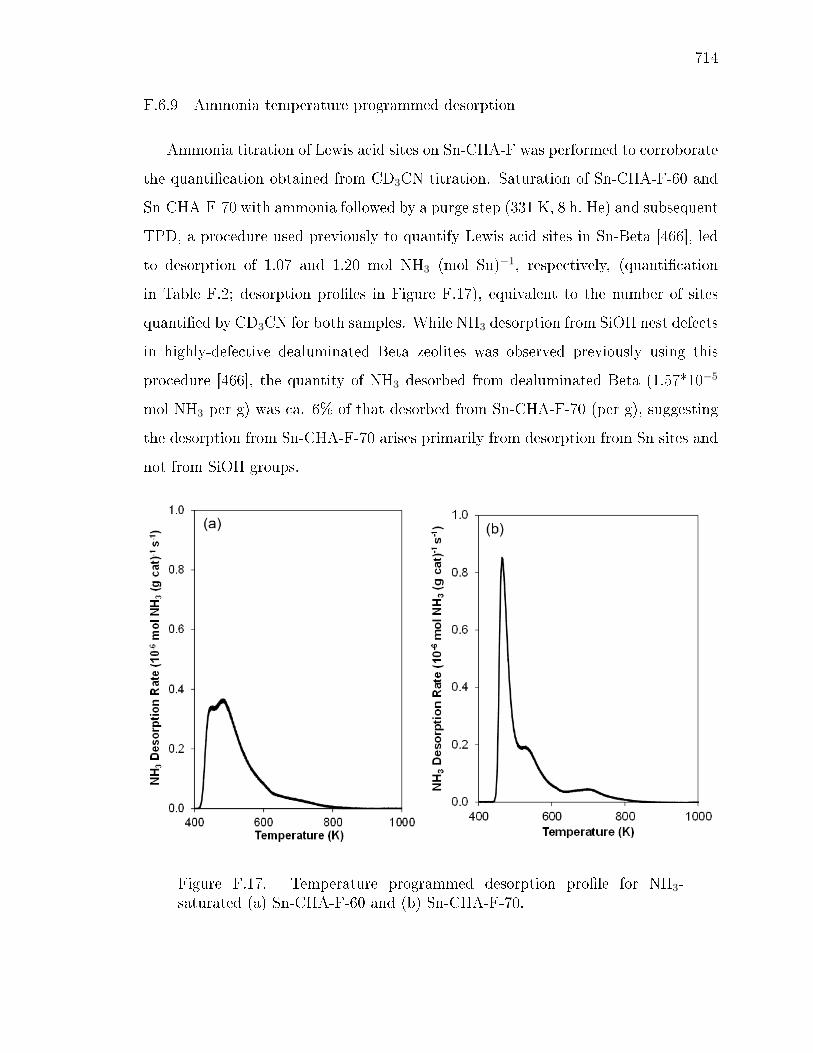
714
F.6.9 Ammonia temperature programmed desorption
Ammonia titration of Lewis acid sites on Sn-CHA-F was performed to corroborate
the quantication obtained from CD3CN titration. Saturation of Sn-CHA-F-60 and
Sn-CHA-F-70 with ammonia followed by a purge step (331 K, 8 h, He) and subsequent
TPD, a procedure used previously to quantify Lewis acid sites in Sn-Beta [466], led
to desorption of 1.07 and 1.20 mol NH3 (mol Sn)−1, respectively, (quantication
in Table F.2; desorption proles in Figure F.17), equivalent to the number of sites
quantied by CD3CN for both samples. While NH3 desorption from SiOH nest defects
in highly-defective dealuminated Beta zeolites was observed previously using this
procedure [466], the quantity of NH3 desorbed from dealuminated Beta (1.57*10−5
mol NH3 per g) was ca. 6% of that desorbed from Sn-CHA-F-70 (per g), suggesting
the desorption from Sn-CHA-F-70 arises primarily from desorption from Sn sites and
not from SiOH groups.
Figure F.17. Temperature programmed desorption prole for NH3-saturated (a) Sn-CHA-F-60 and (b) Sn-CHA-F-70.

715
F.6.10 Intermolecular MPVO reactions
Intermolecular MPVO reactions were performed between ethanol and acetone, in
order to avoid known condensation reactions of terminal aldehydes and their MPV
product alcohols. Initial acetaldehyde formation rates (313 K), measured under dier-
ential acetone conversions (<10%) in ethanol solvent and far from the equilibrium ace-
tone conversion (ca. 60%, Fig. F.18), were 3.20*10−2 and 3.80*10−3 mol (mol Sn)−1
s−1 for Sn-Beta-F-116 and Sn-CHA-F-60, respectively (Table F.7). The ethanol-
acetone MPVO rate for Sn-Beta-F-116 per open Sn site is 10× greater than that
for Sn-CHA-F-60 (per Sn site). Open sites are the most reactive sites in Sn-Beta-F
zeolites based on theoretical calculations [628,629] and previous experimental studies
of the glucose isomerization reaction that is mediated by an analogous kinetically-
relevant intramolecular hydride shift [466]. The lower reaction rate on Sn-CHA-F-60
may reect diusion limitations in Sn-CHA-F-60, or dierences in transition state
stability or prevalent surface coverages in Sn-CHA-F-60.
Due to poor separation between ethanol and isopropanol in GC chromatograms
when ethanol solvent was used, determination of isopropanol formation rates was
not possible for these reactions and precluded conrmation that acetaldehyde was
formed via a MPVO reaction. This complication was avoided by performing reac-
tions with ethanol diluted in acetone solvent. Under these conditions (0.2 M ethanol,
333 K), the isopropanol formation rate over Sn-Beta-F-116 was 2.2*10−3 mol (mol
Sn)−1 s−1, and the isopropanol:acetaldehyde ratio was ca. 2:1, as would be expected if
acetaldehyde underwent subsequent condensation reactions to a greater extent than
isopropanol. In acetone solvent, Sn-CHA-F-60 produced acetaldehyde at a rate of
7.0*10−5 mol (mol Sn)−1 s−1, ca. 15× lower than the acetaldehyde production rate
observed for Sn-Beta-F-116, similar to the 10× lower acetaldehyde production rate
observed over Sn-CHA-F-60 for ethanol-acetone MPVO in ethanol solvent. How-
ever, the isopropanol:acetaldehyde ratio over Sn-CHA-F-60 was only 0.05, suggesting
severe diusion limitations for isopropanol formed in Sn-CHA pores. The ratio of
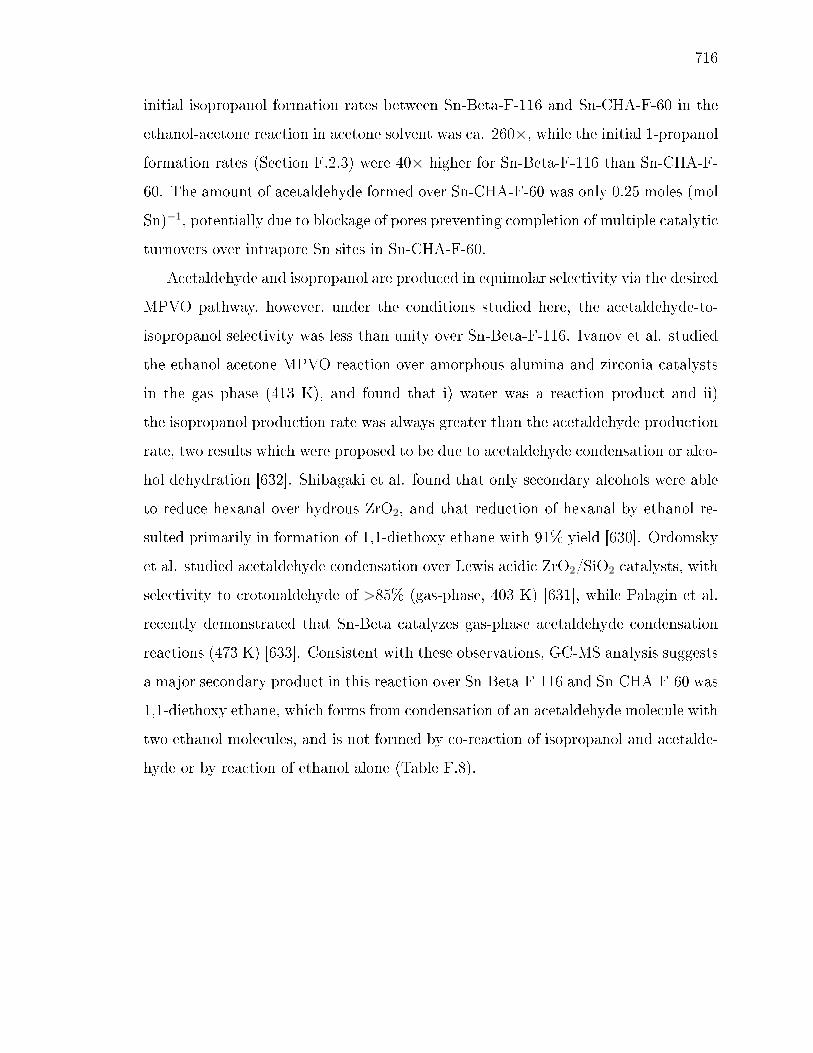
716
initial isopropanol formation rates between Sn-Beta-F-116 and Sn-CHA-F-60 in the
ethanol-acetone reaction in acetone solvent was ca. 260×, while the initial 1-propanol
formation rates (Section F.2.3) were 40× higher for Sn-Beta-F-116 than Sn-CHA-F-
60. The amount of acetaldehyde formed over Sn-CHA-F-60 was only 0.25 moles (mol
Sn)−1, potentially due to blockage of pores preventing completion of multiple catalytic
turnovers over intrapore Sn sites in Sn-CHA-F-60.
Acetaldehyde and isopropanol are produced in equimolar selectivity via the desired
MPVO pathway, however, under the conditions studied here, the acetaldehyde-to-
isopropanol selectivity was less than unity over Sn-Beta-F-116. Ivanov et al. studied
the ethanol-acetone MPVO reaction over amorphous alumina and zirconia catalysts
in the gas phase (413 K), and found that i) water was a reaction product and ii)
the isopropanol production rate was always greater than the acetaldehyde production
rate, two results which were proposed to be due to acetaldehyde condensation or alco-
hol dehydration [632]. Shibagaki et al. found that only secondary alcohols were able
to reduce hexanal over hydrous ZrO2, and that reduction of hexanal by ethanol re-
sulted primarily in formation of 1,1-diethoxy ethane with 91% yield [630]. Ordomsky
et al. studied acetaldehyde condensation over Lewis acidic ZrO2/SiO2 catalysts, with
selectivity to crotonaldehyde of >85% (gas-phase, 403 K) [631], while Palagin et al.
recently demonstrated that Sn-Beta catalyzes gas-phase acetaldehyde condensation
reactions (473 K) [633]. Consistent with these observations, GC-MS analysis suggests
a major secondary product in this reaction over Sn-Beta-F-116 and Sn-CHA-F-60 was
1,1-diethoxy ethane, which forms from condensation of an acetaldehyde molecule with
two ethanol molecules, and is not formed by co-reaction of isopropanol and acetalde-
hyde or by reaction of ethanol alone (Table F.8).
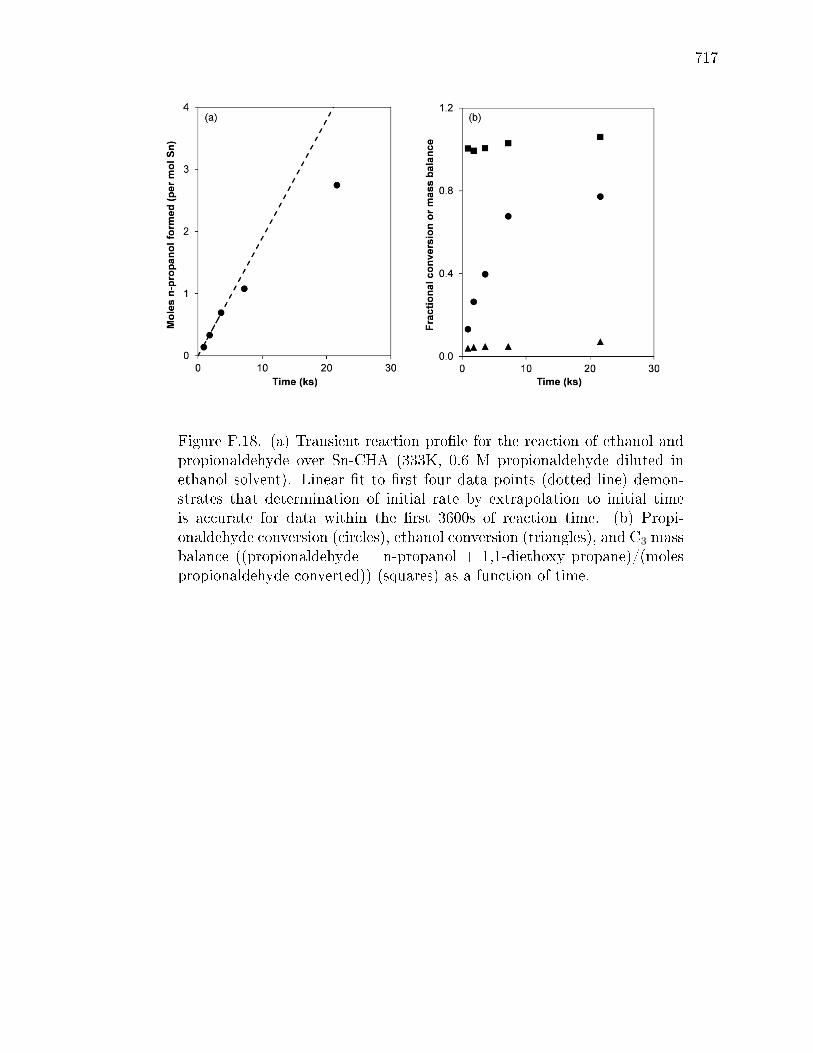
717
Figure F.18. (a) Transient reaction prole for the reaction of ethanol andpropionaldehyde over Sn-CHA (333K, 0.6 M propionaldehyde diluted inethanol solvent). Linear t to rst four data points (dotted line) demon-strates that determination of initial rate by extrapolation to initial timeis accurate for data within the rst 3600s of reaction time. (b) Propi-onaldehyde conversion (circles), ethanol conversion (triangles), and C3 massbalance ((propionaldehyde + n-propanol + 1,1-diethoxy propane)/(molespropionaldehyde converted)) (squares) as a function of time.

718
Table F.7.Reaction rates over Sn-CHA-F-60, Sn-Beta-F-116, Si-CHA-F, and Sn-xerogel, for the intermolecular MPVO reaction of ethanol and acetone.
Catalyst Ethanol, 0.2 M
acetone rate
(per Sn)a
0.2 M Ethanol,
acetone rate
(per Sn)b
Sn-CHA-F-60 3.80*10−3 7.0*10−5
Sn-Beta-F-116 3.20*10−2 2.2*10−3
Sn-xerogel n.m.* 1.6*10−4
Si-CHA-F n.p.** n.p.**
a313 K, 0.2 M acetone in ethanol solvent, acetaldehyde formation rate
Errors are ± 15%.b333 K, 0.2 M ethanol in acetone solvent, acetaldehyde formation rate
Errors are ± 15%.
*n.m., not measured.
**n. p., no products observed.
Figure F.19. Equilibrium conversion of (a) acetone as a function of ini-tial ethanol:acetone ratio (diamonds, 333 K; circles, 313 K) and (b) propi-onaldehyde as a function of initial ethanol:propionaldehdye ratio (333 K).Determined using AIChE DIPPR database [662].
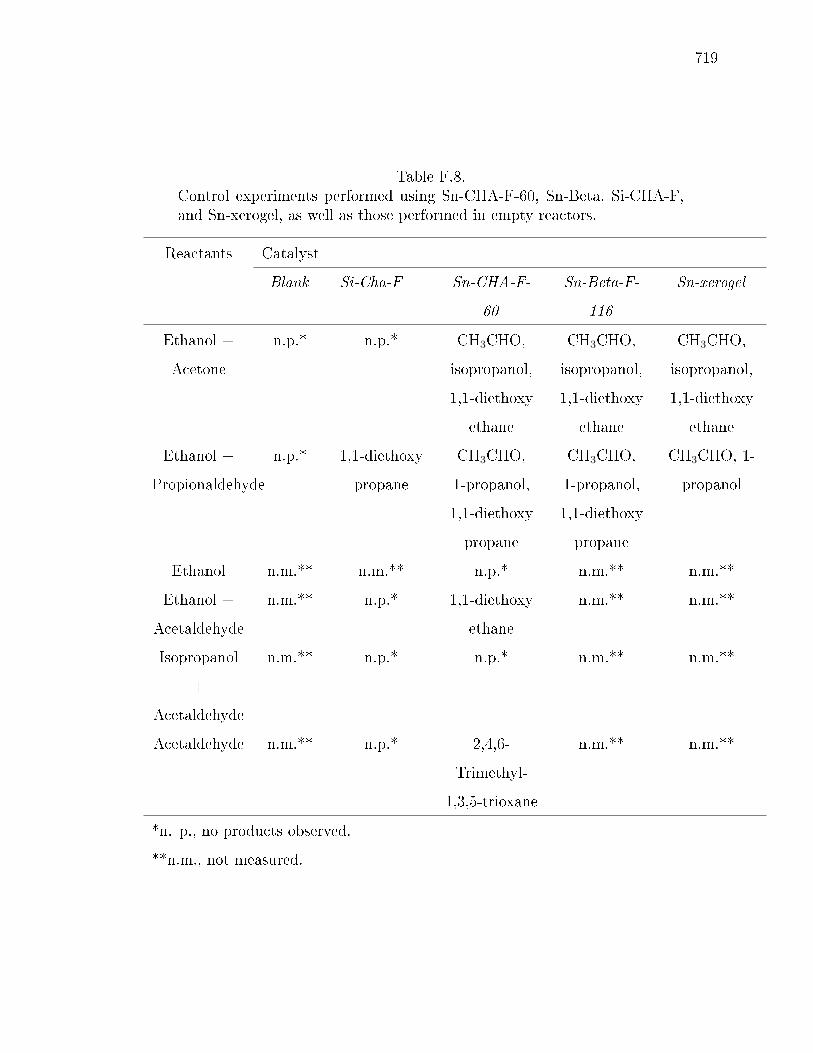
719
Table F.8.Control experiments performed using Sn-CHA-F-60, Sn-Beta, Si-CHA-F,and Sn-xerogel, as well as those performed in empty reactors.
Reactants Catalyst
Blank Si-Cha-F Sn-CHA-F-
60
Sn-Beta-F-
116
Sn-xerogel
Ethanol +
Acetone
n.p.* n.p.* CH3CHO,
isopropanol,
1,1-diethoxy
ethane
CH3CHO,
isopropanol,
1,1-diethoxy
ethane
CH3CHO,
isopropanol,
1,1-diethoxy
ethane
Ethanol +
Propionaldehyde
n.p.* 1,1-diethoxy
propane
CH3CHO,
1-propanol,
1,1-diethoxy
propane
CH3CHO,
1-propanol,
1,1-diethoxy
propane
CH3CHO, 1-
propanol
Ethanol n.m.** n.m.** n.p.* n.m.** n.m.**
Ethanol +
Acetaldehyde
n.m.** n.p.* 1,1-diethoxy
ethane
n.m.** n.m.**
Isopropanol
+
Acetaldehyde
n.m.** n.p.* n.p.* n.m.** n.m.**
Acetaldehyde n.m.** n.p.* 2,4,6-
Trimethyl-
1,3,5-trioxane
n.m.** n.m.**
*n. p., no products observed.
**n.m., not measured.
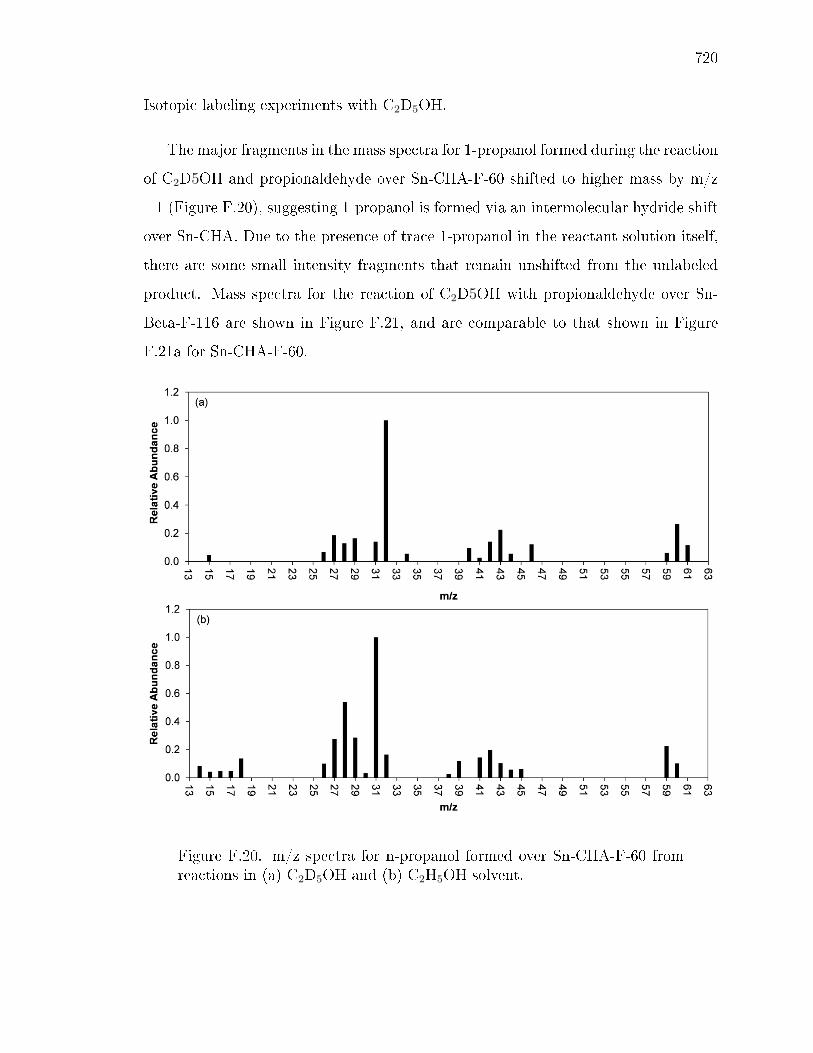
720
Isotopic labeling experiments with C2D5OH.
The major fragments in the mass spectra for 1-propanol formed during the reaction
of C2D5OH and propionaldehyde over Sn-CHA-F-60 shifted to higher mass by m/z
=1 (Figure F.20), suggesting 1-propanol is formed via an intermolecular hydride shift
over Sn-CHA. Due to the presence of trace 1-propanol in the reactant solution itself,
there are some small intensity fragments that remain unshifted from the unlabeled
product. Mass spectra for the reaction of C2D5OH with propionaldehyde over Sn-
Beta-F-116 are shown in Figure F.21, and are comparable to that shown in Figure
F.21a for Sn-CHA-F-60.
Figure F.20. m/z spectra for n-propanol formed over Sn-CHA-F-60 fromreactions in (a) C2D5OH and (b) C2H5OH solvent.

721
Figure F.21. m/z spectra for n-propanol formed over Sn-Beta-F-116 fromreaction of C2D5OH and propionaldehyde in C2D5OH solvent.
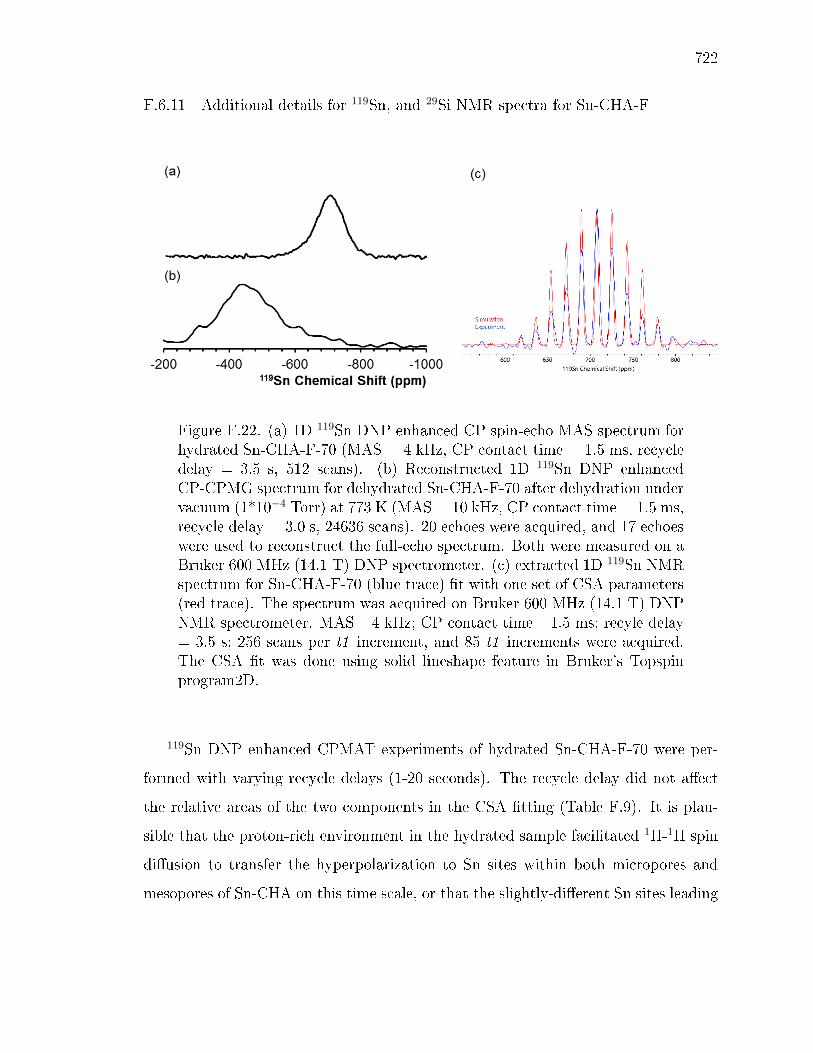
722
F.6.11 Additional details for 119Sn, and 29Si NMR spectra for Sn-CHA-F
Figure F.22. (a) 1D 119Sn DNP enhanced CP spin-echo MAS spectrum forhydrated Sn-CHA-F-70 (MAS = 4 kHz, CP contact time = 1.5 ms, recycledelay = 3.5 s, 512 scans). (b) Reconstructed 1D 119Sn DNP enhancedCP-CPMG spectrum for dehydrated Sn-CHA-F-70 after dehydration undervacuum (1*10−4 Torr) at 773 K (MAS = 10 kHz, CP contact time = 1.5 ms,recycle delay = 3.0 s, 24636 scans). 20 echoes were acquired, and 17 echoeswere used to reconstruct the full-echo spectrum. Both were measured on aBruker 600 MHz (14.1 T) DNP spectrometer. (c) extracted 1D 119Sn NMRspectrum for Sn-CHA-F-70 (blue trace) t with one set of CSA parameters(red trace). The spectrum was acquired on Bruker 600 MHz (14.1 T) DNPNMR spectrometer. MAS= 4 kHz; CP contact time= 1.5 ms; recyle delay= 3.5 s; 256 scans per t1 increment, and 85 t1 increments were acquired.The CSA t was done using solid lineshape feature in Bruker's Topspinprogram2D.
119Sn DNP enhanced CPMAT experiments of hydrated Sn-CHA-F-70 were per-
formed with varying recycle delays (1-20 seconds). The recycle delay did not aect
the relative areas of the two components in the CSA tting (Table F.9). It is plau-
sible that the proton-rich environment in the hydrated sample facilitated 1H-1H spin
diusion to transfer the hyperpolarization to Sn sites within both micropores and
mesopores of Sn-CHA on this time scale, or that the slightly-dierent Sn sites leading

723
to the two CSA t are distributed similarly between the microporous and mesoporous
portions of the Sn-CHA.
Table F.9.Reaction rates over Sn-CHA-F-60, Sn-Beta-F-116, Si-CHA-F, and Sn-xerogel, for the intermolecular MPVO reaction of ethanol and acetone.
Recycle delay (s) Site 1a Site 2a
1.0 85% 15%
4.1 87% 13%
10 85% 15%
20 86% 14%
aErrors are ± 9%,
calculated by the signal-to-noise ratio of the spectrum.
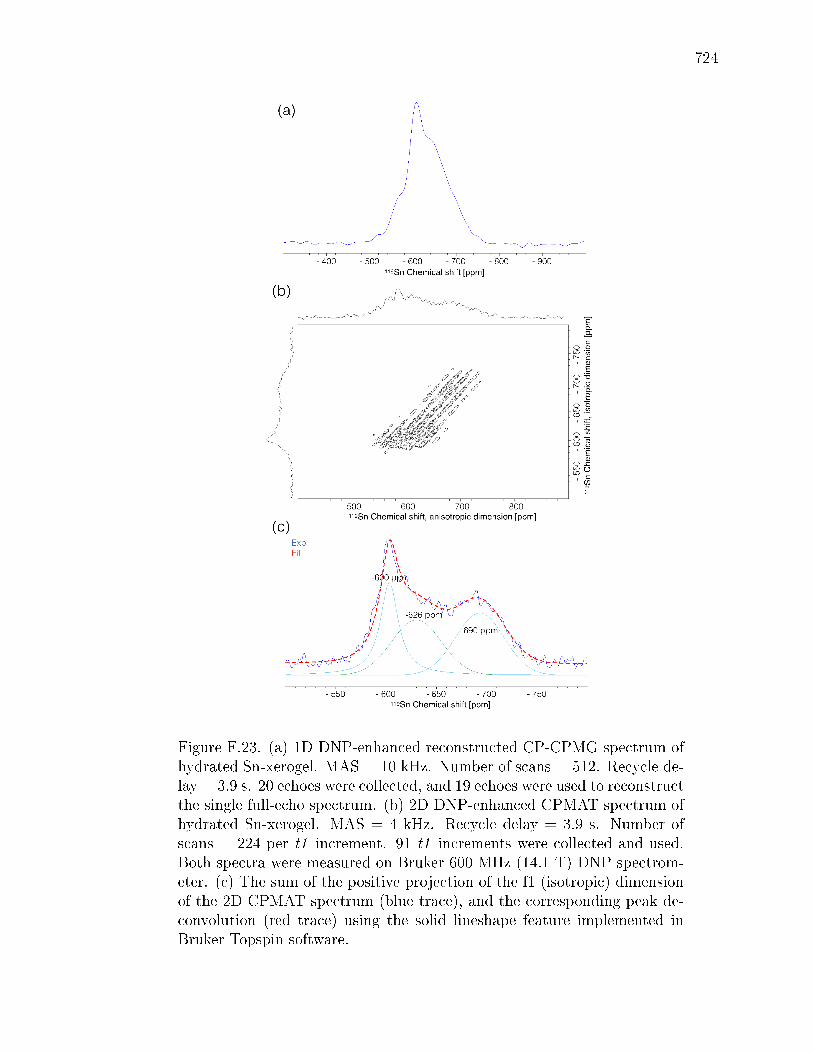
724
Figure F.23. (a) 1D DNP-enhanced reconstructed CP-CPMG spectrum ofhydrated Sn-xerogel. MAS = 10 kHz. Number of scans = 512. Recycle de-lay = 3.9 s. 20 echoes were collected, and 19 echoes were used to reconstructthe single full-echo spectrum. (b) 2D DNP-enhanced CPMAT spectrum ofhydrated Sn-xerogel. MAS = 4 kHz. Recycle delay = 3.9 s. Number ofscans = 224 per t1 increment. 91 t1 increments were collected and used.Both spectra were measured on Bruker 600 MHz (14.1 T) DNP spectrom-eter. (c) The sum of the positive projection of the f1 (isotropic) dimensionof the 2D CPMAT spectrum (blue trace), and the corresponding peak de-convolution (red trace) using the solid lineshape feature implemented inBruker Topspin software.
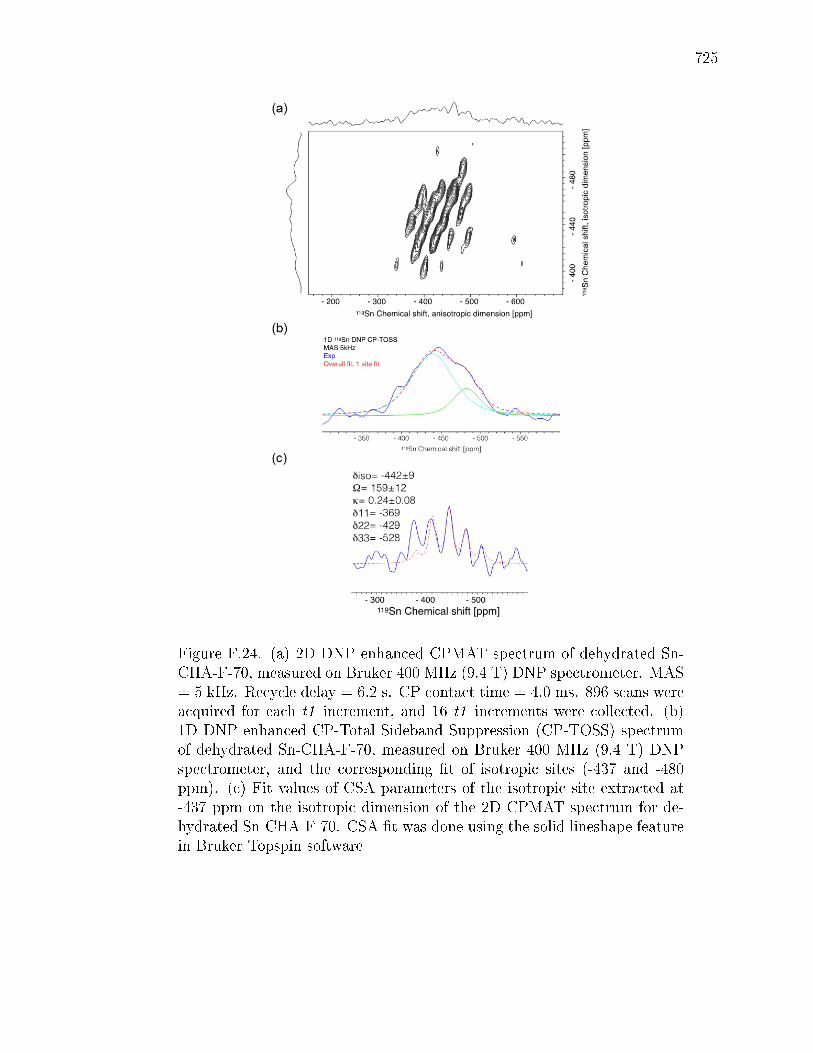
725
Figure F.24. (a) 2D DNP enhanced CPMAT spectrum of dehydrated Sn-CHA-F-70, measured on Bruker 400 MHz (9.4 T) DNP spectrometer. MAS= 5 kHz. Recycle delay = 6.2 s. CP contact time = 4.0 ms. 896 scans wereacquired for each t1 increment, and 16 t1 increments were collected. (b)1D DNP enhanced CP-Total Sideband Suppression (CP-TOSS) spectrumof dehydrated Sn-CHA-F-70, measured on Bruker 400 MHz (9.4 T) DNPspectrometer, and the corresponding t of isotropic sites (-437 and -480ppm). (c) Fit values of CSA parameters of the isotropic site extracted at-437 ppm on the isotropic dimension of the 2D CPMAT spectrum for de-hydrated Sn-CHA-F-70. CSA t was done using the solid lineshape featurein Bruker Topspin software

726
Figure F.25. 29Si DNP enhanced CPMAS NMR spectra for hydrated Sn-CHA-F-70, measured on Bruker 600 MHz (14.1 T) DNP spectrometer.The corresponding peak deconvolution (envelope: red trace) using solidlineshape feature implemented in Bruker Topspin software.
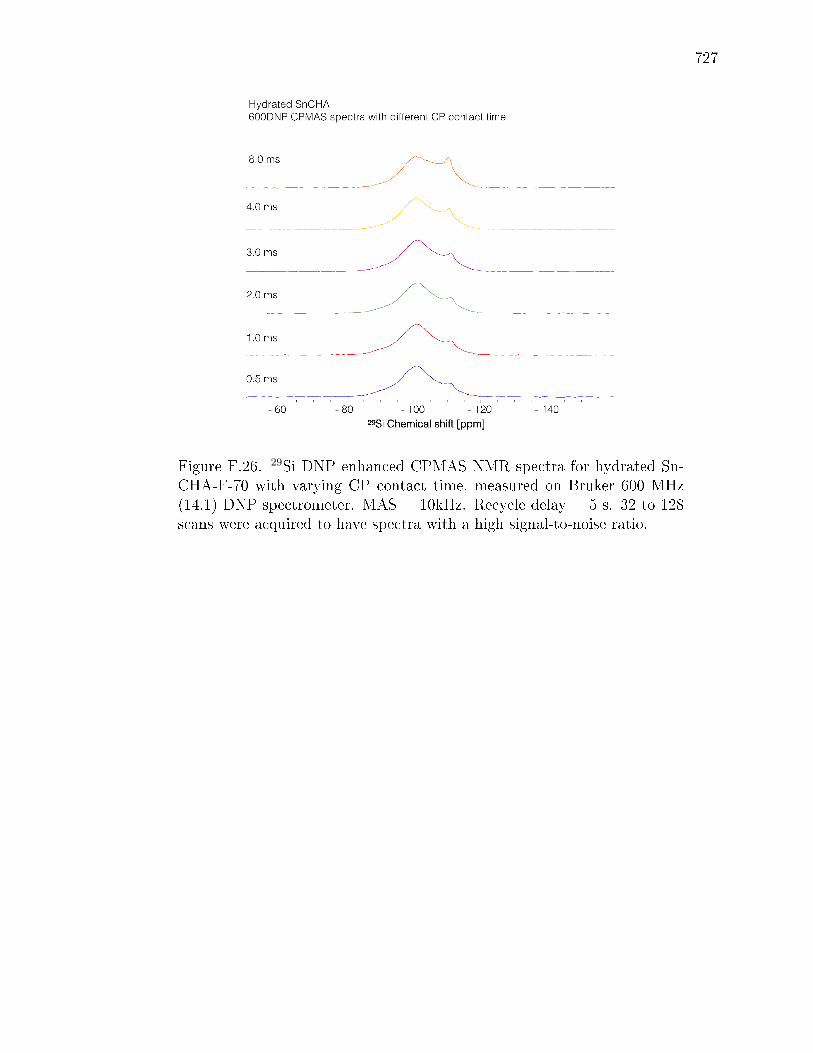
727
Figure F.26. 29Si DNP enhanced CPMAS NMR spectra for hydrated Sn-CHA-F-70 with varying CP contact time, measured on Bruker 600 MHz(14.1) DNP spectrometer. MAS = 10kHz. Recycle delay = 5 s. 32 to 128scans were acquired to have spectra with a high signal-to-noise ratio.
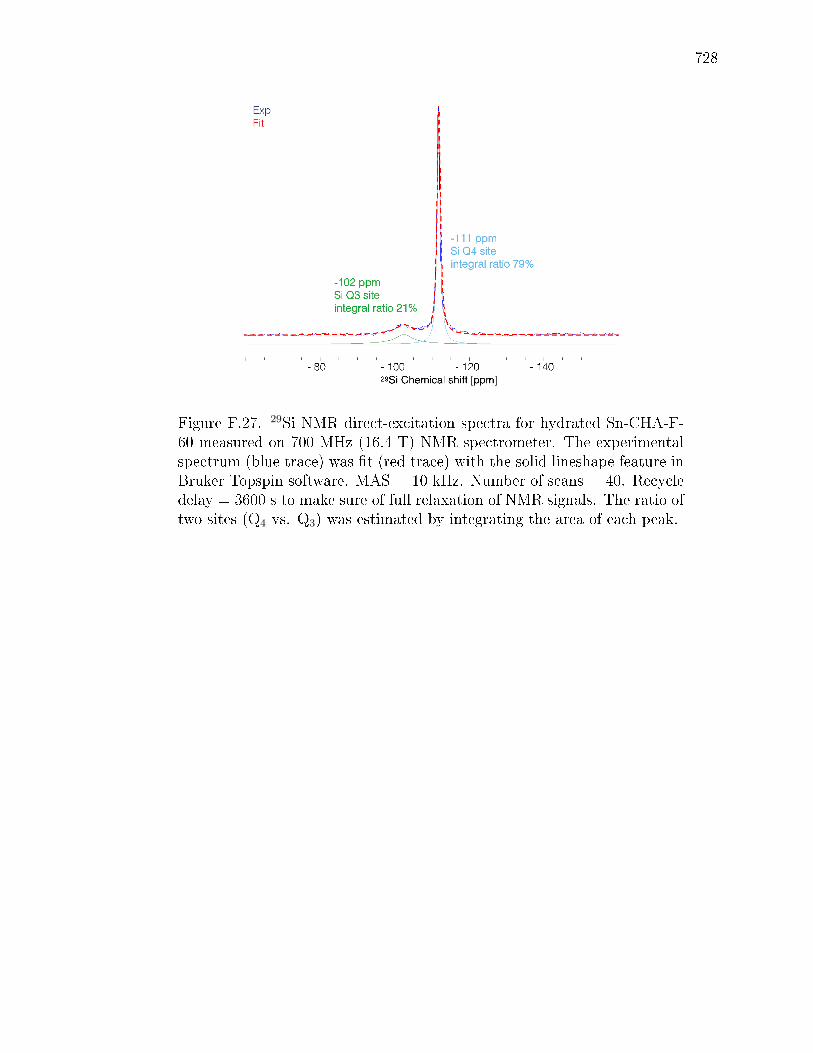
728
Figure F.27. 29Si NMR direct-excitation spectra for hydrated Sn-CHA-F-60 measured on 700 MHz (16.4 T) NMR spectrometer. The experimentalspectrum (blue trace) was t (red trace) with the solid lineshape feature inBruker Topspin software. MAS = 10 kHz. Number of scans = 40. Recycledelay = 3600 s to make sure of full relaxation of NMR signals. The ratio oftwo sites (Q4 vs. Q3) was estimated by integrating the area of each peak.
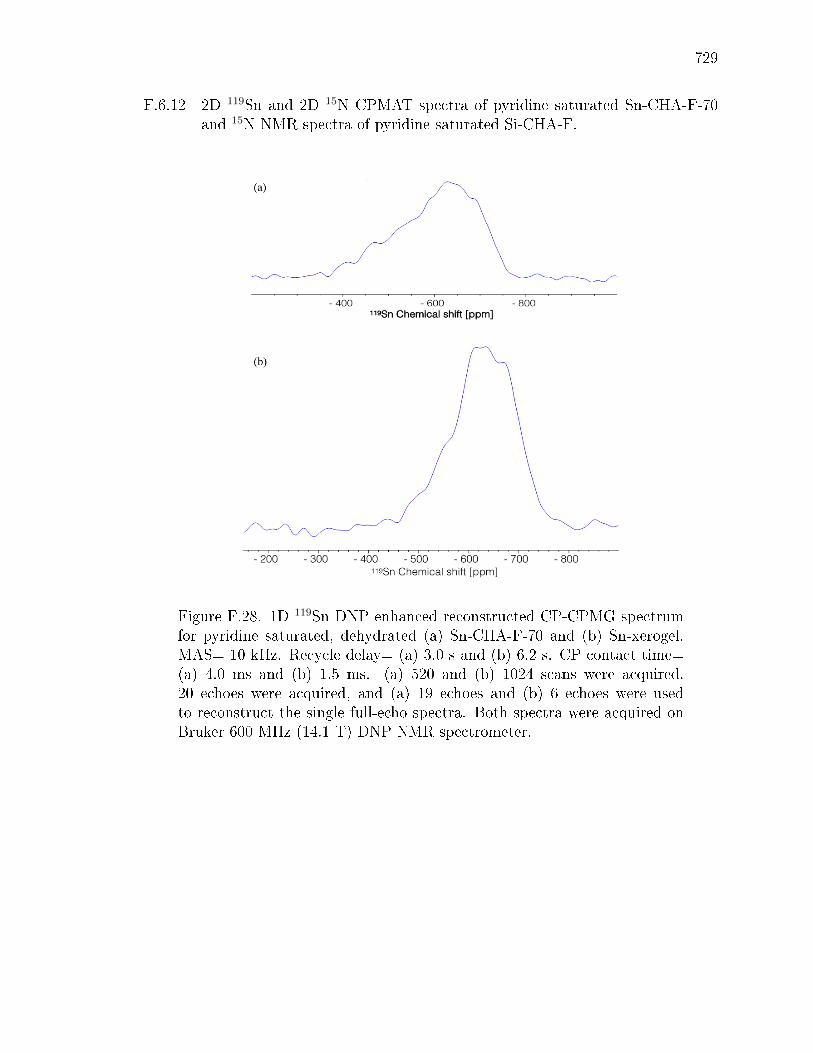
729
F.6.12 2D 119Sn and 2D 15N CPMAT spectra of pyridine saturated Sn-CHA-F-70and 15N NMR spectra of pyridine saturated Si-CHA-F.
Figure F.28. 1D 119Sn DNP enhanced reconstructed CP-CPMG spectrumfor pyridine saturated, dehydrated (a) Sn-CHA-F-70 and (b) Sn-xerogel.MAS= 10 kHz. Recycle delay= (a) 3.0 s and (b) 6.2 s. CP contact time=(a) 4.0 ms and (b) 1.5 ms. (a) 520 and (b) 1024 scans were acquired.20 echoes were acquired, and (a) 19 echoes and (b) 6 echoes were usedto reconstruct the single full-echo spectra. Both spectra were acquired onBruker 600 MHz (14.1 T) DNP NMR spectrometer.

730
Figure F.29. (a) 2D 119Sn CPMAT NMR spectra for pyridine-saturated Sn-CHA-F-70 and (b) extracted 1D 119Sn NMR spectra for pyridine-saturatedSn-CHA-F-70 for the two resonances observed in the isotropic dimension.The spectrum was acquired on Bruker 600 MHz (14.1 T) DNP NMR spec-trometer. MAS= 6 kHz; CP contact time= 4.0 ms; recyle delay = 3.0 s; 448scans per t1 increment, and 107 t1 increments were acquired. The CSA twas done using the solid lineshape feature in Bruker's Topspin program.
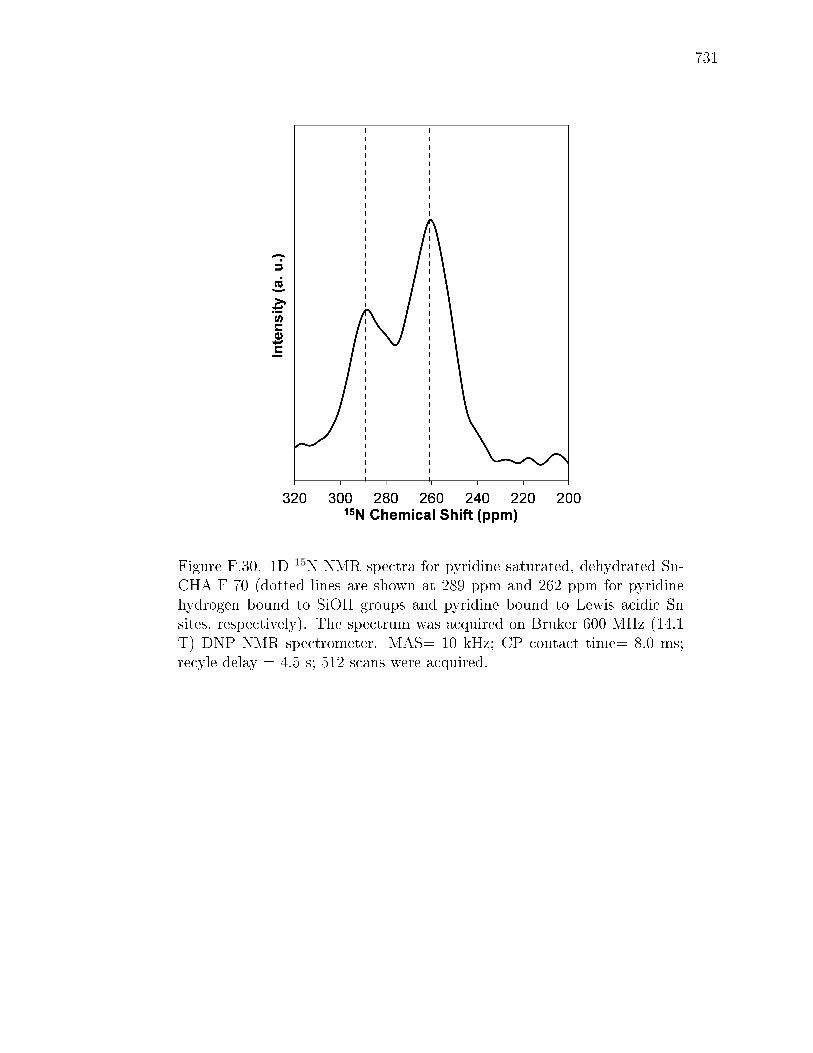
731
Figure F.30. 1D 15N NMR spectra for pyridine saturated, dehydrated Sn-CHA-F-70 (dotted lines are shown at 289 ppm and 262 ppm for pyridinehydrogen bound to SiOH groups and pyridine bound to Lewis acidic Snsites, respectively). The spectrum was acquired on Bruker 600 MHz (14.1T) DNP NMR spectrometer. MAS= 10 kHz; CP contact time= 8.0 ms;recyle delay = 4.5 s; 512 scans were acquired.

732
Figure F.31. DNP-enhanced 15N CPMAS spectrum of 15N pyridine treateddehydrated Sn-xerogel (MAS = 11.5 kHz, Recycle delay = 6.8 s, numberof scans = 64). The spectrum was acquired on Bruker 600 MHz (14.1 T)DNP NMR spectrometer.
Figure F.32. DNP-enhanced 15N CPMAS spectrum of 15N pyridine treateddehydrated Si-CHA-F. The spectrum was acquired on Bruker 600 MHz(14.1 T) DNP NMR spectrometer. MAS= 10 kHz; CP contact time= 8.0ms; recyle delay = 6.0 s; 7136 scans were acquired.

733
F.6.13 DFT Calculations
Table F.10.NMR CSA parameters calculated from DFT for hydrated (two watermolecules bound to each Sn site, two second shell waters, and implicitwater) and dehydrated Sn-CHA.
Sn Site 119Sn δiso
(ppm)
Span
(Ω, ppm)
Skew
(κ)
Hydrated
closed -728 299 0.50
hydrolyzed-open -721 141 -0.42
defect -707 215 0.58
Dehydrated
closed -424 100 0.50
hydrolyzed-open -566 392 -0.65
defect -425 196 0.33
Table F.11.NMR CSA parameters calculated with DFT for pyridine saturated Sn-CHA-F and Si-CHA-F.
Site One Bound Pyridine Molecule Two Bound Pyridine Molecules
119Sn δiso
(ppm)
Span
(Ω, ppm)
Skew
(κ)
119Sn δiso
(ppm)
Span
(Ω, ppm)
Skew
(κ)
Sn-CHA-F
defect Sn -623 421 -0.36 -718 132 0.18
closed Sn -595 449 -0.65 -728 221 0.77
Si-CHA-F
SiOH 300 606 0.49

734
Table F.12.DFT calculated pyridine adsorption free energies (calculated at 298 K) withrespect to each site and the corresponding isolated pyridine molecules (∆G,kcal mol−1). The optimized structures were calculated at the lower levelof theory described in the computational details section (Section F.6.2).The energies correspond to single-point calculations performed with theM06, and Sn was described by the LanL2DZ eective core pseudopotential(ECP) augmented with a d polarization function; the rest of atoms directlywere described by a 6-311+G(d, p) basis set. The thermal correction termswere included and taken from the calculations at the lower level of theorydescribed in the computational details section (Section F.6.2).
One pyridine binding
closed -12.86
defect -15.55
Two pyridine binding
closed -11.59
defect -17.85
Figure F.33. DFT optimized (B3LYP-D3) structures for pyridine saturated(a) closed Sn with 2 bound pyridine and (b) defect Sn sites with one boundpyridine. Atoms that were not bound directly to Sn were treated withthe 6-31G(d,p) basis set (Si: yellow, O: red, C: gray, H: white)), while Oand N atoms bonded to Sn were treated with the 6-31+G(d) basis set (N:green, O: red) and Sn (blue) was treated with the LanL2DZ eective corepseudopotential augmented with a d polarization function.

VITA

735
VITA
John Di Iorio was born in Kirkland, WA and was raised in Redmond, WA. The
son of a pediatrics nurse and a medical coding specialist, John attended elementary
school at Horace Mann Elementary School (not Horseman, as many rst-graders once
thought) and Redmond Junior High School (now Redmond Middle School), before
attending Redmond High School. John grew up riding bikes and trailblazing through
the backwoods of the Nike and Hartman park forests. As an avid soccer player,
he was a part of the Redmond High School soccer team and local rec league team.
John joined the high school cross-country team and earned a spot on the 4th-place
state varsity roster his senior year. He and his family would routinely travel to the
Oregon coast for summer vacations and this still remains one of his favorite travel
destinations.
After graduating from Redmond High, John attended The University of Wash-
ington where he majored in Chemical Engineering. During his time at UW, John
discovered ultimate frisbee and spent many Friday evenings playing ultimate well into
the night. He spent two years as a Resident Advisor for the engineering residence
hall community and worked closely with the UW College of Engineering to organize
and plan engagement events. Many of these activities focused on developing sim-
ple demonstrations of various scientic principles that members of the engineering
community could participate in (including rocketry, non-Newtonian uids, aerody-
namics, structural design, and chemistry). John also spent three years working as
an undergrad research assistant for Graham Allan working the conversion of biomass
and plastics to fuels and chemicals using supercritical water. Through this research,
John was able to spend his summers working as a intern at a local start-up company,
736
Xtrudx based in Auburn, WA, assisting in the design and construction of a continuous
supercritical water reactor.
John decided to continue his education by attending graduate school at Purdue
University where he became a member of the inaugural Gounder Group. He worked
endlessly with Michael Cordon and Ravi Joshi to build, design, construct, leak test,
calibrate, install, and manage the birth of an academic lab space. Perhaps the greatest
accomplishment of our time is the installation of a He line to the ASAP 2020 free
space port that, with the meticulous help of Ravi, will most likely retain pressure until
well after Raj has left Purdue. After leaving Purdue, John will begin a post-doctoral
appointment at the MIT working with Prof. Yuriy Roman-Leshkov.