X-ray fluorescence elemental mapping and microscopy to follow hepatic disposition of a Gd-based...
12
X-ray fluorescence elemental mapping and microscopy to follow hepatic disposition of a Gd-based magnetic resonance imaging contrast agent Riccarda Delfino,* † Matteo Altissimo, ‡ Ralf Hendrik Menk, § Roberto Alberti, { Tomasz Klatka, { Tommaso Frizzi, { ** Antonio Longoni, { Murielle Salome `, †† Giuliana Tromba, § Fulvia Arfelli, ‡‡ Milan Clai, §§ Lisa Vaccari, § Vito Lorusso, {{ Claudio Tiribelli* and Lorella Pascolo § *** *Centre for Liver Studies, AREA Science Park, † Department of Pharmaceutical Sciences, University of Trieste, ‡‡ Department of Physics, University of Trieste and INFN, § Synchrotron Trieste S.C.p.A, §§ University Hospital Trieste, ***Institute for Maternal and Child Health, IRCCS Burlo Garofolo, Trieste, { Department of Electronics and Informatics, Politecnico of Milan and INFN, {{ Bracco Imaging S.p.A, **XGLab s.r.l., Milan, Italy, ‡ CSIRO Materials Science and Engineering, Melbourne, Australia and †† European Synchrotron Radiation Facility, Grenoble, France SUMMARY 1. Spatially resolved X-ray fluorescence (XRF) spectroscopy with synchrotron radiation is a technique that allows imaging and quantification of chemical elements in biological specimens with high sensitivity. In the present study, we applied XRF tech- niques at a macro and micro level to carry out drug distribution studies on ex vivo models to confirm the hepatobiliary disposition of the Gd-based magnetic resonance imaging contrast agent B22956 / 1. 2. Gd presence was selectively quantified allowing the determi- nation of the time dependent disappearance of the drug from blood and its hepatic accumulation in mice after administration. Elemental mapping highlighted the drug distribution differences between healthy and diseased livers. XRF microanalyses showed that in CCl 4 -induced hepatitis, B22956 / 1 has greatly reduced hepatic accumulation, shown as a 20-fold reduction of Gd pres- ence. Furthermore, a significant increase of Fe presence was found in steatotic compared with healthy livers, in line with the disease features. 3. The present results show that XRF might be useful in pre- clinical pharmacological studies with drugs containing exogenous elements. Furthermore, quantitative and high-sensitivity elemen- tal mapping allows simultaneous detection of chemical variation, showing pathological conditions. This approach was useful in suggesting reduced B22956 / 1 accumulation in steatotic livers, thus opening possible new diagnostic perspectives for this drug. Key words: chemical imaging, liver, magnetic resonance imaging contrast agents, X-ray fluorescence. INTRODUCTION X-ray fluorescence (XRF) spectroscopy (XRF) is a powerful tech- nique for qualitative and quantitative chemical imaging in biological specimens. Exploiting the penetrating capability of high-brilliance X-ray synchrotron radiation micro-beams, attogram sensitivity in bio- logical samples has been achieved in microscopy for some transition metals and other biologically relevant trace elements. 1 With labora- tory instrumentation based on conventional X-ray generators coupled to polycapillary lenses, a spatial resolution of the order of some tens of micrometers and a sensitivity of the order of 10 ppm can be reached for selected elements. 2,3 Spatial resolution down to 100 nm can be achieved routinely in micromapping applications with third- generation synchrotron light sources. With the next-generation microprobes under development, a resolution limit of < 30 nm will be achieved. 4–6 The possibility of focusing an incident monochromatic X-ray beam generated by a synchrotron source enables spatially-resolved XRF microspectroscopic imaging. This allows simultaneous specific chemical mapping for different elements of interest. Its high spatial resolution and large penetration depth makes synchrotron Radiation XRF (SR-XRF) one of the few techniques capable of quantitative in situ elemental imaging over a range of length scales, from the cellular level to micrometric histological sections. 7 In the present work, we describe the application of XRF in the study of pharmacological biodistribution. In particular, synchrotron radiation (SR) XRF microspectroscopy was used to determine the hepatic disposition of the magnetic resonance imaging (MRI) contrast agent B22956 ⁄ 1, by taking advantage of the presence of the exogenous element gadolinium (Gd). Gadocoletic acid trisodium salt, or B22956 ⁄ 1, is a new Gd-based magnetic resonance (MR) contrast agent that has been formulated to be used as a blood pool agent, as its structure assures high binding to plasma proteins. 8 Pharmacological studies in animal models and in healthy human volunteers have shown that biliary excretion is the primary route of elimination of the contrastographic B22956 ⁄ 1, 9 which is mainly mediated by the canalicular adensosine triphosphate (ATP)-dependent transporter, multidrug resistance-related protein 2 (MRP2; ABCC2). Additionally, we recently reported that the accumulation of this compound in human hepatic cells is mediated Correspondence: Dr Lorella Pascolo, Institute for Maternal and Child Health, IRCCS Burlo Garofolo, Via dell’Istria 65 ⁄ 1, 34137 Trieste, Italy. Email: [email protected] Received 25 October 2010; revision 23 September 2011; accepted 26 September 2011. Ó 2011 The Authors Clinical and Experimental Pharmacology and Physiology Ó 2011 Blackwell Publishing Asia Pty Ltd Clinical and Experimental Pharmacology and Physiology (2011) 38, 834–845 doi: 10.1111/j.1440-1681.2011.05618.x
Transcript of X-ray fluorescence elemental mapping and microscopy to follow hepatic disposition of a Gd-based...
X-ray fluorescence elemental mapping and microscopy to follow hepaticdisposition of a Gd-based magnetic resonance imaging contrast agent
Riccarda Delfino,*† Matteo Altissimo,‡ Ralf Hendrik Menk,§ Roberto Alberti,{ Tomasz Klatka,{
Tommaso Frizzi,{** Antonio Longoni,{ Murielle Salome,†† Giuliana Tromba,§ Fulvia Arfelli,‡‡ Milan
Clai,§§ Lisa Vaccari,§ Vito Lorusso,{{ Claudio Tiribelli* and Lorella Pascolo§***
*Centre for Liver Studies, AREA Science Park, †Department of Pharmaceutical Sciences, University of Trieste, ‡‡Department of
Physics, University of Trieste and INFN, §Synchrotron Trieste S.C.p.A, §§University Hospital Trieste, ***Institute for Maternal
and Child Health, IRCCS Burlo Garofolo, Trieste, {Department of Electronics and Informatics, Politecnico of Milan and INFN,{{Bracco Imaging S.p.A, **XGLab s.r.l., Milan, Italy, ‡CSIRO Materials Science and Engineering, Melbourne, Australia and
††European Synchrotron Radiation Facility, Grenoble, France
SUMMARY
1. Spatially resolved X-ray fluorescence (XRF) spectroscopy
with synchrotron radiation is a technique that allows imaging
and quantification of chemical elements in biological specimens
with high sensitivity. In the present study, we applied XRF tech-
niques at a macro and micro level to carry out drug distribution
studies on ex vivomodels to confirm the hepatobiliary disposition
of the Gd-based magnetic resonance imaging contrast agent
B22956 ⁄1.
2. Gd presence was selectively quantified allowing the determi-
nation of the time dependent disappearance of the drug from
blood and its hepatic accumulation in mice after administration.
Elemental mapping highlighted the drug distribution differences
between healthy and diseased livers. XRF microanalyses showed
that in CCl4-induced hepatitis, B22956 ⁄1 has greatly reduced
hepatic accumulation, shown as a 20-fold reduction of Gd pres-
ence. Furthermore, a significant increase of Fe presence was
found in steatotic compared with healthy livers, in line with the
disease features.
3. The present results show that XRF might be useful in pre-
clinical pharmacological studies with drugs containing exogenous
elements. Furthermore, quantitative and high-sensitivity elemen-
tal mapping allows simultaneous detection of chemical variation,
showing pathological conditions. This approach was useful in
suggesting reduced B22956 ⁄1 accumulation in steatotic livers,
thus opening possible new diagnostic perspectives for this drug.
Key words: chemical imaging, liver, magnetic resonance
imaging contrast agents, X-ray fluorescence.
INTRODUCTION
X-ray fluorescence (XRF) spectroscopy (XRF) is a powerful tech-
nique for qualitative and quantitative chemical imaging in biological
specimens. Exploiting the penetrating capability of high-brilliance
X-ray synchrotron radiation micro-beams, attogram sensitivity in bio-
logical samples has been achieved in microscopy for some transition
metals and other biologically relevant trace elements.1 With labora-
tory instrumentation based on conventional X-ray generators coupled
to polycapillary lenses, a spatial resolution of the order of some tens
of micrometers and a sensitivity of the order of 10 ppm can be
reached for selected elements.2,3 Spatial resolution down to 100 nm
can be achieved routinely in micromapping applications with third-
generation synchrotron light sources. With the next-generation
microprobes under development, a resolution limit of < 30 nm will
be achieved.4–6
The possibility of focusing an incident monochromatic X-ray
beam generated by a synchrotron source enables spatially-resolved
XRF microspectroscopic imaging. This allows simultaneous specific
chemical mapping for different elements of interest. Its high spatial
resolution and large penetration depth makes synchrotron Radiation
XRF (SR-XRF) one of the few techniques capable of quantitative
in situ elemental imaging over a range of length scales, from the
cellular level to micrometric histological sections.7
In the present work, we describe the application of XRF in the
study of pharmacological biodistribution. In particular, synchrotron
radiation (SR) XRF microspectroscopy was used to determine the
hepatic disposition of the magnetic resonance imaging (MRI)
contrast agent B22956 ⁄1, by taking advantage of the presence of the
exogenous element gadolinium (Gd).
Gadocoletic acid trisodium salt, or B22956 ⁄1, is a new Gd-based
magnetic resonance (MR) contrast agent that has been formulated to
be used as a blood pool agent, as its structure assures high binding to
plasma proteins.8 Pharmacological studies in animal models and in
healthy human volunteers have shown that biliary excretion is the
primary route of elimination of the contrastographic B22956 ⁄1,9
which is mainly mediated by the canalicular adensosine triphosphate
(ATP)-dependent transporter, multidrug resistance-related protein 2
(MRP2; ABCC2). Additionally, we recently reported that the
accumulation of this compound in human hepatic cells is mediated
Correspondence: Dr Lorella Pascolo, Institute for Maternal and Child
Health, IRCCS Burlo Garofolo, Via dell’Istria 65 ⁄ 1, 34137 Trieste, Italy.
Email: [email protected]
Received 25 October 2010; revision 23 September 2011; accepted 26
September 2011.
� 2011 The Authors
Clinical and Experimental Pharmacology and Physiology
� 2011 Blackwell Publishing Asia Pty Ltd
Clinical and Experimental Pharmacology and Physiology (2011) 38, 834–845 doi: 10.1111/j.1440-1681.2011.05618.x

by liver-specific transport proteins (organic anion transporting poly-
peptide (OATP) transporters, particularly OATP1B3),10 and thus is
potentially affected in those diseases where the expression of these
transporters is changed.11 In animal models, it was reported that is
chaemia in mice produces a marked reduction in the expression of
both basolateral passive transporters (including oatps) and canalicular
export pumps (including Mrp2).12 In rodents, liver dysfunction
induced by CCl4 administration causes altered hepatic elimination of
different drugs, in particular reduced biliary excretion of organic
anions, and seems to be partially related to changed expression of
organic anion transporters.13,14 With regard to MRI contrast agent
categories, which are mainly organic anions, it was reported that the
contrast agent Gd-BOPTA has decreased biliary excretion and modi-
fied hepatic distribution in rats with final stage biliary cirrhosis.9,15
Similarly, in clinical practice with Gd-BOPTA, an altered signal
enhancement has been reported in some benign hepatic diseases (as
focal fatty infiltration), potentially in concurrence with altered accu-
mulation of the contrast agent in hepatocytes.16 Magnetic resonance
imaging is highly effective in detecting hepatic anatomical dysfunc-
tions and neoplastic lesions, especially when Gd-based contrast
agents are used. However, the limited spatial resolution of MRI does
not allow determination of whether these commercial Gd complexes
are really accumulated differently in healthy and diseased hepato-
cytes. Solving this issue would be of particular diagnostic interest if it
shows specific change in hepatic disposition during the early stages
of both benign and malign diseases. In the present study, we suggest
the use of XRF imaging at two length scales to clarify the major
features of Gd complex distribution in mouse liver.
We report on the time-dependent hepatic disposition of B22956 ⁄ 1
in mice, and the different accumulation in healthy and CCl4-treated
animals. SR-XRF microscopy on histological slices is also described,
that correlates the contrast agent distribution and some endogenous
element changes with the pathological condition. The possibility of
imaging Gd concentration with high spatial resolution at the intracel-
lular level in tissue is reported.
METHODS
Chemicals and materials
Gadocoletic acid trisodium salt (Bracco code B22956 ⁄ 1), which is a trisodium
salt derivative of gadopentetate, was synthesized by methods described previ-
ously.15 B22956 ⁄ 1 was pharmaceutically formulated as sterile and apyrogenic
0.25 mol ⁄L (39.25 mg ⁄mL of gadolinium) aqueous solution for injections
without additional eccipients. Different dilutions in water of the B22956 ⁄ 1
stock solutions were prepared in order to achieve a final concentration ranging
from 10 mg ⁄mL to approximately 1 lg ⁄mL to be used for quantitative cali-
bration of XRF measurements.
500-nm thick silicon nitride membranes, with an area of 1 mm2, fabricated
by means of a standard combination of ultraviolet lithography, dry and wet
etching, were kindly provided by the LILIT group (TASC-INFM Nanolitho-
graphy beamline at the Elettra). All other chemicals, unless otherwise speci-
fied, were purchased from Sigma-Aldrich (Milan, Italy).
Animal studies
Female CBA mice weighing 20–25 g were used for the present study. Ani-
mals were housed in standard plastic cages at a constant temperature of 22�C,
with a 12-h light-dark cycle and ad libitum access to water and standard
mouse diet. The colony was maintained specific-pathogen free in the animal
house of the University of Trieste. All the experimental procedures were
carried out in accordance with the Animal Care and Use guidelines of the eth-
ics Committee of The University of Trieste.
To carry out pharmacokinetic studies, six animals were given 0.2 mg ⁄ g of
B22956 ⁄ 1 (0.189 lmol ⁄ g bodyweight) by injection in the tail vein. At 5, 15
and 30 min after the injection, two mice were killed by cervical dislocation
and 200 lL of venous blood were collected into heparinized tubes. At the
same times, the liver and other organs were explanted rapidly from carcasses,
rinsed extensively with PBS, immediately frozen in M-1 embedding medium
(Thermo Shandon, Pittsburgh, PA, USA) and stored at )20�C until section-
ing. The experiment was carried out in duplicate.
To induce steatosis in mice, CCl4 administration was selected as a well-
characterized and widely available model of hepatocellular injury.17 Three
animals were given 1 lL ⁄ g of CCl4 dissolved in corn oil i.p. whereas control
animals received an equal volume of corn oil only (100 lL). All animals
treated with CCl4 developed steatosis.
A total of 24 h later, the animals were given 0.2 mg ⁄ g of B22956 ⁄ 1 by
injection in the tail vein, as described before. At 15 min after the injection, the
mice were killed and samples were collected. The tissue samples analysed at
Elettra were prepared by removing the excess of embedding medium and slic-
ing the sample with a cryostat at )18�C ⁄)20�C (Leica Microsystems GmbH,
Wetzlar, Germany). The samples were cut to dimensions of 0.9 cm · 0.9
cm · 0.5 cm in order to be housed in an appropriate plastic support of exter-
nal dimensions 1 cm · 1 cm · 0.5 cm. As a result of the particular morpho-
logy of mouse liver, the left lobe was selected for quantitative measurement,
allowing a better estimate of the overall organ distribution, whereas the centro-
lobular portion including the gallbladder was preferred for XRF mapping in
order to monitor possible biliary excretion.
Then, 5-lm sections of frozen liver tissue were mounted on silicon nitride
windows and air-dried. Each specimen was mounted into the ID-21 Scanning
X-ray Microscope vacuum chamber, at the European Synchrotron Radiation
Facility (ESRF), Grenoble (France).
Histological examination
For the histological analysis, 5-lm sections of the frozen liver tissue were
mounted on glass slices and air-dried. Samples were stained after standard
procedures utilizing haematoxylin–eosin solution for cryostatic sections and
analysed using a Leica microscope (Leica Microsystems GmbH).
Description of XRF experimental set-up at SYRMEP (Elettra)
At the SYRMEP beamline of the Elettra synchrotron light source in Trieste
(Italy),18 XRF spectra were obtained by utilizing a collimated
(500 lm · 500 lm for element mapping) monochromatic X-ray beam with
an incident photon energy of 9 keV.
A compact detection module equipped with a high-performance X-ray sen-
sor was developed by the authors. This includes a new 10-mm2 ‘droplet type’
SiliconDrift Detector (SDD) cooled by a Peltier element to a temperature lower
than 0�C.2,19 The fluorescence detection system has a spectroscopic resolution
of 133 eV (FWHM) at the Mn Ka line (5.89 keV) and a peak-to-background
ratio of approximately 800.3 Its sensitivity allows the identification of chemical
elements with atomic numbers above Z = 11 (Na) and the presence of trace
elements down to approximately 1 ppm. In order to minimize the Compton
background, the detector was mounted perpendicular to the incident beamwith
a detector-to-sample distance of 3 cm. A charge-coupled device camera down-
stream of the sample was used to monitor the beam-sample alignment
(Fig. S1a, in supplementary material). A custom developed readout, control
and acquisition unit,4 specially designed for elemental mapping applications,
allowed automatic mesh scans of selected areas with online data visualization
and other features, such as energy calibration and emission peak identification.
Tissue and blood XRF quantification, XRF tissue mapping
In order to quantify Gd concentrations, the system at the SYRMEP beamline
was calibrated using different solutions of B22956 ⁄ 1 ranging from
6.73 lg ⁄mL (6.37 lmol ⁄L) to 67.3 mg ⁄mL (63.7 mmol ⁄L), which translates
� 2011 The Authors
Clinical and Experimental Pharmacology and Physiology � 2011 Blackwell Publishing Asia Pty Ltd
XRF imaging and Gd-B22950 agent 835

into Gd concentrations ranging from 1 lg ⁄mL to 10 mg ⁄mL. The calibration
solutions, as well as the blood samples, were enclosed in plastic test tubes and
were analysed using a collimated, monochromatic X-ray beam at a photon
energy of 9 keV and with a spatial extension of 8 · 2 mm at the sample posi-
tion. The beam energy was chosen to be slightly above the L12s-edge of Gd
(8.376 keV) in order to optimize the excitation efficiency for this element.19
Blood samples were analysed using the same geometry as that used for the
system calibration. For quantitative measurements, liver samples were also
analysed using a similar geometry.
During imaging, liver samples accommodated in their plastic supports
(1 · 1 · 0.5 cm) were installed on an XY motorized translation stage con-
trolled by the computer that also controlled the measurement procedure and
data acquisition. The samples were enclosed in a semi-open hood flooded with
dry nitrogen and cooled by a thermoelectric Peltier element. In this case, the
9 keV X-ray excitation beam was collimated down to 500 · 500 lm at
the sample position. Typically, the samples were raster scanned using a
pitch of 500 lm in both directions and covering an area of 10 · 10 cm. The
dwell time per point ranged from 30 to 60 s.
Micro XRF elemental analysis
The Micro XRF element analyses were carried out at the ID 21 beamline of
the ESRF using a set-up that has been described previously.20 A monochro-
matic X-ray beam was focused onto the sample. The photon energy of the
X-rays was set to 7.3 keV, which is the highest energy available at this beam-
line. The spot size was either 2 lm · 2 lm or 500 nm · 500 nm. The sample
was mounted on a custom XYZ stage, tilted by 30� from the optical axis,
facing a Ge fluorescence detector placed at 3.5 cm from the sample. A photo-
diode was placed downstream of the sample, slightly off axis. This allowed
the collection of transmission data, while simultaneously collecting the fluo-
rescence signal, as described previously.21,22 Fig. S1b in the supplementary
material shows the experimental set-up.
Images were acquired by raster scanning the samples through the stationary
beam. The step size ranged from 0.5 to 2 lm and the dwell time was
2 s ⁄ pixel. The fluorescence images were then processed with the PyMCA
software, which allows the extraction of qualitative and quantitative data. Rel-
ative quantifications are obtained from internal software calibration, setting
sample (composition and thickness) and measuring parameters,23 as we previ-
ously reported.24
Software
At Elettra, data acquisition was carried out using the PoliMiMCA software
developed by Politecnico di Milano (Milan, Italy) and Matlab (The Math-
Works, Natick, MA, USA) was used for data processing.
At ESRF, the PyMCA software23 developed by the Beamline Instrumenta-
tion Software Support group (BLISS) of the ESRF was used for micro XRF
spectra acquisition and analysis.
Statistical analysis
Results are expressed as the mean ± SD (standard deviation) of three assays
(two in one case) per condition. Statistical analysis was carried out using anal-
ysis of variance combined with Student’s two-tailed t-test. Differences among
the conditions were considered significant at P < 0.05. Correlations between
elemental maps were evaluated using Pearson’s linear correlation coefficient,
which shows the strength of a linear relationship between two variables. The
correlation coefficient, R, is a scalar quantity in the interval ()1.0, 1.0) and is
defined as the ratio of the covariance of the sample populations to the product
of their standard deviations. It is a direct measure of how well two sample
populations vary jointly. A value of R close to +1 or )1 shows a high degree
of correlation and a good fit to a positive or negative linear model. A value of
R close to 0 shows a poor fit to a linear model. In order to describe the homo-
geneity of an elemental map, the relative error rR defined as the mean value
of the image photon counts divided by the standard deviation has been intro-
duced, which can be compared with the relative error as a result of Poisson
(photon) statistics rP. A map with (rP ⁄rR)2 > 40% is considered homo-
geneous.
RESULTS
Quantitative kinetics of B22956 ⁄1 in blood, liver and tissues of
healthy mice by XRF means
The system calibration for the data acquired at Elettra (Fig. S2)
shows that under the described experimental conditions and geome-
try, the minimum detection limit is 5 lg ⁄mL of Gd, corresponding to
33.63 lg ⁄mL (31.85 lmol ⁄L) of contrast agent. The applied condi-
tions allowed analysis of both blood samples and frozen tissue
samples.
The pharmacokinetic distribution curves were determined by col-
lecting mouse liver and blood samples at 5, 15 and 30 min after i.v.
injection of a single dose of B22956 ⁄1 (0.189 lmol ⁄g). Different
experiments were carried out in at least three periods of beamtime
scheduled at Elettra, which gave comparable results. In Fig. 1, we
report the results for the distribution curves of B22956 ⁄1 in the liver
(Fig. 1a) and in blood (Fig. 1b) from healthy mice. It can be seen that
the Fe signal in the blood spectra is as prominent as expected (Fe Ka
at 6.4 keV and Fe Kb at 7.06 keV) and partially overlapping the Gd
L peaks. In the liver, the Fe signal is lower whereas the Gd peak
remained almost the same.
Only the Gd concentration can be quantified. Other elemental vari-
ations are only qualitative, as they have not been specifically cali-
brated. The pharmacokinetic trend reported in Fig. 1c shows a rapid
disappearance in blood, where the first registered B22956 ⁄1 concen-
tration (5 min) is approximately 583.4 lmol ⁄L, decreasing to 83%
(485.7 lmol ⁄L) and 25% (146.5 lmol ⁄L) at 15 and 30 min respec-
tively. In agreement with the main biliary elimination of B22956 ⁄ 1
already reported, a rapid and time-dependent accumulation in the
liver was registered; the XRF measurements showed concentrations
of 305.7 lmol ⁄L, 790.4 lmol ⁄L and 785.3 lmol ⁄L at 5, 15 and
30 min, respectively.
XRF analyses on spleen and kidney samples of the animals given
the contrast agent (data not shown) showed undetectable or negligi-
ble presence of Gd.
Animal model of hepatitis (early steatosis)
The induction of liver steatosis by CCl4 treatment was verified by
both histological examination of liver tissue and assessment of serum
enzyme activities. As shown in Fig. 2, compared with the control
(Fig. 2a), the liver of a CCl4-treated mouse (Fig. 2b) presents marked
signs of steatosis and initial necrotic processes. The hepatocytes of
steatotic tissue are increased in size with the presence of many lipid
vacuoles in the cytoplasm. In agreement with a poisoning hepatitis,
necrotic cells are widely spread within the tissue and are not limited
to the perivascular area.
Serum enzymes for hepatobilary disease confirmed the pathologi-
cal model for the CCl4-treated mice; aspartate aminotransferase
(AST) and alanine aminotransferase (ALT) activities have values that
are 100-fold (22 624 vs 223 UI ⁄mL) and 464-fold (23 672 vs
51 UI ⁄mL) the normal upper limit. No significant variation was
found for cGT (1 vs 0 UI ⁄mL, CCl4-treated vs normal mouse).
Figure 1d shows blood spectra acquired in healthy and steatotic
animals at 15 min after B22956 ⁄ 1 was given. In line with the
� 2011 The Authors
Clinical and Experimental Pharmacology and Physiology � 2011 Blackwell Publishing Asia Pty Ltd
836 R Delfino et al.

reduced hepatic function, a higher level of Gd was detected in the
blood of steatotic animals, showing prolonged presence of B22956 ⁄ 1
and decelerated excretion.
Elemental mapping in healthy and steatotic mouse livers
In Fig. 3, the elemental analysis of a healthy liver specimen is shown.
The leftmost upper panel shows an optical image of the tissue sample
containing the gallbladder region inserted in a plastic frame. The ele-
mental distribution profile is obtained as a result of a deconvolution
of the fluorescence spectra. Because it was not possible to obtain
calibrated concentrations for these element maps, the pixel values of
the latter were normalized to the maximum of the K map using the
following algorithm, where m(x,y) and p(x,y) denote the measured
and the normalized pixel value of an elemental map at the position
x,y, respectively:
(b)
(a)
Fig. 2 Steatotic model: histological analyses and blood distribution. Histo-
logical analyses of 5-lm frozen sections of (a) steatotic and (b) healthy mouse
liver. Slices were stained with haematoxylin–eosin solution for cryostatic
sections and analysed using a Leica microscope (magnification: · 100).
(a)
(b)
(c)
(d)
Fig. 1 Kinetics of distribution for B22957 ⁄ 1 in mouse blood and organs. (a)
The liver spectra acquired at 5 (black), 15 (red) and 30 m (green) after the i.v.
injection of 0.189 lmol ⁄ g bodyweight of B22956 ⁄ 1. X-ray beam energy 9
keV, spot size approximately 500 · 500 lm. (b) Spectra acquired from blood
samples at the same times. X-ray excitation 9 keV, spot size approximately
8 · 2 mm. (c) Pharmacokinetic trend of B22957 ⁄ 1 in blood (¤) and liver
(•) according to the calibrated Gd content. The means and standard deviation
of six animals (three measurements each) are shown. (d) The blood spectra of
healthy (black) and steatotic (grey) mice. Blood was collected 15 min after
i.v. injection of 0.189 mmol ⁄ kg of B22956 ⁄ 1. X-ray beam 9 keV, spot size
approximately 500 · 500 lm.
b
� 2011 The Authors
Clinical and Experimental Pharmacology and Physiology � 2011 Blackwell Publishing Asia Pty Ltd
XRF imaging and Gd-B22950 agent 837

pðx; yÞ ¼ maxðKÞ �mðx; yÞ �minðmÞ
maxðmÞ �minðmÞ
Furthermore, max(K) is the maximum value found in the K map
and min(m) and max(m) are the minimum ⁄maximum values found
in the respective elemental map.
In healthy livers, a clear co-localization of S, Gd, K and Ca in the
gallbladder portion was found, which could be statistically proven by
the correlation coefficient R between the different element popula-
tions in this region of interest. The following correlations were found:
Gd � Ca (R = 0.721), Gd � K (R = 0.762) and Gd � S
(R = 0.885). It can be seen that Fe is very low Gd � Fe (R = 0.042)
in this area, whereas it is quite homogeneously distributed in the
healthy liver tissue (rR = 0.06, rR being the relative error defined as
the mean value of the image values divided by the standard deviation.
The relative error as a result of Poisson (photon) statistics is
rP = 0.04). The high concentration of Gd in the gallbladder shows
the presence of B22956 ⁄1 and is clearly related to the biliary elimina-
tion process of the drug. The intensity of the signal is strongly related
to tissue thickness (as verified by X-ray beam absorption analyses),
whereas concomitant high concentrations of Fe and Gd in the same
zones seem related to hidden vessels and ⁄or blood stagnation.
Because samples were prepared by rapid freezing of excised organs,
residual drug in the blood could affect, to a certain extent, the quanti-
tative measures and maps. This is particularly true in the central
region of the organ, where many vessels are present. Some abnormal-
ities in the K (and Cl) distribution, which extended over tissue bor-
ders, are a result of the presence of K and Cl containing embedding
medium used in the sample preparation.
When elemental analyses are carried out in the steatotic mouse
liver (Fig. 4), the mapping, which is the result of a deconvolution of
fluorescence spectra profile, appears less homogeneous as expected
for an injured tissue (rR = 0.21 instead of rR = 0.06) and high
intensity areas appear for elements, such as Ca, K, and Fe. The corre-
lation coefficients, R, between those maps and the Gd map are
Gd � Ca (R = 0.789), Gd � K (R = 0.772), Gd � Fe (R = 0.740).
Only for Gd � S (R = 0.03) do the populations seem to be less corre-
lated. The gallbladder was included in this sample (Fig. 4a).
(a) (b) (c)
(d) (e) (f)
Fig. 3 Macro-elemental mapping in healthy mouse liver 15 min after B22956 ⁄ 1 was given. Synchrotron radiation X-ray fluorescence elemental scan, 9.0 keV
X-ray beam energy, frozen section of healthy mouse liver at 15 min after B22956 ⁄ 1 was given. (a) Optical image of a central portion of the organ, 50–100 lm
below the scanned area (cryostatic excision) and exposing the gallbladder region (1 · 1 · 0.5 cm). Same sample, single element maps of (b) iron, (c) calcium, (d)
potassium, (e) gadolinium and (f) sulphur. Scanned area: 9 · 9 mm, 500 lm pitch, acquisition time 60 s ⁄ pixel. The colour table is the relative count intensity
scaled to the maximum intensity of the K map. Bar, 2 mm for all images.
� 2011 The Authors
Clinical and Experimental Pharmacology and Physiology � 2011 Blackwell Publishing Asia Pty Ltd
838 R Delfino et al.

As expected, K, S and Gd co-localize in the gallbladder area, where
the high concentration of Ca could be indicative of some biliary
excretion impairment.
Micro XRF elemental analysis in histological mouse liver
specimens
Quantitative micro XRF microscopy (under vacuum) was carried out
on liver slices from healthy and steatotic mice after treatment with
B22956 ⁄ 1. The microscope imaging end-station at ID21 of the ESRF
allows optical imaging at a micrometric level, before and during the
XRF measurements. As shown in Figs 5a,6a, images of the analysed
regions were also acquired using an external visible light microscope.
Elemental mapping was obtained by deconvolving the X-ray fluores-
cent signals with PyMca software.
Fig. 5 shows the elemental mapping of P, S, Cl, K, Ca, Gd and Fe
in a 100 · 100-lm section of the liver sample from a healthy mouse
15 min after administration of B22956 ⁄1. The sample analysed is a
reduced slice of a specimen considered in the pharmacokinetic curve
of Fig. 1. Elemental mapping shows that all the elements are concen-
trated in the hepatic cells. Interestingly, the high signals of Gd associ-
ate with high P (R = 0.762 for Gd � P) and S (R = 0.739 for Gd
� S) signals, suggesting that the Gd-based drug uptake depends on
cell density in the tissue.
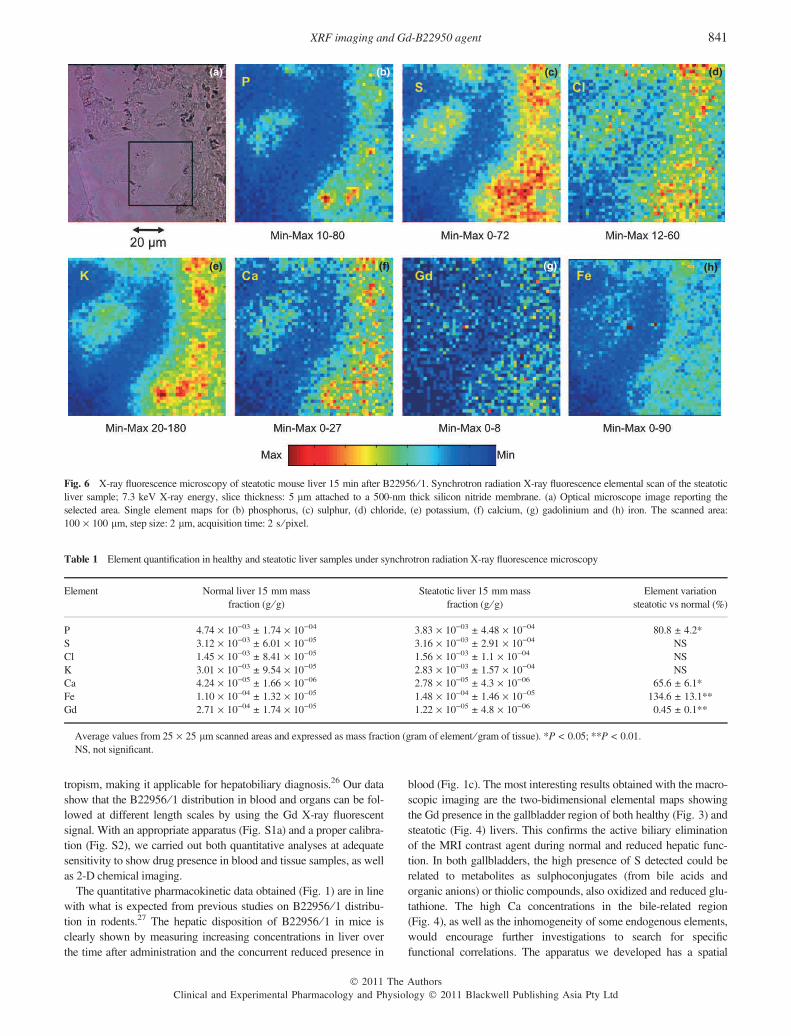
In Fig. 6, microscopic XRF analyses are shown in a liver sample
from a CCL4-treated mouse 15 min after administration of
B22956 ⁄1. Compared with the data in Fig. 5, the steatotic tissue
shows a clearly decreased concentration of Gd with respect to P and
S abundance (R = 0.601 for Gd � P and R = 0.511 for Gd � S).
To better appreciate variations in elemental concentrations, differ-
ent regions of interest of the liver specimen sections reported in
Fig. 5 (two areas of a single tissue) and Fig. 6 (three areas of a single
tissue) with the same dimension of 25 · 25 lm2 were analysed by
the MAPS software and compared in terms of total mass fraction
concentration of the different elements (Table 1). Quoted are the
mean values of the counts within these regions of interest, which are
proportional to the element concentration. Subsequently, the standard
error was calculated as the square root of the variance from the mean.
A theoretical matrix composition was considered to normalize
and calibrate signal intensities and thus obtain a semi-quantitative
(a) (b) (c)
(d) (e) (f)
Fig. 4 Macro-elemental mapping in steatotic mouse liver 15 min after B22956 ⁄ 1 was given. Synchrotron radiation X-ray fluorescence elemental scan elemental
scan, 9.0 keV X-ray energy, frozen section of steatotic mouse liver 15 min after B22956 ⁄ 1 was given. (a) Optical image 50–100 lm below the mapped area
(cryostatic excision) highlighting inclusion of the gallbladder region. The sample is not inserted into the plastic frame. Single element maps for (b) iron, (c) cal-
cium, (d) potassium, (e) gadolinium and (f) sulphur. Scanned area: 9 · 9mm, 500 lm pitch, acquisition time 60 s ⁄ pixel. The colour table is the relative count
intensity scaled to the maximum intensity of K map. Bar, 2 mm for all images.
� 2011 The Authors
Clinical and Experimental Pharmacology and Physiology � 2011 Blackwell Publishing Asia Pty Ltd
XRF imaging and Gd-B22950 agent 839

evaluation of the elements.24 As shown in Table 1, P, Ca, Fe and Gd
are the elements with the highest changes when comparing average
values in healthy and steatotic tissues. Although there is apparently
no change in the S content in the steatotic versus healthy sample
(P > 0.1), there is a trend towards a decrease in the P ⁄S ratio
(1.21 ± 0.21 vs 1.52 ± 0.14, P < 0.05), which is an indicator of cel-
lular state. From average data, Gd presence in the steatotic liver is
estimated to be 95% lower compared with normal liver areas. The
concurrent increase of Fe presence (35%) and the decrease of Ca
(30%) are also significant.
The content of P in biological samples, as a constituent of non-
diffusible solutes, nucleic acids and cell membranes, has been
previously correlated with cell mass and density in studies using
X-ray microanalyses.25 The apparent decrease could partially reflect
the extensive structural damage in steatotic tissue. Similar calcula-
tions have been carried out on remaining tissue samples (steatotic vs
control) from all animals (two steatotic and two healthy animals at
15 min after administration). Similar variations of the Gd (85–95%
reduction in steatotic vs normal) and Fe (30–40% increase in steatotic
vs normal) content were estimated. Because results were obtained
during different beamtimes with slightly different experimental set-
ups (detection efficiency and beam intensity), results are not very
comparable in terms of total counts and are therefore not grouped in
a single table.
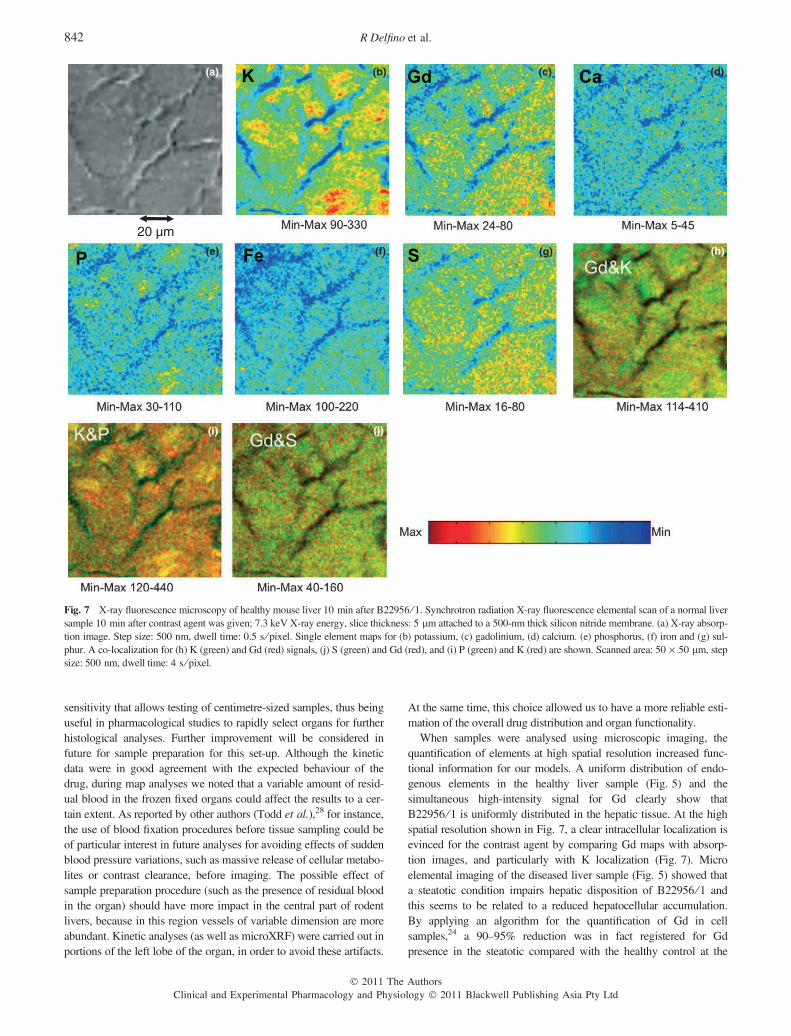
Figure 7 shows micro XRF results at high spatial resolution
(0.5 lm pixel size) of a section of health liver 10 min after B-22956
administration. The X-ray absorption image (Fig. 7a) shows density
variations in the section compatible with cellular matter and intersti-
tial spaces. Potassium, being the most abundant intracellular cation,
delineates the intracellular spaces in the tissue section. The gadolin-
ium map (Fig. 7c), particularly when compared with K distribution,
shows that the element is quite exclusively intracellular (Fig. 7h).
Some signal increases in the K map tend to co-localize, to a certain
extent, with P, and to a lesser extent with other elements, possibly
showing specific intracellular regions of higher density. The other
analysed elemental concentrations, although clearly higher intracellu-
larly, are less specifically localized compared with Gd and K.
DISCUSSION
The present study shows the applicability of XRF techniques for
pharmacological investigations in ex vivo animals as a complemen-
tary method to other analytical and imaging techniques. The com-
pound in the present study is in fact a contrast agent (CA) for one of
the most powerful clinical imaging modalities (MRI). However, MRI
cannot reach the quantitative and spatial sensitivity we obtained with
XRF elemental analyses over the large range of scaling dimensions.
Gd-based MRI CA are complexes with very high stability con-
stants. On administration of pharmacological doses, they are not
metabolized and Gd release from the molecule is prevented during
the normal distribution and elimination times. This has been proven
for the drug used in the present study, which has high hepatic
(a) (b) (c)
(e) (f) (g)
(d)
(h)
Fig. 5 X-ray fluorescence microscopy of healthy mouse liver 15 min after B22956 ⁄ 1. Synchrotron radiation X-ray fluorescence elemental scan of the healthy
liver sample; 7.3 keV X-ray energy, slice thickness: 5 lm attached to a 500-nm thick silicon nitride membrane. (a) Optical microscope image reporting the
selected area. Single element maps for (b) phosphorus, (c) sulphur, (d) chloride, (e) potassium, (f) calcium, (g) gadolinium and (h) iron. The scanned area:
100 · 100 lm, step size: 2 lm, acquisition time: 2 s ⁄ pixel.
� 2011 The Authors
Clinical and Experimental Pharmacology and Physiology � 2011 Blackwell Publishing Asia Pty Ltd
840 R Delfino et al.
tropism, making it applicable for hepatobiliary diagnosis.26 Our data
show that the B22956 ⁄1 distribution in blood and organs can be fol-
lowed at different length scales by using the Gd X-ray fluorescent
signal. With an appropriate apparatus (Fig. S1a) and a proper calibra-
tion (Fig. S2), we carried out both quantitative analyses at adequate
sensitivity to show drug presence in blood and tissue samples, as well
as 2-D chemical imaging.
The quantitative pharmacokinetic data obtained (Fig. 1) are in line
with what is expected from previous studies on B22956 ⁄1 distribu-
tion in rodents.27 The hepatic disposition of B22956 ⁄ 1 in mice is
clearly shown by measuring increasing concentrations in liver over
the time after administration and the concurrent reduced presence in
blood (Fig. 1c). The most interesting results obtained with the macro-
scopic imaging are the two-bidimensional elemental maps showing
the Gd presence in the gallbladder region of both healthy (Fig. 3) and
steatotic (Fig. 4) livers. This confirms the active biliary elimination
of the MRI contrast agent during normal and reduced hepatic func-
tion. In both gallbladders, the high presence of S detected could be
related to metabolites as sulphoconjugates (from bile acids and
organic anions) or thiolic compounds, also oxidized and reduced glu-
tathione. The high Ca concentrations in the bile-related region
(Fig. 4), as well as the inhomogeneity of some endogenous elements,
would encourage further investigations to search for specific
functional correlations. The apparatus we developed has a spatial
(a) (b) (c)
(e) (f) (g)
(d)
(h)
Fig. 6 X-ray fluorescence microscopy of steatotic mouse liver 15 min after B22956 ⁄ 1. Synchrotron radiation X-ray fluorescence elemental scan of the steatotic
liver sample; 7.3 keV X-ray energy, slice thickness: 5 lm attached to a 500-nm thick silicon nitride membrane. (a) Optical microscope image reporting the
selected area. Single element maps for (b) phosphorus, (c) sulphur, (d) chloride, (e) potassium, (f) calcium, (g) gadolinium and (h) iron. The scanned area:
100 · 100 lm, step size: 2 lm, acquisition time: 2 s ⁄ pixel.
Table 1 Element quantification in healthy and steatotic liver samples under synchrotron radiation X-ray fluorescence microscopy
Element Normal liver 15 mmmass
fraction (g ⁄ g)
Steatotic liver 15 mmmass
fraction (g ⁄ g)
Element variation
steatotic vs normal (%)
P 4.74 · 10)03 ± 1.74 · 10)04 3.83 · 10)03 ± 4.48 · 10)04 80.8 ± 4.2*
S 3.12 · 10)03 ± 6.01 · 10)05 3.16 · 10)03 ± 2.91 · 10)04 NS
Cl 1.45 · 10)03 ± 8.41 · 10)05 1.56 · 10)03 ± 1.1 · 10)04 NS
K 3.01 · 10)03 ± 9.54 · 10)05 2.83 · 10)03 ± 1.57 · 10)04 NS
Ca 4.24 · 10)05 ± 1.66 · 10)06 2.78 · 10)05 ± 4.3 · 10)06 65.6 ± 6.1*
Fe 1.10 · 10)04 ± 1.32 · 10)05 1.48 · 10)04 ± 1.46 · 10)05 134.6 ± 13.1**
Gd 2.71 · 10)04 ± 1.74 · 10)05 1.22 · 10)05 ± 4.8 · 10)06 0.45 ± 0.1**
Average values from 25 · 25 lm scanned areas and expressed as mass fraction (gram of element ⁄ gram of tissue). *P < 0.05; **P < 0.01.
NS, not significant.
� 2011 The Authors
Clinical and Experimental Pharmacology and Physiology � 2011 Blackwell Publishing Asia Pty Ltd
XRF imaging and Gd-B22950 agent 841
sensitivity that allows testing of centimetre-sized samples, thus being
useful in pharmacological studies to rapidly select organs for further
histological analyses. Further improvement will be considered in
future for sample preparation for this set-up. Although the kinetic
data were in good agreement with the expected behaviour of the
drug, during map analyses we noted that a variable amount of resid-
ual blood in the frozen fixed organs could affect the results to a cer-
tain extent. As reported by other authors (Todd et al.),28 for instance,
the use of blood fixation procedures before tissue sampling could be
of particular interest in future analyses for avoiding effects of sudden
blood pressure variations, such as massive release of cellular metabo-
lites or contrast clearance, before imaging. The possible effect of
sample preparation procedure (such as the presence of residual blood
in the organ) should have more impact in the central part of rodent
livers, because in this region vessels of variable dimension are more
abundant. Kinetic analyses (as well as microXRF) were carried out in
portions of the left lobe of the organ, in order to avoid these artifacts.
At the same time, this choice allowed us to have a more reliable esti-
mation of the overall drug distribution and organ functionality.
When samples were analysed using microscopic imaging, the
quantification of elements at high spatial resolution increased func-
tional information for our models. A uniform distribution of endo-
genous elements in the healthy liver sample (Fig. 5) and the
simultaneous high-intensity signal for Gd clearly show that
B22956 ⁄1 is uniformly distributed in the hepatic tissue. At the high
spatial resolution shown in Fig. 7, a clear intracellular localization is
evinced for the contrast agent by comparing Gd maps with absorp-
tion images, and particularly with K localization (Fig. 7). Micro
elemental imaging of the diseased liver sample (Fig. 5) showed that
a steatotic condition impairs hepatic disposition of B22956 ⁄1 and
this seems to be related to a reduced hepatocellular accumulation.
By applying an algorithm for the quantification of Gd in cell
samples,24 a 90–95% reduction was in fact registered for Gd
presence in the steatotic compared with the healthy control at the
(a) (b) (c)
(e) (f)
(i) (j)
(g)
(d)
(h)
20 µm
Fig. 7 X-ray fluorescence microscopy of healthy mouse liver 10 min after B22956 ⁄ 1. Synchrotron radiation X-ray fluorescence elemental scan of a normal liver
sample 10 min after contrast agent was given; 7.3 keV X-ray energy, slice thickness: 5 lm attached to a 500-nm thick silicon nitride membrane. (a) X-ray absorp-
tion image. Step size: 500 nm, dwell time: 0.5 s ⁄ pixel. Single element maps for (b) potassium, (c) gadolinium, (d) calcium. (e) phosphorus, (f) iron and (g) sul-
phur. A co-localization for (h) K (green) and Gd (red) signals, (j) S (green) and Gd (red), and (i) P (green) and K (red) are shown. Scanned area: 50 · 50 lm, step
size: 500 nm, dwell time: 4 s ⁄ pixel.
� 2011 The Authors
Clinical and Experimental Pharmacology and Physiology � 2011 Blackwell Publishing Asia Pty Ltd
842 R Delfino et al.

same administration time. Specific reasons for reduced hepatic accu-
mulation are not shown by the present work. They could be con-
nected to a reduced blood supply caused by spreading necrosis
and ⁄or other factors prejudicing normal cellular functions, but this
needs further investigation. An important observation from the results
obtained is that the greatly reduced accumulation of the diagnostic
CA is associated with specific chemical changes in the hepatic tissues
that are symptomatic of cellular malfunction and tissue damage. The
data are particularly relevant when a possible clinical diagnostic
application of B22956 ⁄1 in MRI is considered to highlight morpho-
logical and functional changes of liver under diseased conditions.
The present technical approach could in fact be useful in an expanded
study for trying to associate the concentration of contrast agent accu-
mulation into the hepatocytes with the different early and late states
of cell sufferance.
CCl4 is a chemical that causes strong oxidative conditions and aci-
dosis in hepatocytes and some necrosis, as shown by histological
examination.17 A pH of approximately seven in hepatocytes was
reported in the case of CCl4 administration to rats.29 It is interesting
to note that some elemental variations we found by comparing nor-
mal and diseased liver (Table 1) could be explained by both oxida-
tive stress, acidosis and some cell necrosis. The S ⁄P ratio is generally
considered to reflect cell state, reflecting cell apoptosis progression
and is affected by extensive structural changes.30,31 A possible reduc-
tion in phosphorus spatial distribution could also be related to hepato-
cyte enlargement with increased presence of fat vesicles (Fig. 2) or a
reduced phosphate presence related to acidosis compensation. The
present results seem also to suggest a reduction of Ca in steatotic
liver, which is evident when comparing average quantifications. Fur-
ther investigations are needed to verify if this change can be related
to pH variations and oxidative stress mechanisms of diseased liver.
In Table 1, we also report that liver steatosis, when induced by
poisoning, causes a large Fe accumulation in hepatic tissue. This has
already been reported by other authors using a different approach.32
Thus, the present results confirm the previous evidence suggesting
the potential for using XRF microscopy for quantitative assessment
of the phenomena in experimental models or biopsies.
Chemical imaging represents an important challenge in biological
studies, as in principle, it could allow investigations of tissue damage,
cellular homeostasis parameters and cycle checkpoints, as well as dis-
turbed regulations. For instance, XRF has recently been used to eluci-
date the role of Fe, Zn or Co in neurons during neurodegenerative
diseases.33,34 The same trace elements were investigated in the liver
to characterize colorectal liver metastases over surrounding normal
livers.35 It should also be noted that gadolinium detection by syn-
chrotron XRF microscopy in human skin histological samples has
recently been applied in the study and diagnosis of a rare disease
associated with the administration of Gd-based CA in renal
patients.36 Other studies have also shown that these techniques are
useful to investigate Gd-based MRI and novel nanoparticles at single
cell and tissue level.37,38 Certainly, the ionizing nature of X-rays puts
some constraints on biomedical applications. The administered radia-
tion dose varies from 5 lGy for our low-resolution samples up to 106
Gy for the high-resolution samples. The latter is certainly too high
for in vivo applications; however, it is feasible for ex vivo studies. For
the quoted radiation doses, we have not observed any alteration of
the tissue as a result of the influence of the ionizing radiation, even
for the high-resolution mapping. In fact, repetitive element mapping
of the same sample delivered similar results (P � 0.01).
One drawback of synchrotron imaging, however, is the limited
access to the facilities, which does not allow large series of samples
to be analysed and longitudinal or repetitive measurements. How-
ever, the advantages of high sensitivity, chemical speciation and
mapping allow unique information to be obtained, thus facilitating
further investigations and speculations.
Overall, the present results show that SR-XRF elemental mapping
represents a new tool and a challenge in pharmacological and toxico-
logical investigations in animal models. We have shown that both
pharmacological distribution studies and diagnostic investigations
could greatly benefit from these X-ray spectroscopy techniques. The
possibility of investigating different length scales enables the moni-
toring of drug targeting from the organ to the cellular level, while
simultaneously correlating it with its physical and pathological status.
These techniques could thus open new perspectives and understand-
ing in hepatological and pharmacological research.
ACKNOWLEDGEMENTS
The authors acknowledge Marco Stebel for technical assistance in
animal studies. RD was recipient of a fellowship supported by a
MIUR grant (FIRB 2005-2009 RBIN04HC3S). We thank Kevin
Prince for careful reading of the manuscript.
REFERENCES
1. Fahrni CJ. Biological applications of X-ray fluorescence microscopy:
Exploring the subcellular topography and speciation of transition metals.
Curr. Opin. Chem. Biol. 2007; 11: 121–7.
2. Alberti R, Fiorini C, Guazzoni C et al. Performance Evaluation of an
Advanced XRF Elemental Mapping System Featuring a Novel Ring-
Shaped Monolithic Array of Silicon Drift Detectors. IEEE Trans.-
Nucl.Sci. 2007; 54: 751–7.
3. Alberti R, Guazzoni C, Klatka T, Longoni A, Fiorini C. Elemental Map-
ping by means of an Ultra-fast XRF Spectrometer based on a novel
high-performance monolithic array of Silicon Drift Detectors. Nucl.
Instrum.and Meth. B 2007; 580: 1004–7.
4. Alberti R, Guazzoni C, Klatka T. USB 2.0 data acquisition system for
high-speed X-ray elemental mapping. JINST 2008; 3: P03004.
5. Kang HC, Yan H, Winarski RP et al. Focusing of hard x-rays to 16
nanometers with a multilayer Laue lens. Appl. Phys. Lett. 2008; 92:
221114.
6. Paunesku T, Vogt S, Maser J, Lai B, Woloschak G. X-ray fluorescence
microprobe imaging in biology and medicine. J. Cell. Biochem. 2006;
99: 1489–502.
7. Corezzi S, Urbanelli L, Cloetens P et al. Synchrotron-based X-ray fluo-
rescence imaging of human cells labeled with CdSe quantum dots. Anal.
Biochem. 2009; 388: 33–9.
8. Setti I, Celeste R, Mariani G, Dal FD, Morisetti A, Lorusso V. High-per-
formance liquid chromatographic determination of the magnetic reso-
nance imaging contrast agent Gadocoletate ion in human plasma, urine
and faeces. J. Chromatogr. B Analyt. Technol. Biomed. Life Sci. 2006;
835: 1–15.
9. Lorusso V, Pascolo L, Fernetti C, Anelli PL, Uggeri F, Tiribelli C. Mag-
netic resonance contrast agents: From the bench to the patient. Curr.
Pharm. Des. 2005; 11: 4079–98.
10. Libra A, Fernetti C, Lorusso V et al. Molecular determinants in the
transport of a bile acid-derived diagnostic agent in tumoral and nontu-
moral cell lines of human liver. J. Pharmacol. Exp. Ther. 2006; 319:
809–17.
11. Kojima H, Nies AT, Konig J et al. Changes in the expression and locali-
zation of hepatocellular transporters and radixin in primary biliary
cirrhosis. J. Hepatol. 2003; 39: 693–702.
� 2011 The Authors
Clinical and Experimental Pharmacology and Physiology � 2011 Blackwell Publishing Asia Pty Ltd
XRF imaging and Gd-B22950 agent 843
12. Tanaka Y, Chen C, Maher JM, Klaassen CD. Kupffer cell-mediated
downregulation of hepatic transporter expression in rat hepatic ische-
mia-reperfusion. Transplantation 2006; 82: 258–66.
13. Aleksunes LM, Scheffer GL, Jakowski AB, Pruimboom-Brees IM,
Manautou JE. Coordinated expression of multidrug resistance-associ-
ated proteins (Mrps) in mouse liver during toxicant-induced injury. Toxi-
col. Sci. 2006; 89: 370–9.
14. Song IS, Lee YM, Chung SJ, Shim CK. Multiple alterations of canalicu-
lar membrane transport activities in rats with CCl(4)-induced hepatic
injury. Drug Metab. Dispos. 2003; 31: 482–90.
15. Cavagna FM, Lorusso V, Anelli PL, Maggioni F, de HC. Preclinical
profile and clinical potential of gadocoletic acid trisodium salt
(B22956 ⁄ 1), a new intravascular contrast medium for MRI. Acad.
Radiol. 2002; 9(Suppl 2): S491–4.
16. Marin D, Iannaccone R, Catalano C, Passariello R. Multinodular focal
fatty infiltration of the liver: Atypical imaging findings on delayed T1-
weighted Gd-BOPTA-enhanced liver-specific MR images. J. Magn.
Reson. Imaging 2006; 24: 690–4.
17. Okumura H, Katoh M, Minami K, Nakajima M, Yokoi T. Change of
drug excretory pathway by CCl4-induced liver dysfunction in rat. Bio-
chem. Pharmacol. 2007; 74: 488–95.
18. Arfelli F, Assante M, Bonvicini V et al. Low-dose phase contrast x-ray
medical imaging. Phys. Med. Biol. 1998; 43: 2845–52.
19. Alberti R, Fiorini C, Guazzoni C et al. Feasibility evaluation of the
application of Silicon Drift Detectors in studies of drug delivery in
liver. Proc. IEEE Nucl. Sci. Symp. 2006; 3: 1528–32.
20. Chaurand P, Rose J, Briois V et al. New methodological approach for
the vanadium K-edge X-ray absorption near-edge structure interpreta-
tion: Application to the speciation of vanadium in oxide phases from
steel slag. J. Phys Chem. B 2007; 111: 5101–10.
21. Kaulich B, Wilhein T, Di FE et al. Differential interference contrast
x-ray microscopy with twin zone plates. J. Opt. Soc. Am. A Opt. Image
Sci. Vis. 2002; 19: 797–06.
22. Susini J, Salome M, Fayard B, Ortega R, Kaulich B. The scanning
X-ray microprobe at the ESRF. Surf. Rev. Lett. 2002; 9: 203–11.
23. Sole A, Papillon E, Cotte M, Walter P, Susini J. A multiplatform code
for the analysis of energy-dispersive X-ray fluorescence spectra. Spec-
trochim. Acta 2007; 62: 63–8.
24. Altissimo M, Pascolo L, Delfino R, Salome M, Lorusso V. Tracing
exogenous Gd and its effects in single Chang cells. Nucl. Instr. and
Meth. A 2010; 619: 348–52.
25. Bowler JM, McLaughlin CW, Butt AG, Purves RD, Macknight AD.
Effects of voltage clamping on epithelial cell composition in toad uri-
nary bladder studied with x-ray microanalysis. J. Membr. Biol. 1995;
145: 175–85.
26. Anelli PL, Lattuada L, Lorusso V et al. Conjugates of gadolinium com-
plexes to bile acids as hepatocyte-directed contrast agents for magnetic
resonance imaging. J. Med. Chem. 2004; 47: 3629–41.
27. Lorusso V, Pascolo L, Fernetti C, Visigalli M, Anelli P, Tiribelli C.
In vitro and in vivo hepatic transport of the magnetic resonance imaging
contrast agent B22956 ⁄ 1: Role of MRP proteins. Biochem. Biophys.
Res. Commun. 2002; 293: 100–5.
28. Todd MM, Weeks JB, Warner DS. Microwave fixation for the determi-
nation of cerebral blood volume in rats. J. Cereb. Blood Flow Metab.
1993; 13: 328–36.
29. Towner RA, Brauer M, Janzen EG, Ling MF. In vivo and in vitro 31P-
NMR spectroscopy of rat liver treated with halocarbons. Biochim. Bio-
phys. Acta 1989; 993: 92–9.
30. Roomans GM. X-ray microanalysis of epithelial cells in culture. Meth-
ods Mol. Biol. 2002; 188: 273–89.
31. Roomans GM, Dragomir A. X-ray microanalysis in the scanning elec-
tron microscope.Methods Mol. Biol. 2007; 369: 507–28.
32. Soubasis N, Rallis TS, Vlemmas J et al. Serum and liver iron concentra-
tion in dogs with experimentally induced hepatopathy. J. Gastroenterol.
Hepatol. 2006; 21: 599–604.
33. Miller LM, Wang Q, Telivala TP, Smith RJ, Lanzirotti A, Miklossy J.
Synchrotron-based infrared and X-ray imaging shows focalized accumu-
lation of Cu and Zn co-localized with beta-amyloid deposits in Alzhei-
mer’s disease. J. Struct. Biol. 2006; 155: 30–7.
34. Ortega R, Cloetens P, Deves G, Carmona A, Bohic S. Iron storage
within dopamine neurovesicles revealed by chemical nano-imaging.
PLoS ONE 2007; 2: e925.
35. Gurusamy KS, Farquharson MJ, Craig C, Davidson BR. An evaluation
study of trace element content in colorectal liver metastases and sur-
rounding normal livers by X-ray fluorescence. Biometals 2008; 21:
373–8.
36. George SJ, Webb SM, Abraham JL, Cramer SP. Synchrotron X-ray
analyses demonstrate phosphate-bound gadolinium in skin in nephro-
genic systemic fibrosis. Br J. Dermatol. 2010; 163: 1077–81.
37. Endres P, Paunesku T, Vogt S, Meade T, Woloschak G. DNA-TiO2
Nanoparticle conjugates Labeled with MR Contrast Agents. J. Am.
Chem. Soc. 2007; 129: 15760–3.
38. Jansen SA, Paunesku T, Fan X et al. Ductal carcinoma in situ: X-ray
fluorescence microscopy and dynamic contrast-enhanced MR imaging
reveals gadolinium uptake within neoplastic mammary ducts in a murine
model. Radiology 2009; 253: 399–406.
� 2011 The Authors
Clinical and Experimental Pharmacology and Physiology � 2011 Blackwell Publishing Asia Pty Ltd
844 R Delfino et al.

SUPPORTING INFORMATION
Additional Supporting Information may be found in the online version of this article: http://onlinelibrary.wiley.com/doi/10.1111/j.1440-
1681.2011.05618.x/suppinfo):
Figure S1. Layouts of the experimental set-up used at (a) the SYRMEP beam line at Elettra and at (b) the ID 21 beam line at the European Syn-
chrotron Radiation Facility (ESRF).
Figure S2. Calibration curve for Gd sensitivity recorded for the SYRMEP beam line at Elettra. The inlet depicts a typical spectra obtained for
the B2256 ⁄1 at a concentration of 100 lg ⁄mL of Gd.
Please note: Wiley-Blackwell are not responsible for the content or functionality of any supporting materials supplied by the authors. Any
queries (other than missing material) should be directed to the corresponding author for the article.
� 2011 The Authors
Clinical and Experimental Pharmacology and Physiology � 2011 Blackwell Publishing Asia Pty Ltd
XRF imaging and Gd-B22950 agent 845