WT/TPR/S/361/Rev.1 12 January 2018 (18-0361) Page - WTO ...
115
WT/TPR/S/361/Rev.1 12 January 2018 (18-0361) Page: 1/115 Trade Policy Review Body TRADE POLICY REVIEW REPORT BY THE SECRETARIAT ICELAND Revision This report, prepared for the fifth Trade Policy Review of Iceland, has been drawn up by the WTO Secretariat on its own responsibility. The Secretariat has, as required by the Agreement establishing the Trade Policy Review Mechanism (Annex 3 of the Marrakesh Agreement Establishing the World Trade Organization), sought clarification from Iceland on its trade policies and practices. Any technical questions arising from this report may be addressed to Mr John Finn, Tel: 022 739 5081, email: [email protected], Ms Denby Probst, Tel: 022 739 5847, email: [email protected]; and Mr Usman Ali Khilji, Tel: 022 739 6936, email: [email protected]. Document WT/TPR/G/361 contains the policy statement submitted by Iceland. Note: This report was drafted in English.
-
Upload
khangminh22 -
Category
Documents
-
view
4 -
download
0
Transcript of WT/TPR/S/361/Rev.1 12 January 2018 (18-0361) Page - WTO ...

WT/TPR/S/361/Rev.1
12 January 2018
(18-0361) Page: 1/115
Trade Policy Review Body
TRADE POLICY REVIEW
REPORT BY THE SECRETARIAT
ICELAND
Revision
This report, prepared for the fifth Trade Policy Review of Iceland, has been drawn up by the WTO Secretariat on its own responsibility. The Secretariat has, as required by the Agreement establishing the Trade Policy Review Mechanism (Annex 3 of the Marrakesh Agreement Establishing the World Trade Organization), sought clarification from Iceland on its trade policies
and practices. Any technical questions arising from this report may be addressed to Mr John Finn, Tel: 022 739 5081, email: [email protected], Ms Denby Probst, Tel: 022 739 5847, email: [email protected]; and Mr Usman Ali Khilji, Tel: 022 739 6936, email:
Document WT/TPR/G/361 contains the policy statement submitted by Iceland.
Note: This report was drafted in English.

WT/TPR/S/361/Rev.1 • Iceland
- 2 -
CONTENTS
SUMMARY ........................................................................................................................ 7
1 ECONOMIC ENVIRONMENT ........................................................................................ 11
1.1 Main Features of the Economy .....................................................................................11
1.2 Recent Economic Developments ...................................................................................15
1.2.1 Monetary policy .......................................................................................................15
1.2.2 Fiscal policy ............................................................................................................16
1.2.3 Balance of payments ................................................................................................16
1.3 Trade Performance .....................................................................................................19
1.3.1 Composition of trade ................................................................................................19
1.3.2 Direction of trade .....................................................................................................21
1.4 Foreign Direct Investment ...........................................................................................22
2 TRADE AND INVESTMENT REGIME ............................................................................ 23
2.1 General Framework ....................................................................................................23
2.2 Trade Policy Objectives ...............................................................................................25
2.3 Trade Agreements and Arrangements ...........................................................................26
2.3.1 WTO ......................................................................................................................26
2.3.2 Regional and preferential agreements ........................................................................27
2.3.2.1 European Free Trade Association (EFTA) ..................................................................27
2.3.2.2 European Economic Area (EEA) ...............................................................................28
2.3.2.3 Bilateral agreements .............................................................................................29
2.3.2.3.1 China ................................................................................................................29
2.3.2.3.2 Faroe Islands and Greenland ...............................................................................30
2.3.2.4 Non-reciprocal preferences .....................................................................................30
2.3.3 Other agreements and arrangements .........................................................................30
2.4 Investment Regime ....................................................................................................31
2.4.1 Investment agreements............................................................................................31
2.4.2 Investment restrictions .............................................................................................32
2.4.3 Investment incentives ..............................................................................................32
3 TRADE POLICIES AND PRACTICES BY MEASURE ........................................................ 35
3.1 Measures Directly Affecting Imports ..............................................................................35
3.1.1 Customs procedures and requirements .......................................................................35
3.1.1.1 Trade facilitation ...................................................................................................37
3.1.2 Customs valuation ...................................................................................................38
3.1.3 Rules of origin .........................................................................................................38
3.1.4 Tariffs ....................................................................................................................39
3.1.4.1 Nomenclature and WTO bindings ............................................................................40
3.1.4.2 Applied rates ........................................................................................................40
3.1.4.3 Special tariff treatment and duty suspensions ...........................................................44

WT/TPR/S/361/Rev.1 • Iceland
- 3 -
3.1.4.4 Tariff quotas (TQs) and administration .....................................................................44
3.1.4.5 Preferential tariffs .................................................................................................45
3.1.5 Other charges affecting imports .................................................................................46
3.1.6 Import prohibitions, restrictions, and licensing ............................................................48
3.1.6.1 Prohibitions and restrictions ...................................................................................48
3.1.6.2 Licensing .............................................................................................................49
3.1.7 Anti-dumping, countervailing, and safeguard measures ................................................50
3.1.8 Other measures .......................................................................................................51
3.1.8.1 Sanctions .............................................................................................................51
3.2 Measures Directly Affecting Exports ..............................................................................52
3.2.1 Export procedures and requirements ..........................................................................52
3.2.2 Export taxes, charges, and levies ...............................................................................52
3.2.3 Export prohibitions, restrictions, and licensing .............................................................52
3.2.4 Export support and promotion ...................................................................................54
3.2.5 Export finance, insurance, guarantees ........................................................................54
3.3 Measures Affecting Production and Trade .......................................................................54
3.3.1 Taxation .................................................................................................................54
3.3.2 Incentives ...............................................................................................................57
3.3.3 Technical barriers to trade ........................................................................................58
3.3.4 Sanitary and phytosanitary requirements ....................................................................60
3.3.5 Competition policy and price controls .........................................................................62
3.3.6 State trading, state-owned enterprises, and privatization .............................................64
3.3.6.1 State trading ........................................................................................................64
3.3.6.2 State-owned enterprises and privatization ................................................................64
3.3.7 Government procurement .........................................................................................65
3.3.8 Intellectual property rights ........................................................................................68
3.3.8.1 Patents ................................................................................................................70
3.3.8.2 Copyright .............................................................................................................71
3.3.8.3 Trademarks ..........................................................................................................71
3.3.8.4 Designs ...............................................................................................................71
3.3.8.5 Geographical indications (GIs) ................................................................................71
3.3.8.6 Appeals and enforcement .......................................................................................72
4 TRADE POLICIES BY SECTOR ..................................................................................... 73
4.1 Agriculture and fishing ................................................................................................73
4.1.1 Agriculture ..............................................................................................................73
4.1.1.1 Features ..............................................................................................................73
4.1.1.2 Trade ..................................................................................................................74
4.1.1.3 Agriculture policies ................................................................................................75
4.1.1.3.1 Trade policies ....................................................................................................76
4.1.1.3.2 Domestic policies ...............................................................................................77
WT/TPR/S/361/Rev.1 • Iceland
- 4 -
4.1.1.3.2.1 Dairy and beef ................................................................................................77
4.1.1.3.2.2 Sheep ............................................................................................................78
4.1.1.3.2.3 Horticulture ....................................................................................................79
4.1.1.3.2.4 Other policies and sectors.................................................................................79
4.1.1.3.3 Domestic support levels ......................................................................................80
4.1.1.3.3.1 WTO notifications ............................................................................................80
4.1.1.3.3.2 OECD monitoring and evaluation of agricultural policies .......................................82
4.1.2 Fisheries .................................................................................................................84
4.1.2.1 Features ..............................................................................................................84
4.1.2.2 Trade ..................................................................................................................87
4.1.2.3 Policies ................................................................................................................88
4.2 Mining and Energy ......................................................................................................90
4.2.1 Regulation ..............................................................................................................92
4.3 Services ....................................................................................................................93
4.3.1 Financial sector .......................................................................................................93
4.3.1.1 Banking ...............................................................................................................93
4.3.1.1.1 Structure and performance ..................................................................................93
4.3.1.1.2 Regulation .........................................................................................................96
4.3.2 Telecommunications .................................................................................................97
4.3.2.1 Fixed-line telephony ..............................................................................................97
4.3.2.2 Mobile telephony ...................................................................................................98
4.3.2.3 Internet ...............................................................................................................98
4.3.2.4 Regulations ..........................................................................................................98
4.3.3 Transport ................................................................................................................99
4.3.3.1 Air transport .........................................................................................................99
4.3.3.2 Maritime transport .............................................................................................. 100
4.3.4 Tourism ................................................................................................................ 101
4.3.4.1 Regulation ......................................................................................................... 103
4.3.4.2 Strategy ............................................................................................................ 104
5 APPENDIX TABLES .................................................................................................. 105
CHARTS
Chart 1.1 Product composition of merchandise trade, 2012 and 2016 .......................................20
Chart 1.2 Direction of merchandise trade, 2012 and 2016 .......................................................21
Chart 1.3 Foreign direct investment (ISK billion), 2010-15 ......................................................22
Chart 3.1 Frequency distribution of MFN tariff rates, 2017 .......................................................42
Chart 3.2 Tariff distribution by type of duty, 2017 ..................................................................42
Chart 3.3 Tax revenue and social contributions, 2007-16 ........................................................55
Chart 4.1 Domestic support notifications, 2004-16 .................................................................81
Chart 4.2 OECD estimates of support to agriculture, 2004-15 .................................................82

WT/TPR/S/361/Rev.1 • Iceland
- 5 -
Chart 4.3 Number of fishing vessels by size category, 2005-16 ................................................85
Chart 4.4 Volume of catch by vessel size category, 2005-15 ...................................................85
Chart 4.5 Fish processing, 2000-15 .....................................................................................86
Chart 4.6 Primary energy use in Iceland – 2015 ....................................................................91
Chart 4.7 Non-performing loans, 2009-2016 .........................................................................94
Chart 4.8 Commercial banks' capital adequacy ratios, 2009-16 ................................................95
Chart 4.9 Total tourism spending in Iceland, 2009-15 ........................................................... 102
Chart 4.10 Passenger numbers through Keflavik airport, 2003-16 .......................................... 103
TABLES Table 1.1 Selected macroeconomic indicators, 2012-16 ..........................................................11
Table 1.2 Basic economic indicators, 2012-16 ........................................................................13
Table 1.3 Balance of payments, 2012-16 ..............................................................................16
Table 1.4 Composition of trade in services, 2012-16 ..............................................................17
Table 2.1 Organization of main economic and trade-related matters, 2017 ................................24
Table 2.2 Investment restrictions, 2017 ................................................................................32
Table 3.1 Tariff structure of Iceland, 2012 and 2017 ..............................................................41
Table 3.2 Summary analysis of Iceland's MFN tariff, 2017 .......................................................43
Table 3.3 Tariff exemptions .................................................................................................44
Table 3.4 Summary analysis of the Icelandic preferential tariffs, 2016 ......................................45
Table 3.5 Prohibitions or restrictions on imports, 2017 ............................................................48
Table 3.6 Products subject to import licensing, 2017 ..............................................................49
Table 3.7 Prohibitions or restrictions on exports, 2017 ............................................................54
Table 3.8 Excise duties and related taxes, 2017 .....................................................................56
Table 3.9 Large SOEs, 2016 ................................................................................................65
Table 3.10 Public procurement legal framework, 2017 ............................................................66
Table 3.11 Domestic thresholds: central Government (and sub-central Government from 2019) ...............................................................................................................................67
Table 3.12 EEA thresholds, 2017 ..........................................................................................67
Table 3.13 Main intellectual property laws and regulations, 2017 .............................................69
Table 3.14 Trends in intellectual property, 2012-16 ................................................................69
Table 4.1 Agriculture: employment and output, 2010-16 ........................................................73
Table 4.2 Trade in agricultural products, 2012-16 ..................................................................74
Table 4.3 Dairy and beef cattle support, 2017-26 ..................................................................78
Table 4.4 Support for sheep farming, 2017-26 ......................................................................78
Table 4.5 Support for horticulture, 2017-26 .........................................................................79
Table 4.6 General operating environment for agriculture, 2017-26 ..........................................79
Table 4.7 OECD indicators for support to agriculture in Iceland, 2009-15 ..................................83
Table 4.8 Fisheries in the economy, 2010-16 .........................................................................84
Table 4.9 Aquaculture production, 2010-16 ...........................................................................86

WT/TPR/S/361/Rev.1 • Iceland
- 6 -
Table 4.10 Exports of fish products, 2007-15 ........................................................................87
Table 4.11 Credit system assets, 2008-16 .............................................................................94
BOXES Box 2.1 Minister of Foreign Affairs, policy objectives in certain trade-related areas,
2015-16 ...........................................................................................................................25
APPENDIX TABLES
Table A1.1 Merchandise imports by product group, 2010-16 ................................................. 105
Table A1.2 Merchandise exports by destination, 2010-16 ...................................................... 107
Table A1.3 Merchandise imports by origin, 2010-16 ............................................................. 108
Table A1.4 Inflows of foreign direct investment, 2010-16 ...................................................... 109
Table A1.5 FDI inward stock, 2010-16 ................................................................................ 110
Table A1.6 Outflows of foreign direct investment, 2010-16 .................................................... 111
Table A1.7 FDI outward stock, 2010-16 .............................................................................. 112
Table A2.1 Selected Notifications to the WTO, 1 July 2012-30 June 2017 ................................ 113
Table A2.2 Iceland's free trade agreements, 2017 ................................................................ 115

WT/TPR/S/361/Rev.1 • Iceland
- 7 -
SUMMARY
1. Since the last Trade Policy Review of Iceland in 2012, a number of significant changes to its trade policy have been introduced. Tariffs on non-agricultural goods were fully eliminated and tariffs on some agricultural goods were also reduced. In addition, a number of measures were undertaken and projects are currently under way to improve customs procedures and new free trade agreements have been signed. On the other hand, although new regulations for the
agriculture sector took effect in 2017 for the period 2017-2026, the sector continues to be protected by high tariffs and supported by subsidies. In addition, foreign investment restrictions remain in some sectors, notably fishing and energy.
2. Since 2012, the country has continued to recover from the severe economic crisis that started in 2008. GDP growth averaged 3.8% for 2012-16, while GDP per capita reached nearly US$60,000 in 2016. Growth during this period was driven by tourism-related services while the
contribution to GDP from the traditional fishing, fish processing, and aluminium sectors declined.
3. With a small open economy and limited range of natural resources, trade is critically important to Iceland's economy and exports and imports of goods and services were the equivalent of over 90% of GDP in 2016. The main goods exported were fish and fish products, and aluminium and products thereof which together accounted for over three-quarters of the value of goods exports in 2016. However, a surplus in trade-in-goods in 2012 became a deficit in 2014 as imports increased while exports declined due to lower aluminium prices and lower quantities of fish
exports. The EU is the main destination for exports (nearly three-quarters) and source of imports (nearly half). The deficit in trade-in-goods was more than compensated by the rising surplus in trade-in-services, primarily due to increased tourism. Tourism is now Iceland's largest export sector, and tourism services (transport and travel) were responsible for nearly 80% of Iceland's services receipts in 2016, which resulted in a tourism-services-related surplus of ISK 300 billion.
4. Practically, all the temporary restrictions on certain types of cross-border capital transfers
and foreign exchange transactions that were introduced following the collapse of the banking
sector have been removed. A capital account liberalization strategy was introduced in 2015 and controls were progressively reduced. In March 2017, the restrictions on foreign exchange transactions and cross-border movement of domestic and foreign currency were largely lifted.
5. Iceland is an active Member of the WTO but has a mixed record for notifications with no TBT, import licensing or preferential rules of origin notifications and only two SPS notifications were made in the period 2012 to 2016. On the other hand, several notifications from Iceland were
distributed in the first half of 2017, including on domestic support for agriculture for the years 2013-15, new public procurement rules, and state trading enterprises.
6. As a member of the European Free Trade Association (EFTA) and the European Economic Area (EEA), many of Iceland's trade and trade-related policies and laws are closely related to those of the European Union and Iceland is part of the Internal Market with free movement of goods, services, capital and workers. However, some issues such as trade policy and taxation are
not incorporated into the EEA and agriculture is covered by bilateral arrangements. In 2015, a new
bilateral agreement on trade in agricultural goods between Iceland and the EU was concluded which eliminated or reduced tariffs on a range of products, increased the quantities in some existing tariff quotas, and created new tariff quotas. As part of the agreement, Iceland is to apply the same level of protection as the EU for GI products registered in the EU.
7. Iceland is a party to 32 reciprocal preferential agreements, mostly through the EFTA, with three new agreements having entered into force during the review period (Bosnia and Herzegovina, certain Central American states (Costa Rica and Panama), and the GCC). In addition,
during the review period, Iceland concluded an FTA on its own behalf with China.
8. Since 2012, several projects have been implemented to improve customs procedures, including the introduction of a risk management system, and the introduction of a quality control system. In addition, work is under way on the establishment of an authorized economic operator
programme, a single window system, implementation of the revised single administrative document, and an electronic system for the clearance of vessels. The instrument of ratification of
the Trade Facilitation Agreement was submitted to the WTO on 31 October 2016.

WT/TPR/S/361/Rev.1 • Iceland
- 8 -
9. In a significant development, Iceland eliminated tariffs on all non-agricultural products, with tariffs on clothing and footwear eliminated on 1 January 2016 and tariffs on remaining products eliminated on 1 January 2017. As a result, nearly 90% of tariff lines are now duty-free compared to 70% in 2012. In addition, tariffs on some agricultural products were also reduced. As a result, the overall average tariff fell from 8.3% in 2012 to 4.6% in 2017. However, tariffs on several agricultural product groups, particularly meat, dairy, plants, and flowers, remain high and often
take the form of complex non-ad valorem duties. Nevertheless, the average applied tariff on agricultural products declined to 20% in 2017 compared to 29% in 2012 although tariffs are much higher on some products, such as dairy products. About 95% of tariff lines are bound and the unbound tariffs apply to a wide variety of products including some fuels, fertilizers, and machinery products all of which now have duty free applied rates. It was not possible to calculate the ad valorem equivalents for bound tariffs given the complex nature of some of them. However,
there were no cases of applied rates exceeding bound rates.
10. Tariff quotas are used for a number of agricultural products either under the WTO Agreement on Agriculture, FTAs, or autonomously. In many cases, the current applied tariff for tariff lines subject to WTO tariff quotas is the same as, or lower than, the bound in-quota tariff and, therefore, the quota is not used.
11. Iceland has never used or initiated investigations for anti-dumping or countervailing duties, nor has it ever used the special agricultural safeguard although its customs legislation does
provide for them and Iceland reserved the right to use the SSG on 390 tariff lines. There is no legislation on global safeguards although safeguard provisions are generally included in the free trade agreements to which Iceland is a party. According to Iceland’s notifications to the WTO, export subsidies for agricultural products have not been used since 31 August 1998.
12. Although a number of amendments have been made during the review period to the laws relating to SPS measures they remain strict and are justified on the grounds that Iceland's domestic animals are highly susceptible to exotic pests and diseases. Imports of some products
are prohibited and others are subject to controls and licensing requirements. In general, Iceland applies the EU's rules on food and imported food must comply with requirements that are at least equivalent to those applicable in the EU.
13. Incentives for regional investment are provided for under new legislation; the previous legislation expired at the end of 2013. Some of the projects approved under the expired legislation had been found by the EFTA Surveillance Authority to be incompatible with the EEA Agreement.
Under the new legislation, tax incentives apply for investments outside the Reykjavik area which are limited to 15-35% of the initial investment depending on the size of the enterprise with the higher limits applying to smaller enterprises. In addition, there are incentives for research and investment through tax credits and grants.
14. Although there have been no substantive changes to the legislation on competition policy during the review period, the Icelandic Competition Authority (ICA) has been actively implementing the law and, in the 2012-17 period, has prevented one merger, imposed conditions
on a further 25 mergers, and has fined 17 companies a total of over €22 million for collusion or abuse of dominant position. In addition, in an opinion issued in 2015, the ICA found that due to the slot allocation arrangements at Keflavik Airport Icelandair has enjoyed a de facto priority for the most important slot times.
15. The legal framework for public procurement was significantly revised during the review period with a new Act on Public Procurement and other laws and regulations (including new thresholds) introduced to bring legislation into line with EEA rules. The new Act, which applies to
the State, local authorities, their institutions and other public entities, sets out to ensure equal treatment of economic operators, encourage efficiency in public sector operations through active competition and to promote innovation and development in public procurement of supplies, works and services. Iceland has been a party to the WTO Agreement on Government Procurement (GPA) since 2001 and has completed the procedures for becoming a party to the revised GPA, which entered into force for Iceland on 6 April 2014.
16. In addition to changes in legislation on various aspects of intellectual property (IP), including on geographical indications (GIs), the trademark law, and a new fee structure, more changes are

WT/TPR/S/361/Rev.1 • Iceland
- 9 -
foreseen to bring national laws into line with the EEA. Furthermore, the Intellectual Property Policy, 2016-22, issued in 2016, put forward a number of proposals to review laws, promote the role of IP in the economy, and improve procedures for registration and enforcement of IP rights. The new act and regulation on GIs apply to food, wine, spirit drinks, and some other products. The product name may be protected if the product originates from a specific area, has qualities or characteristics of the area, and the production, processing and preparation of the product takes
place in the area. The name must be registered by the Icelandic Food and Veterinary Authority (MAST). In addition, as part of the agreement with the EU on trade in agricultural products, Iceland is to provide protection for a list of 1,150 EU GIs.
17. Agriculture represents a small part of GDP and employment but remains historically, socially, and culturally important for Iceland, as well as being relatively highly protected and subsidized. Imports (at US$492 million in 2016) exceeded exports (US$95 million). Domestic
policies were revised under new agreements between the Government and the farmers'
association for the period 2017-26. For dairy and beef, the production quota system remains but is to be reviewed in 2019 to consider the feasibility of abolishing it; headage payments continue and milk payments are to be increased; and support entitlements (basic payments to all active dairy and cattle farmers) are to be phased out. For sheep, support entitlements are also to be phased out while quality assurance payments are to be increased and headage payments introduced. Under these and other changes, the total support to agriculture is to decrease slightly over the
duration of the agreements. During 2012 to 2016, support to agriculture in ISK terms increased under the Green, Blue, and Amber Boxes of the WTO and for the 2012 to 2015 period under the OECD's total and producer support estimates (TSE and PSE). The dairy sector is the most heavily supported; in 2016, it accounted for ISK 18.5 billion out of a total of ISK 21.3 billion in Amber Box support and, together with beef, ISK 0.7 billion in the Blue Box. Overall, the PSE was nearly ISK 26 billion in 2015 or 56% of gross farm receipts, the third highest among OECD countries.
18. Although the contributions of fishing and fish processing to GDP have declined, they remain
relatively very important and represented 4.6% and 2.7% respectively in 2016. Total exports of
fish and fish products were US$1,925 million in 2016, representing 43% of exports of goods, while imports were US$134 million. Fisheries policy has not changed significantly over the past few years. Based on stock assessments by the Marine and Freshwater Research Institute (MRFI), total allowable catches (TACs) are established which are allocated to individual vessels under the individual transferable quota (ITQ) systems. In addition, a number of effort and gear restrictions
apply, discards of commercial species are prohibited, and a vessel owner may not leave port without an adequate quota for the trip. According to the OECD, the Fisheries Support Estimates (FSE) for 2012 to 2014 was negative indicating a net average annual contribution of ISK 4.4 billion from the fisheries sector as fees were greater than the estimates of support. The FSE was positive for 2015 when general services support was greater than cost recovery charges. Foreign ownership of fishing operations and fish processing is limited to 25% direct and 49% direct plus indirect ownership although up to 33% direct foreign ownership may be permitted in some cases.
19. Hydro and thermal power sources are abundant in Iceland and electricity prices for industrial consumers are the lowest in the EEA. As a result, energy intensive industries, such as aluminium
production, have been established and aluminium and alloys thereof represent over one-third of total exports of goods (US$1.5 billion). Investment and ownership of energy exploitation rights and the production and distribution of energy are limited to EEA and EFTA residents, while Landsnet, a private company, has the exclusive right to provide transmission services.
20. Since the financial crisis, the banking system has stabilized and recovered. Currently there
are four commercial and four savings banks (compared with nine in 2012). Two of the commercial banks are wholly state-owned, while a third has a minority government stake. The restructuring of the banks has also resulted in the ratio of non-performing loans to total loans declining from a peak of 20% in 2010 to 2.1% in 2016. In June 2015, the authorities announced a plan to unwind the estates of the failed banks and the remaining offshore ISK holdings (mainly bank deposits, treasury securities and equity interests). In June 2016, the Central Bank held the first of three
voluntary euro auctions for offshore ISK holders with the exchange rate based on a sliding scale related to the size of the bid. Direct state assistance to the financial sector was the equivalent of about 34% of GDP. However, recoveries were estimated to be about 43% of GDP (mainly bank
equity and subordinated debt, and stability contributions from the estates of the failed banks). Thus, the State is estimated to have made a net gain in excess of 9% of GDP. During the review period, several regulatory changes were introduced including the establishment of new bodies to

WT/TPR/S/361/Rev.1 • Iceland
- 10 -
assess the financial system, systemic risk, and financial stability and formulate policies. In addition, several other measures, including new liquidity rules, funding ratios, capital buffers, and rules relating to consumer mortgage credit were introduced.
21. Tourism has increased considerably since 2010 and, in 2016, represented about 10% of GDP and nearly 40% of export receipts for goods and services. Total spending on tourism-related activities increased from ISK 93 billion in 2009 to ISK 222 billion in 2015. Apart from Iceland's
unique landscape and other attractions, the increase can also be attributed to the depreciation in the ISK after the financial crisis, better and more frequent flight connections, and better marketing. Tourism also accounts for the increase in air passengers, as well as Icelandic airlines becoming a more financially viable option for transatlantic passengers and the promotion of Iceland as a transatlantic hub. The total number of passengers through Keflavik airport in 2017 is estimated to be in the region of 9 million.
22. Iceland has improved trading and investment conditions since 2012 and partly as a result of this the economy has recovered and is expanding rapidly. With a small population and limited natural resources, apart from energy and fish, trade remains important but the range of exports is limited to tourism, fish and fish products, and aluminium and products thereof. Therefore, the country remains vulnerable to shocks, including the appreciation of the ISK, overheating of the economy, and Brexit. However, short term exposure to external factors has been reduced: at end-2016, total external debt was US$23.4 billion compared to US$105.8 billion in 2012 and
international reserves were over US$7 trillion (partly due to the unwinding of the estates of the failed banks). Furthermore, despite uncertainties relating to Brexit, as growth picks up in the EU, Iceland's main trading partner, opportunities for trade in goods and services should continue to improve.

WT/TPR/S/361/Rev.1 • Iceland
- 11 -
1 ECONOMIC ENVIRONMENT
1.1 Main Features of the Economy
1.1. Iceland is a high-income developed economy with a GDP per capita of ISK 7.2 million (€53,948) and a population of 338,450 in 2016 (Table 1.1). Fishing and fish processing remain important to the economy (contributing 7.2% to GDP in 2016), but services have continued to increase (now representing 71% of GDP), as have manufacturing (mainly aluminium) (8.4%), and
construction (6.8%). Trade is critical to the economy, with imports and exports of goods and services equivalent to about 92% of GDP. Merchandise exports continue to be concentrated in fish and fish products and aluminium manufacturing, both of which were responsible for over three quarters of merchandise exports in 2016. Furthermore, during the review period, services exports have shown robust growth, driven primarily by the tourism sector (Table 1.2).
1.2. Iceland was one of the countries worst affected by the 2008 financial crisis with the banking
system collapsing and the country going into a deep recession. 2009 to 2010, real GDP contracted by over 10%. In response, the Government enacted the Emergency Act (the Act on the Authority for Treasury Disbursements due to Unusual Financial Market Circumstances, etc., No. 125/2008) which allowed for, inter alia, immediate intervention in the operations of the collapsing banks and the putting in place of capital controls. Furthermore, funding from Nordic countries and the IMF through a Stand-By Arrangement helped to shore up the economy.1 Prudent macroeconomic management and continued openness of the economy have since helped turn the economy
around. During the review period (2012-16), real GDP grew at an average annual rate of 3.8% and is estimated to grow at the same rate in 2017 (Table 1.1). Growth has been fuelled mainly by tourism-related services (wholesale and retail trade, hotels and restaurants, and transportation and storage) (Table 1.2). As a result of the growth, GDP per capita rose from around US$44,000 in 2012 to nearly US$60,000 in 2016 and the unemployment rate halved from 6% to 3% over the same period.
Table 1.1 Selected macroeconomic indicators, 2012-16
2012 2013 2014 2015 2016
Real GDP (ISK billion) 1,135.2 1,185.3 1,208.1 1,257.6 1,348.1
Real GDP (US$ million) 9,075.5 9,701.0 10,346.0
9,532.9 11,158.8
Current GDP (ISK billion) 1,778.5 1,891.2 2,005.9 2,214.1 2,422.0
Current GDP (US$ million) 14,218.6
15,479.3
17,179.0
16,783.7
20,047.4
GDP per capita at current market price (US$) 44,330.6
47,806.9
52,471.9
50,735.8
59,654.9
National accounts (%age change based on constant figures, unless otherwise indicated)
Real GDP 1.2 4.4 1.9 4.1 7.2
Consumption 0.8 1.0 2.5 3.3 5.3
Private consumption expenditure 2.0 1.0 2.9 4.3 6.9
Government consumption expenditure -1.8 1.0 1.7 1.0 1.5
Gross fixed capital formation 5.3 2.2 16.0 17.8 22.7
Exports of goods and services 3.6 6.7 3.2 9.2 11.1
Imports of goods and services 4.6 0.1 9.8 13.5 14.7
XGS/GDP (%, at current market price) 57.0 55.4 53.3 53.7 49.1
MGS/GDP (%, at current market price) 51.0 47.5 47.0 46.2 42.5
Unemployment rate (%) 6.0 5.4 5.0 4.0 3.0
Prices and interest rates
Inflation (CPI, %age change) 5.2 3.9 2.0 1.6 1.7
Lending rate (%) 8.32 8.15 7.74 7.61 8.24
1 For details of the Government's response to the crisis please see WTO Document WT/TPR/S/273/Rev.1
12 November 2012.

WT/TPR/S/361/Rev.1 • Iceland
- 12 -
2012 2013 2014 2015 2016
Discount rate (%) 7.00 7.00 6.25 7.50 6.75
Exchange rate
ISK/US$ (annual average) 125.08 122.18 116.77 131.92 120.81
Nominal effective exchange rate (%age change, based on CPI)
-3.3 2.2 5.9 1.3 10.9
Real effective exchange rate (%age change, based on CPI)
-0.3 4.6 6.6 2.2 11.7
Fiscal policy of general government (% of current GDP, unless otherwise indicated)
Total revenue 41.7 42.1 45.2 42.0 58.4
Tax revenue 31.6 32.1 34.9 33.1 32.8
Total expenditure 45.4 43.9 45.3 42.9 41.2
Overall balance -3.7 -1.8 -0.1 -0.8 17.2
General government gross debt 92.5 84.8 82.5 68.1 ..
Saving and investment
Gross national saving 12.1 21.5 21.3 24.6 29.3
Gross domestic investment 16.1 15.4 17.3 19.1 21.3
Savings-investment gap -4.0 6.0 4.0 5.5 8.0
External sector
Current account balance -4.0 6.0 4.0 5.5 8.0
Net merchandise trade 0.7 0.4 -0.5 -1.6 -4.2
Merchandise exports 32.4 29.7 28.3 27.7 22.3
Merchandise imports 31.7 29.3 28.8 29.4 26.5
Services balance 5.3 7.5 6.8 9.1 10.7
Financial account -0.1 -0.1 -0.1 -0.1 -0.1
Direct investment -5.1 7.1 3.5 5.6 10.2
Terms of trade (%age change) -5.3 -4.2 4.8 .. ..
Merchandise exports (%age change -national currency)
2.4 -2.7 1.3 8.1 -12.1
%age change in US$ -5.1 -0.3 6.0 -4.3 -4.0
Merchandise imports (%age change - national currency)
7.2 -2.0 4.6 12.3 -1.2
%age change in US$ -0.6 0.4 9.4 -0.6 7.8
Service exports (%age change - national currency) 9.3 11.4 2.7 14.9 13.0
%age change in US$ 1.3 14.1 7.5 1.7 23.4
Service imports (%age change - national currency) 13.9 0.4 5.8 2.2 4.4
%age change in US$ 5.6 2.8 10.7 -9.5 14.0
International reserves, excl. gold (US$ million) 4,085.3 4,160.8 4,100.1 4,972.9 7,152.5
Total external debt (US$ billion; end-period) 105.8 101.7 106.3 29.7 23.4
.. Not available.
Source: Statistics Iceland and Central Bank of Iceland online information; and IMF, International Financial Statistics indicators.

WT/TPR/S/361/Rev.1 • Iceland
- 13 -
Table 1.2 Basic economic indicators, 2012-16
2012 2013 2014 2015 2016
GDP by economic activity, at constant prices (%age change)
Agriculture, forestry and fishing 8.2 -7.2 -1.0 4.6 -1.5
Fishing 8.4 -8.8 -1.5 5.5 -4.2
Mining and quarrying -2.6 7.5 5.9 18.1 13.1
Manufacture 3.2 5.7 2.7 4.8 2.1
Food products, beverages and tobacco products 4.8 10.0 -2.0 2.9 -4.8
Fish processing 3.5 10.9 -6.9 2.8 -9.2
Electricity, gas, steam and air conditioning supply 3.0 23.9 2.5 4.7 ..
Construction 1.4 8.8 9.6 10.4 30.9
Services -2.2 1.8 1.9 4.3 ..
Wholesale and retail trade; repair of motor vehicles and motorcycles
0.1 0.9 5.8 11.3 9.7
Hotels and restaurants 13.8 15.5 27.9 19.4 36.5
Transportation and storage 10.1 11.7 1.3 14.2 17.3
Information and communication 6.5 9.5 7.3 6.9 13.6
Finance and insurance -17.8 -17.7 -12.6 -14.7 -5.1
Real estate 1.4 1.9 0.2 0.9 1.1
Professional, scientific and technical activities 3.5 30.7 3.6 6.0 10.3
Administrative and support service activities -1.7 8.8 8.8 22.7 26.7
Public administration and defence; compulsory social security -1.5 1.0 1.7 1.0 1.5
Education -1.5 1.0 1.7 1.0 1.5
Human health and social work activities -1.5 1.0 1.7 1.0 1.5
Other services 0.6 6.4 2.8 1.2 9.2
Value added by economic activity, at current prices (%)
Agriculture, forestry and fishing 7.7 6.9 6.1 6.2 5.8
Fishing 6.4 5.5 4.8 5.0 4.5
Mining and quarrying 0.1 0.1 0.1 0.1 0.1
Manufacture 13.0 12.9 12.4 11.5 11.1
Food products, beverages and tobacco products 5.8 5.9 5.0 4.9 4.4
Fish processing 4.0 4.0 3.2 3.2 2.7
Electricity, gas and water supply 6.2 5.9 5.1 5.4 5.0
Construction 4.6 4.9 5.5 5.5 6.8
Services 68.4 69.4 70.8 71.0 71.4
Wholesale and retail trade; repair of motor vehicles and motorcycles
8.7 8.7 9.2 9.5 9.8
Hotels and restaurants 2.3 2.5 2.9 3.2 4.2
Transportation and storage 5.5 5.9 5.6 6.6 7.3
Information and communication 4.2 4.9 4.6 4.8 5.1
Finance and insurance 9.2 7.9 7.9 6.3 5.6
Real estate 9.8 10.0 10.4 10.1 9.0
Professional, scientific and technical activities 4.4 4.5 4.7 4.7 4.9
Administrative and support service activities 2.6 2.8 3.3 3.8 4.5
Public administration and defence; compulsory social security 5.7 5.4 5.4 5.3 5.1
Education 6.1 6.1 6.1 6.0 5.7
Human health and social work activities 7.1 7.8 7.9 7.9 7.3
Other services 2.8 2.9 2.8 2.8 2.9
Share of sector in total employment
Agriculture 5.7 4.6 4.5 4.3 3.9
Fishing and aquaculture 3.0 2.2 2.5 2.2 2.1
Manufacturing 11.6 11.4 11.1 10.3 10.1
Fish processing 2.5 2.9 2.6 2.0 1.9
Electricity and water supply 1.1 1.1 1.3 1.3 1.2
Construction 5.5 6.0 5.9 6.2 6.2

WT/TPR/S/361/Rev.1 • Iceland
- 14 -
2012 2013 2014 2015 2016
Services 76.1 76.9 77.2 78.0 78.7
Wholesale and retail trade, repairs 13.2 13.4 13.1 13.0 13.3
Hotels and restaurants 4.8 5.8 6.0 6.1 6.2
Transport and storage 5.2 5.3 5.7 6.2 6.8
Information and communication 4.2 4.2 4.6 5.1 5.2
Finance and insurance 4.4 4.1 3.8 3.4 3.3
Real estate 0.5 0.5 0.4 0.5 0.6
Professional, scientific and technical activities 5.7 5.7 6.0 6.2 6.2
Administrative and support service activities 3.0 3.0 3.5 3.1 3.6
Public administration and defence; compulsory social security 5.3 5.2 4.3 4.1 4.4
Education 11.5 11.7 12.4 12.8 12.1
Human health and social work activities 11.4 11.8 11.4 11.4 11.1
Other services 6.9 6.3 6.0 6.2 6.0
.. Not available.
Source: Statistics Iceland online information.
1.3. The main risks to sustained growth stem from the potential overheating of the economy which would be perpetuated by the recent large wage awards, capital account liberalization (which could result in monetary and exchange rate instability), and the uncertainty surrounding the aftermath of Brexit. To mitigate the risks from these, the right policy mix would include monetary and some fiscal tightening to cool demand.
1.4. The large wage awards (about 25% for 2015-18) could increase domestic demand and,
coupled with fiscal easing, could give rise to inflationary pressures.
1.5. To keep fiscal policy in check, the parliament passed new legislation on public sector finances in December 2015. The new legislation imposes stringent rules on operational performance and developments in the debt level. The main objective of the new legislation is to provide for sound macro-fiscal policy based on comprehensive medium-term budgeting and reporting. The new medium-term fiscal framework (MTFF), the cornerstone of the new Act, is designed to address gaps in the old legal framework from budget formulation to execution. The objective is to set up a
transparent and credible MTFF that serves the purpose of mapping out macroeconomic and fiscal policy-making. The Act establishes a procedural fiscal rule that maps out a five-year general government fiscal path with the following three fiscal rules: the overall result over a five-year period must always be positive, and the annual deficit may not exceed 2.5% of GDP; total debt, excluding pension obligations and accounts payable, but including cash balances and deposits, may not exceed 30% of GDP; and, if the net debt ratio rises above 30%, the excess portion must decline by an average of at least 5% per year in each three-year period.
1.6. The objective of the capital controls that were introduced as a temporary measure during the
crisis was to place temporary restrictions on certain types of cross-border capital transfers and foreign exchange transactions that could cause monetary and exchange rate instability while the resurrection of the Icelandic economy and financial system was underway. The capital controls played an important role in achieving and safeguarding the objectives of the Icelandic policy response to stabilize the exchange rate, ensure medium-term fiscal sustainability, and develop a
comprehensive bank restructuring strategy. According to the authorities, the controls were successful in achieving these objectives.
1.7. The Government's updated capital account liberalization strategy was presented in June 2015. The strategy proposed that the controls be lifted in stages. The first phase in the strategy involved reducing the size of outflows through the foreign exchange market in connection with the resolution of the failed banks' estates, either through voluntary composition agreements based on specific stability conditions or through taxation that would mitigate the adverse balance of
payments effects. The second phase would focus on reducing the externalities associated with outflows from offshore ISK owners through an auction and secure segregation of the offshore
market from the onshore market during the liberalization of restrictions on households and businesses. The third phase would focus on households and businesses.

WT/TPR/S/361/Rev.1 • Iceland
- 15 -
1.8. The Act No. 37/2016 on the Treatment of Króna-Denominated Assets Subject to Special Restrictions was passed by the parliament in May 2016 enabling the authorities to segregate offshore ISK and take the next step towards lifting the capital controls. Under the provisions of the Act, offshore ISK holders were allowed to invest in the same instruments as before, with the addition of special certificates of deposit issued by the Central Bank. However, the banks holding the accounts of offshore ISK owners were required to buy equivalent certificates of deposit from
the Central Bank. These instruments bear an interest rate of 0.5%, which is reviewed every 12 months. In June 2016, the Central Bank held a foreign currency single price auction in which owners of offshore ISK assets were given the option of exchanging their holdings for foreign currency. The auction price was set at ISK 190/euro and the Bank accepted all offers submitted at that rate. The auction helped to facilitate the exit of offshore ISK without negative effects on the foreign exchange market, and the outstanding stock of offshore ISK was reduced significantly.2
The Act grants the owners of offshore ISK assets temporary authorization to withdraw and conclude foreign exchange transactions at a reference rate of ISK 220/euro; such transactions
amounted to a further ISK 15.5 billion exiting. In March 2017, the Central Bank concluded agreements with several owners of offshore ISK assets subject to special restrictions pursuant to Act No. 37/2016. Under the agreement, the Bank purchased a further ISK 90 billion at an exchange rate of ISK 137.5/euro of offshore ISK assets. As a result of the above measures, the remaining offshore ISK assets are now estimated to be ISK 103.6 billion or 4.3% of GDP and the
risk of large-scale outflows of offshore ISK through the foreign exchange market following the liberalization of capital controls has been mitigated.
1.9. Owners of offshore króna assets who were not parties to the March agreement were subsequently given the option of concluding a transaction with the Central Bank on the same terms. The Central Bank's offer was valid until 28 April 2017. Owners of remaining offshore ISK assets continue to have the right to sell their assets; they can make withdrawals, exchange all interest payments in the foreign exchange market, and trade in the offshore market.
1.10. Additionally, Act No. 105/2016 (amending the Foreign Exchange Act, No. 87/1992), which is
aimed at lifting capital controls on individuals and businesses, entered into force on 21 October 2016. The Act authorized immediate outward FDI and easing of restrictions on long- and short-term portfolio investment up to a limit of ISK 30 million. Effective 1 January 2017, the limit was raised to ISK 100 million and expanded to include cross-border deposit transfers. The Central Bank is authorized to ease these limits until they are abolished, along with limitations on
derivatives and other instruments and other remaining restrictions.
1.11. Furthermore, in June 2016, in order to pre-empt any disruptions caused by the lifting of capital controls, the Central Bank of Iceland published new Rules on Special Reserve Requirements for New Foreign Currency Inflows, No. 490/2016. The main purpose of the Temporary Provision was to provide the Central Bank with a policy instrument, generally referred to as a capital flow management measure (CFM), which is designed to temper inflows of foreign currency and to affect the composition of such inflows. The CFM aimed to reduce the risk of excessive and speculative
capital inflows aimed at exploiting the wide interest rate differential between Iceland and its trading partners and to safeguard against implementation risks associated with the second and
third phase of the capital account liberalization strategy. From 14 March 2017, the restrictions on foreign exchange transactions and cross-border movement of domestic and foreign currency were largely lifted.3
1.2 Recent Economic Developments
1.2.1 Monetary policy
1.12. The Central Bank's main monetary policy objective is to maintain price stability. The Bank has full instrumental independence to achieve its goal. The price stability goal is defined as an annual inflation (as measured by the consumer price index) target of 2.5%. The Bank is also financially independent with direct financing of the Government by the Central Bank prohibited.
2 Accepted offers amounted to ISK 83 billion, of a total of ISK 188 billion that were submitted in the
auction and the post-auction tender. 3 Central Bank of Iceland online information. Viewed at:
http://www.cb.is/publications/news/news/2017/03/12/New-Rules-on-Foreign-Exchange-/ [April 2017].

WT/TPR/S/361/Rev.1 • Iceland
- 16 -
1.13. In the aftermath of the 2008 financial crisis, the inflation-targeting regime was refined (dubbed "inflation-targeting plus"). Active use of intervention in the foreign exchange market to correct excessive exchange rate fluctuations has become an important part of the post-crisis monetary policy framework, which also emphasizes the use of additional policy instruments such as macro-prudential tools and capital flow management measures to curb destabilizing capital inflows.
1.14. After the large spike in inflation following the financial crisis in 2008, inflation gradually declined towards the inflation target in early 2014. It fell further following the large decline in global oil prices in late 2014 and has remained below or close to the target for the last three years (Table 1.1). The Monetary Policy Committee of the Central Bank of Iceland started raising interest rates again in 2015 in the face of rising risks of inflation expectations becoming unmoored following a very generous wage settlement. As inflation expectations eased back to target, the
Bank has started lowering rates again. The monetary policy stance remains tight, however, as
output grows strongly and spare capacity is fully absorbed.
1.2.2 Fiscal policy
1.15. The legacy of the 2008 financial crisis continues to affect Iceland's fiscal position. The crisis increased social protection expenses mainly through unemployment benefits, which peaked at 1.9% of GDP in 2009 before subsiding to 0.5% of GDP in 2015 (still higher than they were in 2008). The crisis also imposed a debt burden on the Government resulting in increased interest
payments, which rose to 6% of GDP in 2009, before falling to around 4.5% of GDP in 2015. Consequently, since the advent of the crisis, Iceland had continuously registered a fiscal deficit, which was 0.8% of GDP in 2015. In recent years, public sector wage growth and increased municipal borrowing have fuelled the deficit. On the other hand, general government gross debt, which was over 90% of GDP in 2012, had fallen to under 70% of GDP in 2015 (Table 1.1).
1.16. The settlement of the failed banks' estates resulted in a one-off windfall gain of around 17%
of GDP. As a result, Iceland registered a fiscal surplus of over 17% of GDP in 2016. The proceeds
from the settlement of the banks' estates are to be used for public debt reduction, which should reduce the general government gross debt to around 50% of GDP.
1.17. The 2016 budget included a reform of the personal income tax (PIT) system. The main objectives of the reform were to lower taxes on average wage income, and also to simplify the system, increase its efficiency and make it more transparent. The personal income tax rates were reduced and the current three rate bands harmonized into two, in two phases, for an annual
revenue loss of about 0.5% of GDP. The latter phase was subject to a general proviso that the changes would only be implemented if it can be considered justifiable in view of economic developments and prospects as they were assessed in mid-2016. That test was passed and the latter phase of the PIT changes came into force from the beginning of the year 2017. No specific tax measures were made to make up the revenue loss from the PIT changes.
1.2.3 Balance of payments
1.18. During the period under review, Iceland's current account showed a drastic turnaround.
From a deficit of around 4% of GDP in 2012, the current account registered a surplus of 8% of GDP in 2016, reflecting an increasing difference between gross national savings and gross national investment (Table 1.3).
Table 1.3 Balance of payments, 2012-16
(ISK million) 2012 2013 2014 2015 2016
Current account -70,335.1 114,260.8 79,845.1 121,141.2 193,500.6
Balance on goods 12,035.2 7,815.0 -10,318.7 -35,497.2 -101,505.1
Merchandise exports f.o.b. 576,339.7 561,036.4 568,315.5 614,381.9 540,333.0
Merchandise imports f.o.b. 564,304.4 553,221.4 578,634.2 649,879.0 641,838.1
Balance on services 94,177.7 142,629.1 135,733.0 202,112.1 260,340.8
Credit 436,928.5 486,871.5 500,004.8 574,362.5 648,936.9
Transportation .. 190,114.7 189,240.3 205,022.1 218,129.6

WT/TPR/S/361/Rev.1 • Iceland
- 17 -
2012 2013 2014 2015 2016
Travel .. 131,063.9 160,077.3 213,328.8 291,808.2
Debit 342,750.8 344,242.4 364,271.8 372,250.4 388,596.1
Transportation .. 59,812.4 58,531.0 63,037.1 61,866.9
Travel .. 103,452.5 113,594.1 131,407.2 153,219.4
Primary income, net -166,897.0 -23,433.1 -32,986.9 -10,143.7 51,038.0
Credit 109,533.8 130,376.3 107,579.3 115,375.4 118,223.3
Compensation of employees 18,532.0 23,970.6 23,749.9 25,536.7 27,344.0
Investment income 82,781.2 99,969.1 77,323.2 82,729.7 82,812.1
Reserve assets 8,220.6 6,436.6 6,506.2 7,109.0 8,067.1
Debit 276,430.8 153,809.3 140,566.2 125,519.1 67,185.3
Compensation of employees 4,230.5 4,337.4 6,701.5 3,759.2 7,212.1
Investment income 272,200.3 149,472.0 133,864.7 121,759.9 59,973.2
Secondary income, net -9,651.1 -12,750.3 -12,582.4 -35,330.0 -16,373.1
Capital account -1,243.5 -1,289.7 -1,591.7 -1,476.0 -1,387.5
Financial account -91,166.6 134,558.4 70,932.0 123,378.9 246,651.9
Direct investment, net -529,197.2 5,962.0 -85,603.0 -92,248.0 -86,375.0
Iceland's direct investment abroad -400,971.2 63,046.0 2,799.0 56,571.0 -225,047.0
Direct investment in Iceland 128,225.9 57,084.0 88,402.0 148,819.0 -138,672.0
Portfolio investment, net -59,775.4 135,076.4 -139,310.4 504,323.3 223,302.1
Assets 78,232.0 150,076.5 -8,905.4 -390,811.0 114,494.1
Liabilities 138,007.4 15,000.1 130,405.0 -895,134.3 -108,808.0
Financial derivatives, net -14.4 -628.3 -743.2 2,162.2 2,961.4
Other investment, net 1,041,277.4 -6,981.8 261,165.0 -434,366.0 -182,276.1
Assets 253,108.6 -113,322.3 -371,610.1 -54,562.3 -651,077.2
Liabilities -788,168.9 -106,340.5 -632,775.1 379,803.7 -468,801.1
Reserve assets -543,457.0 1,130.0 35,423.5 143,507.5 289,039.5
Net errors and omissions -19,587.9 21,587.3 -7,321.4 3,713.6 54,538.9
.. Not available.
Source: Central Bank of Iceland online information.
1.19. The improvement in the current account since the 2008 financial crisis was initially due to reduced interest payments and a surplus in merchandise trade, which has since turned into a deficit. However the increase in the surplus for services has more than compensated for the
negative goods balance. The growth in the services balance was primarily due to the strong performance of the tourism sector. Between 2010 and 2015, the number of visitors to Iceland grew by an average annual rate of 22% to reach 1.3 million, and tourism-related spending more than doubled to ISK 222 billion over the same period (Section 4.3.4). Consequently, tourism is Iceland's largest export sector, and tourism services (transport and travel) were responsible for nearly 80% of Iceland's services receipts in 2016, which resulted in a tourism-services-related surplus of ISK 300 billion in 2016 (Table 1.4). Additionally the balance on the income account,
which had reached a deficit of over ISK 300 billion in 2008, has also shown a significant
improvement, albeit not as marked as the services surplus, reaching a surplus of ISK 51 billion. The improvement has come about due to reduced outlays in lieu of investment.4
Table 1.4 Composition of trade in services, 2012-16
2012 2013 2014 2015 2016
Total credit (ISK million) 436,929 486,872 500,005 574,363 648,937
% of total credit
Manufacturing services on physical inputs owned by others
.. 10.4 5.1 3.1 1.1
Maintenance and repair services n.i.e. .. 1.0 1.2 0.9 1.0
Transport .. 39.0 37.8 35.7 33.6
Passenger transport by air .. 29.9 28.9 27.2 26.9
Travel .. 26.9 32.0 37.1 45.0
4 In line with BOP6 prescriptions, interest on debt, in default and arrears, should be calculated and
accounted for in the BOP accounts until the debt has been fully paid or written off. This happened at the end of the year 2015, which explains lower interest charges in 2016.

WT/TPR/S/361/Rev.1 • Iceland
- 18 -
2012 2013 2014 2015 2016
Construction .. 0.9 0.7 0.4 0.4
Insurance and pension services .. 0.7 0.5 0.5 0.4
Financial services .. 4.4 3.9 2.9 2.3
Charges for the use of intellectual property n.i.e. .. 2.3 3.7 5.3 3.5
Telecommunications, computer and information services
.. 5.0 5.2 5.6 5.1
Other business services .. 7.9 8.0 7.0 6.0
Personal, cultural and recreational services .. 1.1 1.0 1.0 1.3
Government goods and services n.i.e. .. 0.5 0.7 0.4 0.4
Total debit (ISK million) 342,751 344,242 364,272 372,250 388,596
% of total debit
Maintenance and repair services n.i.e. .. 5.6 4.9 4.9 4.7
Transport .. 17.4 16.1 16.9 15.9
Passenger transport by air .. 2.1 2.0 2.1 1.9
Travel .. 30.1 31.2 35.3 39.4
Construction .. 0.3 0.2 0.5 0.7
Insurance and pension services .. 1.9 1.5 1.3 1.2
Financial services .. 5.6 4.3 2.7 1.8
Charges for the use of intellectual property n.i.e. .. 2.8 3.8 3.0 2.9
Telecommunications, computer and information services
.. 5.7 5.6 6.3 6.0
Other business services .. 28.8 30.1 26.9 24.8
Personal, cultural and recreational services .. 1.4 1.7 1.8 2.1
Government goods and services n.i.e. .. 0.6 0.6 0.6 0.5
.. Not available.
Source: Data provided by the authorities.
1.20. The capital account measures capital transfers between residents and non-residents; these can include investment grants, debt forgiveness, or unusually large insurance compensation
payments. The financial account includes net transactions with financial assets and liabilities that take place between residents and non-residents. Not all entries in the financial account derive from actual transactions. In certain instances, imputed values are entered into the financial account even though no transaction has taken place, so as to reflect the underlying economic relationship. Reinvested earnings, investment income earned on technical reserves, accrued unpaid interest on liabilities, interest added to the principal amount, and interest in arrears are all classified as financial account transactions. The difference between assets and liabilities is the international
investment position (IIP), which indicates whether there is a net claim or a net liability vis-à-vis non-residents. Net direct investment, portfolio investment and financial derivatives are also included in the financial account.
1.21. During the period under review, the capital and financial account has gone from a deficit of around ISK 92 billion in 2012 to a surplus of ISK 300 billion in 2016. Iceland's net international
investment position (NIIP) improved considerably in the post-crisis period, through debt repayments facilitated by the current account surplus, debt write-offs due to bankruptcies of
private sector entities, and the composition agreements of the failed financial institutions' estates in late 2015. With regard to failed banks and the settlement of their estates, the underlying NIIP calculated by the Central Bank of Iceland was -131% of GDP in 2008, but that improved to -31.5% in 2015. Nearly 40% of the reduction is due to the current account surplus and GDP growth during the period, while the rest is due to asset revaluation and debt restructuring.5 Furthermore, at the end of 2008, the failed banks owned 77% of total foreign loans. This share increased to 90% at
year-end 2009 but had fallen to 64% by the end of 2014. Between 2009 and 2014, the stock of foreign lending by the deposit money banks in winding-up proceedings dropped from 63% of GDP to 11%. The main reason for this decline is that some of the loans were reclassified as foreign direct investment (FDI) at the end of 2009 because of financial difficulties among the banks' debtors, prompting a takeover of the companies concerned. At the end of 2015, foreign lending by the holding companies of the failed banks amounted to 7.4% of GDP, and had decreased further to 5.6% of GDP in 2016.
5 Central Bank of Iceland online information. Viewed at: www.sedlabanki.is.

WT/TPR/S/361/Rev.1 • Iceland
- 19 -
1.22. In addition to the current account surplus, the Central Bank purchased foreign currency through interventions so as to build up foreign exchange reserves in preparation for the lifting of capital controls. At the end of 2016, reserves amounted to 34% of GDP and provided import cover for nine months.
1.3 Trade Performance
1.23. Iceland's economy has continued to depend on trade, and trade in goods and services as a
proportion of GDP exceeded 92%. During the period under review, the balance on trade in goods turned from a surplus to a deficit as exports fell and import rose, due mainly to an appreciation of the exchange rate. In contrast, the services surplus more than doubled during the review period to over ISK 260 billion in 2016. The increase was mainly due to an upsurge in tourism.
1.3.1 Composition of trade
1.24. During the review period, the composition of Iceland's exports did not change; exports of
primary products in total merchandise exports remained static at around 85% of total exports (Chart 1.1). Within primary products, the share of agriculture, fish, and food products increased. In contrast, the share of aluminium products fell (Table A1.1). The share of manufactures declined from over 14% in 2012 to around 13% in 2016. Within manufactures, the decline was due to reduced exports of iron and steel and chemicals.

WT/TPR/S/361/Rev.1 • Iceland
- 20 -
Chart 1.1 Product composition of merchandise trade, 2012 and 2016
Source: UNSD, Comtrade database (SITC Rev.3).
1.25. The share of primary products in total merchandise imports declined from nearly 40% in 2012 to 31.5% in 2016. Within primary products, the decline was due to reduced imports of alumina on account of lower alumina prices (Table A1.1). On the other hand, the share of manufacturing in total merchandise imports rose from around 60% in 2012 to 68.4% in 2016.
Within manufactures, imports of transport equipment and consumer goods rose partly due to increased tourism and strong consumption growth fuelled by a rapid rise in households' purchasing
power.

WT/TPR/S/361/Rev.1 • Iceland
- 21 -
1.3.2 Direction of trade
1.26. Iceland's main export destination in 2016 remained the EU-28, followed by the United States, and then other EFTA countries (Norway, Liechtenstein, and Switzerland). The shares of the EU-28 and EFTA declined negligibly during the review period, while the share of the United States and that of Asia as a whole increased (Chart 1.2 and Table A1.2).
Chart 1.2 Direction of merchandise trade, 2012 and 2016
Source: UNSD, Comtrade database.

WT/TPR/S/361/Rev.1 • Iceland
- 22 -
1.27. The EU-28 remains Iceland's largest import supplier, followed by EFTA and the United States. During the period under review, the EU-28 share rose significantly, as did that of Asia as a whole, while the shares of Brazil and EFTA declined sharply (Table A1.3). The decline in the latter two is explained by declining oil and other commodity prices.
1.4 Foreign Direct Investment
1.28. During the period under review, both inward and outward FDI flows were volatile. FDI
inflows peaked at over ISK 128 billion in both 2011 and 2012 (around 11% of GDP), before declining to ISK 48 billion (4% of GDP) in 2013. They have since picked up, and amounted to ISK 93 billion in 2015 (around 7% of GDP). Consequently, the stock of inward FDI peaked at 104% in the beginning of 2012 but had fallen back to 75% of GDP by year-end 2015 because of the restructuring of a pharmaceutical company, in 2012 and again in 2015. The 2012 restructuring also explains the turnaround in the net FDI position, which was negative in 2010 and 2011 but had
turned positive by year-end 2012. Furthermore, non-residents' equity as a share of inward FDI had been roughly 12% in 2011 but fell to 0 at the end of 2013 because of the restructuring of the pharmaceutical company. At year-end 2015, the ratio had risen up to 32%, due to a further restructuring of the pharmaceutical company in early 2015 (Chart 1.3).
Chart 1.3 Foreign direct investment (ISK billion), 2010-15
Source: Statistics Iceland online information.
1.29. In 2015, the main investor in Iceland was Luxembourg (nearly 80% of FDI stock), followed by the Netherlands and Switzerland. Most of the FDI in Iceland takes the form of inter-company
loans; and Luxembourg has a large banking industry and a large cross-border fund administration industry (Table A1.4 and A1.6). Netherlands is the largest recipient of FDI from Iceland, followed by the United Kingdom and Luxembourg (Table A1.5 and A1.7). According to the authorities, FDI investment in the Netherlands and in Luxembourg is most often related to affiliates of domestic companies that have headquarters in these countries due to tax reasons. The FDI in the United Kingdom can to some extent be explained by investment in companies that have been acquired as
a result of debt restructuring and which are being prepared for sale by their holders.

WT/TPR/S/361/Rev.1 • Iceland
- 23 -
2 TRADE AND INVESTMENT REGIME
2.1 General Framework
2.1. Iceland, an island nation, located strategically between Europe and North America, has excellent connectivity, both by air and sea. It possesses plentiful energy resources from geothermal and hydroelectric sources, which has allowed it to have 100% renewable energy and thus one of the most reliable power infrastructures. The country also benefits from social stability
and a well-educated work force. Iceland has capitalized on these elements and has developed many energy-intensive industries and data centres, and propelled its tourism sector to the leading export earner. As a representative democracy, Iceland's people assign powers to their elected representatives in the parliament, who have legislative and fiscal powers. Iceland is governed by rule of law whereby the judiciary is autonomous and the executive is answerable to parliament.
2.2. Iceland's constitution forms the country's main legal framework and is comprised of seven
sections covering the parliament, president, judiciary, church (including freedom of religion), and human rights. The current constitution dates from 1944, but has been amended eight times since. The most recent amendment1 was in 2013 and concerned a temporary provision that applied until 30 April 2017 on rules to amend the constitution.2 It provided that in order to amend the constitution, the parliament (Althingi) was required to vote two-thirds in favour and that a referendum would then be launched so that the electorate of the country could vote to approve or reject the amendment. These temporary provisions have since expired and are no longer relevant.
2.3. The main law for the judiciary, Act No. 15/1998 on the Judiciary, will be replaced by Act No. 50/2016 on the Judiciary, with entry into force as of 1 January 2018. Under Act No. 50/2016, the Supreme Court remains the highest court, while a court on national law and appeals (Landsréttur) has been introduced between the Supreme Court and the eight district courts. The specialized Labour Court and Courts of Impeachment remain. Most provisions of Act No. 50/2016 are to take effect from 1 January 2018, but provisional provisions I, II, IV, V and VI entered into
force on 14 June 2016, as necessary for the Act's entry into force. There are no special courts for
trade disputes; they are handled by the general courts.
2.4. In 2009, the Althingi instructed the Government to apply for EU membership. The European Commission commenced negotiations with Iceland in 2010, however following a change of government in 2013, Iceland's EU membership negotiations were halted. In 2015, Iceland formally informed the European Union that it had no intention of resuming the accession process and was no longer a candidate country.3 In 2014, the Icelandic Government presented a policy on Europe,
including main priorities and implementation.4 The policy gives priority to the efficient implementation of the EEA Agreement, proactive and close collaboration with the EU, and collaboration among EFTA States for access to international markets.
2.5. A Presidential Decree was issued in January 2017 setting out the organization and administrative responsibilities of the various ministries in the Government of Iceland.5 The decree introduced some changes of reporting or responsibility for the Central Bank and Statistics Iceland,
among others. There are several ministries involved in economic and trade-related policies; these
include the Ministry of Finance and Economic Affairs responsible for customs and tax matters and the Ministry for Foreign Affairs for trade policy and agreements. However a number of other ministries have various roles in trade and economic matters, particularly the Ministry of Industries and Innovation (Table 2.1)
1 Act No. 91/2013. 2 Althingi online information. Viewed at: http://www.althingi.is/lagas/nuna/1944033.html. 3 Ministry of Foreign Affairs online information. Viewed at: https://www.mfa.is/tasks/european-co-
operation/. 4 Ministry of Foreign Affairs online information. Viewed at: https://www.mfa.is/news-and-
publications/nr/7990 and https://www.mfa.is/media/esb/Evropustefna-ENS.pdf. 5 Althingi online information. Viewed at: http://www.althingi.is/lagas/nuna/2017001.html. Presidential
Decree No. 1 of 11 January 2017.

WT/TPR/S/361/Rev.1 • Iceland
- 24 -
Table 2.1 Organization of main economic and trade-related matters, 2017
Ministries and responsibilities Prime Minister's Office Economic activity Central Bank Ministry of Industries and Innovation Intellectual property rights Investment Energy and natural resources Business and legal framework Fisheries resources Agriculture, food, and food safety Industry, trade in services Consumer affairs Ministry of Finance and Economic Affairs Taxation Customs and excise Economic policy and financial stability Financial markets Public procurement Trade in alcohol and tobacco products
Ministry of the Interiora Law enforcement Transportation Telecommunications Ministry for the Environment and Natural Resources Forestry and timber products Fisheries and international trade in wild animals and plants threatened with extinction GMOs Ministry for Foreign Affairs Export trade Preparation and implementation of trade agreements Trade fairs
a The Ministry of the Interior, as of 1 May 2017, was to be split into two Ministries: Ministry of Justice and Ministry of Transport and Local Government. Prime Minister's Office online information. Viewed at: https://www.forsaetisraduneyti.is/frettir/ny-raduneyti-domsmala-og-samgongu-og-sveitarstjornarmala-sett-a-fot.
Source: Althingi, Presidential Decree No. 1 of 11 January 2017. Viewed at: http://www.althingi.is/lagas/nuna/2017001.html.
2.6. In late 2015, the Althingi passed legislation to amend its law on International Development Cooperation6 transferring all activities of the Icelandic International Development Agency (ICEIDA) to the Ministry for Foreign Affairs.7 The reasons for these amendments were to simplify
organizational aspects, improve harmonization and results, and to ensure the best use of funds. The amendments also create a new Development Cooperation Committee and a new five-year development policy plan.8 Iceland's Strategy for Development Cooperation 2013-16 focuses on the fight against poverty and hunger and highlights human rights, gender equality, democracy, and
peace and security. It gives priority to natural resources, social infrastructure, and peace-building through bilateral and multilateral cooperation.9 A new strategy is currently being developed which is expected to be presented to the Althingi later in 2017.
2.7. There are no specific laws or regulations concerning consultations with the private sector on trade matters or trade policy matters. However, the administration regularly holds consultations with the private sector or the relevant sectors thereof on such matters.
6 Act No. 121/2008. Ministry for Foreign Affairs online information. Viewed at:
https://www.mfa.is/media/MFA_pdf/Act-on-Icelands-International-Development-Cooperation.pdf. 7 Act No. 122/ 2015. Althingi online information. Viewed at:
http://www.althingi.is/altext/stjt/2015.122.html. 8 Ministry for Foreign Affairs online information. Viewed at: https://www.mfa.is/news-and-
publications/all-of-icedia-s-activities-transferred-to-the-ministry-for-foreign-affairs. 9 Ministry for Foreign Affairs online information. Viewed at:
https://www.mfa.is/media/throunarsamvinna/MFA-StrategyforIcelandsDevelopmentCooperation-2013-2016.pdf.

WT/TPR/S/361/Rev.1 • Iceland
- 25 -
2.2 Trade Policy Objectives
2.8. Iceland's Minister of Foreign Affairs reports annually to the Althingi on the matters under its competence, including international trade. In the most recent report covering the legislative period 2015-16, the Minister enumerated a number of priorities and objectives in various trade and investment areas (Box 2.1).
Box 2.1 Minister of Foreign Affairs, policy objectives in certain trade-related areas,
2015-16
International trade Strengthen the network of free trade agreements: Asian countries, Mercosur, and Canada
Advance TISA negotiations Finalize WTO negotiations on environmental goods Identify Iceland's interests in transnational trade agreements Facilitate further trade with China by obtaining the necessary
authorizations for new product exports to China Aid Icelandic companies in foreign markets Strengthen the business environment in foreign markets, especially in
relation to investment and air transport agreements Secure the important trade relationship with the UK post-Brexit
Artic and Nordic regions Preparation for Chairmanship of the Artic Council in 2019 Address the growing importance of foreign policy in the region Foreign ministers will continue to discuss important international and
regional issues with the Nordic countries, such as security in Europe, the situation in Syria, terrorist threats and issues with refugees
Increase the number of subjects and enhance cooperation and flexibility in the Nordic Council
European Economic Area Achieve a transposition deficit below 1% and ensure that issues do not come before the EFTA Court
Strengthen cooperation within stakeholder consultative groups within
the EEA Focus on analysing EEA proposals in the early stages Continue to promote information about the EEA both within and outside
the Government Launch a centralized database of EEA Acts
International agreements Focus on Iceland's interest in the work on the Law of the Sea Participate in discussions on agreements to protect against uncontrolled
fishing in the North Sea and protect biodiversity beyond national jurisdictions
International development cooperation
Continue work towards the framework strategy on International Development Cooperation 2013-2016
Work to prepare the International Development Cooperation framework for the period 2017-2021
Source: Ministry of Foreign Affairs online information. Viewed at: https://www.utanrikisraduneyti.is/media/gunnar-bragi/Sky%CC%81rslautanri%CC%81kisra%CC%81dherra-til-Althingis-2016.pdf.
2.9. Iceland's Statement of Fiscal Policy and Fiscal Strategy Plan 2017-21 was presented by the
Government to the parliament in 2016 in order to better prepare Iceland for the future and to incorporate new legislation on public sector finances; it was thereafter formally approved.10 In addition to imposing stringent rules on the level of public debt, it also provides policy aims and objectives by government unit. In terms of trade and foreign affairs, there has been an emphasis placed on promoting Icelandic interests abroad, ensuring access to foreign markets, facilitating international cooperation, promoting the image of Iceland, attracting foreign investment and tourists to Iceland, developing a network of free trade agreements, completing the TISA
negotiations, actively participating in Nordic cooperation, and implementing EEA rules in a timely
10 Ministry of Finance and Economic Affairs online information, "Fiscal Policy and Fiscal Strategy Plan,
2017-2021". Viewed at: https://www.ministryoffinance.is/news/statement-of-fiscal-policy-and-fiscal-strategy-plan-presented-for-the-first-time and http://fjarlog.origo.is/Opinber-fjarmal-2017-2021.pdf.

WT/TPR/S/361/Rev.1 • Iceland
- 26 -
manner.11 As of the first quarter of 2017, a new Plan for 2018-2022 was under discussion in the Althingi.
2.10. Iceland's 2017 budget provides for a number of priorities or direction in certain policies.12 It notes the success of recent economic and fiscal policies leading to a cumulative surplus of ISK 96 billion during 2014-16, in part due to tax reform and cuts. Iceland is to continue working towards simplification and improving the efficiency of the tax system, notably the abolishment of
the general excise in 2015, the elimination of duties on non-agricultural products in 2016-17, and simplification of the VAT system. The 2017 budget gives priority to social security, health, and education activities. For example, there has been a continued increase in spending on healthcare, higher education, and research and technology; and a new framework put in place for agriculture with support amounting to ISK 1.1 billion.13
2.11. The Directorate of Customs also has a policy document – Customs 2020.14 It provides for
trust, cooperation and progress in all areas of customs. There are a number of performance objectives for customs including: efficient and effective collection of taxes and fees; effective partnerships with industry and stakeholders; effective financial management; health and safety matters; and responsible information and records management.
2.3 Trade Agreements and Arrangements
2.3.1 WTO
2.12. Iceland has been a Member of the WTO since its establishment in 1995 and was a GATT
Contracting Party from 1968. It has participated in the post-Uruguay Round negotiations on telecommunications, financial services, and the ITA. More recently, it completed the WTO procedures and implemented the revised ITA product coverage, and it ratified the Trade Facilitation Agreement in October 2016. Iceland is also a party to the plurilateral Government Procurement Agreement (GPA) and completed the procedures for adopting the revised GPA in
April 2014.
2.13. During the Doha Round, Iceland has made proposals or joint proposals in the areas of
services; intellectual property; fisheries subsidies; and market access, including for trade liberalization of fish and fish products. More recent communications during 2015-16 have concerned sustainable development in fisheries and on effective disciplines for fisheries subsidies.15 At the last Ministerial Conference in Nairobi, Iceland contributed to a joint ministerial statement on fisheries subsidies.16
2.14. In terms of dispute settlement, Iceland has not been involved as a complainant or as a
respondent in any DSB cases during the review period. However, it has been a third party to three disputes since 2012.17
2.15. Regarding notifications, Iceland has had mixed compliance with its notification obligations
during the review period. For example, there have been no notifications on TBT, import licensing and preferential rules of origin despite Iceland having measures or completing new preferential arrangements during the period. There have only been two notifications on SPS (in 2012). However, in early 2017 Iceland notified its state trading entity, GPA legislation and made its first
notifications of statistical information under the GPA. An overview of notifications is provided (Table A2.1).
11 Ministry of Finance and Economic Affairs online information. Viewed at:
https://eng.fjarmalaraduneyti.is/government-finance/fiscal-budget/fiscal-policy-and-fiscal-strategy-plan-for-2017-2021.
12 Ministry of Finance and Economic Affairs online information. Viewed at: https://www.fjarmalaraduneyti.is/frettir/fjarlagafrumvarp-2017.
13 Ministry of Finance and Economic Affairs online information. Viewed at: https://www.fjarmalaraduneyti.is/frettir/fjarlagafrumvarp-2017.
14 Directorate of Customs online information. Viewed at: https://www.tollur.is/library/Skrar/Stefna/BAeklingar/Tollur%202020%20web.pdf.
15 WTO documents TN/RL/W/258, TN/RL/W/272, and TN/RL/W/272/Rev.1. 16 WTO document WT/MIN(15)/37 and WT/MIN(15)/37/Rev.1. 17 WT/DS400, WT/DS401, and WT/DS469.

WT/TPR/S/361/Rev.1 • Iceland
- 27 -
2.3.2 Regional and preferential agreements
2.16. To date, Iceland participates in 32 reciprocal preferential agreements, mostly through EFTA FTAs (Table A2.2). However, in recent years, where FTAs could not be concluded with EFTA partners, Iceland has proceeded on its own and has concluded FTAs with China and the Faroe Islands.18 As of early 2017, no plans have been made for additional bilateral negotiations. Iceland also continues to pursue FTAs as part of EFTA, as there are a number of agreements currently in
the pipeline (Section 2.3.2.1). During the review period, there have been no changes in policy with respect to FTAs.
2.17. In 2015, as part of the European Economic Area (EEA), Iceland pursued more market opening with the European Union on agriculture (both processed and unprocessed), including the protection of GIs. This will result in the further elimination of tariffs, reduction of tariffs, and greater access through TRQs when it is implemented. As of early 2017, the old agreement was still
in force, pending the finalization of internal procedures for the entry into force of the new agreement.
2.18. More recently, in August 2016, Iceland, Greenland, and the Faroe Islands (West Nordic countries) signed a declaration to increase cooperation between them.19 The Foreign Ministers of the three countries agreed in a statement to establish a working group with participants from the three countries to draft a proposal for a cooperation agreement and to assess common benefits. As of early 2017, the working group had not yet finalized its work.
2.19. Iceland is actively involved in the Trade in Services Agreement (TISA) negotiations among 50 countries to further liberalize trade in services building upon the GATS.20 As of November 2016, 21 rounds of negotiations had taken place and Iceland had made two conditional offers. These include sector-specific commitments in professional, courier, financial, telecommunications, construction, distribution, tourism & travel, entertainment & sporting, transport, and environmental services.21
2.3.2.1 European Free Trade Association (EFTA)
2.20. Iceland has been a member of EFTA since 1970 and follows the EFTA Convention for free trade between the EFTA States and the free trade and partnerships agreements that the EFTA States have negotiated with third parties.22 The EFTA Convention dates from 1960 and originally provided a framework for the liberalization of trade in goods, but was expanded in 2002 to cover intellectual property, agriculture, services, investment, public procurement, movement of persons, air and land transport, social security, and mutual recognition of conformity assessments.23 Since
that time, the EFTA Council has made a number of smaller amendments. During the review period, amendments were made with respect to mutual recognition, basic agricultural products, air transport, land transport, and social security.24
2.21. Iceland, as part of EFTA, currently participates in 25 EFTA FTAs which cover trade with
36 partners (Table A2.2).25 EFTA has an extensive coverage of FTAs and its members benefit from being integrated into the global economy; about 80% of their merchandise trade benefits from FTAs. As a group, EFTA countries ranked 8th in world merchandise trade and 5th in services trade in
18 Ministry of Foreign Affairs online information. Viewed at:
https://www.utanrikisraduneyti.is/media/gunnar-bragi/Sky%CC%81rsla-utanri%CC%81kisra%CC%81dherra-til-Althingis-2016.pdf.
19 Iceland Review Online, online information. Viewed at: http://icelandreview.com/news/2016/08/23/west-nordics-increase-cooperation.
20 Ministry of Foreign Affairs online information. Viewed at: https://www.utanrikisraduneyti.is/nyr-starfssvid/vidskiptasvid/vidskiptasamningar/tisa-yfirlit/.
21 Ministry of Foreign Affairs online information. Viewed at: https://www.utanrikisraduneyti.is/media/PDF/Annad-endurskodad-tilbod-Islands-i-TiSA-vidraedunum.pdf.
22 EFTA Member States are Iceland, Liechtenstein, Norway, and Switzerland. 23 EFTA online information. Viewed at: http://www.efta.int/legal-texts/efta-convention/detailed-
overview-of-the-efta-convention. 24 EFTA online information. Viewed at: http://www.efta.int/legal-texts/efta-convention. 25 Twenty-five were in force as of May 2017; an additional two have been completed but entry into force
remains pending.

WT/TPR/S/361/Rev.1 • Iceland
- 28 -
2014.26 During the review period, EFTA concluded new agreements that have entered into force with Bosnia and Herzegovina, Central America, and the Gulf Cooperation Council. These FTAs have generally covered the following subjects: trade in non-agricultural products, trade in services, investment, protection of intellectual property, government procurement, competition, trade and sustainable development, cooperation, and dispute settlement. Trade in unprocessed agricultural products is generally excluded from the EFTA agreements. For the agreements with Bosnia and
Herzegovina and Central American States, Iceland has substantially eliminated tariff protection, however 6.7% and 5.2%, respectively, of all tariff lines remain dutiable under the agreements.27 As of May 2017, the agreement with the Gulf Cooperation Council had not been notified to the WTO.
2.22. As of May 2017, EFTA States were pursuing FTA negotiations with Algeria, Ecuador, India, Indonesia, Malaysia, the Russian Federation, Belarus, Kazakhstan, Thailand, and Viet Nam; but
negotiations were on hold with respect to Algeria, Thailand and the Customs Union of the Russian
Federation, Belarus and Kazakhstan.28 EFTA was also undergoing work to update certain existing agreements. The FTAs with Georgia and the Philippines were concluded in 2016 but had not yet entered into force as of May 2017.
2.3.2.2 European Economic Area (EEA)
2.23. Iceland, as a signatory of the EEA agreement, is integrated with Norway and Liechtenstein together with the European Union to form the Internal Market, providing for the free movement of
goods, services, capital and workers. The European Economic Area also provides for cooperation in competition, state aid, research and development, environment, education, consumer protection, enterprise, tourism, and social policy. Iceland, as part of the European Economic Area, is expected to incorporate EU legislation in these areas into its own legal framework following a decision by the EEA Joint Committee. In 2015, for example, the EEA Joint Committee adopted 320 decisions to incorporate 483 EU legal acts.29 Although included in the Internal Market, trade policy, taxation, the customs union, and agricultural products are not incorporated into the EEA. Agriculture is
generally covered by bilateral agreements.
2.24. In 2015, Iceland and the European Union concluded new bilateral agreements on agricultural products and GIs under the auspices of the EEA Article 19. The new agreements, which will supersede the previously applicable agreement, will increase market access for agriculture by significantly increasing the number of agricultural products granted duty-free status by Iceland to more than 800 tariff lines, and with reduced tariffs on nearly 200 tariff lines.30 This results in
duty-free trade on nearly all processed agricultural products and above 90% of trade of basic agricultural products. At the same time, many bilateral quotas are increased to gain better access and new ones created; the agreement now provides for Iceland to grant quotas under nine categories of products31, and the European Union under eight categories.32 For processed agricultural products, full liberalization was reached on the approximate 500 Icelandic tariff lines covered by Protocol 3 to the EEA Agreement, with the exception of around 20 tariff lines that will continue to be subject to customs tariffs. As for GIs, Iceland has committed to the same level of
protection as the European Union for its 1,150 agricultural and foodstuff GI products.33 The
internal procedures for the entry into force of the agreements are still under way; entry into force of the agreements is envisaged at the end of 2017 at the earliest.
26 EFTA online information. Viewed at: http://www.efta.int/sites/default/files/publications/fact-
sheets/General-EFTA-fact-sheets/EFTAs-Free-Trade-Relations-FAQs.pdf. 27 WTO documents WT/REG357/1/Rev.1 and WT/REG360/1. 28 EFTA online information. Viewed at: http://www.efta.int/free-trade/ongoing-negotiations-talks; and
information provided by the authorities. 29 EFTA online information. Viewed at: http://www.efta.int/sites/default/files/publications/annual-
report/annual-report-2015.pdf. 30 Ministry of Foreign Affairs, online information. Viewed at:
https://www.utanrikisraduneyti.is/media/esb/Agreed-minutes-annexes.pdf. 31 Beef, pig meat, poultry, poultry – organic/free-range, meat (salted, dried, or smoked), cheese,
sausages, and processed meat products. 32 Sheep meat, processed sheep meat, pig meat, poultry, skyr, butter, cheese, and sausages. 33 European Commission online information. Viewed at:
http://ec.europa.eu/agriculture/newsroom/224_en.

WT/TPR/S/361/Rev.1 • Iceland
- 29 -
2.25. In 2014, pursuant to Iceland's policy on Europe, Iceland decided to give priority to the efficient implementation of the EEA Agreement.34 In this context, a steering group was established by the Government. The steering group subsequently published its report in December 2015, where it made a number of recommendations to improve the implementation of the EEA Agreement in Iceland.35 As part of these recommendations, Iceland, inter alia, planned to work on the implementing acts at an earlier stage, increase communication between the Government and
parliament, and provide more resources to relieve the backlog.36
2.26. The EFTA Surveillance Authority (ESA) is responsible for monitoring the implementation of EEA provisions in the EEA-EFTA States; EEA-EFTA States should furthermore notify the transposition into domestic law. The ESA also has certain enforcement mechanisms, i.e. it can order repayment, impose fines, etc. As of October 2016, ESA gained new authority over financial sector supervision and can now take certain binding decisions similar to those of the European
Supervisory Authorities.
2.27. According to the ESA's latest Internal Market Scoreboard from January 2017, Iceland has the largest transposition deficit of the three EEA members and the scorecard states: "Iceland's performance remains disappointing on all counts and the Icelandic Government is once again urged to take steps to improve and demonstrate its commitment to the EEA Agreement".37 It was noted that Iceland's situation had continued to deteriorate since the last bi-annual scoreboard with a 0.2% increase in the transposition deficit. It had 18 directives and 65 regulations overdue for
transposition. Most of Iceland's outstanding directives concerned technical barriers on goods and the outstanding regulations concerned mainly the categories of food and feed, animal health and welfare, and financial services.38 The ESA had also initiated the largest percentage of infringement cases due to non-transposition against Iceland; as of December 2016, 75% of the cases were with respect to Iceland. Once the ESA has issued a reasoned opinion alleging infringement, the matter may be brought to the EFTA Court; the Court is also the forum for appeals of ESA decisions.
2.28. It was noted that the Icelandic authorities were committed to reducing the transposition
deficit and it remained a firm priority of the Government. There were a number of reasons for the transposition deficit.
2.3.2.3 Bilateral agreements
2.29. The majority of Iceland's reciprocal trade agreements are through EFTA. However, excluding its relationship with the EU, it has three bilateral free trade agreements with China, Greenland, and the Faroe Islands.
2.3.2.3.1 China
2.30. As of 1 July 2014, the free trade agreement between Iceland and China, the Iceland-China Free Trade Agreement, has entered into force and covers trade in both goods and services.39 It has been described as similar to the FTA's Iceland has entered into as part of EFTA, as it abolishes
the majority of tariffs on goods, and covers trade in services, and other areas such as investment, trade facilitation, competition, and intellectual property.40 Despite large differences in the size of their economies and rank in world trade, Iceland and China continue to have growing trade
interests as Iceland's imports from China have grown constantly in recent years, with the exception of 2014, where there was a slight decrease of imports from the previous year. Iceland's
34 Ministry of Foreign Affairs online information. Viewed at:
https://www.mfa.is/media/esb/Evropustefna-ENS.pdf. 35 Government of Iceland online information. Viewed at:
https://www.forsaetisraduneyti.is/media/Skyrslur/skyrsla-styrihops-um-framkvaemd-EES.pdf. 36 Government of Iceland online information. Viewed at:
https://www.forsaetisraduneyti.is/media/Skyrslur/skyrsla-styrihops-um-framkvaemd-EES.pdf. 37 ESA online information. Viewed at: http://www.eftasurv.int/media/scoreboard/Internal-Market-
Scoreboard-No-39.pdf. 38 ESA online information. Viewed at: http://www.eftasurv.int/media/scoreboard/Internal-Market-
Scoreboard-No-39.pdf. 39 WTO Document WT/REG355/1. 40 Ministry of Foreign Affairs online information. Viewed at: https://www.mfa.is/news-and-
publications/nr/7655.

WT/TPR/S/361/Rev.1 • Iceland
- 30 -
main and growing export to China has been seafood.41 Exports of goods from Iceland to China doubled in value between 2014 and 2015, and increased by 15% in 2016 from the previous year.
2.3.2.3.2 Faroe Islands and Greenland
2.31. Iceland's FTA with the Faroe Islands dates from 2006 and the substantive scope covers: trade in goods, trade in services, movement of persons and right to residence, movement of capital and investment, right of establishment, competition, state monopolies, state aid, public
procurement, and cooperation in other areas. National treatment and MFN provisions form an integral part of the agreement although there are some exceptions to national treatment such as for investment in the fish sector and for trade in goods subject to SPS restrictions. There have been no developments during the review period.
2.32. Iceland's agreement with Greenland dates from 1985, through the Agreement between
Iceland and Denmark on trade between Iceland and Greenland, and covers trade in goods. The
agreement has six articles and mainly pertains to the continued trade provisions once Greenland left the European Community and became an overseas country and territory (OCT). This FTA has not been notified to the WTO. As part of the group of West Nordic countries, Iceland and Greenland are forging stronger ties and working towards greater cooperation (Section 2.3.2).
2.3.2.4 Non-reciprocal preferences
2.33. In 2003, Iceland notified its Generalized System of Preferences (GSP) scheme to the WTO's Committee on Trade and Development.42 Only the poorest countries benefit from Iceland's
scheme, consistent with similar tariff preferences given in the EEA.43 Iceland's customs regulation on the GSP provides the product coverage and rules of origin of the programme.44 Iceland's GSP programme provides for both reduced rates of duty and elimination of duties for the GSP preference products (see Section 3.1.3 for GSP origin information and 3.1.4 for GSP preferential tariffs). According to the authorities, Iceland plans to upgrade is GSP scheme during 2017.
2.3.3 Other agreements and arrangements
2.34. As of April 2017, Iceland has concluded 95 air transport agreements.45 The agreements
generally have provisions on traffic rights, code sharing, operational flexibility, freight, and competition provisions.46 Often there are other provisions, for example on cabotage, charter flights, or tax issues; depending on the agreement and the country concerned. There have been 34 concluded during the review period.
2.35. Iceland is also a member of the Nordic Cooperation Council, which was created in 1962 and includes Denmark, Finland, Norway, Sweden, Faroe Islands, Greenland, and the Aland Islands.47
This regional body cooperates in a number of ways and includes agreements or provisions on the free movement of persons, tax issues, and the labour market. Among certain members, (Denmark, Iceland, Norway, and Sweden) there is also an agreement on cooperation in matters of
competition and with respect to formalities for bus transport services (Denmark, Finland, Norway,
41 Ministry of Foreign Affairs online information. Viewed at: https://www.mfa.is/media/fta-
kina/China_fact_sheet_enska_15042013_Final.pdf. 42 WTO document WT/COMTD/N/17. 43 Beneficiaries as of May 2017: Afghanistan, Angola, Bangladesh, Benin, Burkina Faso, Burundi,
Bhutan, Cambodia, Cabo Verde, Central African Republic, Chad, Congo, Comoros, Djibouti, Eritrea, Equatorial Guinea, Ethiopia, The Gambia, Guinea, Guinea-Bissau, Haiti, Kiribati, Lao People's Democratic Republic, Lesotho, Liberia, Madagascar, Malawi, Maldives, Mali, Mauritania, Mozambique, Myanmar, Nepal, Niger, Rwanda, Solomon Islands, Samoa, Sao Tome and Principe, Sierra Leone, Somalia, Sudan, Tanzania, Togo, Tuvalu, Uganda, Vanuatu, Yemen and Zambia.
44 Regulation 119/2002. 45 Ministry of Foreign Affairs online information. Viewed at:
https://www.utanrikisraduneyti.is/samningar/loftferdasamningar/. 46 Ministry of Foreign Affairs online information. Viewed at:
https://www.utanrikisraduneyti.is/media/utn-pdf-skjol/Yfirlit-yfir-loftferdasamninga-Islands-i-arslok-desember.pdf.
47 Nordic Cooperation online information. Viewed at: https://www.norden.org/en/om-samarbejdet-1/formal-nordic-co-operation.

WT/TPR/S/361/Rev.1 • Iceland
- 31 -
Sweden).48 The agreement on competition dates from 2003 and provides for the strengthening of the formal cooperation between competition authorities of the parties, including for the exchange of information, notification and enforcement measures, and formal requirements.49
2.4 Investment Regime
2.36. Iceland's investment regime remains principally governed by its 1991 Law on Investment by Non-Residents in Business Enterprises as amended in 2014 by Act No. 57/2014.50 It allows
non-residents to invest in business enterprises in Iceland pursuant to the provisions or limitations in the Act. In particular, it outlines investment restrictions (Section 2.4.2), provides for notification of investments to the Minister of Industries and Innovation when applicable, gives rights for the transfer and conversion of foreign currency, and sets up a Committee on Foreign Investment for monitoring and enforcement. The 2014 amendment removed the pre-existing general notification obligation for all foreign investments by limiting the obligation to foreign investments in areas
where specific restrictions apply, as well as by granting exemptions to legal and natural persons from the EEA countries, the EFTA countries and the Faroe Islands. Another development during the period was the entry into force of the 2015 Act on Incentives for Initial Investments in Iceland which sets out specific investment incentives and the procedures for receiving them51 (Section 2.4.3). Iceland has maintained about the same number of investment contracts, i.e. less than 10 per year, under the old and new incentive regimes.
2.37. Iceland's investment policy is developed by the Ministry of Industries and Innovation, which
also has role in entering into contracts for incentives. Invest in Iceland is Iceland's one-stop shop for information on investing in Iceland; it provides information on investment opportunities and the business environment. It is part of Promote Iceland, a public-private partnership created by a 2010 Act to enhance Iceland's image and attract investment, among others.52 Promote Iceland also has advisory boards composed of representatives from government and industry to cooperate on policy, set priorities, develop new projects, and make recommendations.
2.4.1 Investment agreements
2.38. Iceland has eight bilateral investment treaties (BITs) in force, with Chile, China, India, Latvia, Lithuania, Lebanon, Mexico, and Viet Nam. The agreements with Latvia and Lithuania are being evaluated as to their future need. In addition, for example, within the EFTA framework, Iceland has signed a multilateral investment agreement with the Republic of Korea, and the EFTA-Singapore FTA includes a chapter on investment.53 In general, investment provisions are covered in Iceland's FTAs, but not investor-state dispute settlement (ISDS) mechanisms. Iceland
has concluded a BIT with Egypt but it has not entered into force as of March 2017.
2.39. Iceland's BITs are generally long-standing, the last one being concluded in 2008. However, there are two draft agreements awaiting signature, and two others under discussion as of May 2017. There has been no change in policy with respect to Iceland's BITs. Iceland's BITs generally contain provisions on promotion and protection of investments, national and MFN treatment, expropriation, compensation for losses, repatriation, subrogation, and disputes.
48 Nordic Cooperation online information. Viewed at: https://www.norden.org/en/om-samarbejdet-
1/nordic-agreements/treaties-and-agreements/industry-trade. 49 Nordic Cooperation online information. Viewed at: https://www.norden.org/en/om-samarbejdet-
1/nordic-agreements/treaties-and-agreements/industry-trade/agreement-between-denmark-iceland-norway-and-sweden-concerning-cooperation-in-matters-of-competition.
50 Ministry of Industries and Innovation, online information. Viewed at: https://eng.atvinnuvegaraduneyti.is/laws-and-regulations/nr/nr/7448 and http://www.stjornartidindi.is/Advert.aspx?RecordID=ca66a5c9-486f-4610-b3d6-786d850f2be4.
51 Ministry of Industries and Innovation, online information. Viewed at: https://eng.atvinnuvegaraduneyti.is/media/acts/Act-on-incentives-for-initial-investments-in-Iceland-English-2015.pdf.
52 Promote Iceland, online information. Viewed at: http://www.islandsstofa.is/en/about/the-promote-iceland-act.
53 Information provided by the authorities.

WT/TPR/S/361/Rev.1 • Iceland
- 32 -
2.40. In addition to investment agreements, Iceland has also concluded 44 agreements on the avoidance of double taxation and 36 on tax information exchange.54
2.4.2 Investment restrictions
2.41. Iceland's investment restrictions have remained essentially unchanged since the last review, with restrictions remaining in three main sectors (fish/fish processing, energy, and air transport) and other restrictions remaining on foreign public ownership, property ownership, and with respect
to companies/business establishment (Table 2.2). There are no plans to remove these restrictions at this time according to the authorities.
2.42. While there are no official statistics available on approvals, the authorities indicate that in the majority of cases (around 95%), permission is granted for the investments requiring approval.
2.43. In March 2017, Iceland lifted the capital controls it had in place since 2008 as a result of the banking crisis.55 Iceland's central bank has removed the restrictions on businesses pursuant to the
Foreign Exchange Act. Thus, foreign investment, hedging, and foreign exchange are no longer subject to these restrictions (Sections 1 and 4.3.1).
Table 2.2 Investment restrictions, 2017
Sector Restriction Legal reference Fishing and fish processing
The right to operate fishing operations or fish processing is restricted to Icelandic citizens or Icelandic legal entities controlled by Icelandic entities.
Act No. 34 of 1991
Energy Energy exploitation rights, production, and distribution of energy are restricted to Icelandic citizens, Icelandic entities, or EEA residents/legal entities.
Act No. 34 of 1991
Air transport Icelandic airline companies limit the maximum share capital to 49% for non-residents.
Act No. 34 of 1991
Foreign public ownership
Special permission is required from the Minister of Industries and Innovation for investments by foreign States, municipalities, or authorities.
Act No. 34 of 1991
Business establishment
Individuals not domiciled in an EEA or OECD country require permission from the Minister of Industries and Innovation to establish an unlimited liability company in Iceland.
Act No. 138/1994 and Act No. 2/1995
Foreign companies Companies domiciled outside EEA or OECD countries may only operate in Iceland if permitted by treaty or when granted permission from the Minister of Industries and Innovation.
Act No. 138/1994 and Act No. 2/1995
Board membership The manager and at least half the board members of Icelandic companies must be resident in Iceland unless a waiver is granted by the Ministry of Industries and Innovation. This does not apply to citizens of the EEA countries, the EFTA countries, or the Faroe Islands.
Act No. 138/1994 and Act No. 2/1995
Ownership of real property
Restrictions exist for the ownership of property for residents and legal entities outside EEA or EFTA.
Act No. 34 of 1991
Source: Invest in Iceland, online information. Viewed at: http://www.invest.is/doing-business/restrictions; and Ministry of Industries and Innovation, online information. Viewed at: https://eng.atvinnuvegaraduneyti.is/invest-in-iceland/investments-by-non-residents-in-iceland---restrictions/.
2.4.3 Investment incentives
2.44. Invest in Iceland, as Iceland's one-stop shop for information on investing in Iceland, has a number of roles, including collecting data on the business environment, arranging site visits and contacts with local authorities, arranging meetings with local business partners and consultants,
lobbying the Government for improved conditions in legislation, creating task forces for specific projects, and operating the Film in Iceland Commission project. There are also regional investment promotion agencies that work to attract businesses in certain regions of Iceland; they offer local
54 Information provided by the authorities. 55 Invest in Iceland, online information. Viewed at: http://www.invest.is/press--
media/news/invest/capital-controls-lifted/243.

WT/TPR/S/361/Rev.1 • Iceland
- 33 -
expertise and information to potential investors. Iceland has also created certain development agreements to facilitate business clusters, i.e. to increase cooperation between local businesses, universities, municipalities, and the State.
2.45. Invest in Iceland has identified 11 key sectors to promote investment in Iceland; these are: data centres, chemical industry, carbon fibre, life sciences, sodium chlorate, polysilicon, algae culture, energy dependent industries, greenhouses, fish farming, and tourism.56 The sectors were
chosen based on benchmarking studies and where Iceland has a competitive advantage. The incentives offered are non-discriminatory and apply to all sectors equally.
2.46. Among the incentives that Invest in Iceland promotes are low corporate taxes, available land, and competitive energy prices. In addition, there are a number of specific incentives available depending on the project. Pursuant to the 2015 Act on Incentives, initial investments in Iceland are eligible for certain incentives contracted through the Minister of Industries and
Innovation if they meet certain criteria.57 The requirements include, inter alia, that a separate company be established in Iceland, 75% of the investment cost be financed without state aid, the annual turnover be a minimum of ISK 300 million or 20-man years of employment, the investment be in operation in the specified area of Iceland for at least 10 years, etc.58 The Act provides for several different types of incentives: granting of regional aid in amounts not exceeding 15%/25%/35% of investment costs, depending on the size of the enterprise; derogations from taxes59 or public levies; sale or lease of land from the State or municipalities; and derogations
from certain specific laws such as compulsory insurance and residence of board members of LLCs. Incentives are granted on a case-by-case basis upon the recommendation of a Committee formed under the Minster for the purpose of examining the investment proposal. When an agreement is reached, the incentives are enumerated in a contract with the investor that gives the specific provisions. Certain sectors are not eligible for these incentives, i.e. financial institutions, insurance operations, securities, airports, and energy production (Section 3.3.2). In 2015, there were four new investment contracts concluded under the provisions of the 2015 Act, in biotechnology, heavy
industry, and fishing sectors.60
2.47. Also, there are other incentives that may be given pursuant to other legislation. The 2009 Act on support for innovation enterprises61 provides for tax credits for innovation companies involved in research and development.62 In general, the enterprise is entitled to a special tax credit of 20% of the paid costs up to a certain cost ceiling of ISK 300 or 450 million.63 In 2014, the Act was extended until the end of 2019.64 There are also tax incentives for foreign experts hired to
work in Iceland in the form of reduced tax base to 75% for personal income tax based on the provisions contained in Act No. 90/2003.65
2.48. Iceland also offered direct start-up grants for SMEs through the Innovation Center Iceland and through Landsbanki Iceland during the period 2012-13. The grants ranged from ISK 500,000 to ISK 10 million per year depending upon the type of project. Direct R&D grants are available through the Icelandic Centre for Research to promote innovation in Iceland. 66 A maximum grant of
56 Invest in Iceland, online information. Viewed at: http://www.invest.is/key-sectors. 57 Act No. 41/2015. Ministry of Industries and Innovation online information. Viewed at:
https://eng.atvinnuvegaraduneyti.is/media/acts/Act-on-incentives-for-initial-investments-in-Iceland-English-2015.pdf.
58 See Article 5 of Act No. 41/2015 for the full list of conditions. 59 This includes the exemption from customs duties for imported building materials, machinery and
equipment, and other capital goods used for the investment project. 60 Information provided by the authorities. 61 Act No. 152/2009. Ministry of Finance and Economic Affairs online information. Viewed at:
https://eng.fjarmalaraduneyti.is/media/log-reglur/Act_No_152_2009.pdf. 62 Invest in Iceland, online information. Viewed at: http://www.invest.is/files/skjol/pdff/iceland-
incentives-factsheet.pdf. 63 Act No. 152/2009. Ministry of Finance and Economic Affairs online information. Viewed at:
https://eng.fjarmalaraduneyti.is/media/log-reglur/Act_No_152_2009.pdf. 64 Act No. 126/2014. 65 Invest in Iceland, online information. Viewed at: http://www.invest.is/files/skjol/pdff/iceland-
incentives-factsheet.pdf. 66 Rannis online information. Viewed at: https://en.rannis.is/funding/research/technology-development-
fund/.
WT/TPR/S/361/Rev.1 • Iceland
- 34 -
ISK 45 million is available to eligible companies over a three-year period. 67 Special incentives are also made available to producers of film and TV material in Iceland whereby all costs are eligible for a 25% reimbursement by the Film in Iceland Agency.68
2.49. In October 2015, Iceland launched a Route Development Fund to encourage new flight routes to Iceland.69 The Fund makes grants to eligible service providers after they make an application to the Ministry of Industries and Innovation. The maximum grant for route
development is €200,000 over a three-year period and, for promotion/marketing support, a minimum of ISK 10 million for each flight route.70
2.50. Iceland also offers incentives pursuant to EU regulations. EU Regulation No. 651/2014 provides the legal basis for Iceland pursuant to the EEA to offer training aid, aid to SMEs, and to environmental protection investment projects.71
67 Invest in Iceland, online information. Viewed at: http://www.invest.is/doing-business/incentives-and-
support/. 68 Ministry of Industries and Innovation, online information. Viewed at:
https://eng.atvinnuvegaraduneyti.is/laws-and-regulations/film-reimbursement. 69 Ministry of Industries and Innovation, online information. Viewed at:
https://eng.atvinnuvegaraduneyti.is/subjects/the-icelandic-route-development-fund/. 70 Ministry of Industries and Innovation, online information. Viewed at:
https://eng.atvinnuvegaraduneyti.is/media/Acrobat/Protocols-of-the-Board-of-Directors-of-the-Icelandic-Route-Development-Fund.pdf.
71 Invest in Iceland, online information. Viewed at: http://www.invest.is/files/skjol/pdff/iceland-incentives-factsheet.pdf.

WT/TPR/S/361/Rev.1 • Iceland
- 35 -
3 TRADE POLICIES AND PRACTICES BY MEASURE
3.1 Measures Directly Affecting Imports
3.1.1 Customs procedures and requirements
3.1. Iceland's Customs Law sets out the basic framework and rules for customs procedures, including valuation, tariff classification, warehousing, rules of origin, anti-dumping and countervailing duties, etc.1 It also contains the customs tariff and tariff quota information in its
annexes. Some of these subjects and others in the Customs Law are supplemented or further clarified by regulations. Since the last review, the Customs Law has been amended sixteen times.2 These amendments mainly concerned: the incorporation of the amendments to the excise and VAT tax legislation; changes to the rules for the allocation of tariff quotas, including rates of duty; updates to the Customs Tariff in Annex I; adoption of the World Customs Organization (WCO)
Authorized Economic Operator (AEO) standard; and rules for duty-free stores and bonded
warehouses.
3.2. Customs duty revenue amounted to ISK 6.06 billion in 2014, before the autonomous liberalization of customs duties on non-agricultural products in 2016 and 2017.3 At that time, agricultural products, clothing and footwear, and other non-agricultural products amounted to about one-third of revenue each.4 With the tariff elimination implemented in 2016-17, it is expected that customs revenue will decrease. In 2016, customs duty revenue amounted to ISK 5.2 billion and it is estimated to be ISK 2.57 billion in 2017.5 Thus, customs revenues are
relatively small and declining, accounting for about 0.3% of GDP in 2014 and 0.21% in 2016.6
3.3. According to the World Bank's Ease of Doing Business rankings, Iceland ranked 66th in the category trading across borders which is significantly worse than its overall rank of 20th.7 The lower ranking for trading is mainly due to very high border compliance costs for both imports and exports. The cost to export (preparing the paperwork, border handling, customs clearance, etc.)
was US$655 for Iceland compared to US$ 115-150 for OECD high-income countries. Also noteworthy was that Iceland's time to export was 2 hours, similar to OECD high-income countries,
while its time to import was twelve times that amount (24 hours).
3.4. Iceland's Directorate of Customs (Tollstjori), under the Ministry of Finance and Economic Affairs, has the responsibility for administering customs matters for the importation, transit, and exportation of goods in the customs territory of Iceland, which includes the country, islands, and skerries, including 12 nautical miles of territorial waters and airspace above these areas. Certain entities have exclusions from paying customs duties by law, including NATO, Partnership for Peace,
and United States' forces.8 Customs operates 11 customs offices and designates 23 customs ports for the loading/unloading, storage, and customs control of goods. As an island nation, customs offices are located where there are major air or sea cargo facilities. The State Customs Committee, under the Directorate of Customs, was discontinued as of early 2015, with its functions (i.e. independent administrational committee) transferred to the Internal Revenue Board.9 As such, most disputes concerning customs (e.g. tariff classification) are now handled by the Internal
Revenue Board but disputes concerning administrative matters are handled by the Ministry of
Finance and Economic Affairs, and can ultimately be taken to the courts. Traders must first appeal to the Directorate of Customs for a review/re-opening before taking the matter to the Board.
1 Law No. 88/2005. Viewed at: https://www.tollur.is/library/Skrar/Enski-
vefurinn/Customs_law_11_3_2015.pdf. 2 Law No. 16/2013, Law No. 21/2013, Law No. 22/2013, Law No. 141/2013, Law No. 5/2014, Law
No. 123/2014 and Law No. 125/2014. 3 Information provided by the authorities. 4 Ministry of Finance and Economic Affairs, online information. Viewed at:
https://www.fjarmalaraduneyti.is/frettir/nr/19725. 5 Information provided by the authorities. 6 Information provided by the authorities. 7 World Bank's Doing Business online information. Viewed at:
http://www.doingbusiness.org/data/exploreeconomies/iceland#trading-across-borders. 8 Customs Law. Viewed at: https://www.tollur.is/library/Skrar/Enski-
vefurinn/Customs_law_11_3_2015.pdf. 9 Iceland Rulings and Opinions. Viewed at: https://www.urskurdir.is/fjr/rikistollanefnd/ and
http://www.althingi.is/altext/144/s/pdf/0480.pdf.

WT/TPR/S/361/Rev.1 • Iceland
- 36 -
3.5. During the review period, the Directorate of Customs had a number of major projects. These included the introduction of a risk management system, revision of the long-standing single administrative document (SAD), introduction of a quality control system, advances towards the establishment of an authorized economic operator (AEO) programme, and work towards a single window application and an electronic system for the clearance of vessels.10
3.6. Iceland commenced work on its Single Window project in 2014 by outlining the project,
defining the benefits, and envisioning its future application. It is expected to be completed by 2020.11 Iceland also worked on a risk management application that uses its electronic systems to determine risks in line with guidelines from the WCO.
3.7. In 2014, Iceland introduced a quality control system adhering to the requirements of ISO 9001 standard in order to harmonize procedures, facilitate improvements, improve efficiency and provide quality services. This work focused on the services and collection division with the
introduction of a quality management system. Other aspects of the project included training and implementation of new systems. In 2015, it was completed and Iceland received this certification, thus improving work processes and predictability.
3.8. Iceland's import procedures require that upon arrival a cargo manifest be delivered to Customs; this commences the customs clearance process. The manifest is to contain information about the vessel and on the individual shipment such as ID number of importer, product description, quantity and type of packaging, cargo manifest number, etc.12 With the development
of electronic systems, i.e. electronic data interchange (EDI), the import clearance process is increasingly conducted through electronic means (about 98% of declarations).13 Customs clearance further requires an entry form – the SAD, with accompanying documents such as bill of lading, commercial invoice, invoices for determining c.i.f., and permits or certificates if applicable.
3.9. Iceland's new SAD was launched in 2014 and it is to replace the previous document that has been in place for over 40 years. As of May 2017, the new SAD was expected to be implemented in
the near future but the exact implementation remained unclear. The new SAD was introduced to
improve disclosure, breakdown and fee calculations. Furthermore, it is applicable in the EEA and more compatible with other countries' standards and formalities. The new SAD will be applicable to all types of customs clearance and is expected to better facilitate trade.
3.10. Iceland launched its AEO system in 2014 based on the WCO's SAFE framework and modelled on relevant EU legislation. This will allow trusted operators to receive certain benefits and special treatment at Customs. The AEO parameters were incorporated into the Customs Law
by Act No. 112/2016 in 2016.14 These rules provide that traders can apply for AEO status from the Directorate of Customs if they have not been guilty of a serious offence in the last three years, have been financially solvent in the last three years, have accounting and supply chain systems for adequate customs control, and have adequate internal security procedures. As of early 2017, the AEO was in a pilot phase with the framework still being established. It is expected to be operational in 2018.
3.11. Bonded warehouses, warehouses for duty-free supplies, and free zones are provided for in
Articles 91-108 of the Customs Law and Regulation No. 1100/2006.15 Bonded warehouses may be
10 Directorate of Customs, Annual Report. Viewed at:
https://www.tollur.is/library/Skrar/sameiginlegt/arsskyrslur/%C3%81rssk%C3%BDrsla%202014.pdf and information provided by the authorities.
11 Directorate of Customs, Annual Report. Viewed at: https://www.tollur.is/library/Skrar/sameiginlegt/arsskyrslur/%C3%81rssk%C3%BDrsla%202014.pdf.
12 Regulation 1100/2006. Viewed at: http://www.stjornartidindi.is/Advert.aspx?RecordID=47456e07-71e5-4913-a444-18cf22ee8c8c.
13 Directorate of Customs, online information. Viewed at: https://www.tollur.is/english/businesses/customs/procedural-aspects/importing-to-iceland/customs-procedures/.
14 Stjornartidindi online information. Viewed at: http://www.stjornartidindi.is/Advert.aspx?RecordID=1ecb5df2-60b6-4f0d-9725-72b19b2f4d83.
15 Stjornartidindi online information. Viewed at: http://www.stjornartidindi.is/Advert.aspx?RecordID=47456e07-71e5-4913-a444-18cf22ee8c8c.

WT/TPR/S/361/Rev.1 • Iceland
- 37 -
established in Iceland by legal persons16 or registered companies granted a licence by Customs for the operation of such warehouses. Other criteria must also be met such as payment of a security bond, adequate storage and inspection facilities, knowledgeable personnel, etc. Bonded warehouses are established for the storage of goods and no commerce, sales, or industrial processing can take place through bonded warehouses except for simple repacking, labelling, assembling, testing, and cleaning that does not result in a change of customs classification of the
goods.17 Both customs cleared and uncleared goods may be stored in the warehouses provided they are in separate areas or can otherwise be sufficiently differentiated visually. Recent changes to the rules on bonded warehouses provide that owners cannot operate their own bonded warehouses, thus there are only independent operators. Iceland's rules on free zones provide for the processing of uncleared goods and domestic goods beyond what is permitted in bonded warehouses. A similar type of licensing procedure as for bonded warehouses is required by
Customs to operate free zones.18 Iceland has never had any free zones in operation although the customs legislation provides for them. According to the authorities, the bonded warehouse scheme
sufficiently accommodates the import/export requirements of traders to date, thus no free zones have been established.
3.12. The Customs Law also contains rules for customs brokers. They are authorized to represent importers or exporters before the customs authorities with respect to aiding in the completion of customs documentation, completion of customs declarations, requests for customs clearance, and
payment of import charges. The Customs Directorate licenses customs brokers on the condition that they are a legal person with at least two executive board members resident in Iceland or citizens of EEA/EFTA countries or Faeroese citizens. Furthermore, there shall be a day-to-day manager and employees must have attended a special course on customs matters by the Customs Academy. According to the authorities, of the 559,000 annual customs declarations, the majority (426,000) were processed through brokers.
3.1.1.1 Trade facilitation
3.13. Iceland submitted its instrument of ratification of the WTO Trade Facilitation Agreement (TFA) on 31 October 2016.19 No laws were introduced or amended to implement the agreement. There have been no TFA notifications by Iceland since that time. In October 2015, Iceland accepted the WCO's Revised Kyoto Convention (International Convention on the Simplification and Harmonization of Customs Procedures) which entered into force on 8 January 2016.20 Iceland has also been including trade facilitation provisions in many recent FTAs.
3.14. Advance rulings are provided for customs classification in the form of binding classification opinions as set out in the Customs Law, Article 21. A request for a binding classification opinion is to be made to the Director of Customs with the accompanying documentation necessary to determine the classification of the goods. The Director of Customs is required to reply within 30 days of receipt. The decision is binding on Customs and on the applicant for six years. A decision may be appealed to the Internal Revenue Board. The Directorate of Customs may revoke an opinion based on the provisions of administrational law or due to legislative changes.21 There
are no provisions for making binding classification opinions available to the public. There have
been no advance rulings provided for origin determination to date, although it is possible to request them.
3.15. Iceland has recently put in place a risk management system (Section 3.1.1) and regularly performs post-clearance audit functions as outlined in Article 119 of the Customs Law. Post-clearance audit encompasses all types of inspection activities to determine the accuracy of import
16 At least two executive board members that are resident in Iceland or citizens of EEA/EFTA countries
or Faeroese citizens and have an unblemished record. 17 Customs Law. Viewed at: https://www.tollur.is/library/Skrar/Enski-
vefurinn/Customs_law_11_3_2015.pdf. 18 Customs Law. Viewed at: https://www.tollur.is/library/Skrar/Enski-
vefurinn/Customs_law_11_3_2015.pdf. 19 WTO online information. Viewed at: http://www.tfafacility.org/ratifications. 20 WCO online information. Viewed at:
http://www.wcoomd.org/en/media/newsroom/2015/october/iceland-becomes-103rd-contracting-party-to-the-wco-revised-kyoto-convention.aspx.
21 Administrative Procedures Act, Act No. 37/1993. Viewed at: https://eng.forsaetisraduneyti.is/acts-of-law/nr/17.

WT/TPR/S/361/Rev.1 • Iceland
- 38 -
declarations. The Customs Law also contains provisions for importers to amend an import declaration after customs clearance. This option is valid for six years from the date of customs clearance pursuant to the provisions of Article 116 of the Customs Law.
3.16. Iceland has provisions for expedited shipments; these are contained in the Customs Law (Articles 22 and 36) and Regulation No. 111/2006. The Act provides that expedited shipments may be released into circulation before the customs declaration documents have been submitted and
that customs brokers may deliver express consignments before payment of customs charges by providing information about the consignor and the consignment, and paying a security deposit.
3.17. There are no pre-shipment inspection requirements for the import of goods into Iceland.
3.1.2 Customs valuation
3.18. Customs valuation in Iceland is provided for in the Customs Law, Articles 14-19, and Regulation No. 1100/2006. The Customs Law provides for transaction value as the principle
method of valuation, additions to the price actually paid or payable, and conditions on the use of transaction value. The Regulation provides for the sequential application of the other valuation methods based on Article VII of GATT 1994. There have been no significant changes to the customs valuation framework during the review period. According to the authorities, nearly all imports use transaction value as the methodology for valuation.
3.19. Since 2007, Iceland has required the use of an official rate of exchange for customs clearance of goods.22 Thus, customs value is based on the official rate of exchange published by
the Central Bank each weekday. These exchange rates are posted on the Customs website.23 Iceland values goods on a c.i.f. basis for imports and f.o.b. for exports.
3.20. Iceland's Regulation on the Custody and Customs Clearance of Goods provides additional rules on customs valuation.24 This in particular contains special provisions on the importation of
vehicles classified in HS headings 8701-8706, and 8711. Icelandic Customs uses reference prices from foreign countries to determine the customs value if the transaction value deviates from the comparison value determined by Customs. According to the authorities, these deviations are rare.
Customs determines the f.o.b. price and then makes adjustments to get an approximate retail price; they also use a depreciation method from new car prices to determine used car prices.
3.21. Iceland's law on the Production, Pricing, and Sale of Agriculture Products provides for the tariff to be set for agricultural products in ISK per kg, up to a certain maximum, based on the c.i.f. price and wholesale margin of the product.25
3.22. Iceland has previously notified to the WTO that the Interpretative Notes of the Agreement
on Implementation of Article VII of the GATT 1994 have not been included in its respective laws and regulations and that the provisions of the Decision on the Treatment of Interest Charges in the Customs Value of Imported Goods has not been implemented.26 Iceland's current regulation on
customs valuation, Regulation No. 1100/2006, has yet to be notified to the WTO.
3.1.3 Rules of origin
3.23. Iceland's Customs Law sets out the basic framework for its rules of origin in Chapter XX (Article 145). It provides for three basic methods: change in customs classification, percentage of
value, and methods of production or processing, but refers to rules of origin published in the regulations. At present, there are no Icelandic regulations on rules of origin, and therefore origin determination is pursuant to the various bilateral or plurilateral agreements. For non-preferential origin determination, Iceland generally accepts what the importer has declared in the import documentation.
22 Article 19, Customs Law. 23 Directorate of Customs, online information. Viewed at:
https://www.tollur.is/english/businesses/customs/import-duties/exchange-rates/. 24 Regulation 1100/2006. Viewed at: http://www.stjornartidindi.is/Advert.aspx?RecordID=47456e07-
71e5-4913-a444-18cf22ee8c8c. 25 Act No. 99/1993. 26 WTO document G/VAL/N/2/ISL/1.

WT/TPR/S/361/Rev.1 • Iceland
- 39 -
3.24. For preferential rules of origin, Iceland has a number of different rules depending on the agreement. For FTAs that involve parties of the Regional Convention on pan-Euro-Mediterranean preferential rules of origin (PEM Convention),27 Iceland follows these rules.28 Origin under the PEM Convention provides for wholly obtained goods whereby a list of products or processes identifies these goods.29 When goods are not wholly obtained, the Convention provides for origin to be conferred when the products are sufficiently worked or processed, as determined by processes
listed in Annex II by HS chapter.30 Three main criteria are used for the determination of sufficiently worked or processed: value percentage, change of tariff heading, and specific rules. The PEM Convention also provides for bilateral and diagonal accumulation between the parties, and full accumulation between EEA partners. Previous origin rules under the EEA have been replaced by the PEM Convention and entered into force for Iceland in 2015.
3.25. Origin rules of many EFTA FTAs involving partners outside the Euro-Mediterranean area, in
particular developing countries, often involves simpler rules, i.e. more use of change of tariff
heading.
3.26. Iceland's recent FTA with China has defined originating goods as those wholly obtained in the territory of a Party, goods produced entirely in the territory of one or the other Party from originating goods, or goods from non-originating materials that conform to origin determination in the Agreement. Annex IV lists the rules by HS heading; these mainly concern a change in tariff classification or regional value content rules, however, a process requirement or other rule
specified in the Annex may also be used. The agreement also allows for accumulation between the parties, provides for de minimis origin rules, and lists operations that do not confer origin.
3.27. For GSP, Iceland follows UNCTAD conventions for origin determination. The first criterion provides for "wholly obtained products" and secondly, if the wholly obtained criterion is not met, then sufficient working or processing is required. The Regulation lists the criterion for wholly obtained products and references the processes for sufficient work through the EEA Agreement which in turn references the PEM Convention rules of preferential origin. There are also provisions
for insufficient working or processing; accessories, spare parts, and tools; and sets. Per UNCTAD guidance, Iceland either requires GSP Certificate of Origin Form A or an invoice declaration declaring origin per Iceland's rules for GSP eligibility.
3.28. Iceland's last notification to the Committee on Rules of Origin was in 2012 for the notification of preferential rules of origin pursuant to the free trade agreement between Ukraine and the EFTA States.31 Certain other preferential rules of origin were notified in 1997 for EFTA free
trade agreements in force at that time.32
3.1.4 Tariffs
3.29. Iceland's Customs Law provides the main legal framework for tariffs. Its annexes contain the applied tariffs by HS code and the basic information on tariff quotas (TQs). In addition, a number of regulations supplement the information on quotas by providing more detailed information. The main changes to the legal framework for tariffs during the period were the
changes in tariff nomenclature and rates, as outlined in detail below, and new regulations to adjust
quota quantities or rates of duty.
27 The EU, EFTA States, Faroe Islands, participants to the Barcelona Process (Algeria, Egypt, Israel,
Jordan, Lebanon, Morocco, Palestine, Syria, Tunisia, and Turkey), participants in the EU's Stabilisation and Association Process (Albania, Bosnia and Herzegovina, the former Yugoslav Republic of Macedonia, Montenegro, Serbia and Kosovo), and Moldova.
28 The FTA with Ukraine also provides for PEM Convention rules of origin determination. 29 European Commission online information. Viewed at:
http://ec.europa.eu/taxation_customs/business/calculation-customs-duties/rules-origin/general-aspects-preferential-origin/arrangements-list/paneuromediterranean-cumulation-pem-convention_en.
30 PEM Convention. Official Journal of the European Union, L 54, 26 February 2013. Viewed at: http://eur-lex.europa.eu/legal-content/EN/TXT/?uri=OJ:L:2013:054:TOC.
31 WTO document G/RO/N/82. 32 WTO document G/RO/N/15.

WT/TPR/S/361/Rev.1 • Iceland
- 40 -
3.1.4.1 Nomenclature and WTO bindings
3.30. Since 1 January 2017, Iceland has implemented the latest (HS2017) Harmonized System (HS) changes from the WCO in its customs tariff, as contained in Annex 1 to the Customs Law. This Annex is updated periodically to keep the tariff current, with the most substantial change during the review period being the HS2017 implementation. Since that revision, the tariff has been updated two more times to implement the tariff liberalization for non-agricultural products and to
amend certain dairy tariffs to align with the consumer price index movements since 1995.33 Other changes to the tariff nomenclature during the review period were mainly for statistical purposes and due to changes in other taxes, i.e. recycling tax.
3.31. Iceland's WTO Schedule of tariff commitments is currently in the HS2002 nomenclature. The submissions of the HS2007, HS2012, and HS2017 changes to its schedule were outstanding as of May 2017.34 Iceland is currently not covered by WTO waiver for these changes. Formal changes to
Iceland's WTO schedule that were certified during the review period were the HS2002 changes and the expanded ITA product coverage.35 These did not change the overall binding coverage or rates significantly, i.e. the additional ITA products lowered some of the bindings on these products and bindings were added to a few unbound lines.
3.32. Iceland maintains 95% binding coverage of its tariff, remaining statistically unchanged since 2012 (Table 3.1). The unbound lines include certain fish, petroleum gas, fertilizer, tyres, paper, books, wool, yarn, fibre, motor vehicles, and airplane products. Iceland's bound rates offer
considerable tariff protection, especially in agriculture and fisheries, where there are several ad valorem bound rates in excess of 200%, and more than 150 bound at over 100%. When examining the bindings of non-ad valorem rates, they offer considerably more tariff protection with an ad valorem component often exceeding 100%, and many over 500%, with a specific component that may allow the binding to go even higher, depending on which of the two components is higher.
3.1.4.2 Applied rates
3.33. As of 1 January 2017, Iceland removed the customs duties on all non-agricultural36 products.37 This measure was implemented in two phases, with tariffs eliminated on clothing and footwear products on 1 January 2016 and the remaining products on 1 January 2017. This initiative is expected to lead to a reduction in customs revenues of ISK 2.5 to 3.5 billion per year.38
3.34. As a result of this initiative, the simple average tariff rate has been reduced significantly from 8.3% in 2012 to 4.6% in 2017 (Table 3.1). Agricultural products39 have also seen some
reductions since 2012, i.e. 28.6% to 20.2%, but they remain high and prohibitive in certain HS chapters, in particular, the meat, dairy, and plant and flower chapters (Table 3.2). However, nearly 90% of all tariff lines are now duty-free, an increase from 70% in 2012 (Chart 3.1 and Table 3.1).
3.35. Iceland continues to maintain a significant number (4.4%) of tariff lines with non-ad valorem rates, a slight decrease from 5% in 2012, and these constitute about 40% of all dutiable tariff lines. Non-ad valorem rates are mostly complex duties (3.7%), while 0.7% are specific duties
(Chart 3.2). For the purpose of tariff analysis, the ad valorem equivalents (AVEs) were calculated and these result in significantly high rates, averaging 75.8%, with more than one-fourth above 100%, thus offering significant tariff protection. In comparison, ad valorem applied rates averaged 21.6%. The highest rate of 429.6% was for meat of swine, and the next highest was 322.6% for milk and cream. Thus, non-ad valorem rates are concentrated in the sectors with highest tariff
33 Act No. 102/2016. 34 WTO online information. Viewed at:
https://www.wto.org/english/tratop_e/schedules_e/goods_schedules_table_e.htm. 35 WTO documents WT/Let/1003 and WT/Let/1202. 36 Those in HS chapters 25 to 97. 37 Ministry of Finance and Economic Affairs, online information. Viewed at:
https://www.fjarmalaraduneyti.is/media/frettir/Skilagrein-starfshops-um-endurskodun-tollskrar.pdf. 38 Iceland Monitor online information. Viewed at:
http://icelandmonitor.mbl.is/news/politics_and_society/2015/07/09/customs_duties_abolished_from_2017/. 39 WTO definition.

WT/TPR/S/361/Rev.1 • Iceland
- 41 -
protection, i.e. meat and dairy (Table 3.2). These two sectors are also the ones providing the most tariff peaks.
3.36. A comparison of Iceland's applied and bound rates was undertaken. While there were no cases of tariffs exceeding bindings when conducting a direct comparison of ad valorem rates, there may be some inconsistencies in a few instances when comparison was undertaken using ad valorem equivalents.40 It is noted that the methodology was not precise and difficulties remain
with obtaining adequate trade statistical information for more than one year for some tariff lines.
3.37. Iceland's submission to the Integrated Data Base for tariff and trade data was last notified in 2014, thus 2015 and 2016 submissions were outstanding as of March 2017.
Table 3.1 Tariff structure of Iceland, 2012 and 2017
MFN applied
2012 2017
Bound tariff lines (% of all tariff lines) 95.0 95.0
Simple average rate 8.3 4.6
WTO agricultural products 28.6 20.2
WTO non-agricultural products 2.5 0.2
HS01-24 22.1 15.5
HS25-97 2.5 0.0
Duty-free tariff lines (% of all tariff lines) 70.1 89.6
Simple average of dutiable lines only 27.8 44.3
Tariff quotas (% of all tariff lines) .. 1.6
Non-ad valorem tariffs (% of all tariff lines) 5.1 4.4
Domestic tariff "peaks" (% of all tariff lines)b 5.7 7.5
International tariff "peaks" (% of all tariff lines)c 8.5 7.5
Coefficient of variation 4.9 4.5
Nuisance applied rates (% of all tariff lines)d 0.1 0.1
Total number of tariff lines 8,513 8,971
Ad valorem rates 8,075 8,580
Duty-free rates 5,965 8,037
Specific rates 53 61
Compound rates 385 330
.. Not available
a Including ad valorem rates and AVEs for non-ad valorem rates. AVEs are calculated based on import figures taken from Iceland Statistics online information. Where no import figures are available, ITC Market Access Map AVEs are used.
b Domestic tariff peaks are defined as those exceeding three times the overall simple average applied rate.
c International tariff peaks are defined as those exceeding 15%. d Nuisance rates are those greater than zero, but less than or equal to 2%.
Note: All tariff calculations exclude in-quota rates. The 2012 tariff is based on HS12 nomenclature, and the 2017 tariff on HS17.
Source: WTO Secretariat calculations, based on data received by the authorities and based on Iceland Statistics online information as well as ITC Market Access Map online information.
40 Products within HS heading 1905.

WT/TPR/S/361/Rev.1 • Iceland
- 42 -
Chart 3.1 Frequency distribution of MFN tariff rates, 2017
(89.6%)
(2.7%) (2.8%)(0.9%) (0.4%) (0.4) (1.0%) (1.1%) (1.2%)
80%
82%
84%
86%
88%
90%
92%
94%
96%
98%
100%
0
1,000
2,000
3,000
4,000
5,000
6,000
7,000
8,000
9,000
Duty free >0%-10% >10%-20% >20%-30% >30%-40% >40%-50% >50%-60% >60%-100% >100%
Chart 3.[] Frequency distribution of MFN tariff rates, 2017
Number of tariff lines
Cumulative %
Number of lines (% of total)
Note: Including AVEs for non-ad valorem rates.
Source: WTO Secretariat calculations, based on data provided by the authorities.
Note: Including AVEs for non-ad valorem rates.
Source: WTO Secretariat calculations, based on data provided by the authorities.
Chart 3.2 Tariff distribution by type of duty, 2017
Chart 3.1 Tariff distribution by type of duty, 2017
Source: WTO Secretariat calculations , based on data provided by the authorities.
Ad valorem6.1%
Duty free89.6%
Non-ad valorem4.4%
Compound duty3.7%
Specific duty0.7%
Source: WTO Secretariat calculations, based on data provided by the authorities.

WT/TPR/S/361/Rev.1 • Iceland
- 43 -
Table 3.2 Summary analysis of Iceland's MFN tariff, 2017
Number of lines
Average (%)
Range (%)
Standard deviation
(%)
Non-ad valorem
rates (%)
Duty- free (%)
Total 8,971 4.6 0-429.6 21.0 4.4 89.6 By WTO category WTO agricultural products 1,990 20.2 0-429.6 40.8 19.6 59.0 Animals and products thereof 234 88.1 0-429.6 66.6 83.3 16.7 Dairy products 44 73.3 30.5-322.6 53.2 100.0 0.0 Fruit, vegetables, and plants 331 16.5 0-248.1 35.3 10.9 60.4 Coffee and tea 57 12.1 0-40.4 11.4 40.4 36.8 Cereals and preparations 292 12.9 0-144.8 22.8 27.7 54.5 Oils seeds, fats, oil and their products 134 4.9 0-55 15.1 3.0 89.6 Sugars and confectionary 50 5.4 0-55 12.5 0.0 80.0 Beverages, spirits and tobacco 631 6.9 0-43.8 9.5 1.3 63.5 Cotton 5 0.0 0.0 0.0 0.0 100.0 Other agricultural products, n.e.s. 212 5.2 0-55 15.7 0.0 89.6 WTO non-agricultural products 6,981 0.2 0-10 1.3 0.0 98.3 Fish and fishery products 766 1.6 0-10 3.6 0.0 84.5 Minerals and metals 1,105 0.0 0.0 0.0 0.0 100.0 Chemicals and photographic supplies 1,261 0.0 0.0 0.0 0.0 100.0 Wood, pulp, paper and furniture 496 0.0 0.0 0.0 0.0 100.0 Textiles 674 0.0 0.0 0.0 0.0 100.0 Clothing 243 0.0 0.0 0.0 0.0 100.0 Leather, rubber, footwear and travel goods 234 0.0 0.0 0.0 0.0 100.0 Non-electric machinery 683 0.0 0.0 0.0 0.0 100.0 Electric machinery 318 0.0 0.0 0.0 0.0 100.0 Transport equipment 570 0.0 0.0 0.0 0.0 100.0 Non-agricultural products, n.e.s. 598 0.0 0.0 0.0 0.0 100.0 Petroleum 33 0.0 0.0 0.0 0.0 100.0 By ISIC sectora ISIC 1 - Agriculture, hunting and fishing 566 10.0 0-248.1 29.6 7.6 78.4 ISIC 2 – Mining 111 0.0 0-10 0.0 0.0 100.0 ISIC 3 – Manufacturing 8,293 4.3 0-429.6 20.3 4.2 90.2 By stage of processing First stage of processing 1,244 5.2 0-248.1 21.6 4.0 89.6 Semi-processed products 2,310 0.6 0-55 5.1 0.0 98.4 Fully processed products 5,417 6.2 0-429.6 24.5 6.3 85.8 By HS chapters HS 01-24 2,660 15.5 0-429.6 36.2 14.7 64.9 HS 01 - Live animals 37 0.0 0 0.0 0.0 100.0 HS 02 - Meat and edible meat offal 157 108.1 0-429.6 62.7 98.7 1.3 HS 03 - Fish and crustaceans 632 0.4 0-10 2.1 0.0 95.6 HS 04 - Dairy products; eggs; natural honey; etc. 57 70.0 0-322.6 53.1 93.0 7.0 HS 05 - Products of animal origins, n.e.s. 42 0.0 0 0.0 0.0 100.0 HS 06 - Plants and flowers 58 48.1 0-213.7 52.7 44.8 19.0 HS 07 - Vegetables and certain roots 92 23.7 0-248.1 36.8 8.7 20.7 HS 08 - Fruit and nuts 76 0.0 0 0.0 0.0 100.0 HS 09 - Coffee, tea, maté, spices 43 0.0 0 0.0 0.0 100.0 HS 10 – Cereals 44 17.5 0-55 25.6 0.0 68.2 HS 11 - Products of the milling industry 60 15.2 0-55 24.1 0.0 66.7 HS 12 - Oil seeds and oleaginous fruit, etc. 64 1.7 0-55 9.6 0.0 96.9 HS 13 - Vegetable sap and extracts 18 0.0 0 0.0 0.0 100.0 HS 14 - Vegetable plaiting materials 6 0.0 0 0.0 0.0 100.0 HS 15 - Animal or vegetable fats and oils 109 1.0 0-37.9 5.5 3.7 96.3 HS 16 - Preparations of meat and fish 135 33.7 0-176.7 43.5 29.6 3.0 HS 17 - Sugars and sugar confectionary 50 5.4 0-55 12.5 0.0 80.0 HS 18 - Cocoa and cocoa preparations 39 14.1 0-40.4 11.6 59.0 25.6 HS 19 - Preparations of cereals, flour, or milk 103 8.2 0-42.5 10.8 45.6 44.7 HS 20 - Preparations of vegetables, fruit, nuts 220 14.1 0-76 13.2 0.9 35.9 HS 21 - Misc. edible preparations 86 7.7 0-47.8 11.7 29.1 51.2 HS 22 - Beverages, spirits, vinegar 458 3.9 0-43.8 7.9 1.7 77.7 HS 23 - Waste from the food industries 46 31.1 0-55 27.3 0.0 43.5 HS 24 - Tobacco 28 0.0 0 0.0 0.0 100.0 HS 25-97 6,311 0.0 0.0 0.0 0.0 100.0
a ISIC Rev.2 classification, excluding electricity (1 line).
Note: Excluding in-quota rates and including AVEs for non-ad valorem rates. AVEs are calculated based on 2016 or 2015 import data at the 8-digit tariff line level taken from Iceland Statistics online. Where no import figures are available, ITC Market Access Map 2016 AVEs are used.
Source: WTO Secretariat calculations, based on data received by the authorities.

WT/TPR/S/361/Rev.1 • Iceland
- 44 -
3.1.4.3 Special tariff treatment and duty suspensions
3.38. Iceland maintains a number of exemptions to the customs tariff for various reasons; these include gifts, temporary import, designated investments, products of designated monopolies, special projects, etc. (Table 3.3).
3.39. Iceland's Customs Law provides for duty suspensions on a few products. According to Article 7, duty suspensions apply to raw materials and certain grated cheeses, fresh potatoes,
margarines, and rusks and similar toasted products where the products are used in domestic production.41
Table 3.3 Tariff exemptions
Product/subject Exemption Law or reference
Exemption of import duty Write-offs decided by the Committee
Committee on the write-off of public expenditure
Building material, plant equipment Alcoa in Iceland import tax exemption
Law No. 12/2003
Alcohol State Monopoly Board exemption Regulation No. 505/1998 Tobacco State Tobacco Monopoly Letter 20/12/95 and 08/10/98 Building material, plant equipment Duty exemptions for airport Law No. 124/1999 Building materials machinery and equipment and other capital goods
Data centre exemption Law No. 57/2010
Contracting expenses EU contractors exemption Law No. 53/2012
Construction and raw materials Bakki Silicon exemption Law No. 52/2013 Alloys Icelandic railway exemption Law No. 18/1977
Source: Directorate of Customs online information. Viewed at: https://www.tollur.is/atvinnurekstur/tollamal/adflutningsgjold/skilmalar/undanthagur/.
3.1.4.4 Tariff quotas (TQs) and administration
3.40. Iceland maintains a number of TQs on agricultural products. There are essentially three different types of quotas – those pursuant to WTO multilateral rules (current and minimum access), those pursuant to FTAs (EU, EEA, and FTAs with third parties), and autonomous quotas. Determination of the quota amount, in-quota rate, and allocation is dependent upon the type of
quota. WTO quotas are established by the statutes, whereas autonomous quotas are determined by the Minister who administers agricultural affairs on the basis of the provisions in the statutes.
3.41. WTO TQs are contained in Annexes IIIA and IIIB of the Customs Law. There are currently 141 tariff lines with WTO TQs covering products in the meat & edible offal, dairy, and preparations of meat sectors.42 The Customs Law sets the in-quota tariffs at 32% and 30% of the base rate. In a few cases, the in-quota rates are higher than out-of-quota rates.43 Quotas are allocated on a yearly basis based on the recommendation of a Committee established under the Minister in
charge of agriculture. Allocation may be on the basis of drawing lots or based on the previous level
of imports.
3.42. Autonomous quotas are contained in Annexes IVA and IVB and include meat, milk & milk products, butter, cheese, eggs, flowers & plants, potatoes, tomatoes, onion, cabbage, lettuce, carrots, cucumber, leguminous vegetables, and other vegetables. These quota levels and rates are determined by the Minister in charge of agriculture once domestic demand and pricing parameters have been determined. Annex V contains a subset of the Annex IV quotas for 23 tariff lines of TQs
on products in HS chapters 2, 4, 6, and 7. These have preferential duty rates but the quota volumes are as stated in Annex IV.
41 Information provided by the authorities. 42 HS chapters 2, 4, and 16. 43 HS 0206.9009 and 0204.4309.

WT/TPR/S/361/Rev.1 • Iceland
- 45 -
3.43. Iceland also has a number of bilateral TQs pursuant to FTAs; the quota quantity and in-quota rates are set by the specific agreement. TQs for the European Union are on beef, pig meat, poultry, meat, cheese, sausages, and processed meat products. Iceland also has quotas on cheese and beef from EFTA States.44
3.1.4.5 Preferential tariffs
3.44. Iceland's preferential agreements generally provide more market access for signatories
through lower tariffs but this now only applies to agricultural goods as Iceland eliminated duties on industrial tariffs on an MFN basis. With the exception of the Faroe Islands, Iceland only provides slight improvements in agricultural market access as most FTAs have tariff averages in agriculture near the MFN average of 20.2% (Table 3.4). This indicates that Iceland continues to have sensitivities in certain agricultural products.
3.45. For GSP preferential imports, Iceland's Regulation on GSP provides for the product
coverage.45 As with the other preferential agreements, GSP benefits now only apply with respect to agriculture on 323 tariff lines, as other lines previously benefitting are now MFN duty-free. About 23% of agricultural product tariff lines are excluded from GSP, most being in the sensitive sectors of meat and dairy.
Table 3.4 Summary analysis of the Icelandic preferential tariffs, 2016
Total WTO agriculture WTO non-agriculture
Average (%)
Duty-free rates (%)
Average (%)
Duty-free rates (%)
Average (%)
Duty-free rates (%)
MFN 4.6 89.6 20.2 59.0 0.2 98.3
GSP 4.1 92.0 18.5 64.1 0.0 100.0
Regional trade agreements:
Albania 3.7 94.0 16.5 73.0 0.0 100.0
Bosnia and Herzegovina 3.7 93.7 16.7 71.8 0.0 100.0
Canada 3.4 95.0 15.1 77.4 0.0 100.0
Central America – Costa Rica
3.4 94.9 15.2 77.2 0.0 100.0
Central America – Panama 3.4 94.9 15.3 77.1 0.0 100.0
Chile 3.8 94.1 17.0 73.5 0.0 100.0
China 3.1 95.8 14.0 81.3 0.0 100.0
Colombia 3.4 95.0 15.1 77.6 0.0 100.0
Egypt 3.7 94.0 16.7 72.8 0.0 100.0
Faroe Islands 0.0 0.0 0.0 100.0 0.0 100.0
Gulf Cooperation Council 3.7 93.9 16.6 72.5 0.0 100.0
Hong Kong, China 3.8 93.9 17.0 72.4 0.0 100.0
Israel 3.9 93.9 17.6 72.6 0.0 100.0
Jordan 3.9 93.2 17.7 69.2 0.0 100.0
Korea, Rep. of 3.7 94.4 16.5 74.8 0.0 100.0
Lebanon 3.8 93.9 17.2 72.5 0.0 100.0
Mexico 3.8 94.1 17.2 73.5 0.0 100.0
Montenegro 3.8 93.5 17.0 70.6 0.0 100.0
Morocco 3.8 93.6 17.2 71.0 0.0 100.0
Peru 3.4 94.7 15.1 77.6 0.0 99.6
SACU 3.8 93.8 17 71.9 0.0 100.0
Serbia 3.7 93.7 16.5 72.9 0.0 100.0
Singapore 3.8 94.2 16.9 73.8 0.0 100.0
44 Ministry of Finance and Economic Affairs, online information. Viewed at:
https://www.fjarmalaraduneyti.is/auglysingar/nr/19485; and information provided by the authorities. 45 Regulation No. 119/2002.

WT/TPR/S/361/Rev.1 • Iceland
- 46 -
Total WTO agriculture WTO non-agriculture
Average (%)
Duty-free rates (%)
Average (%)
Duty-free rates (%)
Average (%)
Duty-free rates (%)
The former Yugoslav Republic of Macedonia
3.9 93.5 17.5 70.8 0.0 100.0
Tunisia 3.9 93.5 17.5 70.9 0.0 100.0
Turkey 3.9 94.0 17.6 73.0 0.0 100.0
Ukraine 3.7 94.0 16.9 72.9 0.0 100.0
EU-28 2.7 95.1 12.2 77.7 0.0 100.0
EEA – Switzerland 3.8 93.9 16.9 72.7 0.0 100.0
EFTA 3.1 92.9 13.6 73.9 0.0 100.0
Note: Excluding in-quota rates and including AVEs for non-ad valorem rates. AVEs are calculated based on 2016 or 2015 import data at the 8-digit tariff line level taken from Iceland Statistics online. Where no import figures are available, ITC Market Access Map 2016 AVEs are used.
Source: WTO Secretariat calculations, based on data received by the authorities.
3.1.5 Other charges affecting imports
3.46. Iceland's Directorate of Customs charges certain customs fees for its processing and clearance of goods. A fee structure is set out for the customs clearance of freight, cargo, ships, etc. on the Customs website for services provided at certain times, e.g. after office hours.46 Other
fees are also set out for disposal of goods, temporary imports, cargo security seals, customs inspection, etc.
3.47. Since 1 January 2006, pursuant to Iceland's commitments under the EU Directive on packaging and packaging waste47, Iceland has levied a recycling fee upon importation on all
cardboard, paper, and plastic packaging waste.48 Certain other categories of products (listed by HS code) are also subject to a recycling or disposal fee upon importation – oil products, organic solvents, halogenated compounds, isocyanates and polyurethanes, paint, printing inks, batteries
and accumulators, photographic products, mercury products, pesticides, refrigerants, tyres, motor vehicles, synthetic fishing gear, and electrical and electronic equipment.49 Importers, at the time of importation, should declare the net weight of all packaging imported into Iceland on the basis of which a fee is levied and collected by Customs. Exported packaging is exempt from the fee provided the exporter can demonstrate the packaging will be transported out of the country. The recycling fees on domestic packaging are collected by regional tax authorities in the same manner
as the excise tax. The recycling fee is collected in a recycling fund which is managed by a seven-member board. The fees are then channelled to cooperatives operated by local authorities to offset their costs of operating waste collection and disposal facilities. The fund has been running a surplus in recent years and has set aside the additional amounts for future liabilities.50 The recycling fee varies depending on type of packaging or product concerned. The fees have been updated several times; as of January 2017, the recycling fee for paper/paperboard packaging was
ISK 15/kg and for plastic packaging ISK 16/kg; fees for other products vary considerably, e.g.
ISK 0.20/kg for certain oils, ISK 2,880/kg for certain photographic products, and ISK 707/piece for
46 Directorate of Customs online information. Viewed at:
https://www.tollur.is/library/Skrar/Gjaldskrar/gjaldskra.pdf, https://www.tollur.is/library/Skrar/Gjaldskrar/rate_list.pdf, and https://www.tollur.is/atvinnurekstur/tollamal/adflutningsgjold/skilmalar/urvinnslugjold/.
47 European Parliament and Council Directive 94/62 EC of 20 December 1994, OJ No. L 365/10. European Commission online information. Viewed at: http://eur-lex.europa.eu/legal-content/EN/TXT/PDF/?uri=CELEX:31994L0062&from=en.
48 Iceland Recycling online information. Viewed at: http://www.urvinnslusjodur.is/voruflokkar/#umbudir and http://www.althingi.is/lagas/nuna/2002162.html.
49 The law (Act No. 162/2002) provides for a special exemption for manufacturers and importers of electrical and electronic devices if they have their own system for the collection of electric and electronic waste in the country and dispose of it appropriately.
50 Annual Report on Recycling 2015, online information. Viewed at: http://www.urvinnslusjodur.is/media/arsskyrslur/Arsskyrsla-2015-vef.pdf.

WT/TPR/S/361/Rev.1 • Iceland
- 47 -
certain batteries for vehicles.51 In 2015, the recycling fees levied on imported goods amounted to ISK 1,147.2 million.52
3.48. In January 2014, Iceland's new stamp duty law came into force and replaced the previous 1978 law53; the new law only applies to the transfer of ownership of real estate and ships over 5 gross tons. The stamp duty on the documents for the transfer is now 0.8% of the value for an individual or 1.6% for a legal entity (company). For individuals purchasing real estate for the first
time, the rate is 0.4%. Historically, the stamp duty revenues were between 0.2 to 0.4% of GDP and mainly applied to the financial sector.54 With the new law, stamp duty is no longer applied to insurance contracts, loan agreements, or rental of real estate; and the overall rate has been lowered.
3.49. Since 2014, Iceland has launched reforms to simplify and improve efficiency in its VAT and excise tax systems. This has led to a reduction in the gap between the general and lower VAT
rates, and also to its broader application and the elimination of the general excise duty. Since 2016, pursuant to the reforms, the tourism sector is now subject to VAT whereas previously it was exempt.55
3.50. VAT has undergone modernization and reform during the review period to lower the standard rate and increase the reduced rate, broaden the base, and increase the threshold. As of 1 January 2017, the VAT threshold was raised to ISK 2 million per year, the standard rate was 24% and the reduced rate was 11%.56
3.51. Following earlier reforms, in 2016 the Ministry of Finance and Economic Affairs launched a process for further reforms to the VAT. Draft legislation was circulated for comment on foreign enterprises selling electronically delivered services being able to opt for simple registration for the return of VAT.57 This was still a draft and not a formal proposal as of May 2017. The Government was also examining the third phase of reforms and calling for proposals from the public to address these matters.58 Further changes were envisioned but had not been further developed or approved
as of May 2017.
3.52. The general excise duty was abolished as of 1 January 2015. However, a specific excise is still charged on certain motor vehicles (e.g. rental cars, taxis, etc.), based on CO2 emissions. Further changes are due to take place in 2018 when the specific excise duty will be eliminated only on rental vehicles. This is expected to increase government revenues by ISK 2.5 billion.59 Excise duty continues to be charged on imported and domestic alcohol and tobacco products.
3.53. There are a number of exemptions to the excise duty on vehicles, fuel, etc. for embassies
and diplomatic missions, and for international organizations, and on tractors, snowmobiles, self-loading or self-unloading trailers and semi-trailers for agricultural purposes, vehicles owned by the Government used for fire-fighting and ambulances, vehicles owned by the Government or
51 Icelandic Recycling Fund online information. Viewed at: http://www.urvinnslusjodur.is/media/log-og-
reglur/Log-nr-162-2002-med-breytingum-vefur-2017.pdf. 52 Icelandic Recycling Fund, Annual Report on Recycling 2015. Viewed at:
http://www.urvinnslusjodur.is/media/arsskyrslur/Arsskyrsla-2015-vef.pdf. 53 Act No. 36/1978. 54 Ministry of Finance and Economic Affairs, Department of Taxation and Revenue, online information.
Viewed at: http://nsfr.dk/uf/90000_99999/92226/4058da63b99ca5ba3aa54227ece64ecc.pdf. 55 Ministry of Finance and Economic Affairs online information, "Fiscal Policy and Fiscal Strategy Plan,
2017-2021". Viewed at: https://www.ministryoffinance.is/news/statement-of-fiscal-policy-and-fiscal-strategy-plan-presented-for-the-first-time and http://fjarlog.origo.is/Opinber-fjarmal-2017-2021.pdf.
56 Ministry of Finance and Economic Affairs online information. Viewed at: https://www.velferdarraduneyti.is/media/skyrslur2016/Fjarlagafrumvarp2017.pptx.
57 Ministry of Finance and Economic Affairs online information. Viewed at: https://www.fjarmalaraduneyti.is/media/frettatengt2016/Greinargerd-starfshops.pdf.
58 Ministry of Finance and Economic Affairs online information. Viewed at: https://www.fjarmalaraduneyti.is/frettir/greinargerd-starfshops-um-kaup-og-solu-a-voru-og-thjonustu-milli-landa.
59 Ministry of Finance and Economic Affairs online information. Viewed at: https://www.velferdarraduneyti.is/media/skyrslur2016/Fjarlagafrumvarp2017.pptx.

WT/TPR/S/361/Rev.1 • Iceland
- 48 -
municipal authorities specially equipped for moving disabled people, vehicles owned by persons with disabilities specifically equipped with wheelchair lift, etc.60
3.54. Other fees are charged on certain fire and electrical safety, and electrical goods by the Iceland Construction Authority. The fee is collected by customs on imported goods' c.i.f. value at a rate of 0.15%; it is equally charged on domestic goods.61 A carbon tax is also charged on domestic and imported carbon based fuels as a specific duty per litre which varies by product based on its
emissions.62 There is also a transport equalization fee applied on certain petroleum products such as gasoline, jet fuel, etc. to offset the transport costs within the country. A specific duty per litre is charged depending on the product concerned. According to the authorities, this is applied to imported products.63
3.1.6 Import prohibitions, restrictions, and licensing
3.1.6.1 Prohibitions and restrictions
3.55. Iceland maintains a number of measures that either prohibit or restrict imports. Many of these measures are long-standing, although there have been a few developments during the review period as outlined below. Eight categories of restrictions or prohibitions on imports are maintained and several relate to international agreements such as CITES, Montreal Protocol, etc. (Table 3.5). Products prohibited due to sanctions or dual-use goods are not covered in this section (see Sections 3.1.8 and 3.2.3 respectively for the restrictions on these products).
3.56. Other developments during the period include changes to the product coverage and the
enumeration of certain exemptions in 2014 to CITES.64 Certain sharks were added to the coverage, while certain whales, dolphins, porpoises, and sharks were excluded through the exemptions.
3.57. In its last notification of quantitative restrictions in 2004, Iceland notified the WTO
Committee on Market Access that it did not maintain any quantitative restrictions.65
Table 3.5 Prohibitions or restrictions on imports, 2017
Product Measure Legislation Narcotic drugs Prohibition Act No. 65/1974 on Narcotics and Act No. 93/1994 on Medicinal
Products; also Regulations Nos. 233/2001 and 232/2001 on habit-forming and narcotic substances and other controlled substances.
Certain animal and plant species pursuant to CITES
Restriction Regulation No. 813/2014 amending Regulation No. 829/2005.
Asbestos and products containing asbestos
Prohibition Act No. 61/2013, Chemicals Act, amending Act 52/1988 on toxic and dangerous substances.
Ozone-depleting substances
Prohibition Act No. 61/2013, Chemicals Act, amending Act No. 52/1988 on toxic and dangerous substances; Act No. 7/1998 on public health and pollution control; and Regulation No. 586/2002 on substances that deplete the ozone layer
PCBs Prohibition Act No. 52/1988 on toxic and dangerous substances; Regulation No. 489/1988 on the import, use and disposal of PCBs
Weapons, firearms, ammunition
Prohibition Act No. 16/1998 on Weapons; Regulations No. 16/1978 on firearms and ammunition, No. 174/1979, and No. 474/1988 amendments to the regulation; and No. 536/1988 on the sale and handling of fireworks
60 Iceland Directorate of Customs online information. Viewed at:
https://www.tollur.is/atvinnurekstur/tollamal/adflutningsgjold/skilmalar/undanthagur/. 61 Information provided by the authorities and Regulation No. 678/2009. 62 Information provided by the authorities and Act No. 129/2009. 63 Information provided by the authorities, Act No. 103/1994, and Regulation No. 1164/2016. 64 Reglugerdasafan online information. Viewed at: http://www.reglugerd.is/reglugerdir/eftir-
raduneytum/atvinnuvega--og-nyskopunarraduneyti/nr/19238. 65 WTO document G/MA/NTM/QR/1/Add.10.

WT/TPR/S/361/Rev.1 • Iceland
- 49 -
Product Measure Legislation Textile products treated with certain chemical substances
Prohibition Regulation No. 448/1996
Batteries and accumulators containing above a certain percentage of mercury, cadmium, or lead
Prohibition Regulation No. 571/1997
Source: Iceland Directorate of Customs online information. Viewed at: https://www.tollur.is/atvinnurekstur/tollamal/adflutningsgjold/skilmalar/bonn/; MAST online information. Viewed at: http://www.mast.is/english/frontpage/import-export/; WTO document G/LIC/N/1/ISL/1; and information provided by the authorities.
3.1.6.2 Licensing
3.58. Iceland imposes import licences on twelve categories of goods (Table 3.6). Most of these measures are non-automatic licences and imposed for security or safety reasons. There have not been many changes to the products subject to licensing requirements during the review period.
3.59. In 2013, Iceland was the first to ratify the new Arms Trade Treaty negotiated under the
auspices of the United Nations to regulate international trade in conventional weapons; it subsequently entered into force in 2014. It creates a legally binding agreement to control the import, export, transit, trans-shipment, and brokering of these goods. While there are more requirements on exports, provisions on imports require each party to take measures for the regulation of imports which may include import systems. Iceland requires a licence for such products.
3.60. Amendments were made in 2013 to the Law on Radiation66, which clarified a number of
provisions related to nuclear and radioactive material/equipment.67 In particular, the amendments
prohibited the importation of certain goods (food, feed, toys, jewellery and cosmetics) to which radioactive substances have been added.
3.61. Iceland last notified the products subject to import licence to the Committee on Import Licensing in 2004.68
Table 3.6 Products subject to import licensing, 2017
Product Regime Automatic/non-automatic
Legislation
Agricultural products (animal products, fishery products, certain foodstuffs, live animals, fish, aquatic animals, insects, genes, feed, fertilizer, seeds, plants, soil, tree wood with bark, and used fishing equipment and clothing)
To control the import of certain agricultural products
Non-automatic Act No. 54/1990, Act No. 25/1993, Regulation No. 189/1990, Regulation No. 448/2012
Used agricultural machinery Importation is prohibited, except under certain conditions such as disinfection certified by an official veterinarian
Non-automatic Act No. 25/1993, Act No. 87/1995, and Regulation No. 448/2012
Toxic and hazardous substances
To ensure the safe handling of the materials and to control the quantity of imported goods
Non-automatic Act No. 52/1988
Conventional weapons Pursuant to the Arms Trade Treaty
Non-automatic
66 Law No. 44/2002. Viewed at: http://www.stjornartidindi.is/Advert.aspx?RecordID=a389af87-39d6-
4580-bfd7-89215cfa4edb. 67 Law No. 121/2013. Viewed at: http://www.stjornartidindi.is/Advert.aspx?RecordID=c16b0669-5869-
4561-b41c-97dd61d3bbe1. 68 WTO document G/LIC/N/3/ISL/3.

WT/TPR/S/361/Rev.1 • Iceland
- 50 -
Product Regime Automatic/non-automatic
Legislation
Machines for public works (mobile or construction machinery)
Prior declaration and approval needed from the Administration of Occupational Safety and Health
Non-automatic Regulation No. 388/1989
Toys containing lead Licences are required from the Food Agency for the import, production, and distribution of toys
Non-automatic Act No. 52/1988 and Regulation No. 520/1991
Drugs and medicines Importing, selling, or delivering complete medicines requires a licence for marketing authorization
Non-automatic Regulation No. 462/2000
Telecommunications equipment
Import of certain telecommunications equipment requires prior approval or recognition
Non-automatic Law No. 73/1984, Law No. 32/1993, Regulation No. 733/1983, Regulation No. 322/1985, Regulation No. 473/1989, Regulation No.71/1991
Ships, boats, and floating structures
Subject to prior approval of the Transport Authority
Non-automatic Regulation No. 708/2000, Regulation No. 47/2003, Regulation No. 168/1997, and Regulation No. 708/2000
Weapons (including ammunition, fireworks, explosives)
Requires prior approval of the National Police Commissioner for the regulation and control of the importation of weapons
Non-automatic Act No. 16/1998, Regulation No. 16/1978, Regulation Nos. 174/1979 and 474/1988, Regulation No. 536/1988, Regulation No. 684/1999
Nuclear and radioactive material/equipment
Requires prior approval and following the regulations of the Radiation Safety Authority
Non-automatic Act No. 44/2002, Act No. 121/2013
Laser and IPL devices Importation requires prior notification of the Radiation Safety Authority
Automatic Regulation No. 1339/2015
Source: Iceland Directorate of Customs online information. Viewed at: https://www.tollur.is/atvinnurekstur/tollamal/adflutningsgjold/skilmalar/bonn/; and MAST online information. Viewed at: http://www.mast.is/english/frontpage/import-export/.
3.1.7 Anti-dumping, countervailing, and safeguard measures
3.62. Iceland's regime on contingency measures has not undergone revision since the last review. The anti-dumping and countervailing duty legislation framework is contained in Articles 133-139 of the Customs Law and in Regulation No. 351/1994 on the preparation and application of the imposition and the collection of anti-dumping and countervailing duties, which remain applicable.
Article 139 of the Customs Law provides for the WTO's special agricultural safeguard (SSG)
mechanism. Anti-dumping and countervailing duties can be applied to goods, including goods assembled or produced in Iceland containing imported materials, and services.69 There have been no anti-dumping or countervailing duty investigations by Iceland to date. Iceland last notified the Committee on Anti-Dumping Practices in 2012 that it had not taken any anti-dumping actions during the last six-month period. A similar notification was made to the Committee on Subsidies and Countervailing Measures in 2006.
3.63. The legislation and the regulations provide that the Minister of Finance and Economic Affairs
can impose anti-dumping or countervailing duties following the advice of a seven-member Advisory Committee established to hear complaints. Temporary duties may be in place for a period of 12 months and final duties for a period not longer than five years. Duties may be invoked retroactively under certain conditions.
69 Regulation No. 351/1994.

WT/TPR/S/361/Rev.1 • Iceland
- 51 -
3.64. Pursuant to EEA provisions, anti-dumping and countervailing duties are not applied between EEA member States. In regard to FTAs, in particular EFTA FTAs, there is generally a provision to incorporate WTO anti-dumping and countervailing duty rules into the FTA, and in some of the more recent FTAs, the agreement goes further and often incorporates the "lesser duty" rule.
3.65. Iceland does not have global safeguard legislation. It notified the WTO to this effect in 1995.70 It does however generally include safeguard provisions in free trade arrangements. Most
EFTA FTAs, e.g. those with Ukraine, Central America, and the Republic of Korea, have safeguard rules. These include provisions related to global safeguards and bilateral safeguards. The bilateral FTAs Iceland has concluded with China and the Faroe Islands also contain safeguard provisions similar to those of the EFTA Agreements. The global safeguard provisions in its FTAs generally reaffirm the rights of the parties pursuant to Article XIX of GATT 1994 and exclude imports of the parties when taking such safeguard measures if these imports are not a substantial cause of
serious injury or threat thereof. The bilateral safeguard provisions provide a remedy in the case
where an increase in imports causes serious injury or threat thereof, but generally only during the transition period or for a limited period of time.
3.66. Iceland's provisions on safeguards with the European Union emanate from their 1972 FTA and the EEA Agreement. Recently in 2015, the EU issued a new regulation on the safeguard measures between the EU and Iceland.71 This revised regulation updates certain provisions pursuant to the EU's consolidation process and clarifies certain rules; it does not substantially alter
the safeguard mechanism or procedures.72
3.1.8 Other measures
3.1.8.1 Sanctions
3.67. Iceland imposes a number of international sanctions on various countries or entities in order to maintain peace or security in the world or to uphold human rights and freedoms. The basis for
Iceland's numerous sanction regulations is the 2008 Act on the Implementation of International Sanctions.73 The Act provides for the enforcement of measures established by the UN Security
Council or by other international organizations/groups of countries. The act lists the following types of enforcement measures that can be put in place by regulation:
ban on trade and investment; ban on imports and exports; freezing of funds and other assets; prohibition of communication, including
telecommunications and other exchanges;
ban on movement of persons and vehicles; ban on the provision of services and training; ban on providing economic and technical assistance; prohibition of activities and participation in the economy; and other similar measures that are to maintain peace, security, or to ensure respect for
human rights and fundamental freedoms.
3.68. Further to the Act, Iceland's Regulation on the Implementation of International Sanctions provides the general provisions and definitions for the legislation. Individual regulations are then issued for each measure which list the measure to be put in place and who they are to be levied against.
3.69. Thus, most of Iceland's sanctions are put in place through regulation. Many of them change or are amended frequently; the measures currently in place can be found on the Ministry of
70 WTO document G/SG/N/1/ISL/1. 71 Regulation (EU) 2015/475 of the European Parliament and of the Council of 11 March 2015 on the
safeguard measures provided for in the Agreement between the European Economic Community and the Republic of Iceland. OJ L 83/1, 27 March 2015. Viewed at: http://eur-lex.europa.eu/legal-content/EN/TXT/PDF/ ?uri=CELEX:32015R0475&from= EN.
72 EU online information. Viewed at: http://publications.europa.eu/resource/cellar/daf9ab6e-9cfb-45dd-a0c3-65e49fefb2d0.0006.02/DOC_2.
73 Act No. 93/2008. Viewed at: http://www.stjornartidindi.is/Advert.aspx?RecordID=3d1cce68-39c9-47d5-a0d0-75a802957813.

WT/TPR/S/361/Rev.1 • Iceland
- 52 -
Foreign Affairs' website (https://www.mfa.is/foreign-policy/sanctions/). As of March 2017, measures relating to trade were in place for 21 entities.74 A majority of these were issued in respect of UN sanctions and concerned arms embargoes and bans on the provision of certain services. In practice, Iceland issues sanctions issued by the European Union based on their relationship through the EEA and EFTA, and by the Organization for Security and Co-operation in Europe (OSCE).
3.70. Iceland also has in place export controls for goods, services, and investment relating to national security (Section 3.2.3) and takes measures to combat money laundering and terrorist financing pursuant to the recommendations of its Steering Committee to Combat Money Laundering and the Financial Action Task Force (FATF).
3.2 Measures Directly Affecting Exports
3.2.1 Export procedures and requirements
3.71. Iceland's Customs Law also provides for the procedures on exportation. Exporters are required to submit an export declaration through the EDI interface to the Directorate of Customs; this generally includes an invoice, bill of lading, freight bill, and other relevant documents such as a licence or certificate if necessary. The exporter is responsible for the accuracy of the information in the export declaration and for submitting the necessary information for special preferential tariff treatment if applicable.
3.72. There are simplified export procedures for postal trade exports on small consignments.
These exporters can apply to the Directorate of Customs for a special licence to submit simplified export declarations for their shipments pursuant to the provisions in Article 40 of Regulation 1100/2006. Special export procedures for the fishing sector allow for the reporting of catch to occur after the ship has returned to Iceland from a foreign market. There have been no significant changes to the export procedures during the review period.
3.73. As of early 2017, the authorities had not made any decisions as to whether Iceland's single window would also be extended to apply to exports.
3.74. Icelandic Customs maintains lists for approved exporters that are allowed to provide proof of preferential origin pursuant to the provisions on origin in certain free trade agreements.
3.75. Since 2010, Iceland has provisions on cargo security measures to improve maritime safety and reduce terrorism or other illegal activities.75 The Director of Customs has the role of certifying exporters, freight forwarders, cargo transporters and other companies as secure cargo handlers in respect of the cargo security measures. At each port of export there are restricted cargo security
areas and a place for customs to inspect goods. Exported security containers and goods in bulk are required to have a cargo security declaration upon exportation. Depending on the type of cargo and container, they are generally then sealed for export.
3.2.2 Export taxes, charges, and levies
3.76. Iceland does not have any export taxes, charges, or levies except for a fee on the export of horses (Section 3.2.3) and a 5% levy on the export of unprocessed fish.76
3.2.3 Export prohibitions, restrictions, and licensing
3.77. Export restrictions, prohibitions, and licensing continue to apply in a number of cases; and most have remained in place for many years without change (Table 3.7).
74 Afghanistan, Azerbaijan, Belarus, Central African Republic, Democratic Republic of Congo, Côte
d'Ivoire, Eritrea, Guinea, Iran, Iraq, Democratic People's Republic of Korea, Lebanon, Liberia, Libya, Myanmar, the Russian Federation, Somalia, South Sudan, Sudan, Syria, foreign terrorist organizations, Ukraine, and Zimbabwe.
75 Act No. 141/2010. 76 Act No. 116/2006.

WT/TPR/S/361/Rev.1 • Iceland
- 53 -
3.78. The Law on the Export of Horses77 was adopted and entered into force in 2011, replacing the previous legislation on the exportation of horses.78 The new law slightly amends the previous law by removing certain restrictions and increasing the export fee which has increased three-fold.
3.79. Iceland provides certain services for the exportation of meat, live animals, and wood packaging pursuant to import requirements in foreign markets.79 For live animals, i.e. pet exports and live horses, Iceland provides an official veterinary certificate for exports destined for the EU,
Norway, and Switzerland.80 Iceland follows the FAO Guidelines for regulating wood packaging material in international trade, International Standards for Phytosanitary Measures No. 15, and thus provides certification for the export of wood packaging.81
3.80. As a member of the EEA, Iceland adopted EU legislation as it pertains to export controls of defence-related products and dual-use products. Through its Law on the Control of Services and Items that may have Strategic Significance, No. 58/2010, Iceland has implemented the relevant
EU directives, regulations, and common position on the subject.82 Thus, exportation of these products requires an export licence from the Minister of Foreign Affairs. In 2016 and 2017, Iceland issued new regulations pertaining to this legislation.83 The new regulations amend the earlier regulations, updating them to align with the relevant EU directives on the matter.
3.81. Iceland ratified the Arms Trade Treaty in July 2013, which subsequently entered into force on 24 December 2014.84 It focuses on the control of exports of conventional arms. The provisions of this agreement require parties to control exports, imports, transhipments, and dissemination of
weapons, ammunition, and related components. Iceland implements these provisions through its regulation and licensing provisions for dual-use goods.
3.82. Iceland is a participant in the Australia Group, Missile Technology Control Regime, Nuclear Suppliers Group, and Chemical Weapons Convention, and follows the rules of the Wassenaar Arrangement but is not a member. Thus Iceland cooperates with these organizations on monitoring or controlling exports of products under their respective purview.
3.83. Transporting waste outside Iceland is not permitted. Iceland prohibits the export of wastes
except under certain conditions.85 For hazardous wastes and the removal of waste for recovery, an export licence is required from the Environment Agency of Iceland.
3.84. Other formalities or restrictions exist for the export of certain cultural objects or national treasures of significant cultural value. Pursuant to the Cultural Heritage Act, Iceland restricts or otherwise requires a licence from the Ministry of Education, Science, and Culture for the export of certain cultural objects such as identified in the Act.86
77 Act No. 27/2011. Viewed at: http://www.althingi.is/lagas/nuna/2011027.html. 78 Act No. 55/2002. 79 MAST online information. Viewed at: http://www.mast.is/english/frontpage/import-export/. 80 MAST online information. Viewed at: http://www.mast.is/english/frontpage/import-
export/export/live-animals/. 81 MAST online information. Viewed at: http://www.mast.is/inn-ogutflutningur/vidarumbudir/krofur-og-
vottun/ . 82 Directive 2009/43/EC of the European Parliament and of the Council of 6 May 2009 simplifying terms
and conditions of transfers of defence-related products within the Community; Council Common Position 2008/944/CFSP of 8 December 2008 defining common rules governing control of exports of military technology and equipment; and Council Regulation (EC) No. 428/2009 of 5 May 2009 setting up a Community regime for the control of exports, transfer, brokering and transit of dual-use items.
83 Regulation Nos. 361/2016 and 189/2017. Government of Iceland Regulations, online information. Viewed at: http://www.reglugerd.is/reglugerdir/eftir-raduneytum/utanrikisraduneyti/nr/20082 and http://www.reglugerd.is/reglugerdir/eftir-raduneytum/utanrikisraduneyti/nr/20457.
84 Ministry of Foreign Affairs online information. Viewed at: https://www.utanrikisraduneyti.is/malefni/lagamal/althjodasamningar-o.fl./oryggismal/ and https://www.utanrikisraduneyti.is/malefni/lagamal/utflutningseftirlit/att/.
85 Environment Agency of Iceland, online information. Viewed at: http://www.ust.is/atvinnulif/umsoknir-og-eydublod/uflutningur-a-urgangi/.
86 Act No. 80/2012.

WT/TPR/S/361/Rev.1 • Iceland
- 54 -
Table 3.7 Prohibitions or restrictions on exports, 2017
Product Measure/Rational Legislation Live horses Requires prior inspection by the Chief Veterinary
Officer of the export port; fee of ISK 1,500 to be paid to the protection fund; and a passport from the Farmer's association
Law No. 27/2011
Narcotics Export prohibition Law No. 65/1974 Ozone-depleting substances
Export prohibition (with some exceptions, for example, export for the purposes of waste disposal or recycling; export to non-signatories of the Montreal Protocol (1987) is prohibited in all cases)
Regulation No. 586/2002 on Ozone Depleting Substances
Consumer goods that are a danger to health
Export prohibition Act on Product Safety No. 134/1995
Wild animals and parts of wild animals, as well as eggs
Minister for the Environment shall in a regulation stipulate the requirements for the import and export of wild animals and their parts, as well as eggs
Act on Protection and Hunting of Wild Birds and Animals, No. 64/1994
Antiques and objects of historical value
Exports require a special licence to be granted by the Museum's Committee
Law on Export of Cultural Goods, No. 105/2001
Natural artefacts, micro-organisms and their DNA
Exports require a special licence from the Icelandic Institute for Natural History
Law on the National Institute for National History, No. 60/1992
Dual-use items and defence-related products
Applies Council Regulation (EC) No. 428/2009 for dual-use items, and Directive 2009/43/EC on defence-related products; licences from the Minister of Foreign Affairs are required
Act No. 58/2010 and Regulation 800/2011 on Control of Services and Items that May Have Strategic Significance
Plants and plant products
Exports require a special health certificate from the Agricultural Research Institute
Regulation No. 189/1990
Source: Information provided by the authorities; and WT/TPR/S/273/Rev.1.
3.2.4 Export support and promotion
3.85. Iceland's public-private partnership, Promote Iceland, also has a role in promoting Iceland's exports. It provides consulting, workshops, and information to help Icelandic companies obtain
business in foreign markets. Its activities include providing information on export processes, customs, free trade agreements, exhibitions, IP rights, procurement, business culture, and key figures on markets.
3.86. Iceland does not have any export processing zones.
3.2.5 Export finance, insurance, guarantees
3.87. The New Business Venture Fund (NSA Ventures) is a state-owned venture capital fund that invests in new start-up companies. It was established by parliament and operates under Law
No. 61/1997.87 It provides finance for innovation and start-up businesses primarily through equity investments and small bridge loans. Funding for its operations was initially by the State but since 2005 it has been self-financed and not received any further support. It continues to have an
Export Credit Guarantee Department to provide export credit insurance and guarantees to start-ups. According to the authorities, the export credit guarantee operation has been more or less dormant for the last 10 years, as there have not been any new credit guarantees since 2012.
3.3 Measures Affecting Production and Trade
3.3.1 Taxation
3.88. In 2016, total tax revenue in Iceland was ISK 794 billion and social contributions were ISK 87 billion compared to total government revenue of ISK 1,415 billion (ISK 1,031 after deducting ISK 384.3 billion in extraordinary revenue from the contribution from the estates of the failed banks). Taxes payable by individuals are the main contributor to tax revenue, followed by taxes on sales and services. Over the past five years, several changes to the tax system have
been implemented including simplification and broadening of the VAT system, and abolition of Act No. 97/1987 on Excise Tax. The increase in tax revenue in 2016 can be attributed to the changes
to the VAT system as well as general economic growth (Chart 3.3).
87 Althingi online information. Viewed at: http://www.althingi.is/lagas/nuna/1997061.html.

WT/TPR/S/361/Rev.1 • Iceland
- 55 -
Chart 3.3 Tax revenue and social contributions, 2007-16
ISK billion
Source: Statistics Iceland.
3.89. Corporations pay corporate income tax of 20% of net profits (including capital gains) plus a payroll tax. The payroll tax was increased from 5.34% of the wage bill to 8.65% following the financial crisis in 2008 but has since been reduced to 6.85%. Financial enterprises pay an additional payroll tax of 5.5%, plus a 6% charge on profits over ISK 1 billion and a tax of 0.376%
on debts exceeding ISK 50 billion. Property taxes are collected by municipalities and, for corporations, averaged about 1.64% in 2016.
3.90. Income taxes on individuals are levied by the central and local governments as progressive taxes. As regards the central government rate, the first ISK 1.79 million of income is tax-free and the maximum rate for income over ISK 10.02 million is 31.8%. Local government income tax rates vary from one municipality to another and average 14.44% of total income. Income of individuals from dividends, rents, interest and capital gains are taxed separately at 20%.
3.91. Value added tax is the main component of general taxes on goods and services which is the second biggest source of tax revenue after taxes payable by individuals (Chart 3.3). The principal legislation on VAT is Act No. 50/1988 on Value Added Tax which was last amended in 2016. The general rate for VAT is 24% with a reduced rate of 11% for food, accommodation, road tolls, books, newspaper and media subscriptions, audio recordings, indoor heating, and selected services. Enterprises with annual sales of taxable goods and services of ISK 2 million or less are
exempt from VAT, meaning they do not charge VAT for sales but must pay VAT for inputs.
3.92. VAT on imports is assessed based on the import price plus customs duties and other charges. Exports of goods and services are zero-rated (i.e. VAT paid on inputs is refunded) as are some other goods and services including: transportation of goods between countries; design and planning of constructions based abroad; provisioning of inter-country vessels; sale and leasing of aircraft and ships; shipbuilding and maintenance of ships and aircraft; services to foreign fishing vessels related to landing and sale of fish in Iceland; direct payments to farmers; and
telecommunications services.

WT/TPR/S/361/Rev.1 • Iceland
- 56 -
3.93. The main legislative acts for excise duties are: Act No. 29/1993 on Excise Duties on Vehicles, Fuel, etc.; Act No. 96/1995 on Alcohol and Tobacco Tax; Act No. 129/2009 on Environmental and Resource Taxes; and Act No. 87/2004 on Oil Tax and Mileage Fee. An exception from excise duties for rental vehicles under Act No. 29/1993 is to end with effect from 1 January 2018.88
3.94. Assessment for excise duties depends on the product and origin:
Excise duties on imports (except commercial imports of tobacco) are assessed and collected by the Customs Directorate and paid at the point of import;
Excise duties on domestic production and sales are assessed by the Internal Revenue Directorate at the point of leaving the factory; and
Excise duties on tobacco products and domestic production of alcoholic beverages are assessed when they leave the production centre.
3.95. In general, excise duties and other similar charges are applied to alcoholic beverages, mineral fuels, and vehicles as set out in Table 3.8.
Table 3.8 Excise duties and related taxes, 2017
Product Excise duty rate Alcohol products
Beer and ale containing more than 2.25% alcohol
ISK 117.25/cl of pure alcohol
Wine and fermented beverages up to 15% alcohol
ISK 106.80/cl of pure alcohol
Other alcohol ISK 144.50/cl of pure alcohol Tobacco Cigarettes ISK 481.40/pack of 20 cigarettes Snuff ISK 26.75/g Other tobacco ISK 26.75/g Excise duties on vehicle fuel
Petrol General excise duty Special excise duty
ISK 26.80/litre ISK 43.25/litre (unleaded) ISK 45.85/litre (other)
Diesel ISK 60.10/litre Biofuels Reduction based on the proportion of biofuel
Environment tax Petrol ISK 5.50/litre Diesel ISK 6.30/litre Mineral oils ISK 6.90/kg Fuel oil ISK 7.75/kg
Excise duties on private motor vehicles Emissions in grams of CO2/km Standard % Taxis and rental cars %
Depending on CO2 rating 0-65% 0-30% Excise duties on motor vehicles other than private automobiles
Large goods vehicles, large special-purpose vehicles, tractors, agriculture trailers, large snow-mobiles, amphibious vehicles, competition cars and motorbikes, vehicles for transport of disabled persons, rescue vehicles, large coaches
Exempt
Small goods vehicles, small special-purpose vehicles, vehicles over 40 years old, motor vehicle bodies
13%
Small coaches, motorbikes, other vehicles 30% (5% on small coaches owned by concessionaires) Semi-annual road tax 0-3,500 kg Emissions of 0-120 g of CO2/km ISK 5,810
Emissions greater than 120 g of CO2/km
ISK 5,810 + 139/g of COs/km over 121 g of CO2/km
More than 3,500 kg ISK 54,420 + 2.32/g over 3,500 g up to a maximum of ISK 85,660
Vehicle disposal charge ISK 350 every six months for 15 years, ISK 15,000 refund
when scrapped
88 Act No. 125/2015 on various budget proposals for 2016, Article 31.

WT/TPR/S/361/Rev.1 • Iceland
- 57 -
Product Excise duty rate Weight distance tax (payable every six months) Vehicles Progressive based on weight of 10 tonnes
and more
ISK 0.30-13.87/km
Trailers Progressive based on weight of 5 tonnes
and more
ISK 9.10-38.17/km
Source: Althingi, Legal Code, Chapter 13. Viewed at: http://www.althingi.is/lagasafn/kaflar/nuna/13.html [May 2017].
3.3.2 Incentives
3.96. According to the EFTA Surveillance Authority, Iceland provided about €60 million in state aid in 2015, 81% of which was in the form of grants and 14% as tax concessions. About half the aid
was for research, development and innovation (R&D&I), 23% for culture and heritage conservation, and 20% for regional development and cohesion. Most of the aid for R&D&I was
provided through the Icelandic Centre for Research (Rannis) which provides public support for scientific research.89
3.97. Under Act No. 99/2010 on Incentives for Initial Investments in Iceland and accompanying regulations90, a number of incentives were available for investment throughout Iceland and regional aids for investment outside of Reykjavik and surrounding municipalities. The Act expired on 31 December 2013. Six investment projects were approved under the Act and were eligible for grant aid, which was provided through reductions in various taxes and charges. In October 2014,
the EFTA Surveillance Authority found that the aid provided under some of these projects was incompatible with the EEA Agreement and directed the Icelandic authorities to recover the aid.91 At end-May 2017, recovery amounts had been calculated for the three companies concerned and recovery orders issued and put into formal procedures.
3.98. Under Act No. 41/2015 on Regional Incentives, which applies to Iceland outside the Reykjavik area, investment projects may qualify for tax incentives. These incentives include: an income tax rate ceiling of 15% for 10 years; accelerated depreciation allowances for real estate,
equipment and moveable assets; reduction in property tax and the general social security charge by 50% for 10 years; and exemption from customs duties and excise duties for construction materials, machinery and equipment, and other capital goods. In addition, the State and municipalities may allow for leasing a site for the project at reduced rates. The Act expires on 1 July 2020.
3.99. To qualify for incentives under Act No. 41/2015, the investment project must meet criteria
which include:
annual turnover of at least ISK 300 million or creation of at least 20 permanent jobs in the first two years;
commencement of the project after signing the investment contract;
minimum 20% equity from the investor; and
minimum operation period in Iceland of 10 years.
3.100. The incentives are not available for investments in financial services, airports or energy
production. The general ceiling for aid is limited to 15% of the initial investment cost although this may be increased to 25% for medium-sized enterprises and 35% for small enterprises where: a small enterprise is defined as one employing less than 50 persons, with an annual turnover of €2 million or less, and total assets of €10 million or less; and a medium-sized enterprise is defined as employing 50-250 persons, with an annual turnover of €50 million or less, and total assets of €43 million or less.
89 EFTA Surveillance Authority (2017), State Aid Scoreboard 2016 for the EEA EFTA States, March,
pp. 12-13. 90 Ministry of Industry, Regulation No. 985/2010 and Regulation No. 1150/2010. 91 EFTA Surveillance Authority Decision No. 404/14/COL, 8 October 2014 on the Investment Incentive
Scheme in Iceland [2016/340].

WT/TPR/S/361/Rev.1 • Iceland
- 58 -
3.101. In addition, under Act No. 152/2009 on Support for Innovation Companies, tax credits may be provided for 20% of the research and development expenses, up to a maximum total cost of ISK 300 million for internal research and development or ISK 450 million for R&D cooperation between two companies. Direct grants for R&D for up to 50% of the cost, up to ISK 45 million over three years, are available through the Technology Development Fund administered by Rannis, and Landsbanki provides innovation grants to companies of up to ISK 10 million per year.
3.3.3 Technical barriers to trade
3.102. As part of the EEA, Iceland applies EU legislation on technical regulations, standards, conformity assessment, certification, and accreditation, including harmonized technical regulations, and standards, and CE marking.92 Under the EEA Agreement, Iceland is required to notify draft technical regulations, before they are adopted, to the EFTA Surveillance Authority, which publishes them on its website93, and to DG GROW in the European Commission, which includes them in the
TRIS database94. In March 2016, in a reasoned opinion, the EFTA Surveillance Authority stated that Iceland "still has not notified a number of the technical regulations in question, adopted in 2012, and is thus still in breach of its obligations under Directive 98/34[95] with respect to a number of these […]. Furthermore, Iceland has not enacted a rule of non-enforceability concerning technical regulations adopted without following the due notification procedure in Directive 98/34 and the corresponding Icelandic implementing measures".96 In July 2016, the Authority reiterated its assertion that non-enforceability rules should be implemented and the Government of Iceland
again rejected this opinion in a letter dated 13 January 2017.
3.103. Several ministries are responsible for policy and legislation on technical regulations, standards, and related issues, including the Ministry of the Interior, the Ministry for the Environment and Natural Resources, the Ministry of Industries and Innovation, and the Ministry of Welfare.
3.104. Icelandic Standards (IST) is the national standards body. Under Act No. 36/2003 on
Standards, all standards must be approved by IST before they become applicable in Iceland and
IST is responsible for representing Iceland in international standards organizations. Four sector-specific committees operate under IST: BSTR in the building sector, FIF in the fishing sector, FUT in the information technology sector, and RST in the electrotechnical sector.97
3.105. IST is a member of the International Organization for Standardization (ISO), an associate member of the International Electrotechnical Commission (IEC), a member of the European Committee for Standardization (CEN) and the European Committee for Electrotechnical
Standardization (CENELEC), and an associate member of the European Telecommunications Standards Institute (ETSI).
3.106. The Icelandic Board for Technical Accreditation (ISAC), an independent department in the Icelandic Patent Office, is responsible for accreditation of inspection bodies, certification bodies, laboratories (testing and calibration) and notified bodies, in accordance with the relevant IST EN ISO/IEC 17000 series of standards and guides and the harmonized IST EN 45000 series of
European standards. Additionally ISAC is the responsible body in Iceland for good laboratory
practice (GLP). The legal basis for ISAC's status and responsibilities is set out in Act No. 24/2006 on Accreditation, etc.98 ISAC is a full member of the European co-operation for Accreditation (EA). A list of accredited bodies in Iceland is available from ISAC.99
3.107. Under Act No. 91/2006 on Measurements, Measurement Standards and Weights, the Consumer Agency has legal responsibility for metrology and calibration services. The Agency was
92 See WTO document WT/TPR/S/317/Rev.1, 21 October 2015, Section 3.1.8. 93 Online information. Viewed at: http://www.eftasurv.int/internal-market-affairs/notifications/draft-
technical-regulations/notifications-lists/ [March 2017]. 94 Online information. Viewed at: http://ec.europa.eu/growth/tools-databases/tris/en/ [March 2017]. 95 Directive 98/34/EC of the European Parliament and of the Council of 22 June 1998 laying down a
procedure for the provision of information in the field of technical standards and regulations. 96 EFTA Surveillance Authority Reasoned Opinion Case No. 74074, Document No. 807036, Decision
No. 153/16/COL. Viewed at: http://www.eftasurv.int/media/esa-docs/physical/807036.pdf [March 2017]. 97 Icelandic Standards online information. Viewed at: http://www.stadlar.is/verslun/ [March 2017]. 98 ISAC online information. Viewed at: http://www.els.is/en/about-isac [March 2017]. 99 ISAC online information. Viewed at: http://www.els.is/en/accredited-bodies [March 2017].

WT/TPR/S/361/Rev.1 • Iceland
- 59 -
established under Act No. 62/2005 on the Consumer Agency and Consumer Spokesman, under the Ministry of the Interior, with responsibility for market surveillance of business operators, good functioning and transparency of the markets in respect to safety and consumers' legal rights, as well as enforcement of legislation for protection of consumers' health, legal and economic rights.100
3.108. The Icelandic Construction Authority, established under Act No. 160/2010 on Construction, is responsible for market surveillance for electrical equipment (except low-voltage consumer
appliances), power plants and electrical installations, buildings and construction works.
3.109. Several other agencies, including the Icelandic Medicines Authority, the Environment Agency, and local health authorities, have specific responsibility for surveillance and enforcement for products for which they have competence, while the Customs Directorate is responsible for verifying conformity of imports with Icelandic legislation.
3.110. Under the TBT Agreement, Iceland's enquiry point for technical regulations is the Institute
for Accreditation, Legal Metrology, Market Surveillance, Metrology and Electrical Safety and the enquiry point for standards is Icelandic Standards. The External Trade Department in the Ministry for Foreign Affairs has also been notified as an enquiry point. No specific trade concerns have been raised by other WTO Members about TBT measures taken by Iceland.101 Iceland has made only two notifications to the WTO on TBT issues, the last in 2000.102
3.111. From 1 January 2012 to 30 April 2017, Iceland made 22 notifications to the EFTA Surveillance Authority and the DG GROW TRIS database of draft technical regulations.
3.112. As of 1 December 2010, almost 22,620 European standards (i.e. nearly all standards by CEN, CENELEC, and ETSI) had been transposed in Iceland.103 Legislation on technical issues, often including conformity assessment, is generally found in the sector-specific law adopted by relevant ministries in order to transpose EU Directives, for example, Regulation Nos. 627/2013 and 1296/2013 on the entry into force of EU Regulations on medical devices and Regulation
Nos. 424/2015, 385/2015, and 384/2015 on certain construction products. At end-November 2016, eight EU regulations and 19 EU directives relating to goods technical barriers had not yet
been transposed by Iceland.104
3.113. As a member of the EEA, products placed on the market in accordance with harmonized technical regulations may circulate freely throughout the EEA and, when the EU negotiates mutual recognition agreements it does so on the basis that the third country will conclude a parallel MRA with the EEA. Through EFTA, Iceland has mutual recognition agreements with:
New Zealand (2000) covering pharmaceuticals (good manufacturing practices, GMP),
medical devices, telecommunications terminal equipment, low voltage equipment, electromagnetic compatibility (EMC), machinery, and pressure equipment;
Australia (2000) covering electromagnetic compatibility (EMC), pharmaceuticals (good
manufacturing practice, GMP), medical devices, telecommunications terminal equipment, automotive product, pressure equipment, machinery, and low voltage equipment;
Canada (2001) covering telecommunications terminal equipment, electromagnetic
compatibility (EMC), electrical safety, recreational craft, pharmaceuticals (good manufacturing practices, GMP), and medical devices;
Switzerland (2002) covering machinery, personal protective equipment (PPE), safety of toys, medical devices, gas appliances and boilers, pressure equipment, telecommunications terminal equipment, equipment and protective systems intended
100 Consumer Agency online information. Viewed at: http://www.neytendastofa.is/english [March 2017]. 101 WTO TBT Information Management System online database. Viewed at: http://tbtims.wto.org/
[March 2017]. 102 WTO document G/TBT/Notif.00/71, 15 February 2000. 103 European Commission (2011), Chapter 1 – Free Movement of Goods, p. 3. 104 EFTA Surveillance Authority (2017), Internal Market Scoreboard, No. 39, EEA EFTA States of the
European Economic Area, Brussels, pp. 4-5.

WT/TPR/S/361/Rev.1 • Iceland
- 60 -
for use in potentially explosive atmosphere (ATEX), electrical safety and electromagnetic compatibility, construction plant and equipment, measuring instruments and pre-packages, motor vehicles, agricultural and forestry tractors, good laboratory practice (GLP), good manufacturing practice (GMP) inspection and batch certification, construction products, lifts, biocidal products, cableway installations, and explosives for civil use;
United States, the first (2005) covering marine equipment, and the second (2006) covering telecommunications equipment, electromagnetic compatibility, and recreational craft; and
Turkey (2011) covering all sectors.105
3.3.4 Sanitary and phytosanitary requirements
3.114. During the period under review, the legal and institutional framework for sanitary and
phytosanitary (SPS) requirements in Iceland remained largely unchanged.106 The Icelandic Food and Veterinary Authority (MAST), under the Ministry of Industries and Innovation,107 is responsible for implementing legislation concerning food safety, animal health and welfare, control of feed, seed and fertilizers, plant health, and water for human consumption. According to the authorities, the Ministry of Industries and Innovation is the national notification authority and MAST is the enquiry point in the WTO for Iceland's SPS measures.
3.115. During the review period, a number of amendments were made to the legislation affecting
SPS measures:
Act No. 54/1990 on the Importation of Animals was amended in 2013 through Act No. 60/2013 on the Protection of Nature requiring that before a certain species of animal or plant that is foreign to Iceland can be imported, a licence from the
Environment Agency of Iceland must be obtained, as well as a licence from the Ministry of Industries and Innovation;
Act No. 54/1990 was further amended by Act No. 48/2015 authorizing MAST to grant
licences for the importation of genetic material for beef cattle, if certain requirements are fulfilled. These requirements are related, for example, to the origin of the genetic material and to an investigation of the health standards of the animals born in the quarantine station. MAST was also granted powers to set standards for the farms receiving these animals. In the event that these requirements are not met, or if MAST considers there to be a risk of infectious diseases, MAST shall revoke the licence,
destroy the genetic material and euthanize the animals; and
Act No. 25/1993 on Animal Diseases and their Prevention was amended by Act No. 71/2015 transferring the processing of applications for imports of raw products of
animal origin from the Ministry of Industries and Innovation to MAST in order to simplify import procedures for these products.
3.116. Iceland notified two regular SPS measures to the WTO between 1 January 2012 and 30 April 2017.108 The notifications covered the inspection procedures for imports of animal
products originating outside of the European Economic Area (EEA), and measures on importation of animal products. Iceland did not notify any emergency measures during the review period.
105 EFTA online information. Viewed at: http://www.efta.int/eea/mras [March 2017]. 106 Legislation on SPS measures is available in Icelandic on the Icelandic Food and Veterinary Authority
(MAST) website. MAST online information, "Lög og reglur". Viewed at: http://mast.is/matvaelastofnun/log-og-reglur/.
107 The Ministry of Industries and Innovation was established in September 2012 following the amalgamation of the Ministry of Fisheries and Agriculture, the Ministry of Industry, Energy and Tourism and part of the Ministry of Economic Affairs. The competences originally falling under the Ministry of Fisheries and Agriculture have been assumed by the Ministry of Industries and Innovation since its creation.
108 WTO documents G/SPS/N/ISL/8 and G/SPS/N/ISL/9, 15 November 2012.

WT/TPR/S/361/Rev.1 • Iceland
- 61 -
3.117. Iceland is a member of the World Organisation for Animal Health (OIE) and the Codex Alimentarius Commission, and a contracting party to the International Plant Protection Convention (IPPC).
Sanitary
3.118. Iceland, as a member of the EEA, has adopted EU legislation on SPS measures including foodstuffs, feed, and other food chain related issues, but maintains national rules on live terrestrial
animals, germplasm (e.g. ova, embryo, and semen), and plant health. Measures on live aquatic animals follow EU legislation. MAST is the national European Food Safety Authority (EFSA) focal point and the contact point for the EU's Rapid Alert System for Food and Feed (RASFF).
3.119. Most EU food safety rules are implemented in Iceland. All food business operators in the primary production of food and feed, irrespective of animal origin, must be registered with and
approved by MAST.109 Imported food must comply with the relevant requirements that are at least
equivalent to those set forth in the EU food law and animal and plant health rules. EU legislation on novel foods110 was adopted in Iceland through Regulation No. 990/2015 on novel foods.
3.120. Imports of live animals and animal products are subject to controls through an import permit system. Under Act No. 54/1990 on Importation of Animals, Act No. 25/1993 on Animal Disease Prevention, and related regulations (e.g. Regulation No. 448/2012 on the prevention of animal diseases and contaminated products), import prohibitions are maintained on live terrestrial animals, raw meat, raw eggs, and animal products not for human consumption111 (e.g. meat and
fat meal, raw skins and hides which have not been disinfected, and animal wastes). However, the Minister for Fisheries and Agriculture may grant permits for imports, based on a positive recommendation from MAST.
3.121. Imports of used agricultural machinery, riding gear, and fishing gear are subject to similar import permit requirements provided they meet the cleaning and disinfection conditions set by
MAST. However, some used riding equipment112 and used fishing equipment113 are strictly prohibited from importation.
3.122. Permit requests for first-time imports of live animals (i.e. new species) and products of animal origin (raw or unsterilized) must undergo a risk assessment by MAST. The authorities indicated that risk assessments follow international standards such as those laid down by the OIE, and are based on the information from exporting countries, OIE and other international institutions concerning animal and public health issues.114
3.123. Import permits are applied to animal products. Imports of raw meat and meat products
that have not been fully heat treated must be accompanied by certificates confirming that the meat was stored for at least one month at -18˚C or colder, and are free of salmonella and contaminants. Some products that have been treated with methods that are deemed equivalent to full heat treatment, including some cheeses and meat sausages and salted, dried or smoked meat,
can be imported without the freezing requirements. Meat must be derived from animals that are slaughtered and processed in the establishments approved by the EU or authorized in the EEA. Products originating from outside the EEA must be accompanied by official certificates showing:
origin and health, and that the animals from which the products were derived were not given growth-promoting substances.
3.124. When an application is submitted for the first time to import raw or unsterilized products, an importer must provide the MAST with the necessary information on the product for consideration and approval before the product is dispatched from the country of export. However,
109 A list of approved establishments is available on MAST website. MAST online information, "Listi yfir
starfsstöðvar". Viewed at: https://skyrslur.mast.is/. 110 Regulation (EC) No. 258/97 of the European Parliament and of the Council of 27 January 1997
concerning novel foods and novel food ingredients. 111 Article 3, Regulation No. 448/2012. 112 Used riding equipment includes saddles, bridles, nosebands, pads, rugs, whips, and riding gloves. 113 Used fishing equipment includes fishing rods, reels, hooks/lures/flies, waders and nets. 114 MAST online information, "Import & Export". Viewed at:
http://www.mast.is/english/frontpage/import-export/ [31/03/2017].

WT/TPR/S/361/Rev.1 • Iceland
- 62 -
if the importer submits exactly the same application as previously, MAST can issue an import permit once the products have been stored for at least one month at -18˚C or less, and that storage can take place in Iceland. Live animals, including pets, cannot be dispatched from the exporting country until all requirements have been met and the import permit has been issued.
3.125. In addition to meeting health requirements such as vaccinations and testing, pets are subject to quarantine at the isolation station for four weeks upon arrival. Fur animals have been
imported in recent years, but are subject to a longer quarantine period at a special isolation station. Iceland employs the EU's Trade Control and Expert System (TRACES)115 for its sanitary measures. All imports of animal products from outside the EEA are subject to health check at an approved Border Inspection Post (BIP).116 Importers must notify the BIP through TRACES at least 24 hours prior to the arrival of the imports. MAST is responsible for the control at the BIP.117
3.126. Feed imports may only be conducted by registered importers. Imported feed must be
accompanied by documentation showing the ingredients, their chemical composition, and, if any ingredient is of animal origin, a health certificate stating the sanitary procedures used in production, packing, and handling (e.g. method of sterilization, autoclavation, etc.), and the absence of micro-organisms.
Phytosanitary
3.127. The main legislation concerning phytosanitary measures is Act No. 51/1981 on Prevention of Diseases and Pests of Plants, and Regulation No. 189/1990 on Import and Export of Plants and
Plant Products and its succeeding amendments.118 MAST is the national plant protection organization of Iceland and is responsible for plant health and seed quality.
3.128. Entry into Iceland is prohibited for harmful organisms listed in Appendix I and plants listed in Appendix III of the Regulation; entry is permitted subject to specific requirements for plants listed in Annex IV; and Appendix II lists pests that may be present in a very small proportion of
plants intended for future breeding. The Appendices were amended on 27 March 2015 and entered into force on 1 June with the addition of Phytophthora ramorum to Appendix I, firs (Abies spp) to
Appendix III, and azaleas (Rhododendron spp) to Annex IV (except Rhododendron simisii and plants from areas where Phytophthora ramorum does not exist).
3.129. Iceland maintains controls of quarantine organisms on potato and the export of wood packing materials. Iceland has implemented the EU legislation on seed.
3.130. All imported plants and plant parts are subject to phytosanitary checks and phytosanitary certificates are required.
3.131. With regard to genetically modified organisms (GMOs), Iceland has implemented the EU Directive 2001/18/EC on the deliberate release of GMOs into the environment. EU Regulations (EC) Nos. 1829/2003 and 1830/2003 on the marketing, labelling and traceability of genetically modified
food and feed have not been incorporated into Icelandic legislation. Regulation No. 1237/2014 on traceability and labelling of GM food and GM feed applies to food and feed when more than 0.9% of each ingredient is produced from GMOs.
3.3.5 Competition policy and price controls
3.132. During the period under review, there has been no substantive change to policy or legislation concerning competition in Iceland. The main legislation governing competition policy continues to be Competition Law No. 44/2005, as amended by Acts Nos. 52/2007, 94/2008, and
115 A description of the Trade Control and Expert System (TRACES) can be found on the European
Commission website. European Commission online information, "TRACES: TRAde Control and Expert System". Viewed at: http://ec.europa.eu/food/animals/traces_en.
116 There are seven approved border inspection posts in Iceland. MAST online information, "Import & Export: Animal products". Viewed at: http://www.mast.is/english/frontpage/import-export/import/rawmeat/.
117 Iceland Customs is responsible for checks on personal luggage of travellers. The coast guard is responsible for the monitoring of vessels in national waters.
118 MAST online information, "Import to Iceland: Plants". Viewed at: http://www.mast.is/english/library/Reglugerðir/Regulation189_1990importexportplants.pdf.

WT/TPR/S/361/Rev.1 • Iceland
- 63 -
14/2011. The Law is administered by the Icelandic Competition Authority (ICA), which is an independent agency under the Ministry of Industries and Innovation.119 The Competition Authority reports to the Minister of Industry and Innovation.
3.133. The Law prohibits anti-competitive agreements and practices by businesses, abuse of a dominant position and agreements between businesses that restrict competition. Furthermore, the Competition Authority must be notified of mergers where the total turnover of the undertakings in
question is ISK 1 billion or more. Under the provisions of the Law, the ICA may set conditions for mergers, prevent them from taking place or annul them after they have been concluded if it determines that they would obstruct effective competition.
3.134. As a member of the EEA, Iceland's competition policy is aligned with that of the European Union. Both national and EEA rules are applied in tandem. If restrictive practices affect trade between EEA countries, EEA rules apply. National decisions should not inhibit EEA rules.
Furthermore, Iceland's membership of the EEA requires that the ICA enforce the prohibition rules (collusion and ban on abuse of a dominant position) of the EEA Agreement. This is done in close cooperation with the EFTA Surveillance Authority (ESA). ESA ensures that the investigations and decisions of the ICA provide for an effective implementation of the EEA Agreement. Iceland has also subscribed to competition provisions within the context of the EFTA Convention and in each of EFTA's free trade agreements with third countries. Additionally, the ICA cooperates with the authorities from other Nordic countries (Norway, Denmark, Sweden, Finland, the Faroe Islands,
and Greenland). There is also a formal agreement on exchange of confidential competition-related information between the authorities of Denmark, Iceland, Norway, and Sweden. According to the authorities, this formal agreement is under review and a new, fuller agreement is expected to be signed in 2017 or 2018 and is likely to also include Finland, Greenland and the Faroe Islands.
3.135. ICA's policy objectives are to contribute to increased competition in the domestic sector and public services. Based on these objectives, the ICA has prioritized important markets, such as the financial market, groceries and agriculture, construction, the public sector, as well as
transportation. With respect to the public sector, the ICA advocates for competition incentives being used to increase efficiency and quality in public services, such as waste management, health care and education.
3.136. During the period under review, the ICA published 181 decisions and handled 36 appeals. Between 2008 and 2011, the number of pending cases had risen from around 100 to 170; this number has since been reduced and currently stands at around 80.120 Since 2012, the ICA has
prevented one merger and imposed conditions on a further 25 mergers, and has fined 17 companies a total of over €22 million for collusion or abuse of a dominant position.
3.137. Some of the important measures taken by the ICA during the review period have included reaching settlements with each of the three largest banks in Iceland and the two largest payment card companies in 2014. These settlements brought significant changes to the payment market, including reduced interchange fees. In March 2015, the ICA issued a report on competition in the groceries market. In the report, the ICA identified many obstacles to competition. The report
summarized earlier recommendations and interpretations, concerning competition in the market and the conduct of companies. The compilation also addresses desirable changes in the agricultural sector, advocating for more competition. In 2014, the ICA fined two of the largest hardware store chains in Iceland for serious violations of the ban on collusion. In 2015, the ICA fined MS (dominant Icelandic dairy) for abusing its dominant position in the market. In 2015, the ICA also conducted a market investigation into the fossil fuel market in Iceland. According to the preliminary findings, there were signs of restrictions to competition in important sections of the
market.
119 Prior to September 2012, policy and legislation on competition was the responsibility of the Ministry
of Economic Affairs, which took over most of the functions of the Ministry of Business, including responsibility for the Competition Authority and the Financial Supervisory Authority (FSA). These two authorities are responsible for implementing policy in their respective areas. In September 2012, the functions of the Ministry of Economic Affairs were divided between the Ministry of Finance and Economic Affairs and the Ministry of Industry and Innovation.
120 OECD, Annual Report on Competition Policy Developments in Iceland 2015.

WT/TPR/S/361/Rev.1 • Iceland
- 64 -
3.138. In 2015, the ICA issued an opinion, which found that due to the slot allocation arrangements at Keflavik Airport, the incumbent competitor, Icelandair, has enjoyed a de facto priority as concerns the most vital slot times. This also applies to the allocation of new slots that have become available. The arrangement has therefore limited the ability of other competitors to compete with Icelandair. The ICA has informed the Minister of the Interior and the Icelandic Transport Authority of these concerns and requested that this issue be addressed.
Price controls
3.139. According to the authorities, Iceland has no price controls except in the dairy market (Section 4.1.1.3.2.1).
3.3.6 State trading, state-owned enterprises, and privatization
3.3.6.1 State trading
3.140. As per the definition under GATT Article XVII, the only state trading enterprise notified by
Iceland is the State Alcohol and Tobacco Company of Iceland (ÁTVR), which was established under Act No. 63/1969 on the Sale of Tobacco and Alcoholic Beverages.121 Since June 2011, ÁTVR has operated in accordance with the provisions of Act No. 86/2011 on the Sale of Tobacco and Alcoholic Beverages. Act No. 86/2011 has however been amended twice, by law No. 126/2011 and No. 69/2014. Under the provision of the Act and its amendments, the ÁTVR, which is wholly state-owned, has the exclusive right to the retail sale and distribution of all alcoholic beverages with an alcohol content of more than 2.25%, as well as the exclusive right to the wholesale of
tobacco to retailers.
3.141. The Act stipulates that the ÁTVR is required to sell alcohol products at the same prices in each of its 49 retail outlets. Under the Act, the mark-up above wholesale prices permitted for retail, is fixed at 18% for beverages with 22% alcohol by volume or less and 12% for beverages
with more than 22% alcohol. Similarly, the mark-up for wholesale of tobacco is fixed at 18%.
3.142. Additionally, other regulations provide details on the terms of purchase and sale by the ÁTVR, such as Regulation No. 1106/2015 on ÁTVR Selection, Purchase and Distribution of Alcohol,
and Regulation No. 496/2012 on ÁTVR Selection and Sale of Tobacco and Trade Terms with Suppliers.122
3.3.6.2 State-owned enterprises and privatization
3.143. Due to the nature of the country and the economy, state involvement in the economy is quite prevalent and the near collapse of the financial sector in 2008 necessitated a state takeover of banks. At the start of 2016, the State had a majority stake in 34 enterprises. Furthermore,
during the period under review, the Government's stake in the banks has increased, with the State having a 98% share in Landsbanki, 13% share in Arion Banki, and complete ownership of
Islandsbanki. The increased shareholding has come about due to the signing of the "composition" agreements in late 2015, whereby the banks assigned most of their ISK assets to the State (17% of GDP), so that they could immediately distribute liquid foreign assets to foreign claimants (for details please see Section 4.3.1.1). In a draft of an updated ownership policy for its financial services institutions, the Government has outlined plans to privatize Islandsbanki when the
economic conditions are right, and the State will also sell a large stake in Landsbanki in due course. The Government's stake in Arion Banki will be sold as soon as possible, probably at the time the majority owner exits. The exact timeframe for the privatization has not been provided. The Government of Iceland had acquired a considerable stake in many companies through its shares in the banks, but these holdings have been exited for the most part as the banks have sold their stakes in these companies. The governance of SOEs is set out in the Government's ownership policy, which is modelled on the relevant OECD guidelines. Under the policy, the ownership
function is centralized within the Ministry of Finance and there is a clear separation of roles and responsibility between the State, as the owner, and the boards and management of the
121 WTO document G/STR/N/S/ISL, 1 October 1999. 122 For the laws, regulations, and rules governing pricing, sale, advertising, and other aspects of trade in
alcohol and tobacco, see ÁTVR online information (mostly in Icelandic only). Viewed at: http://www.vinbudin.is/english/heim/um_atvr/loeg-og-reglur.aspx.

WT/TPR/S/361/Rev.1 • Iceland
- 65 -
enterprises. According to the authorities, work is under way to update the ownership policy to better reflect the updated OECD guidelines.
3.144. The general policy concerning state involvement in the business sector has not changed during the review period. The central Government's current holdings include businesses involved in the production and distribution of electricity, postal services, the Housing Financing Fund, the Student Loan Fund, and some smaller financial institutions. In addition, Isavia, a wholly
government-owned entity under the Ministry of the Interior, owns and operates all airports (see Section 4.3.3.1). Local government holdings are mainly in geothermal production of heating and electricity, as the municipalities own almost all of the geothermal power companies, which supply heating to most homes in Iceland and, on an increasing scale, electricity to the aluminium industry. There is free competition in the energy market, with consumers free to choose their supplier (Section 4.2). However, FDI in critical sectors like energy is likely to be met with demands
for Icelandic ownership, either formally or from overwhelming public opinion. For example, in
2008, Sudurnes Energy Company was split up into two separate companies, H.S Orka and H.S Veitur, with the former an energy production company and the latter a distribution company. In 2010, Canadian company Magma Energy acquired a 95% stake in the energy production company, H.S Orka, but sold a 33.4% stake to the Icelandic pension funds after considerable public pressure. In 2012, the company received an offer to buy out its stake, but negotiations were unsuccessful. In addition, several local governments own harbours and operating companies for
harbours. The authorities also stated that the Government intends to add a special section to cover governance and ownership strategy in the energy sector in the update to the general ownership policy.
3.145. The authorities stated that private enterprises have the same access to financing as SOEs through the banking system. However, in exceptional circumstances, the State does provide financial guarantees or even direct loans to SOEs, but these have been mostly related to restructuring activities following the financial crisis, as well as situations where a limited liability
company has been set up to conduct public policy initiatives, such as providing a loan to a special
purpose vehicle for building a new state hospital. One exception would be financial guarantees on certain loans for Landsvirkjun (National Power Corp.), but these are being phased out.
Table 3.9 Large SOEs, 2016
Company Government stake (%)
EBIT (ISK billion) Operating revenue (ISK billion)
ISAVIA* 100 4 26 Landsbanki 98 25 48 Arion Banki 13 27 53 Islandsbanki 100 22 53 Landsvirkjun 100 20 46 *Accounts for ISAVIA are for 2015
Source: Various annual reports.
3.3.7 Government procurement
3.146. Iceland's legal framework underwent substantial revision during the review period with the
adoption of the new Act on Public Procurement (PPA).123 There are a number of other laws and regulations that also came into force as a result of the new Act (Table 3.10). It was implemented by Iceland to reflect new EEA rules on public procurement based on EU Directives Nos. 2014/23/EU, 2014/24/EU, and 2014/25/EU. Further, Iceland had fully implemented the Utilities (2014/23/EU) Directive and was in the process of implementing the Concessions (2014/25/EU) Directive through Regulations as of early 2017. Public procurement in Iceland amounted to ISK 167 billion (excluding municipalities) in 2015, and was estimated at ISK 250 billion when
including municipalities.124
123 Act No. 120/2016. Viewed at: https://www.rikiskaup.is/media/rammavefur/Act-on-Public-
Procurment-No.-120-2016.pdf. 124 Ministry of Finance and Economic Affairs online information. Viewed at:
https://www.fjarmalaraduneyti.is/frettir/betri-opinber-innkaup-i-forgangi and information provided by the authorities.

WT/TPR/S/361/Rev.1 • Iceland
- 66 -
3.147. Responsibility for public procurement in Iceland is divided among a number of entities. The Ministry of Finance and Economic Affairs has the overall responsibility for the legal framework and policy, and the Central Purchasing Body (Ríkiskaup) is responsible for coordinating the procurement process. The Government Construction Contracting Agency, Icelandic Road and Coastal Administration, and Icelandic Maritime Administration have their own procurement functions for their particular areas, although their tenders are also often listed at the Central
Purchasing Body. The Central Purchasing Body aims to promote maximum efficiency in procurement for state operations focusing on effective competition, equality and innovation. It provides guidance and expertise to government departments and agencies for the procurement process and prepares framework agreements on behalf of the State.
Table 3.10 Public procurement legal framework, 2017
Law or regulation Legal reference Act on Public Procurement Act No. 120/2016 Public procurement of clean and energy-efficient vehicles Law No. 70/2012 Procurement covered by social services and other specialized services under the GPA
Regulation 1000/2016
The standard form for the single European qualification statement and standard forms for the publication of notices of public procurement above the EEA threshold
Regulation 971/2016
Public procurement requirements for information to be included in advertisements and other notices, supporting evidence for the economic and financial situation, and technical requirements for tools and the electronic receipt
Regulation 955/2016
Thresholds for public procurement in the EEA under the WTO GPA Regulation 904/2016 Procurement agencies in the field of defence and security Regulation 845/2014, updated by
Regulation 221/2016 Procurement procedures of entities operating in the water, energy, transport and telecommunications sectors
Regulation 340/2017
Thresholds for public procurement in the EEA under the WTO GPA Regulation 223/2016 Procurement procedures Regulation 260/2016
Source: Compiled by the WTO Secretariat from the State Trading Centre. Viewed at: https://www.rikiskaup.is; Stjornartidindi. Viewed at: http://www.stjornartidindi.is/#; and the sources in the table.
3.148. Since 2014, Iceland has placed a priority on improving procurement.125 In 2015, Iceland's Ministry of Finance and Economic Affairs created a special working group to examine and promote
effective cooperation between the Government and the private sector on procurement. The working group suggested new ideas for public procurement and made the following recommendations:
Examine long-term needs for procurement and link to the budget; Government to apply procurement procedures in a targeted manner, e.g. through joint
purchases, mini-tendering, auctions, and contracting with fewer suppliers; Include additional information so that the Government has a better overview of its
purchases in order to further optimize procurement;
Create an incentive scheme for institutions and suppliers; and Better incorporate market rent prices for institutions in order to optimize their office
rents.126 3.149. The working group estimated that introducing these reforms would save the Government between ISK 2 to 4 billion a year in public procurement.127 Thus, some of these have been
incorporated in the new PPA by incorporating better framework contracts, i.e. by focusing on joint procurement and single supplier framework contracts.
125 Ministry of Finance and Economic Affairs online information. Viewed at:
https://www.fjarmalaraduneyti.is/frettir/betri-opinber-innkaup-i-forgangi. 126 Ministry of Finance and Economic Affairs online information. Viewed at:
https://www.fjarmalaraduneyti.is/frettir/nr/19149 and https://www.fjarmalaraduneyti.is/media/frettatengt2015/2015-03-19-Nyjar-aherslur-i-innkaupum.pdf.
127 Ministry of Finance and Economic Affairs online information. Viewed at: https://www.fjarmalaraduneyti.is/frettir/nr/19149.

WT/TPR/S/361/Rev.1 • Iceland
- 67 -
3.150. The new Act on Public Procurement sets out to ensure the equal treatment of economic operators, encourage efficiency in public sector operations through active competition and to promote innovation and development in public procurement of supplies, works and services. It applies to the State, local authorities, their institutions and other public entities.
3.151. All public procurement, above domestic thresholds, is subject to the same general provisions regarding scope of applications, exceptions, general principles etc. Overall, the PPA is
modelled on EEA Law. It incorporates developments in case law, interpretative communications, etc., that have a direct relevance for the interpretation of the Act.
3.152. The new thresholds for domestic public procurement went into effect as of 28 October 2016 and for the EEA as of 1 November 2016 (Table 3.11 and Table 3.12). Article 23 of the PPA provides that procurement of goods and services over ISK 15.5 million and construction over ISK 49 million shall be awarded according to the procedures set out in Chapter IV. These
apply to public bodies and agencies, including local governments. However, for local governments, implementation takes effect only from 31 May 2019, but local authorities will need to advertise tenders above these thresholds from 2017. Previously, local governments were only obliged to follow the public procurement law above EEA thresholds.
3.153. For procurement under the domestic thresholds, the PPA specifies that the procurer shall ensure efficiency and make comparisons among as many economic operators as possible, and this must be done electronically. Provisions on technical specifications and equality must also be
respected. As set out in Chapter IV, when the threshold is exceeded, procurement is to be made on the basis of an open procedure (all economic operators may submit a tender following publication of a contract notice) or a restricted procedure (economic operators can apply for permission to participate in a procurement procedure following publication of a contract notice by submitting information for qualitative selection). According to the authorities, the open procurement procedure is the most common procurement method. Almost 98% of procurement subject to the GPA carried out by the Central Purchasing Body on behalf of all state institutions
was subject to open procedures during 2015 and 2016, according to the authorities.
Table 3.11 Domestic thresholds: central Government (and sub-central Government from 2019)
Threshold in GPA in SDR
Threshold in GPA in ISK
Applied threshold in domestic regulation
in ISK Supplies 102,650 15,500,000 15,500,000 Services 102,650 15,500,000 15,500,000 Construction Services 324,500 49,000,000 49,000,000
Source: Information provided by the authorities.
Table 3.12 EEA thresholds, 2017
Threshold in GPA in SDR
Threshold in GPA in ISK
Applied threshold in domestic regulation
in ISK Central government entities: Supplies 130,000 23,214,852 20,811,600 Services 130,000 23,214,852 20,811,600 Construction services 5,000,000 892,878,916 805,486,000 Sub-central government entities: Supplies 200,000 35,715,157 32,219,440 Services 200,000 35,715,157 32,219,440 Construction services 5,000,000 892,878,916 805,486,000 Other entities: Supplies 400,000 71,430,313 64,438,880 Services 400,000 71,430,313 64,438,880 Construction services 5,000,000 892,878,852 805,486,000
Source: Information provided by the authorities.
3.154. Iceland's PPA has provisions on electronic means of procurement. It allows for the use of
electronic auctions but does not make it mandatory. However, a new rule to come into effect in 2018 would establish the use of electronic methods for all procurement. It also establishes an

WT/TPR/S/361/Rev.1 • Iceland
- 68 -
electronic dynamic purchasing system for making commonly used purchases; however, this is not widely used at present. For the communication and submission of documents, the PPA indicates that this will be conducted through electronic means. As of early 2017, the authorities confirmed that all tender documents are available electronically and are free of charge.
3.155. For procurement disputes, Iceland continues to use the Public Procurement Complaints Commission which operated under the old law and is also contained in the new PPA without
change. It is established as an independent body under the Ministry of Finance and Economic Affairs to rule or decide on complaints of alleged violations of the PPA. The Commission has the right to impose administrative fines if violations are found. During the last three years, there have been between 25-30 complaints filed per year with the Complaints Commission; and the average procedure time for dealing with these complaints was between 100 and 125 days.128 The process allows for the right to appeal.
3.156. Iceland has been a party to the WTO GPA since 2001 and has since also completed the procedures for becoming a party to the revised GPA, which entered into force for Iceland on 6 April 2014. Iceland's commitments under the new agreement provide the same or similar coverage with no significant changes according to the authorities.
3.157. GPA parties are required to notify the WTO of their laws and other relevant implementing legislation, including revisions thereof. Iceland had notified its original legislation in 2002, and most recently, in April 2017, notified its updated legislation.129 Furthermore, pursuant to Article
XVI:4, parties are to notify procurement statistics. As of early 2017, Iceland had notified such statistics for the years 2015 and 2016.130
3.158. Iceland's FTAs generally have provisions on government procurement.
3.3.8 Intellectual property rights
3.159. There were several developments in the field of intellectual property (IP) in Iceland during the review period. These developments include new legislation on geographical indications (GIs), amendments to trademark law,131 and a new fee structure. Intellectual property is covered by the
EEA, thus Iceland has implemented relevant EU regulations and directives in the field of IP. However, further changes are foreseen in the near future to incorporate recently added EEA legislation, in the areas of patents, trademarks, and trade secrets.
3.160. Iceland's Patent Office (Einkaleyfastofan – ELS/IPO)132 is the main agency involved in intellectual property issues; it covers patents, trademarks, design, related rights and accreditation.133 Also, since September 2012, the Ministry of Industries and Innovation has general
oversight of the Patent Office and is responsible for overall policy matters on industrial intellectual property rights.134 Copyright matters are under the responsibility of the Ministry of Education, Science and Culture.
3.161. Iceland adheres to the key IP international agreements, e.g. Paris Convention for the Protection of Industrial Property, Protocol Relating to the Madrid Agreement Concerning the International Registration of Marks, and Patent Cooperation Treaty, etc.135 During the last five years, Iceland ratified two new treaties that entered into force: Singapore Treaty on the Law of
Trademarks and Convention on the Rights of Persons with Disabilities.136
128 Information provided by the authorities and Ministry of Justice online information. Viewed at:
https://www.urskurdir.is/fjaramala/kaerunefndutbodsmala/. 129 WTO document GPA/144. 130 WTO documents GPA/137/Add.6 and GPA/142/Add.2. 131 Act No. 44/2012. 132 As of spring 2017, a bill of law, changing the name of the IPO to Hugverkastofan (i.e. Intellectual
Property Office) was presented and was being discussed. 133 ISAC Accreditation is an independent department within the IPO, not IPR related. Accreditation aims
to determine technical competence of a body to perform specific tasks as outlined in Act No. 24/2006. 134 Althingi online information. Viewed at: http://www.althingi.is/lagas/nuna/2017001.html. 135 For the full list see: http://www.els.is/en/international-cooperation
orhttp://www.wipo.int/wipolex/en/profile.jsp?code=IS. 136 WIPO online information. Viewed at: http://www.wipo.int/wipolex/en/profile.jsp?code=IS.

WT/TPR/S/361/Rev.1 • Iceland
- 69 -
Table 3.13 Main intellectual property laws and regulations, 2017
Law Reference Patents Patents Act Act No. 17/1991
Act respecting Employees' Inventions Act No. 72/2004 Fees for Patents Regulation No. 818/2016 Patent applications Regulation No. 477/2012 amended with
Regulation No. 938/2013 Compulsory licence for the export of drugs to developing countries and countries plagued by severe health problems
Regulation No. 1011/2006
Copyright Act Act No. 73/1972 Copyright Trademark Act Act No. 45/1997 Trademarks Trademark Amendment Act Act No. 44/2012
Trademark Amendment Article 42 of Act No. 130/2014 Trademark Regulation Regulation No. 310/1997 Trademark Amendment Regulation Regulation No. 511/2012 Collective Marks Act No. 155/2002 Fees for trademarks and collective marks Regulation No. 818/2016 Classification of goods and services for trademarks
Announcement No. 130/2017
Registration of trademarks and certification marks owned by the employer in certain foreign countries
Announcement No. 228/1990
Design Act Act No. 46/2001 Designs Design Regulation Regulation No. 706/2001
Fees for Designs Regulation No. 818/2016 Protection of topographies for semiconductors Act No. 78/1993
GIs Act on the protection of product names as designations of origin, geographical indications or traditional specialties
Act No. 130/2014
Regulation on the registration of product names Regulation No. 596/2016 Other Collection of Evidence Relating to Alleged
Violations of Intellectual Property Rights Act No. 53/2006
Provisions for hallmarks Act No. 138/2011 Board of Appeal of Industrial Intellectual Property Rights
Regulation No. 275/2008
Source: Icelandic Patent Office. Viewed at: www.els.is.
3.162. Intellectual property activity in Iceland trended slightly upward during the period 2012-16 (Table 3.14). There has been a steady rise in European patent (EP) validations of patents. Regarding trademarks, there has been a slight increase in national applications and registrations, but a slight decrease in Madrid system applications in recent years. For patents, during 2012-14 there was a backlog of patent applications and since that time, a balance has been reached. Thus,
in Iceland there are 52,000 registered trademarks owned by foreigners and 7,300 owned by Icelanders as of the end of 2016.137 Furthermore, a report that examined intellectual property trends in Iceland states that the number of trademark listings in Iceland is comparable to other Western countries taking into account the size of the country and market, but patent and design applications by Icelanders has generally trended downward in recent years and this has created some concerns.138
Table 3.14 Trends in intellectual property, 2012-16
2012 2013 2014 2015 2016 Patents Patent applications: National applications 39 41 38 38 36 PCT applications 5 5 11 2 2 Requests for EP validations 881 911 908 1,006 1,226 Patents granted: National applications 47 43 54 17 22 EP validations 881 911 908 1,006 1,226 Supplementary protection certificates: Applications 12 18 23 40 33 Issued 6 4 6 15 22 Trademarks
137 Statistical information from the Icelandic Patent Office. 138 Ministry of Industries and Innovation, online information. Viewed at:
https://www.atvinnuvegaraduneyti.is/media/Acrobat/160610-Hugverkastefna-vefutgafa.pdf.

WT/TPR/S/361/Rev.1 • Iceland
- 70 -
2012 2013 2014 2015 2016 Trademark applications: National 1,274 1,133 1,300 1,194 1,424 Madrid 2,277 2,585 2,373 2,734 2,368 Trademark registrations: National 1,194 1,067 981 907 1,299 Madrid 2,181 2,217 2,224 2,116 2,120 Designs Applications for registration of designs:
National 36 31 31 17 33 International 85 87 66 73 85 Registration of designs: National 36 34 25 18 29 International 95 83 71 68 87
Source: Iceland Patent Office. Viewed at: http://www.els.is/en/; and information provided by the authorities.
3.163. In 2016, Iceland's Ministry of Industries and Innovation issued the "Intellectual Property
Policy, 2016-2022" following the recommendation of a working group established to examine intellectual policy matters.139 The policy acknowledges that intellectual property creates a strong competitive environment, increases value creation, drives economic growth, and that innovation plays a key role in the betterment of society. The policy made the following proposals:
Establish a Technology Transfer Office (TTO); Public research grants to take into account IP potential; Strengthen patent technology development grants to cover costs of the patent process;
Assist SMEs to protect IPR; Explore the adoption of utility models; Increase awareness of IP in the business community; Promote education and training in IPR;
Improve the Patent Office appeals procedure; Review the provisions on corporate names;
Review the rules on inventions by employees; and Increase emphasis on monitoring IP infringement.
3.164. While no annual status report has been issued at this time, the authorities have reported that work has begun to establish a TTO, and also with respect to increasing awareness of IP with the cooperation of government agencies and changing the name of the IPO.140
3.3.8.1 Patents
3.165. Iceland's main patent law dates from 1991 and there have been no amendments or changes to it during the review period. However, in 2012 and 2013 there were changes to the Patent Regulation. Iceland also introduced new fee schedules for patents in 2014 and 2016 (also applicable to trademarks, designs and appeal procedures).141 The 2014 regulation raised the fees
for Patent Office applications and related fees and simplified the overall fee structure, whereas a slight increase was introduced in 2016.
3.166. The changes made in 2012 were outlined in the last trade policy review.142 The new patent
regulation that entered into force in May 2012 introduced several changes, but mostly clarified the established patent application procedures and requirements. The changes from 2013 were minor changes only correcting misspellings and wording, and one correcting the period of validity of Supplementary Protection Certificates as well.
139 Ministry of Industries and Innovation, online information. Viewed at:
https://www.atvinnuvegaraduneyti.is/media/Acrobat/160610-Hugverkastefna-vefutgafa.pdf. 140 Iceland online information. Viewed at: http://ttoiceland.hi.is/audna/. 141 Regulation 818/2016. Iceland Patent Office, online information. Viewed at:
http://els.is/sites/els.is/files/atoms/files/regulation_on_fees_for_patents_trade_marks_designs_etc._no_818.2016.pdf.
142 WTO document, WT/TPR/S/273/Rev.1, para. 105.

WT/TPR/S/361/Rev.1 • Iceland
- 71 -
3.167. Iceland cooperates with other Nordic countries on patent matters through the Nordic Patent Institute which coordinates matters between Nordic States and offers patent search and analysis services to businesses.
3.3.8.2 Copyright
3.168. There have been several changes to the legal framework on copyright during the review period; thus the 1972 Copyright Law remains applicable with these amendments. The Copyright
Law was amended four times in 2016 in relation to: authors' exclusive rights and collective agreements, implementation of a directive regarding orphan works, prolongation of the protection period for sound recordings, and copying for personal use.143 Pursuant to the copyright reform initiative, the Copyright Act continues to be amended and updated in stages as the different sections are prepared and incorporated in legal texts.
3.169. There is no registration of copyright in Iceland.
3.3.8.3 Trademarks
3.170. Iceland's trademark law underwent amendment in 2012 and 2014 for minor changes.144 The 2012 changes were outlined in the last trade policy review; they mainly resulted from the ratification of the Singapore Treaty but, in addition, invalidation procedures were introduced and the Icelandic procedures were aligned with Nordic legislation.145
3.171. In 2014, a new Act No. 130/2014 on the protection of product names as designations of origin, geographical indications or traditional specialties entered into force. In addition to providing
for registration of product names (usually referred to as GIs) by the Food and Veterinary Authority, it introduced a new Article 14(1)(10) in the Trademark Act. According to the provision, the IPO is responsible for verifying if there is a registered GI or if a prior GI application has been filed when examining the registration possibilities for trademarks.
3.172. In 2017, Iceland introduced revised rules on the classification of goods and services for trademarks.146 These rules follow the changes made in the 11th edition of the Nice Agreement and make other corrections. Previously, Iceland had incorporated changes from the 10th edition of the
Nice Agreement in 2016, but these were superseded, and the 2017 rules are currently applicable.
3.3.8.4 Designs
3.173. There were no amendments to the Act on Designs during the review period; therefore designs continue to follow the provision in the 2001 Design Act, as last amended in 2011.
3.3.8.5 Geographical indications (GIs)
3.174. During the review period, Iceland enacted its first Act specific to GIs, Act No. 130/2014 on
the protection of product names as designations of origin, geographical indications or traditional specialties;147 it also has an accompanying Regulation No. 596/2016.148 The Act and Regulation apply to food, wine, spirit drinks, and other products (i.e. wool, feathers, skin/fur, leather, horns and bones, cotton, cork, hemp, wicker, natural rubber and resins, natural pigments, flowers, essential oils, tobacco, and mixtures for animal feed) listed in Annex I of the regulation.149 The product name may be protected if the product is originating in a specific region, place or country;
143 Act Nos. 9/2016, 10/2016, 11/2016, and 109/2016. 144 Law No. 44/2012 and 130/2014. 145 WTO document, WT/TPR/S/273/Rev.1, para. 111. 146 Stjornartidindi online information. Viewed at:
http://www.stjornartidindi.is/Advert.aspx?RecordID=e695e31e-63ca-4f6e-8ccb-29a6fabed8ad. 147 Unofficial English translation provided by the Ministry of Industries and Innovation. 148 Althingi online information. Viewed at: http://www.althingi.is/lagas/144a/2014130.html; and
Regulation No. 596/2016. Viewed at: http://www.reglugerd.is/reglugerdir/eftir-raduneytum/atvinnuvega--og-nyskopunarraduneyti/nr/20163.
149 Regulations online information. Viewed at: https://www.stjornartidindi.is/DocumentActions.aspx?ActionType=Open&documentID=4fc01bcc-4a8b-4602-933e-963bdfde901f.

WT/TPR/S/361/Rev.1 • Iceland
- 72 -
it has qualities or characteristics of the geographical area; and the production, processing and preparation of the product takes place in the defined geographical area. A name referring to a territory may also be protected. The law provides that the name will be protected against any misuse, imitation, and misleading associations or any other activity that could mislead consumers. In order to protect a GI, a registration process must be followed as outlined in the law and regulation, accompanied by a fee of ISK 75,000. GIs are registered by the Icelandic Food and
Veterinary Authority (MAST), with fees regulated by Regulation 596/2016.
3.175. As part of the agreements reached with the European Union on agriculture in 2015, Iceland also concluded an agreement on geographical indications (Section 2.3.2.2). As a result of this agreement, a list of 1,150 protected agricultural products and foodstuffs of the European Union will receive the same level of protection in Iceland as in the EU market. As of the first quarter 2017, the agreement had not yet entered into force.150
3.3.8.6 Appeals and enforcement
3.176. Iceland has provisions for appeals in several of its intellectual property laws. For example, the laws on patents, trademarks and designs have articles that pertain to the settling of disputes. Furthermore, the Regulation on the Board of Appeal of Industrial Intellectual Property Rights, No. 275/2008, provides that appeals must be filed with the Ministry of Industries and Innovation within the statutory time limit, which is two months from the date of the decision of the IPO. Then the matter is referred to the Board of Appeal to examine the matter through submissions and
hearings. A ruling is then taken by the Board and sent to the parties of the dispute. Following the appeals procedure, parties may bring the disputed matters to national courts.
3.177. Provisions relating to IP infringement are to some extent provided for in Icelandic laws on IP rights. Furthermore, Act No. 31/1990 relating to Attachment of Property, Restraining Orders etc.; Article 132 of the Customs Law; and Act No. 53/2006 on Collection of Evidence Relating to Alleged Violations of Intellectual Property Rights provide for the procedures in relation to IP
infringement. Apart from the right holder's initiative in such matters, IP infringement matters in
Iceland can in general first be addressed by a district magistrate/sheriff to invoke an injunction. In general, IP infringement matters are heard before the Reykjavik District Court. For copyright infringement, Article 59a provides that copyright collecting societies may file for an injunction against intermediaries such as internet service providers to block users' access to web sites containing infringing material. There were no available statistics on IP enforcement.
3.178. Iceland accepted the amendment to the TRIPS Agreement on patents and public health on
12 October 2015; it subsequently entered into force in January 2017.151 Upon accepting the amendment, Iceland reviewed the relevant provisions of the Patents Act and since the provisions were already considered to be in line with the TRIPS amendments it was not considered necessary to make any legislative changes. Iceland did not make any notifications to the WTO on IP during the review period.
150 Information provided by the authorities. 151 WTO online information. Viewed at:
https://www.wto.org/english/tratop_e/trips_e/amendment_e.htm.

WT/TPR/S/361/Rev.1 • Iceland
- 73 -
4 TRADE POLICIES BY SECTOR
4.1 Agriculture and fishing
4.1.1 Agriculture
4.1.1.1 Features
4.1. Agriculture is a relatively small part of the economy in Iceland. Agriculture, hunting, and related services contributed 1.1-1.2% to GDP in 2013-16, and it remains small compared to
fishing and aquaculture (Section 4.1.2). The manufacture of food products, beverages and tobacco products (less fish processing) contributed a further 1.7% to GDP. In employment terms, in 2014, agriculture employed about 3,900 people or 2.2% of employed persons, a decline from 5,000 people in 2011.1
4.2. After several years of steady increases, the value of agricultural output (in producer prices) was relatively stable from 2014 to 2016 at ISK 50 to ISK 52 billion. Production of animals and
animal products dominates total production with milk representing about 21% of the total value of all agricultural products, and sheep and goats about 12%. Crop output represents about one-third of total output, but most of this is forage production linked to livestock (Table 4.1).
Table 4.1 Agriculture: employment and output, 2010-16
ISK thousand in producer prices, unless otherwise stated 2010 2011 2012 2013 2014 2015 2016 Contribution to GDP % Agriculture, hunting,
related services 1.1 1.1 1.1 1.2 1.1 1.1 1.1
Manufacture of food products, beverages and tobacco products (less fish)
2.0 1.9 1.8 1.9 1.8 1.7 1.7
Number employed persons 4,900 5,000 4,800 4,700 3,900 .. .. Value of output ISK 000 36,384 41,477 46,394 48,814 52,346 50,198 51,068 of which Crop output ISK 000 12,840 14,034 16,560 18,000 20,483 16,727 17,491 of which Forage plants ISK 000 9,003 10,143 11,883 13,443 15,213 11,815 12,129
Vegetable and horticultural
ISK 000 2,585 2,644 2,870 3,044 3,070 3,144 3,467
Potatoes ISK 000 568 668 849 807 1,341 1,314 1,498 Animal output ISK 000 23,544 27,443 29,834 30,814 31,863 33,471 33,577 of which Sheep and goats ISK 000 4,935 5,889 6,381 6,678 6,648 7,349 6,535 Cattle ISK 000 2,098 2,450 2,743 2,683 3,410 3,416 4,152 Pigs ISK 000 1,696 2,086 2,231 2,993 2,864 2,815 2,594 Poultry ISK 000 2,692 3,149 3,629 4,073 4,033 4,421 4,527 Milk ISK 000 8,609 9,193 9,567 9,709 10,521 11,570 12,163
.. Not available.
Source: Statistics Iceland.
4.3. Only about 1% of Iceland's land area of 103,022 km2 is suitable for cultivation and about 25% is suitable for grazing, some of which can also be used to grow fodder crops. In 2010, there were about 2,592 farms, practically all family owned and operated. Most farms tend to be small in business terms: in 2013, there were about 43 cows on the average dairy farm.2
4.4. In addition to the harsh climate and lack of suitable land, the scope for increasing productivity in Iceland is limited to some extent by the narrow genetic base: there is only one dairy breed, one sheep breed, and one horse breed. These breeds have developed in isolation from
1 Statistics Iceland, online database. Viewed at: http://statice.is/ [May 2017]. 2 Statistics Iceland, online database. Viewed at:
https://hagstofa.is/talnaefni/atvinnuvegir/landbunadur/bureikningar/ [May 2017].

WT/TPR/S/361/Rev.1 • Iceland
- 74 -
the rest of the world and are vulnerable to transmittable diseases, making it difficult to safely introduce new genetic material.3
4.1.1.2 Trade
4.5. Iceland is a net importer of agricultural products (WTO definition4) with, in 2016, exports of US$95 million and imports of US$492 million. The main exports are water, sheep meat products, and pure-bred horses. Exports of mink skins declined by nearly three-quarters in 2014 compared
to 2013 but recovered in 2016 – although still less than in 2013. According to the authorities, the fluctuations in export values for furskins were linked to prices on the Copenhagen Fur market where the majority of skins are sold. Imports are more broadly based than exports and increased from US$402 million in 2012 to US$492 in 2016. The increase in the US dollar value of imports of animal feed preparations was linked to increased production of milk, poultry and pigs and the stronger króna (Table 4.2).
Table 4.2 Trade in agricultural products, 2012-16
US$ million 2012 2013 2014 2015 2016 Total agricultural exports 77.8 85.3 74.7 71.1 94.7 of which 220190 Water not containing added sugar or other
sweetening matter nor flavoured; ice and snow - Other
7.6 7.7 9.9 10.6 15.8
010121 Live animals - Horses - pure bred breeding animals
6.2 5.4 5.2 4.9 6.3
430110 Raw furskins - Of mink, whole, with or without head, tail or paws
12.7 16.3 2.9 3.6 6.2
050510 Feathers of a kind used for stuffing; down 4.1 5.0 4.2 4.5 5.8 230990 Preparations of a kind used in animal feeding.
- Other 0.3 0.2 0.1 0.5 5.7
020442 Other meat of sheep, frozen: - Other cuts with bone in
4.8 6.6 7.5 5.1 4.7
040610 Fresh (unripened or uncured) cheese 2.0 2.7 3.0 3.6 4.1 020430 - Carcasses and half-carcasses of lamb, frozen 5.7 6.4 5.5 4.3 4.1 230910 - Dog or cat food, put up for retail sale 0.9 1.1 1.7 2.4 4.0 220300 Beer made from malt 0.6 1.1 2.1 2.3 3.4 Total agricultural imports 402.1 436.7 463.7 446.5 491.9 of which 210690 Food preparations not elsewhere specified or
included - Other
29.8 34.3 38.1 31.5 37.2
230990 Preparations of a kind used in animal feeding - Other
7.8 12.9 19.6 26.2 35.0
190590 Bakers' wares, - Other
14.8 16.1 17.6 16.6 19.4
220421 Wine of fresh grapes - Other wine; grape with fermentation prevented or arrested by the addition of alcohol: - In containers holding 2 litres or less
12.8 13.7 15.1 14.2 15.3
240220 Cigarettes containing tobacco 13.8 12.7 14.0 13.3 14.1 090121 Coffee roasted: - Not decaffeinated 11.5 11.3 11.3 13.0 12.4 190410 Prepared foods obtained by the swelling or
roasting of cereals or cereal products 13.5 13.4 12.9 11.0 12.4
210390 Sauces and preparations therefor; mixed condiments and mixed seasonings; mustard flour and meal and prepared mustard. - Other
10.9 10.9 10.8 10.5 11.2
3 Jóhannesson, T. (2010), Agriculture in Iceland: Conditions and Characteristics. Agricultural University
of Iceland, p. 15. Viewed at: http://www.lbhi.is/sites/default/files/gogn/vidhengi/thjonusta/utgefid_efni/RitLbhi/Rit_31_ICELANDIC_AGRICULTURE.pdf [May 2017].
4 For the purposes of this section of the report, agricultural products are those set out in Annex I of the Agreement on Agriculture where fish and fish products are under HS 2012 headings 02840, 03, 050800, 050900, 051191, 121229, 1504, 1603, 1604, 1605, and 230120. Trade in fisheries products is addressed in Section 4.2.2.

WT/TPR/S/361/Rev.1 • Iceland
- 75 -
2012 2013 2014 2015 2016 220210 Waters, including mineral waters and aerated
waters, containing added sugar or other sweetening matter or flavoured
6.2 6.8 7.2 8.2 9.1
020230 Meat and edible meat offal - Meat of bovine animals, frozen - Boneless
2.4 2.7 7.7 7.5 7.7
Source: UNSD Comtrade.
4.1.1.3 Agriculture policies
4.6. Agriculture policy is the responsibility of the Ministry of Industries and Innovation, which was formed in September 2012 by the amalgamation of the Ministry of Fisheries and Agriculture, the Ministry of Industry, Energy and Tourism and part of the Ministry of Economic Affairs. In January 2008, the Icelandic Food and Veterinary Authority (Matvælastofnun - MAST) was
established as an inspection and administrative body with responsibilities that include: food safety; plant and livestock quality, and health-related matters; feed, seed, and fertilizer services; administration of organic production; and monitoring of animal welfare.5
4.7. The Farmers' Association of Iceland (BI) represents farmers in discussions and negotiations with the Government in developing general and sectoral policies as well as providing extension and advisory services to farmers through the Agricultural Consultation Centres (RML). BI's members are agricultural associations representing farmers in different regions and farming companies most
of which represent specific agricultural sectors, such as the Association of Egg Producers, the Association of Poultry Farmers, the Association of Sheep Farmers, and the Federation of Dairy Farmers.6
4.8. The overall objective of agriculture policy is to maintain and strengthen a diverse agricultural sector, as far as natural and marketing conditions allow. The main emphases of policy are: to meet
domestic demand to the extent that this goal is realistic; to maintain sustainable production of
high quality and healthy products; to improve efficiency and competitiveness; to improve farmers' incomes; to improve creativity and create job opportunities; and to sustain livelihoods in rural areas.
4.9. The legal basis for agriculture policy is set out in several legislative acts, including:
Act No. 99/1993 (last amended in 2016) on Agricultural Produce, which sets out the policy framework, the legal basis for production controls, and provisions for slaughter and processing, pricing and support measures; and
Act No. 70/1998 (last amended in 2016) on Agriculture, which provides the legal basis for development projects, extension services, and livestock improvements.7
4.10. Under Act No. 99/1993, the Government and the Farmers' Association of Iceland (BI) negotiate multiannual agreements on agricultural policy and support for agriculture. Following the
expiration of the previous agreements between the Government and the Farmers' Association, new agreements were concluded for the ten year period from 2017 to 2026 with extensive reviews in 2019 and 2023. These agreements called for a revision of Act No. 99/1993, which entered into
force on 1 January 2017. The agreements are implemented with regulations which include a general regulation on support for agriculture and three sector-specific regulations:
Regulation No. 1240/2016 on horizontal support for agriculture;
Regulation No. 1150/2016 on support for cattle;
Regulation No. 1234/2016 on support for horticulture; and
Regulation No. 1151/2016 on support for sheep.8
5 MAST online information. Viewed at: http://www.mast.is/english/frontpage/about-mast/ [May 2017]. 6 Farmers' Association online information. Viewed at: http://www.bondi.is/um-bi/ [May 2017]. 7 Iceland Government, Legal Code, Chapter 34. Viewed at:
http://www.althingi.is/lagasafn/kaflar/nuna/34.html [May 2017].

WT/TPR/S/361/Rev.1 • Iceland
- 76 -
4.1.1.3.1 Trade policies
4.11. Tariffs on agricultural products (WTO definition) vary considerably within and among product groups averaging 20%, varying from zero to nearly 430%, and with a standard deviation of 41. Nearly 41% of the 1,990 tariff lines for agricultural products, and nearly all under HS headings 02 (meat and edible meat offal) and 04 (dairy products, eggs, etc.) are non-ad valorem, mostly with ad valorem and specific duty components (Section 3.1.4).
4.12. Iceland reserved the right to use the special agricultural safeguard on 390 tariff lines but it has never applied it to any tariff line.9
4.13. According to a notification by Iceland to the WTO on imports under tariff quotas, Iceland has nine minimum access quotas and 78 current access quotas. Out of the total of 87 tariff quotas, 57 had imports greater than 100% of the tariff quota quantity in the year ending 30 June 2016
and 59 in the year ending 30 June 2015. However, the notification also notes that, for a range of
products under tariff quota commitments, the applied tariff for all imports is equal to, or less than the in-quota tariff although the notification lists all bound tariff quotas and the import level. Therefore, these quotas do not have a specific administration or allocation system.10
4.14. For other quotas, including quotas applicable under agreements with the European Union, Norway and Switzerland, the Ministry of Industries and Innovation posts invitations for applications for TQ allocations and the results of the allocations on its website.11
4.15. In June 2016, the Ministry of Industries and Innovation amended the system for
administering the WTO tariff quotas for meat, butter, cheese, eggs and their products, and meat preparations by requesting applications for allocations for the six month period ending 31 December 2016 instead of a twelve month period. Once awarded, an allocation is not transferrable.12
4.16. In September 2015, Iceland and the EU reached an agreement on trade in agricultural products, and the protection of geographical indications. Under the agreement, Iceland:
granted duty-free access for a range of agricultural products (mostly processed
products but also live animals, and some fresh fruits and vegetables);
expanded existing tariff quotas for beef, pig meat, poultry, cheese, and certain meat products;
reduced tariffs on imports of meat, some vegetables, and some other products; and
provides protection for EU-listed GIs.
4.17. In return, under the Agreement, the EU grants duty-free access for a range of products and
opens or expands tariff quotas, including an expansion of the existing quota for skyr from 380 to 4,000 tonnes over four years.
4.18. According to the European Commission, the agreement will mean that 99% of the value of trade in EU processed agricultural products and 91% of basic agricultural products will be duty free
8 Iceland Government Laws, regulations, online information. Viewed at: http://www.reglugerd.is/
[May 2017]. 9 WTO documents: G/AG/N/ISL/38, 18 May 2017; G/AG/N/ISL/34, 16 September 2014;
G/AG/N/ISL/27, 27 July 2009; G/AG/N/ISL/23, 29 July 2003; G/AG/N/ISL/21, 30 October 2002; G/AG/N/ISL/18, 23 February 2001; G/AG/N/ISL/13, 26 January 1999; and G/AG/N/ISL/7, 15 July 1997.
10 WTO document G/AG/N/ISL/37, 13 December 2016. 11 Ministry of Industries and Innovation online information. Viewed at:
https://www.atvinnuvegaraduneyti.is/verkefni/malaflokkar/landbunadur/innflutningur-landbunadarafurda/ [May 2017].
12 Ministry of Industries and Innovation online information. Viewed at: https://www.atvinnuvegaraduneyti.is/sjavarutvegs-og-landbunadarmal/frettir/auglysing-um-wto-tollkvota-vegna-innflutnings-a-kjoti-smjori-ostum-fuglseggjum-og-afurdum-theirra-og-unnum-kjotvorum [May 2017].

WT/TPR/S/361/Rev.1 • Iceland
- 77 -
and Iceland will afford the same level of protection to the 1,150 agricultural products and foodstuffs on the GI list.13
4.19. According to the notifications by Iceland to the WTO, export subsidies for agricultural goods have not been provided since the year ending 31 August 1998.14
4.1.1.3.2 Domestic policies
4.1.1.3.2.1 Dairy and beef
4.20. A quota system for milk production was first introduced in 1980 based on individual non-transferrable quotas for milk producers and went through a number of reforms until, in 1992, the current system of freely transferable quotas was introduced and production subsidies were linked to the quota and paid directly to the farmer. The introduction of freely transferable quotas
resulted in a considerable level of trade in quotas and concentration of production: between 1995 and 2005 the number of dairy farmers fell by 50% and average production per farm increased by
100%.15
4.21. Regulation No. 1150/2016 and the Agreement on the operating environment for the cattle sector represent a change in policy for dairy and cattle farming in Iceland.16 The Agreement states that the 2019 revision will consider the feasibility of abolishing production quotas, based on a vote by milk producers. Furthermore, the system of "support entitlements" (basic payments to all active dairy and cattle farmers) is to be phased out over the duration of the Agreement while payments per litre of milk produced are to be de-linked from support entitlements and increased while a new
system for supporting beef production is introduced.
4.22. The total production quota for milk for 2017 was set at 144 million litres which is divided among the individual quota holders. Production in excess of the quota must be exported (Article 11 of Regulation No. 1150/2016). Payments to farmers are made in equal monthly payments of one-
twelfth of annual quota.
4.23. Minimum prices paid by dairies for milk delivered within the production quota are decided by the government-chaired Agricultural Pricing Committee (Verdlagsnefnd buvara) which includes
representatives of the Farmers' Association and, on behalf of consumers, the labour union. Since 1 January 2017, the minimum price has been ISK 87.40 per litre.
4.24. In addition to payments for milk delivered to dairies, headage payments are provided for dairy and beef cows, initially for a total of 25,000 dairy and 3,000 beef cows with the number revised annually. The payment per cow is subject to a reduction factor depending on the number of cows on the farm.
4.25. Other programmes covered by the Regulation and Agreement include a breeding programme, investment aids, measures to help balance production and demand, and support for
beef production. The measures to balance production and demand are discretionary and are to be allocated when there is a need to respond to changes in supply and demand. These measures could include improved marketing of cattle products, support for diversification, temporary farm support, and compensation for slaughtering. The measures for beef production include a slaughter premium and ISK 100 million in 2017 for a quarantine facility for imports of genetic material
(Table 4.3).
13 DG GROW online information. Viewed at: http://ec.europa.eu/growth/tools-
databases/newsroom/cf/itemdetail.cfm?item_id=8459&lang=en [May 2017]. 14 WTO documents: G/AG/N/ISL/39, 18 May 2017; G/AG/N/ISL/35, 16 September 2014;
G/AG/N/ISL/28/Add.1, 31 July 2009; G/AG/N/ISL/28, 27 July 2009; G/AG/N/ISL/17/Rev.1, 26 August 2003; G/AG/N/ISL/17, 28 February 2001; G/AG/N/ISL/15/Corr.1, 8 September 1999; G/AG/N/ISL/15, 2 September 1999; G/AG/N/ISL/10, 13 March 1998; and G/AG/N/ISL/6, 9 June 1997.
15 Bjarnadottier E, Kristofersson DM (2008), The cost of the Icelandic transferable dairy quota system, Icelandic Agricultural Sciences, 21-2008. Viewed at: http://www.ias.is/landbunadur/wgsamvef.nsf/key2/iascontents [May 2017].
16 Ministry of Industries and Innovation online information. Viewed at: https://www.atvinnuvegaraduneyti.is/media/Acrobat/Cattle-Sector-Agreement---English.pdf [May 2017].

WT/TPR/S/361/Rev.1 • Iceland
- 78 -
Table 4.3 Dairy and beef cattle support, 2017-26
ISK million 2017 2018 2019 2020 2021 2022 2023 2024 2025 2026
Support entitlements 1,942 1,934 1,927 1,633 1,355 1,074 798 527 260 -
Milk payments 2,629 2,619 2,609 2,688 2,949 3,193 3,431 3,665 3,894 4,117
Headage – dairy cows 1,175 1,171 1,166 1,298 1,293 1,282 1,271 1,259 1,248 1,237
Headage – beef cows 141 140 140 156 155 154 152 151 150 148
Production-demand balance
99 98 98 97 97 96 95 94 93 92
Breeding 197 196 196 193 193 191 189 188 186 184
Investment aid 193 192 191 189 188 187 185 183 182 180
Beef production 173 98 121 143 166 186 184 182 181 179
Total 6,550 6,449 6,448 6,398 6,396 6,363 6,305 6,249 6,193 6,138
Source: Agreement on the operating environment for the cattle sector, Annex I.
4.26. The 2016 amendments to Act No. 99/1993 included a provision to change the specific duties for certain cheese and milk powder products17 based on changes to the SDR/ISK exchange rate from 1995 to 2016 effective from 1 March 2017 and annually thereafter based on the annual change in the exchange rate.18 This resulted in a reduction in the specific duty component of the
tariff on these products as the ISK had appreciated relative to the SDR, for example, the tariff on HS 0406 2000 (grated or powdered cheese) was 30% + 715 ISK/kg which was reduced to 30% + 635 ISK/kg.
4.1.1.3.2.2 Sheep
4.27. Programmes relating to sheep production are set out in the Agreement on the operating environment for the sheep sector and Regulation No. 1151/2016 on support for sheep.
4.28. As for dairy farming, the support entitlements for sheep farming are to be phased out by
end-2025 and replaced by quality assurance premiums for farmers for sheep meat meeting requirements relating to, inter alia, animal welfare, sustainable land use, and quality.
4.29. Headage payments for winter-fed sheep will be introduced from 1 January 2020 with higher payments for new entrants. In addition, starting in 2018, farm support payments, also based on the number of winter-fed sheep, will be paid to producers keeping over 100 winter-fed sheep. The farm support payments range from ISK 20,000 for farms with 101-120 sheep up to a maximum of ISK 320,000 for farms with more than 800 sheep.
4.30. In addition, support under the Agreement is also available for wool production, regional support for some regions, investment aid, and promotion of higher value sheep products (Table 4.1).
Table 4.4 Support for sheep farming, 2017-26
ISK million
2017 2018 2019 2020 2021 2022 2023 2024 2025 2026 Support entitlements 2,506 2,267 2,205 1,944 1,635 1,319 1,046 777 422 .. Quality assurance premiums
1,714 1,679 1,674 1,652 1,816 1,970 2,120 2,268 2,504 2,482
Headage paymentsa 20 .. .. 95 225 355 445 534 621 1,033 Farm support 194 242 239 238 235 233 231 229 227 Utilization of wool 446 437 436 430 428 424 420 417 413 409 Investment aid .. 48 48 95 95 94 93 93 92 91 Regional support 99 145 145 143 143 141 140 139 138 136 Higher value sheep products
148 145 145 95 95 94 93 93 92 91
17 HS headings 0402 1010, 0402 1090, 0402 2100, 0402 2900, 0402 9100, 0402 9900, 0406 2000,
0406 3000, 0406 4000, and 0406 9000. 18 Act No. 102/2016 amending Agricultural Products Act, the Equipment Act, Customs Act and Animal
Welfare Act, Article 53.
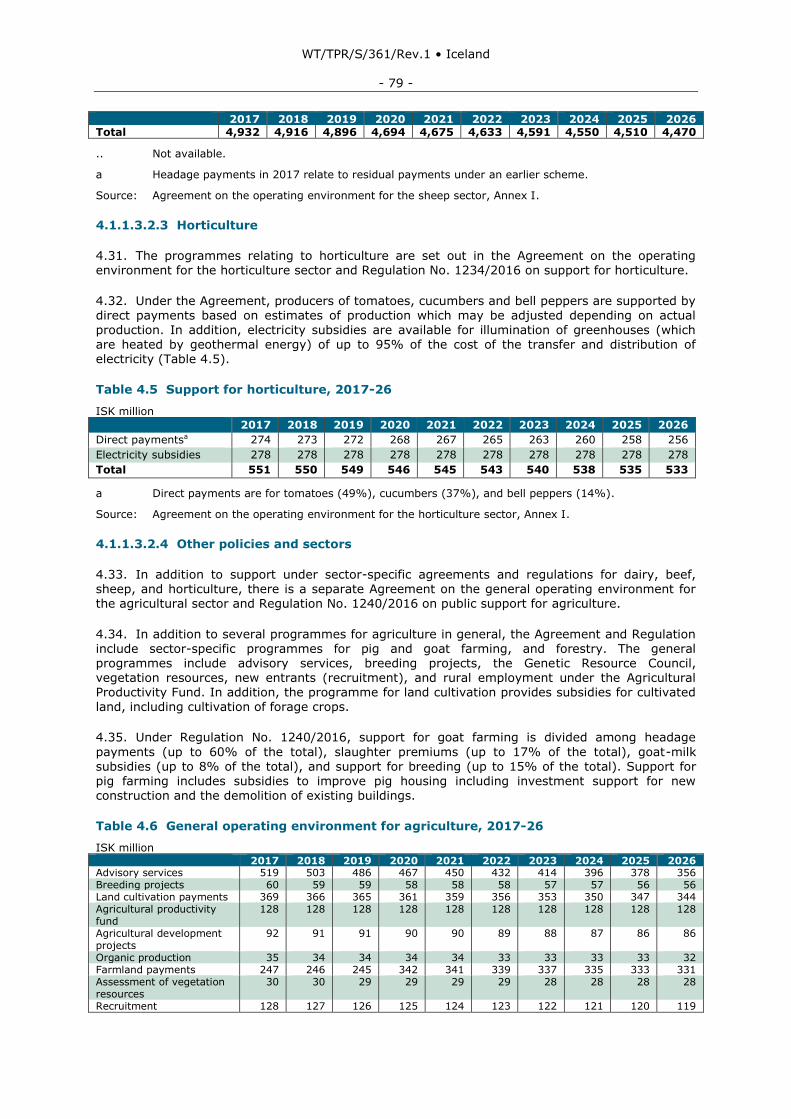
WT/TPR/S/361/Rev.1 • Iceland
- 79 -
2017 2018 2019 2020 2021 2022 2023 2024 2025 2026 Total 4,932 4,916 4,896 4,694 4,675 4,633 4,591 4,550 4,510 4,470
.. Not available.
a Headage payments in 2017 relate to residual payments under an earlier scheme.
Source: Agreement on the operating environment for the sheep sector, Annex I.
4.1.1.3.2.3 Horticulture
4.31. The programmes relating to horticulture are set out in the Agreement on the operating environment for the horticulture sector and Regulation No. 1234/2016 on support for horticulture.
4.32. Under the Agreement, producers of tomatoes, cucumbers and bell peppers are supported by direct payments based on estimates of production which may be adjusted depending on actual
production. In addition, electricity subsidies are available for illumination of greenhouses (which are heated by geothermal energy) of up to 95% of the cost of the transfer and distribution of electricity (Table 4.5).
Table 4.5 Support for horticulture, 2017-26
ISK million
2017 2018 2019 2020 2021 2022 2023 2024 2025 2026
Direct paymentsa 274 273 272 268 267 265 263 260 258 256
Electricity subsidies 278 278 278 278 278 278 278 278 278 278
Total 551 550 549 546 545 543 540 538 535 533
a Direct payments are for tomatoes (49%), cucumbers (37%), and bell peppers (14%).
Source: Agreement on the operating environment for the horticulture sector, Annex I.
4.1.1.3.2.4 Other policies and sectors
4.33. In addition to support under sector-specific agreements and regulations for dairy, beef, sheep, and horticulture, there is a separate Agreement on the general operating environment for the agricultural sector and Regulation No. 1240/2016 on public support for agriculture.
4.34. In addition to several programmes for agriculture in general, the Agreement and Regulation include sector-specific programmes for pig and goat farming, and forestry. The general programmes include advisory services, breeding projects, the Genetic Resource Council, vegetation resources, new entrants (recruitment), and rural employment under the Agricultural Productivity Fund. In addition, the programme for land cultivation provides subsidies for cultivated land, including cultivation of forage crops.
4.35. Under Regulation No. 1240/2016, support for goat farming is divided among headage
payments (up to 60% of the total), slaughter premiums (up to 17% of the total), goat-milk
subsidies (up to 8% of the total), and support for breeding (up to 15% of the total). Support for pig farming includes subsidies to improve pig housing including investment support for new construction and the demolition of existing buildings.
Table 4.6 General operating environment for agriculture, 2017-26
ISK million 2017 2018 2019 2020 2021 2022 2023 2024 2025 2026 Advisory services 519 503 486 467 450 432 414 396 378 356 Breeding projects 60 59 59 58 58 58 57 57 56 56 Land cultivation payments 369 366 365 361 359 356 353 350 347 344 Agricultural productivity fund
128 128 128 128 128 128 128 128 128 128
Agricultural development projects
92 91 91 90 90 89 88 87 86 86
Organic production 35 34 34 34 34 33 33 33 33 32 Farmland payments 247 246 245 342 341 339 337 335 333 331 Assessment of vegetation resources
30 30 29 29 29 29 28 28 28 28
Recruitment 128 127 126 125 124 123 122 121 120 119
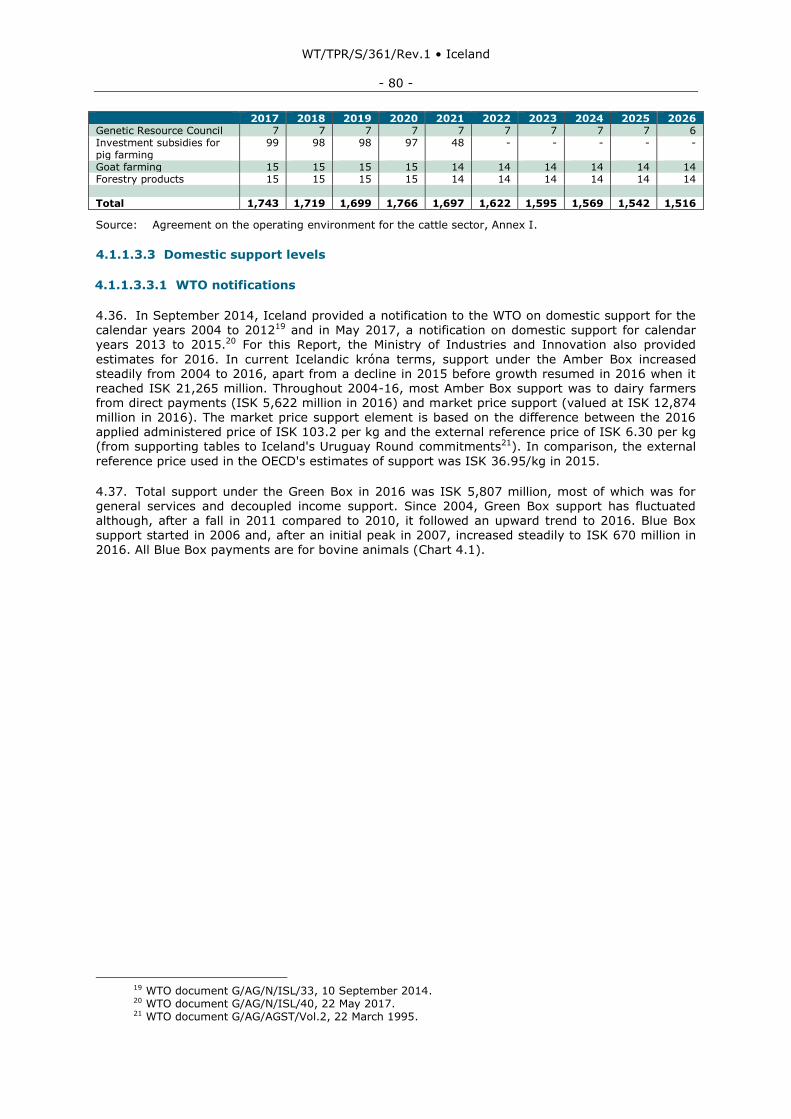
WT/TPR/S/361/Rev.1 • Iceland
- 80 -
2017 2018 2019 2020 2021 2022 2023 2024 2025 2026 Genetic Resource Council 7 7 7 7 7 7 7 7 7 6 Investment subsidies for pig farming
99 98 98 97 48 - - - - -
Goat farming 15 15 15 15 14 14 14 14 14 14 Forestry products 15 15 15 15 14 14 14 14 14 14 Total 1,743 1,719 1,699 1,766 1,697 1,622 1,595 1,569 1,542 1,516
Source: Agreement on the operating environment for the cattle sector, Annex I.
4.1.1.3.3 Domestic support levels
4.1.1.3.3.1 WTO notifications
4.36. In September 2014, Iceland provided a notification to the WTO on domestic support for the
calendar years 2004 to 201219 and in May 2017, a notification on domestic support for calendar years 2013 to 2015.20 For this Report, the Ministry of Industries and Innovation also provided
estimates for 2016. In current Icelandic króna terms, support under the Amber Box increased steadily from 2004 to 2016, apart from a decline in 2015 before growth resumed in 2016 when it reached ISK 21,265 million. Throughout 2004-16, most Amber Box support was to dairy farmers from direct payments (ISK 5,622 million in 2016) and market price support (valued at ISK 12,874 million in 2016). The market price support element is based on the difference between the 2016 applied administered price of ISK 103.2 per kg and the external reference price of ISK 6.30 per kg (from supporting tables to Iceland's Uruguay Round commitments21). In comparison, the external
reference price used in the OECD's estimates of support was ISK 36.95/kg in 2015.
4.37. Total support under the Green Box in 2016 was ISK 5,807 million, most of which was for general services and decoupled income support. Since 2004, Green Box support has fluctuated although, after a fall in 2011 compared to 2010, it followed an upward trend to 2016. Blue Box support started in 2006 and, after an initial peak in 2007, increased steadily to ISK 670 million in
2016. All Blue Box payments are for bovine animals (Chart 4.1).
19 WTO document G/AG/N/ISL/33, 10 September 2014. 20 WTO document G/AG/N/ISL/40, 22 May 2017. 21 WTO document G/AG/AGST/Vol.2, 22 March 1995.

WT/TPR/S/361/Rev.1 • Iceland
- 81 -
Chart 4.1 Domestic support notifications, 2004-16
ISK million
Source: WTO Secretariat based on WTO notifications.

WT/TPR/S/361/Rev.1 • Iceland
- 82 -
4.1.1.3.3.2 OECD monitoring and evaluation of agricultural policies
4.38. Compared to the methodology used to calculate the level of support provided under the Amber, Blue, and Green Boxes in the WTO, the OECD's annual monitoring and evaluation reports on agricultural policies in OECD countries use a different methodology to calculate the value of support which is expressed in a number of indicators, including: the Producer Support Estimate (PSE) for gross transfers from consumers and tax payers to agricultural producers; the Total
Support Estimate (TSE) for transfers to the agricultural sector in general; and the Single Commodity Transfers (SCT) for transfers to specific commodities. As previously noted, the PSE represents the value of transfers to producers, unlike support under the Amber Box, Blue Box and Green Box which measure compliance with WTO commitments. Therefore, the value of support as notified to the WTO is neither compatible nor comparable with the values calculated by the OECD.22
4.39. According to the OECD, the TSE had been relatively stable from 2006 to 2013, but then increased in the following two years reaching nearly ISK 27 billion in 2015, compared to a total value of production of ISK 34 billion. While the TSE represents total transfers to producers, including government support for research, the PSE represents total transfers to producers resulting from government policies, and the PSE, at nearly ISK 26 billion in 2015, accounted for most of the TSE. At 56% of gross farm receipts, the PSE for Iceland was the third highest among OECD countries.23 Market price support, which is largely the result of high tariffs and high
domestic prices, was the main element of support (Chart 4.1).
Chart 4.2 OECD estimates of support to agriculture, 2004-15
ISK million
Source: OECD Producer and Consumer Support Estimates database. Viewed at: http://www.oecd.org/chile/producerandconsumersupportestimatesdatabase.htm [March 2017].
4.40. The degree of support to producers from high domestic prices is reflected in the Producer Nominal Protection Coefficient (NPC), where a coefficient greater than one indicates the degree to
22 WTO document WT/TR/S/284/Rev.2, 28 November 2013, paragraph 4.34. 23 OECD (2016), Agricultural Policy Monitoring and Evaluation 2016, OECD Publishing, Paris, p. 44.
Viewed at: http://dx.doi.org/10.1787/agr_pol-2016-enOECD [March 2017].

WT/TPR/S/361/Rev.1 • Iceland
- 83 -
which domestic prices exceed the reference price. In Iceland, the Producer NPC varies from one commodity to another and averages 2.02 overall – indicating that, on average, domestic prices of supported commodities are twice the external price.
4.41. Most support for agriculture is provided to specific commodities, as shown by the Specific Commodity Transfers (SCT) to producers (Chart 4.2). In terms of gross farm receipts, the SCT varies from 73% for poultry meat to 28% for beef (Table 4.7).
Table 4.7 OECD indicators for support to agriculture in Iceland, 2009-15
(ISK million (except producer NPC))
2009 2010 2011 2012 2013 2014 2015
Total Value of production 23,981 24,933 27,008 30,447 32,004 33,956 34,429 TSE 17,452 16,484 17,433 20,254 18,913 23,455 26,979 PSE 16,144 15,184 16,217 18,928 17,901 22,401 25,884 SCT 15,735 14,781 16,064 18,629 17,509 22,130 25,575 MPS 6,836 5,540 6,443 8,500 6,762 11,141 14,361 Producer NPC 1.68 1.54 1.56 1.63 1.50 1.75 2.02 Milk Value of production 9,106 9,030 9,618 9,280 9,697 10,909 11,756 SCT 8,256 7,103 7,747 8,752 7,061 9,927 12,390 MPS 3,072 1,722 2,103 2,826 966 3,649 6,030 Producer NPC 2.27 1.88 1.93 2.24 1.72 2.26 3.02 Sheep meat Value of production 3,322 3,708 4,608 5,192 5,571 5,742 5,541 SCT 3,331 3,433 3,563 3,770 3,875 3,977 4,041 MPS 0.00 0.00 0.00 0.00 0.00 0.00 0.00 Producer NPC 1.00 1.00 1.00 1.00 1.00 1.00 1.00 Poultry meat Value of production 2,244 2,251 2,650 3,299 3,435 3,500 3,720 SCT 1,555 1,590 1,840 2,356 2,420 2,578 2,706 MPS 1,555 1,546 1,810 2,335 2,416 2,577 2,702 Producer NPC 3.26 3.19 3.15 3.42 3.37 3.79 3.65 Pork Value of production 1,798 1,749 2,188 2,449 2,758 2,783 2,777 SCT 162 375 658 821 990 1,208 1,242 MPS 162 374 657 818 990 1,208 1,242 Producer NPC 1.10 1.27 1.43 1.50 1.56 1.77 1.81 Beef Value of production 1,605 2,228 1,986 2,235 2,382 2,307 2,528 SCT 136 300 146 154 158 532 744 MPS - 161 - - - 369 579 Producer NPC 1.00 1.08 1.00 1.00 1.00 1.19 1.30
Note: Total support estimate (TSE) is the annual monetary value of all gross transfers from taxpayers and consumers arising from policy measures that support agriculture, net of associated budgetary receipts, regardless of their objectives and impacts on farm production and income, or consumption of farm products.
Producer support estimate (PSE) is the annual monetary value of gross transfers from consumers and taxpayers to agricultural producers, measured at the farm-gate level, arising from policy measures that support agriculture, regardless of their nature, objectives or impacts on farm production or income.
Single commodity transfers (SCT) is the annual monetary value of gross transfers from consumers and taxpayers to agricultural producers, measured at the farm-gate level, arising from policy measures directly linked to the production of a single commodity such that the producer must produce the designated commodity in order to receive the transfer.
Market price support (MPS) is an indicator of the annual monetary value of gross transfers from consumers and taxpayers to agricultural producers arising from policy measures creating a gap between domestic producer prices and reference prices of a specific agricultural commodity measured at the farm-gate level.
The Producer Nominal Protection Co-efficient (Producer NPC) is an indicator of the nominal rate of protection for producers measuring the ratio between the average price received by producers (at farm-gate), including payments per tonne of current output, and the border price (measured at farm-gate level).
Source: Icelandic authorities and OECD Producer and Consumer Support Estimates database. Viewed at: http://www.oecd.org/chile/producerandconsumersupportestimatesdatabase.htm [March 2017].

WT/TPR/S/361/Rev.1 • Iceland
- 84 -
4.1.2 Fisheries
4.1.2.1 Features
4.42. Fisheries are an important part of the economy of Iceland contributing over 5% to GDP in 2015, with fish processing contributing an additional 3.1%. In 2014, 4,400 people were employed in fishing and 4,700 in fish processing.
4.43. The value of the total catch was ISK 133 billion in 2016, down from a peak of
ISK 159 billion in 2012. Cod remains the most important species in terms of value, representing nearly 44% of total value of catch in 2016, while mackerel has increased in importance, from negligible levels in 2005 to ISK 18 billion in 2011 and ISK 11 billion in 2016 (Table 4.8). Of the total value of catch of ISK 151 billion in 2015, ISK 137 billion was caught in Iceland's 200 mile EEZ.24
Table 4.8 Fisheries in the economy, 2010-16
2010 2011 2012 2013 2014 2015 2016
Contribution to GDP
(%)
Fishing and
aquaculture
% 6.3 6.6 6.5 5.6 5.0 5.1 4.6
Fish processing % 3.5 4.0 4.0 4.0 3.2 3.2 2.7
Number employed
Fishing persons 5,300 5,200 4,900 3,600 4,400 .. ..
Fish processing persons 3,300 3,800 4,200 5,000 4,700 .. ..
Value of catch
All species ISK million 132,979 153,872 159,273 152,752 136,310 151,301 133,021
Cod ISK million 44,582 46,387 49,506 47,341 53,040 60,964 58,002 Redfish ISK million 12,016 14,973 14,536 13,876 13,167 13,443 11,122
Mackerel ISK million 7,824 17,846 14,433 15,403 15,264 10,360 10,897
Haddock ISK million 15,236 11,992 12,212 12,097 10,336 11,467 9,279
Saithe ISK million 8,480 9,139 9,448 9,805 7,872 9,529 8,477
Greenland halibut ISK million 6,682 7,635 8,396 7,796 5,144 7,463 6,810
Quantity of catch
All species 000 tonnes 1,063.47 1,148.87 1,448.55 1,362.79 1,076.87 1,319.40 1,067.36
Cod 000 tonnes 178.52 182.03 204.65 236.05 237.76 243.87 264.15
Redfish 000 tonnes 56.31 56.78 55.42 60.37 57.61 58.09 63.53 Mackerel 000 tonnes 122.03 158.64 151.94 153.81 170.46 168.25 169.86
Haddock 000 tonnes 64.95 51.30 47.68 45.47 35.81 40.71 38.47
Saithe 000 tonnes 53.89 50.49 50.98 57.42 46.05 48.17 49.62
Greenland halibut 000 tonnes 13.31 13.21 13.76 15.00 9.91 12.45 12.73
.. Not available
Source: Statistics Iceland.
4.44. After several years of decline up to 2008, the fishing fleet increased and has remained relatively stable since 2012. However, most of the increase between 2008 and 2012 was in small
undecked vessels which account for a small portion of the total catch. The numbers in other size categories have declined or remained stable (Chart 4.3 and Chart 4.4). In addition there are two
registered whaling vessels although neither was active in 2016.
24 Statistics Iceland online database. Viewed at: https://www.statice.is/ [May 2017].

WT/TPR/S/361/Rev.1 • Iceland
- 85 -
Chart 4.3 Number of fishing vessels by size category, 2005-16
Source: Statistics Iceland.
4.45. Although the majority of vessels are less than 10 GT or undecked, these categories account for a relatively small amount of the value and volume of catch, while the 45 vessels (including trawlers) of over 1,000 GT account for two-thirds of the volume of catch. In terms of value,
vessels under 1,000 GT account for over half the value of total catch as they specialize in higher-value-per-kilogram fish (Chart 4.4). This reflects that the largest vessels hold most of the quotas in small pelagics, i.e. capelin, herring and mackerel, while the higher-value species are
mostly demersal, including cod.
Chart 4.4 Volume of catch by vessel size category, 2005-15
Source: Statistics Iceland.
4.46. In terms of fish processing, several long-term trends appear to have come to an end in the 2010-17 period. The quantity of fish for oil and fishmeal production, which had been in steady decline since the early 2000s when it accounted for about two-thirds of total fish processing, has
fluctuated since 2010 reflecting reductions in capelin catch which had been mostly used for meal

WT/TPR/S/361/Rev.1 • Iceland
- 86 -
and oil production. On the other hand, the quantity of frozen fish had increased steadily to over half of the total by 2010, but has since declined to 40% in 2015 (Chart 4.5). According to the authorities, the change from long-term trends in the mid-2000s is due to climate change and mackerel and capelin stocks moving further north.
Chart 4.5 Fish processing, 2000-15
Tonnes
Source: Statistics Iceland.
4.47. Aquaculture is much smaller than the capture subsector but it has been growing
significantly in recent years. In 2016, about 15,000 tonnes of farmed fish were produced – an increase of 80% compared to 2015. Salmon are the main species produced (8,000 tonnes) followed by Arctic char (4,200 tonnes).
Table 4.9 Aquaculture production, 2010-16
Tonnes 2010 2011 2012 2013 2014 2015 2016 Atlantic salmon 1,068 1,083 2.923 3,018 3,965 3,260 8,000 Arctic char 2,427 3,021 3,089 3,215 3,471 3,937 4,200 Rainbow trout 88 226 422 113 603 728 2,500 Tilapia 0 2 0 1 0 1 1 Cod 1,317 877 892 282 310 72 0 Halibut 72 33 13 0 0 0 0 Turbot 46 20 28 58 0 0 0 Senegal sole 0 0 0 0 0 290 500
Source: Icelandic Aquaculture Association. Viewed at: http://www.lf.is/is/hagtolur/ [May 2017].

WT/TPR/S/361/Rev.1 • Iceland
- 87 -
4.1.2.2 Trade
4.48. According to UN Comtrade, total exports of fish and fish products were US$ 1,925 million in 2016, representing 43% of exports of goods, while imports were US$ 134 million.25 Furthermore, imports of some products, such as shrimp, are processed in Iceland and the processed products exported. Thus, in 2016, US$ 44 million in frozen shrimp (HS 030616) were imported and US$ 78 million of prepared shrimp (HS 160521) were exported. The applied tariff on imports of all
fish and fisheries products is zero, except for imports of meat of whales and other cetaceans, which are subject to an applied tariff of 30% plus ISK 363/kg.
4.49. According to Statistics Iceland, total exports of fish and fish products were ISK 265 million in 2015. Exports of cod and products of cod have traditionally been greatest, at ISK 100 million in 2015, followed by capelin, redfish, and haddock. Changes in the value of exports have been driven by changes in prices more than changes in quantities, for example, the value of shrimp exports
more than doubled from 2007 to 2015, while the quantity exported fell by nearly one-third (Table 4.10).
Table 4.10 Exports of fish products, 2007-15 Value ISK million, quantity 000 tonnes 2007 2008 2009 2010 2011 2012 2013 2014 2015 All species Value 127.6 171.3 208.6 220.5 251.6 268.6 272.5 244.0 264.6 Quantity 619.5 696.9 668.9 632.0 672.2 748.6 785.7 654.5 631.9 Cod Value 49.6 59.5 75.5 72.5 77.2 83.1 87.8 89.6 100.5 Quantity 100.7 88.3 109.5 95.8 94.7 100.6 120.8 117.8 121.7 Capelin Value 9.9 10.3 2.9 12.4 18.3 29.7 33.8 15.3 29.1 Quantity 103.9 75.6 17.9 57.2 99.8 177.7 181.7 76.3 115.7 Redfish Value 8.2 11.7 16.0 16.5 19.4 19.3 17.6 14.7 15.0 Quantity 43.9 47.4 45.4 42.3 38.5 37.5 39.4 34.6 33.5 Haddock Value 16.6 19.8 20.3 19.2 16.1 16.4 15.7 13.2 14.7 Quantity 47.5 53.1 42.0 30.5 22.9 20.9 19.4 15.1 16.0 Shrimp Value 6.4 9.2 9.8 11.3 11.3 11.1 9.4 10.7 14.2 Quantity 15.6 17.6 12.6 15.0 12.2 10.5 9.0 9.3 9.4 Saithe Value 6.0 8.9 12.1 12.6 12.6 12.5 13.5 11.9 12.9 Quantity 29.8 29.9 30.2 27.4 24.2 23.2 27.2 22.9 20.8 Mackerel Value 0.0 0.6 2.4 8.5 24.1 19.6 21.3 23.7 12.7 Quantity 0.1 3.6 13.2 53.7 109.6 106.7 112.6 130.1 85.5 Herring Value 9.2 18.8 25.7 20.7 24.1 25.6 23.5 17.4 10.5 Quantity 140.3 183.6 208.9 159.7 129.7 114.7 116.9 91.0 56.2 Greenland halibut Value 2.5 3.9 8.2 7.3 8.0 9.5 10.3 7.1 9.8 Quantity 8.3 8.7 12.5 9.8 9.5 11.3 13.9 10.2 11.2 Blue whiting Value 2.7 3.4 3.3 3.6 0.4 2.8 3.1 6.7 7.4 Quantity 38.6 45.8 32.2 29.5 3.5 27.1 16.5 35.3 40.6
Source: Statistics Iceland.
4.50. The main destination for exports is the United Kingdom (18.3% of total exports of fish), followed by Spain (8.8%), France (8.8%), Norway (7.6%), and the United States (6.9%). However, the authorities noted that some of the larger fish exporters export to large cold stores
and the fish products may then be re-exported to other countries, but they do not have data on these re-exports.
25 For the purposes of this paragraph, fish and fish products are those under HS 2012 headings 02840,
03, 050800, 050900, 051191, 121229, 1504, 1603, 1604, 1605, and 230120. Trade in agricultural products is addressed in Section 4.1.1.

WT/TPR/S/361/Rev.1 • Iceland
- 88 -
4.1.2.3 Policies
4.51. The Department of Fisheries and Innovation in the Ministry of Industries and Innovation is responsible for developing policies and preparing legislation. The Directorate of Fisheries, which is run as a separate entity within the Ministry, is responsible for implementing government policy, running the management system, monitoring and controlling fishing activities, collecting data, and imposing penalties for illegal catches. The Icelandic Coast Guard's responsibilities include
inspection, control, and enforcement of the laws at sea. The Marine and Freshwater Research Institute (MRFI) in the Ministry is responsible for research and advising the Government on sustainable use of marine resources. Both the directorate and the MRFI provide information on fisheries to the authorities, the fishing sector, and the public in their respective fields.26 The main stakeholders in the industry include Fisheries Iceland (which was formed in 2014 from the merger of the Federation of Icelandic Fishing Vessel Owners and the Federation of Icelandic Fish
Processing Plants), and the National Association of Small Boat Owners. These stakeholders
represent the fisheries and processing industries in policy discussions with the Ministry.27
4.52. The principal legislation regulating fishing in Iceland includes:
Act No. 116/2006 (last amended 2016) on Fisheries Management;
Act No. 71/2008 (last amended 2015) on Aquaculture;
Act No. 151/1996 (last amended 2012) on Fishing Outside Icelandic Jurisdiction;
Act No. 57/1996 (last amended 2015) on the Treatment of Commercial Marine Stocks;
and
Act No. 74/2012 (last amended 2015) on Fishing Fees.
4.53. Under these acts, the Ministry issues numerous regulations (58 in 2016) which provide details for many of these laws including setting catch quotas.
4.54. The Fisheries Management Act consolidated most of the existing legislation on fisheries management, including Act No. 38/1990 on Fisheries Management. The Act states that fish resources are the property of the nation and that the policy objective is to promote conservation
and efficient utilization of these resources to ensure stable employment and settlement. The Act provides the legal basis for the Minister to establish, through regulations, total allowable catches (TACs) for individual marine stocks which are allocated to individual vessels under the individual transferable quota (ITQ) systems. There are two quota systems: the general system; and a system that applies to small boats (less than 15 GRT) which may only fish with hand lines or longlines. The Ministry reserves part of the TACs for fishing companies that have been affected by
significant shocks due to a fall in catches or quotas and for vessels from disfavoured areas that are heavily dependent on fishing.28
4.55. The MRFI is responsible for assessing marine stocks and these assessments are reviewed by the International Council for the Exploration of the Sea (ICES). Based on these assessments, the Ministry establishes a TAC for each species.
4.56. For some fish stocks that are shared with other countries, international and/or bilateral agreements may apply and under them Iceland has a quota share:
Iceland is a contracting party to the Northeast Atlantic Fisheries Commission (NEAFC) that administers stocks in the international area in the Northeast Atlantic. Icelandic vessels fish blue whiting, Northeast Atlantic mackerel, Atlanto-Scandian (Norwegian spring-spawning) herring, and deep-sea redfish in the NEAFC convention area;
26 Marine Research Institute online information. Viewed at: http://www.hafro.is/undir.php?ID=1&REF=1
[May 2017]. 27 Fisheries Iceland online information. Viewed at: http://www.sfs.is/english/more/general-information
[May 2017]. 28 Directorate of Fisheries (2010), The Icelandic Directorate of Fisheries – Responsibilities and main
tasks. Viewed at: http://www.fiskistofa.is/media/utgefid_efni/DOF.pdf [May 2017].
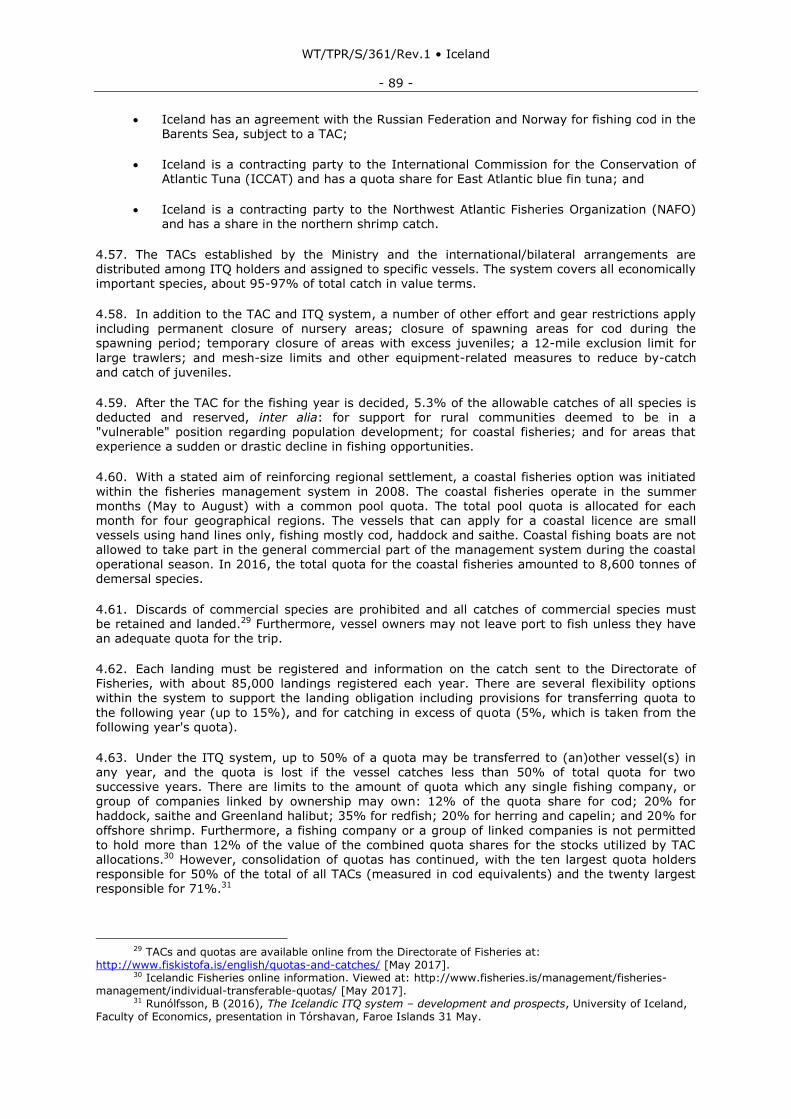
WT/TPR/S/361/Rev.1 • Iceland
- 89 -
Iceland has an agreement with the Russian Federation and Norway for fishing cod in the Barents Sea, subject to a TAC;
Iceland is a contracting party to the International Commission for the Conservation of Atlantic Tuna (ICCAT) and has a quota share for East Atlantic blue fin tuna; and
Iceland is a contracting party to the Northwest Atlantic Fisheries Organization (NAFO) and has a share in the northern shrimp catch.
4.57. The TACs established by the Ministry and the international/bilateral arrangements are distributed among ITQ holders and assigned to specific vessels. The system covers all economically important species, about 95-97% of total catch in value terms.
4.58. In addition to the TAC and ITQ system, a number of other effort and gear restrictions apply
including permanent closure of nursery areas; closure of spawning areas for cod during the spawning period; temporary closure of areas with excess juveniles; a 12-mile exclusion limit for
large trawlers; and mesh-size limits and other equipment-related measures to reduce by-catch and catch of juveniles.
4.59. After the TAC for the fishing year is decided, 5.3% of the allowable catches of all species is deducted and reserved, inter alia: for support for rural communities deemed to be in a "vulnerable" position regarding population development; for coastal fisheries; and for areas that experience a sudden or drastic decline in fishing opportunities.
4.60. With a stated aim of reinforcing regional settlement, a coastal fisheries option was initiated
within the fisheries management system in 2008. The coastal fisheries operate in the summer months (May to August) with a common pool quota. The total pool quota is allocated for each month for four geographical regions. The vessels that can apply for a coastal licence are small vessels using hand lines only, fishing mostly cod, haddock and saithe. Coastal fishing boats are not
allowed to take part in the general commercial part of the management system during the coastal operational season. In 2016, the total quota for the coastal fisheries amounted to 8,600 tonnes of demersal species.
4.61. Discards of commercial species are prohibited and all catches of commercial species must be retained and landed.29 Furthermore, vessel owners may not leave port to fish unless they have an adequate quota for the trip.
4.62. Each landing must be registered and information on the catch sent to the Directorate of Fisheries, with about 85,000 landings registered each year. There are several flexibility options within the system to support the landing obligation including provisions for transferring quota to
the following year (up to 15%), and for catching in excess of quota (5%, which is taken from the following year's quota).
4.63. Under the ITQ system, up to 50% of a quota may be transferred to (an)other vessel(s) in any year, and the quota is lost if the vessel catches less than 50% of total quota for two successive years. There are limits to the amount of quota which any single fishing company, or group of companies linked by ownership may own: 12% of the quota share for cod; 20% for haddock, saithe and Greenland halibut; 35% for redfish; 20% for herring and capelin; and 20% for
offshore shrimp. Furthermore, a fishing company or a group of linked companies is not permitted to hold more than 12% of the value of the combined quota shares for the stocks utilized by TAC allocations.30 However, consolidation of quotas has continued, with the ten largest quota holders responsible for 50% of the total of all TACs (measured in cod equivalents) and the twenty largest responsible for 71%.31
29 TACs and quotas are available online from the Directorate of Fisheries at:
http://www.fiskistofa.is/english/quotas-and-catches/ [May 2017]. 30 Icelandic Fisheries online information. Viewed at: http://www.fisheries.is/management/fisheries-
management/individual-transferable-quotas/ [May 2017]. 31 Runólfsson, B (2016), The Icelandic ITQ system – development and prospects, University of Iceland,
Faculty of Economics, presentation in Tórshavan, Faroe Islands 31 May.

WT/TPR/S/361/Rev.1 • Iceland
- 90 -
4.64. Under Act No. 74/2012, vessel operators must pay a fishing fee to offset the cost of services provided by the State and as a tax on the exploitation of marine resources. The fee is based on total earnings before tax (EBT) plus a portion of EBT for processing operations under a methodology set out in the Act. The fees for each fishing season in ISK per kilogram of ungutted catch are set out in regulations by the Ministry of Industries and Innovation.32 In quota year 2016/17, the total fee was estimated to be ISK 5.2 billion, or about 3% of the 2015 catch value.
4.65. In addition to the regular fees applicable to all vessels using a harbour, fishing vessels pay harbour fees which vary from 0.7% to 2.3% of landed value, the lower rates applying to sea products that are frozen or processed at sea. Fishing vessels also pay fees for registration of landing weights and species by harbour employees. This information is sent to the Directorate's online database and the fees are intended to cover the costs of registration. Under Act No. 116/2006 an export levy of 5% is applied to exports of unprocessed fish by the Directorate of
Fisheries.
4.66. There are no direct government financial transfers to the fisheries sector, including fishing processing and, with tariffs on nearly all fishing products at zero, no consumer transfer to the sector either. A tax concession for the crew of fishing vessels was phased out in 2013.33 Government support to the fishing sector is through research, management, and regulation. According to the OECD, the fisheries support estimate (FSE) for Iceland was negative for 2012-14, indicating a net average annual contribution of ISK 4.4 billion from the fisheries sector as fees
were greater than the estimates of support. In 2015, there was a net contribution to the sector of ISK 0.8 billion as general services support was ISK 4.2 billion while cost recovery charges (fees) were ISK 3.4 billion (from ISK 8.1 billion the previous year).34
4.67. As noted in the previous review, foreign ownership of fishing operations and primary fish processing (defined as salting, freezing, drying, and other processing to protect from decay, and the production of fish oil or fishmeal) is limited to no more than 25% direct and 49% combined direct and indirect ownership. In certain circumstances, direct foreign ownership of up to 33% may
be permitted.35
4.2 Mining and Energy
4.68. The unique geography and natural terrain provide Iceland with an unusual energy profile. Iceland is the world's largest green energy producer per capita and also has the world's highest share of renewable energy in any national total energy budget. Currently, hydro and geothermal sources supply almost all of Iceland's electricity and 85% of Iceland's total consumption of primary
energy (Chart 4.6); the remainder comprises fossil fuels (refined oil), which are used entirely for transport and fisheries.
4.69. Hydropower is responsible for nearly three quarters of electricity generation, while the rest is produced through geothermal means. Around 80% of the electricity generated is consumed by the industrial sector (mainly aluminium); residential consumption is around 5%. Around 90% of space heating is through direct geothermal energy.
4.70. Electricity prices for industrial consumers are low compared to other European countries: in
the second half of 2015 the average price for industrial consumers was €0.029 per kWh, the lowest in the EEA, while electricity prices for households were €0.127 per kWh which was fourth lowest in the EEA.36
32 Regulation No. 580/2016 on the amount, assessment and collection of the fishing fee for fishing year
2016/2017. 33 OECD (2015), OECD Review of Fisheries: Policies and Summary Statistics 2015, OECD Publishing.
Viewed at: http://dx.doi.org/10.1787/9789264240223-en [May 2017]. 34 OECD Fisheries Support Estimate. Online database. Viewed at:
https://stats.oecd.org/Index.aspx?DataSetCode=FISH_FSE# [May 2017]. 35 WTO document WT/TPR/S/273/Rev.1, 29 November 2012, Section IV, para. 44 and Central Bank of
Iceland (2016), Economy of Iceland, Reykjavik, p. 21. 36 Eurostat Electricity price statistics, tables and graphs, Tables 2 and 3. Viewed at:
http://ec.europa.eu/eurostat/statistics-explained/index.php/Electricity_price_statistics#Electricity_prices_for_industrial_consumers [March 2017].

WT/TPR/S/361/Rev.1 • Iceland
- 91 -
Chart 4.6 Primary energy use in Iceland – 2015
Source: Iceland National Energy Agency
4.71. Companies in the energy sector in Iceland are vertically integrated. Under the law, a single power company can function as generator, distributor and supplier. However, accounting
separation is required between concession (transfer of electricity in a certain area) and competitive
activities.
4.72. Companies owned by the State or municipalities dominate the electricity sector. Landsvirkjun, which is wholly state-owned, is the largest energy company in Iceland, providing approximately 75% of all the electricity produced in Iceland.37 Furthermore, Landsvirkjun is responsible for more than 96% of all hydro generation in Iceland, and its share in total geothermal electricity generation is around 11%.
4.73. Landsvirkjun has US Dollar denominated long-term contracts with foreign-owned energy intensive companies (aluminium smelters); as such it sells 80% of the electricity it generates to these companies. The remaining 20% is bought by public utilities and the Icelandic Transmission System Operator (Landsnet).
4.74. Currently Landsvirkjun's core debt programme is run under its Euro Medium Term Note
(EMTN) master agreements. They consist of two agreements, an EMTN programme, which is
guaranteed by the State and another without a state guarantee.38 The Minister of Finance manages the ownership of Landsvirkjun and appoints all five board members and five alternate members. Lansdvirkjun is also the main owner of Landsnet, with a share of 65%.
4.75. Orkuveita Reykjavíkur (OR) is a public utility company, which is owned by the City of Reykjavík and adjacent municipalities. It is the largest local provider of electricity and heating to end-users. The main service area of the company is the larger Reykjavik Metropolitan Area, covering two-thirds of the Icelandic population. HS Orka is the third main electricity-generating
firm in Iceland. It was privatized in 2007. Its largest shareholder is the Canadian Alterra Power, which owns two-thirds of the company. The rest is owned by a group of Icelandic pension funds. There are several other small electricity firms and utilities in Iceland; these are owned by the Icelandic State and/or municipalities.
37 In 2016, Lansdvirkjun had operating revenues of over US$420 million, earnings before income and
taxes of over US$183 million, and a net profit of nearly US$67 million. 38 For details please see: http://www.landsvirkjun.com/Finance/Funding/.

WT/TPR/S/361/Rev.1 • Iceland
- 92 -
4.2.1 Regulation
4.76. The energy sector in Iceland is governed by Act No. 57/1998 on Survey and Utilization of Ground Resources, Act No. 65/2003 on Electricity, Act No. 13/2001 on Prospecting, Exploration and Production of Hydrocarbons and accompanying regulations and amendments39, and Act No. 109/2011 on the Taxation of Hydrocarbon Extraction. All the above Acts are administered by the National Energy Authority (Orkustofun).
4.77. The National Energy Authority (NEA) is a government agency under the Ministry of Industries and Innovation. The NEA's main responsibilities include advising the Government on energy issues and related topics, licensing and monitoring the development and exploitation of energy and mineral resources, regulating the operation of the electrical transmission and distribution system, and promoting energy research. Furthermore, administrative decisions made by the NEA with respect to the above-mentioned Acts can be appealed to the Appeals Committee
for Environmental and Resource Matters as per Act No. 130/2011. Since the establishment of the committee in 2012, appeals have averaged 120 annually, while in 2016 there were 175 appeals. Complainants have recourse to the courts after the non-judicial appeals process has been exhausted.
4.78. Under the provisions of these laws, investment and/or ownership of energy exploitation rights and the production and distribution of energy are limited to EEA and EFTA residents. Act No. 57/1998 stipulates that resources within the ground belong to the owner of the land. However,
a licence from the National Energy Authority is required to survey or prospect on the land40; additionally a compensation agreement with the landowner is required. Recent changes to Act No. 57/1998 on Survey and Utilization of Ground Resources and Act No. 65/2003 on Electricity stipulate that:
The State or municipalities can no longer sell the ownership of resources; however, utilization rights can be leased to a developer for up to 65 years with a possibility of
extension. Royalties for the utilization are determined by the Prime Minister.
Producers of electricity compete in an open market in Iceland. Therefore CHP power plants are obliged to keep separate accounts for heat and power production to prevent cross subsidization of electricity.
4.79. The energy market in Iceland is open, with foreign companies operating in the sector. As part of its accession process to the EU, which was suspended in September 2013, Iceland implemented the first and second electricity directives of the EU. The generation and distribution
segments of the market are open to competition from companies in the EEA. The Electricity Act allows third-party access for transmission and distribution networks. Under the provisions of the Electricity Act, only Landsnet (IceGrid), a private company may provide electricity transmission services in the country and it also has the exclusive right to construct new transmission infrastructure. Landsnet operates under a concession arrangement and is subject to regulation by the National Energy Authority (NEA). The NEA determines the revenue framework on which
Landsnet's tariff is based. The law stipulates that a single power company can function as
generator, distributor and supplier. However, accounting separation is required between concession (transfer of electricity in a certain area) and competitive activities. While consumers must use the distributor holding the concession for their respective area, the distributor need not be the same company as the supplier, thus consumers are able to choose their supplier.
4.80. Power companies determine the price of electricity that they sell, while transmission and distribution fees are set by the NEA.41 The NEA sets an upper limit on Landsnet's income, and Landsnet's profits are also bound by an upper limit under the Act. These measures indirectly
control the tariff that Landsnet may charge. Iceland also operates a policy of equalization of energy prices. Under this policy, homes that are heated by oil and electricity (where no other means of heating are available) are subsidized by the State. The annual subsidy amount is
39 Regulation No. 884/2011 and Regulation No. 39/2009. 40 As of August 2008, the National Energy Authority may grant licences on behalf of the Minister of
Industry, Energy and Tourism. 41 Electricity prices in Iceland have declined in real terms since 2007 and are significantly lower than
those in other EU countries.

WT/TPR/S/361/Rev.1 • Iceland
- 93 -
approved by the Parliament in the Budget each year; in 2015 it was over ISK 1.2 billion. With a view to promoting a more efficient market for electricity trading, Landsnet has been working on establishing an electronic market for electricity trading (ISBAS). However, it is unclear when it would be operational.
4.81. At the time of the last review, the authorities were in the process of preparing a comprehensive energy strategy for 2020 that was to be released in 2012. The salient features of
the strategy were: replacing fossil fuels with renewable energy; following an environmentally protective and precautionary approach in hydroelectric and geothermal energy production; supporting diversified industry with an emphasis on ecologically beneficial high-tech industry; sustainable utilization of all energy sources; and encouraging better energy utilization. The strategy was not concluded in 2012 as planned. The authorities stated that they are currently in the process of preparing a new comprehensive energy strategy, which they aim to publish in 2018.
4.3 Services
4.3.1 Financial sector
4.3.1.1 Banking
4.82. Iceland was one of the countries' worst affected by the 2008 financial crisis: the financial system was on the verge of collapse; equity prices fell by over 90%; money market rates rose to 18%; and the Icelandic króna depreciated by around 40% in real terms. As a result of lower asset prices, debt to collateral ratios increased and, along with higher inflation and a currency
depreciation, resulted in a spike in non-performing loans. The Government intervened through several emergency measures, including: liquidation of the three largest commercial banks and the establishment of three new commercial banks, which took over their domestic operations; the introduction of capital controls; and putting in place an international financial aid package.42
4.3.1.1.1 Structure and performance
4.83. Since the crisis, the banking system has stabilized and recovered. Currently the banking sector in Iceland is comprised of four commercial banks and four savings banks (compared with
nine in 2012). Two of the commercial banks are wholly state-owned, while a third has a minority government stake. The activities of the banks are focused mainly on serving the domestic economy.
4.84. The assets of the financial system rose from ISK 7,715 billion in 2010, to nearly ISK 10,034 billion in 2016, while over the same period the assets of the commercial banks rose from ISK 2,627 billion to ISK 3,199 billion. The restructuring of the banks has also resulted in the
ratio of non-performing loans43 to total loans declining from a peak of 20% in 2010 to 2.1% in 2016 (Chart 4.7).44
42 WTO document WT/TPR/S/273/Rev.1. 43 NPLs are defined as loans in default for over 90 days. 44 Data is only for domestic systemically important banks.

WT/TPR/S/361/Rev.1 • Iceland
- 94 -
Table 4.11 Credit system assets, 2008-16
ISK billion
2008 2010 2012 2014 2016
Banking system 4,632 3,878 3,809 3,758 3,737 Central Bank of Iceland 1,187 1,328 1,075 957 901 Commercial banks 3,417 2,627 2,850 2,939 3,199 Savings banks 768 137 57 56 21 Other credit institutions 1,388 1,265 1,234 1,216 1,718 Housing finance fund 733 836 876 824 787 Pension funds 1,665 1,989 2,439 2,935 3,515 Insurance companies 122 138 155 169 177 Mutual funds, investment and institutional funds
212 284 410 488 670
State loan funds 125 161 192 226 216 Total assets 8,144 7,715 8,239 8,791 10,034
Source: Central Bank of Iceland.
Chart 4.7 Non-performing loans, 2009-16
Source: Financial Supervisory Authority, Central Bank of Iceland.
4.85. Furthermore, during the period under review, Icelandic banks have been profitable, with return on assets being 1.8% and return on equity 9% in 2016. In 2016, income from equity
securities and upward loan value adjustments contracted significantly from 2015 and operating expenses rose. On the other hand, net interest income rose markedly. Additionally, the banks' capital position is robust, with capital adequacy ratios of 28%; including 27% in Tier 1 capital. Both ratios are well in excess of the statutory minimum (Chart 4.8).

WT/TPR/S/361/Rev.1 • Iceland
- 95 -
Chart 4.8 Commercial banks' capital adequacy ratios, 2009-16
Source: Central bank of Iceland.
4.86. With regard to the banking sector, a lingering issue had been the resolution of the estates of the failed banks. In June 2015, the authorities announced a plan to unwind both the estates of the failed banks and the remaining offshore ISK holdings, comprising mainly bank deposits, treasury
securities and equity interests, which involved a combination of incentives so as to motivate the boards responsible for winding up the insolvent banks to reach voluntary agreements with the claimholders to allocate outstanding assets in a way that ensured financial stability. These included:
Measures to neutralize the threat from distributing króna-denominated assets45, such as making an offsetting "stability contribution" to the Icelandic treasury;
extending the maturity of foreign-currency denominated domestic assets; and
refinancing or otherwise ensuring the repayment of foreign-exchange denominated loans granted by the authorities to the new banks following the crisis.
4.87. The "composition" agreements were signed in late 2015; these discounted further bank claims in default since 2008–09 as a quid pro quo for lifting capital controls on the estates. The estates assigned most of their ISK assets to the State (17% of GDP), distributed recoveries to the Central Bank of Iceland (CBI) as a claimant (about 4%), termed out their domestic foreign
currency deposits for seven years (4%), and drew from their external assets so as to refinance certain CBI and Government claims on the banks (2.5% of GDP). They agreed to these actions so they could immediately distribute liquid foreign assets worth around 35% of GDP to their mainly foreign claimants, with more to follow over time.
4.88. With respect to the offshore ISK holders, the CBI held a euro auction in June 2016. All accepted bids were offered to investors at the same price. The auction exchange rate was based on a sliding scale according to the size of the total bid, with a best rate of ISK 190:€1, implying a
euro premium of roughly 27% over the onshore market rate. Participation was voluntary.
45 Threats stem from pressure on balance of payments and financial instability due to disorderly capital
outflows.

WT/TPR/S/361/Rev.1 • Iceland
- 96 -
Settlement took place on 29 June 2016. Since then, a further two auctions have taken place (Section 1.1).
4.89. Direct state assistance to the financial sector amounted to around 34% of GDP. Both the CBI and the banks had to be recapitalized. To cover this, the Government gave the CBI a bond equivalent to 17% of GDP in 2009. In 2009 to 2012, it provided the banks a separate bond equivalent to 15% of GDP. According to the IMF, recoveries are estimated at 43% of GDP. These
consist of: bank equity and subordinated debt taken in 2009 as consideration for recapitalizations, the estimated value of which was 15% of GDP at end-2015; dividends and coupons on those claims, cumulating to around 3% of GDP in 2010-15; the stability contributions from the failed bank estates in the context of the compositions, valued on an accruals basis at 17% of GDP; and profits and interest payments to the CBI by the asset management subsidiary it established in 2009 to hold its seized collateral, cumulating to an expected 8% of GDP over 2010-16. Thus the
State is estimated to have made a net gain in excess of 9% of GDP.
4.3.1.1.2 Regulation
4.90. During the period under review, significant regulatory changes have included the establishment of the Financial Stability Council (FSC) and the Systemic Risk Committee (SRC) in 2014 as the official fora for collaboration on financial stability.46 The FSC is a three member Council (Minister of Finance (chair), CBI Governor, and Director General (DG) of the Financial Supervisory Authority), which is responsible for formulating public policy on financial stability;
assessing economic imbalances, financial system risks, undesirable incentives and other circumstances liable to jeopardize financial stability; defining actions, other than implementing the CBI's monetary policy management tools, which are considered necessary to influence the financial system with the objective of reinforcing and safeguarding financial stability; and confirming definitions of systemically important regulated entities, infrastructure and markets of such nature that their activities can impact financial stability. The FSC draws from recommendations and assessments from the SRC and other available data and submits recommendations to the relevant
authorities.
4.91. The SRC is a five voting member Committee (CBI Governor (chair); DG of the Financial Supervisory Authority (Deputy Chair); CBI Deputy Governor; Deputy DG of the Financial Supervisory Authority; an outside expert in financial markets appointed by the Finance Minister; and the Permanent Secretary of the Finance Ministry in a non-voting capacity). The SRC evaluates the current situation and outlook for the financial system, systemic risk, and financial stability. The
SRC is mandated to take account of the FSC's official policy and intermediate objectives on financial stability. Its assessments are based on analysis carried out by the CBI and the Financial Supervisory Authority's joint risk assessment groups. Assessments and recommendations are submitted to the FSC.
4.92. Additionally, new liquidity rules issued by the Central Bank of Iceland took effect in December 2013, based on the liquidity coverage ratio (LCR) issued by the Basel Committee, and set minimum liquidity under stress scenarios.47 Banks must fulfil requirements for both
foreign-denominated and overall liquidity. Furthermore, a net stable funding ratio (NSFR) on foreign currency funding was put in place in December 2014. This was based on the Basel Committee's rules on NSFRs. The funding ratio is intended to ensure a minimum level of stable one-year funding in foreign currencies and therefore restrict the degree to which the commercial banks can rely on unstable short-term funding to finance long-term foreign-denominated lending. The rules on funding ratios reduce maturity mismatches and limit the extent to which the banks can depend on unstable short-term funding to finance long-term assets that could prove difficult to
sell.
4.93. In early 2016, the Financial Stability Council (FSC) recommended that the Icelandic Financial Supervisory Authority (FME) impose three capital buffers48: a 2% capital buffer on systemically important financial institutions as of 1 April 2016; a systemic risk buffer amounting to 3% of risk-weighted domestic assets on systemically important deposit-taking institutions as of 1 April 2016; and a 1% countercyclical capital buffer on all financial institutions, effective 12
46 Act No. 66/2014 on the Financial Stability Council. 47 Rules on Liquidity Ratio No. 1055/2013. 48 In March 2016, the FME put these buffers in place in accordance with the FSC's recommendations.

WT/TPR/S/361/Rev.1 • Iceland
- 97 -
months after the date of the FME's decision. In addition, a capital conservation buffer was put in place at the beginning of 2016; it will rise in increments to 2.5% by the beginning of 2017. In October of 2016, the Financial Stability Council recommended that the Systemic Risk Buffer be increased by 1.25%, effective 12 months after the date of the FME's decision. Capital buffers may only include Tier 1 capital. When fully implemented, in November 2018, the combined capital buffers imposed on the three largest banks will be 8.75%.
4.94. From 1 April 2017, the Icelandic Financial Supervisory Authority (FME) can set ceilings on loan-to-value (LTV) and debt-service-to-income (DSTI) ratios of consumer mortgage credit. Before the FME can do this, the Financial Stability Council is required to give its opinion on the matter. The FME has yet to use this authorization.49 There is a bill under discussion in the Icelandic Parliament that will, if passed, grant the Central Bank of Iceland authorization to limit the lending of financial undertakings to unhedged parties. Before the CBI can do this, the Financial Stability
Council is required to give its opinion on the matter.50
4.95. Currently there is one stock exchange in Iceland, which is operated by Nasdaq Iceland hf., a part of the Nasdaq Group. Trading at the Nasdaq Iceland is governed by the Issuer Rules, the Member Rules and the Warrant Rulebook. The market is supervised by the Financial Supervisory Authority of Iceland. As of end of April 2017, there were 17 companies listed on the exchange with a market capitalization of €8.7 billion, compared with €2.2 billion in 2013. The OMX18 index has risen from 1,144 points in July 2014 to 1,822 points in April 2017.
4.96. To operate in Iceland, Insurance companies need an operating licence from the Financial Supervisory Authority of Iceland. Restriction on investment in the sector depends on the insurance company's risk profile. Currently there are 12 insurance companies operating in Iceland. Four companies operate in the non-life insurance segment, five operate in the life insurance segment, there are two reinsurance companies, and there is the Iceland Natural Catastrophe Insurance, which operates under special legislation (Act No. 100/2016 on Insurance Activity and Act No. 55/1992 on Iceland Catastrophe Insurance). At the end of 2015, the assets of all insurance
companies stood at approximately ISK 165 billion compared with over ISK 140 billion in 2011. The solvency ratio of the three largest companies was within the range of 125% and 156%. Both segments of the insurance market continue to be profitable, with non-insurance companies registering a profit of over ISK 4 billion in 2015, a decline from around ISK 8 billion in 2012, while over the same period the profits of life insurance companies grew from about ISK 1.2 billion to over 1.7 billion.
4.3.2 Telecommunications
4.97. The review period has seen the share of the information and communications sector in GDP steadily increasing to 5.1% in 2016 compared with 3.6% in 2010. This is in contrast to the previous review period where the share of the sector declined. Total income rose from ISK 43.4 billion in 2010 to nearly ISK 55 billion in 2015; during the same period, investment in the sector rose from around ISK 5.3 billion to ISK 8.6 billion. The fixed-line segment has been the major recipient of the investment due to fibre optic roll-out replacing copper. With regard to
income generated, the largest amount is derived from the mobile networks followed by data transfer and internet services. During the review period, total telecommunication subscriptions continued to rise, resulting in the telecommunications penetration rate rising from 163% in 2010 to over 176% in 2016. The growth has come about almost entirely due to increased mobile subscriptions.
4.3.2.1 Fixed-line telephony
4.98. During the period under review, the fixed-line segment has continued to decline as it did
during the previous review period. Total subscribers declined from nearly 142,500 in 2010 to around 136,000 in 2016, while total traffic declined from about 620 million minutes to about 330 million minutes. Fixed-line services accounted for around 25% of total revenue in the telecommunications industry in 2016, a fall from over 30% in 2010. Currently there are three main
49 Chapter VII of Act No. 118/2016 on consumer mortgage credit. Viewed at:
http://www.althingi.is/lagas/nuna/2016118.html. 50 Article 3 of the Bill of Law on Foreign Currency Loans. Viewed at:
http://www.althingi.is/altext/146/s/0300.html.

WT/TPR/S/361/Rev.1 • Iceland
- 98 -
service providers in the fixed-line segment: Siminn, Vodafone, and 365. Although it has been losing market share, Siminn continues to dominate, with over 56% market share followed by Vodafone, which has a 30% share of the market. Both providers are classified as having "significant market power" in certain service markets and hence may be subject to various obligations, imposed by the Post and Telecom Administration (PTA) with respect to access to infrastructure, interconnection, and carrier selection and pre-selection.
4.3.2.2 Mobile telephony
4.99. The mobile communications market has continued to grow steadily. Total subscriptions rose from 375,430 in 2010 to over 451,000 in 2016. Over the same period, traffic has also increased from around 750 million minutes to around 827 million minutes. Growth was driven by increased subscriptions and usage by the younger segment of the population. The mobile sector is the largest revenue generator in the telecommunications sector, accounting for nearly 30% of total
revenue in electronic communications in 2015. Currently there are four main companies operating in the mobile communications sector (Nova, Siminn, Vodafone, and 365). Siminn has continued to lose market share and is no longer the main supplier. Nova has the largest market share with nearly 35% of the market followed by Siminn (32.6%) and Vodafone (27.8%).
4.3.2.3 Internet
4.100. As is the global trend, the internet sector has been the fastest growing subsector within the electronic communications industry. Total subscriptions rose from around 110,000 in 2010 to
nearly 128,000 in 2016. Furthermore, in 2015, the internet sector accounted for nearly 18% of total revenue in the electronic communications sector compared with 16.4% in 2010. At present, four companies operate in the market, with Siminn controlling nearly 48% of the market in 2016; its market share has fallen from over 52% in 2010. Vodafone, the other major internet service provider, controlled nearly 28% of the market in 2016.
4.3.2.4 Regulations
4.101. During the period under review, there have been no significant changes to the legislation
governing the telecommunications sector in Iceland except for Act No. 62 of 25 June 2012 amending the Electronic Communications Act and the Act on the Post and Telecom Administration, which addresses cyber security. The legal framework for electronic communications and postal services is influenced by Directives of the European Union. Having signed the Agreement on the European Economic Area, Iceland made a commitment to adopt all of the Directives of the European Union in the fields of electronic communications and postal services. The main laws
governing the sector continue to be the Act on the Post and Telecom Administration No. 69/2003 and Electronic Communications Act No. 81/2003. The Acts implement the major provisions of the EU Communications Directive package of 2002. The Acts are administered by the Postal and Telecom Administration (PTA) which is part of the Ministry of the Interior. The PTA is also the regulator for the sector.
4.102. The PTA's responsibilities include inter alia: implementing the Electronic Communications Act and supervising electronic communications as provided for in the Act; encouraging competition
in postal and electronic communications services and preventing unfair business practices; participating in developing the market for electronic communications and information technology; safeguarding public interest; advising the authorities and ministries and ensuring that Iceland fulfils its international obligations as well as making recommendations, if necessary, for amendments to acts and regulations; and participating in cooperation resulting from international obligations.
4.103. The Electronic Communications Act provides for a general authorization for natural persons
and legal entities established within the EEA and within WTO Member states to start operations, implying that they do not need a licence, unless specific frequencies are involved. Registration with the PTA is required for all operators. An individual licence is required for all frequencies except open spectrum. In most cases the procedure is simple and frequencies are assigned by the PTA
within six weeks of receipt of application.

WT/TPR/S/361/Rev.1 • Iceland
- 99 -
4.104. The Act also addresses transparency and non-discrimination; rules on number portability, and on carrier selection and pre-selection; and provisions relating to competition within the sector. Furthermore, under Chapter VII of the Act, the PTA is expected to "ensure access and interconnection and interoperability of services in a satisfactory and efficient manner" (Article 25) and may, inter alia, impose obligations with respect to open and non-discriminatory access and price control. The Act also ensures that all users are entitled to universal service at the same tariff
rate throughout the country. To ensure this obligation is met, the PTA may place obligations on electronic communications providers and set minimum quality requirements. The PTA also operates the equalization fund, which subsidises universal service operations that are unprofitable or loss making.
4.105. Violations of the provisions of the Electronic Communications Act or the Act on the Post and Telecom Administration must be rectified within a month of their notification by the PTA. If
operators fail to remedy the violations, the PTA has the authority to impose daily fines, or to
cancel the right to use numbers or the general authorization to operate. Serious or repeated violations may result in imprisonment. Rulings by the PTA may be referred to the Rulings Committee for Electronic Communications and Postal Affairs, and to the courts.
4.3.3 Transport
4.3.3.1 Air transport
4.106. The air transport sector in Iceland comprises passenger and cargo airlines, airports, and
associated services. The sector has continued to grow during the review period, with the sector's contribution to GDP rising from 6.6% in 2010 to approximately 15% in 2016; however, the authorities stated that the contribution to GDP is hard to estimate due to an annual growth of 30-40% over the past few years.
4.107. Since 2011, total passenger traffic has grown significantly and was over 7.6 million
(including transit/transfer passengers) in 2016 compared with 3.3 million in 2011, of which 6.8 million were international passengers (Chart 4.10). The growth was due almost entirely to the
increase in international passenger traffic, while domestic passenger traffic fluctuated slightly during the review period. Growth of international traffic is due to Iceland attracting more tourists as well as Icelandic airlines becoming a more financially viable option for transatlantic passengers and the promotion of Iceland as a transatlantic hub. The total number of passengers through Keflavik airport in 2017 is estimated to be in the region of 9 million.
4.108. After declining during the previous review period, total mail and cargo also increased
during the current review period from about 40 thousand tonnes in 2011 to over 52 thousand tonnes in 2016. The increase is due to strong growth in online shopping (mainly from China), as well as an increase in the export of fresh fish.
4.109. There are 24 foreign passenger transport operators in Iceland which operate scheduled air
services. Currently, there are four international and nine domestic airports operating scheduled flights in Iceland. In 2016, Reykjavik airport accounted for nearly 50% of domestic traffic, while nearly all international air traffic was through Keflavik airport. All airports in Iceland are
state-owned. Since its establishment in 2010, Isavia, a government-owned company with the Ministry of Finance as a sole shareholder, has been responsible for all operations, development, assets, and obligations of all airports, based on an annual service agreement with the Ministry of Transport. Furthermore, Isavia manages air traffic in the Icelandic air traffic control area. It is also the owner and operator of Fríhöfnin ehf (The Duty-free store), Tern Systems ehf, Domavia ehf and Suluk ApS. Ground handling at Keflavik airport is provided by four independent service providers: Ace Handling, Airport Associates, IGS Ground Services and SouthAir. Airline operators are also
allowed to undertake ground handling services themselves; this is the most common method at the domestic airports.
4.110. With regards to procedures and fees, Iceland accords national treatment to both domestic and international airline companies. Scheduled air services to certain domestic destinations that

WT/TPR/S/361/Rev.1 • Iceland
- 100 -
are not economically viable, but fall within given criteria of public service obligation, are subsidized by the Government. Such contracts are awarded to airlines via an open tender.51
4.111. Act No. 60/1998 as amended on Aviation is the main legislation governing the air transport sector. The Act is administered by the Icelandic Transport Authority, which is under the Ministry of the Interior.52 The authorities stated that the Aviation Act follows European legislation, thus making Iceland compliant with European rules on licensing, access to aircrafts and ground
handling, competition, slot allocation, airport charges, and aviation safety and security. Furthermore, under the provisions of the Act, EEA operators are allowed to engage in cabotage, while non-EEA operators are only allowed to engage in cabotage if specified in a bilateral agreement.53
4.112. The Icelandic Transport Authority was established in accordance with Act No. 119/2012 on the Icelandic Transport Authority (ICETRA), Administrative Institution for Transport Affairs. Under
the provisions of the ICETRA Act, all tasks that were the responsibility of the Icelandic Civil Aviation Administration have been taken over by ICETRA. As such, ICETRA is responsible for inter alia: overseeing general aviation; overseeing commercial aviation of Icelandic parties, procedural rules of air operators, flight crew members, as well as the financial status of air operators; ensuring the issuance of air operator licences in accordance with Council Regulation No. 1008/2008 and Commission Regulation No. 965/2012 on air transport flights with subsequent amendments; issuing air operator certificates which attest that the air operator is in control of
flight safety aspects in its operations. Furthermore, all licences for flight operations are subject to ICETRA's approval and control. ICETRA is also responsible for overseeing flights of foreign carriers to and from Iceland and issues permits to fly through Icelandic airspace. Assessments of air operators' management of flight operations are also carried out by ICETRA.
4.113. As per EU regulations, Iceland operates under a "Single European Sky". In addition, Iceland has bilateral aviation agreements with Armenia; Azerbaijan; Bahrain; Barbados; Brazil; Canada; Chile; China; Columbia; Croatia; Denmark; Dominican Republic; Egypt; Finland;
Germany; Ghana; Hong Kong, China; India; Indonesia; Jamaica; Jordan; Kuwait; Laos; Lebanon; Luxembourg; Macau, China; Malaysia; Mongolia; Netherlands; Norway; Oman; Paraguay; Qatar; Russian Federation; Rwanda; Saudi Arabia; Singapore; South Africa; Spain; Sweden; Syria; Thailand; Turkey; Turkmenistan; United Kingdom; Viet Nam; and Zambia. Iceland is also party to the EU-USA Open Skies Agreement, which is the only open skies agreement that Iceland has in place other than the "Single European Sky".54
4.114. Under the provisions of Act No. 34/1991 on Foreign Investment in Companies, foreign ownership in Icelandic companies involved in airline operations may not exceed 49%. This limitation does not apply to nationals of the EEA, who are treated as Icelandic nationals. Additionally, no entity may be granted an operating licence unless it is effectively controlled by EEA nationals. There are no limitations on foreign participation in auxiliary services.
4.3.3.2 Maritime transport
4.115. As an island nation with a high dependence on international trade, maritime transport is
very important for Iceland. Nearly all of Iceland's merchandise trade is conducted by sea. There are around 1,200 open boats, 1,100 decked vessels, a petroleum tanker, a container ship and a chemical tanker registered in Iceland.
4.116. At the time of the last review, there were approximately 60 harbours in Iceland, of these 15 had appreciable cargo activities, with four of these ports having the capability to handle ships of up to 40,000 DWT. The rest were essentially fishing ports but were able to accommodate larger merchant vessels for fish-based products. Faxafloahafnir Associated Icelandic Ports was the largest
51 In 2011 subsidies amounted to ISK 263, in 2012 ISK 338 million, in 2013 ISK 262 million, in 2014
ISK 258 million, in 2015 ISK 313 million, and in 2016 ISK 306 million. 52 Prior to 2013, the Act was administered by the Icelandic Civil Aviation Administration. 53 As per the provisions of their bilateral agreements, operators from Greenland, Paraguay, and Chile
are allowed to engage in cabotage. 54 For a full list of aviation agreements see: https://www.utanrikisraduneyti.is/media/utn-pdf-
skjol/Yfirlit-yfir-loftferdasamninga-Islands-i-arslok-desember.pdf.

WT/TPR/S/361/Rev.1 • Iceland
- 101 -
port in the country, accounting for nearly 50% of total cargo in Iceland. Harbours and coastal protection structures are owned and operated by the municipalities where they are located.
4.117. In 2013, the Icelandic Maritime Administration Act of 1996 was repealed and the Iceland Maritime Authority (IMA) dissolved. Currently, the sector is governed by two agencies, the ICETRA and the Icelandic Road and Coastal Administration (IRCA). The ICETRA has regulatory and oversight responsibilities, while infrastructure project procurement and operational tasks are the
responsibility of the IRCA.
4.118. ICETRA's responsibilities include inter alia: port state control of foreign merchant vessels in Icelandic ports; seamen's certification and crew issues; implementation of the International Convention on Standards of Training, Certification and Watchkeeping for Seafarers (STCW); issuing professional diving and pilots' certificates; and maritime traffic services and security. Preparing new maritime legislation, publishing marine-safety training materials and training are
also the responsibility of ICETRA. Iceland's maritime legislation is fully aligned with EU regulations on freedom to provide services, transfer of cargo and passenger ships between registers, action to safeguard free access to cargoes in ocean trades, and maritime cabotage. With respect to cabotage, Iceland is the only WTO Member that has scheduled a binding commitment on cabotage.
4.119. With respect to harbour administration, the IRCA is responsible for coastal protection and harbour projects, research, and planning for the development of coastal protections and harbours. The State is responsible for conducting basic research pertaining to harbour projects as well as
provision of financial support for new harbour projects. The Director General of IRCA is a member of the National Transport Plan Committee, which is responsible for developing proposals for a 4-year and a 12-year transport policy plan for the Minister. Furthermore, most harbour funds are owned by municipalities but most harbour development projects are eligible for state grants and in the transport plan there is a list of approved harbour development projects that have been approved for state grants.
4.120. The port state control system implemented in 2011 continues to be in use. It follows the
EU Directive on port state control. Under this system, termed the New Inspection Regime (NIR), inspections are targeted according to a Ship Risk Profile so that "risky" ships are inspected frequently, while "good" ships are inspected less frequently. A ship's risk profile is determined according to, inter alia, age, flag, type, and company.
4.121. Iceland has ratified and incorporated into its laws and regulations most of the conventions and instruments adopted by the International Maritime Organisation (IMO), such as: the
International Convention for the Safety of Life at Sea (SOLAS); International Convention on Standards of Training, Certification and Watchkeeping for Seafarers (STCW); International Convention on Standards of Training, Certification and Watchkeeping for Fishing Vessel Personnel (STCW-F); International Convention on Load Lines; International Convention for the Prevention of Pollution from Ships (MARPOL); Convention on the International Regulations for Preventing Collisions at Sea (COLREG); International Convention on Maritime Search and Rescue (SAR); and Convention for the Suppression of Unlawful Acts against the Safety of Maritime Navigation (SUA).
4.3.4 Tourism
4.122. Since 2010, the tourism sector's importance in Iceland's economy has increased significantly. Tourisms' contribution to GDP nearly doubled from 5.6% in 2010 to around 10% in 2016. Between 2010 and 2015, the number of visitors to Iceland has grown at an average annual rate of around 22%, to reach nearly 1.3 million visitors in 2015.
4.123. The tourism sector has overtaken fisheries and aluminium as the largest export sector responsible for nearly 40% of Iceland's export receipts of goods and services in 2016. Employment
in the sector also rose during the review period from 15,700 in 2010 to 24,200 in 2016.
4.124. Total spending on tourism-related activities has also increased steadily from 2009 to 2015: from ISK 93 billion to ISK 222 billion, about half of which is from air passenger transportation and
accommodation (Chart 4.9).

WT/TPR/S/361/Rev.1 • Iceland
- 102 -
Chart 4.9 Total tourism spending in Iceland, 2009-15
ISK million
Source: Iceland statistics.
4.125. The tourism industry tends to be cyclical and income elastic. As such, the recent growth can be attributed in part to the ongoing economic recovery in key source markets (Europe and North America) after the global economic crisis of 2008; as well as Iceland becoming a more affordable destination due to the exchange rate depreciation. As a result, the average spend per person rose from ISK 140,300 in 2010 to ISK 161,600 in 2015. Additionally, better and more
frequent flight connections and improved and more specifically targeted marketing campaigns have also had a positive impact. Another positive impact of the marketing campaigns has been the increased share of visitors in winter months. Although tourism remains very cyclical, and the number of summer visitors is much greater than the number who come in winter, both have increased significantly, as indicated by the number of arrivals to Keflavik airport (although this also reflects the growing number of transit passengers) (Chart 4.10). In 2011, nearly half the tourists came in the summer months, while around 20% came in the winter season; in 2015, the share of
visitors in winter had risen to nearly 30%, while the share of those coming in the summer had fallen to around 40%.

WT/TPR/S/361/Rev.1 • Iceland
- 103 -
Chart 4.10 Passenger numbers through Keflavik airport, 2003-16
0
50,000
100,000
150,000
200,000
250,000
300,000
350,000Total passengers through Keflavik airport per month (non-Icelandic)
Source: Iceland statistics.
4.3.4.1 Regulation
4.126. The main legislation governing the tourism sector is the Tourism Administration Act (Act No. 73/2005). The Act is administered by the Icelandic Tourist Board.
4.127. The objective of the Act is to promote the development of tourism as an economic sector and an important facet of Icelandic economic and societal activity. The guiding principles are economic efficiency, Icelandic culture, environmental protection, professionalism, and the
safeguarding of consumer interests.
4.128. The Icelandic Tourist Board is an independent authority under the Ministry of Industries and Innovation. Under the provisions of the Act, the Icelandic Tourist Board is responsible for: (i) issuance of licences, registration of operations, and monitoring in order to ensure that
requirements for operations are met; (ii) development, quality control, and organizational issues related to tourism; that is, the implementation of a defined tourism strategy, the co-ordination of environmental and educational affairs, the dissemination of information, regional and local
development, and international collaboration; and (iii) marketing and promotion of tourism services.
4.129. Furthermore, Act No. 41/2015 on Regional Incentives, which applies to the whole of Iceland outside the capital area, is also applicable to the tourism sector. Incentives under the Act include the authorization to: fix an income tax rate ceiling of only 15% for 10 years; depreciate real estate, equipment and moveable assets fully; reduce the rate of property tax and the general social security charge by 50%; grant exemption from customs and excise duties for construction
materials, machinery and equipment, and other capital goods; and the State and municipalities are allowed to lease a site for projects at reduced rates. Additionally, under Commission Regulation (EC) No. 651/2014, on General Block Exemptions, state aid is permissible for certain categories; these include: incentives as training aid of up to a maximum of €2 million; incentives as aid to
SMEs, which includes up to 10% of investment cost in medium-sized enterprises or 20% of investment cost in small enterprises, up to a ceiling of €7.5 million; and incentives as aid to
environmental protection investment projects with a ceiling of €15 million. According to the

WT/TPR/S/361/Rev.1 • Iceland
- 104 -
authorities, the Regulation falls under the Agreement on the European Economic Area and is currently being incorporated into Icelandic legislation.
4.3.4.2 Strategy
4.130. Under the Government's growth plan (Iceland 2020), the tourism sector was specifically identified as a main growth sector.55 In this regard, parliament approved the Tourism Strategy 2011-2020, in 2011. Salient aims of the strategy are:
to increase the profitability of the sector, through inter alia off-season product development and marketing;
to engage in systematic development of tourist destinations, effective product development, and promotion and advertising work so as to create the opportunity to
lengthen the tourist season, reduce seasonal fluctuations, and contribute to better distribution of tourists throughout the country56;
to enhance quality, professionalism, safety, and environment-awareness in the tourism sector57; and
to define and maintain Iceland's uniqueness as a tourist destination, in part through effective analysis and research.
55 Prime Minister's Office (2011), Iceland 2020 – governmental policy statement for the economy and
community, p. 18. 56 In this regard, the Tourism Road Map 2015-2020 was launched in 2015, the Tourist Site Protection
Fund was established in 2011, the Route Development Fund was established in 2016 in order to open new flight-hubs into the country, and a special marketing campaign was initiated – "Inspired by Iceland", which is a public-private collaboration with the aim of lengthening the stay of tourists, reducing seasonal fluctuations and increasing profitability.
57 Initiatives in this respect include: annual measurements of tourist carrying capacity in popular tourist places provided by the University of Iceland and Icelandic Tourism Research Centre; "Vakinn", the quality and environmental system for Icelandic Tourism, was established by the Icelandic Tourist Board; the Centre for Qualifications in the Tourist Sector was established in 2016; a webpage Safetravel.is was launched in 2016; and a safety application (app) "112 Iceland" was also launched.

WT/TPR/S/361/Rev.1 • Iceland
- 105 -
5 APPENDIX TABLES
Table A1.1 Merchandise imports by product group, 2010-16
2010 2011 2012 2013 2014 2015 2016
Total imports (US$ million) 3,914.3 4,845.8 4,771.9 5,019.2 5,371.9 5,285.8 5,703.2
(% of total)
Total primary products 41.3 41.4 39.4 43.3 40.6 37.0 31.5
Agriculture 12.2 11.6 11.3 11.6 11.6 12.6 11.4
Food 11.0 10.5 10.3 10.5 10.7 11.3 10.4
0361 - Crustaceans, frozen 1.5 1.2 0.9 0.7 1.1 1.8 0.8
0989 - Food preparations, n.e.s.
0.8 0.7 0.7 0.8 0.8 0.7 0.7
0819 - Food wastes and prepared animal feeds, n.e.s.
0.3 0.3 0.3 0.4 0.5 0.6 0.7
Agricultural raw material 1.3 1.1 1.0 1.1 1.0 1.2 1.0
Mining 29.0 29.8 28.1 31.6 28.9 24.4 20.1
Ores and other minerals 14.0 12.8 11.4 10.7 9.9 10.4 8.0
2852 - Alumina (aluminium oxide), other than artificial corundum
13.2 11.9 10.6 10.0 9.2 9.8 7.5
Non-ferrous metals 1.9 2.6 1.6 1.8 1.9 1.5 1.5
6842 - Aluminium and aluminium alloys, worked
1.1 1.8 1.3 1.5 1.4 1.1 1.0
Fuels 13.1 14.4 15.0 19.0 17.2 12.5 10.6
334 Petroleum oils, other than crude
11.8 13.4 13.9 17.9 16.4 11.7 10.0
Manufactures 58.6 58.4 60.4 56.6 59.3 62.8 68.4
Iron and steel 1.4 1.3 1.3 1.1 1.1 1.1 1.3
Chemicals 10.1 9.3 8.9 9.0 9.1 9.0 9.3
5429 - Medicaments, n.e.s. 2.7 2.3 2.3 2.3 2.3 2.0 2.6
5986 - Organic chemical products, n.e.s.
0.6 0.5 0.4 0.5 0.7 0.9 1.1
Other semi-manufactures 7.3 6.9 6.9 6.8 6.7 6.8 7.4
6911 - Structures (excluding prefabricated buildings of group 811) and parts of structures (e.g. bridges and bridge sections, lock-gates, towers, lattice masts, roofs, roofing frameworks, doors and windows and their frames and thresholds for doors, shutters)
0.3 0.3 0.3 0.3 0.3 0.5 0.7
Machinery and transport equipment
27.2 29.6 32.4 28.7 31.1 35.0 38.5
Power generating machines 1.3 0.6 0.6 0.8 0.6 0.7 0.8
Other non-electrical machinery
4.9 4.7 5.3 5.2 5.2 5.9 6.9
Agricultural machinery and tractors
0.2 0.3 0.4 0.5 0.5 0.6 0.6
Office machines & telecommunication equipment
4.3 4.4 4.2 4.9 5.1 5.3 5.5
7643 - Transmission apparatus for radio-telephony, radio-telegraphy, radio-broadcasting or television, whether or not incorporating reception apparatus or sound-recording or reproducing apparatus
0.5 0.6 0.7 0.8 1.0 1.1 1.0
7522 - Digital automatic data-processing machines, containing in the same housing at least a central processing unit and an
0.9 0.9 0.9 1.0 1.0 0.8 0.9

WT/TPR/S/361/Rev.1 • Iceland
- 106 -
2010 2011 2012 2013 2014 2015 2016
input and output unit, whether or not combined
Other electrical machines 10.9 11.7 10.7 10.6 9.7 8.9 8.4
7788 - Electrical machinery and equipment, n.e.s.
8.0 8.4 7.7 7.4 7.1 6.0 5.3
Automotive products 2.8 3.6 5.1 4.6 5.9 7.8 10.5
7812 - Motor vehicles for the transport of persons, n.e.s.
1.7 2.5 3.7 3.1 4.0 5.5 7.1
7821 - Motor vehicles for the transport of goods
0.2 0.2 0.3 0.4 0.7 0.9 1.3
7831 - Motor vehicles for the transport of ten or more persons, including the driver
0.2 0.2 0.3 0.3 0.3 0.4 0.8
7843 - Other parts and accessories of the motor vehicles of groups 722, 781, 782 and 783
0.4 0.4 0.5 0.4 0.5 0.6 0.6
Other transport equipment 3.0 4.6 6.6 2.7 4.7 6.3 6.4
7924 - Aeroplanes and other aircraft, mechanically-propelled (other than helicopters), of an unladen weight exceeding 15,000 kg
0.8 1.4 3.0 0.7 0.8 2.9 3.5
7929 - Parts, n.e.s. (not including tyres, engines and electrical parts), of the goods of group 792
1.0 0.6 1.0 0.6 0.4 0.5 0.9
7932 - Ships, boats and other vessels (other than pleasure craft, tugs, pusher craft, special-purpose vessels and vessels for breaking up)
0.6 1.8 1.7 0.6 2.4 2.0 0.8
Textiles 1.1 1.0 1.0 1.0 1.0 1.0 1.0
Clothing 2.9 2.6 2.5 2.5 2.5 2.3 2.6
Other consumer goods 8.5 7.7 7.4 7.5 7.7 7.6 8.3
8931 - Articles for the conveyance or packing of goods, of plastics; stoppers, lids, caps and other closures, of plastics
0.7 0.7 0.7 0.7 0.6 0.5 0.6
Other 0.2 0.2 0.3 0.2 0.2 0.2 0.1
Source: UNSD, Comtrade database (SITC Rev.3).

WT/TPR/S/361/Rev.1 • Iceland
- 107 -
Table A1.2 Merchandise exports by destination, 2010-16
2010 2011 2012 2013 2014 2015 2016
Total exports (US$ million) 4,603.1 5,348.8 5,063.4 4,997.7 5,051.3 4,722.0 4,449.7
(% of total)
Americas 5.7 5.0 6.2 6.6 8.2 8.7 9.9
United States 4.6 3.7 4.5 4.7 4.9 5.7 7.8
Other America 1.1 1.3 1.6 1.9 3.2 3.0 2.1
Canada 0.4 0.4 0.6 0.8 0.8 1.2 1.0
Greenland 0.3 0.3 0.4 0.4 1.8 0.7 0.5
Europe 84.8 84.6 81.4 81.5 79.0 80.4 80.4
EU-28 77.6 78.4 73.3 74.4 71.6 73.5 73.2
Netherlands 34.0 32.4 30.0 30.0 29.2 26.1 25.5
United Kingdom 10.1 9.0 9.8 9.5 11.2 11.6 11.3
Spain 4.7 3.9 3.5 3.9 7.5 11.5 10.4
Germany 14.0 15.0 12.9 12.1 6.0 7.4 6.9
France 3.1 3.9 4.4 4.6 5.0 5.7 6.7
Denmark 2.7 2.3 2.6 2.9 2.0 2.4 2.4
Belgium 1.7 1.5 1.6 1.7 2.2 2.3 2.3
Portugal 1.2 1.7 1.5 1.2 1.5 1.5 1.9
Poland 1.1 1.2 1.4 1.3 0.7 0.5 1.2
Italy 1.6 2.5 2.1 2.2 1.7 1.3 1.1
Hungary 0.0 0.0 0.0 0.9 1.5 1.0 1.0
Lithuania 1.5 1.9 1.7 1.7 1.1 0.4 0.6
Sweden 0.5 0.6 0.5 0.4 0.4 0.5 0.6
EFTA 6.1 5.1 6.8 5.8 6.1 5.8 5.6
Norway 4.2 4.4 5.1 4.7 4.5 4.7 4.3
Switzerland 1.8 0.7 1.7 1.1 1.6 1.1 1.3
Other Europe 1.2 1.1 1.3 1.4 1.3 1.1 1.6
Faroe Islands 0.6 0.6 1.1 1.0 0.9 0.7 1.1
Commonwealth of Independent States (CIS)
2.5 3.5 4.5 4.7 5.4 2.6 1.5
Africa 2.0 2.1 2.8 2.1 3.0 2.7 1.5
Nigeria 1.8 2.0 2.6 2.0 2.5 2.2 1.1
Middle East 0.2 0.1 0.4 0.5 0.2 0.1 0.1
Asia 4.7 4.7 4.8 4.5 4.3 5.4 6.6
China 0.6 0.9 1.2 1.1 0.8 1.5 2.1
Japan 2.5 2.5 2.0 1.9 1.8 2.0 2.2
Other Asia 1.6 1.3 1.5 1.5 1.6 1.9 2.3
Chinese Taipei 0.4 0.3 0.3 0.2 0.2 0.3 0.5
Source: UNSD, Comtrade database.

WT/TPR/S/361/Rev.1 • Iceland
- 108 -
Table A1.3 Merchandise imports by origin, 2010-16
2010 2011 2012 2013 2014 2015 2016
Total imports (US$ million) 3,914.3 4,845.8 4,771.9 5,019.2 5,371.9 5,285.4 5,703.2
(% of total)
Americas 22.8 22.1 21.4 20.7 19.4 20.5 16.5
United States 7.9 10.9 10.2 9.6 10.1 7.9 10.0
Other America 14.8 11.2 11.2 11.0 9.3 12.6 6.5
Bermuda 0.0 0.0 0.0 0.0 0.0 0.0 1.8
Brazil 8.7 5.8 6.7 7.3 5.5 6.1 1.7
Canada 1.7 1.2 1.1 1.1 1.2 1.9 1.2
Europe 63.4 64.7 63.6 65.1 65.9 64.7 64.0
EU-28 52.0 46.0 44.8 47.3 48.2 50.6 52.5
Germany 7.5 7.9 9.2 8.0 7.6 8.6 10.0
Netherlands 8.5 7.4 6.0 5.0 6.6 5.9 7.5
Denmark 7.1 6.2 5.7 8.3 7.6 7.1 6.1
United Kingdom 5.1 5.2 4.6 6.0 6.0 5.0 6.0
Sweden 5.2 3.9 3.8 4.0 3.6 3.8 3.9
Italy 3.0 3.2 3.0 3.3 3.1 2.9 3.1
France 1.8 1.8 2.1 2.5 2.5 4.5 2.8
Poland 1.2 2.0 1.2 1.6 1.6 1.9 2.1
Spain 1.1 1.0 1.2 1.3 1.5 1.3 1.5
Belgium 1.4 1.3 1.3 1.2 1.4 1.3 1.3
Ireland 0.8 0.5 1.5 0.7 1.0 2.2 1.3
Czech Republic 0.6 0.6 0.8 1.0 1.0 1.1 1.2
EFTA 10.4 17.9 17.7 16.8 16.0 12.0 10.1
Norway 9.1 15.9 16.6 15.1 14.6 10.1 9.0
Switzerland 1.4 2.0 1.1 1.7 1.4 1.8 1.1
Other Europe 1.0 0.8 1.0 1.0 1.6 2.2 1.4
Commonwealth of Independent States (CIS)
0.6 0.9 0.8 0.7 0.5 0.4 0.3
Africa 0.5 0.6 0.9 0.5 0.5 0.8 0.9
Middle East 0.2 0.4 0.4 0.2 0.9 0.2 1.1
Asia 12.5 11.3 12.9 12.8 12.8 13.5 17.3
China 6.0 6.3 7.2 7.8 7.4 7.8 7.4
Japan 2.3 1.6 1.5 1.4 1.4 1.7 2.0
Other Asia 4.1 3.4 4.3 3.6 4.0 3.9 8.0
Australia 0.6 0.1 0.1 0.1 0.1 0.3 2.1
Korea, Republic of 0.5 0.6 0.7 0.9 1.1 1.1 1.3
India 1.0 0.9 0.7 0.7 0.6 0.6 1.0
Source: UNSD, Comtrade database.

WT/TPR/S/361/Rev.1 • Iceland
- 109 -
Table A1.4 Inflows of foreign direct investment, 2010-16
2010 2011 2012 2013 2014 2015 2016
Total inflows (ISK million) 29,966.1 128,418.0 128,225.9 48,482.7 52,208.2 93,468.4 ..
By sector:
Agriculture, forestry and fishing 673.0 -2.0 72.8 3,332.9 4,338.4 169.2 ..
Manufacturing, mining and
quarrying and other industry
34,250.8 62,116.0 28,750.2 6,265.7 -11,159.1 -5,043.3 ..
Construction -785.8 4,843.0 551.7 -517.8 81.3 212.6 ..
Wholesale and retail trade,
transportation and storage,
accommodation and food service
activities
1,701.9 1,546.0 3,213.6 50,810.1 75,358.1 -
292,715.1
..
Information and communication 14.9 2,686.0 674.0 3,200.7 1,007.9 5,118.5 ..
Financial and insurance activities -6,357.3 57,475.0 75,034.3 -33,752.1 -27,681.7 379,922.6 ..
Real estate activities 0.0 0.0 11,508.8 10,502.2 3,795.3 3,133.3 ..
Professional, scientific, technical,
administration and support service activities
468.8 -247.0 4,137.2 3,068.3 5,807.0 2,137.3 ..
Other 0.0 0.0 4,283.4 5,572.8 660.9 533.3 ..
By origin:
Netherlands -23,833.5 -4,055.0 -6,609.2 8,952.7 19,265.8 67,972.1 ..
United Kingdom 89.7 2,593.0 10,731.2 426.3 10,639.2 33,678.2 ..
Malta 0.0 0.0 1,589.2 -28,900.4 6,440.9 9,757.1 ..
Germany 19.7 77.0 2,587.5 -1,537.4 -883.5 9,404.4 ..
Norway 1,748.3 -1,176.0 -1,388.5 3,424.6 818.3 4,845.2 ..
Ireland 136.6 6.0 2,318.2 2,474.7 7,177.6 4,316.4 ..
United States -1,231.0 8,292.0 -136.2 -581.7 10,541.6 3,191.4 ..
Denmark 325.7 2,639.0 3,652.6 28,406.3 4,756.0 1,363.8 ..
Italy 641.8 195.0 -293.1 -600.1 1,432.1 1,189.8 ..
Australia 0.0 0.0 0.0 -7,231.6 -3,212.7 1,020.1 ..
Switzerland 579.1 29,157.0 20,658.9 274.4 -38,951.0 769.4 ..
Cyprus 0.0 0.0 2,927.1 1,643.2 -362.8 -47.9 ..
Sweden 18,113.8 -6,963.0 -2,985.4 2,964.1 3,969.9 -240.5 ..
Luxembourg 32,629.1 92,875.0 70,336.3 45,299.9 7,058.5 -63,164.2 ..
Not allocated 746.8 4,778.0 24,837.2 -6,532.4 23,518.1 19,413.0 ..
.. Not available
Source: Statistics Iceland online information.

WT/TPR/S/361/Rev.1 • Iceland
- 110 -
Table A1.5 FDI inward stock, 2010-16
2010 2011 2012 2013 2014 2015 2016
Total inward stock (ISK million)
1,355,736.3 1,552,991.0 1,337,204.8 851,255.5 1,001,094.7 1,017,413.0 ..
By sector:
Agriculture, forestry and fishing
822.0 856.0 1,476.6 4,723.1 8,928.6 8,736.6 ..
Manufacturing, mining and quarrying and other industry
777,836.6 875,293.0 986,533.9 165,541.2 219,302.0 207,269.8 ..
Construction 6,653.4 8,556.0 7,304.5 1,013.5 158.6 534.2 ..
Wholesale and retail trade, transportation and storage, accommodation and food service activities
37,207.0 38,191.0 28,039.2 361,325.3 376,718.6 23,552.3 ..
Information and communication
1,160.2 5,206.0 1,409.1 7,920.2 14,063.3 20,542.5 ..
Financial and insurance activities
534,102.1 625,168.0 271,050.0 258,282.2 304,010.9 672,868.4 ..
Real estate activities 0.0 0.0 22,442.2 25,650.9 33,565.3 37,038.5 ..
Professional, scientific, technical, administration and support service activities
-2,045.0 -279.0 9,572.1 10,142.0 23,231.4 26,354.7 ..
Public administration, defence, education, human health and social work activities
0.0 0.0 0.0 0.0 0.0 0.0 ..
Other services 0.0 0.0 0.0 0.0 0.0 0.0 ..
Unallocated 0.0 0.0 9,377.0 16,657.1 21,116.2 20,516.0 ..
By origin:
Luxembourg 1,097,359.7 1,229,631.0 918,666.9 868,604.2 935,719.4 809,164.9 ..
Netherlands 129,740.0 136,440.0 126,199.8 98,112.9 130,727.4 193,568.8 ..
Switzerland 21,055.0 48,695.0 72,117.0 69,383.9 52,205.3 75,477.5 ..
United Kingdom 931.6 6,171.0 20,456.8 6,291.0 19,292.3 49,182.0 ..
Denmark 24,632.0 29,045.0 54,134.6 40,035.6 53,319.5 47,709.9 ..
Norway 26,356.4 25,643.0 27,908.3 27,822.4 27,905.6 30,726.0 ..
Sweden 17,373.1 12,890.0 17,466.2 15,776.0 22,006.4 24,053.4 ..
Ireland 294.5 7,544.0 8,007.7 9,594.3 20,420.2 18,152.6 ..
Italy 7,956.8 1,956.0 8,879.4 8,377.1 8,990.4 10,157.9 ..
Cyprus 0.0 0.0 403.6 1,914.7 7,547.0 7,331.3 ..
Germany 670.8 570.0 2,597.2 10,973.6 -3,790.9 6,140.4 ..
Malta 0.0 0.0 1,589.2 -23,397.5 -16,481.5 -3,956.0 ..
Australia 0.0 0.0 0.0 -7,694.8 -11,009.6 -10,234.9 ..
United States 24,696.3 44,951.0 49,743.7 -290,828.8 -330,202.9 -336,306.5 ..
Not allocated 4,670.6 9,457.8 29,034.5 16,291.0 84,446.2 96,245.7 ..
.. Not available
Source: Statistics Iceland online information.

WT/TPR/S/361/Rev.1 • Iceland
- 111 -
Table A1.6 Outflows of foreign direct investment, 2010-16
2010 2011 2012 2013 2014 2015 2016
Total outflows (ISK million)
-289,451.3 2,047.0 -400,970.8 56,234.8 -30,011.3
-4,123.7 ..
By sector:
Agriculture, forestry and fishing
1,701.5 -10,281.0 1,879.2 -3,867.0 797.3 2,764.7 ..
Manufacturing, mining and quarrying and other industry
-37,624.0 14,366.0 317,479.9 9,880.2 3,831.2 17,734.7 ..
Construction -244.4 -483.0 12.4 79.9 -462.0 7,183.1 ..
Wholesale and retail trade, transportation and storage, accommodation and food service activities
-7,636.5 -24,711.0 -521,235.5 1,104.3 2,337.1 7,653.3 ..
Information and communication
-2,850.0 2,907.0 -419.8 -1,050.5 326.1 50.1 ..
Financial and insurance activities
-229,258.5 8,695.0 -196,619.7 41,857.7 -31,025.4
-20,437.7 ..
Real estate activities -12,462.2 15,057.0 -340.0 8,389.9 -6,389.2 -6,058.5 ..
Professional, scientific, technical, administration and support service activities
4,506.0 -3,093.0 -441.0 -97.2 57.8 -13,186.3 ..
Public administration, defence, education, human health and social work activities
0.0 0.0 0.0 -74.2 516.0 152.9 ..
Other services 0.0 0.0 0.0 0.0 0.0 0.0 ..
Other -5,583.4 -411.0 -1,286.8 11.8 0.0 19.8 ..
By destination:
Cyprus 798.8 561.0 473.0 -563.5 -302.9 36,175.0 ..
United Kingdom -9,977.0 10,775.0 -270,295.1 -14,231.8 6,606.9 12,468.8 ..
Spain 1,099.9 1,348.0 92.9 559.7 1,148.8 3,612.2 ..
Germany -10,526.6 1,875.0 -8,235.9 -307.0 -1,904.6 1,722.4 ..
Denmark -98,461.4 2,131.0 3,091.9 -2,967.8 1,364.4 1,547.2 ..
France -1,020.1 827.0 914.1 64.1 0.4 657.0 ..
Canada 549.7 1,437.0 229.7 -1,534.6 63.4 158.5 ..
Faroe Islands 2,152.5 -5,378.0 698.8 1,773.3 1,460.6 0.4 ..
British Virgin Islands 0.8 1.0 -1,067.6 0.0 0.0 0.0 ..
Bulgaria -741.1 -2,728.0 4,127.5 0.0 0.0 0.0 ..
United States -42,278.2 1,399.0 28,300.4 81.0 -2,959.8 -381.5 ..
Luxembourg -91,052.0 13,305.0 -176,755.6 1,444.5 -46,632.2
-1,258.0 ..
Latvia -1,525.1 -4,417.0 -1,268.1 -5,188.7 -4,940.1 -2,995.0 ..
Finland 1.9 -5,270.0 730.8 1,024.7 -247.3 -7,925.8 ..
Sweden -4,075.4 3,220.0 -531.5 5,047.3 -4,970.7 -11,755.2 ..
Netherlands -17,764.6 -20,209.0 2,045.3 65,368.0 12,792.9 -25,332.9 ..
Norway -6,194.8 7,484.0 2,916.0 8,945.3 845.9 -41,484.5 ..
Not allocated -10,438.8 -4,314.0 13,562.5 -3,279.5 7,663.0 30,667.6 ..
.. Not available
Source Statistics Iceland online information.

WT/TPR/S/361/Rev.1 • Iceland
- 112 -
Table A1.7 FDI outward stock, 2010-16
2010 2011 2012 2013 2014 2015 2016
Total outward stock (US$ million)
1,319,186.5 1,413,710.0 1,587,172.1 1,098,088.6 1,067,844.9 989,627.3 ..
By sector:
Agriculture, forestry and fishing
15,998.7 5,677.0 22,785.0 19,179.1 18,415.9 16,438.1 ..
Manufacturing, mining and quarrying and other industry
309,318.3 253,809.0 537,095.0 160,626.4 170,352.1 211,137.4 ..
Construction 5,746.9 3,510.0 40,152.2 36,389.6 38,757.3 20,636.7 ..
Wholesale and retail trade, transportation and storage, accommodation and food service activities
331,600.3 337,040.0 140,985.8 94,796.7 111,120.9 112,633.5 ..
Information and communication
8,162.1 14,535.0 12,576.2 9,408.4 3,753.4 3,607.6 ..
Financial and insurance activities
618,928.7 759,221.0 765,586.6 684,093.0 571,534.9 486,238.6 ..
Real estate activities 17,671.0 28,289.0 13,789.6 33,701.7 45,825.5 27,911.6 ..
Professional, scientific, technical, administration and support service activities
6,487.4 9,304.0 37,433.4 43,091.9 43,784.9 49,183.2 ..
Public administration, defence, education, human health and social work activities
0.0 0.0 0.0 9,052.0 13,477.6 14,682.6 ..
Other, unallocated 5,273.1 2,325.0 16,768.3 7,749.7 50,822.4 47,158.1 ..
By destination:
Netherlands 212,824.4 206,740.0 421,747.9 427,917.5 345,160.4 325,724.7 ..
United Kingdom 370,468.6 459,934.0 270,589.7 215,112.2 225,611.0 212,016.1 ..
Luxembourg 245,703.9 303,141.0 161,673.2 147,863.5 111,955.8 89,424.1 ..
Cyprus 16,678.8 15,184.0 17,979.6 8,444.1 20,419.1 72,069.1 ..
Sweden 47,585.4 60,977.0 81,434.7 77,795.1 79,067.9 48,171.2 ..
British Virgin Islands 13,553.1 35.0 31,727.0 28,505.4 31,571.0 32,219.5 ..
Norway 19,668.6 32,629.0 41,226.7 44,410.7 52,373.1 15,622.4 ..
Finland 31,136.5 29,013.0 30,868.7 26,432.4 27,543.6 15,588.4 ..
Germany 25,581.9 18,293.0 5,904.1 11,749.3 11,318.1 13,867.4 ..
Canada 18,145.2 20,077.0 16,821.8 13,954.3 13,743.3 13,280.1 ..
Spain 11,527.3 6,952.0 9,619.5 8,493.7 9,154.0 11,844.5 ..
Faroe Islands 9,827.3 893.0 7,543.2 8,224.4 18,019.9 10,348.0 ..
Denmark 61,335.5 60,636.0 51,473.4 -4,062.1 5,310.2 9,131.0 ..
Latvia 13,917.7 14,816.0 18,866.3 19,267.2 14,277.5 6,989.1 ..
United States 144,248.9 159,106.0 375,319.3 6,777.4 5,010.3 2,601.1 ..
France 3,451.0 3,573.0 4,560.0 1,244.4 330.7 231.3 ..
Bulgaria 284.4 -2,925.0 1,128.5 0.0 0.0 0.0 ..
Not allocated 73,248.4 24,640.0 38,688.4 55,959.2 96,979.2 110,499.3 ..
.. Not available
Source: Statistics Iceland online information.

WT/TPR/S/361/Rev.1 • Iceland
- 113 -
Table A2.1 Selected Notifications to the WTO, 1 July 2012-30 June 2017
WTO Agreement
Description Document symbol Date
Agreement on Agriculture
Article 10 and 18.2; ES:1, ES:2
Export subsidy commitments G/AG/N/ISL/39
G/AG/N/ISL/35
18/05/2017
16/09/2014
Article 18.2; DS:1
Domestic support G/AG/N/ISL/40
G/AG/N/ISL/33
22/05/2017
10/09/2014
Article 18.2; MA:2
Tariff quotas G/AG/N/ISL/37
G/AG/N/ISL/36
G/AG/N/ISL/32
G/AG/N/ISL/31
13/12/2016
26/09/2014
21/07/2014
19/11/2012
Articles 5.7 and
18.2; MA:5
Special safeguard G/AG/N/ISL/38
G/AG/N/ISL/34
18/05/2017
16/09/2014
Agreement on the Implementation of Article VI of the GATT 1994 (Anti-Dumping)
Article 16.4 – semi annual
Anti-dumping actions (taken within the preceding six months)
G/ADP/N/216/Add.1/Rev.1 25/07/2012
GATT 1994 and/or GATS
Article XXIV:7(a) of GATT 1994
Notification of regional trade agreements or changes: Bosnia and Herzegovina and EFTA States; Montenegro and the EFTA States; the Arab Republic of Egypt and the EFTA States; EFTA States and Croatia; EFTA States and Jordan; EFTA States and Morocco
WT/REG360/N/1
WT/REG323/N/1
WT/REG232/N/1/Add.2
WT/REG232/N/1/Add.3
WT/REG232/N/1/Add.4
WT/REG132/N/1/Add.5
WT/REG133/N/1/Add.1
WT/REG133/N/1/Add.2
WT/REG133/N/1/Add.3
WT/REG91/N/1/Add.2/Rev.1
WT/REG91/N/1/Add.3/Rev.1
08/01/2015
25/10/2012
27/06/2013
27/06/2013
25/03/2015
26/11/2013
11/09/2013
11/09/2013
11/09/2013
25/03/2013
25/03/2013
Article XXIV:7(a) of GATT 1994 and Article V:7(a) of GATS
Notification of regional trade agreements: Chile and EFTA States; the Central American States and the EFTA States; Iceland and China; Hong Kong, China and the EFTA States; Colombia and the EFTA States; Mexico and EFTA States
WT/REG179/N/1/Add.4
WT/REG357/N/1, S/C/N/774
WT/REG355/N/1, S/C/N/771
WT/REG322/N/1, S/C/N/654
WT/REG299/N/2, S/C/N/600/Add.1
WT/REG126/N/1/Add.2
WT/REG126/N/1/Add.3
WT/REG126/N/1/Add.4
WT/REG126/N/1/Add.5
WT/REG126/N/1/Add.6
08/05/2017
21/11/2014
13/10/2014
01/10/2012
09/01/2015
18/09/2013
18/09/2013
18/09/2013
18/09/2013
18/09/2013
Article XXIV:7(c) of GATT 1994
Notification of regional trade agreements: EFTA States and the Republic of Lebanon
WT/REG224/N/1/Add.1 25/04/2013
GATT 1994 Article XVII and the Understanding on the Interpretation of Article XVII
GATT 1994 Art. XVII:4(a) and Para. 1 of the Understanding on the Interpretation of Article XVII
New and full notification of state-trading enterprises
G/STR/N/15/ISL 07/06/2017
General Agreement on Trade in Services
Services LDC Waiver
Preferential treatment to services and
service suppliers of least developed countries
S/C/N/835 13/10/2015
Agreement on Rules of Origin
Paragraph 4 of Annex II
Preferential rules of origin G/RO/N/82 31/08/2012
Agreement on Sanitary and Phytosanitary Measures
Article 7
Annex B
Sanitary and phytosanitary
regulations
G/SPS/N/ISL/9
G/SPS/N/ISL/8
15/11/2012
15/11/2012

WT/TPR/S/361/Rev.1 • Iceland
- 114 -
WTO Agreement
Description Document symbol Date
Agreement on Government Procurement
Article XVI:4 Statistics reported under Article XVI:4 of the revised GPA
GPA/142/Add.2
GPA/137/Add.6
25/04/2017
25/04/2017
Article XXIV:5(b) and XXII:5
Notification of national implementing legislation
GPA/144 28/04/2017
Appendix I Thresholds in national currency GPA/W/336/Add.11
GPA/W/325/Add.9
GPA/W/314/Add.9
21/11/2016
22/07/2014
10/09/2012
Source: WTO Secretariat.

WT/TPR/S/361/Rev.1 • Iceland
- 115 -
Table A2.2 Iceland's free trade agreements, 2017
Free trade agreement Date of entry into force
Coverage
EFTA – Bosnia and Herzegovina 1-Jan-15 Goods
EFTA – Central America (Costa Rica and Panama)
19-Aug-14 Goods & Services
EFTA – Gulf Cooperation Council 1-Jul-14 Goods & Services
Iceland – China 1-Jul-14 Goods & Services
EFTA – Hong Kong, China 1-Oct-12 Goods & Services
EFTA – Montenegro 1-Sep-12 Goods
EFTA – Ukraine 1-Jun-12 Goods & Services
EFTA – Colombia 1-Jul-11 Goods & Services
EFTA – Peru 1-Jul-11 Goods
EFTA – Albania 1-Nov-10 Goods
EFTA – Serbia 1-Oct-10 Goods
EFTA – Canada 1-Jul-09 Goods
EFTA – SACU 1-May-08 Goods
EFTA – Egypt 1-Aug-07 Goods
EFTA – Lebanon 1-Jan-07 Goods
Iceland – Faroe Islands 1-Nov-06 Goods & Services
EFTA – Republic of Korea 1-Sep-06 Goods & Services
EFTA – Tunisia 1-Jun-05 Goods
EFTA – Chile 1-Dec-04 Goods & Services
EFTA – Singapore 1-Jan-03 Goods & Services
EFTA – Jordan 1-Sep-02 Goods
EFTA – The former Yugoslav Republic of Macedonia
1-May-02 Goods
EFTA – Mexico 1-Jul-01 Goods & Services
EFTA – Morocco 1-Dec-99 Goods
EFTA – Palestinian Authority 1-Jul-99 Goods
European Economic Area (EEA) 1-Jan-94 Goods & Services
EFTA – Israel 1-Jan-93 Goods
EFTA – Turkey 1-Apr-92 Goods
Iceland – European Union (EU) 1-Apr-73 Goods
EFTA – Accession of Iceland 1-Mar-70 Goods
Iceland – European Free Trade Association (EFTA)
3-May-60 1-Jun-02
Goods Services
Iceland – Greenland 1-Feb-85 Goods
Source: Compiled by the WTO Secretariat.
__________