WT1 and its transcriptional cofactor BASP1 redirect the differentiation pathway of an established...
13
Biochem. J. (2011) 435, 113–125 (Printed in Great Britain) doi:10.1042/BJ20101734 113 WT1 and its transcriptional cofactor BASP1 redirect the differentiation pathway of an established blood cell line Sarah J. GOODFELLOW*, Michelle R. REBELLO†, Eneda TOSKA†, Leo A. H. ZEEF*, Sean G. RUDD* 1 , Kathryn F. MEDLER† and Stefan G. E. ROBERTS*† 2 *Faculty of Life Sciences, The Michael Smith Building, University of Manchester, Oxford Road, Manchester M13 9PT, U.K., and †Department of Biological Sciences, University at Buffalo, Buffalo, NY 14260, U.S.A. The Wilms’ tumour suppressor WT1 (Wilms’ tumour 1) is a transcriptional regulator that plays a central role in organogenesis, and is mutated or aberrantly expressed in several childhood and adult malignancies. We previously identified BASP1 (brain acid-soluble protein 1) as a WT1 cofactor that suppresses the transcriptional activation function of WT1. In the present study we have analysed the dynamic between WT1 and BASP1 in the regulation of gene expression in myelogenous leukaemia K562 cells. Our findings reveal that BASP1 is a significant regulator of WT1 that is recruited to WT1-binding sites and suppresses WT1-mediated transcriptional activation at several WT1 target genes. We find that WT1 and BASP1 can divert the differentiation programme of K562 cells to a non-blood cell type following induction by the phorbol ester PMA. WT1 and BASP1 co- operate to induce the differentiation of K562 cells to a neuronal- like morphology that exhibits extensive arborization, and the expression of several genes involved in neurite outgrowth and synapse formation. Functional analysis revealed the relevance of the transcriptional reprogramming and morphological changes, in that the cells elicited a response to the neurotransmitter ATP. Taken together, the results of the present study reveal that WT1 and BASP1 can divert the lineage potential of an established blood cell line towards a cell with neuronal characteristics. Key words: brain acid-soluble protein 1 (BASP1), K562 cell, Wilms’ tumour, Wilms’ tumour 1 (WT1). INTRODUCTION The Wilms’ tumour suppressor protein WT1 (Wilms’ tumour 1) is mutated or aberrantly expressed in several childhood and adult cancers, where it can act as either a tumour suppressor or oncogene [1,2]. WT1 is a transcriptional regulator that plays a central role in the development of several organs and tissues, including the kidneys, gonads and spleen [3]. More recent studies have revealed a critical role for WT1 in the development of specific neuronal tissues including the retinal ganglia and olfactory epithelia [4,5]. Indeed, WT1 is also expressed in the spinal cord and specific regions of the brain during development [6]. WT1 can either activate or repress genes involved in growth, apoptosis and differentiation. The transcriptional regulatory activity of WT1 is subject to extensive control by interaction with other factors that can act as either co-activators or co-repressors [7]. We identified BASP1 (brain acid-soluble protein 1) as a WT1-interacting protein that binds to the suppression domain of WT1 (residues 71–101) and inhibits its transcriptional activation function [8,9]. WT1 and BASP1 are spatially and temporally co- expressed at several sites in the developing embryo, suggesting a significant role for BASP1 in the regulation of WT1 activity in development. The suppression domain of WT1 also forms a key binding site for the serine protease HtrA2, which cleaves WT1 under apoptotic conditions [10]. BASP1 was originally isolated from neuronal cells, where it is predominantly cytoplasmic with partial membrane localization mediated by the N-terminal myristoylation of BASP1 [11]. The function of BASP1 in neuronal cells is still unclear, but it has been proposed to play a role in nerve sprouting. Several cell types also contain a nuclear pool of BASP1 [9,12,13]. Indeed BASP1 contains a bipartite NLS (nuclear localization sequence), sites of SUMO (small ubiquitin-related modifier)-modification, and a portion of BASP1 localizes to PML (promyelocytic leukaemia) bodies within the nucleus [13]. Since our previous report of a transcriptional role for BASP1 [9], others have also described a function for BASP1 in the nu- cleus. It has been reported that BASP1 localizes from the nucleus to the cytoplasm in cells that are undergoing apoptosis [12]. In addition, a recent study found that BASP1 can inhibit cellular transformation by the v-Myc oncogene, and can block the regulation of Myc target genes [14]. This same work showed that BASP1 is consistently down-regulated in Myc-transformed cells. BASP1 does not interact with Myc, however, suggesting an indirect mechanism. BASP1 is also down-regulated in a significant proportion of hepatocellular carcinomas, and this is attributed to silencing of the BASP1 gene by methylation [15]. In addition, BASP1 expression has also been reported to be frequently down-regulated in both ALL (acute lymphocytic leukaemia) and CLL (chronic lymphocytic leukaemia) [16,17]. Abbreviations used: ALL, acute lymphocytic leukaemia; BASP1, brain acid-soluble protein 1; ChIP, chromatin immunoprecipitation; CLL, chronic lymphocytic leukaemia; CPA, cyclopiazonic acid; DAB2, Disabled homologue 2; ENC1, ectodermal neural cortex 1; FBS, foetal bovine serum; fura 2/AM, fura 2 acetoxymethyl ester; GFP, green fluorescent protein; HA, haemagglutinin; ITGA2 , integrin α2; ITGA2B, integrin α2b; ITGB3 , integrin β3; MAOA , monoamine oxidase A; NLS, nuclear localization sequence; pol II, RNA polymerase II; qPCR, quantitative PCR; SERCA, sarcoplasmic/endoplasmic reticulum Ca 2+ -ATPase; siRNA, small interfering RNA; VDR, vitamin D receptor; WT1, Wilms’ tumour 1. 1 Present address: Genome Damage and Stability Centre, University of Sussex, Brighton BN1 9RQ, U.K. 2 To whom correspondence should be addressed (email [email protected]) The array data are available in a MIAME-compliant standard in the Array Express database (Experiment E-MEXP-2573, http://www.ebi.ac.uk/ microarray-as/ae/). c The Authors Journal compilation c 2011 Biochemical Society www.biochemj.org Biochemical Journal © 2010 The Author(s) The author(s) has paid for this article to be freely available under the terms of the Creative Commons Attribution Non-Commercial Licence (http://creativecommons.org/licenses/by-nc/2.5/) which permits unrestricted non-commercial use, distribution and reproduction in any medium, provided the original work is properly cited.
-
Upload
independent -
Category
Documents
-
view
0 -
download
0
Transcript of WT1 and its transcriptional cofactor BASP1 redirect the differentiation pathway of an established...
Biochem. J. (2011) 435, 113–125 (Printed in Great Britain) doi:10.1042/BJ20101734 113
WT1 and its transcriptional cofactor BASP1 redirect the differentiationpathway of an established blood cell lineSarah J. GOODFELLOW*, Michelle R. REBELLO†, Eneda TOSKA†, Leo A. H. ZEEF*, Sean G. RUDD*1, Kathryn F. MEDLER† andStefan G. E. ROBERTS*†2
*Faculty of Life Sciences, The Michael Smith Building, University of Manchester, Oxford Road, Manchester M13 9PT, U.K., and †Department of Biological Sciences, University atBuffalo, Buffalo, NY 14260, U.S.A.
The Wilms’ tumour suppressor WT1 (Wilms’ tumour 1) is atranscriptional regulator that plays a central role in organogenesis,and is mutated or aberrantly expressed in several childhood andadult malignancies. We previously identified BASP1 (brainacid-soluble protein 1) as a WT1 cofactor that suppresses thetranscriptional activation function of WT1. In the present studywe have analysed the dynamic between WT1 and BASP1 in theregulation of gene expression in myelogenous leukaemia K562cells. Our findings reveal that BASP1 is a significant regulatorof WT1 that is recruited to WT1-binding sites and suppressesWT1-mediated transcriptional activation at several WT1 targetgenes. We find that WT1 and BASP1 can divert the differentiationprogramme of K562 cells to a non-blood cell type following
induction by the phorbol ester PMA. WT1 and BASP1 co-operate to induce the differentiation of K562 cells to a neuronal-like morphology that exhibits extensive arborization, and theexpression of several genes involved in neurite outgrowth andsynapse formation. Functional analysis revealed the relevance ofthe transcriptional reprogramming and morphological changes,in that the cells elicited a response to the neurotransmitter ATP.Taken together, the results of the present study reveal that WT1and BASP1 can divert the lineage potential of an established bloodcell line towards a cell with neuronal characteristics.
Key words: brain acid-soluble protein 1 (BASP1), K562 cell,Wilms’ tumour, Wilms’ tumour 1 (WT1).
INTRODUCTION
The Wilms’ tumour suppressor protein WT1 (Wilms’ tumour 1)is mutated or aberrantly expressed in several childhood and adultcancers, where it can act as either a tumour suppressor or oncogene[1,2]. WT1 is a transcriptional regulator that plays a central rolein the development of several organs and tissues, including thekidneys, gonads and spleen [3]. More recent studies have revealeda critical role for WT1 in the development of specific neuronaltissues including the retinal ganglia and olfactory epithelia [4,5].Indeed, WT1 is also expressed in the spinal cord and specificregions of the brain during development [6].
WT1 can either activate or repress genes involved in growth,apoptosis and differentiation. The transcriptional regulatoryactivity of WT1 is subject to extensive control by interaction withother factors that can act as either co-activators or co-repressors[7]. We identified BASP1 (brain acid-soluble protein 1) as aWT1-interacting protein that binds to the suppression domain ofWT1 (residues 71–101) and inhibits its transcriptional activationfunction [8,9]. WT1 and BASP1 are spatially and temporally co-expressed at several sites in the developing embryo, suggesting asignificant role for BASP1 in the regulation of WT1 activity indevelopment. The suppression domain of WT1 also forms a keybinding site for the serine protease HtrA2, which cleaves WT1under apoptotic conditions [10].
BASP1 was originally isolated from neuronal cells, where itis predominantly cytoplasmic with partial membrane localizationmediated by the N-terminal myristoylation of BASP1 [11]. Thefunction of BASP1 in neuronal cells is still unclear, but it has beenproposed to play a role in nerve sprouting. Several cell types alsocontain a nuclear pool of BASP1 [9,12,13]. Indeed BASP1contains a bipartite NLS (nuclear localization sequence), sitesof SUMO (small ubiquitin-related modifier)-modification, and aportion of BASP1 localizes to PML (promyelocytic leukaemia)bodies within the nucleus [13].
Since our previous report of a transcriptional role for BASP1[9], others have also described a function for BASP1 in the nu-cleus. It has been reported that BASP1 localizes from thenucleus to the cytoplasm in cells that are undergoing apoptosis[12]. In addition, a recent study found that BASP1 can inhibitcellular transformation by the v-Myc oncogene, and can blockthe regulation of Myc target genes [14]. This same work showedthat BASP1 is consistently down-regulated in Myc-transformedcells. BASP1 does not interact with Myc, however, suggestingan indirect mechanism. BASP1 is also down-regulated in asignificant proportion of hepatocellular carcinomas, and thisis attributed to silencing of the BASP1 gene by methylation[15]. In addition, BASP1 expression has also been reported tobe frequently down-regulated in both ALL (acute lymphocyticleukaemia) and CLL (chronic lymphocytic leukaemia) [16,17].
Abbreviations used: ALL, acute lymphocytic leukaemia; BASP1, brain acid-soluble protein 1; ChIP, chromatin immunoprecipitation; CLL, chroniclymphocytic leukaemia; CPA, cyclopiazonic acid; DAB2, Disabled homologue 2; ENC1, ectodermal neural cortex 1; FBS, foetal bovine serum; fura 2/AM,fura 2 acetoxymethyl ester; GFP, green fluorescent protein; HA, haemagglutinin; ITGA2, integrin α2; ITGA2B, integrin α2b; ITGB3, integrin β3; MAOA,monoamine oxidase A; NLS, nuclear localization sequence; pol II, RNA polymerase II; qPCR, quantitative PCR; SERCA, sarcoplasmic/endoplasmicreticulum Ca2+-ATPase; siRNA, small interfering RNA; VDR, vitamin D receptor; WT1, Wilms’ tumour 1.
1 Present address: Genome Damage and Stability Centre, University of Sussex, Brighton BN1 9RQ, U.K.2 To whom correspondence should be addressed (email [email protected])The array data are available in a MIAME-compliant standard in the Array Express database (Experiment E-MEXP-2573, http://www.ebi.ac.uk/
microarray-as/ae/).
c© The Authors Journal compilation c© 2011 Biochemical Society
www.biochemj.org
Bio
chem
ical
Jo
urn
al
© 2010 The Author(s)
The author(s) has paid for this article to be freely available under the terms of the Creative Commons Attribution Non-Commercial Licence (http://creativecommons.org/licenses/by-nc/2.5/)which permits unrestricted non-commercial use, distribution and reproduction in any medium, provided the original work is properly cited.

114 S. J. Goodfellow and others
Taken together, these recent studies suggest that BASP1 probablyacts as a tumour suppressor.
The role of WT1 in leukaemia has attracted considerableattention over the last few years [2,18,19]. In total, 74% ofAML (acute myeloid leukaemia), 66% of ALL and over 50%of CLL samples show high levels of wild-type WT1 expression.Moreover, leukaemia patients with elevated WT1 have a poorprognosis and significantly reduced 5-year survival rates. WT1plays a role in haemopoeisis, serving to maintain the self-renewal of primitive CD34+ cells in the bone marrow [18].As differentiation proceeds WT1 is down-regulated and is notexpressed in mature blood cells. Thus it has been proposedthat, in leukaemia, WT1 contributes to the maintenance of thededifferentiated state and promotes proliferation [2].
In the present study, we have analysed the role of BASP1as a WT1 cofactor in myelogenous leukaemia K562 cells. Wefind that BASP1 regulates WT1 activity at several previouslyidentified WT1 target genes and that this involves the recruitmentof BASP1 to the promoter. WT1 and BASP1 together divertthe differentiation of K562 cells away from the blood celllineage and direct differentiation towards cells with neuronal-likemorphology, gene expression pattern and functional properties.The results of the present study suggest that the WT1/BASP1dynamic plays a central role in directing cell fate duringdifferentiation.
EXPERIMENTAL
Cell culture and transfection
K562 cells were cultured in RPMI 1640 medium supplementedwith 10% FBS (foetal bovine serum), 100 mg/ml streptomycin,100 units/ml penicillin and 2 mM L-glutamine. Cells weretransfected using LipofectamineTM 2000 (Invitrogen) or byelectroporation using the Amaxa Nucleofector. K562 cells stablytransfected with pcDNA3 were selected with 2 mg/ml G418(Sigma) and pools of cells were maintained in 2 mg/mlG418. PMA and haemin were purchased from Sigma. ControlsiRNAs (small interfering RNAs) used were from Ambion(AM4611 and AM4635) and WT1 siRNAs were from Santa CruzBiotechnology (sc-36846) and Ambion (s14912).
Cell extracts
To prepare whole-cell extracts, cells were washed twice in ice-cold PBS and then lysed for 20 min in Triton lysis buffer[20 mM Tris/HCl (pH 7.4), 137 mM NaCl, 2 mM EDTA, 25 mM2-glycerophosphate, 1 mM sodium orthovanadate, 1 mM PMSF,1×protease inhibitor cocktail (Sigma), 10% (v/v) glycerol and1% (v/v) Triton X-100]. Insoluble material was removed bycentrifugation at 16000 g for 10 min at 4 ◦C. FLAG-taggedBASP1 was immunoprecipitated from whole-cell extracts usinganti-FLAG M2 affinity gel (Sigma). Nuclear and cytosolicextracts were prepared using a nuclear extract kit (Active Motif)according to the manufacturer’s protocol. For immunoblotting,equal amounts of protein were resuspended in protein loadingdye, resolved by SDS/PAGE and then transferred on to a PVDFmembrane.
Antibodies and immunofluorescence
Anti-WT1 (C-19), anti-lamin A/C (N-18), anti-P2X5 (H-90)and anti-DAB2 (Disabled homologue 2) (H-110) were fromSanta Cruz Biotechnology. Anti-pol II (RNA polymerase II)(ab5408), anti-ENC1 (ectodermal neural cortex 1) (ab56348)
Table 1 Primers used for mRNA analysis
AREG, gene encoding amphiregulin; EGFR, epidermal growth factor receptor; GAPDH,glyceraldehyde-3-phosphate dehydrogenase.
Gene Forward (5′→3′) Reverse (5′→3′)
GAPDH ACAGTCAGCCGCATCTTCTT ACGACCAAATCCGTTGACTCRenin GAAAGCCTGAAGGAACGA GTACTGGGTGTCCATGTAGTTAREG TGGATTGGACCTCAATGACA ACTGTGGTCCCCAGAAAATGAngiopoietin GCAAATGTGCCCTCATGTTA TAGATTGGAGGGGCCACABax GCCCTTTTGCTTCAGGGTTT TCCAATGTCCAGCCCATGATEGFR GTGACCGTTTGGGAGTTGATGA GGCTGAGGGAGGCGTTCTCETS-1 AAACTTGCTACCATCCCGTACGT ATGGTGAGAGTCGGCTTGAGATp21 GCAGACCAGCATGACAGATTT GCAGACCAGCATGACAGATTTVDR CTGACCCTGGAGACTTTGAC GGATTAGGGCTTCCTCTTGGAITGA2 AACTCTTTGGATTTGCGTGTG TGGCAGTCTCAGAATAGGCTTCDAB2 GGGCATTTGGTTACGTGTG CTTTGCTGGCTTCCTCTATCITGA2B AGGTGAGAGGGAGCAGAACA TCCACCTTGAGAGGGTTGACITGB3 GTGACCTGAAGGAGAATCTGC TTCTTCGAATCATCTGGCCENC1 CCCCACAATCAACAAATGG ACTACTGCGGCGTTGCTAAMAOA CCTTGACTGCCAAGATTCACTTC TGCACTTAATGACAGCTCCCATSynapsin I GAACACATGCAAGGAGCTGA AGAGCACCAGGTTCAGGAAGP2X5 TCTTTGCCTGGTGCCCGTTG ATCACGGAGCCCAGTCGGAAGγ -Globin GGACAAGGCTACTATCACAA CAGTGGTATCTGGAGGACAG
and anti-β-tubulin (ab6046) were from Abcam. Control IgG andanti-WT1 (6F-H2) antibodies were from Millipore. Therabbit anti-FLAG antibody was from Cell Signaling Technology.Anti-BASP1 antibodies have been described previously [9,13].Immunofluorescence was performed as described previously [9]using Jackson ImmunoResearch Dylight secondary antibodies.
Plasmids and reagents
To generate pcDNA3-FLAG-HA (control vector) (HA ishaemagglutinin), the following oligonucleotides were annealedand subcloned into the EcoRI/XbaI sites of pcDNA3: sense5′-AATTCGTCGACAAGACTACAAGGACGACGATGACAA-GTCGGCCGCTGGAGGATACCCCTACGACGTGCCCGACT-ACGCCTAGT-3′ and antisense 5′-CTAGACTAGGCGTAGTCG-GGCACGTCGTAGGGGTATCCTCCAGCGGCCGACTTGTC-ATCGTCGTCCTTGTAGTCTTGTCGACG-3′. Human BASP1cDNA was amplified (using 5′-GCGGATCCATGGGAGGC-AAGCTCAGC-3′ and 5′-CCGAATTCCCTCTTTCACGGTTA-CGGT-3′) and subcloned into the BamHI/EcoRI sites of thecontrol vector to give the expression construct pcDNA3-BASP1-FLAG-HA. The plasmid for GFP (green fluorescent protein)expression was pCMV6-AC-GFP (Origene).
ChIP (chromatin immunoprecipitation) and RNA analysis
Total RNA was prepared using the Qiagen RNeasy kit and cDNAprepared using the Promega Reverse Transcription kit or the Bio-Rad cDNA synthesis kit. Real-time PCR was performed using aBio-Rad MiniOpticon System and SYBR Green assay reagents.Primers for mRNA analysis are shown in Table 1.
ChIP assays were performed as described previously [20].Primers for the amplification of WT1-binding regions weredesigned based on the work of others: renin [21], VDR (vitamin Dreceptor) [22], ETS-1 [23] and amphiregulin [23,24]. Sequencesof the primers are shown in Table 2. Control primers amplified aregion 3′ of the human c-Myc gene.
Affymetrix microarray and analysis
Stably transfected V-K562 and B-K562 cells were seededat equal densities (approx. 1×10⁵ cells/ml) in RPMI 1640
c© The Authors Journal compilation c© 2011 Biochemical Society© 2010 The Author(s)
The author(s) has paid for this article to be freely available under the terms of the Creative Commons Attribution Non-Commercial Licence (http://creativecommons.org/licenses/by-nc/2.5/)which permits unrestricted non-commercial use, distribution and reproduction in any medium, provided the original work is properly cited.
WT1/BASP1 in gene regulation and differentiation 115
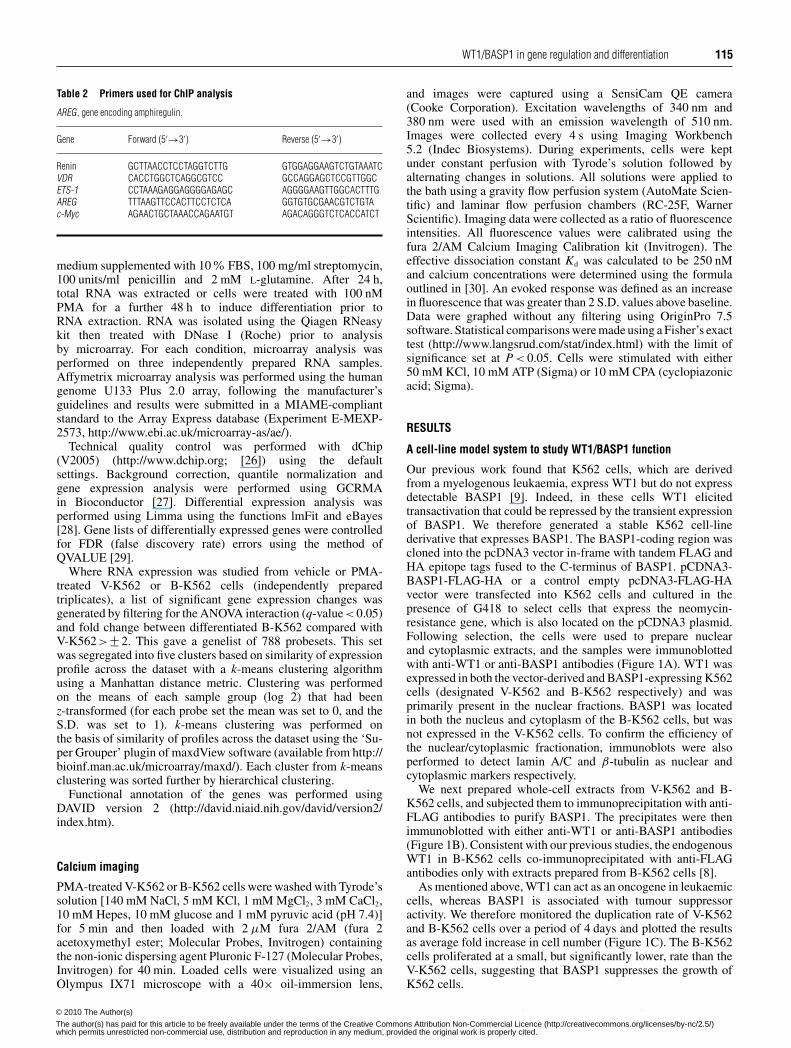
Table 2 Primers used for ChIP analysis
AREG, gene encoding amphiregulin.
Gene Forward (5′→3′) Reverse (5′→3′)
Renin GCTTAACCTCCTAGGTCTTG GTGGAGGAAGTCTGTAAATCVDR CACCTGGCTCAGGCGTCC GCCAGGAGCTCCGTTGGCETS-1 CCTAAAGAGGAGGGGAGAGC AGGGGAAGTTGGCACTTTGAREG TTTAAGTTCCACTTCCTCTCA GGTGTGCGAACGTCTGTAc-Myc AGAACTGCTAAACCAGAATGT AGACAGGGTCTCACCATCT
medium supplemented with 10% FBS, 100 mg/ml streptomycin,100 units/ml penicillin and 2 mM L-glutamine. After 24 h,total RNA was extracted or cells were treated with 100 nMPMA for a further 48 h to induce differentiation prior toRNA extraction. RNA was isolated using the Qiagen RNeasykit then treated with DNase I (Roche) prior to analysisby microarray. For each condition, microarray analysis wasperformed on three independently prepared RNA samples.Affymetrix microarray analysis was performed using the humangenome U133 Plus 2.0 array, following the manufacturer’sguidelines and results were submitted in a MIAME-compliantstandard to the Array Express database (Experiment E-MEXP-2573, http://www.ebi.ac.uk/microarray-as/ae/).
Technical quality control was performed with dChip(V2005) (http://www.dchip.org; [26]) using the defaultsettings. Background correction, quantile normalization andgene expression analysis were performed using GCRMAin Bioconductor [27]. Differential expression analysis wasperformed using Limma using the functions lmFit and eBayes[28]. Gene lists of differentially expressed genes were controlledfor FDR (false discovery rate) errors using the method ofQVALUE [29].
Where RNA expression was studied from vehicle or PMA-treated V-K562 or B-K562 cells (independently preparedtriplicates), a list of significant gene expression changes wasgenerated by filtering for the ANOVA interaction (q-value<0.05)and fold change between differentiated B-K562 compared withV-K562>+− 2. This gave a genelist of 788 probesets. This setwas segregated into five clusters based on similarity of expressionprofile across the dataset with a k-means clustering algorithmusing a Manhattan distance metric. Clustering was performedon the means of each sample group (log 2) that had beenz-transformed (for each probe set the mean was set to 0, and theS.D. was set to 1). k-means clustering was performed onthe basis of similarity of profiles across the dataset using the ‘Su-per Grouper’ plugin of maxdView software (available from http://bioinf.man.ac.uk/microarray/maxd/). Each cluster from k-meansclustering was sorted further by hierarchical clustering.
Functional annotation of the genes was performed usingDAVID version 2 (http://david.niaid.nih.gov/david/version2/index.htm).
Calcium imaging
PMA-treated V-K562 or B-K562 cells were washed with Tyrode’ssolution [140 mM NaCl, 5 mM KCl, 1 mM MgCl2, 3 mM CaCl2,10 mM Hepes, 10 mM glucose and 1 mM pyruvic acid (pH 7.4)]for 5 min and then loaded with 2 μM fura 2/AM (fura 2acetoxymethyl ester; Molecular Probes, Invitrogen) containingthe non-ionic dispersing agent Pluronic F-127 (Molecular Probes,Invitrogen) for 40 min. Loaded cells were visualized using anOlympus IX71 microscope with a 40× oil-immersion lens,
and images were captured using a SensiCam QE camera(Cooke Corporation). Excitation wavelengths of 340 nm and380 nm were used with an emission wavelength of 510 nm.Images were collected every 4 s using Imaging Workbench5.2 (Indec Biosystems). During experiments, cells were keptunder constant perfusion with Tyrode’s solution followed byalternating changes in solutions. All solutions were applied tothe bath using a gravity flow perfusion system (AutoMate Scien-tific) and laminar flow perfusion chambers (RC-25F, WarnerScientific). Imaging data were collected as a ratio of fluorescenceintensities. All fluorescence values were calibrated using thefura 2/AM Calcium Imaging Calibration kit (Invitrogen). Theeffective dissociation constant Kd was calculated to be 250 nMand calcium concentrations were determined using the formulaoutlined in [30]. An evoked response was defined as an increasein fluorescence that was greater than 2 S.D. values above baseline.Data were graphed without any filtering using OriginPro 7.5software. Statistical comparisons were made using a Fisher’s exacttest (http://www.langsrud.com/stat/index.html) with the limit ofsignificance set at P < 0.05. Cells were stimulated with either50 mM KCl, 10 mM ATP (Sigma) or 10 mM CPA (cyclopiazonicacid; Sigma).
RESULTS
A cell-line model system to study WT1/BASP1 function
Our previous work found that K562 cells, which are derivedfrom a myelogenous leukaemia, express WT1 but do not expressdetectable BASP1 [9]. Indeed, in these cells WT1 elicitedtransactivation that could be repressed by the transient expressionof BASP1. We therefore generated a stable K562 cell-linederivative that expresses BASP1. The BASP1-coding region wascloned into the pcDNA3 vector in-frame with tandem FLAG andHA epitope tags fused to the C-terminus of BASP1. pCDNA3-BASP1-FLAG-HA or a control empty pcDNA3-FLAG-HAvector were transfected into K562 cells and cultured in thepresence of G418 to select cells that express the neomycin-resistance gene, which is also located on the pCDNA3 plasmid.Following selection, the cells were used to prepare nuclearand cytoplasmic extracts, and the samples were immunoblottedwith anti-WT1 or anti-BASP1 antibodies (Figure 1A). WT1 wasexpressed in both the vector-derived and BASP1-expressing K562cells (designated V-K562 and B-K562 respectively) and wasprimarily present in the nuclear fractions. BASP1 was locatedin both the nucleus and cytoplasm of the B-K562 cells, but wasnot expressed in the V-K562 cells. To confirm the efficiency ofthe nuclear/cytoplasmic fractionation, immunoblots were alsoperformed to detect lamin A/C and β-tubulin as nuclear andcytoplasmic markers respectively.
We next prepared whole-cell extracts from V-K562 and B-K562 cells, and subjected them to immunoprecipitation with anti-FLAG antibodies to purify BASP1. The precipitates were thenimmunoblotted with either anti-WT1 or anti-BASP1 antibodies(Figure 1B). Consistent with our previous studies, the endogenousWT1 in B-K562 cells co-immunoprecipitated with anti-FLAGantibodies only with extracts prepared from B-K562 cells [8].
As mentioned above, WT1 can act as an oncogene in leukaemiccells, whereas BASP1 is associated with tumour suppressoractivity. We therefore monitored the duplication rate of V-K562and B-K562 cells over a period of 4 days and plotted the resultsas average fold increase in cell number (Figure 1C). The B-K562cells proliferated at a small, but significantly lower, rate than theV-K562 cells, suggesting that BASP1 suppresses the growth ofK562 cells.
c© The Authors Journal compilation c© 2011 Biochemical Society© 2010 The Author(s)
The author(s) has paid for this article to be freely available under the terms of the Creative Commons Attribution Non-Commercial Licence (http://creativecommons.org/licenses/by-nc/2.5/)which permits unrestricted non-commercial use, distribution and reproduction in any medium, provided the original work is properly cited.

116 S. J. Goodfellow and others
Figure 1 Characterization of a K562 cell-line derivative that expresses BASP1
(A) V-K562 and B-K562 cells were used to prepare nuclear (N) and cytoplasmic (C) extracts and immunoblotting was performed with the antibodies indicated. (B) Anti-FLAG antibodies were usedin immunoprecipitation (IP) with nuclear extracts prepared from V-K562 and B-K562 cells. The samples were then immunoblotted with anti-WT1 or anti-BASP1 antibodies. (C) An equal number ofV-K562 and B-K562 cells were grown over a 4 day period and each day the cells were counted. The y-axis of the graph shows the fold increase in cell number during the period. Immunoblotsof WT1, BASP1 and β-tubulin are shown in the right-hand panels. Values are means +− S.D. for six independent experiments. P < 0.01 by Student’s t test.
The regulation of transcription by WT1 and BASP1 in K562 cells
We next performed an Affymetrix expression array with mRNAderived from V-K562 and B-K562 cells. The data are presentedas a volcano plot in Figure 2(A). The grey area of the plotindicates small changes with low significance, whereas the redarea indicates significant changes (q-value<0.1). In total, 1308genes were up-regulated and 1376 genes were down-regulated inthe B-K562 cells compared with the V-K562 cells (1706 and 1683probesets respectively; full details are in Supplementary Table S1at http://www.BiochemJ.org/bj/435/bj4350113add.htm). Genespreviously described as WT1 targets are highlighted in bluein Figure 2(A) (full details are in Supplementary Table S2 athttp://www.BiochemJ.org/bj/435/bj4350113add.htm). In the setof differentially expressed genes with q-value <0.1, the WT1target genes showed significant down-regulation (19 genes wererepressed, compared with three that showed increased activity,Fisher’s exact test P = 0.006). Thus, while the overall expressionchanges caused by BASP1 included a similar number of up- anddown-regulated genes, 19 out of the 22 WT1 target genes on thearray that exhibited altered expression in the presence of BASP1were transcriptionally repressed.
The efficacy of the array data was confirmed by the directmeasurement of several WT1 target genes by qPCR (quantitativePCR) (Figure 2B). Bax was included as a control because itsexpression did not significantly change in the array and it has notbeen proposed as a target gene of WT1. Thus the introductionof BASP1 into K562 cells leads to the repression of a significantproportion of previously identified WT1 target genes.
We next sought to confirm that the expression of a group ofthe above genes was indeed WT1-dependent in K562 cells. V-K562 or B-K562 cells were transfected with WT1 siRNA or acontrol siRNA and, 48 h later, RNA was extracted and cDNAwas prepared. Whole-cell extracts were also immunoblotted withanti-WT1 antibodies to confirm that WT1 was down-regulatedby the transfection of WT1 siRNA (Figure 2C). qPCR was usedto determine the expression of four of the genes identified in thearray and also Bax as a control. Transfection of V-K562 cells withWT1 siRNA resulted in the down-regulation of amphiregulin,ETS-1, renin and VDR, consistent with transcriptional activationof these genes by WT1 in the absence of BASP1. In contrast,the expression of Bax was not affected by WT1 depletion. Asabove, in the B-K562 cells, the expression of the WT1 targetgenes was down-regulated when compared with the V-K562 cells.
c© The Authors Journal compilation c© 2011 Biochemical Society© 2010 The Author(s)
The author(s) has paid for this article to be freely available under the terms of the Creative Commons Attribution Non-Commercial Licence (http://creativecommons.org/licenses/by-nc/2.5/)which permits unrestricted non-commercial use, distribution and reproduction in any medium, provided the original work is properly cited.

WT1/BASP1 in gene regulation and differentiation 117
Figure 2 Expression of BASP1 in K562 cells leads to the general down-regulation of WT1 target genes
(A) Microarray analysis was performed with B-K562 cells and V-K562 cells and the data were analysed as described in the text. A volcano plot shows that, even though B-K562 cells show an equivalentnumber of repressed and activated genes, the vast majority of altered WT1 target genes are repressed. Signal within the grey area indicates small changes below the level of significance, whereas the redarea shows significant changes. The known WT1 target changes are indicated in blue. Full details of the expression changes observed in V-K562 and B-K562 cells are shown in Supplementary Table S1 (athttp://www.BiochemJ.org/bj/435/bj4350113add.htm). The probesets representing the WT1 target genes are shown in Supplementary Table S2 at http://www.BiochemJ.org/bj/435/bj4350113add.htm.Sources of the WT1 target genes are cited throughout the text and also include genomic analysis and reviews [2,25,42,43]. (B) qPCR was performed to quantify the expression of thegenes indicated. Results are presented as the expression relative to GAPDH (glyceraldehyde-3-phosphate dehydrogenase) mRNA. Values are means +− S.D. for three independent experiments.(C) V-K562 and B-K562 cells were transfected with control siRNA or WT1 siRNA and 48 h later whole-cell extracts or RNA were prepared. Samples were immunoblotted with anti-WT1, anti-BASP1or anti-β-tubulin antibodies. The right-hand panels show the expression of the indicated genes as determined by qPCR. Values are means +− S.D. for three independent experiments. (D) V-K562 andB-K562 cells were subject to ChIP analysis with either control, anti-WT1 or anti-BASP1 antibodies. qPCR was used to amplify the WT1-binding sites of the indicated genes or a control region. Theresults are expressed as the percentage of bound chromatin compared with input. Values are means +− S.D. for three independent experiments.
Moreover, consistent with the BASP1-mediated suppression ofWT1 transcription function, the depletion of WT1 in B-K562cells had little effect on the expression of amphiregulin, ETS-1,renin or VDR.
Our results so far suggest that BASP1 suppresses the activationof several WT1 target genes in K562 cells. We next performedChIP analysis of V-K562 and B-K562 cells to determine the
occupancy of the WT1-binding site regions of a selection ofthe above genes by WT1 and BASP1 (Figure 2D). ChIP wasperformed with control, anti-WT1 or anti-BASP1 antibodies usingfragmented cross-linked chromatin prepared from either V-K562or B-K562 cells. The WT1-binding regions of the amphiregulin,ETS-1, renin and VDR genes were amplified, along with a controlgenomic region. WT1 was present at the promoter regions of all
c© The Authors Journal compilation c© 2011 Biochemical Society© 2010 The Author(s)
The author(s) has paid for this article to be freely available under the terms of the Creative Commons Attribution Non-Commercial Licence (http://creativecommons.org/licenses/by-nc/2.5/)which permits unrestricted non-commercial use, distribution and reproduction in any medium, provided the original work is properly cited.

118 S. J. Goodfellow and others
Figure 3 Expression of BASP1 induces an altered PMA-dependent differentiation programme
(A) V-K562 cells or B-K562 cells were treated with 100 nM PMA (+) or vehicle ( − ) and 48 h later the cells were photographed. The right-hand panel shows quantification of the percentage ofarborized cells. Values are means +− S.D. for six independent experiments (P < 0.005 by Student’s t test). (B) Immunofluorescence of V-K562 and B-K562 cells that had been treated with PMA as in(A), but for 4 days. Anti-β-tubulin, anti-pol II and anti-BASP1 antibodies were used as indicated. The control is rabbit IgG.
of the genes tested, but not at the control site, in both V-K562and B-K562 cells. Consistent with the lack of BASP1 expression,anti-BASP1 antibodies did not significantly precipitate the WT1-binding regions of any of the target genes using fragmentedchromatin prepared from V-K562 cells. However, analysis of thefragmented chromatin prepared from B-K562 cells revealed thatBASP1 was present within the WT1-binding regions of all of thetarget genes tested. Thus BASP1-mediated suppression of WT1transcriptional activation coincides with the recruitment ofBASP1 to promoter-bound WT1. Taken together, the resultsshown in Figure 2 suggest that BASP1 is a negative regulator ofWT1 transcriptional activation at a significant proportion of WT1target genes and acts via recruitment to WT1-bound promoters.
Diversion of K562 cell differentiation by WT1 and BASP1
K562 cells can be induced to differentiate along blood cellpathway lineages by various agents [31]. We therefore testedthe effect of BASP1 expression on the K562 differentiation
pathway induced by PMA. Treatment of K562 cells with 100 nMPMA causes the cells to differentiate along the megakaryocytelineage. Surprisingly, however, even though the B-K562 cellsappeared morphologically similar to the V-K562 cells beforePMA treatment, the effect following PMA treatment was dramatic(Figure 3A). Whereas PMA treatment of V-K562 cells inducedthe formation of megakaryocytes, the PMA-treated B-K562cells became elongated and formed processes. Quantificationof the arborized cells in the differentiated V-K562 and B-K562 pools is shown on the right-hand side of Figure 3(A).This quantification included any cells that formed a process,but even the small number observed in the V-K562 cells didnot form processes as elaborate as those observed in the B-K562 cells. The same effects were observed in a different,independently produced, stable BASP1-expressing K562 cell line(results not shown and Figure 4). Immunofluorescence was usedto detect β-tubulin in V-K562 and B-K562 cells that had beentreated with PMA for 4 days (Figure 3B). β-Tubulin stainingclearly showed the extent of arborization of the B-K562 cells,whereas the V-K562 cells maintain the rounded shape typical
c© The Authors Journal compilation c© 2011 Biochemical Society© 2010 The Author(s)
The author(s) has paid for this article to be freely available under the terms of the Creative Commons Attribution Non-Commercial Licence (http://creativecommons.org/licenses/by-nc/2.5/)which permits unrestricted non-commercial use, distribution and reproduction in any medium, provided the original work is properly cited.

WT1/BASP1 in gene regulation and differentiation 119
Figure 4 Nuclear BASP1 is required for the altered PMA-dependent differentiation programme of B-K562 cells
(A) New pools of V-K562, B-K562 and B-K562 (K7A:K9A) cells were used to prepare nuclear (N) and cytoplasmic (C) extracts and immunoblotting was performed with the antibodies indicated. (B)RNA was prepared from V-K562, B-K562 and B-K562 (K7A:K9A) cells and qPCR was performed to quantify the expression of the amphiregulin gene. Data are presented as expression relative toGAPDH (glyceraldehyde-3-phosphate dehydrogenase) mRNA. Values are means +− S.D. for three independent experiments. (C) V-K562, B-K562 and B-K562 (K7A:K9A) cells were treated with PMAas described in Figure 3(A).
of megakaryocytes. BASP1 expression, restricted to the B-K562cells, shows a nuclear/cytoplasmic distribution comparable withthat observed by us previously in podocyte and Cos-1 cells[9,13]. Immunofluorescence was also used to detect pol II asa nuclear marker in differentiated V-K562 and B-K562 cells. It isevident from Figure 3 that the PMA-treated B-K562 cells have notdifferentiated along the megakaryocyte pathway and have insteadgained morphology akin to neuronal cells or fibroblasts.
As mentioned above, BASP1 contains a bipartite NLS at its N-terminus. We therefore generated a mutant derivative of BASP1(K7A:K9A) to disrupt the NLS and generated stable K562 celllines with either an empty pCDNA expression vector or the samevector driving expression of either wild-type BASP1 or BASP1K7A:K9A. Nuclear and cytoplasmic extracts of the cell-linederivatives were prepared and immunoblotted with anti-BASP1,anti-WT1 or anti-β-tubulin antibodies (Figure 4A). Mutation ofthe BASP1 NLS resulted in a significant reduction of nuclearBASP1. The expression of amphiregulin in each of the cell-line derivatives was then determined by RNA preparation andqPCR. The results show that, as before, expression of wild-typeBASP1 resulted in the repression of amphiregulin expression(Figure 4B). In contrast, the BASP1 mutant derivative K6A:K9Adid not drive repression of amphiregulin expression. These resultsare consistent with the requirement for nuclear localizationof BASP1 to act as a WT1 transcriptional co-suppressor. Wenext analysed the effect of PMA on the differentiation of V-K562, B-K562 or B-K562 (K7A:K9A) cells (Figure 4C). The
results demonstrate that, although wild-type BASP1 divertedthe differentiation programme of K562 cells to an arborizedphenotype, PMA treatment of BASP1 (K7A:K9A) cells did not.
Differentiation of K562 cells has been reported to beaccompanied by a reduction in WT1 expression [13]. We thereforedetermined the fate of WT1 in the V-K562 and B-K562 cellsfollowing treatment with PMA. V-K562 or B-K562 cells were ex-posed to PMA as described above and whole-cell extracts wereprepared at intervals up to 48 h. Proteins were resolved bySDS/PAGE, transferred to membrane and immunoblotted withanti-WT1 antibodies (Figure 5A). Consistent with previousreports [13], WT1 was down-regulated following treatment ofboth the V-K562 and B-K562 cells with PMA, and by 12 h wasalmost undetectable. This raised the question of whether or notthe altered B-K562 cell differentiation programme was dependenton WT1. To address this, B-K562 cells or V-K562 cells weretransfected with WT1 siRNA or a control siRNA. Immunoblottingconfirmed that the WT1 siRNA caused a significant reduction inWT1 protein (Figure 5B). Cells transfected with control siRNAor WT1 siRNA along with a plasmid driving expression ofGFP were then induced to differentiate with PMA for 48 hfollowed by imaging to detect the transfected GFP-expressingcells (Figure 5C). As above, the PMA-treated B-K562 cellsshowed a marked difference in their appearance when comparedwith the V-K562 cells. However, the transfection of B-K562cells with WT1 siRNA significantly reduced the differentiation-dependent arborized morphology that is induced by PMA in the
c© The Authors Journal compilation c© 2011 Biochemical Society© 2010 The Author(s)
The author(s) has paid for this article to be freely available under the terms of the Creative Commons Attribution Non-Commercial Licence (http://creativecommons.org/licenses/by-nc/2.5/)which permits unrestricted non-commercial use, distribution and reproduction in any medium, provided the original work is properly cited.

120 S. J. Goodfellow and others
Figure 5 WT1 is required for the altered PMA-dependent differentiation programme of B-K562 cells
(A) V-K562 or B-K562 cells were treated with 100 nM PMA for the times indicated and then whole-cell extracts were prepared and subjected to immunoblotting with anti-WT1 antibodies. (B) V-K562and B-K562 cells were transfected with either control or WT1 siRNA. At 24 h later, whole-cell extracts were prepared and immunoblotted with the antibodies indicated. (C) V-K562 or B-K562 cellswere transfected as described in (B) along with a vector driving expression of GFP, and 24 h later were treated with 100 nM PMA or vehicle control. At 48 h later, the cells were imaged. Quantificationof the arborized cells is shown in the lower panel. Values are means +− S.D. for six experiments (P < 0.05 by Student’s t test).
B-K562 cells. Quantification of the arborized cells is shownbelow. Thus WT1 expression is required for the altereddifferentiation programme of B-K562 cells that occurs in responseto PMA treatment.
The regulation of gene expression by WT1 and BASP1 indifferentiating K562 cells
We next explored the gene-regulatory events that resultin the WT1/BASP1 reprogramming of the PMA-dependentdifferentiation pathway in K562 cells. Arrays were performedwith RNA derived from vehicle-treated V-K562 or B-K562cells, and also the same cells treated with PMA (independentlyprepared triplicates). A list of significant gene expression changeswas generated by filtering for the ANOVA interaction (q-value<0.05) and fold change between differentiated B-K562compared with V-K562 >+− 2. This gave 788 probesets, whichwere grouped into five clusters based on their expressionprofiles over the four conditions as shown in Figure 6(A) (full
details are in Supplementary Table S3 at http://www.BiochemJ.org/bj/435/bj4350113add.htm). The changes in gene expressionfall into five clusters (A–E). Cluster E genes are highly inducedin the PMA-treated V-K562 cells, but not by PMA-treatment ofB-K562 cells. This group includes ITGA2 (integrin α2, CD49B),ITGA2B (integrin α2b, CD41), ITGB3 (integrin β3, CD61),PPBP (pro-platelet basic protein), CD2226, CD84, Arhgap9 (RhoGTPase-activating protein 9) and DAB2, all of which are well-characterized genes that are involved in the differentiation of K562cells along a megakaryocyte programme [31,32]. In Figure 6(B),qPCR validation of the array data for the megakaryocyte markergenes ITGA2, DAB2, ITGA2B and ITGB3 is shown, confirmingthe induction of these genes in PMA-treated V-K562 cells, but notPMA-treated B-K562 cells. Thus the expression data can explainwhy the B-K562 cells do not differentiate into megakaryocytecells upon exposure to PMA.
Cluster A contains genes that are up-regulated in B-K562, butsignificantly less so in V-K562 cells following PMA treatment.These genes include ENC1, Pak1 (p21-activated kinase 1) and
c© The Authors Journal compilation c© 2011 Biochemical Society© 2010 The Author(s)
The author(s) has paid for this article to be freely available under the terms of the Creative Commons Attribution Non-Commercial Licence (http://creativecommons.org/licenses/by-nc/2.5/)which permits unrestricted non-commercial use, distribution and reproduction in any medium, provided the original work is properly cited.

WT1/BASP1 in gene regulation and differentiation 121
Figure 6 Differentiation-dependent regulation of gene expression in V-K562 and B-K562 cells
(A) Arrays were performed with RNA derived from vehicle-treated V-K562 or B-K562 cells and also the same cells treated with PMA. The data were analysed as described in the text. V,V-K562 cells; B, B-K562 cells. A colour-coded key of expression level is shown below the panel. Five distinct clusters of genes (A–E) are indicated on the right. Supplementary Table S3 (athttp://www.BiochemJ.org/bj/435/bj4350113add.htm) shows the genes associated with each cluster. (B) qPCR analysis of selected genes from clusters E (top panels) and A (bottom panels). Valuesare means +− S.D for three independent experiments. (C) Immunofluorescence was performed with V-K562 and B-K562 cells that had been treated with PMA and allowed to differentiate for 4 days.Antibodies are indicated above the panels. The control is rabbit IgG.
Nidogen2, which have been shown to play a role in axon growth(qPCR for ENC1 shown in Figure 6B, lower panel; [33–35]).In addition, cluster A contains synapsin I, P2X5 and MAOA(monoamine oxidase A; qPCR shown in Figure 6B), which allplay a central role in synapse function [36,37]. Figure 6(C) showsimmunofluorescence with anti-β-tubulin (cytoplasm marker),anti-BASP1, anti-DAB2 (megakaryocyte marker), anti-ENC1and anti-P2X5 antibodies, confirming that the changes in mRNAare accompanied by changes in protein. Specifically, the results
show that DAB2 expression is restricted to the differentiated V-K562 cells, whereas ENC1 and P2X5 expression are elevated inthe differentiated B-K562 cells. Thus the expression of BASP1 inK562 cells diverts the PMA-induced differentiation programmeaway from the megakaryocyte pathway, and instead leads to amorphological appearance akin to neuronal cells. The altereddifferentiation pathway of B-K562 cells requires the expressionof WT1, which is accompanied by the suppression of genesthat specify the megakaryocyte and, furthermore, leads to the
c© The Authors Journal compilation c© 2011 Biochemical Society© 2010 The Author(s)
The author(s) has paid for this article to be freely available under the terms of the Creative Commons Attribution Non-Commercial Licence (http://creativecommons.org/licenses/by-nc/2.5/)which permits unrestricted non-commercial use, distribution and reproduction in any medium, provided the original work is properly cited.

122 S. J. Goodfellow and others
Figure 7 PMA-differentiated B-K562 cells are responsive to the neurotransmitter ATP
(A) A 30 s application of 10 mM ATP elicited a large increase in cytosolic calcium in B-K562 cells that slowly returned to baseline levels as ATP was washed out. (B) A comparable ATP applicationin V-K562 cells did not affect baseline calcium levels. Application of 10 mM CPA, a reversible SERCA pump inhibitor, illustrates that it was possible to evoke a measurable change in cytosoliccalcium in these cells. (C) Analysis of ATP responsiveness in B-K562 and V-K562 cells on days 4 and 7 after PMA-induced differentiation in culture found that B-K562 cells were significantly moreresponsive to ATP than the V-K562 cells on both days 4 (B-K562, n = 54; V-K562, n = 16) and 7 (B-K562, n = 20; V-K562, n = 39). **P < 0.005.
induction of several genes involved in axon growth and synapsefunction.
Neuronal properties of B-K562 cells
The neurotransmitter receptor P2X5 was significantly up-regulated in B-K562 cells following PMA treatment (Figure 6B).P2X5 is a ligand-gated purinergic receptor that respondsto extracellular ATP and is found in both neurons andmuscle cells [36]. Therefore we next determined whether theB-K562 cells possess the capacity to elicit a response to ATP.V-K562 or B-K562 cells were induced to differentiate bytreatment with PMA for 4 days. ATP (10 mM) was then appliedto the cells and calcium influx was measured by fluorescenceimaging. The treatment of differentiated B-K562 cells with ATPcaused a rapid increase in cytosolic calcium that slowly returnedto baseline calcium levels in 87 % of cells tested (example shownin Figure 7A, upper panel). The ATP response in B-K562 cellswas abolished when external calcium was removed, indicatingthat the calcium signal was due to an influx from the externalenvironment (results not shown). Experiments using B-K562 cellsthat had been treated with PMA for 7 days yielded similar results(shown graphically in Figure 7B). In contrast, similar treatmentof the differentiated V-K562 cells revealed that only 10% ofthe cells were sensitive to ATP, even when we increased theATP concentration to 500 mM (example shown in Figure 7A,lower panel, and quantification is shown in Figure 7B). However,application of the reversible SERCA (sarcoplasmic/endoplasmic
reticulum Ca2+-ATPase) inhibitor CPA elicited a response,confirming that the V-K562 cells are viable and are specificallyunresponsive to ATP (Figure 7A, lower panel). Statistical analysisof the number of ATP-sensitive cells found that B-K562 cells weresignificantly more responsive to ATP compared with the V-K562cells (P < 0.005). Thus the expression of synaptic proteins in thePMA-induced B-K562 cells is accompanied by the endowmentof the cells with the capacity to respond to the neurotransmitterATP.
Specificity of differentiation reprogramming of B-K562 cells
K562 cells are situated at the common progenitor stage of themegakaryocyte and erythroid lineages of haemopoietic stemcell differentiation [31]. Whereas PMA induces K562 cells todifferentiate along a megakaryocyte programme, haemin caninduce K562 cells to differentiate along an erythroid programme.We therefore treated the V-K562 and B-K562 cells with haeminor PMA, and 48 h later, imaged the cells under phase microscopy(Figure 8A). As before, PMA treatment induced the arborizationof the B-K562 cells, but not the V-K562 cells. However, followingtreatment with haemin, the morphology of the B-K562 cells wassimilar to that of the V-K562 cells. To confirm that the inductionof megakaryocyte and erythrocyte differentiation was successful,RNA was prepared and cDNA was derived, then qPCR wasperformed to analyse the expression of ITGA2 (megakaryocytemarker), ENC1 (induced by PMA in B-K562 cells and involvedin axon growth) and γ -globin (a standard marker for erythroid
c© The Authors Journal compilation c© 2011 Biochemical Society© 2010 The Author(s)
The author(s) has paid for this article to be freely available under the terms of the Creative Commons Attribution Non-Commercial Licence (http://creativecommons.org/licenses/by-nc/2.5/)which permits unrestricted non-commercial use, distribution and reproduction in any medium, provided the original work is properly cited.

WT1/BASP1 in gene regulation and differentiation 123
Figure 8 BASP1 specifically diverts the megakaryocyte pathway of K562 cell differentiation
(A) V-K562 and B-K562 cells were mock-treated or treated with 100 nM PMA or 0.5 mM haemin, and 48 h later the cells were imaged using phase microscopy. (B) As in (A), except that RNA wasprepared and analysed by qPCR for the expression of the genes indicated. Values are means +− S.D. for three independent experiments.
differentiation). As above, ITGA2 was specifically induced byPMA only in the V-K562 cells, and ENC1 was induced by PMAonly in the B-K562 cells (Figure 8B). The marker for erythroiddifferentiation, γ -globin, was induced only by haemin, but thiswas observed in both the V-K562 and B-K562 cells. These resultssuggest that the erythroid differentiation pathway of the K562cells is, at least in part, intact in the B-K562 cells. Thus theexpression of BASP1 specifically results in the reprogrammingof the megakaryocyte differentiation pathway of K562 cells thatis induced by PMA.
DISCUSSION
In the present study we have demonstrated that the stableexpression of BASP1 in K562 cells leads to the down-regulation of a significant proportion of WT1-dependent targetgenes. ChIP analysis confirmed that the suppression of WT1-mediated transcriptional activation by BASP1 coincides withthe recruitment of BASP1 to WT1-dependent promoters. Takentogether, the results of the present study suggest that BASP1 is ageneral regulator of WT1 that acts to suppress the transcriptionalactivation function of WT1. BASP1 expression in K562 cellsalso led to the activation and repression of several other genes,the majority of which are unlikely to be direct targets of WT1.Although this will include indirect effects, it is also possible thatBASP1 may act through other transcription factors either as aco-repressor or co-activator.
PMA-induced differentiation of K562 cells into megakaryo-cytes was blocked by the expression of BASP1. Indeed, severalmarkers of megakaryocyte differentiation failed to up-regulate inresponse to PMA, presumably due to the altered gene expression
profile that was established by the expression of BASP1. Instead,the K562 cells that express BASP1 gained a neuronal-likemorphology following treatment with PMA that was accompaniedby the induction of several genes that are involved in axonextension and synapse function. The PMA-induced differentiationof K562 cells to megakaryocytes is well established and has beenstudied for several years. One study has reported that K562 cellscan differentiate, albeit at a low efficiency, to antigen-presentingdendritic cells. However, none of the dendritic cell markers (e.g.MHC class I and class II, interleukin-12, CD86 and CD40)were induced in the B-K562 cells, suggesting that this particularpathway is not induced by WT1 and BASP1 [38]. The PMA-treated B-K562 cells exhibited calcium influx when exposed to theneurotransmitter ATP, suggesting a gain-of-function consistentwith an excitable cell. To our knowledge, this is the first reportthat K562 cells have been differentiated into anything other thana blood cell.
BASP1 can induce arborization of PC12E2 neuronal cells orprimary hippocampal neurons [39]. Moreover, WT1 has beenshown to be required for the neuronal differentiation of Y-79retinoblastoma cells in culture [40], formation of the retinalganglia and olfactory epithelia [4,5], and is expressed in severalother neuronal cells [6]. However, the results of the presentstudy demonstrate that WT1 and BASP1 can induce neuronal-like morphology and physiological properties in cells that arenot originally from a neuronal lineage. Thus WT1 and BASP1together can reprogramme the differentiation potential of K562cells.
WT1 and BASP1 are co-expressed in the podocyte cells ofthe developing and adult kidney, which form processes thatsurround the capillary network of the glomerulus and providea filtration barrier [9]. Our previous studies suggested that
c© The Authors Journal compilation c© 2011 Biochemical Society© 2010 The Author(s)
The author(s) has paid for this article to be freely available under the terms of the Creative Commons Attribution Non-Commercial Licence (http://creativecommons.org/licenses/by-nc/2.5/)which permits unrestricted non-commercial use, distribution and reproduction in any medium, provided the original work is properly cited.

124 S. J. Goodfellow and others
WT1 and BASP1 co-operate in the changes in gene regulationthat occur during the differentiation of podocytes in vitro [13].It is therefore interesting to note that parallels between theformation of processes in podocytes and neurons have beendrawn, particularly regarding the formation of cellular extensions,which are microtubule-rich with actin-based projections [41].Moreover, several genes involved in intracellular trafficking,signal transduction and cytoskeletal components are co-ordinatelyexpressed in both cell types. It is therefore possible that WT1 andBASP1 play an important role in establishing the transcriptionnetworks associated with cellular arborization in podocytes andsome neuronal cells. In contrast with the events in podocytes,however, the differentiation of K562 cells is accompanied by areduction in WT1 expression. This suggests that the neuronalcharacteristics that we report in the present paper require thetransient function of WT1, and that WT1 is probably not neededfor the maintenance of the differentiated phenotype.
It is interesting to note that BASP1 expression does not appear toaffect the haemin-induced differentiation of K562 cells along theerythrocyte pathway, at least morphologically or in the inductionof γ -globin expression. Thus WT1 and BASP1 expression donot fix the destiny of K562 cells to a neuronal-like lineage.However, the alterations set the stage for further changes thatare induced by PMA, but require the prior modifications that havebeen induced by WT1 and BASP1. The precise chain of eventsthat leads from WT1/BASP1 regulation of transcription to thereprogramming of K562 differentiation induced by PMA is likelyto be complex. Indeed several cell types, including others that areblood-cell-derived, express WT1 and BASP1. We suggest thatthe action of WT1 and BASP1 on specific target genes resultsin changes in the cellular milieu that, under specific conditions,can lead to arborization. In summary, the results of the presentstudy suggest that WT1 and BASP1 can co-operatively act atfundamental step(s) in determining the differentiation pathway.
AUTHOR CONTRIBUTION
Sarah Goodfellow and Stefan Roberts conceived the study. Sarah Goodfellow, KathrynMedler and Stefan Roberts designed the experiments. Sarah Goodfellow, Michelle Rebello,Eneda Toska, Sean Rudd and Stefan Roberts performed the experiments. Leo Zeef analysedand presented the microarray data. Sarah Goodfellow, Kathryn Medler and Stefan Robertsinterpreted the data and wrote the paper.
ACKNOWLEDGEMENTS
We thank Sue Kimber for helpful discussions. We also thank Wensheng Deng, PaulShore and members of the Roberts laboratory for comments on the manuscript prior tosubmission.
FUNDING
This work was funded by Cancer Research UK [grant number C1356/A6630 (to S.G.E.R.)];the Wellcome Trust [grant number WT061207/Z/00/A (to S.G.E.R.)]; and the NationalScience Foundation [NSF0917893 (to K.F.M.)].
REFERENCES
1 Rivera, M. N. and Haber, D. A. (2005) Wilms’ tumour: connecting tumorigenesis andorgan development in the kidney. Nat. Rev. Cancer 5, 699–712
2 Yang, L., Han, Y., Suarez Saiz, F. and Minden, M. D. (2007) A tumor suppressor andoncogene: the WT1 story. Leukemia 21, 868–876
3 Hohenstein, P. and Hastie, N. D. (2006) The many facets of the Wilms’ tumour gene, WT1.Hum. Mol. Genet. 15, R196–R201
4 Wagner, K. D., Wagner, N., Vidal, V. P., Schley, G., Wilhelm, D., Schedl, A., Englert, C. andScholz, H. (2002) The Wilms’ tumor gene Wt1 is required for normal development of theretina. EMBO J. 21, 1398–1405
5 Wagner, N., Wagner, K. D., Hammes, A., Kirschner, K. M., Vidal, V. P., Schedl, A. andScholz, H. (2005) A splice variant of the Wilms’ tumour suppressor Wt1 is required fornormal development of the olfactory system. Development 132, 1327–1336
6 Armstrong, J. F., Pritchard-Jones, K., Bickmore, W. A., Hastie, N. D. and Bard, J. B.(1993) The expression of the Wilms’ tumour gene, WT1, in the developing mammalianembryo. Mech. Dev. 40, 85–97
7 Roberts, S. G. E. (2005) Transcriptional regulation by WT1 in development. Curr. Opin.Genet. Dev. 15, 542–547
8 McKay, L. M., Carpenter, B. and Roberts, S. G. E. (1999) Regulation of the Wilms’ tumoursuppressor protein transcriptional activation domain. Oncogene 18, 6546–6554
9 Carpenter, B., Hill, K. J., Charalambous, M., Wagner, K. J., Lahiri, D., James, D. I.,Anderson, J. S., Schumacher, V., Royer-Pokora, B., Mann, M. et al. (2004) BASP1 is atranscriptional cosuppressor for the Wilms’ tumour suppressor protein WT1. Mol. Cell.Biol. 24, 537–549
10 Hartkamp, J., Carpenter, B. and Roberts, S. G. E. (2010) The Wilms’ tumour suppressorprotein WT1 is processed by the serine protease HtrA2/Omi. Mol. Cell 37, 159–171
11 Mosevitsky, M. I. (2005) Nerve ending ‘signal’ proteins GAP-43, MARCKS, and BASP1.Int. Rev. Cytol. 245, 245–325
12 Ohsawa, S., Watanabe, T., Katada, T., Nishina, H. and Miura, M. (2008) Novel antibody tohuman BASP1 labels apoptotic cells post-caspase activation. Biochem. Biophys. Res.Commun. 371, 639–643
13 Green, L. M., Wagner, K. J., Campbell, H. A., Addison, K. and Roberts, S. G. E. (2009)Dynamic interaction between WT1 and BASP1 in transcriptional regulation duringdifferentiation. Nucleic Acids Res. 37, 431–440
14 Hartl, M., Nist, A., Khan, M. I., Valovka, T. and Bister, K. (2009) Inhibition of Myc-inducedcell transformation by brain acid-soluble protein 1 (BASP1). Proc. Natl. Acad. Sci. U.S.A.106, 5604–5609
15 Moribe, T., Iizuka, N., Miura, T., Stark, M., Tamatsukuri, S., Ishitsuka, H., Hamamoto, Y.,Sakamoto, K., Tamesa, T. and Oka, M. (2008) Identification of novel aberrant methylationof BASP1 and SRD5A2 for early diagnosis of hepatocellular carcinoma by genome-widesearch. Int. J. Oncol. 33, 949–958
16 Yeoh, E. J., Ross, M. E., Shurtleff, S. A., Williams, W. K., Patel, D., Mahfouz, R., Behm,F. G., Raimondi, S. C., Relling, M. V., Patel, A. et al. (2002) Classification, subtypediscovery, and prediction of outcome in pediatric acute lymphoblastic leukemia by geneexpression profiling. Cancer Cell 1, 133–143
17 Wang, J., Coombes, K. R., Highsmith, W. E., Keating, M. J. and Abruzzo, L. V. (2004)Differences in gene expression between B-cell chronic lymphocytic leukemia and normalB cells: a meta-analysis of three microarray studies. Bioinformatics 20, 3166–3178
18 Ariyaratana, S. and Loeb, D. M. (2007) The role of the Wilms tumour gene (WT1) innormal and malignant haematopoiesis. Expert Rev. Mol. Med. 9, 1–17
19 Rosenfeld, C., Cheever, M. A. and Gaiger, A. (2003) WT1 in acute leukemia, chronicmyelogenous leukemia and myelodysplastic syndrome: therapeutic potential of WT1targeted therapies. Leukemia 17, 1301–1312
20 Nelson, J. D., Denisenko, O. and Bomsztyk, K. (2006) Protocol for the fast chromatinimmunoprecipitation (ChIP) method. Nat. Protoc. 1, 179–185
21 Steege, A., Fahling, M., Paliege, A., Bondke, A., Kirschner, K.M., Martinka, P., Kaps, C.,Patzak, A., Persson, P. B., Thiele, B. J. et al. (2008) Wilms’ tumor protein (-KTS)modulates renin gene transcription. Kidney Int. 74, 458–466
22 Lee, T. H. and Pelletier, J. (2001) Functional characterization of WT1 binding sites withinthe human vitamin D receptor gene promoter. Physiol. Genomics 7, 187–200
23 Wagner, N., Michiels, J. F., Schedl, A. and Wagner, K. D. (2008) The Wilms’ tumoursuppressor WT1 is involved in endothelial cell proliferation and migration: expression intumour vessels in vivo. Oncogene 27, 3662–3672
24 Lee, S. B., Huang, K., Palmer, R., Truong, V. B., Herzlinger, D., Kolquist, K. A., Wong, J.,Paulding, C., Yoon, S. K., Gerald, W. et al. (1999) The Wilms tumor suppressor WT1encodes a transcriptional activator of amphiregulin. Cell 98, 663–673
25 Kim, H. S., Kim, M. S., Hancock, A. L., Harper, J. C., Park, J. Y., Poy, G., Perantoni, A. O.,Cam, M., Malik, K. and Lee, S. B. (2007) Identification of novel Wilms’ tumor suppressorgene target genes implicated in kidney development. J. Biol. Chem. 282, 16278–16287
26 Li, C. and Wong, W. H. (2001) Model-based analysis of oligonucleotide arrays: expressionindex computation and outlier detection. Proc. Natl. Acad. Sci. U.S.A. 98, 31–6
27 Wu, Z., Irizarry, R. A., Gentleman, R., Martinez-Murillo, F. and Spencer, F. (2004) Amodel-based background adjustment for oligonucleotide expression arrays. J. Am. Stat.Assoc. 99, 909–917
28 Smyth, G. K. (2004) Linear models and empirical Bayes methods for assessingdifferential expression in microarray experiments. Stat. Appl. Genet. Mol. Biol. 3, Article3
29 Storey, J. D. and Tibshirani, R. (2003) Statistical significance for genomewide studies.Proc. Natl. Acad. Sci. U.S.A. 100, 9440–9445
c© The Authors Journal compilation c© 2011 Biochemical Society© 2010 The Author(s)
The author(s) has paid for this article to be freely available under the terms of the Creative Commons Attribution Non-Commercial Licence (http://creativecommons.org/licenses/by-nc/2.5/)which permits unrestricted non-commercial use, distribution and reproduction in any medium, provided the original work is properly cited.
WT1/BASP1 in gene regulation and differentiation 125
30 Grynkiewicz, G., Poenie, M. and Tsien, R. Y. (1985) A new generation of Ca2+ indicatorswith greatly improved fluorescence properties. J. Biol. Chem. 260, 3440–3450
31 Tsiftsoglou, A. S., Pappas, I. S. and Vizirianakis, I. S. (2003) Mechanisms involved in theinduced differentiation of leukemia cells. Pharmacol. Ther. 100, 257–90
32 Huo, X. F., Yu, J., Peng, H., Du, Z. W., Liu, X. L., Ma, Y. N., Zhang, X., Zhang, Y., Zhao,H. L. and Zhang, J. W. (2006) Differential expression changes in K562 cells during thehemin-induced erythroid differentiation and the phorbol myristate acetate (PMA)-inducedmegakaryocytic differentiation. Mol. Cell. Biochem. 292, 155–167
33 Daniels, R. H., Hall, P. S. and Bokoch, G. M. (1998) Membrane targeting of p21-activated kinase 1 (PAK1) induces neurite outgrowth from PC12 cells. EMBO J. 17,754–764
34 Kim, T. A., Lim, J., Ota, S., Raja, S., Rogers, R., Rivnay, B., Avraham, H. and Avraham, S.(1998) NRP/B, a novel nuclear matrix protein, associates with p110(RB) and is involvedin neuronal differentiation. J. Cell Biol. 141, 553–566
35 Fox, M. A., Ho, M. S., Smyth, N. and Sanes, J. R. (2008) A synaptic nidogen:developmental regulation and role of nidogen-2 at the neuromuscular junction. NeuralDev. 25, 3–24
36 North, R. A. (2002) Molecular physiology of P2X receptors. Physiol. Rev. 82, 1013–106737 Fornasiero, E. F., Bonanomi, D., Benfenati, F. and Valtorta, F. (2009) The role of synapsins
in neuronal development. Cell. Mol. Life Sci. 67, 1383–1396
38 Lindner, I., Kharfan-Dabaja, M. A., Ayala, E., Kolonias, D., Carlson, L. M., Beazer-Barclay,Y., Scherf, U., Hnatyszyn, J. H. and Lee, KP. (2003) Induced dendritic cell differentiation ofchronic myeloid leukemia blasts is associated with down-regulation of BCR-ABL.J. Immunol. 171, 1780–1791
39 Korshunova, I., Caroni, P., Kolkova, K., Berezin, V., Bock, E. and Walmod, P. S. (2008)Characterization of BASP1-mediated neurite outgrowth. J. Neurosci. Res. 86, 2201–2213
40 Wagner, N., Wagner, K. D., Schley, G., Coupland, S. E., Heimann, H., Grantyn, R. andScholz, H. (2002) The Wilms’ tumor suppressor Wt1 is associated with the differentiationof retinoblastoma cells. Cell Growth Differ. 13, 297–305
41 Kobayashi, N., Gao, S. Y., Chen, J., Saito, K., Miyawaki, K., Li, C. Y., Pan, L., Saito, S.,Terashita, T. and Matsuda, S. (2004) Process formation of the renal glomerular podocyte:is there common molecular machinery for processes of podocytes and neurons? Anat.Sci. Int. 79, 1–10
42 Udtha, M., Lee, S. J., Alam, R., Coombes, K. and Huff, V. (2003) Upregulation of c-MYCin WT1-mutant tumors: assessment of WT1 putative transcriptional targets using cDNAmicroarray expression profiling of genetically defined Wilms’ tumors. Oncogene 22,3821–3826
43 Kim, M. K., McGarry, T. J., O’Broin, P., Flatow, J. M., Golden, A. A. and Licht, J. D. (2009)An integrated genome screen identifies the Wnt signaling pathway as a major target ofWT1. Proc. Natl. Acad. Sci. U.S.A. 106, 11154–11159
Received 22 October 2010/20 January 2011; accepted 26 January 2011Published as BJ Immediate Publication 26 January 2011, doi:10.1042/BJ20101734
c© The Authors Journal compilation c© 2011 Biochemical Society© 2010 The Author(s)
The author(s) has paid for this article to be freely available under the terms of the Creative Commons Attribution Non-Commercial Licence (http://creativecommons.org/licenses/by-nc/2.5/)which permits unrestricted non-commercial use, distribution and reproduction in any medium, provided the original work is properly cited.