Worldwide mortality in men and women aged 15–59 years from 1970 to 2010: a systematic analysis
17
Articles 1704 www.thelancet.com Vol 375 May 15, 2010 Lancet 2010; 375: 1704–20 This online publication has been corrected. The corrected version first appeared at thelancet.com on November 19, 2010 Published Online April 30, 2010 DOI:10.1016/S0140- 6736(10)60517-X See Comment page 1668 Institute for Health Metrics and Evaluation, University of Washington, Seattle, WA, USA (J K Rajaratnam PhD, J R Marcus BA, A Levin-Rector BSPH, H Wang PhD, L Dwyer BA, M Costa BA, Prof C J L Murray MD); Harvard Medical School, Harvard University, Boston, MA, USA (A N Chalupka); and School of Population Health, University of Queensland, Brisbane, QLD, Australia (Prof A D Lopez PhD) Correspondence to: Prof Christopher J L Murray, Institute for Health Metrics and Evaluation, University of Washington, 2301 5th Avenue, Suite 600, Seattle, WA 98121, USA [email protected] Introduction Public health efforts in the 1980s and 1990s had a substantial focus on improving mortality and morbidity in children. 1–3 Both the numbers and rates of death in children under 5 years of age have been falling for several decades, although many countries are not on track to achieve Millennium Development Goal (MDG) 4, which calls for a two-thirds reduction in the mortality rate in children younger than 5 years between 1990 and 2015. 1,3–6 Concomitant with decreases in under-5 mortality, global fertility has declined from a total fertility rate (TFR) of 5·0 in 1950 to 2·5 in 2009, leading to a substantial increase in the mean and median age of most populations. 7 Declining under-5 mortality rates and ageing populations also mean that a larger proportion of deaths occur in adults. 7,8 Despite the increase in adult population and the related change in population health issues that follow this demographic shift, there has been much less global health focus on the health and survival of adults. In 1992, Feachem and colleagues 9 drew attention to deaths in adults aged 15–59 years. Deaths in individuals aged younger than 60 years can be considered premature by any standard. 10–12 Deaths in the most economically and socially active groups can also have major effects on society. 13–15 For these reasons, the World Bank and subsequently WHO have reported adult mortality risk, also referred to as 45q15. 8,16 For a given year, 45q15 represents the probability that an individual who has just turned 15 years will die before reaching the age of 60 years, on the assumption that the age-specific mortality conditions of the year are constant throughout this individual’s life. Interest in adult mortality has been intensified through the Millennium Declaration. MDG 5 on maternal health focuses on one of the important causes of death in women aged 15–49 years. Adult female mortality rates are an essential component of the measurement of the maternal mortality ratio. 17 Two of the three diseases covered by MDG 6, tuberculosis and HIV, are largely killers of adults—95% and 85% of deaths from these diseases, respectively, occur in people older than 15 years. 8 Although maternal mortality, HIV, and tuberculosis have received substantial policy attention and development assistance for health, 18 the rising burden of non- communicable diseases in developing countries has received much less policy attention. 19–21 Despite the attention on specific diseases that affect adults, policy traction towards improving overall adult Worldwide mortality in men and women aged 15–59 years from 1970 to 2010: a systematic analysis Julie Knoll Rajaratnam, Jake R Marcus, Alison Levin-Rector, Andrew N Chalupka, Haidong Wang, Laura Dwyer, Megan Costa, Alan D Lopez, Christopher J L Murray Summary Background Adult deaths are a crucial priority for global health. Causes of adult death are important components of Millennium Development Goals 5 and 6. However, adult mortality has received little policy attention, resources, or monitoring efforts. This study aimed to estimate worldwide mortality in men and women aged 15–59 years. Methods We compiled a database of 3889 measurements of adult mortality for 187 countries from 1970 to 2010 using vital registration data and census and survey data for deaths in the household corrected for completeness, and sibling history data from surveys corrected for survival bias. We used Gaussian process regression to generate yearly estimates of the probability of death between the ages of 15 years and 60 years (45q15) for men and women for every country with uncertainty intervals that indicate sampling and non-sampling error. We showed that these analytical methods have good predictive validity for countries with missing data. Findings Adult mortality varied substantially across countries and over time. In 2010, the countries with the lowest risk of mortality for men and women are Iceland and Cyprus, respectively. In Iceland, male 45q15 is 65 (uncertainty interval 61–69) per 1000; in Cyprus, female 45q15 is 38 (36–41) per 1000. Highest risk of mortality in 2010 is seen in Swaziland for men (45q15 of 765 [692–845] per 1000) and Zambia for women (606 [518–708] per 1000). Between 1970 and 2010, substantial increases in adult mortality occurred in sub-Saharan Africa because of the HIV epidemic and in countries in or related to the former Soviet Union. Other regional trends were also seen, such as stagnation in the decline of adult mortality for large countries in southeast Asia and a striking decline in female mortality in south Asia. Interpretation The prevention of premature adult death is just as important for global health policy as the improvement of child survival. Routine monitoring of adult mortality should be given much greater emphasis. Funding Bill & Melinda Gates Foundation.
-
Upload
independent -
Category
Documents
-
view
0 -
download
0
Transcript of Worldwide mortality in men and women aged 15–59 years from 1970 to 2010: a systematic analysis
Articles
1704 www.thelancet.com Vol 375 May 15, 2010
Lancet 2010; 375: 1704–20
This online publication has been corrected. The
corrected version fi rst appeared at thelancet.com
on November 19, 2010
Published OnlineApril 30, 2010
DOI:10.1016/S0140-6736(10)60517-X
See Comment page 1668
Institute for Health Metrics and Evaluation, University of
Washington, Seattle, WA, USA (J K Rajaratnam PhD,
J R Marcus BA, A Levin-Rector BSPH,
H Wang PhD, L Dwyer BA, M Costa BA,
Prof C J L Murray MD); Harvard Medical School, Harvard
University, Boston, MA, USA (A N Chalupka); and School of
Population Health, University of Queensland, Brisbane, QLD, Australia (Prof A D Lopez PhD)
Correspondence to:Prof Christopher J L Murray,
Institute for Health Metrics and Evaluation, University of
Washington, 2301 5th Avenue, Suite 600, Seattle, WA 98121,
IntroductionPublic health eff orts in the 1980s and 1990s had a substantial focus on improving mortality and morbidity in children.1–3 Both the numbers and rates of death in children under 5 years of age have been falling for several decades, although many countries are not on track to achieve Millennium Development Goal (MDG) 4, which calls for a two-thirds reduction in the mortality rate in children younger than 5 years between 1990 and 2015.1,3–6 Concomitant with decreases in under-5 mortality, global fertility has declined from a total fertility rate (TFR) of 5·0 in 1950 to 2·5 in 2009, leading to a substantial increase in the mean and median age of most populations.7 Declining under-5 mortality rates and ageing populations also mean that a larger proportion of deaths occur in adults.7,8 Despite the increase in adult population and the related change in population health issues that follow this demographic shift, there has been much less global health focus on the health and survival of adults.
In 1992, Feachem and colleagues9 drew attention to deaths in adults aged 15–59 years. Deaths in individuals aged younger than 60 years can be considered premature by any standard.10–12 Deaths in the most economically and
socially active groups can also have major eff ects on society.13–15 For these reasons, the World Bank and subsequently WHO have reported adult mortality risk, also referred to as 45q15.8,16 For a given year, 45q15 represents the probability that an individual who has just turned 15 years will die before reaching the age of 60 years, on the assumption that the age-specifi c mortality conditions of the year are constant throughout this individual’s life.
Interest in adult mortality has been intensifi ed through the Millennium Declaration. MDG 5 on maternal health focuses on one of the important causes of death in women aged 15–49 years. Adult female mortality rates are an essential component of the measurement of the maternal mortality ratio.17 Two of the three diseases covered by MDG 6, tuberculosis and HIV, are largely killers of adults—95% and 85% of deaths from these diseases, respectively, occur in people older than 15 years.8 Although maternal mortality, HIV, and tuberculosis have received substantial policy attention and development assistance for health,18 the rising burden of non-communicable diseases in developing countries has received much less policy attention.19–21
Despite the attention on specifi c diseases that aff ect adults, policy traction towards improving overall adult
Worldwide mortality in men and women aged 15–59 years from 1970 to 2010: a systematic analysisJulie Knoll Rajaratnam, Jake R Marcus, Alison Levin-Rector, Andrew N Chalupka, Haidong Wang, Laura Dwyer, Megan Costa, Alan D Lopez, Christopher J L Murray
SummaryBackground Adult deaths are a crucial priority for global health. Causes of adult death are important components of Millennium Development Goals 5 and 6. However, adult mortality has received little policy attention, resources, or monitoring eff orts. This study aimed to estimate worldwide mortality in men and women aged 15–59 years.
Methods We compiled a database of 3889 measurements of adult mortality for 187 countries from 1970 to 2010 using vital registration data and census and survey data for deaths in the household corrected for completeness, and sibling history data from surveys corrected for survival bias. We used Gaussian process regression to generate yearly estimates of the probability of death between the ages of 15 years and 60 years (45q15) for men and women for every country with uncertainty intervals that indicate sampling and non-sampling error. We showed that these analytical methods have good predictive validity for countries with missing data.
Findings Adult mortality varied substantially across countries and over time. In 2010, the countries with the lowest risk of mortality for men and women are Iceland and Cyprus, respectively. In Iceland, male 45q15 is 65 (uncertainty interval 61–69) per 1000; in Cyprus, female 45q15 is 38 (36–41) per 1000. Highest risk of mortality in 2010 is seen in Swaziland for men (45q15 of 765 [692–845] per 1000) and Zambia for women (606 [518–708] per 1000). Between 1970 and 2010, substantial increases in adult mortality occurred in sub-Saharan Africa because of the HIV epidemic and in countries in or related to the former Soviet Union. Other regional trends were also seen, such as stagnation in the decline of adult mortality for large countries in southeast Asia and a striking decline in female mortality in south Asia.
Interpretation The prevention of premature adult death is just as important for global health policy as the improvement of child survival. Routine monitoring of adult mortality should be given much greater emphasis.
Funding Bill & Melinda Gates Foundation.
Articles
www.thelancet.com Vol 375 May 15, 2010 1705
health outcomes continues to be low.9 This disinterest has led to widespread neglect for building and maintaining data systems for measuring adult mortality.22,23 Tracking change in this basic outcome of adult health is important for assessing progress, improving interventions, and driving further investment.24 However, challenges in measurement of adult mortality have been noted historically and continue to persist.2,22,23,25,26
Assessments every 2 years by the United Nations Population Division (UNPD) are undertaken to produce population estimates and projections for most countries for 5-year periods. These eff orts also produce estimates of life expectancy, age-specifi c deaths, and 45q15, but for most developing countries, the estimates are based on models that assume a close correlation between adult and under-5 mortality.7 WHO also periodically produces estimates of 45q15; these often diff er substantially from UNPD estimates. WHO does not produce a complete time series (only selected years) and, similar to UNPD, major limitations of WHO’s approach are that the process is neither transparent nor replicable.27 Large-scale systematic assessments that cover all publicly available data sources over several decades have been completed for children but not for adults.1,28,29 In countries without complete vital registration systems, there has been disagreement about the best methods to analyse and interpret partial vital registration data, survey data for sibling histories, and survey or census recall of deaths.2 For some regions, important comparative analyses of available data have been undertaken but these eff orts did not cover the entire developing and developed world.30 The absence of a systematic assessment of the evidence on trends in adult mortality, especially in developing countries, has resulted in a “scandal of ignorance”.2,30,31
Several developments in data availability and analytical methods now make a systematic assessment of trends in 45q15 feasible. Improved methods for analysis of incomplete vital registration or sample registration data are now available.32 Issues of survivor bias in the analysis of sibling histories widely available in sub-Saharan Africa have been addressed and practical implementation of this approach worked out.33,34 More demographic surveillance system and sample registration data are available.35 Finally, techniques used to synthesise multiple data sources for children can be adapted for studying adult mortality (Rajaratnam J K, et al, unpublished data). In this study, we systematically analysed data for 187 countries from 1970 to 2010 to estimate 45q15 for men and women.
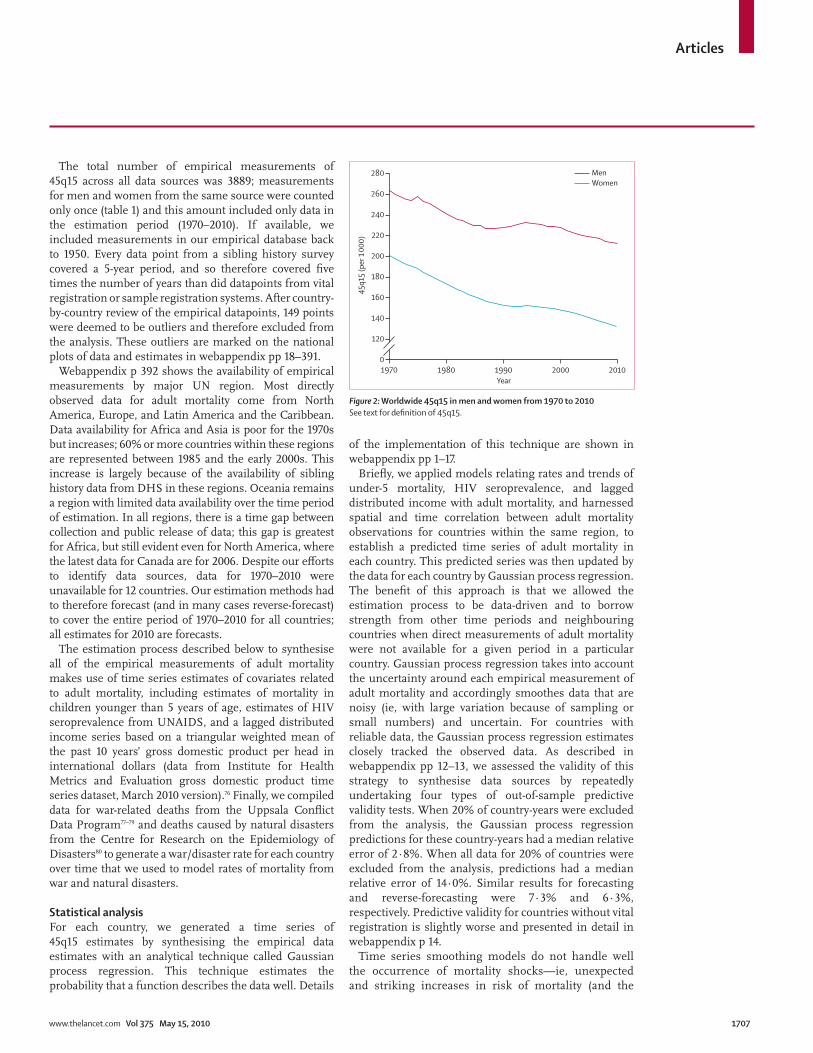
MethodsData sourcesEmpirical measurements of adult mortality were drawn from four types of sources (table 1): (1) vital registration data, (2) sample registration systems (when available), and nationally representative survey or census data that enable direct estimation of age-specifi c adult mortality
rates from questions about either (3) deaths in the household or (4) the survival of siblings of a respondent. In a few cases, an estimate of 45q15 from survey reports was used when other sources of microdata or tabulated data were not obtainable for direct analysis. For three countries (Bangladesh, Vietnam, and Papua New Guinea), we included mortality estimates from demographic surveillance sites. For China, we included data from the disease surveillance points system68 to supplement the few nationally representative data sources available.
We assessed, by use of the most eff ective methods, the level of completeness of reporting of deaths in vital registration systems, sample registration systems, and household sources relative to completeness of census coverage.32 If several assessments of completeness for each of these sources were available, we combined the results to create a time series of completeness as described in webappendix pp 9–12. For vital registration and sample registration systems, if the rate of death reporting was lower than 95% (we assumed that it was not possible for these systems to over-register deaths), age-specifi c estimates of death rates were adjusted upward by the inverse of the estimated level of completeness. For survey data for deaths in the household, estimates of age-specifi c death rates were adjusted either up or down on the basis of the inverse of the estimated level of completeness, because “telescoping”, or including deaths from outside the recall period, can lead to overestimation of death rates.74,75 Age-specifi c population estimates7,36 were used to compute death rates for vital registration and census
Empirical measurements
Outliers
Vital registration36–41 3489 114
Sample registration systems42–46 61 3
Household deaths
Demographic and Health surveys47 10 2
Pan Arab Project for Child Development surveys48–56
9 0
Censuses38 25 4
Country-specifi c surveys57–63 14 2
Sibling histories
Demographic and Health surveys47 179 1
Pan Arab Project for Family Health surveys64 3 3
CDC reproductive health surveys65 19 0
Country-specifi c surveys61,66 6 0
Demographic surveillance sites: Bangladesh, Papua New Guinea, Vietnam67
47 17
Disease surveillance points: China68 10 0
Other38, 69–73 17 3
Total 3889 149
CDC=Centers for Disease Control and Prevention. Outliers are points excluded from analysis after country-by-country review of all data.
Table 1: Data sources for empirical measurements of adult mortality
See Online for webappendix
Articles
1706 www.thelancet.com Vol 375 May 15, 2010
household deaths. The population for Cyprus does not include the Turkish Cypriot population that is not captured in the vital registration data. Singapore vital registration data capture deaths of legal residents, but not deaths of migrant workers or their families. Denominators for other sources, such as sample registration systems and survey household deaths that represented samples of the total population, were obtained directly from those sources.
Microdata from surveys containing information about survival of siblings were analysed by use of the
methods described by Obermeyer and colleagues34 that correct for survival and recall bias in this type of survey. All Demographic and Health Surveys (DHS) were pooled together as the analytic method required. Sibling survival data from other sources (eg, US Centers for Disease Control and Prevention reproductive health surveys, Pan Arab Project for Family Health surveys) were pooled with DHS to establish reliable age patterns of mortality, but only results from the additional surveys (non-DHS) were retained from these analyses.
350Chile, menA
300
250
200
150
100
50
1970 1980 1990 2000 2010
1970 1980 1990 2000 2010
120
100
80
60
40
20
Iceland, womenB
Philippines, womenC
Colombia, men
Year
Year1970 1980 1990 2000 2010
1970 1980 1990 2000 20101970 1980 1990 2000 2010
E
Zambia, womenD
00
180
160
140
120
100
80
0
700
600
500
400
300
200
0
300
250
200
150
100
0
45q1
5 (p
er 1
000)
45q1
5 (p
er 1
000)
45q1
5 (p
er 1
000)
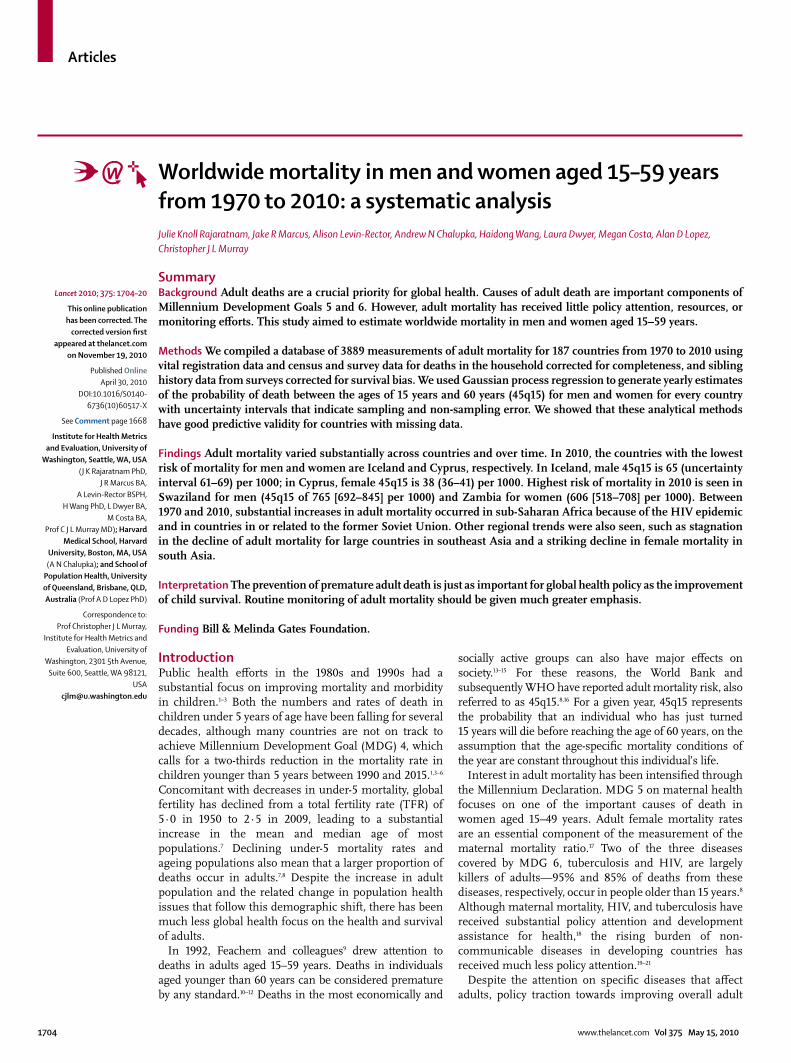
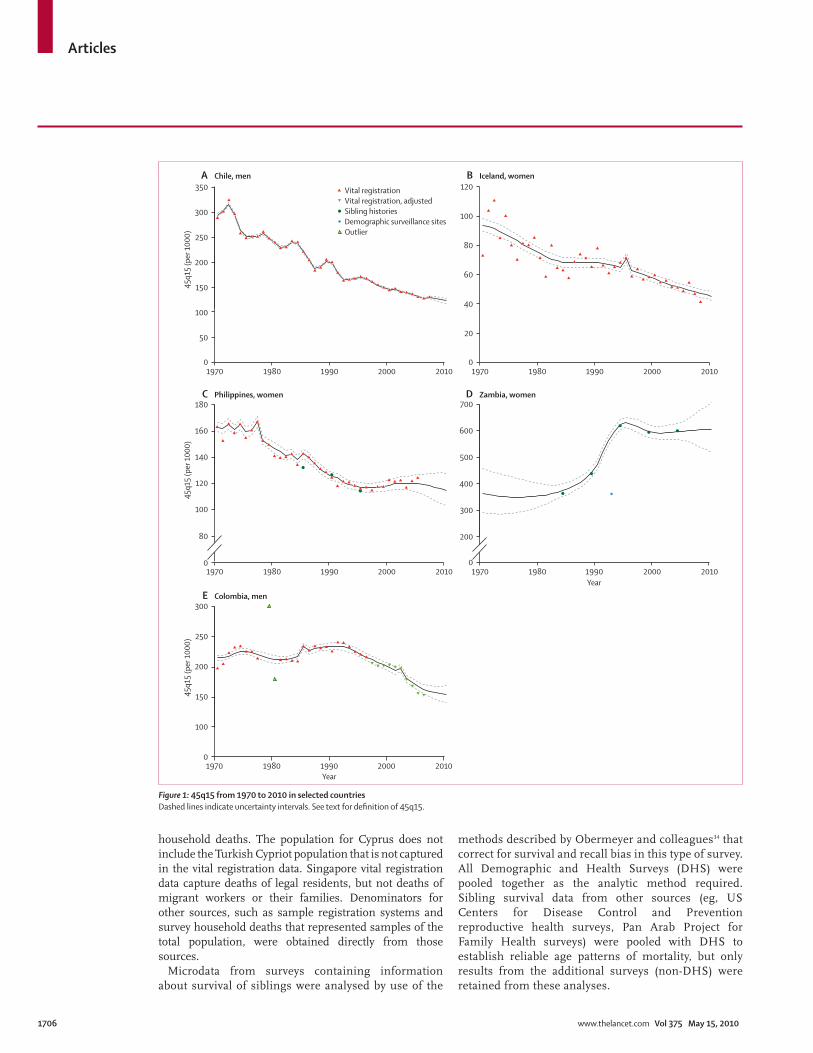
Vital registrationVital registration, adjustedSibling historiesDemographic surveillance sitesOutlier
Figure 1: 45q15 from 1970 to 2010 in selected countriesDashed lines indicate uncertainty intervals. See text for defi nition of 45q15.
Articles
www.thelancet.com Vol 375 May 15, 2010 1707
The total number of empirical measurements of 45q15 across all data sources was 3889; measurements for men and women from the same source were counted only once (table 1) and this amount included only data in the estimation period (1970–2010). If available, we included measurements in our empirical database back to 1950. Every data point from a sibling history survey covered a 5-year period, and so therefore covered fi ve times the number of years than did datapoints from vital registration or sample registration systems. After country-by-country review of the empirical datapoints, 149 points were deemed to be outliers and therefore excluded from the analysis. These outliers are marked on the national plots of data and estimates in webappendix pp 18–391.
Webappendix p 392 shows the availability of empirical measurements by major UN region. Most directly observed data for adult mortality come from North America, Europe, and Latin America and the Caribbean. Data availability for Africa and Asia is poor for the 1970s but increases; 60% or more countries within these regions are represented between 1985 and the early 2000s. This increase is largely because of the availability of sibling history data from DHS in these regions. Oceania remains a region with limited data availability over the time period of estimation. In all regions, there is a time gap between collection and public release of data; this gap is greatest for Africa, but still evident even for North America, where the latest data for Canada are for 2006. Despite our eff orts to identify data sources, data for 1970–2010 were unavailable for 12 countries. Our estimation methods had to therefore forecast (and in many cases reverse-forecast) to cover the entire period of 1970–2010 for all countries; all estimates for 2010 are forecasts.
The estimation process described below to synthesise all of the empirical measurements of adult mortality makes use of time series estimates of covariates related to adult mortality, including estimates of mortality in children younger than 5 years of age, estimates of HIV seroprevalence from UNAIDS, and a lagged distributed income series based on a triangular weighted mean of the past 10 years’ gross domestic product per head in international dollars (data from Institute for Health Metrics and Evaluation gross domestic product time series dataset, March 2010 version).76 Finally, we compiled data for war-related deaths from the Uppsala Confl ict Data Program77–79 and deaths caused by natural disasters from the Centre for Research on the Epidemiology of Disasters80 to generate a war/disaster rate for each country over time that we used to model rates of mortality from war and natural disasters.
Statistical analysisFor each country, we generated a time series of 45q15 estimates by synthesising the empirical data estimates with an analytical technique called Gaussian process regression. This technique estimates the probability that a function describes the data well. Details
of the implementation of this technique are shown in webappendix pp 1–17.
Briefl y, we applied models relating rates and trends of under-5 mortality, HIV seroprevalence, and lagged distributed income with adult mortality, and harnessed spatial and time correlation between adult mortality observations for countries within the same region, to establish a predicted time series of adult mortality in each country. This predicted series was then updated by the data for each country by Gaussian process regression. The benefi t of this approach is that we allowed the estimation process to be data-driven and to borrow strength from other time periods and neighbouring countries when direct measurements of adult mortality were not available for a given period in a particular country. Gaussian process regression takes into account the uncertainty around each empirical measurement of adult mortality and accordingly smoothes data that are noisy (ie, with large variation because of sampling or small numbers) and uncertain. For countries with reliable data, the Gaussian process regression estimates closely tracked the observed data. As described in webappendix pp 12–13, we assessed the validity of this strategy to synthesise data sources by repeatedly undertaking four types of out-of-sample predictive validity tests. When 20% of country-years were excluded from the analysis, the Gaussian process regression predictions for these country-years had a median relative error of 2·8%. When all data for 20% of countries were excluded from the analysis, predictions had a median relative error of 14·0%. Similar results for forecasting and reverse-forecasting were 7·3% and 6·3%, respectively. Predictive validity for countries without vital registration is slightly worse and presented in detail in webappendix p 14.
Time series smoothing models do not handle well the occurrence of mortality shocks—ie, unexpected and striking increases in risk of mortality (and the
45q1
5 (p
er 1
000
)
Year1970 1980 1990 2000 2010
200
180
160
120
140
260
280
240
220
0
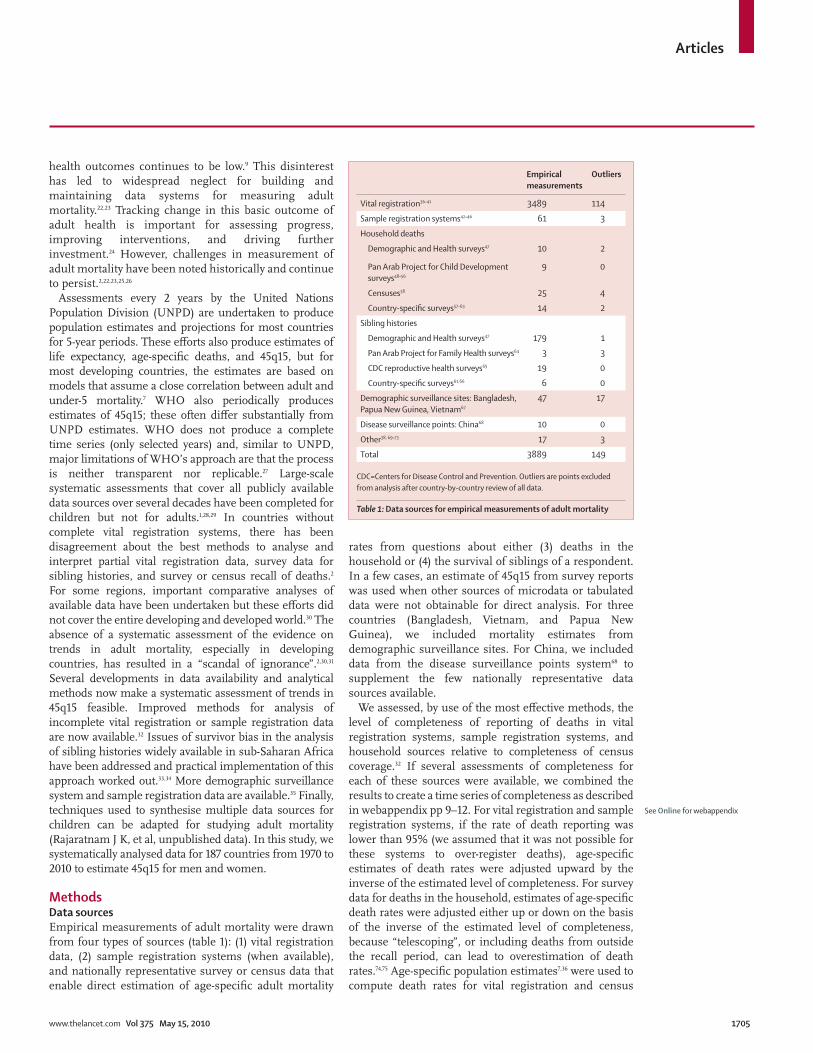
MenWomen
Figure 2: Worldwide 45q15 in men and women from 1970 to 2010See text for defi nition of 45q15.
Articles
1708 www.thelancet.com Vol 375 May 15, 2010
subsequent steep declines) caused by natural disasters or war. To account for mortality shocks in our time series estimates, we withheld empirical measurements obtained during war or disaster periods from the Gaussian process regression estimation process. This approach allowed our model to generate a counter-factual estimate of mortality during the shock period to which we added excess mortality caused by the shock.
Excess mortality was calculated by several steps. Shock years were defi ned as those in which the war/disaster rate was reported to exceed one death per 10 000 population in a year. We developed an empirical model that related change in 45q15 from baseline observed in the empirical datasets to the war/disaster
death rate. On the basis of this model, for each shock year we predicted the increase in 45q15. If data for that shock year were available in a country and the 45q15 value was higher than the predicted increase, the observed data were used for the shock. If no data were available, the predicted excess mortality was used (webappendix p 7).
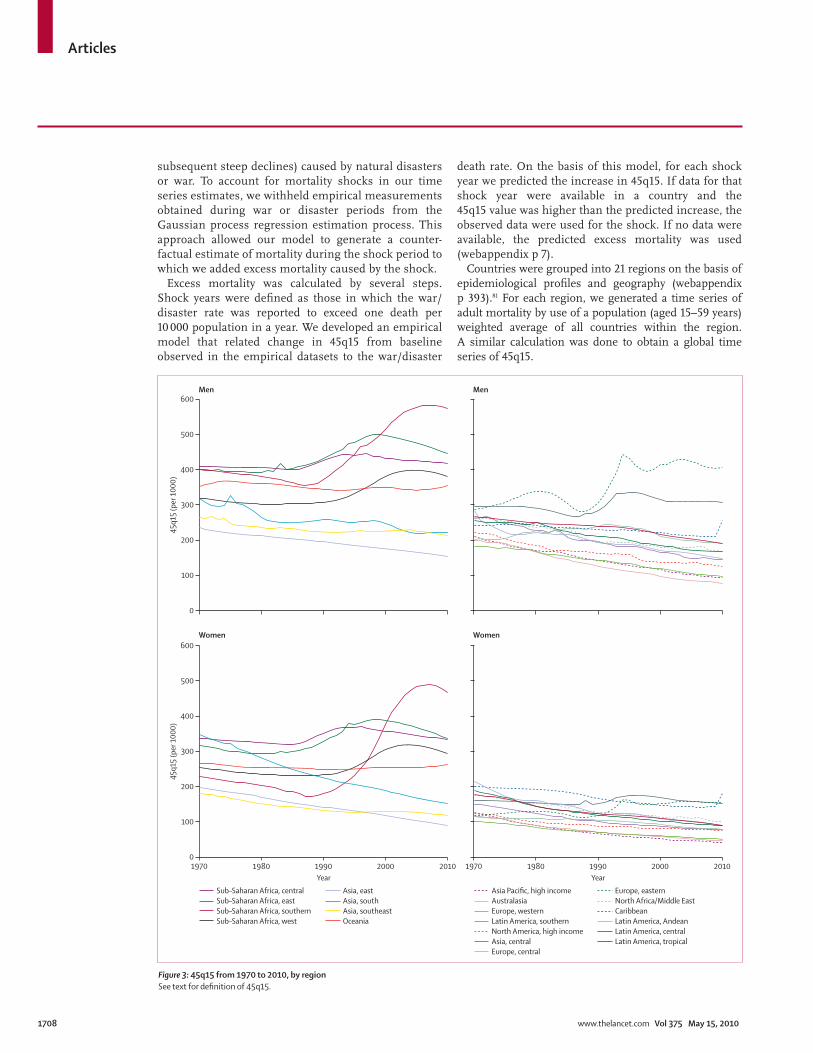
Countries were grouped into 21 regions on the basis of epidemiological profi les and geography (webappendix p 393).81 For each region, we generated a time series of adult mortality by use of a population (aged 15–59 years) weighted average of all countries within the region. A similar calculation was done to obtain a global time series of 45q15.
45q1
5 (p
er 1
000)
400
300
200
600
500
100
0
Sub–Saharan Africa, centralSub–Saharan Africa, eastSub–Saharan Africa, southernSub–Saharan Africa, west
Asia, eastAsia, southAsia, southeastOceania
Asia Pacific, high incomeAustralasiaEurope, westernLatin America, southernNorth America, high incomeAsia, centralEurope, central
Europe, easternNorth Africa/Middle EastCaribbeanLatin America, AndeanLatin America, centralLatin America, tropical
Men Men
45q1
5 (p
er 1
000)
400
300
200
600
500
100
0
Year1970 1980 1990 2000 2010
Year1970 1980 1990 2000 2010
Women Women
Figure 3: 45q15 from 1970 to 2010, by regionSee text for defi nition of 45q15.
Articles
www.thelancet.com Vol 375 May 15, 2010 1709
Role of the funding sourceThe sponsor of the study had no role in study design, data collection, data analysis, data interpretation, or preparation of the report. The corresponding author had full access to all the data in the study and had fi nal responsibility for the decision to submit for publication.
ResultsThe empirical measurements of 45q15 and the results of our data synthesis, including uncertainty intervals, are available for each country in webappendix pp 18–391; fi ve examples of these data plots are shown in fi gure 1. Data for adult male mortality in Chile provide an example of a complete time series with complete vital registration
1970 1990 2010
Women Men Women Men Women Men
Asia-Pacifi c, high income
Brunei 157 (149–165) 174 (166–182) 119 (113–126) 152 (144–159) 91 (82–100) 116 (106–128)
Japan 103 (102–103) 171 (170–171) 53 (53–54) 109 (108–109) 41 (38–45) 84 (78–90)
Singapore 145 (141–149) 240 (234–245) 85 (83–87) 145 (142–148) 47 (44–51) 87 (81–95)
South Korea 221 (199–244) 379 (345–417) 99 (98–101) 233 (230–237) 40 (38–43) 112 (104–120)
Asia, Central
Armenia 108 (97–120) 200 (178–225) 99 (97–101) 210 (205–216) 77 (72–82) 209 (193–227)
Azerbaijan 150 (136–165) 280 (250–314) 131 (128–134) 273 (266–280) 105 (97–113) 220 (203–239)
Georgia 134 (119–152) 277 (247–310) 108 (105–112) 252 (245–258) 86 (79–94) 235 (217–255)
Kazakhstan 153 (135–173) 335 (296–379) 141 (137–145) 316 (310–323) 181 (167–195) 440 (408–474)
Kyrgyzstan 168 (148–190) 314 (279–354) 148 (144–152) 288 (281–294) 144 (134–155) 325 (304–348)
Mongolia 257 (230–289) 321 (286–359) 262 (252–272) 356 (344–369) 241 (229–254) 490 (468–512)
Tajikistan 192 (172–215) 263 (234–295) 169 (164–174) 245 (239–252) 151 (140–163) 259 (239–281)
Turkmenistan 197 (179–216) 324 (295–355) 167 (163–170) 284 (278–289) 120 (109–132) 273 (249–301)
Uzbekistan 170 (154–187) 286 (256–319) 175 (171–179) 285 (277–292) 167 (155–179) 283 (260–308)
Asia, east
China 198 (183–214) 236 (220–254) 142 (137–147) 197 (191–204) 90 (85–97) 155 (144–166)
North Korea 215 (202–230) 300 (285–317) 159 (149–170) 232 (219–245) 141 (130–153) 223 (208–239)
Taiwan 140 (136–144) 219 (213–226) 90 (88–92) 179 (175–183) 59 (56–61) 144 (138–151)
Asia, south
Afghanistan 398 (326–487) 347 (278–432) 323 (259–402) 299 (238–377) 295 (227–383) 289 (215–389)
Bangladesh 308 (276–344) 306 (247–378) 192 (184–200) 231 (217–245) 121 (106–137) 172 (141–209)
Bhutan 357 (331–384) 335 (312–361) 208 (192–226) 246 (226–267) 129 (113–147) 185 (160–213)
India 358 (347–370) 330 (305–358) 225 (219–231) 266 (256–276) 145 (135–155) 228 (197–265)
Nepal 282 (217–366) 301 (225–403) 212 (190–237) 260 (230–293) 118 (100–138) 179 (149–213)
Pakistan 283 (257–313) 235 (208–265) 226 (209–243) 241 (222–261) 218 (182–260) 241 (192–302)
Asia, southeast
Burma 250 (231–271) 331 (311–352) 210 (194–228) 318 (299–339) 165 (148–185) 272 (248–298)
Cambodia 209 (178–246) 443 (380–515) 186 (176–197) 363 (346–381) 162 (145–181) 324 (288–364)
Indonesia 175 (147–209) 231 (200–266) 132 (126–138) 196 (188–203) 131 (115–148) 215 (195–237)
Laos 268 (247–290) 343 (319–369) 215 (198–234) 318 (296–342) 167 (149–187) 265 (241–291)
Malaysia 196 (185–208) 255 (244–266) 118 (116–120) 187 (185–189) 82 (73–93) 154 (139–171)
Maldives 349 (296–412) 279 (242–321) 229 (217–241) 212 (201–223) 76 (68–85) 107 (99–117)
Mauritius 199 (192–206) 309 (299–319) 117 (113–122) 255 (247–262) 107 (97–118) 213 (192–236)
Philippines 163 (159–167) 249 (244–254) 125 (122–128) 246 (242–250) 115 (103–128) 225 (211–241)
Seychelles 155 (142–169) 253 (238–270) 117 (109–125) 267 (253–282) 93 (79–110) 258 (232–287)
Sri Lanka 156 (153–158) 211 (208–214) 98 (94–103) 217 (210–224) 68 (57–80) 192 (169–220)
Thailand 190 (186–194) 265 (257–273) 106 (103–108) 198 (192–204) 100 (93–107) 200 (181–221)
Timor-Leste 265 (246–285) 338 (315–363) 197 (183–213) 305 (284–328) 171 (152–191) 275 (250–303)
Vietnam 149 (124–179) 328 (283–381) 121 (104–141) 245 (215–280) 81 (72–92) 201 (180–224)
Australasia
Australia 113 (112–115) 202 (200–204) 67 (66–68) 124 (122–125) 44 (42–46) 76 (73–78)
New Zealand 116 (114–119) 193 (190–197) 88 (87–90) 142 (140–145) 56 (54–59) 84 (81–87)
(Continues on next page)
Articles
1710 www.thelancet.com Vol 375 May 15, 2010
For the yearly estimates of 45q15 for each country see
http://www.healthmetricsandevaluation.org/resources/
datasets/2010/mortality/results/adult/adult.html
data. In this case, our Gaussian process regression model produced estimates that were very close to the observed data and the uncertainty intervals represent only the sampling uncertainty in the death rates at each age. Iceland also had a complete vital registration system
but because of small population size, 45q15 for women fl uctuated from year to year. The model, taking into account this sampling variance, produced a smooth time trend that followed the empirical data, and, because of the degree of sampling error, uncertainty intervals for
1970 1990 2010
Women Men Women Men Women Men
(Continued from previous page)
Caribbean
Antigua and Barbuda 168 (153–183) 227 (208–247) 102 (93–111) 183 (169–199) 99 (82–120) 193 (162–229)
Barbados 142 (136–148) 200 (190–210) 104 (100–109) 175 (168–183) 82 (73–92) 133 (114–156)
Belize 139 (129–150) 174 (162–188) 115 (106–123) 172 (162–183) 138 (116–164) 226 (193–264)
Cuba 113 (112–115) 144 (142–146) 108 (107–109) 153 (152–155) 79 (75–84) 120 (113–128)
Dominica 170 (154–188) 233 (211–258) 125 (113–138) 189 (171–210) 100 (82–122) 164 (135–200)
Dominican Republic 143 (136–150) 166 (159–174) 103 (98–108) 163 (156–171) 100 (87–115) 180 (157–205)
Grenada 182 (168–198) 250 (233–268) 146 (135–159) 214 (201–228) 133 (113–157) 236 (206–270)
Guyana 218 (209–228) 298 (285–311) 176 (170–183) 306 (295–318) 175 (159–194) 253 (221–290)
Haiti 475 (375–601) 530 (424–661) 411 (393–430) 481 (460–502) 483 (410–569) 585 (505–676)
Jamaica 175 (168–182) 227 (219–236) 125 (99–158) 190 (152–236) 108 (90–131) 193 (163–228)
Saint Lucia 182 (161–204) 244 (222–269) 144 (133–156) 204 (192–216) 103 (85–124) 187 (163–216)
Saint Vincent and the Grenadines 169 (149–191) 235 (211–262) 143 (127–159) 201 (184–219) 132 (110–158) 203 (176–235)
Suriname 226 (207–246) 285 (266–305) 168 (160–177) 255 (245–266) 184 (160–211) 293 (257–335)
The Bahamas 240 (227–253) 357 (340–376) 171 (164–179) 292 (281–304) 142 (127–159) 252 (229–277)
Trinidad and Tobago 199 (194–204) 260 (254–265) 161 (157–165) 241 (236–246) 106 (95–119) 210 (190–231)
Europe, central
Albania 112 (105–119) 178 (164–192) 76 (74–78) 145 (142–147) 62 (57–66) 126 (117–135)
Bosnia and Herzegovina 146 (136–156) 247 (228–267) 94 (92–97) 199 (195–204) 70 (67–73) 149 (143–156)
Bulgaria 101 (99–103) 164 (161–166) 97 (95–99) 218 (215–220) 87 (83–92) 211 (198–225)
Croatia 130 (120–142) 262 (238–288) 94 (92–96) 234 (230–238) 62 (59–65) 160 (151–168)
Czech Republic 109 (108–111) 222 (220–225) 94 (93–95) 220 (218–223) 63 (61–65) 139 (134–144)
Hungary 114 (112–116) 199 (196–201) 133 (131–135) 304 (301–307) 103 (97–109) 245 (229–261)
Macedonia 121 (112–131) 186 (170–202) 95 (92–98) 169 (165–173) 77 (73–81) 149 (142–156)
Montenegro 154 (143–167) 238 (216–261) 109 (102–117) 200 (185–217) 81 (78–85) 164 (156–173)
Poland 105 (104–106) 206 (204–207) 102 (101–103) 263 (262–265) 78 (74–83) 207 (195–220)
Romania 121 (119–122) 188 (186–190) 114 (112–115) 238 (236–240) 91 (86–96) 217 (204–232)
Serbia 127 (117–138) 195 (179–213) 96 (91–102) 177 (166–188) 70 (68–73) 145 (140–150)
Slovakia 109 (107–111) 214 (211–218) 102 (100–104) 268 (265–272) 74 (70–78) 191 (180–204)
Slovenia 140 (130–150) 287 (263–314) 91 (89–93) 222 (218–227) 56 (53–59) 138 (129–146)
Europe, eastern
Belarus 115 (111–119) 255 (246–264) 116 (112–120) 300 (292–309) 132 (122–142) 378 (347–411)
Estonia 104 (101–107) 256 (250–262) 110 (107–113) 297 (291–303) 87 (81–93) 253 (235–272)
Latvia 113 (110–116) 262 (257–268) 117 (114–120) 308 (302–314) 121 (112–130) 325 (299–354)
Lithuania 105 (103–108) 247 (242–252) 108 (106–111) 289 (284–294) 115 (108–122) 316 (295–338)
Moldova 181 (165–200) 297 (265–334) 157 (154–160) 281 (276–287) 140 (132–150) 310 (290–333)
Russia 121 (118–123) 308 (302–315) 118 (116–120) 316 (310–322) 157 (147–167) 412 (383–442)
Ukraine 108 (105–111) 240 (234–246) 113 (111–116) 286 (280–292) 157 (146–169) 422 (388–458)
Europe, western
Andorra 76 (71–81) 145 (137–154) 64 (60–68) 125 (117–132) 49 (45–52) 96 (90–103)
Austria 107 (105–109) 206 (203–208) 74 (72–75) 156 (154–159) 48 (46–51) 98 (93–103)
Belgium 105 (103–107) 194 (192–197) 76 (74–77) 140 (138–142) 60 (57–63) 104 (99–110)
Cyprus 97 (90–104) 151 (142–161) 58 (55–60) 109 (105–112) 38 (36–41) 85 (80–90)
Denmark 104 (102–106) 158 (155–160) 98 (97–100) 151 (149–153) 65 (62–68) 108 (103–114)
(Continues on next page)

Articles
www.thelancet.com Vol 375 May 15, 2010 1711
Iceland were much larger than they were for Chile. The estimation of mortality shocks can also been seen in the case example of Iceland. In 1995, there were two avalanches that killed 34 people. Even 34 deaths is a fairly substantial number for Iceland and caused a sharp rise in 45q15 for that year. The Philippines is an example of a
country with data from two independent sources—vital registration and sibling histories gathered in a household survey. In this case, the two sources were quite consistent and the Gaussian process regression estimates incorporated both sources with appropriate uncertainty intervals. Zambia had data from sibling histories only.
1970 1990 2010
Women Men Women Men Women Men
(Continued from previous page)
Finland 101 (99–103) 259 (255–263) 70 (68–72) 182 (179–184) 54 (51–57) 124 (118–130)
France 98 (97–99) 199 (198–200) 67 (66–67) 162 (161–163) 53 (50–56) 116 (110–122)
Germany 109 (108–110) 192 (191–193) 77 (76–77) 157 (156–158) 54 (52–57) 102 (97–108)
Greece 79 (78–81) 133 (131–135) 56 (55–57) 118 (116–120) 41 (39–44) 101 (97–106)
Iceland 94 (90–99) 172 (166–178) 68 (64–71) 111 (107–115) 44 (41–47) 65 (61–69)
Ireland 120 (117–123) 181 (178–185) 79 (77–81) 134 (131–136) 52 (49–55) 85 (81–89)
Israel 112 (110–115) 161 (158–165) 73 (72–75) 116 (114–118) 46 (43–48) 83 (79–88)
Italy 95 (94–96) 176 (175–178) 61 (60–62) 131 (130–132) 41 (39–44) 79 (75–83)
Luxembourg 115 (111–119) 227 (221–232) 80 (77–82) 162 (157–166) 51 (48–54) 102 (97–108)
Malta 110 (105–114) 184 (177–190) 64 (61–66) 108 (104–112) 45 (42–48) 73 (69–77)
Netherlands 86 (85–88) 157 (155–159) 68 (67–69) 116 (114–117) 55 (52–57) 73 (70–77)
Norway 77 (75–78) 156 (153–158) 66 (65–68) 128 (126–130) 50 (48–53) 77 (73–81)
Portugal 109 (107–111) 208 (206–211) 79 (78–81) 176 (174–178) 49 (46–52) 121 (115–127)
Spain 94 (93–95) 166 (164–167) 60 (59–61) 147 (145–148) 43 (40–45) 102 (96–107)
Sweden 84 (83–86) 143 (141–145) 65 (64–66) 115 (113–116) 44 (42–46) 71 (68–74)
Switzerland 88 (86–89) 165 (163–168) 63 (62–64) 128 (126–130) 43 (41–46) 74 (70–78)
UK 107 (106–108) 180 (179–181) 78 (77–79) 129 (128–130) 58 (54–61) 93 (88–98)
Latin America, Andean
Bolivia 291 (273–311) 357 (325–392) 178 (169–188) 283 (270–296) 136 (115–160) 226 (187–272)
Ecuador 181 (177–185) 216 (212–221) 115 (112–118) 181 (177–186) 79 (71–87) 146 (133–159)
Peru 202 (194–210) 291 (281–303) 110 (105–114) 175 (169–181) 80 (69–92) 127 (110–147)
Latin America, central
Colombia 167 (164–171) 216 (212–220) 115 (111–118) 235 (229–241) 67 (59–75) 155 (142–169)
Costa Rica 126 (123–129) 158 (154–162) 79 (77–81) 131 (128–134) 58 (53–63) 110 (103–117)
El Salvador 187 (183–191) 253 (248–258) 112 (109–115) 254 (248–260) 92 (84–101) 246 (230–263)
Guatemala 308 (300–317) 372 (364–380) 177 (172–182) 269 (263–276) 136 (122–152) 269 (247–294)
Honduras 221 (213–230) 262 (254–272) 163 (153–173) 208 (197–219) 182 (153–216) 164 (146–183)
Mexico 190 (187–193) 272 (268–277) 117 (115–119) 210 (206–213) 88 (84–93) 158 (149–168)
Nicaragua 216 (203–231) 280 (266–296) 116 (110–122) 178 (169–186) 99 (87–113) 174 (161–188)
Panama 157 (152–162) 175 (171–180) 82 (79–85) 135 (132–139) 68 (61–76) 126 (117–135)
Venezuela 158 (155–161) 222 (219–225) 106 (104–107) 179 (177–181) 81 (71–91) 177 (162–194)
Latin America, southern
Argentina 140 (139–142) 256 (254–258) 102 (101–103) 198 (197–200) 83 (80–87) 156 (148–164)
Chile 181 (179–184) 292 (289–296) 96 (95–97) 192 (190–194) 60 (57–62) 115 (110–121)
Uruguay 125 (123–128) 228 (224–232) 96 (94–98) 193 (190–197) 82 (78–87) 161 (150–172)
Latin America, tropical
Brazil 177 (164–192) 271 (259–283) 122 (121–124) 244 (241–247) 89 (83–96) 193 (185–201)
Paraguay 130 (126–134) 151 (147–155) 103 (100–106) 134 (131–138) 117 (98–139) 173 (158–190)
North Africa and Middle East
Algeria 253 (222–288) 306 (270–346) 113 (100–127) 143 (128–159) 84 (67–106) 130 (102–165)
Bahrain 178 (147–216) 239 (207–276) 143 (134–153) 170 (162–179) 102 (88–118) 147 (130–167)
Egypt 154 (150–159) 293 (285–300) 156 (152–161) 229 (222–236) 121 (108–137) 201 (180–226)
Iran 168 (146–193) 231 (199–269) 109 (100–120) 185 (164–209) 95 (83–108) 183 (158–212)
(Continues on next page)
Articles
1712 www.thelancet.com Vol 375 May 15, 2010
The Gaussian process regression estimates tracked the data fairly closely, with the estimates after the most recent data point and before the oldest data point largely informed by the modelling process. As expected, uncertainty intervals widened as time from available data increased. Figure 1 shows data for Colombian men and shows how two datapoints have been coded as outliers in the time series.
Risk of mortality is generally higher (up to 2·2 times as high) for men than for women; however, in 2·5% of country-years, risk is higher for women than for men. By combining results for every country and weighting by population, we can examine the worldwide trend in 45q15 for men and women from 1970 to 2010 (fi gure 2). Over this period, 45q15 dropped by 19% for men and by 34% for women. Yearly rates of decline from 1970 to 1990
1970 1990 2010
Women Men Women Men Women Men
(Continued from previous page)
Iraq 160 (146–175) 226 (207–246) 117 (103–133) 156 (139–174) 89 (76–104) 145 (122–172)
Jordan 145 (114–184) 197 (156–250) 120 (94–152) 122 (97–154) 97 (76–124) 94 (75–117)
Kuwait 119 (114–125) 180 (176–185) 134 (120–149) 178 (160–198) 128 (101–161) 186 (146–235)
Lebanon 98 (77–124) 185 (147–233) 75 (64–87) 169 (145–196) 52 (42–64) 125 (103–152)
Libya 163 (153–175) 189 (176–202) 113 (101–127) 150 (131–171) 90 (76–105) 115 (98–135)
Morocco 218 (178–267) 284 (232–349) 123 (116–130) 210 (198–223) 100 (83–119) 166 (137–200)
Occupied Palestinian territories 186 (172–202) 273 (248–300) 137 (125–149) 202 (183–222) 119 (105–135) 185 (163–211)
Oman 238 (188–300) 256 (202–324) 138 (113–169) 176 (145–213) 86 (76–96) 139 (124–155)
Qatar 110 (90–136) 185 (151–228) 85 (76–95) 96 (86–108) 67 (56–81) 81 (68–96)
Saudi Arabia 188 (149–237) 196 (156–246) 104 (83–129) 132 (106–164) 89 (75–106) 122 (103–144)
Syria 194 (179–209) 341 (312–373) 168 (150–188) 231 (202–265) 124 (108–141) 214 (186–246)
Tunisia 217 (211–225) 262 (255–269) 85 (81–89) 135 (130–140) 56 (45–70) 109 (91–130)
Turkey 137 (117–161) 261 (219–311) 115 (112–118) 220 (215–226) 85 (78–93) 174 (158–191)
United Arab Emirates 125 (113–137) 194 (178–212) 76 (68–84) 130 (119–142) 46 (40–53) 95 (85–108)
Yemen 285 (228–356) 349 (278–437) 212 (186–242) 273 (240–311) 165 (132–206) 234 (190–289)
North America, high income
Canada 101 (100–102) 185 (184–187) 70 (69–71) 127 (126–128) 52 (50–54) 84 (81–87)
USA 126 (125–126) 228 (227–228) 89 (89–90) 167 (166–167) 77 (75–80) 130 (126–134)
Oceania
Federated states of Micronesia 263 (241–288) 351 (317–389) 220 (200–241) 324 (293–357) 171 (149–197) 276 (240–318)
Fiji 210 (201–219) 315 (303–327) 219 (193–249) 330 (299–364) 234 (186–295) 316 (262–382)
Kiribati 238 (183–311) 299 (237–377) 200 (177–226) 307 (272–347) 167 (138–203) 309 (254–375)
Marshall Islands 207 (161–267) 291 (227–372) 214 (193–236) 304 (276–335) 219 (172–279) 283 (228–350)
Papua New Guinea 281 (259–306) 367 (343–394) 264 (243–288) 359 (332–389) 283 (249–320) 380 (343–422)
Samoa 223 (205–244) 362 (338–388) 150 (115–198) 273 (218–342) 94 (73–122) 150 (121–185)
Solomon Islands 249 (229–271) 343 (319–369) 201 (184–221) 313 (291–336) 187 (163–215) 293 (264–326)
Tonga 197 (161–241) 225 (193–264) 154 (119–199) 213 (168–269) 128 (101–162) 206 (169–252)
Vanuatu 265 (239–292) 355 (330–382) 214 (192–238) 320 (296–346) 165 (143–192) 271 (241–304)
Sub-Saharan Africa, central
Angola 336 (317–356) 436 (413–461) 320 (301–339) 388 (367–411) 310 (288–334) 386 (358–416)
Central African Republic 329 (299–361) 452 (411–497) 478 (461–496) 600 (582–618) 491 (446–539) 600 (544–663)
Congo 337 (303–376) 383 (342–429) 370 (348–393) 421 (396–447) 349 (319–381) 415 (380–453)
Democratic Republic of the Congo 339 (305–378) 407 (363–457) 352 (327–379) 431 (405–459) 327 (300–356) 420 (387–455)
Equatorial Guinea 315 (293–338) 424 (401–448) 306 (285–328) 384 (362–406) 341 (314–371) 413 (384–444)
Gabon 232 (208–258) 310 (279–344) 225 (212–238) 319 (300–339) 313 (285–344) 412 (374–454)
Sub-Saharan Africa, east
Burundi 434 (372–506) 493 (426–571) 420 (335–526) 498 (404–614) 426 (339–536) 516 (409–649)
Comoros 332 (276–400) 359 (301–430) 280 (221–355) 330 (266–409) 238 (188–301) 300 (244–368)
Djibouti 253 (232–276) 319 (296–342) 221 (203–241) 318 (295–342) 253 (226–283) 379 (342–420)
Eritrea 429 (355–519) 633 (525–763) 379 (356–404) 541 (514–570) 361 (298–438) 454 (372–555)
Ethiopia 430 (355–521) 583 (475–716) 440 (423–457) 617 (598–637) 372 (328–422) 484 (424–551)
(Continues on next page)

Articles
www.thelancet.com Vol 375 May 15, 2010 1713
were 0·7% for men and 1·4% for women. From 1990, worldwide male 45q15 increased until 1995 and then began to decline. From 1990, female 45q15 declined at a much faster rate than did male 45q15, apart from during the period between 1994 and 2003, when both were declining roughly at the same pace. Worldwide, the gap between adult male and female 45q15 was 63 per 1000 in 1970 and increased to 80 per 1000 in 2010. In relative terms, the gap between sexes has widened even more, and accords with the sex diff erence in adult mortality in the USA and other high-income countries during the
mid-20th century. Worldwide, the 1990s reversal in the trend in adult mortality is probably a result of the HIV pandemic and the sharp rise in adult mortality in countries of the former Soviet Union.
Figure 3 presents male and female 45q15 for 21 regions of the world, showing a high degree of variation between regions. For men, regional 45q15 varied from 182 to 413 per 1000 in 1970 and from 77 to 579 per 1000 in 2010—a 117% increase in the spread across regions. Rising inequality in adult mortality across regions is also evident for women, for whom 45q15 ranged from 101 to 347 per
1970 1990 2010
Women Men Women Men Women Men
(Continued from previous page)
Kenya 216 (175–266) 284 (236–343) 223 (213–235) 288 (275–302) 250 (212–296) 335 (285–393)
Madagascar 441 (401–486) 404 (369–442) 292 (279–307) 373 (356–391) 222 (190–259) 316 (276–362)
Malawi 308 (257–369) 298 (253–352) 332 (316–350) 428 (405–452) 517 (437–611) 696 (586–827)
Mozambique 292 (236–360) 329 (272–399) 229 (213–245) 342 (323–363) 470 (398–556) 630 (540–734)
Rwanda 338 (270–422) 426 (347–522) 443 (419–468) 560 (536–585) 296 (250–349) 410 (344–490)
Somalia 317 (292–344) 371 (345–398) 271 (249–296) 374 (349–401) 242 (214–273) 339 (306–377)
Sudan 218 (202–235) 331 (305–359) 203 (193–213) 253 (242–266) 207 (171–252) 273 (227–327)
Tanzania 234 (192–285) 304 (253–366) 284 (270–300) 365 (348–383) 318 (274–370) 459 (397–531)
Uganda 195 (161–237) 264 (220–317) 387 (367–407) 512 (493–533) 338 (296–387) 509 (455–571)
Zambia 363 (289–456) 430 (352–525) 471 (453–491) 555 (536–575) 606 (518–708) 733 (647–831)
Sub-Saharan Africa, southern
Botswana 183 (143–235) 205 (165–254) 145 (117–179) 172 (141–209) 412 (346–490) 637 (544–746)
Lesotho 247 (195–312) 482 (398–584) 191 (172–211) 435 (410–461) 524 (451–609) 727 (643–823)
Namibia 234 (179–305) 468 (380–575) 212 (199–227) 437 (417–458) 444 (373–527) 682 (586–792)
South Africa 228 (187–278) 417 (334–519) 160 (151–169) 384 (364–404) 439 (399–484) 532 (466–608)
Swaziland 341 (261–446) 443 (364–539) 269 (238–306) 372 (339–407) 597 (517–689) 765 (692–845)
Zimbabwe 211 (163–272) 342 (276–423) 244 (230–259) 344 (329–359) 577 (471–708) 725 (613–858)
Sub-Saharan Africa, west
Benin 260 (224–302) 364 (319–416) 180 (167–193) 316 (298–334) 224 (199–252) 363 (331–399)
Burkina Faso 276 (245–311) 376 (332–425) 266 (253–280) 400 (383–418) 259 (233–288) 398 (354–448)
Cameroon 270 (237–307) 372 (325–426) 242 (231–253) 355 (339–372) 347 (317–380) 439 (395–487)
Cape Verde 164 (143–189) 237 (207–272) 114 (106–123) 241 (226–257) 93 (79–108) 209 (182–240)
Chad 250 (218–287) 320 (280–365) 266 (253–280) 313 (298–328) 364 (326–407) 419 (378–464)
Côte d’Ivoire 279 (247–314) 337 (293–387) 280 (268–293) 434 (413–456) 385 (346–428) 472 (416–536)
Ghana 286 (246–332) 278 (239–323) 266 (251–282) 254 (240–268) 249 (232–268) 347 (325–371)
Guinea 291 (253–335) 331 (287–380) 268 (253–283) 323 (305–341) 325 (290–363) 431 (388–478)
Guinea-Bissau 285 (266–305) 377 (352–404) 270 (252–289) 347 (324–373) 307 (281–336) 397 (363–434)
Liberia 329 (287–377) 484 (428–547) 237 (213–263) 335 (308–363) 286 (256–320) 362 (328–398)
Mali 330 (292–372) 358 (321–400) 267 (254–280) 338 (326–351) 256 (231–282) 374 (345–406)
Mauritania 343 (299–395) 336 (295–383) 288 (271–307) 298 (281–317) 257 (227–292) 300 (265–339)
Niger 362 (320–409) 451 (391–520) 308 (294–323) 356 (337–376) 251 (229–275) 282 (252–314)
Nigeria 216 (186–251) 282 (244–325) 205 (186–227) 275 (253–298) 298 (271–327) 381 (356–408)
Sao Tome and Principe 202 (188–218) 286 (267–306) 160 (144–177) 213 (192–237) 147 (126–172) 201 (174–232)
Senegal 258 (227–292) 353 (310–402) 208 (198–219) 309 (294–324) 201 (182–222) 279 (252–308)
Sierra Leone 333 (288–385) 511 (442–589) 297 (269–327) 490 (445–540) 333 (303–367) 456 (415–500)
The Gambia 281 (258–305) 360 (337–384) 231 (212–252) 317 (295–341) 221 (200–245) 312 (283–344)
Togo 250 (219–285) 332 (291–379) 221 (209–233) 302 (288–317) 274 (242–309) 398 (349–453)
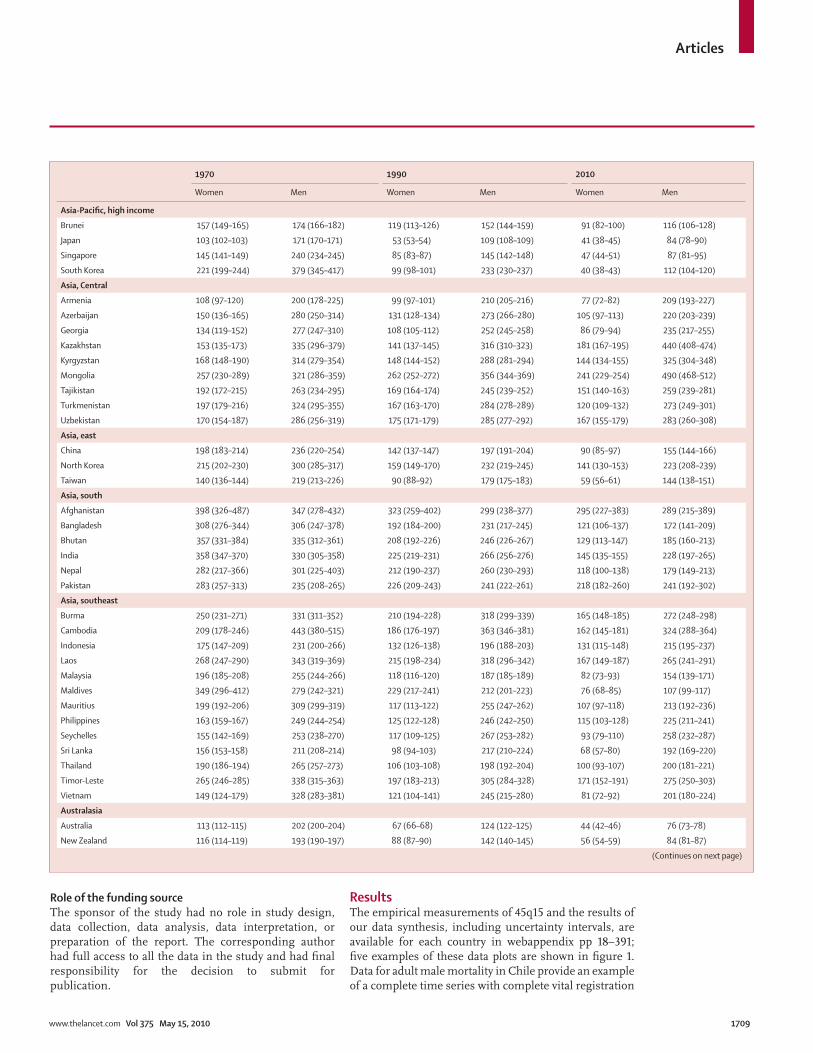
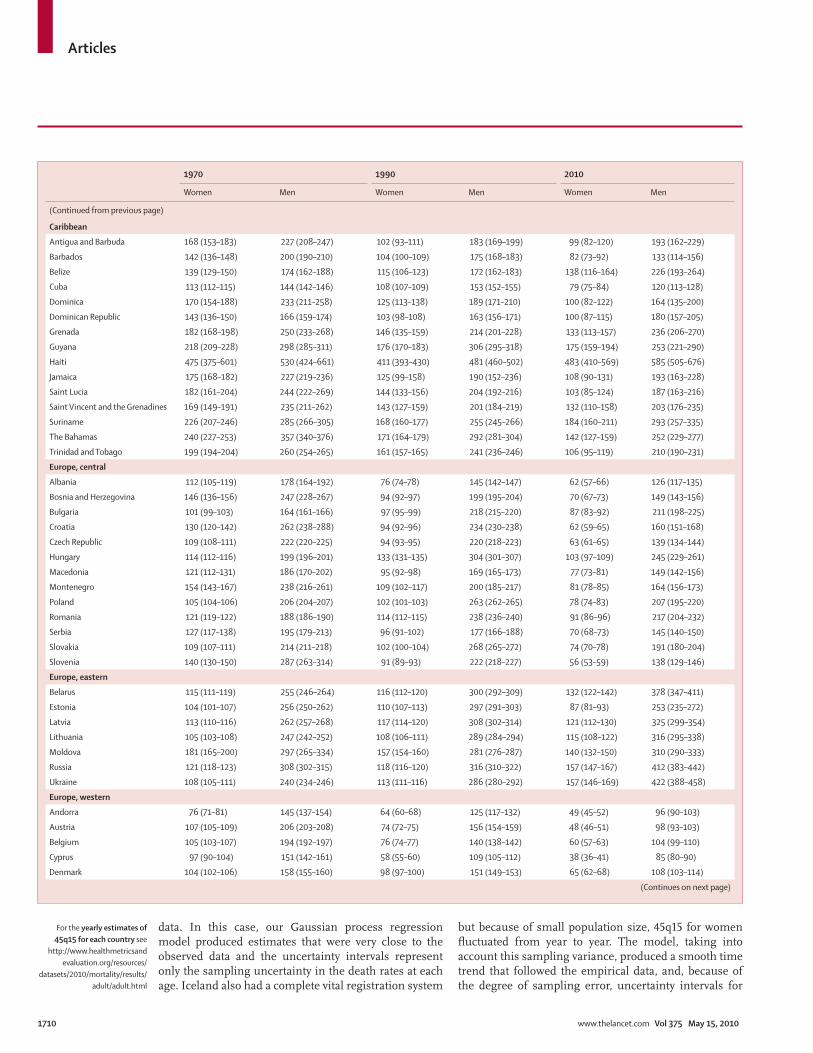
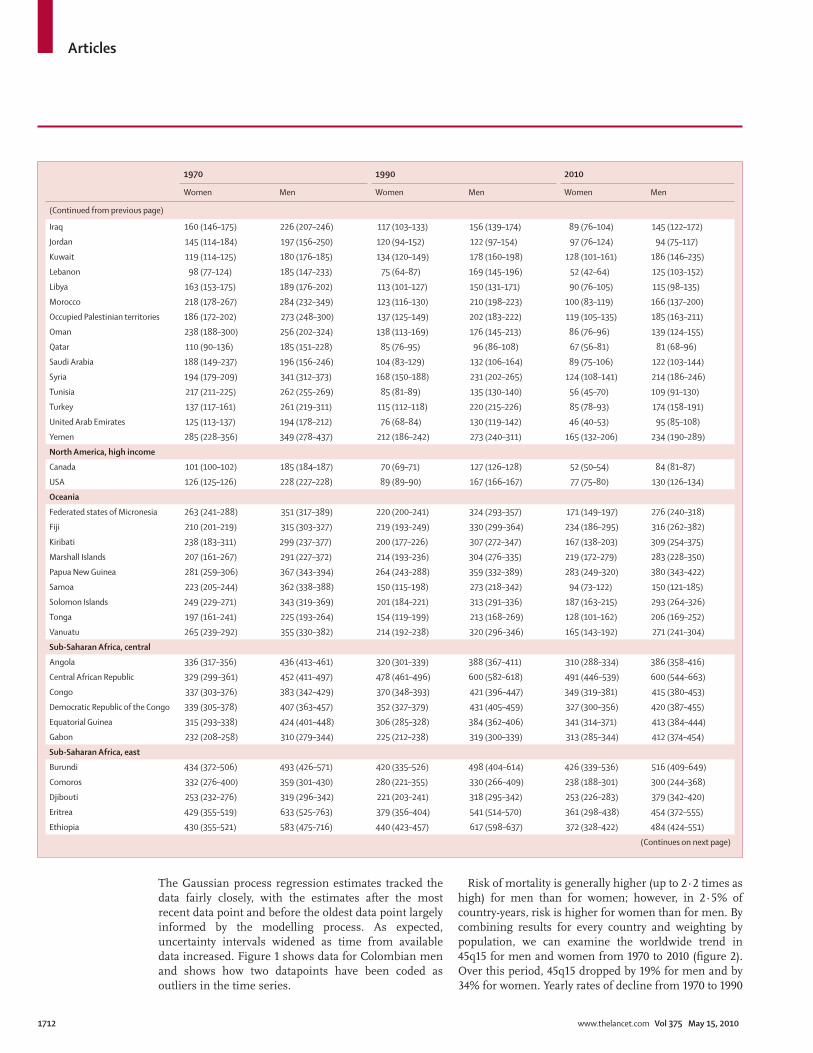
Country estimates are grouped into 21 regions on the basis of epidemiological profi les and geography. See text for defi nition of 45q15.
Table 2: 45q15 (uncertainty interval) per 1000 for women and men in 1970, 1990, and 2010
Articles
1714 www.thelancet.com Vol 375 May 15, 2010
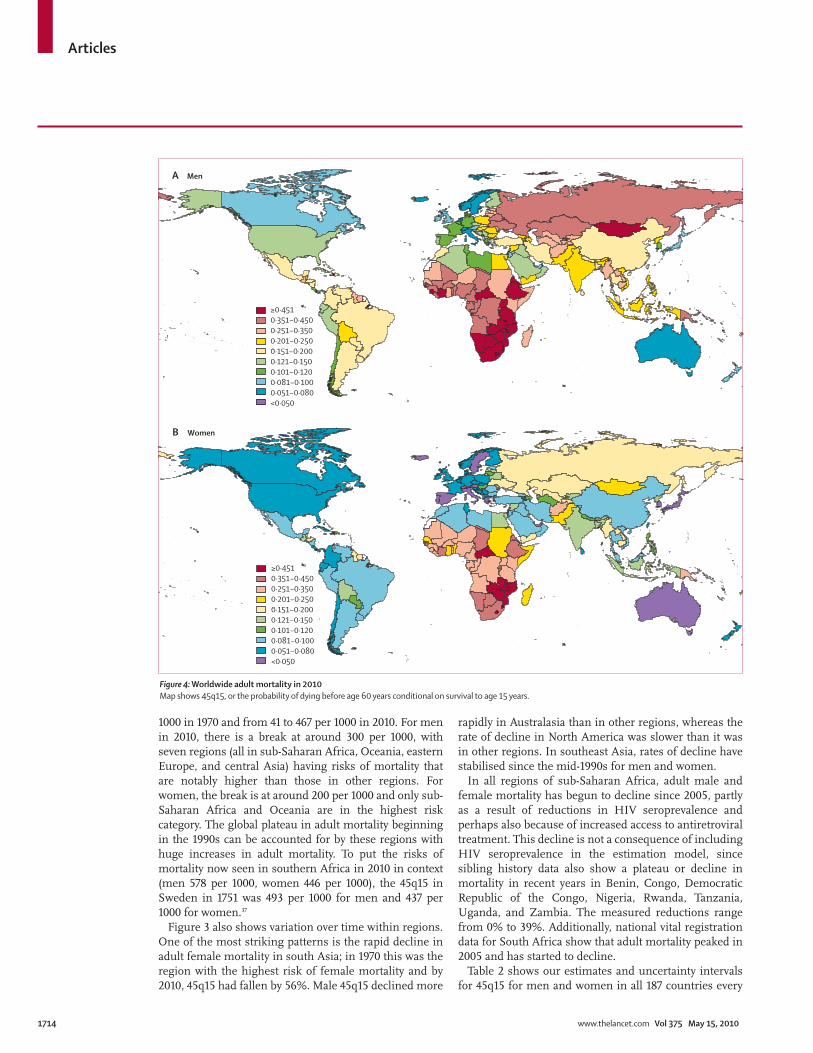
1000 in 1970 and from 41 to 467 per 1000 in 2010. For men in 2010, there is a break at around 300 per 1000, with seven regions (all in sub-Saharan Africa, Oceania, eastern Europe, and central Asia) having risks of mortality that are notably higher than those in other regions. For women, the break is at around 200 per 1000 and only sub-Saharan Africa and Oceania are in the highest risk category. The global plateau in adult mortality beginning in the 1990s can be accounted for by these regions with huge increases in adult mortality. To put the risks of mortality now seen in southern Africa in 2010 in context (men 578 per 1000, women 446 per 1000), the 45q15 in Sweden in 1751 was 493 per 1000 for men and 437 per 1000 for women.37
Figure 3 also shows variation over time within regions. One of the most striking patterns is the rapid decline in adult female mortality in south Asia; in 1970 this was the region with the highest risk of female mortality and by 2010, 45q15 had fallen by 56%. Male 45q15 declined more
rapidly in Australasia than in other regions, whereas the rate of decline in North America was slower than it was in other regions. In southeast Asia, rates of decline have stabilised since the mid-1990s for men and women.
In all regions of sub-Saharan Africa, adult male and female mortality has begun to decline since 2005, partly as a result of reductions in HIV seroprevalence and perhaps also because of increased access to antiretroviral treatment. This decline is not a consequence of including HIV seroprevalence in the estimation model, since sibling history data also show a plateau or decline in mortality in recent years in Benin, Congo, Democratic Republic of the Congo, Nigeria, Rwanda, Tanzania, Uganda, and Zambia. The measured reductions range from 0% to 39%. Additionally, national vital registration data for South Africa show that adult mortality peaked in 2005 and has started to decline.
Table 2 shows our estimates and uncertainty intervals for 45q15 for men and women in all 187 countries every
≥0·4510·351−0·4500·251−0·3500·201−0·2500·151−0·2000·121−0·1500·101−0·1200·081−0·1000·051−0·080<0·050
≥0·4510·351−0·4500·251−0·3500·201−0·2500·151−0·2000·121−0·1500·101−0·1200·081−0·1000·051−0·080<0·050
B Women
A Men
Figure 4: Worldwide adult mortality in 2010Map shows 45q15, or the probability of dying before age 60 years conditional on survival to age 15 years.

Articles
www.thelancet.com Vol 375 May 15, 2010 1715
20 years from 1970 to 2010. These results and the yearly estimates (available from the Institute for Health Metrics and Evaluation website) show substantial variation in levels and trends in 45q15 within regions.
Figure 4 shows worldwide adult mortality in 2010 (worldwide adult mortality in 1970 and 1990 is shown in webappendix pp 394–97). Substantial reductions in risks of adult male and female mortality have occurred over the 40-year period; however, increases have occurred in eastern and southern Africa and in eastern Europe. Some countries have unusual risks or trends in adult mortality. By 2010, Guatemala, Honduras, Haiti, Guyana, and Suriname had higher risks of adult mortality than did neighbouring countries. Within the European Union, there is substantial heterogeneity in risks of adult male and female mortality, most of which does not seem to be strongly related to income per head or development. In 2010, adult mortality is generally low in north Africa and the Middle East, apart from in Yemen (female mortality) and Morocco, Egypt, Yemen, and Syria (male mortality). In sub-Saharan Africa, several west African countries such as Benin, The Gambia, and Senegal have lower risks of mortality than do neighbouring countries, especially in women. Within south Asia, Afghanistan and Pakistan have higher risks of mortality than do India, Nepal, or Bangladesh. In southeast Asia and Oceania, Burma, Laos, Cambodia, and Papua New Guinea have high risks of adult mortality.
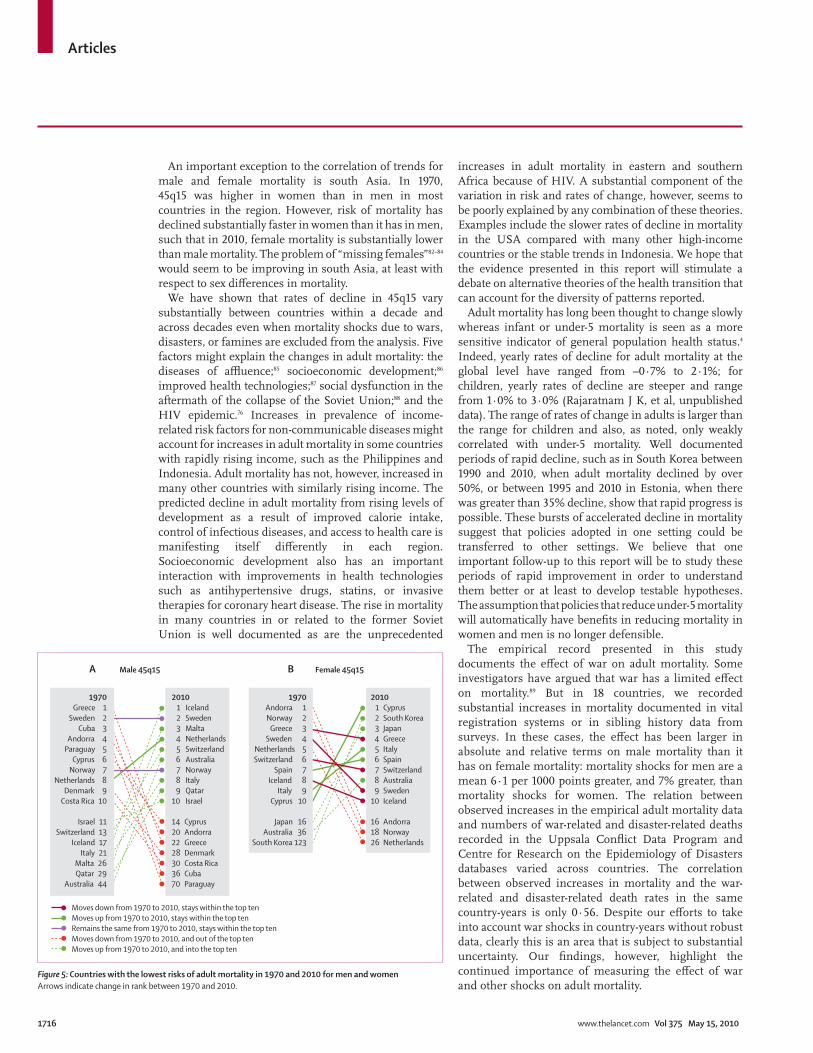
The ten countries with the lowest risks of adult male and female mortality in 1970 and 2010 are shown in fi gure 5. For male mortality, only three countries remained in this list over the 40-year period: Sweden, Norway, and the Netherlands. Notably, Australia moved from 44th in the 1970 list to sixth in 2010. Paraguay had a low risk of male mortality in 1970 but dropped to 70th in the list by 2010. The countries with the lowest risks of male mortality in 2010 represent several regions: northern Europe and Scandinavia, the Mediterranean, the Middle East, and Australasia. There has been more consistency in countries with lowest risk of female mortality: Greece, Sweden, Switzerland, Spain, Iceland, Italy, and Cyprus all remained in the top ten between 1970 and 2010. In 1970, the countries with the lowest risks of female mortality were all in Europe or the Mediterranean. By 2010, South Korea, Japan, and Australia had joined the list. South Korean women have lower risk of mortality than do Japanese women (notably, Japanese men do not make the top ten list in either decade—they ranked 16th in 1970 and are 12th in 2010). Also for women, northern European countries tended to fall in the ranking, whereas southern European and Mediterranean countries improved.
The development of annual estimates of adult mortality enables us to examine more carefully the rates of change. The focus on rates of change provides some insight into national performance in reducing adult mortality. Table 3 shows the distributions of
yearly rates of change in adult mortality by decade. For both men and women, in all four decades both the mean and median rates of change were negative. Mean and median rates of change in all time periods were more negative for women than for men, suggesting faster declines for women. Table 3 also provides a measure of inequality in the rates of change: the SDs across countries were similar in the 1970s, 1980s, and 2000s for both men and women. However, in the 1990s, there was a much greater dispersion of rates of change; in other words, many countries actually had rising adult mortality. This period of increased heterogeneity in the trend in adult mortality seemed to have disappeared by the 2000s. Table 3 also shows the same analyses with exclusion of sub-Saharan Africa, eastern Europe, central Europe, and central Asia. For the remaining regions of the world, mean, median, and distribution of rates of change have been consistent over four decades.
Figure 6 shows the yearly percentage decline in 45q15 from 1970 to 2010 by country. The areas with stable or increasing risk of adult mortality are evident and refl ect the rise in prevalence of HIV in sub-Saharan Africa, the increase in adult mortality in eastern Europe and countries of the former Soviet Union, and the plateau in decline for southeast Asia, dominated by the Philippines, Indonesia, and Thailand. Additionally, some countries such as Paraguay had unusually low risks of adult mortality in 1970 and have shown increases in risk over the past 40 years. Among high-income countries, the USA is notable for having a rate of decline of less than 1% per year, as are Norway (female mortality only) and Spain (male mortality only).
DiscussionOur analysis of all available empirical data for adult mortality from 1970 to 2010 for 187 countries shows that the rates of change for adult mortality are substantially more varied than are those for mortality in children under 5 years of age (Rajaratnam J K, et al, unpublished data). Risk of mortality is generally higher for men than for women; however in 2·5% of country-years, risk is higher for women than for men. There is also a widening gap between risks of male and female mortality.
Despite the sex diff erences in mortality, there is sub-stantial consistency in time trends; the correlation in yearly rates of change for male and female adult mortality is 0·70. By comparison, the correlations between rates of change in adult mortality and rates of change in under-5 mortality are 0·24 and 0·35 for males and females, respectively. A plausible explanation for these fi ndings is that determinants of mortality in adults are substantially diff erent from those for mortality in children. The unique patterns and trends in adult mortality highlight the importance of tracking adult mortality as distinct from metrics that focus on separate or wider age ranges, including under-5 mortality and life expectancy at birth.
Articles
1716 www.thelancet.com Vol 375 May 15, 2010
An important exception to the correlation of trends for male and female mortality is south Asia. In 1970, 45q15 was higher in women than in men in most countries in the region. However, risk of mortality has declined substantially faster in women than it has in men, such that in 2010, female mortality is substantially lower than male mortality. The problem of “missing females”82–84 would seem to be improving in south Asia, at least with respect to sex diff erences in mortality.
We have shown that rates of decline in 45q15 vary substantially between countries within a decade and across decades even when mortality shocks due to wars, disasters, or famines are excluded from the analysis. Five factors might explain the changes in adult mortality: the diseases of affl uence;85 socioeconomic development;86 improved health technologies;87 social dysfunction in the aftermath of the collapse of the Soviet Union;88 and the HIV epidemic.76 Increases in prevalence of income-related risk factors for non-communicable diseases might account for increases in adult mortality in some countries with rapidly rising income, such as the Philippines and Indonesia. Adult mortality has not, however, increased in many other countries with similarly rising income. The predicted decline in adult mortality from rising levels of development as a result of improved calorie intake, control of infectious diseases, and access to health care is manifesting itself diff erently in each region. Socioeconomic development also has an important interaction with improvements in health technologies such as antihypertensive drugs, statins, or invasive therapies for coronary heart disease. The rise in mortality in many countries in or related to the former Soviet Union is well documented as are the unprecedented
increases in adult mortality in eastern and southern Africa because of HIV. A substantial component of the variation in risk and rates of change, however, seems to be poorly explained by any combination of these theories. Examples include the slower rates of decline in mortality in the USA compared with many other high-income countries or the stable trends in Indonesia. We hope that the evidence presented in this report will stimulate a debate on alternative theories of the health transition that can account for the diversity of patterns reported.
Adult mortality has long been thought to change slowly whereas infant or under-5 mortality is seen as a more sensitive indicator of general population health status.4 Indeed, yearly rates of decline for adult mortality at the global level have ranged from –0·7% to 2·1%; for children, yearly rates of decline are steeper and range from 1·0% to 3·0% (Rajaratnam J K, et al, unpublished data). The range of rates of change in adults is larger than the range for children and also, as noted, only weakly correlated with under-5 mortality. Well documented periods of rapid decline, such as in South Korea between 1990 and 2010, when adult mortality declined by over 50%, or between 1995 and 2010 in Estonia, when there was greater than 35% decline, show that rapid progress is possible. These bursts of accelerated decline in mortality suggest that policies adopted in one setting could be transferred to other settings. We believe that one important follow-up to this report will be to study these periods of rapid improvement in order to understand them better or at least to develop testable hypotheses. The assumption that policies that reduce under-5 mortality will automatically have benefi ts in reducing mortality in women and men is no longer defensible.
The empirical record presented in this study documents the eff ect of war on adult mortality. Some investigators have argued that war has a limited eff ect on mortality.89 But in 18 countries, we recorded substantial increases in mortality documented in vital registration systems or in sibling history data from surveys. In these cases, the eff ect has been larger in absolute and relative terms on male mortality than it has on female mortality: mortality shocks for men are a mean 6·1 per 1000 points greater, and 7% greater, than mortality shocks for women. The relation between observed increases in the empirical adult mortality data and numbers of war-related and disaster-related deaths recorded in the Uppsala Confl ict Data Program and Centre for Research on the Epidemiology of Disasters databases varied across countries. The correlation between observed increases in mortality and the war-related and disaster-related death rates in the same country-years is only 0·56. Despite our eff orts to take into account war shocks in country-years without robust data, clearly this is an area that is subject to substantial uncertainty. Our fi ndings, however, highlight the continued importance of measuring the eff ect of war and other shocks on adult mortality.
Figure 5: Countries with the lowest risks of adult mortality in 1970 and 2010 for men and womenArrows indicate change in rank between 1970 and 2010.
A Male 45q15
2010 1 Iceland 2 Sweden 3 Malta 4 Netherlands 5 Switzerland 6 Australia 7 Norway 8 Italy 9 Qatar10 Israel
14 Cyprus20 Andorra22 Greece28 Denmark30 Costa Rica36 Cuba70 Paraguay
1970 Greece 1 Sweden 2 Cuba 3 Andorra 4 Paraguay 5 Cyprus 6 Norway 7 Netherlands 8 Denmark 9
Costa Rica 10
Israel 11 Switzerland 13 Iceland 17 Italy 21 Malta 26 Qatar 29 Australia 44
B Female 45q15
2010 1 Cyprus 2 South Korea 3 Japan 4 Greece 5 Italy 6 Spain 7 Switzerland 8 Australia 9 Sweden10 Iceland
16 Andorra18 Norway26 Netherlands
1970 Andorra 1 Norway 2 Greece 3 Sweden 4 Netherlands 5 Switzerland 6 Spain 7 Iceland 8 Italy 9
Cyprus 10
Japan 16 Australia 36
South Korea 123
Moves down from 1970 to 2010, stays within the top tenMoves up from 1970 to 2010, stays within the top tenRemains the same from 1970 to 2010, stays within the top tenMoves down from 1970 to 2010, and out of the top tenMoves up from 1970 to 2010, and into the top ten

Articles
www.thelancet.com Vol 375 May 15, 2010 1717
Although we have been able to examine 3489 country-years of vital registration data, 257 survey-based observations, 25 censuses, 118 sample registration systems, demographic surveillance system results, and points from other sources, there are still substantial gaps in the data. Our estimates of adult mortality were based
on the best available evidence; however, there are trends, especially over short periods, in datasets that need further investigation. For example, the sibling histories for Benin suggest female 45q15 reduced to as low as 163 per 1000 in the early 1990s. Since we did not fi nd any objective reason in the data or the analysis to reject this datapoint, we
Worldwide Worldwide (excluding sub-Saharan Africa, eastern Europe, central Europe, and central Asia)
Men Women Men Women
Mean Median SD Mean Median SD Mean Median SD Mean Median SD
1971–80 –0·58% –0·58% 0·0096 –1·41% –1·40% 0·0103 –0·86% –0·80% 0·0089 –1·75% –1·68% 0·0100
1981–90 –0·66% –0·65% 0·0114 –1·01% –1·18% 0·0121 –1·05% –1·07% 0·0103 –1·43% –1·51% 0·0102
1991–2000 –0·17% –0·45% 0·0168 –0·30% –0·85% 0·0193 –0·79% –0·86% 0·0118 –1·08% –1·16% 0·0111
2001–10 –0·87% –0·85% 0·0098 –1·22% –1·25% 0·0096 –1·17% –1·19% 0·0090 –1·46% –1·46% 0·0086
Statistics are computed only for the middle 95% of the distributions to exclude mortality shocks.
Table 3: Distributions of yearly rates of change in adult mortality (%), by decade
<0%0−0·5%0·5−1·0%1·0−1·5%1·5−2%≥2·0%
<0%0−0·5%0·5−1%1·0−1·5%1·5−2·0%≥2·0%
B Women
A Men
Figure 6: Yearly percentage decline in adult mortality, 1970–2010
Articles
1718 www.thelancet.com Vol 375 May 15, 2010
included it in our estimates. Consideration of neighbouring countries and levels of socioeconomic development, however, are a cause for concern. In South Africa, the rise in adult female mortality in the 1990s was twice the rise in male mortality, largely because of the disagreement between levels provided in the sibling history estimates and those shown in vital registration data for men. Because the vital registration system in South Africa was undergoing substantial improvement in coverage during the mid 1990s, we chose to exclude the earlier data points from our analysis since it is diffi cult to tease out real trends in mortality from changes in the vital registration system.90,91 The eff ect of this approach and diff erences between vital registration and sibling history data for men has resulted in the striking diff erences between male and female mortality. For some countries, especially those with large corrections to completeness of vital registration or sample registration systems or those with only a limited number of surveys, care should be taken to not over interpret short-term trends in the results. Because we have developed and applied a set of methods that are transparent, available in computer code, and replicable, we hope that researchers will be able to further refi ne and advance this analysis of adult mortality.
Our estimates of adult mortality are substantially diff erent from those reported by UNPD. For overlapping years, the correlation is 0·84 for men and 0·87 for women. Regionally, our estimates for south Asia, southeast Asia, Latin America tropical and North Africa and the Middle East are substantially lower than are those reported by UNPD. These diff erences seem to be a result of variations in the data examined, our application of newer methods to diff erent data sources, and the use of model life tables by the UN based on data mainly gathered before 1970. The eff ect of the UN’s methods can even be seen in countries with complete vital registration systems such as the USA or UK, for which UNPD estimates diff er from the data by 19·3% and 12·2%, respectively, in 2007.7 Furthermore, for some regions, the UN has taken UNAIDS estimates of HIV mortality and added these to the results of their demographic estimation.92 In this study, we used data sources for mortality from all causes, and did not use disease-specifi c transmission models or assumed case-fatality rates. Although WHO has not produced a coherent time series of 45q15, it has generated cross-sectional estimates. Because of changing datasets and the application of alternative methods from year to year, their 45q15 estimates have varied substantially over years for the same country. For example, in Côte d’Ivoire, WHO estimates of female 45q15 range from 355 to 502 during the years 2000–07. Hopefully, our carefully constructed database and application of improved methods will be informative to both the UNPD and WHO in their future eff orts at mortality estimation. Use of the best possible estimates of adult mortality is important for planning purposes and as a direct input into the estimation of maternal mortality.
In some countries with large HIV epidemics such as Swaziland, risk of adult mortality reach very high levels. The increase in 45q15 seems to be larger than population HIV seroprevalence. These fi ndings can be understood in terms of several potential factors. First, adult mortality in southern Africa—especially in men—was high before the start of the HIV epidemic (in some cases risk of death was around 400 per 1000). Second, because of the concentration of HIV in adults aged 15–59 years, the average seroprevalence in that population will be higher than the seroprevalence in the entire adult population. Third, because the natural epidemic curve for HIV can lead to high prevalence and then drop to an equilibrium prevalence, rises in period estimates of 45q15 can be larger than the rise in the cohort 45q15. Finally, there might also be secondary eff ects of large HIV epidemics on other causes of death mediated through economic, social, and domestic disruption.
Our improved methods predicted estimates of mortality for countries with no data with 14% error and generated forecasts with 6·3% error (by use of out-of-sample and out-of-time predictive validity tests). Nevertheless, the strongest step a country can take to improving the surveillance of adult female and male mortality is to strengthen national vital registration systems. No amount of post-data collection analysis will be as eff ective as implementation of a complete system.22,23,32 For countries without complete vital registration systems, we found that survey data for sibling histories were very informative, with a few notable exceptions. We believe more widespread and frequent use of sibling histories in surveys would strengthen surveillance of adult mortality. In countries with HIV epidemics where antiretroviral use is being scaled up, survey data for sibling histories can prove very useful for documenting eff ects on mortality.
Every year, more than 7·7 million children die before their fi fth birthday; however, over three times that number of adults—nearly 24 million—die under the age of 70 years. The prevention of premature adult death is just as important for global health policy as the improvement of child survival. The global health community needs to broaden its focus and to learn from measures applied in countries such as Australia and South Korea to ensure that those who survive to adulthood will also survive until old age. This refocus will require much greater eff orts to equip all countries with reliable and timely mortality surveillance systems, preferably complete vital registration systems, to guide prevention policies and programmes.
ContributorsJKR managed the research process, including data management and
analysis and interpretation of results, and co-wrote the fi rst draft of the
report. JRM contributed to methods development, data management,
data analysis and interpretation, and contributed to the writing of the
report. AL-R, ANC, HW, LD, and MC contributed to data management
and analysis and reviewed the report. ADL conceived the research idea,
contributed to data analysis and interpretation, and contributed to the
writing of the report. CJLM conceived the research idea, contributed to
data analysis and interpretation, and co-wrote the fi rst draft of the report.

Articles
www.thelancet.com Vol 375 May 15, 2010 1719
Confl icts of interestWe declare that we have no confl icts of interest.
AcknowledgmentsThis research was supported by funding from the Bill & Melinda Gates
Foundation. We thank the many individuals around the world who have
helped us collate data from various sources. We also thank
David Phillips and Summer Ohno for their assistance with the
production of this report.
References1 Murray CJL, Laakso T, Shibuya K, Hill K, Lopez AD. Can we achieve
Millennium Development Goal 4? New analysis of country trends and forecasts of under-5 mortality to 2015. Lancet 2007; 370: 1040–54.
2 Gakidou E, Hogan M, Lopez AD. Adult mortality: time for a reappraisal. Int J Epidemiol 2004; 33: 710–17.
3 Countdown Coverage Writing Group on behalf of the Countdown to 2015 Core Group. Countdown to 2015 for maternal, newborn, and child survival: the 2008 report on tracking coverage of interventions. Lancet 2008; 371: 1247–58.
4 Ahmad OB, Lopez AD, Inoue M. The decline in child mortality: a reappraisal. Bull World Health Organ 2008; 78: 1175–91.
5 Hill K, Pebley AR. Child mortality in the developing world. Popul Dev Rev 1989; 15: 657–87.
6 You D, Wardlaw T, Salama P, Jones G. Levels and trends in under 5 mortality, 1990–2008. Lancet 2010; 375: 100–03.
7 United Nations Population Division. World population prospects: the 2008 revision population database. 2009. http://esa.un.org/unpp (accessed March 12, 2010).
8 WHO. The global burden of disease 2004 update. 2008. http://www.who.int/healthinfo/global_burden_disease/GBD_report_2004update_full.pdf (accessed March 12, 2010).
9 Feachem RGA, Kjellstrom T, Murray CJL, Over M, Phillips MA. The health of adults in the developing world. New York, NY: Oxford University Press, 1992.
10 Gardner JW, Sanborn JS. Years of potential life lost (YPLL)—what does it measure? Epidemiology 1990; 1: 322–29.
11 Krieger N, Rehkopf DH, Chen JT, Waterman PD, Marcelli E, Kennedy M. The fall and rise of US inequities in premature mortality: 1960–2002. PLoS Med 2008; 5: e46.
12 Romeder JM, McWhinnie JR. Potential years of life lost between ages 1 and 70: an indicator of premature mortality for health planning. Int J Epidemiol 1977; 6: 143–51.
13 Kambou G, Devarajan S, Over M. The economic eff ects of the AIDS epidemic in sub-Saharan Africa: a general equilibrium analysis. Rev Econ Dev 1993; 1: 37–62.
14 Beegle K. Labor eff ects of adult mortality in Tanzanian households. Econ Dev Cult Change 2005; 53: 655–83.
15 Yamano T, Jayne TS. Measuring the impacts of working-age adult mortality on small-scale farm households in Kenya. World Dev 2004; 32: 91–119.
16 Lopez AD, Mathers CD, Ezzati M, Jamison DT, Murray CJL, eds. Global burden of disease and risk factors. New York, NY: Oxford University Press and the World Bank, 2006.
17 Hill K, Thomas K, AbouZahr C, et al, on behalf of the Maternal Mortality Working Group. Estimates of maternal mortality worldwide between 1990 and 2005: an assessment of available data. Lancet 2007; 370: 1311–19.
18 Ravishankar N, Gubbins P, Cooley RJ, et al. Financing of global health: tracking development assistance for health from 1990 to 2007. Lancet 2009; 373: 2113–24.
19 Frenk J. Comprehensive policy analysis for health system reform. Health Policy 1995; 32: 257–77.
20 Marshall SJ. Developing countries face double burden of disease. Bull World Health Organ 2004; 82: 556.
21 Mufunda J, Chatora R, Ndambakuwa Y, et al. Emerging non-communicable disease epidemic in Africa: preventive measures from the WHO Regional Offi ce for Africa. Ethn Dis 2006; 16: 521–26.
22 Mathers CD, Fat DM, Inoue M, Rao C, Lopez AD. Counting the dead and what they died from: an assessment of the global status of cause of death data. Bull World Health Organ 2005; 83: 171–77.
23 Hill K, Lopez AD, Shibuya K, Jha P, on behalf of the Monitoring of Vital Events (MoVE) writing group. Interim measures for meeting needs for health sector data: births, deaths, and causes of death. Lancet 2007; 370: 1726–35.
24 Stuckler D, Basu S, McKee M. Drivers of inequality in Millennium Development Goal progress: a statistical analysis. PLoS Med 2010; 7: e1000241.
25 Timaeus IM. Measurement of adult mortality in less developed countries: a comparative review. Popul Index 1991; 57: 552–68.
26 Murray C, Yang G, Qiao X. Adult mortality: levels, patterns and causes. In: Feachem R, Kjellstrom T, Murray C, Over M, Phillips M, eds. The health of adults in the developing world. New York, NY: Oxford University Press, 1992: 23–112.
27 WHO. World health statistics 2009. 2009. http://www.who.int/whosis/whostat/EN_WHS09_Full.pdf(accessed Mar 12, 2010).
28 UNICEF. The state of the world’s children 2008: child survival. 2008. http://www.unicef.org/sowc08/docs/sowc08.pdf (accessed Nov 19, 2009).
29 UNICEF. State of the world’s children 2009. 2010. http://www.unicef.org/sowc09/report/report.php (accessed Jan 30, 2010).
30 Phillips M, Feachem RG, Murray CJ, Over M, Kjellstrom T. Adult health: a legitimate concern for developing countries. Am J Public Health 1993; 83: 1527–30.
31 Chandramohan D, Shibuya K, Setel P, et al. Should data from demographic surveillance systems be made more widely available to researchers? PLoS Med 2008; 5: e57.
32 Murray CJL, Rajaratnam JK, Marcus J, Laakso T, Lopez AD. What can we conclude from death registration? Improved methods for evaluating completeness. PLoS Med 2010; 7: e1000262.
33 Gakidou E, King G. Death by survey: estimating adult mortality without selection bias from sibling survival data. Demography 2006; 43: 569–85.
34 Obermeyer Z, Rajaratnam JK, Park CH, et al. Measuring adult mortality using sibling survival: a new analytical method and new results for 44 countries, 1974–2006. PLoS Med 2010; 7: e1000260.
35 Indepth Network. INDEPTH model life tables for sub-Saharan Africa. Burlington, VT: Ashgate Publishing Company, 2004.
36 WHO. Mortality and population databases. http://www.who.int/whosis/mort/download/en/index.html (accessed Jan 7, 2009).
37 Human Mortality Database. Human mortality database. http://www mortality.org 2009. http://www.mortality.org (accessed Aug 21, 2009).
38 United Nations Statistics Division. Demographic yearbook. 2007. http://unstats.un.org/unsd/demographic/products/dyb/dyb2.htm (accessed Aug 24, 2009).
39 National Statistical Offi ce of Mongolia. Mongolian statistical yearbooks. Ulaanbaatar, Mongolia: NSO of Mongolia, 1999.
40 Waltisperger D, Centrelle P, Ralijaona O. The mortality in Antananarivo from 1984 to 1995. Paris, France: French Center on Population and Development, 1998 (in French).
41 Xu J, Kochanek KD, Tejada-Vera B. Deaths: preliminary data for 2007. Nat Vital Stat Rep 2009; 58.
42 Offi ce of the Registrar General and Consensus Commissioner, India. Sample registration system statistical report 1983–2006. 2009. http://www.censusindia.gov.in/Vital_Statistics/SRS/Sample_Registration_System.aspx#2 (accessed Dec 17, 2009).
43 Bangladesh Bureau of Statistics. Report on sample vital registration in Bangladesh 1981–1992. Dhaka, Bangladesh: Bangladesh Bureau of Statistics, 1994.
44 Bangladesh Bureau of Statistics. Report on sample vital registration system, 2005–06. Dhaka, Bangladesh: Bangladesh Bureau of Statistics, 2007.
45 Bangladesh Bureau of Statistics. Report on sample vital registration system, 2007. Dhaka, Bangladesh: Bangladesh Bureau of Statistics, Planning Division, Ministry of Planning, Government of the People’s Republic of Bangladesh, 2008.
46 Bangladesh Bureau of Statistics. Report on sample vital registration system, 2003. Dhaka, Bangladesh: Bangladesh Bureau of Statistics, Planning Division, Ministry of Planning, Government of the People’s Republic of Bangladesh, 2006.
47 Macro International. MEASURE DHS. Demographic and Health Surveys. 2009. http://www measuredhs com (accessed March 12, 2010).

Articles
1720 www.thelancet.com Vol 375 May 15, 2010
48 Algeria, Ministry of Health, Pan Arab Project for Child Development. Algeria maternal and child health survey. Cairo, Egypt: WHO EMRO, PAPCHILD, 1994.
49 Egypt, Ministry of Health, Pan Arab Project for Child Development. Egypt maternal and child health survey. Cairo, Egypt: WHO EMRO, PAPCHILD, 1993.
50 Lebanon, Ministry of Public Health, Pan Arab Project for Child Development. Lebanon maternal and child health survey. Cairo, Egypt: WHO EMRO, PAPCHILD, 1998.
51 Libyan Arab Jamahiriya, Ministry of Health, Pan Arab Project for Child Development. Arab Libyan maternal and child health survey. Cairo, Egypt: WHO EMRO, PAPCHILD, 1996.
52 Mauritania, National Statistics Offi ce, Pan Arab Project for Child Development. Mauritania maternal and child health survey. Cairo, Egypt: WHO EMRO, PAPCHILD, 1992.
53 Morocco, Ministry of Health, Pan Arab Project for Child Development. Moroccan maternal and child health survey. Cairo, Egypt: WHO EMRO, PAPCHILD, 2000.
54 Sudan, Ministry of Public Health. Sudan maternal and child health survey. Cairo, Egypt: WHO EMRO, PAPCHILD, 1995.
55 Syrian Arab Republic, Central Bureau of Statistics, Pan Arab Project for Child Development. Syrian maternal and child health survey. Cairo, Egypt: WHO EMRO, PAPCHILD, 1992.
56 Tunisia, Ministry of Public Health, Pan Arab Project for Child Development. Tunisia maternal and child health survey. Cairo, Egypt: WHO EMRO, PAPCHILD, 1996.
57 Ministry of Health and Family Welfare and International Institute for Population Sciences. District level Household and Facility Survey 2. Mumbai, India: International Institute for Population Sciences India, 2004.
58 Ministry of Health and Family Welfare and International Institute for Population Sciences. District Level Household and Facility Survey 3. Mumbai, India: International Institute for Population Sciences India, 2010.
59 Ministre de l’Economie et du Plan. World fertility survey, Cameroon 1978. 2009. http://opr.princeton.edu/archive/wfs/CM.asp (accessed Dec 15, 2009).
60 Central Offi ce of Statistics and Information Iraq, Fafo. Iraq multiple indicator rapid assessment. 2005. http://www.fafo.no/ais/middeast/iraq/imira/index.htm (accessed Dec 16, 2009).
61 WHO, Republic of Iraq, Central Organization for Statistics and Information Technology, Ministry of Health/Kurdistan, Kurdistan Regional Statistics Offi ce. Iraq family health survey report 2006–2007. 2008. http://www.emro.who.int/iraq/pdf/ifhs_report_en.pdf (accessed Dec 12, 2009).
62 Central Statistics Offi ce, Republic of Botswana. Botswana demographic survey. Gaborone: Government Printer, 2009.
63 Department of Population and Labour Statistics, General Statistics Offi ce Ministry of Planning, Investment Viet Nam. Population change and family planning survey. Ha Noi, Vietnam: Government of Vietnam, 2007.
64 Lebanon, Ministry of Public Health, Pan Arab Project for Family Health. Lebanese family health survey. Cairo, Egypt: WHO, EMRO, PAPFAM, 2006.
65 CDC. CDC reproductive health surveys. http://www.cdc.gov/reproductivehealth/Surveys/SurveyCountries.htm (accessed Dec 18, 2009).
66 NIPORT, ORC, Macro International, JHU. Bangladesh maternal health services and maternal mortality survey. 2001. http://www.measuredhs.com/pubs/pub_details.cfm?ID=456 (accessed March 12, 2010).
67 Indepth Network. Health and demographic surveillance dystems. 2009. http://www.indepth-ishare.org/ (accessed March 10, 2010).
68 Department of Health and Epidemic Prevention of MOPH, Chinese Academy of Preventive Medicine. 1992 annual report on Chinese disease surveillance. Beijing, China: Hua Xia Publishing House, 1994.
69 China Data Center. China National Data Center. 2010. http://chinadatacenter.org/newcdc/onlinedata.htm (accessed March 10, 2010).
70 China National Data Center. China fertility survey. 2010. http://chinasurveycenter.org/CSDN_EN/DownLoadChannel_new/detail.aspx?ClassID=4&DataID=20 (accessed March 10, 2010).
71 RAND Labor and Populations. The Indonesia family life survey (IFLS). 2009. http://www.rand.org/labor/FLS/IFLS/index.html (accessed March 10, 2010).
72 RAND Labor and Populations. The national socio-economic survey (SUSENAS). http://www.rand.org/labor/bps/susenas/ (accessed Dec 28, 2009).
73 Organisation for Economic Co-Operation and Development. OECD economic surveys. 2010. http://www.oecd.org/document/59/0,3343,en_2649_34111_35106811_1_1_1_1,00.html (accessed March 10, 2010).
74 Gaskell GD, Wright DB, O’Muircheartaigh CA. Telescoping of landmark events: implications for survey research. Public Opin Q 2000; 64: 77–89.
75 Lessler JT, Sirken MG. Laboratory-based research on the cognitive aspects of survey methodology: the goals and methods of the National Center for Health Statistics Study. Milbank Q 1985; 63: 565–81.
76 UNAIDS, WHO. AIDS epidemic update. 2006. http://www.unaids.org/en/KnowledgeCentre/HIVData/EpiUpdate/EpiUpdArchive/2006/default.asp (accessed March 12, 2010).
77 Uppsala Confl ict Data Program. UCDP/PRIO armed confl ict dataset v.4-2009, 1946–2008. 2009. http://www.pcr.uu.se/research/UCDP/data_and_publications/datasets.htm(accessed March 2, 2010).
78 Uppsala Confl ict Data Program. UCDP non-state confl ict dataset v. 2.1, 2002–2007. 2009. http://www.pcr.uu.se/research/UCDP/data_and_publications/datasets.htm (accessed March 2, 2010).
79 Uppsala Confl ict Data Program. UCDP non-state actor dataset v. 1-2009. 2009. http://www.pcr.uu.se/research/UCDP/data_and_publications/datasets.htm (accessed March 2, 2010).
80 Centre for Research on the Epidemiology of Disasters. Deaths due to natural disasters, 1900–2007. 2009. http://www.emdat.be/advanced-search (accessed Oct 12, 2009).
81 Harvard University, Institute for Health Metrics and Evaluation at the University of Washington, Johns Hopkins University, University of Queensland, WHO. Global burden of disease study operations manual. 2009. http://www.globalburden.org/GBD_Study_Operations_Manual_Jan_20_2009.pdf (accessed March 9, 2010).
82 Sen A. More than 100-million women are missing. New York Review of Books 1990; 37: 61–66.
83 Coale AJ. Excess female mortality and the balance of the sexes in the population: an estimate of the number of “missing females”. Popul Dev Rev 1991; 17: 517–23.
84 Klasen S, Wink C. A turning point in gender bias in mortality? An update on the number of missing women. Popul Dev Rev 2002; 28: 285–312.
85 Ezzati M, Vander Hoorn S, Lawes CMM, et al. Rethinking the “diseases of affl uence” paradigm: global patterns of nutritional risks in relation to economic development. PloS Med 2005; 2: 404–12.
86 Fenton L. Preventing HIV/AIDS through poverty reduction: the only sustainable solution? Lancet 2004; 364: 1186–87.
87 Preston SH. The changing relation between mortality and level of economic development. Int J Epidemiol 2007; 36: 484–90.
88 Schkolnikov V, McKee M, Leon DA. Changes in life expectancy in Russia in the mid-1990s. Lancet 2001; 357: 917–21.
89 Human Security Report Project. Human security report 2009: the shrinking costs of war. 2009. http://www.humansecurityreport.info/2009Report/2009Report_Complete.pdf (accessed March 12, 2010).
90 Dorrington R, Bourne D, Bradshaw D, Laubscher R, Timaeus I. The impact of HIV/AIDS on adult mortality in South Africa. 2001. http://www.mrc.ac.za/bod/complete.pdf (accessed March 12, 2010).
91 Udjo EO. Estimation of mortality from vital registrations in South Africa. Curr HIV Res 2006; 4: 469–74.
92 United Nations Population Division. World population prospects: the 2008 revision assumptions and variants. 2009. http://esa.un.org/unpp/index.asp?panel=4 (accessed March 12, 2010).