World Vitiviniculture situation in 2012 XXXVIth World Congress of Vine and Wine
33
O.I.V.2013 World Vitiviniculture situation in 2012 XXXVIth World Congress of Vine and Wine Bucarest, 3 rd June 2013 Federico Castellucci Director General
-
Upload
independent -
Category
Documents
-
view
1 -
download
0
Transcript of World Vitiviniculture situation in 2012 XXXVIth World Congress of Vine and Wine
O.I.V.2013
World Vitiviniculture situation in 2012
XXXVIth World Congress of Vine and Wine
Bucarest, 3rd June 2013
Federico Castellucci Director General
O.I.V.2013
State of the vitiviniculture world market 2012
Surface area
Grape production & yield
Wine
Focus on wine trade

O.I.V.2013
Surface area of vineyards
• Surface area of world vineyards
• European vineyards
• Southern Hemisphere & USA vineyards
• Asian vineyards
• Emerging vitiviniculture countries
O.I.V.2013
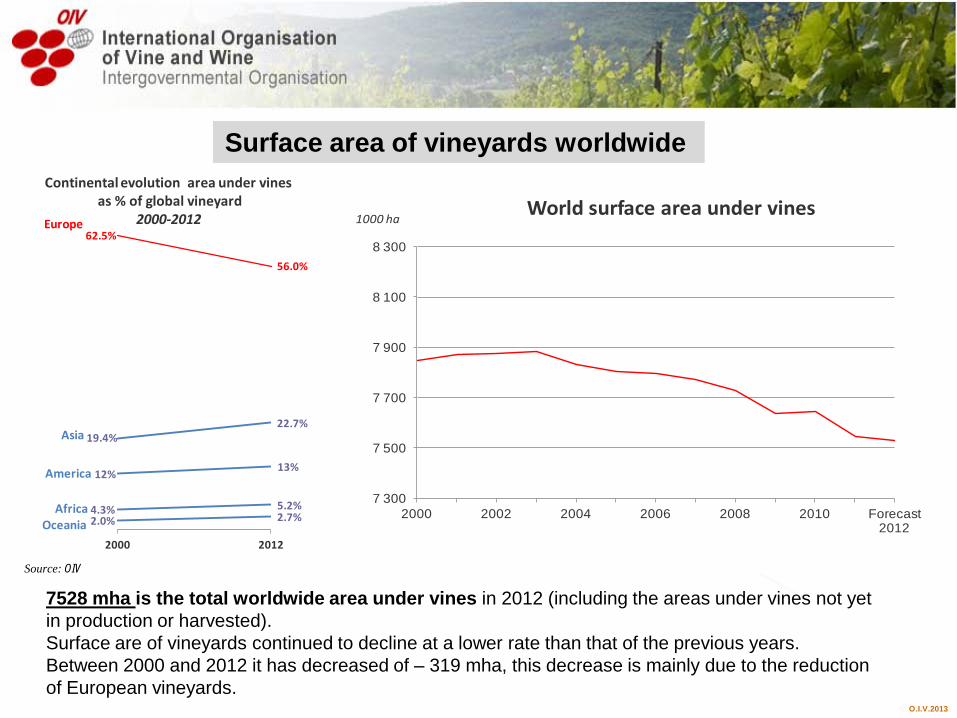
Surface area of vineyards worldwide
Source: OIV
7528 mha is the total worldwide area under vines in 2012 (including the areas under vines not yet in production or harvested). Surface are of vineyards continued to decline at a lower rate than that of the previous years. Between 2000 and 2012 it has decreased of – 319 mha, this decrease is mainly due to the reduction of European vineyards.
7 300
7 500
7 700
7 900
8 100
8 300
2000 2002 2004 2006 2008 2010 Forecast 2012
1000 haWorld surface area under vines
62.5%
56.0%
19.4%22.7%
12%13%
4.3% 5.2%2.0% 2.7%
2000 2012
Continental evolution area under vinesas % of global vineyard
2000-2012Europe
OceaniaAfrica
America
Asia
O.I.V.2013
European vineyards
0
500
1000
1500
2000
2500
3000
3500
2000 2002 2004 2006 2008 2010 Forecast 2012
1000 ha
Trends, 2000-2012
Portugal
Italy
France
Spain
-17%
-12%
-15%
-3 %
Source: OIV
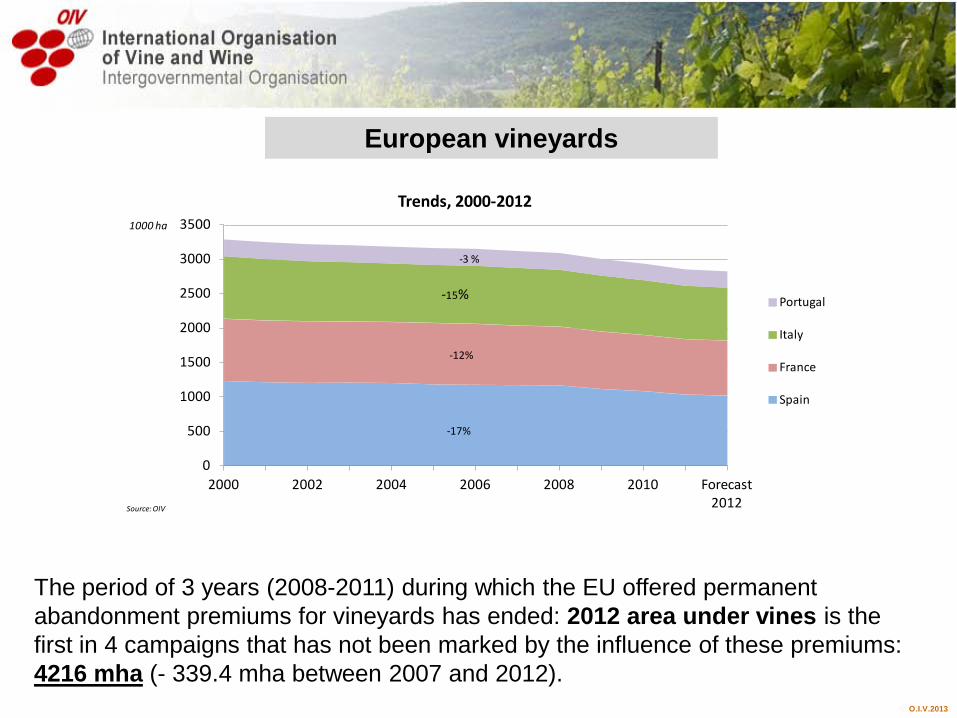
The period of 3 years (2008-2011) during which the EU offered permanent abandonment premiums for vineyards has ended: 2012 area under vines is the first in 4 campaigns that has not been marked by the influence of these premiums: 4216 mha (- 339.4 mha between 2007 and 2012).
O.I.V.2013
Southern Hemisphere + USA vineyards
0
200
400
600
800
1000
1200
1400
2000 2002 2004 2006 2008 2010 Forecast 2012
1000 haTrends, 2000-2012
South Africa
New Zealand
Australia
USA
Chile
Argentina
+10%
+18 %
-1%
+21%
+168%+5%
Source: OIV
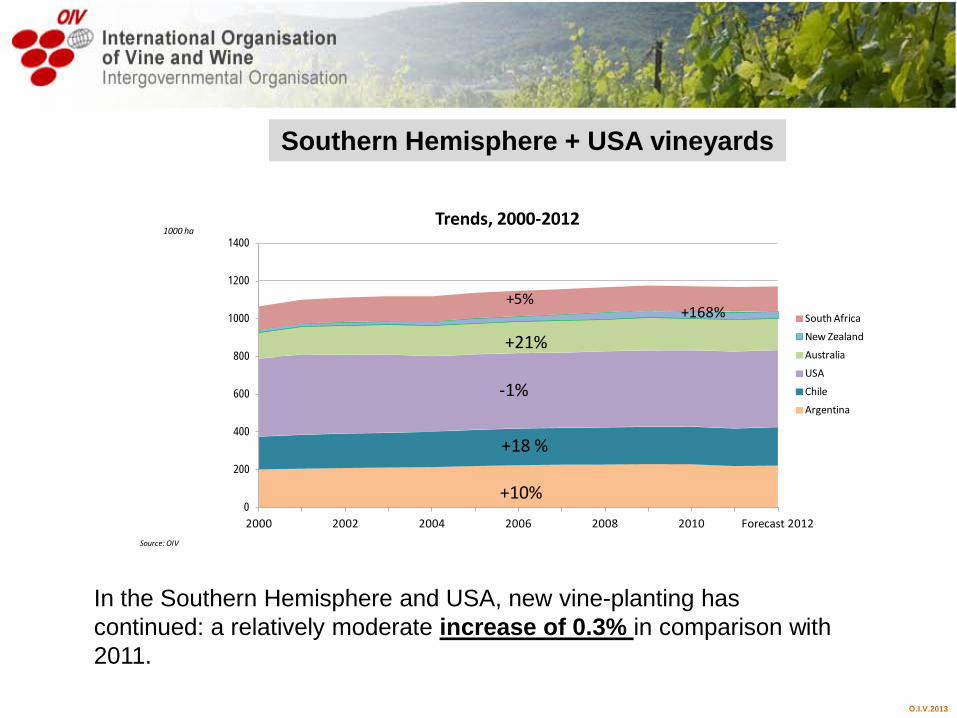
In the Southern Hemisphere and USA, new vine-planting has continued: a relatively moderate increase of 0.3% in comparison with 2011.

O.I.V.2013
Asian vineyards
0
200
400
600
800
1000
1200
1400
2000 2002 2004 2006 2008 2010 Forecast 2012
1000 haTrends, 2000-2012
Iran
China
Turkey -10%
+90%
-18%
Source: OIV
With 1705 mha areas under vines, Asia continues to see its vineyards growing: +12 % between 2000 and 2012 (+122 mha).
O.I.V.2013
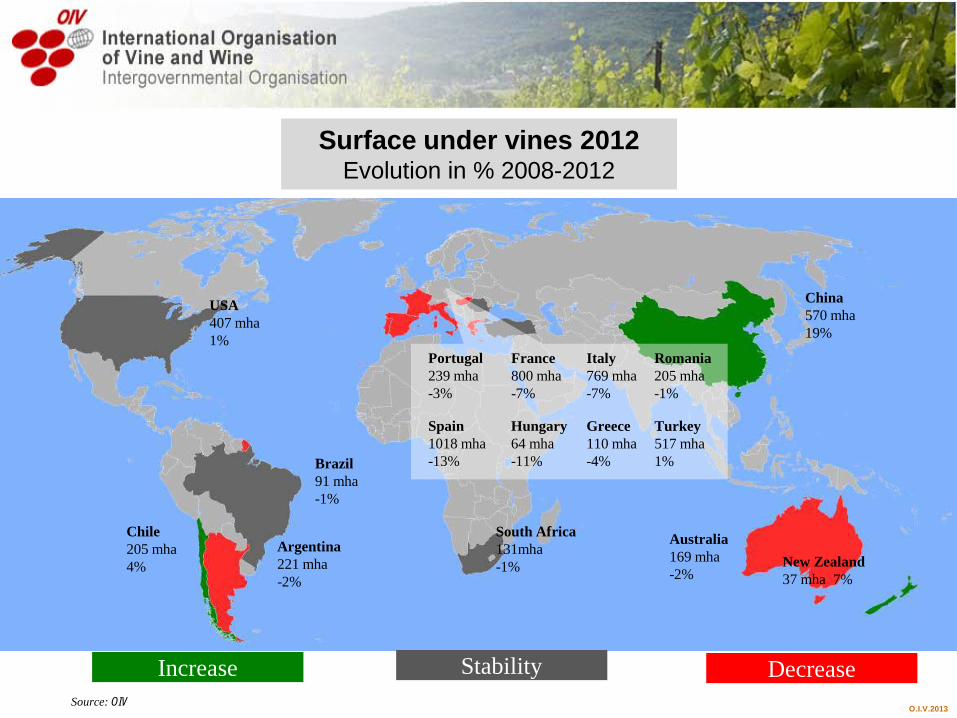
USA 407 mha 1%
Chile 205 mha 4%
Argentina 221 mha -2%
South Africa 131mha -1%
Brazil 91 mha -1%
New Zealand 37 mha 7%
China 570 mha 19%
Australia 169 mha -2%
Increase Stability Decrease
Portugal 239 mha -3%
Italy 769 mha -7%
Spain 1018 mha -13%
Romania 205 mha -1%
France 800 mha -7%
Hungary 64 mha -11%
Greece 110 mha -4%
Turkey 517 mha 1%
Source: OIV
Surface under vines 2012 Evolution in % 2008-2012

O.I.V.2013
Surface area of vineyards has grown by 5% and more in the last 5 years
Emerging vitiviniculture countries
In addition to a rapid growth of an overall planted area…grape production growth is particularly significant
0% 50% 100% 150% 200%
Canada
Egypt
Brazil
India
Peru
Grape production: evolution 2000-2012
Growth rate 2000-2012
0
20
40
60
80
100
120
1401000 ha
Area under vines: evolution
Peru
India
Brasil
Egypt
Canada
Source: OIV

O.I.V.2013
These countries are getting more and more sensitive to the taste of wine
0500
100015002000250030003500400045005000
2007 2008 2009 2010 2011 Forecast 2012
1000 hlEvolution of wine consumption
India
Brazil
Peru
Canada
1000 hl 2007
Forecast 2012
Variation %
India 120 150 25%
Brazil 3254 3399 4%
Peru 683 809 19%
Canada 4018 4476 11%
Wine consumption
Emerging vitiviniculture countries
Source: OIV
O.I.V.2013
Global grape production & Yield

O.I.V.2013
Global grape production
Source: OIV
In 2012 world production of grapes (691 Mql) decreased: - 23 Mql between 2011-2012. An increased trend in grape production (+7%/2000), despite decrease in area under vines : this can be explained in part by an increase in yields.
200
400
600
800
1 000
2000 2001 2002 2003 2004 2005 2006 2007 2008 2009 2010 2011 Forecast 2012
Mql
World grapes production
62,5%
39,0%
19,4%
31,2%
12%
21%
4,3%6,3%
2,0% 2,7%
2000 2012
Continental evolution grapes prouctionas % of global production
2000-2012Europe
OceaniaAfrica
America
Asia

O.I.V.2013
Global grape production & Yield
020406080
100120140160
Yield evolution (total grapes/total area including vines not in production yet)
World Total
Africa
America
Asia
Europe
Oceania
ql/ha
Source: OIV
Yield is the measure of amount of grapes or wine produced per unit surface of vineyard: the trend has increased at world level to 91.7 ql/ha. Productivity is growing especially in the countries that produce non-fermented products and table grapes.
O.I.V.2013
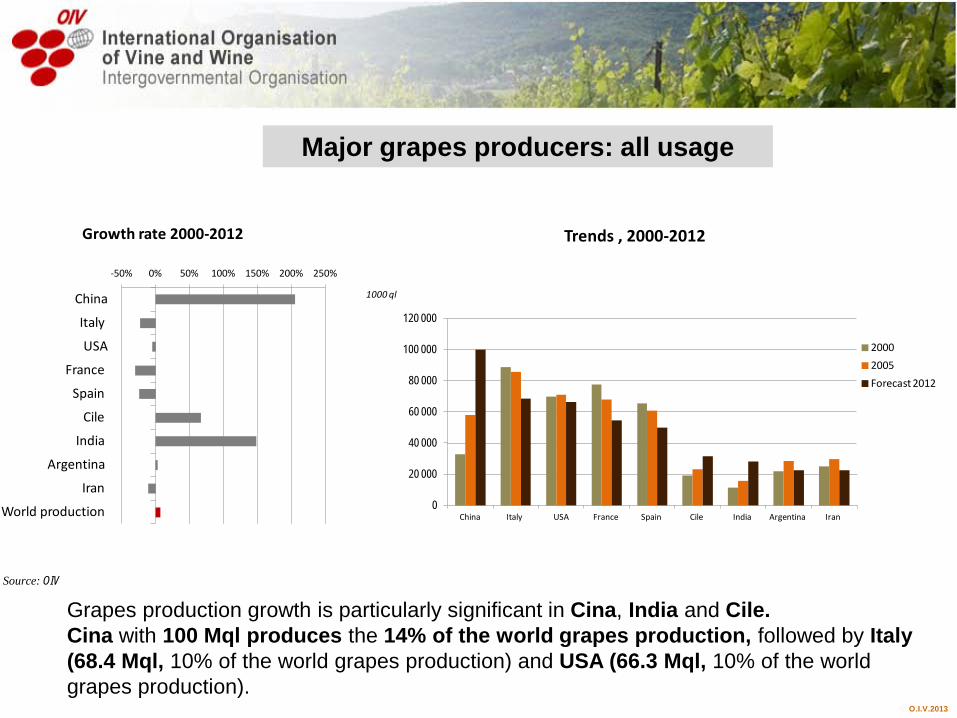
Major grapes producers: all usage
Source: OIV
Grapes production growth is particularly significant in Cina, India and Cile. Cina with 100 Mql produces the 14% of the world grapes production, followed by Italy (68.4 Mql, 10% of the world grapes production) and USA (66.3 Mql, 10% of the world grapes production).
-50% 0% 50% 100% 150% 200% 250%
China
Italy
USA
France
Spain
Cile
India
Argentina
Iran
World production
Growth rate 2000-2012
0
20 000
40 000
60 000
80 000
100 000
120 000
China Italy USA France Spain Cile India Argentina Iran
1000 ql
Trends , 2000-2012
2000
2005
Forecast 2012
O.I.V.2013
Wine Production of wine
• World production • Major producers
Consumption of wine • World consumption • Major consumers
Focus on wine trade
• World wine trade: value & volume • Top world Exportes • Top world IMporters
O.I.V.2013
Wine production • World wine production
• Major producers
O.I.V.2013
220
240
260
280
300
320
Europe72,7%
Asia4,5%
America17,0%
Africa4,3%
Oceania3,1%
Europe62,3%
Asia6,9%
America19,8%
Africa5,1%
Oceania5,9%
millions hl
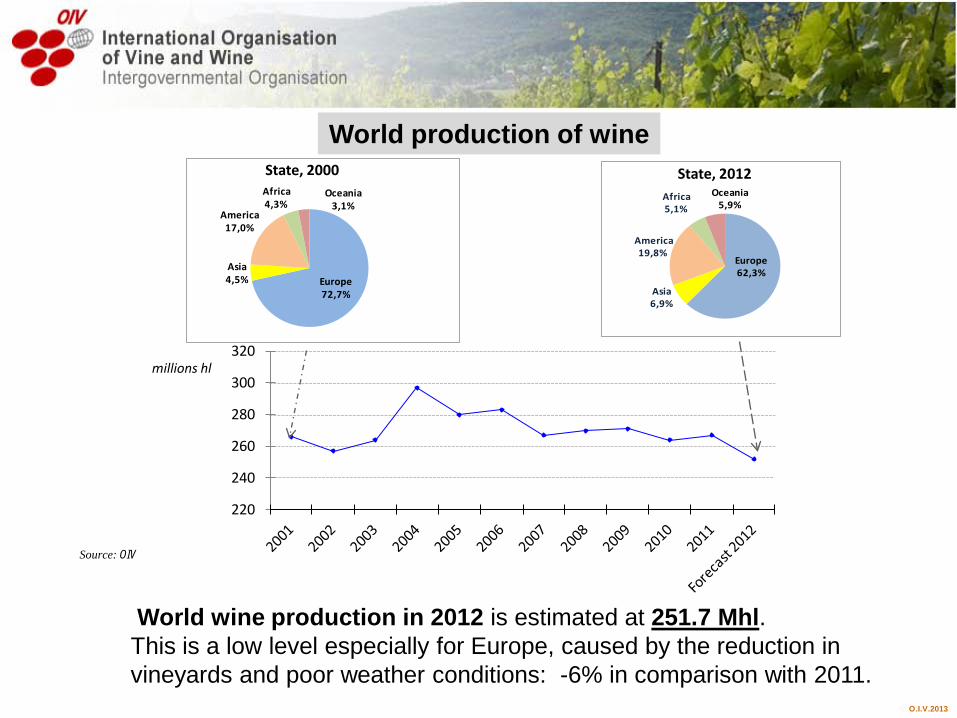
World production of wine
Source: OIV
State, 2000 State, 2012
World wine production in 2012 is estimated at 251.7 Mhl. This is a low level especially for Europe, caused by the reduction in vineyards and poor weather conditions: -6% in comparison with 2011.
O.I.V.2013
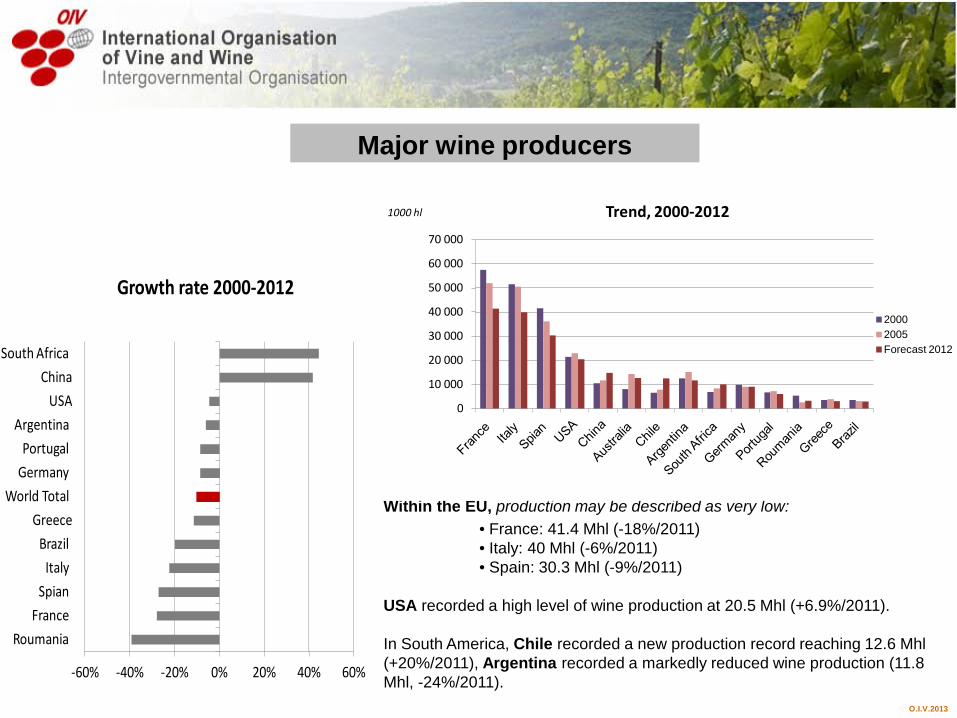
Major wine producers
Source: OIV
Within the EU, production may be described as very low: • France: 41.4 Mhl (-18%/2011) • Italy: 40 Mhl (-6%/2011) • Spain: 30.3 Mhl (-9%/2011)
USA recorded a high level of wine production at 20.5 Mhl (+6.9%/2011). In South America, Chile recorded a new production record reaching 12.6 Mhl (+20%/2011), Argentina recorded a markedly reduced wine production (11.8 Mhl, -24%/2011).
0
10 000
20 000
30 000
40 000
50 000
60 000
70 000
1000 hl Trend, 2000-2012
20002005Forecast 2012
-60% -40% -20% 0% 20% 40% 60%
Roumania
France
Spian
Italy
Brazil
Greece
World Total
Germany
Portugal
Argentina
USA
China
South Africa
Growth rate 2000-2012
O.I.V.2013
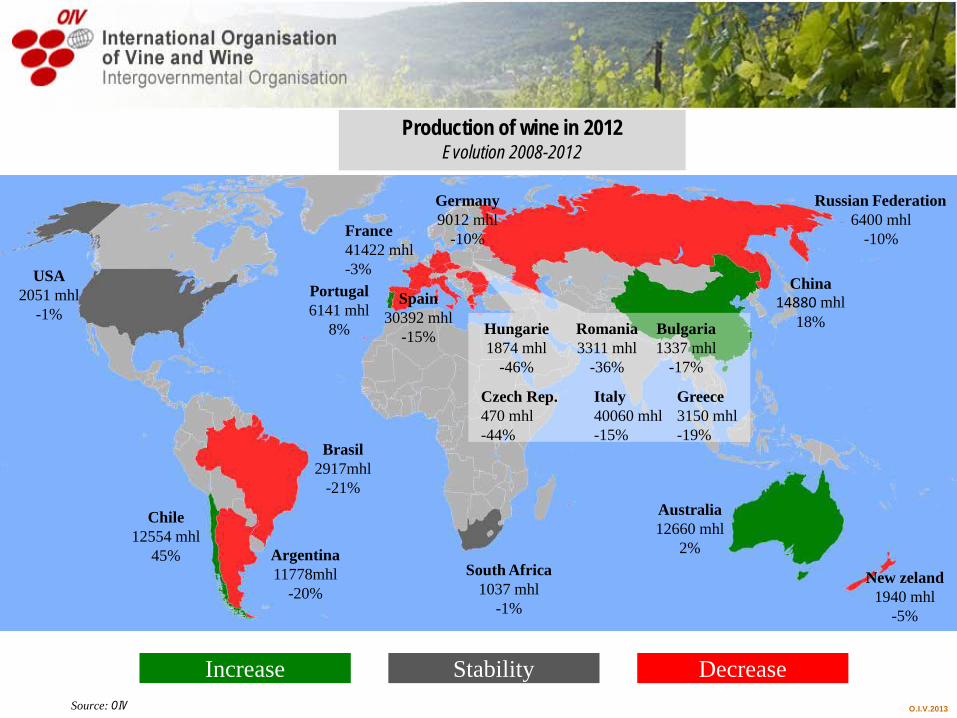
Increase Decrease
France 41422 mhl -3%
Spain 30392 mhl
-15%
USA 2051 mhl
-1%
Argentina 11778mhl
-20%
Australia 12660 mhl
2%
Chile 12554 mhl
45% South Africa
1037 mhl -1%
Germany 9012 mhl
-10%
Russian Federation 6400 mhl
-10%
Portugal 6141 mhl
8%
Brasil 2917mhl
-21%
New zeland 1940 mhl
-5%
Hungarie 1874 mhl
-46%
Bulgaria 1337 mhl
-17%
Czech Rep. 470 mhl -44%
Romania 3311 mhl
-36%
Italy 40060 mhl -15%
Greece 3150 mhl -19%
China 14880 mhl
18%
Source: OIV
Stability
Production of wine in 2012 Evolution 2008-2012

O.I.V.2013
Wine consumption • World consumption • Major consumers
O.I.V.2013
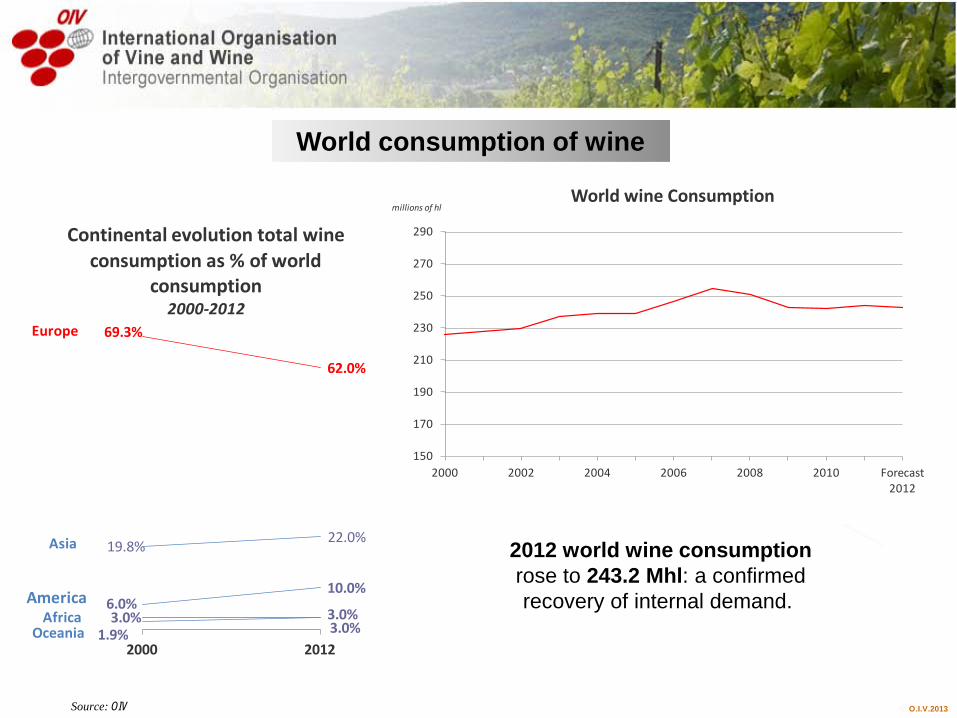
World consumption of wine
2012 world wine consumption rose to 243.2 Mhl: a confirmed recovery of internal demand.
Source: OIV
150
170
190
210
230
250
270
290
2000 2002 2004 2006 2008 2010 Forecast 2012
millions of hlWorld wine Consumption
69.3%
62.0%
6.0%10.0%
19.8%22.0%
3.0%3.0%1.9%3.0%
2000 2012
Continental evolution total wine consumption as % of world
consumption 2000-2012
Europe
OceaniaAfrica
America
Asia
O.I.V.2013
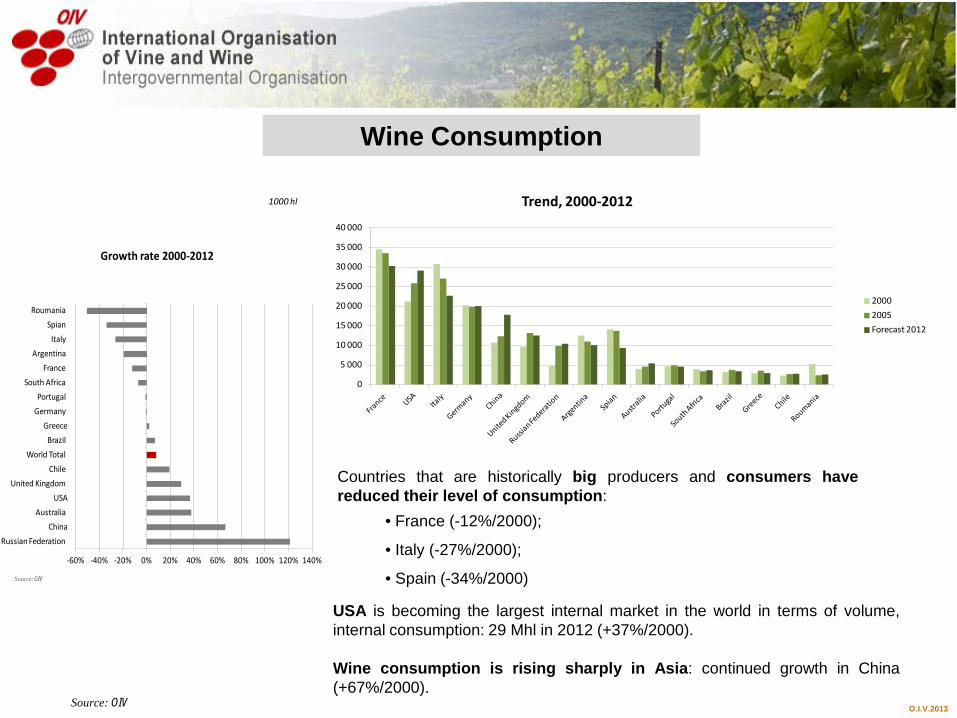
Wine Consumption
Source: OIV
Countries that are historically big producers and consumers have reduced their level of consumption:
• France (-12%/2000);
• Italy (-27%/2000);
• Spain (-34%/2000)
0
5 000
10 000
15 000
20 000
25 000
30 000
35 000
40 000
1000 hl Trend, 2000-2012
2000
2005
Forecast 2012
-60% -40% -20% 0% 20% 40% 60% 80% 100% 120% 140%
Russian Federation
China
Australia
USA
United Kingdom
Chile
World Total
Brazil
Greece
Germany
Portugal
South Africa
France
Argentina
Italy
Spian
Roumania
Growth rate 2000-2012
Source: OIV
USA is becoming the largest internal market in the world in terms of volume, internal consumption: 29 Mhl in 2012 (+37%/2000). Wine consumption is rising sharply in Asia: continued growth in China (+67%/2000).

O.I.V.2013
*in collaboration with the Spanish Observatory of Wine Markets (OeMv)
Focus on Wine trade* • World wine trade: value & volume
• Top world Exportes • Top world IMporters
NOTE: data for world trade are taken from GTA, which, in turn, take them from official administration bodies in more than 80 countries of the world. Not all countries are, therefore, included.
O.I.V.2013
International wine trade
According to data officially provided to the OIV in 2012 : world market, considered as the sum of exports from all countries reached 102.2 Mhl
world import stood at 97.9 Mhl
Data for the special focus on world trade are taken from GTA, representing more than 80 countries.
O.I.V.2013
2.27 2.30 2.12 2.19 2.13 2.14 2.17 2.20 2.29 2.08 2.23 2.32 2.55
13 767 14 16614 964 15 259 15 775
16 39317 750
19 924 20 042
17 953
20 947
23 345
25 290
6 066 6 1577 061 6 958 7 413 7 643
8 1979 048 8 749 8 614
9 38510 073 9 903
2000 2001 2002 2003 2004 2005 2006 2007 2008 2009 2010 2011 2012
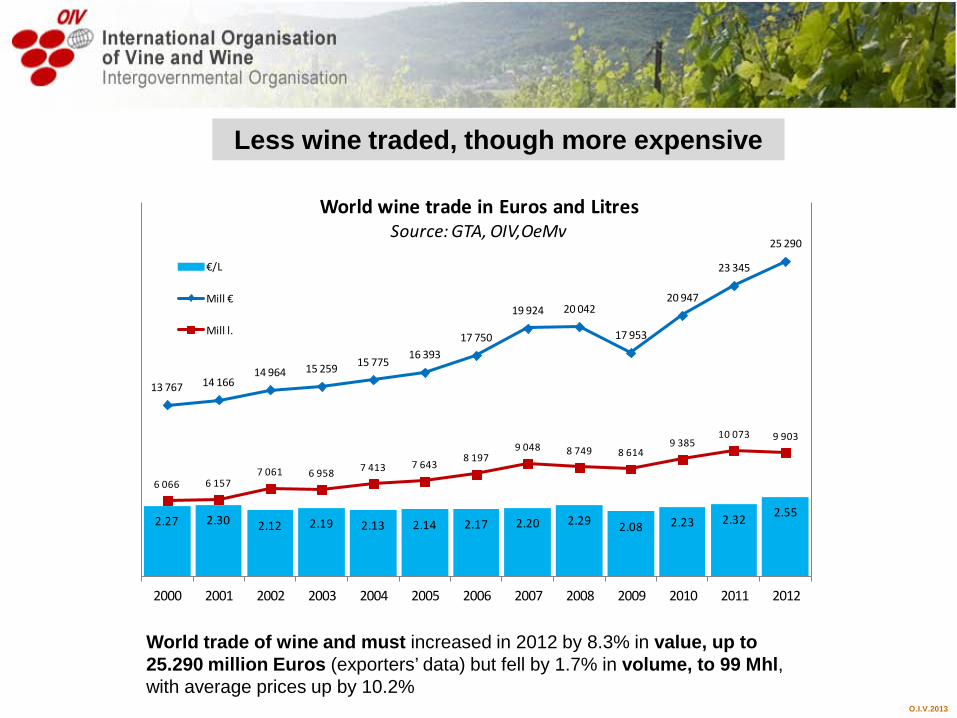
World wine trade in Euros and LitresSource: GTA, OIV,OeMv
€/L
Mill €
Mill l.
World trade of wine and must increased in 2012 by 8.3% in value, up to 25.290 million Euros (exporters’ data) but fell by 1.7% in volume, to 99 Mhl, with average prices up by 10.2%
Less wine traded, though more expensive

O.I.V.2013
In value terms, since the beginning of the Century, Sparkling remains with the same share (around 17% of total), whereas 2 percentage points are exchanged between bottled wine (less) and wine sold in bulk (more).
Changing the composition: value
16.9% 15.4% 16.2% 16.8% 17.1% 17.9% 18.6% 19.7% 19.9% 16.5% 16.7% 17.0% 17.1%
73.7% 76.1% 75.6% 74.3% 73.3% 73.2% 72.6% 71.6% 70.7% 73.1% 73.2% 72.4% 71.5%
9.0% 8.2% 7.8% 8.6% 9.2% 8.6% 8.6% 8.4% 9.2% 10.0% 9.7% 10.2% 11.0%
2000 2001 2002 2003 2004 2005 2006 2007 2008 2009 2010 2011 2012
Must
Bulk
Bottled
Sparkling
+ 2%
- 2.2%

O.I.V.2013
More clearly, in terms of volume where wine in bulk and containers above 2 l. are getting close to 38% of total market (up 3 percentage points since 2000), bottled wines reduce their share from 60% to 55% in the same period.
Bottled and bulk categories: volume
60.1%
62.9%64.5%
60.6% 59.9%61.6%
59.4%57.7% 57.7% 57.2% 56.8%
54.9% 55.4%
33.6%30.9%
29.1%
32.6% 33.5%32.0%
34.5%35.8% 35.1% 36.1% 36.3%
37.8% 37.5%
2000 2001 2002 2003 2004 2005 2006 2007 2008 2009 2010 2011 2012
Bottled
Bulk

O.I.V.2013
Top wine exporters account for almost 90% of total value and more than 92% of total volume. With “traditional” producers growing in 2012 at a rate of 7.2% in Euros, versus 11.7% for “new” exporters. However, sales for the traditional producers decreased by 6.2% in volume whereas that of “new” producers increased last year by 6.4%.Similarly, export average prices grew faster in the “old world” (14.4%) than in the “new” (5%).
Top world Exporters
Top wine world exporters
2011 2012 Variation 2011 2012 Variation 2011 2012 Variation France 7 194.1 7 836.6 8.9% 1 419.4 1 499.2 5.6% 5.07 5.23 3.1%Italy 4 404.7 4 690.6 6.5% 2 323.8 2 120.0 -8.8% 1.90 2.21 16.7%Spain 2 215.1 2 359.9 6.5% 2 254.9 1 947.2 -13.6% 0.98 1.21 23.4%Germany 981.4 973.7 -0.8% 415.1 396.0 -4.6% 2.36 2.46 4.0%Portugal 657.8 707.5 7.6% 307.6 338.6 10.1% 2.14 2.09 -2.3%
Australia 1 426.7 1 523.7 6.8% 720.5 734.9 2.0% 1.98 2.07 4.7%Chile 1 220.5 1 399.5 14.7% 666.6 751.7 12.8% 1.83 1.86 1.7%USA 966.7 1 077.4 11.5% 421.8 400.9 -5.0% 2.29 2.69 17.3%New Zealand 646.5 767.0 18.6% 168.1 175.8 4.6% 3.85 4.36 13.5%Argentina 610.1 711.3 16.6% 317.1 364.7 15.0% 1.92 1.95 1.4%South Africa 541.8 566.1 4.5% 375.2 412.8 10.0% 1.44 1.37 -5.0%
Rest of the world
2 479.4 2 676.7 8.0% 682.4 761.6 11.6% 3.63 3.51 -3.3%
WORLD TOTAL 23 344.8 25 290.0 8.3% 10 072.6 9 903.3 -1.7% 2.32 2.55 10.2%
Mill. € Mill. l. €/l
7.2%
11.7%
-6.2%
6.4%
14.4%
5%
O.I.V.2013
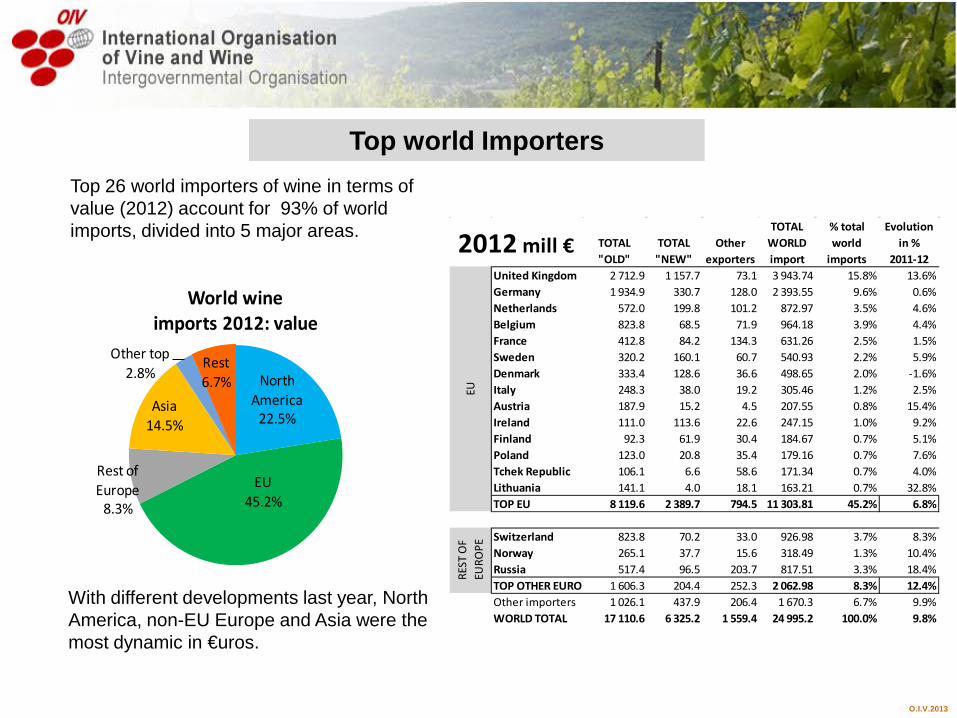
Top 26 world importers of wine in terms of value (2012) account for 93% of world imports, divided into 5 major areas.
Top world Importers
TOTAL "OLD"
TOTAL "NEW"
Other exporters
TOTAL WORLD import
% total world
imports
Evolution in %
2011-12United Kingdom 2 712.9 1 157.7 73.1 3 943.74 15.8% 13.6%Germany 1 934.9 330.7 128.0 2 393.55 9.6% 0.6%Netherlands 572.0 199.8 101.2 872.97 3.5% 4.6%Belgium 823.8 68.5 71.9 964.18 3.9% 4.4%France 412.8 84.2 134.3 631.26 2.5% 1.5%Sweden 320.2 160.1 60.7 540.93 2.2% 5.9%Denmark 333.4 128.6 36.6 498.65 2.0% -1.6%Italy 248.3 38.0 19.2 305.46 1.2% 2.5%Austria 187.9 15.2 4.5 207.55 0.8% 15.4%Ireland 111.0 113.6 22.6 247.15 1.0% 9.2%Finland 92.3 61.9 30.4 184.67 0.7% 5.1%Poland 123.0 20.8 35.4 179.16 0.7% 7.6%Tchek Republic 106.1 6.6 58.6 171.34 0.7% 4.0%Lithuania 141.1 4.0 18.1 163.21 0.7% 32.8%TOP EU 8 119.6 2 389.7 794.5 11 303.81 45.2% 6.8%
Switzerland 823.8 70.2 33.0 926.98 3.7% 8.3%Norway 265.1 37.7 15.6 318.49 1.3% 10.4%Russia 517.4 96.5 203.7 817.51 3.3% 18.4%TOP OTHER EUROP 1 606.3 204.4 252.3 2 062.98 8.3% 12.4%Other importers 1 026.1 437.9 206.4 1 670.3 6.7% 9.9%WORLD TOTAL 17 110.6 6 325.2 1 559.4 24 995.2 100.0% 9.8%
2012 mill €
EURE
ST O
F EU
ROPE
North America
22.5%
EU45.2%
Rest of Europe
8.3%
Asia14.5%
Other top2.8%
Rest6.7%
World wine imports 2012: value
With different developments last year, North America, non-EU Europe and Asia were the most dynamic in €uros.
O.I.V.2013
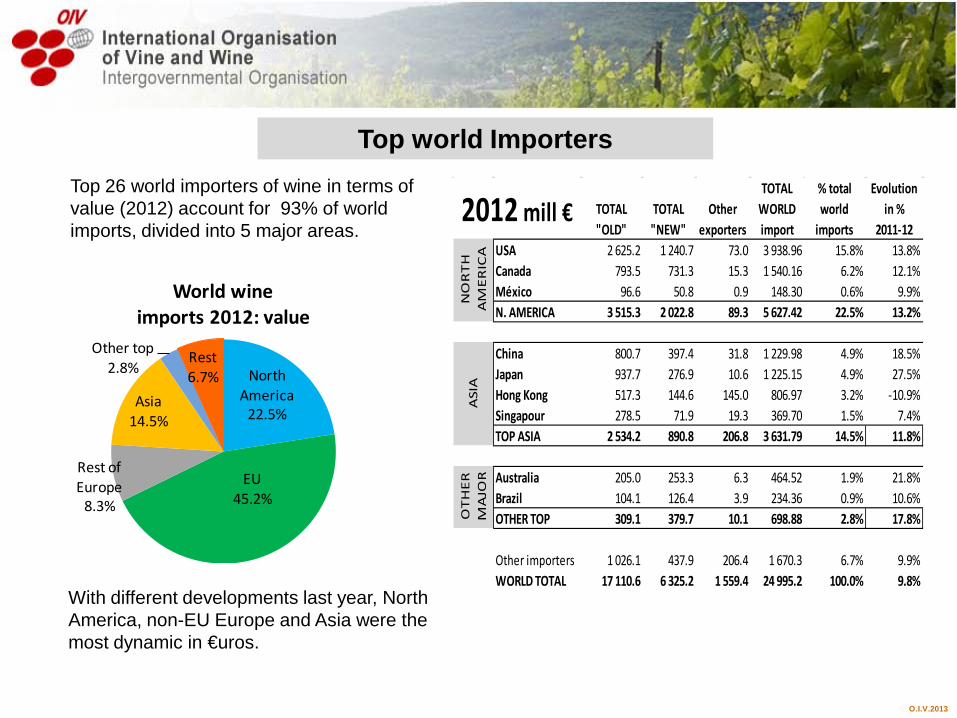
Top 26 world importers of wine in terms of value (2012) account for 93% of world imports, divided into 5 major areas.
Top world Importers
TOTAL "OLD"
TOTAL "NEW"
Other exporters
TOTAL WORLD import
% total world
imports
Evolution in %
2011-12USA 2 625.2 1 240.7 73.0 3 938.96 15.8% 13.8%Canada 793.5 731.3 15.3 1 540.16 6.2% 12.1%México 96.6 50.8 0.9 148.30 0.6% 9.9%N. AMERICA 3 515.3 2 022.8 89.3 5 627.42 22.5% 13.2%
China 800.7 397.4 31.8 1 229.98 4.9% 18.5%Japan 937.7 276.9 10.6 1 225.15 4.9% 27.5%Hong Kong 517.3 144.6 145.0 806.97 3.2% -10.9%Singapour 278.5 71.9 19.3 369.70 1.5% 7.4%TOP ASIA 2 534.2 890.8 206.8 3 631.79 14.5% 11.8%
Australia 205.0 253.3 6.3 464.52 1.9% 21.8%Brazil 104.1 126.4 3.9 234.36 0.9% 10.6%OTHER TOP 309.1 379.7 10.1 698.88 2.8% 17.8%
Other importers 1 026.1 437.9 206.4 1 670.3 6.7% 9.9%WORLD TOTAL 17 110.6 6 325.2 1 559.4 24 995.2 100.0% 9.8%
OT
HE
R
MA
JOR
2012 mill €
NO
RT
H
AM
ER
ICA
ASI
ANorth America
22.5%
EU45.2%
Rest of Europe
8.3%
Asia14.5%
Other top2.8%
Rest6.7%
World wine imports 2012: value
With different developments last year, North America, non-EU Europe and Asia were the most dynamic in €uros.
O.I.V.2013
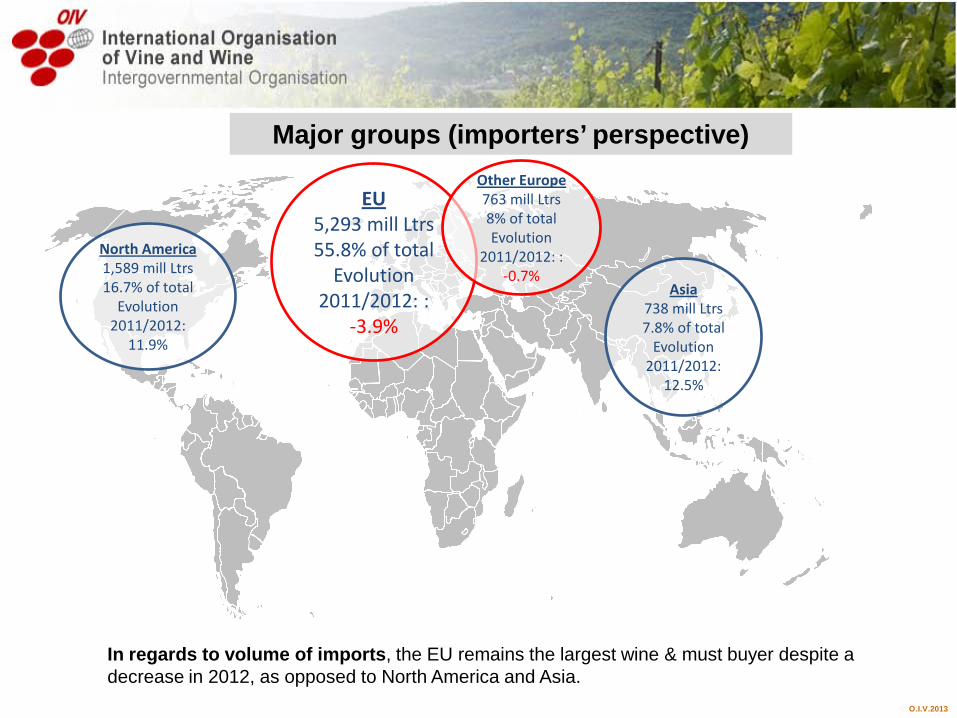
In regards to volume of imports, the EU remains the largest wine & must buyer despite a decrease in 2012, as opposed to North America and Asia.
Major groups (importers’ perspective)
North America 1,589 mill Ltrs 16.7% of total
Evolution 2011/2012:
11.9%
EU 5,293 mill Ltrs 55.8% of total
Evolution 2011/2012: :
-3.9%
Other Europe 763 mill Ltrs 8% of total Evolution
2011/2012: : -0.7%
Asia 738 mill Ltrs 7.8% of total
Evolution 2011/2012:
12.5%

O.I.V.2013
Perspectives and trends
Decline of surface areas (and production): will this trend continue? (Slight) recovery of world consumption: notably outside Europe, the evolution is a positive one although 2008 levels have not yet been met. Decrease in available volume of export resulting in a reduction from the bulk wine, particularly for European producers.
O.I.V.2013
Thank you for your attention
Vielen Dank für Ihre Aufmerksamkeit
Grazie per la Loro attenzione
Gracias por su atención
Merci de votre attention