Open-loop recycling: A LCA case study of PET bottle-to-fibre recycling
Upload
khangminh22Category
view
3download
0
Ferrous Division
WORLD STEEL RECYCLING IN FIGURES 2017 – 2021
13TH EDITION
Steel Scrap – a Raw Material for Green Steelmaking
BIR GLOBAL FACTS & FIGURES FERROUS METALS

2 World Steel Recycling in Figures 2017 – 2021
Copyright BIR 2022. All rights reserved.

World Steel Recycling in Figures 2017 – 2021 1
CONTENTS
Foreword 2
Executive Summary 4
Graphs & Tables 8
World Crude Steel Production 8
World Crude Steel Production by BOF and EF Process 10
The 12 Largest Steel-Producing Countries 12
Production of Crude Steel and Primary Iron in the World 12
Steel Scrap Use for Steelmaking in Key Countries and Regions 13
Steel Scrap Use and Crude Steel Production in Key Countries and Regions 13
Individual Reports of Steel Scrap Use for Steelmaking in Key Countries and Regions 14
Ferrous Scrap Use in Iron and Steel Foundries in the World 22
Volume of Global External Steel Scrap Trade 23
Main Steel Scrap Importers 23
Main Steel Scrap Exporters 27
Major Net Steel Scrap Exporters 27
Main Flows of Steel Scrap Exports 28
Steel Scrap Price Curves 38
Glossary 40

2 World Steel Recycling in Figures 2017 – 2021
The latest edition of our BIR report “World Steel Recycling in Figures”, which covers the five-year period between 2017 and 2021, highlights the global importance of ferrous scrap as a raw material for the world’s steelworks and for its iron and steel foundries.
It is a great pleasure for me to announce the publication of what is the 13th edition of “World Steel Recycling in Figures”. This compilation of important statistics relating to the global ferrous scrap markets has received a hugely positive welcome ever since it appeared for the first time in 2010. And following a decision
from the BIR Ferrous Division board, this latest edition features a new subtitle to emphasize the importance of steel scrap usage for green steelmaking.
The full-year figures for 2021 contained in this report show an increase in world crude steel output and a higher steel scrap usage in most countries and regions. Indeed, total steel scrap use in our seven key countries and regions was around 503 million tonnes last year while corresponding crude steel production was 1.555 billion tonnes. It is important to note that the steel scrap usage figure in our statistics represents verified data for 79.7% of global steelmaking in 2021.
According to our calculations, annual ferrous scrap use in the world’s iron and steel foundries has been between 67 and 73 million tonnes over recent years.
The final figures for 2021 also show positive developments in external steel scrap trading, which increased to 109.6 million tonnes.
FOREWORD

World Steel Recycling in Figures 2017 – 2021 3
The 13th edition of “World Steel Recycling in Figures” also contains an overview (supported by graphs) of the main suppliers to Turkey as the world’s foremost steel scrap importer, to the EU-27 as the second-largest importer and to the USA as the third-largest. The report once again highlights the scale of world trade in steel scrap and thus serves to underline the need for a free raw materials market.
In total, the report contains eight flow charts – features which have received a particularly warm welcome – and incorporates a total of 60 graphs and tables.
I would like to extend special thanks to Rolf Willeke, the BIR Ferrous Division’s Statistics Advisor, who prepared and evaluated all the figures as well as developed the graphs and tables in this report. Since 2017, he has enjoyed the excellent co-operation of Daniela Entzian, the BIR Ferrous Division’s Deputy
Statistics Advisor, to whom I extend my appreciation. Rolf and his team are working with a worldwide network, so I would like to express my deep thanks to all the supporters of our publication.
For an even more accurate appraisal of the market, we aim to continue to improve the ferrous scrap figures at our disposal, including our quarterly update of the world statistics.
We hope that, as with its predecessors, the 13th
edition of “World Steel Recycling in Figures 2017-2021” will prove useful to you.
Brussels, May 2022
Denis Reuter President of the BIR Ferrous Division

4 World Steel Recycling in Figures 2017 – 2021
The 13th edition of “World Steel Recycling in Figures” features a new subtitle highlighting the importance of steel scrap use in green steelmaking. The statistics in our publication show 3.8% growth in global crude steel output in 2021, as well as an increase in steel scrap use in most key countries and regions. It also includes an overview of global external steel scrap trading, revealing an increase in Turkey’s imports and in the EU-27’s exports.
Global crude steel production totalled 1.952 billion tonnes in 2021, up 3.8% from the previous year. According to worldsteel, global oxygen furnace production was almost unchanged on 1.381 billion tonnes whereas the electric furnace total jumped 14.4% to 563 million tonnes. There were also increases in the global production
of both blast furnace iron (+1.2% to 1.346 billion tonnes) and DRI (+9.9% to 114.5 million tonnes).
Data in our corresponding table show a decrease in China’s crude steel production last year (-3% to 1.033 billion tonnes), thereby reducing the country’s share of global production from 56.6% in 2020 to 53% in 2021. In contrast, increased crude steel production was registered in 2021 by the EU-27 (+15.4% to 152.575 million tonnes), Japan (+15.8% to 96.334 million tonnes), the USA (+18% to 85.791 million tonnes), Russia (+5% to 76.894 million tonnes), the
Republic of Korea (+5% to 70.418 million tonnes), Turkey (+12.7% to 40.360 million tonnes) and Canada (+18.1% to 12.976 million tonnes).
New subtitle: Steel Scrap – a Raw Material for Green SteelmakingThe 13th edition of “World Steel Recycling in Figures” features a new subtitle to highlight the importance of steel scrap use for green steelmaking. In the 11th edition, our own calculations and those of worldsteel concluded that, in 2019, 630 million tonnes of steel scrap was being recycled on an annual basis, thus preventing nearly 950 million tonnes each year of CO2 emissions that would have come from the production of steel from virgin sources.
Besides this significant reduction in greenhouse gas emissions, it should also be noted that steel recycling saves energy and conserves natural resources, thus making a decisive contribution to climate protection.
EXECUTIVE SUMMARY

World Steel Recycling in Figures 2017 – 2021 5
Higher steel scrap usage in most countries and regionsAccording to our statistics, steel scrap consumption in China was 2.8% lower last year at 226.21 million tonnes, although the country remained the world’s largest user. The proportion of scrap used in China’s steel production was 21.9% in 2021 owing to an 11.5% increase in scrap-intensive electric furnace production.
Conversely, there were increases in steel scrap consumption last year in the EU-27, the USA, Turkey, Japan, Russia and the Republic of Korea.
The EU-27 recorded 16.7% growth in steel scrap consumption to 87.853 million tonnes in 2021, alongside the 15.4% increase in its crude steel production. The proportion of steel scrap used in the EU-27’s crude steel production increased to 57.6% in 2021.
The USA recorded crude steel production growth of 18% last year and an increase in steel scrap usage of 18.3% to 59.4 million tonnes. The proportion of steel scrap used in US crude steel production improved to 69.2%.
Steel scrap usage increased in Turkey last year (+15.7% to 34.813 million tonnes) while its crude steel production was 12.7% higher. The proportion of steel scrap used in its crude steel production increased to 86.1%.
Our 2021 statistics reveal an increase in Japan’s steel scrap usage (+19% to 34.727 million tonnes) compared to a crude steel production gain of 15.8%.
The 5% growth in Russia’s crude steel production last year was exceeded by the increase in the nation’s steel scrap usage (+7% to 32.138 million tonnes). The proportion of steel scrap used in Russia’s crude steel production climbed to 41.7% in 2021.
The Republic of Korea recorded an increase in steel scrap usage last year of 9.5% to 28.296 million tonnes whereas its crude steel production climbed only 5%. The proportion of steel scrap used in the Republic of Korea’s crude steel production increased to 40.1%.
Almost 67 million tonnes of scrap used in iron and steel foundries in 2020Our calculation model for global ferrous scrap use in iron and steel foundries is produced in collaboration with the German Foundry Association (BDG). These calculations cover the period from 2014 to 2020. It was not possible to incorporate figures for 2021 because world casting production is determined by “Modern Casting” magazine with a time lag of one year. For 2020, global ferrous scrap usage of 66.9 million tonnes has been calculated (-4.3% compared to 2019) for a world iron and steel casting production total of 84.2 million tonnes (-1.6%).

6 World Steel Recycling in Figures 2017 – 2021
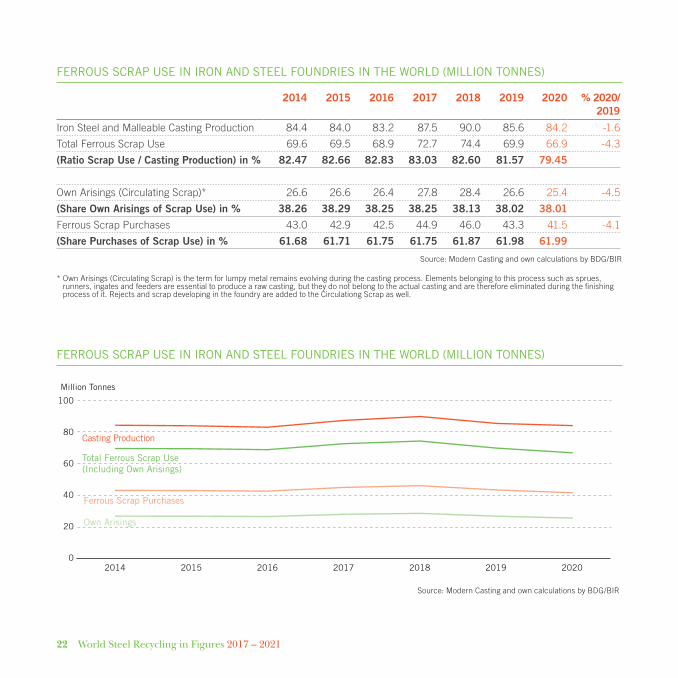
Turkey increases overseas steel scrap purchases by 11.4%Last year brought an 11.4% year-on-year increase in Turkey’s overseas steel scrap purchases to 24.992 million tonnes, thus confirming the country as the world’s foremost steel scrap importer. Its main suppliers were the USA (-13.7% to 3.768 million tonnes), the Netherlands (+1.9% to 3.214 million tonnes), the UK (+1.4% to 2.337 million tonnes) and Russia (-13.6% to 2.031 million tonnes).
The EU-27 took over as the world’s second-largest steel scrap importer in 2021 (+31.1% to 5.367 million tonnes), with the region’s main suppliers being the UK (+26.8% to 1.633 million tonnes), Switzerland (+1.9% to 0.796 million tonnes) and the USA (+107.1% to 0.551 million tonnes).
The world’s third-largest steel scrap importer last year was the USA (+17.1% to 5.262 million tonnes); its main suppliers were Canada (+18.2% to 3.757 million tonnes), Mexico (+12.9% to 0.562 million tonnes) and the UK (+92.5% to 0.308 million tonnes).
Also higher last year were steel scrap imports into the Republic of Korea (+8.9% to 4.789 million tonnes), Thailand (+18% to 1.653 million tonnes), Malaysia (+9.8% to 1.533 million tonnes) and Indonesia (+3% to 1.462 million tonnes). Conversely, import declines were recorded by India (-4.6% to 5.133 million
tonnes), Pakistan (-8.4% to 4.156 million tonnes), Belarus (-14.7% to 1.136 million tonnes) and Canada (-21% to 0.815 million tonnes).
EU-27 overseas steel scrap shipments climb by 11.5% Global external steel scrap trade - including internal EU-27 trade - amounted to 109.6 million tonnes last year (+9.7% compared to 2020).
The EU-27 was the world’s leading steel scrap exporter last year in growing its outbound shipments by 11.5% to 19.460 million tonnes, the main buyer being Turkey on 13.110 million tonnes (+11.3% year on year). The EU-27 also increased its overseas shipments to Egypt (+68.4% to 1.817 million tonnes), Switzerland (+16.4% to 0.561 million tonnes) and Moldova (+37.8% to 0.346 million tonnes).
In contrast, a drop was recorded in EU-27 deliveries to Pakistan (-13.1% to 0.804 million tonnes), the USA (-3.8% to 0.604 million tonnes) and India (-22.4% to 0.535 million tonnes). The largest EU-27 steel scrap exporter in 2021 was the Netherlands, with its total shipments of 4.687 million tonnes representing a 17% increase over the previous year.
EU-27 internal steel scrap exports totalled 29.328 million tonnes in 2021 (+14.5% compared to 2020).

World Steel Recycling in Figures 2017 – 2021 7
Last year also brought an increase in US overseas steel scrap shipments of 6.1% to 17.906 million tonnes; among the leading buyers to extend their purchases from the USA were Mexico (+51.4% to 3.142 million tonnes) and Vietnam (+44.9% to 1.435 million tonnes). In contrast, decreases in US deliveries were recorded by main customer Turkey (-14% to 3.466 million tonnes), Malaysia (-8.2% to 1.449 million tonnes), Taiwan (-10.8% to 1.423 million tonnes), Bangladesh (-0.9% to 1.356 million tonnes) and Canada (-7.3% to 0.840 million tonnes).
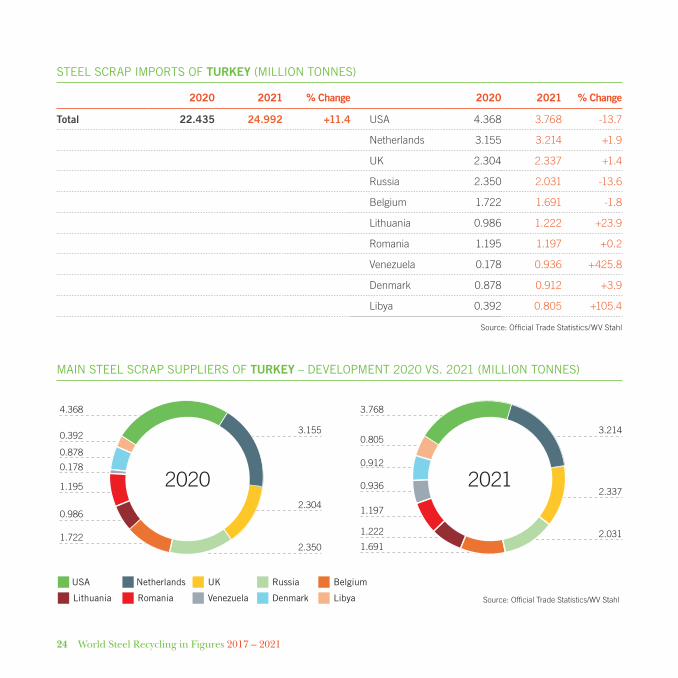
Last year, increases were recorded in steel scrap exports from the UK (+21.4% to 8.287 million tonnes), Canada (+7.8% to 4.863 million tonnes), Australia (+6.9% to 2.224 million tonnes) and Singapore (+35.4% to 0.685 million tonnes), whereas declines in overseas shipments were registered by Japan (-22.1% to 7.301 million tonnes) and Russia (-12.4% to 4.140 million tonnes).
Most of the world’s leading steel scrap exporters are major net steel scrap exporters: last year’s export surplus was, for example, 14.1 million tonnes for the EU-27 and 12.6 million tonnes for the USA.
Over the past 13 years, we have been able to show the worldwide use of steel scrap as a raw material in steelworks and foundries, as well as to underline that
our steel scrap is an ecological raw material and an internationally-traded commodity subject to world market prices.
I am grateful for the very good co-operation with BIR Ferrous Division President Denis Reuter and his board, as well as with the BIR Secretariat. I would like to extend my deep thanks to all those supporting this publication. Last but not least, I would like to offer my special thanks to Daniela Entzian, the BIR Ferrous Division’s Deputy Statistics Advisor, for her excellent co-operation.
Rolf Willeke Statistics Advisor of the BIR Ferrous Division

8 World Steel Recycling in Figures 2017 – 2021
WORLD CRUDE STEEL PRODUCTION SUMMARY (MILLION TONNES)
2017 2018 2019 2020 2021 % 2021/2020
European Union (27) 161.0 160.0 150.2 132.2 152.6 +15.4
Other Europe 49.7 49.7 45.9 47.1 52.3 +11.1
of which Turkey 37.5 37.3 33.7 35.8 40.4 +12.7
of which United Kingdom 7.5 7.3 7.2 7.1 7.2 +1.9
C.I.S. 100.2 101.0 100.6 100.2 105.4 +5.1
of which Russia 71.6 72.8 72.0 73.3 76.9 +5.0
North America 115.4 120.9 119.7 101.0 117.9 +16.7
of which USA 81.6 86.6 87.8 72.7 85.8 +18.0
of which Canada 13.2 13.4 12.9 11.0 13.0 +18.1
South America 44.1 44.9 41.7 38.7 45.7 +18.1
Africa 15.0 17.8 17.4 17.4 21.1 +21.5
of which South Africa 6.3 6.3 6.2 3.9e 5.0e +29.5
Middle East 34.7 43.2 44.3 45.4 45.8 +1.1
of which Iran 21.2 24.5 25.6 29.0 28.5 -1.8
Asia 1209.0 1282.7 1349.4 1392.3 1404.7 +0.9
of which China 870.7 929.0 995.4 1064.7 1032.8 -3.0
of which India 101.4 109.3 111.4 100.3 118.2 +17.9
of which Japan 104.7 104.3 99.3 83.2 96.3 +15.8
of which Republic of Korea 71.0 72.5 71.4 67.1 70.4 +5.0
Oceania 6.0 6.3 6.2 6.1 6.4 +5.7
of which Australia 5.3 5.7 5.5 5.5 5.8 +5.3
World 1735.1 1825.6 1675.3 1880.4 1951.9 +3.8
Total 64 Countries
Source: worldsteel and Ruslom
GRAPHS & TABLES

World Steel Recycling in Figures 2017 – 2021 9
WORLD CRUDE STEEL PRODUCTION (MILLION TONNES)
Source: worldsteelWorld Steel Production Of which China
0
300
600
900
1200
1500
1800
2017 2018 2019 2020 2021
1735
870.7
1675
995.4
18801952
1064.4 1032.8929.0
1826
CRUDE STEEL PRODUCTION ANNUAL GROWTH TREND (IN PERCENT)
Percentage
Source: worldsteelChina WorldRest of World
20152014 2016 2017 202120192018 2020-10
-5
0
5
10
15

10 World Steel Recycling in Figures 2017 – 2021
WORLD CRUDE STEEL PRODUCTION BY BOF AND EF PROCESS
YEAR 2021 Million Tonnes Percentage of Total Production
BOF EF BOF EF
European Union (28) 91.5 68.3 57.3 42.7
Other Europe 13.7 31.4 30.4 69.6
of which Turkey 11.5 28.9 28.4 71.6
C.I.S. 65.2 34.8 61.8 33.0
of which Russia 44.6 29.5 59.0 39.0
North America 36.5 81.4 31.0 69.0
of which USA 26.5 59.3 30.8 69.2
South America 30.8 14.2 67.7 31.3
Africa 3.4 17.1 16.1 83.9
of which South Africa 2.9 2.1 57.7 42.3
Middle East 2.8 43.1 6.0 94.0
of which Iran 2.8 25.7 9.7 90.3
Asia 1132.8 270.2 80.7 19.3
of which China 923.5 109.3 89.4 10.6
of which India 53.0 65.2 44.8 55.2
of which Japan 71.9 24.4 74.7 25.3
of which Republic of Korea 48.0 22.4 68.2 31.8
Oceania 4.9 1.5 76.2 23.8
of which Australia 4.3 1.5 73.6 26.4
World 1381.5 562.7 70.8 28.9
Total 64 Countries
BOF – Basic Oxygen Furnace Source: worldsteelEF – Electric Furnace

World Steel Recycling in Figures 2017 – 2021 11
WORLD BOF – BASIC OXYGEN FURNACE PRODUCTION (MILLION TONNES)
WORLD EF – ELECTRIC FURNACE PRODUCTION (MILLION TONNES)
Source: worldsteel
0
300
600
900
1200
1500
2017 2018 2019 2020 2021
1244 12671343 13821378
Source: worldsteel
0
300
600
900
1200
1500
2017 2018 2019 2020 2021
468524 523
492
563

12 World Steel Recycling in Figures 2017 – 2021
PRODUCTION OF CRUDE STEEL AND PRIMARY IRON IN THE WORLD (MILLION TONNES)
2017 2018 2019 2020 2021 % 2021/ 2020
Crude Steel Production 1735 1827 1874 1880 1952 +3.8
of which
Basic Oxygen Furnace (BOF) 1244 1267 1343 1378 1382 +0.2
Electric Furnace (EF) 468 524 523 492 563 +14.4
(Share BOF of Crude Steel) in % 72.3 70.9 72.6 73.3 70.8
(Share EF of Crude Steel) in % 27.2 29.2 28.3 26.1 28.9
Blast Furnace Iron 1183 1258 1321 1336 1346 +0.8
(Ratio B F Iron / Crude Steel) in % 68.2 68.9 70.5 71.1 69.0
Direct Reduced Iron (DRI) 92.2 105.3 109.4 104.3 114.5 +9.9
(Ratio DRI / Crude Steel) in % 5.3 5.8 5.8 5.5 5.9
Source: worldsteel
THE 12 LARGEST STEEL-PRODUCING COUNTRIES (MILLION TONNES)
2017 2018 2019 2020 2021 % 2021/ 2020
1 China 870.9 920.0 995.4 1064.8 1032.8 -3.0
2 India 101.4 109.3 111.3 100.2 118.1 +17.9
3 Japan 104.7 104.3 99.3 83.2 96.3 +15.8
4 USA 81.6 86.6 87.8 72.7 86.0 +18.3
5 Russia 71.6 72.8 72.0 73.2 76.0 +6.1
6 Republic of Korea 71.0 72.5 71.4 67.1 70.6 +5.2
7 Turkey 37.5 37.3 33.7 35.8 40.4 +12.7
8 Germany 43.3 42.4 39.7 35.7 40.1 +12.3
9 Brazil 34.4 35.4 32.6 30.9 36.0 +14.7
10 Iran 21.2 24.5 25.6 29.0 28.5 -1.8
11 Taiwan 22.4 23.2 22.0 20.5 23.2 +10.9
12 Ukraine 21.4 21.1 20.8 20.6 21.4 +3.6
Source: worldsteel and RUSLOM

World Steel Recycling in Figures 2017 – 2021 13
STEEL SCRAP USE AND CRUDE STEEL PRODUCTION IN KEY COUNTRIES AND REGIONS (MILLION TONNES)
STEEL SCRAP USE FOR STEELMAKING IN KEY COUNTRIES AND REGIONS (MILLION TONNES)
2017 2018 2019 2020 2021 % 2021/ 2020
China 147.9 187.8 215.9 232.62 226.21 -2.8
EU28/27 93.6 90.939 86.473 75.255 87.853 +16.7
USA 58.8 60.1 60.7 50.2 59.4 +18.3
Turkey 30.27 31.317 27.900 30.077 34.813 +15.7
Japan 35.77 36.513 33.682 29.179 34.727 +19.0
Russia 29.34 31.776 30.173 30.030 32.138 +7.0
Republic of Korea 30.67 29.956 28.601 25.831 28.296 +9.5
Canada 6.29 6.67 6.28 * *
* Not available at editorial deadline Source: EUROFER, CAMU, USGS/ISRI-calculations, TCUD, EU-27 since 2020 Japan Ministry of Economy, RUSMET, KOSA, CARI
Steel Scrap Consumption Crude Steel Production
2021 2020 % Change 2021 2020 % Change
China 226.21 232.62 -2.8 1032.790 1064.732 -3.0
EU-27 87.853 75.255 +16.7 152.575 132.177 +15.4
USA 59.4 50.2 +18.3 85.791 72.732 +18.0
Turkey 34.813 30.077 +15.7 40.360 35.810 +12.7
Japan 34.727 29.179 +19.0 96.334 83.839 +15.8
Russia 32.138 30.030 +7.0 76.894 73.251 +5.0
Republic of Korea 28.296 25.831 +9.5 70.418 67.079 +5.0
Canada * * 12.976 10.986 +18.1
*Not available at editorial deadline Source: CAMU, EUROFER, ISRI-calculations, TCUD, Japan Ministry of Economy, RUSMET, KOSA, CARI, worldsteel

14 World Steel Recycling in Figures 2017 – 2021
CRUDE STEEL PRODUCTION AND STEEL SCRAP USE IN CHINA (MILLION TONNES)
2017 2018 2019 2020 2021 % 2021/ 2020
Crude Steel Production 870.7 929.0 995.4 1064.7 1032.8 -3.0
of which
Share BOF of Crude Steel in % 90.7 87.0 89.6 90.8 89.4
Share EF of Crude Steel in % 9.3 13.0 10.4 9.2 10.6
Total Steel Scrap Use 147.9 187.8 215.9 232.6 226.2 -2.8
Ratio Steel Scrap / Crude Steel in % 17.0 20.2 21.7 21.8 21.9
BOF – Basic Oxygen Furnace Source: worldsteel and CAMUEF – Electric Furnace
STEEL SCRAP FOR STEELMAKING IN CHINA (MILLION TONNES)
0
250
500
750
1000
1250
Source: worldsteel and CAMUCrude Steel Production Steel Scrap Use
2017 2018 2019 2020 2021
870.7
187.8
995.4
215.9 232.6
1064.7
147.9
929.0
226.2
1032.8

World Steel Recycling in Figures 2017 – 2021 15
STEEL SCRAP FOR STEELMAKING IN THE EU-28/27 (MILLION TONNES)
0
50
100
150
200
Source: worldsteel and EUROFERCrude Steel Production Steel Scrap Use
2017 2018 2019 2020 2021
167.1168.5
93.8
157.4
90.986.5
75.3
132.2
87.9
152.6
CRUDE STEEL PRODUCTION AND STEEL SCRAP USE IN THE EU-28/27 (MILLION TONNES)
2017 2018 2019 2020* 2021* % 2021/ 2020
Crude Steel Production 168.5 167.1 157.4 132.2 152.6 +15.4
of which
Share BOF of Crude Steel in % 59.6 58.5 59.6 56.3 56.1
Share EF of Crude Steel in % 40.4 41.5 40.4 43.7 43.9
Total Steel Scrap Use 93.8 90.9 86.5 75.3 87.9 +16.7
Ratio Steel Scrap / Crude Steel in % 55.5 54.4 55.0 57.0 57.6
BOF – Basic Oxygen Furnace Source: worldsteel and EUROFEREF – Electric Furnace*Data EU-27

16 World Steel Recycling in Figures 2017 – 2021
CRUDE STEEL PRODUCTION AND STEEL SCRAP USE IN THE USA (MILLION TONNES)
2017 2018 2019 2020 2021 % 2021/ 2020
Crude Steel Production 81.6 86.6 87.8 72.7 85.8 +18.0
of which
Share BOF of Crude Steel in % 31.6 32.0 30.0 29.4 30.9
Share EF of Crude Steel in % 68.4 68.0 69.7 70.6 69.1
Total Steel Scrap Use 58.8 60.1 60.7 50.2 59.4 +18.3
Ratio Steel Scrap / Crude Steel in % 72.1 69.4 69.1 69.1 69.2
BOF – Basic Oxygen Furnace Source: worldsteel and USGS/ISRI calculationEF – Electric Furnace
STEEL SCRAP FOR STEELMAKING IN THE USA (MILLION TONNES)
0
25
50
75
100
Source: worldsteel and USGS/ISRI calculationCrude Steel Production Steel Scrap Use
2017 2018 2019 2020 2021
58.8
81.6
60.1
86.6
60.7
87.8
72.7
50.2
85.8
59.4

World Steel Recycling in Figures 2017 – 2021 17
CRUDE STEEL PRODUCTION AND STEEL SCRAP USE IN TURKEY (MILLION TONNES)
2017 2018 2019 2020 2021 % 2021/ 2020
Crude Steel Production 37.5 37.3 33.7 35.8 40.4 +12.7
of which
Share BOF of Crude Steel in % 30.8 30.9 32.2 30.7 28.4
Share EF of Crude Steel in % 69.2 69.1 67.8 69.2 71.5
Total Steel Scrap Use 30.3 30.1 27.9 30.1 34.8 +15.7
Ratio Steel Scrap / Crude Steel in % 80.8 80.7 82.8 84.1 86.1
BOF – Basic Oxygen Furnace Source: worldsteel and TCUDEF – Electric Furnace
STEEL SCRAP FOR STEELMAKING IN TURKEY (MILLION TONNES)
0
10
20
30
40
50
Source: worldsteel and TCUDCrude Steel Production Steel Scrap Use
2017 2018 2019 2020 2021
37.5
30.3
37.3
30.133.7
27.9
35.8
30.1
40.4
34.8

18 World Steel Recycling in Figures 2017 – 2021
CRUDE STEEL PRODUCTION AND STEEL SCRAP USE IN JAPAN (MILLION TONNES)
2017 2018 2019 2020 2021 % 2021/ 2020
Crude Steel Production 104.7 104.3 99.3 83.8 96.3 +15.8
of which
Share BOF of Crude Steel in % 75.8 75.0 75.5 74.4 74.7
Share EF of Crude Steel in % 24.2 25.0 24.5 25.2 25.3
Total Steel Scrap Use 35.8 36.5 33.7 29.2 34.7 +19.0
Ratio Steel Scrap / Crude Steel in % 34.2 35.0 33.9 34.8 34.8
BOF – Basic Oxygen Furnace Source: worldsteel and Ministry of Economy in JapanEF – Electric Furnace
STEEL SCRAP FOR STEELMAKING IN JAPAN (MILLION TONNES)
0
30
60
90
120
Source: worldsteel and Ministry of Economy in JapanCrude Steel Production Steel Scrap Use
2017 2018 2019 2020 2021
35.8
104.7
36.5
104.3
33.7
99.3
29.2
83.8
34.7
96.3

World Steel Recycling in Figures 2017 – 2021 19
CRUDE STEEL PRODUCTION AND STEEL SCRAP USE IN RUSSIA (MILLION TONNES)
2017 2018 2019 2020 2021 % 2021/ 2020
Crude Steel Production 71.59 72.82 72.0 73.3 76.9 +5.0
of which
Share BOF of Crude Steel in % 67.7 66.7 65.9 64.1 58.0
Share EF of Crude Steel in % 29.0 30.7 30.2 33.6 38.4
Total Steel Scrap Use 27.8 29.3 31.8 30.0 32.1 +7.0
Ratio Steel Scrap / Crude Steel in % 39.5 41.0 43.7 40.9 41.7
BOF – Basic Oxygen Furnace Source: worldsteel and RUSLOMEF – Electric Furnace
STEEL SCRAP FOR STEELMAKING IN RUSSIA (MILLION TONNES)
0
25
50
75
100
Source: worldsteel and RUSLOMCrude Steel Production Steel Scrap Use
2017 2018 2019 2020 2021
27.8
71.59
29.3
72.82
31.8
72.0
30.0
73.3
32.1
76.9

20 World Steel Recycling in Figures 2017 – 2021
CRUDE STEEL PRODUCTION AND STEEL SCRAP USE IN THE REPUBLIC OF KOREA (MILLION TONNES)
2017 2018 2019 2020 2021 % 2021/ 2020
Crude Steel Production 71.0 72.5 71.4 67.1 70.4 +5.0
of which
Share BOF of Crude Steel in % 67.1 66.6 68.2 69.0 68.0
Share EF of Crude Steel in % 32.9 33.4 31.8 31.0 31.7
Total Steel Scrap Use 30.7 30.0 28.6 25.8 28.3 +9.5
Ratio Steel Scrap / Crude Steel in % 43.2 41.4 39.9 38.5 40.1
BOF – Basic Oxygen Furnace Source: worldsteel and KOSAEF – Electric Furnace
STEEL SCRAP FOR STEELMAKING IN THE REPUBLIC OF KOREA (MILLION TONNES)
0
25
50
75
100
Source: worldsteel and KOSACrude Steel Production Steel Scrap Use
2017 2018 2019 2020 2021
30.7
71.0
30.0
72.5
28.6
71.4
25.8
67.1
28.3
70.4

World Steel Recycling in Figures 2017 – 2021 21
CRUDE STEEL PRODUCTION AND STEEL SCRAP USE IN CANADA (MILLION TONNES)
2017 2018 2019 2020 2021 % 2021/ 2020
Crude Steel Production 13.6 13.4 12.9 10.99 12.976 +18.1
of which
Share BOF of Crude Steel in % 53.4 56.9 60.6 54.3 54.7
Share EF of Crude Steel in % 46.6 43.1 39.4 46.7 45.3
Total Steel Scrap Use 6.29 6.67 6.28 * *
Ratio Steel Scrap / Crude Steel in % 46.3 49.8 49.1
BOF – Basic Oxygen Furnace Source: worldsteel and CARIEF – Electric Furnace
*Not available at editorial deadline
STEEL SCRAP FOR STEELMAKING IN CANADA (MILLION TONNES)
0
10
20
30
40
50
Source: worldsteel and CARICrude Steel Production Steel Scrap Use
2017 2018 2019 2020 2021
13.6
6.29
13.4
6.67
12.910.99
12.976
6.28
22 World Steel Recycling in Figures 2017 – 2021
FERROUS SCRAP USE IN IRON AND STEEL FOUNDRIES IN THE WORLD (MILLION TONNES)
2014 2015 2016 2017 2018 2019 2020 % 2020/ 2019
Iron Steel and Malleable Casting Production 84.4 84.0 83.2 87.5 90.0 85.6 84.2 -1.6
Total Ferrous Scrap Use 69.6 69.5 68.9 72.7 74.4 69.9 66.9 -4.3
(Ratio Scrap Use / Casting Production) in % 82.47 82.66 82.83 83.03 82.60 81.57 79.45
Own Arisings (Circulating Scrap)* 26.6 26.6 26.4 27.8 28.4 26.6 25.4 -4.5
(Share Own Arisings of Scrap Use) in % 38.26 38.29 38.25 38.25 38.13 38.02 38.01
Ferrous Scrap Purchases 43.0 42.9 42.5 44.9 46.0 43.3 41.5 -4.1
(Share Purchases of Scrap Use) in % 61.68 61.71 61.75 61.75 61.87 61.98 61.99
Source: Modern Casting and own calculations by BDG/BIR
* Own Arisings (Circulating Scrap) is the term for lumpy metal remains evolving during the casting process. Elements belonging to this process such as sprues, runners, ingates and feeders are essential to produce a raw casting, but they do not belong to the actual casting and are therefore eliminated during the finishing process of it. Rejects and scrap developing in the foundry are added to the Circulationg Scrap as well.
FERROUS SCRAP USE IN IRON AND STEEL FOUNDRIES IN THE WORLD (MILLION TONNES)
Million Tonnes
201620152014 2017 2018 20202019
Casting Production
Total Ferrous Scrap Use (Including Own Arisings)
Ferrous Scrap Purchases
Own Arisings
0
20
40
60
80
100
Source: Modern Casting and own calculations by BDG/BIR

World Steel Recycling in Figures 2017 – 2021 23
MAIN STEEL SCRAP IMPORTERS (MILLION TONNES)
2017 2018 2019 2020 2021 % 2021/2020
Turkey 20.980 20.660 18.857 22.435 24.992 +11.4
EU-28/27 3.071 2.828 2.893 4.094 5.367 +31.1
USA 4.036 5.030 4.268 4.512 5.262 +17.1
India 5.365 6.330 7.053 5.383 5.133 -4.6
Republic of Korea 6.175 6.393 6.495 4.398 4.789 +8.9
Pakistan 5.123 5.013 4.337 4.535 4.156 -8.4
Taiwan 2.919 3.629 3.523 3.616 3.088 -14.6
Thailand 1.741 1.724 1.094 1.401 1.653 +18.0
Malaysia 0.644 0.980 1.532 1.396 1.533 +9.8
Indonesia 1.857 2.510 2.614 1.420 1.462 +3.0
Belarus 1.353 1.497 1.280 1.331 1.136 -14.7
Canada 2.115 3.471 2.129 1.031 0.815 -21.0
Source: Official Trade Statistics/WV Stahl
VOLUME OF GLOBAL EXTERNAL STEEL SCRAP TRADE (MILLION TONNES)
Global External Steel Scrap Trade including reciprocal data from non-reporting countries
Steel Scrap External Trade Including EU Intra Trade
Source: Official Trade Statistics/WV Stahl
0
20
40
60
80
100
120
EU Intra Trade (Steel Scrap Trade between EU countries)
2007 2008 2009 2010 2011 2012 2013 2014 2015 2016 2017 2018 2019 2020 2021
109.6
97.495.8
105.4 103.0 102.7
110.8 109.1
88.1
106.6103.0 100.6 99.3
91.0
101.8
EU 27 since 2020
24 World Steel Recycling in Figures 2017 – 2021
MAIN STEEL SCRAP SUPPLIERS OF TURKEY – DEVELOPMENT 2020 VS. 2021 (MILLION TONNES)
Source: Official Trade Statistics/WV Stahl
0.936
0.912
0.805
3.768
1.197
1.691
1.222
3.214
2.337
2.031
0.178
0.878
0.392
4.368
1.195
1.722
0.986
3.155
2.304
2.350
RussiaNetherlandsUSA UK Belgium
DenmarkLithuania Romania Venezuela Libya
20212020
STEEL SCRAP IMPORTS OF TURKEY (MILLION TONNES)
2020 2021 % Change 2020 2021 % Change
Total 22.435 24.992 +11.4 USA 4.368 3.768 -13.7
Netherlands 3.155 3.214 +1.9
UK 2.304 2.337 +1.4
Russia 2.350 2.031 -13.6
Belgium 1.722 1.691 -1.8
Lithuania 0.986 1.222 +23.9
Romania 1.195 1.197 +0.2
Venezuela 0.178 0.936 +425.8
Denmark 0.878 0.912 +3.9
Libya 0.392 0.805 +105.4
Source: Official Trade Statistics/WV Stahl

World Steel Recycling in Figures 2017 – 2021 25
MAIN STEEL SCRAP SUPPLIERS OF THE EU-27 – DEVELOPMENT 2020 VS. 2021 (MILLION TONNES)
Source: Official Trade Statistics/WV Stahl
0.0470.191
0.082
0.084
0.029
0.354 0.781
0.266
0.513
1.288
0.190
0.176
0.161
0.139
0.246
0.3580.796
0.551
0.496
1.633
Norway
Bosnia and HerzegovinaCanada Lebanon
UK
Turkey
Switzerland RussiaUSA
Venezuela
2020 2021
STEEL SCRAP IMPORTS OF THE EU-27 (MILLION TONNES)
2020 2021 % Change 2020 2021 % Change
Total 4.094 5.367 +31.1 UK 1.288 1.633 +26.8
Switzerland 0.781 0.796 +1.9
USA 0.266 0.551 +107.1
Norway 0.513 0.496 -3.3
Russia 0.354 0.358 +1.1
Venezuela 0.029 0.246 +748.3
Canada 0.047 0.190 +304.3
Lebanon 0.191 0.176 -7.9
Turkey 0.082 0.161 +96.3
Bosnia and Herzegovina 0.084 0.139 +65.5
Source: Official Trade Statistics/WV Stahl

26 World Steel Recycling in Figures 2017 – 2021
MAIN STEEL SCRAP SUPPLIERS OF THE USA – DEVELOPMENT 2019 VS. 2020 (MILLION TONNES)
Source: Official Trade Statistics/WV Stahl
UK PolandSwedenMexicoCanada Netherlands
SpainNew ZealandGermanyBelgium
3.7570.5620.3080.2810.1040.0520.0480.0460.0300.028
0.562
0.308
0.0280.0300.0460.0480.052
0.1040.281
3.757
2021
0.498
0.160
0.0410.0190.01100.028
0.254
0.271
3.178
2020
STEEL SCRAP IMPORTS OF THE USA (MILLION TONNES)
2020 2021 % Change 2020 2021 % Change
Total 4.512 5.262 +17.1 Canada 3.178 3.757 +18.2
Mexico 0.498 0.562 +12.9
UK 0.160 0.308 +92.5
Netherlands 0.271 0.281 +3.7
Sweden 0.254 0.104 -59.1
Poland 0.028 0.052 +85.7
Belgium 0 0.048 -
Germany 0.011 0.046 +318.2
New Zealand 0.019 0.030 +57.9
Spain 0.041 0.028 -31.7
Source: Official Trade Statistics/WV Stahl
World Steel Recycling in Figures 2017 – 2021 27
MAJOR NET STEEL SCRAP EXPORTERS 2021 (MILLION TONNES)
0
5
10
15
20
25
Source: Official Trade Statistics/WV StahlSteel Scrap Export Steel Scrap Import
EU-27 USA JAPAN CANADA RUSSIA
17.906
7.301
4.863
0.008 0.815 0.888
5.3674.129
5.262
19.460
MAIN STEEL SCRAP EXPORTERS (MILLION TONNES)
2017 2018 2019 2020 2021 % 2021/2020
EU-28/27 20.085 21.656 21.750 17.449 19.460 +11.5
USA 15.016 17.332 17.685 16.874 17.906 +6.1
UK* 6.829 8.287 +21.4
Japan 8.208 7.402 7.651 9.371 7.301 -22.1
Canada 4.409 5.107 4.369 4.512 4.863 +7.8
Russia 5.320 5.591 4.099 4.728 4.140 -12.4
Australia 1.979 1.968 2.325 2.083 2.224 +6.9
Singapore 0.790 0.775 0.759 0.506 0.685 +35.4
* Brexit Source: Official Trade Statistics/WV Stahl

28 World Steel Recycling in Figures 2017 – 2021
EU-27 STEEL SCRAP EXPORTS 2021 (MILLION TONNES)
Biggest Buyers
Change: % 2021/2020 Source: Official Trade Statistics/WV Stahl
Total EU-27 exports 2021: 19.460 (+11.5%)
Turkey: 13.110 (+11.3%)
USA: 0.604 (-3.8%)
Egypt: 1.817 (+68.4%)
Switzerland: 0.561 (+16.4%)
Pakistan: 0.804 (-13.1%)
India: 0.535 (-22.4%)
Moldova: 0.346 (+37.8%)
MAIN FLOWS OF EU-27 STEEL SCRAP EXPORTS 2021 (MILLION TONNES)
Change: % 2021/2020 Source: Official Trade Statistics/WV Stahl
0.604(-3.8%) 0.804
(-13.1%) 1.817(+68.4%)
0.535(-22.4%)
Switzerland
Egypt
Moldova
Pakistan
USA
Turkey
Total EU-27 exports 202119.460(+11.5%)
13.110(+11.3%)
0.346(+37.8%)
0.561(+16.4%)
India

World Steel Recycling in Figures 2017 – 2021 29
EU-27 EXTERNAL STEEL SCRAP EXPORTS BY COUNTRY (MILLION TONNES)
Steel Scrap Exports by Main EU-27 Exporters to Third Countries Exporters 2021 2020 % Change Biggest Buyers 2021 % Change
Netherlands 4.687 4.007 +17.0 Turkey 3.185 +0.9
Egypt 0.635 -
USA 0.320 +19.4
India 0.133 -10.1
Belgium 3.141 3.061 +2.6 Turkey 1.673 +0.5
Egypt 1.158 +10.4
Pakistan 0.159 +14.4
Romania 1.396 1.305 +7.0 Turkey 1.049 -0.4
Moldova 0.345 +37.5
Germany 1.276 1.228 +3.9 Turkey 0.718 +17.0
Switzerland 0.324 +9.1
Pakistan 0.102 -30.1
India 0.069 -
France 1.014 0.948 +7.0 Turkey 0.722 +17.0
Switzerland 0.126 +18.5
India 0.061 -
Sweden 0.795 0.956 -16.8 Turkey 0.283 -18.4
Norway 0.196 -4.9
USA 0.147 -34.4
Bulgaria 0.568 0.406 +40.0 Turkey 0.460 +42.0
EU-27 Extra Trade 19.460 17.449 +11.5Change: % 2021/2020
Source: Official Trade Statistics/WV Stahl

30 World Steel Recycling in Figures 2017 – 2021
EU-27 INTERNAL STEEL SCRAP EXPORTS BY COUNTRY (MILLION TONNES)
Main Steel Scrap Exports between EU-27 Countries Exporters 2021 2020 % Change Biggest Buyers 2021 % Change
Germany 7.214 7.186 +0.4 Netherlands 1.873 +5.3
Italy 1.569 -2.1
Belgium 1.109 -7.9
Luxembourg 1.030 +7.5
France 6.098 5.187 +17.6 Belgium 1.869 +24.5
Spain 1.861 +17.0
Luxembourg 0.856 +9.6
Italy 0.706 +19.1
Netherlands 2.934 2.352 +24.7 Germany 1.277 +37.2
Belgium 0.700 +19.5
Spain 0.338 +31.0
Czech Rep. 2.353 2.166 +8.5 Germany 1.060 +10.2
Italy 0.494 +21.1
Austria 0.341 +32.7
Poland 1.931 1.432 +34.8 Germany 0.914 +36.8
Czech Rep. 0.360 +23.3
Austria 1.286 1.079 +19.2 Italy 0.717 +6.7
Germany 0.401 +54.2
Belgium 1.089 1.014 +7.4 France 0.436 +8.1
Netherlands 0.319 +16.4
Luxembourg 0.215 +7.5
EU-27 Intra Trade 29.328 25.603 +14.5
Change: % 2021/2020 Source: Official Trade Statistics/WV Stahl

World Steel Recycling in Figures 2017 – 2021 31
Turkey: 3.466 (-14.0%)
MAIN FLOWS OF US STEEL SCRAP EXPORTS 2020 (MILLION TONNES)
Change: % 2021/2020 Source: Official Trade Statistics/WV Stahl
0.840(-7.3%)
3.142(+51.4%)
3.466(-14.0%)
1.356(-0.9%)
1.435(+44.9%)
1.449(-8.2%)
1.423(-10.8%)
Turkey Taiwan
Mexico
Vietnam
Bangladesh
TotalUSA exports
17.906(+6.1%)
Malaysia Canada
US STEEL SCRAP EXPORTS 2021 (MILLION TONNES)
Biggest Buyers
Change: % 2021/2020 Source: Official Trade Statistics/WV Stahl
Total USA exports: 17.906 (+6.1%)
Malaysia: 1.449 (-8.2%)
Mexico: 3.142 (+51.4%)
Vietnam: 1.435 (+44.9%)
Canada: 0.840 (-7.3%)
Bangladesh: 1.356 (-0.9%)
Taiwan: 1.423 (-10.8%)
32 World Steel Recycling in Figures 2017 – 2021
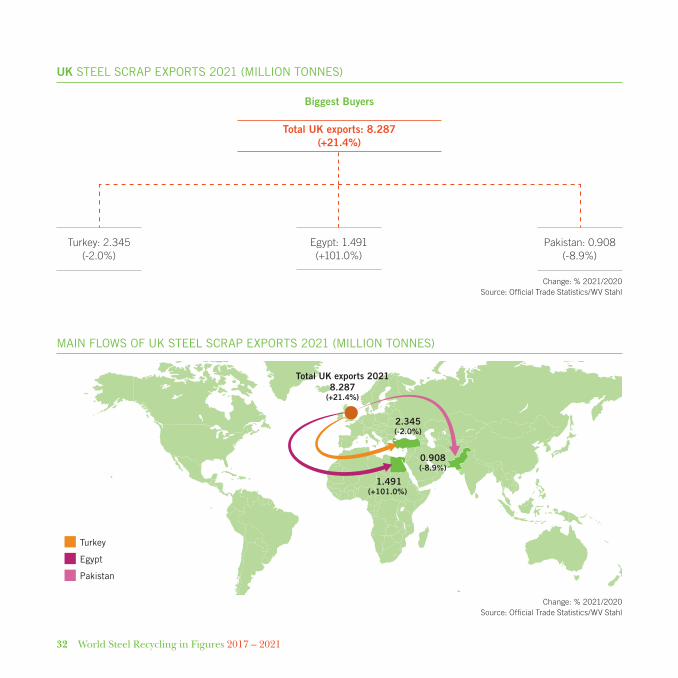
UK STEEL SCRAP EXPORTS 2021 (MILLION TONNES)
Biggest Buyers
Change: % 2021/2020 Source: Official Trade Statistics/WV Stahl
Total UK exports: 8.287 (+21.4%)
MAIN FLOWS OF UK STEEL SCRAP EXPORTS 2021 (MILLION TONNES)
0.908(-8.9%)
1.491(+101.0%)
Egypt
Pakistan
Turkey
Total UK exports 20218.287
(+21.4%)
2.345(-2.0%)
Change: % 2021/2020 Source: Official Trade Statistics/WV Stahl
Turkey: 2.345 (-2.0%)
Egypt: 1.491 (+101.0%)
Pakistan: 0.908 (-8.9%)

World Steel Recycling in Figures 2017 – 2021 33
JAPAN STEEL SCRAP EXPORTS 2021 (MILLION TONNES)
Biggest Buyers
Change: % 2021/2020 Source: Official Trade Statistics/WV Stahl
Total Japan exports: 7.301 (-22.1%)
Republic of Korea: 3.090 (+4.5%)
Vietnam: 2.246 (-34.1%)
Taiwan: 0.595 (-46.5%)
MAIN FLOWS OF JAPANESE STEEL SCRAP EXPORTS 2021 (MILLION TONNES)
Change: % 2021/2020 Source: Official Trade Statistics/WV Stahl
0.595(-46.5%)
3.090(+4.5%)
Taiwan
Republic of Korea
2.246(-34.1%)
Total Japan exports7.301
(-22.1%)
Vietnam

34 World Steel Recycling in Figures 2017 – 2021
MAIN FLOWS OF CANADIAN STEEL SCRAP EXPORTS 2021 (MILLION TONNES)
Change: % 2021/2020 Source: Official Trade Statistics/WV Stahl
Taiwan
3.757(+17.8%) 0.314
(+14.2%)
USA
Turkey
0.161(-2.4%)
Total Canada exports4.863(+7.8%)
0.144(-16.8%)
India
CANADA STEEL SCRAP EXPORTS 2021 (MILLION TONNES)
Biggest Buyers
Change: % 2021/2020 Source: Official Trade Statistics/WV Stahl
Total Canada exports: 4.863 (+7.8%)
USA: 3.757 (+17.8%)
Turkey: 0.314 (+14.2%)
Taiwan: 0.144 (-16.8%)
India: 0.161 (-2.4%)

World Steel Recycling in Figures 2017 – 2021 35
MAIN FLOWS OF RUSSIAN STEEL SCRAP EXPORTS 2021 (MILLION TONNES)
Change: % 2021/2020 Source: Official Trade Statistics/WV Stahl
Turkey
Republic of Korea
Lithuania
Total Russia exports
4.140(-12.4%)
Belarus
0.946(+2.5%)
0.778(+30.5%)
1.729(-31.8%)
0.135(+200.0%)
RUSSIA STEEL SCRAP EXPORTS 2021 (MILLION TONNES)
Biggest Buyers
Change: % 2021/2020 Source: Official Trade Statistics/WV Stahl
Total Russia exports: 4.140 (-12.4%)
Turkey: 1.729 (-31.8%)
Republic of Korea: 0.778 (+30.5%)
Lithuania: 0.135 (+200.0%)
Belarus: 0.946 (+2.5%)

36 World Steel Recycling in Figures 2017 – 2021
AUSTRALIA STEEL SCRAP EXPORTS 2021 (MILLION TONNES)
Biggest Buyers
Change: % 2021/2020 Source: Official Trade Statistics/WV Stahl
Total Australia exports: 2.224 (+6.9%)
Bangladesh: 0.434 (-16.9%)
Vietnam: 0.541 (+51.1%)
Indonesia: 0.387 (+23.5%)
Taiwan: 0.264 (+78.4%)
MAIN FLOWS OF AUSTRALIAN STEEL SCRAP EXPORTS 2021 (MILLION TONNES)
Total Australia exports
2.224(+6.9%)
Indonesia
Bangladesh
0.541(+51.1%)
0.264(+78.4%)
0.387(+23.5%)
0.434(-16.9%)
Vietnam
Taiwan
Change: % 2021/2020 Source: Official Trade Statistics/WV Stahl

World Steel Recycling in Figures 2017 – 2021 37
SINGAPORE STEEL SCRAP EXPORTS 2021 (MILLION TONNES)
Biggest Buyers
Change: % 2021/2020 Source: Official Trade Statistics/WV Stahl
Total Singapore exports: 0.685 (+35.4%)
Vietnam: 0.132 (+97.0%)
MAIN FLOWS OF SINGAPORE STEEL SCRAP EXPORTS 2021 (MILLION TONNES)
Change: % 2021/2020 Source: Official Trade Statistics/WV Stahl
0.132(+97.0%)
Malaysia
Indonesia
Vietnam
0.119(+95.1%)
0.214(+31.3%)
Total Singapore exports0.685
(+35.4%)
Indonesia: 0.214 (+31.3%)
Malaysia: 0.119 (+95.1%)
38 World Steel Recycling in Figures 2017 – 2021
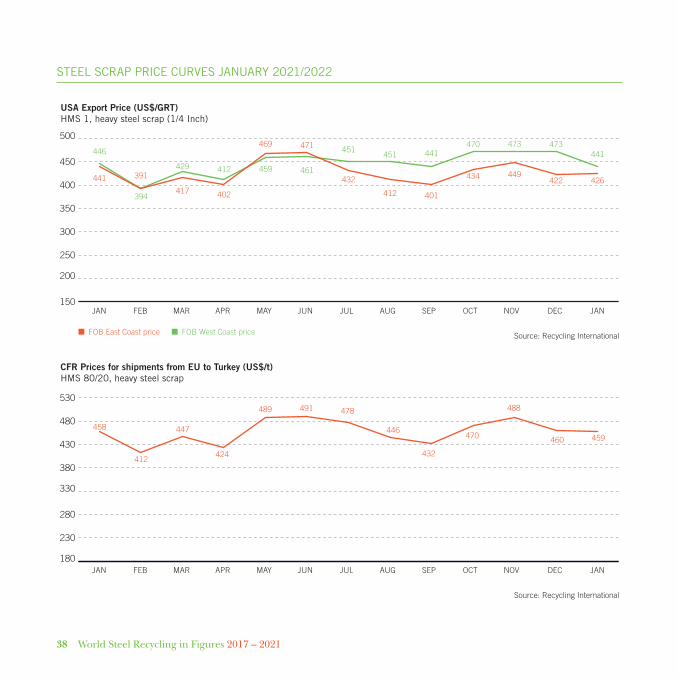
STEEL SCRAP PRICE CURVES JANUARY 2021/2022
150
200
250
300
350
400
450
500
180
230
280
330
380
430
480
530
Source: Recycling International
441 391
394
429
446
417
412 459 461
402
469 471 451
432
451
412
441
401
470
434
473473
422
441
426449
JAN FEB MAR APR MAY JUN JUL AUG SEP OCT NOV DEC JAN
USA Export Price (US$/GRT)HMS 1, heavy steel scrap (1/4 Inch)
Source: Recycling International
FOB East Coast price FOB West Coast price
459460
488
JAN FEB MAR APR MAY JUN JUL AUG SEP OCT NOV DEC JAN
CFR Prices for shipments from EU to Turkey (US$/t)HMS 80/20, heavy steel scrap
470
432
446
478491489
424
447
412
458

World Steel Recycling in Figures 2017 – 2021 39
STEEL SCRAP PRICE CURVES JANUARY 2021/2022
200
250
300
350
400
450
500
150
200
250
300
350
400
450
Source: Recycling International
399
390
423
396
405
449460450
425
460
380
443418
JAN FEB MAR APR MAY JUN JUL AUG SEP OCT NOV DEC JAN
USA Domestic Scrap Prices (US$/GRT)HMS 1, heavy steel scrap (1/4 Inch) composite price delivered at mills
Source: Recycling International
308.2
338.3
326.3 332.8
362.7
416.0 424.4
368.4
406.6
358.6
396.2 396.3 394.6
JAN FEB MAR APR MAY JUN JUL AUG SEP OCT NOV DEC JAN
Composite Sales Price ex Yard in Germany* (€/t)E3/European Standard Quality No. 3, heavy old steel scrap (>6mm)* Composite sales price considers sales to domestic and international steel works and foundries on weighted average basisSource: BDSV/SecureCalc
40 World Steel Recycling in Figures 2017 – 2021
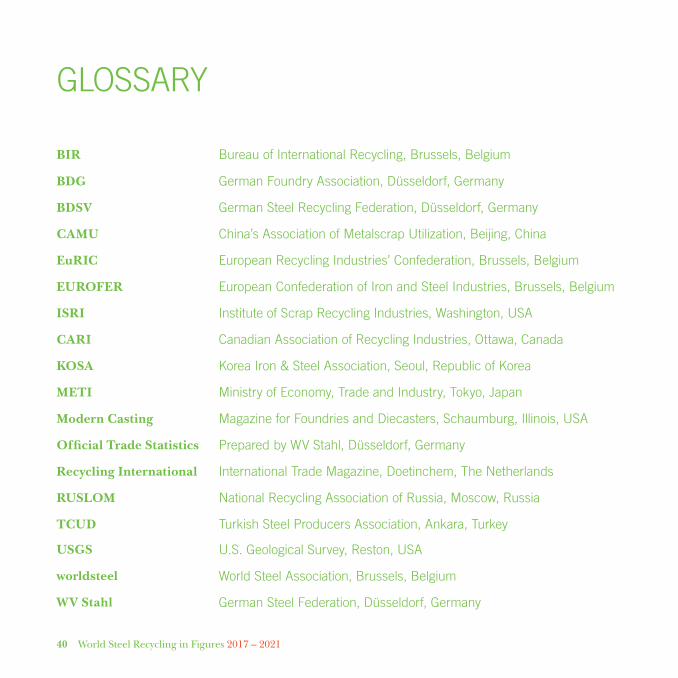
GLOSSARY
BIR Bureau of International Recycling, Brussels, Belgium
BDG German Foundry Association, Düsseldorf, Germany
BDSV German Steel Recycling Federation, Düsseldorf, Germany
CAMU China’s Association of Metalscrap Utilization, Beijing, China
EuRIC European Recycling Industries’ Confederation, Brussels, Belgium
EUROFER European Confederation of Iron and Steel Industries, Brussels, Belgium
ISRI Institute of Scrap Recycling Industries, Washington, USA
CARI Canadian Association of Recycling Industries, Ottawa, Canada
KOSA Korea Iron & Steel Association, Seoul, Republic of Korea
METI Ministry of Economy, Trade and Industry, Tokyo, Japan
Modern Casting Magazine for Foundries and Diecasters, Schaumburg, Illinois, USA
Official Trade Statistics Prepared by WV Stahl, Düsseldorf, Germany
Recycling International International Trade Magazine, Doetinchem, The Netherlands
RUSLOM National Recycling Association of Russia, Moscow, Russia
TCUD Turkish Steel Producers Association, Ankara, Turkey
USGS U.S. Geological Survey, Reston, USA
worldsteel World Steel Association, Brussels, Belgium
WV Stahl German Steel Federation, Düsseldorf, Germany


Bureau of International Recycling aisbl Avenue Franklin Roosevelt 241050 BrusselsBelgiumT. +32 2 627 57 70F. +32 2 627 57 [email protected]
Copyright © 2022 FDOKUMEN