World Oil Review 2020 volume 1 - Eni
88
World Oil Review 2020 volume 1
-
Upload
khangminh22 -
Category
Documents
-
view
4 -
download
0
Transcript of World Oil Review 2020 volume 1 - Eni

World Oil Review 2020volume 1


World Oil Review 2020


Introduction
List of Countries VI
Notes and Methods VIII
Oil - Supply and Demand Oil - Production Quality
Reserves 2 46
Areas and Aggregates 2 46
The World Top 10 Reserves Holders 3 46
Countries 4 46
Cluster of Companies 6 47
World
Crude Production by Quality
Crude Production by Gravity
Crude Production by Sulphur Content
Quality and Production Volume of Main Crudes
Crude Production by Quality - Charts 48
Production 7
Areas and Aggregates 7 49
The World Top 10 Producers 8 49
Countries 9 49
Cluster of Companies 11 50
The World Top 10 Natural Gas Liquids Producers 12
Europe
Crude Production by Quality
Quality and Production Volume of Main Crudes
Crude Production by Quality - Charts
Countries 51
Reserves/Production Ratio 13 52
Areas and Aggregates 13 52
The World Top 10 Producers Ranked by 52
Reserves/Production Ratio 14 53
Countries 15
Russia and Central Asia
Crude Production by Quality
Quality and Production Volume of Main Crudes
Crude Production by Quality - Charts
Countries 54
Consumption 18 55
Areas and Aggregates 18 55
The World Top 10 Consumers 19 55
Countries 20 56
Middle East
Crude Production by Quality
Quality and Production Volume of Main Crudes
Crude Production by Quality - Charts
Countries 57
Per Capita Consumption 23
Areas and Aggregates 23 58
The World Top 10 Consumers Ranked by 58
Per Capita Consumption Ratio 24 58
Countries 25 59
Africa
Crude Production by Quality
Quality and Production Volume of Main Crudes
Crude Production by Quality - Charts
Countries 60
Production/Consumption Ratio 28
Areas and Aggregates 28 62
The World Top 10 Producers Ranked by 62
Production/Consumption Ratio 29 62
Countries 30 63
Asia - Pacific
Crude Production by Quality
Quality and Production Volume of Main Crudes
Crude Production by Quality - Charts
Countries 64
Oil - Trade and Prices
Regional Crude Balances 34 66
Crude Surplus Deficit by Area 34 66
66
Exports 35 67
The World Top 10 Exporters 35
Americas
Crude Production by Quality
Quality and Production Volume of Main Crudes
Crude Production by Quality - Charts
Countries 68
Countries 36
Oil - Refining Industry
Imports 39
The World Top 10 Importers 39 Refining Capacity 72
Countries 40 Areas and Aggregates 72
Primary Capacity by Cluster of Companies 74
Crude Future Price and Open Interests 43
Contents

Introduction
List of Countries:
Europe: Albania, Austria, Belarus, Belgium, Bosnia Herzegovina, Bulgaria, Croatia, Cyprus, Czech Republic, Denmark, Estonia, Finland, France, Germany, Gibraltar, Greece, Hungary, Iceland, Ireland, Italy, Kosovo, Latvia, Lithuania, Luxembourg, Macedonia, Malta, Moldova, Montenegro, Netherlands, Norway, Poland, Portugal, Romania, Serbia, Slovakia, Slovenia, Spain, Sweden, Switzerland, Turkey, Ukraine and United Kingdom.
Russia and Central Asia: Russia, Armenia, Azerbaijan, Georgia, Kazakhstan, Kyrgyzstan, Tajikistan, Turkmenistan and Uzbekistan.
Middle East: Bahrain, Iran, Iraq, Israel, Jordan, Kuwait, Lebanon, Oman, Qatar, Saudi Arabia, Syria, United Arab Emirates and Yemen.
Africa: Algeria, Angola, Benin, Cameroon, Chad, Congo, Côte d’Ivoire, Dem. Rep. Congo, Egypt, Equatorial Guinea, Ethiopia, Gabon, Ghana, Kenya, Libya, Madagascar, Mauritania, Morocco, Mozambique, Namibia, Niger, Nigeria, Rwanda, Senegal, Sierra Leone, Somalia, South Africa, South Sudan, Sudan, Tanzania, Tunisia, Uganda, Zambia and Zimbabwe.
Asia - Pacific: Afghanistan, Australia, Bangladesh, Brunei, China, East Timor, Hong Kong, India, Indonesia, Japan, Malaysia, Mongolia, Myanmar, Nepal, New Zealand, North Korea, Pakistan, Papua New Guinea, Philippines, Singapore, South Korea, Sri Lanka, Taiwan, Thailand and Vietnam.
Americas: North America and Central South America.
North America: Canada and the United States.
Central South America: Argentina, Barbados, Belize, Bolivia, Brazil, Chile, Colombia, Costa Rica, Cuba, Dominican Republic, Ecuador, El Salvador, Guatemala, Guyana, Haiti, Honduras, Jamaica, Mexico, Nicaragua, Panama, Paraguay, Peru, Suriname, Trinidad and Tobago, Uruguay and Venezuela.
European Union: Austria, Belgium, Bulgaria, Croatia, Cyprus, Czech Republic, Denmark, Estonia, Finland, France, Germany, Greece, Hungary, Ireland, Italy, Latvia, Lithuania, Luxembourg, Malta, Netherlands, Poland, Portugal, Romania, Slovakia, Slovenia, Spain, Sweden and United Kingdom.
OECD: Australia, Austria, Belgium, Canada, Chile, Czech Republic, Denmark, Estonia, Finland, France, Germany, Greece, Hungary, Iceland, Ireland, Israel, Italy, Japan, Latvia, Lithuania, Luxembourg, Mexico, Netherlands, New Zealand, Norway, Poland, Portugal, Slovakia, Slovenia, South Korea, Spain, Sweden, Switzerland, Turkey, United Kingdom and United States.
OPEC: Algeria, Angola, Congo, Ecuador, Equatorial Guinea, Gabon, Iran, Iraq, Kuwait, Libya, Nigeria, Saudi Arabia, United Arab Emirates and Venezuela.
MENA (Middle East and North Africa): Bahrain, Iran, Iraq, Israel, Jordan, Kuwait, Lebanon, Oman, Qatar, Saudi Arabia, Syria, United Arab Emirates, Yemen and Algeria, Egypt, Libya, Morocco and Tunisia.
VI

Introduction
This Review adopts the most commonly used names for countries and not necessarily the official name.
The names used do not in any way indicate the opinion of Eni on the legal status of countries, territories, cities or areas mentioned. The term “country” is used to indicate, when necessary, also a territory or area. Borders between countries are indicated on the maps and do not imply judgement of any kind or the position of Eni with regard to current international disputes.
This Review has been prepared by the Scenarios, Positioning and Medium–Long Term Plan Department.
VII

Introduction
Notes and Methods
The sources of the data are: CME, DECC, EIA DOE, Enerdata, Energy Intelligence, ICE, ICIS Consulting, International Energy Agency, IHS Global Insight, Italian Ministry for Economic Development, Norwegian Petroleum Directorate, Oil & Gas Journal, OPEC, S&P Global Platts, Wood MacKenzie and other official sources.
In all the chapters of oil, in some countries figures may include oil from non conventional sources and others sources of supply.
The figures for “Reserves” refer to proven reserves as at 31st December. The figures for other chapters indicate annual averages.
Blank spaces in the tables indicate that the figure was not available, zero indicates a figure that is not significant (except for the chapters “Production Quality” where “zero” is used for both not available and not significant figures). Total may differ from the sum of the individual figures as a result of rounding up/down. Percentages have been calculated before rounding.
In some chapters, data for Sudan also include South Sudan data.
The difference between the Consumption and the Production of oil is given by the change in stocks, the processing gains obtained in refining and the amount of biofuels which is not included in Production.
In all the chapters, the list of the “The world top 10…” is drawn up by ordering the countries on the basis of the last available year. In the chapters “Reserves/Production Ratio” and “Production/Consumption Ratio”, the list of the “The world top 10…” is drawn up by selecting the largest producers in the last available year and ordering them on the basis of the value of the reserves/production and production/consumption ratio. In the chapter “Per Capita Consumption”, the list of the world top is drawn up by selecting the largest consumers in the last available year and ordering them by the value of per capita consumption.
In the chapter “Production Quality” figures for total oil production in each area or country do not coincide with the figures in the “Production” chapter of the Review. This is due to the exclusion of natural gas liquids and extra heavy crude from the figures for the first (except for Venezuela). Moreover, it has not been possible to allocate or define total production. In some countries the ‘Ultra Light’ category also includes, in total or in part, the production of condensates. For Canada the production includes syncrude.
API degree is used universally to express a crude’s relative density. The arbitrary formula used to obtain it is: API gravity = (141.5/SG at 60°F) -131.5, where SG is the specific gravity of the fluid. Lighter the crude, higher the API gravity. The API scale was designed so that most values would fall between 10 and 70 API gravity degrees. Fresh water has an API density of 10.
Atmospheric distillates yields are obtained according to TBP (True Boiling Point) technique, ASTM D2892 procedure. Figures are expressed in mass percentage.
For the definition of the qualitative parameters for single crudes, the data of “Eni–R&M downstream laboratories" have been used, wherever possible. Quality levels, indicating API gravity and sulphur content, are defined as follows.
Quality levels - API gravity and sulphur content
Ultra Light API level equal to or greater than 50° and a low sulphur content Light & Sweet API level equal to or greater than 35° and less than 50°, sulphur content less 0.5% Light & Medium Sour API level equal to or greater than 35° and less than 50°, sulphur content equal to or greater than 0.5% and less than 1% Light & Sour API level equal to or greater than 35° and less than 50°, sulphur content equal to or greater than 1%
Medium & Sweet API level equal to or greater than 26° and less than 35°, sulphur content less 0.5% Medium & Medium Sour API level equal to or greater than 26° and less than 35°, sulphur content equal to or greater than 0.5% and less than 1% Medium & Sour API level equal to or greater than 26° and less than 35°, sulphur content equal to or greater than 1%
Heavy & Sweet API level equal to or greater than 10° and less than 26°, sulphur content less 0.5% Heavy & Medium Sour API level equal to or greater than 10° and less than 26°, sulphur content equal to or greater than 0.5% and less than 1% Heavy & Sour API level equal to or greater than 10° and less than 26°, sulphur content equal to or greater than 1%
Supply and Demand Trade and Prices
Production Quality
VIII

Introduction
The “Refining Capacity” set of tabulations provides the following information:
- Refineries: includes asphalt and lube oriented units, when dedicated topping capacity is present. Condensate refineries are included.
- Primary Capacity: represents a pro rated annual average of available capacity, excluding turnarounds. - Conversion Capacity (FCC eqv.): sum of conversion capacity, converted to “Catcracking (FCC) equivalent” capacity. “FCC
equivalent” capacity equals 1; other conversion capacities can be higher or lower than 1 (the equivalent factors are reported below in the next table).
- Complexity Ratio – FCC eqv.: ratio of Conversion Capacity (converted to FCC equivalent) over Primary Capacity, calculated on a weight basis. The higher is the complexity index, the higher is the capability of a refinery to produce high equivalent quality and value products.
- Complexity Ratio – NCI (Nelson Complexity Index): is another measure of secondary conversion capacity in comparison to the primary distillation capacity. The units are rated in terms of their costs relative to the primary distillation unit. The higher is the index the higher is the capability of a refinery to produce high quality and value products.
The equivalent factors for the FCC equivalent calculation, reported below, change according to the type and the configuration of the conversion unit and are from ICIS Consulting. The factors for the Nelson calculation are standard factors, modified as necessary by Eni. Oxygenates and Aromatics are excluded.
Refining Industry
Conversion type Conversion type
Alkylation 0.00 10.00 Hydrodesulf-diesel 0.00 2.50
Alkylation-hydrofluoric 0.00 10.00 Hydrodesulf-gasoline 0.00 2.50
Alkylation-sulfunic 0.00 10.00 Hydrodesulf-kero 0.00 2.50
Asphalt 0.25 1.50 Hydrodesulf-mid-distillates 0.00 2.50
Coking-delayed 1.35 6.00 Hydrodesulf-naphta 0.00 2.50
Coking-f/d 1.35 6.00 Hydrodesulf-residue 0.20 2.50
Coking-fluid 1.35 6.00 Hydrodesulf-gvgo 0.05 2.50
Coking-fxc 1.35 6.00 Isomerization-c4 0.00 15.00
Condensate distillation 0.00 1.00 Isomerization-In 0.00 15.00
Crude 0.00 1.00 Lube 0.50 60.00
Deasphalting 0.00 1.50 Polymerization 0.00 10.00
Deasphalting-c3 0.00 1.50 Reforming-aromax 0.00 5.00
Deasphalting-c4 0.00 1.50 Reforming-btx 0.00 5.00
Deep catcraking 1.10 6.00 Reforming-cc 0.00 5.00
Distillate dewaxing 0.10 85.00 Reforming-cyclic 0.00 5.00
Fluid cat-cracking 1.00 6.00 Reforming-Ipg feed 0.00 5.00
Fluid catcracking-residue 1.90 6.00 Reforming-sr 0.00 5.00
Heavy residual gasification 1.30 12.00 Thermal cat-cracking 0.80 2.75
Hydrocracking-distillates 1.30 6.00 Thermal cracking 0.65 2.75
Hydrocracking-mild 0.30 6.00 Vacuum 0.00 2.00
Hydrocracking-residue 0.40 6.00 Visbreaking 0.25 2.75
IX


World Oil Review 2020
Reserves
Production
Reserves/Production Ratio
Consumption
Per Capita Consumption
Production/Consumption Ratio
Oil - Supply and Demand
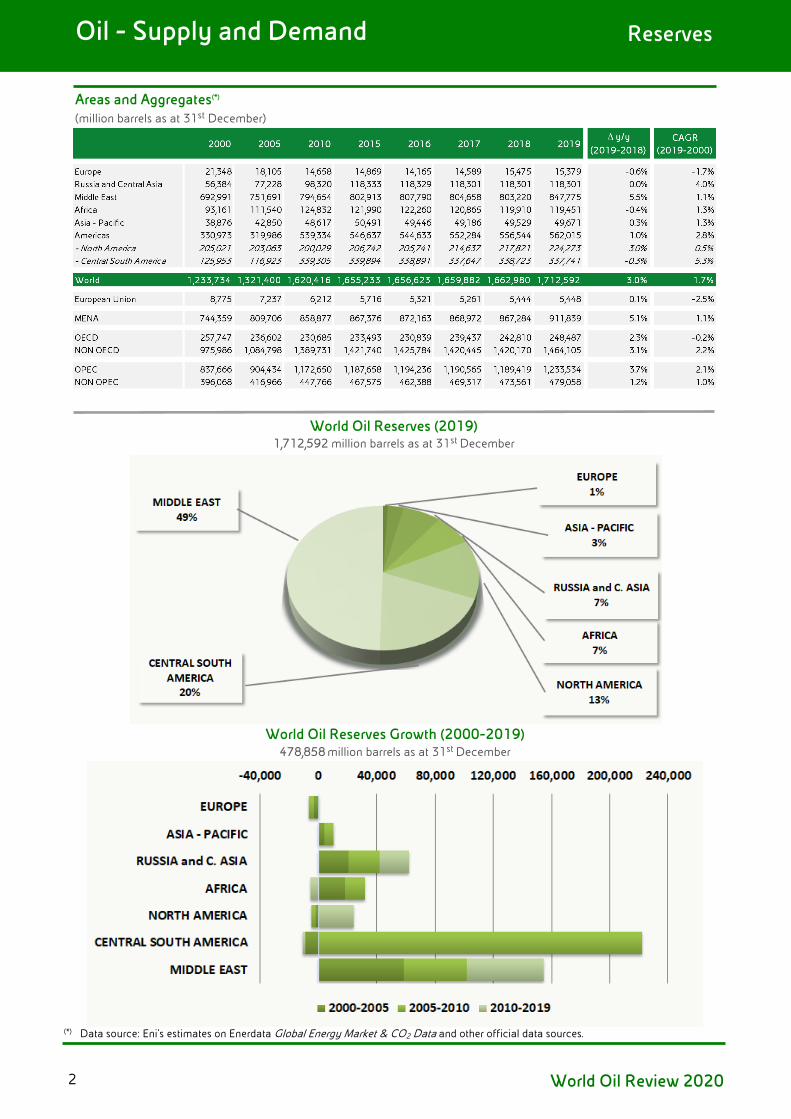
Oil - Supply and Demand Reserves
Areas and Aggregates(*)
(million barrels as at 31st December)
World Oil Reserves (2019) 1,712,592 million barrels as at 31st December
World Oil Reserves Growth (2000-2019) 478,858 million barrels as at 31st December
(*) Data source: Eni’s estimates on Enerdata Global Energy Market & CO2 Data and other official data sources.
World Oil Review 20202

Oil - Supply and Demand Reserves
The World Top 10 Reserves Holders(*)
(million barrels as at 31st December)
The World Top 10 (2019)
(*) Data source: Eni’s estimates on Enerdata Global Energy Market & CO2 Data and other official data sources.
World Oil Review 2020 3
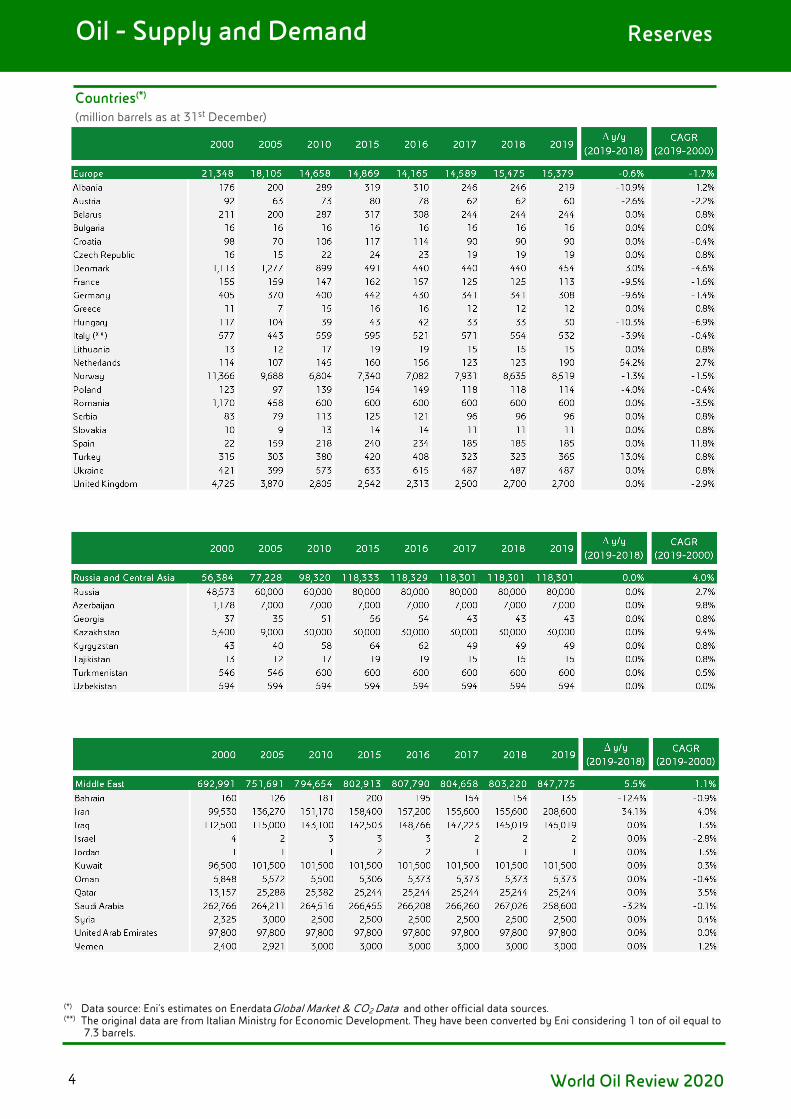
Oil - Supply and Demand Reserves
Countries(*)
(million barrels as at 31st December)
(*) Data source: Eni’s estimates on Enerdata Global Market & CO2 Data and other official data sources. (**) The original data are from Italian Ministry for Economic Development. They have been converted by Eni considering 1 ton of oil equal to
7.3 barrels.
World Oil Review 20204
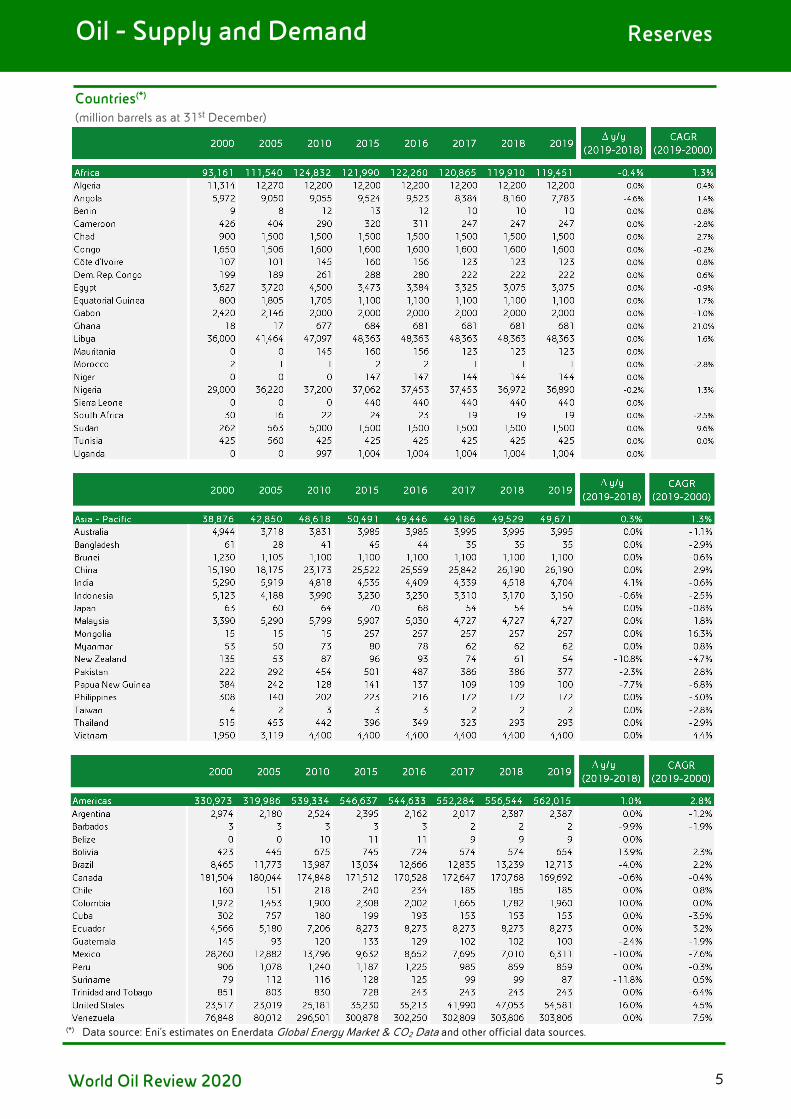
Oil - Supply and Demand Reserves
Countries(*)
(million barrels as at 31st December)
(*) Data source: Eni’s estimates on Enerdata Global Energy Market & CO2 Data and other official data sources.
World Oil Review 2020 5
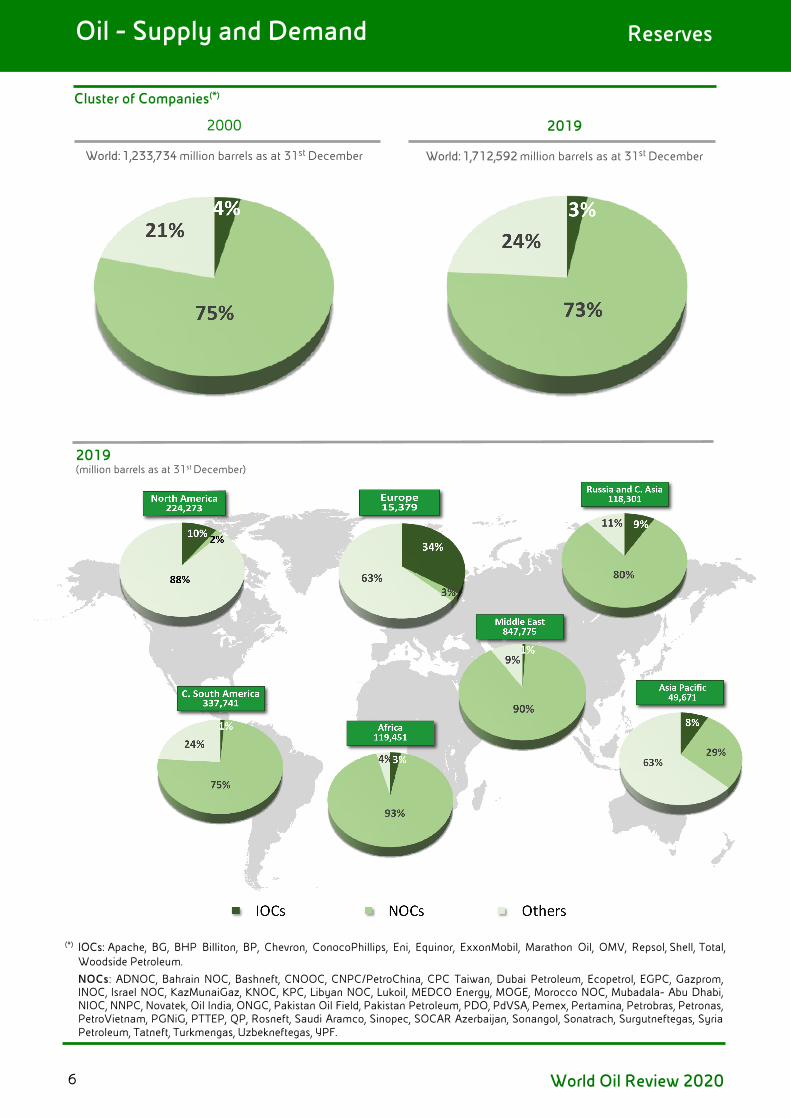
Oil - Supply and Demand Reserves
Cluster of Companies(*)
2000
World: 1,233,734 million barrels as at 31st December
2019
World: 1,712,592 million barrels as at 31st December
2019(million barrels as at 31st December)
(*)
NOCs: ADNOC, Bahrain NOC, Bashneft, CNOOC, CNPC/PetroChina, CPC Taiwan, Dubai Petroleum, Ecopetrol, EGPC, Gazprom, INOC, Israel NOC, KazMunaiGaz, KNOC, KPC, Libyan NOC, Lukoil, MEDCO Energy, MOGE, Morocco NOC, Mubadala- Abu Dhabi, NIOC, NNPC, Novatek, Oil India, ONGC, Pakistan Oil Field, Pakistan Petroleum, PDO, PdVSA, Pemex, Pertamina, Petrobras, Petronas, PetroVietnam, PGNiG, PTTEP, QP, Rosneft, Saudi Aramco, Sinopec, SOCAR Azerbaijan, Sonangol, Sonatrach, Surgutneftegas, Syria Petroleum, Tatneft, Turkmengas, Uzbekneftegas, YPF.
IOCs: Apache, BG, BHP Billiton, BP, Chevron, ConocoPhillips, Eni, Equinor, ExxonMobil, Marathon Oil, OMV, Repsol, Shell, Total, Woodside Petroleum.
World Oil Review 20206
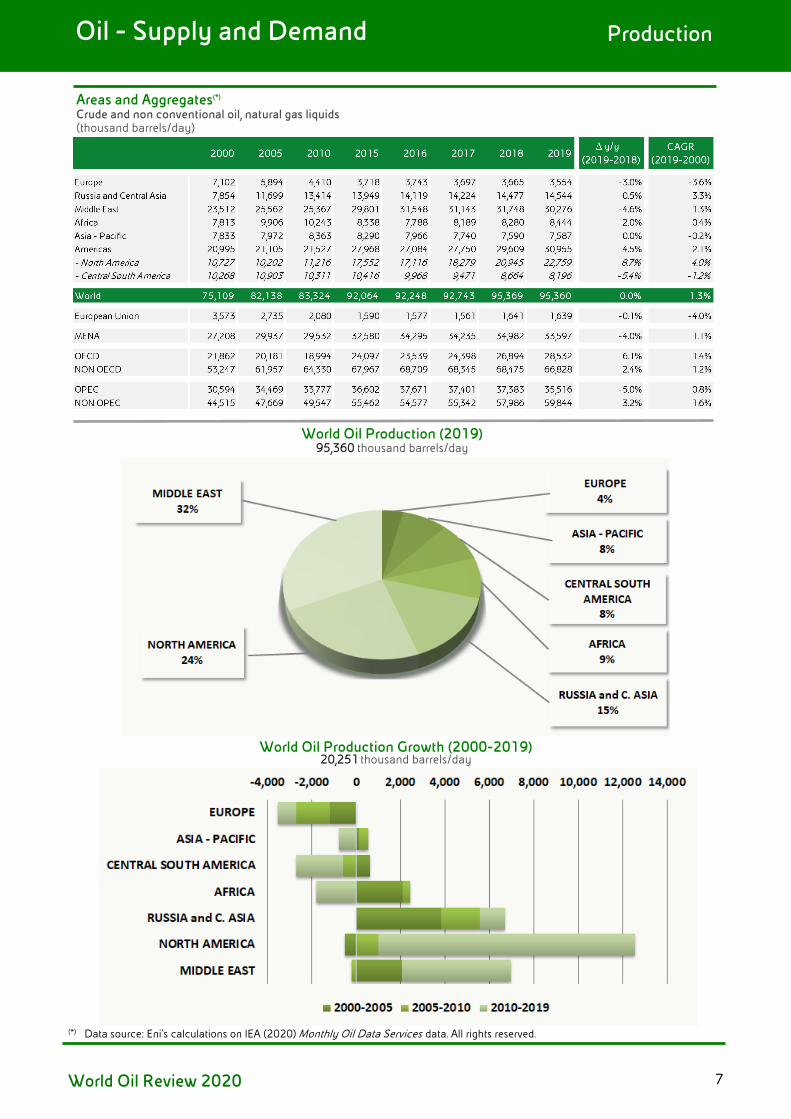
Oil - Supply and Demand Production
Areas and Aggregates(*)
Crude and non conventional oil, natural gas liquids (thousand barrels/day)
World Oil Production (2019) 95,360 thousand barrels/day
World Oil Production Growth (2000-2019) 20,251 thousand barrels/day
(*) Data source: Eni’s calculations on IEA (2020) Monthly Oil Data Services data. All rights reserved.
World Oil Review 2020 7
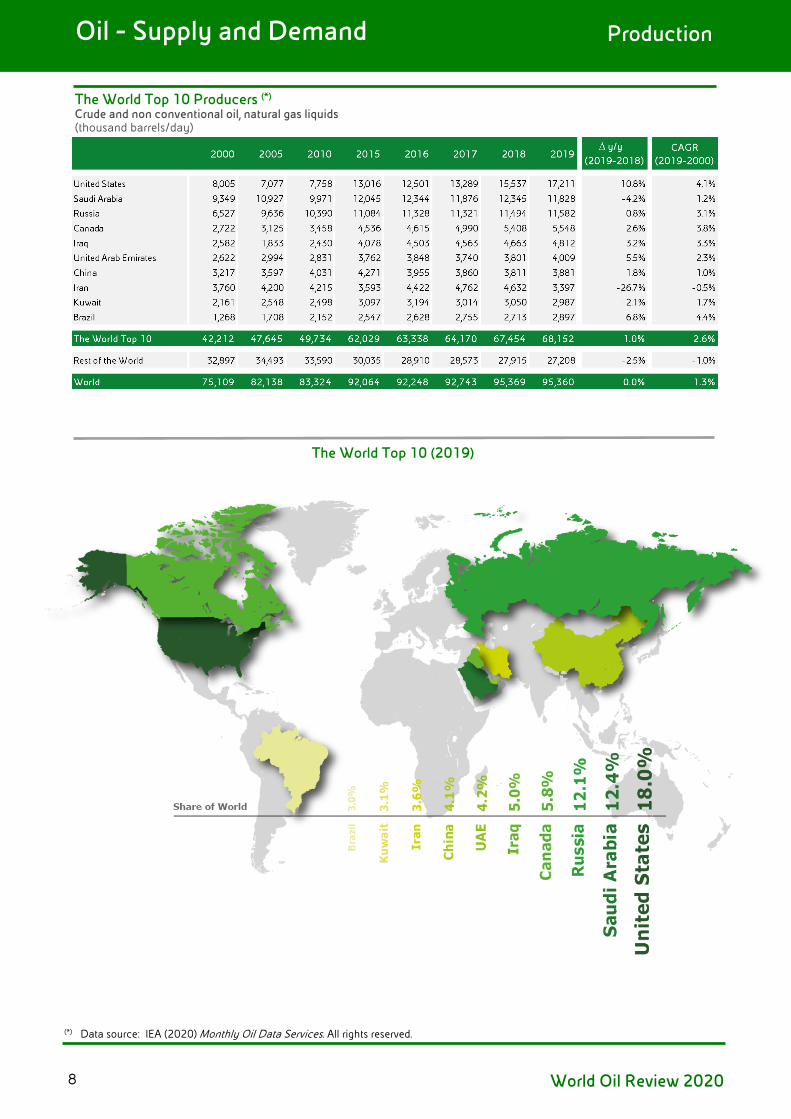
Oil - Supply and Demand Production
The World Top 10 Producers (*)
Crude and non conventional oil, natural gas liquids (thousand barrels/day)
The World Top 10 (2019)
(*) Data source: IEA (2020) Monthly Oil Data Services. All rights reserved.
World Oil Review 20208
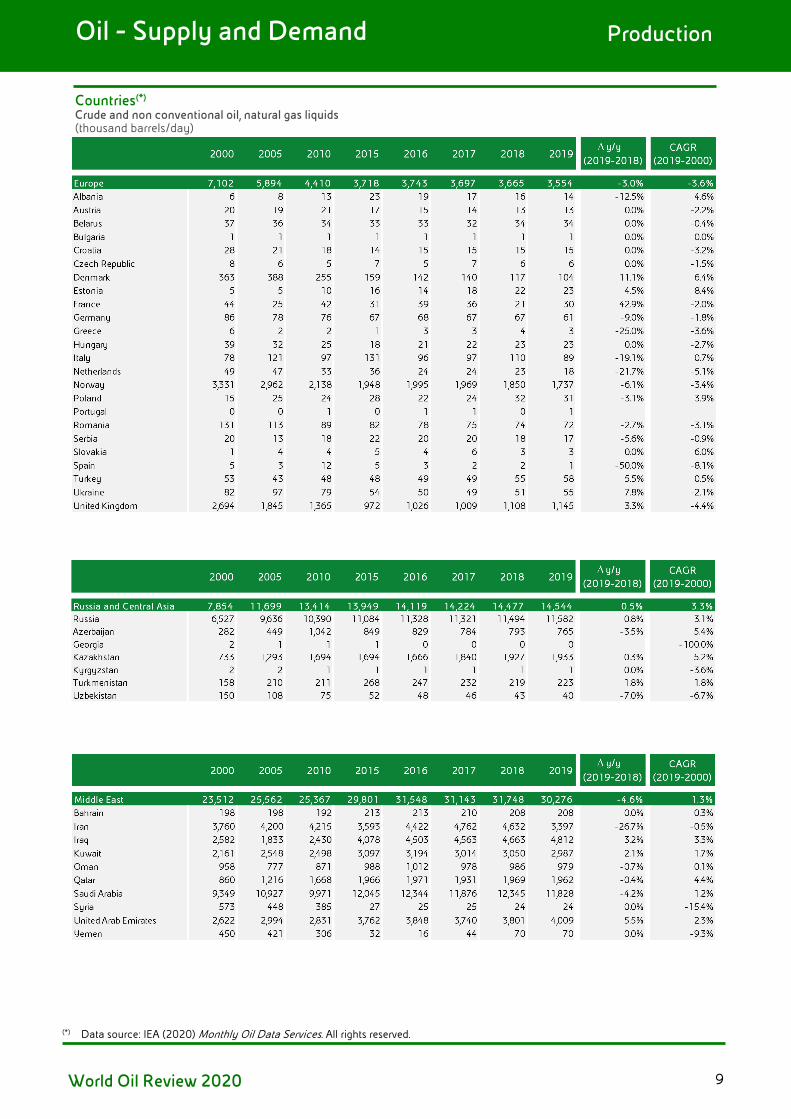
Oil - Supply and Demand Production
Countries(*)
Crude and non conventional oil, natural gas liquids (thousand barrels/day)
(*) Data source: IEA (2020) Monthly Oil Data Services. All rights reserved.
World Oil Review 2020 9

Oil - Supply and Demand Production
Countries(*)
Crude and non conventional oil, natural gas liquids (thousand barrels/day)
(*) Data source: IEA (2020) Monthly Oil Data Services. All rights reserved.
World Oil Review 202010

Oil - Supply and Demand Production
Cluster of Companies(*)
2000
World: 75,109 thousand barrels/day
2019
World: 95,360 thousand barrels/day
2019(thousand barrels/day)
(*)
NOCs: ADNOC, Bahrain NOC, Bashneft, CNOOC, CNPC/PetroChina, CPC Taiwan, Dubai Petroleum, Ecopetrol, EGPC, Gazprom, INOC, Israel NOC, KazMunaiGaz, KNOC, KPC, Libyan NOC, Lukoil, MEDCO Energy, MOGE, Morocco NOC, Mubadala- Abu Dhabi, NIOC, NNPC, Novatek, Oil India, ONGC, Pakistan Oil Field, Pakistan Petroleum, PDO, PdVSA, Pemex, Pertamina, Petrobras, Petronas, PetroVietnam, PGNiG, PTTEP, QP, Rosneft, Saudi Aramco, Sinopec, SOCAR Azerbaijan, Sonangol, Sonatrach, Surgutneftegas, Syria Petroleum, Tatneft, Turkmengas, Uzbekneftegas, YPF.
IOCs: Apache, BG, BHP Billiton, BP, Chevron, ConocoPhillips, Eni, Equinor, ExxonMobil, Marathon Oil, OMV, Repsol, Shell, Total, Woodside Petroleum.
World Oil Review 2020 11

Oil - Supply and Demand Production
The World Top 10 Natural Gas Liquids Producers(*)
(thousand barrels/day)
The World Top 10 (2019)
(*) Data source: IEA (2020) Monthly Oil Data Services. All rights reserved.
World Oil Review 202012
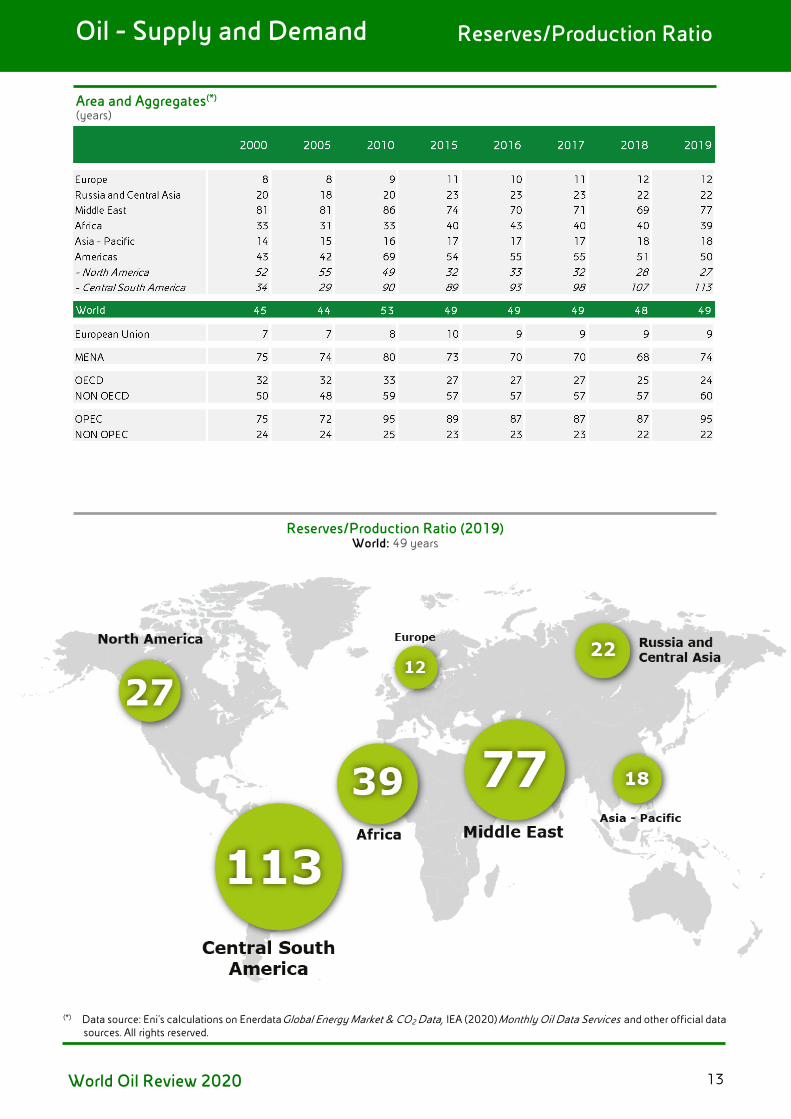
Oil - Supply and Demand Reserves/Production Ratio
Area and Aggregates(*)
(years)
Reserves/Production Ratio (2019) World: 49 years
(*) Data source: Eni’s calculations on Enerdata Global Energy Market & CO2 Data, IEA (2020) Monthly Oil Data Services and other official datasources. All rights reserved.
World Oil Review 2020 13
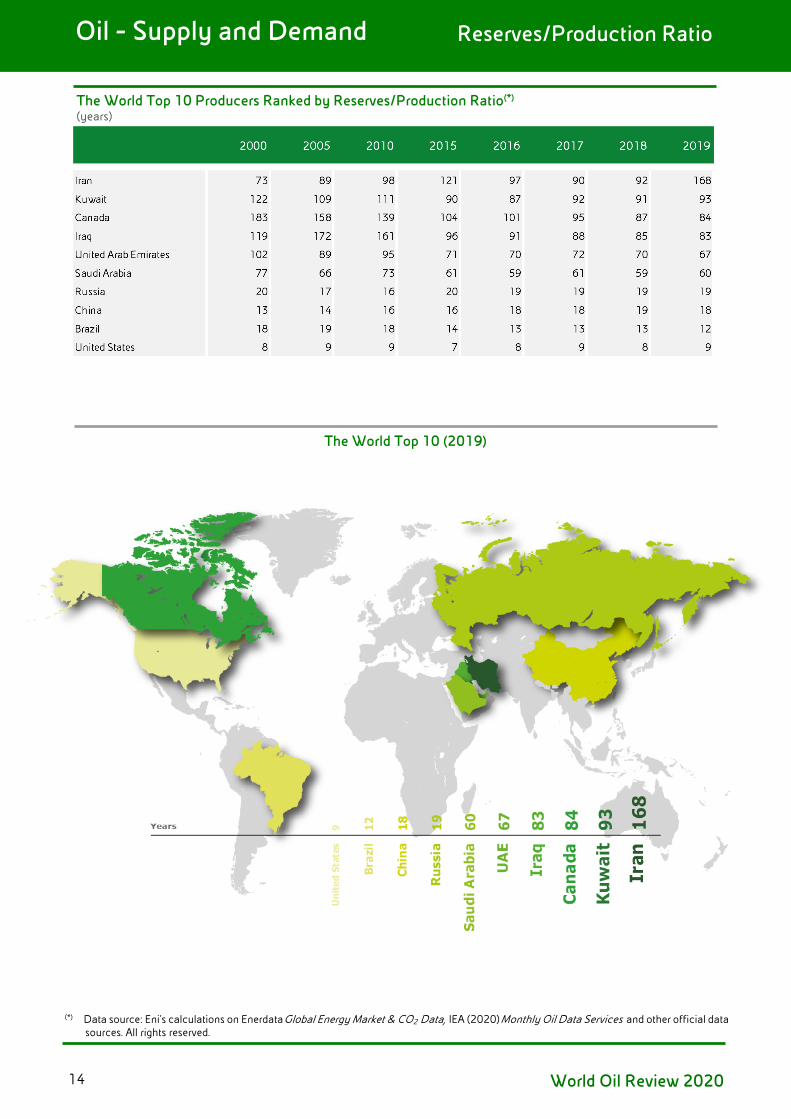
Oil - Supply and Demand Reserves/Production Ratio
The World Top 10 Producers Ranked by Reserves/Production Ratio(*) (years)
The World Top 10 (2019)
(*) Data source: Eni’s calculations on Enerdata Global Energy Market & CO2 Data, IEA (2020) Monthly Oil Data Services and other official datasources. All rights reserved.
World Oil Review 202014
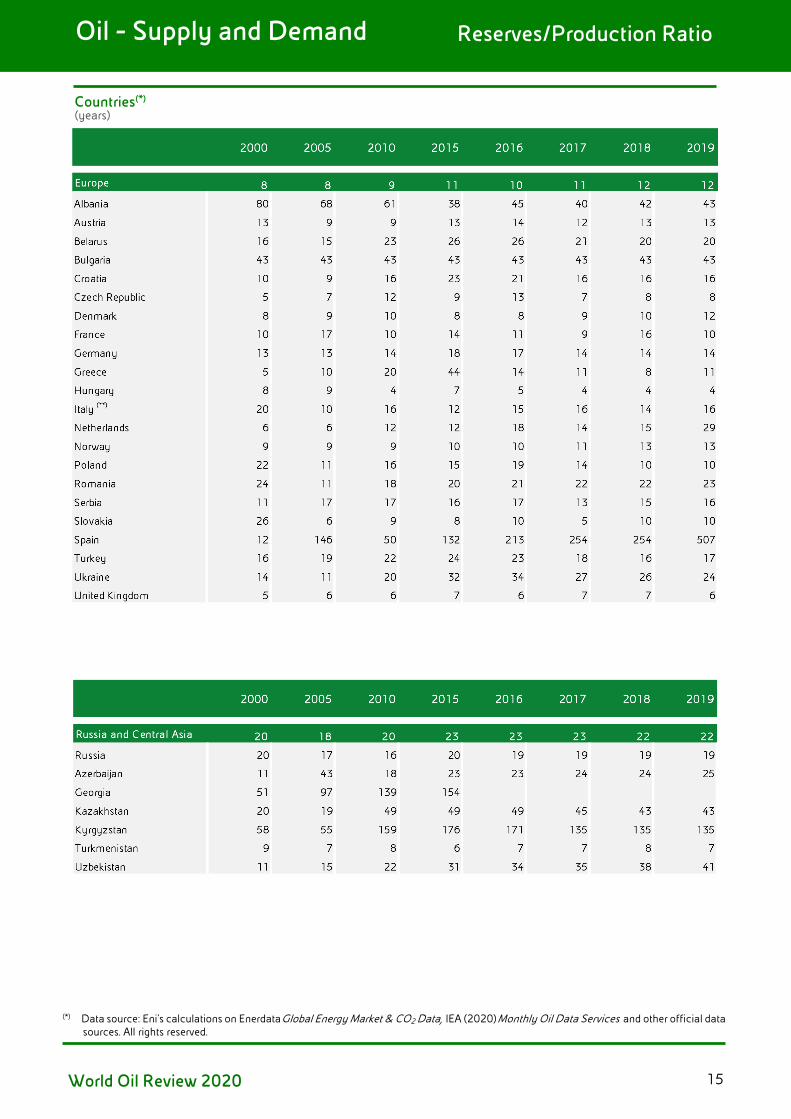
Oil - Supply and Demand Reserves/Production Ratio
Countries(*)
(years)
(*) Data source: Eni’s calculations on Enerdata Global Energy Market & CO2 Data, IEA (2020) Monthly Oil Data Services and other official datasources. All rights reserved.
World Oil Review 2020 15
Oil - Supply and Demand Reserves/Production Ratio
Countries(*)
(years)
(*) Data source: Eni’s calculations on Enerdata Global Energy Market & CO2 Data, IEA (2020) Monthly Oil Data Services and other official datasources. All rights reserved.
World Oil Review 202016

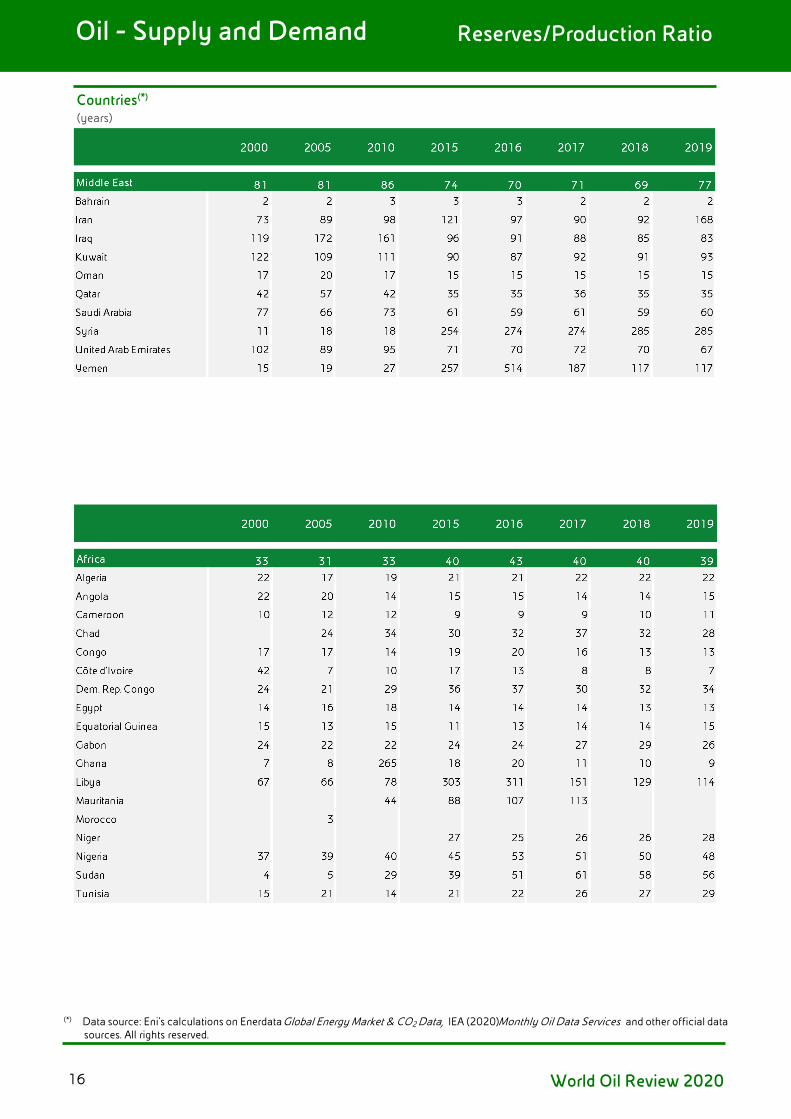
Oil - Supply and Demand Reserves/Production Ratio
Countries(*)
(years)
sources. All rights reserved.
(*) Data source: Eni’s calculations on Enerdata Global Energy Market & CO2 Data, IEA (2020) Monthly Oil Data Services and other official data
World Oil Review 2020 17
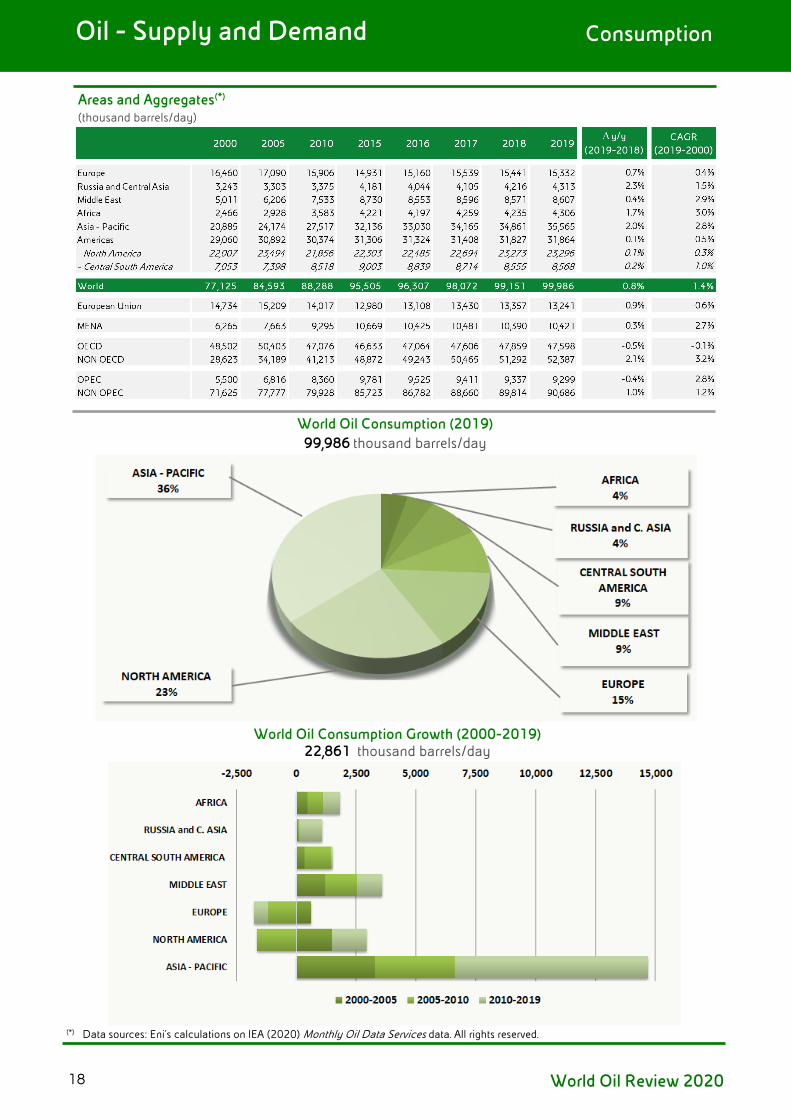
Oil - Supply and Demand Consumption
Areas and Aggregates(*)
(thousand barrels/day)
World Oil Consumption (2019) 99,986 thousand barrels/day
World Oil Consumption Growth (2000-2019) 22,861 thousand barrels/day
(*) Data sources: Eni’s calculations on IEA (2020) Monthly Oil Data Services data. All rights reserved.
World Oil Review 202018
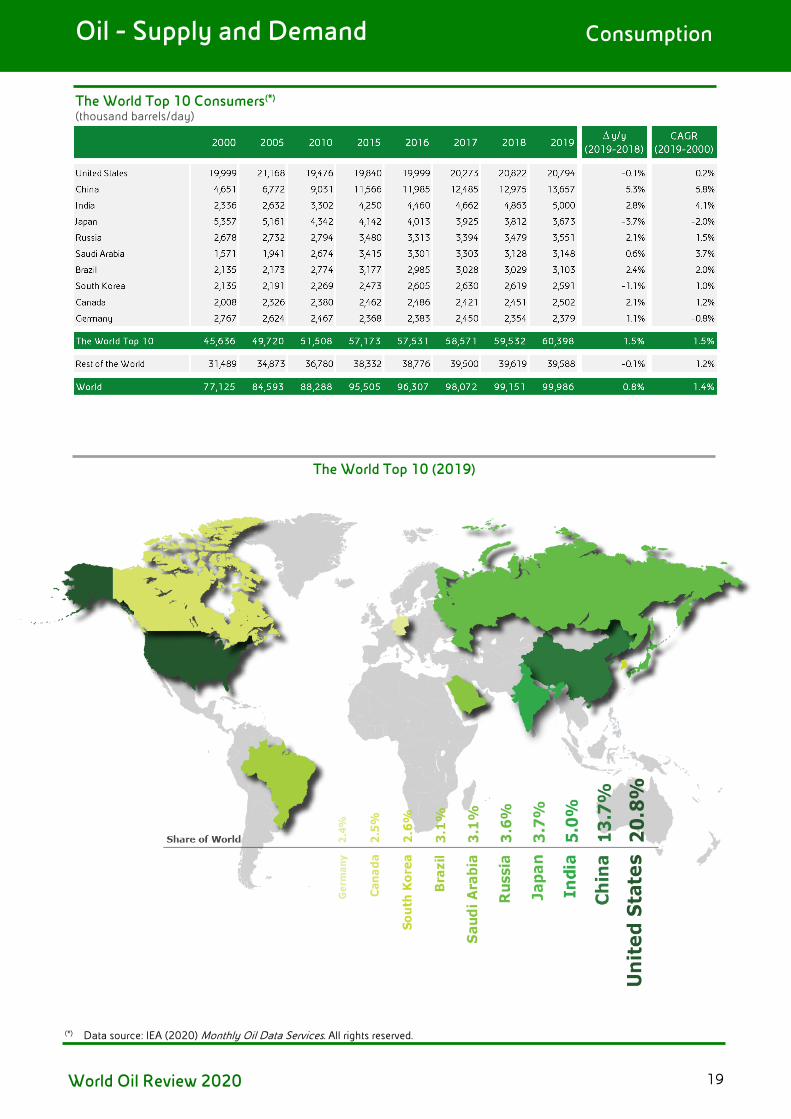
Oil - Supply and Demand Consumption
The World Top 10 Consumers(*)
(thousand barrels/day)
The World Top 10 (2019)
(*) Data source: IEA (2020) Monthly Oil Data Services. All rights reserved.
World Oil Review 2020 19
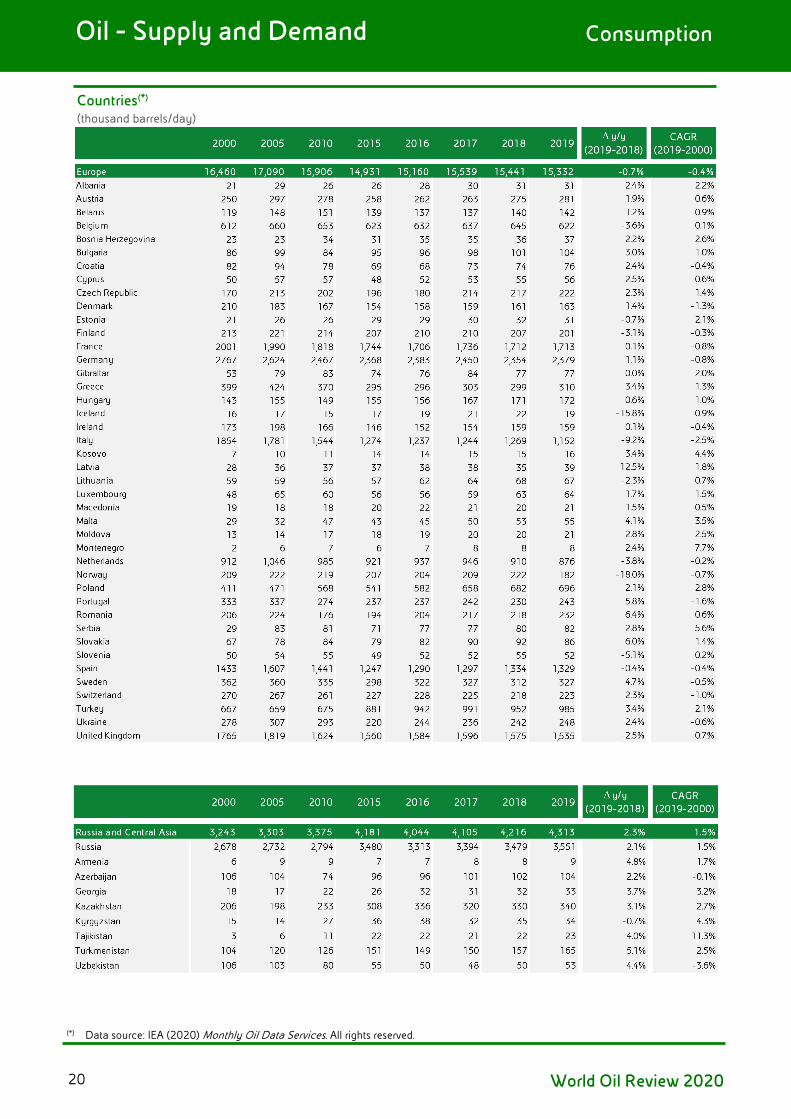
Oil - Supply and Demand Consumption
Countries(*)
(thousand barrels/day)
(*) Data source: IEA (2020) Monthly Oil Data Services. All rights reserved.
World Oil Review 202020

Oil - Supply and Demand Consumption
Countries(*)
(thousand barrels/day)
(*) Data source: IEA (2020) Monthly Oil Data Services. All rights reserved.
World Oil Review 2020 21

Oil - Supply and Demand Consumption
Countries(*)
(thousand barrels/day)
(*) Data source: IEA (2020) Monthly Oil Data Services. All rights reserved.
World Oil Review 202022
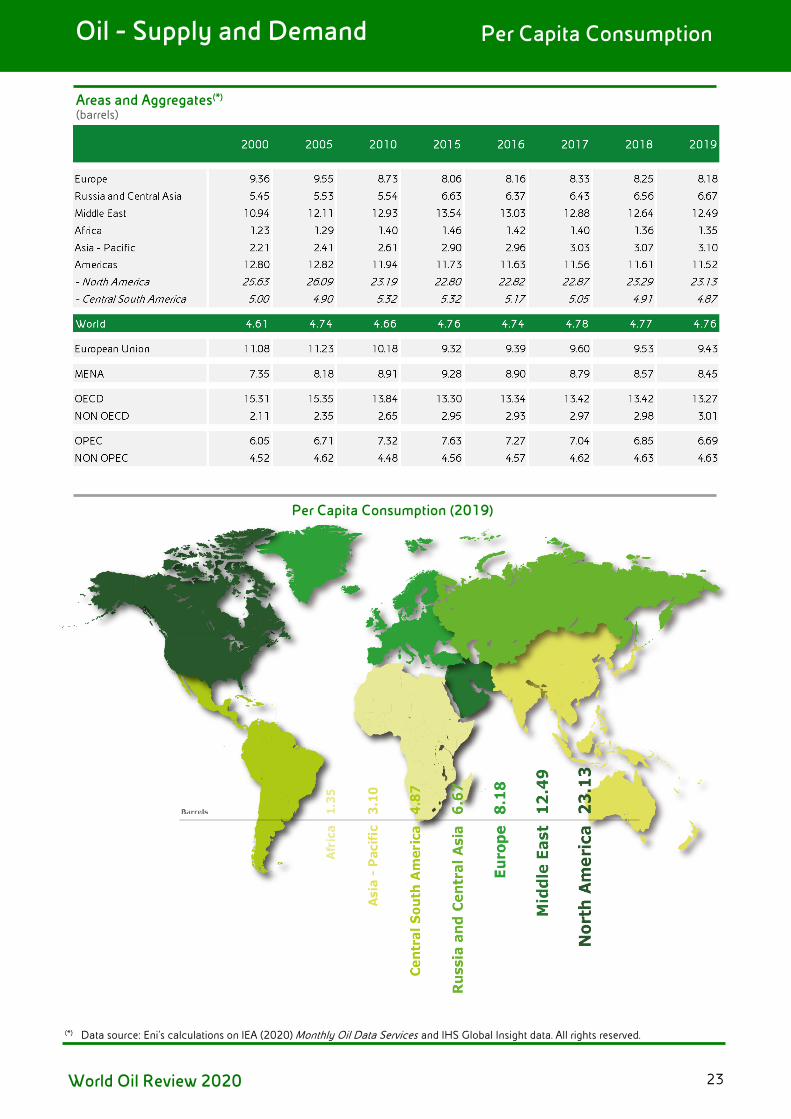
Oil - Supply and Demand Per Capita Consumption
Areas and Aggregates(*)
(barrels)
Per Capita Consumption (2019)
(*) Data source: Eni’s calculations on IEA (2020) Monthly Oil Data Services and IHS Global Insight data. All rights reserved.
World Oil Review 2020 23
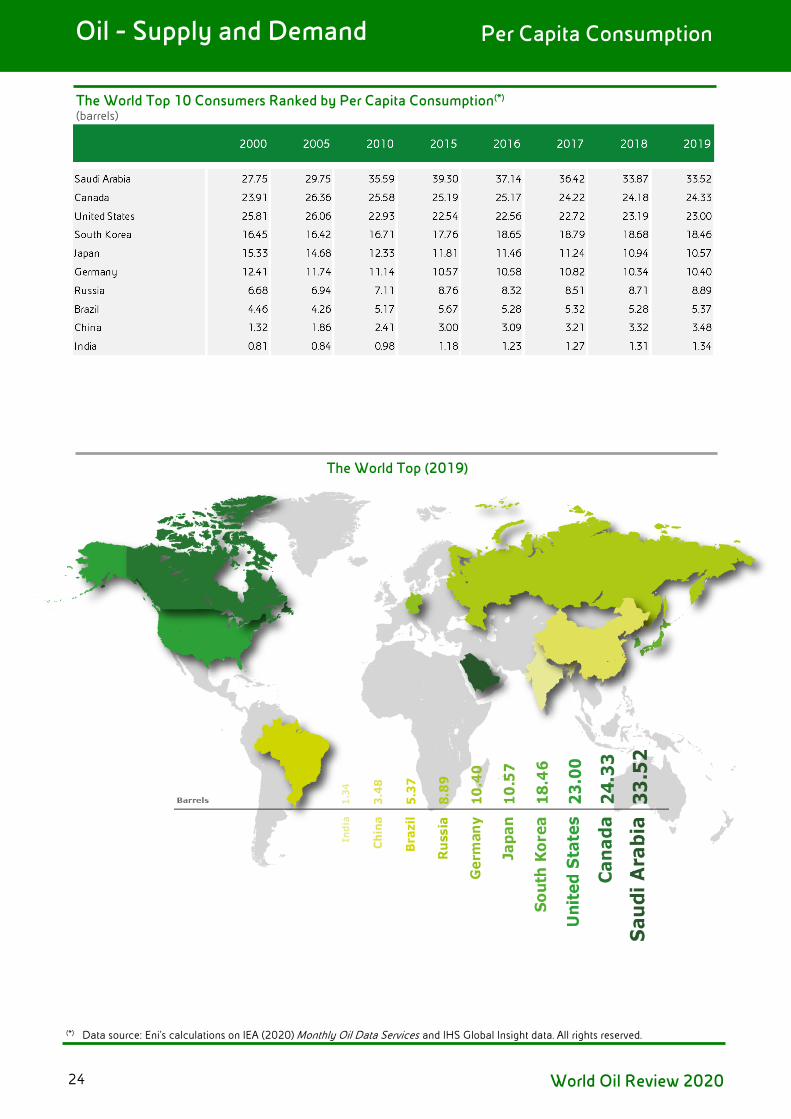
Oil - Supply and Demand Per Capita Consumption
The World Top 10 Consumers Ranked by Per Capita Consumption(*) (barrels)
The World Top (2019)
(*) Data source: Eni’s calculations on IEA (2020) Monthly Oil Data Services and IHS Global Insight data. All rights reserved.
World Oil Review 202024
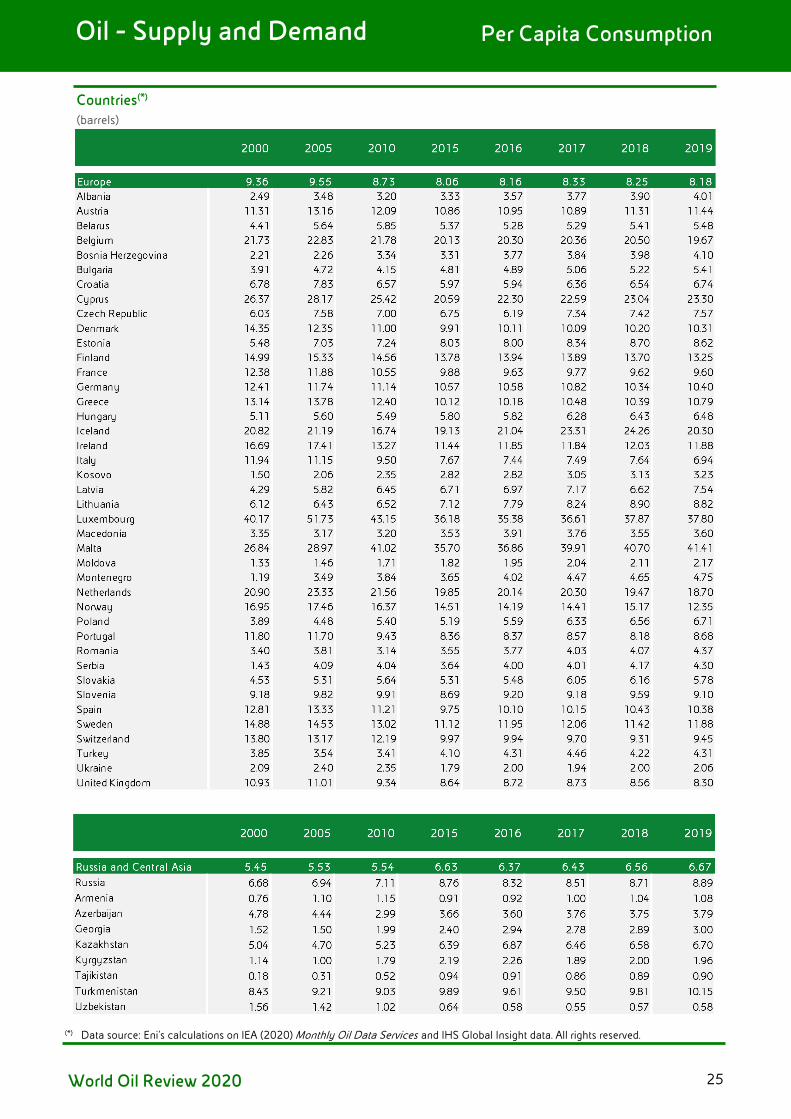
Oil - Supply and Demand Per Capita Consumption
Countries(*) (barrels)
(*) Data source: Eni’s calculations on IEA (2020) Monthly Oil Data Services and IHS Global Insight data. All rights reserved.
World Oil Review 2020 25

Oil - Supply and Demand Per Capita Consumption
Countries(*) (barrels)
(*) Data source: Eni’s calculations on IEA (2020) Monthly Oil Data Services and IHS Global Insight data. All rights reserved.
World Oil Review 202026
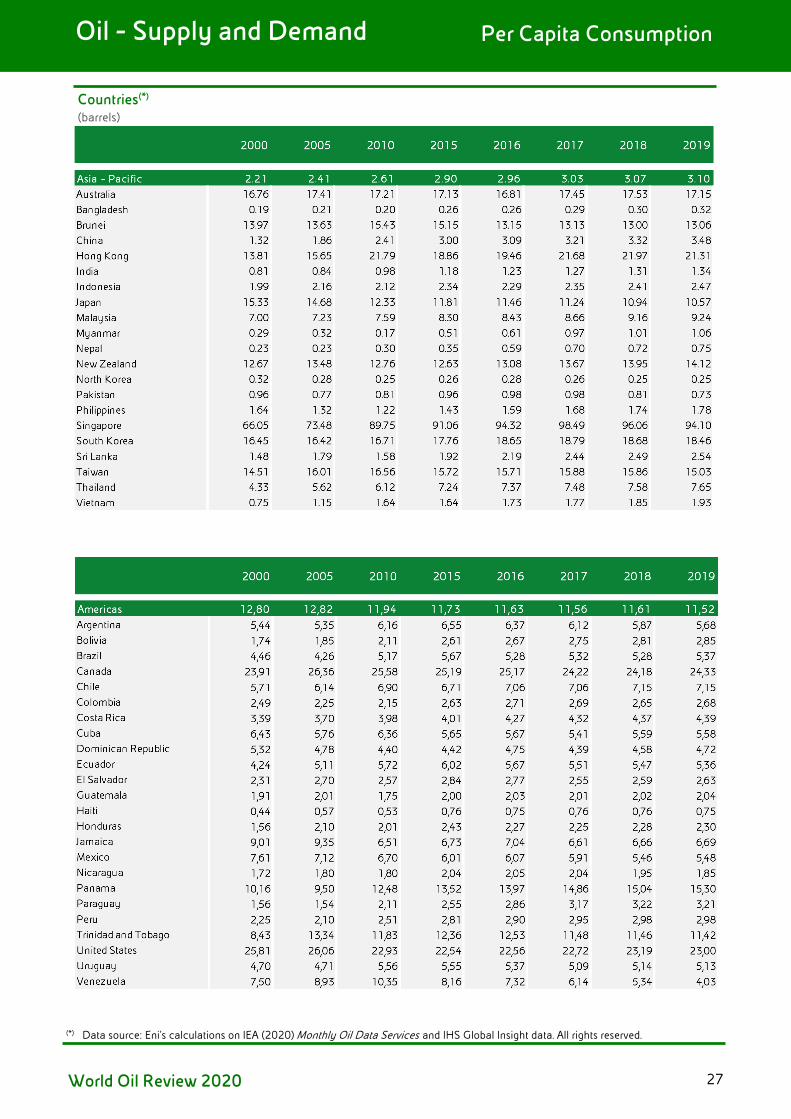
Oil - Supply and Demand Per Capita Consumption
Countries(*) (barrels)
(*) Data source: Eni’s calculations on IEA (2020) Monthly Oil Data Services and IHS Global Insight data. All rights reserved.
World Oil Review 2020 27
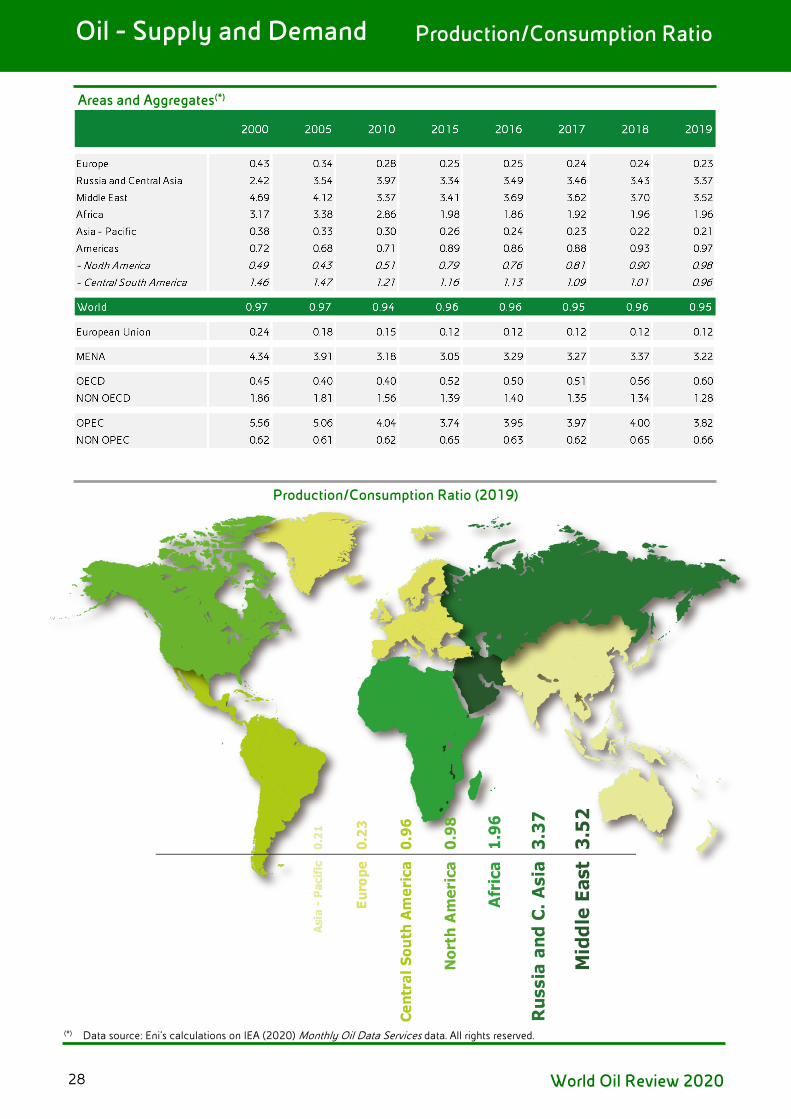
Oil - Supply and Demand Production/Consumption Ratio
Areas and Aggregates(*)
Production/Consumption Ratio (2019)
(*) Data source: Eni’s calculations on IEA (2020) Monthly Oil Data Services data. All rights reserved.
World Oil Review 202028

Oil - Supply and Demand Production/Consumption Ratio
The World Top 10 Producers Ranked by Production/Consumption Ratio(*)
The World Top 10 (2019)
(*) Data source: Eni’s calculations on IEA (2020) Monthly Oil Data Services data. All rights reserved.
World Oil Review 2020 29

Oil - Supply and Demand Production/Consumption Ratio
Countries(*)
(*) Data source: Eni’s calculations on IEA (2020) Monthly Oil Data Services data. All rights reserved.
World Oil Review 202030
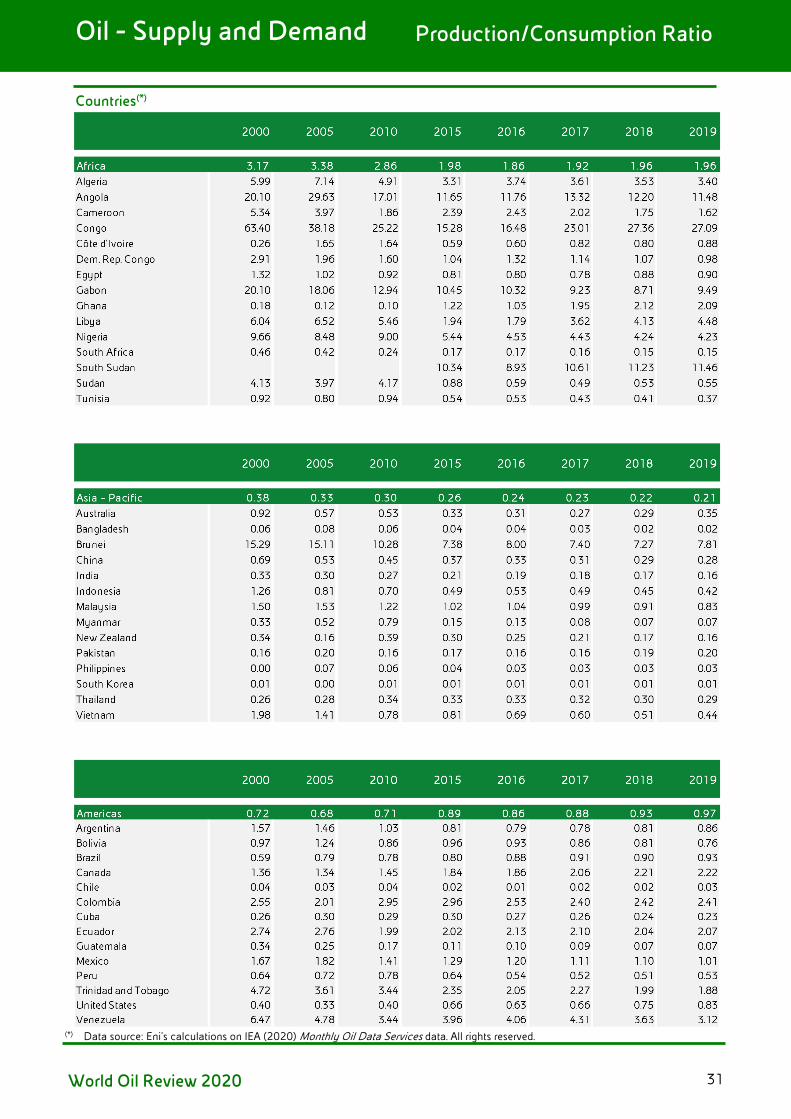
Oil - Supply and Demand Production/Consumption Ratio
Countries(*)
(*) Data source: Eni’s calculations on IEA (2020) Monthly Oil Data Services data. All rights reserved.
World Oil Review 2020 31

World Oil Review 2020
Regional Crude Balances
Exports
Imports
Crude Future Price and Open Interests
Oil - Trade and Prices
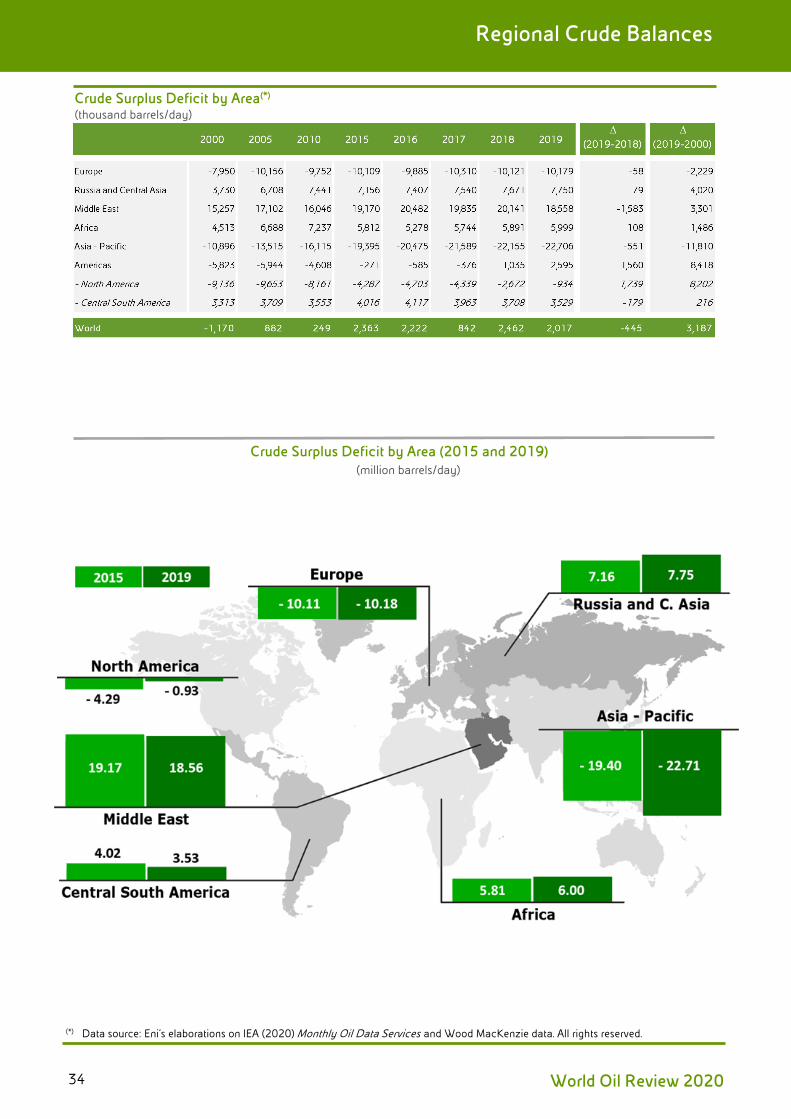
Regional Crude Balances
Crude Surplus Deficit by Area(*)
(thousand barrels/day)
Crude Surplus Deficit by Area (2015 and 2019)
(million barrels/day)
(*) Data source: Eni’s elaborations on IEA (2020) Monthly Oil Data Services and Wood MacKenzie data. All rights reserved.
World Oil Review 202034
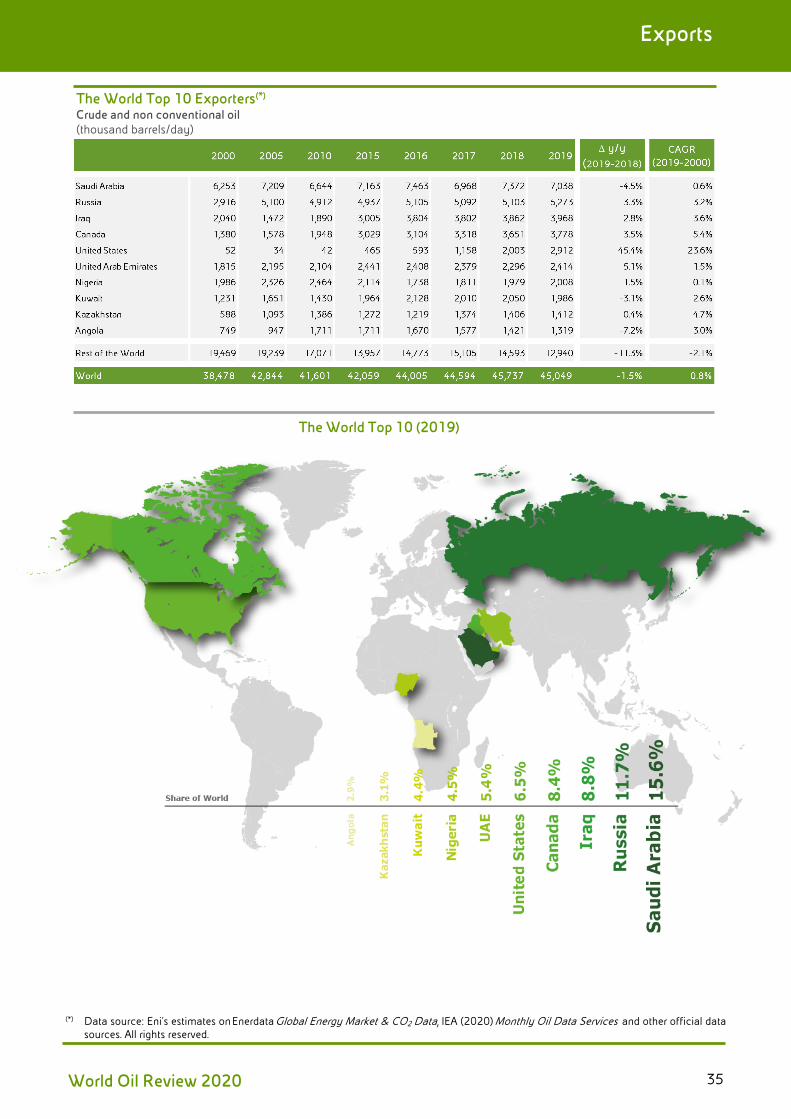
Exports
The World Top 10 Exporters(*)
Crude and non conventional oil (thousand barrels/day)
The World Top 10 (2019)
(*) Data source: Eni’s estimates on Enerdata Global Energy Market & CO2 Data, IEA (2020) Monthly Oil Data Services and other official data
sources. All rights reserved.
World Oil Review 2020 35

Exports
Countries(*)
Crude and non conventional oil (thousand barrels/day)
(*) Data source: Eni’s estimates on Enerdata Global Energy Market & CO2 Data, IEA (2020) Monthly Oil Data Services and other official data
sources. All rights reserved.
World Oil Review 202036
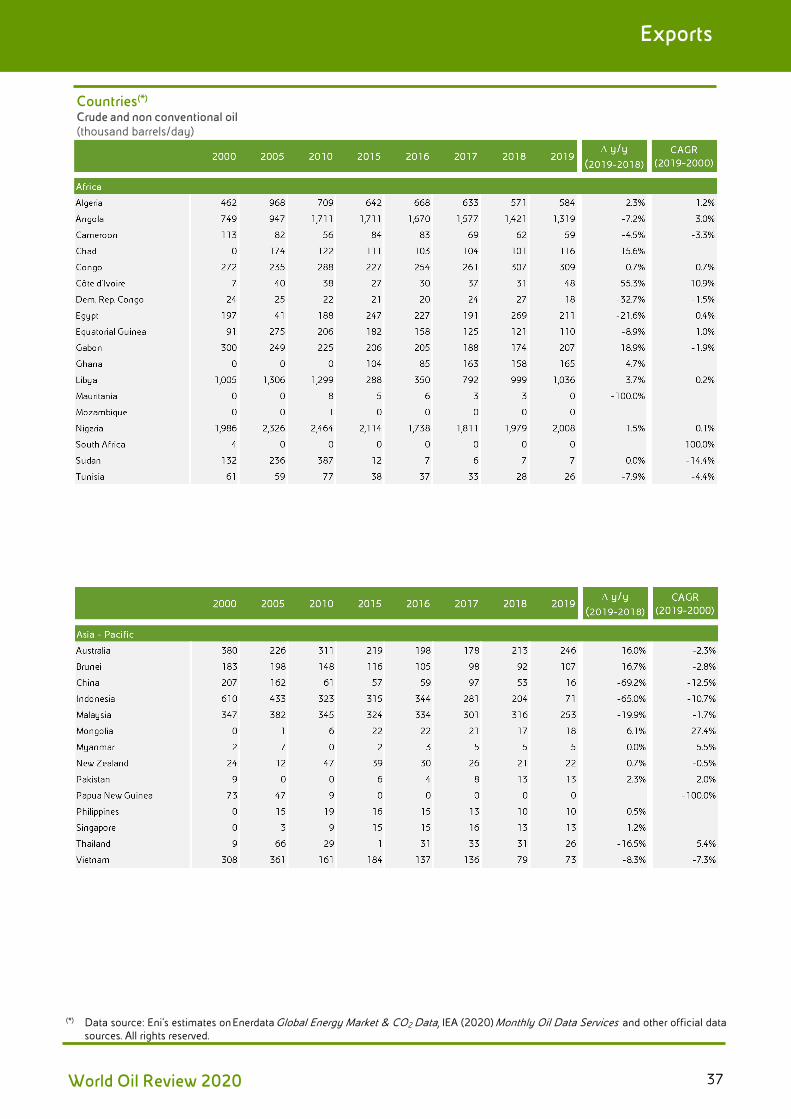
Exports
Countries(*)
Crude and non conventional oil (thousand barrels/day)
(*) Data source: Eni’s estimates on Enerdata Global Energy Market & CO2 Data, IEA (2020) Monthly Oil Data Services and other official data
sources. All rights reserved.
World Oil Review 2020 37
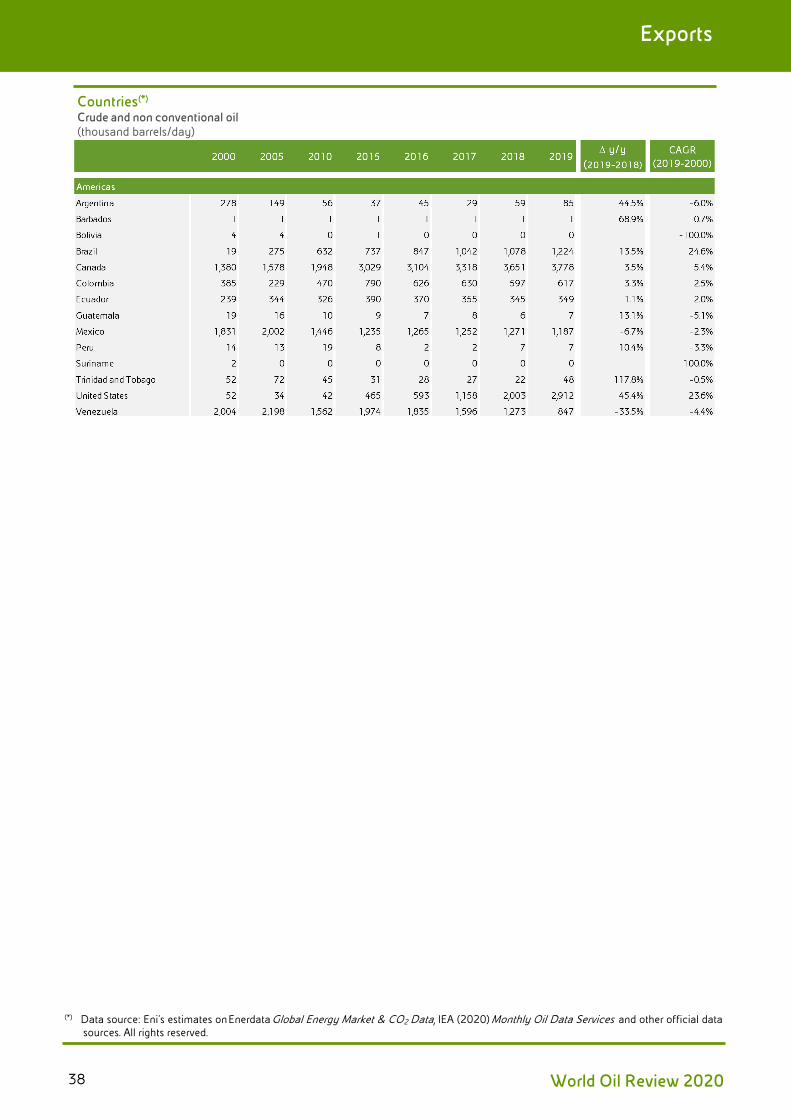
Exports
Countries(*)
Crude and non conventional oil (thousand barrels/day)
(*) Data source: Eni’s estimates on Enerdata Global Energy Market & CO2 Data, IEA (2020) Monthly Oil Data Services and other official data
sources. All rights reserved.
World Oil Review 202038
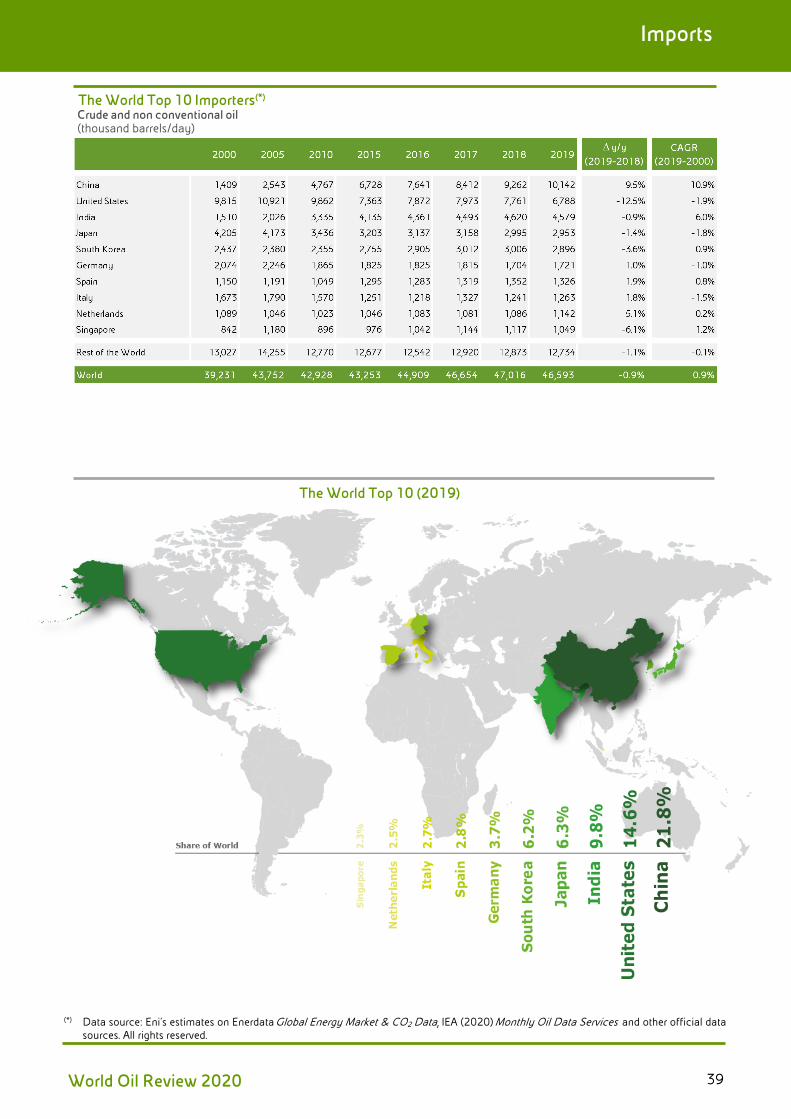
Imports
The World Top 10 Importers(*)
Crude and non conventional oil (thousand barrels/day)
The World Top 10 (2019)
(*) Data source: Eni’s estimates on Enerdata Global Energy Market & CO2 Data, IEA (2020) Monthly Oil Data Services and other official datasources. All rights reserved.
World Oil Review 2020 39
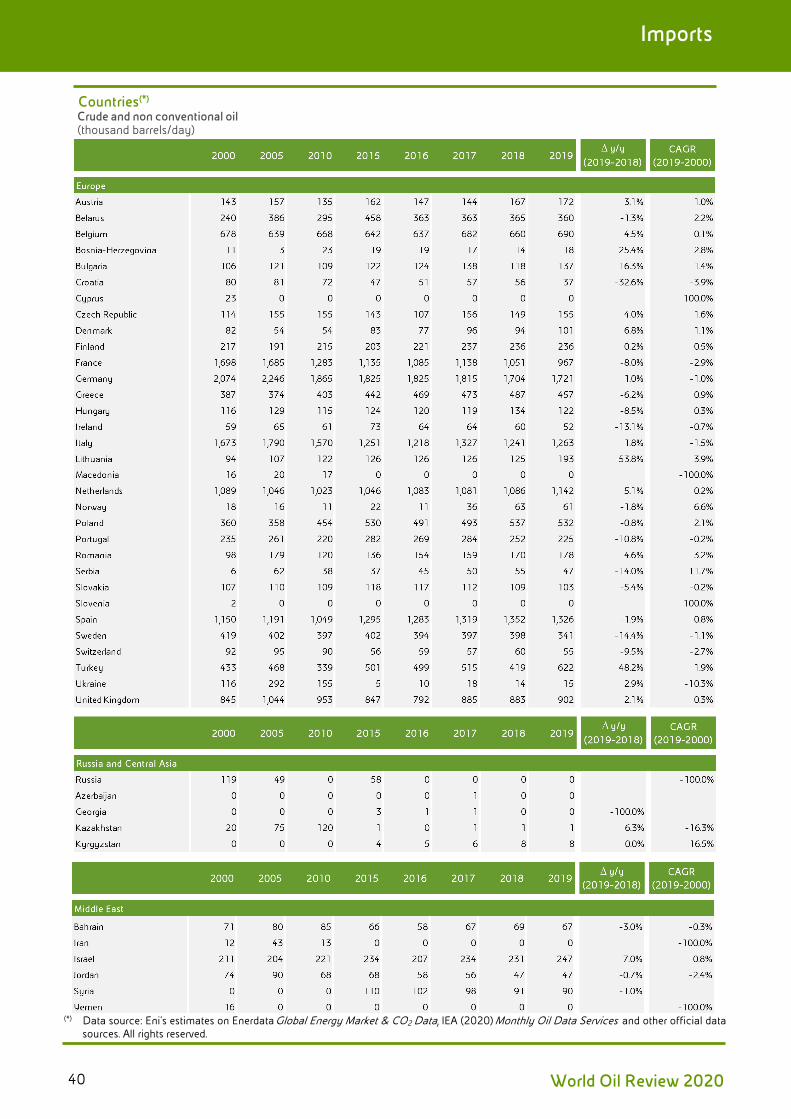
Imports
Countries(*) Crude and non conventional oil (thousand barrels/day)
(*) Data source: Eni’s estimates on Enerdata Global Energy Market & CO2 Data, IEA (2020) Monthly Oil Data Services and other official datasources. All rights reserved.
World Oil Review 202040

Imports
Countries(*) Crude and non conventional oil (thousand barrels/day)
(*) Data source: Eni’s estimates on Enerdata Global Energy Market & CO2 Data, IEA (2020) Monthly Oil Data Services and other official datasources. All rights reserved.
World Oil Review 2020 41
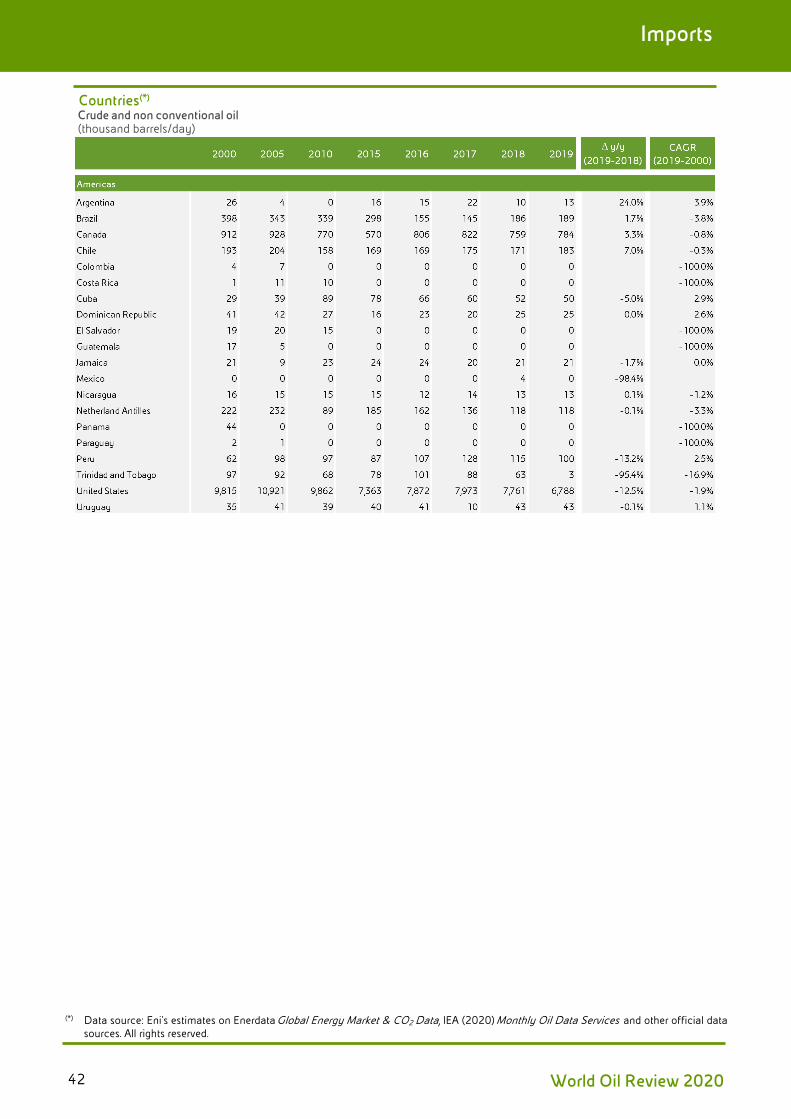
Imports
Countries(*) Crude and non conventional oil (thousand barrels/day)
(*) Data source: Eni’s estimates on Enerdata Global Energy Market & CO2 Data, IEA (2020) Monthly Oil Data Services and other official datasources. All rights reserved.
World Oil Review 202042
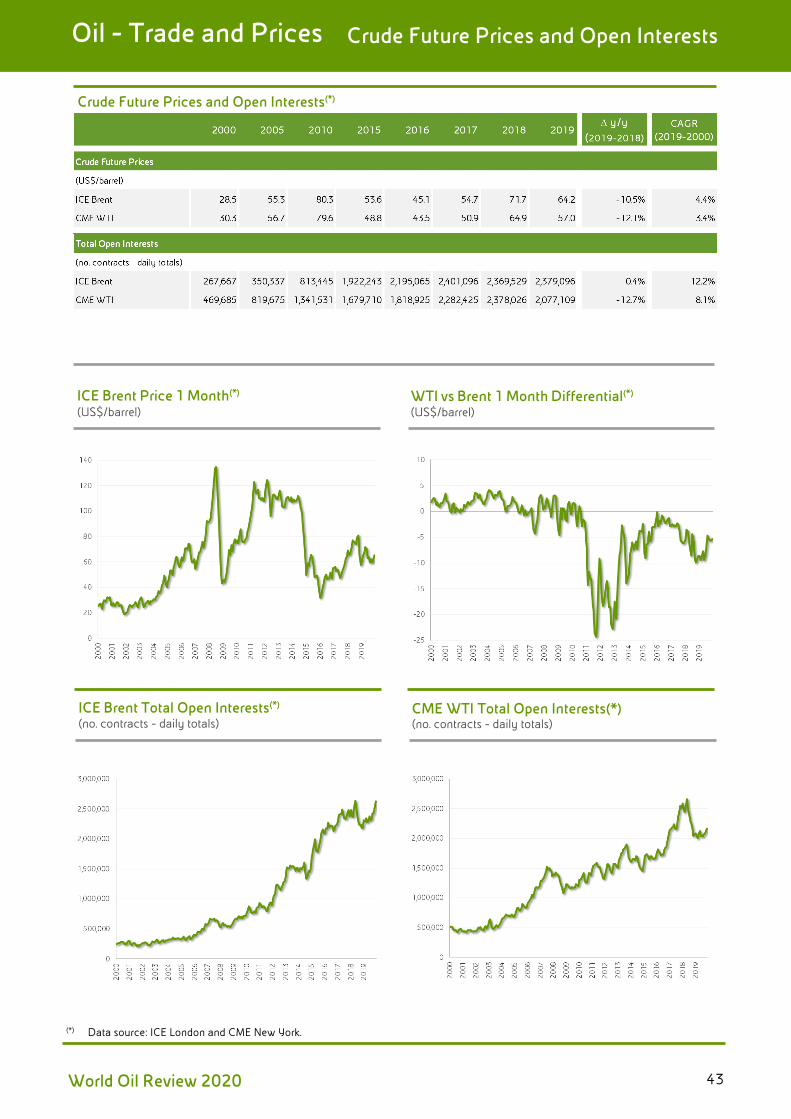
Crude Future Prices and Open Interests(*)
ICE Brent Price 1 Month(*)
(US$/barrel) WTI vs Brent 1 Month Differential(*)
(US$/barrel)
ICE Brent Total Open Interests(*)
(no. contracts - daily totals) CME WTI Total Open Interests(*)(no. contracts - daily totals)
(*) Data source: ICE London and CME New York.
World Oil Review 2020 43
Oil - Trade and Prices Crude Future Prices and Open Interests


World
Europe
Russia and Central Asia
Middle East
Africa
Asia Pacific
Americas
Oil - Production Quality
World Oil Review 2020
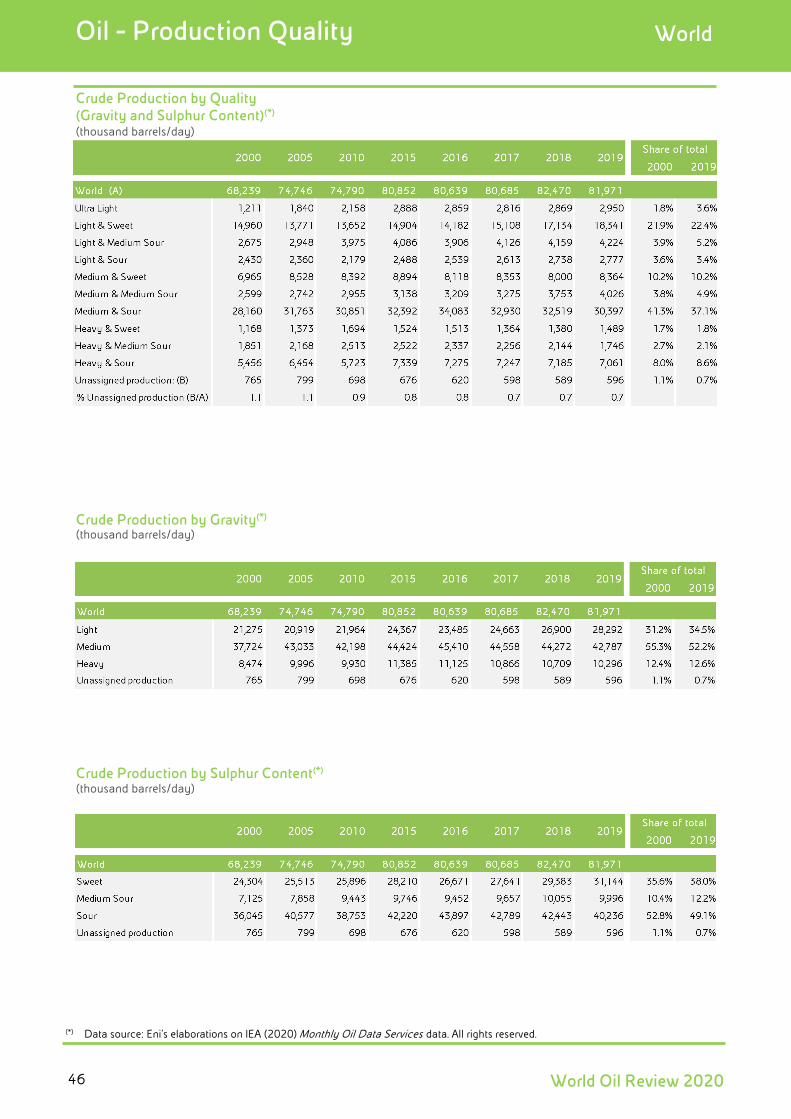
Oil - Production Quality World
Crude Production by Quality (Gravity and Sulphur Content)(*) (thousand barrels/day)
Crude Production by Gravity(*)
(thousand barrels/day)
Crude Production by Sulphur Content(*)
(thousand barrels/day)
(*) Data source: Eni’s elaborations on IEA (2020) Monthly Oil Data Services data. All rights reserved.
World Oil Review 202046

Oil - Production Quality World
Quality and Production Volume of Main 2019 Crudes(*)
(thousand barrels/day)
(*) Data source: Eni.
World Oil Review 2020 47
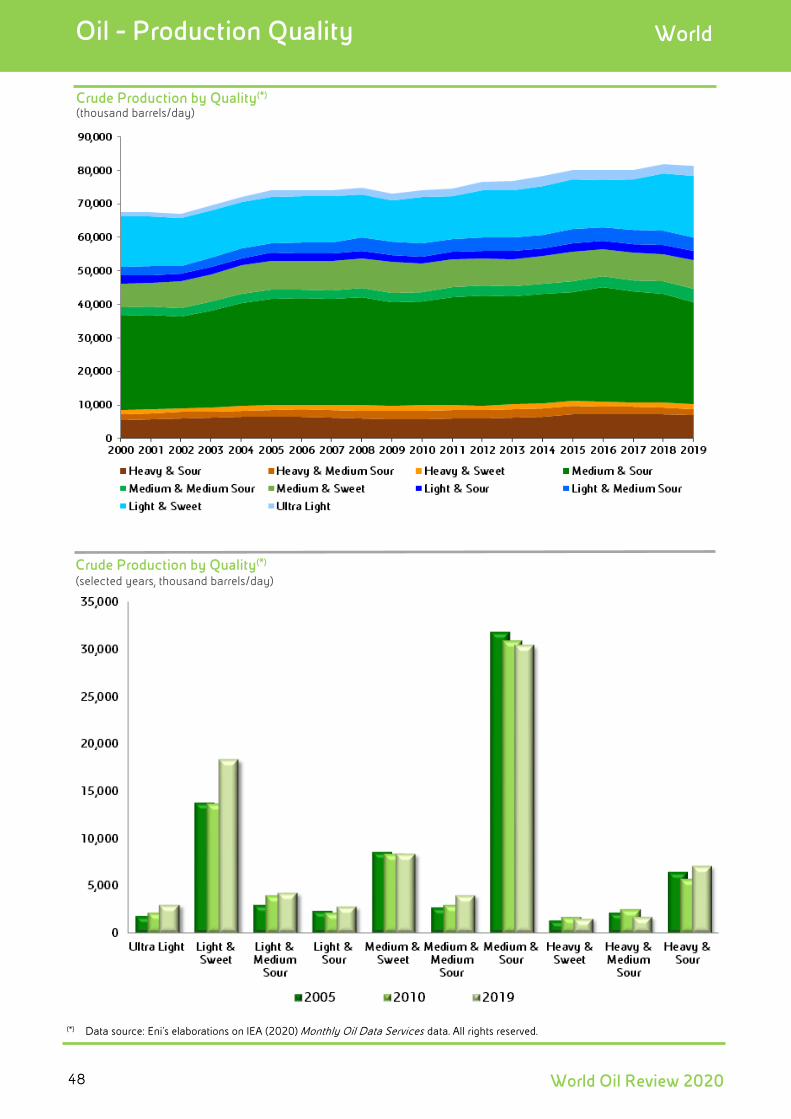
Oil - Production Quality World
Crude Production by Quality(*)
(thousand barrels/day)
Crude Production by Quality(*) (selected years, thousand barrels/day)
(*) Data source: Eni’s elaborations on IEA (2020) Monthly Oil Data Services data. All rights reserved.
World Oil Review 202048
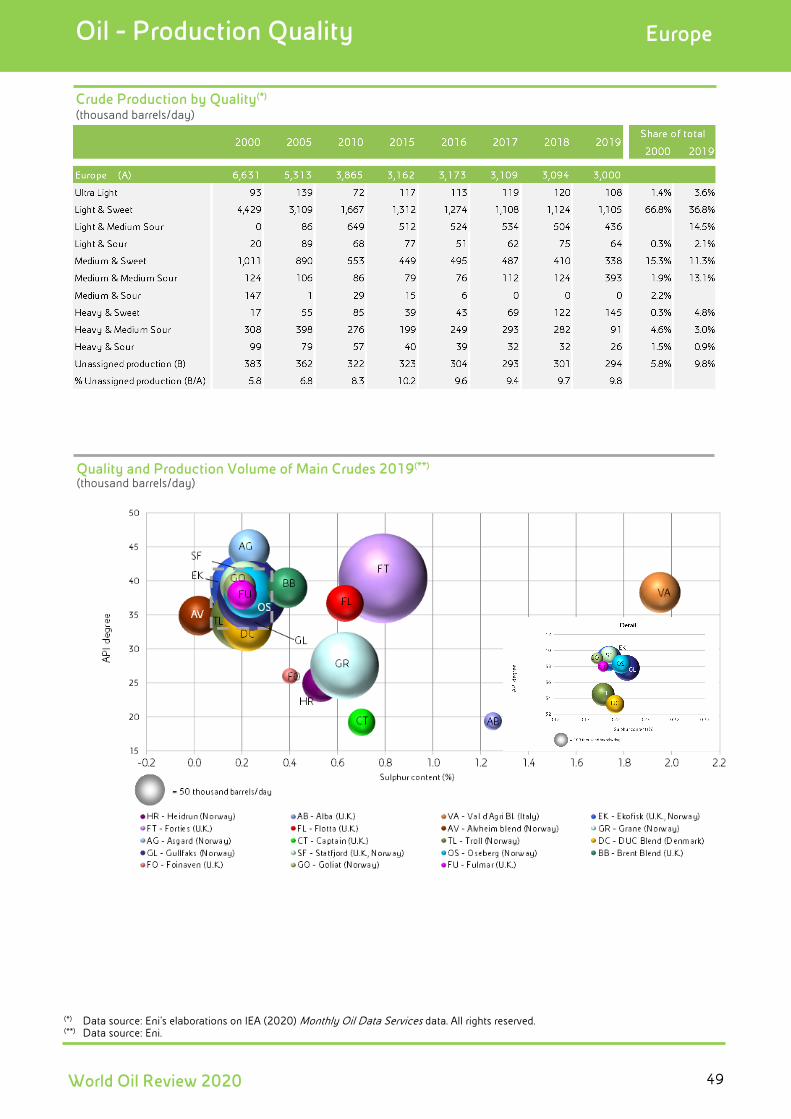
Oil - Production Quality Europe
Crude Production by Quality(*) (thousand barrels/day)
Quality and Production Volume of Main Crudes 2019(**)
(thousand barrels/day)
(*) Data source: Eni’s elaborations on IEA (2020) Monthly Oil Data Services data. All rights reserved. (**) Data source: Eni.
World Oil Review 2020 49
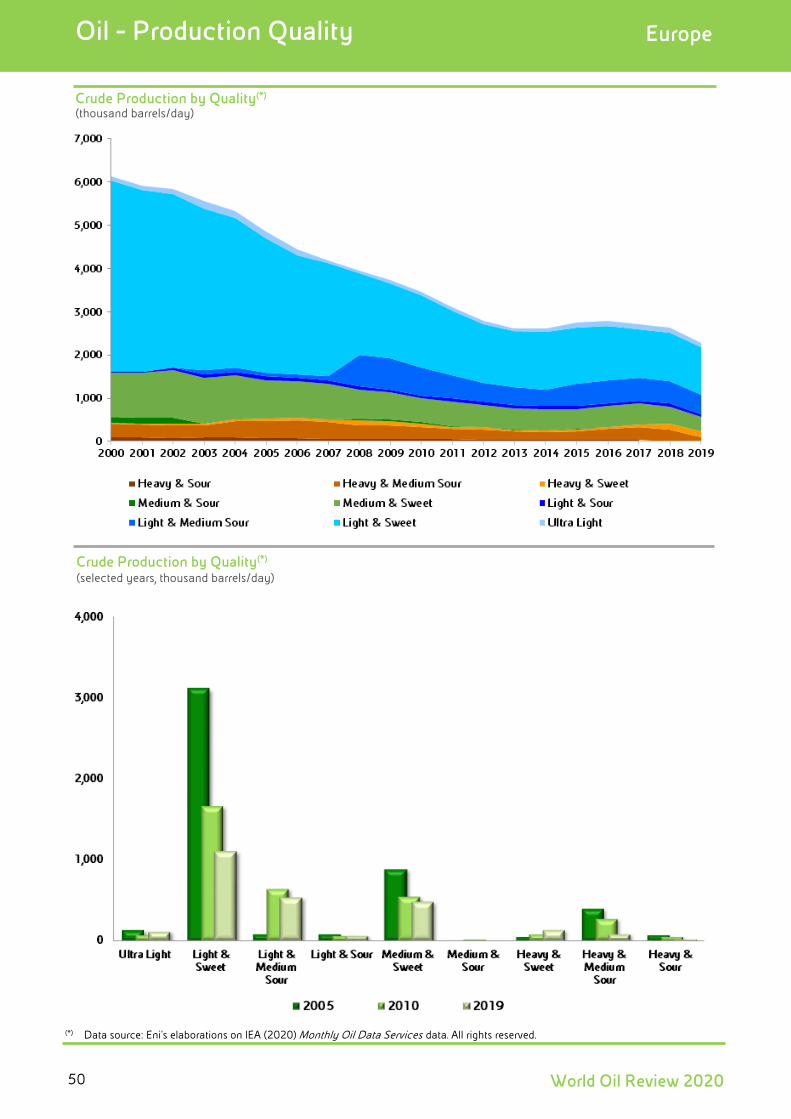
Oil - Production Quality Europe
Crude Production by Quality(*)
(thousand barrels/day)
Crude Production by Quality(*) (selected years, thousand barrels/day)
(*) Data source: Eni’s elaborations on IEA (2020) Monthly Oil Data Services data. All rights reserved.
World Oil Review 202050
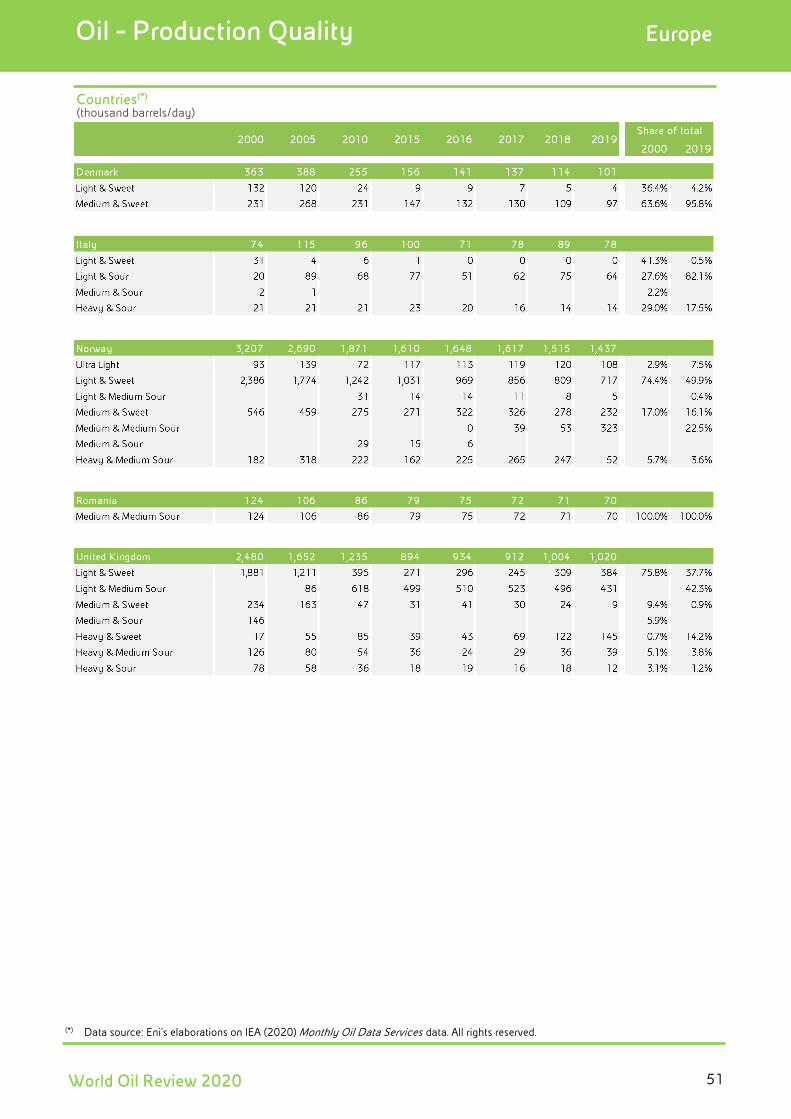
Oil - Production Quality Europe
Countries(*)
(thousand barrels/day)
(*) Data source: Eni’s elaborations on IEA (2020) Monthly Oil Data Services data. All rights reserved.
World Oil Review 2020 51
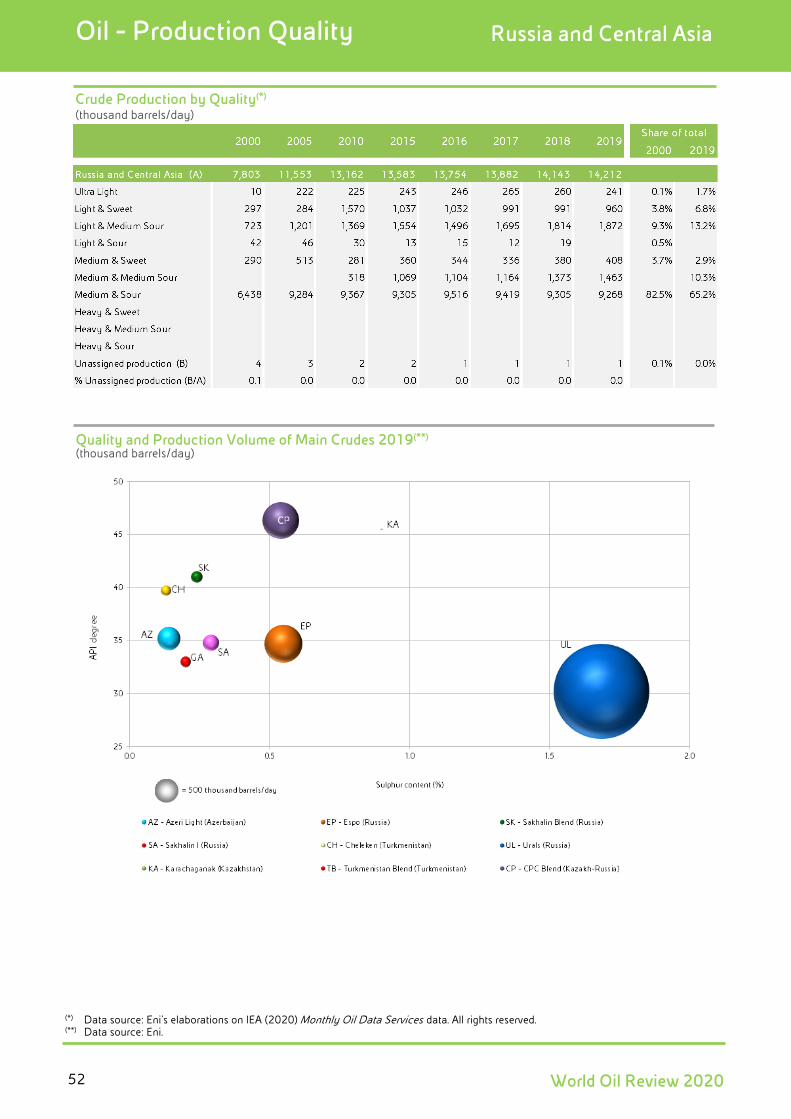
Oil - Production Quality Russia and Central Asia
Crude Production by Quality(*) (thousand barrels/day)
Quality and Production Volume of Main Crudes 2019(**)
(thousand barrels/day)
(*) Data source: Eni’s elaborations on IEA (2020) Monthly Oil Data Services data. All rights reserved. (**) Data source: Eni.
World Oil Review 202052
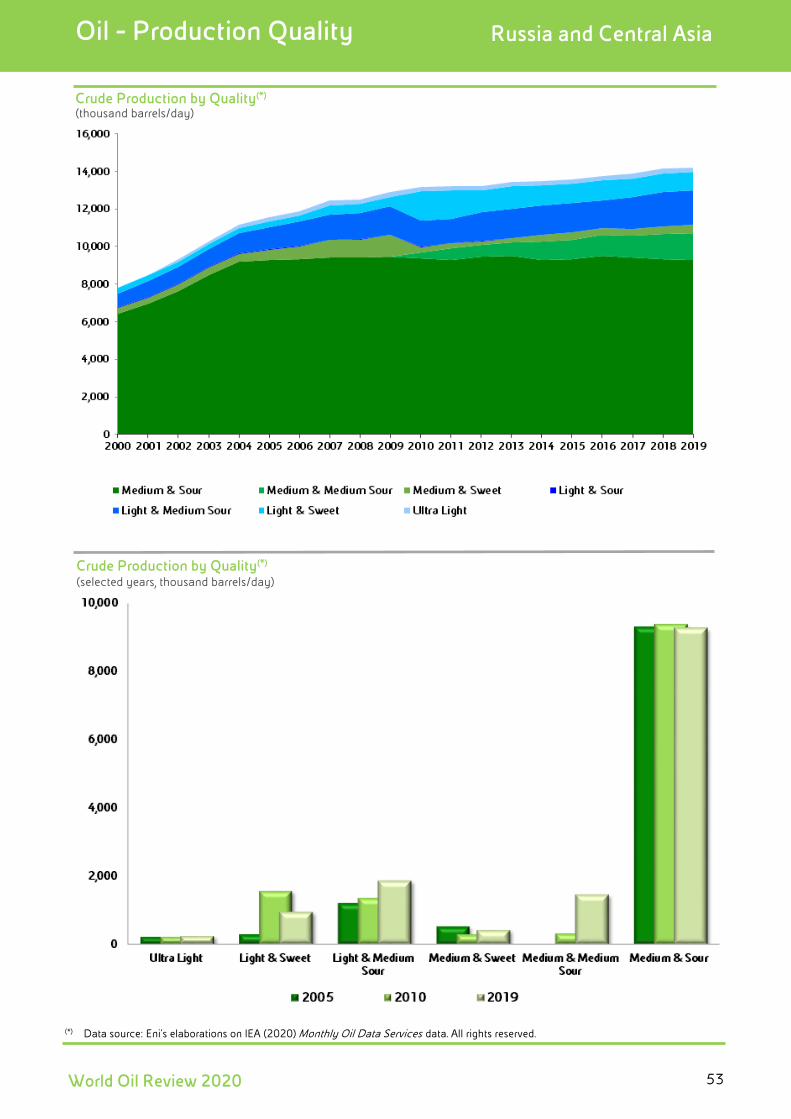
Oil - Production Quality Russia and Central Asia
Crude Production by Quality(*)
(thousand barrels/day)
Crude Production by Quality(*) (selected years, thousand barrels/day)
(*) Data source: Eni’s elaborations on IEA (2020) Monthly Oil Data Services data. All rights reserved.
World Oil Review 2020 53
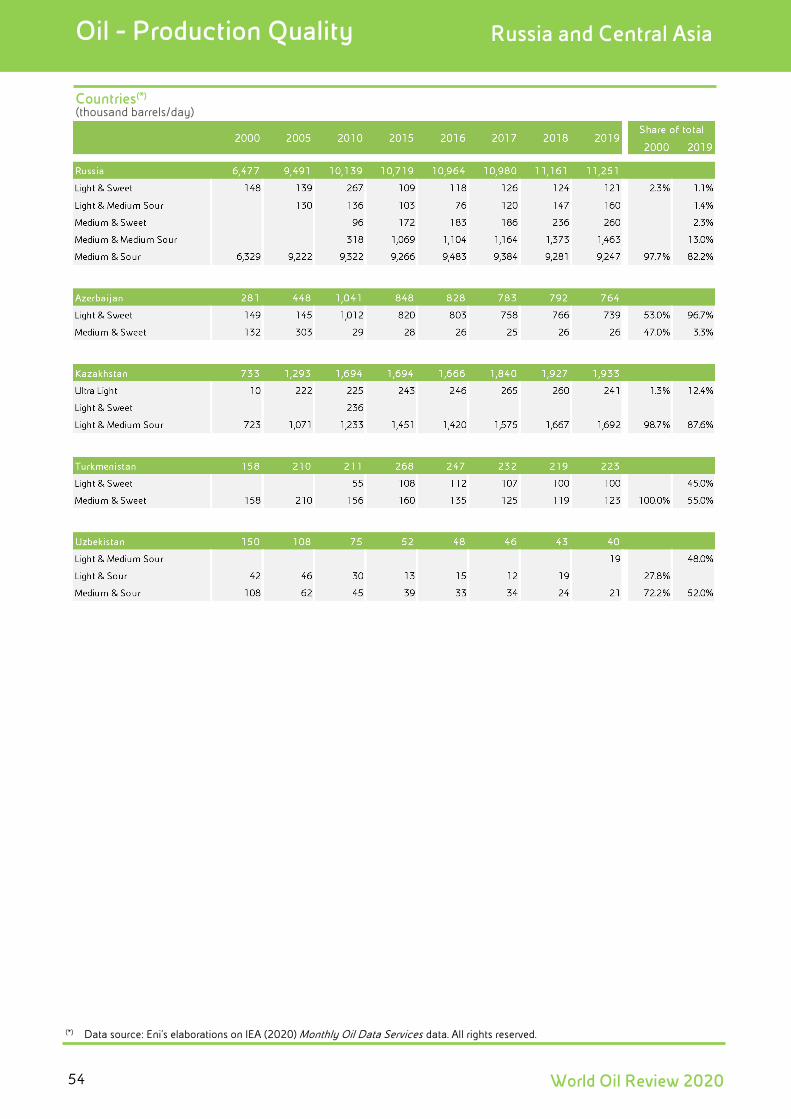
Oil - Production Quality Russia and Central Asia
Countries(*)
(thousand barrels/day)
(*) Data source: Eni’s elaborations on IEA (2020) Monthly Oil Data Services data. All rights reserved.
World Oil Review 202054

Oil - Production Quality Middle East
Crude Production by Quality(*) (thousand barrels/day)
Quality and Production Volume of Main Crudes 2019(**)
(thousand barrels/day)
(*) Data source: Eni’s elaborations on IEA (2020) Monthly Oil Data Services data. All rights reserved. (**) Data source: Eni.
World Oil Review 2020 55

Oil - Production Quality Middle East
Crude Production by Quality(*)
(thousand barrels/day)
Crude Production by Quality(*) (selected years, thousand barrels/day)
(*) Data source: Eni’s elaborations on IEA (2020) Monthly Oil Data Services data. All rights reserved.
World Oil Review 202056
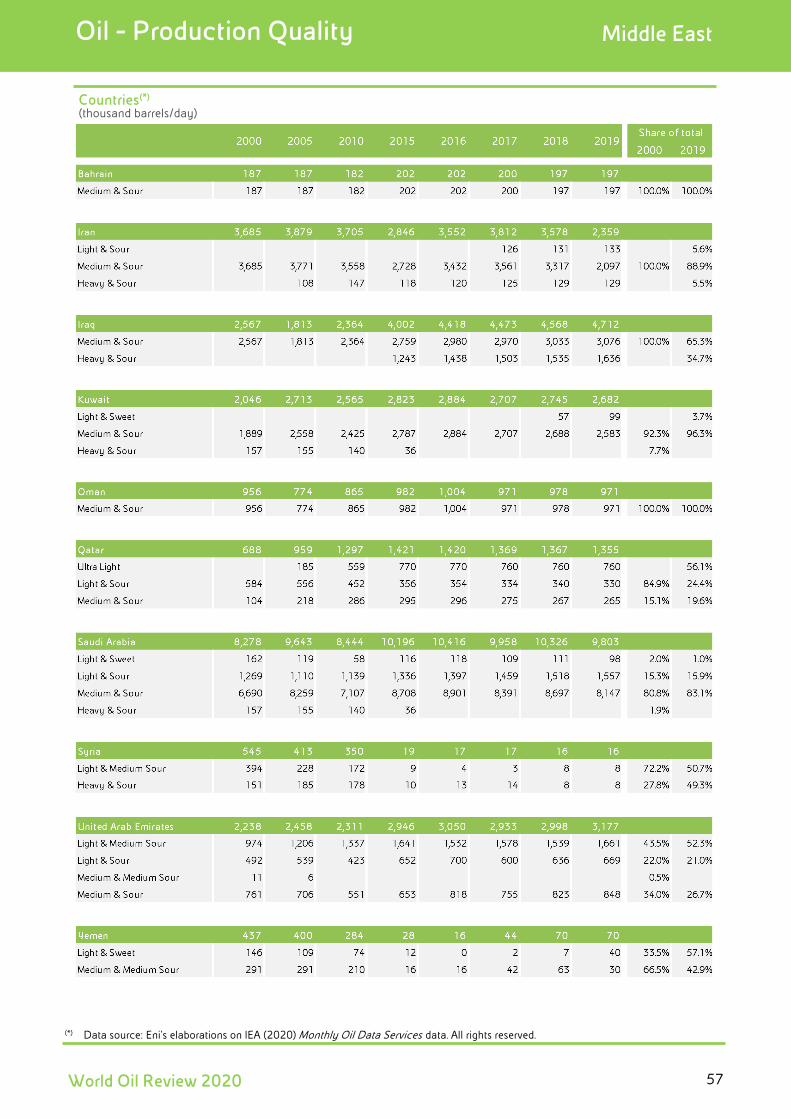
Oil - Production Quality Middle East
Countries(*)
(thousand barrels/day)
(*) Data source: Eni’s elaborations on IEA (2020) Monthly Oil Data Services data. All rights reserved.
World Oil Review 2020 57

Oil - Production Quality Africa
Crude Production by Quality(*) (thousand barrels/day)
Quality and Production Volume of Main Crudes 2019(**)
(thousand barrels/day)
(*) Data source: Eni’s elaborations on IEA (2020) Monthly Oil Data Services data. All rights reserved. (**) Data source: Eni.
World Oil Review 202058
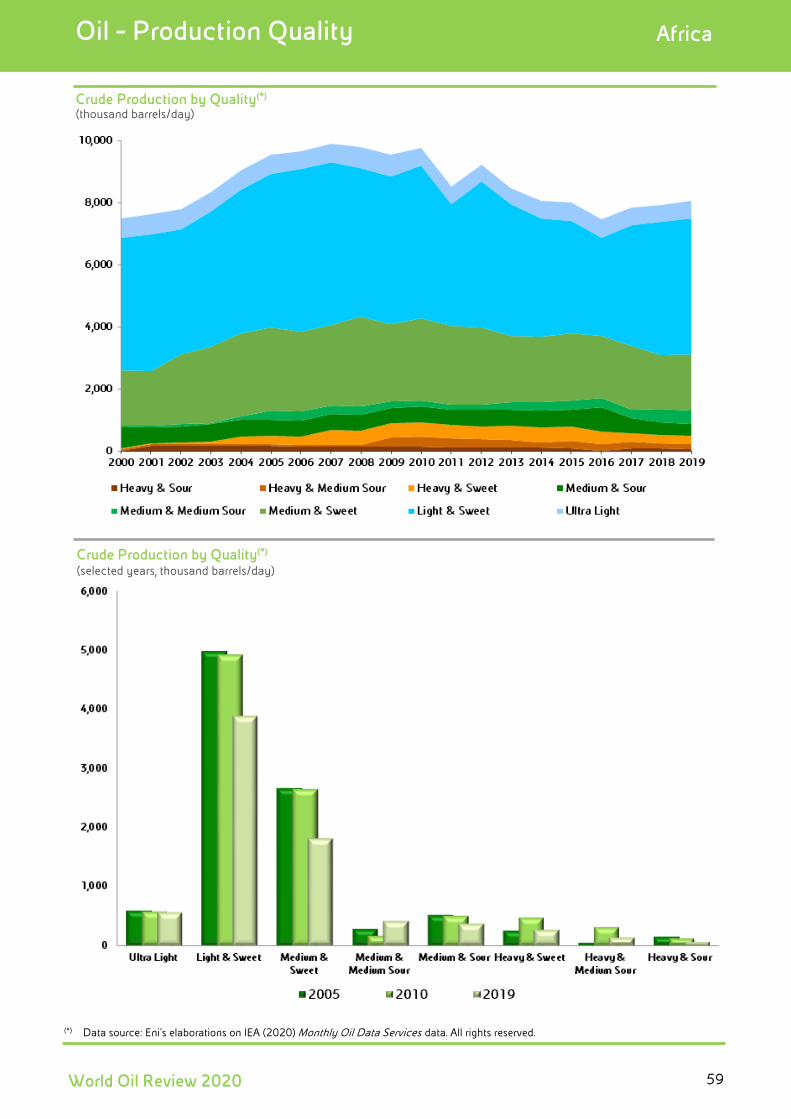
Oil - Production Quality Africa
Crude Production by Quality(*)
(thousand barrels/day)
Crude Production by Quality(*) (selected years, thousand barrels/day)
(*) Data source: Eni’s elaborations on IEA (2020) Monthly Oil Data Services data. All rights reserved.
World Oil Review 2020 59
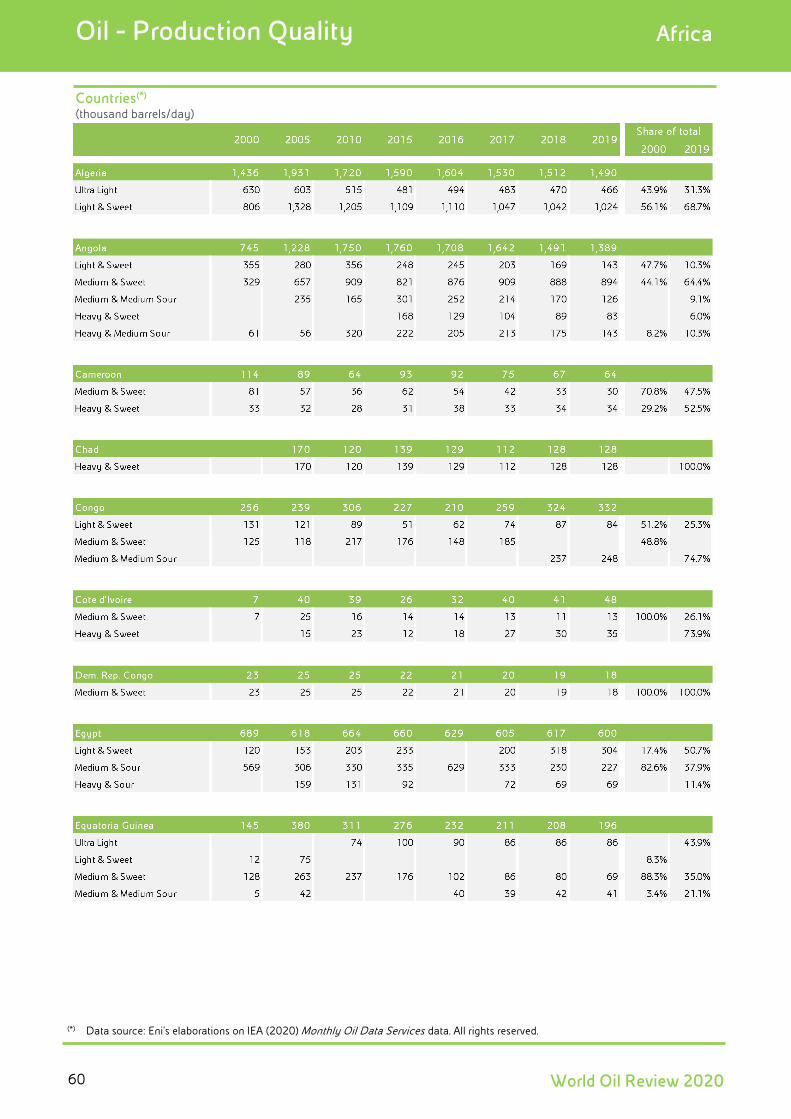
Oil - Production Quality Africa
Countries(*) (thousand barrels/day)
(*) Data source: Eni’s elaborations on IEA (2020) Monthly Oil Data Services data. All rights reserved.
World Oil Review 202060
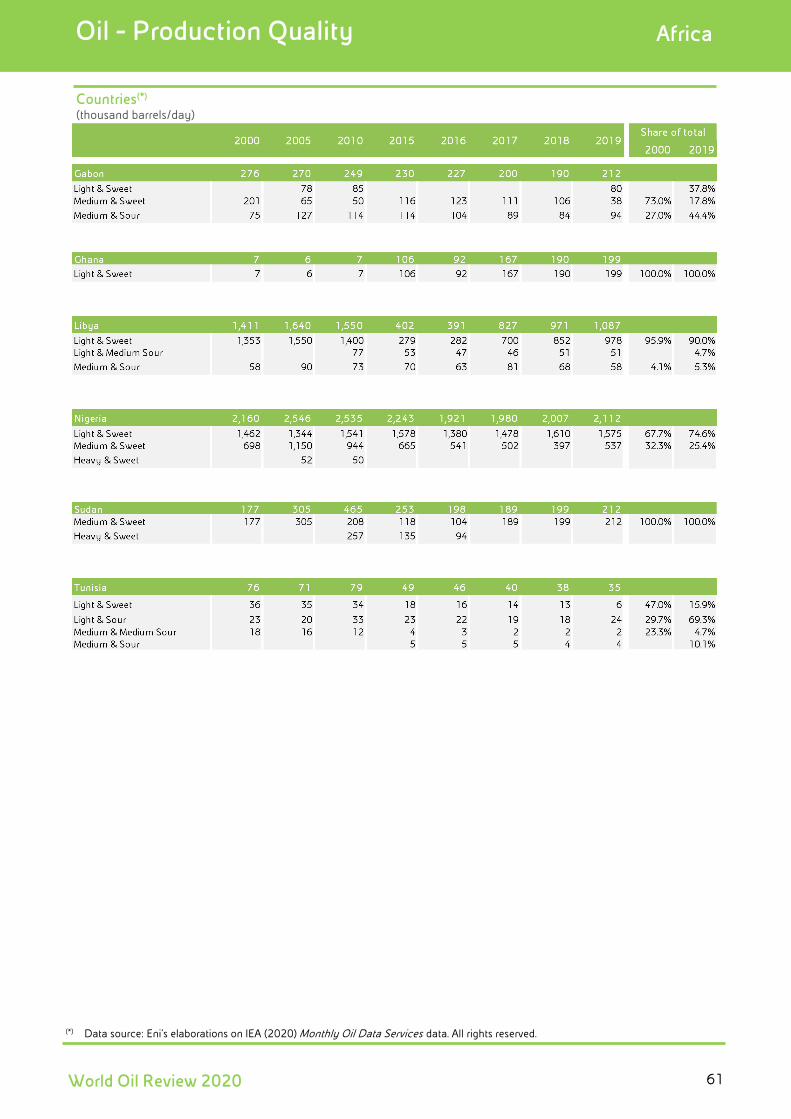
Oil - Production Quality Africa
Countries(*) (thousand barrels/day)
(*) Data source: Eni’s elaborations on IEA (2020) Monthly Oil Data Services data. All rights reserved.
World Oil Review 2020 61
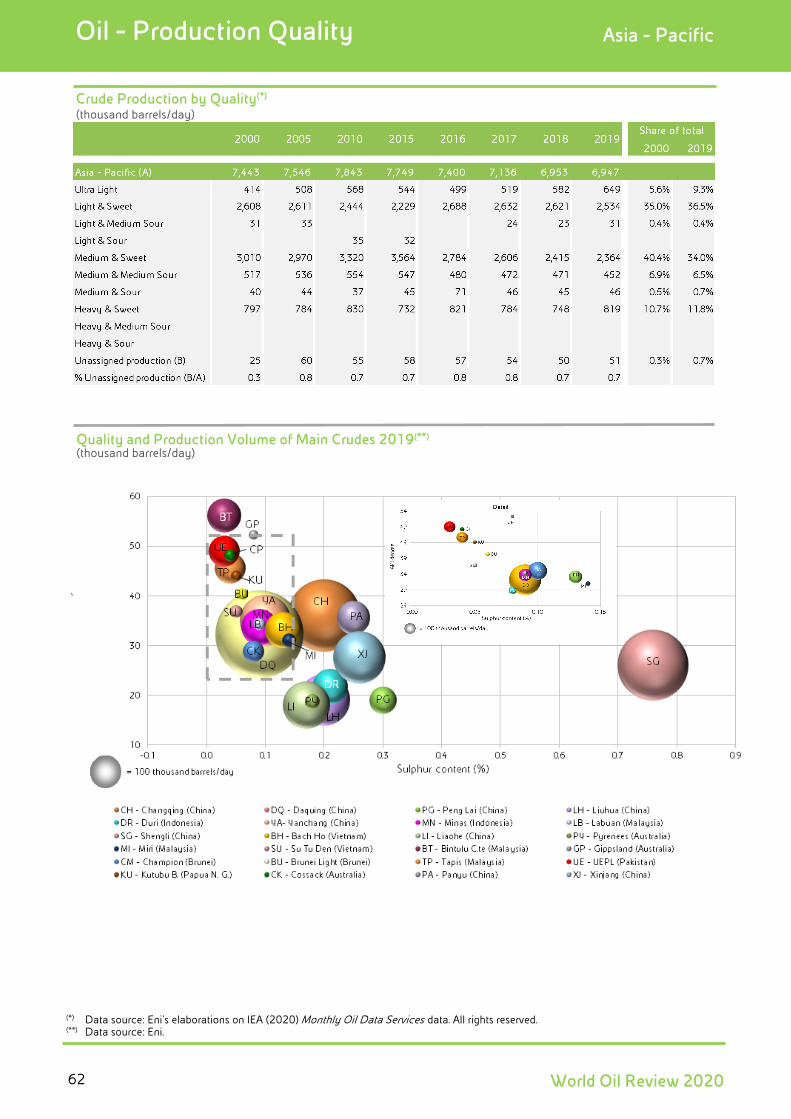
Oil - Production Quality Asia - Pacific
Crude Production by Quality(*) (thousand barrels/day)
Quality and Production Volume of Main Crudes 2019(**)
(thousand barrels/day)
(*) Data source: Eni’s elaborations on IEA (2020) Monthly Oil Data Services data. All rights reserved. (**) Data source: Eni.
World Oil Review 202062
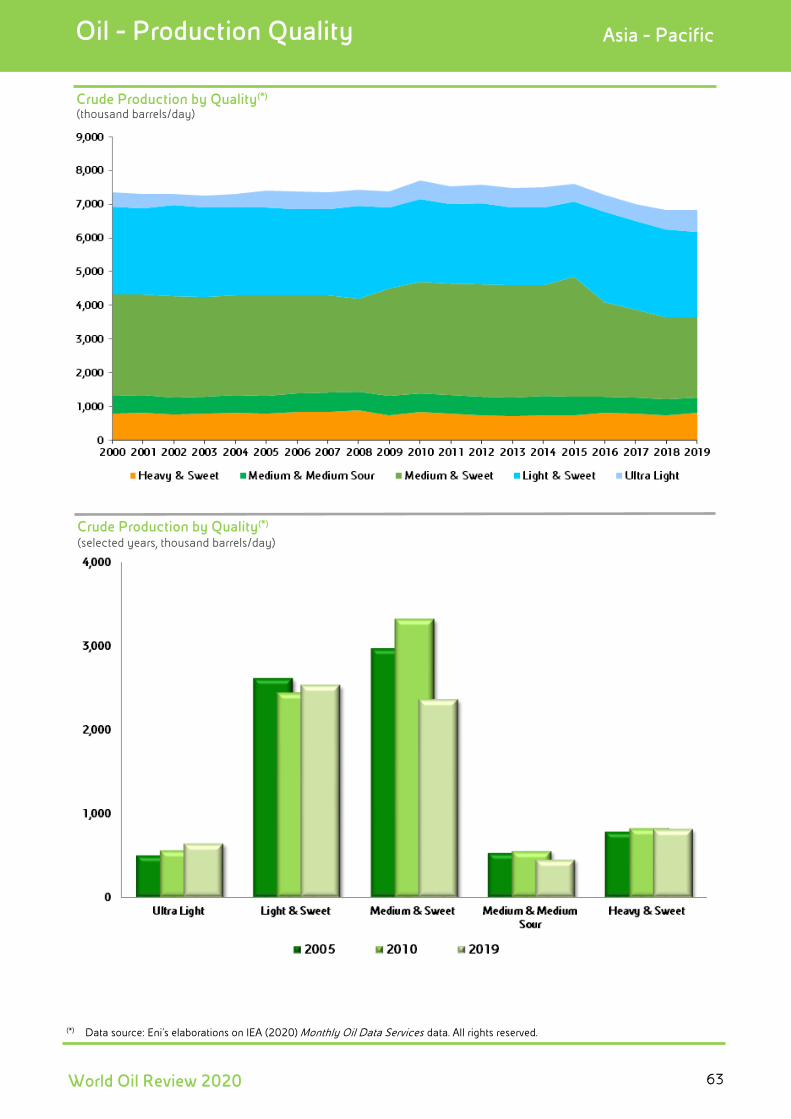
Oil - Production Quality Asia - Pacific
Crude Production by Quality(*)
(thousand barrels/day)
Crude Production by Quality(*) (selected years, thousand barrels/day)
(*) Data source: Eni’s elaborations on IEA (2020) Monthly Oil Data Services data. All rights reserved.
World Oil Review 2020 63
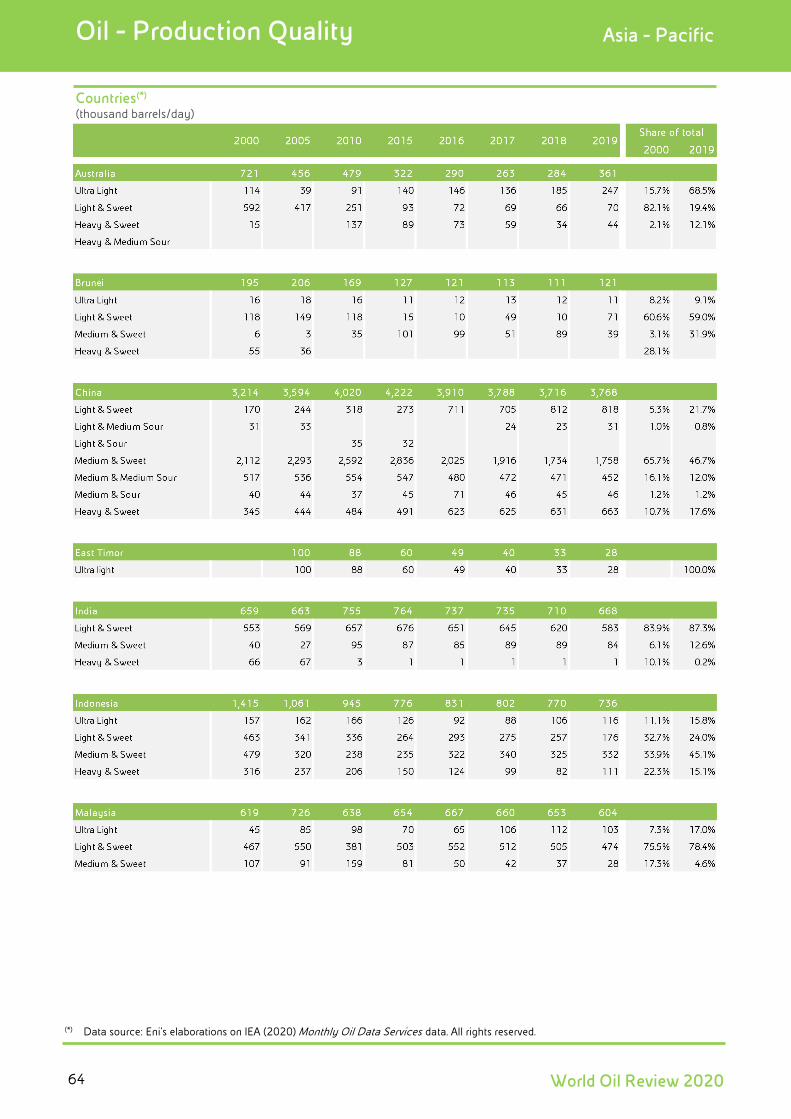
Oil - Production Quality Asia - Pacific
Countries(*) (thousand barrels/day)
(*) Data source: Eni’s elaborations on IEA (2020) Monthly Oil Data Services data. All rights reserved.
World Oil Review 202064
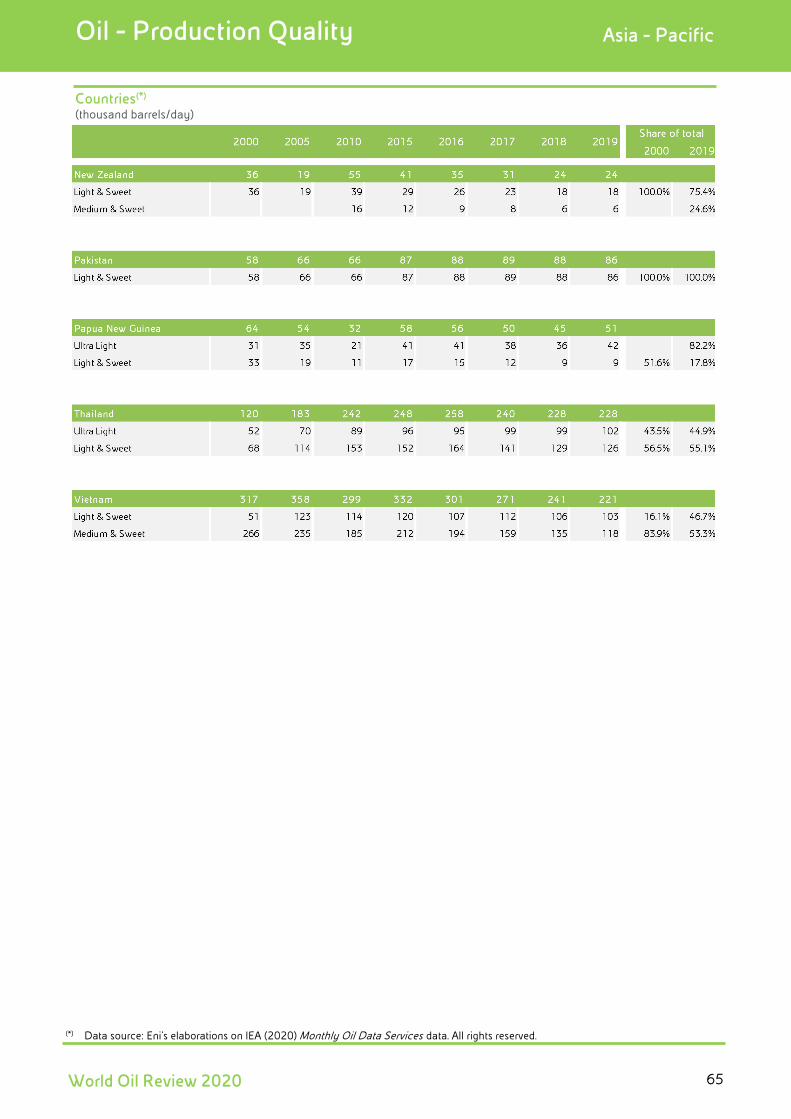
Oil - Production Quality Asia - Pacific
Countries(*) (thousand barrels/day)
(*) Data source: Eni’s elaborations on IEA (2020) Monthly Oil Data Services data. All rights reserved.
World Oil Review 2020 65
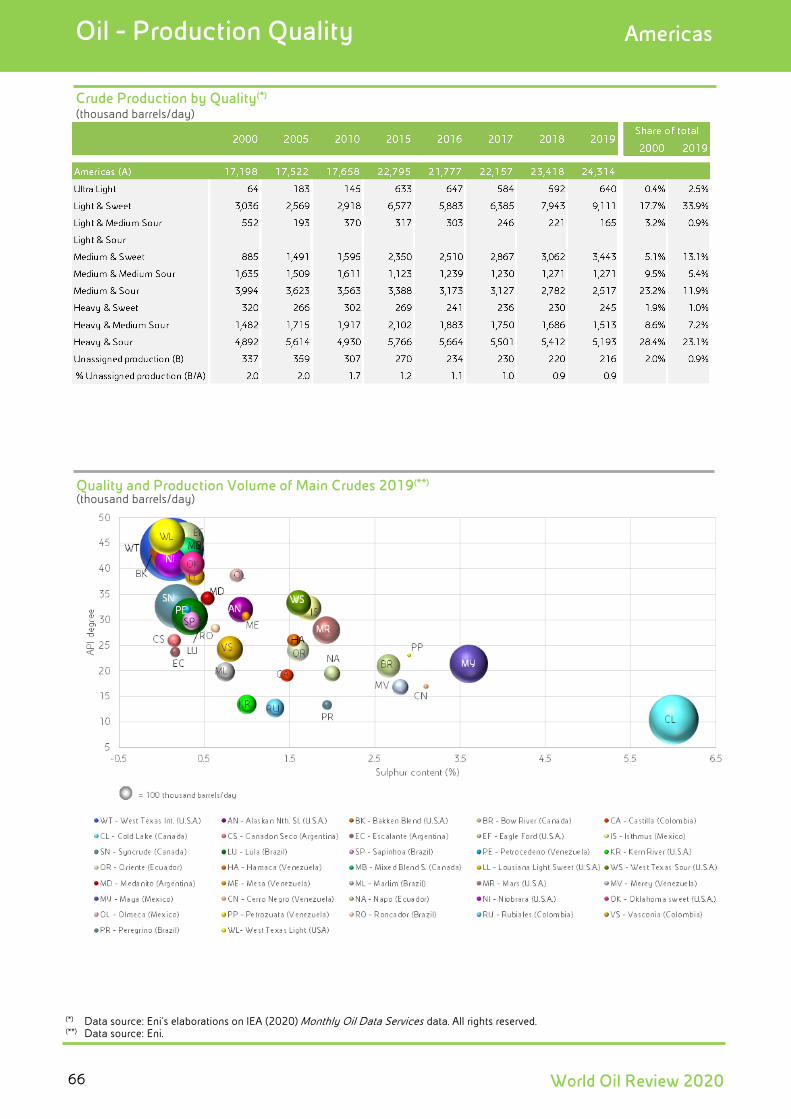
Oil - Production Quality Americas
Crude Production by Quality(*) (thousand barrels/day)
Quality and Production Volume of Main Crudes 2019(**)
(thousand barrels/day)
(*) Data source: Eni’s elaborations on IEA (2020) Monthly Oil Data Services data. All rights reserved. (**) Data source: Eni.
World Oil Review 202066
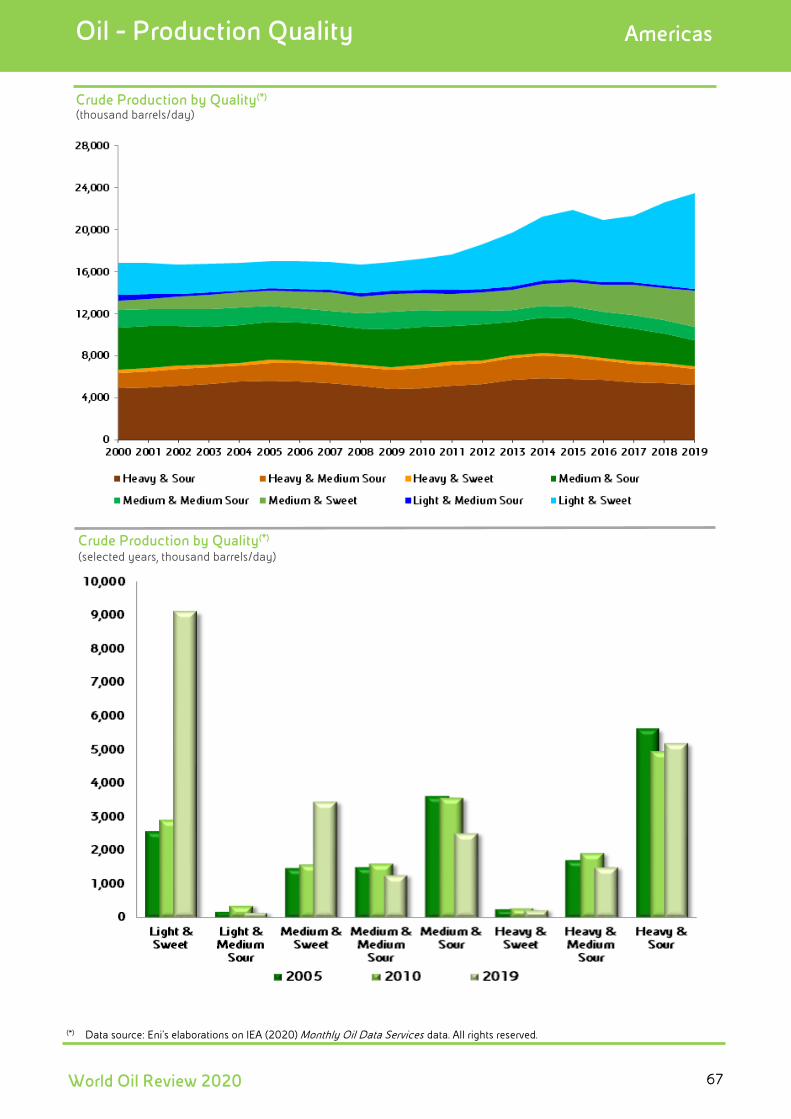
Oil - Production Quality Americas
Crude Production by Quality(*)
(thousand barrels/day)
Crude Production by Quality(*) (selected years, thousand barrels/day)
(*) Data source: Eni’s elaborations on IEA (2020) Monthly Oil Data Services data. All rights reserved.
World Oil Review 2020 67
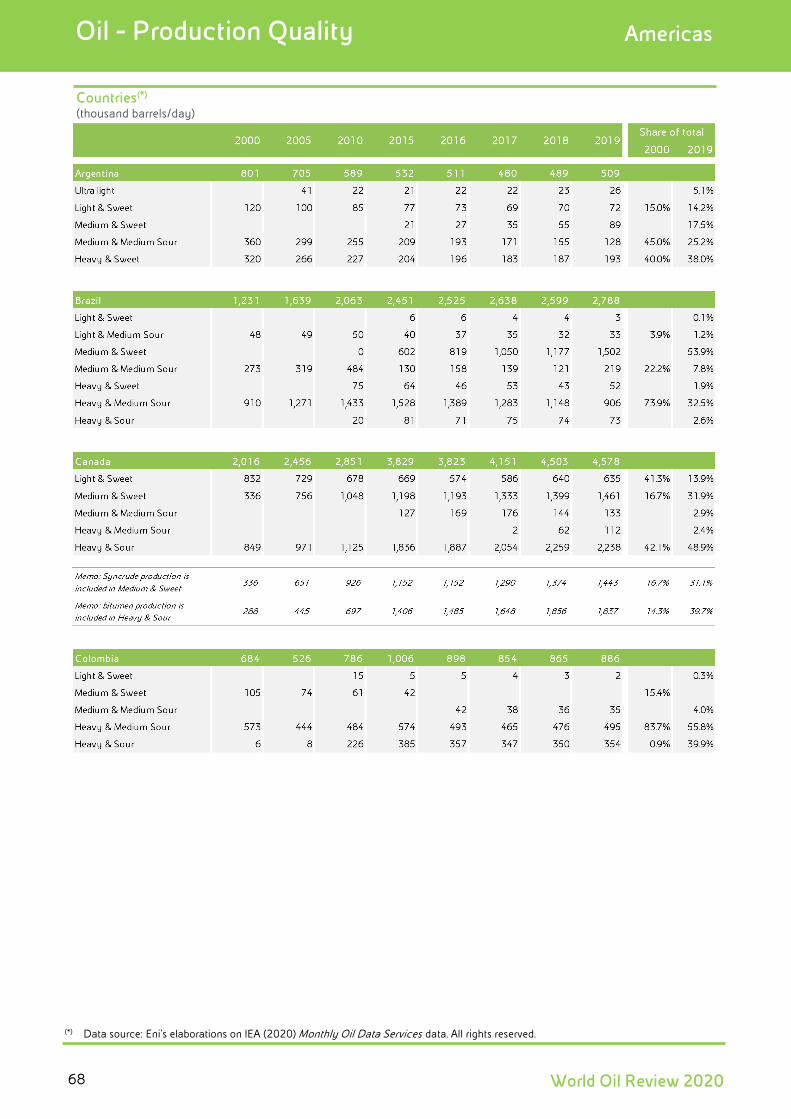
Oil - Production Quality Americas
Countries(*) (thousand barrels/day)
(*) Data source: Eni’s elaborations on IEA (2020) Monthly Oil Data Services data. All rights reserved.
World Oil Review 202068
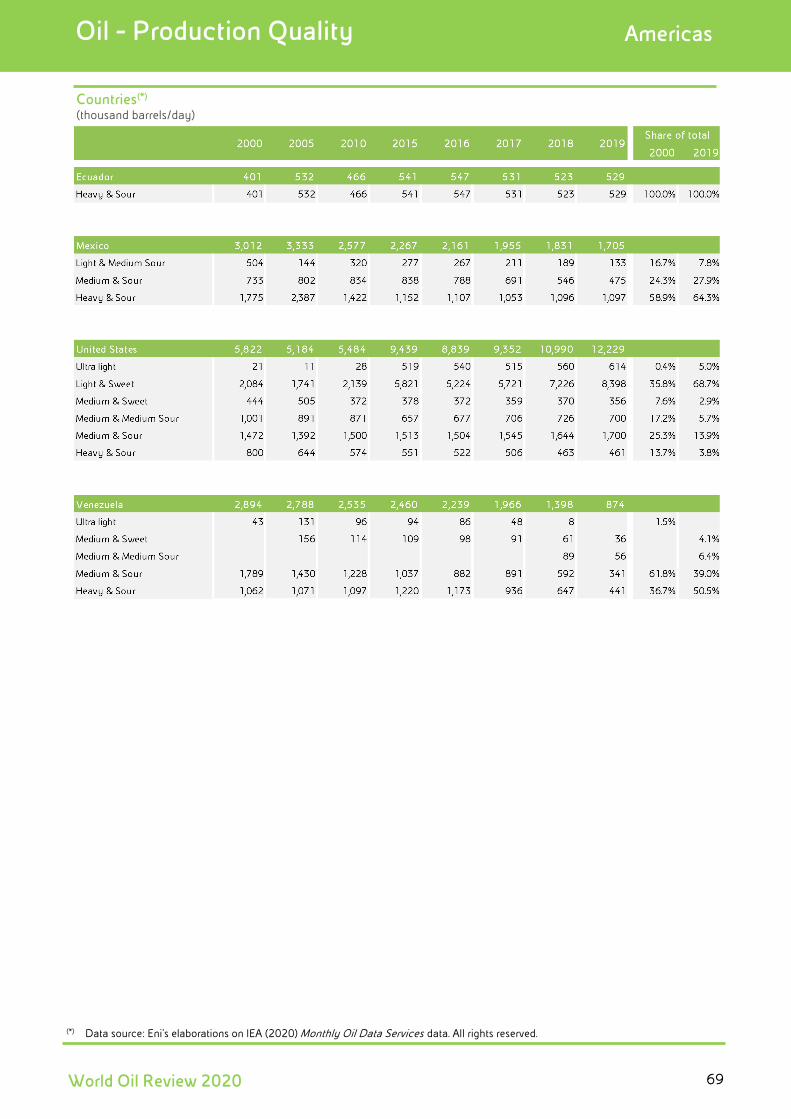
Oil - Production Quality Americas
Countries(*) (thousand barrels/day)
(*) Data source: Eni’s elaborations on IEA (2020) Monthly Oil Data Services data. All rights reserved.
World Oil Review 2020 69


World Oil Review 2020
Refining Capacity
Oil – Refining Industry
Oil - Refining Industy Refining Capacity
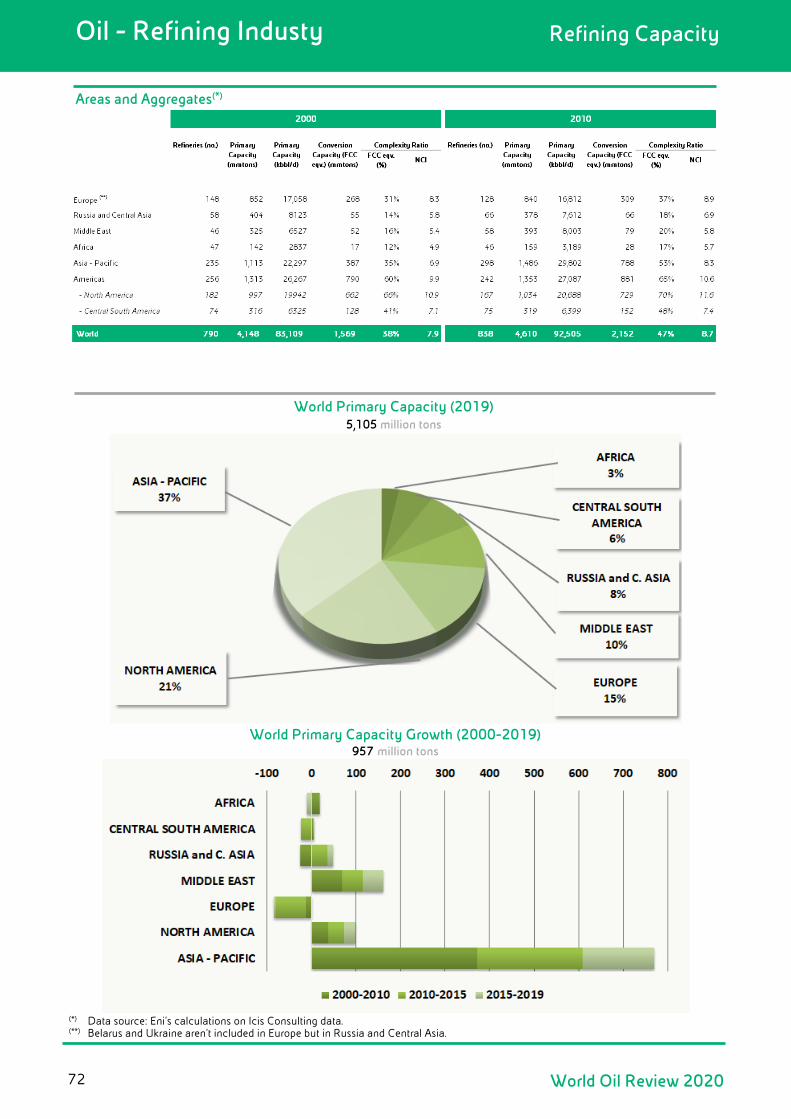
Areas and Aggregates(*)
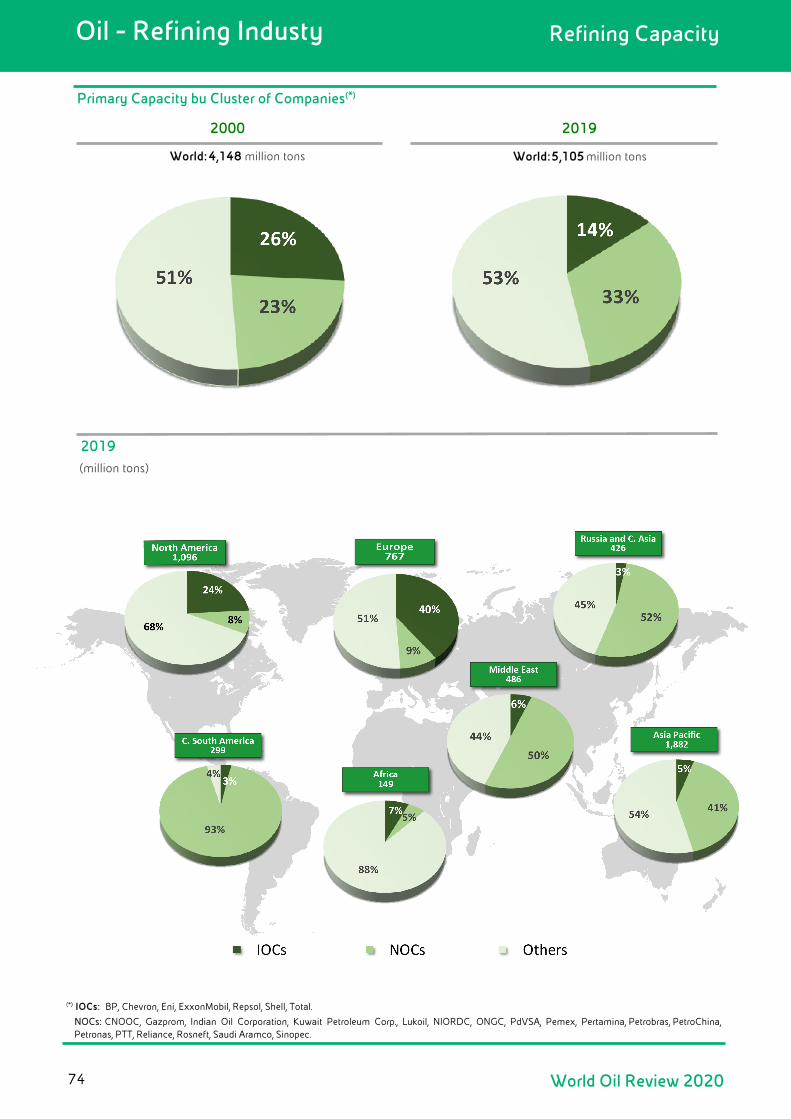
World Primary Capacity (2019) 5,105 million tons
World Primary Capacity Growth (2000-2019) 957 million tons
(*) Data source: Eni’s calculations on Icis Consulting data. (**) Belarus and Ukraine aren’t included in Europe but in Russia and Central Asia.
World Oil Review 202072
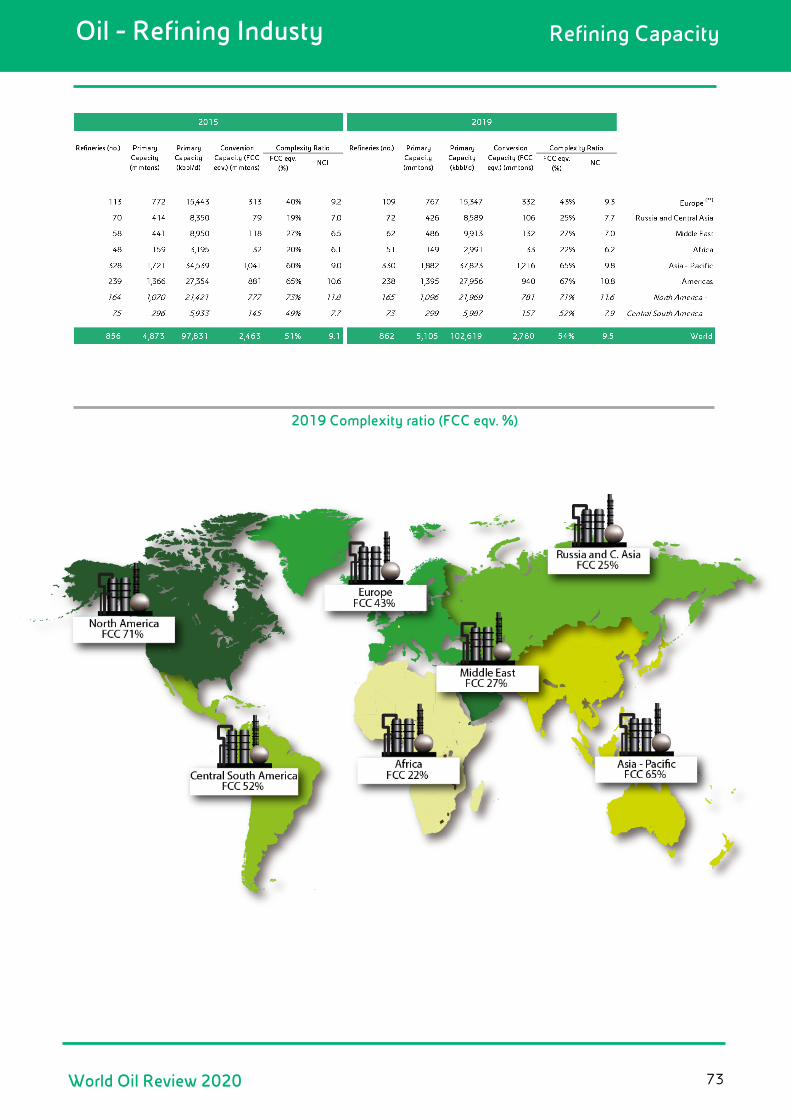
Oil - Refining Industy Refining Capacity
2019 Complexity ratio (FCC eqv. %)
World Oil Review 2020 73
Oil - Refining Industy Refining Capacity
Primary Capacity bu Cluster of Companies(*)
2019
World: 5,105 million tons
2000
World: 4,148 million tons
2019
(million tons)
(*) IOCs: BP, Chevron, Eni, ExxonMobil, Repsol, Shell, Total.
NOCs: CNOOC, Gazprom, Indian Oil Corporation, Kuwait Petroleum Corp., Lukoil, NIORDC, ONGC, PdVSA, Pemex, Pertamina, Petrobras, PetroChina, Petronas, PTT, Reliance, Rosneft, Saudi Aramco, Sinopec.
World Oil Review 202074
Eni SpA
Headquarters
Piazzale Enrico Mattei, 1 - Rome - Italy
Capital Stock: € 4,005,358,876.00 fully paid up
Rome Companies Register Tax Identification Number 00484960588
Branches
Via Emilia, 1 - San Donato Milanese (MI) - Italy
Piazza Ezio Vanoni, 1 - San Donato Milanese (MI) - Italy
Web site
eni.com
Produced by
Eni SpA
Page layout and supervision
Scenarios, Positioning and Medium – Long Term Plan Department
Cover PhotoHead Office Rome - P.le Enrico Mattei, 1
Eni SpAPiazzale Enrico Mattei, 100144 RomaPh. +39 0659821 - Fax +39 06 59822141
eni.com
volume 1World Oil Review 2020