World Film Market Trends / Tendances du Marché mondial du ...
68
Focus cus FOCUS World Film Market Trends / Tendances du Marché mondial du film 2020 Observatoire européen de l’audiovisuel European Audiovisual Observatory Europäische Audiovisuelle Informationsstelle
-
Upload
khangminh22 -
Category
Documents
-
view
1 -
download
0
Transcript of World Film Market Trends / Tendances du Marché mondial du ...
Focus
Focus
FOCUSWorld Film Market Trends / Tendances du Marché mondial du film
2020
Observatoire européen de l’audiovisuel European Audiovisual Observatory Europäische Audiovisuelle Informationsstelle
MDF_2020_COUV-PUBLICATIONS_OK2.indd 10MDF_2020_COUV-PUBLICATIONS_OK2.indd 10 20/05/2020 11:0320/05/2020 11:03

Observatoire européen de l’audiovisuel European Audiovisual Observatory Europäische Audiovisuelle Informationsstelle
How is Europe supporting its film industry through the COVID-19 pandemic?
We’re tracking support measures in the audiovisual sector!
Over 700
measures in
41 countries
DOWNLOAD YOUR FREE EXCEL TRACKER
Information products and services for the audiovisual sector www.obs.coe.int
Regular
up-dates!
https://bit.ly/2XqWLXu

focus 2020World Film Market TrendsTendances du marché mondial du film
2
The European Audiovisual Observatory, set up in 1992, is a public-service body whose mission is to supply information services (concerning film, televi-sion, home video, on demand audiovisual services as well as related public policies) to the audiovisual industry in Europe. The Observatory has 41 member countries, along with the European Union represent-ed by the European Commission. The Observatory is part of the Council of Europe and located in Stras-bourg, France. It carries out its mission with the help of a network of partners, correspondents and profes-sional organisations. The Observatory provides infor-mation on markets, financing and legal aspects of the audiovisual sector and edits the “FOCUS, World Film Market Trends”.
➥ http://www.obs.coe.int
Créé en 1992, l’Observatoire européen de l’audio-visuel est un organisme de service public qui a pour mission de proposer des services d’information au secteur audiovisuel en Europe (concernant le cinéma, la télévision, la vidéo, les services audiovisuels à la demande et les politiques publiques afférentes). Il compte actuellement 41 Etats membres, ainsi que l’Union européenne qui est représentée par la Com-mission européenne. L’Observatoire fait partie du Conseil de l’Europe et a son siège à Strasbourg en France. Pour accomplir sa mission, il s’appuie sur un réseau de partenaires, de correspondants et d’orga-nisations professionnelles. L’Observatoire propose des informations relatives aux différents marchés audio-visuels, au financement et aux aspects juridiques du secteur ; il édite aussi FOCUS, Tendances du marché mondial du film.
Editors Martin Kanzler ([email protected])Patrizia Simone ([email protected])Film Analysts, Department for Market Information, European Audiovisual Observatory
Lay-out: Acom* Media (Paris)© 2020, Marché du Film

3
FOCUS has existed as a publication for well over two decades now and I am very proud of our long term relationship with the European Audiovisual Observatory. In these difficult and changing times for the whole of the film industry, the Marché du Film is continuing to evolve, creating its first online edition in June 2020, and FOCUS remains more than ever an essential reference guide for pro-fessional attendees. Not only does it help grasp the changing practices of the film industry, but it also provides specific information on produc-tion and distribution around the world, as well as current information on the impact caused by Covid-19. Special thanks to Susanne Nikoltchev and her team, with whom we have worked to provide this invaluable insight into the world of film market trends.
Jérôme Paillard Executive Director Marché du Film
FOCUS existe en tant que publication depuis plus de deux décennies déjà et je suis très fier de notre si longue collaboration avec l’Observatoire européen de l’audiovisuel. En ces temps diffi-ciles et nouveaux pour toute l’industrie ciné-matographique, le Marché du Film continue d’évoluer en créant sa première édition en ligne en juin 2020, et FOCUS reste plus que jamais un guide de référence essentiel pour les profession-nels qui y participent. Non seulement il permet de comprendre les nouvelles pratiques de l’industrie cinématographique, mais il fournit également des informations spécifiques sur la production et la distribution à travers le monde, ainsi que des informations actuelles sur l’impact du Covid-19. Nous remercions tout particulièrement Susanne Nikoltchev et son équipe, avec qui nous avons travaillé pour fournir cet éclairage précieux sur les tendances du marché du film.
Jérôme Paillard Directeur Délégué Marché du Film
“It was the best of times, it was the worst of times” … This year’s FOCUS must surely tell A Tale of Two Cinemas. We look back at 2019 which, globally speaking, was an extremely positive year for the international cinema industry. Some coun-tries even broke previous attendance records in 2019. And this report documents the country-by-country successes of last year. Then came the pandemic with its catastrophic effect on global film production and distribution. We’ve tried to document the effects of COVID-19 where data was available but at the time of writing, we cannot yet paint a complete picture of this “worst of times”. A fuller analysis will be made by the European Audiovisual Observatory in the coming months. In the meantime an entire industry will rebuild itself within the rules of the ‘new normal’. And we’ll be there for you to report on its renaissance.
Susanne NikoltchevExecutive DirectorEuropean Audiovisual Observatory
« C’était le meilleur des temps, c’était le pire des temps » … Le FOCUS de cette année raconte sans aucun doute Le Conte de deux cinémas. Mais revenons sur l’année 2019 qui, globalement, a été une année extrêmement positive pour l’industrie cinématographique internationale. Certains pays ont même battu leurs précédents records de fréquen-tation en 2019. Ce rapport détaille les succès de l’année dernière, pays par pays. Puis est survenue la pandémie et ses effets catastrophiques sur la production et la distribution des œuvres ciné-matographiques mondiales. Nous avons essayé de documenter les effets du COVID-19 lorsque des données étaient disponibles, mais à l’heure où nous écrivons ces lignes, nous ne pouvons pas encore dresser un tableau exhaustif du « pire des temps ». Une analyse plus complète sera faite par l’Observatoire européen de l’audiovisuel dans les prochains mois. Dans l’intervalle, toute une industrie va se reconstruire dans les règles de la « nouvelle normalité ». Et nous serons là pour vous rendre compte de sa renaissance.
Susanne Nikoltchev Directrice exécutive Observatoire européen de l’audiovisuel
Editorial

4

5
focus 2020Introduction 7 World 11 Europe European Union 14France 22Germany 24Italy 26Spain 28United Kingdom 30Russian Federation 32Poland 34Turkey 35Other Western Europe 36Nordic Countries 38Baltics and Central Europe 40South-Eastern Europe 41 Americas North America 42Latin America 44 Australia and New Zealand 48 Asia China 50Japan 52India 54South Korea 56Other Asia 58 Africa 60 Middle East 62 Sources 64
Contents


7
Introduction
Revenue impacts of the crisis on the film industry
While it is too early to assess the financial impact of the COVID-19 crisis along the value chain of the European film industries, one can venture some educated guesses. Cinema admissions, on the one hand, and TV advertising on the other are likely to be the segments most affected, at least in the short term. Pay-services are probably more resilient to the crisis but may see revenues shift from Pay-TV to Subscription Video-On-Demand (SVOD) providers which stand to benefit from the lockdown as well as social distancing measures.
Evidently, the theatrical sector - exhibitors and distributors - has been hit hardest and in the most abrupt manner due to cinema closures in practically all European markets from mid-March onwards. According to figures collected for selected EU markets by the International Union of Cinemas (UNIC) box office figures from January to May 2020 have declined on average by over 50% compared to the previous year and it remains to be seen to what extent audiences will come back to cinemas in the remaining months of the year. It seems reasonable to expect that social distancing, the lack of consumer confidence and strain on disposable income may adversely impact ticket sales in the months and years to come and
it may take a long time for box office takings to climb back to levels achieved in 2019.
Advertising expenditure is correlated to the general economic climate. The 2008 crisis has shown that a recession of the gross domestic product causes a decrease in advertising expen-diture which is proportionally double in size. The boost of TV audiences is therefore unlikely to produce more TV advertising revenues – and, anyway, early figures seem to indicate that TV audi-ences rapidly come back to their pre COVID-19 levels once the lockdown is over. It remains to be seen whether the COVID-19 crisis will trans-late into a loss of advertising market share for broadcasters to the benefit of Internet with the corresponding revenues consequently being lost for the audiovisual sector, as the bulk of adver-tising goes to Google and Facebook which – in contrast to broadcasters – are not (at least not yet) investing in films or audiovisual content, in particular high-end series.
Linear pay-television is likely to have shown some resilience during the confinement: con-sumers are often bound by one-year-contracts; pay-services are often bundled with Internet access services. However, pay-TV providers have had to discount their services as sport competitions were suspended. SVOD revenues were already growing fast before the crisis, and the growth
This edition of FOCUS comes in troubled times for the film industry. As of June 2020, cinemas have just initiated a reopening process or are preparing for it under heavy constraints, one of the many reasons why assessing the impact of the COVID-19 crisis on the film industry is premature. Still, some early hypotheses can be explored. The Observatory believes that, as far as audiovisual content is concerned, European theatrical film production and distribution are likely to be the sectors proportionally hit hardest and most profoundly by the crisis. The immediate impact is direct and short-term because all theatrical film distribution as well as film and TV production having come to a sudden stop threatening the existence of thousands of businesses as well as causing mass unemployment among film professionals. The more indirect and mid-term consequences can be seen in the cascading effects of the current loss of box office revenues due to cinema closures putting further pressure on film financing as well as in the accelerated shift towards TV content instead of film.
Covid-19: cascading effects pushing independent film production and distribution towards a prolonged crisis?

8
Introduction
Breakdown of cumulative financing volume by financing source | 2017Sample analysis based on 576 European fiction films released in 2017 with a cumulative investment volume of EUR 1.85 billlon.
Sample analysis based on 391 European fiction films (excl. French films) released in 2017 with a cumulative investment volume of EUR 883 million.
Direct public funding26%
Broadcaster investments24%
Producer investments (exc. TV)18%
Production incentives12%
Pre-sales (excl. TV)15%
Privateequity
2%
Debtfinan-cing1%
Otherfinancingsources
1%
In-kindinvest-ments
1%
Direct public funding36%
Broadcasterinvestments
11%
Producer investments (exc. TV)18% Production
incentives11%
Pre-sales (excl. TV)14%
Private equity5%
Debt financing3%
Otherfinancingsources
1%
In-kindinvest-ments
1%
Source: OBS
Source: OBS

9
may even accelerate as many new consumers have made use of trial subscriptions during the lockdown. The ability to offer content at com-paratively lower prices might also play into the hands of SVOD providers as economies could slide into a recession with severe economic and social implications affecting disposable income. SVOD / TVOD services also benefitted from the fact that some US studios as well as other distrib-utors used the cinema lockdown to experiment with direct to VOD releases. This raised ques-tions about the US studios’ intentions to bypass the theatrical window in a more systematic way, even in a post-COVID-19 world.
Just like the theatrical exhibition and distribu-tion sector, the European production sector came to a complete standstill in Europe in March, with production set to restart under strict security mea-sures in many countries from late May onwards. The production halt is expected to have a severe economic and social impact on the European film industry which is dominated by thousands of small and medium sized enterprises and mil-lions of freelancers which may not be able to absorb the immediate financial impact and risk bankruptcy. The current lag in productions is fur-thermore expected to cause a lack of work for the post-production sector in a couple of months. The COVID-19 crisis might also result in increasing production costs e.g. due to security measures at a time when financing is under pressure. Further down the road, a lack of content, particularly for streaming services and broadcasters, could lead not only to a production boom when filming resumes but also accelerate the shift from film to TV productions, particularly high-end series.
Mid-term impacts on film financing
In Europe all segments of the audiovisual sector contribute directly or indirectly to film financing, creating a complicated film financing ecosystem. A systematic review of how each of them will be affected and how each will cope with the crisis will therefore be needed to better understand
the potential long-term effects of the COVID-19 crisis on European film productions.
The analysis of European film financing plans by the European Audiovisual Observatory (1) shows that direct public funding, broadcasters’ investments and pre-sales (including distributors’ minimum guarantees) are the most important financing sources cumulatively accounting for about 65% of film financing.
The financing mix of course varies between countries, with, in particular, a specific situation for France: on the one hand, a higher share of broadcasters’ investments and, on the other, a lower share of direct public funding. Another specificity of France is the high proportion of taxes and levies in the funding of its public sup-port system. (2)
Given that public funding and pre-sales to broadcasters as well as to sales agents or distribu-tors are closely linked to actual or expected box office results, all three major financing sources could come under significant pressure in the months and years to come as theatrical revenues will plummet this year and may even in the mid-term not reach pre COVID-19 levels. The funding of Public Service Broadcasters and of film funds could shrink due to lower income from taxes and levies as well as due to austerity measures addressing post-COVID economic crises, pre-sales could be valued at lower prices and broadcasters, particu-larly public broadcasters would not only have less money earmarked for production investment, but might furthermore increasingly shift their produc-tion focus further towards “audiovisual content”. In this scenario, the traditional main financiers of European theatrical film production would leave a financing gap.
Could SVOD revenues offset the losses from other financing sources? According to the above-mentioned research on film financing, SVOD ser-vices play – from a big picture point of view – a limited role in the financing of films. Figures are from 2017 and have certainly evolved. But, whereas SVOD is a significant new source of financing and revenues for a limited number of films, rough estimates suggest that it is unlikely that the total investments in films from SVOD
Introduction
(1) Fiction film financing in Europe: A sample analysis of films released in 2017
(2) Public financing for film and television content - The state of soft money in Europe

10
services could offset a long-lasting decrease in broadcaster investments and box-office revenues. Should the COVID-19 crisis translate into an accel-erated switch from traditional pay-TV players to SVOD platforms, the corresponding revenues could in principle still benefit the production of films, provided that the leading platforms actu-ally do invest in film production. However, even in this scenario the investment capacities of the pay-service sector may be lower than they used to be, as SVOD subscriptions are less expensive than pay-TV services and cumulative consumer expenditure on pay-services (Pay-TV and SVOD) is likely to decrease. Furthermore, there is no indi-cation that SVOD services would follow the same pattern as broadcasters regarding the balancing of their investments between film and TV con-tent; nor indeed that SVOD investments in films would be spread over many films rather than con-centrated on a limited number of film projects.
These developments could have severe mid to long-term effects on the European film pro-duction sector as financing theatrical films will become even more difficult, likely confronting producers with the need to cut budgets (thus low-ering the competitiveness of European films due to lower production values), to invest more (i.e. to increase the risk) as pre-financing will decrease at a time when box-office revenues needed to recoup their investments will not have returned to their pre-crisis levels.
The COVID-19 crisis could hence accelerate and amplify trends already at work in the film industry: increasing difficulty to finance films due to pressure on advertising revenues and stag-nating resources of film funds; pre-sales mostly available for high-budget films; box-office reve-nues concentrated around a limited number of films. At the heart of this potential development lies the increasing fragility of cinemas, and in particular art-house establishments, caused by the COVID-19 crisis. As regards audiovisual con-tent, films are therefore likely to be particularly
affected: directly, because cinemas are among the most impacted segments; indirectly, because audiovisual services that could be reinforced by the crisis may indeed focus more on TV content than on films. As a consequence, theatrical film production levels would be forced to drop put-ting independent film production and cultural diversity at risk.
These threats and the need for public sup-port targeting the film and audiovisual sectors have been rapidly identified and governments, film funds and the EU have been quick in setting up short term general support measures ranging from solidarity funds or short-term unemployment schemes as well as sector specific support mea-sures, ranging from emergency funding, advancing support payments and relaxing requirements and deadlines. At the time of writing over 650 COVID-19 sector related support measures have been tracked by the Observatory across Europe. (3) In addition several countries have already set up industry-wide task forces to define strategies to support the European film industries and its cul-tural diversity in the mid- to long term.
Gilles Fontaine Head of the Market Information Department
Martin KanzlerFilm Analyst
Patrizia SimoneFilm Analyst
(3) https://www.obs.coe.int/en/web/observatoire/covid-19-audiovisual-sector-measures

11
World
Top 10 markets worldwide by gross box office | 2015-2019 e
In USD billion. Converted at average annual exchange rates. Ranked by 2019 values.
Top 10 markets worldwide by admissions | 2015-2019 e
In million. Ranked by 2019 admissions.
Sources: OBS, MPA, Comscore, Omdia, National data sources
Sources: OBS, Omdia, National data sources
Rank Market 2015 2016 2017 2018
2019Annual growth rate
5 years 1 year1 US & Canada 11.14 11.37 11.12 11.88 11.38 0.5% -4.3%2 China 6.81 6.60 8.27 9.24 9.30 8.1% 0.7%3 Japan 1.80 2.17 2.04 2.02 2.40 7.4% 18.9%4 South Korea 1.37 1.50 1.55 1.65 1.64 4.6% -0.5%5 France 1.48 1.54 1.56 1.58 1.62 2.3% 2.7%6 United Kingdom 1.90 1.66 1.65 1.71 1.60 -4.3% -6.7%7 India 1.60 1.49 1.48 1.50 1.60 0.0% 6.7%8 Germany 1.29 1.13 1.19 1.06 1.15 -2.9% 7.9%9 Mexico 0.84 0.79 0.85 0.85 0.97 3.5% 14.2%
10 Russian Federation 1.15 0.73 0.91 0.81 0.86 -7.1% 5.3%
World total e 39.1 39.3 40.9 41.8 42.2 1.9% 1.0%
Growth rate - World 7.4% 0.5% 4.1% 2.2% 1.0% 1.9% 1.0%Growth rate - Top 10 14.2% -1.4% 5.7% 5.4% 0.7% 2.6% 0.7%Growth rate - Top 10without China 8.0% -0.9% -0.1% 3.1% 0.6% 0.7% 0.6%
Rank Market 2015 2016 2017 2018 2019Annual growth rate e
5 years 1 year1 China 1 260 1 370 1 620 1 720 1 727 8.2% 0.4%2 India e 2 073 1 860 1 429 1 463 1 561 -6.8% 6.7%3 US & Canada 1 321 1 315 1 240 1 304 1 242 -1.5% -4.8%4 Mexico 286 321 338 320 342 4.6% 6.9%5 South Korea 217 217 220 216 227 1.1% 4.8%6 Russian Federation 174 193 212 200 219 6.0% 9.5%7 France 205 213 209 201 213 0.9% 5.9%8 Japan 167 180 174 169 195 4.0% 15.2%9 Brazil 173 184 181 163 176 0.5% 8.2%
10 United Kingdom 172 168 171 177 176 0.6% -0.5%
World total e 7 498 7 560 7 347 7 482 7 644 0.5% 2.2%
Growth rate - World e 12.4% 0.8% -2.8% 1.8% 2.2% 0.5% 2.2%Growth rate - Top 10 e 13.1% -0.4% -3.8% 2.4% 2.4% 0.1% 2.4%Growth rate - Top 10 e
without China 5.9% -2.8% -10.3% 1.0% 3.2% -2.4% 3.2%

12
World
(1) Restated series. Refers to digital and e-cinema screens.
Worldwide number of digital and 3D screens | 2015-2019 e
In units.
0
200 000
50 000
100 000
150 000
2015 2016 2017 2018 2019 Digital screensby region 2019
2D3D 14 986
97 518
44 167
44 283
66 489
74 561
141 050
155 069
67 893
87 176
169 274
69 635
99 639
182 019
76 823
105 196
195 282
79 185
116 097
Source: MPA
Top 10 markets worldwide by number of screens | 2015-2019 e
In units. Ranked by 2019 values.
Sources: OBS, MPA, Omdia
Latin America
Europe/Middle East/Africa
Asia Pacific
US/CA
Rank Market 2015 2016 2017 2018 2019Annual growth rate e
5 years 1 year1 China 31 627 41 179 50 776 60 079 69 787 21.9% 16.2%2 US & Canada 43 661 43 531 43 500 43 459 44 283 0.4% 1.9%3 India (1) 9 500 9 481 9 530 9 601 9 527 0.1% -0.8%4 Mexico 5 977 6 225 6 633 7 024 7 493 5.8% 6.7%5 France 5 741 5 842 5 913 5 983 6 114 1.6% 2.2%6 Russia 3 994 4 376 4 805 5 341 5 597 8.8% 4.8%7 Italy 5 053 5 104 5 315 5 205 5 385 1.6% 3.5%8 Germany 4 692 4 739 4 803 4 849 4 961 1.4% 2.3%9 UK 4 046 4 150 4 264 4 340 4 395 2.1% 1.3%
10 Spain 3 588 3 554 3 618 3 589 3 695 0.7% 3.0%
World total e 152 142 163 928 171 755 186 859 200 954 7.1% 7.5%
Growth rate - World e 7.0% 7.7% 4.8% 8.8% 7.5% 7.1% 7.5%Growth rate - Top 10 e 5.8% 8.7% 8.6% 7.4% 7.9% 8.1% 7.9%Growth rate - Top 10 e
(without China and India) 1.4% 1.0% 1.7% 1.2% 2.7% 1.6% 2.7%

13
World
(1) Still grossing in 2020.
(2) Unofficial cumulated BO.
(1) Country data include minority co-productions.
(2) Films certified.
(3) Does not include films produced outside the official system of script and final print approval.
(4) Includes films that were made for or by an online video service; does not include student films, documentaries, films created for straight-to-DVD or Blue-ray release.
(5) Feature films released.
Top 20 films by gross box office worldwide | 2019In USD million. GBO for 2019 only. Does not include carryovers.
Sources: Variety, Comscore, OBS
Top 10 markets worldwide by feature film production (1) | 2015-2019 e
In units. Ranked by 2019 values.
Sources: OBS, Omdia, National data sources
Original titleCountry of origin Studio
North American box office
Inter-national
box office
Global box
office1 Avengers: Endgame US Walt Disney 858.37 1 939.56 2 797.932 The Lion King US/GB Walt Disney 543.64 1 113.42 1 657.063 Frozen 2 (1) US Walt Disney 430.14 815.60 1 245.744 Spider-Man: Far From Home US Sony Pictures 390.53 741.46 1 131.995 Captain Marvel US Walt Disney 426.83 702.88 1 129.716 Toy Story 4 US Walt Disney 434.04 640.07 1 074.117 Joker (1) US Warner Bros. 333.77 732.48 1 066.258 Aladdin US Walt Disney 355.56 695.46 1 051.029 Star Wars: Episode IX - The Rise of… (1) US Walt Disney 390.71 396.30 787.01
10 Fast & Furious Presents: Hobbs & Shaw US/JP Universal 173.96 586.62 760.5811 Ne Zha (1)(2) CN Coco Cartoon 3.70 724.18 727.8812 The Wandering Earth (2) CN CFGC 4.96 684.17 689.1313 How to Train Your Dragon: The Hidden… US/JP Universal 160.80 361.25 522.0514 Jumanji: The Next Level (1) US Sony Pictures 192.09 321.18 513.2815 Maleficent: Mistress of Evil (1) US/GB/CA Walt Disney 113.29 377.91 491.2016 It Chapter Two US/CA Warner Bros. 211.59 261.36 472.9517 The Secret Life of Pets 2 US/FR/JP Universal 157.95 275.64 433.5918 Pokémon Detective Pikachu US/JP Warner Bros. 144.11 288.90 433.0119 My People, My Country (1)(2) CN Bona Film/Alibaba 2.36 412.74 415.1020 The Captain (1)(2) CN Bona Film/Alibaba 0.71 404.34 405.05
Rank Market 2015 2016 2017 2018 2019Annual growth rate 5 years 1 year
1 India (2) 1 845 1 903 1 986 1 813 2 446 7.3% 34.9%2 China (3) 686 944 970 1 082 1 037 10.9% -4.2%3 US (4) 732 788 812 808 814 2.7% 0.7%4 Japan (5) 581 610 594 613 689 4.4% 12.4%5 South Korea (5) 232 339 494 454 502 21.3% 10.6%6 Italy 185 224 235 273 325 15.1% 19.0%7 France 300 283 300 300 301 0.1% 0.3%8 Germany (5) 236 256 247 247 265 2.9% 7.3%9 Argentina 185 200 220 238 265 9.4% 11.3%
10 Spain (2) 254 254 279 264 263 0.9% -0.4%
World total e 7 648 7 893 8 026 7 895 8 652 3.1% 9.6%
Growth rate - World e 2.6% 3.2% 1.7% -1.6% 9.6% 3.1% 9.6%Growth rate - Top 10 e 0.1% 10.8% 5.8% -0.7% 13.4% 7.2% 13.4%Growth rate - Top 10 e
(without China and India) 2.3% 9.2% 7.7% 0.5% 7.1% 6.1% 7.1%

14
European Union
EU admissions topped 1 billion in 2019
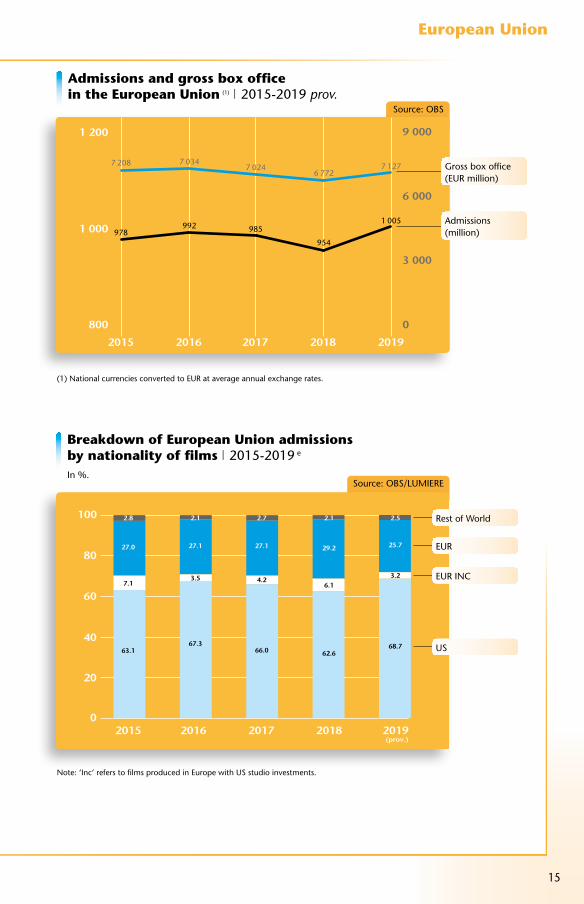
The European Audiovisual Observatory estimates that in 2019 cinema attendance in the 28 European Union Member States jumped by 5.3% to over one billion tickets sold. This is 51 million admissions more than in 2018 and the best result registered in the EU since 2004. Gross box office earnings also bounced back after falling below EUR 7 bil-lion in 2018 growing by 5.2% to EUR 7.13 billion (USD 7.89 billion).The surge in EU admissions was almost entirely driven by the comparatively strong performance of US blockbusters as admissions to European films and European films produced in Europe with incoming US investment (EUR inc) actually declined. The estimated market share for US films therefore increased from 62.6% to 68.7%, the highest level observed since 2013, while the market share for European films in the EU decreased from 29.2% to 25.7%, the lowest level since 2005.
A very strong 2019 will be followed by a catas-trophic 2020 which will see admissions plum-meting as cinemas were closed all across Europe in March due to the COVID-19 pandemic. Some countries started to reopen cinemas by the end of May while they remain closed in many mar-kets until at least mid-June. According to figures collected for selected EU markets by UNIC box office figures from January to May 2020 declined
Information on the number of European digital screens is provided by MEDIA Salles and refers only to digital screens equipped with DLP Cinema or SXRD technology. MEDIA Salles operates in the framework of the EU’s Creative Europe MEDIA sub-programme and supports the promotion of European films through information and training specifically for cinema exhibitors.
Complementary admissions data to top European films are provided by Europa Cinemas, the first international network of cinemas for the circulation of European films with members in 34 MEDIA countries, 685 cities, 1 134 cinemas and 2 761 screens.
Information on the impacts of the COVID-19 crisis on the European exhibition sector have been tracked by UNIC, i.e. the Union Internationale des Cinémas/International Union of Cinemas is the European grouping of cinema trade associations and key operators, covering 38 territories across the region.
on average between 50% and 60% compared to the previous year and it remains to be seen to which extent audiences will come back to cinemas in the remaining months of the year.
EU production reached record highEU film production volume continued its long-
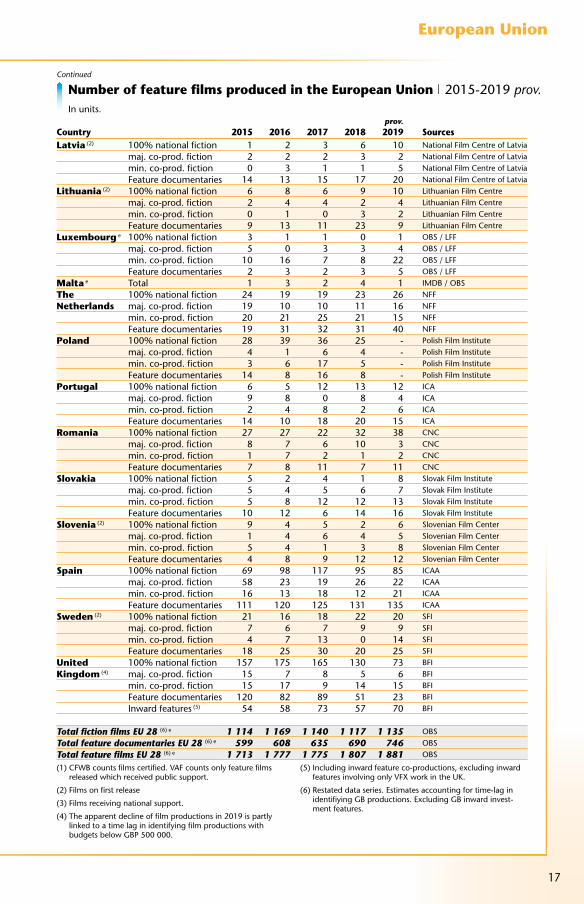
standing growth trend as the estimated number of theatrical feature films produced in the EU increased from 1 807 to 1 881 films, breaking down into an estimated 1 135 fiction films (60%) and 746 fea-ture documentaries (40%). The increase in produc-tion activity continued to be driven by a growing number of international co-productions and fea-ture documentaries.
It is expected that the film production industry could be the market segment to be hit hardest the COVID-19 crisis. In the short term produc-tion activity came to a complete standstill due to the lock-down measures taken all over Europe from March onwards. In the mid-term film pro-duction stands to suffer from cascading effects of lost box office revenues further aggravating film financing. In order to mitigate the impacts of the crisis, European film agencies and governments across Europe have been implementing a variety of support measures, ranging from emergency funding, advancing support payments to relaxing requirements and deadlines.
Source: European Audiovisual Observatory (OBS)
Population 2019 e 513.5 millionGDP per capita 2019 e 38 294 USDGross box office 2019 e 7.13 bn EUR (7.98 bn USD)Admissions 2019 e 1.0 billionAverage ticket price 2019 e 7.1 EUR (7.9 USD)Average admissions per capita 2019 e 2.0Screens 2018 | 2019 33 255 | 33 956Digital screens 2018 | 2019 31 268 | 31 717Digital 3D screens 2018 | 2019 14 580 | 14 592
Market shares 2019 e
US68.7%
Others2.5%
European films25.7%
EUR inc/US3.2%
Please note that all 2019 figures for the EU are provisional estimates. “Inc” refers to films produced in a “host” country with US studio incoming investment.
15
European Union
Admissions and gross box office in the European Union (1) | 2015-2019 prov.
800
1 200
1 000
2015 2016 2017 2018 2019
0
9 000
6 000
3 000
7 208
978992
7 034
985
7 024
954
6 772
1 005
7 127
Source: OBS
Breakdown of European Union admissions by nationality of films | 2015-2019 e
In %.
0
100
80
60
40
20
2015 2016 2017 2018 2019(prov.)
27.0
7.1
63.1
2.8 2.1
27.1
3.5
67.3
2.7
27.1
4.2
66.0
2.1
29.2
6.1
62.6
2.5
25.7
3.2
68.7
Source: OBS/LUMIERE
Rest of World
EUR
EUR INC
US
Admissions (million)
Gross box office (EUR million)
(1) National currencies converted to EUR at average annual exchange rates.
Note: ‘Inc’ refers to films produced in Europe with US studio investments.

16
European Union
Number of feature films produced in the European Union | 2015-2019 prov.In units.
prov.Country 2015 2016 2017 2018 2019 SourcesAustria 100% national fiction 15 13 9 12 14 Austrian Film Institute
maj. co-prod. fiction 1 3 6 5 1 Austrian Film Institute
min. co-prod. fiction 7 7 9 9 3 Austrian Film Institute
Feature documentaries 17 23 20 25 26 Austrian Film Institute
Belgium (1) 100% national fiction 14 16 14 14 9 CFWB / VAF
maj. co-prod. fiction 16 21 22 13 19 CFWB / VAF
min. co-prod. fiction 34 28 38 31 28 CFWB / VAF
Feature documentaries 9 17 15 17 14 CFWB / VAF
Bulgaria 100% national fiction 10 18 10 5 9 National Film Center
maj. co-prod. fiction 2 6 4 1 2 National Film Center
min. co-prod. fiction 5 7 5 5 1 National Film Center
Feature documentaries 8 11 4 10 12 National Film Center
Cyprus (2) e 100 % national fiction 1 3 2 2 1 OBS/MOECSY
maj. co-prod. Fiction 0 0 0 2 0 OBS/MOECSY
min. co-prod. Fiction 0 0 0 0 1 OBS/MOECSY
Feature documentaries 1 0 1 0 0 OBS/MOECSY
Croatia 100% national fiction 5 6 6 10 6 Croatian Audiovisual Centre
maj. co-prod. fiction 4 4 2 4 6 Croatian Audiovisual Centre
min. co-prod. fiction 5 6 9 8 15 Croatian Audiovisual Centre
Feature documentaries 1 1 16 14 13 Croatian Audiovisual Centre
Czech Rep. 100% national fiction 20 24 16 23 21 Czech FIlm Fund
maj. co-prod. fiction 7 17 8 13 16 Czech FIlm Fund
min. co-prod. fiction 9 7 5 11 12 Czech FIlm Fund
Feature documentaries 20 31 25 30 39 Czech FIlm Fund
Denmark (2) 100% national fiction 14 15 13 13 11 Danish Film Institute
maj. co-prod. fiction 9 8 8 9 8 Danish Film Institute
min. co-prod. fiction 8 8 9 10 9 Danish Film Institute
Feature documentaries 40 31 24 26 28 Danish Film Institute
Estonia (2) 100% national fiction 1 7 3 6 9 Estonian Film Institute
maj. co-prod. fiction 3 2 4 1 3 Estonian Film Institute
min. co-prod. fiction 2 3 5 3 2 Estonian Film Institute
Feature documentaries 19 8 7 11 13 Estonian Film Institute
Finland (3) 100% national fiction 14 16 20 18 17 Finnish Film Foundation
maj. co-prod. fiction 5 3 2 0 2 Finnish Film Foundation
min. co-prod. fiction 2 5 2 7 4 Finnish Film Foundation
Feature documentaries 24 22 18 24 23 Finnish Film Foundation
France 100% national fiction 126 125 147 140 138 CNC
maj. co-prod. fiction 66 55 38 48 46 CNC
min. co-prod. fiction 61 59 72 56 52 CNC
Feature documentaries 47 44 43 56 65 CNC
Germany (2) 100% national fiction 76 82 80 78 96 SPIO
maj. co-prod. fiction 24 41 27 35 38 SPIO
min. co-prod. fiction 45 43 34 40 23 SPIO
Feature documentaries 91 90 106 94 108 SPIO
Greece (2) e 100% national fiction 14 6 11 9 12 GFC / OBS
maj. co-prod. fiction 1 5 3 2 5 GFC / OBS
min. co-prod. fiction 7 10 6 3 4 GFC / OBS
Feature documentaries 8 6 6 6 9 GFC / OBS
Hungary 100% national fiction 13 15 12 15 - National Film Office (NMHH)
maj. co-prod. fiction 2 3 2 2 - National Film Office (NMHH)
min. co-prod. fiction 3 1 2 1 - National Film Office (NMHH)
Feature documentaries 3 1 3 0 - National Film Office (NMHH)
Ireland 100% national fiction 4 6 2 3 6 Screen Ireland
maj. co-prod. fiction 7 10 12 11 4 Screen Ireland
min. co-prod. fiction 6 4 6 6 6 Screen Ireland
Feature documentaries 15 9 7 14 10 Screen Ireland
Italy 100% national fiction 126 142 153 147 160 MiBACT
maj. co-prod. fiction 22 23 18 23 32 MiBACT
min. co-prod. fiction 5 7 5 10 11 MiBACT
Feature documentaries 31 50 61 91 122 MiBACT
17
European Union
Number of feature films produced in the European Union | 2015-2019 prov.In units.
Latvia (2) 100% national fiction 1 2 3 6 10 National Film Centre of Latvia maj. co-prod. fiction 2 2 2 3 2 National Film Centre of Latvia
min. co-prod. fiction 0 3 1 1 5 National Film Centre of LatviaFeature documentaries 14 13 15 17 20 National Film Centre of Latvia
Lithuania (2) 100% national fiction 6 8 6 9 10 Lithuanian Film Centre maj. co-prod. fiction 2 4 4 2 4 Lithuanian Film Centre
min. co-prod. fiction 0 1 0 3 2 Lithuanian Film CentreFeature documentaries 9 13 11 23 9 Lithuanian Film Centre
Luxembourg e 100% national fiction 3 1 1 0 1 OBS / LFF maj. co-prod. fiction 5 0 3 3 4 OBS / LFF min. co-prod. fiction 10 16 7 8 22 OBS / LFF
Feature documentaries 2 3 2 3 5 OBS / LFFMalta e Total 1 3 2 4 1 IMDB / OBSThe 100% national fiction 24 19 19 23 26 NFFNetherlands maj. co-prod. fiction 19 10 10 11 16 NFF
min. co-prod. fiction 20 21 25 21 15 NFFFeature documentaries 19 31 32 31 40 NFF
Poland 100% national fiction 28 39 36 25 - Polish Film Institute maj. co-prod. fiction 4 1 6 4 - Polish Film Institute min. co-prod. fiction 3 6 17 5 - Polish Film Institute
Feature documentaries 14 8 16 8 - Polish Film InstitutePortugal 100% national fiction 6 5 12 13 12 ICA maj. co-prod. fiction 9 8 0 8 4 ICA
min. co-prod. fiction 2 4 8 2 6 ICAFeature documentaries 14 10 18 20 15 ICA
Romania 100% national fiction 27 27 22 32 38 CNC maj. co-prod. fiction 8 7 6 10 3 CNC min. co-prod. fiction 1 7 2 1 2 CNC
Feature documentaries 7 8 11 7 11 CNCSlovakia 100% national fiction 5 2 4 1 8 Slovak Film Institute maj. co-prod. fiction 5 4 5 6 7 Slovak Film Institute min. co-prod. fiction 5 8 12 12 13 Slovak Film Institute
Feature documentaries 10 12 6 14 16 Slovak Film InstituteSlovenia (2) 100% national fiction 9 4 5 2 6 Slovenian Film Center maj. co-prod. fiction 1 4 6 4 5 Slovenian Film Center min. co-prod. fiction 5 4 1 3 8 Slovenian Film Center
Feature documentaries 4 8 9 12 12 Slovenian Film CenterSpain 100% national fiction 69 98 117 95 85 ICAA maj. co-prod. fiction 58 23 19 26 22 ICAA min. co-prod. fiction 16 13 18 12 21 ICAA
Feature documentaries 111 120 125 131 135 ICAASweden (2) 100% national fiction 21 16 18 22 20 SFI maj. co-prod. fiction 7 6 7 9 9 SFI min. co-prod. fiction 4 7 13 0 14 SFI
Feature documentaries 18 25 30 20 25 SFIUnited 100% national fiction 157 175 165 130 73 BFIKingdom (4) maj. co-prod. fiction 15 7 8 5 6 BFI
min. co-prod. fiction 15 17 9 14 15 BFIFeature documentaries 120 82 89 51 23 BFIInward features (5) 54 58 73 57 70 BFI
Total fiction films EU 28 (6) e 1 114 1 169 1 140 1 117 1 135 OBSTotal feature documentaries EU 28 (6) e 599 608 635 690 746 OBSTotal feature films EU 28 (6) e 1 713 1 777 1 775 1 807 1 881 OBS
prov.Country 2015 2016 2017 2018 2019 Sources
Continued
(1) CFWB counts films certified. VAF counts only feature films released which received public support.
(2) Films on first release
(3) Films receiving national support.
(4) The apparent decline of film productions in 2019 is partly linked to a time lag in identifying film productions with budgets below GBP 500 000.
(5) Including inward feature co-productions, excluding inward features involving only VFX work in the UK.
(6) Restated data series. Estimates accounting for time-lag in identifiying GB productions. Excluding GB inward invest-ment features.

18
European Union
prov.ISO Country 2015 2016 2017 2018 2019 2019/18 Sources
AT Austria e 15.9 15.1 14.6 12.9 13.7 5.8% Austrian Film Institute
BE Belgium e 21.1 19.4 19.6 18.8 19.5 3.8% VAF / CFWB / Cinedata
BG Bulgaria 5.3 5.5 5.6 4.9 5.0 2.4% National Film Center (NFC)
CY Cyprus e 0.7 0.7 0.7 0.8 0.8 11.7% Dept. of Cultural Service (MOECSY)
CZ Czech Republic 13.0 15.6 15.2 16.3 18.3 12.1% Czech Film Fund
DE Germany 139.2 121.1 122.3 105.4 118.6 12.6% FFA
DK Denmark 13.8 13.0 11.9 12.5 13.2 6.0% Statistics Denmark / Danish Film Institute
EE Estonia 3.1 3.3 3.5 3.6 3.7 1.5% Estonian Film Institute
ES Spain e 96.1 101.8 99.8 98.9 104.9 6.1% ICAA
FI Finland e 8.7 8.7 8.8 8.1 8.4 3.8% Finnish Film Foundation
FR France 205.4 213.2 209.4 201.2 213.0 5.9% CNC
GB United Kingdom 171.9 168.3 170.6 177.0 176.1 -0.5% BFI / DCM
GR Greece e 9.8 10.0 10.1 9.4 9.6 2.1% Greek Film Center
HR Croatia 3.9 4.3 4.5 4.6 4.9 6.6% Croatian Audiovisual Centre
HU Hungary e 13.0 14.6 14.9 15.5 – – National Film Office
IE Ireland e 15.2 15.8 16.7 15.8 15.1 -4.2% Screen Ireland
IT Italy e 106.7 113.8 99.6 91.7 104.4 13.9% SIAE / Cinetel / ANICA
LT Lithuania 3.3 3.7 4.1 4.3 4.2 -2.9% Lithuanian Film Centre
LU Luxembourg e 1.3 1.1 1.2 1.1 1.1 8.6% CNA
LV Latvia 2.4 2.5 2.5 2.5 2.7 7.9% National Film Centre of Latvia
MT Malta 0.7 0.7 0.8 0.8 – – National Statistics Office Malta
NL Netherlands 33.0 34.2 36.0 35.7 38.0 6.5% NFF / MaccsBox - NVB & NVF
PL Poland 44.7 52.1 56.6 59.7 60.6 1.5% Polish Film Institute
PT Portugal 14.6 14.9 15.6 14.8 15.5 5.0% Instituto do Cinema e do Audiovisual
RO Romania 11.2 13.0 13.9 13.3 13.1 -1.6% Centrul National al Cinematografiei
SE Sweden 17.0 17.8 16.9 16.4 15.9 -2.8% Swedish Film Institute
SI Slovenia 2.1 2.3 2.4 2.5 2.4 -4.9% Slovenian Film Centre
SK Slovak Republic 4.6 5.7 6.7 6.0 6.5 9.5% Slovak Film Institute / UFD
EU 28 - Total e 978 992 985 954 1 005 5.3% European Audiovisual Observatory
Admissions in the European Union | 2015-2019 prov.In millions. Provisional data.
Source: OBS
19
European Union
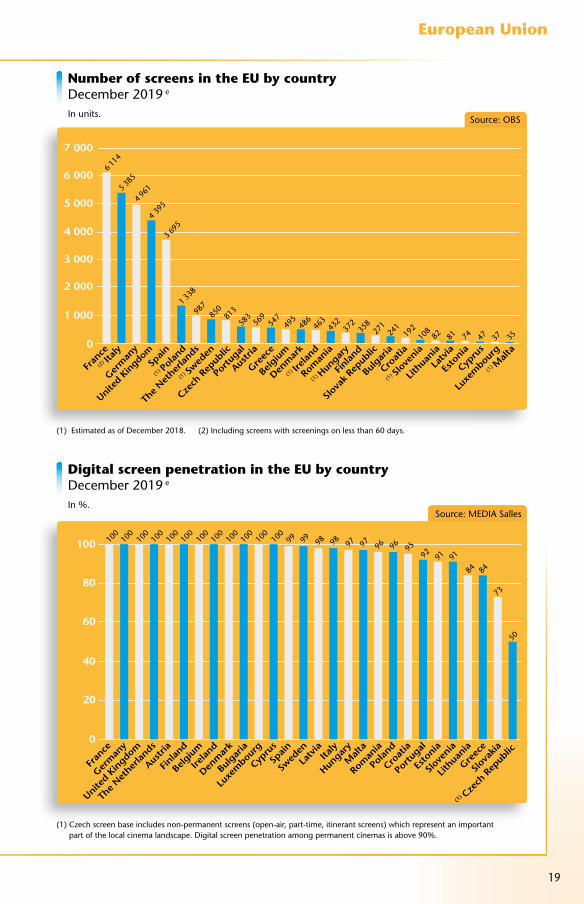
(1) Estimated as of December 2018. (2) Including screens with screenings on less than 60 days.
(1) Czech screen base includes non-permanent screens (open-air, part-time, itinerant screens) which represent an important part of the local cinema landscape. Digital screen penetration among permanent cinemas is above 90%.
Source: MEDIA Salles
Source: OBS
Digital screen penetration in the EU by country December 2019 e
In %.
Number of screens in the EU by country December 2019 e
In units.
0
100
80
60
40
20
Fran
ce
Germ
any
United K
ingdom
The
Nether
lands
Austri
a
Finlan
d
Belgiu
m
Irelan
d
Denm
ark
Bulgar
ia
Luxe
mbou
rg
Cypru
s
Spain
Swed
en
Latv
iaIta
ly
Roman
ia
Malt
a
Polan
d
Croat
ia
Portu
gal
Esto
nia
Slov
enia
Lithua
nia
Greec
e
Slov
akia
(1)
Czech
Rep
ublic
100
100
100
100
100
100
100
100
100
100
100
100
99 99 98 98 97 97 96 96 9592 91 91
84 84
73
50
Hungar
y
0
7 000
Fran
ce
(2) Ita
ly
Germ
any
United K
ingdom
Spain
(1)
Polan
d
The
Nether
lands
(1
) Swed
en
Czech
Rep
ublic
Portu
gal
Greec
e
Austri
a
Belgiu
m
Denm
ark
(1
) Irelan
d
Roman
ia
(1) H
ungar
y
Finlan
d
Slov
ak R
epub
lic
Bulgar
ia
Croat
ia
(1) Sl
oven
ia
Lithua
nia
Latv
ia
Esto
nia
Cypru
s
Luxe
mbou
rg
(1) M
alta
6 000
5 000
4 000
3 000
2 000
1 000
6 114
5 385
4 961
4 39
5
3 695
1 338
987
850
813
583
569
547
495
486
463
432
372
358
271
241
192
108
82 81 74 47 37 35
20
European Union
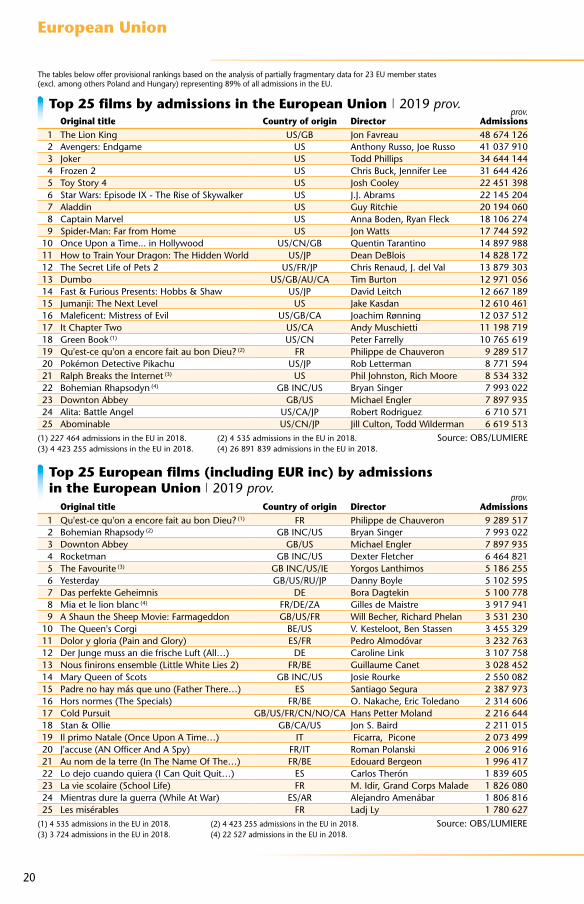
The tables below offer provisional rankings based on the analysis of partially fragmentary data for 23 EU member states (excl. among others Poland and Hungary) representing 89% of all admissions in the EU.
(1) 227 464 admissions in the EU in 2018. (2) 4 535 admissions in the EU in 2018. Source: OBS/LUMIERE(3) 4 423 255 admissions in the EU in 2018. (4) 26 891 839 admissions in the EU in 2018.
(1) 4 535 admissions in the EU in 2018. (2) 4 423 255 admissions in the EU in 2018. Source: OBS/LUMIERE(3) 3 724 admissions in the EU in 2018. (4) 22 527 admissions in the EU in 2018.
Top 25 films by admissions in the European Union | 2019 prov.
Top 25 European films (including EUR inc) by admissions in the European Union | 2019 prov.
Original title Country of origin Directorprov.
Admissions1 The Lion King US/GB Jon Favreau 48 674 1262 Avengers: Endgame US Anthony Russo, Joe Russo 41 037 9103 Joker US Todd Phillips 34 644 1444 Frozen 2 US Chris Buck, Jennifer Lee 31 644 4265 Toy Story 4 US Josh Cooley 22 451 3986 Star Wars: Episode IX - The Rise of Skywalker US J.J. Abrams 22 145 2047 Aladdin US Guy Ritchie 20 194 0608 Captain Marvel US Anna Boden, Ryan Fleck 18 106 2749 Spider-Man: Far from Home US Jon Watts 17 744 592
10 Once Upon a Time... in Hollywood US/CN/GB Quentin Tarantino 14 897 98811 How to Train Your Dragon: The Hidden World US/JP Dean DeBlois 14 828 17212 The Secret Life of Pets 2 US/FR/JP Chris Renaud, J. del Val 13 879 30313 Dumbo US/GB/AU/CA Tim Burton 12 971 05614 Fast & Furious Presents: Hobbs & Shaw US/JP David Leitch 12 667 18915 Jumanji: The Next Level US Jake Kasdan 12 610 46116 Maleficent: Mistress of Evil US/GB/CA Joachim Rønning 12 037 51217 It Chapter Two US/CA Andy Muschietti 11 198 71918 Green Book (1) US/CN Peter Farrelly 10 765 61919 Qu'est-ce qu'on a encore fait au bon Dieu? (2) FR Philippe de Chauveron 9 289 51720 Pokémon Detective Pikachu US/JP Rob Letterman 8 771 59421 Ralph Breaks the Internet (3) US Phil Johnston, Rich Moore 8 534 33222 Bohemian Rhapsodyn (4) GB INC/US Bryan Singer 7 993 02223 Downton Abbey GB/US Michael Engler 7 897 93524 Alita: Battle Angel US/CA/JP Robert Rodriguez 6 710 57125 Abominable US/CN/JP Jill Culton, Todd Wilderman 6 619 513
Original title Country of origin Directorprov.
Admissions1 Qu'est-ce qu'on a encore fait au bon Dieu? (1) FR Philippe de Chauveron 9 289 5172 Bohemian Rhapsody (2) GB INC/US Bryan Singer 7 993 0223 Downton Abbey GB/US Michael Engler 7 897 9354 Rocketman GB INC/US Dexter Fletcher 6 464 8215 The Favourite (3) GB INC/US/IE Yorgos Lanthimos 5 186 2556 Yesterday GB/US/RU/JP Danny Boyle 5 102 5957 Das perfekte Geheimnis DE Bora Dagtekin 5 100 7788 Mia et le lion blanc (4) FR/DE/ZA Gilles de Maistre 3 917 9419 A Shaun the Sheep Movie: Farmageddon GB/US/FR Will Becher, Richard Phelan 3 531 230
10 The Queen's Corgi BE/US V. Kesteloot, Ben Stassen 3 455 32911 Dolor y gloria (Pain and Glory) ES/FR Pedro Almodóvar 3 232 76312 Der Junge muss an die frische Luft (All…) DE Caroline Link 3 107 75813 Nous finirons ensemble (Little White Lies 2) FR/BE Guillaume Canet 3 028 45214 Mary Queen of Scots GB INC/US Josie Rourke 2 550 08215 Padre no hay más que uno (Father There…) ES Santiago Segura 2 387 97316 Hors normes (The Specials) FR/BE O. Nakache, Eric Toledano 2 314 60617 Cold Pursuit GB/US/FR/CN/NO/CA Hans Petter Moland 2 216 64418 Stan & Ollie GB/CA/US Jon S. Baird 2 211 01519 Il primo Natale (Once Upon A Time…) IT Ficarra, Picone 2 073 49920 J'accuse (AN Officer And A Spy) FR/IT Roman Polanski 2 006 91621 Au nom de la terre (In The Name Of The…) FR/BE Edouard Bergeon 1 996 41722 Lo dejo cuando quiera (I Can Quit Quit…) ES Carlos Therón 1 839 60523 La vie scolaire (School Life) FR M. Idir, Grand Corps Malade 1 826 08024 Mientras dure la guerra (While At War) ES/AR Alejandro Amenábar 1 806 81625 Les misérables FR Ladj Ly 1 780 627

21
European Union
Note: A total of 192 European films (including 15 EUR inc films) were identified among the top 600 films on release in the US and Canada in 2019, generating cumulative admissions of 61.2 million (4.9% market share).
(1) Data based on Europa Cinemas members in 34 MEDIA countries, 685 cities, 1 134 cinemas, 2 761 screens. (2) Country of origin and production year as allocated in LUMIERE database.
Sources: Comscore, OBS/LUMIERE
Sources: Europa Cinemas, OBS
Top 25 European films (including EUR inc) by admissions in the US & Canada | 2019 e
Admissions estimated based on average ticket price of USD 9.16.
Top 25 EU films by admissions in the Europa Cinemas Network (1) | 2019 e
Original title Country of origin Director Distributor Admissions e 1 Downton Abbey GB/US Michael Engler Focus/Focus Features 10 573 5672 Rocketman GB INC/US Dexter Fletcher Paramount Pictures 10 520 5413 Yesterday GB/US/RU/JP Danny Boyle Universal Pictures 3 837 4184 Cold Pursuit GB/US/FR/CN/… H. Petter Moland Lionsgate 3 508 6105 Bohemian Rhapsody GB INC/US Bryan Singer 20th Century Fox 2 732 1536 Judy GB/US/FR Rupert Goold Roadside Attractions 2 622 6057 Fighting with My Family GB INC/US Stephen Merchant MGM-Dimension 2 506 3958 47 Meters Down: Uncaged GB/US Johannes Roberts Entert. Studios Motion Pict. 2 430 2299 Cats GB INC/US Tom Hooper Universal Pictures 2 411 674
10 The Favourite GB INC/US/IE Yorgos Lanthimos Fox Searchlight 1 839 46911 The Kid Who Would Be King GB INC/US Joe Cornish 20th Century Fox 1 833 05512 They Shall Not Grow Old GB/NZ Peter Jackson Warner Bros. 1 337 67113 Blinded by the Light GB/US Gurinder Chadha Warner Bros. 1 299 25214 Greta IE/US Neil Jordan Focus/Focus Features 1 151 12515 Anna FR/US Luc Besson Lionsgate 932 69016 The Mustang FR/BE L. Clermont-T. Focus/Focus Features 845 39217 Stan & Ollie GB/CA/US Jon S. Baird Sony Pictures 582 62418 Mary Queen of Scots GB INC/US Josie Rourke Focus/Focus Features 581 14119 Zimna wojna (Cold War) PL/FR/GB Pawel Pawlikowski Amazon Studios 566 64620 Dolor y gloria (Pain and Glory) ES/FR Pedro Almodóvar Sony Pictures 480 20721 Maiden GB Alex Holmes Sony Pictures 345 60322 Everybody Knows ES/FR/IT Asghar Farhadi Focus/Focus Features 292 33623 Fantastic Beasts: The Crimes… GB INC/US David Yates Warner Bros. 234 42424 Official Secrets GB/US Gavin Hood IFC Films 217 32825 The White Crow GB INC/US/RS Ralph Fiennes Sony Pictures 199 648
Original titleCountry
of origin (2) Directorprov.
Admissions1 Dolor y Gloria (Pain and Glory) ES/FR Pedro Almodóvar 1 347 1792 The Favourite GB INC/US/IE Yorgos Lanthimos 1 325 2153 Downton Abbey GB/US Michael Engler 714 5094 Qu'est-ce qu'on a encore fait au Bon Dieu ? FR Philippe de Chauveron 540 8545 Yesterday GB/US/RU/JP Danny Boyle 532 3466 Rocketman GB INC/US Dexter Fletcher 507 3527 Der Junge muss an die frische Luft DE Caroline Link 487 2668 Sorry We Missed You GB/FR/BE KenLoach 447 8719 Portrait de la jeune fille en feu FR Céline Sciamma 427 413
10 J'accuse (An Officer and a Spy) FR/IT Roman Polanski 423 32611 Il traditore (The Traitor) IT/FR/DE/BE Marco Bellocchio 379 50612 Systemsprenger (System Crasher) DE Nora Fingscheidt 373 99613 The White Crow GB Ralph Fiennes 365 34614 Grâce à Dieu (By the Grace of God) FR/BE François Ozon 360 25215 Les Invisibles (Invisibles) FR Louis-Julien Petit 330 19316 La belle époque FR/BE Nicolas Bedos 303 57417 Doubles Vies (Non-Fiction) FR Olivier Assayas 302 26518 Zimna wojna (Cold War) PL/FR/GB Pawel Pawlikowski 282 14719 Hors Normes (The Specials) FR/BE Eric Toledano, Olivier Nakache 273 81920 Werk ohne Autor (Never Look Away) DE/IT Florian Henckel von Donnersmarck 268 29021 The Wife GB/SE/US Björn Runge 259 89522 A Shaun the Sheep Movie: Farmageddon GB/US/FR Will Becher, Richard Phelan 252 82223 Martin Eden IT/FR/DE Pietro Marcello 251 02724 Mientras Dure la Guerra (While at War) ES/AR Alejandro Amenábar 245 02925 Das perfekte Geheimnis DE Bora Dagtekin 235 543

22
France
(1) Officially recognised films.
(1) Source: CNC (2) MEDIA Salles
Number of French feature films produced | 2015-2019In units.
0
400
300
200
100
2015 2016 2017 2018 2019
300
158
76
66
300
177
78
45
300
182
63
55
301
185
61
55
283
159
62
62
Source: CNC
Population 2019 e 67.0 millionGDP per capita 2019 e 41 761 USDGross box office 2019 e 1.45 bn EUR (1.62 bn USD)Admissions 2019 e 213.0 millionAverage ticket price 2019 e 6.8 EUR (7.6 USD)Average admissions per capita 2019 e 3.2Screens 2018 | 2019 (1) 5 983 | 6 114Digital screens 2018 | 2019 (2) 5 981 | 6 045Digital 3D screens 2018 | 2019 (2) 3 030 | 3 030
Admissions and gross box office in France | 2015-2019
100
300
250
200
150
2015 2016 2016 2018 2019
400
800
1 600
1 200
205.4213.2 209.4
201.2213.0
1 331.71 388.4 1 380.6
1 336.9
1 447.4
Source: CNC
Market shares 2019 e
Total (1)
100% national
Admissions (million)
Gross box office (EUR million)
Others65.2%
National34.8%
Maj. co-prod.Min. co-prod.

23
France
Distribution and exhibition2019 saw French cinema attendance reach
its third highest level since 1966 as admissions increased by 5.9% to 213.0 million tickets sold. This marks the sixth consecutive year of admis-sions exceeding 200 million. As the average ticket price increased from EUR 6.64 to EUR 6.79, GBO jumped by 8.3% to EUR 1.45 billion, the highest level in history. Box office growth was driven entirely by a 32.3% surge in admissions to US films which reached their highest level since 1957 and captured 55.2% of the market, while French market share dropped from 39.5% to 34.8%, with Qu’est-ce qu’on a encore fait au bon Dieu? and Nous finirons ensemble being the only two French led productions to feature in the top 20 ranking in 2019.
In response to the COVID-19 crisis, French cinemas were ordered to close on March 14. Consequently, GBO takings from January to May 31 were estimated to have plunged by 59% com-pared to the same period in 2019. Mitigating the grave impact of venue closures, virtual cinema initiatives were created e.g. by La Toile, a French VOD platform, and La Vingt-Cinquième Heure, which provides a geolocated platform allowing access to screenings to people living within 40 km radius from participating cinemas. Without calling into question the French media chronology, emer-gency regulation allows an exceptional four-month reduction in the theatrical release time for VOD pay-per-view basis or for a DVD release of films
during the closing of cinemas. French cinemas will be allowed to reopen from June 22 onwards.
Production and fundingWith 301 feature films approved by the coun-
try’s national funding body, the CNC, in 2019 French film production continued to remain stable at record levels. In 2019 the average production cost of French initiative films amounted to EUR 3.8 million, compared to EUR 4.0 million in 2018 and EUR 5.5 million in 2016. Total investment in film production in France continued to decrease by 0.8% to EUR 1.12 billon in 2019, EUR 903 million of which was invested in French initiative films. These are the second lowest levels registered in the past decade and will most likely drop to a record low in 2020 due to the current standstill of production activity in France due to COVID-19.
In response to the crisis, the French govern-ment and the CNC introduced a variety of sup-port measures, including additional supports and emergency funds, cash flow measures through mobilization of funds in advance, flexibilization of rules and payment obligations and additional loan guarantees. In April, Audiens (the social pro-tection group for the cultural sector) and Netflix launched an emergency aid fund for intermit-tent artists and technicians in the audiovisual and film industries.
Sources: CNC, Le Film Français, UNIC, OBS
Top 20 films by admissions in France | 2019 (1)
(1) Covering film releases and admissions between 27/12/2017 and 25/12/2018. Source: Le Film Français
Original titleCountry of origin Director
Distributor Admissions e
1 The Lion King US/GB Jon Favreau Walt Disney Studios 10 019 1732 Avengers: Endgame US Anthony & Joe Russo Walt Disney Studios 6 942 3313 Qu'est-ce qu'on a encore fait au… FR P. de Chauveron UGC Distribution 6 714 8094 Frozen 2 US C. Buck, Jennifer Lee Walt Disney Studios 6 642 6285 Joker US Todd Phillips Warner Bros. 5 567 2426 Toy Story 4 US Josh Cooley Walt Disney Studios 4 599 9447 Star Wars: Episode IX - The Rise… US J.J. Abrams Walt Disney Studios 4 291 2158 How to Train Your Dragon: The… US/JP Dean DeBlois Universal Pict. Intl FR 3 389 8549 Captain Marvel US A. Boden, R. Fleck Walt Disney Studios 3 374 614
10 Spider-Man: Far from Home US Jon Watts Sony Pict. Releasing 3 215 83511 Nous finirons ensemble (Little… FR/BE Guillaume Canet Pathé Distribution 2 800 00412 Maleficent: Mistress of Evil US Joachim Rønning Walt Disney Studios 2 719 52313 Once Upon a Time... in Hollywood US/CN/GB Quentin Tarantino Sony Pict. Releasing 2 647 74814 Aladdin US Guy Ritchie Walt Disney Studios 2 510 81315 Fast & Furious Presents: Hobbs… US/JP David Leitch Universal Pict. Intl FR 2 451 75016 Jumanji: The Next Level US Jake Kasdan Sony Pict. Releasing 2 413 89617 Dumbo US/GB/AU/CA Tim Burton Walt Disney Studios 2 397 40518 Ralph Breaks the Internet US Johnston, Moore Walt Disney Studios 2 315 78619 The Secret Life of Pets 2 US/FR/JP C. Renaud, J. del Val Universal Pict. Intl FR 2 309 32820 Green Book US Peter Farrelly Metropolitan Filmexport 2 090 550

24
Germany
Population 2019 e 83.0 millionGDP per capita 2019 e 46 564 USDGross box office 2019 e 1.02 bn EUR (1.15 bn USD)Admissions 2019 e 118.6 millionAverage ticket price 2019 e 8.6 EUR (10.1 USD)Average admissions per capita 2019 e 1.4Screens 2018 | 2019 (1) 4 849 | 4 961Digital screens 2018 | 2019 (2) 4 848 | 4 961Digital 3D screens 2018 | 2019 (2) 2 220 | 2 246
(1) Films on first release.
Admissions and gross box office in Germany | 2015-2019
100
200
180
160
140
120
2015 2016 2017 2018 2019
600
1 200
1 000
800
1 167.1
1 023.0
121.1
1 056.1
122.3
899.3
105.4
1 024.0
118.6
139.2
Source: FFA
Number of German feature films produced (1) | 2015-2019In units.
0
300
200
100
2015 2016 2017 2018 2019
236
139
55
42
256
138
57
61
247
155
48
44 49
54
247
144
265
179
28
58
Source: SPIO
Market shares 2019 e
(1) Source: FFA (2) Source: MEDIA Salles
Others78.5%
National21.5%
Total
100% national
Admissions (million)
Gross box office (EUR million)
Min. co-prod.Maj. co-prod.
25
Germany
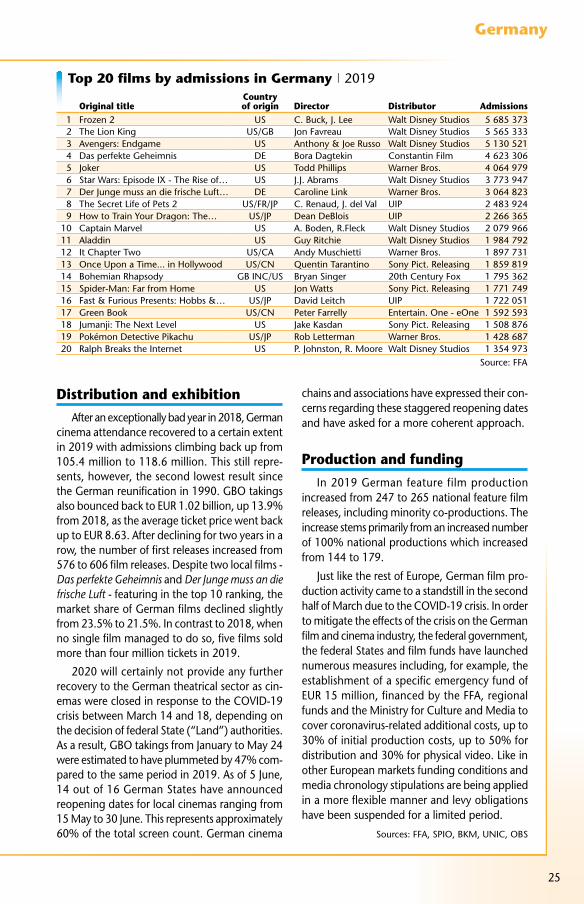
Top 20 films by admissions in Germany | 2019
Distribution and exhibitionAfter an exceptionally bad year in 2018, German
cinema attendance recovered to a certain extent in 2019 with admissions climbing back up from 105.4 million to 118.6 million. This still repre-sents, however, the second lowest result since the German reunification in 1990. GBO takings also bounced back to EUR 1.02 billion, up 13.9% from 2018, as the average ticket price went back up to EUR 8.63. After declining for two years in a row, the number of first releases increased from 576 to 606 film releases. Despite two local films - Das perfekte Geheimnis and Der Junge muss an die frische Luft - featuring in the top 10 ranking, the market share of German films declined slightly from 23.5% to 21.5%. In contrast to 2018, when no single film managed to do so, five films sold more than four million tickets in 2019.
2020 will certainly not provide any further recovery to the German theatrical sector as cin-emas were closed in response to the COVID-19 crisis between March 14 and 18, depending on the decision of federal State (“Land”) authorities. As a result, GBO takings from January to May 24 were estimated to have plummeted by 47% com-pared to the same period in 2019. As of 5 June, 14 out of 16 German States have announced reopening dates for local cinemas ranging from 15 May to 30 June. This represents approximately 60% of the total screen count. German cinema
chains and associations have expressed their con-cerns regarding these staggered reopening dates and have asked for a more coherent approach.
Production and fundingIn 2019 German feature film production
increased from 247 to 265 national feature film releases, including minority co-productions. The increase stems primarily from an increased number of 100% national productions which increased from 144 to 179.
Just like the rest of Europe, German film pro-duction activity came to a standstill in the second half of March due to the COVID-19 crisis. In order to mitigate the effects of the crisis on the German film and cinema industry, the federal government, the federal States and film funds have launched numerous measures including, for example, the establishment of a specific emergency fund of EUR 15 million, financed by the FFA, regional funds and the Ministry for Culture and Media to cover coronavirus-related additional costs, up to 30% of initial production costs, up to 50% for distribution and 30% for physical video. Like in other European markets funding conditions and media chronology stipulations are being applied in a more flexible manner and levy obligations have been suspended for a limited period.
Sources: FFA, SPIO, BKM, UNIC, OBS
Original titleCountry of origin Director Distributor Admissions
1 Frozen 2 US C. Buck, J. Lee Walt Disney Studios 5 685 3732 The Lion King US/GB Jon Favreau Walt Disney Studios 5 565 3333 Avengers: Endgame US Anthony & Joe Russo Walt Disney Studios 5 130 5214 Das perfekte Geheimnis DE Bora Dagtekin Constantin Film 4 623 3065 Joker US Todd Phillips Warner Bros. 4 064 9796 Star Wars: Episode IX - The Rise of… US J.J. Abrams Walt Disney Studios 3 773 9477 Der Junge muss an die frische Luft… DE Caroline Link Warner Bros. 3 064 8238 The Secret Life of Pets 2 US/FR/JP C. Renaud, J. del Val UIP 2 483 9249 How to Train Your Dragon: The… US/JP Dean DeBlois UIP 2 266 365
10 Captain Marvel US A. Boden, R.Fleck Walt Disney Studios 2 079 96611 Aladdin US Guy Ritchie Walt Disney Studios 1 984 79212 It Chapter Two US/CA Andy Muschietti Warner Bros. 1 897 73113 Once Upon a Time... in Hollywood US/CN Quentin Tarantino Sony Pict. Releasing 1 859 81914 Bohemian Rhapsody GB INC/US Bryan Singer 20th Century Fox 1 795 36215 Spider-Man: Far from Home US Jon Watts Sony Pict. Releasing 1 771 74916 Fast & Furious Presents: Hobbs &… US/JP David Leitch UIP 1 722 05117 Green Book US/CN Peter Farrelly Entertain. One - eOne 1 592 59318 Jumanji: The Next Level US Jake Kasdan Sony Pict. Releasing 1 508 87619 Pokémon Detective Pikachu US/JP Rob Letterman Warner Bros. 1 428 68720 Ralph Breaks the Internet US P. Johnston, R. Moore Walt Disney Studios 1 354 973
Source: FFA
26
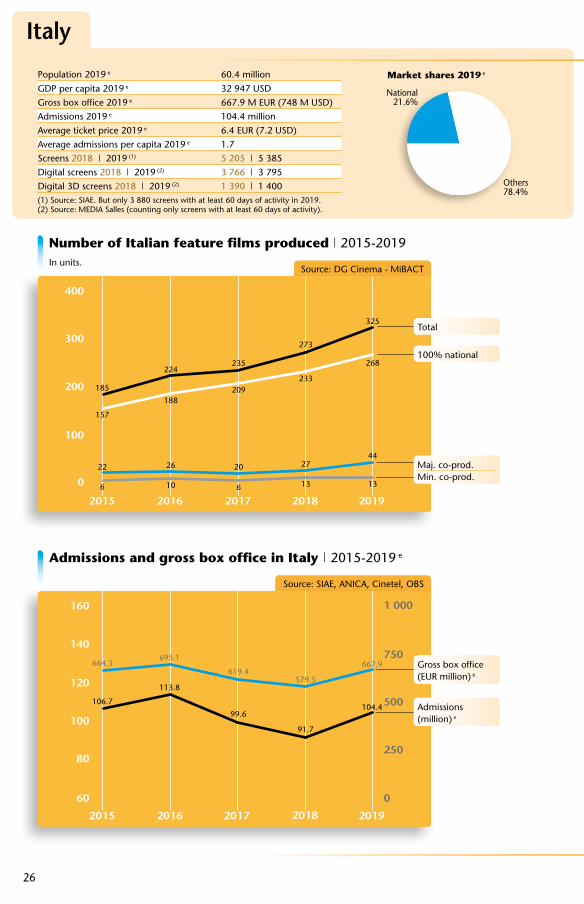
Italy
Population 2019 e 60.4 millionGDP per capita 2019 e 32 947 USDGross box office 2019 e 667.9 M EUR (748 M USD)Admissions 2019 e 104.4 millionAverage ticket price 2019 e 6.4 EUR (7.2 USD)Average admissions per capita 2019 e 1.7Screens 2018 | 2019 (1) 5 205 | 5 385Digital screens 2018 | 2019 (2) 3 766 | 3 795Digital 3D screens 2018 | 2019 (2) 1 390 | 1 400
Number of Italian feature films produced | 2015-2019In units.
0
400
300
200
100
2015 2016 2017 2018 2019
157
22
6
185
188
26
10
224
209
20
6
235
233
27
13 13
273
268
44
325
Source: DG Cinema - MiBACT
100% national
Total
Admissions and gross box office in Italy | 2015-2019 e
60
100
80
160
140
120
2015 2016 2017 2018 2019
0
250
500
750
1 000
106.7
113.8
695.1
99.6
619.4
91.7
579.5
104.4
667.9664.3
Source: SIAE, ANICA, Cinetel, OBS
Market shares 2019 e
Gross box office (EUR million) e
Admissions (million) e
(1) Source: SIAE. But only 3 880 screens with at least 60 days of activity in 2019.(2) Source: MEDIA Salles (counting only screens with at least 60 days of activity).
Others78.4%
National21.6%
Maj. co-prod.Min. co-prod.

27
Italy
Top 20 films by admissions in Italy | 2019
Distribution and exhibition
2019 saw Italian box office recovering from its 2018 low of 91.7 million admissions (the lowest level in ticket sales since 1995) jumping by 13.9% to 104.4 million tickets sold. Gross box office takings even increased by 15.3% to an estimated EUR 668 million as the average ticket prices increased slightly to EUR 6.40. The increase in the Italian box office, was primarily driven by the compar-atively strong performance of US blockbusters, whose market share rose from 60.0% to 64.3% in 2019. Admissions to Italian films increased as well but at a much slower rate which caused market share for national films to decrease from 23.0% to 21.6%. Led by Il primo Natale, a total of four Italian films generated more than 1 mil-lion admissions in 2019 with three of them fea-turing among the top 20 films.
Italy was the first European country to become a COVID-19 hotspot and was the first European country to close its cinemas with almost half the country´s screens being closed as early as of 23 February due to regional bans and a nationwide closure on 8 March. GBO takings from January to May 31 were estimated to have plummeted by 51% compared to the same period in 2019. As in Germany or Spain, the decision on the reopening of cinemas is taken at regional level with opening dates planned from June 15 onwards.
Production and fundingItalian feature film production continued to
grow to a new record high of 325 films produced in 2019. However, the COVID-19 crisis will most likely put an end to this growth trend as the pro-duction and exhibition sector are among the industry sectors hit hardest by the crisis.
In order to alleviate some of the effects the Italian government put in place a EUR 130 mil-lion emergency fund for the cinema, audiovisual and live entertainment sectors to support profes-sionals and businesses. Following the approval of the “Relaunch” Law Decree on 13 May, this amount was increased to EUR 245 million, which could potentially be increased by an additional EUR 50 million by the end of the year. The DG Cinema is accelerating the payments of ordi-nary funded aid resulting from the Cinema Law, including tax credit measures of EUR 100 million to facilitate investments in new and renovated cinemas, EUR 10 million for art-house cinemas. Other measures include the relaxation of require-ments and deadlines, the suspension of tax obliga-tions and a revision of the rule on media chronology.
Sources: DG Cinema-MiBACT, SIAE, ANICA, Cinetel, UNIC, OBS
Source: Cinetel
Original titleCountry of origin Director Distributor Admissions
1 The Lion King US/GB Jon Favreau Walt Disney 5 692 2142 Joker US Todd Phillips Warner Bros. 4 193 4773 Avengers: Endgame US Anthony & Joe Russo Walt Disney 4 098 4214 Frozen 2 US C. Buck, Jennifer Lee Walt Disney 2 813 1765 Aladdin US Guy Ritchie Walt Disney 2 411 8646 Il primo Natale (Once Upon A Time in… IT Ficarra, Picone Medusa Film 2 073 4997 Dumbo US/GB/AU/CA Tim Burton Walt Disney 2 004 8828 Maleficent: Mistress of Evil US/GB/CA Joachim Rønning Walt Disney 1 872 5299 Spider-Man: Far from Home US Jon Watts Warner Bros. 1 768 876
10 Once Upon a Time... in Hollywood US/CN Quentin Tarantino Warner Bros. 1 716 65611 Ralph Breaks the Internet US P. Johnston, R. Moore Walt Disney 1 684 48412 Pinocchio IT/FR/GB Matteo Garrone 01 Distribution 1 654 17913 Green Book US/CN Peter Farrelly Eagle Pictures 1 631 68714 Captain Marvel US A. Boden, Ryan Fleck Walt Disney 1 556 09115 Aquaman US James Wan Warner Bros. 1 537 77716 Star Wars: Episode IX - The Rise of… US J.J. Abrams Walt Disney 1 501 94117 It Chapter Two US/CA Andy Muschietti Warner Bros. 1 339 10618 10 giorni senza mamma (When Mom… IT Alessandro Genovesi Medusa Film 1 193 68119 Bohemian Rhapsody GB INC/US Bryan Singer 20th Cent. Fox 1 152 71220 How to Train Your Dragon: The Hidden… US/JP Dean DeBlois Universal 1 126 183

28
Spain
Population 2019 e 46.9 millionGDP per capita 2019 e 29 961 USDGross box office 2019 e 614.7 M EUR (688.2 M USD)Admissions 2019 e 104.9 millionAverage ticket price 2019 e 5.9 EUR (6.6 USD)Average admissions per capita 2019 e 2.2Screens 2018 | 2019 (1) 3 589 | 3 695Digital screens 2018 | 2019 (2) 3 546 | 3 575Digital 3D screens 2018 | 2019 (2) 1 120 | 1 100
Admissions and gross box office in Spain | 2015-2019 prov.
0
200
150
100
50
2015 2016 2017 2018 2019
200
400
600
800
96.1
575.2602.0
101.8
591.3
99.8
585.7
98.9
614.7
104.9
Source: ICAA
Number of Spanish feature films produced (1) | 2015-2019In units.
0
300
200
100
2015 2016 2017 2018 2019(prov.)
254
166
68
20
254
214
27
13
279
237
20
22
264
214
34
16
263
211
27
25
Source: ICAA
Market shares 2019 e
(1) Films certified. (2) Including parity co-productions.
(1) Source: ICAA (2) Source: MEDIA Salles
Gross box office (EUR million)
Admissions (million)
Total
100% national
Others84.9%
National15.1%
Maj. co-prod. (2)
Min. co-prod.

29
Spain
Distribution and exhibitionSpanish cinema attendance reached its highest
level since 2009, growing by 6.1% to 104.9 mil-lion admissions. Seen in a wider context, 2019 hence sustained a longer-term recovery of the Spanish box office which had reached a record low of 76.9 million admissions in 2013. GBO takings increased by 5.0% to EUR 615 million, as the average ticket price decreased slightly to EUR 5.86. The increase in Spanish box office was largely due to the extraordinary performance of Disney titles which represented seven out of the top 10 titles in 2019. In contrast, admissions to Spanish films declined by almost 9% and caused national market share to drop from 17.6% to 15.1%, the lowest value since 2013. Four local titles, including three remakes of foreign com-edies: Padre no hay más que uno, Lo dejo cuando quiera, Mientras dure la guerra, Si yo fuera rico, sold more than 1 million tickets and made it into the top 20, while several award winning Spanish films including Pedro Almodóvar’s Dolor y gloria, Oliver Laxe’s O que arde or La trinchera infinita failed to attract comparable audiences.
As elsewhere in Europe, Spain will see a major drop in admissions in 2020 as cinemas had to close in response to the COVID-19 crisis on March 14. GBO takings from January to May 31 were esti-mated to have plummeted by 57% compared to the same period in 2019. As in Germany, the
decision on the reopening of cinemas is taken at regional level with opening dates foreseen between May 25 and June 8.
Production and funding
Spanish film production activity remained stable with a total of 263 films certified by ICAA, the country’s national public funding body, in 2019. As in other parts of Europe, film production came to a halt in March 2020 but has become possible under strict conditions in certain pro vinces from May 11 onwards while still not being allowed in other regions.
Among other non-sector specific measures, the Spanish government approved in early May EUR 76.4 million specifically aimed at supporting the cultural sector. Of this sum, EUR 13.2 mil-lion will be allocated to cinema operators. The support is redistributed by the ICAA, which also increased flexibility in funding obligations and increased the production incentive by 5% upping the maximum amount from EUR 3 to EUR 10 mil-lion. Additionally, a new support scheme was launched by Netflix, Acción Cultural Española, la Academia de Cine and ICAA aimed at helping artistic and/or technical workers due to the ces-sation of audiovisual production and CREA-SGR increased its loan guarantees by EUR 20 million.
Sources: ICAA, UNIC, Screen International, OBS
Top 20 films by admissions in Spain | 2019 prov.
Sources: ICAA, Comscore
Original titleCountry of origin Director Distributor
Admissions
1 The Lion King US/GB Jon Favreau Walt Disney 5 910 7252 Joker US Todd Phillips Warner Bros. 4 867 3693 Avengers: Endgame US Anthony & Joe Russo Walt Disney 4 550 4374 Aladdin US Guy Ritchie Walt Disney 4 417 7685 Toy Story 4 US Josh Cooley Walt Disney 3 877 8056 Frozen 2 US C. Buck, Jennifer Lee Walt Disney 2 848 6557 Dumbo US/GB/AU/CA Tim Burton Walt Disney 2 430 1778 Padre no hay más que uno (Father… ES Santiago Segura Sony Pictures 2 387 9739 Spider-Man: Far from Home US Jon Watts Sony Pictures 2 249 013
10 Captain Marvel US A. Boden, Ryan Fleck Walt Disney 2 158 59011 Maleficent: Mistress of Evil US/GB/CA Joachim Rønning Walt Disney 2 087 04712 Star Wars: Episode IX - The Rise of… US J.J. Abrams Walt Disney 2 080 00213 The Secret Life of Pets 2 US/FR/JP C. Renaud, J. del Val UPI 2 003 83414 Once Upon a Time... in Hollywood US/CN/GB Quentin Tarantino Sony Pictures 1 911 98615 Lo dejo cuando quiera (I Can Quit… ES Carlos Therón Sony Pictures 1 838 81916 Mientras dure la guerra (While At War) ES/AR Alejandro Amenábar Walt Disney 1 802 64717 Si yo fuera rico (If I Were A Rich Man) ES Á. Fernández Armero Paramount 1 709 28818 Green Book US/CN Peter Farrelly Aurum Prod. 1 558 40319 How to Train Your Dragon: The Hidden… US/JP Dean DeBlois UPI 1 538 71820 Fast & Furious Presents: Hobbs & Shaw US/JP David Leitch UPI 1 481 486

30
United Kingdom
Population 2019 e 66.6 millionGDP per capita 2019 e 41 030 USDGross box office 2019 e 1.25 bn GBP (1.60 bn USD)Admissions 2019 e 176.1 millionAverage ticket price 2019 e 7.1 GBP (9.1 USD)Average admissions per capita 2019 e 2.6Screens 2018 (1) | 2019 (2) 4 340 | 4 395Digital screens 2018 (1) | 2019 (2) 4 340 | 4 395Digital 3D screens 2018 | 2019 (2) 2 090 | 2 063
Market shares 2019 e
Admissions and gross box office in the United Kingdom | 2015-2019
100
250
150
200
2015 2016 2017 2018 2019
600
1 500
1 200
900
171.9 168.3 170.6177.0 176.1
1 242.2 1 228.11 279.4 1 282.1
1 253.9
Sources: BFI, DCM/CAA, Comscore
Number of films produced in the United Kingdom | 2015-2019 prov. (1)
In units.
0
400
300
200
100
2015 2016 2017 2018 2019(prov.)
(1)
361
258
63
21
19
339
246
63
20
10
344
243
78
11
12
257
177
59
16
5
187
93
71
15
8
Source: BFI
Others52.9%
(1) Source: BFI (2) Source: MEDIA Salles
National47.1%
Total
100% national
Inward features (2)
Min. co-prod. Maj. co-prod.
Gross box office (GBP million)
Admissions (million)
(1) The apparent decline of film productions in 2019 is partially linked linked to a time lag in identifying film productions with budgets below GBP 500 000.
(2) Including inward investemt features except features involving only VFX work in the UK.
31
United Kingdom
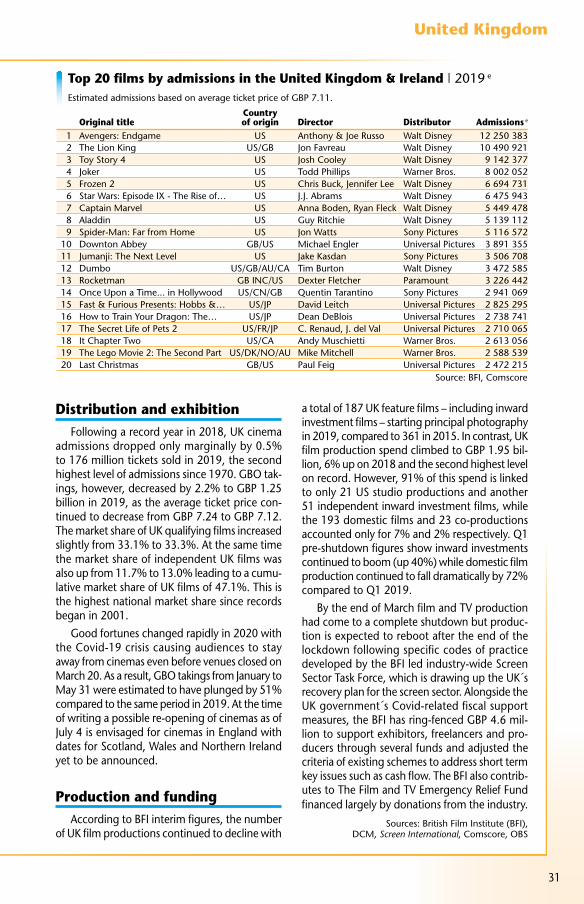
Top 20 films by admissions in the United Kingdom & Ireland | 2019 e
Estimated admissions based on average ticket price of GBP 7.11.
Distribution and exhibitionFollowing a record year in 2018, UK cinema
admissions dropped only marginally by 0.5% to 176 million tickets sold in 2019, the second highest level of admissions since 1970. GBO tak-ings, however, decreased by 2.2% to GBP 1.25 billion in 2019, as the average ticket price con-tinued to decrease from GBP 7.24 to GBP 7.12. The market share of UK qualifying films increased slightly from 33.1% to 33.3%. At the same time the market share of independent UK films was also up from 11.7% to 13.0% leading to a cumu-lative market share of UK films of 47.1%. This is the highest national market share since records began in 2001.
Good fortunes changed rapidly in 2020 with the Covid-19 crisis causing audiences to stay away from cinemas even before venues closed on March 20. As a result, GBO takings from January to May 31 were estimated to have plunged by 51% compared to the same period in 2019. At the time of writing a possible re-opening of cinemas as of July 4 is envisaged for cinemas in England with dates for Scotland, Wales and Northern Ireland yet to be announced.
Production and funding According to BFI interim figures, the number
of UK film productions continued to decline with
a total of 187 UK feature films – including inward investment films – starting principal photography in 2019, compared to 361 in 2015. In contrast, UK film production spend climbed to GBP 1.95 bil-lion, 6% up on 2018 and the second highest level on record. However, 91% of this spend is linked to only 21 US studio productions and another 51 independent inward investment films, while the 193 domestic films and 23 co-productions accounted only for 7% and 2% respectively. Q1 pre-shutdown figures show inward investments continued to boom (up 40%) while domestic film production continued to fall dramatically by 72% compared to Q1 2019.
By the end of March film and TV production had come to a complete shutdown but produc-tion is expected to reboot after the end of the lockdown following specific codes of practice developed by the BFI led industry-wide Screen Sector Task Force, which is drawing up the UK´s recovery plan for the screen sector. Alongside the UK government´s Covid-related fiscal support measures, the BFI has ring-fenced GBP 4.6 mil-lion to support exhibitors, freelancers and pro-ducers through several funds and adjusted the criteria of existing schemes to address short term key issues such as cash flow. The BFI also contrib-utes to The Film and TV Emergency Relief Fund financed largely by donations from the industry.
Sources: British Film Institute (BFI), DCM, Screen International, Comscore, OBS
Original titleCountry of origin Director
Distributor Admissions e
1 Avengers: Endgame US Anthony & Joe Russo Walt Disney 12 250 3832 The Lion King US/GB Jon Favreau Walt Disney 10 490 9213 Toy Story 4 US Josh Cooley Walt Disney 9 142 3774 Joker US Todd Phillips Warner Bros. 8 002 0525 Frozen 2 US Chris Buck, Jennifer Lee Walt Disney 6 694 7316 Star Wars: Episode IX - The Rise of… US J.J. Abrams Walt Disney 6 475 9437 Captain Marvel US Anna Boden, Ryan Fleck Walt Disney 5 449 4788 Aladdin US Guy Ritchie Walt Disney 5 139 1129 Spider-Man: Far from Home US Jon Watts Sony Pictures 5 116 572
10 Downton Abbey GB/US Michael Engler Universal Pictures 3 891 35511 Jumanji: The Next Level US Jake Kasdan Sony Pictures 3 506 70812 Dumbo US/GB/AU/CA Tim Burton Walt Disney 3 472 58513 Rocketman GB INC/US Dexter Fletcher Paramount 3 226 44214 Once Upon a Time... in Hollywood US/CN/GB Quentin Tarantino Sony Pictures 2 941 06915 Fast & Furious Presents: Hobbs &… US/JP David Leitch Universal Pictures 2 825 29516 How to Train Your Dragon: The… US/JP Dean DeBlois Universal Pictures 2 738 74117 The Secret Life of Pets 2 US/FR/JP C. Renaud, J. del Val Universal Pictures 2 710 06518 It Chapter Two US/CA Andy Muschietti Warner Bros. 2 613 05619 The Lego Movie 2: The Second Part US/DK/NO/AU Mike Mitchell Warner Bros. 2 588 53920 Last Christmas GB/US Paul Feig Universal Pictures 2 472 215
Source: BFI, Comscore
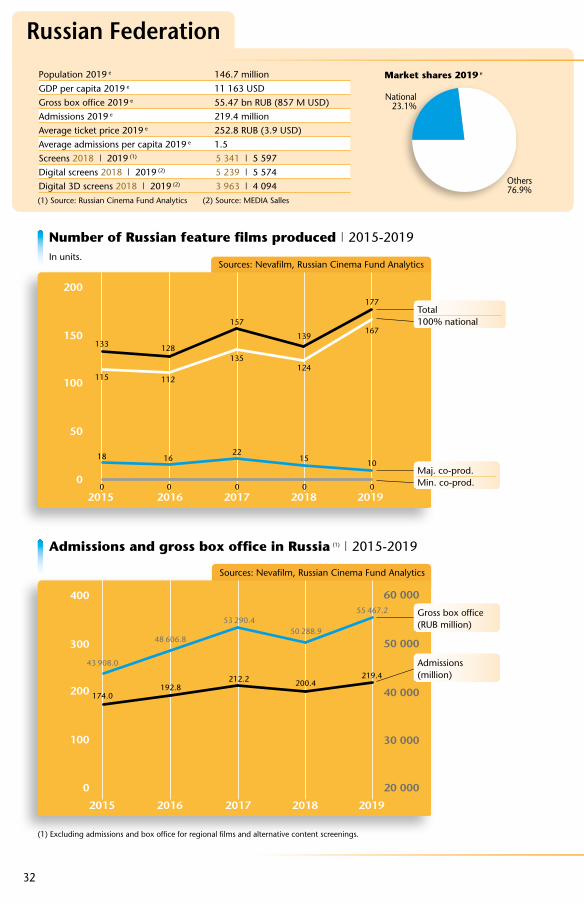
32
Russian Federation
Population 2019 e 146.7 millionGDP per capita 2019 e 11 163 USDGross box office 2019 e 55.47 bn RUB (857 M USD)Admissions 2019 e 219.4 millionAverage ticket price 2019 e 252.8 RUB (3.9 USD)Average admissions per capita 2019 e 1.5Screens 2018 | 2019 (1) 5 341 | 5 597Digital screens 2018 | 2019 (2) 5 239 | 5 574Digital 3D screens 2018 | 2019 (2) 3 963 | 4 094
Admissions and gross box office in Russia (1) | 2015-2019
0
400
300
100
200
2015 2016 2017 2018 2019
20 000
60 000
40 000
50 000
30 000
43 908.0
48 606.8
53 290.450 288.9
55 467.2
174.0192.8
212.2 200.4219.4
Sources: Nevafilm, Russian Cinema Fund Analytics
Number of Russian feature films produced | 2015-2019In units.
Market shares 2019 e
0
200
150
100
50
2015 2016 2017 2018 2019
133
115
18
0 0 0 0 0
128
112
16
157
135
22
139
124
15
177
167
10
Sources: Nevafilm, Russian Cinema Fund Analytics
(1) Source: Russian Cinema Fund Analytics (2) Source: MEDIA Salles
Maj. co-prod.Min. co-prod.
Others76.9%
National23.1%
Gross box office (RUB million)
Admissions (million)
Total100% national
(1) Excluding admissions and box office for regional films and alternative content screenings.

33
Russian Federation
Top 20 films by admissions in the Russian Federation (1) | 2019
Source: Russian Cinema Fund Analytics
Distribution and exhibitionRussian box office bounced back in 2019 after
the FIFA World Cup related dip in 2018. Cinema attendance jumped by 9.5% to a record 219 mil-lion, confirming Russia´s position as Europe’s largest market in terms of admissions for the third consecutive year. GBO increased by 10.3% to RUB 55.5 billion. This is the highest box office result measured in local currency in Russia’s recent history. Measured in US dollars however, GBO continues to be well below the levels observed between 2010 and 2014. As in other European markets box office growth was driven primarily by the strong performance of US blockbusters. After growing for several years, market share for Russian films declined from a record 28.9% to 23.1% in 2019, still the third highest level in recent years. A total of three Russian films featured among the top 20 in 2019, compared to five films in 2018: War action film T-34 (8.8 million) followed by the latest instalments of two local comedy franchises Christmas Trees. Final (3.6 million) and Policeman VIP (3.0 million)
The COVID-19 crisis reached Russia slightly later than other European countries and Russian cinemas were the last ones to close following an official Government decree on 25 March. Mid-July was announced as a potential date for reopening cinemas. As elsewhere in Europe, several drive-in cinemas have been opened in the meantime. GBO takings from January to May 24 were estimated
to have dropped by 34% compared to the same period in 2019.
Production and funding
Russian film production levels – including regional films – grew to a new record high, increasing from 139 in 2018 to 177 feature film releases in 2019. This is the highest level regis-tered in recent history. Public support for the pro-duction and distribution of Russian films comes from the National Cinema Fund which focuses on films with larger commercial potential, and the Ministry of Culture. In addition, Russian tycoon Roman Abramovich’s private film fund Kinoprime became operational in 2019, boasting a budget of USD 100 million for the period 2019 to 2021. The Fund supports both mainstream and arthouse Russian titles as well as international and English-language projects with a Russian flavour.
At the time of writing the Russian Cinema Fund has extended application deadlines for several of its support schemes but in contrast to most other European markets, no sector specific support measures could be identified. The film industry was however listed as one of the economic sec-tors most affected by the COVID-19 crisis in a government resolution.
Sources: Russian Cinema Fund Analytics, UNIC, Screen International, OBS
Original titleCountry of origin Director Distributor Admissions e
1 The Lion King US/GB Jon Favreau Walt Disney/Sony 10 860 7752 T-34 RU Aleksey Sidorov Central Partnership 8 771 3423 Avengers: Endgame US Anthony & Joe Russo Walt Disney/Sony 8 703 6694 Maleficent: Mistress of Evil US/GB/CA Joachim Rønning Walt Disney/Sony 7 623 5455 How to Train Your Dragon: The… US/JP Dean DeBlois UPI 7 239 7176 The Secret Life of Pets 2 US/FR/JP C. Renaud, J. del Val UPI 6 889 6347 Frozen 2 US C. Buck, J. Lee Walt Disney/Sony 6 858 0638 Joker US Todd Phillips Caro Premier 6 814 9449 Aladdin US Guy Ritchie Walt Disney/Sony 4 914 327
10 Spider-Man: Far from Home US Jon Watts Walt Disney/Sony 4 764 06011 It Chapter Two US/CA Andy Muschietti Caro Premier 4 238 90112 Captain Marvel US A. Boden, R. Fleck Walt Disney/Sony 4 085 70513 Fast & Furious Presents: Hobbs &… US/JP David Leitch UPI 4 024 70114 Once Upon a Time... in Hollywood US/CN Quentin Tarantino Walt Disney/Sony 3 872 00515 Politseyskiy s Rublyovki… RU Ilya Kulikov Caroprokat 3 634 05616 The Addams Family US/CA G. Tiernan, C. Vernon UPI 3 353 32117 Abominable US/CN/JP J. Culton, T. Wilderman UPI 3 155 27818 Jumanji: The Next Level US Jake Kasdan Walt Disney/Sony 3 007 12319 Politseyskiy s Rublyovki… 2 RU Ilya Kulikov Central Partnership 2 998 17220 Alita: Battle Angel US/CA/JP Robert Rodriguez 20 Cent. Fox - CIS 2 612 167

34
Poland
Distribution and exhibition
2019 was another strong year for the Polish film industry. Cinema attendance continued to grow for the sixth year in a row and reached a record high of 60.6 million admissions, up 1.5% from 2018. This is the highest level since 1989. GBO takings surpassed the PLN 1 billion barrier for the third consecutive year, increasing by 1.8% to PLN 1.14 billion (USD 298 million) as the average ticket price remained stable at PLN 18.9 (USD 4.9). In contrast to 2018 when the surge in cinema attendance was driven by national films, it was the strong performance of US titles which nudged Polish box office to its new record high. While not matching 2018 record levels Polish films continued to perform well. Led by comedy sequel Miszmasz czyli Kogel Mogel 3 and political drama Polityka a total of four Polish films featured among the top 10 films and national market share reached 28.2% in 2019, the second highest level since 2011.
In response to the COVID-19 crisis, the Polish government decided to close all cinemas from 12 March onwards with a potential reopening of venues planned for June 6.
Production and funding
While no reliable production figures could be identified for Poland in 2019, it is assumed that the level of production remained comparable to the level observed in 2018 when 42 films were produced. Film production was set to resume on 18 May as Poland relaxes its lockdown measures in response to the COVID-19 crisis.
Film production in Poland is publicly supported by the Polish Film Institute (PISF) as well as a net-work of 12 regional funds. In an effort to increase production activity in the country, Poland intro-duced a 30% cash rebate at the start of 2019 and supported 26 projects with about USD 13 million in its first year. Mitigating the effects of the COVID-19 pandemic, the PISF established a crisis team to develop support measures for the film industry which include changes in operational programs to support financial liquidity, grants for filmmakers and artists, changes in the Cinematography Act and the Act on financial support for audiovisual production and bank loans available for cinemas.
Sources: Polish Film Institute (PISF), UNIC, Cineuropa, Screen International, OBS
(1) Sources: Polski Instytut Sztuki Filmowej (PISF), OBS (2) Source: MEDIA Salles
Population 2019 e 38.0 millionGDP per capita 2019 e 14 902 USDGross box office 2019 e 1.1 bn PLN (298.1 M USD)Admissions 2019 e 60.6 millionAverage ticket price 2019 e 18.9 PLN (4.9 USD)Average admissions per capita 2019 e 1.6Screens 2018 | 2019 (1) 1 338 | 1 360Digital screens 2018 | 2019 (2) 1 270 | 1 300Digital 3D screens 2018 | 2019 (2) 720 | 720National films produced 2018 | 2019 42 | >40
Others71.8%
National28.2%
Market shares 2019 e
Top 10 films by admissions in Poland | 2019
Original titleCountry of origin Director Distributor
Admissions (in million)
1 The Lion King US/GB Jon Favreau Walt Disney 2.522 Frozen 2 US Chris Buck, Jennifer Lee Walt Disney 2.463 Miszmasz czyli Kogel Mogel 3 PL Kordian Piwowarski Next Film 2.394 Joker US Todd Phillips Warner Bros. 1.965 Polityka PL Patryk Vega Kino Swiat 1.896 Avengers: Endgame US Anthony Russo, Joe Russo Walt Disney 1.887 The Secret Life of Pets 2 US/FR/JP Chris Renaud, J. del Val UIP 1.458 Planeta Singli 3 PL Sam Akina, Michal Chacinski Kino Swiat 1.449 Boze Ciało (Corpus Christi) PL/FR Jan Komasa Kino Swiat 1.40
10 How to Train Your Dragon: The Hidden World US/JP Dean DeBlois UIP 1.27Sources: FILMNEWEUROPE, Box Office Mojo, OBS
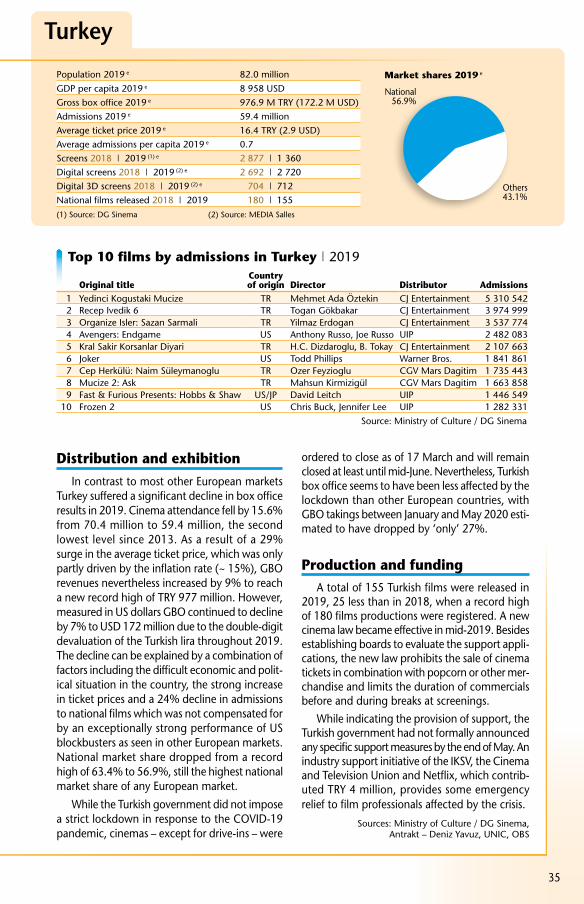
35
Turkey
Population 2019 e 82.0 millionGDP per capita 2019 e 8 958 USDGross box office 2019 e 976.9 M TRY (172.2 M USD)Admissions 2019 e 59.4 millionAverage ticket price 2019 e 16.4 TRY (2.9 USD)Average admissions per capita 2019 e 0.7Screens 2018 | 2019 (1) e 2 877 | 1 360Digital screens 2018 | 2019 (2) e 2 692 | 2 720Digital 3D screens 2018 | 2019 (2) e 704 | 712National films released 2018 | 2019 180 | 155
Market shares 2019 e
(1) Source: DG Sinema (2) Source: MEDIA Salles
Others43.1%
National56.9%
Source: Ministry of Culture / DG Sinema
Distribution and exhibitionIn contrast to most other European markets
Turkey suffered a significant decline in box office results in 2019. Cinema attendance fell by 15.6% from 70.4 million to 59.4 million, the second lowest level since 2013. As a result of a 29% surge in the average ticket price, which was only partly driven by the inflation rate (~ 15%), GBO revenues never theless increased by 9% to reach a new record high of TRY 977 million. However, measured in US dollars GBO continued to decline by 7% to USD 172 million due to the double-digit devaluation of the Turkish lira throughout 2019. The decline can be explained by a combination of factors including the difficult economic and polit-ical situation in the country, the strong increase in ticket prices and a 24% decline in admissions to national films which was not compensated for by an exceptionally strong performance of US blockbusters as seen in other European markets. National market share dropped from a record high of 63.4% to 56.9%, still the highest national market share of any European market.
While the Turkish government did not impose a strict lockdown in response to the COVID-19 pandemic, cinemas – except for drive-ins – were
ordered to close as of 17 March and will remain closed at least until mid-June. Nevertheless, Turkish box office seems to have been less affected by the lockdown than other European countries, with GBO takings between January and May 2020 esti-mated to have dropped by ‘only’ 27%.
Production and fundingA total of 155 Turkish films were released in
2019, 25 less than in 2018, when a record high of 180 films productions were registered. A new cinema law became effective in mid-2019. Besides establishing boards to evaluate the support appli-cations, the new law prohibits the sale of cinema tickets in combination with popcorn or other mer-chandise and limits the duration of commercials before and during breaks at screenings.
While indicating the provision of support, the Turkish government had not formally announced any specific support measures by the end of May. An industry support initiative of the IKSV, the Cinema and Television Union and Netflix, which contrib-uted TRY 4 million, provides some emergency relief to film professionals affected by the crisis.
Sources: Ministry of Culture / DG Sinema, Antrakt – Deniz Yavuz, UNIC, OBS
Top 10 films by admissions in Turkey | 2019
Original titleCountry of origin Director
Distributor Admissions
1 Yedinci Kogustaki Mucize TR Mehmet Ada Öztekin CJ Entertainment 5 310 5422 Recep Ivedik 6 TR Togan Gökbakar CJ Entertainment 3 974 9993 Organize Isler: Sazan Sarmali TR Yilmaz Erdogan CJ Entertainment 3 537 7744 Avengers: Endgame US Anthony Russo, Joe Russo UIP 2 482 0835 Kral Sakir Korsanlar Diyari TR H.C. Dizdaroglu, B. Tokay CJ Entertainment 2 107 6636 Joker US Todd Phillips Warner Bros. 1 841 8617 Cep Herkülü: Naim Süleymanoglu TR Ozer Feyzioglu CGV Mars Dagitim 1 735 4438 Mucize 2: Ask TR Mahsun Kirmizigül CGV Mars Dagitim 1 663 8589 Fast & Furious Presents: Hobbs & Shaw US/JP David Leitch UIP 1 446 549
10 Frozen 2 US Chris Buck, Jennifer Lee UIP 1 282 331

36
Other Western Europe
(1) In units. Including minority co-produc-tions and feature documentaries.
Admissions in selected Western European countries | 2015-2019In millions.
0
40
20
30
10
2015 2016 2017 2018 2019
33.0
21.1
15.2
14.4
9.8
34.2
19.4
15.8
13.4
10.0
36.0
19.6
16.7
13.5
10.1
35.7
18.8
15.8
11.7
9.4
38.0
19.5
15.1
12.5
9.6
Sources: OFI /SPF Economie, Cinedata, VAF, CFWB / Screen Ireland, CSA / GFC / NFF, MaccsBox - NVB & NVF / ICA / OFS / OBS
Number of feature films produced by selected Western European countries (1) | 2015-2019In units.
0
150
60
30
120
90
2015 2016 2017 2018 2019
109
82
73
4032
30
81
46
29
27
8286
44
27
26
44
26
30
89 86
75
51
34
20
97
70
109
123130
115
Sources: OFI / CFWB-VAF / Screen Ireland / GFC / NFF / ICA / OFS /OBS
SwitzerlandThe NetherlandsBelgium
(1) National data source (2) Source: MEDIA Salles (3) 2018
AustriaPortugalGreeceIreland
Austria Belgium Greece Ireland Netherlands Portugal Switzerland
Population 2019 e (million) 8.9 11.5 10.7 4.9 17.3 10.3 8.5GDP per capita 2019 e (USD) 50 023 45 176 19 974 31 431 52 368 23 031 83 717Gross box office 2019 (M USD) 145.0 191.4 68.2 134.0 389.1 93.0 194.6Admissions 2019 (million) 13.7 19.5 9.6 15.1 38.0 15.5 12.5Average ticket price 2019 (USD) 10.6 9.8 7.1 8.9 10.2 6.0 15.6Average admissions per capita 2019 1.5 1.7 0.9 3.1 2.2 1.5 1.5Screens 2019 e (1) 577 (3) 495 547 463 (3) 987 583 605Digital screens 2019 (2) 576 503 460 543 985 527 596Digital 3D screens 2019 (2) 347 180 160 267 530 254 313National market shares 2019 e 3.1% 8.0% 5.3% 1.7% 11.7% 4.5% 6.7%
The Netherlands
Belgium e
Portugal IrelandAustriaSwitzerlandGreece

37
Other Western Europe
Top 10 films by admissions in the Netherlands | 2019
Top 10 films by admissions in Portugal | 2019
Top 10 films by admissions in Belgium | 2019
Top 10 films by admissions in Austria | 2019
Sources: MaccsBox - NVB & NVF
Sources: Austrian Film Institute (OFI) / Comscore
Sources: CFWB, VAF, Cinedata
Source: ICA
Original titleCountry of origin Director Distributor Admissions
1 The Lion King US/GB Jon Favreau Walt Disney 3 077 5862 Avengers: Endgame US Anthony Russo, Joe Russo Walt Disney 1 205 4103 Joker US Todd Phillips Warner Bros. 1 157 1594 Bohemian Rhapsody GB INC/US Bryan Singer Warner Bros. 1 081 2105 Frozen 2 US Chris Buck, Jennifer Lee Walt Disney 1 032 3276 Aladdin US Guy Ritchie Walt Disney 982 3087 The Secret Life of Pets 2 US/FR/JP C. Renaud, J. del Val UPI 701 6348 Once Upon a Time... in Hollywood US/CN/GB Quentin Tarantino UPI 643 6599 The Queen's Corgi BE/US V. Kesteloot, Ben Stassen Independent Films 636 851
10 Spider-Man: Far from Home US Jon Watts UPI 632 307
Original titleCountry of origin Director Distributor Admissions
1 The Lion King US/GB Jon Favreau Walt Disney 1 329 5042 Frozen 2 US Chris Buck, Jennifer Lee Walt Disney 766 5493 Joker US Todd Phillips Warner Bros. 726 7214 Avengers: Endgame US Anthony Russo, Joe Russo Walt Disney 669 7185 Aladdin US Guy Ritchie Walt Disney 471 8906 Toy Story 4 US Josh Cooley Walt Disney 405 9097 Dumbo US/GB/AU/CA Tim Burton Walt Disney 377 6788 Star Wars: Episode IX - The Rise… US J.J. Abrams Walt Disney 368 3669 Fast & Furious Presents: Hobbs… US/JP David Leitch Sony Pictures 334 357
10 F.C. De Kampioenen 4: Viva Boma! BE Jan Verheyen Indep. Films Dist. 330 978
Original titleCountry of origin Director Distributor Admissions
1 The Lion King US/GB Jon Favreau NOS Luso. Audio. 1 280 7432 Joker US Todd Phillips NOS Luso. Audio. 900 9343 Avengers: Endgame US Anthony Russo, Joe Russo NOS Luso. Audio. 670 5864 Frozen 2 US Chris Buck, Jennifer Lee NOS Luso. Audio. 580 1665 Toy Story 4 US Josh Cooley NOS Luso. Audio. 400 1866 Spider-Man: Far from Home US Jon Watts Big Picture 2 Films 334 6957 Dumbo US/GB/AU/CA Tim Burton NOS Luso. Audio. 295 7188 Aladdin US Guy Ritchie NOS Luso. Audio. 293 7699 Captain Marvel US Anna Boden, Ryan Fleck NOS Luso. Audio. 288 002
10 Once Upon a Time... in Hollywood US/CN/GB Quentin Tarantino Big Picture 2 Films 281 411
Original titleCountry of origin Director Distributor Admissions
1 The Lion King US/GB Jon Favreau Walt Disney 839 7032 Frozen 2 US Chris Buck, Jennifer Lee Walt Disney 623 6663 Avengers: Endgame US Anthony Russo, Joe Russo Walt Disney 611 6354 Joker US Todd Phillips Warner Bros. 543 3125 Das perfekte Geheimnis DE Bora Dagtekin Constantin Film 461 1266 Star Wars: Episode IX - The Rise… US J.J. Abrams Walt Disney 339 3627 The Secret Life of Pets 2 US/FR/JP C. Renaud, J. del Val Universal Pictures 307 9958 Captain Marvel US Anna Boden, Ryan Fleck Walt Disney 283 5889 How to Train Your Dragon: The… US/JP Dean DeBlois Universal Pictures 262 280
10 Aladdin US Guy Ritchie Walt Disney 259 352
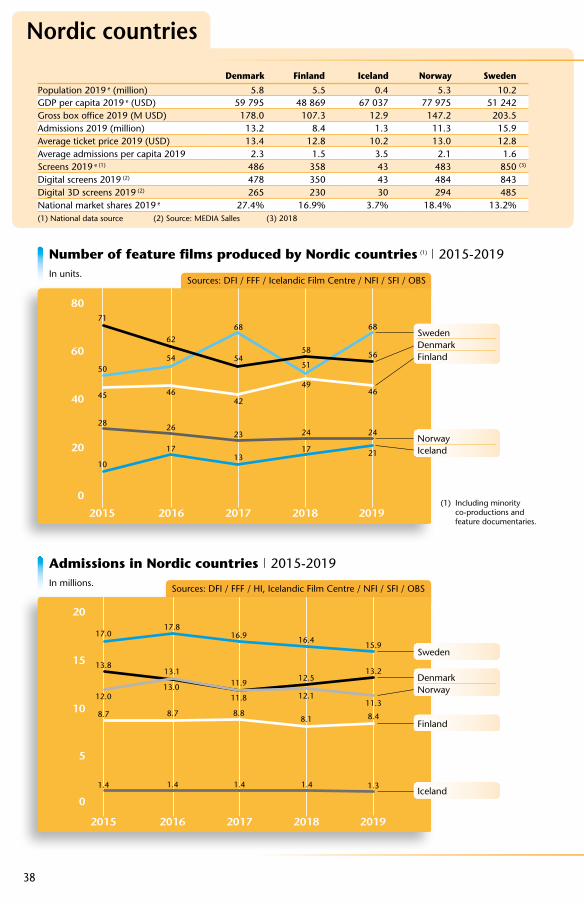
38
Nordic countries
(1) Including minority co-productions and feature documentaries.
Admissions in Nordic countries | 2015-2019In millions.
0
20
10
15
5
2015 2016 2017 2018 2019
13.8
17.0
12.0
8.7
1.4
13.1
17.8
13.0
8.7
1.4 1.4 1.4 1.3
11.9
16.9
11.8
8.8
12.5
16.4
12.1
8.1
13.2
15.9
11.3
8.4
Sources: DFI / FFF / HI, Icelandic Film Centre / NFI / SFI / OBS
Denmark Finland Iceland Norway Sweden
Population 2019 e (million) 5.8 5.5 0.4 5.3 10.2GDP per capita 2019 e (USD) 59 795 48 869 67 037 77 975 51 242Gross box office 2019 (M USD) 178.0 107.3 12.9 147.2 203.5Admissions 2019 (million) 13.2 8.4 1.3 11.3 15.9Average ticket price 2019 (USD) 13.4 12.8 10.2 13.0 12.8Average admissions per capita 2019 2.3 1.5 3.5 2.1 1.6Screens 2019 e (1) 486 358 43 483 850 (3)
Digital screens 2019 (2) 478 350 43 484 843Digital 3D screens 2019 (2) 265 230 30 294 485National market shares 2019 e 27.4% 16.9% 3.7% 18.4% 13.2%
Number of feature films produced by Nordic countries (1) | 2015-2019In units.
0
80
60
40
20
2015 2016 2017 2018 2019
71
50
45
28
10
62
54
46
26
17
54
42
23
13
68
58
51
49
24 24
17
56
46
21
68
Sources: DFI / FFF / Icelandic Film Centre / NFI / SFI / OBS
Sweden
Iceland
Finland
(1) National data source (2) Source: MEDIA Salles (3) 2018
DenmarkNorway
NorwayIceland
Sweden DenmarkFinland

39
Nordic countries
Top 10 films by admissions in Sweden | 2019
Top 10 films by admissions in Norway | 2019
Top 10 films by admissions in Denmark | 2019
Top 10 films by admissions in Finland | 2019
Source: OBS/LUMIERE, Comscore
Source: Film og Kino
Source: Danmark Statistics / DFI
Source: Finnish Film Foundation(1) Nordisk Film Theatrical Distribution
Original titleCountry of origin Director Distributor Admissions
1 The Lion King US/GB Jon Favreau Walt Disney 1 120 3212 Avengers: Endgame US Anthony Russo, Joe Russo Walt Disney 769 8173 Joker US Todd Phillips Svensk Filmindustri 654 8784 Frozen 2 US Chris Buck, Jennifer Lee Walt Disney 573 1845 Star Wars: Episode IX - The Rise of… US J.J. Abrams Walt Disney 550 6036 Ralph Breaks the Internet US Phil Johnston, Rich Moore Walt Disney 357 5887 Aladdin US Guy Ritchie Walt Disney 357 1418 How to Train Your Dragon: The… US/JP Dean DeBlois UIP/Universal 355 9329 Once Upon a Time... in Hollywood US/CN Quentin Tarantino Svensk Filmindustri 332 245
10 Captain Marvel US Anna Boden, Ryan Fleck Walt Disney 328 390
Original titleCountry of origin Director Distributor Admissions
1 Ternet ninja (Cleckered Ninja) DK Christoffersen, Matthesen Nordisk Film Distr. 621 4632 Avengers: Endgame US Anthony Russo, Joe Russo Walt Disney 574 2483 Joker US Todd Phillips SF Studios 515 6604 The Lion King US/GB Jon Favreau Walt Disney 512 2315 Jagtsæson (Hunting Season) DK Tilde Harkamp Nordisk Film Distr. 473 6226 Ser du månen, Daniel (Daniel) DK/NO/SE N. Oplev, A. Berthelsen Nordisk Film Distr. 472 5597 Frozen 2 US Chris Buck, Jennifer Lee Walt Disney 417 5978 Green Book US/CN Peter Farrelly Nordisk Film Distr. 415 3399 A Star Is Born US Bradley Cooper SF Studios 371 893
10 Dronningen (Queen Of Hearts) DK/SE May el-Toukhy Nordisk Film Distr. 333 486
Original titleCountry of origin Director Distributor Admissions
1 The Lion King US/GB Jon Favreau Walt Disney 618 1842 Avengers: Endgame US Anthony Russo, Joe Russo Walt Disney 520 1513 Joker US Todd Phillips SF Norway 446 8294 Snekker Andersen og den vesle… NO Andrea Eckerbom Nordisk Film Distr. 415 4365 Frozen 2 US Chris Buck, Jennifer Lee Walt Disney 387 7706 Star Wars: Episode IX - The Rise of… US J.J. Abrams Walt Disney 295 9597 Once Upon a Time... in Hollywood US/CN/GB Quentin Tarantino SF Norway 270 5178 Askeladden - I Soria Moria slott NO Mikkel Brænne Sandemose Nordisk Film Distr. 257 9929 Kaptein Sabeltann og den magiske… NO M. Aune, R. Sivertsen Nordisk Film Distr. 250 141
10 Ralph Breaks the Internet US Phil Johnston, Rich Moore Walt Disney 249 151
Original titleCountry of origin Director Distributor Admissions
1 Joker US Todd Phillips SF Film Finland 402 8922 Avengers: Endgame US Anthony Russo, Joe Russo Walt Disney 342 8933 The Lion King US/GB Jon Favreau Walt Disney 333 2394 Star Wars: Episode IX - The Rise of… US J.J. Abrams Walt Disney 293 8495 Risto Räppääjä ja pullistelija FI Markus Lehmusruusu Nordisk Film… (1) 288 3056 Frozen 2 US Chris Buck, Jennifer Lee Walt Disney 256 0327 Downton Abbey GB/US Michael Engler Finnkino 229 7218 The Secret Life of Pets 2 US/FR/JP C. Renaud, J. del Val Finnkino 226 4889 Once Upon a Time... in Hollywood US/CN/GB Quentin Tarantino SF Film Finland 216 938
10 Aladdin US Guy Ritchie Walt Disney 201 350

40
Baltics and Central Europe
Top 10 films by admissions in Slovakia | 2019
Top 10 films by admissions in the Czech Republic | 2019
Top 10 films by admissions in Lithuania | 2019
Source: Slovak Film Institute / UFD
Source: Czech Film Fund / Unie Filmovvych Distributoru
Source: Lithuanian Film Centre(1) Theatrical Film Distribution/WDSMPI
(1) National data source (2) Source: MEDIA Salles (3) 2018 data
Original titleCountry of origin Director Distributor Admissions
1 Zeny v behu (Women On The Run) CZ Martin Horský CinemArt 1 543 8422 Avengers: Endgame US Anthony & Joe Russo Falcon 935 9153 Bohemian Rhapsody GB INC/US Bryan Singer CinemArt 758 0764 Frozen 2 US Chris Buck, Jennifer Lee Falcon 749 7845 How to Train Your Dragon: The… US/JP Dean DeBlois CinemArt 636 1626 Joker US Todd Phillips Vertical Entertainment 514 6427 Poslední aristokratka CZ/SK Jirí Vejdelek Falcon 468 4168 Once Upon a Time... in Hollywood US/CN/GB Quentin Tarantino Falcon 441 9419 The Lion King US/GB Jon Favreau Falcon 437 361
10 Spider-Man: Far from Home US Jon Watts Falcon 421 922
Original titleCountry of origin Director Distributor Admissions
1 Avengers: Endgame US Anthony & Joe Russo Saturn Entertainment 278 3012 Trhlina SK Peter Bebjak Continental Film 262 5883 How to Train Your Dragon: The… US/JP Dean DeBlois CinemaArt 252 1024 Frozen 2 US Chris Buck, Jennifer Lee Saturn Entertainment 238 4285 Stastny novy rok SK/CZ Jakub Kroner Continental Film 201 8586 The Lion King US/GB Jon Favreau Saturn Entertainment 195 9347 Joker US Todd Phillips Continental Film 189 9268 The Secret Life of Pets 2 US/FR/JP C. Renaud, J. del Val CinemaArt 179 0819 Spider-Man: Far from Home US Jon Watts Itafilm 135 267
10 Zeny v behu (Women On The Run) CZ Martin Horský CinemaArt 131 727
Original titleCountry of origin Director Distributor Admissions
1 Pats Sau Milijonierius (Fake Millionaire) LT Tadas Vidmantas Stambus planas 204 8602 Joker US Todd Phillips ACME/Warner Bros. 155 9863 The Lion King US/GB Jon Favreau Theatrical Film… (1) 154 3634 How to Train Your Dragon: The… US/JP Dean DeBlois NCG Distr./Universal 134 2185 Ir visi ju vyrai (And All Their Men) LT Donatas Ulvydas Acme 121 1236 The Secret Life of Pets 2 US/FR/JP C. Renaud, J. del Val NCG Distr./Universal 111 3077 Frozen 2 US Chris Buck, Jennifer Lee Theatrical Film… (1) 99 7848 Avengers: Endgame US Anthony & Joe Russo Theatrical Film… (1) 92 5239 Pasmerkti. Kauno Romanas LT Ramunas Rudokas Singing Fish 88 763
10 Once Upon a Time... in Hollywood US/CN/GB Quentin Tarantino ACME/Sony 76 044
Czech Republic Estonia Hungary (3) Latvia Lithuania Slovenia SlovakiaPopulation 2019 e (million) 10.6 1.3 9.8 1.9 2.8 2.1 5.5GDP per capita 2019 e (USD) 23 214 23 524 17 463 18 172 19 267 26 170 19 548Gross box office 2019 (M USD) 114.2 24.4 78.3 16.8 25.2 14.1 41.7Admissions 2019 (million) 18.3 3.7 15.5 2.7 4.2 2.4 6.5Average ticket price 2019 (USD) 6.2 6.6 5.1 6.2 6.1 5.8 6.4Average admissions per capita 2019 1.7 2.8 1.6 1.4 1.5 1.2 1.2Screens 2019 e (1) 813 74 372 81 82 0 271Digital screens 2019 (2) 533 89 332 74 62 97 197Digital 3D screens 2019 (2) 300 44 194 37 30 44 101Films produced 2019 88 27 18 37 25 31 44National market shares 2019 e 26.5% 23.0% 6.9% 20.2% 19.2% 6.6% 16.5%
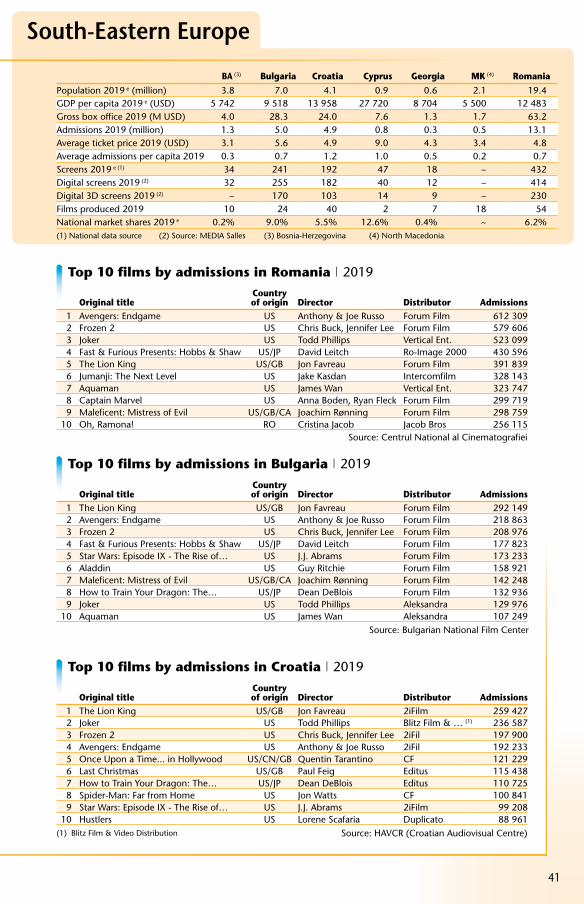
41
South-Eastern Europe
Top 10 films by admissions in Bulgaria | 2019
Top 10 films by admissions in Romania | 2019
Top 10 films by admissions in Croatia | 2019
Source: Bulgarian National Film Center
Source: Centrul National al Cinematografiei
Source: HAVCR (Croatian Audiovisual Centre)(1) Blitz Film & Video Distribution
Original titleCountry of origin Director Distributor Admissions
1 Avengers: Endgame US Anthony & Joe Russo Forum Film 612 3092 Frozen 2 US Chris Buck, Jennifer Lee Forum Film 579 6063 Joker US Todd Phillips Vertical Ent. 523 0994 Fast & Furious Presents: Hobbs & Shaw US/JP David Leitch Ro-Image 2000 430 5965 The Lion King US/GB Jon Favreau Forum Film 391 8396 Jumanji: The Next Level US Jake Kasdan Intercomfilm 328 1437 Aquaman US James Wan Vertical Ent. 323 7478 Captain Marvel US Anna Boden, Ryan Fleck Forum Film 299 7199 Maleficent: Mistress of Evil US/GB/CA Joachim Rønning Forum Film 298 759
10 Oh, Ramona! RO Cristina Jacob Jacob Bros 256 115
Original titleCountry of origin Director Distributor Admissions
1 The Lion King US/GB Jon Favreau Forum Film 292 1492 Avengers: Endgame US Anthony & Joe Russo Forum Film 218 8633 Frozen 2 US Chris Buck, Jennifer Lee Forum Film 208 9764 Fast & Furious Presents: Hobbs & Shaw US/JP David Leitch Forum Film 177 8235 Star Wars: Episode IX - The Rise of… US J.J. Abrams Forum Film 173 2336 Aladdin US Guy Ritchie Forum Film 158 9217 Maleficent: Mistress of Evil US/GB/CA Joachim Rønning Forum Film 142 2488 How to Train Your Dragon: The… US/JP Dean DeBlois Forum Film 132 9369 Joker US Todd Phillips Aleksandra 129 976
10 Aquaman US James Wan Aleksandra 107 249
Original titleCountry of origin Director Distributor Admissions
1 The Lion King US/GB Jon Favreau 2iFilm 259 4272 Joker US Todd Phillips Blitz Film & … (1) 236 5873 Frozen 2 US Chris Buck, Jennifer Lee 2iFil 197 9004 Avengers: Endgame US Anthony & Joe Russo 2iFil 192 2335 Once Upon a Time... in Hollywood US/CN/GB Quentin Tarantino CF 121 2296 Last Christmas US/GB Paul Feig Editus 115 4387 How to Train Your Dragon: The… US/JP Dean DeBlois Editus 110 7258 Spider-Man: Far from Home US Jon Watts CF 100 8419 Star Wars: Episode IX - The Rise of… US J.J. Abrams 2iFilm 99 208
10 Hustlers US Lorene Scafaria Duplicato 88 961
BA (3) Bulgaria Croatia Cyprus Georgia MK (4) RomaniaPopulation 2019 e (million) 3.8 7.0 4.1 0.9 0.6 2.1 19.4GDP per capita 2019 e (USD) 5 742 9 518 13 958 27 720 8 704 5 500 12 483Gross box office 2019 (M USD) 4.0 28.3 24.0 7.6 1.3 1.7 63.2Admissions 2019 (million) 1.3 5.0 4.9 0.8 0.3 0.5 13.1Average ticket price 2019 (USD) 3.1 5.6 4.9 9.0 4.3 3.4 4.8Average admissions per capita 2019 0.3 0.7 1.2 1.0 0.5 0.2 0.7Screens 2019 e (1) 34 241 192 47 18 ~ 432Digital screens 2019 (2) 32 255 182 40 12 ~ 414Digital 3D screens 2019 (2) ~ 170 103 14 9 ~ 230Films produced 2019 10 24 40 2 7 18 54National market shares 2019 e 0.2% 9.0% 5.5% 12.6% 0.4% ~ 6.2%(1) National data source (2) Source: MEDIA Salles (3) Bosnia-Herzegovina (4) North Macedonia
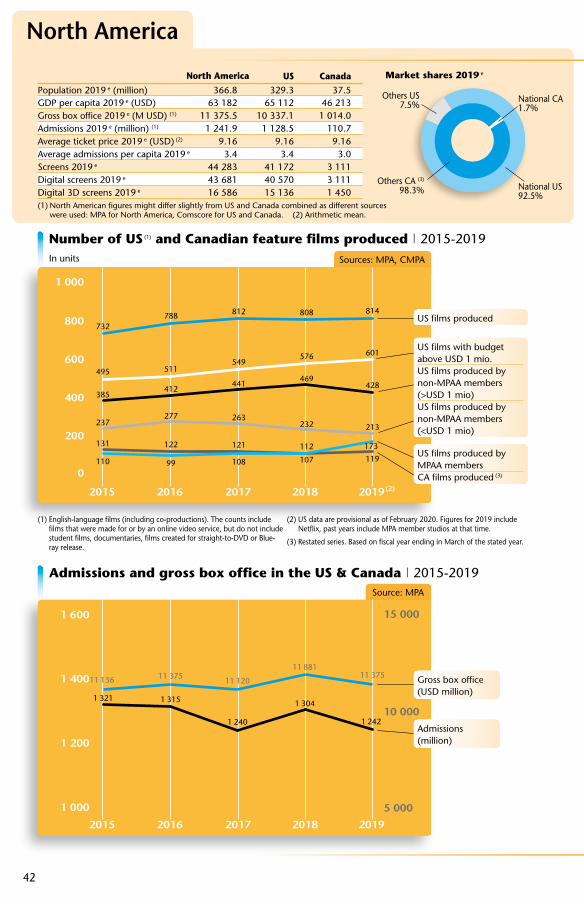
42
North America
Market shares 2019 e
Admissions and gross box office in the US & Canada | 2015-2019
1 600
1 400
1 000
1 200
2015 2016 2017 2018 2019
10 000
5 000
15 000
11 136
1 321
11 375
1 315
11 120
1 240
11 881
1 304
11 375
1 242
Source: MPA
Number of US (1) and Canadian feature films produced | 2015-2019In units
0
400
200
1 000
800
600
2015 2016 2017 2018 2019
732
495
385
237
110
131
788
511
412
277
122
99
812
549
441
263
121
108
808
576
469
232
112
107
814
601
428
213
173
119
(2)
Sources: MPA, CMPA
Others US 7.5%
Others CA (3) 98.3% National US
92.5%
National CA 1.7%
Admissions (million)
Gross box office (USD million)
US films produced
(1) English-language films (including co-productions). The counts include films that were made for or by an online video service, but do not include student films, documentaries, films created for straight-to-DVD or Blue-ray release.
(2) US data are provisional as of February 2020. Figures for 2019 include Netflix, past years include MPA member studios at that time.
(3) Restated series. Based on fiscal year ending in March of the stated year.
US films with budget above USD 1 mio.US films produced by non-MPAA members (>USD 1 mio)US films produced by non-MPAA members (<USD 1 mio)
US films produced by MPAA membersCA films produced (3)
North America US CanadaPopulation 2019 e (million) 366.8 329.3 37.5 GDP per capita 2019 e (USD) 63 182 65 112 46 213 Gross box office 2019 e (M USD) (1) 11 375.5 10 337.1 1 014.0 Admissions 2019 e (million) (1) 1 241.9 1 128.5 110.7 Average ticket price 2019 e (USD) (2) 9.16 9.16 9.16 Average admissions per capita 2019 e 3.4 3.4 3.0 Screens 2019 e 44 283 41 172 3 111 Digital screens 2019 e 43 681 40 570 3 111 Digital 3D screens 2019 e 16 586 15 136 1 450 (1) North American figures might differ slightly from US and Canada combined as different sources
were used: MPA for North America, Comscore for US and Canada. (2) Arithmetic mean.
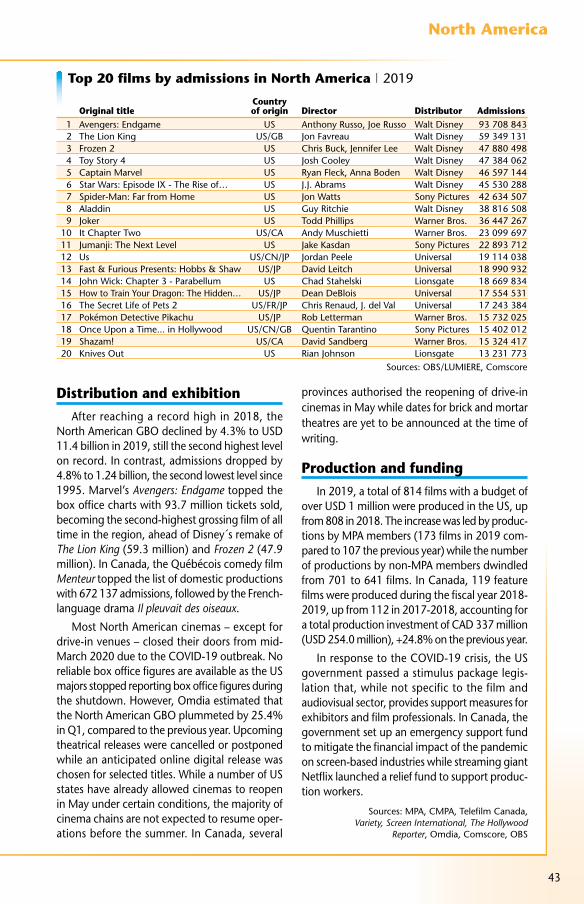
43
North America
Sources: OBS/LUMIERE, Comscore
Distribution and exhibitionAfter reaching a record high in 2018, the
North American GBO declined by 4.3% to USD 11.4 billion in 2019, still the second highest level on record. In contrast, admissions dropped by 4.8% to 1.24 billion, the second lowest level since 1995. Marvel’s Avengers: Endgame topped the box office charts with 93.7 million tickets sold, becoming the second-highest grossing film of all time in the region, ahead of Disney´s remake of The Lion King (59.3 million) and Frozen 2 (47.9 million). In Canada, the Québécois comedy film Menteur topped the list of domestic productions with 672 137 admissions, followed by the French-language drama Il pleuvait des oiseaux.
Most North American cinemas – except for drive-in venues – closed their doors from mid-March 2020 due to the COVID-19 outbreak. No reliable box office figures are available as the US majors stopped reporting box office figures during the shutdown. However, Omdia estimated that the North American GBO plummeted by 25.4% in Q1, compared to the previous year. Upcoming theatrical releases were cancelled or postponed while an anticipated online digital release was chosen for selected titles. While a number of US states have already allowed cinemas to reopen in May under certain conditions, the majority of cinema chains are not expected to resume oper-ations before the summer. In Canada, several
provinces authorised the reopening of drive-in cinemas in May while dates for brick and mortar theatres are yet to be announced at the time of writing.
Production and fundingIn 2019, a total of 814 films with a budget of
over USD 1 million were produced in the US, up from 808 in 2018. The increase was led by produc-tions by MPA members (173 films in 2019 com-pared to 107 the previous year) while the number of productions by non-MPA members dwindled from 701 to 641 films. In Canada, 119 feature films were produced during the fiscal year 2018-2019, up from 112 in 2017-2018, accounting for a total production investment of CAD 337 million (USD 254.0 million), +24.8% on the previous year.
In response to the COVID-19 crisis, the US government passed a stimulus package legis-lation that, while not specific to the film and audiovisual sector, provides support measures for exhibitors and film professionals. In Canada, the government set up an emergency support fund to mitigate the financial impact of the pandemic on screen-based industries while streaming giant Netflix launched a relief fund to support produc-tion workers.
Sources: MPA, CMPA, Telefilm Canada, Variety, Screen International, The Hollywood
Reporter, Omdia, Comscore, OBS
Top 20 films by admissions in North America | 2019
Original titleCountry of origin Director
Distributor Admissions
1 Avengers: Endgame US Anthony Russo, Joe Russo Walt Disney 93 708 8432 The Lion King US/GB Jon Favreau Walt Disney 59 349 1313 Frozen 2 US Chris Buck, Jennifer Lee Walt Disney 47 880 4984 Toy Story 4 US Josh Cooley Walt Disney 47 384 0625 Captain Marvel US Ryan Fleck, Anna Boden Walt Disney 46 597 1446 Star Wars: Episode IX - The Rise of… US J.J. Abrams Walt Disney 45 530 2887 Spider-Man: Far from Home US Jon Watts Sony Pictures 42 634 5078 Aladdin US Guy Ritchie Walt Disney 38 816 5089 Joker US Todd Phillips Warner Bros. 36 447 267
10 It Chapter Two US/CA Andy Muschietti Warner Bros. 23 099 69711 Jumanji: The Next Level US Jake Kasdan Sony Pictures 22 893 71212 Us US/CN/JP Jordan Peele Universal 19 114 03813 Fast & Furious Presents: Hobbs & Shaw US/JP David Leitch Universal 18 990 93214 John Wick: Chapter 3 - Parabellum US Chad Stahelski Lionsgate 18 669 83415 How to Train Your Dragon: The Hidden… US/JP Dean DeBlois Universal 17 554 53116 The Secret Life of Pets 2 US/FR/JP Chris Renaud, J. del Val Universal 17 243 38417 Pokémon Detective Pikachu US/JP Rob Letterman Warner Bros. 15 732 02518 Once Upon a Time... in Hollywood US/CN/GB Quentin Tarantino Sony Pictures 15 402 01219 Shazam! US/CA David Sandberg Warner Bros. 15 324 41720 Knives Out US Rian Johnson Lionsgate 13 231 773
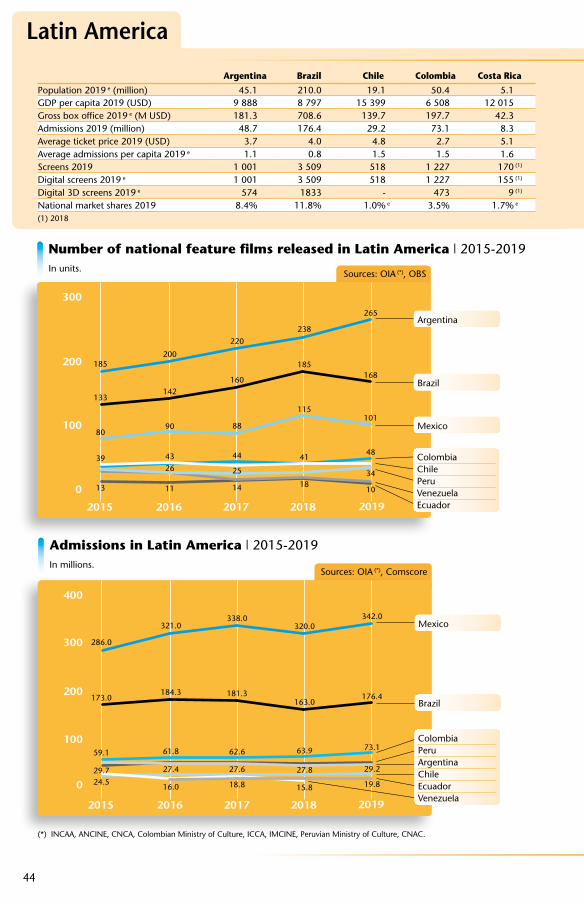
44
Latin America
Sources: OIA (*), Comscore
Admissions in Latin America | 2015-2019In millions.
0
400
200
300
100
2015 2016 2017 2018 2019
286.0
173.0
59.1
29.724.5
321.0
184.3
61.8
27.4
16.0
338.0
181.3
62.6
27.6
18.8
320.0
163.0
63.9
27.8
15.8
342.0
176.4
73.1
29.2
19.8
Mexico
Brazil
ColombiaPeruArgentinaChileEcuadorVenezuela
Argentina Brazil Chile Colombia Costa Rica
Population 2019 e (million) 45.1 210.0 19.1 50.4 5.1GDP per capita 2019 (USD) 9 888 8 797 15 399 6 508 12 015Gross box office 2019 e (M USD) 181.3 708.6 139.7 197.7 42.3Admissions 2019 (million) 48.7 176.4 29.2 73.1 8.3Average ticket price 2019 (USD) 3.7 4.0 4.8 2.7 5.1Average admissions per capita 2019 e 1.1 0.8 1.5 1.5 1.6Screens 2019 1 001 3 509 518 1 227 170 (1)
Digital screens 2019 e 1 001 3 509 518 1 227 155 (1)
Digital 3D screens 2019 e 574 1833 - 473 9 (1)
National market shares 2019 8.4% 11.8% 1.0% e 3.5% 1.7% e
(1) 2018
Number of national feature films released in Latin America | 2015-2019In units.
0
300
200
100
2015 2016 2017 2018 2019
185
133
80
39
13
200
142
90
4326
11
220
160
88
25
14
44
238
185
115
41
18
265
168
101
48
34
10
Sources: OIA (*), OBS
Argentina
Brazil
Mexico
ColombiaChilePeruVenezuelaEcuador
(*) INCAA, ANCINE, CNCA, Colombian Ministry of Culture, ICCA, IMCINE, Peruvian Ministry of Culture, CNAC.
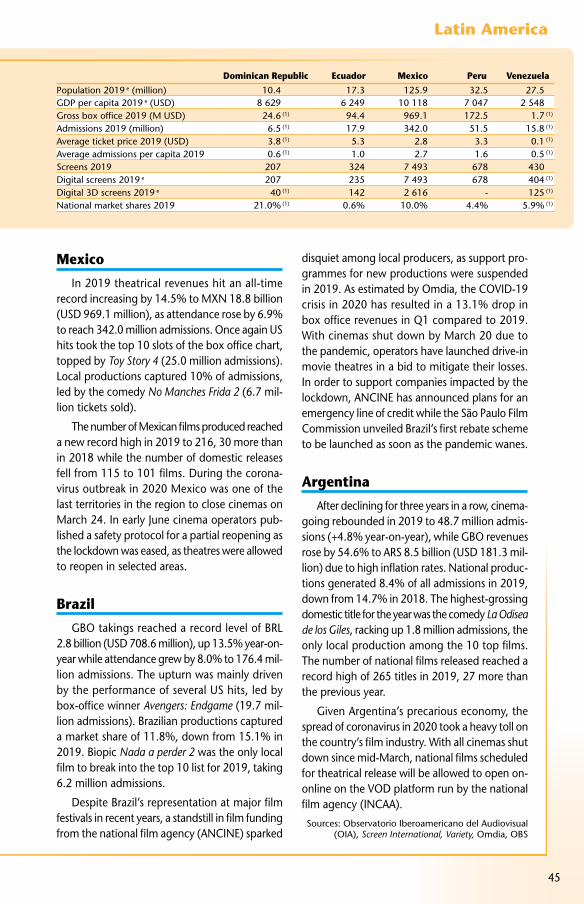
45
Latin America
Dominican Republic Ecuador Mexico Peru Venezuela
Population 2019 e (million) 10.4 17.3 125.9 32.5 27.5GDP per capita 2019 e (USD) 8 629 6 249 10 118 7 047 2 548Gross box office 2019 (M USD) 24.6 (1) 94.4 969.1 172.5 1.7 (1)
Admissions 2019 (million) 6.5 (1) 17.9 342.0 51.5 15.8 (1)
Average ticket price 2019 (USD) 3.8 (1) 5.3 2.8 3.3 0.1 (1)
Average admissions per capita 2019 0.6 (1) 1.0 2.7 1.6 0.5 (1)
Screens 2019 207 324 7 493 678 430Digital screens 2019 e 207 235 7 493 678 404 (1)
Digital 3D screens 2019 e 40 (1) 142 2 616 - 125 (1)
National market shares 2019 21.0% (1) 0.6% 10.0% 4.4% 5.9% (1)
Mexico
In 2019 theatrical revenues hit an all-time record increasing by 14.5% to MXN 18.8 billion (USD 969.1 million), as attendance rose by 6.9% to reach 342.0 million admissions. Once again US hits took the top 10 slots of the box office chart, topped by Toy Story 4 (25.0 million admissions). Local productions captured 10% of admissions, led by the comedy No Manches Frida 2 (6.7 mil-lion tickets sold).
The number of Mexican films produced reached a new record high in 2019 to 216, 30 more than in 2018 while the number of domestic releases fell from 115 to 101 films. During the corona-virus outbreak in 2020 Mexico was one of the last territories in the region to close cinemas on March 24. In early June cinema operators pub-lished a safety protocol for a partial reopening as the lockdown was eased, as theatres were allowed to reopen in selected areas.
Brazil
GBO takings reached a record level of BRL 2.8 billion (USD 708.6 million), up 13.5% year-on-year while attendance grew by 8.0% to 176.4 mil-lion admissions. The upturn was mainly driven by the performance of several US hits, led by box-office winner Avengers: Endgame (19.7 mil-lion admissions). Brazilian productions captured a market share of 11.8%, down from 15.1% in 2019. Biopic Nada a perder 2 was the only local film to break into the top 10 list for 2019, taking 6.2 million admissions.
Despite Brazil’s representation at major film festivals in recent years, a standstill in film funding from the national film agency (ANCINE) sparked
disquiet among local producers, as support pro-grammes for new productions were suspended in 2019. As estimated by Omdia, the COVID-19 crisis in 2020 has resulted in a 13.1% drop in box office revenues in Q1 compared to 2019. With cinemas shut down by March 20 due to the pandemic, operators have launched drive-in movie theatres in a bid to mitigate their losses. In order to support companies impacted by the lockdown, ANCINE has announced plans for an emergency line of credit while the São Paulo Film Commission unveiled Brazil’s first rebate scheme to be launched as soon as the pandemic wanes.
Argentina
After declining for three years in a row, cinema-going rebounded in 2019 to 48.7 million admis-sions (+4.8% year-on-year), while GBO revenues rose by 54.6% to ARS 8.5 billion (USD 181.3 mil-lion) due to high inflation rates. National produc-tions generated 8.4% of all admissions in 2019, down from 14.7% in 2018. The highest-grossing domestic title for the year was the comedy La Odisea de los Giles, racking up 1.8 million admissions, the only local production among the 10 top films. The number of national films released reached a record high of 265 titles in 2019, 27 more than the previous year.
Given Argentina’s precarious economy, the spread of coronavirus in 2020 took a heavy toll on the country’s film industry. With all cinemas shut down since mid-March, national films scheduled for theatrical release will be allowed to open on-online on the VOD platform run by the national film agency (INCAA).
Sources: Observatorio Iberoamericano del Audiovisual (OIA), Screen International, Variety, Omdia, OBS
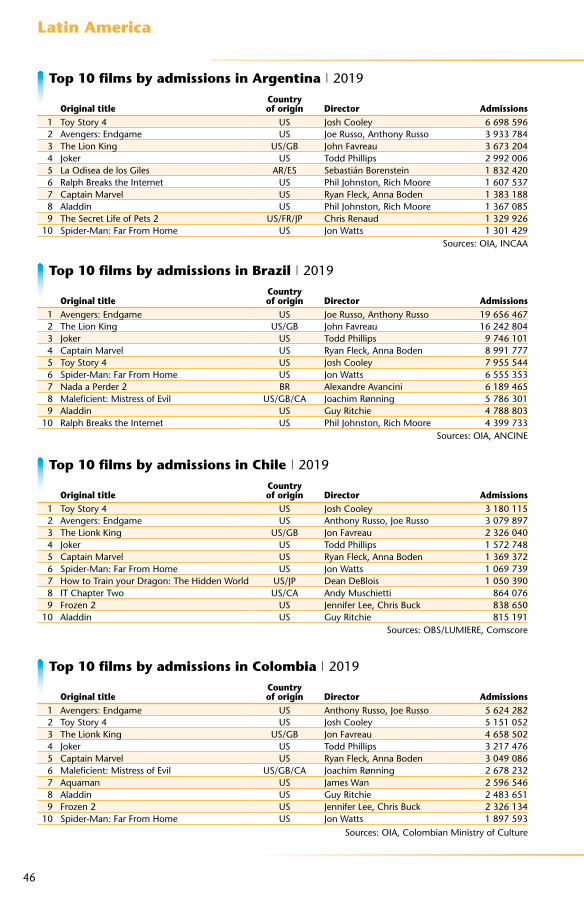
46
Latin America
Top 10 films by admissions in Argentina | 2019
Top 10 films by admissions in Chile | 2019
Top 10 films by admissions in Brazil | 2019
Top 10 films by admissions in Colombia | 2019
Sources: OIA, INCAA
Sources: OBS/LUMIERE, Comscore
Sources: OIA, ANCINE
Sources: OIA, Colombian Ministry of Culture
Original titleCountry of origin Director Admissions
1 Toy Story 4 US Josh Cooley 6 698 5962 Avengers: Endgame US Joe Russo, Anthony Russo 3 933 7843 The Lion King US/GB John Favreau 3 673 2044 Joker US Todd Phillips 2 992 0065 La Odisea de los Giles AR/ES Sebastián Borenstein 1 832 4206 Ralph Breaks the Internet US Phil Johnston, Rich Moore 1 607 5377 Captain Marvel US Ryan Fleck, Anna Boden 1 383 1888 Aladdin US Phil Johnston, Rich Moore 1 367 0859 The Secret Life of Pets 2 US/FR/JP Chris Renaud 1 329 926
10 Spider-Man: Far From Home US Jon Watts 1 301 429
Original titleCountry of origin Director Admissions
1 Toy Story 4 US Josh Cooley 3 180 1152 Avengers: Endgame US Anthony Russo, Joe Russo 3 079 8973 The Lionk King US/GB Jon Favreau 2 326 0404 Joker US Todd Phillips 1 572 7485 Captain Marvel US Ryan Fleck, Anna Boden 1 369 3726 Spider-Man: Far From Home US Jon Watts 1 069 7397 How to Train your Dragon: The Hidden World US/JP Dean DeBlois 1 050 3908 IT Chapter Two US/CA Andy Muschietti 864 0769 Frozen 2 US Jennifer Lee, Chris Buck 838 650
10 Aladdin US Guy Ritchie 815 191
Original titleCountry of origin Director Admissions
1 Avengers: Endgame US Joe Russo, Anthony Russo 19 656 4672 The Lion King US/GB John Favreau 16 242 8043 Joker US Todd Phillips 9 746 1014 Captain Marvel US Ryan Fleck, Anna Boden 8 991 7775 Toy Story 4 US Josh Cooley 7 955 5446 Spider-Man: Far From Home US Jon Watts 6 555 3537 Nada a Perder 2 BR Alexandre Avancini 6 189 4658 Maleficient: Mistress of Evil US/GB/CA Joachim Rønning 5 786 3019 Aladdin US Guy Ritchie 4 788 803
10 Ralph Breaks the Internet US Phil Johnston, Rich Moore 4 399 733
Original titleCountry of origin Director Admissions
1 Avengers: Endgame US Anthony Russo, Joe Russo 5 624 2822 Toy Story 4 US Josh Cooley 5 151 0523 The Lionk King US/GB Jon Favreau 4 658 5024 Joker US Todd Phillips 3 217 4765 Captain Marvel US Ryan Fleck, Anna Boden 3 049 0866 Maleficient: Mistress of Evil US/GB/CA Joachim Rønning 2 678 2327 Aquaman US James Wan 2 596 5468 Aladdin US Guy Ritchie 2 483 6519 Frozen 2 US Jennifer Lee, Chris Buck 2 326 134
10 Spider-Man: Far From Home US Jon Watts 1 897 593

47
Latin America
Top 10 films by admissions in Costa Rica | 2019
Top 10 films by admissions in Ecuador | 2019
Top 10 films by admissions in Mexico | 2019
Sources: OBS/LUMIERE, Comscore
Sources: OIA, ICCA
Sources: OIA, IMCINE
Original titleCountry of origin Director Admissions
1 Avengers: Endgame US Anthony Russo, Joe Russo 833 4362 Toy Story 4 US Josh Cooley 669 5323 The Lion King US/GB Jon Favreau 627 0194 Joker US Todd Phillips 479 6505 Captain Marvel US Ryan Fleck, Anna Boden 403 4236 Frozen 2 US Jennifer Lee, Chris Buck 392 9057 Spider-Man: Far From Home US Jon Watts 325 8118 Maleficent: Mistress Of Evil US/GB/CA Joachim Rønning 323 2519 Aladdin US Guy Ritchie 312 846
10 Dumbo US/GB/AU/CA Tim Burton 236 880
Original titleCountry of origin Director Admissions
1 Avengers: Endgame US Anthony Russo, Joe Russo 1 855 0862 The Lion King US/GB Jon Favreau 1 175 3543 Toy Story 4 US Josh Cooley 1 116 5464 Captain Marvel US Ryan Fleck, Anna Boden 928 6185 Joker US Todd Phillips 795 5076 Maleficient: Mistress of Evil US/GB/CA Joachim Rønning 703 3547 Aladdin US Guy Ritchie 687 0318 Spider-Man: Far From Home US Jon Watts 631 1189 Frozen 2 US Jennifer Lee, Chris Buck 671 773
10 IT Chapter Two US/CA Andrés Muschietti 535 969
Original titleCountry of origin Director Admissions
1 Toy Story 4 US Josh Cooley 25 200 5142 Avengers: Endgame US Anthony Russo, Joe Russo 24 861 9353 The Lion King US/GB Jon Favreau 18 040 7044 Joker US Todd Phillips 15 062 1285 Aladdín US Guy Ritchie 11 686 1776 Captain Marvel US Ryan Fleck, Anna Boden 11 513 4707 Spider-Man: Far from Home US Jon Watts 10 809 9518 Frozen 2 US Chris Buck, Jennifer Lee 9 925 2279 Maleficent: Mistress of Evil US/GB/CA Joachim Rønning 9 368 428
10 How to Train your Dragon: The Hidden World US/JP Dean DeBlois 8 046 402
Top 10 films by admissions in Peru | 2019
Sources: OIA, Peruvian Ministry of Culture
Original titleCountry of origin Director Admissions
1 Avengers: Endgame US Anthony Russo, Joe Russo 3 860 9922 The Lion King US/GB Jon Favreau 3 447 3593 Toy Story 4 US Josh Cooley 2 788 8964 Joker US Todd Phillips 2 384 7835 Captain Marvel US Ryan Fleck, Anna Boden, 1 984 4996 Aladdin US Guy Ritchie 1 954 0307 Maleficent: Mistress Of Evil US/GB/CA Joachim Rønning 1 934 8748 Jumanji: The Next Level US Jake Kasdan 1 580 2189 Spider-Man: Far From Home US Jon Watts 1 533 610
10 Dumbo US/GB/AU/CA Tim Burton 1 353 575

48
Australia and New Zealand
(1) By GBO
Admissions and gross box office in Australia and New Zealand | 2015-2019
0
160
80
120
40
2015 2016 2017 2018 2019
0
900
600
300
1 500
1 200
90.2
15.5
1 226.3 1 259.31 201.3
189.7
1 245.1
203.4
1 228.7
204.2
91.3
16.0
85.0
15.8
89.8
16.7 16.1
84.7
193.0 206.6
Sources: MPDAA, Screen Australia, MPDA, NZ Film Commission
Number of Australian and New Zealand feature films produced | 2015-2019In units.
0
10
40
50
20
30
2015 2016 2017 2018 2019
41
39
26
2
38
37
20
1
38
36
25
4
3331
30
3
49
49
3
Sources: Screen Australia, NZ Film Commission
(1) Restated series. Films with budgets below AUD 0.5 million are only included if they had a theatrical release or major festival screening. Refers to fiscal year ending that year.
(2) Includes films under Australian creative control that were 100% foreign financed.
(3) Does not include unofficial co-productions.(4) Feature films made in New Zealand with a theatrical release
in the country or a paid screening in a NZ public film festival and/or available on a SVOD or TVOD platform; includes official co-productions included.
Market shares 2019 (1) e
National AU 3.3%
National NZ 2.3%
Others AU96.7%Others NZ
97.7%
Australia New ZealandPopulation 2019 e (million) 25.6 5.0 GDP per capita 2019 e (USD) 53 825 40 634 Gross box office 2019 (M USD) 854.4 134.6 Admissions 2019 (million) 84.7 16.1 Average ticket price 2019 (USD) 10.1 8.4 Average admissions per capita 2019 3.3 3.2 Screens 2019 2 310 458 Digital screens 2019 e 2 131 458 Digital 3D screens 2019 988 186
AU co-prod. (1)(3)
AU Admissions (million)
NZ Gross box office (NZD million)
AU Gross box office (AUD million)
NZ Admissions (million)
Total Australia (1)(3)
New Zealand (4)
100% AU (1)(2)
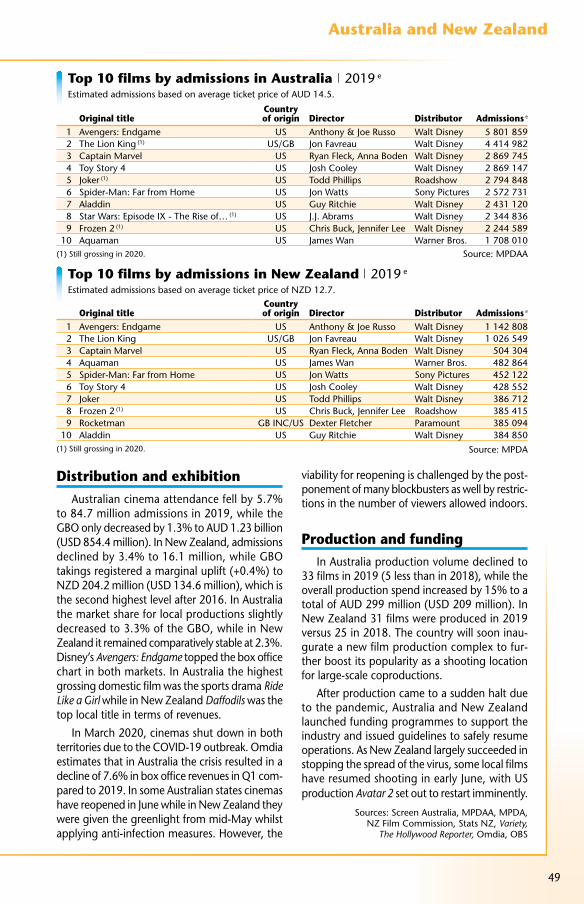
49
Australia and New Zealand
Distribution and exhibitionAustralian cinema attendance fell by 5.7%
to 84.7 million admissions in 2019, while the GBO only decreased by 1.3% to AUD 1.23 billion (USD 854.4 million). In New Zealand, admissions declined by 3.4% to 16.1 million, while GBO takings registered a marginal uplift (+0.4%) to NZD 204.2 million (USD 134.6 million), which is the second highest level after 2016. In Australia the market share for local productions slightly decreased to 3.3% of the GBO, while in New Zealand it remained comparatively stable at 2.3%. Disney’s Avengers: Endgame topped the box office chart in both markets. In Australia the highest grossing domestic film was the sports drama Ride Like a Girl while in New Zealand Daffodils was the top local title in terms of revenues.
In March 2020, cinemas shut down in both territories due to the COVID-19 outbreak. Omdia estimates that in Australia the crisis resulted in a decline of 7.6% in box office revenues in Q1 com-pared to 2019. In some Australian states cinemas have reopened in June while in New Zealand they were given the greenlight from mid-May whilst applying anti-infection measures. However, the
viability for reopening is challenged by the post-ponement of many blockbusters as well by restric-tions in the number of viewers allowed indoors.
Production and fundingIn Australia production volume declined to
33 films in 2019 (5 less than in 2018), while the overall production spend increased by 15% to a total of AUD 299 million (USD 209 million). In New Zealand 31 films were produced in 2019 versus 25 in 2018. The country will soon inau-gurate a new film production complex to fur-ther boost its popularity as a shooting location for large-scale coproductions.
After production came to a sudden halt due to the pandemic, Australia and New Zealand launched funding programmes to support the industry and issued guidelines to safely resume operations. As New Zealand largely succeeded in stopping the spread of the virus, some local films have resumed shooting in early June, with US production Avatar 2 set out to restart imminently.
Sources: Screen Australia, MPDAA, MPDA, NZ Film Commission, Stats NZ, Variety,
The Hollywood Reporter, Omdia, OBS
Top 10 films by admissions in Australia | 2019 e
Estimated admissions based on average ticket price of AUD 14.5.
Top 10 films by admissions in New Zealand | 2019 e
Estimated admissions based on average ticket price of NZD 12.7.
Original titleCountry of origin Director
Distributor Admissions e
1 Avengers: Endgame US Anthony & Joe Russo Walt Disney 5 801 8592 The Lion King (1) US/GB Jon Favreau Walt Disney 4 414 9823 Captain Marvel US Ryan Fleck, Anna Boden Walt Disney 2 869 7454 Toy Story 4 US Josh Cooley Walt Disney 2 869 1475 Joker (1) US Todd Phillips Roadshow 2 794 8486 Spider-Man: Far from Home US Jon Watts Sony Pictures 2 572 7317 Aladdin US Guy Ritchie Walt Disney 2 431 1208 Star Wars: Episode IX - The Rise of… (1) US J.J. Abrams Walt Disney 2 344 8369 Frozen 2 (1) US Chris Buck, Jennifer Lee Walt Disney 2 244 589
10 Aquaman US James Wan Warner Bros. 1 708 010
Original titleCountry of origin Director
Distributor Admissions e
1 Avengers: Endgame US Anthony & Joe Russo Walt Disney 1 142 8082 The Lion King US/GB Jon Favreau Walt Disney 1 026 5493 Captain Marvel US Ryan Fleck, Anna Boden Walt Disney 504 3044 Aquaman US James Wan Warner Bros. 482 8645 Spider-Man: Far from Home US Jon Watts Sony Pictures 452 1226 Toy Story 4 US Josh Cooley Walt Disney 428 5527 Joker US Todd Phillips Walt Disney 386 7128 Frozen 2 (1) US Chris Buck, Jennifer Lee Roadshow 385 4159 Rocketman GB INC/US Dexter Fletcher Paramount 385 094
10 Aladdin US Guy Ritchie Walt Disney 384 850
Source: MPDAA
Source: MPDA
(1) Still grossing in 2020.
(1) Still grossing in 2020.

50
People’s Republic of China
(1) As per end of June 2018. (2) By GBO.
Population 2019 e 1 400.2 millionGDP per capita 2019 e 10 099 USDGross box office 2019 e 64.27 bn CNY (9.30 bn USD)Admissions 2019 e 1.73 billionAverage ticket price 2019 e 37.2 CNY (5.4 USD)Average admissions per capita 2019 e 1.2Screens 2018 | 2019 e 60 079 | 69 787Digital screens 2018 | 2019 e 60 079 | 69 787Digital 3D screens 2018 | 2019 e (1) 49 170 | ~
Market shares 2019 (2)
Admissions and gross box office in China | 2015-2019 e
0
3 000
1 000
2 000
2015 2016 2017 2018 2019
0
75 000
50 000
25 000
44 09246 000
1 370
55 911
1 620
60 976
1 720
64 266
1 727
1 260
Sources: China Film Bureau, China Media Management Inc, Variety
Number of feature films produced in China | 2015-2019 e
In units.
300
1 200
600
900
2015 2016 2017 2018 2019
686
944970
1 0821 037
Sources: China Film Bureau, China Media Management Inc, Variety
(1) Does not include films produced outside the official system of script and final print approval.
Others35.9%
National64.1%
Feature films produced (1)
Admissions (million) e
Gross box office (CNY million)
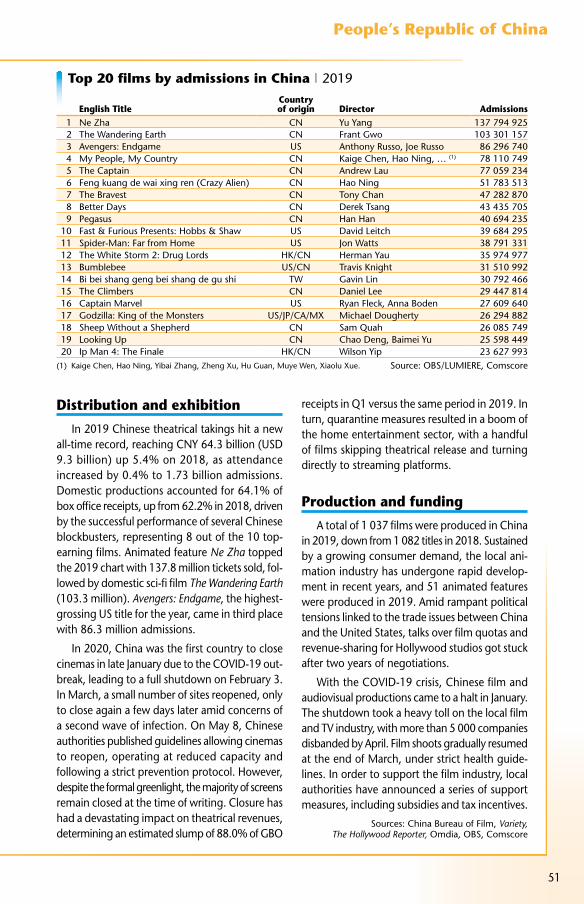
51
People’s Republic of China
Distribution and exhibition
In 2019 Chinese theatrical takings hit a new all-time record, reaching CNY 64.3 billion (USD 9.3 billion) up 5.4% on 2018, as attendance increased by 0.4% to 1.73 billion admissions. Domestic productions accounted for 64.1% of box office receipts, up from 62.2% in 2018, driven by the successful performance of several Chinese blockbusters, representing 8 out of the 10 top-earning films. Animated feature Ne Zha topped the 2019 chart with 137.8 million tickets sold, fol-lowed by domestic sci-fi film The Wandering Earth (103.3 million). Avengers: Endgame, the highest-grossing US title for the year, came in third place with 86.3 million admissions.
In 2020, China was the first country to close cinemas in late January due to the COVID-19 out-break, leading to a full shutdown on February 3. In March, a small number of sites reopened, only to close again a few days later amid concerns of a second wave of infection. On May 8, Chinese authorities published guidelines allowing cinemas to reopen, operating at reduced capacity and following a strict prevention protocol. However, despite the formal greenlight, the majority of screens remain closed at the time of writing. Closure has had a devastating impact on theatrical revenues, determining an estimated slump of 88.0% of GBO
receipts in Q1 versus the same period in 2019. In turn, quarantine measures resulted in a boom of the home entertainment sector, with a handful of films skipping theatrical release and turning directly to streaming platforms.
Production and funding
A total of 1 037 films were produced in China in 2019, down from 1 082 titles in 2018. Sustained by a growing consumer demand, the local ani-mation industry has undergone rapid develop-ment in recent years, and 51 animated features were produced in 2019. Amid rampant political tensions linked to the trade issues between China and the United States, talks over film quotas and revenue-sharing for Hollywood studios got stuck after two years of negotiations.
With the COVID-19 crisis, Chinese film and audiovisual productions came to a halt in January. The shutdown took a heavy toll on the local film and TV industry, with more than 5 000 companies disbanded by April. Film shoots gradually resumed at the end of March, under strict health guide-lines. In order to support the film industry, local authorities have announced a series of support measures, including subsidies and tax incentives.
Sources: China Bureau of Film, Variety, The Hollywood Reporter, Omdia, OBS, Comscore
English TitleCountry of origin Director Admissions
1 Ne Zha CN Yu Yang 137 794 9252 The Wandering Earth CN Frant Gwo 103 301 1573 Avengers: Endgame US Anthony Russo, Joe Russo 86 296 7404 My People, My Country CN Kaige Chen, Hao Ning, … (1) 78 110 7495 The Captain CN Andrew Lau 77 059 2346 Feng kuang de wai xing ren (Crazy Alien) CN Hao Ning 51 783 5137 The Bravest CN Tony Chan 47 282 8708 Better Days CN Derek Tsang 43 435 7059 Pegasus CN Han Han 40 694 235
10 Fast & Furious Presents: Hobbs & Shaw US David Leitch 39 684 29511 Spider-Man: Far from Home US Jon Watts 38 791 33112 The White Storm 2: Drug Lords HK/CN Herman Yau 35 974 97713 Bumblebee US/CN Travis Knight 31 510 99214 Bi bei shang geng bei shang de gu shi TW Gavin Lin 30 792 46615 The Climbers CN Daniel Lee 29 447 81416 Captain Marvel US Ryan Fleck, Anna Boden 27 609 64017 Godzilla: King of the Monsters US/JP/CA/MX Michael Dougherty 26 294 88218 Sheep Without a Shepherd CN Sam Quah 26 085 74919 Looking Up CN Chao Deng, Baimei Yu 25 598 44920 Ip Man 4: The Finale HK/CN Wilson Yip 23 627 993
(1) Kaige Chen, Hao Ning, Yibai Zhang, Zheng Xu, Hu Guan, Muye Wen, Xiaolu Xue.
Top 20 films by admissions in China | 2019
Source: OBS/LUMIERE, Comscore
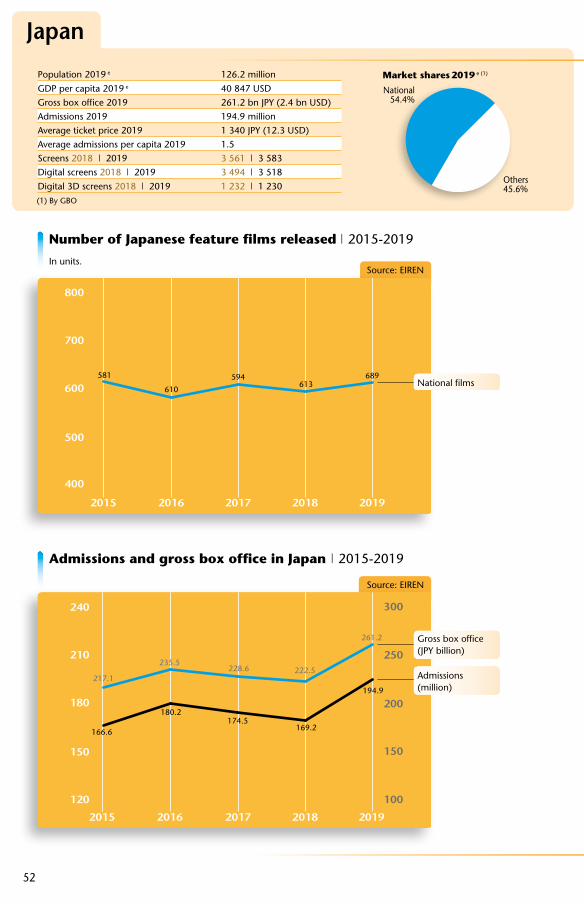
52
Japan
Population 2019 e 126.2 millionGDP per capita 2019 e 40 847 USDGross box office 2019 261.2 bn JPY (2.4 bn USD)Admissions 2019 194.9 millionAverage ticket price 2019 1 340 JPY (12.3 USD)Average admissions per capita 2019 1.5Screens 2018 | 2019 3 561 | 3 583Digital screens 2018 | 2019 3 494 | 3 518Digital 3D screens 2018 | 2019 1 232 | 1 230
Market shares 2019 e (1)
(1) By GBO
Admissions and gross box office in Japan | 2015-2019
120
240
180
210
150
2015 2016 2017 2018 2019
100
150
200
250
300
166.6
217.1
235.5
180.2
228.6
174.5
222.5
169.2
261.2
194.9
Source: EIREN
Number of Japanese feature films released | 2015-2019
In units.
400
800
500
600
700
2015 2016 2017 2018 2019
581
610
594613
689
Source: EIREN
Others45.6%
National54.4%
Admissions (million)
Gross box office (JPY billion)
National films

53
Japan
Top 20 films by admissions in Japan | 2019 e
Estimated admissions based on average ticket price of JPY 1 340.
Distribution and exhibition2019 marked a new record high for the Japanese
box office as theatrical revenues surged by 17.4% to JPY 261.2 billion (USD 2.4 billion). Similarly, cinema attendance went up 15.2% on 2018 to 194.9 million tickets sold, the highest level since 1971. The hike in cinema-going was the result the strong performance of several titles, four of which individually grossed more than JPY 10 bil-lion (USD 91.8 million). The national market share remained stable, as local features took 54.4% of box office revenues. Among the ten highest-earning films in 2019, six were animated features, led by the domestic title Weathering With You ranking first with 10.5 million admissions. Other domestic hits included the latest instalments of the Detective Conan and Doraemon animation franchises as well as the live-action film Kingdom. Disney took the box office by storm with three titles in the top 5 slots: Frozen 2 (9.5 million admissions), Aladdin (9.1 million) and Toy Story 4 (7.5 million).
As the COVID-19 crisis emerged in 2020, the country’s exhibition circuit stopped in mid-April, a setback particularly threatening for small arthouse cinemas. Fears over the epidemic had taken a toll on cinema attendance even before the shutdown, resulting in an estimated decline of 36.7% in box office receipts in Q1, compared to 2019. In selected areas, theatres began to resume operations in May, implementing safety
and social distancing measures. The chains that have reopened are showing old releases and clas-sics, as new titles have been pushed back to avoid poor box office returns.
Production and fundingThe number of national film releases jumped to
a record high in 2019, to a total of 689 titles, com-pared to 613 in 2018. According to the Association of Japanese Animation (AJA), the local animation industry increased for the ninth consecutive year in 2018 to a total value of JPY 2.18 trillion (USD 20 billion), driven by continued growth in overseas sales. For the first time in 2019, Japan launched a pilot production incentive scheme, offering a rebate of up to 20% of qualifying spend to foreign film and TV productions shooting in the country.
In 2020, while the government unveiled sup-port measures for small and medium-sized compa-nies hit by the pandemic, no specific plans for the film industry were announced so far. Meanwhile, national film celebrities have launched crowd-funding initiatives to support exhibitors, while tech giant Sony set up a USD 100 million relief fund to support workers affected by the pandemic, including an envelope aimed at those employed in the entertainment industry.
Sources: EIREN, AJA, Variety, The Hollywood Reporter, Omdia
English TitleCountry of origin Director Distributor Admissions
1 Weathering With You JP Makoto Shinkai Toho 10 492 5132 Frozen II US Chris Buck, Jennifer Lee Walt Disney 9 544 7543 Aladdin US Guy Ritchie Walt Disney 9 074 6064 Toy Story 4 US Josh Cooley Walt Disney 7 529 8335 Detective Conan: The Fist of Blue Sapphire JP Tomoka Nagaoka Toho 6 992 5216 The Lion King US/GB Jon Favreau Walt Disney 4 977 6017 Fantastic Beasts: The Crimes of Grindelwald GB INC/US David Yates Warner Bros. 4 902 9748 Avengers: Endgame US Anthony & Joe Russo Walt Disney 4 567 1549 Kingdom JP Shinsuke Sato Toho/Sony 4 276 110
10 One Piece : Stampede JP Takashi Otsuka Toei 4 141 78211 Doraemon: Nobita's Chronicle of the… JP S. Yakuwa, J.-beom Lee Toho 3 746 26012 Joker US Todd Phillips Warner Bros. 3 746 26013 Masquerade Hotel JP Masayuki Suzuk Toho 3 462 67914 Dragonball Super - Broly JP Tatsuya Nagamine Toei 2 985 06815 Ralph Breaks the Internet US Rich Moore, P. Johnston Walt Disney 2 880 59016 Fly me to the Saitama JP Hideki Takeuchi Toei 2 805 96417 Hit Me Anyone One More Time JP Koki Mitani Toho 2 716 41218 Spider-Man: Far From Home US Jon Watts Sony 2 283 57719 Fast & Furious Presents: Hobbs & Shaw US/JP David Leitch Towa 2 283 57720 Pokémon Detective Pikachu US/JP Rob Letterman Toho 2 246 263
Sources: EIREN, OBS

India
54
Market shares 2019
Admissions and gross box office in India | 2015-2019 (1)
1
2
3
4
2015 2016 2017 2018 2019
0
40
80
120
2.07
101.4
85.6
1.86
96.3
1.43
102.1
1.46
115.2
1.56
Sources: FICCI-KPMG, FICCI-EY, Omdia, OBS
Number of Indian feature films certified (1) | 2015-2019
In units.
1 000
2 500
1 500
2 000
2015 2016 2017 2018 2019
1 8451 903
1 986
1 813
2 446
Source: Central Board of Film Certification (CBFC)
Admissions (billion) e
Films produced (certified)
Gross box office (INR billion) e
(1) Based on fiscal year ending in March of the stated year.
(1) Restated data series.
Others13.0%
National87.0%
Population 2019 e 1 351.8 millionGDP per capita 2019 e 2 172 USDGross box office 2019 e 115.2 bn INR (1.6 bn USD)Admissions 2019 e 1.56 billionAverage ticket price 2019 e 70.1 INR (1.0 USD)Average admissions per capita 2019 e 1.2Screens 2018 | 2019 e ~ | ~Digital screens 2018 e | 2019 e (1) 9 601 | 9 5273D screens 2018 | 2019 e 1 183 (2) | ~(1) Includes e-cinema screens. (2) 2016

55
India
Top 10 Bollywood films by gross box office in India | 2019GBO calculated using an average exchange rate of 1 USD = INR 70.43.
Source: Koimoi.com
Distribution and exhibition2019 saw Indian theatrical revenues increase
by 12.8% on the previous year to INR 115.2 bil-lion (USD 1.6 billion), due to the success of sev-eral Hindi-language productions (Bollywood) and US blockbusters. Once again national productions dominated the box office in 2019 with an 87% market share. Hindi titles registered the highest revenues on record generating 43% of total box office receipts, despite representing only 14% of films released. The top 10 Hindi films accounted for 52% of the Hindi box office, led by the action thriller War (USD 45.3 million). Indian films in other regional languages accounted for 44% of box office takings, compared to 13% for US and international titles. Superhero movie Avengers: Endgame became the highest grossing Hollywood title of all time in India taking USD 44.2 million at the box office.
As cinemas were shut nationwide in Mid-March 2020 due to the pandemic, many titles sched-uled to open were postponed. This resulted in a reported decline of 29.1% in box office revenues for Q1, compared to the same period in 2019. As infection fears persist, there is still no indication of a reopening date for theatres. In a move that
sparked debate, some producers bypassed the theatrical window securing direct to streaming deals for major movies.
Production and fundingAccording to the Central Board of Film Certifi-
cation the number of national feature films certi-fied for release peaked at 2 446 films in 2019, up from 1813 in 2018. In 2019, India announced plans for production incentives aimed to boost international co-productions and attract foreign film shoots. However, details of the implementa-tion of these schemes have not been unveiled yet.
In 2020, all productions came to a halt as the country was ordered into lockdown. While there is no clear picture as to when filming will start again nationwide, Hindi-language produc-tions (Bollywood) will resume operations in June. Film bodies have issued a series of guidelines covering both production and exhibition activi-ties, including social distancing and sanitisation measures as well as provisions for online ticketing.
Sources: CBFC, FICCI, Ernst & Young (EY), Variety, Screen International, The Hollywood Reporter,
The Financial Times, The Financial Express, OBS
Original titleCountry of origin Director
Gross box office (in USD)
1 Avengers: Endgame US Anthony Russo, Joe Russo 44 215 2002 The Lion King US/GB Jon Favreau 21 910 6333 Spider-Man: Far From Home US Jon Watts 13 052 8764 Fast & Furious Presents: Hobbs & Shaw US/JP David Leitch 12 098 6235 Joker US Todd Phillips 11 739 1676 Captain Marvel US Ryan Fleck, Anna Boden 11 613 2557 Jumanji: The Next Level US Jake Kasdan 9 155 3788 Aladdin US Guy Ritchie 7 021 1139 Annabelle Comes Home US Gary Dauberman 4 566 994
10 Godzilla: King Of The Monsters US/JP/CN/MX Michael Dougherty 3 857 637
Original titleCountry of origin Director
Gross box office (in USD)
1 War IN Siddharth Anand 45 283 7302 Kabir Singh IN Sandeep Reddy Vanga 39 621 8403 Uri - The Surgical Strike IN Aditya Dhar 34 754 5514 Bharat IN Ali Abbas Zafar 29 813 2135 Housefull 4 IN Sajid Samji, Farhad Samji 29 334 7436 Good Newwz IN Raj Mehta 28 642 6717 Mission Mangal IN Jagan Shakti 28 503 1188 Total Dhamaal IN Indra Kumar 21 972 5779 Kesari IN Anurag Singh 21 787 455
10 Chhichhore IN Nitesh Tiwari 21 411 515
Top 10 US films by gross box office in India | 2019
Source: Comscore

56
South Korea
Market shares 2019 e
Others49.0%
National51.0%
Admissions and gross box office in South Korea | 2015-2019
100
600
200
400
500
300
2015 2016 2017 2018 2019
232
339
494
454
502
Source: KOFIC
Number of Korean feature films released | 2015-2019In units.
400
100
300
200
2015 2016 2017 2018 2019
1 500
1 000
500
2 500
2 000
1 590.1
217.3
1 743.2
217.0
1 757.1
219.9
1 814.0
216.4
1 914.0
226.7
Source: KOFIC
Box Office (KRW billion)
National films released
Admissions (million)
Population 2019 e 51.8 millionGDP per capita 2019 e 31 431 USDGross box office 2019 1 914.0 bn KRW (1.6 bn USD)Admissions 2019 226.7 millionAverage ticket price 2019 8 442.9 KRW (7.2 USD)Average admissions per capita 2019 4.2Screens 2018 | 2019 2 937 | 3 079Digital screens 2018 | 2019 ~ | ~Digital 3D screens 2018 | 2019 ~ | ~

57
South Korea
Source: KOFIC
Distribution and exhibition
South Korean cinema attendance hit an all-time record in 2019, as admissions increased by 4.8% on the previous year to 226.7 million tickets sold. Box office takings also soared to KRW 1 914.0 billion (USD 1.64 billion), up 5.5% on 2018. The box office chart was dominated by a mix of US and local big-budget films, with top 10 titles accounting for 44.6% of total admis-sions. Five films passed the 10 million admissions benchmark, led by the domestic comedy Extreme Job (16.3 million admissions) which became the second most viewed national film of all time. Other successful Korean films included the 2019 Palme d’Or recipient Parasite, ranking fifth with 10.1 million ticket sold, and the action comedy Exit (9.4 million). Disney took the lion’s share at the box office, with five titles among the top 10 films, led by superhero hit Avengers: Endgame (13.9 million admissions). Domestic productions captured a market share of 51.0%, in line with previous years.
While the closing of cinemas was not ordered nationwide, many exhibitors decided to shut down during the COVID-19 crisis, as attendance started to taper off as early as January. According to the Korean Film Council (KOFIC), admissions only totalled 1.83 million in March 2020, compared to 14.7 million in March 2019. Omdia estimates
that the box office revenues plunged by 53.1% in Q1 compared to the same period in 2019. Cinemas slowly started to reopen at the end of April, putting in place social distancing measures and contactless operations. After pushing back many releases, distributors are now hoping for a return to normal for the summer.
Production and fundingProduction volume increased in 2019 to an
unprecedented total of 502 local films released during the year, 48 more than in 2018. South Korea announced a new development strategy for the film industry, including the launch of a fund for small and mid-sized production companies and the extension of tax credits. The country also set out to establish a joint organisation to foster ties with film agencies in the Southeast Asian region.
In response to the COVID-19 outbreak, the government unveiled measures to support the film industry, including subsidies for marketing costs of cancelled releases, financial aid for produc-tions halted during the pandemic and the exemp-tion for multiplexes from contributing to the film development fund. In a bid to draw audiences back into cinemas, KOFIC has also announced the distribution of 1.3 million discount coupons for the purchase of film tickets.
Sources: KOFIC, Variety, Screen International, The Hollywood Reporter, Omdia, OBS
Original titleCountry of origin Director Distributor Admissions
1 Extreme Job KR Byeong-heon Lee CJ Entertainment 16 265 6182 Avengers: Endgame US Anthony Russo, Joe RussoWalt Disney 13 934 5923 Frozen 2 US Chris Buck, Jennifer Lee Walt Disney 13 369 0794 Aladdin US Guy Ritchie Walt Disney 12 552 2835 Parasite KR Bong Joon Ho CJ Entertainment 10 085 2756 Exit KR Sang Geun Lee CJ Entertainment 9 426 0117 Spider-Man: Far from Home US Jon Watts Walt Disney 8 021 1458 Ashfall KR B.-seo Kim, H.-jun Lee CJ Entertainment 6 290 7739 Captain Marvel US Ryan Fleck, Anna Boden Walt Disney 5 802 810
10 Joker US Todd Phillips Warner Bros. 5 247 87411 The Battle: Roar to Victory KR Shin-yeon Won Showbox/Big… (1) 4 787 53812 The Lion King US/GB Jon Favreau Walt Disney 4 743 26413 Bad Guys: Reign of Chaos KR Yong-ho Son CJ Entertainment 4 573 90214 Kim Ji-Young: Born 1982 KR Kim Do-Young Lotte Entertainment 3 678 15615 Fast & Furious Presents: Hobbs & Shaw US/JP David Leitch Universal 3 657 53616 Toy Story 4 US Josh Cooley Walt Disney 3 400 03417 Money KR Noo-ri Park Showbox 3 389 12518 The Gangster, the Cop, the Devil KR Won-Tae Lee K-Movie 3 364 71219 Crazy Romance KR Kim Han-Kyul Contents Panda 2 924 56320 MAL·MO·E: The Secret Mission KR Yu-na Eom Lotte Entertainment 2 812 877
(1) Showbox/Big Stone/W-Pictures.
Top 20 films by admissions in South Korea | 2019

58
Other Asia
Admissions in selected Asian countries | 2015-2019 e In million.
Number of feature films produced in selected Asian countries | 2015-2019In units. Sources: Hong Kong Box Office, Pusbangfilm, Indonesian Film Board, Film
Indonesia, FINAS, Omdia, IMDA/Singapore Film Commission, Taiwan Cinema, OBS
0
150
120
30
90
60
2015 2016 2017 2018 2019
81.0
68.1
15.4
28.335.8
16.0
25.732.8
71.6
104.5
15.8
24.2
34.5
72.8
113.9
16.3
24.4
77.8
111.4
34.8
24.6
38.5
77.3
135.1
Sources: Hong Kong Box Office, Pusbangfilm, Indonesian Film Board, Film Indonesia, FINAS, IMDA/Singapore Film Commission, Omdia, Comscore, OBS
0
150
120
60
30
90
2015 2016 2017 2018 2019
114
82
59
20
124
64
73
47
38
17
112
59
78
53
32
11
53
40
13
128
70
54
129
48
44
31
13
Indonesia (1)(2)
Philippines
(1) Films released.
(2) Restated series.
(1) Restated data series.
Malaysia (1)(2)
Hong Kong (1)
TaiwanThailandSingapore
Indonesia e
MalaysiaThailand
TaiwanHong KongSingaporePhilippines (1)
Hong Kong Indonesia Malaysia Philippines Singapore Taiwan ThailandPopulation 2019 e (million) 7.6 267.0 32.8 108.3 5.7 23.6 67.9GDP per capita 2019 e (USD) 49 334 4 164 11 137 3 294 63 987 24 828 7 792Gross box office 2019 e (M USD) 245.4 326.4 260.7 218.0 (2) 128.6 261.0 176.6 (1)
Admissions 2019 e (million) 24.4 111.4 77.8 85.01 (2) 18.5 34.8 38.5 (1)
Average ticket price 2019 e (USD) 10.1 2.9 3.4 2.6 (2) 7.0 7.5 4.6 (1)
Average admissions per capita 2019 e 3.2 0.4 2.4 0.8 (2) 3.3 1.5 0.6 (1)
Screens 2019 e 323 2 110 1 134 1 069 297 972 1 321Digital screens 2019 e 323 2 110 1 134 1 069 297 972 1 3213D screens 2019 e 245 (1) 1 253 299 (1) 171 (1) 97 (1) 454 (1) 430 (1)
National market shares 2019 e 13.2% 46.6% 14.9% ~ 1.4% (3) 6.7% ~(1) 2018 (2) 2017 (3) By GBO

59
Other Asia
Distribution and exhibitionBased on available data for 2019, cinema
attendance declined in several Asian markets, including Hong Kong (-1.0% to 24.4 million admissions), Indonesia (-17.5% to 111.4 mil-lion admissions), Singapore (-5.6% to 18.4 mil-lion admissions) and Taiwan (-9.6% to 34.8 mil-lion). In contrast, admissions slightly increased in Malaysia to 77.8 million tickets sold. In Hong Kong and Singapore, US films dominated the box office chart, topped by superhero hit Avengers: Endgame. In both markets, no domestic produc-tion ranked among the 10 top-grossing films. In turn, in Malaysia a number of national titles made the top 10 list, including the computer-animated films Ejen Ali: The Movie, BoBoiBOy Movie 2 and Upin & Ipin: The Lone Gibbon Kris.
As the 2020 coronavirus outbreak ravaged the exhibition sector in the region, the majority of cinemas shut down in March across all ter-ritories. Following the easing of the lockdown restrictions, individual countries have gradually authorised the reopening of cinemas in selected areas from May onwards, operating at reduced capacity and following strict preventive measures.
Production and funding
Production volume decreased year-on-year in several Asian markets: Hong Kong (-7 films), Malaysia (-6 films), Taiwan (-26 films) and Thailand (-9 films). In turn, the number of films produced remained stable in Singapore. Malaysia announced a new support scheme to help local directors shoot multiple linguistic versions of a film, in a bid to increase their attractiveness to foreign audiences. In 2019, Singapore launched a grant programme to boost coproductions with Southeast Asia, providing up to SGD 250 000 (USD 183 000) in funding.
As film productions were halted due to the COVID-19 pandemic, several countries issued stimulus packages to cushion the impact of the crisis on the sector. Among others, Hong Kong launched a subsidy for cinema screens while Singapore and Thailand established a relief fund to support local freelancers.
Sources: Hong Kong Box Office Ltd, FINAS, Singapore Film Commission, Indonesian Film Board,
IMDA/Singapore Film Commission, Variety, Screen International, Comscore, Omdia, OBS
Sources: OBS/LUMIERE, Comscore
Sources: OBS/LUMIERE, Comscore
Top 10 films by admissions in Hong Kong | 2019
Top 10 films by gross box office in Singapore | 2019
Original titleCountry of origin Director
Distributor Admissions
1 Avengers: Endgame US Anthony Russo, Joe Russo Walt Disney 1 688 3262 Toy Story 4 US Josh Cooley Walt Disney 1 121 4793 Spider-Man: Far from Home US Jon Watts Sony Pictures 960 8284 Joker US Todd Phillips Warner Bros. 873 2745 Aladdin US Guy Ritchie Walt Disney 861 4046 Frozen 2 US Chris Buck, Jennifer Lee Walt Disney 831 9597 Alita: Battle Angel US/CA/JP Robert Rodriguez 20th Century Fox 539 5828 The Lion King US/GB Jon Favreau Walt Disney 528 6559 Captain Marvel US Ryan Fleck, Anna Boden Walt Disney 489 629
10 Fast & Furious Presents: Hobbs & Shaw US/JP David Leitch Universal 466 159
Original titleCountry of origin Director
Distributor Admissions
1 Avengers: Endgame US Anthony Russo, Joe Russo Walt Disney 1 598 2512 Captain Marvel US Ryan Fleck, Anna Boden Walt Disney 938 5783 Jumanji: The Next Level US Jake Kasdan Sony Pictures 888 1524 Spider-Man: Far from Home US Jon Watts Sony Pictures 866 8665 Frozen 2 US Chris Buck, Jennifer Lee Walt Disney 769 1976 Ip Man 4: The Finale HK/CN Wilson Yip Shaw 694 4647 Joker US Todd Phillips Warner Bros. 579 2648 Aladdin US Guy Ritchie Walt Disney 562 3119 Fast & Furious Presents: Hobbs & Shaw US/JP David Leitch Universal 498 273
10 The Lion King US/GB Jon Favreau Walt Disney 476 184

60
Africa
Gross box office in selected African countries | 2015-2019In USD million.
0
120
40
80
2015 2016 2017 2018 2019
94.4
25.6
7.5
77.5
25.9
6.1
89.8
20.7
7.9
99.0
25.7
7.6
92.2
29.2
9.7
Sources: NFVF, Ster-Kinekor, CCM, Empire Cinemas, Omdia
Number of feature films produced in selected African countries | 2015-2019In units.
10
40
30
20
2015 2016 2017 2018 2019
34
28
22
26
28
24
39
35
30
22
32
22
22
39
23
Sources: Omdia, OBS, CCM, NFVF
(1) Films released.
(1) Includes box office from open-air screenings.
South Africa (1)
Egypt
South Africa e
Morocco e (1)
Egypt e
Morocco
Egypt Morocco South AfricaPopulation 2019 e (million) 99.2 35.6 58.8GDP per capita 2019 e (USD) 3 047 3 345 6 100Gross box office 2019 e (in M USD) 29.2 9.7 92.2Admissions 2019 e (million) 6.1 1.9 18.5Admissions per capita 2019 e 0.1 0.1 0.3Average ticket price 2019 e (in USD) 4.8 5.1 5.0Screens 2019 e 289 77 776Digital screens 2019 e 289 72 776National market shares 2019 e ~ 26.0% 5.0% (1)
(1) By GBO
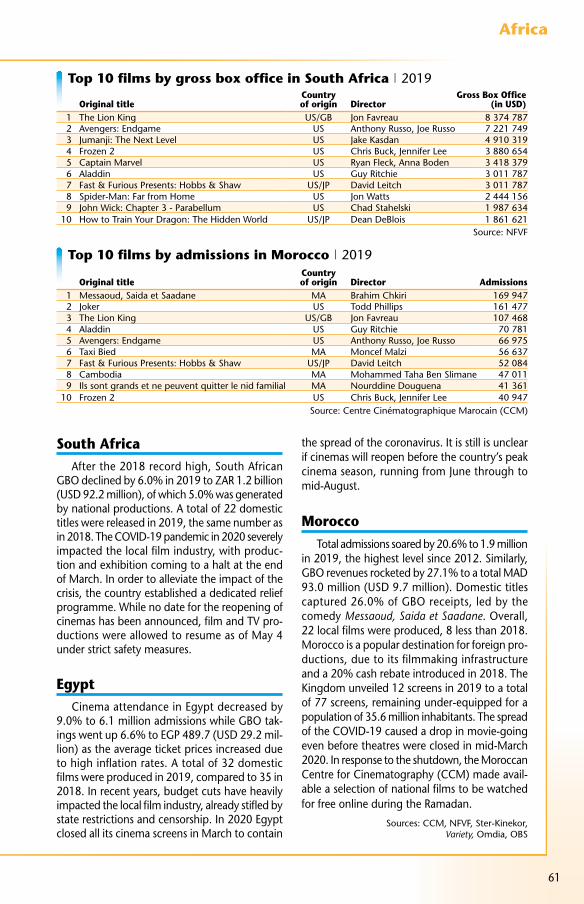
61
Africa
South AfricaAfter the 2018 record high, South African
GBO declined by 6.0% in 2019 to ZAR 1.2 billion (USD 92.2 million), of which 5.0% was generated by national productions. A total of 22 domestic titles were released in 2019, the same number as in 2018. The COVID-19 pandemic in 2020 severely impacted the local film industry, with produc-tion and exhibition coming to a halt at the end of March. In order to alleviate the impact of the crisis, the country established a dedicated relief programme. While no date for the reopening of cinemas has been announced, film and TV pro-ductions were allowed to resume as of May 4 under strict safety measures.
EgyptCinema attendance in Egypt decreased by
9.0% to 6.1 million admissions while GBO tak-ings went up 6.6% to EGP 489.7 (USD 29.2 mil-lion) as the average ticket prices increased due to high inflation rates. A total of 32 domestic films were produced in 2019, compared to 35 in 2018. In recent years, budget cuts have heavily impacted the local film industry, already stifled by state restrictions and censorship. In 2020 Egypt closed all its cinema screens in March to contain
the spread of the coronavirus. It is still is unclear if cinemas will reopen before the country’s peak cinema season, running from June through to mid-August.
MoroccoTotal admissions soared by 20.6% to 1.9 million
in 2019, the highest level since 2012. Similarly, GBO revenues rocketed by 27.1% to a total MAD 93.0 million (USD 9.7 million). Domestic titles captured 26.0% of GBO receipts, led by the comedy Messaoud, Saida et Saadane. Overall, 22 local films were produced, 8 less than 2018. Morocco is a popular destination for foreign pro-ductions, due to its filmmaking infrastructure and a 20% cash rebate introduced in 2018. The Kingdom unveiled 12 screens in 2019 to a total of 77 screens, remaining under-equipped for a population of 35.6 million inhabitants. The spread of the COVID-19 caused a drop in movie-going even before theatres were closed in mid-March 2020. In response to the shutdown, the Moroccan Centre for Cinematography (CCM) made avail-able a selection of national films to be watched for free online during the Ramadan.
Sources: CCM, NFVF, Ster-Kinekor, Variety, Omdia, OBS
Top 10 films by gross box office in South Africa | 2019
Top 10 films by admissions in Morocco | 2019
Original titleCountry of origin
Gross Box Office Director (in USD)
1 The Lion King US/GB Jon Favreau 8 374 7872 Avengers: Endgame US Anthony Russo, Joe Russo 7 221 7493 Jumanji: The Next Level US Jake Kasdan 4 910 3194 Frozen 2 US Chris Buck, Jennifer Lee 3 880 6545 Captain Marvel US Ryan Fleck, Anna Boden 3 418 3796 Aladdin US Guy Ritchie 3 011 7877 Fast & Furious Presents: Hobbs & Shaw US/JP David Leitch 3 011 7878 Spider-Man: Far from Home US Jon Watts 2 444 1569 John Wick: Chapter 3 - Parabellum US Chad Stahelski 1 987 634
10 How to Train Your Dragon: The Hidden World US/JP Dean DeBlois 1 861 621
Original titleCountry of origin
Director Admissions
1 Messaoud, Saida et Saadane MA Brahim Chkiri 169 9472 Joker US Todd Phillips 161 4773 The Lion King US/GB Jon Favreau 107 4684 Aladdin US Guy Ritchie 70 7815 Avengers: Endgame US Anthony Russo, Joe Russo 66 9756 Taxi Bied MA Moncef Malzi 56 6377 Fast & Furious Presents: Hobbs & Shaw US/JP David Leitch 52 0848 Cambodia MA Mohammed Taha Ben Slimane 47 0119 Ils sont grands et ne peuvent quitter le nid familial MA Nourddine Douguena 41 361
10 Frozen 2 US Chris Buck, Jennifer Lee 40 947
Source: NFVF
Source: Centre Cinématographique Marocain (CCM)

62
Middle East
Number of films produced in selected Middle East countries | 2015-2019 e
In units.
0
200
150
100
50
2015 2016 2017 2018 20192
15
32
110
132
169
116130
18
30
19
28 26
15 166 9
Sources: Iranian Independents, Israel Film Fund, Omdia, OBS
Admissions in selected Middle Eastern countries | 2015-2019 e
In millions.
0
30
20
10
2015 2016 2017 2018 2019
16.7
13.4
13.0
3.8
16.5
14.0
3.5 3.5
0.5
14.0
25.3
20.2
16.0
4.0
22.9
20.5
28.1
20.3
2.7
6.5
26.0
Sources: Israeli Film Fund, Empire Cinemas, Iranian Independents
Lebanon e
Saudi Arabia e
Iran
Iran
Israel e
United Arab Emirates e
IsraelLebanonUnited Arab Emirated
Iran Israel Kuwait Lebanon QatarSaudi
ArabiaUnited Arab
EmiratesPopulation 2019 e (million) 83.3 9.1 4.7 6.1 2.8 34.1 34.1GDP per capita 2019 e (USD) 5 506 42 823 29 267 9 655 69 688 22 865 22 865Gross box office 2019 e (in M USD) 71.4 156.0 (1) 69.4 25.6 43.3 112.1 247.4Admissions 2019 e (million) 26.0 14.0 (1) 5.9 2.7 3.1 6.5 20.3Admissions per capita 2019 e 0.3 1.6 (1) 1.2 0.4 1.1 0.2 0.6Average ticket price 2019 e (USD) 2.7 11.1 (1) 11.8 9.4 13.7 17.2 12.2Screens 2019 e 609 464 115 154 139 129 618Digital screens 2019 e 609 464 115 154 139 129 618National market shares 2019 e 94.4% 12.0% (1) ~ 20.2% ~ ~ ~(1) 2018

63
Middle East
Top 10 films by admissions in the United Arab Emirates | 2019
Original titleCountry of origin Director
Distributor Admissions
1 Joker US Todd Phillips Warner Bros. 532 6142 Fast & Furious Presents: Hobbs & Shaw US/JP David Leitch Universal Pictures 269 3493 The Lion King US/GB Jon Favreau Walt Disney 247 8474 Jumanji: The Next Level US Jake Kasdan Columbia 215 9165 Aladdin US Guy Ritchie Walt Disney 231 7606 Frozen 2 US Chris Buck, Jennifer Lee Walt Disney 199 4827 Maleficent: Mistress of Evil US/GB/CA Joachim Rønning Walt Disney 193 4098 Avengers: Endgame US Anthony Russo, Joe Russo Walt Disney 174 8489 Spider-Man: Far from Home US Jon Watts Columbia 165 204
10 Toy Story 4 US Josh Cooley Walt Disney 184 587
Original titleCountry of origin Director
Distributor Admissions
1 Avengers: Endgame US Anthony Russo, Joe Russo Walt Disney 938 1962 Aladdin US Guy Ritchie Walt Disney 790 4223 The Lion King US/GB Jon Favreau Walt Disney 709 0694 Fast & Furious Presents: Hobbs & Shaw US/JP David Leitch Universal Pictures 626 3935 Joker US Todd Phillips Warner Bros. 560 1646 Spider-Man: Far from Home US Jon Watts Columbia 486 4997 Jumanji: The Next Level US Jake Kasdan Columbia 458 1218 Captain Marvel US Ryan Fleck, Anna Boden Walt Disney 425 5359 Frozen 2 US Chris Buck, Jennifer Lee Walt Disney 468 861
10 Maleficent: Mistress of Evil US/GB/CA Joachim Rønning Walt Disney 382 390 Source: Empire Cinemas
Top 10 films by admissions in Saudi Arabia | 2019
Source: Empire Cinemas
Iran
Iranian cinema attendance fell by 7.6% to 26 million admissions in 2019 while GBO takings grew by 21% to IRR 3 trillion (USD 71.4 million). Local films dominated the box office, generating 94.4% of revenues. The domestic comedy Motreb (The Singer) topped the charts taking a total of IRR 385 billion (USD 9.5 million) and becoming the highest-grossing film of all time in Iran. The number of national productions grew from 116 to 130 films in 2019, of which 58 were released in the same year. Economic sanctions took a toll on the national film industry, leading to a down-turn in funding and international sales. In 2020, as the coronavirus pandemic hit Iran, all cinema activities came to a halt in March. With all reg-ular cinemas closed, a drive-in movie theatre has opened for the first time since their ban in 1979.
United Arab Emirates
After a record-breaking 2018, UAE cinema atten-dance marginally declined in 2019 to 20.3 mil-lion admissions (-0.6%), as box office takings dropped slightly by 1.1% to UAD 908.7 million (USD 247.4 million). In 2020, all cinemas in UAE were shut down in mid-March following the corona-
virus outbreak. However, as the country started to ease lockdown restrictions, multiplexes in Dubai began to reopen at the end of May, operating at reduced capacity with sanitary measures in place.
Saudi ArabiaAfter the ban on movie theatres was lifted in
April 2018, admissions in Saudi Arabia soared to 6.5 million in 2019, up from 0.5 million in 2018. The country’s theatrical infrastructure is growing rapidly, counting 129 screens at the beginning of 2020, with an estimated potential to grow up to 2 600 by 2030. The Kingdom has announced a series of initiatives to foster the local film industry, including plans to establish a national film archive and a film festival. However, the first edition of the Red Sea International Film Festival, sched-uled for March 2020, was postponed due to the COVID-19 pandemic. In response to the pan-demic, the non-profit foundation organising the festival announced the creation of a relief fund of Saudi filmmakers. Saudi Arabia, one of the first territories to close all cinemas in early March, has announced that theatres will be allowed to reopen from June 21.
Sources: Empire Cinemas, Iranian Independents, Variety, Screen International, The Hollywood
Reporter, Associated Press, Omdia, OBS
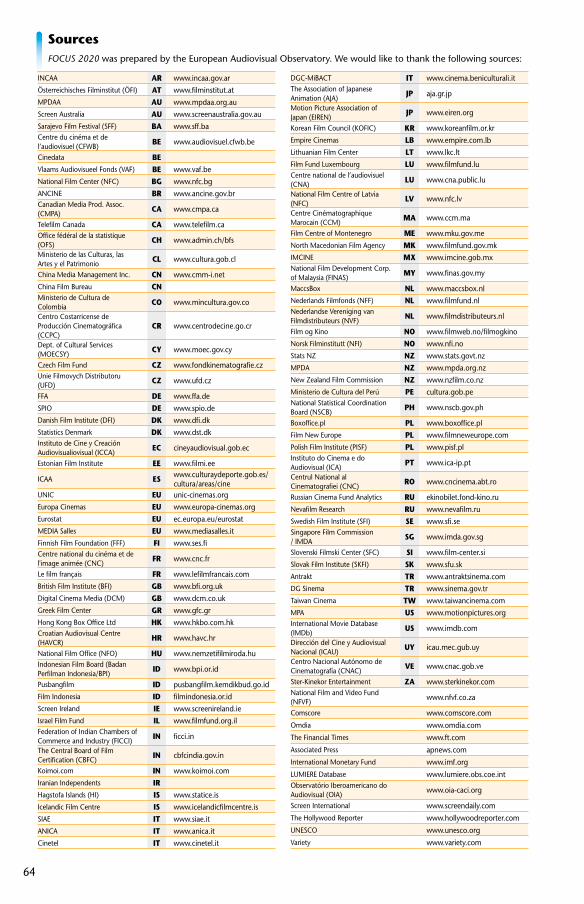
64
SourcesFOCUS 2020 was prepared by the European Audiovisual Observatory. We would like to thank the following sources:
INCAA AR www.incaa.gov.arÖsterreichisches Filminstitut (ÖFI) AT www.filminstitut.atMPDAA AU www.mpdaa.org.auScreen Australia AU www.screenaustralia.gov.auSarajevo Film Festival (SFF) BA www.sff.baCentre du cinéma et de l’audiovisuel (CFWB) BE www.audiovisuel.cfwb.be
Cinedata BEVlaams Audiovisueel Fonds (VAF) BE www.vaf.beNational Film Center (NFC) BG www.nfc.bgANCINE BR www.ancine.gov.brCanadian Media Prod. Assoc. (CMPA) CA www.cmpa.ca
Telefilm Canada CA www.telefilm.caOffice fédéral de la statistique (OFS) CH www.admin.ch/bfs
Ministerio de las Culturas, las Artes y el Patrimonio CL www.cultura.gob.cl
China Media Management Inc. CN www.cmm-i.netChina Film Bureau CNMinisterio de Cultura de Colombia CO www.mincultura.gov.co
Centro Costarricense de Producción Cinematográfica (CCPC)
CR www.centrodecine.go.cr
Dept. of Cultural Services (MOECSY) CY www.moec.gov.cy
Czech Film Fund CZ www.fondkinematografie.czUnie Filmovych Distributoru (UFD) CZ www.ufd.cz
FFA DE www.ffa.de SPIO DE www.spio.deDanish Film Institute (DFI) DK www.dfi.dkStatistics Denmark DK www.dst.dkInstituto de Cine y Creación Audiovisualiovisual (ICCA) EC cineyaudiovisual.gob.ec
Estonian Film Institute EE www.filmi.ee
ICAA ES www.culturaydeporte.gob.es/cultura/areas/cine
UNIC EU unic-cinemas.orgEuropa Cinemas EU www.europa-cinemas.orgEurostat EU ec.europa.eu/eurostatMEDIA Salles EU www.mediasalles.it Finnish Film Foundation (FFF) FI www.ses.fiCentre national du cinéma et de l'image animée (CNC) FR www.cnc.fr
Le film français FR www.lefilmfrancais.comBritish Film Institute (BFI) GB www.bfi.org.ukDigital Cinema Media (DCM) GB www.dcm.co.ukGreek Film Center GR www.gfc.grHong Kong Box Office Ltd HK www.hkbo.com.hkCroatian Audiovisual Centre (HAVCR) HR www.havc.hr
National Film Office (NFO) HU www.nemzetifilmiroda.hu Indonesian Film Board (Badan Perfilman Indonesia/BPI) ID www.bpi.or.id
Pusbangfilm ID pusbangfilm.kemdikbud.go.idFilm Indonesia ID filmindonesia.or.idScreen Ireland IE www.screenireland.ieIsrael Film Fund IL www.filmfund.org.ilFederation of Indian Chambers of Commerce and Industry (FICCI) IN ficci.in
The Central Board of Film Certification (CBFC) IN cbfcindia.gov.in
Koimoi.com IN www.koimoi.comIranian Independents IRHagstofa Islands (HI) IS www.statice.is Icelandic Film Centre IS www.icelandicfilmcentre.isSIAE IT www.siae.itANICA IT www.anica.it Cinetel IT www.cinetel.it
DGC-MiBACT IT www.cinema.beniculturali.itThe Association of Japanese Animation (AJA) JP aja.gr.jp
Motion Picture Association of Japan (EIREN) JP www.eiren.org
Korean Film Council (KOFIC) KR www.koreanfilm.or.krEmpire Cinemas LB www.empire.com.lbLithuanian Film Center LT www.lkc.ltFilm Fund Luxembourg LU www.filmfund.luCentre national de l’audiovisuel (CNA) LU www.cna.public.lu
National Film Centre of Latvia (NFC) LV www.nfc.lv
Centre Cinématographique Marocain (CCM) MA www.ccm.ma
Film Centre of Montenegro ME www.mku.gov.meNorth Macedonian Film Agency MK www.filmfund.gov.mkIMCINE MX www.imcine.gob.mxNational Film Development Corp. of Malaysia (FINAS) MY www.finas.gov.my
MaccsBox NL www.maccsbox.nlNederlands Filmfonds (NFF) NL www.filmfund.nlNederlandse Vereniging van Filmdistributeurs (NVF) NL www.filmdistributeurs.nl
Film og Kino NO www.filmweb.no/filmogkinoNorsk Filminstitutt (NFI) NO www.nfi.noStats NZ NZ www.stats.govt.nzMPDA NZ www.mpda.org.nzNew Zealand Film Commission NZ www.nzfilm.co.nzMinisterio de Cultura del Perú PE cultura.gob.peNational Statistical Coordination Board (NSCB) PH www.nscb.gov.ph
Boxoffice.pl PL www.boxoffice.plFilm New Europe PL www.filmneweurope.comPolish Film Institute (PISF) PL www.pisf.pl Instituto do Cinema e do Audiovisual (ICA) PT www.ica-ip.pt
Centrul National al Cinematografiei (CNC) RO www.cncinema.abt.ro
Russian Cinema Fund Analytics RU ekinobilet.fond-kino.ruNevafilm Research RU www.nevafilm.ruSwedish Film Institute (SFI) SE www.sfi.seSingapore Film Commission / IMDA SG www.imda.gov.sg
Slovenski Filmski Center (SFC) SI www.film-center.siSlovak Film Institute (SKFI) SK www.sfu.skAntrakt TR www.antraktsinema.comDG Sinema TR www.sinema.gov.trTaiwan Cinema TW www.taiwancinema.comMPA US www.motionpictures.orgInternational Movie Database (IMDb) US www.imdb.com
Dirección del Cine y Audiovisual Nacional (ICAU) UY icau.mec.gub.uy
Centro Nacional Autónomo de Cinematografía (CNAC) VE www.cnac.gob.ve
Ster-Kinekor Entertainment ZA www.sterkinekor.comNational Film and Video Fund (NFVF) www.nfvf.co.za
Comscore www.comscore.comOmdia www.omdia.comThe Financial Times www.ft.comAssociated Press apnews.comInternational Monetary Fund www.imf.orgLUMIERE Database www.lumiere.obs.coe.intObservatório Iberoamericano do Audiovisual (OIA) www.oia-caci.org
Screen International www.screendaily.comThe Hollywood Reporter www.hollywoodreporter.comUNESCO www.unesco.orgVariety www.variety.com


Yearbook Online
The BEST SOURCE OF DATA on:• television • film • video• on-demand audiovisual servicesin 40 EUROPEAN COUNTRIES
400 tables with over 25,000 data elements40 country profiles in French, English and German
2019/2020
NEW
FREECOPY
IN THESUBSCRIPTION
VISIT THE YEARBOOK WEBSITE
http://yearbook.obs.coe.int
KEY TRENDSPRINT VERSION
OR PDF VERSION(68 PAGES)
FOCUS 2020
33€ PDF
66€ print