
Workshop on Satellite Power Systems (SPS) Effects on Optical ...
237
I i J : Conf-7905143 Workshop on Satellite Power Systems (SPS) Effects on Optical and Radio Astromony WASTE April 1980 U.S. Department of Energy Office of Energy Research Satellite Power System Project Division DOE/NASA Satellite Power System Concept Development and Evaluation Program
-
Upload
khangminh22 -
Category
Documents
-
view
3 -
download
0
Transcript of Workshop on Satellite Power Systems (SPS) Effects on Optical ...

I i J :
Conf-7905143
Workshop on Satellite Power Systems (SPS)Effects on Optical and Radio Astromony
WASTE
April 1980
U.S. Department of EnergyOffice of Energy ResearchSatellite Power System Project Division
DOE/NASA
Satellite Power SystemConcept Development andEvaluation Program

CONF-7905143Dist. Catg. UC-13, 34b
Workshop on Satellite Power Systems (SPS)Effects on Optical and Radio Astronomy
Apt .980
Battelle, Seattle Conference CenterSeattle, WashingtonMay 1979
Edited by:P. A. Ekstron and G. M. StokesPacific Northwest LaboratoryRichland, Washington 99352
Under Contract No. KD-03-82029
Prepared for:U.S. Department of EnergyOffice of Energy ResearchSatellite Power System Project DivisionWashington, D.C. 20545
DOE/NASA
Satellite Power SystemConcept Development andEvaluation Program

CONTENTS
Page
INTRODUCTION AND SUMMRY vii
WORKSHOP OPENING STATEMENT oaix
INTRODUCTION 1
BRIEFING DOCUMENT 9
INTRODUCTION 11
GENERAL CHARACTERISTICS OF THE SPS REFERENCE SYSTEM . . . 12
SATELLITE OPTICAL EFFECTS 13
A. DIFFUSE REFLECTION 13
B. SPECULAR REFLECTION OF SUNLIGHT 14
C. DIFFUSE SKY BRIGHTNESS 15
D. SATELLITE THERMAL INFRARED EMISSION 17
E. IONOSPHERIC INFRARED AND OPTICAL EMISSIONS . . . 17
RADIO EFFECTS 19
f. SATELLITE MAIN POWER BEAM 19
B. SATELLITE HARMONIC RADIATION 20
C. SATELLITE NOISE RADIATION 20
D. RECTENNA POWER BEAM SCATTERING 22
E. RECTENNA HARMONIC RADIATION 22
F. RECTENNA NOISE RADIATION 22
APPENDIX A - TIME-VARYING BRIGHTNESS OF THE SOLAR COLLECTING ARRAY 24
INVITFD PRFSENTATIONS ON SPS EFFECTS ON OPTICAL ASTRONOMY . . . 27
LIMITATIONS OF THE BRIEFING DOCUMENT'S CHARACTERIZATION OF THESPS REFERENCE SYSTEM - G. M. Stokes 29
COMMENTS ON THE EFFECTS OF INCREASED DIFFUSE SKY BRIGHTNESS ON FAINTOBJECT ASTRONOMICAL OBSERVATIONS - J. S. Gallagher and S. M. Faber 33

EFFECTS OF THE SATELLITE POWER SYSTEM ON GROUND-BASED ASTRONOMICALTELESCOPES - P. B. Boyce 39INFRARED ASTRONOMY - D. A. Harper 45
POSSIBLE IMPACT: OF THE SPS ON THE SPACE TELESCOPE - E. J. Groth . 47
REPORT OF THE OPTICAL ASTRONOMY WORKING GROUP 51
THE NATURE OF ASTRONOMICAL OBSERVATIONS 54
THE ORIGIN OF SPS EFFECTS ON OPTICAL ASTRONOMY . . . . 64
IMPACT THRESHOLDS OF THE SPS ON OPTICAL ASTRONOMY . . . . 69
EFFECTS ON OPTICAL ASTRONOMY 75
RECOMMENDATIONS AND REMEDIES 77
REPORT ON SPS EFFECTS ON AERONOMY 81
INTRODUCTION 83
EFFECTS ON AERONOMY OBSERVATIONS - K. Clark 85
INVITED PRES rNTATIONS ON SPS EFFECTS ON RADIO ASTRONOMY . . . 95
MICROWAVE POWER TRANSMISSION SYSTEM - G. D. Arndt . . . . 97
SPS NOISE AND HARMONICS - R. M. Dickinson 103
SPS-GENERATED FIELD STRENGTHS AT 2.45 GHz TYPICAL EFFECTS -
W. Grant 119
INTERFERENCE EFFECTS ON RADIO ASTRONOMY EQUIPMENT - W. C. Erickson 123
POSSIBLE OVERLOAD AND PHYSICAL DAMAGE OF A RADIO ASTRONOMY RECEIVERCAUSED BY THE SPS - H. Hvatum 127POTENTIAL IMPACT OF OUT-OF-BAND RADIATION FROM THE SATELLITE POWERSYSTEM AT ARECIBO OBSERVATORY - M. M. Davis 131THE EFFECTS OF THE PROPOSED SATELLITE POWER SYSTEM ON THE VLA -A. R. Thompson 135SATELLITE POWER SYSTEM EFFECTS ON VLBI - B. F. Burke . . . 143
CONSIDERATIONS REGARDING DEEP SPACE COMMUNICATIONS AND THE SPS -N. de Groot 147

REPORT OF THE RADIO ASTROMONY WORKING GROUP 153
SUMMARY STATEMENT 155
ACTUAL PROPERTIES OF THE MICROWAVE POWER TRANSMISSION SYSTEM . 158
ASSIGNMENT OF SPS HARMONIC FREQUENCIES 159
TIME-VARIABILITY OF SPS OFF-AXIS RADIATION AND INTRINSIC MULTIPLE
SATELLITE EFFECTS 159
THE "RUSTY BOLT EFFECT" 160
INTERFERENCE REJECTION PROPERTIES PECULIAR TO SYNTHESIS ARRAYS
(AS THE VLA) 161
SITING CONSIDERATIONS 162
ON MOVING RADIO ASTROMONY TO THE LUNAR FAR SIDE . . . . 164
APPENDIX A - CCIR REPORTS ON RADIO ASTRONOMY (Reports 223-4 and224-4) A.IAPPENDIX B - CCIR REPORTS ON DEEP-SPACE RESEARCH (Reports 365-3 and685) B.IAPPENDIX C - EFFECT OF SOLAR POWER SATELLITE TRANSMISSIONS ON RADIO
ASTRONOMICAL RESEARCH C.I
APPENDIX D - NATIONAL ACADEMY OF SCIENCES REPORT ON SPS EFFECTS . . D.I
APPENDIX E - ENVIRONMENTAL CONSIDERATIONS FOR THE MICROWAVE BEAM FROMA SOLAR POWER SATELLITE E.IACKNOWLEDGMENTS 255

INTRODUCTION AND SUNMARY
BACKGROUND
This report summarizes the proceedings of a workshop on the potential
impact of the conceptual satellite power system on astronomy. The workshop
addressed two questions: "What will the SPS look like to an observer?"
and, "What will that mean to astronomy?" It was organized by the U.S.
Department of Energy (DOE) and Pacific Northwest Laboratory (PNL) (operated
by Battelle Memorial Institute) and held at the Battelle Seattle Conference
Center on May 23 and 24, 1979. This workshop and report were produced under
the electromagnetic compatibility subtask of the environmental assessment
portion of the joint DOE/NASA Satellite Power Systems (SPS) project.
The SPS concept has been suggested as a possible new energy source
which, if fully developed, could provide a source of power equal to all the
electrical energy generated in the United States in 1975. The energy would
be collected by building and operating satellites equipped with large solar
arrays in geostationary orbits around the earth. In the present version,
solar energy would be converted to microwaves and transmitted from space to
earth. Earth receiving stations would convert the microwave energy to
electricity, which could be fed directly into utility networks. Each satellite/
receiving station combination wuuld provide approximately b GW of electric
power. Other transmission systems, such as lasers, also are being considered,
but this workshop considered only the microwave version.
The workshop considered the SPS design concept described in the
"Reference System Report" of October 1978 (DOE/ER-0023). The Reference System's
purpose is to serve as a common basis for further technological development
VI i

(systems definition and critical supporting investigations), preliminary
environmental and societal assessments, and comparative analyses of the SPS
concept and other national energy ventures. For the most parr, the Reference
System is based on fully-matured engineering precepLs (methods, materials,
practices, etc.) and realizable projections of future improvements. However,
it is by no means an optimized engineering design, and does not account for
newly emerging technologies which might become standard practices in the
post-2000 era. Continuing systems definition undoubtedly will change many of the
current characteristics of the Reference System. Some of those changes can
already be reasonably perceived, but others most likely will occur that cannot
yet be appreciated. Thus some potential problems associated with the present
Reference System may subsequently become moot, an<' new ones will be recognized
as development continues. Despite its current limitations, the Reference
System is an important tool for identifying and evaluating significant
side effects which conceivably could accompany SPS.
The general features of the current microwave-based SPS Reference
System which are of concern to astronomy are:
• The Reference System consists of 60 satellites each of whose
2solar collecting area is 55 km .
• The energy would be transmitted to earth as microwaves at a
frequency of 2.45 GHz.
Vlll

• Materials would be assembled at work stations and staging
areas in low earth orbit (LEO), and the satellites would be
constructed in geostationary orbit (GEO).
• Some energy would be lost in each stage of energy conversion
and transmission. That is, the solar array would not absorb
all of the energy striking it, the transmitting antenna would
not radiate all of the energy absorbed by the solar array, the
ground receiving station would not receive all of the energy
transmitted, and the receiving station would not collect all
of the energy illuminating it.
WORKSHOP ORGANIZATION
During the process of organizing and conducting the workshop, three
distinct kinds of documents were generated. All three bound together form
the workshop proceedings. The first is the Workshop Briefing Document which
was the basis for the discussions, invited contributions, and reports.
This document was prepared by Battelle on the basis of the SPS Reference
System Report and on calculations made to elucidate system features relevant
to astronomy. The primary goal of the Briefing Document, like the Reference
System Report, was to provide a set of consistent parameters for discussing
SPS. A tabulation of the most important parameters used in the Briefing
Document is shown in T P M P 1. The Briefing Document is by nu means final,
of course, since it is based almost entirely on the current Reference System.
The second document is the report on topics that the workshop
organizers felt would be important areas of discussion. These reports were
prepared by the participants and were based on the characterization of the
system as described in the Briefing Document.

TABLE 1.
Data Relevant to the SPS Reference System
Geosynchronous Orbit Altitude 35800 kmRadius 42200 km
Satellite Spacing in Orbit 1°
Inclination of Planned Orbit 0°
Planned Number of Satellites 60
Delivered Power Per Satellite - Rectenna Pair 5 GW
Dimensions of Solar Collector Blanket 10.4 km x 5.2 km
Area of Solar Collector Blanket 54 km
Area of Transmitting Antenna Array 0.8 km
Power Transmission Frequency 2.45 GHz
Solid Angle Subtended by Satellite seen from Surface of a oEarth at Sub-Satellite Point 4.3 x 10"° Rad^
Angle Subtended by Satellite 1 by 1/2 arc minutes
10 2Solid Angle Subtended by the Transmitting Array 6.1 x 10 Rad
Angle Subtended by Transmitting Array 6 arc seconds
Angle Subtended by Earth seen from Synchronous Orbit 17.5°
Angle Subtended by Sun, Average 32 arc minutes
Solid Angle Subtended by Sun, Average 6.8 x 10"5 Rad2
-4Satellite Solid Angle as a Fraction of Sun Solid Angle 6.3 x 10 = 1/1600
Antenna Solid Angle as a Fraction of Sun Solid Angle 9.2 x 10"
Illuminance of Brightest Moonlight as a Fraction of fi
Nnnn Sunlight 2.15 x 10
Illuminance of Venus at Maximum Brilliance (m = -4.3) qas a Fraction of Noon Sunlight 1.12 x 10
Effective Aperture of an Ideal Isotropic Antenna at 9
2.45 GHz (X = 0.122 m) A2/4n = 12 a / = -29 dB M^

Following an introductory statement, the invited contributions were
presented and discussed. The group was then divided into radio and optical
working groups for more detailed consideration of SPS effects on astronomy.
The form and content of the working group meetings were largely left to the
members of each group with one exception. Both groups were specifically
asked to comment on the possibility of moving the affected portions of
astronomical observations to facilities located in space or on the far side
of the moon. The reports of the working groups make up the final document
in the workshop proceedings.
The objective of the meeting was to identify the potential impacts of
the SPS on astronomy and to do so in a fashion that would allow system
designers to recognize and modify those aspects of the system that create
potential problems to the extent it may be possible to do so.
The actual content of these various documents fell into two natural
divisions: optical and radio effects. From one viewpoint, this division is
in keeping with an astronomical tradition of dividing the profession according
to the portion of the electromagnetic spectrum that is observed. From another
viewpoint, the division expresses the separate effects of the passive and
active properties of the satellite system. In particular, the major optical
effects caused by SPS would be functions of the system's structures in orbit
and would continue even if the system were turned off. Radio astronomy,
however, would be particularly affected by the active portion of the system —
the intended microwave transmission of energy from space to earth. In terms
of design, both optical and radio astronomy impacts are primarily a result
of unintentional side effects. The optical effects would occur because the
SPS solar blankets would reflect some of the light that strikes them. The
radio effects would occur because a small portion of the transmitted energy

would not be confined to the narrow beam from the orbiting antenna to the.
earth rectenna, or to the assigned portion of the radio spectrum.
BASIC CONCLUSIONS OF THE WORKSHOP
The effects on astronomy discussed below must be understood in the
general context of how astronomical research is conducted. Participants at
the workshop continually emphasized that virtually all of our knowledge
about the Universe outside of the Solar System has been obtained by studying
the electromagnetic emissions of celestial objects. Because the most distant
objects are also the faintest, all branches of astronomy have attempted to
develop the most sensitive detectors possible. Because these detectors are
so sensitive, they are limited by interference due to other sources of
radiation. The effect of the SPS would be to substantially increase the amount
of man-made interfering radiation. This would further limit the astronomer's
ability to observe faintobjects and thus the size of the measurable Universe.
The primary effect on optical astronomy is attributed to increased sky brightness.
The increase in sky brightness comes from sunlight which would be reflected
from the SPS solar cell blanket. The amount of light scattered from a
satellite is measured by its diffuse albedo, which is simply the amount of
scattered light expressed as a percentage of the total incident light. Using
the lowest estimates of light scattering for the conceptual SPS design, an
albedo of 4 percent, each satellite would be as bright as the planet Venus at
its brightest. This would make the satellites the third brightest objects
in the sky, only the sun and the moon being brighter. The magnitude of the
effect is a function of SPS design parameters.
Any increase in the brightness of the sky results in a proportional
reduction in the effective aperture of a telescope when it is being used on
xii

faint sources. The predicted increases of sky brightness from sixty
satellites suggest that at a minimum any observatory would be prevented from
effectively observing faint sources in a 10 degree by 70 degree band defined
by the line of satellites. There would also be a noticeable effect on
observation over a region more than 60 degrees by 90 degrees (approximately
half of the night sky).
For radio astronomy and deep space research there are three, potential
major effects. Microwave radiation leaking from a single satellite's power beam
could temporarily overload or permanently damage sensitive receivers used for
radio observation. This effect would prevent successful operation of centimeter-
wave radio telescopes located too close to SPS power receiver (rectenna) locations
or to regions of high'leakage. Necessary avoidance distances may be hundreds of
kilometers, and even at those distances some problems may remain. The effect
would also prevent successful operation of such telescopes pointed too near the
line of power satellites. The magnitude of this effect can be influenced to a
limited extent by the design of the radio telescope, and by the design of the SPS.
The second major effect arises if power beam leakage from two or
more satellites were received simultaneously by a single radio telescope.
Depending upon SPS design, the result could be a slow, partly random variation
in receiver properties. This could be extremely difficult to distinguish from
natural astronomical piueesses, As a result, muiti-sateliite power beam
leakage effects could do markedly greater harm.
The third major effect arises from unintentional radio emissions
associated with massive amounts of microwave power, or with the presence of
large, warm structures in orbit. These emissions from power satellites would

make the satellites appear as individual stationary radio sources, unlike
natural radio sources. Emissions originating at the power receiving (rectenna)
arrays could be much like other terrestrial sources of interference. Emissions
in the allocated radio astronomy bands are subject to constraints under inter-
national treaty. Emissions at other frequencies can also harm a substantial
number of important radio astronomy observations that occur at spectral lines
and frequencies of opportunity outside the protected radio astronomy bands.
While the potential effects of SPS on astronomical research are quite
diverse, particularly as they apply to the radio and optical regimes of the
electromagnetic spectrum, there are two important effects of common origin
that would affect both areas of research. The satellites would be in geo-
stationary orbits and occupy the same portion of the sky at all times.
Therefore, a fixed region of the sky would not be usable for astronomical
research. The size of the region depends on the design of the satellites,
the particular observation being made, and the kind of instrumentation being
used. The second effect is that the source of electromagnetic interference
and light pollution would be high ir. the sky. As a result, the general
strategy of placing observatories in remote locations to avoid local interfer-
ence and light pollution effects would be very little help in mitigating SPS
effects on astronomical observations.
Finally, optical effects resulting in increased sky brightness would
affect not only optical astronomy, but aeronomy as well. Aeronomers study
the physics and chemistry of the upper atmosphere by observing naturally
occurring optical emissions such as airglow. This is difficult to distinguish
from other increases in night sky brightness. It was concluded that a
substantial fraction of faint airglow studies are incompatible with the current
SPS Reference System.
xiv

RECOMMENDATIONS
Beyond the conclusions noted above, the working groups made several
recommendations for further study to account for information which is not yet
adequate for a complete assessment of SPS effects on astronomy and aeronomy.
Satellites as a source of light pollution are a phenomenon new to optical
astronomy. While an attempt was made to assess as much of the potential impact
as possible, the optical astronomy working group recommended four areas for
future study:
1. Diffuse Reflectivity - Most of the effects discussed by the
group are a direct function of the diffuse reflectivity.
Baffling systems should be investigated as a way of lowering
the reflectivity. Each evolving design for power satellites
should include a calculated meaningful estimate of the reflectivity
and its potential for change over the orbital lifetime of the
system. If active baffling were adopted, the effect of its
failure or any system failure on the reflectivity should be
estimated.
2. Low Earth Orbit Structures - It was recommended that the design
of these structures be brought to a level which would permit their
reflectivity to be computed and the impact assessed.*
3. Atmospheric Effects - Calculations of the effect of the satellites
on sky brightness should be carried out for those meteorological
conditions appropriate to real observatories.*
* Since the workshop, tht- Department of Energy has initiated a study tocharacterize reflected light from the SPS Reference System, includingstructures in low earth orbit. Also, a study of tropospheric lightscatter has been started.
XV

4. Ionospheric Heating - Ionospheric and atmospheric heating
calculations should be used to estimate the effects of
emitted optical and IR radiation on astronomy.
Although a substantial basis already exists for quantitative evaluation
of SPS radio interference, uncertainties concerning properties of SPS and radio
astronomy equipment still remain and in several cases preclude quantitative
estimates of effects. Among the areas the radio group recommended for further
study were:
1. Noise Radiation - Uncertainties in the noise levels in the protected
bands make it clear that noise measurements for any planned system
should be made at an early stage.
2. Effect on the Very Large Array and Arecibo Facilities - Current
engineering data are not adequate to determine the level of 4.9 GHz
second harmonic interference to these two unique facilities. This
potential problem should be given careful study.
3. Rectenna Siting - Rectenna sites have associated leakage. Its
effect on existing facilities should be investigated.
4. keradiated Energy - Rectenna arrays would reradiate energy at
various frequencies in the radio spectrum. Their properties are
not yet sufficiently defined to allow a meaningful assessment of the
consequences of this radiation.
Both the optical and radio working groups further recommended an ongoing
panel to continually evaluate the impact of SPS as system designs evolve.
* All these areas are being considered in the current electro-magneticcompatibility task of the SPS Environmental Assessment Program.
XVI

MITIGATION
Due both to the lack of specific SPS data relative to interference
with astronomy and the limited time available for the workshop, mitigation
possibilities were not considered in detail. A specific request was made,
however, to consider the use of space-based facilities to compensate for
interference with earth-based ones.
The discussion of space astronomy as a mitigation strate; y was quite
different for each of the two working groups. The optical group noted that
the development of the technology required for the SPS should make it both
easier and cheaper to construct and maintain space telescopes. It is also
recognized that a great deal of the future of astronomy will depend on devel-
oping space astronomy beyond current and planned levels and that some kinds
of astronomy can only be done from space.
Two problems were noted in association with any proposal that space
astronomy might serve as a substitute for lost capability of ground-based
telescopes. First, ground-based facilities have historically been used to
complement those studies made from space, and SPS could affect that interaction
by decreasing the effectiveness of ground-based facilities. Second, it is
important to recognize that astronomy is an observational rather than an
experimental science. It has not always been obvious what the critical
observations are or what the best instruments to pursue them will be. As a
result, the diversity of astronomy has been an important source of vitality in
research. The working group felt that while astronomy from space is important
and desirable, creating a single space facility to replace ground-based
facilities would not preserve this vitality.
XVU

The radio working group, however, concluded that the reconstruction
and operation of several hundred million dollars' worth of existing ground-
based radio facilities on the lunar farside would be so expensive that it is
rot realistic.
The following points were noted with regard to mitigating possible SPS
effects on earth-based observations:
1. Because of SPS's orbital location, distance and terrain cannot
be used to isolate observatories from the source of interference
as has historically been done for earth based interferers. However,
effects on radio observatories could be. minimized by providing
maximum separation between them and SPS rectenna sites (expected
to be local interference sources) and locations of strong SPS
microwave leakage.
2. Modification of existing radio astronomy receiving systems to
reduce SPS interference, e.g., by addition of filters, is possible
but would result in some degradation of receiver performance.
As mentioned earlier, SPS is not yet fully developed. Mitigating
strategies appropriate to reducing potential impacts on astronomy should be
accounted for principally by satellite and rectenna designs and engineering
practices, including compliance with regulations governing the shared use of
the electromagnetic spectrum. The early recognition of potential problems,
such as is possible through workshops like the one reported here, is especially
important in providing guidance for future SPS development and electromagnetic
compatibility.
xviii

WORKSHOP OPENING STATEMENT
Ladies and Gentlemen, welcome. In the interest of precision, let me
read a short opening statement. It is the last time I plan to read to you.
Our job at this workshop is to elucidate the probable effects of the
proposed Satellite Power System on observational astronomy. Each of you
invited participants is here for at least two reasons, one technical and
one political. Each of you has some technical information or special
expertise to contribute to our efforts. Each of you also has experience as
a working scientist in one of the areas of observational astronomy which
may be affected. You are here not only to contribute information and skill,
but also to represent the concerns of your colleagues, to make their voices
heard in the complex process of deciding what, how, and whether a Satellite
Power System should be.
The output of this workshop will be a report entitled Satellite Power
System Effects on Optical and Radio Astronomy. This opening statement will be
its preface. About a month ago each of you received a briefing document that
outlined our best information on the nature and emissions of the SPS satellites
and ground-based components. That document, including any corrections sug-
gested here, will form the first major section of the report. A number of you
have been asked to prepare presentations on various SPS effects and to bring
with you written versions of those presentations. These will form the second
major section. The remainder of the report will consist of those additional
items that you contribute or develop here during the workshop. We have pro-
vided the first section and organized the second. The third is yours to write.
As I have said, each of you has an axe to grind. You were chosen because
you know and care about some area of observational astronomy. When we called
around, asking your colleagues who should represent this or that aspect of the
SPS-effects problem, yours were the names which kept cropping up. Presumably
you consented to come and work here because you hope to help preserve the
environment in which you do your research. To accomplish that goal, we need
to answer two questions: "What will the SPS look like to an observer?" and,
"What will that mean to astronomy?"
xix

In answering the latter question, bear in mind that this report will be
read by many people who do not much care about astronomy, and do not neces-
sarily understand the significance and value of data on an object such as a
galaxy. It will also be read by persons who care so much about astronomy that
no other consideration--such as a society's need for energy—weighs very heavily.
If our report is to be influential, both groups must be able to agree that the
issues have been addressed fairly. As you bear in mind this diverse audience,
remember as well that any eventual SPS built 20 years from now will likely
differ from the Reference System in many ways we cannot now anticipate. The
most useful kinds of statements will be those which are not only obviously
fair and penetrating, but also easily applied to all future system variants
that may be proposed.
We have our work cut out for us.
Thank you.
(These remarks delivered by R. A. Stokes.)
xx

INTRODUCTION
BACKGROUND
This document reports the proceedings of a workshop on the potential
impact of the proposed Satellite Power System (SPS) on astronomy. The work-
shop was organized by the U.S. Department of Energy (DOE) and Pacific North-
west Laboratory (PNL) (operated by Battelle Memorial Institute) and held at
the Battelle Seattle Conference Center on May 23 and 24, i°79. The workshop
was conducted and the report prepareu under the electromagnetic compatibility
subtask of the environmental assessment portion of the joint NASA/DOE Satel-
lite Power System project.
While the possible effects of the SPS on radio astronomy had been discussed
in an initial assessment of the electromagnetic compatibility of the SPS
(PNL-2482), it was decided that it would be useful to convene a workshop to
more broadly assess the effects on astronomy in general. It was felt that
such a workshop would be the most effective way to involve the astronomical
community as a whole in the assessment of SPS. The goal was to keep the
investigation of the SPS as open a process as possible. Second, it had become
apparent at both DOE and PNL that there were potential adverse effects of the
SPS on optical astronomy that did not fall under the clear responsibility of
any of the subtasks in the environmental assessment. Responsibility for
optical effects was subsequently added to PNL's subtask.
ORGANIZATION OF THE WORKSHOP
The Workshop Briefing Document (see p. 9)provides the basis for the
discussions, invited contributions, and reports that appear in this proceed-
ings. This document was prepared by P. A. Ekstrom and G. M. Stokes on the
basis of the October 1978 SPS Reference System Report (DOE/ER-0023) and on
calculations they made to elucidate system features not well covered in the
report. The primary objective of both the Briefing Document and the Reference
System Report is to provide a set of numbers that could serve as a point of
reference for discussion of SPS. It is essential to understand that the

Briefing Document is by no means final. While a conscientious attempt was made
to identity and quantify those system parameters that are important to astronomy,
the document is based on the reference system. As mentioned in the Briefing
Document, major design changes are 1ikely--perhaps as a result of this assess-
ment effort--and these changes may affect assumed system properties in a major
way. For example, G. D. Arndt's invited presentation includes design changes
that reduce grating side lobe intensities by a factor of 10 from those given
in the Reference System report.
Many of the workshop participants were asked to prepare reports on specific
topics that we felt would be important areas of discussion. These reports were
to be based on the characterization of the system as described in the Briefing
Document. Each participant was provided with a copy of both the Briefing
Document and the Reference System Report about three weeks prior to the work-
shop.
The workshop itself was convened with a statement read by R. A. Stokes
of PNL which serves as the preface to this report. Following this introductory
statement, the invited contributions were presented and discussed. This pro-
cess too^ most of the first day, after which the participants were divided
into optical and radio working groups for more detailed consideration of SPS
effects on astronomy. The form and content of the working group meetings were
largely left to the members of each group with one exception: Both groups were
specifically asked to discuss and comment on the possibility of moving the
affected portions of astronomical observations to facilities located in space
or on the far side of the moon.
ORGANIZATION OF THE REPORT
The entire process of convening, conducting and summarizing this work-
shop fell into two natural divisions from the outset. We have, with reason-
able accuracy, described these two sections as optical and radio effects,
respectively. From one viewpoint, this division is in keeping with an astro-
nomical tradition of dividing the profession according to the portion of the
electromagnetic spectrum that is observed. From another viewpoint, the
division expresses ,ne separate effects of the passive and active properties

of the satellite system. In particular, the major optical effects caused by
the system are a function of the very existence of the system's structures in
orbit and would continue even if the system were turned off. Radio astronomy,
however, bears the brunt of the active portion of the system--the intentional
transmission of energy to the ground in the form of microwave radiation. In
terms of system design, the impacts on both optical and radio astronomy are a
result of the fact that SPS is not "perfect". The optical effects arise
because the SPS solar blankets will not absorb 100% of the light that strikes
them; the radio effects come from the inability to confine all of the trans-
mitted energy either to the narrow cone that connects the orbiting antenna to
the rectenna on the ground, or to the assigned portion of the radio spectrum.
Another difference between radio and optical astronomy is manifest in their
history of dealing with problems such as those presented by the SPS. Radio
astronomy is a member cf a very large, international commirnty that uses the
radio frequency portion of the electromagnetic spectrum. Because these users
include both emitters and receivers of radiation that could potentially inter-
fere with each other, the spectrum is managed by the International Telecom-
munications Union (ITU) which exists by virtue of international treaty. The
management process consists of assigning portions of the spectrum to specific
classes of users and setting strict standards on the extent to which other
users may interfere with certain portions of the spectrum. Radio astronomy
has several such bands assigned to it that mist be viewed as regions pro-
tected by international law. Radio astronomy also has a tradition of vigorous
action against those who infringe on these bands. This history of spectrum
management has created within radio astronomy a collection of individuals who
are specialists in this area. Many of the workshop participants are such
specialists and as a result many of the individuals in the radio astronomy
working group had served together on similar committees, discussed the effects
of satellites on radio astronomy in other contexts, and discussed SPS pre-
viously, with some involved in the writing of the NAS/CORF report.
The legal basis for protection of radio astronomy and the experience
of the radio workshop participants had several effects. The standards on
interference in the protected bands that the SPS must meet already exist.

The group felt that the SPS would have an extremely difficult task meeting
these standards. Partly as a resulc of focusing on the protected bands, the
effects on radio observations outsiJe the protected bands may not have been
treated in as much detail as might be eventually required. This viewpoint was,
in fact, probably the most appropriate one for a workshop of this duration.
The section in the radio working group report on the "Rusty Bolt Effect" illus-
trates the fact that all of the ways in which the system could create radio
frequency interference in protected bands will not be known until the SPS is
actually turned on.
Optical astronomy has no such history of enforced protection of observa-
tions from interference. Optical astronomers who are interested in faint
sources have simply tried to avoid strong sources of light in the planning of
their observations and the construction of observatories. They observe at
places that are as far removed from large cities as was practical at the time
of the construction of the observatory. As with out-of-band radio astronomy,
terrain shielding is the method by which optical astronomers attempt to pro-
tect their observations from interference. Because of this difference in the
history of optical and radio astronomy, existing light pollution standards for
optical astronomy are few and have sanction under municipal law only in iso-
lated instances. There are very few light pollution specialists in optical
astronomy. As a result, much of the discussion of the optical group centered
on setting reasonable standards for light pollution that could be used in this
assessment of SPS effects. The concept of "impact thresholds" was developed
in this context, and whereas it does not have the quantitative basis that the
ra^io regulations do, the concept should be useful in assessing satellite
designs.
A final major difference between the optical and radio working group
reports can be found in the extensive discussion of the conduct of optical
astronomical observations. The optical working group felt that it was nec-
essary to provide sufficient background to allow someone unfamiliar with
astronomy to understand the working group report. On the other hand, since
the radio working group felt that the discussion of astronomy in the CCIR 224-4
report served the same function for its report, the CCIR report is included
here as an appendix to the radio astronomy section.

Once the optical astronomy working group convened, it became increasingly
clear that optical aeronomy, represented by K. Clark of the University of
Washington, deserved attention beyond that which could be provided in the
optical astronomy report. As such, aeronomy has been separated out as a third
topic of the workshop. This separation is quite appropriate because a large
fraction of the natural background sky brightness comes from aurorae and air-
glow phenomena studied by aeronomers. Since the effects studied produce
relatively diffuse light emission which is especially difficult to distinguish
from other increases in sky brightness, the thresholds for impacts on aeronomy
are lower than they would be for optical astronomy.
BASIC CONCLUSIONS OF THE WORKSHOP
While the effects of the SPS on astronomical research are quite diverse,
particularly as they apply to the radio and optical regimes of the electro-
magnetic spectrum, there are two important effects that have a common origin
that will affect both areas of research. The geostationary character of the
satellite orbits means that the satellites will occupy the sane portion of the
sky at all times. Therefore, a fixed region of the sky will be unusable for
astronomical research. How large this region is depends on the design of the
satellites, the particular observation being made, and the kind of instrumen-
tation being used. A further effect is that placing the source of electro-
magnetic interference and light pollution relatively high in the sky will
essentially eliminate terrain shielding as a strategy to combat pollution and
interference effects.
The primary effect on optical astronomy was attributed to increased sky
brightness. Any increase in the brightness of the sky results in a propor-
tional reduction in the effective aperture of a telescope when it is being
used on faint sources. The predicted increases of sky brightness suggest that
at a minimum any western hemisphere observatory will be prevented from effec-
tively observing faint sources in a region that covers 10° in declination and
70° in hour angle surrounding the line of satellites. There will also be,
again as a minimum, a noticeable effect on observation over a region that
covers more than 60° in declination and 90° in hour angle, approximately half

of the night 'Ay. The magnitude of this effect is a strong function of SPS
design parameters, and it appears that for more likely design parameters, in
particular for a likely increase in the diffuse albedo of the satellites, the
effect will be much greater.
For radio astronomy and deep space research there are three major effects.
Microwave radiation leaking from a single satellite's intentionally generated
power beam can temporarily overload or permanently damage the sensitive
receivers used for radio observation. This effect will prevent successful
operation of centimeter-wave radio telescopes located too close to power
receiver (rectenna) locations or to regions i f high leakage (grating side
lobes). Necessary avoidance distances may exceed hundreds of kilometers.
The effect will also prevent successful operation of such telescopes pointed
too near the line of power satellites. The magnitude of this effect can be
influenced to some extent by the design of the radio telescope, and to a
smaller extent by the design of the SPS.
The second major effect arises when power beam leakage from two or more
satellites is received simultaneously by a single radio telescope. The result
will be a slow, partly random variation in receiver properties that can be
extremely difficult to distinguish from the astronomical process being observed.
As a result, power beam leakage effects will do markedly greater harm whpn
more than one satellite is operating simultaneously.
The third major effect arises from unintentional radio emissions unavoid-
ably associated either with the generation and handling of massive amounts of
microwave power, or with the presence of large, warm structures in orbit.
When these emissions originate in the power satellites, they make the satel-
lites appear as individual radio sources that do not move as do natural radio
sources. When the emissions originate in the power receiving (rectenna)
arrays, they can be much like other terrestrial sources of interference.
When these emissions lie in the allocated radio fstronomy bands, they are
subject to the most stringent regulations under international treaty. These
regulations may prove extremely difficult for the system to meet. When the
emissions occur at other frequencies, they are subject to less stringent

standards but can still do comparable harm to the substantial amount of impor-
tant radio astronomy observation that occurs at spectral lines and frequencies
of opportunity outside the protected radio astronomy bands.
Although a substantial basis already exists for quantitative evaluation
of the SPS radio interference, specific uncertainties concerning properties
of the SPS and of radio astronomy equipment still remain and in several cases
preclude quantitative estimates of effects. The report of the radio working
group offers those quantitative estimates that can be made now, makes a number
of recommendations for further investigation, and urges that an ongoing panel
be constituted to evaluate the impact of SPS as the design of the system
evolves.

SPACE POWER SATELLITE BRIEFING DOCUMENT--RADIO AND OPTICAL ASTRONOMY EFFECTS

SPACE POWER SATELLITE BRIEFING DOCUMENT-
RADIO AND OPTICAL ASTRONOMY EFFECTS
INTRODUCTION
This briefing document was prepared for participants in a workshop on
Satellite Power System (SPS) effects on optical and radio astronomy held
May 1979 in Seattle, Washington. The document draws much of its information
from, and is meant to be used in conjunction with, the SPS Reference System
Report, DOE/ER-0023, dated October 1978. The aim of this Briefing Document is
to collect information relevant to SPS effects on optical and radio astronomy,
to present the information in a manner that is both useful to the astronomical
observing communities, and is as independent as possible of future changes in
the SPS design.
In most cases, the numerical quantities of greatest interest are not
given in the Reference System Report and had to be calculated or es:imated
based on information that was available. In such cases, the numbers were
calculated in the simplest manner consistent with a useful result. Results of
more than one significant figure are seldom offered for a quantity. Greater
emphasis has been given to the identification of qualitative effects, and some
effects are mentioned for which no magnitude estimate is currently available.
In view of probable SPS design changes and uncertainties in the pro-
perties of some system components, it is important to regard the information
presented here as reference numbers used to focus discussion, and not as
definitive results. These same uncertainties mean that the most useful and
influential statements on SPS effects will be those phrased in one of two
ways: they either should be parametric in the level of SPS emission or should
offer design criteria to be observed if corresponding effects are to be avoided.
Persons evaluating SPS effects are encouraged to report their conclusions in
one of these two forms whenever possible.
11

GENERAL CHARACTERISTICS OF THE SPS REFERENCE SYSTEM
The Reference System consists of 60 satellites in synchronous orbit, eachp
consisting of a large (54-km ), solar photovoltaic cell array and a microwavebeam generator used to transmit power to an antenna-rectifier ("rectenna")array on the earth's surface. Each satellite transmits 6.7 GW (10 W) at2.45 GHz, and delivers a nominal 5 GW to the utility power grid. Pages 10-46of the Reference System Report, DOE/ER-0023, provide a good introduction tothe system, and should be read by anyone unfamiliar with the details of theReference System.
Table 1 lists data relevant to the Reference System drawn from the Refer-ence System Report. The table also presents calculated values based on thatdata and on data from the American Ephemeris and Nautical Almanac and the RCAElectro-Optics Handbook. The values in Table 1 are the basis for most of thecalculated quantities appearing in later sections of this document.
TABLE 1. Data Relevant to the SPS Reference System
Si-el lite Spacing in Orbit
Inclination o* Planned Orbit
Planned Number of Satellites
Delivered Power Per Satellite
Dimensions o* Solar Collector
- Reitenna Pair
Blanket
Area of Solar Collector Blanket
Area of Transmitting Antenna t
Earth at Sub-Satellite Point
Angle Subtended by Satellite
Solid Angle Subtended by rne T
Angle Subtended by T r a n s m u t m
Angle Subtended by tarth seei
irra,
ransmuting Arra
g Array
from Synchronous
Angle Subtended by Sun, Average
Solid Angle Subtended by Sun, Average
Satellite Solid Angle as a Frauior, of Sun So1
Antenna Solid Angle as a 'ract
Illuminance Of Brightest Moonl
Noon $un1ignt
Illuminance of Venus at Hammuas a fraction of Noon Sunlight
2.45 GH* !• - 0.122 m) • -'1-
ion of Sur Sol id
tght as a fracti'
n Brilliance im^
I1
4
1
/ 6
6
ure,t
1 4
.3 «
by
. 1 »
arc
3580042200
1
n
60
6 r,w
km K !
bi km'
U U
ID'8
U2 »'
io-"
km
i.2
B2
Had
•c m
' n.
seconds
17 5
32 arc minutes
i
id Angle 6
Angle 9
on of _
• -4 i,1 ,
8 >
3 •
2 i
s.
12
12
lO"1
!0-4
ID"6
10"6
cm2 »
Km
- i
-29
km
unutes
1
•' ] 60C
dB «''
12

SATELLITE OPTICAL EFFECTS
A. DIFFUSE REFLECTION
Each satellite is oriented so that the solar cell array approximatelyfaces an observer at the subsatellite point once each day, at local midnight.This condition combines the maximum projected area visible to the observerwith the darkest sky and represents a worst case.
For this worst-case situation, an attenuation factor for scattered sun-light can be obtained by assuming that sunlight intercepted by the solar arrayis scattered in a Larnbertian (cosine) pattern with a diffuse albedo a. Ifthe solid angle subtended by the satellite is n , the expected illuminance atthe Eartn's surface, expressed as a fraction of noon sunlight, is aft /n =
o s
1.38 x 10 a. For a 4% albedo, approximately 1/4 that of lunar material, thesatellite will appear as bright as Venus at its most brilliant.
The actual albedo is a combination of the diffuse reflectance of thesolar cell surface, whicn will be small for any efficient cell, and thecombined specular reflections from variously oriented pieces of satellitestructure. Discussions with a solar cell manufacturer indicate that currentSi cells absorb 93 to 96% of all incident visible light, leaving no more than7% total reflectance, most of which is probably specular. However, the e»id-of-life degradation in cell and concentrator efficiency is presumably a resultof increased surface roughness and other damage. This would increase diffusereflectivity. The uncertainties encountered here are typical of those to befound tnroughout this effort to assess SPS effects.
Pending the availability of better data, the value a = 0.04 mentionedabove can be recommended as a reference value, and the satellite taken asapproximately as bright as Venus ever is. The combined light from 60 satelliteswill then be approximately as bright as that of the moon halfway between newand quarter phase. The solar blanket subtends an apparent angle of 1/2 x 1arc minutes, and will appear to the naked eye as a point source under all butideal conditions.
13

B. SPECULAR REFLECTION OF SUNLIGHT
Both the solar cell blanket and the transmitting antenna array have large,
flat specularly-reflecting surfaces. Although the antenna array is much2 2
smaller, 0.8 km versus 54 km , its expected reflectance is much greater,
leading to comparable estimated illumination levels at the Earth's surface
for reflections from each surface, The antenna's aluminum front surface is
expected to have a specular reflectance above 0.9. Of the various possible
reflecting interfaces in the solar blanket, the boundary between vacuum and
front cover sheet is easily analyzed and can be used to set a lower bound to
array reflectance. The silicon cell option employs a borosilicate glass
cover sheet with a reflectance of 0.04. The GaAlAs option employs synthetic
sapphire with a reflectance of 0.063, but at a concentration ratio of two, so
that only half of the blanket area is cover sheet. The effective reflectance
for the GaAlAs option is therefore 0.032. Ue adopt a mean value of 0.036.
The reflected spot of light on the surface of the Earth may be regarded
as a pinhole camera image of the Sun approximately 330 km in diameter. It
will be reduced in brightness from that of noon sunlight by the product of the
specular reflectance of the surface and the ratio of solid angle subtended by
the satellite to that subtended by the Sun's disk. For the solar blanket, the
illumination as a fraction of noon sunlight is 2.3 x 10 , or approximately
ten times that of brightest moonlight. For the antenna array, the fractional
illumination is 8 x 10" , roughly four times that of brightest moonlight.
If the solar blanket were held precisely facing the Sun, then specular
reflection from it could fall on the Earth only for the brief period when the
satellite was in the Earth's penumbra, and would be visible only at local
sunset or sunrise. If the satellite's attitude is controlled only well enough
to avoid significant power loss, the reflected spot could fall on a much
larger portion of the Earth's night side.
The transmitting antenna is constrained by beam-forming requirements to
point with high precision directly toward its rectenna array. The path of the
reflected spot across the surface of the Earth is, therefore, completely
determined once the longitude of the satellite and location of the rectenna
are specified. Livingston (L. E. Livingston, Visibility of Solar Power
Satellites from the Earth, Document JSC-14715, L. B. Johnson Space Center,
14

Houston, TX, Feb. 1979) has analyzed the situation and concludes that each
antenna's reflected spot will illuminate any given observer on approximately
two successive nights in the spring and two in the summer. The period of
illumination can be as long as 2 minutes and, as mentioned above, will be
significantly brighter than the full moon.
It should be noted that this illumination comes from a much smaller
object and corresponds to a much larger surface brightness than that of the
moon. The surface brightness is expected to be just the reflectivity of the
satellite times the surface brightness of the Sun. High-surface brightnesses
are of special concern regarding possible local damage to the photosensitive
surface of any imaging optical detector that can resolve or nearly resolve the
satellite. As one example, the dark-adapted human eye may be at risk.
C. DIFFUSE SKY BRIGHTNESS
Increases in diffuse sky brightness are expected from either the diffuse
reflection from the solar collector or the specular reflection from the antenna.
The effects of these two phenomena are quite different.
The diffuse reflection is a persistent effect. The satellites always
occupy the same position in the sky, with their apparent brightness varying
with time as described in the appendix. The apparent positions of the indi-
vidual satellites, for a 60-satellite system, as seen from Kitt Peak,
Cerro Tololo, and Mauna Kea are shown in Figure 1.
The net effect of the diffuse brightness of these satellites can be
estimated using Ivan King's study of the profile of stellar images (Publi-
cations of the Astronomical Society of the Pacific, Volume 83, p. 199, 1971).
He found that well away from a star the sky brightness falls off as r , such
that the sky brightness around an object, in magnitudes per square second of
arc, is given by
ni(sky) = m(obj) + 7.5 + 5 log r
where m(obj) is the apparent visual magnitude of a satellite's solar blanket,
and r is the angular separation in arc seconds. The total contribution of the
Reference System to diffuse sky brightness is, therefore, simply the super-
position of the effects of the 60 satellites.
15

60° 30°EAST
FIGURE 1 .
0°HOUR ANGLE
30° 60° 90°WEST
Apparent Satellite Positions for 60-SattelliteSystem as Seen from Three Major Observatories
If we assume the maximum brightness of individual satellites is equal to
that of Venus, m = -4.3, then observatories located in longitudes 70° to
130° will experience some deterioration in quality of dark-time observing.
The additional sky brightness from SPS for these observatories would exceed
the average dark sky brightness, m - 22/sq. second of arc, for a zone which
crosses the meridian and covers more than 70° in hour angle and up to 10° in
declination. This zone would have a sharply peaked ridge of emission centered
on the apparent position of the array of satellites, such that within a 3° wide
band the sky is five times brighter than dark night sky and within ±20 minutes
of arc the effect is more than 10 times that of the dark sky.
When the specularly reflected beam from the microwave-transmitting antenna
is illuminating ground features or part of the atmosphere visible from an
observatory, multiple scattering (or single scattering when the beam passes
overhead) can contribute additional diffuse sky brightness. The magnitude of
this effect has not been calculated, even for the best case of a dust-free
16

cloudless night. The effect will occur whenever the specular beam from any of
the 60 satellites passes sufficiently near an observing site: presumably, once
per night for several minutes for the few days preceding and following the
direct illumination of the site by each satellite.
D. SATELLITE THERMAL INFRARED EMISSION
Both the GaAlAs and the Si cell solar blankets absorb about 50 GW more
power as sunlight than they deliver as electrical output. This excess power
is radiated in the infrared from both sides of the blanket. For an assumed
Lambertian pattern,
I = 50 GW/2n ^ 8 GW/Rad2
power incident per unit area on Earth is
I/r2 = 6.3 x 10"6 W/M2.
The GaAlAs cells cover about half the area of the array (the rest in concentra-
tor) and operate at 125°C, which is associated with a blackbody peak at
6.9 microns. The Si cells operate at 36.5°C for a blackbody peak at 8.8 microns.
The actual spectral distribution of the radiation will depend on the
wavelength dependence of solar cell emissivity, as determined by the details
of anti-reflection coatings, etc.
E. IONOSPHERIC INFRARED AND OPTICAL EMISSIONS
Transmission of the microwave beam is expected to raise the electron tem-
perature to a peak of at least 950 K throughout the D- and E-region of the
ionosphere, causing a significant perturbation in the ambient conditions along
the beam. Electron energy loss mechanisms will produce some enhancement of° i
6300A airglow emissions from 0('D) and 4.3-y and 6.5-y infrared emissions from
17

COp and H?O, respectively. Diurnal variations are significant, and quantita-
tive estimates of the intensity of these emissions are not readily available
at present. If these particular line emissions pose a special problem for obser-
vational work, a determination of the maximum permissible enhancement should be
made.
18

RADIO EFFECTS
A. SATELLITE MAIN POWER BEAM
The power transmission beam, 6.7 GW at 2.45 GHz, is the satellite's
dominant microwave emission. Concern over possible ionospheric heating
effects has resulted in a limitation of the microwave power densities within2
the transmitting beam to a maximum of 23 milliwatts/cm . At the perimeter of2
the rectenna array power density will be approximately 1 milliwatt/cm .Power density far from the beam center depends critically on details of the
2transmitting array design, but is nominally 2 microwatts/m as f^r as oneEarth radius away from the beam center. In addition, design-dependent
2isolated subsidiary peaks (grating lobes) of ^ l watt/m power density willoccur at intervals of 440 km along an east-west line through the main beam;
this line will be repeated at comparable intervals (stretched at high latitudes
by projection effects) north and south. Figures 19 through 22 of the Reference
Syst ...i Document and the accompanying text give further details on expected
power densities.
An ideal isotropic antenna (0 dB gain) has an effective aperture of
12 cm at 2.45 GHz. Such an antenna mounted on an aircraft or satellite
passing through the center of the main beam could intercept and deliver to the
receiver terminals approximately 1/4 watt of power, wlich is sufficient to
damage many receivers. An isotropic antenna located 1 Earth radius away from
a beam center would intercept 2.5 nanowatts per operating satellite. An2
antenna with 1/2 m effective aperture, e.g., a 26-dB radio telescope sidelobe, could deliver one microwatt, which is sufficient to overload many
parametric amplifiers.
The frequency of the main power beam must be very stable in order to
avoid unintentional frequency-scanning of the beam by the transmitting phased
array. Amplitude stability is only loosely constrained by system requirement:
and will depend on details of satellite D,C. power switch-gear and on the
power control strategy adopted. The Reference System Report gives no values
for either stability.
19

The beam center frequency choice of 2.45 GHz is a reasonable one from
many viewpoints. Nonetheless, no international frequency assignment has been
made, and this choice cannot yet be considered final.
B. SATELLITE HARMONIC RADIATION
Any microwave power generator can be expected to produce some power at
frequencies harmonically related to the main frequency generated. For the
klystron tubes of the Reference System, the fraction of output power appearing
as harmonics is expected to be small, but no values are given. The radiation
pattern of the transmitting phased array when driven at harmonic frequencies
is very dependent on details of feed design, and again no information is
given. Nonetheless, the large powers involved mean that even a fractionally
small diversion of power into harmonics could be significant, and persons
evaluating potential effects should attempt to determine effect thresholds at
the first few integer multiples of 2.45 GHz.
C. SATELLITE NOISE RADIATION
At frequencies far removed from the beam center frequency, the dominant
microwave radiation source will be thermal emission from the hot solar cell
blanket. A 330-Kelvin blackbody radiator (case of Si cells, microwave
emissivity = 1 ) in the Rayleigh-Jeans limit has a surface brightness of
7.3 x 10" 1 9 W/m2 Hz Rad2 at 2.45 GHz. Since the solar cell blanket subtends
4.32 x 10" Rad , this surface brightness results in a noise power densitypr p p
at the Earth's surface of 3.16 x 10" ° W/m Hz, or -255 dB W/m Hz. This
density should be multiplied by the actual microwave emissivity of the cell
blanket, a number less than unity. Unless the emissivity is very small, it
will not affect the qualitative conclusions below.Figure 26 of the Reference System Report shows an actively radiated noise
ppower density equal to -255 dB W/m Hz at 70 MHz away from the beam centerfrequency, rising rapidly as the center frequency is approached. The central
plateau region is a factor of 10 (60 dB) brighter.
Since the transmitting antenna is a much smaller object than the blanket,
this brightness comparison is valid only for an antenna whose main beam is at
20

least as large as the cell blanket. A beam solid angle of 4.3 x 10~2
Rad or less implies a directivity greater than 84 dB and, at these frequencies,5 2an effective aperture greater than 3.4 x 10 m . The Arecibo dish has an
aperture only twice this large, and all other single dishes are smaller.p
Interferometers which can just resolve the 0.8 km transmitting antenna
will see it become brighter than the blanket over a band extending approxi-
mately 140 MHz on each side of the center frequency. Further increases in
resolution will eventually reveal the transmitting array center to be
2.5 times brighter because of illumination taper.
The total integrated noise power implied by the spectrum of Figure 26 is-13 2approximately 5 x 10 W/m .
The calculation reported as Figure 26 (G. D. Arndt and L. Leopold,
"Environmental Considerations for the Microwave Beam from a Solar Power
Satellite," 13th Intersociety Energy Conversion Engineering Conference, San
Diego, CA, August 1978) implies a noise beam width approximately 100 times
larger than the power beam width. Frequency scanning effects are neglected,
as is any noise contribution to the klystron drive source. To date, no one has
constructed a prototype SPS klystron. All noise data are extrapolated from
performance of existing tubes both with respect to tube construction and with
respect to frequency dependence in the wings of the noise spectrum. It is
difficult for us to assess the reliability of these extrapolations.
Although not currently part of the Reference System, both amplitron tubes
and solid-state devices are being seriously considered in some quarters as
alternatives to klystrons. Of the two, the amplitrons are inherently much
noisier devices with much broader emissions, and are most convenient to apply
in cascades which are significantly noisier than individual tubes. A variety
of solid-state devices is being considered, and the present rapid rate of
device development may well make available entirely new devices in the decade
or more which will elapse before the transmitter design must be frozen. As a
result, the formulation of effects statements suggested in the introduction,
either as parametric in system properties or as effect thresholds, is especially
important for noise effects.
21

D. RECTENNA POWER BEAM SCATTERING
Although designed to efficiently absorb the incident power beam, the
rectenna structure will inevitably reflect and scatter some small percentage
of the beam power. The 2.45-GHz power density in its immediate vicinity will,
therefore, be somewhat larger and more complicated in structure than is implied
by the transmitting antenna's beam pattern. This is not expected to be a
large effect, although no magnitude estimates are given.
E. RECTENNA HARMONIC RADIATION
The rectenna can be expected to radiate harmonic energy originating in
its rectifying diodes. This is recognized to be a problem both for power
conversion efficiency and for EMI effects, and low-pass filters have been
incorporated into the more recent rectenna designs. Details of the rectenna
are still in flux, but initial measurements on one prototype (Arndt and
Leopold, op. cit. p. 21) showed that power re-radiated at the second' har-
monic (4.9 GHz) was 25 dB below the incident power. This corresponds to
re-radiation of 21 MW from a rectenna illuminated by a 6.7 GW beam. Third and
fourth harmonics were found to be 40 dB and >70 dB below incident power,
corresponding to re-radiation of 670 KW and less than 670 W, respectively.
Harmonic radiation from individual dipole elements should be partially
coherent across the rectenna array, leading to formation uf beams. Their
detailed structure will depend in turn upon the details of the partial
coherence of the incident power beam, and will be time-varying.
Again, the most useful statements to be made concerning harmonic radiation
effects are those which are parametric in harmonic signal strength, or are
effect thresholds.
F. RECTENNA NOISE RADIATION
The fraction of incident power absorbed by the rectenna dipoles depends
on the accuracy of their impedance match with the rectifier diodes, and that
in turn depends on the rectenna D.C. bus voltage and diode current. There-
fore, any variation in system bus voltage, e.g., as a result of cyclic
commutator loading or switchgear operation, and any fluctuation in diode
current, e.g., as a result of wideband internal diode noise sources, will
modulate the reflected power and radiate noise sidebands. Although no
magnitude estimate is given for this effect, the radiated noise can be
expected to most strongly affect those installations within a few rectenna
diameters (10 km) of a rectenna.

APPENDIX
TIME-VARYING BRIGHTNESS OF THE SOLAR COLLECTING ARRAY
ASSUMPTIONS
The analysis of time-varying brightness is based on the approximation ofthe diffuse reflecting character of a solar collecting array as a Lambertiansurface, which implies that the diffuse brightness varies in proportion to theprojected area of the object as seen by the observer. The system that willbe analyzed is a 59-satellite system (instead of 60, for calculational con-venience) in geosynchronous orbit, the satellites spaced 1° apart along thecelestial equator with the central satellite above longitude 100°. The col-lecting arrays are assumed to be oriented perpendicular to the orbital plane.This orientation results in an 8% variation in effective satellite illumina-tion over a year. This effect is small compared to the errors in the assumedsatellite parameters and has been neglected. Similarly, the effect on appar-ent satellite luminosity of the varying distance to the individual satellitesis small and has also been neglected.
LATITUDINAL EFFECTS
The changes in the apparent area of the satellite as a result of theequivalent of rotations about an axis parallel to the equator arise simplyfrom the latitude of the observing station. The effect will be
A1 = AQ COS 9
whereAQ = the total area of the antenna (assume = 1)
0 = projection angle as a result of the latitude of theobserver
_1 RE sin(lat)= tan" _ cos(lat)
24

with RF = the radius of the Earth
FL = the radius of the geosynchronous orbit.
LONGITUDINAL EFFECTS
The projection effects that are a result of the equivalent of rotationsaround a perpendicular to the equatorial plane are the diurnal variation andan effect as a result of the position of the satellite. Assuming a satellitenumbering system such that n = 1 is above longitude 99° and n = -1 is above101°
A 2 = Ai cos n H(n
whereH(n, Long) = LST - IL±JLonfl_LJOgl
with LST = local solar time in hours defined such that
0 occurs at midniaht.
25

LIMITATIONS OF THE BRIEFING DOCUMENT'S
CHARACTERIZATION OF THE SPS REFERENCE SYSTEM
G. M. Stokes
Virtually all of the major effects of the SPS on optical astronomy,
infrared astronomy and aeronomy arise from what can be called the passive
properties of the SPS. That is to say, the effects are not a result of what
the system does, but rather a result of the simple existence of the system.
The characterization of the Reference System in the Briefing Document repre-
.its our best estimate of what a 60-satellite system will look like. In
order to assess the effects of the passive properties of the system on astro-
nomy and aeronomy, it is important to understand the limitations of the
Briefing Document assessments.
The effect of primary interest, i.e., the increase in diffuse sky bright-
ness, has origins in both the system design and the propagation of light
through the atmosphere. There are at present four areas in wiiich the Briefing
Document description may be subject to alteration:
1. The Albedo Estimate - The adopted value of 4% may be wrong by as
much as a factor of two. Values in the range 2 to 10% have been
quoted and no real estimate exists of the change in albedo as the
system is aged through micrometeoritic bombardment.
2. The Satellites Were the Only Structures Considered - One feature of
the reference system is a low Earth orbit (LEO) support area. This
structure or structures could be very bright, and because of its
orbit, it would be a great detriment whenever visible.
3. Glints from the Support Structure - In computing the apparent visual
magnitude of the system, a contribution from specular glints from
the support structures were not included. Their effect may be
large.
29

4. The Distribution and Number of Satellites - The Briefing Document
speaks only to a 60-satellite system. Upwards of 120 satellites
have been considered and the possibility of other nations building
such systems cannot be excluded.
We have identified five weak areas in the atmospheric characterization:
1. Wavelength Dependence of Diffuse Sky Brightness - The Briefingo
Document calculation is good for approximately 5000A chosen as a
compromise between the high scattering in the blue and somewhat
lower values in the red. As an illustration of how much worse the
situation may be in the blue, it should be recalled that the opacity
due to aerosols goes as > " , while Rayleigh scattering goes as-4
2. Variable Conditions - The estimate of the increase in night sky
brightness due to the SPS found in the Briefing Document is based
on an empirical study of the image profile of astronomical objects.
Figure 1 shows how much the wings of the radiance profile of the sun
can vary as a function of location and conditions. It is the wings
of the profile that are of primary interest in computing the
increased s«y brightness. While the King profile in the Briefing
Document may represent the conditions of a particular local sky,
conditions such as subvisual cirrus or high turbidity could raise
the wings of the profile considerably.
3. Polarization Effects - The added SPS sky brightness should be
polarized just as scattered moonlight and the day sky &re. The
Briefing Document does not add.-ess this issue.
4. The Effects of the Specular Beam - As noted in the Briefing Docu-
ment, we have had no estimates of the effects of the specular beam
yet. Atmospheric scattering of the beam radiation as it passes near
an observatory may be an even greater problem than the brief periods
when the same site is actually in the beam.
30

0.1 1 10 100
ANGULAR ARC FROM SUN'S CENTER, degrees
FIGURE 1. Radiance of the Sun and Sky (The radi-ance of the sun and sky as presented ina report on circumsolar radiation givenon behalf of WATT Engineering Ltd at theDOE Environmental Resource AssessmentsBranch Contractors Review, November 13,1978, Manassas, VA)
5. Atmospheric Heating - For those observatories located near rectenna
sites, ionospheric heating may result in regions of enhanced air-
glow. The magnitude of this affect remains unknown.
In conclusion, it should be recalled throughout these proceedings that
there are large uncertainties in the relevant parameters used to estimate the
SPS contribution to sky brightness. The computed SPS brightness profile is
sharply peaked as noted in the Briefing Document. Therefore, the size of the
31

region in which the SPS contribution equals or exceeds the natural sky back-
ground is much easier to increase than decrease. Figure 2 shows the outer
contours of the regions in which the SPS contribution equals or exceeds natu-
ral dark sky background for increases in either the apparent magnitude of the
satellites or the intensity of the wings of their brightness profile by fac-
tors of 2 and 5. It is critical to note how important small changes can be ir
assessing the impact of the SPS on optical astronomy.
o
20
10
0
-10
-20
50Ei
HOUR ANGLE0i
(degrees)50W
FIGURE 2. KITT Peak - 0 Local Time at the Vernal Fquinox(The size of the zones in which the SPS-inducedbackground would equal the natural brightness ifthe satellites were 2 or 5 times brighter thandescribed in the Briefing Document.)
32

COMMENTS ON THE EFFECTS OF INCREASED
DIFFUSE SKY BRIGHTNESS ON
FAINT OBJECT ASTRONOMICAL OBSERVATIONS
J. S. Gallagher and S. M. Faber
Progress in astronomy for the last century has been strongly dependent on
the development of large telescopes and improved auxiliary instrumentation
which have allowed the collection of more information for increasingly fainter
objects. For example, the known scale of the universe has increased from that
of a single galaxy at the turn of the century to a region of billions of light
years containing millions of individual galaxies, primarily through the use of
\/ery large telescopes. Based on this history- the astronomical community is
committed to building the largest feasible t iescopes and equipping them with
the best detectors. Even with the advent of space telescopes, large, ground-
based telescopes will continue to play a major role in astronomical research
during the next 20 years (e.g., the New Generation Telescope program is pur-
suing studies of a telescope having an aperture 5 times larger than existing
telescopes.)
The sensitivity of even these large instruments is primarily limited by
the sky's brightness for observations of faint objects, and any degradation of
sky quality is therefore a matter of serious concern. At present, city lights
provide the major source of light pollution; astronomers have therefore sought
to develop remote sites, such as Mauna Kea in Hawaii, and have encouraged
astronomically-oriented cities such as Tucson, Arizona, to pass ordinances
designed to curb light pollution. Large artificial satellites, such as the
SPS, pose a new and more ubiquitous problem. When such satellites are illu-
minated by the sun, they become bright sources whose light will be scattered
in the Earth's atmosphere, thereby increasing the diffuse brightness of the
night sky. In addition, direct and scattered light from specularly reflected
sunlight could cause a loss of observing time during certain seasons.
For the purposes of a preliminary assessment of the effects of the SPS on
faint-object, ground-based astronomy, we will consider how measurements of the
33

optical light from objects having continuous spectra with absorption lines
(galaxies, stars, etc.) and a surface brightness less than the natural night
sky depend on the degree of light pollution. Furthermore, as it is difficult
to extrapolate astronomical instrumentation over 20 years, we will consider
the environmental impact of the SPS on data acquisition using existing
techniques.
Two types of detectors are routinely used for studies of faint objects—
photographic emulsions and photon detectors. Photographic emulsions have a
large capacity for information storage through the huge number of pixels
available, low cost, and acceptable uniformity of response at the expense of
linearity and efficiency (quantum efficiencies of at most a few percent).
Plates also have the undesirable property that above a threshold, the signal-
to-noise ratio for a given area essentially becomes independent of the amount
of flux collected. In contrast, photon-counting detectors have higher quantum
efficiencies which in principle, though not always in practice, are limited in
accuracy only .y photon statistics. Detectors of this type provide a best
case for dealing with the problem of sky subtraction.
Now consider an interesting object (star, galaxy, cluster, etc.) which is2
seen against, a natural sky background of surface brightness N photons/cm2
s arcsec through some spectral bandpass defined by either a spectrometer or
filter. We assume that we are in the optical spectral region and are not
centered on a strong night sky emission line; so we will use V band brightness
measurements as a representative case. The region of interest within a given
object will have a surface brightness gN where often g«l. We will compare
this circumstance with the same measurements taken against a sky with an
increased brightness pN (p>l), in which case the object surface brightness is
(g/p)pN. The critical question then is how do our observational capabilities
depend on the magnitude of p?
Since the maximum signal-to-noise ratio on a photographic plate over some
fixed physical area is set by the emulsion and processing and not by the
photon flux, then the detectable signal against sky is always the same frac-
tion f of the sky brightness. Thus, under ideal conditions a given plate-
telescope combination might allow an intensity level of fN to be recorded,
34

while a polluted sky would increase the recorded intensity to fpN. We might
then find losses to be objectionable for p ̂ 1.1-1.2 and serious for p > 1.2.
Table 1 provides a description of the sky brightness pattern associated with a
full complement of 60 solar power satellites, each having m = -4.3 and assum-2ing a 1/r diffuse brightness profile under perfect conditions. We take m.. =
_p22 mag arcsec for the natural sky and consider the brightness in zones
centered on the satellites. Table 1 shows that for photographic plates, the
SPS-induced background would be serious over approximately 1/6 of the sky and
would cover a large fraction (̂ 1/4) of the prime region near the meridian.
This problem could in principle be overcome by stacking several plates, but
systematic errors will probably cause a loss of efficiency so that photo-
graphic techniques would no longer be useful over much of the sky. In par-
ticular, wide-field survey capabilities with fast Schmidt telescopes would
probably become a thing of the past.
TABLE 1. Assumed Sky Brightness Profiles for the SPS (mv = -4.3)
Area
3°
10°20°
40°
60°10°10°
X
X
X
X
X
X
X
(DEC
63°
70°75°
80°
90°
70°
70°
x RA)
(a)
(b)
JL6
21.41.2
1.14
1.6
PhotographicLoss in Mag
1.9
0.75
0.4
0.2
0.1
1.5
0.5
Photon CountingMag
1.0
0.4
0.2
0.1
0.04
0.75
0.3
Sp
6
2
1
1
14
1
Loss in:eed
.4
.2
.1
.6
(a) Assumes mv = -5.3 per satellite.
(b) Assumes mv = -3.3 per satellite.
35

Photon detectors are affec'dd differently, as it is possible to compen-
sate for increased sky brightness by integrating for longer times. The time2
to reach a given signal-to-noise ratio R over a region of area A arcsec wita telescope of collecting area o equipped with a detector of efficiency Q is
t .g /p AoQpN
Alternatively, the increase in sky brightness decreases the intensity
level detectable with a given telescope and fixed integration time by a factor
of l//]p~ . The variation in t and the magnitude loss factor for photon
counting detectors are also given in Table 1, and we see that for an ideal
photon detector the SPS background outside of a contaminated zone of 20°x75°
is marginally tolerable and is objectionable over 40°x80°. Within this
smaller contaminated zone, telescope performance is reduced below an accept-
able level.
How will these contaminated areas affect astronomy? Note first that the
parallax between will be sufficiently large in declination (10°) such that the
contaminated zones for photon detectors overlap in only a small area. Thus,
between these two observatory sites, and assuming that by 2000 use of photon
detectors will predominate, little of the sky would be irrevocably lost for
faint object work. If we take only KPNO and assume that sources will be
observed within ±2 hours (±30°) of the meridian, then in principle about 1/6
of the sky will be lost, and studies of objects distributed at random would
not be seriously affected. The brightest examples of various astrophysical
systems are, however, not distributed at random, and we might well lose access
to critical individual objects. For example, the contaminated band as seen
from KPNO lies within declinations of +4° to -16°, which includes a selection
of very interesting objects such as the bright globular cluster M3, the Orion
Nebula, some important galaxies, and several interesting but faint quasars in
the equatorial zone. The extra light contributed by the SPS would be detri-
mental to frontier optical astronomy.
36

For photographic detectors the situation is, of course, more severe. As
seen from KPNO, the contaminated zone extends from declination -28° to +14"
and now would include the Virgo cluster, which as the nearest example of a
regular cluster of galaxies plays a critical role in extragalactic astronomy
and is e cornerstone in the cosmological distance scale. The contaminated
zone also would extend dangerously close to the North Galactic Pole (NGP). In
a region around the NGP the blockage due to dust and confusion by galactic
stars is at a minimum, and thus the polar regions provide irreplaceable win-
dows within which the large-scale structure of the Universe can be observed.
Thus, if we consider only the diffusely reflected l"i"l''t under ideal
conditions, the effects of the SPS are disagreeable for photon detectors and
would seriously limit the use of photographic plates or any other detector
with finite signal-to-noise ratios. Unfortunately, even at good sites observ-
ing conditions are often not ideal. The addition of aerosols or presence of
thin clouds, which would produce a minor effect on observations taken against
the natural night sky, would increase the level of scattered light. It should
be emphasized that even a factor of two increase in the scattered light from
SPS would produce an unacceptably large contaminated zone, even for photon
detectors. It therefore is likely that the SPS would lead to a reduction in
efficiency due to the loss of imperfect nights for faint object work. Simi-
larly, if the brightness of the satellites were to be increased by even a
factor of two over m = -4.3 (which would occur near midnight for a cosine
distribution of reflected light), then even under ideal atmospheric conditions
1/4 or more of the prime observable region would be lost.
There would also be a number of secondary effects. Obviously, the
brightness level of ambient light would increase, necessitating improved
shielding and instrument design. In addition, scattered direct light from the
satellites within the telescopes and by the observatory building can produce
an additional source of unwanted background light, with the unpleasant poten-
tial for being non-uniform across the telescope's field of view. The back-
ground of both direct and scattered light would be time-varying and is, there-
fore, difficult to remove. Finally, scattering processes becomr ™ r e severe
37

at shorter wavelengths, so the SPS background will be more serious at shorterwavelengths (such as the blue and ultraviolet) where most optical data tradi-tionally are obtained.
In conclusion, faint object optical astronomy involves the measurement ofweak signals against a comparatively bright, night sky background. It is clearthat any additional sources of background light are undesirable and that largestructures in space, therefore, can seriously compromise our ability to makeoptical astronomical observations from the Earth. The SPS sits on the limitof acceptability, and its impact will depend on the details of the design. A60-satellite system with brightness m = -4.3 per station would eliminateastronomical 'dark' time (no moon present), which is currently when most faintobject astronomy is done. Great care will be required to ensure that we donot lose our observational access to the universe, which would seriously limitthe growth of our knowledge of fundamental physical laws, on which techno-logical advances ultimately are based.
38

EFFECTS OF THE SATELLITE POWER SYSTEM ON
GROUND-BASED ASTRONOMICAL TELESCOPES
P. B. Boyce
GENERAL COMMENTS
Astronomers are continually working to extract information from the small
numbers of photons which arrive at the Earth from distant stars and galaxies.
For many years now the brightness of the night sky has been a major limiting
factor in the attempt to extend our knowledge of the universe. The blackouts
in California during the Second World War provided an opportunity to make some
substantial breakthroughs in our understanding of the composition of our
neighboring ga'.axies. We have come a long way since then. We have bigger
telescopes at darker sites. We have new detectors with higher efficiencies
and better characteristics than the old photographic plates used in the 1940s.
We have improved our ability to count photons and detect signals in the pres-
ence of the sky background. But the fact remains that the interesting and
significant discoveries continue to be made at the limits of what can be
detected with the current telescopes, auxiliary instruments and techniques.
For this reason any significant increase in the brightness of the night
sky will have a major impact on further progress in astronomy, an impact far
larger than one might think from the small increases in brightness being
predicted. The light pollution generated by the SPS will have several unde-
sirable characteristics:
1. The additional light will be widespread. Unlike city lights which
are confined to relatively limited area, the SPS light pollution
will affect all U.S. observatories. A significant number of active
foreign observatories will also be affected. Table 1 lists the
observatories with telescopes of 1.5-meter-diameter aperture or
larger. All the telescopes are in active use and most have been
built within the last decade. In particular, the two major foreign
telescopes in Hawaii have just been completed and were placed on
39

Diameter,Meters
4 5(<V4.0(b)4.03.03.02.72.52.52.32.32.22.12.11.81
TABLE 1. Ground-Based Telescopes Affected by SPS
U.S. Telescopes
55
1.51.51.51.51.20.60.6
3.83.63.62.31.91.91.61.51.51.20.7
Location
PalomarMt. HopkinsCTIOKitt PeakMauna KeaLick Obs.McDonald Obs.Las CampanasMt. WilsonJelnt Mt.Kitt PeakMauna KeaKitt PeakMcDonald Obs.Lowell Obs.U.S. Naval Obs.CTIOMt. LemmonMt. LemmonMt. LemmonPalomarMt. HopkinsMt. WilsonState CollegeAgassiz Sta.PalomarKPNOCTIO
Operating Institution
CAAZChileAZHICATXChileCAWYAZHIAZTXAZAZChileAZAZAZCAAZCAPAMACAAZChile
Hale ObservatoriesArizona - Smithsonian Multiple Mirror Tel.AURA Inc. - Cerro Tololo Inter-American Obs,AURA inc. - National ObservatoryNASA - Infrared Telescope FacilityUniversity of CaliforniaUniversity of TexasHale Obs. - Carnegie Southern Obs. - ChileHale ObservatoriesWyoming Infrared ObservatoryUniversity of ArizonaUniversity of HawaiiAURA Inc. - National ObservatoryUniversity of TexasLowell - Ohio State UniversityFlagstaff StationAURA Inc. - Cerro Tololo Inter-American Obs.U.C. San Diego - MinnesotaUniversity of ArizonaNASAHale ObservatoriesSmithsonian Astrophysical Obs.Hale ObservatoriesPennsylvania StateHarvard College ObservatoryHale Observatory - Schmidt TelescopeCase Western Reserve - Schmidt TelescopeUniversity of Michigan - Schmidt Telescope
Foreign TelescopesLocation
Mauna KeaESOMauna KeaBaja Calif.VictoriaRichmond HillQuebecCordobaBaja Calif.ESOTonant2intla
Operating Institution
HIChileHIMexicoCanadaCanadaCanadaSpainMexicoChileMexico
British Infrared TelescopeEuropean Southern ObservatoryCanada-France-Hawaii TelescopeMexican National ObservatoryDominion Astrophysical Observatory - CanadaDavid Dunlap Observatory - CanadaL'Observatoire Astronomique du QuebecArgentinaMexicoSchmidt TelescopeMexico - Schmidt Telescope
(a) The Multiple Mirror Telescope is a new design using six 6-ft-diameter mirrorsand active control of tuP optics to achieve the equivalent diameter listedin the table.
(b) Substantial foreign interest in this telescope.
40

Mauna Kea after an exhaustive search for the darkest and best sitesin the world. The reaction of the respective governments to the SPSwill have to be considered.
2. The scattered light will have the spectrum of sunlight. Compensat-ing for such a spectrally complex background will be more difficultthan correcting for light scattered from incandescent street lamps.In comparison to low-pressure sodium and mercury vapor lamps, thesituation is even worse. They emit much of the light in a fewspectral lines, leaving the space in between relatively uncontam-inated. The SPS light will contaminate the whole observable spectralrange. The scattered light will be polarized and will vary withtime because of varying concentrations of dust and aerosol in theatmosphere.
3. At certain times the specular reflection from the satellites couldpose a danger to astronomers' eyes and to instruments. While thispossibility is remote, it will have to be guarded against and willrequire the installation of special TV camera systems at all tele-scope eyepieces. It is not clear how to protect amateur astrono-mers, sailors and general sky watchers who use telescopes orbinoculars.
4. The string of satellites located along the equator will completelyblock out access to the Orion Nebula for optical and infrared tele-scopes in the U.S. As the closest large region of star formation,the Orion Nebula plays a key role in helping to clarify how starsand planetary systems are formed and the process by which material,after being incorporated into stars, is once again recycled into theinterstellar medium. The SPS zone of avoidance will be invariantwith time, permanently denying U.S. astronomers access to an impor-tant section of our galaxy, including parts of the galactic spiralarms just interior to our own. Studies which depend on completenessin order to develop a coherent picture of our own galaxy will nolonger be possible.
41

SPECIFIC COMMENTS
The effects of increased sky brightness on astronomical measurements have
been well treated elsewhere in this workshop. Effects may slightly vary
depending on the type of detector and telescope. For example, photographic
film is much more sensitive to increasing sky background than is a linear
detector with a large storage capacity. But it is clear that we will have to
rely on photographic film as a simple yet effective detector for large format-
imaging applications for some time to come.
For a linear, photon-counting detector the limitation is the sky back-
ground. Most of the significant work being done in optical astronomy now
involves observing objects at levels between 1/10 and 1/100 of the sky back-
ground. At these levels the effective observing time needed to achieve a given
accuracy with a given telescope scales linearly with the increase of sky
background. However, beyond an exposure time of several minutes, the stabil-
ity of instrumentation and observing conditions becomes a negative factor.
It is impossible to express this rigorously, but the effective limit to expo-
surp time is about one hour.
Some of the assumptions used in preparing the Briefing Document for the
workshop do not appear to be valid, specifically:
1. The light scattered back into the atmosphere should not be ignored
in computing the increase of sky brightness. This will be variable
in time and place. In winter with a snow blanket the present mea-
sured sky brightness at places such as Lowell Observatory increases
markedly. For Mauna Kea, which is surrounded by a high albedo
ocean, the backscattering must be significant. It will be difficult
to estimate, but some attempt should be made.
2. The assumption of 4% reflectivity for the concentrator configuration
is not valid. The configuration will act as a corner cube (within
certain limits) and will effectively reflect from the whole area.
From half the area the angle of reflection off the sapphire cover
will be 30°, which should increase the reflectivity. I would expect
the total reflectivity to be closer to 8%.
42

3. The far (> 1°) wings of the scattering profile assumed for this
study have not been measured well to my knowledge. It is not clear2
that the 1/r profile is anything more than a best guess at this
point. The scattering will be critically sensitive to dust and
aerosols in the atmosphere.
NEW INSTRUMENTS
Astronomy is in the midst of a period of tremendous intellectual growth
and excitement. This has been fueled in part by the improvement in instru-
mentation used to overcome physical limitations. The number of major tele-
scopes at good, dark-sky sites has more than tripled in the last decade. It
is no accident that most of these new telescopes, whether U.S. or foreign,
were built along the west coasts of North and South America and on Hawaii.
These sites are the premier astronomical sites in the world. Unfortunately,
they lie directly under the SPS array.
Astronomers, always faced with the photon limit, are now considering a
new type of telescope which will provide much larger apertures of 10 to
25 meters. The University of California is planning for the construction of a
10-meter instrument which would be located in California and would serve the
entire University of California system. The Kitt Peak National Observatory
has also started on a program which will lead to the construction of a 25-meter
telescope. Both these instruments are being built to observe faint and dis-
tant objects, fainter by far than can be reached by the space telescope (which
is only a 100-inch telescope). They would operate in the regime where increas-
ing sky brightness would be most detrimental.
Unfortunately, new detectors are not the answer. For many applications
the technology is already available to record and count all possible photons
and to subtract the contribution from the sky as effectively as possible. The
next generation of optical telescopes will suffer the full brunt of any
increased sky brightness, losing capability linearly with increasing bright-
ness and being effectively blocked from access to an interesting portion of
the sky.
43

INFRARED ASTRONOMY
D. A. Harper
In general, the impacts of l,;e SPS on infrared (IR) observations should
be much less severe than on optical measurements. For example, many infrared
telescopes can be operated quite successfully during the daytime. Daytime
operations are typically limited by the absolute pointing of the telescope
or atmospheric turbulence rather than by increased sky background.
However, IR telescopes are usually designed to minimize the total ther-
mal background from the telescope itself, a requirement which is often incom-
patible witn tffective baffling of stray light. Thus, a problem may arise if
a very bright object such as the SPS satellite array is located within a few
degrees of a faint infrared source. The magnitude of the problem will depend
on the design of individual telescopes and the nature of the desired observa-
tions. However, it is probably reasonable to assume that an array of 60 sat-
ellites, each representing a 330°K radiator with a projected area of ^ 1 square
arcminute, will compromise observations of very faint objects within a strip
of sky no larger than ^ 2 to 10° wide and 60° long.
45

POSSIBLE IMPACTS OF THE SPS ON THE SPACE TELESCOPE
E. J. Groth
The goals of the Space Telescope (ST) as described in the NASA Announce-
ment of Opportunity are to determine:
• The constitution, physical characteristics, and dynamics of celestial
entities
• The nature of processes which occur in the extreme physical conditions
existing in and between astronomical objects
• The history and evolution of the universe
• Whether the laws of nature are universal in the space-time continuum.
To meet these goals, the ST must be able to detect and measure objects which
are several magnitudes fainter than can be observed with ground-based telescopes.
The rnain advantage of the ST is that its 2.4-m aperture produces diffrac-
tion limited images; therefore, the background light within a stellar image is
reduced several orders of magnitude compared to what can be obtained on the
ground. Other advantages of the ST are that it can work in the UV and IR
spectral regions; there is no atmospheric absorption and emission or fluctua-
tions in the absorption and emission; and the image size is smaller than
G.I arcsec (as compared to > 1 arcsec from the ground), which not only increases
the S/N for stellar objects by a factor of >20 compared to an identical ground-
based telescope but also allows high resolution studies of extended objects.
The orbit of the ST is circular and at an altitude of 500 km, an incli-
nation of 28.8° and with a period of 94.5 minutes.
The background sources which limit the sensitivity of the ST are:
• Zodiacal light (23 m /arcsec at minimum)
• Stray light from Sun, Earth, and Moon (and SPS).
The zodiacal light (sunlight scattered from interplanetary dust particles)
is a diffuse source with a minimum brightness corresponding to about 23 visual
47

magnitudes per arcsec . The ST will have a baffling system which, under the
conditions described above, must reduce the stray light from the Sun, Earth,2
and Moon to less than 23 mv/arcsec , when >50° from the Sun, >70c from
bright Earth and >15° from bright Moon. The details of the baffle design and
stray light response are to be determined.
Figure 1 shows an unofficial estimate of the amount of power (with a solarp
spectrum) versus off-axis angle required to produce 23 rn /arcsec in the focalplane of the ST. The SPS specular value shown on the figure corresponds to
14 full moons and represents the specular reflection from both the solar array
and the microwave antenna for one satellite as described in the Briefing Docu-
ment. The SPS diffuse reflection at the level described in the Briefing Docu-
ment is too small to appear on the figure.
The SPS is likely to have some impact on three areas of the ST: stray
light, bright object avoidance, and communications. The diffuse reflection
from the SPS will be negligible, except on axis. But the SPS specular reflec-
tion bean will cause the ST stray light specifications to be exceeded whenever
~E 1
oo
-2
-3
(UNOFFICIAL!
EARTH SPEC
r- MOON SPEC
- SPS SPECULAR
I , I ,9 10 20 30 40 50 60 70 80
OFF-AXIS ANGLE
FIGURE 1 . Of f -Ax is I n tens i t y Producing 23 my/arcsec^
90
48

the beam strikes the ST at angles less than 30° from the axis. However, the
ST is moving at 7.5 km/s and the beam is moving at a high velocity. Thus, the
time that the ST spends in the beam is < 44 seconds (the value for a station-
ary beam) and depends on the details of the geometry. For long exposures, the
effect of the specular reflection beam will be reduced. The effect of the
SPS on the ST will be to require either 1) a zone of avoidance ^ 60° x 120°,
or 2) detailed modeling of the effects for each target. Either option will
require detailed simulations to provide a realistic assessment of the impacts.
However, it appears likely that contamination by the specular reflection beam
may exclude observations of certain regions of the sky during portions of the
ST orbit. Ordinarily, this will not be a major problem since the affected
regions can be scheduled for observations when the SPS is favorably located
(until Europeans, the Soviet Union, the Chinese, etc. put up their own SPS,
which will fill the entire equator with satellites). However, very long expo-
sures (with an elapsed time of about 30 hours) or observations which must
occur at specific times may still be adversely affected.
A typical path of an SPS satellite as seen from the ST is shown in
Figure 2. This complicated path is important for bright object avoidance.
The specular and diffuse reflections from the SPS satellite^ are so bright
that they cannot be imaged on an operating sensor without risk of damage to the
sensor. To ensure that this does not happen, the ground systems will have to
calculate the positions of all the satellites as seen from the ST whenever the
ST is observing a target close to the equator. This will greatly complicate
the ground system activity associated with scheduling, constraint checking, and
command generation. It may also force the ST into a zone of avoidance mode to
keep the ground systems costs under control. This would exclude the 12° band
around the equator and would also complicate star tracker usage. There will
undoubtedly be a cost impact although further study is required before a real-
istic assessment of the cost and complexity of the impacts can be given.
Ground communications for the ST are via the Tracking and Data Relay
Satellite System at the following carrier frequencies: 2.106 GHz, 2.255 GHz,
and 2.287 GHz. These frequencies are uncomfortably close (within 200 to
49

FIGURE 2. Typical One-Day Path of SPS as Seen from ST
300 MHz) to the SPS microwave transmission frequency (2.45 GHz). Further study
is required to determine whether communications with the ST will be adversely
affected by the SPS.
To summarize, the scientific performance of the ST will be somewhat affected
by stray light from the SPS specular reflection beam; the need to avoid imaging
both the diffuse and specular reflections from the SPS will lead to adverse
cost, complexicy, and flexibility impacts; and there is a possibility that the
ST communication links will be affected by interference from SPS microwave
transmissions. In all cases, further study is required to fully define the
nature and extent of the possible impacts identified here.
50

REPORT OF THE OPTICAL ASTRONOMY WORKING GROUP
The optical astronomy working group met in order to synthesize the con-
tents of the Briefing Document and the invited presentations into a statement
of the potential impact of the SPS on optical astronomy. In the judgment of
the working group, the primary effect of the SPS on optical astronomy (an
effect that could be properly characterized from the description of the
Reference System) would be through the predicted increases in brightness of
the night sky, as described in the briefing document. For this reason, the
working group's deliberations focused on the effect on optical astronomy of
the diffuse reflections from the satellites. Other concerns, such as the
effects of the specular beam and possible impacts on infrared and space
astronomy, are not treated in detail, primarily because 1) understanding of
potential SPS effects is inadequate, as in the case of airglow from an SPS-
heated ionosphere, and 2) the details of other effects could only be completely
characterized if more specific information were available about tne Reference
System. For example, specific effects of specular reflections from the antenna
depend heavily on rectenna siting and antenna properties.
The report of the working group that follows is based on an outline and
some text developed by the working group members during the two-day workshop.
Most of the report writing was delegated to the chairman of the session, with
the understanding that the working group would have the opportunity to review
it prior to publication. The report consists of five parts: 1) an introduc-
tion to the way in which astronomical observations are performed, which is
intended to provide background to readers unfamiliar with astronomical
problems and techniques; 2) a discussion of the way in which the Reference
System would impact astronomy if it were built, 3) a quantitative discussion
of the magnitude of SPS effects and their relationship to astronomical observa-
tions, emphasizing the relative magnitudes of natural and SPS-induced sky
brightness; 4) the working group's assessment of the qualitative impact of
SPS on optical astronomy; and 5) a set of recommendations for future study of
SPS effects on optical astronomy and a disucssion of possible methods of miti-
gating these effects.
53

The members of the working group were:
B. Balick
P. Boyce
K. Clark
J. Gallagher
E. Groth
D. Harper
G. Stokes, Chairman
ThE NATURE OF ASTRONOMICAL OBSERVATIONS
Counting Photons
The actual method of conducting astronomical research is the root of any
effect of the proposed SPS on astronomy, and on optical astronomy in parti-
cular. Astronomy is an observational rather than an experimental science.
Although laboratory measurements of the properties of matter are extremely
important to astronomy, the success of astronomical research is measured
largely by its ability to explain objects and phenomena over which we have no
control. Astronomy is the extreme case of remote sensing. The information we
have about astronomical objects comes almost entirely from our ability to
detect the electromagnetic radiation emitted, reflected or affected by the
astronomical objects.
As noted in the introduction to these proceedings, astronomy is sometimes
divided according to the portion of the electromagnetic spectrum under study.
An important characteristic of optical astronomy is its preoccupation with the
detection of photons.
A photon can be thought of as a packet of light. A photon of visible-12
light represents about 4 x 1C ergs of energy, which means that if a 100-watt20
light bulb emitted 100 watts of visible photons, it would emit 10 of themevery second. Detectors used in optical astronomy are sensitive enough to
detect single photons. In many cases, astronomical detectors are merely
photon counters.
54

An important problem encountered in photon counting is that the answer
arrived at includes an uncertainty corresponding to the square root of the
total number of photons counted. Therefore, the fractional error in the
number of photons detected is 1//N where N is the total number of photons
detected. If an astronomer counts 100 photons, the uncertainty is 10%, if
10,000, the uncertainty is 1 .
Unfortunately, the detection of photons from astronomical objects is
complicated by the fact that the sky is a source of photons as well. In the
case of an idealized astronomical observation, one can imagine looking at an
astronomical object with a typical optical detection system and trying to
make an observation with 1% accuracy. Because the detector cannot avoid
looking at both the sky and the object, it collects and counts the photons
from both. Howevtr, when the object is very much brighter than the sky, the
photons from the sky make a negligible contribution to the total signal, and
we get 1% accuracy just as soon as we have detected 10,000 photons from the
source. In such a case, the brightness of the source determines how long the
observation will take. If, however, the number of photons received from the
sky is comparable to or greater than the number from the object under study,
then the brightness of a nearby portion of sky must be determined and sub-
tracted from the observation of the object. However, sky photons can only be
measured at best to an accuracy of 1/Af just as photons are from the object.
For example, if the sky is nine times brighter than the object and our detector
counts 10,000 photons from the sky and object together, which gave us 1%
accuracy before, our accuracy for measurement of the object would only be 10%.
In this case, the observation is said to be "sky limited"--in order to get a
1% measurement of our source, the detector must have detected 1,000,000 photons.
This value represents 100,000 photons from the source or ten times as many as
was required to get a 1% measurement without the sky. Therefore, even if the
sources in our two examples were the same brightness, the addition of the
bright sky would increase by a factor of ten the amount of observing time
required for the same accuracy measurement.
55

It is exactly these considerations that led to Gallagher and Faber'sequation (see their invited paper) that gives the amount of time necessary toreach a given signal-to-noise ratio (fractional error),
f _ (2 + (s/p))R2 mS (g /P ) AOQpN
In this equation, g is the ratio of the brightness of the object to thebrightness of t/ie natural sky, p is the ratio of the actual sky brightness tothe natural sky brightness (p always - 1), R is the desired signal-to-noiseratio, A x N is the brightness of natural sky in photons/sec/cm , Q is thedetector efficiency and o is the collecting area of the telescope in cm . Forthe case of faint objects:
t = P x 1 x ̂ (2)s ° g^AQN
which means that required observing time is proportional to the brightness ofthe sky and inversely proportional to the collecting area of the telescope.It is easy, then, to understand why astronomers need dark skies and largetelescopes to observe faint objects.
Astronomical Accommodation to Existing Sources of Sky Brightness
Natural and man-made sources of sky brightness already have a significantimpact on the conduct of optical astronomy. The largest natural contributionto the diffuse night sky brightness comes from the moon. The moon has such aprofound effect on the sky that observatories routinely divide their observingschedule into "dark" (no moon) and "bright" (moon up) time. Generally, darktime is in much greater demand than bright time on large telescopes, as seenin the distribution of visitor proposals at Kitt Peak National Observatory(KPNO) for dark time and bright time for February 1, 1979 to July 31, 1979(Table 1).
56

TABLE 1. Visitor Proposals for Time on theThree Largest Telescopes at KPNOFebruary 1, 1979 to July 31, 1979
Telescope
4.0 meter
Dark
Bright
2.1 meter
Dark
Bright
1.3 meter
Dark
Bright
Number of NightsRequestedby Visitors
184
117
181
92
130
98
Number of NightsAvailable forVisitor Observing
47
49
44
41
49
49
At present, the primary man-made source of sky brightness is outdoor
light from cities and towns. Astronomers have attempted to combat this light
pollution in a number of ways—the most obvious, building telescopes in remote
locations well away from city lights. For example, the detailed site surveys
that precede construction of a major observatory always include assessments of
the sky brightness. In some cases, urban areas have grown up adjacent to
observatories. At some of these observatories, observations are limited to
the kinds of of objects observed during "bright" observing time at darker
sites as is the case at Mt. Wilson Observatory where the light pollution from
Los Angeles and nearby cities makes the sky very bright. At other observa-
tories, observatory staffs have attempted to convince local public officials
that it is possible to control light pollution and minimize the effects of
outdoor lighting on astronomy. Tucson, Arizona and Richland, Washington, among
others, have very strong light abatement ordinances specifically tailored to
preserve dark skies.
57

Astronomical Observations:_ Types cf Objects
It is now appropriate to consider the kinds of objects most sensitive to
increased iky brightness. Objects of astronomical observations fall into two
categories: point sources and extended sources. Returning to equation (1),
we note the term A x N, the brightness of the sky. This brightness is a
product of N, the number of photons coming from a unit of area of the sky,
and A, the amount of sky being observed. For point sources, every attempt
usually is made to make A as small as possible. Although there are limits
as a result of the turbulence of the atmosphere, a small aperture does repre-
sent a practical method of reducing the effect of sky brightness for objects
that appear as point sources, such as stars.
However, this strategy will not work for extended objects, such as
galaxies. In oruer to reduce the amount of sky being observed, one must
correspondingly reduce the amount of the object to be studied. The case of
galaxies is an important one since the average surface brightness of a galaxy
(the number of photons emitted per unit area) is considerably less than the
average brightness of the dark night sky. Galaxies are brighter toward their
nuclei; therefore, the net effect of increasing the sky brightness is to
reduce the amount of a galaxy that can be observed. This effect is qualita-
tively illustrated in Figure 1. The research consequences of not being able
to observe the outer regions of galaxies are noted, along with other research
programs, after the following section.
Astronomical Observations: Organization and Conduct of Programs
An observing program is the set of observations that astronomers will
make in order to address a particular astronomical problem. The organization
of typical observing programs is important because the increase in diffuse sky
brightness as a result of SPS is a function of position on the sky, which
implies that in particular regions of the sky it will not be possible to
observe particular kinds of objects.
Observing programs consist of surveys and type studies. Most observing
programs include elements of both kinds of studies. A survey entails the
58

* • - • * . - • B
FIGURE 1. Photograph Taken at Prime-Focus of the Cerro Tololo Inter-AmericanObservatory 4-m Telescope of the Galaxy NGC 1079 (40-min exposureIllaj plate and GG385 filter). Photograph A shows conventionalprint contrast; B shows the contrast stretched to go between darkand light over a narrow brightness range just above sky backgroundusing the Interactive Picture Processing System of Kitt PeakNational Observatory. The difference between the two picturesshows the loss of outer detail seen in B that would occur with adoubling of the background sky brightness.
59

measurement of a few parameters for a large number of objects. An example is
the National Geographic-Palomar Sky Survey. This survey, conducted in the
1950s, consists of photographs taken through two different colored filters of
almost the entire sky visible from Mt. Palomar. A type study is the detailed
study of a single object that is either unique or thought to be representative
of a class of objects. Generally, type examples are usually the nearest
members of the class.
When planning the details of an astronomical observing program—specifi-
cally, what objects are to be observed—several other factors must be considered.
The most important is the fact that the atmosphere is not completely trans-
parent so that the flux of photons from an object is attenuated as it passes
through the atmosphere. The amount of attenuation is exponentially related
to the amount of the atmosphere the radiation passes through, which is mea-
sured in airmasses. An airmass is the ratio of the amount of air toward the
object to the amount of air toward the zenith, the point straight above the
observer. In order to maximize the number of photons observed, observations
must be planned to minimize the average airmass through which the object is
observed. In practical terms, this usually means that an object will be
observed during the time that the object is within 30° of the meridian, an
imaginary line on the sky on which astronomical objects are at their minimum
airmasses. Objects are in this band for four hours every day. Many astrono-
mers have concluded that four hours is a practical upper limit for a single
observation.
Finally, because objects more than 60° from the zenith must be observed
through more than two airmasses, objects that never come closer than 60° to
the zenith are usually not included in an observing program.
Astronomical Observations: Scientific Programs
Listed here are current areas of active research that would be negatively
affected by the SPS program. These research areas are typical, but no
effort at completeness is intended.
60

Cosmology and Extragalactic Astronomy (Studies of Objects Beyond theMilky Way)
Distances to extragalactic objects are very great. For this reason,
most galaxies, although as luminous as several billion stars, are as difficult
to discern and study as the faintest stars visible in our own galaxy.
1) The Size of the Universe. Measurements of the size of the universe
depend on our ability not only to observe the most distant (and faint)
objects but also to develop techniques for distance measurement. The
identification of distant objects is extremely marginal because of their
faintness and is complicated by the presence of a bright sky background
"against" which they must be viewed from the ground. Even small
increases in sky brightness can render these objects undetectable.
2) Curvature of the Universe. Ever since its beginning 15 billion years
ago, our expanding universe has probably been decelerating as the
attractive gravitational forces between all massive objects operate to
counteract the initial expansion. This deceleration, however, is not
large at the present time. At an earlier epoch, objects were closer
together and the effects of gravity were stronger. The finite speed of
light affords us an opportunity to study the ancient universe—but only
at distances of M 5 billion light-years. A question of nearly universal
interest is the ultimate fate of our universe: will it ever fall back on
itself (closed), or will it expand forever (open)? The answer will come
directly from measuring the deceleration of the universe.
3) Formation Era of Galaxies. All galaxies are believed to have formed as
soon as the early universe cooled to a few thousand degrees (some 100,000
years after the big bang) but before the expansion of the universe spread
the available matter over large distances. The formation of galaxies is
extremely complex, and our comprehension of existing galaxies is
incomplete without a good idea of the initial conditions of formation.
4) Open or Closed Universe? In addition to the difficult observational
strategy of measuring the deceleration of the universe, the question of
an open or closed universe can be settled by measuring all of the mass in
the universe. At present, the visible forms of mass accessible to
61

observation (luminous stars and heated dust and gas) fall far short of
the critical mass required for closure. Many recent studies, both
theoretical and observational, indirectly suggest that more mass might
exist, perhaps in extremely faint halos around galaxies. Attempts to
observe faint galactic halos are suggestive, but limited by the sky
background.
5) Active Galaxies and Quasars. Events leading to and the effects of the
tremendously large energy sources in the centers of exploding galaxies
and quasars have captivated the interests of both astronomers and the
public for nearly a generation. Although the nuclei of these objects are
often bright, the material ejected into space and the processes that
supply energy to the nuclei are very faint and difficult to observe.
6) Faint Regions of Nearby Galaxies. Nearby galaxies afford favorable
observing opportunities because of their proximity, and intense efforts
to understand their structure and evolution have characterized modern
astronomy. These faint regions not only may contain the mass necessary
to close the universe but also reflect the subtle tidal effects that
galaxies exert on each other.
The Milky Way.
Our galaxy is one of the most interesting, yet enigmatic, of astronomical
objects. We look to our solar neighborhood to understand how stars are born,
live their lives, and die, and to understand how our galaxy is structured.
The nuclei of many galaxies harbor unusual and, as yet, not understood energetic
processes. What about our own? Do other stars have planets? To complicate
observations, large clouds of dust hide 901 of the galaxy from view to observers
using optical and ultraviolet techniques. The effective size of the visible
galaxy would be severely diminished by even small increases in the night sky
levels.
1) Diffuse Galactic Light. "Hot tunnels" carved through the galaxy by
supernova blast waves appear to permeate the galaxy. Many studies are
underway to understand the physical conditions (e.g., temperatures of a
62

million degrees) through optical and ultraviolet observations, but the
light levels from these regions are very, very low (they were only
recently discovered).
2) Faint Nebulae. The follow are all types of objects which have been
of intense interest to ast ^nomers for the past century: the remnants
of supernova explosions (once the interior of stars); material ejected
from thermonuclear detonations on the surfaces of white dwarfs; material
lifted off the surface of a dying star by its own light and acoustic
nnise; and material ionized by energetic photons of very hot stars. Not
all of these objects are faint, but most of the interesting ones have
important properties that require low background levels in order to be
studied.
3) Stellar Winds and Mass Loss. Stars are formed from the reservoir of dust
and aas in our galaxy. It is easy to show that this reservoir is being
depleted at a rate so large that, without reolenishment, star formation
would be completely arrested in only a billion years (the galaxy is
thougnt to be many billions of years old). It seems certain that replen-
ishment occurs, but it is not clear how. Recent studies have shown that
many stars continuously lose their mass through a stellar "wind."
Studies of the very faint wind and how the material in the wind finds it
way back into the interstellar reservoir are at the limit of modern
techniques.
4) Structure of the Galaxy. We now understand the galaxy to consist of
spiral arms of gas, dust, and young stars. Outside and between the
spiral arms, the structure of our galaxy is poorly understood—partly
because the stellar constituents are cool and faint for the most part.
Even though billions of stars are involved, their light and problems of
foreground dust make studies of these objects very difficult. Studies
of stars outside the galaxy in a surrounding "halo" and in extremely
old "globular" clusters that appear to have been formed at about the
same time as the galaxy are important to our understanding the general
problem of galaxy formation and evolution.
63

The Solar System.
We need not describe here the interest of the public as well as of the
scientific community that has been raised by studies of objects in the solar
system; indeed, the magnitude of NASA programs in this area speaks for itself.
The planets themselves, while of prime interest, are generally very bright,
and ground-based studies of them and their satellites would not be greatly
affected by SPS light pollution. There are, however, other interests in the
solar system for which a bright background would severely impede ground-based
research.
For example, comets and their tails, asteroids, and other "minor" con-
stituents of the solar system are generally faint. The plane of the ecliptic
is fairly closely aligned with the equatorial plane of the Earth and the
satellites, and the faint objects found preferentially in the ecliptic plane,
such as minor bodies, will be difficult to observe near the satellites.
Although comfs do not have ecliptic orbits, they and their tails are generally
in their most favorable aspects as they near the ecliptic. Similarly, the
zodiacal light is also confined to the ecliptic plane and, likewise, will be
difficult to observe near the satellites.
THE ORIGIN OF SPS EFFECTS ON OPTICAL ASTRONOMY
The single most important point to keep in mind when considering the
effects of SPS on optical astronomy and aeronomy is that the major effect, the
increase of sky brightness, stems from the passive properties of the system.
As such, this effect is inherent in any space-based power collection scheme.
For the Reference System, the solar blanket intercepts 70 GW of solar radiation,
only 6 GW of which is actually radiated toward Earth in the microwave beam.
The most important portion of the remaining 64 GW of energy which has an effect
on astronomy is the light reflected from the front surface of the blanket.
This reflected radiation constitutes approximately 7 to 15% of the visible
radiation incident on the solar blanket and is made up of both diffuse and
specular reflection, as described in the Briefing Document. The diffuse
reflection is responsible for the most persistent and troublesome effects on
64

astronomical and aeronomical observations. The magnitude of the effects is
determined by the apparent brightness of the satellites and the properties of
the atmosphere. In turn, the brightness of the satellites is determined by
their size and reflectivity. The satellites will be exceeded in brightness by
only the sun and the moon. Each one will in fact be bright enough to cast a
shadow.
Parametric Characterization of the Effect of the SPS on Diffuse Sky Brightness
In order to meaningfully assess the SPS effects on diffuse sky brightness,
the computations presented in the Briefing Document and the limitations of the
Briefing Document as discussed in the invited presentation of G. M. Stokes
were carefully considered. While the working group agreed that the SPS effects
can all be described in terms of the apparent brightness of the satellites,
the useful numbers for designers of the power satellites are the collecting
area and the reflectivity of the various parts of the satellites.
The problem of a large collecting area is not solved simply by reducing
satellite size. The important number is the total collecting area for the
system, which for the Reference System is 3300 km , about the size of the
state of Rhode Island. A reduction in total surface area would require an
increase in the overall efficiency of the System, which is now about 7%.
Analysis in the Reference System documentation does not suggest that the
overall efficiency of the SPS will change much. If this is the case, then the
most important parameter in determining the apparent brightness of the satel-
lite is its albedo, which is the ratio of the radiation reflected from an
object to the total incident radiation. As noted in the preceding section,
the albedo consists of a specular component, a measure of the extent to which
the object acts like a mirror, and a diffuse component, which is a measure of
one's ability to see the object in any aspect.
The working group's deliberations on the diffuse albedo of the SPS solar
blankets led to two conclusions. First, the diffuse albedo of 4%, as des-
cribed in the Briefing Document, is an optimistic estimate. As such, the
effects predicted on the basis of the 4% albedo were taken as lower limits of
the possible effects of the SPS on optical astronomy. A second, related
65

conclusion, was that the relative distribution of reflected radiation between
the diffuse and specular components of an actual SPS was likely to be quite
different than the 50-50 distribution assumed in the Briefing Document. In
particular, the potential hazard to eyesight that the specular reflections may
represent will undoubtedly lead to designs specifically tailored to reduce the
energy contained in the specular beam. In the opinion of the working group,
the most likely solutions to the problem of the specular beam will result in
an increase in the diffuse albedo, and the reduction of the total albedo of
the individual satellites (diffuse albedo plus specular albedo) is not likely.
The solutions will rather be of the kind that make the antenna structure and
solar blanket less like- a mirror and more like a piece of white paper. Given
the optimistic estimate of the diffuse albedo and the likely fate of the large
specular reflections, it would not be surprising if the actual diffuse albedo
of the satellites reached 10%, two and a half times the Briefing Document
estimate.
In summary, it was the concensus of the working group that the magnitude
of diffuse albedo of the individual satellites is the major factor in deter-
mining the effect of the reference SPS on optical astronomy.
Intensity Profile of the SPS Brightness Distribution
An essential feature of the Briefing Document is that it attempts to
provide a method for calculating the distribution of added sky brightness as
a result of the SPS. There are limits to the practicality of this approach as
described by Stokes in his discussion of the limitations of the Briefing
Document characterization. In spite of the fact that the actual brightness
distribution around an individual power satellite will depend strongly on
physical conditions, several properties of the brightness distribution of the
entire system are relatively independent of local physical conditions.
As described in the Briefing Document, the area of increased brightness
is sharply peaked. In Figure 2 the predicted increase in the sky brightness
along the meridian at midnight for Kitt Peak National Observatory has been
plotted for a 60-satellite system. While the intensity scale shown in the
figure is for a satellite brightness equal to that of Venus, the shape of the
66

18on
on<C
O
UJO
20
24
26
1 1 1 l
/
/
A/ \- """
i i I I
i i i
-
P=2.0
P=1.3
P=l.l
1 1 I
-40u -20u 0° 20°DECLINATION
40" 60u 80u
FIGURE 2. The SPS Brightness Profile. This figure shows the predictedbrightness of the sky as a result of a 60-satellite SPS systemalong the meridian at local midnight for Kitt Peak NationalObservatory at the vernal equinox. The calculation of thisprofile is based on an assumed 4% diffuse albedo. The brightnesslevels corresponding to the three impact thresholds describedin the text are also shown.
profile is independent of satellite brightness and variations in local mete-
orological conditions of the kind described by Stokes. The profile has two
parts, which we will call the core and the wings. The sharply peaked core
region represents the portion of the sky in which the scattered radiation from
the one or two nearest satellites dominate the brightness distribution. In
the wings, all of the satellites make a modest contribution to the sky bright-
ness. Where the transition between core and wings takes place is determined
primarily by the separation between the satellites, which for the Reference
System is 1°.
In Figure 2 we also show the thresholds for a noticeable effect, hindrance
and contamination as described after the following section. The width of the
affected zones is the regions between the intersection of the brightness profile
and the various thresholds. Both the effect of changing satellite brightness
67

and varying meteorological conditions can be thought of as moving the brightness
distribution profile up or down with respect to the threshold values. For
example, with either brighter satellites or less favorable weather conditions
that were assumed in the Briefing Document, the profile is moved upward,
thereby substantially increasing the amount of the sky in the different
zones.
Unfortunately, the total area at the contaminated zone is not directly
proportional to satellite brightness. Because the brightness profile is so
sharply peaked, even relatively large reductions (by factors of 2 or 3) in the
brightness of the individual satellites would not greatly reduce the size of
;he contaminated zone. Alternatively, the relatively broad wings of the
intensity profile mean that corresponding increases in the apparent magnitudes
of the satellites will result in quite large increases in the size of the
contaminated zone.
Associated SPS Structures
A major deficiency in the Reference System document is the lack of speci-
fic details of associated SPS structures, such as the low Earth orbit (LEO)
docking areas for the Heavy Launch Vehicles (HLV). Because of this deficiency,
it was impossible to even begin to estimate how bright any of these associated
structures must be. Two factors dominated the discussion of the LEO and other
structures, both of which stemmed from the differences between the appearance
of objects in geostationary orbits (GEO) s^d those in LEO.
First, objects in LEO are closer than those in GEO end their apparent2
size is correspondingly greater. An object thcit has a surface area of 1 km
and is in an 800-km-high orbit has the same apparent size as the 55-km solar
blanket. Their relative brightness will then be determined by geometry and
albedo. One difference is that the LEO object is only illuminated through the
portion of its orbit that is not in the Earth's shadow.
Another difference between GEO and LEO objects poses a particular problem
for astronomical observations. As discussed later, since the power satellites
themselves are located in GEO, their position in the sky is fixed. As a result,
68

if it is possible to make a marked reduction in their apparent luminosity, then
the parallactic effect between the northern and southern hemisphere observa-
tories would allow astronomical observations to be planned in a fashion that
would minimize but not remove the effect of the SPS on observing programs.
An object in LEO is not geostationary, and as it travels in its orbit
around the Earth, the object will appear to move across the sky. Therefore, if
the LEO structures are large and reflective, they would appear as bright
planet-like objects moving relatively rapidly across the sky. Members of the
working group pointed out that observations made with the 48-in. Schmidt
telescope located on Mt. Palomar are routinely affected by existing satellites.
The photooraphs made with this telescope cover a relatively large area of the
sky, about the size of the bowl of the Big Dipper, and are usually made with
exposure times of about one hour. Since there are a large number of objects
now in orbit around the Earth, it is not unusual for a picture taken with this
telescope to show the trails of satellites. Because current satellites are
small, they are not very bright and the trails are primarily a nuisance. As
LEO satellites get larger and brighter, it will be necessary to schedule
observations to avoid them.
IMPACT THRESHOLDS OF THE SPS ON OPTICAL ASTRONOMY
Selecting the Thresholds for Adverse Effects
Because there are natural sources of diffuse sky brightness (sunlight
reflected by dust in the solar system and auroral and airglow in the Earth's
upper atmosphere), any effect of the SPS should be compared to those sources of
radiation. Equation (1) provides the comparison through the parameter p, which
is the factor by which the flux of radiation from the night sky is increased
over its natural value. In general, the working group felt uncomfortable
associating particular values of p with specific effects on optical astronomy.
Howevfir, in the following paragraphs we suggest that p>l.l results in a notice-
able effect, that 1.3<p<2.0 creates a serious hindrance to optical astronomy,
and that regions of the sky with p>2 are contaminated zones within which faint
object astronomy is no longer a reasonable endeavor.
69

As described earlier, the primary effect on optical astronomy comes for
cases in which the sky brightness is the limiting factor. For those cases,
equation (1) was simplified to:
g AQN
Here we can see that required observing time is directly proportional to our
pollution factor p. This equation also shows that when working on faint
sources, increase in light pollution is equivalent to reducing the aperture of
a telescope by a factor of l//p . For the largest American telescope, the
200-in. telescope at Mt. Palomar, the effect of doubling the sky brightness
would be to reduce the aperture of the telescope to 140 in.
The threshold values for effects on optical astronomy described above were
arrived at in the following fashion:
1. Noticeable effect (P = 1.1 - 1.3) - l.'hereas we recognized that some
members of the astronomical community would find any additional source of
diffuse sky brightness unacceptable, we believe p = 1.1 *s a result of
SPS to be the threshold for a demonstrable impact on optical astronomy.
This figure is the usual value quoted for the onset of "light pollution"
for the purposes of light abatement ordinances with cities near observa-
tories. The value represents a 10% increase in the night sky brightness
and is equal o about 1/2 of the natural variation of the airglow over
the 11-year solar cycle. As a further reference, at Kitt Peak National
Observatory, the lights of Tucson, Arizona result in p = 1.07 at the
zenith.
2. Severe hindrance (p = 1.3 - 2.0) - It should be clear that this level of
light pollution will have a demonstrable effect on optical astronomy.
The lower range (p = 1.3) means that observations will take 30% longer
to reach the same level of statistical accuracy; p = 2.0 corresponds to
the doubling of observing time.
70

3. Contamination (p > 2.0) - At this level of light pollution, the option of
compensating for increased sky brightness with increased observing time
is no longer an option. Figure 1 illustrates the loss of information
for observations of galaxies that would result from p > 2.0.
These thresholds represent the views of the working group and not the
consensus of the astronomical community. We are prepared to justify these
values but feel that the general question of acceptability of various degrees
of light pollution needs be addressed in a wider forum than the workshop could
reasonably be expected to provide. It is important to emphasize that light
pollution affects primarily the large, expensive telescopes that are the main-
stay of faint object astronomy and that are already severely oversubscribed.
The Effects of the Geostationary Orbit for SPS
The reTationship among the SPS-induced increases in sky brightness,
typical astronomical observing programs, and the thresholds for specific impacts
on optical astronomy is summarized in Figure 3. The four diagrams in this
figure show the outer contours of three light pollution zones described in
the preceding section as they would appear at midnight from two major observa-
tories, Kitt Peak National Observatory (KPNO) and Cerro Tololo Inter-American
Observatory (CTIO). These two observatories were chosen as representative of
the observatories located on the major continental masses of the Western
hemisphere.
Diagrams 3A and 3C show the computed ccntours for the set of assumptions
described in the Briefing Document. Diagrams 3B and 3D show the contours if
the apparent brightness of the individual satellites were increased by a factor
of two. The vertical axis in each of these diagrams is declination, the asiro-
nomical equivalent of latitude. As the Earth rotates, astronomical objects
will appear to rise at the left of these diagrams and move to the right at
constant declination. Because the power satellites are in geostationary orbit,
the brightness contours will remain fixed in this coordinate system, and astro-
nomical objects at the same declinations will appear to move through these
zones of light pollution.
71

60'50' HORIZON
40'
30"
-2tf-30'
40'-50
-60'
FIGURE 3. (A, B, C, D) Distribution of Predicted Increases in Diffuse NightSky Brightness as a Result of a 60-Satellite System. A and B showthe distribution of brightness as sun at midnight, the night ofthe vernal equinox, from KPNO. C and D show the distribution ofbrightness for the assumptions used in the Workshop Briefing Docu-ment that led to an apparent visual magnitude of -4.3 (as brightas Venus) for the individual satellites. The brightness distri-butions in B and D are the result of increasing the brightness ofthe satellites by a factor of 2. The map is an equal area pro-jection and the area enclosed with the horizon line is all of thesky that is visible at a given time from the respective observa-tories. The separate regions correspond to the impact thresholdzones described in the text: 1) contaminated zone; 2) severehindrance; 3) noticeable effect. Contours showing the fractionof the sky more than 30° above the horizon (z-60°) and 60° above -the horizon (z=30°) are also shown for reference.
72

HORIZON
-10'
-zd-3tf
-40°-50'
-60'
-Iff
-2tf-30
-40'
-50-60'
HORIZON
z=30u
73

60'50'
40'
30'
-10'
-20'
30'•40
-50'-60 HORIZON
z=30" 2=60"
The four diagrams in Figure 3 amply illustrate how extremely sensitive the
specific impacts on astronomy are to the detailed properties of the proposed
system. Although the contours for KPNO and CTIO are similar in shape, they are
shifted both north and south and east anr1 west with respect to each other.
This effect is the result of parallax and is important for two reasons:
1. In those cases in which the contaminated zone crosses the meridian, at
least half of the ideal observing zone (the region within %30° of the
meridian) would be lost. The loss of one half of the available observing
zone is equivalent to increasing the sky background by a factor of two.
Therefore, the working group concluded that this would effectively mean
that faint-object astronomy would be impossible within the declination
band of the contaminated zone as seen from a particular observatory.
2. Because of the apparent position of the contaminated zones, as viewed
from mid-latitude observatories, the zones will, for all practical -pur-
poses, mark the southern boundary of faint object astronomy for northern
hemisphere observatories. It will mark the northern boundary for southern
hemisphere observatories.
74

The north-south shift could be used to avoid a good fraction of the
problems created by the contaminated zones if objects north of 0° declination
were always observed from KPNO while objects south of 0° were observed from
CTIO. However, in order to avoid the contaminated zones completely, these
zones for the respective observatories must not overlap in declination. In
Figures 3A and 3C the zones for CTIO and KPNO do overlap a small amount, creating
a band between declinations -2' and +2° in which faint object astronomy would
not be feasible from either observatory. This 4 n band represents the minimum
effect, reflecting the assumptions made in the Briefing Document. However, by
doubling the apparent brightness of the individual satellites (Figures 3B and
3D), this band is increased in width to 12°, more than one-tenth of the visible
sky. This doubling would increase the width of the zone in which SPS is a
severe hindrar~e to more than 40°, or approximately one-third of the sky.
This condition dramatically illustrates a major concern of the working group--
that seemingly small deviations from the Briefing Document description of the
SPS will result in a considerably amplified effect on optical astronomy.
A final consequence of the positioning of the satellites in geostationary
orbits is illustrated in Figure 1 of the Briefing Document. This figure shows
the apparent position of the satellites as they would appear from several
observatories. The working group noted that if the satellites were positioned
as described in the Briefing Document, Mauna Kea Observatory (MKO) in Hawaii
would be far less affected by the SPS. The possibility that the Pacific Ocean
area could be kept free of power satellites was perceived as an important
possibility. This, however, would make Hawaii ineligible for power from the
SPS.
EFFECTS ON OPTICAL ASTRONOMY
The primary effect of the SPS on optical astronomy is to contaminate a
large region of the sky to the extent that the study of astronomical objects
currently at the limit of detection would be impossible within that zone. The
size of the region is extremely sensitive to the properties of the SPS and the
meteorological conditions at specific observatories. The impact is greatest
for those observatories at longitudes nearest the center of the satellite
75

array. For the Reference System, the instruments most affected are those on the
North and South American continents. The kinds of observations most affected
are those currently limited by sky background.
The practical consequences for the research programs outlined in
"Astronomical Observations: Scientific Programs" are as follows:
1. ^or those programs involving the study of randomly distributed objects,
such as intrinsically faint stars and, in some respects, faint galaxies,
the number of objects that can be studied will be reduced by an amount
proportional to the fraction of the sky covered by the contaminated zones
estimated between 3 and 10 . Further, these observations will be severely
hindered in a region that may cover as much as a third of the sky.
2. Surveys designed to ascertain the cosmic distribution of objects may
become subject to systematic errors stemming from the inability to study
the whole sky.
3. Specific regions of the sky may be excluded from observation. Various
parts of the sky provide a better opportunity to study particular classes
of objects. The region most seriously affected by the Reference System is
the ecliptic plane. Two regions are at the edqe of the zones most
noticeably affected, the galactic poles and the Virgo cluster of galaxies.
These two areas of the sky are extremely important to extragalactic
astronomy, and the working group expressed concern over the possibility
that gross changes in the SPS configuration would render these areas
unusable for many important kinds of observations.
4. Several important kinds of observations, type examples of classes of
objects, will be lost to astronomy. These objects, as noted earlier,
are usually the nearest members of the class and are generally the subject
of extensive observation and extremely detailed analysis, which is essen-
tial to the identification of the physical processes that control the
structure of the source. Examples of specific objects discussed that will
fall within the contaminated zone include a) the Orion Nebula, a major
testbed for theories of star formation; b) 3C273 and 3C120, two of the
brightest quasistellar radio sources (Quasars); and c) NGC 1068, one of
the brightest and closest galaxies that has an active nucleus.
76

5. Space astronomy may be faced with severe scheduling problems as outlined
in Groth's paper.
A secondary effect of the SPS on optical astronomy is the potential impact
on naked-eye astronomy. The human eye is a background-limited detector, and
the increases in sky brightness as a result o, the SPS will make such phenomena
as the gegenschein, zodiacal light, and many comet tails invisible from
North America. The visibility of the Milky Way will be reduced and the total
number of stars visible will be reduced somewhat. These effects may have some
impact on the identification of comets, novae, and other variable objects that
are generally discovered by voluntary searches on the part of amateurs. The
working group also expressed the concern that the SPS-induced changes in sky
brightness may reduce the popularity of astronomy as a hobby and erode some of
the excellent public support the field has enjoyed in the past. Several members
of the group pointed out that the appearance of the night sky will be changed
markedly, and that the aesthetics of the change were likely to be an issue and
a concern.
Finally, the working group assessed the potential financial impact on
astronomy. It was continually emphasized that an increase in sky brightness
is equivalent to a reduction in telescope aperture. Currently, the price of
a telescope scales as approximately the cube of the aperture. This means that
to build a larger telescope to compensate for a 30% increase in sky brightness
would increase the price of the telescope by approximately 120%.
RECOMMENDATIONS AND REMEDIES
Satellites as a source of light pollution are a phenomenon new to optical
astronomy. While the working group attempted to assess as much of the poten-
tial impact as possible, the information on which many of the conclusions were
based was uncertain. For this reason, the working group recommended five areas
requiring future study:
1. The diffuse albedo - Most of the f ects discussed by the grou[^ are a
direct function of the diffuse a' ido. It was recommended that a) baffl-
ing systems be investigated as . way of lowering the albedo; b) each
77

design for the power satellite include a calculation of a meaningful
estimate of the albedo and its potential for change over the orbital
lifetime of the system; and c) if active baffling is adopted, then the
effect of its failure or any system failure on the albedo be estimated.
2. LEO structures - It was recommended that these structures be brought to
a level of design at which their albedo can be computed and the impact
assessed.
3. Atmospheric effects - It was recommended that a detailed calculation of
the effect of the satellites on sky brightness be carried out for those
meteorological conditions appropriate to real observatories.
4. Ionospheric heating - It was recommended that ionospheric and atmospheric
heating calculations be used to actually estimate the effects of emitted
optical and IR radiation on astronomy.
5. Further assessment - It was recommended that a more permanent group be
created within the optical astronomy community in order to monitor the
potential impacts of the SPS ar.d other orbital systems on optical
astronomy.
Finally, the working group considered the possibility of mitigating the
effect of the SPS on optical astronomy by performing the affected types of
study with telescopes in space. It was noted that the development of the
technology required for the SPS should make it both easier and cheaper to
construct and maintain space telescopes. It is also widely recognized that a
great deal of the future of astronomy will depend on developing space astronomy
beyond current and planned levels and that some kinds of astronomy can only be
done from space.
Two problems were noted in association with any proposal that space
astronomy might serve as a substitute for lost capability of ground-based
telescopes. First, ground-based facilities have historically been used to
complement those studies made from space, and the effect of the SPS will be to
decrease that interaction. Second, it is always important to remember that
astronomy is an observational rather than an experimental science. It has not
78

always been obvious what the critical observations are or what the best instru-
ments to pursue them will be. As a result, the diversity of astronomy has been
a source of vitality in research. The working group felt that while astronomy
from space is important and desirable, creating a single space facility to
replace ground-based facilities would not preserve this vitality.
79

REPORT ON AERONOMICAL EFFECTS
The proposed SPS will have two effects on aeronomy. The first is analo-
gous but not identical to the effect on optical astronomy, which ib that the
illumination of the night sky by the diffuse reflection from the SPS solar
arrays will interfere with aeronomical observations. This effect is discussed
both here and as part of the invited contribution of M. Davis which can be
found in the radio effects section. Davis's remarks suggest that a substantial
fraction of Arecibo's current optical aeronomy observations would be impossible
following the construction of an SPS.
The second effect of the SPS creates an aeronomical phenomenon through
the interaction of the microwave beam with the ionosphere. K. Clark's contri-
bution, which follows, describes this effect.
In response to Clark's remarks, the optical astronomy working group con-
cluded that the actual optical emissions that would result from the interaction
should be predicted, which would allow their effect on optical astronomy to be
assessed. The detailed analysis of ionospheric effects is another element of
the current DOE/NASA SPS assessment, and, hopefully, that portion of the assess-
ment will result in a prediction of the optical emissions.
83

EFFECTS ON AERONOMY OBSERVATIONS
K. Clark
INTRODUCTION
The feasibility of establishing a belt of up to three-score geosynchronous
solar power satellites can be considered from an aspect that is neither mundane
nor celestial but which concerns the earth's upper atmosphere. We can ask,
what optical effects of the satellites would be important to the growth or
inhibition of our scientific understanding of the distant atmosphere? Because
the future is unknown, these effects are an open-ended topic, but quantitative
assessments of some of the recognizable impacts of aeronomical effects have
been published and will be used in the following comments.
The deposit of energy by the radio frequency beam coming through the iono-
sphere occurs in a geographically local region. The region's vertical and
lateral extent is limited by ionospheric electron concentration and by beam
width, and so the range of its view from the ground is roughly only several
hundred kilometers. Significant increases of light emission are anticipated
in this deposition region. An additional, different concern is the direct
viewing of a well illuminated satellite from the ground, seen permanently from
nearly all the Western hemisphere. Both of these effects would influence our
study of the upper atmospheric environment.
LOCAL HEATING
Concentrations of free electrons are greatest in the ionospheric F region1
broadly from 200 to 350 km, remain significant in the E region from 100 to
150 km, and are appreciable down to the D region around 80 km. The intense
electric field in the RF beam transfers a fraction of the beam power into
heating the available electrons en route. The field raises their temperature
and, by their subsequent collisions, the energy of the atmospheric con-
stituents. The temperatures, or average energies, of electrons, ions, and
85

neutrals are set by the balancing of all processes for energy gain and loss,and the RF beam is a noteworthy contributor.
The electron heating rate Q per unit volume in the beam is proportionalto several factors:
Q % E 2 (ne/f2) (fi + fn)
whereE = beam electric fieldf = beam frequency
n = electron concentrationf- = electron-ion collision frequencyf = electron-neutral collision frequency
To determine the dominant loss processes for electron heat energy, onemust consider details of the atmospheric composition, the relevant collisioncross sections, and the interplay of mean free path, thermal conduction, andmagnetic confinement. Recently, Perkins and Roble (1978) (hereinafter PR) havenumerically evaluated the resultant effects of these processes in standard mid-latitude atmospheres with typical RF heating. They point out the comparabilityof effects from the low-frequency Arecibo antenna (15 MHz, 1 to 3 MW) and froma possible satellite power station (2.45 GHz, 10 GW).
In the low D and E regions, the heated free electrons lose energy mostlyby collisions exciting rotational and vibrational states of the major moelculesN2 and Op. Since these homonuclear molecules cannot radiate the energy, it iscollisionally transferred to and emitted by CCk (4.3 u) and H90 (6.5 u ) ,respectively. Throughout the E region the abundant atomic 0 provides for elec-tron energy loss by the excitation of fine structure levels in ground state0( P). Also, Coulomb collisions of electrons and ions are significant. Inthe more highly ionized F region, principal electron energy degradation is by elec-tron Coulomb collisions and by electron-spin exchange collisions producing metast-
l °able 0( D) and its subsequent 6300A emission. A list of the above follows:
86

D, E regions: e + N? • e + N«*(r,v.)
V + C02 ' \ + C02*( '4>3 u)
e + 0 2 • e + 02*(r,v)
02" + H20 • 0 2 + H20*( -6.5 u )
E region: e + 0(3P) - e + 0*(3P)
e, M : Coulomb collisions
F region: e + 0(3P) - e + O ^ D )
e, e: Coulomb collisions
The loss of electron energy by thermal conduction out of the beam is slow
below 150 km because of thp small mean free path. The incident RF beam
intersection determines the form of the hot region. Above about 200 km, heat
conduction is magnetically confined Lransverse to the magnetic field direction
but is good parallel to the field. Some illustrations from PR are reproduced
here, by permission.
Figure 1 shows energy loss rates versus height for certain of the atmo-
spheric products, using a daytime model atmosphere with and without irradiation
by the assumed RF beam. Large effects near 100 km are to be noted. The
assumed satellite beam of 10 GW is taken parallel to the field. Figure 2 shows1 °the daytime intensity distribution of 0( D) 6300A emission near Boulder as
affected by the satellite beam. The maximum heating curve takes the beam
parallel to the field; the others are for indicated intersections of the beam
with the field line at heights of 200, 250, and 350 km. Even with the strong
daytime photoproduction, one sees pronounced enhancements caused by the added
beam.
GREAT LOCAL HEATING
So-called runaway thermal heating is an interesting possibility in
ionospheric radio-froquency heating, as discussed by Holway and Meltz (1973)
and others. The inception of thermal runaway can be noted in ground-based
studies with \iery large antennas. The higher the electron temperature
becomes, the greater is the ability to transfer RF energy via collision
frequency. The loss rates for electron energy are lessened as electron
87

temperature rises and as heat conduction becomes restricted at low heights,
and it is thereby quite possible to produce a localized great enhancement of
temperature. Figure 3 from the PR calculations for Arecibo illustrates that
the temperature at low altitudes rises faster with beam power than it does at
higher altitudes. With sufficient and attainable power, the assumed loss
processes are unable to control the increasing heat gain. Unbounded runaway
temperatures, however, refer only to the modelled processes; actual limiting
would occur at sufficiently high temperatures as ignored loss channels become
more important.
The production of thermal runaway temperatures in the low (50 to 100 km)
portion of a strong RF beam is an intriguing, though not catastrophic, result
of intense atmospheric RF heating. It is seen in tha example of Figure 4,
which gives the calculated meridional distribution of T at Boulder for
various intersection heights of the beam with the field line. Temperature
rises of 700°K are indicated at the high F region electron concentrations,
though good conduction is a mediator. The runaway effect, however, is shown
below 100 km by the unlimited breakthrough of temperature contours. The
nonlinear effects that develop in such a regime make accurate calculations
unsure. It should be emphasized that no tendency toward runaway becomes
noticeable until the beam power is very intense.
LOCAL OPTICAL RESULTS
The natural excitation of upper atmospheric emissions comes from:
• Direct excitation by daytime photons (effectively a few to 20 eV)
• Direct photoionization and excitation (10 to 20 eV)
• Collisions with secondary photoelectrons (effectively a few to 20 eV)
• Dissociative recombination of molecular ions and electrons (several eV)
• Chemical reactions yielding excited products (a few eV)
• Collisions with energetic electrons (auroral 0.5 to 10 keV, and
secondaries)
• Collisions with superthermal electrons from plasmasphere (to 100 eV)
• Minor contribution from energetic incident ions (0.5 to 30 keV)
88

The beam-heated electrons provide at most a few eV of energy, and their
effect is considered to be only on the very low-lying energy states. The two
lowest-lying metastable states of 0^, a I and b A , yield infrared
bands at 1.27 u and 0.86 y, respectively, and would show abnormal intensity ino
the region below 100 km. The forbidden 0 6300,6364A doublet would, as
noted, show abnormal brightness in the F region, where deactivation collisions
are infrequent. The 4.3-u and 6.5-u emission enhancement for C0? and HpO
at low altitudes has been mentioned previously. Only at highly pronounced
runaway heating belcv 100 km would higher energy states of available
constituents be appreciably excited by the beam; the next highest metastable
atomic oxygen state, for example, requires about 4 eV and yields the brighto
green auroral and airglow line at 5577A. While normally the electron and
neutral temperatures at low (below 100 km) altitudes are essentially equal, RFheating would raibe the T several times greater than T and thereby lead
to the various excitations. Another complex result would come from the fact
that a small fraction of the electron heat is not radiated away but is
transferred to heating the neutral components; the enhanced reaction rates of
the processes of atmospheric chemistry for the many constituents of the D
region will not be analyzed here.
The effect at heights below 100 km, seen locally for the infrared
emissions by C0~, H?0, and 0 ?, might roughly double the naturally
occurring intensities. The normal daytime intensity of 6300A, peaking around
250 km and coming to a total of about 4 kilorayleighs, comes mostly from
photoelectrons, photodissociation, and dissociative recombination with only
about 1% from thermal electron impact. The RF heating would bring the latter
contribution up to several kilorayleighs itself. At night especially, this
heating would be the dominant source of the light, and the glow could be
faintly visible as well as highly measurable. It would be as bright as a good
stable auroral red arc (SAR arc) at midlatitudes, and equivalent to a weak
auroral display.
While it is conceivable that special studies of processes might take
advantage of the uniquely localized parameters within the beam, the masking
effect of the artificial excitation would vitiate most studies of the natural
89

upper atmospheric environment using these standard emissions within a ground
radius of 300 to 1000 km, depending on height and project.
WIDESPREAD EFFECTS
A more pervasive consideration is the permanent and general illumination
by a belt of sunlit satellites, whose finite reflectivity produced light
estimated as brighter than perhaps 0.1 of a full moon. This light is seen not
only close to the sources via small angle scattering but also is distributed
more or less over the sky seen from a ground station, depending on the
prevalence of fine haze. We note, but set aside here, the interactions of
this background light with astronomy. In optical studies of the upper
atmosphere itself, much research rests on ground-based spectrophotometric
measurements of the faint light emissions, which give information on the
energy delivered within the sun's outer environment of particles, waves, and
radiation. How the solar wind energizes the earth's magnetosphere is traced
by the pattern of auroras formed by incident electrons, and the chemistry of
upper atmospheric processes is shown by the airglow.
This highly developed science depends on measurement of faint-sky light,
accurately discriminated as to wavelength, intensity, and variations with time
and space. The airglow, with all its spectral components, is roughly equal to
astronomical sources in providing the brightness of the dark sky. Intensities
of auroras, which cover a wide range in various circumstances, often approach
those of the airglow while yet maintaining much information content.
Especially at midlatitudes, the subvisual stable auroral red arcs and the
diffuse auroras require very sensitive spectral measurement and are unique
indicators of the plasmapause region of the magnetosphere. Wuxh future study
will center on relatively weak emissions extending from the near ultraviolet
to the near infrared. Many measurements press detection sensitivity to the
limits of background light. The SAR arcs are reliably mapped and measured
over the sky at levels of 50 Rayleighs. High-resolution studies of Doppler
shifts in thermospheric winds are at the limit of photon statistics. The
airglow continuum is already compromised by natural backgrounds, and the
artificial light would directly overwhelm it in any but the best conditions.
90

Weak band emissions from minor atmospheric components would find obvious
competition from scattering. The numerical estimates of limits cannot well be
reckoned because of the variable stringencies of different experimental tasks,
the ranges of thin haze cover, and the various contributions from aerosol and
Rayleigh scattering. Effects would translate into reduced hours and poor
intensity discrimination.
Actual examples are probably the best evidence. Moonlight now limits the
validity of ground-based spectrophotometric measurements. Typically, a
quarter moon sets the limit on photometry anywhere in the clear sky, and for
many studies the moon cannot be present in any phase of its brightness. The
emission by incident hydrogen, regardless of its Doppler profile, is an
important observational link in magnetospheric interaction studies; the blue
H-beta line is the best to use, and narrow interference filters are variously
employed for it. The villainy of scattered moonlight is heightened by the
structure of Fraunhofer absorption lines in the solar spectrum near Ho;
spurious results can come from scanning the filter pass band because of the
contaminating scattered light from the sky. The moon must be gone.
The moon would never be gone, at any hour or any day, if the satellites
contributed the equivalent of a 1/8 crescent. The background solar spectrum
scattered in the dark hours would effectively end many desired aeronomic
studies based on faint airglow and aurora.
REFERENCES
Perkins, F. W. and R. G. Roble, Journal of Geophysical Research. 83(A4):1611-1624, 1978.
Holway, L. H., Jr. and G. Meltz, Journal of Geophysical Research. 78(A34):8402-8408, 1973.
91

DAYTIME IONOSPHERE
100
SO400
3S0
300
250
200
ISO
100
30400
3S0
300
230
200
ISO
(Q)
too *
so
- >̂« °"N
^-^^^^
\ '^^^ ^ 1 1
^ ^
1 •
SPS-MAX
C \ Told n
S^N. - -1 'ARECIBO IS MHz. 3MW
sTotal e
10' 10* 10* I04 »*
LOSS RATES (EV CM"JS"')
10* IOT
Fig. 7. Calculated vertical profiles of the total neutral gas heating rate (dashed curve, total />). eV cm" ' s 1 . the totalelectron loss rate in collisions with neutrals (solid curve, total e), and various electron loss components. The curve labelsindicate electron loss rates: N, E , O1F, and OE are due lo elastic collisions with N,. Q*. and O. respectively: N, f f and O M
ate due to excitation of rotational structure of N j and O,i fi,v and On are due to excitation of vibrational levels of O ,and N ] : O ( 9 / ' ) a n d O('D) are due to excitation of atomic oxygen line structure and atomic oxygen to the 'D level. O2(6'!£,)and Oi(o 'A, ) are due to excitation of O j to the ' I , and 'A, levels by electron impact, and tw indicates electron-ion Coulombcollisions. The cases are (a) loss rates in undisturbed daytime ionosphere (A) rn»«imi.~; heating by the satellite powcistation, and ( r ) maximum heating by the I j - M H z . 3 -MW Arecibo heating experiment.
FIGURE. 1.(a)
(a) Source: Perkins, F. W. and R. G. Roble, "Ionospheric Heating by RadioWaves: Predictions for Arecibo and the Satellite Power Station." Journalof Geophysical Research. 83(A4):1611-1624, April 1, 1978.
92

6 0 0
250 km (5.73 KR)
350 km (4.34 KR)
MAX (12 KR)
6330-A VOLUME EMISSION RATE(photon* c m ' f ' l
Fig. 8. The calculated vertical profile of the 6300-A volume emis-sion rate (photons cnr 3 s ' ) . The solid curve is the volume emissionrate in the undisturbed daytime ionosphere, and the long dashed-shortdashed curve is the emission rate calculated for maximum heating bythe satellite power station, the dashed curves are volume emissionrates calculated over Boulder along geomagnetic field lines that inter-sect the radio wave beam at 200, 250, and 350 km, respectively.
FIGURE 2 . (a)
1 2 1 4HEATING POWER (MWI
Fig. 16. Relationship between electron temperature and heatingpower for an Arecibo heating experiment at various altitudes in the Dand £ regions.
FIGURE 3. (a)
800 r-r
JO 15 10 5 0 5 10 I I 20DISTANCE (km)
Fig. 4. Contours of calculated electron temperature (in degrees Kelvin) over Boulder for radio wave heating by thesatellite power station. The dashed lines give the radio wave beam direction, and the light solid lines indicate thegeomagnetic field direction.
FIGURE 4.(a)
(a) Source: Perkins, R. W. and R. G. Roble, "Ionospheric Heating by RadioWaves: Predictions for Arecibo and the Satellite Power Station." Journalof Geophysical Research. 83(A4):1611-1624, April 1, 1978.
93


MICROWAVE POWER TRANSMISSION SYSTEM
G. D. Arndt
The SPS microwave system has DC-RF power converters feeding a 1-km-diameter phased array antenna with a 10-decibel (dB) Gaussian illuminationtaper across the array surface. This system, as described on pages 25-46 ofthe SPS Reference System Report, DOE/ER-0023, dated October 1978, has not beensignificantly altered to date (May 1979). There are, however, two microwaveareas with new analyses available now: 1) scattered power as a function ofelectrical and mechanical tolerances, and 2) grating lobe characteristics whenthe phase control system conjugates at the power module (tube) level ratherthan at the subarray level.
SCATTERED POWER AT 2450 MHz
Microwave interference with communications and navigation systems andradio astronomy will come primarily from three spacetenna sources: sidebandradiation from the 2450-MHz main power beam, harmonics of 2450 MHz generatedby the DC-RF converter tubes, and tube noise outside the IMS frequency band(2450 ± 50 MHz). In addition, there will be reradiation and reflections fromthe rectenna. A considerable amount of power at 2450 MHz will be scatteredinto the side lobes due to electrical and mechanical tolerances within theantenna. Figure 1 gives the microwave power lost due to these tolerances;i.e., 2% tube failures, 10° phase error, 3 arcmin subarray tilt, ±1 dB ampli-tude error across the subarray or power module surface, 1 arcmin antenna tilt,and a 0.25-inch mechanical spacing between the subarrays. Tube failuresproduce the largest loss in rectenna power (268 MW) because of the reductionin antenna area and in the amount of transmitted power. Random phase errorsand 3 arcmin random subarray tilt earh produce 188 MW of scattered power. Theother error sources combine to scatter about 100 MW of power.
There are two types of errors within the SPS phase control system whichindirectly affect astronomers:
97

oQ.
t.
O
O
SCO
2 *FAILURES
FIGURE 1 .
10°PHASEERROR
3-MIN 1-dB 1-MINRANDOM AMPLITUDE ANTENNA
SUBARRAY ERROR TILTTILT
,25- IN. SPACINGBETWEEN
SUBARRAYS
Scattered Microwave Power Due toElectrical and Mechanical Errors
1. Random - due to errors in the RF receiver/conjugation electronics, powertubes, ionospheric perturbations on the uplink pilot beam signal, sub-array misalignment, and errors in the upper levels of the phase referencedistribution system within the antenna. These errors scatter the mainbeam power and result in higher side lobe levels.
2. Correlated - due to errors in the first and second levels of the refer-ence distribution system within the antenna. These errors produce a mainbeam pointing error of approximately 25 meters/ degree of correlatederror.
In summarizing the phase error effects, 10° of error produce 188 MW ofscattered power and a maximum beam misalignment of 250 m from rectennaforesight.
98

GRATING LOBE CHARACTERISTICS
The grating lobe peaks as described in the Reference System Report havemaxima at 440-km intervals from the rectenna. The 440-km separation waspredicated on phase conjugating at each 10.4-m x 10.4-m subarray, which wasthe smallest entity for phase control. Recent studies indicate that phaseconjugation can be done at the power module (tube) level. Conjugation at thetube level improves main beam efficiency and reduces microwave environmentaleffects, but increases costs and complexity. The cost tradeoffs show that, ifthe cost per RF receiver and conjugating electronics is less than about$800.00, then phase control can economically be extended dnwn to the tubelevel. Since the distance between maxima for the grating lobes is inverselyproportional to the spacings between phase control receivers, an extension tothe power tube level would reduce both the amplitude and the number of gratinglobes.
The grating lobe locations for the two conditions of phase controlling atthe subarray and at the power tube levels are shown in Figure 2. The first
* DENOTES GRATING LOBES FOR 10-m SUBARRAYS(PEAKS ARE AT440-Km INTERVALS)
• DENOTES GRATING LOBES FOR PHASE CONTROLDOWN TO POWER MODULES (TUBES>
( I A FRACTION DENOTING PEAK POWER DENSITY RELATIVETO 1ST GRATING LOBE PEAK ASSOCIATED WITH 10-mSUBARRAY
1} * • • • » • • • •
MAIN BEAM 848 Km 1272 Km 1696 Km 2120 Km 2544 Km 3392 KmAT RECTENNA (0.011) (0.01461 (0.02151 (0.0053) (0.018) 10.0054)
FIGURE 2. Grating Lobe Maxima
99

grating lobe peak for the power tube level is 848 km from the rectenna with anamplitude of 0.011 relative to the first grating lobe peak associated with10-m subarrays. This grating lobe pattern for phase controlling at the powertube level is expanded to encompass the continental United States as shown inFigure 3. For a rectenna location as shown for a mid-latitude, approximately35 grating lobe peaks are incident upon the United States. Since this corres-ponds to only about 0.01% of the nation's land area, rectenna siting should beable to preclude any grating lobes incident upon an observatory.
The microwave power density levels as a function of range from the rec-
tenna are shown in Figure 4 for phase control at the tube level. An antenna-4 2tilt of 1 arcmin produces grating lobe peaks of approximately 2 x 10 mW/cm
in the United States. This level is almost two orders of magnitude below the2
USSR guideline of 0.01 mW/cm . The variation in peak power density as afunction of antenna tilt and phase control level is illustrated in Figure 5.The grating lobe peaks are improved (reduced) by phase controlling at the tubelevel rather than at the subarray level. If there is a problem in the attitudecontrol system meeting the ± 1 arcmin pointing requirement, it is possible to
^YFIGURE 3. Grating Lobe Pattern for Fhase Control Down
to Power Modules
100

1
0.1
10-2
CONDITIONS:
10 dB GAUSSIAN TAPERo . | 0 ° . l l d B . »FAILURES
1 ANTtNNATILT-2MIN
I
10*
— ra
-
\ Mil %« B 1000 1500 MOO 2500 3000
RADIUS FROM RCCTENNA tORESIGHT(Km)
FIGURE 4. Power Density Levels as a Functionof Range from Rectenna
0.01
0.001
0.000]
0.00001
CONDITIONS:
10 dB GAUSSIAN IAPER
0.10° . t l d B . » FAILURES
NO SU8ARRAY TILTS
PHASE CONTROL TOTOWER MODULES;ANTENNA TILT-3 MIN
10-SUBARRAY
ANTENNA TILT '1MIN
PHASE CONTROL TOPOWER MODULESANTENNA TILT • 1 WIN
MO 880 1320 1720 2200 2640 3080 3320 3920 MOO
DISTANCE FROM RECTENNA BORESIGW (Km)
FIGURE 5. Grating Lobe Peaks for 10 Meter Subarraysand Phase Control to Power Modules (tubes)
101

2raise the pointing standard to ±3 arcmin and still be in the 0.001 mW/cmpower density range. The analysis also indicates the grating lobe peaks arevery sensitive to changes in antenna or systematic tilt but are relativelyinsensitive to random or subarray tilts. Hence, the ±3 arcmin subarray tiltrequirement is independent of the phase control level.
In summarizing the advantages of phase controlling at the power tubelevel, the grating lobe peaks are wider spaced and the magnitudes are 1/10 to1/100 of those for K-m subarrays. Proper rectenna sitings should excluderadio astronomy observatories from grating lobe locations.
102

SPS NOISE AND HARMONICS
R. M. Dickinson
NOTE: Although Dr. Dickinson was unable to attend the workshop, he has con-tributed copies of the slides prepared in support of his invited presentation.
103

SLIDE 1
BEAMED RF POWER TECHNOLOGYMICROWAVE SUBSYSTEM CHARACTERISTICSFOR SPS SYSTEM DESIGNERS AND ANALYST
GENERATORSNOISE &HARMONICSSPECTRUMS
• ANTENNAEMISSIONPATTERNS
• PHASEDARRAYPOINTINGACCURACY
TVI
RECTENNASCATTERING,SPILLOVER &HARMONICSPATTERNS
THE INTRODUCTORY VIEWGRAPH COLLAGE DEPICTS THE MAJOR PORTIONS OF THE JPLBEAMED RF POWER TECHNOLOGY TASK FOR NASA.
RF PERFORMANCE CHARACTERISTICS SUCH AS NOISE LEVELS, HARMONIC PATTERNSAND ARRAY POINTING ACCURACY ARE BEING MEASURED FOR DC TO RF CONVERTERS,TRANTENNAS AND RECTENNAS.
THE MEASURED DATA ARE USEFUL FOR SPS SYSTEM DESIGNERS AND ANALYSTS TO ASSISTIN DETERMINING THE MAGNITUDE OF AND TO MINIMIZE THE POTENTIAL RF INTERFERENCETO OTHER SPECTRUM USERS.
104

SLIDE 2
BEAMED RF POWER TECHNOLOGY
CURRENT ACTIVITIES
1. DESIGNING, FABRICATING& ASSEMBLING AN 8-ELEMENT ACTIVERETROD IRECTIVE ARRAY (ARA) MODEL & INSTRUMENTATION FORVERIFICATION TESTING OF BEAM FORMING AND POINTING ACCURACY
2. MEASURING PERFORMANCE CHARACTERISTICS OF dc TO RF CONVERTERS
3. RECORDING RADIATED HARMONICS OF RECTENNAS AND SLOTTEDWAVEGUIDE ANTENNAS
PLANNED ACTIVITIES
1. CONDUCT EXTENSIVE ARA PERFORMANCE MEASUREMENTS
2. RECORD ARA HARMONIC PATTERN DISTRIBUTIONS
3. INVESTIGATE TECHNIQUES FOR REDUCING ARRAY HARMONIC LEVELS
THE CURRENT AND PLANNED ACTIVITIES ARE LISTED FOR THE BEAMED RF POWERTECHNOLOGY TASK AT JPL.
SUBSEQUENT VIEWGRAPHS WILL PRESENT PRELIMINARY MEASUREMENT RESULTS INSELECTED TECHNOLOGY AREAS. WHILE THE RESULTS ARE NOT IDENTICAL TO EXPECTEDFLIGHT HARDWARE OR GROUND EQUIPMENT, THEY ARE FELT TO BE REPRESENTATIVEOF THE VERY COMPLEX AND, IN SOME CASES, ALMOST INCALCULABLE RESULTS OFHARMONIC PERFORMANCE AND, AS SUCH, SHOULD BE OF VALUE TO DESIGNERS ANDANALYST.
A JPL TECHNICAL REPORT IS BEING PREPARED ON THE NOISE AND HARMONIC DATA.A SEPARATE, LATER REPORT WILL DEAL WITH THE ARRAY BEAM POINTING.
105

SLIDE 3
BEAMED RF POWER TECHNOLOGYTRANSMITTING PHASED ARRAY
RFI, NOISE AND HARMONICS
TRANSMITTING ARRAYCOMPONENTS
1. dc — R FCONVEPTER
2. WAVEGUIDE RFCOLLECTION
3. NOISE BAND PASSLIMITING AND HAR-MONIC FILTERING — _
i. PILOT SIGNAL-POWER SIGNAL Dl-PLEX1\G FILTER —
5. WAVEGUIDE RFDISTRIBUTION-*.^
6. SU3ARRAY ANTENNAx"
7. ARRAY PATTERN
GENERATOR CHARACTERISTICS. TRANSMISSIONAND RADIATION TRANSFER FUNCTIONS
1. PHASEJITTER. am, LINEWIDTH, NOISE. SPURIOUS.HARMONICS
^ _ - 2 . GUIDE MODES, IMPEDANCES, TERMINATIONS
3. SKIRT WIDTH. REJECTION, INSERTION LOSS,_^ PASSBAND RIPPLE
4. CHANNEL SEPARATION, IN AND OUT OF CHANNEL^ ATTENUATION, BANDWIDTHS
5. GUIDE MODES, IMPEDANCES, TERMINATIONS,AMPLITUDE POWER SPLIT UNIFORMITY, PHASE AND
^AMPLITUDE STABILITY
6. TAPER, SIZE, DISPLACEMENT. TILT, OUTPUT-• AMPLITUDE AND PHASE
7. ARRAY ENSEMBLE POINTING, DIRECT AND CROSSPOLARIZATION
SPATIAL, SPECTRAL AND TEMPORAL DISTRIBUTION OF EMITTED ENERGY
NOISE
J
A SIMPLIFIED SCHEMATIC ILLUSTRATING THE COMPONENTS AND THEIRASSOCIATED PARAMETERS IN THE COMPLEX CHAIN FROM RF GENERATORTO RF RADIATOR.
THE RADIATED ANTENNA PATTERNS OF HARMONICS ARE ESPECIALLY COMPLEXBECAUSE OF THE MULTI -MODE NATURE OF HARMONIC PROPAGATION. THEIMPEDANCE AT THE HARMONIC FREQUENCIES THAT IS PRESENTED TO THECONVERTERS ALMOST DEFIES CALCULATION. THUS, UNTIL TYPICAL HARDWAREIS AVAILABLE, ONLY "REPRESENTATIVE," INSTEAD OF ACTUAL HARMONIC,PATTERNS ARE AVAILABLE.
106

SLIDE 4
BEAMED RF POWER TECHNOLOGYdc-RF CONVERTER HARMONICS
CO•a
z
o
CO
oo<£
80 -
70 -
60 -
s 50 -
4010
1
SILICONTRANSISTORAMPLIFIERS
;2ND
X2ND(10WH20W)
t
1
(100W)1
' 5K 70 SG KLYSTRON
INJECTION LOCKED \L-5001 MAGNETRON \ 4 T H LINEAR(FILAMENT OFF) Xv \ »
X4TH S A T U R A T E D X XX 3RD \ \
\ 2ND \SATURATED^ X
X 2ND «
(1KW) U0KW)i i
20 30
S-BAND POWER OUTPUT, dBW40
MEASURED HARMONIC LEVELS ARE DISPLAYED FOR SELECTED SOLID STATE ANDTUBE-TYPE CONVERTERS.
THE KLYSTRON HIGH POWER MEASUREMENTS ARE DIFFICULT AS THEY REQUIREA SPECIALLY DESIGNED, MULTI-APERTURED ("PORCUPINE"), WAVEGUIDE DEVICETO ENSURE SAMPLING THE CONTRIBUTIONS IN ALL MODES TO DETERMINE THETOTAL HARMONIC POWER.
THE KLYSTRON DATA SHOWS THAT THE FOURTH HARMONIC LEVELS MAY BESLIGHTLY REDUCED BY OPERATING THE UNIT IN A LINEAR, RATHER THANSATURATED, MODE-HOWEVER, THE EFFICIENCY SUFFERS.
107

"if
SLIDE 5
BEAMED RF POWER TECHNOLOGYdc^RF CONVERTER RFI CHARACTERISTICS
a:LLJ
.CA
RR
I
_j
^ —
LU
<
—*U_
^»
oU JCO
CC
20
3040
50
60
70
80
90
100
110
120
130
140
150
-
-
-
-
i i i i
I 2450 + ;n i SM BA
\ \ TYP dc - R F CONVERTER\ \ SPECTRAL NOISE POWER\ \ D E N S I T Y IN 4 kHz BANDWIDTH
i i i
TYP HARMONICS:
2;
RANGES
( 3
0 MHz |5
NDEDGE—
i
-
—
—
i i i
1105 106 10RF FREQUENCY, Hz FROM 2.45 GHz CARRIER
10* 101
A CaLECTION OF AVERAGE PM AND AM NOISE DATA AND HARMONICS FROM VARIOUSPOWER LEVEL KLYSTRONS AND MAGNETRONS IS SHOWN EXTRAPOLATED TO A 4 KHzBANDWIDTH. THE MAGNETRONS ARE PHASE INJECTION LOCKED AND HAVE THEIRFILAMENT EXCITATION REMOVED AFTER TURN-ON. SOME KLYSTRON AND EVEN SOLIDSTATE DEVICES1 NOISE PERFORMANCE IS BETTER IN SELECTED DESIGNS AND INSELECTED REGIONS FROM THE CARRIER. THIS "AVERAGE" DATA IS FELT TO REPRESENTAN UPPER BOUND.
THERE IS A CONSTANT NOISE "FLOOR" OUT OF KLYSTRONS THAT EXISTS EVEN WITHOUTRF DRIVE, DUE TO THE HOT-RANDOM ELECTRON BEAM PASSING BY THE OUTPUTRESONATOR CAVITY. ON AVERAGE, THE KLYSTRON APPEARS AS A 35 TO 45 dB NOISEFl GURE AMPLIFIER INDEPENDENT OF OUTPUT POWER LEVEL.
ADDITIONALLY, A BURST-LIKE, BROADBAND NOISE OUTPUT CHARACTER IS EXHIBITEDBY HIGH POWER WAVEGUIDE SYSTEMS DUETO MICROCRACK DISCHARGES. THEDURATION AND LEVEL IS A FUNCTION OF GUIDE CLEANLINESS AND MAINTENANCE.
108

SLIDE 6
BEAMED RF POWER TECHNOLOGY
S-BAND SLOTTED WAVEGUIDE SUBARRAY
W = SLOT WIDTH
= RADIATING FACE THICKNESS
o = INTERIOR GUIDE WIDTH
b - INTERIOR GUIDE HEIGHT
c = SHORT SPACING
d = SLOT DISPLACEMENT
t = SLOT LENGTH
S - SLOT SPACING
ONCE THE HARMONICS AND NOISE ARE GENERATED IN A DC TO RF CONVERTER,THE UNDESIRED RF MAY BE TRANSPORTED TO THE RADIATING ANTENNA WITHWAVEGUIDE TRANSMISSION LINES.
THE HARMONIC PATTERNS THAT ISSUE FROM THE SLOTTED WAVEGUIDE ANTENNAARE A FUNCTION OF THE MULTI -MODE INTERNAL CURRENT DISTRIBUTIONSLAUNCHED INTO THE GUIDE AT THE HARMONIC FREQUENCIES.
109

SLIDE 7
BEAMED RF POWER TECHNOLOGY8 x 8 SLOTTED W A V E G U I D E S U B A R R A Y
F U N D A M E N T A L ( 2 . 4 5 G H z ) A N D H A R M O N I C PATTERNS
90 60 30 0 305 ANGLE, deg
IAVE2nd & 5th
60
THE E AND H-PLANE, CROSS-POLARIZED AND HARMONIC PATTERNS ARE SHOWN FOR A 6WAVELENGTH SQUARE SUBARRAY ANTENNA. THE SLOTTED WAVEGUIDE RADIATOR CONSISTSOF EIGHT WAVEGUIDE STICKS HAVING EIGHT SLOTS EACH.
THE SECOND THROUGH FIFTH HARMONICS ARE BOUNDED BY AN APPROXIMATELY C O S U eENVELOPE. THE AVERAGE HARMONIC GAIN LEVEL BELOW THE PEAK FUNDAMENTAL SIGNALGAIN LEVEL FOR THE SUBARRAY IS ABOUT 30dB LOWER THAN THE CORRESPONDING LEVELFOR A SINGLE, EIGHT SLOT STICK OF WAVEGUIDE. THUS, FOR THE HARMONICS, THEFEED GUIDE-ARRAY OF WAVEGUIDE STICKS, NET LOSS IS ABOUT 30 dB.
THE CROSS-POLARIZED GAIN LEVEL OF THE FUNDAMENTAL IS ABOUT 50 dB BELOW THEDESIRED POLARIZATION.
THESE RESULTS MUST BE EXTRAPOLATED TO THE PROPOSED LARGER SUBARRAY ANTENNASOFTHESPS. ADDITIONAL WAVEGUIDE JUNCTIONS MAY FURTHER REDUCE THE HARMONICPATTERN GAIN LEVELS.
no

SLIDE 8
09•o</•>
O
LLJ
-32
BEAMED RF POWER TECHNOLOGYSLOTTED WAVEGUIDE RADIATORS BANDWIDTHS
I ' I ' I8X8ARRAY
END FED32-SLOT STICK
CENTER FED32-SLOT STICKBOEING
'CENTER FED8-SLOT STICK
I j I I L0.984 0.988 0.992 0.996 1.0 1.004
NORMALIZED FREQUENCY1.008 1.012 1.016
THE RESONANT, SLOTTED WAVEGUIDE ARRAY MAY POTENTIALLY BE A FILTER FORWIDEBAND NOISE AROUND THE 2.45 GHz FUNDAMENTAL.
A COLLECTION OF IMPEDANCE BANDWIDTH DATA FOR VARIOUS SLOTTED WAVEGUIDERADIATORS FROM JPL, BOEING AND RAYTHEON MANUFACTURE ARE SHOWN. RATHERNARROW BANDWIDTHS ARE ACHIEVABLE, BUT THEIR PRACTICALITYdONG TERMSTABILITY, REPEATIBILITYAND ACCURACY OF MANUFACTURE AND POWER HANDLINGCAPABILITY) REMAINS TO BE DEMONSTRATED FOR USE AS ADDITIONAL FILTERING OFTHE SPS TRANSMITTERS AT THE ISM BAND EDGE.
IT SHOULD BE NOTED THAT A DIFFERENT IMPEDANCE-MATCH TUNING OF THE 8 x 8ARRAY YIELDS A LESS THAN 1.5:1 VSWR (RETURN LOSS OF -14 dB) OVER THE ENTIRE100MHz WIDE ISM BANDWIDTH (0.98 TO 1.02 IN NORMALIZED FREQUENCY).
I l l

SLIDE 9
BEAMED RF POWER TECHNOLOGYBEAM FORMING ARRAY PATTERNS
ARRAYREFERENCEUNIT
FLEXIBLESUPPORTSTRUCTURE
ANECHOIC CHAMBERANTENNA RANGE
TYPICAL SUBARRAYRECEIVER-TRANSMITTERUNIT
POSITIONABLEPILOT TRANSMITTER
MONOPULSE"POWER" BEAMRECEIVERS
A CONCEPT DRAWING FOR THE PI LOT-BEAM-STEERED, RETRODIRECTIVE ARRAY CURRENTLYUNDER CONSTRUCTION AT JPL IS SHOWN.
BEAM POINTING ACCURACY AND OTHER ARRAY PERFORMANCE CHARACTERISTICS AS AFUNCTION OF VARIOUS PARAMETERS SUCH AS PILOT SIGNAL-TO-NOISE RATIO ANDINTERCONNECTING CABLE LENGTHS WILL BE MEASURED. BEAM FORMING PRECISION ANDSIDELOBE LEVELS WILL BE DETERMINED ALONG WITH MEASUREMENT OF THE PHASEREFERENCE DISTRIBUTION AND PHASE CONJUGATION PERFORMANCE.
EACH SUBARRAY RECEIVER-TRANSMITTER UNIT WILL EMPLOY A 64-SLOT WAVEGUIDESUBARRAY ANTENNA DIPLEXED TO BOTH RECEIVE THE PILOT SIGNALS AND TO TRANSMITA LOW POWER SIGNAL REPRESENTING THE POWER BEAM.
AN ANECHOIC CHAMBER ANTENNA RANGE IS USED TOMINIMIZE MULTIPATH REFLECTION?AND TO REDUCE ENVIRONMENTAL PROTECTION COSTS FOR THE EQUIPMENT IN THESEVERIFICATION TESTS.
112

SLIDE 10
BEAMED RF POWER TECHNOLOGY8-ELEMENT ARA MILESTONE CHART
ViAJOX MILESTONES
&ENCH TEST 2-ELEMENT ARA V/ITHPHASE REFERENCE REGENERATOR
REDESIGN & REWORK
ALL SUSAR3AYS BUILT & TESTED
PiLOT SOURCE BUILT & TESTED
INSTALL ARA IN ANECHOIC CHAMBE'
TEST ARA IN ANECHOIC CHA.-/3ER
fY 79
A M J J A s
FY80
O N D J F
7
—7
M A M
7
J J A
7
S
THE REVISED ACTIVE RETROD I RECTIVE ARRAY (ARA; SCHEDULE ISSHOWN. DIFFICULT CIRCUIT DESIGN FOR THE REQUIRED PHASEPRECISION, SLOW EQUIPMENT DELIVERIES AND RAPIDLY INFLATIONOF EQUI PMENT COSTS HAVE CONTRI BUTED TO SCHEDULE SLI PPAGEPAST THE BEGINNING OF FY'80.
113

SLIDE 11
BEAMED RF POWER TECHNOLOGY8-ELEMENT EXPERIMENTAL ACTIVE
RETROOIRECTIVE ARRAY (ARA) BLOCK DIAGRAM
CENTRALNODE ASSY
SECONDARY NODE ASSY
"1I
LEGEND:fl-T - RCVR-XMTR-OIPLEXER ASSY•PC - PHASE CONJUSATORVRR - PHASE REFERENCE REGENERATOR<£„• REFERENCE PHASE2PLX • DIPLEXER
THE OVERALL BLOCK DIAGRAM OF THE ARA IS SHOWN ALONGWITH THE DIPLEXED PILOT SIGNALS TRANSMITTER.
114
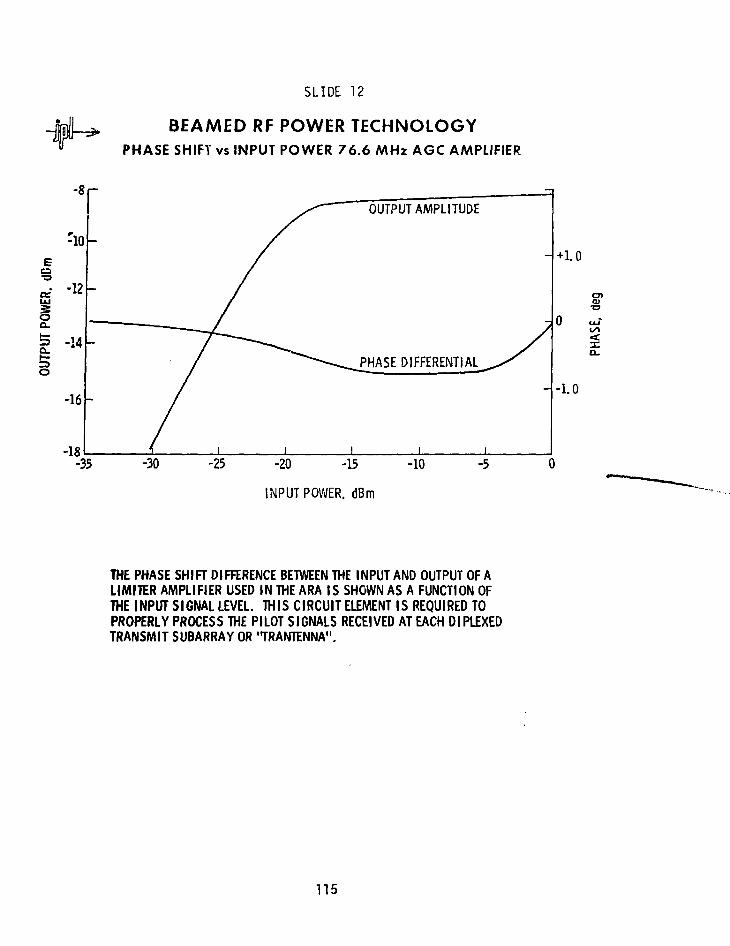
SLIDE 12
BEAMED RF POWER TECHNOLOGYPHASE SHIFT vs INPUT POWER 76.6 MHz AGC AMPLIFIER
E
oa.
a.
©
- +1.0
C7>Q>
•o
<
D-
- - 1 . 0
-30 -25 -20 -15
INPUT POWER. dBm
-10 -5
THE PHASE SHIFT DIFFERENCE BETWEEN THE INPUT AND OUTPUT OF ALIMITER AMPLIFIER USED IN THE ARA IS SHOWN AS A FUNCTION OFTHE INPUT SIGNAL LEVEL. THIS CIRCUIT ELEMENT IS REQUIRED TOPROPERLY PROCESS THE PILOT SIGNALS RECEIVED AT EACH Dl PLEXEDTRANSMIT SUBARRAY OR 'TRANTENNA".
115

SLIDE 13
BEAMED RF POWER TECHNOLOGYRECTENNA PATTERNS
FUNDAMENTAL& HARMON ICRECEIVINGANTENNAS
ANECHOICCHAMBER
2450 MHzGENERATOR
& Ac LOADRESISTOR
POSITIONER
IN ORDER TO CHARACTERIZE THE EXTERNAL ELECTROMAGNETIC RADIATIONPERFORMANCE OF THE RECEIVING OR "RECTENNA" END OF THE SPSMICROWAVE SUBSYSTEM, THE EQUIPMENT ARRANGEMENT FOR RECORDINGSCATTERED FUNDAMENTAL AND EMITTED HARMONICS FROM A SMALL, 42-DI POLE ELEMENT RECTENNA SUBARRAY IS SHOWN.
116
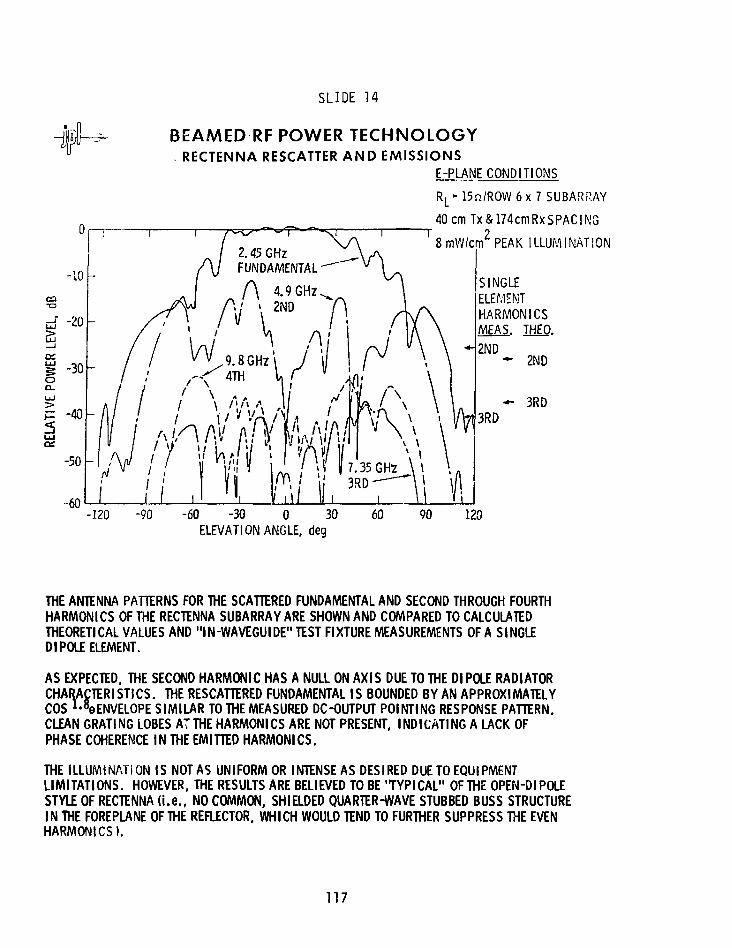
SLIDE 14
-10
rf" -20
-30Oa.
f= -40
UJ
-50
-60
BEAMED RF POWER TECHNOLOGYRECTENNA RESCATTER AND EMISSIONS
E-PLANE CONDITIONS
RL- 15n/ROW6x7 SUBARRAY
40 cm Tx&174cmRxSPACh\G
8mW/cm2PEAK ILLUMINATION2.45 GHzFUNDAMENTAL
9 . 8 G H z
4TH
. 1 1 ' I-120 -90 -60 -30 0 30
ELEVATION ANGLE, deg60 90
SINGLEELEMENTHARMONICSMEAS. THEO.
2ND- 2ND
- 3RD3RD
120
THE ANTENNA PATTERNS FOR THE SCATTERED FUNDAMENTAL AND SECOND THROUGH FOURTHHARMONICS OF THE RECTENNA SUBARRAY ARE SHOWN AND COMPARED TO CALCULATEDTHEORETICAL VALUES AND "IN-WAVEGUIDE" TEST FIXTURE MEASUREMENTS OF A SINGLEDI POLE ELEMENT.
AS EXPECTED, THE SECOND HARMONIC HAS A NULL ON AXIS DUE TO THE Dl POLE RADIATORCHARACTERISTICS. THE RESCATTERED FUNDAMENTAL IS BOUNDED BY AN APPROXIMATELYCOS 1>8eENVELOPE SIMILAR TO THE MEASURED DC-OUTPUT POINTING RESPONSE PATTERN.CLEAN GRATING LOBES AT THE HARMONICS ARE NOT PRESENT, INDICATING A LACK OFPHASE COHERENCE IN THE EMITTED HARMONICS.
THE ILLUMINATION IS NOT AS UNIFORM OR INTENSE AS DESIRED DUE TO EQUIPMENTLIMITATIONS. HOWEVER, THE RESULTS ARE BELIEVED TO BE "TYPICAL" OF THE OPEN-DIPOLESTYLE OF RECTENNA ( i .e . , NO COMMON, SHIELDED QUARTER-WAVE STUBBED BUSS STRUCTUREIN THE FOREPLANE OF THE REFLECTOR. WHICH WOULD TEND TO FURTHER SUPPRESS THE EVENHARMONICS).
117

SLIDE 15
BEAMED RF POWER TECHNOLOGYRECTENNA RESCATTER AND EMISSIONS
QID
Q_
<
Oon
5LU
OdB
10 dB
2CdB
30 dB
40 dB
50 dB
60 dB
70 dB
i i ^ ^ - ^
y/I/
" A!- / / i c . \ .•
, / -.1
r •
- 1 - • * ) » , > < >
/ , " t t ' •
' •' • • • • • • " ' • •
.? . : • ••''
1 1 1
2450 MHz — ^
\
Ai / \
4900 MHz ̂ \ /
\ ! i; :.; \;l\ i '• i ,* •
' .' * *
r X A i < ••
r * T
I- . ; ' : ' V : 98Oo MHZ
T •
':.-•_, : : . ^ 7 3 5 0 MHz: •
i ' i i
E-PLANECONDITIONS14 mW/cm2 PK -dc BUSS SHORTED6 ELEMENT X
J ROW ARRAY -
i r J f\. \ i
V- i -
V
>
-
i ' • • • i
-120 -90 -60 -30 0 30 60ELEVATION ANGLE, deg
90 120
THE LAST VIEWGRAPH SHOWS THAT THE RECTENNA EMITTED HARMONICS AREREDUCED RELATIVE TO THE REFLECTED FUNDAMENTAL WHEN THE RECTENNA ISTERMINATED WITH A SHORT CIRCUIT. MOST OF THE RF ENERGY IS REFLECTEDDUE TO THE RESULTING IMPROPER ARRAY IMPEDANCE.
118

SPS-GENERATED FIELD STRENGTHS AT 2.45 GHz, TYPICAL EFFECTS
W. Grant
NOTE: Dr. Grant reviewed the Institute for Telecommunication Sciences'
studies of RFI and EMI effects on a wide variety of electronic equipment.
Unfortunately, no written version is available, and copies of his slides do not
themselves form an understandable account of his wide-ranging presentation.
The four figures which follow (based on his slides) are those most dir-
ectly relevant to astronomy effects. Figure 1 presents calculated main beam
power densities at two National Radio Astronomy Observatory sites resulting
from two candidate rectenna locations. Figure 2 presents for comparison esti-
mated thresholds for the VLA Receiver adjacent channel overload effects. On
both Figures 1 and 2 the fundamental frequency of 2.45 GHz is denoted fQ; the
second harmonic at 4.90 GHz is denoted f~. Figure 3 shows a calculated contour
map of 2.45 GHz power density for one candidate rectenna site. Figure 4 shows
calculatet' SPS transmitting antenna power gain versus angle from pattern center
(theta).
CANDIDATE RECTENNA SITE NROSITE POWER DENSITY
• SOUTHWEST ARIZONA
• 32° - 35' N
• 113°-10'W
• NORTHEAST ARIZONA
• 33° - 40' N
• 109° - 50' W
K i n PEAK Fo -1.8 - 10'4 mw/cm2
VLA
F2 - 1 . 9 • 10"11 mw/cm2
F Q - 1 . 1 • 10"4 mw/cm2
F2 - 1 . 2 - 1 0 ' 1 1 mw/cm2
FIGURE 1. Typical NRO Candidate RectennaSite Interference Relationships
119

SPS F Q - 8 . 2 - 1 0 " 6 mw/cm2
SPS ?2 ' 6.5 • 10"16 mw/cm2
RCVRIF - 50 MHz
FILTERS - 24MHz
FIGURE 2. Initial VLA Receiver ThresholdPower Density Estimates
SPS SINGLE SATELLITE POWER DENSITY DISTRIBUTION, mw/cm?
FIGURE 3. Calculated Contour Map of 2.45 GHz PowerDensity for One Candidate Rectenna Site
120

INTERFERENCE EFFECTS ON RADIO ASTRONOMY EQUIPMENT
W. C. Erickson
The principal interference effects of the proposed SPS on radio astronomi-
cal observations have been discussed in the Briefing Document and in the
Committee on Radio Frequencies/National Academy of Sciences (CORF/NAS) assess-
ment. I will amplify on these assessments.
Radio astronomy is particularly sensitive to interference. Because we-18 -21typically detect signal levels of 10" to 10" W, we are sensitive to very
low levels of interference. For this reason, radio astronomers have success-
fully endeavored to obtain protection from interference by active users of the
radio spectrum. Radio astronomy has been established as a Radio Service in the
frequency management community and has been granted protection from interfer-
ence by the other Services. The degree of this protection varies from band to
band depending on our needs and those of the other Services.
In order to provide standards which can be used in the design of systems
that might interfere with radio astronomy observations, it is necessary to
state a formal definition of "harmful interference" to radio astronomy. This
has been done by the CCIR Report-224 which was first issued in 1963 and has
been occasionally updated, the most recent issue—CCIR Report 224-4—having
been adopted by the 1978 Kyoto KIV Plenary Assembly (cf Appendix A). This
definition of "harmful interference" has changed little over the years and has
proven to be a remarkably accurate statement of our needs.
The relevant standards for continuum bands are:
Frequency (GHz)
1.42.5
5
10
15
Power Flux Spectral DensitydB (w/m2-Hz)
-255
-247
-241
-240
-233
123

These standards assume state-of-the-arc system noise temperatures, RAcontinuum bandwidths (10-100 MHz), 2000 sec integration, 10% error, and thatthe interfering source is in a far side lobe of the radio astronomy antenna.
The meaning of protected band is shown in the illustration below:
PROTECTED BAND iiO GO
HARMFUL INTERFERENCE LIMITFREQUENCY
RA BAND EDGES
We will of course object to any infringement by SPS in a protected band andwill seek legal means to have the source turned off. This is especially trueof foreign radio astronomers acting through the government agencies that havecognizance over the treaties regulating frequency-spectrum management (Chair-man's note: cf Appendix C). Note: In some frequency ranges the standard isbelow the level of some natural sources, such as the sun; in some cases we mustwork at night for most sensitive observations.
We foresee special difficulties with SPS in that the standards would allowinfinite power at 1 Hz outside the band edge. SPS would generate extremelystrong out-of-band signals which are not proscribed by existing standards, andwhich may be impractical to reject completely with filters. We must expand ourconcerns to include the problems of overloading, cross-modulation noise genera-tion, and other nonlinear effects of strong out-of-band signals. To obtainterrain shielding, radio observatories are located in remote sites. The SPSeliminates such protection. In fact, the siting requirements of rectennas andRA observatories are parallel in many respects. Not only far-out side lobesbut also the 440-km grating lobes and near-in side lobes may fall on radioobservatories.
124

The seriousness of the problem is indicated by the following:
• Within a 30-MHz RA band at 2.7 GHz, -255 dB(w/m2 Hz) implies total noiseemission of 15 mW by an isotropic radiator at a distance of 35800 km. Inany 3-kHz band 1.5 yW would exceed the standard. If a sub-array gain of50 dB is assumed, numbers are decreased by 10 . •?'I ,H implies 156-dBreduction in signal level from 2.45 GHz to 2.67 GHz or 206-dB reductionif sub-array gain is considered.
• For the case of 100 satellites, an additional 20 dB is required.
Depending on transmitter amplifier and antenna design, this level ofperformance is at least conceivable. However, reliability of transmitter
csubsystems would be extremely critical. Each satellite has 10 x 70-KWklystrons. One of these devices developing some subtle error to radiate^ 1 pW in an RA band will exceed standards. It may prove to be extremelydifficult to locate and turn off the offending unit.
The potential overloading problems are severe. The projected power levelsat 2.45 GHz for (̂ 1 Earth radius) from the SPS main beam are ^ 2 uW/m2.This is equivalent to the power level from a 10-kw transmitter with gain of 20located 100 km from observatory, line-of-sight. A large telescope with% 40-dB side lobes would produce % 1 yW from such a source. Parametricamplifiers give trouble at about 0.001 yW. System performance may be seriouslydegraded by one satellite at 2.45 GHz, but good filters might handle theproblem. It is interesting to note that a 100-satellite system is equivalentto a 10-kW transmitter at 10 km from the observatory. A 440-km side lobe isequivalent to a transmitter at 1.4 km from the observatory. It does not appearto be possible for a radio observatory to operate within a few hundred kilo-meters of a rectenna. This problem needs much more study.
Other effects of interference require investigation, including:
• Ionospheric Modification: What of scattering at 2.45 GHz? What ofreflection of terrestrial interference by modified ionosphere?What of ionospheric cross-modulation effects? What of large-scaleionospheric modification?
125

Rectenna Scattering: If 2% of incident power is scattered, therectenna forms a 12O-MW transmitter at 2.45 GHz.
Harmonic Emission:RA Band
2nd Harmonic at 4.90 GHz 4.95-5.0Formaldehyde at 4.829 GHz
4th Harmonic at 9.80 GHz 10.6-10.7 GHz9th Harmonic at 22.05 GHz 22.21-22.5
H20 at 22.235 GHz
Thermal Noise: Thermal emission from SPS could interfere with manyobservations.
Test Systems: Initial, low-power tests of components of the SPS couldseriously damage radio astronomy observations.
126

POSSIBLE OVERLOAD AND PHYSICAL DAMAGE OF A RADIOASTRONOMY RECEIVER CAUSED BY THE SPS
H. Hvatum
The extremely high microwave power radiated from the SPS (several ordersof magnitude higher than any other existing or planned microwave transmitter)raises the question of overload problems and, perhaps, physical damage toradio astronomy receivers. It is therefore of interest to estimate the powerlevels in a radio astronomy receiver under various conditions that might arise.
One may safely assume that the main beam of the SPS will always be dir-ected towards a rectenna and that in case of equipment failure the beam willdegenerate into the phase failure mode. Thus, a radio astronomy receiver willnever be exposed to a SPS main beam, but will be illuminated either by the SPSside lobe structure or the phase failure mode radiation. If one assumes thata complete SPS consists of approximately 100 SPS sets (60 and 120 sets havebeen mentioned), the average distance between two adjacent rectennas will beabout 300 km. Thus, a radio astronomy installation will, on the average, bewithin a few hundred kilometers from a rectenna and be illuminated with about3 mW/m from one SPS transmitter. With 100 systems in operation, the fluxwill be higher, although not 100 times higher since the contribution from mostsystems will come from far-out side lobes.
2A combined flux of 50 to 100 mW/m seems to be a reasonable estimate of
the combined power flux that could be expected from all SPS transmitters.With 1Q0 SPS transmitters in simultaneous operation, it becomes quite likely
2that a grating lobe with a power flux of 100 mW/m will fall on a radio
2astronomy telescope. In the following calculations, 100 mW/m has been usedas a typical expected power flux at a radio astronomy observatory.
The interfering radiation will be coupled into the radio astronomyreceivers either through the side lobes of the radio telescope or occasionallythrough the main beam. Both cases must be considered.
127

Under normal operation the radiation from the SPS transmitter will coupleinto the side lobes of the radio telescope. The side lobe response of a radioastronomy telescope is independent of its size, about 7 dB below the isotropicresponse.
The SPS satellites will be in geosynchronous orbits, which means thatthey will occupy a band across the United States near the celestial equator, aregion of great interest to radio astronomy. One must assume that the mainbeam of a radio telescope accidentally may point at one of the SPS transmitters.For a 25-m-diameter telescope the gain is about 54 dB at 2.4 GHz, which givesabout 61 dB higher power level in the input amplifier compared to the casewhere the antenna is pointed away from the satellite.
In the case of an SPS transmitter operating in the phase failure mode,
the radiated beam becomes very wide and will cover the entire United States.2
The power flux from one SPS will then be 30 mW/m anywhere.
A typical radio astronomy system uses parametric amplifiers as low-noiseinput stages. The overload level, defined here as a 0.1-dB compression in
_Q
the amplifier, is about 3 x 10 W and the level where the varactor may be
physically damaged (burn-out) is about 100 mW.In order to achieve the best possible system noise temperature, a normal
radio astronomy receiving system does not employ filters in front of the inputamplifer. Thus, a system operating in the 2690 to 2700 MHz radio astronomyband will also be exposed to fields at 2450 MHz, the SPS frequency.
The rectennas will reradiate 5% of the incoming power, or about 100 MW.Most of the reradiated power will be at 2.45 GHz, but some (-25 dB) will occurat 4.9 GHz. If one assumes that the reradiation will be isotropic, at a dis-
2tance of 150 km the power flux will then be approximately 5yW/m .
One can now assume the following parameters for the SPS-radio astronomy
system:
128

100 mW/m
5 yW/m2
30 mW/m2
300 m2
250 x 10
3 x 10"9
2
" 6 m 2
W
• Power flux from SPS =
• Power flux from rectennas:
• Power flux in phase failure mode:
• Collecting area cf the main beam
of a 25-m telescope:
• Collecting area of a side lobe:
• Overload level (0.1-dB compression)
in a parametric amplifier:
• Burn-out level of a varactor: 100 mW
Based on these parameters, one can construct a table showing the neces-
sary power reduction (filtering) at the SPS frequency in order to protect a
typical radio astronomy system from overload or physical damage. It is pos-
sible to achieve filtering that will protect a radio astronomy installation
in most cases. A notch filter in the receiver input with a 100 dB loss at
2.45 GHz will probably be difficult to achieve, and it might not be possible
to protect observations near the celestial equator where it is likely that
the main beam will be pointed at or \/ery near an SPS transmitter. It must be
noted that the input filtering needed to protect radio astronomy receivers
from the effects discussed here will reduce the sensitivity of the radiometers
by introducing loss (0.5 dB) in the signal path and by the thermal radiation
of the filter components. The addition of an input filter may increase the
system noise temperature 25% or more even if the filter is cooled to the physi-
cal temperature of a cooled parameteric amplifier (̂ 20 K), a quite undesirable
degradation of the radiometer performance.
One must keep in mind that this discussion estimates the impact of a
future system (SPS), one that might be in operation several decades hence, on
the performance parameters of a typical radio astronomy system which is cur-
rently being used. A future system may be more sensitive to overload and
physical damage, but could also be .ess vulnerable.
129

Table 1 shows the ratio of SPS power flux to the harmful limits in the
radio astronomy receiver for various operating conditions. A positive number
indicates that the power flux is above the harmful level.
TABLE 1. Ratio of Power Flux to Harmful Limits
RA
Main Beam '
Side Lobe ^
SPS
0.1 dB ( d )
B u r n ^
0.1 dB ( d )
B u r n ^
SPS Transmitter
Grating Lobe^c' Phase Failure
+ 100 dB
+ 25 dB
+ 39 dB
- 36 dB
+ 95 dB
+ 20 dB
+ 34 dB
. 41 dB
Rectenna^'
Re-Radiation
—
--
-4 dB
--
(a) Main beam of the radio telescope pointed at the SPS.(b) Main beam of the radio telescope pointed away from the SPS.(c) Assumed power flux 100 mW/m^. _(d) Radio astronomy reciver overload level (0.1 dB compression) 3 x 10 W.(e) Varactor burn-out 100 mW.(f) Assumed 100 MW radiated isotropically from the rectenna and 150 km
distance over average terrain.
130

POTENTIAL IMPACT OF OUT-OF-BAND RADIATIONFROM THE SATELLITE POWER SYSTEM
AT ARECIBO OBSERVATORY
N M. M. Davis
Arecibo Observatory, operated as a national research center by CornellUniversity, has the world's largest radio/radar telescope. Its S-band radarsystem at 2380 MHz is the source of the most powerful collimated signal leavingthe Earth; at the same time, its 20-acre collecting area and maser receiversprovide the highest instantaneous sensitivity anywhere for the reception offaint signals. The observatory carries out a wide range of research inastronomy, planetary radar and atmospheric physics over its usable frequencyrange of 5 to 5000 MHz. In addition, an active optical program of airglowresearch is underway ~s part of the atmospheric physics program.
All of these p- grams could be severely affected by out-of-band radiationor optical scattering from the satellite power system. The harmful interfer-ence levels for radio astronomy in the protected frequency bands are adequatelycovered by the discussion and tables in CCIR 224-4. It should be noted,however, that these tables are based on an isotropic side lobe level, andassume that the main beam and near-in side lobes are pointed well away from theinterfering source. At Arecibo, the available sky coverage is limited to amaximum of 20° zenith angle. The relationship between the Arecibo coverage andthe power satellite locations is shown in Figure 1. The figure makes clearthat at southern declinations the beam must necessarily come close to the powersatellites. In general, the need to accurately correct for spherical aberra-tion has as a byproduct a remarkably "clean" beam pattern at Arecibo, but it isnevertheless clear that the sensitivity at southern declinations may be par-ticularly affected by SPS out-of-band radiation.
Three areas are of particular concern at Arecibo: second harmonic radia-tion, the effect on the planetary radar system at 2380 MHz, and the impact onairglow observations. Second harmonic SPS radiation is of special concern atArecibo because it falls in our highest frequency band. The Arecibo reflector
131

0 1.0 20 30
60LHA (m)
70
80
70
60
50
3040
n - JQ . -20. - 1 . ?1 L - - . P . °_ W f i? S A T E L L I T E SA R E C I B O SKY C O V E R A G E - 1 • * * • • • • • • • • • • • • • • • • • • -
FIGURE 1. Arecibo Sky Coverage
was upgraded recently to provide high sensitivity and resolving power (1'FWHM)in the protected band at 5 GHz, and any radiation in this band above the harm-ful interference limits of CCIR 224-4 will degrade or eliminate the Arecibo6-cm research.
The second concern is not directly addressed by CCIR 224-4, as it involvesplanetary radar. The 430-kw Arecibo cw radar operates on an assigned frequencyof 2380 MHz. The receiver is a Jet Propulsion Laboratory maser. The normalobserving mode involves transmitting for periods ranging from a few to tens ofminutes in order to fill the round-trip travel time window between the earthand the target planet, satellite, or asteroid. A reception period of equalduration then follows. The bandwidth used during reception is set by thenature of the target and ranges from 0.02 Hz for Venus at conjunction to 30 kHzfor Saturn's rings. The harmful interference level calculated for these band-widths, but otherwise using the same criteria as CCIR 224-4, ranges from-204 to -235 dbW/m -Hz. The latter figure, which applies to "soft" targets
132

such as Saturn's rings, is similar to the values derived in CCIR 224-4 forspectral line radio astronomy in this wavelength region. If the SPS noisepower density can in fact be limited to that shown in Figure 26 of SatellitePower System: System Report, DOE/ER - 0023, October 1978, then the noise from60 power satellites lies at the harmful interference threshold for planetaryradar research.
The third area of particular concern to Arecibo is the impact of directand scattered sunlight on airglow research. Because of the weakness of most(non-auroral) airglow emission features, airglow observing is traditionally a"dark moon" activity. It is almost impossible to obtain useful measurementswith direct moonlight in the field of view of an instrument. In fact, manyautomatic photometers incorporate protection devices to guard against possibledetector damage caused by exposure to direct moonlight. In investigations ofspatial variations, north-south meridian scanning is a common mode of opera-tion. A chain of satellites across a meridian could seriously limit studies ofthe dynamic behavior of the airglow.
The problem of moonlight scattered into the field of view is rather dif-ficult to quantify, as it depends on local tropospheric conditions. Adequatemeasurements of strong emission features can probably be obtained when the moonis less than 1/4 full. However, recent developments on instrument design anddetector technology have made it possible to observe very weak airglow features.Work of this type is seriously compromised by an increase in background bright-ness by a factor of 5, such as is caused by the presence of the Milky Way inthe field of view. At Arecibo, an increase in sky brightness of this order isobserved at the zenith when a moon about 1/8 full (by area) is present near thehorizon. Scattered light from the SPS of this amount would seriously compro-mise present airglow research at Arecibo.
The discussion has thus far assumed that a rectenna array is not placed inPuerto Rico. In fact, the extrapolated power requirements in Puerto Rico matchthe 5-GW capability of an SPS, and the island imports 100% of its energy. Forthese and other reasons, it may be selected for a rectenna. site early in theprogram. If it is selected, the interference criteria may be much more dif-ficult to meet, both because the observatory will lie in the near-pattern of
133

the transmitting array and because rectenna scattering and noise generationwill have to be taken into account. Such effects will require careful studyif the observatory's research is not to be unnecessarily affected.
This discussion is based on current operations at the Arecibo Observatory.The present 1000-ft telescope is a general-purpose instrument with enormouspressure for observing time from its widely-diversified user community. Thereare at present no plans to duplicate this facility; and as a unique instrumentit is expected to continue in operation for many decades. Extrapolating intothe future, there are plans to erect a 100-m aperture all-sky telescope, withwavelength coverage extending down to ^ 1 cm. The SPS therefore poses a veryreal threat if out-of-band radiation cannot be controlled to the requiredstrict thresholds stated in CCIR 224-4.
134

THE EFFECTS OF THE PROPOSEDSATELLITE POWER SYSTEM ON THE VLA
A. R. Thompson
The Very Large Array (VLA) is being constructed on the Plains of SanAugustin, New Mexico as a facility to map the sky at centimetre wavelengthswith angular resolution down to a few tenths of an arcsecond. The array, whencompleted, will consist of 27 fully steerable paraboloid antennas of 25-mdiameter, located on a three-armed array with nine on each arm. The antennascan be moved between foundations so that the scale of the array can be variedin four steps in which the distance of the furthest antenna from the centervaries between 0.6 and 21 km. A general description of the array has beengiven by Heeschen (1975), and more detailed accounts can be found in NRAOtechnical reports.
The array operates in the Fourier Synthesis mode in which signals from allpossible pairs of antennas are combined to form a two-dimensional visibilityfunction. To obtain sufficient data the point in the sky being observed isusually tracked over a range of at least -4 to +4 hours in hour angle. The skybrightness function is then obtained from the visibility by Fourier transforma-tion. For an account of the principles involved see, for example, Swenson andMathur (1968) or Fomalont and Wright (1974).
Table 1 gives the four wavelength bands in which the VLA is equipped tooperate at the present time. Each of these VLA bands encompasses a narrowerband assigned to radio astronomy. Note that harmonics of the SPS frequency at4.9, 14.7 and 22.05 GHz fall within VLA operating bands. The receiving equip-ment is capable of operation with an instantaneous bandwidth of up to 100 MHzin two orthogonal polarizations. Bandwidths wider than the assigned radioastronomy bands are often used, if no other signals are encountered, to maxi-mize the sensitivity.
Two effects in the operation of such an array reduce the response to
radiation fr9m directions in the sky other than that desired. First, the
unwanted source does not have the expected motion across the sky of the point
135

TABLE 1. VLA Observing Bands
CO
an
VLA Band
1340-1730 MHz
4500-5000 MHz
j
14.4-15.4 GHz
22.0-24.0 GHz
Wavelength
18-21 cm
6 cm
2 cm
1.3 cm
MinimumSignal(a)
10"30 W m"
8 x 10"31
5 x 10"30
7 x 10"30
Detectable(Approximate)
2 Hz'1
W m"2 Hz
W m"2 Hz"1
W m"2 Hz"!
Radio Astronomyj Band i
; 1400-1427 MHz1
; 4990-5000 MHz
; 15.35-15.40 GHz: 23.6-24.0 GHz
Atomic and Molecular Lines
Neutral Hydrogen 1420.4 MHzHC0NH2 (Formamide) 1538-1542 MHzCH 1612, 1665, 1667, 1721 MHzHCOOH (Formic Acid) 1639 MHz
HC0NH2 (Formamide) 4517-4620 MHzOH 4660, 4751, 4766 MHzH2C0 (Formaldehyde) 4830 MHz
H2C0 (Formaldehyde) 14.489 GHz
H20 22.235 GHzNH3 (Ammonia) 22.835-23.870 GHz
'Signal level equivalent to 5 times rms noise.

under observation. The receiving system is set up to compensate for phasechanges resulting from the expected motion, and the output from the unwantedsignal becomes a quasi-sinusoidal waveform which is reduced in amplitude bytime-averaging in the data processing. This effect will be referred to asfringe-frequency averaging. Second, the variable delays within the receivingsystem are adjusted to compensate for the difference in space transmissionpaths for radiation from the desired direction, but the time delays for inter-fering signals are generally unequal. If the interference is broadband, it istherefore partially decorrelated.
Calculations have been made to estimate the quantitative effects of thefringe-frequency averaging and the decorrelation. The fringe-frequency aver-aging depends on the size of the synthesized field of view, and hence on theconfiguration and observing frequency. The most compact configuration, forwhich the interference reduction is least effective, will be used in consider-ing the tolerable interference levels. For this case the reduction is approxi-mately 10 dB for the 18 to 21 cm band and 17 dB for 1.3 cm. These figuresrefer to declinations south of +70°, and the fring-frequency averaging becomesless effective toward the pole. The decorrelation effect depends mainly on theantenna configuration and the bandwidth, and again the most compact configura-tion will be considered. The interference reduction is approximately 17 dB fora 25-MHz bandwidth and 17 dB for a 50-MHz bandwidth. These figures apply to asource of interference at the declination of the satellite, -5.5°, and for anobserving declination north of +20°. As the observing declination approachesthat of the satellite, the interference reduction becomes much less effective.
Harmful interference levels, which are regarded as the general criteriafor radio astronomy observations, are given in CCIR Report 224-4. These levelsare derived by considering observations using a single large antenna, for whichthe fringe-frequency averaging and decorrelation effects do not apply. Thus,under certain circumstances, the array should be able to operate with nodecrease in performance in the presence of interference levels above thoseindicated in CCIR Report 224-4. The CCIR levels refer to interference receivedin the far side lobes of the antennas, for which the gain is equivalent to thatof an isotropic radiator. With this condition, and for declinations from +20°
137

to +75°, leels of interference about 20 dB to 35 dB higher than the CCIR levelsshould be tolerable. However, as the declination of the satellite isapproached, this margin falls to about 13 dB.
Figure 1 shows the levels corresponding to the VLA bands from CCIR Report224-4, the maximum sensitivity levels for the VLA, and the predicted fluxdensity levels from the satellites, including both thermal and transmitter-generated radiation. For the thermal radiation, unit emissivity and a tempera-ture of 330 K are assumed. Consider first the response to the thermal radia-tion. With all of the satellites in the far side lobes of the antennas, theresponse of any pair of antennas in the array consists of 60 sinusoidal compo-nents, the phases of which may be considered random. The rms level of thecombined response is thus greater than that for a single satellite by a factorof /BIT or P.9 dB, and the effective flux density is midway between the curvesfor one satellite and 60 satellites in Figure 1. Thus the 20- to 30-dB marginabove the CCIR levels should easily allow the array to operate in the presenceof the satellites for those declinations for which the required 8 hours of
170
190 -
210 -
- 230 -
E250 -
270 -
310
•
-
-
; J 1
SECOND HARMONICNOISE. ASSUMED -40dB
7
• J i 1 1
•
_ _ ^ . — •
60 SATELLITES
^ ^ — ^
^ " '
__^Jt-——~~~~ ONE SATELLITE
— \
THERMAL RADIATION ASSUMESUNIT EMISSIVITY
• CCIR 224 4 LEVELS
i—i VLA BAND AND SENSITIVITYAT 5TIMES R .M.S . NOISE
1.0 5.0 10
CHZ
100
FIGURE 1. Comparison of Flux and Sensitivity Levels
138

tracking can be achieved without presenting to the satellites an antennaresponse much greater than isotropic. There will be a small additional inter-ference-reducing effect resulting from the resolution of the 0.5- x 1.0-arc-minute collector arrays by the spaced antennas. This resolution effect,incidentally, enables the array to operate in the daytime in the presence ofthe quiet sun, which is, of course, much more highly resolved than a satellite.
Since the line of satellites is essentially constant in declination, at-5.5° as viewed from the VLA site, there will be a zone of declinationscentered on -5.5° in which the array cannot operate without receiving inter-ference above a tolerable level. In this zone interference could be avoidedonly by reducing the range of hour angle tracking by something more than the60° longitude range of the satellites, and satisfactory mapping of celestialobjects would not be possible. At the present time the low level response ofthe antennas is not well enough known to define the zone with accuracy. Theantennas operate in the Cassegrain mode with the feeds placed on a circle of0.97-m radius about the vertex (Weinreb et al. 1977, Gustincic and Napier 1977).As a source of radiation moves away from the beam center, the antenna responsefalls sharply, but then becomes dependent on spillover of the feed response atthe edge of the subreflector. The subreflector subtends an angle of 18° atthe feed, and the gain of the feeds falls from 26 dB near the center of thesubreflector to 13 dB at the edge. Thus, at 9° off axis the antenna gain isclose to 13 dB, ' and it fallsto the isotropic level at the angle at whichthe feed response becomes isotropic. This angle is given for each feed inTable 2. The very large angle for 18 to 21 cm results from the horn beingplaced 1.5 m behind the correcting lens, which provides a compact and econom-ical design, but allows some spillover at the edge of the lens. However, itshould be possible, by using much more expensive feeds, to bring the side lobeperformance at 18 to 21 cm much closer to that of the other feeds.
Because the tolerable interference level falls as the declination ofobservation approaches that of the satellites, observations with satellitesin the 13 dB side lobe at the subreflector edge would be very close to the
(a) Because of the offset feed arrangement, the spillover side lobe is notprecisely centered on the main beam and the 9° figure is the mean distancefrom the beam axis.
139

TABLE 2. Gain and Side Lobe Estimates for VLA Antennas
Wavelength(cm)
22
621.35
L
C
K
GainMain
48
5968
72
onBeam
dB
Approximate Level ofWide-Angle Side LobesRelative to Main Beam
-52 dB
-63-73-77
Angle at WhichGain is Isotropic
±44°
±12°
±12°
±12C
threshold of harmful interference, at least with the most compact antenna
configuration. It is also possible that scattering by subreflector supports
may produce side lobes which will preclude pointing as close to the satellites
as the angles in Table 2. The most that can presently be said is that for some
observations, particularly those of lower angular resolution, the zone in which
satisfactory mapping is precluded is probably not much less than 24° wide in
declination.
It will be realized, of course, that the level of thermal radiation from a
satellite is similar to the flux density of many of the stronger cosmic radio
sources. The positions and flux densities of such sources are accurately
known, and their responses can be calculated with precision and subtracted from
maps of other objects. The satellites, however, would be expected to vary
relatively rapidly in flux density and position as they maneuver to track the
sun and hold their stations in orbit.
Now consider the transmitter-generated radiation, which is much more
dependent on presently unknown design details than is the thermal radiation.
At a few hundred km from a rectenna, the 2.45-GHz power signal from the cor-
responding satellite would be received at a level of about -60 dB W in an
isotropic radiator. This is about 13 dB over the threshold for overloading of
the parametric amplifiers. The 18 to 21rcm band would require some additional
filtering, but for the other bands 2.45 GHz is below cutoff for the input wave
guides. The second harmonic, for which a relative level of -40 dB will be
assumed, would produce about -100 dB W. It can also be generated from the
140

fundamental within the receiving front end. The frequency falls within the4.5 to 5.0-GHz band of the parametric amplifiers, and even though rejected bythe final IF stage, it could disrupt the automatic level control at theantennas.
Problems of this type, which result from nonlinear effects of strongsignals outside the receiving passband, depend on details of the current elec-tronic design and can be reduced or probably eliminated at the cost of con-siderable design modification. A more fundamental problem is the reduction ofthe tuning range of the receiving system, since it will almost certainly not bepossible to operate with a harmonic of 2.45 GHz within the passband. Eachharmonic will be accompanied by a narrow-band enhancement of the transmitternoise, but no information is available on the magnitude to be expected. Thesecond harmonic noise band has been included in Figure 1 at an arbitrary levelof -40 dB relative to the 2.45-GHz noise, as a reminder that the effect mustnot be ignored. The noise enhancement at 4.9 GHz could severely restrict theperformance in the 6-cm band. This band is the one with the best combinationof antenna efficiency, system temperature, and present usable bandwidth, andis likely to be the band most often used for observations of very faint sources.
The terrain shielding between the array and the rectennas must be suffi-cient to keep the level of the second harmonic of the power signal and theaccompanying noise from the rectenna at a tolerable level. The response of thearray to radiation from broad sources around the horizon is complicated todetermine, but a total flux density level of 13 dB above the CCIR 224-4 levelshould not adversely affect the performance of the array.
The tolerable interference levels are likely to be more precisely definedin the future by further studies of the response of the array to interferingsignals, measurements of antenna side lobes, etc. For some observing fre-quencies the width of the zone in which operation is precluded may depend onpresently unknown levels of transmitter-generated noise and harmonics, ratherthan the thermal radiation. The loss of a wide declination band centered onthe satellites would be extremely serious when considered with regard to thespecification and aims of the VLA. Simpler arrays with a single east-west lineof antennas are capable of producing satisfactory maps at declinations from
141

about +30° to the pole. Arrays of that type, but with somewhat less resolutionand sensitivity than the VLA, operate at Westerbork in the Netherlands andCambridge, England. The VLA was designed with the specific requirement ofbeing able to extend high-resolution observations down to at least -20° declina-tion, and the three-armed configuration and the large number of antennas resultdirectly from this need. The lost declination would thus occur in preciselythe most valuable region, and would severely restrict the scientific potentialof the instrument.
REFERENCES
CCIR Report 224-4, XlVth Plenary Assembly, Kyoto, 1978, published by Inter-national Telecommunications Union, Geneva, 1978.
Fomalont, E. B. and M. C. H. Wright, Galactic and Extra-Galactic Radio Astron-omy, Eds. G. L. Verschuur and K. I. Killermann, Springer-Verlag, New York, 1974Ch. 10.
Gustincic, J. J. and P. J. Napier, Proc. IEEE Symposium on Antennas and Propa-gation, Stanford, California, June 20-22, 1977, p. 361.
Heeschen, D. S. Sky and Telescope 49, 344 (1975).
Swenson, G. W. and N. C. Mathur. Proc. IEEE 56, 2114 (1968).
Weinreb, S., M. Balister, S. Maas and P. J. Napier. EEE Trans. MicrowaveTheory and Tech., MTT-25, 243 (1977).
142

SATELLITE POWER SYSTEM EFFECTS ON VLBI
B. F. Burke
EFFECTS OF SPURIOUS NOISE EMISSIONS
Very-Long Baseline Interferometry (VLBI) systems cross-correlate signalsfrom two or more separately situated telescopes. The average cross-correlationis affected by noise of the receivers and by the presence of a coherent signal.Celestial sources move through the fringe system at a sidereal rate, and bydetermining the best value of the average amplitude and phase of the siderealfringe rate signal, one obtains the desired data. In general, we find thatVLBI is not as sensitive to interference, but since it involves collaborationof many expensive telescopes, the harmful effects of such interference have amajor financial impact.
The satellite power systems are not moving at a sidereal rate, so spuriousnoise signals would not mimic celestial sources except at predictable times.Furthermore, the coherence length of the received signals is the reciprocal ofthe bandwidth, which means that typical continuous measurements with megahertzbandwidths have coherence lengths on the order of hundreds of meters. The onlycoherent contribution, then, can come from aliasing of out-of-band signals,which are usually reduced by 80 dB or so. On both counts, therefore, thedirect interference effects are minimal. However, spectral lines are narrower,with OH lines being only 1-kHz wide, so coherence lengths are on the order ofhundreds of kilometers, and somewhat more careful consideration is needed.
The direct effects of the spurious noise on the process of taking datamust also be considered. A 10% increase in noise temperature in the receiverwould be undesirable. Noise temperatures of the order of 10 K can be expectedin the future, so a 1-K noise contribution would constitute harmful interfer-ence. The received noise power, P, with standard antennas, would be on theorder of
p = h— c4TT
SN
143

where the effective collecting area is assumed (as in CCIR 224-4, which is
reproduced in 'ppendix A) to be that of an isotropic antenna, and S^ is the
incident flux .ensity at the antenna. We therefore arrive at a tolerable noise
flux density n dB) of
-SN = 231 - 1 1 + 2 0 log A
or -S N = 220 + 20 log A
owhere A is expressed in meters, and S.. is in dB W/m -Hz.
EFFECTS OF HARMONIC RADIATION
Two principal effects of harmonic radiation must be considered: the
possibility of saturating the front end with a harmonic signal, and the per-
turbing effects of a non-Gaussian noise on the VLBI signal sampling system.
Saturation is a potential concern if the input noise power of the receiver
doubles. A typical Mark II VLBI system has a 2-MHz bandwidth, so that the
total input power for a 10 K system would be -167 dB W. A flux of harmonic
power at the receiver of (-156 -20 log A)dB W/m would be harmful, under the
assumptions of the preceding section.
The second, less commonly considered, effect is that of a strong non-
Gaussian signal such as a spurious harmonic or side-band emission on a 1-bit
sampling system. This in effect acts like a local oscillator in the receiving
band, scrambling the received noise signal and making it impossible to recover
the original data. The 1-bit sampling process is nonlinear, and so the require-
ment that the non-Gaussian signal be harmless is that its power be very small
compared to the total noise power. A safe criterion appears to be that the
amplitude of the discrete signal be less than 0.01 of the noise signal ampli-
tude, i.e., its power should be 40 dB below the input noise power. Again,
under the assumption of the first section, we obtain a harmful flux level S,..Gfrom this source of
- S N G = 196 + 20 log Am dB W/m2
144

CONSIDERATIONS REGARDING DEEP SPACE
COMMUNICATIONS AND THE SPS
N. de Groot
Exploration of the solar system by means of spacecraft is totally depen-dent on radio communication, which is carried out in radio frequency bandsallocated to space research. The region of space beyond the moon is calleddeep space. Deep-space communications depend on radio systems of exceptionalsensitivity, rivaled only by those of radio astronomy.
The proposed SPS is characterized by such unprecedented microwave powerthat it is essential to examine its relationship to the needs of successfuldeep-space research.
This paper will consider the radio frequency interference that can betolerated by deep-space communications and the effects of excessive interfer-ence. In attempting to assess the environment that would be created by SPS,missing or incomplete information will be identified, along with suggestedstudies and tests.
DEEP-SPACE COMMUNICATION SYSTEMS
United States deep-space missions are conducted from three earth stationcomplexes, located at Goidstone, California, in Spain, and in Australia. TheGoidstone complex would be most directly affected by SPS, and includes a 64-mantenna with a 100-kw transmitter and a receiver with 16 to 30 K system noisetemperature, depending on band and operating mode. (The system noise tempera-ture includes the clear atmosphere.) Signals from deep space are received inthe bands 2290 to 2300 MHz and C400 to 8500 MHz. There is a proposed band at12.75 to 13.25 GHz. The microwave window in the vicinity of 32 GHz is a candi-date for future use.
Earth-to-space and space-to-Earth communication links utilize phasecoherent reception for carrier tracking and data recovery. Phase shift keyed,biphase modulation is utilized, with additional coding of the baseband datastream for error reduction. Error rates no higher than 10 are tolerated for
147

most data types; video images can be acceptable quality with a somewhat highererror rate. Spacecraft navigation is accomplished by Doppler tracking andrange (distance) measurement.
EFFECTS OF INTERFERENCE
Radio frequency interference can affect two vital functions: carriertracking and data detection. Interference that falls within the carriertracking loop bandwidth can introduce phase jitter which gives rise to noisyDoppler data. In severe cases, the receiver will lose lock on the desiredsignal. Interference within the data bandwidth can increase the error rate,and ultimately cause complete loss of data. The end result of radio frequencyinterference is a degradation of data quality, and, in some cases, irretriev-able loss of scientific information.
PROTECTION CRITERIA
Interference protection criteria for deep-space communications have beendeveloped and are contained in CCIR Report 685 and the associated Recommenda-tion 365-3 (see Appendix B). Table 1 lists the criteria:
TABLE 1. Protection Criteria for Deep-Space Communications
Maximum Power SpectralDensity at Receiver Maximum Power Spectral
Maser Input (dB W/Hz) Flux Density (dB W/m2-Hz)
-222.5 -256.2
-220.9 -253.8
%15V<J' -219.3 -250.2
(a) The figure for M 5 GHz will apply to the currently proposed13-GHz band.
148

In addition . the foregoing in-band criteria are receiver saturation effects
that can result from out-of-band signals of sufficient strength.
ANTENNA POINTING AND GAIN
The 64-m earth station antenna has a main beam gain of 62 dBi at 2.3 GHz
and 72 dBi at 8.4 GHz. While tracking a particular spacecraft in or near the
ecliptic plane, the beam from at least one earth station will intersect the
geostationary orbit once a day. Assuming the CCIR reference antenna pattern,
the receiving antenna gain in the direction of the geostationary orbit will
never be less than -10 dBi.
RELATIONSHIP TO SPS
The SPS frequency of 2450 MHz is 150 MHz above the edge of the 2300-MHz
deep-space band. The interference from SPS cannot yet be calculated since
there is not enough data on transmitted noise sidebands. The satellite e.i.r.p.
in the deep-space band must be less than -220-62+191 = -91 dB W/Hz not to
violate the protection criteria while the earth station antenna is pointed at
an SPS satellite, or less than -220+10+191 = -19 dB W/Hz for the minimum gain
case. Considering the +98 dB W transmitter power of just one satellite, the
combination of noise sidebands, transmitting antenna patterns, and 60 satel-
lites can be expected to result in substantial degradation of deep-space
communication links.
Harmonic radiation is another potential problem. The 13th and 14th har-
monics of the SPS frequency fall within the 32-GHz region of interest for
future deep-space applications. While such high order harmonics are not nor-
mally considered problematic, the extremely high SPS power at least poses a
question of interference. Lower order harmonics fall outside the deep-space
bands.
The concept of a "Goldstone in the sky" has been studied. An antenna and
receiver for deep-space communication could be placed in geostationary orbit,
yielding some important performance advantages. While not currently planned,
the possibility of such a station in the time period of SPS implementation
149

should be considered. This station would not enjoy 191 dB of space loss fromSPS. At a range of 300 km from the nearest power satellite, the smaller freespace loss of 149 dB will aggravate interference by 42 dB.
Goldstone is located in a desert area northeast of Los Angeles, a locationthat may be attractive for a rectenna. Reflection and radiation from therectenna's fundamental or harmonic signals can he coupled into the Goldstonereceiver via clear weather inhomogeneities and from diffraction over terrainfeatures. Rain cells also provide coupling paths. Separation distances ofmany tens to several hundreds of kilometers may be required between Goldstoneand the rectenna to provide needed transmission loss for rectenna-generatedsignals that fall within deep-space bands.
Unlike radio astronomy observations, deep-space links cannot overcomeadded noise interference through increased integration time. The detectionbandwidth is dictated by data rate. Furthermore, some mission phases are time-critical and cannot be repeated at a later time.
Continuous tracking through the direction of the geostationary orbit isoften required for navigation and scientific data recovery. With SPS satel-lites located at one-degree intervals over a substantial part of the geosta-tionary arc over Goldstone, there is a significant probability of intersectionby the earth station antenna, main beam, or near-main beam. Assuming 0 dBi SPSgain in the direction of the earth station, a -31 dB W input to the maser wouldresult. This is 60 dB above the gain compression point and thus can beexpected to cause performance degradation.
An aspect of interference to space communications not treated in thisarticle is that of the effects on signals received by spacecraft. While earthstations are relatively more sensitive, harm to Earth-to-space communicationlinks must nevertheless be evaluated in connection with SPS feasibility.
CONCLUSION
The extreme sensitivity of deep-space communication systems makes them
exceptionally vulnerable to radio frequency interference, particularly from
very high power sources such as SPS. A definitive calculation of potential
150

interference cannot be made at present because the satellite's and rectenna's
radiation characteristics are not sufficiently known. It is therefore essen-
tial that this characterization be experimentally determined by early labora-
tory tests on prototype SPS equipment.
Calculations made in this article were generally based on the assumed
conditions for one power satellite. The potential interference resulting from
the complex interaction of 60 satellite signals remains to be determined and is
likely to be more severe.
751

REPORT OF THE RADIO ASTRONOMY WORKING GROUP

REPORT OF THE RADIO ASTRONOMY WORKING GROUP
The radio working group met to discuss issues raised by the briefingmaterial and the invited presentations. After initial discussions, topics wereassigned to individual members who then wrote short statements specific to eachtopic, and an overall summary statement. These statements assume the avail-ability of the tutorial material in CCIR Report 224-4 (in Appendix A) as back-ground for persons not so familiar with the nature of radio astronomy obser-vations. The working group then reconvened, and each of the individual state-ments was discussed, modified, and then adopted by the entire group. Takentogether, these statements constitute the working group report.
Members of the radio astronomy working group were:
B. Burke
K. DavisM. DavisN. De Groot
P. Ekstrom, ChairmanW. EricksonJ. Hagen
W. HowardH. HvatumA. MoffetG. SwensonA. Thompson
SUMMARY STATEMENT
The Satellite Power System (SPS) has a number of potentially damagingconsequences for radio astronomy and for space research that have been examinedin detail in the following sections. For example, careful studies of radioradiation from the universe, involving long work efforts by large researchteams, can be rendered misleading or useless by radio interference. Spacecommunication signals, contaminated by man-made interference, can lose uniquedata or give false information to the controllers on the ground; incorrect
155

control commands would then be sent to the spacecraft, with potentially damag-
ing consequences for missions that took years to prepare.
It is important to examine these effects for both financial and intel-
lectual reasons. The United States, and the rest of the world, have made a
cumulative capital investment in radio astronomy of approximately $400,000,000,
with the U.S. share being about half of that total. The capital investment in
space research is even larger. For example, as part of the U.S. space program,
NASA presently launches major interplanetary probes at the rate of one every
year or so, each mission costing an amount comparable to the total capital
investment in radio astronomy. Beyond -the direct investment cost, however, is
the intellectual value of the knowledge gained by this research. Study of the
philosophical implications of cosmology, the examination and testing of basic
physical laws, the exploration of the solar system to which the earth belongs,
and the possibility of finding if there is other intelligent life in the
universe are intellectual activities beyond price.
Radio astronomy aid space research are recognized radio services as
defined in the Radio Regulations of the International Telecommunication Union,
with recognized frequency bands that are protected by allocations and by foot-
notes in the treaty documents. Definitions of harmful interference to these
services have been developed by the International Radio Consultative Committee
(the usual abbreviation, CCIR, is derived from its name in French). CCIR
Report 224-4 describes these criteria for radio astronomy, and CCIR Reports
365-3 and 685 give the criteria for the space research service. These reports
are included in the Appendices A and B, respectively. The harmful flux spec-2
tral densities, specified in dB W/m -Hz, have been established as reasonable
and measurable quantities, and an SPS must conform to those specifications in
order to avoid harmful interference to those services.
The harmful interference can come from production of harmonic radiation,
or generation of noise-like radiation throughout the spectrum. All microwave
power generating devices inevitably produce both types of radiation in some
quantity that can be measured. This radiation is produced both by normal
operation and in potentially more damaging quantities by various failure modes.
156

Both situations must be considered. Tbe Important space research band at2.3 GHz is close to the planned SPS frequency, and since interplanetary spacevehicles must be tracked continuously along the ecliptic plane, the harmful
interference criteria are stringent. A power flux spectral density of2
-256 dB W/m -Hz must not be exceeded by the noise radiated by the SPS at thisfrequency. The radio astronomy bands at 1400-1427 MHz and at 2690-2700 MHz are
the next closest bands to the planned SPS frequency, and the harmful flux2
levels for these bands, of -255 and -247 dB W/m -Hz respectively, must not beexceeded. Presently available data make it clear that these criteria will bedifficult to meet; the uncertainties in the available data make it clear thatnoise measurements for any planned system must be made at an early stage.
The strongest harmonic, the second at 4.9 GHz, does not fall into a pres-ently allocated band of these services, but does fall well within the principaloperating band of the VLA, a major national radio astronomy facility inSocorro, New Mexico, and at the shortest usable wavelengths of the Arecibotelescope, the world's largest radio/radar telescope. These facilities areunique in the world and could be seriously compromised if not protected againstthe consequences of such interference. The available data are insufficient toconclude that the SPS will not cause such interference, and we recommend thatthe problem be given a careful engineering study.
The SPS is unique in the impressively large quantities of radio frequencyradiation that will be generated, especially at the fundamental frequency.Radio observatories have been carefully situated at remote sites to protectagainst such adjacent channel interference effects from earth-based transmit-ters, but location cannot protect against such effects from transmitters insynchronous orbits. The field strengths in grating side lobes are of parti-cular concern, and in view of the large number of SPS ground-receiving sta-tions, it is not clear that grating side lobes will miss the active radioobservatories, or that observatory operation within a side lobe will bepractical. The National Radio Astronomy Observatory at Green Bank, WestVirginia is in a National Radio Quiet Zone, as specified in the National Rules(Vol. Ill, § 73.1030), and the effects of the SPS side-lobe levels on theoperation of this facility should be investigated carefully. Furthermore, major
157

national facilities such as the VLA and the Goldstone tracking station of NASAwere carefully sited to be isolated from major population centers and arenational initiatives that should be considered in the SPS impact studies.
The rectenna system is a further potential source of harmful interferencesince it is a nonlinear device that will reradiate substantial quantities ofradio frequency radiation at the fundamental and its harmonics. We haverecommended that its properties be better defined in order to evaluate theconsequences of radiation at major radio astronomy and space research facilities.
The possibility of relocating radio astronomy and space science facilitiesto the far side of the moon has been discussed; however, the reconstruction andoperation of several hundred million dollars' worth of present ground-basedradio facilities on the lunar farside would clearly be so expensive that norealistic option of that sort exists.
The radio working group wishes to endorse the concluding statement of theNational Academy of Sciences report on SPS effects (see Appendix D):
The Committee on Radio Frequencies concludes that the potential forharmful interference to radio astronomy is so great that protectionfrom satellite-generated radio interference must be a major designconsideration even for the earliest low-powered prototypes of thepower satellite system. There may well be other radio servicesthat share these concerns. The proposers of a new program such asthis must perform adequate and realistic analysis and that workmust be independently confirmed to assure that the public interestis served.
ACTUAL PROPERTIES OF THE MICROWAVE POWER TRANSMISSION SYSTEM
The potential for SPS interference with radio astronomy and deep spaceresearch and the possibility of compliance with CCIR 224-4, 685, and 365-3depend crucially upon the noise and harmonic generation properties of themicrowave power generator and receivers used. At present, the properties ofthe klystrons in the Reference System must be estimated by extrapolation withrespect to both klystron structure and frequency.
We therefore recommend as an urgent task that prototype SPS transmittersand antennas be developed and subjected to extensive laboratory testing. The
158

objective of these tests is thorough characterization of radiated power in therange from approximately 1000 MHz up to the frequency where radiation in theSPS main beam is no more than the amount equivalent to the satellite's passivethermal radiation as seen from the surface of the earth. These measurementswould include harmonic signals and noise products, as well as any nonharmon-ically related spurious emissions. This characterization is needed to permitcalculations of the impact of SPS on radio astronomy, space research and otherradio services.
ASSIGNMENT OF SPS HARMONIC FREQUENCIES
The power density level of the SPS at the primary transmitting frequencyand at the next several harmonics will be so great, and the spectral character-istics at the harmonic frequencies so uncertain, that the allocation of fre-quency bands containing the 2nd, 3rd and 4th harmonics will likely be necessaryfor SPS use. The existence of the extensive series of grating lobes throughoutthe United States, Canada and Mexico is a further complicating factor which mayrequire international coordination in order to assure that harmful interferencewill not be experienced by services operating at or near the harmonic fre-quencies 4.90 GHz, 7.35 GHz, 9.8 GHz, etc.
TIME-VARIABILITY OF SPS OFF-AXIS RADIATION AND INTRINSIC MULTIPLE SATELLITEEFFECTS
The interference and overload potential of the SPS Reference System issignificantly increased should its off-axis signals become time-varying on thesame time scales as are used for astronomical observations, as it can thenmimic the expected behavior of the observations. As presently defined, theReference System has such an intrinsic time-variability. In the ReferenceSystem, all 60 satellites transmit at 2450 MHz. However, it is not possibleto phaselock the satellites in such a way that the off-axis radiation fromdifferent satellites will remain phase-constant for all ground-based observers.Each satellite pair, considered as a transmitting interferometer, will havean off-axis fringe pattern. Unavoidable station-keeping motion will cause thisfringe pattern to sweep across the United States in a complex and partiallyunpredictable pattern.
159

One potential solution is to offset the frequencies of different satel-lites by small amounts, to introduce lobe rotation and thus reduce the averag-ing time needed to reduce the interference. However, a careful study is needed,as inappropriate choices for the offset frequencies can lead to potential rfintermodulation problems, making the situation worse rather than better.
THE "RUSTY BOLT EFFECT"
A major contribution to spurious emissions in the radio frequency spectrumwill be generation of harmonics and intermodulation products in nonlinearelements in the SPS and its environment. Nonlinear effects in the transmittingarray and in the rectenna are mentioned elsewhere in this report. Here we callattention to the possibility, indeed likelihood, that nonlinear devicesaccidentally present in the field of the transmitter will produce seriousmodulation products.
The following well-known effect occurs in situations in which manyantennas transmitting on different frequencies are assembled in a small area.In the geographical vicinity of such "antenna farms" the spectrum is frequentlycluttered with out-of-band intermodulation products. These are the result ofthe interaction of currents of different frequencies in rectifying junctions inmetal structures—thus the appellation "rusty bolt effect." Normally, theintermodulation products would be attenuated rapidly with distance from anantenna farm.
The extremely high-field strength in the main beam of the SPS, of theorder of 200 volts/meter at the earth's surface, makes it virtually certainthat nonlinear conduction will occur in any structure containing corrodedjoints or fasteners or other nonlinear elements. Even if it were possible toeliminate all electrically nonlinear joints in the vicinity of the rectenna,the diodes in the array will serve as modulators, producing the same effectunless elaborate filtering provisions are made. Other signals of much lowerstrength, such as those from television or radar transmitters some distanceaway, can be expected to interact with the SPS fundamental frequency and manyof its harmonics. It is conceivable that these modulation products may be of
160

suitable frequencies and strengths to be transmitted over great distances by
reflection from the ionosphere or from aircraft or spacecraft.
Illumination of other spacecraft or aircraft by the beam of the SPS mayresult in similar effects. These vehicles carry antennas connected to non-linear receiving and transmitting circuits. Especially in the transmittingcircuit, the SPS frequency and the other transmitting frequency, or theirharmonics, may mix in ways to produce strong out-of-band radiation. Nonlineareffects from metal structures on the vehicle may also be expected.
Accurate prediction of the effects discussed here is likely to provedifficult. However, as they have the potential to pollute nearly the entireradio spectrum within a substantial geographical area centered on each rectenna,it is essential that they be studied carefully.
INTERFERENCE REJECTION PROPERTIES PECULIAR TO SYNTHESIS ARRAYS (AS THE VLA)
Calculations have been made to estimate the quantitative effects of thefringe-frequency averaging and the decorrelation on the VLA sensitivity tointerference. Other synthesis arrays exhibit qualitatively similar effectswhose magnitude depends on parameters of the particular array. The fringe-frequency averaging depends on the size of the synthesized field of view andhence on the configuration and observing frequency. The most compact VLAconfiguration, for which the interference reduction is least effective, will beused as an example in considering the tolerable interference levels. For thiscase the reduction is approximately 10 dB for the 18 to 21-cm band and 17 dBfor 1.3 cm. These figures refer to declinations south of +70°, and the fringe-frequency averaging becomes less effective toward the pole.
The decorrelation effect depends mainly on the antenna configuration andthe bandwidth, and again the most compact configuration will be considered.The interference reduction is approximately 14 dB for a 25-MHz bandwidth and17 dB for a 50-MHz bandwidth. These figures apply to a source of interferenceat the declination of the satellite, -5.5°, and for an observing declinationnorth of +20°. As the observing declination approaches that of the satellite,the interference reduction becomes much less effective.
161

Under certain circumstances the above effects should allow the array tooperate with no decrease in performance in the presence of interference levelsabove those indicated in CCIR Report 224-4. The CCIR levels refer to inter-ference received in the far side lobes of the antennas, for which the gain isequivalent to that of an isotropic radiator. With this condition, and fordeclinations from +20° to +75°, levels of interference about 20 dB to 30 dBhigher than the CCIR levels should be tolerable. However, as the declinationof the satellite is approached, this margin falls to about 13 dB.
Figure 1 in A. R. Thompson's paper shows the levels corresponding to theVLA bands from CCIR Report 224-4, the maximum sensitivity levels of the VLA andthe predicted flux density levels from the satellites, including both thermaland transmitter-generated radiation. For the thermal radiation unit emissivityis assumed. The transmitter noise at the second harmonic is arbitrarilyassumed to be 40 dB below that at the fundamental frequency. The 20-30 dBmargin above the CCIR levels should allow the array to operate in the presenceof the satellites for those declinations for which the required 8 hours oftracking can be achieved without presenting to the satellites an antennaresponse much greater than isotropic. The resolution of the 0.5 x 1.0 arc-minute collector arrays by the spaced antennas will have the effect of furtherreducing interference from the thermal radiation. This effect, incidentally,enables the array to operate in the daytime in the presence of the quiet sun,which is, of course, much more highly resolved than the satellites would be.
Since the line of satellites is essentially constant in declination,at -5.5° as viewed from the VLA site, there will be a zone of declinationscentered on -5.5° in which the array cannot operate without receiving inter-ference above a tolerable level. To avoid such interference, the range of hourangle tracking would have to be reduced by something more than the 60° longi-tude range of the satellites, and satisfactory mapping of celestial objects inthis zone would not be possible.
SITING CONSIDERATIONS
In addition to the specific bands allocated to the Radio Astronomy Ser-vice, passive radio astronomy research is conducted at many frequencies
162

throughout the spectrum. Many of the frequencies of interest are spectrallines (often Doppler shifted from their real frequencies). A list of suchspectral lines is included in CCIR Report 223 (Appendix A). In order toachieve reasonable interference protection at frequencies outside the bandsallocated to radio astronomy, radio observatories have been located in remoteareas where man-made interference levels are low. Also, in order to formalizesuch protection, the FCC established in 1958 a National Radio Quiet Zonesurrounding the National Radio Astronomy Observatory in Green Bank, WestVirginia and the nearby Naval Radio Research Laboratory in Sugar Grove, WestVirginia. Within this quiet zone, FCC licensing procedures are intended to
allow only transmitters that produce power fluxes at the observatories of less17 2than 10 W/m . A few broadcasting stations remote from the National Radio
Quiet Zone (NRQZ) do exceed these limits, producing power fluxes at the-12 2observatories on the order of 10 W/m .
Other observatories and the Deep Space Network Station at Goldstone,California have less formal arrangements to minimize local sources of inter-ference, generally based on the requirement that spurious radiation in theprotected bands not exceed the levels given in CCIR Report 224-4 (or CCIRReport 685 in the case of the Deep Space Network).
Estimates of the side lobe radiation flux from each power satellite vary,-3 2but range as high as 2 x 10 W/m within a few hundred kilometers of the
- 1 2 -5 2
rectenna, 10 W/m at the grating lobes, and 10 W/m at various peaks out todistances of 4000 km from the rectenna (DOE/ER-0023, Figures 19 and 22). Forcomparison, the flux of radio and TV broadcast signals in major metropolitanareas (e.g., in Los Angeles at a distance of 20 km from Mt. Wilson) might be of
-3 2the order 10 W/m . A fully-developed system with 100 satellites serving the-3 2entire country would raise the power flux to this value (̂ 10 W/m ) in sidelobe peaks over the whole country, since the mean spacing between rectennasites would then be ^ 300 km. Thus, in a sense, construction of the SPS wouldmake the radio environment of the whole country as unsuitable for sensitiveobservations as the most densely populated areas are now.
163

Further studies of the SPS side lobe levels should be carried out withrealistic estimates of the antenna and transmitter properties. The side lobelevels in the 100 to 1000-km range are probably determined in large part by thenumber of out-of-service power modules. (If we estimate individual klystron
A
lifetimes at <10 hours, we can expect >10 klystrons to fail per hour in eachsatellite.) Reduction of side lobe levels would ease the problem of sitingrectennas, which we recommend should be studied further.
We foresee considerable difficulty in designing sensitive receivers whichare not adversely affected by such high interfering power fluxes. Further studyof this problem is also required.
In addition to the satellite signal, an unknown amount of fundamental andharmonic power and wideband noise would be reradiated by the rectennas.Studies should be carried out to determine the nature of this secondary radia-tion. This radiation may be reflected by aircraft and by unusual meteorolog-ical conditions to distances of the order of 100 km from the rectenna site.The severity of the direct radiation problem will depend on local topography.The aircraft problem can be reduced by extending the restricted airspace whichwill presumably be required around the rectenna site.
At the side lobe levels given in the Reference System Report, we expectthat the minimum separation distance between rectenna and observatory mustexceed several hundred kilometers, and that grating lobes must also be kept farfrom any observatory.
ON MOVING RADIO ASTRONOMY TO THE LUNAR FAR SIDE
The suggestion has been made that if the SPS makes radio astronomicalobservations impossible from the surface of the earth, all radio observatoriesshould be relocated to the far side of the moon. While the far side of themoon is a highly advantageous site for certain, specific investigations whichcannot be conducted from the surface of the earth, the capital expense and,particularly, the annual operating costs of a general program of astronomicalresearch on the lunar far side may 'e so high as to be prohibitive in compari-son with the cost of installing proper mitigative measures in the SPS that
164

would allow radio astronomy to continue from the earth's surface. However, thecost and feasibility of such measures remain to be determined. It should alsobe noted that many of these mitigative measures would be necessary in any eventin order to prevent interference with communication and navigation systems onthe earth's surface that are vital to health and safety.
165

APPENDIX A
CCIR REPORTS ON RADIO ASTRONOMY(Reports 223-4 and 224-4)

A NOTE ON CCIR REPORT 224-4 AND THE FUTURE
Any interference generated by SPS will affect the radio astronomy measure-ments being made 20 years from now, not those of today. As an aid to under-standing how these measurements might differ from today's, Hein Hvatum hascontributed the following section of an early draft of CCIR 224-4. Tables IIIand IV, given here, would have paralleled Tables I and II of the report, givingan estimate of what those tables would look like in an updated version of CCIR224 written about 1990. However, it was judged inappropriate to display twovalues for each interference threshold, and the entire section containingTables III and IV was deleted from the final draft of that report.
Nonetheless, this section offers a valuable look at the future which canbe summarized as follows: By the time SPS could be deployed, the sensitivityof Earthbound radio astronomy will have reached its fundamental limits. In thefrequency range most likely to be affected by SPS, signal detection thresholdsand the corresponding harmful interference thresholds will have decreased by nomore than 4 dB.
A.I

A 10 TO 20 YEAR PROJECTION
As technology improves, so does the sensitivity obtainable in radio astron-omy. It is, therefore, of interest to try to forecast the sensitivities thatmight be available in 1985-1995. Table III is an attempt to do this forcontinuum observations and Table IV for the spectral line observations. Thedifferences between these two future tables and today's values are caused bythe anticipated improvements in the receiver noise temperature. It is simplyassumed that a noise temperature of 10 K will be obtained in the late nineteeneighties at all frequencies below 300 GHz. Thus, the receiver noise becomes aninsignificant part of most radio astronomy observations, and the sensitivity islimited by unavoidable external noise Tft, which is caused by galactic, magneto-spheric, atmospheric and Earth radiation. It follows that further significantimprovements in system noise become unlikely, if not impossible, for Earthboundradio astronomy observations.
A.2

TABLE III. Sensitivity and Harmful Interference Levels for RadioAstronomy Continum Observations, 10-20 Year Projection
NominalFrequency
(1)
fn(MHz)
204080
150327408610
1 4202 7005 000
10 68015 35023 80031 40033 20089 000
137 500235 000
CenterFrequency
(2)
f c(MHz)
21.86038.00073.800
152.000325.300408.050611.000
1 413.5002 695.0004 995.000
10 69015 37623 80031 40033 20089 000
135 000235 000
AllocatedBandwidth
(3)
flfA(MHz)
0.0200.5001.6002.0006.6003.9006.000
27.00010.00010.0002050
400200400
6 00010 00010 000
Min i mi im11 III 1 lltUIII
Antenna NoiseTemperature
(4)
TA
w30 000
6 0001 000
2004025151010101215151870304035
RproIwarr\CLc 1 VCI
NoiseTemperature
(5)
TR(K)
101010101010101010101010101010101010
System Sens i t i v i t y(Noise Fluctuations)
Temperature
(6)
AT
(mK)
3 33513412.6302.3500.3080.2800.1610.0510.1000.1000.0780.0560.0200.0310.0630.0080.0080.007
Power Density
(7)
&P
(dBW Hz"1)
-223-237-248-255-264-264-267-271-269-269-270-271-276-274-271-279-280-280
Harmful Interference Levels
InputPower
(8)
*PH(dBW)
-190-190-19*-202-206-208-209-206-209-209-207-204-200-201-195-192-190-190
PowerFlux
(9)
S H * f A(dBW m'2)
-202-197-197-197-194-195-192-182-179-173-165-159-151-149-143-131-126
: -121
PowerFlux Density
(10)
SH(dBW m~2 Hz'1)
-245-254-259-260-262-260-259-256-249-243-238-236-237-232-229-229-226-221

TABLE IV. Sensitivity and Harmful Interference Levels for RadioAstronomy Spectral Line Observations, 10-20 Year Projection
Frequency
(D
! f
(MHz 5
327
1 420
1 665
4 830
14 488
22 235
88 630
115 271
146 969
Spectral Line
Bandwidth
(2)
fc(kHz)
10
20
20
50
170
250
1 000
1 300
1 700
MinimumAn t o fin A Nni cpnil tcllllQ I"U 1 JC
Temperature
(3)
TA(K)
40
10
10
10
15
40
30
50
35
ReceiverNnicp111/ 1 OC
Temperature
(4)
TR(K)
10
10
10
10
10
10
10
10
10
System Sensitivity(Noise Fluctuations)
Temperature
(5)
AT
(mK)
7.91
2.24
2.24
1.41
0.96
1.58
0.63
0.83
0.55
Power Density
(6)
AP
(dBW Hz"1)
-250
-255
-255
-257
-259-257
-261
-259-261
Harmful Interference LevelsTnnutPower
(7)
APH
(dBW) (
-220
-222
-222
-220
-216
-213
-211
-208
-209
Pnuprr unci
Flux(8)
S H f cdBW in ' 2 )
-208
-198
-196
-185
-172
-164
-150
-146
-144
Pit WAT• unci
Flux Density
(9)
SH(dBW m"2Hz">)
-248
-241
-239
-232
-224
-218
-210
-207
-206

Rep. 223-1 365
SECTION 2k. RAOIOASTRONOMY AND RADAR ASTRONOMY
Recommendations and Reports
REPORT 223-4
I INF FREQl FNCIKS. ARISING FROM NATURAI PHENOMENA. OF INTERESTTO RADIOASTRONOMY AND RELATED SCIENCES
(Question 5-1/2)
(1963- 1966- 1970- 1974- 1978)
The amount of scientific information obtained from radioaslronomical observations has greatly increasedin recent years. Technology improvements in receivers and antennae have been partly responsible for this increase.Astronomical observations have now been made from ground based observatories using radio techniques, alwavelengths shorter than I mm (300 GHz), employing cooled bolometric detectors or various solid stale devices.Thus from the point of view of availability of equipment, the entire radio spectrum can now be employed forastronomical measurements.
Another reason for the rapid growth of interest, particularly in that part of the spectrum from 100 MHz to300 GHz. has been the discovery of line radiation from a number of extra-terrestrial substances of astrophysicalimportance.
First, there are many discrete spectral lines called "recombination lines" that arise when atoms ofhydrogen, helium, carbon, etc. gain or lose energy as their electrons jump from one orbit to another underdifferent conditions of atomic excitation The first of these lines was discovered in space in 1964 by radioastronomers in the U S S R |Sorotchenko, el al., 1964). These lines are numerous and spread throughout the radiospectrum (Lillev and Palmer. 1968]. Through careful observation of the strengths and shapes of these lines, radioastronomers are able to determine the physical conditions such as temperature, density and the extent of orderedor random motions of any celestial object in which recombination lines are found.
Second, there have been discoveries of emission or absorption lines arising in interstellar space due loneutral atomic hydrogen and many inorganic and organic molecules. Following the first observation of thehyperfine spin-flip transition of hydrogen in 1951 [Ewen and Purcell, 1951). it was not until 1963 that the firstmolecular line (OH) was detected in the radio spectrum [Weinreb el al.. I963|. and not until 1968 that othermolecules wee observed However, since then many more interstellar molecules have been identified, the majorityby means of spectral lines at millimetre wavelengths. Table I lists, in order of increasing frequency, the lines ofinterstellar organic and inorganic molecules reported by radio astronomers. The first column in each table givesthe frequency; the second column lists the molecular formula and name, and the third column indicates whetherthe spectral line has been observed in absorption (A) or emission (E). A double asterisk in this column indicatesthat the line is afforded at least footnote recognition by the World Administrative Radio Conference for SpaceTelecommunic lions, Geneva, 1971. It is realized that only some of these lines can be afforded protection in theRadio Regulations by allocations, and the astrophysically most important lines are listed in Report 224-4 andRecommendation 314-4
The formation mechanism for interstellar molecules is not well understood. For typical interstellar clouddensities ranging between one and one million molecules per cubic centimetre and temperatures between 10 K and100 K, the time between molecular collisions ranges from one thousand years to one third of a day. Thus typicalconditions in interstellar clouds do not enhance collisional formation of polyatomic molecules although it ispossible to explain the presence of C'H. C"H* and C'N by invoking radiative association. Also, recent laboratorydeterminations of lifetime against photo dissociation (Steif et a/., 1972], indicate that, given an ambient ultravioletradiation field of 4 x 10 ergs cm ' A |Habing, 1968], it takes only ten years for unshielded interstellarcarbonyl sulphide to be destroyed; thirty years for formaldehyde; forty years for ammonia; and one thousandyears for carbon monoxide, (ertainlv. under these ccndilions an unshielded polyatomic molecule could notsurvive the harsh interstellar environment.
Even though molecular formation is not clear'y understood, there are three reasons which appear toexplain the remarkable observational results which radio astronomers are now obtaining. First, all the newmolecules appear to be associated with regions of obscuration or interstellar dust. Experimentally, it has beenfound.that molecular lifetime with respect lo photo dissociation increases tremendously with each increment ofvisual extinction. Thus once formed, a molecule may exist many orders of magnitude longer inside a dust cloudthan it can in unshielded space before ultra-violet photo dissociation occurs. Second, radio waves are notsignificantly attenuated by dust particles which are of sub-micron size; hence, radio signals can penetrate cloudswhich completely attenuate optical waves. Third, the excitation requirements are low for radio detection ofmolecules. For example, optical astronomers require a background source of excitation of at least 15 000 K inorder to observe optical absorption lines, thus a very special geometry of a very hot star with an intervening

366 Rep. 223-4
molecular cloud of low opacity places stringent conditions on optical astronomy. On the other hand, thirty timesless excitation energy will produce a typical molecular rotational transition. Thus radio detection does not requirea bright, hot star with an intervening molecular cloud; the background source might be. an ionized hydrogenregion, infra-red star, radio galaxy, or even the 3 K isotropic background radiation.
As a direct consequence of the interstellar molecular radio spectroscopy of the past few years, a number ofphenomena have been discovered which indicate that radio astronomers are studying a new area of chemistry. Thedetection of as yet unidentified molecules, such as X-ogen, emphasizes the role of a typical interstellar cloud as aunique chemical laboratory - a sample cell which would be difficult if not impossible, to duplicate in its entiretyin terrestrial laboratories. With mean free paths as long as 10" cm, low temperatures, and catalytic dust grainsurfaces present, it is not unreasonable to expect future detection of interstellar molecules which cannot beobserved terrestrially because of rapid collisional destruction or rapid recombination mechanisms. This newchemistry should not be considered exotic or unusual, however, as it is the common chemistry of the galaxy andman stands to gain a greater understanding of his galactic environment from it.
Long, painstaking observations which often require many hours of integration are needed by radioastronomers in order to achieve initial detection of most of these lines. Many more orders of magnitude of timeand effort are expended in detecting each line in other gas clouds and to obtain the signal-to-noise ratiosnecessary to draw conclusions of astrophysical interest from the observations. In general, bandwidths of 0.2 percent or more of the rest line frequency are required in order to observe all components of the Doppler-shiftedobserved line frequency of these clouds moving along the line-of-sight within our galactic system. Widerbandwidths will of course be required for extragalactic observations.
The choice of wavelength for astronomical observations naturally depends on the lines to be observed, butit may also be strongly influenced by the transmission properties of the Earth's atmosphere, i.e., by the location ofthe so-called "windows" in the atmosphere. The regions of interest for ground-based observations known atpresent, are shown schematically in Fig. 1, based on Report 719 of Study Group 5. This Report contains the studyof the attenuation in clouds at frequencies above 50 GHz. In general, the windows are defined by the resonancesof molecular oxygen and water vapour. The abundance of other atmospheric constituents, for example, CO, NO,NO,, etc., is sufficiently small that their presence in a window will not significantly alter the usefulness of thiswindow for astronomical observations.
The curves in Fi" 1 show the total one-way absorption in the vertical direction for a dry atmosphere andfor two representative : ..nospheres with water vapour concentrations of 0.5 and 7.5 g/m1 at the Earth's surface.These curves are based partly on theoretical calculations and partly on measurements. The model atmosphereadopted is one in which the water vapour concentration decreases exponentially with increasing height, the scaleheight being 2 km.
The Annexes summarize some of the types of spectral line observations that are being conducted atobservatories throughout the world. The five Annexes deal with lines of atomic hydrogen and the fourmolecules OH, H2O, H2CO and CO. These are not the only lines important to radioastronomy, and for historicalreasons the selection does not give full weight to the millimetre wave region of the spectrum. A more complete listis given in Recommendation 314-4. However, those included in the Annexes are a reasonably representativesample showing the kinds of observation made and the variety of results obtained. The Annexes also demonstratehow some of the significant conclusions concerning the nature oi the Universe can be reached on the basis ofspectral line observations.
REFERENCES
EWEN, H. I. and PURCELL, E. M. [1951] Nature, 168. 356.HABING, H. J. [1968| Bulletin Astr. Inst. Netherlands, 19, 421LILLEY, A. E. and PALMER, P. [1968] Astrophys. Journ. (Suppl. Ser. 144), 16, 143.SOROTCHENKO, R. L., BORODZITCH, O. S., DRAVSKIKH, Z V. and KOLBASSOV, V. A. (1964) Proceeding* of the Xllth
General Assembly of the International Astronomical Union, HamburgSTEIF, L ;., DONN, B., GLICKER, S.. GENT1EU, E. P. and MENTALL, J. E. |I972] Astrophys. Journ., 171, 21.WEINREB, S., BARRETT, A. H., MEEKS, M L. and HENRY, l.C. [1963| Nature. 200. 829.

Rep. 223-4 367
TABLE I - Interstellar lines detected by radio astronomers and the corresponding rest frequencies(from ref. 10, Lovas et at., 19 73, unless otherwise specified in column 3) *
(up to August 1977)
Frequency (GHz)
(1)
0.834267
.065075
.371709
.371794
.371947
.420406
.538135
.538693
.539295
1.539570
1.539851
1 541018
1.610249
1.610906
1 6122310
1.62443
1.62617
1.637564
1.638805
1.639503
1 6654018
1.6673590
1 7205300
2.66161
2.66287
2.66476
3.139406
3.195167
3.263794
3.335481
3.349193
4.3887786
4.3887960
4.3887963
4.3888011
4.3888035
4.3888084
4.5929563
4.5929738
4.5929759
4.5929857
4.5929934
4.5930494
Molecule/Atom
(2)
CHjOH - methyl alcohol
CH3CHO - acetaldehyde
CH2CHCN - vinyl cyanide
CH2CHCN - vinyl cyanide
CH2CHCN - vinyl cyanide
H - hydrogen
NH2CHO - formamide
NH2CHO - formamide
NH2CHO - formamide
NH2CHO - formamide
NH2CHO - formamide
NH2CHO - formamide
HCOOCH3 - methyl formate
HCOOCH3 - methyl formate
OH - hydroxyl
17OH - hydroxyl17OH - hydroxyl18OH - hydroxyl
HCOOH - formic acidI8OH - hydroxyl
OH - hydroxyl
OH - hydioxyl
OH - hydroxyl
HCCCCCN - cyanodiacetylene
HCCCCCN - cyanodiacetylene
HCCCCCN - cyanodiacetylene
HjCS - thioformaldehyde
CH3CHO - acetaldehyde
CH - CH radical
CH - CH radical
CH - CH radical
H2C18O - formaldehyde
H2C I8O - formaldehyde
H2C18O - formaldehyde
H2C18O - formaldehyde
H2C18O - formaldehyde
H2C18O - formaldehyde
H213CO - formaldehyde
H213CO - formaldehyde
H213CO - formaldehyde
H213CO - formaldehyde
H213CO - formaldehyde
H213CO - formaldehyde
Absorption (A) ot emission (E)
(3)
EE
E«»E»«E*»
AamtE"
EEE
E
EEE
E
A and E "
A1
A»
AEA
A and E "
A and E "
A«ndE«
EE
E
AEE
AandE
AandE
A
A
A
A
A
A
A
AA
A
A
A
•/ • • Sec notes at the end of the Table.

368 Rep. 22.V4
I M i l I I i t i i i i n n u
(1)
45930690
4.5930800
4 5930812
4 5930864
459308654
45930942
4 5930961
4 5930985
4 5930994
4 5931039
4 5931741
4 5931795
4 5932003
4 5932046
4 5932099
4 617126
4 618966
4 619988
4 6bO242
4 750656
4 765562
4 8296413
4 B296S83
4 8296596
4 8296639
4 8296664
4 8296710
4916312
5 00532
5 289011
5 289685
5 289814
5 290610
5 290880
5 291676
6 030747
6.035092
6.278631
6.38949
8.135868
8.18883
8.77506
8.77738
8.77818
8.77947
9.058498
9.059330
9.059739
(21
H,13('O loimaldfhydi'
H213CO fiirmaldt-hydv
H,13CO formaldvhydt'
H,13CO . lormaldflndi:
H,1 3 (O lormaldflndf
H, I3CO - lonnaldflndi'
H,1 3 (O liumaldt'h>dt'
H , " ( 'O liirnuldvhydt'
H i ' - ' en lurmaldi'hydc
1 1 , ' V o Icirmaldcliydi-
H , I 3 (O Inrmaldfhv di-
l l , 1 ' ( ( ) tmmaldt-lndi-
H , I 3 O) tormaldchvdf
H i ' V o Inrmaldehydf
I I , I 3CO - liirmaldchydi'
NH,( HO lormanndt'
MliCHO lormamidi'
NHiCHO tormanildf
OH hvdroxyl
OH hydt.ixvl
OH hydroxvl
H i ( ( ) lormaldfhvdf
|| ,( () InrnialJclndi'
11,1(1 tiiimaldt'livdt'
H,(O Inimaldfliydf
H,CO l'iumaldch>df
H,( O lurmaldi'hydi'
HCOOII I'nrniK'Jtid
(H^OH methyl j luihii l
HiCNH mi'llianimmt1
HiCNH mt'lhanimmt1
HiCNH mt'thaiiiminf
HiCNH mvlhanunini1
I I , (NH mt'thaniininc
HiCNH • inoihaniinmt'
OH - hydroxyl
OH hydroxyl
HiCS thiol't>rmaldfh>df
CH^CHO acftaldchydf
OH hydroxyl
not yi'I id^ntillod
CH^NHi - mi'thylamine
CH^NH, - nu'thylannnf
CH^NHi - methylamiiic
CHjNH-) nit'thylaniint1
Hr'^CC'N cyamiaft'tylfnc
HC('13CN cyaniiai-flyk-nc
HC'I3CC'N fyamiatrtylt'no
(31
A
A
A
A
A
A
A
A
A
A
A
A
A
A
A
1
1
1
1
1
1
Aandl •••
A and ! • • •
A a n d l "
A a n d l * •
A a n d l "
A and I "
1
1
1
1
1
! •
1
1
A and 1
A and 1
A.
1
1
1
1
1
1
1
1
1
1

Rep. 223-4
TABLE I (continued)
369
(1)
9.060617
9.061700
9.062553
9.0970346
9.0983321
9.1002727
9 118818
9.119670
9.120515
10.152002
10.31003
10.31070
10.463970
10.650643
13.043832
13.434596
13.441365
13.778804
14.488458
14.488471
14.488479
14.488489
18.194936
18.195190
18.196279
21.301247
21.98054533
21.98.47055
21.98208535
22.235044
22.235077
22.235120
22.235253
22.23S298
22.65300
22.68824
22.834185
23.098817
23.694496
23.722633
23.870130
24.13941
24.532986
24.93347
24.95908
25.01814
2S.056025
25.12488
(2)
HCC13CN - cyanoicetytene
HC13CCN - cyanoacetylene
HCC13CN - cyanoacetylene
HCCCN - cyanoacetylene
HCCCN • - cyanoacetylene
HCCCN - cyanoacetylene
CH3OCH3 - dimethylether
CH3OCH3 - dimethylether
CH3OCH3 - dimethylether
HCCCCCCCN - cyanohexatriyne
CH3NHD - deuterated methylamine
CH3NHD - deutented methyUmine
H2CS - thioformaldehyde
HCCCCCN - cyanodiacetylene
SO - sulphur m 3r*oxide
OH - hydroxyl
OH - hydroxyl
H213CO - fonnaldehyde
HjCO - formaldehyde
H2CO - fonnaldehyde
H2CO - formaldehyde
H2CO - formaldehyde
HCCCN - cyanoacetytene
HCCCN - cyanoacetylene
HCCCN - cyanoacetylene
HCCCCCN - cyanodiacetylene
HNCO - isocyanic acid
HNCO - isocyanic acid
HNCO - isocyanic acid
H2O - water
H2O - water
H2O - water
H2O - water
H2O - water
NH3 - ammonia
NHj - ammonia
NH3 - ammonia
NH3 - ammonia
NH3 - ammonia
NHj - ammonia
NHj - ammonia
NH3 - ammonia
NH3 - ammonia
CH3OH - methyl alcohol
CH3CH - methyl alcohol
CH3OH - methyl alcohol
NHj - ammonia
CH3OH - methyl alcohol
(3)
E
E
E
E
E
E
E
E
E
E*
AandE
AandE
A
E*»
E
E
E
E
AandE"
AandE'*
A and E**
A and E**
E
E
E
E
E
E
E
E»*
E "
E "
E»«
E "
E*
E»
E
E
E "
E "
E "
E
E
E
E
E
E
E

370 Rep. 223-4
TABLE i (continued)
(1) (2) (3)
25.29441
28.974781
28.974804
28.974814
30.0015236
31.10526
31.10620
31.10712
36.16924
16 309631
36.466
36.7952
42.820539
43.122027
43.423798
43.96277
45.490307
46.247472
48.206948
48.284519
48.37260
48.37709
48.583264
48.585906
48.589068
48.6516063
48.991000
68.972145
69.575918
72.039354
72.409097
72.4134843
72.4135143
72.4135584
72.4149054
72.4149270
72.4149732
72.4170297
72.758210
72.783822
72.837974
72.9767845
73.04401
73.04420
73.04515
76.305727
79.15
79.915101
79.979596
CHjOHH2CO
H2CO
H2CO
SO
CH3OCH3
CHjOCH-,
CH3OCH3
CH3OH
SiS
HCH3CN
SiO
SiO
SiO
HNCO
HCCCNI3CS
C3"sH2CO
CH3OH
CH3OH
c«sc» s
c»socscsso2so2DCO+
HjCO
DCN
DCN
DCN
DCN
DCN
DCN
DCN
so2HCCCN
H2CO
OCS
CH3NH2
CH3NH2
CH3NH2
DNC
-
NH2CN
NH2CN
methyl alcoholformaldehyde
formaldehyde
formaldehyde
sulphur monoxide
dimethyl ether
dimethyl ether
dimethyl ether
methyl alcohol
Miitun sulphide
excited hydrogen
methyl cyanide
silicon monoxide
silicon monoxide
silicon monoxide
isocyanic acid
cyanoacetylene
carbon monosulphide
carbon monosulphide
formaldehyde
methyl alcohol
methyl alcohol
carbon monosulphide
carbon monosulphide
- carbon monosulphide
carbonyl sulphide
caibon monosulphidc
sulphur dioxide
sulphur dioxide
dcuterated formyl ion
formaldehyde
deuterium cyanide
deuterium cyanide
deuterium cyanide
deuterium cyanide
deuterium cyanide
deuterium cyanide
deuterium cyanide
sulphur dioxide
cyanoacetylene
formaldehyde
carbonyl sulphide
methylamine
methylaminc
- methylamine
deuterium isocyanide
not yet identified
cyanamide
- cyanamide
E
A
A
A
E
E
E
E
E
E
E
E*
E
E
E
E
E
E
E
E
E
E
E
E
E
E
E
E
E
E
E
E
E
E
E
E
E
E
E
E '
E
E
E
E
E
E
E
E
E

Rep. 223-4
TABLE I (continued)
371
(1)
80.076611
80.484
80.50460
80.536242
80.S38S41
80.540884
80.S78283
80.832076
81.44749
81.5427
81.586193
81.881458
82.65072
82.68849
83.58426
83.688071
84.50535
84.52121
84.63440
84.74601
85.1391081
85.26542
85.435
85.442523
85.450730
85.455622
85.457272
85.5676
B5.758953
85.9
86.054961
86.07420
86.07444
86.07543
86.093969
86.226728
86.243350
86.338767
86.340184
86.342274
86.6154
86.639138
86.67065
86.70838
86.754330
86.7568
86.77752
86.80582
(2)
H2CCO - leetene
not yet identified
NH2CN - cyanamide
CH2OCH3 - dimethyl ether
CH3OCH3 - dimethyl ether
CH3OCH3 - dimethyl ether
HDO - deuterated water
H2CCO - ketene
HNO - nitioxyl hydride
not yet identified
H2CCO - ketene
HCCCN - cyanoacetylene
CH3OCH3 - dimethyl ether
CH3OCH3 - dimethyl ether
CH3CHO - acetaldehydc
SO2 - sulphur dioxide
(CH2)2O - ethylene oxide
CH3OH methyl alcohol
CH3OCH3 - dimethyl ether30SiO - silicon monoxide
OCS - carbonyl sulphide
CH3CH2CH - trans ethanol
not yet identified
CH3CCH - methylacetylene
CH3CCH - methylacetylene
CH3CCH - methylacetylene
CH3CCH - methylacetylene
CH3OH - methyl alcoholz'SiO - silicon monoxide
NH2D - deuterated ammonia
HC1SN - hydrogen cyanide
CH3NH2 - methylamine
CH3NH2 - methylamine
CH3NH3 - methylamine
SO - sulphur monoxide
CH3OCH3 - dimethyl ether
SiO - silicon monoxide
H"CN - hydrogen cyanide
H13CN - hydiu»?n cyanide
H"CN - hydrogen cyanide
CH3OH - methyl alcohol
SO2 - sulphur dioxide
HCO - formyl radical
HCO - formyl radical
H1 3CO+ - formylion
- not yet identified
HCO - formyl radical
HCO - formyl radical
(3)
E
E*
E
E
E
E
E
E
E
E
E
E
E
E
E
E
EE
E
E
E
E
E
E
E
E
E
E
E
E«
E*»
E . .
E*»
E«
E»«
E "
E "
E "
E«»
E»*
E "
E*»
E»«E7*»
E "
E "
E ? »
E 7 «

372 Rep. 223-4
1 A HI I I itimnnued)
(1)
86 846891
86 9035
87090851
87 31705
87 32870
87 40210
8740723
87925238
88.239027
8832372
886304157
886318473
88.6339360
8866806
8866862
8866961
88865692
890457
89 0644
89 188523
89 5046
89.56224
89 56495
89 56803
8957298
89 58998
89 59096
89 62841
89 68467
90 11761
90 146
90 663602
9O77M46
90937539
90 938099
90 938674
90 979023
91 20261
91 33332
91 54910
91 959206
91.971374
91 979998
91 985284
91 987054
92 3J27
92 494084
93 17188
(2>
SiO silicon monoxide
CH 3 OH methyl alcohol
HN (' hydrogen isocyanidi1
HOT cthynyl radical
H< ( ethynyl radical
HOC cthynyl radical
HC"( ethynvl radical
HNCO iuii-vanii- acid
HNCT) isocyanu acid
C H J C ' H J C N cthylcyanide
HCN hydrogen cyanide
HCN hydrogen cyanide
HCN hydrogen cyanide
C ' H J N H J methylamine
CHjNH2 methylamine
C H J N H J methylamine
H ' * NC hy drogen 1 wcy anide
CCCN C'3N radical
CCCN C3N radical
HCO* formyl ion
C H 3 U H methyl alcohol
C H 3 C H : C N ethylcyanidc
CH3CH2C"N ethylcyanide
C H j C t ^ C N ethykyanide
C'H 3 CH 2 rN ethyltyanide
C H j C H i C N ethylcyanide
<"HjCH2CN ethylcyanide
C H J C H J C N ethylcyanide
C H J C H J C N ethylcyanide
r H 3 C H 2 O H tran-.cthanol
mil yet identified
HN( hydrogen no)anide
SiS Mlicon sulphide
CH3CXH3 dimethyl ether
CH3OCH3 dimethyl ether
O ^ X ' H j dimethyl ether
HC'C'CN cyanoacetylene
HCCX'N cyanoacetylene
HCCCN cyanuacetylene
CH3CH2CN ethylcyanide
CH3CN methyl cyanide
C'HjCN methyl cyanide
C"H}rN methyl cyanide
( H j C N methyl cyanide
CHjCN methyl cyanide
not yet identified
l^CS carbon monosulphide
H N N * dia/enyliuin
(3)
. . .
1 * *
. . . .
t."
1 • • •
r * *i "
« • • •
V"
1 • • •
1 . .
1 • • •
! : •*
! • •
> . .
1 • • •
r "
1 • • •
I * "
I ' •
1 • •
1 * *
1 * *
1 * •
1 * *
1 * *
1 • •
! • • •
1 • •
1 • •
! • * •
1 • *
1 "
1 "
J. • •
1 • • '
1 "
1
' •
1

Rep. 223-4
TABLE I (continued/
373
(I)
93.17370
93.17613
93.85711
93.87173
94.2766
94.40517
94.40702
94.5407
95.16944
95.44244
96.412953
96.73939
96.74142
96.75551
96.84963
96.91971
97.171824
97.171843
97.3012130
97.702389
97.71539
97 )81007
98.17755
98.52380
98.524S8
98'32OI
98.53391
98.56478
98.56674
98.61007
98.70107
98.9399
98.9586
99.299867
100.029644
100.076392
100.09451
100.1S70
100.2004
100.61428
100.62950
100.6404
100.878119
101.03671
101.139
101.477752
101.98139
103.040399
(2)
HNN+ - diazenvlium
HNN+ - diazenylium
CH3OCH3 - dimethyl ether
NH2CHO - formamide
CHjCHCN - vinyl cyanideI3CH3OH - methyl alcoholl3CH3OH - methyl alcohol
CH3OH - methyl alcohol
CH3OH - methyl alcohol
CHjCH2CN - ethyl cyanide
C S - carbon monosulphide
CH3OH - methyl alcohol
CH3OH - methyl alcohol
CH3OH - methyl alcohol
CH3OCH3 - dimethyl ether
CH3CH2CN - ethyl cyanide
C^S - carbon mono:ulphide
C3 3S - carbon monosulphide
OCS - carbonyl sulphide
SO 2 ~ sulphur dioxide
^*SO - sulphur monoxide
CS - carbon monosulphidc
CH3CH2CN ethyl cyanide
CH3CH2CN ethyl cyanide
CH3CH2CN ethyl cyanide
CH3CH2CN ethyl cyanide
CH3CH2CN - ethyl cyanide
CH3CH2CN ethyl cyanide
CH3CH2CN ethyl cyanide
CH3CH2CN ethyl cyanide
CI13CH2CN ethyl cyanide
CCCN C3N radical
CCCN C3N radical
SO sulphur monoxide
SO sulphur monoxide
HCCCN cyanoacetylcne
H2CCO ketenc
not yet identified
not yet identified
CH3CH2C"N ethyl cyanide
NH2CN cyanamidc
CHjCHO acctaldehyde
SOj - sulphur dioxide
H2CCO - ketcne
~ - not yet identified
H2CS - thioformaldehyde
H2CCO ketene
H2CS thioformaldehyde
(3)
E
E
E
E
E
E
EE
E
E
EEE
E
E
E
b
E
E
EE
E
EE
E
E
E
EE
E
E
E
E
E
E
E
E
E
E
E
E
E
E
E
E
L
E
L

374 Rep. 223-4
TABLE I (continued)
(1) (2) (3)
103.91527104.029398
104.05124
104.06076
104.239272
104.589
104.616977
104.667
104.70266
104.711416
104.8086:
104.811
105.472
105.577
106.74292
108.924267
109.173634
109.252226
109.463079
109.65029
109.782182
109.905753
110.2
110.201370
110.330728
110.349706
110.364490
110.374986
110.381362
110.383494
110.70955
110.71222
112.24872
112.25448
112.35872
112.358980
112.360016
113.144192
113.170528
113.191317
113.488140
113.490982
113.499639
113.508944
113.97821
114.93990
114.95965
115.15392
(CH2)2O
so2CH3CH2CN
CH3OH
so2
-H2CO
Cl^OCH-,13C18O '
CH3CH2OH
-
3"SO
SiS
HCCCN
SO
OCS
CH3CH2CN
C 1 8 O
HNCO
NH2D
•3CO
CH3CN
CH3CN
CH3CN
CH3CN
CH3CN
CH3CN
CH3CN
CH3CN
CH3CHO
CH3CHO
C17O
c"oc'7oCN
CN
CN
CN
CN
CN
CN
CH3CH2CN
CH3CHO
CH3CHO
NS
ethylenc oxide
sulphur dioxide
ethyl cyanide
methyl alcohol
sulphur dioxide
not yet identified
thioformaldehydc
not yet identified
dimethyl ether
carbon monoxide
trans ethano]
not yet identified
not yet identified
not yet identified
sulphur monoxide
silicon sulphide
cyanoacelylene
sulphur monoxide
carbonyl sulphide
ethyl cyanide
carbon monoxide
isocyanic acid
deuterated ammonia
carbon monoxide
methyl cyanide
methyl cyanide
methyl cyanide
methyl cyanide
methyl cyanide
methyl cyanide
methyl cyanide
methyl cyanide
acetaldehyde
acctaldehyde
carbon monoxide
carbon monoxide
carbon monoxide
cyanogen radical
cyanogen radical
cyanogen radical
cyanogen radical
cyanogen radical
cyanogen radical
cyanogen radical
ethyl cyanide
acetaldehyde
acetaldehyde
nitrogen sulphide
E
E
E
E
K
E
E
E
E
E
K
E
E
E
E
E
E
E
E
B
t£
E 6
E
E
E
E
E
t"E
E
E
F
E
E
E
E
F
E
E
f
E
E
E
E
E
E
E

Rep. 223-4
TABLE I /continued/
375
(1)
115.15697115.271204
115.55643
115.57120
115.89435
127.367666
129.363262
130.268574
135.69602
138.178645
138.73897
140.839529
144.617117
144.8265727
1448268097
144.8268414
144.8280003
144.8281093
144.8303358
145.09375
145.09747
145 10323
145.12441
145.12637
145.13188
145.13346
145.602971
145.755619
145.755635
145.756374
145.756392
145.9468205
146.969039
150.498359
168.76276237
169.33534
172.107956
172.676573
172.677959
172.680209
177.2596767
177.2599233
177.2611104
177.2611112
177.2612232
177.2634450
183
217.238531
(2)
NS - nitrogen sulphide
CO - carbon monoxide
NS - nitrogen sulphide
NS - nitrogen sulphide
CH3CH2CN - ethyl cyanide
HCCCN - cyanoacetylene
SiO - silicon monoxide
SiO - silicon monoxide
SO2 - sulphur dioxide
SO - sulphur dioxide
' ^CS - carbon monosulphide
H2CO - formaldehyde
C S - carbon monosulphide
DCN - deuterium cyanide
DCN - deuterium cyanide
DCN - deuterium cyanide
DCN - deuterium cyanide
DCN - deuterium cyanide
DCN - deuterium cyanide
CH3OH - methyl alcohol
CH3OH - methyl alcohol
CH3OH - methyl alcohol
CH3OII - methyl alcohol
CH3OH - methyl alcohol
CH3OH - methyl alcohol
CH3OH - methyl alcohol
H2CO - formaldehyde
C " S - carbon monosulphide
C " S - carbon monosulphidc
C"S - carbon monosulphidc
C"S - carbon monosulphide
OCS - carbonyl sulphide
CS - carbon monosulphide
H2CO - formaldehyde
H2S - hydrogen sulphide
CH3CH - methyl alcohol
HC15N - hydrogen cyanide
H'^CN - hydrogen cyanide
H'^CN - hydrogen cyanide
H'^CN - hydrogen cyanide
HCN - hydrogen cyanide
HCN - hydrogen cyanide
HCN - hydrogen cyanide
HCN - hydrogen cyanide
HCN - hydrogen cyanide
HCN - . hydrogen cyanide
H2O - water
DCN - deuterium cyanide
(3)
E
E "
EE
EE
E
F "
E*«
E "
E "
E
EE
E
E
EE
E
E
E
E
E
E
EEE
E
E
E
E
E
E
E
E
E
E
E
E
E
E
EE
E
E
E
E8
E

376 Rep. 223-4
TABU I (euntmueiij
(1)
219.560369
220.398714
230.538001
345
(2)
c ' ^ O - carbon monoxide
' ^CO - carbon monoxide
CO carbon monoxide
CO - carbon monoxide
(3)
1
!•••
1-9
* A complete list of radio atomic and molecular lines is piven in order to facilitate protection arrangements There are also a largenumber of important recombination lines of hydrogen, helium, carbon etc A full table of recombination line frequencies is availableILilley and Palmer (I968)|.
** Afforded some measure of protection by the Radio Regulations.
REFERENCES (TABLE I)
1. GARDNER, F. F. and WHITEOAK, J. B. |1976J. Monthly Notes of the Royal Astronomical Society, 176, 57
2. KROTfi. H. W., K1RBY. C, WALTON, D. R. M.. AVERY, L. W., BRUTEN, N W., OKA. T. and MACLEOD, J M[1977). Bulletin of the American Astronomical Society, 9, 303.
3. SWEITZER, J. S.. PALMER. P.. MORRIS, M , TURNER. B E and ZUC 'HERMAN, B. [1977) Bulletin of theAmerican Astronomical Society, 9, 373.
4. BLACKMAN. G L, BROWN, R. D.. GODFREY. P D, BASSF-.Z. M. P. OTTREY. A. L. WRINKLER, D. andROBINSON, B. J. (1977). Monthly Notes of the Royal Astronomical Society. 180, 1.
5. TURNER. B. E., KISLYAKOV, A. «., LISZT, H. S. and KAIf-U. N.. [I975| Astrophys. Journ. (Letters), 201, L 149.6. BLAKE. B. H. and PALMER. P. (1977) Bulletin of the American Astronomical Society, 9, 4297. SNYDER, L. E., HOLL1S, J. M. and U L K H . B. L. |I976] Aslrophys. Journ. (Letters). 208, L 91
8. WATERS, J. W., GUSTINCIC. J. J.. KAKAR. R. K.. KUIPER, T. B. H.. SWANSON, P.N, KfcRR, A. R. andTHADDEUS, P. [I976| Bulletin of the American Astronomical Society. 8, 564.
9. HUGGINS. P. J.. PHILLIPS, T. G.. NEUGEBAUER. G., WtRNER, M V.. WANNIER. P G and bNMS, D. |1977)Bulletin of the American Astronomical Society. 9. .15 V
10. LOVAS. F. J., JOHNSON. D. R. and SNYDER. L. fc. |I978|, Aslrophys. Journ Suppl. (in preparation)
ANNEX I
THE NEUTRAL HYDROGEN LINfc AT 1420.406 MHz
Emission from alomic hydrogen occurs from a hyperfine spin-flip transition at (he ground level of theatom. This emission was first observed in 1951 [Ewen and Purcell. 1951], The study of the neutral hydrogencomponent of the interstellar medium is particularly suitable for a number of fundamental astronomical problems.Hydrogen, the most abundant element in the Universe, is also the main observed constituent of the interstellarmedium. The motions and distribution of hydrogen are closely related to those of other galactic constituents, bothstellar and interstellar. The interstellar medium is transparent enough to radio emission at 1420 MHz, so that, withthe exception of a few directions along the galactic equator, it is possible to investigate the entire Milky Waygalaxy and other distant galaxies. This transparency allows investigation of regions of the Milky Way which aretoo distant, or are too obscured by dust in the interstellar medium, to be studied optically. Interstellar neutralhydrogen is so abundant and is distributed in such a general fashion throughout the galaxy, that the emission linehas been detected at every direction in the sky at which a suitably equipped radio telescope has been pointed. Notime variation of (his line has been found. Many 21-cm surveys of galactic hydrogen have been published. Theseare listed by [Kerr, 1969) and |Burton, 1974) and (Heiles and Wrixon, 1976].
What is detected is a line profile giving intensity, usually expressed as a brightness temperature, as afunction of frequency. The frequency observed for the line may indicate a Doppler shift from the natural restfrequency of 1420.406 MHz. The Doppler-shift information inherent in observations of hydrogen within.a galaxyis very important since it allows the kinematic distribution of the gas lo be studied, in addition to the spatialdistribution of intensities. In practice, the measured frequency shifts are converted to radial velocities. At1420 MHz, a velocity of recession of I km/s corresponds to a reduction in frequency of 4.74 kHz. The naturalwidth of the neutral hydrogen line is 5 x 10"""' Hz and is thus infinitesimally small compared to that which canbe measured by radioastronomical methods. However, profiles observed near the Milky Way typically extend over500 kHz. This broadening occurs throughout several mechanisms. The broadening corresponding to the thermalvelocities of atoms within a single concentration of gas is typically 5 or 10 kHz. Turbulent motions within aconcentration of hydrogen gas will also produce profile broadening of this order of magnitude. Large-scalestreaming motions with Doppler-shift amplitudes of the order of 30 kHz have been observed in our galaxy and inothers, and these motions influence the measured width of features in a profile. However, most of the total linebroadening in galaxies comes from the differential rotation of the galaxy as a whole. For many galaxies thisrotation broadens the profiles by 2500 kHz. Large-scale expansion motions in the still poorly understood centralregion of the Milky Way result in profiles broadened by a similar amount.

Rep. 223-4 377
10 JO
Frequency (GHz)
FICil'RK 1 Total attenuation along vertical path througha clear atmosphere
A Average atmosphere with water vapour concentration of7.5 g/m5 (15 cm equivalent depth) at the larth's surface
B: Average atmosphere with water vapour concentration of0.5 g/m1 (1 mm equivalent depth! at the Karth's surface
C Dry atmosphere
The most intense emission features are measured near the plane of the Milky Way resulting in brightnesstemperatures of about 100 K. In other regions of our Galaxy, brightness temperatures from normal gas rangedown to about I K. Abnormal gas, with high velocities, provides temperatures which range down to arbitrarilysmall values, and sensitivity requirements are severe. Special studies of normal gas, including for example, themeasurement of Zeeman splitting to derive the magnetic field in the Galaxy, also place severe requirements onsensitivity; with modern equipment, integration times of 50 hours are sometimes necessary [Verschuur, 1971].
The zero level of the intensity scale is usually found by interpolation between the wings of the profileswhich are considered to cor'ain no hydrogen emission. This method of zero-level determination requires anaddition of about 100 kHz. or more, which must be observed beyond the wings of the line itself. To eliminate thecontribution of the continuum background emission, frequency-switching techniques are generally employed.Frequency switching over 1.5 or 2 MHz is typical, but observations of high-velocity gas may require switchingover 3 to 5 M-iz. usually on both the high and low frequency sides of the line.
In addition to the emission arising from the hyperfine transition, absorption effects are also present andextensively studied. The frequency requirements for absorption studies are similar to those for emission studies.Absorption observations provide unique information on the spin temperature of hydrogen concentrations, and
.provide measures which are very sensitive to low temperature.

" 8 Rep. 223-4
External galaxies exhibit the well-known "red shift", a decrease of the observed frequency dependent onthe distance of the galaxy. Receivers used at present allow successful studies to he made at intensities below0.01 jansky *. Most normal spiral galaxies at this flux density level have radial velocities of 4000 to 6000 km/s,and therefore are observed at frequencies down to 1390 MHz. The number of normal galaxies for whichhydrogen-line data are available is approximately 500; this number is increasing rapidly, and is being augmentedby investigations of nearby dwarf galaxies which were heretofore undetectable. These studies are important fordetermining the gross properties of galaxies such as distance, mass and hydrogen content. Data on a wide varietyof objects will facilitate the development of theories of galactic formation and evolution. Concurrently, detailedsynthetic aperture observations of the larger nearby galaxies are being made to confirm theories of spiral structure.
Some of the most exciting and important present day radio observations involve detection of the observedhydrogen line in distant continuum sources. These have been accomplished for the radio galaxy Perseus A (DeYoung et al.. I973| and for the quasi-stellar objects .K" 286 [Brown and Roberts, 1973] and AO 0235 + 164IRoberts el al.. 1976). The detection of red-shifted 21 em radiation from AO 0235 + 164 is of great cosmologicalsignificance. Since red-shifted optical lines (Mg*) had been previously detected in this source it became possible tomake a direct comparison between the radio and optical red-shifts over a large cosmological distance. The factthat the radio and optical red-shifts agreed to within the experimental uncertainties (I part in 5000 for the opticalmeasurement, and I part in 50 000 for the radio), allows one to place upper limits on the time variations of thephysical constants which enter the atomic theory of spectroscopy
Historically, the first line to be detected in the radio spectrum, the 21-cm hydrogen line, continues to growin importance. The development of sensitive receivers has broadened the scope of extra-galactic studies to includeobjects with large Doppler shifts. Current observational programmes are directed towards obtaining spectra oflarge numbers of galaxies having emission frequencies at and below 1370 MHz at intensities of about 0.01 jansky.At the same time, detailed studies of our own and nearby galaxies are continuing between 1415 and 1427 MHz.
RI-.M-.RI-.NC IS
BROWN. R L and ROBbRTS. M S [ I W | Atrophy* Journ. 184, 17
BURTON, W 11 (1974] Odljcnc and extrugjlaaic radio astronomy bds Ci L Verschuur and K 1. Kellermiinn. SpringerVcrlag. .-..'
l>b YOUNG. D S. ROBbRTS. M S and SASI.AW. W ( | I " /M| Astntphys Journ . 185. X(W
EWbN. H I and PURC b.LL. b M [I<*S|| Nature. 168. }5h
HFILbS. L <ind WRIXON, Ci [I976|. Methods of experimental physics. I U . ed. M I. M«kv I Academic Press New >ork). 5S
KERR. f- 1 |IV<iV| Annual Reuev, of A.siron. Astrophys. 7 .W
ROBERTS. M.S. BROWN. R L. BRUNDAGI. W 1). ROTS. A H . HAYNbS. M l> and WOLI-fc. A M |ls>76| Astron
Journ. 81. 291
VbRSCHUUR. G L |I97|| Astrophys Journ. 165. 6.M
ANNfcX II
THb OH LINKS IN RADIOASTRONOMY
I. Introduction
Radio-frequency spectral lines due to the hydroxyl molecule (OH) were first detected and measured in thelaboratory in 1959 [Ehrenslein el al.. I959|. and in interstellar space in 1963 [Weinreb et al.. 1963]. Absorption ofradio-frequency radiation from the radio source Cassiopeia A was observed at frequencies *• which correspond tothose of the two principal ground state lines, at 1665.401 and 1667.358 MHz. Shortly afterwards, even strongerabsorption lines were found from the region of the galactic centre [Bolton el al., 1964a; Robinson et al., 1964;Goldstein ef al., I964|, and two expected subsidiary ground-state lines, arising from alternative configurations ofspins within the OH molecule, were detected and their rest frequencies determined at 1612.231 and 1720.527 MHz|Goss, 1968]. The vety much lower intensity absorption line at 1639 MHz has been detected in the direction of thegalactic centre [Rogers and Barrett, 1966). This line is due to the O'"H molecule where the oxygen is the mass-18isotope of the normal O"1. Investigation of narrow-band emissions from regions of ionized hydrogen in the galaxyI'vVeaver et al., 1965; Zuckerman et al., 1965] identified them as arising from OH. This emission is unexpectedlyintense, producing increases in antenna temperature of as much as 150 K, and it has, surprisingly, been found tohave a circularly polarized component [Davics ct al., 1966]. A number of the sources of OH emission have nowbeen studied with interferometers, to get more precise positions of the sources [Rogers et al., 1967] and estimatesof the angular sizes of the sources [Davies et al., 1967). The new technique of "very long base-line' or VLBinterferometry, with base-lines of length comparable with the diameter of the Earth, have been used to study someOH sources [Moran era/., 1967) and, also apparent angular sizes of less than 0.005 seconds of arc have beenmeasured. This last technique, by an equipment improvement which is within the state of our present knowledge,
One jansky <Jy) = I flux unit (f.u.) = 10- -<• W/nV per Hz.The frequencies in this Report are the rest frequencies for the radiation concerned.

Rtp. 223-4 379
opens up possibilities of using radio sources of very small angular size as position references for the location ofthe observing points on the Earth. Possible uses in measuring earth tides, continental drift, and accurate terrestrialrates of rotation, have been predicted [Gold. 1967; MacDonald, 1967].
The discovery of lines due to OH is of great astrophysical significance. The extent by which the observedfrequencies are displaced from their rest frequencies by Doppler effects provides direct information about themotions of the gas clouds in which the OH occurs. The anomalies in the line intensities, both in emission andabsorption, throw new and unexpected light on the physical conditions in particular regions of our galaxy. Theobservations also give more information on the structure of our galaxy.
2. The distribution of OH in the galaxy
Early survey work [Goss, 1968] showed, and later more thorough work [Turner, 1970; Turner, 1972]confirmed, that OH is very widely distributed throughout the galactic disk in a region within a few hundredparsecs * of the galactic plane. It is somewhat more closely confined to the plane than atomic hydrogen, andappears to be an excellent tracer of spiral arms. It does not appear to be closely associated with continuumsources, but rather to delineate the presence of dense neutral clouds of gas in a manner which is not possibleoptically or by means of 21-cm line of atomic hydrogen. This latter aspect has been of immense importance in theburgeoning studies of many other newly discovered interstellar molecules, as these molecules have been found injust these same dense clouds. In a literal sense, OH has proved to be the tracer molecule in the new field ofinterstellar molecular chemistry. Apart from its location in dense neutral gas clouds, OH has been discovered insome types of infra-red stars. A variety of other types of astronomical objects, such as planetary nebulae,Wolf-Rayet and T-Tauri stars, young and highly reddened stellar associations and clusters, do not yield observableOH to very low limits. It is anticipated that studies of physical conditions in these objects will shed light on thequestions of for.naiiuu and destruction of interstellar molecules in general, and OH in particular. Detection of OHin both absorption and emission has been made in comets, and research in this area is having importantimplications as to the origin and history of (he solar system.
3. The properties of the absorption lines
The anomalies in the intensities of the lines when observed in absorption, continue to pose importantproblems, as these relative intensities in the observed lines sometimes differ considerably from the expected valuesfor a source in thermodynamic equilibrium. For example, the absorption spectrum of the supernova remnant,Cassiopeia A, was examined at the frequencies of the two satellite lines, 1612 and 1720 MHz. Whereas both the1665 and 1667 MHz transitions show splitting into two lines, neither the 1612 nor the 1720 MHz transition showsany splitting. Furthermore, the absorption at 1612 MHz is approximately one half of that at 1665 MHz, instead ofone fifth, as expected. Finally, the observations indicate a small amount of OH emission at 1720 MHz, but noneis detectable at 1612 MHz. The unusual absorption features and the presence of weak emission have beenindependently confirmed. It is very difficult to see how any of these observations can be explained in terms of amedium in thermodynamic equilibrium, and these observations are among the many that require furtherexplanation.
Other absorption anomalies have been found in the-spectrum of the galactic centre [Robinson et a/., 1964;Goldstein ef a/., 1964; Goss, 1968; Bolton et al., 1964b). For example, the observed ratios of line intensities amongthe four lines are quite different from the ratios that are expected on the basis of thermal equilibrium. It istempting to try to explain the observed values in terms of a medium exhibiting large attenuation, for which allratios would approach unity, but this attempt fails. For example, isolated regions near the galactic centre showstronger absorption at 1665 than at 1667 MHz, and many regions show unequal absorption at 1612 and at1720 MHz. It seems clear that these observations require the assumption of non-thermal distribution of theOH molecules among the inter:.al energy states from which the radio lines are derived.
The OH observations in the galactic centre pose problems other than anomalous line-intensity ratios. OHabsorption is very strong and extends over a considerable frequency, or velocity range. If OH profiles for thegalactic centre are interpreted in a manner similar to that described for Cassiopeia A, then one derives on OH/Habundance ratio of — lO"4 some I03 times the ratio in the direction of Cassiopeia A. However, this value must beused with extreme caution, because any derived values, based upon observations, must await a full understandingof the mechanism by ' -h OH is formed, how it is distributed with respect to its internal energy levels, and howit absorbs and emit' Jio energy. From the frequency at which OH absorption occurs, one can determine thevelocity in the line jight of the OH cloud relative to the Sun; and it is found that much of the OH is movingtoward the galac* centre with a velocity of 40 km/s. This cloud also contains other molecules and neutralhydrogen. Or. '>* <her hand, most of the other gases associated with the galactic centre appear to be streamingaway from thr t ,tre. The motions in the central region are clearly very complex. This is a curious situation andmay force ?. r •/ aion of our ideas about the physical conditions in the galactic nucleus. It should be emphasized,though, thai I £ observations tell us nothing about the distances to the OH and H; the concept that they areassociated wi'.i the galactic centre rests strictly on interpretations of the accumulated evidence.
parsec = 3.26 light years.

380 Rep. 223-4
4. The properties of the emission lines
The observations of the OH emission lines have similarly opened up a new and complex area ofastronomical research. Early attempts to detect OH emission were confined to observations at 1667 MHz becauseit was thought this would be the strongest transition, but all attempts gave negative results. When OH was finallydiscovered in emission at 1665 MHz, not 1667 MHz, its properties were so unusual that two out of the first threegroups of radio astronomers to observe it did not attribute the line to OH.
Australian observers first observed OH emission in June, 1964, when a narrow, intense emission line wasdetected to the side of an absorption line at 1665 MHz in the direction of the galactic centre [McGee et al., I965J.However, the effect was apparently thought to be an instrumental effect and was not reported at the time. Sixmonths or more later, OH emission was observed by groups at Harvard and Berkeley, with properties sounexpected that the Berkeley radio astronomers thought they had detected an unidentified micro-wave spectralline; they nicknamed the line "mystenum" until identification could be established. Although "mysterium" wasalmost immediately identified as OH, the name can hardly be called a misnomer in view of the strange propertiesexhibited in interstellar OH.
The first OH emission sources found, were characterized by intense, narrow emission lines at 1665 MHz,with lines of lesser intensity at the other three OH frequencies. Departures by several orders of magnitude fromthe expected intensity ratios were the rule, furthermore, the spectrum obtained at one frequency was usuallycompletely uncorrelated with that obtained at another. This early type of OH emission source is now recognizedas only one of three distinctly different types of such sources. A second type radiates solely in the 1720 MHz line,while the third type has strongest emission at 1612 MHz but may be accompanied by weaker emission at both1665 and 1667 MHz. While the peculiarities of these three types of emission source may appear random, in factthis is not so. Observationally, each type is rather well defined with respect to the relative intensities among thefour lines, and each type also shows distinct polarization properties. Theoretically, models have been developedwhich, although probably not unique, do appear to explain the salient properties of each type of source.
The objects with which the various types of OH emission source aid associated, are a major factor in themodels proposed to explain them. Unlike the 21-cm emission of atomic hydrogen which is widely distributedthroughout the Milky Way, each type of OH emission source is found only in special regions. The type associatedwith strong 1665 MHz emission is found only in isolated positions near ionized hydrogen regions, at positionswhere strong sources of infra-red are often found; while the type associated with strong 1612 MHz lines comesfrom the atmospheres of cool stars. The sources emitting in only the 1720 MHz line have a more obscure origin,although they are definitely not associated with slellar-like objects.
Between 1968 and 1971, a total of five different emission lines have been discovered which arise fromtransitions within excited rotational energy states of OH [Zuckerman et al., 1968; Yen et al., 1969; Turner etal, 1970]. Many other lines from these states which theoretically ought to be present are not found. This situationoffers evidence as strong as that provided by the peculiar properties of the 18-cm lines, that the excitation of OHis in general not consistent with a medium in thermodynamic equilibrium. Observations of excited-state lines havealso proved very valuable in distinguishing between the various theoretical models for anomalous excitation ofOH.
5. The O18H and O17H lines
The strong OH absorption found in the direction of the galactic centre has made another experimentfeasible. All the results discussed above have referred to the abundant isotopic species C'H, but the observationof strong absorption suggested the possibility that the isotopic species O"H and possibly also O|7H could bedetected. The frequencies of these isotopes are shifted relative to those of the OI6H lines because of mass-dependent effects on the molecular energy levels.
Early searches for the OI8H lines were successful [Rogers and Barrett, 1966; Wilson and Barrett, I970J.Although weak as expected, both main lines (at 1637 and 1639 MHz) were detected in the galactic centre, andyielded an abundance ratio OI8H/O"'H of 1/390, which is consistent with the terrestrial ratio for O'VO"1 of 1/490within the uncertainties in the observations.
Laboratory measurements of the 18 cm lines in the ground states of O'*H and O|7H have been made [Ballet al., 1970]. Because of the nuclear spin of the O" nucleus, there are many more hyperfine transitions within theground state of OI7H than in the other two isotopes. However, the line strengths of only two of these 0|7H linesare strong enough to warrant astronomical searches with present equipment. These two lines, at 1624.4 and1626.2 MHz have been found in the direction towards the galactic centre.
6. Positions and sizes of OH emission sources
The positions of a number of the OH sources have been determined to an accuracy of better than onesecond of arc [Rogers et al., 1967]. The results have shown that an emission source can be a number of very smallbright regions separated by angular distances of a few seconds of arc. The angular sizes of the regions themselveshave been studied with interferometers of ever increasing base lines and angular resolutions. First results comewith spacings between the antennae of 127 km, or 7 x 10s wavelengths (Davies et al., 1967], and these showedthat one emitting region was less than 0.05 seconds of arc in size.

Rep. 223-4 381
The technique of very long base-line (VLB) interferometry began at about this time. In these experiments,two very distant radio telescopes observe the same source, and work as an interferometer because the localoscillator or phase reference at each telescope is derived from a highly stable rubidium maser. The resultingrecords for each telescope are subsequently carried to a computer and cross-correlated to develop the interferencefringes. This technique was shown to work first for continuum observations [Broten et al., 1967; Bare el al., 1967);but it is now extensively applied to OH line studies. As examples of base lines used, the radio telescopes at HatCreek (University of California), Lincoln Laboratory (Massachusetts Institute of Technology, near Boston),National Radio Astronomy Observatory (Green Bank, West Virginia) and Onsala (near Gothenburg, Sweden)have all experimented on OH line work in pairs. The results show that OH emission sources can be as small as0.005 seconds of arc in size. This limit may be still further reduced as experiments continue.
If (he frequency and phase stability of the VLB experiments can be improved (by he use of hydrogenmasers, for example), the technique may be usable for measuring the absolute positions of sources in the sky tobetter than 1 0 * seconds of arc. This in turn corresponds to position measures on Eart I of 3 cm and thepossibility of using such measures for a variety of geodetic and geophysical measurement* is very attractive [Gold,1967; MacDonald, 1967J.
7. The emission mechanism
The emission line intensities and the very small angular sizes of the sources raise difficult problems in theunderstanding of the mechanism by which the sources emit. Most attempts to explain the OH observational resultshave centred around some kind of population inversion of the energy levels, whereby the OH medium would beconverted into a medium which amplifies rather than absorbs. For amplification to occur, the population of thehigher energy levels (those defining the radio lines) must exceed those of the lower-energy levels, so that the neteffect of the passage of a radio wave through the OH is to induce more transitions from high to low energy levelsthan from low to high levels. As transitions from high to low energy levels add energy to the radio wave, andthose from low to high levels subtract energy, a medium with population inversion will add energy to the radiowave — that is, will amplify the radio wave.
The most obvious reason for attempting to invoke maser action to explain the OH observations is to meetthe requirement for explaining the extremely intense lines. The intrinsic temperatures of the lines correspond totemperatures in the range IO|; to 10M K, a circumstance which is highly suggestive of amplification processes,because such temperatures exceed, by several orders of magnitude, known physical temperatures. But the intensityof the lines is not the only reason for suspecting maser processes. Extremely narrow lines have been observed, andamplifying processes can lead to a line narrowing, line shapes as well as widths being altered by the amplification.Thus line widths of 600 Hz, corresponding to kinetic temperatures of S K, could exist in situations where the lineintensities correspond to temperatures between I012 K and 1014 K. Furthermore, if the maser mechanism weresensitive to polarization, then the observed radiation might exhibit a large degree of polarization, such as isobserved.
Finally, another property of maser processes should not be overlooked. If an OH medium can be broughtto a state of amplification, then sources of radiation lying behind it, as viewed from the Earth, or emission of themedium itself, may appear as sources of extremely small angular size. This may be true because of the coherentnature of the amplifying processes, which produces a high degree of directionality in the amplified radiation. Ifthis is indeed happening, then the small angular sizes observed in the interferometric observations may actually be"apparent" sizes rather than true angular sizes. For this reason, the linear dimensions of the OH emitting regionsmay be considerably larger than those inferences obtained from observations.
8. Techniques
The continuation of this research, and particularly the investigation of the mechanism by which theOH molecule is formed in interstellar space; will involve further detailed observations using the greatest attainablesensitivity and freedom from harmful interference.
Receivers used to study the OH lines need to have narrower resolutions than those used in the observationof the 1420 MHz line of hydrogen. The OH lines are usually narrower than the hydrogen lines because theOH molecule exists only in regions which are both more quiescent and of higher density. Linewidths of I to10 kHz are typical. The receivers need, however, to be tunable over an appropriate range, since the lines observedare broadened and displaced in frequency up to several megahertz, as a result of Doppler effects due to relativemotions in the line-of-sight. Furthermore, accurate measurements of the shape of the spectral lines requirecomparison measurements at adjacent frequencies which are free from the effects of OH absorption or emission.The overall frequency band technically necessary for detailed study of the two principal lines at 1665.4 and1667.4 MHz, taking into account the requirements for comparison observations and Doppler shifts, is at least5 MHz, and preferably about 10 MHz. In the foregoing, the OH molecule referred to is the OH molecule withinour galaxy; however, OH has also been detected in external galaxies [Welizchew, 1971]. The studies in this arearequire downward extensions in frequency since the Doppler shift of the lines is much larger for gas residing inexternal galaxies than in our own galaxy.

382 Rep. 223-4
REFERENCES
BALL, ;. A., ZUCKERMAN, B., GOTTLIEB. C. A. and RADFORD, H E . [1970) Bulletin of the American AstronomicalSociety, 2, 293.
BARE, C , CLARK, B. C , KELLERMANN. K. I., COHEN, M. H. and JAUNCEY, D. L. [1967] Science, IS7, 189.
BOLTON, J. G., van DAMME, K.J., GARDNER. F. F. and ROBINSON, B.J. (1964a] Nature, 201, 279.
BOLTON, J. G., GARDNER, F. F., McGEE, R. X. and ROBINSON, B. J. [I964b| Nature, 204, 30.
BROTEN, N. W., LEGG, T.H., LOCKE. J. L, McLEISH, C. W., RICHARDS, R. S., CHISOLM, R. M., GUSH, H. P., YENJ. L. and GALT, } . A. [1967] Science, 156, 1592.
DA VIES. R. D., de JAEGER, G. and VERSCHUUR. G. L. [1966] Nature, 209, 974.
DA VIES. R. D., ROWSON, B., BOOTH. R. S.. COOPER. A. J.. GENT, H., ADGIE, R. L. and CROWTHER, J. H. [1967]Nature. 213, 1109.
EHRENSTE1N, G.. TOWNES, C. H. and STEVENSON, M. J. |1959] Phys. Rev. Utters, 3, 40.
GOLD, T. [I967J Science, IS7, 302-304.
GOLDSTEIN, S. J., GUNDERMANN, E. J., PENZIAS, A. A. and LILLEY, A. E. [19641 Nature, 203, 65.
GOSS, W. M. [1968] Astrophys. Journ., Suppl., 15, 131.MacDONALD. G. J. F. |1967] Science, 157, 304-305.
McGEE, R. X., ROBINSON, B. J., GARDNER, F. F. and BOLTON, J. G. [1965) Nature, 208, 1193.
MORAN, J. M.. CROWTHER, P. P., BURKE, B. F, BARRETT. A. H., ROGERS, A. E. E., BALL, J. A., CARTER, J. C. andBARE. C. C. (1967) Science , 157, 676.
ROBINSON. B. J., GARDNER, F. F., van DAMME, K. J. and BOLTON, J. G. [1964] Nature, 202, 989.
ROGERS. A. E. E. and BARRETT, A. H. [1966] Astron. Journ., 71, 868.
ROGERS, A. E. E.. MORAN, J. M., CROWTHER, P. P., BURKE, B. F., MEEKS, M. L., BALL, J. A. and HYDE, G. M. [I967JAstrophys. Journ., 147, 369.
TURNER. B. E. [19701 Astrophys. Journ. (Letters), 6, 99.
TURNER. B. E. [1972! Ascophys. Journ., 171, 503.
TURNER, B. E., PALMER, P. and ZUCKERMAN, B. [1970] Astrophys. Journ. (Letters), 160, LI25.
WEAVER. H., WILLIAMS, D. R. W., DIETER, N. H. and LUM, W. T. [1965] Nature, 208, 29.
WEINREB. S., BARRETT, A. H., MEEKS, M. L. and HENRY, J.C. [19631 Nature, 200, 829.
WE1NREB, S., MEEKS, M. L., CARTER, J. C . BARRETT, AH. and ROGERS, A. E. E. [1965] Nature, 208, 440.
WELIZCHEW. L. [1971] Astrophys. Journ. (Letters), 167, L47.
WILSON, W. J. and BARRETT. A. H. [1970) Astropys. Journ. (Letters), 6, 231.
YEN. J. L., ZUCKERMAN, B., PALMER, P. and PENF1ELD, H. [1969] Astrophys. Journ. (Letters), 156, L27.
ZUCKERMAN, B., LILLEY, A. E. and PENFIELD, H. [1965] Nature, 208, 441.
ZUCKERMAN, B.. PALMER, P., PENFIELD. H. and LILLEY, A. E. (1968] Astrophys. Journ. (Letters), 153, L69.
ANNEX HI
WATER VAPOUR LINE AT 22.235 GHz
I. Introduction
The 22.235 GHz spectral line of the water molecule is well known to radio engineers because of itscontribution to atmospheric absorption of radio waves. The water vapour line in the atmosphere is pressurebroadened causing significant propagation loss over a band of several GHz around the 22.235 GHz centrefrequency.
The important possibility that water molecules in space could be detected through identification of this linewas considered feasible [Snyder and Buhl, I969J, since the line width will be much narrower for molecules at verylow pressure in space, and can easily be distinguished from the very broad atmospheric line. The line emissionfrom H2O molecules in space was discovered in 1968 [Cheung et al., 1969] in three separate regions in the Galaxy,and at a suprisingly high intensity level. In fact, by orders of magnitude, the H2O sources are the most intensecelestial radio sources in this frequency range, with the exception of continuous emissions from the Sun and theMoon.
In rapid succession, a number of additional very intense celestial H2O sources were discovered and it wasfound that the sources emit complex spectra of Doppler-shifted lines; that the radiation is in some cases linearlypolarized; that the sources are smaller than the beams of large radio telescopes; and that the line intensities arehighly variable, in some cases over periods of a week which suggests extremely small source sizes [Knowles et al.,1969a,b; Meeks et al., 1969; Buhl et al., 1969; Turner et al., I97C; Sullivan, 1971, 1973; Johnston et al., 1971a,1973; Turner et al., 1971]. Investigations by the technique of very long base-line interferometry have shownangular sizes for the sources as small as 0.0003 arc seconds, comparable in angular diameter with the smallestknown celestial radio continuum sources [Burke et al., 1970, 1971; Johnston et al., 1971b; Abliazov et al., 1974].Maser amplification by the water molecules is indicated by the very high line intensities and very small sot.-ce

Rep. 223-4 383
diameters giving apparent brightness temperatures greater than 1O|: K; and by polarization of the radiation. Thefirst celestial H:O sources were found in, or near, galactic ionized hydrogen clouds and positions near OH emis-sion sources and in some cases infra-red sources. Subsequently, the line emission of water molecules was found ina number of infra-red stars (Knowles el al., 1969a; Turner et al., 1970; Schwartz and Barrett, 1970; Schwartz,1971; Dickinson et al., 1973], and in external galaxies [Churchwell et al., 1977].
The discovery of the intense non-thermal radio radiation from water molecules in space, is of greatastrophysical significance and practical importance. It provides a new means for investigating the distribution ofmolecules in the Universe, the motions of the gas clouds, and the physical conditions in space which support themaser amplification process. These intense, very small radio sources in the sky give a new potential forapplications as known radio beacons, and with the very long base-line interferometry a technique for accurateposition determination on earth over great distances.
Thermal emission or absorption by water molecules in space has not yet been detected and it is importantto extend the research to weaker signal levels to determine the distribution of water molecules in the Universe.
2. Spectral properties
Speciromeiry with high resolution shows the H,O source spectra to be complex composites of intense,narrow lines which are Doppler-shifted in frequency by different amounts depending on the velocities in theline-of-sight of the emitting gas clouds, with respect to the Earth. The broadest known spectrum, in the sourceW49, shows line" spread over a range of line-of-sight velocities of at least ± 240 km/s corresponding to afrequency spread of 37 MHz. Individual lines have total widths at the half intensity point as small as 40 kHz(corresponding to about 0.S km/s in the line-of-sight velocity), the range of line widths extends up to three timesthis value, and lines at different Doppler shifts blend together to produce broad spectral features.
Individual line intensities range up to a flux density of approximately IO~21 W/m2 • Hz and vary withlime. In some cases, order of magnitude intensity variations are observed on a time scale of weeks, while somelines vary little over lime periods of a year or more. An increase in line intensity is, in many cases, accompaniedby maser narrowing of line width. Small variations of line frequency with time are observed, and are probably theresult of intensity variations in unresolved line blends. The intensity variations of individual lines are largelyunrelated, indicating separate emission regions, and neither order nor periodicity has been found in most sources.Exceptions are the H,O sources associated with long period variable stars, where the H2O emission variesperiodically in phase with the stellar light variation.
3. Polarization properties
Linear polarization of a magnitude up to approximately 50% has been obser -"ed in some lines, but thelinear polarization of the majority of the observed lines is less than 10%. The degree jf polarization observed inthe Orion Nebula varies with time in the same sense as the line intensity. Circula: polarization has not beendetected.
4. Sizes and positions of H2O sources
The sizes and positions of the H2O sources are currently being investigated by the technique of very longbase-line interferometry. The intense source, W49, has been most intensively studied at increasing'y longer baselines up to 7375 km (547 million wave lengths) where the fringe spacing is 0.00038 arc seconds. At ihis base line,the strongest emission source is partially resolved; this result is consistent with a uniformly bright source ofdiameter 0.0003 arc seconds. In comparison, the sizes of OH sources in the same vicinity are abcut 0.05 arcseconds. The H2O sources in the Orion region, which is about 30 times nearer Earth than the W49 region, are insome cases partially resolved at a base line ten times shorter.
At shorter base lines, the relative positions of the sources, each of which corresponds to an individual linein the W49 spectrum, have been measured. They are found to scatter over an area of sky about 1.5 arc seconds indiameter. There is no obvious correlation between the positions and the line-of-sight velocities of the lines whichwould indicate systematic motions of the water molecule clouds. The absolute positions of the most intense lineswere measured to 1" x 10" arc accuracy and there is agreement, within this range of uncertainty, with theposition of the OH source. The dimensions of the space occupied by the Orion and W49 sources are roughlyequal, despite a difference of over three orders of magnitude in their intrinsic intensities.
Accurate interferometer positions have been measured for several of the intense H2O sources [Hills et al.,1972] confirming the close association of H,O and OH sources, and in some cases, close association in positionwith infra-red sources and compact ionized hydrogen regions.
These experiments demonstrate that H,O sources can be used for interferometry over the maximumdistances allowable on Earth for astrophysical, geodetic, and geophysical investigations.

384 Rep. 223-4
5. Emission mechanism
The observed line intensities and the very small apparent source diameters observed by very long base-lineinterferometer techniqi'. s. give maximum source bripKness temperatures of the order of I01' K and hence requirea non-thermal process. Maser amplification by water molecules is consistent with the intensity requirements andline narrowing from reasonable interstellar conditions, and provides possible mechanisms for extreme timevariability through changes in population inversion of the molecular energy levels, changes in amplification pathlength, and changes in beaming of the radiation. The mechanism for overpopulating the higher energy levelrelative to the lower energy level to allow amplification may be radiative, collisional, or chemical. The occutrenceand temporal behaviour of H O sources near coo! stars, strongly suggests radiative inversion of the H^O rotationallevels via the 2 to 5 mu near-infra-red vibration-rotation bands. This mechanism, however, appears to beinadequate to explain emission from the vicinity of ionized hydrogen regions. The apparent coincidence of the OHand H O masers in many objects suggests a common inversion mechnnism, perhaps involving the creation anddestruction of H.O molecules by radiation or collision but. as yet. no quantitative description of such a processexists. Theoretical and experimental work is still proceeding to define a clear preference for one uniquemechanism
6. I t ihnical requirements
Continuation of this research, and the important extension to the weak lines of normal water molecules, aswell ;is research into the scientific applications of the very long basel ine interferometer technique to make precisemeasurements of positions on the harth. and earth motions for geodesy and geophysics, will require the highestpossible measurement sensitivity and freedom from harmful interference
The observed lines are narrow (40 kHz) but are spread over a band of at least 37 MHz by Doppler shifts,hxtra-galuctic water lines are Doppler-shil'ted by greater amounts. Detailed measurements require receivers with afrequency resolution of less than 4(1 kHz. but tunable over many megahertz The overall frequency band requiredfor detailed study of the 22.215 CiH/ H O line is at least 50 M H /
Rl H-RI-NCl S
ABLIA/OV V A. A L I K S l l V . V I, SOROK HI NKO. K I.. TROIT/KI. V S . AMOM.TZ. M A . ARISKIN. V A..VI KSHIN. V P. (iATILJLK. I (j . 1)1 MIN. V M. I IANOV. V. A. K I T L / A . B. CJ.. MINIATOV. B. N.,MATVH NKO. I . I . MKRITCHAN. S M . MOIJSI I V. I d . NIKONOV. V N . , ATANI.SIAN. V. A.,SANAMIAN. V A. SIZOV. A S. SOSNIV V ('. ( O l l f V. H P. K HIKIN. H N and TSHfcKOTIF.V. B. V [(y74J/ /uv / . i \iu Series "Kadiol'i/ikd"
111 ML. . SNYDf R. I t , SCHWARIZ. P R .trnJ BARRI II . A H H469] Astrophys Journ (Letters}. 15X. L97.BL RKI . II h . MATVI VI NM). L I . MORAY J M . MOISI VI V. I (i . KNOW! 1 S. S H , ( I ARK. I) G . fcEANOV, V. A ,
JOHNSTON. K J . KOCiAN. I R . KOSTI NKO. V I . 1 O. K V . PAPA. D C .. I'APADOPOl LOS. Ci. D., ROGERS,A I I and SCHWARTZ. I' R |Dcemner. I47|| Abstract. l.'6lh Meeting AAS
Bl RKI. I) I . PAPA. I) ( . PAPADOPOl LOS. (J I) . S( HWARI/ . l> R. KNOW! IS. S H.. SI LLIVAN. W. T., MfcLKS.
M L and MORAN. J M |I47<)| Asiroph}- Journ tteller*!. IW». 16?
C H t l N C i . A ( . RANK. I) M . TOWN I S. ( H . I HORN ION. I) I) jnd Wl I ( H. VA J |lsihs)] S.iiurc. 221. 626
C HUR< HWI.LL. I . WIT/LI. A. HICHTMIIIK. W. I'AL 1 IN V IOT H. I. ROLAND. J and SILBhR. W [IS)77JAstronomy jnd As/n>phys/ts. 54. 464
D I C K I N S O N . I ) 1 . B I - . C H I S , K P a n d B A R R I n . A H | !SI7? | A t r o p h y - Journ.. INII. Ktl
H I L L S . I:.. J A N S S h N . M. A . T H O R N T O N , I ) I ) .mi l W M . C H . W J | t s > 7 : | 4 - m y i / n v Journ tLelter<.}. 175 . L 5 9 .J O H N S T O N . K J . K N O W L I S . S H a n d SI I I I V A N . W T | l < i T | a | A s i r o p h . w . Journ. i L e t t e n . ! . 167 . L9.VJ O H N S T O N . K . J . . K N O W L I S , S H . S l ' l . l I V A N . W I . M O R A N . J M . B U R K 1 . B . I - . . L O . K Y . P A P A . D C .
P A P A D O I ' O l ' l O S . G . I ) . S t H W A R T / . , P R . K N I C i H T . ( A , S H A P I R O . I I a n d W I L C H , W. J. [ 1 4 7 1 b ] A s t r o -phys Journ (Letters), I6h, 1.21
J O H N S T O N , K J . S L O A N A K I R. R M and DOLOCiNA. J M. [ I W J Astwphys. Journ . 182. 67.
K N O W L b S . S. H.. MAYt-.R. ( H . ( H M M i . A ( . R A N K . I) M and TOWNJ.S . ( H |W64a) Science. I6.V 1055
K N O W L K S , S. H . MAYI R. < H . SL LI IVAN. W T and CHI-.l'NCi. A ( [I96s>b| Science. 166. 221
M E E K S . M L . C A R T h R , J. C . BARRI TT. A H . S C H W A R T Z . P R . . W A T l . R S . J. W and B R O W N , W I. | l % 9 ] Science.
165, 1X0.
S C H W A R T Z , P. R |7 M a j , 1471) Dissertation, MIT
S C H W A R T Z . P. R and BARRI-.TT. A. H |I97()| Astrophys. Journ. /Letter*). 154. LI2.V
S N Y D K R . L. E. and BUHJ-. I). 11469] Ailrophyy Journ. (Letter*). 155. 1.65
S U L L I V A N , W. T. | I9 July, 1471] Aslrophy*. Journ.. 166. .121. Dissertation, l i n i v of Maryland
S U L L I V A N . W. T [!97.1| Astrophys. Journ.. Suppl., 222. 25. .W.V
T U R N E R , B. E., B U H L . I). . C H U R C HWI-.I.l.. f B.. Mi.ZiilR. P.O. and S N Y D E R . L h (!97()| Astronomy and Astrophysics.
4. 165.
T U R N E R . B. E. and R U B I N . R. H. | I 9 7 I | Aslrophys. Journ. (Letters). 17(1. LI 13.

Rep. 223-4 385
ANNEX IV
THE FORMALDEHYDE LINES
1. Introduction
Radio lines from clouds of formaldehyde <H*CO) in our galaxy have been detected on at least eightdifferent frequencies Lines from the carbon-13 isotope at 4593 MHz and the oxygen-18 isotope at 4389 MHz havealso been detected. The most important ;>ne is at 4830 MHz which generally appears in absorption against brightradio sources, ionized hydrogen regions, and even the microwave background in nearby dust clouds. The nextlines of importance after this line, are those at 14.488 GHz and at 140.840 GHz. 145.603 GHz, and 150.498 GHz.The las! three lines appear in the high density cores of rapidly condensing galactic clouds.
2. Kurma.'jchtdc absorption at 4830 MM/
The discovery in March. 1969, of the 4830 MHz absorption line of formaldehyde (Snyder ef al., 1969) hadfollowed the detection of ammonia and water in late 1968, and so. clearly demonstrated the existence of organicpolyatomic molecules in interstellar space. None of the molecular lines subsequently discovered in 1970 and 1971(with the possible exception of the CO line at 115.267 GHz) are as important to the study of dust clouds andgalactic structure as the 4K3O MHz line of formaldehyde. A large number of radio sources have formaldehydeabsorption lines m them (^uckerman cl al.. 1970, Whileouk and Gardner. 1970) showing that formaldehyde, likehydrogen and h>di\ xvl. is a common constituent of galactic spiral arms. Hence, it can be used to study thestructure of our Milky Wai galaxy High-resolution studies have been made of the formaldehyde lines in thegalactic centre using lunar occupation techniques [Kerr and Sandqvist. 1970] and inlerferometry [Fomalont andWehachew. 1973) Absorption at 4X30 MH/ has been detected in external galaxies [Gardner and Whiteoak, 1974).
One of the most interesting aspects of formaldehyde absorption are the anomalous lines observed in anumber of nearby dust clouds |Palmer et ill., I969|. This aspect is quite anomalous, since only emission lines fromother molecules are obser\ed in the same cloud. The absorption must be produced against the 3 K backgroundradiation, the microwave remnant of the primeval fireball. Accordingly rrany nearby dust clouds can be examinedby means of the formaldehyde molecule without the need for a H ickground radio source. This refrigeratormechanism is the inverse of a maser mechanism and it is only observed in dust clouds and possibly in the verydense cores of galactic sources [Townes and Cheung, 1969). Hence the 4830 MHz transition is useful for studyingthe physical conditions inside dust clouds.
Formaldehyde is separated into ortho and para levels and transitions between (he ortho and para states areforbidden by electric dipole transition. This can be thought of as two species of the molecule that differ in energy:o«ho formaldehyde and para formaldehyde. The lowest energy slate for ortho formaldehyde will normally have ahigh population Not only is this the optimum configuration for producing an absorption line, but also 4830 MHzis a good frequency for large telescopes. At lower frequencies, the spatial resolution deteriorates and at higherradio frequencies, the continuum background necessary for absorption becomes weaker. A similar situation occursin ibe OH molecule. The formaldehyde line is actually split into six components covering about 30 kHz [Tuckeret nL 1971). In most cases the Doppler broadening of the line is much greater than this.
3. Other formaldehyde absorption lints
Absorption lines from -«.o other pairs of levels of ortho formaldehyde have been found. The lines appearat 14.489 GHz, 28.975 GHz and 48.285 GHz, and have a large optical depth in the galactic centre [Evanset uf., 197(1; 'Velch. I97(>|. Thi\ are rarely seen outside this region, which indicates that the higher energy levelsare not as •veil populated as those levels that give rise to the 4830 MHz transition. In addition, the continuumsources arc considerably weaker al the above 14. 29 and 48 GHz lines. Increases in receiver sensitivity may makethese lines useful in the future for studying the excitation of formaldehyde.
4. The 140 to 190 ( i H / emission lints
Three high frequency emission lines of formaldehyde have been found in the Orion Nebula. Lines of orthoformaldehyde have been delected in Orion A, the galactic centre source Sgr A (NH,A) and at least two othergalactic sources [Kutner. etui., 1971; Thaddeus. et al.. I97IJ. The emission lines are the i lost intense in Orion,whereas the 4830 MHz absorption line is very weak [Kutner and Thaddeus, 1971). This happens because themolecular cloud is located in the dus(y region behind the bright nebulae and radio source. The angular diameterof the emission region is about 3' arc, and is generally centred on the OH maser [Thaddeus et al., 1971], a regionwhere emission lines from other molecules have been found. Another line at a frequency of 72.838 GHz has beendelected, and is important because it is the lowest ground state transition of the formaldehyde molecule. We knowfrom the 4830 MHz absorption measurements that the formaldehyde cloud extends southward for at least 30' arc[Kutner and Thaddeus, 1971). The conclusion is thai the densities required to produce the 140 to 150 GHzemission lines are quite high, of the order of 10* hydrogen molecules/cm' [Thaddeus et al., 1971). Such densitiesare only achieved in the central part of the nebula. It is generally assumed that these dense regions are highlycollapsed clcuds in the process of forming stars. Hence we can see the importance of both the 140 to 150 GHzemission, and 4830 MHz absorption lines, in studying this region which is at an important stage in the evolutionof interstellar clouds.

386 Rep. 223-4
REFERENCES
EVANS, N. J. II, CHEUNG. A. C. and SLOANAKER, R. M. (I970J Astrophys. Journ., 159, L9.
FOMALONT, E B. and WEL1ACHEW. L. N. |I973| Astrophys, Journ., 181, 781.
GARDNER, F. F. and WHITEOAK, J. B. (1974] Nature, 247, 526.
KERR, F J. and SANDQVIST. Aa. (1970] Astrophys. Lett., 5, 59.
KUTNER. M. and THADDEUS, P. [I97IJ Astrophys. Journ.. 168, L67.
KUTNER, M.. THADDEUS, P., JEFFERTS, K. B.. PENZ1AS. A. A. and WILSON, R. W. [1971] Astrophys. Journ., 164, L49.
PALMER, P.. ZUCKERMAN, B., BUHL, D. and SNYDER, L. E. [1969] Astrophys. Journ., IS6, L147.
SNYDER, L. E., BUHL, D.. ZUCKERMAN. B. and PALMER, P. [1969] Phys. Rev. Lett., 22, 679.
THADDEUS, P.. WILSON, R W., KUTNER, M., PENZIAS, A. A. and JEFFERTS, K. B. (1971] Astrophys. Journ.. 168, L59.
TOWNES. C. H. and CHEUNG, A. C [19691 Astrophys. Journ., IS7 L103.
TUCKER. K D.. TOMASEVICH, G. R. and THADDEUS, P. (1971] Astrophys. Journ.. 169, 429.
WELCH, W J [1970] Bulletin of the American Astronomy Society. 2, 355.
WHITEOAK. J. B and GARDNER, F. F. |1970] Astrophys. Lett., 5, 5.
ZUCKERMAN. B.. BUHL, D., PALMER, P. and SNYDER, L. E. (1970) Astrophys, Journ., 160, 485.\\\t
\ ANNEX V
THE\CARBON MONOXIDE LINES
1. IntroductionCarbon monoxide is a diatomic molecule with a simple rotation spectrum (Gilliam el a/., 1950). This
molecule was first detected in interstellar space in 1970 when line emission from l?r'*O at 115.2712 GHz, "CI6Oa< 110.2014 GHz and i:C'"O at 109.7822 GHz was discovered [Wilson et al., 1970; Penzias et al., 1971]. The mostintense line, that of ':C'*O, has been found (o be readily detectable over much of the area near the plane of ourgalaxy, as well as in the directions of ionized hydrogen regions, interstellar dust clouds, supernova remnants andan infra-red star. This emission typically covers a considerably larger area of the sky than (he optical size of (heobject. The corresponding "C"O lines are generally present with between one third to one tenth the intensity ofthe more common isotope. The weaker i:C lhO line has been detected in the strongest sources and found to beabout one fifth that of (he ^C'"O line.
2. General
Perhaps because it is, by a considerable^margin, the most stable of the known interstellar molecules[Brewer et al., 1948), it appears, after molecular hydrogen, to be the most abundant. Its wide distribution makes itan extremely useful tool in the study of a variety of astronomical problems pertaining to the chemicalcomposition, mass motion, excitation and density distribution ol interstellar space. It permits the study of galacticmotion in direct analogy with the 1420 MHz line of neutral atomic hydrogen. The much shorter wavelength of theCO line affords a large increase in resolution: I' arc for the CO line on a 11 m diameter millimetre wave antennacompared with 10' arc resolution for the hydrogen line on a 100 m antenna. Furthermore, by observing severalCO isotope lines one can obtain opacity information in the dense regions near the centre of (he galaxy. Theobserved CO column densities are so high that much of the interstellar carbon must be in the form of CO,enabling us to investigate the total mass of hydrogen from the C/H ratio.
3. Techniques
All the present work has been done with a receiver of almost two orders of magnitude less sensitive thanthose now used at the hydrogen-line frequency. With the advent of cryogenically cooled receivers for this work, areduction in noise of at least a factor of ten seems likely. Such an improvement in sensitivity will undoubtedlyreveal many fainter areas of CO. The most important of these will be external galaxies which may be expected tohave Doppler shifts of several hundreds of MHz from the rest frequencies of the lines. The widest CO linesobserved so far, those near the galactic centre, require a frequency band at least 100 MHz wide for their study.
REFERENCES
BREWER, L., GILLES. P. W. and JENKINS, F. A. [1948] Journ. Chem. Phys. 16, 797.GILLIAM, O. R., JOHNSON, C. M. and GORDY, W. (19501 Phys. Rev. 78, 1940.
PENZIAS, A. A.. JEFFERTS. K. B. and WILSON. R. W. (1971) Astrophys. Journ. 165. 229.
WILSON, R. W., JEFFERTS. K. B. and PENZIAS, A. A. (1970] Astrophys. Journ., 161, L43.

Rep. 224-4 387
RfcPORT 224-4
( H\R\C IKRISIKS Oh IMK KADIOASTRONOYIY SERVICE.\ M ) IVIKRI KRKM r I'ROIKCI ION C RITKRIA
( Q u e s t i o n 5 1 2 )
(1963 - 1966 - 1970 - 1974 - 1978)
A < HAKA( I I RINIK S ()l I HE RADIOASTRONOMY SERVICE
I. liilruduiticin
Fhc science of astronomy iontcrnN itself with the study of the Universe. With very few exceptions, such asmeteorites, particles elected hv the Sun jnd space probes, all the available information about the Universe isconveyed by electromagnetic waves.
Radiojsironomy jnd (he radioasironomy service .ire defined in Article I. Nos. 74, 75, and 75A of theR.n'io Regulations as being astronomy hased upon the reception of radio waves of cosmic origin. Since it usesreceiving techniques only, the radioasironomy servic: does not cause interference to any other service. Radio-.istronomv .it present utilizes the electromagnetic spectrum ranging from I M H / to about 300 GHz.
Radar .istronumv. which involves the transmission of a signal at a high power-level and the detection ofth.it signal .liter reflection Iron) celestial bodies, man-made satellites, or meteor trails; is a quite different service,.mil is covered in (Question h-1 2
Radioastronomy began with the discovery in 14^2. by Karl Jansky. of radio waves of extra-terrestrialorigin |J.insk>. |s>l!>| Ihe cosmic emissions with which the radioastronomy service is concerned constitute the"cosmic background noise" ol communications engineering
Since J.msky's original observations, remarkable progress ha, been made in identifying the nature of theseemissions, .md radioastronomy is now firmly established as an important branch of astronomy. It is a new field ofscience, but it has alreadv made important contributions lo our knowledge of the measurement of atmosphericabsorption at radio Ircquencics and also to our knowledge of the composition and nature of the Sun, the planets,interplanetary space and. in particular, the m.i|or disturbances in the solar atmosphere which are often theforerunners ol interruptions to , .idioiom/mimcaiion circuits and of radiation hazards to man in space. Furtherafield, studies of individual sources over a ange of frequencies, and of the "line" emissions at precise frequenciesresulting from transitions within certain atoms and molecules, provide information basic to our understanding ofihe physical processes responsible for the emissions of plasmas, and of ihe structure and evolution of galaxies andof the I inverse is a whole The radioastronomy service offers means for studying magnetic fields in distantregions ol the (inverse, .ind much of the information it provides is unique in thai il is unobtainable by optical orother ivci'uids. one ol its most spectacular characteristics is the ability lo probe even further into the depths ofspace "h :,i is possible with the largest optical telescopes
•i addition lo providing new knowledge and understanding of great significance to astrophysics andcosmology radioastronomy is repaying, in a practical way. some of the investment of specialized radio techniquesthai helped u I".rig it ,nto being II supplied a major stimulus to the development of maser and parametricamplifier tec tin r.c- am) hence to an increase, by orders of magnitude, in the sensitivity attainable in radioreceivers It has als.. made, and is continuing lo make, significant contributions lo the design of large steerableantennae and leed svsiems Ihe techniques of very long base-line interferometry (VLBI) are becoming ofincreasing importance for geodetic measurements of global distances. Radioastronomy methods are now beingemployed lor radionavig.iiion and are finding applications in the medical field.
Ihe cosmic emissions with which the radioaslronomv service is concerned are characterized by low powerflux leveis at the I arth Most emissions show no modulation, other than random noise: an exception is thepulsars, which emu pulses of radio energy at extremely regular repetition rates. For many sources, the best timesfor observation are dictated by natural phenomena over which the observer has no control, and so radioastronomers are not generally able lo observe over any chosen limited time interval at their own convenience,furthermore, ihe radio astronomer is unable to change ihe character of the "signal" he wishes lo receive; hecannot increase the transmitter power nor code the transmitted signal lo increase its detectabilily. Recentdiscoveries ol dis.cn tv line emission from molecules at frequencies other than those currently allocated toradioastronomy cause ..idio astronomers to he faced with interference situations over which they have no control.
Studying radiation, the radio astronomer observes and measures all the properties of the electromagneticemission. These are.
intensity,frequency.
- polarization.- ihe position in the sky. and- Ihe variation of these parameters with time.
Ihe results are combined in order lo gain an understanding of the physical processes in the Universe.

388 Rep. 224-4
2. Origin and nature of the emissions
2.1 The radio waves with which the radioastronomy service is concerned are generated in extra-terrestrialsources by four distinct mechanisms:
- thermal emission from hot ionized gas and from solid bodies;
- non-thermal processes, mainly synchrotron emission from electrons spiralling in a magnetic field, butincluding also emission from plasmas (as in the solar atmosphere): and the pulses emitted by pulsars;
- "line" emission resulting from transitions within individual atoms and molecules;
- primordial radiation fields.
These combine to produce:
2.1.1 A continuum of radiation, which extends relatively smoothly over the whole frequency rangeaccessible to observation; upper and lower limits of observation are imposed by the Earth's atmosphere atroughly 300 GHz and 1.5 MHz respectively.
The continuum is composed of a background together with numerous small "bright" regions, thediscrete radio sources. The background shows a general distribution over the whole sky with a broadmaximum in the direction of the galactic centre, together with a ridge of intense emission around thegalactic equator (the Milky Way), showing a marked maximum in the direction of the centre.
The discrete sources, often referred to as radio stars, are, with a few exceptions, (notably the Sun,and special types of nearby stars), not stars but radio "nebulae". They are of two kinds, those ofextra-galactic origin and those originating within our galaxy. The extra-galactic sources are, in general,distributed randomly over the sky while the galactic sources are for the most part confined to within a fewdegrees of the galactic equator.
2.1.2 "Line" emission which, though occurring at the source at one or more precise frequenciesdetermined by the transitions involved, is observable over a band of frequencies, the result of Dopplershifts due to relative motions in the line-of-sight. Spectral lines are also observable in absorption when astrong source of continuum emission is viewed through an intervening gaseous medium.
2.1.3 Intermittent emission ("bursts") of durations which may vary from seconds to hours. They are mostintense in the flf- and VHF bands, and those from disturbances in the solar atmosphere may varyprogressively in frequency, from high to low, during their lifetime. Those so far detected originate inlocalized areas on the Sun. some types of stars, the planet Jupiter and (at a lower level) X-ray sources.
2.1.4 Pulsating emission (pulsars) was discovered in 1967 |Hewish et at., 1968) and is believed to beradiation from stars composed only of neutrons and thus to be matter in its most highly condensed state.The neutron star rotates and the interaction of its magnetic field with the surrounding plasma generates thepulses of radio waves. The rate of emission of these pulses varies in different pulsars from about 30 persecond to about one pulse every 4 seconds. Some pulsars are slowing down: cases have occurred where thepulse recurrence frequency has changed suddenly. A general description of pulsars has been published(Radhakrishnan. 1969]. Pulsars are not only important astrophysical objects but they often serve for theinvestigation of the interstellar and interplanetary media. Furthermore, observation of a pulsar member ofa binary star system offers a possible new technique for investigating the general theory of relativity.
2.2 Continuum radiation and discrete sources
The discovery of the largest class of radio sources and the bulk of current knowledge about their natureand distribution, and the processes responsible for the radio emission from them, has come about throughobservations of the continuum radiation, made at a limited number of frequencies at the lower end of the bandtransmitted by the ionosphere. Observations of intensity need to be made at a number of frequencies to determinethe characteristic "spectra" of sources, but, because the distribution of continuum radiation with frequency isrelatively smooth, observations of this kind do not need to be made at specific or closely adjacent frequencies. Formany types of observation, bands spaced at intervals of an octave are satisfactory. However, there are someunusual sources, for example those showing self-absorption, newly-created sources such as novae and pulsars forwhich observations at intervals of less than half an octave are desirable. In addition the study of polarizationoften requires observations at closely spaced frequencies.
The detailed structure of many radio sources is an important feature which can lead to a betterunderstanding of the ways in which radio energy is generated. To observe this structure, high angular resolutionsare needed. Antenna systems (arrays) capable of producing details with a resolution of a few seconds of arc havevery large dimensions (100 000 wavelengths or more). Much finer detail can be observed by using very long baseline interferometers with antennae separated by thousands of kilometres or by observing when the Moon occultsthe source. World-wide protection of the continuum bands is needed to ensure that no transmitter in the protectedbands will illuminate the Moon or be able to interfere via any antenna of an interferometer system which oftenextends over different countries or different continents.

Rep. 224-4 389
The continuum radiation from most discrete sources and from parts of the background is partially planepolarized. A study of this polarization over a range of frequencies can be used to deduce the Faraday rotation,and hence the magnetic field conditions in the radiation source, the ionosphere and the interstellar regions of theMilky Way. For this work, observations at more closely spaced frequency intervals than the normally adequateoctave separation are desirable at frequencies below about 2 GHz.
The bands made available to the radioastronomy service, in accordance with the Final Acts of the WorldAdministrative Radio Conference for Space Telecommunications, Geneva, 1971, represent a significant improve-ment over the international allocations made to the service in 1959 and 1963 and are a partial fulfilment of therequirements of the service. However, many of the allocated bands have insufficient bandwidths; they are in mostcases shared with other services; many apply (o limited areas of the world; and there are large intervals betweensome of the allocated bands.
2.3 Line radiation
The first line radio radiation discovered in 195] was that due to neutral atomic hydrogen at a restfrequency of 1420.4 MHz [Ewen and Purcell, I95I|. In 1963, the hydroxyl molecule OH was found [Weinreb etal., 1963|; it has a group of 4 lines at about 1612, I66S, 1667 and 1721 MHz and other transitions includingisotopes of the molecule, are known, which give frequencies near 4.6, 6.0 and 8.1 GHz. More completedescriptions of specific molecular lines in emission and absorption can be found in Report 223-4 Since that time,many other radio lines have been found. Hydrogen, helium and carbon in their excited states give rise to a wholeseries of lines throughout the spectrum. These have been observed at frequencies as low as 400 MHz and as highas 85.69 GHz |Lilley and Palmer, I968|.
Lines from more complex molecules and their isotopes have recently been discovered at a remarkable rate.Water, ammonia, carbon monoxide, cyanogen, hydrogen cynanide. formaldehyde, formic acid, methyl alcohol andcyano-acetylene are all now known to exist in interstellar space. More than thirty-five different molecules havenow been identified in interstellar space by means of radio observations of spectral lines. Isotopic forms of manyof these molecules have also been identified. When it is considered that each of these molecules and their isotopicforms may have a number of spectral lines, each associated with different energy level transitions, then it isunderstandable that the radio spectrum is found to be heavily populated with line signals. More than two hundredand fifty radio spectral lines have already been detected in interstellar space and are listed in Report 223-4. Notall are of equal astronomical interest, and the most important are listed in Annex I of this present Report.
The value to astronomy of line oDservations is now very great. By using the neutral hydrogen line, thedistribution and motion of hydrogen is mapped, both within our own galaxy and in many of our neighbouringgalaxies. Studies of the Zceman etiect on radio waves absorbed in clouds of hydrogen allowed the very smallmagnetic fields in interstellar space to be measured [Vcrschuur, 1969). The recombination lines allow measure-ments to be made of temperature as well as of the relative abundance of hydrogen and helium in the ionizednebulae in our galaxy. The OH lines, the water lines and the ammonia lines lead to complex theories of maseraction in space to explain their behaviour. The formaldehyde line was (he precursor to other, more complex,organic compound lines, with all the implications that their discovery might have on our knowledge of how lifecan be generated in our Universe.
The study of radio frequency lines is one of the most difficult fields in radioastronomy. The best antennaeand receivers and the most highly developed electronic processing equipment is used. Integration times of manyhours are common. For all these reasons, freedom from harmful interference is necessary. It is necessary over aband of frequencies for each line, a band wide enough to include broadening and shifting of (he original emissiondue to Dopplcr effects, together with a band of comparable width for comparison or reference purposes, adjacentto that containing the line.
2.4 Hursts, pulsars and variable sources
The Sun is an outstanding source of short-period bursts of radio energy of many types which gi"eimportant knowledge of processes of solar and plasma physics [Wild et al., I963J. Some stars seem, like the Sun,to show large increases in their output in the form of flares of optical and radio waves together, and these shortduration flares can be detected by radio astronomers. Jupiter is a source of large bursts of radio energy, observedsporadically at frequencies below about 30 MHz [Roberts, I963J.
Pulsars are sources which emit pulses of remarkably regular periodicities, in the approximate range from30 pulses per second to one pulse every four seconds. The emissions can be observed in the frequency rangebetween 30 MHz and 15 GHz, and observation at several frequencies in this range are needed. Only for strongpulsars is the detection of single pulses possible. For weak sources pulse averaging techniques with integrationtimes of up to some hours are used to detect the mean pulse profile. Pulse arrival time measurements, extendingover some years give not only information about proper motions of the pulsars and their positions, with anaccuracy of 0.01 arc second, but also about the long-term stability of the pulsar period.
Some radio sources, particularly the quasars, show variability of their radio emission over a time scale of afew weeks, and, recently, novae and X-ray sources have been found to emit a changing level of their radio noiseas their optical brightness changes.

390 Rep. 224-4
2.5 Observations below 30 MHz
Several phenomena of astrophysical interest manifest themselves only at observations at wavelengths of theorder of 10 m or longer. Free-free absorption in ionized regions of the Galaxy, self-absorption in radio galaxiesand in quasars, and low-frequency emission from tenuous plasmas in clusters of galaxies are a few which requireextensive investigation.
2.6 Summary
This outline of the nature of radio signals in radioastronomy shows two general facts. First, there is a widevariety of phenomena to be studied over the whole accessible range of radio frequencies. Second, the science isstill growing at a rapid rate and enormously increasing our knowledge. These two facts demonstrate clearly thedifficulties which face both the astronomer and the frequency allocation authorities in their search for the bestsolution to the problem of achieving the right degree of protection for a radioastronomy service.
3. Frequent) considerations of I hi- radioastrononn srmcv
Spectral line observations must be made at the specific frequency or frequencies set by nature for thespectral emission of the atoms or molecules of interesl. Report 223-4 lists many details of spectral lineobservations already made by radio astronomers. Of the many spectral lines listed there, radio astronomers haveidentified a much smaller number which are of major importance and form part of the frequency requirements ofthe radioastronomy service. These are listed in Annex I. Bandwidths required for these spectral line observationsare sel by the changes in line frequency resulting from the Doppler frequency shifts. For many molecules,observable only within the Galaxy, the Doppler shifts are related directly to the velocity of galactic rotation. Forthe hydrogen line near 1420 MHz there is an additional requirement for a frequency band below 1400 MHz. In(his case the Doppler shift in frequency is much greater because observations are being made of other galaxieswhich are retreating from us at very high velocities.
In the case of continuum observations the radio astronomer wishes to define the frequency variation ofcontinuum emission, from sources of interest, over the entire spectrum available to them. It has been theexperience of radio astronomers that observations at intervals of a factor of two in frequency are in generaladequate for defining the overall spectrum, although closer spacings are needed for some specialized types ofobservation such as the measurement of polarization (see § 2.2). For ground based radioastronomy the lower limitof the frequency spectrum for which there is a requirement is about 1.5 MHz. At the present time the upper limit
•is set by the availability of suitable technology and is about 300 GHz. It may be expected to go to higherfrequencies in the future. Within these broad limits there is a general requirement for a frequency band in eachoctave of the spectrum. Some adjustment may be necessary at frequencies above 30 GHz since it is of importancethat radioastronomy have access to the atmospheric windows of low attenuation. The attenuation curve is shownin Fig. I, Report 223-4.
The radioastronomy service has identified the need for bandwidths of the order of l"» to 2% for continuummeasurements. As is pointed out later in this Report the sensitivity of radioastronomy receivers is improved whenbandwidths are widened. For paraboloidal telescopes, wider bandwidths and consequent better sensitivities lead toimproved efficiency in the use of these major astronomical installations. The same is true in the case of telescopeswith unfilled apertures (such as the 7" or cross antenna). However, in this case, bandwidth can have a direct effecton the cost of the telescope. If the required sensitivity is not achieved because of an insufficiently wide bandwidththen it may be necessary to fill in more of the aperture at a very large cost.
4. Classes of observations
1.i Rdiiioasironomy observations can be broadly divided into two classes:
4.1.1 Class A observations are those in which the sensitivity of the equipment is not a primary factor.They are often used in the study of those cosmic emissions«which are of relatively high intensity. Many ofthe solar, Jupiter, riometer, and scintillation observations fall into this class; continuity is a primary factorfor these observations.
4.1.2 Class B observations are of such nature that they can be made only with advanced low-noisereceivers using the best available techniques; long integration times and wide receiver bandwidths areusually involved. The significance of these observations is critically dependent upon the sensitivity of theequipment used in making them.
4.2 The sensitivity of receivers used for class B observations and the levels of harmful interference arediscussed later in this Report. The simplest way to define the sensitivity of an observation in radioastronomy is tostate the smallest power level change at the radiometer input which can, with high certainty, be detected andmeasured by the radiometer. In § 7 this quantity is defined, and typical values for it are derived. It is convenientto measure the smallest detectable change (A7"r) in the equivalent temperature of the output terminals of theantenna connected to the radiometer.

Rep. 224-4 391
Details of radioaslronomy observatories
Appendix !A (Section F) of the Radio Regulations describes the information on observatories and on theobservations in progress or planned, which Administrations should furnish to the IFRB for incorporation in theMaster International Frequency Register. This information is published by the ITU from time to time, in the formoutlined in the revision of Appendix 9 of the Radio Regulations (List VIIIA). Collected information and theactivities of radioastronomy and radar observatories can be obtained upon application to the Secretary-General ofIUCAF, Appleton Laboratory, Slough, United Kingdom.
B. PROTECTION CRITERIA FOR THE RADIOASTRONOMY SERVICE
6. Introduction
The random radiation encountered in radioastronomy induces signals which have a Gaussian probabilitydistribution in amplitude, and which qualitatively cannot be distinguished from the noise generated in thereceivers or from thermal radiation from the Earth and its atmosphere. Furthermore, the intensity of cosmicradiation is usually much lower than that of noise, often by 30 dB or more. A full recognition of these facts is thekey to understanding the interference problems encountered by the radioastronomy service. The radio astro-nome-s' signal-to-noise ratio is - 3 0 dB or worse; in extreme cases a signal-to-noise ratio as low as - 6 0 dB mayyield I'seful data. In the following paragraphs the theoretical considerations leading to the sensitivity criteria inrad'i35tronomy are described.
7. Sensitivity of radioastronomy systems
7.1 Theoretical considerations
The output of the radiometer detector is a function of the total power at the input of the receiver. (It isassumed that the gain and other parameters of the receiving system remain constant during the observation.) Thetotal input power consists of the wanted signal power Ps and the unwanted noise power PN (e.g. thermal andreceiver noise). Both Ps and Ps are caused by random processes, and it is not possible to distinguish between themqualitatively. However, both have an average power level, and if these levels can be established with sufficientprecision, the presence of the wanted signal can be detected. The statistical average of a stationary randomvariable such as noise power (P) can be found with a precision which is inversely proportional to the square rootof the number of samples (A0, and the standard deviation of this average is:
AP ' jit <»The standard deviation (A/1) is often called root mean square or rms
By observing a sufficient number of samples (A/), the measurement of the radio noise power can be madewith any desired precision. By reducing the fluctuations A/* to a value less than the wanted signal power, Ps,detection of very weak signals is possible. S can be made very large by using wide bandwidths and longobserving times. Within a band A£ approximately Af samples per second are measured by the radiometer, and byextending the observing time (r), (also called integration time), N can be made very large.
Now,
N = A/"- t (2)
and if this relation is combined with (I)
A b i
(3)
which is the basic sensitivity relation in radioastronomy.
The proportionality factor Ts which is needed to make (3) an equation, is dependent on details of theequipment and the observing technique. Conditions making this factor l/y'2 have been discussed by Kraus [1966].With this value adopted, the sensitivity equation becomes:
AP 1 1

392 Rep. 224-4
Now AP, the noise fluctuation in power density, in the sensitivity equation (4), is related to the total systemsensitivity (noise fluctuations) expressed in temperature units throughout the Boltzmann constant, k, as shown inequation (5):
AP = kAT: also P = kT (5)
and we may express the sensitivity equation as:
AT = -7TTT ( 6 )
V2A/twhere.
T = r , + Tk (7)
and represents the sum of TA, (the antenna noise temperature contribution from the cosmic background, theEarth's atmosphere and radiation from the Earth), and TH, the receiver noise temperature.
7.2 Sensitivity estimates
It is now possible to estimate the expected sensitivity by substituting reasonable numbers for A/and t. Thishas been done in Table I by assuming Af to be the bandwidth of an allocated radioastronomy band and theobserving (or integration) time to be 2000 seconds. In Table II A/" is assumed to be the channel bandwidth of atypical spectral line observing system, and the observing (or integration) time is assumed also to be 2000 seconds.
The harmful interference levels given in Tables 1 and II are expressed as the interference le\el whichintroduces an error of 10% in the measurement of AP(or AT), i.e.:
AH,, = 0 1 APAf (8)
Summarizing, the appropriate columns in Tables I and II may be calculated using the following methods:
- AT, using equations (6) and (7),
- AP, using equation (5).
- APH, using equation (8).
Harmful interference can also be expressed in terms of the power flux incident at tne antenna, either in thetotal bandwidth or as a flux density S,, per I Hz of bandwidth ' . For convenience, the values are given for anantenna having a gain, in the direction of arrival of the interference, equal to that of an isotropic antenna (whichhas an effective area of C : /4H/" : , where c is the speed of propagation and /'the frequency). Appropriate allowancemust he made if the gain has a different value. Values of S,,A/i in dB(W/m). are derived from APH b\ adding:
20 log /' - 38.6 dB
where / i s in MHz. SH is then derived by subtracting 10 log A/'to allow for the bandwidth.
Fig. I shows graphically the harmful interference levels for the radioastronomy service expressed inTables I and II where SH in dB(W/(m" . Hz)) is plotted as a function of frequency. The curves are not smoothbecause the different frequency bands have different bandwidths.
The calculated sensitivities and harmful interference levels presented in Tables I and II are based onassumed integration limes of 2000 seconds. Integration times actually used in astronomical observations cover awide range of values. Continuum observations made by telescopes operating singly (rather than ii. interferometricarrays) are reasonably well represented by the integration time of 2000 seconds. Ii is representative of good qualityobservations although there are many occasions when this time is exceeded by an order of magnitude. On theOther hand 2000 seconds is less representative of spectral line observations. Improvements in receiver stability andtfie increased use of correlation spectrometers ha \ a resulted in the more frequent use of longer integration times.Spectral line observations lasting severaf hours arc now nmie common. A mere representative valui wouiu be10 hours with a consequent improvement in sensitivity of 6 dB over that now shown in Table II.
In radioastronomy, SH is generally denoted by the term "power flux-densily". Because of the definition of powerflux-densily (W/m") used elsewhere in the C'C'IR. SH is referred to in the following Tables as "power flux spectral density"

Rep. 224-4 393
-200
-210
S -220
E -230 -
CQ
3 -240
-250
-260
-270
J
1
11
i
1
K
i
1•
i
» r"B
1
t
**
•
j1
i
\-
\ !
w
-•
iTi
t
i
I
1
i
I
i
i i
A LineB Continuum
0.01 0,02 0,05 0,1 0,2 0.5 1 2 5 10 20 50 100 200 500 1000
l-requcncy (GHz)
HGURt I Harmful interferenci limits versus jrequency as expressed in Tables I and II for t = 2000 s
The sensitivity ot a radioaslronomy receiving system to wideband radiation improves when the bandwidthis increased (equations (4) and (6)). The reason lor this is the following: the noise power increases with bandwidth,but, since the signal also is broadband noise, so does the signal. Actually the signal-to-noise power ratio remainsconstant, independent of the bandwidth. However, as the bandwidth increases, the precision of the determinationof the power levels improves (by a factor of | A/"), an i thus the sensitivity is correspondingly improved.
liquations (4) or (6) suggest that one may achieve any desired sensitivity by making the bandwidth and/orthe observing time, large enough. In reality, however, factors other than the statistical ones described above,sooner or later put a practical limit on (he sensitivity of a radioastronomy observation. Examples of such othereffects are the stability of the receiver, fluctuations in the Earth's atmosphere and the pai-ertr and endurance ofthe observer. The sensitivity levels given in Tables I and II use values for the bandwidth and integration time forwhich these other factors usually are insignificant. However, one should bear in mind that these sensitivity levelsare not fundamental limits and that they actually have been exceeded in cases where the utmost sensitivity wasrequired for a successful experiment.
It should be recognized that astronomical sources of radiation exist which may interfere with highlysensitive observations; their power flux-densities can exceed those given in Table I. The Sun is a powerful sourceof emission. Because of :;o!^r interference, certai.i i.ivestiga'.ions c-"1 nnly he mnHnrtpH at night Otherexperiments are possible during daytime except during periods of solar activity, especially for frequencies belowabout 200 MHz. The quiet Sun is of large angular diameter and constant in flux; it usually presents no difficulties.Below 38 MHz. radiation from Jupiter may also exceed the limits given in Table I. At such frequencies Jupiter isa sporadic radio source which emits strongly only a few per cent of the time at highly predictable periods. Theseperiods of emission can be avoided.
Below 1 GHz, many other cosmic radio sources exceed the power flux-densities given in Table I. Thesesources however, are generally at known positions and of known constant flux and vary only slowly in frequency.In principle and in practice the radioastronomer can make corrections for their effects. This is necessary whenperforming observations at the highest possible sensitivity. On the other hand, low level terrestrial interferencenormally has an unknown position, flux and spectrum, and can be highly time variable, so corrections cannot bemade for its effects.

TABLE I — Sensitivities and harmful interference levels for radioastronomy continuum observations with 2000 tecond integration time
Nominalfrequency
(MHz)
(1)
204080
150327408610
14202 7005 000
1065015 35023 80031400
90000135 000235 000
Centrefrequency (' t
(MHz)
(2)
21.86038.00073.800
152.000325.300408.050611.000
1413.5002695.0004 995.000
1069015 37523 80031400
89 000135 000235 000
Assumedbandwidth
Hi(MHz)
(3)
0.0200.5001.6003.0006.6003.9006.000
27.00010.00010.000
10050
400200
5 0001000010000
Minimumantenna noisetemperature
(4)
3000060001000
20040251510101012151518
304035
Receivernoise
temperature
<%
(5)
100100100100100100100
202020203050
100
150150200
System sensitivity(noise fluctuations)
Temperature
(mK)
(6)
3 365.00136.00
13.752.740.861.000.740.090.150.150.050.100.050.13
0.040.030.04
Powerspectraldensity
(dBfW/Hz))
(7)
-223-237-247-253-259-259-260-269-267-267-272-269-271-267
-273-274-273
Harmful interference levels
Inputpower*PH
(dBW)
(8)
-190-190-195-199-201-203-202-205-207-207-202-202-195-194
-185-184-183
Powerflux
(dBOV/m1))
(9)
-202-197-196-195-189-189-185-180-177-171-160-156-146-143
-125-120-114
Power fluxspectral density
%(dB(W/(m' • Hz)))
HO)
-245-254-258-259-258-255-253-255-247-241-240-233-233-226
-223-220
214
30
-3
t
(') Calculation of h a m ful interference Itvels is based on the centre frequency shown in this column although not all regions have the same allocations.
Note- - If an integration time of 15 minutes, one hour, two hours, five hours or ten hours is used, the relevant values in the Table should be varied by + 1 7 , - 1 . 3 , - 2 . 8 , - 4 . 8 or - 6 . 3 dBrespectively.

T ABLfc II - Sensitivities and harmful interference levels for radioastronomy spectral line observations with 2000 second integration
Frequency
/(MHz)
(1)
327
1420
1665
4 830
14 488
22 235
88630
115271
Assumedspectral line
channelbandwidth
(kHz)
(2)
10
20
20
50
170
250
1000
1300
Minimumantenna noisetemperature
(3)
40
10
10
10
15
40
30
50
Receivernoise
temperature
(4)
100
20
20
20
20
50
150
150
System sensitivity(noise fluctuations)
Temperature
(mK)
(5)
22.10
3.35
3.35
2.12
1.34
2.85
2.85
2.77
Powerspectraldensity
A/>(dB(W/Hz»
(6)
-245
-253
-253
-255
-257
-254
-254
-254
Harmful interference levels
Input power
(dBW)
(7)
-215
220
220
-218
-215
-210
-204
-203
Power flux
Su*fc(dBOV/m1))
(8)
-203
- 1 %
-194
-183
-170
-162
-144
-140
Power fluxspectraldensity
Su(dB(W/mJ-Hz)>
(9)
-243
-239
-237
-230
-223
-216
-204
-201
1
Note. - If an integration time of 15 minutes, one hour, two hours, five hours or ten hours is used, the relevant values in the Table should be changed by +1 .7 , - 1 . 3 , - 2 8 , - 4 . 8 or - 6 . 3 dB,respectively.

3 % Rep. 224-4
(OI .LMN INSCRIPTIONS K)K TAIU I I
( olumn
i l l I he nomiriiil Irecjuencv js it ts customarilv used to identity a rachoastronomv hand
(2) The centre frequencv ol (he allocated radioastronornv hand.
(3) The assumed bandwidth.
( 4 ) I h e m i n i m u m a n t e n n a n o i s e t e m p e r a t u r e i n c l u d e s c o n t r i b u t i o n s f r o m i h e i o n o s p h e r e , t h e f a r t h ' s l o w e r a t m o s p h e r e a n dr a d u t l i o n f r o m t h e l - j r t h
( 5 ) T h e r e c e i v e r n o i s e t e m p e r a t u r e is r e p r e s e n t a t i v e o f a g o o d r a d i o m e t e r s y s t e m i n t e n d e d ( o r u s e in h i g h s e n s i t i v i t \r a d i a a s t r o n o r m o b s e r v a t i o n s
<6) T h e t o t a l s y s t e m s e n s i t t v i t v in m i l l i k e l v i n s a s c a l c u l a t e d f r o m e q u a t i o n ( 4 ) u s i n g t h e c o m b i n e d a n t e n n a a n d r e c e i v e r
n o i s e t e m p e r a t u r e s , t h e a l l o c a t e d b a n d w i d t h a n d a n i n t e g r a t i o n t i m e o f 21)00 s
(7) T h e s a m e a s ) 6 ) a b o v e , b u t e x p r e s s e d in n o i s e p o w e r d e n s i t v u s i n g t h e e q u a t i o n \ / ' k\l w h e r e A = 1,3*
* 10 " -•* ( J / K ) ( B o l t / m a n n ' s c o n s t a n t ) . T h e a c t u a l n u m b e r s in t h e T a b l e a r e t h e l o g a r i t h m i c e x p r e s s i o n ol \P
( 8 ) T h e p o w e r l e v e l m t h e i n p u t o l t h e r e c e i v e r c o n s i d e r e d h a r m f u l t o h i g h s e n s i t m t v o b s e r v a t i o n s \.\Pfi}. T h i s ts e x p r e s s e d
a s t h e i n t e r f e r e n c e l eve l w h i c h i n t r o d u c e s a n e r r o r o f n o t m o r e l h a n l<> in t h e m e a s u r e m e n t o l \P.
\PH = 0 I \ P \ t \ T h e n u m b e r s in t h e T a b l e a r e t h e l o g a r i t h m i c e x p r e s s i o n o l .\Pt(
{9) The total power (lux in the allocated band needed to product1 a power level .\Pf, in the receiving svstem assuming an
isotropic receiving a n t e n n a The number s in the Table are the l o g a n i h m i c expression ol SH.\t x
(10) The average power fiuxdensin in the al located band needed to produce a power level A/ ' / / in the receiving svstemassuming an isotropic receiving an tenna The numbers in the Table are the logar i thmic expression of ,S^
( O U M N DISC R I I M I O N S H ) R 1 A B M II
( olumn
'4j
( 5 )
( I ) T h e n o m i n a l f r e q u e n c y o f t h e s p e c t r a l l i n e
| 2 ) T h e s p e c t r a l l i n e r e c e i v e r c h a n n e l b a n d w i d t h T h e c h a n n e l h a n d w i d i h s u s e d r e p r e s e n t i v p K . i l c h a n n e l w i d t h s u s e d f o r
s p e c t r a l l i n e o b s e r v a t i o n s
(}) The m i n i m u m an tenna noise lempera ture includes cont r ibu t ions Irom the ionosphere , ihe I •irlh's a tmosphere and
radia t ion Irom Ihe har th
The receiver noise t empera tu re is representat ive ol ,i good radiometer sv stem intended tor use in high sensitiv itvrad ioas t ronomv ob«.ervations
The total svstem sens i lmlv in milhkelvins j s calculated Irom equat ion <4i using the combined an tenna and receivernoise t empera tu res , the assumed channel bandwid th ^nd an integrat ion time of 2000 s
(6j The s a m e as (5) above but expressed in noise power density using the equa t ion \f* = A A 7. whereA - I 3K x 1 0 " - ' U / K ) ( Bol \7mann 's cons tan t ) 1 he actual number s in the 1 able are the logar i thmic expression of .\P
(7) The power level at the input of (he receiver considered harmful lo high s e n s i t i v e n h s i ' r u i m n * i \Ptf\. Th ; . i- CSJMCS^CU
a-, the in tc rT i i cu ic Sever which introduces an error of nol more than 10" in Ihe measurement of A / ' . \PH = " I .\P\/[
The n u m b e r s in the Table are the logari thmic expression ol \Pu
<K) The p o w e r flux in a spec t r a l l ine c h a n n e l n e e d e d to p r o d u c e a p o w e r level of \PH in the receiving svstem a s s u m i n g anisotropic receiving antenna. The numbers in the Table are the logarithmic expression ol S/i.\fi
The average power flux-density in a spectral line channel needed to produce a power level .\Pn in the receiving system
assuming an isotropic receiving antenna. The numbers in the Table are the logarithmic expression of Sj,
7.2.1 Observed sensitivities
The sensitivities in Tables I and U are extremely good, se\eral orders of magnitude belter lhan
often considered practical, or even obtainable, in other radio services It is of" interest to examine actual
high sensilivily observations which have been made at various radioastronomy observatories, and compare
these results with the calculated values in Tables I and II.
The following Table gives examples of very sensitive continuum and line observations appearing in
published literature.
(9)

8.
Rep. 224-4
TABLE HI - Comparison of observational results with harmful interference limits given in Tables I and II
397
Frequency(MHz)
2700
8785
1420
16*0
Line/Continuum
Continuum
Continuum
Line
Line
Observed
Af(dBfW/Hz))
-269
-265
-254
-256
(mK)
0.0001
0.00024
0.003
0002
Harmful limit
A/>(dB(W/Hz))
-267
•=-267
253
-253
(mK)
0.00015
=0.0001
0.0035
0.0035
References
WADE, CM. era/. (1971)Astrophys. Journ. 163, LI 05.
FOMALONT, E.B. el at. (1975)Astron. and Astrophys 36,273.
BIGNELL, R.C. (1973)Astrophys. Journ. 186,889.
GOTTESMAN, S. era/. (1971)Astrophys. Journ. 168, 131.
Table III shows that very sensitive observations are being made at various radioastronomyobservatories. The system temperatures, bandwidths and integration times chosen for the calculationsleading to harmful interference limits given in Tables I and II and in Fig. 1, represent practical valuescurrently being used by the radioastronomy service throughout the world. Were interference lo beencountered with intensities increasing above these limits, radioastronomy observations would becomeincreasingly untrustworthy.
Changes in receiving systems can be expected to give improved performance in the future. It is safeto assume that within ten years observations will be made routinely at sensitivity levels better than thoseshown in Tables I and II. Such improvements might result from changes in a.py one of the factors enteringinto Equations 6 and 7. It appears unlikely however, that major improvements could result from changesin receiver noise temperature. At frequencies of 150 MHz and less, the receiver temperature is not a largecontributor to the total system temperature. At the high frequency end of the spectrum now being used byradio astronomers, improvements in receiver technology are likely to have their largest effect. If receivertemperatures of 10 K can be achieved at frequencies in excess of 30 GHz then improvements in sensitivityof 6 dB will result in this millimetric region of the spectrum.
The radk>aslronom\ antenna
The typical radioastronomy antenna has high directivity in order to obtain the best possible angularresolution of the observed sources, and a large collecting area (high gain) for good sensitivity. In modern systemsbeamwidths of the order of minutes of arc to seconds of arc are used (100 millidegrees-10 millidegrees).corresponding to antenna gains of more than 70 dB. The high gain combined with the good sensitivity of aradioastronomy receiving system makes it possible for the radio astronomer to observe very faint power fluxesindeed. For example at 1420 MHz, with a receiver sensitivity of 10 " W/Hz ( - 2 7 0 dB(W/Hz)) and with aneffective collecting area of the antenna of 4000 m : (61 dB gain), the detectable power flux density is:
10- -. ' !
4000vil\m' • Ml
-306 dB(W/(m". Hz)).
Obviously a different antenna would yield a different sensitivity level.
To obtain a general feel for the interference problems which may be applied to all radio telescopes, largeand small, the conditions where the telescope is pointed away from the interfering source should be considered.The harmful power flux and power flux-density shown in Tables I and II are based on the isotropic case andshould be regarded as the general interference criteria for high sensitivity radioastronomy observations
9.
9.1
Interference
Types of interference
It is convenient to divide harmful interference into three main categories:
Category I: Strong interference that causes non-linear operation of the receiver, sometimes to the point ofharming the sensitive input amplifier.

398 Rep. 224-4
Fortunately, this type ol interference is rare and unlikely to be caused by normal transmissions. However,radar transmitters m low living aircraft are capable of physically damaging the electronics ol' a radioastronomyreceiving system. Typically a power level it ihe radiometer input of (I I W would burn out the varactor in aparametric amplifier This corresponds to a power flux of ID W/u {1(1 dB(\V/m" I) at 14(10 MH/. if the interferingsource is outside the main beam of the antenna. The corresponding power liux-density. assuming a bandwidth of27 MH/ (1400 to 1427 MH/l would he 3.7 x 10 "W/(nv. H/) or 64 dH(W/(m . H/)l. If the antenna isaccidentally pointed at such a strong interference source, the powei fluwien-.it> that could burn out the inputvaractor must be reduced b\ the gain of the antenna.
Categon 2: Relatively strong interference which is easy to recognize.
Usually this is the case if the interference power is stronger than the noise power in the radiometer input.This type of interference is fatal to observations, and there is no doubt that it is interference. There is no choicebut to discard the data. Typically, interference power fluxes above - IK) dB(W'nr) belong in this category. Withan assumed bandwidth of 27 MHz (the 141.1.5 MH/ band), the corresponding power flux-density is- 184 dB(W (nr . Hz)).
C'ntegor\ .?: Very low-level interference with a very low interference to noise ratio (less than -20 dB) that cannotbe recognized
The long integration times required to bring the wanted signal out of the noise will mask the characteristicfeatures of the interfering signal It cannot be recognized as interference and erroneous data result: this type oflow-level interference is therefore particularly harmful Furthermore, because the radio astronomer cannotdetermine by examination of the data that he has encountered interference, there is no possibility of identifyingthe source.
9.2 Interference reduction techniques
A number of techniques designed to reduce the effects of interference can be tried by the radio astronomer.Some of these are obvious and straightforward, and some are clever, complicated and often time consuming. Theyall suffer from the problem ol being of limited usefulness In general, the employment of interference reductiontechniques leads to the need for more observing time.
9.2.1 Filtering techniques
Unwanted signal energy outside the observed band is rejected in the radioastronomy receiver byusing bandpass filters. Normally, when the interfering signals are of low intensity and do not causenon-linear operation anywhere in the system, limiting the observed passband by a filter in the IF channelis useful. Since the IF frequencies are relatively low, typicallv between 100 to 300 MH/., relatively steepskirt selectivity is possible. However, limiting the observing band decreases the sensitivity of the systemwhich is proportional to ;A7* Filtering in the radiometer input is also used, particularly when thepotentially interfering signals are strong. Again decreased sensitivity is the result, both because of thenarrower bandwidth and because of the insertion loss of the niter which, when inserted in the receiverinput, adds to the loss and the noise temperature of the system. Since the filtering takes place at theobserving frequency, adequate skirt selectivity may be a problem. Typicallv. about 75".i of an allocatedband remains available after a reasonable IF Tillering (see Report 696) which corresponds to a sensitivityloss of about I.Vv If input filtering is needed, sensitivity reduction of a factor of 2 or more could beexpected
In order to obtain 100 dB reduction of the midband response at the band edge of the radio-astronomy band, one needs three or more K-section filters in the IF channel. Although such a filter systemis feasible, there are important phase considerations to he taken into ac•• >unt when observing with anantenna array or interferometer. This makes it questionable whether filtering really is a viable generalsolution to the band edge interference problem. Bandpass niters do not. of course, alleviate the in-bandinterference problem.
9.2 2 Observing technique*
It is possible, and often necessary, to reduce the effect of interference by using special observingtechniques One possibility is to repeat the observation several times, with the assumption that theinterference is present only occasionally. It is also useful to move the telescope on and off the sourceduring an observing run, assuming that the interference is present all the time. Both methods are of limitedusefulness, because of the assumptions one has to make of the behaviour o! the celestrial source as well asof the interference. They also increase the required observing time by a sizeable factor. Furthermore, the

Rep. 224-4 399
technique of repeating the observations is not very useful in the case of sources of variable intensity, as itis not possible to distinguish between variations in the interference and in intrinsic variations in the source.The on off technique is not useful for observations of extended astronomical objects, such as the cosmicbackground, since there is no region of the sky which can be considered off-source. An assumption thatthe intensity of (he interference is constant must also be made. This is not generally true; often theinterference varies in intensity with time and in a complicated way across the frequency band.
9.2.3 Data processing techniques.
After-the-fact reduction of the effects of very low level interference is of very limited usefulness inradioastronomy. One reason for this is thai in order to detect power at a very low levei, long integrationtimes, which mask the identifying characteristics of the interfering signals, have to be used. The addedpower caused by the interference is then no longer distinguishable from the random noise one is lookingfor. It might be possible, in some special cases such as pulsed radar interference where the characteristicsof the interfering signals are also accurately known, to process the data in a way that might reduce theeffect of the interference^
Continuum observations, which require a large bandwidth in order to achieve good sensitivity, canbe made b> a receiver covering the desired bandwidth with a number of contiguous channels (a spectralline receiver). The spectra! information can then be used to identify a narrow interfering signal. However,for interference covering a bandwidth comparable to the continuum bandwidth observed, this technique isnot useful.
In very special and rare cases if the characteristics of the wanted signal are known, this fact can beused lo separate it from the interference and noise. However, for the general case of radioastronomyobservations, there seems not to be any useful data processing technique that may be used to identify andreduce interference.
9.3 Interference and long baseline interferometers
High resolution observations require the use of interferometers or arrays of antennae with wide spacingsbetween their elements. Each an'enna may be subject to different interference conditions. In the extreme case ofvery long base-line interferometer (VLBI), the interference may affect only one antenna of the system. This mayreduce the effect of interference by a small factor. On the other hand, it should be noted that VLBI experimentsinvolve sophisticated data reduction and use of very distant antennae with consequent co-ordination problems.Interference affecting only one antenna may invalidate a whole observation. This leads to the need for world-wideprotection of VLBI observations.
REFERENCES AND BIBLIOGRAPHY
COHhN, M H | I W ) | High resolution observations of radio sources Annual Rev of Astron. and Astrophys., 7, 619-664.
ELLIS, Ci R A and HAMILTON. P A. |I966| Aslrophys. Journ., 143, 227.
EWEN. H I and PL'RCFLL, F. M. |I95IJ Nature, 168. .156.
HF.WISH. A . Bf-.LL. S J . PILKINGTON. J. D. H.. SCOTT, P R and COLLINS. R. A. J1968] Observations of a rapidlypulsating radio source. Nature. 217, 709-71.1.
JANSKY. K.G. [19.151 Proc. IRE. 23. 1158.
KRAUS. J. I). |I966] Radio Astronomy. McGraw Hill, New York. USA.
LILLEY, A. Ii. and PALMER, P. [1968] Tables of radio frequency recombination lines. Astrophys. Journ., Suppl. Series No. 144,In, 143-174.
RADHAKRISHNAN. V. (1969) Fifteen months of pulsar astronomy. Proc. Astron. Soc. of Australia, I, 254-263.
ROBERTS, J. A. |l%.1] Radio emission from the planets. Planet, and Space Science, 11, 221.
SNYDER. L. F , BUHL, [).. ZUCKERMAN, B. and PALMER, P. [1969J Microwave detection of interstellar formaldehyde.Phvs. Rev. Letters, 22, 679.
VERSCHUUR, G. L. [1969] Measurements of magnetic fields in interstellar clouds of neutral hydrogen. Astrophys. Journ., 156,
XM-874.
WEINREB. S. BARRETT, A. H.. MEEKS, M. L. and HENRY. J. C. (1963] Nature. 200. 829.
WILD. J. P.. SMERD. S. F. and WEISS. A. A. |I963| Solar bursts. Annual Ret. of Astron. and Astrophys.. 1, 291.
(XIR Document
11971]: Report of the CCIR Special Joint Meeting, Geneva. 1971. Chapter 3. Table 3.3-IV.

400 Rep. 224-4
ANNhX 1
RADIO-FRF-QUS-.NC Y LINOS OF- THF CiRI-.ATF-.S7 IMI>ORT\N( I IO RADIOAS I RONOM N
Substance
Deuterium
Hydrogen
Hydroxyl
Hydroxyl
Hydroxyl
Hydroxyl
CH Radical
CH Radical
CH Radical
Formaldehyde
Formaldehyde
Water vapour
Ammonia
Ammonia
Ammonia
Excited hydrogen
Silicon monoxide
Silicon monoxide
Carbon monosulphide
Hydrogen cyanide
HCO+ (Formyl ion)
Carbon monosulphide
Carbon monoxide " C O
Carbon monoxide "C"O
Carbon monoxide n C " O
Formaldehyde
Deuterated hydrogen cyanide
Formaldehyde
Carbon monosulphide
Formaldehyde
Carbon monoxide "C"O
Carbon monoxide I3C"O
Carbon monoxide 11C"O
Rest frequency
327.384 MHz
1420.406 MHz
1612 231 MHz
1665.402 MHz
1667.359 MHz
1720.530 MHz
3263.794 MHz
3335.481 MHz
3349.193 MHz
4829.660 MHz
14.488 GHz
22.235 GHz
23.694 GHz
23.723 GHz
23.870 GHz
36.466 GHz
42.821 GHz
43.I22GHz
48.991 GHz
88.632 GHz
89.1 89 C
97.981 GHz
109.782 GHz
1 10.201 GHz
115 371 GHz
140.840 GHz
144.827 GHz
145.603 GHz
146.969 GHz
1 50.498 GHz
2 I 9.560 GHz
220.399 GHz
230.538 GHz
:;HZ /
Suggested bandwidth
327.0 to 327.7 MHz
1370 to 1427 MHz
1610.6 to 1613.8 MHz
1660 to 1670 MHz
1718.8 to 1722.2 MHz
3260.0 to 3267.0 MHz
3332.0 to 3339.0 MHz
3345.8 to 3352.5 MHz
4780.0 to 4835.0 MHz
14.47lo 14.50 GHz
22.01 lo 22.28 GHz
23.6 to 24.0 GHz
36.43 to 36.50 GHz
42.77 to 42.86 GHz
43.07 to 43.1 7 GHz
48.94 to 49.04 GHz
86.0 to 92.0 GHz
Notes")
97.88 lo
109.67 to
110.09 to
114.11 lo
140.69 to
144.68 to
145.45 to
146.82 to
150.34 to
219.34 to
220.17 lo
230.30 to
98.08 GHz
109.89 GHz.
110.31 GHz
115.5 GHz
140.98 GHz
144.97 GHz
145.75 GHz
147.11 GHz
150.65 GHz
219.78 GHz
220 6? (HI?
230.77 GHz
(2 ) (3 )
(3)
(31
(3)
(3)
(3)
13)
(3)
0 ) The band limits for all lines in this table with the exception of those denoted by no.e'3> are the Doppler-shifted frequenciescorresponding to radial velocities of t 300 km/s.
(2) An extension of the present exclusive allocation of 1400 to 1427 MHz is required to allow for the large, cosmological Dopplershifts on radiation from very distant sources.
(3) These line frequencies are being observed in distant galaxies with large Doppler shifts, and therefore require bandwidthswidened towards the lower frequencies.

144 Rec. 365-.*
RECOMMENDATION 365-3 •
FREQUENCIES, BANDWIDTHS AND PROTECTION CRITERIAFOR MANNED AND UNMANNED DEEP-SPACE RESEARCH
(Question 1-1 2)
11463 - l%6 - 1974-- 1478)The CCIR.
CONSIDERING
(a) (hat suitable operating frequencies, required radio-frequency bandwidths. and limiting interference criteriafor deep-space manned and unmanned research telecommunication links are determined by the technicalconsiderations set forth in Reports 536-1, 6X3 and 6X5.
(b) (hat cosmic noise and man-made noise militate against the use of frequencies lower than 100 MHz andthat atmospheric noise and absorption allow the use of only particular frequency kinds at frequencies muchhigher than 10 GHz;
(c) that some high precision tracking techniques required for guidance of spacecraft to the Moon and theplanets and for manoeuvres in their vicinity result in a preference for several widely separated frequencies above1 GHz;
(d) that two-way communication is required for all deep-space missions, and is v-it.il for manned deep-spjcemissions;
(e) that manned deep-space missions require in particular lwo-w-y voice and ,(ko television as aids tocommand and control, guidance navigation and other telecommunication functions:
(0 thai for most deep-space missions the typical operating noise temperature of earth station receivers,operating at frequencies in the 2 GHz region will be 16 K. equivalent to - 217 dH(W-Hz), in the 8 GHzregion will be 23 K, equivalent to - 215 dB(W Hz), and in the 15 GHz region will he 33 K, equivalent to- 2 1 3 dB(W/Hz), with design margins of less than 6 dB; and that for reception at frequencies less than I GHzcosmic noise increases the system noise temperature approximately as the inverse of the square of the frequency;
(g) that the typical operating input noise temperature of a receiver in a deep space station operating atfrequencies in the 2 GHz region will be 600 K, equivalent to -201 dB(W H/), in the 7 GH/ region will be800 K, equivalent to - 200 dB( W/Hz), and in the 15 GHz region will be 1100 K. equivalent to - 198 dB(W-Hz).with design margins of less than 6 dB; and that for reception at frequencies less than 300 MH?. cosmic noiseincreases the system noise temperature approximately as the inverse of the square of the frequency;
(h) that, at frequencies higher than 4 GHz, water vapour in the atmosphere can produce significantdegradation in the quality of deep-space communications;
(j) that typical deep-space systems will use directional antennae both on the l.arlh and on the spacecraft.These antennae will have a surface precision of between 0.24 mm and 5 mm r.m.s., regardless of diameter, so thatfrequencies between I ?.:id 20 GHz will generally be more suitable for efficient transmission;
(k) that Doppler shifts can be of the order of I x I0"4 of the carrier frequency:
(I) that interruptions in communications which aggregate to more than five minutes on any one day withoutprior planning, could seriously affect the success of the mission;
(m) that real-time television from the iunai nuiface i> practical v.ith frame rates. re«ilntinns. and qualitiescomparable to terrestrial television, and that photographic facsimile from the nearer planets is similarly practical;
(n) that it is practical and desirable to effect telemetering, data transmission, and tracking functions on thesame space-to-Earth link, and telecommand and tracking functions on the same F'arth-tu-space link;
(o) that to effect precision tracking, a pair of coherently-related Earth-to-space and space-to-Earth frequencieswith a separation of at least 7% of the higher frequency in any one band- (e.g. pairs near 2 GHz, 8 GHz and theregion of 15 GHz) is required, and that for more accurate correction for effects of charged particles on spacepropagation delays, simultaneous use of space-Earth links with coherent frequencies in two or more of thesebands is required;
(p) that to enable precision tracking corrections and to allow both low-rate weather-immune emergencycommunications, and high-rate primary communications, both Earth-to-space and space-to-Earth communicationsare desirable on two or more widely separated frequency bands (e.g. 2 GHz, 8 GHz and near 15 GHz);
(q) that the angular spacings of the Moon and the planets are often such that the same frequency may be usedfor probes at different celestial coordinates, but that different spacecraft in the vicinity of the same coordinates orin the antenna beamwidth may require different frequencies:
This Recommendation is brought to the attention of Study Groups I, 4, 7, 8, 9, 10 and 11

Roc. 365-3 145
fr) that geographical separations which permit sharing between terrestrial services and deep-space researchoperations are typically several hundreds of kilometres, and may be greater than 500 km in the absence of terrainshielding; that separations of this magnitude are not readily obtainable in many parts of the world; and that thespacecraft are visible over large areas of the Earth;
Is) that considerable difficulties can be expected when sharing frequencies between deep-space researchoperations and other services, due to the technical problems of furnishing the required protection against bothterrestrial and near-Earth satellite transmissions,
INANIMOUSLY RK'OMME-NDS
I. that frequencies for deep-space manned and unmanned telecommunication links be located in thefrequeue) band between 100 MHz and 30 GHz, with additional links for use during near-Earth and recoveryphases of manned space-flights in the frequency bands below 25 MHz, in accordance with the followingguidelines:
1.1 frequencies in the Hh range below 25 MHz are technically suitable for two-way voice and othercommunications during manned mission near-Earth and recovery phases;
1.2 the hand between 100 MH? and I GHz is generally more suitable for narrow-band telemetering, tracking,telecommand and voice from launch to intermediate distances;
1.3 the band between 1 GHz and 6 GHz is generally more suitable for wideband telemetering, precisiontracking, telecommand, voice and television from launch to extreme distances;
1.4 the band above 6 GHz is generally more suitable for very wideband telemetering, very precise tracking andtelevision at various distances;
1.5 that special consideration should be given to the availability of coherently related frequencies, spacedat 7"(, or more of the higher frequency in the bands above 1 GHz, and to the availability of frequencies in threebands, widely separated in frequency, such as the 2 GHz, 8 GHz and 15 GHz regions for precision trackingsystems;
2. thai spectrum space of the order of 2 to 4 MHz per link (due account being taken of the dependency ofthe radio-frequency bandwidth on the type of modulation used) is technically suitable for the transmission ofwideband information for lunar flights.
3. that spectrum space of the order of 2 to 6 MHz per link is technically suitable for the transmission ofwideband signals for precision two-way ranging;
A. that bandwidths of the order of 40 to 400 MHz per link are technically suitable for the transmission ofvery wideband signals for very~prccise two-way tracking:
5. that tracking be time-multiplexed with lunar television or planetary facsimile where practicable;
6. that where practicable, frequencies be shared among deep-space probes with different launch periods anddifferent celestial coordinates, but not generally with spacecraft with the same celestial coordinates;
7. that the protection criteria for earth stations be established as follows: the total time during which thepower spectral density of noise-like interference, or the total power of CW-type interference in any single bandand all sets of bands 1 Hz wide, is greater than -222 dB(W/Hz) in the 2 GHz region, - 2 2 0 dB(W/Hz) in the8 GHz region, and -218 dB(W/Hz) in the 15 GHz region, at the input terminals of the receiver, shall not exceedan aggregate of five minutes on any one day without prior planning; for frequencies below I GHz, the permissibleinterference power level may be increased at the rate of 20 dB per decreasing frequency decade;
8. that the protection criteria for space stations be established as follows: the total time during which thepower spectral density of noise-like interference or the total power of C'W-type interference in any single bandand all sets of bands 1 kHz wide, is greater than - 171 dB(W/kHz) in the 2 GHz region, - 170 dB(W/kHz) in the7 GHz region and - 168 dB(W kHz) in the 15 GHz region, at the input terminals of the receiver, shall not exceedan aggregate of five minutes of any one day; for frequencies less than 300 MHz, the permissible interference maybe increased at the rate of 20 dB per decreasing frequency decade;
9. that, when necessary for emergency purposes, manned deep-space (lights use the recognized distressfrequencies in accordance with the Radio Regulations;
10. that a deep-space research service cannot share Earth-to-space bands with:
10.1 receiving aeronautical mobile stations,
10.2 receiving satellite stations, and
10.3 transmitting terrestrial stations and earth stations utilizing high average e.i.r.p.: for example, transmittingtrans-horizon stations, and transmitting fixed satellite earth stations.
When coordination is practicable, sharing is feasible with other stations of all services. In some cases,coordination distances may be unacceptably great;

146 Rec. 365-3. 36-4-3
11. that a deep-space research service cannot share space-to-Earth bands uith:
I I.I transmitting aeronautical mobile stations, and
11.2 transmitting satellite stations.
When coordination is practicable, sharing is feasible with other stations of all services. In some cases,coordination distances may be unacceptable great.
RECOMMENDATION .164-3 •
TKI.MOMMl NK \TION LINKS FOR M A W I I ) AM)
IWIANNEI) \ l AR-KARIH KF.SK-XHC II SATKI.I.I IKS
Frequencies, band»idlhs and criteria for protection from interference
( Q u e s t i o n s 1 X 2 a n d 2 2 / 2 )
11963 - 1966- 1970- 1978)The CCIR ,
CONSIDERING
(a) that suitable operating frequencies, required raduvfrequency bandsvidths, and limiting interference criteriafor near-Earth satellite telecommunication links are determined by the technical considerations set forth in theappropriate Reports;
(b) that, based on past experience, it is expected that of the order of 100 acti\e research near-harth satellitesmay be in orbit simultaneously;
(c) that two-way communication is required for many near-Harth missions, and is vital for manned missions;
(d) that various radio-frequency bands are suitable for near-Earth satellite telecommunication links, and thaithe variety of functions and the conditions under which they must be performed divide this region into thefollowing suitable regions: below I GHz, 1 to 6 GHz, 6 lo 1(1 GHz, and 10 to 30 GHz;
(e) that telemetering data links typically require radio-frequency bandwidths ranging from 10 kHz to 20 MHzper link in the frequency range from 100 MHz to 30 GHz, with a bandwidth of 10 kHz in the lower portion, andup to 20 MHz in the upper portion;
(0 that tracking links typically require radio-frequency bandwidths ranging from 10 kHz to 100 MHz per linkin the frequency range from 100 MHz to 15 GHz with bandwidths of 10 kHz in the lower portion and up to100 MHz in the upper portion of this range, the latter being required for high precision two-way, coherent, rangeand range rate systems;
(g) that voice links typically require radio-frequency bandwidths ranging from 3 kHz to 45 kHz per link;
(h) that wideband data and television links typically require radio-frequency bandwidths within the range50 kHz to 300 MHz in the frequency range from 100 MHz lo 30 GHz. with preference for 50 kHz in the lowerportion and 300 MHz in the upper portion of i!• i.-> range;
(j) that the operating noise temperatures of earth-station telemetering and tracking receiving systems usuallyrange from 30 K above I GHz to 3000 K at 100 MHz (equivalent to -214 dB(W Hz) and - 194 dB(W Hz)):
(k) that earth-station antennje for satellite communication do not operate at elevation angles less than 5 ,except for initial acquisition;
(I) that typical operating noise temperatures for receivers in near-Earth research spacecraft are approximately600 K (—171 dB(W/kHz)), but that measures can he taken to protect the spacecraft receiving system againstinterference approximately 10 dB greater than (hi' noise level;
(m) that telecommand requirements can normally be satisfied by one data link channel per craft withradio-frequency bandwidths ranging from 10 kHz at 100 MHz to 500 kHz at 15 GHz, largely determined by theDoppler shift which may be of the order of I x 10 J of the carrier frequency;
(n) that coding techniques and the future use of narrow-beam antennae may make possible the control ofseveral crafts using the same radio-frequency telecommand channel:
(o) that circuit design in spacecraft for high precision coherent tracking systems dictate that two frequencies beused, spaced by at least 6"o of the higher one;
This Recommendation is brought to (he attention of Study Groups 1,4, 7. 8, 9. 10 and

Rec. 364-3, Rep. 584 147
(p) that, for some frequency sharing situations between near-Earth research satellites and certain representativeterrestrial services, separations of several hundreds of kilometres between the earth terminals may be required andthat, in many parts of the world, separations of this magnitude are not readily attainable:(q) that frequency sharing among near-Earth research satellites is desirable and feasible;(r) that difficulties can be expected when frequencies are shared between near-Earth research satellites andstations in other Services, due to the technical problems of furnishing the required protection against terrestrialServices,
UNANIMOUSLY RECOMMENDS
1. that the range below I GHz is technically suitable for near-Earth research satellites, with each satelliteusing radio-frequency bandwidths varying from 10 to 500 kHz per link, for accomplishing telemetering, widebanddata transmission, tracking, telecommand and voice functions;2. that the range between I GHz and 6 GHz is technically suitable for near-Earth research satellites, witheach satellite using radio-frequency bandwidths varying from 500 kHz to 4 MHz per link, for accomplishingtelemetering, wideband data transmission, tracking, telecommand, voice and television functions;3. that the range between 6 and 10 GHz is technically suitable for near-Earth research satellites, with eachsatellite using radio frequency bandwidths varying from 500 kHz to 20 MHz per link, for accomplishingtelemetering, wideband data transmission, tracking, telecommand, voice and television functions;4. that the range between 10 GHz and 30 GHz is technically suitable for near-Earth research satellites, witheach satellite using radio frequency bandwidths ranging from I MHz to 300 MHz per link, for accomplishingtelemetering, wideband data transmission and television functions;5. that high frequencies below about 25 MHz are technically suitable for two-way voice communicationduring manned-mission near-Earth and recovery phases;6. that, when necessary, for emergency purposes in manned near-Earth missions, the recognized distressfrequencies be used in accordance with the Radic Regulations;7. that consideration be given to the availability of coherently related frequencies spaced by more than 6% ofthe higher frequency for precision tracking systems;8. that frequency sharing be accomplished to the maximum extent feasible among near-Earth researchsatellites;9. that the protection criterion for earth receiving stations be established as follows: for frequencies greaterthan I GHz and up to at least 10 GHz, the total time for which the power spectral density of noise-likeinterference or the total power of CW-type interference in any single band and all sets of bands 1 Hz wide isgreater than - 220 dB(W/Hz) at the input terminals of the receiver, shall not exceed 5 minutes per day, formanned research missions (0.1% of the time being permissible for other near-Earth research missions); forfrequencies less than I GHz, the permissible interference may be increased at the rate of 20 dB per decreasingfrequency decade;10. that the protection criterion for receivers in spacecraft be established as follows: for frequencies greaterthan 300 MHz and up to at least 10 GHz, the total time during which the power spectral-density of noise-likeinterference or the total power of CW-type interference in any single band or all sets of bands 1 kHz wide isgreater than -171 dB(VWkHz) at the input terminals of the receiver, shall not exceed 5 minutes per day formanned research missions ( - 161 dB(W/kKz) during a maximum of 0.1% of the time being permissible for othernear-Earth research missions); for frequencies less than 300 MHz, the permissible interference may be increased atthe rate of 20 dB per decreasing frequency decade;11. that note be taken of the difficulties to be expected in frequency sharing between near-Earth researchsatellites and stations in other services.

158 Rep. 685
REPORT 685
PROTECTION CRITERIA AM) SHARING CONSIDERATIONSRELATING TO DEEP-SPACE RESEARCH
(Question 1-1/2)
(1978)1. Introduction
This Report discusses the sharing of frequencies in the range I lo 20 GHz between deep-space researchstations and stations of other services. Deep-space earth and space station protection criteria are discussed.Potential interference is considered, and conclusions are drawn about the feasibility of sharing.
The I to 20 GHz range includes current allocations applicable to deep-space research and some of thefrequencies desired for future operational use. Preferred frequencies are given in [CCIR 1974-78a). United Statesearth and space station characteristics for deep-space research are given in [CCIR 197478b).
2. Deep-space earth station factors pertinent lo sharing
The principal deep-space earth station parameters which pertain to interference and sharing are transmitterpower, antenna gain and pointing, receiver sensitivity (including noise temperature) and bandwidth. Typical valuesof these parameters are given in [CCIR 1974-78b]. This seciion of the Report considers some aspects of antennapointing, and develops protection criteria for receivers at deep-space earth stations. The section finishes withremarks about co-ordination. Considerations of transmitter power are given in a later section.
2.1 Intersections of satellite orbits and antenna beams from deep-space earth stations
The locations of the US deep-space earth stations are given in [CCIR l974-78bj. The stations are spacedapproximately equally in longitude (120° apart) with two stations in (he northern hemisphere, and the third in thesouthern hemisphere. Spacecraft in deep space currently remain in or near the plane of the ecliptic, which is liltedat 23.5° from the Earth's equatorial plane. The daily rotation of the Earth causes the antenna beam of at least oneearth station to intersect the equatorial plane and hence the geostationary satellite orbit when tracking a givenspacecraft. The earth station may be subjected lo interference from satellites within the antenna beam, and maycause interference to those satellites
Satellites that are not geostationary can pass through one or more deep-space tracking beams each day.Details of visibility statistics and in-beam duration times for satellites in low altitude orbits are contained inReport 684.
In the future the United States plans to deliver deep-space probes into orbits out of the plane of theecliptic. These missions will also result in some earth station tracking beams passing through the orbits of bothgeostationary and non-geostationary satellites.
2.2 Susceptibility of deep-space earth station receivers to interference
A deep-space telecommunication system is typically a phase-sensitive system. The earth station receiverutilizes phase-locked loops for carrier tracking and data recovery. CW or noiselike interference in these loops canresult either in degradation or loss of tracking and data. Report 544 contains information on the effects ofinterference in phase-locked loops. Report 545 presents information on the degradation of telemetering perfor-mance due lo interference.
2.2.1 CW signal interference
2.2.1.1 Receiver capture
The changing Doppler shift of a received desired signal can cause the receiver pass band io movepast a fixed frequency unwanted CW signal. Depending upon rate of motion and the amplitude of theunwanted signal, the receiver may lock lo the interfering signal if R, the ratio of the CW signal power tothe desired signal power, satisfies the relation:
*>&
where dfis the rate of frequency change in Hz/s and /"„ is the loop natural frequency in Hz.
An interfering CW signal thai is 10 dB above a strong desired signal and is moving through thereceiver passband at 100 Hz/s would cause the receiver to lock to the interfering signal. At a lower rate ofmovement, the required interfering signal level is proportionately lower until at a signal-to-interferenceratio greater than one, the interfering signal will no longer capture the receiver, even if the movement rateis zero. Undesired CW signals not strong enough to cause receiver capture may cause interference tocarrier tracking.

Rep. 685 159
2.2.1.2 Carrier tracking degradation
An interfering CW signal can induce a phase modulation on the desired carrier signal when thefrequency separation between the two signals is comparable to, or less than, the phase locked loopbandwidth. A maximum acceptable phase modulation of 10° amplitude results from an interference-to-carrier power ratio of - 15 dB. The design margin for carrier tracking is typically 10 dB with reference tothe noise power in the carrier tracking loop bandwidth. For maximum acceptable carrier trackingdegradation, the power in a CW interfering signal that may be within the phase locked loop bandwidthmust not be greater than the amount shown in Table 1.
TABLI I CW interference with carrier tracking
frequency(CHzl
2.3
8.5
150
Noise in I Hz loop(dBW)
216.6
215 0
213.4
Minimum earner power(dBW)
206.6
205.0
203.4
Maximum CW interference(dBW)
221 6
220.0
- 2184
2.2.1.3 Telemetering degradation
Telemetering degradation is defined as the amount bv which the signal-to-noise ratio must beincreased to make the bit error rate, when an interfering signal is present, equal to that which it would beif the interfering signal were absent. The maximum allowable degradation for deep-space telemetering isI dB. For coded telemetering with a threshold signal-to-noise ratio of 2.3 dB, CW interference 6.8 dBbelow the noise power will result in I dB degradation. For uncoded telemetering with a thresholdsignal-to-noise ratio of 9.8 dB, CW interference 5 dB below the noise will result in I dB degradation. Thenoise power is proportional to the data bandwidth and the receiver noise spectral density. Examples ofallowable level of CW interference are shown in Table II.
TABLI II CW interference with telemetering
Frequency(GHz)
2.38 4
15.0
Data rate(bit/s)
40.uncoded40,coded
115 k. coded40,coded
115 k.coded
Noise power in databandwidth (dBW)
200.6200.0
- 164.4197.4
-162.8
Interference-to-noiseratio for 1 dB
degradation (dB)
5.06.86.86 8
-6 .8
Maximum CWinterference
(dBW)
-205.6-206.8-171.2-204.2-169.6

160 Rip. 685
2.2.2 Wideband interference
Wideband signals or noise which reduces the signal-to-noise ratio, affects both the carrier trackingand the data channels. In the case of the telemetering channel, the spectral density of the interfering signalmust be at least 5.9 dB below the spectral density of the receiver noise, in order not to degrade thethreshold performance by more than I dB. Maximum levels of wideband interference are shown inTable III.
TABLI- 111 Wideband interference with telemetering
Frequency(GHz)
2.3
8.4
15.0
Noise spectral density(dB(W/Hz))
216.6
215.0
-213.4
Interference-to-noiseratio (dB)
5.9
5.9
-5.9
Maximum wideband interference(dBfW/Hz»
222.5
220.9
219.3
2.2.3 Interference to maser operation
Mixing of signals with the idler frequency of the maser pump can cause interference and saturationin the receiver passband. There are-many frequencies at which such mixing can occur, all of which are farremoved from the normal frequency of reception. Table IV gives possible interference frequencies for thetwo frequency bands currently used for reception at deep-space research earth stations.
Interfering signals must be above - 120 dBW in the idler bandwidth (which is very broad) at themaser input, to be significant.
TABLE IV - Frequencies at which interference may be caused by mixing in the maser
Receiver frequency band
Maser pump frequency
Interference frequencies
2290 to 2300 MHz
12.7 GHz
15.0 GHz10.47.55.2
8400 to 8500 MHz
19.3 and 24.0 GHz
32.4 GHz27.315.610.9
2.2.4 Adjacent channel receiver saturation
The cryogenically cooled maser of the deep-space receiver has a bandpass of approximately50 MHz. Adjacent channel signals, if received at total power levels greater than - 120 dBW, can generateintermodulation products in the mixer and other receiver elements, causing saturation of the receiver.

Rep. 685 161
2.2.5 Interference protection for deep-space earth station receivers
Interruption of telecommunications can result from interference that is strong enough to causereceiver capture or saturation. Weaker interference may result in degraded carrier tracking and teleme-tering performance. The level of interference that can be tolerated is determined by acceptable performancedegradation. To protect deep-space earth station receivers, the power spectral density of widebandinterference, or the total power of CW interference, in any single band and all sets of bands 1 Hz wide,should not be greater than the values shown in Table V, for an aggregate of five minutes in any one day *.Table V also shows the maximum power flux-density of interference, considering the effective area of a70 m earth station antenna.
TABLh V Interference protection for earth station receivers
Band(GHz)
2.3
8 4
15.0
Maximum power spectral density(dB(W/Hz»
222.5
220 9
2193
Maximum spectral power flux-density (dBfW/(mVHz)))
256.2
253.8
250.2
2.3 Co-ordination considerations
The practicability of co-ordination is determined partially by the number of stations with whichco-ordination must be effected. This is in turn controlled by the co-ordination distance. For deep-space research,the practicable co-ordination distance is currently considered to be 1500 km.
Co-ordination distance may be calculated by the method of Appendix 28 of the Radio Regulations. Analternative method of evaluating propagation factors is given in Report 724. The two ways of determining distancegive different results. For example, assuming a transhorizon station (i.e., 93 dB(W/IO kHz), in the 2.3 GHz band),the distances are 2100 and 800 km, respectively.
A decision on the practicability of sharing with transhorizon stations is thus not possible, and furtherstudy is necessary.
3. Deep-space station parameters and protection pertinent to sharing
The principal deep-space station parameters which pertain to interference and sharing are antenna gainand pointing, transmitter power and receiver sensitivity. Details of these parameters are given in [CCIR 1974-78b).
Space station and earth station receivers for deep-space research function in a similar manner, except thatthe space station does not include a maser. Space stations are as susceptible to interference as described earlier forearth stations.
The criterion for protection of deep-space station receivers is that interference power must be no strongerthan receiver noise power. Compared to deep-space earth station criteria, this is less severe and is a consequenceof generally larger performance margins on the earth-to-space link. For protection of deep-space stations, thepower spectral density of wideband interference, or total power of CW interference, in any I kHz band should beno larger than the amount shown in Table VI. for an aggregate of 5 minutes per day.
Deep-space station e.i.r.p. is normally reduced while near the Earth, thus minimizing the potential forinterference to other stations.
4. Sharing considerations: Earth-to-space bands
Table VII and the following paragraphs consider the possibility of interference in the deep-space researchEarth-to-space bands.
• Five minutes per day is generally taken as 0.001% of the time, as discussed in Report 536-1.

162 Rep. 685
TABLE VI - Interference protection for deep-space station receivers
Frequency (GHz)
2.1
7.2
15.0
Maximum interference level (dB(W/kHz))
170.8
169.6
168.1
TABLE VII - Potential interference in Earthtospace bands
Source
Deep-space earth station
Deep-space earth station
Terrestrial orearth station
Near-Earth satellite
Reciver
Terrestrial orearth station
Near-Earth satellite
Deep-space station
Deep-space station
4.1 Potential interference to terrestrial or earth station receivers from deep-space earth station transmitters
The normal maximum total power for current US deep-space earth stations is 50 dBW. For a typicalminimum elevation angle of 10°, the e.i.r.p. directed towards the horizon does not exceed 57 dB(W/4 kHz),assuming the reference earth station antenna radiation pattern of Recommendation 509. For spacecraft emergen-cies, the maximum total power may be increased to 56 dBW, giving not more than 63 dB(W/4 kHz) at thehorizon. These values of e.i.r.p. meet the requirements of No. 470F of th': Radio Regulations.
Aircraft s'ations within line-of-sight of a deep-space earth station will encounter total power flux-densitiesas shown in Fig. I. For an aircraft altitude of 12 km, the maximum line-of-sight distance to an earth station is391 km and the total power flux-density al the aircraft can never be lower than - 8 3 dB(W/m2), again assumingthe antenna pattern of Recommendation 509. Depending on distance and earth station antenna direction, theaircraft station may experience much higher flux-densities and interference levels. Co-ordination with airbornestations is generally not practicable.
Tropospheric phenomena and rain scatter may couple deep-space ea.th station transmitting signals intotranshorizon, space system and other surface stations. When practicable, co-ordination should provide sufficientprotection for terrestrial receivers and earth station receivers. See § 2.3 for co-ordination considerations.
4.2 Potential interference to satellite receivers from deep-space earth station transmitters
Satellites that come within the deep-space earth station beam will encounter power flux-densities as shownin Fig. I. When the earth station is tracking a spacecraft so that the antenna beam passes through thegeostationary satellite orbit, the flux-density at a point on that orbit will vary with time as shown in Fig. 2. Forexample, the total power flux-density will be - 9 5 dB(W/m2) or inore for 32 minutes. The figure assumes atransmitter power of 50 dBW, a 64 m antenna, and the reference eaHi station pattern of Recommendation 509.An importa.it observation is that the minimum flux-density at the geostationary satellite orbit within line of sightof a deep-space earth station is - 122 dB(W/m2), regardless of the antenna pointing direction.
The duration and magnitude of signals from deep-space earth station transmitters which may interfere withsatellites in non-geostationary orbits depends upon those orbits and the particular deep-space tracking at that time.
4.3 Potential interference to deep-space station receivers from terrestrial or earth station transmitters
Terrestrial or earth station transmitters within sight of a deep-space station are potential sources ofinterference. Fig. 3 shows the space station distance at which interference power density from such a transmitterequals the receiver noise power density. For example, a transhorizon station with 93 dB(W/IO kHz) e.i.r.p. in the2.1 GHz band could interfere with a space station receiver at ranges up to 4.1 x I09 km (600 K noisetemperature, 3.7 m spacecraft antenna). The possibility of interference at such a great distance poses a threat tospace missions to planets as far away as Uranus. Stations with lower e.i.r.p., or with antennae pointing away fromthe ecliptic plane, have less potential for interference.

Rep. 685 163
107
5
2
106
5
J
/
/
/
— / -
/
/
/
- //
/
• — / •— / -
/
— /
/
/
* / B
' /
f
—//
//
y -
/
i/
//
//
*-—/-
-(-f—•
/(
/
4-—
—f//c/
//—/—
-/—
I—f-—/f- —
10«
5
2
103
5
0 -20 -40 -60 -80 -100 -120 -140
Power flux-density (dBOV/m1))
FIGURE 1 - Power flux-density from earth stationtransmitter 100 kW,64m antenna
A Main beam, IS GHz
B: Main beam, 2.1 GHz
C: 5° off axis
(14.5 dB gain, Recommendation 509)
D: >48° off axis (-10 dB gain, Rec. 509)
. . : Altitude of geostationary satellite orbit, 3.56 X 10* km
-11010
Cumulative time at or above minimum power flux-density(minutes)
FIGURE 2 - Duration of potential interference to geostationarysatellite intenecting beam axis from earth station with 100 kW
transmitter and 64 m antenna
: 2.1 GHz
: 15GHI

164 Rep. 685
1O1U
5
109
d108
3
2
107
s
?
•>
in''
D,
" /
j
yS
f />
/
/
/
— ~ -
— - ^
^ —
- — -
—7H
c
- /
1 7^S
y A
-/—
/ B
/
0 10 20 30 40 50 60 70
Space station antenna gain (dBi)
FIGURE 3 - Space station distance from terrestrial transmitterfor interference power equal to receiver noise power
A: 15 GHz relay transmitter, 55 dB(W/]0 kHz); 168 (JBOV/kHz) receiver noise power
B 7.2 GHz relay transmitter, 55 dB(W/IO kHz); -170 dB(W/kHz) receiver noise power
C. 2.1 GHz relay transmitter. 55 dB(W/10 kHz); -171 dBOV/kHz) receiver noise power
D. 2.1 GHz transhorizon Iransmirler, 93 dBOV/10kHz); 171 dBOV/kHz) receiver musi- power
d : Space station range of 1 astronomical unit. 1.5 x 10' km
4.4 Potential interference to deep-space station receivers from near-Earth satellite transmitters
Near-Earth satellites typically have antennae directed to the Earth or to other satellites. Interference withdeep-space station receivers may occur for those brief periods when the satellite antenna is directed near theecliptic plane. As received at deep-space stations, signals from satellites will usually be relatively weaker thanthose from earth stations.
5. Sharing considerations: space-lo-Karth bands
Table VIII and the following paragraphs consider the possibility of interference in (he deep-space researchspace-to-Earth bands.
TABLE VIII - Potential interference in space-to-Earth bands
Source
Deep-space station
Deep-space station
Terrestrial oreaith station
Near-Karth satellite
Receiver
Terrestrial orearth station
Near-Karth satellite
Deep-space earth station
Deep-space earth station

Rep. 685 165
5.1 Potential interferer s to terrestrial or earth station receivers from deep-space station transmitters
Fig. 4 shows power flux-density at the surface of the Earth caused by deep-space stations with characteris-tics as shown in [CCIR l974-78b). These stations typically use low gain, wide beam antennae while near Earth.After a lime not exceeding six hours from launching, they are usually at a sufficient distance for the power(lux-density at the surface of the Earth to be less than the maximum permitted by Radio Regulations forprotection of line-of-sight radio-relay systems. For example, the MARINER Jupiter Saturn spacecraft is expectedto use the low gain antenna until 4.2 x I07 km from Earth, at which time the power flux-density would be- 198 dB(W/nr) in 4 kHz after switching to the high gain antenna.
10'
5
2
5
U
10*
5
2
5
2
11)2
—ft/I
i/
fIr
/
/
1
J-/A /
/
f
/r-f—//
Jif
8
J
//
i
i—1 -I
1
!
/
— y -//
X104k
— / -/
/r
n
•60 -80 -100 -120 -140 -160 -180 -200Power flux density (dBfW/m1))
FIGURE 4 - Power flux density at surface of Earth fromspace station transmitter
A: 11 dBW transmitter, 37 dBi antenna
B: 14 dBW transmitter, 0 dBi antenna
: -154 dB(W/m') (Number 470 NE of the Radio Regulations)
When the transmitting space station is using a higher gain directional antenna, there is the potential forinterference with sensitive terrestrial receivers if their antennae are directed in the ecliptic plane. A space stationoperating at 2.3 GHz with an e.i r.p. of SI dBW at a distance of 5 x I08 km could create an input of -168 dBWto a transhorizon receiver (27 m antenna, main beam). The duration of such interference would be of the order of.a few minutes, once a day, because of the rotation of the Earth.
5.2 Potential interference to near-Earth satellite receivers from deep-space station transmitters
Considerations of this interference are similar to those for the space station to terrestrial receiver case,§ 5.1, with the exception of the path geometry. Depending on the changing conditions of that geometry,occasional brief interference is possible.
5.3 Potential interference to deep-space earth station receivers from terrestrial or earth station transmitters
Interference to deep-space earth station receivers may come from terrestrial or earth stations overline-of-sight paths, by transhorizon phenomena, or by rain scatter. For co-ordination considerations see § 2.3.
Other services with high power transmitters and high gain antennae are potential interference sources.Radiolocation stations are an example. Earth station transmitters are less likely sources of interference, dependingon e.i.r.p. in the direction of the deep-space earth station. Co-ordination should enable adequate protection fromradio-relay stations to be provided.

166 Rep. 685
Aircraft transmitters within sight of a deep-space earth station may cause serious interference. Atmaximum line-of-sight distance in any direction (391 km for an aircraft at 12 km altitude), an e.i.r.p. of- 2 6 dB(W/Hz) (for example, 10 dB(W/4 kHz) and 0 dBi antenna) will exceed the earth station interference limitby at least the amount shown in Table IX, assuming the reference earth station antenna pattern.
Co-ordination with airborne stations is generally not practicable.
TABLE IX - Interference from assumed aircraft transmitter
Frequency(GHz)
2.3
8.4
15.0
Deep-space earth stationinterference limit (dB(W/Hz))
-222.5
-220.9
-219.3
Harmful interference from aircraft " )(dB)
35.7
22.1
15.5
' I) Aircraft signal less deep-space earth station interference limit
5.4 Potential interference to deep-space earth station receivers from near-Earth satellite transmitters
An analysis of the case for satellites in highly eccentric orbits may be found in Report 688. It is concludedthat sharing is not feasible. This conclusion is also valid for satellites in circular and moderately eccentric orbits.
6. Discussion
Sharing with stations that are within line-of-sight (LOS) of deep-space earth stations is not feasible.Stations within LOS will create excessive interference to receivers of deep-space earth stations, or will be exposedto excessive interference from transmitters of these stations. Aeronautical mobile stations and near-Earth satellitesfrequently come within LOS of deep-space earth stations.
Sharing of deep-space Earth-to-space bands with stations utilizing high average e.i.r.p. is not feasiblebecause of potential interference to stations in deep-space. It is currently considered that stations with an e.i.r.p.that is more than 30 dB below the implemented or planned e.i.r.p. for space research earth stations do not pose asignificant problem. From the data in [CCIR 1974-78b], this means an average e.i.r.p. no greater than 82 dBW at2 GHz, and 92 dBW at 7 GHz. The deep-space earth station e.i.r.p. for other frequencies is not now known.
7. Conclusion
Criteria and considerations presented in this Report lead to the following conclusions:
7.1 Sharing of Earth-to-space bands
Deep-space research cannot share Earth-to-space bands with:
- receiving aeronautical mobile stations,- receiving satellite stations, and- transmitting terrestrial stations and earth stations utilizing high average e.i.r.p., for example, transmitting
transhorizon stations, and transmitting fixed-satellite earth stations.
When co-ordination is practicable, sharing is feasible with other stations of all services. In some cases,co-ordination distances may be unacceptably great.
7.2 Sharing of space-to-Earth bands
Deep-space research cannot share space-to-Earth bands with:- transmitting aeronautical mobile stations, and
- transmitting satellite stations.When co-ordination is practicable, sharing is feasible with other stations of all services. In some cases,
co-ordination distances may be unacceptably great.The matter of unacceptably long co-ordination distance requires further study.
REFERENCES
CCIR Documents(1974-78]: a. 2/168 (USA); b. 2/167 (USA).

Chairman's Note: The following paper has been submitted by its authors
to the British Royal Society of London and is reprinted here by permission of
the Society.* Although its analysis is based on SPS parameters which differ
somewhat from those of the current Reference System, its conclusions are
similar to those of the working group. It is included here as an example of
international concern over SPS effects on radio astronomy.
The working group's brief discussion of this paper noted that the
assumed parametric amplifier receiver first stage represents a worst case
for out-of-passband overload sensitivity. While parametric amplifiers are
extremely useful and widely used, and while all likely alternatives exhibit
qualitatively similar overload phenomena, it seems likely that quantitative
improvements in the overload performance of low noise receivers can be
expected in the next two decaaes.
* The present text was retyped at PNL to improve reproducibility and PNLaccepts responsibility for any typographic errors.
C.I

Effect of Solar Power Satellite transmissionson radio astronomical research
by B. Anderson and Sir Bernard Lovell, F.R.S.
Nuffield Radio Astronomy Laboratories, Jodrell Bank,University of Manchester
SUMMARY
Solar power satellites (SPS) now in the research and development stage are
intended to be placed in geostationary orbits where large arrays of photocells
will collect solar en "-gy which will be delivered to Earth on a frequency of
2.45 GHz at a power level of 10 gigawatts. The calculations in this paper
indicate that severe restrictions will be placed on the use of radio tele-
scopes on Earth for the study of radio emissions from celestial objects. For
a single SPS it would be possible to operate with the radio receiver protected
by suitable filters at radio frequencies well separated from 2.45 GHz and at
angles of look well displaced from the SPS. However, operational systems
involving many SPS to supply significant amounts of power to Earth would
create serious hazards to radio astronomi .al research, except possibly in
thinly populated areas of the Earth.
1. Introduction
It is now several years since Glased ' of the Arthur D. Little Consul-
tancy in the U.S. proposed that solar power should be collected by an orbit-
ing satellite and beamed to Earth using a microwave transmitter. The concept
is based on the consideration that the solar energy flux incident on the
atmosphere (1360 W m" ) is several times greater than mean ground level values
in Europe and twice the mean flux in the Sahara. Further, at a frequency of
2.45 GHz, radiation penetrates the atmosphere from space with near unit trans-
mission coefficient under all atmospheric conditions. Therefore if power is
transmitted to Earth from space at this frequency there is negligible energy
exchange with the atmosphere and a secure 24 hour system can be envisaged

with the efficiency dependent only on the conversion factors for the solar
collector and transmitter in space and the collector on Earth. Substantial
encouragement has now been given for the initiation of R & D on the systenr
and in this paper we draw attention to the effects which an operational system
might have on important areas of astronomical research.
2. The present proposals for a Solar Power Satellite System (SPS)
In a 1975 presentation to NASA of advanced space concepts for the epoch(3)1980-2000 AD, Bekeyv ' outlined parameters for a system around which most of
the subsequent discussion has centred. The scheme invisages a number of satel-
lites in synchronous equatorial orbits. Each satellite would have solar col-
lecting arrays with dimensions of 13.5 x 4.8 km feeding a 10 GW transmitter
beamed to Earth on a frequency of 2.45 GHz through a 1 km aerial array. The
beam would be directed to an antenna on Earth covering 10 km x 10 km and it
is computed that each system would ultimately deliver 5 to 10 GW into the
terrestrial distribution system. Each satellite would weigh over 11 million kg
and require 20 billion photocells, and at the turn of the century it has been
estimated that 8 satellites of this type could supply the UK electrical needs
and that 100 could provide one-third of the U.S. electricity requirements.
The power density at Earth in the 10 GW, 2.45 GHz beam transmitted from each
satellite is computed to be 200 W m and we first compare this flux with that
received from celestial sources by radio telescopes.
3. Interference with radio telescopes
Terrestrial radio telescopes normally operate over the radio wavebands
from a few centimetres to several metres. Research in the millimetre waveband
generally demands special high altitude sites and at the long wave end the
ionosphere becomes the limiting factor. By normal standards the signals re-
ceived from the galaxy and extragalactic objects are extremely weak. The
achievable sensitivity varies over the waveband but as a guide for present
purposes it may be assumed that most radio astronomical systems today work at-29 -2 -1
sensitivity limits of a few millijansky (1 mJy = 10" W m" Hz" ). Inter-
nationally regulated bands for terrestrial transmitters screen a few frequen-
cies for use in radio astronomy within bandwidths of the order 4 MHz. Thus
the incident flux on the antennae at limiting sensitivity is of the order

10" 2 3 W m"2. Since the flux from the SPS is of the order 10 2 5 times that of
the natural radio signals from astronomical objects it is necessary to enquire
whether the operational conditions of the SPS and of radio telescopes lead to
any measure of compatibility.
4. Operational circumstances
The feasibility of operating radio telescopes when the 2.45 GHz beams are
incident on Earth depends (a) on the polar diagram and the sidelobe level of
the solar power beam, (b) on the polar diagram and the sidelobe level of the
radio telescope and (c) on the undesired ambient power levels at which the
receiver of the telescope can operate. On these points the following informa-
tion is available.
(a) The polar diagram of the 2.45 GHz array
The 1 km diameter SPS array on 2.45 GHz will have a beam width of approx-
imately 0.02 deg. The flux in the main beam collected by a 10 km "rec-_2
tenna" on Earth will be 200 W m . At the edge of the rectenna the polardiagram of the SPS must be such that the radiation safety standards must
2be met. These allowable limits at present extend from 100 W m in the
-? -?
USA to 0.1 W m in the USSR. We assume an intermediate value of 1 W in
at the edge of the collector and that by skilful design and control of the
array elements in space the far-out sidelobes could be reduced to -50dB
with respect to the main beam. At a level of 200 W m in the main beam
the intensity of the far-out sidelobes would then be of the order 2 x-3 -2 (A)
10 W m . However, Kassing and Reinhertzv ' quote a figure 50 times
greater of 0.1 W m as the achievable diminution of flux from the SPS
in the far out-zones. In the present calculations these values of 10-3 -2and 2 x 10 W m are taken as the likely maximum and minimum values of
the SPS flux in the far-out zones.
(b) The polar diagram of the terrestrial radio telescope
We are concerned with the power delivered to the focus of the radio
telescope from the 2.45 GHz transmissions from the SPS, notwithstanding
the actual frequency on which the telescope is receiving the signals
from celestial objects. The relevant characteristics of the radio

telescope are therefore those appropriate to the SPS frequency of 2.45 GHz,For simplicity we take the characteristics of the Mk IA radio telescope atJodrell Bank. On 2.45 GHz these are -
Beam width to 3dB points = 5 arc min.Mean sidelobe level to 5° off axis = -30dB with respect to main beam.Sidelobe level beyond 5° = -60dB with respect to main beam.
3 2Effective area of the collector = 3 x 10 m .
We assume that the telescope is far enough removed (say more than 100 km)from the SPS terrestrial collector that it can be considered to be onlyin the far-out zone flux of the SPS. The power delivered at the focusfor the maximum and minimum limits considered in 4(a) can then be calcu-lated for typical circumstances. Table 1 gives the power delivered tothe focus for three values of 6 - the angle between the axis of the tele-scope beam and the SPS.
Table 1
Power delivered to the focus of the radio telescope atdifferent values of 6 for two levels of the far-out zonefield of the SPS.
0
a) 8 < 0.1°b) 0.5° < 9 < 5°c) e > 5°
SPS field (far-out zone)2 x 10"3 W m"2
6W6 x 10"3W6 x 10"6W
10"1 W m"2
300W3 x lO^W3 x 10"4W
The power delivered to the focus of the telescope from a celestial-29 -2 -1source (assuming a limiting sensitivity of 10 W m Hz and a typical
-19bandwidth of 4 MHz) will be of the order 10 watts. Thus the powerinput from the SPS into the telescope focus will be from approximately
14 2210 to 10 times greater than that from the celestial source which itis desired to study.

(c) The characteristics of typical radio frequency amplifiers in adisturbing fieldWith such a great disparity between wanted and unwanted power levels thefeasibility of operating a radio telescope even in the far-out field ofthe SPS depends on the level of rejection of the SPS signal which can beobtained by filtering at the 2.45 GHz frequency. It is possible to pro-vide adequate protection from out-of-band interfering signals for allthe stages of a radio receiver except the first. The first stage istypically a parametric amplifier that has been optimised for minimumnoise figure so that maximum sensitivity is achieved. Protection of aparametric amplifier by means of a filter results in a degradation innoise performance due to the insertion loss of the filter and the noisethat it contributes. The amount of degradation increases with theamount of protection that is required and also as the unwanted frequencyapproaches the desired frequency.
Measurements have been made of the effect of out-of-band interfer-ence on several of the relatively narrow bandwidth (£ 1%) parametricamplifiers in regular use at Jodrell Bank. Three main effects have beenobserved:-
(i) gain compression for the case where the interfering frequencyis within a few percent of the desired frequency,
(ii) detuning and gain peaking where the frequency separation is
greater than in (i).
(iii) cross modulation i.e. the generation of an inband signal in
the parametric amplifier from two out-of-band signals.
Many astronomical observations would be prejudiced by gain changes
of 0.01% and/or spurious in-band components of 10 times the receiverQ
noise. Interference levels of about 10 w at the parametric amplifierare sufficient to cause these changes if the frequencies are within afew percent of one another. Stronger interference can be tolerated ifthe frequency offset is greater.Filtering requirements
The discussion in the preceding section indicates that the maximum

tolerable level of an interfering signal at a parametric amplifier variesg
from approximately 10 W for frequencies offset by less than 10% from the
desired signal to approximately 10 W for offsets greater than 50%. These
data are combined with those from Table 1 to deduce the specification of a
filter to give the necessary protection to the parametric amplifier. The
results are shown in Table 2.
Another relevant parameter of a filter is the insertion loss at the
desired frequency and the effect of this on signal to noise ratios. The
best parametric amplifiers currently achieve system noise temperature of
about 40K; a filter with an insertion loss of 0.2 dB at room temperature
would degrade signal to noise ratios with this system by 40% and, further-
more, would limit the amount of possible improvement by future developments
in parametric amplifiers. It is difficult to combine high rejection and
low insertion loss in a filter, especially if the fractional separation of
the pass and reject bands is small.
Table 2
Filter attenuations required to protect the
parametric amplifier from the power levels of Table 1.
The maximum and minimum values correspond to the mostpessimistic and optimistic estimates respectively ofthe sidelobe levels from the SPS.
a)
b)c)
8
0
e
e
< 0.1°
.5° < e < 5°
> 5°
frequency
100 -
70 -
40 -
Filter attenuation
separation10%
117 dB
87 dB
57 dB
frequency
80 -
50 -
20 -
separation50%
97
6737
dB
dBdB

Discussion(i) The following comments may be made on Tables 1 and 2.
(a) If a large radio telescope is directed so that an SPS lieswithin its main beam then the receiver will be damaged un-less protected by a filter to ensure that the power levelat the parametric amplifier is less than 1W (a rejection ofat least 25 dB at 2.45 GHz for the worst case).
(b) Observations within 5° of an SPS will only be possible withseverely reduced sensitivity.
(c) Observations in directions more than 5° away from the SPSbut on a frequency within 10% of 2.45 GHz will have reducedsensitivity because of the filtering requirements. The radioastronomy band at 2.7 GHz would be affected and also thesatellite communication bands at 2.2-2.3 GHz which are alsoused for radio astronomical observations.
(ii) The estimates in (i) refer to the circumstance where only thefundamental 2.45 GHz signal from the SPS is significant. Anyappreciable harmonic content in the signal beamed to Earth wouldincrease the complexity of the filters required and might extendthe limitations considered in 6(i) to other frequency bands re-served for radio astronomy. The seriousness of this cannot beassessed until the characteristics of the space transmitters aredefined.
(iii) The calculation of interfering levels and rejection needed havebeen based on the characteristics of the 250ft Mk IA radio tele-scope at Jodrell Bank. These figures may be taken as typicalfor parabolic reflectors now in use as radio telescopes. Forsmaller reflectors the area of forbidden sky around SPS for thevarious cases considered would increase approximately linearlyas the aperture of the telescope decreases. For combinations ofradio telescopes used as interferometers or in aperture synthesisnetworks, the effect of the SPS signal on the system needs more

detailed analysis. At best, the restrictions assessed in 6(i),
as applied to the smallest aperture telescope in the network would
seem to be the limiting factor.
7. Conclusions
The parameters for solar power satellites now under discussion would
illuminate radio telescopes situated remotely from the SPS terrestrial col-20lector at power levels at least 10 times greater than those received from
the celestial sources now being investigated and several orders of magnitude
greater than those from other man made sources. The extent of the inhibition
to radio astronomical research would depend critically on the polar diagram
of the space array, the harmonic content of the space transmitter and the
number of such power systems operating in space. For a single space station
with the best attainable polar diagram and negligible harmonic radiation it
should be possible to filter the interfering signal at the radio telescope so
that observations would be possible except on frequencies near the protected
band of 2.45 GHz, although investigations of the celestial radiation within
several degrees of the satellite would be severely restricted. On the other
hand.operational systems requiring several satellites to supply significant
amounts of energy to Earth would create serious hazards to radio astronomical
research except in thinly populated areas of the Earth. For example, it is
estimated that 8 space stations would be required to supply the needs of the
U.K. by 2000 AD. If the terrestrial collectors were distributed over the
U.K. then it is unlikely that any site would remain for the satisfactory
operation of a radio telescope.
Apart from these direct effects of the space power beam on radio astro-
nomical research it may be noted that other possibilities are now under study
which may influence such research. For example, measurements with the
Arecibo radio telescope are in progress to determine the possible influence
of the 2.45 GHz beam on the electron temperature in the ionosphere^ '; and
studies at Harvard by Grossi and Colombo^ ' relate to the possibility of
weather modification by using a space transmitter at 22.2 GHz. Should this
be attempted then, at least,all research on the water vapour spectral line
from celestial sources would be brought to a halt.

References and Notes
(1) P.E. Glaser - Science Jj£, 857, 1968.
(2) In 1978 NASA and the U.S. Department of Energy were authorised tocommission a $25M study. Boeing Aerospace and Grumman Corporationare involved in these studies. In the U.K., British Aerospace statethat they have a £59k study contract from the European Space Agencyrelated to this problem (British Aerospace News No.10 March 1978;Press Release 8 Feb. 1978).
(3) Bekey, I. Aerospace Corp. presentation
NASA Space Station study NASA-MSFC. Dec.1975.(4) Kassing, D. and Reinhertz, K.K. ESA Journal 1, 179, 1978.(5) Microwave Systems News, 8_, 38, 1978.(6) Grossi, M.D. and Colombo, G. Jr. of Microwave Power 12, 209, 1977.
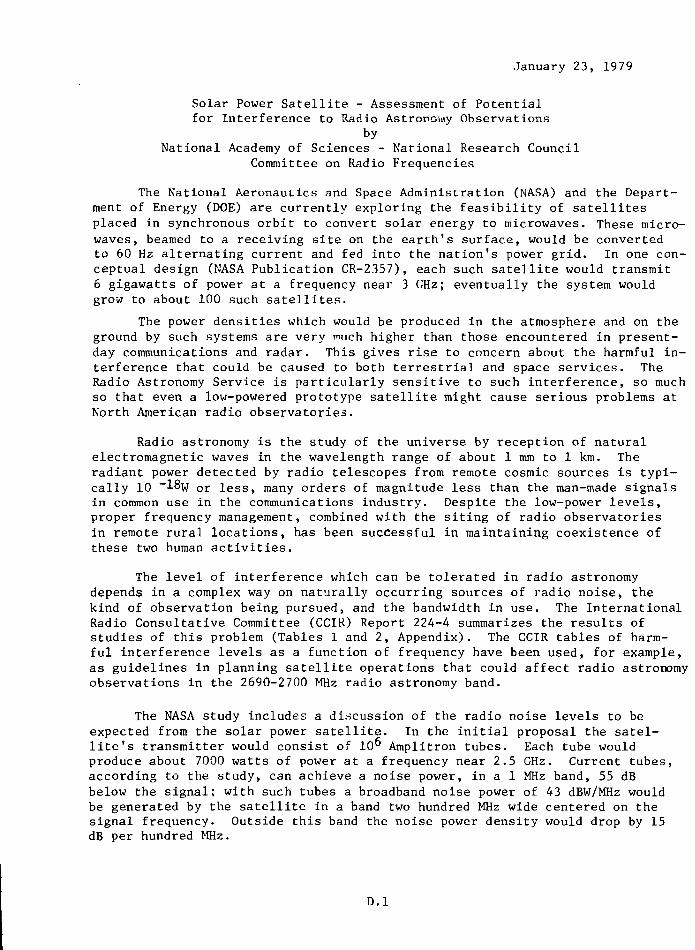
January 23, 1979
Solar Power Satellite - Assessment of Potentialfor Interference to Radio Astronomy Observations
byNational Academy of Sciences - National Research Council
Committee on Radio Frequencies
The National Aeronautics and Space Administration (NASA) and the Depart-ment of Energy (DOE) are currently exploring the feasibility of satellitesplaced in synchronous orbit to convert solar energy to microwaves. These micro-waves, beamed to a receiving site on the earth's surface, would be convertedto 60 Hz alternating current and fed into the nation's power grid. In one con-ceptual design (NASA Publication CR-2357), each such satellite would transmit6 gigawatts of power at a frequency near 3 GHz; eventually the system wouldgrow to about 100 such satellites.
The power densities which would be produced in the atmosphere and on theground by such systems are very much higher than those encountered in present-day communications and radar. This gives rise to concern about the harmful in-terference that could be caused to both terrestrial and space services. TheRadio Astronomy Service is particularly sensitive to such interference, so muchso that even a low-powered prototype satellite might cause serious problems atNorth American radio observatories.
Radio astronomy is the study of the universe by reception of naturalelectromagnetic waves in the wavelength range of about 1 mm to 1 km. Theradiant power detected by radio telescopes from remote cosmic sources is typi-cally 10 "l^W or less, many orders of magnitude less than the man-made signalsin common use in the communications industry. Despite the low-power levels,proper frequency management, combined with the siting of radio observatoriesin remote rural locations, has been successful in maintaining coexistence ofthese two human activities.
The level of interference which can be tolerated in radio astronomydepends in a complex way on naturally occurring sources of radio noise, thekind of observation being pursued, and the bandwidth in use. The InternationalRadio Consultative Committee (CCIR) Report 224-4 summarizes the results ofstudies of this problem (Tables 1 and 2, Appendix). The CCIR tables of harm-ful interference levels as a function of frequency have been used, for example,as guidelines in planning satellite operations that could affect radio astronomyobservations in the 2690-2700 MHz radio astronomy band.
The NASA study includes a discussion of the radio noise levels to beexpected from the solar power satellite. In the initial proposal the satel-lite's transmitter would consist of 10" Amplitron tubes. Each tube wouldproduce about 7000 watts of power at a frequency near 2.5 GHz. Current tubes,according to the study, can achieve a noise power, in a 1 MHz band, 55 dBbelow the signal; with such tubes a broadband noise power of 43 dBW/MHz wouldbe generated by the satellite in a band two hundred MHz wide centered on thesignal frequency. Outside this band the noise power density would drop by 15dB per hundred MHz.
D.I

This noise power would be focused differently from the signal. Eachtube would feed one element of a phased array, each element have an effectivearea of about one square meter, with a forward gain of 30 dB at the designfrequency, falling off slowly (1 dB/100 MHz) with frequency. The signal beamfrom the 1 km diameter phased array would subtend an angle of less than an arc-minute, placing more than 90 percent of the signal in an area 10 km across theearth's surface. However, the noise voltages would not be correlated from oneAmplitron to the next, hence the noise beamwidth would be defined by the pat-tern of the individual elements, about 10°. The noise would therefore be dis-tributed over an area some thousands of miles in diameter centered on eachreceiving site.
The study proposes reducing this noise level, which is unacceptable evenfor commercial communications services, by further development of the Amplitrontubes and by filtering the signal from the uubes before it reaches the antennaelements. The filtering requirements are severe if permanent damage to radioand radar astronomy is to be avoided. The unfiltered noise signal with currenttube designs would be -153 JBW m^ Hz~l at the earth's surface. The harmfulinterference levels defined in the CCIR report lies some 80 to 90 dB belowthis level in the 2-3 GHz region. Even if adequate filters could be designed,the failure of a single one of the 10" filters could produce a noise level inexcess of khe harmful limits of CCIR 224-4. (These limits apply when the radiotelescope is pointed away from the satellite; in a small area around the satel-lite's p~ Ltion the interference would be much worse). There are several othermechaniL.us by which serious out-of--band interference might be generated byvirtue of extremely high r-f power levels. These include non-linear effectsin the earth's atmosphere and in metallic structures in the satellite or onthe earth's surface.
In addition to the problems from the noise power, the signal power itselfwill be so high that there could be substantial interference due to the energywhich goes into directions other than the main beam, and to frequencies outsidethe intended band. It is never possible to confine all the energy of a radiosignal to the main beam and the assigned frequency band, but with normal trans-mitters the out-of-beam and out-of-band levels are usually low enough to benegligible. The situation would be quite different for the very powerful trans-mitters being considered here, especially for interference to the very sensitivereceivers used in radio astronomy.
Many observatories could be affected by any of the types of interferenceconsidered above; major U.S. installations are currently located at Green Bank,WV; Socorro, NM; Tucson, AZ; Hat Creek and Owens Vally,(sic) CA; Marfa, TX;Arecibo, PR; Amherst and Westford, MA, and Danville, IL. A remote locationprovides no protection from satellite interference. National borders areequally ineffective; Canadian installations in Algonquin Park, Ontario, andPenticton, BC, would also be affected. A particularly severe problem wouldexist for the world's most powerful and sensitive radar system, located atArecibo, as its assigned operating frequency of 2380 MHz lies just outsidethe 2400-2500 MHz band currently under consideration for use by the powersatellite.
D.2

Deep space communications frequencies at 2300 MHz and a radio astronomyband at 2700 MHz are other frequencies where there would be great danger ofsatellite-generated interference. The radio astronomy band at 5 GHz wouldbe endangered by the second harmonic of the satellite power signal.
The Committee on Radio Frequencies concludes that the potential forharmful interference to radio astronomy is so great that protection fromsatellite-generated radio interference must be a major design considerationeven for the earliest low-powered prototypes of the power satellite system.There may well be other radio services that share these concerns. Theproposers of a new program such as this must perform adequate and realisticanalyses and that work, must be independently confirmed to assure that thepublic interest is served.
D.3

APPENDIX E
ENVIRONMENTAL CONSIDERATIONS FOR THE MICROWAVE BEAMFROM A SOLAR POWER SATELLITE

ENVIRONMENTAL CONSIDERATIONS FOR THEMICROWAVE BEAM FROM A SOLAR POWER SATELLITE
G. 0. Arndt and L. Leopold
Johnson Space CenterHouston, Texas
ABSTRACT
Solar power satellite (SPS) systems ingeosynchronous orbit are possible future energysources. The SPS concept uses a highly focusedmicrowave beam to transmit the energy to the earth.The microwave power transmission system parametersare summarized, emphasing those parameters whichmay affect the earth's environment. Environmentalimpacts of the microwave beam are discussed. Thepower levels for the main beam, sidelobes, gratinglobes, and ground receiving antenna reradiationpatterns are presented. Ionospheric/microwavebeam Interaction studies, experimental andtheoretical, are reviewed. Possible radio frequencyInterference sources and tne magnitude of expectedInterference levels are discussed.
A number of studies using large solar powersatellite (SPS) systems in geosynchronous orbit(GEO) to supply power for Earth use are now under-way. This concept requires power transmission bya microwave beam from GEO to the Earth's surface.Each microwave beam provides approximately 5 GW ofelectrical power to the commercial utility grids.The power density levels associated with the microwave beam poses potential problems for radiofrequency interference to existing communicationsand navigation systems as well as possible low-level radiation concerns for public health andecological balance within areas close to theterrestrial receiving rectonnas.
This paper summarizes the microwave powertransmission system parameters, with emphasis onthose parameters directly affecting the Earth'senvironment. The antenna pattern characteristicsfor the main beam, sidelobes, and grating lobes,as well as the rectenna reradiation density levelsare given. The results of initial studies intomicrowave beam Interactions with the ionosphere arereviewed, together with possible problem areas.The noise characteristics of proposed DC-RF powerconverter tubes In their respective antenna con-figurations are discussed.
The present SPS microwave system has a large,1 KM diameter phased array which Is divided into7220 smaller subarrays, 10.4 meters X 10.4 meterson a side. The subarrays radiate through slottedwaveguides with the DC-RF power converters mountedon the backside. Each subarray, with uniformamplitude and phase Illumination across the sur-face, has its own phasing electronic and RFreceiver to process a pilot beam from the ground.
The subarrays are phased together to form a sing!?bean at the ground rectenna. The ground rectennaIllumination function has a diameter or approximately10 KM and receives 88» of the transmitted energy.
ANTENNA PATTERN CHARACTERISTICSThe SPS microwave system must have a highly
focused main beam with low sidelobes and gratinglobes. There should be minimal wandering of thebeam boresight, with a fail-safe mechanism in theevent of a total failure of the phase control system.An active, retrodirective phasing techniquesatisfies this latter requirement as will be shownlater. A number of different antenna illurinatior,functions were investigated to determine an optiruiIllumination in terms of maximizing the power inthe main beam and minimizing the sidelobe levels(Ref. 1). The 10 dB Gaussian taper which had thebest overall performance provides a power bea^ witra peak of 23 mw/cm' at the center of the recttnraand 1.0 tnw/cmz at the edge as shown in figure 1.The first sidelobe has a.07 mw/cn/ peak at a dis-tance of approximately 7.7 Km from the center ofthe rectenna. This sidelobe density is over afactor of 100 less than the present U.S. standardof 10 mw/cm2 (but exceeds the USSR guideline of.01 nw/cmZl. It 1s not anticipated that these sice-lobe levels will be an environmental problem; how-ever, there are a number of new studies sponsoredby the Department of Energy which will be addressingthe allowable radiation levels. It is possible tofurther reduce the sidelobe levels by increasingthe amount of Gaussian taper. Increasing tnetaper produces a lower boresigh*. density, a widermainlobe, and lower sidelobes. A 17 dB tape'- canreduce the sidelobe peak to .01 mw/cn^, the USSRguideline (Ref. 2); however, this large taoer hasgreater thermal dissipation problems at the canterof the transmit array due to waste heat f-o*: thepower tubes. An active cooling system for ea;htube would probably be required for this taper.
E.I

If th?re is a total failure within the phasecontrol system (for example, the uplink pilot beamtransmitter is shut off), the subarrays will no longerbe phased together and the total beam will be de-focused. As shown in figure 1, the peak intensityof the beam drops to .003 mw/cm? and the beam widthgreatly increases. Since this peak power density isless than even the stringent USSR guideline therewill not be any health problem if the phase controlsystem fails completely. This is the fail-safemechanism mentioned previously. In addition therewould be sensors near the rectenna to detect anylarge changes in incident power density; this in-formation would immediately be transmitted to theantenna to cease operations.
In addition to the sidelobe patterns near therectenna as given in figure 1, the far-sidelobepatterns .ave been calculated. There had been someconcern about the radio interference levels overeastern European countries because of frequencyallocation problems. The SPS downlink power beamHes in the 2400-2500 MHz frequency band which hasbeen reserved for Government and nonGovernmentIndustrial, medical, and scientific (IMS) usage. Bydefinition anyone operating in an IMS band mustaccept interference from any other user within thisband. However, this 100 MHz band is not recognizedby some of the European countries, including Albania,Bulgaria, Hungary, Poland, Rommania, Czechoslovakia,and the USSR. These countries reserve 2375 MHz +50 MHz for the IMS band. The far sidelobe levels asshown in figure 2 indicate the peak levels for one5 gigawatt SPS system are three to four orders ofmagnitude below .01 mw/cm?. For simultaneousoperation of one hundred, ten gigawatt SPS systems,the average peak level 1s still one to two orders ofmagnitude lower than .01 mw/cm2.
I '
;
h
—
— -—*- —/
,*
• . . • * •
—
When the boresights of the subarrays are not a-Hned with the uplink pilot beam transmitter at trerectenna, the unwanted contributions of the arrayfactor of the antenna do not lie in the null-pointsof the subarray pattern as shown in figure 3. Eventhough the phase control system will still point thecomposite beam at the rectenna, some energy will betransferred from the main beam into the grating lobes.The amount of energy in the grating lobes dependsupon the misalinement (or how far the array factor isdisplaced from the null points of the subarray patte"These orating lobes are somewhat unique in that theydo not spatially move with misalinement changes,rather they are stationary with an amplitudedependence upon the mechanical misalinements. Thisbehavior is due to the operating characteristics ofthe retrodirective phasing system. From environ-mental considerations the grating lobes are constrain:to be less than .01 mw/cm^. The total mechanicalalinement requirements for both the subarrays andthe total array can be determined from this constraint.If the 10.4 meter X 10.4 meter subarray is considereato be the smallest entity for phase control, thenthe peaks of the grating lobe patterns at the groundare shown in figure 4. Since the distance betweenmaxima for the grating lobes is inversely proportiona'to the spacings between subarrays, a 10.4 meter squaresubarray has peaks every 440 Km. If the phase con-trol system for focusing the downlink beam is ex-tended down to the power tube level, the maximum sub-array size has its linear dimension reduced by afactor of two (there are a minimum of 4 tubes persubarray at the edge of the transmit array). Thegrating lobes would then have peaks spaced a minimumof 880 Km apart.
tttmt % Ciitlit Li»f Cii'MftmtU,
PUI* Ml"
• • o
IM nn jctf t>M M M
Grating lobes, which occur at 440 Km intervalsfrom the rectenna, are functions of subarray size andmechanical misalinement of the subarrays within the1 Km phased array. The grating lobes occur at spatial
arrays add in-phase.
There are two types of mechanical misalinements:1) a systematic tilt of the entire antenna structure,and 2) a random tilt of the individual subarrays.
E.2

An example of the first qra'ting lobe peak for anantenna till of 2 arc-minutes and a random subarraytilt of 3 arc-minutes is shown in figure 5. Othersimulations have established a mechanical aline-nent requirement of 3 arc-minutes for both the sub-irray and array misalinements in order to keep thegrating lobe peaks below .01 mw/cm2. The systematictilts have a greater impact than the random sub-array tilts on the peaks. The alinement
requirement can be writtenp " ••̂ ••̂ 9 9 7
"TOTAL " < 3 m l n ) = "ARRAY + °SUBARRAY (1)Present studies Into the antenna structural designtnd Into techniques for subarray alinement indicatethat the 3 arc-minute requirement should be attain-able (ref 3).
RECTENNA PATTERNSThe present ground receiving antenna (rectenna)
configuration, which receives and rectifies thedownlink power beam, has half-wave dipoles feedingSchottky barrier diodes. Two-stage low-pass filtersbetween the dipoles and diodes suppress harmonicgeneration and provide Impedance matching. A wiremesh screen with 75-8031 optical transparency is usedfor the ground plane. The circular antenna patternfrom a geosynchronous SPS microwave antenna is anellipse at latitudes off the equator. For economicalreasons the rectenna Is a series of serrated sectionsperpendicular to the Incident beam rather than acontinuous structure. The rectenna will produce RFIeffects due to reseattered Incident radiation andharmonic generation within the diodes. There willalso be a small amount of RF energy leakage throughthe ground screen as well as knife edge diffractionpatterns at the top edge of each rectenna section.
To provide an estimate of the power levels aroundthe rectenna, studies Indicate that the dipoles havea 98S collection efficiency under normal loading con-ditions (Ref 4 ) . The 2* reflected microwave powerIs directed upward and towards the southern horizon.
This reflected energy at 2.45 GH7 is only partiallycoherent since the regions of coherence for theIncident beam are limited due to phase irregularitiesin the heated ionosphere and atmosphere.
Harmonics of 2.45 GHz will be generated withinthe half-wave rectifying diodes end will be re-radiated back through the low-pass filters anddipoles. Initial measurements of the harmoniclevels relative to the fundamental indicate the 2nd,3rd, and 4th harmonics are down by -25 dB, -40 dE,and <-70 dB respectively for the normal dipole/diode rectifier configuration (Ref 4). Theseharmonics are radiated *n the direction of the in-coming radiation plus all other spatial directionswhere the energy adds m-phase, provided tneseparation of the dipole elements are in excess ofone wavelength. Since the present configuration hasmultiple dipoles feeding one diode, the separationbetween radiating elements will exceed one wave-length, thus producing multiple harmonic lobesoff-axis.
There will also be leakage power through therectenna. For a ground plane transparency of 80.,approximately IS of the incident power appears asleakage through the wire mesh (Ref 5). This energywill have a maximum of .2 mw/cm2 at the center ofthe rectenna and decrease to .01 mw/cm2 at the edge.
Since the rectenna's receiving surface appearsserrated with individual sections perpendicular tothe incident radiation, there will be diffractionlosses at the top edge of each section. An analysisof the knife edge diffraction pattern has beenmade to determine the variation in power densityIncident upon the adjacent rectenna section (Ref 6).The power density will vary in the shadow region(area behind the rectenna section) as shown infigure 6. It may be necessary to extend the sizeof the rectenna section to intercept part of theshadow region. There will also be energy lost asheat in the rectenna due to I2R losses in the re-ceiving elements and in the diodes. Approximately7% of the incident energy is expected to be lost asheat. Studies into possible weather modificationsdue to this heat dissipation indicate very minimaleffects may be expected (Ref 7). The rectenna isequivalent to a surburban community as a heat source,with little or no detectable changes in weatherpatterns.
The expected power levels around the rectennafor reflected energy, leakage energy, harmonics,diffractions, and heat losses are summarized infigure 6. niwi. •*«««« MI,'M •*< ***** m,'i
E.3
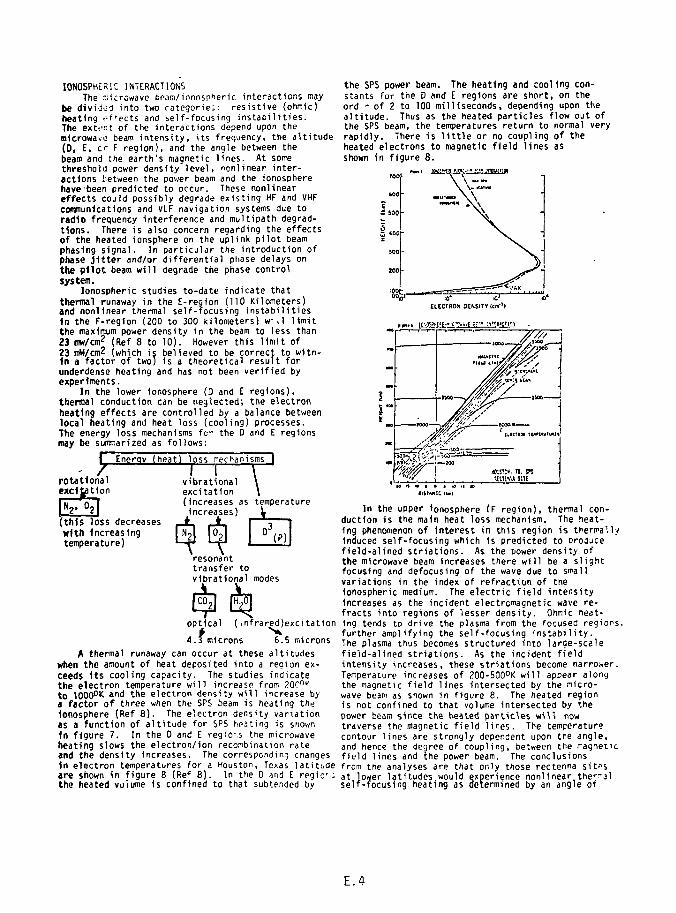
IONOSPHERIC INTERACTIONSThe ~icrowave beam/ionospheric interactions may
be divided into two rategorie;: resistive (ohmic)heating pffects and self-focusing instabilities.The extent of the interactions depend upon themicrowave beam intensity, its frequency, the altitude(0, E, c f region), and the angle between thebeam and the earth's magnetic lines. At somethreshold power density level, "onlinear inter-actions tetween the power beam and the ionospherehave been predicted to occur. These nonlineareffects could possibly degrade existing HF and VHFcommunications and VLF navigation systems due toradio frequency Interference and multipath degrad-tions. There is also concern regarding the effectsof the heated ionsphere on the uplink pilot beamphasing signal. In particular the introduction ofphase jitter and/or differential phase delays onthe pilot beam will degrade the phase controlsystem.
Ionospheric studies to-date indicate thatthermal runaway in the E-region (110 Kilometers)and nonlinear thermal self-focusing instabilitiesIn the F-region (200 to 300 kilometers) w .1 limitthe maximum power density in the beam to less than23 mw/cm2 (Ref 8 to 10). However this limit of23 riW/cm2 (which is believed to be correct to witn-1n a factor of two) is a theoretical result forunderdense heating and has not been verified byexperiments.
In the lower ionosphere (0 and E regions),thermal conduction can be neglected; the electronheating effects are controlled by a balance betweenlocal heating and heat loss (cooling) processes.The energy loss mechanisms fcr the D and E regionsmay be summarized as follows:
I Energy (heat) loss mechanisms I
(this loss decreaseswith Increasingtemperature)
I Ivibrationalexcitation(Increases as temperature.Increases) V
\
(P)
resonanttransfer tovibrational modes
the SPS power beam. The heating and cooling con-stants for the D and E regions are short, on theord - of 2 to 100 milliseconds, depending upon thealtitude. Thus as the heated particles flow out ofthe SPS beam, the temperatures return to normal veryrapidly. There is little or no coupling of theheated electrons to magnetic field lines asshown in figure 8.
optical (infrared)excitationt *"*4.3 microns 6.5 microns
A thermal runaway can occur at these altitudeswhen the amount of heat deposited into a region ex-ceeds Its cooling capacity. The studies indicatethe electron temperature will increase from 200°''to 1000°K and the electron density will increase bya factor of three when the SPS beam is heating theIonosphere (Ref 8 ) . The electron density variationas a function of altitude for SPS heating is shown1n figure 7. In the 0 and E regio-.s the microwaveheating slows the electron/Ion reconbination rateand the density increases. The corresponding changesin electron temperatures for a Houston, Texas latitudeare shown in figure 8 (Ref 8). In the 0 arid E regie:the heated volume Is confined to that subtended by
In the upper Ionosphere (F region), thermal con-duction Is the main heat loss mechanism. The heat-Ing phenomenon of interest in this region is thermallyInduced self-focusing which is predicted to orodjeefield-alined striations. As the power density ofthe microwave beam increases there will be a slightfocusing and defocusing of the wave due to smallvariations in the index of refraction of theIonospheric medium. The electric field intensityIncreases as the incident electromagnetic wave re-fracts into regions of lesser density. Ohmic neat-ing tends to drive the plasma from the focused regions,further amplifying the self-focusing instability.The plasma thus becomes structured into large-scalefield-alined striations. As the incident fieldintensity increases, these striations become narrower.Temperature increases of 200-50O°K will appear alongthe magnetic field lines intersected by the nicro-wave beam as shown in figure 8. The heated regionis not confined to that volume intersected by thepower beam since the heated particles will nowtraverse the magnetic field lines. The temperaturecontour lines are strongly dependent upon the angle,and hence the degree of coupling, between the ragneucfield lines and the power beam. The conclusionsfrom the analyses are that only those rectenna sit«sat lower latitudes would experience nonlinear the^-alself-focusing heating as determined by an angle of
E.4

incidence of seven degrees or less between themicrowave beam and the earth's magnetic field lines(Ref 8).
The theoretical results indicate that a micro-wave power density of 20-25 mW/cmz is the thresholdfor achieving thermal runaway in the D and E regionsand thermal self-focusing 1n the F-region (with theadded requirement of 70 or less as the angle betweenthe power beam and the magnetic field Hnes).Experimentally, a series of tests were conducted atthe Arecibo Observatory, Puerto Rico, in June 1977,under the direction of Dr. W. Gordon of RiceUniversity to heat the Ionosphere and to look forpossible communications effects. Heating frequenciesof 10 MHz, 430 MHz, and 2380 MHz were used to simu-late SPS heating effects. Using the existingfacilities at Arecibo thp hpat input levels werebelow the equivalent SPS levels and the heated vol-ume was smaller. For these conditions and employinga diagnostic radar properly located to detect anyfield-alined striations, nr thermal runaways in theD and E regions nor thermal self-focusing instabilit-ies 1n the F region were observed. In addition nocommunication effects were detected.
A series of tests have been proposed usinghigher powers to equal or exceed the equivalent SPSheating levels ir order to simulate the conditionsmore closely of the solar power satellite. Theseexperiments could involve communications and dia-nostic tests at several facilities over the nextseveral years, with the objectives of determiningthe extent of the Ionosphere/microwave beam inter-actions and any effects on communications/navigationsystems.
The question of phase perturbations induced up-on the uplink pilot beam by the heated ionosphereIs also under study now. Previously, there had beenevidence of.scintillations produced by a normalIonosphere on microwave signals between geosynchronoussatellites and the ground (Ref 11). However, thesescintillations usually occur at ground stations inthe tropics, in the early evening, and at the timesof equinox. For the SPS pilot beam system, theregion of interest 1n the heated ionosphere is a10 meter diameter spot around boresight. This 10meter circle is the geonictrical area subtended inthe Ionosphere by the 1 Km transmit array at thegeosynchronous satellite as shown below. Thecorresponding angle (9) subtended by the 1 Km arrayIs (0) • Sin"' i Km/36,000 Km = .0016° which, for anIonospheric mean height of 360 Km, subtends a 10meter diameter area. „
M.OOO «•
MO M i
i ?
The Ionosphere cgradations to the updifferential phase tsight misalinement),must be included in10° for the phase c<variations (resulti1
receivers in the trdetermine the maximpermissible by thethe downlink power7220 subarrays willin the ionosphere Udipole) at the recttat the rectenna of *•addition to the 50
induce several types ' de-"k pilot beam Includir.9i}'. (which results in bore-jnJom phase jitter (whichp RMS phase error budget ofrol system), and amplitudein AM-to-PM conversion at the1 it array). In order todifferential phase delaysjsphere, let us first look atn. All the beams from the.0 go through a 10 meter spot:ach a point source (one>. For a beam displacement•eters (which would be In
cer displacement produced bythe previously disclosed 2° mean phase buildupspecification on the transmit antenna), thecorresponding differential phase delay, S, inelectrical degrees is S = 360° (X/.1225 m) whereX/10 meters = 50 meters/360 Km or B • 4.08° acrossthe 10 meter area.
On the uplink beam, if there is a corresponding4° differential delay through the 10 meter area,then a distance, D, where 0 ~ (36,000 Km) (50/360 Km)• 5 Km. Thus the uplink boresight beam will beshifted 5 Km from the transmit array as shown in thediagram. The 10 meter spot in the ionosphere thatis actually incident upon the satellite's transmitarray is shifted from boresight by
fj60 Km "IflO =136,000 Km] 5 Km • 50 meters 1n the ionosphere.
The allowable differential phase delay (on bothuplink and downlink signals) through a 10 meter dia-meter area in the heated ionosphere is 4°. Pre-liminary studies indicate the actual delay may besmaller by several orders of magnitude (Ref 12).
The pilot beam/ionosphere differential delayrelationships may be summarized as follows:The uplink pilot signal and the downlink power beamsfrom each of the 7220 subarrays to a single dipoleelement at the rectenna will intersect a 10 r.eterdiameter area in the ionosphere. For a differentialphase delay of 4° across this 10 meter area, tnedownlink beam will be shifted by 50 meters (whichhas been taken as the alinement requirement foreach source of error). The spatial portion of up-link pilot signal that intersects the transmitantenna will be shifted 50 meters from true Dare-sight. This shift will introduce an additional 50meter alinement error in the retrodirective piasecontrol system. (The fact that the uplink pilotand downlink power beam do not transverse the samepaths through the ionosphere does not present aproblem. After the retrodirective beam leaves thesatellite antenna, the required areas of coherenceare limited to 10 meter diameter sections in theionosphere.)
The ionosphere puts an additional constraint onthe uplink pilot beam signal. The present pilotbeam system has double-sideband, suppressed earnermodulation which is symmetrical about the downlinkpower beam frequency, f^, as shown below:
MODULATION
I on Uplink Pilot
E.5

The two sidebands are-demodulated in the RF re-ceivers in the subarrays and the carrier Is recon-structed. The ionosphere constrains the frequencyseparation if between the upper and lower sidebandsand the downlink carrier to be greater than themaximum plasma resonance frequency (about 10 MHz).This limitation is to prevent intermodulation pro-ducts between the uplink pilot beam and the down-link power beam from creating parametric Instabili-ties associated with overdense ionospheric heating.
RFI CONSIDERATIONSThe radio-frequency interference comes primarily
from the DC-RF power conterter tubes. This inter-ference can be divided into three main categories:(1) interference from the nigh power downlink beamdue to sidelobe and grating lobe radiations, (2)spurious noise generated near the carrier frequencyby the tubes, and (3) harmonic generation withinthe tubes.
The sidelobe and grating lobe levels were pre-viously examined, with the results given in figures1 to 4. The phase noise characteristics for aVarian V-58 klystron as a function of frequency isshown in figure 10. The SPS phase control systenwill probably have a phase lock loop (PLL) aroundeach power tube to provide frequency and phasestability and to reduce the output noise. Arepresentative loop would have a 5 MHz bandwidth,with a 2nd or 3rd order filter. The phase noisespectral density out of the tube would be reducedas shown. This PLL filtering will reduce the noiseclose to the carrier frequency, but we'd not affectthe noise characteristics outside the 2450 + 50MHz band.
The SPS configuration has a 10 dB Gaussian taperfor the aperture illumination which means that thepower radiated at the center of the antenna is 10times that radiated at the edge. However, it can be
LIs
•10
- i r
. 1W
. m
-
i • i i i i i
•"— twtf C- - - U N *
ph*ttH i S " M ,
Iocs loch
y • . •
Ftlurt 10. Kljrltfflfi HOtll CliirjCtCrtftfCI
shown that, for noise power calculations, uniformIllumination fs a good approximation. The averageantenna area illuminated by a single klystron with-in the 1 Km array is r(50O)'/9O,O0O klystrons or8.7 m' per klystron. For the conditon of no mutualcoupling between klystrons, the effective antennagain 1s given by
where A = antenna area (8.7 m ), A = wavelei.cjth(.1225m), N = coherency factor (.5)Since there will De 90.' 00 klystrons in the antennafor the 5 Gw system. (.hi.- total power density genera-ted within the antenna will be
PN = (# of klystrcns; (signal power/klystron)(Noise Spectrai lensity)
= (90,000) (72.001) (-160 dB/Hz)= -61.9 dBW/Hz (3)
The noise spectral rensity at the ground isPu_r , P., GN/4TTR
2 "- -187.4 dBW/mVHz.rN-G. rNThe CCIR (Internet--mal Radio Consultative
Committee) requirements for power flux density at theearth's surface is -180 dBW/m'/Hz for S-band frequence;with an angle oT arrival above 25 . Trie klystrontubes will have a multiple cavity design which pro-vides additional filtering to reduce out-of-bandnoise. Using a 24 dB/octave attenuation characteristicfor multiple cavities, the SPS noise characteristicsare shown in figure 11. Summarizing, the RFI effectsdue to spurious noise will be below the CCIR require-ments, provided the klystrons tubes are phase-lockedfor noise reduction and a multiple cavity designis used.
CtlUC'l W
l*0O-l«?f K
Rricntntf
IftfrO- It.70 »«
I«O 4000 P
••' It
fi IL i '
»r tI t n
: : )
•ilkftitCHI
/<Jro9*B
f l rOl f l)
t
i
-IW
•;on
•!2O
-?<0
-?K)
• ? K
-JOO
• ]7O
j ursT*l— — —
i
i
i
i •
i
I
—
lndj t t '1«l B«nd
... - j• 10
FSIOUIUCI
_ _
i
CCIH Rf»
• ; ' — -
]r• 100 »10D?
GN •= 4nAH/r = 3650, or 35.6 dB (2)
t r ' r r t n < r i
J. Sol«r Potr' l i t p l n t f s T i t t * OeHntcon '.tudr Vo' IV. P j ' l 1.MSA Conlr«cl MS 9 - n t H . Boc*ig itrn%Mct U> . S e t t l l r . ¥itf> ,
Otc H "
1. 'Acrnniblf fl*trc\t In t l i^c *Hr<*i<rt fgit' Antfni.' MAS f-lS4?3.K1d-Ur« Progrftt Rrport. C F " " , 1 D/f>«niC1. p^r[n 1970
**t#)»1oa Ifro.in*l o* • t'tC-'iV*Ct »<tCrO"«WC f>Cmtr t r * n u - I n 10"Syttr". ' MS* B^porl CP t J5194 . <ug 1. t«/?
IflpiCti l id B f n ( ' H i , " J*t Propulsion HborHory, PiUOerij,Uttt., Itpl I9H
Srs RfCtennt* To be Published
1. •Prt11»-1n«r7 Study of Paui&'e Wnthrf I f f e c t i «Jf to Solir »o^r
St te l i l t r Rectfni* 0fcri*1(Jfl- JSC [n t t rm: Ho:c I /SI9, i*"0jt)ttnrd
Icitn !ntpr#ct io Study." hAS 9-1 S?1 ?. Rue Uni«cr ju / . Horn ton.
T«i4l, SrpI- 197?
f . f . U. Perkloi «nd It G •ob'f . *lo"0iphff1c Krit^ng by RidiOwivCI:
J . Ccop»yilC*t l u f i r c f i . (lo t t Poblnhel)
10. I . H. K<.1»jy, A M. K*ty, G Meltf, "lonoip^rrU F ' f f t U o' I
Hv^orandu^ 1-1028. w*)th«m. M. * . . Nav 19/7.
11. 'Jotn>iptcrr/Hicrowt»t &*•**• lotfr jct ion SluOy." HAS 9- ISZI i . Dtc. 1977,HontMy Proyrm Report, fiu* Un iver iU / . Ore. 19/7.
12. W. E. Cordon, RU» U n i o f n U ; , pr1.* t * corruntcttion, H*rch 1978.
E.6

ACKNOWLEDGMENTS
The editors wish to thank the National Academy of Sciences, and G. D. Arndtand L. Leopold of the Johnson Space Center for permission to reproduce materialin Appendices D and E. Thanks are also extended to the International RadioConsultative Committee for permission to reproduce reports in Appendices A andB. We would also like to thank R. A. Stokes who organized the workshop, andthose who assisted in the preparation of this report, 6. Long, L. Foley,T. Jewell and V. Tarr.
• U . S . OOVHUetENT PRINTING OFTICE : 1980 0 - 6 3 0 - J O } / } *
255